UNITED STATES
SECURITIES AND EXCHANGE COMMISSION
Washington, D.C. 20549
FORM N-CSR
CERTIFIED SHAREHOLDER REPORT OF REGISTERED
MANAGEMENT INVESTMENT COMPANIES
Investment Company Act file number: 811-23117
JPMorgan Trust IV
(Exact name of registrant as specified in charter)
270 Park Avenue
New York, NY 10017
(Address of principal executive offices) (Zip code)
Noah D. Greenhill, Esq.
270 Park Avenue
New York, NY 10017
(Name and Address of Agent for Service)
Registrant’s telephone number, including area code: (800) 480-4111
Date of fiscal year end: Last day of February
Date of reporting period: March 1, 2018 through August 31, 2018
Form N-CSR is to be used by management investment companies to file reports with the Commission not later than 10 days after the transmission to stockholders of any report that is required to be transmitted to stockholders under Rule 30e-1 under the Investment Company Act of 1940 (17 CFR 270.30e-1). The Commission may use the information provided on Form N-CSR in its regulatory, disclosure review, inspection, and policymaking roles.
A registrant is required to disclose the information specified by Form N-CSR, and the Commission will make this information public. A registrant is not required to respond to the collection of information contained in Form N-CSR unless the Form displays a currently valid Office of Management and Budget (“OMB”) control number. Please direct comments concerning the accuracy of the information collection burden estimate and any suggestions for reducing the burden to Secretary, Securities and Exchange Commission, 450 Fifth Street, NW, Washington, DC 20549-0609. The OMB has reviewed this collection of information under the clearance requirements of 44 U.S.C. Section 3507.
ITEM 1. REPORTS TO STOCKHOLDERS.
The following is a copy of the report transmitted to shareholders pursuant to Rule 30e-1 under the Investment Company Act of 1940 (17 CFR 270.30e-1).
Semi-Annual Report
J.P. Morgan Money Market Funds
August 31, 2018 (Unaudited)
JPMorgan Prime Money Market Fund
JPMorgan Institutional Tax Free Money Market Fund
JPMorgan Liquid Assets Money Market Fund
JPMorgan U.S. Government Money Market Fund
JPMorgan U.S. Treasury Plus Money Market Fund
JPMorgan Federal Money Market Fund
JPMorgan 100% U.S. Treasury Securities Money Market Fund
JPMorgan Tax Free Money Market Fund
JPMorgan Municipal Money Market Fund

CONTENTS
The following disclosure applies to the JPMorgan Liquid Assets Money Market Fund, JPMorgan Tax Free Money Market Fund and the JPMorgan Municipal Money Market Fund.
You could lose money by investing in a Fund. Although each Fund seeks to preserve the value of your investment at $1.00 per share, it cannot guarantee it will do so. A Fund may impose a fee upon the sale of your shares or may temporarily suspend your ability to sell shares if the Fund’s liquidity falls below required minimums because of market conditions or other factors. An investment in a Fund is not insured or guaranteed by the Federal Deposit Insurance Corporation or any other government agency. The Funds’ sponsor has no legal obligation to provide financial support to the Funds, and you should not expect that the sponsor will provide financial support to the Funds at any time.
The following disclosure applies to the JPMorgan Prime Money Market Fund and JPMorgan Institutional Tax Free Money Market Fund.
You could lose money by investing in a Fund. Because the share price of each Fund will fluctuate, when you sell your shares they may be worth more or less than what you originally paid for them. A Fund may impose a fee upon the sale of your shares or may temporarily suspend your ability to sell shares if the Fund’s liquidity falls below required minimums because of market conditions or other factors. An investment in a Fund is not insured or guaranteed by the Federal Deposit Insurance Corporation or any other government agency. The Funds’ sponsor has no legal obligation to provide financial support to the Funds, and you should not expect that the sponsor will provide financial support to the Funds at any time.
Any gain resulting from the sale or exchange of Fund shares will be taxable as long-term or short-term gain, depending upon how long you have held your shares.
The following disclosure applies to the JPMorgan U.S. Government Money Market Fund, JPMorgan U.S. Treasury Plus Money Market Fund, JPMorgan Federal Money Market Fund and the JPMorgan 100% U.S. Treasury Securities Money Market Fund.
You could lose money by investing in a Fund. Although each Fund seeks to preserve the value of your investment at $1.00 per share, it cannot guarantee it will do so. An investment in a Fund is not insured or guaranteed by the Federal Deposit Insurance Corporation or any other government agency. The Funds’ sponsor has no legal obligation to provide financial support to the Funds, and you should not expect that the sponsor will provide financial support to the Funds at any time.
Past performance is no guarantee of future performance. The general market views expressed in this report are opinions based on market and other conditions through the end of the reporting period and are subject to change without notice. These views are not intended to predict the future performance of a Fund or the securities markets. References to specific securities and their issuers are for illustrative purposes only and are not intended to be, and should not be interpreted as, recommendations to purchase or sell such securities. Such views are not meant as investment advice and may not be relied on as an indication of trading intent on behalf of any Fund.
Prospective investors should refer to the Funds’ prospectuses for a discussion of the Funds’ investment objectives, strategies and risks. Call J.P. Morgan Funds Service Center at 1-800-480-4111 (retail investors) or 1-800-766-7722 (institutional investors) for a prospectus containing more complete information about a Fund, including management fees and other expenses. Please read it carefully before investing.
CEO’S LETTER
October 9, 2018 (Unaudited)
Dear Shareholder,
The world’s leading economies continued to expand in the six months ended August 31, 2018, though the pattern of synchronized global growth that had characterized the previous two years began to dissipate amid geopolitical tensions and rising borrowing costs for emerging market nations.
| | |
 | | “During the reporting period, the current U.S. economic expansion became the second longest on record.” — George C.W. Gatch |
U.S. gross domestic product (GDP) growth surged to 4.2% in the second quarter of 2018 from 2.2% in the first quarter. Notably, unemployment stood at 3.9% in August, though wage growth remained subdued. While the U.S. raised import tariffs on Chinese goods worth billions of dollars and the Chinese government responded in kind during the reporting period, trade tensions with China and other U.S. trading partners appeared to have little impact on business sentiment in the U.S. In response to continued economic growth and falling unemployment, the U.S. Federal Reserve raised benchmark interest rates in March and again in June. (Subsequent to the end of the reporting period, the central bank raised interest rates in September 2018.)
In the European Union, positive economic growth was clouded by political uncertainty. Second quarter GDP rose 2.1%, though core inflation remained below the European Central Bank’s (ECB) target rate. Unemployment in the 19-nation euro area fell to 8.1% in August, the lowest level since November 2008. However, a new government in Italy raised investor concerns that its budget plans would deviate from the European Commission’s stability and growth pact and force the commission to enact punitive measures. Against this backdrop, the ECB held to its plan to maintain interest rates at current levels until at least next summer. Meanwhile, negotiations over the U.K.’s exit from the European Union continued without resolution, raising political tensions between leaders in the EU and the U.K. as well as within the Britain’s ruling Conservative Party.
While trade tensions led to a decline in Chinese exports to the U.S., the Chinese government took steps to further stimulate domestic demand and capital outflows from China appeared limited at the end of the reporting period.
Meanwhile, select emerging market nations saw the value of their currencies and their sovereign debt plummet. Nations dependent on foreign lending and imported petroleum were hit hardest by rising U.S. interest rates and a strengthening U.S. dollar that effectively raised borrowing costs. The economies of Argentina, Brazil, South Africa and Turkey were among those hurt by rising borrowing costs and/or political uncertainty.
In financial markets, U.S. equities largely recovered from a sharp sell-off in February 2018 and outperformed other regions and other asset classes. Record corporate earnings, strong consumer spending and positive economic data bolstered equity prices and pushed the S&P 500 Index to record highs in August. Equity prices in other developed markets were weak and prices fell sharply in emerging markets. Bond markets were mixed, with limited positive returns in select U.S. Treasury bonds and U.S. high yield bonds (also called “junk bonds”) and negative returns for emerging markets debt. Notably, global energy prices rose somewhat during the reporting period, which supported oil exporting economies without becoming a large drag on global economic growth.
During the reporting period, the current U.S. economic expansion became the second longest on record. While the underlying fundamentals of continued global economic growth remained in place at the end of August, the longer-term impact of protectionist U.S. trade policy and the extent of currency devaluation in emerging markets were key issues looming over global financial markets.
We believe that investors may be best served by a well-diversified portfolio and a patient outlook. We look forward to managing your investment needs for years to come. Should you have any questions, please visit www.jpmorganfunds.com or contact the J.P. Morgan Funds Service Center at 1-800-480-4111.
Sincerely yours,

George C.W. Gatch
CEO, Global Funds Management
J.P. Morgan Asset Management
| | | | | | | | |
| | | |
| AUGUST 31, 2018 | | J.P. MORGAN MONEY MARKET FUNDS | | | | | 1 | |
JPMorgan Prime Money Market Fund
FUND FACTS
SIX MONTHS ENDED AUGUST 31, 2018 (Unaudited)
| | |
| Objective | | Seeks current income while seeking to maintain liquidity and a low volatility of principal |
| Primary Investments | | High quality, short-term, U.S. dollar-denominated money market instruments |
| Suggested investment time frame | | Short-term |
| Share classes offered | | Class C, Agency, Capital, IM, Institutional Class, Morgan, Premier and Reserve |
| Net Assets as of August 31, 2018 | | $43.6 Billion |
| Weighted Average Maturity^ | | 25 calendar days |
| Weighted Average Life^^ | | 74 calendar days |
| | | | |
MATURITY SCHEDULE*^ | |
| 2–7 calendar days | | | 40.9 | % |
| 8–30 calendar days | | | 36.2 | |
| 31–60 calendar days | | | 9.0 | |
| 61–90 calendar days | | | 9.0 | |
| 91–180 calendar days | | | 4.6 | |
| 181+ calendar days | | | 0.3 | |
| | | | |
7-DAY SEC YIELD AS OF AUGUST 31, 2018(1) | |
| Class C Shares | | | 1.28 | % |
| Agency Shares | | | 2.00 | |
| Capital Shares | | | 2.09 | |
| IM Shares | | | 2.11 | |
| Institutional Class Shares | | | 2.05 | |
| Morgan Shares | | | 1.74 | |
| Premier Shares | | | 1.81 | |
| Reserve Shares | | | 1.56 | |
The performance quoted is past performance and is not a guarantee of future results. Mutual funds are subject to certain market risks. Investment returns and principal value of an investment will fluctuate so that an investor’s shares, when redeemed, may be worth more or less than their original cost. Current performance may be higher or lower than the performance data shown. For up-to-date month-end performance information please call 1-800-480-4111 (retail investors) or 1-800-766-7722 (institutional investors).
An investment in a money market fund is not insured by the FDIC or any other government agency.
| ^ | The calculation takes into account the period remaining until the date on which, in accordance with the terms of the security, the principal amount must unconditionally be paid, or in the case of a security called for redemption, the date on which the redemption payment must be made and may utilize the interest rate reset date for variable or floating rate securities. |
| ^^ | The calculation takes into account the period remaining until the date on which, in accordance with the terms of the security, the principal amount must unconditionally be paid, or in the case of a security called for redemption, the date on which the redemption payment must be made. |
| * | Percentages indicated are based upon total investments as of August 31, 2018. |
| (1) | The yields for Class C Shares, Agency Shares, Capital Shares, IM Shares, Institutional Class Shares, Morgan Shares, Premier Shares and Reserve Shares reflect the reimbursements and/or waivers of certain expenses. Without these reimbursements and/or waivers, the yields would have been (0.74)%, 1.95%, 2.06%, 2.11%, 2.00%, 1.73%, 1.80% and 1.45% for Class C Shares, Agency Shares, Capital Shares, IM Shares, Institutional Class Shares, Morgan Shares, Premier Shares and Reserve Shares, respectively. |
| | An unaudited, uncertified list of prior-day portfolio holdings of the JPMorgan Prime Money Market Fund is available upon request. Please contact your J.P. Morgan representative to obtain further information regarding this facility and information on holdings. |
| | | | | | |
| | | |
| 2 | | | | J.P. MORGAN MONEY MARKET FUNDS | | AUGUST 31, 2018 |
JPMorgan Institutional Tax Free Money Market Fund
FUND FACTS
SIX MONTHS ENDED AUGUST 31, 2018 (Unaudited)
| | |
| Objective | | Seeks current income while seeking to maintain liquidity and a low volatility of principal |
| Primary Investments | | High quality short-term municipal securities, the interest on which is excluded from federal income taxes |
| Suggested investment time frame | | Short-term |
| Share classes offered | | Agency, Capital, IM and Institutional Class |
| Net Assets as of August 31, 2018 | | $600.9 Million |
| Weighted Average Maturity^ | | 11 calendar days |
| Weighted Average Life^^ | | 16 calendar days |
| | | | |
MATURITY SCHEDULE*^ | |
| 2–7 calendar days | | | 28.6 | % |
| 8–30 calendar days | | | 58.7 | |
| 31–60 calendar days | | | 12.7 | |
| | | | |
7-DAY SEC YIELD AS OF AUGUST 31, 2018(1) | |
| Agency Shares | | | 1.30 | % |
| Capital Shares | | | 1.38 | |
| IM Shares | | | 1.40 | |
| Institutional Class Shares | | | 1.35 | |
The performance quoted is past performance and is not a guarantee of future results. Mutual funds are subject to certain market risks. Investment returns and principal value of an investment will fluctuate so that an investor’s shares, when redeemed, may be worth more or less than their original cost. Current performance may be higher or lower than the performance data shown. For up-to-date month-end performance information please call 1-800-480-4111 (retail investors) or 1-800-766-7722 (institutional investors).
An investment in a money market fund is not insured by the FDIC or any other government agency.
| ^ | The calculation takes into account the period remaining until the date on which, in accordance with the terms of the security, the principal amount must unconditionally be paid, or in the case of a security called for redemption, the date on which the redemption payment must be made and may utilize the interest rate reset date for variable or floating rate securities. |
| ^^ | The calculation takes into account the period remaining until the date on which, in accordance with the terms of the security, the principal amount must unconditionally be paid, or in the case of a security called for redemption, the date on which the redemption payment must be made. |
| * | Percentages indicated are based upon total investments as of August 31, 2018. |
| (1) | The yields for Agency Shares, Capital Shares, IM Shares and Institutional Class Shares reflect the reimbursements and/or waivers of certain expenses. Without these reimbursements and/or waivers, the yields would have been 1.30%, 1.38%, 1.40% and 1.35% for Agency Shares, Capital Shares, IM Shares and Institutional Class Shares, respectively. |
| | An unaudited, uncertified list of prior-day portfolio holdings of the JPMorgan Institutional Tax Free Money Market Fund is available upon request. Please contact your J.P. Morgan representative to obtain further information regarding this facility and information on holdings. |
| | | | | | | | |
| | | |
| AUGUST 31, 2018 | | J.P. MORGAN MONEY MARKET FUNDS | | | | | 3 | |
JPMorgan Liquid Assets Money Market Fund
FUND FACTS
SIX MONTHS ENDED AUGUST 31, 2018 (Unaudited)
| | |
| Objective | | Seeks current income with liquidity and stability of principal |
| Primary Investments | | High quality, short-term instruments including corporate notes, U.S. government securities, asset-backed securities, repurchase agreements, commercial paper, funding agreements, certificates of deposit, municipal obligations and bank obligations |
| Suggested investment time frame | | Short-term |
| Share classes offered | | Class C, Agency, Capital, E*Trade^, Institutional Class, Investor, Morgan, Premier and Reserve Shares |
| Net Assets as of August 31, 2018 | | $3.2 Billion |
| Weighted Average Maturity^^ | | 27 calendar days |
| Weighted Average Life^^^ | | 67 calendar days |
| | | | |
MATURITY SCHEDULE*^^ | |
| 2–7 calendar days | | | 42.6 | % |
| 8–30 calendar days | | | 28.2 | |
| 31–60 calendar days | | | 14.5 | |
| 61–90 calendar days | | | 7.7 | |
| 91–180 calendar days | | | 6.8 | |
| 181+ calendar days | | | 0.2 | |
| | | | |
7-DAY SEC YIELD AS OF AUGUST 31, 2018(1) | |
| Class C Shares | | | 1.28 | % |
| Agency Shares | | | 2.00 | |
| Capital Shares | | | 2.08 | |
| Institutional Class Shares | | | 2.05 | |
| Investor Shares | | | 1.74 | |
| Morgan Shares | | | 1.66 | |
| Premier Shares | | | 1.80 | |
| Reserve Shares | | | 1.55 | |
The performance quoted is past performance and is not a guarantee of future results. Mutual funds are subject to certain market risks. Investment returns and principal value of an investment will fluctuate so that an investor’s shares, when redeemed, may be worth more or less than their original cost. Current performance may be higher or lower than the performance data shown. For up-to-date month-end performance information please call 1-800-480-4111 (retail investors) or 1-800-766-7722 (institutional investors).
An investment in a money market fund is not insured by the FDIC or any other government agency. Although money market funds strive to preserve the value of the investment at $1.00 per share, it is possible to lose money by investing in a money market fund.
| ^ | E*Trade Shares had no assets from the close of business on October 19, 2016. |
| ^^ | The calculation takes into account the period remaining until the date on which, in accordance with the terms of the security, the principal amount must unconditionally be paid, or in the case of a security called for redemption, the date on which the redemption payment must be made and may utilize the interest rate reset date for variable or floating rate securities. |
| ^^^ | The calculation takes into account the period remaining until the date on which, in accordance with the terms of the security, the principal amount must unconditionally be paid, or in the case of a security called for redemption, the date on which the redemption payment must be made. |
| * | Percentages indicated are based upon total investments as of August 31, 2018. |
| (1) | The yields for Class C Shares, Agency Shares, Capital Shares, Institutional Class Shares, Investor Shares, Morgan Shares, Premier Shares and Reserve Shares reflect the reimbursements and/or waivers of certain expenses. Without these reimbursements and/or waivers, the yields would have been 1.08%, 1.94%, 2.05%, 2.00%, 1.74%, 1.63%, 1.78% and 1.54% for Class C Shares, Agency Shares, Capital Shares, Institutional Class Shares, Investor Shares, Morgan Shares, Premier Shares and Reserve Shares, respectively. |
| | An unaudited, uncertified list of prior-day portfolio holdings of the JPMorgan Liquid Assets Money Market Fund is available upon request. Please contact your J.P. Morgan representative to obtain further information regarding this facility and information on holdings. |
| | | | | | |
| | | |
| 4 | | | | J.P. MORGAN MONEY MARKET FUNDS | | AUGUST 31, 2018 |
JPMorgan U.S. Government Money Market Fund
FUND FACTS
SIX MONTHS ENDED AUGUST 31, 2018 (Unaudited)
| | |
| Objective | | Seeks high current income with liquidity and stability of principal |
| Primary Investments | | High quality, short-term securities issued or guaranteed by the U.S. government or by U.S. government agencies or instrumentalities and repurchase agreements collateralized by such obligations |
| Suggested investment time frame | | Short-term |
| Share classes offered | | Agency, Capital, Direct^, Eagle Class, Eagle Private Wealth Class, E*Trade, IM, Institutional Class, Investor, Morgan, Premier, Reserve and Service Shares |
| Net Assets as of August 31, 2018 | | $133.1 Billion |
| Weighted Average Maturity^^ | | 30 calendar days |
| Weighted Average Life^^^ | | 86 calendar days |
| | | | |
MATURITY SCHEDULE*^^ | |
| 2–7 calendar days | | | 55.2 | % |
| 8–30 calendar days | | | 21.5 | |
| 31–60 calendar days | | | 4.8 | |
| 61–90 calendar days | | | 8.0 | |
| 91–180 calendar days | | | 7.8 | |
| 181+ calendar days | | | 2.7 | |
| | | | |
7-DAY SEC YIELD AS OF AUGUST 31, 2018(1) | |
| Agency Shares | | | 1.77 | % |
| Capital Shares | | | 1.86 | |
| Eagle Class Shares | | | 1.33 | |
| Eagle Private Wealth Class Shares | | | 1.73 | |
| E*Trade Shares | | | 1.02 | |
| IM Shares | | | 1.88 | |
| Institutional Class Shares | | | 1.82 | |
| Investor Shares | | | 1.53 | |
| Morgan Shares | | | 1.44 | |
| Premier Shares | | | 1.58 | |
| Reserve Shares | | | 1.33 | |
| Service Shares | | �� | 0.97 | |
The performance quoted is past performance and is not a guarantee of future results. Mutual funds are subject to certain market risks. Investment returns and principal value of an investment will fluctuate so that an investor’s shares, when redeemed, may be worth more or less than their original cost. Current performance may be higher or lower than the performance data shown. For up-to-date month-end performance information please call 1-800-480-4111 (retail investors) or 1-800-766-7722 (institutional investors).
An investment in a money market fund is not insured by the FDIC or any other government agency. Although money market funds strive to preserve the value of the investment at $1.00 per share, it is possible to lose money by investing in a money market fund.
| ^ | Direct Shares had no assets from the close of business on November 22, 2017. |
| ^^ | The calculation takes into account the period remaining until the date on which, in accordance with the terms of the security, the principal amount must unconditionally be paid, or in the case of a security called for redemption, the date on which the redemption payment must be made and may utilize the interest rate reset date for variable or floating rate securities. |
| ^^^ | The calculation takes into account the period remaining until the date on which, in accordance with the terms of the security, the principal amount must unconditionally be paid, or in the case of a security called for redemption, the date on which the redemption payment must be made. |
| * | Percentages indicated are based upon total investments as of August 31, 2018. |
| (1) | The yields for Agency Shares, Capital Shares, Eagle Class Shares, Eagle Private Wealth Class Shares, E*Trade Shares, IM Shares, Institutional Class Shares, Investor Shares, Morgan Shares, Premier Shares, Reserve Shares and Service Shares reflect the reimbursements and/or waivers of certain expenses. Without these reimbursements and/or waivers, the yields would have been 1.73%, 1.83%, 1.33%, 1.73%, 0.96%, 1.88%, 1.77%, 1.53%, 1.42%, 1.57%, 1.32% and 0.97% for Agency Shares, Capital Shares, Eagle Class Shares, Eagle Private Wealth Class Shares, E*Trade Shares, IM Shares, Institutional Class Shares, Investor Shares, Morgan Shares, Premier Shares, Reserve Shares and Service Shares, respectively. |
| | An unaudited, uncertified list of prior-day portfolio holdings of the JPMorgan U.S. Government Money Market Fund is available upon request. Please contact your J.P. Morgan representative to obtain further information regarding this facility and information on holdings. |
| | | | | | | | |
| | | |
| AUGUST 31, 2018 | | J.P. MORGAN MONEY MARKET FUNDS | | | | | 5 | |
JPMorgan U.S. Treasury Plus Money Market Fund
FUND FACTS
SIX MONTHS ENDED AUGUST 31, 2018 (Unaudited)
| | |
| Objective | | Seeks current income with liquidity and stability of principal |
| Primary Investments | | Direct obligations of the U.S. Treasury including Treasury bills, bonds and notes and other obligations issued or guaranteed by the U.S. Treasury and repurchase agreements collateralized by U.S. Treasury securities |
| Suggested investment time frame | | Short-term |
| Share classes offered | | Class C, Agency, Capital, Direct^, IM, Institutional Class, Investor, Morgan, Premier and Reserve Shares |
| Net Assets as of August 31, 2018 | | $25.0 Billion |
| Weighted Average Maturity^^ | | 15 calendar days |
| Weighted Average Life^^^ | | 88 calendar days |
| | | | |
MATURITY SCHEDULE*^^ | |
| 2–7 calendar days | | | 79.6 | % |
| 8–30 calendar days | | | 9.6 | |
| 31–60 calendar days | | | 2.5 | |
| 61–90 calendar days | | | 1.8 | |
| 91–180 calendar days | | | 6.5 | |
| | | | |
7-DAY SEC YIELD AS OF AUGUST 31, 2018(1) | |
| Class C Shares | | | 1.06 | % |
| Agency Shares | | | 1.78 | |
| Capital Shares | | | 1.86 | |
| IM Shares | | | 1.88 | |
| Institutional Class Shares | | | 1.83 | |
| Investor Shares | | | 1.53 | |
| Morgan Shares | | | 1.44 | |
| Premier Shares | | | 1.58 | |
| Reserve Shares | | | 1.33 | |
The performance quoted is past performance and is not a guarantee of future results. Mutual funds are subject to certain market risks. Investment returns and principal value of an investment will fluctuate so that an investor’s shares, when redeemed, may be worth more or less than their original cost. Current performance may be higher or lower than the performance data shown. For up-to-date month-end performance information please call 1-800-480-4111 (retail investors) or 1-800-766-7722 (institutional investors).
An investment in a money market fund is not insured by the FDIC or any other government agency. Although money market funds strive to preserve the value of the investment at $1.00 per share, it is possible to lose money by investing in a money market fund.
| ^ | Direct Shares had no assets from the close of business on November 22, 2017. |
| ^^ | The calculation takes into account the period remaining until the date on which, in accordance with the terms of the security, the principal amount must unconditionally be paid, or in the case of a security called for redemption, the date on which the redemption payment must be made and may utilize the interest rate reset date for variable or floating rate securities. |
| ^^^ | The calculation takes into account the period remaining until the date on which, in accordance with the terms of the security, the principal amount must unconditionally be paid, or in the case of a security called for redemption, the date on which the redemption payment must be made. |
| * | Percentages indicated are based upon total investments as of August 31, 2018. |
| (1) | The yields for Class C Shares, Agency Shares, Capital Shares, IM Shares, Institutional Class Shares, Investor Shares, Morgan Shares, Premier Shares and Reserve Shares reflect the reimbursements and/or waivers of certain expenses. Without these reimbursements and/or waivers, the yields would have been 0.87%, 1.73%, 1.86%, 1.88%, 1.79%, 1.53%, 1.42%, 1.57% and 1.33% for Class C Shares, Agency Shares, Capital Shares, IM Shares, Institutional Class Shares, Investor Shares, Morgan Shares, Premier Shares and Reserve Shares, respectively. |
| | An unaudited, uncertified list of prior-day portfolio holdings of the JPMorgan U.S. Treasury Plus Money Market Fund is available upon request. Please contact your J.P. Morgan representative to obtain further information regarding this facility and information on holdings. |
| | | | | | |
| | | |
| 6 | | | | J.P. MORGAN MONEY MARKET FUNDS | | AUGUST 31, 2018 |
JPMorgan Federal Money Market Fund
FUND FACTS
SIX MONTHS ENDED AUGUST 31, 2018 (Unaudited)
| | |
| Objective | | Aims to provide current income while still preserving capital and maintaining liquidity |
| Primary Investments | | Direct obligations of the U.S. Treasury including Treasury bills, bonds and notes as well as debt obligations issued or guaranteed by U.S. government agencies or instrumentalities |
| Suggested investment time frame | | Short-term |
| Share classes offered | | Agency, Institutional Class, Morgan and Premier Shares |
| Net Assets as of August 31, 2018 | | $3.4 Billion |
| Weighted Average Maturity^ | | 33 calendar days |
| Weighted Average Life^^ | | 94 calendar days |
| | | | |
MATURITY SCHEDULE*^ | |
| 2–7 calendar days | | | 12.6 | % |
| 8–30 calendar days | | | 66.5 | |
| 31–60 calendar days | | | 5.8 | |
| 61–90 calendar days | | | 6.7 | |
| 91–180 calendar days | | | 5.5 | |
| 181+ calendar days | | | 2.9 | |
| | | | |
7-DAY SEC YIELD AS OF AUGUST 31, 2018(1) | |
| Agency Shares | | | 1.75 | % |
| Institutional Class Shares | | | 1.80 | |
| Morgan Shares | | | 1.42 | |
| Premier Shares | | | 1.56 | |
The performance quoted is past performance and is not a guarantee of future results. Mutual funds are subject to certain market risks. Investment returns and principal value of an investment will fluctuate so that an investor’s shares, when redeemed, may be worth more or less than their original cost. Current performance may be higher or lower than the performance data shown. For up-to-date month-end performance information please call 1-800-480-4111 (retail investors) or 1-800-766-7722 (institutional investors).
An investment in a money market fund is not insured by the FDIC or any other government agency. Although money market funds strive to preserve the value of the investment at $1.00 per share, it is possible to lose money by investing in a money market fund.
| ^ | The calculation takes into account the period remaining until the date on which, in accordance with the terms of the security, the principal amount must unconditionally be paid, or in the case of a security called for redemption, the date on which the redemption payment must be made and may utilize the interest rate reset date for variable or floating rate securities. |
| ^^ | The calculation takes into account the period remaining until the date on which, in accordance with the terms of the security, the principal amount must unconditionally be paid, or in the case of a security called for redemption, the date on which the redemption payment must be made. |
| * | Percentages indicated are based upon total investments as of August 31, 2018. |
| (1) | The yields for Agency Shares, Institutional Class Shares, Morgan Shares and Premier Shares reflect the reimbursements and/or waivers of certain expenses. Without these reimbursements and/or waivers, the yields would have been 1.70%, 1.75%, 1.28% and 1.54% for Agency Shares, Institutional Class Shares, Morgan Shares and Premier Shares, respectively. |
| | An unaudited, uncertified list of prior-day portfolio holdings of the JPMorgan Federal Money Market Fund is available upon request. Please contact your J.P. Morgan representative to obtain further information regarding this facility and information on holdings. |
| | | | | | | | |
| | | |
| AUGUST 31, 2018 | | J.P. MORGAN MONEY MARKET FUNDS | | | | | 7 | |
JPMorgan 100% U.S. Treasury Securities Money Market Fund
FUND FACTS
SIX MONTHS ENDED AUGUST 31, 2018 (Unaudited)
| | |
| Objective | | Aims to provide the highest possible level of current income while still maintaining liquidity and providing maximum safety of principal |
| Primary Investments | | Direct obligations of the U.S. Treasury including Treasury bills, bonds and notes |
| Suggested investment time frame | | Short-term |
| Share classes offered | | Agency, Capital, Institutional Class, Morgan, Premier and Reserve Shares |
| Net Assets as of August 31, 2018 | | $41.3 Billion |
| Weighted Average Maturity^ | | 44 calendar days |
| Weighted Average Life^^ | | 99 calendar days |
| | | | |
MATURITY SCHEDULE*^ | |
| 2–7 calendar days | | | 24.7 | % |
| 8–30 calendar days | | | 38.5 | |
| 61–90 calendar days | | | 22.7 | |
| 91–180 calendar days | | | 14.1 | |
| | | | |
7-DAY SEC YIELD AS OF AUGUST 31, 2018(1) | |
| Agency Shares | | | 1.77 | % |
| Capital Shares | | | 1.86 | |
| Institutional Class Shares | | | 1.83 | |
| Morgan Shares | | | 1.44 | |
| Premier Shares | | | 1.58 | |
| Reserve Shares | | | 1.33 | |
The performance quoted is past performance and is not a guarantee of future results. Mutual funds are subject to certain market risks. Investment returns and principal value of an investment will fluctuate so that an investor’s shares, when redeemed, may be worth more or less than their original cost. Current performance may be higher or lower than the performance data shown. For up-to-date month-end performance information please call 1-800-480-4111 (retail investors) or 1-800-766-7722 (institutional investors).
An investment in a money market fund is not insured by the FDIC or any other government agency. Although money market funds strive to preserve the value of the investment at $1.00 per share, it is possible to lose money by investing in a money market fund.
| ^ | The calculation takes into account the period remaining until the date on which, in accordance with the terms of the security, the principal amount must unconditionally be paid, or in the case of a security called for redemption, the date on which the redemption payment must be made and may utilize the interest rate reset date for variable or floating rate securities. |
| ^^ | The calculation takes into account the period remaining until the date on which, in accordance with the terms of the security, the principal amount must unconditionally be paid, or in the case of a security called for redemption, the date on which the redemption payment must be made. |
| * | Percentages indicated are based upon total investments as of August 31, 2018. |
| (1) | The yields for Agency Shares, Capital Shares, Institutional Class Shares, Morgan Shares, Premier Shares and Reserve Shares reflect the reimbursements and/or waivers of certain expenses. Without these reimbursements and/or waivers, the yields would have been 1.72%, 1.83%, 1.78%, 1.42%, 1.57% and 1.32% for Agency Shares, Capital Shares, Institutional Class Shares, Morgan Shares, Premier Shares and Reserve Shares, respectively. |
| | An unaudited, uncertified list of prior-day portfolio holdings of the JPMorgan 100% U.S. Treasury Securities Money Market Fund is available upon request. Please contact your J.P. Morgan representative to obtain further information regarding this facility and information on holdings. |
| | | | | | |
| | | |
| 8 | | | | J.P. MORGAN MONEY MARKET FUNDS | | AUGUST 31, 2018 |
JPMorgan Tax Free Money Market Fund
FUND FACTS
SIX MONTHS ENDED AUGUST 31, 2018 (Unaudited)
| | |
| Objective | | Aims to provide the highest possible level of current income which is excluded from gross income, while still preserving capital and maintaining liquidity* |
| Primary Investments | | High quality short-term municipal securities, the interest on which is excluded from federal income taxes |
| Suggested investment time frame | | Short-term |
| Share classes offered | | Agency, Institutional Class, Morgan, Premier and Reserve Shares |
| Net Assets as of August 31, 2018 | | $15.7 Billion |
| Weighted Average Maturity^ | | 11 calendar days |
| Weighted Average Life^^ | | 11 calendar days |
| | | | |
MATURITY SCHEDULE**^ | |
| 2–7 calendar days | | | 24.0 | % |
| 8–30 calendar days | | | 68.7 | |
| 31–60 calendar days | | | 5.0 | |
| 61-90 calendar days | | | 2.0 | |
| 91–180 calendar days | | | 0.3 | |
| | | | |
7-DAY SEC YIELD AS OF AUGUST 31, 2018(1) | |
| Agency Shares | | | 1.32 | % |
| Institutional Class Shares | | | 1.37 | |
| Morgan Shares | | | 0.99 | |
| Premier Shares | | | 1.13 | |
| Reserve Shares | | | 0.88 | |
The performance quoted is past performance and is not a guarantee of future results. Mutual funds are subject to certain market risks. Investment returns and principal value of an investment will fluctuate so that an investor’s shares, when redeemed, may be worth more or less than their original cost. Current performance may be higher or lower than the performance data shown. For up-to-date month-end performance information please call 1-800-480-4111 (retail investors) or 1-800-766-7722 (institutional investors).
An investment in a money market fund is not insured by the FDIC or any other government agency. Although money market funds strive to preserve the value of the investment at $1.00 per share, it is possible to lose money by investing in a money market fund.
| ^ | The calculation takes into account the period remaining until the date on which, in accordance with the terms of the security, the principal amount must unconditionally be paid, or in the case of a security called for redemption, the date on which the redemption payment must be made and may utilize the interest rate reset date for variable or floating rate securities. |
| ^^ | The calculation takes into account the period remaining until the date on which, in accordance with the terms of the security, the principal amount must unconditionally be paid, or in the case of a security called for redemption, the date on which the redemption payment must be made. |
| * | A portion of the Fund’s income distributions may be subject to the Alternative Minimum Tax (AMT), and some investors may be subject to certain state and local taxes. |
| ** | Percentages indicated are based upon total investments as of August 31, 2018. |
| (1) | The yields for Agency Shares, Institutional Class Shares, Morgan Shares, Premier Shares and Reserve Shares reflect the reimbursements and/or waivers of certain expenses. Without these reimbursements and/or waivers, the yields would have been 1.27%, 1.32%, 0.88%, 1.12% and 0.87% for Agency Shares, Institutional Class Shares, Morgan Shares, Premier Shares and Reserve Shares, respectively. |
| | An unaudited, uncertified list of prior-day portfolio holdings of the JPMorgan Tax Free Money Market Fund is available upon request. Please contact your J.P. Morgan representative to obtain further information regarding this facility and information on holdings. |
| | | | | | | | |
| | | |
| AUGUST 31, 2018 | | J.P. MORGAN MONEY MARKET FUNDS | | | | | 9 | |
JPMorgan Municipal Money Market Fund
FUND FACTS
SIX MONTHS ENDED AUGUST 31, 2018 (Unaudited)
| | |
| Objective | | Seeks as high a level of current interest income exempt from federal income tax as is consistent with liquidity and stability of principal* |
| Primary Investments | | High quality short-term municipal securities, the interest on which is excluded from federal income taxes |
| Suggested investment time frame | | Short-term |
| Share classes offered | | Agency, Eagle Class, E*Trade^, Institutional Class, Morgan, Premier and Service Shares |
| Net Assets as of August 31, 2018 | | $2.8 Billion |
| Weighted Average Maturity^^ | | 9 calendar days |
| Weighted Average Life^^^ | | 9 calendar days |
| | | | |
MATURITY SCHEDULE**^^ | |
| 2–7 calendar days | | | 9.3 | % |
| 8–10 calendar days | | | 90.7 | |
| | | | |
7-DAY SEC YIELD AS OF AUGUST 31, 2018(1) | |
| Agency Shares | | | 1.36 | % |
| Eagle Class Shares | | | 0.92 | |
| Institutional Class Shares | | | 1.41 | |
| Morgan Shares | | | 1.03 | |
| Premier Shares | | | 1.17 | |
| Service Shares | | | 0.57 | |
The performance quoted is past performance and is not a guarantee of future results. Mutual funds are subject to certain market risks. Investment returns and principal value of an investment will fluctuate so that an investor’s shares, when redeemed, may be worth more or less than their original cost. Current performance may be higher or lower than the performance data shown. For up-to-date month-end performance information please call 1-800-480-4111 (retail investors) or 1-800-766-7722 (institutional investors).
An investment in a money market fund is not insured by the FDIC or any other government agency. Although money market funds strive to preserve the value of the investment at $1.00 per share, it is possible to lose money by investing in a money market fund.
| ^ | E*Trade Shares had no assets from the close of business on September 21, 2016. |
| ^^ | The calculation takes into account the period remaining until the date on which, in accordance with the terms of the security, the principal amount must unconditionally be paid, or in the case of a security called for redemption, the date on which the redemption payment must be made and may utilize the interest rate reset date for variable or floating rate securities. |
| ^^^ | The calculation takes into account the period remaining until the date on which, in accordance with the terms of the security, the principal amount must unconditionally be paid, or in the case of a security called for redemption, the date on which the redemption payment must be made. |
| * | A portion of the Fund’s income distributions may be subject to the Alternative Minimum Tax (AMT), and some investors may be subject to certain state and local taxes. |
| ** | Percentages indicated are based upon total investments as of August 31, 2018. |
| (1) | The yields for Agency Shares, Eagle Class Shares, Institutional Class Shares, Morgan Shares, Premier Shares and Service Shares reflect the reimbursements and/or waivers of certain expenses. Without these reimbursements and/or waivers, the yields would have been 1.30%, 0.90%, 1.35%, 0.97%, 1.15% and 0.55% for Agency Shares, Eagle Class Shares, Institutional Class Shares, Morgan Shares, Premier Shares and Service Shares, respectively. |
| | An unaudited, uncertified list of prior-day portfolio holdings of the JPMorgan Municipal Money Market Fund is available upon request. Please contact your J.P. Morgan representative to obtain further information regarding this facility and information on holdings. |
| | | | | | |
| | | |
| 10 | | | | J.P. MORGAN MONEY MARKET FUNDS | | AUGUST 31, 2018 |
JPMorgan Prime Money Market Fund
SCHEDULE OF PORTFOLIO INVESTMENTS
AS OF AUGUST 31, 2018 (Unaudited)
| | | | | | | | |
| INVESTMENTS (a) | | PRINCIPAL
AMOUNT
($000) | | | VALUE
($000) | |
Repurchase Agreements — 15.1% | | | | | | | | |
Agency Joint Trading Account I, J.P. Morgan Investment Management Inc., as agent, 1.96% - 1.97%, dated 8/31/2018, due 9/4/18, repurchase price $500,109. [1] | | | 500,000 | | | | 500,000 | |
Agency Joint Trading Account II, J.P. Morgan Investment Management Inc., as agent, 1.97%, dated 8/31/2018, due 9/4/18, repurchase price $588,959. [2] | | | 588,830 | | | | 588,830 | |
Barclays Capital, Inc., 2.16%, dated 8/31/2018, due 9/7/2018, repurchase price $190,080, collateralized by Asset-Backed Securities, 3.75% - 5.80%, due 3/25/2024 - 7/25/2056, Collateralized Mortgage Obligations, 3.05% - 5.50%, due 6/25/2035 - 5/17/2061, and FNMA Connecticut Avenue Securities, 4.00% - 9.21%, due 11/25/2021 - 8/25/2056, with a value of $206,439. | | | 190,000 | | | | 190,000 | |
Barclays Capital, Inc., 2.43%, dated 8/31/2018, due 10/5/2018, repurchase price $400,946, collateralized by Asset-Backed Securities, 3.10% - 10.00%, due 3/15/2022 - 4/30/2048, Collateralized Mortgage Obligations, 0.00% - 6.00%, due 12/15/2034 - 9/17/2057, and FNMA Connecticut Avenue Securities, 4.00% - 13.81%, due 11/25/2021 - 8/25/2056, with a value of $433,277. | | | 400,000 | | | | 400,000 | |
BMO Capital Markets Corp., 2.01%, dated 8/31/2018, due 9/4/2018, repurchase price $255,057, collateralized by Asset-Backed Securities, 1.89% - 3.17%, due 12/19/2019 - 2/25/2066, Corporate Bonds, 1.25% - 9.25%, due 1/18/2019 - 5/1/2058, Corporate Notes, 1.90% - 3.45%, due 1/22/2019 - 4/17/2024, and Sovereign Government Securities, 1.25% - 2.38%, due 2/4/2019 - 1/29/2021, with a value of $268,313. | | | 255,000 | | | | 255,000 | |
BNP Paribas SA, 2.10%, dated 8/31/2018, due 9/4/2018, repurchase price $135,032, collateralized by Corporate Bonds, 0.00% - 12.00%, due 4/15/2019 - 12/31/2099, and FNMA Connecticut Avenue Securities, 5.51%, due 10/25/2029, with a value of $145,819. | | | 135,000 | | | | 135,000 | |
BNP Paribas SA, 2.10%, dated 8/31/2018, due 9/6/2018, repurchase price $200,070, collateralized by Asset-Backed Securities, 0.00% - 5.02%, due 9/15/2025 - 3/25/2036, and Corporate Bonds, 0.00% - 9.88%, due 10/15/2020 - 7/18/2036, with a value of $214,388. | | | 200,000 | | | | 200,000 | |
| | | | | | | | |
| INVESTMENTS | | PRINCIPAL
AMOUNT
($000) | | | VALUE
($000) | |
| | | | | | | | |
Citigroup Global Markets Holdings, Inc., 2.51%, dated 8/31/2018, due 10/22/2018, repurchase price $238,562, collateralized by U.S. Treasury Securities, 1.25% - 2.00%, due 6/30/2019 - 6/30/2024, with a value of $242,454. | | | 237,700 | | | | 237,700 | |
Citigroup Global Markets Holdings, Inc., 2.92%, dated 8/31/2018, due 12/4/2018, repurchase price $228,951, collateralized by Asset-Backed Securities, 3.00% - 5.03%, due 4/18/2026 - 10/25/2057, and Collateralized Mortgage Obligations, 1.03% - 5.98%, due 8/10/2045 - 8/25/2057, with a value of $244,445. | | | 227,200 | | | | 227,200 | |
Credit Suisse Securities USA LLC, 2.11%, dated 8/31/2018, due 9/5/2018, repurchase price $85,025, collateralized by Asset-Backed Securities, 0.00% - 6.02%, due 12/16/2021 - 8/25/2064, and Collateralized Mortgage Obligations, 0.25% - 6.00%, due 12/26/2030 - 8/17/2048, with a value of $93,083. | | | 85,000 | | | | 85,000 | |
Credit Suisse Securities USA LLC, 2.48%, dated 8/31/2018, due 10/5/2018, repurchase price $481,157, collateralized by Asset-Backed Securities, 0.00% - 15.00%, due 1/15/2021 - 8/25/2057, Collateralized Mortgage Obligations, 0.00% - 13.11%, due 7/20/2020 - 1/17/2059, and FNMA Connecticut Avenue Securities, 3.00% - 4.75%, due 5/25/2045 - 11/26/2057, with a value of $527,592. | | | 480,000 | | | | 480,000 | |
HSBC Securities USA, Inc., 2.17%, dated 8/31/2018, due 9/4/2018, repurchase price $205,049, collateralized by Corporate Bonds, 3.80% - 12.00%, due 2/15/2020 - 12/31/2099, and Municipal Debt Securities, 5.35%, due 8/1/2031, with a value of $221,453. | | | 205,000 | | | | 205,000 | |
ING Financial Markets LLC, 2.07%, dated 8/31/2018, due 9/4/2018, repurchase price $158,036, collateralized by Corporate Bonds, 2.90% - 3.80%, due 10/30/2020 - 8/15/2028, Corporate Notes, 3.50%, due 1/12/2024, and Sovereign Government Securities, 3.38% - 6.38%, due 7/12/2020 - 1/15/2045, with a value of $166,687. | | | 158,000 | | | | 158,000 | |
ING Financial Markets LLC, 2.11%, dated 8/31/2018, due 9/4/2018, repurchase price $125,029, collateralized by Corporate Bonds, 3.70% - 9.25%, due 12/1/2020 - 3/1/2078, and Sovereign Government Securities, 5.75%, due 9/26/2023, with a value of $135,032. | | | 125,000 | | | | 125,000 | |
SEE NOTES TO FINANCIAL STATEMENTS.
| | | | | | | | |
| | | |
| AUGUST 31, 2018 | | J.P. MORGAN MONEY MARKET FUNDS | | | | | 11 | |
JPMorgan Prime Money Market Fund
SCHEDULE OF PORTFOLIO INVESTMENTS
AS OF AUGUST 31, 2018 (Unaudited) (continued)
| | | | | | | | |
| INVESTMENTS | | PRINCIPAL
AMOUNT
($000) | | | VALUE
($000) | |
Repurchase Agreements — continued | | | | | | | | |
ING Financial Markets LLC, 2.07%, dated 8/31/2018, due 9/5/2018, repurchase price $200,058, collateralized by Corporate Bonds, 2.90% - 3.70%, due 10/30/2020 - 8/15/2025, Corporate Notes, 2.88% - 3.50%, due 1/12/2024 - 8/15/2025, and Sovereign Government Securities, 3.38% - 6.38%, due 7/12/2020 - 1/15/2045, with a value of $209,579. | | | 200,000 | | | | 200,000 | |
Merrill Lynch PFS, Inc., 2.16%, dated 8/31/2018, due 9/4/2018, repurchase price $200,048, collateralized by Corporate Bonds, 3.88% - 12.00%, due 10/15/2018 - 12/31/2099, and Corporate Notes, 7.35%, due 12/1/2026, with a value of $216,000. | | | 200,000 | | | | 200,000 | |
Merrill Lynch PFS, Inc., 2.40%, dated 8/31/2018, due 10/5/2018, repurchase price $275,642, collateralized by Corporate Bonds, 3.15% - 12.00%, due 1/15/2020 - 4/1/2037, and Corporate Notes, 8.50%, due 7/28/2025, with a value of $297,000. | | | 275,000 | | | | 275,000 | |
Societe Generale SA, 2.14%, dated 8/31/2018, due 9/4/2018, repurchase price $925,220, collateralized by Corporate Bonds, 2.10% - 12.75%, due 11/15/2018 - 1/1/2099, Corporate Notes, 3.30% - 5.63%, due 1/31/2023 - 5/20/2043, and Sovereign Government Securities, 3.70% - 11.88%, due 3/11/2019 - 3/13/2048, with a value of $996,646. | | | 925,000 | | | | 925,000 | |
Societe Generale SA, 2.19%, dated 8/31/2018, due 9/4/2018, repurchase price $865,210, collateralized by Corporate Bonds, 1.70% - 13.75%, due 9/26/2018 - 6/5/2115, Corporate Notes, 2.63% - 9.38%, due 3/25/2020 - 5/20/2043, FHLMC, 11.00%, due 9/1/2020, Sovereign Government Securities, 3.25% - 11.88%, due 3/11/2019 - 4/23/2048, and U.S. Treasury Securities, 1.25% - 2.00%, due 5/31/2019 - 1/31/2020, with a value of $931,904. | | | 865,000 | | | | 865,000 | |
UBS Securities LLC, 2.12%, dated 8/31/2018, due 9/10/2018, repurchase price $300,177, collateralized by Asset-Backed Securities, 4.75%, due 10/11/2023, Corporate Bonds, 1.75% - 10.18%, due 12/7/2018 - 1/24/2077, Corporate Notes, 1.90% - 7.00%, due 1/17/2019 - 11/4/2044, and Sovereign Government Securities, 0.00%, due 6/29/2037, with a value of $315,002. | | | 300,000 | | | | 300,000 | |
| | | | | | | | |
| INVESTMENTS | | PRINCIPAL
AMOUNT
($000) | | | VALUE
($000) | |
| | | | | | | | |
Wells Fargo Securities LLC, 2.01%, dated 8/31/2018, due 9/4/2018, repurchase price $25,006, collateralized by Sovereign Government Securities, 1.88% - 4.88%, due 4/1/2019 - 6/17/2019, with a value of $26,257. | | | 25,000 | | | | 25,000 | |
| | | | | | | | |
Total Repurchase Agreements
(COST $6,576,730) | | | | | | | 6,576,730 | |
| | | | | | | | |
U.S. Government Agency Securities — 0.5% | |
FHLB | | | | | | | | |
DN, 1.93%, 9/17/2018 (b) | | | 100,000 | | | | 99,930 | |
DN, 1.92%, 9/19/2018 (b) | | | 100,000 | | | | 99,919 | |
| | | | | | | | |
Total U.S. Government Agency Securities
(Cost $199,818) | | | | | | | 199,849 | |
| | | | | | | | |
Municipal Bonds - 0.3% | |
Alaska - 0.2% | |
Alaska Housing Finance Corp., State Capital Project Series A, Rev., VRDO, 1.98%, 9/10/2018 (c) | | | 90,000 | | | | 90,000 | |
| | | | | | | | |
California - 0.1% | |
City and County of San Francisco, Multifamily Housing, Taxable, Transbay Block 8 Tower Apartments | | | | | | | | |
Series H-4, Rev., VRDO, LOC: Bank of China, 2.04%, 9/10/2018 (c) | | | 24,190 | | | | 24,190 | |
Series H-3, Rev., VRDO, LOC: Bank of China, 2.05%, 9/10/2018 (c) | | | 15,190 | | | | 15,190 | |
| | | | | | | | |
| | | | | | | 39,380 | |
| | | | | | | | |
New York - 0.0% (d) | | | | | | | | |
New York State Housing Finance Agency, 572 11th Avenue Housing Series A, Rev., VRDO, LOC: Bank of China, 2.12%, 9/4/2018 (c) | | | 18,350 | | | | 18,350 | |
| | | | | | | | |
Total Municipal Bonds
(Cost $147,730) | | | | | | | 147,730 | |
| | | | | | | | |
Supranational - 0.2% | |
International Bank for Reconstruction & Development (Supranational) 2.05%, 10/1/2018
(Cost $99,829) | | | 100,000 | | | | 99,846 | |
| | | | | | | | |
Short-Term Investments - 84.8% | | | | | | | | |
Certificates of Deposit - 36.0% | | | | | | | | |
Agricultural Bank of China Ltd. (China) 2.45%, 9/11/2018 | | | 25,002 | | | | 25,002 | |
Banco Del Estado De Chile (Chile)
2.29%, 10/31/2018 | | | 60,000 | | | | 60,016 | |
2.29%, 11/5/2018 | | | 30,000 | | | | 30,007 | |
Bank of China Ltd. (China) 2.50%, 11/21/2018 | | | 100,000 | | | | 100,011 | |
SEE NOTES TO FINANCIAL STATEMENTS.
| | | | | | |
| | | |
| 12 | | | | J.P. MORGAN MONEY MARKET FUNDS | | AUGUST 31, 2018 |
| | | | | | | | |
| INVESTMENTS | | PRINCIPAL
AMOUNT
($000) | | | VALUE
($000) | |
Short-Term Investments — continued | | | | | | | | |
Certificates of Deposit — continued | | | | | | | | |
Bank of Montreal (Canada) 2.27%, 9/27/2018 | | | 100,000 | | | | 100,017 | |
2.28%, 11/7/2018 | | | 300,000 | | | | 300,042 | |
2.30%, 11/26/2018 | | | 150,000 | | | | 150,008 | |
Bank of Nova Scotia (The) (Canada) (ICE LIBOR USD 1 Month + 0.23%), 2.31%, 9/4/2018 (e) | | | 75,000 | | | | 75,027 | |
(ICE LIBOR USD 1 Month + 0.32%), 2.40%, 9/19/2018 (e) | | | 97,000 | | | | 97,115 | |
(ICE LIBOR USD 1 Month + 0.27%), 2.35%, 8/2/2019 (e) | | | 75,000 | | | | 75,000 | |
BNP Paribas SA (France) (ICE LIBOR USD 1 Month + 0.28%), 2.35%, 9/11/2018 (e) | | | 100,000 | | | | 100,057 | |
(ICE LIBOR USD 1 Month + 0.33%), 2.39%, 9/17/2018 (e) | | | 110,000 | | | | 110,021 | |
(ICE LIBOR USD 3 Month + 0.25%), 2.59%, 9/26/2018 (e) | | | 137,000 | | | | 137,093 | |
(ICE LIBOR USD 3 Month + 0.25%), 2.59%, 9/27/2018 (e) | | | 100,000 | | | | 100,071 | |
(ICE LIBOR USD 3 Month + 0.13%), 2.47%, 10/5/2018 (e) | | | 135,000 | | | | 135,011 | |
(ICE LIBOR USD 3 Month + 0.02%), 2.36%, 11/6/2018 (e) | | | 109,000 | | | | 108,995 | |
Canadian Imperial Bank of Commerce (Canada) (ICE LIBOR USD 1 Month + 0.20%), 2.28%, 9/4/2018 (e) | | | 150,000 | | | | 150,058 | |
China Construction Bank Corp. | | | | | | | | |
2.45%, 9/4/2018 | | | 125,000 | | | | 125,006 | |
2.45%, 9/7/2018 | | | 50,000 | | | | 50,004 | |
2.50%, 9/17/2018 | | | 150,000 | | | | 150,029 | |
2.50%, 10/2/2018 | | | 100,000 | | | | 100,030 | |
2.50%, 10/9/2018 | | | 100,000 | | | | 100,032 | |
2.52%, 11/2/2018 | | | 25,000 | | | | 25,008 | |
2.52%, 11/9/2018 | | | 105,000 | | | | 105,028 | |
2.50%, 11/19/2018 | | | 21,002 | | | | 21,002 | |
2.50%, 12/3/2018 | | | 69,999 | | | | 69,999 | |
Commonwealth Bank of Australia (Australia) | | | | | | | | |
(ICE LIBOR USD 1 Month + 0.22%), 2.30%, 9/6/2018 (e) | | | 50,000 | | | | 50,000 | |
(ICE LIBOR USD 3 Month + 0.21%), 2.55%, 10/30/2018 (e) | | | 125,000 | | | | 125,069 | |
(ICE LIBOR USD 3 Month + 0.25%), 2.59%, 4/3/2019 (e) | | | 50,000 | | | | 50,046 | |
Cooperatieve Rabobank UA (Netherlands) | | | | | | | | |
(ICE LIBOR USD 1 Month + 0.18%), 2.24%, 9/11/2018 (e) | | | 100,000 | | | | 100,037 | |
(ICE LIBOR USD 1 Month + 0.41%), 2.47%, 9/17/2018 (e) | | | 250,000 | | | | 250,195 | |
| | | | | | | | |
| INVESTMENTS | | PRINCIPAL
AMOUNT
($000) | | | VALUE
($000) | |
| | | | | | | | |
Certificates of Deposit — continued | | | | | | | | |
(ICE LIBOR USD 1 Month + 0.22%), 2.28%, 9/27/2018 (e) | | | 200,000 | | | | 199,994 | |
(ICE LIBOR USD 3 Month + 0.08%), 2.42%, 11/6/2018 (e) | | | 200,000 | | | | 199,969 | |
Credit Agricole Corporate and Investment Bank (France) | | | | | | | | |
2.30%, 10/2/2018 | | | 150,000 | | | | 150,050 | |
2.45%, 1/25/2019 | | | 65,000 | | | | 65,031 | |
Credit Industriel et Commercial (France) | | | | | | | | |
(ICE LIBOR USD 1 Month + 0.29%), 2.37%, 9/4/2018 (e) | | | 46,000 | | | | 46,043 | |
(ICE LIBOR USD 1 Month + 0.30%), 2.38%, 9/8/2018 (e) | | | 200,000 | | | | 200,147 | |
(ICE LIBOR USD 1 Month + 0.30%), 2.36%, 9/16/2018 (e) | | | 450,000 | | | | 450,413 | |
2.18%, 9/26/2018 (b) | | | 5,000 | | | | 4,993 | |
(ICE LIBOR USD 3 Month + 0.09%), 2.43%, 10/5/2018 (e) | | | 60,000 | | | | 60,003 | |
(ICE LIBOR USD 3 Month + 0.07%), 2.38%, 11/23/2018 (e) | | | 50,000 | | | | 49,996 | |
2.53%, 1/28/2019 (b) | | | 300,000 | | | | 296,913 | |
2.52%, 2/11/2019 (b) | | | 120,000 | | | | 118,639 | |
Dexia Credit Local SA (France) (ICE LIBOR USD 1 Month + 0.18%), 2.24%, 9/10/2018 (e) | | | 30,000 | | | | 30,008 | |
Industrial & Commercial Bank of China Ltd. (China) | | | | | | | | |
2.45%, 9/4/2018 | | | 120,000 | | | | 120,006 | |
2.45%, 9/6/2018 | | | 195,000 | | | | 195,014 | |
2.50%, 10/9/2018 | | | 50,000 | | | | 50,016 | |
2.50%, 10/29/2018 | | | 15,000 | | | | 15,005 | |
2.50%, 11/16/2018 | | | 336,000 | | | | 336,054 | |
2.50%, 11/19/2018 | | | 25,000 | | | | 25,003 | |
2.50%, 11/20/2018 | | | 25,000 | | | | 25,003 | |
2.50%, 11/30/2018 | | | 119,999 | | | | 119,999 | |
ING Bank NV (Netherlands) | | | | | | | | |
(ICE LIBOR USD 3 Month + 0.11%), 2.42%, 10/9/2018 (e) | | | 200,000 | | | | 200,000 | |
2.36%, 11/1/2018 | | | 165,000 | | | | 165,000 | |
(ICE LIBOR USD 3 Month + 0.12%), 2.42%, 11/21/2018 (e) | | | 150,000 | | | | 150,000 | |
2.50%, 12/27/2018 | | | 155,000 | | | | 155,000 | |
2.51%, 1/31/2019 | | | 270,000 | | | | 270,000 | |
ING BANK NV (ICE LIBOR USD 3 Month + 0.20%), 2.54%, 10/6/2018 (e) | | | 200,000 | | | | 200,000 | |
Landesbank Hessen-Thueringen (Germany) 1.94%, 9/4/2018 | | | 100,000 | | | | 100,000 | |
SEE NOTES TO FINANCIAL STATEMENTS.
| | | | | | | | |
| | | |
| AUGUST 31, 2018 | | J.P. MORGAN MONEY MARKET FUNDS | | | | | 13 | |
JPMorgan Prime Money Market Fund
SCHEDULE OF PORTFOLIO INVESTMENTS
AS OF AUGUST 31, 2018 (Unaudited) (continued)
| | | | | | | | |
| INVESTMENTS | | PRINCIPAL
AMOUNT
($000) | | | VALUE
($000) | |
Short-Term Investments — continued | | | | | | | | |
Certificates of Deposit — continued | | | | | | | | |
Lloyds Bank Corporate Markets plc (United Kingdom) 2.31%, 10/26/2018 (b) | | | 50,000 | | | | 49,831 | |
Mitsubishi UFJ Trust & Banking Corp. (Japan) | | | | | | | | |
(ICE LIBOR USD 1 Month + 0.31%), 2.39%, 9/6/2018 (e) | | | 120,000 | | | | 120,068 | |
(ICE LIBOR USD 1 Month + 0.30%), 2.38%, 9/9/2018 (e) | | | 140,000 | | | | 140,065 | |
(ICE LIBOR USD 1 Month + 0.30%), 2.36%, 9/16/2018 (e) | | | 75,000 | | | | 75,050 | |
(ICE LIBOR USD 1 Month + 0.30%), 2.36%, 9/16/2018 (e) | | | 150,000 | | | | 150,000 | |
2.32%, 9/20/2018 (b) | | | 100,000 | | | | 99,883 | |
(ICE LIBOR USD 1 Month + 0.23%), 2.30%, 9/22/2018 (e) | | | 50,000 | | | | 50,020 | |
(ICE LIBOR USD 1 Month + 0.19%), 2.27%, 10/9/2018 (e) | | | 195,000 | | | | 194,991 | |
2.30%, 11/9/2018 (b) | | | 30,000 | | | | 29,871 | |
Mizuho Bank Ltd. (Japan) | | | | | | | | |
(ICE LIBOR USD 1 Month + 0.32%), 2.38%, 9/10/2018 (e) | | | 225,000 | | | | 225,026 | |
2.41%, 9/10/2018 (b) | | | 100,000 | | | | 99,941 | |
(ICE LIBOR USD 1 Month + 0.20%), 2.27%, 9/13/2018 (e) | | | 50,000 | | | | 50,006 | |
(ICE LIBOR USD 1 Month + 0.20%), 2.26%, 9/28/2018 (e) | | | 385,000 | | | | 385,063 | |
Mizuho Corporate Bank Ltd. (United Kingdom) 2.35%, 11/15/2018 (b) | | | 100,000 | | | | 99,514 | |
2.34%, 11/21/2018 (b) | | | 25,000 | | | | 24,867 | |
Natixis SA (France) (ICE LIBOR USD 1 Month + 0.25%), 2.31%, 9/10/2018 (e) | | | 200,000 | | | | 200,107 | |
(ICE LIBOR USD 1 Month + 0.22%), 2.29%, 9/21/2018 (e) | | | 250,000 | | | | 250,103 | |
(ICE LIBOR USD 3 Month + 0.10%), 2.41%, 11/19/2018 (e) | | | 100,000 | | | | 99,993 | |
2.50%, 2/7/2019 | | | 120,000 | | | | 120,047 | |
Norinchukin Bank (The) (United Kingdom) | | | | | | | | |
2.20%, 9/25/2018 (b) | | | 80,000 | | | | 79,883 | |
2.08%, 9/28/2018 (b) | | | 125,000 | | | | 124,806 | |
2.09%, 10/4/2018 (b) | | | 230,000 | | | | 229,600 | |
2.34%, 10/5/2018 (b) | | | 50,000 | | | | 49,896 | |
Oversea-Chinese Banking Corp. Ltd. (Singapore) (ICE LIBOR USD 1 Month + 0.21%), 2.28%, 9/24/2018 (e) | | | 100,000 | | | | 100,043 | |
Royal Bank of Canada (Canada) | | | | | | | | |
(ICE LIBOR USD 3 Month + 0.17%), 2.50%, 9/21/2018 (e) | | | 75,000 | | | | 75,005 | |
| | | | | | | | |
| INVESTMENTS | | PRINCIPAL
AMOUNT
($000) | | | VALUE
($000) | |
| | | | | | | | |
Certificates of Deposit — continued | | | | | | | | |
(ICE LIBOR USD 1 Month + 0.23%), 2.30%, 9/23/2018 (e) | | | 75,000 | | | | 75,026 | |
(ICE LIBOR USD 1 Month + 0.25%), 2.32%, 9/24/2018 (e) | | | 30,000 | | | | 30,023 | |
(ICE LIBOR USD 1 Month + 0.23%), 2.29%, 9/28/2018 (e) | | | 10,000 | | | | 10,006 | |
(ICE LIBOR USD 3 Month + 0.08%), 2.43%, 11/2/2018 (e) | | | 145,000 | | | | 144,986 | |
Shizuoka Bank Ltd. (The) (Japan) | | | | | | | | |
2.17%, 9/25/2018 | | | 30,001 | | | | 30,001 | |
2.19%, 10/9/2018 | | | 40,002 | | | | 40,002 | |
Skandinaviska Enskilda Banken AB (Sweden)
(ICE LIBOR USD 1 Month + 0.28%), 2.36%, 9/10/2018 (e) | | | 70,000 | | | | 70,044 | |
Societe Generale SA (France) 2.46%, 1/31/2019 | | | 100,000 | | | | 100,028 | |
Standard Chartered Bank (United Kingdom) | | | | | | | | |
2.30%, 9/19/2018 | | | 50,000 | | | | 50,009 | |
(ICE LIBOR USD 3 Month + 0.14%), 2.48%, 10/3/2018 (e) | | | 250,000 | | | | 250,019 | |
(ICE LIBOR USD 3 Month + 0.05%), 2.36%, 11/26/2018 (e) | | | 14,999 | | | | 14,999 | |
(ICE LIBOR USD 3 Month + 0.08%), 2.40%, 11/29/2018 (e) | | | 135,000 | | | | 134,994 | |
2.48%, 1/25/2019 | | | 200,000 | | | | 200,027 | |
Sumitomo Mitsui Banking Corp. (Japan) | | | | | | | | |
(ICE LIBOR USD 1 Month + 0.23%), 2.35%, 9/4/2018 (e) | | | 100,000 | | | | 100,037 | |
(ICE LIBOR USD 1 Month + 0.18%), 2.25%, 9/10/2018 (e) | | | 100,000 | | | | 100,013 | |
(ICE LIBOR USD 1 Month + 0.31%), 2.39%, 9/10/2018 (e) | | | 150,000 | | | | 150,071 | |
(ICE LIBOR USD 1 Month + 0.26%), 2.32%, 9/16/2018 (e) | | | 50,000 | | | | 50,022 | |
(ICE LIBOR USD 1 Month + 0.22%), 2.29%, 9/23/2018 (e) | | | 100,000 | | | | 100,029 | |
(ICE LIBOR USD 1 Month + 0.20%), 2.27%, 9/28/2018 (e) | | | 150,000 | | | | 149,993 | |
(ICE LIBOR USD 1 Month + 0.21%), 2.27%, 9/28/2018 (e) | | | 150,000 | | | | 150,034 | |
(ICE LIBOR USD 1 Month + 0.22%), 2.28%, 9/28/2018 (e) | | | 200,000 | | | | 200,057 | |
(ICE LIBOR USD 1 Month + 0.26%), 2.33%, 9/29/2018 (e) | | | 80,000 | | | | 80,024 | |
(ICE LIBOR USD 1 Month + 0.20%), 2.28%, 10/3/2018 (e) | | | 170,000 | | | | 169,986 | |
SEE NOTES TO FINANCIAL STATEMENTS.
| | | | | | |
| | | |
| 14 | | | | J.P. MORGAN MONEY MARKET FUNDS | | AUGUST 31, 2018 |
| | | | | | | | |
| INVESTMENTS | | PRINCIPAL
AMOUNT
($000) | | | VALUE
($000) | |
Short-Term Investments — continued | | | | | | | | |
Certificates of Deposit — continued | | | | | | | | |
Sumitomo Mitsui Trust Bank Ltd. (United Kingdom) | | | | | | | | |
(ICE LIBOR USD 1 Month + 0.25%), 2.33%, 9/5/2018 (e) | | | 100,000 | | | | 100,031 | |
(ICE LIBOR USD 1 Month + 0.20%), 2.28%, 9/20/2018 (e) | | | 100,000 | | | | 100,020 | |
(ICE LIBOR USD 1 Month + 0.16%), 2.23%, 9/24/2018 (e) | | | 92,000 | | | | 92,004 | |
(ICE LIBOR USD 1 Month + 0.24%), 2.31%, 9/30/2018 (e) | | | 100,000 | | | | 99,988 | |
2.30%, 10/26/2018 (b) | | | 200,000 | | | | 199,318 | |
(ICE LIBOR USD 1 Month + 0.39%), 2.45%, 11/13/2018 (e) | | | 195,000 | | | | 195,000 | |
2.48%, 1/28/2019 (b) | | | 20,000 | | | | 19,797 | |
Svenska Handelsbanken AB (Sweden) | | | | | | | | |
(ICE LIBOR USD 1 Month + 0.16%), 2.24%, 9/8/2018 (e) | | | 100,000 | | | | 100,030 | |
(ICE LIBOR USD 1 Month + 0.27%), 2.33%, 9/15/2018 (e) | | | 325,000 | | | | 325,258 | |
(ICE LIBOR USD 1 Month + 0.22%), 2.30%, 9/18/2018 (e) | | | 200,000 | | | | 200,094 | |
(ICE LIBOR USD 1 Month + 0.21%), 2.28%, 9/23/2018 (e) | | | 135,000 | | | | 135,068 | |
Wells Fargo Bank NA | | | | | | | | |
(ICE LIBOR USD 1 Month + 0.35%), 2.42%, 9/11/2018 (e) | | | 100,000 | | | | 100,134 | |
(ICE LIBOR USD 1 Month + 0.23%), 2.30%, 9/13/2018 (e) | | | 200,000 | | | | 200,070 | |
(ICE LIBOR USD 1 Month + 0.25%), 2.32%, 9/22/2018 (e) | | | 250,000 | | | | 250,150 | |
(ICE LIBOR USD 1 Month + 0.23%), 2.29%, 9/27/2018 (e) | | | 100,000 | | | | 100,046 | |
(ICE LIBOR USD 1 Month + 0.27%), 2.34%, 9/28/2018 (e) | | | 195,000 | | | | 195,139 | |
(ICE LIBOR USD 1 Month + 0.28%), 2.34%, 9/28/2018 (e) | | | 375,000 | | | | 375,320 | |
(ICE LIBOR USD 1 Month + 0.21%), 2.28%, 9/30/2018 (e) | | | 130,000 | | | | 130,050 | |
Westpac Banking Corp. (Australia) (ICE LIBOR USD 1 Month + 0.23%), 2.31%, 9/20/2018 (e) | | | 100,000 | | | | 100,050 | |
| | | | | | | | |
Total Certificates of Deposit
(Cost $15,710,692) | | | | | | | 15,715,011 | |
| | | | | | | | |
| | | | | | | | |
| INVESTMENTS | | PRINCIPAL
AMOUNT
($000) | | | VALUE
($000) | |
| | | | | | | | |
Time Deposits — 24.7% | | | | | | | | |
Australia & New Zealand Banking Group Ltd. | | | | | | | | |
1.91%, 9/4/2018 | | | 500,000 | | | | 500,000 | |
1.94%, 9/4/2018 | | | 450,000 | | | | 450,000 | |
1.96%, 9/4/2018 | | | 400,000 | | | | 400,000 | |
BNP Paribas SA | | | | | | | | |
1.95%, 9/4/2018 | | | 200,000 | | | | 200,000 | |
1.95%, 9/5/2018 | | | 175,000 | | | | 175,000 | |
China Construction Bank Corp. 1.93%, 9/4/2018 | | | 705,000 | | | | 705,000 | |
Citibank NA 1.94%, 9/6/2018 | | | 350,000 | | | | 350,000 | |
DZ Bank AG 1.91%, 9/4/2018 | | | 500,000 | | | | 500,000 | |
Erste Group Bank AG 1.92%, 9/4/2018 | | | 490,000 | | | | 490,000 | |
First Abu Dhabi Bank PJSC 1.92%, 9/4/2018 | | | 755,000 | | | | 755,000 | |
Industrial & Commercial Bank of China Ltd. | | | | | | | | |
1.93%, 9/4/2018 | | | 500,000 | | | | 500,000 | |
1.93%, 9/4/2018 | | | 505,000 | | | | 505,000 | |
ING Bank NV 1.92%, 9/4/2018 | | | 150,000 | | | | 150,000 | |
KBC Bank NV 1.91%, 9/4/2018 | | | 800,000 | | | | 800,000 | |
Mizuho Bank Ltd. 1.91%, 9/4/2018 | | | 400,000 | | | | 400,000 | |
Natixis SA (France) 1.91%, 9/4/2018 | | | 595,000 | | | | 595,000 | |
Nordea Bank AB | | | | | | | | |
1.91%, 9/4/2018 | | | 500,000 | | | | 500,000 | |
1.91%, 9/4/2018 | | | 990,269 | | | | 990,269 | |
Royal Bank of Canada 1.93%, 9/4/2018 | | | 500,000 | | | | 500,000 | |
Skandinaviska Enskilda TD 1.91%, 9/4/2018 | | | 16,490 | | | | 16,490 | |
Swedbank AB 1.91%, 9/4/2018 | | | 1,000,000 | | | | 1,000,000 | |
The Chiba Bank Ltd. 1.93%, 9/4/2018 | | | 295,000 | | | | 295,000 | |
| | | | | | | | |
Total Time Deposits
(Cost $10,776,759) | | | | | | | 10,776,759 | |
| | | | | | | | |
Commercial Paper — 22.1% | | | | | | | | |
Alpine Securitization Ltd. (Switzerland) | | | | | | | | |
2.40%, 11/1/2018 (f) | | | 50,000 | | | | 50,019 | |
2.50%, 1/22/2019 (f) | | | 102,000 | | | | 102,000 | |
Atlantic Asset Securitization LLC (ICE LIBOR USD 1 Month + 0.18%), 2.26%, 9/6/2018 (e) | | | 20,000 | | | | 20,000 | |
Australia & New Zealand Banking Group Ltd. (Australia) (ICE LIBOR USD 3 Month + 0.21%), 2.55%, 10/30/2018 (e) (f) | | | 175,000 | | | | 175,118 | |
Bank Nederlandse Gemeenten NV (Netherlands) 2.05%, 9/10/2018 (b) | | | 250,000 | | | | 249,862 | |
Bank of China Ltd. (China) 2.52%, 9/12/2018 (b) (f) | | | 100,000 | | | | 99,934 | |
2.53%, 10/9/2018 (b) (f) | | | 50,000 | | | | 49,884 | |
SEE NOTES TO FINANCIAL STATEMENTS.
| | | | | | | | |
| | | |
| AUGUST 31, 2018 | | J.P. MORGAN MONEY MARKET FUNDS | | | | | 15 | |
JPMorgan Prime Money Market Fund
SCHEDULE OF PORTFOLIO INVESTMENTS
AS OF AUGUST 31, 2018 (Unaudited) (continued)
| | | | | | | | |
| INVESTMENTS | | PRINCIPAL
AMOUNT
($000) | | | VALUE
($000) | |
Short-Term Investments — continued | | | | | | | | |
Commercial Paper — continued | | | | | | | | |
2.56%, 10/23/2018 (b) | | | 33,000 | | | | 32,893 | |
2.51%, 11/5/2018 (b) | | | 500,000 | | | | 497,899 | |
Bank of Nova Scotia (The) (Canada) (ICE LIBOR USD 3 Month + 0.08%), 2.42%, 11/8/2018 (e) (f) | | | 65,000 | | | | 64,994 | |
Barclays Bank plc (United Kingdom) 2.32%, 11/13/2018 (b) (f) | | | 100,000 | | | | 99,541 | |
Bedford Row Funding Corp. | | | | | | | | |
(ICE LIBOR USD 1 Month + 0.46%), 2.54%, 9/4/2018 (e) (f) | | | 50,000 | | | | 50,093 | |
(ICE LIBOR USD 1 Month + 0.22%), 2.30%, 9/6/2018 (e) (f) | | | 20,001 | | | | 20,001 | |
(ICE LIBOR USD 1 Month + 0.24%), 2.32%, 9/6/2018 (e) (f) | | | 85,000 | | | | 85,026 | |
(ICE LIBOR USD 1 Month + 0.26%), 2.34%, 9/8/2018 (e) (f) | | | 100,000 | | | | 100,057 | |
(ICE LIBOR USD 1 Month + 0.29%), 2.37%, 9/8/2018 (e) (f) | | | 20,000 | | | | 20,016 | |
(ICE LIBOR USD 1 Month + 0.34%), 2.40%, 9/10/2018 (e) (f) | | | 103,000 | | | | 103,133 | |
(ICE LIBOR USD 1 Month + 0.24%), 2.31%, 9/13/2018 (e) (f) | | | 20,000 | | | | 20,007 | |
(ICE LIBOR USD 1 Month + 0.24%), 2.35%, 9/20/2018 (e) (f) | | | 100,000 | | | | 100,046 | |
(ICE LIBOR USD 1 Month + 0.27%), 2.33%, 9/26/2018 (e) (f) | | | 69,000 | | | | 69,045 | |
(ICE LIBOR USD 1 Month + 0.22%), 2.28%, 9/27/2018 (e) (f) | | | 25,000 | | | | 25,005 | |
(ICE LIBOR USD 3 Month + 0.11%), 2.42%, 11/26/2018 (e) (f) | | | 35,000 | | | | 34,997 | |
BNZ International Funding Ltd. (New Zealand) (ICE LIBOR USD 1 Month + 0.38%), 2.44%, 9/17/2018 (e) (f) | | | 40,000 | | | | 40,022 | |
BPCE SA (France) 2.33%, 9/12/2018 (b) (f) | | | 105,000 | | | | 104,932 | |
2.51%, 10/31/2018 (b) (f) | | | 100,000 | | | | 99,642 | |
Commonwealth Bank of Australia (Australia) | | | | | | | | |
(ICE LIBOR USD 1 Month + 0.20%), 2.28%, 9/4/2018 (e) (f) | | | 87,000 | | | | 87,034 | |
(ICE LIBOR USD 1 Month + 0.23%), 2.31%, 9/8/2018 (e) (f) | | | 50,000 | | | | 50,024 | |
(ICE LIBOR USD 1 Month + 0.20%), 2.26%, 9/10/2018 (e) (f) | | | 83,000 | | | | 83,024 | |
(ICE LIBOR USD 1 Month + 0.20%), 2.27%, 9/13/2018 (e) (f) | | | 165,000 | | | | 165,050 | |
(ICE LIBOR USD 1 Month + 0.20%), 2.26%, 9/15/2018 (e) (f) | | | 30,000 | | | | 30,009 | |
(ICE LIBOR USD 1 Month + 0.26%), 2.33%, 9/22/2018 (e) (f) | | | 125,000 | | | | 125,067 | |
| | | | | | | | |
| INVESTMENTS | | PRINCIPAL
AMOUNT
($000) | | | VALUE
($000) | |
| | | | | | | | |
Commercial Paper — continued | | | | | | | | |
(ICE LIBOR USD 1 Month + 0.21%), 2.27%, 9/27/2018 (e) (f) | | | 125,000 | | | | 125,052 | |
Cooperative Centrale (ICE LIBOR USD 3 Month + 0.06%), 2.30%, 11/26/2018 (e) | | | 35,000 | | | | 34,997 | |
DBS Bank Ltd. (Singapore) 2.27%, 10/3/2018 (b) (f) | | | 50,000 | | | | 49,903 | |
2.46%, 1/23/2019 (b) (f) | | | 85,000 | | | | 84,162 | |
Erste Finance LLC (Austria) 2.16%, 10/9/2018 (b) | | | 121,000 | | | | 120,697 | |
First Abu Dhabi Bank PJSC (United Arab Emirates) | | | | | | | | |
2.33%, 9/11/2018 (b) (f) | | | 80,000 | | | | 79,952 | |
2.34%, 9/13/2018 (b) (f) | | | 400,000 | | | | 399,714 | |
2.34%, 9/18/2018 (b) (f) | | | 35,000 | | | | 34,965 | |
2.34%, 9/28/2018 (b) (f) | | | 54,000 | | | | 53,913 | |
2.32%, 10/22/2018 (b) (f) | | | 82,000 | | | | 81,739 | |
2.35%, 10/26/2018 (b) (f) | | | 150,000 | | | | 149,477 | |
2.31%, 11/13/2018 (b) (f) | | | 50,000 | | | | 49,760 | |
General Electric Co. 1.94%, 9/6/2018 (b) | | | 150,000 | | | | 149,951 | |
Gotham Funding Corp. | | | | | | | | |
2.31%, 10/9/2018 (b) (f) | | | 25,000 | | | | 24,944 | |
2.31%, 10/11/2018 (b) (f) | | | 62,000 | | | | 61,853 | |
2.31%, 12/6/2018 (b) (f) | | | 39,197 | | | | 38,956 | |
2.31%, 12/10/2018 (b) (f) | | | 50,000 | | | | 49,678 | |
HSBC Bank plc (United Kingdom) | | | | | | | | |
(ICE LIBOR USD 1 Month + 0.21%), 2.29%, 9/5/2018 (e) (f) | | | 32,000 | | | | 32,013 | |
(ICE LIBOR USD 1 Month + 0.21%), 2.27%, 9/26/2018 (e) (f) | | | 150,000 | | | | 150,054 | |
(ICE LIBOR USD 3 Month + 0.17%), 2.51%, 10/3/2018 (e) (f) | | | 210,000 | | | | 210,095 | |
ING US Funding LLC (Netherlands) (ICE LIBOR USD 1 Month + 0.30%), 2.36%, 9/16/2018 (e) | | | 90,000 | | | | 90,073 | |
Lloyds Bank plc (United Kingdom) (ICE LIBOR USD 1 Month + 0.30%), 2.36%, 9/10/2018 (e) | | | 100,000 | | | | 100,011 | |
LMA-Americas LLC 2.37%, 9/10/2018 (b) (f) | | | 70,100 | | | | 70,062 | |
2.31%, 9/11/2018 (b) (f) | | | 60,000 | | | | 59,964 | |
Mitsubishi UFJ Trust & Banking Corp. (Japan) 2.33%, 9/18/2018 (b) (f) | | | 50,000 | | | | 49,950 | |
National Australia Bank Ltd. (Australia) | | | | | | | | |
(ICE LIBOR USD 1 Month + 0.31%), 2.37%, 9/11/2018 (e) (f) | | | 80,000 | | | | 80,105 | |
(ICE LIBOR USD 1 Month + 0.19%), 2.27%, 9/20/2018 (e) (f) | | | 125,000 | | | | 125,039 | |
(ICE LIBOR USD 1 Month + 0.23%), 2.29%, 9/28/2018 (e) (f) | | | 75,000 | | | | 75,071 | |
SEE NOTES TO FINANCIAL STATEMENTS.
| | | | | | |
| | | |
| 16 | | | | J.P. MORGAN MONEY MARKET FUNDS | | AUGUST 31, 2018 |
| | | | | | | | |
| INVESTMENTS | | PRINCIPAL
AMOUNT
($000) | | | VALUE
($000) | |
Short-Term Investments — continued | | | | | | | | |
Commercial Paper — continued | | | | | | | | |
Natixis SA (France) | | | | | | | | |
(ICE LIBOR USD 1 Month + 0.44%), 2.51%, 9/12/2018 (e) | | | 200,000 | | | | 200,036 | |
(ICE LIBOR USD 1 Month + 0.36%), 2.42%, 9/15/2018 (e) | | | 73,000 | | | | 73,076 | |
(ICE LIBOR USD 1 Month + 0.30%), 2.37%, 9/21/2018 (e) | | | 125,000 | | | | 125,082 | |
Nederlandse Waterschapsbank NV (Netherlands) 2.11%, 10/9/2018 (b) (f) | | | 250,000 | | | | 249,442 | |
Nestle Capital Corp. (Switzerland) 2.42%,
12/19/2018 (b) (f) | | | 125,000 | | | | 124,152 | |
Nieuw Amsterdam Receivables Corp. | | | | | | | | |
2.30%, 9/4/2018 (b) (f) | | | 100,000 | | | | 99,978 | |
2.16%, 10/10/2018 (b) (f) | | | 20,000 | | | | 19,954 | |
Old Line Funding LLC | | | | | | | | |
(ICE LIBOR USD 1 Month + 0.15%), 2.31%, 9/4/2018 (b) (e) (f) | | | 100,000 | | | | 100,000 | |
(ICE LIBOR USD 1 Month + 0.23%), 2.30%, 9/22/2018 (e) (f) | | | 40,000 | | | | 40,015 | |
Oversea-Chinese Banking Corp. Ltd. (Singapore) | | | | | | | | |
(ICE LIBOR USD 1 Month + 0.25%), 2.33%, 9/9/2018 (e) (f) | | | 150,000 | | | | 150,080 | |
(ICE LIBOR USD 1 Month + 0.27%), 2.34%, 9/13/2018 (e) (f) | | | 20,000 | | | | 20,007 | |
2.45%, 1/23/2019 (b) (f) | | | 65,000 | | | | 64,389 | |
Sheffield Receivables Co. LLC (United Kingdom) (SOFRRATE + 0.35%), 2.28%, 9/28/2018 (e) (f) | | | 25,000 | | | | 25,000 | |
Standard Chartered Bank (United Kingdom) 2.48%, 1/25/2019 (b) (f) | | | 15,000 | | | | 14,851 | |
Sumitomo Mitsui Trust Bank Ltd. (Japan) 2.31%, 10/31/2018 (b) (f) | | | 110,000 | | | | 109,597 | |
Thunder Bay Funding LLC | | | | | | | | |
(ICE LIBOR USD 1 Month + 0.30%), 2.36%, 9/16/2018 (e) (f) | | | 90,000 | | | | 90,078 | |
(ICE LIBOR USD 1 Month + 0.24%), 2.31%, 9/27/2018 (e) (f) | | | 150,000 | | | | 150,000 | |
(ICE LIBOR USD 1 Month + 0.20%), 2.31%, 10/3/2018 (e) (f) | | | 250,000 | | | | 250,060 | |
Toronto-Dominion Bank (The) (Canada) | | | | | | | | |
(ICE LIBOR USD 3 Month + 0.06%), 2.41%, 9/4/2018 (b) (e) (f) | | | 130,000 | | | | 130,000 | |
(ICE LIBOR USD 1 Month + 0.27%), 2.35%, 9/8/2018 (e) | | | 150,000 | | | | 150,107 | |
(ICE LIBOR USD 1 Month + 0.37%), 2.43%, 9/11/2018 (e) (f) | | | 200,000 | | | | 200,310 | |
| | | | | | | | |
| INVESTMENTS | | PRINCIPAL
AMOUNT
($000) | | | VALUE
($000) | |
| | | | | | | | |
Commercial Paper — continued | | | | | | | | |
(ICE LIBOR USD 1 Month + 0.19%), 2.26%,
9/12/2018 (e) (f) | | | 50,000 | | | | 50,005 | |
(ICE LIBOR USD 1 Month + 0.27%), 2.34%,
9/14/2018 (e) (f) | | | 200,000 | | | | 200,144 | |
(ICE LIBOR USD 1 Month + 0.25%), 2.32%,
9/22/2018 (e) (f) | | | 240,000 | | | | 240,136 | |
(ICE LIBOR USD 3 Month + 0.27%), 2.61%,
9/26/2018 (e) (f) | | | 130,000 | | | | 130,158 | |
(ICE LIBOR USD 3 Month + 0.07%), 2.42%,
11/2/2018 (e) (f) | | | 175,000 | | | | 174,983 | |
Toyota Credit Canada, Inc. (Canada) (ICE LIBOR USD 1 Month + 0.25%), 2.32%,
9/16/2018 (e) | | | 50,000 | | | | 50,026 | |
Toyota Finance Australia Ltd. (Australia) | | | | | | | | |
(ICE LIBOR USD 1 Month + 0.21%), 2.29%,
9/20/2018 (e) | | | 30,000 | | | | 30,009 | |
(ICE LIBOR USD 1 Month + 0.21%), 2.29%,
9/20/2018 (e) | | | 15,000 | | | | 15,005 | |
Toyota Motor Corp. (Japan) (ICE LIBOR USD 1 Month + 0.23%), 2.29%,
9/28/2018 (e) | | | 70,000 | | | | 70,038 | |
Toyota Motor Credit Corp. (Japan) | | | | | | | | |
(ICE LIBOR USD 1 Month + 0.23%), 2.29%,
9/28/2018 (e) | | | 135,000 | | | | 135,074 | |
(ICE LIBOR USD 3 Month + 0.08%), 2.43%,
11/2/2018 (e) | | | 35,000 | | | | 34,997 | |
UBS AG (Switzerland) | | | | | | | | |
(ICE LIBOR USD 1 Month + 0.30%), 2.36%,
9/16/2018 (e) (f) | | | 100,000 | | | | 100,066 | |
(ICE LIBOR USD 1 Month + 0.30%), 2.37%,
9/23/2018 (e) (f) | | | 90,000 | | | | 90,060 | |
(ICE LIBOR USD 3 Month + 0.09%), 2.41%,
11/16/2018 (e) (f) | | | 135,000 | | | | 134,990 | |
Victory Receivables Corp. 2.04%, 10/3/2018 (b) (f) | | | 76,929 | | | | 76,784 | |
Westpac Banking Corp. (Australia) | | | | | | | | |
(ICE LIBOR USD 1 Month + 0.19%), 2.27%,
9/5/2018 (e) (f) | | | 90,000 | | | | 90,004 | |
(ICE LIBOR USD 1 Month + 0.23%), 2.30%,
9/14/2018 (e) (f) | | | 100,000 | | | | 100,049 | |
(ICE LIBOR USD 1 Month + 0.19%), 2.25%,
9/27/2018 (e) (f) | | | 50,000 | | | | 50,007 | |
| | | | | | | | |
Total Commercial Paper
(Cost $9,641,990) | | | | | | | 9,645,273 | |
| | | | | | | | |
SEE NOTES TO FINANCIAL STATEMENTS.
| | | | | | | | |
| | | |
| AUGUST 31, 2018 | | J.P. MORGAN MONEY MARKET FUNDS | | | | | 17 | |
JPMorgan Prime Money Market Fund
SCHEDULE OF PORTFOLIO INVESTMENTS
AS OF AUGUST 31, 2018 (Unaudited) (continued)
| | | | | | | | |
| INVESTMENTS | | PRINCIPAL
AMOUNT
($000) | | | VALUE
($000) | |
Short-Term Investments — continued | | | | | |
U.S. Treasury Obligations — 2.0% | | | | | | | | |
U.S. Treasury Bills 1.91%, 9/6/2018 (b) | | | 150,000 | | | | 149,984 | |
1.92%, 9/13/2018 (b) | | | 730,000 | | | | 729,652 | |
| | | | | | | | |
Total U.S. Treasury Obligations
(Cost $879,494) | | | | | | | 879,636 | |
| | | | | | | | |
Total Short-term Investments
(Cost $37,008,935) | | | | | | | 37,016,679 | |
| | | | | | | | |
Total Investments — 100.9%
(Cost $44,033,042) | | | | | | | 44,040,834 | |
Liabilities in Excess of
Other Assets — (0.9%) | | | | | | | (402,352 | ) |
| | | | | | | | |
NET ASSETS — 100.0% | | | | | | | 43,638,482 | |
| | | | | | | | |
Percentages indicated are based on net assets.
Abbreviations
| | |
| DN | | Discount Notes |
| FFCB | | Federal Farm Credit Bank |
| FHLB | | Federal Home Loan Bank |
| FHLMC | | Federal Home Loan Mortgage Corp. |
| FNMA | | Federal National Mortgage Association |
| GNMA | | Government National Mortgage Association |
| ICE | | Intercontinental Exchange |
| LIBOR | | London Interbank Offered Rate |
| LOC | | Letter of Credit |
| Rev. | | Revenue |
| USD | | United States Dollar |
| VRDO | | Variable Rate Demand Obligation. The interest rate shown is the rate in effect as of August 31, 2018. |
| |
| (a) | | The date shown represents the earliest of the next put date, next demand date or final maturity date. |
| (b) | | The rate shown is the effective yield as of August 31, 2018. |
| (c) | | Variable or floating rate security, the interest rate of which adjusts periodically based on changes in current interest rates and prepayments on the underlying pool of assets. The interest rate shown is the current rate as of August 31, 2018. |
| (d) | | Amount rounds to less than 0.1% of net assets. |
| (e) | | Variable or floating rate security, linked to the referenced benchmark. The interest rate shown is the current rate as of August 31, 2018. |
| (f) | | Securities exempt from registration under Rule 144A or section 4(a)(2), of the Securities Act of 1933, as amended. Under procedures approved by the Board of Trustees, such securities have been determined to be liquid by the investment adviser and may be resold, normally to qualified institutional buyers in transactions exempt from registration. |
Additional Investment Information:
[1] Agency Joint Trading Account I — At August 31, 2018, certain Funds had undivided interests in the Agency Joint Trading Account I with a maturity date of September 04, 2018, as follows (amounts in thousands):
| | | | | | | | | | | | |
| Fund | | Principal
Amount | | | Repurchase
Price | | | Collateral
Value
Allocation | |
JPMorgan Prime Money Market Fund | | $ | 500,000 | | | $ | 500,109 | | | $ | 510,148 | |
Repurchase Agreements — August 31, 2018, the Principal Amounts of certain Funds’ interests in the Agency Joint Trading Account I were as follows (amounts in thousands):
| | | | | | | | |
| | |
| Counterparty | | Interest
Rate | | | JPMorgan Prime
Money Market
Fund | |
BNP Paribas SA | | | 1.97 | % | | $ | 100,917 | |
Credit Agricole Corporate and Investment Bank | | | 1.97 | % | | | 22,936 | |
MUFG Securities Americas, Inc. | | | 1.96 | % | | | 77,982 | |
Societe Generale SA | | | 1.97 | % | | | 22,936 | |
TD Securities (USA) LLC | | | 1.97 | % | | | 50,459 | |
Wells Fargo Securities LLC | | | 1.97 | % | | | 224,770 | |
| | | | | | | | |
Total | | | | | | $ | 500,000 | |
| | | | | | | | |
August 31, 2018, the Agency Joint Trading Account I was fully collateralized by:
| | | | | | | | |
| | |
| Issuer | | Interest Rates | | | Maturity Dates | |
FFCB | | | 1.23% - 3.28% | | | | 11/13/2018 - 11/2/2037 | |
FHLB | | | 0.00% - 5.63% | | | | 9/5/2018 - 7/15/2036 | |
FHLMC | | | 0.88% - 7.00% | | | | 9/14/2018 - 9/1/2048 | |
FNMA | | | 0.00% - 7.25% | | | | 9/18/2018 - 9/1/2048 | |
GNMA | | | 2.00% - 7.50% | | | | 8/16/2022 - 5/20/2068 | |
Tennessee Valley Authority | | | 1.75% - 7.13% | | | | 10/15/2018 - 9/15/2065 | |
U.S. Treasury Securities | | | 0.00% - 8.13% | | | | 2/21/2019 - 2/15/2046 | |
[2] Agency Joint Trading Account II — At August 31, 2018, certain Funds had undivided interests in the Agency Joint Trading Account II with a maturity date of September 04, 2018, as follows (amounts in thousands):
| | | | | | | | | | | | |
| Fund | | Principal
Amount | | | Repurchase
Price | | | Collateral
Value
Allocation | |
JPMorgan Prime Money Market Fund | | $ | 588,830 | | | $ | 588,959 | | | $ | 600,624 | |
SEE NOTES TO FINANCIAL STATEMENTS.
| | | | | | |
| | | |
| 18 | | | | J.P. MORGAN MONEY MARKET FUNDS | | AUGUST 31, 2018 |
Repurchase Agreements — At August 31, 2018, the Principal Amounts of certain Funds’ interests in the Agency Joint Trading Account II were as follows (amounts in thousands):
| | | | | | | | |
| Counterparty | | Interest
Rate | | | JPMorgan Prime
Money Market
Fund | |
Citibank NA | | | 1.97 | % | | $ | 80,662 | |
Citigroup Global Markets Holdings, Inc. | | | 1.97 | % | | | 80,662 | |
Merrill Lynch PFS, Inc. | | | 1.97 | % | | | 427,506 | |
| | | | | | | | |
Total | | | | | | $ | 588,830 | |
| | | | | | | | |
At August 31, 2018, the Agency Joint Trading Account II was fully collateralized by:
| | | | | | | | |
| | |
| Issuer | | Interest Rates | | | Maturity Dates | |
FFCB | | | 2.48% - 3.82% | | | | 2/15/2022 - 3/20/2037 | |
FHLB | | | 0.00% - 3.83% | | | | 10/19/2018 - 9/6/2041 | |
FHLMC | | | 0.00% - 8.00% | | | | 4/15/2019 - 9/1/2048 | |
FNMA | | | 0.00% - 7.00% | | | | 11/15/2018 - 8/1/2048 | |
GNMA | | | 1.50% - 10.00% | | | | 9/15/2018 - 8/15/2060 | |
U.S. Treasury Securities | | | 0.00% - 2.63% | | | | 11/8/2018 - 5/15/2048 | |
SEE NOTES TO FINANCIAL STATEMENTS.
| | | | | | | | |
| | | |
| AUGUST 31, 2018 | | J.P. MORGAN MONEY MARKET FUNDS | | | | | 19 | |
JPMorgan Institutional Tax Free Money Market Fund
SCHEDULE OF PORTFOLIO INVESTMENTS
AS OF AUGUST 31, 2018 (Unaudited)
| | | | | | | | |
| INVESTMENTS (a) | | PRINCIPAL
AMOUNT
($000) | | | VALUE
($000) | |
| | | | | | | | |
Municipal Bonds — 63.7% | | | | | | | | |
California — 7.5% | | | | | | | | |
City & County of San Francisco, Multifamily Housing, Transbay Block 8 Tower Apartments Series H-2, Rev., VRDO, LOC: Bank of China, 1.63%, 9/10/2018 (b) | | | 10,000 | | | | 10,000 | |
Los Angeles Department of Water and Power Series B, Subseries B-2, Rev., VRDO, 1.27%, 9/10/2018 (b) | | | 2,000 | | | | 2,000 | |
Metropolitan Water District of Southern California, Water Series A-1, Rev., VRDO, 1.33%, 9/4/2018 (b) | | | 12,735 | | | | 12,735 | |
Modesto Irrigation District Financing Authority, Municipal Securities Trust Receipts Class A, Rev., VRDO, NATL-RE, LOC: Societe Generale, 1.57%, 9/10/2018 (b) | | | 8,960 | | | | 8,960 | |
RBC Municipal Products, Inc. Trust, Floater Certificates Series G-26, Rev., VRDO, LOC: Royal Bank of Canada, 1.71%, 9/10/2018 (b) (c) | | | 5,000 | | | | 5,000 | |
Tender Option Bond Trust Receipts/CTFS Series 2018-ZF0679, Rev., VRDO, LIQ: Bank of America NA, 1.60%, 9/10/2018 (b) (c) | | | 6,615 | | | | 6,615 | |
| | | | | | | | |
| | | | | | | 45,310 | |
| | | | | | | | |
Colorado — 1.3% | | | | | | | | |
Colorado Health Facilities Authority, SCL Health System Series A, Rev., VRDO, 1.56%, 9/10/2018 (b) | | | 3,000 | | | | 3,000 | |
Tender Option Bond Trust Receipts/CTFS Series 2018-XG0195, COP, VRDO, LIQ: Bank of America NA, 1.66%, 9/10/2018 (b) (c) | | | 4,925 | | | | 4,925 | |
| | | | | | | | |
| | | | | | | 7,925 | |
| | | | | | | | |
Delaware — 2.2% | | | | | | | | |
University of Delaware Series C, Rev., VRDO, 1.52%, 9/4/2018 (b) | | | 12,945 | | | | 12,945 | |
| | | | | | | | |
District of Columbia — 0.8% | | | | | | | | |
District of Columbia Rev., VRDO, LOC: Bank of America NA, 1.57%, 9/10/2018 (b) | | | 1,200 | | | | 1,200 | |
Tender Option Bond Trust Receipts/CTFS Series 2018-ZM0610, Rev., VRDO, LIQ: Morgan Stanley Bank, 1.59%, 9/10/2018 (b) (c) | | | 3,670 | | | | 3,670 | |
| | | | | | | | |
| | | | | | | 4,870 | |
| | | | | | | | |
Florida — 1.9% | | | | | | | | |
City of Gainesville, Utilities System Series A, Rev., VRDO, 1.53%, 9/4/2018 (b) | | | 5,410 | | | | 5,410 | |
Florida Department of Environmental Protection Series A, Rev., VRDO, AGC, 1.58%, 9/10/2018 (b) | | | 390 | | | | 390 | |
| | | | | | | | |
| INVESTMENTS | | PRINCIPAL
AMOUNT
($000) | | | VALUE
($000) | |
| | | | | | | | |
| | | | | | | | |
Florida — continued | | | | | | | | |
Tender Option Bond Trust Receipts/CTFS Series 2018-G-41, Rev., VRDO, LOC: Royal Bank of Canada, 1.76%, 9/10/2018 (b) (c) | | | 5,665 | | | | 5,665 | |
| | | | | | | | |
| | | | | | | 11,465 | |
| | | | | | | | |
Illinois—9.3% | | | | | | | | |
County of Lake, Multifamily Housing, Whispering Oaks Apartments Project Rev., VRDO, FHLMC, LIQ: FHLMC, 1.60%, 9/10/2018 (b) | | | 21,500 | | | | 21,500 | |
Illinois Educational Facilities Authority, Adler Planetarium Series 1997, Rev., VRDO, LOC: PNC Bank NA, 1.57%, 9/10/2018 (b) | | | 8,000 | | | | 8,000 | |
Illinois Educational Facilities Authority, Columbia College Chicago Rev., VRDO, LOC: BMO Harris Bank NA, 1.58%, 9/10/2018 (b) | | | 1,700 | | | | 1,700 | |
Illinois Finance Authority, Advocate Healthcare Network Subseries C-3A, Rev., VRDO, 1.57%, 9/10/2018 (b) | | | 2,750 | | | | 2,750 | |
Illinois Finance Authority, North Park University Project Rev., VRDO, LOC: U.S. Bank NA, 1.56%, 9/10/2018 (b) | | | 2,385 | | | | 2,385 | |
Illinois Finance Authority, The University of Chicago Medical Center Series 2011B, Rev., VRDO, LOC: Sumitomo Mitsui Banking Corp., 1.57%, 9/10/2018 (b) | | | 930 | | | | 930 | |
Illinois Finance Authority, Youth Hostels Project Rev., VRDO, LOC: Bank of Montreal, 1.56%, 9/10/2018 (b) | | | 2,830 | | | | 2,830 | |
Illinois State Toll Highway Authority Series A-2B, Rev., VRDO, LOC: PNC Bank NA, 1.56%, 9/10/2018 (b) | | | 15,675 | | | | 15,675 | |
Joliet Regional Port District Rev., VRDO, 1.52%, 9/4/2018 (b) | | | 395 | | | | 395 | |
| | | | | | | | |
| | | | | | | 56,165 | |
| | | | | | | | |
Indiana — 0.7% | | | | | | | | |
Indiana Finance Authority, Duke Energy Indiana, Inc. Project Series A-3, Rev., VRDO, LOC: Mizuho Bank Ltd., 1.59%, 9/10/2018 (b) | | | 4,035 | | | | 4,035 | |
| | | | | | | | |
Iowa — 3.9% | | | | | | | | |
Iowa Finance Authority, Midwestern Disaster Area, Chrisbro III, Inc. Project Rev., VRDO, 1.62%, 9/10/2018 (b) | | | 22,000 | | | | 22,000 | |
Tender Option Bond Trust Receipts/CTFS Series 2018-ZM0582, Rev., VRDO, LIQ: Barclays Bank plc, 1.59%, 9/10/2018 (b) (c) | | | 1,200 | | | | 1,200 | |
| | | | | | | | |
| | | | | | | 23,200 | |
| | | | | | | | |
SEE NOTES TO FINANCIAL STATEMENTS.
| | | | | | |
| | | |
| 20 | | | | J.P. MORGAN MONEY MARKET FUNDS | | AUGUST 31, 2018 |
| | | | | | | | |
| INVESTMENTS | | PRINCIPAL
AMOUNT
($000) | | | VALUE
($000) | |
| | | | | | | | |
Municipal Bonds — continued | | | | | | | | |
Maryland — 3.5% | | | | | | | | |
RBC Municipal Products, Inc. Trust, Floater Certificates Series G-28, Rev., VRDO, LOC: Royal Bank of Canada, 1.76%, 9/10/2018 (b) (c) | | | 7,615 | | | | 7,615 | |
Tender Option Bond Trust Receipts/CTFS | | | | | | | | |
Series 2018-XF2581, Rev., VRDO, LIQ: Morgan Stanley Bank, 1.59%, 9/10/2018 (b) (c) | | | 1,460 | | | | 1,460 | |
Series 2018-ZM0618, Rev., VRDO, LIQ: Morgan Stanley Bank, 1.59%, 9/10/2018 (b) (c) | | | 3,350 | | | | 3,350 | |
Series 2018-XG0177, Rev., VRDO, LIQ: Barclays Bank plc, 1.60%, 9/10/2018 (b) (c) | | | 3,750 | | | | 3,750 | |
Series 2018-G-42, Rev., VRDO, LOC: Royal Bank of Canada, 1.76%, 9/10/2018 (b) (c) | | | 5,000 | | | | 5,000 | |
| | | | | | | | |
| | | | | | | 21,175 | |
| | | | | | | | |
Massachusetts — 2.1% | | | | | | | | |
Commonwealth of Massachusetts Class A, GO, VRDO, FGIC, LIQ: Societe Generale, 1.57%, 9/10/2018 (b) (c) | | | 975 | | | | 975 | |
Rib Floater Trust Series 2018-012, Rev., VRDO, LIQ: Barclays Bank plc, 1.59%, 9/10/2018 (b) (c) | | | 11,870 | | | | 11,870 | |
| | | | | | | | |
| | | | | | | 12,845 | |
| | | | | | | | |
Michigan — 1.0% | | | | | | | | |
Rib Floater Trust Series 2018-009, Rev., VRDO, LOC: Barclays Bank plc, 1.60%, 9/10/2018 (b) (c) | | | 4,000 | | | | 4,000 | |
Tender Option Bond Trust Receipts/CTFS Series 2017-XF0595, Rev., VRDO, LIQ: Bank of America NA, 1.61%, 9/10/2018 (b) (c) | | | 1,800 | | | | 1,800 | |
| | | | | | | | |
| | | | | | | 5,800 | |
| | | | | | | | |
Mississippi — 4.3% | | | | | | | | |
Mississippi Business Finance Corp., Gulf Opportunity Zone Industrial Development, Chevron USA, Inc. Project | | | | | | | | |
Series A, Rev., VRDO, 1.54%, 9/4/2018 (b) | | | 9,935 | | | | 9,935 | |
Series G, Rev., VRDO, 1.54%, 9/4/2018 (b) | | | 11,870 | | | | 11,870 | |
Series G, Rev., VRDO, 1.54%, 9/4/2018 (b) | | | 4,320 | | | | 4,320 | |
| | | | | | | | |
| | | | | | | 26,125 | |
| | | | | | | | |
Missouri — 4.0% | | | | | | | | |
Health and Educational Facilities Authority of the State of Missouri, SSM Health Series D, Rev., VRDO, 1.52%, 9/10/2018 (b) | | | 11,000 | | | | 11,000 | |
| | | | | | | | |
| INVESTMENTS | | PRINCIPAL
AMOUNT
($000) | | | VALUE
($000) | |
| | | | | | | | |
| | | | | | | | |
Missouri — continued | | | | | | | | |
Tender Option Bond Trust Receipts/CTFS | | | | | | | | |
Series 2018-XM0575, Rev., VRDO, LIQ: Royal Bank of Canada, 1.59%, 9/10/2018 (b) (c) | | | 8,000 | | | | 8,000 | |
Series 2018-XG0184, Rev., VRDO, LOC: Citibank NA, 1.61%, 9/10/2018 (b) (c) | | | 5,000 | | | | 5,000 | |
| | | | | | | | |
| | | | | | | 24,000 | |
| | | | | | | | |
Nevada — 0.2% | | | | | | | | |
Tender Option Bond Trust Receipts/CTFS Series 2018-XF0612, GO, VRDO, LIQ: Royal Bank of Canada, 1.59%, 9/10/2018 (b) (c) | | | 1,000 | | | | 1,000 | |
| | | | | | | | |
New York — 4.9% | | | | | | | | |
City of New York, Fiscal Year 2014 Subseries D-4, GO, VRDO, LOC: TD Bank NA, 1.50%, 9/4/2018 (b) | | | 3,550 | | | | 3,550 | |
City of New York, Fiscal Year 2018 Subseries E-5, GO, VRDO, LOC: TD Bank NA, 1.50%, 9/4/2018 (b) | | | 4,125 | | | | 4,125 | |
Metropolitan Transportation Authority Series D, Subseries D-1, Rev., VRDO, LOC: Landesbank Hessen-Thueringen, 1.59%, 9/10/2018 (b) | | | 230 | | | | 230 | |
New York City Municipal Water Finance Authority, Water and Sewer System, Fiscal Year 2015 Rev., VRDO, 1.53%, 9/4/2018 (b) | | | 3,150 | | | | 3,150 | |
New York City Transitional Finance Authority, Future Tax Secured Subseries C-6, Rev., VRDO, LOC: Sumitomo Mitsui Banking Corp., 1.58%, 9/10/2018 (b) | | | 1,525 | | | | 1,525 | |
New York State Housing Finance Agency, Manhattan West Residential Housing Series A, Rev., VRDO, LOC: Bank of China, 1.63%, 9/10/2018 (b) | | | 650 | | | | 650 | |
Tender Option Bond Trust Receipts/CTFS | | | | | | | | |
Series 2015-ZF0264, Rev., VRDO, LIQ: TD Bank NA, 1.58%, 9/10/2018 (b) (c) | | | 6,265 | | | | 6,265 | |
Series 2017-XF0566, Rev., VRDO, LIQ: TD Bank NA, 1.58%, 9/10/2018 (b) (c) | | | 4,000 | | | | 4,000 | |
Series 2016-XF2344, Rev., VRDO, LIQ: Citibank NA, 1.59%, 9/10/2018 (b) (c) | | | 3,500 | | | | 3,500 | |
Series 2018-XF2529, Rev., VRDO, LIQ: Citibank NA, 1.59%, 9/10/2018 (b) (c) | | | 2,625 | | | | 2,625 | |
| | | | | | | | |
| | | | | | | 29,620 | |
| | | | | | | | |
Ohio — 1.0% | | | | | | | | |
Ohio Air Quality Development Authority Series D, Rev., VRDO, LOC: Bank of Tokyo-Mitsubishi UFJ Ltd., 1.58%, 9/10/2018 (b) | | | 200 | | | | 200 | |
SEE NOTES TO FINANCIAL STATEMENTS.
| | | | | | | | |
| | | |
| AUGUST 31, 2018 | | J.P. MORGAN MONEY MARKET FUNDS | | | | | 21 | |
JPMorgan Institutional Tax Free Money Market Fund
SCHEDULE OF PORTFOLIO INVESTMENTS
AS OF AUGUST 31, 2018 (Unaudited) (continued)
| | | | | | | | |
| INVESTMENTS | | PRINCIPAL
AMOUNT
($000) | | | VALUE
($000) | |
| | | | | | | | |
Municipal Bonds — continued | | | | | | | | |
Ohio — continued | | | | | | | | |
Tender Option Bond Trust Receipts/CTFS | | | | | | | | |
Series 2018-ZF0670, Rev., VRDO, LIQ: Bank of America NA, 1.59%, 9/10/2018 (b) (c) | | | 2,000 | | | | 2,000 | |
Series 2018-XF2613-1, Rev., VRDO, LIQ: Citibank NA, 1.64%, 9/10/2018 (b) (c) | | | 4,000 | | | | 4,000 | |
| | | | | | | | |
| | | | | | | 6,200 | |
| | | | | | | | |
Oregon — 0.9% | | | | | | | | |
Oregon State Facilities Authority, Peacehealth Systems Series A, Rev., VRDO, LOC: U.S. Bank NA, 1.57%, 9/10/2018 (b) | | | 1,500 | | | | 1,500 | |
Tender Option Bond Trust Receipts/CTFS Series 2018-ZM0637, Rev., VRDO, LIQ: Royal Bank of Canada, 1.59%, 9/10/2018 (b) (c) | | | 4,000 | | | | 4,000 | |
| | | | | | | | |
| | | | | | | 5,500 | |
| | | | | | | | |
Pennsylvania—2.8% | | | | | | | | |
Delaware County Industrial Development Authority/PA Series A, Rev., VRDO, 1.60%, 9/10/2018 (b) | | | 400 | | | | 400 | |
Emmaus General Authority, Downingtown Area School District Subseries F24, Rev., VRDO, LOC: U.S. Bank NA, 1.55%, 9/10/2018 (b) | | | 3,200 | | | | 3,200 | |
Philadelphia Authority, Industrial Development Multi-Modal Lease Series B-3, Rev., VRDO, LOC: PNC Bank NA, 1.56%, 9/10/2018 (b) | | | 10,900 | | | | 10,900 | |
Tender Option Bond Trust Receipts/CTFS Series 2018-ZF0660, Rev., VRDO, LIQ: Bank of America NA, 1.59%, 9/10/2018 (b) (c) | | | 2,500 | | | | 2,500 | |
| | | | | | | | |
| | | | | | | 17,000 | |
| | | | | | | | |
Rhode Island — 1.7% | | | | | | | | |
Tender Option Bond Trust Receipts/CTFS | | | | | | | | |
Series 2018-ZM0631, Rev., VRDO, LIQ: Royal Bank of Canada, 1.61%, 9/10/2018 (b) (c) | | | 6,035 | | | | 6,035 | |
Series 2018-ZM0632, Rev., VRDO, LIQ: Royal Bank of Canada, 1.61%, 9/10/2018 (b) (c) | | | 4,050 | | | | 4,050 | |
| | | | | | | | |
| | | | | | | 10,085 | |
| | | | | | | | |
South Carolina — 0.1% | | | | | | | | |
City of North Charleston, Municipal Golf Course Rev., VRDO, 1.60%, 9/10/2018 (b) | | | 405 | | | | 405 | |
| | | | | | | | |
Tennessee — 0.9% | | | | | | | | |
Clarksville Public Building Authority Series 2005, Rev., VRDO, LOC: Bank of America NA, 1.55%, 9/4/2018 (b) | | | 3,015 | | | | 3,015 | |
| | | | | | | | |
| INVESTMENTS | | PRINCIPAL
AMOUNT
($000) | | | VALUE
($000) | |
| | | | | | | | |
| | | | | | | | |
Tennessee — continued | | | | | | | | |
Tender Option Bond Trust Receipts/CTFS Series 2018-XF2576, Rev., VRDO, LOC: Barclays Bank plc, 1.59%, 9/10/2018 (b) (c) | | | 2,250 | | | | 2,250 | |
| | | | | | | | |
| | | | | | | 5,265 | |
| | | | | | | | |
Texas — 5.0% | | | | | | | | |
Dallas Performing Arts Cultural Facilities Corp., Center for the Performing Arts Foundation, Inc. Rev., VRDO, LOC: Bank of America NA, 1.57%, 9/10/2018 (b) | | | 5,575 | | | | 5,575 | |
Lower Neches Valley Authority Industrial Development Corp., ExxonMobil Project | | | | | | | | |
Series A-2, Rev., VRDO, 1.55%, 9/4/2018(b) | | | 1,170 | | | | 1,170 | |
Subseries A-3, Rev., VRDO, 1.55%, 9/4/2018 (b) | | | 300 | | | | 300 | |
RBC Municipal Products, Inc. Trust, Floater Certificates Series G-21, GO, VRDO, LOC: Royal Bank of Canada, 1.59%, 9/10/2018 (b) (c) | | | 5,000 | | | | 5,000 | |
Tarrant County Cultural Education Facilities Finance Corp. Rev., VRDO, 1.58%, 9/10/2018(b) | | | 3,000 | | | | 3,000 | |
Rev., VRDO, LOC: Bank of New York Mellon, 1.60%, 9/10/2018(b) | | | 3,200 | | | | 3,200 | |
Tarrant County Cultural Education Facilities Finance Corp., Texas Health Resources System Series 2012-B, Rev., VRDO, 1.58%, 9/10/2018(b) | | | 150 | | | | 150 | |
Tender Option Bond Trust Receipts/CTFS | | | | | | | | |
Series 2018-XF0645, Rev., VRDO, LIQ: TD Bank NA, 1.59%, 9/10/2018 (b) (c) | | | 4,000 | | | | 4,000 | |
Series 2018-XF0648, GO, VRDO, PSF-GTD, LIQ: TD Bank NA, 1.59%, 9/10/2018 (b) (c) | | | 3,745 | | | | 3,745 | |
Series 2018-ZF2662, GO, VRDO, PSF-GTD, LIQ: Morgan Stanley Bank, 1.59%, 9/10/2018 (b) (c) | | | 3,840 | | | | 3,840 | |
| | | | | | | | |
| | | | | | | 29,980 | |
| | | | | | | | |
Utah — 0.6% | | | | | | | | |
Tender Option Bond Trust Receipts/CTFS Series 2018-ZM0652, Rev., VRDO, LIQ: Morgan Stanley Bank, 1.60%, 9/10/2018 (b) (c) | | | 3,425 | | | | 3,425 | |
| | | | | | | | |
Virginia — 1.3% | | | | | | | | |
Fairfax County Industrial Development Authority, Virginia Health Care, Inova Health System Project Rev., VRDO, 1.55%, 9/10/2018 (b) | | | 5,000 | | | | 5,000 | |
Tender Option Bond Trust Receipts/CTFS Series 2018-XG0183, Rev., VRDO, LIQ: Barclays Bank plc, 1.58%, 9/10/2018 (b) (c) | | | 3,000 | | | | 3,000 | |
| | | | | | | | |
| | | | | | | 8,000 | |
| | | | | | | | |
SEE NOTES TO FINANCIAL STATEMENTS.
| | | | | | |
| | | |
| 22 | | | | J.P. MORGAN MONEY MARKET FUNDS | | AUGUST 31, 2018 |
| | | | | | | | |
| INVESTMENTS | | PRINCIPAL
AMOUNT
($000) | | | VALUE
($000) | |
| | | | | | | | |
Municipal Bonds — continued | | | | | | | | |
Washington — 0.6% | | | | | | | | |
County of Washington, Junior Lien, Sewer Series A, Rev., VRDO, LOC: Landesbank Hessen-Thueringen, 1.56%, 9/10/2018 (b) | | | 350 | | | | 350 | |
Washington State Housing Finance Commission Rev., VRDO, LOC: Wells Fargo Bank NA, 1.57%, 9/10/2018 (b) | | | 320 | | | | 320 | |
Washington State Housing Finance Commission, Overlake School Project Rev., VRDO, LOC: Wells Fargo Bank NA, 1.57%, 9/10/2018 (b) | | | 2,900 | | | | 2,900 | |
| | | | | | | | |
| | | | | | | 3,570 | |
| | | | | | | | |
Wisconsin — 1.0% | | | | | | | | |
Tender Option Bond Trust Receipts/CTFS | | | | | | | | |
Series 2018-XF2634, Rev., VRDO, LIQ: Creidt Suisse, 1.61%, 9/10/2018 (b) (c) | | | 2,000 | | | | 2,000 | |
Series 2018-XG0174, Rev., VRDO, LIQ: Bank of America NA, 1.61%, 9/10/2018 (b) (c) | | | 4,000 | | | | 4,000 | |
| | | | | | | | |
| | | | | | | 6,000 | |
| | | | | | | | |
Wyoming — 0.2% | | | | | | | | |
County of Uinta Rev., VRDO, 1.54%, 9/4/2018 (b) | | | 975 | | | | 975 | |
| | | | | | | | |
Total Municipal Bonds
(cost $382,885) | | | | 382,885 | |
| | | | | | | | |
| | | SHARES
(000) | | | | |
Variable Rate Demand Preferred Shares — 2.5% | |
Other — 2.5% | | | | | | | | |
Nuveen AMT-Free Quality Municipal Income Fund Series 4, LIQ: Barclays Bank plc, 1.65%, 9/10/2018 # (c)
(Cost $15,000) | | | 15,000 | | | | 15,000 | |
| | | | | | | | |
| | |
| | | PRINCIPAL
AMOUNT
($000) | | | | |
Short-term Investments — 33.7% | | | | | | | | |
Commercial Paper — 33.7% | | | | | | | | |
California Statewide Communities Development Authority 1.30%, 9/4/2018 | | | 12,000 | | | | 12,000 | |
City of Dallas Series D-1, 1.68%, 9/26/2018 | | | 5,000 | | | | 5,000 | |
City of Garland, Electric Utility System | | | | | | | | |
1.37%, 9/5/2018 | | | 11,000 | | | | 11,000 | |
1.61%, 9/13/2018 | | | 1,500 | | | | 1,500 | |
City of Rochester, Health Care Facilities | | | | | | | | |
1.38%, 10/1/2018 | | | 5,000 | | | | 4,999 | |
1.50%, 10/1/2018 | | | 5,000 | | | | 4,999 | |
| | | | | | | | |
| INVESTMENTS | | PRINCIPAL
AMOUNT
($000) | | | VALUE
($000) | |
| | | | | | | | |
| | | | | | | | |
Commercial Paper — continued | | | | | | | | |
County of York, National Rural Utilities Cooperative Finance Corp. | | | | | | | | |
1.40%, 9/4/2018 | | | 15,000 | | | | 14,999 | |
1.40%, 9/4/2018 | | | 12,950 | | | | 12,950 | |
Indiana Finance Authority 1.55%, 10/2/2018 | | | 7,000 | | | | 6,999 | |
Las Vegas Valley Water District 1.38%, 10/1/2018 | | | 20,000 | | | | 19,995 | |
Massachusetts Health and Educational Facilities Authority 1.32%, 9/5/2018 | | | 17,750 | | | | 17,749 | |
Omaha Public Power District, Electric System 1.67%, 10/11/2018 | | | 10,000 | | | | 10,000 | |
Regents of the University of Michigan | | | | | | | | |
1.60%, 9/4/2018 | | | 9,760 | | | | 9,760 | |
1.63%, 10/1/2018 | | | 10,000 | | | | 10,000 | |
San Diego Public Facilities Financing Authority 1.30%, 9/5/2018 | | | 10,000 | | | | 10,000 | |
Southwestern Illinois Development Authority Health Facility 1.38%, 10/1/2018 | | | 10,000 | | | | 9,998 | |
State of Maryland, Health & Higher Educational Facilities Authority Series B, 1.60%, 9/4/2018 | | | 9,000 | | | | 9,000 | |
University of Massachusetts Building Authority 1.60%, 9/13/2018 | | | 5,000 | | | | 5,000 | |
University of Texas System | | | | | | | | |
1.60%, 9/13/2018 | | | 4,419 | | | | 4,419 | |
1.61%, 9/14/2018 | | | 12,740 | | | | 12,740 | |
Wisconsin Health and Educational Facilities Authority 1.38%, 10/1/2018 | | | 9,415 | | | | 9,413 | |
| | | | | | | | |
Total Commercial Paper
(Cost $202,534) | | | | 202,520 | |
| | | | | | | | |
Total Short-term Investments
(COST $202,534) | | | | | | | 202,520 | |
| | | | | | | | |
Total Investments — 99.9%
(Cost $600,419) | | | | | | | 600,405 | |
Other Assets Less Liabilities — 0.1% | | | | | | | 455 | |
| | | | | | | | |
NET ASSETS — 100.0% | | | | | | | 600,860 | |
| | | | | | | | |
Percentages indicated are based on net assets.
SEE NOTES TO FINANCIAL STATEMENTS.
| | | | | | | | |
| | | |
| AUGUST 31, 2018 | | J.P. MORGAN MONEY MARKET FUNDS | | | | | 23 | |
JPMorgan Institutional Tax Free Money Market Fund
SCHEDULE OF PORTFOLIO INVESTMENTS
AS OF AUGUST 31, 2018 (Unaudited) (continued)
Abbreviations
| | |
| AGC | | Insured by Assured Guaranty Corp. |
| AMT | | Alternative Minimum Tax |
| COP | | Certificate of Participation |
| FGIC | | Insured by Financial Guaranty Insurance Co. |
| FHLMC | | Federal Home Loan Mortgage Corp. |
| GO | | General Obligation |
| LIQ | | Liquidity Agreement |
| LOC | | Letter of Credit |
| NATL | | Insured by National Public Finance Guarantee Corp. |
| PSF-GTD | | Permanent School Fund Guaranteed |
| RE | | Reinsured |
| Rev. | | Revenue |
| VRDO | | Variable Rate Demand Obligation. The interest rate shown is the rate in effect as of August 31, 2018. |
| | |
| (a) | | The date shown represents the earliest of the next put date, next demand date or final maturity date. |
| (b) | | Variable or floating rate security, the interest rate of which adjusts periodically based on changes in current interest rates and prepayments on the underlying pool of assets. The interest rate shown is the current rate as of August 31, 2018. |
| (c) | | Securities exempt from registration under Rule 144A or section 4(a)(2), of the Securities Act of 1933, as amended. Under procedures approved by the Board of Trustees, such securities have been determined to be liquid by the investment adviser and may be resold, normally to qualified institutional buyers in transactions exempt from registration. |
| # | | Variable Rate Demand Preferred Shares of a closed-end investment company which has a weekly demand feature. The interest rate shown is the rate in effect as of August 31, 2018. |
SEE NOTES TO FINANCIAL STATEMENTS.
| | | | | | |
| | | |
| 24 | | | | J.P. MORGAN MONEY MARKET FUNDS | | AUGUST 31, 2018 |
JPMorgan Liquid Assets Money Market Fund
SCHEDULE OF PORTFOLIO INVESTMENTS
AS OF AUGUST 31, 2018 (Unaudited)
| | | | | | | | |
| INVESTMENTS (a) | | PRINCIPAL
AMOUNT
($000) | | | VALUE
($000) | |
Repurchase Agreements — 27.8% | | | | | | | | |
Agency Joint Trading Account II, J.P. Morgan Investment Management Inc., as agent, 1.97%, dated 8/31/2018, due 9/4/18, repurchase price $538,494. [2] | | | 538,376 | | | | 538,376 | |
Barclays Capital, Inc., 2.16%, dated 8/31/2018, due 9/7/2018, repurchase price $10,004, collateralized by Asset-Backed Securities, 5.95%, due 7/25/2024, and FNMA Connecticut Avenue Securities, 5.81% - 6.91%, due 10/25/2029 - 5/25/2043, with a value of $10,893. | | | 10,000 | | | | 10,000 | |
Barclays Capital, Inc., 2.43%, dated 8/31/2018, due 10/5/2018, repurchase price $30,071, collateralized by Asset-Backed Securities, 0.00%, due 1/10/2031, and FNMA Connecticut Avenue Securities, 5.81% - 7.56%, due 9/25/2029 - 5/25/2043, with a value of $32,845. | | | 30,000 | | | | 30,000 | |
BMO Capital Markets Corp., 2.01%, dated 8/31/2018, due 9/4/2018, repurchase price $35,008, collateralized by Asset-Backed Securities, 1.89% - 3.05%, due 11/16/2020 - 4/17/2023, Corporate Bonds, 1.25% - 11.00%, due 6/17/2019 - 11/16/2048, Corporate Notes, 1.88% - 4.75%, due 4/22/2019 - 4/15/2058, and Sovereign Government Securities, 2.75%, due 11/2/2027, with a value of $37,030. | | | 35,000 | | | | 35,000 | |
BMO Capital Markets Corp., 2.30%, dated 8/31/2018, due 9/5/2018, repurchase price $25,008, collateralized by Asset-Backed Securities, 1.89% - 2.91%, due 6/15/2021 - 2/25/2066, Corporate Bonds, 2.00% - 8.88%, due 1/30/2019 - 11/16/2048, Corporate Notes, 2.13% - 3.45%, due 9/4/2018 - 1/11/2025, and Sovereign Government Securities, 1.38% - 2.38%, due 10/3/2018 - 11/15/2022, with a value of $26,508. | | | 25,000 | | | | 25,000 | |
BNP Paribas SA, 2.10%, dated 8/31/2018, due 9/4/2018, repurchase price $25,006, collateralized by Asset-Backed Securities, 2.56% - 7.21%, due 2/15/2026 - 3/25/2036, with a value of $27,511. | | | 25,000 | | | | 25,000 | |
BNP Paribas SA, 2.10%, dated 8/31/2018, due 9/6/2018, repurchase price $5,002, collateralized by Asset-Backed Securities, 6.85%, due 6/1/2034, and Corporate Bonds, 3.15% - 14.00%, due 10/15/2018 - 8/9/2028, with a value of $5,402. | | | 5,000 | | | | 5,000 | |
| | | | | | | | |
| INVESTMENTS | | PRINCIPAL
AMOUNT
($000) | | | VALUE
($000) | |
| | | | | | | | |
Credit Suisse Securities USA LLC, 2.11%, dated 8/31/2018, due 9/5/2018, repurchase price $15,004, collateralized by Asset-Backed Securities, 0.00% - 4.50%, due 7/25/2029 - 8/25/2045, Collateralized Mortgage Obligations, 3.01% - 6.50%, due 10/25/2037 - 11/18/2048, and FNMA Connecticut Avenue Securities, 4.31% - 6.31%, due 7/25/2030 - 1/27/2031, with a value of $16,323. | | | 15,000 | | | | 15,000 | |
Credit Suisse Securities USA LLC, 2.48%, dated 8/31/2018, due 10/5/2018, repurchase price $20,048, collateralized by Asset-Backed Securities, 5.00%, due 9/25/2034, Collateralized Mortgage Obligations, 0.00% - 12.07%, due 12/1/2018 - 2/25/2055, Corporate Bonds, 0.00% - 14.00%, due 2/13/2020 - 2/12/2055, Corporate Notes, 6.75%, due 5/20/2036, FNMA Connecticut Avenue Securities, 4.31%, due 7/25/2030, and Sovereign Government Securities, 7.50%, due 3/31/2030, with a value of $21,960. | | | 20,000 | | | | 20,000 | |
HSBC Securities USA, Inc., 2.17%, dated 8/31/2018, due 9/4/2018, repurchase price $20,005, collateralized by Corporate Bonds, 2.40% - 8.25%, due 6/5/2020 - 1/1/2099, with a value of $21,605. | | | 20,000 | | | | 20,000 | |
ING Financial Markets LLC, 2.11%, dated 8/31/2018, due 9/4/2018, repurchase price $50,012, collateralized by Sovereign Government Securities, 5.50% - 5.75%, due 7/12/2020 - 9/26/2023, with a value of $54,014. | | | 50,000 | | | | 50,000 | |
Merrill Lynch PFS, Inc., 2.40%, dated 8/31/2018, due 10/5/2018, repurchase price $40,093, collateralized by Commercial Paper, 0.00%, due 4/2/2019, and Municipal Debt Securities, 0.00% - 6.30%, due 2/1/2019 - 7/1/2043, with a value of $43,128. | | | 40,000 | | | | 40,000 | |
Societe Generale SA, 2.04%, dated 8/31/2018, due 9/4/2018, repurchase price $20,005, collateralized by Corporate Bonds, 2.75% - 8.10%, due 4/15/2020 - 9/1/2048, Corporate Notes, 0.00% - 4.75%, due 11/23/2018 - 4/15/2058, Sovereign Government Securities, 3.00%, due 1/13/2026, and U.S. Treasury Securities, 0.00% - 2.00%, due 12/6/2018 - 11/15/2046, with a value of $20,790. | | | 20,000 | | | | 20,000 | |
SEE NOTES TO FINANCIAL STATEMENTS.
| | | | | | | | |
| | | |
| AUGUST 31, 2018 | | J.P. MORGAN MONEY MARKET FUNDS | | | | | 25 | |
JPMorgan Liquid Assets Money Market Fund
SCHEDULE OF PORTFOLIO INVESTMENTS
AS OF AUGUST 31, 2018 (Unaudited) (continued)
| | | | | | | | |
| INVESTMENTS | | PRINCIPAL
AMOUNT
($000) | | | VALUE
($000) | |
Repurchase Agreements — continued | | | | | | | | |
Societe Generale SA, 2.14%, dated 8/31/2018, due 9/4/2018, repurchase price $50,012, collateralized by Corporate Bonds, 2.10% - 10.75%, due 7/30/2019 - 1/1/2049, Corporate Notes, 3.25% - 6.35%, due 5/21/2020 - 1/31/2023, Sovereign Government Securities, 3.00% - 11.88%, due 10/14/2019 - 3/13/2048, and U.S. Treasury Securities, 0.00%, due 12/6/2018, with a value of $53,673. | | | 50,000 | | | | 50,000 | |
Societe Generale SA, 2.19%, dated 8/31/2018, due 9/4/2018, repurchase price $5,001, collateralized by Corporate Bonds, 3.19% - 9.50%, due 4/15/2019 - 1/1/2099, Corporate Notes, 4.88%, due 4/23/2030, and Sovereign Government Securities, 3.70% - 11.88%, due 4/18/2023 - 3/1/2041, with a value of $5,371. | | | 5,000 | | | | 5,000 | |
Wells Fargo Securities LLC, 2.01%, dated 8/31/2018, due 9/4/2018, repurchase price $12,003, collateralized by Sovereign Government Securities, 1.38% - 4.88%, due 6/17/2019 - 7/10/2024, with a value of $12,630. | | | 12,000 | | | | 12,000 | |
| | | | | | | | |
Total Repurchase Agreements
(COST $900,376) | | | | | | | 900,376 | |
| | | | | | | | |
| | |
Municipal Bonds — 1.2% | | | | | | | | |
Alaska — 0.8% | | | | | | | | |
Alaska Housing Finance Corp., State Capital Project Bonds II Series B, Rev., VRDO, 1.96%, 9/10/2018 (b) | | | 25,000 | | | | 25,000 | |
| | | | | | | | |
California — 0.1% | | | | | | | | |
City and County of San Francisco, Multifamily Housing, Taxable, Transbay Block 8 Tower Apartments | | | | | | | | |
Series H-4, Rev., VRDO, LOC: Bank of China, 2.04%, 9/10/2018 (b) | | | 2,000 | | | | 2,000 | |
Series H-3, Rev., VRDO, LOC: Bank of China, 2.05%, 9/10/2018 (b) | | | 2,000 | | | | 2,000 | |
| | | | | | | | |
| | | | | | | 4,000 | |
| | | | | | | | |
New York — 0.3% | | | | | | | | |
New York State Housing Finance Agency, 572 11th Avenue Housing Series A, Rev., VRDO, LOC: Bank of China, 2.12%, 9/4/2018 (b) | | | 10,000 | | | | 10,000 | |
| | | | | | | | |
Total Municipal Bonds
(Cost $39,000) | | | | | | | 39,000 | |
| | | | | | | | |
| | | | | | | | |
| INVESTMENTS | | PRINCIPAL
AMOUNT
($000) | | | VALUE
($000) | |
U.S. Government Agency Securities — 0.8% | | | | | | | | |
FHLB DN, 1.92%, 9/19/2018 (c)
(Cost $24,976) | | | 25,000 | | | | 24,976 | |
| | | | | | | | |
Short-Term Investments — 70.7% | | | | | | | | |
Certificates of Deposit — 31.1% | | | | | | | | |
Banco Del Estado De Chile (Chile) 2.28%, 10/2/2018 | | | 10,000 | | | | 10,000 | |
2.29%, 10/31/2018 | | | 5,000 | | | | 5,000 | |
Bank of Montreal (Canada)
2.27%, 9/27/2018 | | | 5,000 | | | | 5,000 | |
2.30%, 11/26/2018 | | | 25,000 | | | | 25,000 | |
Bank of Nova Scotia (The) (Canada) | | | | | | | | |
(ICE LIBOR USD 1 Month + 0.23%), 2.31%, 9/4/2018 (d) | | | 5,000 | | | | 5,000 | |
(ICE LIBOR USD 1 Month + 0.27%), 2.35%, 8/2/2019 (d) | | | 5,000 | | | | 5,000 | |
BNP Paribas SA (France) | | | | | | | | |
(ICE LIBOR USD 1 Month + 0.27%), 2.35%, 9/4/2018 (d) | | | 15,000 | | | | 15,000 | |
(ICE LIBOR USD 3 Month + 0.25%), 2.59%, 9/26/2018 (d) | | | 10,000 | | | | 10,000 | |
(ICE LIBOR USD 3 Month + 0.02%), 2.36%, 11/6/2018 (d) | | | 5,000 | | | | 5,000 | |
Canadian Imperial Bank of Commerce (Canada) | | | | | | | | |
(ICE LIBOR USD 1 Month + 0.20%), 2.28%, 9/4/2018 (d) | | | 5,000 | | | | 5,000 | |
(ICE LIBOR USD 3 Month + 0.25%), 2.58%, 9/13/2018 (d) | | | 1,500 | | | | 1,500 | |
Chiba Bank Ltd. (Japan) 2.19%, 10/4/2018 | | | 10,000 | | | | 10,000 | |
China Construction Bank Corp. (China) | | | | | | | | |
2.45%, 9/7/2018 | | | 20,000 | | | | 20,000 | |
2.45%, 9/7/2018 | | | 5,000 | | | | 5,000 | |
2.52%, 11/1/2018 | | | 6,000 | | | | 6,000 | |
2.50%, 11/19/2018 | | | 4,000 | | | | 4,000 | |
2.50%, 12/3/2018 | | | 30,000 | | | | 30,000 | |
Commonwealth Bank of Australia (Australia) (ICE LIBOR USD 3 Month + 0.21%), 2.55%, 10/30/2018 (d) | | | 5,000 | | | | 5,000 | |
Cooperatieve Rabobank UA (Netherlands) | | | | | | | | |
(ICE LIBOR USD 1 Month + 0.22%), 2.28%, 9/27/2018 (d) | | | 6,000 | | | | 6,000 | |
(ICE LIBOR USD 3 Month + 0.08%), 2.42%, 11/6/2018 (d) | | | 15,000 | | | | 15,000 | |
Credit Agricole Corporate and Investment Bank (France) | | | | | | | | |
2.30%, 10/2/2018 | | | 15,000 | | | | 15,000 | |
2.45%, 1/25/2019 | | | 10,000 | | | | 10,000 | |
SEE NOTES TO FINANCIAL STATEMENTS.
| | | | | | |
| | | |
| 26 | | | | J.P. MORGAN MONEY MARKET FUNDS | | AUGUST 31, 2018 |
| | | | | | | | |
| INVESTMENTS | | PRINCIPAL
AMOUNT
($000) | | | VALUE
($000) | |
Short-Term Investments — continued | | | | | | | | |
Certificates of Deposit — continued | | | | | | | | |
Credit Industriel et Commercial (France) | | | | | | | | |
(ICE LIBOR USD 1 Month + 0.30%), 2.36%, 9/16/2018 (d) | | | 20,000 | | | | 20,000 | |
(ICE LIBOR USD 1 Month + 0.29%), 2.35%, 9/28/2018 (d) | | | 20,000 | | | | 20,000 | |
2.53%, 1/28/2019 (c) | | | 10,000 | | | | 9,896 | |
Industrial & Commercial Bank of China Ltd. (China) | | | | | | | | |
2.45%, 9/6/2018 | | | 5,000 | | | | 5,000 | |
2.45%, 9/10/2018 | | | 20,000 | | | | 20,000 | |
2.50%, 10/9/2018 | | | 7,000 | | | | 7,000 | |
2.50%, 10/29/2018 | | | 6,000 | | | | 6,000 | |
2.50%, 11/16/2018 | | | 5,000 | | | | 5,000 | |
2.50%, 11/19/2018 | | | 5,000 | | | | 5,000 | |
2.50%, 11/30/2018 | | | 15,000 | | | | 15,000 | |
2.50%, 11/30/2018 | | | 3,000 | | | | 3,000 | |
ING Bank NV (Netherlands)
2.36%, 11/1/2018 | | | 30,000 | | | | 30,000 | |
(ICE LIBOR USD 3 Month + 0.12%), 2.42%, 11/21/2018 (d) | | | 10,000 | | | | 10,000 | |
2.50%, 12/27/2018 | | | 15,000 | | | | 15,000 | |
2.51%, 1/31/2019 | | | 10,000 | | | | 10,000 | |
Lloyds Bank Corporate Markets plc (United Kingdom) 2.31%, 10/26/2018 (c) | | | 10,000 | | | | 9,965 | |
Mitsubishi UFJ Trust & Banking Corp. (Japan) | | | | | | | | |
(ICE LIBOR USD 1 Month + 0.34%), 2.42%, 9/4/2018 (d) | | | 10,000 | | | | 10,000 | |
(ICE LIBOR USD 1 Month + 0.19%), 2.27%, 10/9/2018 (d) | | | 30,000 | | | | 30,000 | |
Mizuho Bank Ltd. (Japan)
2.41%, 9/10/2018 (c) | | | 5,000 | | | | 4,997 | |
2.41%, 9/12/2018 (c) | | | 13,000 | | | | 12,990 | |
(ICE LIBOR USD 3 Month + 0.50%), 2.84%, 9/24/2018 (d) | | | 4,000 | | | | 4,001 | |
(ICE LIBOR USD 1 Month + 0.20%), 2.26%, 9/28/2018 (d) | | | 10,000 | | | | 10,000 | |
2.34%, 10/10/2018 (c) | | | 15,000 | | | | 14,962 | |
2.32%, 10/19/2018 | | | 5,000 | | | | 5,000 | |
Mizuho Corporate Bank Ltd. (Japan) 2.34%, 11/21/2018 (c) | | | 10,000 | | | | 9,948 | |
Natixis SA (France)
(ICE LIBOR USD 1 Month + 0.38%), 2.46%, 9/4/2018 (d) | | | 11,000 | | | | 11,000 | |
(ICE LIBOR USD 3 Month + 0.10%), 2.41%, 11/19/2018 (d) | | | 10,000 | | | | 10,000 | |
| | | | | | | | |
| INVESTMENTS | | PRINCIPAL
AMOUNT
($000) | | | VALUE
($000) | |
| | | | | | | | |
Certificates of Deposit — continued | | | | | | | | |
Norinchukin Bank (The) (United Kingdom) 2.20%, 9/25/2018 (c) | | | 10,000 | | | | 9,985 | |
2.08%, 9/28/2018 (c) | | | 10,000 | | | | 9,985 | |
2.34%, 10/5/2018 (c) | | | 20,000 | | | | 19,956 | |
Oversea-Chinese Banking Corp. Ltd. (Singapore) (ICE LIBOR USD 1 Month + 0.21%), 2.28%, 9/24/2018 (d) | | | 20,000 | | | | 20,000 | |
Royal Bank of Canada (Canada)
(ICE LIBOR USD 1 Month + 0.21%), 2.29%, 9/20/2018 (d) | | | 2,000 | | | | 2,000 | |
(ICE LIBOR USD 3 Month + 0.17%), 2.50%, 9/21/2018 (d) | | | 5,000 | | | | 5,000 | |
(ICE LIBOR USD 1 Month + 0.23%), 2.30%, 9/23/2018 (d) | | | 25,000 | | | | 25,000 | |
(ICE LIBOR USD 1 Month + 0.25%), 2.32%, 9/24/2018 (d) | | | 10,000 | | | | 10,000 | |
(ICE LIBOR USD 3 Month + 0.08%), 2.43%, 11/2/2018 (d) | | | 15,000 | | | | 15,000 | |
Shizuoka Bank Ltd. (The) (Japan) 2.17%, 9/25/2018 | | | 10,000 | | | | 10,000 | |
Standard Chartered Bank (United Kingdom)
2.30%, 9/19/2018 | | | 5,000 | | | | 5,000 | |
(ICE LIBOR USD 1 Month + 0.29%), 2.36%, 9/23/2018 (d) | | | 25,000 | | | | 25,000 | |
(ICE LIBOR USD 3 Month + 0.08%), 2.40%, 11/29/2018 (d) | | | 10,000 | | | | 10,000 | |
2.50%, 12/21/2018 | | | 25,000 | | | | 25,000 | |
State Street Bank & Trust Co. (ICE LIBOR USD 1 Month + 0.21%), 2.27%, 9/26/2018 (d) | | | 10,000 | | | | 10,000 | |
Sumitomo Mitsui Banking Corp. (Japan) | | | | | | | | |
(ICE LIBOR USD 1 Month + 0.22%), 2.29%, 9/23/2018 (d) | | | 25,000 | | | | 25,000 | |
(ICE LIBOR USD 1 Month + 0.20%), 2.27%, 9/28/2018 (d) | | | 25,000 | | | | 25,000 | |
(ICE LIBOR USD 1 Month + 0.26%), 2.33%, 9/29/2018 (d) | | | 10,000 | | | | 10,000 | |
(ICE LIBOR USD 1 Month + 0.20%), 2.28%, 10/3/2018 (d) | | | 30,000 | | | | 30,000 | |
Sumitomo Mitsui Trust Bank Ltd. (Japan) | | | | | | | | |
(ICE LIBOR USD 1 Month + 0.25%), 2.33%, 9/5/2018 (d) | | | 10,000 | | | | 10,000 | |
2.51%, 1/7/2019 (c) | | | 25,000 | | | | 24,779 | |
Sumitomo Trust and Banking Co. (United Kingdom) 2.29%, 10/25/2018 (c) | | | 15,000 | | | | 14,948 | |
Svenska Handelsbanken AB (Sweden)
(ICE LIBOR USD 1 Month + 0.22%), 2.30%, 9/6/2018 (d) | | | 10,000 | | | | 10,000 | |
SEE NOTES TO FINANCIAL STATEMENTS.
| | | | | | | | |
| | | |
| AUGUST 31, 2018 | | J.P. MORGAN MONEY MARKET FUNDS | | | | | 27 | |
JPMorgan Liquid Assets Money Market Fund
SCHEDULE OF PORTFOLIO INVESTMENTS
AS OF AUGUST 31, 2018 (Unaudited) (continued)
| | | | | | | | |
| INVESTMENTS | | PRINCIPAL
AMOUNT
($000) | | | VALUE
($000) | |
Short-Term Investments — continued | | | | | | | | |
Certificates of Deposit — continued | | | | | | | | |
(ICE LIBOR USD 1 Month + 0.21%), 2.28%, 9/23/2018 (d) | | | 15,000 | | | | 15,000 | |
(ICE LIBOR USD 1 Month + 0.26%), 2.32%, 9/28/2018 (d) | | | 10,000 | | | | 10,000 | |
Swedbank AB (Sweden) (ICE LIBOR USD 1 Month + 0.20%), 2.28%, 9/5/2018 (d) | | | 10,000 | | | | 10,000 | |
Wells Fargo Bank NA
(ICE LIBOR USD 1 Month + 0.23%), 2.30%, 9/13/2018 (d) | | | 15,000 | | | | 15,000 | |
(ICE LIBOR USD 1 Month + 0.25%), 2.32%, 9/22/2018 (d) | | | 15,000 | | | | 15,000 | |
(ICE LIBOR USD 1 Month + 0.23%), 2.29%, 9/27/2018 (d) | | | 10,000 | | | | 10,000 | |
(ICE LIBOR USD 1 Month + 0.28%), 2.34%, 9/28/2018 (d) | | | 25,000 | | | | 25,000 | |
(ICE LIBOR USD 1 Month + 0.33%), 2.40%, 9/29/2018 (d) | | | 10,000 | | | | 10,000 | |
(ICE LIBOR USD 1 Month + 0.21%), 2.28%, 9/30/2018 (d) | | | 15,000 | | | | 15,000 | |
| | | | | | | | |
Total Certificates of Deposit
(Cost $1,007,912) | | | | | | | 1,007,912 | |
| | | | | | | | |
Commercial Paper — 28.9% | | | | | | | | |
Alpine Securitization Ltd. (Switzerland) 2.40%, 11/1/2018 (e) | | | 5,000 | | | | 5,000 | |
Antalis SA (Jersey) 2.32%, 10/2/2018 (c) (e) | | | 15,000 | | | | 14,970 | |
Australia & New Zealand Banking Group Ltd. (Australia) (ICE LIBOR USD 3 Month + 0.21%), 2.55%, 10/30/2018 (d) (e) | | | 5,000 | | | | 5,000 | |
Bank of China Ltd. (China)
2.52%, 9/12/2018 (c) (e) | | | 10,000 | | | | 9,992 | |
2.53%, 10/9/2018 (c) (e) | | | 10,000 | | | | 9,974 | |
2.56%, 10/23/2018 (c) | | | 23,000 | | | | 22,915 | |
Bank of Nova Scotia (The) (Canada) | | | | | | | | |
(ICE LIBOR USD 1 Month + 0.27%), 2.33%, 9/15/2018 (d) (e) | | | 20,000 | | | | 20,000 | |
(ICE LIBOR USD 3 Month + 0.08%), 2.42%, 11/8/2018 (d) (e) | | | 3,000 | | | | 3,000 | |
Barton Capital LLC 2.30%, 10/24/2018 (c) (e) | | | 25,000 | | | | 24,916 | |
Bedford Row Funding Corp. | | | | | | | | |
(ICE LIBOR USD 1 Month + 0.22%), 2.30%, 9/6/2018 (d) (e) | | | 3,000 | | | | 3,000 | |
(ICE LIBOR USD 1 Month + 0.24%), 2.32%, 9/6/2018 (d) (e) | | | 15,000 | | | | 15,000 | |
(ICE LIBOR USD 1 Month + 0.24%), 2.31%, 9/13/2018 (d) (e) | | | 20,000 | | | | 20,000 | |
(ICE LIBOR USD 1 Month + 0.26%), 2.32%, 9/20/2018 (d) (e) | | | 10,000 | | | | 10,000 | |
| | | | | | | | |
| INVESTMENTS | | PRINCIPAL
AMOUNT
($000) | | | VALUE
($000) | |
| | | | | | | | |
Commercial Paper — continued | | | | | | | | |
(ICE LIBOR USD 1 Month + 0.27%), 2.33%, 9/26/2018 (d) (e) | | | 5,000 | | | | 5,000 | |
(ICE LIBOR USD 1 Month + 0.23%), 2.29%, 9/28/2018 (d) (e) | | | 5,000 | | | | 5,000 | |
(ICE LIBOR USD 3 Month + 0.11%), 2.42%, 11/26/2018 (d) (e) | | | 10,000 | | | | 10,000 | |
BPCE SA (France)
2.33%, 9/12/2018 (c) (e) | | | 5,000 | | | | 4,996 | |
2.50%, 12/17/2018 (c) (e) | | | 5,000 | | | | 4,963 | |
2.56%, 3/4/2019 (c) (e) | | | 1,500 | | | | 1,481 | |
Canadian Imperial Bank of Commerce (Canada) (ICE LIBOR USD 1 Month + 0.30%), 2.38%, 9/8/2018 (d) (e) | | | 10,000 | | | | 10,000 | |
Cancara Asset Securitisation LLC 2.29%, 10/2/2018 (c) (e) | | | 15,000 | | | | 14,970 | |
Commonwealth Bank of Australia (Australia) | | | | | | | | |
(ICE LIBOR USD 1 Month + 0.20%), 2.28%, 9/4/2018 (d) (e) | | | 10,000 | | | | 10,000 | |
(ICE LIBOR USD 1 Month + 0.23%), 2.31%, 9/8/2018 (d) (e) | | | 15,000 | | | | 15,000 | |
(ICE LIBOR USD 1 Month + 0.20%), 2.27%, 9/13/2018 (d) (e) | | | 20,000 | | | | 20,000 | |
Cooperative Centrale (ICE LIBOR USD 3 Month + 0.06%), 2.30%, 11/26/2018 (d) | | | 15,000 | | | | 15,000 | |
DBS Bank Ltd. (Singapore)
2.27%, 10/3/2018 (c) (e) | | | 10,000 | | | | 9,980 | |
2.46%, 1/23/2019 (c) (e) | | | 15,000 | | | | 14,853 | |
DZ Bank AG (Germany) (ICE LIBOR USD 1 Month + 0.25%), 2.33%, 9/6/2018 (d) (e) | | | 10,000 | | | | 10,000 | |
Erste Finance Delaware LLC (Austria) 2.16%, 10/5/2018 (c) (e) | | | 62,000 | | | | 61,874 | |
First Abu Dhabi Bank PJSC (United Arab Emirates) | | | | | | | | |
2.34%, 9/13/2018 (c) (e) | | | 25,000 | | | | 24,981 | |
2.34%, 9/18/2018 (c) (e) | | | 10,000 | | | | 9,989 | |
2.34%, 9/28/2018 (c) (e) | | | 4,000 | | | | 3,993 | |
2.32%, 10/22/2018 (c) (e) | | | 18,000 | | | | 17,941 | |
2.34%, 11/1/2018 (c) (e) | | | 3,000 | | | | 2,988 | |
Gotham Funding Corp.
2.31%, 10/9/2018 (c) (e) | | | 10,000 | | | | 9,976 | |
2.31%, 12/6/2018 (c) (e) | | | 20,000 | | | | 19,877 | |
ING US Funding LLC (Netherlands) | | | | | | | | |
(ICE LIBOR USD 1 Month + 0.27%), 2.35%, 9/4/2018 (d) | | | 5,000 | | | | 5,000 | |
(ICE LIBOR USD 1 Month + 0.30%), 2.36%, 9/16/2018 (d) | | | 10,000 | | | | 10,000 | |
(ICE LIBOR USD 3 Month + 0.08%), 2.39%, 11/26/2018 (d) | | | 10,000 | | | | 10,000 | |
SEE NOTES TO FINANCIAL STATEMENTS.
| | | | | | |
| | | |
| 28 | | | | J.P. MORGAN MONEY MARKET FUNDS | | AUGUST 31, 2018 |
| | | | | | | | |
| INVESTMENTS | | PRINCIPAL
AMOUNT
($000) | | | VALUE
($000) | |
Short-Term Investments — continued | | | | | | | | |
Commercial Paper — continued | | | | | | | | |
Liberty Street Funding LLC 2.29%, 10/2/2018 (c) (e) | | | 50,000 | | | | 49,902 | |
LMA-Americas LLC 2.31%, 9/11/2018 (c) (e) | | | 10,000 | | | | 9,994 | |
Mitsubishi UFJ Trust & Banking Corp. (Japan) | | | | | | | | |
2.30%, 9/7/2018 (c) (e) | | | 8,000 | | | | 7,997 | |
2.33%, 9/18/2018 (c) (e) | | | 6,000 | | | | 5,993 | |
2.32%, 10/1/2018 (c) (e) | | | 10,000 | | | | 9,981 | |
National Australia Bank Ltd. (Australia) (ICE LIBOR USD 1 Month + 0.23%), 2.29%, 9/28/2018 (d) (e) | | | 5,000 | | | | 5,000 | |
Nationwide Building Society (United Kingdom) 2.10%, 10/1/2018 (c) (e) | | | 5,000 | | | | 4,991 | |
Natixis SA (France) | | | | | | | | |
(ICE LIBOR USD 1 Month + 0.44%), 2.51%, 9/12/2018 (d) | | | 10,000 | | | | 10,000 | |
(ICE LIBOR USD 1 Month + 0.34%), 2.41%, 9/13/2018 (d) | | | 15,000 | | | | 15,000 | |
Nestle Capital Corp. (Switzerland) 2.42%, 12/19/2018 (c) (e) | | | 25,000 | | | | 24,818 | |
Oversea-Chinese Banking Corp. Ltd. (Singapore) 2.45%, 1/23/2019 (c) (e) | | | 5,000 | | | | 4,951 | |
Sheffield Receivables Co. LLC (United Kingdom) | | | | | | | | |
(SOFRRATE + 0.35%), 2.28%, 9/28/2018 (d) (e) | | | 5,000 | | | | 5,000 | |
2.30%, 10/1/2018 (c) (e) | | | 10,000 | | | | 9,981 | |
Sinopec Century Bright Capital Investment Ltd. (China) 2.25%, 10/2/2018 (c) (e) | | | 25,000 | | | | 24,952 | |
Starbird Funding Corp. 2.36%, 9/4/2018 (c) (e) | | | 10,000 | | | | 9,998 | |
State of Netherlands (Netherlands) 1.95%, 9/5/2018 (c) (e) | | | 10,000 | | | | 9,998 | |
Sumitomo Mitsui Banking Corp. (Japan) 2.30%, 9/20/2018 (c) (e) | | | 5,000 | | | | 4,994 | |
Sumitomo Mitsui Trust Bank Ltd. (Japan) 2.31%, 10/31/2018 (c) (e) | | | 30,000 | | | | 29,885 | |
Toronto-Dominion Bank (The) (Canada) | | | | | | | | |
(ICE LIBOR USD 1 Month + 0.37%), 2.43%, 9/11/2018 (d) (e) | | | 16,000 | | | | 16,000 | |
(ICE LIBOR USD 1 Month + 0.25%), 2.32%, 9/22/2018 (d) (e) | | | 5,000 | | | | 5,000 | |
(ICE LIBOR USD 1 Month + 0.25%), 2.32%, 9/22/2018 (d) (e) | | | 25,000 | | | | 25,000 | |
(ICE LIBOR USD 3 Month + 0.27%), 2.61%, 9/26/2018 (d) (e) | | | 5,000 | | | | 5,000 | |
Toyota Credit Canada, Inc. (Canada) (ICE LIBOR USD 1 Month + 0.25%), 2.32%, 9/16/2018 (d) | | | 10,000 | | | | 10,000 | |
Toyota Finance Australia Ltd. (Australia) (ICE LIBOR USD 1 Month + 0.21%), 2.29%, 9/20/2018 (d) | | | 5,000 | | | | 5,000 | |
| | | | | | | | |
| INVESTMENTS | | PRINCIPAL
AMOUNT
($000) | | | VALUE
($000) | |
| | | | | | | | |
Commercial Paper — continued | | | | | | | | |
Toyota Motor Credit Corp. (Japan)
(ICE LIBOR USD 1 Month + 0.23%), 2.29%, 9/28/2018 (d) | | | 15,000 | | | | 15,000 | |
(ICE LIBOR USD 1 Month + 0.34%), 2.41%, 9/30/2018 (d) | | | 15,000 | | | | 15,000 | |
(ICE LIBOR USD 3 Month + 0.08%), 2.43%, 11/2/2018 (d) | | | 5,000 | | | | 5,000 | |
UBS AG (Switzerland)
(ICE LIBOR USD 1 Month + 0.30%), 2.36%, 9/16/2018 (d) (e) | | | 50,000 | | | | 50,000 | |
(ICE LIBOR USD 3 Month + 0.09%), 2.41%, 11/16/2018 (d) (e) | | | 15,000 | | | | 15,000 | |
Versailles Commercial Paper LLC 2.38%, 1/2/2019 (c) (e) | | | 10,000 | | | | 9,919 | |
Westpac Banking Corp. (Australia)
(ICE LIBOR USD 1 Month + 0.19%), 2.27%, 9/5/2018 (d) (e) | | | 10,000 | | | | 10,000 | |
(ICE LIBOR USD 1 Month + 0.27%), 2.34%, 9/13/2018 (d) (e) | | | 3,000 | | | | 3,000 | |
(ICE LIBOR USD 1 Month + 0.19%), 2.25%, 9/27/2018 (d) (e) | | | 10,000 | | | | 10,000 | |
| | | | | | | | |
Total Commercial Paper
(Cost $933,983) | | | | | | | 933,983 | |
| | | | | | | | |
Time Deposits — 9.9% | | | | | | | | |
Australia & New Zealand Banking Group Ltd. | | | | | | | | |
1.94%, 9/4/2018 | | | 50,000 | | | | 50,000 | |
1.96%, 9/4/2018 | | | 50,000 | | | | 50,000 | |
BNP Paribas SA 1.95%, 9/5/2018 | | | 50,000 | | | | 50,000 | |
China Construction Bank Corp. 1.93%, 9/4/2018 | | | 50,000 | | | | 50,000 | |
Industrial & Commercial Bank of China Ltd. 1.93%, 9/4/2018 | | | 45,000 | | | | 45,000 | |
Mizuho Bank Ltd. 1.91%, 9/4/2018 | | | 75,000 | | | | 75,000 | |
| | | | | | | | |
Total Time Deposits
(Cost $320,000) | | | | | | | 320,000 | |
| | | | | | | | |
U.S. Treasury Obligations — 0.8% | | | | | | | | |
U.S. Treasury Bills 1.92%, 9/13/2018 (c)
(Cost $24,984) | | | 25,000 | | | | 24,984 | |
| | | | | | | | |
Total Short-Term Investments
(Cost $2,286,879) | | | | | | | 2,286,879 | |
| | | | | | | | |
Total Investments — 100.5%
(Cost $3,251,231)* | | | | | | | 3,251,231 | |
Liabilities in Excess of
Other Assets — (0.5%) | | | | | | | (17,266 | ) |
| | | | | | | | |
NET ASSETS — 100.0% | | | | | | | 3,233,965 | |
| | | | | | | | |
Percentages indicated are based on net assets.
SEE NOTES TO FINANCIAL STATEMENTS.
| | | | | | | | |
| | | |
| AUGUST 31, 2018 | | J.P. MORGAN MONEY MARKET FUNDS | | | | | 29 | |
JPMorgan Liquid Assets Money Market Fund
SCHEDULE OF PORTFOLIO INVESTMENTS
AS OF AUGUST 31, 2018 (Unaudited) (continued)
Abbreviations
| | |
| DN | | Discount Notes |
| FFCB | | Federal Farm Credit Bank |
| FHLB | | Federal Home Loan Bank |
| FHLMC | | Federal Home Loan Mortgage Corp. |
| FNMA | | Federal National Mortgage Association |
| GNMA | | Government National Mortgage Association |
| ICE | | Intercontinental Exchange |
| LIBOR | | London Interbank Offered Rate |
| LOC | | Letter of Credit |
| Rev. | | Revenue |
| USD | | United States Dollar |
| VRDO | | Variable Rate Demand Obligation. The interest rate shown is the rate in effect as of August 31, 2018. |
| |
| (a) | | The date shown represents the earliest of the next put date, next demand date or final maturity date. |
| (b) | | Variable or floating rate security, the interest rate of which adjusts periodically based on changes in current interest rates and prepayments on the underlying pool of assets. The interest rate shown is the current rate as of August 31, 2018. |
| (c) | | The rate shown is the effective yield as of August 31, 2018. |
| (d) | | Variable or floating rate security, linked to the referenced benchmark. The interest rate shown is the current rate as of August 31, 2018. |
| (e) | | Securities exempt from registration under Rule 144A or section 4(a)(2), of the Securities Act of 1933, as amended. Under procedures approved by the Board of Trustees, such securities have been determined to be liquid by the investment adviser and may be resold, normally to qualified institutional buyers in transactions exempt from registration. |
| * | | The cost of securities is substantially the same for federal income tax purposes. |
Additional Investment Information:
[2] Agency Joint Trading Account II — At August 31, 2018, certain Funds had undivided interests in the Agency Joint Trading Account II with a maturity date of September 04, 2018, as follows (amounts in thousands):
| | | | | | | | | | |
| | | |
| Fund | | Principal
Amount | | Repurchase
Price | | | Collateral
Value
Allocation | |
JPMorgan Liquid Assets Money Market Fund | | $538,376 | | $ | 538,494 | | | $ | 549,159 | |
Repurchase Agreements — At August 31, 2018, the Principal Amounts of certain Funds’ interests in the Agency Joint Trading Account II were as follows (amounts in thousands):
| | | | | | | | |
| | |
| Counterparty | | Interest
Rate | | | JPMorgan Liquid
Assets Money
Market Fund | |
Citibank NA | | | 1.97 | % | | $ | 73,750 | |
Citigroup Global Markets Holdings, Inc. | | | 1.97 | % | | | 73,750 | |
Merrill Lynch PFS, Inc. | | | 1.97 | % | | | 390,876 | |
| | | | | | | | |
Total | | | | | | $ | 538,376 | |
| | | | | | | | |
At August 31, 2018, the Agency Joint Trading Account II was fully collateralized by:
| | | | | | | | |
| | |
| Issuer | | Interest Rates | | | Maturity Dates | |
FFCB | | | 2.48% - 3.82% | | | | 2/15/2022 - 3/20/2037 | |
FHLB | | | 0.00% - 3.83% | | | | 10/19/2018 - 9/6/2041 | |
FHLMC | | | 0.00% - 8.00% | | | | 4/15/2019 - 9/1/2048 | |
FNMA | | | 0.00% - 7.00% | | | | 11/15/2018 - 8/1/2048 | |
GNMA | | | 1.50% - 10.00% | | | | 9/15/2018 - 8/15/2060 | |
U.S. Treasury Securities | | | 0.00% - 2.63% | | | | 11/8/2018 - 5/15/2048 | |
SEE NOTES TO FINANCIAL STATEMENTS.
| | | | | | |
| | | |
| 30 | | | | J.P. MORGAN MONEY MARKET FUNDS | | AUGUST 31, 2018 |
JPMorgan U.S. Government Money Market Fund
SCHEDULE OF PORTFOLIO INVESTMENTS
AS OF AUGUST 31, 2018 (Unaudited)
| | | | | | | | |
| INVESTMENTS (a) | | PRINCIPAL
AMOUNT
($000) | | | VALUE
($000) | |
Repurchase Agreements — 55.6% | | | | | | | | |
Agency Joint Trading Account I, J.P. Morgan Investment Management Inc., as agent, 1.96% - 1.97%, dated 8/31/2018, due 9/4/18, repurchase price $9,016,050. [1] | | | 9,014,078 | | | | 9,014,078 | |
Agency Joint Trading Account II, J.P. Morgan Investment Management Inc., as agent, 1.97%, dated 8/31/2018, due 9/4/18, repurchase price $228,018. [2] | | | 227,967 | | | | 227,967 | |
Bank of America Corp., 1.97%, dated 8/31/2018, due 9/4/2018, repurchase price $750,164, collateralized by GNMA, 3.50%, due 2/20/2047, with a value of $765,000. | | | 750,000 | | | | 750,000 | |
Bank of Montreal, 1.96%, dated 8/31/2018, due 9/4/2018, repurchase price $200,044, collateralized by FHLMC, 2.00% - 4.50%, due 1/15/2023 - 8/1/2047, FNMA, 1.75% - 5.00%, due 10/25/2025 - 8/1/2048, GNMA, 3.00% - 5.50%, due 4/15/2027 - 5/20/2048, and U.S. Treasury Securities, 2.13% - 3.75%, due 11/15/2018 - 8/15/2021, with a value of $204,305. | | | 200,000 | | | | 200,000 | |
Bank of Nova Scotia (The), 1.96%, dated 8/31/2018, due 9/4/2018, repurchase price $500,109, collateralized by FHLMC, 2.50% - 5.00%, due 5/1/2026 - 5/1/2048, FNMA, 2.50% - 4.50%, due 7/1/2026 - 5/1/2048, and GNMA, 3.00% - 4.50%, due 8/20/2043 - 8/20/2047, with a value of $510,000. | | | 500,000 | | | | 500,000 | |
Barclays Capital, Inc., 1.95%, dated 8/31/2018, due 9/4/2018, repurchase price $2,000,433, collateralized by U.S. Treasury Securities, 0.00% - 4.25%, due 11/15/2018 - 5/15/2048, with a value of $2,040,000. | | | 2,000,000 | | | | 2,000,000 | |
BMO Capital Markets Corp., 1.96%, dated 8/31/2018, due 9/4/2018, repurchase price $100,022, collateralized by FFCB, 0.00% - 5.50%, due 10/22/2018 - 4/17/2036, FHLB, 0.88% - 3.00%, due 9/17/2018 - 6/9/2023, FHLMC, 0.88% - 4.50%, due 4/15/2019 - 4/1/2048, FNMA, 1.00% - 5.00%, due 9/18/2018 - 5/1/2048, GNMA, 3.00% - 6.00%, due 6/15/2041 - 8/20/2046, and U.S. Treasury Securities, 0.00% - 9.00%, due 10/11/2018 - 11/15/2045, with a value of $102,283. | | | 100,000 | | | | 100,000 | |
| | | | | | | | |
| INVESTMENTS | | PRINCIPAL
AMOUNT
($000) | | | VALUE
($000) | |
| | | | | | | | |
BNP Paribas SA, 1.95%, dated 8/31/2018, due 9/7/2018, repurchase price $2,000,758, collateralized by FHLMC, 2.50% - 7.50%, due 10/1/2018 - 6/1/2048, FNMA, 0.00% - 6.50%, due 7/1/2019 - 1/1/2057, GNMA, 2.50% - 5.50%, due 3/15/2030 - 8/20/2048, and U.S. Treasury Securities, 0.00% - 4.38%, due 9/6/2018 - 11/15/2039, with a value of $2,046,848. | | | 2,000,000 | | | | 2,000,000 | |
BNP Paribas SA, 1.96%, dated 8/31/2018, due 9/7/2018, repurchase price $2,000,762, collateralized by U.S. Treasury Securities, 0.00% - 8.75%, due 11/29/2018 - 8/15/2048, with a value of $2,044,887. | | | 2,000,000 | | | | 2,000,000 | |
BNP Paribas SA, 1.97%, dated 8/31/2018, due 9/7/2018, repurchase price $1,500,575, collateralized by FHLB, 5.37%, due 9/9/2024, FHLMC, 2.20% - 7.00%, due 10/1/2018 - 7/1/2048, FNMA, 1.30% - 7.50%, due 10/1/2018 - 4/1/2053, GNMA, 1.50% - 5.50%, due 3/15/2024 - 7/20/2048, and U.S. Treasury Securities, 0.00% - 3.63%, due 10/4/2018 - 5/15/2044, with a value of $1,535,607. | | | 1,500,000 | | | | 1,500,000 | |
BNP Paribas SA, 1.98%, dated 8/31/2018, due 9/7/2018, repurchase price $1,000,385, collateralized by FHLB, 3.63%, due 12/29/2036, FHLMC, 0.00% - 7.50%, due 10/1/2025 - 6/1/2048, FNMA, 0.00% - 6.00%, due 4/1/2019 - 4/1/2053, GNMA, 2.59% - 5.50%, due 5/15/2025 - 7/20/2048, and U.S. Treasury Securities, 0.00% - 8.75%, due 10/11/2018 - 5/15/2045, with a value of $1,025,318. | | | 1,000,000 | | | | 1,000,000 | |
BNP Paribas SA, 2.00%, dated 8/31/2018, due 9/7/2018, repurchase price $500,194, collateralized by FHLB, 3.63% - 4.00%, due 9/1/2028 - 12/29/2036, FHLMC, 2.50% - 6.00%, due 5/1/2033 - 6/1/2047, FNMA, 2.45% - 6.25%, due 8/1/2019 - 8/1/2048, GNMA, 1.50% - 7.00%, due 8/15/2029 - 7/20/2048, and U.S. Treasury Securities, 0.00% - 2.75%, due 11/30/2019 - 5/15/2046, with a value of $513,307. | | | 500,000 | | | | 500,000 | |
SEE NOTES TO FINANCIAL STATEMENTS.
| | | | | | | | |
| | | |
| AUGUST 31, 2018 | | J.P. MORGAN MONEY MARKET FUNDS | | | | | 31 | |
JPMorgan U.S. Government Money Market Fund
SCHEDULE OF PORTFOLIO INVESTMENTS
AS OF AUGUST 31, 2018 (Unaudited) (continued)
| | | | | | | | |
| INVESTMENTS | | PRINCIPAL
AMOUNT
($000) | | | VALUE
($000) | |
Repurchase Agreements — continued | | | | | | | | |
BNP Paribas SA, 2.00%, dated 8/31/2018, due 9/7/2018, repurchase price $1,000,389, collateralized by FFCB, 3.34%, due 1/14/2031, FHLMC, 2.50% - 7.00%, due 1/1/2028 - 2/1/2048, FNMA, 2.36% - 7.00%, due 8/1/2020 - 4/1/2053, GNMA, 2.00% - 6.50%, due 9/15/2024 - 4/20/2048, and U.S. Treasury Securities, 0.00% - 8.13%, due 1/3/2019 - 5/15/2044, with a value of $1,026,390. | | | 1,000,000 | | | | 1,000,000 | |
BNP Paribas SA, 2.00%, dated 8/31/2018, due 9/7/2018, repurchase price $1,500,583, collateralized by FHLB, 0.88%, due 10/1/2018, FHLMC, 2.50% - 7.00%, due 4/1/2020 - 8/1/2048, FNMA, 2.41% - 7.00%, due 7/1/2019 - 7/1/2048, GNMA, 2.00% - 5.00%, due 10/20/2035 - 8/20/2048, and U.S. Treasury Securities, 0.00% - 8.13%, due 10/11/2018 - 2/15/2041, with a value of $1,540,077. | | | 1,500,000 | | | | 1,500,000 | |
BNP Paribas SA, 2.15%, dated 8/31/2018, due 9/7/2018, repurchase price $2,000,836, collateralized by FHLMC, 2.50% - 6.00%, due 11/1/2024 - 7/1/2048, FNMA, 2.36% - 7.00%, due 5/1/2028 - 4/1/2053, GNMA, 3.00% - 5.50%, due 3/15/2035 - 6/20/2048, and U.S. Treasury Securities, 0.00% - 4.75%, due 10/15/2019 - 11/15/2047, with a value of $2,051,731. | | | 2,000,000 | | | | 2,000,000 | |
BNP Paribas SA, 2.00%, dated 8/31/2018, due 9/17/2018, repurchase price $500,472, collateralized by FHLMC, 3.98% - 6.50%, due 6/15/2031 - 8/1/2047, FNMA, 2.36% - 7.00%, due 7/1/2026 - 8/1/2048, GNMA, 2.77% - 5.50%, due 3/20/2038 - 4/20/2048, and U.S. Treasury Securities, 0.00% - 3.00%, due 2/29/2020 - 11/15/2044, with a value of $512,599. | | | 500,000 | | | | 500,000 | |
Credit Agricole Corporate and Investment Bank, 1.95%, dated 8/31/2018, due 9/4/2018, repurchase price $1,800,390, collateralized by U.S. Treasury Securities, 1.13% - 5.38%, due 1/15/2021 - 8/15/2047, with a value of $1,836,000. | | | 1,800,000 | | | | 1,800,000 | |
Credit Suisse Securities USA LLC, 1.95%, dated 8/31/2018, due 9/4/2018, repurchase price $7,001,517, collateralized by U.S. Treasury Securities, 0.00% - 7.63%, due 9/13/2018 - 2/15/2048, with a value of $7,141,547. | | | 7,000,000 | | | | 7,000,000 | |
| | | | | | | | |
| INVESTMENTS | | PRINCIPAL
AMOUNT
($000) | | | VALUE
($000) | |
| | | | | | | | |
Daiwa Capital Markets America. Inc., 1.96%, dated 8/31/2018, due 9/4/2018, repurchase price $1,500,327, collateralized by FHLMC, 2.82% - 4.50%, due 9/1/2026 - 8/1/2048, FNMA, 2.37% - 9.75%, due 8/25/2019 - 9/1/2048, and GNMA, 2.75% - 5.50%, due 7/20/2033 - 8/20/2048, with a value of $1,530,583. | | | 1,500,000 | | | | 1,500,000 | |
Daiwa Capital Markets America. Inc., 1.97%, dated 8/31/2018, due 9/4/2018, repurchase price $2,500,547, collateralized by FFCB, 0.00% - 2.88%, due 3/5/2019 - 7/17/2023, FHLB, 2.65% - 3.63%, due 3/12/2021 - 9/19/2036, FHLMC, 2.01% - 6.00%, due 8/15/2019 - 9/1/2048, FNMA, 2.16% - 9.75%, due 4/1/2019 - 9/1/2048, GNMA, 2.49% - 6.50%, due 7/20/2033 - 5/20/2066, and U.S. Treasury Securities, 0.00% - 9.00%, due 9/27/2018 - 2/15/2044, with a value of $2,552,054. | | | 2,500,000 | | | | 2,500,000 | |
Deutsche Bank Securities, Inc., 1.96%, dated 8/31/2018, due 9/4/2018, repurchase price $998,694, collateralized by U.S. Treasury Securities, 0.13% - 2.75%, due 4/15/2019 - 8/15/2047, with a value of $1,018,447. | | | 998,478 | | | | 998,478 | |
Deutsche Bank Securities, Inc., 1.97%, dated 8/31/2018, due 9/4/2018, repurchase price $1,000,219, collateralized by U.S. Treasury Securities, 0.00% - 4.25%, due 11/15/2018 - 8/15/2047, with a value of $1,020,000. | | | 1,000,000 | | | | 1,000,000 | |
Deutsche Bank Securities, Inc., 1.95%, dated 8/31/2018, due 9/5/2018, repurchase price $1,000,271, collateralized by U.S. Treasury Securities, 0.13% - 3.88%, due 7/15/2019 - 2/15/2048, with a value of $1,020,000. | | | 1,000,000 | | | | 1,000,000 | |
HSBC Securities USA, Inc., 1.95%, dated 8/31/2018, due 9/4/2018, repurchase price $1,731,375, collateralized by U.S. Treasury Securities, 0.00% - 4.50%, due 12/13/2018 - 8/15/2044, with a value of $1,766,003. | | | 1,731,000 | | | | 1,731,000 | |
HSBC Securities USA, Inc., 1.97%, dated 8/31/2018, due 9/4/2018, repurchase price $950,208, collateralized by FHLMC, 3.00% - 6.50%, due 8/1/2022 - 7/1/2048, and FNMA, 2.76% - 5.50%, due 4/1/2023 - 1/1/2057, with a value of $969,212. | | | 950,000 | | | | 950,000 | |
SEE NOTES TO FINANCIAL STATEMENTS.
| | | | | | |
| | | |
| 32 | | | | J.P. MORGAN MONEY MARKET FUNDS | | AUGUST 31, 2018 |
| | | | | | | | |
| INVESTMENTS | | PRINCIPAL
AMOUNT
($000) | | | VALUE
($000) | |
Repurchase Agreements — continued | | | | | | | | |
HSBC Securities USA, Inc., 1.97%, dated 8/31/2018, due 9/5/2018, repurchase price $1,000,274, collateralized by FHLMC, 2.31% - 4.50%, due 6/1/2024 - 9/1/2048, and FNMA, 3.09% - 5.00%, due 2/1/2033 - 7/1/2048, with a value of $1,020,279. | | | 1,000,000 | | | | 1,000,000 | |
ING Financial Markets LLC, 1.97%, dated 8/31/2018, due 9/4/2018, repurchase price $500,109, collateralized by FHLMC, 2.84% - 5.00%, due 11/1/2026 - 8/1/2048, and FNMA, 2.50% - 5.00%, due 3/1/2026 - 6/1/2056, with a value of $510,112. | | | 500,000 | | | | 500,000 | |
ING Financial Markets LLC, 1.97%, dated 8/31/2018, due 9/4/2018, repurchase price $500,109, collateralized by FHLMC, 2.50% - 5.00%, due 12/1/2024 - 8/1/2048, FNMA, 2.40% - 6.50%, due 5/1/2023 - 8/1/2048, and GNMA, 3.50% - 4.50%, due 7/20/2045 - 8/20/2048, with a value of $510,112. | | | 500,000 | | | | 500,000 | |
Mitsubishi UFJ Trust & Banking Corp., 1.94%, dated 8/31/2018, due 9/6/2018, repurchase price $50,016, collateralized by GNMA, 3.00%, due 7/20/2046, with a value of $51,006. | | | 50,000 | | | | 50,000 | |
Mitsubishi UFJ Trust & Banking Corp., 1.94%, dated 8/31/2018, due 9/6/2018, repurchase price $1,800,582, collateralized by U.S. Treasury Securities, 1.63% - 2.25%, due 8/31/2022 - 2/15/2027, with a value of $1,836,198. | | | 1,800,000 | | | | 1,800,000 | |
Natixis SA, 1.95%, dated 8/31/2018, due 9/4/2018, repurchase price $3,000,650, collateralized by U.S. Treasury Securities, 0.00% - 8.75%, due 9/30/2018 - 11/15/2047, with a value of $3,060,663. | | | 3,000,000 | | | | 3,000,000 | |
Natixis SA, 1.97%, dated 8/31/2018, due 9/4/2018, repurchase price $1,000,219, collateralized by FFCB, 3.13% - 3.98%, due 9/4/2035 - 4/5/2038, FHLB, 2.63% - 4.08%, due 8/1/2031 - 4/30/2038, FHLMC, 0.00% - 6.00%, due 12/1/2028 - 7/1/2048, FNMA, 0.00% - 5.80%, due 7/1/2024 - 6/1/2048, GNMA, 2.39% - 5.00%, due 7/20/2034 - 8/16/2058, Tennessee Valley Authority, 4.25% - 5.25%, due 9/15/2039 - 9/15/2065, and U.S. Treasury Securities, 0.00% - 8.75%, due 11/8/2018 - 11/15/2047 with a value of $1,020,292. | | | 1,000,000 | | | | 1,000,000 | |
| | | | | | | | |
| INVESTMENTS | | PRINCIPAL
AMOUNT
($000) | | | VALUE
($000) | |
| | | | | | | | |
Natwest Markets plc, 1.96%, dated 8/31/2018, due 9/4/2018, repurchase price $2,100,457, collateralized by U.S. Treasury Securities, 0.00% - 9.00%, due 9/6/2018 - 5/15/2048, with a value of $2,142,466. | | | 2,100,000 | | | | 2,100,000 | |
Nomura Securities Co. Ltd., 1.97%, dated 8/31/2018, due 9/4/2018, repurchase price $7,701,685, collateralized by FHLMC, 2.00% - 9.00%, due 9/15/2018 - 9/1/2048, FNMA, 0.00% - 9.00%, due 9/25/2018 - 2/1/2057, GNMA, 1.50% - 10.50%, due 2/15/2019 - 8/20/2068, and U.S. Treasury Securities, 0.00% - 8.13%, due 10/15/2018 - 2/15/2047, with a value of $7,855,719. | | | 7,700,000 | | | | 7,700,000 | |
Norinchukin Bank (The), 2.01%, dated 8/31/2018, due 9/10/2018, repurchase price $250,140, collateralized by U.S. Treasury Securities, 2.63%, due 11/15/2020, with a value of $253,048. | | | 250,000 | | | | 250,000 | |
Norinchukin Bank (The), 2.01%, dated 8/31/2018, due 9/11/2018, repurchase price $200,123, collateralized by U.S. Treasury Securities, 2.63%, due 11/15/2020, with a value of $202,439. | | | 200,000 | | | | 200,000 | |
Norinchukin Bank (The), 2.01%, dated 8/31/2018, due 9/13/2018, repurchase price $250,181, collateralized by U.S. Treasury Securities, 0.13%, due 4/15/2020, with a value of $254,894. | | | 250,000 | | | | 250,000 | |
Norinchukin Bank (The), 2.04%, dated 8/31/2018, due 9/14/2018, repurchase price $700,555, collateralized by U.S. Treasury Securities, 3.63%, due 4/15/2028, with a value of $706,340. | | | 700,000 | | | | 700,000 | |
Norinchukin Bank (The), 2.04%, dated 8/31/2018, due 9/18/2018, repurchase price $250,255, collateralized by U.S. Treasury Securities, 0.13%, due 4/15/2020, with a value of $254,894. | | | 250,000 | | | | 250,000 | |
Norinchukin Bank (The), 2.00%, dated 8/31/2018, due 9/25/2018, repurchase price $300,417, collateralized by U.S. Treasury Securities, 0.13% - 1.13%, due 4/15/2020 - 1/15/2021, with a value of $305,706. | | | 300,000 | | | | 300,000 | |
Norinchukin Bank (The), 2.05%, dated 8/31/2018, due 10/3/2018, repurchase price $500,940, collateralized by U.S. Treasury Securities, 0.38% - 1.13%, due 1/15/2021 - 1/15/2027, with a value of $509,618. | | | 500,000 | | | | 500,000 | |
SEE NOTES TO FINANCIAL STATEMENTS.
| | | | | | | | |
| | | |
| AUGUST 31, 2018 | | J.P. MORGAN MONEY MARKET FUNDS | | | | | 33 | |
JPMorgan U.S. Government Money Market Fund
SCHEDULE OF PORTFOLIO INVESTMENTS
AS OF AUGUST 31, 2018 (Unaudited) (continued)
| | | | | | | | |
| INVESTMENTS | | PRINCIPAL
AMOUNT
($000) | | | VALUE
($000) | |
Repurchase Agreements — continued | | | | | | | | |
Norinchukin Bank (The), 2.05%, dated 8/31/2018, due 10/5/2018, repurchase price $450,897, collateralized by U.S. Treasury Securities, 1.13%, due 1/15/2021, with a value of $458,349. | | | 450,000 | | | | 450,000 | |
Norinchukin Bank (The), 2.05%, dated 8/31/2018, due 10/9/2018, repurchase price $200,444, collateralized by U.S. Treasury Securities, 2.63%, due 11/15/2020, with a value of $202,439. | | | 200,000 | | | | 200,000 | |
Norinchukin Bank (The), 2.05%, dated 8/31/2018, due 10/11/2018, repurchase price $250,584, collateralized by U.S. Treasury Securities, 0.13% - 2.63%, due 4/15/2020 - 11/15/2020, with a value of $253,782. | | | 250,000 | | | | 250,000 | |
Norinchukin Bank (The), 2.08%, dated 8/31/2018, due 10/22/2018, repurchase price $651,953, collateralized by U.S. Treasury Securities, 3.63%, due 4/15/2028, with a value of $655,886. | | | 650,000 | | | | 650,000 | |
RBC Capital Markets LLC, 1.96%, dated 8/31/2018, due 9/4/2018, repurchase price $1,000,218, collateralized by FFCB, 1.17% - 2.80%, due 5/16/2019 - 6/13/2028, FHLB, 0.00% - 3.13%, due 10/31/2018 - 9/12/2025, FHLMC, 1.13% - 6.00%, due 3/27/2019 - 4/1/2048, FNMA, 1.13% - 7.25%, due 9/18/2018 - 11/25/2057, GNMA, 2.53% - 6.50%, due 7/20/2037 - 8/20/2065, and Tennessee Valley Authority, 5.25%, due 9/15/2039, with a value of $1,021,795. | | | 1,000,000 | | | | 1,000,000 | |
Sumitomo Mitsui Banking Corp., 1.96%, dated 8/31/2018, due 9/4/2018, repurchase price $4,000,871, collateralized by U.S. Treasury Securities, 1.25% - 3.00%, due 10/31/2021 - 11/15/2045, with a value of $4,093,194. | | | 4,000,000 | | | | 4,000,000 | |
Sumitomo Mitsui Banking Corp., 1.98%, dated 8/31/2018, due 9/4/2018, repurchase price $1,000,220, collateralized by GNMA, 3.00% - 3.50%, due 8/20/2047 - 10/20/2047, with a value of $1,024,956. | | | 1,000,000 | | | | 1,000,000 | |
Sumitomo Mitsui Banking Corp., 1.98%, dated 8/31/2018, due 9/4/2018, repurchase price $3,000,660, collateralized by GNMA, 3.00% - 4.00%, due 10/20/2042 - 5/20/2048, with a value of $3,073,409. | | | 3,000,000 | | | | 3,000,000 | |
| | | | | | | | |
Total Repurchase Agreements (Cost $73,921,523) | | | | | | | 73,921,523 | |
| | | | | | | | |
| | | | | | | | |
| INVESTMENTS | | PRINCIPAL
AMOUNT
($000) | | | VALUE
($000) | |
U.S. Government Agency Securities — 32.3% | | | | | | | | |
FFCB | | | | | | | | |
(Federal Reserve Bank Prime Loan Rate US - 2.83%), 2.17%, 9/4/2018 (b) | | | 300,000 | | | | 300,000 | |
(ICE LIBOR USD 3 Month - 0.11%), 2.22%, 9/11/2018 (b) | | | 400,000 | | | | 400,000 | |
(ICE LIBOR USD 1 Month + 0.09%), 2.17%, 9/19/2018 (b) | | | 375,000 | | | | 375,000 | |
(ICE LIBOR USD 1 Month - 0.11%), 1.96%, 9/23/2018 (b) | | | 300,000 | | | | 300,000 | |
FHLB | | | | | | | | |
(ICE LIBOR USD 1 Month - 0.10%), 1.98%, 9/4/2018 (b) | | | 500,000 | | | | 500,000 | |
(ICE LIBOR USD 1 Month - 0.09%), 1.99%, 9/4/2018 (b) | | | 350,000 | | | | 350,000 | |
(ICE LIBOR USD 1 Month - 0.08%), 2.00%, 9/4/2018 (b) | | | 350,000 | | | | 350,000 | |
(ICE LIBOR USD 3 Month - 0.30%), 2.03%, 9/4/2018 (b) | | | 500,000 | | | | 500,000 | |
(ICE LIBOR USD 3 Month - 0.30%), 2.04%, 9/5/2018 (b) | | | 1,000,000 | | | | 1,000,000 | |
(ICE LIBOR USD 1 Month - 0.09%), 1.99%, 9/6/2018 (b) | | | 835,000 | | | | 835,000 | |
(ICE LIBOR USD 1 Month - 0.12%), 1.95%, 9/7/2018 (b) | | | 1,500,000 | | | | 1,500,000 | |
(ICE LIBOR USD 1 Month - 0.11%), 1.96%, 9/9/2018 (b) | | | 945,000 | | | | 945,000 | |
(ICE LIBOR USD 1 Month - 0.10%), 1.97%, 9/9/2018 (b) | | | 500,000 | �� | | | 500,000 | |
(ICE LIBOR USD 3 Month - 0.20%), 1.01%, 9/10/2018 (b) (c) | | | 250,000 | | | | 250,000 | |
(ICE LIBOR USD 3 Month - 0.19%), 1.01%, 9/10/2018 (b) (c) | | | 300,000 | | | | 300,000 | |
(ICE LIBOR USD 3 Month - 0.19%), 1.01%, 9/10/2018 (b) (c) | | | 300,000 | | | | 300,000 | |
(ICE LIBOR USD 1 Month - 0.11%), 1.95%, 9/10/2018 (b) | | | 500,000 | | | | 500,000 | |
(ICE LIBOR USD 3 Month - 0.16%), 2.16%, 9/10/2018 (b) | | | 250,000 | | | | 250,077 | |
(ICE LIBOR USD 1 Month - 0.11%), 1.96%, 9/11/2018 (b) | | | 395,000 | | | | 395,000 | |
(ICE LIBOR USD 1 Month - 0.11%), 1.96%, 9/11/2018 (b) | | | 500,000 | | | | 500,000 | |
(ICE LIBOR USD 1 Month - 0.09%), 1.98%, 9/11/2018 (b) | | | 425,000 | | | | 425,000 | |
(ICE LIBOR USD 1 Month - 0.09%), 1.98%, 9/12/2018 (b) | | | 380,000 | | | | 380,000 | |
(ICE LIBOR USD 1 Month - 0.11%), 1.96%, 9/13/2018 (b) | | | 250,000 | | | | 250,000 | |
(ICE LIBOR USD 1 Month - 0.08%), 1.99%, 9/13/2018 (b) | | | 1,975,000 | | | | 1,975,000 | |
SEE NOTES TO FINANCIAL STATEMENTS.
| | | | | | |
| | | |
| 34 | | | | J.P. MORGAN MONEY MARKET FUNDS | | AUGUST 31, 2018 |
| | | | | | | | |
| INVESTMENTS | | PRINCIPAL
AMOUNT
($000) | | | VALUE
($000) | |
U.S. Government Agency Securities — continued | | | | | |
(ICE LIBOR USD 1 Month - 0.12%), 1.95%, 9/14/2018 (b) | | | 2,400,000 | | | | 2,400,000 | |
(ICE LIBOR USD 1 Month - 0.11%), 1.96%, 9/14/2018 (b) | | | 500,000 | | | | 500,000 | |
(ICE LIBOR USD 1 Month - 0.09%), 1.98%, 9/14/2018 (b) | | | 204,000 | | | | 204,015 | |
(ICE LIBOR USD 1 Month - 0.09%), 1.98%, 9/14/2018 (b) | | | 225,000 | | | | 225,000 | |
(ICE LIBOR USD 1 Month - 0.11%), 1.95%, 9/15/2018 (b) | | | 250,000 | | | | 250,000 | |
(ICE LIBOR USD 1 Month - 0.08%), 1.98%, 9/16/2018 (b) | | | 500,000 | | | | 500,000 | |
(ICE LIBOR USD 1 Month - 0.08%), 1.98%, 9/16/2018 (b) | | | 500,000 | | | | 500,000 | |
(ICE LIBOR USD 1 Month - 0.11%), 1.97%, 9/19/2018 (b) | | | 450,000 | | | | 450,000 | |
(ICE LIBOR USD 3 Month - 0.30%), 2.04%, 9/19/2018 (b) | | | 750,000 | | | | 750,000 | |
DN, 1.91%, 9/24/2018 (c) | | | 100,000 | | | | 99,878 | |
(ICE LIBOR USD 1 Month - 0.12%), 1.95%, 9/24/2018 (b) | | | 125,000 | | | | 125,000 | |
(ICE LIBOR USD 1 Month - 0.12%), 1.95%, 9/25/2018 (b) | | | 1,000,000 | | | | 1,000,000 | |
(ICE LIBOR USD 1 Month - 0.09%), 1.98%, 9/25/2018 (b) | | | 250,000 | | | | 249,999 | |
(ICE LIBOR USD 1 Month - 0.12%), 1.95%, 9/26/2018 (b) | | | 150,000 | | | | 150,000 | |
(ICE LIBOR USD 1 Month - 0.11%), 1.96%, 9/26/2018 (b) | | | 250,000 | | | | 250,000 | |
(ICE LIBOR USD 1 Month - 0.11%), 1.96%, 9/26/2018 (b) | | | 480,000 | | | | 480,000 | |
(ICE LIBOR USD 1 Month - 0.09%), 1.98%, 9/26/2018 (b) | | | 975,000 | | | | 975,000 | |
(ICE LIBOR USD 1 Month - 0.09%), 1.98%, 9/26/2018 (b) | | | 250,000 | | | | 250,030 | |
(ICE LIBOR USD 3 Month - 0.24%), 2.10%, 9/26/2018 (b) | | | 1,350,000 | | | | 1,350,000 | |
(ICE LIBOR USD 1 Month - 0.10%), 1.96%, 9/27/2018 (b) | | | 350,000 | | | | 349,989 | |
(ICE LIBOR USD 1 Month - 0.10%), 1.96%, 9/28/2018 (b) | | | 350,000 | | | | 350,000 | |
(ICE LIBOR USD 3 Month - 0.32%), 2.02%, 9/28/2018 (b) | | | 500,000 | | | | 500,000 | |
(ICE LIBOR USD 1 Month - 0.11%), 1.96%, 9/30/2018 (b) | | | 250,000 | | | | 250,000 | |
(ICE LIBOR USD 3 Month - 0.15%), 2.18%, 10/3/2018 (b) | | | 200,000 | | | | 199,955 | |
(ICE LIBOR USD 3 Month - 0.32%), 2.02%, 10/5/2018 (b) | | | 2,000,000 | | | | 2,000,000 | |
| | | | | | | | |
| INVESTMENTS | | PRINCIPAL
AMOUNT
($000) | | | VALUE
($000) | |
| | | | | | | | |
(ICE LIBOR USD 3 Month - 0.32%), 2.01%, 10/10/2018 (b) | | | 1,000,000 | | | | 1,000,000 | |
(ICE LIBOR USD 3 Month - 0.34%), 2.00%, 10/16/2018 (b) | | | 100,000 | | | | 100,000 | |
(ICE LIBOR USD 3 Month - 0.19%), 2.15%, 10/17/2018 (b) | | | 400,000 | | | | 400,000 | |
(ICE LIBOR USD 3 Month - 0.19%), 2.14%, 10/18/2018 (b) | | | 200,000 | | | | 200,000 | |
(ICE LIBOR USD 3 Month - 0.16%), 2.19%, 10/22/2018 (b) | | | 500,000 | | | | 500,000 | |
(ICE LIBOR USD 3 Month - 0.32%), 2.02%, 11/9/2018 (b) | | | 2,000,000 | | | | 2,000,000 | |
(ICE LIBOR USD 3 Month - 0.26%), 2.09%, 11/12/2018 (b) | | | 1,600,000 | | | | 1,600,000 | |
(ICE LIBOR USD 3 Month - 0.26%), 2.06%, 11/16/2018 (b) | | | 500,000 | | | | 500,000 | |
(ICE LIBOR USD 3 Month - 0.26%), 2.06%, 11/16/2018 (b) | | | 500,000 | | | | 500,000 | |
(ICE LIBOR USD 3 Month - 0.25%), 2.07%, 11/16/2018 (b) | | | 500,000 | | | | 500,000 | |
(ICE LIBOR USD 3 Month - 0.25%), 2.07%, 11/16/2018 (b) | | | 300,000 | | | | 300,000 | |
(ICE LIBOR USD 3 Month - 0.25%), 2.07%, 11/16/2018 (b) | | | 750,000 | | | | 750,000 | |
(ICE LIBOR USD 3 Month - 0.26%), 2.07%, 11/20/2018 (b) | | | 250,000 | | | | 250,000 | |
(ICE LIBOR USD 3 Month - 0.25%), 2.08%, 11/20/2018 (b) | | | 570,000 | | | | 570,000 | |
(ICE LIBOR USD 3 Month - 0.30%), 2.01%, 11/22/2018 (b) | | | 200,000 | | | | 200,000 | |
(ICE LIBOR USD 3 Month - 0.30%), 2.01%, 11/23/2018 (b) | | | 250,000 | | | | 250,000 | |
(ICE LIBOR USD 3 Month - 0.26%), 2.06%, 11/24/2018 (b) | | | 2,000,000 | | | | 2,000,000 | |
(ICE LIBOR USD 3 Month - 0.30%), 2.01%, 11/25/2018 (b) | | | 150,000 | | | | 150,000 | |
(ICE LIBOR USD 3 Month - 0.30%), 2.01%, 11/25/2018 (b) | | | 750,000 | | | | 750,000 | |
(ICE LIBOR USD 3 Month - 0.30%), 2.01%, 11/25/2018 (b) | | | 250,000 | | | | 250,000 | |
FHLMC | | | | | | | | |
(ICE LIBOR USD 3 Month - 0.22%), 2.13%, 9/6/2018 (b) (c) | | | 1,500,000 | | | | 1,500,000 | |
(ICE LIBOR USD 3 Month - 0.22%), 1.01%, 9/9/2018 (b) (c) | | | 1,000,000 | | | | 1,000,000 | |
| | | | | | | | |
Total U.S. Government Agency securities (Cost $43,008,943) | | | | | | | 43,008,943 | |
| | | | | | | | |
U.S. Treasury Obligations — 6.7% | | | | | |
U.S. Treasury Notes
1.00%, 9/15/2018 | | | 835,000 | | | | 834,718 | |
SEE NOTES TO FINANCIAL STATEMENTS.
| | | | | | | | |
| | | |
| AUGUST 31, 2018 | | J.P. MORGAN MONEY MARKET FUNDS | | | | | 35 | |
JPMorgan U.S. Government Money Market Fund
SCHEDULE OF PORTFOLIO INVESTMENTS
AS OF AUGUST 31, 2018 (Unaudited) (continued)
| | | | | | | | |
| INVESTMENTS | | PRINCIPAL
AMOUNT
($000) | | | VALUE
($000) | |
U.S. Treasury Obligations — continued | | | | | |
0.75%, 9/30/2018 | | | 805,000 | | | | 804,507 | |
1.38%, 9/30/2018 | | | 2,227,000 | | | | 2,226,633 | |
1.25%, 10/31/2018 | | | 333,000 | | | | 332,569 | |
1.25%, 12/31/2018 | | | 2,015,000 | | | | 2,009,076 | |
1.38%, 12/31/2018 | | | 1,550,000 | | | | 1,546,072 | |
1.50%, 12/31/2018 | | | 1,100,000 | | | | 1,097,661 | |
| | | | | | | | |
Total U.S. Treasury Obligations
(Cost $8,851,236) | | | | | | | 8,851,236 | |
| | | | | | | | |
Short-Term Investments — 7.3% | | | | | | | | |
U.S. Treasury Obligations — 7.3% | | | | | | | | |
U.S. Treasury Bills
1.89%, 9/13/2018 (c) | | | 100,000 | | | | 99,937 | |
2.10%, 12/27/2018 (c) | | | 500,000 | | | | 496,623 | |
2.14%, 1/10/2019 (c) | | | 1,000,000 | | | | 992,308 | |
2.16%, 1/17/2019 (c) | | | 1,000,000 | | | | 991,797 | |
2.15%, 1/24/2019 (c) | | | 1,000,000 | | | | 991,421 | |
2.22%, 2/14/2019 (c) | | | 500,000 | | | | 494,939 | |
2.21%, 2/21/2019 (c) | | | 2,000,000 | | | | 1,978,951 | |
2.23%, 2/28/2019 (c) | | | 3,750,000 | | | | 3,708,613 | |
| | | | | | | | |
Total U.S. Treasury Obligations (Cost $9,754,589) | | | | | | | 9,754,589 | |
| | | | | | | | |
Total Short-Term Investments
(Cost $9,754,589) | | | | | | | 9,754,589 | |
| | | | | | | | |
Total Investments — 101.9%
(Cost $135,536,291)* | | | | | | | 135,536,291 | |
Liabilities in Excess of Other
Assets — (1.9%) | | | | | | | (2,475,793 | ) |
| | | | | | | | |
NET ASSETS — 100.0% | | | | | | | 133,060,498 | |
| | | | | | | | |
Percentages indicated are based on net assets.
Abbreviations
| | |
| DN | | Discount Notes |
| FFCB | | Federal Farm Credit Bank |
| FHLB | | Federal Home Loan Bank |
| FHLMC | | Federal Home Loan Mortgage Corp. |
| FNMA | | Federal National Mortgage Association |
| GNMA | | Government National Mortgage Association |
| ICE | | Intercontinental Exchange |
| LIBOR | | London Interbank Offered Rate |
| USD | | United States Dollar |
| |
| (a) | | The date shown represents the earliest of the next put date, next demand date or final maturity date. |
| (b) | | Variable or floating rate security, linked to the referenced benchmark. The interest rate shown is the current rate as of August 31, 2018. |
| (c) | | The rate shown is the effective yield as of August 31, 2018. |
| * | | The cost of securities is substantially the same for federal income tax purposes. |
Additional Investment Information:
[1] Agency Joint Trading Account I — At August 31, 2018, certain Funds had undivided interests in the Agency Joint Trading Account I with a maturity date of September 04, 2018, as follows (amounts in thousands):
| | | | | | | | | | |
| Fund | | Principal
Amount | | Repurchase
Price | | | Collateral
Value
Allocation | |
JPMorgan U.S. Government Money Market Fund | | $9,014,078 | | $ | 9,016,050 | | | $ | 9,197,033 | |
Repurchase Agreements — August 31, 2018, the Principal Amounts of certain Funds’ interests in the Agency Joint Trading Account I were as follows (amounts in thousands):
| | | | | | | | |
| | |
| Counterparty | | Interest Rate | | | JPMorgan
U.S. Government
Money Market Fund | |
BNP Paribas SA | | | 1.97 | % | | $ | 1,819,355 | |
Credit Agricole Corporate and Investment Bank | | | 1.97 | % | | | 413,490 | |
MUFG Securities Americas, Inc. | | | 1.96 | % | | | 1,405,865 | |
Societe Generale SA | | | 1.97 | % | | | 413,490 | |
TD Securities (USA) LLC | | | 1.97 | % | | | 909,678 | |
Wells Fargo Securities LLC | | | 1.97 | % | | | 4,052,200 | |
| | | | | | | | |
Total | | | | | | $ | 9,014,078 | |
| | | | | | | | |
August 31, 2018, the Agency Joint Trading Account I was fully collateralized by:
| | | | | | | | |
| | |
| Issuer | | Interest Rates | | | Maturity Dates | |
FFCB | | | 1.23% - 3.28% | | | | 11/13/2018 - 11/2/2037 | |
FHLB | | | 0.00% - 5.63% | | | | 9/5/2018��- 7/15/2036 | |
FHLMC | | | 0.88% - 7.00% | | | | 9/14/2018 - 9/1/2048 | |
FNMA | | | 0.00% - 7.25% | | | | 9/18/2018 - 9/1/2048 | |
GNMA | | | 2.00% - 7.50% | | | | 8/16/2022 - 5/20/2068 | |
Tennessee Valley Authority | | | 1.75% - 7.13% | | | | 10/15/2018 - 9/15/2065 | |
U.S. Treasury Securities | | | 0.00% - 8.13% | | | | 2/21/2019 - 2/15/2046 | |
[2] Agency Joint Trading Account II — At August 31, 2018, certain Funds had undivided interests in the Agency Joint Trading Account II with a maturity date of September 04, 2018, as follows (amounts in thousands):
| | | | | | | | | | |
| Fund | | Principal
Amount | | Repurchase
Price | | | Collateral
Value
Allocation | |
JPMorgan U.S. Government Money Market Fund | | $227,967 | | $ | 228,018 | | | $ | 232,534 | |
SEE NOTES TO FINANCIAL STATEMENTS.
| | | | | | |
| | | |
| 36 | | | | J.P. MORGAN MONEY MARKET FUNDS | | AUGUST 31, 2018 |
Repurchase Agreements — At August 31, 2018, the Principal Amounts of certain Funds’ interests in the Agency Joint Trading Account II were as follows (amounts in thousands):
| | | | | | | | |
| | |
| Counterparty | | Interest Rate | | | JPMorgan
U.S. Government
Money Market Fund | |
| Citibank NA | | | 1.97 | % | | $ | 31,228 | |
| Citigroup Global Markets Holdings, Inc. | | | 1.97 | % | | | 31,228 | |
| Merrill Lynch PFS, Inc. | | | 1.97 | % | | | 165,511 | |
| | | | | | | | |
| Total | | | | | | $ | 227,967 | |
| | | | | | | | |
At August 31, 2018, the Agency Joint Trading Account II was fully collateralized by:
| | | | | | | | |
| | |
| Issuer | | Interest Rates | | | Maturity Dates | |
FFCB | | | 2.48% - 3.82% | | | | 2/15/2022 - 3/20/2037 | |
FHLB | | | 0.00% - 3.83% | | | | 10/19/2018 - 9/6/2041 | |
FHLMC | | | 0.00% - 8.00% | | | | 4/15/2019 - 9/1/2048 | |
FNMA | | | 0.00% - 7.00% | | | | 11/15/2018 - 8/1/2048 | |
GNMA | | | 1.50% - 10.00% | | | | 9/15/2018 - 8/15/2060 | |
U.S. Treasury Securities | | | 0.00% - 2.63% | | | | 11/8/2018 - 5/15/2048 | |
SEE NOTES TO FINANCIAL STATEMENTS.
| | | | | | | | |
| | | |
| AUGUST 31, 2018 | | J.P. MORGAN MONEY MARKET FUNDS | | | | | 37 | |
JPMorgan U.S. Treasury Plus Money Market Fund
SCHEDULE OF PORTFOLIO INVESTMENTS
AS OF AUGUST 31, 2018 (Unaudited)
| | | | | | | | |
| INVESTMENTS (a) | | PRINCIPAL
AMOUNT
($000) | | | VALUE
($000) | |
Repurchase Agreements — 61.4% | | | | | | | | |
BNP Paribas SA, 1.95%, dated 8/31/2018, due 9/4/2018, repurchase price $500,108, collateralized by U.S. Treasury Securities, 0.00% - 3.13%, due 1/15/2019 - 11/15/2047, with a value of $510,111. | | | 500,000 | | | | 500,000 | |
BNP Paribas SA, 1.96%, dated 8/31/2018, due 9/7/2018, repurchase price $500,191, collateralized by U.S. Treasury Securities, 0.00% - 8.50%, due 8/15/2019 - 8/15/2047, with a value of $511,222. | | | 500,000 | | | | 500,000 | |
BNP Paribas SA, 1.96%, dated 8/31/2018, due 9/7/2018, repurchase price $1,500,572, collateralized by U.S. Treasury Securities, 0.00% - 8.13%, due 11/15/2018 - 2/15/2047, with a value of $1,533,499. | | | 1,500,000 | | | | 1,500,000 | |
Citigroup Global Markets Holdings, Inc., 1.95%, dated 8/31/2018, due 9/4/2018, repurchase price $100,022, collateralized by U.S. Treasury Securities, 1.50%, due 5/15/2020, with a value of $102,000. | | | 100,000 | | | | 100,000 | |
Credit Agricole Corporate and Investment Bank, 1.95%, dated 8/31/2018, due 9/4/2018, repurchase price $144,031, collateralized by U.S. Treasury Securities, 2.13%, due 9/30/2024, with a value of $146,880. | | | 144,000 | | | | 144,000 | |
HSBC Securities USA, Inc., 1.95%, dated 8/31/2018, due 9/4/2018, repurchase price $150,033, collateralized by U.S. Treasury Securities, 0.00% - 4.63%, due 10/4/2018 - 8/15/2043, with a value of $153,033. | | | 150,000 | | | | 150,000 | |
J.P. Morgan Securities LLC, 1.95%, dated 8/31/2018, due 9/4/2018, repurchase price $250,054, collateralized by U.S. Treasury Securities, 2.25% - 2.50%, due 11/15/2024 - 1/31/2025, with a value of $255,055. | | | 250,000 | | | | 250,000 | |
Merrill Lynch PFS, Inc., 1.95%, dated 8/31/2018, due 9/4/2018, repurchase price $270,115, collateralized by U.S. Treasury Securities, 0.00% - 0.63%, due 4/15/2023 - 2/15/2026, with a value of $275,457. | | | 270,056 | | | | 270,056 | |
Mizuho Securities USA LLC, 1.95%, dated 8/31/2018, due 9/4/2018, repurchase price $500,108, collateralized by U.S. Treasury Securities, 2.00%, due 4/30/2024 - 8/15/2025, with a value of $500,108. | | | 500,000 | | | | 500,000 | |
| | | | | | | | |
| INVESTMENTS | | PRINCIPAL
AMOUNT
($000) | | | VALUE
($000) | |
| | | | | | | | |
MUFG Securities Americas, Inc., 1.93%, dated 8/31/2018, due 9/4/2018, repurchase price $300,064, collateralized by U.S. Treasury Securities, 0.00% - 2.88%, due 11/30/2018 - 5/15/2028, with a value of $306,066. | | | 300,000 | | | | 300,000 | |
Natixis SA, 1.95%, dated 8/31/2018, due 9/4/2018, repurchase price $3,000,650, collateralized by U.S. Treasury Securities, 0.00% - 7.88%, due 9/15/2018 - 2/15/2048, with a value of $3,060,663. | | | 3,000,000 | | | | 3,000,000 | |
Natwest Markets plc, 1.96%, dated 8/31/2018, due 9/4/2018, repurchase price $400,087, collateralized by U.S. Treasury Securities, 0.13% - 2.25%, due 4/15/2021 - 2/15/2040, with a value of $408,089. | | | 400,000 | | | | 400,000 | |
Natwest Markets plc, 1.96%, dated 8/31/2018, due 9/4/2018, repurchase price $750,163, collateralized by U.S. Treasury Securities, 0.00% - 6.63%, due 10/25/2018 - 8/15/2047, with a value of $765,167. | | | 750,000 | | | | 750,000 | |
Norinchukin Bank (The), 2.01%, dated 8/31/2018, due 9/13/2018, repurchase price $250,181, collateralized by U.S. Treasury Securities, 0.13%, due 4/15/2020, with a value of $254,894. | | | 250,000 | | | | 250,000 | |
Norinchukin Bank (The), 2.05%, dated 8/31/2018, due 10/5/2018, repurchase price $150,299, collateralized by U.S. Treasury Securities, 2.63%, due 11/15/2020, with a value of $151,829. | | | 150,000 | | | | 150,000 | |
Norinchukin Bank (The), 2.08%, dated 8/31/2018, due 10/19/2018, repurchase price $100,283, collateralized by U.S. Treasury Securities, 2.63%, due 11/15/2020, with a value of $101,219. | | | 100,000 | | | | 100,000 | |
Norinchukin Bank (The), 2.08%, dated 8/31/2018, due 10/22/2018, repurchase price $100,300, collateralized by U.S. Treasury Securities, 2.63%, due 11/15/2020, with a value of $101,219. | | | 100,000 | | | | 100,000 | |
Societe Generale SA, 1.90%, dated 8/31/2018, due 9/4/2018, repurchase price $300,063, collateralized by U.S. Treasury Securities, 0.00% - 3.00%, due 2/28/2019 - 5/15/2047, with a value of $306,000. | | | 300,000 | | | | 300,000 | |
Societe Generale SA, 1.95%, dated 8/31/2018, due 9/7/2018, repurchase price $500,190, collateralized by U.S. Treasury Securities, 0.00% - 6.50%, due 10/31/2018 - 5/15/2047, with a value of $510,000. | | | 500,000 | | | | 500,000 | |
SEE NOTES TO FINANCIAL STATEMENTS.
| | | | | | |
| | | |
| 38 | | | | J.P. MORGAN MONEY MARKET FUNDS | | AUGUST 31, 2018 |
| | | | | | | | |
| INVESTMENTS | | PRINCIPAL
AMOUNT
($000) | | | VALUE
($000) | |
Repurchase Agreements — continued | | | | | | | | |
Sumitomo Mitsui Banking Corp., 1.96%, dated 8/31/2018, due 9/4/2018, repurchase price $2,000,436, collateralized by U.S. Treasury Securities, 1.88% - 2.75%, due 9/30/2022 - 5/15/2046, with a value of $2,053,347. | | | 2,000,000 | | | | 2,000,000 | |
Treasury Joint Trading Account I, J.P. Morgan Investment Management Inc., as agent, 1.95%, dated 8/31/2018, due 9/4/18, repurchase price $2,000,433. [3] | | | 2,000,000 | | | | 2,000,000 | |
Treasury Joint Trading Account II, J.P. Morgan Investment Management Inc., as agent, 1.95%, dated 8/31/2018, due 9/4/18, repurchase price $1,100,238. [4] | | | 1,100,000 | | | | 1,100,000 | |
UBS Securities LLC, 1.96%, dated 8/31/2018, due 9/4/2018, repurchase price $500,109, collateralized by U.S. Treasury Securities, 0.00% - 8.00%, due 9/6/2018 - 2/15/2044, with a value of $510,000. | | | 500,000 | | | | 500,000 | |
| | | | | | | | |
Total Repurchase Agreements
(Cost $15,364,056) | | | | | | | 15,364,056 | |
| | | | | | | | |
U.S. Treasury Obligations — 24.9% | | | | | | | | |
U.S. Treasury Floating Rate Notes
(US Treasury 3 Month Bill Money Market Yield + 0.00%), 2.09%, 9/4/2018 (b) | | | 850,000 | | | | 849,834 | |
(US Treasury 3 Month Bill Money Market Yield + 0.03%), 2.12%, 9/4/2018 (b) | | | 550,000 | | | | 549,992 | |
(US Treasury 3 Month Bill Money Market Yield + 0.05%), 2.14%, 9/4/2018 (b) | | | 850,000 | | | | 850,086 | |
(US Treasury 3 Month Bill Money Market Yield + 0.06%), 2.15%, 9/4/2018 (b) | | | 300,000 | | | | 300,000 | |
(US Treasury 3 Month Bill Money Market Yield + 0.07%), 2.16%, 9/4/2018 (b) | | | 700,000 | | | | 700,033 | |
(US Treasury 3 Month Bill Money Market Yield + 0.14%), 2.23%, 9/4/2018 (b) | | | 500,000 | | | | 500,110 | |
(US Treasury 3 Month Bill Money Market Yield + 0.17%), 2.26%, 9/4/2018 (b) | | | 939,000 | | | | 939,114 | |
(US Treasury 3 Month Bill Money Market Yield + 0.04%), 2.13%, 10/31/2018 (b) | | | 445,000 | | | | 444,995 | |
U.S. Treasury Notes
1.38%, 9/30/2018 | | | 350,000 | | | | 349,867 | |
1.38%, 12/31/2018 | | | 500,000 | | | | 498,733 | |
1.50%, 12/31/2018 | | | 250,000 | | | | 249,451 | |
| | | | | | | | |
Total U.S. Treasury Obligations
(Cost $6,232,215) | | | | | | | 6,232,215 | |
| | | | | | | | |
| | | | | | | | |
| INVESTMENTS | | PRINCIPAL
AMOUNT
($000) | | | VALUE
($000) | |
Short-Term Investments — 11.4% | | | | | | | | |
U.S. Treasury Obligations — 11.4% | | | | | | | | |
U.S. Treasury Bills 1.91%, 9/6/2018 (c) | | | 500,000 | | | | 499,867 | |
1.91%, 9/13/2018 (c) | | | 250,000 | | | | 249,842 | |
1.90%, 9/20/2018 (c) | | | 500,000 | | | | 499,504 | |
1.92%, 9/27/2018 (c) | | | 500,000 | | | | 499,306 | |
1.93%, 10/4/2018 (c) | | | 250,000 | | | | 249,562 | |
2.10%, 12/27/2018 (c) | | | 350,000 | | | | 347,633 | |
2.16%, 1/17/2019 (c) | | | 500,000 | | | | 495,898 | |
| | | | | | | | |
Total U.S. Treasury Obligations
(Cost $2,841,612) | | | | | | | 2,841,612 | |
| | | | | | | | |
Total Short-Term Investments
(COST $2,841,612) | | | | | | | 2,841,612 | |
| | | | | | | | |
Total Investments — 97.7%
(Cost $24,437,883)* | | | | | | | 24,437,883 | |
Other Assets Less Liabilities — 2.3% | | | | | | | 569,105 | |
| | | | | | | | |
NET ASSETS — 100.0% | | | | | | | 25,006,988 | |
| | | | | | | | |
Percentages indicated are based on net assets.
| | |
| (a) | | The date shown represents the earliest of the next put date, next demand date or final maturity date. |
| (b) | | Variable or floating rate security, linked to the referenced benchmark. The interest rate shown is the current rate as of August 31, 2018. |
| (c) | | The rate shown is the effective yield as of August 31, 2018. |
| * | | The cost of securities is substantially the same for federal income tax purposes. |
Additional Investment Information:
[3] Treasury Joint Trading Account I — At August 31, 2018, certain Funds had undivided interests in the Treasury Joint Trading Account I with a maturity date of September 04, 2018, as follows (amounts in thousands):
| | | | | | | | | | |
| Fund | | Principal
Amount | | Repurchase
Price | | | Collateral
Value
Allocation | |
JPMorgan U.S. Treasury Plus Money Market Fund | | $2,000,000 | | $ | 2,000,433 | | | $ | 2,040,415 | |
Repurchase Agreements — At August 31, 2018, the Principal Amounts of certain Funds’ interests in the Treasury Joint Account I were as follows (amounts in thousands):
| | | | | | |
| Counterparty | | Interest Rate | | JPMorgan
U.S. Treasury Plus
Money Market Fund | |
| Citibank NA | | 1.95% | | $ | 123,457 | |
| Wells Fargo Securities LLC | | 1.95% | | | 1,876,543 | |
| | | | | | |
| Total | | | | $ | 2,000,000 | |
| | | | | | |
SEE NOTES TO FINANCIAL STATEMENTS.
| | | | | | | | |
| | | |
| AUGUST 31, 2018 | | J.P. MORGAN MONEY MARKET FUNDS | | | | | 39 | |
JPMorgan U.S. Treasury Plus Money Market Fund
SCHEDULE OF PORTFOLIO INVESTMENTS
AS OF AUGUST 31, 2018 (Unaudited) (continued)
At August 31, 2018, the Treasury Joint Account I was fully collateralized by:
| | | | |
| Issuer | | Interest Rates | | Maturity Dates |
| U.S. Treasury Securities | | 0.00% - 9.00% | | 9/20/2018 - 5/15/2048 |
[4] Treasury Joint Trading Account II — At August 31, 2018, certain Funds had undivided interests in the Treasury Joint Trading Account II with a maturity date of September 04, 2018, as follows (amounts in thousands):
| | | | | | | | | | |
| | | |
| Fund | | Principal
Amount | | Repurchase
Price | | | Collateral Value
Allocation | |
JPMorgan U.S. Treasury Plus Money Market Fund | | $1,100,000 | | $ | 1,100,238 | | | $ | 1,122,135 | |
Repurchase Agreements — At August 31, 2018, the Principal Amounts of certain Funds’ interests in the Treasury Joint Account II were as follows (amounts in thousands):
| | | | | | |
| | |
| Counterparty | | Interest Rate | | JPMorgan U.S.
Treasury Plus
Money Market Fund | |
| BNP Paribas SA | | 1.95% | | $ | 611,111 | |
| Merrill Lynch PFS, Inc. | | 1.95% | | | 488,889 | |
| | | | | | |
| Total | | | | $ | 1,100,000 | |
| | | | | | |
At August 31, 2018, the Treasury Joint Account II was fully collateralized by:
| | | | |
| Issuer | | Interest Rates | | Maturity Dates |
| U.S. Treasury Securities | | 0.00% - 8.13% | | 10/31/2018 - 8/15/2047 |
SEE NOTES TO FINANCIAL STATEMENTS.
| | | | | | |
| | | |
| 40 | | | | J.P. MORGAN MONEY MARKET FUNDS | | AUGUST 31, 2018 |
JPMorgan Federal Money Market Fund
SCHEDULE OF PORTFOLIO INVESTMENTS
AS OF AUGUST 31, 2018 (Unaudited)
| | | | | | | | |
| INVESTMENTS (a) | | PRINCIPAL
AMOUNT
($000) | | | VALUE
($000) | |
U.S. Government Agency Securities — 79.8% | | | | | | | | |
FFCB | | | | | | | | |
(US Federal Funds Effective Rate (continuous series) + 0.10%), 2.02%, 9/4/2018 (b) | | | 75,000 | | | | 75,000 | |
(Federal Reserve Bank Prime Loan Rate US - 2.96%), 2.05%, 9/4/2018 (b) | | | 25,000 | | | | 25,000 | |
(Federal Reserve Bank Prime Loan Rate US - 2.91%), 2.09%, 9/4/2018 (b) | | | 25,000 | | | | 24,997 | |
(US Treasury 3 Month Bill Money Market Yield + 0.10%), 2.19%, 9/4/2018 (b) | | | 24,999 | | | | 24,999 | |
(US Treasury 3 Month Bill Money Market Yield + 0.19%), 2.28%, 9/4/2018 (b) | | | 22,999 | | | | 22,999 | |
(US Treasury 3 Month Bill Money Market Yield + 0.28%), 2.37%, 9/4/2018 (b) | | | 10,002 | | | | 10,002 | |
DN, 1.90%, 9/13/2018 (c) | | | 75,000 | | | | 74,952 | |
(ICE LIBOR USD 3 Month - 0.21%), 2.14%, 11/10/2018 (b) | | | 33,000 | | | | 33,000 | |
FHLB | | | | | | | | |
(ICE LIBOR USD 1 Month - 0.12%), 1.96%, 9/4/2018 (b) | | | 25,000 | | | | 25,000 | |
(3 Month Treasury Bill Rate + 0.07%), 2.19%, 9/4/2018 (b) | | | 25,000 | | | | 25,000 | |
DN, 1.90%, 9/5/2018 (c) | | | 73,100 | | | | 73,085 | |
DN, 1.92%, 9/7/2018 (c) | | | 375,000 | | | | 374,880 | |
(ICE LIBOR USD 1 Month - 0.07%), 2.01%, 9/9/2018 (b) | | | 25,000 | | | | 25,000 | |
DN, 1.91%, 9/10/2018 (c) | | | 130,258 | | | | 130,196 | |
DN, 1.91%, 9/11/2018 (c) | | | 100,000 | | | | 99,947 | |
(ICE LIBOR USD 1 Month - 0.11%), 1.96%, 9/11/2018 (b) | | | 25,000 | | | | 25,000 | |
(ICE LIBOR USD 1 Month - 0.09%), 1.98%, 9/11/2018 (b) | | | 25,000 | | | | 25,000 | |
DN, 1.91%, 9/12/2018 (c) | | | 100,000 | | | | 99,942 | |
(ICE LIBOR USD 1 Month - 0.09%), 1.98%, 9/12/2018 (b) | | | 28,000 | | | | 28,000 | |
DN, 1.91%, 9/14/2018 (c) | | | 125,000 | | | | 124,914 | |
(ICE LIBOR USD 1 Month - 0.09%), 1.97%, 9/16/2018 (b) | | | 40,000 | | | | 40,000 | |
DN, 1.92%, 9/19/2018 (c) | | | 59,300 | | | | 59,243 | |
(ICE LIBOR USD 1 Month - 0.13%), 1.95%, 9/20/2018 (b) | | | 25,000 | | | | 25,000 | |
DN, 1.94%, 9/21/2018 (c) | | | 100,000 | | | | 99,892 | |
(ICE LIBOR USD 1 Month - 0.07%), 2.00%, 9/22/2018 (b) | | | 25,000 | | | | 25,000 | |
(ICE LIBOR USD 1 Month - 0.12%), 1.95%, 9/24/2018 (b) | | | 25,000 | | | | 25,000 | |
DN, 1.91%, 9/25/2018 (c) | | | 100,000 | | | | 99,873 | |
(ICE LIBOR USD 1 Month - 0.09%), 1.98%, 9/25/2018 (b) | | | 25,000 | | | | 25,000 | |
| | | | | | | | |
| INVESTMENTS | | PRINCIPAL
AMOUNT
($000) | | | VALUE
($000) | |
| | | | | | | | |
DN, 1.94%, 9/26/2018 (c) | | | 223,907 | | | | 223,606 | |
(ICE LIBOR USD 1 Month - 0.12%), 1.95%, 9/26/2018 (b) | | | 25,000 | | | | 25,000 | |
(ICE LIBOR USD 1 Month - 0.12%), 1.95%, 9/26/2018 (b) | | | 69,998 | | | | 69,998 | |
DN, 1.94%, 9/27/2018 (c) | | | 200,000 | | | | 199,720 | |
(ICE LIBOR USD 1 Month - 0.10%), 1.97%, 9/27/2018 (b) | | | 30,000 | | | | 30,000 | |
DN, 1.93%, 9/28/2018 (c) | | | 100,000 | | | | 99,855 | |
DN, 1.94%, 10/2/2018 (c) | | | 100,000 | | | | 99,833 | |
DN, 1.98%, 10/10/2018 (c) | | | 100,000 | | | | 99,786 | |
(ICE LIBOR USD 3 Month - 0.25%), 2.08%, 11/20/2018 (b) | | | 49,000 | | | | 49,000 | |
DN, 2.26%, 3/1/2019 (c) | | | 100,000 | | | | 98,879 | |
| | | | | | | | |
Total U.S. Government Agency Securities
(Cost $2,741,598) | | | | | | | 2,741,598 | |
| | | | | | | | |
U.S. Treasury Obligations — 3.9% | | | | | | | | |
U.S. Treasury Floating Rate Notes (US Treasury 3 Month Bill Money Market Yield + 0.00%), 2.09%, 9/4/2018 (b) | | | 33,000 | | | | 33,000 | |
U.S. Treasury Notes 1.38%, 9/30/2018 | | | 100,000 | | | | 99,949 | |
| | | | | | | | |
Total U.S. Treasury Obligations
(Cost $132,949) | | | | | | | 132,949 | |
| | | | | | | | |
Short-Term Investments — 15.9% | | | | | | | | |
U.S. Treasury Obligations — 15.9% | | | | | | | | |
U.S. Treasury Bills
1.84%, 9/6/2018 (c) | | | 93,000 | | | | 92,977 | |
1.91%, 9/13/2018 (c) | | | 100,000 | | | | 99,936 | |
1.93%, 9/27/2018 (c) | | | 17,780 | | | | 17,755 | |
2.02%, 11/8/2018 (c) | | | 146,500 | | | | 145,944 | |
2.16%, 1/17/2019 (c) | | | 90,000 | | | | 89,262 | |
2.18%, 1/31/2019 (c) | | | 100,000 | | | | 99,089 | |
| | | | | | | | |
Total U.S. Treasury Obligations
(Cost $544,963) | | | | | | | 544,963 | |
| | | | | | | | |
Total Short-Term Investments
(COST $544,963) | | | | | | | 544,963 | |
| | | | | | | | |
Total Investments — 99.6%
(Cost $3,419,510)* | | | | | | | 3,419,510 | |
Other Assets Less Liabilities — 0.4% | | | | | | | 14,364 | |
| | | | | | | | |
NET ASSETS — 100.0% | | | | | | | 3,433,874 | |
| | | | | | | | |
Percentages indicated are based on net assets.
SEE NOTES TO FINANCIAL STATEMENTS.
| | | | | | | | |
| | | |
| AUGUST 31, 2018 | | J.P. MORGAN MONEY MARKET FUNDS | | | | | 41 | |
JPMorgan Federal Money Market Fund
SCHEDULE OF PORTFOLIO INVESTMENTS
AS OF AUGUST 31, 2018 (Unaudited) (continued)
Abbreviations
| | |
DN | | Discount Notes |
FFCB | | Federal Farm Credit Bank |
FHLB | | Federal Home Loan Bank |
ICE | | Intercontinental Exchange |
LIBOR | | London Interbank Offered Rate |
USD | | United States Dollar |
| | |
| (a) | | The date shown represents the earliest of the next put date, next demand date or final maturity date. |
| (b) | | Variable or floating rate security, linked to the referenced benchmark. The interest rate shown is the current rate as of August 31, 2018. |
| (c) | | The rate shown is the effective yield as of August 31, 2018. |
| * | | The cost of securities is substantially the same for federal income tax purposes. |
SEE NOTES TO FINANCIAL STATEMENTS.
| | | | | | |
| | | |
| 42 | | | | J.P. MORGAN MONEY MARKET FUNDS | | AUGUST 31, 2018 |
JPMorgan 100% U.S. Treasury Securities Money Market Fund
SCHEDULE OF PORTFOLIO INVESTMENTS
AS OF AUGUST 31, 2018 (Unaudited)
| | | | | | | | |
| INVESTMENTS (a) | | PRINCIPAL
AMOUNT
($000) | | | VALUE
($000) | |
U.S. Treasury Obligations — 20.3% | | | | | | | | |
U.S. Treasury Floating Rate Notes | | | | | | | | |
(US Treasury 3 Month Bill Money Market Yield + 0.00%), 2.09%, 9/4/2018 (b) | | | 1,149,000 | | | | 1,148,813 | |
(US Treasury 3 Month Bill Money Market Yield + 0.03%), 2.12%, 9/4/2018 (b) | | | 846,000 | | | | 846,034 | |
(US Treasury 3 Month Bill Money Market Yield + 0.05%), 2.14%, 9/4/2018 (b) | | | 200,000 | | | | 200,005 | |
(US Treasury 3 Month Bill Money Market Yield + 0.06%), 2.15%, 9/4/2018 (b) | | | 875,000 | | | | 875,004 | |
(US Treasury 3 Month Bill Money Market Yield + 0.07%), 2.16%, 9/4/2018 (b) | | | 450,000 | | | | 449,966 | |
(US Treasury 3 Month Bill Money Market Yield + 0.14%), 2.23%, 9/4/2018 (b) | | | 650,000 | | | | 650,233 | |
(US Treasury 3 Month Bill Money Market Yield + 0.17%), 2.26%, 9/4/2018 (b) | | | 452,250 | | | | 452,274 | |
(US Treasury 3 Month Bill Money Market Yield + 0.04%), 2.13%, 10/31/2018 (b) | | | 895,775 | | | | 895,773 | |
U.S. Treasury Notes 0.75%, 9/30/2018 | | | 300,000 | | | | 299,703 | |
1.38%, 9/30/2018 | | | 200,000 | | | | 199,900 | |
1.25%, 10/31/2018 | | | 175,000 | | | | 174,766 | |
3.75%, 11/15/2018 | | | 1,815,539 | | | | 1,821,602 | |
1.50%, 12/31/2018 | | | 368,000 | | | | 367,181 | |
| | | | | | | | |
Total U.S. Treasury Obligations
(Cost $8,381,254) | | | | | | | 8,381,254 | |
| | | | | | | | |
Short-Term Investments — 76.7% | | | | | | | | |
U.S. Treasury Obligations — 76.7% | | | | | | | | |
U.S. Treasury Bills
1.90%, 9/6/2018 (c) | | | 4,321,400 | | | | 4,320,264 | |
1.91%, 9/13/2018 (c) | | | 4,900,000 | | | | 4,896,893 | |
1.90%, 9/20/2018 (c) | | | 5,000,000 | | | | 4,995,012 | |
| | | | | | | | |
| INVESTMENTS (a) | | PRINCIPAL
AMOUNT
($000) | | | VALUE
($000) | |
| | | | | | | | |
U.S. Treasury Obligations — continued | | | | | | | | |
1.90%, 9/27/2018 (c) | | | 5,532,220 | | | | 5,524,632 | |
2.02%, 11/8/2018 (c) | | | 3,224,500 | | | | 3,212,270 | |
2.04%, 11/15/2018 (c) | | | 2,410,000 | | | | 2,399,800 | |
2.05%, 11/23/2018 (c) | | | 875,000 | | | | 870,886 | |
2.05%, 12/13/2018 (c) | | | 1,000,000 | | | | 994,188 | |
2.09%, 12/20/2018 (c) | | | 1,350,000 | | | | 1,341,453 | |
2.16%, 1/17/2019 (c) | | | 1,000,000 | | | | 991,797 | |
2.16%, 1/24/2019 (c) | | | 1,000,000 | | | | 991,396 | |
2.18%, 1/31/2019 (c) | | | 1,150,000 | | | | 1,139,533 | |
| | | | | | | | |
Total U.S. Treasury Obligations
(Cost $31,678,124) | | | | | | | 31,678,124 | |
| | | | | | | | |
Total Short-Term Investments
(Cost $31,678,124) | | | | | | | 31,678,124 | |
| | | | | | | | |
Total Investments — 97.0%
(Cost $40,059,378)* | | | | | | | 40,059,378 | |
Other Assets Less Liabilities — 3.0% | | | | | | | 1,237,008 | |
| | | | | | | | |
NET ASSETS — 100.0% | | | | | | | 41,296,386 | |
| | | | | | | | |
Percentages indicated are based on net assets.
| | |
| (a) | | The date shown represents the earliest of the next put date, next demand date or final maturity date. |
| (b) | | Variable or floating rate security, linked to the referenced benchmark. The interest rate shown is the current rate as of August 31, 2018. |
| (c) | | The rate shown is the effective yield as of August 31, 2018. |
| * | | The cost of securities is substantially the same for federal income tax purposes. |
SEE NOTES TO FINANCIAL STATEMENTS.
| | | | | | | | |
| | | |
| AUGUST 31, 2018 | | J.P. MORGAN MONEY MARKET FUNDS | | | | | 43 | |
JPMorgan Tax Free Money Market Fund
SCHEDULE OF PORTFOLIO INVESTMENTS
AS OF AUGUST 31, 2018 (Unaudited)
| | | | | | | | |
| INVESTMENTS (a) | | PRINCIPAL
AMOUNT
($000) | | | VALUE
($000) | |
Municipal Bonds — 81.7% | | | | | | | | |
Alabama — 0.3% | | | | | | | | |
East Alabama Health Care Authority Series B, Rev., VRDO, 1.58%, 9/10/2018 (b) | | | 29,745 | | | | 29,745 | |
Mobile County IDA, PCR, ExxonMobil Project Rev., VRDO, 1.55%, 9/4/2018 (b) | | | 2,575 | | | | 2,575 | |
Mobile Downtown Redevelopment Authority, Gulf Opportunity Zone, Austal USA LLC Project | | | | | | | | |
Series A, Rev., VRDO, LOC: Bank of America NA, 1.58%, 9/10/2018 (b) (c) | | | 7,375 | | | | 7,375 | |
Series B, Rev., VRDO, LOC: Wells Fargo Bank NA, 1.58%, 9/10/2018 (b) (c) | | | 9,290 | | | | 9,290 | |
| | | | | | | | |
| | | | | | | 48,985 | |
| | | | | | | | |
Alaska — 1.4% | | | | | | | | |
Alaska Housing Finance Corp. Series B, Rev., VRDO, 1.53%, 9/10/2018 (b) | | | 27,795 | | | | 27,795 | |
Alaska Housing Finance Corp., Home Mortgage | | | | | | | | |
Series A, Rev., VRDO, 1.51%, 9/10/2018 (b) | | | 42,765 | | | | 42,765 | |
Series B, Rev., VRDO, BAN, 1.51%, 9/10/2018 (b) | | | 43,490 | | | | 43,490 | |
Series A, Rev., VRDO, 1.54%, 9/10/2018 (b) | | | 14,635 | | | | 14,635 | |
Series B, Rev., VRDO, 1.54%, 9/10/2018 (b) | | | 14,630 | | | | 14,630 | |
Alaska Housing Finance Corp., Various, Governmental Purpose Series A, Rev., VRDO, 1.51%, 9/10/2018 (b) | | | 20,785 | | | | 20,785 | |
City of Valdez, Exxon Pipeline Co. Project | | | | | | | | |
Rev., VRDO, 1.52%, 9/4/2018 (b) | | | 14,930 | | | | 14,930 | |
Series A, Rev., VRDO, 1.55%, 9/4/2018 (b) | | | 2,525 | | | | 2,525 | |
Series B, Rev., VRDO, 1.55%, 9/4/2018 (b) | | | 33,460 | | | | 33,460 | |
Series C, Rev., VRDO, 1.55%, 9/4/2018 (b) | | | 11,480 | | | | 11,480 | |
| | | | | | | | |
| | | | | | | 226,495 | |
| | | | | | | | |
Arizona — 1.1% | | | | | | | | |
Arizona Health Facilities Authority, Banner Health | | | | | | | | |
Series G, Rev., VRDO, LOC: Wells Fargo Bank NA, 1.58%, 9/10/2018 (b) | | | 16,590 | | | | 16,590 | |
Series H, Rev., VRDO, LOC: Northern Trust Co., 1.60%, 9/10/2018 (b) | | | 40,315 | | | | 40,315 | |
Arizona Health Facilities Authority, Catholic Healthcare West Loan 2008 Series B, Rev., VRDO, LOC: Barclays Bank plc, 1.56%, 9/10/2018 (b) | | | 3,200 | | | | 3,200 | |
| | | | | | | | |
| INVESTMENTS | | PRINCIPAL
AMOUNT
($000) | | | VALUE
($000) | |
| | | | | | | | |
Arizona — continued | | | | | | | | |
Arizona State University Series A, Rev., VRDO, 1.55%, 9/10/2018 (b) | | | 15,350 | | | | 15,350 | |
Industrial Development Authority of the City of Phoenix (The), Arizona Health Care Facilities, Mayo Clinic Series A, Rev., VRDO, 1.46%, 9/4/2018 (b) | | | 35,650 | | | | 35,650 | |
Maricopa County Industrial Development Authority, Multifamily Housing, San Clemente Apartments Project Rev., VRDO, FNMA, LOC: FNMA, 1.62%, 9/10/2018 (b) | | | 18,200 | | | | 18,200 | |
Phoenix City IDA, Multi-Family Housing, Del Mar Terrace Apartments Project Series A, Rev., VRDO, FHLMC, LOC: FHLMC, 1.63%, 9/10/2018 (b) | | | 2,000 | | | | 2,000 | |
Salt River Pima-Maricopa Indian Community Rev., VRDO, LOC: Bank of America NA, 1.61%, 9/10/2018 (b) | | | 38,740 | | | | 38,740 | |
| | | | | | | | |
| | | | | | | 170,045 | |
| | | | | | | | |
California — 3.2% | | | | | | | | |
California Educational Facilities Authority Series 2015-XF2188, Rev., VRDO, LIQ: Morgan Stanley Bank, 1.59%, 9/10/2018 (b) (c) | | | 1 | | | | 1 | |
California Statewide Communities Development Authority, Kaiser Permanente | | | | | | | | |
Series J, Rev., VRDO, 1.45%, 9/10/2018 (b) | | | 23,710 | | | | 23,710 | |
Series M, Rev., VRDO, 1.51%, 9/10/2018 (b) | | | 27,910 | | | | 27,910 | |
Series B, Rev., VRDO, 1.52%, 9/10/2018 (b) | | | 24,670 | | | | 24,670 | |
California Statewide Communities Development Authority, Multi-Family Housing, Bay Vista Meadow Park Series NN-1, Rev., VRDO, FNMA, LOC: FNMA, 1.51%, 9/10/2018 (b) | | | 26,145 | | | | 26,145 | |
California Statewide Communities Development Authority, Multi-Family Housing, Kelvin Court Series B, Rev., VRDO, FNMA, LOC: FNMA, 1.43%, 9/10/2018 (b) | | | 5,500 | | | | 5,500 | |
City & County of San Francisco, Multifamily Housing, Taxable, Transbay Block 8 Tower Apartments Series H-1, Rev., VRDO, LOC: Bank of China, 1.56%, 9/10/2018 (b) | | | 85,940 | | | | 85,940 | |
City & County of San Francisco, Multifamily Housing, Transbay Block 8 Tower Apartments Series H-2, Rev., VRDO, LOC: Bank of China, 1.63%, 9/10/2018 (b) | | | 23,030 | | | | 23,030 | |
SEE NOTES TO FINANCIAL STATEMENTS.
| | | | | | |
| | | |
| 44 | | | | J.P. MORGAN MONEY MARKET FUNDS | | AUGUST 31, 2018 |
| | | | | | | | |
| INVESTMENTS | | PRINCIPAL
AMOUNT
($000) | | | VALUE
($000) | |
Municipal Bonds — continued | | | | | | | | |
California — continued | | | | | | | | |
City of Irvine, Reassessment District No. 05-21, Limited Obligation Improvement Bonds Series A, VRDO, LOC: U.S. Bank NA, 1.30%, 9/4/2018 (b) (c) | | | 18,829 | | | | 18,829 | |
City of San Jose, Multifamily Housing, Almaden Lake Village Apartments Series A, Rev., VRDO, FNMA, LOC: FNMA, 1.52%, 9/10/2018 (b) | | | 8,500 | | | | 8,500 | |
County of Sacramento, Special Facilities Apartment Rev., VRDO, LOC: Bank of America NA, 1.59%, 9/10/2018 (b) | | | 5,800 | | | | 5,800 | |
Metropolitan Water District of Southern California, Water | | | | | | | | |
Series A-1, Rev., VRDO, 1.33%, 9/4/2018 (b) | | | 59,185 | | | | 59,185 | |
Series A-2, Rev., VRDO, 1.33%, 9/4/2018 (b) | | | 48,200 | | | | 48,200 | |
San Diego Community College District Series 2016-ZF2382, GO, VRDO, LIQ: Citibank NA, 1.52%, 9/10/2018 (b) (c) | | | 18,000 | | | | 18,000 | |
Tender Option Bond Trust Receipts/CTFS | | | | | | | | |
Series 2015-XM0075, Rev., VRDO, LIQ: Bank of America NA, 1.57%, 9/10/2018 (b) (c) | | | 7,260 | | | | 7,260 | |
Series 2016-XM0230, Rev., VRDO, LIQ: Bank of America NA, 1.57%, 9/10/2018 (b) (c) | | | 14,250 | | | | 14,250 | |
Series XF0568, Rev., VRDO, LIQ: Bank of America NA, 1.57%, 9/10/2018 (b) (c) | | | 14,400 | | | | 14,400 | |
Series 2016-XF0431, GO, VRDO, LIQ: Bank of America NA, 1.58%, 9/10/2018 (b) (c) | | | 55,260 | | | | 55,260 | |
Series 2018-BAML0005, Rev., VRDO, FHLMC, LIQ: Bank of America NA, 1.68%, 9/10/2018 (b) (c) | | | 42,480 | | | | 42,480 | |
| | | | | | | | |
| | | | | | | 509,070 | |
| | | | | | | | |
Colorado — 2.5% | | | | | | | | |
City of Colorado Springs, Utilities Revenue System, Sub Lien Series A, Rev., VRDO, 1.56%, 9/10/2018 (b) | | | 68,050 | | | | 68,050 | |
City of Colorado Springs, Utilities System Improvement | | | | | | | | |
Series A, Rev., VRDO, 1.54%, 9/10/2018 (b) | | | 43,110 | | | | 43,110 | |
Series A, Rev., VRDO, 1.54%, 9/10/2018 (b) | | | 10,200 | | | | 10,200 | |
Series C, Rev., VRDO, 1.56%, 9/10/2018 (b) | | | 18,590 | | | | 18,590 | |
| | | | | | | | |
| INVESTMENTS | | PRINCIPAL
AMOUNT
($000) | | | VALUE
($000) | |
| | | | | | | | |
Colorado — continued | | | | | | | | |
City of Colorado Springs, Utilities System, Sub Lien Series A, Rev., VRDO, 1.58%, 9/10/2018 (b) | | | 88,280 | | | | 88,280 | |
Colorado Educational and Cultural Facilities Authority, Nature Conservancy Project Series 2012, Rev., VRDO, 1.56%, 9/10/2018 (b) | | | 92,390 | | | | 92,390 | |
Colorado Health Facilities Authority, SCL Health System Series A, Rev., VRDO, 1.56%, 9/10/2018 (b) | | | 30,045 | | | | 30,045 | |
Colorado Housing and Finance Authority, Single Family Mortgage Series B-2, Class 1, Rev., VRDO, AMT, 1.61%, 9/10/2018 (b) | | | 36,495 | | | | 36,495 | |
County of Arapahoe, Multi-Family Rental Housing, Hunter’s Run Project Rev., VRDO, FHLMC, LOC: FHLMC, 1.58%, 9/10/2018 (b) | | | 14,320 | | | | 14,320 | |
| | | | | | | | |
| | | | | | | 401,480 | |
| | | | | | | | |
Connecticut — 1.4% | | | | | | | | |
Connecticut Housing Finance Authority Subseries A-3, Rev., VRDO, 1.58%, 9/10/2018 (b) | | | 22,335 | | | | 22,335 | |
Connecticut Housing Finance Authority, Housing Mortgage Finance Program | | | | | | | | |
Subseries B-3, Rev., VRDO, 1.57%, 9/10/2018 (b) | | | 10,000 | | | | 10,000 | |
Subseries C-3, Rev., VRDO, AMT, 1.57%, 9/10/2018 (b) | | | 20,000 | | | | 20,000 | |
Subseries A-3, Rev., VRDO, 1.62%, 9/10/2018 (b) | | | 20,335 | | | | 20,335 | |
Connecticut Housing Finance Authority, Housing Mortgage Finance Program Bonds | | | | | | | | |
Subseries E-3, Rev., VRDO, 1.50%, 9/10/2018 (b) | | | 23,370 | | | | 23,370 | |
Subseries F-5, Rev., VRDO, 1.57%, 9/10/2018 (b) | | | 48,200 | | | | 48,200 | |
Series D, Subseries D-3, Rev., VRDO, AMT, 1.62%, 9/10/2018 (b) | | | 28,300 | | | | 28,300 | |
State of Connecticut, Health and Educational Facility Authority | | | | | | | | |
Series A, Rev., VRDO, 1.50%, 9/10/2018 (b) | | | 10,000 | | | | 10,000 | |
Series D, Rev., VRDO, LOC: Bank of America NA, 1.58%, 9/10/2018 (b) | | | 42,770 | | | | 42,770 | |
| | | | | | | | |
| | | | | | | 225,310 | |
| | | | | | | | |
SEE NOTES TO FINANCIAL STATEMENTS.
| | | | | | | | |
| | | |
| AUGUST 31, 2018 | | J.P. MORGAN MONEY MARKET FUNDS | | | | | 45 | |
JPMorgan Tax Free Money Market Fund
SCHEDULE OF PORTFOLIO INVESTMENTS
AS OF AUGUST 31, 2018 (Unaudited) (continued)
| | | | | | | | |
| INVESTMENTS | | PRINCIPAL
AMOUNT
($000) | | | VALUE
($000) | |
Municipal Bonds — continued | | | | | | | | |
Delaware — 0.1% | | | | | | | | |
Delaware State Health Facilities Authority, Christiana Care Health Services Series B, Rev., VRDO, 1.56%, 9/10/2018 (b) | | | 18,105 | | | | 18,105 | |
| | | | | | | | |
District of Columbia — 1.8% | | | | | | | | |
District of Columbia, Georgetown University Series 2007 C-2, Rev., VRDO, LOC: Sumitomo Mitsui Banking Corp., 1.56%, 9/10/2018 (b) | | | 28,725 | | | | 28,725 | |
District of Columbia, Georgetown University Issue Series C, Rev., VRDO, LOC: Bank of Tokyo-Mitsubishi UFJ Ltd., 1.57%, 9/10/2018 (b) | | | 33,055 | | | | 33,055 | |
District of Columbia, Medlantic/Helix Issue, Tranche II Series A, Rev., VRDO, LOC: TD Bank NA, 1.54%, 9/10/2018 (b) | | | 22,385 | | | | 22,385 | |
District of Columbia, Pew Charitable Trust Series A, Rev., VRDO, LOC: PNC Bank NA, 1.56%, 9/10/2018 (b) | | | 80,020 | | | | 80,020 | |
District of Columbia, Water and Sewer Authority, Public Utility Subordinated Lien Multimodal, Weekly Rate Period Series B, Subseries B-1, Rev., VRDO, 1.51%, 9/10/2018 (b) | | | 22,510 | | | | 22,510 | |
Metropolitan Washington Airports Authority | | | | | | | | |
Series D, Subseries D-2, Rev., VRDO, LOC: TD Bank NA, 1.54%, 9/10/2018 (b) | | | 17,310 | | | | 17,310 | |
Series A, Subseries A-1, Rev., VRDO, LOC: Royal Bank of Canada, 1.59%, 9/10/2018 (b) | | | 52,040 | | | | 52,040 | |
RBC Municipal Products, Inc. Trust, Floater Certificates | | | | | | | | |
Series E-108, GO, VRDO, LIQ: Royal Bank of Canada, 1.59%, 9/10/2018 (b) (c) | | | 35,000 | | | | 35,000 | |
| | | | | | | | |
| | | | | | | 291,045 | |
| | | | | | | | |
Florida — 2.4% | | | | | | | | |
City of Gainesville, Utilities System Series B, Rev., VRDO, 1.57%, 9/10/2018 (b) | | | 30,000 | | | | 30,000 | |
County of Miami-Dade, Seaport Department Series A, Rev., VRDO, LOC: Bank of Tokyo-Mitsubishi UFJ Ltd., 1.56%, 9/10/2018 (b) | | | 11,050 | | | | 11,050 | |
Florida Gulf Coast University Financing Corp., Housing Project Series A, Rev., VRDO, LOC: BMO Harris Bank NA, 1.57%, 9/10/2018 (b) | | | 17,160 | | | | 17,160 | |
Florida Keys Aqueduct Authority Rev., VRDO, LOC: TD Bank NA, 1.56%, 9/10/2018 (b) | | | 23,100 | | | | 23,100 | |
| | | | | | | | |
| INVESTMENTS | | PRINCIPAL
AMOUNT
($000) | | | VALUE
($000) | |
| | | | | | | | |
Florida — continued | | | | | | | | |
Florida Municipal Power Agency, All Requirements Power Supply Project Series C, Rev., VRDO, LOC: Bank of America NA, 1.57%, 9/4/2018 (b) | | | 31,520 | | | | 31,520 | |
Highlands County Health Facilities Authority, Adventist Health System/Sunbelt Obligated Group | | | | | | | | |
Series I-1, Rev., VRDO, 1.54%, 9/10/2018 (b) | | | 27,450 | | | | 27,450 | |
Series 2012I, Rev., VRDO, 1.55%, 9/10/2018 (b) | | | 29,500 | | | | 29,500 | |
Highlands County Health Facilities Authority, Hospital, Adventist Health System/Sunbelt Obligated Group | | | | | | | | |
Series I-2, Rev., VRDO, 1.53%, 9/10/2018 (b) | | | 49,100 | | | | 49,100 | |
Series A, Rev., VRDO, 1.55%, 9/10/2018 (b) | | | 30,950 | | | | 30,950 | |
Hillsborough County, Housing Finance Authority, Multifamily Housing, Brandywine Apartments Rev., VRDO, LOC: Citibank NA, 1.61%, 9/10/2018 (b) | | | 2,895 | | | | 2,895 | |
JEA, Electric System Series Three 2008B-2, Rev., VRDO, 1.57%, 9/10/2018 (b) | | | 21,925 | | | | 21,925 | |
JEA, Water and Sewer System Series A-2, Rev., VRDO, LOC: Sumitomo Mitsui Banking Corp., 1.60%, 9/10/2018 (b) | | | 46,670 | | | | 46,670 | |
Orange County Health Facilities Authority, The Nemours Foundation Project Series B, Rev., VRDO, LOC: Northern Trust Co., 1.50%, 9/10/2018 (b) | | | 26,410 | | | | 26,410 | |
Osceola County Multi-Family Housing Finance Authority, Regatta Bay Apartments Series A, Rev., VRDO, FNMA, LOC: FNMA, 1.61%, 9/10/2018 (b) | | | 10,400 | | | | 10,400 | |
Palm Beach County Multi-Family Housing Finance Authority, Renaissance Apartments Series A, Rev., VRDO, AMT, FNMA, LOC: FNMA, 1.61%, 9/10/2018 (b) | | | 8,900 | | | | 8,900 | |
RBC Municipal Products, Inc. Trust, Floater Certificates Series G-25, Rev., VRDO, LOC: Royal Bank of Canada, 1.81%, 9/10/2018 (b) (c) | | | 8,000 | | | | 8,000 | |
| | | | | | | | |
| | | | | | | 375,030 | |
| | | | | | | | |
Georgia — 0.7% | | | | | | | | |
DeKalb Private Hospital Authority, Children’s Healthcare of Atlanta, Inc. Project Rev., VRDO, 1.57%, 9/10/2018 (b) | | | 82,590 | | | | 82,590 | |
SEE NOTES TO FINANCIAL STATEMENTS.
| | | | | | |
| | | |
| 46 | | | | J.P. MORGAN MONEY MARKET FUNDS | | AUGUST 31, 2018 |
| | | | | | | | |
| INVESTMENTS | | PRINCIPAL
AMOUNT
($000) | | | VALUE
($000) | |
Municipal Bonds — continued | | | | | | | | |
Georgia — continued | | | | | | | | |
Griffin-Spaulding County Development Authority, Industrial Development, Norcom, Inc. Project Rev., VRDO, LOC: Bank of America NA, 1.64%, 9/10/2018 (b) | | | 2,130 | | | | 2,130 | |
Henry County Water and Sewer Authority, EAGLE Series 2005-0008, Class A, Rev., VRDO, BHAC, FSA-CR, NATL-RE, LIQ: Citibank NA, 1.60%, 9/10/2018 (b) | | | 5,940 | | | | 5,940 | |
Rib Floater Trust Various Series 2018-016, Rev., VRDO, LIQ: Barclays Bank plc, 1.59%, 9/10/2018 (b) (c) | | | 20,000 | | | | 20,000 | |
Tender Option Bond Trust Receipts/CTFS Series 2018-ZF0656, Rev., VRDO, LIQ: Bank of America NA, 1.61%, 9/10/2018 (b) (c) | | | 7,500 | | | | 7,500 | |
| | | | | | | | |
| | | | | | | 118,160 | |
| | | | | | | | |
Hawaii — 0.1% | | | | | | | | |
RBC Municipal Products, Inc. Trust, Floater Certificates Series G-13, GO, VRDO, LOC: Royal Bank of Canada, 1.59%, 9/10/2018 (b) (c) | | | 20,000 | | | | 20,000 | |
| | | | | | | | |
Idaho — 0.1% | | | | | | | | |
Coeur d’Alene Tribe Rev., VRDO, LOC: Bank of America NA, 1.67%, 9/10/2018 (b) | | | 5,275 | | | | 5,275 | |
Idaho State Building Authority, Prison Facilities Project Series A, Rev., VRDO, 1.56%, 9/10/2018 (b) | | | 5,885 | | | | 5,885 | |
| | | | | | | | |
| | | | | | | 11,160 | |
| | | | | | | | |
Illinois — 5.3% | | | | | | | | |
Chicago O’Hare International Airport, Third Lien Rev., VRDO, LOC: Barclays Bank plc, 1.61%, 9/10/2018 (b) | | | 96,600 | | | | 96,600 | |
City of Galesburg, Knox College Project Series 1996, Rev., VRDO, LOC: PNC Bank NA, 1.57%, 9/10/2018 (b) | | | 4,300 | | | | 4,300 | |
County of Cook, Illinois, Catholic Theological Union Project Series 2005, Rev., VRDO, LOC: U.S. Bank NA, 1.56%, 9/10/2018 (b) | | | 23,256 | | | | 23,256 | |
County of Cook, Village of Justice, Multi-Family Housing, Candlewood Apartments Project Rev., VRDO, FNMA, LOC: FNMA, 1.62%, 9/10/2018 (b) | | | 9,600 | | | | 9,600 | |
County of Lake, A L Hansen Manufacturing Co. Project Rev., VRDO, LOC: BMO Harris Bank NA, 1.59%, 9/10/2018 (b) | | | 940 | | | | 940 | |
County of Will, ExxonMobil Project Rev., VRDO, 1.57%, 9/4/2018 (b) | | | 26,515 | | | | 26,515 | |
| | | | | | | | |
| INVESTMENTS | | PRINCIPAL
AMOUNT
($000) | | | VALUE
($000) | |
| | | | | | | | |
Illinois — continued | | | | | | | | |
Illinois Educational Facilities Authority, Columbia College Chicago Rev., VRDO, LOC: BMO Harris Bank NA, 1.58%, 9/10/2018 (b) | | | 11,790 | | | | 11,790 | |
Illinois Finance Authority, Advocate Healthcare Network | | | | | | | | |
Subseries C-3A, Rev., VRDO, 1.57%, 9/10/2018 (b) | | | 17,150 | | | | 17,150 | |
Subseries C-2A, Rev., VRDO, 1.58%, 9/10/2018 (b) | | | 48,730 | | | | 48,730 | |
Illinois Finance Authority, Bradley University | | | | | | | | |
Series A, Rev., VRDO, LOC: PNC Bank NA, 1.56%, 9/10/2018 (b) | | | 28,385 | | | | 28,385 | |
Series B, Rev., VRDO, LOC: PNC Bank NA, 1.56%, 9/10/2018 (b) | | | 12,790 | | | | 12,790 | |
Illinois Finance Authority, Chicago Symphony Orchestra Series 2008, Rev., VRDO, LOC: PNC Bank NA, 1.56%, 9/10/2018 (b) | | | 83,015 | | | | 83,015 | |
Illinois Finance Authority, Elmhurst Memorial Healthcare Series D, Rev., VRDO, LOC: Bank of America NA, 1.59%, 9/10/2018 (b) | | | 25,500 | | | | 25,500 | |
Illinois Finance Authority, Hospital Sisters Services, Inc. Series 2012-G, Rev., VRDO, LOC: Bank of Montreal, 1.56%, 9/10/2018 (b) | | | 20,945 | | | | 20,945 | |
Illinois Finance Authority, Mccormick Theological Seminary Project Rev., VRDO, LOC: Northern Trust Co., 1.55%, 9/10/2018 (b) | | | 14,750 | | | | 14,750 | |
Illinois Finance Authority, Northwestern Memorial Hospital Series A-4, Rev., VRDO, 1.52%, 9/4/2018 (b) | | | 16,590 | | | | 16,590 | |
Illinois Finance Authority, OSF Healthcare System Series B, Rev., VRDO, LOC: PNC Bank NA, 1.56%, 9/10/2018 (b) | | | 20,750 | | | | 20,750 | |
Illinois Finance Authority, The University of Chicago Medical Center | | | | | | | | |
Series A, Rev., VRDO, LOC: Bank of America NA, 1.50%, 9/4/2018 (b) | | | 25,650 | | | | 25,650 | |
Series 2011B, Rev., VRDO, LOC: Sumitomo Mitsui Banking Corp., 1.57%, 9/10/2018 (b) | | | 38,820 | | | | 38,820 | |
Illinois Finance Authority, The University Of Chicago Medical Center | | | | | | | | |
Series D-1, Rev., VRDO, LOC: PNC Bank NA, 1.53%, 9/4/2018 (b) | | | 7,150 | | | | 7,150 | |
Series B, Rev., VRDO, LOC: Wells Fargo Bank NA, 1.54%, 9/4/2018 (b) | | | 5,955 | | | | 5,955 | |
SEE NOTES TO FINANCIAL STATEMENTS.
| | | | | | | | |
| | | |
| AUGUST 31, 2018 | | J.P. MORGAN MONEY MARKET FUNDS | | | | | 47 | |
JPMorgan Tax Free Money Market Fund
SCHEDULE OF PORTFOLIO INVESTMENTS
AS OF AUGUST 31, 2018 (Unaudited) (continued)
| | | | | | | | |
| INVESTMENTS | | PRINCIPAL
AMOUNT
($000) | | | VALUE
($000) | |
Municipal Bonds — continued | | | | | | | | |
Illinois — continued | | | | | | | | |
Illinois Finance Authority, University of Chicago Series B, Rev., VRDO, 1.55%, 9/10/2018 (b) | | | 20,358 | | | | 20,358 | |
Illinois Housing Development Authority, Homeowner Mortgage | | | | | | | | |
Rev., VRDO, GNMA/FNMA/FHLMC, 1.58%, 9/10/2018 (b) | | | 12,500 | | | | 12,500 | |
Series C-3, Rev., VRDO, AMT, 1.60%, 9/10/2018 (b) | | | 5,700 | | | | 5,700 | |
Illinois Housing Development Authority, Multifamily Housing, Foxview I and II Apartments Rev., VRDO, FHLMC, LOC: FHLMC, 1.56%, 9/10/2018 (b) | | | 19,000 | | | | 19,000 | |
Illinois Housing Development Authority, Multifamily Housing, Prairie Station Apartments Rev., VRDO, FNMA, LOC: FNMA, 1.63%, 9/10/2018 (b) | | | 17,900 | | | | 17,900 | |
Illinois State Toll Highway Authority | | | | | | | | |
Series A-1B, Rev., VRDO, LOC: Bank of America NA, 1.55%, 9/10/2018 (b) | | | 20,000 | | | | 20,000 | |
Series A-2B, Rev., VRDO, LOC: PNC Bank NA, 1.56%, 9/10/2018 (b) | | | 1,000 | | | | 1,000 | |
Series A-2C, Rev., VRDO, LOC: Landesbank Hessen-Thueringen, 1.58%, 9/10/2018 (b) | | | 26,700 | | | | 26,700 | |
Series A-2A, Rev., VRDO, LOC: Bank of Tokyo-Mitsubishi UFJ Ltd., 1.59%, 9/10/2018 (b) | | | 51,900 | | | | 51,900 | |
Illinois State Toll Highway Authority, Variable Rate Senior Priority Series A-1B, Rev., VRDO, LOC: Landesbank Hessen-Thueringen, 1.58%, 9/10/2018 (b) | | | 74,510 | | | | 74,510 | |
Jackson-Union Counties Regional Port District, Port Facility, Enron Transportation Services, LP Project Rev., VRDO, LOC: Wells Fargo Bank NA, 1.60%, 9/10/2018 (b) | | | 21,300 | | | | 21,300 | |
Joliet Regional Port District Rev., VRDO, 1.52%, 9/4/2018 (b) | | | 14,950 | | | | 14,950 | |
Regional Transportation Authority Series SGC-55, Class A, Rev., VRDO, FGIC, LOC: Societe Generale, 1.57%, 9/10/2018 (b) (c) | | | 4,345 | | | | 4,345 | |
| | | | | | | | |
| | | | | | | 829,344 | |
| | | | | | | | |
Indiana — 2.6% | | | | | | | | |
City of Rockport, PCR, AEP Generating Co. Project Series A, Rev., VRDO, LOC: Bank of Tokyo-Mitsubishi UFJ Ltd., 1.58%, 9/10/2018 (b) | | | 9,100 | | | | 9,100 | |
| | | | | | | | |
| INVESTMENTS | | PRINCIPAL
AMOUNT
($000) | | | VALUE
($000) | |
| | | | | | | | |
Indiana — continued | | | | | | | | |
Indiana Finance Authority, Ascension Health Senior Credit Group Rev., VRDO, 1.53%, 9/10/2018 (b) | | | 53,575 | | | | 53,575 | |
Indiana Finance Authority, Ascention Health SR Credit Group Series E-8, Rev., VRDO, 1.56%, 9/10/2018 (b) | | | 39,525 | | | | 39,525 | |
Indiana Finance Authority, Duke Energy Indiana, Inc. Project Series A-3, Rev., VRDO, LOC: Mizuho Bank Ltd., 1.59%, 9/10/2018 (b) | | | 26,575 | | | | 26,575 | |
Indiana Finance Authority, Educational Facilities Series A, Rev., VRDO, LOC: Northern Trust Co., 1.53%, 9/10/2018 (b) | | | 21,145 | | | | 21,145 | |
Indiana Finance Authority, Parkview Health System, Inc. | | | | | | | | |
Series D, Rev., VRDO, LOC: Wells Fargo Bank NA, 1.56%, 9/10/2018 (b) | | | 24,000 | | | | 24,000 | |
Series C, Rev., VRDO, LOC: Sumitomo Mitsui Banking Corp., 1.57%, 9/10/2018 (b) | | | 65,870 | | | | 65,870 | |
Indiana Finance Authority, Trinity Health Credit Group Series D-1, Rev., VRDO, 1.56%, 9/10/2018 (b) | | | 74,260 | | | | 74,260 | |
Indiana Health and Educational Facility Financing Authority, Community Hospital of Lagrange County, Inc. Project Series A, Rev., VRDO, LOC: PNC Bank NA, 1.56%, 9/10/2018 (b) | | | 17,970 | | | | 17,970 | |
Indiana Health Facility Financing Authority, Ascension Health Series A-2, Rev., VRDO, 1.53%, 9/10/2018 (b) | | | 24,000 | | | | 24,000 | |
Indiana State Finance Authority Hospital, University Health Obligated Group | | | | | | | | |
Series E, Rev., VRDO, LOC: Bank of America NA, 1.55%, 9/10/2018 (b) | | | 17,300 | | | | 17,300 | |
Series 2009C, Rev., VRDO, LOC: Northern Trust Co., 1.56%, 9/10/2018 (b) | | | 20,510 | | | | 20,510 | |
Indiana State Finance Authority, Lease Appropriation, Stadium Project Series A, Rev., VRDO, 1.55%, 9/10/2018 (b) | | | 14,265 | | | | 14,265 | |
| | | | | | | | |
| | | | | | | 408,095 | |
| | | | | | | | |
Iowa — 0.3% | | | | | | | | |
Iowa Finance Authority, Midwestern Disaster Area, Archer-Daniels-Midland Co. Project Rev., VRDO, 1.62%, 9/10/2018 (b) | | | 27,635 | | | | 27,635 | |
Iowa Finance Authority, Midwestern Disaster Area, Chrisbro III, Inc. Project | | | | | | | | |
Series 2011, Rev., VRDO, LOC: U.S. Bank NA, 1.58%, 9/10/2018 (b) | | | 6,610 | | | | 6,610 | |
Rev., VRDO, 1.62%, 9/10/2018 (b) | | | 10,000 | | | | 10,000 | |
SEE NOTES TO FINANCIAL STATEMENTS.
| | | | | | |
| | | |
| 48 | | | | J.P. MORGAN MONEY MARKET FUNDS | | AUGUST 31, 2018 |
| | | | | | | | |
| INVESTMENTS | | PRINCIPAL
AMOUNT
($000) | | | VALUE
($000) | |
Municipal Bonds — continued | | | | | | | | |
Iowa — continued | | | | | | | | |
Iowa Finance Authority, Trinity Health Series D, Rev., VRDO, 1.56%, 9/10/2018 (b) | | | 7,630 | | | | 7,630 | |
| | | | | | | | |
| | | | | | | 51,875 | |
| | | | | | | | |
Kansas — 0.1% | | | | | | | | |
City of Mission, Multi-Family Housing, Silverwood Apartment Project Rev., VRDO, FNMA, LOC: FNMA, 1.59%, 9/10/2018 (b) | | | 11,000 | | | | 11,000 | |
| | | | | | | | |
Kentucky — 1.0% | | | | | | | | |
Boyle County, Centre College Project Series A, Rev., VRDO, LOC: PNC Bank NA, 1.56%, 9/10/2018 (b) | | | 34,035 | | | | 34,035 | |
County of Carroll, Kentucky Environmental Facilities, Utilities Co. Project Rev., VRDO, AMT, LOC: Bank of Tokyo-Mitsubishi UFJ Ltd., 1.64%, 9/10/2018 (b) | | | 70,147 | | | | 70,147 | |
Louisville Regional Airport Authority, Special Facilities, BT-OH, LLC Project Series A, Rev., VRDO, 1.57%, 9/4/2018 (b) | | | 42,600 | | | | 42,600 | |
Louisville Regional Airport Authority, Special Facilities, UPS Worldwide Forwarding Series A, Rev., VRDO, 1.55%, 9/4/2018 (b) | | | 12,300 | | | | 12,300 | |
| | | | | | | | |
| | | | | | | 159,082 | |
| | | | | | | | |
Louisiana — 1.1% | | | | | | | | |
Consolidated Government of the City of Baton Rouge and Parish of East Baton Rouge Rev., VRDO, 1.52%, 9/4/2018 (b) | | | 59,025 | | | | 59,025 | |
Consolidated Government of the City of Baton Rouge and Parish of East Baton Rouge, State Of Louisiana Road And Street Improvement Series A, Rev., VRDO, LOC - DEXIA CREDIT LOCAL , LOC: Citibank NA, 1.55%, 9/10/2018 (b) | | | 22,765 | | | | 22,765 | |
East Baton Rouge Parish Industrial Development Board, Inc., ExxonMobil Project Series A, Rev., VRDO, 1.52%, 9/4/2018 (b) | | | 26,420 | | | | 26,420 | |
Louisiana Public Facilities Authority, Multifamily Housing, River View Rev., VRDO, FHLMC, 1.58%, 9/10/2018 (b) | | | 11,200 | | | | 11,200 | |
Parish of St Charles, Pollution Control, Shell Oil Co., Norco Project Rev., VRDO, 1.56%, 9/4/2018 (b) | | | 50,000 | | | | 50,000 | |
State of Louisiana, Gas and Fuels Tax Series 2016-XG0035, Rev., VRDO, LIQ: Citibank NA, 1.59%, 9/10/2018 (b) (c) | | | 7,240 | | | | 7,240 | |
| | | | | | | | |
| | | | | | | 176,650 | |
| | | | | | | | |
| | | | | | | | |
| INVESTMENTS | | PRINCIPAL
AMOUNT
($000) | | | VALUE
($000) | |
| | | | | | | | |
Maryland — 0.7% | | | | | | | | |
Maryland Community Development Administration, Department of Housing and Community Development, Multi-Family Housing, Barrington Apartments Project Series A, Rev., VRDO, FNMA, LOC: FNMA, 1.63%, 9/10/2018 (b) | | | 5,265 | | | | 5,265 | |
Maryland Community Development Administration, Department of Housing and Community Development, Multi-Family Housing, Walker Mews Apartments Series A, Rev., VRDO, FHLMC, LOC: FHLMC, 1.60%, 9/10/2018 (b) | | | 11,700 | | | | 11,700 | |
Maryland Economic Development Corp., Howard Hughes Medical Institute Series B, Rev., VRDO, 1.57%, 9/10/2018 (b) | | | 23,260 | | | | 23,260 | |
Maryland Health and Higher Educational Facilities Authority, Pooled Loan Program | | | | | | | | |
Series B, Rev., VRDO, LOC: TD Bank NA, 1.54%, 9/10/2018 (b) | | | 6,300 | | | | 6,300 | |
Series D, Rev., VRDO, LOC: Bank of America NA, 1.77%, 9/10/2018 (b) | | | 1,354 | | | | 1,354 | |
Maryland Health and Higher Educational Facilities Authority, University of Maryland Medical System Issue Series D, Rev., VRDO, LOC: TD Bank NA, 1.50%, 9/4/2018 (b) | | | 1,100 | | | | 1,100 | |
Maryland Stadium Authority, Sports Facilities, Football Stadium Issue Series 2007, Rev., VRDO, 1.55%, 9/10/2018 (b) | | | 25,655 | | | | 25,655 | |
Montgomery County Housing Opportunities Commission, Oakfield Apartments Rev., VRDO, AMT, FNMA, LOC: FNMA, 1.60%, 9/10/2018 (b) | | | 2,000 | | | | 2,000 | |
Montgomery County Housing Opportunities Commission, Single Family Mortgage Series B, Rev., VRDO, AMT, LOC: PNC Bank NA, 1.59%, 9/10/2018 (b) | | | 8,450 | | | | 8,450 | |
Tender Option Bond Trust Receipts/CTFS Series 2018-XF2581, Rev., VRDO, LIQ: Morgan Stanley Bank, 1.59%, 9/10/2018 (b) (c) | | | 18,000 | | | | 18,000 | |
| | | | | | | | |
| | | | | | | 103,084 | |
| | | | | | | | |
Massachusetts — 1.7% | | | | | | | | |
Commonwealth of Massachusetts | | | | | | | | |
Series B, GO, VRDO, 1.43%, 9/4/2018 (b) | | | 40,010 | | | | 40,010 | |
Class A, GO, VRDO, FGIC, LIQ: Societe Generale, 1.57%, 9/10/2018 (b) (c) | | | 13,605 | | | | 13,605 | |
Massachusetts Bay Transportation Authority, General Transportation System Series A-1, Rev., VRDO, 1.54%, 9/10/2018 (b) | | | 10,480 | | | | 10,480 | |
SEE NOTES TO FINANCIAL STATEMENTS.
| | | | | | | | |
| | | |
| AUGUST 31, 2018 | | J.P. MORGAN MONEY MARKET FUNDS | | | | | 49 | |
JPMorgan Tax Free Money Market Fund
SCHEDULE OF PORTFOLIO INVESTMENTS
AS OF AUGUST 31, 2018 (Unaudited) (continued)
| | | | | | | | |
| INVESTMENTS | | PRINCIPAL
AMOUNT
($000) | | | VALUE
($000) | |
Municipal Bonds — continued | | | | | | | | |
Massachusetts — continued | | | | | | | | |
Massachusetts Department of Transportation Series A-6, Rev., VRDO, 1.58%, 9/10/2018 (b) | | | 21,265 | | | | 21,265 | |
Massachusetts Development Finance Agency, Boston University Series U-6E, Rev., VRDO, LOC - BANK OF NOVA SCOTIA , LOC: TD Bank NA, 1.45%, 9/10/2018 (b) | | | 48,995 | | | | 48,995 | |
Massachusetts Health and Educational Facilities Authority Series G, Rev., VRDO, LOC: TD Bank NA, 1.50%, 9/4/2018 (b) | | | 19,250 | | | | 19,250 | |
Massachusetts Health and Educational Facilities Authority, Museum of Fine Arts Series A-1, Rev., VRDO, 1.51%, 9/4/2018 (b) | | | 36,850 | | | | 36,850 | |
Massachusetts Health and Educational Facilities Authority, Partners Healthcare System Series F3, Rev., VRDO, LOC: TD Bank NA, 1.53%, 9/10/2018 (b) | | | 14,865 | | | | 14,865 | |
Massachusetts State Development Finance Agency, First Mortgage Brookhaven Series B, Rev., VRDO, LOC: Bank of America NA, 1.63%, 9/10/2018 (b) | | | 1,700 | | | | 1,700 | |
Massachusetts State Health and Educational Facilities Authority, Capital Asset Program | | | | | | | | |
Series M-2, Rev., VRDO, LOC: Bank of America NA, 1.54%, 9/10/2018 (b) | | | 15,400 | | | | 15,400 | |
Series M-4A, Rev., VRDO, LOC: Bank of America NA, 1.61%, 9/10/2018 (b) | | | 1,900 | | | | 1,900 | |
Massachusetts Water Resources Authority Series A-3, Rev., VRDO, 1.57%, 9/10/2018 (b) | | | 22,000 | | | | 22,000 | |
University of Massachusetts Building Authority Series 1, Rev., VRDO, 1.57%, 9/10/2018 (b) | | | 19,070 | | | | 19,070 | |
| | | | | | | | |
| | | | | | | 265,390 | |
| | | | | | | | |
Michigan — 1.3% | | | | | | | | |
Kent Hospital Finance Authority, Spectrum Health System Series C, Rev., VRDO, LOC: Bank of New York Mellon, 1.60%, 9/10/2018 (b) | | | 1,320 | | | | 1,320 | |
Michigan State Housing Development Authority, Rental Housing | | | | | | | | |
Series C, Rev., VRDO, AMT, LIQ: Royal Bank of Canada, 1.61%, 9/10/2018 (b) | | | 33,420 | | | | 33,420 | |
Series D, Rev., VRDO, AMT, 1.62%, 9/10/2018 (b) | | | 48,675 | | | | 48,675 | |
| | | | | | | | |
| INVESTMENTS | | PRINCIPAL
AMOUNT
($000) | | | VALUE
($000) | |
| | | | | | | | |
Michigan — continued | | | | | | | | |
Michigan State Housing Development Authority, Single-Family Mortgage | | | | | | | | |
Series D, Rev., VRDO, 1.60%, 9/10/2018 (b) | | | 12,700 | | | | 12,700 | |
Series B, Rev., VRDO, AMT, 1.63%, 9/10/2018 (b) | | | 53,615 | | | | 53,615 | |
Tender Option Bond Trust Receipts/CTFS | | | | | | | | |
Series 2018-XG0186, Rev., VRDO, LIQ: Bank of America NA, 1.58%, 9/10/2018 (b) (c) | | | 21,540 | | | | 21,540 | |
Series 2016-XF0394, Rev., VRDO, LIQ: Bank of America NA, 1.61%, 9/10/2018 (b) (c) | | | 11,580 | | | | 11,580 | |
University of Michigan Series A, Rev., VRDO, 1.39%, 9/4/2018 (b) | | | 16,105 | | | | 16,105 | |
| | | | | | | | |
| | | | | | | 198,955 | |
| | | | | | | | |
Minnesota — 1.3% | | | | | | | | |
City of Oak Park Heights, Multi-Family Rev., VRDO, FHLMC, LIQ: FHLMC, 1.55%, 9/10/2018 (b) | | | 22,295 | | | | 22,295 | |
City of Rochester, Health Care Facilities, Mayo Clinic Series A, Rev., VRDO, 1.54%, 9/10/2018 (b) | | | 20,250 | | | | 20,250 | |
County of Hennepin Series B, GO, VRDO, 1.51%, 9/10/2018 (b) | | | 17,100 | | | | 17,100 | |
Midwest Consortium of Municipal Utilities, Draw Down Association Financing Project Series B, Rev., VRDO, LOC: U.S. Bank NA, 1.55%, 9/10/2018 (b) | | | 8,010 | | | | 8,010 | |
Minneapolis and St Paul Housing and Redevelopment Authority, Health Care System, Allina Health System | | | | | | | | |
Series C-1, Rev., VRDO, LOC: Wells Fargo Bank NA, 1.57%, 9/10/2018 (b) | | | 43,175 | | | | 43,175 | |
Series C-2, Rev., VRDO, LOC: Wells Fargo Bank NA, 1.57%, 9/10/2018 (b) | | | 37,145 | | | | 37,145 | |
Minnesota Housing Finance Agency, Residential Housing Finance | | | | | | | | |
Series F, Rev., VRDO, GNMA/FNMA/FHLMC, 1.56%, 9/10/2018 (b) | | | 37,800 | | | | 37,800 | |
Series F, Rev., VRDO, AMT, GNMA/FNMA/FHLMC COLL, 1.59%, 9/10/2018 (b) | | | 23,000 | | | | 23,000 | |
| | | | | | | | |
| | | | | | | 208,775 | |
| | | | | | | | |
Mississippi — 3.5% | | | | | | | | |
Chevron USA, Inc. Project, Series B, Rev., VRDO, 1.56%, 9/4/2018 (b) | | | 18,750 | | | | 18,750 | |
County of Jackson, Port Facility, Chevron USA, Inc. Project Rev., VRDO, 1.54%, 9/4/2018 (b) | | | 26,925 | | | | 26,925 | |
SEE NOTES TO FINANCIAL STATEMENTS.
| | | | | | |
| | | |
| 50 | | | | J.P. MORGAN MONEY MARKET FUNDS | | AUGUST 31, 2018 |
| | | | | | | | |
| INVESTMENTS | | PRINCIPAL
AMOUNT
($000) | | | VALUE
($000) | |
Municipal Bonds — continued | | | | | | | | |
Mississippi — continued | | | | | | | | |
Mississippi Business Finance Corp Series I, Rev., VRDO, 1.54%, 9/4/2018 (b) | | | 40,080 | | | | 40,080 | |
Mississippi Business Finance Corp., Gulf Opportunity Zone Industrial Development, Chevron USA, Inc. Project | | | | | | | | |
Series A, Rev., VRDO, 1.54%, 9/4/2018 (b) | | | 70,225 | | | | 70,225 | |
Series A, Rev., VRDO, 1.54%, 9/4/2018 (b) | | | 9,990 | | | | 9,990 | |
Series C, Rev., VRDO, 1.54%, 9/4/2018 (b) | | | 33,470 | | | | 33,470 | |
Series D, Rev., VRDO, CHEVRON CORP (GTD) / CHEVRON U S A INC (OBLI), 1.54%, 9/4/2018 (b) | | | 16,965 | | | | 16,965 | |
Series D, Rev., VRDO, 1.54%, 9/4/2018 (b) | | | 11,800 | | | | 11,800 | |
Series E, Rev., VRDO, 1.54%, 9/4/2018 (b) | | | 1,950 | | | | 1,950 | |
Series G, Rev., VRDO, 1.54%, 9/4/2018 (b) | | | 19,825 | | | | 19,825 | |
Series G, Rev., VRDO, 1.54%, 9/4/2018 (b) | | | 19,260 | | | | 19,260 | |
Series F, Rev., VRDO, 1.56%, 9/4/2018 (b) | | | 37,100 | | | | 37,100 | |
Series K, Rev., VRDO, 1.56%, 9/4/2018 (b) | | | 29,850 | | | | 29,850 | |
Series L, Rev., VRDO, 1.56%, 9/4/2018 (b) | | | 12,950 | | | | 12,950 | |
Series A, Rev., VRDO, 1.55%, 9/10/2018 (b) | | | 103,430 | | | | 103,430 | |
Series C, Rev., VRDO, 1.57%, 9/10/2018 (b) | | | 23,790 | | | | 23,790 | |
Series E, Rev., VRDO, 1.57%, 9/10/2018 (b) | | | 9,100 | | | | 9,100 | |
Mississippi Development Bank Special Obligation, Harrison County Coliseum Series B, Rev., VRDO, LOC: Bank of America NA, 1.63%, 9/10/2018 (b) | | | 38,900 | | | | 38,900 | |
Mississippi Development Bank Special Obligation, Jackson County, Industrial Water System Project Series 2009, Rev., VRDO, 1.54%, 9/4/2018 (b) | | | 15,350 | | | | 15,350 | |
Mississippi Hospital Equipment and Facilities Authority, North Mississippi Health Services Rev., VRDO, 1.56%, 9/10/2018 (b) | | | 8,390 | | | | 8,390 | |
| | | | | | | | |
| | | | | | | 548,100 | |
| | | | | | | | |
| | | | | | | | |
| INVESTMENTS | | PRINCIPAL
AMOUNT
($000) | | | VALUE
($000) | |
| | | | | | | | |
Missouri — 3.0% | | | | | | | | |
City of Kansas Series E, Rev., VRDO, LOC: Sumitomo Mitsui Banking Corp., 1.58%, 9/10/2018 (b) | | | 59,075 | | | | 59,075 | |
Health and Educational Facilities Authority of the State of Missouri | | | | | | | | |
Series A, Rev., VRDO, LIQ: BJC Health System, 1.53%, 9/10/2018 (b) | | | 56,500 | | | | 56,500 | |
Series C, Rev., VRDO, LIQ: BJC Health System, 1.53%, 9/10/2018 (b) | | | 77,075 | | | | 77,075 | |
Series D, Rev., VRDO, 1.53%, 9/10/2018 (b) | | | 64,230 | | | | 64,230 | |
Series E, Rev., VRDO, 1.55%, 9/10/2018 (b) | | | 38,295 | | | | 38,295 | |
Series F, Rev., VRDO, 1.55%, 9/10/2018 (b) | | | 49,750 | | | | 49,750 | |
Health and Educational Facilities Authority of the State of Missouri, Bethesda Health Group Series B, Rev., VRDO, LOC: Bank of America NA, 1.52%, 9/4/2018 (b) | | | 11,995 | | | | 11,995 | |
Health and Educational Facilities Authority of the State of Missouri, SSM Health Series E, Rev., VRDO, 1.52%, 9/10/2018 (b) | | | 9,975 | | | | 9,975 | |
Kansas City IDA, Livers Bronze Co. Project Rev., VRDO, LOC: Bank of America NA, 1.73%, 9/10/2018 (b) | | | 250 | | | | 250 | |
Missouri Development Finance Board, Cultural Facilities, The Nelson Gallery Foundation Series A, Rev., VRDO, 1.55%, 9/4/2018 (b) | | | 27,590 | | | | 27,590 | |
Missouri State Health and Educational Facilities Authority Series B, Rev., VRDO, LIQ: BJC Health System, 1.53%, 9/10/2018 (b) | | | 61,810 | | | | 61,810 | |
Missouri State Health and Educational Facilities Authority, Health Facilities, SSM Health Care Series G, Rev., VRDO, 1.55%, 9/10/2018 (b) | | | 13,100 | | | | 13,100 | |
| | | | | | | | |
| | | | | | | 469,645 | |
| | | | | | | | |
Nebraska — 0.3% | | | | | | | | |
County of Lancaster, Hospital Authority No. 1, BryanLGH Medical Center | | | | | | | | |
Series B-1, Rev., VRDO, LOC: U.S. Bank NA, 1.52%, 9/4/2018 (b) | | | 21,390 | | | | 21,390 | |
Series B-2, Rev., VRDO, LOC: U.S. Bank NA, 1.55%, 9/10/2018 (b) | | | 26,645 | | | | 26,645 | |
| | | | | | | | |
| | | | | | | 48,035 | |
| | | | | | | | |
SEE NOTES TO FINANCIAL STATEMENTS.
| | | | | | | | |
| | | |
| AUGUST 31, 2018 | | J.P. MORGAN MONEY MARKET FUNDS | | | | | 51 | |
JPMorgan Tax Free Money Market Fund
SCHEDULE OF PORTFOLIO INVESTMENTS
AS OF AUGUST 31, 2018 (Unaudited) (continued)
| | | | | | | | |
| INVESTMENTS | | PRINCIPAL
AMOUNT
($000) | | | VALUE
($000) | |
Municipal Bonds — continued | | | | | | | | |
Nevada — 1.0% | | | | | | | | |
City of Reno, Hospital, Renown Regional Medical Center Project Series A, Rev., VRDO, LOC: MUFG Union Bank NA, 1.58%, 9/10/2018 (b) | | | 30,060 | | | | 30,060 | |
Clark County, Nevada Airport System, Sub Lien Series C-3, Rev., VRDO, AMT, LOC: Sumitomo Mitsui Banking Corp., 1.61%, 9/10/2018 (b) | | | 9,175 | | | | 9,175 | |
County of Clark, Airport Series A, GO, VRDO, AMT, 1.61%, 9/10/2018 (b) | | | 40,105 | | | | 40,105 | |
County of Clark, Department of Aviation, Nevada Airport System Series B-2, Rev., VRDO, AMT, LOC: State Street Bank & Trust, 1.60%, 9/10/2018 (b) | | | 32,235 | | | | 32,235 | |
County of Clark, Passenger Facility Charge, Mccarran International Airport Series F-2, Rev., VRDO, LOC: MUFG Union Bank NA, 1.58%, 9/10/2018 (b) | | | 31,015 | | | | 31,015 | |
Nevada Housing Division, Multi-Unit Housing Series A, Rev., VRDO, FNMA, LOC: FNMA, 1.59%, 9/10/2018 (b) | | | 8,050 | | | | 8,050 | |
| | | | | | | | |
| | | | | | | 150,640 | |
| | | | | | | | |
New Hampshire — 0.1% | | | | | | | | |
New Hampshire Health and Education Facilities Authority, Dartmouth College Series B, Rev., VRDO, 1.47%, 9/4/2018 (b) | | | 16,540 | | | | 16,540 | |
| | | | | | | | |
New Jersey — 0.3% | | | | | | | | |
RBC Municipal Products, Inc. Trust, Floater Certificates Series E-102, Rev., VRDO, LIQ: Royal Bank of Canada, 1.59%, 9/10/2018 (b) (c) | | | 40,000 | | | | 40,000 | |
| | | | | | | | |
New Mexico — 0.1% | | | | | | | | |
University of New Mexico, Subordinate Lien System Series B, Rev., VRDO, 1.56%, 9/10/2018 (b) | | | 14,205 | | | | 14,205 | |
| | | | | | | | |
New York — 21.7% | | | | | | | | |
City of New York | | | | | | | | |
Subseries L-5, GO, VRDO, 1.52%, 9/4/2018 (b) | | | 10,250 | | | | 10,250 | |
Series D, Subseries D-3A, GO, VRDO, 1.55%, 9/4/2018 (b) | | | 49,155 | | | | 49,155 | |
Subseries J-6, GO, VRDO, LOC: Landesbank Hessen-Thueringen, 1.56%, 9/4/2018 (b) | | | 55,310 | | | | 55,310 | |
City of New York, Fiscal Year 2006 | | | | | | | | |
Series I, Subseries I-4, GO, VRDO, LOC: TD Bank NA, 1.50%, 9/4/2018 (b) | | | 21,300 | | | | 21,300 | |
| | | | | | | | |
| INVESTMENTS | | PRINCIPAL
AMOUNT
($000) | | | VALUE
($000) | |
| | | | | | | | |
New York — continued | | | | | | | | |
Series I, Subseries I-5, GO, VRDO, LOC: Bank of New York Mellon, 1.55%, 9/4/2018 (b) | | | 31,500 | | | | 31,500 | |
Series F, Subseries F-3, GO, VRDO, LOC: Sumitomo Mitsui Banking Corp., 1.58%, 9/10/2018 (b) | | | 36,400 | | | | 36,400 | |
City of New York, Fiscal Year 2008 Subseries D-3, GO, VRDO, 1.53%, 9/10/2018 (b) | | | 24,700 | | | | 24,700 | |
City of New York, Fiscal Year 2012 | | | | | | | | |
Series G, Subseries G-7, GO, VRDO, LOC: Bank of Tokyo-Mitsubishi UFJ Ltd., 1.51%, 9/4/2018 (b) | | | 32,250 | | | | 32,250 | |
Series G, Subseries G-6, GO, VRDO, LOC: Mizuho Bank Ltd., 1.52%, 9/4/2018 (b) | | | 81,200 | | | | 81,200 | |
City of New York, Fiscal Year 2013 | | | | | | | | |
Series F, Subseries F-3, GO, VRDO, LIQ: Bank of America NA, 1.52%, 9/4/2018 (b) | | | 20,450 | | | | 20,450 | |
Series A, Subseries A-2, GO, VRDO, LOC: Mizuho Bank Ltd., 1.57%, 9/4/2018 (b) | | | 28,100 | | | | 28,100 | |
Series A, Subseries A-3, GO, VRDO, LOC: Mizuho Bank Ltd., 1.57%, 9/4/2018 (b) | | | 3,400 | | | | 3,400 | |
City of New York, Fiscal Year 2014 | | | | | | | | |
Subseries D-4, GO, VRDO, LOC: TD Bank NA, 1.50%, 9/4/2018 (b) | | | 53,725 | | | | 53,725 | |
Series D, Subseries D-5, GO, VRDO, LOC: PNC Bank NA, 1.56%, 9/10/2018 (b) | | | 61,550 | | | | 61,550 | |
City of New York, Fiscal Year 2015 Series F, Subseries F-7, GO, VRDO, LOC: Bank of Tokyo-Mitsubishi UFJ Ltd., 1.55%, 9/10/2018 (b) | | | 14,200 | | | | 14,200 | |
City of New York, Fiscal Year 2016 Series I, Subseries I-6, GO, VRDO, LOC: Bank of New York Mellon, 1.55%, 9/4/2018 (b) | | | 10,225 | | | | 10,225 | |
City of New York, Fiscal Year 2017 Series A, Subseries A-6, GO, VRDO, 1.56%, 9/4/2018 (b) | | | 35,345 | | | | 35,345 | |
City of New York, Housing Development Corp. Series A, Rev., VRDO, FNMA, LIQ: FNMA, 1.62%, 9/10/2018 (b) | | | 19,700 | | | | 19,700 | |
City of New York, Housing Development Corp., State Renaissance Court Rev., VRDO, FHLMC, LIQ: FHLMC, 1.58%, 9/10/2018 (b) | | | 35,200 | | | | 35,200 | |
Metropolitan Transportation Authority | | | | | | | | |
Series A-1, Rev., VRDO, LOC: TD Bank NA, 1.50%, 9/4/2018 (b) | | | 7,000 | | | | 7,000 | |
Subseries E-1, Rev., VRDO, LOC: U.S. Bank NA, 1.55%, 9/4/2018 (b) | | | 1,615 | | | | 1,615 | |
SEE NOTES TO FINANCIAL STATEMENTS.
| | | | | | |
| | | |
| 52 | | | | J.P. MORGAN MONEY MARKET FUNDS | | AUGUST 31, 2018 |
| | | | | | | | |
| INVESTMENTS | | PRINCIPAL
AMOUNT
($000) | | | VALUE
($000) | |
Municipal Bonds — continued | | | | | | | | |
New York — continued | | | | | | | | |
Subseries D-2, Rev., VRDO, LOC: Landesbank Hessen-Thueringen, 1.57%, 9/4/2018 (b) | | | 11,300 | | | | 11,300 | |
Subseries G-2, Rev., VRDO, LOC: TD Bank NA, 1.53%, 9/10/2018 (b) | | | 54,525 | | | | 54,525 | |
Subseries E-1, Rev., VRDO, LOC: PNC Bank NA, 1.56%, 9/10/2018 (b) | | | 47,590 | | | | 47,590 | |
Series D, Subseries D-1, Rev., VRDO, LOC: Landesbank Hessen-Thueringen, 1.59%, 9/10/2018 (b) | | | 75,945 | | | | 75,945 | |
Nassau County Interim Finance Authority, A Public Benefit Corp. of the State of New York, Sales Tax Secured Series B, Rev., VRDO, 1.57%, 9/10/2018 (b) | | | 43,460 | | | | 43,460 | |
Nassau County Interim Finance Authority, Sales Tax Secured Series A, Rev., VRDO, 1.62%, 9/10/2018 (b) | | | 48,750 | | | | 48,750 | |
Nassau Health Care Corp., Nassau County Guaranteed | | | | | | | | |
Subseries B-1, Rev., VRDO, LOC: TD Bank NA, 1.54%, 9/10/2018 (b) | | | 9,345 | | | | 9,345 | |
Subseries B-2, Rev., VRDO, LOC: TD Bank NA, 1.55%, 9/10/2018 (b) | | | 18,750 | | | | 18,750 | |
New York City Health and Hospital Corp., Health System | | | | | | | | |
Series B, Rev., VRDO, LOC: TD Bank NA, 1.54%, 9/10/2018 (b) | | | 8,750 | | | | 8,750 | |
Series C, Rev., VRDO, LOC: TD Bank NA, 1.55%, 9/10/2018 (b) | | | 36,100 | | | | 36,100 | |
New York City Housing Development Corp., Multi-Family Housing, Ogden Ave. Apartments Series A, Rev., VRDO, FNMA, LOC: FNMA, 1.58%, 9/10/2018 (b) | | | 4,760 | | | | 4,760 | |
New York City Housing Development Corp., Multi-Family Mortgage, 245 East 124th Street Series A, Rev., VRDO, FHLMC, LOC: FHLMC, 1.53%, 9/10/2018 (b) | | | 2,800 | | | | 2,800 | |
New York City Housing Development Corp., Multi-Family Mortgage, Highbridge Apartments Series A, Rev., VRDO, FNMA, LOC: FNMA, 1.58%, 9/10/2018 (b) | | | 13,600 | | | | 13,600 | |
New York City Housing Development Corp., Multi-Family Rental Housing, West 89th Street Development Series A, Rev., VRDO, FNMA, LOC: FNMA, 1.57%, 9/10/2018 (b) | | | 10,630 | | | | 10,630 | |
New York City Municipal Water Finance Authority, Water and Sewer System Subseries A-1, Rev., VRDO, 1.55%, 9/4/2018 (b) | | | 10,000 | | | | 10,000 | |
| | | | | | | | |
| INVESTMENTS | | PRINCIPAL
AMOUNT
($000) | | | VALUE
($000) | |
| | | | | | | | |
New York — continued | | | | | | | | |
New York City Municipal Water Finance Authority, Water and Sewer System, Fiscal Year 2008 Subseries B-1A, Rev., VRDO, 1.57%, 9/10/2018 (b) | | | 64,400 | | | | 64,400 | |
New York City Municipal Water Finance Authority, Water and Sewer System, Fiscal Year 2012 Subseries A-2, Rev., VRDO, 1.52%, 9/4/2018 (b) | | | 20,345 | | | | 20,345 | |
New York City Municipal Water Finance Authority, Water and Sewer System, Fiscal Year 2013 Series AA, Subseries AA-1, Rev., VRDO, 1.55%, 9/4/2018 (b) | | | 34,640 | | | | 34,640 | |
New York City Municipal Water Finance Authority, Water and Sewer System, Fiscal Year 2015 Rev., VRDO, 1.53%, 9/4/2018 (b) | | | 42,300 | | | | 42,300 | |
New York City Municipal Water Finance Authority, Water and Sewer System, Second General Resolution Subseries AA-4, Rev., VRDO, 1.53%, 9/4/2018 (b) | | | 39,660 | | | | 39,660 | |
New York City Municipal Water Finance Authority, Water and Sewer System, Second General Resolution, Fiscal Year 2001 Subseries F-1, Rev., VRDO, 1.57%, 9/4/2018 (b) | | | 32,250 | | | | 32,250 | |
New York City Municipal Water Finance Authority, Water and Sewer System, Second General Resolution, Fiscal Year 2011 | | | | | | | | |
Series DD-1, Rev., VRDO, 1.50%, 9/4/2018 (b) | | | 38,825 | | | | 38,825 | |
Series DD-3B, Rev., VRDO, 1.55%, 9/4/2018 (b) | | | 27,050 | | | | 27,050 | |
New York City Municipal Water Finance Authority, Water and Sewer System, Second General Resolution, Fiscal Year 2013 Subseries AA-2, Rev., VRDO, 1.56%, 9/10/2018 (b) | | | 37,700 | | | | 37,700 | |
New York City Municipal Water Finance Authority, Water and Sewer System, Second General Resolution, Fiscal Year 2014 | | | | | | | | |
Series AA, Subseries AA1-AA6, Rev., VRDO, 1.50%, 9/4/2018 (b) | | | 43,145 | | | | 43,145 | |
Series AA, Subseries AA-5, Rev., VRDO, 1.57%, 9/4/2018 (b) | | | 74,815 | | | | 74,815 | |
New York City Municipal Water Finance Authority, Water and Sewer System, Second General Resolution, Fiscal Year 2015 | | | | | | | | |
Subseries BB-4, Rev., VRDO, 1.55%, 9/4/2018 (b) | | | 10,000 | | | | 10,000 | |
SEE NOTES TO FINANCIAL STATEMENTS.
| | | | | | | | |
| | | |
| AUGUST 31, 2018 | | J.P. MORGAN MONEY MARKET FUNDS | | | | | 53 | |
JPMorgan Tax Free Money Market Fund
SCHEDULE OF PORTFOLIO INVESTMENTS
AS OF AUGUST 31, 2018 (Unaudited) (continued)
| | | | | | | | |
| INVESTMENTS | | PRINCIPAL
AMOUNT
($000) | | | VALUE
($000) | |
Municipal Bonds — continued | | | | | | | | |
New York — continued | | | | | | | | |
Series BB-3, Rev., VRDO, 1.56%, 9/10/2018 (b) | | | 42,350 | | | | 42,350 | |
New York City Municipal Water Finance Authority, Water and Sewer System, Second General Resolution, Fiscal Year 2016 Series AA-2, Rev., VRDO, 1.55%, 9/4/2018 (b) | | | 49,480 | | | | 49,480 | |
New York City Municipal Water Finance Authority, Water and Sewer System, Second General Resolution, Fiscal Year 2017 | | | | | | | | |
Series BB, Rev., VRDO, 1.52%, 9/4/2018 (b) | | | 34,625 | | | | 34,625 | |
Series BB-1B, Rev., VRDO, 1.52%, 9/4/2018 (b) | | | 32,460 | | | | 32,460 | |
Subseries BB-3, Rev., VRDO, 1.56%, 9/10/2018 (b) | | | 37,500 | | | | 37,500 | |
New York City Transitional Finance Authority, Future Tax Secured | | | | | | | | |
Subseries A-4, Rev., VRDO, 1.52%, 9/4/2018 (b) | | | 49,910 | | | | 49,910 | |
Subseries E-4, Rev., VRDO, 1.52%, 9/4/2018 (b) | | | 1,350 | | | | 1,350 | |
Rev., VRDO, 1.55%, 9/4/2018 (b) | | | 36,935 | | | | 36,935 | |
Subseries C-6, Rev., VRDO, LOC: Sumitomo Mitsui Banking Corp., 1.58%, 9/10/2018 (b) | | | 30,800 | | | | 30,800 | |
New York City Transitional Finance Authority, Future Tax Secured, Fiscal Year 2001 Series C, Rev., VRDO, 1.56%, 9/10/2018 (b) | | | 50,510 | | | | 50,510 | |
New York City Transitional Finance Authority, Future Tax Secured, Fiscal Year 2003 | | | | | | | | |
Subseries A-4, Rev., VRDO, 1.50%, 9/4/2018 (b) | | | 38,420 | | | | 38,420 | |
Subseries C4, Rev., VRDO, 1.57%, 9/4/2018 (b) | | | 1,100 | | | | 1,100 | |
New York City Transitional Finance Authority, Future Tax Secured, Fiscal Year 2010 Subseries F-5, Rev., VRDO, LOC: Sumitomo Mitsui Banking Corp., 1.53%, 9/10/2018 (b) | | | 41,340 | | | | 41,340 | |
New York City Transitional Finance Authority, Future Tax Secured, Fiscal Year 2013 Subseries C-5, Rev., VRDO, LOC: Sumitomo Mitsui Banking Corp., 1.53%, 9/10/2018 (b) | | | 32,300 | | | | 32,300 | |
| | | | | | | | |
| INVESTMENTS | | PRINCIPAL
AMOUNT
($000) | | | VALUE
($000) | |
| | | | | | | | |
New York — continued | | | | | | | | |
New York City Transitional Finance Authority, Future Tax Secured, Fiscal Year 2014 Subseries D-3, Rev., VRDO, 1.57%, 9/4/2018 (b) | | | 83,190 | | | | 83,190 | |
New York City Transitional Finance Authority, Future Tax Secured, Fiscal Year 2015 Subseries A-3, Rev., VRDO, 1.56%, 9/4/2018 (b) | | | 76,365 | | | | 76,365 | |
New York City Transitional Finance Authority, New York City Recovery | | | | | | | | |
Subseries 2-F, Rev., VRDO, LIQ: Sumitomo Mitsui Banking, 1.53%, 9/10/2018 (b) | | | 11,110 | | | | 11,110 | |
Series 1, Subseries 1A, Rev., VRDO, LIQ: Landesbank Hessen-Thuringen, 1.55%, 9/10/2018 (b) | | | 1,765 | | | | 1,765 | |
Series 3, Subseries 3-G, Rev., VRDO, 1.59%, 9/10/2018 (b) | | | 14,815 | | | | 14,815 | |
New York City Transitional Finance Authority, Recovery Series 1, Subseries 1D, Rev., VRDO, 1.50%, 9/4/2018 (b) | | | 8,195 | | | | 8,195 | |
New York City Trust for Cultural Resources, American Museum of Natural History Series B3, Rev., VRDO, 1.56%, 9/10/2018 (b) | | | 13,485 | | | | 13,485 | |
New York City Water and Sewer System, Water and Sewer System Subseries B, Rev., VRDO, 1.55%, 9/4/2018 (b) | | | 14,390 | | | | 14,390 | |
New York Liberty Development Corp. Series 2015-XF2146, Rev., VRDO, LIQ: Citibank NA, 1.58%, 9/10/2018 (b) (c) | | | 3,160 | | | | 3,160 | |
New York State Dormitory Authority | | | | | | | | |
Series 2016-XF2282, Rev., VRDO, LIQ: Citibank NA, 1.59%, 9/10/2018 (b) (c) | | | 7,400 | | | | 7,400 | |
Series A, Rev., VRDO, FNMA, LOC: FNMA, 1.59%, 9/10/2018 (b) | | | 37,615 | | | | 37,615 | |
New York State Dormitory Authority, City University System, CONS Fifth General Resolution | | | | | | | | |
Series C, Rev., VRDO, LOC: Bank of America NA, 1.53%, 9/10/2018 (b) | | | 97,275 | | | | 97,275 | |
Series D, Rev., VRDO, LOC: TD Bank NA, 1.53%, 9/10/2018 (b) | | | 42,730 | | | | 42,730 | |
New York State Dormitory Authority, Court Facilities Lease Series B, Rev., VRDO, LOC: Mizuho Bank Ltd., 1.63%, 9/10/2018 (b) | | | 69,525 | | | | 69,525 | |
SEE NOTES TO FINANCIAL STATEMENTS.
| | | | | | |
| | | |
| 54 | | | | J.P. MORGAN MONEY MARKET FUNDS | | AUGUST 31, 2018 |
| | | | | | | | |
| INVESTMENTS | | PRINCIPAL
AMOUNT
($000) | | | VALUE
($000) | |
Municipal Bonds — continued | | | | | | | | |
New York — continued | | | | | | | | |
New York State Energy Research and Development Authority, Consolidated Edison Co. of New York, Inc. Project Series C, Subseries C-1, Rev., VRDO, LOC: Mizuho Bank Ltd., 1.65%, 9/10/2018 (b) | | | 12,700 | | | | 12,700 | |
New York State Energy Research and Development Authority, Consolidated Edison Co., Inc. Project | | | | | | | | |
Series A, Subseries A-1, Rev., VRDO, LOC: Mizuho Bank Ltd., 1.57%, 9/10/2018 (b) | | | 18,600 | | | | 18,600 | |
Series A, Subseries A-3, Rev., VRDO, LOC: Mizuho Bank Ltd., 1.58%, 9/10/2018 (b) | | | 14,920 | | | | 14,920 | |
New York State Housing Finance Agency | | | | | | | | |
Series A, Rev., VRDO, LOC: Landesbank Hessen-Thueringen, 1.54%, 9/4/2018 (b) | | | 12,900 | | | | 12,900 | |
Series A, Rev., VRDO, FNMA, LOC: FNMA, 1.62%, 9/10/2018 (b) | | | 46,900 | | | | 46,900 | |
New York State Housing Finance Agency, 10 Barclay Street Series A, Rev., VRDO, FNMA, LOC: FNMA, 1.56%, 9/10/2018 (b) | | | 2,755 | | | | 2,755 | |
New York State Housing Finance Agency, 222 East 44th Street Housing Series A, Rev., VRDO, LOC: Bank of China, 1.62%, 9/10/2018 (b) | | | 23,250 | | | | 23,250 | |
New York State Housing Finance Agency, 240 East 39th Street Housing Series A, Rev., VRDO, AMT, FNMA, LOC: FNMA, 1.62%, 9/10/2018 (b) | | | 14,500 | | | | 14,500 | |
New York State Housing Finance Agency, 25 West 25th Street Housing Series A, Rev., VRDO, FNMA, LOC: FNMA, 1.62%, 9/10/2018 (b) | | | 56,500 | | | | 56,500 | |
New York State Housing Finance Agency, 350 West 43rd Street Housing Series A, Rev., VRDO, LOC: Landesbank Hessen-Thueringen, 1.57%, 9/4/2018 (b) | | | 29,500 | | | | 29,500 | |
New York State Housing Finance Agency, 360 West 43rd Street Series A, Rev., VRDO, FNMA, LOC: FNMA, 1.57%, 9/10/2018 (b) | | | 2,400 | | | | 2,400 | |
New York State Housing Finance Agency, 363 West 30th Street Series A, Rev., VRDO, FHLMC, LIQ: FHLMC, 1.62%, 9/10/2018 (b) | | | 9,000 | | | | 9,000 | |
New York State Housing Finance Agency, 42nd and 10th Housing | | | | | | | | |
Series A, Rev., VRDO, FHLMC, LOC: FHLMC, 1.54%, 9/10/2018 (b) | | | 13,010 | | | | 13,010 | |
| | | | | | | | |
| INVESTMENTS | | PRINCIPAL
AMOUNT
($000) | | | VALUE
($000) | |
| | | | | | | | |
New York — continued | | | | | | | | |
Series A, Rev., VRDO, AMT, FHLMC, LOC: FHLMC, 1.60%, 9/10/2018 (b) | | | 67,530 | | | | 67,530 | |
New York State Housing Finance Agency, 42nd West 10th Street Housing Series A, Rev., VRDO, FHLMC, LOC: FHLMC, 1.54%, 9/10/2018 (b) | | | 16,425 | | | | 16,425 | |
New York State Housing Finance Agency, 505 West 37th Street Housing Series A, Rev., VRDO, LOC: Landesbank Hessen-Thueringen, 1.50%, 9/4/2018 (b) | | | 58,310 | | | | 58,310 | |
New York State Housing Finance Agency, 555 Tenth Avenue Housing Series A, Rev., VRDO, LOC: Landesbank Hessen-Thueringen, 1.64%, 9/10/2018 (b) | | | 58,250 | | | | 58,250 | |
New York State Housing Finance Agency, 606 West 57th Street Housing Series A, Rev., VRDO, LOC: Wells Fargo Bank NA, 1.56%, 9/10/2018 (b) | | | 13,715 | | | | 13,715 | |
New York State Housing Finance Agency, 625 West 57th Street Housing Series A-1, Rev., VRDO, LOC: Bank of New York Mellon, 1.54%, 9/10/2018 (b) | | | 14,050 | | | | 14,050 | |
New York State Housing Finance Agency, Clinton Park Phase II Series A-1, Rev., VRDO, LOC: Wells Fargo Bank NA, 1.62%, 9/10/2018 (b) | | | 3,900 | | | | 3,900 | |
New York State Housing Finance Agency, East 84th Street Housing Series A, Class E, Rev., VRDO, FNMA, LOC: FNMA, 1.62%, 9/10/2018 (b) | | | 28,200 | | | | 28,200 | |
New York State Housing Finance Agency, Madison Avenue Series A, Rev., VRDO, LOC: Landesbank Hessen-Thueringen, 1.54%, 9/4/2018 (b) | | | 58,880 | | | | 58,880 | |
New York State Housing Finance Agency, Manhattan West Residential Housing Series A, Rev., VRDO, LOC: Bank of China, 1.63%, 9/10/2018 (b) | | | 42,750 | | | | 42,750 | |
New York State Housing Finance Agency, North End Series A, Rev., VRDO , FNMA, LOC: FNMA, 1.53%, 9/10/2018 (b) | | | 7,050 | | | | 7,050 | |
New York State Housing Finance Agency, Service Contract Series M-1, Rev., VRDO, LOC: Bank of America NA, 1.55%, 9/10/2018 (b) | | | 10,995 | | | | 10,995 | |
New York State Housing Finance Agency, Theater Row Series A, Rev., VRDO, FHLMC, LOC: FHLMC, 1.57%, 9/10/2018 (b) | | | 11,300 | | | | 11,300 | |
New York State Housing Finance Agency, Tribeca Landing Series A, Rev., VRDO, FNMA, LOC: FNMA, 1.57%, 9/10/2018 (b) | | | 1,800 | | | | 1,800 | |
SEE NOTES TO FINANCIAL STATEMENTS.
| | | | | | | | |
| | | |
| AUGUST 31, 2018 | | J.P. MORGAN MONEY MARKET FUNDS | | | | | 55 | |
JPMorgan Tax Free Money Market Fund
SCHEDULE OF PORTFOLIO INVESTMENTS
AS OF AUGUST 31, 2018 (Unaudited) (continued)
| | | | | | | | |
| INVESTMENTS | | PRINCIPAL
AMOUNT
($000) | | | VALUE
($000) | |
Municipal Bonds — continued | | | | | | | | |
New York — continued | | | | | | | | |
New York State Housing Finance Agency, Union Square South Housing Rev., VRDO, FNMA, LOC: FNMA, 1.62%, 9/10/2018 (b) | | | 41,950 | | | | 41,950 | |
New York State Housing Finance Agency, West 23rd Street Series A, Rev., VRDO, FNMA, LOC: FNMA, 1.57%, 9/10/2018 (b) | | | 2,100 | | | | 2,100 | |
New York State Housing Finance Agency, West End Rev., VRDO, FNMA, LOC: FNMA, 1.65%, 9/10/2018 (b) | | | 13,200 | | | | 13,200 | |
New York State Housing Finance Agency, Weyant Green Apartments Series A, Rev., VRDO, FNMA, LOC: FNMA, 1.57%, 9/10/2018 (b) | | | 100 | | | | 100 | |
New York State Housing Finance Agency, Worth Street Series A, Rev., VRDO, FNMA, LOC: FNMA, 1.57%, 9/10/2018 (b) | | | 3,400 | | | | 3,400 | |
RBC Municipal Products, Inc. Trust, Floater Certificates | | | | | | | | |
Series E-120, Rev., VRDO, LOC: Royal Bank of Canada, 1.53%, 9/4/2018 (b) (c) | | | 10,000 | | | | 10,000 | |
Series E-121, Rev., VRDO, LOC: Royal Bank of Canada, 1.53%, 9/4/2018 (b) (c) | | | 35,000 | | | | 35,000 | |
Series E-99, Rev., VRDO, LIQ: Royal Bank of Canada, 1.59%, 9/10/2018 (b) (c) | | | 20,000 | | | | 20,000 | |
Tender Option Bond Trust Receipts/CTFS | | | | | | | | |
Series E-118, GO, LOC: Royal Bank of Canada, 1.53%, 9/4/2018 (b) | | | 50,000 | | | | 50,000 | |
Series 2016-XG0018, Rev., VRDO, LIQ: Bank of America NA, 1.59%, 9/10/2018 (b) (c) | | | 11,250 | | | | 11,250 | |
Series 2018-XF0685, Rev., VRDO, LIQ: TD Bank NA, 1.59%, 9/10/2018 (b) (c) | | | 20,000 | | | | 20,000 | |
Series 2018-XF2550, Rev., VRDO, LIQ: Citibank NA, 1.59%, 9/10/2018 (b) (c) | | | 18,375 | | | | 18,375 | |
Triborough Bridge and Tunnel Authority, MTA Bridges and Tunnels | | | | | | | | |
Subseries B-3, Rev., VRDO, LOC: State Street Bank & Trust, 1.52%, 9/4/2018 (b) | | | 55,000 | | | | 55,000 | |
Series A, Rev., VRDO, LOC: TD Bank NA, 1.54%, 9/10/2018 (b) | | | 26,450 | | | | 26,450 | |
| | | | | | | | |
| | | | | | | 3,411,025 | |
| | | | | | | | |
North Carolina — 2.6% | | | | | | | | |
Buncombe County Metropolitan Sewerage District Series A, Rev., VRDO, 1.55%, 9/10/2018 (b) | | | 23,960 | | | | 23,960 | |
City of Charlotte, 2003 Governmental Facilities Projects Series G, COP, VRDO, LIQ: Wells Fargo Bank NA, 1.56%, 9/10/2018 (b) | | | 46,860 | | | | 46,860 | |
| | | | | | | | |
| INVESTMENTS | | PRINCIPAL
AMOUNT
($000) | | | VALUE
($000) | |
| | | | | | | | |
North Carolina — continued | | | | | | | | |
City of Charlotte, Governmental Facilities Series F, COP, VRDO, 1.61%, 9/10/2018 (b) | | | 7,675 | | | | 7,675 | |
City of Greensboro, Combined Enterprise System Series A, Rev., VRDO, 1.53%, 9/10/2018 (b) | | | 19,580 | | | | 19,580 | |
City of Raleigh, Combined Enterprise System Series B, Rev., VRDO, 1.60%, 9/10/2018 (b) | | | 28,300 | | | | 28,300 | |
City of Raleigh, Downtown Improvement Projects | | | | | | | | |
Series A, COP, VRDO, 1.58%, 9/10/2018 (b) | | | 40,900 | | | | 40,900 | |
Series B-1, COP, VRDO, 1.58%, 9/10/2018 (b) | | | 46,570 | | | | 46,570 | |
City of Raleigh, Enterprise System Series A, Rev., VRDO, 1.60%, 9/10/2018 (b) | | | 7,835 | | | | 7,835 | |
Durham County Industrial Facilities and Pollution Control Financing Authority, Research Triangle Institute Series 2007, Rev., VRDO, LOC: Wells Fargo Bank NA, 1.45%, 9/10/2018 (b) | | | 17,260 | | | | 17,260 | |
Forsyth County Series A, GO, VRDO, 1.53%, 9/10/2018 (b) | | | 5,635 | | | | 5,635 | |
North Carolina Capital Facilities Finance Agency, NCCU Real Estate Series A, Rev., VRDO, LOC: Wells Fargo Bank NA, 1.57%, 9/10/2018 (b) | | | 14,600 | | | | 14,600 | |
North Carolina Medical Care Commission, Health Care Facilities, WakeMed Series C, Rev., VRDO, LOC: Wells Fargo Bank NA, 1.54%, 9/10/2018 (b) | | | 12,385 | | | | 12,385 | |
North Carolina Medical Care Commission, Moses Cone Health System | | | | | | | | |
Series B, Rev., VRDO, 1.54%, 9/4/2018 (b) | | | 31,410 | | | | 31,410 | |
Series A, Rev., VRDO, 1.54%, 9/10/2018 (b) | | | 33,755 | | | | 33,755 | |
Person County Industrial Facilities and Pollution Control Financing Authority, Recovery Zone Facility, CertainTeed Gypsum NC, Inc. Series 2010, Rev., VRDO, LOC: Credit Industriel et Commercial, 1.62%, 9/10/2018 (b) | | | 14,800 | | | | 14,800 | |
University of North Carolina, University Hospital at Chapel Hill | | | | | | | | |
Series A, Rev., VRDO, 1.54%, 9/4/2018 (b) | | | 12,390 | | | | 12,390 | |
Series B, Rev., VRDO, 1.54%, 9/4/2018 (b) | | | 31,975 | | | | 31,975 | |
SEE NOTES TO FINANCIAL STATEMENTS.
| | | | | | |
| | | |
| 56 | | | | J.P. MORGAN MONEY MARKET FUNDS | | AUGUST 31, 2018 |
| | | | | | | | |
| INVESTMENTS | | PRINCIPAL
AMOUNT
($000) | | | VALUE
($000) | |
Municipal Bonds — continued | | | | | | | | |
North Carolina — continued | | | | | | | | |
Series A, Rev., VRDO, 1.53%, 9/10/2018 (b) | | | 10,870 | | | | 10,870 | |
| | | | | | | | |
| | | | | | | 406,760 | |
| | | | | | | | |
Ohio — 1.7% | | | | | | | | |
City of Blue Ash, Economic Development, Ursuline Academy of Cincinnati Project Series 2008, Rev., VRDO, LOC: PNC Bank NA, 1.56%, 9/10/2018 (b) | | | 300 | | | | 300 | |
City of Cleveland, Airport System Series D, Rev., VRDO, LOC: U.S. Bank NA, 1.55%, 9/10/2018 (b) | | | 5,175 | | | | 5,175 | |
Columbus Regional Airport Authority, Airport Facility, Flightsafety International Inc. Rev., VRDO, AMT, 1.61%, 9/10/2018 (b) | | | 22,170 | | | | 22,170 | |
County of Cleveland-Cuyahoga, Port Authority Cultural Facility, Museum of Art Project Series B, Rev., VRDO, 1.56%, 9/10/2018 (b) | | | 20,000 | | | | 20,000 | |
County of Cuyahoga, Ohio, Hospital Facilities, Sisters of Charity Health System Series 2000, Rev., VRDO, LOC: PNC Bank NA, 1.56%, 9/10/2018 (b) | | | 22,305 | | | | 22,305 | |
County of Franklin, Ohio Hospital Facilities Rev., VRDO, 1.55%, 9/10/2018 (b) | | | 20,000 | | | | 20,000 | |
County of Hamilton, Hospital Facilities Series B, Rev., VRDO, LOC: PNC Bank NA, 1.56%, 9/10/2018 (b) | | | 10,500 | | | | 10,500 | |
County of Hamilton, Hospital Facilities, Elizabeth Gamble Deaconess Home Association Series A, Rev., VRDO, LOC: Northern Trust Co., 1.57%, 9/10/2018 (b) | | | 14,550 | | | | 14,550 | |
Ohio Higher Educational Facility Commission, Hospital, Cleveland Clinic Health System | | | | | | | | |
Series B-4, Rev., VRDO, 1.52%, 9/4/2018 (b) | | | 41,535 | | | | 41,535 | |
Rev., VRDO, LIQ: Bank of New York Mellon, 1.55%, 9/4/2018 (b) | | | 6,550 | | | | 6,550 | |
Ohio State Water Development Authority, Water Pollution Control Loan Fund Series 2016 A, Rev., VRDO, LIQ: BMO Harris Bank NA, 1.61%, 9/10/2018 (b) | | | 38,000 | | | | 38,000 | |
RBC Municipal Products, Inc. Trust, Floater Certificates | | | | | | | | |
Series E-104, Rev., VRDO, LIQ: Royal Bank of Canada, 1.59%, 9/10/2018 (b) (c) | | | 28,745 | | | | 28,745 | |
Series E-119, Rev., VRDO, LOC: Royal Bank of Canada, 1.59%, 9/10/2018 (b) (c) | | | 15,000 | | | | 15,000 | |
| | | | | | | | |
| INVESTMENTS | | PRINCIPAL
AMOUNT
($000) | | | VALUE
($000) | |
| | | | | | | | |
Ohio — continued | | | | | | | | |
State of Ohio, Infrastructure Improvement Series A, GO, VRDO, 1.58%, 9/10/2018 (b) | | | 15,375 | | | | 15,375 | |
| | | | | | | | |
| | | | | | | 260,205 | |
| | | | | | | | |
Oregon — 0.2% | | | | | | | | |
Clackamas County Hospital Facility Authority, Legacy Health System Series B, Rev., VRDO, LOC: U.S. Bank NA, 1.56%, 9/10/2018 (b) | | | 15,450 | | | | 15,450 | |
Oregon Health and Science University Series B-3, Rev., VRDO, LOC: U.S. Bank NA, 1.55%, 9/4/2018 (b) | | | 7,500 | | | | 7,500 | |
State of Oregon, Facilities Authority, PeaceHealth Series B, Rev., VRDO, LOC: U.S. Bank NA, 1.57%, 9/10/2018 (b) | | | 3,635 | | | | 3,635 | |
| | | | | | | | |
| | | | | | | 26,585 | |
| | | | | | | | |
Other — 1.0% | | | | | | | | |
FHLMC, Multi-Family Housing | | | | | | | | |
Series M015, Class A, Rev., VRDO, FHLMC, LIQ: FHLMC, 1.61%, 9/10/2018 (b) | | | 5,820 | | | | 5,820 | |
Series M019, Class A, Rev., VRDO, FHLMC, LIQ: FHLMC, 1.61%, 9/10/2018 (b) | | | 33,915 | | | | 33,915 | |
Series M020, Class A, Rev., VRDO, FHLMC, LIQ: FHLMC, 1.61%, 9/10/2018 (b) | | | 17,812 | | | | 17,812 | |
Series M021, Class A, Rev., VRDO, FHLMC, LIQ: FHLMC, 1.61%, 9/10/2018 (b) | | | 46,810 | | | | 46,810 | |
Series M024, Class A, Rev., VRDO, FHLMC, LIQ: FHLMC, 1.61%, 9/10/2018 (b) | | | 16,395 | | | | 16,395 | |
Series M025, Class A, Rev., VRDO, FHLMC, LIQ: FHLMC, 1.63%, 9/10/2018 (b) | | | 20,240 | | | | 20,240 | |
Series M026, Class A, Rev., VRDO, FHLMC, LIQ: FHLMC, 1.63%, 9/10/2018 (b) | | | 11,205 | | | | 11,205 | |
SunAmerica Taxable Trust | | | | | | | | |
Series 2, Class A, Rev., VRDO, FHLMC, LOC: FHLMC, 1.62%, 9/10/2018 (b) | | | 2,360 | | | | 2,360 | |
| | | | | | | | |
| | | | | | | 154,557 | |
| | | | | | | | |
Pennsylvania — 3.5% | | | | | | | | |
Bucks County IDA, Grand View Hospital | | | | | | | | |
Series A, Rev., VRDO, LOC: TD Bank NA, 1.53%, 9/10/2018 (b) | | | 400 | | | | 400 | |
Series B, Rev., VRDO, LOC: PNC Bank NA, 1.56%, 9/10/2018 (b) | | | 20,300 | | | | 20,300 | |
Butler County General Authority Series SGC-58, Class A, Rev., VRDO, LIQ: Societe Generale, 1.57%, 9/10/2018 (b) (c) | | | 19,090 | | | | 19,090 | |
SEE NOTES TO FINANCIAL STATEMENTS.
| | | | | | | | |
| | | |
| AUGUST 31, 2018 | | J.P. MORGAN MONEY MARKET FUNDS | | | | | 57 | |
JPMorgan Tax Free Money Market Fund
SCHEDULE OF PORTFOLIO INVESTMENTS
AS OF AUGUST 31, 2018 (Unaudited) (continued)
| | | | | | | | |
| INVESTMENTS | | PRINCIPAL
AMOUNT
($000) | | | VALUE
($000) | |
Municipal Bonds — continued | | | | | | | | |
Pennsylvania — continued | | | | | | | | |
Butler County General Authority, North Allegheny School District Project Series B, Rev., VRDO, 1.57%, 9/10/2018 (b) | | | 8,570 | | | | 8,570 | |
City of Philadelphia, Gas Works, 1998 General Ordinance, Eight | | | | | | | | |
Series D, Rev., VRDO, LOC: Royal Bank of Canada, 1.56%, 9/10/2018 (b) | | | 12,900 | | | | 12,900 | |
Series E, Rev., VRDO, LOC: PNC Bank NA, 1.56%, 9/10/2018 (b) | | | 24,770 | | | | 24,770 | |
Series B, Rev., VRDO, LOC: Wells Fargo Bank NA, 1.57%, 9/10/2018 (b) | | | 18,115 | | | | 18,115 | |
County of Allegheny | | | | | | | | |
Series C, GO, VRDO, LOC: PNC Bank NA, 1.56%, 9/10/2018 (b) | | | 33,775 | | | | 33,775 | |
Series C-51, GO, VRDO, LOC: PNC Bank NA, 1.56%, 9/10/2018 (b) | | | 12,000 | | | | 12,000 | |
Delaware Valley Regional Finance Authority, Local Government Class A, Rev., VRDO, LIQ: Societe Generale, 1.57%, 9/10/2018 (b) (c) | | | 16,295 | | | | 16,295 | |
Fayette County Hospital Authority, Regional Health System Series A, Rev., VRDO, LOC: PNC Bank NA, 1.56%, 9/10/2018 (b) | | | 25,895 | | | | 25,895 | |
Lackawanna County Multi-Purpose Stadium Authority, Hotel Room Rental Tax Rev., VRDO, LOC: PNC Bank NA, 1.57%, 9/10/2018 (b) | | | 15,540 | | | | 15,540 | |
Montgomery County Redevelopment Authority, Multi-Family Housing, Brookside Manors Apartments Project | | | | | | | | |
Series A, Rev., VRDO, FNMA, LOC: FNMA, 1.56%, 9/10/2018 (b) | | | 18,910 | | | | 18,910 | |
Series A-T2, Rev., VRDO, FNMA, LOC: FNMA, 1.56%, 9/10/2018 (b) | | | 1,890 | | | | 1,890 | |
Montgomery County Redevelopment Authority, Multi-Family Housing, Kingswood Apartments Project Series A, Rev., VRDO, FNMA, LOC: FNMA, 1.62%, 9/10/2018 (b) | | | 17,080 | | | | 17,080 | |
Pennsylvania Higher Educational Facilities Authority, Drexel University Series B, Rev., VRDO, LOC: TD Bank NA, 1.54%, 9/4/2018 (b) | | | 9,800 | | | | 9,800 | |
Pennsylvania Higher Educational Facilities Authority, Susquehanna University Rev., VRDO, LOC: PNC Bank NA, 1.57%, 9/10/2018 (b) | | | 2,400 | | | | 2,400 | |
Pennsylvania Housing Finance Agency, Single Family Mortgage Series 2007-99C, Rev., VRDO, AMT, 1.59%, 9/10/2018 (b) | | | 4,475 | | | | 4,475 | |
| | | | | | | | |
| INVESTMENTS | | PRINCIPAL
AMOUNT
($000) | | | VALUE
($000) | |
| | | | | | | | |
Pennsylvania — continued | | | | | | | | |
Philadelphia Authority, Industrial Development Multi-Modal Lease Series B-3, Rev., VRDO, LOC: PNC Bank NA, 1.56%, 9/10/2018 (b) | | | 17,405 | | | | 17,405 | |
RBC Municipal Products, Inc. Trust, Floater Certificates | | | | | | | | |
Series E-110, Rev., VRDO, LIQ: Royal Bank of Canada, 1.53%, 9/4/2018 (b) (c) | | | 40,000 | | | | 40,000 | |
Series E-111, Rev., VRDO, LOC: Royal Bank of Canada, 1.53%, 9/4/2018 (b) (c) | | | 160,095 | | | | 160,095 | |
Series E-101, Rev., VRDO, LIQ: Royal Bank of Canada, 1.59%, 9/10/2018 (b) (c) | | | 72,250 | | | | 72,250 | |
| | | | | | | | |
| | | | | | | 551,955 | |
| | | | | | | | |
Rhode Island — 0.4% | | | | | | | | |
Rhode Island Health & Educational Building Corp., Educational Institution, International Institute of Rhode Island Rev., VRDO, LOC: Bank of America NA, 1.62%, 9/10/2018 (b) | | | 1,475 | | | | 1,475 | |
Rhode Island Health & Educational Building Corp., Higher Education Facilities, Roger Williams University Issue Series 2008 B, Rev., VRDO, LOC: U.S. Bank NA, 1.55%, 9/10/2018 (b) | | | 32,190 | | | | 32,190 | |
Rhode Island Health & Educational Building Corp., Higher Education Facility, Rhode Island School of Design Issue Series 2008 B, Rev., VRDO, LOC: TD Bank NA, 1.54%, 9/10/2018 (b) | | | 7,045 | | | | 7,045 | |
Rhode Island Housing & Mortgage Finance Corp., Multi-Family Housing, Sutterfield Project Rev., VRDO, AMT, FHLMC, LOC: FHLMC, 1.63%, 9/10/2018 (b) | | | 7,000 | | | | 7,000 | |
Rhode Island Industrial Facilities Corp., Marine Terminal, ExxonMobil Project Rev., VRDO, 1.55%, 9/4/2018 (b) | | | 450 | | | | 450 | |
Tender Option Bond Trust Receipts/CTFS Series 2018-XF2559, Rev., VRDO, LIQ: Citibank NA, 1.59%, 9/10/2018 (b) (c) | | | 9,000 | | | | 9,000 | |
| | | | | | | | |
| | | | | | | 57,160 | |
| | | | | | | | |
South Carolina — 0.1% | | | | | | | | |
City of Columbia, Waterworks and Sewer System Series 2009, Rev., VRDO, LOC: Sumitomo Mitsui Banking Corp., 1.56%, 9/10/2018 (b) | | | 10,000 | | | | 10,000 | |
City of North Charleston, Public Facilities Convention, Convention Center Project COP, VRDO, LOC: Bank of America NA, 1.59%, 9/10/2018 (b) | | | 1,800 | | | | 1,800 | |
| | | | | | | | |
| | | | | | | 11,800 | |
| | | | | | | | |
SEE NOTES TO FINANCIAL STATEMENTS.
| | | | | | |
| | | |
| 58 | | | | J.P. MORGAN MONEY MARKET FUNDS | | AUGUST 31, 2018 |
| | | | | | | | |
| INVESTMENTS | | PRINCIPAL
AMOUNT
($000) | | | VALUE
($000) | |
Municipal Bonds — continued | | | | | | | | |
Tennessee — 1.0% | | | | | | | | |
Clarksville Public Building Authority, Pooled Financing, Tennessee Municipal Bond Fund Rev., VRDO, LOC: Bank of America NA, 1.55%, 9/4/2018 (b) | | | 33,615 | | | | 33,615 | |
Greeneville Health and Educational Facilities Board, Ballad Health Series B, Rev., VRDO, LOC: U.S. Bank NA, 1.55%, 9/10/2018 (b) | | | 100,000 | | | | 100,000 | |
Metropolitan Government of Nashville and Davidson County Industrial Development Board, Multifamily Housing, Arbor Knoll Series A, Rev., VRDO, FNMA, LOC: FNMA, 1.56%, 9/10/2018 (b) | | | 13,400 | | | | 13,400 | |
Tender Option Bond Trust Receipts/CTFS Series 2018-ZF0650, Rev., VRDO, LIQ: Royal Bank of Canada, 1.59%, 9/10/2018 (b) (c) | | | 7,500 | | | | 7,500 | |
| | | | | | | | |
| | | | | | | 154,515 | |
| | | | | | | | |
Texas — 6.6% | | | | | | | | |
Bexar County Housing Finance Authority, Multi-Family Housing, Altamonte Apartment Projects Rev., VRDO, FNMA, LOC: FNMA, 1.60%, 9/10/2018 (b) | | | 8,400 | | | | 8,400 | |
City of Austin, Airport System Subseries 2005-4, Rev., VRDO, AMT, AGM, LOC: Sumitomo Mitsui Banking Corp., 1.58%, 9/10/2018 (b) | | | 24,325 | | | | 24,325 | |
City of Austin, Texas Hotel Occupancy Tax Series A, Rev., VRDO, LOC: Citibank NA, 1.56%, 9/10/2018 (b) | | | 18,715 | | | | 18,715 | |
City of Austin, Water and Wastewater System Rev., VRDO, LOC: Citibank NA, 1.57%, 9/10/2018 (b) | | | 36,015 | | | | 36,015 | |
City of Houston, Combined Utility System, First Lien | | | | | | | | |
Series 2004B-3, Rev., VRDO, LOC: Sumitomo Mitsui Banking Corp., 1.57%, 9/10/2018 (b) | | | 10,600 | | | | 10,600 | |
Series B-2, Rev., VRDO, LOC: Citibank NA, 1.57%, 9/10/2018 (b) | | | 21,000 | | | | 21,000 | |
Series B-4, Rev., VRDO, LOC: Bank of Tokyo-Mitsubishi UFJ Ltd., 1.57%, 9/10/2018 (b) | | | 41,700 | | | | 41,700 | |
County of Harris, Cultural Education Facilities Finance Corp., Hospital, Memorial Hermann Health System Rev., VRDO, 1.57%, 9/10/2018 (b) | | | 25,000 | | | | 25,000 | |
County of Harris, Industrial Development Corp., Pollution Control Rev., VRDO, 1.52%, 9/4/2018 (b) | | | 17,700 | | | | 17,700 | |
| | | | | | | | |
| INVESTMENTS | | PRINCIPAL
AMOUNT
($000) | | | VALUE
($000) | |
| | | | | | | | |
Texas — continued | | | | | | | | |
County of Harris, Industrial Development Corp., Pollution Control, Exxon Corp. Rev., VRDO, 1.52%, 9/4/2018 (b) | | | 21,200 | | | | 21,200 | |
County of Jefferson, Port of Port Arthur Navigation District, Fina Oil and Chemical Co. Project Rev., VRDO, 1.65%, 9/10/2018 (b) | | | 10,600 | | | | 10,600 | |
Gulf Coast Waste Disposal Authority, Environmental Facilities, American Acryl LP Project Series 2003, Rev., VRDO, AMT, LOC: Bank of Tokyo-Mitsubishi UFJ Ltd., 1.61%, 9/10/2018 (b) | | | 12,000 | | | | 12,000 | |
Gulf Coast Waste Disposal Authority, Environmental Facilities, ExxonMobil Project | | | | | | | | |
Rev., VRDO, 1.57%, 9/4/2018 (b) | | | 1,780 | | | | 1,780 | |
Series B, Rev., VRDO, 1.57%, 9/4/2018 (b) | | | 9,350 | | | | 9,350 | |
Gulf Coast Waste Disposal Authority, Environmental Facilities, Exxonmobile Project Series A, Rev., VRDO, 1.57%, 9/4/2018 (b) | | | 20,075 | | | | 20,075 | |
Gulf Coast Waste Disposal Authority, Exxon Corp. Rev., VRDO, 1.52%, 9/4/2018 (b) | | | 32,900 | | | | 32,900 | |
Harris County Cultural Education Facilities Finance Corp., Memorial Hermann Health System | | | | | | | | |
Rev., VRDO, 1.57%, 9/10/2018 (b) | | | 22,615 | | | | 22,615 | |
Series D, Rev., VRDO, 1.57%, 9/10/2018 (b) | | | 18,500 | | | | 18,500 | |
Harris County Industrial Development Corp., Pollution Control, Exxon Corp. Series 1987, Rev., VRDO, 1.57%, 9/4/2018 (b) | | | 15,300 | | | | 15,300 | |
Lower Neches Valley Authority Industrial Development Corp, Exxonmobil Project Series B, Rev., VRDO, 1.58%, 9/4/2018 (b) | | | 49,830 | | | | 49,830 | |
Lower Neches Valley Authority Industrial Development Corp. Subseries B-2, Rev., VRDO, 1.57%, 9/4/2018 (b) | | | 16,480 | | | | 16,480 | |
Lower Neches Valley Authority Industrial Development Corp., ExxonMobil Project | | | | | | | | |
Series 2010, Rev., VRDO, 1.54%, 9/4/2018 (b) | | | 10,000 | | | | 10,000 | |
Series 2011, Rev., VRDO, 1.54%, 9/4/2018 (b) | | | 13,325 | | | | 13,325 | |
Series A, Rev., VRDO, 1.55%, 9/4/2018 (b) | | | 30,400 | | | | 30,400 | |
Series A-2, Rev., VRDO, 1.55%, 9/4/2018 (b) | | | 1,300 | | | | 1,300 | |
SEE NOTES TO FINANCIAL STATEMENTS.
| | | | | | | | |
| | | |
| AUGUST 31, 2018 | | J.P. MORGAN MONEY MARKET FUNDS | | | | | 59 | |
JPMorgan Tax Free Money Market Fund
SCHEDULE OF PORTFOLIO INVESTMENTS
AS OF AUGUST 31, 2018 (Unaudited) (continued)
| | | | | | | | |
| INVESTMENTS | | PRINCIPAL
AMOUNT
($000) | | | VALUE
($000) | |
Municipal Bonds — continued | | | | | | | | |
Texas — continued | | | | | | | | |
Subseries A-3, Rev., VRDO, 1.55%, 9/4/2018 (b) | | | 100 | | | | 100 | |
North Texas Tollway Authority | | | | | | | | |
Series D, Rev., VRDO, LOC: Royal Bank of Canada, 1.58%, 9/10/2018 (b) | | | 18,600 | | | | 18,600 | |
Series 2016-XG0036, Rev., VRDO, LIQ: Citibank NA, 1.59%, 9/10/2018 (b) (c) | | | 6,750 | | | | 6,750 | |
State of Texas | | | | | | | | |
GO, VRDO, LIQ: FHLB, 1.55%, 9/10/2018 (b) | | | 70,000 | | | | 70,000 | |
Series 2016, GO, VRDO, 1.60%, 9/10/2018 (b) | | | 45,450 | | | | 45,450 | |
State of Texas, Veterans Bonds GO, VRDO, LIQ: State Street Bank & Trust, 1.54%, 9/10/2018 (b) | | | 13,905 | | | | 13,905 | |
State of Texas, Veterans Housing Assistance Program GO, VRDO, LIQ: State Street Bank & Trust, 1.54%, 9/10/2018 (b) | | | 11,360 | | | | 11,360 | |
Tarrant County Cultural Education Facilities Finance Corp. | | | | | | | | |
Series B, Rev., VRDO, LOC: TD Bank NA, 1.50%, 9/4/2018 (b) | | | 36,415 | | | | 36,415 | |
Rev., VRDO, 1.55%, 9/10/2018 (b) | | | 55,735 | | | | 55,735 | |
Rev., VRDO, 1.58%, 9/10/2018 (b) | | | 17,000 | | | | 17,000 | |
Rev., VRDO, LOC: Bank of New York Mellon, 1.60%, 9/10/2018 (b) | | | 20,200 | | | | 20,200 | |
Tarrant County Cultural Education Facilities Finance Corp., Methodist Hospitals of Dallas Project Series A, Rev., VRDO, LOC: TD Bank NA, 1.50%, 9/4/2018 (b) | | | 28,190 | | | | 28,190 | |
Tarrant County Cultural Education Facilities Finance Corp., Texas Health Resources System | | | | | | | | |
Rev., VRDO, 1.58%, 9/10/2018 (b) | | | 35,900 | | | | 35,900 | |
Series 2012-B, Rev., VRDO, 1.58%, 9/10/2018 (b) | | | 34,000 | | | | 34,000 | |
Series A, Rev., VRDO, 1.58%, 9/10/2018 (b) | | | 46,860 | | | | 46,860 | |
Tender Option Bond Trust Receipts/CTFS | | | | | | | | |
Series 2018-XF2669, Rev., VRDO, LIQ: Citibank NA, 1.59%, 9/10/2018 (b) (c) | | | 17,820 | | | | 17,820 | |
Series 2015-XM0071, Rev., VRDO, AGM, LIQ: Bank of America NA, 1.61%, 9/10/2018 (b) (c) | | | 1,360 | | | | 1,360 | |
Texas Department of Housing and Community Affairs, Multi-Family Housing, Terraces at Cibolo Rev., VRDO, LOC: Citibank NA, 1.61%, 9/10/2018 (b) | | | 4,700 | | | | 4,700 | |
| | | | | | | | |
| INVESTMENTS | | PRINCIPAL
AMOUNT
($000) | | | VALUE
($000) | |
| | | | | | | | |
Texas — continued | | | | | | | | |
Texas Department of Housing and Community Affairs, Multi-Family Housing, Timber Point Apartments Project Series A-1, Rev., VRDO, FHLMC, LOC: FHLMC, 1.63%, 9/10/2018 (b) | | | 740 | | | | 740 | |
Texas Transportation Commission, State Highway Fund, First Tier Series B1, Rev., VRDO, LIQ: Sumitomo Mitsui Banking Corp., 1.56%, 9/10/2018 (b) | | | 30,000 | | | | 30,000 | |
University of Texas Series B4, Rev., VRDO, LIQ: University of Texas Investment Management Co., 1.47%, 9/10/2018 (b) | | | 23,050 | | | | 23,050 | |
University of Texas, Permanent University System Series A, Rev., VRDO, LIQ: University of Texas Investment Management Co., 1.59%, 9/10/2018 (b) | | | 37,655 | | | | 37,655 | |
| | | | | | | | |
| | | | | | | 1,044,900 | |
| | | | | | | | |
Utah — 1.4% | | | | | | | | |
Central Utah Water Conservancy District Series A, Rev., VRDO, 1.58%, 9/10/2018 (b) | | | 23,700 | | | | 23,700 | |
County of Utah Hospital, IHC Health Services, Inc. | | | | | | | | |
Series C, Rev., VRDO, 1.52%, 9/4/2018 (b) | | | 16,700 | | | | 16,700 | |
Series B, Rev., VRDO, 1.55%, 9/10/2018 (b) | | | 8,425 | | | | 8,425 | |
Series C, Rev., VRDO, 1.55%, 9/10/2018 (b) | | | 95,440 | | | | 95,440 | |
Series C, Rev., VRDO, 1.55%, 9/10/2018 (b) | | | 8,775 | | | | 8,775 | |
Series C, Rev., VRDO, 1.56%, 9/10/2018 (b) | | | 27,650 | | | | 27,650 | |
Utah Housing Finance Agency, Single Family Mortgage | | | | | | | | |
Series D-1, Rev., VRDO, AMT, 1.59%, 9/10/2018 (b) | | | 2,715 | | | | 2,715 | |
Series E-1, Class I, Rev., VRDO, AMT, 1.59%, 9/10/2018 (b) | | | 2,820 | | | | 2,820 | |
Series F-2, Class I, Rev., VRDO, 1.59%, 9/10/2018 (b) | | | 2,945 | | | | 2,945 | |
Utah Water Finance Agency Series B-2, Rev., VRDO, 1.58%, 9/10/2018 (b) | | | 25,000 | | | | 25,000 | |
| | | | | | | | |
| | | | | | | 214,170 | |
| | | | | | | | |
SEE NOTES TO FINANCIAL STATEMENTS.
| | | | | | |
| | | |
| 60 | | | | J.P. MORGAN MONEY MARKET FUNDS | | AUGUST 31, 2018 |
| | | | | | | | |
| INVESTMENTS | | PRINCIPAL
AMOUNT
($000) | | | VALUE
($000) | |
Municipal Bonds — continued | | | | | | | | |
Virginia — 0.8% | | | | | | | | |
Albermarle County Economic Development Authority, Virginia Hospital Facilities, Sentara Martha Jefferson Hospital Series A, Rev., VRDO, 1.57%, 9/10/2018 (b) | | | 16,000 | | | | 16,000 | |
County of Loudon, IDA, Multi-Modal, Howard Huges Medical Institute Series B, Rev., VRDO, 1.57%, 9/10/2018 (b) | | | 300 | | | | 300 | |
Fairfax County Industrial Development Authority, Virginia Health Care Rev., VRDO, 1.50%, 9/10/2018 (b) | | | 20,600 | | | | 20,600 | |
Fairfax County Industrial Development Authority, Virginia Health Care, Inova Health System Project Rev., VRDO, 1.55%, 9/10/2018 (b) | | | 25,000 | | | | 25,000 | |
Loudoun County Economic Development Authority Series C, Rev., VRDO, 1.57%, 9/10/2018 (b) | | | 18,570 | | | | 18,570 | |
Loudoun County IDA, Howard Hughes Medical Institute | | | | | | | | |
Series E, Rev., VRDO, 1.56%, 9/10/2018 (b) | | | 20,500 | | | | 20,500 | |
Series D, Rev., VRDO, 1.57%, 9/10/2018 (b) | | | 15,000 | | | | 15,000 | |
Loudoun County Sanitation Authority, Water and Sewer System Rev., VRDO, 1.57%, 9/10/2018 (b) | | | 6,410 | | | | 6,410 | |
Virginia College Building Authority, Educational Facilities, University of Richmond Project Series 2004, Rev., VRDO, 1.55%, 9/10/2018 (b) (c) | | | 9,975 | | | | 9,975 | |
| | | | | | | | |
| | | | | | | 132,355 | |
| | | | | | | | |
Washington — 1.1% | | | | | | | | |
Chelan County Public Utility District No. 1 Series B, Rev., VRDO, 1.56%, 9/10/2018 (b) | | | 17,000 | | | | 17,000 | |
County of King, Sewer Series B, Rev., VRDO, LOC: Landesbank Hessen-Thueringen, 1.56%, 9/10/2018 (b) | | | 22,000 | | | | 22,000 | |
Port of Seattle, Subordinate Lien Series 1997, Rev., VRDO, LOC: Bank of America NA, 1.64%, 9/10/2018 (b) | | | 7,330 | | | | 7,330 | |
Washington State Housing Finance Commission, Local 82 - JATC Educational Development Trust Project Rev., VRDO, LOC: U.S. Bank NA, 1.70%, 9/4/2018 (b) | | | 1,575 | | | | 1,575 | |
Washington State Housing Finance Commission, Multi-Family Housing, Barkley Ridge Apartments Series A, Rev., VRDO, FHLMC, LOC: FHLMC, 1.61%, 9/10/2018 (b) | | | 9,985 | | | | 9,985 | |
| | | | | | | | |
| INVESTMENTS | | PRINCIPAL
AMOUNT
($000) | | | VALUE
($000) | |
| | | | | | | | |
Washington — continued | | | | | | | | |
Washington State Housing Finance Commission, Multi-Family Housing, Merrill Gardens at University Village Project Rev., VRDO, FNMA, LOC: FNMA, 1.63%, 9/10/2018 (b) | | | 23,540 | | | | 23,540 | |
Washington State Housing Finance Commission, Multi-Family Housing, Queen Anne Project Series A, Rev., VRDO, FNMA, LOC: FNMA, 1.61%, 9/10/2018 (b) | | | 27,180 | | | | 27,180 | |
Washington State Housing Finance Commission, Multi-Family Housing, Seasons Apartments Project Rev., VRDO, AMT, FNMA, LOC: FNMA, 1.59%, 9/10/2018 (b) | | | 14,660 | | | | 14,660 | |
Washington State Housing Finance Commission, Multi-Family Housing, The New Haven Apartments Project Rev., VRDO, FNMA, LOC: FNMA, 1.56%, 9/10/2018 (b) | | | 17,400 | | | | 17,400 | |
Washington State Housing Finance Commission, Multi-Family Housing, Urban Center Apartments Project Series 2012, Rev., VRDO, FHLMC, LOC: FHLMC, 1.59%, 9/10/2018 (b) | | | 24,415 | | | | 24,415 | |
Washington State Housing Finance Commission, Vintage Spokane Project Series A, Rev., VRDO, FNMA, LOC: FNMA, 1.65%, 9/10/2018 (b) | | | 15,095 | | | | 15,095 | |
| | | | | | | | |
| | | | | | | 180,180 | |
| | | | | | | | |
Wisconsin — 0.1% | | | | | | | | |
Wisconsin Housing and EDA, Home Ownership Series C, Rev., VRDO, 1.57%, 9/10/2018 (b) | | | 11,205 | | | | 11,205 | |
| | | | | | | | |
Wyoming — 0.7% | | | | | | | | |
County of Lincoln, Wyoming Pollution Control, Exxonmobile Project. Series 2014-E, Rev., VRDO, 1.52%, 9/4/2018 (b) | | | 48,450 | | | | 48,450 | |
County of Sublette, Wyoming Pollution Control, Exxonmobile Project Rev., VRDO, 1.52%, 9/4/2018 (b) | | | 31,600 | | | | 31,600 | |
County of Uinta Rev., VRDO, 1.54%, 9/4/2018 (b) | | | 22,720 | | | | 22,720 | |
Wyoming Community Development Authority Housing Series 2, Rev., VRDO, 1.56%, 9/10/2018 (b) | | | 9,750 | | | | 9,750 | |
| | | | | | | | |
| | | | | | | 112,520 | |
| | | | | | | | |
Total Municipal Bonds
(Cost $12,844,192) | | | | | | | 12,844,192 | |
| | | | | | | | |
SEE NOTES TO FINANCIAL STATEMENTS.
| | | | | | | | |
| | | |
| AUGUST 31, 2018 | | J.P. MORGAN MONEY MARKET FUNDS | | | | | 61 | |
JPMorgan Tax Free Money Market Fund
SCHEDULE OF PORTFOLIO INVESTMENTS
AS OF AUGUST 31, 2018 (Unaudited) (continued)
| | | | | | | | |
| INVESTMENTS | |
SHARES
(000) | | | VALUE
($000) | |
Variable Rate Demand Preferred Shares — 6.9% | |
California — 2.0% | | | | | | | | |
Nuveen California AMT-Free Quality Municipal Income Fund | | | | | | | | |
Series 6, LIQ: Sumitomo Mitsui Banking, 1.57%, 9/10/2018 #(c) | | | 30,000 | | | | 30,000 | |
Series 3, LIQ: TD Bank NA, 1.59%, 9/10/2018 #(c) | | | 26,500 | | | | 26,500 | |
Nuveen California Quality Municipal Income Fund | | | | | | | | |
Series 3, LIQ: TD Bank NA, 1.66%, 9/10/2018 #(b) (c) | | | 26,800 | | | | 26,800 | |
Series 2, LIQ: Citibank NA, 1.71%, 9/10/2018 #(c) | | | 27,500 | | | | 27,500 | |
Series 4, LIQ: Royal Bank of Canada, 1.71%, 9/10/2018 #(c) | | | 58,500 | | | | 58,500 | |
Series 6, LIQ: Citibank NA, 1.71%, 9/10/2018 #(c) | | | 67,600 | | | | 67,600 | |
Series 7, LIQ: Royal Bank of Canada, 1.71%, 9/10/2018 #(b) (c) | | | 21,000 | | | | 21,000 | |
Series 1, LIQ: Societe Generale, 1.72%, 9/10/2018 #(c) | | | 59,200 | | | | 59,200 | |
| | | | | | | | |
| | | | | | | 317,100 | |
| | | | | | | | |
Illinois — 0.6% | | | | | | | | |
Nuveen AMT-Free Municipal Credit Income Fund Series 4, LIQ: Citibank NA, 1.66%, 9/10/2018 #(c) | | | 95,000 | | | | 95,000 | |
| | | | | | | | |
New York — 0.8% | | | | | | | | |
Nuveen New York AMT-Free Quality Municipal Income Fund | | | | | | | | |
Series 5, LIQ: TD Bank NA, 1.60%, 9/10/2018 #(c) | | | 40,000 | | | | 40,000 | |
Series 1, LIQ: Citibank NA, 1.62%, 9/10/2018 #(c) | | | 28,600 | | | | 28,600 | |
Series 2, LIQ: Citibank NA, 1.62%, 9/10/2018 #(c) | | | 47,400 | | | | 47,400 | |
Series 3, LIQ: Citibank NA, 1.62%, 9/10/2018 #(c) | | | 8,500 | | | | 8,500 | |
| | | | | | | | |
| | | | | | | 124,500 | |
| | | | | | | | |
Other — 3.5% | | | | | | | | |
Nuveen AMT-Free Municipal Credit Income Fund | | | | | | | | |
Series 5, LIQ: Societe Generale, 1.66%, 9/10/2018 #(c) | | | 147,000 | | | | 147,000 | |
Series 6, LIQ: Sumitomo Mitsui Banking, 1.66%, 9/10/2018 #(c) | | | 133,300 | | | | 133,300 | |
Nuveen AMT-Free Quality Municipal Income Fund | | | | | | | | |
Series 3, LIQ: TD Bank NA, 1.61%, 9/10/2018 #(c) | | | 153,500 | | | | 153,500 | |
Series 2, LIQ: Citibank NA, 1.66%, 9/10/2018 #(c) | | | 92,000 | | | | 92,000 | |
| | | | | | | | |
| INVESTMENTS | |
SHARES
(000) | | | VALUE
($000) | |
| |
Other — continued | | | | | | | | |
Series 5, LOC: Sumitomo Mitsui Banking Corp., 1.66%, 9/10/2018 #(c) | | | 30,000 | | | | 30,000 | |
| | | | | | | | |
| | | | | | | 555,800 | |
| | | | | | | | |
Total Variable Rate Demand Preferred Shares
(Cost $1,092,400) | | | | | | | 1,092,400 | |
| | | | | | | | |
| | |
| | | PRINCIPAL
AMOUNT
($000) | | | | |
Short-Term Investments — 11.2% | | | | | | | | |
Commercial Paper — 11.2% | | | | | | | | |
Alachua County Health Facilities Authority 1.69%, 10/11/2018 | | | 31,240 | | | | 31,240 | |
California Statewide Communities Development Authority | | | | | | | | |
1.30%, 9/4/2018 | | | 19,000 | | | | 19,000 | |
1.30%, 9/4/2018 | | | 13,000 | | | | 13,000 | |
1.30%, 9/5/2018 | | | 19,865 | | | | 19,865 | |
Series B-5, 1.73%, 10/10/2018 | | | 6,250 | | | | 6,250 | |
Series B-6, 1.73%, 10/10/2018 | | | 48,750 | | | | 48,750 | |
Series B-2, 1.76%, 11/6/2018 | | | 25,000 | | | | 25,000 | |
Series D, 1.76%, 11/6/2018 | | | 50,500 | | | | 50,500 | |
1.50%, 11/15/2018 | | | 30,000 | | | | 30,000 | |
1.50%, 11/15/2018 | | | 17,000 | | | | 17,000 | |
City of Dallas Series D-1, 1.68%, 9/26/2018 | | | 16,000 | | | | 16,000 | |
City of Jacksonville, Health Care Facilities | | | | | | | | |
1.83%, 11/1/2018 | | | 70,000 | | | | 70,000 | |
1.83%, 11/1/2018 | | | 35,000 | | | | 35,000 | |
City of Rochester, Health Care Facilities | | | | | | | | |
1.38%, 10/1/2018 | | | 20,000 | | | | 20,000 | |
1.50%, 10/1/2018 | | | 40,000 | | | | 40,000 | |
1.67%, 10/11/2018 | | | 20,000 | | | | 20,000 | |
City of Rochester, Health Care Facilities, Mayo Clinic Series C, 1.83%, 11/1/2018 | | | 50,000 | | | | 50,000 | |
County of Hillsborough 1.60%, 9/20/2018 | | | 16,953 | | | | 16,953 | |
County of Miami-Dade, Aviation Series C, 1.48%, 10/1/2018 | | | 68,000 | | | | 68,000 | |
County of Montgomery 1.45%, 9/10/2018 | | | 114,000 | | | | 114,000 | |
District of Columbia 1.55%, 9/4/2018 | | | 59,000 | | | | 59,000 | |
Health and Educational Facilities Authority of the State of Missouri | | | | | | | | |
1.34%, 9/13/2018 | | | 50,000 | | | | 50,000 | |
1.45%, 10/4/2018 | | | 50,000 | | | | 50,000 | |
Health and Educational Facilities Authority of the State of Missouri Series E, 1.65%, 10/18/2018 | | | 50,000 | | | | 50,000 | |
Indiana Finance Authority 1.55%, 10/2/2018 | | | 75,040 | | | | 75,040 | |
Las Vegas Valley Water District 1.65%, 9/4/2018 | | | 50,000 | | | | 50,000 | |
1.38%, 10/1/2018 | | | 80,000 | | | | 80,000 | |
SEE NOTES TO FINANCIAL STATEMENTS.
| | | | | | |
| | | |
| 62 | | | | J.P. MORGAN MONEY MARKET FUNDS | | AUGUST 31, 2018 |
| | | | | | | | |
| INVESTMENTS | | PRINCIPAL
AMOUNT
($000) | | | VALUE
($000) | |
Short-Term Investments — continued | | | | | | | | |
Commercial Paper — continued | | | | | | | | |
Massachusetts Health and Educational Facilities Authority 1.20%, 9/17/2018 | | | 13,235 | | | | 13,234 | |
Metropolitan Government of Nashville and Davidson County, Water and Sewer 1.65%, 10/9/2018 | | | 25,000 | | | | 25,000 | |
Missouri State Health and Educational Facilities Authority 1.65%, 10/18/2018 | | | 50,000 | | | | 50,000 | |
Regents of the University of Michigan 1.60%, 9/4/2018 | | | 40,000 | | | | 40,000 | |
1.63%, 10/1/2018 | | | 30,950 | | | | 30,950 | |
Regents of the University of Minnesota 1.67%, 10/11/2018 | | | 37,000 | | | | 37,000 | |
San Antonio Electric and Gas 1.59%, 10/5/2018 | | | 54,500 | | | | 54,500 | |
Southwestern Illinois Development Authority, Health Facilities Authority Series 2017-B, 1.73%, 12/11/2018 | | | 39,870 | | | | 39,870 | |
State of California Department of Water Resources 1.63%, 10/4/2018 | | | 24,255 | | | | 24,255 | |
State of Maryland, Health & Higher Educational Facilities Authority Series B, 1.60%, 9/4/2018 | | | 10,000 | | | | 10,000 | |
State of Texas, Public Finance Authority 1.62%, 9/17/2018 | | | 31,465 | | | | 31,465 | |
State of Wisconsin 1.60%, 9/4/2018 | | | 18,230 | | | | 18,230 | |
University of Massachusetts Building Authority 1.60%, 9/13/2018 | | | 14,000 | | | | 14,000 | |
University of Minnesota 1.40%, 10/1/2018 | | | 13,300 | | | | 13,300 | |
1.40%, 10/3/2018 | | | 22,750 | | | | 22,750 | |
University of Missouri 1.53%, 11/7/2018 | | | 34,640 | | | | 34,640 | |
University of Texas 1.60%, 9/4/2018 | | | 22,336 | | | | 22,336 | |
1.60%, 9/7/2018 | | | 20,520 | | | | 20,520 | |
University of Texas System 1.38%, 9/5/2018 | | | 25,000 | | | | 25,000 | |
1.45%, 9/5/2018 | | | 25,000 | | | | 25,000 | |
1.60%, 9/13/2018 | | | 10,000 | | | | 10,000 | |
1.61%, 9/17/2018 | | | 25,000 | | | | 25,000 | |
1.45%, 10/1/2018 | | | 25,000 | | | | 25,000 | |
Wisconsin Health and Educational Facilities Authority 1.38%, 10/1/2018 | | | 20,000 | | | | 20,000 | |
| | | | | | | | |
Total Commercial Paper
(Cost $1,756,648) | | | | | | | 1,756,648 | |
| | | | | | | | |
Total Short-Term Investments
(COST $1,756,648) | | | | | | | 1,756,648 | |
| | | | | | | | |
Total Investments — 99.8%
(Cost $15,693,240)* | | | | | | | 15,693,240 | |
Other Assets Less Liabilities — 0.2% | | | | | | | 33,864 | |
| | | | | | | | |
NET ASSETS — 100.0% | | | | | | | 15,727,104 | |
| | | | | | | | |
Percentages indicated are based on net assets.
Abbreviations
| | |
| AGM | | Insured by Assured Guaranty Municipal Corp. |
| AMT | | Alternative Minimum Tax |
| BHAC | | Insured by Berkshire Hathaway Assurance Corp. |
| COLL | | Collateral |
| CONS | | Consolidated Bonds |
| COP | | Certificate of Participation |
| CR | | Custodial Receipts |
| EAGLE | | Earnings of accrual generated on local tax-exempt securities |
| EDA | | Economic Development Authority |
| FGIC | | Insured by Financial Guaranty Insurance Co. |
| FHLB | | Federal Home Loan Bank |
| FHLMC | | Federal Home Loan Mortgage Corp. |
| FNMA | | Federal National Mortgage Association |
| FSA | | Insured by Financial Security Assurance, Inc. |
| GNMA | | Government National Mortgage Association |
| GO | | General Obligation |
| IDA | | Industrial Development Authority |
| LIQ | | Liquidity Agreement |
| LOC | | Letter of Credit |
| MTA | | Metropolitan Transportation Authority |
| NATL | | Insured by National Public Finance Guarantee Corp. |
| PCR | | Pollution Control Revenue |
| RE | | Reinsured |
| Rev. | | Revenue |
| VRDO | | Variable Rate Demand Obligation. The interest rate shown is the rate in effect as of August 31, 2018. |
| |
| (a) | | The date shown represents the earliest of the next put date, next demand date or final maturity date. |
| (b) | | Variable or floating rate security, the interest rate of which adjusts periodically based on changes in current interest rates and prepayments on the underlying pool of assets. The interest rate shown is the current rate as of August 31, 2018. |
| (c) | | Securities exempt from registration under Rule 144A or section 4(a)(2), of the Securities Act of 1933, as amended. Under procedures approved by the Board of Trustees, such securities have been determined to be liquid by the investment adviser and may be resold, normally to qualified institutional buyers in transactions exempt from registration. |
| # | | Variable Rate Demand Preferred Shares of a closed-end investment company which has a weekly demand feature. The interest rate shown is the rate in effect as of August 31, 2018. |
| * | | The cost of securities is substantially the same for federal income tax purposes. |
SEE NOTES TO FINANCIAL STATEMENTS.
| | | | | | | | |
| | | |
| AUGUST 31, 2018 | | J.P. MORGAN MONEY MARKET FUNDS | | | | | 63 | |
JPMorgan Municipal Money Market Fund
SCHEDULE OF PORTFOLIO INVESTMENTS
AS OF AUGUST 31, 2018 (Unaudited)
| | | | | | | | |
| INVESTMENTS (a) | | PRINCIPAL
AMOUNT
($000) | | | VALUE
($000) | |
Municipal Bonds — 94.5% | | | | | | | | |
Alabama — 0.2% | | | | | | | | |
Alabama Housing Finance Authority Rev., VRDO, LOC: U.S. Bank NA, 1.63%, 9/10/2018 (b) | | | 5,435 | | | | 5,435 | |
| | | | | | | | |
Arizona — 0.5% | | | | | | | | |
Tender Option Bond Trust Receipts/CTFS | | | | | | | | |
Series 2017-XM0563, Rev., VRDO, LIQ: Royal Bank of Canada, 1.63%, 9/10/2018 (b) (c) | | | 5,435 | | | | 5,435 | |
Series 2018-ZM0615, Rev., VRDO, LIQ: Royal Bank of Canada, 1.64%, 9/10/2018 (b) (c) | | | 7,500 | | | | 7,500 | |
| | | | | | | | |
| | | | | | | 12,935 | |
| | | | | | | | |
Arkansas — 2.1% | | | | | | | | |
Arkansas Development Finance Authority, Solid Waste Disposal, Waste Management of Ark Project Rev., VRDO, LOC: Bank of America NA, 1.62%, 9/10/2018 (b) | | | 15,000 | | | | 15,000 | |
City of Osceola, Solid Waste Disposal Rev., VRDO, LOC: Goldman Sachs Bank USA, 1.61%, 9/10/2018 (b) | | | 44,500 | | | | 44,500 | |
| | | | | | | | |
| | | | | | | 59,500 | |
| | | | | | | | |
California — 1.9% | | | | | | | | |
City and County of San Francisco, Multifamily Housing, Transbay Block 8 Tower Apartments Series H-2, Rev., VRDO, LOC: Bank of China, 1.63%, 9/10/2018 (b) | | | 35,000 | | | | 35,000 | |
Tender Option Bond Trust Receipts/CTFS | | | | | | | | |
Series 2016-XG0043, GO, VRDO, AGC, LIQ: TD Bank NA, 1.56%, 9/10/2018 (b) (c) | | | 500 | | | | 500 | |
Series 2018-XG0181, GO, VRDO, LIQ: Bank of America NA, 1.58%, 9/10/2018 (b) (c) | | | 4,985 | | | | 4,985 | |
Series 2018-XX1082, Rev., VRDO, LIQ: Barclays Bank plc, 1.59%, 9/10/2018 (b) (c) | | | 6,835 | | | | 6,835 | |
Series 2017-ZF0581, Rev., VRDO, LIQ: Royal Bank of Canada, 1.62%, 9/10/2018 (b) (c) | | | 2,375 | | | | 2,375 | |
Series 2017-ZM0473, Rev., VRDO, LIQ: Royal Bank of Canada, 1.62%, 9/10/2018 (b) (c) | | | 2,600 | | | | 2,600 | |
Series 2017-ZM0487, Rev., VRDO, LIQ: Royal Bank of Canada, 1.62%, 9/10/2018 (b) (c) | | | 1,465 | | | | 1,465 | |
| | | | | | | | |
| | | | | | | 53,760 | |
| | | | | | | | |
Colorado — 2.8% | | | | | | | | |
Colorado Housing and Finance Authority, Multi-Family Housing Rev., VRDO, LOC: U.S. Bank NA, 1.63%, 9/10/2018 (b) | | | 10,240 | | | | 10,240 | |
Colorado Housing and Finance Authority, Single Family Mortgage Series B-3, Class 1, Rev., VRDO, AMT, FHLB, 1.61%, 9/10/2018 (b) | | | 2,180 | | | | 2,180 | |
| | | | | | | | |
| INVESTMENTS | | PRINCIPAL
AMOUNT
($000) | | | VALUE
($000) | |
| | | | | | | | |
Colorado — continued | | | | | | | | |
RBC Municipal Products, Inc. Trust, Floater Certificates Series G-24, GO, VRDO, LOC: Royal Bank of Canada, 1.59%, 9/10/2018 (b) (c) | | | 12,500 | | | | 12,500 | |
Tender Option Bond Trust Receipts/CTFS Series 2016-ZF0467, Rev., VRDO, LIQ: Royal Bank of Canada, 1.63%, 9/10/2018 (b) (c) | | | 52,895 | | | | 52,895 | |
| | | | | | | | |
| | | | | | | 77,815 | |
| | | | | | | | |
Connecticut — 1.7% | | | | | | | | |
Connecticut Housing Finance Authority, Housing Mortgage Finance Program Bonds
Subseries D-3, Rev., VRDO, AMT, GNMA/FNMA/FHLMC, 1.57%, 9/10/2018 (b) | | | 7,000 | | | | 7,000 | |
Series D, Subseries D-3, Rev., VRDO, AMT, 1.62%, 9/10/2018 (b) | | | 5,900 | | | | 5,900 | |
Connecticut State Development Authority Rev., VRDO, LOC: Bank of Montreal, 1.61%, 9/10/2018 (b) | | | 30,000 | | | | 30,000 | |
RBC Municipal Products, Inc. Trust, Floater Certificates Series G-3, GO, VRDO, LOC: Royal Bank of Canada, 1.59%, 9/10/2018 (b) (c) | | | 5,000 | | | | 5,000 | |
| | | | | | | | |
| | | | | | | 47,900 | |
| | | | | | | | |
Delaware — 0.4% | | | | | | | | |
County of New Castle, Delaware Airport Facility Rev., VRDO, 1.60%, 9/10/2018 (b) | | | 10,880 | | | | 10,880 | |
| | | | | | | | |
District of Columbia — 1.5% | | | | | | | | |
District of Columbia, Pew Charitable Trust Series A, Rev., VRDO, LOC: PNC Bank NA, 1.56%, 9/10/2018 (b) | | | 10,200 | | | | 10,200 | |
Metropolitan Washington Airports Authority, Remarketing Subseries A-2, Rev., VRDO, AMT, LOC: Royal Bank of Canada, 1.59%, 9/10/2018 (b) | | | 12,755 | | | | 12,755 | |
RBC Municipal Products, Inc. Trust, Floater Certificates Series E-108, GO, VRDO, LIQ: Royal Bank of Canada, 1.59%, 9/10/2018 (b) (c) | | | 15,000 | | | | 15,000 | |
Tender Option Bond Trust Receipts/CTFS Series 2017-ZM0554, Rev., VRDO, LIQ: Citibank NA, 1.62%, 9/10/2018 (b) (c) | | | 2,500 | | | | 2,500 | |
| | | | | | | | |
| | | | | | | 40,455 | |
| | | | | | | | |
Florida — 4.8% | | | | | | | | |
Alachua County Housing Finance Authority Rev., VRDO, LOC: Citibank NA, 1.61%, 9/10/2018 (b) | | | 3,330 | | | | 3,330 | |
Collier County IDA, Allete, Inc. Project Series 2006, Rev., VRDO, LOC: Wells Fargo Bank NA, 1.62%, 9/10/2018 (b) | | | 22,800 | | | | 22,800 | |
SEE NOTES TO FINANCIAL STATEMENTS.
| | | | | | |
| | | |
| 64 | | | | J.P. MORGAN MONEY MARKET FUNDS | | AUGUST 31, 2018 |
| | | | | | | | |
| INVESTMENTS | | PRINCIPAL
AMOUNT
($000) | | | VALUE
($000) | |
Municipal Bonds — continued | | | | | | | | |
Florida — continued | | | | | | | | |
Collier County IDA, Ave Maria Utility Co. Project Rev., VRDO, AMT, LOC: Northern Trust Co., 1.59%, 9/10/2018 (b) | | | 13,665 | | | | 13,665 | |
Collier County, Housing Finance Authority Series A, Rev., VRDO, FNMA, LOC: FNMA, 1.61%, 9/10/2018 (b) | | | 2,670 | | | | 2,670 | |
County of Okeechobee, Landfill, Inc. Project Rev., VRDO, LOC: Wells Fargo Bank NA, 1.62%, 9/10/2018 (b) | | | 15,000 | | | | 15,000 | |
County of Palm Beach, Florida Schood Board Class A, COP, VRDO, LIQ: Citibank NA, 1.60%, 9/10/2018 (b) (c) | | | 6,590 | | | | 6,590 | |
County of Palm Beach, Special Purpose Facilities, Flight Safety Project Rev., VRDO, 1.60%, 9/10/2018 (b) | | | 18,000 | | | | 18,000 | |
Florida Housing Finance Corp., Multi-Family Mortgage, Boynton Bay Apartments Series I, Rev., VRDO, LOC: Citibank NA, 1.61%, 9/10/2018 (b) | | | 14,385 | | | | 14,385 | |
Hillsborough County, Housing Finance Authority, Multifamily Housing, Brandywine Apartments Rev., VRDO, LOC: Citibank NA, 1.61%, 9/10/2018 (b) | | | 3,245 | | | | 3,245 | |
Sumter County IDA, Solid Waste Disposal, American Cement Co., LLC Project Rev., VRDO, LOC: Bank of America NA, 1.63%, 9/10/2018 (b) | | | 16,000 | | | | 16,000 | |
Tender Option Bond Trust Receipts/CTFS | | | | | | | | |
Series 2018-XG0167, Rev., VRDO, LIQ: Citibank NA, 1.59%, 9/10/2018 (b) (c) | | | 6,135 | | | | 6,135 | |
Series 2018-ZM0615, Rev., VRDO, LIQ: Citibank NA, 1.59%, 9/10/2018 (b) (c) | | | 7,500 | | | | 7,500 | |
Series 2017-ZF2503, Rev., VRDO, LIQ: Citibank NA, 1.62%, 9/10/2018 (b) (c) | | | 3,750 | | | | 3,750 | |
| | | | | | | | |
| | | | | | | 133,070 | |
| | | | | | | | |
Georgia — 0.7% | | | | | | | | |
Atkinson/Coffee Counties Joint Development Authority, Solid Waste Disposal, Langboard, Inc. Project Rev., VRDO, LOC: Wells Fargo Bank NA, 1.60%, 9/10/2018 (b) | | | 16,800 | | | | 16,800 | |
Tender Option Bond Trust Receipts/CTFS Series 2017-ZF0589, Rev., VRDO, LIQ: Bank of America NA, 1.60%, 9/10/2018 (b) (c) | | | 3,750 | | | | 3,750 | |
| | | | | | | | |
| | | | | | | 20,550 | |
| | | | | | | | |
Illinois — 3.5% | | | | | | | | |
Chicago Midway Airport, 2nd Lien Series C-2, Rev., VRDO, AMT, LOC: Bank of Montreal, 1.58%, 9/10/2018 (b) | | | 20,870 | | | | 20,870 | |
| | | | | | | | |
| INVESTMENTS | | PRINCIPAL
AMOUNT
($000) | | | VALUE
($000) | |
| | | | | | | | |
Illinois — continued | | | | | | | | |
Illinois Educational Facilities Authority, Adler Planetarium Series 1997, Rev., VRDO, LOC: PNC Bank NA, 1.57%, 9/10/2018 (b) | | | 10,000 | | | | 10,000 | |
Illinois Finance Authority Rev., VRDO, LOC: PNC Bank NA, 1.57%, 9/10/2018 (b) | | | 18,500 | | | | 18,500 | |
Illinois Finance Authority, Chicago Historical Society Rev., VRDO, LOC: BMO Harris Bank NA, 1.58%, 9/10/2018 (b) | | | 31,035 | | | | 31,035 | |
Illinois Finance Authority, St. Ignatius College Prep. Project Rev., VRDO, LOC: PNC Bank NA, 1.57%, 9/10/2018 (b) | | | 12,000 | | | | 12,000 | |
Illinois State Toll Highway Authority, Variable Rate Senior Priority Series A-1B, Rev., VRDO, LOC: Landesbank Hessen-Thueringen, 1.58%, 9/10/2018 (b) | | | 5,600 | | | | 5,600 | |
| | | | | | | | |
| | | | | | | 98,005 | |
| | | | | | | | |
Indiana — 0.5% | | | | | | | | |
City of Chicago, Gary International Airport Authority, Multi-Modal Special purpose Facility Rev., VRDO, LOC: BMO Harris Bank NA, 1.59%, 9/10/2018 (b) | | | 5,975 | | | | 5,975 | |
Indiana Finance Authority, Solid Waste Disposal, Four-Leaf Clover Dairy LLC Project Rev., VRDO, LOC: Bank of America NA, 1.65%, 9/10/2018 (b) | | | 4,100 | | | | 4,100 | |
Indiana Finance Authority, Solid Waste Disposal, New Holland Dairy Leasing Rev., VRDO, LOC: Bank of America NA, 1.65%, 9/10/2018 (b) | | | 410 | | | | 410 | |
Tender Option Bond Trust Receipts/CTFS Series 2016-ZF0280, Rev., VRDO, LIQ: TD Bank NA, 1.60%, 9/10/2018 (b) (c) | | | 2,500 | | | | 2,500 | |
| | | | | | | | |
| | | | | | | 12,985 | |
| | | | | | | | |
Iowa — 3.4% | | | | | | | | |
Iowa Finance Authority Solid Waste Facilities, Midamerican Energy Co. Project Rev., VRDO, AMT, 1.63%, 9/10/2018 (b) | | | 45,800 | | | | 45,800 | |
Iowa Finance Authority, Midwestern Disaster Area, Chrisbro III, Inc. Project Rev., VRDO, 1.62%, 9/10/2018 (b) | | | 20,800 | | | | 20,800 | |
Iowa Finance Authority, Multi-Family Housing | | | | | | | | |
Series A, Rev., VRDO, AMT, 1.59%, 9/10/2018 (b) | | | 10,910 | | | | 10,910 | |
Series B, Rev., VRDO, AMT, 1.59%, 9/10/2018 (b) | | | 7,230 | | | | 7,230 | |
Iowa Finance Authority, Wellness Facility, Community of MarshallTown Project Rev., VRDO, LOC: Northern Trust Co., 1.60%, 9/10/2018 (b) | | | 7,600 | | | | 7,600 | |
SEE NOTES TO FINANCIAL STATEMENTS.
| | | | | | | | |
| | | |
| AUGUST 31, 2018 | | J.P. MORGAN MONEY MARKET FUNDS | | | | | 65 | |
JPMorgan Municipal Money Market Fund
SCHEDULE OF PORTFOLIO INVESTMENTS
AS OF AUGUST 31, 2018 (Unaudited) (continued)
| | | | | | | | |
| INVESTMENTS | | PRINCIPAL
AMOUNT
($000) | | | VALUE
($000) | |
Municipal Bonds — continued | | | | | | | | |
Iowa — continued | | | | | | | | |
Tender Option Bond Trust Receipts/CTFS Series 2018-ZM0582, Rev., VRDO, LIQ: Barclays Bank plc, 1.59%, 9/10/2018 (b) (c) | | | 2,550 | | | | 2,550 | |
| | | | | | | | |
| | | | | | | 94,890 | |
| | | | | | | | |
Kansas — 1.7% | | | | | | | | |
City of Mission, Multi-Family Housing, The Falls Apartments Project Rev., VRDO, LOC: U.S. Bank NA, 1.62%, 9/10/2018 (b) | | | 7,750 | | | | 7,750 | |
City of Wichita, Kans Airport Facilities Series 2003, Rev., VRDO, 1.60%, 9/10/2018 (b) | | | 20,780 | | | | 20,780 | |
RBC Municipal Products, Inc. Trust, Floater Certificates Series G-23, GO, VRDO, LOC: Royal Bank of Canada, 1.59%, 9/10/2018 (b) (c) | | | 12,500 | | | | 12,500 | |
Tender Option Bond Trust Receipts/CTFS Series 2017-XF2507, Rev., VRDO, LIQ: Morgan Stanley Bank, 1.61%, 9/10/2018 (b) (c) | | | 6,950 | | | | 6,950 | |
| | | | | | | | |
| | | | | | | 47,980 | |
| | | | | | | | |
Kentucky — 1.3% | | | | | | | | |
County of Carroll, Kentucky Environmental Facilities, Utilities Co. Project | | | | | | | | |
Rev., VRDO, AMT, LOC: Bank of Tokyo-Mitsubishi UFJ Ltd., 1.64%, 9/10/2018 (b) | | | 6,800 | | | | 6,800 | |
Series A, Rev., VRDO, AMT, LOC: Bank of Tokyo-Mitsubishi UFJ Ltd., 1.67%, 9/10/2018 (b) | | | 7,100 | | | | 7,100 | |
Kenton County Airport Board, Flight Safety International, Inc. Project Series A, Rev., VRDO, 1.60%, 9/10/2018 (b) | | | 16,350 | | | | 16,350 | |
Maysville Industrial Bldg., Green Tokai Co. Rev., VRDO, LOC: Bank of Tokyo-Mitsubishi UFJ Ltd., 1.61%, 9/10/2018 (b) | | | 5,740 | | | | 5,740 | |
| | | | | | | | |
| | | | | | | 35,990 | |
| | | | | | | | |
Louisiana — 0.3% | | | | | | | | |
Parish of St Bernard, Mobil Oil Rev., VRDO, EXXON MOBIL CORP (OBLI), 1.57%, 9/4/2018 (b) | | | 8,000 | | | | 8,000 | |
| | | | | | | | |
Maine — 1.0% | | | | | | | | |
Maine State Housing Mortgage Authority | | | | | | | | |
Series G, Rev., VRDO, AMT, 1.58%, 9/10/2018 (b) | | | 17,090 | | | | 17,090 | |
Series B2, Rev., VRDO, AMT, 1.63%, 9/10/2018 (b) | | | 10,570 | | | | 10,570 | |
| | | | | | | | |
| | | | | | | 27,660 | |
| | | | | | | | |
Maryland — 4.8% | | | | | | | | |
City of Baltimore Series 2015-ZF2095, Rev., VRDO, LIQ: Morgan Stanley Bank, 1.64%, 9/10/2018 (b) (c) | | | 6,665 | | | | 6,665 | |
| | | | | | | | |
| INVESTMENTS | | PRINCIPAL
AMOUNT
($000) | | | VALUE
($000) | |
| | | | | | | | |
Maryland — continued | | | | | | | | |
Maryland Community Development Administration, Department of Housing and Community Development, Multi-Family Housing, Barrington Apartments Project Series A, Rev., VRDO, FNMA, LOC: FNMA, 1.63%, 9/10/2018 (b) | | | 34,500 | | | | 34,500 | |
Maryland Community Development Administration, Department of Housing and Community Development, Residential | | | | | | | | |
Series G, Rev., VRDO, AMT, 1.60%, 9/10/2018 (b) | | | 21,050 | | | | 21,050 | |
Series J, Rev., VRDO, AMT, 1.64%, 9/10/2018 (b) | | | 26,000 | | | | 26,000 | |
Prince Georges County Housing Authority, Multi-Family, Allentowne Apartments Project Rev., VRDO, FHLMC, LOC: FHLMC, 1.61%, 9/10/2018 (b) | | | 13,900 | | | | 13,900 | |
State of Maryland, Transportation Authority | | | | | | | | |
Rev., VRDO, AMT, LOC: Wells Fargo Bank NA, 1.63%, 9/10/2018 (b) | | | 15,000 | | | | 15,000 | |
Tender Option Bond Trust Receipts/CTFS | | | | | | | | |
Series 2018-ZM0596, Rev., VRDO, LIQ: Morgan Stanley Bank, 1.59%, 9/10/2018 (b) (c) | | | 7,500 | | | | 7,500 | |
Series 2018-ZM0621, Rev., VRDO, LIQ: Morgan Stanley Bank, 1.59%, 9/10/2018 (b) (c) | | | 4,000 | | | | 4,000 | |
Series 2018-XF0605, Rev., VRDO, LIQ: Bank of America NA, 1.62%, 9/10/2018 (b) (c) | | | 3,300 | | | | 3,300 | |
| | | | | | | | |
| | | | | | | 131,915 | |
| | | | | | | | |
Massachusetts — 0.4% | | | | | | | | |
Massachusetts State Development Finance Agency, Housing, Cordis Mills LLC Rev., VRDO, FNMA, LIQ: FNMA, 1.63%, 9/10/2018 (b) | | | 9,850 | | | | 9,850 | |
| | | | | | | | |
Michigan — 4.5% | | | | | | | | |
Kent Hospital Finance Authority, Spectrum Health System Series C, Rev., VRDO, LOC: Bank of New York Mellon, 1.60%, 9/10/2018 (b) | | | 8,865 | | | | 8,865 | |
Michigan State Housing Development Authority, Rental Housing | | | | | | | | |
Series C, Rev., VRDO, AMT, LIQ: Royal Bank of Canada, 1.61%, 9/10/2018 (b) | | | 23,410 | | | | 23,410 | |
Series A, Rev., VRDO, AMT, 1.62%, 9/10/2018 (b) | | | 5,015 | | | | 5,015 | |
Series D, Rev., VRDO, AMT, 1.62%, 9/10/2018 (b) | | | 4,625 | | | | 4,625 | |
SEE NOTES TO FINANCIAL STATEMENTS.
| | | | | | |
| | | |
| 66 | | | | J.P. MORGAN MONEY MARKET FUNDS | | AUGUST 31, 2018 |
| | | | | | | | |
| INVESTMENTS | | PRINCIPAL
AMOUNT
($000) | | | VALUE
($000) | |
Municipal Bonds — continued | | | | | | | | |
Michigan — continued | | | | | | | | |
Michigan State Housing Development Authority, Single-Family Mortgage | | | | | | | | |
Series D, Rev., VRDO, AMT, 1.61%, 9/10/2018 (b) | | | 15,750 | | | | 15,750 | |
Series B, Rev., VRDO, AMT, 1.63%, 9/10/2018 (b) | | | 54,380 | | | | 54,380 | |
Rib Floater Trust Series 2018-009, Rev., VRDO, LOC: Barclays Bank plc, 1.60%, 9/10/2018 (b) (c) | | | 6,000 | | | | 6,000 | |
Tender Option Bond Trust Receipts/CTFS | | | | | | | | |
Series 2017-XF0597, Rev., VRDO, LIQ: Royal Bank of Canada, 1.59%, 9/10/2018 (b) (c) | | | 3,000 | | | | 3,000 | |
Series 2017-XG0158, Rev., VRDO, LIQ: Bank of America NA, 1.60%, 9/10/2018 (b) (c) | | | 4,075 | | | | 4,075 | |
| | | | | | | | |
| | | | | | | 125,120 | |
| | | | | | | | |
Minnesota — 0.7% | | | | | | | | |
Minnesota Housing Finance Agency, Residential Housing Finance Rev., VRDO, AMT, GNMA/FNMA/FHLMC COLL, 1.59%, 9/10/2018 (b) | | | 13,200 | | | | 13,200 | |
Oakdale Multifamily, Housing Cottage Homesteads Rev., VRDO, FHLMC, LOC: FHLMC, 1.59%, 9/10/2018 (b) | | | 7,000 | | | | 7,000 | |
| | | | | | | | |
| | | | | | | 20,200 | |
| | | | | | | | |
Mississippi — 0.4% | | | | | | | | |
Mississippi Business Finance Corp Series I, Rev., VRDO, 1.54%, 9/4/2018 (b) | | | 10,300 | | | | 10,300 | |
| | | | | | | | |
Missouri — 2.4% | | | | | | | | |
Rib Floater Trust Series 2017-010, Rev., VRDO, LOC: Barclays Bank plc, 1.61%, 9/10/2018 (b) (c) | | | 28,685 | | | | 28,685 | |
St. Charles County IDA, Country Club Apartments Project Rev., VRDO, FNMA, LOC: FNMA, 1.56%, 9/10/2018 (b) | | | 25,000 | | | | 25,000 | |
St. Charles County IDA, Remington Apartments Project Rev., VRDO, FNMA, LOC: FNMA, 1.56%, 9/10/2018 (b) | | | 11,600 | | | | 11,600 | |
| | | | | | | | |
| | | | | | | 65,285 | |
| | | | | | | | |
Nebraska — 1.0% | | | | | | | | |
Nebraska Investment Finance Authority, Multi-Family Housing Series A, Rev., VRDO, LOC: Citibank NA, 1.63%, 9/10/2018 (b) | | | 10,000 | | | | 10,000 | |
Tender Option Bond Trust Receipts/CTFS | | | | | | | | |
Series 2018-XF2551, Rev., VRDO, LIQ: Citibank NA, 1.61%, 9/10/2018 (b) (c) | | | 9,635 | | | | 9,635 | |
Series 2018-XF2558, Rev., VRDO, LIQ: Citibank NA, 1.61%, 9/10/2018 (b) (c) | | | 8,000 | | | | 8,000 | |
| | | | | | | | |
| | | | | | | 27,635 | |
| | | | | | | | |
| | | | | | | | |
| INVESTMENTS | | PRINCIPAL
AMOUNT
($000) | | | VALUE
($000) | |
| | | | | | | | |
Nevada — 0.4% | | | | | | | | |
Tender Option Bond Trust Receipts/CTFS | | | | | | | | |
Series 2018-XF0612, GO, VRDO, LIQ: Royal Bank of Canada, 1.59%, 9/10/2018 (b) (c) | | | 5,840 | | | | 5,840 | |
Series 2018-ZM0633, GO, VRDO, LIQ: Royal Bank of Canada, 1.59%, 9/10/2018 (b) (c) | | | 4,100 | | | | 4,100 | |
| | | | | | | | |
| | | | | | | 9,940 | |
| | | | | | | | |
New Jersey — 0.9% | | | | | | | | |
RBC Municipal Products, Inc. Trust, Floater Certificates Series E-102, Rev., VRDO, LIQ: Royal Bank of Canada, 1.59%, 9/10/2018 (b) (c) | | | 10,000 | | | | 10,000 | |
Tender Option Bond Trust Receipts/CTFS | | | | | | | | |
Series 2018-XX1091, Rev., VRDO, NATL-RE, LOC: Barclays Bank plc, 1.58%, 9/10/2018 (b) (c) | | | 9,000 | | | | 9,000 | |
Series 2018-XX1093, Rev., VRDO, LOC: Barclays Bank plc, 1.58%, 9/10/2018 (b) (c) | | | 5,700 | | | | 5,700 | |
| | | | | | | | |
| | | | | | | 24,700 | |
| | | | | | | | |
New York — 13.9% | | | | | | | | |
Erie County Industrial Development Agency Series 2008, Rev., VRDO, LOC: Manufacturers & Trader Trust Co., 1.66%, 9/10/2018 (b) | | | 12,000 | | | | 12,000 | |
Housing Development Corp Series A, Rev., VRDO, FNMA, LOC: FNMA, 1.62%, 9/10/2018 (b) | | | 60,000 | | | | 60,000 | |
Metropolitan Transportation Authority Series A-1, Rev., VRDO, LOC: TD Bank NA, 1.50%, 9/4/2018 (b) | | | 27,370 | | | | 27,370 | |
Subseries G-2, Rev., VRDO, LOC: TD Bank NA, 1.53%, 9/10/2018 (b) | | | 9,810 | | | | 9,810 | |
Nassau County Industrial Development Housing Agency Rev., VRDO, FNMA, LOC: FNMA, 1.55%, 9/10/2018 (b) | | | 13,500 | | | | 13,500 | |
New York City Housing Development Corp., Multi-Family Mortgage, Related-Upper East Series A, Rev., VRDO, AMT, LOC: Landesbank Baden-Wuerttemberg, 1.57%, 9/10/2018 (b) | | | 30,000 | | | | 30,000 | |
New York City Industrial Development Agency, Special Facility, Air Express International Corp. Project Rev., VRDO, LOC: Citibank NA, 1.60%, 9/10/2018 (b) | | | 19,000 | | | | 19,000 | |
SEE NOTES TO FINANCIAL STATEMENTS.
| | | | | | | | |
| | | |
| AUGUST 31, 2018 | | J.P. MORGAN MONEY MARKET FUNDS | | | | | 67 | |
JPMorgan Municipal Money Market Fund
SCHEDULE OF PORTFOLIO INVESTMENTS
AS OF AUGUST 31, 2018 (Unaudited) (continued)
| | | | | | | | |
| INVESTMENTS | | PRINCIPAL
AMOUNT
($000) | | | VALUE
($000) | |
Municipal Bonds — continued | | | | | | | | |
New York — continued | | | | | | | | |
New York City Transitional Finance Authority, Future Tax Secured Subseries C-6, Rev., VRDO, LOC: Sumitomo Mitsui Banking Corp., 1.58%, 9/10/2018 (b) | | | 10,675 | | | | 10,675 | |
New York Liberty Development Corp. Series 2015-XF2023, Rev., VRDO, LIQ: Morgan Stanley Bank, 1.61%, 9/10/2018 (b) (c) | | | 10,000 | | | | 10,000 | |
New York State Housing Finance Agency, 188 Ludlow Street Series A, Rev., VRDO, LOC: Landesbank Hessen-Thueringen, 1.72%, 9/10/2018 (b) | | | 24,800 | | | | 24,800 | |
New York State Housing Finance Agency, 222 East 44th Street Housing Series A, Rev., VRDO, LOC: Bank of China, 1.62%, 9/10/2018 (b) | | | 21,550 | | | | 21,550 | |
New York State Housing Finance Agency, 25 West 25th Street Housing Series A, Rev., VRDO, FNMA, LOC: FNMA, 1.62%, 9/10/2018 (b) | | | 17,640 | | | | 17,640 | |
New York State Housing Finance Agency, 250 West 93rd Street Housing Series A, Rev., VRDO, LOC: Landesbank Hessen-Thueringen, 1.61%, 9/10/2018 (b) | | | 30,000 | | | | 30,000 | |
New York State Housing Finance Agency, 42nd and 10th Housing Series A, Rev., VRDO, AMT, FHLMC, LOC: FHLMC, 1.60%, 9/10/2018 (b) | | | 25,005 | | | | 25,005 | |
New York State Housing Finance Agency, 455 West 37th Street Housing Series A, Rev., VRDO, AMT, LOC: Landesbank Hessen-Thueringen, 1.57%, 9/4/2018 (b) | | | 20,000 | | | | 20,000 | |
Tender Option Bond Trust Receipts/CTFS | | | | | | | | |
Series E-118, GO, LIQ: Royal Bank of Canada, 1.53%, 9/4/2018 (b) | | | 6,000 | | | | 6,000 | |
Series 2017-XF0566, Rev., VRDO, LIQ: TD Bank NA, 1.58%, 9/10/2018 (b) (c) | | | 4,000 | | | | 4,000 | |
Series 2017-XF0566, Rev., VRDO, LIQ: TD Bank NA, 1.58%, 9/10/2018 (b) (c) | | | 4,300 | | | | 4,300 | |
Series 2018-XF0238, Rev., VRDO, LIQ: TD Bank NA, 1.58%, 9/10/2018 (b) (c) | | | 23,815 | | | | 23,815 | |
Series 2017-XG0156, Rev., VRDO, LIQ: Citibank NA, 1.59%, 9/10/2018 (b) (c) | | | 2,020 | | | | 2,020 | |
Series 2017-XF2488, Rev., VRDO, LIQ: Citibank NA, 1.61%, 9/10/2018 (b) (c) | | | 2,500 | | | | 2,500 | |
Series 2018-XM0616, Rev., VRDO, LIQ: Citibank NA, 1.62%, 9/10/2018 (b) (c) | | | 10,425 | | | | 10,425 | |
| | | | | | | | |
| | | | | | | 384,410 | |
| | | | | | | | |
| | | | | | | | |
| INVESTMENTS | | PRINCIPAL
AMOUNT
($000) | | | VALUE
($000) | |
| | | | | | | | |
North Carolina — 0.6% | | | | | | | | |
North Carolina Capital Facilities Finance Agency, Educational Facilities Series 2016-ZM0153, Rev., VRDO, LIQ: Morgan Stanley Bank, 1.59%, 9/10/2018 (b) (c) | | | 5,000 | | | | 5,000 | |
Tender Option Bond Trust Receipts/CTFS Series 2018-XG0170, Rev., VRDO, LIQ: Royal Bank of Canada, 1.59%, 9/10/2018 (b) (c) | | | 3,000 | | | | 3,000 | |
Union County Industrial Facilities and Pollution Control Financing Authority Series 2007, Rev., VRDO, LOC: BB&T Corp., 1.62%, 9/10/2018 (b) | | | 10,000 | | | | 10,000 | |
| | | | | | | | |
| | | | | | | 18,000 | |
| | | | | | | | |
North Dakota — 1.0% | | | | | | | | |
North Dakota Housing Finance Agency, Housing Finance Program, Home Mortgage Series B, Rev., VRDO, AMT, 1.60%, 9/10/2018 (b) | | | 27,055 | | | | 27,055 | |
| | | | | | | | |
Ohio — 0.1% | | | | | | | | |
RBC Municipal Products, Inc. Trust, Floater Certificates Series G-30, GO, VRDO, LOC: Royal Bank of Canada, 1.59%, 9/10/2018 (b) (c) | | | 3,905 | | | | 3,905 | |
| | | | | | | | |
Oregon — 2.2% | | | | | | | | |
Confederated Tribes of The Umatilla Indian Reservation, Tribal Infrastructure Rev., VRDO, LOC: Wells Fargo Bank NA, 2.07%, 9/10/2018 (b) | | | 11,455 | | | | 11,455 | |
Marion County Housing Authority, Residence At Marian Rev., VRDO, LOC: U.S. Bank NA, 1.60%, 9/10/2018 (b) | | | 240 | | | | 240 | |
Port of Portland, Oregon International Airport, Multimodal Variable Rate Rev., VRDO, AMT, LOC: Industrial & Commercial Bank of China, 1.60%, 9/10/2018 (b) | | | 12,300 | | | | 12,300 | |
Port of Portland, Oregon Portland International Airport Series 18B, Rev., VRDO, AMT, LOC: Industrial & Commercial Bank of China, 1.65%, 9/10/2018 (b) | | | 32,320 | | | | 32,320 | |
Tender Option Bond Trust Receipts/CTFS Series 2018-ZM0637, Rev., VRDO, LIQ: Royal Bank of Canada, 1.59%, 9/10/2018 (b) (c) | | | 3,500 | | | | 3,500 | |
| | | | | | | | |
| | | | | | | 59,815 | |
| | | | | | | | |
Other — 2.7% | | | | | | | | |
FHLMC, Multi-Family Housing | | | | | | | | |
Series M015, Class A, Rev., VRDO, FHLMC, LIQ: FHLMC, 1.61%, 9/10/2018 (b) | | | 15,780 | | | | 15,780 | |
Series M021, Class A, Rev., VRDO, FHLMC, LIQ: FHLMC, 1.61%, 9/10/2018 (b) | | | 12,185 | | | | 12,185 | |
SEE NOTES TO FINANCIAL STATEMENTS.
| | | | | | |
| | | |
| 68 | | | | J.P. MORGAN MONEY MARKET FUNDS | | AUGUST 31, 2018 |
| | | | | | | | |
| INVESTMENTS | | PRINCIPAL
AMOUNT
($000) | | | VALUE
($000) | |
Municipal Bonds — continued | | | | | | | | |
Other — continued | | | | | | | | |
Series M025, Class A, Rev., VRDO, FHLMC, LIQ: FHLMC, 1.63%, 9/10/2018 (b) | | | 20,300 | | | | 20,300 | |
Series M026, Class A, Rev., VRDO, FHLMC, LIQ: FHLMC, 1.63%, 9/10/2018 (b) | | | 21,415 | | | | 21,415 | |
SunAmerica Taxable Trust Series 2, Class A, Rev., VRDO, FHLMC, LOC: FHLMC, 1.62%, 9/10/2018 (b) | | | 4,450 | | | | 4,450 | |
| | | | | | | | |
| | | | | | | 74,130 | |
| | | | | | | | |
Pennsylvania — 2.9% | | | | | | | | |
City of Philadelphia Pennsylvania Airport Subseries C-1, Rev., VRDO, AMT, LOC: TD Bank NA, 1.59%, 9/10/2018 (b) | | | 14,865 | | | | 14,865 | |
Delaware County Industrial Development Authority, Solid Waste | | | | | | | | |
Series D, Rev., VRDO, 1.60%, 9/10/2018 (b) | | | 13,300 | | | | 13,300 | |
Series E, Rev., VRDO, 1.60%, 9/10/2018 (b) | | | 13,500 | | | | 13,500 | |
Pennsylvania Housing Finance Agency, Single Family Mortgage | | | | | | | | |
Series 2006-93B, Rev., VRDO, AMT, 1.59%, 9/10/2018 (b) | | | 14,335 | | | | 14,335 | |
Series 2007-98C, Rev., VRDO, AMT, 1.59%, 9/10/2018 (b) | | | 15,765 | | | | 15,765 | |
Series 2007-99C, Rev., VRDO, AMT, 1.59%, 9/10/2018 (b) | | | 3,760 | | | | 3,760 | |
Tender Option Bond Trust Receipts/CTFS Series 2018-XL0061, Rev., VRDO, LOC: Citibank NA, 1.62%, 9/10/2018 (b) (c) | | | 4,490 | | | | 4,490 | |
| | | | | | | | |
| | | | | | | 80,015 | |
| | | | | | | | |
Rhode Island — 0.9% | | | | | | | | |
Rhode Island Housing and Mortgage Finance Corp., Multi-Family Housing, University Heights Project Rev., VRDO, AMT, FHLMC, LOC: FHLMC, 1.63%, 9/10/2018 (b) | | | 25,500 | | | | 25,500 | |
| | | | | | | | |
South Carolina — 1.1% | | | | | | | | |
South Carolina State Housing Finance and Development Authority, Rental Housing, Rocky Creek Rev., VRDO, LOC: Wells Fargo Bank NA, 1.62%, 9/10/2018 (b) | | | 1,185 | | | | 1,185 | |
Tender Option Bond Trust Receipts/CTFS | | | | | | | | |
Series 2015-XF2204, Rev., VRDO, LIQ: Citibank NA, 1.59%, 9/10/2018 (b) (c) | | | 5,000 | | | | 5,000 | |
Series 2018-BAML0003, Rev., VRDO, LOC: Bank of America NA, 1.84%, 9/10/2018 (b) (c) | | | 25,000 | | | | 25,000 | |
| | | | | | | | |
| | | | | | | 31,185 | |
| | | | | | | | |
| | | | | | | | |
| INVESTMENTS | | PRINCIPAL
AMOUNT
($000) | | | VALUE
($000) | |
| | | | | | | | |
Tennessee — 4.6% | | | | | | | | |
Clarksville Public Building Authority Series 2005, Rev., VRDO, LOC: Bank of America NA, 1.55%, 9/4/2018 (b) | | | 750 | | | | 750 | |
Clarksville Public Building Authority, Pooled Financing, Morristown Loans | | | | | | | | |
Rev., VRDO, LOC: Bank of America NA, 1.55%, 9/4/2018 (b) | | | 7,815 | | | | 7,815 | |
Clarksville Public Building Authority, Pooled Financing, Tennessee Municipal Bond Fund Rev., VRDO, LOC: Bank of America NA, 1.55%, 9/4/2018 (b) | | | 34,535 | | | | 34,535 | |
Rev., VRDO, LOC: Bank of America NA, 1.55%, 9/4/2018 (b) | | | 7,480 | | | | 7,480 | |
Series 2004, Rev., VRDO, LOC: Bank of America NA, 1.55%, 9/4/2018 (b) | | | 7,775 | | | | 7,775 | |
Jackson Industrial Development Board, Industrial Development, General Cable Corp. Project Rev., VRDO, LOC: PNC Bank NA, 1.60%, 9/10/2018 (b) | | | 9,000 | | | | 9,000 | |
Metropolitan Government of Nashville and Davidson County Industrial Development Board, Multifamily Housing, Arbor Crest Rev., VRDO, FNMA, LOC: FNMA, 1.56%, 9/10/2018 (b) | | | 12,750 | | | | 12,750 | |
Metropolitan Government of Nashville and Davidson County, Health and Educational Facilities Board, Multi-Family Housing, The Retreat at Dry Creek Farms Apartments Project Rev., VRDO, LOC: Citibank NA, 1.63%, 9/10/2018 (b) | | | 10,750 | | | | 10,750 | |
Montgomery County Public Building Authority, Pooled Financing, Tennessee County Loan Pool | | | | | | | | |
Rev., VRDO, LOC: Bank of America NA, 1.55%, 9/4/2018 (b) | | | 7,470 | | | | 7,470 | |
Series 2004, Rev., VRDO, LOC: Bank of America NA, 1.55%, 9/4/2018 (b) | | | 4,315 | | | | 4,315 | |
Series 2006, Rev., VRDO, LOC: Bank of America NA, 1.55%, 9/4/2018 (b) | | | 7,480 | | | | 7,480 | |
Tender Option Bond Trust Receipts/CTFS | | | | | | | | |
Series 2018-XF2576, Rev., VRDO, LOC: Barclays Bank plc, 1.59%, 9/10/2018 (b) (c) | | | 13,140 | | | | 13,140 | |
Series 2018-XL0062, Rev., VRDO, LOC: Citibank NA, 1.62%, 9/10/2018 (b) (c) | | | 4,420 | | | | 4,420 | |
| | | | | | | | |
| | | | | | | 127,680 | |
| | | | | | | | |
Texas — 8.9% | | | | | | | | |
Capital Area Housing Finance Corp., Cypress Creek At River Bend Apartments Rev., VRDO, LOC: Citibank NA, 1.62%, 9/10/2018 (b) | | | 10,170 | | | | 10,170 | |
SEE NOTES TO FINANCIAL STATEMENTS.
| | | | | | | | |
| | | |
| AUGUST 31, 2018 | | J.P. MORGAN MONEY MARKET FUNDS | | | | | 69 | |
JPMorgan Municipal Money Market Fund
SCHEDULE OF PORTFOLIO INVESTMENTS
AS OF AUGUST 31, 2018 (Unaudited) (continued)
| | | | | | | | |
| INVESTMENTS | | PRINCIPAL
AMOUNT
($000) | | | VALUE
($000) | |
Municipal Bonds — continued | | | | | | | | |
Texas — continued | | | | | | | | |
City of Austin, Airport System Subseries 2005-4, Rev., VRDO, AMT, AGM, LOC: Sumitomo Mitsui Banking Corp., 1.58%, 9/10/2018 (b) | | | 19,700 | | | | 19,700 | |
City of Austin, Texas Hotel Occupancy Tax Series B, Rev., VRDO, LOC: Sumitomo Mitsui Banking Corp., 1.60%, 9/10/2018 (b) | | | 13,550 | | | | 13,550 | |
County of Harris, Cultural Education Facilities Finance Corp., Hospital, Memorial Hermann Health System Rev., VRDO, 1.57%, 9/10/2018 (b) | | | 7,300 | | | | 7,300 | |
County of Jefferson, Port of Port Arthur Navigation District, Fina Oil and Chemical Co. Project Rev., VRDO, 1.65%, 9/10/2018 (b) | | | 7,825 | | | | 7,825 | |
Gulf Coast Waste Disposal Authority, Environmental Facilities, ExxonMobil Project Rev., VRDO, 1.57%, 9/4/2018 (b) | | | 12,600 | | | | 12,600 | |
Lower Neches Valley Authority Industrial Development Corp, Exxonmobil Project Series B, Rev., VRDO, 1.58%, 9/4/2018 (b) | | | 25,000 | | | | 25,000 | |
Montgomery Country Housing Finance Corp., Multi-Family Housing, Park at Woodline Townhomes Rev., VRDO, LOC: Citibank NA, 1.62%, 9/10/2018 (b) | | | 12,415 | | | | 12,415 | |
North Texas Tollway Authority Series 2016-XF2220, Rev., VRDO, LIQ: Citibank NA, 1.59%, 9/10/2018 (b) (c) | | | 10,950 | | | | 10,950 | |
RBC Municipal Products, Inc. Trust, Floater Certificates | | | | | | | | |
Series G-20, GO, VRDO, LOC: Royal Bank of Canada, 1.59%, 9/10/2018 (b) (c) | | | 10,000 | | | | 10,000 | |
Series G-31, GO, VRDO, LOC: Royal Bank of Canada, 1.59%, 9/10/2018 (b) (c) | | | 3,000 | | | | 3,000 | |
Series G-34, GO, VRDO, PSF-GTD, LOC: Royal Bank of Canada, 1.59%, 9/10/2018 (b) (c) | | | 3,400 | | | | 3,400 | |
Southeast Texas Housing Finance Corp., Wyndham Park Apartments Rev., VRDO, FNMA, LOC: FNMA, 1.62%, 9/10/2018 (b) | | | 8,100 | | | | 8,100 | |
State of Texas Series C, GO, VRDO, 1.60%, 9/10/2018 (b) | | | 20,290 | | | | 20,290 | |
Tender Option Bond Trust Receipts/CTFS | | | | | | | | |
Series 2017-XF0599, Rev., VRDO, LIQ: Royal Bank of Canada, 1.59%, 9/10/2018 (b) (c) | | | 9,000 | | | | 9,000 | |
Series 2017-XG0155, GO, VRDO, PSF-GTD, LIQ: Citibank NA, 1.59%, 9/10/2018 (b) (c) | | | 5,543 | | | | 5,543 | |
Series 2018-XG0166, Rev., VRDO, LIQ: Citibank NA, 1.59%, 9/10/2018 (b) (c) | | | 3,320 | | | | 3,320 | |
| | | | | | | | |
| INVESTMENTS | | PRINCIPAL
AMOUNT
($000) | | | VALUE
($000) | |
| | | | | | | | |
Texas — continued | | | | | | | | |
Series 2018-XG0163, GO, VRDO, PSF-GTD, LIQ: Bank of America NA, 1.60%, 9/10/2018 (b) (c) | | | 5,015 | | | | 5,015 | |
Series 2016-ZF0465, Rev., VRDO, LIQ: Royal Bank of Canada, 1.63%, 9/10/2018 (b) (c) | | | 48,605 | | | | 48,605 | |
Texas Department of Housing and Community Affairs, Single Family Mortgage Series D, Rev., VRDO, AMT, GNMA/FNMA/FHLMC, LIQ: Texas Comptroller of Public Accounts, 1.58%, 9/10/2018 (b) | | | 9,540 | | | | 9,540 | |
| | | | | | | | |
| | | | | | | 245,323 | |
| | | | | | | | |
Utah — 3.5% | | | | | | | | |
Tender Option Bond Trust Receipts/CTFS Series 2018-XG0171, Rev., VRDO, LIQ: Royal Bank of Canada, 1.62%, 9/10/2018 (b) (c) | | | 3,000 | | | | 3,000 | |
Utah Housing Corp., Single Family Mortgage | | | | | | | | |
Series A-1, Class I, Rev., VRDO, 1.59%, 9/10/2018 (b) | | | 2,470 | | | | 2,470 | |
Series B, Class I, Rev., VRDO, 1.59%, 9/10/2018 (b) | | | 3,695 | | | | 3,695 | |
Series C-2, Class I, Rev., VRDO, FHA, 1.59%, 9/10/2018 (b) | | | 4,455 | | | | 4,455 | |
Series D-2, Class I, Rev., VRDO, 1.59%, 9/10/2018 (b) | | | 4,470 | | | | 4,470 | |
Utah Housing Finance Agency, Single Family Mortgage Series A-2, Rev., VRDO, 1.59%, 9/10/2018 (b) | | | 1,970 | | | | 1,970 | |
Wells Fargo Stage Trust Series 33C, Rev., VRDO, LIQ: Wells Fargo Bank NA, 1.61%, 9/10/2018 (b) (c) | | | 77,674 | | | | 77,674 | |
| | | | | | | | |
| | | | | | | 97,734 | |
| | | | | | | | |
Vermont — 0.0% (d) | | | | | | | | |
Vermont Educational and Health Buildings Financing Agency, Landmark College Project Series A, Rev., VRDO, LOC: TD Bank NA, 1.54%, 9/4/2018 (b) | | | 1,250 | | | | 1,250 | |
| | | | | | | | |
Virginia — 2.5% | | | | | | | | |
County of King George, IDA, Birchwood Power Partners | | | | | | | | |
Series A, Rev., VRDO, LOC: Mizuho Bank Ltd., 1.59%, 9/4/2018 (b) | | | 9,200 | | | | 9,200 | |
Series B, Rev., VRDO, LOC: Mizuho Bank Ltd., 1.59%, 9/4/2018 (b) | | | 9,200 | | | | 9,200 | |
Tender Option Bond Trust Receipts/CTFS | | | | | | | | |
Series 2018-XG0183, Rev., VRDO, LIQ: Barclays Bank plc, 1.58%, 9/10/2018 (b) (c) | | | 3,435 | | | | 3,435 | |
SEE NOTES TO FINANCIAL STATEMENTS.
| | | | | | |
| | | |
| 70 | | | | J.P. MORGAN MONEY MARKET FUNDS | | AUGUST 31, 2018 |
| | | | | | | | |
| INVESTMENTS | | PRINCIPAL
AMOUNT
($000) | | | VALUE
($000) | |
Municipal Bonds — continued | | | | | | | | |
Virginia — continued | | | | | | | | |
Series 2018-XL0069, Rev., VRDO, LIQ: Barclays Bank plc, 1.58%, 9/10/2018 (b) (c) | | | 4,130 | | | | 4,130 | |
Series 2018-XF0606, Rev., VRDO, LIQ: Bank of America NA, 1.59%, 9/10/2018 (b) (c) | | | 8,500 | | | | 8,500 | |
Series 2018-ZM0583, Rev., VRDO, LIQ: Bank of America NA, 1.59%, 9/10/2018 (b) (c) | | | 5,415 | | | | 5,415 | |
Series 2018-BAML0002, Rev., VRDO, FHLMC, LIQ: Bank of America NA, 1.68%, 9/10/2018 (b) (c) | | | 15,390 | | | | 15,390 | |
Series 2018-BAML0004, Rev., VRDO, FHLMC, LIQ: Bank of America NA, 1.68%, 9/10/2018 (b) (c) | | | 15,190 | | | | 15,190 | |
| | | | | | | | |
| | | | | | | 70,460 | |
| | | | | | | | |
Washington — 3.0% | | | | | | | | |
Port Grays Harbor Industrial Development Corp., Murphy Co. Project Rev., VRDO, LOC: U.S. Bank NA, 1.62%, 9/10/2018 (b) | | | 10,000 | | | | 10,000 | |
Port of Seattle, Subordinate Lien Series 2008, Rev., VRDO, AMT, LOC: Bank of Tokyo-Mitsubishi UFJ Ltd., 1.64%, 9/10/2018 (b) | | | 28,515 | | | | 28,515 | |
Tender Option Bond Trust Receipts/CTFS Series 2018-XF0658, Rev., VRDO, LIQ: Bank of America NA, 1.64%, 9/10/2018 (b) (c) | | | 5,610 | | | | 5,610 | |
Washington Economic Development Finance Authority, Solid Waste Disposal, Cleanscapes, Inc. Project Rev., VRDO, LOC: Bank of America NA, 1.62%, 9/10/2018 (b) | | | 20,735 | | | | 20,735 | |
Washington Economic Development Finance Authority, Solid Waste Disposal, Le May Enterprise Project Series B, Rev., VRDO, LOC: Bank of America NA, 1.62%, 9/10/2018 (b) | | | 11,600 | | | | 11,600 | |
Washington State Housing Finance Commission, Multi-Family Housing, Alderwood Court Apartments Series A, Rev., VRDO, FNMA, LOC: FNMA, 1.62%, 9/10/2018 (b) | | | 5,350 | | | | 5,350 | |
| | | | | | | | |
| | | | | | | 81,810 | |
| | | | | | | | |
West Virginia — 0.3% | | | | | | | | |
County of Harrison, Solid Waste Disposal, Waste Management of West Virginia, Inc. Project Series A, Rev., VRDO, LOC: Bank of America NA, 1.62%, 9/10/2018 (b) | | | 8,120 | | | | 8,120 | |
| | | | | | | | |
Wisconsin — 0.2% | | | | | | | | |
City of Appleton, Industrial Development Series A, Rev., VRDO, LOC: Wells Fargo Bank NA, 1.75%, 9/10/2018 (b) | | | 1,300 | | | | 1,300 | |
Tender Option Bond Trust Receipts/CTFS Series 2018-XF2541, Rev., VRDO, LIQ: Citibank NA, 1.59%, 9/10/2018 (b) (c) | | | 3,400 | | | | 3,400 | |
| | | | | | | | |
| | | | | | | 4,700 | |
| | | | | | | | |
| | | | | | | | |
| INVESTMENTS | | PRINCIPAL
AMOUNT
($000) | | | VALUE
($000) | |
| | | | | | | | |
Wyoming — 2.3% | | | | | | | | |
County of Laramie, Wyoming Industrial Development Series B, Rev., VRDO, LOC: Wells Fargo Bank NA, 1.60%, 9/10/2018 (b) | | | 7,000 | | | | 7,000 | |
County of Uinta Rev., VRDO, 1.54%, 9/4/2018 (b) | | | 49,905 | | | | 49,905 | |
Wyoming Community Development Authority, Composite Reoffering Housing Series 6, Rev., VRDO, AMT, 1.61%, 9/10/2018 (b) | | | 5,400 | | | | 5,400 | |
| | | | | | | | |
| | | | | | | 62,305 | |
| | | | | | | | |
Total Municipal Bonds
(Cost $2,616,152) | | | | | | | 2,616,152 | |
| | | | | | | | |
| | |
| | | SHARES
($000) | | | | |
Variable Rate Demand Preferred Shares — 5.3% | | | | | |
California — 0.5% | | | | | | | | |
Nuveen California Quality Municipal Income Fund | | | | | | | | |
Series 4, LIQ: Royal Bank of Canada, 1.71%, 9/10/2018 #(c) | | | 10,000 | | | | 10,000 | |
Series 6, LIQ: Citibank NA, 1.71%, 9/10/2018 #(c) | | | 5,000 | | | | 5,000 | |
| | | | | | | | |
| | | | | | | 15,000 | |
| | | | | | | | |
Other — 4.8% | | | | | | | | |
Nuveen AMT-Free Quality Municipal Income Fund | | | | | | | | |
Series 3, LIQ: TD Bank NA, 1.61%, 9/10/2018 #(c) | | | 25,000 | | | | 25,000 | |
Series 4, LIQ: Barclays Bank plc, 1.65%, 9/10/2018 #(c) | | | 31,700 | | | | 31,700 | |
Nuveen Quality Municipal Income Fund Series 1, LIQ: Barclays Bank plc, 1.71%, 9/10/2018 #(c) | | | 64,700 | | | | 64,700 | |
Nuveen Quality Municipal Income Fund Series 3, LIQ: Barclays Bank plc, 1.71%, 9/10/2018 #(c) | | | 9,700 | | | | 9,700 | |
| | | | | | | | |
| | | | | | | 131,100 | |
| | | | | | | | |
Total Variable Rate Demand Preferred Shares
(Cost $146,100) | | | | | | | 146,100 | |
| | | | | | | | |
Total Investments — 99.8%
(Cost $2,762,252)* | | | | | | | 2,762,252 | |
Other Assets Less Liabilities — 0.2% | | | | | | | 5,035 | |
| | | | | | | | |
NET ASSETS — 100.0% | | | | | | | 2,767,287 | |
| | | | | | | | |
Percentages indicated are based on net assets.
SEE NOTES TO FINANCIAL STATEMENTS.
| | | | | | | | |
| | | |
| AUGUST 31, 2018 | | J.P. MORGAN MONEY MARKET FUNDS | | | | | 71 | |
JPMorgan Municipal Money Market Fund
SCHEDULE OF PORTFOLIO INVESTMENTS
AS OF AUGUST 31, 2018 (Unaudited) (continued)
Abbreviations
| | |
| AGC | | Insured by Assured Guaranty Corp. |
| AGM | | Insured by Assured Guaranty Municipal Corp. |
| AMT | | Alternative Minimum Tax |
| COLL | | Collateral |
| COP | | Certificate of Participation |
| FHA | | Federal Housing Administration |
| FHLB | | Federal Home Loan Bank |
| FHLMC | | Federal Home Loan Mortgage Corp. |
| FNMA | | Federal National Mortgage Association |
| GNMA | | Government National Mortgage Association |
| GO | | General Obligation |
| IDA | | Industrial Development Authority |
| LIQ | | Liquidity Agreement |
| LOC | | Letter of Credit |
| NATL | | Insured by National Public Finance Guarantee Corp. |
| PSF-GTD | | Permanent School Fund Guaranteed |
| RE | | Reinsured |
| Rev. | | Revenue |
| VRDO | | Variable Rate Demand Obligation. The interest rate shown is the rate in effect as of August 31, 2018. |
| | |
| (a) | | The date shown represents the earliest of the next put date, next demand date or final maturity date. |
| (b) | | Variable or floating rate security, the interest rate of which adjusts periodically based on changes in current interest rates and prepayments on the underlying pool of assets. The interest rate shown is the current rate as of August 31, 2018. |
| (c) | | Securities exempt from registration under Rule 144A or section 4(a)(2), of the Securities Act of 1933, as amended. Under procedures approved by the Board of Trustees, such securities have been determined to be liquid by the investment adviser and may be resold, normally to qualified institutional buyers in transactions exempt from registration. |
| (d) | | Amount rounds to less than 0.1% of net assets. |
| # | | Variable Rate Demand Preferred Shares of a closed-end investment company which has a weekly demand feature. The interest rate shown is the rate in effect as of August 31, 2018. |
| * | | The cost of securities is substantially the same for federal income tax purposes. |
SEE NOTES TO FINANCIAL STATEMENTS.
| | | | | | |
| | | |
| 72 | | | | J.P. MORGAN MONEY MARKET FUNDS | | AUGUST 31, 2018 |
THIS PAGE IS INTENTIONALLY LEFT BLANK
| | | | | | | | |
| | | |
| AUGUST 31, 2018 | | J.P. MORGAN MONEY MARKET FUNDS | | | | | 73 | |
STATEMENTS OF ASSETS AND LIABILITIES
AS OF AUGUST 31, 2018 (Unaudited)
(Amounts in thousands, except per share amounts)
| | | | | | | | | | | | |
| | | JPMorgan
Prime Money
Market Fund | | |
JPMorgan
Institutional
Tax Free
Money
Market Fund | | | JPMorgan
Liquid
Assets Money
Market Fund | |
ASSETS: | | | | | | | | | | | | |
Investments in non-affiliates, at value | | $ | 37,464,104 | | | $ | 600,405 | | | $ | 2,350,855 | |
Repurchase agreements, at value | | | 6,576,730 | | | | — | | | | 900,376 | |
Cash | | | 400,000 | | | | 2 | | | | 15,001 | |
Receivables: | | | | | | | | | | | | |
Investment securities sold | | | — | | | | 10,231 | | | | — | |
Investment securities sold — delayed delivery securities | | | — | | | | 215 | | | | — | |
Fund shares sold | | | — | | | | — | | | | — | (a) |
Interest from non-affiliates | | | 38,027 | | | | 943 | | | | 2,467 | |
Due from adviser | | | — | | | | 20 | | | | — | |
Prepaid expenses | | | — | | | | — | | | | 309 | |
| | | | | | | | | | | | |
Total Assets | | | 44,478,861 | | | | 611,816 | | | | 3,269,008 | |
| | | | | | | | | | | | |
| | | |
LIABILITIES: | | | | | | | | | | | | |
Payables: | | | | | | | | | | | | |
Distributions | | | 52,085 | | | | 845 | | | | 3,945 | |
Investment securities purchased | | | 779,290 | | | | 10,000 | | | | 30,000 | |
Accrued liabilities: | | | | | | | | | | | | |
Investment advisory fees | | | 2,899 | | | | — | | | | 206 | |
Administration fees | | | 2,430 | | | | 60 | | | | 174 | |
Distribution fees | | | 7 | | | | — | | | | 29 | |
Service fees | | | 1,883 | | | | 1 | | | | 327 | |
Custodian and accounting fees | | | 360 | | | | 29 | | | | 37 | |
Trustees’ and Chief Compliance Officer’s fees | | | 57 | | | | — | | | | — | |
Printing and mailing cost | | | 594 | | | | 6 | | | | 32 | |
Other | | | 774 | | | | 15 | | | | 293 | |
| | | | | | | | | | | | |
Total Liabilities | | | 840,379 | | | | 10,956 | | | | 35,043 | |
| | | | | | | | | | | | |
Net Assets | | $ | 43,638,482 | | | $ | 600,860 | | | $ | 3,233,965 | |
| | | | | | | | | | | | |
| (a) | Amount rounds to less than one thousand. |
SEE NOTES TO FINANCIAL STATEMENTS.
| | | | | | |
| | | |
| 74 | | | | J.P. MORGAN MONEY MARKET FUNDS | | AUGUST 31, 2018 |
| | | | | | | | | | | | |
| | | JPMorgan
Prime Money
Market Fund | | |
JPMorgan
Institutional
Tax Free
Money
Market Fund | | | JPMorgan
Liquid
Assets Money
Market Fund | |
NET ASSETS: | | | | | | | | | | | | |
Paid-in-Capital | | $ | 43,631,255 | | | $ | 600,871 | | | $ | 3,234,176 | |
Accumulated undistributed (distributions in excess of) net investment income | | | (695 | ) | | | — | | | | (214 | ) |
Accumulated net realized gains (losses) | | | 130 | | | | 3 | | | | 3 | |
Net unrealized appreciation (depreciation) | | | 7,792 | | | | (14 | ) | | | — | |
| | | | | | | | | | | | |
Total Net Assets | | $ | 43,638,482 | | | $ | 600,860 | | | $ | 3,233,965 | |
| | | | | | | | | | | | |
| | | |
Net Assets: | | | | | | | | | | | | |
Class C | | $ | 1,590 | | | $ | — | | | $ | 19,654 | |
Agency | | | 1,858,724 | | | | 101 | | | | 304,060 | |
Capital | | | 26,619,279 | | | | 1,497 | | | | 308,264 | |
IM | | | 2,015,286 | | | | 573,724 | | | | — | |
Institutional Class | | | 10,225,859 | | | | 25,538 | | | | 1,658,432 | |
Investor | | | — | | | | — | | | | 12,935 | |
Morgan | | | 1,536,491 | | | | — | | | | 190,797 | |
Premier | | | 1,352,909 | | | | — | | | | 734,243 | |
Reserve | | | 28,344 | | | | — | | | | 5,580 | |
| | | | | | | | | | | | |
Total | | $ | 43,638,482 | | | $ | 600,860 | | | $ | 3,233,965 | |
| | | | | | | | | | | | |
| | | |
Outstanding units of beneficial interest (shares) | | | | | | | | | | | | |
($0.0001 par value; unlimited number of shares authorized): | | | | | | | | | | | | |
Class C | | | 1,590 | | | | — | | | | 19,656 | |
Agency | | | 1,858,160 | | | | 100 | | | | 304,063 | |
Capital | | | 26,611,337 | | | | 1,497 | | | | 308,264 | |
IM | | | 2,014,648 | | | | 573,736 | | | | — | |
Institutional Class | | | 10,222,767 | | | | 25,539 | | | | 1,658,451 | |
Investor | | | — | | | | — | | | | 12,935 | |
Morgan | | | 1,536,062 | | | | — | | | | 190,804 | |
Premier | | | 1,352,526 | | | | — | | | | 734,252 | |
Reserve | | | 28,336 | | | | — | | | | 5,580 | |
Net Asset Value offering and redemption price per share (all classes) | | $ | 1.0003 | | | $ | 1.0000 | | | $ | 1.00 | |
| | | | | | | | | | | | |
Cost of investments in non-affiliates | | $ | 37,456,312 | | | $ | 600,419 | | | $ | 2,350,855 | |
Cost of repurchase agreements | | | 6,576,730 | | | | — | | | | 900,376 | |
SEE NOTES TO FINANCIAL STATEMENTS.
| | | | | | | | |
| | | |
| AUGUST 31, 2018 | | J.P. MORGAN MONEY MARKET FUNDS | | | | | 75 | |
STATEMENTS OF ASSETS AND LIABILITIES
AS OF AUGUST 31, 2018 (Unaudited) (continued)
(Amounts in thousands, except per share amounts)
| | | | | | | | | | | | |
| | | JPMorgan
U.S. Government
Money
Market Fund | | |
JPMorgan
U.S. Treasury
Plus Money
Market Fund | | | JPMorgan
Federal
Money
Market Fund | |
ASSETS: | | | | | | | | | | | | |
Investments in non-affiliates, at value | | $ | 61,614,768 | | | $ | 9,073,827 | | | $ | 3,419,510 | |
Repurchase agreements, at value | | | 73,921,523 | | | | 15,364,056 | | | | — | |
Cash | | | 882,252 | | | | 574,246 | | | | 15,574 | |
Receivables: | | | | | | | | | | | | |
Fund shares sold | | | 2,986 | | | | — | | | | 3,888 | |
Interest from non-affiliates | | | 138,522 | | | | 18,464 | | | | 1,596 | |
| | | | | | | | | | | | |
Total Assets | | | 136,560,051 | | | | 25,030,593 | | | | 3,440,568 | |
| | | | | | | | | | | | |
| | | |
LIABILITIES: | | | | | | | | | | | | |
Payables: | | | | | | | | | | | | |
Distributions | | | 117,115 | | | | 18,021 | | | | 3,457 | |
Investment securities purchased | | | 3,350,000 | | | | — | | | | — | |
Fund shares redeemed | | | 1,294 | | | | — | | | | 1,828 | |
Accrued liabilities: | | | | | | | | | | | | |
Investment advisory fees | | | 9,593 | | | | 1,732 | | | | 198 | |
Administration fees | | | 8,034 | | | | 1,451 | | | | 170 | |
Distribution fees | | | 1,693 | | | | 263 | | | | 2 | |
Service fees | | | 7,399 | | | | 1,205 | | | | 238 | |
Custodian and accounting fees | | | 640 | | | | 105 | | | | 22 | |
Trustees’ and Chief Compliance Officer’s fees | | | 6 | | | | — | (a) | | | — | |
Printing and mailing cost | | | 3,487 | | | | 556 | | | | 599 | |
Other | | | 292 | | | | 272 | | | | 180 | |
| | | | | | | | | | | | |
Total Liabilities | | | 3,499,553 | | | | 23,605 | | | | 6,694 | |
| | | | | | | | | | | | |
Net Assets | | $ | 133,060,498 | | | $ | 25,006,988 | | | $ | 3,433,874 | |
| | | | | | | | | | | | |
| (a) | Amount rounds to less than one thousand. |
SEE NOTES TO FINANCIAL STATEMENTS.
| | | | | | |
| | | |
| 76 | | | | J.P. MORGAN MONEY MARKET FUNDS | | AUGUST 31, 2018 |
| | | | | | | | | | | | |
| | | JPMorgan
U.S. Government
Money
Market Fund | | |
JPMorgan
U.S. Treasury
Plus Money
Market Fund | | | JPMorgan
Federal
Money
Market Fund | |
NET ASSETS: | | | | | | | | | | | | |
Paid-in-Capital | | $ | 133,063,571 | | | $ | 25,007,595 | | | $ | 3,434,069 | |
Accumulated undistributed (distributions in excess of) net investment income | | | (1,358 | ) | | | (526 | ) | | | (200 | ) |
Accumulated net realized gains (losses) | | | (1,715 | ) | | | (81 | ) | | | 5 | |
| | | | | | | | | | | | |
Total Net Assets | | $ | 133,060,498 | | | $ | 25,006,988 | | | $ | 3,433,874 | |
| | | | | | | | | | | | |
| | | |
Net Assets: | | | | | | | | | | | | |
Class C | | $ | — | | | $ | 356,342 | | | $ | — | |
Agency | | | 12,122,666 | | | | 1,156,915 | | | | 133,372 | |
Capital | | | 72,447,267 | | | | 4,579,938 | | | | — | |
Eagle Class | | | 2,543,097 | | | | — | | | | — | |
Eagle Private Wealth Class | | | 20 | | | | — | | | | — | |
E*Trade | | | 289,752 | | | | — | | | | — | |
IM | | | 4,624,373 | | | | 3,712,803 | | | | — | |
Institutional Class | | | 32,490,193 | | | | 14,032,252 | | | | 3,050,851 | |
Investor | | | 795,534 | | | | 40,579 | | | | — | |
Morgan | | | 1,716,482 | | | | 366,725 | | | | 25,651 | |
Premier | | | 4,123,539 | | | | 746,704 | | | | 224,000 | |
Reserve | | | 65,076 | | | | 14,730 | | | | — | |
Service | | | 1,842,499 | | | | — | | | | — | |
| | | | | | | | | | | | |
Total | | $ | 133,060,498 | | | $ | 25,006,988 | | | $ | 3,433,874 | |
| | | | | | | | | | | | |
| | | |
Outstanding units of beneficial interest (shares) | | | | | | | | | | | | |
($0.0001 par value; unlimited number of shares authorized): | | | | | | | | | | | | |
Class C | | | — | | | | 356,345 | | | | — | |
Agency | | | 12,122,989 | | | | 1,156,942 | | | | 133,385 | |
Capital | | | 72,448,920 | | | | 4,579,946 | | | | — | |
Eagle Class | | | 2,543,131 | | | | — | | | | — | |
Eagle Private Wealth Class | | | 20 | | | | — | | | | — | |
E*Trade | | | 289,760 | | | | — | | | | — | |
IM | | | 4,624,480 | | | | 3,712,888 | | | | — | |
Institutional Class | | | 32,490,904 | | | | 14,032,716 | | | | 3,051,286 | |
Investor | | | 795,545 | | | | 40,579 | | | | — | |
Morgan | | | 1,716,514 | | | | 366,730 | | | | 25,656 | |
Premier | | | 4,123,698 | | | | 746,715 | | | | 224,036 | |
Reserve | | | 65,078 | | | | 14,730 | | | | — | |
Service | | | 1,842,504 | | | | — | | | | — | |
Net Asset Value offering and redemption price per share (all classes) | | $ | 1.00 | | | $ | 1.00 | | | $ | 1.00 | |
| | | | | | | | | | | | |
| | | |
Cost of investments in non-affiliates | | $ | 61,614,768 | | | $ | 9,073,827 | | | $ | 3,419,510 | |
Cost of repurchase agreements | | | 73,921,523 | | | | 15,364,056 | | | | — | |
SEE NOTES TO FINANCIAL STATEMENTS.
| | | | | | | | |
| | | |
| AUGUST 31, 2018 | | J.P. MORGAN MONEY MARKET FUNDS | | | | | 77 | |
STATEMENTS OF ASSETS AND LIABILITIES
AS OF AUGUST 31, 2018 (Unaudited) (continued)
(Amounts in thousands, except per share amounts)
| | | | | | | | | | | | |
| | |
JPMorgan
100% U.S.
Treasury
Securities
Money
Market Fund | | | JPMorgan
Tax Free
Money
Market Fund | | | JPMorgan
Municipal
Money
Market Fund | |
ASSETS: | | | | | | | | | | | | |
Investments in non-affiliates, at value | | $ | 40,059,378 | | | $ | 15,693,240 | | | $ | 2,762,252 | |
Cash | | | 1,245,824 | | | | 15 | | | | 5 | |
Receivables: | | | | | | | | | | | | |
Due from custodian | | | — | | | | 23,735 | | | | — | |
Investment securities sold | | | — | | | | 44,635 | | | | 32,017 | |
Investment securities sold — delayed delivery securities | | | — | | | | 7,545 | | | | 3,985 | |
Interest from non-affiliates | | | 34,296 | | | | 23,062 | | | | 5,801 | |
Prepaid expenses | | | 579 | | | | — | | | | 288 | |
| | | | | | | | | | | | |
Total Assets | | | 41,340,077 | | | | 15,792,232 | | | | 2,804,348 | |
| | | | | | | | | | | | |
| | | |
LIABILITIES: | | | | | | | | | | | | |
Payables: | | | | | | | | | | | | |
Distributions | | | 35,843 | | | | 14,529 | | | | 991 | |
Investment securities purchased | | | — | | | | 46,766 | | | | 35,002 | |
Accrued liabilities: | | | | | | | | | | | | |
Investment advisory fees | | | 2,407 | | | | 985 | | | | 164 | |
Administration fees | | | 2,067 | | | | 836 | | | | 142 | |
Distribution fees | | | 408 | | | | 429 | | | | 253 | |
Service fees | | | 2,556 | | | | 1,428 | | | | 346 | |
Custodian and accounting fees | | | 133 | | | | 100 | | | | 17 | |
Trustees’ and Chief Compliance Officer’s fees | | | — | | | | — | (a) | | | 1 | |
Printing and mailing cost | | | 41 | | | | 53 | | | | 88 | |
Other | | | 236 | | | | 2 | | | | 57 | |
| | | | | | | | | | | | |
Total Liabilities | | | 43,691 | | | | 65,128 | | | | 37,061 | |
| | | | | | | | | | | | |
Net Assets | | $ | 41,296,386 | | | $ | 15,727,104 | | | $ | 2,767,287 | |
| | | | | | | | | | | | |
| (a) | Amount rounds to less than one thousand. |
SEE NOTES TO FINANCIAL STATEMENTS.
| | | | | | |
| | | |
| 78 | | | | J.P. MORGAN MONEY MARKET FUNDS | | AUGUST 31, 2018 |
| | | | | | | | | | | | |
| | |
JPMorgan
100% U.S.
Treasury
Securities
Money
Market Fund | | | JPMorgan
Tax Free
Money
Market Fund | | | JPMorgan
Municipal
Money
Market Fund | |
NET ASSETS: | | | | | | | | | | | | |
Paid-in-Capital | | $ | 41,297,048 | | | $ | 15,726,742 | | | $ | 2,767,039 | |
Accumulated undistributed (distributions in excess of) net investment income | | | (592 | ) | | | (280 | ) | | | (7 | ) |
Accumulated net realized gains (losses) | | | (70 | ) | | | 642 | | | | 255 | |
| | | | | | | | | | | | |
Total Net Assets | | $ | 41,296,386 | | | $ | 15,727,104 | | | $ | 2,767,287 | |
| | | | | | | | | | | | |
| | | |
Net Assets: | | | | | | | | | | | | |
Agency | | $ | 2,458,682 | | | $ | 1,049,447 | | | $ | 172,557 | |
Capital | | | 19,753,287 | | | | — | | | | — | |
Eagle Class | | | — | | | | — | | | | 542,373 | |
Institutional Class | | | 14,448,735 | | | | 11,715,001 | | | | 1,649,767 | |
Morgan | | | 1,882,589 | | | | 10,935 | | | | 18,263 | |
Premier | | | 1,523,542 | | | | 919,543 | | | | 124,535 | |
Reserve | | | 1,229,551 | | | | 2,032,178 | | | | — | |
Service | | | — | | | | — | | | | 259,792 | |
| | | | | | | | | | | | |
Total | | $ | 41,296,386 | | | $ | 15,727,104 | | | $ | 2,767,287 | |
| | | | | | | | | | | | |
| | | |
Outstanding units of beneficial interest (shares) | | | | | | | | | | | | |
($0.0001 par value; unlimited number of shares authorized): | | | | | | | | | | | | |
Agency | | | 2,458,711 | | | | 1,049,415 | | | | 172,543 | |
Capital | | | 19,753,569 | | | | — | | | | — | |
Eagle Class | | | — | | | | — | | | | 542,311 | |
Institutional Class | | | 14,448,961 | | | | 11,714,472 | | | | 1,649,632 | |
Morgan | | | 1,882,607 | | | | 10,934 | | | | 18,261 | |
Premier | | | 1,523,558 | | | | 919,450 | | | | 124,525 | |
Reserve | | | 1,229,552 | | | | 2,032,017 | | | | — | |
Service | | | — | | | | — | | | | 259,757 | |
Net Asset Value offering and redemption price per share (all classes) | | $ | 1.00 | | | $ | 1.00 | | | $ | 1.00 | |
| | | | | | | | | | | | |
Cost of investments in non-affiliates | | $ | 40,059,378 | | | $ | 15,693,240 | | | $ | 2,762,252 | |
SEE NOTES TO FINANCIAL STATEMENTS.
| | | | | | | | |
| | | |
| AUGUST 31, 2018 | | J.P. MORGAN MONEY MARKET FUNDS | | | | | 79 | |
STATEMENTS OF OPERATIONS
FOR THE SIX MONTHS ENDED AUGUST 31, 2018 (Unaudited)
(Amounts in thousands)
| | | | | | | | | | | | |
| | | JPMorgan
Prime Money
Market Fund | | |
JPMorgan
Institutional
Tax Free
Money
Market Fund (a) | | | JPMorgan
Liquid
Assets Money
Market Fund | |
INVESTMENT INCOME: | | | | | | | | | | | | |
Interest income from non-affiliates | | $ | 417,708 | | | $ | 2,294 | | | $ | 24,762 | |
Interest income from affiliates | | | 5,224 | | | | — | | | | 137 | |
| | | | | | | | | | | | |
Total investment income | | | 422,932 | | | | 2,294 | | | | 24,899 | |
| | | | | | | | | | | | |
| | | |
EXPENSES: | | | | | | | | | | | | |
Investment advisory fees | | | 16,152 | | | | 143 | | | | 943 | |
Administration fees | | | 13,896 | | | | 123 | | | | 811 | |
Distribution fees (See Note 4) | | | 38 | | | | — | | | | 169 | |
Service fees (See Note 4) | | | 15,845 | | | | 13 | | | | 1,915 | |
Custodian and accounting fees | | | 621 | | | | 57 | | | | 70 | |
Interest expense to affiliates | | | — | (b) | | | 1 | | | | — | |
Professional fees | | | 255 | | | | 29 | | | | 34 | |
Trustees’ and Chief Compliance Officer’s fees | | | 51 | | | | 11 | | | | 16 | |
Printing and mailing costs | | | 77 | | | | 9 | | | | 11 | |
Registration and filing fees | | | 437 | | | | 8 | | | | 88 | |
Transfer agency fees (See Note 2.F.) | | | 803 | | | | 54 | | | | 46 | |
Offering costs | | | — | | | | 60 | | | | — | |
Other | | | 75 | | | | 5 | | | | 48 | |
| | | | | | | | | | | | |
Total expenses | | | 48,250 | | | | 513 | | | | 4,151 | |
| | | | | | | | | | | | |
Less fees waived | | | (6,571 | ) | | | (42 | ) | | | (633 | ) |
Less expense reimbursements | | | (13 | ) | | | (177 | ) | | | — | |
| | | | | | | | | | | | |
Net expenses | | | 41,666 | | | | 294 | | | | 3,518 | |
| | | | | | | | | | | | |
Net investment income (loss) | | | 381,266 | | | | 2,000 | | | | 21,381 | |
| | | | | | | | | | | | |
| | | |
REALIZED/UNREALIZED GAINS (LOSSES): | | | | | | | | | | | | |
Net realized gain (loss) on transactions from investments in non-affiliates | | | 128 | | | | 3 | | | | 3 | |
Change in net unrealized appreciation/depreciation on investments in non-affiliates | | | 7,629 | | | | (14 | ) | | | — | |
| | | | | | | | | | | | |
Net realized/unrealized gains (losses) | | | 7,757 | | | | (11 | ) | | | 3 | |
| | | | | | | | | | | | |
Change in net assets resulting from operations | | $ | 389,023 | | | $ | 1,989 | | | $ | 21,384 | |
| | | | | | | | | | | | |
| (a) | Commencement of operations was March 1, 2018. |
| (b) | Amount rounds to less than one thousand. |
SEE NOTES TO FINANCIAL STATEMENTS.
| | | | | | |
| | | |
| 80 | | | | J.P. MORGAN MONEY MARKET FUNDS | | AUGUST 31, 2018 |
| | | | | | | | | | | | |
| | | JPMorgan
U.S. Government
Money
Market Fund | | |
JPMorgan
U.S. Treasury
Plus Money
Market Fund | | | JPMorgan
Federal
Money
Market Fund | |
INVESTMENT INCOME: | | | | | | | | | | | | |
Interest income from non-affiliates | | $ | 1,237,699 | | | $ | 226,993 | | | $ | 27,314 | |
Interest income from affiliates | | | 31,742 | | | | 3,738 | | | | 186 | |
Income from interfund lending (net) | | | 102 | | | | — | | | | — | |
| | | | | | | | | | | | |
Total investment income | | | 1,269,543 | | | | 230,731 | | | | 27,500 | |
| | | | | | | | | | | | |
| | | |
EXPENSES: | | | | | | | | | | | | |
Investment advisory fees | | | 55,668 | | | | 10,059 | | | | 1,220 | |
Administration fees | | | 47,924 | | | | 8,658 | | | | 1,049 | |
Distribution fees (See Note 4) | | | 8,833 | | | | 1,621 | | | | 15 | |
Service fees (See Note 4) | | | 61,774 | | | | 11,483 | | | | 1,812 | |
Custodian and accounting fees | | | 1,207 | | | | 268 | | | | 45 | |
Interest expense to affiliates | | | — | | | | — | | | | — | (a) |
Professional fees | | | 765 | | | | 159 | | | | 42 | |
Trustees’ and Chief Compliance Officer’s fees | | | 260 | | | | 56 | | | | 18 | |
Printing and mailing costs | | | 430 | | | | 52 | | | | 155 | |
Registration and filing fees | | | 753 | | | | 119 | | | | 18 | |
Transfer agency fees (See Note 2.F.) | | | 1,527 | | | | 250 | | | | 61 | |
Other | | | 303 | | | | 63 | | | | 10 | |
| | | | | | | | | | | | |
Total expenses | | | 179,444 | | | | 32,788 | | | | 4,445 | |
| | | | | | | | | | | | |
Less fees waived | | | (21,338 | ) | | | (4,769 | ) | | | (891 | ) |
Less expense reimbursements | | | — | (a) | | | — | | | | — | |
| | | | | | | | | | | | |
Net expenses | | | 158,106 | | | | 28,019 | | | | 3,554 | |
| | | | | | | | | | | | |
Net investment income (loss) | | | 1,111,437 | | | | 202,712 | | | | 23,946 | |
| | | | | | | | | | | | |
| | | |
REALIZED/UNREALIZED GAINS (LOSSES): | | | | | | | | | | | | |
Net realized gain (loss) on transactions from investments in non-affiliates | | | (1,360 | ) | | | (26 | ) | | | — | (a) |
| | | | | | | | | | | | |
Change in net assets resulting from operations | | $ | 1,110,077 | | | $ | 202,686 | | | $ | 23,946 | |
| | | | | | | | | | | | |
| (a) | Amount rounds to less than one thousand. |
SEE NOTES TO FINANCIAL STATEMENTS.
| | | | | | | | |
| | | |
| AUGUST 31, 2018 | | J.P. MORGAN MONEY MARKET FUNDS | | | | | 81 | |
STATEMENTS OF OPERATIONS
FOR THE SIX MONTHS ENDED AUGUST 31, 2018 (Unaudited) (continued)
(Amounts in thousands)
| | | | | | | | | | | | |
| | |
JPMorgan
100% U.S.
Treasury
Securities
Money
Market Fund | | | JPMorgan
Tax Free
Money
Market Fund | | | JPMorgan
Municipal
Money
Market Fund | |
INVESTMENT INCOME: | | | | | | | | | | | | |
Interest income from non-affiliates | | $ | 329,050 | | | $ | 111,122 | | | $ | 20,939 | |
Interest income from affiliates | | | 7,364 | | | | — | (a) | | | — | (a) |
| | | | | | | | | | | | |
Total investment income | | | 336,414 | | | | 111,122 | | | | 20,939 | |
| | | | | | | | | | | | |
| | | |
EXPENSES: | | | | | | | | | | | | |
Investment advisory fees | | | 14,887 | | | | 6,505 | | | | 1,197 | |
Administration fees | | | 12,806 | | | | 5,601 | | | | 1,030 | |
Distribution fees (See Note 4) | | | 2,081 | | | | 2,771 | | | | 1,557 | |
Service fees (See Note 4) | | | 19,061 | | | | 11,687 | | | | 2,539 | |
Custodian and accounting fees | | | 354 | | | | 204 | | | | 51 | |
Interest expense to affiliates | | | — | | | | 4 | | | | — | (a) |
Professional fees | | | 189 | | | | 106 | | | | 37 | |
Trustees’ and Chief Compliance Officer’s fees | | | 75 | | | | 42 | | | | 18 | |
Printing and mailing costs | | | 49 | | | | 5 | | | | 10 | |
Registration and filing fees | | | 592 | | | | 174 | | | | 167 | |
Transfer agency fees (See Note 2.F.) | | | 370 | | | | 165 | | | | 26 | |
Other | | | 102 | | | | 57 | | | | 14 | |
| | | | | | | | | | | | |
Total expenses | | | 50,566 | | | | 27,321 | | | | 6,646 | |
| | | | | | | | | | | | |
Less fees waived | | | (6,370 | ) | | | (3,255 | ) | | | (717 | ) |
| | | | | | | | | | | | |
Net expenses | | | 44,196 | | | | 24,066 | | | | 5,929 | |
| | | | | | | | | | | | |
Net investment income (loss) | | | 292,218 | | | | 87,056 | | | | 15,010 | |
| | | | | | | | | | | | |
| | | |
REALIZED/UNREALIZED GAINS (LOSSES): | | | | | | | | | | | | |
Net realized gain (loss) on transactions from investments in non-affiliates | | | (98 | ) | | | 642 | | | | 210 | |
| | | | | | | | | | | | |
Change in net assets resulting from operations | | $ | 292,120 | | | $ | 87,698 | | | $ | 15,220 | |
| | | | | | | | | | | | |
| (a) | Amount rounds to less than one thousand. |
SEE NOTES TO FINANCIAL STATEMENTS.
| | | | | | |
| | | |
| 82 | | | | J.P. MORGAN MONEY MARKET FUNDS | | AUGUST 31, 2018 |
STATEMENTS OF CHANGES IN NET ASSETS
FOR THE PERIODS INDICATED
(Amounts in thousands)
| | | | | | | | | | | | |
| | | JPMorgan Prime Money Market Fund | | |
JPMorgan Institutional
Tax Free Money
Market Fund | |
| | | Six Months Ended
August 31, 2018 (Unaudited) | | | Year Ended
February 28, 2018 | | | Period Ended
August 31, 2018 (a) (Unaudited) | |
CHANGE IN NET ASSETS RESULTING FROM OPERATIONS: | | | | | | | | | | | | |
Net investment income (loss) | | $ | 381,266 | | | $ | 427,469 | | | $ | 2,000 | |
Net realized gain (loss) | | | 128 | | | | 5 | | | | 3 | |
Change in net unrealized appreciation/depreciation | | | 7,629 | | | | (9,211 | ) | | | (14 | ) |
| | | | | | | | | | | | |
Change in net assets resulting from operations | | | 389,023 | | | | 418,263 | | | | 1,989 | |
| | | | | | | | | | | | |
| | | |
DISTRIBUTIONS TO SHAREHOLDERS: | | | | | | | | | | | | |
Class C | | | | | | | | | | | | |
From net investment income | | | (10 | ) | | | (12 | ) | | | — | |
From net realized gains | | | — | | | | — | (b) | | | — | |
Agency | | | | | | | | | | | | |
From net investment income | | | (15,006 | ) | | | (15,003 | ) | | | (1 | ) |
From net realized gains | | | — | | | | — | (b) | | | — | |
Capital | | | | | | | | | | | | |
From net investment income | | | (240,116 | ) | | | (283,012 | ) | | | (7 | ) |
From net realized gains | | | — | | | | (8 | ) | | | — | |
IM | | | | | | | | | | | | |
From net investment income | | | (19,462 | ) | | | (24,837 | ) | | | (1,848 | ) |
From net realized gains | | | — | | | | (1 | ) | | | — | |
Institutional Class | | | | | | | | | | | | |
From net investment income | | | (88,312 | ) | | | (89,677 | ) | | | (144 | ) |
From net realized gains | | | — | | | | (3 | ) | | | — | |
Morgan | | | | | | | | | | | | |
From net investment income | | | (8,423 | ) | | | (5,425 | ) | | | — | |
From net realized gains | | | — | | | | — | (b) | | | — | |
Premier | | | | | | | | | | | | |
From net investment income | | | (9,763 | ) | | | (8,924 | ) | | | — | |
From net realized gains | | | — | | | | — | (b) | | | — | |
Reserve | | | | | | | | | | | | |
From net investment income | | | (173 | ) | | | (472 | ) | | | — | |
From net realized gains | | | — | | | | — | (b) | | | — | |
| | | | | | | | | | | | |
Total distributions to shareholders | | | (381,265 | ) | | | (427,374 | ) | | | (2,000 | ) |
| | | | | | | | | | | | |
| | | |
CAPITAL TRANSACTIONS: | | | | | | | | | | | | |
Change in net assets resulting from capital transactions | | | 5,032,203 | | | | 8,095,806 | | | | 600,871 | |
| | | | | | | | | | | | |
| | | |
NET ASSETS: | | | | | | | | | | | | |
Change in net assets | | | 5,039,961 | | | | 8,086,695 | | | | 600,860 | |
Beginning of period | | | 38,598,521 | | | | 30,511,826 | | | | — | |
| | | | | | | | | | | | |
End of period | | $ | 43,638,482 | | | $ | 38,598,521 | | | $ | 600,860 | |
| | | | | | | | | | | | |
Accumulated undistributed (distributions in excess of) net investment income | | $ | (695 | ) | | $ | (696 | ) | | $ | — | |
| | | | | | | | | | | | |
| (a) | Commencement of operations was March 1, 2018. |
| (b) | Amount rounds to less than one thousand. |
SEE NOTES TO FINANCIAL STATEMENTS.
| | | | | | | | |
| | | |
| AUGUST 31, 2018 | | J.P. MORGAN MONEY MARKET FUNDS | | | | | 83 | |
STATEMENTS OF CHANGES IN NET ASSETS
FOR THE PERIODS INDICATED (continued)
(Amounts in thousands)
| | | | | | | | | | | | | | | | |
| | | JPMorgan Liquid Assets Money Market Fund | | |
JPMorgan U.S. Government Money
Market Fund | |
| | | Six Months Ended
August 31, 2018
(Unaudited) | | | Year Ended
February 28, 2018 | | | Six Months Ended
August 31, 2018
(Unaudited) | | | Year Ended
February 28, 2018 | |
CHANGE IN NET ASSETS RESULTING FROM OPERATIONS: | | | | | | | | | | | | | | | | |
Net investment income (loss) | | $ | 21,381 | | | $ | 13,971 | | | $ | 1,111,437 | | | $ | 1,185,670 | |
Net realized gain (loss) | | | 3 | | | | 15 | | | | (1,360 | ) | | | (355 | ) |
| | | | | | | | | | | | | | | | |
Change in net assets resulting from operations | | | 21,384 | | | | 13,986 | | | | 1,110,077 | | | | 1,185,315 | |
| | | | | | | | | | | | | | | | |
| | | | |
DISTRIBUTIONS TO SHAREHOLDERS: | | | | | | | | | | | | | | | | |
Class C | | | | | | | | | | | | | | | | |
From net investment income | | | (118 | ) | | | (102 | ) | | | — | | | | — | |
From net realized gains | | | — | | | | — | (a) | | | — | | | | — | |
Agency | | | | | | | | | | | | | | | | |
From net investment income | | | (1,884 | ) | | | (1,407 | ) | | | (101,783 | ) | | | (99,978 | ) |
From net realized gains | | | — | | | | (1 | ) | | | — | | | | (290 | ) |
Capital | | | | | | | | | | | | | | | | |
From net investment income | | | (2,320 | ) | | | (679 | ) | | | (660,447 | ) | | | (703,390 | ) |
From net realized gains | | | — | | | | (1 | ) | | | — | | | | (1,825 | ) |
Direct (b) | | | | | | | | | | | | | | | | |
From net investment income | | | — | | | | — | | | | — | | | | (639 | ) |
From net realized gains | | | — | | | | — | | | | — | | | | (3 | ) |
Eagle Class | | | | | | | | | | | | | | | | |
From net investment income | | | — | | | | — | | | | (10,896 | ) | | | (4,324 | ) |
From net realized gains | | | — | | | | — | | | | — | | | | (29 | ) |
Eagle Private Wealth Class (c) | | | | | | | | | | | | | | | | |
From net investment income | | | — | | | | — | | | | — | (a) | | | — | (a) |
From net realized gains | | | — | | | | — | | | | — | | | | — | (a) |
E*Trade | | | | | | | | | | | | | | | | |
From net investment income | | | — | | | | — | | | | (1,274 | ) | | | (273 | ) |
From net realized gains | | | — | | | | — | | | | — | | | | (4 | ) |
IM | | | | | | | | | | | | | | | | |
From net investment income | | | — | | | | — | | | | (34,152 | ) | | | (20,693 | ) |
From net realized gains | | | — | | | | — | | | | — | | | | (67 | ) |
Institutional Class | | | | | | | | | | | | | | | | |
From net investment income | | | (11,496 | ) | | | (8,018 | ) | | | (251,568 | ) | | | (299,129 | ) |
From net realized gains | | | — | | | | (8 | ) | | | — | | | | (847 | ) |
Investor | | | | | | | | | | | | | | | | |
From net investment income | | | (73 | ) | | | (43 | ) | | | (5,132 | ) | | | (3,978 | ) |
From net realized gains | | | — | | | | — | (a) | | | — | | | | (17 | ) |
Morgan | | | | | | | | | | | | | | | | |
From net investment income | | | (1,251 | ) | | | (1,223 | ) | | | (8,437 | ) | | | (8,226 | ) |
From net realized gains | | | — | | | | (1 | ) | | | — | | | | (44 | ) |
Premier | | | | | | | | | | | | | | | | |
From net investment income | | | (4,197 | ) | | | (2,444 | ) | | | (31,212 | ) | | | (43,479 | ) |
From net realized gains | | | — | | | | (3 | ) | | | — | | | | (190 | ) |
Reserve | | | | | | | | | | | | | | | | |
From net investment income | | | (40 | ) | | | (48 | ) | | | (297 | ) | | | (352 | ) |
From net realized gains | | | — | | | | — | (a) | | | — | | | | (3 | ) |
Service | | | | | | | | | | | | | | | | |
From net investment income | | | — | | | | — | | | | (6,239 | ) | | | (1,203 | ) |
From net realized gains | | | — | | | | — | | | | — | | | | (26 | ) |
| | | | | | | | | | | | | | | | |
Total distributions to shareholders | | | (21,379 | ) | | | (13,978 | ) | | | (1,111,437 | ) | | | (1,189,009 | ) |
| | | | | | | | | | | | | | | | |
SEE NOTES TO FINANCIAL STATEMENTS.
| | | | | | |
| | | |
| 84 | | | | J.P. MORGAN MONEY MARKET FUNDS | | AUGUST 31, 2018 |
| | | | | | | | | | | | | | | | |
| | | JPMorgan Liquid Assets Money Market Fund | | |
JPMorgan U.S. Government Money
Market Fund | |
| | | Six Months Ended
August 31, 2018
(Unaudited) | | | Year Ended
February 28, 2018 | | | Six Months Ended
August 31, 2018
(Unaudited) | | | Year Ended
February 28, 2018 | |
| | | | |
CAPITAL TRANSACTIONS: | | | | | | | | | | | | | | | | |
Change in net assets resulting from capital transactions | | $ | 1,441,017 | | | $ | 1,019,947 | | | $ | (19,282,399 | ) | | $ | 622,254 | |
| | | | | | | | | | | | | | | | |
| | | | |
NET ASSETS: | | | | | | | | | | | | | | | | |
Change in net assets | | | 1,441,022 | | | | 1,019,955 | | | | (19,283,759 | ) | | | 618,560 | |
Beginning of period | | | 1,792,943 | | | | 772,988 | | | | 152,344,257 | | | | 151,725,697 | |
| | | | | | | | | | | | | | | | |
End of period | | $ | 3,233,965 | | | $ | 1,792,943 | | | $ | 133,060,498 | | | $ | 152,344,257 | |
| | | | | | | | | | | | | | | | |
Accumulated undistributed (distributions in excess of) net investment income | | $ | (214 | ) | | $ | (216 | ) | | $ | (1,358 | ) | | $ | (1,358 | ) |
| | | | | | | | | | | | | | | | |
| (a) | Amount rounds to less than one thousand. |
| (b) | Direct Shares of JPMorgan U.S. Government Money Market Fund had no assets from the close of business on November 22, 2017. |
| (c) | Commencement of offering of class of shares effective August 18, 2017 for JPMorgan U.S. Government Money Market Fund. |
SEE NOTES TO FINANCIAL STATEMENTS.
| | | | | | | | |
| | | |
| AUGUST 31, 2018 | | J.P. MORGAN MONEY MARKET FUNDS | | | | | 85 | |
STATEMENTS OF CHANGES IN NET ASSETS
FOR THE PERIODS INDICATED (continued)
(Amounts in thousands)
| | | | | | | | | | | | | | | | |
| | |
JPMorgan U.S. Treasury Plus Money
Market Fund | | | JPMorgan Federal Money Market Fund | |
| | | Six Months Ended
August 31, 2018
(Unaudited) | | | Year Ended
February 28, 2018 | | | Six Months Ended
August 31, 2018
(Unaudited) | | | Year Ended February 28, 2018 | |
CHANGE IN NET ASSETS RESULTING FROM OPERATIONS: | | | | | | | | | | | | | | | | |
Net investment income (loss) | | $ | 202,712 | | | $ | 179,112 | | | $ | 23,946 | | | $ | 25,406 | |
Net realized gain (loss) | | | (26 | ) | | | (58 | ) | | | — | (a) | | | 36 | |
| | | | | | | | | | | | | | | | |
Change in net assets resulting from operations | | | 202,686 | | | | 179,054 | | | | 23,946 | | | | 25,442 | |
| | | | | | | | | | | | | | | | |
| | | | |
DISTRIBUTIONS TO SHAREHOLDERS: | | | | | | | | | | | | | | | | |
Class C | | | | | | | | | | | | | | | | |
From net investment income | | | (1,642 | ) | | | (641 | ) | | | — | | | | — | |
From net realized gains | | | — | | | | — | (a) | | | — | | | | — | |
Agency | | | | | | | | | | | | | | | | |
From net investment income | | | (7,647 | ) | | | (8,442 | ) | | | (807 | ) | | | (1,103 | ) |
From net realized gains | | | — | | | | (1 | ) | | | — | | | | (1 | ) |
Capital (b) | | | | | | | | | | | | | | | | |
From net investment income | | | (41,669 | ) | | | (10,766 | ) | | | — | | | | — | |
From net realized gains | | | — | | | | — | (a) | | | — | | | | — | |
Direct (c) | | | | | | | | | | | | | | | | |
From net investment income | | | — | | | | (82 | ) | | | — | | | | — | |
From net realized gains | | | — | | | | — | (a) | | | — | | | | — | |
Eagle Class (d) | | | | | | | | | | | | | | | | |
From net investment income | | | — | | | | — | (a) | | | — | | | | — | |
IM | | | | | | | | | | | | | | | | |
From net investment income | | | (24,404 | ) | | | (32,552 | ) | | | — | | | | — | |
From net realized gains | | | — | | | | (3 | ) | | | — | | | | — | |
Institutional Class | | | | | | | | | | | | | | | | |
From net investment income | | | (120,647 | ) | | | (121,085 | ) | | | (21,448 | ) | | | (23,244 | ) |
From net realized gains | | | — | | | | (14 | ) | | | — | | | | (37 | ) |
Investor | | | | | | | | | | | | | | | | |
From net investment income | | | (251 | ) | | | (292 | ) | | | — | | | | — | |
From net realized gains | | | — | | | | — | (a) | | | — | | | | — | |
Morgan | | | | | | | | | | | | | | | | |
From net investment income | | | (2,008 | ) | | | (1,265 | ) | | | (185 | ) | | | (175 | ) |
From net realized gains | | | — | | | | — | (a) | | | — | | | | — | (a) |
Premier | | | | | | | | | | | | | | | | |
From net investment income | | | (4,358 | ) | | | (3,765 | ) | | | (1,506 | ) | | | (883 | ) |
From net realized gains | | | — | | | | (1 | ) | | | — | | | | (2 | ) |
Reserve (e) | | | | | | | | | | | | | | | | |
From net investment income | | | (84 | ) | | | (215 | ) | | | — | | | | — | (a) |
From net realized gains | | | — | | | | — | (a) | | | — | | | | — | |
Service (d) | | | | | | | | | | | | | | | | |
From net investment income | | | — | | | | — | (a) | | | — | | | | — | |
| | | | | | | | | | | | | | | | |
Total distributions to shareholders | | | (202,710 | ) | | | (179,124 | ) | | | (23,946 | ) | | | (25,445 | ) |
| | | | | | | | | | | | | | | | |
SEE NOTES TO FINANCIAL STATEMENTS.
| | | | | | |
| | | |
| 86 | | | | J.P. MORGAN MONEY MARKET FUNDS | | AUGUST 31, 2018 |
| | | | | | | | | | | | | | | | |
| | |
JPMorgan U.S. Treasury Plus Money
Market Fund | | | JPMorgan Federal Money Market Fund | |
| | | Six Months Ended
August 31, 2018
(Unaudited) | | | Year Ended
February 28, 2018 | | | Six Months Ended
August 31, 2018
(Unaudited) | | | Year Ended February 28, 2018 | |
| | | | |
CAPITAL TRANSACTIONS: | | | | | | | | | | | | | | | | |
Change in net assets resulting from capital transactions | | $ | 2,649,405 | | | $ | (2,393,355 | ) | | $ | 375,791 | | | $ | (5,010 | ) |
| | | | | | | | | | | | | | | | |
| | | | |
NET ASSETS: | | | | | | | | | | | | | | | | |
Change in net assets | | | 2,649,381 | | | | (2,393,425 | ) | | | 375,791 | | | | (5,013 | ) |
Beginning of period | | | 22,357,607 | | | | 24,751,032 | | | | 3,058,083 | | | | 3,063,096 | |
| | | | | | | | | | | | | | | | |
End of period | | $ | 25,006,988 | | | $ | 22,357,607 | | | $ | 3,433,874 | | | $ | 3,058,083 | |
| | | | | | | | | | | | | | | | |
Accumulated undistributed (distributions in excess of) net investment income | | $ | (526 | ) | | $ | (528 | ) | | $ | (200 | ) | | $ | (200 | ) |
| | | | | | | | | | | | | | | | |
| (a) | Amount rounds to less than one thousand. |
| (b) | Commencement of offering of class of shares effective September 22, 2017 for JPMorgan U.S. Treasury Plus Money Market Fund. |
| (c) | Direct Shares of JPMorgan U.S. Treasury Plus Money Market Fund had no assets from the close of business on November 22, 2017. |
| (d) | Liquidated on September 22, 2017 for JPMorgan U.S. Treasury Plus Money Market Fund. |
| (e) | Liquidated on September 22, 2017 for JPMorgan Federal Money Market Fund. |
SEE NOTES TO FINANCIAL STATEMENTS.
| | | | | | | | |
| | | |
| AUGUST 31, 2018 | | J.P. MORGAN MONEY MARKET FUNDS | | | | | 87 | |
STATEMENTS OF CHANGES IN NET ASSETS
FOR THE PERIODS INDICATED (continued)
(Amounts in thousands)
| | | | | | | | | | | | | | | | |
| | |
JPMorgan 100% U.S. Treasury Securities
Money Market Fund | | | JPMorgan Tax Free Money Market Fund | |
| | | Six Months Ended
August 31, 2018
(Unaudited) | | | Year Ended
February 28, 2018 | | | Six Months Ended
August 31, 2018
(Unaudited) | | | Year Ended
February 28, 2018 | |
CHANGE IN NET ASSETS RESULTING FROM OPERATIONS: | | | | | | | | | | | | | | | | |
Net investment income (loss) | | $ | 292,218 | | | $ | 238,073 | | | $ | 87,056 | | | $ | 98,155 | |
Net realized gain (loss) | | | (98 | ) | | | 49 | | | | 642 | | | | 287 | |
| | | | | | | | | | | | | | | | |
Change in net assets resulting from operations | | | 292,120 | | | | 238,122 | | | | 87,698 | | | | 98,442 | |
| | | | | | | | | | | | | | | | |
| | | | |
DISTRIBUTIONS TO SHAREHOLDERS: | | | | | | | | | | | | | | | | |
Agency | | | | | | | | | | | | | | | | |
From net investment income | | | (16,285 | ) | | | (13,483 | ) | | | (5,498 | ) | | | (4,078 | ) |
From net realized gains | | | — | | | | — | (a) | | | — | | | | (21 | ) |
Capital | | | | | | | | | | | | | | | | |
From net investment income | | | (151,382 | ) | | | (126,256 | ) | | | — | | | | — | |
From net realized gains | | | — | | | | (3 | ) | | | — | | | | — | |
Direct (b) | | | | | | | | | | | | | | | | |
From net investment income | | | — | | | | — | | | | — | | | | — | (a) |
Institutional Class | | | | | | | | | | | | | | | | |
From net investment income | | | (99,002 | ) | | | (86,373 | ) | | | (69,119 | ) | | | (80,666 | ) |
From net realized gains | | | — | | | | (2 | ) | | | — | | | | (348 | ) |
Morgan | | | | | | | | | | | | | | | | |
From net investment income | | | (11,782 | ) | | | (5,946 | ) | | | (44 | ) | | | (39 | ) |
From net realized gains | | | — | | | | — | (a) | | | — | | | | — | (a) |
Premier | | | | | | | | | | | | | | | | |
From net investment income | | | (8,693 | ) | | | (5,447 | ) | | | (4,912 | ) | | | (7,756 | ) |
From net realized gains | | | — | | | | — | (a) | | | — | | | | (49 | ) |
Reserve | | | | | | | | | | | | | | | | |
From net investment income | | | (5,073 | ) | | | (559 | ) | | | (7,483 | ) | | | (5,616 | ) |
From net realized gains | | | — | | | | — | (a) | | | — | | | | (70 | ) |
Service (c) | | | | | | | | | | | | | | | | |
From net investment income | | | — | | | | — | (a) | | | — | | | | — | |
| | | | | | | | | | | | | | | | |
Total distributions to shareholders | | | (292,217 | ) | | | (238,069 | ) | | | (87,056 | ) | | | (98,643 | ) |
| | | | | | | | | | | | | | | | |
| | | | |
CAPITAL TRANSACTIONS: | | | | | | | | | | | | | | | | |
Change in net assets resulting from capital transactions | | | 6,283,488 | | | | 10,037,394 | | | | (1,156,906 | ) | | | 1,503,242 | |
| | | | | | | | | | | | | | | | |
| | | | |
NET ASSETS: | | | | | | | | | | | | | | | | |
Change in net assets | | | 6,283,391 | | | | 10,037,447 | | | | (1,156,264 | ) | | | 1,503,041 | |
Beginning of period | | | 35,012,995 | | | | 24,975,548 | | | | 16,883,368 | | | | 15,380,327 | |
| | | | | | | | | | | | | | | | |
End of period | | $ | 41,296,386 | | | $ | 35,012,995 | | | $ | 15,727,104 | | | $ | 16,883,368 | |
| | | | | | | | | | | | | | | | |
Accumulated undistributed (distributions in excess of) net investment income | | $ | (592 | ) | | $ | (593 | ) | | $ | (280 | ) | | $ | (280 | ) |
| | | | | | | | | | | | | | | | |
| (a) | Amount rounds to less than one thousand. |
| (b) | Liquidated on September 22, 2017 for JPMorgan Tax Free Money Market Fund. |
| (c) | Liquidated on September 22, 2017 for JPMorgan 100% U.S. Treasury Securities Money Market Fund. |
SEE NOTES TO FINANCIAL STATEMENTS.
| | | | | | |
| | | |
| 88 | | | | J.P. MORGAN MONEY MARKET FUNDS | | AUGUST 31, 2018 |
| | | | | | | | |
| | |
JPMorgan Municipal Money Market Fund | |
| | | Six Months Ended
August 31, 2018
(Unaudited) | | | Year Ended
February 28, 2018 | |
CHANGE IN NET ASSETS RESULTING FROM OPERATIONS: | |
Net investment income (loss) | | $ | 15,010 | | | $ | 9,459 | |
Net realized gain (loss) | | | 210 | | | | 189 | |
| | | | | | | | |
Change in net assets resulting from operations | | | 15,220 | | | | 9,648 | |
| | | | | | | | |
| | |
DISTRIBUTIONS TO SHAREHOLDERS: | | | | | | | | |
Agency | | | | | | | | |
From net investment income | | | (958 | ) | | | (559 | ) |
From net realized gains | | | — | | | | (9 | ) |
Eagle Class | | | | | | | | |
From net investment income | | | (2,043 | ) | | | (1,643 | ) |
From net realized gains | | | — | | | | (63 | ) |
Institutional Class | | | | | | | | |
From net investment income | | | (10,851 | ) | | | (6,259 | ) |
From net realized gains | | | — | | | | (114 | ) |
Morgan | | | | | | | | |
From net investment income | | | (67 | ) | | | (464 | ) |
From net realized gains | | | — | | | | (1 | ) |
Premier | | | | | | | | |
From net investment income | | | (590 | ) | | | (365 | ) |
From net realized gains | | | — | | | | (8 | ) |
Reserve (a) | | | | | | | | |
From net investment income | | | — | | | | — | (b) |
Service | | | | | | | | |
From net investment income | | | (499 | ) | | | (169 | ) |
From net realized gains | | | — | | | | (30 | ) |
| | | | | | | | |
Total distributions to shareholders | | | (15,008 | ) | | | (9,684 | ) |
| | | | | | | | |
| | |
CAPITAL TRANSACTIONS: | | | | | | | | |
Change in net assets resulting from capital transactions | | | 89,960 | | | | 1,011,088 | |
| | | | | | | | |
| | |
NET ASSETS: | | | | | | | | |
Change in net assets | | | 90,172 | | | | 1,011,052 | |
Beginning of period | | | 2,677,115 | | | | 1,666,063 | |
| | | | | | | | |
End of period | | $ | 2,767,287 | | | $ | 2,677,115 | |
| | | | | | | | |
Accumulated undistributed (distributions in excess of) net investment income | | $ | (7 | ) | | $ | (9 | ) |
| | | | | | | | |
| (a) | Liquidated on September 22, 2017 for JPMorgan Municipal Money Market Fund. |
| (b) | Amount rounds to less than one thousand. |
SEE NOTES TO FINANCIAL STATEMENTS.
| | | | | | | | |
| | | |
| AUGUST 31, 2018 | | J.P. MORGAN MONEY MARKET FUNDS | | | | | 89 | |
STATEMENTS OF CHANGES IN NET ASSETS
FOR THE PERIODS INDICATED (continued)
(Amounts in thousands)
| | | | | | | | | | | | |
| | | JPMorgan Prime Money Market Fund | | | JPMorgan
Institutional Tax
Free Money
Market Fund | |
| | | Six Months Ended
August 31, 2018
(Unaudited) | | | Year Ended
February 28, 2018 | | | Period Ended
August 31, 2018 (a)
(Unaudited) | |
CAPITAL TRANSACTIONS: | | | | | | | | | | | | |
Class C | | | | | | | | | | | | |
Proceeds from shares issued | | $ | — | (b) | | $ | 1 | | | $ | — | |
Distributions reinvested | | | 10 | | | | 12 | | | | — | |
Cost of shares redeemed | | | (432 | ) | | | (2,288 | ) | | | — | |
| | | | | | | | | | | | |
Change in net assets resulting from Class C capital transactions | | $ | (422 | ) | | $ | (2,275 | ) | | $ | — | |
| | | | | | | | | | | | |
Agency Class | | | | | | | | | | | | |
Proceeds from shares issued | | $ | 95,890,160 | | | $ | 175,932,980 | | | $ | 99 | |
Distributions reinvested | | | 1,468 | | | | 1,165 | | | | 1 | |
Cost of shares redeemed | | | (95,527,493 | ) | | | (175,443,023 | ) | | | — | |
| | | | | | | | | | | | |
Change in net assets resulting from Agency Class capital transactions | | $ | 364,135 | | | $ | 491,122 | | | $ | 100 | |
| | | | | | | | | | | | |
Capital | | | | | | | | | | | | |
Proceeds from shares issued | | $ | 94,092,659 | | | $ | 150,433,736 | | | $ | 1,827 | |
Distributions reinvested | | | 94,222 | | | | 123,444 | | | | 7 | |
Cost of shares redeemed | | | (92,226,231 | ) | | | (145,987,910 | ) | | | (337 | ) |
| | | | | | | | | | | | |
Change in net assets resulting from Capital capital transactions | | $ | 1,960,650 | | | $ | 4,569,270 | | | $ | 1,497 | |
| | | | | | | | | | | | |
IM | | | | | | | | | | | | |
Proceeds from shares issued | | $ | 3,953,952 | | | $ | 11,688,910 | | | $ | 1,914,889 | |
Distributions reinvested | | | 329 | | | | 275 | | | | 145 | |
Cost of shares redeemed | | | (3,971,417 | ) | | | (11,667,120 | ) | | | (1,341,299 | ) |
| | | | | | | | | | | | |
Change in net assets resulting from IM capital transactions | | $ | (17,136 | ) | | $ | 22,065 | | | $ | 573,735 | |
| | | | | | | | | | | | |
Institutional Class | | | | | | | | | | | | |
Proceeds from shares issued | | $ | 28,470,262 | | | $ | 58,317,191 | | | $ | 25,395 | |
Distributions reinvested | | | 14,867 | | | | 16,510 | | | | 144 | |
Cost of shares redeemed | | | (26,828,325 | ) | | | (55,846,075 | ) | | | — | |
| | | | | | | | | | | | |
Change in net assets resulting from Institutional Class capital transactions | | $ | 1,656,804 | | | $ | 2,487,626 | | | $ | 25,539 | |
| | | | | | | | | | | | |
Morgan | | | | | | | | | | | | |
Proceeds from shares issued | | $ | 101,987,716 | | | $ | 81,855,717 | | | $ | — | |
Distributions reinvested | | | 1,698 | | | | 2,180 | | | | — | |
Cost of shares redeemed | | | (101,193,207 | ) | | | (81,652,318 | ) | | | — | |
| | | | | | | | | | | | |
Change in net assets resulting from Morgan capital transactions | | $ | 796,207 | | | $ | 205,579 | | | $ | — | |
| | | | | | | | | | | | |
Premier | | | | | | | | | | | | |
Proceeds from shares issued | | $ | 17,653,206 | | | $ | 38,226,415 | | | $ | — | |
Distributions reinvested | | | 748 | | | | 1,480 | | | | — | |
Cost of shares redeemed | | | (17,394,476 | ) | | | (37,821,906 | ) | | | — | |
| | | | | | | | | | | | |
Change in net assets resulting from Premier capital transactions | | $ | 259,478 | | | $ | 405,989 | | | $ | — | |
| | | | | | | | | | | | |
Reserve | | | | | | | | | | | | |
Proceeds from shares issued | | $ | 2,153,884 | | | $ | 17,153,665 | | | $ | — | |
Distributions reinvested | | | 47 | | | | 50 | | | | — | |
Cost of shares redeemed | | | (2,141,444 | ) | | | (17,237,285 | ) | | | — | |
| | | | | | | | | | | | |
Change in net assets resulting from Reserve capital transactions | | $ | 12,487 | | | $ | (83,570 | ) | | $ | — | |
| | | | | | | | | | | | |
Total change in net assets resulting from capital transactions | | $ | 5,032,203 | | | $ | 8,095,806 | | | $ | 600,871 | |
| | | | | | | | | | | | |
| (a) | Commencement of operations was March 1, 2018. |
| (b) | Amount rounds to less than one thousand. |
SEE NOTES TO FINANCIAL STATEMENTS.
| | | | | | |
| | | |
| 90 | | | | J.P. MORGAN MONEY MARKET FUNDS | | AUGUST 31, 2018 |
| | | | | | | | | | | | |
| | | JPMorgan Prime Money Market Fund | | | JPMorgan
Institutional Tax
Free Money
Market Fund | |
| | | Six Months Ended
August 31, 2018
(Unaudited) | | | Year Ended
February 28, 2018 | | | Period Ended
August 31, 2018 (a)
(Unaudited) | |
SHARE TRANSACTIONS: | |
Class C | |
Issued | | | — | (b) | | | 1 | | | | — | |
Reinvested | | | 10 | | | | 11 | | | | — | |
Redeemed | | | (432 | ) | | | (2,288 | ) | | | — | |
| | | | | | | | | | | | |
Change in Class C Shares | | | (422 | ) | | | (2,276 | ) | | | — | |
| | | | | | | | | | | | |
Agency Class | | | | | | | | | | | | |
Issued | | | 95,874,464 | | | | 175,884,590 | | | | 99 | |
Reinvested | | | 1,468 | | | | 1,165 | | | | 1 | |
Redeemed | | | (95,511,573 | ) | | | (175,394,499 | ) | | | — | |
| | | | | | | | | | | | |
Change in Agency Class Shares | | | 364,359 | | | | 491,256 | | | | 100 | |
| | | | | | | | | | | | |
Capital | | | | | | | | | | | | |
Issued | | | 94,081,450 | | | | 150,399,180 | | | | 1,827 | |
Reinvested | | | 94,207 | | | | 123,415 | | | | 7 | |
Redeemed | | | (92,215,349 | ) | | | (145,955,068 | ) | | | (337 | ) |
| | | | | | | | | | | | |
Change in Capital Shares | | | 1,960,308 | | | | 4,567,527 | | | | 1,497 | |
| | | | | | | | | | | | |
IM | | | | | | | | | | | | |
Issued | | | 3,953,592 | | | | 11,685,923 | | | | 1,914,891 | |
Reinvested | | | 329 | | | | 275 | | | | 145 | |
Redeemed | | | (3,971,081 | ) | | | (11,664,181 | ) | | | (1,341,300 | ) |
| | | | | | | | | | | | |
Change in IM Shares | | | (17,160 | ) | | | 22,017 | | | | 573,736 | |
| | | | | | | | | | | | |
Institutional Class | | | | | | | | | | | | |
Issued | | | 28,467,473 | | | | 58,302,140 | | | | 25,395 | |
Reinvested | | | 14,865 | | | | 16,505 | | | | 144 | |
Redeemed | | | (26,825,763 | ) | | | (55,831,823 | ) | | | — | |
| | | | | | | | | | | | |
Change in Institutional Class Shares | | | 1,656,575 | | | | 2,486,822 | | | | 25,539 | |
| | | | | | | | | | | | |
Morgan | | | | | | | | | | | | |
Issued | | | 101,971,220 | | | | 81,838,076 | | | | — | |
Reinvested | | | 1,697 | | | | 2,179 | | | | — | |
Redeemed | | | (101,176,654 | ) | | | (81,634,556 | ) | | | — | |
| | | | | | | | | | | | |
Change in Morgan Shares | | | 796,263 | | | | 205,699 | | | | — | |
| | | | | | | | | | | | |
Premier | | | | | | | | | | | | |
Issued | | | 17,651,067 | | | | 38,215,250 | | | | — | |
Reinvested | | | 748 | | | | 1,480 | | | | — | |
Redeemed | | | (17,392,305 | ) | | | (37,810,799 | ) | | | — | |
| | | | | | | | | | | | |
Change in Premier Shares | | | 259,510 | | | | 405,931 | | | | — | |
| | | | | | | | | | | | |
Reserve | | | | | | | | | | | | |
Issued | | | 2,153,568 | | | | 17,149,062 | | | | — | |
Reinvested | | | 47 | | | | 50 | | | | — | |
Redeemed | | | (2,141,124 | ) | | | (17,232,671 | ) | | | — | |
| | | | | | | | | | | | |
Change in Reserve Shares | | | 12,491 | | | | (83,559 | ) | | | — | |
| | | | | | | | | | | | |
| (a) | Commencement of operations was March 1, 2018. |
| (b) | Amount rounds to less than one thousand. |
SEE NOTES TO FINANCIAL STATEMENTS.
| | | | | | | | |
| | | |
| AUGUST 31, 2018 | | J.P. MORGAN MONEY MARKET FUNDS | | | | | 91 | |
STATEMENTS OF CHANGES IN NET ASSETS
FOR THE PERIODS INDICATED (continued)
(Amounts in thousands)
| | | | | | | | | | | | | | | | |
| | | JPMorgan Liquid Assets Money Market Fund | | |
JPMorgan U.S. Government Money
Market Fund | |
| | | Six Months Ended
August 31, 2018
(Unaudited) | | | Year Ended
February 28, 2018 | | | Six Months Ended
August 31, 2018
(Unaudited) | | | Year Ended
February 28, 2018 | |
CAPITAL TRANSACTIONS: | | | | | | | | | | | | | | | | |
Class C | | | | | | | | | | | | | | | | |
Proceeds from shares issued | | $ | 4,811 | | | $ | 11,298 | | | $ | — | | | $ | — | |
Distributions reinvested | | | 118 | | | | 102 | | | | — | | | | — | |
Cost of shares redeemed | | | (7,541 | ) | | | (22,238 | ) | | | — | | | | — | |
| | | | | | | | | | | | | | | | |
Change in net assets resulting from Class C capital transactions | | $ | (2,612 | ) | | $ | (10,838 | ) | | $ | — | | | $ | — | |
| | | | | | | | | | | | | | | | |
Agency | | | | | | | | | | | | | | | | |
Proceeds from shares issued | | $ | 375,968 | | | $ | 353,640 | | | $ | 696,570,182 | | | $ | 1,332,839,837 | |
Distributions reinvested | | | 92 | | | | 37 | | | | 2,808 | | | | 3,007 | |
Cost of shares redeemed | | | (230,527 | ) | | | (231,257 | ) | | | (698,356,254 | ) | | | (1,331,824,427 | ) |
| | | | | | | | | | | | | | | | |
Change in net assets resulting from Agency capital transactions | | $ | 145,533 | | | $ | 122,420 | | | $ | (1,783,264 | ) | | $ | 1,018,417 | |
| | | | | | | | | | | | | | | | |
Capital | | | | | | | | | | | | | | | | |
Proceeds from shares issued | | $ | 588,304 | | | $ | 317,213 | | | $ | 615,855,573 | | | $ | 1,105,967,727 | |
Distributions reinvested | | | 33 | | | | 15 | | | | 289,311 | | | | 312,296 | |
Cost of shares redeemed | | | (378,888 | ) | | | (323,779 | ) | | | (636,444,379 | ) | | | (1,099,730,645 | ) |
| | | | | | | | | | | | | | | | |
Change in net assets resulting from Capital capital transactions | | $ | 209,449 | | | $ | (6,551 | ) | | $ | (20,299,495 | ) | | $ | 6,549,378 | |
| | | | | | | | | | | | | | | | |
Direct (a) | | | | | | | | | | | | | | | | |
Proceeds from shares issued | | $ | — | | | $ | — | | | $ | — | | | $ | 274,510 | |
Cost of shares redeemed | | | — | | | | — | | | | — | | | | (468,347 | ) |
| | | | | | | | | | | | | | | | |
Change in net assets resulting from Direct capital transactions | | $ | — | | | $ | — | | | $ | — | | | $ | (193,837 | ) |
| | | | | | | | | | | | | | | | |
Eagle Class | | | | | | | | | | | | | | | | |
Proceeds from shares issued | | $ | — | | | $ | — | | | $ | 2,428,465 | | | $ | 1,400,257 | |
Distributions reinvested | | | — | | | | — | | | | 10,795 | | | | 4,308 | |
Cost of shares redeemed | | | — | | | | — | | | | (1,068,964 | ) | | | (1,447,122 | ) |
| | | | | | | | | | | | | | | | |
Change in net assets resulting from Eagle Class capital transactions | | $ | — | | | $ | — | | | $ | 1,370,296 | | | $ | (42,557 | ) |
| | | | | | | | | | | | | | | | |
Eagle Private Wealth Class (b) | | | | | | | | | | | | | | | | |
Proceeds from shares issued | | $ | — | | | $ | — | | | $ | — | | | $ | 20 | |
Distributions reinvested | | | — | | | | — | | | | — | (c) | | | — | (c) |
| | | | | | | | | | | | | | | | |
Change in net assets resulting from Eagle Private Wealth Class capital transactions | | $ | — | | | $ | — | | | $ | — | (c) | | $ | 20 | |
| | | | | | | | | | | | | | | | |
E*Trade | | | | | | | | | | | | | | | | |
Proceeds from shares issued | | $ | — | | | $ | — | | | $ | 200,527 | | | $ | 397,717 | |
Distributions reinvested | | | — | | | | — | | | | 1,274 | | | | 277 | |
Cost of shares redeemed | | | — | | | | — | | | | (203,874 | ) | | | (172,170 | ) |
| | | | | | | | | | | | | | | | |
Change in net assets resulting from E*Trade capital transactions | | $ | — | | | $ | — | | | $ | (2,073 | ) | | $ | 225,824 | |
| | | | | | | | | | | | | | | | |
IM | | | | | | | | | | | | | | | | |
Proceeds from shares issued | | $ | — | | | $ | — | | | $ | 16,317,863 | | | $ | 20,353,261 | |
Distributions reinvested | | | — | | | | — | | | | 19,171 | | | | 14,398 | |
Cost of shares redeemed | | | — | | | | — | | | | (14,206,360 | ) | | | (18,463,543 | ) |
| | | | | | | | | | | | | | | | |
Change in net assets resulting from IM capital transactions | | $ | — | | | $ | — | | | $ | 2,130,674 | | | $ | 1,904,116 | |
| | | | | | | | | | | | | | | | |
SEE NOTES TO FINANCIAL STATEMENTS.
| | | | | | |
| | | |
| 92 | | | | J.P. MORGAN MONEY MARKET FUNDS | | AUGUST 31, 2018 |
| | | | | | | | | | | | | | | | |
| | | JPMorgan Liquid Assets Money Market Fund | | |
JPMorgan U.S. Government Money
Market Fund | |
| | | Six Months Ended
August 31, 2018
(Unaudited) | | | Year Ended
February 28, 2018 | | | Six Months Ended
August 31, 2018
(Unaudited) | | | Year Ended
February 28, 2018 | |
CAPITAL TRANSACTIONS: (continued) | | | | | | | | | | | | | | | | |
Institutional Class | | | | | | | | | | | | | | | | |
Proceeds from shares issued | | $ | 1,379,528 | | | $ | 1,787,887 | | | $ | 187,989,504 | | | $ | 412,069,575 | |
Distributions reinvested | | | 3,676 | | | | 1,955 | | | | 112,293 | | | | 108,654 | |
Cost of shares redeemed | | | (713,107 | ) | | | (1,088,013 | ) | | | (188,155,331 | ) | | | (416,502,322 | ) |
| | | | | | | | | | | | | | | | |
Change in net assets resulting from Institutional Class capital transactions | | $ | 670,097 | | | $ | 701,829 | | | $ | (53,534 | ) | | $ | (4,324,093 | ) |
| | | | | | | | | | | | | | | | |
Investor | | | | | | | | | | | | | | | | |
Proceeds from shares issued | | $ | 11,839 | | | $ | 7,156 | | | $ | 307,262 | | | $ | 515,838 | |
Distributions reinvested | | | 71 | | | | 42 | | | | 5,132 | | | | 3,982 | |
Cost of shares redeemed | | | (7,591 | ) | | | (2,516 | ) | | | (265,158 | ) | | | (691,101 | ) |
| | | | | | | | | | | | | | | | |
Change in net assets resulting from Investor capital transactions | | $ | 4,319 | | | $ | 4,682 | | | $ | 47,236 | | | $ | (171,281 | ) |
| | | | | | | | | | | | | | | | |
Morgan | | | | | | | | | | | | | | | | |
Proceeds from shares issued | | $ | 116,470 | | | $ | 112,914 | | | $ | 100,527,385 | | | $ | 202,793,121 | |
Distributions reinvested | | | 1,232 | | | | 1,211 | | | | 3,232 | | | | 2,654 | |
Cost of shares redeemed | | | (82,955 | ) | | | (102,246 | ) | | | (100,045,338 | ) | | | (204,024,871 | ) |
| | | | | | | | | | | | | | | | |
Change in net assets resulting from Morgan capital transactions | | $ | 34,747 | | | $ | 11,879 | | | $ | 485,279 | | | $ | (1,229,096 | ) |
| | | | | | | | | | | | | | | | |
Premier | | | | | | | | | | | | | | | | |
Proceeds from shares issued | | $ | 843,768 | | | $ | 570,364 | | | $ | 81,380,325 | | | $ | 200,367,318 | |
Distributions reinvested | | | 80 | | | | 85 | | | | 1,605 | | | | 2,194 | |
Cost of shares redeemed | | | (463,416 | ) | | | (372,779 | ) | | | (82,758,350 | ) | | | (202,634,298 | ) |
| | | | | | | | | | | | | | | | |
Change in net assets resulting from Premier capital transactions | | $ | 380,432 | | | $ | 197,670 | | | $ | (1,376,420 | ) | | $ | (2,264,786 | ) |
| | | | | | | | | | | | | | | | |
Reserve | | | | | | | | | | | | | | | | |
Proceeds from shares issued | | $ | 667 | | | $ | 1,031 | | | $ | 338,848 | | | $ | 10,773,546 | |
Distributions reinvested | | | 40 | | | | 48 | | | | 281 | | | | 238 | |
Cost of shares redeemed | | | (1,655 | ) | | | (2,223 | ) | | | (333,387 | ) | | | (10,833,988 | ) |
| | | | | | | | | | | | | | | | |
Change in net assets resulting from Reserve capital transactions | | $ | (948 | ) | | $ | (1,144 | ) | | $ | 5,742 | | | $ | (60,204 | ) |
| | | | | | | | | | | | | | | | |
Service | | | | | | | | | | | | | | | | |
Proceeds from shares issued | | $ | — | | | $ | — | | | $ | 1,089,635 | | | $ | 3,994,455 | |
Distributions reinvested | | | — | | | | — | | | | 6,239 | | | | 1,228 | |
Cost of shares redeemed | | | — | | | | — | | | | (902,714 | ) | | | (4,785,330 | ) |
| | | | | | | | | | | | | | | | |
Change in net assets resulting from Service capital transactions | | $ | — | | | $ | — | | | $ | 193,160 | | | $ | (789,647 | ) |
| | | | | | | | | | | | | | | | |
Total change in net assets resulting from capital transactions | | $ | 1,441,017 | | | $ | 1,019,947 | | | $ | (19,282,399 | ) | | $ | 622,254 | |
| | | | | | | | | | | | | | | | |
| (a) | Direct Shares of JPMorgan U.S. Government Money Market Fund had no assets from the close of business on November 22, 2017. |
| (b) | Commencement of offering of class of shares effective August 18, 2017 for JPMorgan U.S. Government Money Market Fund. |
| (c) | Amount rounds to less than one thousand. |
SEE NOTES TO FINANCIAL STATEMENTS.
| | | | | | | | |
| | | |
| AUGUST 31, 2018 | | J.P. MORGAN MONEY MARKET FUNDS | | | | | 93 | |
STATEMENTS OF CHANGES IN NET ASSETS
FOR THE PERIODS INDICATED (continued)
(Amounts in thousands)
| | | | | | | | | | | | | | | | |
| | | JPMorgan Liquid Assets Money Market Fund | | |
JPMorgan U.S. Government Money
Market Fund | |
| | | Six Months Ended
August 31, 2018
(Unaudited) | | | Year Ended
February 28, 2018 | | | Six Months Ended
August 31, 2018
(Unaudited) | | | Year Ended
February 28, 2018 | |
SHARE TRANSACTIONS: | | | | | | | | | | | | | | | | |
Class C | | | | | | | | | | | | | | | | |
Issued | | | 4,811 | | | | 11,298 | | | | — | | | | — | |
Reinvested | | | 118 | | | | 102 | | | | — | | | | — | |
Redeemed | | | (7,541 | ) | | | (22,238 | ) | | | — | | | | — | |
| | | | | | | | | | | | | | | | |
Change in Class C Shares | | | (2,612 | ) | | | (10,838 | ) | | | — | | | | — | |
| | | | | | | | | | | | | | | | |
Agency | | | | | | | | | | | | | | | | |
Issued | | | 375,968 | | | | 353,640 | | | | 696,570,182 | | | | 1,332,839,837 | |
Reinvested | | | 92 | | | | 37 | | | | 2,808 | | | | 3,007 | |
Redeemed | | | (230,527 | ) | | | (231,257 | ) | | | (698,356,254 | ) | | | (1,331,824,427 | ) |
| | | | | | | | | | | | | | | | |
Change in Agency Shares | | | 145,533 | | | | 122,420 | | | | (1,783,264 | ) | | | 1,018,417 | |
| | | | | | | | | | | | | | | | |
Capital | | | | | | | | | | | | | | | | |
Issued | | | 588,304 | | | | 317,205 | | | | 615,855,573 | | | | 1,105,967,727 | |
Reinvested | | | 33 | | | | 15 | | | | 289,311 | | | | 312,296 | |
Redeemed | | | (378,888 | ) | | | (323,771 | ) | | | (636,444,379 | ) | | | (1,099,730,645 | ) |
| | | | | | | | | | | | | | | | |
Change in Capital Shares | | | 209,449 | | | | (6,551 | ) | | | (20,299,495 | ) | | | 6,549,378 | |
| | | | | | | | | | | | | | | | |
Direct (a) | | | | | | | | | | | | | | | | |
Issued | | | — | | | | — | | | | — | | | | 274,510 | |
Redeemed | | | — | | | | — | | | | — | | | | (468,347 | ) |
| | | | | | | | | | | | | | | | |
Change in Direct Shares | | | — | | | | — | | | | — | | | | (193,837 | ) |
| | | | | | | | | | | | | | | | |
Eagle Class | | | | | | | | | | | | | | | | |
Issued | | | — | | | | — | | | | 2,428,465 | | | | 1,400,257 | |
Reinvested | | | — | | | | — | | | | 10,795 | | | | 4,308 | |
Redeemed | | | — | | | | — | | | | (1,068,964 | ) | | | (1,447,122 | ) |
| | | | | | | | | | | | | | | | |
Change in Eagle Class Shares | | | — | | | | — | | | | 1,370,296 | | | | (42,557 | ) |
| | | | | | | | | | | | | | | | |
Eagle Private Wealth Class (b) | | | | | | | | | | | | | | | | |
Issued | | | — | | | | — | | | | — | | | | 20 | |
Reinvested | | | — | | | | — | | | | — | (c) | | | — | (c) |
| | | | | | | | | | | | | | | | |
Change in Eagle Private Wealth Class Shares | | | — | | | | — | | | | — | (c) | | | 20 | |
| | | | | | | | | | | | | | | | |
E*Trade | | | | | | | | | | | | | | | | |
Issued | | | — | | | | — | | | | 200,527 | | | | 397,717 | |
Reinvested | | | — | | | | — | | | | 1,274 | | | | 277 | |
Redeemed | | | — | | | | — | | | | (203,874 | ) | | | (172,170 | ) |
| | | | | | | | | | | | | | | | |
Change in E*Trade Shares | | | — | | | | — | | | | (2,073 | ) | | | 225,824 | |
| | | | | | | | | | | | | | | | |
IM | | | | | | | | | | | | | | | | |
Issued | | | — | | | | — | | | | 16,317,863 | | | | 20,353,261 | |
Reinvested | | | — | | | | — | | | | 19,171 | | | | 14,398 | |
Redeemed | | | — | | | | — | | | | (14,206,360 | ) | | | (18,463,543 | ) |
| | | | | | | | | | | | | | | | |
Change in IM Shares | | | — | | | | — | | | | 2,130,674 | | | | 1,904,116 | |
| | | | | | | | | | | | | | | | |
Institutional Class | | | | | | | | | | | | | | | | |
Issued | | | 1,379,528 | | | | 1,787,882 | | | | 187,989,504 | | | | 412,069,575 | |
Reinvested | | | 3,676 | | | | 1,955 | | | | 112,293 | | | | 108,654 | |
Redeemed | | | (713,107 | ) | | | (1,088,010 | ) | | | (188,155,331 | ) | | | (416,502,322 | ) |
| | | | | | | | | | | | | | | | |
Change in Institutional Class Shares | | | 670,097 | | | | 701,827 | | | | (53,534 | ) | | | (4,324,093 | ) |
| | | | | | | | | | | | | | | | |
SEE NOTES TO FINANCIAL STATEMENTS.
| | | | | | |
| | | |
| 94 | | | | J.P. MORGAN MONEY MARKET FUNDS | | AUGUST 31, 2018 |
| | | | | | | | | | | | | | | | |
| | | JPMorgan Liquid Assets Money Market Fund | | |
JPMorgan U.S. Government Money
Market Fund | |
| | | Six Months Ended
August 31, 2018
(Unaudited) | | | Year Ended
February 28, 2018 | | | Six Months Ended
August 31, 2018
(Unaudited) | | | Year Ended
February 28, 2018 | |
SHARE TRANSACTIONS: (continued) | | | | | | | | | | | | | | | | |
Investor | | | | | | | | | | | | | | | | |
Issued | | | 11,839 | | | | 7,156 | | | | 307,262 | | | | 515,838 | |
Reinvested | | | 71 | | | | 42 | | | | 5,132 | | | | 3,982 | |
Redeemed | | | (7,591 | ) | | | (2,516 | ) | | | (265,158 | ) | | | (691,101 | ) |
| | | | | | | | | | | | | | | | |
Change in Investor Shares | | | 4,319 | | | | 4,682 | | | | 47,236 | | | | (171,281 | ) |
| | | | | | | | | | | | | | | | |
Morgan | | | | | | | | | | | | | | | | |
Issued | | | 116,470 | | | | 112,912 | | | | 100,527,385 | | | | 202,793,121 | |
Reinvested | | | 1,232 | | | | 1,211 | | | | 3,232 | | | | 2,654 | |
Redeemed | | | (82,955 | ) | | | (102,244 | ) | | | (100,045,338 | ) | | | (204,024,871 | ) |
| | | | | | | | | | | | | | | | |
Change in Morgan Shares | | | 34,747 | | | | 11,879 | | | | 485,279 | | | | (1,229,096 | ) |
| | | | | | | | | | | | | | | | |
Premier | | | | | | | | | | | | | | | | |
Issued | | | 843,768 | | | | 570,364 | | | | 81,380,325 | | | | 200,367,318 | |
Reinvested | | | 80 | | | | 85 | | | | 1,605 | | | | 2,194 | |
Redeemed | | | (463,416 | ) | | | (372,777 | ) | | | (82,758,350 | ) | | | (202,634,298 | ) |
| | | | | | | | | | | | | | | | |
Change in Premier Shares | | | 380,432 | | | | 197,672 | | | | (1,376,420 | ) | | | (2,264,786 | ) |
| | | | | | | | | | | | | | | | |
Reserve | |
Issued | | | 667 | | | | 1,031 | | | | 338,848 | | | | 10,773,546 | |
Reinvested | | | 40 | | | | 48 | | | | 281 | | | | 238 | |
Redeemed | | | (1,655 | ) | | | (2,223 | ) | | | (333,387 | ) | | | (10,833,988 | ) |
| | | | | | | | | | | | | | | | |
Change in Reserve Shares | | | (948 | ) | | | (1,144 | ) | | | 5,742 | | | | (60,204 | ) |
| | | | | | | | | | | | | | | | |
Service | | | | | | | | | | | | | | | | |
Issued | | | — | | | | — | | | | 1,089,635 | | | | 3,994,455 | |
Reinvested | | | — | | | | — | | | | 6,239 | | | | 1,228 | |
Redeemed | | | — | | | | — | | | | (902,714 | ) | | | (4,785,330 | ) |
| | | | | | | | | | | | | | | | |
Change in Service Shares | | | — | | | | — | | | | 193,160 | | | | (789,647 | ) |
| | | | | | | | | | | | | | | | |
| (a) | Direct Shares of JPMorgan U.S. Government Money Market Fund had no assets from the close of business on November 22, 2017. |
| (b) | Commencement of offering of class of shares effective August 18, 2017 for JPMorgan U.S. Government Money Market Fund. |
| (c) | Amount rounds to less than one thousand. |
SEE NOTES TO FINANCIAL STATEMENTS.
| | | | | | | | |
| | | |
| AUGUST 31, 2018 | | J.P. MORGAN MONEY MARKET FUNDS | | | | | 95 | |
STATEMENTS OF CHANGES IN NET ASSETS
FOR THE PERIODS INDICATED (continued)
(Amounts in thousands)
| | | | | | | | | | | | | | | | |
| | |
JPMorgan U.S. Treasury Plus Money
Market Fund | | | JPMorgan Federal Money Market Fund | |
| | | Six Months Ended
August 31, 2018
(Unaudited) | | | Year Ended
February 28, 2018 | | | Six Months Ended
August 31, 2018
(Unaudited) | | | Year Ended
February 28, 2018 | |
CAPITAL TRANSACTIONS: | | | | | | | | | | | | | | | | |
Class C | | | | | | | | | | | | | | | | |
Proceeds from shares issued | | $ | 51,936 | | | $ | 243,273 | | | $ | — | | | $ | — | |
Distributions reinvested | | | 1,642 | | | | 641 | | | | — | | | | — | |
Cost of shares redeemed | | | (114,291 | ) | | | (405,435 | ) | | | — | | | | — | |
| | | | | | | | | | | | | | | | |
Change in net assets resulting from Class C capital transactions | | $ | (60,713 | ) | | $ | (161,521 | ) | | $ | — | | | $ | — | |
| | | | | | | | | | | | | | | | |
Agency | | | | | | | | | | | | | | | | |
Proceeds from shares issued | | $ | 51,101,037 | | | $ | 102,127,895 | | | $ | 583,066 | | | $ | 2,358,284 | |
Distributions reinvested | | | 1,101 | | | | 1,851 | | | | 151 | | | | 155 | |
Cost of shares redeemed | | | (50,875,871 | ) | | | (102,036,811 | ) | | | (577,294 | ) | | | (2,364,215 | ) |
| | | | | | | | | | | | | | | | |
Change in net assets resulting from Agency capital transactions | | $ | 226,267 | | | $ | 92,935 | | | $ | 5,923 | | | $ | (5,776 | ) |
| | | | | | | | | | | | | | | | |
Capital (a) | | | | | | | | | | | | | | | | |
Proceeds from shares issued | | $ | 24,272,015 | | | $ | 8,532,208 | | | $ | — | | | $ | — | |
Distributions reinvested | | | 13,493 | | | | 2,387 | | | | — | | | | — | |
Cost of shares redeemed | | | (23,206,661 | ) | | | (5,033,496 | ) | | | — | | | | — | |
| | | | | | | | | | | | | | | | |
Change in net assets resulting from Capital capital transactions | | $ | 1,078,847 | | | $ | 3,501,099 | | | $ | — | | | $ | — | |
| | | | | | | | | | | | | | | | |
Direct (b) | | | | | | | | | | | | | | | | |
Proceeds from shares issued | | $ | — | | | $ | 131,883 | | | $ | — | | | $ | — | |
Cost of shares redeemed | | | — | | | | (137,695 | ) | | | — | | | | — | |
| | | | | | | | | | | | | | | | |
Change in net assets resulting from Direct capital transactions | | $ | — | | | $ | (5,812 | ) | | $ | — | | | $ | — | |
| | | | | | | | | | | | | | | | |
Eagle Class (c) | | | | | | | | | | | | | | | | |
Distributions reinvested | | $ | — | | | $ | — | (d) | | $ | — | | | $ | — | |
Cost of shares redeemed | | | — | | | | (20 | ) | | | — | | | | — | |
| | | | | | | | | | | | | | | | |
Change in net assets resulting from Eagle Class capital transactions | | $ | — | | | $ | (20 | ) | | $ | — | | | $ | — | |
| | | | | | | | | | | | | | | | |
IM | | | | | | | | | | | | | | | | |
Proceeds from shares issued | | $ | 6,086,906 | | | $ | 16,468,071 | | | $ | — | | | $ | — | |
Distributions reinvested | | | 13,639 | | | | 17,166 | | | | — | | | | — | |
Cost of shares redeemed | | | (5,439,394 | ) | | | (20,883,318 | ) | | | — | | | | — | |
| | | | | | | | | | | | | | | | |
Change in net assets resulting from IM capital transactions | | $ | 661,151 | | | $ | (4,398,081 | ) | | $ | — | | | $ | — | |
| | | | | | | | | | | | | | | | |
Institutional Class | | | | | | | | | | | | | | | | |
Proceeds from shares issued | | $ | 49,242,224 | | | $ | 91,735,482 | | | $ | 5,724,405 | | | $ | 10,114,086 | |
Distributions reinvested | | | 72,345 | | | | 61,952 | | | | 7,215 | | | | 7,270 | |
Cost of shares redeemed | | | (48,783,124 | ) | | | (93,109,531 | ) | | | (5,349,381 | ) | | | (10,220,012 | ) |
| | | | | | | | | | | | | | | | |
Change in net assets resulting from Institutional Class capital transactions | | $ | 531,445 | | | $ | (1,312,097 | ) | | $ | 382,239 | | | $ | (98,656 | ) |
| | | | | | | | | | | | | | | | |
Investor | | | | | | | | | | | | | | | | |
Proceeds from shares issued | | $ | 88,176 | | | $ | 212,805 | | | $ | — | | | $ | — | |
Distributions reinvested | | | 4 | | | | 27 | | | | — | | | | — | |
Cost of shares redeemed | | | (96,420 | ) | | | (235,317 | ) | | | — | | | | — | |
| | | | | | | | | | | | | | | | |
Change in net assets resulting from Investor capital transactions | | $ | (8,240 | ) | | $ | (22,485 | ) | | $ | — | | | $ | — | |
| | | | | | | | | | | | | | | | |
SEE NOTES TO FINANCIAL STATEMENTS.
| | | | | | |
| | | |
| 96 | | | | J.P. MORGAN MONEY MARKET FUNDS | | AUGUST 31, 2018 |
| | | | | | | | | | | | | | | | |
| | |
JPMorgan U.S. Treasury Plus Money
Market Fund | | | JPMorgan Federal Money Market Fund | |
| | | Six Months Ended
August 31, 2018
(Unaudited) | | | Year Ended
February 28, 2018 | | | Six Months Ended
August 31, 2018
(Unaudited) | | | Year Ended
February 28, 2018 | |
CAPITAL TRANSACTIONS: (continued) | | | | | | | | | | | | | | | | |
Morgan | | | | | | | | | | | | | | | | |
Proceeds from shares issued | | $ | 30,794,156 | | | $ | 36,942,807 | | | $ | 43,895 | | | $ | 375,535 | |
Distributions reinvested | | | 300 | | | | 235 | | | | 158 | | | | 120 | |
Cost of shares redeemed | | | (30,711,349 | ) | | | (36,904,251 | ) | | | (50,629 | ) | | | (396,520 | ) |
| | | | | | | | | | | | | | | | |
Change in net assets resulting from Morgan capital transactions | | $ | 83,107 | | | $ | 38,791 | | | $ | (6,576 | ) | | $ | (20,865 | ) |
| | | | | | | | | | | | | | | | |
Premier | | | | | | | | | | | | | | | | |
Proceeds from shares issued | | $ | 6,123,771 | | | $ | 10,216,013 | | | $ | 346,148 | | | $ | 705,346 | |
Distributions reinvested | | | 783 | | | | 663 | | | | 219 | | | | 247 | |
Cost of shares redeemed | | | (5,989,496 | ) | | | (10,245,612 | ) | | | (352,162 | ) | | | (585,080 | ) |
| | | | | | | | | | | | | | | | |
Change in net assets resulting from Premier capital transactions | | $ | 135,058 | | | $ | (28,936 | ) | | $ | (5,795 | ) | | $ | 120,513 | |
| | | | | | | | | | | | | | | | |
Reserve (e) | | | | | | | | | | | | | | | | |
Proceeds from shares issued | | $ | 846,589 | | | $ | 16,088,298 | | | $ | — | | | $ | 1 | |
Distributions reinvested | | | 45 | | | | 49 | | | | — | | | | — | (d) |
Cost of shares redeemed | | | (844,151 | ) | | | (16,185,555 | ) | | | — | | | | (227 | ) |
| | | | | | | | | | | | | | | | |
Change in net assets resulting from Reserve capital transactions | | $ | 2,483 | | | $ | (97,208 | ) | | $ | — | | | $ | (226 | ) |
| | | | | | | | | | | | | | | | |
Service (c) | | | | | | | | | | | | | | | | |
Cost of shares redeemed | | | — | | | | (20 | ) | | | — | | | | — | |
| | | | | | | | | | | | | | | | |
Change in net assets resulting from Service capital transactions | | $ | — | | | $ | (20 | ) | | $ | — | | | $ | — | |
| | | | | | | | | | | | | | | | |
Total change in net assets resulting from capital transactions | | $ | 2,649,405 | | | $ | (2,393,355 | ) | | $ | 375,791 | | | $ | (5,010 | ) |
| | | | | | | | | | | | | | | | |
| (a) | Commencement of offering of class of shares effective September 22, 2017 for JPMorgan U.S. Treasury Plus Money Market Fund. |
| (b) | Direct Shares of JPMorgan U.S. Treasury Plus Money Market Fund had no assets from the close of business on November 22, 2017. |
| (c) | Liquidated on September 22, 2017 for JPMorgan U.S. Treasury Plus Money Market Fund. |
| (d) | Amount rounds to less than one thousand. |
| (e) | Liquidated on September 22, 2017 for JPMorgan Federal Money Market Fund. |
SEE NOTES TO FINANCIAL STATEMENTS.
| | | | | | | | |
| | | |
| AUGUST 31, 2018 | | J.P. MORGAN MONEY MARKET FUNDS | | | | | 97 | |
STATEMENTS OF CHANGES IN NET ASSETS
FOR THE PERIODS INDICATED (continued)
(Amounts in thousands)
| | | | | | | | | | | | | | | | |
| | |
JPMorgan U.S. Treasury Plus Money
Market Fund | | | JPMorgan Federal Money Market Fund | |
| | | Six Months Ended
August 31, 2018
(Unaudited) | | | Year Ended
February 28, 2018 | | | Six Months Ended
August 31, 2018
(Unaudited) | | | Year Ended
February 28, 2018 | |
SHARE TRANSACTIONS: | | | | | | | | | | | | | | | | |
Class C | | | | | | | | | | | | | | | | |
Issued | | | 51,936 | | | | 243,273 | | | | — | | | | — | |
Reinvested | | | 1,642 | | | | 641 | | | | — | | | | — | |
Redeemed | | | (114,291 | ) | | | (405,435 | ) | | | — | | | | — | |
| | | | | | | | | | | | | | | | |
Change in Class C Shares | | | (60,713 | ) | | | (161,521 | ) | | | — | | | | — | |
| | | | | | | | | | | | | | | | |
Agency | | | | | | | | | | | | | | | | |
Issued | | | 51,101,037 | | | | 102,127,895 | | | | 583,060 | | | | 2,358,268 | |
Reinvested | | | 1,101 | | | | 1,851 | | | | 151 | | | | 155 | |
Redeemed | | | (50,875,871 | ) | | | (102,036,811 | ) | | | (577,294 | ) | | | (2,364,207 | ) |
| | | | | | | | | | | | | | | | |
Change in Agency Shares | | | 226,267 | | | | 92,935 | | | | 5,917 | | | | (5,784 | ) |
| | | | | | | | | | | | | | | | |
Capital (a) | | | | | | | | | | | | | | | | |
Issued | | | 24,272,015 | | | | 8,532,208 | | | | — | | | | — | |
Reinvested | | | 13,493 | | | | 2,387 | | | | — | | | | — | |
Redeemed | | | (23,206,661 | ) | | | (5,033,496 | ) | | | — | | | | — | |
| | | | | | | | | | | | | | | | |
Change in Capital Shares | | | 1,078,847 | | | | 3,501,099 | | | | — | | | | — | |
| | | | | | | | | | | | | | | | |
Direct (b) | | | | | | | | | | | | | | | | |
Issued | | | — | | | | 131,883 | | | | — | | | | — | |
Redeemed | | | — | | | | (137,695 | ) | | | — | | | | — | |
| | | | | | | | | | | | | | | | |
Change in Direct Shares | | | — | | | | (5,812 | ) | | | — | | | | — | |
| | | | | | | | | | | | | | | | |
Eagle Class (c) | | | | | | | | | | | | | | | | |
Reinvested | | | — | | | | — | (d) | | | — | | | | — | |
Redeemed | | | — | | | | (20 | ) | | | — | | | | — | |
| | | | | | | | | | | | | | | | |
Change in Eagle Class Shares | | | — | | | | (20 | ) | | | — | | | | — | |
| | | | | | | | | | | | | | | | |
IM | | | | | | | | | | | | | | | | |
Issued | | | 6,086,906 | | | | 16,468,071 | | | | — | | | | — | |
Reinvested | | | 13,639 | | | | 17,166 | | | | — | | | | — | |
Redeemed | | | (5,439,394 | ) | | | (20,883,318 | ) | | | — | | | | — | |
| | | | | | | | | | | | | | | | |
Change in IM Shares | | | 661,151 | | | | (4,398,081 | ) | | | — | | | | — | |
| | | | | | | | | | | | | | | | |
Institutional Class | | | | | | | | | | | | | | | | |
Issued | | | 49,242,224 | | | | 91,735,482 | | | | 5,724,395 | | | | 10,114,077 | |
Reinvested | | | 72,345 | | | | 61,952 | | | | 7,215 | | | | 7,270 | |
Redeemed | | | (48,783,124 | ) | | | (93,109,531 | ) | | | (5,349,381 | ) | | | (10,219,997 | ) |
| | | | | | | | | | | | | | | | |
Change in Institutional Class Shares | | | 531,445 | | | | (1,312,097 | ) | | | 382,229 | | | | (98,650 | ) |
| | | | | | | | | | | | | | | | |
Investor | | | | | | | | | | | | | | | | |
Issued | | | 88,176 | | | | 212,805 | | | | — | | | | — | |
Reinvested | | | 4 | | | | 27 | | | | — | | | | — | |
Redeemed | | | (96,420 | ) | | | (235,317 | ) | | | — | | | | — | |
| | | | | | | | | | | | | | | | |
Change in Investor Shares | | | (8,240 | ) | | | (22,485 | ) | | | — | | | | — | |
| | | | | | | | | | | | | | | | |
Morgan | | | | | | | | | | | | | | | | |
Issued | | | 30,794,156 | | | | 36,942,807 | | | | 43,895 | | | | 375,529 | |
Reinvested | | | 300 | | | | 235 | | | | 158 | | | | 120 | |
Redeemed | | | (30,711,349 | ) | | | (36,904,251 | ) | | | (50,629 | ) | | | (396,514 | ) |
| | | | | | | | | | | | | | | | |
Change in Morgan Shares | | | 83,107 | | | | 38,791 | | | | (6,576 | ) | | | (20,865 | ) |
| | | | | | | | | | | | | | | | |
SEE NOTES TO FINANCIAL STATEMENTS.
| | | | | | |
| | | |
| 98 | | | | J.P. MORGAN MONEY MARKET FUNDS | | AUGUST 31, 2018 |
| | | | | | | | | | | | | | | | |
| | |
JPMorgan U.S. Treasury Plus Money
Market Fund | | | JPMorgan Federal Money Market Fund | |
| | | Six Months Ended
August 31, 2018
(Unaudited) | | | Year Ended
February 28, 2018 | | | Six Months Ended
August 31, 2018
(Unaudited) | | | Year Ended
February 28, 2018 | |
SHARE TRANSACTIONS: (continued) | | | | | | | | | | | | | | | | |
Premier | | | | | | | | | | | | | | | | |
Issued | | | 6,123,771 | | | | 10,216,013 | | | | 346,148 | | | | 705,344 | |
Reinvested | | | 783 | | | | 663 | | | | 219 | | | | 247 | |
Redeemed | | | (5,989,496 | ) | | | (10,245,612 | ) | | | (352,146 | ) | | | (585,076 | ) |
| | | | | | | | | | | | | | | | |
Change in Premier Shares | | | 135,058 | | | | (28,936 | ) | | | (5,779 | ) | | | 120,515 | |
| | | | | | | | | | | | | | | | |
Reserve (e) | | | | | | | | | | | | | | | | |
Issued | | | 846,589 | | | | 16,088,298 | | | | — | | | | 1 | |
Reinvested | | | 45 | | | | 49 | | | | — | | | | — | (d) |
Redeemed | | | (844,151 | ) | | | (16,185,555 | ) | | | — | | | | (227 | ) |
| | | | | | | | | | | | | | | | |
Change in Reserve Shares | | | 2,483 | | | | (97,208 | ) | | | — | | | | (226 | ) |
| | | | | | | | | | | | | | | | |
Service (c) | | | | | | | | | | | | | | | | |
Redeemed | | | — | | | | (20 | ) | | | — | | | | — | |
| | | | | | | | | | | | | | | | |
Change in Service Shares | | | — | | | | (20 | ) | | | — | | | | — | |
| | | | | | | | | | | | | | | | |
| (a) | Commencement of offering of class of shares effective September 22, 2017 for JPMorgan U.S. Treasury Plus Money Market Fund. |
| (b) | Direct Shares of JPMorgan U.S. Treasury Plus Money Market Fund had no assets from the close of business on November 22, 2017. |
| (c) | Liquidated on September 22, 2017 for JPMorgan U.S. Treasury Plus Money Market Fund. |
| (d) | Amount rounds to less than one thousand. |
| (e) | Liquidated on September 22, 2017 for JPMorgan Federal Money Market Fund. |
SEE NOTES TO FINANCIAL STATEMENTS.
| | | | | | | | |
| | | |
| AUGUST 31, 2018 | | J.P. MORGAN MONEY MARKET FUNDS | | | | | 99 | |
STATEMENTS OF CHANGES IN NET ASSETS
FOR THE PERIODS INDICATED (continued)
(Amounts in thousands)
| | | | | | | | | | | | | | | | |
| | |
JPMorgan 100% U.S. Treasury Securities
Money Market Fund | | | JPMorgan Tax Free Money Market Fund | |
| | | Six Months Ended
August 31, 2018
(Unaudited) | | | Year Ended
February 28, 2018 | | | Six Months Ended
August 31, 2018
(Unaudited) | | | Year Ended
February 28, 2018 | |
CAPITAL TRANSACTIONS: | | | | | | | | | | | | | | | | |
Agency | | | | | | | | | | | | | | | | |
Proceeds from shares issued | | $ | 131,063,104 | | | $ | 189,633,479 | | | $ | 1,002,005 | | | $ | 1,261,185 | |
Distributions reinvested | | | 3,180 | | | | 3,553 | | | | 374 | | | | 249 | |
Cost of shares redeemed | | | (130,588,663 | ) | | | (189,504,709 | ) | | | (784,103 | ) | | | (867,975 | ) |
| | | | | | | | | | | | | | | | |
Change in net assets resulting from Agency capital transactions | | $ | 477,621 | | | $ | 132,323 | | | $ | 218,276 | | | $ | 393,459 | |
| | | | | | | | | | | | | | | | |
Capital | | | | | | | | | | | | | | | | |
Proceeds from shares issued | | $ | 87,213,067 | | | $ | 69,563,507 | | | $ | — | | | $ | — | |
Distributions reinvested | | | 79,957 | | | | 75,067 | | | | — | | | | — | |
Cost of shares redeemed | | | (86,748,216 | ) | | | (62,060,124 | ) | | | — | | | | — | |
| | | | | | | | | | | | | | | | |
Change in net assets resulting from Capital capital transactions | | $ | 544,808 | | | $ | 7,578,450 | | | $ | — | | | $ | — | |
| | | | | | | | | | | | | | | | |
Direct (a) | | | | | | | | | | | | | | | | |
Distributions reinvested | | $ | — | | | $ | — | | | $ | — | | | $ | — | (b) |
Cost of shares redeemed | | | — | | | | — | | | | — | | | | (20 | ) |
| | | | | | | | | | | | | | | | |
Change in net assets resulting from Direct capital transactions | | $ | — | | | $ | — | | | $ | — | | | $ | (20 | ) |
| | | | | | | | | | | | | | | | |
Institutional Class | | | | | | | | | | | | | | | | |
Proceeds from shares issued | | $ | 27,574,872 | | | $ | 37,650,859 | | | $ | 22,909,932 | | | $ | 36,962,830 | |
Distributions reinvested | | | 25,058 | | | | 28,093 | | | | 5,498 | | | | 5,287 | |
Cost of shares redeemed | | | (24,249,669 | ) | | | (35,995,237 | ) | | | (23,171,425 | ) | | | (35,565,002 | ) |
| | | | | | | | | | | | | | | | |
Change in net assets resulting from Institutional Class capital transactions | | $ | 3,350,261 | | | $ | 1,683,715 | | | $ | (255,995 | ) | | $ | 1,403,115 | |
| | | | | | | | | | | | | | | | |
Morgan | | | | | | | | | | | | | | | | |
Proceeds from shares issued | | $ | 24,140,185 | | | $ | 108,157,082 | | | $ | 3,502 | | | $ | 6,169 | |
Distributions reinvested | | | 8,174 | | | | 2,930 | | | | 44 | | | | 39 | |
Cost of shares redeemed | | | (23,883,749 | ) | | | (107,690,922 | ) | | | (2,166 | ) | | | (8,121 | ) |
| | | | | | | | | | | | | | | | |
Change in net assets resulting from Morgan capital transactions | | $ | 264,610 | | | $ | 469,090 | | | $ | 1,380 | | | $ | (1,913 | ) |
| | | | | | | | | | | | | | | | |
Premier | | | | | | | | | | | | | | | | |
Proceeds from shares issued | | $ | 9,645,758 | | | $ | 22,204,004 | | | $ | 1,381,258 | | | $ | 5,672,681 | |
Distributions reinvested | | | 3,105 | | | | 976 | | | | 59 | | | | 109 | |
Cost of shares redeemed | | | (8,974,225 | ) | | | (22,213,956 | ) | | | (2,022,126 | ) | | | (5,825,895 | ) |
| | | | | | | | | | | | | | | | |
Change in net assets resulting from Premier capital transactions | | $ | 674,638 | | | $ | (8,976 | ) | | $ | (640,809 | ) | | $ | (153,105 | ) |
| | | | | | | | | | | | | | | | |
Reserve | | | | | | | | | | | | | | | | |
Proceeds from shares issued | | $ | 3,835,669 | | | $ | 1,219,652 | | | $ | 6,037,979 | | | $ | 9,371,823 | |
Distributions reinvested | | | 80 | | | | 62 | | | | 13 | | | | 15 | |
Cost of shares redeemed | | | (2,864,199 | ) | | | (1,036,902 | ) | | | (6,517,750 | ) | | | (9,510,132 | ) |
| | | | | | | | | | | | | | | | |
Change in net assets resulting from Reserve capital transactions | | $ | 971,550 | | | $ | 182,812 | | | $ | (479,758 | ) | | $ | (138,294 | ) |
| | | | | | | | | | | | | | | | |
SEE NOTES TO FINANCIAL STATEMENTS.
| | | | | | |
| | | |
| 100 | | | | J.P. MORGAN MONEY MARKET FUNDS | | AUGUST 31, 2018 |
| | | | | | | | | | | | | | | | |
| | |
JPMorgan 100% U.S. Treasury Securities
Money Market Fund | | | JPMorgan Tax Free Money Market Fund | |
| | | Six Months Ended
August 31, 2018
(Unaudited) | | | Year Ended
February 28, 2018 | | | Six Months Ended
August 31, 2018
(Unaudited) | | | Year Ended
February 28, 2018 | |
CAPITAL TRANSACTIONS: (continued) | | | | | | | | | | | | | | | | |
Service (c) | | | | | | | | | | | | | | | | |
Distributions reinvested | | $ | — | | | $ | — | (b) | | $ | — | | | $ | — | |
Cost of shares redeemed | | | — | | | | (20 | ) | | | — | | | | — | |
| | | | | | | | | | | | | | | | |
Change in net assets resulting from Service capital transactions | | $ | — | | | $ | (20 | ) | | $ | — | | | $ | — | |
| | | | | | | | | | | | | | | | |
Total change in net assets resulting from capital transactions | | $ | 6,283,488 | | | $ | 10,037,394 | | | $ | (1,156,906 | ) | | $ | 1,503,242 | |
| | | | | | | | | | | | | | | | |
| (a) | Liquidated on September 22, 2017 for JPMorgan Tax Free Money Market Fund. |
| (b) | Amount rounds to less than one thousand. |
| (c) | Liquidated on September 22, 2017 for JPMorgan 100% U.S. Treasury Securities Money Market Fund. |
SEE NOTES TO FINANCIAL STATEMENTS.
| | | | | | | | |
| | | |
| AUGUST 31, 2018 | | J.P. MORGAN MONEY MARKET FUNDS | | | | | 101 | |
STATEMENTS OF CHANGES IN NET ASSETS
FOR THE PERIODS INDICATED (continued)
(Amounts in thousands)
| | | | | | | | | | | | | | | | |
| | |
JPMorgan 100% U.S. Treasury Securities
Money Market Fund | | | JPMorgan Tax Free Money Market Fund | |
| | | Six Months Ended
August 31, 2018
(Unaudited) | | | Year Ended
February 28, 2018 | | | Six Months Ended
August 31, 2018
(Unaudited) | | | Year Ended
February 28, 2018 | |
SHARE TRANSACTIONS: | | | | | | | | | | | | | | | | |
Agency | | | | | | | | | | | | | | | | |
Issued | | | 131,063,104 | | | | 189,633,479 | | | | 1,002,005 | | | | 1,261,185 | |
Reinvested | | | 3,180 | | | | 3,553 | | | | 374 | | | | 249 | |
Redeemed | | | (130,588,663 | ) | | | (189,504,709 | ) | | | (784,103 | ) | | | (867,975 | ) |
| | | | | | | | | | | | | | | | |
Change in Agency Shares | | | 477,621 | | | | 132,323 | | | | 218,276 | | | | 393,459 | |
| | | | | | | | | | | | | | | | |
Capital | | | | | | | | | | | | | | | | |
Issued | | | 87,213,067 | | | | 69,563,507 | | | | — | | | | — | |
Reinvested | | | 79,957 | | | | 75,067 | | | | — | | | | — | |
Redeemed | | | (86,748,216 | ) | | | (62,060,124 | ) | | | — | | | | — | |
| | | | | | | | | | | | | | | | |
Change in Capital Shares | | | 544,808 | | | | 7,578,450 | | | | — | | | | — | |
| | | | | | | | | | | | | | | | |
Direct (a) | | | | | | | | | | | | | | | | |
Reinvested | | | — | | | | — | | | | — | | | | — | (b) |
Redeemed | | | — | | | | — | | | | — | | | | (20 | ) |
| | | | | | | | | | | | | | | | |
Change in Direct Shares | | | — | | | | — | | | | — | | | | (20 | ) |
| | | | | | | | | | | | | | | | |
Institutional Class | | | | | | | | | | | | | | | | |
Issued | | | 27,574,872 | | | | 37,650,859 | | | | 22,909,932 | | | | 36,962,830 | |
Reinvested | | | 25,058 | | | | 28,093 | | | | 5,498 | | | | 5,287 | |
Redeemed | | | (24,249,669 | ) | | | (35,995,237 | ) | | | (23,171,425 | ) | | | (35,565,002 | ) |
| | | | | | | | | | | | | | | | |
Change in Institutional Class Shares | | | 3,350,261 | | | | 1,683,715 | | | | (255,995 | ) | | | 1,403,115 | |
| | | | | | | | | | | | | | | | |
Morgan | | | | | | | | | | | | | | | | |
Issued | | | 24,140,185 | | | | 108,157,082 | | | | 3,502 | | | | 6,169 | |
Reinvested | | | 8,174 | | | | 2,930 | | | | 44 | | | | 39 | |
Redeemed | | | (23,883,749 | ) | | | (107,690,922 | ) | | | (2,166 | ) | | | (8,121 | ) |
| | | | | | | | | | | | | | | | |
Change in Morgan Shares | | | 264,610 | | | | 469,090 | | | | 1,380 | | | | (1,913 | ) |
| | | | | | | | | | | | | | | | |
Premier | | | | | | | | | | | | | | | | |
Issued | | | 9,645,758 | | | | 22,204,004 | | | | 1,381,258 | | | | 5,672,681 | |
Reinvested | | | 3,105 | | | | 976 | | | | 59 | | | | 109 | |
Redeemed | | | (8,974,225 | ) | | | (22,213,956 | ) | | | (2,022,126 | ) | | | (5,825,895 | ) |
| | | | | | | | | | | | | | | | |
Change in Premier Shares | | | 674,638 | | | | (8,976 | ) | | | (640,809 | ) | | | (153,105 | ) |
| | | | | | | | | | | | | | | | |
Reserve | | | | | | | | | | | | | | | | |
Issued | | | 3,835,669 | | | | 1,219,652 | | | | 6,037,979 | | | | 9,371,823 | |
Reinvested | | | 80 | | | | 62 | | | | 13 | | | | 15 | |
Redeemed | | | (2,864,199 | ) | | | (1,036,902 | ) | | | (6,517,750 | ) | | | (9,510,132 | ) |
| | | | | | | | | | | | | | | | |
Change in Reserve Shares | | | 971,550 | | | | 182,812 | | | | (479,758 | ) | | | (138,294 | ) |
| | | | | | | | | | | | | | | | |
Service (c) | | | | | | | | | | | | | | | | |
Reinvested | | | — | | | | — | (b) | | | — | | | | — | |
Redeemed | | | — | | | | (20 | ) | | | — | | | | — | |
| | | | | | | | | | | | | | | | |
Change in Service Shares | | | — | | | | (20 | ) | | | — | | | | — | |
| | | | | | | | | | | | | | | | |
| (a) | Liquidated on September 22, 2017 for JPMorgan Tax Free Money Market Fund. |
| (b) | Amount rounds to less than one thousand. |
| (c) | Liquidated on September 22, 2017 for JPMorgan 100% U.S. Treasury Securities Money Market Fund. |
SEE NOTES TO FINANCIAL STATEMENTS.
| | | | | | |
| | | |
| 102 | | | | J.P. MORGAN MONEY MARKET FUNDS | | AUGUST 31, 2018 |
| | | | | | | | |
| | |
JPMorgan Municipal Money Market Fund | |
| | | Six Months Ended
August 31, 2018
(Unaudited) | | | Year Ended
February 28, 2018 | |
CAPITAL TRANSACTIONS: | | | | | | | | |
Agency | | | | | | | | |
Proceeds from shares issued | | $ | 178,188 | | | $ | 219,019 | |
Distributions reinvested | | | 30 | | | | 7 | |
Cost of shares redeemed | | | (146,483 | ) | | | (113,823 | ) |
| | | | | | | | |
Change in net assets resulting from Agency capital transactions | | $ | 31,735 | | | $ | 105,203 | |
| | | | | | | | |
Eagle Class | | | | | | | | |
Proceeds from shares issued | | $ | 343,572 | | | $ | 621,811 | |
Distributions reinvested | | | 2,018 | | | | 1,695 | |
Cost of shares redeemed | | | (352,310 | ) | | | (693,449 | ) |
| | | | | | | | |
Change in net assets resulting from Eagle Class capital transactions | | $ | (6,720 | ) | | $ | (69,943 | ) |
| | | | | | | | |
Institutional Class | | | | | | | | |
Proceeds from shares issued | | $ | 6,003,009 | | | $ | 4,115,619 | |
Distributions reinvested | | | 5,673 | | | | 3,024 | |
Cost of shares redeemed | | | (5,934,162 | ) | | | (2,846,718 | ) |
| | | | | | | | |
Change in net assets resulting from Institutional Class capital transactions | | $ | 74,520 | | | $ | 1,271,925 | |
| | | | | | | | |
Morgan | | | | | | | | |
Proceeds from shares issued | | $ | 10,670 | | | $ | 238,782 | |
Distributions reinvested | | | 67 | | | | 421 | |
Cost of shares redeemed | | | (6,269 | ) | | | (538,210 | ) |
| | | | | | | | |
Change in net assets resulting from Morgan capital transactions | | $ | 4,468 | | | $ | (299,007 | ) |
| | | | | | | | |
Premier | | | | | | | | |
Proceeds from shares issued | | $ | 123,613 | | | $ | 188,701 | |
Distributions reinvested | | | 25 | | | | 25 | |
Cost of shares redeemed | | | (115,430 | ) | | | (103,934 | ) |
| | | | | | | | |
Change in net assets resulting from Premier capital transactions | | $ | 8,208 | | | $ | 84,792 | |
| | | | | | | | |
Reserve (a) | | | | | | | | |
Proceeds from shares issued | | $ | — | | | $ | 152 | |
Distributions reinvested | | | — | | | | — | (b) |
Cost of shares redeemed | | | — | | | | (304 | ) |
| | | | | | | | |
Change in net assets resulting from Reserve capital transactions | | $ | — | | | $ | (152 | ) |
| | | | | | | | |
Service | | | | | | | | |
Proceeds from shares issued | | $ | 79,549 | | | $ | 195,492 | |
Distributions reinvested | | | 499 | | | | 199 | |
Cost of shares redeemed | | | (102,299 | ) | | | (277,421 | ) |
| | | | | | | | |
Change in net assets resulting from Service capital transactions | | $ | (22,251 | ) | | $ | (81,730 | ) |
| | | | | | | | |
Total change in net assets resulting from capital transactions | | $ | 89,960 | | | $ | 1,011,088 | |
| | | | | | | | |
| (a) | Liquidated on September 22, 2017 for JPMorgan Municipal Money Market Fund. |
| (b) | Amount rounds to less than one thousand. |
SEE NOTES TO FINANCIAL STATEMENTS.
| | | | | | | | |
| | | |
| AUGUST 31, 2018 | | J.P. MORGAN MONEY MARKET FUNDS | | | | | 103 | |
STATEMENTS OF CHANGES IN NET ASSETS
FOR THE PERIODS INDICATED (continued)
(Amounts in thousands)
| | | | | | | | |
| | |
JPMorgan Municipal Money Market Fund | |
| | | Six Months Ended
August 31, 2018
(Unaudited) | | | Year Ended
February 28, 2018 | |
SHARE TRANSACTIONS: | | | | | | | | |
Agency | | | | | | | | |
Issued | | | 178,188 | | | | 219,017 | |
Reinvested | | | 30 | | | | 7 | |
Redeemed | | | (146,483 | ) | | | (113,823 | ) |
| | | | | | | | |
Change in Agency Shares | | | 31,735 | | | | 105,201 | |
| | | | | | | | |
Eagle Class | | | | | | | | |
Issued | | | 343,572 | | | | 621,811 | |
Reinvested | | | 2,018 | | | | 1,695 | |
Redeemed | | | (352,310 | ) | | | (693,446 | ) |
| | | | | | | | |
Change in Eagle Class Shares | | | (6,720 | ) | | | (69,940 | ) |
| | | | | | | | |
Institutional Class | | | | | | | | |
Issued | | | 6,003,009 | | | | 4,115,584 | |
Reinvested | | | 5,673 | | | | 3,024 | |
Redeemed | | | (5,934,162 | ) | | | (2,846,718 | ) |
| | | | | | | | |
Change in Institutional Class Shares | | | 74,520 | | | | 1,271,890 | |
| | | | | | | | |
Morgan | | | | | | | | |
Issued | | | 10,670 | | | | 238,782 | |
Reinvested | | | 67 | | | | 421 | |
Redeemed | | | (6,269 | ) | | | (538,182 | ) |
| | | | | | | | |
Change in Morgan Shares | | | 4,468 | | | | (298,979 | ) |
| | | | | | | | |
Premier | | | | | | | | |
Issued | | | 123,613 | | | | 188,699 | |
Reinvested | | | 25 | | | | 25 | |
Redeemed | | | (115,430 | ) | | | (103,934 | ) |
| | | | | | | | |
Change in Premier Shares | | | 8,208 | | | | 84,790 | |
| | | | | | | | |
Reserve (a) | | | | | | | | |
Issued | | | — | | | | 152 | |
Reinvested | | | — | | | | — | (b) |
Redeemed | | | — | | | | (304 | ) |
| | | | | | | | |
Change in Reserve Shares | | | — | | | | (152 | ) |
| | | | | | | | |
Service | | | | | | | | |
Issued | | | 79,549 | | | | 195,492 | |
Reinvested | | | 499 | | | | 199 | |
Redeemed | | | (102,299 | ) | | | (277,413 | ) |
| | | | | | | | |
Change in Service Shares | | | (22,251 | ) | | | (81,722 | ) |
| | | | | | | | |
| (a) | Liquidated on September 22, 2017 for JPMorgan Municipal Money Market Fund. |
| (b) | Amount rounds to less than one thousand. |
SEE NOTES TO FINANCIAL STATEMENTS.
| | | | | | |
| | | |
| 104 | | | | J.P. MORGAN MONEY MARKET FUNDS | | AUGUST 31, 2018 |
THIS PAGE IS INTENTIONALLY LEFT BLANK
| | | | | | | | |
| | | |
| AUGUST 31, 2018 | | J.P. MORGAN MONEY MARKET FUNDS | | | | | 105 | |
FINANCIAL HIGHLIGHTS
FOR THE PERIODS INDICATED
| | | | | | | | | | | | | | | | | | | | | | | | | | | | |
| | | Per share operating performance | |
| | | | | | Investment operations | | | Distributions | |
| | | Net asset
value,
beginning
of period | | | Net
investment
income
(loss) | | | Net realized
and unrealized
gains
(losses) on
investments | | | Total from
investment
operations | | | Net
investment
income | | | Net
realized
gain | | | Total
distributions | |
JPMorgan Prime Money Market Fund* | | | | | | | | | | | | | | | | | | | | | | | | | | | | |
Class C | | | | | | | | | | | | | | | | | | | | | | | | | | | | |
Six Months Ended August 31, 2018 (Unaudited) | | $ | 1.0001 | | | $ | 0.0056 | (d) | | $ | 0.0002 | | | $ | 0.0058 | | | $ | (0.0056 | ) | | $ | — | | | $ | (0.0056 | ) |
Year Ended February 28, 2018 | | | 1.0004 | | | | 0.0039 | (d) | | | — | (e) | | | 0.0039 | | | | (0.0042 | ) | | | — | (e) | | | (0.0042 | ) |
Year Ended February 28, 2017 | | | 1.00 | | | | 0.0001 | (d) | | | 0.0006 | | | | 0.0007 | | | | (0.0003 | ) | | | — | (e) | | | (0.0003 | ) |
Year Ended February 29, 2016 | | | 1.00 | | | | — | (d)(f) | | | — | (f) | | | — | (f) | | | — | (f) | | | — | (f) | | | — | (f) |
Year Ended February 28, 2015 | | | 1.00 | | | | — | (f) | | | — | (f) | | | — | (f) | | | — | (f) | | | — | (f) | | | — | (f) |
Year Ended February 28, 2014 | | | 1.00 | | | | — | (f) | | | — | (f) | | | — | (f) | | | — | (f) | | | — | (f) | | | — | (f) |
| | | | | | | |
Agency | | | | | | | | | | | | | | | | | | | | | | | | | | | | |
Six Months Ended August 31, 2018 (Unaudited) | | | 1.0001 | | | | 0.0093 | (d) | | | 0.0001 | | | | 0.0094 | | | | (0.0092 | ) | | | — | | | | (0.0092 | ) |
Year Ended February 28, 2018 | | | 1.0004 | | | | 0.0114 | (d) | | | (0.0004 | ) | | | 0.0110 | | | | (0.0113 | ) | | | — | (e) | | | (0.0113 | ) |
Year Ended February 28, 2017 | | | 1.00 | | | | 0.0036 | (d) | | | 0.0016 | | | | 0.0052 | | | | (0.0048 | ) | | | — | (e) | | | (0.0048 | ) |
Year Ended February 29, 2016 | | | 1.00 | | | | — | (d)(f) | | | — | (f) | | | — | (f) | | | — | (f) | | | — | (f) | | | — | (f) |
Year Ended February 28, 2015 | | | 1.00 | | | | — | (f) | | | — | (f) | | | — | (f) | | | — | (f) | | | — | (f) | | | — | (f) |
Year Ended February 28, 2014 | | | 1.00 | | | | — | (f) | | | — | (f) | | | — | (f) | | | — | (f) | | | — | (f) | | | — | (f) |
| | | | | | | |
Capital | | | | | | | | | | | | | | | | | | | | | | | | | | | | |
Six Months Ended August 31, 2018 (Unaudited) | | | 1.0001 | | | | 0.0096 | (d) | | | 0.0002 | | | | 0.0098 | | | | (0.0096 | ) | | | — | | | | (0.0096 | ) |
Year Ended February 28, 2018 | | | 1.0004 | | | | 0.0122 | (d) | | | (0.0004 | ) | | | 0.0118 | | | | (0.0121 | ) | | | — | (e) | | | (0.0121 | ) |
Year Ended February 28, 2017 | | | 1.00 | | | | 0.0047 | (d) | | | 0.0014 | | | | 0.0061 | | | | (0.0057 | ) | | | — | (e) | | | (0.0057 | ) |
Year Ended February 29, 2016 | | | 1.00 | | | | — | (d)(f) | | | — | (f) | | | — | (f) | | | — | (f) | | | — | (f) | | | — | (f) |
Year Ended February 28, 2015 | | | 1.00 | | | | — | (f) | | | — | (f) | | | — | (f) | | | — | (f) | | | — | (f) | | | — | (f) |
Year Ended February 28, 2014 | | | 1.00 | | | | — | (f) | | | — | (f) | | | — | (f) | | | — | (f) | | | — | (f) | | | — | (f) |
| | | | | | | |
IM | | | | | | | | | | | | | | | | | | | | | | | | | | | | |
Six Months Ended August 31, 2018 (Unaudited) | | | 1.0001 | | | | 0.0097 | (d) | | | 0.0002 | | | | 0.0099 | | | | (0.0097 | ) | | | — | | | | (0.0097 | ) |
Year Ended February 28, 2018 | | | 1.0004 | | | | 0.0124 | (d) | | | (0.0004 | ) | | | 0.0120 | | | | (0.0123 | ) | | | — | (e) | | | (0.0123 | ) |
Year Ended February 28, 2017 | | | 1.00 | | | | 0.0055 | (d) | | | 0.0007 | | | | 0.0062 | | | | (0.0058 | ) | | | — | (e) | | | (0.0058 | ) |
Year Ended February 29, 2016 | | | 1.00 | | | | — | (d)(f) | | | — | (f) | | | — | (f) | | | — | (f) | | | — | (f) | | | — | (f) |
Year Ended February 28, 2015 | | | 1.00 | | | | — | (f) | | | — | (f) | | | — | (f) | | | — | (f) | | | — | (f) | | | — | (f) |
Year Ended February 28, 2014 | | | 1.00 | | | | — | (f) | | | — | (f) | | | — | (f) | | | — | (f) | | | — | (f) | | | — | (f) |
| | | | | | | |
Institutional Class | | | | | | | | | | | | | | | | | | | | | | | | | | | | |
Six Months Ended August 31, 2018 (Unaudited) | | | 1.0001 | | | | 0.0095 | (d) | | | 0.0002 | | | | 0.0097 | | | | (0.0095 | ) | | | — | | | | (0.0095 | ) |
Year Ended February 28, 2018 | | | 1.0004 | | | | 0.0119 | (d) | | | (0.0004 | ) | | | 0.0115 | | | | (0.0118 | ) | | | — | (e) | | | (0.0118 | ) |
Year Ended February 28, 2017 | | | 1.00 | | | | 0.0044 | (d) | | | 0.0014 | | | | 0.0058 | | | | (0.0054 | ) | | | — | (e) | | | (0.0054 | ) |
Year Ended February 29, 2016 | | | 1.00 | | | | — | (d)(f) | | | — | (f) | | | — | (f) | | | — | (f) | | | — | (f) | | | — | (f) |
Year Ended February 28, 2015 | | | 1.00 | | | | — | (f) | | | — | (f) | | | — | (f) | | | — | (f) | | | — | (f) | | | — | (f) |
Year Ended February 28, 2014 | | | 1.00 | | | | — | (f) | | | — | (f) | | | — | (f) | | | — | (f) | | | — | (f) | | | — | (f) |
| | | | | | | |
Morgan | | | | | | | | | | | | | | | | | | | | | | | | | | | | |
Six Months Ended August 31, 2018 (Unaudited) | | | 1.0001 | | | | 0.0081 | (d) | | | — | | | | 0.0081 | | | | (0.0079 | ) | | | — | | | | (0.0079 | ) |
Year Ended February 28, 2018 | | | 1.0004 | | | | 0.0089 | (d) | | | (0.0005 | ) | | | 0.0084 | | | | (0.0087 | ) | | | — | (e) | | | (0.0087 | ) |
Year Ended February 28, 2017 | | | 1.00 | | | | 0.0014 | (d) | | | 0.0012 | | | | 0.0026 | | | | (0.0022 | ) | | | — | (e) | | | (0.0022 | ) |
Year Ended February 29, 2016 | | | 1.00 | | | | — | (d)(f) | | | — | (f) | | | — | (f) | | | — | (f) | | | — | (f) | | | — | (f) |
Year Ended February 28, 2015 | | | 1.00 | | | | — | (f) | | | — | (f) | | | — | (f) | | | — | (f) | | | — | (f) | | | — | (f) |
Year Ended February 28, 2014 | | | 1.00 | | | | — | (f) | | | — | (f) | | | — | (f) | | | — | (f) | | | — | (f) | | | — | (f) |
| (a) | Annualized for periods less than one year, unless otherwise noted. |
| (b) | Not annualized for periods less than one year. |
| (c) | Includes earnings credits and interest expense, if applicable, each of which is less than 0.005% unless otherwise noted. |
| (d) | Calculated based upon average shares outstanding. |
| (e) | Amount rounds to less than $0.00005. |
| (f) | Amount rounds to less than $0.005. |
| * | The Prime Money Market Fund began utilizing a floating NAV calculated to four decimal places on October 3, 2016. |
SEE NOTES TO FINANCIAL STATEMENTS.
| | | | | | |
| | | |
| 106 | | | | J.P. MORGAN MONEY MARKET FUNDS | | AUGUST 31, 2018 |
| | | | | | | | | | | | | | | | | | | | | | |
| | | Ratios/Supplemental data | |
| | | | | | | | | | Ratios to average net assets (a) | |
Net asset
value,
end of
period | | | Total return (b) | | | Net assets,
end of
period
(000’s) | | | Net
expenses (c) | | | Net
investment
income
(loss) | | | Expenses
without waivers,
reimbursements and
earnings credits | |
| | | | | | | | | | | | | | | | | | | | | | |
| | | | | | | | | | | | | | | | | | | | | | |
| $ | 1.0003 | | | | 0.59 | % | | $ | 1,590 | | | | 0.97 | % | | | 1.11 | % | | | 2.59 | % |
| | 1.0001 | | | | 0.39 | | | | 2,012 | | | | 0.97 | | | | 0.39 | | | | 2.27 | |
| | 1.0004 | | | | 0.07 | | | | 4,289 | | | | 0.60 | | | | 0.01 | | | | 1.20 | |
| | 1.0000 | | | | 0.01 | | | | 39,558 | | | | 0.34 | | | | 0.01 | | | | 1.18 | |
| | 1.0000 | | | | 0.01 | | | | 16,897 | | | | 0.22 | | | | 0.01 | | | | 1.16 | |
| | 1.0000 | | | | 0.01 | | | | 17,658 | | | | 0.23 | | | | 0.01 | | | | 1.16 | |
| | | | | |
| | | | | | | | | | | | | | | | | | | | | | |
| | 1.0003 | | | | 0.95 | | | | 1,858,724 | | | | 0.26 | | | | 1.84 | | | | 0.31 | |
| | 1.0001 | | | | 1.10 | | | | 1,494,001 | | | | 0.26 | | | | 1.14 | | | | 0.31 | |
| | 1.0004 | | | | 0.52 | | | | 1,002,964 | | | | 0.26 | | | | 0.36 | | | | 0.31 | |
| | 1.0000 | | | | 0.07 | | | | 8,141,439 | | | | 0.26 | | | | 0.07 | | | | 0.31 | |
| | 1.0000 | | | | 0.01 | | | | 6,603,508 | | | | 0.22 | | | | 0.01 | | | | 0.31 | |
| | 1.0000 | | | | 0.01 | | | | 7,565,361 | | | | 0.23 | | | | 0.01 | | | | 0.31 | |
| | | | | |
| | | | | | | | | | | | | | | | | | | | | | |
| | 1.0003 | | | | 0.99 | | | | 26,619,279 | | | | 0.18 | | | | 1.91 | | | | 0.21 | |
| | 1.0001 | | | | 1.18 | | | | 24,654,174 | | | | 0.18 | | | | 1.22 | | | | 0.21 | |
| | 1.0004 | | | | 0.61 | | | | 20,091,103 | | | | 0.17 | | | | 0.47 | | | | 0.21 | |
| | 1.0000 | | | | 0.14 | | | | 64,690,852 | | | | 0.18 | | | | 0.14 | | | | 0.21 | |
| | 1.0000 | | | | 0.05 | | | | 66,140,350 | | | | 0.18 | | | | 0.05 | | | | 0.21 | |
| | 1.0000 | | | | 0.06 | | | | 68,193,741 | | | | 0.18 | | | | 0.06 | | | | 0.21 | |
| | | | | |
| | | | | | | | | | | | | | | | | | | | | | |
| | 1.0003 | | | | 1.00 | | | | 2,015,286 | | | | 0.16 | | | | 1.93 | | | | 0.16 | |
| | 1.0001 | | | | 1.21 | | | | 2,032,079 | | | | 0.16 | | | | 1.24 | | | | 0.16 | |
| | 1.0004 | | | | 0.62 | | | | 2,010,581 | | | | 0.16 | | | | 0.55 | | | | 0.17 | |
| | 1.0000 | | | | 0.17 | | | | 2,628,508 | | | | 0.16 | | | | 0.16 | | | | 0.16 | |
| | 1.0000 | | | | 0.07 | | | | 3,749,460 | | | | 0.16 | | | | 0.08 | | | | 0.16 | |
| | 1.0000 | | | | 0.08 | | | | 100 | | | | 0.16 | | | | 0.08 | | | | 0.16 | |
| | | | | |
| | | | | | | | | | | | | | | | | | | | | | |
| | 1.0003 | | | | 0.97 | | | | 10,225,859 | | | | 0.21 | | | | 1.89 | | | | 0.26 | |
| | 1.0001 | | | | 1.15 | | | | 8,567,374 | | | | 0.21 | | | | 1.19 | | | | 0.26 | |
| | 1.0004 | | | | 0.58 | | | | 6,081,787 | | | | 0.20 | | | | 0.44 | | | | 0.26 | |
| | 1.0000 | | | | 0.11 | | | | 20,011,248 | | | | 0.21 | | | | 0.10 | | | | 0.26 | |
| | 1.0000 | | | | 0.02 | | | | 27,718,738 | | | | 0.21 | | | | 0.02 | | | | 0.26 | |
| | 1.0000 | | | | 0.03 | | | | 29,139,007 | | | | 0.21 | | | | 0.03 | | | | 0.26 | |
| | | | | |
| | | | | | | | | | | | | | | | | | | | | | |
| | 1.0003 | | | | 0.81 | | | | 1,536,491 | | | | 0.52 | | | | 1.60 | | | | 0.55 | |
| | 1.0001 | | | | 0.84 | | | | 739,866 | | | | 0.52 | | | | 0.89 | | | | 0.56 | |
| | 1.0004 | | | | 0.26 | | | | 534,288 | | | | 0.52 | | | | 0.14 | | | | 0.54 | |
| | 1.0000 | | | | 0.01 | | | | 1,877,099 | | | | 0.31 | | | | 0.01 | | | | 0.52 | |
| | 1.0000 | | | | 0.01 | | | | 2,278,962 | | | | 0.22 | | | | 0.01 | | | | 0.51 | |
| | 1.0000 | | | | 0.01 | | | | 2,332,919 | | | | 0.23 | | | | 0.01 | | | | 0.51 | |
SEE NOTES TO FINANCIAL STATEMENTS.
| | | | | | | | |
| | | |
| AUGUST 31, 2018 | | J.P. MORGAN MONEY MARKET FUNDS | | | | | 107 | |
FINANCIAL HIGHLIGHTS
FOR THE PERIODS INDICATED (continued)
| | | | | | | | | | | | | | | | | | | | | | | | | | | | |
| | | Per share operating performance | |
| | | | | | Investment operations | | | Distributions | |
| | | Net asset
value,
beginning
of period | | | Net
investment
income
(loss) | | | Net realized
and unrealized
gains
(losses) on
investments | | | Total from
investment
operations | | | Net
investment
income | | | Net
realized
gain | | | Total
distributions | |
JPMorgan Prime Money Market Fund* (continued) | | | | | | | | | | | | | | | | | | | | | | | | | | | | |
Premier | | | | | | | | | | | | | | | | | | | | | | | | | | | | |
Six Months Ended August 31, 2018 (Unaudited) | | $ | 1.0001 | | | $ | 0.0083 | (d) | | $ | 0.0002 | | | $ | 0.0085 | | | $ | (0.0083 | ) | | $ | — | | | $ | (0.0083 | ) |
Year Ended February 28, 2018 | | | 1.0004 | | | | 0.0096 | (d) | | | (0.0005 | ) | | | 0.0091 | | | | (0.0094 | ) | | | — | (e) | | | (0.0094 | ) |
Year Ended February 28, 2017 | | | 1.00 | | | | 0.0020 | (d) | | | 0.0013 | | | | 0.0033 | | | | (0.0029 | ) | | | — | (e) | | | (0.0029 | ) |
Year Ended February 29, 2016 | | | 1.00 | | | | — | (d)(f) | | | — | (f) | | | — | (f) | | | — | (f) | | | — | (f) | | | — | (f) |
Year Ended February 28, 2015 | | | 1.00 | | | | — | (f) | | | — | (f) | | | — | (f) | | | — | (f) | | | — | (f) | | | — | (f) |
Year Ended February 28, 2014 | | | 1.00 | | | | — | (f) | | | — | (f) | | | — | (f) | | | — | (f) | | | — | (f) | | | — | (f) |
| | | | | | | |
Reserve | | | | | | | | | | | | | | | | | | | | | | | | | | | | |
Six Months Ended August 31, 2018 (Unaudited) | | | 1.0001 | | | | 0.0071 | (d) | | | 0.0001 | | | | 0.0072 | | | | (0.0070 | ) | | | — | | | | (0.0070 | ) |
Year Ended February 28, 2018 | | | 1.0004 | | | | 0.0062 | (d) | | | 0.0004 | | | | 0.0066 | | | | (0.0069 | ) | | | — | (e) | | | (0.0069 | ) |
Year Ended February 28, 2017 | | | 1.00 | | | | 0.0003 | (d) | | | 0.0013 | | | | 0.0016 | | | | (0.0012 | ) | | | — | (e) | | | (0.0012 | ) |
Year Ended February 29, 2016 | | | 1.00 | | | | — | (d)(f) | | | — | (f) | | | — | (f) | | | — | (f) | | | — | (f) | | | — | (f) |
Year Ended February 28, 2015 | | | 1.00 | | | | — | (f) | | | — | (f) | | | — | (f) | | | — | (f) | | | — | (f) | | | — | (f) |
Year Ended February 28, 2014 | | | 1.00 | | | | — | (f) | | | — | (f) | | | — | (f) | | | — | (f) | | | — | (f) | | | — | (f) |
| (a) | Annualized for periods less than one year, unless otherwise noted. |
| (b) | Not annualized for periods less than one year. |
| (c) | Includes earnings credits and interest expense, if applicable, each of which is less than 0.005% unless otherwise noted. |
| (d) | Calculated based upon average shares outstanding. |
| (e) | Amount rounds to less than $0.00005. |
| (f) | Amount rounds to less than $0.005. |
| * | The Prime Money Market Fund began utilizing a floating NAV calculated to four decimal places on October 3, 2016. |
SEE NOTES TO FINANCIAL STATEMENTS.
| | | | | | |
| | | |
| 108 | | | | J.P. MORGAN MONEY MARKET FUNDS | | AUGUST 31, 2018 |
| | | | | | | | | | | | | | | | | | | | | | |
| | | Ratios/Supplemental data | |
| | | | | | | | | | Ratios to average net assets (a) | |
Net asset
value,
end of
period | | | Total return (b) | | | Net assets,
end of
period
(000’s) | | | Net
expenses (c) | | | Net
investment
income
(loss) | | | Expenses
without waivers,
reimbursements and
earnings credits | |
| | | | | | | | | | | | | | | | | | | | | | |
| | | | | | | | | | | | | | | | | | | | | | |
| $ | 1.0003 | | | | 0.85 | % | | $ | 1,352,909 | | | | 0.45 | % | | | 1.65 | % | | | 0.46 | % |
| | 1.0001 | | | | 0.91 | | | | 1,093,169 | | | | 0.45 | | | | 0.96 | | | | 0.46 | |
| | 1.0004 | | | | 0.33 | | | | 687,368 | | | | 0.45 | | | | 0.20 | | | | 0.46 | |
| | 1.0000 | | | | 0.02 | | | | 2,030,985 | | | | 0.30 | | | | 0.02 | | | | 0.46 | |
| | 1.0000 | | | | 0.01 | | | | 1,589,780 | | | | 0.22 | | | | 0.01 | | | | 0.46 | |
| | 1.0000 | | | | 0.01 | | | | 2,021,372 | | | | 0.23 | | | | 0.01 | | | | 0.46 | |
| | | | | |
| | | | | | | | | | | | | | | | | | | | | | |
| | 1.0003 | | | | 0.72 | | | | 28,344 | | | | 0.70 | | | | 1.41 | | | | 0.87 | |
| | 1.0001 | | | | 0.66 | | | | 15,846 | | | | 0.70 | | | | 0.62 | | | | 0.76 | |
| | 1.0004 | | | | 0.16 | | | | 99,446 | | | | 0.58 | | | | 0.03 | | | | 0.71 | |
| | 1.0000 | | | | 0.01 | | | | 930,188 | | | | 0.31 | | | | 0.01 | | | | 0.71 | |
| | 1.0000 | | | | 0.01 | | | | 1,154,468 | | | | 0.22 | | | | 0.01 | | | | 0.71 | |
| | 1.0000 | | | | 0.01 | | | | 1,426,646 | | | | 0.23 | | | | 0.01 | | | | 0.71 | |
SEE NOTES TO FINANCIAL STATEMENTS.
| | | | | | | | |
| | | |
| AUGUST 31, 2018 | | J.P. MORGAN MONEY MARKET FUNDS | | | | | 109 | |
FINANCIAL HIGHLIGHTS
FOR THE PERIODS INDICATED (continued)
| | | | | | | | | | | | | | | | | | | | |
| | | Per share operating performance | |
| | | | | | Investment operations | | | Distributions | |
| | | Net asset
value,
beginning
of period | | | Net
investment
income
(loss) | | | Net realized
and unrealized
gains
(losses) on
investments | | | Total from
investment
operations | | | Net
investment
income | |
JPMorgan Institutional Tax Free Money Market Fund | | | | | | | | | | | | | | | | | | | | |
Agency | | | | | | | | | | | | | | | | | | | | |
March 1, 2018 (e) through August 31, 2018 (Unaudited) | | $ | 1.0000 | | | $ | 0.0056 | | | $ | 0.0000 | (f) | | $ | 0.0056 | | | $ | (0.0056 | ) |
| | | | | |
Capital | | | | | | | | | | | | | | | | | | | | |
March 1, 2018 (e) through August 31, 2018 (Unaudited) | | | 1.0000 | | | | 0.0060 | | | | 0.0000 | (f) | | | 0.0060 | | | | (0.0060 | ) |
| | | | | |
IM | | | | | | | | | | | | | | | | | | | | |
March 1, 2018 (e) through August 31, 2018 (Unaudited) | | | 1.0000 | | | | 0.0061 | | | | 0.0000 | (f) | | | 0.0061 | | | | (0.0061 | ) |
| | | | | |
Institutional Class | | | | | | | | | | | | | | | | | | | | |
March 1, 2018 (e) through August 31, 2018 (Unaudited) | | | 1.0000 | | | | 0.0058 | | | | 0.0000 | (f) | | | 0.0058 | | | | (0.0058 | ) |
| (a) | Annualized for periods less than one year, unless otherwise noted. |
| (b) | Not annualized for periods less than one year. |
| (c) | Includes earnings credits and interest expense, if applicable, each of which is less than 0.005% unless otherwise noted. |
| (d) | Certain non-recurring expenses incurred by the Fund were not annualized for the period ended August 31, 2018. |
| (e) | Commencement of operations. |
| (f) | Amount rounds to less than $0.00005. |
SEE NOTES TO FINANCIAL STATEMENTS.
| | | | | | |
| | | |
| 110 | | | | J.P. MORGAN MONEY MARKET FUNDS | | AUGUST 31, 2018 |
| | | | | | | | | | | | | | | | | | | | | | |
| | | Ratios/Supplemental data | |
| | | | | | | | | | Ratios to average net assets (a) | |
Net asset
value, end of
period | | | Total return (b) | | | Net assets,
end of
period
(000’s) | | | Net expenses (c)(d) | | | Net
investment
income
(loss) (d) | | |
Expenses
without waivers,
reimbursements and
earnings credits (d) | |
| | | | | | | | | | | | | | | | | | | | | | |
| | | | | | | | | | | | | | | | | | | | | | |
| $ | 1.0000 | | | | 0.56 | % | | $ | 101 | | | | 0.26 | % | | | 1.10 | % | | | 26.09 | % |
| | | | | |
| | | | | | | | | | | | | | | | | | | | | | |
| | 1.0000 | | | | 0.60 | | | | 1,497 | | | | 0.18 | | | | 1.15 | | | | 2.39 | |
| | | | | |
| | | | | | | | | | | | | | | | | | | | | | |
| | 1.0000 | | | | 0.61 | | | | 573,724 | | | | 0.16 | | | | 1.12 | | | | 0.23 | |
| | | | | |
| | | | | | | | | | | | | | | | | | | | | | |
| | 1.0000 | | | | 0.58 | | | | 25,538 | | | | 0.21 | | | | 1.15 | | | | 0.81 | |
SEE NOTES TO FINANCIAL STATEMENTS.
| | | | | | | | |
| | | |
| AUGUST 31, 2018 | | J.P. MORGAN MONEY MARKET FUNDS | | | | | 111 | |
FINANCIAL HIGHLIGHTS
FOR THE PERIODS INDICATED (continued)
| | | | | | | | | | | | | | | | | | | | | | | | | | | | |
| | | Per share operating performance | |
| | | | | | Investment operations | | | Distributions | |
| | | Net asset
value,
beginning
of period | | | Net
investment
income
(loss) | | | Net realized
and unrealized
gains
(losses) on
investments | | | Total from
investment
operations | | | Net
investment
income | | | Net
realized
gain | | | Total
distributions | |
JPMorgan Liquid Assets Money Market Fund | | | | | | | | | | | | | | | | | | | | | | | | | | | | |
Class C | | | | | | | | | | | | | | | | | | | | | | | | | | | | |
Six Months Ended August 31, 2018 (Unaudited) | | $ | 1.00 | | | $ | 0.01 | (d) | | $ | — | (e) | | $ | 0.01 | | | $ | (0.01 | ) | | $ | — | | | $ | (0.01 | ) |
Year Ended February 28, 2018 | | | 1.00 | | | | — | (d)(e) | | | — | (e) | | | — | (e) | | | — | (e) | | | — | (e) | | | — | (e) |
Year Ended February 28, 2017 | | | 1.00 | | | | — | (d)(e) | | | — | (e) | | | — | (e) | | | — | (e) | | | — | (e) | | | — | (e) |
Year Ended February 29, 2016 | | | 1.00 | | | | — | (d)(e) | | | — | (e) | | | — | (e) | | | — | (e) | | | — | (e) | | | — | (e) |
Year Ended February 28, 2015 | | | 1.00 | | | | — | (e) | | | — | (e) | | | — | (e) | | | — | (e) | | | — | (e) | | | — | (e) |
Year Ended February 28, 2014 | | | 1.00 | | | | — | (e) | | | — | (e) | | | — | (e) | | | — | (e) | | | — | (e) | | | — | (e) |
| | | | | | | |
Agency | | | | | | | | | | | | | | | | | | | | | | | | | | | | |
Six Months Ended August 31, 2018 (Unaudited) | | | 1.00 | | | | 0.01 | (d) | | | — | (e) | | | 0.01 | | | | (0.01 | ) | | | — | | | | (0.01 | ) |
Year Ended February 28, 2018 | | | 1.00 | | | | 0.01 | (d) | | | — | (e) | | | 0.01 | | | | (0.01 | ) | | | — | (e) | | | (0.01 | ) |
Year Ended February 28, 2017 | | | 1.00 | | | | — | (d)(e) | | | — | (e) | | | — | (e) | | | — | (e) | | | — | (e) | | | — | (e) |
Year Ended February 29, 2016 | | | 1.00 | | | | — | (d)(e) | | | — | (e) | | | — | (e) | | | — | (e) | | | — | (e) | | | — | (e) |
Year Ended February 28, 2015 | | | 1.00 | | | | — | (e) | | | — | (e) | | | — | (e) | | | — | (e) | | | — | (e) | | | — | (e) |
Year Ended February 28, 2014 | | | 1.00 | | | | — | (e) | | | — | (e) | | | — | (e) | | | — | (e) | | | — | (e) | | | — | (e) |
| | | | | | | |
Capital | | | | | | | | | | | | | | | | | | | | | | | | | | | | |
Six Months Ended August 31, 2018 (Unaudited) | | | 1.00 | | | | 0.01 | (d) | | | — | (e) | | | 0.01 | | | | (0.01 | ) | | | — | | | | (0.01 | ) |
Year Ended February 28, 2018 | | | 1.00 | | | | 0.01 | (d) | | | — | (e) | | | 0.01 | | | | (0.01 | ) | | | — | (e) | | | (0.01 | ) |
Year Ended February 28, 2017 | | | 1.00 | | | | 0.01 | (d) | | | — | (e) | | | 0.01 | | | | (0.01 | ) | | | — | (e) | | | (0.01 | ) |
Year Ended February 29, 2016 | | | 1.00 | | | | — | (d)(e) | | | — | (e) | | | — | (e) | | | — | (e) | | | — | (e) | | | — | (e) |
Year Ended February 28, 2015 | | | 1.00 | | | | — | (e) | | | — | (e) | | | — | (e) | | | — | (e) | | | — | (e) | | | — | (e) |
Year Ended February 28, 2014 | | | 1.00 | | | | — | (e) | | | — | (e) | | | — | (e) | | | — | (e) | | | — | (e) | | | — | (e) |
| | | | | | | |
E*Trade (f) | | | | | | | | | | | | | | | | | | | | | | | | | | | | |
For the Period Ended October 19, 2016 | | | 1.00 | | | | — | (d)(e) | | | — | (e) | | | — | (e) | | | — | (e) | | | — | (e) | | | — | (e) |
Year Ended February 29, 2016 | | | 1.00 | | | | — | (d) | | | — | (e) | | | — | (e) | | | — | (e) | | | — | (e) | | | — | (e) |
Year Ended February 28, 2015 | | | 1.00 | | | | — | (d) | | | — | (e) | | | — | (e) | | | — | (e) | | | — | (e) | | | — | (e) |
Year Ended February 28, 2014 | | | 1.00 | | | | — | (d) | | | — | (e) | | | — | (e) | | | — | (e) | | | — | (e) | | | — | (e) |
| | | | | | | |
Institutional Class | | | | | | | | | | | | | | | | | | | | | | | | | | | | |
Six Months Ended August 31, 2018 (Unaudited) | | | 1.00 | | | | 0.01 | (d) | | | — | (e) | | | 0.01 | | | | (0.01 | ) | | | — | | | | (0.01 | ) |
Year Ended February 28, 2018 | | | 1.00 | | | | 0.01 | (d) | | | — | (e) | | | 0.01 | | | | (0.01 | ) | | | — | (e) | | | (0.01 | ) |
Year Ended February 28, 2017 | | | 1.00 | | | | — | (d)(e) | | | — | (e) | | | — | (e) | | | — | (e) | | | — | (e) | | | — | (e) |
Year Ended February 29, 2016 | | | 1.00 | | | | — | (d)(e) | | | — | (e) | | | — | (e) | | | — | (e) | | | — | (e) | | | — | (e) |
Year Ended February 28, 2015 | | | 1.00 | | | | — | (e) | | | — | (e) | | | — | (e) | | | — | (e) | | | — | (e) | | | — | (e) |
Year Ended February 28, 2014 | | | 1.00 | | | | — | (e) | | | — | (e) | | | — | (e) | | | — | (e) | | | — | (e) | | | — | (e) |
| | | | | | | |
Investor | | | | | | | | | | | | | | | | | | | | | | | | | | | | |
Six Months Ended August 31, 2018 (Unaudited) | | | 1.00 | | | | 0.01 | (d) | | | — | (e) | | | 0.01 | | | | (0.01 | ) | | | — | | | | (0.01 | ) |
Year Ended February 28, 2018 | | | 1.00 | | | | 0.01 | (d) | | | — | (e) | | | 0.01 | | | | (0.01 | ) | | | — | (e) | | | (0.01 | ) |
Year Ended February 28, 2017 | | | 1.00 | | | | — | (d)(e) | | | — | (e) | | | — | (e) | | | — | (e) | | | — | (e) | | | — | (e) |
Year Ended February 29, 2016 | | | 1.00 | | | | — | (d)(e) | | | — | (e) | | | — | (e) | | | — | (e) | | | — | (e) | | | — | (e) |
Year Ended February 28, 2015 | | | 1.00 | | | | — | (e) | | | — | (e) | | | — | (e) | | | — | (e) | | | — | (e) | | | — | (e) |
Year Ended February 28, 2014 | | | 1.00 | | | | — | (e) | | | — | (e) | | | — | (e) | | | — | (e) | | | — | (e) | | | — | (e) |
| (a) | Annualized for periods less than one year, unless otherwise noted. |
| (b) | Not annualized for periods less than one year. |
| (c) | Includes earnings credits and interest expense, if applicable, each of which is less than 0.005% unless otherwise noted. |
| (d) | Calculated based upon average shares outstanding. |
| (e) | Amount rounds to less than $0.005. |
| (f) | E*Trade Shares of Liquid Assets Money Market Fund had no assets from the close of business on October 19, 2016. |
SEE NOTES TO FINANCIAL STATEMENTS.
| | | | | | |
| | | |
| 112 | | | | J.P. MORGAN MONEY MARKET FUNDS | | AUGUST 31, 2018 |
| | | | | | | | | | | | | | | | | | | | | | |
| | | Ratios/Supplemental data | |
| | | | | | | | | | Ratios to average net assets (a) | |
Net asset
value,
end of
period | | | Total return (b) | | | Net assets,
end of
period
(000’s) | | | Net
expenses (c) | | |
Net
investment
income
(loss) | | | Expenses
without waivers,
reimbursements and
earnings credits | |
| | | | | | | | | | | | | | | | | | | | | | |
| | | | | | | | | | | | | | | | | | | | | | |
| $ | 1.00 | | | | 0.56 | % | | $ | 19,654 | | | | 0.97 | % | | | 1.11 | % | | | 1.18 | % |
| | 1.00 | | | | 0.40 | | | | 22,267 | | | | 0.97 | | | | 0.38 | | | | 1.20 | |
| | 1.00 | | | | 0.04 | | | | 33,104 | | | | 0.55 | | | | 0.01 | | | | 1.18 | |
| | 1.00 | | | | 0.01 | | | | 505,609 | | | | 0.33 | | | | 0.01 | | | | 1.18 | |
| | 1.00 | | | | 0.01 | | | | 704,276 | | | | 0.24 | | | | 0.01 | | | | 1.17 | |
| | 1.00 | | | | 0.01 | | | | 670,626 | | | | 0.24 | | | | 0.01 | | | | 1.18 | |
| | | | | |
| | | | | | | | | | | | | | | | | | | | | | |
| | 1.00 | | | | 0.92 | | | | 304,060 | | | | 0.26 | | | | 1.85 | | | | 0.32 | |
| | 1.00 | | | | 1.11 | | | | 158,527 | | | | 0.26 | | | | 1.16 | | | | 0.34 | |
| | 1.00 | | | | 0.45 | | | | 36,107 | | | | 0.26 | | | | 0.39 | | | | 0.35 | |
| | 1.00 | | | | 0.08 | | | | 71,741 | | | | 0.26 | | | | 0.07 | | | | 0.33 | |
| | 1.00 | | | | 0.01 | | | | 95,650 | | | | 0.24 | | | | 0.01 | | | | 0.32 | |
| | 1.00 | | | | 0.01 | | | | 71,955 | | | | 0.24 | | | | 0.01 | | | | 0.33 | |
| | | | | |
| | | | | | | | | | | | | | | | | | | | | | |
| | 1.00 | | | | 0.97 | | | | 308,264 | | | | 0.18 | | | | 1.95 | | | | 0.22 | |
| | 1.00 | | | | 1.19 | | | | 98,814 | | | | 0.18 | | | | 1.36 | | | | 0.24 | |
| | 1.00 | | | | 0.53 | | | | 105,366 | | | | 0.18 | | | | 0.38 | | | | 0.22 | |
| | 1.00 | | | | 0.16 | | | | 2,071,483 | | | | 0.18 | | | | 0.15 | | | | 0.22 | |
| | 1.00 | | | | 0.07 | | | | 2,889,536 | | | | 0.18 | | | | 0.06 | | | | 0.22 | |
| | 1.00 | | | | 0.07 | | | | 3,795,256 | | | | 0.18 | | | | 0.07 | | | | 0.23 | |
| | | | | |
| | | | | | | | | | | | | | | | | | | | | | |
| | 1.00 | | | | 0.01 | | | | — | | | | 0.54 | | | | 0.01 | | | | 1.08 | |
| | 1.00 | | | | 0.01 | | | | 1,758,478 | | | | 0.30 | | | | 0.01 | | | | 1.07 | |
| | 1.00 | | | | 0.03 | | | | 7,497,985 | | | | 0.22 | | | | 0.03 | | | | 1.07 | |
| | 1.00 | | | | 0.05 | | | | 5,922,072 | | | | 0.20 | | | | 0.05 | | | | 1.08 | |
| | | | | |
| | | | | | | | | | | | | | | | | | | | | | |
| | 1.00 | | | | 0.95 | | | | 1,658,432 | | | | 0.21 | | | | 1.90 | | | | 0.27 | |
| | 1.00 | | | | 1.16 | | | | 988,333 | | | | 0.21 | | | | 1.21 | | | | 0.29 | |
| | 1.00 | | | | 0.50 | | | | 286,502 | | | | 0.21 | | | | 0.37 | | | | 0.28 | |
| | 1.00 | | | | 0.13 | | | | 6,630,618 | | | | 0.21 | | | | 0.13 | | | | 0.28 | |
| | 1.00 | | | | 0.04 | | | | 6,692,633 | | | | 0.21 | | | | 0.04 | | | | 0.27 | |
| | 1.00 | | | | 0.04 | | | | 2,901,004 | | | | 0.21 | | | | 0.04 | | | | 0.28 | |
| | | | | |
| | | | | | | | | | | | | | | | | | | | | | |
| | 1.00 | | | | 0.80 | | | | 12,935 | | | | 0.51 | | | | 1.57 | | | | 0.53 | |
| | 1.00 | | | | 0.86 | | | | 8,616 | | | | 0.51 | | | | 0.89 | | | | 0.55 | |
| | 1.00 | | | | 0.21 | | | | 3,933 | | | | 0.51 | | | | 0.07 | | | | 0.53 | |
| | 1.00 | | | | 0.02 | | | | 117,816 | | | | 0.32 | | | | 0.01 | | | | 0.53 | |
| | 1.00 | | | | 0.01 | | | | 116,196 | | | | 0.23 | | | | 0.01 | | | | 0.52 | |
| | 1.00 | | | | 0.01 | | | | 753,825 | | | | 0.24 | | | | 0.01 | | | | 0.53 | |
SEE NOTES TO FINANCIAL STATEMENTS.
| | | | | | | | |
| | | |
| AUGUST 31, 2018 | | J.P. MORGAN MONEY MARKET FUNDS | | | | | 113 | |
FINANCIAL HIGHLIGHTS
FOR THE PERIODS INDICATED (continued)
| | | | | | | | | | | | | | | | | | | | | | | | | | | | |
| | | Per share operating performance | |
| | | | | | Investment operations | | | Distributions | |
| | | Net asset
value,
beginning
of period | | | Net
investment
income
(loss) | | | Net realized
and unrealized
gains
(losses) on
investments | | | Total from
investment
operations | | | Net
investment
income | | | Net
realized
gain | | | Total
distributions | |
JPMorgan Liquid Assets Money Market Fund (continued) | | | | | | | | | | | | | | | | | | | | | | | | | | | | |
Morgan | | | | | | | | | | | | | | | | | | | | | | | | | | | | |
Six Months Ended August 31, 2018 (Unaudited) | | $ | 1.00 | | | $ | 0.01 | (d) | | $ | — | (e) | | $ | 0.01 | | | $ | (0.01 | ) | | $ | — | | | $ | (0.01 | ) |
Year Ended February 28, 2018 | | | 1.00 | | | | 0.01 | (d) | | | — | (e) | | | 0.01 | | | | (0.01 | ) | | | — | (e) | | | (0.01 | ) |
Year Ended February 28, 2017 | | | 1.00 | | | | — | (d)(e) | | | — | (e) | | | — | (e) | | | — | (e) | | | — | (e) | | | — | (e) |
Year Ended February 29, 2016 | | | 1.00 | | | | — | (d)(e) | | | — | (e) | | | — | (e) | | | — | (e) | | | — | (e) | | | — | (e) |
Year Ended February 28, 2015 | | | 1.00 | | | | — | (e) | | | — | (e) | | | — | (e) | | | — | (e) | | | — | (e) | | | — | (e) |
Year Ended February 28, 2014 | | | 1.00 | | | | — | (e) | | | — | (e) | | | — | (e) | | | — | (e) | | | — | (e) | | | — | (e) |
| | | | | | | |
Premier | | | | | | | | | | | | | | | | | | | | | | | | | | | | |
Six Months Ended August 31, 2018 (Unaudited) | | | 1.00 | | | | 0.01 | (d) | | | — | (e) | | | 0.01 | | | | (0.01 | ) | | | — | | | | (0.01 | ) |
Year Ended February 28, 2018 | | | 1.00 | | | | 0.01 | (d) | | | — | (e) | | | 0.01 | | | | (0.01 | ) | | | — | (e) | | | (0.01 | ) |
Year Ended February 28, 2017 | | | 1.00 | | | | — | (d)(e) | | | — | (e) | | | — | (e) | | | — | (e) | | | — | (e) | | | — | (e) |
Year Ended February 29, 2016 | | | 1.00 | | | | — | (d)(e) | | | — | (e) | | | — | (e) | | | — | (e) | | | — | (e) | | | — | (e) |
Year Ended February 28, 2015 | | | 1.00 | | | | — | (e) | | | — | (e) | | | — | (e) | | | — | (e) | | | — | (e) | | | — | (e) |
Year Ended February 28, 2014 | | | 1.00 | | | | — | (e) | | | — | (e) | | | — | (e) | | | — | (e) | | | — | (e) | | | — | (e) |
| | | | | | | |
Reserve | | | | | | | | | | | | | | | | | | | | | | | | | | | | |
Six Months Ended August 31, 2018 (Unaudited) | | | 1.00 | | | | 0.01 | (d) | | | — | (e) | | | 0.01 | | | | (0.01 | ) | | | — | | | | (0.01 | ) |
Year Ended February 28, 2018 | | | 1.00 | | | | 0.01 | (d) | | | — | (e) | | | 0.01 | | | | (0.01 | ) | | | — | (e) | | | (0.01 | ) |
Year Ended February 28, 2017 | | | 1.00 | | | | — | (d)(e) | | | — | (e) | | | — | (e) | | | — | (e) | | | — | (e) | | | — | (e) |
Year Ended February 29, 2016 | | | 1.00 | | | | — | (d)(e) | | | — | (e) | | | — | (e) | | | — | (e) | | | — | (e) | | | — | (e) |
Year Ended February 28, 2015 | | | 1.00 | | | | — | (e) | | | — | (e) | | | — | (e) | | | — | (e) | | | — | (e) | | | — | (e) |
Year Ended February 28, 2014 | | | 1.00 | | | | — | (e) | | | — | (e) | | | — | (e) | | | — | (e) | | | — | (e) | | | — | (e) |
| (a) | Annualized for periods less than one year, unless otherwise noted. |
| (b) | Not annualized for periods less than one year. |
| (c) | Includes earnings credits and interest expense, if applicable, each of which is less than 0.005% unless otherwise noted. |
| (d) | Calculated based upon average shares outstanding. |
| (e) | Amount rounds to less than $0.005. |
SEE NOTES TO FINANCIAL STATEMENTS.
| | | | | | |
| | | |
| 114 | | | | J.P. MORGAN MONEY MARKET FUNDS | | AUGUST 31, 2018 |
| | | | | | | | | | | | | | | | | | | | | | |
| | | Ratios/Supplemental data | |
| | | | | | | | | | Ratios to average net assets (a) | |
Net asset
value,
end of
period | | | Total return (b) | | | Net assets,
end of
period
(000’s) | | | Net
expenses (c) | | |
Net
investment
income
(loss) | | | Expenses
without waivers,
reimbursements and
earnings credits | |
| | | | | | | | | | | | | | | | | | | | | | |
| | | | | | | | | | | | | | | | | | | | | | |
| $ | 1.00 | | | | 0.76 | % | | $ | 190,797 | | | | 0.59 | % | | | 1.51 | % | | | 0.67 | % |
| | 1.00 | | | | 0.78 | | | | 156,049 | | | | 0.59 | | | | 0.78 | | | | 0.70 | |
| | 1.00 | | | | 0.16 | | | | 144,168 | | | | 0.54 | | | | 0.04 | | | | 0.64 | |
| | 1.00 | | | | 0.01 | | | | 1,609,448 | | | | 0.33 | | | | 0.01 | | | | 0.63 | |
| | 1.00 | | | | 0.01 | | | | 1,684,561 | | | | 0.24 | | | | 0.01 | | | | 0.62 | |
| | 1.00 | | | | 0.01 | | | | 2,367,494 | | | | 0.24 | | | | 0.01 | | | | 0.63 | |
| | | | | |
| | | | | | | | | | | | | | | | | | | | | | |
| | 1.00 | | | | 0.83 | | | | 734,243 | | | | 0.45 | | | | 1.67 | | | | 0.47 | |
| | 1.00 | | | | 0.92 | | | | 353,810 | | | | 0.45 | | | | 0.95 | | | | 0.49 | |
| | 1.00 | | | | 0.26 | | | | 156,136 | | | | 0.45 | | | | 0.18 | | | | 0.48 | |
| | 1.00 | | | | 0.02 | | | | 132,337 | | | | 0.32 | | | | 0.02 | | | | 0.48 | |
| | 1.00 | | | | 0.01 | | | | 118,152 | | | | 0.24 | | | | 0.01 | | | | 0.47 | |
| | 1.00 | | | | 0.01 | | | | 130,733 | | | | 0.24 | | | | 0.01 | | | | 0.48 | |
| | | | | |
| | | | | | | | | | | | | | | | | | | | | | |
| | 1.00 | | | | 0.70 | | | | 5,580 | | | | 0.70 | | | | 1.38 | | | | 0.73 | |
| | 1.00 | | | | 0.67 | | | | 6,527 | | | | 0.70 | | | | 0.65 | | | | 0.74 | |
| | 1.00 | | | | 0.12 | | | | 7,672 | | | | 0.55 | | | | 0.02 | | | | 0.73 | |
| | 1.00 | | | | 0.01 | | | | 189,404 | | | | 0.33 | | | | 0.01 | | | | 0.73 | |
| | 1.00 | | | | 0.01 | | | | 172,653 | | | | 0.24 | | | | 0.01 | | | | 0.72 | |
| | 1.00 | | | | 0.01 | | | | 184,873 | | | | 0.24 | | | | 0.01 | | | | 0.73 | |
SEE NOTES TO FINANCIAL STATEMENTS.
| | | | | | | | |
| | | |
| AUGUST 31, 2018 | | J.P. MORGAN MONEY MARKET FUNDS | | | | | 115 | |
FINANCIAL HIGHLIGHTS
FOR THE PERIODS INDICATED (continued)
| | | | | | | | | | | | | | | | | | | | | | | | | | | | |
| | | Per share operating performance | |
| | | | | | Investment operations | | | Distributions | |
| | | Net asset
value,
beginning
of period | | | Net
investment
income
(loss) | | | Net realized
and unrealized
gains
(losses) on
investments | | | Total from
investment
operations | | | Net
investment
income | | | Net
realized
gain | | | Total
distributions | |
JPMorgan U.S. Government Money Market Fund | | | | | | | | | | | | | | | | | | | | | | | | | | | | |
Agency | | | | | | | | | | | | | | | | | | | | | | | | | | | | |
Six Months Ended August 31, 2018 (Unaudited) | | $ | 1.00 | | | $ | 0.01 | (d) | | $ | — | (e) | | $ | 0.01 | | | $ | (0.01 | ) | | $ | — | | | $ | (0.01 | ) |
Year Ended February 28, 2018 | | | 1.00 | | | | 0.01 | (d) | | | — | (e) | | | 0.01 | | | | (0.01 | ) | | | — | (e) | | | (0.01 | ) |
Year Ended February 28, 2017 | | | 1.00 | | | | — | (d)(e) | | | — | (e) | | | — | (e) | | | — | (e) | | | — | (e) | | | — | (e) |
Year Ended February 29, 2016 | | | 1.00 | | | | — | (d)(e) | | | — | (e) | | | — | (e) | | | — | (e) | | | — | (e) | | | — | (e) |
Year Ended February 28, 2015 | | | 1.00 | | | | — | (e) | | | — | (e) | | | — | (e) | | | — | (e) | | | — | (e) | | | — | (e) |
Year Ended February 28, 2014 | | | 1.00 | | | | — | (e) | | | — | (e) | | | — | (e) | | | — | (e) | | | — | (e) | | | — | (e) |
| | | | | | | |
Capital | | | | | | | | | | | | | | | | | | | | | | | | | | | | |
Six Months Ended August 31, 2018 (Unaudited) | | | 1.00 | | | | 0.01 | (d) | | | — | (e) | | | 0.01 | | | | (0.01 | ) | | | — | | | | (0.01 | ) |
Year Ended February 28, 2018 | | | 1.00 | | | | 0.01 | (d) | | | — | (e) | | | 0.01 | | | | (0.01 | ) | | | — | (e) | | | (0.01 | ) |
Year Ended February 28, 2017 | | | 1.00 | | | | — | (d)(e) | | | — | (e) | | | — | (e) | | | — | (e) | | | — | (e) | | | — | (e) |
Year Ended February 29, 2016 | | | 1.00 | | | | — | (d)(e) | | | — | (e) | | | — | (e) | | | — | (e) | | | — | (e) | | | — | (e) |
Year Ended February 28, 2015 | | | 1.00 | | | | — | (e) | | | — | (e) | | | — | (e) | | | — | (e) | | | — | (e) | | | — | (e) |
Year Ended February 28, 2014 | | | 1.00 | | | | — | (e) | | | — | (e) | | | — | (e) | | | — | (e) | | | — | (e) | | | — | (e) |
| | | | | | | |
Direct (f) | | | | | | | | | | | | | | | | | | | | | | | | | | | | |
For the period ended November 22, 2017 | | | 1.00 | | | | — | (d)(e) | | | — | (e) | | | — | (e) | | | — | (e) | | | — | (e) | | | — | (e) |
Year Ended February 28, 2017 | | | 1.00 | | | | — | (d)(e) | | | — | (e) | | | — | (e) | | | — | (e) | | | — | (e) | | | — | (e) |
Year Ended February 29, 2016 | | | 1.00 | | | | — | (d)(e) | | | — | (e) | | | — | (e) | | | — | (e) | | | — | (e) | | | — | (e) |
Year Ended February 28, 2015 | | | 1.00 | | | | — | (e) | | | — | (e) | | | — | (e) | | | — | (e) | | | — | (e) | | | — | (e) |
Year Ended February 28, 2014 | | | 1.00 | | | | — | (e) | | | — | (e) | | | — | (e) | | | — | (e) | | | — | (e) | | | — | (e) |
| | | | | | | |
Eagle Class | | | | | | | | | | | | | | | | | | | | | | | | | | | | |
Six Months Ended August 31, 2018 (Unaudited) | | | 1.00 | | | | 0.01 | (d) | | | — | (e) | | | 0.01 | | | | (0.01 | ) | | | — | | | | (0.01 | ) |
Year Ended February 28, 2018 | | | 1.00 | | | | — | (d)(e) | | | — | (e) | | | — | (e) | | | — | (e) | | | — | (e) | | | — | (e) |
Year Ended February 28, 2017 | | | 1.00 | | | | — | (d)(e) | | | — | (e) | | | — | (e) | | | — | (e) | | | — | (e) | | | — | (e) |
Year Ended February 29, 2016 | | | 1.00 | | | | — | (d)(e) | | | — | (e) | | | — | (e) | | | — | (e) | | | — | (e) | | | — | (e) |
Year Ended February 28, 2015 | | | 1.00 | | | | — | (e) | | | — | (e) | | | — | (e) | | | — | (e) | | | — | (e) | | | — | (e) |
Year Ended February 28, 2014 | | | 1.00 | | | | — | (e) | | | — | (e) | | | — | (e) | | | — | (e) | | | — | (e) | | | — | (e) |
| | | | | | | |
Eagle Private Wealth Class | | | | | | | | | | | | | | | | | | | | | | | | | | | | |
Six Months Ended August 31, 2018 (Unaudited) | | | 1.00 | | | | 0.01 | (d) | | | — | (e) | | | 0.01 | | | | (0.01 | ) | | | — | | | | (0.01 | ) |
August 18, 2017 (g) through February 28, 2018 | | | 1.00 | | | | — | (d)(e) | | | — | (e) | | | — | (e) | | | — | (e) | | | — | (e) | | | — | (e) |
| | | | | | | |
E*Trade | | | | | | | | | | | | | | | | | | | | | | | | | | | | |
Six Months Ended August 31, 2018 (Unaudited) | | | 1.00 | | | | — | (d)(e) | | | — | (e) | | | — | (e) | | | — | (e) | | | — | | | | — | (e) |
Year Ended February 28, 2018 | | | 1.00 | | | | — | (d)(e) | | | — | (e) | | | — | (e) | | | — | (e) | | | — | (e) | | | — | (e) |
March 9, 2016 (g) through February 28, 2017 | | | 1.00 | | | | — | (d)(e) | | | — | (e) | | | — | (e) | | | — | (e) | | | — | (e) | | | — | (e) |
| | | | | | | |
IM | | | | | | | | | | | | | | | | | | | | | | | | | | | | |
Six Months Ended August 31, 2018 (Unaudited) | | | 1.00 | | | | 0.01 | (d) | | | — | (e) | | | 0.01 | | | | (0.01 | ) | | | — | | | | (0.01 | ) |
Year Ended February 28, 2018 | | | 1.00 | | | | 0.01 | (d) | | | — | (e) | | | 0.01 | | | | (0.01 | ) | | | — | (e) | | | (0.01 | ) |
Year Ended February 28, 2017 | | | 1.00 | | | | — | (d)(e) | | | — | (e) | | | — | (e) | | | — | (e) | | | — | (e) | | | — | (e) |
Year Ended February 29, 2016 | | | 1.00 | | | | — | (d)(e) | | | — | (e) | | | — | (e) | | | — | (e) | | | — | (e) | | | — | (e) |
Year Ended February 28, 2015 | | | 1.00 | | | | — | (e) | | | — | (e) | | | — | (e) | | | — | (e) | | | — | (e) | | | — | (e) |
Year Ended February 28, 2014 | | | 1.00 | | | | — | (e) | | | — | (e) | | | — | (e) | | | — | (e) | | | — | (e) | | | — | (e) |
| (a) | Annualized for periods less than one year, unless otherwise noted. |
| (b) | Not annualized for periods less than one year. |
| (c) | Includes earnings credits and interest expense, if applicable, each of which is less than 0.005% unless otherwise noted. |
| (d) | Calculated based upon average shares outstanding. |
| (e) | Amount rounds to less than $0.005. |
| (f) | Direct Shares of U.S. Government Money Market Fund had no assets from the close of business on November 22, 2017. |
| (g) | Commencement of offering of class of shares. |
SEE NOTES TO FINANCIAL STATEMENTS.
| | | | | | |
| | | |
| 116 | | | | J.P. MORGAN MONEY MARKET FUNDS | | AUGUST 31, 2018 |
| | | | | | | | | | | | | | | | | | | | | | |
| | | Ratios/Supplemental data | |
| | | | | | | | | | Ratios to average net assets (a) | |
Net asset
value,
end of
period | | | Total return (b) | | |
Net assets,
end of
period
(000’s) | | | Net
expenses (c) | | | Net
investment
income
(loss) | | | Expenses
without waivers,
reimbursements and
earnings credits | |
| | | | | | | | | | | | | | | | | | | | | | |
| | | | | | | | | | | | | | | | | | | | | | |
| $ | 1.00 | | | | 0.79 | % | | $ | 12,122,666 | | | | 0.26 | % | | | 1.57 | % | | | 0.31 | % |
| | 1.00 | | | | 0.81 | | | | 13,906,062 | | | | 0.26 | | | | 0.80 | | | | 0.31 | |
| | 1.00 | | | | 0.22 | | | | 12,887,975 | | | | 0.25 | | | | 0.22 | | | | 0.31 | |
| | 1.00 | | | | 0.02 | | | | 7,594,151 | | | | 0.15 | | | | 0.02 | | | | 0.31 | |
| | 1.00 | | | | 0.01 | | | | 7,428,617 | | | | 0.08 | | | | 0.01 | | | | 0.31 | |
| | 1.00 | | | | 0.01 | | | | 7,098,492 | | | | 0.09 | | | | 0.01 | | | | 0.31 | |
| | | | | |
| | | | | | | | | | | | | | | | | | | | | | |
| | 1.00 | | | | 0.83 | | | | 72,447,267 | | | | 0.18 | | | | 1.64 | | | | 0.21 | |
| | 1.00 | | | | 0.89 | | | | 92,747,537 | | | | 0.18 | | | | 0.88 | | | | 0.21 | |
| | 1.00 | | | | 0.33 | | | | 86,200,153 | | | | 0.14 | | | | 0.35 | | | | 0.21 | |
| | 1.00 | | | | 0.04 | | | | 28,046,995 | | | | 0.14 | | | | 0.04 | | | | 0.21 | |
| | 1.00 | | | | 0.01 | | | | 32,973,407 | | | | 0.07 | | | | 0.01 | | | | 0.21 | |
| | 1.00 | | | | 0.01 | | | | 25,817,838 | | | | 0.09 | | | | 0.01 | | | | 0.21 | |
| | | | | |
| | | | | | | | | | | | | | | | | | | | | | |
| | 1.00 | | | | 0.49 | | | | — | | | | 0.30 | | | | 0.65 | | | | 0.31 | |
| | 1.00 | | | | 0.19 | | | | 193,840 | | | | 0.29 | | | | 0.16 | | | | 0.31 | |
| | 1.00 | | | | 0.02 | | | | 870,118 | | | | 0.18 | | | | 0.02 | | | | 0.31 | |
| | 1.00 | | | | 0.01 | | | | 294,989 | | | | 0.07 | | | | 0.01 | | | | 0.31 | |
| | 1.00 | | | | 0.01 | | | | 281,437 | | | | 0.09 | | | | 0.01 | | | | 0.31 | |
| | | | | |
| | | | | | | | | | | | | | | | | | | | | | |
| | 1.00 | | | | 0.57 | | | | 2,543,097 | | | | 0.70 | | | | 1.16 | | | | 0.71 | |
| | 1.00 | | | | 0.37 | | | | 1,172,819 | | | | 0.70 | | | | 0.36 | | | | 0.71 | |
| | 1.00 | | | | 0.01 | | | | 1,215,409 | | | | 0.49 | | | | 0.01 | | | | 0.71 | |
| | 1.00 | | | | 0.01 | | | | 437,372 | | | | 0.18 | | | | 0.01 | | | | 0.71 | |
| | 1.00 | | | | 0.01 | | | | 351,014 | | | | 0.07 | | | | 0.01 | | | | 0.71 | |
| | 1.00 | | | | 0.01 | | | | 1,838,360 | | | | 0.09 | | | | 0.01 | | | | 0.71 | |
| | | | | |
| | | | | | | | | | | | | | | | | | | | | | |
| | 1.00 | | | | 0.77 | | | | 20 | | | | 0.30 | | | | 1.52 | | | | 0.43 | |
| | 1.00 | | | | 0.49 | | | | 20 | | | | 0.30 | | | | 0.92 | | | | 0.33 | |
| | | | | |
| | | | | | | | | | | | | | | | | | | | | | |
| | 1.00 | | | | 0.42 | | | | 289,752 | | | | 1.00 | | | | 0.82 | | | | 1.06 | |
| | 1.00 | | | | 0.13 | | | | 291,828 | | | | 0.97 | | | | 0.17 | | | | 1.06 | |
| | 1.00 | | | | 0.02 | | | | 66,010 | | | | 0.56 | | | | 0.01 | | | | 1.07 | |
| | | | | |
| | | | | | | | | | | | | | | | | | | | | | |
| | 1.00 | | | | 0.84 | | | | 4,624,373 | | | | 0.16 | | | | 1.69 | | | | 0.16 | |
| | 1.00 | | | | 0.91 | | | | 2,493,731 | | | | 0.16 | | | | 0.96 | | | | 0.16 | |
| | 1.00 | | | | 0.33 | | | | 589,694 | | | | 0.14 | | | | 0.34 | | | | 0.16 | |
| | 1.00 | | | | 0.05 | | | | 648,289 | | | | 0.13 | | | | 0.05 | | | | 0.16 | |
| | 1.00 | | | | 0.01 | | | | 1,142,811 | | | | 0.07 | | | | 0.01 | | | | 0.16 | |
| | 1.00 | | | | 0.01 | | | | 563,436 | | | | 0.08 | | | | 0.02 | | | | 0.16 | |
SEE NOTES TO FINANCIAL STATEMENTS.
| | | | | | | | |
| | | |
| AUGUST 31, 2018 | | J.P. MORGAN MONEY MARKET FUNDS | | | | | 117 | |
FINANCIAL HIGHLIGHTS
FOR THE PERIODS INDICATED (continued)
| | | | | | | | | | | | | | | | | | | | | | | | | | | | |
| | | Per share operating performance | |
| | | | | | Investment operations | | | Distributions | |
| | | Net asset
value,
beginning
of period | | | Net
investment
income
(loss) | | | Net realized
and unrealized
gains
(losses) on
investments | | | Total from
investment
operations | | | Net
investment
income | | | Net
realized
gain | | | Total
distributions | |
JPMorgan U.S. Government Money Market Fund (continued) | | | | | | | | | |
Institutional Class | | | | | | | | | | | | | | | | | | | | | | | | | | | | |
Six Months Ended August 31, 2018 (Unaudited) | | $ | 1.00 | | | $ | 0.01 | (d) | | $ | — | (e) | | $ | 0.01 | | | $ | (0.01 | ) | | $ | — | | | $ | (0.01 | ) |
Year Ended February 28, 2018 | | | 1.00 | | | | 0.01 | (d) | | | — | (e) | | | 0.01 | | | | (0.01 | ) | | | — | (e) | | | (0.01 | ) |
Year Ended February 28, 2017 | | | 1.00 | | | | — | (d)(e) | | | — | (e) | | | — | (e) | | | — | (e) | | | — | (e) | | | — | (e) |
Year Ended February 29, 2016 | | | 1.00 | | | | — | (d)(e) | | | — | (e) | | | — | (e) | | | — | (e) | | | — | (e) | | | — | (e) |
Year Ended February 28, 2015 | | | 1.00 | | | | — | (e) | | | — | (e) | | | — | (e) | | | — | (e) | | | — | (e) | | | — | (e) |
Year Ended February 28, 2014 | | | 1.00 | | | | — | (e) | | | — | (e) | | | — | (e) | | | — | (e) | | | — | (e) | | | — | (e) |
| | | | | | | |
Investor | | | | | | | | | | | | | | | | | | | | | | | | | | | | |
Six Months Ended August 31, 2018 (Unaudited) | | | 1.00 | | | | 0.01 | (d) | | | — | (e) | | | 0.01 | | | | (0.01 | ) | | | — | | | | (0.01 | ) |
Year Ended February 28, 2018 | | | 1.00 | | | | 0.01 | (d) | | | — | (e) | | | 0.01 | | | | (0.01 | ) | | | — | (e) | | | (0.01 | ) |
Year Ended February 28, 2017 | | | 1.00 | | | | — | (d)(e) | | | — | (e) | | | — | (e) | | | — | (e) | | | — | (e) | | | — | (e) |
Year Ended February 29, 2016 | | | 1.00 | | | | — | (d)(e) | | | — | (e) | | | — | (e) | | | — | (e) | | | — | (e) | | | — | (e) |
Year Ended February 28, 2015 | | | 1.00 | | | | — | (e) | | | — | (e) | | | — | (e) | | | — | (e) | | | — | (e) | | | — | (e) |
Year Ended February 28, 2014 | | | 1.00 | | | | — | (e) | | | — | (e) | | | — | (e) | | | — | (e) | | | — | (e) | | | — | (e) |
| | | | | | | |
Morgan | | | | | | | | | | | | | | | | | | | | | | | | | | | | |
Six Months Ended August 31, 2018 (Unaudited) | | | 1.00 | | | | 0.01 | (d) | | | — | (e) | | | 0.01 | | | | (0.01 | ) | | | — | | | | (0.01 | ) |
Year Ended February 28, 2018 | | | 1.00 | | | | — | (d)(e) | | | — | (e) | | | — | (e) | | | — | (e) | | | — | (e) | | | — | (e) |
Year Ended February 28, 2017 | | | 1.00 | | | | — | (d)(e) | | | — | (e) | | | — | (e) | | | — | (e) | | | — | (e) | | | — | (e) |
Year Ended February 29, 2016 | | | 1.00 | | | | — | (d)(e) | | | — | (e) | | | — | (e) | | | — | (e) | | | — | (e) | | | — | (e) |
Year Ended February 28, 2015 | | | 1.00 | | | | — | (e) | | | — | (e) | | | — | (e) | | | — | (e) | | | — | (e) | | | — | (e) |
Year Ended February 28, 2014 | | | 1.00 | | | | — | (e) | | | — | (e) | | | — | (e) | | | — | (e) | | | — | (e) | | | — | (e) |
| | | | | | | |
Premier | | | | | | | | | | | | | | | | | | | | | | | | | | | | |
Six Months Ended August 31, 2018 (Unaudited) | | | 1.00 | | | | 0.01 | (d) | | | — | (e) | | | 0.01 | | | | (0.01 | ) | | | — | | | | (0.01 | ) |
Year Ended February 28, 2018 | | | 1.00 | | | | 0.01 | (d) | | | — | (e) | | | 0.01 | | | | (0.01 | ) | | | — | (e) | | | (0.01 | ) |
Year Ended February 28, 2017 | | | 1.00 | | | | — | (d)(e) | | | — | (e) | | | — | (e) | | | — | (e) | | | — | (e) | | | — | (e) |
Year Ended February 29, 2016 | | | 1.00 | | | | — | (d)(e) | | | — | (e) | | | — | (e) | | | — | (e) | | | — | (e) | | | — | (e) |
Year Ended February 28, 2015 | | | 1.00 | | | | — | (e) | | | — | (e) | | | — | (e) | | | — | (e) | | | — | (e) | | | — | (e) |
Year Ended February 28, 2014 | | | 1.00 | | | | — | (e) | | | — | (e) | | | — | (e) | | | — | (e) | | | — | (e) | | | — | (e) |
| | | | | | | |
Reserve | | | | | | | | | | | | | | | | | | | | | | | | | | | | |
Six Months Ended August 31, 2018 (Unaudited) | | | 1.00 | | | | 0.01 | (d) | | | — | (e) | | | 0.01 | | | | (0.01 | ) | | | — | | | | (0.01 | ) |
Year Ended February 28, 2018 | | | 1.00 | | | | — | (d)(e) | | | — | (e) | | | — | (e) | | | — | (e) | | | — | (e) | | | — | (e) |
Year Ended February 28, 2017 | | | 1.00 | | | | — | (d)(e) | | | — | (e) | | | — | (e) | | | — | (e) | | | — | (e) | | | — | (e) |
Year Ended February 29, 2016 | | | 1.00 | | | | — | (d)(e) | | | — | (e) | | | — | (e) | | | — | (e) | | | — | (e) | | | — | (e) |
Year Ended February 28, 2015 | | | 1.00 | | | | — | (e) | | | — | (e) | | | — | (e) | | | — | (e) | | | — | (e) | | | — | (e) |
Year Ended February 28, 2014 | | | 1.00 | | | | — | (e) | | | — | (e) | | | — | (e) | | | — | (e) | | | — | (e) | | | — | (e) |
| | | | | | | |
Service | | | | | | | | | | | | | | | | | | | | | | | | | | | | |
Six Months Ended August 31, 2018 (Unaudited) | | | 1.00 | | | | — | (d)(e) | | | — | (e) | | | — | (e) | | | — | (e) | | | — | | | | — | (e) |
Year Ended February 28, 2018 | | | 1.00 | | | | — | (d)(e) | | | — | (e) | | | — | (e) | | | — | (e) | | | — | (e) | | | — | (e) |
Year Ended February 28, 2017 | | | 1.00 | | | | — | (d)(e) | | | — | (e) | | | — | (e) | | | — | (e) | | | — | (e) | | | — | (e) |
Year Ended February 29, 2016 | | | 1.00 | | | | — | (d)(e) | | | — | (e) | | | — | (e) | | | — | (e) | | | — | (e) | | | — | (e) |
Year Ended February 28, 2015 | | | 1.00 | | | | — | (e) | | | — | (e) | | | — | (e) | | | — | (e) | | | — | (e) | | | — | (e) |
Year Ended February 28, 2014 | | | 1.00 | | | | — | (e) | | | — | (e) | | | — | (e) | | | — | (e) | | | — | (e) | | | — | (e) |
| (a) | Annualized for periods less than one year, unless otherwise noted. |
| (b) | Not annualized for periods less than one year. |
| (c) | Includes earnings credits and interest expense, if applicable, each of which is less than 0.005% unless otherwise noted. |
| (d) | Calculated based upon average shares outstanding. |
| (e) | Amount rounds to less than $0.005. |
SEE NOTES TO FINANCIAL STATEMENTS.
| | | | | | |
| | | |
| 118 | | | | J.P. MORGAN MONEY MARKET FUNDS | | AUGUST 31, 2018 |
| | | | | | | | | | | | | | | | | | | | | | |
| | | Ratios/Supplemental data | |
| | | | | | | | | | Ratios to average net assets (a) | |
Net asset
value,
end of
period | | | Total return (b) | | |
Net assets,
end of
period
(000’s) | | | Net
expenses (c) | | | Net
investment
income
(loss) | | | Expenses
without waivers,
reimbursements and
earnings credits | |
| | | | | | | | | | | | | | | | | | | | | | |
| | | | | | | | | | | | | | | | | | | | | | |
| $ | 1.00 | | | | 0.82 | % | | $ | 32,490,193 | | | | 0.21 | % | | | 1.62 | % | | | 0.26 | % |
| | 1.00 | | | | 0.86 | | | | 32,544,047 | | | | 0.21 | | | | 0.85 | | | | 0.26 | |
| | 1.00 | | | | 0.30 | | | | 36,869,073 | | | | 0.17 | | | | 0.33 | | | | 0.26 | |
| | 1.00 | | | | 0.04 | | | | 8,704,148 | | | | 0.15 | | | | 0.03 | | | | 0.26 | |
| | 1.00 | | | | 0.01 | | | | 8,279,641 | | | | 0.07 | | | | 0.01 | | | | 0.26 | |
| | 1.00 | | | | 0.01 | | | | 7,099,746 | | | | 0.09 | | | | 0.01 | | | | 0.26 | |
| | | | | |
| | | | | | | | | | | | | | | | | | | | | | |
| | 1.00 | | | | 0.67 | | | | 795,534 | | | | 0.51 | | | | 1.32 | | | | 0.51 | |
| | 1.00 | | | | 0.56 | | | | 748,306 | | | | 0.51 | | | | 0.54 | | | | 0.51 | |
| | 1.00 | | | | 0.03 | | | | 919,604 | | | | 0.42 | | | | 0.02 | | | | 0.51 | |
| | 1.00 | | | | 0.01 | | | | 3,856,545 | | | | 0.18 | | | | 0.01 | | | | 0.51 | |
| | 1.00 | | | | 0.01 | | | | 3,066,013 | | | | 0.07 | | | | 0.01 | | | | 0.51 | |
| | 1.00 | | | | 0.01 | | | | 3,664,674 | | | | 0.09 | | | | 0.01 | | | | 0.51 | |
| | | | | |
| | | | | | | | | | | | | | | | | | | | | | |
| | 1.00 | | | | 0.62 | | | | 1,716,482 | | | | 0.59 | | | | 1.24 | | | | 0.61 | |
| | 1.00 | | | | 0.48 | | | | 1,231,217 | | | | 0.59 | | | | 0.44 | | | | 0.61 | |
| | 1.00 | | | | 0.02 | | | | 2,460,361 | | | | 0.46 | | | | 0.02 | | | | 0.61 | |
| | 1.00 | | | | 0.01 | | | | 2,229,161 | | | | 0.17 | | | | 0.01 | | | | 0.61 | |
| | 1.00 | | | | 0.01 | | | | 2,039,361 | | | | 0.08 | | | | 0.01 | | | | 0.61 | |
| | 1.00 | | | | 0.01 | | | | 2,435,725 | | | | 0.09 | | | | 0.01 | | | | 0.61 | |
| | | | | |
| | | | | | | | | | | | | | | | | | | | | | |
| | 1.00 | | | | 0.70 | | | | 4,123,539 | | | | 0.45 | | | | 1.37 | | | | 0.46 | |
| | 1.00 | | | | 0.62 | | | | 5,500,002 | | | | 0.45 | | | | 0.60 | | | | 0.46 | |
| | 1.00 | | | | 0.06 | | | | 7,765,009 | | | | 0.42 | | | | 0.06 | | | | 0.46 | |
| | 1.00 | | | | 0.01 | | | | 7,570,828 | | | | 0.18 | | | | 0.01 | | | | 0.46 | |
| | 1.00 | | | | 0.01 | | | | 3,441,795 | | | | 0.07 | | | | 0.01 | | | | 0.46 | |
| | 1.00 | | | | 0.01 | | | | 3,646,033 | | | | 0.09 | | | | 0.01 | | | | 0.46 | |
| | | | | |
| | | | | | | | | | | | | | | | | | | | | | |
| | 1.00 | | | | 0.57 | | | | 65,076 | | | | 0.70 | | | | 1.12 | | | | 0.71 | |
| | 1.00 | | | | 0.37 | | | | 59,334 | | | | 0.70 | | | | 0.33 | | | | 0.71 | |
| | 1.00 | | | | 0.01 | | | | 119,542 | | | | 0.49 | | | | 0.01 | | | | 0.71 | |
| | 1.00 | | | | 0.01 | | | | 16,298 | | | | 0.12 | | | | 0.01 | | | | 0.71 | |
| | 1.00 | | | | 0.01 | | | | 150,289 | | | | 0.08 | | | | 0.01 | | | | 0.71 | |
| | 1.00 | | | | 0.01 | | | | 48,890 | | | | 0.09 | | | | 0.01 | | | | 0.71 | |
| | | | | |
| | | | | | | | | | | | | | | | | | | | | | |
| | 1.00 | | | | 0.39 | | | | 1,842,499 | | | | 1.05 | | | | 0.78 | | | | 1.06 | |
| | 1.00 | | | | 0.09 | | | | 1,649,354 | | | | 0.93 | | | | 0.08 | | | | 1.06 | |
| | 1.00 | | | | 0.01 | | | | 2,439,027 | | | | 0.50 | | | | 0.01 | | | | 1.06 | |
| | 1.00 | | | | 0.01 | | | | 395,656 | | | | 0.15 | | | | 0.01 | | | | 1.06 | |
| | 1.00 | | | | 0.01 | | | | 913,521 | | | | 0.07 | | | | 0.01 | | | | 1.06 | |
| | 1.00 | | | | 0.01 | | | | 898,352 | | | | 0.09 | | | | 0.01 | | | | 1.06 | |
SEE NOTES TO FINANCIAL STATEMENTS.
| | | | | | | | |
| | | |
| AUGUST 31, 2018 | | J.P. MORGAN MONEY MARKET FUNDS | | | | | 119 | |
FINANCIAL HIGHLIGHTS
FOR THE PERIODS INDICATED (continued)
| | | | | | | | | | | | | | | | | | | | | | | | | | | | |
| | | Per share operating performance | |
| | | | | | Investment operations | | | Distributions | |
| | | Net asset
value,
beginning
of period | | | Net
investment
income
(loss) | | | Net realized
and unrealized gains
(losses) on
investments | | | Total from
investment
operations | | | Net
investment
income | | | Net
realized
gain | | | Total
distributions | |
JPMorgan U.S. Treasury Plus Money Market Fund | | | | |
Class C | | | | | | | | | | | | | | | | | | | | | | | | | | | | |
Six Months Ended August 31, 2018 (Unaudited) | | $ | 1.00 | | | $ | — | (d) | | $ | — | (e) | | $ | — | (e) | | $ | — | (e) | | $ | — | | | $ | — | (e) |
Year Ended February 28, 2018 | | | 1.00 | | | | — | (d)(e) | | | — | (e) | | | — | (e) | | | — | (e) | | | — | (e) | | | — | (e) |
Year Ended February 28, 2017 | | | 1.00 | | | | — | (d)(e) | | | — | (e) | | | — | (e) | | | — | (e) | | | — | (e) | | | — | (e) |
Year Ended February 29, 2016 | | | 1.00 | | | | — | (d)(e) | | | — | (e) | | | — | (e) | | | — | (e) | | | — | (e) | | | — | (e) |
Year Ended February 28, 2015 | | | 1.00 | | | | — | | | | — | (e) | | | — | (e) | | | — | (e) | | | — | (e) | | | — | (e) |
Year Ended February 28, 2014 | | | 1.00 | | | | — | (e) | | | — | (e) | | | — | (e) | | | — | (e) | | | — | (e) | | | — | (e) |
| | | | | | | |
Agency | | | | | | | | | | | | | | | | | | | | | | | | | | | | |
Six Months Ended August 31, 2018 (Unaudited) | | | 1.00 | | | | 0.01 | (d) | | | — | (e) | | | 0.01 | | | | (0.01 | ) | | | — | | | | (0.01 | ) |
Year Ended February 28, 2018 | | | 1.00 | | | | 0.01 | (d) | | | — | (e) | | | 0.01 | | | | (0.01 | ) | | | — | (e) | | | (0.01 | ) |
Year Ended February 28, 2017 | | | 1.00 | | | | — | (d)(e) | | | — | (e) | | | — | (e) | | | — | (e) | | | — | (e) | | | — | (e) |
Year Ended February 29, 2016 | | | 1.00 | | | | — | (d)(e) | | | — | (e) | | | — | (e) | | | — | (e) | | | — | | | | — | (e) |
Year Ended February 28, 2015 | | | 1.00 | | | | — | | | | — | (e) | | | — | (e) | | | — | (e) | | | — | (e) | | | — | (e) |
Year Ended February 28, 2014 | | | 1.00 | | | | — | (e) | | | — | (e) | | | — | (e) | | | — | (e) | | | — | (e) | | | — | (e) |
| | | | | | | |
Capital | | | | | | | | | | | | | | | | | | | | | | | | | | | | |
Six Months Ended August 31, 2018 (Unaudited) | | | 1.00 | | | | 0.01 | (d) | | | — | (e) | | | 0.01 | | | | (0.01 | ) | | | — | | | | (0.01 | ) |
September 22, 2017 (g) through February 28, 2018 | | | 1.00 | | | | 0.01 | (d) | | | (0.01 | ) | | | — | (e) | | | — | (e) | | | — | (e) | | | — | (e) |
| | | | | | | |
Direct (h) | | | | | | | | | | | | | | | | | | | | | | | | | | | | |
For the period ended November 22, 2017 | | | 1.00 | | | | 0.01 | (d) | | | — | (e) | | | 0.01 | | | | (0.01 | ) | | | — | (e) | | | (0.01 | ) |
Year Ended February 28, 2017 | | | 1.00 | | | | — | (d)(e) | | | — | (e) | | | — | (e) | | | — | (e) | | | — | (e) | | | — | (e) |
Year Ended February 29, 2016 | | | 1.00 | | | | — | (d)(e) | | | — | (e) | | | — | (e) | | | — | (e) | | | — | (e) | | | — | (e) |
Year Ended February 28, 2015 | | | 1.00 | | | | — | | | | — | (e) | | | — | (e) | | | — | (e) | | | — | (e) | | | — | (e) |
Year Ended February 28, 2014 | | | 1.00 | | | | — | (e) | | | — | (e) | | | — | (e) | | | — | (e) | | | — | (e) | | | — | (e) |
| | | | | | | |
IM | | | | | | | | | | | | | | | | | | | | | | | | | | | | |
Six Months Ended August 31, 2018 (Unaudited) | | | 1.00 | | | | 0.01 | (d) | | | — | (e) | | | 0.01 | | | | (0.01 | ) | | | — | | | | (0.01 | ) |
Year Ended February 28, 2018 | | | 1.00 | | | | 0.01 | (d) | | | — | (e) | | | 0.01 | | | | (0.01 | ) | | | — | (e) | | | (0.01 | ) |
Year Ended February 28, 2017 | | | 1.00 | | | | — | (d)(e) | | | — | (e) | | | — | (e) | | | — | (e) | | | — | (e) | | | — | (e) |
Year Ended February 29, 2016 | | | 1.00 | | | | — | (d)(e) | | | — | (e) | | | — | (e) | | | — | (e) | | | — | (e) | | | — | (e) |
Year Ended February 28, 2015 | | | 1.00 | | | | — | | | | — | (e) | | | — | (e) | | | — | (e) | | | — | (e) | | | — | (e) |
Year Ended February 28, 2014 | | | 1.00 | | | | — | (e) | | | — | (e) | | | — | (e) | | | — | (e) | | | — | (e) | | | — | (e) |
| (a) | Annualized for periods less than one year, unless otherwise noted. |
| (b) | Not annualized for periods less than one year. |
| (c) | Includes earnings credits and interest expense, if applicable, each of which is less than 0.005% unless otherwise noted. |
| (d) | Calculated based upon average shares outstanding. |
| (e) | Amount rounds to less than $0.005. |
| (f) | Amount rounds to less than 0.005%. |
| (g) | Commencement of offering of class of shares. |
| (h) | Direct Shares of U.S. Treasury Plus Money Market Fund had no assets from the close of business on November 22, 2017. |
SEE NOTES TO FINANCIAL STATEMENTS.
| | | | | | |
| | | |
| 120 | | | | J.P. MORGAN MONEY MARKET FUNDS | | AUGUST 31, 2018 |
| | | | | | | | | | | | | | | | | | | | | | |
| | | Ratios/Supplemental data | |
| | | | | | | | | | Ratios to average net assets (a) | |
Net asset
value,
end of
period | | | Total
return (b) | | | Net assets,
end of
period
(000’s) | | | Net
expenses (c) | | |
Net
investment income
(loss) | | | Expenses
without waivers,
reimbursements and
earnings credits | |
| | | | | | | | | | | | | | | | | | | | | | |
| | | | | | | | | | | | | | | | | | | | | | |
| $ | 1.00 | | | | 0.43 | % | | $ | 356,342 | | | | 0.97 | % | | | 0.85 | % | | | 1.16 | % |
| | 1.00 | | | | 0.15 | | | | 417,056 | | | | 0.90 | | | | 0.13 | | | | 1.16 | |
| | 1.00 | | | | 0.00 | (f) | | | 578,579 | | | | 0.48 | | | | 0.00 | (f) | | | 1.16 | |
| | 1.00 | | | | 0.00 | (f) | | | 154,988 | | | | 0.15 | | | | 0.00 | (f) | | | 1.16 | |
| | 1.00 | | | | 0.00 | (f) | | | 168,863 | | | | 0.07 | | | | 0.00 | (f) | | | 1.16 | |
| | 1.00 | | | | 0.00 | (f) | | | 142,412 | | | | 0.08 | | | | 0.00 | (f) | | | 1.16 | |
| | | | | |
| | | | | | | | | | | | | | | | | | | | | | |
| | 1.00 | | | | 0.79 | | | | 1,156,915 | | | | 0.26 | | | | 1.58 | | | | 0.31 | |
| | 1.00 | | | | 0.81 | | | | 930,654 | | | | 0.26 | | | | 0.82 | | | | 0.31 | |
| | 1.00 | | | | 0.18 | | | | 837,723 | | | | 0.26 | | | | 0.17 | | | | 0.31 | |
| | 1.00 | | | | 0.01 | | | | 956,921 | | | | 0.15 | | | | 0.01 | | | | 0.31 | |
| | 1.00 | | | | 0.00 | (f) | | | 858,260 | | | | 0.07 | | | | 0.00 | (f) | | | 0.31 | |
| | 1.00 | | | | 0.00 | (f) | | | 2,590,914 | | | | 0.08 | | | | 0.00 | (f) | | | 0.31 | |
| | | | | |
| | | | | | | | | | | | | | | | | | | | | | |
| | 1.00 | | | | 0.83 | | | | 4,579,938 | | | | 0.18 | | | | 1.66 | | | | 0.21 | |
| | 1.00 | | | | 0.47 | | | | 3,501,095 | | | | 0.18 | | | | 1.17 | | | | 0.21 | |
| | | | | |
| | | | | | | | | | | | | | | | | | | | | | |
| | 1.00 | | | | 0.48 | | | | — | | | | 0.30 | | | | 0.71 | | | | 0.31 | |
| | 1.00 | | | | 0.14 | | | | 5,812 | | | | 0.30 | | | | 0.09 | | | | 0.31 | |
| | 1.00 | | | | 0.01 | | | | 672,625 | | | | 0.13 | | | | 0.00 | (f) | | | 0.31 | |
| | 1.00 | | | | 0.00 | (f) | | | 1,222,018 | | | | 0.07 | | | | 0.00 | (f) | | | 0.31 | |
| | 1.00 | | | | 0.00 | (f) | | | 1,655,840 | | | | 0.08 | | | | 0.00 | (f) | | | 0.31 | |
| | | | | |
| | | | | | | | | | | | | | | | | | | | | | |
| | 1.00 | | | | 0.85 | | | | 3,712,803 | | | | 0.16 | | | | 1.68 | | | | 0.16 | |
| | 1.00 | | | | 0.90 | | | | 3,051,574 | | | | 0.16 | | | | 0.81 | | | | 0.16 | |
| | 1.00 | | | | 0.28 | | | | 7,449,646 | | | | 0.16 | | | | 0.29 | | | | 0.16 | |
| | 1.00 | | | | 0.04 | | | | 4,788,250 | | | | 0.12 | | | | 0.04 | | | | 0.16 | |
| | 1.00 | | | | 0.00 | (f) | | | 3,045,746 | | | | 0.07 | | | | 0.00 | (f) | | | 0.16 | |
| | 1.00 | | | | 0.00 | (f) | | | 1,931,586 | | | | 0.07 | | | | 0.00 | (f) | | | 0.16 | |
SEE NOTES TO FINANCIAL STATEMENTS.
| | | | | | | | |
| | | |
| AUGUST 31, 2018 | | J.P. MORGAN MONEY MARKET FUNDS | | | | | 121 | |
FINANCIAL HIGHLIGHTS
FOR THE PERIODS INDICATED (continued)
| | | | | | | | | | | | | | | | | | | | | | | | | | | | |
| | | Per share operating performance | |
| | | | | | Investment operations | | | Distributions | |
| | | Net asset
value,
beginning
of period | | | Net
investment
income
(loss) | | | Net realized
and unrealized gains
(losses) on
investments | | | Total from
investment
operations | | | Net
investment
income | | | Net
realized
gain | | | Total
distributions | |
JPMorgan U.S. Treasury Plus Money Market Fund (continued) | | | | | | | | | | | | | |
Institutional Class | | | | | | | | | | | | | | | | | | | | | | | | | | | | |
Six Months Ended August 31, 2018 (Unaudited) | | $ | 1.00 | | | $ | 0.01 | (d) | | $ | — | (e) | | $ | 0.01 | | | $ | (0.01 | ) | | $ | — | | | $ | (0.01 | ) |
Year Ended February 28, 2018 | | | 1.00 | | | | 0.01 | (d) | | | — | (e) | | | 0.01 | | | | (0.01 | ) | | | — | (e) | | | (0.01 | ) |
Year Ended February 28, 2017 | | | 1.00 | | | | — | (d)(e) | | | — | (e) | | | — | (e) | | | — | (e) | | | — | (e) | | | — | (e) |
Year Ended February 29, 2016 | | | 1.00 | | | | — | (d)(e) | | | — | (e) | | | — | (e) | | | — | (e) | | | — | (e) | | | — | (e) |
Year Ended February 28, 2015 | | | 1.00 | | | | — | | | | — | (e) | | | — | (e) | | | — | (e) | | | — | (e) | | | — | (e) |
Year Ended February 28, 2014 | | | 1.00 | | | | — | (e) | | | — | (e) | | | — | (e) | | | — | (e) | | | — | (e) | | | — | (e) |
| | | | | | | |
Investor | | | | | | | | | | | | | | | | | | | | | | | | | | | | |
Six Months Ended August 31, 2018 (Unaudited) | | | 1.00 | | | | 0.01 | (d) | | | — | (e) | | | 0.01 | | | | (0.01 | ) | | | — | | | | (0.01 | ) |
Year Ended February 28, 2018 | | | 1.00 | | | | 0.01 | (d) | | | — | (e) | | | 0.01 | | | | (0.01 | ) | | | — | (e) | | | (0.01 | ) |
Year Ended February 28, 2017 | | | 1.00 | | | | — | (d)(e) | | | — | (e) | | | — | (e) | | | — | (e) | | | — | (e) | | | — | (e) |
Year Ended February 29, 2016 | | | 1.00 | | | | — | (d)(e) | | | — | (e) | | | — | (e) | | | — | (e) | | | — | (e) | | | — | (e) |
Year Ended February 28, 2015 | | | 1.00 | | | | — | | | | — | (e) | | | — | (e) | | | — | (e) | | | — | (e) | | | — | (e) |
Year Ended February 28, 2014 | | | 1.00 | | | | — | (e) | | | — | (e) | | | — | (e) | | | — | (e) | | | — | (e) | | | — | (e) |
| | | | | | | |
Morgan | | | | | | | | | | | | | | | | | | | | | | | | | | | | |
Six Months Ended August 31, 2018 (Unaudited) | | | 1.00 | | | | 0.01 | (d) | | | — | (e) | | | 0.01 | | | | (0.01 | ) | | | — | | | | (0.01 | ) |
Year Ended February 28, 2018 | | | 1.00 | | | | — | (d)(e) | | | — | (e) | | | — | (e) | | | — | (e) | | | — | (e) | | | — | (e) |
Year Ended February 28, 2017 | | | 1.00 | | | | — | (d)(e) | | | — | (e) | | | — | (e) | | | — | (e) | | | — | (e) | | | — | (e) |
Year Ended February 29, 2016 | | | 1.00 | | | | — | (d)(e) | | | — | (e) | | | — | (e) | | | — | (e) | | | — | (e) | | | — | (e) |
Year Ended February 28, 2015 | | | 1.00 | | | | — | | | | — | (e) | | | — | (e) | | | — | (e) | | | — | (e) | | | — | (e) |
Year Ended February 28, 2014 | | | 1.00 | | | | — | (e) | | | — | (e) | | | — | (e) | | | — | (e) | | | — | (e) | | | — | (e) |
| | | | | | | |
Premier | | | | | | | | | | | | | | | | | | | | | | | | | | | | |
Six Months Ended August 31, 2018 (Unaudited) | | | 1.00 | | | | 0.01 | (d) | | | — | (e) | | | 0.01 | | | | (0.01 | ) | | | — | | | | (0.01 | ) |
Year Ended February 28, 2018 | | | 1.00 | | | | 0.01 | (d) | | | — | (e) | | | 0.01 | | | | (0.01 | ) | | | — | (e) | | | (0.01 | ) |
Year Ended February 28, 2017 | | | 1.00 | | | | — | (d)(e) | | | — | (e) | | | — | (e) | | | — | (e) | | | — | (e) | | | — | (e) |
Year Ended February 29, 2016 | | | 1.00 | | | | — | (d)(e) | | | — | (e) | | | — | (e) | | | — | (e) | | | — | (e) | | | — | (e) |
Year Ended February 28, 2015 | | | 1.00 | | | | — | | | | — | (e) | | | — | (e) | | | — | (e) | | | — | (e) | | | — | (e) |
Year Ended February 28, 2014 | | | 1.00 | | | | — | (e) | | | — | (e) | | | — | (e) | | | — | (e) | | | — | (e) | | | — | (e) |
| | | | | | | |
Reserve | | | | | | | | | | | | | | | | | | | | | | | | | | | | |
Six Months Ended August 31, 2018 (Unaudited) | | | 1.00 | | | | 0.01 | (d) | | | — | (e) | | | 0.01 | | | | (0.01 | ) | | | — | | | | (0.01 | ) |
Year Ended February 28, 2018 | | | 1.00 | | | | — | (d)(e) | | | — | (e) | | | — | (e) | | | — | (e) | | | — | (e) | | | — | (e) |
Year Ended February 28, 2017 | | | 1.00 | | | | — | (d)(e) | | | — | (e) | | | — | (e) | | | — | (e) | | | — | (e) | | | — | (e) |
Year Ended February 29, 2016 | | | 1.00 | | | | — | (d)(e) | | | — | (e) | | | — | (e) | | | — | (e) | | | — | (e) | | | — | (e) |
Year Ended February 28, 2015 | | | 1.00 | | | | — | | | | — | (e) | | | — | (e) | | | — | (e) | | | — | (e) | | | — | (e) |
Year Ended February 28, 2014 | | | 1.00 | | | | — | (e) | | | — | (e) | | | — | (e) | | | — | (e) | | | — | (e) | | | — | (e) |
| (a) | Annualized for periods less than one year, unless otherwise noted. |
| (b) | Not annualized for periods less than one year. |
| (c) | Includes earnings credits and interest expense, if applicable, each of which is less than 0.005% unless otherwise noted. |
| (d) | Calculated based upon average shares outstanding. |
| (e) | Amount rounds to less than $0.005. |
| (f) | Amount rounds to less than 0.005%. |
SEE NOTES TO FINANCIAL STATEMENTS.
| | | | | | |
| | | |
| 122 | | | | J.P. MORGAN MONEY MARKET FUNDS | | AUGUST 31, 2018 |
| | | | | | | | | | | | | | | | | | | | | | |
| | | Ratios/Supplemental data | |
| | | | | | | | | | Ratios to average net assets (a) | |
Net asset
value,
end of
period | | | Total return (b) | | | Net assets,
end of
period
(000’s) | | | Net
expenses (c) | | |
Net
investment income
(loss) | | | Expenses
without waivers,
reimbursements and
earnings credits | |
| | | | | | | | | | | | | | | | | | | | | | |
| | | | | | | | | | | | | | | | | | | | | | |
| $ | 1.00 | | | | 0.82 | % | | $ | 14,032,252 | | | | 0.21 | % | | | 1.62 | % | | | 0.26 | % |
| | 1.00 | | | | 0.86 | | | | 13,500,900 | | | | 0.21 | | | | 0.84 | | | | 0.26 | |
| | 1.00 | | | | 0.23 | | | | 14,813,061 | | | | 0.21 | | | | 0.24 | | | | 0.26 | |
| | 1.00 | | | | 0.02 | | | | 8,736,623 | | | | 0.13 | | | | 0.02 | | | | 0.26 | |
| | 1.00 | | | | 0.00 | (f) | | | 6,516,731 | | | | 0.07 | | | | 0.00 | (f) | | | 0.26 | |
| | 1.00 | | | | 0.00 | (f) | | | 7,296,339 | | | | 0.08 | | | | 0.00 | (f) | | | 0.26 | |
| | | | | |
| | | | | | | | | | | | | | | | | | | | | | |
| | 1.00 | | | | 0.67 | | | | 40,579 | | | | 0.51 | | | | 1.32 | | | | 0.51 | |
| | 1.00 | | | | 0.55 | | | | 48,818 | | | | 0.51 | | | | 0.52 | | | | 0.51 | |
| | 1.00 | | | | 0.02 | | | | 71,303 | | | | 0.42 | | | | 0.02 | | | | 0.51 | |
| | 1.00 | | | | 0.00 | (f) | | | 89,016 | | | | 0.14 | | | | 0.00 | (f) | | | 0.51 | |
| | 1.00 | | | | 0.00 | (f) | | | 181,909 | | | | 0.07 | | | | 0.00 | (f) | | | 0.51 | |
| | 1.00 | | | | 0.00 | (f) | | | 237,466 | | | | 0.08 | | | | 0.00 | (f) | | | 0.51 | |
| | | | | |
| | | | | | | | | | | | | | | | | | | | | | |
| | 1.00 | | | | 0.63 | | | | 366,725 | | | | 0.59 | | | | 1.25 | | | | 0.62 | |
| | 1.00 | | | | 0.47 | | | | 283,619 | | | | 0.59 | | | | 0.48 | | | | 0.62 | |
| | 1.00 | | | | 0.00 | (f) | | | 244,830 | | | | 0.43 | | | | 0.00 | (f) | | | 0.61 | |
| | 1.00 | | | | 0.00 | (f) | | | 706,209 | | | | 0.15 | | | | 0.00 | (f) | | | 0.61 | |
| | 1.00 | | | | 0.00 | (f) | | | 734,788 | | | | 0.07 | | | | 0.00 | (f) | | | 0.61 | |
| | 1.00 | | | | 0.00 | (f) | | | 612,152 | | | | 0.08 | | | | 0.00 | (f) | | | 0.61 | |
| | | | | |
| | | | | | | | | | | | | | | | | | | | | | |
| | 1.00 | | | | 0.70 | | | | 746,704 | | | | 0.45 | | | | 1.39 | | | | 0.46 | |
| | 1.00 | | | | 0.61 | | | | 611,645 | | | | 0.45 | | | | 0.61 | | | | 0.46 | |
| | 1.00 | | | | 0.03 | | | | 640,584 | | | | 0.41 | | | | 0.04 | | | | 0.46 | |
| | 1.00 | | | | 0.00 | (f) | | | 244,258 | | | | 0.14 | | | | 0.00 | (f) | | | 0.46 | |
| | 1.00 | | | | 0.00 | (f) | | | 383,019 | | | | 0.07 | | | | 0.00 | (f) | | | 0.46 | |
| | 1.00 | | | | 0.00 | (f) | | | 493,950 | | | | 0.08 | | | | 0.00 | (f) | | | 0.46 | |
| | | | | |
| | | | | | | | | | | | | | | | | | | | | | |
| | 1.00 | | | | 0.57 | | | | 14,730 | | | | 0.70 | | | | 1.14 | | | | 0.71 | |
| | 1.00 | | | | 0.37 | | | | 12,246 | | | | 0.70 | | | | 0.28 | | | | 0.71 | |
| | 1.00 | | | | 0.00 | (f) | | | 109,454 | | | | 0.40 | | | | 0.00 | (f) | | | 0.71 | |
| | 1.00 | | | | 0.00 | (f) | | | 679,587 | | | | 0.15 | | | | 0.00 | (f) | | | 0.71 | |
| | 1.00 | | | | 0.00 | (f) | | | 847,101 | | | | 0.07 | | | | 0.00 | (f) | | | 0.71 | |
| | 1.00 | | | | 0.00 | (f) | | | 943,099 | | | | 0.08 | | | | 0.00 | (f) | | | 0.71 | |
SEE NOTES TO FINANCIAL STATEMENTS.
| | | | | | | | |
| | | |
| AUGUST 31, 2018 | | J.P. MORGAN MONEY MARKET FUNDS | | | | | 123 | |
FINANCIAL HIGHLIGHTS
FOR THE PERIODS INDICATED (continued)
| | | | | | | | | | | | | | | | | | | | | | | | | | | | |
| | | Per share operating performance | |
| | | | | | Investment operations | | | Distributions | |
| | | Net asset
value,
beginning
of period | | | Net
investment
income
(loss) | | | Net realized
and unrealized
gains
(losses) on
investments | | | Total from
investment
operations | | | Net
investment
income | | | Net
realized
gain | | | Total
distributions | |
JPMorgan Federal Money Market Fund | |
Agency | |
Six Months Ended August 31, 2018 (Unaudited) | | $ | 1.00 | | | $ | 0.01 | (d) | | $ | — | (e) | | $ | 0.01 | | | $ | (0.01 | ) | | $ | — | | | $ | (0.01 | ) |
Year Ended February 28, 2018 | | | 1.00 | | | | 0.01 | (d) | | | — | (e) | | | 0.01 | | | | (0.01 | ) | | | — | (e) | | | (0.01 | ) |
Year Ended February 28, 2017 | | | 1.00 | | | | — | (d)(e) | | | — | (e) | | | — | (e) | | | — | (e) | | | — | (e) | | | — | (e) |
Year Ended February 29, 2016 | | | 1.00 | | | | — | (d)(e) | | | — | (e) | | | — | (e) | | | — | (e) | | | — | (e) | | | — | (e) |
Year Ended February 28, 2015 | | | 1.00 | | | | — | (e) | | | — | (e) | | | — | (e) | | | — | (e) | | | — | (e) | | | — | (e) |
Year Ended February 28, 2014 | | | 1.00 | | | | — | (e) | | | — | (e) | | | — | (e) | | | — | (e) | | | — | (e) | | | — | (e) |
|
Institutional Class | |
Six Months Ended August 31, 2018 (Unaudited) | | | 1.00 | | | | 0.01 | (d) | | | — | (e) | | | 0.01 | | | | (0.01 | ) | | | — | | | | (0.01 | ) |
Year Ended February 28, 2018 | | | 1.00 | | | | 0.01 | (d) | | | — | (e) | | | 0.01 | | | | (0.01 | ) | | | — | (e) | | | (0.01 | ) |
Year Ended February 28, 2017 | | | 1.00 | | | | — | (d)(e) | | | — | (e) | | | — | (e) | | | — | (e) | | | — | (e) | | | — | (e) |
Year Ended February 29, 2016 | | | 1.00 | | | | — | (d)(e) | | | — | (e) | | | — | (e) | | | — | (e) | | | — | (e) | | | — | (e) |
Year Ended February 28, 2015 | | | 1.00 | | | | — | (e) | | | — | (e) | | | — | (e) | | | — | (e) | | | — | (e) | | | — | (e) |
Year Ended February 28, 2014 | | | 1.00 | | | | — | (e) | | | — | (e) | | | — | (e) | | | — | (e) | | | — | (e) | | | — | (e) |
|
Morgan | |
Six Months Ended August 31, 2018 (Unaudited) | | | 1.00 | | | | 0.01 | (d) | | | — | (e) | | | 0.01 | | | | (0.01 | ) | | | — | | | | (0.01 | ) |
Year Ended February 28, 2018 | | | 1.00 | | | | — | (d)(e) | | | — | (e) | | | — | (e) | | | — | (e) | | | — | (e) | | | — | (e) |
Year Ended February 28, 2017 | | | 1.00 | | | | — | (d)(e) | | | — | (e) | | | — | (e) | | | — | (e) | | | — | (e) | | | — | (e) |
Year Ended February 29, 2016 | | | 1.00 | | | | — | (d)(e) | | | — | (e) | | | — | (e) | | | — | (e) | | | — | (e) | | | — | (e) |
Year Ended February 28, 2015 | | | 1.00 | | | | — | (e) | | | — | (e) | | | — | (e) | | | — | (e) | | | — | (e) | | | — | (e) |
Year Ended February 28, 2014 | | | 1.00 | | | | — | (e) | | | — | (e) | | | — | (e) | | | — | (e) | | | — | (e) | | | — | (e) |
|
Premier | |
Six Months Ended August 31, 2018 (Unaudited) | | | 1.00 | | | | 0.01 | (d) | | | — | (e) | | | 0.01 | | | | (0.01 | ) | | | — | | | | (0.01 | ) |
Year Ended February 28, 2018 | | | 1.00 | | | | 0.01 | (d) | | | — | (e) | | | 0.01 | | | | (0.01 | ) | | | — | (e) | | | (0.01 | ) |
Year Ended February 28, 2017 | | | 1.00 | | | | — | (d)(e) | | | — | (e) | | | — | (e) | | | — | (e) | | | — | (e) | | | — | (e) |
Year Ended February 29, 2016 | | | 1.00 | | | | — | (d)(e) | | | — | (e) | | | — | (e) | | | — | (e) | | | — | (e) | | | — | (e) |
Year Ended February 28, 2015 | | | 1.00 | | | | — | (e) | | | — | (e) | | | — | (e) | | | — | (e) | | | — | (e) | | | — | (e) |
Year Ended February 28, 2014 | | | 1.00 | | | | — | (e) | | | — | (e) | | | — | (e) | | | — | (e) | | | — | (e) | | | — | (e) |
| (a) | Annualized for periods less than one year, unless otherwise noted. |
| (b) | Not annualized for periods less than one year. |
| (c) | Includes earnings credits and interest expense, if applicable, each of which is less than 0.005% unless otherwise noted. |
| (d) | Calculated based upon average shares outstanding. |
| (e) | Amount rounds to less than $0.005. |
| (f) | Amount rounds to less than 0.005%. |
SEE NOTES TO FINANCIAL STATEMENTS.
| | | | | | |
| | | |
| 124 | | | | J.P. MORGAN MONEY MARKET FUNDS | | AUGUST 31, 2018 |
| | | | | | | | | | | | | | | | | | | | | | |
| | | Ratios/Supplemental data | |
| | | | | | | | | | Ratios to average net assets (a) | |
Net asset
value,
end of
period | | | Total return (b) | | | Net assets,
end of
period
(000’s) | | | Net
expenses (c) | | |
Net
investment income
(loss) | | | Expenses
without waivers,
reimbursements and
earnings credits | |
| | | | | | | | | | | | | | | | | | | | | | |
| | | | | | | | | | | | | | | | | | | | | | |
| $ | 1.00 | | | | 0.78 | % | | $ | 133,372 | | | | 0.26 | % | | | 1.55 | % | | | 0.32 | % |
| | 1.00 | | | | 0.80 | | | | 127,451 | | | | 0.26 | | | | 0.77 | | | | 0.33 | |
| | 1.00 | | | | 0.20 | | | | 133,227 | | | | 0.26 | | | | 0.19 | | | | 0.35 | |
| | 1.00 | | | | 0.02 | | | | 233,955 | | | | 0.16 | | | | 0.02 | | | | 0.33 | |
| | 1.00 | | | | 0.01 | | | | 84,778 | | | | 0.07 | | | | 0.00 | (f) | | | 0.35 | |
| | 1.00 | | | | 0.01 | | | | 233,285 | | | | 0.08 | | | | 0.01 | | | | 0.34 | |
| | | | | |
| | | | | | | | | | | | | | | | | | | | | | |
| | 1.00 | | | | 0.80 | | | | 3,050,851 | | | | 0.21 | | | | 1.59 | | | | 0.27 | |
| | 1.00 | | | | 0.85 | | | | 2,668,613 | | | | 0.21 | | | | 0.84 | | | | 0.28 | |
| | 1.00 | | | | 0.25 | | | | 2,767,271 | | | | 0.21 | | | | 0.25 | | | | 0.30 | |
| | 1.00 | | | | 0.03 | | | | 3,615,992 | | | | 0.13 | | | | 0.03 | | | | 0.28 | |
| | 1.00 | | | | 0.01 | | | | 3,995,934 | | | | 0.06 | | | | 0.01 | | | | 0.30 | |
| | 1.00 | | | | 0.01 | | | | 3,835,871 | | | | 0.07 | | | | 0.01 | | | | 0.29 | |
| | | | | |
| | | | | | | | | | | | | | | | | | | | | | |
| | 1.00 | | | | 0.61 | | | | 25,651 | | | | 0.59 | | | | 1.21 | | | | 0.70 | |
| | 1.00 | | | | 0.46 | | | | 32,224 | | | | 0.59 | | | | 0.44 | | | | 0.69 | |
| | 1.00 | | | | 0.02 | | | | 53,090 | | | | 0.42 | | | | 0.01 | | | | 0.67 | |
| | 1.00 | | | | 0.01 | | | | 131,723 | | | | 0.16 | | | | 0.01 | | | | 0.65 | |
| | 1.00 | | | | 0.01 | | | | 111,292 | | | | 0.07 | | | | 0.01 | �� | | | 0.65 | |
| | 1.00 | | | | 0.01 | | | | 96,652 | | | | 0.07 | | | | 0.01 | | | | 0.64 | |
| | | | | |
| | | | | | | | | | | | | | | | | | | | | | |
| | 1.00 | | | | 0.68 | | | | 224,000 | | | | 0.45 | | | | 1.35 | | | | 0.47 | |
| | 1.00 | | | | 0.60 | | | | 229,795 | | | | 0.45 | | | | 0.65 | | | | 0.48 | |
| | 1.00 | | | | 0.04 | | | | 109,282 | | | | 0.41 | | | | 0.04 | | | | 0.50 | |
| | 1.00 | | | | 0.01 | | | | 171,808 | | | | 0.14 | | | | 0.01 | | | | 0.49 | |
| | 1.00 | | | | 0.01 | | | | 219,792 | | | | 0.06 | | | | 0.01 | | | | 0.50 | |
| | 1.00 | | | | 0.01 | | | | 277,420 | | | | 0.07 | | | | 0.01 | | | | 0.49 | |
SEE NOTES TO FINANCIAL STATEMENTS.
| | | | | | | | |
| | | |
| AUGUST 31, 2018 | | J.P. MORGAN MONEY MARKET FUNDS | | | | | 125 | |
FINANCIAL HIGHLIGHTS
FOR THE PERIODS INDICATED (continued)
| | | | | | | | | | | | | | | | | | | | | | | | | | | | |
| | | Per share operating performance | |
| | | | | | Investment operations | | | Distributions | |
| | | Net asset
value,
beginning
of period | | | Net
investment
income
(loss) | | | Net realized
and unrealized
gains
(losses) on
investments | | | Total from
investment
operations | | | Net
investment
income | | | Net
realized
gain | | | Total
distributions | |
JPMorgan 100% U.S. Treasury Securities Money Market Fund | |
Agency | |
Six Months Ended August 31, 2018 (Unaudited) | | $ | 1.00 | | | $ | 0.01 | (d) | | $ | — | (e) | | $ | 0.01 | | | $ | (0.01 | ) | | $ | — | | | $ | (0.01 | ) |
Year Ended February 28, 2018 | | | 1.00 | | | | 0.01 | (d) | | | — | (e) | | | 0.01 | | | | (0.01 | ) | | | — | (e) | | | (0.01 | ) |
Year Ended February 28, 2017 | | | 1.00 | | | | — | (d)(e) | | | — | (e) | | | — | (e) | | | — | (e) | | | — | (e) | | | — | (e) |
Year Ended February 29, 2016 | | | 1.00 | | | | — | (d)(e) | | | — | (e) | | | — | (e) | | | — | (e) | | | — | (e) | | | — | (e) |
Year Ended February 28, 2015 | | | 1.00 | | | | — | | | | — | (e) | | | — | (e) | | | — | (e) | | | — | (e) | | | — | (e) |
Year Ended February 28, 2014 | | | 1.00 | | | | — | | | | — | (e) | | | — | (e) | | | — | (e) | | | — | (e) | | | — | (e) |
| | | | | | | |
Capital | | | | | | | | | | | | | | | | | | | | | | | | | | | | |
Six Months Ended August 31, 2018 (Unaudited) | | | 1.00 | | | | 0.01 | (d) | | | — | (e) | | | 0.01 | | | | (0.01 | ) | | | — | | | | (0.01 | ) |
Year Ended February 28, 2018 | | | 1.00 | | | | 0.01 | (d) | | | — | (e) | | | 0.01 | | | | (0.01 | ) | | | — | (e) | | | (0.01 | ) |
Year Ended February 28, 2017 | | | 1.00 | | | | — | (d)(e) | | | — | (e) | | | — | (e) | | | — | (e) | | | — | (e) | | | — | (e) |
Year Ended February 29, 2016 | | | 1.00 | | | | — | (d)(e) | | | — | (e) | | | — | (e) | | | — | (e) | | | — | (e) | | | — | (e) |
Year Ended February 28, 2015 | | | 1.00 | | | | — | | | | — | (e) | | | — | (e) | | | — | (e) | | | — | (e) | | | — | (e) |
Year Ended February 28, 2014 | | | 1.00 | | | | — | | | | — | (e) | | | — | (e) | | | — | (e) | | | — | (e) | | | — | (e) |
| | | | | | | |
Institutional Class | | | | | | | | | | | | | | | | | | | | | | | | | | | | |
Six Months Ended August 31, 2018 (Unaudited) | | | 1.00 | | | | 0.01 | (d) | | | — | (e) | | | 0.01 | | | | (0.01 | ) | | | — | | | | (0.01 | ) |
Year Ended February 28, 2018 | | | 1.00 | | | | 0.01 | (d) | | | — | (e) | | | 0.01 | | | | (0.01 | ) | | | — | (e) | | | (0.01 | ) |
Year Ended February 28, 2017 | | | 1.00 | | | | — | (d)(e) | | | — | (e) | | | — | (e) | | | — | (e) | | | — | (e) | | | — | (e) |
Year Ended February 29, 2016 | | | 1.00 | | | | — | (d)(e) | | | — | (e) | | | — | (e) | | | — | (e) | | | — | (e) | | | — | (e) |
Year Ended February 28, 2015 | | | 1.00 | | | | — | | | | — | (e) | | | — | (e) | | | — | (e) | | | — | (e) | | | — | (e) |
Year Ended February 28, 2014 | | | 1.00 | | | | — | | | | — | (e) | | | — | (e) | | | — | (e) | | | — | (e) | | | — | (e) |
| | | | | | | |
Morgan | | | | | | | | | | | | | | | | | | | | | | | | | | | | |
Six Months Ended August 31, 2018 (Unaudited) | | | 1.00 | | | | 0.01 | (d) | | | — | (e) | | | 0.01 | | | | (0.01 | ) | | | — | | | | (0.01 | ) |
Year Ended February 28, 2018 | | | 1.00 | | | | — | (d)(e) | | | — | (e) | | | — | (e) | | | — | (e) | | | — | (e) | | | — | (e) |
Year Ended February 28, 2017 | | | 1.00 | | | | — | (d)(e) | | | — | (e) | | | — | (e) | | | — | (e) | | | — | (e) | | | — | (e) |
Year Ended February 29, 2016 | | | 1.00 | | | | — | (d)(e) | | | — | (e) | | | — | (e) | | | — | (e) | | | — | (e) | | | — | (e) |
Year Ended February 28, 2015 | | | 1.00 | | | | — | | | | — | (e) | | | — | (e) | | | — | (e) | | | — | (e) | | | — | (e) |
Year Ended February 28, 2014 | | | 1.00 | | | | — | | | | — | (e) | | | — | (e) | | | — | (e) | | | — | (e) | | | — | (e) |
| | | | | | | |
Premier | | | | | | | | | | | | | | | | | | | | | | | | | | | | |
Six Months Ended August 31, 2018 (Unaudited) | | | 1.00 | | | | 0.01 | (d) | | | — | (e) | | | 0.01 | | | | (0.01 | ) | | | — | | | | (0.01 | ) |
Year Ended February 28, 2018 | | | 1.00 | | | | 0.01 | (d) | | | — | (e) | | | 0.01 | | | | (0.01 | ) | | | — | (e) | | | (0.01 | ) |
Year Ended February 28, 2017 | | | 1.00 | | | | — | (d)(e) | | | — | (e) | | | — | (e) | | | — | (e) | | | — | (e) | | | — | (e) |
Year Ended February 29, 2016 | | | 1.00 | | | | — | (d)(e) | | | — | (e) | | | — | (e) | | | — | (e) | | | — | (e) | | | — | (e) |
Year Ended February 28, 2015 | | | 1.00 | | | | — | | | | — | (e) | | | — | (e) | | | — | (e) | | | — | (e) | | | — | (e) |
Year Ended February 28, 2014 | | | 1.00 | | | | — | | | | — | (e) | | | — | (e) | | | — | (e) | | | — | (e) | | | — | (e) |
| | | | | | | |
Reserve | | | | | | | | | | | | | | | | | | | | | | | | | | | | |
Six Months Ended August 31, 2018 (Unaudited) | | | 1.00 | | | | 0.01 | (d) | | | — | (e) | | | 0.01 | | | | (0.01 | ) | | | — | | | | (0.01 | ) |
Year Ended February 28, 2018 | | | 1.00 | | | | — | (d)(e) | | | — | (e) | | | — | (e) | | | — | (e) | | | — | (e) | | | — | (e) |
Year Ended February 28, 2017 | | | 1.00 | | | | — | (d)(e) | | | — | (e) | | | — | (e) | | | — | (e) | | | — | (e) | | | — | (e) |
Year Ended February 29, 2016 | | | 1.00 | | | | — | (d)(e) | | | — | (e) | | | — | (e) | | | — | (e) | | | — | (e) | | | — | (e) |
Year Ended February 28, 2015 | | | 1.00 | | | | — | | | | — | (e) | | | — | (e) | | | — | (e) | | | — | (e) | | | — | (e) |
Year Ended February 28, 2014 | | | 1.00 | | | | — | | | | — | (e) | | | — | (e) | | | — | (e) | | | — | (e) | | | — | (e) |
| (a) | Annualized for periods less than one year, unless otherwise noted. |
| (b) | Not annualized for periods less than one year. |
| (c) | Includes earnings credits and interest expense, if applicable, each of which is less than 0.005% unless otherwise noted. |
| (d) | Calculated based upon average shares outstanding. |
| (e) | Amount rounds to less than $0.005. |
| (f) | Amount rounds to less than 0.005%. |
SEE NOTES TO FINANCIAL STATEMENTS.
| | | | | | |
| | | |
| 126 | | | | J.P. MORGAN MONEY MARKET FUNDS | | AUGUST 31, 2018 |
| | | | | | | | | | | | | | | | | | | | | | |
| | | Ratios/Supplemental data | |
| | | | | | | | | | Ratios to average net assets (a) | |
Net asset
value,
end of
period | | | Total return (b) | | | Net assets,
end of
period
(000’s) | | | Net
expenses (c) | | | Net
investment
income
(loss) | | |
Expenses
without waivers,
reimbursements and
earnings credits | |
| | | | | | | | | | | | | | | | | | | | | | |
| | | | | | | | | | | | | | | | | | | | | | |
| $ | 1.00 | | | | 0.78 | % | | $ | 2,458,682 | | | | 0.26 | % | | | 1.55 | % | | | 0.31 | % |
| | 1.00 | | | | 0.79 | | | | 1,981,066 | | | | 0.26 | | | | 0.80 | | | | 0.31 | |
| | 1.00 | | | | 0.15 | | | | 1,848,739 | | | | 0.26 | | | | 0.15 | | | | 0.31 | |
| | 1.00 | | | | 0.01 | | | | 1,895,744 | | | | 0.10 | | | | 0.01 | | | | 0.31 | |
| | 1.00 | | | | 0.00 | (f) | | | 1,700,093 | | | | 0.05 | | | | 0.00 | | | | 0.31 | |
| | 1.00 | | | | 0.00 | (f) | | | 1,991,907 | | | | 0.07 | | | | 0.00 | | | | 0.31 | |
| | | | | |
| | | | | | | | | | | | | | | | | | | | | | |
| | 1.00 | | | | 0.82 | | | | 19,753,287 | | | | 0.18 | | | | 1.62 | | | | 0.21 | |
| | 1.00 | | | | 0.87 | | | | 19,208,530 | | | | 0.18 | | | | 0.89 | | | | 0.21 | |
| | 1.00 | | | | 0.23 | | | | 11,630,048 | | | | 0.18 | | | | 0.23 | | | | 0.21 | |
| | 1.00 | | | | 0.02 | | | | 9,678,309 | | | | 0.08 | | | | 0.01 | | | | 0.21 | |
| | 1.00 | | | | 0.00 | (f) | | | 8,717,551 | | | | 0.04 | | | | 0.00 | | | | 0.21 | |
| | 1.00 | | | | 0.00 | (f) | | | 9,468,647 | | | | 0.06 | | | | 0.00 | | | | 0.21 | |
| | | | | |
| | | | | | | | | | | | | | | | | | | | | | |
| | 1.00 | | | | 0.81 | | | | 14,448,735 | | | | 0.21 | | | | 1.60 | | | | 0.26 | |
| | 1.00 | | | | 0.84 | | | | 11,098,506 | | | | 0.21 | | | | 0.83 | | | | 0.26 | |
| | 1.00 | | | | 0.20 | | | | 9,414,776 | | | | 0.21 | | | | 0.21 | | | | 0.26 | |
| | 1.00 | | | | 0.01 | | | | 7,378,773 | | | | 0.08 | | | | 0.01 | | | | 0.26 | |
| | 1.00 | | | | 0.00 | (f) | | | 10,302,127 | | | | 0.04 | | | | 0.00 | | | | 0.26 | |
| | 1.00 | | | | 0.00 | (f) | | | 9,143,359 | | | | 0.06 | | | | 0.00 | | | | 0.26 | |
| | | | | |
| | | | | | | | | | | | | | | | | | | | | | |
| | 1.00 | | | | 0.61 | | | | 1,882,589 | | | | 0.59 | | | | 1.21 | | | | 0.61 | |
| | 1.00 | | | | 0.45 | | | | 1,617,985 | | | | 0.59 | | | | 0.46 | | | | 0.61 | |
| | 1.00 | | | | 0.00 | (f) | | | 1,148,892 | | | | 0.40 | | | | 0.00 | (f) | | | 0.61 | |
| | 1.00 | | | | 0.00 | (f) | | | 1,990,677 | | | | 0.10 | | | | 0.00 | (f) | | | 0.61 | |
| | 1.00 | | | | 0.00 | (f) | | | 1,477,551 | | | | 0.05 | | | | 0.00 | | | | 0.61 | |
| | 1.00 | | | | 0.00 | (f) | | | 1,625,797 | | | | 0.07 | | | | 0.00 | | | | 0.61 | |
| | | | | |
| | | | | | | | | | | | | | | | | | | | | | |
| | 1.00 | | | | 0.68 | | | | 1,523,542 | | | | 0.45 | | | | 1.38 | | | | 0.46 | |
| | 1.00 | | | | 0.59 | | | | 848,906 | | | | 0.45 | | | | 0.59 | | | | 0.46 | |
| | 1.00 | | | | 0.02 | | | | 857,883 | | | | 0.38 | | | | 0.02 | | | | 0.46 | |
| | 1.00 | | | | 0.00 | (f) | | | 1,219,310 | | | | 0.10 | | | | 0.00 | (f) | | | 0.46 | |
| | 1.00 | | | | 0.00 | (f) | | | 1,259,597 | | | | 0.04 | | | | 0.00 | | | | 0.46 | |
| | 1.00 | | | | 0.00 | (f) | | | 1,130,636 | | | | 0.07 | | | | 0.00 | | | | 0.46 | |
| | | | | |
| | | | | | | | | | | | | | | | | | | | | | |
| | 1.00 | | | | 0.56 | | | | 1,229,551 | | | | 0.70 | | | | 1.15 | | | | 0.71 | |
| | 1.00 | | | | 0.35 | | | | 258,002 | | | | 0.70 | | | | 0.41 | | | | 0.71 | |
| | 1.00 | | | | 0.00 | (f) | | | 75,190 | | | | 0.41 | | | | 0.00 | | | | 0.71 | |
| | 1.00 | | | | 0.00 | (f) | | | 108,109 | | | | 0.14 | | | | 0.00 | (f) | | | 0.71 | |
| | 1.00 | | | | 0.00 | (f) | | | 46,667 | | | | 0.04 | | | | 0.00 | | | | 0.71 | |
| | 1.00 | | | | 0.00 | (f) | | | 44,246 | | | | 0.07 | | | | 0.00 | | | | 0.71 | |
SEE NOTES TO FINANCIAL STATEMENTS.
| | | | | | | | |
| | | |
| AUGUST 31, 2018 | | J.P. MORGAN MONEY MARKET FUNDS | | | | | 127 | |
FINANCIAL HIGHLIGHTS
FOR THE PERIODS INDICATED (continued)
| | | | | | | | | | | | | | | | | | | | | | | | | | | | |
| | | Per share operating performance | |
| | | | | | Investment operations | | | Distributions | |
| | | Net asset
value,
beginning
of period | | | Net
investment
income
(loss) | | | Net realized
and unrealized
gains
(losses) on
investments | | | Total from
investment
operations | | | Net
investment
income | | | Net
realized
gain | | | Total
distributions | |
JPMorgan Tax Free Money Market Fund | | | | | | | | | | | | | | | | | | | | | | | | | | | | |
Agency | | | | | | | | | | | | | | | | | | | | | | | | | | | | |
Six Months Ended August 31, 2018 (Unaudited) | | $ | 1.00 | | | $ | 0.01 | (d) | | $ | — | (e) | | $ | 0.01 | | | $ | (0.01 | ) | | $ | — | | | $ | (0.01 | ) |
Year Ended February 28, 2018 | | | 1.00 | | | | 0.01 | (d) | | | — | (e) | | | 0.01 | | | | (0.01 | ) | | | — | (e) | | | (0.01 | ) |
Year Ended February 28, 2017 | | | 1.00 | | | | — | (d)(e) | | | — | (e) | | | — | (e) | | | — | (e) | | | — | (e) | | | — | (e) |
Year Ended February 29, 2016 | | | 1.00 | | | | — | (d)(e) | | | — | (e) | | | — | (e) | | | — | (e) | | | — | (e) | | | — | (e) |
Year Ended February 28, 2015 | | | 1.00 | | | | — | (e) | | | — | (e) | | | — | (e) | | | — | (e) | | | — | (e) | | | — | (e) |
Year Ended February 28, 2014 | | | 1.00 | | | | — | (e) | | | — | (e) | | | — | (e) | | | — | (e) | | | — | (e) | | | — | (e) |
| | | | | | | |
Institutional Class | | | | | | | | | | | | | | | | | | | | | | | | | | | | |
Six Months Ended August 31, 2018 (Unaudited) | | | 1.00 | | | | 0.01 | (d) | | | — | (e) | | | 0.01 | | | | (0.01 | ) | | | — | | | | (0.01 | ) |
Year Ended February 28, 2018 | | | 1.00 | | | | 0.01 | (d) | | | — | (e) | | | 0.01 | | | | (0.01 | ) | | | — | (e) | | | (0.01 | ) |
Year Ended February 28, 2017 | | | 1.00 | | | | — | (d)(e) | | | — | (e) | | | — | (e) | | | — | (e) | | | — | (e) | | | — | (e) |
Year Ended February 29, 2016 | | | 1.00 | | | | — | (d)(e) | | | — | (e) | | | — | (e) | | | — | (e) | | | — | (e) | | | — | (e) |
Year Ended February 28, 2015 | | | 1.00 | | | | — | (e) | | | — | (e) | | | — | (e) | | | — | (e) | | | — | (e) | | | — | (e) |
Year Ended February 28, 2014 | | | 1.00 | | | | — | (e) | | | — | (e) | | | — | (e) | | | — | (e) | | | — | (e) | | | — | (e) |
| | | | | | | |
Morgan | | | | | | | | | | | | | | | | | | | | | | | | | | | | |
Six Months Ended August 31, 2018 (Unaudited) | | | 1.00 | | | | — | (d)(e) | | | — | (e) | | | — | (e) | | | — | (e) | | | — | | | | — | (e) |
Year Ended February 28, 2018 | | | 1.00 | | | | — | (d)(e) | | | — | (e) | | | — | (e) | | | — | (e) | | | — | (e) | | | — | (e) |
Year Ended February 28, 2017 | | | 1.00 | | | | — | (d)(e) | | | — | (e) | | | — | (e) | | | — | (e) | | | — | (e) | | | — | (e) |
Year Ended February 29, 2016 | | | 1.00 | | | | — | (d)(e) | | | — | (e) | | | — | (e) | | | — | (e) | | | — | (e) | | | — | (e) |
Year Ended February 28, 2015 | | | 1.00 | | | | — | (e) | | | — | (e) | | | — | (e) | | | — | (e) | | | — | (e) | | | — | (e) |
Year Ended February 28, 2014 | | | 1.00 | | | | — | (e) | | | — | (e) | | | — | (e) | | | — | (e) | | | — | (e) | | | — | (e) |
| | | | | | | |
Premier | | | | | | | | | | | | | | | | | | | | | | | | | | | | |
Six Months Ended August 31, 2018 (Unaudited) | | | 1.00 | | | | — | (d)(e) | | | — | (e) | | | — | (e) | | | — | (e) | | | — | | | | — | (e) |
Year Ended February 28, 2018 | | | 1.00 | | | | — | (d)(e) | | | — | (e) | | | — | (e) | | | — | (e) | | | — | (e) | | | — | (e) |
Year Ended February 28, 2017 | | | 1.00 | | | | — | (d)(e) | | | — | (e) | | | — | (e) | | | — | (e) | | | — | (e) | | | — | (e) |
Year Ended February 29, 2016 | | | 1.00 | | | | — | (d)(e) | | | — | (e) | | | — | (e) | | | — | (e) | | | — | (e) | | | — | (e) |
Year Ended February 28, 2015 | | | 1.00 | | | | — | (e) | | | — | (e) | | | — | (e) | | | — | (e) | | | — | (e) | | | — | (e) |
Year Ended February 28, 2014 | | | 1.00 | | | | — | (e) | | | — | (e) | | | — | (e) | | | — | (e) | | | — | (e) | | | — | (e) |
| | | | | | | |
Reserve | | | | | | | | | | | | | | | | | | | | | | | | | | | | |
Six Months Ended August 31, 2018 (Unaudited) | | | 1.00 | | | | — | (d)(e) | | | — | (e) | | | — | (e) | | | — | (e) | | | — | | | | — | (e) |
Year Ended February 28, 2018 | | | 1.00 | | | | — | (d)(e) | | | — | (e) | | | — | (e) | | | — | (e) | | | — | (e) | | | — | (e) |
Year Ended February 28, 2017 | | | 1.00 | | | | — | (d)(e) | | | — | (e) | | | — | (e) | | | — | (e) | | | — | (e) | | | — | (e) |
Year Ended February 29, 2016 | | | 1.00 | | | | — | (d)(e) | | | — | (e) | | | — | (e) | | | — | (e) | | | — | (e) | | | — | (e) |
Year Ended February 28, 2015 | | | 1.00 | | | | — | (e) | | | — | (e) | | | — | (e) | | | — | (e) | | | — | (e) | | | — | (e) |
Year Ended February 28, 2014 | | | 1.00 | | | | — | (e) | | | — | (e) | | | — | (e) | | | — | (e) | | | — | (e) | | | — | (e) |
| (a) | Annualized for periods less than one year, unless otherwise noted. |
| (b) | Not annualized for periods less than one year. |
| (c) | Includes earnings credits and interest expense, if applicable, each of which is less than 0.005% unless otherwise noted. |
| (d) | Calculated based upon average shares outstanding. |
| (e) | Amount rounds to less than $0.005. |
SEE NOTES TO FINANCIAL STATEMENTS.
| | | | | | |
| | | |
| 128 | | | | J.P. MORGAN MONEY MARKET FUNDS | | AUGUST 31, 2018 |
| | | | | | | | | | | | | | | | | | | | | | |
| | | Ratios/Supplemental data | |
| | | | | | | | | | Ratios to average net assets (a) | |
Net asset
value,
end of
period | | | Total return (b) | | | Net assets,
end of
period
(000’s) | | | Net
expenses (c) | | | Net
investment
income
(loss) | | |
Expenses
without waivers,
reimbursements and
earnings credits | |
| | | | | | | | | | | | | | | | | | | | | | |
| | | | | | | | | | | | | | | | | | | | | | |
| $ | 1.00 | | | | 0.56 | % | | $ | 1,049,447 | | | | 0.26 | % | | | 1.11 | % | | | 0.31 | % |
| | 1.00 | | | | 0.68 | | | | 831,137 | | | | 0.26 | | | | 0.70 | | | | 0.31 | |
| | 1.00 | | | | 0.27 | | | | 437,689 | | | | 0.25 | | | | 0.26 | | | | 0.31 | |
| | 1.00 | | | | 0.03 | | | | 344,578 | | | | 0.05 | | | | 0.01 | | | | 0.31 | |
| | 1.00 | | | | 0.02 | | | | 322,389 | | | | 0.07 | | | | 0.01 | | | | 0.31 | |
| | 1.00 | | | | 0.02 | | | | 307,751 | | | | 0.12 | | | | 0.01 | | | | 0.31 | |
| | | | | |
| | | | | | | | | | | | | | | | | | | | | | |
| | 1.00 | | | | 0.59 | | | | 11,715,001 | | | | 0.21 | | | | 1.16 | | | | 0.26 | |
| | 1.00 | | | | 0.73 | | | | 11,970,538 | | | | 0.21 | | | | 0.73 | | | | 0.26 | |
| | 1.00 | | | | 0.32 | | | | 10,567,571 | | | | 0.20 | | | | 0.31 | | | | 0.26 | |
| | 1.00 | | | | 0.03 | | | | 10,007,028 | | | | 0.04 | | | | 0.01 | | | | 0.26 | |
| | 1.00 | | | | 0.02 | | | | 11,663,024 | | | | 0.07 | | | | 0.01 | | | | 0.26 | |
| | 1.00 | | | | 0.02 | | | | 10,650,809 | | | | 0.10 | | | | 0.01 | | | | 0.26 | |
| | | | | |
| | | | | | | | | | | | | | | | | | | | | | |
| | 1.00 | | | | 0.40 | | | | 10,935 | | | | 0.59 | | | | 0.78 | | | | 0.67 | |
| | 1.00 | | | | 0.35 | | | | 9,555 | | | | 0.59 | | | | 0.34 | | | | 0.66 | |
| | 1.00 | | | | 0.05 | | | | 11,468 | | | | 0.44 | | | | 0.04 | | | | 0.62 | |
| | 1.00 | | | | 0.03 | | | | 111,381 | | | | 0.04 | | | | 0.01 | | | | 0.62 | |
| | 1.00 | | | | 0.02 | | | | 109,439 | | | | 0.08 | | | | 0.01 | | | | 0.61 | |
| | 1.00 | | | | 0.02 | | | | 280,117 | | | | 0.12 | | | | 0.01 | | | | 0.61 | |
| | | | | |
| | | | | | | | | | | | | | | | | | | | | | |
| | 1.00 | | | | 0.47 | | | | 919,543 | | | | 0.45 | | | | 0.91 | | | | 0.46 | |
| | 1.00 | | | | 0.49 | | | | 1,560,291 | | | | 0.45 | | | | 0.48 | | | | 0.46 | |
| | 1.00 | | | | 0.12 | | | | 1,713,414 | | | | 0.38 | | | | 0.10 | | | | 0.46 | |
| | 1.00 | | | | 0.03 | | | | 2,984,160 | | | | 0.04 | | | | 0.01 | | | | 0.46 | |
| | 1.00 | | | | 0.02 | | | | 2,593,113 | | | | 0.07 | | | | 0.01 | | | | 0.46 | |
| | 1.00 | | | | 0.02 | | | | 2,390,160 | | | | 0.12 | | | | 0.01 | | | | 0.46 | |
| | | | | |
| | | | | | | | | | | | | | | | | | | | | | |
| | 1.00 | | | | 0.34 | | | | 2,032,178 | | | | 0.70 | | | | 0.68 | | | | 0.71 | |
| | 1.00 | | | | 0.24 | | | | 2,511,847 | | | | 0.70 | | | | 0.23 | | | | 0.71 | |
| | 1.00 | | | | 0.02 | | | | 2,650,165 | | | | 0.47 | | | | 0.02 | | | | 0.71 | |
| | 1.00 | | | | 0.03 | | | | 4,220,927 | | | | 0.04 | | | | 0.01 | | | | 0.71 | |
| | 1.00 | | | | 0.02 | | | | 4,208,768 | | | | 0.07 | | | | 0.01 | | | | 0.71 | |
| | 1.00 | | | | 0.02 | | | | 4,484,279 | | | | 0.12 | | | | 0.01 | | | | 0.71 | |
SEE NOTES TO FINANCIAL STATEMENTS.
| | | | | | | | |
| | | |
| AUGUST 31, 2018 | | J.P. MORGAN MONEY MARKET FUNDS | | | | | 129 | |
FINANCIAL HIGHLIGHTS
FOR THE PERIODS INDICATED (continued)
| | | | | | | | | | | | | | | | | | | | | | | | | | | | |
| | | Per share operating performance | |
| | | | | | Investment operations | | | Distributions | |
| | | Net asset
value,
beginning
of period | | | Net
investment
income
(loss) | | | Net realized
and unrealized
gains
(losses) on
investments | | | Total from
investment
operations | | | Net
investment
income | | | Net
realized
gain | | | Total
distributions | |
JPMorgan Municipal Money Market Fund | | | | | | | | | | | | | | | | | | | | | | | | | | | | |
Agency | | | | | | | | | | | | | | | | | | | | | | | | | | | | |
Six Months Ended August 31, 2018 (Unaudited) | | $ | 1.00 | | | $ | 0.01 | (d) | | $ | — | (e) | | $ | 0.01 | | | $ | (0.01 | ) | | $ | — | | | $ | (0.01 | ) |
Year Ended February 28, 2018 | | | 1.00 | | | | 0.01 | (d) | | | — | (e) | | | 0.01 | | | | (0.01 | ) | | | — | (e) | | | (0.01 | ) |
Year Ended February 28, 2017 | | | 1.00 | | | | — | (d)(e) | | | — | (e) | | | — | (e) | | | — | (e) | | | — | (e) | | | — | (e) |
Year Ended February 29, 2016 | | | 1.00 | | | | — | (d)(e) | | | — | (e) | | | — | (e) | | | — | (e) | | | — | (e) | | | — | (e) |
Year Ended February 28, 2015 | | | 1.00 | | | | — | (e) | | | — | (e) | | | — | (e) | | | — | (e) | | | — | (e) | | | — | (e) |
Year Ended February 28, 2014 | | | 1.00 | | | | — | (e) | | | — | (e) | | | — | (e) | | | — | (e) | | | — | | | | — | (e) |
| | | | | | | |
Eagle Class | | | | | | | | | | | | | | | | | | | | | | | | | | | | |
Six Months Ended August 31, 2018 (Unaudited) | | | 1.00 | | | | — | (d)(e) | | | — | (e) | | | — | (e) | | | — | (e) | | | — | | | | — | (e) |
Year Ended February 28, 2018 | | | 1.00 | | | | — | (d)(e) | | | — | (e) | | | — | (e) | | | — | (e) | | | — | (e) | | | — | (e) |
July 1, 2016 (f) through February 28, 2017 | | | 1.00 | | | | — | (d)(e) | | | �� | (e) | | | — | (e) | | | — | (e) | | | — | (e) | | | — | (e) |
| | | | | | | |
E*Trade (g) | | | | | | | | | | | | | | | | | | | | | | | | | | | | |
For the Period Ended September 21, 2016 | | | 1.00 | | | | — | (d)(e) | | | — | (e) | | | — | (e) | | | — | (e) | | | — | | | | — | (e) |
Year Ended February 29, 2016 | | | 1.00 | | | | — | (d)(e) | | | — | (e) | | | — | (e) | | | — | (e) | | | — | (e) | | | — | (e) |
Year Ended February 28, 2015 | | | 1.00 | | | | — | (e) | | | — | (e) | | | — | (e) | | | — | (e) | | | — | (e) | | | — | (e) |
Year Ended February 28, 2014 | | | 1.00 | | | | — | (e) | | | — | (e) | | | — | (e) | | | — | (e) | | | — | | | | — | (e) |
| | | | | | | |
Institutional Class | | | | | | | | | | | | | | | | | | | | | | | | | | | | |
Six Months Ended August 31, 2018 (Unaudited) | | | 1.00 | | | | 0.01 | (d) | | | — | (e) | | | 0.01 | | | | (0.01 | ) | | | — | | | | (0.01 | ) |
Year Ended February 28, 2018 | | | 1.00 | | | | 0.01 | (d) | | | — | (e) | | | 0.01 | | | | (0.01 | ) | | | — | (e) | | | (0.01 | ) |
Year Ended February 28, 2017 | | | 1.00 | | | | — | (d)(e) | | | — | (e) | | | — | (e) | | | — | (e) | | | — | (e) | | | — | (e) |
Year Ended February 29, 2016 | | | 1.00 | | | | — | (d)(e) | | | — | (e) | | | — | (e) | | | — | (e) | | | — | (e) | | | — | (e) |
Year Ended February 28, 2015 | | | 1.00 | | | | — | (e) | | | — | (e) | | | — | (e) | | | — | (e) | | | — | (e) | | | — | (e) |
Year Ended February 28, 2014 | | | 1.00 | | | | — | (e) | | | — | (e) | | | — | (e) | | | — | (e) | | | — | | | | — | (e) |
| | | | | | | |
Morgan | | | | | | | | | | | | | | | | | | | | | | | | | | | | |
Six Months Ended August 31, 2018 (Unaudited) | | | 1.00 | | | | — | (d)(e) | | | — | (e) | | | — | (e) | | | — | (e) | | | — | | | | — | (e) |
Year Ended February 28, 2018 | | | 1.00 | | | | — | (d)(e) | | | — | (e) | | | — | (e) | | | — | (e) | | | — | (e) | | | — | (e) |
Year Ended February 28, 2017 | | | 1.00 | | | | — | (d)(e) | | | — | (e) | | | — | (e) | | | — | (e) | | | — | (e) | | | — | (e) |
Year Ended February 29, 2016 | | | 1.00 | | | | — | (d)(e) | | | — | (e) | | | — | (e) | | | — | (e) | | | — | (e) | | | — | (e) |
Year Ended February 28, 2015 | | | 1.00 | | | | — | (e) | | | — | (e) | | | — | (e) | | | — | (e) | | | — | (e) | | | — | (e) |
Year Ended February 28, 2014 | | | 1.00 | | | | — | (e) | | | — | (e) | | | — | (e) | | | — | (e) | | | — | | | | — | (e) |
| | | | | | | |
Premier | | | | | | | | | | | | | | | | | | | | | | | | | | | | |
Six Months Ended August 31, 2018 (Unaudited) | | | 1.00 | | | | — | (d)(e) | | | — | (e) | | | — | (e) | | | — | (e) | | | — | | | | — | (e) |
Year Ended February 28, 2018 | | | 1.00 | | | | 0.01 | (d) | | | — | (e) | | | 0.01 | | | | (0.01 | ) | | | — | (e) | | | (0.01 | ) |
Year Ended February 28, 2017 | | | 1.00 | | | | — | (d)(e) | | | — | (e) | | | — | (e) | | | — | (e) | | | — | (e) | | | — | (e) |
Year Ended February 29, 2016 | | | 1.00 | | | | — | (d)(e) | | | — | (e) | | | — | (e) | | | — | (e) | | | — | (e) | | | — | (e) |
Year Ended February 28, 2015 | | | 1.00 | | | | — | (e) | | | — | (e) | | | — | (e) | | | — | (e) | | | — | (e) | | | — | (e) |
Year Ended February 28, 2014 | | | 1.00 | | | | — | (e) | | | — | (e) | | | — | (e) | | | — | (e) | | | — | | | | — | (e) |
| | | | | | | |
Service | | | | | | | | | | | | | | | | | | | | | | | | | | | | |
Six Months Ended August 31, 2018 (Unaudited) | | | 1.00 | | | | — | (d)(e) | | | — | (e) | | | — | (e) | | | — | (e) | | | — | | | | — | (e) |
Year Ended February 28, 2018 | | | 1.00 | | | | — | (d)(e) | | | — | (e) | | | — | (e) | | | — | (e) | | | — | (e) | | | — | (e) |
Year Ended February 28, 2017 | | | 1.00 | | | | — | (d)(e) | | | — | (e) | | | — | (e) | | | — | (e) | | | — | (e) | | | — | (e) |
Year Ended February 29, 2016 | | | 1.00 | | | | — | (d)(e) | | | — | (e) | | | — | (e) | | | — | (e) | | | — | (e) | | | — | (e) |
Year Ended February 28, 2015 | | | 1.00 | | | | — | (e) | | | — | (e) | | | — | (e) | | | — | (e) | | | — | (e) | | | — | (e) |
Year Ended February 28, 2014 | | | 1.00 | | | | — | (e) | | | — | (e) | | | — | (e) | | | — | (e) | | | — | | | | — | (e) |
| (a) | Annualized for periods less than one year, unless otherwise noted. |
| (b) | Not annualized for periods less than one year. |
| (c) | Includes earnings credits and interest expense, if applicable, each of which is less than 0.005% unless otherwise noted. |
| (d) | Calculated based upon average shares outstanding. |
| (e) | Amount rounds to less than $0.005. |
| (f) | Commencement of offering of class of shares. |
| (g) | E*Trade Shares of Municipal Money Market Fund had no assets from the close of business on September 21, 2016. |
| (h) | Amount rounds to less than 0.005%. |
SEE NOTES TO FINANCIAL STATEMENTS.
| | | | | | |
| | | |
| 130 | | | | J.P. MORGAN MONEY MARKET FUNDS | | AUGUST 31, 2018 |
| | | | | | | | | | | | | | | | | | | | | | |
| | | Ratios/Supplemental data | |
| | | | | | | | | | Ratios to average net assets (a) | |
Net asset
value,
end of
period | | | Total return (b) | | | Net assets,
end of
period
(000’s) | | | Net
expenses (c) | | | Net
investment
income
(loss) | | |
Expenses
without waivers,
reimbursements and
earnings credits | |
| | | | | | | | | | | | | | | | | | | | | | |
| | | | | | | | | | | | | | | | | | | | | | |
| $ | 1.00 | | | | 0.58 | % | | $ | 172,557 | | | | 0.26 | % | | | 1.14 | % | | | 0.32 | % |
| | 1.00 | | | | 0.73 | | | | 140,809 | | | | 0.26 | | | | 0.76 | | | | 0.35 | |
| | 1.00 | | | | 0.33 | | | | 35,608 | | | | 0.23 | | | | 0.20 | | | | 0.33 | |
| | 1.00 | | | | 0.01 | | | | 193,260 | | | | 0.08 | | | | 0.01 | | | | 0.32 | |
| | 1.00 | | | | 0.01 | | | | 81,196 | | | | 0.12 | | | | 0.01 | | | | 0.32 | |
| | 1.00 | | | | 0.01 | | | | 39,280 | | | | 0.19 | | | | 0.01 | | | | 0.32 | |
| | | | | |
| | | | | | | | | | | | | | | | | | | | | | |
| | 1.00 | | | | 0.36 | | | | 542,373 | | | | 0.70 | | | | 0.70 | | | | 0.72 | |
| | 1.00 | | | | 0.29 | | | | 549,053 | | | | 0.70 | | | | 0.27 | | | | 0.75 | |
| | 1.00 | | | | 0.04 | | | | 619,001 | | | | 0.67 | | | | 0.04 | | | | 0.76 | |
| | | | | |
| | | | | | | | | | | | | | | | | | | | | | |
| | 1.00 | | | | 0.01 | | | | — | | | | 0.41 | | | | 0.01 | | | | 1.07 | |
| | 1.00 | | | | 0.01 | | | | 1,935,318 | | | | 0.08 | | | | 0.01 | | | | 1.07 | |
| | 1.00 | | | | 0.01 | | | | 2,000,898 | | | | 0.13 | | | | 0.01 | | | | 1.07 | |
| | 1.00 | | | | 0.01 | | | | 1,992,153 | | | | 0.18 | | | | 0.01 | | | | 1.07 | |
| | | | | |
| | | | | | | | | | | | | | | | | | | | | | |
| | 1.00 | | | | 0.60 | | | | 1,649,767 | | | | 0.21 | | | | 1.19 | | | | 0.27 | |
| | 1.00 | | | | 0.78 | | | | 1,575,116 | | | | 0.21 | | | | 0.83 | | | | 0.31 | |
| | 1.00 | | | | 0.37 | | | | 303,233 | | | | 0.21 | | | | 0.39 | | | | 0.30 | |
| | 1.00 | | | | 0.01 | | | | 132,605 | | | | 0.08 | | | | 0.01 | | | | 0.27 | |
| | 1.00 | | | | 0.01 | | | | 188,480 | | | | 0.13 | | | | 0.01 | | | | 0.27 | |
| | 1.00 | | | | 0.02 | | | | 224,592 | | | | 0.18 | | | | 0.02 | | | | 0.27 | |
| | | | | |
| | | | | | | | | | | | | | | | | | | | | | |
| | 1.00 | | | | 0.41 | | | | 18,263 | | | | 0.59 | | | | 0.80 | | | | 0.65 | |
| | 1.00 | | | | 0.40 | | | | 13,794 | | | | 0.59 | | | | 0.28 | | | | 0.63 | |
| | 1.00 | | | | 0.08 | | | | 312,787 | | | | 0.49 | | | | 0.07 | | | | 0.64 | |
| | 1.00 | | | | 0.01 | | | | 387,521 | | | | 0.08 | | | | 0.01 | | | | 0.62 | |
| | 1.00 | | | | 0.01 | | | | 353,483 | | | | 0.13 | | | | 0.01 | | | | 0.62 | |
| | 1.00 | | | | 0.00 | (h) | | | 330,333 | | | | 0.19 | | | | 0.00 | (h) | | | 0.62 | |
| | | | | |
| | | | | | | | | | | | | | | | | | | | | | |
| | 1.00 | | | | 0.48 | | | | 124,535 | | | | 0.45 | | | | 0.95 | | | | 0.47 | |
| | 1.00 | | | | 0.54 | | | | 116,319 | | | | 0.45 | | | | 0.57 | | | | 0.51 | |
| | 1.00 | | | | 0.16 | | | | 31,528 | | | | 0.41 | | | | 0.12 | | | | 0.49 | |
| | 1.00 | | | | 0.01 | | | | 28,451 | | | | 0.08 | | | | 0.01 | | | | 0.47 | |
| | 1.00 | | | | 0.01 | | | | 29,376 | | | | 0.13 | | | | 0.01 | | | | 0.47 | |
| | 1.00 | | | | 0.00 | (h) | | | 40,357 | | | | 0.19 | | | | 0.00 | (h) | | | 0.47 | |
| | | | | |
| | | | | | | | | | | | | | | | | | | | | | |
| | 1.00 | | | | 0.18 | | | | 259,792 | | | | 1.04 | | | | 0.36 | | | | 1.07 | |
| | 1.00 | | | | 0.07 | | | | 282,024 | | | | 0.91 | | | | 0.05 | | | | 1.09 | |
| | 1.00 | | | | 0.03 | | | | 363,754 | | | | 0.54 | | | | 0.01 | | | | 1.09 | |
| | 1.00 | | | | 0.01 | | | | 515,523 | | | | 0.08 | | | | 0.01 | | | | 1.07 | |
| | 1.00 | | | | 0.01 | | | | 397,469 | | | | 0.12 | | | | 0.01 | | | | 1.07 | |
| | 1.00 | | | | 0.00 | (h) | | | 238,328 | | | | 0.19 | | | | 0.00 | (h) | | | 1.07 | |
SEE NOTES TO FINANCIAL STATEMENTS.
| | | | | | | | |
| | | |
| AUGUST 31, 2018 | | J.P. MORGAN MONEY MARKET FUNDS | | | | | 131 | |
NOTES TO FINANCIAL STATEMENTS
AS OF AUGUST 31, 2018 (Unaudited)
1. Organization
JPMorgan Trust I (“JPM I”), JPMorgan Trust II (“JPM II”) and JPMorgan Trust IV (“JPM IV”) (collectively, the “Trusts”) were formed on November 12, 2004 and November 11, 2015, respectively, as Delaware statutory trusts, pursuant to Declarations of Trust dated November 5, 2004 and November 11, 2015, respectively, and are registered under the Investment Company Act of 1940, as amended (the “1940 Act”), as open-end management investment companies.
The following are 9 separate funds of the Trusts (each, a “Fund” and collectively, the “Funds”) covered by this report:
| | | | | | |
| | | Classes Offered | | Trust | | Diversified/Non-Diversified |
| JPMorgan Prime Money Market Fund | | Class C, Agency, Capital, IM, Institutional Class, Morgan, Premier and Reserve | | JPM I | | Diversified |
| JPMorgan Institutional Tax Free Money Market Fund^ | | Agency, Capital, IM and Institutional Class | | JPMIV | | Diversified |
| JPMorgan Liquid Assets Money Market Fund | | Class C, Agency, Capital, E*Trade^^, Institutional Class, Investor, Morgan, Premier and Reserve | | JPM II | | Diversified |
| JPMorgan U.S. Government Money Market Fund | | Agency, Capital, Direct^^^, Eagle Class, Eagle Private Wealth Class^^^^, E*Trade, IM, Institutional Class, Investor, Morgan, Premier, Reserve and Service | | JPM II | | Diversified |
| JPMorgan U.S. Treasury Plus Money Market Fund | | Class C, Agency, Capital^^^^^, Direct^^^, IM, Institutional Class, Investor, Morgan, Premier and Reserve | | JPM II | | Diversified |
| JPMorgan Federal Money Market Fund | | Agency, Institutional Class, Morgan and Premier | | JPM I | | Diversified |
| JPMorgan 100% U.S. Treasury Securities Money Market Fund | | Agency, Capital, Institutional Class, Morgan, Premier and Reserve | | JPM I | | Diversified |
| JPMorgan Tax Free Money Market Fund | | Agency, Institutional Class, Morgan, Premier and Reserve | | JPM I | | Diversified |
| JPMorgan Municipal Money Market Fund | | Agency, Eagle Class, E*Trade^^, Institutional Class, Morgan, Premier and Service | | JPM II | | Diversified |
| ^ | The JPMorgan Institutional Tax Free Money Market Fund commenced operations on March 1, 2018. |
| ^^ | E*Trade Shares of JPMorgan Liquid Assets Money Market Fund and JPMorgan Municipal Money Market Fund had no assets from the close of business on October 19, 2016 and September 21, 2016, respectively. |
| ^^^ | Direct Shares of JPMorgan U.S. Government Money Market Fund and JPMorgan U.S. Treasury Plus Money Market Fund had no assets from the close of business on November 22, 2017. |
| ^^^^ | Commenced operations on August 18, 2017. |
| ^^^^^ | Commenced operations on September 22, 2017. |
The investment objective of JPMorgan Prime Money Market Fund (“Prime Money Market Fund”) and JPMorgan Institutional Tax Free Money Market Fund (“Institutional Tax Free Money Market Fund”) is to seek current income while seeking to maintain liquidity and a low volatility of principal.
The investment objective of JPMorgan Liquid Assets Money Market Fund (“Liquid Assets Money Market Fund”) and JPMorgan U.S. Treasury Plus Money Market Fund (“U.S. Treasury Plus Money Market Fund”) is to seek current income with liquidity and stability of principal.
The investment objective of JPMorgan U.S. Government Money Market Fund (“U.S. Government Money Market Fund”) is to seek high current income with liquidity and stability of principal.
The investment objective of JPMorgan Federal Money Market Fund (“Federal Money Market Fund”) is to provide current income while still preserving capital and maintaining liquidity.
The investment objective of JPMorgan 100% U.S. Treasury Securities Money Market Fund (“100% U.S. Treasury Securities Money Market Fund”) is to provide the highest possible level of current income while still maintaining liquidity and providing maximum safety of principal.
The investment objective of JPMorgan Tax Free Money Market Fund (“Tax Free Money Market Fund”) is to provide the highest possible level of current income which is excluded from gross income, while still preserving capital and maintaining liquidity.
The investment objective of JPMorgan Municipal Money Market Fund (“Municipal Money Market Fund”) is to seek as high a level of current interest income exempt from federal income tax as is consistent with liquidity and stability of principal.
The Liquid Assets Money Market Fund, Tax Free Money Market Fund and Municipal Money Market Fund seek to qualify as retail money market funds in accordance with criteria established by the Securities and Exchange Commission (“SEC”). Under applicable SEC rules, these Funds are ordinarily permitted to utilize amortized cost accounting to value their portfolio securities and transact at a stable $1.00 share price. These Funds have adopted policies and procedures that allow the Boards of Trustees (the “Boards”) to impose a liquidity fee and/or redemption gate in the event that their weekly liquid assets fall below a designated threshold.
| | | | | | |
| | | |
| 132 | | | | J.P. MORGAN MONEY MARKET FUNDS | | AUGUST 31, 2018 |
The Prime Money Market Fund and Institutional Tax Free Money Market Fund do not seek to qualify as a Retail or Government money market fund and transact utilizing a floating net asset value (“NAV”) calculated to four decimal places. The Funds have adopted policies and procedures that allow the Boards to impose a liquidity fee and/or redemption gate in the event that their weekly liquid assets fall below a designated threshold.
The U.S. Government Money Market Fund, U.S. Treasury Plus Money Market Fund, Federal Money Market Fund and 100% U.S. Treasury Securities Money Market Fund seek to qualify as Government money market funds in accordance with criteria established by the SEC. Under applicable SEC rules, these Funds are ordinarily permitted to utilize amortized cost accounting to value their portfolio securities and transact at a stable $1.00 share price.
Class C Shares provide for a contingent deferred sales charge (“CDSC”). No sales charges are assessed with respect to the Agency, Capital, Direct, Eagle Class, Eagle Private Wealth Class, E*Trade, IM, Institutional Class, Investor, Morgan, Premier, Reserve and Service Shares. All classes of shares have equal rights as to earnings, assets and voting privileges, except that each class may bear different distribution and service fees and each class has exclusive voting rights with respect to its distribution plan and shareholder servicing agreements.
J.P. Morgan Investment Management Inc. (“JPMIM”), an indirect, wholly-owned subsidiary of JPMorgan Chase & Co. (“JPMorgan”), acts as Adviser (the “Adviser”) and Administrator (the “Administrator”) to the Funds.
2. Significant Accounting Policies
The following is a summary of significant accounting policies followed by the Funds in the preparation of their financial statements. The Funds are investment companies and, thus, follow the investment company accounting and reporting guidance of the Financial Accounting Standards Board Accounting Standards Codification Topic 946 — Investment Companies, which is part of U.S. generally accepted accounting principles (“GAAP”). The preparation of financial statements in conformity with GAAP requires management to make estimates and assumptions that affect the reported amounts of assets and liabilities and disclosure of contingent assets and liabilities at the date of the financial statements and the reported amounts of increases and decreases in net assets from operations during the reporting period. Actual results could differ from those estimates.
A. Valuation of Investments — The valuation of investments is in accordance with GAAP and the Funds’ valuation policies set forth by and under the supervision and responsibility of the Boards, which established the following approach to valuation, as described more fully below: securities and other debt instruments held by money market funds pursuant to Rule 2a-7 under the 1940 Act shall be valued using the amortized cost method provided that certain conditions are met, with the exception of the Prime Money Market Fund and Institutional Tax Free Money Market Fund.
The amortized cost method of valuation involves valuing a security at its cost initially and thereafter assuming a constant amortization to maturity of any discount or premium, regardless of the impact of fluctuating interest rates on the market value of the security. This method may result in periods during which value, as determined by amortized cost, is higher or lower than the price each Fund would receive if it sold the security. The market value of securities in the Funds can be expected to vary inversely with changes in prevailing interest rates.
The Administrator has established the J.P. Morgan Asset Management Americas Valuation Committee (“AVC”) to assist the Boards with the oversight and monitoring of the valuation of the Funds’ investments. The Administrator implements the valuation policies of the Funds’ investments, as directed by the Boards. The AVC oversees and carries out the policies for the valuation of investments held in the Funds. This includes monitoring the appropriateness of fair values based on results of ongoing valuation oversight including, but not limited to, consideration of macro or security specific events, market events and pricing vendor and broker due diligence. This includes also monitoring on a daily basis that the amortized cost valuation method fairly reflects the market-based net asset value (“NAV”) of the Funds. The Administrator is responsible for discussing and assessing the potential impacts to the fair values on an ongoing basis, and at least on a quarterly basis with the AVC and the Boards.
For the Prime Money Market Fund and Institutional Tax Free Money Market Fund, fixed income instruments for which market quotations are not readily available are fair valued based on prices received from approved affiliated and unaffiliated pricing vendors or third party broker-dealers (collectively referred to as “Pricing Services”). The Pricing Services use multiple valuation techniques to determine the valuation of fixed income instruments. In instances where sufficient market activity exists, the Pricing Services may utilize a market based approach through which trades or quotes from market makers are used to determine the valuation of these instruments. In instances where sufficient market activity may not exist, the Pricing Services also utilize proprietary valuation models which may consider market transactions in comparable securities and the various relationships between securities in determining fair value and/or market characteristics in order to estimate the relevant cash flows, which are then discounted to calculate the fair values.
Valuations reflected in this report are as of the report date. As a result, changes in valuation due to market events and/or issuer related events after the report date and prior to issuance of the report are not reflected herein.
The various inputs that are used in determining the fair value of the Funds’ investments are summarized into the three broad levels listed below.
| • | | Level 1 — Quoted prices in active markets for identical securities. |
| • | | Level 2 — Other significant observable inputs (including quoted prices for similar securities, interest rates, prepayment speeds, credit risk, etc.). |
| • | | Level 3 — Significant unobservable inputs (including the Funds’ own assumptions in determining the fair value of investments). |
A financial instrument’s level within the fair value hierarchy is based on the lowest level of any input, both individually and in the aggregate, that is significant to the fair value measurement. The inputs or methodology used for valuing securities are not necessarily an indication of the risk
| | | | | | | | |
| | | |
| AUGUST 31, 2018 | | J.P. MORGAN MONEY MARKET FUNDS | | | | | 133 | |
NOTES TO FINANCIAL STATEMENTS
AS OF AUGUST 31, 2018 (Unaudited) (continued)
associated with investing in those securities. For example, certain money market securities are valued using amortized cost, in accordance with rules under the 1940 Act. Generally, amortized cost approximates the current fair value of a security, but since the value is not obtained from a quoted price in an active market, such securities are reflected as level 2.
The following tables represent each valuation input as presented on the Schedules of Portfolio Investments (“SOIs”) (amounts in thousands):
Prime Money Market Fund
| | | | | | | | | | | | | | | | |
| | | Level 1 Quoted prices | | | Level 2 Other significant observable inputs | | | Level 3 Significant unobservable inputs | | | Total | |
Total Investments in Securities (a) | | $ | — | | | $ | 44,040,834 | | | $ | — | | | $ | 44,040,834 | |
| | | | | | | | | | | | | | | | |
| |
| Institutional Tax Free Money Market Fund | | | | | |
| | | Level 1
Quoted prices | | | Level 2
Other significant observable inputs | | | Level 3
Significant unobservable inputs | | | Total | |
Total Investments in Securities (a) | | $ | — | | | $ | 600,405 | | | $ | — | | | $ | 600,405 | |
| | | | | | | | | | | | | | | | |
|
| The following is a summary of the inputs used as of August 31, 2018, in valuing the Funds’ assets and liabilities carried at amortized cost which approximates fair value (amounts in thousands): | |
| |
| Liquid Assets Money Market Fund | | | | | |
| | | Level 1
Quoted prices | | | Level 2
Other significant observable inputs | | | Level 3
Significant unobservable inputs | | | Total | |
Total Investments in Securities (a) | | $ | — | | | $ | 3,251,231 | | | $ | — | | | $ | 3,251,231 | |
| | | | | | | | | | | | | | | | |
| |
| U.S. Government Money Market Fund | | | | | |
| | | Level 1
Quoted prices | | | Level 2
Other significant observable inputs | | | Level 3
Significant unobservable inputs | | | Total | |
Total Investments in Securities (a) | | $ | — | | | $ | 135,536,291 | | | $ | — | | | $ | 135,536,291 | |
| | | | | | | | | | | | | | | | |
| |
| U.S. Treasury Plus Money Market Fund | | | | | |
| | | Level 1
Quoted prices | | | Level 2
Other significant observable inputs | | | Level 3
Significant unobservable inputs | | | Total | |
Total Investments in Securities (a) | | $ | — | | | $ | 24,437,883 | | | $ | — | | | $ | 24,437,883 | |
| | | | | | | | | | | | | | | | |
| |
| Federal Money Market Fund | | | | | |
| | | Level 1
Quoted prices | | | Level 2
Other significant observable inputs | | | Level 3
Significant unobservable inputs | | | Total | |
Total Investments in Securities (a) | | $ | — | | | $ | 3,419,510 | | | $ | — | | | $ | 3,419,510 | |
| | | | | | | | | | | | | | | | |
| |
| 100% U.S. Treasury Securities Money Market Fund | | | | | |
| | | Level 1
Quoted prices | | | Level 2
Other significant observable inputs | | | Level 3
Significant unobservable inputs | | | Total | |
Total Investments in Securities (a) | | $ | — | | | $ | 40,059,378 | | | $ | — | | | $ | 40,059,378 | |
| | | | | | | | | | | | | | | | |
| |
| Tax Free Money Market Fund | | | | | |
| | | Level 1
Quoted prices | | | Level 2
Other significant observable inputs | | | Level 3
Significant unobservable inputs | | | Total | |
Total Investments in Securities (a) | | $ | — | | | $ | 15,693,240 | | | $ | — | | | $ | 15,693,240 | |
| | | | | | | | | | | | | | | | |
| | | | | | |
| | | |
| 134 | | | | J.P. MORGAN MONEY MARKET FUNDS | | AUGUST 31, 2018 |
| | | | | | | | | | | | | | | | |
| Municipal Money Market Fund | | | | | |
| | | Level 1
Quoted prices | | | Level 2
Other significant observable inputs | | | Level 3
Significant unobservable inputs | | | Total | |
Total Investments in Securities (a) | | $ | — | | | $ | 2,762,252 | | | $ | — | | | $ | 2,762,252 | |
| | | | | | | | | | | | | | | | |
| (a) | All portfolio holdings designated as level 2 are disclosed individually on the SOIs. Please refer to the SOIs for specifics of the major categories of portfolio holdings. |
There were no transfers among any levels during the six month ended August 31, 2018.
B. Restricted Securities — Certain securities held by the Funds may be subject to legal or contractual restrictions on resale. Restricted securities generally are resold in transactions exempt from registration under the Securities Act of 1933, as amended (the “Securities Act”). Disposal of these securities may involve time-consuming negotiations and expense. Prompt sale at the current valuation may be difficult and could adversely affect the net asset values of the Funds.
As of August 31, 2018, the Funds had no investments in restricted securities other than securities sold to the Funds under Rule 144A under the Securities Act.
C. Repurchase Agreements — The Funds may enter into repurchase agreement transactions that meet the credit guidelines of JPMIM, an indirect, wholly-owned subsidiary of JPMorgan. Repurchase agreements involve the purchase of securities subject to the seller’s agreement to repurchase the securities at a mutually agreed upon date and price. The Funds require that the collateral received in a repurchase agreement transaction be transferred to a custodian in a manner sufficient to enable the Funds to obtain collateral in the event of a counterparty default. If the counterparty defaults and the fair value of the collateral declines, realization of the collateral by the Funds may be delayed or limited. Repurchase agreement collateral may be held in segregated accounts maintained by JPMorgan Chase Bank, N.A. (“JPMCB”), a wholly-owned subsidiary of JPMorgan. The Prime Money Market Fund, Liquid Assets Money Market Fund, U.S. Government Money Market Fund and U.S. Treasury Plus Money Market Fund or their affiliates may transfer uninvested cash into joint accounts, which are utilized by multiple accounts or funds managed by the Adviser or its affiliates, the daily aggregate balance of which is invested in one or more repurchase agreements. Under these joint accounts, the Funds maintain pro-rata credit exposure to the underlying repurchase agreements’ counterparties and collateral.
The Funds’ repurchase agreements are not subject to master netting arrangements.
D. When-Issued Securities, Delayed Delivery Securities and Forward Commitments — The Tax Free Money Market Fund and Municipal Money Market Fund purchased when-issued securities, including To Be Announced (“TBA”) securities, and entered into contracts to purchase or sell securities for a fixed price that may be settled a month or more after the trade date, or purchased delayed delivery securities which generally settle seven days after the trade date. When-issued securities are securities that have been authorized, but not issued in the market. A forward commitment involves entering into a contract to purchase or sell securities for a fixed price at a future date that may be settled a month or more after the trade date. A delayed delivery security is agreed upon in advance between the buyer and the seller of the security and is generally delivered beyond seven days of the agreed upon date. The purchase of securities on a when-issued, delayed delivery or forward commitment basis involves the risk that the value of the security to be purchased declines before the settlement date. The sale of securities on a forward commitment basis involves the risk that the value of the securities sold may increase before the settlement date. The Funds may be exposed to credit risk if the counterparty fails to perform under the terms of the transaction. Interest income for securities purchased on a when-issued, delayed delivery or forward commitment basis is not accrued until the settlement date.
The Tax Free Money Market Fund and Municipal Money Market Fund had delayed delivery securities outstanding as of August 31, 2018, which are shown as a Receivable for Investment securities sold — delayed delivery securities on the Statements of Assets and Liabilities.
E. Security Transactions and Investment Income — Investment transactions are accounted for on the trade date (the date the order to buy or sell is executed). Securities gains and losses are calculated on a specifically identified cost basis. Interest income is determined on the basis of coupon interest accrued using the effective interest method which adjusts for amortization of premiums and accretion of discounts.
F. Allocation of Income and Expenses — Expenses directly attributable to a fund are charged directly to that fund, while the expenses attributable to more than one fund of the Trusts are allocated among the respective funds. In calculating the NAV of each class, investment income, realized and unrealized gains and losses and expenses, other than class specific expenses, are allocated daily to each class of shares based upon the proportion of net assets of each class at the beginning of each day.
| | | | | | | | |
| | | |
| AUGUST 31, 2018 | | J.P. MORGAN MONEY MARKET FUNDS | | | | | 135 | |
NOTES TO FINANCIAL STATEMENTS
AS OF AUGUST 31, 2018 (Unaudited) (continued)
Transfer agency fees are class-specific expenses. The amount of the transfer agency fees charged to each class of the Funds for the six months ended August 31, 2018 are as follows (amounts in thousands):
| | | | | | | | | | | | | | | | | | | | | | | | | | | | | | | | | | | | |
| | | Prime Money
Market Fund | | | Institutional
Tax Free
Money
Market Fund | | | Liquid
Assets
Money
Market Fund | | | U.S.
Government
Money Market
Fund | | | U.S.
Treasury
Plus Money
Market Fund | | | Federal
Money Market
Fund | | | 100% U.S.
Treasury
Securities
Money Market
Fund | | | Tax Free
Money Market
Fund | | | Municipal
Money Market
Fund | |
Class C | | $ | 13 | | | | n/a | | | $ | 1 | | | | n/a | | | $ | 5 | | | | n/a | | | | n/a | | | | n/a | | | | n/a | |
Agency | | | 35 | | | $ | 13 | | | | 1 | | | $ | 133 | | | | 12 | | | $ | 2 | | | $ | 18 | | | $ | 7 | | | $ | 1 | |
Capital | | | 312 | | | | 13 | | | | — | (a) | | | 825 | | | | 29 | | | | n/a | | | | 165 | | | | n/a | | | | n/a | |
Direct | | | n/a | | | | n/a | | | | n/a | | | | — | | | | — | | | | n/a | | | | n/a | | | | n/a | | | | n/a | |
Eagle Class | | | n/a | | | | n/a | | | | n/a | | | | 15 | | | | n/a | | | | n/a | | | | n/a | | | | n/a | | | | 6 | |
Eagle Private Wealth Class | | | n/a | | | | n/a | | | | n/a | | | | — | (a) | | | n/a | | | | n/a | | | | n/a | | | | n/a | | | | n/a | |
E*Trade | | | n/a | | | | n/a | | | | n/a | | | | 2 | | | | n/a | | | | n/a | | | | n/a | | | | n/a | | | | n/a | |
IM | | | 40 | | | | 15 | | | | n/a | | | | 40 | | | | 17 | | | | n/a | | | | n/a | | | | n/a | | | | n/a | |
Institutional Class | | | 125 | | | | 13 | | | | 2 | | | | 359 | | | | 159 | | | | 41 | | | | 123 | | | | 116 | | | | 12 | |
Investor | | | n/a | | | | n/a | | | | — | (a) | | | 5 | | | | 1 | | | | n/a | | | | n/a | | | | n/a | | | | n/a | |
Morgan | | | 214 | | | | n/a | | | | 39 | | | | 62 | | | | 17 | | | | 13 | | | | 41 | | | | 3 | | | | 3 | |
Premier | | | 43 | | | | n/a | | | | 3 | | | | 76 | | | | 9 | | | | 5 | | | | 18 | | | | 15 | | | | 1 | |
Reserve | | | 21 | | | | n/a | | | | — | (a) | | | 2 | | | | 1 | | | | n/a | | | | 5 | | | | 24 | | | | n/a | |
Service | | | n/a | | | | n/a | | | | n/a | | | | 8 | | | | n/a | | | | n/a | | | | n/a | | | | n/a | | | | 3 | |
| | | | | | | | | | | | | | | | | | | | | | | | | | | | | | | | | | | | |
Total | | $ | 803 | | | $ | 54 | | | $ | 46 | | | $ | 1,527 | | | $ | 250 | | | $ | 61 | | | $ | 370 | | | $ | 165 | | | $ | 26 | |
| | | | | | | | | | | | | | | | | | | | | | | | | | | | | | | | | | | | |
| (a) | Amount rounds to less than one thousand. |
G. Federal Income Taxes — Each Fund is treated as a separate taxable entity for Federal income tax purposes. Each Fund’s policy is to comply with the provisions of the Internal Revenue Code (the “Code”), applicable to regulated investment companies and to distribute to shareholders all of its distributable net investment income and net realized capital gains on investments. Accordingly, no provision for Federal income tax is necessary. Management has reviewed the Funds’ tax positions for all open tax years and has determined that as of August 31, 2018, no liability for income tax is required in the Funds’ financial statements for net unrecognized tax benefits. However, management’s conclusions may be subject to future review based on changes in, or the interpretation of, the accounting standards or tax laws and regulations. Each of the Funds’ Federal tax returns for the prior three fiscal years remains subject to examination by the Internal Revenue Service.
H. Distributions to Shareholders — Distributions from net investment income, if any, are generally declared daily and paid monthly and are declared separately for each class. No class has preferential dividend rights; differences in per share rates are due to differences in separate class expenses. Net realized capital gains, if any, are distributed by each Fund at least annually. The amount of distributions from net investment income and net realized capital gains is determined in accordance with Federal income tax regulations, which may differ from GAAP. To the extent these “book/tax” differences are permanent in nature (i.e., that they result from other than timing of recognition — “temporary differences”), such amounts are reclassified within the capital accounts based on their Federal tax-basis treatment.
3. Fees and Other Transactions with Affiliates
A. Investment Advisory Fee — Pursuant to Investment Advisory Agreements, the Adviser supervises the investments of each Fund and for such services is paid a fee. The fee is accrued daily and generally paid monthly at an annual rate of 0.08% of each Fund’s average daily net assets.
The Adviser waived Investment Advisory fees and/or reimbursed expenses as outlined in Note 3.F.
B. Administration Fee — Pursuant to Administration Agreements, the Administrator provides certain administration services to the Funds. In consideration of these services, the Administrator receives a fee accrued daily and paid monthly at an annual rate of 0.10% of the first $100 billion of the average daily net assets of all money market funds in the J.P. Morgan Funds Complex covered by the Administration Agreement and 0.05% of the average daily net assets in excess of $100 billion of all such funds. For the six months ended August 31, 2018, the effective annualized rate was 0.07% of each Fund’s average daily net assets, notwithstanding any fee waivers and/or expense reimbursements.
The Administrator waived Administration fees as outlined in Note 3.F.
JPMCB serves as the Funds’ sub-administrator (the “Sub-administrator”). For its services as Sub-administrator, JPMCB receives a portion of the fees payable to the Administrator.
C. Distribution Fees — Pursuant to a Distribution Agreement, JPMorgan Distribution Services, Inc. (“JPMDS”), an indirect, wholly-owned subsidiary of JPMorgan, serves as the Trusts’ principal underwriter and promotes and arranges for the sale of each Fund’s shares.
The Boards have adopted a Distribution Plan (the “Distribution Plan”) for Class C, Eagle Class, E*Trade, Morgan, Reserve and Service Shares of the Funds, as applicable, in accordance with Rule 12b-1 under the 1940 Act. The Agency, Capital, Direct, Eagle Private Wealth Class, IM, Institutional
| | | | | | |
| | | |
| 136 | | | | J.P. MORGAN MONEY MARKET FUNDS | | AUGUST 31, 2018 |
Class, Investor and Premier Shares do not participate in the Distribution Plan. The Distribution Plan provides that each Fund shall pay distribution fees, including payments to JPMDS, at annual rates of the average daily net assets as shown in the table below:
| | | | | | | | | | | | | | | | | | | | | | | | |
| | | Class C | | | Eagle
Class | | | E*Trade | | | Morgan | | | Reserve | | | Service | |
Prime Money Market Fund | | | 0.75 | % | | | n/a | | | | n/a | | | | n/a | | | | 0.25 | % | | | n/a | |
Institutional Tax Free Money Market Fund | | | n/a | | | | n/a | | | | n/a | | | | n/a | | | | n/a | | | | n/a | |
Liquid Assets Money Market Fund | | | 0.75 | | | | n/a | | | | 0.60 | % | | | 0.10 | % | | | 0.25 | | | | n/a | |
U.S. Government Money Market Fund | | | n/a | | | | 0.25 | % | | | 0.60 | | | | 0.10 | | | | 0.25 | | | | 0.60 | % |
U.S. Treasury Plus Money Market Fund | | | 0.75 | | | | n/a | | | | n/a | | | | 0.10 | | | | 0.25 | | | | n/a | |
Federal Money Market Fund | | | n/a | | | | n/a | | | | n/a | | | | 0.10 | | | | n/a | | | | n/a | |
100% U.S. Treasury Securities Money Market Fund | | | n/a | | | | n/a | | | | n/a | | | | 0.10 | | | | 0.25 | | | | n/a | |
Tax Free Money Market Fund | | | n/a | | | | n/a | | | | n/a | | | | 0.10 | | | | 0.25 | | | | n/a | |
Municipal Money Market Fund | | | n/a | | | | 0.25 | | | | n/a | | | | 0.10 | | | | n/a | | | | 0.60 | |
JPMDS waived Distribution fees as outlined in Note 3.F.
In addition, JPMDS is entitled to receive the CDSC from redemptions of Class C Shares. For the six months ended August 31, 2018, JPMDS retained the following amounts (in thousands):
| | |
| | | CDSC |
Liquid Assets Money Market Fund | | $—(a) |
| (a) | Amount rounds to less than one thousand. |
D. Service Fees — The Trusts, on behalf of the Funds, have entered into a Shareholder Servicing Agreement with JPMDS under which JPMDS provides certain support services to the shareholders. For performing these services, JPMDS receives a fee that is accrued daily and paid monthly equal to a percentage of the average daily net assets as shown in the table below:
| | | | | | | | | | | | | | | | | | | | | | | | |
| | | Class C | | | Agency | | | Capital | | | Direct | | | Eagle Class | | | Eagle
Private Wealth
Class | |
Prime Money Market Fund | | | 0.25 | % | | | 0.15 | % | | | 0.05 | % | | | n/a | | | | n/a | | | | n/a | |
Institutional Tax Free Money Market Fund | | | n/a | | | | 0.15 | | | | 0.05 | | | | n/a | | | | n/a | | | | n/a | |
Liquid Assets Money Market Fund | | | 0.25 | | | | 0.15 | | | | 0.05 | | | | n/a | | | | n/a | | | | n/a | |
U.S. Government Money Market Fund | | | n/a | | | | 0.15 | | | | 0.05 | | | | 0.15 | % | | | 0.30 | % | | | 0.15 | % |
U.S. Treasury Plus Money Market Fund | | | 0.25 | | | | 0.15 | | | | 0.05 | | | | 0.15 | | | | n/a | | | | n/a | |
Federal Money Market Fund | | | n/a | | | | 0.15 | | | | n/a | | | | n/a | | | | n/a | | | | n/a | |
100% U.S. Treasury Securities Money Market Fund | | | n/a | | | | 0.15 | | | | 0.05 | | | | n/a | | | | n/a | | | | n/a | |
Tax Free Money Market Fund | | | n/a | | | | 0.15 | | | | n/a | | | | n/a | | | | n/a | | | | n/a | |
Municipal Money Market Fund | | | n/a | | | | 0.15 | | | | n/a | | | | n/a | | | | 0.30 | | | | n/a | |
| | | | | | | | | | | | | | | | | | | | | | | | | | | | |
| | | E*Trade | | | Institutional
Class | | | Investor | | | Morgan | | | Premier | | | Reserve | | | Service | |
Prime Money Market Fund | | | n/a | | | | 0.10 | % | | | n/a | | | | 0.35 | % | | | 0.30 | % | | | 0.30 | % | | | n/a | |
Institutional Tax Free Money Market Fund | | | n/a | | | | 0.10 | | | | n/a | | | | n/a | | | | n/a | | | | n/a | | | | n/a | |
Liquid Assets Money Market Fund | | | 0.30 | % | | | 0.10 | | | | 0.35 | % | | | 0.35 | | | | 0.30 | | | | 0.30 | | | | n/a | |
U.S. Government Money Market Fund | | | 0.30 | | | | 0.10 | | | | 0.35 | | | | 0.35 | | | | 0.30 | | | | 0.30 | | | | 0.30 | % |
U.S. Treasury Plus Money Market Fund | | | n/a | | | | 0.10 | | | | 0.35 | | | | 0.35 | | | | 0.30 | | | | 0.30 | | | | n/a | |
Federal Money Market Fund | | | n/a | | | | 0.10 | | | | n/a | | | | 0.35 | | | | 0.30 | | | | n/a | | | | n/a | |
100% U.S. Treasury Securities Money Market Fund | | | n/a | | | | 0.10 | | | | n/a | | | | 0.35 | | | | 0.30 | | | | 0.30 | | | | n/a | |
Tax Free Money Market Fund | | | n/a | | | | 0.10 | | | | n/a | | | | 0.35 | | | | 0.30 | | | | 0.30 | | | | n/a | |
Municipal Money Market Fund | | | n/a | | | | 0.10 | | | | n/a | | | | 0.35 | | | | 0.30 | | | | n/a | | | | 0.30 | |
The IM Shares do not pay a fee under the Shareholder Servicing Agreement.
JPMDS has entered into shareholder services contracts with affiliated and unaffiliated financial intermediaries who provide shareholder services and other related services to their clients or customers who invest in the Funds under which JPMDS will pay all or a portion of such fees earned to financial intermediaries for performing such services.
JPMDS waived service fees as outlined in Note 3.F.
| | | | | | | | |
| | | |
| AUGUST 31, 2018 | | J.P. MORGAN MONEY MARKET FUNDS | | | | | 137 | |
NOTES TO FINANCIAL STATEMENTS
AS OF AUGUST 31, 2018 (Unaudited) (continued)
E. Custodian and Accounting Fees — JPMCB provides portfolio custody and accounting services to the Funds. For performing these services, the Funds pay JPMCB transaction and asset-based fees that vary according to the number of transactions and positions, plus out-of-pocket expenses. The amounts paid directly to JPMCB by the Funds for custody and accounting services are included in Custodian and accounting fees on the Statements of Operations. Interest income earned on cash balances at the custodian, if any, is included in Interest income from affiliates on the Statements of Operations. Prior to March 1, 2018, payments to the custodian were reduced by credits earned by each Fund, based on uninvested cash balances held by the custodian. Such earnings credits, if any, are presented separately on the Statements of Operations.
Interest expense paid to the custodian related to cash overdrafts, if any, is included in Interest expense to affiliates on the Statements of Operations.
F. Waivers and Reimbursements — The Adviser, Administrator and JPMDS have contractually agreed to waive fees and/or reimburse the Funds, except IM Shares, to the extent that total annual operating expenses (excluding acquired fund fees and expenses, dividend and interest expenses related to short sales, interest, taxes, expenses related to litigation and potential litigation, and extraordinary expenses) exceed the percentages of the Funds’ respective average daily net assets as shown in the table below:
| | | | | | | | | | | | | | | | | | | | | | | | |
| | | Class C | | | Agency | | | Capital | | | Direct | | | Eagle Class | | | Eagle
Private
Wealth
Class | |
Prime Money Market Fund | | | 0.97 | % | | | 0.26 | % | | | 0.18 | % | | | n/a | | | | n/a | | | | n/a | |
Institutional Tax Free Money Market Fund | | | n/a | | | | 0.26 | | | | 0.18 | | | | n/a | | | | n/a | | | | n/a | |
Liquid Assets Money Market Fund | | | 0.97 | | | | 0.26 | | | | 0.18 | | | | n/a | | | | n/a | | | | n/a | |
U.S. Government Money Market Fund | | | n/a | | | | 0.26 | | | | 0.18 | | | | 0.30 | % | | | 0.70 | % | | | 0.30 | % |
U.S. Treasury Plus Money Market Fund | | | 0.97 | | | | 0.26 | | | | 0.18 | | | | 0.30 | | | | n/a | | | | n/a | |
Federal Money Market Fund | | | n/a | | | | 0.26 | | | | n/a | | | | n/a | | | | n/a | | | | n/a | |
100% U.S. Treasury Securities Money Market Fund | | | n/a | | | | 0.26 | | | | 0.18 | | | | n/a | | | | n/a | | | | n/a | |
Tax Free Money Market Fund | | | n/a | | | | 0.26 | | | | n/a | | | | n/a | | | | n/a | | | | n/a | |
Municipal Money Market Fund | | | n/a | | | | 0.26 | | | | n/a | | | | n/a | | | | 0.70 | | | | n/a | |
| | | | | | | | | | | | | | | | | | | | | | | | | | | | | | | | |
| | | E*Trade | | | IM | | | Institutional
Class | | | Investor | | | Morgan | | | Premier | | | Reserve | | | Service | |
Prime Money Market Fund | | | n/a | | | | n/a | | | | 0.21 | % | | | n/a | | | | 0.52 | % | | | 0.45 | % | | | 0.70 | % | | | n/a | |
Institutional Tax Free Money Market Fund | | | n/a | | | | 0.16 | % | | | 0.21 | | | | n/a | | | | n/a | | | | n/a | | | | n/a | | | | n/a | |
Liquid Assets Money Market Fund | | | 1.00 | % | | | n/a | | | | 0.21 | | | | 0.51 | % | | | 0.59 | | | | 0.45 | | | | 0.70 | | | | n/a | |
U.S. Government Money Market Fund | | | 1.00 | | | | n/a | | | | 0.21 | | | | 0.51 | | | | 0.59 | | | | 0.45 | | | | 0.70 | | | | 1.05 | % |
U.S. Treasury Plus Money Market Fund | | | n/a | | | | n/a | | | | 0.21 | | | | 0.51 | | | | 0.59 | | | | 0.45 | | | | 0.70 | | | | n/a | |
Federal Money Market Fund | | | n/a | | | | n/a | | | | 0.21 | | | | n/a | | | | 0.59 | | | | 0.45 | | | | n/a | | | | n/a | |
100% U.S. Treasury Securities Money Market Fund | | | n/a | | | | n/a | | | | 0.21 | | | | n/a | | | | 0.59 | | | | 0.45 | | | | 0.70 | | | | n/a | |
Tax Free Money Market Fund | | | n/a | | | | n/a | | | | 0.21 | | | | n/a | | | | 0.59 | | | | 0.45 | | | | 0.70 | | | | n/a | |
Municipal Money Market Fund | | | 1.00 | | | | n/a | | | | 0.21 | | | | n/a | | | | 0.59 | | | | 0.45 | | | | n/a | | | | 1.05 | |
The expense limitation agreements were in effect for the six months ended August 31, 2018, and are in place until at least June 30, 2019.
In addition, the Funds’ service providers have voluntarily waived fees during the six months ended August 31, 2018. However, the Funds’ service providers are under no obligation to do so and may discontinue such voluntary waivers at any time.
For the six months ended August 31, 2018, the Funds’ service providers waived fees and/or reimbursed expenses for each of the Funds as follows (amounts in thousands). None of these parties expect the Funds to repay any such waived fees and/or reimbursed expenses in future years.
| | | | | | | | | | | | | | | | | | | | |
| | | Contractual Waivers | | | | |
| | | Investment
Advisory Fees | | | Administration
Fees | | | Service
Fees | | | Total | | | Contractual
Reimbursements | |
Prime Money Market Fund | | $ | 8 | | �� | $ | — | | | $ | 6,563 | | | $ | 6,571 | | | $ | 13 | |
Institutional Tax Free Money Market Fund | | | 19 | | | | 16 | | | | 7 | | | | 42 | | | | 177 | |
Liquid Assets Money Market Fund | | | 101 | | | | 67 | | | | 465 | | | | 633 | | | | — | |
U.S. Government Money Market Fund | | | 31 | | | | — | | | | 21,307 | | | | 21,338 | | | | — | (a) |
U.S. Treasury Plus Money Market Fund | | | 5 | | | | — | | | | 4,764 | | | | 4,769 | | | | — | |
Federal Money Market Fund | | | 200 | | | | 134 | | | | 557 | | | | 891 | | | | — | |
100% U.S. Treasury Securities Money Market Fund | | | 843 | | | | 559 | | | | 4,968 | | | | 6,370 | | | | — | |
Tax Free Money Market Fund | | | 403 | | | | 267 | | | | 2,585 | | | | 3,255 | | | | — | |
Municipal Money Market Fund | | | 181 | | | | 120 | | | | 406 | | | | 707 | | | | — | |
| | | | | | |
| | | |
| 138 | | | | J.P. MORGAN MONEY MARKET FUNDS | | AUGUST 31, 2018 |
| | | | |
| | | Voluntary Waivers | |
| | | Distribution | |
Municipal Money Market Fund | | $ | 10 | |
| (a) | Amount rounds to less than one thousand. |
G. Other — Certain officers of the Trusts are affiliated with the Adviser, the Administrator and JPMDS. Such officers, with the exception of the Chief Compliance Officer, receive no compensation from the Funds for serving in their respective roles.
The Boards appointed a Chief Compliance Officer to the Funds in accordance with Federal securities regulations. Each Fund, along with other affiliated funds, makes reimbursement payments, on a pro-rata basis, to the Administrator for a portion of the fees associated with the Office of the Chief Compliance Officer. Such fees are included in Trustees’ and Chief Compliance Officer’s fees on the Statements of Operations.
Certain Funds earn interest on certain uninvested cash balances held at the custodian, which is included in the Interest income from affiliates on the Statements of Operations.
The Trusts adopted a Trustee Deferred Compensation Plan (the “Plan”) which allows the Independent Trustees to defer the receipt of all or a portion of compensation related to performance of their duties as Trustees. The deferred fees are invested in various J.P. Morgan Funds until distribution in accordance with the Plan.
The Funds may use related party broker-dealers. For the six months ended August 31, 2018, the Funds did not incur any brokerage commissions with broker-dealers affiliated with the Adviser.
The SEC has granted an exemptive order permitting the Funds to engage in principal transactions with J.P. Morgan Securities, Inc., an affiliated broker, involving taxable money market instruments, subject to certain conditions.
The Funds are permitted to effect purchase and sale transactions with affiliated Funds under procedures adopted by the Board. The procedures have been designed to seek to ensure that any such security transaction complies with certain conditions of Rule 17a-7 of the 1940 Act. Further, as defined under the procedures, each transaction is effected at the current market price. Pursuant to these procedures, for the six months ended August 31, 2018, the Funds below engaged in such transactions in the following amounts (amounts in thousands):
| | | | | | | | | | | | |
| | | Purchases | | | Sales | | | Realized
Gain (Loss) | |
Institutional Tax Free Money Market Fund | | $ | 129,623 | | | $ | 310,507 | | | $ | — | |
Tax Free Money Market Fund | | | 629,800 | | | | 306,304 | | | | — | |
Municipal Money Market Fund | | | 210,633 | | | | 325,642 | | | | — | |
4. Class Specific Expenses
The Funds’ class specific gross expenses for the six months ended August 31, 2018 were as follows (amounts in thousands):
| | | | | | | | |
| | | Distribution | | | Service | |
Prime Money Market Fund | | | | | | | | |
Class C | | $ | 7 | | | $ | 2 | |
Agency | | | — | | | | 1,223 | |
Capital | | | — | | | | 6,276 | |
Institutional Class | | | — | | | | 4,683 | |
Morgan | | | — | | | | 1,845 | |
Premier | | | — | | | | 1,779 | |
Reserve | | | 31 | | | | 37 | |
| | | | | | | | |
| | $ | 38 | | | $ | 15,845 | |
| | | | | | | | |
Institutional Tax Free Money Market Fund | | | | | | | | |
Agency | | $ | — | | | $ | — | (a) |
Capital | | | — | | | | — | (a) |
Institutional Class | | | — | | | | 13 | |
| | | | | | | | |
| | $ | — | | | $ | 13 | |
| | | | | | | | |
| | | | | | | | |
| | | |
| AUGUST 31, 2018 | | J.P. MORGAN MONEY MARKET FUNDS | | | | | 139 | |
NOTES TO FINANCIAL STATEMENTS
AS OF AUGUST 31, 2018 (Unaudited) (continued)
| | | | | | | | |
| | | Distribution | | | Service | |
Liquid Assets Money Market Fund | | | | | | | | |
Class C | | $ | 79 | | | $ | 26 | |
Agency | | | — | | | | 153 | |
Capital | | | — | | | | 60 | |
Institutional Class | | | — | | | | 605 | |
Investor | | | — | | | | 16 | |
Morgan | | | 83 | | | | 290 | |
Premier | | | — | | | | 756 | |
Reserve | | | 7 | | | | 9 | |
| | | | | | | | |
| | $ | 169 | | | $ | 1,915 | |
| | | | | | | | |
U.S. Government Money Market Fund | | | | | | | | |
Agency | | $ | — | | | $ | 9,754 | |
Capital | | | — | | | | 20,110 | |
Eagle Class | | | 2,358 | | | | 2,830 | |
Eagle Private Wealth Class | | | — | | | | — | (a) |
E*Trade | | | 933 | | | | 466 | |
Institutional Class | | | — | | | | 15,574 | |
Investor | | | — | | | | 1,358 | |
Morgan | | | 679 | | | | 2,375 | |
Premier | | | — | | | | 6,828 | |
Reserve | | | 66 | | | | 80 | |
Service | | | 4,797 | | | | 2,399 | |
| | | | | | | | |
| | $ | 8,833 | | | $ | 61,774 | |
| | | | | | | | |
U.S. Treasury Plus Money Market Fund | | | | | | | | |
Class C | | $ | 1,442 | | | $ | 481 | |
Agency | | | — | | | | 728 | |
Capital | | | — | | | | 1,258 | |
Institutional Class | | | — | | | | 7,425 | |
Investor | | | — | | | | 67 | |
Morgan | | | 160 | | | | 561 | |
Premier | | | — | | | | 941 | |
Reserve | | | 19 | | | | 22 | |
| | | | | | | | |
| | $ | 1,621 | | | $ | 11,483 | |
| | | | | | | | |
Federal Money Market Fund | | | | | | | | |
Agency | | $ | — | | | $ | 78 | |
Institutional Class | | | — | | | | 1,346 | |
Morgan | | | 15 | | | | 54 | |
Premier | | | — | | | | 334 | |
| | | | | | | | |
| | $ | 15 | | | $ | 1,812 | |
| | | | | | | | |
100% U.S. Treasury Securities Money Market Fund | | | | | | | | |
Agency | | $ | — | | | $ | 1,580 | |
Capital | | | — | | | | 4,661 | |
Institutional Class | | | — | | | | 6,185 | |
Morgan | | | 976 | | | | 3,417 | |
Premier | | | — | | | | 1,892 | |
Reserve | | | 1,105 | | | | 1,326 | |
| | | | | | | | |
| | $ | 2,081 | | | $ | 19,061 | |
| | | | | | | | |
Tax Free Money Market Fund | | | | | | | | |
Agency | | $ | — | | | $ | 745 | |
Institutional Class | | | — | | | | 5,981 | |
Morgan | | | 6 | | | | 20 | |
Premier | | | — | | | | 1,623 | |
Reserve | | | 2,765 | | | | 3,318 | |
| | | | | | | | |
| | $ | 2,771 | | | $ | 11,687 | |
| | | | | | | | |
| | | | | | |
| | | |
| 140 | | | | J.P. MORGAN MONEY MARKET FUNDS | | AUGUST 31, 2018 |
| | | | | | | | |
| | | Distribution | | | Service | |
Municipal Money Market Fund | | | | | | | | |
Agency | | $ | — | | | $ | 126 | |
Eagle Class | | | 728 | | | | 873 | |
Institutional Class | | | — | | | | 913 | |
Morgan | | | 8 | | | | 29 | |
Premier | | | — | | | | 187 | |
Service | | | 821 | | | | 411 | |
| | | | | | | | |
| | $ | 1,557 | | | $ | 2,539 | |
| | | | | | | | |
| (a) | Amount rounds to less than one thousand. |
5. Federal Income Tax Matters
For Federal income tax purposes, the estimated cost and unrealized appreciation (depreciation) in value of investments held at August 31, 2018 were as follows (amounts in thousands):
| | | | | | | | | | | | | | | | |
| | | Aggregate
Cost | | | Gross Unrealized
Appreciation | | | Gross
Unrealized Depreciation | | | Net Unrealized
Appreciation
(Depreciation) | |
Prime Money Market Fund | | $ | 44,033,042 | | | $ | 8,045 | | | $ | 253 | | | $ | 7,792 | |
Institutional Tax Free Money Market Fund | | | 600,419 | | | | — | | | | 14 | | | | (14 | ) |
6. Borrowings
The Funds rely upon an exemptive order granted by the SEC (the “Order”) permitting the establishment and operation of an Interfund Lending Facility (the “Facility”). The Facility allows the Funds to directly lend and borrow money to or from any other fund relying upon the Order at rates beneficial to both the borrowing and lending funds. Advances under the Facility are taken primarily for temporary or emergency purposes, including the meeting of redemption requests that otherwise might require the untimely disposition of securities, and are subject to each Fund’s borrowing restrictions. The Interfund loan rate is determined, as specified in the Order, by averaging the current repurchase agreement rate and the current bank loan rate. The Order was granted to JPM II and may be relied upon by the Funds because the Funds and the series of JPM II are all investment companies in the same “group of investment companies” (as defined in Section 12(d)(1)(G) of the 1940 Act).
In addition, the Trusts and JPMCB have entered into a financing arrangement. Under this arrangement, JPMCB provides an unsecured, uncommitted credit facility in the aggregate amount of $100 million to certain of the J.P. Morgan Funds, including the Funds. Advances under the arrangement are taken primarily for temporary or emergency purposes, including the meeting of redemption requests that otherwise might require the untimely disposition of securities, and are subject to each Fund’s borrowing restrictions. Interest on borrowings is payable at a rate determined by JPMCB at the time of borrowing. This agreement has been extended until November 5, 2018.
As of August 31, 2018, the Funds had no outstanding loans to another fund. Average loans made to another fund under the Facility for the year ended February 28, 2018, were as follows (amounts in thousands except number of days outstanding):
| | | | | | | | | | | | |
| | | Average
Loans | | | Number of
Days Outstanding | | | Interest
Earned | |
U.S. Government Money Market Fund | | $ | 16,501 | | | | 68 | | | $ | 102 | |
Interest earned as a result of lending money to another fund for the six months ended August 31, 2018, if any, is included in Income from interfund lending (net) on the Statements of Operations.
The Funds had no borrowings outstanding from another fund or from the unsecured, uncommitted credit facility during the six months ended August 31, 2018.
7. Risks, Concentrations and Indemnifications
In the normal course of business, the Funds enter into contracts that contain a variety of representations which provide general indemnifications. Each Fund’s maximum exposure under these arrangements is unknown. The amount of exposure would depend on future claims that may be brought against each Fund. However, based on experience, the Funds expect the risk of loss to be remote.
| | | | | | | | |
| | | |
| AUGUST 31, 2018 | | J.P. MORGAN MONEY MARKET FUNDS | | | | | 141 | |
NOTES TO FINANCIAL STATEMENTS
AS OF AUGUST 31, 2018 (Unaudited) (continued)
As of August 31, 2018, the Funds had omnibus accounts which owned more than 10% of the respective Fund’s outstanding shares as follows:
| | | | | | | | | | | | | | | | |
| | | Number of
Affiliates Omnibus
Accounts | | | % of the Fund | | | Number of
Non-Affiliates Omnibus
Accounts | | | % of the Fund | |
Prime Money Market Fund | | | 1 | | | | 28.7 | % | | | — | | | | — | % |
Institutional Tax Free Money Market Fund | | | 1 | | | | 95.5 | | | | — | | | | — | |
Liquid Assets Money Market Fund | | | 1 | | | | 70.7 | | | | — | | | | — | |
U.S. Treasury Plus Money Market Fund | | | — | | | | — | | | | 2 | | | | 33.8 | |
Federal Money Market Fund | | | 1 | | | | 58.6 | | | | 1 | | | | 17.5 | |
100% U.S. Treasury Securities Money Market Fund | | | 1 | | | | 23.5 | | | | — | | | | — | |
Tax Free Money Market Fund | | | 1 | | | | 49.0 | | | | 2 | | | | 43.3 | |
Municipal Money Market Fund | | | 2 | | | | 69.1 | | | | 1 | | | | 19.6 | |
Significant shareholder transactions by these shareholders may impact the Funds’ performance.
The Municipal Money Market Fund and Tax Free Money Market Fund invest primarily in a portfolio of debt obligations issued by states, territories and possessions of the United States and by the District of Columbia, and by their political subdivisions and duly constituted authorities. An issuer’s ability to meet its payment obligations may be affected by economic or political developments in a specific state or region. These debt obligations may be insured by private insurers who guarantee the payment of principal and interest in the event of issuer default. The value of these investments may be impacted by changes to bond insurers’ ratings and the Municipal Money Market Fund’s and Tax Free Money Market Fund’s ability to collect principal and interest, in the event of an issuer’s default, may be limited if the private insurer does not have the wherewithal to satisfy its obligation.
The profitability of banks depends largely on the availability and cost of funds, which can change depending upon economic conditions. Banks are also exposed to losses if borrowers cannot repay their loans.
8. New Accounting Pronouncement
In August 2018, the Financial Accounting Standard Board (“FASB”) issued Accounting Standard Update (“ASU”) 2018-13 (“ASU 2018-13”), Fair Value Measurement (Topic 820): Disclosure Framework — Changes to the Disclosure Requirements for Fair Value Measurement, which adds, removes, and modifies certain aspects of the fair value disclosure. ASU 2018-13 amendments are the result of a broader disclosure project, FASB Concepts Statement Conceptual Framework for Financial Reporting — Chapter 8: Notes to Financial Statements, to improve the effectiveness of the fair value disclosure requirements. ASU 2018-13 is effective for the fiscal years, and interim periods within those fiscal years, beginning after December 15, 2019; early adoption is permitted. Management is currently evaluating the implications of these changes.
| | | | | | |
| | | |
| 142 | | | | J.P. MORGAN MONEY MARKET FUNDS | | AUGUST 31, 2018 |
SCHEDULE OF SHAREHOLDER EXPENSES
(Unaudited)
Hypothetical $1,000 Investment
As a shareholder of the Funds, you incur two types of costs: (1) transaction costs, including sales charges (loads) on purchase payments and (2) ongoing costs, including investment advisory fees, administration fees, distribution fees and other Fund expenses. The examples below are intended to help you understand your ongoing costs (in dollars) of investing in the Funds and to compare these ongoing costs with the ongoing costs of investing in other mutual funds. The examples assume that you had a $1,000 investment in each Class at the beginning of the reporting period, March 1, 2018, and continued to hold your shares at the end of the reporting period, August 31, 2018.
Actual Expenses
For each Class of each Fund in the table below, the first line provides information about actual account values and actual expenses. You may use the information in this line, together with the amount you invested, to estimate the expenses that you paid over the period. Simply divide your account value by $1,000 (for example, an $8,600 account value divided by $1,000 = 8.6), then multiply the result by the number in the first line of each Class under the heading entitled “Expenses Paid During the Period” to estimate the expenses you paid on your account during this period.
Hypothetical Example for Comparison Purposes
The second line of each Class in the table below provides information about hypothetical account values and hypothetical expenses based on the Class’ actual expense ratio and an assumed rate of return of 5% per year before expenses, which is not the Class’ actual return. The hypothetical account values and expenses may not be used to estimate the actual ending account balance or expenses you paid for the period. You may use this information to compare the ongoing costs of investing in the Class of the Fund and other funds. To do so, compare this 5% hypothetical example with the 5% hypothetical examples that appear in the shareholder reports of the other funds. Please note that the expenses shown in the table are meant to highlight your ongoing costs only and do not reflect any transaction costs, such as sales charges (loads). Therefore, the second line for each Class in the table is useful in comparing ongoing costs only, and will not help you determine the relative total costs of owning different funds. In addition, if these transaction costs were included, your costs would have been higher. The examples also assume all dividends and distributions have been reinvested.
| | | | | | | | | | | | | | | | |
| | | Beginning
Account Value
March 1, 2018 | | | Ending
Account Value
August 31, 2018 | | | Expenses
Paid During
the Period* | | | Annualized
Expense
Ratio | |
JPMorgan Prime Money Market Fund | | | | | | | | | | | | | | | | |
Class C | | | | | | | | | | | | | | | | |
Actual | | $ | 1,000.00 | | | $ | 1,005.90 | | | $ | 4.90 | | | | 0.97 | % |
Hypothetical | | | 1,000.00 | | | | 1,020.32 | | | | 4.94 | | | | 0.97 | |
Agency | | | | | | | | | | | | | | | | |
Actual | | | 1,000.00 | | | | 1,009.50 | | | | 1.32 | | | | 0.26 | |
Hypothetical | | | 1,000.00 | | | | 1,023.89 | | | | 1.33 | | | | 0.26 | |
Capital | | | | | | | | | | | | | | | | |
Actual | | | 1,000.00 | | | | 1,009.90 | | | | 0.91 | | | | 0.18 | |
Hypothetical | | | 1,000.00 | | | | 1,024.30 | | | | 0.92 | | | | 0.18 | |
IM | | | | | | | | | | | | | | | | |
Actual | | | 1,000.00 | | | | 1,010.00 | | | | 0.81 | | | | 0.16 | |
Hypothetical | | | 1,000.00 | | | | 1,024.40 | | | | 0.82 | | | | 0.16 | |
Institutional Class | | | | | | | | | | | | | | | | |
Actual | | | 1,000.00 | | | | 1,009.70 | | | | 1.06 | | | | 0.21 | |
Hypothetical | | | 1,000.00 | | | | 1,024.15 | | | | 1.07 | | | | 0.21 | |
Morgan | | | | | | | | | | | | | | | | |
Actual | | | 1,000.00 | | | | 1,008.10 | | | | 2.63 | | | | 0.52 | |
Hypothetical | | | 1,000.00 | | | | 1,022.58 | | | | 2.65 | | | | 0.52 | |
Premier | | | | | | | | | | | | | | | | |
Actual | | | 1,000.00 | | | | 1,008.50 | | | | 2.28 | | | | 0.45 | |
Hypothetical | | | 1,000.00 | | | | 1,022.94 | | | | 2.29 | | | | 0.45 | |
Reserve | | | | | | | | | | | | | | | | |
Actual | | | 1,000.00 | | | | 1,007.20 | | | | 3.54 | | | | 0.70 | |
Hypothetical | | | 1,000.00 | | | | 1,021.68 | | | | 3.57 | | | | 0.70 | |
| | | | |
JPMorgan Institutional Tax Free Money Market Fund | | | | | | | | | | | | | | | | |
Agency | | | | | | | | | | | | | | | | |
Actual | | | 1,000.00 | | | | 1,005.60 | | | | 1.31 | | | | 0.26 | |
Hypothetical | | | 1,000.00 | | | | 1,023.89 | | | | 1.33 | | | | 0.26 | |
| | | | | | | | |
| | | |
| AUGUST 31, 2018 | | J.P. MORGAN MONEY MARKET FUNDS | | | | | 143 | |
SCHEDULE OF SHAREHOLDER EXPENSES
(Unaudited) (continued)
Hypothetical $1,000 Investment
| | | | | | | | | | | | | | | | |
| | | Beginning
Account Value
March 1, 2018 | | | Ending
Account Value
August 31, 2018 | | | Expenses
Paid During
the Period* | | | Annualized
Expense
Ratio | |
JPMorgan Institutional Tax Free Money Market Fund (continued) | | | | | |
Capital | | | | | | | | | | | | | | | | |
Actual | | $ | 1,000.00 | | | $ | 1,006.00 | | | $ | 0.91 | | | | 0.18 | % |
Hypothetical | | | 1,000.00 | | | | 1,024.30 | | | | 0.92 | | | | 0.18 | |
IM | | | | | | | | | | | | | | | | |
Actual | | | 1,000.00 | | | | 1,006.10 | | | | 0.81 | | | | 0.16 | |
Hypothetical | | | 1,000.00 | | | | 1,024.40 | | | | 0.82 | | | | 0.16 | |
Institutional Class | | | | | | | | | | | | | | | | |
Actual | | | 1,000.00 | | | | 1,005.80 | | | | 1.06 | | | | 0.21 | |
Hypothetical | | | 1,000.00 | | | | 1,024.15 | | | | 1.07 | | | | 0.21 | |
| |
JPMorgan Liquid Assets Money Market Fund | | | | | |
Class C | | | | | | | | | | | | | | | | |
Actual | | | 1,000.00 | | | | 1,005.60 | | | | 4.90 | | | | 0.97 | |
Hypothetical | | | 1,000.00 | | | | 1,020.32 | | | | 4.94 | | | | 0.97 | |
Agency | | | | | | | | | | | | | | | | |
Actual | | | 1,000.00 | | | | 1,009.20 | | | | 1.32 | | | | 0.26 | |
Hypothetical | | | 1,000.00 | | | | 1,023.89 | | | | 1.33 | | | | 0.26 | |
Capital | | | | | | | | | | | | | | | | |
Actual | | | 1,000.00 | | | | 1,009.70 | | | | 0.91 | | | | 0.18 | |
Hypothetical | | | 1,000.00 | | | | 1,024.30 | | | | 0.92 | | | | 0.18 | |
Institutional Class | | | | | | | | | | | | | | | | |
Actual | | | 1,000.00 | | | | 1,009.50 | | | | 1.06 | | | | 0.21 | |
Hypothetical | | | 1,000.00 | | | | 1,024.15 | | | | 1.07 | | | | 0.21 | |
Investor | | | | | | | | | | | | | | | | |
Actual | | | 1,000.00 | | | | 1,008.00 | | | | 2.58 | | | | 0.51 | |
Hypothetical | | | 1,000.00 | | | | 1,022.63 | | | | 2.60 | | | | 0.51 | |
Morgan | | | | | | | | | | | | | | | | |
Actual | | | 1,000.00 | | | | 1,007.60 | | | | 2.99 | | | | 0.59 | |
Hypothetical | | | 1,000.00 | | | | 1,022.23 | | | | 3.01 | | | | 0.59 | |
Premier | | | | | | | | | | | | | | | | |
Actual | | | 1,000.00 | | | | 1,008.30 | | | | 2.28 | | | | 0.45 | |
Hypothetical | | | 1,000.00 | | | | 1,022.94 | | | | 2.29 | | | | 0.45 | |
Reserve | | | | | | | | | | | | | | | | |
Actual | | | 1,000.00 | | | | 1,007.00 | | | | 3.54 | | | | 0.70 | |
Hypothetical | | | 1,000.00 | | | | 1,021.68 | | | | 3.57 | | | | 0.70 | |
| | | | |
JPMorgan U.S. Government Money Market Fund | | | | | | | | | | | | | | | | |
Agency | | | | | |
Actual | | | 1,000.00 | | | | 1,007.90 | | | | 1.32 | | | | 0.26 | |
Hypothetical | | | 1,000.00 | | | | 1,023.89 | | | | 1.33 | | | | 0.26 | |
Capital | | | | | | | | | | | | | | | | |
Actual | | | 1,000.00 | | | | 1,008.30 | | | | 0.91 | | | | 0.18 | |
Hypothetical | | | 1,000.00 | | | | 1,024.30 | | | | 0.92 | | | | 0.18 | |
Eagle Class | | | | | | | | | | | | | | | | |
Actual | | | 1,000.00 | | | | 1,005.70 | | | | 3.54 | | | | 0.70 | |
Hypothetical | | | 1,000.00 | | | | 1,021.68 | | | | 3.57 | | | | 0.70 | |
| |
Eagle Private Wealth Class | | | | | |
Actual | | | 1,000.00 | | | | 1,007.70 | | | | 1.52 | | | | 0.30 | |
Hypothetical | | | 1,000.00 | | | | 1,023.69 | | | | 1.53 | | | | 0.30 | |
E*Trade | | | | | | | | | | | | | | | | |
Actual | | | 1,000.00 | | | | 1,004.20 | | | | 5.05 | | | | 1.00 | |
Hypothetical | | | 1,000.00 | | | | 1,020.16 | | | | 5.09 | | | | 1.00 | |
IM | | | | | | | | | | | | | | | | |
Actual | | | 1,000.00 | | | | 1,008.40 | | | | 0.81 | | | | 0.16 | |
Hypothetical | | | 1,000.00 | | | | 1,024.40 | | | | 0.82 | | | | 0.16 | |
| | | | | | |
| | | |
| 144 | | | | J.P. MORGAN MONEY MARKET FUNDS | | AUGUST 31, 2018 |
| | | | | | | | | | | | | | | | |
| | | Beginning
Account Value
March 1, 2018 | | | Ending
Account Value
August 31, 2018 | | | Expenses
Paid During
the Period* | | | Annualized
Expense
Ratio | |
JPMorgan U.S. Government Money Market Fund (continued) | | | | | |
Institutional Class | | | | | | | | | | | | | | | | |
Actual | | $ | 1,000.00 | | | $ | 1,008.20 | | | $ | 1.06 | | | | 0.21 | % |
Hypothetical | | | 1,000.00 | | | | 1,024.15 | | | | 1.07 | | | | 0.21 | |
Investor | | | | | | | | | | | | | | | | |
Actual | | | 1,000.00 | | | | 1,006.70 | | | | 2.58 | | | | 0.51 | |
Hypothetical | | | 1,000.00 | | | | 1,022.63 | | | | 2.60 | | | | 0.51 | |
Morgan | | | | | | | | | | | | | | | | |
Actual | | | 1,000.00 | | | | 1,006.20 | | | | 2.98 | | | | 0.59 | |
Hypothetical | | | 1,000.00 | | | | 1,022.23 | | | | 3.01 | | | | 0.59 | |
Premier | | | | | | | | | | | | | | | | |
Actual | | | 1,000.00 | | | | 1,007.00 | | | | 2.28 | | | | 0.45 | |
Hypothetical | | | 1,000.00 | | | | 1,022.94 | | | | 2.29 | | | | 0.45 | |
Reserve | | | | | | | | | | | | | | | | |
Actual | | | 1,000.00 | | | | 1,005.70 | | | | 3.54 | | | | 0.70 | |
Hypothetical | | | 1,000.00 | | | | 1,021.68 | | | | 3.57 | | | | 0.70 | |
Service | | | | | | | | | | | | | | | | |
Actual | | | 1,000.00 | | | | 1,003.90 | | | | 5.30 | | | | 1.05 | |
Hypothetical | | | 1,000.00 | | | | 1,019.91 | | | | 5.35 | | | | 1.05 | |
| |
JPMorgan U.S. Treasury Plus Money Market Fund | | | | | |
Class C | | | | | | | | | | | | | | | | |
Actual | | | 1,000.00 | | | | 1,004.30 | | | | 4.90 | | | | 0.97 | |
Hypothetical | | | 1,000.00 | | | | 1,020.32 | | | | 4.94 | | | | 0.97 | |
Agency | | | | | | | | | | | | | | | | |
Actual | | | 1,000.00 | | | | 1,007.90 | | | | 1.32 | | | | 0.26 | |
Hypothetical | | | 1,000.00 | | | | 1,023.89 | | | | 1.33 | | | | 0.26 | |
Capital | | | | | | | | | | | | | | | | |
Actual | | | 1,000.00 | | | | 1,008.30 | | | | 0.91 | | | | 0.18 | |
Hypothetical | | | 1,000.00 | | | | 1,024.30 | | | | 0.92 | | | | 0.18 | |
IM | | | | | | | | | | | | | | | | |
Actual | | | 1,000.00 | | | | 1,008.50 | | | | 0.81 | | | | 0.16 | |
Hypothetical | | | 1,000.00 | | | | 1,024.40 | | | | 0.82 | | | | 0.16 | |
Institutional Class | | | | | | | | | | | | | | | | |
Actual | | | 1,000.00 | | | | 1,008.20 | | | | 1.06 | | | | 0.21 | |
Hypothetical | | | 1,000.00 | | | | 1,024.15 | | | | 1.07 | | | | 0.21 | |
Investor | | | | | | | | | | | | | | | | |
Actual | | | 1,000.00 | | | | 1,006.70 | | | | 2.58 | | | | 0.51 | |
Hypothetical | | | 1,000.00 | | | | 1,022.63 | | | | 2.60 | | | | 0.51 | |
Morgan | | | | | | | | | | | | | | | | |
Actual | | | 1,000.00 | | | | 1,006.30 | | | | 2.98 | | | | 0.59 | |
Hypothetical | | | 1,000.00 | | | | 1,022.23 | | | | 3.01 | | | | 0.59 | |
Premier | | | | | | | | | | | | | | | | |
Actual | | | 1,000.00 | | | | 1,007.00 | | | | 2.28 | | | | 0.45 | |
Hypothetical | | | 1,000.00 | | | | 1,022.94 | | | | 2.29 | | | | 0.45 | |
Reserve | | | | | | | | | | | | | | | | |
Actual | | | 1,000.00 | | | | 1,005.70 | | | | 3.54 | | | | 0.70 | |
Hypothetical | | | 1,000.00 | | | | 1,021.68 | | | | 3.57 | | | | 0.70 | |
| |
JPMorgan Federal Money Market Fund | | | | | |
Agency | | | | | | | | | | | | | | | | |
Actual | | | 1,000.00 | | | | 1,007.80 | | | | 1.32 | | | | 0.26 | |
Hypothetical | | | 1,000.00 | | | | 1,023.89 | | | | 1.33 | | | | 0.26 | |
Institutional Class | | | | | | | | | | | | | | | | |
Actual | | | 1,000.00 | | | | 1,008.00 | | | | 1.06 | | | | 0.21 | |
Hypothetical | | | 1,000.00 | | | | 1,024.15 | | | | 1.07 | | | | 0.21 | |
| | | | | | | | |
| | | |
| AUGUST 31, 2018 | | J.P. MORGAN MONEY MARKET FUNDS | | | | | 145 | |
SCHEDULE OF SHAREHOLDER EXPENSES
(Unaudited) (continued)
Hypothetical $1,000 Investment
| | | | | | | | | | | | | | | | |
| | | Beginning
Account Value
March 1, 2018 | | | Ending
Account Value
August 31, 2018 | | | Expenses
Paid During
the Period* | | | Annualized
Expense
Ratio | |
JPMorgan Federal Money Market Fund (continued) | | | | | |
Morgan | | | | | | | | | | | | | | | | |
Actual | | $ | 1,000.00 | | | $ | 1,006.10 | | | $ | 2.98 | | | | 0.59 | % |
Hypothetical | | | 1,000.00 | | | | 1,022.23 | | | | 3.01 | | | | 0.59 | |
Premier | | | | | | | | | | | | | | | | |
Actual | | | 1,000.00 | | | | 1,006.80 | | | | 2.28 | | | | 0.45 | |
Hypothetical | | | 1,000.00 | | | | 1,022.94 | | | | 2.29 | | | | 0.45 | |
| |
JPMorgan 100% U.S. Treasury Securities Money Market Fund | | | | | |
Agency | | | | | | | | | | | | | | | | |
Actual | | | 1,000.00 | | | | 1,007.80 | | | | 1.32 | | | | 0.26 | |
Hypothetical | | | 1,000.00 | | | | 1,023.89 | | | | 1.33 | | | | 0.26 | |
Capital | | | | | | | | | | | | | | | | |
Actual | | | 1,000.00 | | | | 1,008.20 | | | | 0.91 | | | | 0.18 | |
Hypothetical | | | 1,000.00 | | | | 1,024.30 | | | | 0.92 | | | | 0.18 | |
Institutional Class | | | | | | | | | | | | | | | | |
Actual | | | 1,000.00 | | | | 1,008.10 | | | | 1.06 | | | | 0.21 | |
Hypothetical | | | 1,000.00 | | | | 1,024.15 | | | | 1.07 | | | | 0.21 | |
Morgan | | | | | | | | | | | | | | | | |
Actual | | | 1,000.00 | | | | 1,006.10 | | | | 2.98 | | | | 0.59 | |
Hypothetical | | | 1,000.00 | | | | 1,022.23 | | | | 3.01 | | | | 0.59 | |
Premier | | | | | | | | | | | | | | | | |
Actual | | | 1,000.00 | | | | 1,006.80 | | | | 2.28 | | | | 0.45 | |
Hypothetical | | | 1,000.00 | | | | 1,022.94 | | | | 2.29 | | | | 0.45 | |
Reserve | | | | | | | | | | | | | | | | |
Actual | | | 1,000.00 | | | | 1,005.60 | | | | 3.54 | | | | 0.70 | |
Hypothetical | | | 1,000.00 | | | | 1,021.68 | | | | 3.57 | | | | 0.70 | |
| |
JPMorgan Tax Free Money Market Fund | | | | | |
Agency | | | | | | | | | | | | | | | | |
Actual | | | 1,000.00 | | | | 1,005.60 | | | | 1.31 | | | | 0.26 | |
Hypothetical | | | 1,000.00 | | | | 1,023.89 | | | | 1.33 | | | | 0.26 | |
Institutional Class | | | | | | | | | | | | | | | | |
Actual | | | 1,000.00 | | | | 1,005.90 | | | | 1.06 | | | | 0.21 | |
Hypothetical | | | 1,000.00 | | | | 1,024.15 | | | | 1.07 | | | | 0.21 | |
Morgan | | | | | | | | | | | | | | | | |
Actual | | | 1,000.00 | | | | 1,004.00 | | | | 2.98 | | | | 0.59 | |
Hypothetical | | | 1,000.00 | | | | 1,022.23 | | | | 3.01 | | | | 0.59 | |
Premier | | | | | | | | | | | | | | | | |
Actual | | | 1,000.00 | | | | 1,004.70 | | | | 2.27 | | | | 0.45 | |
Hypothetical | | | 1,000.00 | | | | 1,022.94 | | | | 2.29 | | | | 0.45 | |
Reserve | | | | | | | | | | | | | | | | |
Actual | | | 1,000.00 | | | | 1,003.40 | | | | 3.53 | | | | 0.70 | |
Hypothetical | | | 1,000.00 | | | | 1,021.68 | | | | 3.57 | | | | 0.70 | |
| |
JPMorgan Municipal Money Market Fund | | | | | |
Agency | | | | | | | | | | | | | | | | |
Actual | | | 1,000.00 | | | | 1,005.80 | | | | 1.31 | | | | 0.26 | |
Hypothetical | | | 1,000.00 | | | | 1,023.89 | | | | 1.33 | | | | 0.26 | |
Eagle Class | | | | | | | | | | | | | | | | |
Actual | | | 1,000.00 | | | | 1,003.60 | | | | 3.54 | | | | 0.70 | |
Hypothetical | | | 1,000.00 | | | | 1,021.68 | | | | 3.57 | | | | 0.70 | |
Institutional Class | | | | | | | | | | | | | | | | |
Actual | | | 1,000.00 | | | | 1,006.00 | | | | 1.06 | | | | 0.21 | |
Hypothetical | | | 1,000.00 | | | | 1,024.15 | | | | 1.07 | | | | 0.21 | |
Morgan | | | | | | | | | | | | | | | | |
Actual | | | 1,000.00 | | | | 1,004.10 | | | | 2.98 | | | | 0.59 | |
Hypothetical | | | 1,000.00 | | | | 1,022.23 | | | | 3.01 | | | | 0.59 | |
| | | | | | |
| | | |
| 146 | | | | J.P. MORGAN MONEY MARKET FUNDS | | AUGUST 31, 2018 |
| | | | | | | | | | | | | | | | |
| | | Beginning
Account Value
March 1, 2018 | | | Ending
Account Value
August 31, 2018 | | | Expenses
Paid During
the Period* | | | Annualized
Expense
Ratio | |
JPMorgan Municipal Money Market Fund (continued) | | | | | |
Premier | | | | | | | | | | | | | | | | |
Actual | | $ | 1,000.00 | | | $ | 1,004.80 | | | $ | 2.27 | | | | 0.45 | % |
Hypothetical | | | 1,000.00 | | | | 1,022.94 | | | | 2.29 | | | | 0.45 | |
Service | | | | | | | | | | | | | | | | |
Actual | | | 1,000.00 | | | | 1,001.80 | | | | 5.25 | | | | 1.04 | |
Hypothetical | | | 1,000.00 | | | | 1,019.96 | | | | 5.30 | | | | 1.04 | |
| * | Expenses are equal to each Class’ respective annualized expense ratio, multiplied by the average account value over the period, multiplied by 184/365 (to reflect the one-half year period). |
| | | | | | | | |
| | | |
| AUGUST 31, 2018 | | J.P. MORGAN MONEY MARKET FUNDS | | | | | 147 | |
BOARD APPROVAL OF INVESTMENT ADVISORY AGREEMENTS
(Unaudited)
The Board of Trustees has established various standing committees composed of Trustees with diverse backgrounds, to which the Board of Trustees has assigned specific subject matter responsibilities to further enhance the effectiveness of the Board’s oversight and decision making. The Board of Trustees and its investment committees (money market and alternative products, equity, and fixed income) meet regularly throughout the year and consider factors that are relevant to their annual consideration of investment advisory agreements at each meeting. They also meet for the specific purpose of considering investment advisory agreement annual renewals. The Board of Trustees held meetings in person in June and August 2018, at which the Trustees considered the continuation of the investment advisory agreements for each Fund whose semi-annual report is contained herein (each an “Advisory Agreement” and collectively, the “Advisory Agreements”). At the June meeting, the Board’s investment committees met to review and consider performance, expense and related information for the J.P. Morgan Funds. Each investment committee reported to the full Board, which then considered the investment committee’s preliminary findings. At the August meeting, the Trustees continued their review and consideration. The Trustees, including a majority of the Trustees who are not “interested persons” (as defined in the 1940 Act) of any party to the Advisory Agreements or any of their affiliates, approved the continuation of each Advisory Agreement on August 15, 2018.
As part of their review of the Advisory Agreements, the Trustees considered and reviewed performance and other information about the Funds received from the Adviser. This information includes the Funds’ performance as compared to the performance of their peers and analyses by the Adviser of the Funds’ performance. In addition, the Trustees have engaged an independent management consulting firm (“independent consultant”) to report on the performance of certain J.P. Morgan Funds at each of the Trustees’ regular meetings. In addition, in preparation for the June and August meetings, the Trustees requested, received and evaluated extensive materials from the Adviser, including performance and expense information compiled by Broadridge, using data from Lipper Inc., independent providers of investment company data (together, “Broadridge/Lipper”). The Trustees’ independent consultant also provided additional analyses of the performance of certain J.P. Morgan Funds with greater than two years of performance history in connection with the Trustees’ review of the Advisory Agreements. Before voting on the Advisory Agreements, the Trustees reviewed the Advisory Agreements with representatives of the Adviser, counsel to the Trusts and independent legal counsel, and received a memorandum from independent legal counsel to the Trustees discussing the legal standards for their consideration of the Advisory Agreements. The Trustees also discussed the Advisory Agreements in executive sessions with independent legal counsel at which no representatives of the Adviser were present.
A summary of the material factors evaluated by the Trustees in determining whether to approve each Advisory Agreement is provided below. Each Trustee attributed different weights to the various factors and no factor alone was considered determinative. The Trustees considered information provided with respect to the Funds throughout the year, as well as materials furnished specifically in connection with the annual review process. From year to year, the Trustees consider and place emphasis on relevant information in light of changing circumstances in market and economic conditions.
After considering and weighing the factors and information they had received, the Trustees found that the compensation to be received by the Adviser from each Fund under the applicable Advisory Agreement was fair and reasonable under the circumstances and determined that the continuance of each Advisory Agreement was in the best interests of each Fund and its shareholders.
Nature, Extent and Quality of Services Provided by the Adviser
The Trustees received and considered information regarding the nature, extent and quality of the services provided to each Fund under the applicable Advisory Agreement. The Trustees took into account information furnished throughout the year at Trustee meetings, as well as the materials furnished specifically in connection with this annual review process. The Trustees considered the background and experience of the Adviser’s senior management and the expertise of, and the amount of attention given to each Fund by, investment personnel of the Adviser. In addition, the Trustees reviewed the qualifications, backgrounds and responsibilities of the portfolio management team primarily responsible for the day-to-day management of each Fund and the infrastructure supporting the team, including personnel changes. The Trustees also considered information provided by the Adviser and JPMorgan Distribution Services, Inc. (“JPMDS”) about the structure and distribution strategy of each Fund. The Trustees reviewed information relating to the Adviser’s risk governance model and reports showing the Adviser’s compliance structure and ongoing compliance processes. The Trustees also considered the quality of administrative services provided by the Adviser in its role as administrator.
The Trustees also considered their knowledge of the nature and quality of the services provided by the Adviser and its affiliates to the Funds gained from their experience as Trustees of the J.P. Morgan Funds. In addition, they considered the overall reputation and capabilities of the Adviser and its affiliates, the commitment of the Adviser to provide high quality service to the Funds, their overall confidence in the Adviser’s integrity and the Adviser’s responsiveness to questions or concerns raised by them, including the Adviser’s willingness to consider and implement organizational and operational changes designed to improve investment results and the services provided to each Fund.
| | | | | | |
| | | |
| 148 | | | | J.P. MORGAN MONEY MARKET FUNDS | | AUGUST 31, 2018 |
Based upon these considerations and other factors, the Trustees concluded that they were satisfied with the nature, extent and quality of the investment advisory services provided to the Funds by the Adviser.
Costs of Services Provided and Profitability to the Adviser and its Affiliates
The Trustees received and considered information regarding the profitability to the Adviser and its affiliates in providing services to each Fund. The Trustees reviewed and discussed this information. The Trustees recognized that this information is not audited and represents the Adviser’s determination of its and its affiliates’ revenues from the contractual services provided to the Funds, less expenses of providing such services. Expenses include direct and indirect costs and are calculated using an allocation methodology developed by the Adviser. The Trustees also recognized that it is difficult to make comparisons of profitability from fund investment advisory contracts because comparative information is not generally publicly available and is affected by numerous factors, including the structure of the particular adviser, the types of funds it manages, its business mix, numerous assumptions regarding allocations and the fact that publicly-traded fund managers’ operating profits and net income are net of distribution and marketing expenses. Based upon their review, the Trustees concluded that the profitability to the Adviser under each Advisory Agreement was not unreasonable in light of the services and benefits provided to each Fund.
The Trustees also considered that JPMDS, an affiliate of the Adviser, and the Adviser earn fees from the Funds for providing shareholder and administration services, respectively. These fees were shown separately in the profitability analysis presented to the Trustees. The Trustees also considered the payments of Rule 12b-1 fees to JPMDS, which also acts as the Funds’ distributor and that these fees are in turn generally paid to financial intermediaries that sell the Funds, including financial intermediaries that are affiliates of the Adviser. The Trustees also considered the fees paid to JPMorgan Chase Bank, N.A. (“JPMCB”) for custody and fund accounting, and other related services.
Fall-Out Benefits
The Trustees reviewed information regarding potential “fallout” or ancillary benefits received by the Adviser and its affiliates as a result of their relationship with the Funds. The Trustees also reviewed the Adviser’s allocation of fund brokerage for the J.P. Morgan Funds complex, including allocations to brokers who provide research to the Adviser.
Economies of Scale
The Trustees considered the extent to which the Funds may benefit from economies of scale. The Trustees considered that there may not be a direct relationship between economies of
scale realized by the Funds and those realized by the Adviser as assets increase. The Trustees considered the extent to which the Funds were priced to scale and whether it would be appropriate to add advisory fee breakpoints, but noted that each Fund has implemented fee waivers and contractual expense limitations (“Fee Caps”) for certain share classes which allow each Fund’s shareholders to share potential economies of scale from a Fund’s inception and that the fees remain competitive with peer funds. The Trustees also considered that the Adviser has added or enhanced services to the Funds over time, noting the Adviser’s substantial investments in its business in support of the Funds, including investments in trading systems and technology (including cybersecurity improvements), attraction and retention of key talent, additions to analyst and portfolio management teams, and regulatory support enhancements. The Trustees concluded that the current fee structure was reasonable in light of the Fee Caps that the Adviser has in place that serve to limit the overall net expense ratios of each Fund at competitive levels. The Trustees concluded that the Funds’ shareholders received the benefits of potential economies of scale through the Fee Caps and the Adviser’s reinvestment in its operations to serve the Funds and their shareholders.
Independent Written Evaluation of the Funds’ Senior Officer/Chief Compliance Officer
The Trustees noted that, upon their direction, the Senior Officer for the Prime Money Market Fund, Liquid Assets Money Market Fund, U.S. Government Money Market Fund, U.S. Treasury Plus Money Market Fund, 100% U.S. Treasury Securities Money Market Fund and Municipal Money Market Fund had prepared an independent written evaluation in order to assist the Trustees in determining the reasonableness of the proposed management fees. In determining whether to continue the Advisory Agreements, the Trustees considered the Senior Officer’s report.
The Trustees noted that, upon their direction, the Chief Compliance Officer for the Federal Money Market Fund and Tax Free Money Market Fund had prepared an independent written evaluation in order to assist the Trustees in determining the reasonableness of the proposed management fees. The Trustees considered the written evaluation in determining whether to continue the Advisory Agreements.
Fees Relative to Adviser’s Other Clients
The Trustees received and considered information about the nature and extent of investment advisory services and fee rates offered to other clients of the Adviser, including institutional separate accounts and/or funds sub-advised by the Adviser, and for investment management styles substantially similar to that of each Fund. The Trustees considered the complexity of investment management for registered mutual funds relative to the Adviser’s other clients and noted differences in the
| | | | | | | | |
| | | |
| AUGUST 31, 2018 | | J.P. MORGAN MONEY MARKET FUNDS | | | | | 149 | |
BOARD APPROVAL OF INVESTMENT ADVISORY AGREEMENTS
(Unaudited) (continued)
regulatory, legal and other risks and responsibilities of providing services to the different clients. The Trustees considered that serving as an adviser to a registered mutual fund involves greater responsibilities and risks than acting as a sub-adviser and observed that sub-advisory fees may be lower than those charged by the Adviser to each Fund. The Trustees also noted that the adviser, not the mutual fund, pays the sub-advisory fee and that many responsibilities related to the advisory function are retained by the primary adviser. The Trustees concluded that the fee rates charged to each Fund in comparison to those charged to the Adviser’s other clients were reasonable.
Investment Performance
The Trustees received and considered absolute and/or relative performance information for the Funds in a report prepared by Broadridge/Lipper. The Trustees considered the total return performance information, which included the ranking of the Funds within a performance universe made up of funds with the same Broadridge/Lipper investment classification and objective (the “Universe”), as well as a subset of funds within the Universe (the “Peer Group”), by total return for applicable one-, three- and five-year periods. The Trustees reviewed a description of Broadridge/Lipper’s methodology for selecting mutual funds in each Fund’s Peer Group and Universe. The Broadridge/Lipper materials provided to the Trustees highlighted information with respect to certain representative classes to assist the Trustees in their review. As part of this review, the Trustees also considered the performance information provided for the Funds at regular Board meetings by the Adviser. The Trustees also engaged with the Adviser to consider what steps might be taken to improve performance, as applicable. The Broadridge/Lipper performance data noted by the Trustees as part of their review and the determinations made by the Trustees with respect to each Fund’s performance for certain representative classes are summarized below:
The Trustees noted that the Prime Money Market Fund’s performance for the Institutional shares was in the first quintile based upon the Peer Group for the one-year period ended December 31, 2017, and in the first quintile based upon the Universe, for each of the one-, three-, and five-year periods ended December 31, 2017. The Trustees noted that the performance for the Morgan shares was in the fifth, quintile based upon the Peer Group for the one-year period ended December 31, 2017, and in the fourth quintile based upon the Universe, for each of the one-, three-, and five-year periods ended December 31, 2017. The Trustees discussed the performance and investment strategy of the Fund with the Adviser and based upon this discussion and various other factors, the Trustees concluded that the Fund’s performance was satisfactory.
The Trustees noted that the Liquid Assets Money Market Fund’s performance for the Institutional shares was in the first quintile
based upon the Peer Group for the one-year period ended December 31, 2017, and in the first quintile based upon the Universe for each of the one-, three- and five-year periods ended December 31, 2017. The Trustees noted that the performance for the Morgan shares was in the first quintile based on the Peer Group for each of the one-, three- and five-year periods ended December 31, 2017, and in the third, second, and second quintiles based upon the Universe, for the one-, three- and five-year periods ended December 31, 2017, respectively. The Trustees discussed the performance and investment strategy of the Fund with the Adviser and based upon this discussion and various other factors, the Trustees concluded that the Fund’s performance was satisfactory.
The Trustees noted that the U.S. Government Money Market Fund’s performance for the Institutional shares was in the first quintile based upon both the Peer Group and the Universe, for each of the one-, three- and five-year periods ended December 31, 2017. The Trustees noted that the performance for Morgan shares was in first quintile based upon the Peer Group for the one-year period ended December 31, 2017, and in the second quintile based upon the Universe for each of the one-, three-, and five-year periods ended December 31, 2017. The Trustees noted that the performance for Service shares was in the fifth quintile based upon both the Peer Group and Universe for each of the one-, three- and five-year periods ended December 31, 2017 The Trustees discussed the performance and investment strategy of the Fund with the Adviser and based upon this discussion and various other factors, the Trustees concluded that the Fund’s performance was satisfactory.
The Trustees noted that the U.S. Treasury Plus Money Market Fund’s performance for the Institutional shares was in the first, first, and second quintiles based upon both the Peer Group and Universe, for the one-, three-, and five-year periods ended December 31, 2017, respectively. The Trustees noted that the performance for the Morgan shares was in the second, first, and first quintiles based upon the Peer Group for the one-, three- and five-year periods ended December 31, 2017, respectively, and in the third quintile based upon the Universe for each of the one-, three- and five-year periods ended December 31, 2017. The Trustees discussed the performance and investment strategy of the Fund with the Adviser and, based upon this discussion and various other factors, the Trustees concluded that the Fund’s performance was satisfactory.
The Trustees noted that the Federal Money Market Fund’s performance for the Institutional shares was in the first and second quintiles based upon the Peer Group and Universe, respectively, for each of the one-, three-, and five-year periods ended December 31, 2017. The Trustees noted that the performance for the Morgan shares was in the first and second quintiles based upon the Peer Group and Universe, respectively, for each of the one-, three-, and five-year periods ended December 31, 2017. The Trustees discussed the performance and investment strategy of
| | | | | | |
| | | |
| 150 | | | | J.P. MORGAN MONEY MARKET FUNDS | | AUGUST 31, 2018 |
the Fund with the Adviser and based upon this discussion and various other factors, the Trustees concluded that the Fund’s performance was satisfactory.
The Trustees noted that the 100% U.S. Treasury Securities Money Market Fund’s performance for the Institutional shares was in the second, first, and second quintiles based upon the Peer Group for the one-, three-, and five-year periods ended December 31, 2017, respectively, and in the second quintile based upon the Universe, for each of the one-, three- and five-year period ended December 31, 2017. The Trustees noted that the performance for the Morgan shares was in the second, first, and first quintiles based upon the Peer Group for the one-, three-, and five-year periods ended December 31, 2017, respectively, and in the third quintile based upon the Universe, for each of the one-, three- and five-year periods ended December 31, 2017. The Trustees discussed the performance and investment strategy of the Fund with the Adviser and, based upon this discussion and various other factors, the Trustees concluded that the Fund’s performance was satisfactory.
The Trustees noted that the Tax Free Money Market Fund’s performance for the Institutional shares was in the first quintile based upon the Peer Group for each of the one-, three-, and five-year periods ended December 31, 2017, and in the first, second, and second quintiles based upon the Universe, for the one-, three-, and five-year periods ended December 31, 2017, respectively. The Trustees noted that the performance for the Morgan shares was in the first and fourth quintiles based upon the Peer Group and Universe, respectively, for each of the one-, three-, and five-year periods ended December 31, 2017. The Trustees discussed the performance and investment strategy of the Fund with the Adviser and, based upon this discussion and various other factors, the Trustees concluded that the Fund’s performance was satisfactory.
The Trustees noted that the Municipal Money Market Fund’s performance for the Institutional shares was in the second and first quintiles based upon the Peer Group and Universe, respectively, for each of the one-, three-, and five-year periods ended December 31, 2017. The Trustees noted that the performance for the Morgan shares was in the first and fourth quintiles based upon the Peer Group and Universe, respectively, for each of the one-, three-, and five-year periods ended December 31, 2017. The Trustees noted that the performance for the Service shares was in the third, fourth, and fourth quintiles based upon the Peer Group for the one-, three- and five-year periods ended December 31, 2017, respectively, and in the fifth quintile based upon the Universe, for each of the one-, three-, and five-year periods ended December 31, 2017. The Trustees discussed the performance and investment strategy of the Fund with the Adviser and, based upon this discussion and various other factors, the Trustees concluded that the Fund’s performance was satisfactory.
Advisory Fees and Expense Ratios
The Trustees considered the contractual advisory fee rate and administration fee rate paid by each Fund to the Adviser and compared the combined rate to the information prepared by Broadridge/Lipper concerning management fee rates paid by other funds in the same Broadridge/Lipper category as each Fund. The Trustees recognized that Broadridge/Lipper reported each Fund’s management fee rate as the combined contractual advisory fee and administration fee rates. The Trustees also reviewed information about other expenses and the expense ratios for each Fund. The Trustees considered the Fee Caps currently in place for each Fund, the net advisory fee rate after taking into account any waivers and/or reimbursements, and, where deemed appropriate by the Trustees, additional waivers and/or reimbursements. The Trustees recognized that it is difficult to make comparisons of advisory fees because there are variations in the services that are included in the fees paid by other funds. The Trustees’ determinations as a result of the review of each Fund’s advisory fees and expense ratios for certain representative classes are summarized below:
The Trustees noted that the Prime Money Market Fund’s net advisory fee for the Institutional shares was in the third and fifth quintiles based upon the Peer Group and Universe, respectively, and that the actual total expenses were in the first and second quintiles based upon the Peer Group and Universe, respectively. The Trustees noted that the net advisory fee for the Morgan shares was in the third and fifth quintiles based upon the Peer Group and Universe, respectively, and that the actual total expenses were in the fifth quintile based upon both the Peer Group and Universe. After considering the factors identified above, the Trustees concluded that the advisory fees were satisfactory in light of the services provided to the Fund.
The Trustees noted that the Liquid Assets Money Market Fund’s net advisory fee and actual total expenses for the Institutional shares were in the first quintile based upon both the Peer Group and Universe. The Trustees noted that both the net advisory fee and actual total expenses for the Morgan shares were in the first and second quintiles based upon the Peer Group and Universe, respectively. After considering the factors identified above, the Trustees concluded that the advisory fees were satisfactory in light of the services provided to the Fund.
The Trustees noted that the U.S. Government Money Market Fund’s net advisory fee and actual total expenses for Institutional shares were in the third and second quintiles, respectively, based upon both the Peer Group and Universe. The Trustees noted that the net advisory fee and actual total expenses for the Morgan shares were in the first and third quintiles based upon the Peer Group and Universe, respectively. The Trustees noted that the net advisory fee and actual total expenses for the Service shares were in the third and fifth quintiles, respectively, based upon both the Peer Group and Universe. After considering the factors identified
| | | | | | | | |
| | | |
| AUGUST 31, 2018 | | J.P. MORGAN MONEY MARKET FUNDS | | | | | 151 | |
BOARD APPROVAL OF INVESTMENT ADVISORY AGREEMENTS
(Unaudited) (continued)
above, the Trustees concluded that the advisory fees were satisfactory in light of the services provided to the Fund.
The Trustees noted that the U.S. Treasury Plus Money Market Fund’s net advisory fee for the Institutional shares were in the second and third quintiles based upon the Peer Group and Universe, respectively, and that the actual total expenses were in the first and second quintiles based upon the Peer Group and Universe, respectively. The Trustees noted that the net advisory fee for the Morgan shares was in the third and second quintiles based upon the Peer Group and Universe, respectively, and that the actual total expenses were in the in the third and fourth quintiles based upon the Peer Group and Universe, respectively. After considering the factors identified above, the Trustees concluded that the advisory fees were satisfactory in light of the services provided to the Fund.
The Trustees noted that the Federal Money Market Fund’s net advisory fee for the Institutional shares was in the second quintile based upon both the Peer Group and Universe, and that the actual total expenses were in the first and second quintiles based upon the Peer Group and Universe, respectively. The Trustees noted that the net advisory fee for the Morgan shares was in the second quintile based upon both the Peer Group and Universe, and that the actual total expenses were in the fourth and third quintiles based upon the Peer Group and Universe, respectively. After considering the factors identified above, the Trustees concluded that the advisory fees were satisfactory in light of the services provided to the Fund.
The Trustees noted that the 100% U.S. Treasury Securities Money Market Fund’s net advisory fee for the Institutional shares were in the second and third quintiles based upon the Peer Group and Universe, respectively, and that the actual total expenses were in the second quintile based upon both the Peer Group and Universe. The Trustees noted that the net advisory fee for the Morgan shares was in the third and second quintiles
based upon the Peer Group and Universe, respectively, and that the actual total expenses were in the third and fourth quintiles based upon the Peer Group and Universe, respectively. After considering the factors identified above, the Trustees concluded that the advisory fees were satisfactory in light of the services provided to the Fund.
The Trustees noted that the Tax Free Money Market Fund’s net advisory fee for Institutional shares was in the third and fourth quintiles based upon the Peer Group and Universe, respectively, and that the actual total expenses were in the first quintile based upon both the Peer Group and Universe. The Trustees noted that the net advisory fee and actual total expenses for the Morgan shares were in the fourth and second quintiles, respectively, based upon both the Peer Group and Universe. After considering the factors identified above, the Trustees concluded that the advisory fees were satisfactory in light of the services provided to the Fund.
The Trustees noted that the Municipal Money Market Fund’s net advisory fee for the Institutional shares was in the first and second quintiles based upon the Peer Group and Universe, respectively, and that the actual total expenses were in the first quintile based upon both the Peer Group and Universe. The Trustees noted that the net advisory fee for the Morgan shares was in the third and second quintiles based upon the Peer Group and Universe, respectively, and that the actual total expenses were in the second quintile based upon both the Peer Group and Universe, The Trustees noted that the net advisory fee for the Service shares was in the third and second quintiles based upon the Peer Group and Universe, respectively, and that the actual total expenses were in the fifth quintile based upon both the Peer Group and Universe. After considering the factors identified above, the Trustees concluded that the advisory fees were satisfactory in light of the services provided to the Fund.
| | | | | | |
| | | |
| 152 | | | | J.P. MORGAN MONEY MARKET FUNDS | | AUGUST 31, 2018 |
J.P. Morgan Funds are distributed by JPMorgan Distribution Services, Inc., which is an affiliate of JPMorgan Chase & Co. Affiliates of JPMorgan Chase & Co. receive fees for providing various services to the funds.
Contact JPMorgan Distribution Services, Inc. at 1-800-480-4111 (retail investors) or 1-800-766-7722 (institutional investors) for a fund prospectus. You can also visit us at www.jpmorganfunds.com. Investors should carefully consider the investment objectives and risk as well as charges and expenses of the mutual fund before investing. The prospectus contains this and other information about the mutual fund. Read the prospectus carefully before investing.
Investors may obtain information about the Securities Investor Protection Corporation (SIPC), including the SIPC brochure, by visiting www.sipc.org or by calling SIPC at 202-371-8300.
Each Fund files a complete schedule of its fund holdings for the first and third quarters of its fiscal year with the SEC on Form N-Q. The Funds’ Forms N-Q are available on the SEC’s website at http://www.sec.gov and may be reviewed and copied at the SEC’s Public Reference Room in Washington, DC. Information on the operation of the SEC’s Public Reference Room may be obtained by calling 1-800-SEC-0330. Shareholders may request the Form N-Q without charge by calling 1-800-480-4111 (retail investors) or 1-800-766-7722 (institutional investors) or by visiting the J.P. Morgan Funds’ website at www.jpmorganfunds.com.
A description of each Fund’s policies and procedures with respect to the disclosure of each Fund’s holdings is available in the prospectuses and Statement of Additional Information.
A copy of proxy policies and procedures is available without charge upon request by calling 1-800-480-4111 (retail investors) or 1-800-766-7722 (institutional investors) and on the Funds’ website at www.jpmorganfunds.com. A description of such policies and procedures is on the SEC’s website at www.sec.gov. The Trustees have delegated the authority to vote proxies for securities owned by the Funds to the Adviser. A copy of the Funds’ voting record for the most recent 12-month period ended June 30 is available on the SEC’s website at www.sec.gov or at the Funds’ website at www.jpmorganfunds.com no later than August 31 of each year. The Funds’ proxy voting record will include, among other things, a brief description of the matter voted on for each fund security, and will state how each vote was cast, for example, for or against the proposal.


J.P. Morgan Asset Management is the marketing name for the asset management businesses of JPMorgan Chase & Co. Those businesses include, but are not limited to, J.P. Morgan Investment Management Inc., Security Capital Research & Management Incorporated and J.P. Morgan Alternative Asset Management, Inc.
| | | | |
| | © JPMorgan Chase & Co., 2018. All rights reserved. August 2018. | | SAN-MMKT-818 |
Semi-Annual Report
J.P. Morgan SMA Funds
August 31, 2018 (Unaudited)
JPMorgan Core Focus SMA Fund

CONTENTS
Investments in the Fund are not deposits or obligations of, or guaranteed or endorsed by, any bank and are not insured or guaranteed by the FDIC, the Federal Reserve Board or any other government agency. You could lose money if you sell when the Fund’s share price is lower than when you invested.
Past performance is no guarantee of future performance. The general market views expressed in this report are opinions based on market and other conditions through the end of the reporting period and are subject to change without notice. These views are not intended to predict the future performance of the Fund or the securities markets. References to specific securities and their issuers are for illustrative purposes only and are not intended to be, and should not be interpreted as, recommendations to purchase or sell such securities. Such views are not meant as investment advice and may not be relied on as an indication of trading intent on behalf of the Fund.
Prospective investors should refer to the Fund’s prospectus for a discussion of the Fund’s investment objective, strategies and risks. Call J.P. Morgan Funds Service Center at 1-800-766-7722 for a prospectus containing more complete information about the Fund, including management fees and other expenses. Please read it carefully before investing.
CEO’S LETTER
October 9, 2018 (Unaudited)
Dear Shareholder,
The world’s leading economies continued to expand in the six months ended August 31, 2018, though the pattern of synchronized global growth that had characterized the previous two years began to dissipate amid geopolitical tensions and rising borrowing costs for emerging market nations.
| | |
 | | “During the reporting period, the current U.S. economic expansion became the second longest on record.” — George C.W. Gatch |
U.S. gross domestic product (GDP) growth surged to 4.2% in the second quarter of 2018 from 2.2% in the first quarter. Notably, unemployment stood at 3.9% in August, though wage growth remained subdued. While the U.S. raised import tariffs on Chinese goods worth billions of dollars and the Chinese government responded in kind during the reporting period, trade tensions with China and other U.S. trading partners appeared to have little impact on business sentiment in the U.S. In response to continued economic growth and falling unemployment, the U.S. Federal Reserve raised benchmark interest rates in March and again in June. (Subsequent to the end of the reporting period, the central bank raised interest rates in September 2018.)
In the European Union, positive economic growth was clouded by political uncertainty. Second quarter GDP rose 2.1%, though core inflation remained below the European Central Bank’s (ECB) target rate. Unemployment in the 19-nation euro area fell to 8.1% in August, the lowest level since November 2008. However, a new government in Italy raised investor concerns that its budget plans would deviate from the European Commission’s stability and growth pact and force the commission to enact punitive measures. Against this backdrop, the ECB held to its plan to maintain interest rates at current levels until at least next summer. Meanwhile, negotiations over the U.K.’s exit from the European Union continued without resolution, raising political tensions between leaders in the EU and the U.K. as well as within the Britain’s ruling Conservative Party.
While trade tensions led to a decline in Chinese exports to the U.S., the Chinese government took steps to further stimulate domestic demand and capital outflows from China appeared limited at the end of the reporting period.
Meanwhile, select emerging market nations saw the value of their currencies and their sovereign debt plummet. Nations dependent on foreign lending and imported petroleum were hit hardest by rising U.S. interest rates and a strengthening U.S. dollar that effectively raised borrowing costs. The economies of Argentina, Brazil, South Africa and Turkey were among those hurt by rising borrowing costs and/or political uncertainty.
In financial markets, U.S. equities largely recovered from a sharp sell-off in February 2018 and outperformed other regions and other asset classes. Record corporate earnings, strong consumer spending and positive economic data bolstered equity prices and pushed the S&P 500 Index to record highs in August. Equity prices in other developed markets were weak and prices fell sharply in emerging markets. Bond markets were mixed, with limited positive returns in select U.S. Treasury bonds and U.S. high yield bonds (also called “junk bonds”) and negative returns for emerging markets debt. Notably, global energy prices rose somewhat during the reporting period, which supported oil exporting economies without becoming a large drag on global economic growth.
During the reporting period, the current U.S. economic expansion became the second longest on record. While the underlying fundamentals of continued global economic growth remained in place at the end of August, the longer-term impact of protectionist U.S. trade policy and the extent of currency devaluation in emerging markets were key issues looming over global financial markets.
We believe that investors may be best served by a well-diversified portfolio and a patient outlook. We look forward to managing your investment needs for years to come. Should you have any questions, please visit www.jpmorganfunds.com or contact the J.P. Morgan Funds Service Center at 1-800-480-4111.
Sincerely yours,

George C.W. Gatch
CEO, Global Funds Management
J.P. Morgan Asset Management
| | | | | | | | |
| | | |
| AUGUST 31, 2018 | | J.P. MORGAN SMA FUNDS | | | | | 1 | |
JPMorgan Core Focus SMA Fund
FUND SUMMARY
FOR THE SIX MONTHS ENDED MARCH 1, 2018 (FUND INCEPTION DATE) THROUGH AUGUST 31, 2018 (Unaudited)
| | | | |
| Reporting Period Return: | |
Fund* | | | 1.60% | |
| Bloomberg Barclays U.S. Aggregate Bond Index | | | 0.87% | |
| |
| Net Assets as of 8/31/2018 | | $ | 25,385,053 | |
| Duration as of 8/31/2018 | | | 4.4 years | |
INVESTMENT OBJECTIVE** AND STRATEGIES
The JPMorgan Core Focus SMA Fund (the “Fund”) seeks to provide total return. The Fund invests in a diversified portfolio of corporate bonds, U.S. government and agency securities, asset-backed, mortgage-related and mortgage backed securities. The Adviser utilizes a value-driven, bottom-up security selection process with an emphasis on risk management and leverages a team of dedicated research analysts.
| | | | |
PORTFOLIO COMPOSITION*** | |
| Collateralized Mortgage Obligations | | | 31.6 | % |
| Asset-Backed Securities | | | 30.5 | |
| Corporate Bonds | | | 23.5 | |
| Commercial Mortgage-Backed Securities | | | 8.8 | |
| U.S. Treasury Obligations | | | 1.9 | |
| Mortgage-Backed Securities | | | 1.5 | |
| Short-Term Investments | | | 2.2 | |
| * | | The return shown is based on net asset values calculated for shareholder transactions and may differ from the return shown in the financial highlights, which reflects adjustments made to the net asset values in accordance with accounting principles generally accepted in the United States of America. |
| ** | | The adviser seeks to achieve the Fund’s objective. There can be no guarantee it will be achieved. |
| *** | | Percentages indicated are based on total investments as of August 31, 2018. The Fund’s portfolio composition is subject to change. |
| | | | | | |
| | | |
| 2 | | | | J.P. MORGAN SMA FUNDS | | AUGUST 31, 2018 |
| | | | | | | | | | | | |
AVERAGE ANNUAL TOTAL RETURNS AS OF AUGUST 31, 2018 | |
| | | |
| | | INCEPTION DATE OF
CLASS | | | 6 MONTH* | | | SINCE INCEPTION* | |
JPMORGAN CORE FOCUS SMA FUND | | | March 1, 2018 | | | | 1.60 | % | | | 1.60 | % |
LIFE OF FUND PERFORMANCE (3/1/18 TO 8/31/18)
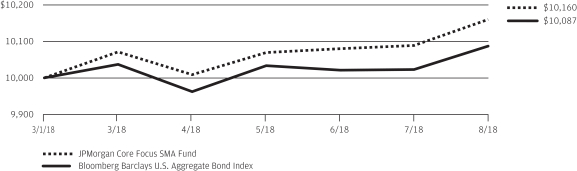
The performance quoted is past performance and is not a guarantee of future results. Mutual funds are subject to certain market risks. Investment returns and principal value of an investment will fluctuate so that an investor’s shares, when redeemed, may be worth more or less than their original cost. Current performance may be higher or lower than the performance data shown. For up-to-date, month-end performance information please call 1-800-766-7722.
The Fund commenced operations on March 1, 2018.
The graph illustrates comparative performance for $10,000 invested in the JPMorgan Core Focus SMA Fund, the Bloomberg Barclays U.S. Aggregate Bond Index from March 1, 2018 to August 31, 2018. The performance of the Fund assumes reinvestment of all dividends and capital gain distributions, if any. The performance of the Bloomberg Barclays U.S. Aggregate Bond Index does not reflect the deduction of expenses or a sales charge associated with a mutual fund and has been adjusted to reflect reinvestment of all dividends and capital gain distributions of securities included in the benchmark, if applicable. These expenses are not identical to the expenses incurred by the Fund. The Bloomberg Barclays U.S. Aggregate Bond Index is an unmanaged index that represents securities that are SEC-registered, taxable and dollar denominated. The Index covers the U.S. investment grade fixed rate bond market, with index
components for government and corporate securities, mortgage pass-through securities, and asset-backed securities.
Fund performance may reflect the waiver of the Fund’s fees and reimbursement of expenses for certain periods since the inception date. Without these waivers and reimbursements, performance would have been lower. Also, performance shown in this section does not reflect the deduction of taxes that a shareholder would pay on Fund distributions or redemptions of Fund shares.
The returns shown are based on net asset values calculated for shareholder transactions and may differ from the returns shown in the financial highlights, which reflect adjustments made to the net asset values in accordance with accounting principles generally accepted in the United States of America.
The Fund is offered as a component of the JPMorgan Core Focus SMA Managed Account Strategy (“SMA Strategy”) to participants in separately managed account programs. The SMA Strategy consists of a separately managed account that holds both the Fund and other securities and investments directly for the SMA clients. As a result, the Fund will not hold all of the core bond investments of the SMA Strategy but rather will invest in certain securities and investments that can be traded more efficiently if held by an investment company rather than directly. Since the Fund will be used as part of a SMA Strategy, it is not intended to be a stand-alone core bond investment strategy.
| | | | | | | | |
| | | |
| AUGUST 31, 2018 | | J.P. MORGAN SMA FUNDS | | | | | 3 | |
JPMorgan Core Focus SMA Fund
SCHEDULE OF PORTFOLIO INVESTMENTS
AS OF AUGUST 31, 2018 (Unaudited)
| | | | | | | | |
| INVESTMENTS | | PRINCIPAL
AMOUNT($) | | | VALUE($) | |
Collateralized Mortgage Obligations — 31.5% | |
FHLMC REMIC | | | | | | | | |
Series 2488, Class GM, 6.00%, 8/15/2032 | | | 46,320 | | | | 50,054 | |
Series 4151, Class YC, 2.50%, 1/15/2033 | | | 230,088 | | | | 210,214 | |
Series 2740, Class PE, 5.50%, 1/15/2034 | | | 154,257 | | | | 166,991 | |
Series 2943, Class ZC, 5.00%, 2/15/2034 | | | 55,459 | | | | 58,663 | |
Series 2768, Class PK, 5.00%, 3/15/2034 | | | 37,345 | | | | 39,429 | |
Series 3237, Class CE, 5.50%, 11/15/2036 | | | 50,000 | | | | 57,183 | |
Series 3249, Class CB, 4.25%, 12/15/2036 | | | 43,600 | | | | 45,273 | |
Series 3258, Class XX, 5.50%, 12/15/2036 | | | 53,000 | | | | 59,136 | |
Series 4031, Class AB, 5.50%, 6/15/2037 | | | 183,990 | | | | 199,269 | |
Series 3404, Class DC, 5.50%, 1/15/2038 | | | 50,000 | | | | 55,881 | |
Series 3601, Class HB, 5.00%, 11/15/2039 | | | 25,000 | | | | 28,201 | |
Series 3626, Class ME, 5.00%, 1/15/2040 | | | 29,000 | | | | 32,153 | |
Series 3680, Class ZA, 4.50%, 6/15/2040 | | | 191,670 | | | | 201,018 | |
Series 3777, Class WA, 4.00%, 12/15/2040 | | | 168,109 | | | | 172,409 | |
Series 3772, Class NE, 4.50%, 12/15/2040 | | | 180,000 | | | | 196,974 | |
Series 3939, Class AZ, 4.00%, 3/15/2041 | | | 243,385 | | | | 248,328 | |
Series 4240, Class DK, 4.00%, 11/15/2042 | | | 93,924 | | | | 96,723 | |
Series 4283, Class EW, 4.50%, 12/15/2043 (a) | | | 154,793 | | | | 162,481 | |
FNMA REMIC | | | | | | | | |
Series 2013-17, Class YM, 4.00%, 3/25/2033 | | | 129,696 | | | | 133,551 | |
Series 2003-32, Class UJ, 5.50%, 5/25/2033 | | | 35,055 | | | | 37,860 | |
Series 2003-82, Class Z, 5.50%, 8/25/2033 | | | 56,680 | | | | 60,969 | |
Series 2004-17, Class H, 5.50%, 4/25/2034 | | | 130,676 | | | | 141,449 | |
Series 2004-31, Class MZ, 4.25%, 5/25/2034 | | | 27,360 | | | | 28,979 | |
Series 2004-36, Class CB, 5.00%, 5/25/2034 | | | 28,000 | | | | 30,131 | |
| | | | | | | | |
| INVESTMENTS | | PRINCIPAL
AMOUNT($) | | | VALUE($) | |
| | | | | | | | |
Series 2004-91, Class BR, 5.50%, 12/25/2034 | | | 47,078 | | | | 51,378 | |
Series 2009-13, Class PM, 4.00%, 4/25/2035 | | | 171,165 | | | | 173,841 | |
Series 2005-29, Class WQ, 5.50%, 4/25/2035 | | | 158,455 | | | | 171,533 | |
Series 2005-109, Class GD, 6.00%, 10/25/2035 | | | 20,859 | | | | 22,228 | |
Series 2015-65, Class LD, 3.50%, 1/25/2036 | | | 80,000 | | | | 78,072 | |
Series 2005-122, Class PY, 6.00%, 1/25/2036 | | | 71,000 | | | | 84,170 | |
Series 2006-24, Class Z, 5.50%, 4/25/2036 | | | 151,077 | | | | 163,932 | |
Series 2007-36, Class PH, 5.50%, 4/25/2037 | | | 43,221 | | | | 46,912 | |
Series 2007-60, Class ZB, 4.75%, 5/25/2037 | | | 240,193 | | | | 256,844 | |
Series 2009-42, Class TZ, 4.50%, 3/25/2039 | | | 204,524 | | | | 214,260 | |
Series 2009-66, Class KE, 4.00%, 9/25/2039 | | | 86,224 | | | | 88,261 | |
Series 2009-105, Class DB, 4.50%, 12/25/2039 | | | 25,000 | | | | 26,611 | |
Series 2010-43, Class EM, 5.00%, 5/25/2040 | | | 20,600 | | | | 23,319 | |
Series 2010-87, Class PJ, 3.50%, 6/25/2040 | | | 46,361 | | | | 46,835 | |
Series 2010-59, Class EB, 5.00%, 6/25/2040 | | | 300,000 | | | | 339,040 | |
Series 2011-146, Class LX, 3.50%, 10/25/2040 | | | 200,000 | | | | 201,111 | |
Series 2011-1, Class QA, 4.50%, 10/25/2040 | | | 115,600 | | | | 119,801 | |
Series 2010-133, Class GP, 4.00%, 11/25/2040 | | | 250,000 | | | | 261,229 | |
Series 2010-123, Class KU, 4.50%, 11/25/2040 | | | 123,589 | | | | 131,113 | |
Series 2010-129, Class PZ, 4.50%, 11/25/2040 | | | 224,286 | | | | 224,217 | |
Series 2010-136, Class CY, 4.00%, 12/25/2040 | | | 290,000 | | | | 298,885 | |
Series 2010-141, Class AL, 4.00%, 12/25/2040 | | | 231,000 | | | | 237,029 | |
Series 2010-154, Class KZ, 4.50%, 1/25/2041 | | | 41,348 | | | | 45,883 | |
Series 2011-55, Class BZ, 3.50%, 6/25/2041 | | | 160,578 | | | | 161,214 | |
Series 2011-115, Class UC, 4.00%, 11/25/2041 | | | 70,000 | | | | 73,304 | |
SEE NOTES TO FINANCIAL STATEMENTS.
| | | | | | |
| | | |
| 4 | | | | J.P. MORGAN SMA FUNDS | | AUGUST 31, 2018 |
| | | | | | | | |
| INVESTMENTS | | PRINCIPAL
AMOUNT($) | | | VALUE($) | |
Collateralized Mortgage Obligations — continued | | | | | |
Series 2013-114, Class LM, 4.00%, 3/25/2042 | | | 200,000 | | | | 204,585 | |
Series 2012-120, Class PA, 3.50%, 10/25/2042 | | | 111,569 | | | | 112,161 | |
Series 2014-19, Class Z, 4.50%, 4/25/2044 | | | 242,974 | | | | 261,581 | |
Series 2015-61, Class PV, 3.50%, 5/25/2044 | | | 24,838 | | | | 25,025 | |
Series 2016-32, Class PA, 3.00%, 12/25/2045 | | | 184,942 | | | | 182,862 | |
GNMA | | | | | | | | |
Series 2003-46, Class HA, 4.50%, 6/20/2033 | | | 120,518 | | | | 125,832 | |
Series 2004-55, Class MC, 5.50%, 7/20/2034 | | | 27,000 | | | | 29,329 | |
Series 2005-16, Class CA, 5.00%, 2/20/2035 | | | 29,000 | | | | 31,725 | |
Series 2005-17, Class GE, 5.00%, 2/20/2035 | | | 199,418 | | | | 212,958 | |
Series 2008-25, Class AD, 4.50%, 3/20/2038 | | | 147,981 | | | | 153,871 | |
Series 2009-16, Class ZD, 6.00%, 3/20/2039 | | | 192,932 | | | | 212,216 | |
Series 2009-58, Class PA, 4.50%, 7/20/2039 | | | 254,333 | | | | 263,939 | |
Series 2010-69, Class ME, 3.00%, 4/20/2040 | | | 117,167 | | | | 116,857 | |
| | | | | | | | |
Total Collateralized Mortgage Obligations
(Cost $7,973,105) | | | | 7,987,282 | |
| | | | | |
Asset-Backed Securities — 30.4% | |
ACC Trust Series 2018-1, Class A, 3.70%, 12/21/2020 (b) | | | 78,723 | | | | 78,729 | |
American Credit Acceptance Receivables Trust | | | | | | | | |
Series 2016-3, Class C, 4.26%, 8/12/2022 (b) | | | 58,000 | | | | 58,381 | |
Series 2017-1, Class C, 2.88%, 3/13/2023 (b) | | | 95,000 | | | | 94,862 | |
Series 2017-1, Class D, 3.54%, 3/13/2023 (b) | | | 230,000 | | | | 230,138 | |
AmeriCredit Automobile Receivables Series 2015-4, Class D, 3.72%, 12/8/2021 | | | 225,000 | | | | 226,521 | |
B2R Mortgage Trust | | | | | | | | |
Series 2015-1, Class A1, 2.52%, 5/15/2048 ‡ (b) | | | 58,746 | | | | 58,010 | |
Series 2015-2, Class A, 3.34%, 11/15/2048 (b) | | | 62,684 | | | | 62,499 | |
| | | | | | | | |
| INVESTMENTS | | PRINCIPAL
AMOUNT($) | | | VALUE($) | |
| | | | | | | | |
Business Jet Securities LLC | | | | | | | | |
Series 2018-2, Class A, 4.45%, 6/15/2033 (b) | | | 194,317 | | | | 195,883 | |
Series 2018-2, Class B, 5.44%, 6/15/2033 (b) | | | 192,177 | | | | 193,328 | |
CarFinance Capital Auto Trust Series 2015-1A, Class A, 1.75%, 6/15/2021 (b) | | | 5,849 | | | | 5,844 | |
CLUB Credit Trust | | | | | | | | |
Series 2017-NP1, Class B, 3.17%, 4/17/2023 ‡ (b) | | | 52,997 | | | | 52,989 | |
Series 2018-NP1, Class A, 2.99%, 5/15/2024 (b) | | | 110,794 | | | | 110,848 | |
Series 2018-NP1, Class B, 3.67%, 5/15/2024 ‡ (b) | | | 115,000 | | | | 114,809 | |
CPS Auto Receivables Trust Series 2018-B, Class B, 3.23%, 7/15/2022 (b) | | | 100,000 | | | | 99,728 | |
Credit Acceptance Auto Loan Trust Series 2018-2A, Class A, 3.47%, 5/17/2027 (b) | | | 250,000 | | | | 250,505 | |
Drive Auto Receivables Trust Series 2016-BA, Class C, 3.19%, 7/15/2022 (b) | | | 40,312 | | | | 40,360 | |
DT Auto Owner Trust | | | | | | | | |
Series 2017-4A, Class B, 2.44%, 1/15/2021 (b) | | | 146,000 | | | | 145,395 | |
Series 2017-2A, Class B, 2.44%, 2/15/2021 (b) | | | 100,000 | | | | 99,896 | |
Series 2017-3A, Class B, 2.40%, 5/17/2021 (b) | | | 215,000 | | | | 214,365 | |
Series 2018-1A, Class B, 3.04%, 1/18/2022 (b) | | | 98,000 | | | | 97,805 | |
Series 2018-1A, Class D, 3.81%, 12/15/2023 (b) | | | 88,000 | | | | 87,663 | |
ENGS Commercial Finance Trust Series 2018-1A, Class A2, 3.39%, 2/22/2023 (b) | | | 100,000 | | | | 99,712 | |
Exeter Automobile Receivables Trust | | | | | | | | |
Series 2017-3A, Class A, 2.05%, 12/15/2021 (b) | | | 138,773 | | | | 138,147 | |
Series 2017-1A, Class B, 3.00%, 12/15/2021 (b) | | | 45,000 | | | | 44,939 | |
Series 2018-2A, Class B, 3.27%, 5/16/2022 (b) | | | 100,000 | | | | 99,881 | |
First Investors Auto Owner Trust | | | | | | | | |
Series 2015-1A, Class D, 3.59%, 1/18/2022 (b) | | | 100,000 | | | | 100,021 | |
Series 2016-2A, Class C, 2.53%, 7/15/2022 ‡ (b) | | | 200,000 | | | | 196,525 | |
Series 2018-1A, Class A2, 3.22%, 1/17/2023 (b) | | | 45,000 | | | | 45,052 | |
SEE NOTES TO FINANCIAL STATEMENTS.
| | | | | | | | |
| | | |
| AUGUST 31, 2018 | | J.P. MORGAN SMA FUNDS | | | | | 5 | |
JPMorgan Core Focus SMA Fund
SCHEDULE OF PORTFOLIO INVESTMENTS
AS OF AUGUST 31, 2018 (Unaudited) (continued)
| | | | | | | | |
| INVESTMENTS | | PRINCIPAL
AMOUNT($) | | | VALUE($) | |
Asset-Backed Securities — continued | | | | | | | | |
Flagship Credit Auto Trust | | | | | | | | |
Series 2016-2, Class C, 6.22%, 9/15/2022 (b) | | | 100,000 | | | | 104,156 | |
Series 2017-2, Class B, 2.57%, 4/15/2023 (b) | | | 115,000 | | | | 113,900 | |
Series 2018-2, Class B, 3.56%, 5/15/2023 (b) | | | 150,000 | | | | 150,125 | |
Series 2017-4, Class C, 2.92%, 11/15/2023 (b) | | | 150,000 | | | | 146,836 | |
GM Financial Automobile Leasing Trust Series 2015-3, Class C, 2.98%, 11/20/2019 | | | 118,715 | | | | 118,737 | |
Goodgreen (Cayman Islands) Series 2018-1A, Class A, 3.93%, 10/15/2053 (a) (b) | | | 176,681 | | | | 179,205 | |
Hero Funding (Cayman Islands) Series 2017-3A, Class A2, 3.95%, 9/20/2048 (b) | | | 107,090 | | | | 106,997 | |
Lendmark Funding Trust Series 2016-2A, Class B, 4.66%, 4/21/2025 ‡ (b) | | | 100,000 | | | | 100,899 | |
Marlette Funding Trust Series 2018-2A, Class A, 3.06%, 7/17/2028 (b) | | | 83,318 | | | | 83,313 | |
OnDeck Asset Securitization Trust LLC Series 2018-1A, Class A, 3.50%, 4/18/2022 (b) | | | 104,000 | | | | 103,950 | |
OneMain Direct Auto Receivables Trust Series 2017-2A, Class B, 2.55%, 11/14/2023 (b) | | | 100,000 | | | | 98,802 | |
OneMain Financial Issuance Trust | | | | | | | | |
Series 2014-2A, Class C, 4.33%, 9/18/2024 ‡ (b) | | | 7,082 | | | | 7,088 | |
Series 2015-2A, Class A, 2.57%, 7/18/2025 (b) | | | 14,962 | | | | 14,959 | |
Series 2015-1A, Class A, 3.19%, 3/18/2026 (b) | | | 135,602 | | | | 135,849 | |
Series 2015-1A, Class C, 5.12%, 3/18/2026 ‡ (b) | | | 140,000 | | | | 142,098 | |
Series 2016-2A, Class A, 4.10%, 3/20/2028 (b) | | | 78,564 | | | | 79,035 | |
Series 2016-1A, Class A, 3.66%, 2/20/2029 (b) | | | 100,000 | | | | 100,419 | |
Prosper Marketplace Issuance Trust | | | | | | | | |
Series 2017-1A, Class A, 2.56%, 6/15/2023 (b) | | | 85,319 | | | | 85,298 | |
Series 2017-2A, Class A, 2.41%, 9/15/2023 (b) | | | 97,787 | | | | 97,659 | |
Series 2018-1A, Class A, 3.11%, 6/17/2024 (b) | | | 115,982 | | | | 116,031 | |
Series 2018-2A, Class A, 3.35%, 10/15/2024 (b) | | | 141,000 | | | | 140,969 | |
| | | | | | | | |
| INVESTMENTS | | PRINCIPAL
AMOUNT($) | | | VALUE($) | |
| | | | | | | | |
Santander Drive Auto Receivables Trust | | | | | | | | |
Series 2017-1, Class C, 2.58%, 5/16/2022 | | | 78,000 | | | | 77,535 | |
Series 2018-1, Class B, 2.63%, 7/15/2022 | | | 177,000 | | | | 176,060 | |
Series 2017-3, Class C, 2.76%, 12/15/2022 | | | 39,000 | | | | 38,519 | |
SoFi Consumer Loan Program LLC | | | | | | | | |
Series 2016-3, Class A, 3.05%, 12/26/2025 (b) | | | 100,234 | | | | 99,888 | |
Series 2017-1, Class A, 3.28%, 1/26/2026 (b) | | | 103,189 | | | | 103,201 | |
Series 2017-2, Class A, 3.28%, 2/25/2026 (b) | | | 106,818 | | | | 106,700 | |
SoFi Consumer Loan Program Trust Series 2018-2, Class A1, 2.93%, 4/26/2027 (b) | | | 150,453 | | | | 150,263 | |
Springleaf Funding Trust | | | | | | | | |
Series 2015-AA, Class A, 3.16%, 11/15/2024 (b) | | | 48,630 | | | | 48,646 | |
Series 2015-BA, Class B, 3.80%, 5/15/2028 ‡ (b) | | | 100,000 | | | | 99,098 | |
Tidewater Auto Receivables Trust Series 2018-AA, Class C, 3.84%, 11/15/2024 (b) | | | 250,000 | | | | 249,925 | |
Towd Point Mortgage Trust Series 2017-6, Class A1, 2.75%, 10/25/2057 (a) (b) | | | 92,729 | | | | 90,672 | |
VOLT LVII LLC Series 2017-NPL4, Class A1, 3.38%, 4/25/2047 ‡ (b) (c) | | | 44,087 | | | | 43,950 | |
VOLT LXI LLC Series 2017-NPL8, Class A1, 3.13%, 6/25/2047 ��� (b) (c) | | | 50,350 | | | | 49,964 | |
VOLT LXIX LLC | | | | | | | | |
Series 2018-NPL5, Class A1A, 4.21%, 8/25/2048 (b) (c) | | | 100,000 | | | | 99,918 | |
Series 2018-NPL5, Class A1B, 4.70%, 8/25/2048 (b) (c) | | | 100,000 | | | | 99,888 | |
VOLT LXVII LLC Series 2018-NPL3, Class A1, 4.37%, 6/25/2048 ‡ (b) (c) | | | 98,969 | | | | 98,955 | |
Westgate Resorts LLC | | | | | | | | |
Series 2018-1A, Class A, 3.38%, 12/20/2031 (b) | | | 233,105 | | | | 232,781 | |
Series 2018-1A, Class B, 3.58%, 12/20/2031 ‡ (b) | | | 233,105 | | | | 231,677 | |
Westlake Automobile Receivables Trust Series 2016-2A, Class C, 2.83%, 5/17/2021 (b) | | | 150,000 | | | | 150,029 | |
| | | | | | | | |
Total Asset-Backed Securities
(Cost $7,707,822) | | | | | | | 7,716,829 | |
| | | | | | | | |
SEE NOTES TO FINANCIAL STATEMENTS.
| | | | | | |
| | | |
| 6 | | | | J.P. MORGAN SMA FUNDS | | AUGUST 31, 2018 |
| | | | | | | | |
| INVESTMENTS | | PRINCIPAL
AMOUNT($) | | | VALUE($) | |
Corporate Bonds — 23.4% | | | | | | | | |
Aerospace & Defense — 0.4% | | | | | | | | |
Northrop Grumman Corp.
3.20%, 2/1/2027 | | | 30,000 | | | | 28,351 | |
3.85%, 4/15/2045 | | | 20,000 | | | | 18,278 | |
Rockwell Collins, Inc.
2.80%, 3/15/2022 | | | 20,000 | | | | 19,522 | |
3.50%, 3/15/2027 | | | 15,000 | | | | 14,366 | |
United Technologies Corp. 2.80%, 5/4/2024 | | | 25,000 | | | | 23,846 | |
| | | | | | | | |
| | | | | | | 104,363 | |
| | | | | | | | |
Automobiles — 0.7% | | | | | | | | |
Ford Motor Co.
4.35%, 12/8/2026 | | | 30,000 | | | | 28,175 | |
7.45%, 7/16/2031 | | | 35,000 | | | | 38,793 | |
General Motors Co. 5.15%, 4/1/2038 | | | 30,000 | | | | 28,465 | |
Hyundai Capital America
3.45%, 3/12/2021 (b) | | | 30,000 | | | | 29,566 | |
Nissan Motor Acceptance Corp.
3.15%, 3/15/2021 (b) | | | 60,000 | | | | 59,540 | |
| | | | | | | | |
| | | | | | | 184,539 | |
| | | | | | | | |
Banks — 4.6% | | | | | | | | |
Australia & New Zealand Banking Group Ltd. (Australia) 5.10%, 1/13/2020 (b) | | | 100,000 | | | | 102,862 | |
Bank of America Corp. (ICE LIBOR USD 3 Month + 0.93%),
2.82%, 7/21/2023 (d) | | | 65,000 | | | | 63,107 | |
4.20%, 8/26/2024 | | | 60,000 | | | | 60,282 | |
5.00%, 1/21/2044 | | | 55,000 | | | | 59,438 | |
Bank of Montreal (Canada)
2.10%, 6/15/2020 | | | 70,000 | | | | 68,930 | |
Bank of Nova Scotia (The) (Canada) | | | | | | | | |
2.35%, 10/21/2020 | | | 60,000 | | | | 59,057 | |
Citigroup, Inc.
3.75%, 6/16/2024 | | | 60,000 | | | | 60,101 | |
8.13%, 7/15/2039 | | | 30,000 | | | | 43,092 | |
Citizens Financial Group, Inc. 2.38%, 7/28/2021 | | | 50,000 | | | | 48,356 | |
Commonwealth Bank of Australia (Australia)
2.25%, 3/10/2020 (b) | | | 30,000 | | | | 29,625 | |
3.45%, 3/16/2023 (b) | | | 70,000 | | | | 69,736 | |
Huntington Bancshares, Inc. 2.30%, 1/14/2022 | | | 50,000 | | | | 48,119 | |
Mitsubishi UFJ Financial Group, Inc. (Japan)
3.46%, 3/2/2023 | | | 45,000 | | | | 44,784 | |
3.78%, 3/2/2025 | | | 45,000 | | | | 44,980 | |
PNC Financial Services Group, Inc. (The) 5.13%, 2/8/2020 | | | 35,000 | | | | 36,038 | |
Regions Financial Corp. 2.75%, 8/14/2022 | | | 40,000 | | | | 38,789 | |
| | | | | | | | |
| INVESTMENTS | | PRINCIPAL
AMOUNT($) | | | VALUE($) | |
| | | | | | | | |
Banks — continued | | | | | | | | |
Santander UK Group Holdings plc (United Kingdom) 3.13%, 1/8/2021 | | | 30,000 | | | | 29,646 | |
Sumitomo Mitsui Financial Group, Inc. (Japan)
2.06%, 7/14/2021 | | | 30,000 | | | | 28,887 | |
3.10%, 1/17/2023 | | | 25,000 | | | | 24,514 | |
3.36%, 7/12/2027 | | | 25,000 | | | | 23,960 | |
SunTrust Bank 2.25%, 1/31/2020 | | | 25,000 | | | | 24,744 | |
Wells Fargo & Co. | | | | | | | | |
Series M, 3.45%, 2/13/2023 | | | 70,000 | | | | 68,968 | |
4.65%, 11/4/2044 | | | 30,000 | | | | 29,496 | |
Westpac Banking Corp. (Australia) 3.40%, 1/25/2028 | | | 65,000 | | | | 62,805 | |
| | | | | | | | |
| | | | | | | 1,170,316 | |
| | | | | | | | |
Beverages — 0.4% | | | | | | | | |
Anheuser-Busch InBev Finance, Inc. (Belgium)
3.65%, 2/1/2026 | | | 25,000 | | | | 24,456 | |
4.90%, 2/1/2046 | | | 25,000 | | | | 25,407 | |
Anheuser-Busch InBev Worldwide, Inc. (Belgium) 3.75%, 1/15/2022 | | | 25,000 | | | | 25,396 | |
Molson Coors Brewing Co. | | | | | | | | |
4.20%, 7/15/2046 | | | 15,000 | | | | 13,334 | |
| | | | | | | | |
| | | | | | | 88,593 | |
| | | | | | | | |
Biotechnology — 0.5% | | | | | | | | |
AbbVie, Inc. 2.85%, 5/14/2023 | | | 30,000 | | | | 29,014 | |
Amgen, Inc. 4.95%, 10/1/2041 | | | 15,000 | | | | 15,353 | |
Celgene Corp.
3.25%, 8/15/2022 | | | 15,000 | | | | 14,850 | |
4.63%, 5/15/2044 | | | 20,000 | | | | 18,836 | |
Gilead Sciences, Inc.
3.70%, 4/1/2024 | | | 30,000 | | | | 30,165 | |
4.80%, 4/1/2044 | | | 15,000 | | | | 15,641 | |
| | | | | | | | |
| | | | | | | 123,859 | |
| | | | | | | | |
Building Products — 0.2% | | | | | | | | |
Masco Corp. 4.45%, 4/1/2025 | | | 25,000 | | | | 25,388 | |
Owens Corning 4.20%, 12/15/2022 | | | 15,000 | | | | 15,156 | |
| | | | | | | | |
| | | | | | | 40,544 | |
| | | | | | | | |
Capital Markets — 1.5% | | | | | | | | |
Credit Suisse AG (Switzerland) 5.40%, 1/14/2020 | | | 25,000 | | | | 25,704 | |
Credit Suisse USA, Inc. (Switzerland) 7.13%, 7/15/2032 | | | 15,000 | | | | 19,296 | |
Goldman Sachs Group, Inc. (The)
4.00%, 3/3/2024 | | | 50,000 | | | | 50,448 | |
(ICE LIBOR USD 3 Month + 1.37%), 4.02%, 10/31/2038 (d) | | | 65,000 | | | | 60,417 | |
SEE NOTES TO FINANCIAL STATEMENTS.
| | | | | | | | |
| | | |
| AUGUST 31, 2018 | | J.P. MORGAN SMA FUNDS | | | | | 7 | |
JPMorgan Core Focus SMA Fund
SCHEDULE OF PORTFOLIO INVESTMENTS
AS OF AUGUST 31, 2018 (Unaudited) (continued)
| | | | | | | | |
| INVESTMENTS | | PRINCIPAL
AMOUNT($) | | | VALUE($) | |
Corporate Bonds — continued | | | | | | | | |
Capital Markets — continued | | | | | | | | |
Macquarie Group Ltd. (Australia)
6.00%, 1/14/2020 (b) | | | 10,000 | | | | 10,338 | |
6.25%, 1/14/2021 (b) | | | 30,000 | | | | 31,821 | |
(ICE LIBOR USD 3 Month + 1.37%), 3.76%, 11/28/2028 (b) (d) | | | 20,000 | | | | 18,686 | |
Morgan Stanley
2.63%, 11/17/2021 | | | 45,000 | | | | 43,944 | |
3.13%, 1/23/2023 | | | 30,000 | | | | 29,482 | |
4.00%, 7/23/2025 | | | 60,000 | | | | 60,220 | |
3.95%, 4/23/2027 | | | 25,000 | | | | 24,082 | |
| | | | | | | | |
| | | | | | | 374,438 | |
| | | | | | | | |
Chemicals — 0.4% | | | | | | | | |
Mosaic Co. (The)
3.25%, 11/15/2022 | | | 10,000 | | | | 9,811 | |
4.05%, 11/15/2027 | | | 10,000 | | | | 9,712 | |
5.63%, 11/15/2043 | | | 10,000 | | | | 10,208 | |
Nutrien Ltd. (Canada)
3.00%, 4/1/2025 | | | 20,000 | | | | 18,564 | |
6.13%, 1/15/2041 | | | 20,000 | | | | 22,754 | |
Sherwin-Williams Co. (The) 2.75%, 6/1/2022 | | | 35,000 | | | | 34,060 | |
| | | | | | | | |
| | | | | | | 105,109 | |
| | | | | | | | |
Construction Materials — 0.1% | | | | | | | | |
Martin Marietta Materials, Inc. 3.45%, 6/1/2027 | | | 30,000 | | | | 27,858 | |
| | | | | | | | |
Consumer Finance — 0.6% | | | | | | | | |
American Express Co. 2.50%, 8/1/2022 | | | 30,000 | | | | 28,883 | |
Capital One Financial Corp.
4.75%, 7/15/2021 | | | 15,000 | | | | 15,523 | |
4.20%, 10/29/2025 | | | 15,000 | | | | 14,759 | |
3.75%, 3/9/2027 | | | 25,000 | | | | 23,846 | |
General Motors Financial Co., Inc.
4.20%, 3/1/2021 | | | 25,000 | | | | 25,346 | |
3.25%, 1/5/2023 | | | 20,000 | | | | 19,373 | |
HSBC Finance Corp. 6.68%, 1/15/2021 | | | 30,000 | | | | 31,991 | |
| | | | | | | | |
| | | | | | | 159,721 | |
| | | | | | | | |
Diversified Financial Services — 0.2% | | | | | | | | |
ORIX Corp. (Japan) 3.70%, 7/18/2027 | | | 30,000 | | | | 29,034 | |
Shell International Finance BV (Netherlands) 5.50%, 3/25/2040 | | | 25,000 | | | | 29,610 | |
| | | | | | | | |
| | | | | | | 58,644 | |
| | | | | | | | |
Diversified Telecommunication Services — 1.0% | | | | | |
AT&T, Inc.
3.00%, 6/30/2022 | | | 25,000 | | | | 24,420 | |
| | | | | | | | |
| INVESTMENTS | | PRINCIPAL
AMOUNT($) | | | VALUE($) | |
| | | | | | | | |
Diversified Telecommunication Services — continued | | | | | |
3.40%, 5/15/2025 | | | 30,000 | | | | 28,503 | |
5.35%, 9/1/2040 | | | 65,000 | | | | 63,952 | |
Telefonica Emisiones SAU (Spain)
5.13%, 4/27/2020 | | | 10,000 | | | | 10,303 | |
5.46%, 2/16/2021 | | | 10,000 | | | | 10,469 | |
7.05%, 6/20/2036 | | | 15,000 | | | | 18,187 | |
Verizon Communications, Inc.
4.33%, 9/21/2028 (b) | | | 41,000 | | | | 41,306 | |
4.86%, 8/21/2046 | | | 55,000 | | | | 54,355 | |
| | | | | | | | |
| | | | | | | 251,495 | |
| | | | | | | | |
Electric Utilities — 1.4% | | | | | | | | |
Cleveland Electric Illuminating Co. (The) 5.95%, 12/15/2036 | | | 20,000 | | | | 23,624 | |
Duke Energy Corp.
1.80%, 9/1/2021 | | | 15,000 | | | | 14,371 | |
2.65%, 9/1/2026 | | | 25,000 | | | | 22,737 | |
3.75%, 9/1/2046 | | | 25,000 | | | | 22,364 | |
Edison International 4.13%, 3/15/2028 | | | 20,000 | | | | 20,042 | |
Emera US Finance LP (Canada)
2.15%, 6/15/2019 | | | 10,000 | | | | 9,927 | |
3.55%, 6/15/2026 | | | 10,000 | | | | 9,503 | |
4.75%, 6/15/2046 | | | 10,000 | | | | 9,992 | |
Entergy Louisiana LLC 4.00%, 3/15/2033 | | | 40,000 | | | | 40,663 | |
Fortis, Inc. (Canada) 3.06%, 10/4/2026 | | | 30,000 | | | | 27,710 | |
Indiana Michigan Power Co. | | | | | | | | |
Series K, 4.55%, 3/15/2046 | | | 15,000 | | | | 15,723 | |
LG&E & KU Energy LLC 3.75%, 11/15/2020 | | | 20,000 | | | | 20,153 | |
Metropolitan Edison Co. 3.50%, 3/15/2023 (b) | | | 15,000 | | | | 14,898 | |
Pacific Gas & Electric Co.
3.50%, 10/1/2020 | | | 30,000 | | | | 29,999 | |
3.30%, 3/15/2027 | | | 30,000 | | | | 27,636 | |
PNM Resources, Inc. 3.25%, 3/9/2021 | | | 15,000 | | | | 14,904 | |
PPL Capital Funding, Inc. 3.10%, 5/15/2026 | | | 20,000 | | | | 18,732 | |
Southern Co. (The) 3.25%, 7/1/2026 | | | 30,000 | | | | 28,221 | |
| | | | | | | | |
| | | | | | | 371,199 | |
| | | | | | | | |
Electrical Equipment — 0.2% | | | | | | | | |
Eaton Corp.
2.75%, 11/2/2022 | | | 20,000 | | | | 19,514 | |
3.10%, 9/15/2027 | | | 25,000 | | | | 23,562 | |
| | | | | | | | |
| | | | | | | 43,076 | |
| | | | | | | | |
Electronic Equipment, Instruments & Components — 0.1% | |
Arrow Electronics, Inc. 3.25%, 9/8/2024 | | | 25,000 | | | | 23,559 | |
| | | | | | | | |
SEE NOTES TO FINANCIAL STATEMENTS.
| | | | | | |
| | | |
| 8 | | | | J.P. MORGAN SMA FUNDS | | AUGUST 31, 2018 |
| | | | | | | | |
| INVESTMENTS | | PRINCIPAL
AMOUNT($) | | | VALUE($) | |
Corporate Bonds — continued | | | | | | | | |
Energy Equipment & Services — 0.1% | | | | | | | | |
Halliburton Co.
3.80%, 11/15/2025 | | | 25,000 | | | | 24,949 | |
4.50%, 11/15/2041 | | | 10,000 | | | | 9,883 | |
| | | | | | | | |
| | | | | | | 34,832 | |
| | | | | | | | |
Equity Real Estate Investment Trusts (REITs) — 1.5% | | | | | |
American Tower Corp. 5.00%, 2/15/2024 | | | 30,000 | | | | 31,492 | |
Brixmor Operating Partnership LP
3.65%, 6/15/2024 | | | 25,000 | | | | 24,218 | |
EPR Properties
5.25%, 7/15/2023 | | | 15,000 | | | | 15,508 | |
4.50%, 6/1/2027 | | | 10,000 | | | | 9,641 | |
Government Properties Income Trust
3.75%, 8/15/2019 | | | 20,000 | | | | 20,104 | |
Host Hotels & Resorts LP
5.25%, 3/15/2022 | | | 15,000 | | | | 15,594 | |
3.88%, 4/1/2024 | | | 15,000 | | | | 14,773 | |
Liberty Property LP 4.40%, 2/15/2024 | | | 35,000 | | | | 35,717 | |
National Retail Properties, Inc.
3.80%, 10/15/2022 | | | 20,000 | | | | 20,060 | |
4.00%, 11/15/2025 | | | 20,000 | | | | 19,822 | |
Realty Income Corp.
3.25%, 10/15/2022 | | | 20,000 | | | | 19,822 | |
3.65%, 1/15/2028 | | | 25,000 | | | | 24,315 | |
Select Income 3.60%, 2/1/2020 | | | 20,000 | | | | 19,914 | |
Senior Housing Properties Trust
3.25%, 5/1/2019 | | | 30,000 | | | | 30,006 | |
VEREIT Operating Partnership LP
4.13%, 6/1/2021 | | | 15,000 | | | | 15,191 | |
4.88%, 6/1/2026 | | | 10,000 | | | | 10,155 | |
Welltower, Inc.
6.13%, 4/15/2020 | | | 15,000 | | | | 15,638 | |
4.00%, 6/1/2025 | | | 25,000 | | | | 24,790 | |
| | | | | | | | |
| | | | | | | 366,760 | |
| | | | | | | | |
Food & Staples Retailing — 0.3% | | | | | | | | |
Kroger Co. (The)
2.65%, 10/15/2026 | | | 20,000 | | | | 17,997 | |
5.15%, 8/1/2043 | | | 20,000 | | | | 19,984 | |
Sysco Corp.
3.55%, 3/15/2025 | | | 20,000 | | | | 19,654 | |
4.45%, 3/15/2048 | | | 30,000 | | | | 29,755 | |
| | | | | | | | |
| | | | | | | 87,390 | |
| | | | | | | | |
Food Products — 0.5% | | | | | | | | |
Campbell Soup Co.
3.65%, 3/15/2023 | | | 20,000 | | | | 19,553 | |
3.80%, 8/2/2042 | | | 20,000 | | | | 15,684 | |
| | | | | | | | |
| INVESTMENTS | | PRINCIPAL
AMOUNT($) | | | VALUE($) | |
| | | | | | | | |
Food Products — continued | | | | | | | | |
Kraft Heinz Foods Co.
3.95%, 7/15/2025 | | | 20,000 | | | | 19,685 | |
6.50%, 2/9/2040 | | | 15,000 | | | | 17,003 | |
Mead Johnson Nutrition Co. (United Kingdom) 4.60%, 6/1/2044 | | | 20,000 | | | | 20,754 | |
Tyson Foods, Inc.
4.50%, 6/15/2022 | | | 15,000 | | | | 15,453 | |
3.95%, 8/15/2024 | | | 15,000 | | | | 15,052 | |
5.15%, 8/15/2044 | | | 10,000 | | | | 10,238 | |
| | | | | | | | |
| | | | | | | 133,422 | |
| | | | | | | | |
Health Care Equipment & Supplies — 0.4% | | | | | | | | |
Abbott Laboratories
2.55%, 3/15/2022 | | | 15,000 | | | | 14,589 | |
3.75%, 11/30/2026 | | | 30,000 | | | | 29,744 | |
4.75%, 11/30/2036 | | | 15,000 | | | | 15,958 | |
Becton Dickinson and Co.
2.89%, 6/6/2022 | | | 10,000 | | | | 9,736 | |
3.70%, 6/6/2027 | | | 15,000 | | | | 14,363 | |
Zimmer Biomet Holdings, Inc.
3.70%, 3/19/2023 | | | 6,000 | | | | 6,009 | |
3.55%, 4/1/2025 | | | 10,000 | | | | 9,640 | |
| | | | | | | | |
| | | | | | | 100,039 | |
| | | | | | | | |
Health Care Providers & Services — 0.7% | | | | | | | | |
Aetna, Inc. 2.80%, 6/15/2023 | | | 35,000 | | | | 33,734 | |
Anthem, Inc.
3.70%, 8/15/2021 | | | 15,000 | | | | 15,133 | |
3.35%, 12/1/2024 | | | 15,000 | | | | 14,588 | |
4.63%, 5/15/2042 | | | 20,000 | | | | 19,378 | |
CVS Health Corp.
3.70%, 3/9/2023 | | | 30,000 | | | | 29,919 | |
4.30%, 3/25/2028 | | | 41,000 | | | | 40,691 | |
4.78%, 3/25/2038 | | | 27,000 | | | | 26,859 | |
| | | | | | | | |
| | | | | | | 180,302 | |
| | | | | | | | |
Hotels, Restaurants & Leisure — 0.2% | | | | | | | | |
McDonald’s Corp. 3.80%, 4/1/2028 | | | 35,000 | | | | 34,790 | |
| | | | | | | | |
Household Durables — 0.1% | | | | | | | | |
Newell Brands, Inc.
4.00%, 12/1/2024 | | | 10,000 | | | | 9,729 | |
4.20%, 4/1/2026 | | | 15,000 | | | | 14,419 | |
5.38%, 4/1/2036 | | | 10,000 | | | | 9,629 | |
| | | | | | | | |
| | | | | | | 33,777 | |
| | | | | | | | |
Independent Power and Renewable Electricity Producers — 0.2% | |
Exelon Generation Co. LLC
5.75%, 10/1/2041 | | | 45,000 | | | | 45,975 | |
| | | | | | | | |
SEE NOTES TO FINANCIAL STATEMENTS.
| | | | | | | | |
| | | |
| AUGUST 31, 2018 | | J.P. MORGAN SMA FUNDS | | | | | 9 | |
JPMorgan Core Focus SMA Fund
SCHEDULE OF PORTFOLIO INVESTMENTS
AS OF AUGUST 31, 2018 (Unaudited) (continued)
| | | | | | | | |
| INVESTMENTS | | PRINCIPAL
AMOUNT($) | | | VALUE($) | |
Corporate Bonds — continued | | | | | | | | |
Industrial Conglomerates — 0.4% | | | | | | | | |
General Electric Co.
3.38%, 3/11/2024 | | | 40,000 | | | | 39,592 | |
4.13%, 10/9/2042 | | | 35,000 | | | | 31,975 | |
Roper Technologies, Inc. 2.80%, 12/15/2021 | | | 30,000 | | | | 29,443 | |
| | | | | | | | |
| | | | | | | 101,010 | |
| | | | | | | | |
Insurance — 1.5% | | | | | | | | |
American Financial Group, Inc.
3.50%, 8/15/2026 | | | 20,000 | | | | 18,863 | |
American International Group, Inc.
3.30%, 3/1/2021 | | | 10,000 | | | | 9,995 | |
3.75%, 7/10/2025 | | | 20,000 | | | | 19,565 | |
3.88%, 1/15/2035 | | | 25,000 | | | | 22,678 | |
Athene Global Funding 3.00%, 7/1/2022 (b) | | | 25,000 | | | | 24,348 | |
Athene Holding Ltd. 4.13%, 1/12/2028 | | | 10,000 | | | | 9,381 | |
Cincinnati Financial Corp. 6.92%, 5/15/2028 | | | 20,000 | | | | 24,549 | |
Lincoln National Corp.
4.20%, 3/15/2022 | | | 15,000 | | | | 15,305 | |
3.63%, 12/12/2026 | | | 15,000 | | | | 14,539 | |
4.35%, 3/1/2048 | | | 20,000 | | | | 18,970 | |
Markel Corp. 3.50%, 11/1/2027 | | | 20,000 | | | | 18,838 | |
Metropolitan Life Global Funding I
2.00%, 4/14/2020 (b) | | | 150,000 | | | | 147,650 | |
Prudential Financial, Inc. | | | | | | | | |
3.88%, 3/27/2028 | | | 30,000 | | | | 30,073 | |
| | | | | | | | |
| | | | | | | 374,754 | |
| | | | | | | | |
IT Services — 0.1% | | | | | | | | |
Western Union Co. (The) 3.60%, 3/15/2022 | | | 10,000 | | | | 9,921 | |
| | | | | | | | |
Media — 0.5% | | | | | | | | |
Charter Communications Operating LLC 5.75%, 4/1/2048 | | | 10,000 | | | | 9,833 | |
Comcast Corp.
3.38%, 2/15/2025 | | | 30,000 | | | | 29,238 | |
3.20%, 7/15/2036 | | | 40,000 | | | | 34,371 | |
Cox Communications, Inc.
3.15%, 8/15/2024 (b) | | | 25,000 | | | | 23,833 | |
4.60%, 8/15/2047 (b) | | | 15,000 | | | | 13,998 | |
| | | | | | | | |
| | | | | | | 111,273 | |
| | | | | | | | |
Metals & Mining — 0.2% | | | | | | | | |
Glencore Funding LLC (Switzerland)
3.13%, 4/29/2019 (b) | | | 20,000 | | | | 19,885 | |
4.63%, 4/29/2024 (b) | | | 15,000 | | | | 15,099 | |
| | | | | | | | |
| | | | | | | 34,984 | |
| | | | | | | | |
| | | | | | | | |
| INVESTMENTS | | PRINCIPAL
AMOUNT($) | | | VALUE($) | |
| | | | | | | | |
Multiline Retail — 0.0% (e) | | | | | | | | |
Dollar General Corp. 4.13%, 5/1/2028 | | | 5,000 | | | | 4,984 | |
| | | | | | | | |
Multi-Utilities — 0.4% | | | | | | | | |
Dominion Energy, Inc. 4.45%, 3/15/2021 | | | 15,000 | | | | 15,360 | |
Series D, 2.85%, 8/15/2026 | | | 25,000 | | | | 22,796 | |
Series C, 4.05%, 9/15/2042 | | | 20,000 | | | | 18,776 | |
Sempra Energy
2.40%, 3/15/2020 | | | 20,000 | | | | 19,741 | |
3.80%, 2/1/2038 | | | 25,000 | | | | 22,957 | |
| | | | | | | | |
| | | | | | | 99,630 | |
| | | | | | | | |
Oil, Gas & Consumable Fuels — 2.2% | | | | | | | | |
Anadarko Petroleum Corp. 3.45%, 7/15/2024 | | | 25,000 | | | | 24,238 | |
APT Pipelines Ltd. (Australia) 4.25%, 7/15/2027 (b) | | | 30,000 | | | | 29,750 | |
Buckeye Partners LP
4.35%, 10/15/2024 | | | 10,000 | | | | 9,852 | |
5.85%, 11/15/2043 | | | 10,000 | | | | 9,466 | |
Canadian Natural Resources Ltd. (Canada)
3.80%, 4/15/2024 | | | 15,000 | | | | 14,902 | |
6.45%, 6/30/2033 | | | 15,000 | | | | 17,752 | |
Cenovus Energy, Inc. (Canada) 3.00%, 8/15/2022 | | | 25,000 | | | | 24,051 | |
Enbridge, Inc. (Canada) 4.25%, 12/1/2026 | | | 20,000 | | | | 20,088 | |
Enterprise Products Operating LLC
5.25%, 1/31/2020 | | | 25,000 | | | | 25,736 | |
3.75%, 2/15/2025 | | | 30,000 | | | | 30,098 | |
5.10%, 2/15/2045 | | | 15,000 | | | | 15,889 | |
Kinder Morgan Energy Partners LP 3.95%, 9/1/2022 | | | 25,000 | | | | 25,261 | |
Marathon Petroleum Corp. 6.50%, 3/1/2041 | | | 15,000 | | | | 17,696 | |
MPLX LP
4.13%, 3/1/2027 | | | 15,000 | | | | 14,674 | |
4.50%, 4/15/2038 | | | 10,000 | | | | 9,296 | |
Nexen Energy ULC (China) 5.88%, 3/10/2035 | | | 20,000 | | | | 23,169 | |
Noble Energy, Inc. 5.05%, 11/15/2044 | | | 30,000 | | | | 29,392 | |
ONEOK Partners LP 4.90%, 3/15/2025 | | | 30,000 | | | | 31,616 | |
Phillips 66
3.90%, 3/15/2028 | | | 20,000 | | | | 19,818 | |
4.88%, 11/15/2044 | | | 20,000 | | | | 20,674 | |
Spectra Energy Partners LP 4.50%, 3/15/2045 | | | 20,000 | | | | 19,041 | |
Sunoco Logistics Partners Operations LP
4.25%, 4/1/2024 | | | 15,000 | | | | 15,030 | |
4.00%, 10/1/2027 | | | 10,000 | | | | 9,560 | |
5.35%, 5/15/2045 | | | 30,000 | | | | 29,014 | |
SEE NOTES TO FINANCIAL STATEMENTS.
| | | | | | |
| | | |
| 10 | | | | J.P. MORGAN SMA FUNDS | | AUGUST 31, 2018 |
| | | | | | | | |
| INVESTMENTS | | PRINCIPAL
AMOUNT($) | | | VALUE($) | |
Corporate Bonds — continued | | | | | |
Oil, Gas & Consumable Fuels — continued | | | | | | | | |
TransCanada PipeLines Ltd. (Canada)
4.88%, 1/15/2026 | | | 25,000 | | | | 26,261 | |
4.63%, 3/1/2034 | | | 15,000 | | | | 15,181 | |
5.00%, 10/16/2043 | | | 10,000 | | | | 10,301 | |
Williams Cos., Inc. (The) 3.90%, 1/15/2025 | | | 20,000 | | | | 19,785 | |
| | | | | | | | |
| | | | | | | 557,591 | |
| | | | | | | | |
Pharmaceuticals — 0.2% | | | | | | | | |
Allergan Funding SCS
3.00%, 3/12/2020 | | | 10,000 | | | | 9,973 | |
4.55%, 3/15/2035 | | | 10,000 | | | | 9,804 | |
Shire Acquisitions Investments Ireland DAC 2.40%, 9/23/2021 | | | 30,000 | | | | 28,989 | |
| | | | | | | | |
| | | | | | | 48,766 | |
| | | | | | | | |
Road & Rail — 0.2% | | | | | | | | |
Burlington Northern Santa Fe LLC 4.40%, 3/15/2042 | | | 30,000 | | | | 30,883 | |
ERAC USA Finance LLC 5.63%, 3/15/2042 (b) | | | 30,000 | | | | 33,280 | |
| | | | | | | | |
| | | | | | | 64,163 | |
| | | | | | | | |
Semiconductors & Semiconductor Equipment — 0.2% | | | | | |
Broadcom Corp.
2.65%, 1/15/2023 | | | 20,000 | | | | 18,921 | |
3.88%, 1/15/2027 | | | 25,000 | | | | 23,372 | |
| | | | | | | | |
| | | | | | | 42,293 | |
| | | | | | | | |
Software — 0.2% | | | | | | | | |
Oracle Corp. 3.85%, 7/15/2036 | | | 60,000 | | | | 58,249 | |
| | | | | | | | |
Specialty Retail — 0.1% | | | | | | | | |
Advance Auto Parts, Inc. 4.50%, 12/1/2023 | | | 25,000 | | | | 25,605 | |
| | | | | | | | |
Technology Hardware, Storage & Peripherals — 0.2% | | | | | |
Apple, Inc. 4.65%, 2/23/2046 | | | 30,000 | | | | 32,675 | |
Dell International LLC 4.42%, 6/15/2021 (b) | | | 25,000 | | | | 25,424 | |
| | | | | | | | |
| | | | | | | 58,099 | |
| | | | | | | | |
Tobacco — 0.2% | | | | | | | | |
BAT International Finance plc (United Kingdom) 2.75%, 6/15/2020 (b) | | | 30,000 | | | | 29,728 | |
Reynolds American, Inc. (United Kingdom) 5.85%, 8/15/2045 | | | 25,000 | | | | 27,251 | |
| | | | | | | | |
| | | | | | | 56,979 | |
| | | | | | | | |
Trading Companies & Distributors — 0.3% | | | | | | | | |
Aviation Capital Group LLC
2.88%, 1/20/2022 (b) | | | 30,000 | | | | 29,138 | |
3.50%, 11/1/2027 (b) | | | 20,000 | | | | 18,428 | |
International Lease Finance Corp. 4.63%, 4/15/2021 | | | 35,000 | | | | 35,752 | |
| | | | | | | | |
| | | | | | | 83,318 | |
| | | | | | | | |
| | | | | | | | |
| INVESTMENTS | | PRINCIPAL
AMOUNT($) | | | VALUE($) | |
| | | | | | | | |
Wireless Telecommunication Services — 0.2% | | | | | |
Vodafone Group plc (United Kingdom)
3.75%, 1/16/2024 | | | 20,000 | | | | 19,830 | |
4.38%, 5/30/2028 | | | 25,000 | | | | 24,788 | |
5.00%, 5/30/2038 | | | 11,000 | | | | 10,944 | |
| | | | | | | | |
| | | | | | | 55,562 | |
| | | | | | | | |
Total Corporate Bonds
(Cost $6,005,533) | | | | | | | 5,931,781 | |
| | | | | | | | |
Commercial Mortgage-backed Securities — 8.8% | |
20 Times Square Trust | | | | | | | | |
Series 2018-20TS, Class D, 3.20%, 5/15/2035 ‡ (a) (b) | | | 100,000 | | | | 95,384 | |
Series 2018-20TS, Class E, 3.20%, 5/15/2035 ‡ (a) (b) | | | 100,000 | | | | 94,368 | |
Citigroup Commercial Mortgage Trust | | | | | | | | |
Series 2013-GC11, Class A3, 2.82%, 4/10/2046 | | | 24,674 | | | | 24,206 | |
Series 2014-GC19, Class A3, 3.75%, 3/10/2047 | | | 15,000 | | | | 15,156 | |
Series 2014-GC23, Class A3, 3.36%, 7/10/2047 | | | 15,000 | | | | 14,946 | |
Cold Storage Trust | | | | | | | | |
Series 2017-ICE3, Class B, 3.31%, 4/15/2036 ‡ (a) (b) | | | 200,000 | | | | 200,999 | |
Commercial Mortgage Trust | | | | | | | | |
Series 2014-PAT, Class A, 2.87%, 8/13/2027 (a) (b) | | | 125,000 | | | | 125,000 | |
Series 2014-UBS2, Class A4, 3.69%, 3/10/2047 | | | 15,000 | | | | 15,169 | |
Series 2014-CR17, Class A4, 3.70%, 5/10/2047 | | | 30,000 | | | | 30,459 | |
Series 2014-UBS3, Class A3, 3.55%, 6/10/2047 | | | 25,000 | | | | 25,140 | |
Core Industrial Trust Series 2015-CALW, Class A, 3.04%, 2/10/2034 (b) | | | 42,690 | | | | 42,459 | |
FHLMC Multifamily Structured Pass-Through Certificates Series K731, Class AM, 3.60%, 2/25/2025 (a) | | | 200,000 | | | | 203,748 | |
FREMF Mortgage Trust Series 2013-K26, Class B, 3.72%, 12/25/2045 (a) (b) | | | 99,000 | | | | 99,190 | |
GPMT Ltd. (Cayman Islands) Series 2018-FL1, Class AS, 3.27%, 11/21/2035 ‡ (a) (b) | | | 150,000 | | | | 150,217 | |
GS Mortgage Securities Trust | | | | | | | | |
Series 2013-GC16, Class AS, 4.65%, 11/10/2046 | | | 111,000 | | | | 116,312 | |
Series 2013-GC16, Class B, 5.16%, 11/10/2046 (a) | | | 50,000 | | | | 53,102 | |
SEE NOTES TO FINANCIAL STATEMENTS.
| | | | | | | | |
| | | |
| AUGUST 31, 2018 | | J.P. MORGAN SMA FUNDS | | | | | 11 | |
JPMorgan Core Focus SMA Fund
SCHEDULE OF PORTFOLIO INVESTMENTS
AS OF AUGUST 31, 2018 (Unaudited) (continued)
| | | | | | | | |
| INVESTMENTS | | PRINCIPAL
AMOUNT($) | | | VALUE($) | |
Commercial Mortgage-backed Securities — continued | |
JP Morgan Chase Commercial Mortgage Securities Trust | | | | | | | | |
Series 2014-FL6, Class B, 4.34%, 11/15/2031 ‡ (a) (b) | | | 151,880 | | | | 152,224 | |
Series 2013-LC11, Class A4, 2.69%, 4/15/2046 | | | 16,480 | | | | 16,115 | |
Series 2011-C5, Class B, 5.58%, 8/15/2046 (a) (b) | | | 169,000 | | | | 176,464 | |
JPMBB Commercial Mortgage Securities Trust Series 2013-C15, Class C, 5.25%, 11/15/2045 (a) | | | 30,000 | | | | 31,347 | |
JPMCC Re-REMIC Trust Series 2014-FRR1, Class BK10, 2.52%, 11/27/2049 ‡ (a) (b) | | | 180,000 | | | | 172,611 | |
Morgan Stanley Bank of America Merrill Lynch Trust | | | | | | | | |
Series 2014-C18, Class A2, 3.19%, 10/15/2047 | | | 90,568 | | | | 90,917 | |
Series 2015-C27, Class A3, 3.47%, 12/15/2047 | | | 130,000 | | | | 129,234 | |
Wells Fargo Commercial Mortgage Trust Series 2015-NXS4, Class A3, 3.45%, 12/15/2048 | | | 130,000 | | | | 129,134 | |
WFRBS Commercial Mortgage Trust Series 2013-C13, Class A3, 2.75%, 5/15/2045 | | | 28,283 | | | | 27,638 | |
| | | | | | | | |
Total Commercial Mortgage-Backed Securities
(Cost $2,214,344) | | | | 2,231,539 | |
| | | | | | | | |
U.S. Treasury Obligations — 1.9% | | | | | | | | |
U.S. Treasury Notes
2.63%, 2/28/2023 | | | 265,000 | | | | 263,706 | |
2.75%, 2/15/2028 | | | 230,000 | | | | 227,727 | |
| | | | | | | | |
Total U.S. Treasury Obligations
(Cost $492,813) | | | | | | | 491,433 | |
| | | | | | | | |
Mortgage-Backed Securities — 1.5% | | | | | | | | |
FNMA, Other | | | | | | | | |
Pool # AM4660, 3.77%, 12/1/2025 | | | 135,000 | | | | 138,603 | |
Pool # AM5940, 3.24%, 6/1/2026 | | | 69,873 | | | | 69,744 | |
Pool # AM6428, 3.58%, 8/1/2029 | | | 89,161 | | | | 90,099 | |
Pool # AM6430, 3.58%, 8/1/2029 | | | 89,161 | | | | 90,099 | |
| | | | | | | | |
Total Mortgage-Backed Securities
(Cost $390,190) | | | | | | | 388,545 | |
| | | | | | | | |
| | | | | | | | |
| INVESTMENTS | | SHARES | | | VALUE($) | |
Short-term Investments — 2.2% | |
Investment Companies — 2.2% | | | | | |
JPMorgan Prime Money Market Fund Class Institutional Shares, 2.04% (f) (g)
(Cost $551,948) | | | 551,860 | | | | 552,025 | |
| | | | | | | | |
Total Investments — 99.7%
(Cost $25,335,755) | | | | | | | 25,299,434 | |
Other Assets Less Liabilities — 0.3% | | | | | | | 85,619 | |
| | | | | |
NET ASSETS — 100.0% | | | | | | $ | 25,385,053 | |
| | | | | |
Percentages indicated are based on net assets.
| | |
Abbreviations |
| FHLMC | | Federal Home Loan Mortgage Corp. |
| FNMA | | Federal National Mortgage Association |
| GNMA | | Government National Mortgage Association |
| GS | | Goldman Sachs |
| ICE | | Intercontinental Exchange |
| LIBOR | | London Interbank Offered Rate |
| REIT | | Real Estate Investment Trust |
| REMIC | | Real Estate Mortgage Investment Conduit |
| USD | | United States Dollar |
| |
| (a) | | Variable or floating rate security, the interest rate of which adjusts periodically based on changes in current interest rates and prepayments on the underlying pool of assets. The interest rate shown is the current rate as of August 31, 2018. |
| (b) | | Securities exempt from registration under Rule 144A or section 4(a)(2), of the Securities Act of 1933, as amended. Under procedures approved by the Board of Trustees, such securities have been determined to be liquid by the investment adviser and may be resold, normally to qualified institutional buyers in transactions exempt from registration. |
| (c) | | Step bond. Interest rate is a fixed rate for an initial period that either resets at a specific date or may reset in the future contingent upon a predetermined trigger. The interest rate shown is the current rate as of August 31, 2018. |
| (d) | | Variable or floating rate security, linked to the referenced benchmark. The interest rate shown is the current rate as of August 31, 2018. |
| (e) | | Amount rounds to less than 0.1% of net assets. |
| (f) | | Investment in affiliate. Fund is registered under the Investment Company Act of 1940, as amended, and advised by J.P. Morgan Investment Management Inc. |
| (g) | | The rate shown is the current yield as of August 31, 2018. |
| ‡ | | Value determined using significant unobservable inputs. |
SEE NOTES TO FINANCIAL STATEMENTS.
| | | | | | |
| | | |
| 12 | | | | J.P. MORGAN SMA FUNDS | | AUGUST 31, 2018 |
STATEMENT OF ASSETS AND LIABILITIES
AS OF AUGUST 31, 2018 (Unaudited)
| | | | |
| | | JPMorgan
Core Focus
SMA Fund | |
ASSETS: | |
Investments in non-affiliates, at value | | $ | 24,747,409 | |
Investments in affiliates, at value | | | 552,025 | |
Cash | | | 8,715 | |
Receivables: | | | | |
Interest from non-affiliates | | | 112,394 | |
Dividends from affiliates | | | 982 | |
Due from Adviser | | | 2,903 | |
Prepaid expenses | | | 14,562 | |
| | | | |
Total Assets | | | 25,438,990 | |
| | | | |
LIABILITIES: | |
Accrued liabilities: | | | | |
Custodian and accounting fees | | | 7,608 | |
Trustees’ and Chief Compliance Officer’s fees | | | 1 | |
Audit fees | | | 40,299 | |
Printing & Postage fees | | | 3,116 | |
Other | | | 2,913 | |
| | | | |
Total Liabilities | | | 53,937 | |
| | | | |
Net Assets | | $ | 25,385,053 | |
| | | | |
NET ASSETS: | |
Paid-in-Capital | | $ | 25,424,974 | |
Accumulated undistributed (distributions in excess of) net investment income | | | (595 | ) |
Accumulated net realized gains (losses) | | | (3,005 | ) |
Net unrealized appreciation (depreciation) | | | (36,321 | ) |
| | | | |
Total Net Assets | | $ | 25,385,053 | |
| | | | |
| |
Outstanding units of beneficial interest (shares) ($0.0001 par value; unlimited number of shares authorized): | | | 2,542,570 | |
Net asset value, offering and redemption price per share (a) | | $ | 9.98 | |
Cost of investments in non-affiliates | | $ | 24,783,807 | |
Cost of investments in affiliates | | | 551,948 | |
| (a) | Per share amounts may not recalculate due to rounding of net assets and/or shares outstanding. |
SEE NOTES TO FINANCIAL STATEMENTS.
| | | | | | | | |
| | | |
| AUGUST 31, 2018 | | J.P. MORGAN SMA FUNDS | | | | | 13 | |
STATEMENT OF OPERATIONS
FOR THE SIX MONTHS ENDED AUGUST 31, 2018 (Unaudited)
| | | | |
| | | JPMorgan
Core Focus
SMA Fund (a) | |
INVESTMENT INCOME: | |
Interest income from non-affiliates | | $ | 402,826 | |
Interest income from affiliates | | | 2,725 | |
Dividend income from affiliates | | | 18,828 | |
| | | | |
Total investment income | | | 424,379 | |
| | | | |
| |
EXPENSES: | | | | |
Administration fees | | | 10,221 | |
Custodian and accounting fees | | | 14,676 | |
Professional fees | | | 40,448 | |
Trustees’ and Chief Compliance Officer’s fees | | | 10,457 | |
Printing and mailing costs | | | 6,044 | |
Registration and filing fees | | | 15 | |
Transfer agency fees | | | 99 | |
Offering costs | | | 14,804 | |
Other | | | 4,304 | |
| | | | |
Total expenses | | | 101,068 | |
| | | | |
Less fees waived | | | (10,221 | ) |
Less expense reimbursements | | | (90,847 | ) |
| | | | |
Net expenses | | | — | |
| | | | |
Net investment income (loss) | | | 424,379 | |
| | | | |
| |
REALIZED/UNREALIZED GAINS (LOSSES): | | | | |
Net realized gain (loss) on transactions from: | |
Investments in non-affiliates | | | (2,415 | ) |
Investments in affiliates | | | (634 | ) |
| | | | |
Net realized gain (loss) | | | (3,049 | ) |
| | | | |
Distributions of capital gains received from investment company affiliates | | | 44 | |
| | | | |
Change in net unrealized appreciation/depreciation on: | |
Investments in non-affiliates | | | (36,398 | ) |
Investments in affiliates | | | 77 | |
| | | | |
Change in net unrealized appreciation/depreciation | | | (36,321 | ) |
| | | | |
Net realized/unrealized gains (losses) | | | (39,326 | ) |
| | | | |
Change in net assets resulting from operations | | $ | 385,053 | |
| | | | |
| (a) | Commencement of operations was March 1, 2018. |
SEE NOTES TO FINANCIAL STATEMENTS.
| | | | | | |
| | | |
| 14 | | | | J.P. MORGAN SMA FUNDS | | AUGUST 31, 2018 |
STATEMENT OF CHANGES IN NET ASSETS
FOR THE PERIOD INDICATED
| | | | |
| | | JPMorgan Core
Focus SMA Fund | |
| | | Period Ended
August 31, 2018 (a) (Unaudited) | |
CHANGE IN NET ASSETS RESULTING FROM OPERATIONS: | |
Net investment income (loss) | | $ | 424,379 | |
Net realized gain (loss) | | | (3,049 | ) |
Distributions of capital gains received from investment company affiliates | | | 44 | |
Change in net unrealized appreciation/depreciation | | | (36,321 | ) |
| | | | |
Change in net assets resulting from operations | | | 385,053 | |
| | | | |
|
DISTRIBUTIONS TO SHAREHOLDERS: | |
From net investment income | | | (424,974 | ) |
| |
CAPITAL TRANSACTIONS: | | | | |
Proceeds from shares issued | | $ | 25,000,000 | |
Distributions reinvested | | | 424,974 | |
| | | | |
Change in net assets resulting from capital transactions | | $ | 25,424,974 | |
| | | | |
|
NET ASSETS: | |
Change in net assets | | | 25,385,053 | |
Beginning of period | | | — | |
| | | | |
End of period | | $ | 25,385,053 | |
| | | | |
Accumulated undistributed (distributions in excess of) net investment income | | $ | (595 | ) |
| | | | |
|
SHARE TRANSACTIONS: | |
Issued | | | 2,500,000 | |
Reinvested | | | 42,570 | |
| | | | |
Change in Shares | | | 2,542,570 | |
| | | | |
| (a) | Commencement of operations was March 1, 2018. |
SEE NOTES TO FINANCIAL STATEMENTS.
| | | | | | | | |
| | | |
| AUGUST 31, 2018 | | J.P. MORGAN SMA FUNDS | | | | | 15 | |
FINANCIAL HIGHLIGHTS
FOR THE PERIODS INDICATED
| | | | | | | | | | | | | | | | | | | | |
| | | Per share operating performance | |
| | | | | | Investment operations | | | Distributions | |
| | | Net asset
value,
beginning
of period | | | Net
investment
income
(loss) (b) | | | Net realized
and unrealized
gains
(losses) on
investments | | | Total from
investment
operations | | | Net
investment
income | |
JPMorgan Core Focus SMA Fund | | | | | | | | | | | | | | | | | |
March 1, 2018 (g) through August 31, 2018 (Unaudited) | | $ | 10.00 | | | $ | 0.17 | | | $ | (0.02 | ) | | $ | 0.15 | | | $ | (0.17 | ) |
| (a) | Annualized for periods less than one year, unless otherwise noted. |
| (b) | Calculated based upon average shares outstanding. |
| (c) | Not annualized for periods less than one year. |
| (d) | Includes adjustments in accordance with accounting principles generally accepted in the United States of America and as such, the net asset values for financial reporting purposes and the returns based upon those net asset values may differ from the net asset values and returns for shareholder transactions. |
| (e) | Includes earnings credits and interest expense, if applicable, each of which is less than 0.005% unless otherwise noted. |
| (f) | Certain non-recurring expenses incurred by the Fund were not annualized for the period ended August 31, 2018. |
| (g) | Commencement of operations. |
SEE NOTES TO FINANCIAL STATEMENTS.
| | | | | | |
| | | |
| 16 | | | | J.P. MORGAN SMA FUNDS | | AUGUST 31, 2018 |
| | | | | | | | | | | | | | | | | | | | | | | | | | |
| | | Ratios/Supplemental data | |
| | | | | | | | | | | | | | | | Ratios to average net assets (a) | |
Net asset
value,
end of
period | | | Total
return (c)(d) | | | Net assets,
end of period | | | Net
expenses (e)(f) | | |
Net investment
income
(loss) (f) | | | Expenses
without waivers
and reimbursements (f) | | | Portfolio
turnover
rate (c) | |
| | | | | | | | | | | | | | | | | | | | | | | | | | |
| $ | 9.98 | | | | 1.50 | % | | $ | 25,385,053 | | | | — | % | | | 3.37 | % | | | 0.82 | % | | | 32 | % |
SEE NOTES TO FINANCIAL STATEMENTS.
| | | | | | | | |
| | | |
| AUGUST 31, 2018 | | J.P. MORGAN SMA FUNDS | | | | | 17 | |
NOTES TO FINANCIAL STATEMENTS
AS OF AUGUST 31, 2018 (Unaudited)
1. Organization
JPMorgan Trust IV (the “Trust”) was formed on November 11, 2015, as a Delaware statutory trust, pursuant to a Declaration of Trust dated November 11, 2015 and is registered under the Investment Company Act of 1940, as amended (the “1940 Act”), as an open-end management investment company.
The following is a separate fund of the Trust (the “Fund”) covered by this report:
| | | | |
| | | | | Diversified/Non-Diversified |
| JPMorgan Core Focus SMA Fund* | | | | Diversified |
The investment objective of the Fund is to seek to maximize total return from a portfolio of investment grade bonds securities.
| * | Commenced operations on March 1, 2018. |
Shares of the Fund may be purchased only by or on behalf of separately managed accounts where J.P. Morgan Investment Management Inc. (the “Adviser” or “JPMIM”), an indirect, wholly-owned subsidiary of JPMorgan Chase & Co. (“JPMorgan”), serves as the investment adviser, sub-adviser or model portfolio provider for the account with the separately managed account sponsor or directly with the client. The Fund’s shares may not be purchased directly by individuals..
2. Significant Accounting Policies
The following is a summary of significant accounting policies followed by the Fund in the preparation of its financial statements. The Fund is an investment company and, thus, follows the investment company accounting and reporting guidance of the Financial Accounting Standards Board Accounting Standards Codification Topic 946 — Investment Companies, which is part of U.S. generally accepted accounting principles (“GAAP”). The preparation of financial statements in conformity with GAAP requires management to make estimates and assumptions that affect the reported amounts of assets and liabilities and disclosure of contingent assets and liabilities at the date of the financial statements and the reported amounts of increases and decreases in net assets from operations during the reporting period. Actual results could differ from those estimates.
A. Valuation of Investments — The valuation of investments is in accordance with GAAP and the Fund’s valuation policies set forth by and under the supervision and responsibility of the Board of Trustees (the “Board”), which established the following approach to valuation, as described more fully below: (i) investments for which market quotations are readily available shall be valued at such unadjusted quoted prices and (ii) all other investments for which market quotations are not readily available shall be valued at their fair value as determined in good faith by the Board.
The Administrator has established the J.P. Morgan Asset Management Americas Valuation Committee (“AVC”) to assist the Board with the oversight and monitoring of the valuation of the Fund’s investments. The Administrator implements the valuation policies of the Fund’s investments, as directed by the Board. The AVC oversees and carries out the policies for the valuation of investments held in the Fund. This includes monitoring the appropriateness of fair values based on results of ongoing valuation oversight including, but not limited to, consideration of macro or security specific events, market events and pricing vendor and broker due diligence. The Administrator is responsible for discussing and assessing the potential impacts to the fair values on an ongoing basis, and at least on a quarterly basis with the AVC and the Board.
A market-based approach is primarily used to value the Fund’s investments. Investments for which market quotations are not readily available are fair valued by approved affiliated and unaffiliated pricing vendors or third party broker-dealers (collectively referred to as “Pricing Services”) or may be internally fair valued using methods set forth by the valuation policies approved by the Board. This may include related or comparable assets or liabilities, recent transactions, market multiples, book values and other relevant information for the investment to determine the fair value of the investment. An income-based valuation approach may be used in which the anticipated future cash flows of the investment are discounted to calculate the fair value. Discounts may also be applied due to the nature or duration of any restrictions on the disposition of the investments. Valuations may be based upon current market prices of securities that are comparable in coupon, rating, maturity and industry. It is possible that the estimated values may differ significantly from the values that would have been used, had a ready market for the investments existed, and such differences could be material.
Fixed income instruments are valued based on prices received from Pricing Services. The Pricing Services use multiple valuation techniques to determine the valuation of fixed income instruments. In instances where sufficient market activity exists, the Pricing Services may utilize a market-based approach through which trades or quotes from market makers are used to determine the valuation of these instruments. In instances where sufficient market activity may not exist, the Pricing Services also utilize proprietary valuation models which may consider market transactions in comparable securities and the various relationships between securities in determining fair value and/or market characteristics in order to estimate the relevant cash flows, which are then discounted to calculate the fair values.
Investments in open-end investment companies (the “Underlying Funds”) are valued at each Underlying Fund’s net asset value (“NAV”) per share as of the report date.
See the table on “Quantitative Information about Level 3 Fair Value Measurements” for information on the valuation techniques and inputs used to
value level 3 securities held by the Fund at August 31, 2018.
Valuations reflected in this report are as of the report date. As a result, changes in valuation due to market events and/or issuer related events after the report date and prior to issuance of the report are not reflected herein.
| | | | | | |
| | | |
| 18 | | | | J.P. MORGAN SMA FUNDS | | AUGUST 31, 2018 |
The various inputs that are used in determining the valuation of the Fund’s investments are summarized into the three broad levels listed below.
| • | | Level 1 — Unadjusted inputs using quoted prices in active markets for identical investments. |
| • | | Level 2 — Other significant observable inputs including, but not limited to, quoted prices for similar investments, inputs other than quoted prices that are observable for investments (such as interest rates, prepayment speeds, credit risk, etc.) or other market corroborated inputs. |
| • | | Level 3 — Significant inputs based on the best information available in the circumstances, to the extent observable inputs are not available (including the Fund’s assumptions in determining the fair value of investments). |
A financial instrument’s level within the fair value hierarchy is based on the lowest level of any input, both individually and in the aggregate, that is significant to the fair value measurement. The inputs or methodology used for valuing instruments are not necessarily an indication of the risk associated with investing in those instruments.
The following table represents each valuation input by sector as presented on the Schedule of Portfolio Investments:
| | | | | | | | | | | | | | | | |
| | | Level 1
Quoted prices | | | Level 2
Other significant
observable inputs | | | Level 3
Significant unobservable inputs | | | Total | |
Investments in Securities | | | | | | | | | |
Debt Securities | | | | | | | | | |
Asset-Backed Securities | | $ | — | | | $ | 6,520,767 | | | $ | 1,196,062 | | | $ | 7,716,829 | |
Collateralized Mortgage Obligations | | | — | | | | 7,987,282 | | | | — | | | | 7,987,282 | |
Commercial Mortgage-Backed Securities | | | — | | | | 1,365,736 | | | | 865,803 | | | | 2,231,539 | |
Corporate Bonds | | | | | | | | | |
Other Corporate Bonds | | | — | | | | 5,931,781 | | | | — | | | | 5,931,781 | |
| | | | | | | | | | | | | | | | |
Total Corporate Bonds | | | — | | | | 5,931,781 | | | | — | | | | 5,931,781 | |
| | | | | | | | | | | | | | | | |
Mortgage-Backed Securities | | | — | | | | 388,545 | | | | — | | | | 388,545 | |
U.S. Treasury Obligations | | | — | | | | 491,433 | | | | — | | | | 491,433 | |
Short-Term Investments | | | | | | | | | | | | | | | | |
Investment Companies | | | 552,025 | | | | — | | | | — | | | | 552,025 | |
| | | | | | | | | | | | | | | | |
Total Investments in Securities | | $ | 552,025 | | | $ | 22,685,544 | | | $ | 2,061,865 | | | $ | 25,299,434 | |
| | | | | | | | | | | | | | | | |
There were no transfers between any levels during the six months ended August 31, 2018.
The following is a summary of investments for which significant unobservable inputs (level 3) were used in determining fair value:
| | | | | | | | | | | | | | | | | | | | | | | | | | | | | | | | | | | | |
| | | Balance as of
February 28,
2018 | | | Realized
gain (loss) | | | Change in
unrealized
appreciation
(depreciation) | | | Net
accretion
(amortization) | | | Purchases1 | | | Sales2 | | | Transfers
into Level 3 | | | Transfers
out
of Level 3 | | | Balance as of
August 31,
2018 | |
Investments in Securities: | | | | | | | | | | | | | | | | | | | | | | | | | | | | | | | | | | | | |
Asset-Backed Securities | | $ | — | | | $ | — | | | $ | (481 | ) | | $ | 249 | | | $ | 1,570,331 | | | $ | (374,037 | ) | | $ | — | | | $ | — | | | $ | 1,196,062 | |
Commercial Mortgage-Backed Securities | | | — | | | | — | | | | 5,579 | | | | 237 | | | | 928,138 | | | | (68,151 | ) | | | — | | | | — | | | | 865,803 | |
| | | | | | | | | | | | | | | | | | | | | | | | | | | | | | | | | | | | |
| | $ | — | | | $ | — | | | $ | 5,098 | | | $ | 486 | | | $ | 2,498,469 | | | $ | (442,188 | ) | | $ | — | | | $ | — | | | $ | 2,061,865 | |
| | | | | | | | | | | | | | | | | | | | | | | | | | | | | | | | | | | | |
| 1 | Purchases include all purchases of securities and securities received in corporate actions. |
| 2 | Sales include all sales of securities, maturities, paydowns and securities tendered in corporate actions. |
The change in net unrealized appreciation (depreciation) attributable to securities owned at August 31, 2018, which were valued using significant unobservable inputs (level 3), amounted to $5,098.
| | | | | | | | |
| | | |
| AUGUST 31, 2018 | | J.P. MORGAN SMA FUNDS | | | | | 19 | |
NOTES TO FINANCIAL STATEMENTS
AS OF AUGUST 31, 2018 (continued)
Core Focus SMA Fund
Quantitative Information about Level 3 Fair Value Measurements #
| | | | | | | | | | | | |
| | | Fair Value at
August 31, 2018 | | | Valuation Technique(s) | | Unobservable Input | | Range (Weighted Average) | |
| | $ | 1,196,062 | | | Discounted Cash Flow | | Constant Prepayment Rate | | | 0.00% - 40.00% (18.81%) | |
| | | | | | | | Yield (Discount Rate of Cash Flows) | | | 2.37% - 4.42% (3.87%) | |
| | | | | | | | | | | | |
| Asset-Backed Securities | | | 1,196,062 | | | | | | | | | |
| | | | | | | | | | | | |
| | | 715,587 | | | Discounted Cash Flow | | Yield (Discount Rate of Cash Flows) | | | 4.23% - 4.73% (4.47%) | |
| | | | | | | | | | | | |
| Commercial Mortgage-Backed Securities | | | 715,587 | | | | | | | | | |
| | | | | | | | | | | | |
| Total | | $ | 1,911,649 | | | | | | | | | |
| | | | | | | | | | | | |
| # | The table above does not include certain level 3 securities that are valued by brokers and pricing services. At August 31, 2018, the value of these securities was $150,216. The inputs for these securities are not readily available or cannot be reasonably estimated and are generally those inputs described in Note A. |
The significant unobservable inputs used in the fair value measurement of the Fund’s investments are listed above. Generally, a change in the assumptions used in any input in isolation may be accompanied by a change in another input. Significant changes in any of the unobservable inputs may significantly impact the fair value measurement. The impact is based on the relationship between each unobservable input and the fair value measurement. Significant increases (decreases) in the yield and default rate may decrease (increase) the fair value measurement. A significant change in the prepayment rate (Constant Prepayment Rate or PSA Prepayment Model) may decrease or increase the fair value measurement.
B. Restricted Securities — Certain securities held by the Fund may be subject to legal or contractual restrictions on resale. Restricted securities generally are resold in transactions exempt from registration under the Securities Act of 1933, as amended (the “Securities Act”). Disposal of these securities may involve time-consuming negotiations and expense. Prompt sale at the current valuation may be difficult and could adversely affect the net asset value of the Fund. As of August 31, 2018, the Fund had no investments in restricted securities other than securities sold to the Fund under Rule 144A and/or Regulation S under the Securities Act.
C. Investment Transactions with Affiliates — The Fund invested in an Underlying Fund which is advised by the Adviser or its affiliates. An issuer which is under common control with the Fund may be considered an affiliate. For the purposes of the financial statements, the Fund assumes the issuer listed in the table below to be affiliated issuer. Underlying Fund’s distributions may be reinvested into the Underlying Fund. Reinvestment amounts are included in the purchase cost amount in the table below.
| | | | | | | | | | | | | | | | | | | | | | | | | | | | | | | | | | | | |
| For the six months ended August 31, 2018 | |
| Security Description | | Value at
March 1,
2018 (a) | | | Purchases
at Cost | | | Proceeds
from Sales | | | Net
Realized
Gain
(Loss) | | | Change
in Unrealized
Appreciation/
(Depreciation) | | | Value at
August 31,
2018 | | | Shares at
August 31,
2018 | | | Dividend
Income | | | Capital Gain
Distributions | |
JPMorgan Prime Money Market Fund Class Institutional Shares, 2.04% (b)(c) | | $ | — | | | $ | 29,331,884 | | | $ | 28,779,302 | | | $ | (634 | ) | | $ | 77 | | | $ | 552,025 | | | | 551,860 | | | $ | 18,828 | | | $ | 44 | |
| | | | | | | | | | | | | | | | | | | | | | | | | | | | | | | | | | | | |
| (a) | Commencement of operations was March 1, 2018. |
| (b) | Investment in affiliate. Fund is registered under the Investment Company Act of 1940, as amended, and advised by J.P. Morgan Investment Management Inc. |
| (c) | The rate shown is the current yield as of August 31, 2018. |
D. Security Transactions and Investment Income — Investment transactions are accounted for on the trade date (the date the order to buy or sell is executed). Securities gains and losses are calculated on a specifically identified cost basis. Interest income is determined on the basis of coupon interest accrued using the effective interest method which adjusts for amortization of premiums and accretion of discounts. Dividend income, net of foreign taxes withheld, if any, is recorded on the ex-dividend date or when the Fund first learns of the dividend.
E. Allocation of Expenses — Expenses directly attributable to a fund are charged directly to that fund, while the expenses attributable to more than one fund of the Trust are allocated among the respective funds.
F. Federal Income Taxes — The Fund is treated as a separate taxable entity for Federal income tax purposes. The Fund’s policy is to comply with the provisions of the Internal Revenue Code (the “Code”), applicable to regulated investment companies and to distribute to shareholders all of its distributable net investment income and net realized capital gains on investments. Accordingly, no provision for Federal income tax is necessary. Management has reviewed the Fund’s tax positions for all open tax years and has determined that as of August 31, 2018, no liability for income tax is required in the Fund’s financial statements for net unrecognized tax benefits. However, management’s conclusions may be subject to future review based on changes in, or the interpretation of, the accounting standards or tax laws and regulations. The Fund’s Federal tax returns for the prior three fiscal years, or since inception if shorter, remains subject to examination by the Internal Revenue Service.
| | | | | | |
| | | |
| 20 | | | | J.P. MORGAN SMA FUNDS | | AUGUST 31, 2018 |
G. Distributions to Shareholders — Distributions from net investment income, are generally declared daily and paid monthly and are declared separately for each class. No class has preferential dividend rights; differences in per share rates are due to differences in separate class expenses. Net realized capital gains, if any, are distributed by the Fund at least annually. The amount of distributions from net investment income and net realized capital gains is determined in accordance with Federal income tax regulations, which may differ from GAAP. To the extent these “book/tax” differences are permanent in nature (i.e., that they result from other than timing of recognition — “temporary differences”), such amounts are reclassified within the capital accounts based on their Federal tax-basis treatment.
3. Fees and Other Transactions with Affiliates
A. Investment Advisory Fee — Pursuant to an Investment Advisory Agreement, the Adviser does not charge an advisory fee to the Fund. It should be understood, however, that the Fund is an integral part of separately managed account programs. Participants in these programs pay a fee to the sponsor of the program. The Adviser is compensated by the separately managed account sponsors.
B. Administration Fee — Pursuant to an Administration Agreement, the Administrator provides certain administration services to the Fund. In consideration of these services, the Administrator receives a fee accrued daily and paid monthly at an annual rate of 0.15% of the first $25 billion of the average daily net assets of all funds in the J.P. Morgan Funds Complex covered by the Administration Agreement (excluding certain funds of funds and money market funds) and 0.075% of the average daily net assets in excess of $25 billion of all such funds. For the period ended August 31, 2018, the effective annualized rate was 0.08% of the Fund’s average daily net assets, notwithstanding any fee waivers and/or expense reimbursements.
The Administrator waived Administration fees as outlined in Note 3.E.
JPMorgan Chase Bank N.A. (“JPMCB”) serves as the Fund’s sub-administrator (the “Sub-administrator”). For its services as Sub-administrator, JPMCB receives a portion of the fees payable to the Administrator.
C. Distribution Fees — Pursuant to a Distribution Agreement, JPMorgan Distribution Services, Inc. (“JPMDS”), an indirect, wholly-owned subsidiary of JPMorgan, serves as the Trust’s exclusive underwriter and promotes and arranges for the sale of the Fund’s shares. JPMDS receives no compensation in its capacity as the Fund’s underwriter.
D. Custodian and Accounting Fees — JPMCB provides portfolio custody and accounting services to the Fund. For performing these services, the Fund pays JPMCB transaction and asset-based fees that vary according to the number of transactions and positions, plus out-of-pocket expenses. The amount paid directly to JPMCB by the Fund for custody and accounting services are included in Custodian and accounting fees on the Statement of Operations. Interest income earned on cash balances at the custodian, if any, is included in Interest income from affiliates on the Statement of Operations. Prior to March 1, 2018, payments to the custodian may be reduced by credits earned by the Fund, based on uninvested cash balances held by the custodian. Such earnings credits, if any, are presented separately on the Statement of Operations.
Interest expense paid to the custodian related to cash overdrafts, if any, is included in Interest expense to affiliates on the Statement of Operations.
E. Waivers and Reimbursements — No expenses or fees (excluding acquired fund fees and expenses, dividend expenses related to short sales, interest expenses related to short sales, interest, taxes, expenses related to litigation and potential litigation and extraordinary expenses) are borne by the Funds pursuant to contractual arrangements with the Adviser through June 30, 2019.
For the period ended August 31, 2018, the Fund’s service providers waived fees and/or reimbursed expenses for the Fund as follows. None of these parties expect the Fund to repay any such waived fees and reimbursed expenses in future years.
| | | | | | | | |
| | | Contractual Waivers
Administration Fees | | | Contractual
Reimbursements | |
| | $ | 10,221 | | | $ | (90,847 | ) |
Additionally, the Fund may invest in one or more money market funds advised by the Adviser or its affiliates (affiliated money market funds). The Adviser, Administrator and JPMDS, as shareholder servicing agent, have contractually agreed to waive fees and/or reimburse expenses in an amount sufficient to offset the respective net fees each collects from the affiliated money market fund on the Fund’s investment in such affiliated money market fund. A portion of the waiver is voluntary.
The amount of these waivers resulting from investments in these money market funds for the period ended August 31, 2018 was $2,725.
F. Other — Certain officers of the Trust are affiliated with the Adviser, the Administrator and JPMDS. Such officers, with the exception of the Chief Compliance Officer, receive no compensation from the Fund for serving in their respective roles.
The Board appointed a Chief Compliance Officer to the Fund in accordance with Federal securities regulations. The Fund, along with other affiliated funds, makes reimbursement payments, on a pro-rata basis, to the Administrator for a portion of the fees associated with the Office of the Chief Compliance Officer. Such fees are included in Trustees’ and Chief Compliance Officer’s fees on the Statement of Operations.
The Trust adopted a Trustee Deferred Compensation Plan (the “Plan”) which allows the Independent Trustees to defer the receipt of all or a portion of compensation related to performance of their duties as Trustees. The deferred fees are invested in various J.P. Morgan Funds until distribution in accordance with the Plan.
| | | | | | | | |
| | | |
| AUGUST 31, 2018 | | J.P. MORGAN SMA FUNDS | | | | | 21 | |
NOTES TO FINANCIAL STATEMENTS
AS OF AUGUST 31, 2018 (continued)
During the period ended August 31, 2018, the Fund purchased securities from an underwriting syndicate in which the principal underwriter or members of the syndicate were affiliated with the Adviser.
The Fund may use related party broker-dealers. For the period ended August 31, 2018, the Fund did not incur any brokerage commissions with broker-dealers affiliated with the Adviser.
The Securities and Exchange Commission (“SEC”) has granted an exemptive order permitting the Fund to engage in principal transactions with J.P. Morgan Securities, Inc., an affiliated broker, involving taxable money market instruments, subject to certain conditions.
4. Investment Transactions
During the period ended August 31, 2018, purchases and sales of investments (excluding short-term investments) were as follows:
| | | | | | | | | | | | | | | | |
| | | Purchases
(excluding
U.S. Government) | | | Sales
(excluding
U.S. Government) | | | Purchases
of U.S.
Government | | | Sales
of U.S.
Government | |
| | $ | 26,976,376 | | | $ | 2,664,598 | | | $ | 4,479,980 | | | $ | 3,985,576 | |
5. Federal Income Tax Matters
For Federal income tax purposes, the estimated cost and unrealized appreciation (depreciation) in value of investments held at August 31, 2018 were as follows:
| | | | | | | | | | | | | | | | |
| | | Aggregate
Cost | | | Gross
Unrealized
Appreciation | | | Gross
Unrealized
Depreciation | | | Net Unrealized
Appreciation
(Depreciation) | |
| | $ | 25,335,755 | | | $ | 77,199 | | | $ | 113,520 | | | $ | (36,321 | ) |
6. Borrowings
The Fund relies upon an exemptive order granted by the SEC (the “Order”) permitting the establishment and operation of an Interfund Lending Facility (the “Facility”). The Facility allows the Fund to directly lend and borrow money to or from any other fund relying upon the Order at rates beneficial to both the borrowing and lending funds. Advances under the Facility are taken primarily for temporary or emergency purposes, including the meeting of redemption requests that otherwise might require the untimely disposition of securities, and are subject to the Fund’s borrowing restrictions. The Interfund loan rate is determined, as specified in the Order, by averaging the current repurchase agreement rate and the current bank loan rate. The Order was granted to JPMorgan Trust II and may be relied upon by the Fund because the Fund and the series of JPMorgan Trust II are both investment companies in the same “group of investment companies” (as defined in Section 12(d)(1)(G) of the 1940 Act).
The Trust and JPMCB have entered into a financing arrangement. Under this arrangement, JPMCB provides an unsecured, uncommitted credit facility in the aggregate amount of $100 million to certain of the J.P. Morgan Funds, including the Fund. Advances under the arrangement are taken primarily for temporary or emergency purposes, including the meeting of redemption requests that otherwise might require the untimely disposition of securities, and are subject to the Fund’s borrowing restrictions. Interest on borrowings is payable at a rate determined by JPMCB at the time of borrowing. This agreement has been extended until November 5, 2018.
The Fund had no borrowings outstanding from another fund or from the unsecured, uncommitted credit facility during the period ended August 31, 2018.
The Trust, along with certain other trusts (“Borrowers”), has entered into a joint syndicated senior unsecured revolving credit facility totaling $1.5 billion (“Credit Facility”) with various lenders and The Bank of New York Mellon, as administrative agent for the lenders. This Credit Facility provides a source of funds to the Borrowers for temporary and emergency purposes, including the meeting of redemption requests that otherwise might require the untimely disposition of securities. Under the terms of the Credit Facility, a borrowing fund must have a minimum of $25,000,000 in adjusted net asset value and not exceed certain adjusted net asset coverage ratios prior to and during the time in which any borrowings are outstanding. If a fund does not comply with the aforementioned requirements, the fund must remediate within three business days with respect to the $25,000,000 minimum adjusted net asset value or within one business day with respect to certain asset coverage ratios or the administrative agent at the request of, or with the consent of, the lenders may terminate the Credit Facility and declare any outstanding borrowings to be due and payable immediately.
Interest associated with any borrowing under the Credit Facility is charged to the borrowing fund at a rate of interest equal to 1.00% plus the greater of the federal funds effective rate or one month LIBOR. The annual commitment fee to maintain the Credit Facility is 0.15% and is incurred on the unused portion of the Credit Facility and is allocated to all participating funds pro rata based on their respective net assets. Effective August 14, 2018, this agreement has been amended and restated for a term of 364 days, unless extended.
The Fund did not utilize the Credit Facility during the period ended August 31, 2018.
7. Risks, Concentrations and Indemnifications
In the normal course of business, the Fund enters into contracts that contain a variety of representations which provide general indemnifications. The Fund’s maximum exposure under these arrangements is unknown. The amount of exposure would depend on future claims that may be brought against the Fund. However, based on experience, the Fund expects the risk of loss to be remote.
| | | | | | |
| | | |
| 22 | | | | J.P. MORGAN SMA FUNDS | | AUGUST 31, 2018 |
As of August 31, 2018, the Fund had one affiliated omnibus account that owned approximately 100% of the Fund’s outstanding shares.
Significant shareholder transactions by this shareholder may impact the Fund’s performance.
The Fund is subject to interest rate and credit risk. The value of debt securities may decline as interest rates increase. The Fund could lose money if the issuer of a fixed income security is unable to pay interest or repay principal when it is due. Many factors can cause interest rates to rise. Some examples include central bank monetary policy, rising inflation rates and general economic conditions. Given that the Federal Reserve has been raising interest rates and may continue to do so, the Fund may face a heightened level of interest rate risk. The ability of the issuers of debt to meet their obligations may be affected by the economic and political developments in a specific industry or region.
The Fund is subject to risks associated with securities with contractual cash flows including asset-backed securities. The value, liquidity and related income of these securities are sensitive to changes in economic conditions, including real estate value, prepayments, delinquencies and/or defaults, and may be adversely affected by shifts in the market’s perception of the issuers and changes in interest rates.
The Fund is subject to the risk that should the Fund decide to sell an illiquid investment when a ready buyer is not available at a price the Fund deems to be representative of its value, the value of the Fund’s net assets could be adversely affected.
8. New Accounting Pronouncement
In March 2017, the Financial Accounting Standards Board (“FASB”) issued Accounting Standards Update (“ASU”) 2017-08 (“ASU 2017-08”) Premium Amortization on Purchased Callable Debt Securities, which shortens the premium amortization period for purchased non-contingently callable debt securities. ASU 2017-08 requires that the premium be amortized to the earliest call date, for purchased non-contingently callable debt securities. ASU 2017-08 is effective for the fiscal years, and interim periods within those fiscal years, beginning after December 15, 2018. Management is currently evaluating the implications of these changes on the financial statements, if any.
In August 2018, the FASB issued ASU 2018-13 Fair Value Measurement (Topic 820): Disclosure Framework — Changes to the Disclosure Requirements for Fair Value Measurement, which adds, removes, and modifies certain aspects of the fair value disclosure. ASU 2018-13 amendments are the result of a broader disclosure project, FASB Concepts Statement Conceptual Framework for Financial Reporting — Chapter 8: Notes to Financial Statements, to improve the effectiveness of the fair value disclosure requirements. ASU 2018-13 is effective for the fiscal years, and interim periods within those fiscal years, beginning after December 15, 2019; early adoption is permitted. Management is currently evaluating the implications of these changes.
9. Subsequent Event
Effective October 5, 2018, the Fund may engage in securities lending to broker dealers or other financial institutions approved by the Fund. Citibank N.A. serves as lending agent for the Fund.
| | | | | | | | |
| | | |
| AUGUST 31, 2018 | | J.P. MORGAN SMA FUNDS | | | | | 23 | |
SCHEDULE OF SHAREHOLDER EXPENSES
(Unaudited)
Hypothetical $1,000 Investment
As a shareholder of the Fund, you incur two types of costs: (1) transaction costs, including sales charges (loads) on purchase payments and (2) ongoing costs, including investment advisory fees, administration fees, distribution fees and other Fund expenses. The examples below are intended to help you understand your ongoing costs (in dollars) of investing in the Fund and to compare these ongoing costs with the ongoing costs of investing in other mutual funds. The examples assume that you had a $1,000 investment in the Fund at the beginning of the reporting period, March 1, 2018, and continued to hold your shares at the end of the reporting period, August 31, 2018.
Actual Expenses
For the Fund in the table below, the first line provides information about actual account values and actual expenses. You may use the information in this line, together with the amount you invested, to estimate the expenses that you paid over the period. Simply divide your account value by $1,000 (for example, an $8,600 account value divided by $1,000 = 8.6), then multiply the result by the number in the first line of each Class under the heading entitled “Expenses Paid During the Period” to estimate the expenses you paid on your account during this period.
Hypothetical Example for Comparison Purposes
The second line in the table below provides information about hypothetical account values and hypothetical expenses based on the Fund’s actual expense ratio and an assumed rate of return of 5% per year before expenses, which is not the Fund’s actual return. The hypothetical account values and expenses may not be used to estimate the actual ending account balance or expenses you paid for the period. You may use this information to compare the ongoing costs of investing in the Class of the Fund and other funds. To do so, compare this 5% hypothetical example with the 5% hypothetical examples that appear in the shareholder reports of the other funds. Please note that the expenses shown in the table are meant to highlight your ongoing costs only and do not reflect any transaction costs, such as sales charges (loads) or redemption fees. Therefore, the second line in the table is useful in comparing ongoing costs only, and will not help you determine the relative total costs of owning different funds. In addition, if these transaction costs were included, your costs would have been higher. The examples also assume all dividends and distributions have been reinvested.
| | | | | | | | | | | | | | | | |
| | | Beginning Account Value March 1, 2018 | | | Ending Account Value August 31, 2018 | | | Expenses Paid During the Period†* | | | Annualized Expense Ratio† | |
JPMorgan Core Focus SMA Fund | | | | | | | | | | | | | | | | |
Actual | | $ | 1,000.00 | | | $ | 1,015.00 | | | $ | — | | | | — | % |
Hypothetical | | | 1,000.00 | | | | 1,025.21 | | | | — | | | | — | |
| † | Reflects the fact that no fees or expenses are borne by the Fund. The Fund is an integral part of “separately managed accounts” programs sponsored by investment advisers and/or broker-dealers unaffiliated with the Fund and the Adviser. Participants in these programs pay a fee to the sponsor of the program. |
| * | Expenses are equal to the Fund’s respective annualized expense ratio, multiplied by the average account value over the period, multiplied by 184/365 (to reflect the one-half year period). Commencement of operations was March 1, 2018. |
| | | | | | |
| | | |
| 24 | | | | J.P. MORGAN SMA FUNDS | | AUGUST 31, 2018 |
BOARD APPROVAL OF INVESTMENT ADVISORY AGREEMENT
(Unaudited)
The Board of Trustees has established various standing committees, composed of Trustees with diverse backgrounds, to which the Board of Trustees has assigned specific subject matter responsibilities to further enhance the effectiveness of the Board’s oversight and decision making. The Board of Trustees and its investment committees (money market and alternative products, equity, and fixed income) meet regularly throughout the year and consider factors that are relevant to their annual consideration of investment advisory agreements at each meeting. They also meet for the specific purpose of considering investment advisory agreement annual renewals. The Board of Trustees held meetings in person in June and August 2018, at which the Trustees considered the continuation of the investment advisory agreement for the Fund whose semi-annual report is contained herein ( the “Advisory Agreement”). At the June meeting, the Board’s investment committees met to review and consider performance, expense and related information for the J.P. Morgan Funds. Each investment committee reported to the full Board, which then considered the investment committee’s preliminary findings. At the August meeting, the Trustees continued their review and consideration. The Trustees, including a majority of the Trustees who are not “interested persons” (as defined in the 1940 Act) of any party to the Advisory Agreement or any of their affiliates, approved the continuation of the Advisory Agreement on August 15, 2018.
As part of their review of the Advisory Agreement, the Trustees considered and reviewed performance and other information about the Fund received from the Adviser. This information includes the Fund’s performance as compared to the performance of its peers and benchmarks and analyses by the Adviser of the Fund’s performance. In addition, the Trustees have engaged an independent management consulting firm (“independent consultant”) to report on the performance of certain J.P. Morgan Funds at each of the Trustees’ regular meetings. In addition, in preparation for the June and August meetings, the Trustees requested, received and evaluated extensive materials from the Adviser, including performance and expense information compiled by Broadridge, using data from Lipper Inc., independent providers of investment company data (together “Broadridge/Lipper”). The Trustees’ independent consultant also provided additional analyses of the performance of certain J.P. Morgan Funds with greater than two years of performance history in connection with the Trustees’ review of the Advisory Agreements. Before voting on the Advisory Agreement, the Trustees reviewed the Advisory Agreement with representatives of the Adviser, counsel to the Trust and independent legal counsel and received a memorandum from independent legal counsel to the Trustees discussing the legal standards for their consideration of the Advisory Agreement. The Trustees also discussed the Advisory Agreement in executive sessions with independent legal counsel at which no representatives of the Adviser were present.
A summary of the material factors evaluated by the Trustees in determining whether to approve the Advisory Agreement is provided below. Each Trustee attributed different weights to the various factors and no factor alone was considered determinative. The Trustees considered information provided with respect to the Fund throughout the year, as well as materials furnished specifically in connection with the annual review process. From year to year, the Trustees consider and place emphasis on relevant information in light of changing circumstances in market and economic conditions.
After considering and weighing the factors and information they had received, the Trustees found that the overall arrangement between the Fund and the Adviser, as provided in the Advisory Agreement was fair and reasonable under the circumstances and determined that the continuance of the Advisory Agreement was in the best interests of the Fund and its shareholders.
Nature, Extent and Quality of Services Provided by the Adviser
The Trustees received and considered information regarding the nature, extent and quality of the services provided to the Fund under the Advisory Agreement. The Trustees took into account information furnished throughout the year at Trustee meetings, as well as the materials furnished specifically in connection with this annual review process. The Trustees considered the background and experience of the Adviser’s senior management and the expertise of, and the amount of attention given to the Fund by, investment personnel of the Adviser. In addition, the Trustees reviewed the qualifications, backgrounds and responsibilities of the portfolio management team primarily responsible for the day-to-day management of the Fund and the infrastructure supporting the team, including personnel changes. The Trustees also considered information provided by the Adviser and JPMorgan Distribution Services, Inc. (“JPMDS”) about the structure and distribution strategy of the Fund. The Trustees reviewed information relating to the Adviser’s risk governance model and reports showing the Adviser’s compliance structure and ongoing compliance processes. The Trustees also considered the quality of the administrative services provided by the Adviser in its role as administrator.
The Trustees also considered their knowledge of the nature and quality of the services provided by the Adviser and its affiliates to the Fund gained from their experience as Trustees of the J.P. Morgan Funds. In addition, they considered the overall reputation and capabilities of the Adviser and its affiliates, the commitment of the Adviser to provide high quality service to the Fund, their overall confidence in the Adviser’s integrity and the Adviser’s responsiveness to questions or concerns raised by them, including the Adviser’s willingness to consider and implement organizational and operational changes designed to improve investment results and the services provided to the Fund.
| | | | | | | | |
| | | |
| AUGUST 31, 2018 | | J.P. MORGAN SMA FUNDS | | | | | 25 | |
BOARD APPROVAL OF INVESTMENT ADVISORY AGREEMENT
(Unaudited) (continued)
Based upon these considerations and other factors, the Trustees concluded that they were satisfied with the nature, extent and quality of the investment advisory services provided to the Fund by the Adviser.
Costs of Services Provided and Profitability to the Adviser and its Affiliates
The Trustees noted that there was no advisory fee charged to the Funds. The Trustees received and considered information regarding the profitability to the Adviser and its affiliates in providing services to the Fund. The Trustees reviewed and discussed this information. The Trustees recognized that this information is not audited and represents the Adviser’s determination of its and its affiliates’ revenues from the contractual services provided to the Fund, less expenses of providing such services. Expenses include direct and indirect costs and are calculated using an allocation methodology developed by the Adviser. The Trustees also recognized that it is difficult to make comparisons of profitability from fund investment advisory contracts because comparative information is not generally publicly available and is affected by numerous factors, including the structure of the particular adviser, the types of funds it manages, its business mix, numerous assumptions regarding allocations and the fact that publicly-traded fund managers’ operating profits and net income are net of distribution and marketing expenses. Based on their review, the Trustees concluded that the profitability to the Adviser under the Advisory Agreement was not unreasonable in light of the services and benefits provided to the Fund.
The Trustees also considered that the Adviser did not earn fees from the Fund for providing administrative services due to contractual waivers it has in place. The Trustees also considered the fees paid to JPMorgan Chase Bank, N.A. (“JPMCB”) for custody and fund accounting, and other related services. In addition, the Trustees considered that the Adviser receives fees from sponsors of, and/or investors in, separately managed accounts that are invested in the Fund.
Fall-Out Benefits
The Trustees reviewed information regarding potential “fallout” or ancillary benefits received by the Adviser and its affiliates as a result of their relationship with the Funds. The Trustees also reviewed the Adviser’s allocation of fund brokerage for the J.P. Morgan Funds complex, including allocations to brokers who provide research to the Adviser.
Economies of Scale
The Trustees considered the extent to which the Fund may benefit from economies of scale. The Trustees considered that there may not be a direct relationship between economies of scale realized by the Fund and those realized by the Adviser as assets increase. The Trustees noted that there was not an investment advisory fee charged to the Fund. The Trustees also
considered that the Fund has implemented fee waivers and contractual expense limitations (“Fee Caps”) which allow the Fund’s shareholders to share potential economies of scale from the Fund’s inception. The Trustees also considered that the Adviser has added or enhanced services to the Fund over time, noting the Adviser’s substantial investments in its business in support of the Fund, including investments in trading systems and technology (including cybersecurity improvements), attraction and retention of key talent, additions to analyst and portfolio management teams, and regulatory support enhancements. The Trustees concluded that the Fund’s shareholders received the benefits of potential economies of scale through the Fee Caps and the Adviser’s reinvestment in its operations to serve the Fund and its shareholders.
Independent Written Evaluation of the Funds’ Chief Compliance Officer
The Trustees noted that, upon their direction, the Chief Compliance Officer for the Fund had prepared an independent written evaluation in order to assist the Trustees in determining the reasonableness of the Advisory Agreement or management fees including administrative fees. The Trustees considered the written evaluation in determining whether to continue the Advisory Agreement.
Fees Relative to Adviser’s Other Clients
The Trustees received and considered information about the nature and extent of investment advisory services and fee rates offered to other clients of the Adviser, including institutional separate accounts and/or funds sub-advised by the Adviser, and for investment management styles substantially similar to that of the Fund. The Trustees considered the complexity of investment management for registered mutual funds relative to the Adviser’s other clients and noted differences in the regulatory, legal and other risks and responsibilities of providing services to the different clients. The Trustees considered that serving as an adviser to a registered mutual fund involves greater responsibilities and risks than acting as a sub-adviser and observed that sub-advisory fees may be lower than those charged by the Adviser to the Fund. The Trustees also noted that the adviser, not the mutual fund, pays the sub-advisory fee and that many responsibilities related to the advisory function are retained by the primary adviser. The Trustees concluded that the fee rates charged to the Fund in comparison to those charged to the Adviser’s other clients were reasonable.
Investment Performance
The Trustees considered the Fund’s investment strategy and process, portfolio management team and competitive positioning against identified peer funds, and concluded that the prospects for competitive future performance were acceptable.
| | | | | | |
| | | |
| 26 | | | | J.P. MORGAN SMA FUNDS | | AUGUST 31, 2018 |
Advisory Fees and Expense Ratios
The Fund is not charged a separate investment advisory fee by the Adviser because the Fund is offered as a component of the SMA Strategy to participants in separately managed account programs that hold both the Fund and other securities and investments directly for the SMA clients. The Adviser is compensated by the separately managed account sponsors. The Trustees considered the Fund’s contractual advisory fee rate and administration fee rate and compared the combined rate to the information prepared by Broadridge/Lipper concerning management fee rates paid by other funds in the same Broadridge/Lipper category as the Fund. The Trustees recognized that Broadridge/Lipper reported the Fund’s management fee rate as the combined contractual advisory fee (which is 0.00%) and administration fee rates. The Trustees also reviewed information about other expenses and the expense ratios for the Fund. The Trustees considered the Fee
Caps currently in place for the Fund and considered the expenses of the Fund after taking into account any waivers and/or reimbursements, and, where deemed appropriate by the Trustee, additional waivers and/or reimbursements. The Trustees recognized that it is difficult to make comparisons of expense ratios because there are variations in the services that are included in the fees paid by other funds. The Trustees’ determination as a result of the review of the Fund’s expense ratios are summarized below:
The Trustees noted that, based upon the Universe, the Fund’s contractual advisory fee and the actual total expenses were in the first quintile. After considering the factors identified above, in light of this information, the Trustees concluded that the advisory fee was satisfactory in light of the services provided to the Fund.
| | | | | | | | |
| | | |
| AUGUST 31, 2018 | | J.P. MORGAN SMA FUNDS | | | | | 27 | |
J.P. Morgan Funds are distributed by JPMorgan Distribution Services, Inc., which is an affiliate of JPMorgan Chase & Co. Affiliates of JPMorgan Chase & Co. receive fees for providing various services to the funds.
Contact JPMorgan Distribution Services, Inc. at 1-800-480-4111 for a fund prospectus. You can also visit us at www.jpmorganfunds.com. Investors should carefully consider the investment objectives and risk as well as charges and expenses of the mutual fund before investing. The prospectus contains this and other information about the mutual fund. Read the prospectus carefully before investing.
Investors may obtain information about the Securities Investor Protection Corporation (SIPC), including the SIPC brochure, by visiting www.sipc.org or by calling SIPC at 202-371-8300.
The Fund files a complete schedule of its fund holdings for the first and third quarters of its fiscal year with the SEC on Form N-Q. The Fund’s Forms N-Q are available on the SEC’s website at http://www.sec.gov and may be reviewed and copied at the SEC’s Public Reference Room in Washington, DC. Information on the operation of the SEC’s Public Reference Room may be obtained by calling 1-800-SEC-0330. Shareholders may request the Form N-Q without charge by calling 1-800-480-4111 or by visiting the J.P. Morgan Funds’ website at www.jpmorganfunds.com.
A description of the Fund’s policies and procedures with respect to the disclosure of the Fund’s holdings is available in the prospectuses and Statement of Additional Information.
A copy of proxy policies and procedures is available without charge upon request by calling 1-800-480-4111 and on the Fund’s website at www.jpmorganfunds.com. A description of such policies and procedures is on the SEC’s website at www.sec.gov. The Trustees have delegated the authority to vote proxies for securities owned by the Fund to the Adviser. A copy of the Fund’s voting record for the most recent 12-month period ended June 30 is available on the SEC’s website at www.sec.gov or at the Fund’s website at www.jpmorganfunds.com no later than August 31 of each year. The Fund’s proxy voting record will include, among other things, a brief description of the matter voted on for each fund security, and will state how each vote was cast, for example, for or against the proposal.

J.P. Morgan Asset Management is the marketing name for the asset management businesses of JPMorgan Chase & Co. Those businesses include, but are not limited to, J.P. Morgan Investment Management Inc., Security Capital Research & Management Incorporated and J.P. Morgan Alternative Asset Management, Inc.
| | | | |
| | © JPMorgan Chase & Co., 2018. All rights reserved. August 2018. | | SAN-CFSMA-818 |
Semi-Annual Report
J.P. Morgan Municipal Bond Funds
August 31, 2018 (Unaudited)
JPMorgan Municipal Income Fund
JPMorgan Short-Intermediate Municipal Bond Fund
JPMorgan Tax Free Bond Fund
JPMorgan Ultra-Short Municipal Fund

CONTENTS
Investments in a Fund are not deposits or obligations of, or guaranteed or endorsed by, any bank and are not insured or guaranteed by the FDIC, the Federal Reserve Board or any other government agency. You could lose money if you sell when a Fund’s share price is lower than when you invested.
Past performance is no guarantee of future performance. The general market views expressed in this report are opinions based on market and other conditions through the end of the reporting period and are subject to change without notice. These views are not intended to predict the future performance of a Fund or the securities markets. References to specific securities and their issuers are for illustrative purposes only and are not intended to be, and should not be interpreted as, recommendations to purchase or sell such securities. Such views are not meant as investment advice and may not be relied on as an indication of trading intent on behalf of any Fund.
Prospective investors should refer to the Funds’ prospectuses for a discussion of the Funds’ investment objectives, strategies and risks. Call J.P. Morgan Funds Service Center at 1-800-480-4111 for a prospectus containing more complete information about a Fund, including management fees and other expenses. Please read it carefully before investing.
CEO’S LETTER
October 9, 2018 (Unaudited)
Dear Shareholder,
The world’s leading economies continued to expand in the six months ended August 31, 2018, though the pattern of synchronized global growth that had characterized the previous two years began to dissipate amid geopolitical tensions and rising borrowing costs for emerging market nations.
| | |
 | | “During the reporting period, the current U.S. economic expansion became the second longest on record.” — George C.W. Gatch |
U.S. gross domestic product (GDP) growth surged to 4.2% in the second quarter of 2018 from 2.2% in the first quarter. Notably, unemployment stood at 3.9% in August, though wage growth remained subdued. While the U.S. raised import tariffs on Chinese goods worth billions of dollars and the Chinese government responded in kind during the reporting period, trade tensions with China and other U.S. trading partners appeared to have little impact on business sentiment in the U.S. In response to continued economic growth and falling unemployment, the U.S. Federal Reserve raised benchmark interest rates in March and again in June. (Subsequent to the end of the reporting period, the central bank raised interest rates in September 2018.)
In the European Union, positive economic growth was clouded by political uncertainty. Second quarter GDP rose 2.1%, though core inflation remained below the European Central Bank’s (ECB) target rate. Unemployment in the 19-nation euro area fell to 8.1% in August, the lowest level since November 2008. However, a new government in Italy raised investor concerns that its budget plans would deviate from the European Commission’s stability and growth pact and force the commission to enact punitive measures. Against this backdrop, the ECB held to its plan to maintain interest rates at current levels until at least next summer. Meanwhile, negotiations over the U.K.’s exit from the European Union continued without resolution, raising political tensions between leaders in the EU and the U.K. as well as within the Britain’s ruling Conservative Party.
While trade tensions led to a decline in Chinese exports to the U.S., the Chinese government took steps to further stimulate domestic demand and capital outflows from China appeared limited at the end of the reporting period.
Meanwhile, select emerging market nations saw the value of their currencies and their sovereign debt plummet. Nations dependent on foreign lending and imported petroleum were hit hardest by rising U.S. interest rates and a strengthening U.S. dollar that effectively raised borrowing costs. The economies of Argentina, Brazil, South Africa and Turkey were among those hurt by rising borrowing costs and/or political uncertainty.
In financial markets, U.S. equities largely recovered from a sharp sell-off in February 2018 and outperformed other regions and other asset classes. Record corporate earnings, strong consumer spending and positive economic data bolstered equity prices and pushed the S&P 500 Index to record highs in August. Equity prices in other developed markets were weak and prices fell sharply in emerging markets. Bond markets were mixed, with limited positive returns in select U.S. Treasury bonds and U.S. high yield bonds (also called “junk bonds”) and negative returns for emerging markets debt. Notably, global energy prices rose somewhat during the reporting period, which supported oil exporting economies without becoming a large drag on global economic growth.
During the reporting period, the current U.S. economic expansion became the second longest on record. While the underlying fundamentals of continued global economic growth remained in place at the end of August, the longer-term impact of protectionist U.S. trade policy and the extent of currency devaluation in emerging markets were key issues looming over global financial markets.
We believe that investors may be best served by a well-diversified portfolio and a patient outlook. We look forward to managing your investment needs for years to come. Should you have any questions, please visit www.jpmorganfunds.com or contact the J.P. Morgan Funds Service Center at 1-800-480-4111.
Sincerely yours,

George C.W. Gatch
CEO, Global Funds Management
J.P. Morgan Asset Management
| | | | | | | | |
| | | |
| AUGUST 31, 2018 | | J.P. MORGAN MUNICIPAL BOND FUNDS | | | | | 1 | |
J.P. Morgan Municipal Bond Funds
MARKET OVERVIEW
SIX MONTHS ENDED AUGUST 31, 2018 (Unaudited)
During the reporting period, U.S. bond markets largely underperformed U.S. equities, which were supported by record corporate profits, strong consumer spending and continued economic growth. The U.S. Federal Reserve raised interest rates in March and again in June.
Within fixed-income markets, high yield bonds (also known as “junk bonds”) continued to outperform investment grade corporate debt and U.S. Treasury bonds. However, bond prices overall were weighed down by expectations of accelerating inflation and rising interest rates as the U.S. economic expansion became the second-longest on record.
Within the U.S. municipal bond market, interest rates rose significantly in the short end of the yield curve but largely moved in a narrow band for maturities of five years and longer during the reporting period. The yield curve shows the relationship between yields and maturity dates for a set of similar bonds at a given point in time. For the six months ended August 31, 2018, the Bloomberg Barclays Municipal Bond Index returned 1.75%.
| | | | | | |
| | | |
| 2 | | | | J.P. MORGAN MUNICIPAL BOND FUNDS | | AUGUST 31, 2018 |
JPMorgan Municipal Income Fund
FUND COMMENTARY
SIX MONTHS ENDED AUGUST 31, 2018 (Unaudited)
| | | | |
| REPORTING PERIOD RETURN: | |
| Fund (Class I Shares)* | | | 1.17% | |
| Bloomberg Barclays U.S. 1-15 Year Blend (1-17) Municipal Bond Index | | | 1.57% | |
| |
| Net Assets as of 8/31/2018 (In Thousands) | | $ | 201,430 | |
| Duration as of 8/31/2018 | | | 4.7 years | |
INVESTMENT OBJECTIVE**
The JPMorgan Municipal Income Fund (the “Fund”) seeks current income exempt from federal income taxes.
WHAT WERE THE MAIN DRIVERS OF THE FUND’S PERFORMANCE?
For the six months ended August 31, 2018, the Fund’s Class I Shares underperformed the Bloomberg Barclays U.S. 1-15 Year Blend (1-17) Municipal Bond Index (the “Benchmark”). Interest rates rose on two-year and five-year bonds during the reporting period and moved in a narrow range and ended slightly lower on ten-year, fifteen-year and thirty-year bonds. Overall, lower quality bonds outperformed higher quality bonds.
Relative to the Benchmark, the Fund’s shorter duration in the housing sector hurt performance as interest rates rose on bonds with shorter maturities. Duration measures the price sensitivity of a bond or a portfolio of bonds to relative changes in interest rates. Generally, bonds with shorter duration will experience a larger decrease in price as interest rates rise. The Fund’s underweight position in the ten-plus-year portion of the yield curve and its underweight position in general obligation bonds also detracted from relative performance. The yield curve shows the relationship between yields and maturity dates for a set of similar bonds at a given point in time.
The Fund’s overweight position and longer duration in the hospital sector and its underweight position in the pre-refunded sector were leading contributors to relative per-
formance. The Fund’s overweight position in single-A rated bonds also helped relative performance.
HOW WAS THE FUND POSITIONED?
The Fund’s portfolio managers continued to emphasize higher yielding sectors, particularly the housing sector. At the end of the six month period, the Fund’s overall duration was slightly shorter than that of the Benchmark.
| | | | |
CREDIT QUALITY ALLOCATIONS*** | |
| AAA | | | 23.5 | % |
| AA | | | 46.5 | |
| A | | | 22.9 | |
| BBB | | | 5.5 | |
| NR | | | 1.6 | |
| * | | The return shown is based on net asset values calculated for shareholder transactions and may differ from the return shown in the financial highlights, which reflects adjustments made to the net asset values in accordance with accounting principles generally accepted in the United States of America. |
| ** | | The adviser seeks to achieve the Fund’s objective. There can be no guarantee it will be achieved. |
| *** | | Percentages indicated are based on total investments as of August 31, 2018. The Fund’s portfolio composition is subject to change. |
| | | | | | | | |
| | | |
| AUGUST 31, 2018 | | J.P. MORGAN MUNICIPAL BOND FUNDS | | | | | 3 | |
JPMorgan Municipal Income Fund
FUND COMMENTARY
SIX MONTHS ENDED AUGUST 31, 2018 (Unaudited) (continued)
| | | | | | | | | | | | | | | | | | |
AVERAGE ANNUAL TOTAL RETURNS AS OF AUGUST 31, 2018 | |
| | | | | |
| | | INCEPTION DATE OF
CLASS | | 6 MONTH* | | | 1 YEAR | | | 5 YEAR | | | 10 YEAR | |
| | | | | | | | | | | | | | | | | | |
CLASS A SHARES | | February 23, 1993 | | | | | | | | | | | | | | | | |
With Sales Charge** | | | | | (2.85 | )% | | | (4.79 | )% | | | 1.98 | % | | | 2.72 | % |
Without Sales Charge | | | | | 0.92 | | | | (1.03 | ) | | | 2.75 | | | | 3.12 | |
CLASS C SHARES | | November 4, 1997 | | | | | | | | | | | | | | | | |
With CDSC*** | | | | | (0.24 | ) | | | (2.49 | ) | | | 2.17 | | | | 2.54 | |
Without CDSC | | | | | 0.76 | | | | (1.49 | ) | | | 2.17 | | | | 2.54 | |
CLASS I SHARES | | February 9, 1993 | | | 1.17 | | | | (0.69 | ) | | | 3.01 | | | | 3.39 | |
CLASS R6 SHARES | | November 6, 2017 | | | 1.11 | | | | (0.71 | ) | | | 3.01 | | | | 3.38 | |
| ** | | Sales Charge for Class A Shares is 3.75%. |
| *** | | Assumes a 1% CDSC (contingent deferred sales charge) for the 6 month and one year periods and 0% CDSC thereafter. |
TEN YEAR PERFORMANCE (8/31/08 TO 8/31/18)
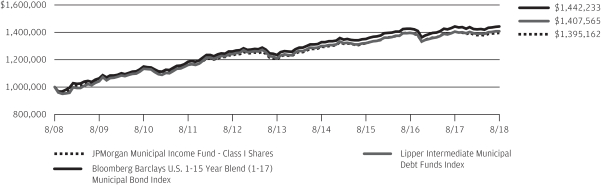
The performance quoted is past performance and is not a guarantee of future results. Mutual funds are subject to certain market risks. Investment returns and principal value of an investment will fluctuate so that an investor’s shares, when redeemed, may be worth more or less than their original cost. Current performance may be higher or lower than the performance data shown. For up-to-date, month-end performance information please call 1-800-480-4111.
Returns for Class R6 Shares prior to its inception date are based on the performance of Class I Shares. The actual returns of Class R6 Shares would have been different than those shown because Class R6 Shares had different expenses than Class I Shares.
The graph illustrates comparative performance for $1,000,000 invested in Class I Shares of the JPMorgan Municipal Income Fund, the Bloomberg Barclays U.S. 1-15 Year Blend (1-17) Municipal Bond Index and the Lipper Intermediate Municipal Debt Funds Index from August 31, 2008 to August 31, 2018. The performance of the Fund assumes reinvestment of all dividends and capital gain distributions, if any, and does not include a sales charge. The performance of the Bloomberg Barclays U.S. 1-15 Year Blend (1-17) Municipal Bond Index does not reflect the deduction of expenses or a sales charge associated with a mutual fund and has been adjusted to reflect reinvestment of all dividends and capital gain distributions of the securities included in the benchmark, if applicable. The performance of the Lipper Intermediate Municipal Debt Funds Index
includes expenses associated with a mutual fund, such as investment management fees. These expenses are not identical to the expenses incurred by the Fund. The Bloomberg Barclays U.S. 1-15 Year Blend (1-17) Municipal Bond Index represents the performance of municipal bonds with maturities from 1 to 17 years. The Lipper Intermediate Municipal Debt Funds Index is an index based on the total returns of certain mutual funds within the Fund’s designated category as determined by Lipper, Inc. Investors cannot invest directly in an index.
Capital gain distributions are subject to federal income tax; a portion of the Fund’s income distributions may be subject to the alternative minimum tax and some investors may be subject to certain state and local taxes.
Class I Shares have a $1,000,000 minimum initial investment.
Fund performance may reflect the waiver of the Fund’s fees and reimbursement of expenses for certain periods since the inception date. Without these waivers and reimbursements, performance would have been lower. Also, performance shown in this section does not reflect the deduction of taxes that a shareholder would pay on Fund distributions or redemptions of Fund shares.
The returns shown are based on net asset values calculated for shareholder transactions and may differ from the returns shown in the financial highlights, which reflect adjustments made to the net asset values in accordance with accounting principles generally accepted in the United States of America.
| | | | | | |
| | | |
| 4 | | | | J.P. MORGAN MUNICIPAL BOND FUNDS | | AUGUST 31, 2018 |
JPMorgan Short-Intermediate Municipal Bond Fund
FUND COMMENTARY
SIX MONTHS ENDED AUGUST 31, 2018 (Unaudited)
| | | | |
| REPORTING PERIOD RETURN: | |
| Fund (Class A Shares, without a sales charge)* | | | 0.94% | |
| Bloomberg Barclays U.S. 1-5 Year Blend (1-6) Municipal Bond Index | | | 0.94% | |
| |
| Net Assets as of 8/31/2018 (In Thousands) | | $ | 1,631,990 | |
| Duration as of 8/31/2018 | | | 3.3 years | |
INVESTMENT OBJECTIVE**
The JPMorgan Short-Intermediate Municipal Bond Fund (the “Fund”) seeks as high a level of current income exempt from federal income tax as is consistent with relative stability of principal.
WHAT WERE THE MAIN DRIVERS OF THE FUND’S PERFORMANCE?
For the six months ended August 31, 2018, the Fund performed in line with the Bloomberg Barclays U.S. 1-5 Year Blend (1-6) Municipal Bond Index (the “Benchmark”). During the reporting period, interest rates rose on two-year and five-year bonds and moved in a narrow band on two-year, fifteen-year and thirty-year bonds before ending the period slightly lower. Overall, lower quality bonds outperformed higher quality bonds.
Relative to the Benchmark, the Fund’s longer duration was a leading contributor to performance. Duration measures the price sensitivity of a portfolio of bonds to changes in interest rates. Generally, bonds with longer duration will experience a larger increase in price as interest rates fall. The Fund’s underweight position in pre-refunded bonds and its overweight positions in the hospitals sector and in California bonds also helped relative performance.
The Funds underweight positions in industrial development revenue/pollution control revenue bonds, leasing sector bonds and in state general obligation bonds were leading detractors from performance relative to the Benchmark.
HOW WAS THE FUND POSITIONED?
During the reporting period, the Fund employed a bottom-up, security selection-based investment approach. The Fund’s portfolio managers sought to take advantage of opportunities stemming from increased volatility, supply pressures and headline credit risk, while maintaining the Fund’s bias toward higher quality issuances.
| | | | |
CREDIT QUALITY ALLOCATIONS*** | |
| AAA | | | 24.5 | % |
| AA | | | 45.0 | |
| A | | | 22.1 | |
| BBB | | | 5.2 | |
| NR | | | 3.2 | |
| * | | The return shown is based on net asset values calculated for shareholder transactions and may differ from the return shown in the financial highlights, which reflects adjustments made to the net asset values in accordance with accounting principles generally accepted in the United States of America. |
| ** | | The adviser seeks to achieve the Fund’s objective. There can be no guarantee it will be achieved. |
| *** | | Percentages indicated are based on total investments as of August 31, 2018. The Fund’s portfolio composition is subject to change. |
| | | | | | | | |
| | | |
| AUGUST 31, 2018 | | J.P. MORGAN MUNICIPAL BOND FUNDS | | | | | 5 | |
JPMorgan Short-Intermediate Municipal Bond Fund
FUND COMMENTARY
SIX MONTHS ENDED AUGUST 31, 2018 (Unaudited) (continued)
| | | | | | | | | | | | | | | | | | |
AVERAGE ANNUAL TOTAL RETURNS AS OF AUGUST 31, 2018 | |
| | | INCEPTION DATE OF
CLASS | | 6 MONTH* | | | 1 YEAR | | | 5 YEAR | | | 10 YEAR | |
CLASS A SHARES | | May 4, 1998 | | | | | | | | | | | | | | | | |
With Sales Charge** | | | | | (1.34 | )% | | | (2.72 | )% | | | 0.46 | % | | | 1.02 | % |
Without Sales Charge | | | | | 0.94 | | | | (0.52 | ) | | | 0.92 | | | | 1.25 | |
CLASS C SHARES | | November 1, 2001 | | | | | | | | | | | | | | | | |
With CDSC*** | | | | | (0.33 | ) | | | (2.06 | ) | | | 0.42 | | | | 0.74 | |
Without CDSC | | | | | 0.67 | | | | (1.06 | ) | | | 0.42 | | | | 0.74 | |
CLASS I SHARES | | June 19, 2009 | | | 1.17 | | | | (0.07 | ) | | | 1.39 | | | | 1.73 | |
| ** | | Sales Charge for Class A Shares is 2.25%. |
| *** | | Assumes a 1% CDSC (contingent deferred sales charge) for the 6 month and one year periods and 0% CDSC thereafter. |
TEN YEAR PERFORMANCE (8/31/08 TO 8/31/18)
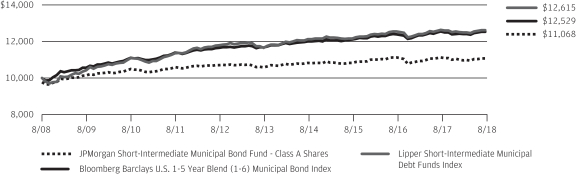
The performance quoted is past performance and is not a guarantee of future results. Mutual funds are subject to certain market risks. Investment returns and principal value of an investment will fluctuate so that an investor’s shares, when redeemed, may be worth more or less than their original cost. Current performance may be higher or lower than the performance data shown. For up-to-date, month-end performance information please call 1-800-480-4111.
Returns for Class I Shares prior to its inception date are based on the performance of Class A Shares. The actual returns of Class I Shares would have been different than those shown because Class I Shares had different expenses than Class A Shares.
The graph illustrates comparative performance for $10,000 invested in Class A Shares of the JPMorgan Short-Intermediate Municipal Bond Fund, the Bloomberg Barclays U.S. 1-5 Year Blend (1-6) Municipal Bond Index and the Lipper Short-Intermediate Municipal Debt Funds Index from August 31, 2008 to August 31, 2018. The performance of the Fund assumes reinvestment of all dividends and capital gain distributions, if any, and does not include a sales charge. The performance of the Bloomberg Barclays U.S. 1-5 Year Blend (1-6) Municipal Bond Index does not reflect the deduction of expenses or a sales charge associated with a mutual fund and has been adjusted to reflect reinvestment of all dividends and capital gain distributions of the securities included in the benchmark, if applicable. The performance of the Lipper Short-Intermediate Municipal Debt Funds Index includes expenses associated with a mutual fund, such as invest-
ment management fees. These expenses are not identical to the expenses incurred by the Fund. The Bloomberg Barclays U.S. 1-5 Year Blend (1-6) Municipal Bond Index is an unmanaged index of investment grade tax-exempt municipal bonds with maturities of 1–5.999 years. The Lipper Short-Intermediate Municipal Debt Funds Index represents the total returns of certain mutual funds within the Fund’s designated category as determined by Lipper, Inc. Investors cannot invest directly in an index.
Capital gain distributions are subject to federal income tax; a portion of the Fund’s income distributions may be subject to the alternative minimum tax and some investors may be subject to certain state and local taxes.
Class A Shares have a $1,000 minimum initial investment and carry a 2.25% sales charge.
Fund performance may reflect the waiver of the Fund’s fees and reimbursement of expenses for certain periods since the inception date. Without these waivers and reimbursements, performance would have been lower. Also, performance shown in this section does not reflect the deduction of taxes that a shareholder would pay on Fund distributions or redemptions of Fund shares.
The returns shown are based on net asset values calculated for shareholder transactions and may differ from the returns shown in the financial highlights, which reflect adjustments made to the net asset values in accordance with accounting principles generally accepted in the United States of America.
| | | | | | |
| | | |
| 6 | | | | J.P. MORGAN MUNICIPAL BOND FUNDS | | AUGUST 31, 2018 |
JPMorgan Tax Free Bond Fund
FUND COMMENTARY
SIX MONTHS ENDED AUGUST 31, 2018 (Unaudited)
| | | | |
| REPORTING PERIOD RETURN: | |
| Fund (Class A Shares, without a sales charge)* | | | 1.41% | |
| Bloomberg Barclays Municipal Bond Index | | | 1.75% | |
| |
| Net Assets as of 8/31/2018 (In Thousands) | | | $368,925 | |
| Duration as of 8/31/2018 | | | 6.5 years | |
INVESTMENT OBJECTIVE**
The JPMorgan Tax Free Bond Fund (the “Fund”) seeks as high a level of current income exempt from federal income tax as is consistent with relative stability of principal.
WHAT WERE THE MAIN DRIVERS OF THE FUND’S PERFORMANCE?
For the six months ended August 31, 2018, the Fund underperformed the Bloomberg Barclays Municipal Bond Index (the “Benchmark”). Interest rates rose on two-year and five-year bonds during the reporting period, while interest rates on ten-year, fifteen-year and thirty-year bonds moved in a narrow range and ended slightly lower. Overall, lower rated bonds outperformed higher rated bonds.
Relative to the Benchmark, the Fund’s overweight position in pre-refunded bonds and its underweight positions in the leasing sector and in bonds issued by California and Illinois detracted from performance.
The Fund’s longer overall duration compared with the Benchmark was a leading contributor to relative performance. Duration measures the price sensitivity of a portfolio of bonds to relative changes in interest rates. Generally, bonds with longer duration will experience a larger increase in price as interest rates rise. The Fund’s overweight allocation to the ten-plus year portion of the yield curve also helped relative performance. The yield curve shows the relationship between yields and maturity dates for a set of similar bonds at a given point in time. The
Fund’s overweight positions in the housing, hospital and industrial development revenue/pollution control revenue bond sector and its overweight positions in single-A rated bonds and BBB rated bonds also helped relative performance.
HOW WAS THE FUND POSITIONED?
The Fund continued to employ a bottom-up, security selection-based investment approach and sought to take advantage of opportunities stemming from increased volatility, supply pressures and headline credit risk.
| | | | |
CREDIT QUALITY ALLOCATIONS*** | |
| AAA | | | 12.2 | % |
| AA | | | 49.7 | |
| A | | | 21.8 | |
| BBB | | | 12.9 | |
| NR | | | 3.4 | |
| * | | The return shown is based on net asset values calculated for shareholder transactions and may differ from the return shown in the financial highlights, which reflects adjustments made to the net asset values in accordance with accounting principles generally accepted in the United States of America. |
| ** | | The adviser seeks to achieve the Fund’s objective. There can be no guarantee it will be achieved. |
| *** | | Percentages indicated are based on total investments as of August 31, 2018. The Fund’s portfolio composition is subject to change. |
| | | | | | | | |
| | | |
| AUGUST 31, 2018 | | J.P. MORGAN MUNICIPAL BOND FUNDS | | | | | 7 | |
JPMorgan Tax Free Bond Fund
FUND COMMENTARY
SIX MONTHS ENDED AUGUST 31, 2018 (Unaudited) (continued)
| | | | | | | | | | | | | | | | | | |
AVERAGE ANNUAL TOTAL RETURNS AS OF AUGUST 31, 2018 | |
| | | INCEPTION DATE OF
CLASS | | 6 MONTH* | | | 1 YEAR | | | 5 YEAR | | | 10 YEAR | |
CLASS A SHARES | | March 1, 1988 | | | | | | | | | | | | | | | | |
With Sales Charge** | | | | | (2.39 | )% | | | (3.31 | )% | | | 3.34 | % | | | 3.33 | % |
Without Sales Charge | | | | | 1.41 | | | | 0.43 | | | | 4.13 | | | | 3.72 | |
CLASS C SHARES | | July 1, 2008 | | | | | | | | | | | | | | | | |
With CDSC*** | | | | | 0.13 | | | | (1.14 | ) | | | 3.45 | | | | 3.03 | |
Without CDSC | | | | | 1.13 | | | | (0.14 | ) | | | 3.45 | | | | 3.03 | |
CLASS I SHARES | | February 1, 1995 | | | 1.53 | | | | 0.66 | | | | 4.31 | | | | 3.91 | |
| ** | | Sales Charge for Class A Shares is 3.75%. |
| *** | | Assumes a 1% CDSC (contingent deferred sales charge) for the 6 month and one year periods and 0% CDSC thereafter. |
TEN YEAR PERFORMANCE (8/31/08 TO 8/31/18)
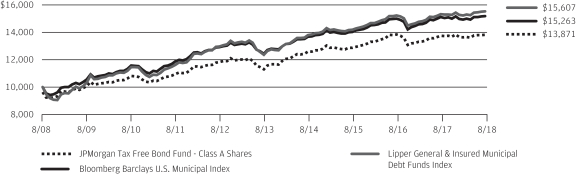
The performance quoted is past performance and is not a guarantee of future results. Mutual funds are subject to certain market risks. Investment returns and principal value of an investment will fluctuate so that an investor’s shares, when redeemed, may be worth more or less than their original cost. Current performance may be higher or lower than the performance data shown. For up-to-date, month-end performance information please call 1-800-480-4111.
The graph illustrates comparative performance for $10,000 invested in Class A Shares of the JPMorgan Tax Free Bond Fund, the Bloomberg Barclays U.S. Municipal Index and the Lipper General & Insured Municipal Debt Funds Index from August 31, 2008 to August 31, 2018. The performance of the Fund assumes reinvestment of all dividends and capital gain distributions, if any, and includes a sales charge. The performance of the Bloomberg Barclays U.S. Municipal Index does not reflect the deduction of expenses or a sales charge associated with a mutual fund and has been adjusted to reflect reinvestment of all dividends and capital gain distributions of the securities included in the benchmark, if applicable. The performance of the Lipper General & Insured Municipal Debt Funds Index includes expenses associated with a mutual fund, such as investment management fees. These expenses are not identical to the expenses incurred by the Fund. The Bloomberg Barclays U.S. Municipal Index is a total return performance benchmark for the
long-term, investment-grade tax-exempt bond market. The Lipper General & Insured Municipal Debt Funds Index represents the total returns of certain mutual funds within the Fund’s designated category as defined by Lipper, Inc. Investors cannot invest directly in an index.
Capital gain distributions are subject to federal income tax; a portion of the Fund’s income distributions may be subject to the alternative minimum tax and some investors may be subject to certain state and local taxes.
Class A Shares have a $1,000 minimum initial investment and carry a 3.75% sales charge.
Fund performance may reflect the waiver of the Fund’s fees and reimbursement of expenses for certain periods since the inception date. Without these waivers and reimbursements, performance would have been lower. Also, performance shown in this section does not reflect the deduction of taxes that a shareholder would pay on Fund distributions or redemptions of Fund shares.
The returns shown are based on net asset values calculated for shareholder transactions and may differ from the returns shown in the financial highlights, which reflect adjustments made to the net asset values in accordance with accounting principles generally accepted in the United States of America.
| | | | | | |
| | | |
| 8 | | | | J.P. MORGAN MUNICIPAL BOND FUNDS | | AUGUST 31, 2018 |
JPMorgan Ultra-Short Municipal Fund
FUND SUMMARY
SIX MONTHS ENDED AUGUST 31, 2018 (Unaudited)
| | | | |
| REPORTING PERIOD RETURN: | |
| Fund (Class I Shares)* | | | 0.73% | |
| Bloomberg Barclays 1 Year Municipal Bond Index | | | 0.69% | |
| |
| Net Assets as of 8/31/2018 (In Thousands) | | $ | 2,417,755 | |
| Duration as of 8/31/2018 | | | 0.7 years | |
INVESTMENT OBJECTIVE**
The JPMorgan Ultra-Short Municipal Fund (the “Fund”) seeks as high a level of current income exempt from federal income tax as is consistent with relative stability of principal.
WHAT WERE THE MAIN DRIVERS OF THE FUND’S PERFORMANCE?
For the six months ended August 31, 2018, the Fund outperformed the Bloomberg Barclays 1 Year Municipal Bond Index (the “Benchmark”). Interest rates on two-year and five-year bonds generally rose during the reporting period, while interest rates on ten-year, fifteen-year and thirty-year bonds moved in a narrow band and ended slightly lower. Lower rated bonds generally outperformed higher rated bonds during the reporting period.
Relative to the Benchmark, the Fund’s allocation to floating rate bonds, which are not held in the Benchmark, was a leading contributor to performance. The Fund’s underweight position in pre-refunded bonds and its overweight positions in the housing and hospital sectors also contributed to relative performance.
The Fund’s underweight position in single-A rated bonds was a leading detractor from performance relative to the Benchmark. The Fund’s underweight position in state general obligation bonds and its overweight positions in local government obligation bonds and the transportation sector also detracted from relative performance.
HOW WAS THE FUND POSITIONED?
During the reporting period, the Fund’s managers sought to maintain an average weighted maturity of two years or less and used a risk/reward analysis to identify investments that they believed would perform well over market cycles.
| | | | |
CREDIT QUALITY ALLOCATIONS*** | |
| AAA | | | 16.4 | % |
| AA | | | 37.7 | |
| A | | | 17.4 | |
| BBB | | | 4.6 | |
| BB | | | 0.1 | |
| NR | | | 23.8 | |
| * | | The return shown is based on net asset values calculated for shareholder transactions and may differ from the return shown in the financial highlights, which reflects adjustments made to the net asset values in accordance with accounting principles generally accepted in the United States of America. |
| ** | | The adviser seeks to achieve the Fund’s objective. There can be no guarantee it will be achieved. |
| *** | | Percentages indicated are based on total investments as of August 31, 2018. The Fund’s portfolio composition is subject to change. |
| | | | | | | | |
| | | |
| AUGUST 31, 2018 | | J.P. MORGAN MUNICIPAL BOND FUNDS | | | | | 9 | |
JPMorgan Ultra-Short Municipal Fund
FUND SUMMARY
SIX MONTHS ENDED AUGUST 31, 2018 (Unaudited) (continued)
| | | | | | | | | | | | | | | | |
AVERAGE ANNUAL TOTAL RETURNS AS OF AUGUST 31, 2018 | |
| | | INCEPTION DATE OF
CLASS | | | 6 MONTH* | | | 1 YEAR | | | SINCE
INCEPTION | |
CLASS A SHARES | | | May 31, 2016 | | | | | | | | | | | | | |
With Sales Charge** | | | | | | | (1.79 | )% | | | (1.66 | )% | | | (0.36 | )% |
Without Sales Charge | | | | | | | 0.47 | | | | 0.59 | | | | 0.65 | |
CLASS I SHARES | | | May 31, 2016 | | | | 0.73 | | | | 0.90 | | | | 0.90 | |
| ** | | Sales Charge for Class A Shares is 2.25%. |
LIFE OF FUND PERFORMANCE (5/31/16 TO 8/31/18)
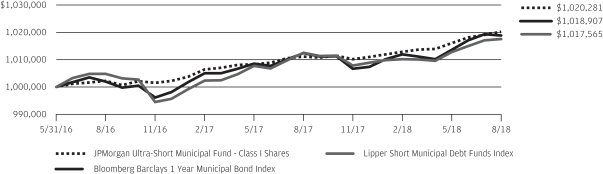
The performance quoted is past performance and is not a guarantee of future results. Mutual funds are subject to certain market risks. Investment returns and principal value of an investment will fluctuate so that an investor’s shares, when redeemed, may be worth more or less than their original cost. Current performance may be higher or lower than the performance data shown. For up-to-date, month-end performance information please call 1-800-480-4111.
The Fund commenced operations on May 31, 2016.
The graph illustrates comparative performance for $1,000,000 invested in Class I Shares of the JPMorgan Ultra-Short Municipal Fund, the Bloomberg Barclays 1 Year Municipal Bond Index and the Lipper Short Municipal Debt Funds Index from May 31, 2016 to August 31, 2018. The performance of the Fund assumes reinvestment of all dividends and capital gain distributions, if any, and does not include a sales charge. The performance of the Bloomberg Barclays 1 Year Municipal Bond Index does not reflect the deduction of expenses or a sales charge associated with a mutual fund and has been adjusted to reflect reinvestment of all dividends and capital gain distributions of securities included in the benchmark, if applicable. The performance of the Lipper Short Municipal Debt Funds Index includes expenses associated with a mutual fund, such as investment management fees. These expenses are not identical to the expenses incurred by the Fund. The Bloomberg Barclays 1 Year Municipal Bond Index is an unmanaged index that includes bonds with a minimum credit rating of BAA3, are issued as part of a deal of at least $50 million, have an amount
outstanding of at least $5 million, and have maturities of 1 to 2 years. The Lipper Short Municipal Debt Funds Index is an index based on the total returns of certain mutual funds within the Fund’s designated category as determined by Lipper, Inc. Investors cannot invest directly in an index.
Capital gain distributions are subject to federal income tax; a portion of the Fund’s income distributions may be subject to the alternative minimum tax and some investors may be subject to certain state and local taxes.
Class I Shares have a $1,000,000 minimum initial investment.
Subsequent to the inception of the Fund on May 31, 2016 until August 31, 2016, the Fund did not experience any shareholder activity. If such shareholder activity had occurred, the Fund’s performance may have been impacted.
Fund performance may reflect the waiver of the Fund’s fees and reimbursement of expenses for certain periods since the inception date. Without these waivers and reimbursements, performance would have been lower. Also, performance shown in this section does not reflect the deduction of taxes that a shareholder would pay on Fund distributions or redemptions of Fund shares.
The returns shown are based on net asset values calculated for shareholder transactions and may differ from the returns shown in the financial highlights, which reflect adjustments made to the net asset values in accordance with accounting principles generally accepted in the United States of America.
| | | | | | |
| | | |
| 10 | | | | J.P. MORGAN MUNICIPAL BOND FUNDS | | AUGUST 31, 2018 |
JPMorgan Municipal Income Fund
SCHEDULE OF PORTFOLIO INVESTMENTS
AS OF AUGUST 31, 2018 (Unaudited)
| | | | | | | | |
| INVESTMENTS | | PRINCIPAL
AMOUNT
($000) | | | VALUE
($000) | |
Municipal Bonds — 96.2% (a) | | | | | | | | |
Alabama — 1.2% | | | | | | | | |
Utility — 1.2% | | | | | | | | |
The Lower Alabama Gas District, Gas Project Series A, Rev., 5.00%, 9/1/2031 | | | 2,000 | | | | 2,334 | |
| | | | | | | | |
Alaska — 0.5% | | | | | | | | |
Housing — 0.5% | | | | | | | | |
Alaska Housing Finance Corp., General Mortgage Series A, Rev., 3.50%, 6/1/2046 | | | 895 | | | | 920 | |
| | | | | | | | |
Arizona — 2.7% | | | | | | | | |
Water & Sewer — 2.7% | | | | | | | | |
City of Scottsdale, Water and Sewer System Rev., 5.25%, 7/1/2022 | | | 2,645 | | | | 2,964 | |
City of Tucson, Water System Rev., 5.00%, 7/1/2024 | | | 2,150 | | | | 2,478 | |
| | | | | | | | |
Total Arizona | | | | | | | 5,442 | |
| | | | | | | | |
California — 1.1% | | | | | | | | |
General Obligation — 0.5% | | | | | | | | |
Salinas Union High School District GO, BAN, Zero Coupon, 8/1/2020 | | | 1,000 | | | | 962 | |
| | | | | | | | |
Hospital — 0.2% | | | | | | | | |
California Municipal Finance Authority, Eisenhower Medical Center Series B, Rev., 5.00%, 7/1/2026 | | | 410 | | | | 465 | |
| | | | | | | | |
Other Revenue — 0.4% | | | | | | | | |
State of California, Department of Veterans Affairs Series B, Rev., 3.50%, 12/1/2045 | | | 685 | | | | 706 | |
| | | | | | | | |
Total California | | | | | | | 2,133 | |
| | | | | | | | |
Colorado — 1.5% | | | | | | | | |
Education — 1.0% | | | | | | | | |
Colorado Educational and Cultural Facilities Authority, University Corp. for Atmospheric Research Project | | | | | | | | |
Rev., 4.00%, 9/1/2020 | | | 450 | | | | 467 | |
Rev., 5.00%, 9/1/2022 | | | 470 | | | | 517 | |
Colorado School of Mines Series A, Rev., (ICE LIBOR USD 1 Month + 0.50%), 1.92%, 10/1/2018 (b) | | | 1,000 | | | | 1,014 | |
| | | | | | | | |
| | | | | | | 1,998 | |
| | | | | | | | |
Hospital — 0.5% | | | | | | | | |
University of Colorado Hospital Authority Series C-1, Rev., 4.00%, 3/1/2020 (c) | | | 1,000 | | | | 1,021 | |
| | | | | | | | |
Total Colorado | | | | | | | 3,019 | |
| | | | | | | | |
| | | | | | | | |
| INVESTMENTS | | PRINCIPAL
AMOUNT
($000) | | | VALUE
($000) | |
| | | | | | | | |
Connecticut — 2.7% | | | | | | | | |
Education — 1.6% | | | | | | | | |
Connecticut State Higher Education Supplemental Loan Authority, CHESLA Loan Program | | | | | | | | |
Series A, Rev., 5.25%, 11/15/2023 | | | 1,560 | | | | 1,665 | |
Series A, Rev., 5.25%, 11/15/2024 | | | 1,500 | | | | 1,599 | |
| | | | | | | | |
| | | | | | | 3,264 | |
| | | | | | | | |
Housing — 1.1% | | | | | | | | |
Connecticut Housing Finance Authority, Housing Mortgage Finance Program | | | | | | | | |
Subseries A-1, Rev., 4.00%, 11/15/2045 | | | 475 | | | | 494 | |
Series D, Subseries D-1, Rev., GNMA/FNMA/FHLMC, 4.00%, 11/15/2047 | | | 1,240 | | | | 1,300 | |
Subseries A-1, Rev., 4.00%, 11/15/2047 | | | 450 | | | | 471 | |
| | | | | | | | |
| | | | | | | 2,265 | |
| | | | | | | | |
Total Connecticut | | | | | | | 5,529 | |
| | | | | | | | |
Delaware — 0.1% | | | | | | | | |
Housing — 0.1% | | | | | | | | |
Delaware State Housing Authority, Senior Single Family Mortgage Series A-1, Rev., AMT, 4.90%, 7/1/2029 | | | 265 | | | | 273 | |
| | | | | | | | |
District of Columbia — 2.2% | | | | | | | | |
Transportation — 0.6% | | | | | | | | |
Washington Metropolitan Area Transit Authority, Gross Transit Bonds Series B, Rev., 5.00%, 7/1/2025 | | | 1,000 | | | | 1,165 | |
| | | | | | | | |
Water & Sewer — 1.6% | | | | | | | | |
District of Columbia Water and Sewer Authority Public Utility, Subordinate Lien, Green Bonds Series A, Rev., 5.00%, 10/1/2045 | | | 3,000 | | | | 3,348 | |
| | | | | | | | |
Total District of Columbia | | | | | | | 4,513 | |
| | | | | | | | |
Florida — 8.6% | | | | | | | | |
Certificate of Participation/Lease — 3.0% | |
South Florida Water Management District COP, 5.00%, 10/1/2032 | | | 2,250 | | | | 2,565 | |
The School Board of Miami-Dade County Series D, COP, 5.00%, 2/1/2027 | | | 3,000 | | | | 3,450 | |
| | | | | | | | |
| | | | | | | 6,015 | |
| | | | | | | | |
Hospital — 0.6% | | | | | | | | |
Palm Beach County Health Facilities Authority, Hospital, BRRH Corp. Obligated Group Rev., 5.00%, 12/1/2021 | | | 1,100 | | | | 1,189 | |
| | | | | | | | |
SEE NOTES TO FINANCIAL STATEMENTS.
| | | | | | | | |
| | | |
| AUGUST 31, 2018 | | J.P. MORGAN MUNICIPAL BOND FUNDS | | | | | 11 | |
JPMorgan Municipal Income Fund
SCHEDULE OF PORTFOLIO INVESTMENTS
AS OF AUGUST 31, 2018 (Unaudited) (continued)
| | | | | | | | |
| INVESTMENTS | | PRINCIPAL
AMOUNT
($000) | | | VALUE
($000) | |
Municipal Bonds — continued | |
Housing — 0.3% | | | | | | | | |
Florida Housing Finance Corp., Homeowner Mortgage, Special Program | | | | | | | | |
Series A, Rev., GNMA/FNMA/FHLMC, 5.00%, 7/1/2028 | | | 185 | | | | 188 | |
Series B, Rev., GNMA COLL, 4.50%, 1/1/2029 | | | 220 | | | | 223 | |
Series B, Rev., GNMA/FNMA/FHLMC, 4.50%, 1/1/2029 | | | 280 | | | | 287 | |
| | | | | | | | |
| | | | | | | 698 | |
| | | | | | | | |
Industrial Development Revenue/Pollution Control Revenue — 0.7% | | | | | |
Broward County Fuel System, Fort Lauderdale Fuel Facilities LLC Project Series A, Rev., AMT, AGM, 5.00%, 4/1/2024 | | | 835 | | | | 919 | |
County of Escambia, Pollution Control, Gulf Power Company Project Rev., 2.10%, 4/11/2019 (c) | | | 500 | | | | 500 | |
| | | | | | | | |
| | | | | | | 1,419 | |
| | | | | | | | |
Other Revenue — 1.1% | | | | | | | | |
Miami Beach Redevelopment Agency, Historic Convention Village Series A, Rev., 5.00%, 2/1/2027 | | | 2,000 | | | | 2,248 | |
| | | | | | | | |
Utility — 2.9% | | | | | | | | |
City of Port St. Lucie, Utility Systems Rev., NATL-RE, 5.25%, 9/1/2024 | | | 5,000 | | | | 5,813 | |
| | | | | | | | |
Total Florida | | | | | | | 17,382 | |
| | | | | | | | |
Georgia — 1.5% | | | | | | | | |
Hospital — 0.5% | | | | | | | | |
Gainesville and Hall County Hospital Authority, Northeast Georgia Health System, Inc. Project Series A, Rev., 5.00%, 2/15/2026 | | | 860 | | | | 990 | |
| | | | | | | | |
Housing — 1.0% | | | | | | | | |
Georgia Housing and Finance Authority, Single Family Mortgage | | | | | | | | |
Series A, Rev., 4.00%, 12/1/2047 | | | 705 | | | | 737 | |
Series B, Rev., 4.00%, 12/1/2047 | | | 1,245 | | | | 1,307 | |
| | | | | | | | |
| | | | | | | 2,044 | |
| | | | | | | | |
Total Georgia | | | | | | | 3,034 | |
| | | | | | | | |
Guam — 0.4% | | | | | | | | |
Water & Sewer — 0.4% | | | | | | | | |
Guam Government Waterworks Authority, Water and Wastewater System (Guam) | | | | | | | | |
Rev., 5.00%, 7/1/2023 | | | 375 | | | | 416 | |
Rev., 5.00%, 7/1/2024 | | | 300 | | | | 336 | |
| | | | | | | | |
Total Guam | | | | | | | 752 | |
| | | | | | | | |
| | | | | | | | |
| INVESTMENTS | | PRINCIPAL
AMOUNT
($000) | | | VALUE
($000) | |
| | | | | | | | |
Illinois — 0.9% | | | | | | | | |
Hospital — 0.2% | | | | | | | | |
Illinois Finance Authority, Healthcare Enterprises, Inc. Series C, Rev., 5.00%, 3/1/2033 | | | 365 | | | | 410 | |
| | | | | | | | |
Housing — 0.7% | | | | | | | | |
City of Aurora, Single Family Mortgage | | | | | | | | |
Series B, Rev., GNMA/FNMA/FHLMC, 5.45%, 12/1/2039 | | | 127 | | | | 127 | |
Series A, Rev., AMT, GNMA/FNMA/FHLMC, 5.50%, 12/1/2039 | | | 133 | | | | 133 | |
City of Peoria, City of Moline and City of Freeport, Collateralized Single Family Mortgage Series A, Rev., GNMA COLL, 7.60%, 4/1/2027 | | | 10 | | | | 10 | |
Illinois Housing Development Authority, Homeowner Mortgage Series C, Rev., 3.50%, 8/1/2046 | | | 1,090 | | | | 1,118 | |
| | | | | | | | |
| | | | | | | 1,388 | |
| | | | | | | | |
Total Illinois | | | | | | | 1,798 | |
| | | | | | | | |
Indiana — 2.9% | | | | | | | | |
Hospital — 0.9% | | | | | | | | |
Indiana Health Facility Financing Authority, Ascension Health Credit Group Series A-1, Rev., 5.00%, 11/15/2034 | | | 1,670 | | | | 1,886 | |
| | | | | | | | |
Housing — 0.2% | | | | | | | | |
Indiana Housing and Community Development Authority, Home First Mortgage Series A, Rev., GNMA/FNMA/FHLMC, 4.50%, 6/1/2028 | | | 355 | | | | 365 | |
| | | | | | | | |
Industrial Development Revenue/Pollution Control Revenue — 1.1% | | | | | |
County of St. Joseph, Economic Development, St. Mary's College Project Series A, Rev., 5.00%, 4/1/2026 | | | 1,880 | | | | 2,151 | |
| | | | | | | | |
Water & Sewer — 0.7% | | | | | | | | |
Indiana State Finance Authority, First Lien Wastewater Utility, CWA Authority Project Series A, Rev., 5.00%, 10/1/2030 | | | 1,250 | | | | 1,377 | |
| | | | | | | | |
Total Indiana | | | | | | | 5,779 | |
| | | | | | | | |
Iowa — 1.5% | | | | | | | | |
Education — 0.5% | | | | | | | | |
Iowa Student Loan Liquidity Corp., Student Loan Series A, Rev., AMT, 5.00%, 12/1/2025 | | | 1,000 | | | | 1,113 | |
| | | | | | | | |
Housing — 1.0% | | | | | | | | |
Iowa Finance Authority, Single Family Mortgage, Mortgage-Backed Securities Program | | | | | | | | |
Series 1, Rev., GNMA/FNMA/FHLMC, 5.00%, 7/1/2028 | | | 10 | | | | 10 | |
SEE NOTES TO FINANCIAL STATEMENTS.
| | | | | | |
| | | |
| 12 | | | | J.P. MORGAN MUNICIPAL BOND FUNDS | | AUGUST 31, 2018 |
| | | | | | | | |
| INVESTMENTS | | PRINCIPAL
AMOUNT
($000) | | | VALUE
($000) | |
Municipal Bonds — continued | |
Housing — continued | | | | | | | | |
Rev., GNMA/FNMA/FHLMC, 3.50%, 1/1/2047 | | | 1,935 | | | | 1,996 | |
| | | | | | | | |
| | | | | | | 2,006 | |
| | | | | | | | |
Total Iowa | | | | | | | 3,119 | |
| | | | | | | | |
Kentucky — 0.5% | | | | | | | | |
Education — 0.3% | | | | | | | | |
Kentucky Higher Education Student Loan Corp. Series A, Rev., AMT, 5.00%, 6/1/2020 | | | 515 | | | | 537 | |
| | | | | | | | |
Industrial Development Revenue/Pollution Control Revenue — 0.2% | | | | | |
County of Carroll, Pollution Control, Kentucky Utilities Company Project Series A, Rev., 1.05%, 9/1/2019 (c) | | | 500 | | | | 496 | |
| | | | | | | | |
Total Kentucky | | | | | | | 1,033 | |
| | | | | | | | |
Louisiana — 0.8% | | | | | | | | |
Housing — 0.2% | | | | | | | | |
East Baton Rouge Mortgage Finance Authority, Single Family Mortgage, Mortgage-Backed Securities Program Series A-2, Rev., GNMA/FNMA/FHLMC, 5.25%, 10/1/2039 | | | 73 | | | | 73 | |
Louisiana Housing Finance Agency, Single Family Mortgage, Home Ownership Program Series A, Rev., GNMA/FNMA/FHLMC, 5.50%, 6/1/2040 | | | 215 | | | | 216 | |
Louisiana Housing Finance Agency, Single Family Mortgage, Mortgage-Backed Securities Program Series A, Rev., GNMA/FNMA/FHLMC, 4.60%, 12/1/2028 | | | 5 | | | | 5 | |
| | | | | | | | |
| | | | | | | 294 | |
| | | | | | | | |
Other Revenue — 0.6% | | | | | | | | |
Louisiana Local Government Environmental Facilities and Community Development Authority, LCTCS Act 391 Project Rev., 5.00%, 10/1/2028 | | | 670 | | | | 789 | |
Louisiana Public Facilities Authority, Archdiocese of New Orleans Project | | | | | | | | |
Rev., 5.00%, 7/1/2021 | | | 165 | | | | 178 | |
Rev., 5.00%, 7/1/2022 | | | 250 | | | | 274 | |
| | | | | | | | |
| | | | | | | 1,241 | |
| | | | | | | | |
Total Louisiana | | | | | | | 1,535 | |
| | | | | | | | |
Maine — 0.7% | | | | | | | | |
Housing — 0.7% | | | | | | | | |
Maine State Housing Authority | | | | | | | | |
Series A-1, Rev., AMT, 4.50%, 11/15/2028 | | | 210 | | | | 217 | |
Series B, Rev., 4.00%, 11/15/2043 | | | 175 | | | | 180 | |
Series A, Rev., 4.00%, 11/15/2045 | | | 925 | | | | 964 | |
| | | | | | | | |
Total Maine | | | | | | | 1,361 | |
| | | | | | | | |
| | | | | | | | |
| INVESTMENTS | | PRINCIPAL
AMOUNT
($000) | | | VALUE
($000) | |
| | | | | | | | |
Maryland — 0.7% | | | | | | | | |
Housing — 0.7% | | | | | | | | |
Montgomery County Housing Opportunities Commission, Single Family Mortgage Series A, Rev., 4.00%, 7/1/2048 | | | 1,405 | | | | 1,471 | |
| | | | | | | | |
Massachusetts — 7.4% | | | | | | | | |
Education — 1.1% | | | | | | | | |
Massachusetts Educational Financing Authority, Education Loan Rev., AMT, 5.00%, 7/1/2021 | | | 1,000 | | | | 1,073 | |
Massachusetts Health and Educational Facilities Authority, Massachusetts Institute of Technology Series L, Rev., 5.25%, 7/1/2033 | | | 820 | | | | 1,059 | |
| | | | | | | | |
| | | | | | | 2,132 | |
| | | | | | | | |
Housing — 0.3% | | | | | | | | |
Massachusetts Housing Finance Agency, Single Family Housing | | | | | | | | |
Series 169, Rev., 4.00%, 12/1/2044 | | | 250 | | | | 258 | |
Series 183, Rev., 3.50%, 12/1/2046 | | | 395 | | | | 406 | |
| | | | | | | | |
| | | | | | | 664 | |
| | | | | | | | |
Water & Sewer — 6.0% | | | | | | | | |
Massachusetts Clean Water Trust, Pool Program Rev., 5.25%, 8/1/2024 | | | 3,000 | | | | 3,514 | |
Massachusetts Water Resources Authority | | | | | | | | |
Series B, Rev., AGM, 5.25%, 8/1/2028 | | | 5,000 | | | | 6,189 | |
Series B, Rev., AGM, 5.25%, 8/1/2029 | | | 2,000 | | | | 2,499 | |
| | | | | | | | |
| | | | | | | 12,202 | |
| | | | | | | | |
Total Massachusetts | | | | | | | 14,998 | |
| | | | | | | | |
Michigan — 1.7% | | | | | | | | |
Education — 0.3% | | | | | | | | |
Eastern Michigan University Series A, Rev., 5.00%, 3/1/2030 | | | 575 | | | | 661 | |
| | | | | | | | |
Housing — 0.6% | | | | | | | | |
Michigan State Housing Development Authority, Single-Family Mortgage Series B, Rev., 3.50%, 6/1/2047 | | | 1,100 | | | | 1,129 | |
| | | | | | | | |
Industrial Development Revenue/Pollution Control Revenue — 0.8% | | | | | |
Michigan Strategic Fund, The Detroit Edison Company Pollution Control Bonds Project Series CC, Rev., 1.45%, 9/1/2021 (c) | | | 570 | | | | 556 | |
Saginaw County Economic Development Corp., BGI South LLC-Recovery Zone Rev., 5.00%, 12/1/2020 | | | 1,075 | | | | 1,111 | |
| | | | | | | | |
| | | | | | | 1,667 | |
| | | | | | | | |
Total Michigan | | | | | | | 3,457 | |
| | | | | | | | |
SEE NOTES TO FINANCIAL STATEMENTS.
| | | | | | | | |
| | | |
| AUGUST 31, 2018 | | J.P. MORGAN MUNICIPAL BOND FUNDS | | | | | 13 | |
JPMorgan Municipal Income Fund
SCHEDULE OF PORTFOLIO INVESTMENTS
AS OF AUGUST 31, 2018 (Unaudited) (continued)
| | | | | | | | |
| INVESTMENTS | | PRINCIPAL
AMOUNT
($000) | | | VALUE
($000) | |
Municipal Bonds — continued | |
Minnesota — 3.0% | | | | | | | | |
General Obligation — 0.0% (d) | | | | | | | | |
State of Minnesota Series A, GO, 5.00%, 10/1/2021 (e) | | | 35 | | | | 38 | |
| | | | | | | | |
Housing — 3.0% | | | | | | | | |
Dakota County Community Development Agency, Single Family Mortgage, Mortgage-Backed Securities Program | | | | | | | | |
Series A, Rev., GNMA/FNMA/FHLMC, 4.50%, 6/1/2035 | | | 295 | | | | 304 | |
Series B, Rev., GNMA/FNMA/FHLMC, 5.15%, 12/1/2038 | | | 7 | | | | 8 | |
Series A, Rev., GNMA/FNMA/FHLMC, 5.13%, 12/1/2040 | | | 233 | | | | 233 | |
Minneapolis Community Development Agency, Multi-Family Housing, Riverside Homes Project Rev., 6.10%, 9/1/2019 | | | 210 | | | | 210 | |
Minneapolis/St. Paul Housing Finance Board, Single Family Mortgage, Mortgage-Backed Securities Program, City Living Home Programs | | | | | | | | |
Series A-1, Rev., GNMA/FNMA/FHLMC, 5.25%, 12/1/2040 | | | 92 | | | | 92 | |
Series A-2, Rev., GNMA/FNMA/FHLMC, 5.52%, 3/1/2041 | | | 370 | | | | 375 | |
Minnesota Housing Finance Agency, Homeownership Finance, Mortgage-Backed Securities Program | | | | | | | | |
Series A, Rev., GNMA/FNMA/FHLMC, 4.25%, 7/1/2028 | | | 200 | | | | 203 | |
Series D, Rev., GNMA/FNMA/FHLMC, 4.50%, 7/1/2034 | | | 170 | | | | 176 | |
Minnesota Housing Finance Agency, Non Profit Housing, State Appropriation | | | | | | | | |
Rev., 5.25%, 8/1/2024 | | | 1,015 | | | | 1,109 | |
Rev., 5.25%, 8/1/2025 | | | 1,070 | | | | 1,169 | |
Rev., 5.25%, 8/1/2026 | | | 825 | | | | 901 | |
Minnesota Housing Finance Agency, Residential Housing Finance | | | | | | | | |
Series D, Rev., GNMA/FNMA/FHLMC, 4.00%, 7/1/2040 | | | 215 | | | | 220 | |
Series B, Rev., GNMA/FNMA/FHLMC COLL, 4.00%, 7/1/2047 | | | 920 | | | | 962 | |
| | | | | | | | |
| | | | | | | 5,962 | |
| | | | | | | | |
Total Minnesota | | | | | | | 6,000 | |
| | | | | | | | |
Mississippi — 0.1% | | | | | | | | |
Housing — 0.1% | | | | | | | | |
Mississippi Home Corp., Home Ownership Mortgage Series A, Rev., GNMA COLL, 4.50%, 12/1/2031 | | | 280 | | | | 286 | |
| | | | | | | | |
| | | | | | | | |
| INVESTMENTS | | PRINCIPAL
AMOUNT
($000) | | | VALUE
($000) | |
| | | | | | | | |
Missouri — 0.9% | | | | | | | | |
Housing — 0.9% | | | | | | | | |
Missouri Housing Development Commission, Single Family Mortgage, First Place Homeownership Loan Program Series B, Rev., GNMA/FNMA/FHLMC COLL, 3.50%, 5/1/2041 | | | 1,680 | | | | 1,731 | |
Missouri Housing Development Commission, Single Family Mortgage, Special Homeownership Loan Program Series E-1, Rev., GNMA/FNMA/FHLMC, 5.00%, 11/1/2027 | | | 145 | | | | 148 | |
| | | | | | | | |
Total Missouri | | | | | | | 1,879 | |
| | | | | | | | |
Nebraska — 0.9% | | | | | | | | |
Hospital — 0.9% | | | | | | | | |
Madison County Hospital Authority No. 1, Faith Regional Health Services Project | | | | | | | | |
Rev., 5.00%, 7/1/2030 | | | 1,020 | | | | 1,108 | |
Rev., 5.00%, 7/1/2031 | | | 720 | | | | 781 | |
| | | | | | | | |
Total Nebraska | | | | | | | 1,889 | |
| | | | | | | | |
Nevada — 0.7% | | | | | | | | |
Hospital — 0.7% | | | | | | | | |
City of Carson, Carson Tahoe Regional Healthcare Project | | | | | | | | |
Rev., 5.00%, 9/1/2026 | | | 555 | | | | 636 | |
Rev., 5.00%, 9/1/2029 | | | 620 | | | | 708 | |
| | | | | | | | |
Total Nevada | | | | | | | 1,344 | |
| | | | | | | | |
New Hampshire — 2.6% | | | | | | | | |
Education — 2.6% | | | | | | | | |
City of Manchester, School Facilities | | | | | | | | |
Rev., NATL-RE, 5.50%, 6/1/2024 | | | 3,545 | | | | 4,160 | |
Rev., NATL-RE, 5.50%, 6/1/2027 | | | 900 | | | | 1,105 | |
| | | | | | | | |
Total New Hampshire | | | | | | | 5,265 | |
| | | | | | | | |
New Jersey — 4.0% | | | | | | | | |
Education — 1.0% | | | | | | | | |
New Jersey Higher Education Student Assistance Authority, Senior Student Loan Series 1A, Rev., AMT, 5.00%, 12/1/2024 | | | 1,750 | | | | 1,958 | |
| | | | | | | | |
General Obligation — 0.7% | | | | | | | | |
Egg Harbor Township School District GO, AGM, 5.75%, 7/15/2024 | | | 1,215 | | | | 1,433 | |
| | | | | | | | |
Hospital — 1.6% | | | | | | | | |
New Jersey Health Care Facilities Financing Authority, University Hospital Issue | | | | | | | | |
Series A, Rev., AGM, 5.00%, 7/1/2022 | | | 1,000 | | | | 1,095 | |
Series A, Rev., AGM, 5.00%, 7/1/2023 | | | 820 | | | | 912 | |
SEE NOTES TO FINANCIAL STATEMENTS.
| | | | | | |
| | | |
| 14 | | | | J.P. MORGAN MUNICIPAL BOND FUNDS | | AUGUST 31, 2018 |
| | | | | | | | |
| INVESTMENTS | | PRINCIPAL
AMOUNT
($000) | | | VALUE
($000) | |
Municipal Bonds — continued | |
Hospital — continued | | | | | | | | |
Series A, Rev., AGM, 5.00%, 7/1/2026 | | | 1,095 | | | | 1,251 | |
| | | | | | | | |
| | | | | | | 3,258 | |
| | | | | | | | |
Housing — 0.7% | | | | | | | | |
New Jersey Housing and Mortgage Finance Agency, Single Family Housing Series A, Rev., 4.50%, 10/1/2048 | | | 1,250 | | | | 1,339 | |
| | | | | | | | |
Total New Jersey | | | | | | | 7,988 | |
| | | | | | | | |
New York — 7.6% | | | | | | | | |
Housing — 1.6% | | | | | | | | |
New York Mortgage Agency, Homeowner Mortgage | | | | | | | | |
Series 197, Rev., 3.50%, 10/1/2044 | | | 1,455 | | | | 1,499 | |
Series 195, Rev., 4.00%, 10/1/2046 | | | 1,470 | | | | 1,531 | |
New York State Mortgage Agency, 39th Series Rev., 5.00%, 4/1/2028 | | | 170 | | | | 174 | |
| | | | | | | | |
| | | | | | | 3,204 | |
| | | | | | | | |
Other Revenue — 0.8% | | | | | | | | |
New York State Dormitory Authority, State Sales Tax Series B, Rev., 5.00%, 3/15/2030 | | | 1,500 | | | | 1,732 | |
| | | | | | | | |
Prerefunded — 0.0% (d) | | | | | | | | |
New York State Dormitory Authority Series A, Rev., 5.25%, 2/15/2019 (e) | | | 5 | | | | 5 | |
| | | | | | | | |
Special Tax — 0.0% (d) | | | | | | | | |
New York State Dormitory Authority, State Personal Income Tax Series A, Rev., 5.25%, 2/15/2024 | | | 75 | | | | 76 | |
| | | | | | | | |
Transportation — 1.7% | | | | | | | | |
Metropolitan Transportation Authority, Dedicated Tax Fund Series A, Rev., 5.00%, 11/15/2029 | | | 1,000 | | | | 1,110 | |
Port Authority of New York and New Jersey, Consolidated, 194th Series Rev., 5.00%, 10/15/2030 | | | 2,000 | | | | 2,314 | |
| | | | | | | | |
| | | | | | | 3,424 | |
| | | | | | | | |
Water & Sewer — 3.5% | | | | | | | | |
New York City Municipal Water Finance Authority, Water and Sewer System, Second General Resolution, Fiscal Year 2015 Series FF, Rev., 5.00%, 6/15/2031 | | | 1,000 | | | | 1,146 | |
New York State Environmental Facilities Corp., State Clean Water and Drinking Water Revolving Funds, New York City Municipal Water Finance Authority Projects — Second Resolution | | | | | | | | |
Series A, Rev., 5.25%, 6/15/2027 | | | 2,500 | | | | 2,570 | |
Series B, Rev., 5.00%, 6/15/2028 | | | 3,000 | | | | 3,257 | |
| | | | | | | | |
| | | | | | | 6,973 | |
| | | | | | | | |
Total New York | | | | | | | 15,414 | |
| | | | | | | | |
| | | | | | | | |
| INVESTMENTS | | PRINCIPAL
AMOUNT
($000) | | | VALUE
($000) | |
| | | | | | | | |
North Carolina — 2.3% | | | | | | | | |
Other Revenue — 0.6% | | | | | | | | |
County of Randolph, Limited Obligation Series B, Rev., 5.00%, 10/1/2026 | | | 1,000 | | | | 1,175 | |
| | | | | | | | |
Water & Sewer — 1.7% | | | | | | | | |
City of Charlotte, Water and Sewer System Rev., 5.25%, 7/1/2022 | | | 3,330 | | | | 3,428 | |
| | | | | �� | | | |
Total North Carolina | | | | | | | 4,603 | |
| | | | | | | | |
North Dakota — 3.2% | | | | | | | | |
Housing — 2.2% | | | | | | | | |
North Dakota Housing Finance Agency, Home Mortgage Finance Program | | | | | | | | |
Series B, Rev., 5.00%, 7/1/2028 | | | 130 | | | | 132 | |
Series D, Rev., 4.50%, 1/1/2029 | | | 285 | | | | 287 | |
Series F, Rev., AMT, 4.50%, 1/1/2035 | | | 260 | | | | 265 | |
Series D, Rev., 3.50%, 7/1/2046 | | | 510 | | | | 525 | |
Series D, Rev., 4.00%, 7/1/2046 | | | 1,615 | | | | 1,682 | |
Series D, Rev., FHA, 4.00%, 1/1/2048 | | | 1,415 | | | | 1,487 | |
| | | | | | | | |
| | | | | | | 4,378 | |
| | | | | | | | |
Utility — 1.0% | | | | | | | | |
McLean County, Solid Waste Facilities, Great River Energy Project Series A, Rev., 4.88%, 7/1/2026 | | | 2,000 | | | | 2,081 | |
| | | | | | | | |
Total North Dakota | | | | | | | 6,459 | |
| | | | | | | | |
Ohio — 2.5% | | | | | | | | |
General Obligation — 0.9% | | | | | | | | |
Lakota Local School District Series A, GO, NATL-RE, 5.25%, 12/1/2025 | | | 1,500 | | | | 1,775 | |
| | | | | | | | |
Housing — 0.7% | | | | | | | | |
Ohio Housing Finance Agency Residential Mortgage, Mortgage-Backed Securities Program Series D, Rev., GNMA/FNMA/FHLMC, 4.00%, 3/1/2047 | | | 1,220 | | | | 1,277 | |
Ohio Housing Finance Agency, Single Family Mortgage Series 1, Rev., GNMA/FNMA/FHLMC, 5.00%, 11/1/2028 | | | 15 | | | | 15 | |
| | | | | | | | |
| | | | | | | 1,292 | |
| | | | | | | | |
Industrial Development Revenue/Pollution Control Revenue — 0.9% | | | | | |
Ohio State Water Development Authority, Water Pollution Control Loan Fund Series B, Rev., 5.00%, 12/1/2029 | | | 1,615 | | | | 1,878 | |
| | | | | | | | |
Total Ohio | | | | | | | 4,945 | |
| | | | | | | | |
Oklahoma — 0.3% | | | | | | | | |
Housing — 0.3% | | | | | | | | |
Oklahoma County Home Finance Authority, Single Family Mortgage-Backed Securities Program Series A, Rev., AMT, GNMA/FNMA/FHLMC, 5.40%, 10/1/2038 | | | 380 | | | | 388 | |
SEE NOTES TO FINANCIAL STATEMENTS.
| | | | | | | | |
| | | |
| AUGUST 31, 2018 | | J.P. MORGAN MUNICIPAL BOND FUNDS | | | | | 15 | |
JPMorgan Municipal Income Fund
SCHEDULE OF PORTFOLIO INVESTMENTS
AS OF AUGUST 31, 2018 (Unaudited) (continued)
| | | | | | | | |
| INVESTMENTS | | PRINCIPAL
AMOUNT
($000) | | | VALUE
($000) | |
Municipal Bonds — continued | |
Housing — continued | | | | | | | | |
Oklahoma Housing Finance Agency, Single Family Mortgage, Homeownership Loan Program Series A, Rev., GNMA COLL, 4.38%, 9/1/2027 | | | 180 | | | | 183 | |
| | | | | | | | |
| | | | | | | 571 | |
| | | | | | | | |
Other Revenue — 0.0% (d) | | | | | | | | |
IDK Partners III Trust, Mortgage Pass-Through Certificates Class A, Rev., 5.10%, 8/1/2023 ‡ | | | 17 | | | | 17 | |
| | | | | | | | |
Total Oklahoma | | | | | | | 588 | |
| | | | | | | | |
Oregon — 0.4% | | | | | | | | |
Housing — 0.4% | | | | | | | | |
Oregon State Housing and Community Services Department, Single Family Mortgage Program Series B, Rev., AMT, 5.00%, 7/1/2030 | | | 785 | | | | 817 | |
| | | | | | | | |
Pennsylvania — 4.5% | | | | | | | | |
Housing — 1.1% | | | | | | | | |
Pennsylvania Housing Finance Agency, Single Family Mortgage | | | | | | | | |
Series 121, Rev., 3.50%, 10/1/2046 | | | 1,615 | | | | 1,662 | |
Series 122, Rev., 4.00%, 10/1/2046 | | | 490 | | | | 512 | |
| | | | | | | | |
| | | | | | | 2,174 | |
| | | | | | | | |
Industrial Development Revenue/Pollution Control Revenue — 2.4% | | | | | |
Philadelphia Authority for Industrial Development, City Service Agreement, Affordable Housing Preservation Programs Project | | | | | | | | |
Rev., 5.00%, 12/1/2023 | | | 2,020 | | | | 2,236 | |
Rev., AGM, 5.00%, 12/1/2026 | | | 1,550 | | | | 1,777 | |
Rev., AGM, 5.00%, 12/1/2027 | | | 680 | | | | 782 | |
| | | | | | | | |
| | | | | | | 4,795 | |
| | | | | | | | |
Other Revenue — 1.0% | | | | | | | | |
Philadelphia Redevelopment Authority, Neighborhood Transformation Initiative Rev., 5.00%, 4/15/2019 | | | 2,000 | | | | 2,038 | |
| | | | | | | | |
Total Pennsylvania | | | | | | | 9,007 | |
| | | | | | | | |
Rhode Island — 1.0% | | | | | | | | |
Housing — 1.0% | | | | | | | | |
Rhode Island Housing and Mortgage Finance Corp., Multi-Family Housing Series 1-A, Rev., 1.70%, 10/1/2019 (c) | | | 2,000 | | | | 1,999 | |
| | | | | | | | |
South Carolina — 1.3% | | | | | | | | |
Housing — 0.7% | | | | | | | | |
South Carolina State Housing Finance and Development Authority | | | | | | | | |
Series 1, Rev., GNMA COLL, 5.00%, 1/1/2028 | | | 135 | | | | 138 | |
| | | | | | | | |
| INVESTMENTS | | PRINCIPAL
AMOUNT
($000) | | | VALUE
($000) | |
| | | | | | | | |
Housing — continued | | | | | | | | |
Series A, Rev., 4.00%, 1/1/2047 | | | 380 | | | | 397 | |
Series B, Rev., FHA, GNMA/FNMA/FHLMC, 4.00%, 7/1/2047 | | | 885 | | | | 929 | |
| | | | | | | | |
| | | | | | | 1,464 | |
| | | | | | | | |
Other Revenue — 0.6% | | | | | | | | |
Town of Hilton Head Island, Beach Preservation Fee Pledge Rev., 5.00%, 8/1/2026 | | | 1,000 | | | | 1,147 | |
| | | | | | | | |
Total South Carolina | | | | | | | 2,611 | |
| | | | | | | | |
South Dakota — 1.0% | | | | | | | | |
Housing — 1.0% | | | | | | | | |
South Dakota Housing Development Authority, Homeownership Mortgage Series D, Rev., 4.00%, 11/1/2045 | | | 1,850 | | | | 1,929 | |
| | | | | | | | |
Tennessee — 1.1% | | | | | | | | |
Housing — 1.1% | | | | | | | | |
Tennessee Housing Development Agency, Housing Finance Program Series A-1, Rev., 5.00%, 1/1/2027 | | | 110 | | | | 112 | |
Tennessee Housing Development Agency, Residential Finance Program | | | | | | | | |
Series 2B, Rev., 4.00%, 7/1/2043 | | | 235 | | | | 243 | |
Rev., 3.50%, 1/1/2048 | | | 1,845 | | | | 1,903 | |
| | | | | | | | |
Total Tennessee | | | | | | | 2,258 | |
| | | | | | | | |
Texas — 5.1% | | | | | | | | |
General Obligation — 1.4% | | | | | | | | |
Socorro Independent School District Series A, GO, PSF-GTD, 5.00%, 8/15/2024 | | | 2,000 | | | | 2,299 | |
State of Texas, Water Financial Assistance Series D, GO, 5.00%, 5/15/2033 | | | 450 | | | | 514 | |
| | | | | | | | |
| | | | | | | 2,813 | |
| | | | | | | | |
Hospital — 0.4% | | | | | | | | |
Irving Hospital Authority, Baylor Scott and White Medical Center | | | | | | | | |
Rev., 5.00%, 10/15/2026 | | | 250 | | | | 283 | |
Rev., 5.00%, 10/15/2027 | | | 500 | | | | 565 | |
| | | | | | | | |
| | | | | | | 848 | |
| | | | | | | | |
Housing — 0.7% | | | | | | | | |
Multi-Family Housing, Bond Pass-Through Certificates, Grand Reserve Apartments Series 8, Rev., 5.95%, 11/1/2023 (c) | | | 1,025 | | | | 1,026 | |
Texas Department of Housing and Community Affairs, Residential Mortgage Series A, Rev., GNMA/FNMA/FHLMC, 5.00%, 7/1/2029 | | | 380 | | | | 395 | |
| | | | | | | | |
| | | | | | | 1,421 | |
| | | | | | | | |
SEE NOTES TO FINANCIAL STATEMENTS.
| | | | | | |
| | | |
| 16 | | | | J.P. MORGAN MUNICIPAL BOND FUNDS | | AUGUST 31, 2018 |
| | | | | | | | |
| INVESTMENTS | | PRINCIPAL
AMOUNT
($000) | | | VALUE
($000) | |
Municipal Bonds — continued | |
Other Revenue — 0.6% | | | | | | | | |
Central Texas Regional Mobility Authority Rev., 5.00%, 1/1/2046 | | | 1,000 | | | | 1,086 | |
| | | | | | | | |
Transportation — 1.6% | | | | | | | | |
Dallas Area Rapid Transit, Senior Lien Series A, Rev., 5.00%, 12/1/2032 | | | 2,800 | | | | 3,212 | |
| | | | | | | | |
Water & Sewer — 0.4% | | | | | | | | |
City of Austin, Water and Wastewater System Rev., 5.00%, 11/15/2027 | | | 665 | | | | 800 | |
| | | | | | | | |
Total Texas | | | | | | | 10,180 | |
| | | | | | | | |
Utah — 4.2% | | | | | | | | |
Housing — 2.6% | | | | | | | | |
Utah Housing Corp., Single Family Mortgage Series D, Rev., FHA, 4.00%, 1/1/2045 | | | 1,520 | | | | 1,587 | |
Utah State Board of Regents, Student Fee and Housing System Rev., NATL-RE, 5.25%, 4/1/2023 | | | 3,245 | | | | 3,667 | |
| | | | | | | | |
| | | | | | | 5,254 | |
| | | | | | | | |
Other Revenue — 0.6% | | | | | | | | |
Utah Transit Authority, Sales Tax Series C, Rev., AGM, 5.25%, 6/15/2029 | | | 970 | | | | 1,193 | |
| | | | | | | | |
Utility — 1.0% | | | | | | | | |
Utah Associated Municipal Power System, Horse Butte Wind Project Series B, Rev., 5.00%, 9/1/2033 | | | 1,700 | | | | 1,960 | |
| | | | | | | | |
Total Utah | | | | | | | 8,407 | |
| | | | | | | | |
Vermont — 3.4% | | | | | | | | |
Education — 2.5% | | | | | | | | |
Vermont Student Assistance Corp., Education Loan | | | | | | | | |
Series A, Rev., AMT, 5.00%, 6/15/2023 | | | 1,000 | | | | 1,087 | |
Series A, Rev., AMT, 5.00%, 6/15/2024 | | | 1,400 | | | | 1,530 | |
Series A, Rev., AMT, 5.00%, 6/15/2025 | | | 2,150 | | | | 2,365 | |
| | | | | | | | |
| | | | | | | 4,982 | |
| | | | | | | | |
Housing — 0.9% | | | | | | | | |
Vermont Housing Finance Agency, Multiple Purpose | | | | | | | | |
Series B, Rev., AMT, 4.13%, 11/1/2042 | | | 200 | | | | 204 | |
Series B, Rev., AMT, 3.75%, 11/1/2045 | | | 1,570 | | | | 1,615 | |
| | | | | | | | |
| | | | | | | 1,819 | |
| | | | | | | | |
Total Vermont | | | | | | | 6,801 | |
| | | | | | | | |
Washington — 3.3% | | | | | | | | |
Hospital — 1.7% | | | | | | | | |
Washington Health Care Facilities Authority, Multicare Health System Series B, Rev., 5.00%, 8/15/2035 | | | 1,850 | | | | 2,108 | |
| | | | | | | | |
| INVESTMENTS | | PRINCIPAL
AMOUNT
($000) | | | VALUE
($000) | |
| | | | | | | | |
Hospital — continued | | | | | | | | |
Washington Health Care Facilities Authority, Virginia Mason Medical Center Rev., 5.00%, 8/15/2026 | | | 1,125 | | | | 1,268 | |
| | | | | | | | |
| | | | | | | 3,376 | |
| | | | | | | | |
Housing — 1.6% | | | | | | | | |
Washington Housing Finance Commission, Single-Family Program | | | | | | | | |
Series 2A-R, Rev., AMT, 3.50%, 12/1/2046 | | | 400 | | | | 410 | |
Series 2N, Rev., GNMA/FNMA/FHLMC, 3.50%, 6/1/2047 | | | 2,720 | | | | 2,799 | |
| | | | | | | | |
| | | | | | | 3,209 | |
| | | | | | | | |
Total Washington | | | | | | | 6,585 | |
| | | | | | | | |
West Virginia — 0.5% | | | | | | | | |
Other Revenue — 0.5% | | | | | | | | |
West Virginia Economic Development Authority, Lease, Correctional Juvenile and Public Safety Facilities Series A, Rev., 5.00%, 6/1/2029 | | | 1,000 | | | | 1,094 | |
| | | | | | | | |
Wisconsin — 2.7% | | | | | | | | |
Education — 2.7% | | | | | | | | |
Wisconsin Health and Educational Facilities Authority, Agnesian Healthcare, Inc. | | | | | | | | |
Rev., 5.00%, 7/1/2024 | | | 250 | | | | 285 | |
Rev., 5.00%, 7/1/2025 | | | 250 | | | | 287 | |
Wisconsin Health and Educational Facilities Authority, Franciscan Sisters of Christian Charity Sponsored Ministries, Inc. | | | | | | | | |
Rev., 5.00%, 9/1/2022 | | | 520 | | | | 565 | |
Rev., 5.00%, 9/1/2023 | | | 550 | | | | 604 | |
Rev., 5.00%, 9/1/2024 | | | 580 | | | | 643 | |
Rev., 5.00%, 9/1/2025 | | | 235 | | | | 262 | |
Rev., 5.00%, 9/1/2026 | | | 385 | | | | 431 | |
Rev., 5.00%, 9/1/2027 | | | 785 | | | | 883 | |
Wisconsin Health and Educational Facilities Authority, Marshfield Clinic Health System, Inc. | | | | | | | | |
Series C, Rev., 5.00%, 2/15/2027 | | | 400 | | | | 459 | |
Series C, Rev., 5.00%, 2/15/2028 | | | 575 | | | | 658 | |
Series C, Rev., 5.00%, 2/15/2029 | | | 375 | | | | 426 | |
| | | | | | | | |
Total Wisconsin | | | | | | | 5,503 | |
| | | | | | | | |
Total Municipal Bonds
(Cost $192,330) | | | | | | | 193,733 | |
| | | | | | | | |
SEE NOTES TO FINANCIAL STATEMENTS.
| | | | | | | | |
| | | |
| AUGUST 31, 2018 | | J.P. MORGAN MUNICIPAL BOND FUNDS | | | | | 17 | |
JPMorgan Municipal Income Fund
SCHEDULE OF PORTFOLIO INVESTMENTS
AS OF AUGUST 31, 2018 (Unaudited) (continued)
| | | | | | | | |
| INVESTMENTS | | SHARES
(000) | | | VALUE
($000) | |
Short-term Investments — 2.6% | | | | | | | | |
Investment Companies — 2.6% | | | | | | | | |
JPMorgan Institutional Tax Free Money Market Fund Class IM Shares, 1.38% (f) (g)
(Cost $5,294) | | | 5,294 | | | | 5,294 | |
| | | | | | | | |
Total Investments — 98.8%
(Cost $197,624) | | | | | | | 199,027 | |
Other Assets Less Liabilities — 1.2% | | | | | | | 2,403 | |
| | | | | | | | |
NET ASSETS — 100.0% | | | | | | | 201,430 | |
| | | | | | | | |
Percentages indicated are based on net assets.
Abbreviations
| | |
| AGM | | Insured by Assured Guaranty Municipal Corp. |
| AMT | | Alternative Minimum Tax |
| BAN | | Bond Anticipation Note |
| BRRH | | Boca Raton Regional Hospital |
| CHESLA | | Connecticut Higher Education Supplemental Loan Authority |
| COLL | | Collateral |
| COP | | Certificate of Participation |
| FHA | | Federal Housing Administration |
| FHLMC | | Federal Home Loan Mortgage Corp. |
| FNMA | | Federal National Mortgage Association |
| GNMA | | Government National Mortgage Association |
| GO | | General Obligation |
| ICE | | Intercontinental Exchange |
| LIBOR | | London Interbank Offered Rate |
| NATL | | Insured by National Public Finance Guarantee Corp. |
| PSF-GTD | | Permanent School Fund Guaranteed |
| RE | | Reinsured |
| Rev. | | Revenue |
| USD | | United States Dollar |
| | |
| |
| (a) | | The date shown represents the earliest of the prerefunded date, next put date or final maturity date. |
| (b) | | Variable or floating rate security, linked to the referenced benchmark. The interest rate shown is the current rate as of August 31, 2018. |
| (c) | | Variable or floating rate security, the interest rate of which adjusts periodically based on changes in current interest rates and prepayments on the underlying pool of assets. The interest rate shown is the current rate as of August 31, 2018. |
| (d) | | Amount rounds to less than 0.1% of net assets. |
| (e) | | Security is prerefunded or escrowed to maturity. |
| (f) | | Investment in affiliate. Fund is registered under the Investment Company Act of 1940, as amended, and advised by J.P. Morgan Investment Management Inc. |
| (g) | | The rate shown is the current yield as of August 31, 2018. |
| ‡ | | Value determined using significant unobservable inputs. |
SEE NOTES TO FINANCIAL STATEMENTS.
| | | | | | |
| | | |
| 18 | | | | J.P. MORGAN MUNICIPAL BOND FUNDS | | AUGUST 31, 2018 |
JPMorgan Short-Intermediate Municipal Bond Fund
SCHEDULE OF PORTFOLIO INVESTMENTS
AS OF AUGUST 31, 2018 (Unaudited)
| | | | | | | | |
| INVESTMENTS | | PRINCIPAL
AMOUNT
($000) | | | VALUE
($000) | |
Municipal Bonds — 94.4% (a) | | | | | | | | |
Alabama — 1.6% | | | | | | | | |
Other Revenue — 0.0% (b) | | | | | | | | |
Montgomery County Public Building Authority, Revenue Refunding Warrants, Facilities Project Rev., 5.00%, 3/1/2023 | | | 500 | | | | 560 | |
| | | | | | | | |
Special Tax — 0.2% | | | | | | | | |
Birmingham-Jefferson Civic Center Authority, Special Tax | | | | | | | | |
Series A, Rev., 5.00%, 7/1/2031 | | | 1,100 | | | | 1,275 | |
Series A, Rev., 5.00%, 7/1/2032 | | | 1,150 | | | | 1,326 | |
| | | | | | | | |
| | | | | | | 2,601 | |
| | | | | | | | |
Utility — 1.4% | | | | | | | | |
Black Belt Energy Gas District, Gas Prepay | | | | | | | | |
Series B-2, Rev., (SIFMA Municipal Swap Index Yield + 0.62%), 2.11%, 9/13/2018 (c) | | | 7,500 | | | | 7,464 | |
Black Belt Energy Gas District, Gas Supply Series A, Rev., LIQ: Royal Bank of Canada, 4.00%, 6/1/2021 (d) | | | 8,320 | | | | 8,684 | |
Southeast Alabama Gas District, Project No. 1 | | | | | | | | |
Series A, Rev., 5.00%, 4/1/2021 | | | 2,865 | | | | 3,067 | |
Series A, Rev., 5.00%, 4/1/2022 | | | 3,220 | | | | 3,504 | |
| | | | | | | | |
| | | | | | | 22,719 | |
| | | | | | | | |
Total Alabama | | | | | | | 25,880 | |
| | | | | | | | |
Alaska — 0.0% (b) | | | | | | | | |
Utility — 0.0% (b) | | | | | | | | |
City of Anchorage, Electric Utilities, Senior Lien Series A, Rev., 5.00%, 12/1/2023 | | | 500 | | | | 564 | |
| | | | | | | | |
Arizona — 1.6% | | | | | | | | |
Certificate of Participation/Lease — 0.0% (b) | |
Arizona School Facilities Board Series A-1, COP, 5.00%, 9/1/2019 | | | 500 | | | | 516 | |
| | | | | | | | |
General Obligation — 0.2% | | | | | | | | |
City of Scottsdale GO, 5.00%, 7/1/2022 | | | 2,550 | | | | 2,839 | |
| | | | | | | | |
Hospital — 0.3% | | | | | | | | |
Arizona Health Facilities Authority, Scottsdale Lincoln Hospitals Series A, Rev., 5.00%, 12/1/2025 | | | 3,540 | | | | 4,010 | |
| | | | | | | | |
Industrial Development Revenue/Pollution Control Revenue — 1.1% | | | | | |
Maricopa County Industrial Development Authority, Banner Health | | | | | | | | |
Series B, Rev., 5.00%, 10/18/2022 (d) | | | 7,370 | | | | 8,189 | |
Series C, Rev., 5.00%, 10/18/2024 (d) | | | 9,000 | | | | 10,307 | |
| | | | | | | | |
| | | | | | | 18,496 | |
| | | | | | | | |
| | | | | | | | |
| INVESTMENTS | | PRINCIPAL
AMOUNT
($000) | | | VALUE
($000) | |
| | | | | | | | |
Other Revenue — 0.0% (b) | | | | | | | | |
Town of Marana, Excise Tax | | | | | | | | |
Series B, Rev., 4.00%, 7/1/2020 | | | 75 | | | | 78 | |
Series B, Rev., 5.00%, 7/1/2021 | | | 100 | | | | 108 | |
| | | | | | | | |
| | | | | | | 186 | |
| | | | | | | | |
Total Arizona | | | | | | | 26,047 | |
| | | | | | | | |
Arkansas — 0.3% | | | | | | | | |
Education — 0.2% | | | | | | | | |
University of Arkansas, UAMS Campus | | | | | | | | |
Rev., 5.00%, 3/1/2020 | | | 535 | | | | 560 | |
Rev., 5.00%, 3/1/2025 | | | 500 | | | | 579 | |
Rev., 5.00%, 3/1/2026 | | | 1,000 | | | | 1,153 | |
University of Central Arkansas, Student Housing System Series A, Rev., 5.00%, 11/1/2021 | | | 1,600 | | | | 1,749 | |
| | | | | | | | |
| | | | | | | 4,041 | |
| | | | | | | | |
Other Revenue — 0.1% | | | | | | | | |
Arkansas Development Finance Authority, Department of Community Correction Project Rev., 5.00%, 11/1/2026 | | | 325 | | | | 381 | |
City of Little Rock, Hotel and Restaurant Rev., 5.00%, 7/1/2020 | | | 580 | | | | 612 | |
| | | | | | | | |
| | | | | | | 993 | |
| | | | | | | | |
Total Arkansas | | | | | | | 5,034 | |
| | | | | | | | |
California — 26.4% | | | | | | | | |
Certificate of Participation/Lease — 0.1% | | | | | | | | |
City of Chula Vista, Police Facility Project | | | | | | | | |
COP, 5.00%, 10/1/2021 | | | 360 | | | | 395 | |
COP, 5.00%, 10/1/2022 | | | 465 | | | | 523 | |
COP, 5.00%, 10/1/2023 | | | 1,000 | | | | 1,148 | |
Goleta Water District Series A, COP, AGM, 5.00%, 12/1/2020 | | | 140 | | | | 150 | |
| | | | | | | | |
| | | | | | | 2,216 | |
| | | | | | | | |
Education — 1.0% | | | | | | | | |
California Educational Facilities Authority, Claremont McKenna College Series A, Rev., 4.00%, 1/1/2024 | | | 1,675 | | | | 1,852 | |
California Municipal Finance Authority, California Lutheran University | | | | | | | | |
Rev., 5.00%, 10/1/2025 | | | 275 | | | | 316 | |
Rev., 5.00%, 10/1/2026 | | | 150 | | | | 173 | |
Rev., 5.00%, 10/1/2027 | | | 150 | | | | 175 | |
Regents of the University of California Series AK, Rev., 5.00%, 5/15/2023 (d) | | | 11,505 | | | | 13,204 | |
| | | | | | | | |
| | | | | | | 15,720 | |
| | | | | | | | |
SEE NOTES TO FINANCIAL STATEMENTS.
| | | | | | | | |
| | | |
| AUGUST 31, 2018 | | J.P. MORGAN MUNICIPAL BOND FUNDS | | | | | 19 | |
JPMorgan Short-Intermediate Municipal Bond Fund
SCHEDULE OF PORTFOLIO INVESTMENTS
AS OF AUGUST 31, 2018 (Unaudited) (continued)
| | | | | | | | |
| INVESTMENTS | | PRINCIPAL
AMOUNT
($000) | | | VALUE
($000) | |
Municipal Bonds — continued | |
General Obligation — 8.6% | | | | | | | | |
Allan Hancock Joint Community College District GO, 5.00%, 8/1/2022 | | | 1,050 | | | | 1,179 | |
City and County of San Francisco Series A, GO, 5.00%, 6/15/2025 | | | 5,310 | | | | 5,933 | |
County of Los Angeles, Community College District Series C, GO, 5.00%, 6/1/2026 | | | 5,000 | | | | 6,033 | |
County of Sacramento, San Juan Unified School District, Election of 2002 | | | | | | | | |
GO, 5.00%, 8/1/2019 | | | 860 | | | | 888 | |
GO, 5.00%, 8/1/2020 | | | 775 | | | | 826 | |
County of Santa Clara, Moreland School District GO, 5.00%, 8/1/2021 | | | 1,000 | | | | 1,095 | |
County of Santa Clara, San Jose Unified School District GO, 5.00%, 8/1/2023 | | | 350 | | | | 403 | |
Grossmont Healthcare District | | | | | | | | |
Series D, GO, 5.00%, 7/15/2026 | | | 1,225 | | | | 1,441 | |
Series D, GO, 5.00%, 7/15/2027 | | | 1,285 | | | | 1,505 | |
Grossmont Healthcare District, Election of 2006 Series C, GO, 5.00%, 7/15/2026 | | | 1,000 | | | | 1,176 | |
Los Angeles Unified School District Series C, GO, 5.00%, 7/1/2021 | | | 11,535 | | | | 12,600 | |
Moulton-Niguel Water District Consolidated GO, 5.00%, 9/1/2018 | | | 300 | | | | 300 | |
Novato Unified School District | | | | | | | | |
GO, 4.00%, 2/1/2022 | | | 535 | | | | 577 | |
GO, 5.00%, 2/1/2023 | | | 685 | | | | 778 | |
GO, 5.00%, 2/1/2024 | | | 870 | | | | 1,008 | |
GO, 5.00%, 8/1/2025 | | | 1,500 | | | | 1,741 | |
GO, 5.00%, 8/1/2026 | | | 1,800 | | | | 2,082 | |
Oak Grove School District GO, 5.00%, 8/1/2023 | | | 1,200 | | | | 1,376 | |
Placentia-Yorba Linda Unified School District GO, 5.00%, 8/1/2025 | | | 1,770 | | | | 2,097 | |
Salinas Union High School District GO, BAN, Zero Coupon, 8/1/2020 | | | 2,000 | | | | 1,923 | |
San Diego Unified School District, Dedicated Unlimited Ad Valorem Property Tax Series R-3, GO, 5.00%, 7/1/2019 | | | 6,310 | | | | 6,495 | |
San Diego Unified School District, Election of 2012 Series F, GO, 5.00%, 7/1/2029 | | | 550 | | | | 644 | |
San Francisco Bay Area Rapid Transit District, Election of 2004 | | | | | | | | |
Series D, GO, 3.00%, 8/1/2022 | | | 2,735 | | | | 2,869 | |
Series D, GO, 5.00%, 8/1/2027 | | | 1,500 | | | | 1,775 | |
Series D, GO, 5.00%, 8/1/2028 | | | 1,685 | | | | 1,990 | |
San Francisco Unified School District | | | | | | | | |
Series A, GO, 4.00%, 8/1/2022 | | | 30 | | | | 33 | |
Series B, GO, 5.00%, 8/1/2026 | | | 50 | | | | 60 | |
| | | | | | | | |
| INVESTMENTS | | PRINCIPAL
AMOUNT
($000) | | | VALUE
($000) | |
| | | | | | | | |
General Obligation — continued | |
San Francisco Unified School District, Proposition A, Election of 2011 Series B, GO, 5.00%, 6/15/2024 | | | 5,190 | | | | 5,808 | |
San Mateo County Community College District | | | | | | | | |
GO, 5.00%, 9/1/2025 | | | 700 | | | | 817 | |
GO, 5.00%, 9/1/2026 | | | 1,095 | | | | 1,274 | |
State of California, Various Purpose | | | | | | | | |
Series B, GO, 5.00%, 9/1/2023 | | | 2,810 | | | | 3,227 | |
GO, 5.00%, 11/1/2023 | | | 3,560 | | | | 4,101 | |
GO, 5.00%, 3/1/2026 | | | 13,210 | | | | 15,473 | |
GO, 5.00%, 9/1/2026 | | | 4,900 | | | | 5,885 | |
GO, 4.00%, 8/1/2028 | | | 4,000 | | | | 4,458 | |
GO, 5.00%, 9/1/2028 | | | 2,500 | | | | 2,739 | |
GO, 4.00%, 8/1/2029 | | | 4,180 | | | | 4,631 | |
GO, 5.00%, 8/1/2029 | | | 7,830 | | | | 9,272 | |
GO, 4.00%, 8/1/2030 | | | 10,000 | | | | 11,001 | |
Vacaville Unified School District, Election of 2014 Series B, GO, 4.00%, 8/1/2019 | | | 1,000 | | | | 1,023 | |
Whittier Union School District GO, 5.00%, 8/1/2023 | | | 10,495 | | | | 12,036 | |
| | | | | | | | |
| | | | | | | 140,572 | |
| | | | | | | | |
Hospital — 3.1% | | | | | | | | |
California Health Facilities Financing Authority, Cedars-Sinai Medical Center Rev., 5.00%, 11/15/2025 | | | 1,850 | | | | 2,190 | |
California Health Facilities Financing Authority, Kaiser Permanente | | | | | | | | |
Series C, Rev., 5.00%, 11/1/2022 (d) | | | 5,000 | | | | 5,619 | |
Series D, Rev., 5.00%, 11/1/2022 (d) | | | 17,420 | | | | 19,579 | |
California Health Facilities Financing Authority, Providence Health and Services | | | | | | | | |
Series A, Rev., 5.00%, 10/1/2021 | | | 750 | | | | 822 | |
Series A, Rev., 5.00%, 10/1/2022 | | | 1,500 | | | | 1,683 | |
California Health Facilities Financing Authority, St. Joseph Health System | | | | | | | | |
Series C, Rev., 5.00%, 10/15/2019 (d) | | | 5,000 | | | | 5,191 | |
Series D, Rev., 5.00%, 10/15/2020 (d) | | | 12,870 | | | | 13,766 | |
California Municipal Finance Authority, NorthBay Healthcare Group | | | | | | | | |
Series A, Rev., 5.00%, 11/1/2023 | | | 500 | | | | 549 | |
Series A, Rev., 5.00%, 11/1/2024 | | | 800 | | | | 887 | |
Series A, Rev., 5.00%, 11/1/2025 | | | 745 | | | | 833 | |
California Statewide Communities Development Authority, Marin General Hospital Project Rev., 5.00%, 8/1/2028 | | | 250 | | | | 298 | |
| | | | | | | | |
| | | | | | | 51,417 | |
| | | | | | | | |
SEE NOTES TO FINANCIAL STATEMENTS.
| | | | | | |
| | | |
| 20 | | | | J.P. MORGAN MUNICIPAL BOND FUNDS | | AUGUST 31, 2018 |
| | | | | | | | |
| INVESTMENTS | | PRINCIPAL
AMOUNT
($000) | | | VALUE
($000) | |
Municipal Bonds — continued | |
Housing — 0.4% | | | | | | | | |
Anaheim Housing and Public Improvements Authority, Electric Utility Distribution System Series 2016-A, Rev., 5.00%, 10/1/2032 | | | 1,725 | | | | 1,890 | |
California Statewide Communities Development Authority, LA Puente Park Apartments Series F, Rev., 1.20%, 10/1/2018 (d) | | | 4,750 | | | | 4,749 | |
| | | | | | | | |
| | | | | | | 6,639 | |
| | | | | | | | |
Other Revenue — 3.2% | | | | | | | | |
Alameda County Transport Authority, Sales Tax | | | | | | | | |
Rev., 4.00%, 3/1/2019 | | | 5,000 | | | | 5,066 | |
Rev., 5.00%, 3/1/2020 | | | 1,240 | | | | 1,305 | |
Rev., 4.00%, 3/1/2022 | | | 5,000 | | | | 5,403 | |
California Infrastructure and Economic Development Bank, The J. Paul Getty Trust | | | | | | | | |
Series A-3, Rev., (ICE LIBOR USD 3 Month + 0.37%), 2.00%, 10/1/2018 (c) | | | 8,000 | | | | 8,120 | |
Series A-4, Rev., (ICE LIBOR USD 3 Month + 0.37%), 2.00%, 10/1/2018 (c) | | | 7,000 | | | | 7,090 | |
California Municipal Finance Authority, Biola University | | | | | | | | |
Rev., 4.00%, 10/1/2019 | | | 205 | | | | 210 | |
Rev., 5.00%, 10/1/2021 | | | 370 | | | | 404 | |
California State Public Works Board, Department of General Services Series F, Rev., 5.00%, 5/1/2021 | | | 4,500 | | | | 4,892 | |
Contra Costa County Transportation Authority, Sales Tax | | | | | | | | |
Series B, Rev., 5.00%, 3/1/2019 | | | 1,750 | | | | 1,783 | |
Series A, Rev., 4.00%, 3/1/2023 | | | 3,420 | | | | 3,761 | |
Series A, Rev., 5.00%, 3/1/2023 | | | 2,420 | | | | 2,766 | |
Series A, Rev., 5.00%, 3/1/2024 | | | 2,000 | | | | 2,335 | |
Golden State Tobacco Securitization Corp., Tobacco Settlement Series A, Rev., 5.00%, 6/1/2021 | | | 1,000 | | | | 1,085 | |
Riverside Community Properties Development, Inc., Riverside County Law Building Project | | | | | | | | |
Rev., 5.00%, 10/15/2018 (e) | | | 640 | | | | 643 | |
Rev., 5.00%, 10/15/2019 (e) | | | 780 | | | | 810 | |
San Diego County Regional Transportation Commission, Sales Tax | | | | | | | | |
Series A, Rev., 5.00%, 4/1/2021 | | | 250 | | | | 271 | |
Series A, Rev., 5.00%, 4/1/2022 | | | 100 | | | | 112 | |
San Francisco Bay Area Rapid Transit District, Sales Tax | | | | | | | | |
Series A, Rev., 5.00%, 7/1/2024 | | | 525 | | | | 611 | |
Series A, Rev., 5.00%, 7/1/2025 | | | 905 | | | | 1,070 | |
| | | | | | | | |
| INVESTMENTS | | PRINCIPAL
AMOUNT
($000) | | | VALUE
($000) | |
| | | | | | | | |
Other Revenue — continued | |
San Francisco State Building Authority and Oakland State Building Authority, Elihu M. Harris State Office Building Series A, Rev., 5.00%, 12/1/2022 | | | 1,700 | | | | 1,918 | |
Santa Clara County Financing Authority, Capital Projects Series A, Rev., 5.00%, 2/1/2019 | | | 1,225 | | | | 1,244 | |
Sonoma County Transportation Authority, Sales Tax Rev., 5.00%, 12/1/2024 | | | 1,000 | | | | 1,174 | |
| | | | | | | | |
| | | | | | | 52,073 | |
| | | | | | | | |
Prerefunded — 0.4% | | | | | | | | |
Anaheim Housing and Public Improvements Authority, Electric Utility Distribution System Series 2016-A, Rev., 5.00%, 10/1/2021 (e) | | | 1,275 | | | | 1,403 | |
California State Public Works Board, California State University Series E, Rev., 5.00%, 4/1/2019 (e) | | | 1,160 | | | | 1,184 | |
California State Public Works Board, California State University, Davidson Library at Santa Barbara Series C, Rev., 5.00%, 3/1/2023 (e) | | | 2,820 | | | | 3,210 | |
| | | | | | | | |
| | | | | | | 5,797 | |
| | | | | | | | |
Transportation — 4.0% | | | | | | | | |
Bay Area Toll Authority, Toll Bridge, San Francisco Bay Area | | | | | | | | |
Series G, Rev., (SIFMA Municipal Swap Index Yield + 0.60%), 2.09%, 9/13/2018 (c) | | | 9,000 | | | | 9,106 | |
Series C, Rev., 1.88%, 4/1/2019 (d) | | | 7,550 | | | | 7,552 | |
Series S-7, Rev., 4.00%, 4/1/2029 | | | 20,000 | | | | 22,200 | |
City of Los Angeles Department of Airports | | | | | | | | |
Series C, Rev., 5.00%, 5/15/2019 | | | 1,000 | | | | 1,025 | |
Series A, Rev., AMT, 5.00%, 5/15/2021 | | | 1,590 | | | | 1,720 | |
Series C, Rev., 5.00%, 5/15/2022 | | | 750 | | | | 832 | |
Series D, Rev., AMT, 5.00%, 5/15/2022 | | | 3,380 | | | | 3,736 | |
Series B, Rev., 4.00%, 5/15/2023 | | | 315 | | | | 344 | |
Series B, Rev., 4.00%, 5/15/2024 | | | 365 | | | | 402 | |
Series C, Rev., 5.00%, 5/15/2024 | | | 700 | | | | 805 | |
Series D, Rev., AMT, 5.00%, 5/15/2027 | | | 2,700 | | | | 3,091 | |
Series D, Rev., AMT, 5.00%, 5/15/2028 | | | 1,950 | | | | 2,226 | |
Series D, Rev., AMT, 5.00%, 5/15/2029 | | | 2,550 | | | | 2,904 | |
Los Angeles County Metropolitan Transportation Authority Series A, Rev., 5.00%, 7/1/2019 | | | 9,665 | | | | 9,959 | |
| | | | | | | | |
| | | | | | | 65,902 | |
| | | | | | | | |
Utility — 2.2% | | | | | | | | |
California Infrastructure and Economic Development Bank, Pacific Gas and Electric Co. Series E, Rev., 1.75%, 6/1/2022 (d) | | | 3,500 | | | | 3,278 | |
SEE NOTES TO FINANCIAL STATEMENTS.
| | | | | | | | |
| | | |
| AUGUST 31, 2018 | | J.P. MORGAN MUNICIPAL BOND FUNDS | | | | | 21 | |
JPMorgan Short-Intermediate Municipal Bond Fund
SCHEDULE OF PORTFOLIO INVESTMENTS
AS OF AUGUST 31, 2018 (Unaudited) (continued)
| | | | | | | | |
| INVESTMENTS | | PRINCIPAL
AMOUNT
($000) | | | VALUE
($000) | |
Municipal Bonds — continued | |
Utility — continued | |
City of Los Angeles Department of Water and Power, Power System Series B, Rev., 5.00%, 12/1/2018 | | | 10,000 | | | | 10,059 | |
City of Los Angeles, Department of Water and Power, Water System Series A, Rev., 5.00%, 7/1/2025 | | | 100 | | | | 119 | |
Sacramento Municipal Utility District, Electric | | | | | | | | |
Series E, Rev., 5.00%, 8/15/2022 | | | 2,740 | | | | 3,082 | |
Series E, Rev., 5.00%, 8/15/2027 | | | 105 | | | | 129 | |
San Francisco City and County Public Utilities Commission Water, Green Bonds Series C, Rev., 2.12%, 10/1/2023 (d) | | | 10,000 | | | | 9,935 | |
Southern California Public Power Authority, Magnolia Power Project Series 1, Rev., 2.00%, 7/1/2020 (d) | | | 7,000 | | | | 7,010 | |
Southern California, Public Power Authority Canyon Power Project Series A, Rev., 5.00%, 7/1/2026 | | | 1,000 | | | | 1,093 | |
Walnut Energy Center Authority Series A, Rev., 5.00%, 1/1/2023 | | | 400 | | | | 453 | |
| | | | | | | | |
| | | | | | | 35,158 | |
| | | | | | | | |
Water & Sewer — 3.4% | | | | | | | | |
Burlingame Financing Authority Water and Wastewater Rev., 4.00%, 4/1/2020 | | | 250 | | | | 260 | |
California State Department of Water Resources, Central Valley Project Water System Series AU, Rev., (SIFMA Municipal Swap Index Yield + 0.22%), 1.71%, 9/13/2018 (c) | | | 10,000 | | | | 10,078 | |
California State Department of Water Resources, Power Supply Series L, Rev., 5.00%, 5/1/2019 | | | 15,000 | | | | 15,362 | |
City of Los Angeles Wastewater System Subordinate | | | | | | | | |
Series A, Rev., 5.00%, 6/1/2019 | | | 1,250 | | | | 1,284 | |
Series A, Rev., 5.00%, 6/1/2022 | | | 2,750 | | | | 3,075 | |
County of San Mateo, Silicon Valley Clean Water Rev., 4.00%, 2/1/2019 | | | 400 | | | | 405 | |
East Bay Municipal Utility District, Wastewater System | | | | | | | | |
Series B, Rev., 5.00%, 6/1/2019 | | | 2,330 | | | | 2,394 | |
Series A, Rev., 5.00%, 6/1/2020 | | | 3,000 | | | | 3,186 | |
Eastern Municipal Water District, Water and Wastewater | | | | | | | | |
Series C, Rev., 5.00%, 7/1/2021 | | | 2,530 | | | | 2,771 | |
Series C, Rev., 5.00%, 7/1/2022 | | | 1,700 | | | | 1,909 | |
| | | | | | | | |
| INVESTMENTS | | PRINCIPAL
AMOUNT
($000) | | | VALUE
($000) | |
| | | | | | | | |
Water & Sewer — continued | |
Metropolitan Water District of Southern California | | | | | | | | |
Series A, Rev., 5.00%, 7/1/2019 | | | 8,000 | | | | 8,239 | |
Series C-1, Rev., 3.00%, 10/1/2019 (d) | | | 6,105 | | | | 6,184 | |
| | | | | | | | |
| | | | | | | 55,147 | |
| | | | | | | | |
Total California | | | | | | | 430,641 | |
| | | | | | | | |
Colorado — 1.7% | | | | | | | | |
Certificate of Participation/Lease — 0.3% | | | | | | | | |
City of Aurora | | | | | | | | |
COP, 3.00%, 12/1/2020 | | | 125 | | | | 128 | |
COP, 4.00%, 12/1/2022 | | | 375 | | | | 404 | |
City of Longmont | | | | | | | | |
Series A, COP, 5.00%, 12/1/2021 | | | 100 | | | | 110 | |
Series A, COP, 5.00%, 12/1/2022 | | | 100 | | | | 112 | |
Series A, COP, 5.00%, 12/1/2024 | | | 100 | | | | 113 | |
County of Boulder, Flood Reconstruction Projects | | | | | | | | |
COP, 5.00%, 12/1/2022 | | | 720 | | | | 769 | |
COP, 5.00%, 12/1/2023 | | | 500 | | | | 534 | |
COP, 5.00%, 12/1/2025 | | | 500 | | | | 534 | |
County of Eagle | | | | | | | | |
COP, 3.00%, 12/1/2018 | | | 500 | | | | 502 | |
COP, 5.00%, 12/1/2022 | | | 200 | | | | 222 | |
State of Colorado Department of Transportation, Headquarters Facilities Lease Purchase Agreement | | | | | | | | |
COP, 3.00%, 6/15/2020 | | | 250 | | | | 255 | |
COP, 3.00%, 6/15/2021 | | | 1,000 | | | | 1,030 | |
COP, 5.00%, 6/15/2023 | | | 450 | | | | 508 | |
| | | | | | | | |
| | | | | | | 5,221 | |
| | | | | | | | |
Education — 0.3% | | | | | | | | |
Board of Governors of the University of Colorado, Enterprise System Series B, Rev., 5.00%, 3/1/2029 | | | 650 | | | | 757 | |
University of Colorado, Enterprise System Series A-2, Rev., 5.00%, 6/1/2022 | | | 1,080 | | | | 1,197 | |
University of Colorado, University Enterprise Series A, Rev., 5.00%, 6/1/2022 | | | 3,150 | | | | 3,492 | |
| | | | | | | | |
| | | | | | | 5,446 | |
| | | | | | | | |
General Obligation — 0.1% | | | | | | | | |
Counties of Gunnison, Watershed School District No. 1 | | | | | | | | |
GO, 4.00%, 12/1/2022 | | | 300 | | | | 325 | |
GO, 5.00%, 12/1/2026 | | | 500 | | | | 577 | |
| | | | | | | | |
| | | | | | | 902 | |
| | | | | | | | |
SEE NOTES TO FINANCIAL STATEMENTS.
| | | | | | |
| | | |
| 22 | | | | J.P. MORGAN MUNICIPAL BOND FUNDS | | AUGUST 31, 2018 |
| | | | | | | | |
| INVESTMENTS | | PRINCIPAL
AMOUNT
($000) | | | VALUE
($000) | |
Municipal Bonds — continued | |
Hospital — 0.3% | | | | | | | | |
Colorado Health Facilities Authority, Parkview Medical Center, Inc. Project Rev., 5.00%, 9/1/2027 | | | 675 | | | | 777 | |
Colorado Health Facilities Authority, Valley View Hospital Association Project Rev., 2.80%, 5/15/2023 (d) | | | 1,150 | | | | 1,159 | |
University of Colorado Hospital Authority Series C-1, Rev., 4.00%, 3/1/2020 (d) | | | 2,620 | | | | 2,676 | |
| | | | | | | | |
| | | | | | | 4,612 | |
| | | | | | | | |
Housing — 0.3% | | | | | | | | |
Adams County Colorado Housing Authority Multifamily Housing, Baker School Apartment Project Rev., 1.50%, 11/1/2019 (d) | | | 5,000 | | | | 4,974 | |
| | | | | | | | |
Other Revenue — 0.1% | | | | | | | | |
Denver Convention Center Hotel Authority | | | | | | | | |
Rev., 4.00%, 12/1/2019 | | | 375 | | | | 383 | |
Rev., 4.00%, 12/1/2020 | | | 500 | | | | 519 | |
| | | | | | | | |
| | | | | | | 902 | |
| | | | | | | | |
Prerefunded — 0.2% | | | | | | | | |
Regional Transportation District Series A, COP, 5.00%, 6/1/2020 (e) | | | 3,700 | | | | 3,903 | |
| | | | | | | | |
Transportation — 0.1% | | | | | | | | |
E-470 Public Highway Authority, Senior LIBOR Index Series A, Rev., (ICE LIBOR USD 1 Month + 0.90%), 2.29%, 9/13/2018 (c) | | | 2,500 | | | | 2,506 | |
| | | | | | | | |
Total Colorado | | | | | | | 28,466 | |
| | | | | | | | |
Connecticut — 3.7% | | | | | | | | |
Education — 2.1% | | | | | | | | |
Connecticut State Health and Educational Facility Authority, Sacred Heart University Series I-1, Rev., 5.00%, 7/1/2031 | | | 400 | | | | 459 | |
State of Connecticut, Health and Educational Facilities Authority, Hartford Healthcare Issue Series G, Rev., (ICE LIBOR USD 1 Month + 0.95%), 2.39%, 10/1/2018 (c) | | | 15,000 | | | | 15,130 | |
State of Connecticut, Health and Educational Facility Authority Series B, Rev., (ICE LIBOR USD 1 Month + 0.55%), 1.97%, 10/1/2018 (c) | | | 18,775 | | | | 18,865 | |
| | | | | | | | |
| | | | | | | 34,454 | |
| | | | | | | | |
General Obligation — 1.6% | | | | | | | | |
State of Connecticut Series A, GO, BAN, 5.00%, 9/14/2018 | | | 24,750 | | | | 24,772 | |
| | | | | | | | |
| INVESTMENTS | | PRINCIPAL
AMOUNT
($000) | | | VALUE
($000) | |
| | | | | | | | |
General Obligation — continued | |
State of Connecticut, SIFMA Index Series B, GO, (SIFMA Municipal Swap Index Yield + 0.49%), 1.98%, 9/13/2018 (c) | | | 1,500 | | | | 1,499 | |
| | | | | | | | |
| | | | | | | 26,271 | |
| | | | | | | | |
Total Connecticut | | | | | | | 60,725 | |
| | | | | | | | |
Delaware — 0.0% (b) | | | | | | | | |
General Obligation — 0.0% (b) | | | | | | | | |
State of Delaware GO, 5.00%, 7/1/2019 | | | 120 | | | | 123 | |
| | | | | | | | |
District of Columbia — 0.2% | | | | | | | | |
Hospital — 0.1% | | | | | | | | |
District of Columbia Children's Hospital | | | | | | | | |
Rev., 5.00%, 7/15/2021 | | | 500 | | | | 542 | |
Rev., 5.00%, 7/15/2022 | | | 850 | | | | 940 | |
| | | | | | | | |
| | | | | | | 1,482 | |
| | | | | | | | |
Transportation — 0.1% | | | | | | | | |
Metropolitan Washington Airports Authority, Airport System Series C, Rev., 5.00%, 10/1/2021 | | | 1,475 | | | | 1,608 | |
| | | | | | | | |
Total District of Columbia | | | | | | | 3,090 | |
| | | | | | | | |
Florida — 1.0% | | | | | | | | |
Certificate of Participation/Lease — 0.1% | | | | | | | | |
School Board of Duval County Series B, COP, 5.00%, 7/1/2021 | | | 750 | | | | 812 | |
Seminole County School Board | | | | | | | | |
Series A, COP, 5.00%, 7/1/2019 | | | 200 | | | | 205 | |
Series A, COP, 5.00%, 7/1/2020 | | | 210 | | | | 222 | |
| | | | | | | | |
| | | | | | | 1,239 | |
| | | | | | | | |
Education — 0.7% | | | | | | | | |
Board of Governors of the University of Florida, Student Activity Rev., 5.00%, 7/1/2020 | | | 1,660 | | | | 1,755 | |
State of Florida, State Board of Education Lottery Series B, Rev., 5.00%, 7/1/2027 | | | 8,540 | | | | 10,063 | |
| | | | | | | | |
| | | | | | | 11,818 | |
| | | | | | | | |
General Obligation — 0.1% | | | | | | | | |
Reedy Creek Improvement District Series B, GO, 4.00%, 6/1/2019 | | | 1,000 | | | | 1,017 | |
| | | | | | | | |
Transportation — 0.1% | | | | | | | | |
Miami-Dade County Expressway Authority, Toll System | | | | | | | | |
Series A, Rev., 5.00%, 7/1/2020 | | | 1,550 | | | | 1,636 | |
Series A, Rev., 5.00%, 7/1/2022 | | | 625 | | | | 692 | |
| | | | | | | | |
| | | | | | | 2,328 | |
| | | | | | | | |
Total Florida | | | | | | | 16,402 | |
| | | | | | | | |
SEE NOTES TO FINANCIAL STATEMENTS.
| | | | | | | | |
| | | |
| AUGUST 31, 2018 | | J.P. MORGAN MUNICIPAL BOND FUNDS | | | | | 23 | |
JPMorgan Short-Intermediate Municipal Bond Fund
SCHEDULE OF PORTFOLIO INVESTMENTS
AS OF AUGUST 31, 2018 (Unaudited) (continued)
| | | | | | | | |
| INVESTMENTS | | PRINCIPAL
AMOUNT
($000) | | | VALUE
($000) | |
Municipal Bonds — continued | |
Georgia — 2.2% | | | | | | | | |
General Obligation — 1.3% | | | | | | | | |
City of Atlanta Series A, GO, 4.00%, 12/1/2019 | | | 1,000 | | | | 1,028 | |
State of Georgia | | | | | | | | |
Series I, GO, 5.00%, 7/1/2019 | | | 1,250 | | | | 1,285 | |
Series I, GO, 5.00%, 7/1/2021 | | | 8,165 | | | | 8,874 | |
Series E, GO, 5.00%, 12/1/2025 | | | 6,750 | | | | 7,960 | |
Series F, GO, 5.00%, 7/1/2028 | | | 2,000 | | | | 2,379 | |
| | | | | | | | |
| | | | | | | 21,526 | |
| | | | | | | | |
Other Revenue — 0.7% | | | | | | | | |
Atlanta Development Authority, New Downtown Atlanta Stadium Project, Senior Lien | | | | | | | | |
Series A-1, Rev., 5.00%, 7/1/2027 | | | 1,000 | | | | 1,142 | |
Series A-1, Rev., 5.00%, 7/1/2028 | | | 1,000 | | | | 1,139 | |
Dahlonega Downtown Development Authority, North Georgia MAC, LLC Project | | | | | | | | |
Series 2017, Rev., 5.00%, 7/1/2023 | | | 325 | | | | 367 | |
Series 2017, Rev., 5.00%, 7/1/2025 | | | 250 | | | | 289 | |
Series 2017, Rev., 5.00%, 7/1/2026 | | | 275 | | | | 321 | |
Series 2017, Rev., 5.00%, 7/1/2027 | | | 300 | | | | 354 | |
Series 2017, Rev., 5.00%, 7/1/2028 | | | 375 | | | | 441 | |
Series 2017, Rev., 4.00%, 7/1/2032 | | | 1,000 | | | | 1,061 | |
Fulton County Development Authority, Technology Athletic Association Project Series A, Rev., 5.00%, 10/1/2022 | | | 5,000 | | | | 5,507 | |
| | | | | | | | |
| | | | | | | 10,621 | |
| | | | | | | | |
Water & Sewer — 0.2% | | | | | | | | |
City of Atlanta, Water and Wastewater, Revenue Refunding Series A-1, Rev., (ICE LIBOR USD 1 Month + 1.50%), 2.89%, 9/13/2018 (c) | | | 3,000 | | | | 3,004 | |
| | | | | | | | |
Total Georgia | | | | | | | 35,151 | |
| | | | | | | | |
Guam — 0.0% (b) | | | | | | | | |
Other Revenue — 0.0% (b) | | | | | | | | |
Government of Guam, Limited Obligation Section 30 (Guam) Series A, Rev., 5.00%, 12/1/2018 | | | 750 | | | | 755 | |
| | | | | | | | |
Hawaii — 1.5% | | | | | | | | |
General Obligation — 1.5% | | | | | | | | |
City and County of Honolulu, Rail Transit Project GO, (SIFMA Municipal Swap Index Yield + 0.30%), 1.79%, 9/13/2018 (c) | | | 2,200 | | | | 2,214 | |
State of Hawaii | | | | | | | | |
Series DY, GO, 5.00%, 2/1/2020 | | | 10,160 | | | | 10,622 | |
Series EF, GO, 5.00%, 11/1/2021 | | | 7,640 | | | | 8,367 | |
| | | | | | | | |
| INVESTMENTS | | PRINCIPAL
AMOUNT
($000) | | | VALUE
($000) | |
| | | | | | | | |
General Obligation — continued | |
Series FK, GO, 5.00%, 5/1/2029 | | | 2,765 | | | | 3,265 | |
| | | | | | | | |
Total Hawaii | | | | | | | 24,468 | |
| | | | | | | | |
Illinois — 4.3% | | | | | | | | |
Education — 0.3% | | | | | | | | |
Illinois Educational Facilities Authority, University of Chicago Series B-2, Rev., 1.55%, 2/13/2020 (d) | | | 5,000 | | | | 4,961 | |
Illinois Finance Authority, DePaul University | | | | | | | | |
Rev., 5.00%, 10/1/2023 | | | 200 | | | | 225 | |
Rev., 5.00%, 10/1/2025 | | | 300 | | | | 345 | |
Rev., 5.00%, 10/1/2028 | | | 250 | | | | 289 | |
| | | | | | | | |
| | | | | | | 5,820 | |
| | | | | | | | |
General Obligation — 2.6% | | | | | | | | |
City of Chicago Series C, GO, 5.00%, 1/1/2022 | | | 5,000 | | | | 5,290 | |
City of Waukegan | | | | | | | | |
Series B, GO, AGM, 5.00%, 12/30/2025 | | | 1,075 | | | | 1,243 | |
Series B, GO, AGM, 5.00%, 12/30/2026 | | | 1,125 | | | | 1,314 | |
Series B, GO, AGM, 5.00%, 12/30/2027 | | | 1,185 | | | | 1,379 | |
Series B, GO, AGM, 5.00%, 12/30/2028 | | | 1,245 | | | | 1,441 | |
Series B, GO, AGM, 5.00%, 12/30/2029 | | | 1,305 | | | | 1,505 | |
Cook County Township High School District No. 225 Series A, GO, 5.00%, 12/1/2023 | | | 5 | | | | 6 | |
Cook County, Community Consolidated School District No. 146 Tinley Park GO, 5.00%, 12/1/2026 | | | 700 | | | | 807 | |
Cook County, Proviso Township High School District No. 209 | | | | | | | | |
GO, 5.00%, 12/1/2022 | | | 2,975 | | | | 3,274 | |
GO, 5.00%, 12/1/2023 | | | 2,350 | | | | 2,619 | |
County of DuPage, Courthouse Project GO, 5.00%, 1/1/2024 | | | 335 | | | | 378 | |
DuPage County Forest Preserve District GO, 5.00%, 1/1/2021 | | | 2,800 | | | | 2,993 | |
Kane and DeKalb Counties Community Unit School District No. 301 GO, 5.00%, 1/1/2027 | | | 355 | | | | 410 | |
Lincoln Land Community College District No. 526 | | | | | | | | |
GO, 5.00%, 12/15/2021 | | | 305 | | | | 329 | |
GO, 4.00%, 12/15/2022 | | | 440 | | | | 460 | |
McHenry County, Woodstock Community Unit School District No. 200 GO, 5.00%, 1/15/2021 | | | 300 | | | | 321 | |
State of Illinois | | | | | | | | |
Series D, GO, 5.00%, 11/1/2020 | | | 10,000 | | | | 10,432 | |
Series D, GO, 5.00%, 11/1/2023 | | | 5,000 | | | | 5,308 | |
SEE NOTES TO FINANCIAL STATEMENTS.
| | | | | | |
| | | |
| 24 | | | | J.P. MORGAN MUNICIPAL BOND FUNDS | | AUGUST 31, 2018 |
| | | | | | | | |
| INVESTMENTS | | PRINCIPAL
AMOUNT
($000) | | | VALUE
($000) | |
Municipal Bonds — continued | |
General Obligation — continued | |
Village of Hoffman Estates | | | | | | | | |
GO, 5.00%, 12/1/2030 | | | 900 | | | | 1,037 | |
GO, 5.00%, 12/1/2032 | | | 1,200 | | | | 1,371 | |
| | | | | | | | |
| | | | | | | 41,917 | |
| | | | | | | | |
Hospital — 1.0% | | | | | | | | |
Illinois Finance Authority, Advocate Health Care Series A-1, Rev., 5.00%, 1/15/2020 (d) | | | 6,000 | | | | 6,241 | |
Illinois Finance Authority, Ascension Health Alliance Senior Credit Group Series E-2, Rev., 1.75%, 4/1/2021 (d) | | | 3,750 | | | | 3,717 | |
Illinois Finance Authority, Edward-Elmhurst Healthcare Series A, Rev., 5.00%, 1/1/2030 | | | 2,500 | | | | 2,813 | |
Illinois Finance Authority, Silver Cross Hospital and Medical Centers | | | | | | | | |
Series C, Rev., 5.00%, 8/15/2021 | | | 150 | | | | 162 | |
Series C, Rev., 5.00%, 8/15/2022 | | | 500 | | | | 547 | |
Southwestern Illinois Development Authority, Hospital Sisters Services, Inc. Obligated Group Series A, Rev., 5.00%, 2/15/2027 | | | 2,000 | | | | 2,328 | |
| | | | | | | | |
| | | | | | | 15,808 | |
| | | | | | | | |
Transportation — 0.3% | | | | | | | | |
City of Chicago, Chicago Midway Airport Second Lien Revenue Refunding | | | | | | | | |
Series A, Rev., AMT, 5.00%, 1/1/2020 | | | 1,425 | | | | 1,478 | |
Series B, Rev., 5.00%, 1/1/2020 | | | 500 | | | | 519 | |
Series A, Rev., AMT, 5.00%, 1/1/2021 | | | 2,580 | | | | 2,736 | |
| | | | | | | | |
| | | | | | | 4,733 | |
| | | | | | | | |
Water & Sewer — 0.1% | | | | | | | | |
City of Waukegan, First Lien Water and Sewer System | | | | | | | | |
Series C, Rev., AGM, 5.00%, 12/30/2023 | | | 535 | | | | 597 | |
Series C, Rev., AGM, 5.00%, 12/30/2026 | | | 680 | | | | 773 | |
Series C, Rev., AGM, 5.00%, 12/30/2027 | | | 710 | | | | 806 | |
Series C, Rev., AGM, 5.00%, 12/30/2028 | | | 395 | | | | 445 | |
| | | | | | | | |
| | | | | | | 2,621 | |
| | | | | | | | |
Total Illinois | | | | | | | 70,899 | |
| | | | | | | | |
Indiana — 0.6% | | | | | | | | |
Education — 0.2% | | | | | | | | |
Indiana Finance Authority, Educational Facilities, Indianapolis Museum of Art, Inc. Project Series B, Rev., 5.00%, 2/1/2019 | | | 1,170 | | | | 1,186 | |
New Albany Floyd County School Building Corp. | | | | | | | | |
Rev., 5.00%, 7/15/2021 | | | 700 | | | | 759 | |
Rev., 5.00%, 7/15/2022 | | | 835 | | | | 924 | |
| | | | | | | | |
| | | | | | | 2,869 | |
| | | | | | | | |
| | | | | | | | |
| INVESTMENTS | | PRINCIPAL
AMOUNT
($000) | | | VALUE
($000) | |
| | | | | | | | |
Other Revenue — 0.1% | | | | | | | | |
Fort Wayne Redevelopment Authority Lease Rental, Harrison Square Project Rev., 5.00%, 8/1/2023 | | | 1,000 | | | | 1,123 | |
Indiana State Office Building Commission, Indiana State Museum Facility Series C, Rev., NATL-RE, 5.25%, 7/1/2019 (e) | | | 750 | | | | 772 | |
| | | | | | | | |
| | | | | | | 1,895 | |
| | | | | | | | |
Utility — 0.3% | | | | | | | | |
City of Rockport, Indiana Michigan Power Company Project Series B, Rev., 3.05%, 6/1/2025 | | | 5,000 | | | | 5,016 | |
| | | | | | | | |
Water & Sewer — 0.0% (b) | | | | | | | | |
Evansville Local Public Improvement Bond Bank, Sewage Works Project Series A, Rev., 5.00%, 7/1/2019 | | | 620 | | | | 637 | |
| | | | | | | | |
Total Indiana | | | | | | | 10,417 | |
| | | | | | | | |
Iowa — 0.9% | | | | | | | | |
Hospital — 0.9% | | | | | | | | |
Iowa Finance Authority, Health Systems Rev., (SIFMA Municipal Swap Index Yield + 0.58%), 2.07%, 9/13/2018 (c) (f) | | | 14,000 | | | | 14,029 | |
| | | | | | | | |
Kansas — 0.4% | | | | | | | | |
General Obligation — 0.2% | | | | | | | | |
Butler County, Unified School District No. 375 GO, 4.00%, 9/1/2024 | | | 200 | | | | 214 | |
Johnson County Unified School District No. 233 Series B, GO, 4.00%, 9/1/2025 | | | 625 | | | | 684 | |
Seward County Unified School District No. 480 Series B, GO, 5.00%, 9/1/2025 | | | 1,750 | | | | 2,022 | |
| | | | | | | | |
| | | | | | | 2,920 | |
| | | | | | | | |
Hospital — 0.0% (b) | | | | | | | | |
University of Kansas Hospital Authority, Health System Series A, Rev., 5.00%, 3/1/2024 | | | 275 | | | | 312 | |
| | | | | | | | |
Water & Sewer — 0.2% | | | | | | | | |
City of Wichita, Water and Sewer Utility Series A, Rev., 5.00%, 10/1/2022 | | | 2,200 | | | | 2,455 | |
| | | | | | | | |
Total Kansas | | | | | | | 5,687 | |
| | | | | | | | |
Kentucky — 0.4% | | | | | | | | |
Education — 0.1% | | | | | | | | |
Northern Kentucky University Series A, Rev., 5.00%, 9/1/2024 | | | 1,310 | | | | 1,489 | |
| | | | | | | | |
Prerefunded — 0.0% (b) | | | | | | | | |
Carter County Kentucky School District Finance Corp. Rev., 4.50%, 2/1/2021 (e) | | | 250 | | | | 266 | |
| | | | | | | | |
SEE NOTES TO FINANCIAL STATEMENTS.
| | | | | | | | |
| | | |
| AUGUST 31, 2018 | | J.P. MORGAN MUNICIPAL BOND FUNDS | | | | | 25 | |
JPMorgan Short-Intermediate Municipal Bond Fund
SCHEDULE OF PORTFOLIO INVESTMENTS
AS OF AUGUST 31, 2018 (Unaudited) (continued)
| | | | | | | | |
| INVESTMENTS | | PRINCIPAL
AMOUNT
($000) | | | VALUE
($000) | |
Municipal Bonds — continued | |
Utility — 0.3% | | | | | | | | |
Kentucky Public Energy Authority, Gas Supply Series A, Rev., 4.00%, 4/1/2024 (d) | | | 2,500 | | | | 2,649 | |
Louisville/Jefferson County Metropolitan Government, Kentucky Pollution Control, Louisville Gas and Electric Company Project Rev., AMT, 2.55%, 5/3/2021 (d) | | | 2,250 | | | | 2,253 | |
| | | | | | | | |
| | | | | | | 4,902 | |
| | | | | | | | |
Total Kentucky | | | | | | | 6,657 | |
| | | | | | | | |
Louisiana — 1.1% | | | | | | | | |
Hospital — 0.6% | | | | | | | | |
Louisiana Public Facilities Authority, Louisiana Children'S Medical Center Project Rev., (SIFMA Municipal Swap Index Yield + 0.65%), 2.14%, 9/13/2018 (c) | | | 10,000 | | | | 10,079 | |
Louisiana Public Facilities Authority, Ochsner Clinic Foundation Project Rev., 5.00%, 5/15/2023 | | | 400 | | | | 446 | |
| | | | | | | | |
| | | | | | | 10,525 | |
| | | | | | | | |
Other Revenue — 0.2% | | | | | | | | |
Louisiana Local Government Environmental Facilities and Community Development Authority, LCTCS Act 391 Project Rev., 5.00%, 10/1/2021 | | | 2,350 | | | | 2,546 | |
Louisiana Public Facilities Authority, Tulane University Project | | | | | | | | |
Rev., 5.00%, 12/15/2022 | | | 230 | | | | 256 | |
Rev., 5.00%, 12/15/2023 | | | 315 | | | | 355 | |
Rev., 5.00%, 12/15/2025 | | | 250 | | | | 288 | |
| | | | | | | | |
| | | | | | | 3,445 | |
| | | | | | | | |
Water & Sewer — 0.3% | | | | | | | | |
City of Shreveport, Water and Sewer, Junior Lien | | | | | | | | |
Series C, Rev., 3.00%, 12/1/2021 | | | 175 | | | | 180 | |
Series C, Rev., 5.00%, 12/1/2022 | | | 270 | | | | 300 | |
Series C, Rev., 5.00%, 12/1/2023 | | | 365 | | | | 412 | |
Series C, Rev., 5.00%, 12/1/2024 | | | 1,510 | | | | 1,721 | |
Series C, Rev., 5.00%, 12/1/2025 | | | 915 | | | | 1,052 | |
Series C, Rev., 5.00%, 12/1/2026 | | | 500 | | | | 580 | |
Series C, Rev., 5.00%, 12/1/2028 | | | 400 | | | | 471 | |
| | | | | | | | |
| | | | | | | 4,716 | |
| | | | | | | | |
Total Louisiana | | | | | | | 18,686 | |
| | | | | | | | |
Maryland — 1.0% | | | | | | | | |
General Obligation — 0.8% | | | | | | | | |
State of Maryland, State and Local Facilities Loan of 2013, Second Series Series A, GO, 5.00%, 8/1/2020 | | | 12,795 | | | | 13,568 | |
| | | | | | | | |
| | | | | | | | |
| INVESTMENTS | | PRINCIPAL
AMOUNT
($000) | | | VALUE
($000) | |
| | | | | | | | |
Prerefunded — 0.2% | | | | | | | | |
State of Maryland, State and Local Facilities Loan of 2015 Series A, GO, 5.00%, 3/1/2023 (e) | | | 3,000 | | | | 3,375 | |
| | | | | | | | |
Total Maryland | | | | | | | 16,943 | |
| | | | | | | | |
Massachusetts — 1.9% | | | | | | | | |
General Obligation — 0.5% | | | | | | | | |
City of Boston Series A, GO, 5.00%, 3/1/2023 | | | 7,360 | | | | 8,331 | |
| | | | | | | | |
Hospital — 0.7% | | | | | | | | |
Massachusetts Development Finance Agency, Partners Healthcare System Issue Series 2017S, Rev., (SIFMA Municipal Swap Index Yield + 0.50%), 1.99%, 9/13/2018 (c) | | | 10,000 | | | | 10,143 | |
Massachusetts State Development Finance Agency, Lahey Health System Series F, Rev., 5.00%, 8/15/2026 | | | 500 | | | | 529 | |
| | | | | | | | |
| | | | | | | 10,672 | |
| | | | | | | | |
Other Revenue — 0.2% | | | | | | | | |
Massachusetts Development Finance Agency, Caregroup Series H-1, Rev., 5.00%, 7/1/2019 | | | 3,250 | | | | 3,333 | |
| | | | | | | | |
Water & Sewer — 0.5% | | | | | | | | |
Massachusetts Clean Water Trust, State Revolving Fund Rev., 5.00%, 8/1/2025 | | | 6,775 | | | | 7,951 | |
| | | | | | | | |
Total Massachusetts | | | | | | | 30,287 | |
| | | | | | | | |
Michigan — 1.1% | | | | | | | | |
General Obligation — 0.3% | | | | | | | | |
City of Royal Oak, Capital Improvement | | | | | | | | |
GO, 5.00%, 4/1/2027 | | | 625 | | | | 727 | |
GO, 5.00%, 4/1/2028 | | | 245 | | | | 287 | |
Kalamazoo Public Schools GO, 5.00%, 5/1/2022 | | | 1,000 | | | | 1,102 | |
Troy School District, School Building and Site | | | | | | | | |
GO, Q-SBLF, 5.00%, 5/1/2019 | | | 650 | | | | 665 | |
GO, Q-SBLF, 5.00%, 5/1/2020 | | | 500 | | | | 526 | |
GO, Q-SBLF, 5.00%, 5/1/2021 | | | 550 | | | | 594 | |
GO, Q-SBLF, 5.00%, 5/1/2022 | | | 500 | | | | 551 | |
| | | | | | | | |
| | | | | | | 4,452 | |
| | | | | | | | |
Hospital — 0.3% | | | | | | | | |
Michigan Finance Authority, Trinity Health Credit Group Series 2017A, Rev., 5.00%, 12/1/2025 | | | 2,500 | | | | 2,901 | |
Michigan State Hospital Finance Authority, Ascension Health Credit Group Series B-4, Rev., 5.00%, 11/15/2027 | | | 2,250 | | | | 2,558 | |
| | | | | | | | |
| | | | | | | 5,459 | |
| | | | | | | | |
SEE NOTES TO FINANCIAL STATEMENTS.
| | | | | | |
| | | |
| 26 | | | | J.P. MORGAN MUNICIPAL BOND FUNDS | | AUGUST 31, 2018 |
| | | | | | | | |
| INVESTMENTS | | PRINCIPAL
AMOUNT
($000) | | | VALUE
($000) | |
Municipal Bonds — continued | |
Industrial Development Revenue/Pollution Control Revenue — 0.2% | | | | | |
Michigan Strategic Fund, The Detroit Edison Company Pollution Control Bonds Project Series CC, Rev., 1.45%, 9/1/2021 (d) | | | 2,600 | | | | 2,538 | |
| | | | | | | | |
Other Revenue — 0.1% | | | | | | | | |
Michigan Finance Authority, Local Government Loan Program | | | | | | | | |
Series B, Rev., 4.00%, 11/1/2018 | | | 1,290 | | | | 1,294 | |
Series B, Rev., 4.00%, 11/1/2019 | | | 675 | | | | 691 | |
Series B, Rev., 4.00%, 11/1/2020 | | | 455 | | | | 474 | |
| | | | | | | | |
| | | | | | | 2,459 | |
| | | | | | | | |
Water & Sewer — 0.2% | | | | | | | | |
City of Grand Rapids, Sanitary Sewer System Improvement Rev., 5.00%, 1/1/2022 | | | 350 | | | | 385 | |
Michigan Finance Authority, Clean Water Revolving Fund Rev., 5.00%, 10/1/2021 | | | 2,250 | | | | 2,460 | |
| | | | | | | | |
| | | | | | | 2,845 | |
| | | | | | | | |
Total Michigan | | | | | | | 17,753 | |
| | | | | | | | |
Minnesota — 0.3% | | | | | | | | |
Education — 0.0% (b) | | | | | | | | |
Minnesota Higher Education Facilities Authority Series L, Rev., 4.00%, 4/1/2020 | | | 350 | | | | 362 | |
Minnesota Higher Education Facilities Authority, Macalester College Rev., 5.00%, 3/1/2029 | | | 150 | | | | 175 | |
| | | | | | | | |
| | | | | | | 537 | |
| | | | | | | | |
Transportation — 0.1% | | | | | | | | |
Minneapolis-St Paul Metropolitan Airports Commission, Subordinate Airport | | | | | | | | |
Series A, Rev., 5.00%, 1/1/2020 | | | 220 | | | | 229 | |
Series A, Rev., 5.00%, 1/1/2022 | | | 1,000 | | | | 1,097 | |
| | | | | | | | |
| | | | | | | 1,326 | |
| | | | | | | | |
Utility — 0.2% | | | | | | | | |
Western Minnesota Municipal Power Agency, Power Supply | | | | | | | | |
Series A, Rev., 5.00%, 1/1/2023 | | | 1,500 | | | | 1,681 | |
Series A, Rev., 5.00%, 1/1/2024 | | | 1,000 | | | | 1,141 | |
| | | | | | | | |
| | | | | | | 2,822 | |
| | | | | | | | |
Total Minnesota | | | | | | | 4,685 | |
| | | | | | | | |
Mississippi — 0.1% | | | | | | | | |
Other Revenue — 0.1% | | | | | | | | |
Mississippi Development Bank, Rankin County Bond Project Rev., 5.00%, 3/1/2023 | | | 750 | | | | 837 | |
| | | | | | | | |
| | | | | | | | |
| INVESTMENTS | | PRINCIPAL
AMOUNT
($000) | | | VALUE
($000) | |
| | | | | | | | |
Missouri — 0.9% | | | | | | | | |
Certificate of Participation/Lease — 0.1% | | | | | | | | |
City of Chesterfield COP, 5.00%, 12/1/2021 | | | 1,000 | | | | 1,094 | |
| | | | | | | | |
Education — 0.2% | | | | | | | | |
Health and Educational Facilities Authority | | | | | | | | |
Rev., 4.00%, 10/1/2018 | | | 450 | | | | 451 | |
Rev., 4.00%, 10/1/2019 | | | 625 | | | | 639 | |
Rev., 4.00%, 10/1/2020 | | | 300 | | | | 312 | |
Rev., 4.00%, 10/1/2021 | | | 300 | | | | 317 | |
Missouri State Health and Educational Facilities Authority, Health Facilities, BJC Health System | | | | | | | | |
Rev., 5.00%, 1/1/2019 | | | 855 | | | | 864 | |
Rev., 5.00%, 1/1/2021 | | | 225 | | | | 241 | |
| | | | | | | | |
| | | | | | | 2,824 | |
| | | | | | | | |
General Obligation — 0.0% (b) | | | | | | | | |
County of Clay, North Kansas City School District 74, Refunding and Improvement, Missouri Direct Deposit Program GO, 5.00%, 3/1/2022 | | | 350 | | | | 385 | |
| | | | | | | | |
Industrial Development Revenue/Pollution Control Revenue — 0.1% | | | | | |
Missouri Environmental Improvement and Energy Resources Authority, Water Pollution Control and Drinking Water Series B, Rev., 5.00%, 7/1/2023 | | | 550 | | | | 590 | |
| | | | | | | | |
Other Revenue — 0.2% | | | | | | | | |
City of Springfield Series A, Rev., 4.00%, 9/1/2018 | | | 350 | | | | 350 | |
County of Jackson, Harry S. Truman Sports Complex Project Rev., 5.00%, 12/1/2022 | | | 3,000 | | | | 3,337 | |
| | | | | | | | |
| | | | | | | 3,687 | |
| | | | | | | | |
Transportation — 0.3% | | | | | | | | |
Kansas City, Missouri Airport Refunding, General Improvement Series B, Rev., 5.00%, 9/1/2018 | | | 1,250 | | | | 1,250 | |
Missouri Airport Refunding, Lambert St. Louis International Airport | | | | | | | | |
Rev., 5.00%, 7/1/2021 | | | 1,575 | | | | 1,701 | |
Rev., 5.00%, 7/1/2022 | | | 1,000 | | | | 1,102 | |
Rev., 5.00%, 7/1/2023 | | | 1,080 | | | | 1,210 | |
| | | | | | | | |
| | | | | | | 5,263 | |
| | | | | | | | |
Total Missouri | | | | | | | 13,843 | |
| | | | | | | | |
Montana — 0.2% | | | | | | | | |
General Obligation — 0.2% | | | | | | | | |
State of Montana, Long-Range Building Program | | | | | | | | |
GO, 5.00%, 8/1/2021 | | | 690 | | | | 753 | |
GO, 5.00%, 8/1/2022 | | | 1,000 | | | | 1,116 | |
SEE NOTES TO FINANCIAL STATEMENTS.
| | | | | | | | |
| | | |
| AUGUST 31, 2018 | | J.P. MORGAN MUNICIPAL BOND FUNDS | | | | | 27 | |
JPMorgan Short-Intermediate Municipal Bond Fund
SCHEDULE OF PORTFOLIO INVESTMENTS
AS OF AUGUST 31, 2018 (Unaudited) (continued)
| | | | | | | | |
| INVESTMENTS | | PRINCIPAL
AMOUNT
($000) | | | VALUE
($000) | |
Municipal Bonds — continued | |
General Obligation — continued | |
Yellowstone County, School District No. 2 Billings, School Building GO, 5.00%, 6/15/2020 | | | 650 | | | | 687 | |
| | | | | | | | |
Total Montana | | | | | | | 2,556 | |
| | | | | | | | |
Nebraska — 0.1% | | | | | | | | |
Certificate of Participation/Lease — 0.1% | | | | | | | | |
Southeast Community College | | | | | | | | |
COP, 5.00%, 12/15/2021 | | | 200 | | | | 219 | |
COP, 5.00%, 12/15/2024 | | | 440 | | | | 506 | |
COP, 5.00%, 12/15/2026 | | | 275 | | | | 323 | |
COP, 5.00%, 12/15/2027 | | | 495 | | | | 586 | |
COP, 5.00%, 12/15/2028 | | | 540 | | | | 641 | |
| | | | | | | | |
Total Nebraska | | | | | | | 2,275 | |
| | | | | | | | |
New Hampshire — 0.2% | | | | | | | | |
General Obligation — 0.2% | | | | | | | | |
State of New Hampshire Series A, GO, 5.00%, 3/1/2026 | | | 2,880 | | | | 3,341 | |
| | | | | | | | |
Other Revenue — 0.0% (b) | | | | | | | | |
New Hampshire Municipal Bond Bank Series A, Rev., 5.00%, 2/15/2019 | | | 520 | | | | 528 | |
| | | | | | | | |
Total New Hampshire | | | | | | | 3,869 | |
| | | | | | | | |
New Jersey — 4.4% | | | | | | | | |
Education — 0.3% | | | | | | | | |
New Jersey Economic Development Authority, School Facilities Construction | | | | | | | | |
Series A, Rev., 5.25%, 12/15/2020 | | | 1,040 | | | | 1,065 | |
Series DDD, Rev., 5.00%, 6/15/2025 | | | 1,500 | | | | 1,664 | |
Series DDD, Rev., 5.00%, 6/15/2026 | | | 1,840 | | | | 2,053 | |
| | | | | | | | |
| | | | | | | 4,782 | |
| | | | | | | | |
General Obligation — 1.5% | | | | | | | | |
County of Passaic GO, 5.00%, 2/1/2021 | | | 90 | | | | 97 | |
State of New Jersey Series Q, GO, 5.00%, 8/15/2020 | | | 10,075 | | | | 10,649 | |
State of New Jersey, Various Purpose GO, 4.00%, 6/1/2026 | | | 3,870 | | | | 4,100 | |
Township of South Brunswick GO, 5.00%, 9/1/2022 | | | 425 | | | | 471 | |
Township of Woodbridge GO, BAN, 3.00%, 8/16/2019 | | | 8,925 | | | | 9,013 | |
| | | | | | | | |
| | | | | | | 24,330 | |
| | | | | | | | |
Other Revenue — 0.4% | | | | | | | | |
Tobacco Settlement Financing Corp. | | | | | | | | |
Series A, Rev., 5.00%, 6/1/2031 | | | 3,070 | | | | 3,496 | |
| | | | | | | | |
| INVESTMENTS | | PRINCIPAL
AMOUNT
($000) | | | VALUE
($000) | |
| | | | | | | | |
Other Revenue — continued | |
Series A, Rev., 5.00%, 6/1/2032 | | | 2,500 | | | | 2,833 | |
| | | | | | | | |
| | | | | | | 6,329 | |
| | | | | | | | |
Prerefunded — 0.1% | | | | | | | | |
New Jersey Transportation Trust Fund Authority, Transportation System Series A, Rev., 6.00%, 12/15/2018 (e) | | | 1,680 | | | | 1,701 | |
| | | | | | | | |
Transportation — 2.1% | | | | | | | | |
New Jersey Transportation Trust Fund Authority, Federal Highway Reimbursement | | | | | | | | |
Rev., 5.00%, 6/15/2028 | | | 3,000 | | | | 3,360 | |
Rev., 5.00%, 6/15/2029 | | | 5,000 | | | | 5,582 | |
Rev., 5.00%, 6/15/2030 | | | 5,000 | | | | 5,566 | |
Rev., 5.00%, 6/15/2031 | | | 4,750 | | | | 5,271 | |
New Jersey Transportation Trust Fund Authority, Transportation Program Series BB-1, Rev., (SIFMA Municipal Swap Index Yield + 1.00%), 2.49%, 9/13/2018 (c) | | | 5,500 | | | | 5,534 | |
New Jersey Turnpike Authority Series C-6, Rev., VRDO, 2.23%, 10/1/2018 (d) | | | 10,000 | | | | 10,000 | |
| | | | | | | | |
| | | | | | | 35,313 | |
| | | | | | | | |
Total New Jersey | | | | | | | 72,455 | |
| | | | | | | | |
New Mexico — 0.2% | | | | | | | | |
Housing — 0.1% | | | | | | | | |
County of Bernalillo, Arroyo Vista Apartments Project Rev., 1.40%, 3/1/2019 (d) | | | 2,500 | | | | 2,495 | |
| | | | | | | | |
Other Revenue — 0.1% | | | | | | | | |
New Mexico Finance Authority, Senior Lien Public Project Series B, Rev., 5.00%, 6/1/2021 | | | 800 | | | | 866 | |
| | | | | | | | |
Total New Mexico | | | | | | | 3,361 | |
| | | | | | | | |
New York — 9.7% | | | | | | | | |
Education — 0.5% | | | | | | | | |
New York State Dormitory Authority, Columbia University Series B, Rev., 5.00%, 10/1/2021 | | | 585 | | | | 641 | |
New York State Dormitory Authority, Montefiore Obligated Group | | | | | | | | |
Rev., 5.00%, 8/1/2027 | | | 3,225 | | | | 3,696 | |
Rev., 5.00%, 8/1/2028 | | | 1,700 | | | | 1,962 | |
New York State Dormitory Authority, The New School Series A, Rev., 5.00%, 7/1/2024 | | | 1,100 | | | | 1,249 | |
| | | | | | | | |
| | | | | | | 7,548 | |
| | | | | | | | |
General Obligation — 1.4% | | | | | | | | |
Bedford Central School District GO, 5.00%, 11/15/2022 | | | 2,410 | | | | 2,703 | |
SEE NOTES TO FINANCIAL STATEMENTS.
| | | | | | |
| | | |
| 28 | | | | J.P. MORGAN MUNICIPAL BOND FUNDS | | AUGUST 31, 2018 |
| | | | | | | | |
| INVESTMENTS | | PRINCIPAL
AMOUNT
($000) | | | VALUE
($000) | |
Municipal Bonds — continued | |
General Obligation — continued | |
City of New York, Fiscal Year 2012 Subseries G-1, GO, 5.00%, 4/1/2020 | | | 3,860 | | | | 4,052 | |
City of New York, Fiscal Year 2013 Series B, GO, 4.00%, 8/1/2019 | | | 3,695 | | | | 3,772 | |
Counties of Rockland and Orange, Ramapo Central School District GO, 4.00%, 10/15/2019 | | | 2,030 | | | | 2,084 | |
County of Orange, Public Improvement | | | | | | | | |
Series B, GO, 5.00%, 3/1/2021 | | | 1,510 | | | | 1,629 | |
Series B, GO, 5.00%, 3/1/2022 | | | 1,000 | | | | 1,107 | |
County of Suffolk, Longwood Central School District | | | | | | | | |
GO, 5.00%, 6/15/2026 | | | 365 | | | | 437 | |
GO, 5.00%, 6/15/2027 | | | 795 | | | | 946 | |
Hampton Bays Union Free School District GO, 5.00%, 9/15/2022 | | | 2,025 | | | | 2,264 | |
Town of East Hampton | | | | | | | | |
GO, 5.00%, 5/15/2021 | | | 1,000 | | | | 1,086 | |
GO, 5.00%, 5/15/2023 | | | 1,000 | | | | 1,139 | |
White Plains City School District GO, 5.00%, 5/15/2024 | | | 1,550 | | | | 1,795 | |
| | | | | | | | |
| | | | | | | 23,014 | |
| | | | | | | | |
Hospital — 0.5% | | | | | | | | |
Build Resource Corp., The New York Methodist Hospital Project Rev., 5.00%, 7/1/2021 | | | 550 | | | | 595 | |
Nassau County Local Economic Assistance Corp., Catholic Health Services, Long Island Obligated Group Project Series B, Rev., 5.00%, 7/1/2023 | | | 800 | | | | 888 | |
New York State Dormitory Authority, Memorial Sloan-Kettering Cancer Center | | | | | | | | |
Series 2017-1, Rev., 5.00%, 7/1/2026 | | | 1,000 | | | | 1,185 | |
Series 2017-1, Rev., 5.00%, 7/1/2027 | | | 4,705 | | | | 5,740 | |
| | | | | | | | |
| | | | | | | 8,408 | |
| | | | | | | | |
Industrial Development Revenue/Pollution Control Revenue — 0.2% | | | | | |
New York State Energy Research and Development Authority, Pollution Control, Electric and Gas Corp., Project Series C, Rev., 2.00%, 5/1/2020 (d) | | | 3,000 | | | | 2,995 | |
| | | | | | | | |
Other Revenue — 3.5% | | | | | | | | |
Battery Park City Authority | | | | | | | | |
Series A, Rev., 3.00%, 11/1/2018 | | | 3,450 | | | | 3,459 | |
Series A, Rev., 4.00%, 11/1/2019 | | | 2,500 | | | | 2,569 | |
Brooklyn Arena Local Development Corp., Pilot Refunding, Barclays Center Series A, Rev., 5.00%, 7/15/2020 | | | 500 | | | | 526 | |
| | | | | | | | |
| INVESTMENTS | | PRINCIPAL
AMOUNT
($000) | | | VALUE
($000) | |
| | | | | | | | |
Other Revenue — continued | |
City of Troy Capital Resources Corp., Rensselaer Polytechnic Institute Project Rev., 5.00%, 8/1/2020 | | | 500 | | | | 527 | |
New York City Transitional Finance Authority, Future Tax Secured, Fiscal Year 2003 Series B, Rev., 5.00%, 2/1/2020 | | | 2,750 | | | | 2,876 | |
New York City Transitional Finance Authority, Future Tax Secured, Fiscal Year 2014 Series A, Subseries A-1, Rev., 5.00%, 11/1/2020 | | | 3,700 | | | | 3,951 | |
New York Convention Center Development Corp. Hotel Unit Fee Secured Rev., 5.00%, 11/15/2026 | | | 5,000 | | | | 5,808 | |
New York State Dormitory Authority, State Sales Tax | | | | | | | | |
Series A, Rev., 5.00%, 3/15/2021 | | | 2,000 | | | | 2,156 | |
Series A, Rev., 5.00%, 3/15/2024 | | | 6,135 | | | | 7,044 | |
Sales Tax Asset Receivable Corp., Fiscal Year 2015 | | | | | | | | |
Series A, Rev., 5.00%, 10/15/2020 | | | 15,405 | | | | 16,455 | |
Series A, Rev., 5.00%, 10/15/2022 | | | 4,800 | | | | 5,384 | |
Series A, Rev., 5.00%, 10/15/2025 | | | 4,500 | | | | 5,223 | |
Schenectady County Capital Resource Corp., Union College Project | | | | | | | | |
Rev., 5.00%, 1/1/2024 | | | 960 | | | | 1,094 | |
Rev., 5.00%, 1/1/2025 | | | 400 | | | | 462 | |
| | | | | | | | |
| | | | | | | 57,534 | |
| | | | | | | | |
Prerefunded — 0.3% | | | | | | | | |
Brooklyn Arena Local Development Corp., Pilot Refunding, Barclays Center Rev., 6.38%, 1/15/2020 (e) | | | 4,305 | | | | 4,579 | |
| | | | | | | | |
Special Tax — 0.1% | | | | | | | | |
New York State Dormitory Authority, Personal Income Tax Series G, Rev., 5.00%, 8/15/2021 | | | 1,110 | | | | 1,209 | |
| | | | | | | | |
Transportation — 2.7% | | | | | | | | |
Buffalo and Fort Erie Public Bridge Authority, Toll Bridge System | | | | | | | | |
Rev., 5.00%, 1/1/2020 | | | 465 | | | | 485 | |
Rev., 5.00%, 1/1/2021 | | | 815 | | | | 874 | |
Metropolitan Transportation Authority | | | | | | | | |
Series D, Rev., 5.00%, 11/15/2018 | | | 2,770 | | | | 2,788 | |
Subseries C-1, Rev., 5.00%, 11/15/2019 | | | 2,000 | | | | 2,076 | |
Subseries A-1, Rev., 5.00%, 11/15/2020 | | | 1,435 | | | | 1,531 | |
Subseries C-1, Rev., 5.00%, 11/15/2024 | | | 3,000 | | | | 3,440 | |
Metropolitan Transportation Authority, Green Bonds Series B-2, Rev., 4.00%, 11/15/2032 | | | 4,000 | | | | 4,312 | |
SEE NOTES TO FINANCIAL STATEMENTS.
| | | | | | | | |
| | | |
| AUGUST 31, 2018 | | J.P. MORGAN MUNICIPAL BOND FUNDS | | | | | 29 | |
JPMorgan Short-Intermediate Municipal Bond Fund
SCHEDULE OF PORTFOLIO INVESTMENTS
AS OF AUGUST 31, 2018 (Unaudited) (continued)
| | | | | | | | |
| INVESTMENTS | | PRINCIPAL
AMOUNT
($000) | | | VALUE
($000) | |
Municipal Bonds — continued | |
Transportation — continued | |
New York Transportation Development Corp., Delta Air Lines, Inc., Laguardia Airport Terminals C&D Redevelopment Project Rev., AMT, 5.00%, 1/1/2023 | | | 9,200 | | | | 10,054 | |
Triborough Bridge and Tunnel Authority | | | | | | | | |
Subseries B-C, Rev., (ICE LIBOR USD 1 Month + 0.40%), 1.82%, 10/1/2018 (c) | | | 15,000 | | | | 15,038 | |
Series A, Rev., 5.00%, 11/15/2024 | | | 3,290 | | | | 3,700 | |
| | | | | | | | |
| | | | | | | 44,298 | |
| | | | | | | | |
Utility — 0.5% | | | | | | | | |
Long Island Power Authority, Electric System | | | | | | | | |
Series C, Rev., (ICE LIBOR USD 1 Month + 0.65%), 2.13%, 10/1/2018 (c) | | | 5,000 | | | | 5,006 | |
Series 2017, Rev., 5.00%, 9/1/2025 | | | 500 | | | | 580 | |
Series 2017, Rev., 5.00%, 9/1/2026 | | | 1,000 | | | | 1,172 | |
Series 2017, Rev., 5.00%, 9/1/2027 | | | 500 | | | | 592 | |
Series 2017, Rev., 5.00%, 9/1/2028 | | | 750 | | | | 885 | |
| | | | | | | | |
| | | | | | | 8,235 | |
| | | | | | | | |
Total New York | | | | | | | 157,820 | |
| | | | | | | | |
North Carolina — 1.0% | | | | | | | | |
Education — 0.4% | | | | | | | | |
University of North Carolina, Chapel Hill Series B, Rev., (ICE LIBOR USD 1 Month + 0.40%), 1.82%, 10/1/2018 (c) | | | 5,750 | | | | 5,802 | |
Winston-Salem State University Foundation LLC Rev., AGM, 5.00%, 10/1/2023 | | | 445 | | | | 504 | |
| | | | | | | | |
| | | | | | | 6,306 | |
| | | | | | | | |
General Obligation — 0.6% | | | | | | | | |
State of North Carolina Series D, GO, 4.00%, 6/1/2020 | | | 9,670 | | | | 10,050 | |
| | | | | | | | |
Other Revenue — 0.0% (b) | | | | | | | | |
Jacksonville Public Facilities Corp. Series 2017, Rev., 5.00%, 4/1/2027 | | | 550 | | | | 650 | |
| | | | | | | | |
Total North Carolina | | | | | | | 17,006 | |
| | | | | | | | |
Ohio — 1.9% | | | | | | | | |
Education — 0.2% | | | | | | | | |
Ohio Higher Educational Facility Commission, Case Western Reserve University Project Series A, Rev., 4.00%, 12/1/2019 | | | 535 | | | | 549 | |
Ohio State Higher Educational Facility Commission, Oberlin College | | | | | | | | |
Rev., 4.00%, 10/1/2018 | | | 600 | | | | 601 | |
Rev., 4.00%, 10/1/2019 | | | 675 | | | | 692 | |
| | | | | | | | |
| INVESTMENTS | | PRINCIPAL
AMOUNT
($000) | | | VALUE
($000) | |
| | | | | | | | |
Education — continued | |
Rev., 5.00%, 10/1/2020 | | | 1,000 | | | | 1,064 | |
| | | | | | | | |
| | | | | | | 2,906 | |
| | | | | | | | |
General Obligation — 0.3% | | | | | | | | |
City of Dublin, Various Purpose GO, 4.00%, 12/1/2028 | | | 200 | | | | 219 | |
Cuyahoga Ohio Community College District, Facilities Construction and Improvement Bonds | | | | | | | | |
GO, 5.00%, 12/1/2028 | | | 2,300 | | | | 2,677 | |
Series 2018, GO, 4.00%, 12/1/2032 | | | 1,250 | | | | 1,329 | |
Series 2018, GO, 4.00%, 12/1/2033 | | | 1,300 | | | | 1,372 | |
| | | | | | | | |
| | | | | | | 5,597 | |
| | | | | | | | |
Hospital — 1.1% | | | | | | | | |
Akron, Bath and Copley Joint Township Hospital District, Summa Health Obligated Group Rev., 5.00%, 11/15/2021 | | | 375 | | | | 402 | |
County of Allen, Mercy Health Series B, Rev., (SIFMA Municipal Swap Index Yield + 0.75%), 2.24%, 9/13/2018 (c) | | | 10,800 | | | | 10,844 | |
County of Lake, Hospital Facilities, Lake Hospital System, Inc. | | | | | | | | |
Rev., 5.00%, 8/15/2023 | | | 1,445 | | | | 1,588 | |
Rev., 5.00%, 8/15/2024 | | | 1,655 | | | | 1,834 | |
State of Ohio, University Hospitals Health System, Inc. Series B, Rev., VRDO, 1.74%, 9/4/2018 (d) | | | 2,500 | | | | 2,500 | |
| | | | | | | | |
| | | | | | | 17,168 | |
| | | | | | | | |
Other Revenue — 0.1% | | | | | | | | |
City of Cleveland, Subordinate Lien, Public Facilities Improvements | | | | | | | | |
Rev., 5.00%, 10/1/2024 | | | 200 | | | | 230 | |
Rev., 5.00%, 10/1/2025 | | | 150 | | | | 174 | |
Rev., 5.00%, 10/1/2026 | | | 385 | | | | 451 | |
Rev., 5.00%, 10/1/2027 | | | 250 | | | | 295 | |
Rev., 5.00%, 10/1/2028 | | | 250 | | | | 297 | |
State of Ohio, Capital Facilities Lease-Appropriation Series A, Rev., 5.00%, 10/1/2018 | | | 1,000 | | | | 1,002 | |
| | | | | | | | |
| | | | | | | 2,449 | |
| | | | | | | | |
Water & Sewer — 0.2% | | | | | | | | |
Hamilton County, Sewer System, Metropolitan Sewer District of Greater Cincinnati | | | | | | | | |
Series A, Rev., 5.00%, 12/1/2018 | | | 500 | | | | 504 | |
Series A, Rev., 5.00%, 12/1/2019 | | | 640 | | | | 666 | |
SEE NOTES TO FINANCIAL STATEMENTS.
| | | | | | |
| | | |
| 30 | | | | J.P. MORGAN MUNICIPAL BOND FUNDS | | AUGUST 31, 2018 |
| | | | | | | | |
| INVESTMENTS | | PRINCIPAL
AMOUNT
($000) | | | VALUE
($000) | |
Municipal Bonds — continued | |
Water & Sewer — continued | |
Series A, Rev., 5.00%, 12/1/2021 | | | 1,375 | | | | 1,508 | |
| | | | | | | | |
| | | | | | | 2,678 | |
| | | | | | | | |
Total Ohio | | | | | | | 30,798 | |
| | | | | | | | |
Oklahoma — 0.6% | | | | | | | | |
Education — 0.6% | | | | | | | | |
Blaine County Educational Facilities Authority, Educational Facilities, Watonga Public Schools Project Rev., 5.00%, 12/1/2018 | | | 555 | | | | 559 | |
Carter County Public Facilities Authority, Educational Facilities Lease, Ardmore City Schools Project | | | | | | | | |
Rev., 5.00%, 9/1/2025 | | | 365 | | | | 411 | |
Rev., 5.00%, 9/1/2026 | | | 820 | | | | 927 | |
Rev., 5.00%, 9/1/2027 | | | 1,250 | | | | 1,421 | |
Grady County School Finance Authority, Educational Facilities Lease, Minco Public Schools Project | | | | | | | | |
Rev., 5.00%, 9/1/2028 | | | 375 | | | | 430 | |
Rev., 5.00%, 9/1/2029 | | | 1,175 | | | | 1,344 | |
Oklahoma County Finance Authority, Educational Facilities, Lease Midwest City-Del City Public Schools Project | | | | | | | | |
Series 2018, Rev., 5.00%, 10/1/2022 | | | 500 | | | | 553 | |
Series 2018, Rev., 5.00%, 10/1/2023 | | | 355 | | | | 398 | |
Series 2018, Rev., 5.00%, 10/1/2025 | | | 1,000 | | | | 1,146 | |
Oklahoma County Finance Authority, Educational Facilities, Lease Western Heights Public School Project | | | | | | | | |
Rev., 4.00%, 9/1/2018 (e) | | | 250 | | | | 250 | |
Rev., 5.00%, 9/1/2019 | | | 325 | | | | 336 | |
Tulsa County Industrial Authority Educational Facilities Lease, Jenks Public Schools Project Rev., 5.00%, 9/1/2021 | | | 2,000 | | | | 2,170 | |
| | | | | | | | |
| | | | | | | 9,945 | |
| | | | | | | | |
Other Revenue — 0.0% (b) | | | | | | | | |
Cleveland County Justice Authority, Sales Tax, Detention Facility Project Rev., 4.00%, 3/1/2020 | | | 500 | | | | 505 | |
| | | | | | | | |
Total Oklahoma | | | | | | | 10,450 | |
| | | | | | | | |
Oregon — 0.6% | | | | | | | | |
Education — 0.0% (b) | | | | | | | | |
Oregon State Facilities Authority, Reed College Project | | | | | | | | |
Series A, Rev., 5.00%, 7/1/2028 | | | 125 | | | | 148 | |
Series A, Rev., 4.00%, 7/1/2032 | | | 350 | | | | 377 | |
| | | | | | | | |
| | | | | | | 525 | |
| | | | | | | | |
| | | | | | | | |
| INVESTMENTS | | PRINCIPAL
AMOUNT
($000) | | | VALUE
($000) | |
| |
Prerefunded — 0.4% | | | | | | | | |
Oregon State Department of Administrative Services, Lottery Series A, Rev., 5.25%, 4/1/2019 (e) | | | 6,210 | | | | 6,339 | |
| | | | | | | | |
Transportation — 0.2% | | | | | | | | |
Port of Portland, International Airport | | | | | | | | |
Series 23, Rev., 5.00%, 7/1/2023 | | | 1,000 | | | | 1,128 | |
Series 23, Rev., 5.00%, 7/1/2024 | | | 1,595 | | | | 1,827 | |
| | | | | | | | |
| | | | | | | 2,955 | |
| | | | | | | | |
Water & Sewer — 0.0% (b) | | | | | | | | |
City of Portland, Sewer System, First Lien Series A, Rev., 5.00%, 10/1/2023 | | | 40 | | | | 46 | |
| | | | | | | | |
Total Oregon | | | | | | | 9,865 | |
| | | | | | | | |
Pennsylvania — 5.3% | | | | | | | | |
Education — 0.7% | | | | | | | | |
Pennsylvania State Higher Educational Facilities Authority, Trustees of the University Series B, Rev., 5.00%, 10/1/2022 | | | 5,055 | | | | 5,649 | |
State Public School Building Authority, Community College of Philadelphia Project | | | | | | | | |
Rev., 5.00%, 6/15/2021 | | | 2,760 | | | | 2,971 | |
Rev., 5.00%, 6/15/2024 | | | 2,625 | | | | 2,960 | |
| | | | | | | | |
| | | | | | | 11,580 | |
| | | | | | | | |
General Obligation — 0.3% | | | | | | | | |
Commonwealth of Pennsylvania Series 2011, GO, 4.00%, 11/15/2028 | | | 5,000 | | | | 5,222 | |
Schuylkill Valley School District GO, 5.00%, 4/1/2022 | | | 350 | | | | 385 | |
| | | | | | | | |
| | | | | | | 5,607 | |
| | | | | | | | |
Hospital — 1.0% | | | | | | | | |
Allegheny County Hospital Development Authority, Allegheny Health Network Obligated Group | | | | | | | | |
Rev., 5.00%, 4/1/2026 | | | 2,500 | | | | 2,839 | |
Rev., 5.00%, 4/1/2027 | | | 7,275 | | | | 8,305 | |
Berks County Industrial Development Authority, Tower Health Project | | | | | | | | |
Rev., 5.00%, 11/1/2023 | | | 1,000 | | | | 1,116 | |
Rev., 5.00%, 11/1/2024 | | | 1,000 | | | | 1,127 | |
Montgomery County Higher Education and Health Authority, Thomas Jefferson University Rev., 5.00%, 9/1/2024 | | | 1,000 | | | | 1,135 | |
Southcentral General Authority, Hanover Hospital, Inc. Rev., 5.00%, 12/1/2026 | | | 1,400 | | | | 1,594 | |
SEE NOTES TO FINANCIAL STATEMENTS.
| | | | | | | | |
| | | |
| AUGUST 31, 2018 | | J.P. MORGAN MUNICIPAL BOND FUNDS | | | | | 31 | |
JPMorgan Short-Intermediate Municipal Bond Fund
SCHEDULE OF PORTFOLIO INVESTMENTS
AS OF AUGUST 31, 2018 (Unaudited) (continued)
| | | | | | | | |
| INVESTMENTS | | PRINCIPAL
AMOUNT
($000) | | | VALUE
($000) | |
Municipal Bonds — continued | |
Hospital — continued | |
Southcentral General Authority, Wellspan Health Obligation Group Series A, Rev., 5.00%, 6/1/2024 | | | 380 | | | | 431 | |
| | | | | | | | |
| | | | | | | 16,547 | |
| | | | | | | | |
Industrial Development Revenue/Pollution Control Revenue — 0.4% | | | | | |
Lehigh County Industrial Development Authority, Pollution Control | | | | | | | | |
Rev., 1.80%, 8/15/2022 (d) | | | 4,000 | | | | 3,937 | |
Rev., 1.80%, 9/1/2022 (d) | | | 2,500 | | | | 2,460 | |
| | | | | | | | |
| | | | | | | 6,397 | |
| | | | | | | | |
Other Revenue — 0.3% | | | | | | | | |
Commonwealth Financing Authority, Tobacco Master Settlement Payment | | | | | | | | |
Series 2018, Rev., 5.00%, 6/1/2022 | | | 555 | | | | 605 | |
Series 2018, Rev., 5.00%, 6/1/2023 | | | 1,785 | | | | 1,978 | |
Series 2018, Rev., 5.00%, 6/1/2029 | | | 1,500 | | | | 1,729 | |
Cumberland County Municipal Authority, AICUP Financing Program-Messiah College Project Rev., 2.00%, 4/30/2020 (d) | | | 1,000 | | | | 999 | |
| | | | | | | | |
| | | | | | | 5,311 | |
| | | | | | | | |
Transportation — 1.0% | | | | | | | | |
Pennsylvania Turnpike Commission | | | | | | | | |
Series A-1, Rev., (SIFMA Municipal Swap Index Yield + 0.60%), 2.09%, 9/13/2018 (c) | | | 13,000 | | | | 12,962 | |
Subseries A-2, Rev., (SIFMA Municipal Swap Index Yield + 0.80%), 2.29%, 9/13/2018 (c) | | | 2,500 | | | | 2,502 | |
| | | | | | | | |
| | | | | | | 15,464 | |
| | | | | | | | |
Water & Sewer — 1.6% | | | | | | | | |
Allegheny County Sanitary Authority, Sewer | | | | | | | | |
Rev., 5.00%, 12/1/2021 | | | 3,500 | | | | 3,824 | |
Rev., 5.00%, 12/1/2022 | | | 3,000 | | | | 3,343 | |
Rev., 5.00%, 12/1/2023 | | | 4,000 | | | | 4,529 | |
City of Philadelphia, Water and Wastewater | | | | | | | | |
Series A, Rev., 5.00%, 1/1/2020 | | | 8,530 | | | | 8,885 | |
Series A, Rev., 5.00%, 7/1/2022 | | | 1,510 | | | | 1,671 | |
Series A, Rev., 5.00%, 7/1/2024 | | | 2,595 | | | | 2,965 | |
| | | | | | | | |
| | | | | | | 25,217 | |
| | | | | | | | |
Total Pennsylvania | | | | | | | 86,123 | |
| | | | | | | | |
Rhode Island — 0.2% | | | | | | | | |
General Obligation — 0.2% | | | | | | | | |
State of Rhode Island and Providence Plantations, Consolidated Capital Development Loan Series A, GO, 5.00%, 10/15/2019 (e) | | | 1,475 | | | | 1,529 | |
| | | | | | | | |
| INVESTMENTS | | PRINCIPAL
AMOUNT
($000) | | | VALUE
($000) | |
| |
General Obligation — continued | |
State of Rhode Island and Providence Plantations, Consolidated Capital Development Loan of 2014 Series A, GO, 5.00%, 11/1/2019 | | | 1,000 | | | | 1,038 | |
| | | | | | | | |
Total Rhode Island | | | | | | | 2,567 | |
| | | | | | | | |
South Carolina — 1.1% | | | | | | | | |
General Obligation — 1.0% | | | | | | | | |
County of Charleston Series C, GO, TRAN, 4.00%, 11/1/2028 | | | 14,605 | | | | 16,340 | |
| | | | | | | | |
Other Revenue — 0.1% | | | | | | | | |
County of Charleston | | | | | | | | |
Rev., 5.00%, 12/1/2018 | | | 645 | | | | 650 | |
Rev., 5.00%, 12/1/2019 | | | 1,000 | | | | 1,039 | |
| | | | | | | | |
| | | | | | | 1,689 | |
| | | | | | | | |
Total South Carolina | | | | | | | 18,029 | |
| | | | | | | | |
South Dakota — 0.2% | | | | | | | | |
Education — 0.1% | | | | | | | | |
South Dakota Health and Educational Facilities Authority | | | | | | | | |
Series B, Rev., 4.00%, 11/1/2020 | | | 625 | | | | 651 | |
Series B, Rev., 4.00%, 11/1/2021 | | | 500 | | | | 528 | |
Series B, Rev., 5.00%, 11/1/2022 | | | 375 | | | | 416 | |
| | | | | | | | |
| | | | | | | 1,595 | |
| | | | | | | | |
Other Revenue — 0.1% | | | | | | | | |
South Dakota State Building Authority | | | | | | | | |
Series B, Rev., 5.00%, 6/1/2019 | | | 500 | | | | 512 | |
Series B, Rev., 5.00%, 6/1/2021 | | | 485 | | | | 525 | |
| | | | | | | | |
| | | | | | | 1,037 | |
| | | | | | | | |
Total South Dakota | | | | | | | 2,632 | |
| | | | | | | | |
Tennessee — 0.2% | | | | | | | | |
Other Revenue — 0.0% (b) | | | | | | | | |
Metropolitan Government of Nashville and Davidson, County Sports Authority, Public Improvement Rev., 5.00%, 7/1/2020 | | | 5 | | | | 5 | |
| | | | | | | | |
Utility — 0.2% | | | | | | | | |
City of Chattanooga, Electric System Series A, Rev., 5.00%, 9/1/2022 | | | 800 | | | | 891 | |
| | | | | | | | |
Tennessee Energy Acquisition Corp., Gas Project | | | | | | | | |
Series A, Rev., 4.00%, 5/1/2022 | | | 1,460 | | | | 1,537 | |
Series A, Rev., 4.00%, 5/1/2023 | | | 1,400 | | | | 1,481 | |
| | | | | | | | |
| | | | | | | 3,909 | |
| | | | | | | | |
Total Tennessee | | | | | | | 3,914 | |
| | | | | | | | |
SEE NOTES TO FINANCIAL STATEMENTS.
| | | | | | |
| | | |
| 32 | | | | J.P. MORGAN MUNICIPAL BOND FUNDS | | AUGUST 31, 2018 |
| | | | | | | | |
| INVESTMENTS | | PRINCIPAL
AMOUNT
($000) | | | VALUE
($000) | |
Municipal Bonds — continued | |
Texas — 9.9% | | | | | | | | |
Education — 2.1% | | | | | | | | |
Arlington Higher Education Finance Corp., Uplift Education Series A, Rev., PSF-GTD, 4.00%, 12/1/2029 | | | 1,000 | | | | 1,084 | |
Austin Community College District Public Facility Corp., Lease, Highland Campus Parking Garage Project | | | | | | | | |
Series C, Rev., 5.00%, 8/1/2026 | | | 250 | | | | 291 | |
Series C, Rev., 5.00%, 8/1/2027 | | | 200 | | | | 235 | |
Series C, Rev., 5.00%, 8/1/2028 | | | 275 | | | | 322 | |
Series C, Rev., 5.00%, 8/1/2029 | | | 325 | | | | 379 | |
Series C, Rev., 5.00%, 8/1/2030 | | | 445 | | | | 517 | |
Series C, Rev., 5.00%, 8/1/2031 | | | 260 | | | | 301 | |
Austin Community College District, Combined Fee Series A, Rev., 5.00%, 2/1/2021 | | | 790 | | | | 845 | |
County of Harris, Cultural Education Facilities Finance Corp., Children's Hospital Series 3, Rev., (ICE LIBOR USD 1 Month + 0.85%), 2.26%, 9/13/2018 (c) | | | 7,500 | | | | 7,593 | |
Southwest Higher Education Authority, Inc., Southern Methodist University Project | | | | | | | | |
Series 2017, Rev., 5.00%, 10/1/2021 | | | 425 | | | | 464 | |
Series 2017, Rev., 5.00%, 10/1/2022 | | | 400 | | | | 445 | |
Series 2017, Rev., 5.00%, 10/1/2023 | | | 400 | | | | 453 | |
Series 2017, Rev., 5.00%, 10/1/2024 | | | 400 | | | | 460 | |
Series 2017, Rev., 5.00%, 10/1/2025 | | | 600 | | | | 697 | |
Series 2017, Rev., 5.00%, 10/1/2026 | | | 525 | | | | 616 | |
Stephen F. Austin State University, Board of Regents, Revenue Financing System Rev., 4.00%, 10/15/2018 | | | 790 | | | | 792 | |
Texas State University, Financing System | | | | | | | | |
Series A, Rev., 5.00%, 3/15/2030 | | | 5,100 | | | | 5,953 | |
Series A, Rev., 5.00%, 3/15/2032 | | | 4,365 | | | | 5,053 | |
University of Texas, Financing System Series I, Rev., 5.00%, 8/15/2023 | | | 6,735 | | | | 7,643 | |
| | | | | | | | |
| | | | | | | 34,143 | |
| | | | | | | | |
General Obligation — 3.1% | | | | | | | | |
Austin Independent School District Series B, GO, 5.00%, 8/1/2022 | | | 1,630 | | | | 1,811 | |
City of Abilene, Taylor and Jones Counties GO, 5.00%, 2/15/2021 | | | 475 | | | | 510 | |
City of Colony GO, 5.00%, 8/15/2020 | | | 610 | | | | 647 | |
City of Denton GO, 5.00%, 2/15/2023 | | | 1,045 | | | | 1,169 | |
City of El Paso, Refunding and Improvement | | | | | | | | |
GO, 5.00%, 8/15/2021 | | | 530 | | | | 576 | |
GO, 5.00%, 8/15/2025 | | | 4,035 | | | | 4,660 | |
| | | | | | | | |
| INVESTMENTS | | PRINCIPAL
AMOUNT
($000) | | | VALUE
($000) | |
| |
General Obligation — continued | |
City of Fort Worth, Certificates of Obligation Series A, GO, 4.00%, 3/1/2019 | | | 785 | | | | 794 | |
City of Fort Worth, Refunding and Improvement, General Purpose GO, 4.00%, 3/1/2019 | | | 1,060 | | | | 1,073 | |
City of Houston, Public Improvement | | | | | | | | |
Series A, GO, 5.00%, 3/1/2021 | | | 3,000 | | | | 3,220 | |
Series A, GO, 5.00%, 3/1/2025 | | | 1,195 | | | | 1,376 | |
City of Odessa Series 2017, GO, 4.00%, 3/1/2025 | | | 1,150 | | | | 1,260 | |
Forney Independent School District, School Building | | | | | | | | |
GO, PSF-GTD, 5.00%, 8/15/2024 | | | 1,310 | | | | 1,508 | |
GO, PSF-GTD, 5.00%, 8/15/2025 | | | 3,490 | | | | 4,068 | |
Galveston County, Unlimited Tax Road | | | | | | | | |
Series 2017, GO, 4.00%, 2/1/2024 | | | 980 | | | | 1,071 | |
Series 2017, GO, 4.00%, 2/1/2025 | | | 800 | | | | 879 | |
Judson Independent School District Series A, GO, 5.00%, 2/1/2019 | | | 595 | | | | 603 | |
Katy Independent School District, School Building | | | | | | | | |
GO, PSF-GTD, 4.00%, 2/15/2027 | | | 290 | | | | 310 | |
GO, PSF-GTD, 4.00%, 2/15/2028 | | | 350 | | | | 373 | |
Lewisville Independent School District, School Building | | | | | | | | |
GO, PSF-GTD, 5.00%, 8/15/2024 | | | 825 | | | | 933 | |
GO, PSF-GTD, 5.00%, 8/15/2025 | | | 750 | | | | 847 | |
GO, PSF-GTD, 5.00%, 8/15/2026 | | | 750 | | | | 847 | |
GO, PSF-GTD, 5.00%, 8/15/2027 | | | 650 | | | | 734 | |
Odessa Junior College District, Limited Tax Series 2017, GO, 5.00%, 8/15/2025 | | | 800 | | | | 926 | |
S & S Consolidated Independent School District | | | | | | | | |
GO, PSF-GTD, 4.00%, 2/15/2028 | | | 580 | | | | 641 | |
GO, PSF-GTD, 4.00%, 2/15/2029 | | | 605 | | | | 662 | |
GO, PSF-GTD, 4.00%, 2/15/2030 | | | 630 | | | | 686 | |
Southside Independent School District, School Building GO, PSF-GTD, 5.00%, 8/15/2022 | | | 250 | | | | 278 | |
State of Texas, Transportation Commission Mobility Series B, GO, (SIFMA Municipal Swap Index Yield + 0.38%), 1.87%, 9/13/2018 (c) | | | 17,500 | | | | 17,483 | |
| | | | | | | | |
| | | | | | | 49,945 | |
| | | | | | | | |
Hospital — 0.2% | | | | | | | | |
Irving Hospital Authority, Baylor Scott and White Medical Center | | | | | | | | |
Rev., VRDO, 2.59%, 9/13/2018 (d) | | | 1,750 | | | | 1,750 | |
Rev., 5.00%, 10/15/2022 | | | 250 | | | | 275 | |
Rev., 5.00%, 10/15/2028 | | | 250 | | | | 281 | |
SEE NOTES TO FINANCIAL STATEMENTS.
| | | | | | | | |
| | | |
| AUGUST 31, 2018 | | J.P. MORGAN MUNICIPAL BOND FUNDS | | | | | 33 | |
JPMorgan Short-Intermediate Municipal Bond Fund
SCHEDULE OF PORTFOLIO INVESTMENTS
AS OF AUGUST 31, 2018 (Unaudited) (continued)
| | | | | | | | |
| INVESTMENTS | | PRINCIPAL
AMOUNT
($000) | | | VALUE
($000) | |
Municipal Bonds — continued | |
Hospital — continued | |
Rev., 5.00%, 10/15/2029 | | | 500 | | | | 559 | |
Rev., 5.00%, 10/15/2031 | | | 1,000 | | | | 1,112 | |
| | | | | | | | |
| | | | | | | 3,977 | |
| | | | | | | | |
Other Revenue — 1.1% | | | | | | | | |
Austin Convention Enterprises, Inc., Convention Center Hotel First Tier | | | | | | | | |
Series A, Rev., 5.00%, 1/1/2021 | | | 500 | | | | 528 | |
Series A, Rev., 5.00%, 1/1/2022 | | | 750 | | | | 807 | |
Austin Convention Enterprises, Inc., Convention Center Hotel Second Tier Series B, Rev., 5.00%, 1/1/2021 | | | 800 | | | | 843 | |
Lower Colorado River Authority Series B, Rev., 5.00%, 5/15/2023 | | | 4,700 | | | | 5,188 | |
State of Texas Rev., TRAN, 4.00%, 8/29/2019 | | | 10,000 | | | | 10,207 | |
| | | | | | | | |
| | | | | | | 17,573 | |
| | | | | | | | |
Prerefunded — 0.4% | | | | | | | | |
Harris County Health Facilities Development Corp., Memorial Hermann Healthcare System Series B, Rev., 7.25%, 12/1/2018 (e) | | | 5,605 | | | | 5,681 | |
Lower Colorado River Authority Series B, Rev., 5.00%, 5/15/2022 (e) | | | 60 | | | | 66 | |
| | | | | | | | |
| | | | | | | 5,747 | |
| | | | | | | | |
Transportation — 1.9% | | | | | | | | |
City of Austin, Airport System | | | | | | | | |
Series B, Rev., AMT, 5.00%, 11/15/2026 | | | 1,095 | | | | 1,262 | |
Series B, Rev., AMT, 5.00%, 11/15/2027 | | | 585 | | | | 673 | |
Series B, Rev., AMT, 5.00%, 11/15/2028 | | | 630 | | | | 721 | |
Grand Parkway Transportation Corp. Rev., BAN, 5.00%, 2/1/2023 | | | 10,000 | | | | 11,055 | |
Harris County Toll Road Authority, Senior Lien Series A, Rev., 5.00%, 8/15/2031 | | | 8,000 | | | | 9,391 | |
North Texas Tollway Authority System, First Tier | | | | | | | | |
Series C, Rev., (SIFMA Municipal Swap Index Yield + 0.67%), 2.16%, 9/13/2018 (c) | | | 6,000 | | | | 5,830 | |
Series A, Rev., 4.00%, 1/1/2033 | | | 2,500 | | | | 2,617 | |
| | | | | | | | |
| | | | | | | 31,549 | |
| | | | | | | | |
Utility — 0.7% | | | | | | | | |
City of Cedar Park, Utility System Rev., 5.00%, 8/15/2022 | | | 560 | | | | 621 | |
City of San Antonio, Electric and Gas Systems, Junior Lien Series B, Rev., 2.00%, 12/1/2021 (d) | | | 6,480 | | | | 6,427 | |
City of Victoria, Utility System | | | | | | | | |
Rev., 2.00%, 12/1/2018 | | | 160 | | | | 160 | |
Rev., 2.50%, 12/1/2019 | | | 150 | | | | 152 | |
| | | | | | | | |
| INVESTMENTS | | PRINCIPAL
AMOUNT
($000) | | | VALUE
($000) | |
| |
Utility — continued | |
Texas Municipal Gas Acquisition and Supply Corp. I Series D, Rev., 6.25%, 12/15/2026 | | | 2,005 | | | | 2,318 | |
West Travis County Public Utility Agency | | | | | | | | |
Series 2017, Rev., 5.00%, 8/15/2022 | | | 545 | | | | 603 | |
Series 2017, Rev., 5.00%, 8/15/2023 | | | 325 | | | | 366 | |
Series 2017, Rev., 5.00%, 8/15/2027 | | | 350 | | | | 412 | |
| | | | | | | | |
| | | | | | | 11,059 | |
| | | | | | | | |
Water & Sewer — 0.4% | | | | | | | | |
City of Dallas, Waterworks and Sewer System Series A, Rev., 5.00%, 10/1/2019 | | | 3,520 | | | | 3,644 | |
City of Galveston, Waterworks and Sewer System | | | | | | | | |
Rev., 5.00%, 5/1/2019 | | | 205 | | | | 209 | |
Rev., 5.00%, 5/1/2020 | | | 245 | | | | 257 | |
Rev., 5.00%, 5/1/2021 | | | 265 | | | | 286 | |
Rev., 5.00%, 5/1/2024 | | | 380 | | | | 433 | |
City of San Antonio, Water System, Junior Lien Series E, Rev., 5.00%, 5/15/2019 | | | 1,000 | | | | 1,024 | |
North Harris County, Regional Water Authority, Senior Lien Rev., 5.00%, 12/15/2019 | | | 1,035 | | | | 1,076 | |
| | | | | | | | |
| | | | | | | 6,929 | |
| | | | | | | | |
Total Texas | | | | | | | 160,922 | |
| | | | | | | | |
Utah — 2.7% | | | | | | | | |
General Obligation — 0.3% | | | | | | | | |
State of Utah GO, 5.00%, 7/1/2021 | | | 4,925 | | | | 5,358 | |
| | | | | | | | |
Other Revenue — 0.9% | | | | | | | | |
Utah Infrastructure Agency, Telecommunication Revenue Series A, Rev., 5.00%, 10/15/2025 | | | 10,380 | | | | 11,292 | |
West Valley City Municipal Building Authority | | | | | | | | |
Rev., AGM, 4.00%, 2/1/2024 | | | 500 | | | | 540 | |
Rev., AGM, 5.00%, 2/1/2025 | | | 250 | | | | 286 | |
Rev., AGM, 5.00%, 2/1/2027 | | | 720 | | | | 841 | |
Rev., AGM, 5.00%, 2/1/2029 | | | 1,070 | | | | 1,240 | |
Rev., AGM, 5.00%, 2/1/2030 | | | 500 | | | | 577 | |
| | | | | | | | |
| | | | | | | 14,776 | |
| | | | | | | | |
Transportation — 1.5% | | | | | | | | |
Salt Lake City Corp. Airport Revenue | | | | | | | | |
Series A, Rev., AMT, 5.00%, 7/1/2022 | | | 1,000 | | | | 1,099 | |
Series A, Rev., AMT, 5.00%, 7/1/2029 | | | 5,250 | | | | 6,059 | |
Series A, Rev., AMT, 5.00%, 7/1/2031 | | | 5,000 | | | | 5,727 | |
Series A, Rev., AMT, 5.00%, 7/1/2032 | | | 5,105 | | | | 5,822 | |
Series A, Rev., AMT, 5.00%, 7/1/2033 | | | 4,260 | | | | 4,839 | |
| | | | | | | | |
| | | | | | | 23,546 | |
| | | | | | | | |
Total Utah | | | | | | | 43,680 | |
| | | | | | | | |
SEE NOTES TO FINANCIAL STATEMENTS.
| | | | | | |
| | | |
| 34 | | | | J.P. MORGAN MUNICIPAL BOND FUNDS | | AUGUST 31, 2018 |
| | | | | | | | |
| INVESTMENTS | | PRINCIPAL
AMOUNT
($000) | | | VALUE
($000) | |
Municipal Bonds — continued | |
Vermont — 0.1% | | | | | | | | |
Education — 0.1% | | | | | | | | |
University of Vermont and State Agricultural College | | | | | | | | |
Rev., 5.00%, 10/1/2021 | | | 750 | | | | 818 | |
Rev., 5.00%, 10/1/2022 | | | 855 | | | | 952 | |
| | | | | | | | |
| | | | | | | 1,770 | |
| | | | | | | | |
Other Revenue — 0.0% (b) | | | | | | | | |
Vermont Municipal Bond Bank Series 3, Rev., 5.00%, 12/1/2021 | | | 400 | | | | 439 | |
| | | | | | | | |
Total Vermont | | | | | | | 2,209 | |
| | | | | | | | |
Virginia — 0.6% | | | | | | | | |
General Obligation — 0.1% | | | | | | | | |
Loudoun County, Public Improvement Series A, GO, 5.00%, 12/1/2026 | | | 1,930 | | | | 2,262 | |
| | | | | | | | |
Hospital — 0.1% | | | | | | | | |
Norfolk Economic Development Authority, Sentara Healthcare Series B, Rev., 5.00%, 11/1/2028 (d) | | | 1,375 | | | | 1,642 | |
| | | | | | | | |
Water & Sewer — 0.4% | | | | | | | | |
Fairfax County Water Authority Series B, Rev., 5.25%, 4/1/2024 | | | 5,615 | | | | 6,536 | |
| | | | | | | | |
Total Virginia | | | | | | | 10,440 | |
| | | | | | | | |
Washington — 0.8% | | | | | | | | |
Education — 0.0% (b) | | | | | | | | |
University of Washington Rev., 1.75%, 4/1/2019 | | | 125 | | | | 125 | |
| | | | | | | | |
General Obligation — 0.1% | | | | | | | | |
King County Public Hospital District No. 2, Evergreenhealth GO, 5.00%, 12/1/2019 | | | 870 | | | | 904 | |
| | | | | | | | |
Transportation — 0.2% | | | | | | | | |
Central Puget Sound Regional Transit Authority, Sales Tax and Motor Vehicle Excise Tax | | | | | | | | |
Series S-1, Rev., 5.00%, 11/1/2023 | | | 685 | | | | 782 | |
Series S-1, Rev., 5.00%, 11/1/2034 | | | 2,000 | | | | 2,298 | |
| | | | | | | | |
| | | | | | | 3,080 | |
| | | | | | | | |
Utility — 0.5% | | | | | | | | |
City of Seattle, Municipal Light and Power Series B-1, Rev., VRDO, 2.24%, 9/13/2018 (d) | | | 7,500 | | | | 7,500 | |
County of Snohomish, Public Utility District No. 1, Electric System Rev., 5.00%, 12/1/2025 | | | 500 | | | | 582 | |
| | | | | | | | |
| | | | | | | 8,082 | |
| | | | | | | | |
Total Washington | | | | | | | 12,191 | |
| | | | | | | | |
| | | | | | | | |
| INVESTMENTS | | PRINCIPAL
AMOUNT
($000) | | | VALUE
($000) | |
| |
West Virginia — 0.2% | | | | | | | | |
Utility — 0.2% | | | | | | | | |
West Virginia Economic Development Authority, Appalachian Power Co. - AMOS Project Rev., 2.62%, 6/1/2022 (d) | | | 2,905 | | | | 2,906 | |
| | | | | | | | |
Wisconsin — 1.0% | | | | | | | | |
Education — 0.5% | | | | | | | | |
Wisconsin Health and Educational Facilities Authority, Ascension Health Alliance Senior Credit Group Series B-2, Rev., 4.00%, 5/30/2019 (d) | | | 5,815 | | | | 5,908 | |
Wisconsin Health and Educational Facilities Authority, Aspirus, Inc., Obligated Group | | | | | | | | |
Rev., 5.00%, 8/15/2024 | | | 200 | | | | 228 | |
Rev., 5.00%, 8/15/2025 | | | 325 | | | | 374 | |
Rev., 5.00%, 8/15/2027 | | | 150 | | | | 176 | |
Wisconsin Health and Educational Facilities Authority, Thedacare, Inc. Rev., 5.00%, 12/15/2020 | | | 1,250 | | | | 1,333 | |
| | | | | | | | |
| | | | | | | 8,019 | |
| | | | | | | | |
General Obligation — 0.4% | | | | | | | | |
City of Racine GO, 4.00%, 12/1/2025 | | | 300 | | | | 328 | |
State of Wisconsin Series A, GO, 5.00%, 5/1/2026 | | | 5,050 | | | | 5,874 | |
| | | | | | | | |
| | | | | | | 6,202 | |
| | | | | | | | |
Transportation — 0.1% | | | | | | | | |
County of Milwaukee, Airport | | | | | | | | |
Series A, Rev., AMT, 5.00%, 12/1/2018 | | | 1,400 | | | | 1,410 | |
Series A, Rev., AMT, 5.00%, 12/1/2028 | | | 1,000 | | | | 1,141 | |
| | | | | | | | |
| | | | | | | 2,551 | |
| | | | | | | | |
Total Wisconsin | | | | | | | 16,772 | |
| | | | | | | | |
Total Municipal Bonds
(Cost $1,536,741) | | | | | | | 1,540,909 | |
| | | | | | | | |
Collateralized Mortgage Obligations — 0.0% (b) | |
FNMA REMIC Series 2002-36, Class FS, 2.56%, 6/25/2032 (d)
(Cost $203) | | | 203 | | | | 204 | |
| | | | | | | | |
SEE NOTES TO FINANCIAL STATEMENTS.
| | | | | | | | |
| | | |
| AUGUST 31, 2018 | | J.P. MORGAN MUNICIPAL BOND FUNDS | | | | | 35 | |
JPMorgan Short-Intermediate Municipal Bond Fund
SCHEDULE OF PORTFOLIO INVESTMENTS
AS OF AUGUST 31, 2018 (Unaudited) (continued)
| | | | | | | | |
| INVESTMENTS | | SHARES
(000) | | | VALUE
($000) | |
Short-Term Investments — 6.0% | | | | | | | | |
Investment Companies — 6.0% | | | | | | | | |
JPMorgan Institutional Tax Free Money Market Fund Class IM Shares, 1.38% (g) (h)
(Cost $97,444) | | | 97,445 | | | | 97,444 | |
| | | | | | | | |
Total Investments — 100.4%
(Cost $1,634,388) | | | | | | | 1,638,557 | |
Liabilities in Excess of
Other Assets — (0.4%) | | | | | | | (6,567 | ) |
| | | | | | | | |
NET ASSETS — 100.0% | | | | | | | 1,631,990 | |
| | | | | | | | |
Percentages indicated are based on net assets.
Abbreviations
| | |
| AGM | | Insured by Assured Guaranty Municipal Corp. |
| AMT | | Alternative Minimum Tax |
| BAN | | Bond Anticipation Note |
| COP | | Certificate of Participation |
| FNMA | | Federal National Mortgage Association |
| GO | | General Obligation |
| ICE | | Intercontinental Exchange |
| LIBOR | | London Interbank Offered Rate |
| LIQ | | Liquidity Agreement |
| NATL | | Insured by National Public Finance Guarantee Corp. |
| PSF-GTD | | Permanent School Fund Guaranteed |
| Q-SBLF | | Qualified School Bond Loan Fund |
| RE | | Reinsured |
| REMIC | | Real Estate Mortgage Investment Conduit |
| Rev. | | Revenue |
| SIFMA | | The Securities Industry and Financial Markets Association |
| TRAN | | Tax & Revenue Anticipation Note |
| USD | | United States Dollar |
| VRDO | | Variable Rate Demand Obligation. The interest rate shown is the rate in effect as of August 31, 2018. |
| | |
| (a) | | The date shown represents the earliest of the prerefunded date, next put date or final maturity date. |
| (b) | | Amount rounds to less than 0.1% of net assets. |
| (c) | | Variable or floating rate security, linked to the referenced benchmark. The interest rate shown is the current rate as of August 31, 2018. |
| (d) | | Variable or floating rate security, the interest rate of which adjusts periodically based on changes in current interest rates and prepayments on the underlying pool of assets. The interest rate shown is the current rate as of August 31, 2018. |
| (e) | | Security is prerefunded or escrowed to maturity. |
| (f) | | Securities exempt from registration under Rule 144A or section 4(a)(2), of the Securities Act of 1933, as amended. Under procedures approved by the Board of Trustees, such securities have been determined to be liquid by the investment adviser and may be resold, normally to qualified institutional buyers in transactions exempt from registration. |
| (g) | | Investment in affiliate. Fund is registered under the Investment Company Act of 1940, as amended, and advised by J.P. Morgan Investment Management Inc. |
| (h) | | The rate shown is the current yield as of August 31, 2018. |
SEE NOTES TO FINANCIAL STATEMENTS.
| | | | | | |
| | | |
| 36 | | | | J.P. MORGAN MUNICIPAL BOND FUNDS | | AUGUST 31, 2018 |
JPMorgan Tax Free Bond Fund
SCHEDULE OF PORTFOLIO INVESTMENTS
AS OF AUGUST 31, 2018 (Unaudited)
| | | | | | | | |
| INVESTMENTS | | PRINCIPAL
AMOUNT
($000) | | | VALUE
($000) | |
Municipal Bonds — 95.5% (a) | | | | | | | | |
Alabama — 0.7% | | | | | | | | |
Other Revenue — 0.3% | | | | | | | | |
Montgomery County Public Building Authority, Warrants, Facilities Project Rev., 5.00%, 3/1/2029 | | | 1,000 | | | | 1,125 | |
UAB Medicine Finance Authority Series B-2, Rev., 3.50%, 9/1/2035 | | | 160 | | | | 159 | |
| | | | | | | | |
| | | | | | | 1,284 | |
| | | | | | | | |
Transportation — 0.4% | | | | | | | | |
Alabama Federal Aid Highway Finance Authority Series A, Rev., 4.00%, 6/1/2037 | | | 1,350 | | | | 1,414 | |
| | | | | | | | |
Total Alabama | | | | | | | 2,698 | |
| | | | | | | | |
Alaska — 2.8% | | | | | | | | |
Housing — 0.3% | | | | | | | | |
Alaska Housing Finance Corp., General Mortgage | | | | | | | | |
Series A, Rev., 4.00%, 6/1/2040 | | | 30 | | | | 30 | |
Series A, Rev., 3.50%, 6/1/2046 | | | 890 | | | | 915 | |
| | | | | | | | |
| | | | | | | 945 | |
| | | | | | | | |
Prerefunded — 1.4% | | | | | | | | |
Alaska Municipal Bond Bank Authority Rev., 5.75%, 9/1/2018 (b) | | | 2,500 | | | | 2,500 | |
Matanuska-Susitna Borough, Goose Creek Correctional Center Project Rev., AGC, 6.00%, 9/1/2019 (b) | | | 1,745 | | | | 1,817 | |
Matanuska-Susitna Borough, Goose Creek Correctional Center Project, Unrefunded Balance Rev., AGC, 6.00%, 9/1/2019 (b) | | | 1,005 | | | | 1,047 | |
| | | | | | | | |
| | | | | | | 5,364 | |
| | | | | | | | |
Utility — 1.1% | | | | | | | | |
Alaska Energy Authority, Power, Bradley Lake Hydroelectric Project, Fourth Series Rev., AGM, 6.00%, 7/1/2019 | | | 3,915 | | | | 4,048 | |
| | | | | | | | |
Total Alaska | | | | | | | 10,357 | |
| | | | | | | | |
Arizona — 0.2% | | | | | | | | |
Education — 0.2% | | | | | | | | |
Industrial Development Authority of the City of Phoenix, Downtown Phoenix Student Housing LLC — Arizona State University Project | | | | | | | | |
Rev., 5.00%, 7/1/2032 | | | 350 | | | | 392 | |
Rev., 5.00%, 7/1/2033 | | | 150 | | | | 168 | |
Rev., 5.00%, 7/1/2037 | | | 200 | | | | 220 | |
| | | | | | | | |
| | | | | | | 780 | |
| | | | | | | | |
| | | | | | | | |
| INVESTMENTS | | PRINCIPAL
AMOUNT
($000) | | | VALUE
($000) | |
| | | | | | | | |
Transportation — 0.0% (c) | | | | | | | | |
Phoenix-Mesa Gateway Airport Authority, Mesa Project Rev., 4.00%, 7/1/2019 | | | 20 | | | | 20 | |
| | | | | | | | |
Total Arizona | | | | | | | 800 | |
| | | | | | | | |
Arkansas — 0.1% | | | | | | | | |
Education — 0.1% | | | | | | | | |
Board of Trustees of the University of Arkansas, Various Facility, Fayetteville Campus Series A, Rev., 5.00%, 11/1/2037 | | | 185 | | | | 212 | |
University of Arkansas, Student Fee, UALR Campus Rev., 5.00%, 10/1/2029 | | | 100 | | | | 117 | |
| | | | | | | | |
| | | | | | | 329 | |
| | | | | | | | |
General Obligation — 0.0% (c) | | | | | | | | |
State of Arkansas, Four-Lane Highway Construction and Improvement Series 2013, GO, 5.00%, 6/15/2021 | | | 60 | | | | 65 | |
| | | | | | | | |
Total Arkansas | | | | | | | 394 | |
| | | | | | | | |
California — 14.9% | | | | | | | | |
Certificate of Participation/Lease — 0.5% | | | | | | | | |
City of Palm Springs Subseries B, COP, Zero Coupon, 4/15/2021 (b) | | | 100 | | | | 95 | |
Riverside Public Financing Authority, Riverside Pavement Rehabilitation Project COP, AGM, 5.00%, 6/1/2033 | | | 1,500 | | | | 1,664 | |
| | | | | | | | |
| | | | | | | 1,759 | |
| | | | | | | | |
Education — 0.2% | | | | | | | | |
California Educational Facilities Authority, Claremont McKenna College Series A, Rev., 4.00%, 1/1/2039 | | | 500 | | | | 522 | |
| | | | | | | | |
General Obligation — 4.4% | | | | | | | | |
Alta Loma School District, Election of 2016 Series A, GO, 5.00%, 8/1/2032 | | | 60 | | | | 71 | |
Campbell Union High School District GO, 3.00%, 8/1/2030 | | | 620 | | | | 634 | |
County of Santa Clara, Campbell Union High School District GO, 3.00%, 8/1/2031 | | | 30 | | | | 30 | |
El Monte City School District GO, BAN, Zero Coupon, 4/1/2023 | | | 900 | | | | 817 | |
Los Angeles Unified School District Series D, GO, 5.00%, 1/1/2034 | | | 5,000 | | | | 5,139 | |
Mount San Antonio Community College District, Election of 2008 Series A, GO, Zero Coupon, 8/1/2043 | | | 7,150 | | | | 6,169 | |
Pomona Unified School District Series A, GO, NATL-RE, 6.10%, 2/1/2020 | | | 50 | | | | 53 | |
SEE NOTES TO FINANCIAL STATEMENTS.
| | | | | | | | |
| | | |
| AUGUST 31, 2018 | | J.P. MORGAN MUNICIPAL BOND FUNDS | | | | | 37 | |
JPMorgan Tax Free Bond Fund
SCHEDULE OF PORTFOLIO INVESTMENTS
AS OF AUGUST 31, 2018 (Unaudited) (continued)
| | | | | | | | |
| INVESTMENTS | | PRINCIPAL
AMOUNT
($000) | | | VALUE
($000) | |
Municipal Bonds — continued | |
General Obligation — continued | | | | | | | | |
Santa Maria Joint Union High School District, Santa Barbara and San Luis Obispo GO, Zero Coupon, 8/1/2037 | | | 2,450 | | | | 1,017 | |
State of California, Various Purpose GO, 6.50%, 4/1/2033 | | | 2,285 | | | | 2,350 | |
| | | | | | | | |
| | | | | | | 16,280 | |
| | | | | | | | |
Hospital — 1.2% | | | | | | | | |
California Health Facilities Financing Authority, Sutter Health Series A, Rev., 5.00%, 11/15/2041 | | | 250 | | | | 282 | |
California Municipal Finance Authority, Eisenhower Medical Center Series A, Rev., 5.00%, 7/1/2042 | | | 1,000 | | | | 1,102 | |
California Public Finance Authority, Henry Mayo Newhall Hospital | | | | | | | | |
Rev., 5.00%, 10/15/2037 | | | 500 | | | | 542 | |
Rev., 5.00%, 10/15/2047 | | | 1,000 | | | | 1,072 | |
California Statewide Communities Development Authority, Marin General Hospital Project Rev., 4.00%, 8/1/2045 | | | 1,500 | | | | 1,530 | |
| | | | | | | | |
| | | | | | | 4,528 | |
| | | | | | | | |
Other Revenue — 2.2% | | | | | | | | |
Golden State Tobacco Securitization Corp., Tobacco Settlement Series A-1, Rev., 3.50%, 6/1/2036 | | | 8,000 | | | | 8,029 | |
| | | | | | | | |
Prerefunded — 3.4% | | | | | | | | |
California Health Facilities Financing Authority, Providence Health and Services Series C, Rev., 6.50%, 10/1/2018 (b) | | | 40 | | | | 40 | |
California Health Facilities Financing Authority, Unrefunded Balance, Providence Health and Services Series C, Rev., 6.50%, 10/1/2018 (b) | | | 1,960 | | | | 1,960 | |
San Diego Public Facilities Financing Authority, Senior Sewer Series A, Rev., 5.25%, 5/15/2019 (b) | | | 7,500 | | | | 7,701 | |
State of California, Various Purpose GO, 6.50%, 4/1/2019 (b) | | | 2,715 | | | | 2,795 | |
| | | | | | | | |
| | | | | | | 12,496 | |
| | | | | | | | |
Transportation — 0.6% | | | | | | | | |
Bay Area Toll Authority, Toll Bridge, San Francisco Bay Area Rev., 4.00%, 4/1/2032 | | | 335 | | | | 363 | |
City of Los Angeles, Department of Airports Series A, Rev., AMT, 5.00%, 5/15/2038 | | | 1,250 | | | | 1,367 | |
Los Angeles Harbor Department Rev., 7.60%, 10/1/2018 (b) | | | 415 | | | | 417 | |
| | | | | | | | |
| | | | | | | 2,147 | |
| | | | | | | | |
| | | | | | | | |
| INVESTMENTS | | PRINCIPAL
AMOUNT
($000) | | | VALUE
($000) | |
| | | | | | | | |
Utility — 1.3% | | | | | | | | |
City of Los Angeles, Department of Water and Power, Power System | | | | | | | | |
Series D, Rev., 5.00%, 7/1/2033 | | | 610 | | | | 697 | |
Series A, Rev., 5.00%, 7/1/2035 | | | 1,700 | | | | 1,987 | |
Long Beach Bond Finance Authority, Natural Gas Series A, Rev., 5.25%, 11/15/2021 | | | 2,000 | | | | 2,180 | |
| | | | | | | | |
| | | | | | | 4,864 | |
| | | | | | | | |
Water & Sewer — 1.1% | | | | | | | | |
East Bay Municipal Utility District Water System, Green Bonds Series B, Rev., 5.00%, 6/1/2033 | | | 515 | | | | 596 | |
East Bay Municipal Utility District, Wastewater System Series A, Rev., 5.00%, 6/1/2036 | | | 2,450 | | | | 2,827 | |
Orange County Water District Series A, Rev., 5.00%, 8/15/2034 | | | 650 | | | | 770 | |
| | | | | | | | |
| | | | | | | 4,193 | |
| | | | | | | | |
Total California | | | | | | | 54,818 | |
| | | | | | | | |
Colorado — 3.2% | | | | | | | | |
Certificate of Participation/Lease — 1.1% | | | | | | | | |
Adams County, Colorado Refunding and Improvement COP, 4.00%, 12/1/2040 | | | 2,815 | | | | 2,884 | |
Colorado Department of Transportation Headquarters Facilities COP, 5.00%, 6/15/2041 | | | 1,000 | | | | 1,112 | |
| | | | | | | | |
| | | | | | | 3,996 | |
| | | | | | | | |
Hospital — 0.6% | | | | | | | | |
Colorado Health Facilities Authority, Vail Valley Medical Centre Project Rev., 4.00%, 1/15/2045 | | | 1,095 | | | | 1,118 | |
Denver Health and Hospital Authority Series A, Rev., 5.25%, 12/1/2045 | | | 1,000 | | | | 1,057 | |
| | | | | | | | |
| | | | | | | 2,175 | |
| | | | | | | | |
Prerefunded — 1.5% | | | | | | | | |
Colorado Water Resources and Power Development Authority, Water and Wastewater Utility Enterprise Project | | | | | | | | |
Series A, Rev., AGC, 5.13%, 12/1/2018 (b) | | | 1,000 | | | | 1,008 | |
Series A, Rev., AGC, 5.25%, 12/1/2018 (b) | | | 1,000 | | | | 1,009 | |
State of Colorado, Building Excellent Schools Today Series G, COP, 5.00%, 3/15/2021 (b) | | | 2,000 | | | | 2,155 | |
University of Colorado, University Enterprise Series A, Rev., 5.38%, 6/1/2019 (b) | | | 1,500 | | | | 1,541 | |
| | | | | | | | |
| | | | | | | 5,713 | |
| | | | | | | | |
Total Colorado | | | | | | | 11,884 | |
| | | | | | | | |
SEE NOTES TO FINANCIAL STATEMENTS.
| | | | | | |
| | | |
| 38 | | | | J.P. MORGAN MUNICIPAL BOND FUNDS | | AUGUST 31, 2018 |
| | | | | | | | |
| INVESTMENTS | | PRINCIPAL
AMOUNT
($000) | | | VALUE
($000) | |
Municipal Bonds — continued | |
Connecticut — 1.0% | | | | | | | | |
Education — 0.7% | | | | | | | | |
Connecticut State Higher Education Supplemental Loan Authority, CHESLA Loan Program | | | | | | | | |
Series A, Rev., AMT, 5.00%, 11/15/2019 | | | 175 | | | | 181 | |
Series A, Rev., AMT, 5.00%, 11/15/2020 | | | 300 | | | | 316 | |
State of Connecticut, Health and Educational Facility Authority | | | | | | | | |
Rev., 5.00%, 7/1/2034 | | | 725 | | | | 811 | |
Rev., 5.00%, 7/1/2036 | | | 450 | | | | 499 | |
Rev., 5.00%, 7/1/2039 | | | 490 | | | | 540 | |
University of Connecticut Series A, Rev., 5.00%, 2/15/2028 | | | 15 | | | | 16 | |
| | | | | | | | |
| | | | | | | 2,363 | |
| | | | | | | | |
General Obligation — 0.0% (c) | | | | | | | | |
Town of Cheshire GO, 4.00%, 8/1/2019 | | | 80 | | | | 82 | |
| | | | | | | | |
Housing — 0.3% | | | | | | | | |
Connecticut Housing Finance Authority, Housing Mortgage Finance Program | | | | | | | | |
Subseries B-2, Rev., 4.00%, 11/15/2032 | | | 515 | | | | 529 | |
Subseries A-1, Rev., 4.00%, 11/15/2045 | | | 145 | | | | 151 | |
Subseries A-1, Rev., 4.00%, 11/15/2047 | | | 440 | | | | 461 | |
| | | | | | | | |
| | | | | | | 1,141 | |
| | | | | | | | |
Total Connecticut | | | | | | | 3,586 | |
| | | | | | | | |
Delaware — 0.8% | | | | | | | | |
Education — 0.3% | | | | | | | | |
The Delaware Economic Development Authority, Newark Charter School, Inc. Project | | | | | | | | |
Series A, Rev., 5.00%, 9/1/2036 | | | 500 | | | | 543 | |
Series A, Rev., 5.00%, 9/1/2046 | | | 500 | | | | 534 | |
| | | | | | | | |
| | | | | | | 1,077 | |
| | | | | | | | |
Hospital — 0.4% | | | | | | | | |
Delaware State Health Facilities Authority, Bayhealth Medical Center Project Series A, Rev., 4.00%, 7/1/2043 | | | 1,275 | | | | 1,297 | |
| | | | | | | | |
Housing — 0.1% | | | | | | | | |
Delaware State Housing Authority, Senior Single Family Mortgage Series A-1, Rev., AMT, 4.90%, 7/1/2029 | | | 480 | | | | 494 | |
| | | | | | | | |
Total Delaware | | | | | | | 2,868 | |
| | | | | | | | |
District of Columbia — 1.9% | | | | | | | | |
General Obligation — 1.6% | | | | | | | | |
District of Columbia
Series B, GO, NATL-RE, 6.00%, 6/1/2019 | | | 3,965 | | | | 4,094 | |
| | | | | | | | |
| INVESTMENTS | | PRINCIPAL
AMOUNT
($000) | | | VALUE
($000) | |
| | | | | | | | |
General Obligation — continued | | | | | | | | |
Series A, GO, 5.00%, 6/1/2037 | | | 1,500 | | | | 1,729 | |
| | | | | | | | |
| | | | | | | 5,823 | |
| | | | | | | | |
Prerefunded — 0.3% | | | | | | | | |
District of Columbia Series A, Rev., 6.00%, 7/1/2023 (b) | | | 1,000 | | | | 1,176 | |
| | | | | | | | |
Total District of Columbia | | | | | | | 6,999 | |
| | | | | | | | |
Florida — 2.3% | | | | | | | | |
General Obligation — 0.7% | | | | | | | | |
Hillsborough County, Parks and Recreation Program GO, NATL-RE, 5.25%, 7/1/2025 | | | 2,415 | | | | 2,794 | |
| | | | | | | | |
Hospital — 0.1% | | | | | | | | |
Orange County Health Facilities Authority Series B, Rev., 4.00%, 10/1/2045 | | | 215 | | | | 215 | |
| | | | | | | | |
Housing — 0.0% (c) | | | | | | | | |
Florida Housing Finance Corp., Homeowner Mortgage Series 1, Rev., 5.00%, 7/1/2041 | | | 15 | | | | 15 | |
Florida Housing Finance Corp., Homeowner Mortgage, Special Program Series B, Rev., GNMA/FNMA/FHLMC, 4.50%, 1/1/2029 | | | 120 | | | | 123 | |
| | | | | | | | |
| | | | | | | 138 | |
| | | | | | | | |
Other Revenue — 0.2% | | | | | | | | |
Capital Trust Agency Inc., H-Bay Ministries, Inc., Superior Residences Project | | | | | | | | |
Rev., 3.75%, 7/1/2023 | | | 215 | | | | 216 | |
Rev., 4.00%, 7/1/2028 | | | 375 | | | | 373 | |
| | | | | | | | |
| | | | | | | 589 | |
| | | | | | | | |
Prerefunded — 0.0% (c) | | | | | | | | |
County of Miami-Dade, Miami International Airport Series A, Rev., AMT, AGC, 5.25%, 10/1/2018 (b) | | | 55 | | | | 55 | |
| | | | | | | | |
Transportation — 0.9% | | | | | | | | |
Hillsborough County Aviation Authority, Tampa International Airport Series B, Rev., NATL-RE, 6.00%, 10/1/2018 | | | 3,205 | | | | 3,215 | |
| | | | | | | | |
Utility — 0.4% | | | | | | | | |
Tohopekaliga Water Authority, Utility System Series A, Rev., 4.00%, 10/1/2041 | | | 1,320 | | | | 1,368 | |
| | | | | | | | |
Total Florida | | | | | | | 8,374 | |
| | | | | | | | |
Georgia — 2.2% | | | | | | | | |
Hospital — 1.9% | | | | | | | | |
Dalton Development Authority, Hamilton Health Care System Rev., NATL-RE, 5.50%, 8/15/2026 | | | 3,380 | | | | 3,757 | |
SEE NOTES TO FINANCIAL STATEMENTS.
| | | | | | | | |
| | | |
| AUGUST 31, 2018 | | J.P. MORGAN MUNICIPAL BOND FUNDS | | | | | 39 | |
JPMorgan Tax Free Bond Fund
SCHEDULE OF PORTFOLIO INVESTMENTS
AS OF AUGUST 31, 2018 (Unaudited) (continued)
| | | | | | | | |
| INVESTMENTS | | PRINCIPAL
AMOUNT
($000) | | | VALUE
($000) | |
Municipal Bonds — continued | |
Hospital — continued | | | | | | | | |
Dalton Whitfield County Joint Development Authority, Hamilton Health Care System Series 2017, Rev., 4.00%, 8/15/2041 | | | 1,000 | | | | 1,031 | |
Fulton County Georgia Development Authority, Hospital Revenue Health System Rev., 5.00%, 4/1/2042 | | | 2,150 | | | | 2,366 | |
| | | | | | | | |
| | | | | | | 7,154 | |
| | | | | | | | |
Housing — 0.3% | | | | | | | | |
Georgia Housing and Finance Authority, Single Family Mortgage | | | | | | | | |
Rev., 5.00%, 6/1/2029 | | | 20 | | | | 21 | |
Subseries A-1, Rev., 4.00%, 6/1/2044 | | | 255 | | | | 264 | |
Series A, Rev., 4.00%, 12/1/2047 | | | 705 | | | | 736 | |
| | | | | | | | |
| | | | | | | 1,021 | |
| | | | | | | | |
Total Georgia | | | | | | | 8,175 | |
| | | | | | | | |
Hawaii — 0.6% | | | | | | | | |
General Obligation — 0.6% | | | | | | | | |
City and County of Honolulu Series A, GO, 5.00%, 10/1/2037 | | | 1,970 | | | | 2,231 | |
| | | | | | | | |
Illinois — 2.8% | | | | | | | | |
Education — 0.5% | | | | | | | | |
Chicago Public Building Commission, Board of Education Series A, Rev., NATL-RE, 7.00%, 1/1/2020 (b) | | | 1,750 | | | | 1,821 | |
| | | | | | | | |
General Obligation — 1.3% | | | | | | | | |
City of Chicago Series 2006A, GO, AGM, 4.75%, 1/1/2030 | | | 100 | | | | 100 | |
Cook County Forest Preserve District, Limited Tax Project Series B, GO, 5.00%, 12/15/2037 | | | 295 | | | | 310 | |
State of Illinois GO, 5.50%, 7/1/2038 | | | 3,000 | | | | 3,173 | |
Village of Bolingbrook Series A, GO, AGM, 5.00%, 1/1/2033 | | | 1,000 | | | | 1,122 | |
| | | | | | | | |
| | | | | | | 4,705 | |
| | | | | | | | |
Hospital — 0.1% | | | | | | | | |
Illinois Finance Authority, Healthcare Enterprises, Inc. | | | | | | | | |
Series C, Rev., 5.00%, 3/1/2033 | | | 305 | | | | 342 | |
Series C, Rev., 5.00%, 3/1/2034 | | | 205 | | | | 229 | |
| | | | | | | | |
| | | | | | | 571 | |
| | | | | | | | |
Other Revenue — 0.2% | | | | | | | | |
City of Chicago, Tax Increment, Pilsen Redevelopment Project Series A, Rev., 5.00%, 6/1/2019 | | | 500 | | | | 510 | |
| | | | | | | | |
| INVESTMENTS | | PRINCIPAL
AMOUNT
($000) | | | VALUE
($000) | |
| | | | | | | | |
Other Revenue — continued | | | | | | | | |
Railsplitter Tobacco Settlement Authority Rev., 5.25%, 6/1/2021 | | | 200 | | | | 216 | |
| | | | | | | | |
| | | | | | | 726 | |
| | | | | | | | |
Prerefunded — 0.4% | | | | | | | | |
City of Chicago, O'Hare International Airport, Third Lien Series A, Rev., 5.75%, 1/1/2021 (b) | | | 1,260 | | | | 1,370 | |
| | | | | | | | |
Transportation — 0.3% | | | | | | | | |
City of Chicago, O'Hare International Airport, Third Lien Series A, Rev., 5.75%, 1/1/2039 | | | 240 | | | | 259 | |
Regional Transportation Authority Series D, Rev., NATL-RE, 7.75%, 6/1/2019 | | | 925 | | | | 966 | |
| | | | | | | | |
| | | | | | | 1,225 | |
| | | | | | | | |
Total Illinois | | | | | | | 10,418 | |
| | | | | | | | |
Indiana — 1.2% | | | | | | | | |
Prerefunded — 1.2% | | | | | | | | |
Indiana Finance Authority, State Revolving Fund Program Series A, Rev., 5.00%, 2/1/2022 (b) | | | 4,000 | | | | 4,407 | |
| | | | | | | | |
Iowa — 0.2% | | | | | | | | |
Housing — 0.2% | | | | | | | | |
Iowa Finance Authority Single Family Mortgage-Backed Securities Program | | | | | | | | |
Series 2, Rev., GNMA/FNMA/FHLMC, 4.50%, 7/1/2028 | | | 125 | | | | 128 | |
Series 1, Rev., GNMA/FNMA/FHLMC, 4.50%, 1/1/2029 | | | 25 | | | | 25 | |
Series D, Rev., GNMA/FNMA/FHLMC COLL, 3.50%, 7/1/2046 | | | 645 | | | | 663 | |
| | | | | | | | |
Total Iowa | | | | | | | 816 | |
| | | | | | | | |
Kansas — 0.3% | | | | | | | | |
General Obligation — 0.3% | | | | | | | | |
Wyandotte County Unified School District No. 203 Series A, GO, 4.00%, 9/1/2048 | | | 1,000 | | | | 1,019 | |
| | | | | | | | |
Industrial Development Revenue/Pollution Control Revenue — 0.0% (c) | | | | | |
Kansas State Development Finance Authority, Water Pollution Control Series CW, Rev., 5.00%, 11/1/2018 (b) | | | 15 | | | | 15 | |
| | | | | | | | |
Total Kansas | | | | | | | 1,034 | |
| | | | | | | | |
Kentucky — 0.6% | | | | | | | | |
Education — 0.1% | | | | | | | | |
Kentucky Higher Education Student Loan Corp. Series A, Rev., AMT, 5.00%, 6/1/2019 | | | 460 | | | | 469 | |
| | | | | | | | |
SEE NOTES TO FINANCIAL STATEMENTS.
| | | | | | |
| | | |
| 40 | | | | J.P. MORGAN MUNICIPAL BOND FUNDS | | AUGUST 31, 2018 |
| | | | | | | | |
| INVESTMENTS | | PRINCIPAL
AMOUNT
($000) | | | VALUE
($000) | |
Municipal Bonds — continued | |
Hospital — 0.5% | | | | | | | | |
City of Ashland, Kings Daughters Medical Center Rev., 4.00%, 2/1/2036 | | | 1,750 | | | | 1,759 | |
| | | | | | | | |
Housing — 0.0% (c) | | | | | | | | |
Kentucky Housing Corp. Series A, Rev., 5.00%, 1/1/2028 | | | 50 | | | | 52 | |
| | | | | | | | |
Total Kentucky | | | | | | | 2,280 | |
| | | | | | | | |
Louisiana — 0.6% | | | | | | | | |
Hospital — 0.3% | | | | | | | | |
Louisiana Public Facilities Authority, Ochsner Clinic Foundation Project Rev., 5.00%, 5/15/2047 | | | 1,055 | | | | 1,154 | |
| | | | | | | | |
Other Revenue — 0.3% | | | | | | | | |
Tobacco Settlement Financing Corp., Asset-Backed Series A, Rev., 5.25%, 5/15/2035 | | | 1,000 | | | | 1,081 | |
| | | | | | | | |
Utility — 0.0% (c) | | | | | | | | |
State of Louisiana, Gas and Fuels Tax Series A-1, Rev., 5.00%, 5/1/2020 | | | 100 | | | | 105 | |
| | | | | | | | |
Total Louisiana | | | | | | | 2,340 | |
| | | | | | | | |
Maine — 1.8% | | | | | | | | |
Housing — 0.2% | | | | | | | | |
Maine State Housing Authority Series A, Rev., 4.00%, 11/15/2045 | | | 575 | | | | 599 | |
| | | | | | | | |
Other Revenue — 0.0% (c) | | | | | | | | |
Maine Municipal Bond Bank Series E, Rev., 4.00%, 11/1/2021 | | | 100 | | | | 106 | |
| | | | | | | | |
Prerefunded — 1.6% | | | | | | | | |
Maine Turnpike Authority Rev., 6.00%, 7/1/2019 (b) | | | 5,675 | | | | 5,871 | |
| | | | | | | | |
Total Maine | | | | | | | 6,576 | |
| | | | | | | | |
Maryland — 0.4% | | | | | | | | |
Housing — 0.4% | | | | | | | | |
Montgomery County Housing Opportunities Commission, Single Family Mortgage | | | | | | | | |
Series A, Rev., 4.00%, 1/1/2031 | | | 325 | | | | 337 | |
Series A, Rev., 4.00%, 7/1/2048 | | | 940 | | | | 985 | |
| | | | | | | | |
Total Maryland | | | | | | | 1,322 | |
| | | | | | | | |
Massachusetts — 2.6% | | | | | | | | |
Education — 0.3% | | | | | | | | |
Massachusetts Development Finance Agency, Emerson College | | | | | | | | |
Rev., 5.00%, 1/1/2036 | | | 825 | | | | 913 | |
Rev., 5.00%, 1/1/2037 | | | 315 | | | | 347 | |
| | | | | | | | |
| | | | | | | 1,260 | |
| | | | | | | | |
| | | | | | | | |
| INVESTMENTS | | PRINCIPAL
AMOUNT
($000) | | | VALUE
($000) | |
| | | | | | | | |
General Obligation — 1.0% | | | | | | | | |
Commonwealth of Massachusetts, Consolidated Loan of 2016 Series J, GO, 4.00%, 12/1/2039 | | | 3,690 | | | | 3,831 | |
| | | | | | | | |
Housing — 0.6% | | | | | | | | |
Massachusetts Housing Finance Agency, Single Family Housing | | | | | | | | |
Series 177, Rev., AMT, 4.00%, 6/1/2039 | | | 595 | | | | 618 | |
Series 167, Rev., 4.00%, 12/1/2043 | | | 445 | | | | 460 | |
Series 169, Rev., 4.00%, 12/1/2044 | | | 1,010 | | | | 1,043 | |
| | | | | | | | |
| | | | | | | 2,121 | |
| | | | | | | | |
Transportation — 0.7% | | | | | | | | |
Commonwealth of Massachusetts Transportation Fund, Rail Enhancement and Accelerated Bridge Programs Series B, Rev., 4.00%, 6/1/2046 | | | 2,480 | | | | 2,564 | |
| | | | | | | | |
Total Massachusetts | | | | | | | 9,776 | |
| | | | | | | | |
Michigan — 0.8% | | | | | | | | |
Housing — 0.4% | | | | | | | | |
Michigan State Housing Development Authority, Single-Family Mortgage | | | | | | | | |
Series A, Rev., 4.00%, 6/1/2046 | | | 165 | | | | 171 | |
Series B, Rev., 3.50%, 6/1/2047 | | | 1,095 | | | | 1,124 | |
| | | | | | | | |
| | | | | | | 1,295 | |
| | | | | | | | |
Transportation — 0.4% | | | | | | | | |
State of Michigan, Trunk Line Rev., 5.00%, 11/15/2036 | | | 1,500 | | | | 1,624 | |
| | | | | | | | |
Total Michigan | | | | | | | 2,919 | |
| | | | | | | | |
Minnesota — 1.9% | | | | | | | | |
Education — 0.5% | | | | | | | | |
Minnesota Higher Education Facilities Authority, Carleton College | | | | | | | | |
Rev., 4.00%, 3/1/2032 | | | 1,000 | | | | 1,083 | |
Rev., 4.00%, 3/1/2033 | | | 500 | | | | 537 | |
Minnesota Higher Educational Facilities Authority, The College of Saint Catherine Series 5-N2, Rev., VRDO, LOC: U.S. Bank NA, 1.49%, 9/13/2018 (d) | | | 350 | | | | 350 | |
| | | | | | | | |
| | | | | | | 1,970 | |
| | | | | | | | |
General Obligation — 0.6% | | | | | | | | |
Aurora Independent School District No. 2711, School Building, Capital Appreciation | | | | | | | | |
Series B, GO, Zero Coupon, 2/1/2026 | | | 200 | | | | 161 | |
Series B, GO, Zero Coupon, 2/1/2027 | | | 425 | | | | 329 | |
Series B, GO, Zero Coupon, 2/1/2028 | | | 225 | | | | 167 | |
Series B, GO, Zero Coupon, 2/1/2029 | | | 1,560 | | | | 1,108 | |
Series B, GO, Zero Coupon, 2/1/2030 | | | 880 | | | | 596 | |
| | | | | | | | |
| | | | | | | 2,361 | |
| | | | | | | | |
SEE NOTES TO FINANCIAL STATEMENTS.
| | | | | | | | |
| | | |
| AUGUST 31, 2018 | | J.P. MORGAN MUNICIPAL BOND FUNDS | | | | | 41 | |
JPMorgan Tax Free Bond Fund
SCHEDULE OF PORTFOLIO INVESTMENTS
AS OF AUGUST 31, 2018 (Unaudited) (continued)
| | | | | | | | |
| INVESTMENTS | | PRINCIPAL
AMOUNT
($000) | | | VALUE
($000) | |
Municipal Bonds — continued | |
Housing — 0.7% | | | | | | | | |
Dakota County Community Development Agency, Single Family Mortgage, Mortgage-Backed Securities Program Series A, Rev., GNMA/FNMA/FHLMC, 4.50%, 6/1/2035 | | | 120 | | | | 124 | |
Minneapolis/St. Paul Housing Finance Board, Single Family Mortgage, Mortgage-Backed Securities Program, City Living Home Programs | | | | | | | | |
Series A, Rev., GNMA COLL, 4.50%, 12/1/2026 | | | 100 | | | | 101 | |
Series A-1, Rev., GNMA/FNMA/FHLMC, 5.25%, 12/1/2040 | | | 24 | | | | 24 | |
Series A-2, Rev., GNMA/FNMA/FHLMC, 5.52%, 3/1/2041 | | | 110 | | | | 112 | |
Minnesota Housing Finance Agency, Homeownership Finance, Mortgage-Backed Securities Program | | | | | | | | |
Series B, Rev., GNMA/FNMA/FHLMC, 4.50%, 1/1/2031 | | | 50 | | | | 51 | |
Series D, Rev., GNMA/FNMA/FHLMC, 4.50%, 7/1/2034 | | | 45 | | | | 47 | |
Series E, Rev., GNMA/FNMA/FHLMC, 4.00%, 1/1/2035 | | | 105 | | | | 107 | |
Minnesota Housing Finance Agency, Residential Housing Finance | | | | | | | | |
Series A, Rev., 4.00%, 7/1/2038 | | | 325 | | | | 337 | |
Series D, Rev., GNMA/FNMA/FHLMC, 4.00%, 7/1/2040 | | | 160 | | | | 163 | |
Series C, Rev., AMT, GNMA/FNMA/FHLMC, 4.00%, 1/1/2045 | | | 865 | | | | 900 | |
Series B, Rev., GNMA/FNMA/FHLMC COLL, 4.00%, 7/1/2047 | | | 455 | | | | 476 | |
| | | | | | | | |
| | | | | | | 2,442 | |
| | | | | | | | |
Utility — 0.1% | | | | | | | | |
City of Rochester, Electric Utility Series A, Rev., 5.00%, 12/1/2028 | | | 250 | | | | 294 | |
| | | | | | | | |
Total Minnesota | | | | | | | 7,067 | |
| | | | | | | | |
Mississippi — 0.3% | | | | | | | | |
Water & Sewer — 0.3% | | | | | | | | |
Mississippi Development Bank, Water and Sewer System Project, Special Obligation Rev., AGM, 6.88%, 12/1/2040 | | | 1,000 | | | | 1,197 | |
| | | | | | | | |
Missouri — 0.9% | | | | | | | | |
Education — 0.6% | | | | | | | | |
Missouri State Health and Educational Facilities Authority, Health Facilities, SSM Health Series A, Rev., 4.00%, 6/1/2048 | | | 2,160 | | | | 2,158 | |
| | | | | | | | |
| | | | | | | | |
| INVESTMENTS | | PRINCIPAL
AMOUNT
($000) | | | VALUE
($000) | |
| | | | | | | | |
Housing — 0.3% | | | | | | | | |
Missouri Housing Development Commission, Single Family Mortgage, First Place Homeownership Loan Program | | | | | | | | |
Series B, Rev., GNMA/FNMA/FHLMC COLL, 3.50%, 5/1/2041 | | | 505 | | | | 520 | |
Series B-2, Rev., GNMA/FNMA/FHLMC, 4.00%, 11/1/2045 | | | 675 | | | | 706 | |
Missouri Housing Development Commission, Single Family Mortgage, Special Homeownership Loan Program | | | | | | | | |
Series E-3, Rev., GNMA/FNMA/FHLMC, 4.63%, 5/1/2028 | | | 20 | | | | 21 | |
Series E-4, Rev., GNMA/FNMA/FHLMC, 4.25%, 11/1/2030 | | | 50 | | | | 51 | |
| | | | | | | | |
| | | | | | | 1,298 | |
| | | | | | | | |
Industrial Development Revenue/Pollution Control Revenue — 0.0% (c) | | | | | |
Missouri Environmental Improvement and Energy Resources Authority, Water Pollution Control and Drinking Water Series B, Rev., 5.00%, 7/1/2025 | | | 35 | | | | 37 | |
| | | | | | | | |
Total Missouri | | | | | | | 3,493 | |
| | | | | | | | |
Montana — 0.2% | | | | | | | | |
Housing — 0.1% | | | | | | | | |
Montana Board of Housing, Single Family Homeownership | | | | | | | | |
Series B2, Rev., AMT, 5.00%, 12/1/2027 | | | 290 | | | | 303 | |
Series A-2, Rev., AMT, 4.00%, 12/1/2038 | | | 170 | | | | 176 | |
| | | | | | | | |
| | | | | | | 479 | |
| | | | | | | | |
Prerefunded — 0.1% | | | | | | | | |
City of Helena COP, 5.00%, 1/1/2019 (b) | | | 400 | | | | 404 | |
| | | | | | | | |
Total Montana | | | | | | | 883 | |
| | | | | | | | |
Nebraska — 0.1% | | | | | | | | |
Utility — 0.1% | | | | | | | | |
Public Power Generation Agency, Whelan Energy Center Unit 2 Series A, Rev., 5.00%, 1/1/2034 | | | 185 | | | | 208 | |
| | | | | | | | |
Nevada — 0.1% | | | | | | | | |
Transportation — 0.1% | | | | | | | | |
City of Reno, Sales Tax Revenue, Senior Lien, ReTrac-Reno Transportation Rail Access Corridor Project Rev., AGM, 4.00%, 6/1/2048 | | | 375 | | | | 379 | |
| | | | | | | | |
New Hampshire — 0.1% | | | | | | | | |
Housing — 0.1% | | | | | | | | |
New Hampshire Housing Finance Authority, Single Family Mortgage
Series C, Rev., 4.00%, 1/1/2028 | | | 135 | | | | 137 | |
SEE NOTES TO FINANCIAL STATEMENTS.
| | | | | | |
| | | |
| 42 | | | | J.P. MORGAN MUNICIPAL BOND FUNDS | | AUGUST 31, 2018 |
| | | | | | | | |
| INVESTMENTS | | PRINCIPAL
AMOUNT
($000) | | | VALUE
($000) | |
Municipal Bonds — continued | |
Housing — continued | | | | | | | | |
Series A, Rev., 5.25%, 7/1/2028 | | | 50 | | | | 52 | |
| | | | | | | | |
Total New Hampshire | | | | | | | 189 | |
| | | | | | | | |
New Jersey — 4.3% | | | | | | | | |
Housing — 0.3% | | | | | | | | |
New Jersey Housing and Mortgage Finance Agency, Single Family Housing Series A, Rev., 4.50%, 10/1/2048 | | | 1,000 | | | | 1,071 | |
| | | | | | | | |
Other Revenue — 1.0% | | | | | �� | | | |
Tobacco Settlement Financing Corp. | | | | | | | | |
Series A, Rev., 4.00%, 6/1/2037 | | | 1,000 | | | | 1,017 | |
Series A, Rev., 5.00%, 6/1/2046 | | | 1,000 | | | | 1,089 | |
Series A, Rev., 5.25%, 6/1/2046 | | | 1,500 | | | | 1,673 | |
| | | | | | | | |
| | | | | | | 3,779 | |
| | | | | | | | |
Prerefunded — 0.0% (c) | | | | | | | | |
New Jersey Economic Development Authority, School Facilities Construction Series Y, Rev., 4.75%, 9/1/2018 (b) | | | 40 | | | | 40 | |
| | | | | | | | |
Transportation — 3.0% | | | | | | | | |
New Jersey Transportation Trust Fund Authority, Capital Appreciation, Transportation Systems Series A, Rev., Zero Coupon, 12/15/2036 | | | 10,355 | | | | 4,483 | |
New Jersey Transportation Trust Fund Authority, Federal Highway Reimbursement | | | | | | | | |
Series A-1, Rev., 5.00%, 6/15/2027 | | | 2,670 | | | | 3,003 | |
Rev., 5.00%, 6/15/2031 | | | 3,000 | | | | 3,329 | |
| | | | | | | | |
| | | | | | | 10,815 | |
| | | | | | | | |
Total New Jersey | | | | | | | 15,705 | |
| | | | | | | | |
New Mexico — 0.3% | | | | | | | | |
Housing — 0.3% | | | | | | | | |
New Mexico Mortgage Finance Authority, Single Family Mortgage Program | | | | | | | | |
Series A, Class I, Rev., GNMA/FNMA/FHLMC, 5.00%, 9/1/2030 | | | 35 | | | | 36 | |
Series A, Class I, Rev., GNMA/FNMA/FHLMC, 4.25%, 3/1/2043 | | | 240 | | | | 247 | |
Series B-1, Rev., GNMA/FNMA/FHLMC, 3.75%, 9/1/2048 | | | 645 | | | | 672 | |
| | | | | | | | |
| | | | | | | 955 | |
| | | | | | | | |
Transportation — 0.0% (c) | | | | | | | | |
New Mexico Finance Authority, State Transportation, Senior Lien Series B, Rev., 5.00%, 6/15/2024 | | | 100 | | | | 106 | |
| | | | | | | | |
Total New Mexico | | | | | | | 1,061 | |
| | | | | | | | |
| | | | | | | | |
| INVESTMENTS | | PRINCIPAL
AMOUNT
($000) | | | VALUE
($000) | |
| | | | | | | | |
New York — 7.8% | | | | | | | | |
Housing — 0.1% | | | | | | | | |
New York Mortgage Agency, Homeowner Mortgage Series 197, Rev., 3.50%, 10/1/2044 | | | 430 | | | | 443 | |
| | | | | | | | |
Other Revenue — 1.5% | | | | | | | | |
New York City Transitional Finance Authority Series C, Rev., 5.00%, 11/1/2021 | | | 170 | | | | 181 | |
New York City Transitional Finance Authority, Future Tax Secured, Fiscal Year 2017 Series B, Subseries B-1, Rev., 5.00%, 8/1/2036 | | | 1,020 | | | | 1,171 | |
New York City Transitional Finance Authority, Future Tax Secured, Fiscal Year 2018 Series B-1, Rev., 5.00%, 8/1/2045 | | | 1,160 | | | | 1,315 | |
New York Convention Center Development Corp., Subordinated Lien Hotel Unit fee | | | | | | | | |
Series B, Rev., Zero Coupon, 11/15/2055 | | | 4,970 | | | | 1,036 | |
Series B, Rev., Zero Coupon, 11/15/2056 | | | 6,500 | | | | 1,328 | |
TSASC, Inc., Tobacco Settlement Series B, Rev., 5.00%, 6/1/2020 | | | 500 | | | | 522 | |
| | | | | | | | |
| | | | | | | 5,553 | |
| | | | | | | | |
Prerefunded — 0.0% (c) | | | | | | | | |
Metropolitan Transportation Authority Series H, Rev., 5.00%, 11/15/2022 (b) | | | 65 | | | | 73 | |
| | | | | | | | |
Special Tax — 0.0% (c) | | | | | | | | |
New York State Dormitory Authority, Unrefunded Balance Series A, Rev., 4.00%, 2/15/2019 | | | 100 | | | | 101 | |
| | | | | | | | |
Transportation — 4.1% | | | | | | | | |
Metropolitan Transportation Authority | | | | | | | | |
Series D, Rev., 5.00%, 11/15/2030 | | | 400 | | | | 458 | |
Series D, Rev., 5.00%, 11/15/2031 | | | 400 | | | | 459 | |
Series B, Rev., 5.00%, 11/15/2037 | | | 2,000 | | | | 2,247 | |
New York Transportation Development Corp., Delta Air Lines, Inc., Laguardia Airport Terminals C&D Redevelopment Project | | | | | | | | |
Rev., AMT, 4.00%, 1/1/2036 | | | 1,500 | | | | 1,510 | |
Rev., AMT, 5.00%, 1/1/2036 | | | 1,125 | | | | 1,245 | |
Port Authority of New York and New Jersey, Consolidated, 93rd Series Rev., 6.13%, 6/1/2094 | | | 7,580 | | | | 9,028 | |
| | | | | | | | |
| | | | | | | 14,947 | |
| | | | | | | | |
Utility — 1.3% | | | | | | | | |
Utility Debt Securitization Authority Series TE, Rev., 5.00%, 12/15/2041 | | | 4,250 | | | | 4,740 | |
| | | | | | | | |
Water & Sewer — 0.8% | | | | | | | | |
Erie County Water Authority Rev., 4.00%, 12/1/2038 | | | 1,000 | | | | 1,054 | |
SEE NOTES TO FINANCIAL STATEMENTS.
| | | | | | | | |
| | | |
| AUGUST 31, 2018 | | J.P. MORGAN MUNICIPAL BOND FUNDS | | | | | 43 | |
JPMorgan Tax Free Bond Fund
SCHEDULE OF PORTFOLIO INVESTMENTS
AS OF AUGUST 31, 2018 (Unaudited) (continued)
| | | | | | | | |
| INVESTMENTS | | PRINCIPAL
AMOUNT
($000) | | | VALUE
($000) | |
Municipal Bonds — continued | |
Water & Sewer — continued | | | | | | | | |
New York State Environmental Facilities Corp., State Clean Water and Drinking Water Revolving Funds, Municipal Water Finance Authority Projects-Second Resolution Series A, Rev., 5.00%, 6/15/2037 | | | 1,750 | | | | 2,023 | |
| | | | | | | | |
| | | | | | | 3,077 | |
| | | | | | | | |
Total New York | | | | | | | 28,934 | |
| | | | | | | | |
North Carolina — 1.3% | | | | | | | | |
Education — 0.9% | | | | | | | | |
North Carolina Capital Facilities Finance Agency, Meredith College | | | | | | | | |
Rev., 5.00%, 6/1/2027 | | | 1,060 | | | | 1,200 | |
Rev., 5.00%, 6/1/2028 | | | 905 | | | | 1,017 | |
Rev., 5.00%, 6/1/2029 | | | 350 | | | | 392 | |
Rev., 5.00%, 6/1/2030 | | | 450 | | | | 502 | |
| | | | | | | | |
| | | | | | | 3,111 | |
| | | | | | | | |
Housing — 0.4% | | | | | | | | |
North Carolina Housing Finance Agency, Homeownership | | | | | | | | |
Series 2, Rev., 4.25%, 1/1/2028 | | | 60 | | | | 61 | |
Series 1, Rev., 4.50%, 7/1/2028 | | | 125 | | | | 128 | |
Series A, Rev., AMT, 3.50%, 7/1/2039 | | | 405 | | | | 415 | |
Series 38-B, Rev., 4.00%, 7/1/2047 | | | 960 | | | | 1,007 | |
| | | | | | | | |
| | | | | | | 1,611 | |
| | | | | | | | |
Total North Carolina | | | | | | | 4,722 | |
| | | | | | | | |
North Dakota — 0.3% | | | | | | | | |
Housing — 0.3% | | | | | | | | |
North Dakota Housing Finance Agency, Home Mortgage Finance Program | | | | | | | | |
Series B, Rev., 4.50%, 1/1/2028 | | | 170 | | | | 176 | |
Series D, Rev., 4.25%, 7/1/2028 | | | 110 | | | | 111 | |
Series B, Rev., 5.00%, 7/1/2028 | | | 20 | | | | 20 | |
Series A, Rev., 4.00%, 7/1/2034 | | | 370 | | | | 383 | |
Series D, Rev., 3.50%, 7/1/2046 | | | 515 | | | | 530 | |
| | | | | | | | |
Total North Dakota | | | | | | | 1,220 | |
| | | | | | | | |
Ohio — 1.9% | | | | | | | | |
Education — 0.0% (c) | | | | | | | | |
Miami University, A State University of Ohio Rev., 5.00%, 9/1/2029 | | | 25 | | | | 29 | |
| | | | | | | | |
General Obligation — 1.1% | | | | | | | | |
County of Union, Memorial Hospital GO, 4.00%, 12/1/2041 | | | 1,825 | | | | 1,863 | |
| | | | | | | | |
| INVESTMENTS | | PRINCIPAL
AMOUNT
($000) | | | VALUE
($000) | |
| | | | | | | | |
General Obligation — continued | | | | | | | | |
Greenville City School District, School Improvement | | | | | | | | |
GO, 5.25%, 1/1/2038 | | | 1,000 | | | | 1,097 | |
GO, 5.25%, 1/1/2041 | | | 1,000 | | | | 1,094 | |
State of Ohio, Higher Education Series B, GO, 5.00%, 8/1/2023 | | | 110 | | | | 122 | |
| | | | | | | | |
| | | | | | | 4,176 | |
| | | | | | | | |
Hospital — 0.3% | | | | | | | | |
County of Warren, Otterbein Homes Obligated Group, Healthcare Facilities Series A, Rev., 5.50%, 7/1/2039 | | | 1,000 | | | | 1,109 | |
| | | | | | | | |
Housing — 0.1% | | | | | | | | |
Ohio Housing Finance Agency, Single Family Mortgage | | | | | | | | |
Series 1, Rev., GNMA/FNMA/FHLMC, 4.80%, 11/1/2028 | | | 50 | | | | 51 | |
Series 1, Rev., GNMA/FNMA/FHLMC, 5.00%, 11/1/2028 | | | 35 | | | | 36 | |
Series 3, Rev., GNMA/FNMA/FHLMC, 4.50%, 11/1/2029 | | | 125 | | | | 129 | |
| | | | | | | | |
| | | | | | | 216 | |
| | | | | | | | |
Prerefunded — 0.4% | | | | | | | | |
County of Richland, Correctional Facilities Improvement | | | | | | | | |
GO, AGC, 5.88%, 12/1/2018 (b) | | | 500 | | | | 505 | |
GO, AGC, 6.00%, 12/1/2018 (b) | | | 400 | | | | 405 | |
GO, AGC, 6.13%, 12/1/2018 (b) | | | 650 | | | | 657 | |
| | | | | | | | |
| | | | | | | 1,567 | |
| | | | | | | | |
Total Ohio | | | | | | | 7,097 | |
| | | | | | | | |
Oklahoma — 1.5% | | | | | | | | |
Hospital — 0.2% | | | | | | | | |
Oklahoma Development Finance Authority, Health System, Ou Medicine Project Series B, Rev., AGM, 4.00%, 8/15/2048 | | | 700 | | | | 696 | |
| | | | | | | | |
Housing — 0.0% (c) | | | | | | | | |
Oklahoma Housing Finance Agency, Single Family Mortgage, Homeownership Loan Program | | | | | | | | |
Series B, Rev., GNMA COLL, 4.50%, 9/1/2027 | | | 60 | | | | 62 | |
Series A, Rev., GNMA COLL, 4.75%, 3/1/2028 | | | 55 | | | | 57 | |
| | | | | | | | |
| | | | | | | 119 | |
| | | | | | | | |
Other Revenue — 0.0% (c) | | | | | | | | |
Grand River Dam Authority Series A, Rev., 4.00%, 6/1/2022 | | | 10 | | | | 11 | |
| | | | | | | | |
SEE NOTES TO FINANCIAL STATEMENTS.
| | | | | | |
| | | |
| 44 | | | | J.P. MORGAN MUNICIPAL BOND FUNDS | | AUGUST 31, 2018 |
| | | | | | | | |
| INVESTMENTS | | PRINCIPAL
AMOUNT
($000) | | | VALUE
($000) | |
Municipal Bonds — continued | |
Prerefunded — 0.6% | | | | | | | | |
Oklahoma City Water Utilities Trust, Water and Sewer System Series A, Rev., 5.00%, 7/1/2019 (b) | | | 2,000 | | | | 2,055 | |
| | | | | | | | |
Transportation — 0.7% | | | | | | | | |
Oklahoma Turnpike Authority, Turnpike System, Second Senior | | | | | | | | |
Series A, Rev., 5.00%, 1/1/2037 | | | 1,665 | | | | 1,891 | |
Series C, Rev., 4.00%, 1/1/2042 | | | 600 | | | | 622 | |
| | | | | | | | |
| | | | | | | 2,513 | |
| | | | | | | | |
Total Oklahoma | | | | | | | 5,394 | |
| | | | | | | | |
Oregon — 0.1% | | | | | | | | |
Utility — 0.1% | | | | | | | | |
City of Eugene, Electric Utility System Series A, Rev., 4.00%, 8/1/2031 | | | 325 | | | | 351 | |
| | | | | | | | |
Pennsylvania — 9.0% | | | | | | | | |
Certificate of Participation/Lease — 0.3% | | | | | | | | |
Commonwealth of Pennsylvania, Certificates of Participation Series A, COP, 4.00%, 7/1/2046 | | | 1,200 | | | | 1,212 | |
| | | | | | | | |
General Obligation — 1.2% | | | | | | | | |
City of Pittsburgh GO, 4.00%, 9/1/2031 | | | 1,155 | | | | 1,225 | |
Commonwealth of Pennsylvania Series 2004, GO, AGM, 5.38%, 7/1/2020 | | | 150 | | | | 159 | |
Nazareth Area School District Series E, GO, 5.00%, 11/15/2037 | | | 1,245 | | | | 1,402 | |
The School Board of Philadelphia County Series B, GO, AGM, 4.00%, 9/1/2043 | | | 1,250 | | | | 1,267 | |
Upper Merion Area School District GO, 5.00%, 1/15/2036 | | | 250 | | | | 285 | |
| | | | | | | | |
| | | | | | | 4,338 | |
| | | | | | | | |
Hospital — 3.9% | | | | | | | | |
Allegheny County Hospital Development Authority, Allegheny Health Network Obligated Group Rev., 4.00%, 4/1/2044 | | | 2,000 | | | | 1,968 | |
Berks County Industrial Development Authority, Tower Health Project Rev., 5.00%, 11/1/2037 | | | 430 | | | | 476 | |
DuBois Hospital Authority, Penn Highlands Healthcare Rev., 4.00%, 7/15/2048 | | | 1,200 | | | | 1,181 | |
Lancaster County Hospital Authority, Health Center, Masonic Villages Project | | | | | | | | |
Rev., 5.00%, 11/1/2036 | | | 510 | | | | 561 | |
Rev., 5.00%, 11/1/2037 | | | 250 | | | | 274 | |
Montgomery County Higher Education and Health Authority, Thomas Jefferson University | | | | | | | | |
Rev., 4.00%, 9/1/2038 | | | 3,725 | | | | 3,755 | |
| | | | | | | | |
| INVESTMENTS | | PRINCIPAL
AMOUNT
($000) | | | VALUE
($000) | |
| | | | | | | | |
Hospital — continued | | | | | | | | |
Rev., 4.00%, 9/1/2043 | | | 3,740 | | | | 3,768 | |
West Cornwall Township Municipal Authority, Pleasant View Retirement Community Project | | | | | | | | |
Rev., 3.00%, 12/15/2023 | | | 580 | | | | 576 | |
Rev., 4.00%, 12/15/2028 | | | 1,000 | | | | 1,032 | |
Rev., 5.00%, 12/15/2038 | | | 750 | | | | 811 | |
| | | | | | | | |
| | | | | | | 14,402 | |
| | | | | | | | |
Housing — 0.4% | | | | | | | | |
Pennsylvania Housing Finance Agency, Single Family Mortgage | | | | | | | | |
Series 112, Rev., 5.00%, 4/1/2028 | | | 75 | | | | 77 | |
Series 118A, Rev., AMT, 3.50%, 4/1/2040 | | | 1,025 | | | | 1,047 | |
Series 122, Rev., 4.00%, 10/1/2046 | | | 490 | | | | 512 | |
| | | | | | | | |
| | | | | | | 1,636 | |
| | | | | | | | |
Other Revenue — 2.7% | | | | | | | | |
Commonwealth Financing Authority, Tobacco Master Settlement Payment Series 2018, Rev., AGM, 4.00%, 6/1/2039 | | | 9,950 | | | | 10,113 | |
| | | | | | | | |
Water & Sewer — 0.5% | | | | | | | | |
Erie City Water Authority Series A, Rev., AGM, 5.00%, 12/1/2043 | | | 1,500 | | | | 1,681 | |
| | | | | | | | |
Total Pennsylvania | | | | | | | 33,382 | |
| | | | | | | | |
Rhode Island — 0.1% | | | | | | | | |
Education — 0.1% | | | | | | | | |
Rhode Island Student Loan Authority, Senior Series A, Rev., AMT, 5.00%, 12/1/2020 | | | 300 | | | | 317 | |
| | | | | | | | |
South Carolina — 5.5% | | | | | | | | |
Housing — 0.1% | | | | | | | | |
South Carolina State Housing Finance and Development Authority Series A, Rev., 4.00%, 1/1/2047 | | | 375 | | | | 392 | |
| | | | | | | | |
Prerefunded — 2.6% | | | | | | | | |
Laurens County School District No. 056 GO, AGC, SCSDE, 6.13%, 3/1/2019 (b) | | | 9,515 | | | | 9,725 | |
| | | | | | | | |
Transportation — 0.3% | | | | | | | | |
South Carolina State Ports Authority Rev., AMT, 4.00%, 7/1/2040 | | | 1,095 | | | | 1,103 | |
| | | | | | | | |
Utility — 2.5% | | | | | | | | |
Piedmont Municipal Power Agency, Electric Rev., FGIC, 6.75%, 1/1/2020 (b) | | | 3,900 | | | | 4,155 | |
SEE NOTES TO FINANCIAL STATEMENTS.
| | | | | | | | |
| | | |
| AUGUST 31, 2018 | | J.P. MORGAN MUNICIPAL BOND FUNDS | | | | | 45 | |
JPMorgan Tax Free Bond Fund
SCHEDULE OF PORTFOLIO INVESTMENTS
AS OF AUGUST 31, 2018 (Unaudited) (continued)
| | | | | | | | |
| INVESTMENTS | | PRINCIPAL
AMOUNT
($000) | | | VALUE
($000) | |
Municipal Bonds — continued | |
Utility — continued | | | | | | | | |
Piedmont Municipal Power Agency, Electric, Unrefunded Balance Rev., NATL-RE, 6.75%, 1/1/2020 | | | 4,615 | | | | 4,896 | |
| | | | | | | | |
| | | | | | | 9,051 | |
| | | | | | | | |
Total South Carolina | | | | | | | 20,271 | |
| | | | | | | | |
South Dakota — 0.3% | | | | | | | | |
Housing — 0.3% | | | | | | | | |
South Dakota Housing Development Authority, Homeownership Mortgage | | | | | | | | |
Series D, Rev., AMT, 4.00%, 11/1/2029 | | | 415 | | | | 426 | |
Series A, Rev., AMT, 4.50%, 5/1/2031 | | | 75 | | | | 78 | |
Series D, Rev., 4.00%, 11/1/2045 | | | 550 | | | | 573 | |
South Dakota Housing Development Authority, Single Family Mortgage Series 2, Rev., 4.25%, 5/1/2032 | | | 160 | | | | 164 | |
| | | | | | | | |
Total South Dakota | | | | | | | 1,241 | |
| | | | | | | | |
Tennessee — 2.3% | | | | | | | | |
Hospital — 1.1% | | | | | | | | |
Greeneville Health and Educational Facilities Board, Ballad Health Obligated Group Rev., 4.00%, 7/1/2040 | | | 4,000 | | | | 4,029 | |
| | | | | | | | |
Housing — 0.1% | | | | | | | | |
Tennessee Housing Development Agency, Homeownership Program | | | | | | | | |
Series A, Rev., AMT, 4.50%, 7/1/2031 | | | 120 | | | | 124 | |
Series 1A, Rev., AMT, 4.50%, 1/1/2038 | | | 110 | | | | 114 | |
Tennessee Housing Development Agency, Housing Finance Program Series A, Rev., 4.50%, 1/1/2028 | | | 55 | | | | 57 | |
| | | | | | | | |
| | | | | | | 295 | |
| | | | | | | | |
Utility — 1.1% | | | | | | | | |
Tennessee Energy Acquisition Corp., Gas Project Rev., 4.00%, 11/1/2025 (d) | | | 4,000 | | | | 4,246 | |
| | | | | | | | |
Total Tennessee | | | | | | | 8,570 | |
| | | | | | | | |
Texas — 5.3% | | | | | | | | |
Education — 1.8% | | | | | | | | |
Clifton Higher Education Finance Corp., Idea Public Schools | | | | | | | | |
Series B, Rev., 4.00%, 8/15/2023 | | | 500 | | | | 528 | |
Series B, Rev., 5.00%, 8/15/2024 | | | 345 | | | | 385 | |
Series B, Rev., 5.00%, 8/15/2025 | | | 460 | | | | 516 | |
Rev., 6.00%, 8/15/2033 | | | 1,250 | | | | 1,411 | |
Tarrant County Cultural Education Facilities Finance Corp., Hendrick Medical Center, Hospital | | | | | | | | |
Rev., 5.13%, 9/1/2033 | | | 1,000 | | | | 1,083 | |
| | | | | | | | |
| INVESTMENTS | | PRINCIPAL
AMOUNT
($000) | | | VALUE
($000) | |
| | | | | | | | |
Education — continued | | | | | | | | |
Rev., 5.50%, 9/1/2043 | | | 2,300 | | | | 2,549 | |
University of Texas System Series A, Rev., 5.00%, 7/1/2031 | | | 210 | | | | 242 | |
| | | | | | | | |
| | | | | | | 6,714 | |
| | | | | | | | |
General Obligation — 0.2% | | | | | | | | |
City of Carrollton GO, 5.00%, 8/15/2026 | | | 535 | | | | 551 | |
County of Collin, Wylie Independent School District, Unlimited Tax GO, PSF-GTD, Zero Coupon, 8/15/2020 | | | 135 | | | | 130 | |
| | | | | | | | |
| | | | | | | 681 | |
| | | | | | | | |
Hospital — 0.1% | | | | | | | | |
Harris County Health Facilities Development Corp., Children's Hospital Project Rev., 5.50%, 10/1/2019 (b) | | | 485 | | | | 495 | |
| | | | | | | | |
Housing — 0.1% | | | | | | | | |
Texas Department of Housing and Community Affairs, Residential Mortgage Series B, Rev., GNMA COLL, 4.25%, 1/1/2034 | | | 250 | | | | 257 | |
| | | | | | | | |
Prerefunded — 1.6% | | | | | | | | |
Harris County Health Facilities Development Corp., Memorial Hermann Healthcare System Series B, Rev., 7.25%, 12/1/2018 (b) | | | 3,500 | | | | 3,547 | |
North Texas Tollway Authority, Special Projects System Series A, Rev., 6.00%, 9/1/2021 (b) | | | 2,000 | | | | 2,233 | |
| | | | | | | | |
| | | | | | | 5,780 | |
| | | | | | | | |
Transportation — 0.6% | | | | | | | | |
Dallas-Fort Worth International Airport, Joint Improvement Series A, Rev., 5.00%, 11/1/2042 | | | 1,965 | | | | 2,072 | |
| | | | | | | | |
Utility — 0.0% (c) | | | | | | | | |
City of San Antonio, Electric and Gas Systems Rev., 5.00%, 2/1/2032 | | | 35 | | | | 40 | |
| | | | | | | | |
Water & Sewer — 0.9% | | | | | | | | |
City of Houston, Water and Sewer System, Junior Lien Series A, Rev., AGM, 5.75%, 12/1/2032 (b) | | | 2,500 | | | | 3,384 | |
| | | | | | | | |
Total Texas | | | | | | | 19,423 | |
| | | | | | | | |
Vermont — 1.5% | | | | | | | | |
Education — 1.2% | | | | | | | | |
Vermont Student Assistance Corp., Education Loan | | | | | | | | |
Series B, Class A-1, Rev., (ICE LIBOR USD 3 Month + 1.50%), 3.82%, 10/1/2018 (e) | | | 8 | | | | 8 | |
Series A, Rev., AMT, 5.00%, 6/15/2022 | | | 725 | | | | 775 | |
Series A, Rev., AMT, 3.63%, 6/15/2029 | | | 1,000 | | | | 985 | |
Series A, Rev., AMT, 3.75%, 6/15/2030 | | | 1,400 | | | | 1,388 | |
SEE NOTES TO FINANCIAL STATEMENTS.
| | | | | | |
| | | |
| 46 | | | | J.P. MORGAN MUNICIPAL BOND FUNDS | | AUGUST 31, 2018 |
| | | | | | | | |
| INVESTMENTS | | PRINCIPAL
AMOUNT
($000) | | | VALUE
($000) | |
Municipal Bonds — continued | |
Education — continued | | | | | | | | |
Series A, Rev., AMT, 4.00%, 6/15/2031 | | | 500 | | | | 504 | |
Series A, Rev., AMT, 4.00%, 6/15/2032 | | | 200 | | | | 200 | |
Series A, Rev., AMT, 4.00%, 6/15/2033 | | | 250 | | | | 249 | |
Series A, Rev., AMT, 4.00%, 6/15/2034 | | | 200 | | | | 197 | |
| | | | | | | | |
| | | | | | | 4,306 | |
| | | | | | | | |
Housing — 0.3% | | | | | | | | |
Vermont Housing Finance Agency, Mortgage-Backed Securities Series A, Rev., GNMA/FNMA/FHLMC, 4.50%, 2/1/2026 | | | 120 | | | | 124 | |
Vermont Housing Finance Agency, Multiple Purpose | | | | | | | | |
Series B, Rev., AMT, 4.13%, 11/1/2042 | | | 635 | | | | 647 | |
Series A, Rev., AMT, 4.00%, 11/1/2046 | | | 350 | | | | 364 | |
| | | | | | | | |
| | | | | | | 1,135 | |
| | | | | | | | |
Total Vermont | | | | | | | 5,441 | |
| | | | | | | | |
Virginia — 1.8% | | | | | | | | |
Hospital — 1.2% | | | | | | | | |
Norfolk Economic Development Authority, Sentara Healthcare Series B, Rev., 4.00%, 11/1/2048 | | | 4,375 | | | | 4,450 | |
| | | | | | | | |
Other Revenue — 0.0% (c) | | | | | | | | |
Virginia Resources Authority, Infrastructure and State Moral Obligation | | | | | | | | |
Series B, Rev., 5.00%, 11/1/2023 | | | 90 | | | | 98 | |
Series B, Rev., 5.00%, 11/1/2026 | | | 50 | | | | 55 | |
| | | | | | | | |
| | | | | | | 153 | |
| | | | | | | | |
Prerefunded — 0.1% | | | | | | | | |
Virginia Resources Authority, Infrastructure and State Moral Obligation Series B, Rev., 5.00%, 11/1/2021 (b) | | | 185 | | | | 203 | |
| | | | | | | | |
Transportation — 0.5% | | | | | | | | |
Capital Region Airport Commission (Richmond International Airport) | | | | | | | | |
Series A, Rev., 4.00%, 7/1/2035 | | | 350 | | | | 366 | |
Series A, Rev., 4.00%, 7/1/2036 | | | 320 | | | | 333 | |
Virginia Commonwealth Transportation Board, Capital Projects Series A, Rev., 4.00%, 5/15/2036 | | | 1,000 | | | | 1,051 | |
| | | | | | | | |
| | | | | | | 1,750 | |
| | | | | | | | |
Total Virginia | | | | | | | 6,556 | |
| | | | | | | | |
Washington — 2.2% | | | | | | | | |
Education — 0.9% | | | | | | | | |
Western Washington University, Housing and Dining System, Junior Lien Series A, Rev., AMBAC, 5.50%, 10/1/2022 | | | 2,985 | | | | 3,173 | |
| | | | | | | | |
| | | | | | | | |
| INVESTMENTS | | PRINCIPAL
AMOUNT
($000) | | | VALUE
($000) | |
| | | | | | | | |
General Obligation — 0.0% (c) | | | | | | | | |
State of Washington, Various Purpose Series D, GO, 5.00%, 2/1/2020 | | | 100 | | | | 104 | |
| | | | | | | | |
Housing — 0.2% | | | | | | | | |
Washington Housing Finance Commission, Single-Family Program Series 2A-R, Rev., AMT, 3.50%, 12/1/2046 | | | 390 | | | | 399 | |
Washington State Housing Finance Commission, Homeownership Program Series B, Rev., GNMA/FNMA/FHLMC, 4.25%, 10/1/2032 | | | 375 | | | | 384 | |
| | | | | | | | |
| | | | | | | 783 | |
| | | | | | | | |
Utility — 1.1% | | | | | | | | |
Chelan County Public Utility District No. 1 Series A, Rev., AMT, 5.50%, 7/1/2026 | | | 350 | | | | 381 | |
City of Tacoma, Electric System Rev., 4.00%, 1/1/2047 | | | 3,445 | | | | 3,536 | |
| | | | | | | | |
| | | | | | | 3,917 | |
| | | | | | | | |
Total Washington | | | | | | | 7,977 | |
| | | | | | | | |
West Virginia — 0.3% | | | | | | | | |
Education — 0.3% | | | | | | | | |
West Virginia Hospital Finance Authority, University Health System Rev., 4.00%, 6/1/2051 | | | 1,000 | | | | 984 | |
| | | | | | | | |
Wisconsin — 4.1% | | | | | | | | |
Education — 2.7% | | | | | | | | |
Public Finance Authority, Central District Development Project Rev., 5.00%, 3/1/2027 | | | 280 | | | | 324 | |
Wisconsin Health and Educational Facilities Authority, Children's Hospital of Wisconsin, Inc. | | | | | | | | |
Rev., 4.00%, 8/15/2042 | | | 4,220 | | | | 4,295 | |
Rev., 4.00%, 8/15/2047 | | | 4,800 | | | | 4,851 | |
Wisconsin Health and Educational Facilities Authority, St. John's Communities, Inc. Project Series A, Rev., 5.00%, 9/15/2040 | | | 665 | | | | 691 | |
| | | | | | | | |
| | | | | | | 10,161 | |
| | | | | | | | |
Housing — 1.4% | | | | | | | | |
Wisconsin Housing and Economic Development Authority, Home Ownership | | | | | | | | |
Series B, Rev., 4.00%, 3/1/2048 | | | 2,945 | | | | 3,095 | |
Series C, Rev., FNMA COLL, 4.00%, 3/1/2048 | | | 1,905 | | | | 2,004 | |
| | | | | | | | |
| | | | | | | 5,099 | |
| | | | | | | | |
Total Wisconsin | | | | | | | 15,260 | |
| | | | | | | | |
SEE NOTES TO FINANCIAL STATEMENTS.
| | | | | | | | |
| | | |
| AUGUST 31, 2018 | | J.P. MORGAN MUNICIPAL BOND FUNDS | | | | | 47 | |
JPMorgan Tax Free Bond Fund
SCHEDULE OF PORTFOLIO INVESTMENTS
AS OF AUGUST 31, 2018 (Unaudited) (continued)
| | | | | | | | |
| INVESTMENTS | | PRINCIPAL
AMOUNT
($000) | | | VALUE
($000) | |
Municipal Bonds — continued | |
Wyoming — 0.0% (c) | | | | | | | | |
Housing — 0.0% (c) | | | | | | | | |
Wyoming Community Development Authority Housing Series 1, Rev., AMT, 4.00%, 6/1/2032 | | | 30 | | | | 30 | |
| | | | | | | | |
Total Municipal Bonds
(Cost $340,520) | | | | | | | 352,424 | |
| | | | | | | | |
| | |
| | | NO. OF
WARRANTS
(000) | | | | |
Warrants — 0.0% (c) | | | | | | | | |
Road & Rail — 0.0% (c) | | | | | | | | |
Jack Cooper Enterprises, Inc. expiring 10/29/2027, price 1.00*‡
(Cost $—) | | | — | (f) | | | — | |
| | | | | | | | |
| | |
| Investments | | SHARES
(000) | | | | |
Short-Term Investments — 2.6% | | | | | | | | |
Investment Companies — 2.6% | | | | | | | | |
JPMorgan Institutional Tax Free
Money Market Fund Class IM Shares, 1.38% (g) (h)
(Cost $9,508) | | | 9,508 | | | | 9,508 | |
| | | | | | | | |
Total Investments — 98.1%
(Cost $350,028) | | | | | | | 361,932 | |
Other Assets Less Liabilities — 1.9% | | | | | | | 6,993 | |
| | | | | | | | |
NET ASSETS — 100.0% | | | | | | | 368,925 | |
| | | | | | | | |
Percentages indicated are based on net assets.
| | | | | | | | | | | | | | | | | | | | |
| Futures contracts outstanding as of August 31, 2018 (amounts in thousands, except number of contracts): | |
| DESCRIPTION | | NUMBER OF
CONTRACTS | | | EXPIRATION
DATE | | | TRADING
CURRENCY | | | NOTIONAL
AMOUNT ($) | | | VALUE AND
UNREALIZED
APPRECIATION
(DEPRECIATION) ($) | |
Short Contracts | | | | | | | | | | | | | | | | | | | | |
U.S. Treasury 10 Year Note | | | (53 | ) | | | 12/2018 | | | | USD | | | | (6,368 | ) | | | 8 | |
| | | | | | | | | | | | | | | | | | | | |
| | | | | | | | | | | | | | | 8 | |
| | | | | | | | | | | | | | | | | | | | |
SEE NOTES TO FINANCIAL STATEMENTS.
| | | | | | |
| | | |
| 48 | | | | J.P. MORGAN MUNICIPAL BOND FUNDS | | AUGUST 31, 2018 |
Abbreviations
| | |
| AGC | | Insured by Assured Guaranty Corp. |
| AGM | | Insured by Assured Guaranty Municipal Corp. |
| AMBAC | | Insured by American Municipal Bond Assurance Corp. |
| AMT | | Alternative Minimum Tax |
| BAN | | Bond Anticipation Note |
| CHESLA | | Connecticut Higher Education Supplemental Loan Authority |
| COLL | | Collateral |
| COP | | Certificate of Participation |
| FGIC | | Insured by Financial Guaranty Insurance Co. |
| FHLMC | | Federal Home Loan Mortgage Corp. |
| FNMA | | Federal National Mortgage Association |
| GNMA | | Government National Mortgage Association |
| GO | | General Obligation |
| ICE | | Intercontinental Exchange |
| LIBOR | | London Interbank Offered Rate |
| LOC | | Letter of Credit |
| NATL | | Insured by National Public Finance Guarantee Corp. |
| PSF-GTD | | Permanent School Fund Guaranteed |
| RE | | Reinsured |
| Rev. | | Revenue |
| SCSDE | | South Carolina School District Enhancement |
| USD | | United States Dollar |
| VRDO | | Variable Rate Demand Obligation. The interest rate shown is the rate in effect as of August 31, 2018. |
| | |
| |
| (a) | | The date shown represents the earliest of the prerefunded date, next put date or final maturity date. |
| (b) | | Security is prerefunded or escrowed to maturity. |
| (c) | | Amount rounds to less than 0.1% of net assets. |
| (d) | | Variable or floating rate security, the interest rate of which adjusts periodically based on changes in current interest rates and prepayments on the underlying pool of assets. The interest rate shown is the current rate as of August 31, 2018. |
| (e) | | Variable or floating rate security, linked to the referenced benchmark. The interest rate shown is the current rate as of August 31, 2018. |
| (f) | | Amount rounds to less than one thousand. |
| (g) | | Investment in affiliate. Fund is registered under the Investment Company Act of 1940, as amended, and advised by J.P. Morgan Investment Management Inc. |
| (h) | | The rate shown is the current yield as of August 31, 2018. |
| * | | Non-income producing security. |
| ‡ | | Value determined using significant unobservable inputs. |
SEE NOTES TO FINANCIAL STATEMENTS.
| | | | | | | | |
| | | |
| AUGUST 31, 2018 | | J.P. MORGAN MUNICIPAL BOND FUNDS | | | | | 49 | |
JPMorgan Ultra-Short Municipal Fund
SCHEDULE OF PORTFOLIO INVESTMENTS
AS OF AUGUST 31, 2018 (Unaudited)
| | | | | | | | |
| INVESTMENTS | | PRINCIPAL
AMOUNT
($000) | | | VALUE
($000) | |
Municipal Bonds — 96.5% (a) | | | | | | | | |
Alabama — 2.0% | | | | | | | | |
Education — 0.0% (b) | | | | | | | | |
Alabama Public School and College Authority Series C, Rev., 5.00%, 9/1/2018 | | | 25 | | | | 25 | |
Madison County Board of Education, Tax Anticipation Warrants Rev., 5.00%, 9/1/2018 | | | 45 | | | | 45 | |
| | | | | | | | |
| | | | | | | 70 | |
| | | | | | | | |
General Obligation — 0.0% (b) | | | | | | | | |
City of Orange Beach GO, AGC, 5.00%, 10/1/2018 | | | 25 | | | | 25 | |
| | | | | | | | |
Housing — 0.1% | | | | | | | | |
Alabama Housing Finance Authority Multi-Family Housing, Summit Ridge Apartments Project Series D, Rev., FHA, 1.35%, 7/1/2019 (c) | | | 2,890 | | | | 2,876 | |
| | | | | | | | |
Prerefunded — 0.0% (b) | | | | | | | | |
Madison County Board of Education, Tax Anticipation Warrants | | | | | | | | |
Rev., AGC, 4.80%, 9/1/2018 (d) | | | 25 | | | | 25 | |
Rev., AGC, 5.13%, 9/1/2018 (d) | | | 45 | | | | 45 | |
| | | | | | | | |
| | | | | | | 70 | |
| | | | | | | | |
Utility — 1.9% | | | | | | | | |
Black Belt Energy Gas District, Gas Prepay Series B-2, Rev., (SIFMA Municipal Swap Index Yield + 0.62%), 2.11%, 9/13/2018 (e) | | | 30,000 | | | | 29,856 | |
Black Belt Energy Gas District, Gas Supply Series A, Rev., LIQ: Royal Bank of Canada, 4.00%, 6/1/2021 (c) | | | 11,450 | | | | 11,951 | |
Southeast Alabama Gas District, Project No. 1 Series A, Rev., 5.00%, 4/1/2020 | | | 1,000 | | | | 1,046 | |
Southeast Alabama Gas Supply District (The), Project No. 2 | | | | | | | | |
Series A, Rev., 4.00%, 6/1/2019 | | | 830 | | | | 843 | |
Series A, Rev., 4.00%, 6/1/2020 | | | 1,000 | | | | 1,034 | |
| | | | | | | | |
| | | | | | | 44,730 | |
| | | | | | | | |
Total Alabama | | | | | | | 47,771 | |
| | | | | | | | |
Arizona — 0.9% | | | | | | | | |
Certificate of Participation/Lease — 0.1% | | | | | | | | |
Arizona State University | | | | | | | | |
Series 2018A, COP, 5.00%, 6/1/2019 | | | 1,450 | | | | 1,485 | |
Series 2018A, COP, 5.00%, 6/1/2020 | | | 1,000 | | | | 1,055 | |
| | | | | | | | |
| | | | | | | 2,540 | |
| | | | | | | | |
Education — 0.0% (b) | | | | | | | | |
Industrial Development Authority of The City of Phoenix, Downtown Phoenix Student Housing LLC - Arizona State University Project | | | | | | | | |
Rev., 5.00%, 7/1/2023 | | | 140 | | | | 154 | |
| | | | | | | | |
| INVESTMENTS | | PRINCIPAL
AMOUNT
($000) | | | VALUE
($000) | |
| | | | | | | | |
Education — continued | | | | | | | | |
Rev., 5.00%, 7/1/2024 | | | 200 | | | | 223 | |
| | | | | | | | |
| | | | | | | 377 | |
| | | | | | | | |
General Obligation — 0.2% | | | | | | | | |
Maricopa County School District No. 66, Roosevelt Elementary | | | | | | | | |
GO, 5.00%, 7/1/2020 | | | 1,450 | | | | 1,529 | |
GO, 5.00%, 7/1/2021 | | | 1,520 | | | | 1,639 | |
Maricopa County School District No. 66, Roosevelt Elementary, Arizona School Improvement Bonds | | | | | | | | |
Series 2017-A, GO, 5.00%, 7/1/2020 | | | 1,025 | | | | 1,081 | |
Series 2017-A, GO, 5.00%, 7/1/2021 | | | 1,150 | | | | 1,240 | |
Maricopa County Union High School District No. 201, School Improvement GO, 3.00%, 7/1/2019 | | | 275 | | | | 278 | |
| | | | | | | | |
| | | | | | | 5,767 | |
| | | | | | | | |
Industrial Development Revenue/Pollution Control Revenue — 0.1% | | | | | |
Coconino County Pollution Control Corp., Nevada Power Company Projects Series B, Rev., 1.60%, 5/21/2020 (c) | | | 1,100 | | | | 1,089 | |
| | | | | | | | |
Other Revenue — 0.1% | | | | | | | | |
City of Phoenix Civic Improvement Corp. Series A, Rev., 5.00%, 7/1/2019 | | | 1,000 | | | | 1,027 | |
Gilbert Public Facilities Municipal Property Corp., Revenue Refunding Bonds Rev., 4.00%, 7/1/2019 | | | 20 | | | | 20 | |
| | | | | | | | |
| | | | | | | 1,047 | |
| | | | | | | | |
Transportation — 0.4% | | | | | | | | |
Arizona Department of Transportation State Highway Fund Series A, Rev., 5.00%, 7/1/2020 | | | 400 | | | | 423 | |
Arizona Transportation Board, Maricopa County Regional Area Road Fund Rev., 5.00%, 7/1/2020 | | | 8,565 | | | | 9,061 | |
| | | | | | | | |
| | | | | | | 9,484 | |
| | | | | | | | |
Utility — 0.0% (b) | | | | | | | | |
Salt River Project Agricultural Improvement and Power District, Electric System | | | | | | | | |
Series B, Rev., 4.00%, 12/1/2018 | | | 25 | | | | 25 | |
Series A, Rev., 5.00%, 12/1/2018 | | | 20 | | | | 20 | |
| | | | | | | | |
| | | | | | | 45 | |
| | | | | | | | |
Water & Sewer — 0.0% (b) | | | | | | | | |
Arizona Water Infrastructure Finance Authority, Water Quality | | | | | | | | |
Series A, Rev., 5.00%, 10/1/2018 | | | 10 | | | | 10 | |
SEE NOTES TO FINANCIAL STATEMENTS.
| | | | | | |
| | | |
| 50 | | | | J.P. MORGAN MUNICIPAL BOND FUNDS | | AUGUST 31, 2018 |
| | | | | | | | |
| INVESTMENTS | | PRINCIPAL
AMOUNT
($000) | | | VALUE
($000) | |
Municipal Bonds — continued | |
Water & Sewer — continued | | | | | | | | |
Rev., 4.00%, 10/1/2020 (d) | | | 540 | | | | 564 | |
| | | | | | | | |
| | | | | | | 574 | |
| | | | | | | | |
Total Arizona | | | | | | | 20,923 | |
| | | | | | | | |
Arkansas — 0.2% | | | | | | | | |
Education — 0.1% | | | | | | | | |
Arkansas Technical University, Athletic Enterprises Series A, Rev., 3.00%, 6/1/2019 | | | 120 | | | | 121 | |
Arkansas Technical University, Student Fee Series A, Rev., 3.00%, 6/1/2019 | | | 200 | | | | 202 | |
Board of Trustees of the University of Arkansas, Various Facility, Fayetteville Campus Rev., 5.00%, 11/1/2021 | | | 330 | | | | 360 | |
| | | | | | | | |
| | | | | | | 683 | |
| | | | | | | | |
General Obligation — 0.0% (b) | | | | | | | | |
City of Fayetteville, Library Improvement GO, 3.00%, 1/1/2020 | | | 200 | | | | 203 | |
City of Little Rock GO, 4.00%, 3/1/2019 | | | 20 | | | | 20 | |
| | | | | | | | |
| | | | | | | 223 | |
| | | | | | | | |
Housing — 0.0% (b) | | | | | | | | |
Arkansas Technical University, Housing System Series A, Rev., 3.00%, 6/1/2019 | | | 225 | | | | 227 | |
| | | | | | | | |
Other Revenue — 0.1% | | | | | | | | |
Arkansas Development Finance Authority, 900 West Capitol Building Project Rev., 3.00%, 4/1/2021 | | | 500 | | | | 512 | |
Arkansas Development Finance Authority, Department of Community Correction Project | | | | | | | | |
Rev., 3.00%, 11/1/2019 | | | 510 | | | | 517 | |
Rev., 5.00%, 11/1/2021 | | | 310 | | | | 339 | |
Rev., 5.00%, 11/1/2022 | | | 410 | | | | 457 | |
City of Little Rock | | | | | | | | |
Rev., 2.00%, 10/1/2018 | | | 300 | | | | 300 | |
Rev., 3.00%, 10/1/2019 | | | 500 | | | | 506 | |
| | | | | | | | |
| | | | | | | 2,631 | |
| | | | | | | | |
Water & Sewer — 0.0% (b) | | | | | | | | |
City of Little Rock, Water Reclamation System Rev., 1.15%, 10/1/2018 | | | 100 | | | | 100 | |
Northwest Arkansas Conservation Authority, Wastewater | | | | | | | | |
Rev., 3.00%, 3/1/2019 | | | 220 | | | | 223 | |
Rev., 3.00%, 3/1/2020 | | | 280 | | | | 287 | |
| | | | | | | | |
| | | | | | | 610 | |
| | | | | | | | |
Total Arkansas | | | | | | | 4,374 | |
| | | | | | | | |
| | | | | | | | |
| INVESTMENTS | | PRINCIPAL
AMOUNT
($000) | | | VALUE
($000) | |
| | | | | | | | |
California — 3.5% | | | | | | | | |
Education — 1.3% | | | | | | | | |
California Educational Facilities Authority, Art Center College of Design | | | | | | | | |
Series A, Rev., 5.00%, 12/1/2018 | | | 100 | | | | 101 | |
Series A, Rev., 5.00%, 12/1/2019 | | | 125 | | | | 130 | |
Series A, Rev., 5.00%, 12/1/2020 | | | 180 | | | | 192 | |
California Municipal Finance Authority, California Lutheran University | | | | | | | | |
Rev., 5.00%, 10/1/2018 | | | 600 | | | | 601 | |
Rev., 5.00%, 10/1/2019 | | | 550 | | | | 569 | |
Rev., 5.00%, 10/1/2020 | | | 325 | | | | 345 | |
Rev., 5.00%, 10/1/2021 | | | 250 | | | | 272 | |
San Diego Unified School District Series A, Rev., TRAN, 4.00%, 6/28/2019 | | | 27,000 | | | | 27,534 | |
University of California Series AL-1, Rev., VRDO, 1.18%, 9/4/2018 (c) | | | 550 | | | | 550 | |
| | | | | | | | |
| | | | | | | 30,294 | |
| | | | | | | | |
General Obligation — 0.1% | | | | | | | | |
Mount San Antonio Community College District GO, BAN, Zero Coupon, 4/1/2022 | | | 250 | | | | 234 | |
San Mateo County Community College District Series A, GO, 5.00%, 9/1/2018 | | | 1,250 | | | | 1,250 | |
| | | | | | | | |
| | | | | | | 1,484 | |
| | | | | | | | |
Hospital — 0.0% (b) | | | | | | | | |
California Public Finance Authority, Henry Mayo Newhall Hospital Rev., 5.00%, 10/15/2020 | | | 100 | | | | 105 | |
Pioneers Memorial Healthcare District | | | | | | | | |
Rev., 3.00%, 10/1/2019 | | | 255 | | | | 256 | |
Rev., 3.00%, 10/1/2020 | | | 265 | | | | 266 | |
| | | | | | | | |
| | | | | | | 627 | |
| | | | | | | | |
Other Revenue — 1.2% | | | | | | | | |
California Infrastructure and Economic Development Bank, California Academy of Sciences Rev., (ICE LIBOR USD 1 Month + 0.38%), 1.86%, 9/13/2018 (e) | | | 17,010 | | | | 16,928 | |
California Infrastructure and Economic Development Bank, The J. Paul Getty Trust | | | | | | | | |
Rev., (ICE LIBOR USD 1 Month + 0.20%), 1.68%, 10/1/2018 (e) | | | 10,970 | | | | 11,010 | |
Series A-4, Rev., (ICE LIBOR USD 3 Month + 0.37%), 2.00%, 10/1/2018 (e) | | | 1,000 | | | | 1,013 | |
California Statewide Communities Development Authority, Front Porch Communities and Services Rev., 5.00%, 4/1/2020 | | | 75 | | | | 79 | |
SEE NOTES TO FINANCIAL STATEMENTS.
| | | | | | | | |
| | | |
| AUGUST 31, 2018 | | J.P. MORGAN MUNICIPAL BOND FUNDS | | | | | 51 | |
JPMorgan Ultra-Short Municipal Fund
SCHEDULE OF PORTFOLIO INVESTMENTS
AS OF AUGUST 31, 2018 (Unaudited) (continued)
| | | | | | | | |
| INVESTMENTS | | PRINCIPAL
AMOUNT
($000) | | | VALUE
($000) | |
Municipal Bonds — continued | |
Other Revenue — continued | | | | | | | | |
Los Angeles County Public Works Financing Authority, Los Angeles County Regional Park and Open Space Rev., AGM, 5.25%, 10/1/2018 | | | 35 | | | | 35 | |
Riverside County Redevelopment Successor Agency, Jurupa Valley Redevelopment Project Series B, Rev., AGM, 4.00%, 10/1/2018 | | | 25 | | | | 25 | |
| | | | | | | | |
| | | | | | | 29,090 | |
| | | | | | | | |
Prerefunded — 0.1% | | | | | | | | |
Imperial Irrigation District Electric System Series A, Rev., 5.25%, 11/1/2018 (d) | | | 80 | | | | 81 | |
Pittsburg Unified School District Financing Authority Rev., AGM, 5.50%, 9/1/2021 (d) | | | 3,000 | | | | 3,337 | |
| | | | | | | | |
| | | | | | | 3,418 | |
| | | | | | | | |
Transportation — 0.0% (b) | | | | | | | | |
Bay Area Toll Authority, Toll Bridge, San Francisco Bay Area Series C, Rev., 1.88%, 4/1/2019 (c) | | | 650 | | | | 650 | |
| | | | | | | | |
Utility — 0.3% | | | | | | | | |
California Infrastructure and Economic Development Bank, Pacific Gas and Electric Co. Series G, Rev., 1.05%, 12/1/2018 | | | 6,900 | | | | 6,866 | |
| | | | | | | | |
Water & Sewer — 0.5% | | | | | | | | |
California State Department of Water Resources, Central Valley Project Water System Series AU, Rev., (SIFMA Municipal Swap Index Yield + 0.22%), 1.71%, 9/13/2018 (e) | | | 12,000 | | | | 12,094 | |
| | | | | | | | |
Total California | | | | | | | 84,523 | |
| | | | | | | | |
Colorado — 0.5% | | | | | | | | |
Certificate of Participation/Lease — 0.0% (b) | |
Denver Health and Hospital Authority, 550 Acoma, Inc. | | | | | | | | |
COP, 5.00%, 12/1/2020 (f) | | | 110 | | | | 117 | |
COP, 5.00%, 12/1/2021 (f) | | | 220 | | | | 238 | |
COP, 5.00%, 12/1/2022 (f) | | | 295 | | | | 323 | |
| | | | | | | | |
| | | | | | | 678 | |
| | | | | | | | |
General Obligation — 0.1% | | | | | | | | |
Adams 12 Five Star Schools GO, 5.00%, 12/15/2018 | | | 120 | | | | 121 | |
City of Aurora, Sterling Hills West Metropolitan District | | | | | | | | |
GO, 5.00%, 12/1/2018 | | | 100 | | | | 101 | |
GO, 5.00%, 12/1/2019 | | | 110 | | | | 113 | |
GO, 5.00%, 12/1/2020 | | | 100 | | | | 105 | |
| | | | | | | | |
| INVESTMENTS | | PRINCIPAL
AMOUNT
($000) | | | VALUE
($000) | |
| |
General Obligation — continued | | | | | | | | |
Denver City and County School District No. 1 Series B, GO, 4.00%, 12/1/2019 (d) | | | 255 | | | | 262 | |
Douglas County School District No. Re-1, Douglas and Elbert Counties Series B, GO, 5.00%, 12/15/2018 | | | 20 | | | | 20 | |
Mesa County Valley, School District No. 51, Grand Junction GO, 4.00%, 12/1/2018 | | | 20 | | | | 20 | |
Pueblo County School District No. 70 GO, NATL-RE, 5.00%, 12/1/2018 | | | 25 | | | | 25 | |
| | | | | | | | |
| | | | | | | 767 | |
| | | | | | | | |
Hospital — 0.2% | | | | | | | | |
Colorado Health Facilities Authority, Frasier Meadows Retirement Community Project Series 2017B, Rev., 5.00%, 5/15/2021 | | | 395 | | | | 422 | |
Colorado Health Facilities Authority, Parkview Medical Center, Inc. Project | | | | | | | | |
Rev., 3.00%, 9/1/2018 | | | 100 | | | | 100 | |
Rev., 3.00%, 9/1/2019 | | | 310 | | | | 314 | |
Colorado Health Facilities Authority, Sisters of Charity of Leavenworth Health System, Inc. Series A, Rev., 3.88%, 1/1/2019 | | | 50 | | | | 50 | |
Colorado Health Facilities Authority, The Evangelical Lutheran Good Samaritan Society Project | | | | | | | | |
Rev., 5.00%, 6/1/2019 | | | 200 | | | | 204 | |
Rev., 5.00%, 6/1/2020 | | | 400 | | | | 417 | |
Colorado Health Facilities Authority, Valley View Hospital Association Project Rev., 2.80%, 5/15/2023 (c) | | | 1,600 | | | | 1,612 | |
University of Colorado Hospital Authority Series C-1, Rev., 4.00%, 3/1/2020 (c) | | | 380 | | | | 388 | |
| | | | | | | | |
| | | | | | | 3,507 | |
| | | | | | | | |
Housing — 0.2% | | | | | | | | |
Adams County Colorado Housing Authority Multifamily Housing, Baker School Apartment Project Rev., 1.50%, 11/1/2019 (c) | | | 5,000 | | | | 4,975 | |
| | | | | | | | |
Prerefunded — 0.0% (b) | | | | | | | | |
Rio Blanco County School District No. Re-1 GO, 5.00%, 12/1/2018 (d) | | | 20 | | | | 20 | |
| | | | | | | | |
Transportation — 0.0% (b) | | | | | | | | |
Denver City and County, Department of Aviation Airport System Series A, Rev., 5.00%, 11/15/2018 | | | 35 | | | | 36 | |
E-470 Public Highway Authority, Senior LIBOR Index Series A, Rev., (ICE LIBOR USD 1 Month + 0.90%), 2.29%, 9/13/2018 (e) | | | 500 | | | | 501 | |
SEE NOTES TO FINANCIAL STATEMENTS.
| | | | | | |
| | | |
| 52 | | | | J.P. MORGAN MUNICIPAL BOND FUNDS | | AUGUST 31, 2018 |
| | | | | | | | |
| INVESTMENTS | | PRINCIPAL
AMOUNT
($000) | | | VALUE
($000) | |
Municipal Bonds — continued | |
Transportation — continued | | | | | | | | |
Regional Transportation District, Sales Tax Series A, Rev., 5.25%, 11/1/2018 | | | 25 | | | | 25 | |
| | | | | | | | |
| | | | | | | 562 | |
| | | | | | | | |
Utility — 0.0% (b) | | | | | | | | |
Colorado Water Resources and Power Development Authority, Clean Water Series A, Rev., 5.00%, 3/1/2020 | | | 200 | | | | 210 | |
| | | | | | | | |
Water & Sewer — 0.0% (b) | | | | | | | | |
City of Boulder, Water and Sewer Revenue Series 2012, Rev., 5.00%, 12/1/2018 | | | 100 | | | | 101 | |
Town of Milliken, Water Revenue | | | | | | | | |
Rev., 3.00%, 12/1/2018 | | | 100 | | | | 100 | |
Rev., 3.00%, 12/1/2020 | | | 195 | | | | 199 | |
| | | | | | | | |
| | | | | | | 400 | |
| | | | | | | | |
Total Colorado | | | | | | | 11,119 | |
| | | | | | | | |
Connecticut — 2.8% | | | | | | | | |
Education — 0.2% | | | | | | | | |
State of Connecticut Health And Educational Facilities Authority Revenue Bonds, Yale University Issue Series B-1, Rev., 5.00%, 7/1/2020 (c) | | | 4,000 | | | | 4,230 | |
State of Connecticut, Health and Educational Facility Authority | | | | | | | | |
Rev., 5.00%, 7/1/2021 | | | 665 | | | | 714 | |
Rev., 5.00%, 7/1/2022 | | | 675 | | | | 737 | |
State of Connecticut, Health and Educational Facility Authority, Ascension Health Credit Group Series B, Rev., 1.65%, 3/1/2019 (c) | | | 470 | | | | 469 | |
| | | | | | | | |
| | | | | | | 6,150 | |
| | | | | | | | |
General Obligation — 2.4% | | | | | | | | |
City of Hartford Series B, GO, 4.00%, 4/1/2020 (d) | | | 115 | | | | 119 | |
City of New Haven Series A, GO, 5.25%, 8/1/2019 | | | 750 | | | | 768 | |
City of Waterbury | | | | | | | | |
Series B, GO, 3.00%, 9/1/2018 | | | 265 | | | | 265 | |
Series A, GO, 3.00%, 11/15/2018 | | | 430 | | | | 431 | |
Series B, GO, 3.00%, 9/1/2019 | | | 325 | | | | 329 | |
Series A, GO, 3.00%, 11/15/2019 | | | 485 | | | | 491 | |
City of West Haven Series A, GO, 3.00%, 11/1/2018 | | | 215 | | | | 215 | |
State of Connecticut | | | | | | | | |
Series C, GO, VRDO, 1.61%, 9/13/2018 (c) | | | 5,235 | | | | 5,235 | |
Series E, GO, 5.00%, 9/1/2019 | | | 150 | | | | 154 | |
Series F, GO, 5.00%, 11/15/2019 | | | 11,575 | | | | 11,965 | |
| | | | | | | | |
| INVESTMENTS | | PRINCIPAL
AMOUNT
($000) | | | VALUE
($000) | |
| |
General Obligation — continued | | | | | | | | |
Series C, GO, 5.00%, 12/1/2020 | | | 475 | | | | 491 | |
Series G, GO, 5.00%, 11/1/2021 | | | 200 | | | | 216 | |
Tender Option Bond Trust Receipts/Certificates Series 2017-YX1047, GO, VRDO, LIQ: Barclays Bank plc, 1.62%, 9/13/2018 (c) (g) | | | 6,975 | | | | 6,975 | |
Town of Greenwich GO, BAN, 2.00%, 1/18/2019 | | | 29,390 | | | | 29,428 | |
Town of Groton Court, Lot A GO, 4.00%, 10/1/2018 | | | 20 | | | | 20 | |
| | | | | | | | |
| | | | | | | 57,102 | |
| | | | | | | | |
Other Revenue — 0.2% | | | | | | | | |
Tender Option Bond Trust Receipts/Certificates | | | | | | | | |
Series 2017-YX1077, Rev., VRDO, LIQ: Barclays Bank plc, 1.62%, 9/13/2018 (c) (g) | | | 4,550 | | | | 4,550 | |
| | | | | | | | |
Prerefunded — 0.0% (b) | | | | | | | | |
Town of Old Saybrook GO, 3.00%, 11/1/2018 (d) | | | 30 | | | | 30 | |
| | | | | | | | |
Total Connecticut | | | | | | | 67,832 | |
| | | | | | | | |
Delaware — 0.0% (b) | | | | | | | | |
Utility — 0.0% (b) | | | | | | | | |
Sustainable Energy Utility, Inc., Energy Efficiency Rev., 4.00%, 9/15/2018 | | | 25 | | | | 25 | |
| | | | | | | | |
District of Columbia — 0.2% | | | | | | | | |
Other Revenue — 0.2% | | | | | | | | |
District of Columbia, Income Tax Revenue | | | | | | | | |
Series C, Rev., 5.00%, 12/1/2018 | | | 20 | | | | 20 | |
Series C, Rev., 4.13%, 12/1/2024 | | | 3,710 | | | | 3,819 | |
District of Columbia, Income Tax Secured Series A, Rev., 5.00%, 12/1/2018 | | | 20 | | | | 20 | |
| | | | | | | | |
| | | | | | | 3,859 | |
| | | | | | | | |
Transportation — 0.0% (b) | | | | | | | | |
Metropolitan Washington Airports Authority Series B, Rev., 4.00%, 10/1/2018 | | | 20 | | | | 20 | |
| | | | | | | | |
Total District of Columbia | | | | | | | 3,879 | |
| | | | | | | | |
Florida — 1.5% | | | | | | | | |
Education — 0.0% (b) | | | | | | | | |
Volusia County School Board, Sales Tax Rev., 5.00%, 10/1/2018 | | | 50 | | | | 50 | |
| | | | | | | | |
General Obligation — 0.1% | | | | | | | | |
City of Lauderhill | | | | | | | | |
GO, 3.00%, 1/1/2019 | | | 175 | | | | 176 | |
GO, 3.00%, 1/1/2020 | | | 460 | | | | 467 | |
GO, 3.00%, 1/1/2021 | | | 425 | | | | 435 | |
SEE NOTES TO FINANCIAL STATEMENTS.
| | | | | | | | |
| | | |
| AUGUST 31, 2018 | | J.P. MORGAN MUNICIPAL BOND FUNDS | | | | | 53 | |
JPMorgan Ultra-Short Municipal Fund
SCHEDULE OF PORTFOLIO INVESTMENTS
AS OF AUGUST 31, 2018 (Unaudited) (continued)
| | | | | | | | |
| INVESTMENTS | | PRINCIPAL
AMOUNT
($000) | | | VALUE
($000) | |
Municipal Bonds — continued | |
General Obligation — continued | | | | | | | | |
County of Sarasota, Environmentally Sensitive GO, 4.00%, 10/1/2018 (d) | | | 25 | | | | 25 | |
| | | | | | | | |
| | | | | | | 1,103 | |
| | | | | | | | |
Hospital — 0.7% | | | | | | | | |
Highlands County Health Facilities Authority, Adventist Health System Series A, Rev., VRDO, 1.48%, 9/13/2018 (c) | | | 15,000 | | | | 15,000 | |
Orange County Health Facilities Authority, The Nemours Foundation Project Series B, Rev., VRDO, LOC: Northern Trust Co., 1.43%, 9/13/2018 (c) | | | 1,000 | | | | 1,000 | |
| | | | | | | | |
| | | | | | | 16,000 | |
| | | | | | | | |
Housing — 0.1% | | | | | | | | |
Pinellas County Housing Finance Authority, Multi-Family Housing, Boca Ciega Townhomes Rev., 0.95%, 9/1/2018 | | | 2,000 | | | | 2,000 | |
| | | | | | | | |
Industrial Development Revenue/Pollution Control Revenue — 0.5% | | | | | | | | |
Florida Department of Environmental Protection, Everglades Restoration Series B, Rev., VRDO, AGC, 1.50%, 9/13/2018 (c) | | | 12,870 | | | | 12,870 | |
| | | | | | | | |
Other Revenue — 0.0% (b) | | | | | | | | |
City of Cape Coral, Water and Sewer Rev., AGM, 1.40%, 9/1/2018 | | | 745 | | | | 745 | |
City of Orlando Series B, Rev., 5.00%, 10/1/2018 | | | 50 | | | | 50 | |
County of Pasco Series A, Rev., 5.00%, 12/1/2018 | | | 40 | | | | 41 | |
Osceola County, Sales Tax Rev., AGC, 4.00%, 10/1/2018 (d) | | | 25 | | | | 25 | |
| | | | | | | | |
| | | | | | | 861 | |
| | | | | | | | |
Prerefunded — 0.0% (b) | | | | | | | | |
County of Miami-Dade, Miami International Airport | | | | | | | | |
Series B, Rev., AGC, 5.00%, 10/1/2018 (d) | | | 25 | | | | 25 | |
Series B, Rev., AGM, 5.00%, 10/1/2018 (d) | | | 20 | | | | 20 | |
County of Sarasota, Infrastructure Sales Surtax Series A, Rev., 4.13%, 10/1/2018 (d) | | | 20 | | | | 20 | |
Florida State Municipal Power Agency | | | | | | | | |
Rev., AGM-CR, 5.00%, 10/1/2018 (d) | | | 20 | | | | 20 | |
Series A, Rev., 5.00%, 10/1/2018 (d) | | | 200 | | | | 200 | |
Rev., 5.25%, 10/1/2018 (d) | | | 85 | | | | 85 | |
JEA Electric System Series 3-A, Rev., 2.50%, 10/1/2018 (d) | | | 105 | | | | 105 | |
| | | | | | | | |
| | | | | | | 475 | |
| | | | | | | | |
| | | | | | | | |
| INVESTMENTS | | PRINCIPAL
AMOUNT
($000) | | | VALUE
($000) | |
| |
Transportation — 0.0% (b) | | | | | | | | |
County of Miami-Dade, Aviation Series B, Rev., 5.00%, 10/1/2018 | | | 100 | | | | 100 | |
| | | | | | | | |
Utility — 0.1% | | | | | | | | |
County of Charlotte, Utility System Rev., AGM, 5.00%, 10/1/2018 | | | 35 | | | | 35 | |
JEA Electric System Series 3-A, Rev., 4.00%, 10/1/2018 | | | 110 | | | | 110 | |
Orlando Utilities Commission Series B, Rev., VRDO, 1.48%, 9/13/2018 (c) | | | 2,475 | | | | 2,475 | |
Reedy Creek Improvement District Utility Revenue Series 2, Rev., 5.00%, 10/1/2019 | | | 120 | | | | 124 | |
| | | | | | | | |
| | | | | | | 2,744 | |
| | | | | | | | |
Total Florida | | | | | | | 36,203 | |
| | | | | | | | |
Georgia — 1.7% | | | | | | | | |
General Obligation — 0.3% | | | | | | | | |
Dougherty County School District, Sales Tax | | | | | | | | |
Series 2018, GO, 4.00%, 12/1/2019 | | | 1,775 | | | | 1,825 | |
Series 2018, GO, 4.00%, 12/1/2020 | | | 1,250 | | | | 1,311 | |
Hall County School District | | | | | | | | |
Series 2018, GO, 5.00%, 11/1/2019 | | | 1,500 | | | | 1,556 | |
Series 2018, GO, 5.00%, 11/1/2020 | | | 1,250 | | | | 1,335 | |
Jackson County School District GO, 5.00%, 3/1/2019 | | | 250 | | | | 254 | |
Pike County School District GO, 4.00%, 10/1/2020 | | | 400 | | | | 416 | |
| | | | | | | | |
| | | | | | | 6,697 | |
| | | | | | | | |
Hospital — 0.0% (b) | | | | | | | | |
Fulton County Development Authority, Catholic Health East Issue Rev., 3.75%, 11/15/2018 (d) | | | 25 | | | | 25 | |
Richmond County Hospital Authority, University Health Services, Inc. Project Rev., 5.00%, 1/1/2022 | | | 100 | | | | 109 | |
| | | | | | | | |
| | | | | | | 134 | |
| | | | | | | | |
Other Revenue — 0.0% (b) | | | | | | | | |
Dahlonega Downtown Development Authority, North Georgia MAC, LLC Project | | | | | | | | |
Series 2017, Rev., 5.00%, 7/1/2019 | | | 200 | | | | 205 | |
Series 2017, Rev., 5.00%, 7/1/2020 | | | 275 | | | | 291 | |
Series 2017, Rev., 5.00%, 7/1/2021 | | | 370 | | | | 401 | |
Series 2017, Rev., 5.00%, 7/1/2022 | | | 300 | | | | 332 | |
| | | | | | | | |
| | | | | | | 1,229 | |
| | | | | | | | |
Transportation — 1.0% | | | | | | | | |
Georgia State Road and Tollway Authority, Federal Highway Series B, Rev., 5.00%, 6/1/2020 | | | 15,445 | | | | 16,298 | |
SEE NOTES TO FINANCIAL STATEMENTS.
| | | | | | |
| | | |
| 54 | | | | J.P. MORGAN MUNICIPAL BOND FUNDS | | AUGUST 31, 2018 |
| | | | | | | | |
| INVESTMENTS | | PRINCIPAL
AMOUNT
($000) | | | VALUE
($000) | |
Municipal Bonds — continued | |
Transportation — continued | | | | | | | | |
Metropolitan Atlanta Rapid Transit Authority | | | | | | | | |
Series A, Rev., 3.00%, 7/1/2020 | | | 2,900 | | | | 2,967 | |
Series A, Rev., 3.75%, 7/1/2021 | | | 5,585 | | | | 5,878 | |
| | | | | | | | |
| | | | | | | 25,143 | |
| | | | | | | | |
Utility — 0.3% | | | | | | | | |
Municipal Electric Authority of Georgia Series B, Rev., VRDO, LOC: Barclays Bank plc, 1.50%, 9/13/2018 (c) | | | 7,130 | | | | 7,130 | |
| | | | | | | | |
Water & Sewer — 0.1% | | | | | | | | |
East Point Building Authority, Water and Sewer Project | | | | | | | | |
Rev., AGM, 4.00%, 2/1/2019 | | | 1,000 | | | | 1,010 | |
Rev., AGM, 5.00%, 2/1/2020 | | | 550 | | | | 574 | |
| | | | | | | | |
| | | | | | | 1,584 | |
| | | | | | | | |
Total Georgia | | | | | | | 41,917 | |
| | | | | | | | |
Hawaii — 0.2% | | | | | | | | |
General Obligation — 0.2% | | | | | | | | |
City and County of Honolulu, Rail Transit Project GO, (SIFMA Municipal Swap Index Yield + 0.30%), 1.79%, 9/13/2018 (e) | | | 5,000 | | | | 5,032 | |
County of Maui Series 2012, GO, 5.00%, 6/1/2019 | | | 235 | | | | 241 | |
State of Hawaii Series DT, GO, 4.00%, 11/1/2018 | | | 15 | | | | 15 | |
| | | | | | | | |
| | | | | | | 5,288 | |
| | | | | | | | |
Total Hawaii | | | | | | | 5,288 | |
| | | | | | | | |
Idaho — 0.0% (b) | | | | | | | | |
Prerefunded — 0.0% (b) | | | | | | | | |
Idaho Bond Bank Authority Series C, Rev., 5.63%, 9/15/2018 (d) | | | 30 | | | | 30 | |
| | | | | | | | |
Transportation — 0.0% (b) | | | | | | | | |
Idaho Housing and Finance Association, Federal Highway Trust Rev., GRAN, 5.00%, 7/15/2020 | | | 425 | | | | 449 | |
| | | | | | | | |
Total Idaho | | | | | | | 479 | |
| | | | | | | | |
Illinois — 7.0% | | | | | | | | |
Certificate of Participation/Lease — 0.0% (b) | |
University of Illinois Series A, COP, 5.00%, 10/1/2019 | | | 1,000 | | | | 1,029 | |
| | | | | | | | |
Education — 2.4% | | | | | | | | |
Illinois Educational Facilities Authority, University of Chicago Series B-1, Rev., 1.80%, 2/13/2020 (c) | | | 5,500 | | | | 5,500 | |
| | | | | | | | |
| INVESTMENTS | | PRINCIPAL
AMOUNT
($000) | | | VALUE
($000) | |
| |
Education — continued | | | | | | | | |
Illinois Finance Authority, Chicago International Charter School Project, Refunding and Improvement | | | | | | | | |
Rev., 3.00%, 12/1/2018 | | | 125 | | | | 125 | |
Rev., 3.00%, 12/1/2019 | | | 185 | | | | 186 | |
Illinois Finance Authority, Local Government Program, East Prairie School District Number 73 Project | | | | | | | | |
Rev., 4.00%, 12/1/2019 | | | 200 | | | | 205 | |
Rev., 4.00%, 12/1/2020 | | | 230 | | | | 240 | |
Rev., 5.00%, 12/1/2021 | | | 250 | | | | 271 | |
Illinois Finance Authority, North Park University Project Rev., VRDO, LOC: U.S. Bank NA, 1.48%, 9/13/2018 (c) | | | 9,130 | | | | 9,130 | |
Illinois Finance Authority, Northwestern University Rev., VRDO, 1.46%, 9/13/2018 (c) | | | 3,425 | | | | 3,425 | |
Illinois Finance Authority, The University of Chicago Rev., VRDO, 1.48%, 9/13/2018 (c) | | | 35,773 | | | | 35,773 | |
Peoria Public Building Commission, School District No. 150 Project Rev., 5.00%, 12/1/2019 | | | 300 | | | | 310 | |
University of Illinois, Auxiliary Facilities System Series A, Rev., 5.00%, 4/1/2019 | | | 315 | | | | 320 | |
Will County, Community Consolidated School District No. 70-C Laraway, Lease Certificates | | | | | | | | |
Series A, Rev., AGM, 4.00%, 12/1/2018 | | | 355 | | | | 357 | |
Series A, Rev., AGM, 4.00%, 12/1/2019 | | | 370 | | | | 380 | |
Series A, Rev., AGM, 4.00%, 12/1/2020 | | | 385 | | | | 403 | |
Series A, Rev., AGM, 4.00%, 12/1/2021 | | | 400 | | | | 424 | |
| | | | | | | | |
| | | | | | | 57,049 | |
| | | | | | | | |
General Obligation — 2.4% | | | | | | | | |
Adams County School District No. 172 | | | | | | | | |
GO, AGM, 4.00%, 2/1/2019 | | | 270 | | | | 272 | |
GO, AGM, 4.00%, 2/1/2020 | | | 300 | | | | 308 | |
GO, AGM, 4.00%, 2/1/2021 | | | 300 | | | | 312 | |
Buffalo Grove Park District, Lake and Cook Counties GO, 2.00%, 12/30/2020 | | | 330 | | | | 330 | |
Champaign Coles Et Al Counties Community College District No. 505 | | | | | | | | |
Series B, GO, 4.00%, 12/1/2019 (f) | | | 2,490 | | | | 2,555 | |
Series C, GO, 4.00%, 12/1/2019 (f) | | | 430 | | | | 441 | |
Series B, GO, 4.00%, 12/1/2020 (f) | | | 1,250 | | | | 1,305 | |
Series B, GO, 4.00%, 12/1/2021 (f) | | | 2,500 | | | | 2,645 | |
Series C, GO, 4.00%, 12/1/2021 (f) | | | 465 | | | | 492 | |
Chicago Park District Series C, GO, 5.00%, 1/1/2022 | | | 175 | | | | 189 | |
SEE NOTES TO FINANCIAL STATEMENTS.
| | | | | | | | |
| | | |
| AUGUST 31, 2018 | | J.P. MORGAN MUNICIPAL BOND FUNDS | | | | | 55 | |
JPMorgan Ultra-Short Municipal Fund
SCHEDULE OF PORTFOLIO INVESTMENTS
AS OF AUGUST 31, 2018 (Unaudited) (continued)
| | | | | | | | |
| INVESTMENTS | | PRINCIPAL
AMOUNT
($000) | | | VALUE
($000) | |
Municipal Bonds — continued | |
General Obligation — continued | | | | | | | | |
Chicago Park District, Limited Tax | | | | | | | | |
Series B, GO, 4.00%, 1/1/2020 | | | 50 | | | | 51 | |
Series B, GO, 5.00%, 1/1/2020 | | | 225 | | | | 233 | |
Series B, GO, 4.00%, 1/1/2021 | | | 100 | | | | 103 | |
Series B, GO, 5.00%, 1/1/2021 | | | 100 | | | | 106 | |
Chicago Park District, Unlimited Tax Series C, GO, 3.00%, 1/1/2020 | | | 100 | | | | 101 | |
City of Calumet | | | | | | | | |
Series 2018, GO, 4.00%, 3/1/2019 | | | 150 | | | | 151 | |
Series 2018, GO, 4.00%, 3/1/2020 | | | 150 | | | | 154 | |
City of Rock Island | | | | | | | | |
Series A, GO, AGM, 2.00%, 12/1/2018 | | | 100 | | | | 100 | |
Series B, GO, AGM, 2.00%, 12/1/2018 | | | 120 | | | | 120 | |
Series A, GO, AGM, 2.00%, 12/1/2019 | | | 130 | | | | 129 | |
Series B, GO, AGM, 2.00%, 12/1/2019 | | | 150 | | | | 149 | |
Series B, GO, AGM, 3.00%, 12/1/2020 | | | 200 | | | | 203 | |
Series A, GO, AGM, 3.00%, 12/1/2021 | | | 130 | | | | 132 | |
Series B, GO, AGM, 3.00%, 12/1/2021 | | | 200 | | | | 203 | |
City of Waukegan | | | | | | | | |
Series A, GO, AGM, 3.00%, 12/30/2019 | | | 430 | | | | 436 | |
Series A, GO, AGM, 3.00%, 12/30/2020 | | | 590 | | | | 603 | |
Series A, GO, AGM, 4.00%, 12/30/2023 | | | 525 | | | | 566 | |
Clinton and St. Clair Counties Community Unit School District No. 3, School Building GO, 5.00%, 12/1/2019 | | | 380 | | | | 393 | |
Cook County High School District No. 204, Lyons Township GO, 4.00%, 12/15/2018 | | | 20 | | | | 20 | |
Cook County Township High School District No. 208 Riverside-Brookfield | | | | | | | | |
Series C, GO, 3.00%, 12/15/2018 | | | 920 | | | | 923 | |
Series C, GO, 3.00%, 12/15/2019 | | | 690 | | | | 700 | |
Cook County, Community Consolidated School District No. 146 Tinley Park | | | | | | | | |
GO, 2.00%, 12/1/2018 | | | 225 | | | | 225 | |
GO, 3.00%, 12/1/2019 | | | 250 | | | | 254 | |
GO, 4.00%, 12/1/2020 | | | 200 | | | | 209 | |
GO, 4.00%, 12/1/2021 | | | 200 | | | | 211 | |
Cook County, Proviso Township High School District No. 209 | | | | | | | | |
Series B, GO, AGM, 4.00%, 12/1/2018 | | | 150 | | | | 151 | |
GO, 5.00%, 12/1/2021 | | | 2,825 | | | | 3,059 | |
County of Cook | | | | | | | | |
Series 2018, GO, 3.00%, 11/15/2018 | | | 1,200 | | | | 1,203 | |
Series C, GO, 4.25%, 11/15/2018 | | | 100 | | | | 100 | |
Series A, GO, 5.00%, 11/15/2018 | | | 150 | | | | 151 | |
| | | | | | | | |
| INVESTMENTS | | PRINCIPAL
AMOUNT
($000) | | | VALUE
($000) | |
| |
General Obligation — continued | | | | | | | | |
Series 2018, GO, 5.00%, 11/15/2019 | | | 800 | | | | 827 | |
Series 2018, GO, 5.00%, 11/15/2020 | | | 900 | | | | 952 | |
Series 2018, GO, 5.00%, 11/15/2021 | | | 700 | | | | 754 | |
Series A, GO, 5.00%, 11/15/2021 | | | 355 | | | | 382 | |
Series C, GO, 5.00%, 11/15/2022 | | | 180 | | | | 196 | |
County of Winnebago Series C, GO, 2.00%, 12/30/2018 | | | 185 | | | | 185 | |
County of Winnebago, General Funds Alternate Revenue Source Series A, GO, AGC, 4.00%, 12/30/2018 | | | 50 | | | | 50 | |
County of Winnebago, Illinois Tax Alternate Revenue Source Series D, GO, 2.50%, 12/30/2018 | | | 200 | | | | 201 | |
DuPage County Community High School District No. 94 | | | | | | | | |
GO, 2.00%, 9/1/2018 | | | 300 | | | | 300 | |
GO, 4.00%, 1/1/2019 | | | 830 | | | | 836 | |
GO, 4.00%, 1/1/2020 | | | 300 | | | | 308 | |
GO, 4.00%, 1/1/2021 | | | 200 | | | | 209 | |
Ford etc. Counties Community Unit School District No. 10 Paxton-Buckley-Loda, School Building Series A, GO, AGM, 4.00%, 12/1/2018 | | | 60 | | | | 60 | |
Fox Valley Park District Series B, GO, 4.00%, 12/15/2018 | | | 60 | | | | 60 | |
Grundy and Will Counties Community Unit School District No. 1 Coal City GO, 4.00%, 2/1/2020 | | | 1,595 | | | | 1,638 | |
Grundy Kendall and Will Counties Community High School District No. 111 | | | | | | | | |
GO, 4.00%, 1/1/2019 | | | 270 | | | | 272 | |
GO, 4.00%, 1/1/2020 | | | 855 | | | | 876 | |
Jackson County Community Unit School District No. 186 | | | | | | | | |
GO, AGM, 4.00%, 12/1/2019 | | | 200 | | | | 204 | |
GO, AGM, 4.00%, 12/1/2020 | | | 265 | | | | 275 | |
Kendall Kane and Will Counties Community Unit School District No. 308 | | | | | | | | |
Series B, GO, 3.00%, 10/1/2018 | | | 360 | | | | 360 | |
Series B, GO, 4.00%, 10/1/2019 | | | 120 | | | | 123 | |
Series B, GO, 4.00%, 10/1/2020 | | | 225 | | | | 233 | |
Series B, GO, 4.00%, 10/1/2021 | | | 255 | | | | 268 | |
Series B, GO, 5.00%, 10/1/2022 | | | 1,375 | | | | 1,511 | |
Lake County Forest Preserve District Series B, GO, 5.00%, 12/15/2018 | | | 35 | | | | 35 | |
Lincoln Land Community College District No. 526 GO, 5.00%, 12/15/2021 | | | 125 | | | | 135 | |
Madison County Community Unit School District No. 7 GO, 4.00%, 12/1/2018 | | | 1,240 | | | | 1,246 | |
SEE NOTES TO FINANCIAL STATEMENTS.
| | | | | | |
| | | |
| 56 | | | | J.P. MORGAN MUNICIPAL BOND FUNDS | | AUGUST 31, 2018 |
| | | | | | | | |
| INVESTMENTS | | PRINCIPAL
AMOUNT
($000) | | | VALUE
($000) | |
Municipal Bonds — continued | |
General Obligation — continued | | | | | | | | |
Sangamon County Community Unit School District No. 5 Series B, GO, 5.00%, 1/1/2022 | | | 1,650 | | | | 1,789 | |
Schaumburg Park District Series B, GO, 5.00%, 12/1/2018 | | | 1,600 | | | | 1,613 | |
State of Illinois | | | | | | | | |
GO, 5.00%, 11/1/2018 | | | 355 | | | | 356 | |
Series D, GO, 5.00%, 11/1/2020 | | | 5,000 | | | | 5,216 | |
GO, 5.00%, 2/1/2024 | | | 3,370 | | | | 3,579 | |
Tazewell and Woodford Counties, Community Unit School District No. 701 | | | | | | | | |
Series A, GO, 4.00%, 12/1/2018 | | | 100 | | | | 100 | |
Series A, GO, 4.00%, 12/1/2019 | | | 260 | | | | 266 | |
Town of Cicero GO, 5.00%, 12/1/2019 | | | 550 | | | | 569 | |
Township of Campton GO, 5.00%, 12/15/2018 | | | 25 | | | | 25 | |
Village of Antioch | | | | | | | | |
GO, 2.00%, 12/1/2018 | | | 220 | | | | 220 | |
GO, 2.00%, 12/1/2019 | | | 285 | | | | 284 | |
GO, 3.00%, 12/1/2020 | | | 290 | | | | 295 | |
Village of Bolingbrook | | | | | | | | |
Series A, GO, 4.00%, 1/1/2019 | | | 270 | | | | 272 | |
Series A, GO, AGM, 4.00%, 1/1/2020 | | | 100 | | | | 102 | |
Series A, GO, AGM, 4.00%, 1/1/2021 | | | 185 | | | | 192 | |
Village of Flossmoor | | | | | | | | |
GO, 3.00%, 12/1/2018 | | | 545 | | | | 546 | |
GO, 3.00%, 12/1/2019 | | | 425 | | | | 430 | |
GO, 3.00%, 12/1/2020 | | | 585 | | | | 597 | |
GO, 3.00%, 12/1/2021 | | | 605 | | | | 620 | |
Village of Franklin Park | | | | | | | | |
GO, 4.00%, 1/1/2019 | | | 350 | | | | 352 | |
GO, 4.00%, 1/1/2021 | | | 500 | | | | 519 | |
Village of Hoffman Estates | | | | | | | | |
Series A, GO, 2.00%, 12/1/2019 | | | 110 | | | | 110 | |
GO, 5.00%, 12/1/2019 | | | 380 | | | | 395 | |
Series A, GO, 3.00%, 12/1/2020 | | | 110 | | | | 112 | |
GO, 5.00%, 12/1/2020 | | | 270 | | | | 288 | |
GO, 5.00%, 12/1/2021 | | | 210 | | | | 229 | |
Village of Northbrook Series B, GO, 3.00%, 12/1/2018 | | | 20 | | | | 20 | |
Village of Oswego | | | | | | | | |
GO, 2.00%, 12/15/2018 | | | 100 | | | | 100 | |
GO, 2.00%, 12/15/2019 | | | 100 | | | | 100 | |
Village of Palatine | | | | | | | | |
Series A, GO, 4.00%, 12/1/2018 | | | 1,135 | | | | 1,141 | |
Series A, GO, 4.00%, 12/1/2019 | | | 1,250 | | | | 1,282 | |
Village of Plainfield, Will and Kendall Counties GO, 4.00%, 12/15/2018 | | | 60 | | | | 60 | |
| | | | | | | | |
| INVESTMENTS | | PRINCIPAL
AMOUNT
($000) | | | VALUE
($000) | |
| |
General Obligation — continued | | | | | | | | |
Village of Sugar Grove, Kane County, Waterworks and Sewerage | | | | | | | | |
GO, 2.00%, 5/1/2019 | | | 130 | | | | 130 | |
GO, 3.00%, 5/1/2020 | | | 390 | | | | 396 | |
Village of Villa Park, Illinois Alternate Revenue Source | | | | | | | | |
GO, 3.00%, 12/15/2019 (f) | | | 325 | | | | 329 | |
GO, 3.00%, 12/15/2020 (f) | | | 415 | | | | 423 | |
GO, 4.00%, 12/15/2021 (f) | | | 505 | | | | 533 | |
Village of Villa Park, Illinois Sales Tax Alternate Revenue Source Series B, GO, 2.00%, 12/15/2018 | | | 100 | | | | 100 | |
Village of Woodridge | | | | | | | | |
Series 2017, GO, 2.00%, 2/1/2019 | | | 175 | | | | 175 | |
Series 2017, GO, 3.00%, 2/1/2020 | | | 270 | | | | 274 | |
Series 2017, GO, 3.00%, 2/1/2021 | | | 250 | | | | 255 | |
Whiteside and Lee Counties, Sterling Community Unit School District No. 5 GO, AGM, 4.00%, 12/1/2020 | | | 320 | | | | 333 | |
Whiteside County Community Unit School District No. 6 Morrison | | | | | | | | |
Series A, GO, AGM, 4.00%, 12/1/2020 | | | 205 | | | | 211 | |
Series A, GO, AGM, 4.00%, 12/1/2021 | | | 745 | | | | 775 | |
Will County, Alternate Revenue Source GO, 4.00%, 11/15/2018 | | | 20 | | | | 20 | |
Winnebago and Stephenson Counties School District No. 323, School Building | | | | | | | | |
GO, 5.00%, 11/1/2019 | | | 100 | | | | 103 | |
GO, 5.00%, 11/1/2020 | | | 100 | | | | 106 | |
| | | | | | | | |
| | | | | | | 58,426 | |
| | | | | | | | |
Hospital — 0.9% | | | | | | | | |
Illinois Finance Authority, Ascension Health Alliance Senior Credit Group Series E-2, Rev., 1.75%, 4/1/2021 (c) | | | 250 | | | | 248 | |
Illinois Finance Authority, OSF Healthcare System Series C, Rev., VRDO, LOC: Wells Fargo Bank NA, 1.50%, 9/13/2018 (c) | | | 1,200 | | | | 1,200 | |
University of Illinois, Health Services System Series 2008, Rev., VRDO, LOC: Wells Fargo Bank NA, 1.48%, 9/13/2018 (c) | | | 20,015 | | | | 20,015 | |
| | | | | | | | |
| | | | | | | 21,463 | |
| | | | | | | | |
Other Revenue — 0.8% | | | | | | | | |
City of Rochelle | | | | | | | | |
Series A, Rev., AGM, 3.00%, 6/30/2019 | | | 100 | | | | 101 | |
Series A, Rev., AGM, 3.00%, 6/30/2020 | | | 275 | | | | 278 | |
SEE NOTES TO FINANCIAL STATEMENTS.
| | | | | | | | |
| | | |
| AUGUST 31, 2018 | | J.P. MORGAN MUNICIPAL BOND FUNDS | | | | | 57 | |
JPMorgan Ultra-Short Municipal Fund
SCHEDULE OF PORTFOLIO INVESTMENTS
AS OF AUGUST 31, 2018 (Unaudited) (continued)
| | | | | | | | |
| INVESTMENTS | | PRINCIPAL
AMOUNT
($000) | | | VALUE
($000) | |
Municipal Bonds — continued | |
Other Revenue — continued | | | | | | | | |
Illinois Finance Authority, Carle Foundation Series B, Rev., VRDO, LOC: Northern Trust Co., 1.48%, 9/13/2018 (c) | | | 7,500 | | | | 7,500 | |
Metropolitan Pier and Exposition Authority, Illinois Dedicated State Tax Rev., NATL-RE, Zero Coupon, 6/15/2019 | | | 85 | | | | 83 | |
Metropolitan Pier and Exposition Authority, Illinois Dedicated State Tax, Capital Appreciation | | | | | | | | |
Rev., NATL-RE, Zero Coupon, 6/15/2019 | | | 25 | | | | 25 | |
Class A, Rev., NATL-RE, Zero Coupon, 6/15/2020 | | | 130 | | | | 123 | |
Metropolitan Pier and Exposition Authority, McCormick Place Expansion Project Series B, Rev., 3.00%, 12/15/2018 | | | 250 | | | | 250 | |
State of Illinois Rev., 4.50%, 6/15/2019 | | | 3,880 | | | | 3,949 | |
Tender Option Bond Trust Receipts/Certificates Series 2016-YX1035, Rev., VRDO, LIQ: Barclays Bank plc, 1.71%, 9/13/2018 (c) (g) | | | 7,575 | | | | 7,575 | |
| | | | | | | | |
| | | | | | | 19,884 | |
| | | | | | | | |
Prerefunded — 0.2% | | | | | | | | |
City of Chicago Rev., AGM, 5.25%, 11/1/2018 (d) | | | 2,750 | | | | 2,766 | |
Illinois Finance Authority | | | | | | | | |
Series B, Rev., NATL-RE, 5.25%, 11/1/2018 (d) | | | 30 | | | | 30 | |
Rev., 6.13%, 5/15/2019 (d) | | | 195 | | | | 201 | |
Illinois Finance Authority, Resurrection Health Rev., 6.13%, 5/15/2019 (d) | | | 340 | | | | 350 | |
Williamson County Community Unit School District No. 5 Carterville, Capital Appreciation Series B, GO, AGC, Zero Coupon, 1/1/2019 (d) | | | 810 | | | | 482 | |
| | | | | | | | |
| | | | | | | 3,829 | |
| | | | | | | | |
Special Tax — 0.0% (b) | | | | | | | | |
Village of Hampshire, Special Service Area No. 14, Lakewood Crossing | | | | | | | | |
Rev., 1.70%, 3/1/2019 | | | 180 | | | | 180 | |
Rev., 1.90%, 3/1/2020 | | | 200 | | | | 199 | |
| | | | | | | | |
| | | | | | | 379 | |
| | | | | | | | |
Transportation — 0.2% | | | | | | | | |
Chicago O’Hare International Airport Series A, Rev., AMT, 5.00%, 1/1/2019 | | | 600 | | | | 606 | |
Chicago O’Hare International Airport, General Airport, Senior Lien Series G, Rev., AMT, 5.00%, 1/1/2021 | | | 200 | | | | 213 | |
| | | | | | | | |
| INVESTMENTS | | PRINCIPAL
AMOUNT
($000) | | | VALUE
($000) | |
| |
Transportation — continued | | | | | | | | |
Chicago Transit Authority, Federal Transit Administration Section 5307 Urbanized Area Formula Funds Rev., 5.00%, 6/1/2021 | | | 270 | | | | 288 | |
Chicago Transit Authority, Federal Transit Administration Section 5337 State of Good Repair Formula Funds Rev., 4.00%, 6/1/2019 | | | 2,270 | | | | 2,303 | |
City of Chicago, Chicago Midway Airport Second Lien Revenue Refunding Series A, Rev., AMT, 5.00%, 1/1/2021 | | | 1,000 | | | | 1,060 | |
| | | | | | | | |
| | | | | | | 4,470 | |
| | | | | | | | |
Water & Sewer — 0.1% | | | | | | | | |
City of Chicago, Second Lien Wastewater Transmission Series B, Rev., 5.00%, 1/1/2019 | | | 1,000 | | | | 1,009 | |
City of Chicago, Second Lien Water, Project | | | | | | | | |
Rev., AGM, 4.25%, 11/1/2018 | | | 50 | | | | 50 | |
Rev., 5.00%, 11/1/2018 | | | 1,160 | | | | 1,166 | |
| | | | | | | | |
| | | | | | | 2,225 | |
| | | | | | | | |
Total Illinois | | | | | | | 168,754 | |
| | | | | | | | |
Indiana — 2.4% | | | | | | | | |
Education — 0.6% | | | | | | | | |
Hamilton Southeastern Consolidated School Building Corp. Rev., BAN, 3.00%, 12/15/2018 | | | 2,550 | | | | 2,561 | |
Indiana Finance Authority, Educational Facilities, Valparaiso University | | | | | | | | |
Rev., 4.00%, 10/1/2018 | | | 200 | | | | 200 | |
Rev., 4.00%, 10/1/2019 | | | 255 | | | | 261 | |
Mount Vernon of Hancock County Multi-School Building Corp. | | | | | | | | |
Rev., 4.00%, 1/15/2019 | | | 510 | | | | 514 | |
Rev., 4.00%, 7/15/2019 | | | 210 | | | | 214 | |
Purdue University, Student Facilities System Series C, Rev., VRDO, 1.43%, 9/13/2018 (c) | | | 6,575 | | | | 6,575 | |
Southmont School Building Corp., Ad Valorem Property Tax | | | | | | | | |
Rev., 4.00%, 1/15/2019 | | | 125 | | | | 126 | |
Rev., 4.00%, 7/15/2019 | | | 300 | | | | 305 | |
Rev., 4.00%, 1/15/2020 | | | 550 | | | | 564 | |
Rev., 4.00%, 7/15/2020 | | | 190 | | | | 197 | |
Wawasee High School Building Corp., Ad Valorem Property Tax First Mortgage Bonds Rev., 4.00%, 7/15/2019 | | | 50 | | | | 51 | |
Westfield High School Building Corp., Property Tax, First Mortgage | | | | | | | | |
Rev., 4.00%, 1/15/2019 | | | 1,030 | | | | 1,038 | |
Rev., 4.00%, 7/15/2019 | | | 1,240 | | | | 1,261 | |
| | | | | | | | |
| | | | | | | 13,867 | |
| | | | | | | | |
SEE NOTES TO FINANCIAL STATEMENTS.
| | | | | | |
| | | |
| 58 | | | | J.P. MORGAN MUNICIPAL BOND FUNDS | | AUGUST 31, 2018 |
| | | | | | | | |
| INVESTMENTS | | PRINCIPAL
AMOUNT
($000) | | | VALUE
($000) | |
Municipal Bonds — continued | |
Hospital — 0.4% | | | | | | | | |
Indiana Finance Authority, Health System, Sisters of St. Francis Health Services Rev., 5.38%, 11/1/2032 | | | 4,000 | | | | 4,024 | |
Indiana Health Facility Financing Authority, Ascension Health Subordinate Credit Group Rev., 1.38%, 5/1/2020 (c) | | | 4,510 | | | | 4,463 | |
Indiana State Finance Authority Hospital, University Health Obligated Group Series E, Rev., VRDO, LOC: Bank of America NA, 1.48%, 9/13/2018 (c) | | | 1,445 | | | | 1,445 | |
| | | | | | | | |
| | | | | | | 9,932 | |
| | | | | | | | |
Other Revenue — 0.3% | | | | | | | | |
Hammond Redevelopment District Rev., 4.00%, 7/15/2019 | | | 615 | | | | 626 | |
Indiana State Finance Authority, Lease Appropriation, Stadium Project Series A, Rev., VRDO, 1.48%, 9/13/2018 (c) | | | 7,135 | | | | 7,135 | |
Miami County Holding Corp., Option Income Tax Lease Rental Rev., 3.00%, 1/15/2019 | | | 100 | | | | 101 | |
| | | | | | | | |
| | | | | | | 7,862 | |
| | | | | | | | |
Prerefunded — 0.0% (b) | | | | | | | | |
Indiana Health Facility Financing Authority, Ascension Health Subordinate Credit Group Rev., 1.38%, 5/1/2020 (c) (d) | | | 95 | | | | 94 | |
| | | | | | | | |
Utility — 1.1% | | | | | | | | |
City of Rockport, Indiana Michigan Power Company Project Series B, Rev., 3.05%, 6/1/2025 | | | 6,500 | | | | 6,521 | |
Indiana Finance Authority, Duke Energy Indiana, Inc. Project Series A-3, Rev., VRDO, LOC: Mizuho Bank Ltd., 1.53%, 9/13/2018 (c) | | | 20,000 | | | | 20,000 | |
| | | | | | | | |
| | | | | | | 26,521 | |
| | | | | | | | |
Water & Sewer — 0.0% (b) | | | | | | | | |
City of Martinsville, Waterworks | | | | | | | | |
Rev., AGM, 2.00%, 1/1/2020 | | | 305 | | | | 305 | |
Rev., AGM, 2.00%, 7/1/2020 | | | 310 | | | | 310 | |
| | | | | | | | |
| | | | | | | 615 | |
| | | | | | | | |
Total Indiana | | | | | | | 58,891 | |
| | | | | | | | |
Iowa — 1.0% | | | | | | | | |
Certificate of Participation/Lease — 0.0% (b) | |
Kirkwood Community College Series A, COP, 3.00%, 6/1/2019 | | | 175 | | | | 176 | |
| | | | | | | | |
| | | | | | | | |
| INVESTMENTS | | PRINCIPAL
AMOUNT
($000) | | | VALUE
($000) | |
| |
Education — 0.1% | | | | | | | | |
Iowa Higher Education Loan Authority, Dubuque University, Private Education Working Capital Loan Program Series A, Rev., RAN, 3.50%, 5/9/2019 | | | 2,000 | | | | 2,024 | |
| | | | | | | | |
General Obligation — 0.0% (b) | | | | | | | | |
City of Sac City | | | | | | | | |
GO, 5.00%, 6/1/2020 | | | 150 | | | | 158 | |
GO, 5.00%, 6/1/2021 | | | 160 | | | | 172 | |
| | | | | | | | |
| | | | | | | 330 | |
| | | | | | | | |
Hospital — 0.9% | | | | | | | | |
Iowa Finance Authority, Health Systems Rev., (SIFMA Municipal Swap Index Yield + 0.58%), 2.07%, 9/13/2018 (e) (g) | | | 21,000 | | | | 21,043 | |
| | | | | | | | |
Other Revenue — 0.0% (b) | | | | | | | | |
City of Coralville, Annual Appropriation | | | | | | | | |
Series D, Rev., 3.00%, 5/1/2019 | | | 500 | | | | 502 | |
Series D, Rev., 3.00%, 5/1/2020 | | | 300 | | | | 303 | |
State of Iowa, Ijobs Program Series A, Rev., 5.00%, 6/1/2021 | | | 400 | | | | 434 | |
| | | | | | | | |
| | | | | | | 1,239 | |
| | | | | | | | |
Water & Sewer — 0.0% (b) | | | | | | | | |
Muscatine Power and Water Rev., 2.00%, 12/1/2018 | | | 110 | | | | 110 | |
| | | | | | | | |
Total Iowa | | | | | | | 24,922 | |
| | | | | | | | |
Kansas — 0.1% | | | | | | | | |
General Obligation — 0.0% (b) | | | | | | | | |
City of Olathe Series 218, GO, 5.00%, 10/1/2018 | | | 25 | | | | 25 | |
County of Neosho, Sales Tax GO, 3.00%, 10/1/2018 | | | 65 | | | | 65 | |
Douglas County Unified School District No. 497 | | | | | | | | |
Series A, GO, 2.00%, 9/1/2018 | | | 20 | | | | 20 | |
Series A, GO, 5.00%, 9/1/2018 | | | 20 | | | | 20 | |
Ford County Unified School District No. 443 Series B, GO, 5.00%, 9/1/2018 | | | 100 | | | | 100 | |
Johnson County Unified School District No. 233 Series B, GO, 4.00%, 9/1/2018 | | | 25 | | | | 25 | |
| | | | | | | | |
| | | | | | | 255 | |
| | | | | | | | |
Hospital — 0.1% | | | | | | | | |
City of Lenexa, Kansas Health Care Facility, Lakeview Village, Inc. | | | | | | | | |
Series A, Rev., 5.00%, 5/15/2019 | | | 410 | | | | 417 | |
Series A, Rev., 5.00%, 5/15/2020 | | | 440 | | | | 458 | |
| | | | | | | | |
| | | | | | | 875 | |
| | | | | | | | |
SEE NOTES TO FINANCIAL STATEMENTS.
| | | | | | | | |
| | | |
| AUGUST 31, 2018 | | J.P. MORGAN MUNICIPAL BOND FUNDS | | | | | 59 | |
JPMorgan Ultra-Short Municipal Fund
SCHEDULE OF PORTFOLIO INVESTMENTS
AS OF AUGUST 31, 2018 (Unaudited) (continued)
| | | | | | | | |
| INVESTMENTS | | PRINCIPAL
AMOUNT
($000) | | | VALUE
($000) | |
Municipal Bonds — continued | |
Other Revenue — 0.0% (b) | | | | | | | | |
County of Shawnee, Public Building Commission, Expocentre Project Rev., 4.00%, 9/1/2019 | | | 575 | | | | 588 | |
| | | | | | | | |
Prerefunded — 0.0% (b) | | | | | | | | |
City of Manhattan Series A, GO, 4.10%, 11/1/2018 (d) | | | 25 | | | | 25 | |
Kansas Unified School District No. 265 Sedgwick County GO, AGC, 4.50%, 10/1/2018 (d) | | | 20 | | | | 20 | |
Kansas Unified School District No. 266 Sedgwick County GO, AGM, 5.25%, 9/1/2018 (d) | | | 60 | | | | 60 | |
| | | | | | | | |
| | | | | | | 105 | |
| | | | | | | | |
Total Kansas | | | | | | | 1,823 | |
| | | | | | | | |
Kentucky — 1.3% | | | | | | | | |
Education — 0.0% (b) | | | | | | | | |
City of Berea Education Facilities, Berea College Project Series A, Rev., VRDO, 1.48%, 9/4/2018 (c) | | | 1,150 | | | | 1,150 | |
Eastern Kentucky University Series A, Rev., 2.50%, 10/1/2018 | | | 50 | | | | 50 | |
| | | | | | | | |
| | | | | | | 1,200 | |
| | | | | | | | |
Hospital — 0.0% (b) | | | | | | | | |
Kentucky Economic Development Finance Authority, Owensboro Health, Inc. Series A, Rev., 5.00%, 6/1/2019 | | | 375 | | | | 381 | |
| | | | | | | | |
Housing — 0.3% | | | | | | | | |
Kentucky Housing Corp., Henry Greene Apartments Project Rev., 2.00%, 9/1/2020 (c) | | | 7,200 | | | | 7,191 | |
| | | | | | | | |
Industrial Development Revenue/Pollution Control Revenue — 0.2% | | | | | |
Louisville/Jefferson County Metro Government, Pollution Control, Louisville Gas and Electric Company Project | | | | | | | | |
Series A, Rev., 1.50%, 4/1/2019 (c) | | | 300 | | | | 299 | |
Rev., 1.25%, 6/3/2019 (c) | | | 4,200 | | | | 4,177 | |
| | | | | | | | |
| | | | | | | 4,476 | |
| | | | | | | | |
Other Revenue — 0.2% | | | | | | | | |
Kentucky Rural Water Finance Corp., Construction Series E-1, Rev., 2.25%, 3/1/2020 (f) | | | 5,000 | | | | 5,012 | |
Kentucky State Property and Buildings Commission, Project No. 82 Rev., AGM, 5.25%, 10/1/2018 | | | 75 | | | | 75 | |
Kentucky State Property and Buildings Commission, Project No. 90 Rev., 5.00%, 11/1/2018 | | | 200 | | | | 201 | |
| | | | | | | | |
| | | | | | | 5,288 | |
| | | | | | | | |
| | | | | | | | |
| INVESTMENTS | | PRINCIPAL
AMOUNT
($000) | | | VALUE
($000) | |
| |
Prerefunded — 0.2% | | | | | | | | |
Kentucky State Property and Buildings Commission, Project No. 90 Rev., 5.00%, 11/1/2018 (d) | | | 4,500 | | | | 4,524 | |
University of Louisville, General Receipts Series A, Rev., 4.50%, 9/1/2018 (d) | | | 25 | | | | 25 | |
| | | | | | | | |
| | | | | | | 4,549 | |
| | | | | | | | |
Utility — 0.3% | | | | | | | | |
Kentucky Public Energy Authority, Gas Supply | | | | | | | | |
Series A, Rev., 4.00%, 4/1/2019 | | | 665 | | | | 673 | |
Series A, Rev., 4.00%, 4/1/2020 | | | 780 | | | | 804 | |
Series A, Rev., 4.00%, 4/1/2021 | | | 775 | | | | 810 | |
Series A, Rev., 4.00%, 4/1/2022 | | | 1,210 | | | | 1,274 | |
Louisville/Jefferson County Metropolitan Government, Kentucky Pollution Control, Louisville Gas and Electric Company Project Rev., AMT, 2.55%, 5/3/2021 (c) | | | 2,750 | | | | 2,754 | |
| | | | | | | | |
| | | | | | | 6,315 | |
| | | | | | | | |
Water & Sewer — 0.1% | | | | | | | | |
Louisville/Jefferson County Metro Government, Water System Rev., 5.00%, 11/15/2019 | | | 2,440 | | | | 2,534 | |
| | | | | | | | |
Total Kentucky | | | | | | | 31,934 | |
| | | | | | | | |
Louisiana — 2.2% | | | | | | | | |
Education — 0.0% (b) | | | | | | | | |
Louisiana Public Facilities Authority, Capital Appreciation, Loyola University Project Rev., Zero Coupon, 10/1/2018 | | | 175 | | | | 175 | |
| | | | | | | | |
General Obligation — 0.1% | | | | | | | | |
Calcasieu Parish School District No. 34 GO, 3.00%, 1/15/2022 | | | 520 | | | | 535 | |
Iberia Parishwide School District GO, 2.00%, 3/1/2021 | | | 150 | | | | 150 | |
Natchitoches Parish Consolidated School District No. 7 GO, 2.00%, 3/1/2019 | | | 100 | | | | 100 | |
St. Martin Parish School Board GO, 3.00%, 3/1/2021 | | | 335 | | | | 343 | |
State of Louisiana, St. Tammany Parishwide School District No. 12 | | | | | | | | |
GO, 2.00%, 3/1/2019 | | | 100 | | | | 100 | |
GO, 2.00%, 3/1/2020 | | | 200 | | | | 201 | |
| | | | | | | | |
| | | | | | | 1,429 | |
| | | | | | | | |
Hospital — 1.7% | | | | | | | | |
Louisiana Public Facilities Authority, Louisiana Children’S Medical Center Project Rev., (SIFMA Municipal Swap Index Yield + 0.65%), 2.14%, 9/13/2018 (e) | | | 40,000 | | | | 40,316 | |
SEE NOTES TO FINANCIAL STATEMENTS.
| | | | | | |
| | | |
| 60 | | | | J.P. MORGAN MUNICIPAL BOND FUNDS | | AUGUST 31, 2018 |
| | | | | | | | |
| INVESTMENTS | | PRINCIPAL
AMOUNT
($000) | | | VALUE
($000) | |
Municipal Bonds — continued | |
Hospital — continued | | | | | | | | |
Louisiana Public Facilities Authority, Ochsner Clinic Foundation Project | | | | | | | | |
Rev., 4.00%, 5/15/2019 | | | 225 | | | | 228 | |
Rev., 4.00%, 5/15/2020 | | | 195 | | | | 202 | |
Rev., 5.00%, 5/15/2020 | | | 325 | | | | 342 | |
| | | | | | | | |
| | | | | | | 41,088 | |
| | | | | | | | |
Housing — 0.0% (b) | | | | | | | | |
Louisiana Public Facilities Authority, University Alexandria Student Housing Project Series A, Rev., 2.00%, 10/1/2018 | | | 160 | | | | 160 | |
| | | | | | | | |
Industrial Development Revenue/Pollution Control Revenue — 0.0% (b) | | | | | |
St. Charles Parish, Pollution Control, Shell Oil Co. Project Series B, Rev., VRDO, 1.34%, 9/4/2018 (c) | | | 150 | | | | 150 | |
| | | | | | | | |
Other Revenue — 0.4% | | | | | | | | |
Lafayette Consolidated Government, Public Improvement Sales Tax Series A, Rev., 3.00%, 3/1/2019 | | | 100 | | | | 101 | |
Louisiana Local Government Environmental Facilities and Community Development Authority, Delta Campus Facilities Project | | | | | | | | |
Rev., 5.00%, 10/1/2018 | | | 1,000 | | | | 1,002 | |
Rev., 5.00%, 10/1/2019 | | | 1,715 | | | | 1,771 | |
Louisiana Local Government Environmental Facilities and Community Development Authority, Lake Charles Public Improvement Projects Rev., 4.00%, 5/1/2020 | | | 200 | | | | 207 | |
Louisiana Local Government Environmental Facilities and Community Development Authority, LCTCS Act 391 Project Rev., 5.00%, 10/1/2021 | | | 1,500 | | | | 1,625 | |
Louisiana Office Facilities Corp., Lease Revenue, Capitol Complex Program Series A, Rev., 5.00%, 5/1/2020 | | | 4,290 | | | | 4,507 | |
| | | | | | | | |
| | | | | | | 9,213 | |
| | | | | | | | |
Special Tax — 0.0% (b) | | | | | | | | |
St. Charles Parish, Limited Tax Series A, Rev., AGM, 3.00%, 3/1/2019 | | | 250 | | | | 252 | |
| | | | | | | | |
Transportation — 0.0% (b) | | | | | | | | |
New Orleans Aviation Board, General Airport, North Terminal Project Series A, Rev., 5.00%, 1/1/2020 | | | 135 | | | | 140 | |
| | | | | | | | |
Water & Sewer — 0.0% (b) | | | | | | | | |
City of Shreveport, Water and Sewer Series A, Rev., AGM, 4.00%, 12/1/2018 | | | 200 | | | | 201 | |
| | | | | | | | |
| INVESTMENTS | | PRINCIPAL
AMOUNT
($000) | | | VALUE
($000) | |
| |
Water & Sewer — continued | | | | | | | | |
City of Shreveport, Water and Sewer, Junior Lien Series B, Rev., AGM, 4.00%, 12/1/2018 | | | 150 | | | | 151 | |
| | | | | | | | |
| | | | | | | 352 | |
| | | | | | | | |
Total Louisiana | | | | | | | 52,959 | |
| | | | | | | | |
Maine — 0.0% (b) | | | | | | | | |
Education — 0.0% (b) | | | | | | | | |
Maine Health and Higher Educational Facilities Authority, University of New England Rev., 4.00%, 7/1/2019 | | | 540 | | | | 550 | |
| | | | | | | | |
Other Revenue — 0.0% (b) | | | | | | | | |
Maine Municipal Bond Bank Series F, Rev., 5.00%, 11/1/2018 | | | 25 | | | | 25 | |
| | | | | | | | |
Total Maine | | | | | | | 575 | |
| | | | | | | | |
Maryland — 0.9% | | | | | | | | |
General Obligation — 0.7% | | | | | | | | |
County of Anne Arundel, Consolidated General Improvements GO, 5.00%, 4/1/2019 | | | 6,905 | | | | 7,040 | |
Washington Suburban Sanitary Commission Series A, GO, VRDO, BAN, 1.46%, 9/13/2018 (c) | | | 10,400 | | | | 10,400 | |
| | | | | | | | |
| | | | | | | 17,440 | |
| | | | | | | | |
Other Revenue — 0.2% | | | | | | | | |
City of Rockville, Ingleside at King Farm Project | | | | | | | | |
Series A-2, Rev., 4.00%, 11/1/2018 | | | 165 | | | | 165 | |
Rev., 5.00%, 11/1/2018 | | | 400 | | | | 402 | |
Series A-2, Rev., 4.00%, 11/1/2019 | | | 100 | | | | 102 | |
Rev., 5.00%, 11/1/2019 | | | 150 | | | | 155 | |
Maryland Stadium Authority, Construction and Revitalization Program | | | | | | | | |
Series 2018A, Rev., 5.00%, 5/1/2019 | | | 1,800 | | | | 1,839 | |
Series 2018A, Rev., 5.00%, 5/1/2020 | | | 800 | | | | 842 | |
Series 2018A, Rev., 5.00%, 5/1/2021 | | | 1,215 | | | | 1,312 | |
| | | | | | | | |
| | | | | | | 4,817 | |
| | | | | | | | |
Prerefunded — 0.0% (b) | | | | | | | | |
State of Maryland, Department of Transportation Rev., 4.00%, 9/1/2018 (d) | | | 20 | | | | 20 | |
| | | | | | | | |
Total Maryland | | | | | | | 22,277 | |
| | | | | | | | |
Massachusetts — 3.5% | | | | | | | | |
Education — 0.0% (b) | | | | | | | | |
Massachusetts Development Finance Agency, Western New England University | | | | | | | | |
Rev., 5.00%, 9/1/2020 | | | 300 | | | | 316 | |
Rev., 5.00%, 9/1/2021 | | | 265 | | | | 285 | |
SEE NOTES TO FINANCIAL STATEMENTS.
| | | | | | | | |
| | | |
| AUGUST 31, 2018 | | J.P. MORGAN MUNICIPAL BOND FUNDS | | | | | 61 | |
JPMorgan Ultra-Short Municipal Fund
SCHEDULE OF PORTFOLIO INVESTMENTS
AS OF AUGUST 31, 2018 (Unaudited) (continued)
| | | | | | | | |
| INVESTMENTS | | PRINCIPAL
AMOUNT
($000) | | | VALUE
($000) | |
Municipal Bonds — continued | |
Education — continued | | | | | | | | |
University of Massachusetts Building Authority Series 2, Rev., 4.00%, 11/1/2018 | | | 20 | | | | 20 | |
| | | | | | | | |
| | | | | | | 621 | |
| | | | | | | | |
General Obligation — 1.4% | | | | | | | | |
Commonwealth of Massachusetts | | | | | | | | |
Series D, GO, 5.50%, 10/1/2018 | | | 2,730 | | | | 2,738 | |
Series A, GO, (ICE LIBOR USD 3 Month + 0.55%), 2.12%, 11/1/2018 (e) | | | 30,000 | | | | 29,723 | |
Series D, GO, AMBAC, 5.50%, 10/1/2019 | | | 325 | | | | 338 | |
Town of Avon, Municipal Purpose Loan GO, 4.00%, 12/1/2018 | | | 55 | | | | 55 | |
| | | | | | | | |
| | | | | | | 32,854 | |
| | | | | | | | |
Hospital — 0.6% | | | | | | | | |
Massachusetts Development Finance Agency, Lawrence General Hospital Rev., 5.00%, 7/1/2019 | | | 335 | | | | 342 | |
Massachusetts Development Finance Agency, Partners Healthcare System Series M-1, Rev., VRDO, LOC: U.S. Bank NA, 1.45%, 9/4/2018 (c) | | | 4,195 | | | | 4,195 | |
Massachusetts Development Finance Agency, Partners Healthcare System Issue Series 2017S-5, Rev., (SIFMA Municipal Swap Index Yield + 0.42%), 1.91%, 9/13/2018 (e) | | | 10,000 | | | | 10,108 | |
| | | | | | | | |
| | | | | | | 14,645 | |
| | | | | | | | |
Housing — 0.2% | | | | | | | | |
Massachusetts Housing Finance Agency, Construction Loan Series A, Rev., 1.85%, 6/1/2020 | | | 5,700 | | | | 5,691 | |
| | | | | | | | |
Other Revenue — 0.0% (b) | | | | | | | | |
Massachusetts Development Finance Agency, Newbridge On the Charles, Inc. Series 20, Rev., 3.00%, 10/1/2019 (g) | | | 620 | | | | 625 | |
| | | | | | | | |
Prerefunded — 0.2% | | | | | | | | |
Massachusetts Clean Water Trust, State Revolving Fund Rev., 5.00%, 8/1/2020 (d) | | | 4,720 | | | | 5,007 | |
Massachusetts Development Finance Agency, Harvard Series A, Rev., 5.50%, 11/15/2018 (d) | | | 15 | | | | 15 | |
Massachusetts Development Finance Agency, Phillips Academy Rev., 5.00%, 9/1/2018 (d) | | | 20 | | | | 20 | |
Springfield Water and Sewer Commission Series A, Rev., AGC, 5.00%, 10/15/2018 (d) | | | 30 | | | | 30 | |
| | | | | | | | |
| | | | | | | 5,072 | |
| | | | | | | | |
| | | | | | | | |
| INVESTMENTS | | PRINCIPAL
AMOUNT
($000) | | | VALUE
($000) | |
| |
Transportation — 0.6% | | | | | | | | |
Massachusetts Bay Transportation Authority, General Transportation System Series A-2, Rev., VRDO, 1.56%, 9/13/2018 (c) | | | 14,245 | | | | 14,245 | |
| | | | | | | | |
Water & Sewer — 0.5% | | | | | | | | |
Massachusetts Clean Water Trust (The), Green Bonds Series 20, Rev., 3.00%, 2/1/2019 | | | 1,000 | | | | 1,006 | |
Massachusetts Clean Water Trust, State Revolving Fund Series 15A, Rev., 5.00%, 8/1/2020 | | | 200 | | | | 212 | |
Massachusetts Water Resources Authority Series A-3, Rev., VRDO, 1.51%, 9/13/2018 (c) | | | 9,735 | | | | 9,735 | |
| | | | | | | | |
| | | | | | | 10,953 | |
| | | | | | | | |
Total Massachusetts | | | | | | | 84,706 | |
| | | | | | | | |
Michigan — 1.3% | | | | | | | | |
General Obligation — 0.6% | | | | | | | | |
City of Garden, Capital Improvement | | | | | | | | |
GO, 4.00%, 10/1/2019 | | | 790 | | | | 807 | |
GO, 4.00%, 10/1/2020 | | | 795 | | | | 826 | |
City of Marquette, Capital Improvement | | | | | | | | |
GO, 4.00%, 5/1/2019 | | | 180 | | | | 183 | |
GO, 4.00%, 5/1/2020 | | | 75 | | | | 77 | |
GO, 4.00%, 5/1/2021 | | | 150 | | | | 157 | |
City of Marquette, Limited Tax | | | | | | | | |
GO, 3.00%, 5/1/2019 | | | 280 | | | | 282 | |
GO, 3.00%, 5/1/2020 | | | 85 | | | | 87 | |
GO, 3.00%, 5/1/2021 | | | 125 | | | | 128 | |
City of Romulus, Capital Improvement | | | | | | | | |
Series B, GO, 3.00%, 11/1/2018 | | | 165 | | | | 165 | |
Series B, GO, 3.00%, 11/1/2019 | | | 140 | | | | 142 | |
Kalamazoo Public Schools, School Building and Site | | | | | | | | |
GO, 4.00%, 5/1/2019 | | | 1,275 | | | | 1,295 | |
GO, 4.00%, 5/1/2020 | | | 1,820 | | | | 1,885 | |
GO, 4.00%, 5/1/2021 | | | 775 | | | | 816 | |
Spring Lake Public Schools, School Building and Site GO, Q-SBLF, 5.00%, 11/1/2018 | | | 2,425 | | | | 2,438 | |
Waterford School District GO, 3.00%, 9/25/2019 (f) | | | 5,000 | | | | 5,040 | |
| | | | | | | | |
| | | | | | | 14,328 | |
| | | | | | | | |
Hospital — 0.1% | | | | | | | | |
Michigan Finance Authority, Trinity Health Credit Group Series A, Rev., 5.00%, 12/1/2018 | | | 120 | | | | 121 | |
Michigan State Hospital Finance Authority, Ascension Health Senior Credit Group Rev., 5.00%, 11/15/2018 | | | 330 | | | | 332 | |
SEE NOTES TO FINANCIAL STATEMENTS.
| | | | | | |
| | | |
| 62 | | | | J.P. MORGAN MUNICIPAL BOND FUNDS | | AUGUST 31, 2018 |
| | | | | | | | |
| INVESTMENTS | | PRINCIPAL
AMOUNT
($000) | | | VALUE
($000) | |
Municipal Bonds — continued | |
Hospital — continued | | | | | | | | |
Michigan State Hospital Finance Authority, Ascension Health Subordinate Credit Group Subseries A-1, Rev., 1.38%, 5/1/2020 (c) | | | 2,710 | | | | 2,679 | |
| | | | | | | | |
| | | | | | | 3,132 | |
| | | | | | | | |
Housing — 0.5% | | | | | | | | |
Michigan State Housing Development Authority, Single-Family Mortgage Series D, Rev., VRDO, 1.51%, 9/13/2018 (c) | | | 12,700 | | | | 12,700 | |
| | | | | | | | |
Prerefunded — 0.0% (b) | | | | | | | | |
Ferris State University Rev., AGC, 4.75%, 10/1/2018 (d) | | | 20 | | | | 20 | |
State of Michigan, School Loan Series A, GO, 5.00%, 11/1/2018 (d) | | | 20 | | | | 20 | |
| | | | | | | | |
| | | | | | | 40 | |
| | | | | | | | |
Transportation — 0.1% | | | | | | | | |
Wayne County Airport Authority, Junior Lien | | | | | | | | |
Series B, Rev., AMT, 5.00%, 12/1/2018 | | | 400 | | | | 403 | |
Series B, Rev., AMT, 5.00%, 12/1/2019 | | | 550 | | | | 569 | |
Series B, Rev., AMT, 5.00%, 12/1/2020 | | | 550 | | | | 582 | |
| | | | | | | | |
| | | | | | | 1,554 | |
| | | | | | | | |
Water & Sewer — 0.0% (b) | | | | | | | | |
North Kent Sewer Authority Rev., 3.00%, 11/1/2018 | | | 25 | | | | 25 | |
| | | | | | | | |
Total Michigan | | | | | | | 31,779 | |
| | | | | | | | |
Minnesota — 1.0% | | | | | | | | |
Certificate of Participation/Lease — 0.0% (b) | |
St. Paul Independent School District No. 625 Series B, COP, 5.00%, 2/1/2021 | | | 930 | | | | 994 | |
| | | | | | | | |
Education — 0.2% | | | | | | | | |
City of Deephaven, Minnesota Charter School Lease, Eagle Ridge Academy Project Series A, Rev., 3.00%, 7/1/2019 | | | 50 | | | | 50 | |
Minnesota Higher Education Facilities Authority, Trustees of the Hamline University | | | | | | | | |
Rev., 4.00%, 10/1/2018 | | | 300 | | | | 300 | |
Rev., 4.00%, 10/1/2019 | | | 750 | | | | 762 | |
Rev., 4.00%, 10/1/2020 | | | 780 | | | | 802 | |
Minnesota State Colleges and Universities Rev., 2.00%, 10/1/2018 | | | 25 | | | | 25 | |
University of Minnesota Series A, Rev., 5.00%, 4/1/2022 | | | 2,715 | | | | 2,999 | |
| | | | | | | | |
| | | | | | | 4,938 | |
| | | | | | | | |
| | | | | | | | |
| INVESTMENTS | | PRINCIPAL
AMOUNT
($000) | | | VALUE
($000) | |
| |
General Obligation — 0.2% | | | | | | | | |
City of Glencoe | | | | | | | | |
Series 2018-A, GO, 3.00%, 8/1/2019 | | | 75 | | | | 76 | |
Series 2018-A, GO, 3.00%, 8/1/2020 | | | 75 | | | | 76 | |
Series 2018-A, GO, 3.00%, 8/1/2021 | | | 80 | | | | 82 | |
State of Minnesota Series A, GO, 5.00%, 10/1/2018 | | | 1,845 | | | | 1,850 | |
State of Minnesota, Trunk Highway Series B, GO, 5.00%, 8/1/2021 | | | 1,765 | | | | 1,919 | |
| | | | | | | | |
| | | | | | | 4,003 | |
| | | | | | | | |
Hospital — 0.5% | | | | | | | | |
City of Maple Grove, Maple Grove Hospital Corporation Rev., 3.00%, 5/1/2019 | | | 930 | | | | 937 | |
City of Rochester, Health Care Facilities, Mayo Clinic | | | | | | | | |
Series A, Rev., VRDO, 1.47%, 9/13/2018 (c) | | | 10,000 | | | | 10,000 | |
Series A, Rev., 4.00%, 11/15/2018 (c) | | | 335 | | | | 337 | |
St. Paul Minnesota, Housing and Redevelopment Authority Health Care Series A, Rev., 2.00%, 11/15/2018 | | | 850 | | | | 851 | |
| | | | | | | | |
| | | | | | | 12,125 | |
| | | | | | | | |
Housing — 0.1% | | | | | | | | |
City of St. Paul Park, Senior Housing and Health Care, Presbyterian Homes Bloomington Project | | | | | | | | |
Rev., 3.00%, 9/1/2018 | | | 445 | | | | 445 | |
Rev., 3.00%, 9/1/2019 | | | 795 | | | | 803 | |
St. Paul Minnesota, Housing and Redevelopment Authority, Parking Enterprise Series A, Rev., 3.00%, 8/1/2020 | | | 515 | | | | 527 | |
| | | | | | | | |
| | | | | | | 1,775 | |
| | | | | | | | |
Other Revenue — 0.0% (b) | | | | | | | | |
State of Minnesota, General Fund Appropriation Series B, Rev., 5.00%, 3/1/2020 | | | 400 | | | | 419 | |
| | | | | | | | |
Utility — 0.0% (b) | | | | | | | | |
City of Chaska, Electric Generating Facilities Series A, Rev., 4.00%, 10/1/2018 | | | 20 | | | | 20 | |
| | | | | | | | |
Total Minnesota | | | | | | | 24,274 | |
| | | | | | | | |
Mississippi — 1.0% | | | | | | | | |
General Obligation — 0.2% | | | | | | | | |
State of Mississippi Series F, GO, 5.00%, 11/1/2020 | | | 4,000 | | | | 4,270 | |
| | | | | | | | |
Hospital — 0.1% | | | | | | | | |
Mississippi Hospital Equipment and Facilities Authority, Baptist Memorial Health Care Series B2, Rev., 2.13%, 1/9/2019 (c) | | | 3,000 | | | | 3,002 | |
| | | | | | | | |
SEE NOTES TO FINANCIAL STATEMENTS.
| | | | | | | | |
| | | |
| AUGUST 31, 2018 | | J.P. MORGAN MUNICIPAL BOND FUNDS | | | | | 63 | |
JPMorgan Ultra-Short Municipal Fund
SCHEDULE OF PORTFOLIO INVESTMENTS
AS OF AUGUST 31, 2018 (Unaudited) (continued)
| | | | | | | | |
| INVESTMENTS | | PRINCIPAL
AMOUNT
($000) | | | VALUE
($000) | |
Municipal Bonds — continued | |
Industrial Development Revenue/Pollution Control Revenue — 0.7% | | | | | |
Mississippi Business Finance Corp., Gulf Opportunity Zone Industrial Development, Chevron USA, Inc. Project | | | | | | | | |
Series A, Rev., VRDO, 1.49%, 9/13/2018 (c) | | | 11,150 | | | | 11,150 | |
Series E, Rev., VRDO, 1.50%, 9/13/2018 (c) | | | 6,200 | | | | 6,200 | |
| | | | | | | | |
| | | | | | | 17,350 | |
| | | | | | | | |
Other Revenue — 0.0% (b) | | | | | | | | |
Mississippi Development Bank, Rankin County Bond Project Rev., 3.00%, 3/1/2022 | | | 100 | | | | 103 | |
| | | | | | | | |
Total Mississippi | | | | | | | 24,725 | |
| | | | | | | | |
Missouri — 0.8% | | | | | | | | |
Certificate of Participation/Lease — 0.1% | | | | | | | | |
Blue Eye R-V School District | | | | | | | | |
COP, 4.00%, 4/1/2019 | | | 135 | | | | 137 | |
COP, 4.00%, 4/1/2021 | | | 75 | | | | 78 | |
City of Arnold | | | | | | | | |
COP, 3.00%, 12/15/2018 | | | 120 | | | | 120 | |
COP, 3.00%, 12/15/2019 | | | 120 | | | | 122 | |
City of Waynesville | | | | | | | | |
Series C, COP, 2.00%, 4/15/2019 | | | 125 | | | | 125 | |
Series C, COP, 2.00%, 4/15/2020 | | | 250 | | | | 250 | |
County of Stone | | | | | | | | |
COP, 3.00%, 12/1/2018 | | | 100 | | | | 100 | |
COP, 3.00%, 12/1/2019 | | | 100 | | | | 101 | |
COP, 3.00%, 12/1/2020 | | | 145 | | | | 148 | |
| | | | | | | | |
| | | | | | | 1,181 | |
| | | | | | | | |
Industrial Development Revenue/Pollution Control Revenue — 0.1% | | | | | |
Branson IDA, Branson Shoppes Redevelopment Project Series A, Rev., 3.00%, 11/1/2018 | | | 250 | | | | 250 | |
Cape Girardeau County IDA, South Eastern Health | | | | | | | | |
Rev., 5.00%, 3/1/2019 | | | 300 | | | | 303 | |
Rev., 5.00%, 3/1/2020 | | | 320 | | | | 330 | |
Hannibal IDA, Healthcare Facilities Rev., 5.00%, 10/1/2020 | | | 300 | | | | 317 | |
Riverside IDA, Riverside Horizons Infrastructure Project Rev., 3.00%, 5/1/2019 | | | 2,055 | | | | 2,070 | |
| | | | | | | | |
| | | | | | | 3,270 | |
| | | | | | | | |
Other Revenue — 0.5% | | | | | | | | |
County of Jackson, Harry S. Truman Sports Complex Project Rev., 5.00%, 12/1/2022 | | | 4,000 | | | | 4,450 | |
Missouri State Board of Public Buildings Series A, Rev., 4.00%, 10/1/2018 | | | 25 | | | | 25 | |
| | | | | | | | |
| INVESTMENTS | | PRINCIPAL
AMOUNT
($000) | | | VALUE
($000) | |
| |
Other Revenue — continued | | | | | | | | |
Tender Option Bond Trust Receipts/Certificates Series 2018-XG0176, Rev., VRDO, LIQ: Royal Bank of Canada, 1.66%, 9/13/2018 (c) (g) | | | 8,200 | | | | 8,200 | |
| | | | | | | | |
| | | | | | | 12,675 | |
| | | | | | | | |
Prerefunded — 0.0% (b) | | | | | | | | |
Missouri State Health and Educational Facilities Authority, Health Facilities Series A, Rev., AGM, 5.50%, 11/15/2018 (d) | | | 100 | | | | 101 | |
Missouri State Health and Educational Facilities Authority, Health Facilities, Coxhealth Series A, Rev., 5.50%, 11/15/2018 (d) | | | 15 | | | | 15 | |
| | | | | | | | |
| | | | | | | 116 | |
| | | | | | | | |
Transportation — 0.1% | | | | | | | | |
City of St. Louis, Lambert International Airport Series B, Rev., AMT, AGM, 5.00%, 7/1/2021 | | | 1,305 | | | | 1,405 | |
| | | | | | | | |
Total Missouri | | | | | | | 18,647 | |
| | | | | | | | |
Montana — 0.3% | | | | | | | | |
Education — 0.1% | | | | | | | | |
Montana State Board of Regents, Montana State University Series F, Rev., VRDO, 1.94%, 9/13/2018 (c) | | | 3,500 | | | | 3,500 | |
| | | | | | | | |
Other Revenue — 0.2% | | | | | | | | |
Montana Board of Investments, Municipal Finance Consolidation Act, Intercap Revolving Program Series 2000, Rev., 1.65%, 3/1/2019 (c) | | | 2,600 | | | | 2,602 | |
| | | | | | | | |
Total Montana | | | | | | | 6,102 | |
| | | | | | | | |
Nebraska — 0.1% | | | | | | | | |
General Obligation — 0.1% | | | | | | | | |
Papio-Missouri River Natural Resource District | | | | | | | | |
GO, 3.00%, 12/15/2018 | | | 330 | | | | 331 | |
GO, 4.00%, 12/15/2019 | | | 720 | | | | 740 | |
GO, 4.00%, 12/15/2020 | | | 405 | | | | 423 | |
| | | | | | | | |
| | | | | | | 1,494 | |
| | | | | | | | |
Hospital — 0.0% (b) | | | | | | | | |
Madison County Hospital Authority No. 1, Faith Regional Health Services Project Series A, Rev., 4.00%, 7/1/2019 | | | 725 | | | | 735 | |
| | | | | | | | |
Other Revenue — 0.0% (b) | | | | | | | | |
Upper Republican Natural Resource District, Limited Obligation, Occupation Tax Supported, River Flow Enhancement Rev., AGM, 3.00%, 12/15/2020 | | | 250 | | | | 256 | |
| | | | | | | | |
SEE NOTES TO FINANCIAL STATEMENTS.
| | | | | | |
| | | |
| 64 | | | | J.P. MORGAN MUNICIPAL BOND FUNDS | | AUGUST 31, 2018 |
| | | | | | | | |
| INVESTMENTS | | PRINCIPAL
AMOUNT
($000) | | | VALUE
($000) | |
Municipal Bonds — continued | |
Prerefunded — 0.0% (b) | | | | | | | | |
Douglas County Hospital Authority No. 3 Rev., BHAC-CR, 5.50%, 11/1/2018 (d) | | | 20 | | | | 20 | |
| | | | | | | | |
Utility — 0.0% (b) | | | | | | | | |
City of Lincoln, Electric System Rev., 5.00%, 9/1/2018 | | | 20 | | | | 20 | |
| | | | | | | | |
Total Nebraska | | | | | | | 2,525 | |
| | | | | | | | |
Nevada — 1.2% | | | | | | | | |
General Obligation — 0.1% | | | | | | | | |
Clark County School District Series C, GO, 5.00%, 6/15/2023 | | | 2,000 | | | | 2,243 | |
| | | | | | | | |
Hospital — 0.1% | | | | | | | | |
City of Carson, Carson Tahoe Regional Healthcare Project | | | | | | | | |
Rev., 5.00%, 9/1/2018 | | | 460 | | | | 460 | |
Rev., 5.00%, 9/1/2019 | | | 325 | | | | 335 | |
Rev., 5.00%, 9/1/2020 | | | 250 | | | | 264 | |
Rev., 5.00%, 9/1/2027 | | | 610 | | | | 703 | |
| | | | | | | | |
| | | | | | | 1,762 | |
| | | | | | | | |
Other Revenue — 0.0% (b) | | | | | | | | |
City of Henderson Nevada Local Improvement District No. T-14 Rev., 2.50%, 3/1/2019 | | | 340 | | | | 341 | |
City of Henderson Nevada Local Improvement District No. T-17 Rev., 2.00%, 9/1/2019 | | | 195 | | | | 195 | |
| | | | | | | | |
| | | | | | | 536 | |
| | | | | | | | |
Transportation — 0.9% | | | | | | | | |
County of Clark, Department of Aviation, Nevada Airport System, Junior Subordinate Lien Series A, Rev., 5.00%, 7/1/2021 | | | 18,500 | | | | 20,012 | |
County of Clark, Department of Aviation, Nevada Airport System, Subordinate Lien Series D-3, Rev., VRDO, LOC: Bank of America NA, 1.50%, 9/13/2018 (c) | | | 2,035 | | | | 2,035 | |
| | | | | | | | |
| | | | | | | 22,047 | |
| | | | | | | | |
Utility — 0.1% | | | | | | | | |
County of Clark, Nevada Power Company Projects Rev., 1.60%, 5/21/2020 (c) | | | 3,000 | | | | 2,976 | |
County of Washoe, Gas and Water Facilities, Sierra Pacific Power Company Project Series B, Rev., 3.00%, 6/1/2022 (c) | | | 580 | | | | 595 | |
| | | | | | | | |
| | | | | | | 3,571 | |
| | | | | | | | |
Total Nevada | | | | | | | 30,159 | |
| | | | | | | | |
| | | | | | | | |
| INVESTMENTS | | PRINCIPAL
AMOUNT
($000) | | | VALUE
($000) | |
| |
New Hampshire — 0.4% | | | | | | | | |
Education — 0.4% | | | | | | | | |
New Hampshire Health and Education Facilities Authority Act, University System Series A, Rev., 5.00%, 7/1/2019 | | | 1,385 | | | | 1,423 | |
New Hampshire Health and Education Facilities Authority, Dartmouth College Rev., VRDO, 1.45%, 9/13/2018 (c) | | | 9,000 | | | | 9,000 | |
| | | | | | | | |
| | | | | | | 10,423 | |
| | | | | | | | |
Prerefunded — 0.0% (b) | | | | | | | | |
State of New Hampshire, Capital Improvement Series C, GO, 4.75%, 11/1/2018 (d) | | | 55 | | | | 55 | |
| | | | | | | | |
Transportation — 0.0% (b) | | | | | | | | |
New Hampshire State Turnpike System Rev., 5.00%, 10/1/2018 | | | 25 | | | | 25 | |
| | | | | | | | |
Total New Hampshire | | | | | | | 10,503 | |
| | | | | | | | |
New Jersey — 11.6% | | | | | | | | |
Education — 0.3% | | | | | | | | |
New Jersey Economic Development Authority, School Facilities Construction | | | | | | | | |
Series DDD, Rev., 5.00%, 6/15/2019 | | | 500 | | | | 512 | |
Series DDD, Rev., 5.00%, 6/15/2020 | | | 500 | | | | 524 | |
Series PP, Rev., 5.00%, 6/15/2020 | | | 200 | | | | 209 | |
New Jersey EDA, School Facilities Construction Series XX, Rev., 5.00%, 6/15/2021 | | | 5,000 | | | | 5,333 | |
New Jersey Educational Facilities Authority, The William Paterson University Rev., 5.00%, 7/1/2020 | | | 100 | | | | 105 | |
| | | | | | | | |
| | | | | | | 6,683 | |
| | | | | | | | |
General Obligation — 8.3% | | | | | | | | |
Atlantic County, Township of Galloway Series A, GO, BAN, 3.00%, 8/15/2019 | | | 3,700 | | | | 3,733 | |
Borough of Alpha GO, BAN, 2.50%, 12/10/2018 | | | 2,845 | | | | 2,851 | |
Borough of Avalon GO, BAN, 2.50%, 2/19/2019 | | | 9,254 | | | | 9,289 | |
Borough of Beachwood GO, BAN, 3.00%, 3/6/2019 | | | 12,556 | | | | 12,646 | |
Borough of Bound Brook GO, BAN, 2.75%, 4/19/2019 | | | 2,838 | | | | 2,851 | |
Borough of East Rutherford | | | | | | | | |
GO, BAN, 2.25%, 10/19/2018 | | | 5,274 | | | | 5,273 | |
GO, AGM, 4.00%, 12/1/2018 | | | 260 | | | | 261 | |
GO, AGM, 5.00%, 12/1/2019 | | | 145 | | | | 150 | |
GO, AGM, 5.00%, 12/1/2020 | | | 290 | | | | 308 | |
Borough of Englewood Cliffs GO, BAN, 2.50%, 2/22/2019 | | | 5,284 | | | | 5,304 | |
SEE NOTES TO FINANCIAL STATEMENTS.
| | | | | | | | |
| | | |
| AUGUST 31, 2018 | | J.P. MORGAN MUNICIPAL BOND FUNDS | | | | | 65 | |
JPMorgan Ultra-Short Municipal Fund
SCHEDULE OF PORTFOLIO INVESTMENTS
AS OF AUGUST 31, 2018 (Unaudited) (continued)
| | | | | | | | |
| INVESTMENTS | | PRINCIPAL
AMOUNT
($000) | | | VALUE
($000) | |
Municipal Bonds — continued | |
General Obligation — continued | | | | | | | | |
Borough of Highlands GO, BAN, 2.25%, 10/5/2018 | | | 2,967 | | | | 2,968 | |
Borough of Matawan GO, BAN, 2.75%, 6/5/2019 | | | 2,606 | | | | 2,619 | |
Borough of Metuchen GO, 4.00%, 9/1/2018 | | | 25 | | | | 25 | |
Borough of Oakland GO, BAN, 2.50%, 12/14/2018 | | | 5,251 | | | | 5,263 | |
Borough of Oceanport GO, BAN, 2.75%, 6/28/2019 | | | 8,062 | | | | 8,111 | |
Borough of Rockaway GO, BAN, 2.25%, 9/14/2018 | | | 6,173 | | | | 6,173 | |
Borough of Wallington GO, BAN, 2.75%, 8/23/2019 | | | 5,733 | | | | 5,772 | |
Borough of Woodbury Heights Series A, GO, BAN, 2.75%, 8/1/2019 | | | 5,277 | | | | 5,311 | |
Borough of Woodcliff Lake GO, BAN, 2.50%, 2/22/2019 | | | 5,530 | | | | 5,551 | |
Borough of Wood-Ridge GO, BAN, 2.25%, 11/8/2018 | | | 3,034 | | | | 3,037 | |
City of Atlantic | | | | | | | | |
Series B, GO, AGM, 4.00%, 3/1/2019 | | | 250 | | | | 253 | |
Series B, GO, AGM, 5.00%, 3/1/2020 | | | 200 | | | | 209 | |
City of Atlantic, Tax Appeal Series A, GO, 5.00%, 3/1/2020 | | | 650 | | | | 679 | |
City of Bridgeton GO, 3.00%, 8/23/2019 | | | 9,553 | | | | 9,630 | |
City of Egg Harbor Series A, GO, BAN, 3.00%, 4/8/2019 | | | 865 | | | | 870 | |
City of North Wildwood GO, BAN, 3.00%, 8/22/2019 | | | 9,620 | | | | 9,704 | |
City of Union, County of Hudson Series 2017, GO, 4.00%, 11/1/2019 | | | 1,000 | | | | 1,019 | |
County of Burlington Series A-1, GO, 4.00%, 9/1/2018 | | | 25 | | | | 25 | |
County of Essex Series A, GO, 4.00%, 10/1/2018 | | | 15 | | | | 15 | |
County of Salem Series A, GO, BAN, 3.00%, 6/19/2019 | | | 10,531 | | | | 10,616 | |
County of Somerset GO, 4.00%, 12/1/2018 | | | 20 | | | | 20 | |
Mullica Township School District | | | | | | | | |
GO, 2.00%, 9/15/2018 | | | 106 | | | | 106 | |
GO, 2.00%, 9/15/2019 | | | 105 | | | | 105 | |
The County of Monmouth, The Board of Education of The Borough of Freehold GO, GAN, 2.50%, 11/1/2018 | | | 6,000 | | | | 6,006 | |
The County of Union State of New Jersey, Township of Hillside GO, 3.00%, 7/18/2019 | | | 6,566 | | | | 6,620 | |
Township of Belleville GO, TAN, 3.00%, 4/17/2019 | | | 8,000 | | | | 8,051 | |
| | | | | | | | |
| INVESTMENTS | | PRINCIPAL
AMOUNT
($000) | | | VALUE
($000) | |
| |
General Obligation — continued | | | | | | | | |
Township of Cherry Hill GO, BAN, 3.00%, 10/16/2018 | | | 2,977 | | | | 2,982 | |
Township of Clinton GO, BAN, 3.00%, 3/20/2019 | | | 2,732 | | | | 2,748 | |
Township of Edison, Sewer Utility GO, BAN, 3.00%, 2/8/2019 | | | 26,330 | | | | 26,502 | |
Township of Lyndhurst GO, BAN, 2.50%, 3/14/2019 | | | 8,574 | | | | 8,609 | |
Township of Medford Series A, GO, BAN, 2.25%, 9/25/2018 | | | 5,822 | | | | 5,824 | |
Township of Mount Laure Series 2014, GO, 4.00%, 9/1/2018 | | | 20 | | | | 20 | |
Township of North Hanover Series A, GO, BAN, 2.50%, 10/23/2018 | | | 5,900 | | | | 5,893 | |
Township of South Brunswick Series 2014, GO, 4.00%, 9/1/2018 | | | 20 | | | | 20 | |
Township of West Orange GO, BAN, 2.25%, 9/7/2018 | | | 6,122 | | | | 6,122 | |
| | | | | | | | |
| | | | | | | 200,144 | |
| | | | | | | | |
Hospital — 0.0% (b) | | | | | | | | |
New Jersey Health Care Facilities Financing Authority, Holy Name Medical Center Series 2010, Rev., 4.50%, 7/1/2020 | | | 375 | | | | 390 | |
| | | | | | | | |
Housing — 0.5% | | | | | | | | |
New Jersey Housing and Mortgage Finance Agency, Multifamily Conduit Camden Townhouses Project Series F, Rev., 1.35%, 2/1/2019 (c) | | | 3,500 | | | | 3,494 | |
New Jersey Housing and Mortgage Finance Agency, Multifamily Conduit, Garden Spires Project Series A, Rev., 2.02%, 8/1/2020 (c) | | | 8,000 | | | | 7,991 | |
| | | | | | | | |
| | | | | | | 11,485 | |
| | | | | | | | |
Industrial Development Revenue/Pollution Control Revenue — 0.0% (b) | | | | | |
Passaic County Utilities Authority, Solid Waste Disposal | | | | | | | | |
Series 2018, Rev., 4.13%, 3/1/2019 | | | 170 | | | | 172 | |
Series 2018, Rev., 4.25%, 3/1/2020 | | | 180 | | | | 187 | |
Series 2018, Rev., 4.38%, 3/1/2021 | | | 255 | | | | 270 | |
| | | | | | | | |
| | | | | | | 629 | |
| | | | | | | | |
Other Revenue — 0.8% | | | | | | | | |
Atlantic County Improvement Authority, Aviation Park Project Rev., 2.00%, 10/3/2018 | | | 6,500 | | | | 6,502 | |
Burlington County Bridge Commission, Governmental Leasing Program Series A, Rev., 5.00%, 10/15/2018 | | | 30 | | | | 30 | |
SEE NOTES TO FINANCIAL STATEMENTS.
| | | | | | |
| | | |
| 66 | | | | J.P. MORGAN MUNICIPAL BOND FUNDS | | AUGUST 31, 2018 |
| | | | | | | | |
| INVESTMENTS | | PRINCIPAL
AMOUNT
($000) | | | VALUE
($000) | |
Municipal Bonds — continued | |
Other Revenue — continued | | | | | | | | |
Gloucester County Improvement Authority Series A, Rev., 5.00%, 11/1/2019 | | | 500 | | | | 518 | |
Tender Option Bond Trust Receipts/Certificates Series 2018-XL0058, Rev., VRDO, LIQ: Barclays Bank plc, 1.68%, 9/13/2018 (c) (g) | | | 5,000 | | | | 5,000 | |
The Cumberland County Improvement Authority, Vineland Public Safety Building Project Series 2017, Rev., 5.00%, 12/15/2021 | | | 340 | | | | 370 | |
Tobacco Settlement Financing Corp. | | | | | | | | |
Series A, Rev., 5.00%, 6/1/2019 | | | 3,500 | | | | 3,580 | |
Series A, Rev., 5.00%, 6/1/2020 | | | 3,000 | | | | 3,152 | |
| | | | | | | | |
| | | | | | | 19,152 | |
| | | | | | | | |
Prerefunded — 0.0% (b) | | | | | | | | |
County of Burlington, General Improvement Series A, GO, 4.00%, 9/1/2018 (d) | | | 25 | | | | 25 | |
New Jersey Economic Development Authority, School Facilities Construction | | | | | | | | |
Series Y, Rev., 4.50%, 9/1/2018 (d) | | | 25 | | | | 25 | |
Series Z, Rev., AGC, 5.50%, 12/15/2018 (d) | | | 85 | | | | 86 | |
New Jersey Health Care Facilities Financing Authority, Hospital Asset Transformation | | | | | | | | |
Rev., 5.00%, 10/1/2018 (d) | | | 30 | | | | 30 | |
Rev., 5.25%, 10/1/2018 (d) | | | 35 | | | | 35 | |
State of New Jersey, Equipment Lease Purchase Series A, COP, 5.25%, 6/15/2019 (d) | | | 25 | | | | 26 | |
| | | | | | | | |
| | | | | | | 227 | |
| | | | | | | | |
Transportation — 1.7% | | | | | | | | |
New Jersey Economic Development Authority, Transportation Project Series A, Rev., 5.00%, 5/1/2019 | | | 3,580 | | | | 3,651 | |
New Jersey Transportation Trust Fund Authority, Federal Highway Reimbursement Rev., 5.00%, 6/15/2021 | | | 6,000 | | | | 6,427 | |
New Jersey Transportation Trust Fund Authority, Transportation Program Series BB-1, Rev., (SIFMA Municipal Swap Index Yield + 1.00%), 2.49%, 9/13/2018 (e) | | | 700 | | | | 704 | |
New Jersey Transportation Trust Fund Authority, Transportation System | | | | | | | | |
Rev., 5.00%, 12/15/2018 | | | 20,000 | | | | 20,174 | |
Series B-4, Rev., 5.25%, 12/15/2019 | | | 225 | | | | 234 | |
New Jersey Turnpike Authority | | | | | | | | |
Series C-1, Rev., (ICE LIBOR USD 1 Month + 0.34%), 1.82%, 10/1/2018 (e) | | | 4,000 | | | | 4,003 | |
Series B, Rev., 5.00%, 1/1/2025 | | | 5,345 | | | | 5,967 | |
| | | | | | | | |
| | | | | | | 41,160 | |
| | | | | | | | |
| | | | | | | | |
| INVESTMENTS | | PRINCIPAL
AMOUNT
($000) | | | VALUE
($000) | |
| |
Water & Sewer — 0.0% (b) | | | | | | | | |
Logan Township Municipal Utilities Authority Rev., 4.00%, 5/1/2020 | | | 100 | | | | 103 | |
| | | | | | | | |
Total New Jersey | | | | | | | 279,973 | |
| | | | | | | | |
New Mexico — 0.0% (b) | | | | | | | | |
General Obligation — 0.0% (b) | | | | | | | | |
Jal Public School District No. 19, Credit Enhancement Program GO, AGM, 5.00%, 8/1/2019 | | | 880 | | | | 906 | |
| | | | | | | | |
New York — 18.8% | | | | | | | | |
Education — 0.1% | | | | | | | | |
New York State Dormitory Authority, Fordham University Rev., 5.00%, 7/1/2023 | | | 920 | | | | 1,041 | |
New York State Dormitory Authority, St. John’s University Series B-2, Rev., VRDO, LOC: U.S. Bank NA, 1.47%, 9/13/2018 (c) | | | 1,180 | | | | 1,180 | |
| | | | | | | | |
| | | | | | | 2,221 | |
| | | | | | | | |
General Obligation — 10.9% | | | | | | | | |
Bath Central School District, Steuben County GO, BAN, 3.00%, 6/21/2019 | | | 8,320 | | | | 8,384 | |
Beekmantown Central School District, Clinton County New York GO, BAN, 2.75%, 6/27/2019 | | | 4,035 | | | | 4,060 | |
Binghamton City School District GO, RAN, 2.50%, 1/25/2019 | | | 3,500 | | | | 3,508 | |
City of New York Series E, Subseries E-3, GO, VRDO, LOC: Bank of America NA, 1.47%, 9/13/2018 (c) | | | 15,000 | | | | 15,000 | |
City of New York, Fiscal Year 2012 Subseries G-4, GO, VRDO, LOC: Citibank NA, 1.46%, 9/13/2018 (c) | | | 10,000 | | | | 10,000 | |
City of New York, Fiscal Year 2017 GO, VRDO, LOC: Citibank NA, 1.46%, 9/13/2018 (c) | | | 14,100 | | | | 14,100 | |
City of Olean GO, BAN, 2.75%, 6/13/2019 | | | 6,024 | | | | 6,068 | |
City of Tonawanda GO, BAN, 3.00%, 6/6/2019 | | | 2,894 | | | | 2,922 | |
City of Watertown Series A, GO, BAN, 3.00%, 4/1/2019 | | | 4,360 | | | | 4,391 | |
County of Cattaraugus GO, BAN, 2.75%, 4/3/2019 | | | 707 | | | | 710 | |
County of Columbia, Germantown Central School District GO, BAN, 2.75%, 6/28/2019 | | | 8,937 | | | | 8,995 | |
County of Nassau Series B, GO, TAN, 3.00%, 9/18/2018 | | | 22,495 | | | | 22,508 | |
County of Schoharie | | | | | | | | |
GO, BAN, 2.50%, 2/8/2019 | | | 14,700 | | | | 14,751 | |
GO, BAN, 2.75%, 6/20/2019 | | | 15,000 | | | | 15,103 | |
County of Suffolk Series I, GO, TAN, 2.25%, 9/27/2018 | | | 5,275 | | | | 5,276 | |
SEE NOTES TO FINANCIAL STATEMENTS.
| | | | | | | | |
| | | |
| AUGUST 31, 2018 | | J.P. MORGAN MUNICIPAL BOND FUNDS | | | | | 67 | |
JPMorgan Ultra-Short Municipal Fund
SCHEDULE OF PORTFOLIO INVESTMENTS
AS OF AUGUST 31, 2018 (Unaudited) (continued)
| | | | | | | | |
| INVESTMENTS | | PRINCIPAL
AMOUNT
($000) | | | VALUE
($000) | |
Municipal Bonds — continued | |
General Obligation — continued | | | | | | | | |
County of Suffolk, Longwood Central School District GO, 5.00%, 6/15/2021 | | | 300 | | | | 327 | |
County of Westchester Series A, GO, BAN, 3.00%, 12/14/2018 | | | 11,100 | | | | 11,140 | |
East Ramapo Central School District GO, BAN, 3.00%, 4/26/2019 | | | 9,797 | | | | 9,873 | |
Erie County, Cleveland Hill Union Free School District GO, BAN, 2.75%, 6/25/2019 | | | 7,650 | | | | 7,699 | |
Hilton Central School District GO, BAN, 2.75%, 6/28/2019 | | | 5,800 | | | | 5,839 | |
Holley Central School District GO, BAN, 2.50%, 6/25/2019 | | | 2,105 | | | | 2,114 | |
Marcellus Central School District GO, BAN, 3.00%, 2/22/2019 | | | 6,713 | | | | 6,747 | |
Mayfield Central School District GO, BAN, 2.75%, 6/28/2019 | | | 14,975 | | | | 15,082 | |
Morrisville-Eaton Central School District Series A, GO, BAN, 2.75%, 9/28/2018 | | | 6,500 | | | | 6,504 | |
Newark Central School District GO, BAN, 2.75%, 6/20/2019 | | | 14,000 | | | | 14,104 | |
Oneida County, Sherrill City School District Series B, GO, BAN, 2.50%, 7/26/2019 | | | 8,751 | | | | 8,792 | |
Owego Apalachin Central School District | | | | | | | | |
Series B, GO, RAN, 2.38%, 6/27/2019 | | | 6,443 | | | | 6,455 | |
Series C, GO, RAN, 2.38%, 6/27/2019 | | | 2,500 | | | | 2,504 | |
Pavilion Central School District, Livingston and Wyoming Counties GO, BAN, 2.75%, 6/21/2019 | | | 2,622 | | | | 2,639 | |
Rome City School District GO, BAN, 2.75%, 8/2/2019 | | | 24,925 | | | | 25,119 | |
Town of Islip, Public Improvement Series A, GO, 4.00%, 11/15/2020 | | | 500 | | | | 503 | |
Town of Plattsburgh GO, BAN, 2.75%, 8/23/2019 | | | 3,000 | | | | 3,018 | |
| | | | | | | | |
| | | | | | | 264,235 | |
| | | | | | | | |
Hospital — 0.1% | | | | | | | | |
Jefferson County Civic Facility Development Corp., Samaritan Medical Center Project | | | | | | | | |
Series A, Rev., 2.00%, 11/1/2018 | | | 515 | | | | 514 | |
Series A, Rev., 2.00%, 11/1/2019 | | | 550 | | | | 545 | |
Series A, Rev., 3.00%, 11/1/2020 | | | 575 | | | | 577 | |
| | | | | | | | |
| | | | | | | 1,636 | |
| | | | | | | | |
Housing — 0.1% | | | | | | | | |
Amherst Development Corp., Student Housing Facility, Greiner and Hadley Refunding Projects Series A, Rev., 3.00%, 10/1/2018 | | | 2,360 | | | | 2,362 | |
| | | | | | | | |
| | | | | | | | |
| INVESTMENTS | | PRINCIPAL
AMOUNT
($000) | | | VALUE
($000) | |
| |
Industrial Development Revenue/Pollution Control Revenue — 0.8% | | | | | |
Syracuse City Industrial Development Agency, Syracuse University Project Series A, Rev., VRDO, LOC: U.S. Bank NA, 1.47%, 9/13/2018 (c) | | | 20,145 | | | | 20,145 | |
| | | | | | | | |
Other Revenue — 1.7% | | | | | | | | |
New York City Transitional Finance Authority, Future Tax Secured, Fiscal Year 2003 | | | | | | | | |
Subseries A-4, Rev., VRDO, 1.40%, 9/4/2018 (c) | | | 1,250 | | | | 1,250 | |
Series 2003A-1, Rev., 5.00%, 11/1/2018 | | | 1,000 | | | | 1,006 | |
New York City Transitional Finance Authority, Future Tax Secured, Fiscal Year 2010 | | | | | | | | |
Subseries F-5, Rev., VRDO, LOC: Sumitomo Mitsui Banking Corp., 1.49%, 9/13/2018 (c) | | | 14,675 | | | | 14,675 | |
Series D, Rev., 5.00%, 11/1/2018 | | | 25 | | | | 25 | |
New York City Transitional Finance Authority, Future Tax Secured, Fiscal Year 2013 | | | | | | | | |
Subseries A-7, Rev., VRDO, 1.47%, 9/13/2018 (c) | | | 12,055 | | | | 12,055 | |
Subseries F-1, Rev., 5.00%, 2/1/2019 | | | 150 | | | | 152 | |
New York City Transitional Finance Authority, New York City Recovery Series 3,
Subseries 3-G, Rev., VRDO, 1.51%, 9/13/2018 (c) | | | 4,000 | | | | 4,000 | |
New York State Dormitory Authority, North Shore, Long Island Jewish Obligated Group Series A, Rev., 4.00%, 5/1/2020 | | | 150 | | | | 156 | |
Schenectady Metroplex Development Authority Series A, Rev., BAN, 3.00%, 12/28/2018 | | | 1,240 | | | | 1,246 | |
Tender Option Bond Trust Receipts/Certificates Series 2017-XF0591, Rev., VRDO, LIQ: Bank of America NA, 1.71%, 9/13/2018 (c) (g) | | | 6,000 | | | | 6,000 | |
TSASC, Inc., Tobacco Settlement Series B, Rev., 5.00%, 6/1/2019 | | | 150 | | | | 153 | |
| | | | | | | | |
| | | | | | | 40,718 | |
| | | | | | | | |
Prerefunded — 0.0% (b) | | | | | | | | |
Onondaga County Water Authority Series A, Rev., 5.00%, 9/15/2018 (d) | | | 50 | | | | 50 | |
Triborough Bridge and Tunnel Authority, MTA Bridges and Tunnels Series A, Rev., 5.00%, 1/1/2022 (d) | | | 1,120 | | | | 1,235 | |
| | | | | | | | |
| | | | | | | 1,285 | |
| | | | | | | | |
Special Tax — 0.0% (b) | | | | | | | | |
New York State Dormitory Authority, State Personal Income Tax, General Purpose Series A, Rev., 5.00%, 2/15/2021 | | | 200 | | | | 215 | |
SEE NOTES TO FINANCIAL STATEMENTS.
| | | | | | |
| | | |
| 68 | | | | J.P. MORGAN MUNICIPAL BOND FUNDS | | AUGUST 31, 2018 |
| | | | | | | | |
| INVESTMENTS | | PRINCIPAL
AMOUNT
($000) | | | VALUE
($000) | |
Municipal Bonds — continued | |
Special Tax — continued | | | | | | | | |
New York State Environmental Facilities Corp., State Personal Income Tax Series A, Rev., 5.25%, 12/15/2018 | | | 25 | | | | 25 | |
| | | | | | | | |
| | | | | | | 240 | |
| | | | | | | | |
Transportation — 4.3% | | | | | | | | |
Metropolitan Transportation Authority | | | | | | | | |
Subseries E-3, Rev., VRDO, LOC: Citibank NA, 1.57%, 9/13/2018 (c) | | | 2,365 | | | | 2,365 | |
Subseries E-2, Rev., VRDO, LOC: Bank of Tokyo-Mitsubishi UFJ Ltd., 1.58%, 9/13/2018 (c) | | | 6,935 | | | | 6,935 | |
Rev., (ICE LIBOR USD 1 Month + 0.30%), 1.72%, 10/1/2018 (e) | | | 3,505 | | | | 3,493 | |
Series C-2D, Rev., BAN, 4.00%, 5/15/2019 | | | 15,000 | | | | 15,233 | |
Series A-3, Rev., BAN, 4.00%, 8/15/2019 | | | 13,750 | | | | 14,030 | |
New York State Thruway Authority Series A, Rev., 5.00%, 5/1/2019 | | | 24,395 | | | | 24,909 | |
New York Transportation Development Corp., Delta Air Lines, Inc., Laguardia Airport Terminals C & D Redevelopment Project Rev., AMT, 5.00%, 1/1/2022 | | | 14,000 | | | | 15,061 | |
Port Authority of New York and New Jersey, Consolidated, 173rd Series Rev., 5.00%, 12/1/2018 | | | 100 | | | | 101 | |
Triborough Bridge and Tunnel Authority Series B, Rev., VRDO, LOC: State Street Bank & Trust, 1.44%, 9/13/2018 (c) | | | 12,950 | | | | 12,950 | |
Triborough Bridge and Tunnel Authority, MTA Bridges and Tunnels | | | | | | | | |
Series B-4D, Rev., (ICE LIBOR USD 1 Month + 0.58%), 2.00%, 10/1/2018 (e) | | | 1,500 | | | | 1,503 | |
Series A, Rev., 4.00%, 11/15/2018 | | | 2,210 | | | | 2,221 | |
Series A, Rev., 5.00%, 11/15/2018 | | | 4,010 | | | | 4,038 | |
Series B, Rev., 5.00%, 11/15/2018 | | | 20 | | | | 20 | |
| | | | | | | | |
| | | | | | | 102,859 | |
| | | | | | | | |
Utility — 0.0% (b) | | | | | | | | |
Long Island Power Authority, Electric System Series A, Rev., AGM, Zero Coupon, 12/1/2018 | | | 25 | | | | 25 | |
| | | | | | | | |
Water & Sewer — 0.8% | | | | | | | | |
New York City Municipal Water Finance Authority, Water and Sewer System, Second General Resolution, Fiscal Year 2013 Subseries AA-2, Rev., VRDO, 1.50%, 9/13/2018 (c) | | | 12,560 | | | | 12,560 | |
| | | | | | | | |
| INVESTMENTS | | PRINCIPAL
AMOUNT
($000) | | | VALUE
($000) | |
| |
Water & Sewer — continued | | | | | | | | |
New York City Municipal Water Finance Authority, Water and Sewer System, Second General Resolution, Fiscal Year 2015 Series BB-3, Rev., VRDO, 1.47%, 9/13/2018 (c) | | | 5,680 | | | | 5,680 | |
| | | | | | | | |
| | | | | | | 18,240 | |
| | | | | | | | |
Total New York | | | | | | | 453,966 | |
| | | | | | | | |
North Carolina — 1.1% | | | | | | | | |
Education — 0.2% | | | | | | | | |
North Carolina Capital Facilities Finance Agency, Meredith College | | | | | | | | |
Rev., 5.00%, 6/1/2019 | | | 250 | | | | 256 | |
Rev., 5.00%, 6/1/2020 | | | 275 | | | | 288 | |
University of North Carolina, Chapel Hill Series B, Rev., (ICE LIBOR USD 1 Month + 0.40%), 1.82%, 10/1/2018 (e) | | | 3,250 | | | | 3,279 | |
Winston-Salem State University Foundation LLC, The Board of Governors of The University of North Carolina | | | | | | | | |
Rev., AGM, 3.00%, 10/1/2018 | | | 110 | | | | 110 | |
Rev., AGM, 4.00%, 10/1/2019 | | | 90 | | | | 92 | |
Rev., AGM, 4.00%, 10/1/2020 | | | 120 | | | | 126 | |
| | | | | | | | |
| | | | | | | 4,151 | |
| | | | | | | | |
General Obligation — 0.1% | | | | | | | | |
County of Lincoln Series A, GO, 4.00%, 6/1/2019 | | | 2,535 | | | | 2,581 | |
State of North Carolina Series A, GO, 5.00%, 6/1/2019 | | | 500 | | | | 513 | |
| | | | | | | | |
| | | | | | | 3,094 | |
| | | | | | | | |
Hospital — 0.1% | | | | | | | | |
North Carolina Medical Care Commission, Firsthealth Carolinas Series A, Rev., VRDO, 1.52%, 9/13/2018 (c) | | | 2,935 | | | | 2,935 | |
North Carolina Medical Care Commission, United Methodist Retirement Homes, Inc., Retirement Facilities | | | | | | | | |
Rev., 5.00%, 10/1/2018 | | | 180 | | | | 181 | |
Rev., 5.00%, 10/1/2019 | | | 275 | | | | 283 | |
Northern Hospital District of Surry County, Health Care Facilities Rev., 4.00%, 10/1/2018 | | | 380 | | | | 380 | |
| | | | | | | | |
| | | | | | | 3,779 | |
| | | | | | | | |
Housing — 0.2% | | | | | | | | |
Asheville Housing Authority, Ledgewood Village, Multifamily Housing Rev., 1.90%, 12/1/2019 (c) | | | 4,000 | | | | 3,999 | |
| | | | | | | | |
SEE NOTES TO FINANCIAL STATEMENTS.
| | | | | | | | |
| | | |
| AUGUST 31, 2018 | | J.P. MORGAN MUNICIPAL BOND FUNDS | | | | | 69 | |
JPMorgan Ultra-Short Municipal Fund
SCHEDULE OF PORTFOLIO INVESTMENTS
AS OF AUGUST 31, 2018 (Unaudited) (continued)
| | | | | | | | |
| INVESTMENTS | | PRINCIPAL
AMOUNT
($000) | | | VALUE
($000) | |
Municipal Bonds — continued | |
Other Revenue — 0.3% | | | | | | | | |
City of Greensboro, Combined Enterprise System Series A, Rev., VRDO, 1.47%, 9/13/2018 (c) | | | 6,005 | | | | 6,005 | |
County of Chatham Series 2014, Rev., 5.00%, 11/1/2019 | | | 210 | | | | 218 | |
| | | | | | | | |
| | | | | | | 6,223 | |
| | | | | | | | |
Transportation — 0.0% (b) | | | | | | | | |
North Carolina Turnpike Authority, Monroe Connector System Series 2011, Rev., 5.00%, 7/1/2020 | | | 420 | | | | 444 | |
| | | | | | | | |
Water & Sewer — 0.2% | | | | | | | | |
City of Charlotte, Water and Sewer System Series B, Rev., VRDO, 1.41%, 9/13/2018 (c) | | | 5,810 | | | | 5,810 | |
| | | | | | | | |
Total North Carolina | | | | | | | 27,500 | |
| | | | | | | | |
North Dakota — 0.0% (b) | | | | | | | | |
Hospital — 0.0% (b) | | | | | | | | |
City of Grand Forks, Health Care System, Altru Health System Obligated Group Series A, Rev., 5.00%, 12/1/2018 | | | 270 | | | | 272 | |
| | | | | | | | |
Ohio — 3.9% | | | | | | | | |
Certificate of Participation/Lease — 0.0% (b) | |
Goshen Local School District, School Facilities Project | | | | | | | | |
COP, 4.00%, 12/15/2018 | | | 170 | | | | 171 | |
COP, 4.00%, 12/15/2019 | | | 240 | | | | 246 | |
COP, 1.50%, 12/15/2020 | | | 280 | | | | 277 | |
| | | | | | | | |
| | | | | | | 694 | |
| | | | | | | | |
Education — 0.0% (b) | | | | | | | | |
Lorain County Community College District Rev., 2.00%, 12/1/2018 | | | 225 | | | | 225 | |
Miami University, A State University of Ohio Rev., 4.00%, 9/1/2018 | | | 50 | | | | 50 | |
| | | | | | | | |
| | | | | | | 275 | |
| | | | | | | | |
General Obligation — 1.0% | | | | | | | | |
Antwerp Local School District, School Facilities Construction and Improvement GO, 3.00%, 12/1/2018 | | | 215 | | | | 216 | |
City of Cincinnati, Unlimited Tax Refunding and Improvement | | | | | | | | |
Series 2014A, GO, 5.00%, 12/1/2018 | | | 2,000 | | | | 2,017 | |
Series 2014A, GO, 5.00%, 12/1/2019 | | | 5,925 | | | | 6,164 | |
City of Elyria, Improvement and Refunding, Various Purpose | | | | | | | | |
GO, 3.00%, 12/1/2018 | | | 685 | | | | 687 | |
GO, 5.00%, 12/1/2019 | | | 1,340 | | | | 1,393 | |
| | | | | | | | |
| INVESTMENTS | | PRINCIPAL
AMOUNT
($000) | | | VALUE
($000) | |
| |
General Obligation — continued | | | | | | | | |
City of Elyria, Various Purpose GO, BAN, 2.38%, 5/23/2019 | | | 820 | | | | 825 | |
City of Fairborn, Various Purpose Series B, GO, BAN, 1.75%, 9/7/2018 | | | 425 | | | | 425 | |
City of Fairfield, Various Purpose GO, BAN, 2.50%, 5/1/2019 | | | 3,300 | | | | 3,316 | |
City of Lorain, Streetscape Improvements GO, BAN, 2.75%, 6/20/2019 | | | 650 | | | | 656 | |
City of Marietta, Various Purpose Series A, GO, BAN, 3.00%, 5/9/2019 | | | 3,973 | | | | 3,999 | |
City of Middletown, Various Purpose | | | | | | | | |
GO, 4.00%, 12/1/2018 | | | 250 | | | | 251 | |
GO, 4.00%, 12/1/2019 | | | 500 | | | | 514 | |
City of North Olmsted, Capital Improvements GO, BAN, 2.50%, 4/23/2019 | | | 615 | | | | 618 | |
City of Springboro GO, 5.00%, 12/1/2018 | | | 25 | | | | 25 | |
City of Toledo | | | | | | | | |
GO, AGM, 2.00%, 12/1/2019 | | | 180 | | | | 180 | |
GO, AGM, 4.00%, 12/1/2020 | | | 100 | | | | 105 | |
County of Crawford, Various Purpose GO, AGM, 2.00%, 12/1/2018 | | | 225 | | | | 225 | |
Madison Local School District, Energy Conservation Improvement GO, BAN, 2.00%, 10/4/2018 | | | 645 | | | | 645 | |
Painesville City Local School District, School Improvement GO, Zero Coupon, 12/1/2018 | | | 95 | | | | 95 | |
Riverside Local School District, School Construction and Improvement Series C, GO, 5.00%, 10/1/2018 | | | 100 | | | | 100 | |
State of Ohio Series A, GO, 5.00%, 3/15/2019 | | | 1,000 | | | | 1,018 | |
Wauseon Exempted Village School District, Classroom Facilities and School Improvement GO, 2.00%, 12/1/2018 | | | 230 | | | | 230 | |
| | | | | | | | |
| | | | | | | 23,704 | |
| | | | | | | | |
Hospital — 1.4% | | | | | | | | |
Akron, Bath and Copley Joint Township Hospital District, Summa Health Obligated Group Rev., 5.00%, 11/15/2021 | | | 125 | | | | 134 | |
City of Centerville, Graceworks Lutheran Services | | | | | | | | |
Rev., 5.00%, 11/1/2020 | | | 275 | | | | 288 | |
Rev., 5.00%, 11/1/2021 | | | 285 | | | | 303 | |
County of Allen, Hospital Facilities, Mercy Health Series B, Rev., 5.00%, 5/5/2022 (c) | | | 2,000 | | | | 2,188 | |
County of Franklin, Hospital Facilities Class A, Rev., VRDO, 1.49%, 9/13/2018 (c) | | | 1,190 | | | | 1,190 | |
County of Franklin, Trinity Health Credit Group Rev., 1.37%, 11/1/2018 (c) | | | 20,000 | | | | 19,982 | |
SEE NOTES TO FINANCIAL STATEMENTS.
| | | | | | |
| | | |
| 70 | | | | J.P. MORGAN MUNICIPAL BOND FUNDS | | AUGUST 31, 2018 |
| | | | | | | | |
| INVESTMENTS | | PRINCIPAL
AMOUNT
($000) | | | VALUE
($000) | |
Municipal Bonds — continued | |
Hospital — continued | | | | | | | | |
State of Ohio, University Hospitals Health System, Inc. Series A, Rev., VRDO, 1.74%, 9/4/2018 (c) | | | 8,250 | | | | 8,250 | |
| | | | | | | | |
| | | | | | | 32,335 | |
| | | | | | | | |
Industrial Development Revenue/Pollution Control Revenue — 1.0% | | | | | |
Ohio State Water Development Authority, Water Pollution Control Loan Fund | | | | | | | | |
Series 2016 A, Rev., VRDO, LIQ: BMO Harris Bank NA, 1.55%, 9/13/2018 (c) | | | 10,400 | | | | 10,400 | |
Series B, Rev., (SIFMA Municipal Swap Index Yield + 0.22%), 1.71%, 9/13/2018 (e) | | | 13,935 | | | | 13,919 | |
| | | | | | | | |
| | | | | | | 24,319 | |
| | | | | | | | |
Other Revenue — 0.0% (b) | | | | | | | | |
City of Cleveland, Subordinate Lien, Public Facilities Improvements Rev., 5.00%, 10/1/2022 | | | 265 | | | | 295 | |
Village of Obetz | | | | | | | | |
Rev., 5.00%, 12/1/2019 | | | 110 | | | | 114 | |
Rev., 5.00%, 12/1/2020 | | | 185 | | | | 198 | |
Rev., 5.00%, 12/1/2021 | | | 125 | | | | 137 | |
| | | | | | | | |
| | | | | | | 744 | |
| | | | | | | | |
Prerefunded — 0.0% (b) | | | | | | | | |
City of Cincinnati, Economic Development, Baldwin 300 Project Series B, Rev., 5.00%, 11/1/2018 (d) | | | 20 | | | | 20 | |
Dublin City School District, School Facilities Construction and Improvement GO, 5.00%, 12/1/2018 (d) | | | 25 | | | | 25 | |
Miamisburg City School District, Facilities Construction and Improvement GO, 5.00%, 12/1/2018 (d) | | | 25 | | | | 25 | |
Monroeville Local School District, School Improvement GO, 4.00%, 12/1/2018 (d) | | | 20 | | | | 20 | |
Northmor Local School District, School Facilities Construction and Improvement GO, 5.00%, 11/1/2018 (d) | | | 50 | | | | 51 | |
| | | | | | | | |
| | | | | | | 141 | |
| | | | | | | | |
Transportation — 0.5% | | | | | | | | |
City of Cleveland, Airport System Series D, Rev., VRDO, LOC: U.S. Bank NA, 1.47%, 9/13/2018 (c) | | | 1,420 | | | | 1,420 | |
Columbus Regional Airport Authority, Columbus Ohio Regional Airport Authority Rev., VRDO, LOC: U.S. Bank NA, 1.48%, 9/13/2018 (c) | | | 8,785 | | | | 8,785 | |
| | | | | | | | |
| INVESTMENTS | | PRINCIPAL
AMOUNT
($000) | | | VALUE
($000) | |
| |
Transportation — continued | | | | | | | | |
Ohio Turnpike and Infrastructure Commission, Junior Lien, Infrastructure Projects Series A-1, Rev., 5.00%, 2/15/2019 | | | 735 | | | | 746 | |
| | | | | | | | |
| | | | | | | 10,951 | |
| | | | | | | | |
Water & Sewer — 0.0% (b) | | | | | | | | |
City of Cincinnati, Water System Series A, Rev., 5.00%, 12/1/2018 | | | 20 | | | | 20 | |
County of Butler Rev., 4.00%, 12/1/2018 | | | 30 | | | | 30 | |
| | | | | | | | |
| | | | | | | 50 | |
| | | | | | | | |
Total Ohio | | | | | | | 93,213 | |
| | | | | | | | |
Oklahoma — 0.2% | | | | | | | | |
Education — 0.1% | | | | | | | | |
Canadian County Educational Facilities Authority, Mustang Public Schools Project | | | | | | | | |
Rev., 3.00%, 9/1/2018 | | | 335 | | | | 335 | |
Rev., 3.00%, 9/1/2019 | | | 1,000 | | | | 1,011 | |
Cleveland County Educational Facilities Authority, Educational Facilities Lease, Noble Public Schools Project | | | | | | | | |
Rev., 4.00%, 9/1/2018 | | | 125 | | | | 125 | |
Rev., 4.00%, 9/1/2019 | | | 120 | | | | 122 | |
Cleveland County Educational Facilities Authority, Moore Public Schools Project Rev., 5.00%, 6/1/2019 | | | 300 | | | | 307 | |
Okarche Economic Development Authority, Okarche Public Schools Project Rev., 4.00%, 9/1/2019 | | | 125 | | | | 127 | |
Oklahoma County Finance Authority, Educational Facilities, Lease Midwest City-Del City Public Schools Project Series 2018, Rev., 5.00%, 10/1/2018 | | | 160 | | | | 160 | |
Oklahoma County Finance Authority, Educational Facilities, Lease Western Harrah Public Schools Project Rev., 2.00%, 9/1/2018 | | | 200 | | | | 200 | |
Sequoyah County Educational Facilities Authority, Sallisaw Public Schools Project Rev., 2.00%, 9/1/2018 | | | 500 | | | | 500 | |
| | | | | | | | |
| | | | | | | 2,887 | |
| | | | | | | | |
Housing — 0.1% | | | | | | | | |
Oklahoma Housing Finance Agency, Green Rural Development Portfolio Series 2018, Rev., 1.90%, 3/1/2020 (c) | | | 1,500 | | | | 1,499 | |
| | | | | | | | |
Utility — 0.0% (b) | | | | | | | | |
Stillwater Utilities Authority, Utility System and Sales Tax Series A, Rev., 4.00%, 10/1/2018 | | | 75 | | | | 75 | |
| | | | | | | | |
Total Oklahoma | | | | | | | 4,461 | |
| | | | | | | | |
SEE NOTES TO FINANCIAL STATEMENTS.
| | | | | | | | |
| | | |
| AUGUST 31, 2018 | | J.P. MORGAN MUNICIPAL BOND FUNDS | | | | | 71 | |
JPMorgan Ultra-Short Municipal Fund
SCHEDULE OF PORTFOLIO INVESTMENTS
AS OF AUGUST 31, 2018 (Unaudited) (continued)
| | | | | | | | |
| INVESTMENTS | | PRINCIPAL
AMOUNT
($000) | | | VALUE
($000) | |
Municipal Bonds — continued | |
Oregon — 0.5% | | | | | | | | |
Certificate of Participation/Lease — 0.1% | | | | | | | | |
Oregon Education Districts Series A, COP, 2.50%, 12/31/2018 | | | 1,800 | | | | 1,806 | |
| | | | | | | | |
General Obligation — 0.1% | | | | | | | | |
Clackamas County School District No. 12 Series A, GO, Zero Coupon, 6/15/2019 | | | 250 | | | | 247 | |
County of Washington Series 2016, GO, 5.00%, 6/1/2021 | | | 1,875 | | | | 2,032 | |
Salem-Keizer School District No. 24J | | | | | | | | |
GO, 4.00%, 6/15/2019 | | | 375 | | | | 382 | |
GO, 4.00%, 6/15/2020 | | | 225 | | | | 234 | |
GO, 4.00%, 6/15/2021 | | | 175 | | | | 185 | |
GO, 5.00%, 6/15/2021 | | | 500 | | | | 543 | |
State of Oregon Series L, GO, 5.00%, 11/1/2018 | | | 25 | | | | 25 | |
| | | | | | | | |
| | | | | | | 3,648 | |
| | | | | | | | |
Hospital — 0.3% | | | | | | | | |
Clackamas County Hospital Facility Authority, Legacy Health System Series B, Rev., VRDO, LOC: U.S. Bank NA, 1.47%, 9/13/2018 (c) | | | 1,000 | | | | 1,000 | |
Klamath Falls Intercommunity Hospital Authority, Sky Lakes Medical Center Project Rev., 3.00%, 9/1/2018 | | | 100 | | | | 100 | |
Salem Hospital Facility Authority, Hospital Project Series B, Rev., VRDO, LOC: U.S. Bank NA, 1.47%, 9/13/2018 (c) | | | 5,350 | | | | 5,350 | |
| | | | | | | | |
| | | | | | | 6,450 | |
| | | | | | | | |
Transportation — 0.0% (b) | | | | | | | | |
Tri-County Metropolitan Transportation District of Oregon, Capital Grant Receipts Series A, Rev., 5.00%, 10/1/2018 | | | 35 | | | | 35 | |
| | | | | | | | |
Total Oregon | | | | | | | 11,939 | |
| | | | | | | | |
Pennsylvania — 4.9% | | | | | | | | |
Education — 1.2% | | | | | | | | |
Chester County Health and Education Facilities Authority, Immaculata University Project Rev., 3.00%, 11/1/2018 | | | 255 | | | | 255 | |
Pennsylvania Higher Educational Facilities Authority | | | | | | | | |
Series A, Rev., 5.00%, 9/1/2019 (d) | | | 8,950 | | | | 9,242 | |
Series AN, Rev., 5.00%, 6/15/2020 | | | 5,975 | | | | 6,269 | |
Pennsylvania Higher Educational Facilities Authority, Aicup Financing Program-York College of Pennsylvania Project Rev., 2.23%, 5/1/2019 (c) | | | 1,000 | | | | 1,000 | |
| | | | | | | | |
| INVESTMENTS | | PRINCIPAL
AMOUNT
($000) | | | VALUE
($000) | |
| |
Education — continued | | | | | | | | |
Pennsylvania Higher Educational Facilities Authority, Associates Independent Colleges Rev., 2.72%, 5/1/2021 (c) | | | 2,500 | | | | 2,535 | |
Pennsylvania Higher Educational Facilities Authority, University of Pennsylvania Health System Rev., 5.00%, 8/15/2019 | | | 200 | | | | 206 | |
Pennsylvania Higher Educational Facilities Authority, Widener University Rev., 2.00%, 7/15/2019 | | | 290 | | | | 289 | |
Snyder County Higher Education Authority, Susquehanna University Project Rev., 4.00%, 1/1/2019 | | | 375 | | | | 378 | |
University of Pittsburgh of the Commonwealth System, Higher Education Panthers Rev., (SIFMA Municipal Swap Index Yield + 0.24%), 1.73%, 9/13/2018 (e) | | | 10,000 | | | | 10,080 | |
| | | | | | | | |
| | | | | | | 30,254 | |
| | | | | | | | |
General Obligation — 0.6% | | | | | | | | |
Butler Area School District | | | | | | | | |
GO, AGM, 2.00%, 10/1/2018 | | | 250 | | | | 250 | |
GO, AGM, 3.00%, 10/1/2019 | | | 1,150 | | | | 1,165 | |
GO, AGM, 4.00%, 10/1/2020 | | | 865 | | | | 902 | |
City of Easton Series A, GO, AGM, 2.00%, 11/15/2018 | | | 350 | | | | 350 | |
Commonwealth of Pennsylvania Series 2015, GO, 5.00%, 8/15/2022 | | | 8,995 | | | | 9,930 | |
Cumberland Valley School District, Refunding and Improvement Series A, GO, 4.00%, 11/15/2018 | | | 20 | | | | 20 | |
Great Valley School District GO, 4.00%, 11/1/2018 | | | 20 | | | | 20 | |
Juniata County School District | | | | | | | | |
GO, AGM, 2.00%, 11/15/2019 (f) | | | 190 | | | | 190 | |
GO, AGM, 5.00%, 11/15/2021 (f) | | | 185 | | | | 202 | |
Municipality of Monroeville GO, 3.00%, 6/1/2020 | | | 1,075 | | | | 1,095 | |
Souderton Area School District Series A, GO, 4.00%, 11/15/2018 | | | 20 | | | | 20 | |
The School Board of Philadelphia County Series A, GO, 5.00%, 9/1/2019 | | | 500 | | | | 515 | |
Township of Upper Darby GO, AGM, 2.00%, 5/1/2019 | | | 210 | | | | 210 | |
| | | | | | | | |
| | | | | | | 14,869 | |
| | | | | | | | |
Hospital — 0.1% | | | | | | | | |
Montgomery County Higher Education and Health Authority, Thomas Jefferson University Rev., 5.00%, 9/1/2019 | | | 500 | | | | 515 | |
SEE NOTES TO FINANCIAL STATEMENTS.
| | | | | | |
| | | |
| 72 | | | | J.P. MORGAN MUNICIPAL BOND FUNDS | | AUGUST 31, 2018 |
| | | | | | | | |
| INVESTMENTS | | PRINCIPAL
AMOUNT
($000) | | | VALUE
($000) | |
Municipal Bonds — continued | |
Hospital — continued | | | | | | | | |
Philadelphia Hospitals and Higher Education Facilities Authority, Temple University Health System, Hospital Revenue Rev., 5.00%, 7/1/2019 | | | 1,385 | | | | 1,416 | |
| | | | | | | | |
| | | | | | | 1,931 | |
| | | | | | | | |
Housing — 0.0% (b) | | | | | | | | |
Philadelphia Housing Authority, PHA Headquarters Project Rev., 4.00%, 5/1/2019 | | | 250 | | | | 254 | |
| | | | | | | | |
Industrial Development Revenue/Pollution Control Revenue — 0.1% | | | | | |
Franklin County Industrial Development Authority, Menno-Haven, Inc., Project Rev., 4.00%, 12/1/2020 | | | 520 | | | | 531 | |
Lackawanna County Industrial Development Authority, University of Scranton | | | | | | | | |
Rev., 3.00%, 11/1/2018 | | | 25 | | | | 25 | |
Rev., 3.00%, 11/1/2019 | | | 50 | | | | 50 | |
Rev., 4.00%, 11/1/2020 | | | 100 | | | | 104 | |
Rev., 5.00%, 11/1/2021 | | | 1,000 | | | | 1,081 | |
Pennsylvania Economic Development Financing Authority, Waste Management, Inc. Project Rev., 1.55%, 12/3/2018 (c) | | | 300 | | | | 300 | |
| | | | | | | | |
| | | | | | | 2,091 | |
| | | | | | | | |
Other Revenue — 1.2% | | | | | | | | |
Allentown Neighborhood Improvement Zone Development Authority, City Center Project Rev., 5.00%, 5/1/2023 (g) | | | 250 | | | | 268 | |
Commonwealth Financing Authority, Tobacco Master Settlement Payment | | | | | | | | |
Series 2018, Rev., 5.00%, 6/1/2020 | | | 555 | | | | 581 | |
Series 2018, Rev., 5.00%, 6/1/2021 | | | 535 | | | | 573 | |
Cumberland County Municipal Authority, AICUP Financing Program-Messiah College Project Rev., 2.00%, 4/30/2020 (c) | | | 250 | | | | 250 | |
Emmaus General Authority Rev., VRDO, AGM, 1.54%, 9/13/2018 (c) | | | 6,090 | | | | 6,090 | |
Philadelphia Municipal Authority, City Agreement, Juvenile Justice Services Center Rev., 4.00%, 4/1/2019 | | | 195 | | | | 197 | |
Tender Option Bond Trust Receipts/Certificates | | | | | | | | |
Series 2018-XL0060, Rev., VRDO, LIQ: Barclays Bank plc, LOC: Barclays Bank plc, 1.66%, 9/13/2018 (c) (g) | | | 5,650 | | | | 5,650 | |
Series 2018-XX1, Rev., VRDO, LIQ: Barclays Bank plc, LOC: Barclays Bank plc, 1.66%, 9/13/2018 (c) (g) | | | 8,000 | | | | 8,000 | |
| | | | | | | | |
| INVESTMENTS | | PRINCIPAL
AMOUNT
($000) | | | VALUE
($000) | |
| |
Other Revenue — continued | | | | | | | | |
Series 2018-XM0594, Rev., VRDO, LIQ: Barclays Bank plc, 1.68%, 9/13/2018 (c) (g) | | | 4,600 | | | | 4,600 | |
Urban Redevelopment Authority of Pittsburgh, Crawford Square Apartments Project Rev., 2.25%, 6/1/2020 (c) | | | 1,850 | | | | 1,853 | |
| | | | | | | | |
| | | | | | | 28,062 | |
| | | | | | | | |
Prerefunded — 0.0% (b) | | | | | | | | |
County of Allegheny, West Mifflin Area School District GO, AGM, 5.38%, 10/1/2018 (d) | | | 15 | | | | 15 | |
The School Board of Philadelphia County Series F, GO, BHAC-CR, 5.13%, 9/1/2018 (d) | | | 35 | | | | 35 | |
West Shore School District GO, AGC, 4.50%, 5/15/2019 (d) | | | 25 | | | | 25 | |
| | | | | | | | |
| | | | | | | 75 | |
| | | | | | | | |
Transportation — 1.4% | | | | | | | | |
Delaware River Port Authority Series B, Rev., VRDO, LOC: Barclays Bank plc, 1.47%, 9/13/2018 (c) | | | 15,000 | | | | 15,000 | |
Pennsylvania Turnpike Commission | | | | | | | | |
Series A-1, Rev., (SIFMA Municipal Swap Index Yield + 0.60%), 2.09%, 9/13/2018 (e) | | | 18,000 | | | | 17,947 | |
Series B, Subseries B-2, Rev., 5.00%, 6/1/2019 | | | 75 | | | | 77 | |
Series B, Subseries B-2, Rev., 5.00%, 6/1/2020 | | | 50 | | | | 53 | |
Pennsylvania Turnpike Commission, Senior Lien Series A, Rev., 5.00%, 12/1/2020 | | | 110 | | | | 118 | |
| | | | | | | | |
| | | | | | | 33,195 | |
| | | | | | | | |
Utility — 0.3% | | | | | | | | |
City of Philadelphia, Gas Works, 1998 General Ordinance, Fifteen Rev., 3.00%, 8/1/2019 | | | 2,100 | | | | 2,120 | |
Philadelphia Gas Works Co. Series C, Rev., VRDO, LOC: Barclays Bank plc, 1.47%, 9/13/2018 (c) | | | 6,000 | | | | 6,000 | |
| | | | | | | | |
| | | | | | | 8,120 | |
| | | | | | | | |
Total Pennsylvania | | | | | | | 118,851 | |
| | | | | | | | |
Rhode Island — 0.6% | | | | | | | | |
Education — 0.2% | | | | | | | | |
Rhode Island Health and Educational Building Corp., Higher Education Facility, Rhode Island School of Design Issue Series A, Rev., VRDO, LOC: U.S. Bank NA, 1.48%, 9/13/2018 (c) | | | 4,960 | | | | 4,960 | |
| | | | | | | | |
SEE NOTES TO FINANCIAL STATEMENTS.
| | | | | | | | |
| | | |
| AUGUST 31, 2018 | | J.P. MORGAN MUNICIPAL BOND FUNDS | | | | | 73 | |
JPMorgan Ultra-Short Municipal Fund
SCHEDULE OF PORTFOLIO INVESTMENTS
AS OF AUGUST 31, 2018 (Unaudited) (continued)
| | | | | | | | |
| INVESTMENTS | | PRINCIPAL
AMOUNT
($000) | | | VALUE
($000) | |
Municipal Bonds — continued | |
Industrial Development Revenue/Pollution Control Revenue — 0.0% (b) | | | | | |
Rhode Island Infrastructure Bank, Water Pollution Control Revolving Fund Series A, Rev., 5.00%, 10/1/2018 | | | 35 | | | | 35 | |
| | | | | | | | |
Other Revenue — 0.0% (b) | | | | | | | | |
Providence Public Building Authority, Capital Improvement | | | | | | | | |
Series A, Rev., 3.00%, 9/15/2018 | | | 125 | | | | 125 | |
Series A, Rev., 4.00%, 9/15/2019 | | | 250 | | | | 254 | |
Series A, Rev., 5.00%, 9/15/2020 | | | 200 | | | | 210 | |
| | | | | | | | |
| | | | | | | 589 | |
| | | | | | | | |
Transportation — 0.1% | | | | | | | | |
Rhode Island Commerce Corp., First Lien Special Facility, Rhode Island Airport Corp. Intermodal Facility Project | | | | | | | | |
Series 2018, Rev., 5.00%, 7/1/2019 | | | 500 | | | | 512 | |
Series 2018, Rev., 5.00%, 7/1/2020 | | | 585 | | | | 615 | |
| | | | | | | | |
| | | | | | | 1,127 | |
| | | | | | | | |
Water & Sewer — 0.3% | | | | | | | | |
Narragansett Bay Commission, Wastewater System Series A, Rev., VRDO, LOC: TD Bank NA, 1.38%, 9/13/2018 (c) | | | 7,000 | | | | 7,000 | |
| | | | | | | | |
Total Rhode Island | | | | | | | 13,711 | |
| | | | | | | | |
South Carolina — 0.1% | | | | | | | | |
Education — 0.1% | | | | | | | | |
County of Spartanburg, School District No. 7 Rev., 3.00%, 12/1/2018 | | | 300 | | | | 301 | |
Educational Facilities Authority, Wofford College Series B, Rev., 2.38%, 4/1/2022 (c) | | | 500 | | | | 497 | |
Scago Educational Facilities Corp. for Colleton School District Rev., 5.00%, 12/1/2018 | | | 1,420 | | | | 1,431 | |
| | | | | | | | |
| | | | | | | 2,229 | |
| | | | | | | | |
Hospital — 0.0% (b) | | | | | | | | |
Lexington County Health Services District, Inc., Hospital, LexMed Obligated Group Series 2017, Rev., 5.00%, 11/1/2018 | | | 750 | | | | 753 | |
| | | | | | | | |
Utility — 0.0% (b) | | | | | | | | |
Piedmont Municipal Power Agency, Electric Series A, Rev., 5.00%, 1/1/2019 | | | 250 | | | | 252 | |
| | | | | | | | |
Total South Carolina | | | | | | | 3,234 | |
| | | | | | | | |
South Dakota — 0.0% (b) | | | | | | | | |
Housing — 0.0% (b) | | | | | | | | |
South Dakota Board of Regents, Housing and Auxiliary Facility System Series 2017, Rev., 5.00%, 4/1/2022 | | | 375 | | | | 412 | |
| | | | | | | | |
| | | | | | | | |
| INVESTMENTS | | PRINCIPAL
AMOUNT
($000) | | | VALUE
($000) | |
| |
Other Revenue — 0.0% (b) | | | | | | | | |
South Dakota State Building Authority | | | | | | | | |
Series A, Rev., 3.00%, 6/1/2019 | | | 150 | | | | 151 | |
Series A, Rev., 3.00%, 6/1/2020 | | | 200 | | | | 204 | |
| | | | | | | | |
| | | | | | | 355 | |
| | | | | | | | |
Total South Dakota | | | | | | | 767 | |
| | | | | | | | |
Tennessee — 1.9% | | | | | | | | |
Education — 0.8% | | | | | | | | |
Metropolitan Government of Nashville and Davidson County, Health and Educational Facilities Board Rev., 1.30%, 7/1/2019 (c) | | | 6,250 | | | | 6,218 | |
Metropolitan Government of Nashville and Davidson County, Health and Educational Facilities Board, East Webster Street Apartments Project Rev., 2.05%, 4/1/2020 (c) | | | 2,500 | | | | 2,508 | |
Metropolitan Government of Nashville and Davidson County, Health and Educational Facilities Board, Oakwood Flats Apartments Project Rev., 2.10%, 10/1/2020 (c) | | | 6,500 | | | | 6,521 | |
Metropolitan Government of Nashville and Davidson County, Health and Educational Facilities Board, Twelfth and Wedgewood Apartments Project Series 2017, Rev., GNMA, 1.80%, 12/1/2019 (c) | | | 4,000 | | | | 3,996 | |
| | | | | | | | |
| | | | | | | 19,243 | |
| | | | | | | | |
General Obligation — 0.2% | | | | | | | | |
County of Monroe GO, BAN, 1.20%, 6/15/2019 | | | 3,500 | | | | 3,482 | |
County of Shelby, Public Improvment Series B, GO, VRDO, 1.50%, 9/13/2018 (c) | | | 2,000 | | | | 2,000 | |
County of Sumner, School and Public Improvement Series 2013, GO, 5.00%, 12/1/2019 | | | 105 | | | | 109 | |
| | | | | | | | |
| | | | | | | 5,591 | |
| | | | | | | | |
Housing — 0.7% | | | | | | | | |
Metropolitan Government Nashville and Davidson County Health and Educational Facilities Board, Multifamily Housing, Dandridge Towers Project Rev., 1.87%, 7/1/2020 (c) | | | 2,400 | | | | 2,396 | |
Metropolitan Government Nashville and Davidson County Health and Educational Facilities Board, Multifamily Housing, Trevecca Towers I/East Project Rev., 2.00%, 1/1/2021 (c) | | | 10,000 | | | | 10,020 | |
Metropolitan Government Nashville and Davidson County Health and Educational Facilities Board, Multifamily Housing, Trevecca Towers Ii Project Rev., 2.00%, 1/1/2021 (c) | | | 5,000 | | | | 5,009 | |
| | | | | | | | |
| | | | | | | 17,425 | |
| | | | | | | | |
SEE NOTES TO FINANCIAL STATEMENTS.
| | | | | | |
| | | |
| 74 | | | | J.P. MORGAN MUNICIPAL BOND FUNDS | | AUGUST 31, 2018 |
| | | | | | | | |
| INVESTMENTS | | PRINCIPAL
AMOUNT
($000) | | | VALUE
($000) | |
Municipal Bonds — continued | |
Utility — 0.1% | | | | | | | | |
City of Knoxville, Gas System Series W, Rev., 5.00%, 3/1/2019 | | | 120 | | | | 122 | |
Tennessee Energy Acquisition Corp., Gas Project | | | | | | | | |
Series A, Rev., 4.00%, 5/1/2019 | | | 625 | | | | 634 | |
Series A, Rev., 4.00%, 5/1/2020 | | | 780 | | | | 804 | |
Series A, Rev., 4.00%, 5/1/2021 | | | 730 | | | | 763 | |
| | | | | | | | |
| | | | | | | 2,323 | |
| | | | | | | | |
Water & Sewer — 0.1% | | | | | | | | |
Jackson Energy Authority, Wastewater System | | | | | | | | |
Rev., 5.00%, 12/1/2018 | | | 425 | | | | 428 | |
Rev., 5.00%, 12/1/2019 | | | 350 | | | | 364 | |
| | | | | | | | |
| | | | | | | 792 | |
| | | | | | | | |
Total Tennessee | | | | | | | 45,374 | |
| | | | | | | | |
Texas — 7.4% | | | | | | | | |
Education — 0.3% | | | | | | | | |
Arlington Higher Education Finance Corp., Uplift Education | | | | | | | | |
Series A, Rev., PSF-GTD, 2.00%, 12/1/2018 | | | 700 | | | | 701 | |
Series A, Rev., PSF-GTD, 3.00%, 12/1/2019 | | | 435 | | | | 442 | |
Austin Community College District Public Facility Corp., Lease, Highland Campus Parking Garage Project | | | | | | | | |
Series C, Rev., 5.00%, 8/1/2024 | | | 200 | | | | 228 | |
Series C, Rev., 5.00%, 8/1/2025 | | | 200 | | | | 230 | |
Austin Community College District, Combined Fee | | | | | | | | |
Rev., 5.00%, 2/1/2020 | | | 110 | | | | 115 | |
Rev., 5.00%, 2/1/2021 | | | 160 | | | | 171 | |
Rev., 5.00%, 2/1/2022 | | | 165 | | | | 181 | |
Rev., 5.00%, 2/1/2023 | | | 170 | | | | 190 | |
County of Harris, Cultural Education Facilities Finance Corp., Children’s Hospital | | | | | | | | |
Rev., 5.00%, 11/15/2018 | | | 3,155 | | | | 3,175 | |
Series D, Rev., 5.00%, 11/15/2018 (d) | | | 25 | | | | 25 | |
Harris County Cultural Education Facilities Finance Corp., TECO Project Series 2017, Rev., 5.00%, 11/15/2019 | | | 175 | | | | 182 | |
New Hope Cultural Education Facilities Finance Corp., Longhorn Village Project Rev., 5.00%, 1/1/2020 | | | 195 | | | | 201 | |
Newark Higher Education Finance Corp., Orenda Education Rev., PSF-GTD, 4.00%, 8/15/2019 | | | 200 | | | | 204 | |
Tarrant County Cultural Education Facilities Finance Corp., Buckner Retirement Services, Inc. Project Rev., 5.00%, 11/15/2018 | | | 300 | | | | 302 | |
| | | | | | | | |
| | | | | | | 6,347 | |
| | | | | | | | |
| | | | | | | | |
| INVESTMENTS | | PRINCIPAL
AMOUNT
($000) | | | VALUE
($000) | |
| |
General Obligation — 3.8% | | | | | | | | |
City of Austin GO, 4.00%, 9/1/2018 | | | 20 | | | | 20 | |
City of Granbury | | | | | | | | |
Series 2018, GO, 2.00%, 8/15/2019 | | | 160 | | | | 160 | |
Series 2018, GO, 2.00%, 8/15/2020 | | | 185 | | | | 185 | |
City of Odessa | | | | | | | | |
Series 2017, GO, 4.00%, 3/1/2019 | | | 360 | | | | 364 | |
Series 2017, GO, 4.00%, 3/1/2020 | | | 300 | | | | 310 | |
Clear Creek Independent School District, School Building Series B, GO, PSF-GTD, 1.45%, 8/14/2020 (c) | | | 2,200 | | | | 2,183 | |
Corpus Christi Independent School District, School Building Series A, GO, PSF-GTD, 2.00%, 8/15/2019 (c) | | | 1,250 | | | | 1,254 | |
County of Bexar, Harlandale Independent School District GO, PSF-GTD, 3.00%, 8/15/2021 (c) | | | 4,000 | | | | 4,083 | |
County of Harris | | | | | | | | |
Series B, GO, 4.00%, 10/1/2018 | | | 30 | | | | 30 | |
Series A, GO, 5.00%, 10/1/2018 | | | 25 | | | | 25 | |
County of La Salle | | | | | | | | |
GO, AGM, 5.00%, 3/1/2019 | | | 295 | | | | 300 | |
GO, AGM, 5.00%, 3/1/2020 | | | 315 | | | | 329 | |
GO, AGM, 5.00%, 3/1/2021 | | | 345 | | | | 370 | |
County of La Salle, Unlimited Tax | | | | | | | | |
GO, AGM, 5.00%, 3/1/2019 | | | 1,000 | | | | 1,016 | |
GO, AGM, 5.00%, 3/1/2020 | | | 2,075 | | | | 2,169 | |
GO, AGM, 5.00%, 3/1/2021 | | | 2,135 | | | | 2,287 | |
Cuero Independent School District, School Building Series 2014, GO, PSF-GTD, 5.00%, 8/15/2021 | | | 100 | | | | 109 | |
El Paso County Hospital District GO, 5.00%, 8/15/2019 | | | 175 | | | | 179 | |
Fort Bend County Municipal Utility District No. 151 GO, 3.00%, 9/1/2021 | | | 190 | | | | 194 | |
Fort Bend County, Levee Improvement District No. 15 GO, 0.75%, 9/1/2018 | | | 2,545 | | | | 2,545 | |
Fort Bend Independent School District Series B, GO, PSF-GTD, 1.35%, 8/1/2019 (c) | | | 6,560 | | | | 6,543 | |
Goose Creek Consolidated Independent School District Series B, GO, PSF-GTD, 1.18%, 8/15/2019 (c) | | | 3,100 | | | | 3,083 | |
Harris County Municipal Utility District No. 412 GO, 2.00%, 9/1/2018 | | | 100 | | | | 100 | |
Houston Independent School District, Schoolhouse Series A-2, GO, PSF-GTD, 3.00%, 6/1/2019 (c) | | | 6,000 | | | | 6,058 | |
Leander Independent School District, Capital Appreciation Series B, GO, Zero Coupon, 8/15/2019 | | | 220 | | | | 216 | |
SEE NOTES TO FINANCIAL STATEMENTS.
| | | | | | | | |
| | | |
| AUGUST 31, 2018 | | J.P. MORGAN MUNICIPAL BOND FUNDS | | | | | 75 | |
JPMorgan Ultra-Short Municipal Fund
SCHEDULE OF PORTFOLIO INVESTMENTS
AS OF AUGUST 31, 2018 (Unaudited) (continued)
| | | | | | | | |
| INVESTMENTS | | PRINCIPAL
AMOUNT
($000) | | | VALUE
($000) | |
Municipal Bonds — continued | |
General Obligation — continued | | | | | | | | |
Midlothian Independent School District, School Building Series B, GO, PSF-GTD, 2.50%, 8/1/2020 (c) | | | 5,000 | | | | 5,056 | |
New Caney Independent School District, School Building GO, PSF-GTD, 3.00%, 8/15/2021 (c) | | | 1,500 | | | | 1,544 | |
Northside Independent School District GO, PSF-GTD, 1.45%, 6/1/2020 (c) | | | 4,000 | | | | 3,972 | |
Northside Independent School District, School Building GO, PSF-GTD, 2.00%, 6/1/2021 (c) | | | 1,000 | | | | 995 | |
Pasadena Independent School District, School Building Series 2018, GO, PSF-GTD, 5.00%, 2/15/2019 | | | 600 | | | | 609 | |
Sienna Plantation Levee Improvement District of Fort Bend County GO, 2.00%, 9/1/2019 | | | 250 | | | | 250 | |
Southside Independent School District, School Building GO, PSF-GTD, 2.00%, 8/15/2019 | | | 250 | | | | 251 | |
State of Texas, Public Finance Authority Series A, GO, 5.00%, 10/1/2018 | | | 40 | | | | 40 | |
State of Texas, Transportation Commission, Multi Mode Mobility Fund Series B-R, GO, VRDO, LIQ: Texas Comptroller of Public Accounts, 1.48%, 9/13/2018 (c) | | | 23,505 | | | | 23,505 | |
State of Texas, Veterans Bonds GO, VRDO, 1.53%, 9/13/2018 (c) | | | 21,800 | | | | 21,800 | |
Weslaco Independent School District, Maintenance Tax Notes GO, AGM, 3.00%, 2/15/2019 | | | 230 | | | | 231 | |
| | | | | | | | |
| | | | | | | 92,365 | |
| | | | | | | | |
Hospital — 1.1% | | | | | | | | |
Harris County Cultural Education Facilities Finance Corp., Memorial Hermann Health System | | | | | | | | |
Rev., VRDO, 1.51%, 9/13/2018 (c) | | | 17,215 | | | | 17,215 | |
Series D, Rev., VRDO, 1.51%, 9/13/2018 (c) | | | 8,800 | | | | 8,800 | |
| | | | | | | | |
| | | | | | | 26,015 | |
| | | | | | | | |
Industrial Development Revenue/Pollution Control Revenue — 0.2% | | | | | |
Matagorda County Navigation District No. 1, Pollution Control Rev., AMT, 1.75%, 9/1/2020 (c) | | | 4,000 | | | | 3,928 | |
| | | | | | | | |
Other Revenue — 0.5% | | | | | | | | |
Austin Convention Enterprises, Inc., Convention Center Hotel First Tier Series A, Rev., 5.00%, 1/1/2019 | | | 1,100 | | | | 1,110 | |
Mission Redevelopment Authority, Tax Increment Contract Revenue Rev., AGM, 4.00%, 9/1/2018 | | | 960 | | | | 960 | |
| | | | | | | | |
| INVESTMENTS | | PRINCIPAL
AMOUNT
($000) | | | VALUE
($000) | |
| |
Other Revenue — continued | | | | | | | | |
State of Texas Rev., TRAN, 4.00%, 8/29/2019 | | | 10,000 | | | | 10,207 | |
| | | | | | | | |
| | | | | | | 12,277 | |
| | | | | | | | |
Prerefunded — 0.3% | | | | | | | | |
City of Dallas, Waterworks and Sewer System Rev., 5.00%, 10/1/2018 (d) | | | 25 | | | | 25 | |
Corpus Christi Independent School District, School Building GO, 5.00%, 8/15/2019 (d) | | | 500 | | | | 515 | |
Dallas Area Rapid Transit, Senior Lien Rev., 5.00%, 12/1/2018 (d) | | | 45 | | | | 45 | |
Garland Independent School District, School Building Series A, GO, 5.00%, 2/15/2019 (d) | | | 4,830 | | | | 4,902 | |
Hidalgo County Drain District No. 1, Improvement GO, AGC, 4.75%, 9/1/2018 (d) | | | 20 | | | | 20 | |
North Texas Tollway Authority System, First Tier | | | | | | | | |
Series K-1, Rev., AGC, 5.75%, 1/1/2019 (d) | | | 70 | | | | 71 | |
Series A, Rev., 6.00%, 1/1/2019 (d) | | | 1,220 | | | | 1,237 | |
Series A, Rev., 6.25%, 1/1/2019 (d) | | | 50 | | | | 51 | |
| | | | | | | | |
| | | | | | | 6,866 | |
| | | | | | | | |
Transportation — 0.5% | | | | | | | | |
Brazoria County Toll Road Authority, Limited Contract Tax and Subordinate Lien Toll Road Series B, Rev., BAN, 1.45%, 3/1/2020 | | | 7,000 | | | | 6,965 | |
Camino Real Regional Mobility Authority, Subordinate Lien Vehicle Rev., AGM, 5.00%, 6/1/2019 | | | 155 | | | | 159 | |
Dallas Area Rapid Transit, Senior Lien | | | | | | | | |
Rev., 5.00%, 12/1/2018 | | | 50 | | | | 51 | |
Series A, Rev., 5.00%, 12/1/2018 | | | 50 | | | | 50 | |
Dallas-Fort Worth International Airport Series E, Rev., 5.00%, 11/1/2019 | | | 525 | | | | 544 | |
Harris County Toll Road Authority, Senior Lien | | | | | | | | |
Series A, Rev., 5.00%, 8/15/2019 | | | 1,850 | | | | 1,907 | |
Series A, Rev., 5.00%, 8/15/2020 | | | 1,500 | | | | 1,591 | |
Series A, Rev., 5.00%, 8/15/2021 | | | 1,500 | | | | 1,630 | |
Harris County, Metropolitan Transit Authority Rev., 4.00%, 11/1/2018 (d) | | | 30 | | | | 30 | |
Love Field Airport Modernization Corp. Rev., AMT, 5.00%, 11/1/2021 | | | 125 | | | | 135 | |
Port Beaumont Navigation District | | | | | | | | |
Rev., 3.00%, 9/1/2019 | | | 100 | | | | 101 | |
Rev., 4.00%, 9/1/2020 | | | 155 | | | | 160 | |
Texas Transportation Commission, State Highway Fund | | | | | | | | |
Rev., 4.00%, 10/1/2018 | | | 20 | | | | 20 | |
Series A, Rev., 5.00%, 10/1/2018 | | | 20 | | | | 20 | |
| | | | | | | | |
| | | | | | | 13,363 | |
| | | | | | | | |
SEE NOTES TO FINANCIAL STATEMENTS.
| | | | | | |
| | | |
| 76 | | | | J.P. MORGAN MUNICIPAL BOND FUNDS | | AUGUST 31, 2018 |
| | | | | | | | |
| INVESTMENTS | | PRINCIPAL
AMOUNT
($000) | | | VALUE
($000) | |
Municipal Bonds — continued | |
Utility — 0.2% | | | | | | | | |
City of Houston, Combined Utility System, First Lien Series C, Rev., 5.00%, 11/15/2018 | | | 25 | | | | 25 | |
City of Houston, Utility System Series B-6, Rev., VRDO, LOC: Sumitomo Mitsui Banking Corp., 1.49%, 9/13/2018 (c) | | | 4,425 | | | | 4,425 | |
| | | | | | | | |
| | | | | | | 4,450 | |
| | | | | | | | |
Water & Sewer — 0.5% | | | | | | | | |
City of Austin, Water and Wastewater System Rev., VRDO, LOC: Citibank NA, 1.50%, 9/13/2018 (c) | | | 11,275 | | | | 11,275 | |
North Texas Municipal Water District, Water System Rev., 4.00%, 9/1/2018 | | | 20 | | | | 20 | |
Trinity River Authority Central Regional Wastewater System Revenue | | | | | | | | |
Rev., 5.00%, 8/1/2019 | | | 1,255 | | | | 1,292 | |
Rev., 5.00%, 8/1/2020 | | | 675 | | | | 716 | |
| | | | | | | | |
| | | | | | | 13,303 | |
| | | | | | | | |
Total Texas | | | | | | | 178,914 | |
| | | | | | | | |
Utah — 0.9% | | | | | | | | |
Education — 0.1% | | | | | | | | |
Utah Charter School Finance Authority, Utah Charter Academies Project | | | | | | | | |
Rev., 3.00%, 10/15/2019 | | | 200 | | | | 202 | |
Rev., 3.00%, 10/15/2020 | | | 220 | | | | 223 | |
Rev., 4.00%, 10/15/2021 | | | 305 | | | | 320 | |
| | | | | | | | |
| | | | | | | 745 | |
| | | | | | | | |
Hospital — 0.7% | | | | | | | | |
County of Utah Hospital, IHC Health Services, Inc. | | | | | | | | |
Series B, Rev., VRDO, 1.47%, 9/13/2018 (c) | | | 4,000 | | | | 4,000 | |
Series C, Rev., VRDO, 1.47%, 9/13/2018 (c) | | | 2,500 | | | | 2,500 | |
Series D, Rev., VRDO, 1.47%, 9/13/2018 (c) | | | 11,275 | | | | 11,275 | |
| | | | | | | | |
| | | | | | | 17,775 | |
| | | | | | | | |
Other Revenue — 0.1% | | | | | | | | |
City of Murray, Sales Tax | | | | | | | | |
Series 2018, Rev., 2.00%, 11/15/2018 | | | 200 | | | | 200 | |
Series 2018, Rev., 3.00%, 11/15/2019 | | | 100 | | | | 101 | |
Series 2018, Rev., 3.00%, 11/15/2020 | | | 235 | | | | 241 | |
Series 2018, Rev., 4.00%, 11/15/2021 | | | 150 | | | | 159 | |
Utah Infrastructure Agency, Telecommunication Revenue | | | | | | | | |
Series A, Rev., 2.00%, 10/15/2018 | | | 540 | | | | 540 | |
Series A, Rev., 2.00%, 10/15/2019 | | | 1,000 | | | | 993 | |
| | | | | | | | |
| | | | | | | 2,234 | |
| | | | | | | | |
| | | | | | | | |
| INVESTMENTS | | PRINCIPAL
AMOUNT
($000) | | | VALUE
($000) | |
| |
Utility — 0.0% (b) | | | | | | | | |
City of Lehi, Electric Utility | | | | | | | | |
Series 2018, Rev., 4.00%, 6/1/2019 | | | 75 | | | | 76 | |
Series 2018, Rev., 5.00%, 6/1/2020 | | | 85 | | | | 90 | |
Series 2018, Rev., 5.00%, 6/1/2021 | | | 75 | | | | 81 | |
| | | | | | | | |
| | | | | | | 247 | |
| | | | | | | | |
Water & Sewer — 0.0% (b) | | | | | | | | |
Snyderville Basin Water Reclamation District, Sewer Rev., 5.00%, 9/15/2018 | | | 20 | | | | 20 | |
Weber Basin Water Conservancy District Series A, Rev., 5.00%, 10/1/2018 | | | 20 | | | | 20 | |
| | | | | | | | |
| | | | | | | 40 | |
| | | | | | | | |
Total Utah | | | | | | | 21,041 | |
| | | | | | | | |
Virginia — 2.9% | | | | | | | | |
Education — 0.4% | | | | | | | | |
Virginia College Building Authority, Education Facilities, Public Higher Education Financing Program Series B, Rev., 5.00%, 9/1/2018 | | | 110 | | | | 110 | |
Virginia College Building Authority, Public Higher Education Financing Program Series B, Rev., 5.00%, 9/1/2020 | | | 7,685 | | | | 8,168 | |
Virginia Public School Authority, School Technology and Security Series IV, Rev., 5.00%, 4/15/2019 | | | 1,000 | | | | 1,021 | |
| | | | | | | | |
| | | | | | | 9,299 | |
| | | | | | | | |
General Obligation — 0.1% | | | | | | | | |
City of Charlottesville, Public Improvement Series B, GO, 4.00%, 7/15/2020 | | | 200 | | | | 209 | |
City of Norfolk Series G, GO, 4.00%, 10/1/2018 | | | 25 | | | | 25 | |
Commonwealth of Virginia Series A, GO, 5.00%, 6/1/2021 | | | 1,480 | | | | 1,606 | |
| | | | | | | | |
| | | | | | | 1,840 | |
| | | | | | | | |
Housing — 0.4% | | | | | | | | |
Newport News Redevelopment and Housing Authority, Berkley Preservation Project Rev., FHA, GNMA, 1.20%, 4/1/2019 | | | 10,000 | | | | 9,963 | |
| | | | | | | | |
Industrial Development Revenue/Pollution Control Revenue — 0.6% | | | | | |
Louisa Industrial Development Authority, Virginia Pollution Control Revenue Refunding Bonds Rev., 1.85%, 5/16/2019 (c) | | | 7,550 | | | | 7,538 | |
Wise County Industrial Development Authority Series 2009-A, Rev., 2.15%, 9/1/2020 (c) | | | 7,500 | | | | 7,482 | |
| | | | | | | | |
| | | | | | | 15,020 | |
| | | | | | | | |
SEE NOTES TO FINANCIAL STATEMENTS.
| | | | | | | | |
| | | |
| AUGUST 31, 2018 | | J.P. MORGAN MUNICIPAL BOND FUNDS | | | | | 77 | |
JPMorgan Ultra-Short Municipal Fund
SCHEDULE OF PORTFOLIO INVESTMENTS
AS OF AUGUST 31, 2018 (Unaudited) (continued)
| | | | | | | | |
| INVESTMENTS | | PRINCIPAL
AMOUNT
($000) | | | VALUE
($000) | |
Municipal Bonds — continued | |
Other Revenue — 1.0% | | | | | | | | |
Virginia Public Building Authority, Public Facilities | | | | | | | | |
Series A, Rev., 5.00%, 8/1/2020 | | | 5,220 | | | | 5,535 | |
Series C, Rev., 5.00%, 8/1/2020 | | | 18,830 | | | | 19,968 | |
Virginia Resources Authority, Infrastructure, Unrefunded Balance Rev., 4.00%, 11/1/2018 | | | 20 | | | | 20 | |
| | | | | | | | |
| | | | | | | 25,523 | |
| | | | | | | | |
Prerefunded — 0.4% | | | | | | | | |
Fairfax County EDA, Community Services Facilities Projects Series A, Rev., 4.50%, 3/1/2021 (d) | | | 8,235 | | | | 8,769 | |
Virginia College Building Authority, Educational Facilities, 21st Century College and Equipment Programs Series A, Rev., 5.00%, 2/1/2019 (d) | | | 20 | | | | 20 | |
| | | | | | | | |
| | | | | | | 8,789 | |
| | | | | | | | |
Total Virginia | | | | | | | 70,434 | |
| | | | | | | | |
Washington — 1.1% | | | | | | | | |
Education — 0.1% | | | | | | | | |
University of Washington Series A, Rev., 5.00%, 12/1/2018 | | | 1,100 | | | | 1,109 | |
| | | | | | | | |
General Obligation — 0.0% (b) | | | | | | | | |
Pend Oreille County, Public Hospital District No. 1 | | | | | | | | |
GO, 3.00%, 12/1/2019 | | | 155 | | | | 156 | |
GO, 3.00%, 12/1/2020 | | | 155 | | | | 156 | |
Snohomish County School District No. 25, Marysville GO, 5.00%, 12/1/2020 | | | 170 | | | | 182 | |
State of Washington, Various Purpose Series R-2011B, GO, 5.00%, 7/1/2019 | | | 400 | | | | 411 | |
| | | | | | | | |
| | | | | | | 905 | |
| | | | | | | | |
Hospital — 0.8% | | | | | | | | |
Washington Biomedical Research Properties 3.2 Series A, Rev., 5.00%, 1/1/2019 | | | 145 | | | | 147 | |
Washington Health Care Facilities Authority, Catholic Health Initiatives | | | | | | | | |
Rev., (SIFMA Municipal Swap Index Yield + 1.00%), 2.49%, 9/13/2018 (e) | | | 5,000 | | | | 5,064 | |
Rev., (SIFMA Municipal Swap Index Yield + 1.40%), 2.89%, 9/13/2018 (e) | | | 10,000 | | | | 10,045 | |
Washington Health Care Facilities Authority, Overlake Hospital Medical Center Series 2017B, Rev., 5.00%, 7/1/2022 | | | 1,210 | | | | 1,332 | |
Washington Health Care Facilities Authority, Providence Health and Service Series C, Rev., VRDO, 1.49%, 9/13/2018 (c) | | | 3,150 | | | | 3,150 | |
| | | | | | | | |
| INVESTMENTS | | PRINCIPAL
AMOUNT
($000) | | | VALUE
($000) | |
| |
Hospital — continued | | | | | | | | |
Washington Health Care Facilities Authority, Seattle Children’s Hospital Rev., 5.00%, 10/1/2018 | | | 20 | | | | 20 | |
| | | | | | | | |
| | | | | | | 19,758 | |
| | | | | | | | |
Housing — 0.2% | | | | | | | | |
Washington State Housing Finance Commission, Royal Hills Apartments Series A, Rev., 1.40%, 11/1/2019 | | | 4,000 | | | | 3,975 | |
| | | | | | | | |
Industrial Development Revenue/Pollution Control Revenue — 0.0% (b) | | | | | |
Washington Economic Development Finance Authority, Seadrunar Project Series E, Rev., VRDO, LOC: U.S. Bank NA, 1.70%, 9/13/2018 (c) | | | 120 | | | | 120 | |
| | | | | | | | |
Prerefunded — 0.0% (b) | | | | | | | | |
Snohomish County School District No. 201, Snohomish GO, 5.25%, 12/1/2018 (d) | | | 15 | | | | 15 | |
| | | | | | | | |
Utility — 0.0% (b) | | | | | | | | |
City of Seattle, Municipal Light and Power Series B-2, Rev., VRDO, 2.24%, 9/13/2018 (c) | | | 100 | | | | 100 | |
Lewis County Public Utility District No. 1, Cowlitz Falls Hydroelectric Project Rev., 5.00%, 10/1/2018 | | | 20 | | | | 20 | |
| | | | | | | | |
| | | | | | | 120 | |
| | | | | | | | |
Total Washington | | | | | | | 26,002 | |
| | | | | | | | |
West Virginia — 0.2% | | | | | | | | |
Utility — 0.2% | | | | | | | | |
West Virginia Economic Development Authority, Appalachian Power Co. - AMOS Project Rev., 2.62%, 6/1/2022 (c) | | | 3,805 | | | | 3,806 | |
| | | | | | | | |
Wisconsin — 2.4% | | | | | | | | |
Education — 1.6% | | | | | | | | |
Madison Metropolitan School District Rev., TRAN, 2.00%, 9/6/2018 | | | 8,500 | | | | 8,500 | |
Wisconsin Health and Educational Facilities Authority, Advocate Aurora Health Credit Group Rev., (SIFMA Municipal Swap Index Yield + 0.35%), 1.84%, 9/13/2018 (e) | | | 21,865 | | | | 21,926 | |
Wisconsin Health and Educational Facilities Authority, Franciscan Sisters of Christian Charity Sponsored Ministries, Inc. | | | | | | | | |
Rev., 4.00%, 9/1/2018 | | | 175 | | | | 175 | |
Rev., 5.00%, 9/1/2019 | | | 145 | | | | 149 | |
Rev., 5.00%, 9/1/2020 | | | 155 | | | | 163 | |
Rev., 5.00%, 9/1/2021 | | | 160 | | | | 171 | |
SEE NOTES TO FINANCIAL STATEMENTS.
| | | | | | |
| | | |
| 78 | | | | J.P. MORGAN MUNICIPAL BOND FUNDS | | AUGUST 31, 2018 |
| | | | | | | | |
| INVESTMENTS | | PRINCIPAL
AMOUNT
($000) | | | VALUE
($000) | |
Municipal Bonds — continued | |
Education — continued | | | | | | | | |
Wisconsin School Districts, Cash Flow Administration Program Series A, Rev., 1.38%, 10/8/2018 | | | 8,000 | | | | 7,999 | |
| | | | | | | | |
| | | | | | | 39,083 | |
| | | | | | | | |
General Obligation — 0.2% | | | | | | | | |
City of Fond Du Lac Series B, GO, 2.00%, 4/1/2019 | | | 225 | | | | 226 | |
City of Madison Series A, GO, 5.00%, 10/1/2018 | | | 30 | | | | 30 | |
City of Middletown | | | | | | | | |
GO, 3.00%, 3/1/2020 | | | 200 | | | | 203 | |
GO, 3.00%, 3/1/2021 | | | 355 | | | | 364 | |
City of New Berlin, Promissory Notes GO, 3.50%, 12/1/2018 | | | 25 | | | | 25 | |
Coleman School District, Marinette and Oconto Counties GO, 3.00%, 3/1/2019 | | | 50 | | | | 50 | |
County of Manitowoc | | | | | | | | |
GO, 2.00%, 11/1/2018 | | | 105 | | | | 105 | |
GO, 2.00%, 11/1/2019 | | | 215 | | | | 215 | |
County of Milwaukee, Whitnall School District GO, 3.00%, 3/1/2019 | | | 175 | | | | 176 | |
Eleva-Strum School District | | | | | | | | |
GO, 4.00%, 4/1/2019 | | | 165 | | | | 167 | |
GO, 3.00%, 4/1/2020 | | | 230 | | | | 233 | |
GO, 3.00%, 4/1/2021 | | | 450 | | | | 460 | |
Randall Consolidated School Joint No. 1 | | | | | | | | |
GO, 4.00%, 3/1/2019 | | | 360 | | | | 364 | |
GO, 4.00%, 3/1/2020 | | | 380 | | | | 391 | |
GO, 4.00%, 3/1/2021 | | | 175 | | | | 183 | |
Village of Menomonee Falls, Promissory Note | | | | | | | | |
Series A, GO, 3.00%, 6/1/2019 | | | 50 | | | | 50 | |
Series B, GO, 3.38%, 3/1/2020 | | | 250 | | | | 254 | |
Series A, GO, 3.00%, 6/1/2021 | | | 270 | | | | 277 | |
Village of Pulaski | | | | | | | | |
GO, AGM, 2.00%, 4/1/2019 | | | 160 | | | | 160 | |
GO, AGM, 3.00%, 4/1/2020 | | | 160 | | | | 163 | |
| | | | | | | | |
| | | | | | | 4,096 | |
| | | | | | | | |
Industrial Development Revenue/Pollution Control Revenue — 0.0% (b) | | | | | |
State of Wisconsin Environmental Improvement Fund Series A, Rev., 5.00%, 6/1/2019 | | | 1,000 | | | | 1,025 | |
| | | | | | | | |
Other Revenue — 0.5% | | | | | | | | |
Village of DeForest Series C, Rev., 3.00%, 5/1/2023 | | | 4,865 | | | | 4,964 | |
Village of Howard Rev., 2.00%, 12/1/2021 | | | 6,965 | | | | 6,931 | |
| | | | | | | | |
| | | | | | | 11,895 | |
| | | | | | | | |
| | | | | | | | |
| INVESTMENTS | | PRINCIPAL
AMOUNT
($000) | | | VALUE
($000) | |
| |
Prerefunded — 0.0% (b) | | | | | | | | |
City of Racine GO, 5.00%, 12/1/2018 (d) | | | 20 | | | | 20 | |
| | | | | | | | |
Transportation — 0.1% | | | | | | | | |
Wisconsin Department of Transportation Series 1, Rev., 5.00%, 7/1/2020 | | | 2,135 | | | | 2,259 | |
| | | | | | | | |
Total Wisconsin | | | | | | | 58,378 | |
| | | | | | | | |
Wyoming — 0.0% (b) | | | | | | | | |
Utility — 0.0% (b) | | | | | | | | |
Wyoming Municipal Power Agency, Inc., Power Supply System Series A, Rev., 4.00%, 1/1/2019 | | | 175 | | | | 176 | |
| | | | | | | | |
Total Municipal Bonds
(Cost $2,335,002) | | | | | | | 2,332,806 | |
| | | | | | | | |
Short-Term Investments — 5.4% | | | | | | | | |
Commercial Paper — 0.8% | | | | | | | | |
New York City Trust For Cultural Resources (SIFMA Municipal Swap Index Yield + 0.02%), 1.58%, 4/1/2044 (e)
(Cost $20,000) | | | 20,000 | | | | 20,000 | |
| | | | | | | | |
| | |
| | | SHARES
(000) | | | | |
Investment Companies — 4.6% | | | | | | | | |
JPMorgan Institutional Tax Free Money Market Fund Class IM Shares, 1.38% (h) (i)
(Cost $111,466) | | | 111,467 | | | | 111,466 | |
| | | | | | | | |
Total Short-Term Investments
(Cost $131,466) | | | | | | | 131,466 | |
| | | | | | | | |
Total Investments — 101.9%
(Cost $2,466,468) | | | | | | | 2,464,272 | |
Liabilities in Excess of
Other Assets — (1.9%) | | | | | | | (46,517 | ) |
| | | | | | | | |
NET ASSETS — 100.0% | | | | | | | 2,417,755 | |
| | | | | | | | |
Percentages indicated are based on net assets.
SEE NOTES TO FINANCIAL STATEMENTS.
| | | | | | | | |
| | | |
| AUGUST 31, 2018 | | J.P. MORGAN MUNICIPAL BOND FUNDS | | | | | 79 | |
JPMorgan Ultra-Short Municipal Fund
SCHEDULE OF PORTFOLIO INVESTMENTS
AS OF AUGUST 31, 2018 (Unaudited) (continued)
Abbreviations
| | |
AGC | | Insured by Assured Guaranty Corp. |
AGM | | Insured by Assured Guaranty Municipal Corp. |
AMBAC | | Insured by American Municipal Bond Assurance Corp. |
AMT | | Alternative Minimum Tax |
BAN | | Bond Anticipation Note |
BHAC | | Insured by Berkshire Hathaway Assurance Corp. |
COP | | Certificate of Participation |
CR | | Custodial Receipts |
EDA | | Economic Development Authority |
FHA | | Federal Housing Administration |
GAN | | Grant Anticipation Notes |
| GNMA | | Government National Mortgage Association |
| GO | | General Obligation |
| ICE | | Intercontinental Exchange |
| IDA | | Industrial Development Authority |
| LIBOR | | London Interbank Offered Rate |
| LIQ | | Liquidity Agreement |
| LOC | | Letter of Credit |
| MTA | | Metropolitan Transportation Authority |
| NATL | | Insured by National Public Finance Guarantee Corp. |
| PSF-GTD | | Permanent School Fund Guaranteed |
| Q-SBLF | | Qualified School Bond Loan Fund |
| RAN | | Revenue Anticipation Note |
| RE | | Reinsured |
| Rev. | | Revenue |
| SIFMA | | The Securities Industry and Financial Markets Association |
| TAN | | Tax Anticipation Note |
| TRAN | | Tax & Revenue Anticipation Note |
| USD | | United States Dollar |
| VRDO | | Variable Rate Demand Obligation. The interest rate shown is the rate in effect as of August 31, 2018. |
| | |
| |
| (a) | | The date shown represents the earliest of the prerefunded date, next put date or final maturity date. |
| (b) | | Amount rounds to less than 0.1% of net assets. |
| (c) | | Variable or floating rate security, the interest rate of which adjusts periodically based on changes in current interest rates and prepayments on the underlying pool of assets. The interest rate shown is the current rate as of August 31, 2018. |
| (d) | | Security is prerefunded or escrowed to maturity. |
| (e) | | Variable or floating rate security, linked to the referenced benchmark. The interest rate shown is the current rate as of August 31, 2018. |
| (f) | | All or a portion of the security is a when-issued security, delayed delivery security, or forward commitment. |
| (g) | | Securities exempt from registration under Rule 144A or section 4(a)(2), of the Securities Act of 1933, as amended. Under procedures approved by the Board of Trustees, such securities have been determined to be liquid by the investment adviser and may be resold, normally to qualified institutional buyers in transactions exempt from registration. |
| (h) | | Investment in affiliate. Fund is registered under the Investment Company Act of 1940, as amended, and advised by J.P. Morgan Investment Management Inc. |
| (i) | | The rate shown is the current yield as of August 31, 2018. |
SEE NOTES TO FINANCIAL STATEMENTS.
| | | | | | |
| | | |
| 80 | | | | J.P. MORGAN MUNICIPAL BOND FUNDS | | AUGUST 31, 2018 |
THIS PAGE IS INTENTIONALLY LEFT BLANK
| | | | | | | | |
| | | |
| AUGUST 31, 2018 | | J.P. MORGAN MUNICIPAL BOND FUNDS | | | | | 81 | |
STATEMENTS OF ASSETS AND LIABILITIES
AS OF AUGUST 31, 2018 (Unaudited)
(Amounts in thousands, except per share amounts)
| | | | | | | | |
| | | JPMorgan
Municipal
Income Fund | | | JPMorgan
Short-
Intermediate
Municipal
Bond Fund | |
ASSETS: | |
Investments in non-affiliates, at value | | $ | 193,733 | | | $ | 1,541,113 | |
Investments in affiliates, at value | | | 5,294 | | | | 97,444 | |
Receivables: | | | | | | | | |
Investment securities sold | | | 490 | | | | 1,058 | |
Investment securities sold — delayed delivery securities | | | 30 | | | | — | |
Fund shares sold | | | 12 | | | | 484 | |
Interest from non-affiliates | | | 2,096 | | | | 14,758 | |
Dividends from affiliates | | | 6 | | | | 150 | |
Other assets | | | 26 | | | | — | |
| | | | | | | | |
Total Assets | | | 201,687 | | | | 1,655,007 | |
| | | | | | | | |
|
LIABILITIES: | |
Payables: | | | | | | | | |
Due to custodian | | | 23 | | | | — | (a) |
Investment securities purchased | | | — | | | | 18,518 | |
Fund shares redeemed | | | 87 | | | | 4,023 | |
Accrued liabilities: | | | | | | | | |
Investment advisory fees | | | 37 | | | | 203 | |
Administration fees | | | 4 | | | | 22 | |
Distribution fees | | | 22 | | | | 10 | |
Service fees | | | 12 | | | | 94 | |
Custodian and accounting fees | | | 18 | | | | 53 | |
Audit fees | | | 36 | | | | 36 | |
Other | | | 18 | | | | 58 | |
| | | | | | | | |
Total Liabilities | | | 257 | | | | 23,017 | |
| | | | | | | | |
Net Assets | | $ | 201,430 | | | $ | 1,631,990 | |
| | | | | | | | |
| (a) | Amount rounds to less than one thousand. |
SEE NOTES TO FINANCIAL STATEMENTS.
| | | | | | |
| | | |
| 82 | | | | J.P. MORGAN MUNICIPAL BOND FUNDS | | AUGUST 31, 2018 |
| | | | | | | | |
| | | JPMorgan
Municipal
Income Fund | | | JPMorgan
Short-
Intermediate
Municipal
Bond Fund | |
NET ASSETS: | |
Paid-in-Capital | | $ | 198,866 | | | $ | 1,642,818 | |
Accumulated undistributed (distributions in excess of) net investment income | | | (42 | ) | | | 411 | |
Accumulated net realized gains (losses) | | | 1,203 | | | | (15,408 | ) |
Net unrealized appreciation (depreciation) | | | 1,403 | | | | 4,169 | |
| | | | | | | | |
Total Net Assets | | $ | 201,430 | | | $ | 1,631,990 | |
| | | | | | | | |
|
Net Assets: | |
Class A | | $ | 59,796 | | | $ | 31,159 | |
Class C | | | 14,048 | | | | 5,176 | |
Class I | | | 66,251 | | | | 1,595,655 | |
Class R6 | | | 61,335 | | | | — | |
| | | | | | | | |
Total | | $ | 201,430 | | | $ | 1,631,990 | |
| | | | | | | | |
|
Outstanding units of beneficial interest (shares) | |
($0.0001 par value; unlimited number of shares authorized): | | | | | | | | |
Class A | | | 6,293 | | | | 2,994 | |
Class C | | | 1,493 | | | | 493 | |
Class I | | | 7,023 | | | | 152,534 | |
Class R6 | | | 6,504 | | | | — | |
| | |
Net Asset Value (a): | | | | | | | | |
Class A — Redemption price per share | | $ | 9.50 | | | $ | 10.41 | |
Class C — Offering price per share (b) | | | 9.41 | | | | 10.50 | |
Class I — Offering and redemption price per share | | | 9.43 | | | | 10.46 | |
Class R6 — Offering and redemption price per share | | | 9.43 | | | | — | |
Class A maximum sales charge | | | 3.75 | % | | | 2.25 | % |
Class A maximum public offering price per share
[net asset value per share/(100% — maximum sales charge)] | | $ | 9.87 | | | $ | 10.65 | |
| | | | | | | | |
| | |
Cost of investments in non-affiliates | | $ | 192,330 | | | $ | 1,536,944 | |
Cost of investments in affiliates | | | 5,294 | | | | 97,444 | |
| (a) | Per share amounts may not recalculate due to rounding of net assets and/or shares outstanding. |
| (b) | Redemption price for Class C Shares varies based upon length of time the shares are held. |
SEE NOTES TO FINANCIAL STATEMENTS.
| | | | | | | | |
| | | |
| AUGUST 31, 2018 | | J.P. MORGAN MUNICIPAL BOND FUNDS | | | | | 83 | |
STATEMENTS OF ASSETS AND LIABILITIES
AS OF AUGUST 31, 2018 (Unaudited) (continued)
(Amounts in thousands, except per share amounts)
| | | | | | | | |
| | |
JPMorgan
Tax Free
Bond Fund | | | JPMorgan
Ultra-Short
Municipal Fund | |
ASSETS: | |
Investments in non-affiliates, at value | | $ | 352,424 | | | $ | 2,352,806 | |
Investments in affiliates, at value | | | 9,508 | | | | 111,466 | |
Cash | | | — | (a) | | | — | |
Deposits at broker for futures contracts | | | 115 | | | | — | |
Receivables: | | | | | | | | |
Due from custodian | | | — | | | | 7,003 | |
Investment securities sold | | | 2,399 | | | | 5,315 | |
Investment securities sold—delayed delivery securities | | | 1,200 | | | | 135 | |
Fund shares sold | | | 108 | | | | 4,206 | |
Interest and dividends from non-affiliates | | | 4,069 | | | | 14,232 | |
Dividends from affiliates | | | 13 | | | | 207 | |
Due from adviser | | | — | | | | 59 | |
Prepaid expenses | | | 27 | | | | — | |
| | | | | | | | |
Total Assets | | | 369,863 | | | | 2,495,429 | |
| | | | | | | | |
|
LIABILITIES: | |
Payables: | | | | | | | | |
Due to custodian | | | — | | | | 10,339 | |
Investment securities purchased | | | — | | | | 31,702 | |
Investment securities purchased — delayed delivery securities | | | — | | | | 19,855 | |
Fund shares redeemed | | | 664 | | | | 15,164 | |
Variation margin on futures contracts | | | — | (a) | | | — | |
Accrued liabilities: | | | | | | | | |
Investment advisory fees | | | 51 | | | | — | |
Distribution fees | | | 47 | | | | 2 | |
Service fees | | | 63 | | | | 444 | |
Custodian and accounting fees | | | 24 | | | | 44 | |
Trustees’ and Chief Compliance Officer’s fees | | | — | (a) | | | 1 | |
Audit fees | | | 72 | | | | 48 | |
Other | | | 17 | | | | 75 | |
| | | | | | | | |
Total Liabilities | | | 938 | | | | 77,674 | |
| | | | | | | | |
Net Assets | | $ | 368,925 | | | $ | 2,417,755 | |
| | | | | | | | |
| (a) | Amount rounds to less than one thousand. |
SEE NOTES TO FINANCIAL STATEMENTS.
| | | | | | |
| | | |
| 84 | | | | J.P. MORGAN MUNICIPAL BOND FUNDS | | AUGUST 31, 2018 |
| | | | | | | | |
| | |
JPMorgan
Tax Free
Bond Fund | | | JPMorgan
Ultra-Short
Municipal Fund | |
NET ASSETS: | |
Paid-in-Capital | | $ | 359,762 | | | $ | 2,420,128 | |
Accumulated undistributed (distributions in excess of) net investment income | | | (51 | ) | | | 70 | |
Accumulated net realized gains (losses) | | | (2,698 | ) | | | (247 | ) |
Net unrealized appreciation (depreciation) | | | 11,912 | | | | (2,196 | ) |
| | | | | | | | |
Total Net Assets | | $ | 368,925 | | | $ | 2,417,755 | |
| | | | | | | | |
|
Net Assets: | |
Class A | | $ | 133,986 | | | $ | 8,138 | |
Class C | | | 28,657 | | | | — | |
Class I | | | 206,282 | | | | 2,409,617 | |
| | | | | | | | |
Total | | $ | 368,925 | | | $ | 2,417,755 | |
| | | | | | | | |
|
Outstanding units of beneficial interest (shares) | |
($0.0001 par value; unlimited number of shares authorized): | | | | | | | | |
Class A | | | 11,373 | | | | 813 | |
Class C | | | 2,453 | | | | — | |
Class I | | | 17,587 | | | | 240,816 | |
| | |
Net Asset Value (a): | | | | | | | | |
Class A — Redemption price per share | | $ | 11.78 | | | $ | 10.01 | |
Class C — Offering price per share (b) | | | 11.68 | | | | — | |
Class I — Offering and redemption price per share | | | 11.73 | | | | 10.01 | |
Class A maximum sales charge | | | 3.75 | % | | | 2.25 | % |
Class A maximum public offering price per share | | | | | | | | |
[net asset value per share/(100% — maximum sales charge)] | | $ | 12.24 | | | $ | 10.24 | |
| | | | | | | | |
| | |
Cost of investments in non-affiliates | | $ | 340,520 | | | $ | 2,355,002 | |
Cost of investments in affiliates | | | 9,508 | | | | 111,466 | |
| (a) | Per share amounts may not recalculate due to rounding of net assets and/or shares outstanding. |
| (b) | Redemption price for Class C Shares varies based upon length of time the shares are held. |
SEE NOTES TO FINANCIAL STATEMENTS.
| | | | | | | | |
| | | |
| AUGUST 31, 2018 | | J.P. MORGAN MUNICIPAL BOND FUNDS | | | | | 85 | |
STATEMENTS OF OPERATIONS
FOR THE SIX MONTHS ENDED AUGUST 31, 2018 (Unaudited)
(Amounts in thousands)
| | | | | | | | |
| | | JPMorgan
Municipal
Income Fund | | | JPMorgan
Short-
Intermediate
Municipal
Bond Fund | |
INVESTMENT INCOME: | |
Interest income from non-affiliates | | $ | 3,026 | | | $ | 18,030 | |
Interest income from affiliates | | | — | (a) | | | — | |
Dividend income from affiliates | | | 44 | | | | 321 | |
| | | | | | | | |
Total investment income | | | 3,070 | | | | 18,351 | |
| | | | | | | | |
|
EXPENSES: | |
Investment advisory fees | | | 315 | | | | 2,079 | |
Administration fees | | | 85 | | | | 674 | |
Distribution fees: | | | | | | | | |
Class A | | | 78 | | | | 40 | |
Class C | | | 54 | | | | 21 | |
Service fees: | | | | | | | | |
Class A | | | 78 | | | | 40 | |
Class C | | | 18 | | | | 7 | |
Class I | | | 86 | | | | 2,033 | |
Custodian and accounting fees | | | 37 | | | | 95 | |
Interest expense to affiliates | | | — | | | | 1 | |
Professional fees | | | 30 | | | | 40 | |
Trustees’ and Chief Compliance Officer’s fees | | | 13 | | | | 15 | |
Printing and mailing costs | | | 2 | | | | 13 | |
Registration and filing fees | | | 19 | | | | 30 | |
Transfer agency fees (See Note 2.F.) | | | 4 | | | | 11 | |
Other | | | 6 | | | | 22 | |
| | | | | | | | |
Total expenses | | | 825 | | | | 5,121 | |
| | | | | | | | |
Less fees waived | | | (254 | ) | | | (2,968 | ) |
| | | | | | | | |
Net expenses | | | 571 | | | | 2,153 | |
| | | | | | | | |
Net investment income (loss) | | | 2,499 | | | | 16,198 | |
| | | | | | | | |
| | |
REALIZED/UNREALIZED GAINS (LOSSES): | | | | | | | | |
Net realized gain (loss) on transactions from: | |
Investments in non-affiliates | | | 328 | | | | (3,778 | ) |
Investments in affiliates | | | — | (a) | | | — | |
| | | | | | | | |
Net realized gain (loss) | | | 328 | | | | (3,778 | ) |
| | | | | | | | |
Change in net unrealized appreciation/depreciation on investments in non-affiliates | | | (659 | ) | | | 6,194 | |
| | | | | | | | |
Net realized/unrealized gains (losses) | | | (331 | ) | | | 2,416 | |
| | | | | | | | |
Change in net assets resulting from operations | | $ | 2,168 | | | $ | 18,614 | |
| | | | | | | | |
| (a) | Amount rounds to less than one thousand. |
SEE NOTES TO FINANCIAL STATEMENTS.
| | | | | | |
| | | |
| 86 | | | | J.P. MORGAN MUNICIPAL BOND FUNDS | | AUGUST 31, 2018 |
| | | | | | | | |
| | |
JPMorgan
Tax Free
Bond Fund | | | JPMorgan
Ultra-Short
Municipal Fund | |
INVESTMENT INCOME: | |
Interest income from non-affiliates | | $ | 7,281 | | | $ | 15,863 | |
Interest income from affiliates | | | — | (a) | | | — | (a) |
Dividend income from non-affiliates | | | — | (a) | | | — | |
Dividend income from affiliates | | | 76 | | | | 1,012 | |
| | | | | | | | |
Total investment income | | | 7,357 | | | | 16,875 | |
| | | | | | | | |
|
EXPENSES: | |
Investment advisory fees | | | 538 | | | | 1,693 | |
Administration fees | | | 145 | | | | 915 | |
Distribution fees: | | | | | | | | |
Class A | | | 169 | | | | 6 | |
Class C | | | 106 | | | | — | |
Service fees: | | | | | | | | |
Class A | | | 169 | | | | 6 | |
Class C | | | 35 | | | | — | |
Class I | | | 245 | | | | 2,815 | |
Custodian and accounting fees | | | 51 | | | | 86 | |
Interest expense to affiliates | | | — | (a) | | | 1 | |
Professional fees | | | 33 | | | | 40 | |
Trustees’ and Chief Compliance Officer’s fees | | | 16 | | | | 17 | |
Printing and mailing costs | | | 2 | | | | 19 | |
Registration and filing fees | | | 19 | | | | 229 | |
Transfer agency fees (See Note 2.F.) | | | 10 | | | | 5 | |
Other | | | 52 | | | | 32 | |
| | | | | | | | |
Total expenses | | | 1,590 | | | | 5,864 | |
| | | | | | | | |
Less fees waived | | | (530 | ) | | | (3,146 | ) |
Less expense reimbursements | | | — | | | | (23 | ) |
| | | | | | | | |
Net expenses | | | 1,060 | | | | 2,695 | |
| | | | | | | | |
Net investment income (loss) | | | 6,297 | | | | 14,180 | |
| | | | | | | | |
| | |
REALIZED/UNREALIZED GAINS (LOSSES): | | | | | | | | |
Net realized gain (loss) on transactions from: | |
Investments in non-affiliates | | | (846 | ) | | | (190 | ) |
Investments in affiliates | | | — | (a) | | | — | |
Futures contracts | | | (48 | ) | | | — | |
| | | | | | | | |
Net realized gain (loss) | | | (894 | ) | | | (190 | ) |
| | | | | | | | |
Distributions of capital gains received from investment company non-affiliates | | | 8 | | | | — | |
Change in net unrealized appreciation/depreciation on: | |
Investments in non-affiliates | | | (245 | ) | | | 808 | |
Futures contracts | | | 20 | | | | — | |
| | | | | | | | |
Change in net unrealized appreciation/depreciation | | | (225 | ) | | | 808 | |
| | | | | | | | |
Net realized/unrealized gains (losses) | | | (1,111 | ) | | | 618 | |
| | | | | | | | |
Change in net assets resulting from operations | | $ | 5,186 | | | $ | 14,798 | |
| | | | | | | | |
| (a) | Amount rounds to less than one thousand. |
SEE NOTES TO FINANCIAL STATEMENTS.
| | | | | | | | |
| | | |
| AUGUST 31, 2018 | | J.P. MORGAN MUNICIPAL BOND FUNDS | | | | | 87 | |
STATEMENTS OF CHANGES IN NET ASSETS
FOR THE PERIODS INDICATED
(Amounts in thousands)
| | | | | | | | | | | | | | | | |
| | | JPMorgan Municipal Income Fund | | | JPMorgan Short-Intermediate
Municipal Bond Fund | |
| | | Six Months Ended
August 31, 2018
(Unaudited) | | | Year Ended
February 28, 2018 | | | Six Months Ended
August 31, 2018
(Unaudited) | | | Year Ended
February 28, 2018 | |
CHANGE IN NET ASSETS RESULTING FROM OPERATIONS: | | | | | | | | | | | | | | | | |
Net investment income (loss) | | $ | 2,499 | | | $ | 6,387 | | | $ | 16,198 | | | $ | 35,300 | |
Net realized gain (loss) | | | 328 | | | | 2,097 | | | | (3,778 | ) | | | (2,785 | ) |
Change in net unrealized appreciation/depreciation | | | (659 | ) | | | (4,584 | ) | | | 6,194 | | | | (12,921 | ) |
| | | | | | | | | | | | | | | | |
Change in net assets resulting from operations | | | 2,168 | | | | 3,900 | | | | 18,614 | | | | 19,594 | |
| | | | | | | | | | | | | | | | |
|
DISTRIBUTIONS TO SHAREHOLDERS: | |
Class A | | | | | | | | | | | | | | | | |
From net investment income | | | (693 | ) | | | (1,664 | ) | | | (234 | ) | | | (348 | ) |
From net realized gains | | | — | | | | (471 | ) | | | — | | | | — | |
Class C | | | | | | | | | | | | | | | | |
From net investment income | | | (123 | ) | | | (293 | ) | | | (26 | ) | | | (56 | ) |
From net realized gains | | | — | | | | (111 | ) | | | — | | | | — | |
Class I | | | | | | | | | | | | | | | | |
From net investment income | | | (866 | ) | | | (3,943 | ) | | | (15,539 | ) | | | (34,696 | ) |
From net realized gains | | | — | | | | (566 | ) | | | — | | | | — | |
Class R6 (a) | | | | | | | | | | | | | | | | |
From net investment income | | | (833 | ) | | | (494 | ) | | | — | | | | — | |
From net realized gains | | | — | | | | (593 | ) | | | — | | | | — | |
Select Class (b) | | | | | | | | | | | | | | | | |
From net investment income | | | — | | | | — | | | | — | | | | (171 | ) |
| | | | | | | | | | | | | | | | |
Total distributions to shareholders | | | (2,515 | ) | | | (8,135 | ) | | | (15,799 | ) | | | (35,271 | ) |
| | | | | | | | | | | | | | | | |
|
CAPITAL TRANSACTIONS: | |
Change in net assets resulting from capital transactions | | | (15,518 | ) | | | (49,281 | ) | | | (90,411 | ) | | | (340,775 | ) |
| | | | | | | | | | | | | | | | |
|
NET ASSETS: | |
Change in net assets | | | (15,865 | ) | | | (53,516 | ) | | | (87,596 | ) | | | (356,452 | ) |
Beginning of period | | | 217,295 | | | | 270,811 | | | | 1,719,586 | | | | 2,076,038 | |
| | | | | | | | | | | | | | | | |
End of period | | $ | 201,430 | | | $ | 217,295 | | | $ | 1,631,990 | | | $ | 1,719,586 | |
| | | | | | | | | | | | | | | | |
Accumulated undistributed (distributions in excess of) net investment income | | $ | (42 | ) | | $ | (26 | ) | | $ | 411 | | | $ | 12 | |
| | | | | | | | | | | | | | | | |
| (a) | Commencement of offering of class of shares effective November 6, 2017 for JPMorgan Municipal Income Fund. |
| (b) | Select Class Shares of JPMorgan Short-Intermediate Municipal Bond Fund had no assets from the close of business on April 3, 2017. |
SEE NOTES TO FINANCIAL STATEMENTS.
| | | | | | |
| | | |
| 88 | | | | J.P. MORGAN MUNICIPAL BOND FUNDS | | AUGUST 31, 2018 |
| | | | | | | | | | | | | | | | |
| | |
JPMorgan Tax Free Bond Fund | | | JPMorgan Ultra-Short Municipal Fund | |
| | | Six Months Ended
August 31, 2018
(Unaudited) | | | Year Ended
February 28, 2018 | | | Six Months Ended
August 31, 2018
(Unaudited) | | | Year Ended
February 28, 2018 | |
CHANGE IN NET ASSETS RESULTING FROM OPERATIONS: | | | | | | | | | | | | | | | | |
Net investment income (loss) | | $ | 6,297 | | | $ | 10,704 | | | $ | 14,180 | | | $ | 10,258 | |
Net realized gain (loss) | | | (894 | ) | | | (95 | ) | | | (190 | ) | | | (57 | ) |
Distributions of capital gains received from investment company non-affiliates | | | 8 | | | | — | | | | — | | | | — | |
Change in net unrealized appreciation/depreciation | | | (225 | ) | | | (3,101 | ) | | | 808 | | | | (3,044 | ) |
| | | | | | | | | | | | | | | | |
Change in net assets resulting from operations | | | 5,186 | | | | 7,508 | | | | 14,798 | | | | 7,157 | |
| | | | | | | | | | | | | | | | |
| | | | |
DISTRIBUTIONS TO SHAREHOLDERS: | | | | | | | | | | | | | | | | |
Class A | | | | | | | | | | | | | | | | |
From net investment income | | | (2,314 | ) | | | (4,552 | ) | | | (26 | ) | | | (8 | ) |
Class C | | | | | | | | | | | | | | | | |
From net investment income | | | (412 | ) | | | (779 | ) | | | — | | | | — | |
Class I | | | | | | | | | | | | | | | | |
From net investment income | | | (3,611 | ) | | | (5,375 | ) | | | (14,199 | ) | | | (10,137 | ) |
| | | | | | | | | | | | | | | | |
Total distributions to shareholders | | | (6,337 | ) | | | (10,706 | ) | | | (14,225 | ) | | | (10,145 | ) |
| | | | | | | | | | | | | | | | |
| | | | |
CAPITAL TRANSACTIONS: | | | | | | | | | | | | | | | | |
Change in net assets resulting from capital transactions | | | 54,051 | | | | (3,172 | ) | | | 352,113 | | | | 2,035,882 | |
| | | | | | | | | | | | | | | | |
| | | | |
NET ASSETS: | | | | | | | | | | | | | | | | |
Change in net assets | | | 52,900 | | | | (6,370 | ) | | | 352,686 | | | | 2,032,894 | |
Beginning of period | | | 316,025 | | | | 322,395 | | | | 2,065,069 | | | | 32,175 | |
| | | | | | | | | | | | | | | | |
End of period | | $ | 368,925 | | | $ | 316,025 | | | $ | 2,417,755 | | | $ | 2,065,069 | |
| | | | | | | | | | | | | | | | |
Accumulated undistributed (distributions in excess of) net investment income | | $ | (51 | ) | | $ | (11 | ) | | $ | 70 | | | $ | 115 | |
| | | | | | | | | | | | | | | | |
SEE NOTES TO FINANCIAL STATEMENTS.
| | | | | | | | |
| | | |
| AUGUST 31, 2018 | | J.P. MORGAN MUNICIPAL BOND FUNDS | | | | | 89 | |
STATEMENTS OF CHANGES IN NET ASSETS
FOR THE PERIODS INDICATED (continued)
(Amounts in thousands)
| | | | | | | | | | | | | | | | |
| | | JPMorgan Municipal Income Fund | | | JPMorgan Short-Intermediate
Municipal Bond Fund | |
| | | Six Months Ended
August 31, 2018
(Unaudited) | | | Year Ended
February 28, 2018 | | | Six Months Ended
August 31, 2018
(Unaudited) | | | Year Ended
February 28, 2018 | |
CAPITAL TRANSACTIONS: | | | | | | | | | | | | | | | | |
Class A | | | | | | | | | | | | | | | | |
Proceeds from shares issued | | $ | 2,835 | | | $ | 22,238 | | | $ | 3,783 | | | $ | 10,656 | |
Distributions reinvested | | | 677 | | | | 2,094 | | | | 232 | | | | 344 | |
Cost of shares redeemed | | | (9,869 | ) | | | (33,567 | ) | | | (5,282 | ) | | | (8,869 | ) |
| | | | | | | | | | | | | | | | |
Change in net assets resulting from Class A capital transactions | | $ | (6,357 | ) | | $ | (9,235 | ) | | $ | (1,267 | ) | | $ | 2,131 | |
| | | | | | | | | | | | | | | | |
Class C | | | | | | | | | | | | | | | | |
Proceeds from shares issued | | $ | 722 | | | $ | 5,107 | | | $ | 315 | | | $ | 861 | |
Distributions reinvested | | | 113 | | | | 362 | | | | 23 | | | | 49 | |
Cost of shares redeemed | | | (1,897 | ) | | | (7,178 | ) | | | (1,578 | ) | | | (8,514 | ) |
| | | | | | | | | | | | | | | | |
Change in net assets resulting from Class C capital transactions | | $ | (1,062 | ) | | $ | (1,709 | ) | | $ | (1,240 | ) | | $ | (7,604 | ) |
| | | | | | | | | | | | | | | | |
Class I | | | | | | | | | | | | | | | | |
Proceeds from shares issued | | $ | 10,109 | | | $ | 42,887 | | | $ | 236,604 | | | $ | 1,080,724 | |
Distributions reinvested | | | 839 | | | | 1,807 | | | | 15,272 | | | | 16,842 | |
Cost of shares redeemed | | | (15,752 | ) | | | (149,658 | ) | | | (339,780 | ) | | | (1,429,300 | ) |
Conversion from Select Class Shares | | | — | | | | — | | | | — | | | | 140,758 | |
| | | | | | | | | | | | | | | | |
Change in net assets resulting from Class I capital transactions | | $ | (4,804 | ) | | $ | (104,964 | ) | | $ | (87,904 | ) | | $ | (190,976 | ) |
| | | | | | | | | | | | | | | | |
Class R6 (a) | | | | | | | | | | | | | | | | |
Proceeds from shares issued | | $ | 13,355 | | | $ | 90,639 | | | $ | — | | | $ | — | |
Distributions reinvested | | | 830 | | | | 1,086 | | | | — | | | | — | |
Cost of shares redeemed | | | (17,480 | ) | | | (25,098 | ) | | | — | | | | — | |
| | | | | | | | | | | | | | | | |
Change in net assets resulting from Class R6 capital transactions | | $ | (3,295 | ) | | $ | 66,627 | | | $ | — | | | $ | — | |
| | | | | | | | | | | | | | | | |
Select Class (b) | | | | | | | | | | | | | | | | |
Proceeds from shares issued | | $ | — | | | $ | — | | | $ | — | | | $ | 1,645 | |
Distributions reinvested | | | — | | | | — | | | | — | | | | 28 | |
Cost of shares redeemed | | | — | | | | — | | | | — | | | | (5,241 | ) |
Conversion to Class I Shares | | | — | | | | — | | | | — | | | | (140,758 | ) |
| | | | | | | | | | | | | | | | |
Change in net assets resulting from Select Class capital transactions | | $ | — | | | $ | — | | | $ | — | | | $ | (144,326 | ) |
| | | | | | | | | | | | | | | | |
Total change in net assets resulting from capital transactions | | $ | (15,518 | ) | | $ | (49,281 | ) | | $ | (90,411 | ) | | $ | (340,775 | ) |
| | | | | | | | | | | | | | | | |
| (a) | Commencement of offering of class of shares effective November 6, 2017 for JPMorgan Municipal Income Fund. |
| (b) | Select Class Shares of JPMorgan Short-Intermediate Municipal Bond Fund had no assets from the close of business on April 3, 2017. |
SEE NOTES TO FINANCIAL STATEMENTS.
| | | | | | |
| | | |
| 90 | | | | J.P. MORGAN MUNICIPAL BOND FUNDS | | AUGUST 31, 2018 |
| | | | | | | | | | | | | | | | |
| | | JPMorgan Municipal Income Fund | | | JPMorgan Short-Intermediate
Municipal Bond Fund | |
| | | Six Months Ended
August 31, 2018
(Unaudited) | | | Year Ended
February 28, 2018 | | | Six Months Ended
August 31, 2018
(Unaudited) | | | Year Ended
February 28, 2018 | |
SHARE TRANSACTIONS: | |
Class A | |
Issued | | | 297 | | | | 2,271 | | | | 363 | | | | 1,013 | |
Reinvested | | | 72 | | | | 215 | | | | 23 | | | | 33 | |
Redeemed | | | (1,038 | ) | | | (3,430 | ) | | | (508 | ) | | | (844 | ) |
| | | | | | | | | | | | | | | | |
Change in Class A Shares | | | (669 | ) | | | (944 | ) | | | (122 | ) | | | 202 | |
| | | | | | | | | | | | | | | | |
Class C | |
Issued | | | 77 | | | | 526 | | | | 30 | | | | 81 | |
Reinvested | | | 12 | | | | 38 | | | | 2 | | | | 4 | |
Redeemed | | | (202 | ) | | | (742 | ) | | | (150 | ) | | | (801 | ) |
| | | | | | | | | | | | | | | | |
Change in Class C Shares | | | (113 | ) | | | (178 | ) | | | (118 | ) | | | (716 | ) |
| | | | | | | | | | | | | | | | |
Class I | |
Issued | | | 1,072 | | | | 4,427 | | | | 22,616 | | | | 102,244 | |
Reinvested | | | 89 | | | | 188 | | | | 1,462 | | | | 1,599 | |
Redeemed | | | (1,668 | ) | | | (15,458 | ) | | | (32,503 | ) | | | (135,480 | ) |
Conversion from Select Class Shares | | | — | | | | — | | | | — | | | | 13,367 | |
| | | | | | | | | | | | | | | | |
Change in Class I Shares | | | (507 | ) | | | (10,843 | ) | | | (8,425 | ) | | | (18,270 | ) |
| | | | | | | | | | | | | | | | |
Class R6 (a) | |
Issued | | | 1,415 | | | | 9,369 | | | | — | | | | — | |
Reinvested | | | 88 | | | | 113 | | | | — | | | | — | |
Redeemed | | | (1,851 | ) | | | (2,630 | ) | | | — | | | | — | |
| | | | | | | | | | | | | | | | |
Change in Class R6 Shares | | | (348 | ) | | | 6,852 | | | | — | | | | — | |
| | | | | | | | | | | | | | | | |
Select Class (b) | |
Issued | | | — | | | | — | | | | — | | | | 152 | |
Reinvested | | | — | | | | — | | | | — | | | | 3 | |
Redeemed | | | — | | | | — | | | | — | | | | (500 | ) |
Conversion to Class I Shares | | | — | | | | — | | | | — | | | | (13,393 | ) |
| | | | | | | | | | | | | | | | |
Change in Select Class Shares | | | — | | | | — | | | | — | | | | (13,738 | ) |
| | | | | | | | | | | | | | | | |
| (a) | Commencement of offering of class of shares effective November 6, 2017 for JPMorgan Municipal Income Fund. |
| (b) | Select Class Shares of JPMorgan Short-Intermediate Municipal Bond Fund had no assets from the close of business on April 3, 2017. |
SEE NOTES TO FINANCIAL STATEMENTS.
| | | | | | | | |
| | | |
| AUGUST 31, 2018 | | J.P. MORGAN MUNICIPAL BOND FUNDS | | | | | 91 | |
STATEMENTS OF CHANGES IN NET ASSETS
FOR THE PERIODS INDICATED (continued)
(Amounts in thousands)
| | | | | | | | | | | | | | | | |
| | |
JPMorgan Tax Free Bond Fund | | | JPMorgan Ultra-Short Municipal Fund | |
| | | Six Months Ended
August 31, 2018
(Unaudited) | | | Year Ended
February 28, 2018 | | | Six Months Ended
August 31, 2018
(Unaudited) | | | Year Ended
February 28, 2018 | |
CAPITAL TRANSACTIONS: | | | | | | | | | | | | | | | | |
Class A | | | | | | | | | | | | | | | | |
Proceeds from shares issued | | $ | 9,146 | | | $ | 31,215 | | | $ | 14,569 | | | $ | 2,427 | |
Net assets acquired in Fund reorganization (See Note 8) | | | 21,528 | | | | — | | | | — | | | | — | |
Distributions reinvested | | | 2,226 | | | | 4,375 | | | | 26 | | | | 8 | |
Cost of shares redeemed | | | (28,956 | ) | | | (52,729 | ) | | | (7,231 | ) | | | (2,179 | ) |
| | | | | | | | | | | | | | | | |
Change in net assets resulting from Class A capital transactions | | $ | 3,944 | | | $ | (17,139 | ) | | $ | 7,364 | | | $ | 256 | |
| | | | | | | | | | | | | | | | |
Class C | | | | | | | | | | | | | | | | |
Proceeds from shares issued | | $ | 646 | | | $ | 3,952 | | | $ | — | | | $ | — | |
Net assets acquired in Fund reorganization (See Note 8) | | | 6,298 | | | | — | | | | — | | | | — | |
Distributions reinvested | | | 401 | | | | 770 | | | | — | | | | — | |
Cost of shares redeemed | | | (3,764 | ) | | | (11,395 | ) | | | — | | | | — | |
| | | | | | | | | | | | | | | | |
Change in net assets resulting from Class C capital transactions | | $ | 3,581 | | | $ | (6,673 | ) | | $ | — | | | $ | — | |
| | | | | | | | | | | | | | | | |
Class I | | | | | | | | | | | | | | | | |
Proceeds from shares issued | | $ | 28,017 | | | $ | 59,833 | | | $ | 1,157,440 | | | $ | 3,119,503 | |
Net assets acquired in Fund reorganization (See Note 8) | | | 76,798 | | | | — | | | | — | | | | — | |
Distributions reinvested | | | 3,393 | | | | 3,871 | | | | 14,151 | | | | 5,769 | |
Cost of shares redeemed | | | (61,682 | ) | | | (43,064 | ) | | | (826,842 | ) | | | (1,089,646 | ) |
| | | | | | | | | | | | | | | | |
Change in net assets resulting from Class I capital transactions | | $ | 46,526 | | | $ | 20,640 | | | $ | 344,749 | | | $ | 2,035,626 | |
| | | | | | | | | | | | | | | | |
Total change in net assets resulting from capital transactions | | $ | 54,051 | | | $ | (3,172 | ) | | $ | 352,113 | | | $ | 2,035,882 | |
| | | | | | | | | | | | | | | | |
SEE NOTES TO FINANCIAL STATEMENTS.
| | | | | | |
| | | |
| 92 | | | | J.P. MORGAN MUNICIPAL BOND FUNDS | | AUGUST 31, 2018 |
| | | | | | | | | | | | | | | | |
| | |
JPMorgan Tax Free Bond Fund | | | JPMorgan Ultra-Short Municipal Fund | |
| | | Six Months Ended
August 31, 2018
(Unaudited) | | | Year Ended
February 28, 2018 | | | Six Months Ended
August 31, 2018
(Unaudited) | | | Year Ended
February 28, 2018 | |
SHARE TRANSACTIONS: | |
Class A | | | | | | | | | | | | | | | | |
Issued | | | 773 | | | | 2,587 | | | | 1,456 | | | | 242 | |
Shares issued in connection with Fund reorganization (See Note 8) | | | 1,824 | | | | — | | | | — | | | | — | |
Reinvested | | | 189 | | | | 365 | | | | 3 | | | | 1 | |
Redeemed | | | (2,450 | ) | | | (4,402 | ) | | | (723 | ) | | | (218 | ) |
| | | | | | | | | | | | | | | | |
Change in Class A Shares | | | 336 | | | | (1,450 | ) | | | 736 | | | | 25 | |
| | | | | | | | | | | | | | | | |
Class C | | | | | | | | | | | | | | | | |
Issued | | | 56 | | | | 331 | | | | — | | | | — | |
Shares issued in connection with Fund reorganization (See Note 8) | | | 538 | | | | — | | | | — | | | | — | |
Reinvested | | | 34 | | | | 65 | | | | — | | | | — | |
Redeemed | | | (322 | ) | | | (957 | ) | | | — | | | | — | |
| | | | | | | | | | | | | | | | |
Change in Class C Shares | | | 306 | | | | (561 | ) | | | — | | | | — | |
| | | | | | | | | | | | | | | | |
Class I | | | | | | | | | | | | | | | | |
Issued | | | 2,381 | | | | 5,004 | | | | 115,671 | | | | 311,420 | |
Shares issued in connection with Fund reorganization (See Note 8) | | | 6,534 | | | | — | | | | — | | | | — | |
Reinvested | | | 289 | | | | 324 | | | | 1,415 | | | | 577 | |
Redeemed | | | (5,244 | ) | | | (3,597 | ) | | | (82,634 | ) | | | (108,793 | ) |
| | | | | | | | | | | | | | | | |
Change in Class I Shares | | | 3,960 | | | | 1,731 | | | | 34,452 | | | | 203,204 | |
| | | | | | | | | | | | | | | | |
SEE NOTES TO FINANCIAL STATEMENTS.
| | | | | | | | |
| | | |
| AUGUST 31, 2018 | | J.P. MORGAN MUNICIPAL BOND FUNDS | | | | | 93 | |
FINANCIAL HIGHLIGHTS
FOR THE PERIODS INDICATED
| | | | | | | | | | | | | | | | | | | | | | | | | | | | |
| | | Per share operating performance | |
| | | | | | Investment operations | | | Distributions | |
| | | Net asset
value,
beginning
of period | | | Net
investment
income
(loss) (b) | | |
Net realized
and unrealized
gains
(losses) on
investments | | | Total from
investment
operations | | | Net
investment
income | | | Net
realized
gain | | | Total
distributions | |
JPMorgan Municipal Income Fund | | | | | | | | | | | | | | | | | | | | | | | | | | | | |
Class A | | | | | | | | | | | | | | | | | | | | | | | | | | | | |
Six Months Ended August 31, 2018 (Unaudited) | | $ | 9.52 | | | $ | 0.11 | | | $ | (0.02 | ) | | $ | 0.09 | | | $ | (0.11 | ) | | $ | — | | | $ | (0.11 | ) |
Year Ended February 28, 2018 | | | 9.70 | | | | 0.23 | (f) | | | (0.11 | ) | | | 0.12 | | | | (0.23 | ) | | | (0.07 | ) | | | (0.30 | ) |
Year Ended February 28, 2017 | | | 10.10 | | | | 0.24 | | | | (0.28 | ) | | | (0.04 | ) | | | (0.24 | ) | | | (0.12 | ) | | | (0.36 | ) |
Year Ended February 29, 2016 | | | 10.11 | | | | 0.25 | | | | 0.08 | | | | 0.33 | | | | (0.26 | ) | | | (0.08 | ) | | | (0.34 | ) |
Year Ended February 28, 2015 | | | 9.98 | | | | 0.27 | | | | 0.18 | | | | 0.45 | | | | (0.27 | ) | | | (0.05 | ) | | | (0.32 | ) |
Year Ended February 28, 2014 | | | 10.41 | | | | 0.28 | | | | (0.28 | ) | | | — | (g) | | | (0.29 | ) | | | (0.14 | ) | | | (0.43 | ) |
| | | | | | | |
Class C | | | | | | | | | | | | | | | | | | | | | | | | | | | | |
Six Months Ended August 31, 2018 (Unaudited) | | | 9.42 | | | | 0.08 | | | | (0.01 | ) | | | 0.07 | | | | (0.08 | ) | | | — | | | | (0.08 | ) |
Year Ended February 28, 2018 | | | 9.61 | | | | 0.17 | (f) | | | (0.12 | ) | | | 0.05 | | | | (0.17 | ) | | | (0.07 | ) | | | (0.24 | ) |
Year Ended February 28, 2017 | | | 10.00 | | | | 0.18 | | | | (0.26 | ) | | | (0.08 | ) | | | (0.19 | ) | | | (0.12 | ) | | | (0.31 | ) |
Year Ended February 29, 2016 | | | 10.02 | | | | 0.19 | | | | 0.07 | | | | 0.26 | | | | (0.20 | ) | | | (0.08 | ) | | | (0.28 | ) |
Year Ended February 28, 2015 | | | 9.90 | | | | 0.21 | | | | 0.17 | | | | 0.38 | | | | (0.21 | ) | | | (0.05 | ) | | | (0.26 | ) |
Year Ended February 28, 2014 | | | 10.33 | | | | 0.22 | | | | (0.28 | ) | | | (0.06 | ) | | | (0.23 | ) | | | (0.14 | ) | | | (0.37 | ) |
| | | | | | | |
Class I | | | | | | | | | | | | | | | | | | | | | | | | | | | | |
Six Months Ended August 31, 2018 (Unaudited) | | | 9.45 | | | | 0.12 | | | | (0.02 | ) | | | 0.10 | | | | (0.12 | ) | | | — | | | | (0.12 | ) |
Year Ended February 28, 2018 | | | 9.63 | | | | 0.25 | (f) | | | (0.11 | ) | | | 0.14 | | | | (0.25 | ) | | | (0.07 | ) | | | (0.32 | ) |
Year Ended February 28, 2017 | | | 10.03 | | | | 0.26 | | | | (0.27 | ) | | | (0.01 | ) | | | (0.27 | ) | | | (0.12 | ) | | | (0.39 | ) |
Year Ended February 29, 2016 | | | 10.04 | | | | 0.28 | | | | 0.07 | | | | 0.35 | | | | (0.28 | ) | | | (0.08 | ) | | | (0.36 | ) |
Year Ended February 28, 2015 | | | 9.92 | | | | 0.29 | | | | 0.17 | | | | 0.46 | | | | (0.29 | ) | | | (0.05 | ) | | | (0.34 | ) |
Year Ended February 28, 2014 | | | 10.35 | | | | 0.30 | | | | (0.27 | ) | | | 0.03 | | | | (0.32 | ) | | | (0.14 | ) | | | (0.46 | ) |
| | | | | | | |
Class R6 | | | | | | | | | | | | | | | | | | | | | | | | | | | | |
Six Months Ended August 31, 2018 (Unaudited) | | | 9.45 | | | | 0.12 | | | | (0.02 | ) | | | 0.10 | | | | (0.12 | ) | | | — | | | | (0.12 | ) |
November 6, 2017 (h) through February 28, 2018 | | | 9.74 | | | | 0.08 | (f) | | | (0.21 | ) | | | (0.13 | ) | | | (0.09 | ) | | | (0.07 | ) | | | (0.16 | ) |
| (a) | Annualized for periods less than one year, unless otherwise noted. |
| (b) | Calculated based upon average shares outstanding. |
| (c) | Not annualized for periods less than one year. |
| (d) | Includes adjustments in accordance with accounting principles generally accepted in the United States of America and as such, the net asset values for financial reporting purposes and the returns based upon those net asset values may differ from the net asset values and returns for shareholder transactions. |
| (e) | Includes earnings credits and interest expense, if applicable, each of which is less than 0.005% unless otherwise noted. |
| (f) | Net investment income (loss) may appear disproportionate among classes due to the timing of the Class R6 Shares commencement of operations on November 6, 2017. |
| (g) | Amount rounds to less than $0.005. |
| (h) | Commencement of offering of class of shares. |
SEE NOTES TO FINANCIAL STATEMENTS.
| | | | | | |
| | | |
| 94 | | | | J.P. MORGAN MUNICIPAL BOND FUNDS | | AUGUST 31, 2018 |
| | | | | | | | | | | | | | | | | | | | | | | | | | |
| | | Ratios/Supplemental data | |
| | | | | | | | | | Ratios to average net assets (a) | | | | |
Net asset
value,
end of
period | | | Total return
(excludes
sales charge) (c) (d) | | | Net assets,
end of
period
(000’s) | | | Net expenses
(including
imputed interest) (e) | | | Net
investment
income
(loss) | | | Expenses
without waivers,
reimbursements and
earnings credits
(including imputed
interest) | | | Portfolio
turnover
rate (c) | |
| | | | | | | | | | | | | | | | | | | | | | | | | | |
| | | | | | | | | | | | | | | | | | | | | | | | | | |
| $ | 9.50 | | | | 0.92 | % | | $ | 59,796 | | | | 0.69 | % | | | 2.23 | % | | | 0.99 | % | | | 2 | % |
| | 9.52 | | | | 1.16 | | | | 66,258 | | | | 0.69 | | | | 2.33 | (f) | | | 1.01 | | | | 21 | |
| | 9.70 | | | | (0.40 | ) | | | 76,684 | | | | 0.77 | | | | 2.39 | | | | 1.00 | | | | 15 | |
| | 10.10 | | | | 3.26 | | | | 73,120 | | | | 0.82 | | | | 2.52 | | | | 0.97 | | | | 22 | |
| | 10.11 | | | | 4.47 | | | | 68,003 | | | | 0.86 | | | | 2.65 | | | | 0.97 | | | | 9 | |
| | 9.98 | | | | 0.13 | | | | 64,327 | | | | 0.87 | | | | 2.78 | | | | 0.94 | | | | 3 | |
| | | | | | |
| | | | | | | | | | | | | | | | | | | | | | | | | | |
| | 9.41 | | | | 0.76 | | | | 14,048 | | | | 1.24 | | | | 1.68 | | | | 1.49 | | | | 2 | |
| | 9.42 | | | | 0.51 | | | | 15,138 | | | | 1.24 | | | | 1.78 | (f) | | | 1.51 | | | | 21 | |
| | 9.61 | | | | (0.87 | ) | | | 17,137 | | | | 1.34 | | | | 1.83 | | | | 1.50 | | | | 15 | |
| | 10.00 | | | | 2.61 | | | | 15,950 | | | | 1.39 | | | | 1.95 | | | | 1.48 | | | | 22 | |
| | 10.02 | | | | 3.81 | | | | 14,462 | | | | 1.44 | | | | 2.07 | | | | 1.47 | | | | 9 | |
| | 9.90 | | | | (0.45 | ) | | | 15,425 | | | | 1.44 | | | | 2.20 | | | | 1.44 | | | | 3 | |
| | | | | | |
| | | | | | | | | | | | | | | | | | | | | | | | | | |
| | 9.43 | | | | 1.06 | | | | 66,251 | | | | 0.44 | | | | 2.48 | | | | 0.74 | | | | 2 | |
| | 9.45 | | | | 1.42 | | | | 71,161 | | | | 0.44 | | | | 2.57 | (f) | | | 0.74 | | | | 21 | |
| | 9.63 | | | | (0.16 | ) | | | 176,990 | | | | 0.53 | | | | 2.64 | | | | 0.72 | | | | 15 | |
| | 10.03 | | | | 3.56 | | | | 245,864 | | | | 0.57 | | | | 2.77 | | | | 0.70 | | | | 22 | |
| | 10.04 | | | | 4.66 | | | | 255,153 | | | | 0.61 | | | | 2.91 | | | | 0.71 | | | | 9 | |
| | 9.92 | | | | 0.38 | | | | 279,537 | | | | 0.62 | | | | 3.02 | | | | 0.69 | | | | 3 | |
| | | | | | |
| | | | | | | | | | | | | | | | | | | | | | | | | | |
| | 9.43 | | | | 1.11 | | | | 61,335 | | | | 0.34 | | | | 2.58 | | | | 0.48 | | | | 2 | |
| | 9.45 | | | | (1.42 | ) | | | 64,738 | | | | 0.34 | | | | 2.67 | (f) | | | 0.57 | | | | 21 | |
SEE NOTES TO FINANCIAL STATEMENTS.
| | | | | | | | |
| | | |
| AUGUST 31, 2018 | | J.P. MORGAN MUNICIPAL BOND FUNDS | | | | | 95 | |
FINANCIAL HIGHLIGHTS
FOR THE PERIODS INDICATED (continued)
| | | | | | | | | | | | | | | | | | | | | | | | | | | | |
| | | Per share operating performance | |
| | | | | | Investment operations | | | Distributions | |
| | | Net asset
value,
beginning
of period | | | Net
investment
income
(loss) (b) | | | Net realized
and unrealized
gains
(losses) on
investments | | | Total from
investment
operations | | | Net
investment
income | | | Net
realized
gain | | | Total
distributions | |
JPMorgan Short-Intermediate Municipal Bond Fund | | | | | | | | | | | | | | | | | | | | | | | | | | | | |
Class A | | | | | | | | | | | | | | | | | | | | | | | | | | | | |
Six Months Ended August 31, 2018 (Unaudited) | | $ | 10.39 | | | $ | 0.08 | | | $ | 0.02 | | | $ | 0.10 | | | $ | (0.08 | ) | | $ | — | | | $ | (0.08 | ) |
Year Ended February 28, 2018 | | | 10.48 | | | | 0.12 | | | | (0.09 | ) | | | 0.03 | | | | (0.12 | ) | | | — | | | | (0.12 | ) |
Year Ended February 28, 2017 | | | 10.71 | | | | 0.10 | | | | (0.17 | ) | | | (0.07 | ) | | | (0.10 | ) | | | (0.06 | ) | | | (0.16 | ) |
Year Ended February 29, 2016 | | | 10.62 | | | | 0.08 | | | | 0.09 | | | | 0.17 | | | | (0.08 | ) | | | — | | | | (0.08 | ) |
Year Ended February 28, 2015 | | | 10.61 | | | | 0.06 | | | | 0.01 | | | | 0.07 | | | | (0.06 | ) | | | — | | | | (0.06 | ) |
Year Ended February 28, 2014 | | | 10.63 | | | | 0.07 | | | | (0.03 | ) | | | 0.04 | | | | (0.06 | ) | | | — | | | | (0.06 | ) |
| | | | | | | |
Class C | | | | | | | | | | | | | | | | | | | | | | | | | | | | |
Six Months Ended August 31, 2018 (Unaudited) | | | 10.48 | | | | 0.05 | | | | 0.02 | | | | 0.07 | | | | (0.05 | ) | | | — | | | | (0.05 | ) |
Year Ended February 28, 2018 | | | 10.56 | | | | 0.06 | | | | (0.08 | ) | | | (0.02 | ) | | | (0.06 | ) | | | — | | | | (0.06 | ) |
Year Ended February 28, 2017 | | | 10.80 | | | | 0.04 | | | | (0.17 | ) | | | (0.13 | ) | | | (0.05 | ) | | | (0.06 | ) | | | (0.11 | ) |
Year Ended February 29, 2016 | | | 10.70 | | | | 0.02 | | | | 0.10 | | | | 0.12 | | | | (0.02 | ) | | | — | | | | (0.02 | ) |
Year Ended February 28, 2015 | | | 10.69 | | | | 0.01 | | | | — | (f) | | | 0.01 | | | | — | (f) | | | — | | | | — | (f) |
Year Ended February 28, 2014 | | | 10.71 | | | | 0.01 | | | | (0.02 | ) | | | (0.01 | ) | | | (0.01 | ) | | | — | | | | (0.01 | ) |
| | | | | | | |
Class I | | | | | | | | | | | | | | | | | | | | | | | | | | | | |
Six Months Ended August 31, 2018 (Unaudited) | | | 10.44 | | | | 0.10 | | | | 0.02 | | | | 0.12 | | | | (0.10 | ) | | | — | | | | (0.10 | ) |
Year Ended February 28, 2018 | | | 10.53 | | | | 0.16 | | | | (0.09 | ) | | | 0.07 | | | | (0.16 | ) | | | — | | | | (0.16 | ) |
Year Ended February 28, 2017 | | | 10.76 | | | | 0.15 | | | | (0.17 | ) | | | (0.02 | ) | | | (0.15 | ) | | | (0.06 | ) | | | (0.21 | ) |
Year Ended February 29, 2016 | | | 10.67 | | | | 0.13 | | | | 0.09 | | | | 0.22 | | | | (0.13 | ) | | | — | | | | (0.13 | ) |
Year Ended February 28, 2015 | | | 10.66 | | | | 0.11 | | | | 0.01 | | | | 0.12 | | | | (0.11 | ) | | | — | | | | (0.11 | ) |
Year Ended February 28, 2014 | | | 10.68 | | | | 0.12 | | | | (0.03 | ) | | | 0.09 | | | | (0.11 | ) | | | — | | | | (0.11 | ) |
| (a) | Annualized for periods less than one year, unless otherwise noted. |
| (b) | Calculated based upon average shares outstanding. |
| (c) | Not annualized for periods less than one year. |
| (d) | Includes adjustments in accordance with accounting principles generally accepted in the United States of America and as such, the net asset values for financial reporting purposes and the returns based upon those net asset values may differ from the net asset values and returns for shareholder transactions. |
| (e) | Includes earnings credits and interest expense, if applicable, each of which is less than 0.005% unless otherwise noted. |
| (f) | Amount rounds to less than $0.005. |
SEE NOTES TO FINANCIAL STATEMENTS.
| | | | | | |
| | | |
| 96 | | | | J.P. MORGAN MUNICIPAL BOND FUNDS | | AUGUST 31, 2018 |
| | | | | | | | | | | | | | | | | | | | | | | | | | |
| | | Ratios/Supplemental data | |
| | | | | | | | | | Ratios to average net assets (a) | | | | |
Net asset
value,
end of
period | | | Total return
(excludes
sales charge) (c) (d) | | | Net assets,
end of
period
(000’s) | | | Net
expenses (e) | | | Net
investment
income
(loss) | | |
Expenses
without waivers,
reimbursements and
earnings credits | | | Portfolio
turnover
rate (c) | |
| | | | | | | | | | | | | | | | | | | | | | | | | | |
| | | | | | | | | | | | | | | | | | | | | | | | | | |
| $ | 10.41 | | | | 0.94 | % | | $ | 31,159 | | | | 0.70 | % | | | 1.51 | % | | | 0.86 | % | | | 19 | % |
| | 10.39 | | | | 0.26 | | | | 32,373 | | | | 0.69 | | | | 1.10 | | | | 0.86 | | | | 73 | |
| | 10.48 | | | | (0.69 | ) | | | 30,535 | | | | 0.73 | | | | 0.91 | | | | 0.88 | | | | 31 | |
| | 10.71 | | | | 1.58 | | | | 38,345 | | | | 0.75 | | | | 0.71 | | | | 0.87 | | | | 39 | |
| | 10.62 | | | | 0.64 | | | | 40,468 | | | | 0.74 | | | | 0.55 | | | | 0.87 | | | | 53 | |
| | 10.61 | | | | 0.38 | | | | 41,685 | | | | 0.74 | | | | 0.63 | | | | 0.87 | | | | 39 | |
| | | | | | |
| | | | | | | | | | | | | | | | | | | | | | | | | | |
| | 10.50 | | | | 0.67 | | | | 5,176 | | | | 1.20 | | | | 1.01 | | | | 1.38 | | | | 19 | |
| | 10.48 | | | | (0.19 | ) | | | 6,406 | | | | 1.19 | | | | 0.56 | | | | 1.37 | | | | 73 | |
| | 10.56 | | | | (1.27 | ) | | | 14,013 | | | | 1.23 | | | | 0.41 | | | | 1.40 | | | | 31 | |
| | 10.80 | | | | 1.14 | | | | 17,709 | | | | 1.25 | | | | 0.21 | | | | 1.40 | | | | 39 | |
| | 10.70 | | | | 0.13 | | | | 18,082 | | | | 1.24 | | | | 0.05 | | | | 1.38 | | | | 53 | |
| | 10.69 | | | | (0.10 | ) | | | 21,918 | | | | 1.24 | | | | 0.13 | | | | 1.37 | | | | 39 | |
| | | | | | |
| | | | | | | | | | | | | | | | | | | | | | | | | | |
| | 10.46 | | | | 1.17 | | | | 1,595,655 | | | | 0.25 | | | | 1.96 | | | | 0.61 | | | | 19 | |
| | 10.44 | | | | 0.70 | | | | 1,680,807 | | | | 0.24 | | | | 1.53 | | | | 0.60 | | | | 73 | |
| | 10.53 | | | | (0.20 | ) | | | 1,887,149 | | | | 0.25 | | | | 1.40 | | | | 0.48 | | | | 31 | |
| | 10.76 | | | | 2.09 | | | | 2,453,419 | | | | 0.25 | | | | 1.21 | | | | 0.47 | | | | 39 | |
| | 10.67 | | | | 1.13 | | | | 2,857,462 | | | | 0.24 | | | | 1.05 | | | | 0.47 | | | | 53 | |
| | 10.66 | | | | 0.88 | | | | 2,175,023 | | | | 0.23 | | | | 1.10 | | | | 0.49 | | | | 39 | |
SEE NOTES TO FINANCIAL STATEMENTS.
| | | | | | | | |
| | | |
| AUGUST 31, 2018 | | J.P. MORGAN MUNICIPAL BOND FUNDS | | | | | 97 | |
FINANCIAL HIGHLIGHTS
FOR THE PERIODS INDICATED (continued)
| | | | | | | | | | | | | | | | | | | | | | | | | | | | |
| | | Per share operating performance | |
| | | | | | Investment operations | | | Distributions | |
| | | Net asset
value,
beginning
of period | | | Net
investment
income
(loss) (b) | | | Net realized
and unrealized
gains
(losses) on
investments | | | Total from
investment
operations | | | Net
investment
income | | | Net
realized
gain | | | Total
distributions | |
JPMorgan Tax Free Bond Fund | | | | | | | | | | | | | | | | | | | | | | | | | | | | |
Class A | | | | | | | | | | | | | | | | | | | | | | | | | | | | |
Six Months Ended August 31, 2018 (Unaudited) | | $ | 11.82 | | | $ | 0.20 | | | $ | (0.03 | ) | | $ | 0.17 | | | $ | (0.21 | ) | | $ | — | | | $ | (0.21 | ) |
Year Ended February 28, 2018 | | | 11.93 | | | | 0.39 | | | | (0.11 | ) | | | 0.28 | | | | (0.39 | ) | | | — | | | | (0.39 | ) |
Year Ended February 28, 2017 | | | 12.57 | | | | 0.40 | | | | (0.40 | ) | | | — | (f) | | | (0.39 | ) | | | (0.25 | ) | | | (0.64 | ) |
Year Ended February 29, 2016 | | | 12.70 | | | | 0.45 | | | | (0.01 | ) | | | 0.44 | | | | (0.47 | ) | | | (0.10 | ) | | | (0.57 | ) |
Year Ended February 28, 2015 | | | 12.41 | | | | 0.44 | | | | 0.39 | | | | 0.83 | | | | (0.44 | ) | | | (0.10 | ) | | | (0.54 | ) |
Year Ended February 28, 2014 | | | 12.88 | | | | 0.46 | | | | (0.44 | ) | | | 0.02 | | | | (0.48 | ) | | | (0.01 | ) | | | (0.49 | ) |
| | | | | | | |
Class C | | | | | | | | | | | | | | | | | | | | | | | | | | | | |
Six Months Ended August 31, 2018 (Unaudited) | | | 11.72 | | | | 0.17 | | | | (0.04 | ) | | | 0.13 | | | | (0.17 | ) | | | — | | | | (0.17 | ) |
Year Ended February 28, 2018 | | | 11.84 | | | | 0.32 | | | | (0.12 | ) | | | 0.20 | | | | (0.32 | ) | | | — | | | | (0.32 | ) |
Year Ended February 28, 2017 | | | 12.48 | | | | 0.31 | | | | (0.39 | ) | | | (0.08 | ) | | | (0.31 | ) | | | (0.25 | ) | | | (0.56 | ) |
Year Ended February 29, 2016 | | | 12.60 | | | | 0.37 | | | | (0.01 | ) | | | 0.36 | | | | (0.38 | ) | | | (0.10 | ) | | | (0.48 | ) |
Year Ended February 28, 2015 | | | 12.33 | | | | 0.35 | | | | 0.38 | | | | 0.73 | | | | (0.36 | ) | | | (0.10 | ) | | | (0.46 | ) |
Year Ended February 28, 2014 | | | 12.80 | | | | 0.37 | | | | (0.44 | ) | | | (0.07 | ) | | | (0.39 | ) | | | (0.01 | ) | | | (0.40 | ) |
| | | | | | | |
Class I | | | | | | | | | | | | | | | | | | | | | | | | | | | | |
Six Months Ended August 31, 2018 (Unaudited) | | | 11.77 | | | | 0.22 | | | | (0.04 | ) | | | 0.18 | | | | (0.22 | ) | | | — | | | | (0.22 | ) |
Year Ended February 28, 2018 | | | 11.88 | | | | 0.42 | | | | (0.11 | ) | | | 0.31 | | | | (0.42 | ) | | | — | | | | (0.42 | ) |
Year Ended February 28, 2017 | | | 12.53 | | | | 0.42 | | | | (0.40 | ) | | | 0.02 | | | | (0.42 | ) | | | (0.25 | ) | | | (0.67 | ) |
Year Ended February 29, 2016 | | | 12.65 | | | | 0.47 | | | | — | (f) | | | 0.47 | | | | (0.49 | ) | | | (0.10 | ) | | | (0.59 | ) |
Year Ended February 28, 2015 | | | 12.37 | | | | 0.46 | | | | 0.38 | | | | 0.84 | | | | (0.46 | ) | | | (0.10 | ) | | | (0.56 | ) |
Year Ended February 28, 2014 | | | 12.84 | | | | 0.48 | | | | (0.44 | ) | | | 0.04 | | | | (0.50 | ) | | | (0.01 | ) | | | (0.51 | ) |
| (a) | Annualized for periods less than one year, unless otherwise noted. |
| (b) | Calculated based upon average shares outstanding. |
| (c) | Not annualized for periods less than one year. |
| (d) | Includes adjustments in accordance with accounting principles generally accepted in the United States of America and as such, the net asset values for financial reporting purposes and the returns based upon those net asset values may differ from the net asset values and returns for shareholder transactions. |
| (e) | Includes earnings credits and interest expense, if applicable, each of which is less than 0.005% unless otherwise noted. |
| (f) | Amount rounds to less than $0.005. |
SEE NOTES TO FINANCIAL STATEMENTS.
| | | | | | |
| | | |
| 98 | | | | J.P. MORGAN MUNICIPAL BOND FUNDS | | AUGUST 31, 2018 |
| | | | | | | | | | | | | | | | | | | | | | | | | | |
| | | Ratios/Supplemental data | |
| | | | | | | | | | Ratios to average net assets (a) | | | | |
Net asset
value,
end of
period | | | Total return
(excludes
sales charge) (c) (d) | | | Net assets,
end of
period
(000’s) | | | Net
expenses (e) | | | Net
investment
income
(loss) | | |
Expenses
without waivers,
reimbursements and
earnings credits | | | Portfolio
turnover
rate (c) | |
| | | | | | | | | | | | | | | | | | | | | | | | | | |
| | | | | | | | | | | | | | | | | | | | | | | | | | |
| $ | 11.78 | | | | 1.41 | % | | $ | 133,986 | | | | 0.66 | % | | | 3.44 | % | | | 0.99 | % | | | 28 | % |
| | 11.82 | | | | 2.36 | | | | 130,462 | | | | 0.66 | | | | 3.27 | | | | 0.98 | | | | 39 | |
| | 11.93 | | | | (0.03 | ) | | | 148,987 | | | | 0.66 | | | | 3.16 | | | | 1.00 | | | | 73 | |
| | 12.57 | | | | 3.53 | | | | 152,207 | | | | 0.67 | | | | 3.62 | | | | 0.97 | | | | 94 | |
| | 12.70 | | | | 6.83 | | | | 166,359 | | | | 0.74 | | | | 3.49 | | | | 0.98 | | | | 90 | |
| | 12.41 | | | | 0.31 | | | | 129,124 | | | | 0.74 | | | | 3.72 | | | | 0.99 | | | | 62 | |
| | | | | | |
| | | | | | | | | | | | | | | | | | | | | | | | | | |
| | 11.68 | | | | 1.13 | | | | 28,657 | | | | 1.24 | | | | 2.85 | | | | 1.48 | | | | 28 | |
| | 11.72 | | | | 1.70 | | | | 25,172 | | | | 1.24 | | | | 2.69 | | | | 1.48 | | | | 39 | |
| | 11.84 | | | | (0.66 | ) | | | 32,052 | | | | 1.31 | | | | 2.50 | | | | 1.50 | | | | 73 | |
| | 12.48 | | | | 2.92 | | | | 26,715 | | | | 1.36 | | | | 2.93 | | | | 1.47 | | | | 94 | |
| | 12.60 | | | | 5.99 | | | | 27,579 | | | | 1.43 | | | | 2.81 | | | | 1.48 | | | | 90 | |
| | 12.33 | | | | (0.40 | ) | | | 25,057 | | | | 1.43 | | | | 3.00 | | | | 1.48 | | | | 62 | |
| | | | | | |
| | | | | | | | | | | | | | | | | | | | | | | | | | |
| | 11.73 | | | | 1.53 | | | | 206,282 | | | | 0.44 | | | | 3.64 | | | | 0.73 | | | | 28 | |
| | 11.77 | | | | 2.60 | | | | 160,391 | | | | 0.44 | | | | 3.49 | | | | 0.72 | | | | 39 | |
| | 11.88 | | | | 0.09 | | | | 141,356 | | | | 0.47 | | | | 3.34 | | | | 0.74 | | | | 73 | |
| | 12.53 | | | | 3.82 | | | | 126,091 | | | | 0.50 | | | | 3.79 | | | | 0.71 | | | | 94 | |
| | 12.65 | | | | 6.95 | | | | 149,102 | | | | 0.57 | | | | 3.67 | | | | 0.72 | | | | 90 | |
| | 12.37 | | | | 0.49 | | | | 129,602 | | | | 0.57 | | | | 3.89 | | | | 0.74 | | | | 62 | |
SEE NOTES TO FINANCIAL STATEMENTS.
| | | | | | | | |
| | | |
| AUGUST 31, 2018 | | J.P. MORGAN MUNICIPAL BOND FUNDS | | | | | 99 | |
FINANCIAL HIGHLIGHTS
FOR THE PERIODS INDICATED (continued)
| | | | | | | | | | | | | | | | | | | | |
| | | Per share operating performance | |
| | | | | | Investment operations | | | Distributions | |
| | | Net asset
value,
beginning
of period | | | Net
investment
income
(loss) (b) | | | Net realized
and unrealized
gains
(losses) on
investments | | | Total from
investment
operations | | | Net
investment
income | |
JPMorgan Ultra-Short Municipal Fund | | | | | | | | | | | | | | | | | | | | |
Class A | | | | | | | | | | | | | | | | | | | | |
Six Months Ended August 31, 2018 (Unaudited) | | $ | 10.01 | | | $ | 0.05 | | | $ | — | (f) | | $ | 0.05 | | | $ | (0.05 | ) |
Year Ended February 28, 2018 | | | 10.02 | | | | 0.07 | | | | (0.02 | ) | | | 0.05 | | | | (0.06 | ) |
May 31, 2016 (h) through February 28, 2017 | | | 10.00 | | | | 0.06 | | | | (0.01 | ) | | | 0.05 | | | | (0.03 | ) |
| | | | | |
Class I | | | | | | | | | | | | | | | | | | | | |
Six Months Ended August 31, 2018 (Unaudited) | | | 10.00 | | | | 0.06 | | | | 0.01 | | | | 0.07 | | | | (0.06 | ) |
Year Ended February 28, 2018 | | | 10.02 | | | | 0.09 | | | | (0.03 | ) | | | 0.06 | | | | (0.08 | ) |
May 31, 2016 (h) through February 28, 2017 | | | 10.00 | | | | 0.06 | | | | — | (f) | | | 0.06 | | | | (0.04 | ) |
| (a) | Annualized for periods less than one year, unless otherwise noted. |
| (b) | Calculated based upon average shares outstanding. |
| (c) | Not annualized for periods less than one year. |
| (d) | Includes adjustments in accordance with accounting principles generally accepted in the United States of America and as such, the net asset values for financial reporting purposes and the returns based upon those net asset values may differ from the net asset values and returns for shareholder transactions. |
| (e) | Includes earnings credits and interest expense, if applicable, each of which is less than 0.005% unless otherwise noted. |
| (f) | Amount rounds to less than $0.005. |
| (g) | Certain non-recurring expenses incurred by the Fund were not annualized for the year ended February 28, 2018 and for the period ended February 28, 2017. |
| (h) | Commencement of operations. |
SEE NOTES TO FINANCIAL STATEMENTS.
| | | | | | |
| | | |
| 100 | | | | J.P. MORGAN MUNICIPAL BOND FUNDS | | AUGUST 31, 2018 |
| | | | | | | | | | | | | | | | | | | | | | | | | | |
| | | Ratios/Supplemental data | |
| | | | | | | | | | Ratios to average net assets (a) | | | | |
Net asset
value,
end of
period | | | Total return
(excludes
sales charge) (c) (d) | | |
Net assets,
end of
period
(000’s) | | | Net
expenses (e) | | | Net
investment
income
(loss) | | | Expenses
without waivers,
reimbursements and
earnings credits | | | Portfolio
turnover
rate (c) | |
| | | | | | | | | | | | | | | | | | | | | | | | | | |
| | | | | | | | | | | | | | | | | | | | | | | | | | |
| $ | 10.01 | | | | 0.47 | % | | $ | 8,138 | | | | 0.44 | % | | | 1.09 | % | | | 0.78 | % | | | 34 | % |
| | 10.01 | | | | 0.47 | | | | 772 | | | | 0.44 | (g) | | | 0.67 | (g) | | | 0.85 | (g) | | | 71 | |
| | 10.02 | | | | 0.52 | | | | 519 | | | | 0.44 | (g) | | | 0.81 | (g) | | | 2.56 | (g) | | | 80 | |
| | | | | | |
| | | | | | | | | | | | | | | | | | | | | | | | | | |
| | 10.01 | | | | 0.73 | | | | 2,409,617 | | | | 0.24 | | | | 1.26 | | | | 0.52 | | | | 34 | |
| | 10.00 | | | | 0.63 | | | | 2,064,297 | | | | 0.24 | (g) | | | 0.90 | (g) | | | 0.56 | (g) | | | 71 | |
| | 10.02 | | | | 0.65 | | | | 31,656 | | | | 0.27 | (g) | | | 0.74 | (g) | | | 2.00 | (g) | | | 80 | |
SEE NOTES TO FINANCIAL STATEMENTS.
| | | | | | | | |
| | | |
| AUGUST 31, 2018 | | J.P. MORGAN MUNICIPAL BOND FUNDS | | | | | 101 | |
NOTES TO FINANCIAL STATEMENTS
AS OF AUGUST 31, 2018 (Unaudited)
1. Organization
JPMorgan Trust II (“JPM II”) and JPMorgan Trust IV (“JPM IV”) (the “Trusts”) were formed on November 12, 2004 and November 12, 2015, respectively, as Delaware statutory trusts, pursuant to Declarations of Trust dated November 5, 2004 and November 12, 2015, respectively, and are registered under the Investment Company Act of 1940, as amended (the “1940 Act”), as open-end management investment companies.
The following are 4 separate funds of the Trusts (each, a “Fund” and collectively, the “Funds”) covered by this report:
| | | | | | |
| | | Classes Offered | | Trust | | Diversified/Non-Diversified |
| JPMorgan Municipal Income Fund | | Class A, Class C, Class I and Class R6* | | JPM II | | Diversified |
| JPMorgan Short-Intermediate Municipal Bond Fund | | Class A, Class C and Class I** | | JPM II | | Diversified |
| JPMorgan Tax Free Bond Fund | | Class A, Class C and Class I | | JPM II | | Diversified |
| JPMorgan Ultra-Short Municipal Fund*** | | Class A and Class I | | JPM IV | | Diversified |
| * | Class R6 Shares commenced operations on November 6, 2017 for the JPMorgan Municipal Income Fund. |
| ** | On April 3, 2017, Select Class Shares of the JPMorgan Short-Intermediate Municipal Bond Fund were converted into Institutional Class Shares of the Fund and the Institutional Class Shares were then renamed Class I Shares. Additionally, on April 3, 2017, Select Class Shares were no longer offered. |
| *** | The JPMorgan Ultra-Short Municipal Fund commenced investment operations on May 31, 2016. Prior to May 31, 2016, the Fund had no significant operations other than matters relating to the organization and registration of JPM IV and the issuance of 2,000 shares of Class A Shares and 998,000 shares of Class I Shares to J.P. Morgan Investment Management Inc., an indirect, wholly-owned subsidiary of JPMorgan Chase & Co. (“JPMorgan”). |
The investment objective of JPMorgan Municipal Income Fund (“Municipal Income Fund”) is to seek current income exempt from federal income taxes.
The investment objective of JPMorgan Short-Intermediate Municipal Bond Fund (“Short-Intermediate Bond Fund”), JPMorgan Tax Free Bond Fund (“Tax Free Bond Fund”) and JPMorgan Ultra-Short Municipal Fund (“Ultra-Short Municipal Fund”) is to seek as high a level of current income exempt from federal income tax as is consistent with relative stability of principal.
Tax Free Bond Fund acquired all the assets and liabilities of the JPMorgan Tax Aware Income Opportunities Fund (“Tax Aware Income Opportunities Fund”) in a reorganization on May 4, 2018. Please refer to Note 8 discussing the merger.
Class A Shares generally provide for a front-end sales charge while Class C Shares provide for a contingent deferred sales charge (“CDSC”). No sales charges are assessed with respect to Class I and Class R6 Shares. Certain Class A Shares, for which front-end sales charges have been waived, may be subject to a CDSC as described in the Funds’ prospectuses. Beginning on November 14, 2017, Class C Shares automatically convert to Class A Shares after ten years. All classes of shares have equal rights as to earnings, assets and voting privileges, except that each class may bear different transfer agency, distribution and service fees and each class has exclusive voting rights with respect to its distribution plan and shareholder servicing agreements.
J.P. Morgan Investment Management Inc. (“JPMIM”), an indirect, wholly-owned subsidiary of JPMorgan, acts as Adviser (the “Adviser”) and Administrator (the “Administrator”) to the Funds.
2. Significant Accounting Policies
The following is a summary of significant accounting policies followed by the Funds in the preparation of their financial statements. The Funds are investment companies and, thus, follow the investment company accounting and reporting guidance of the Financial Accounting Standards Board Accounting Standards Codification Topic 946 — Investment Companies, which is part of U.S. generally accepted accounting principles (“GAAP”). The preparation of financial statements in conformity with GAAP requires management to make estimates and assumptions that affect the reported amounts of assets and liabilities and disclosure of contingent assets and liabilities at the date of the financial statements and the reported amounts of increases and decreases in net assets from operations during the reporting period. Actual results could differ from those estimates.
A. Valuation of Investments — The valuation of investments is in accordance with GAAP and the Funds’ valuation policies set forth by and under the supervision and responsibility of the Boards of Trustees (the “Boards”), which established the following approach to valuation, as described more fully below: (i) investments for which market quotations are readily available shall be valued at such unadjusted quoted prices and (ii) all other investments for which market quotations are not readily available shall be valued at their fair value as determined in good faith by the Boards.
The Administrator has established the J.P. Morgan Asset Management Americas Valuation Committee (“AVC”) to assist the Boards with the oversight and monitoring of the valuation of the Funds’ investments. The Administrator implements the valuation policies of the Funds’ investments, as directed by the Boards. The AVC oversees and carries out the policies for the valuation of investments held in the Funds. This includes monitoring the appropriateness of fair values based on results of ongoing valuation oversight including, but not limited to, consideration of macro or security specific events, market events and pricing vendor and broker due diligence. The Administrator is responsible for discussing and assessing the potential impacts to the fair values on an ongoing basis, and at least on a quarterly basis with the AVC and the Boards.
| | | | | | |
| | | |
| 102 | | | | J.P. MORGAN MUNICIPAL BOND FUNDS | | AUGUST 31, 2018 |
A market-based approach is primarily used to value the Funds’ investments. Investments for which market quotations are not readily available are fair valued by approved affiliated and unaffiliated pricing vendors or third party broker-dealers (collectively referred to as “Pricing Services”) or may be internally fair valued using methods set forth by the valuation policies approved by the Boards. This may include related or comparable assets or liabilities, recent transactions, market multiples, book values and other relevant information for the investment to determine the fair value of the investment. An income-based valuation approach may be used in which the anticipated future cash flows of the investment are discounted to calculate the fair value. Discounts may also be applied due to the nature or duration of any restrictions on the disposition of the investments. Valuations may be based upon current market prices of securities that are comparable in coupon, rating, maturity and industry. It is possible that the estimated values may differ significantly from the values that would have been used, had a ready market for the investments existed, and such differences could be material.
Fixed income instruments are valued based on prices received from Pricing Services. The Pricing Services use multiple valuation techniques to determine the valuation of fixed income instruments. In instances where sufficient market activity exists, the Pricing Services may utilize a market-based approach through which trades or quotes from market makers are used to determine the valuation of these instruments. In instances where sufficient market activity may not exist, the Pricing Services also utilize proprietary valuation models which may consider market transactions in comparable securities and the various relationships between securities in determining fair value and/or market characteristics in order to estimate the relevant cash flows, which are then discounted to calculate the fair values.
Futures contracts are generally valued on the basis of available market quotations.
Investments in open-end investment companies (the “Underlying Funds”) are valued at each Underlying Fund’s net asset value per share (“NAV”) as of the report date.
Valuations reflected in this report are as of the report date. As a result, changes in valuation due to market events and/or issuer related events after the report date and prior to issuance of the report are not reflected herein.
The various inputs that are used in determining the valuation of the Funds’ investments are summarized into the three broad levels listed below.
| • | | Level 1 — Unadjusted inputs using quoted prices in active markets for identical investments. |
| • | | Level 2 — Other significant observable inputs including, but not limited to, quoted prices for similar investments, inputs other than quoted prices that are observable for investments (such as interest rates, prepayment speeds, credit risk, etc.) or other market corroborated inputs. |
| • | | Level 3 — Significant inputs based on the best information available in the circumstances, to the extent observable inputs are not available (including the Funds’ assumptions in determining the fair value of investments). |
A financial instrument’s level within the fair value hierarchy is based on the lowest level of any input, both individually and in the aggregate, that is significant to the fair value measurement. The inputs or methodology used for valuing instruments are not necessarily an indication of the risk associated with investing in those instruments.
The following tables represent each valuation input by municipal sector as presented on the Schedules of Portfolio Investments (“SOIs”) (amounts in thousands):
Municipal Income Fund
| | | | | | | | | | | | | | | | |
| | | Level 1
Quoted prices | | | Level 2
Other significant
observable inputs | | | Level 3
Significant
unobservable inputs | | | Total | |
Investments in Securities | | | | | | | | | | | | | | | | |
Debt Securities | | | | | | | | | | | | | | | | |
Municipal Bonds | | | | | | | | | | | | | | | | |
Oklahoma | | | | | | | | | | | | | | | | |
Housing | | $ | — | | | $ | 571 | | | $ | — | | | $ | 571 | |
Other Revenue | | | — | | | | — | | | | 17 | | | | 17 | |
| | | | | | | | | | | | | | | | |
Total Oklahoma | | | — | | | | 571 | | | | 17 | | | | 588 | |
| | | | | | | | | | | | | | | | |
Other Municipal Bonds | | | — | | | | 193,145 | | | | — | | | | 193,145 | |
| | | | | | | | | | | | | | | | |
Total Municipal Bonds | | | — | | | | 193,716 | | | | 17 | | | | 193,733 | |
| | | | | | | | | | | | | | | | |
Short-Term Investments | | | | | | | | | | | | | | | | |
Investment Companies | | | 5,294 | | | | — | | | | — | | | | 5,294 | |
| | | | | | | | | | | | | | | | |
Total Investments in Securities | | $ | 5,294 | | | $ | 193,716 | | | $ | 17 | | | $ | 199,027 | |
| | | | | | | | | | | | | | | | |
| | | | | | | | |
| | | |
| AUGUST 31, 2018 | | J.P. MORGAN MUNICIPAL BOND FUNDS | | | | | 103 | |
NOTES TO FINANCIAL STATEMENTS
AS OF AUGUST 31, 2018 (Unaudited) (continued)
| | | | | | | | | | | | | | | | |
Short-Intermediate Municipal Bond Fund | |
| | | Level 1
Quoted prices | | | Level 2
Other significant
observable inputs | | | Level 3
Significant
unobservable inputs | | | Total | |
Total Investments in Securities (a) | | $ | 97,444 | | | $ | 1,541,113 | | | $ | — | | | $ | 1,638,557 | |
| | | | | | | | | | | | | | | | |
| | | | | | | | | | | | | | | | |
| | | | |
Tax Free Bond Fund | | | | | | | | | | | | | | | | |
| | | Level 1
Quoted prices | | | Level 2
Other significant
observable inputs | | | Level 3
Significant
unobservable inputs | | | Total | |
Investments in Securities | | | | | | | | | | | | | | | | |
Debt Securities | | | | | | | | | | | | | | | | |
Municipal Bonds | | | | | | | | | | | | | | | | |
Other Municipal Bonds | | $ | — | | | $ | 352,424 | | | $ | — | | | $ | 352,424 | |
Warrants | | | | | | | | | | | | | | | | |
Road & Rail | | | — | | | | — | | | | — | (b) | | | — | |
Short-Term Investments | | | | | | | | | | | | | | | | |
Investment Companies | | | 9,508 | | | | — | | | | — | | | | 9,508 | |
| | | | | | | | | | | | | | | | |
Total Investments in Securities | | $ | 9,508 | | | $ | 352,424 | | | $ | — | | | $ | 361,932 | |
| | | | | | | | | | | | | | | | |
Appreciation in Other Financial Instruments | | | | | | | | | | | | | | | | |
Futures Contracts | | $ | 8 | | | $ | — | | | $ | — | | | $ | 8 | |
| | | | | | | | | | | | | | | | |
| | | | | | | | | | | | | | | | |
|
Ultra-Short Municipal Fund | |
| | | Level 1
Quoted prices | | | Level 2
Other significant
observable inputs | | | Level 3
Significant
unobservable inputs | | | Total | |
Total Investments in Securities (a) | | $ | 111,466 | | | $ | 2,352,806 | | | $ | — | | | $ | 2,464,272 | |
| | | | | | | | | | | | | | | | |
| (a) | All portfolio holdings designated as level 1 and level 2 are disclosed individually on the SOIs. Level 1 consists of a money market mutual fund that is held for daily investments of cash. Please refer to the SOIs for industry specifics of portfolio holdings. |
There were no transfers among any levels during the six months ended August 31, 2018.
B. When-Issued Securities, Delayed Delivery Securities and Forward Commitments — Municipal Income Fund, Tax Free Bond and Ultra-Short Municipal Fund purchased when-issued securities, including To Be Announced (“TBA”) securities, and entered into contracts to purchase or sell securities for a fixed price that may be settled a month or more after the trade date, or purchased delayed delivery securities which generally settle seven days after the trade date. When-issued securities are securities that have been authorized, but not issued in the market. A forward commitment involves entering into a contract to purchase or sell securities for a fixed price at a future date that may be settled a month or more after the trade date. A delayed delivery security is agreed upon in advance between the buyer and the seller of the security and is generally delivered beyond seven days of the agreed upon date. The purchase of securities on a when-issued, delayed delivery or forward commitment basis involves the risk that the value of the security to be purchased declines before settlement date. The sale of securities on a forward commitment basis involves the risk that the value of the securities sold may increase before the settlement date. The Funds may be exposed to credit risk if the counterparty fails to perform under the terms of the transaction. Interest income for securities purchased on a when-issued, delayed delivery or forward commitment basis is not accrued until settlement date.
Municipal Income Fund, Tax Free Bond and Ultra-Short Municipal Fund had when-issued securities, forward commitments or delayed delivery securities outstanding as of August 31, 2018, which are shown as a Receivable for Investment securities sold — delayed delivery securities and Payable for Investment securities purchased — delayed delivery securities, respectively, on the Statements of Assets and Liabilities. The values of these securities held at August 31, 2018 are detailed on the SOIs.
The Funds did not have TBA purchase commitments outstanding as of August 31, 2018.
C. Futures Contracts — Tax Free Bond Fund used treasury and interest rate futures contracts to manage and hedge interest rate risk associated with portfolio investments. The Fund also used futures contracts to lengthen or shorten the duration of the overall investment portfolio.
Futures contracts provide for the delayed delivery of the underlying instrument at a fixed price or are settled for a cash amount based on the change in the value of the underlying instrument at a specific date in the future. Upon entering into a futures contract, the Fund is required to deposit with the broker, cash or securities in an amount equal to a certain percentage of the contract amount, which is referred to as the initial margin deposit. Subsequent payments, referred to as variation margin, are made or received by the Fund periodically and are based on changes in the market value of open futures contracts. Changes in the market value of open futures contracts are recorded as Change in net unrealized appreciation/depreciation on the Statements of Operations. Realized gains or losses, representing the difference between the value of the contract
| | | | | | |
| | | |
| 104 | | | | J.P. MORGAN MUNICIPAL BOND FUNDS | | AUGUST 31, 2018 |
at the time it was opened and the value at the time it was closed, are reported on the Statements of Operations at the closing or expiration of the futures contract. Securities deposited as initial margin are designated on the SOI and cash deposited, which is considered restricted, is recorded on the Statements of Assets and Liabilities. A receivable from and/or a payable to brokers for the daily variation margin is also recorded on the Statements of Assets and Liabilities.
The use of futures contracts exposes the Fund to interest rate risk. The Fund may be subject to the risk that the change in the value of the futures contract may not correlate perfectly with the underlying instrument. Use of long futures contracts subjects the Fund to risk of loss in excess of the amounts shown on the Statements of Assets and Liabilities, up to the notional amount of the futures contracts. Use of short futures contracts subjects the Fund to unlimited risk of loss. The Fund may enter into futures contracts only on exchanges or boards of trade. The exchange or board of trade acts as the counterparty to each futures transaction; therefore, the Fund’s credit risk is limited to failure of the exchange or board of trade. Under some circumstances, futures exchanges may establish daily limits on the amount that the price of a futures contract can vary from the previous day’s settlement price, which could effectively prevent liquidation of positions.
The table below discloses the volume of the Fund’s futures contracts activity during the six months ended August 31, 2018 (amounts in thousands):
| | | | |
| | | Tax Free
Bond Fund | |
Futures Contracts-Interest Rate: | | | | |
Average Notional Balance Short | | $ | 6,520 | |
Ending Notional Balance Short | | | 6,368 | |
The Fund’s futures contracts are not subject to master netting arrangements (the right to close out all transactions traded with a counterparty and net amounts owed or due across transactions).
D. Investment Transactions with Affiliates — The Funds invested in Underlying Funds which are advised by the Adviser or its affiliates. An issuer which is under common control with the Funds may be considered an affiliate. For the purposes of the financial statements, the Funds assume the issuers listed in the table below to be affiliated issuers. Underlying Funds’ distributions may be reinvested into the Underlying Funds. Reinvestment amounts are included in the purchase cost amounts in the table below. Included in the purchases and sales amounts in the tables below are exchanges between certain share classes of the Underlying Funds. Such exchanges are not treated as purchases and sales for the purpose of recognizing realized gains (losses) or portfolio turnover. Amounts in the tables below are in thousands.
Municipal Income Fund
| | | | | | | | | | | | | | | | | | | | | | | | | | | | | | | | | | | | |
| For the six months ended August 31, 2018 | |
| Security Description | | Value at
February 28,
2018 | | | Purchases
at Cost | | | Proceeds
from
Sales | | | Net
Realized
Gain
(Loss) | | | Change
in Unrealized
Appreciation/
(Depreciation) | | | Value at
August 31,
2018 | | | Shares at
August 31,
2018 | | | Dividend
Income | | | Capital Gain
Distributions | |
JPMorgan Institutional Tax Free Money Market Fund Class IM Shares, 1.38%(a)(b) | | $ | — | | | $ | 16,302 | | | $ | 11,008 | | | $ | — | (c) | | $ | — | | | $ | 5,294 | | | | 5,294 | | | $ | 13 | | | $ | — | |
JPMorgan U.S. Government Money Market Fund Class Institutional Shares, 1.25%(a)(b) | | | 4,335 | | | | 22,268 | | | | 26,603 | | | | — | | | | — | | | | — | | | | — | | | | 31 | | | | — | |
| | | | | | | | | | | | | | | | | | | | | | | | | | | | | | | | | | | | |
Total | | $ | 4,335 | | | $ | 38,570 | | | $ | 37,611 | | | $ | — | (c) | | $ | — | | | $ | 5,294 | | | | | | | $ | 44 | | | $ | — | |
| | | | | | | | | | | | | | | | | | | | | | | | | | | | | | | | | | | | |
| (a) | Investment in affiliate. Fund is registered under the Investment Company Act of 1940, as amended, and advised by J.P. Morgan Investment Management Inc. |
| (b) | The rate shown is the current yield as of August 31, 2018. |
| (c) | Amount rounds to less than one thousand. |
| | | | | | | | |
| | | |
| AUGUST 31, 2018 | | J.P. MORGAN MUNICIPAL BOND FUNDS | | | | | 105 | |
NOTES TO FINANCIAL STATEMENTS
AS OF AUGUST 31, 2018 (Unaudited) (continued)
Short-Intermediate Municipal Bond Fund
| | | | | | | | | | | | | | | | | | | | | | | | | | | | | | | | | | | | |
| For the six months ended August 31, 2018 | |
| Security Description | | Value at
February 28,
2018 | | | Purchases
at Cost | | | Proceeds
from
Sales | | | Net
Realized
Gain
(Loss) | | | Change
in Unrealized
Appreciation/
(Depreciation) | | | Value at
August 31,
2018 | | | Shares at
August 31,
2018 | | | Dividend
Income | | | Capital Gain
Distributions | |
JPMorgan Institutional Tax Free Money Market Fund Class IM Shares, 1.38%(a)(b) | | $ | — | | | $ | 260,655 | | | $ | 163,211 | | | $ | — | | | $ | — | | | $ | 97,444 | | | | 97,445 | | | $ | 235 | | | $ | — | |
JPMorgan U.S. Government Money Market Fund Class Institutional Shares, 1.25%(a)(b) | | | 11,128 | | | | 169,164 | | | | 180,292 | | | | — | | | | — | | | | — | | | | — | | | | 86 | | | | — | |
| | | | | | | | | | | | | | | | | | | | | | | | | | | | | | | | | | | | |
Total | | $ | 11,128 | | | $ | 429,819 | | | $ | 343,503 | | | $ | — | | | $ | — | | | $ | 97,444 | | | | | | | $ | 321 | | | $ | — | |
| | | | | | | | | | | | | | | | | | | | | | | | | | | | | | | | | | | | |
Tax Free Bond Fund
| | | | | | | | | | | | | | | | | | | | | | | | | | | | | | | | | | | | |
| For the six months ended August 31, 2018 | |
| Security Description | | Value at
February 28,
2018 | | | Purchases
at Cost | | | Proceeds
from
Sales | | | Net
Realized
Gain
(Loss) | | | Change
in Unrealized
Appreciation/
(Depreciation) | | | Value at
August 31,
2018 | | | Shares at
August 31,
2018 | | | Dividend
Income | | | Capital Gain
Distributions | |
JPMorgan Institutional Tax Free Money Market Fund Class IM Shares, 1.38%(a)(b) | | $ | — | | | $ | 44,814 | | | $ | 35,306 | | | $ | — | (c) | | $ | — | | | $ | 9,508 | | | | 9,508 | | | $ | 24 | | | $ | — | |
JPMorgan U.S. Government Money Market Fund Class Institutional Shares, 1.25%(a)(b) | | | 9,885 | | | | 77,824 | | | | 87,709 | | | | — | | | | — | | | | — | | | | — | | | | 52 | | | | — | |
| | | | | | | | | | | | | | | | | | | | | | | | | | | | | | | | | | | | |
Total | | $ | 9,885 | | | $ | 122,638 | | | $ | 123,015 | | | $ | — | (c) | | $ | — | | | $ | 9,508 | | | | | | | $ | 76 | | | $ | — | |
| | | | | | | | | | | | | | | | | | | | | | | | | | | | | | | | | | | | |
Ultra-Short Municipal Fund
| | | | | | | | | | | | | | | | | | | | | | | | | | | | | | | | | | | | |
| For the six months ended August 31, 2018 | |
| Security Description | | Value at
February 28,
2018 | | | Purchases
at Cost | | | Proceeds
from
Sales | | | Net
Realized
Gain
(Loss) | | | Change
in Unrealized
Appreciation/
(Depreciation) | | | Value at
August 31,
2018 | | | Shares at
August 31,
2018 | | | Dividend
Income | | | Capital Gain
Distributions | |
JPMorgan Institutional Tax Free Money Market Fund Class IM Shares, 1.38%(a)(b) | | $ | — | | | $ | 678,238 | | | $ | 566,772 | | | $ | — | | | $ | — | | | $ | 111,466 | | | | 111,467 | | | $ | 487 | | | $ | — | |
JPMorgan U.S. Government Money Market Fund Class Institutional Shares, 1.25%(a)(b) | | | 92,021 | | | | 518,178 | | | | 610,199 | | | | — | | | | — | | | | — | | | | — | | | | 525 | | | | — | |
| | | | | | | | | | | | | | | | | | | | | | | | | | | | | | | | | | | | |
Total | | $ | 92,021 | | | $ | 1,196,416 | | | $ | 1,176,971 | | | $ | — | | | $ | — | | | $ | 111,466 | | | | | | | $ | 1,012 | | | $ | — | |
| | | | | | | | | | | | | | | | | | | | | | | | | | | | | | | | | | | | |
| (a) | Investment in affiliate. Fund is registered under the Investment Company Act of 1940, as amended, and advised by J.P. Morgan Investment Management Inc. |
| (b) | The rate shown is the current yield as of August 31, 2018. |
| (c) | Amount rounds to less than one thousand. |
E. Security Transactions and Investment Income — Investment transactions are accounted for on the trade date (the date the order to buy or sell is executed). Securities gains and losses are calculated on a specifically identified cost basis. Interest income is determined on the basis of coupon interest accrued using the effective interest method which adjusts for amortization of premiums and accretion of discounts. Dividend income net of foreign taxes withheld, if any, is recorded on the ex-dividend date or when a Fund first learns of the dividend.
| | | | | | |
| | | |
| 106 | | | | J.P. MORGAN MUNICIPAL BOND FUNDS | | AUGUST 31, 2018 |
F. Allocation of Income and Expenses — Expenses directly attributable to a fund are charged directly to that fund, while the expenses attributable to more than one fund of the Trusts are allocated among the respective funds. In calculating the NAV of each class, investment income, realized and unrealized gains and losses and expenses, other than class-specific expenses, are allocated daily to each class of shares based upon the proportion of net assets of each class at the beginning of each day.
Transfer agency fees are class-specific expenses. The amount of transfer agency fees charged to each class of the Funds for the six months ended August 31, 2018 are as follows (amounts in thousands):
| | | | | | | | | | | | | | | | | | | | |
| | | Class A | | | Class C | | | Class I | | | Class R6 | | | Total | |
Municipal Income Fund | | | | | | | | | | | | | | | | | | | | |
Transfer agency fees | | $ | 2 | | | $ | 1 | | | $ | 1 | | | $ | — | (a) | | $ | 4 | |
Short-Intermediate Municipal Bond Fund | | | | | | | | | | | | | | | | | | | | |
Transfer agency fees | | | 1 | | | | 1 | | | | 9 | | | | n/a | | | | 11 | |
Tax Free Bond Fund | | | | | | | | | | | | | | | | | | | | |
Transfer agency fees | | | 7 | | | | 1 | | | | 2 | | | | n/a | | | | 10 | |
Ultra-Short Municipal Fund | | | | | | | | | | | | | | | | | | | | |
Transfer agency fees | | | — | (a) | | | n/a | | | | 5 | | | | n/a | | | | 5 | |
| (a) | Amount rounds to less than one thousand. |
G. Federal Income Taxes — Each Fund is treated as a separate taxable entity for Federal income tax purposes. Each Fund’s policy is to comply with the provisions of the Internal Revenue Code (the “Code”), applicable to regulated investment companies and to distribute to shareholders all of its distributable net investment income and net realized capital gains on investments. Accordingly, no provision for Federal income tax is necessary. Management has reviewed the Funds’ tax positions for all open tax years and has determined that as of August 31, 2018, no liability for income tax is required in the Funds’ financial statements for net unrecognized tax benefits. However, management’s conclusions may be subject to future review based on changes in, or the interpretation of, the accounting standards or tax laws and regulations. Each of the Funds’ Federal tax returns for the prior three fiscal years remains subject to examination by the Internal Revenue Service.
H. Distributions to Shareholders — Distributions from net investment income, if any, are generally declared and paid monthly and are declared separately for each class. No class has preferential dividend rights; differences in per share rates are due to differences in separate class expenses. Net realized capital gains, if any, are distributed by each Fund at least annually. The amount of distributions from net investment income and net realized capital gains is determined in accordance with Federal income tax regulations, which may differ from GAAP. To the extent these “book/tax” differences are permanent in nature (i.e., that they result from other than timing of recognition — “temporary differences”), such amounts are reclassified within the capital accounts based on their Federal tax-basis treatment.
3. Fees and Other Transactions with Affiliates
A. Investment Advisory Fee — Pursuant to Investment Advisory Agreements, the Adviser supervises the investments of each Fund and for such services is paid a fee. The fee is accrued daily and paid monthly based on each Fund’s respective average daily net assets. The annual rate for each Fund is as follows:
| | | | |
Municipal Income Fund | | | 0.30 | % |
Short-Intermediate Municipal Bond Fund | | | 0.25 | |
Tax Free Bond Fund | | | 0.30 | |
Ultra-Short Municipal Fund | | | 0.15 | |
The Adviser waived Investment Advisory fees and/or reimbursed expenses as outlined in Note 3.F.
B. Administration Fee — Pursuant to Administration Agreements, the Administrator provides certain administration services to the Funds. In consideration of these services, the Administrator receives a fee accrued daily and paid monthly at an annual rate of 0.15% of the first $25 billion of the average daily net assets of all funds in the J.P. Morgan Funds Complex covered by the Administration Agreement (excluding certain funds of funds and money market funds) and 0.075% of the average daily net assets in excess of $25 billion of all such funds. For the six months ended August 31, 2018, the effective annualized rate was 0.08% of each Fund’s average daily net assets, notwithstanding any fee waivers and/or expense reimbursements.
The Administrator waived Administration fees as outlined in Note 3.F.
JPMorgan Chase Bank, N.A. (“JPMCB”), a wholly-owned subsidiary of JPMorgan, serves as the Funds’ sub-administrator (the “Sub-administrator”). For its services as Sub-administrator, JPMCB receives a portion of the fees payable to the Administrator.
C. Distribution Fees — Pursuant to a Distribution Agreement, JPMorgan Distribution Services, Inc. (“JPMDS”), an indirect, wholly-owned subsidiary of JPMorgan, serves as the Trusts’ principal underwriter and promotes and arranges for the sale of each Fund’s shares.
| | | | | | | | |
| | | |
| AUGUST 31, 2018 | | J.P. MORGAN MUNICIPAL BOND FUNDS | | | | | 107 | |
NOTES TO FINANCIAL STATEMENTS
AS OF AUGUST 31, 2018 (Unaudited) (continued)
The Boards have adopted a Distribution Plan (the “Distribution Plan”) for Class A and Class C Shares of the Funds in accordance with Rule 12b-1 under the 1940 Act. Class I Shares and Class R6 Shares do not charge a distribution fee. The Distribution Plan provides that each Fund shall pay distribution fees, including payments to JPMDS, at annual rates of the average daily net assets as shown in the table below:
| | | | | | | | |
| | | Class A | | | Class C | |
| | | 0.25 | % | | | 0.75 | % |
In addition, JPMDS is entitled to receive the front-end sales charges from purchases of Class A Shares and the CDSC from redemptions of Class C Shares and certain Class A Shares for which front-end sales charges have been waived. For the six months ended August 31, 2018, JPMDS retained the following (amounts in thousands):
| | | | | | | | |
| | | Front-End
Sales
Charge | | | CDSC | |
Municipal Income Fund | | $ | 5 | | | $ | — | |
Short-Intermediate Municipal Bond Fund | | | 1 | | | | — | |
Tax Free Bond Fund | | | 6 | | | | — | |
Ultra-Short Municipal Fund | | | 1 | | | | — | |
D. Service Fees — The Trusts, on behalf of the Funds, have entered into a Shareholder Servicing Agreement with JPMDS under which JPMDS provides certain support services to the shareholders. For performing these services, JPMDS receives a fee, except for Class R6 Shares which do not charge a service fee, that is accrued daily and paid monthly equal to a percentage of the average daily net assets as shown in the table below:
| | | | | | | | | | | | |
| | | Class A | | | Class C | | | Class I | |
Municipal Income Fund | | | 0.25 | % | | | 0.25 | % | | | 0.25 | % |
Short-Intermediate Municipal Bond Fund | | | 0.25 | | | | 0.25 | | | | 0.25 | |
Tax Free Bond Fund | | | 0.25 | | | | 0.25 | | | | 0.25 | |
Ultra-Short Municipal Fund | | | 0.25 | | | | n/a | | | | 0.25 | |
JPMDS has entered into shareholder services contracts with affiliated and unaffiliated financial intermediaries who provide shareholder services and other related services to their clients or customers who invest in the Funds under which JPMDS will pay all or a portion of such fees earned to financial intermediaries for performing such services.
JPMDS waived service fees as outlined in Note 3.F.
E. Custodian and Accounting Fees — JPMCB provides portfolio custody and accounting services to the Funds. For performing these services, the Funds pay JPMCB transaction and asset-based fees that vary according to the number of transactions and positions, plus out-of-pocket expenses. The amounts paid directly to JPMCB by the Funds for custody and accounting services are included in Custodian and accounting fees on the Statements of Operations. Interest income earned on cash balances at the custodian, if any, is included in Interest income from affiliates on the SOP/Statements of Operations. Prior to March 1, 2018, payments to the custodian were reduced by credits earned by each Fund, based on uninvested cash balances held by the custodian. Such earnings credits, if any, are presented separately on the Statements of Operations.
Interest expense paid to the custodian related to cash overdrafts, if any, is included in Interest expense to affiliates on the Statements of Operations.
F. Waivers and Reimbursements — The Adviser, Administrator and/or JPMDS have contractually agreed to waive fees and/or reimburse the Funds to the extent that total annual operating expenses (excluding acquired fund fees and expenses other than certain money market fund fees as described below, dividend and interest expenses related to short sales, interest, taxes, expenses related to litigation and potential litigation, expenses related to trustee elections and extraordinary expenses) exceed the percentages of the Funds’ respective average daily net assets as shown in the table below:
| | | | | | | | | | | | | | | | |
| | | Class A | | | Class C | | | Class I | | | Class R6 | |
Municipal Income Fund | | | 0.70 | % | | | 1.25 | % | | | 0.45 | % | | | 0.35 | % |
Short-Intermediate Municipal Bond Fund | | | 0.70 | | | | 1.20 | | | | 0.25 | | | | n/a | |
Tax Free Bond Fund | | | 0.67 | | | | 1.25 | | | | 0.45 | | | | n/a | |
Ultra-Short Municipal Fund | | | 0.45 | | | | n/a | | | | 0.25 | | | | n/a | |
The expense limitation agreements were in effect for the six months ended August 31, 2018 and the contractual expense limitation percentages in the table above are in place until at least June 30, 2019.
| | | | | | |
| | | |
| 108 | | | | J.P. MORGAN MUNICIPAL BOND FUNDS | | AUGUST 31, 2018 |
For the six months ended August 31, 2018, the Funds’ service providers waived fees and/or reimbursed expenses for each of the Funds as follows (amounts in thousands). None of these parties expect the Funds to repay any such waived fees and/or reimbursed expenses in future years.
| | | | | | | | | | | | | | | | | | | | |
| | | Contractual Waivers | | | | |
| | | Investment
Advisory
Fees | | | Administration
Fees | | | Service
Fees | | | Total | | | Contractual
Reimbursement | |
Municipal Income Fund | | $ | 84 | | | $ | 56 | | | $ | 109 | | | $ | 249 | | | $ | — | |
Short-Intermediate Municipal Bond Fund | | | 810 | | | | 540 | | | | 1,592 | | | | 2,942 | | | | — | |
Tax Free Bond Fund | | | 273 | | | | 143 | | | | 105 | | | | 521 | | | | — | |
Ultra-Short Municipal Fund | | | 1,693 | | | | 915 | | | | 407 | | | | 3,015 | | | | 23 | |
Additionally, the Funds may invest in one or more money market funds advised by the Adviser or its affiliates (affiliated money market funds). The Adviser, Administrator and/or JPMDS, as shareholder servicing agent, have contractually agreed to waive fees and/or reimburse expenses in an amount sufficient to offset the respective net fees each collects from the affiliated money market fund on the applicable Fund’s investment in such affiliated money market fund.
The amounts of these waivers/reimbursements resulting from investments in these money market funds for the six months ended August 31, 2018 were as follows (amounts in thousands):
| | | | |
Municipal Income Fund | | $ | 5 | |
Short-Intermediate Municipal Bond Fund | | | 26 | |
Tax Free Bond Fund | | | 9 | |
Ultra-Short Municipal Fund | | | 131 | |
G. Other — Certain officers of the Trusts are affiliated with the Adviser, the Administrator and JPMDS. Such officers, with the exception of the Chief Compliance Officer, receive no compensation from the Funds for serving in their respective roles.
The Boards appointed a Chief Compliance Officer to the Funds in accordance with Federal securities regulations. Each Fund, along with other affiliated funds, makes reimbursement payments, on a pro-rata basis, to the Administrator for a portion of the fees associated with the Office of the Chief Compliance Officer. Such fees are included in Trustees’ and Chief Compliance Officer’s fees on the Statements of Operations.
The Trusts adopted a Trustee Deferred Compensation Plan (the “Plan”) which allows the Independent Trustees to defer the receipt of all or a portion of compensation related to performance of their duties as Trustees. The deferred fees are invested in various J.P. Morgan Funds until distribution in accordance with the Plan.
During the six months ended August 31, 2018, the Funds purchased securities from an underwriting syndicate in which the principal underwriter or members of the syndicate were affiliated with the Adviser.
The Funds may use related party broker-dealers. For the six months ended August 31, 2018, the Funds did not incur any brokerage commissions with broker-dealers affiliated with the Adviser.
The Securities and Exchange Commission (“SEC”) has granted an exemptive order permitting the Funds to engage in principal transactions with J.P. Morgan Securities, Inc., an affiliated broker, involving taxable money market instruments, subject to certain conditions.
4. Investment Transactions
During the six months ended August 31, 2018, purchases and sales of investments (excluding short-term investments) were as follows (amounts in thousands):
| | | | | | | | |
| | | Purchases (excluding U.S.
Government) | | | Sales (excluding U.S.
Government) | |
Municipal Income Fund | | $ | 4,233 | | | $ | 19,373 | |
Short-Intermediate Municipal Bond Fund | | | 305,713 | | | | 481,606 | |
Tax Free Bond Fund | | | 94,234 | | | | 145,887 | |
Ultra-Short Municipal Fund | | | 1,079,163 | | | | 628,181 | |
During the six months ended August 31, 2018, there were no purchases or sales of U.S. Government securities.
| | | | | | | | |
| | | |
| AUGUST 31, 2018 | | J.P. MORGAN MUNICIPAL BOND FUNDS | | | | | 109 | |
NOTES TO FINANCIAL STATEMENTS
AS OF AUGUST 31, 2018 (Unaudited) (continued)
5. Federal Income Tax Matters
For Federal income tax purposes, the estimated cost and unrealized appreciation (depreciation) in value of investments held at August 31, 2018 were as follows (amounts in thousands):
| | | | | | | | | | | | | | | | |
| | | Aggregate
Cost | | | Gross
Unrealized
Appreciation | | | Gross
Unrealized
Depreciation | | | Net
Unrealized
Appreciation
(Depreciation) | |
Municipal Income Fund | | $ | 197,624 | | | $ | 3,486 | | | $ | 2,083 | | | $ | 1,403 | |
Short-Intermediate Municipal Bond Fund | | | 1,634,388 | | | | 10,382 | | | | 6,213 | | | | 4,169 | |
Tax Free Bond Fund | | | 350,028 | | | | 13,540 | | | | 1,628 | | | | 11,912 | |
Ultra-Short Municipal Fund | | | 2,466,468 | | | | 1,456 | | | | 3,652 | | | | (2,196 | ) |
Net capital losses incurred after October 31 within the taxable year are deemed to arise on the first business day of the Funds’ next taxable year. For the year ended February 28, 2018, the following Funds deferred to March 1, 2018 the net capital losses of (amounts in thousands):
| | | | | | | | |
| | | Net Capital Loss | |
| | | Short-Term | | | Long-Term | |
Municipal Income Fund | | $ | 32 | | | $ | — | |
Short-Intermediate Municipal Bond Fund | | | 2,788 | | | | 7 | |
Tax Free Bond Fund | | | 92 | | | | 107 | |
Ultra-Short Municipal Fund | | | 57 | | | | — | |
6. Borrowings
The Funds rely upon an exemptive order granted by the SEC (the “Order”) permitting the establishment and operation of an Interfund Lending Facility (the “Facility”). The Facility allows the Funds to directly lend and borrow money to or from any other fund relying upon the Order at rates beneficial to both the borrowing and lending funds. Advances under the Facility are taken primarily for temporary or emergency purposes, including the meeting of redemption requests that otherwise might require the untimely disposition of securities, and are subject to each Fund’s borrowing restrictions. The Interfund loan rate is determined, as specified in the Order, by averaging the current repurchase agreement rate and the current bank loan rate. The Order was granted to JPM II and may be relied upon by the Funds because the Funds and the series of JPM II are all investment companies in the same “group of investment companies” (as defined in Section 12(d)(1)(G) of the 1940 Act).
The Trusts and JPMCB have entered into a financing arrangement. Under this arrangement, JPMCB provides an unsecured, uncommitted credit facility in the aggregate amount of $100 million to certain of the J.P. Morgan Funds, including the Funds. Advances under the arrangement are taken primarily for temporary or emergency purposes, including the meeting of redemption requests that otherwise might require the untimely disposition of securities, and are subject to each Fund’s borrowing restrictions. Interest on borrowings is payable at a rate determined by JPMCB at the time of borrowing. This agreement has been extended until November 5, 2018.
The Funds had no borrowings outstanding from another fund or from the unsecured, uncommitted credit facility at August 31, 2018. Average borrowings from the Facility during the six months ended August 31, 2018, were as follows (amounts in thousands, except number of days outstanding):
| | | | | | | | | | | | | | | | |
| | | Average Borrowings | | | Average Interest Rate Paid | | | Number of Days Outstanding | | | Interest Paid | |
Ultra-Short Municipal Fund | | $ | 2,192 | | | | 2.43 | % | | | 1 | | | $ | — | (a) |
| (a) | Amount rounds to less than one thousand. |
Interest expense paid as a result of borrowing from another fund or from the unsecured, uncommitted credit facility is included in Interest expense to affiliates on the Statements of Operations.
JPM II and JPM IV, each on behalf of certain funds, along with certain other trusts (“Borrowers”), have entered into a joint syndicated senior unsecured revolving credit facility totaling $1.5 billion (“Credit Facility”) with various lenders and The Bank of New York Mellon, as administrative agent for the lenders. This Credit Facility provides a source of funds to the Borrowers for temporary and emergency purposes, including the meeting of redemption requests that otherwise might require the untimely disposition of securities. Under the terms of the Credit Facility, a borrowing fund must have a minimum of $25,000,000 in adjusted net asset value and not exceed certain adjusted net asset coverage ratios prior to and during the time in which any borrowings are outstanding. If a fund does not comply with the aforementioned requirements, the fund must remediate within three business days with respect to the $25,000,000 minimum adjusted net asset value or within one business day with respect to certain asset coverage ratios or the administrative agent at the request of, or with the consent of, the lenders may terminate the Credit Facility and declare any outstanding borrowings to be due and payable immediately.
Interest associated with any borrowing under the Credit Facility is charged to the borrowing fund at a rate of interest equal to 1.00% plus the greater of the federal funds effective rate or one month LIBOR. The annual commitment fee to maintain the Credit Facility is 0.15% and is incurred
| | | | | | |
| | | |
| 110 | | | | J.P. MORGAN MUNICIPAL BOND FUNDS | | AUGUST 31, 2018 |
on the unused portion of the Credit Facility and is allocated to all participating funds pro rata based on their respective net assets. Effective August 14, 2018, this agreement has been amended and restated for a term of 364 days, unless extended.
The Funds did not utilize the Credit Facility during the six months ended August 31, 2018.
7. Risks, Concentrations and Indemnifications
In the normal course of business, the Funds enter into contracts that contain a variety of representations which provide general indemnifications. Each Fund’s maximum exposure under these arrangements is unknown. The amount of exposure would depend on future claims that may be brought against each Fund that have not yet occurred. However, based on experience, the Funds expect the risk of loss to be remote.
As of August 31, 2018, the Funds had affiliated omnibus accounts which owned more than 10% of the respective Fund’s outstanding shares as follows:
| | | | | | | | |
| | | Number of
Affiliated Omnibus
Accounts | | | % of the
Fund | |
Municipal Income Fund | | | 1 | | | | 68.7 | % |
Short-Intermediate Municipal Bond Fund | | | 1 | | | | 92.2 | |
Tax Free Bond Fund | | | 1 | | | | 54.3 | |
Ultra-Short Municipal Fund | | | 1 | | | | 98.4 | |
Significant shareholder transactions by these shareholders may impact the Funds’ performance.
Due to Municipal Income Fund investments in Underlying Funds, the Fund indirectly pays a portion of the expenses incurred by the underlying funds. As a result, the cost of investing in the Fund may be higher than the cost of investing in a mutual fund that invests directly in individual securities and financial instruments. The Fund is also subject to certain risks related to the Underlying Funds’ investments in securities and financial instruments such as fixed income securities, including high yield, asset-backed and mortgage-related securities, including collateralized mortgage obligations and stripped mortgage-backed securities, equity securities, foreign and emerging markets securities, and convertible securities. These securities are subject to risks specific to their structure, sector or market.
Derivatives may be riskier than other types of investments because they may be more sensitive to changes in economic and market conditions and could result in losses that significantly exceed the Funds’ original investment. Many derivatives create leverage thereby causing the Funds to be more volatile than they would have been if they had not used derivatives. Derivatives also expose the Funds to counterparty risk (the risk that the derivative counterparty will not fulfill its contractual obligations), including credit risk of the derivative counterparty.
The Funds are subject to interest rate and credit risk. The value of debt securities may decline as interest rates increase. The Funds could lose money if the issuer of a fixed income security is unable to pay interest or repay principal when it is due. The Funds invest in floating rate loans and other floating rate debt securities. Although these investments are generally less sensitive to interest rate changes than other fixed rate instruments, the value of floating rate loans and other floating rate investments may decline if their interest rates do not rise as quickly, or as much, as general interest rates. Many factors can cause interest rates to rise. Some examples include central bank monetary policy, rising inflation rates and general economic conditions. Given that the Federal Reserve has been raising interest rates and may continue to do so, the Funds may face a heightened level of interest rate risk. The ability of the issuers of debt to meet their obligations may be affected by the economic and political developments in a specific industry or region.
Specific risks and concentrations present in the Underlying Funds are disclosed within their individual financial statements and registration statements, as appropriate.
The Funds invest primarily in a portfolio of debt obligations issued by states, territories and possessions of the United States and by the District of Columbia, and by their political subdivisions and duly constituted authorities. These debt obligations may be insured by private insurers who guarantee the payment of principal and interest in the event of issuer default. The value of these investments may be impacted by changes to bond insurers’ ratings and the Fund’s ability to collect principal and interest in the event of an issuer’s default may be limited if the private insurer does not have the wherewithal to satisfy its obligation.
8. Business Combinations
At a meeting held November 14-15, 2017, the Boards of the JPM I and JPM II approved the Plan of Reorganization of the Tax Aware Income Opportunities Fund (the “Target Fund”), a fund of JPM I, into Tax Free Bond Fund (the “Acquiring Fund”), a fund of JPM II. The purpose of the transaction was to combine two portfolios with comparable investment objectives and strategies. The reorganization was effective after the close of business on May 4, 2018. The Acquiring Fund acquired all of the assets and liabilities of the Target Fund as shown in the table below. The transaction was structured to qualify as a tax-free reorganization under the Code. Pursuant to the Agreement and Plan of Reorganization, Class A, Class C and Class I shareholders of the Target Fund received a number of shares of the corresponding class in the Acquiring Fund, with a value equal to their holdings in the Target Fund as of the close of business on the date of the reorganization. The investment portfolio of the Target Fund, with a fair value of approximately $102,702,000 and identified cost of approximately $103,125,000 as of the date of the reorganization, was the principal asset acquired
| | | | | | | | |
| | | |
| AUGUST 31, 2018 | | J.P. MORGAN MUNICIPAL BOND FUNDS | | | | | 111 | |
NOTES TO FINANCIAL STATEMENTS
AS OF AUGUST 31, 2018 (Unaudited) (continued)
by the Acquiring Fund. For financial statement purposes, assets received and shares issued by the Acquiring Fund were recorded at fair value; however, the cost basis of the investments received from the Target Fund was carried forward to align ongoing reporting of the Acquiring Fund’s realized and unrealized gains and losses with amounts distributable to shareholders for tax purposes. As of May 4, 2018, the Target Fund had net capital loss carryforwards of $4,414,866.
The following is a summary of Shares Outstanding, Net Assets, Net Asset Value Per Share and Net Unrealized Appreciation (Depreciation) immediately before and after the reorganization (amounts in thousands, except per share amounts):
| | | | | | | | | | | | | | | | |
| | | Shares
Outstanding | | | Net Assets | | | Net Asset
Value
Per Share | | | Net
Unrealized
Appreciation
(Depreciation) | |
Target Fund | | | | | | | | | | | | | | | | |
Tax Aware Income Opportunities Fund | | | | | | | | | | | | | | $ | (424 | ) |
Class A | | | 2,145 | | | $ | 21,528 | | | $ | 10.04 | | | | | |
Class C | | | 635 | | | | 6,298 | | | | 9.92 | | | | | |
Class I | | | 7,654 | | | | 76,798 | | | | 10.03 | | | | | |
| | | | |
Acquiring Fund | | | | | | | | | | | | | | | | |
Tax Free Bond Fund | | | | | | | | | | | | | | $ | 12,230 | |
Class A | | | 10,401 | | | $ | 122,768 | | | $ | 11.80 | | | | | |
Class C | | | 2,106 | | | | 24,650 | | | | 11.70 | | | | | |
Class I | | | 14,107 | | | | 165,807 | | | | 11.75 | | | | | |
| | | | |
Post Reorganization | | | | | | | | | | | | | | | | |
Tax Free Bond Fund | | | | | | | | | | | | | | $ | 11,806 | |
Class A | | | 12,225 | | | $ | 144,296 | | | $ | 11.80 | | | | | |
Class C | | | 2,644 | | | | 30,948 | | | | 11.70 | | | | | |
Class I | | | 20,641 | | | | 242,605 | | | | 11.75 | | | | | |
Expenses related to reorganization were incurred by the Acquiring Fund. The Adviser, the Administrator and the Distributor waived their fees and/or reimbursed the Fund in an amount sufficient to offset costs incurred by the Fund relating to the reorganization, excluding brokerage fees and brokerage expenses related to the disposition and acquisition of Fund assets associated with the reorganization.
Assuming the reorganization had been completed on March 1, 2018, the beginning of the annual reporting period, the pro forma results of operations for the six months ended August 31, 2018, are as follows:
| | | | |
| | | | |
Net investment income (loss) | | $ | 6,939 | |
Net realized/unrealized gains (losses) | | | (1,574 | ) |
| | | | |
Change in net assets resulting from operations | | $ | 5,365 | |
Because the combined investment portfolios have been managed as a single integrated portfolio since the reorganization was completed, it is not practicable to separate the amounts of revenue and earnings of the Target Fund that have been included on the Statements of Operations since May 4, 2018.
9. New Accounting Pronouncements
In March 2017, the Financial Accounting Standards Board (“FASB”) issued Accounting Standards Update (“ASU”) 2017-08 (“ASU 2017-08”) Premium Amortization on Purchased Callable Debt Securities, which shortens the premium amortization period for purchased non-contingently callable debt securities. ASU 2017-08 requires that the premium be amortized to the earliest call date, for purchased non-contingently callable debt securities. ASU 2017-08 is effective for the fiscal years, and interim periods within those fiscal years, beginning after December 15, 2018. Management is currently evaluating the implications of these changes on the financial statements, if any.
In August 2018, the FASB issued ASU 2018-13 Fair Value Measurement (Topic 820): Disclosure Framework—Changes to the Disclosure Requirements for Fair Value Measurement, which adds, removes, and modifies certain aspects of the fair value disclosure. ASU 2018-13 amendments are the result of a broader disclosure project, FASB Concepts Statement Conceptual Framework for Financial Reporting — Chapter 8: Notes to Financial Statements, to improve the effectiveness of the fair value disclosure requirements. ASU 2018-13 is effective for the fiscal years, and interim periods within those fiscal years, beginning after December 15, 2019; early adoption is permitted. Management is currently evaluating the implications of these changes.
10. Subsequent Event
Effective October 5, 2018, the Funds may engage in securities lending to broker dealers or other financial institutions approved by the Funds. Citibank N.A. serves as lending agent for the Funds.
| | | | | | |
| | | |
| 112 | | | | J.P. MORGAN MUNICIPAL BOND FUNDS | | AUGUST 31, 2018 |
SCHEDULE OF SHAREHOLDER EXPENSES
(Unaudited)
Hypothetical $1,000 Investment
As a shareholder of the Funds, you incur two types of costs: (1) transaction costs, including sales charges (loads) on purchase payments and (2) ongoing costs, including investment advisory, fees, administration fees, distribution fees and other Fund expenses. The examples below are intended to help you understand your ongoing costs (in dollars) of investing in the Funds and to compare these ongoing costs with the ongoing costs of investing in other mutual funds. The examples assume that you had a $1,000 investment in each Class at the beginning of the reporting period, March 1, 2018, and continued to hold your shares at the end of the reporting period, August 31, 2018.
Actual Expenses
For each Class of each Fund in the table below, the first line provides information about actual account values and actual expenses. You may use the information in this line, together with the amount you invested, to estimate the expenses that you paid over the period. Simply divide your account value by $1,000 (for example, an $8,600 account value divided by $1,000 = 8.6), then multiply the result by the number in the first line of each Class under the heading entitled “Expenses Paid During the Period” to estimate the expenses you paid on your account during this period.
Hypothetical Example for Comparison Purposes
The second line of each Class in the table below provides information about hypothetical account values and hypothetical expenses based on the Class’ actual expense ratio and an assumed rate of return of 5% per year before expenses, which is not the Class’ actual return. The hypothetical account values and expenses may not be used to estimate the actual ending account balance or expenses you paid for the period. You may use this information to compare the ongoing costs of investing in the Class of the Fund and other funds. To do so, compare this 5% hypothetical example with the 5% hypothetical examples that appear in the shareholder reports of the other funds. Please note that the expenses shown in the table are meant to highlight your ongoing costs only and do not reflect any transaction costs, such as sales charges (loads) or redemption fees. Therefore, the second line for each Class in the table is useful in comparing ongoing costs only, and will not help you determine the relative total costs of owning different funds. In addition, if these transaction costs were included, your costs would have been higher. The examples also assume all dividends and distributions have been reinvested.
| | | | | | | | | | | | | | | | |
| | | Beginning Account Value
March 1, 2018 | | | Ending Account Value
August 31, 2018 | | | Expenses Paid During
the Period* | | | Annualized
Expense Ratio | |
JPMorgan Municipal Income Fund | | | | | | | | | | | | | | | | |
Class A | | | | | | | | | | | | | | | | |
Actual | | $ | 1,000.00 | | | $ | 1,009.20 | | | $ | 3.49 | | | | 0.69 | % |
Hypothetical | | | 1,000.00 | | | | 1,021.73 | | | | 3.52 | | | | 0.69 | |
Class C | | | | | | | | | | | | | | | | |
Actual | | | 1,000.00 | | | | 1,007.60 | | | | 6.27 | | | | 1.24 | |
Hypothetical | | | 1,000.00 | | | | 1,018.95 | | | | 6.31 | | | | 1.24 | |
Class I | | | | | | | | | | | | | | | | |
Actual | | | 1,000.00 | | | | 1,010.60 | | | | 2.23 | | | | 0.44 | |
Hypothetical | | | 1,000.00 | | | | 1,022.99 | | | | 2.24 | | | | 0.44 | |
Class R6 | | | | | | | | | | | | | | | | |
Actual | | | 1,000.00 | | | | 1,011.10 | | | | 1.72 | | | | 0.34 | |
Hypothetical | | | 1,000.00 | | | | 1,023.49 | | | | 1.73 | | | | 0.34 | |
| | | | |
JPMorgan Short-Intermediate Municipal Bond Fund | | | | | | | | | | | | | | | | |
Class A | | | | | | | | | | | | | | | | |
Actual | | | 1,000.00 | | | | 1,009.40 | | | | 3.55 | | | | 0.70 | |
Hypothetical | | | 1,000.00 | | | | 1,021.68 | | | | 3.57 | | | | 0.70 | |
Class C | | | | | | | | | | | | | | | | |
Actual | | | 1,000.00 | | | | 1,006.70 | | | | 6.07 | | | | 1.20 | |
Hypothetical | | | 1,000.00 | | | | 1,019.16 | | | | 6.11 | | | | 1.20 | |
Class I | | | | | | | | | | | | | | | | |
Actual | | | 1,000.00 | | | | 1,011.70 | | | | 1.27 | | | | 0.25 | |
Hypothetical | | | 1,000.00 | | | | 1,023.95 | | | | 1.28 | | | | 0.25 | |
| | | | | | | | |
| | | |
| AUGUST 31, 2018 | | J.P. MORGAN MUNICIPAL BOND FUNDS | | | | | 113 | |
SCHEDULE OF SHAREHOLDER EXPENSES
(Unaudited) (continued)
| | | | | | | | | | | | | | | | |
| | | Beginning Account Value
March 1, 2018 | | | Ending Account Value
August 31, 2018 | | | Expenses Paid During
the Period* | | | Annualized
Expense Ratio | |
JPMorgan Tax Free Bond Fund | | | | | | | | | | | | | | | | |
Class A | | | | | | | | | | | | | | | | |
Actual | | $ | 1,000.00 | | | $ | 1,014.10 | | | $ | 3.35 | | | | 0.66 | % |
Hypothetical | | | 1,000.00 | | | | 1,021.88 | | | | 3.36 | | | | 0.66 | |
Class C | | | | | | | | | | | | | | | | |
Actual | | | 1,000.00 | | | | 1,011.30 | | | | 6.29 | | | | 1.24 | |
Hypothetical | | | 1,000.00 | | | | 1,018.95 | | | | 6.31 | | | | 1.24 | |
Class I | | | | | | | | | | | | | | | | |
Actual | | | 1,000.00 | | | | 1,015.30 | | | | 2.24 | | | | 0.44 | |
Hypothetical | | | 1,000.00 | | | | 1,022.99 | | | | 2.24 | | | | 0.44 | |
| | | | |
JPMorgan Ultra-Short Municipal Fund | | | | | | | | | | | | | | | | |
Class A | | | | | | | | | | | | | | | | |
Actual* | | | 1,000.00 | | | | 1,004.70 | | | | 2.22 | | | | 0.44 | |
Hypothetical* | | | 1,000.00 | | | | 1,022.99 | | | | 2.24 | | | | 0.44 | |
Class I | | | | | | | | | | | | | | | | |
Actual* | | | 1,000.00 | | | | 1,007.30 | | | | 1.21 | | | | 0.24 | |
Hypothetical* | | | 1,000.00 | | | | 1,024.00 | | | | 1.22 | | | | 0.24 | |
| * | Expenses are equal to each Class’ respective annualized expense ratio, multiplied by the average account value over the period, multiplied by 184/365 (to reflect the one-half year period). |
| | | | | | |
| | | |
| 114 | | | | J.P. MORGAN MUNICIPAL BOND FUNDS | | AUGUST 31, 2018 |
BOARD APPROVAL OF INVESTMENT ADVISORY AGREEMENTS
(Unaudited)
The Board of Trustees has established various standing committees composed of Trustees with diverse backgrounds, to which the Board of Trustees has assigned specific subject matter responsibilities to further enhance the effectiveness of the Board’s oversight and decision making. The Board of Trustees and its investment committees (money market and alternative products, equity, and fixed income) meet regularly throughout the year and consider factors that are relevant to their annual consideration of investment advisory agreements at each meeting. They also meet for the specific purpose of considering investment advisory agreement annual renewals. The Board of Trustees held meetings in person in June and August 2018, at which the Trustees considered the continuation of the investment advisory agreements for each Fund whose semi-annual report is contained herein (each an “Advisory Agreement” and collectively, the “Advisory Agreements”). At the June meeting, the Board’s investment committees met to review and consider performance, expense and related information for the J.P. Morgan Funds. Each investment committee reported to the full Board, which then considered the investment committee’s preliminary findings. At the August meeting, the Trustees continued their review and consideration. The Trustees, including a majority of the Trustees who are not “interested persons” (as defined in the 1940 Act) of any party to the Advisory Agreements or any of their affiliates, approved the continuation of each Advisory Agreement on August 15, 2018.
As part of their review of the Advisory Agreements, the Trustees considered and reviewed performance and other information about the Funds received from the Adviser. This information includes the Funds’ performance as compared to the performance of their peers and benchmarks and analyses by the Adviser of the Funds’ performance. In addition, the Trustees have engaged an independent management consulting firm (“independent consultant”) to report on the performance of certain J.P. Morgan Funds at each of the Trustees’ regular meetings. In addition, in preparation for the June and August meetings, the Trustees requested, received and evaluated extensive materials from the Adviser, including performance and expense information compiled by Broadridge, using data from Lipper Inc., independent providers of investment company data (together, “Broadridge/Lipper”). The Trustees’ independent consultant also provided additional analyses of the performance of the Funds with greater than two years of performance history, as well as a risk/return assessment of certain Funds as compared to the Funds’ objectives and peers. Before voting on the Advisory Agreements, the Trustees reviewed the Advisory Agreements with representatives of the Adviser, counsel to the Trusts and independent legal counsel and received a memorandum from independent legal counsel to the Trustees discussing the legal standards for their consideration of the proposed Advisory Agreements. The Trustees also discussed the Advisory Agreements in executive sessions with independent legal counsel at which no representatives of the Adviser were present.
A summary of the material factors evaluated by the Trustees in determining whether to approve each Advisory Agreement is provided below. Each Trustee attributed different weights to the various factors and no factor alone was considered determinative. The Trustees considered information provided with respect to the Funds throughout the year, as well as materials furnished specifically in connection with the annual review process. From year to year, the Trustees consider and place emphasis on relevant information in light of changing circumstances in market and economic conditions.
After considering and weighing the factors and information they had received, the Trustees found that the compensation to be received by the Adviser from each Fund under the applicable Advisory Agreement was fair and reasonable under the circumstances and determined that the continuance of each Advisory Agreement was in the best interests of each Fund and its shareholders.
Nature, Extent and Quality of Services Provided by the Adviser
The Trustees received and considered information regarding the nature, extent and quality of the services provided to each Fund under the applicable Advisory Agreement. The Trustees took into account information furnished throughout the year at Trustee meetings, as well as the materials furnished specifically in connection with this annual review process. The Trustees considered the background and experience of the Adviser’s senior management and the expertise of, and the amount of attention given to each Fund by, investment personnel of the Adviser. In addition, the Trustees reviewed the qualifications, backgrounds and responsibilities of the portfolio management team primarily responsible for the day-to-day management of each Fund and the infrastructure supporting the team, including personnel changes. The Trustees also considered information provided by the Adviser and JPMorgan Distribution Services, Inc. (“JPMDS”) about the structure and distribution strategy of each Fund. The Trustees reviewed information relating to the Adviser’s risk governance model and reports showing the Adviser’s compliance structure and ongoing compliance processes. The Trustees also considered the quality of administrative services provided by the Adviser in its role as administrator.
The Trustees also considered their knowledge of the nature and quality of the services provided by the Adviser and its affiliates to the Funds gained from their experience as Trustees of the J.P. Morgan Funds. In addition, they considered the overall reputation and capabilities of the Adviser and its affiliates, the commitment of the Adviser to provide high quality service to the Funds, their overall confidence in the Adviser’s integrity and the Adviser’s responsiveness to questions or concerns raised by them, including the Adviser’s willingness to consider and implement organizational and operational changes designed to improve investment results and the services provided to each Fund.
| | | | | | | | |
| | | |
| AUGUST 31, 2018 | | J.P. MORGAN MUNICIPAL BOND FUNDS | | | | | 115 | |
BOARD APPROVAL OF INVESTMENT ADVISORY AGREEMENTS
(Unaudited) (continued)
Based upon these considerations and other factors, the Trustees concluded that they were satisfied with the nature, extent and quality of the investment advisory services provided to the Funds by the Adviser.
Costs of Services Provided and Profitability to the Adviser and its Affiliates
The Trustees received and considered information regarding the profitability to the Adviser and its affiliates in providing services to each Fund. The Trustees reviewed and discussed this information. The Trustees recognized that this information is not audited and represents the Adviser’s determination of its and its affiliates’ revenues from the contractual services provided to the Funds, less expenses of providing such services. Expenses include direct and indirect costs and are calculated using an allocation methodology developed by the Adviser. The Trustees also recognized that it is difficult to make comparisons of profitability from fund investment advisory contracts because comparative information is not generally publicly available and is affected by numerous factors, including the structure of the particular adviser, the types of funds it manages, its business mix, numerous assumptions regarding allocations and the fact that publicly-traded fund managers’ operating profits and net income are net of distribution and marketing expenses. Based upon their review, the Trustees concluded that the profitability to the Adviser under each Advisory Agreement was not unreasonable in light of the services and benefits provided to each Fund.
The Trustees also considered that JPMDS, an affiliate of the Adviser, and the Adviser earn fees from the Funds for providing shareholder and administrative services, respectively. These fees were shown separately in the profitability analysis presented to the Trustees. The Trustees also considered the payments of Rule 12b-1 fees to JPMDS, which also acts as the Funds’ distributor and that these fees are in turn generally paid to financial intermediaries that sell the Funds, including financial intermediaries that are affiliates of the Adviser. The Trustees also considered the fees paid to JPMorgan Chase Bank, N.A. (“JPMCB”) for custody and fund accounting, and other related services.
Fall-Out Benefits
The Trustees reviewed information regarding potential “fallout” or ancillary benefits received by the Adviser and its affiliates as a result of their relationship with the Funds. The Trustees also reviewed the Adviser’s allocation of fund brokerage for the J.P. Morgan Funds complex, including allocations to brokers who provide research to the Adviser.
Economies of Scale
The Trustees considered the extent to which the Funds may benefit from economies of scale. The Trustees considered that there may not be a direct relationship between economies of
scale realized by the Funds and those realized by the Adviser as assets increase. The Trustees considered the extent to which the Funds were priced to scale and whether it would be appropriate to add advisory fee breakpoints, but noted that each Fund has implemented fee waivers and contractual expense limitations (“Fee Caps”) which allow each Fund’s shareholders to share potential economies of scale from a Fund’s inception and that the fees remain competitive with peer funds. The Trustees also considered that the Adviser has added or enhanced services to the Funds over time, noting the Adviser’s substantial investments in its business in support of the Funds, including investments in trading systems and technology (including cybersecurity improvements), attraction and retention of key talent, additions to analyst and portfolio management teams, and regulatory support enhancements. The Trustees concluded that the current fee structure was reasonable in light of the Fee Caps that the Adviser has in place that serve to limit the overall net expense ratios of each Fund at competitive levels. The Trustees concluded that the Funds’ shareholders received the benefits of potential economies of scale through the Fee Caps and the Adviser’s reinvestment in its operations to serve the Funds and their shareholders.
Independent Written Evaluation of the Funds’ Senior Officer/Chief Compliance Officer
The Trustees noted that, upon their direction, the Senior Officer for the Municipal Income Fund, Short-Intermediate Municipal Bond Fund and Tax Free Bond Fund had prepared an independent written evaluation in order to assist the Trustees in determining the reasonableness of the proposed management fees. In determining whether to continue the Advisory Agreements, the Trustees considered the Senior Officer’s report.
The Trustees noted that, upon their direction, the Chief Compliance Officer for the Ultra-Short Municipal Fund had prepared an independent written evaluation in order to assist the Trustees in determining the reasonableness of the proposed management fees. The Trustees considered the written evaluation in determining whether to continue the Advisory Agreement.
Fees Relative to Adviser’s Other Clients
The Trustees received and considered information about the nature and extent of investment advisory services and fee rates offered to other clients of the Adviser, including institutional separate accounts and/or funds sub-advised by the Adviser, and for investment management styles substantially similar to that of each Fund. The Trustees considered the complexity of investment management for registered mutual funds relative to the Adviser’s other clients and noted differences in the regulatory, legal and other risks and responsibilities of providing services to the different clients. The Trustees considered that serving as an adviser to a registered mutual fund involves greater responsibilities and risks than acting as a sub-adviser and observed that sub-advisory fees may be lower than those
| | | | | | |
| | | |
| 116 | | | | J.P. MORGAN MUNICIPAL BOND FUNDS | | AUGUST 31, 2018 |
charged by the Adviser to each Fund. The Trustees also noted that the adviser, not the mutual fund, pays the sub-advisory fee and that many responsibilities related to the advisory function are retained by the primary adviser. The Trustees concluded that the fee rates charged to each Fund in comparison to those charged to the Adviser’s other clients were reasonable.
Investment Performance
The Trustees received and considered absolute and/or relative performance information for the Funds in a report prepared by Broadridge/Lipper. The Trustees considered the total return performance information, which included the ranking of the Funds within a performance universe made up of funds with the same Broadridge/Lipper investment classification and objective (the “Universe”), as well as a subset of funds within the Universe (the “Peer Group”), by total return for applicable one-, three- and five-year periods. The Trustees reviewed a description of Broadridge/Lipper’s methodology for selecting mutual funds in each Fund’s Peer Group and Universe. The Trustees also considered the Funds’ performance in light of their investment strategies and high-quality focus as compared to those of the Peer Group and/or Universe which included competitor funds that did not have a similar focus. The Broadridge/Lipper materials provided to the Trustees highlighted information with respect to certain representative classes to assist the Trustees in their review. As part of this review, the Trustees also reviewed each Fund’s performance against its benchmark and considered the performance information provided for the Funds at regular Board meetings by the Adviser and the Trustees’ independent consultant and also considered the special analysis prepared by the Trustees’ independent consultant. For certain Funds, the Trustees and Adviser determined that the Peer Group and/or Universe were less meaningful and the independent consultant prepared an analysis of those Funds across various risk and return metrics including standard deviation, Sharpe ratio, credit quality, and duration compared to customized peer groups of funds with similar portfolio objectives (as selected by the independent consultant). The Trustees also engaged with the Adviser to consider what steps might be taken to improve performance, as applicable. The Broadridge/Lipper performance data noted by the Trustees as part of their review and the determinations made by the Trustees with respect to each Fund’s performance for certain representative classes are summarized below:
The Trustees noted that the Municipal Income Fund’s performance for Class A shares was in the fifth, fourth, and fourth quintiles based upon the Peer Group, and in the fourth, third, and third quintiles based upon the Universe, for the one-, three-, and five-year periods ended December 31, 2017, respectively. The Trustees noted that the performance for Class I shares was in the third quintile based upon the Peer Group for the one-, and three-year periods ended December 31, 2017, and in the fourth, second and second quintiles based upon the Universe,
for the one-, three-, and five-year periods ended December 31, 2017, respectively. The Trustees discussed the performance and investment strategy of the Fund with the Adviser and reviewed the performance analysis and evaluation prepared by the independent consultant. Based upon these discussions and various other factors, the Trustees concluded that the Fund’s performance was satisfactory.
The Trustees noted that the Short-Intermediate Municipal Bond Fund’s performance for Class A shares was in the fourth, fourth and fifth quintiles based upon the Peer Group and in the third, fourth, and fifth quintiles based upon the Universe, for the one-, three-, and five-year periods ended December 31, 2017, respectively. The Trustees noted that the performance for Class I shares was in the second, second, and third quintiles based upon the Universe for the one-, three-, and five-year periods ended December 31, 2017, respectively. The Trustees discussed the performance and investment strategy of the Fund with the Adviser and reviewed the performance analysis and evaluation prepared by the independent consultant. Based upon these discussions and various other factors, the Trustees concluded that the Fund’s performance was satisfactory, under the circumstances. The Trustees requested, however, that the Adviser provide additional Fund performance information to be reviewed with the members of the Board’s fixed income committee at each of their regular meetings over the course of next year.
The Trustees noted that the Tax Free Bond Fund’s performance for Class A shares was in the third, fourth, and first quintiles based upon the Peer Group, and in the fourth, third and third quintiles based upon the Universe, for the one-, three-, and five-year periods ended December 31, 2017, respectively. The Trustees noted that the performance for Class I shares was in the fifth, fourth, and third quintiles based upon the Peer Group, and in the fourth, third, and second quintiles based upon the Universe, for the one-, three- and five-year periods ended December 31, 2017, respectively. The Trustees discussed the performance and investment strategy of the Fund with the Adviser and reviewed the performance analysis and evaluation prepared by the independent consultant. Based upon these discussions and various other factors, the Trustees concluded that the Fund’s performance was satisfactory.
The Trustees noted that the Ultra-Short Municipal Fund’s performance for Class A and Class I shares was in the fifth quintile based upon the Universe for the one-year period ended December 31, 2017. The Trustees discussed the performance and investment strategy of the Fund with the Advisor and, based upon these discussions and various other factors, concluded that the performance was satisfactory.
Advisory Fees and Expense Ratios
The Trustees considered the contractual advisory fee rate and administration fee rate paid by each Fund to the Adviser and compared the combined rate to the information prepared by
| | | | | | | | |
| | | |
| AUGUST 31, 2018 | | J.P. MORGAN MUNICIPAL BOND FUNDS | | | | | 117 | |
BOARD APPROVAL OF INVESTMENT ADVISORY AGREEMENTS
(Unaudited) (continued)
Broadridge/Lipper concerning management fee rates paid by other funds in the same Broadridge/Lipper category as each Fund. The Trustees recognized that Broadridge/Lipper reported each Fund’s management fee rate as the combined contractual advisory fee and administration fee rates. The Trustees also reviewed information about other expenses and the expense ratios for each Fund. The Trustees considered the Fee Caps currently in place for each Fund, the net advisory fee rate after taking into account any waivers and/or reimbursements, and, where deemed appropriate by the Trustees, additional waivers and/or reimbursements. The Trustees recognized that it is difficult to make comparisons of advisory fees because there are variations in the services that are included in the fees paid by other funds. The Trustees’ determinations as a result of the review of each Fund’s advisory fees and expense ratios for certain representative classes are summarized below:
The Trustees noted that the Municipal Income Fund’s net advisory fee for Class A shares was in the first quintile based upon both the Peer Group and Universe, and that the actual total expenses for Class A shares were in the second quintile based upon both the Peer Group and Universe. The Trustees noted that the net advisory fee for Class I shares was in the first quintile based upon both the Peer Group and Universe, and that the actual total expenses for Class I shares were in the first and second quintiles based upon the Peer Group and Universe, respectively. After considering the factors identified above, in
light of this information, the Trustees concluded that the advisory fee was satisfactory in light of the services provided to the Fund.
The Trustees noted that the Short-Intermediate Municipal Bond Fund’s net advisory fee for Class A shares was in the first quintile based upon both the Peer Group and Universe, and that the actual total expenses for Class A shares were in the third quintile based upon both the Peer Group and Universe. The Trustees noted that both the net advisory fee and actual total expenses for Class I shares were in the first quintile based upon the Universe. After considering the factors identified above, in light of this information, the Trustees concluded that the advisory fee was satisfactory in light of the services provided to the Fund.
The Trustees noted that the Tax Free Bond Fund’s net advisory fee and actual total expenses for Class A and Class I shares were in the first quintile based upon both the Peer Group and Universe. After considering the factors identified above, in light of this information, the Trustees concluded that the advisory fee was satisfactory in light of the services provided to the Fund.
The Trustees noted that the Ultra-Short Municipal Fund’s net advisory fee and actual total expenses for Class A and Class I shares were in the first quintile based upon both the Peer Group and Universe. After considering the factors identified above, in light of this information, the Trustees concluded that the advisory fee was satisfactory in light of the services provided to the Fund.
| | | | | | |
| | | |
| 118 | | | | J.P. MORGAN MUNICIPAL BOND FUNDS | | AUGUST 31, 2018 |
J.P. Morgan Funds are distributed by JPMorgan Distribution Services, Inc., which is an affiliate of JPMorgan Chase & Co. Affiliates of JPMorgan Chase & Co. receive fees for providing various services to the funds.
Contact JPMorgan Distribution Services, Inc. at 1-800-480-4111 for a fund prospectus. You can also visit us at www.jpmorganfunds.com. Investors should carefully consider the investment objectives and risk as well as charges and expenses of the mutual fund before investing. The prospectus contains this and other information about the mutual fund. Read the prospectus carefully before investing.
Investors may obtain information about the Securities Investor Protection Corporation (SIPC), including the SIPC brochure, by visiting www.sipc.org or by calling SIPC at 202-371-8300.
Each Fund files a complete schedule of its fund holdings for the first and third quarters of its fiscal year with the SEC on Form N-Q. The Funds’ Forms N-Q are available on the SEC’s website at http://www.sec.gov and may be reviewed and copied at the SEC’s Public Reference Room in Washington, DC. Information on the operation of the SEC’s Public Reference Room may be obtained by calling 1-800-SEC-0330. Shareholders may request the Form N-Q without charge by calling 1-800-480-4111 or by visiting the J.P. Morgan Funds’ website at www.jpmorganfunds.com.
A description of each Fund’s policies and procedures with respect to the disclosure of each Fund’s holdings is available in the prospectuses and Statement of Additional Information.
A copy of proxy policies and procedures is available without charge upon request by calling 1-800-480-4111 and on the Funds’ website at www.jpmorganfunds.com. A description of such policies and procedures is on the SEC’s website at www.sec.gov. The Trustees have delegated the authority to vote proxies for securities owned by the Funds to the Adviser. A copy of the Funds’ voting record for the most recent 12-month period ended June 30 is available on the SEC’s website at www.sec.gov or at the Funds’ website at www.jpmorganfunds.com no later than August 31 of each year. The Funds’ proxy voting record will include, among other things, a brief description of the matter voted on for each fund security, and will state how each vote was cast, for example, for or against the proposal.

J.P. Morgan Asset Management is the marketing name for the asset management businesses of JPMorgan Chase & Co. Those businesses include, but are not limited to, J.P. Morgan Investment Management Inc., Security Capital Research & Management Incorporated and J.P. Morgan Alternative Asset Management, Inc.
| | | | |
| | © JPMorgan Chase & Co., 2018. All rights reserved. August 2018. | | SAN-MUNIBOND-818 |
J.P. Morgan Income Funds
Semi-Annual Report
August 31, 2018
(Unaudited)
JPMorgan Flexible Long/Short Fund
JPMorgan High Yield Opportunities Fund
Investments in a Fund are not deposits or obligations of, or guaranteed or endorsed by, any bank and are not insured or guaranteed by the FDIC, the Federal Reserve Board or any other government agency. You could lose money if you sell when a Fund’s share price is lower than when you invested.
Past performance is no guarantee of future performance. The general market views expressed in this report are opinions based on market and other conditions through the end of the reporting period and are subject to change without notice. These views are not intended to predict the future performance of a Fund or the securities markets. References to specific securities and their issuers are for illustrative purposes only and are not intended to be, and should not be interpreted as, recommendations to purchase or sell such securities. Such views are not meant as investment advice and may not be relied on as an indication of trading intent on behalf of any Fund.
Prospective investors should refer to the Funds’ prospectuses for a discussion of the Funds’ investment objectives, strategies and risks. Call J.P. Morgan Funds Service Center at 1-800-480-4111 for a prospectus containing more complete information about a Fund including management fees and other expenses. Please read it carefully before investing.
CEO’S LETTER
October 9, 2018 (Unaudited)
Dear Shareholder,
The world’s leading economies continued to expand in the six months ended August 31, 2018, though the pattern of synchronized global growth that had characterized the previous two years began to dissipate amid geopolitical tensions and rising borrowing costs for emerging market nations.
U.S. gross domestic product (GDP) growth surged to 4.2% in the second quarter of 2018 from 2.2% in the first quarter. Notably, unemployment stood at 3.9% in August, though wage growth remained subdued. While the U.S. raised import tariffs on Chinese goods worth billions of dollars and the Chinese government responded in kind during the reporting period, trade tensions with China and other U.S. trading partners appeared to have little impact on business sentiment in the U.S. In response to continued economic growth and falling unemployment, the U.S. Federal Reserve raised benchmark interest rates in March and again in June. (Subsequent to the end of the reporting period, the central bank raised interest rates in September 2018.)
In the European Union, positive economic growth was clouded by political uncertainty. Second quarter GDP rose 2.1%, though core inflation remained below the European Central Bank’s (ECB) target rate. Unemployment in the 19-nation euro area fell to 8.1% in August, the lowest level since November 2008. However, a new government in Italy raised investor concerns that its budget plans would deviate from the European Commission’s stability and growth pact and force the commission to enact punitive measures. Against this backdrop, the ECB held to its plan to maintain interest rates at current levels until at least next summer. Meanwhile, negotiations over the U.K.’s exit from the European Union continued without resolution, raising political tensions between leaders in the EU and the U.K. as well as within the Britain’s ruling Conservative Party.
While trade tensions led to a decline in Chinese exports to the U.S., the Chinese government took steps to further stimulate domestic demand and capital outflows from China appeared limited at the end of the reporting period.
Meanwhile, select emerging market nations saw the value of their currencies and their sovereign debt plummet. Nations dependent on foreign lending and imported petroleum were hit hardest by rising U.S. interest rates and a strengthening U.S. dollar that effectively raised borrowing costs. The economies of Argentina, Brazil, South Africa and Turkey were among those hurt by rising borrowing costs and/or political uncertainty.
In financial markets, U.S. equities largely recovered from a sharp sell-off in February 2018 and outperformed other regions and other asset classes. Record corporate earnings, strong consumer spending and positive economic data bolstered equity prices and pushed the S&P 500 Index to record highs in August. Equity prices in other developed markets were weak and prices fell sharply in emerging markets. Bond markets were mixed, with limited positive returns in select U.S. Treasury bonds and U.S. high yield bonds (also called “junk bonds”) and negative returns for emerging markets debt. Notably, global energy prices rose somewhat during the reporting period, which supported oil exporting economies without becoming a large drag on global economic growth.
During the reporting period, the current U.S. economic expansion became the second longest on record. While the underlying fundamentals of continued global economic growth remained in place at the end of August, the longer-term impact of protectionist U.S. trade policy and the extent of currency devaluation in emerging markets were key issues looming over global financial markets.
We believe that investors may be best served by a well-diversified portfolio and a patient outlook. We look forward to managing your investment needs for years to come. Should you have any questions, please visit www.jpmorganfunds.com or contact the J.P. Morgan Funds Service Center at 1-800-480-4111.
Sincerely yours,

George C.W. Gatch
CEO, Global Funds Management
J.P. Morgan Asset Management
1
JPMorgan Flexible Long/Short Fund
Fund Summary
Six Months Ended August 31, 2018 (Unaudited)
| | | | |
| Reporting Period Return: | | | |
| |
Fund (Class I Shares) * | | | 0.73% | |
Bloomberg Barclays Multiverse Corporate Index | | | (0.93)% | |
Net Assets as of 8/31/2018 (In Thousands) | | | $26,885,797 | |
Duration as of 8/31/2018 | | | 3.0 years | |
| |
| | |
| Investment objective** and strategies. | | The JPMorgan Flexible Long/Short Fund (the “Fund”) seeks to provide total return. The Fund seeks to achieve its investment objective by taking long and short positions in global credit markets. The Fund is flexible and it is not managed to or constrained by a benchmark. Because the Fund is not managed to a benchmark, J.P. Morgan Investment Management Inc. (JPMIM or the Adviser) has broad discretion to shift the Fund’s exposure among strategies and sectors and to invest in a wide variety of credit instruments based on changing market conditions and its view on the best mix of investment opportunities. In determining which investments to buy and sell for the Fund, the Adviser combines top down macroeconomic research with bottom up fundamental security analysis. In establishing the Fund’s macroeconomic views, the Adviser evaluates fundamental, technical and valuation factors along with macro themes from the Adviser’s broader fixed income team to determine the view on risk for the Fund overall. The Adviser uses bottom up fundamental research combined with quantitative analysis to evaluate the relative attractiveness of credit markets, sectors and individual credit instruments. |
| | | | | | | | |
| PORTFOLIO COMPOSITION*** | | | | | | |
Corporate Bonds | | | 66.1% | | | | | |
Loan Assignments | | | 24.5 | | | | | |
Convertible Bonds | | | 2.2 | | | | | |
Others (each less than 1.0%) | | | 1.0 | | | | | |
Short-Term Investments | | | 6.2 | | | | | |
| | * | The return shown is based on net asset values calculated for shareholder transactions and may differ from the return shown in the financial highlights, which reflects adjustments made to the net asset values in accordance with accounting principles generally accepted in the United States of America. |
| | ** | The adviser seeks to achieve the Fund’s objective. There can be no guarantee it will be achieved. |
| | *** | Percentages indicated are based on total investments as of August 31, 2018. The Fund’s portfolio composition is subject to change. |
2
JPMorgan Flexible Long/Short Fund
Fund Summary
Six Months Ended August 31, 2018 (Unaudited)
| | | | | | | | | | | | | | | | |
| AVERAGE ANNUAL TOTAL RETURNS AS OF AUGUST 31, 2018 | |
| |
| | | | |
| | | INCEPTION
DATE OF
CLASS | | | 6 MONTH* | | | 1 YEAR | | | SINCE
INCEPTION | |
CLASS A SHARES | | | June 30, 2016 | | | | | | | | | | | | | |
With Sales Charge** | | | | | | | (3.15)% | | | | (2.22)% | | | | 1.35% | |
Without Sales Charge | | | | | | | 0.59 | | | | 1.62 | | | | 3.15 | |
CLASS C SHARES | | | June 30, 2016 | | | | | | | | | | | | | |
With CDSC*** | | | | | | | (0.65)% | | | | 0.22 | | | | 2.67 | |
Without CDSC | | | | | | | 0.35 | | | | 1.22 | | | | 2.67 | |
CLASS I SHARES | | | June 30, 2016 | | | | 0.73 | | | | 1.84 | | | | 3.41 | |
CLASS R6 SHARES | | | June 30, 2016 | | | | 0.85 | | | | 2.08 | | | | 3.66 | |
| ** | Sales Charge for Class A Shares is 3.75%. |
| *** | Assumes a 1% CDSC (contingent deferred sales charge) for the 6 month and one year period and 0% CDSC thereafter. |
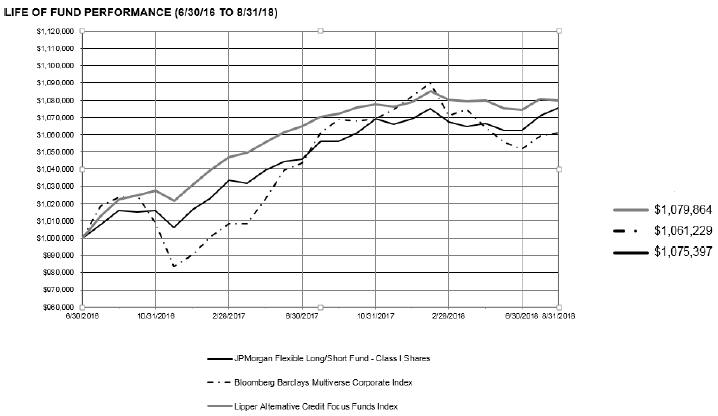
The performance quoted is past performance and is not a guarantee of future results. Mutual funds are subject to certain market risks. Investment returns and principal value of an investment will fluctuate so that an investor’s shares, when redeemed, may be worth more or less than their original cost. Current performance may be higher or lower than the performance data shown. For up-to-date, month-end performance information please call 1-800-480-4111.
3
The Fund commenced operations on June 30, 2016.
The graph illustrates comparative performance for $1,000,000 invested in Class I Shares of the JPMorgan Flexible Long/Short Fund, the Bloomberg Barclays Multiverse Corporate Index and the Lipper Alternative Credit Focus Funds Index from June 30, 2016 to August 31, 2018. The performance of the Fund assumes reinvestment of all dividends and capital gain distributions, if any, and does not include a sales charge. The performance of the Bloomberg Barclays Multiverse Corporate Index does not reflect the deduction of expenses or a sales charge associated with a mutual fund and approximates the minimum possible dividend reinvestment of the securities included in the benchmark, if applicable. The dividend is reinvested after deduction of withholding tax, applying the maximum rate to non-resident institutional investors who do not benefit from double taxation treaties. The Bloomberg Barclays Multiverse Corporate Index provides a broad-based measure of the international fixed-income bond market. The Lipper Alternative Credit Focus Funds Index represents the total returns of certain mutual funds within the Fund’s designated category as determined by Lipper, Inc. Investors cannot invest directly in an index.
Class I Shares have a $1,000,000 minimum initial investment.
Fund performance may reflect the waiver of the Fund’s fees and reimbursement of expenses for certain periods since the inception date. Without these waivers and reimbursements, performance would have been lower. Also, performance shown in this section does not reflect the deduction of taxes that a shareholder would pay on Fund distributions or redemptions of Fund shares.
The returns shown are based on net asset values calculated for shareholder transactions and may differ from the returns shown in the financial highlights, which reflect adjustments made to the net asset values in accordance with accounting principles generally accepted in the United States of America.
4
JPMorgan High Yield Opportunities Fund
Fund Summary
Six Months Ended August 31, 2018 (Unaudited)
| | | | |
| Reporting Period Return: | | | |
| |
Fund (Class I Shares)* | | | 2.28% | |
Bloomberg Barclays Global Aggregate Index (Hedged USD) | | | 1.36% | |
Net Assets as of 8/31/2018 (In Thousands) | | $ | 27,905,688 | |
| |
Investment objective** and strategies. | The JPMorgan High Yield Opportunities Fund (the “Fund”) seeks a high level of current income. Capital appreciation is a secondary objective. The Fund’s principal investment strategy is to invest in high yield, high risk corporate debt securities (also known as “junk bonds”) and instruments from developed markets. The Fund will allocate its assets between U.S. and non-U.S. developed markets depending on investment opportunities. In addition to high yield corporate debt securities and instruments, the Fund also may invest in other types of high yield investments. |
| | | | | | | | |
| PORTFOLIO COMPOSITION*** | | | | | | |
Corporate Bonds | | | 87.8% | | | | | |
Loan Assignments | | | 4.2 | | | | | |
Convertible Bonds | | | 2.6 | | | | | |
Common Stocks | | | 0.8 | | | | | |
Short-Term Investments | | | 4.6 | | | | | |
| | * | The return shown is based on net asset values calculated for shareholder transactions and may differ from the return shown in the financial highlights, which reflects adjustments made to the net asset values in accordance with accounting principles generally accepted in the United States of America. |
| | ** | The adviser seeks to achieve the Fund’s objective. There can be no guarantee it will be achieved. |
| | *** | Percentages indicated are based on total investments as of August 31, 2018. The Fund’s portfolio composition is subject to change. |
5
JPMorgan High Yield Opportunities Fund
Fund Summary
Six Months Ended August 31, 2018 (Unaudited) (continued)
| | | | | | | | | | | | | | | | |
| AVERAGE ANNUAL TOTAL RETURNS AS OF AUGUST 31, 2018 | |
| |
| | | | |
| | | INCEPTION
DATE OF
CLASS | | | 6 MONTH* | | | 1 YEAR | | | SINCE
INCEPTION | |
CLASS A SHARES | | | November 1, 2016 | | | | | | | | | | | | | |
With Sales Charge** | | | | | | | (1.61)% | | | | (0.12)% | | | | 3.94% | |
Without Sales Charge | | | | | | | 2.18 | | | | 3.74 | | | | 6.14 | |
CLASS C SHARES | | | November 1, 2016 | | | | | | | | | | | | | |
With CDSC*** | | | | | | | 0.89 | | | | 2.17 | | | | 5.55 | |
Without CDSC | | | | | | | 1.89 | | | | 3.17 | | | | 5.55 | |
CLASS I SHARES | | | November 1, 2016 | | | | 2.28 | | | | 3.94 | | | | 6.35 | |
CLASS R6 SHARES | | | November 1, 2016 | | | | 2.28 | | | | 4.15 | | | | 6.56 | |
| ** | Sales Charge for Class A Shares is 3.75%. |
| *** | Assumes a 1% CDSC (contingent deferred sales charge) for the 6 month and one year period and 0% CDSC thereafter |
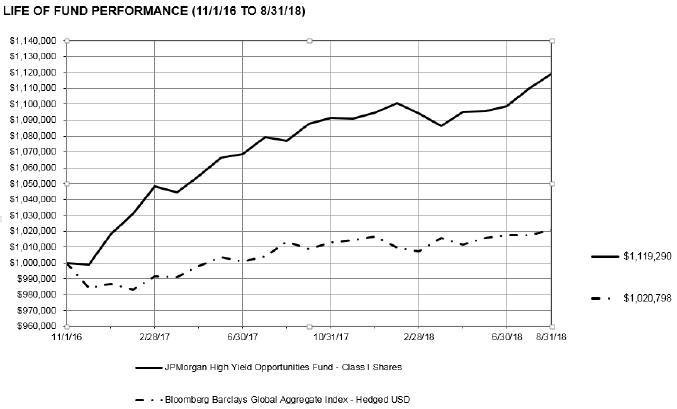
The performance quoted is past performance and is not a guarantee of future results. Mutual funds are subject to certain market risks. Investment returns and principal value of an investment will fluctuate so that an investor’s shares, when redeemed, may be worth more or less than their original cost. Current performance may be higher or lower than the performance data shown. For up-to-date, month-end performance information please call 1-800-480-4111.
6
The Fund commenced operations on November 1, 2016.
The graph illustrates comparative performance for $1,000,000 invested in Class I Shares of the JPMorgan High Yield Opportunities Fund and the Bloomberg Barclays Global Aggregate Index - Hedged USD from November 1, 2016 to August 31, 2018. The performance of the Fund assumes reinvestment of all dividends and capital gain distributions, if any, and does not include a sales charge. The performance of the Bloomberg Barclays Global Aggregate Index - Hedged USD does not reflect the deduction of expenses or a sales charge associated with a mutual fund and approximates the minimum possible dividend reinvestment of the securities included in the benchmark, if applicable. The dividend is reinvested after deduction of withholding tax, applying the maximum rate to non-resident institutional investors who do not benefit from double taxation treaties. The Bloomberg Barclays Global Aggregate Index - Hedged USD provides a broad-based measure of the international fixed-income bond market. Investors cannot invest directly in an index.
Class I Shares have a $1,000,000 minimum initial investment.
Fund performance may reflect the waiver of the Fund’s fees and reimbursement of expenses for certain periods since the inception date. Without these waivers and reimbursements, performance would have been lower. Also, performance shown in this section does not reflect the deduction of taxes that a shareholder would pay on Fund distributions or redemptions of Fund shares.
The returns shown are based on net asset values calculated for shareholder transactions and may differ from the returns shown in the financial highlights, which reflect adjustments made to the net asset values in accordance with accounting principles generally accepted in the United States of America.
7
JPMorgan Flexible Long/Short Fund
SCHEDULE OF PORTFOLIO INVESTMENTS
AS OF AUGUST 31, 2018 (Unaudited)
(Amounts in U.S. Dollars, unless otherwise noted)
| | | | | | | | | | | | |
Investments | | | | | Principal
Amount | | | Value | |
| | | |
CORPORATE BONDS - 66.0% | | | | | | | | | | | | |
| | | |
Aerospace & Defense - 1.7% | | | | | | | | | | | | |
Arconic, Inc.
5.13%, 10/1/2024 | | | | | | | 22,000 | | | | 22,099 | |
5.90%, 2/1/2027 | | | | | | | 79,000 | | | | 79,995 | |
6.75%, 1/15/2028 | | | | | | | 8,000 | | | | 8,180 | |
Bombardier, Inc.
7.75%, 3/15/2020(a) | | | | | | | 42,000 | | | | 44,100 | |
7.50%, 12/1/2024(a) | | | | | | | 5,000 | | | | 5,263 | |
Leonardo SpA
4.88%, 3/24/2025 | | | EUR | | | | 100,000 | | | | 133,382 | |
Rockwell Collins, Inc.
3.50%, 3/15/2027 | | | | | | | 90,000 | | | | 86,199 | |
TransDigm, Inc.
6.00%, 7/15/2022 | | | | | | | 11,000 | | | | 11,110 | |
6.38%, 6/15/2026 | | | | | | | 11,000 | | | | 11,117 | |
United Technologies Corp.
3.95%, 8/16/2025 | | | | | | | 20,000 | | | | 20,088 | |
4.13%, 11/16/2028 | | | | | | | 25,000 | | | | 24,987 | |
| | | | | | | | | | | | |
| | | | | | | | | | | 446,520 | |
| | | | | | | | | | | | |
Airlines - 0.4% | | | | | | | | | | | | |
Continental Airlines Pass-Through Trust
Series 2012-2, Class A,
4.00%, 10/29/2024 | | | | | | | 77,254 | | | | 77,686 | |
United Continental Holdings, Inc.
4.25%, 10/1/2022 | | | | | | | 15,000 | | | | 14,737 | |
5.00%, 2/1/2024 | | | | | | | 15,000 | | | | 14,850 | |
| | | | | | | | | | | | |
| | | | | | | | | | | 107,273 | |
| | | | | | | | | | | | |
Auto Components - 0.8% | | | | | | | | | | | | |
American Axle & Manufacturing, Inc.
6.63%, 10/15/2022 | | | | | | | 6,000 | | | | 6,150 | |
6.25%, 4/1/2025 | | | | | | | 32,000 | | | | 31,840 | |
6.25%, 3/15/2026 | | | | | | | 4,000 | | | | 3,945 | |
6.50%, 4/1/2027 | | | | | | | 6,000 | | | | 5,940 | |
Dana Financing Luxembourg SARL
5.75%, 4/15/2025(a) | | | | | | | 14,000 | | | | 14,000 | |
Goodyear Tire & Rubber Co. (The)
4.88%, 3/15/2027 | | | | | | | 34,000 | | | | 31,195 | |
LKQ Italia Bondco SpA
3.88%, 4/1/2024(b) | | | EUR | | | | 100,000 | | | | 123,039 | |
| | | | | | | | | | | | |
| | | | | | | | | | | 216,109 | |
| | | | | | | | | | | | |
Automobiles - 0.1% | | | | | | | | | | | | |
General Motors Co.
4.00%, 4/1/2025 | | | | | | | 35,000 | | | | 34,095 | |
| | | | | | | | | | | | |
Banks - 11.1% | | | | | | | | | | | | |
Allied Irish Banks plc
(EUR Swap Annual 5 Year + 3.95%),
4.13%, 11/26/2025(b)(c) | | | EUR | | | | 100,000 | | | | 122,898 | |
Bank of America Corp. Series X, (ICE LIBOR USD 3 Month + 3.71%),
6.25%, 9/5/2024(c)(d)(e) | | | | | | | 225,000 | | | | 237,375 | |
(ICE LIBOR USD 3 Month + 0.77%), 3.11%, 2/5/2026(c) | | | | | | | 55,000 | | | | 54,190 | |
| | | | | | | | | | | | |
Investments | | | | | Principal
Amount | | | Value | |
Series FF, (ICE LIBOR USD 3 Month + 2.93%), 5.87%, 3/15/2028(c)(d)(e) | | | | | | | 95,000 | | | | 95,000 | |
Bank of Ireland
(EUR Swap Annual 5 Year + 3.55%), 4.25%, 6/11/2024(b)(c) | | | EUR | | | | 100,000 | | | | 118,924 | |
Bankia SA
(EUR Swap Annual 5 Year + 3.35%), 3.38%, 3/15/2027(b)(c) | | | EUR | | | | 100,000 | | | | 118,772 | |
Bankinter SA
(EUR Swap Annual 5 Year + 2.40%), 2.50%, 4/6/2027(b)(c) | | | EUR | | | | 100,000 | | | | 117,491 | |
Barclays plc
(ICE LIBOR USD 3 Month + 1.38%), 3.70%, 5/16/2024(c) | | | | | | | 200,000 | | | | 198,419 | |
CaixaBank SA
(EUR Swap Annual 5 Year + 3.35%), 3.50%, 2/15/2027(b)(c) | | | EUR | | | | 100,000 | | | | 121,832 | |
CIT Group, Inc.
5.38%, 5/15/2020 | | | | | | | 3,000 | | | | 3,090 | |
5.00%, 8/15/2022 | | | | | | | 24,000 | | | | 24,480 | |
5.25%, 3/7/2025 | | | | | | | 4,000 | | | | 4,067 | |
Citigroup, Inc.
Series R, (ICE LIBOR USD 3 Month + 4.48%), 6.12%, 11/15/2020(c)(d)(e) | | | | | | | 18,000 | | | | 18,819 | |
Series P, (ICE LIBOR USD 3 Month + 3.91%), 5.95%, 5/15/2025(c)(d)(e) | | | | | | | 225,000 | | | | 229,151 | |
Commerzbank AG
4.00%, 3/23/2026(b) | | | EUR | | | | 70,000 | | | | 87,807 | |
Credit Agricole SA
(USD Swap Semi 5 Year + 6.19%), 8.12%, 12/23/2025(a)(c)(d)(e) | | | | | | | 200,000 | | | | 220,025 | |
HSBC Holdings plc
(USD ICE Swap Rate 5 Year + 5.51%), 6.87%, 6/1/2021(c)(d)(e) | | | | | | | 200,000 | | | | 208,250 | |
(EURIBOR 3 Month + 0.50%), 0.18%, 10/5/2023(b)(c) | | | EUR | | | | 100,000 | | | | 115,725 | |
ING Groep NV
(EUR Swap Annual 5 Year + 2.85%), 3.00%, 4/11/2028(c) | | | EUR | | | | 100,000 | | | | 122,683 | |
Intesa Sanpaolo SpA
(USD Swap Semi 5 Year + 5.46%), 7.70%, 9/17/2025(a)(c)(d)(e) | | | | | | | 200,000 | | | | 185,024 | |
Royal Bank of Scotland Group plc
6.00%, 12/19/2023 | | | | | | | 20,000 | | | | 20,854 | |
Societe Generale SA
(EUR Swap Annual 5 Year + 5.54%), 6.75%, 4/7/2021(b)(c)(d)(e) | | | EUR | | | | 100,000 | | | | 125,836 | |
SunTrust Bank
(ICE LIBOR USD 3 Month + 0.59%), 2.92%, 8/2/2022(c) | | | | | | | 70,000 | | | | 70,084 | |
SEE NOTES TO FINANCIAL STATEMENTS.
8
JPMorgan Flexible Long/Short Fund
SCHEDULE OF PORTFOLIO INVESTMENTS
AS OF AUGUST 31, 2018 (Unaudited) (continued)
(Amounts in U.S. Dollars, unless otherwise noted)
| | | | | | | | | | | | |
Investments | | | | | Principal
Amount | | | Value | |
SunTrust Banks, Inc.
Series H, (ICE LIBOR USD 3 Month + 2.79%), 5.12%, 12/15/2027(c)(d)(e) | | | | | | | 65,000 | | | | 61,154 | |
UBS Group AG
(EUR Swap Annual 5 Year + 5.29%), 5.75%, 2/19/2022(b)(c)(d)(e) | | | EUR | | | | 200,000 | | | | 257,658 | |
Wells Fargo & Co.
4.75%, 12/7/2046 | | | | | | | 50,000 | | | | 49,519 | |
| | | | | | | | | | | | |
| | | | | | | | | | | 2,989,127 | |
| | | | | | | | | | | | |
Beverages - 0.4% | | | | | | | | | | | | |
Anheuser-Busch InBev Finance, Inc.
4.90%, 2/1/2046 | | | | | | | 30,000 | | | | 30,488 | |
Anheuser-Busch InBev Worldwide, Inc.
(ICE LIBOR USD 3 Month + 0.74%), 3.08%, 1/12/2024(c) | | | | | | | 40,000 | | | | 40,304 | |
Cott Holdings, Inc.
5.50%, 4/1/2025(a) | | | | | | | 3,000 | | | | 2,938 | |
Keurig Dr Pepper, Inc. | | | | | | | | | | | | |
4.06%, 5/25/2023(a) | | | | | | | 40,000 | | | | 40,226 | |
| | | | | | | | | | | | |
| | | | | | | | | | | 113,956 | |
| | | | | | | | | | | | |
Building Products - 0.7% | | | | | | | | | | | | |
Jeld-Wen, Inc. | | | | | | | | | | | | |
4.63%, 12/15/2025(a) | | | | | | | 2,000 | | | | 1,865 | |
4.88%, 12/15/2027(a) | | | | | | | 2,000 | | | | 1,865 | |
Masco Corp. | | | | | | | | | | | | |
4.38%, 4/1/2026 | | | | | | | 65,000 | | | | 65,062 | |
3.50%, 11/15/2027 | | | | | | | 15,000 | | | | 13,896 | |
Masonite International Corp. | | | | | | | | | | | | |
5.75%, 9/15/2026(a) | | | | | | | 2,000 | | | | 2,020 | |
Owens Corning | | | | | | | | | | | | |
3.40%, 8/15/2026 | | | | | | | 45,000 | | | | 41,752 | |
4.30%, 7/15/2047 | | | | | | | 30,000 | | | | 24,836 | |
PGT Escrow Issuer, Inc. | | | | | | | | | | | | |
6.75%, 8/1/2026(a) | | | | | | | 2,000 | | | | 2,052 | |
Standard Industries, Inc. | | | | | | | | | | | | |
6.00%, 10/15/2025(a) | | | | | | | 22,000 | | | | 22,499 | |
Summit Materials LLC | | | | | | | | | | | | |
6.13%, 7/15/2023 | | | | | | | 19,000 | | | | 19,261 | |
| | | | | | | | | | | | |
| | | | | | | | | | | 195,108 | |
| | | | | | | | | | | | |
Capital Markets - 4.5% | | | | | | | | | | | | |
Bank of New York Mellon Corp. (The)
Series E, (ICE LIBOR USD 3 Month + 3.42%), 4.95%, 6/20/2020(c)(d)(e) | | | | | | | 50,000 | | | | 51,060 | |
Series F, (ICE LIBOR USD 3 Month + 3.13%), 4.62%, 9/20/2026(c)(d)(e) | | | | | | | 94,000 | | | | 90,475 | |
Credit Suisse Group AG
(USD Swap Semi 5 Year + 4.60%), 7.50%, 12/11/2023(a)(c)(d)(e) | | | | | | | 200,000 | | | | 212,500 | |
Goldman Sachs Group, Inc. (The)
Series M, (ICE LIBOR USD 3 Month + 3.92%), 5.38%, 5/10/2020(c)(d)(e) | | | | | | | 225,000 | | | | 230,344 | |
Series D, 6.00%, 6/15/2020 | | | | | | | 40,000 | | | | 41,893 | |
| | | | | | | | | | | | |
Investments | | | | | Principal
Amount | | | Value | |
Series P, (ICE LIBOR USD 3 Month + 2.87%), 5.00%, 11/10/2022(c)(d)(e) | | | | | | | 120,000 | | | | 113,519 | |
(ICE LIBOR USD 3 Month + 1.17%), 3.48%, 5/15/2026(c) | | | | | | | 35,000 | | | | 34,825 | |
(ICE LIBOR USD 3 Month + 1.16%), 3.81%, 4/23/2029(c) | | | | | | | 18,000 | | | | 17,204 | |
LPL Holdings, Inc.
5.75%, 9/15/2025(a) | | | | | | | 7,000 | | | | 6,842 | |
Morgan Stanley
Series H, (ICE LIBOR USD 3 Month + 3.61%), 5.45%, 7/15/2019(c)(d)(e) | | | | | | | 225,000 | | | | 228,094 | |
2.80%, 6/16/2020 | | | | | | | 70,000 | | | | 69,597 | |
2.38%, 3/31/2021 | | | EUR | | | | 20,000 | | | | 24,569 | |
3.88%, 1/27/2026 | | | | | | | 50,000 | | | | 49,309 | |
3.13%, 7/27/2026 | | | | | | | 30,000 | | | | 28,026 | |
MSCI, Inc.
5.25%, 11/15/2024(a) | | | | | | | 18,000 | | | | 18,495 | |
5.38%, 5/15/2027(a) | | | | | | | 3,000 | | | | 3,083 | |
| | | | | | | | | | | | |
| | | | | | | | | | | 1,219,835 | |
| | | | | | | | | | | | |
Chemicals - 1.7% | | | | | | | | | | | | |
Blue Cube Spinco LLC
10.00%, 10/15/2025 | | | | | | | 15,000 | | | | 17,362 | |
CF Industries, Inc.
4.50%, 12/1/2026(a) | | | | | | | 10,000 | | | | 9,981 | |
Chemours Co. (The)
5.38%, 5/15/2027 | | | | | | | 6,000 | | | | 5,895 | |
Cornerstone Chemical Co.
6.75%, 8/15/2024(a) | | | | | | | 3,000 | | | | 2,985 | |
CTC BondCo GmbH
5.25%, 12/15/2025(b) | | | EUR | | | | 100,000 | | | | 114,624 | |
CVR Partners LP
9.25%, 6/15/2023(a) | | | | | | | 43,000 | | | | 45,849 | |
FXI Holdings, Inc.
7.88%, 11/1/2024(a) | | | | | | | 8,000 | | | | 7,710 | |
Hexion, Inc.
6.63%, 4/15/2020 | | | | | | | 21,000 | | | | 19,871 | |
9.00%, 11/15/2020 | | | | | | | 4,000 | | | | 3,390 | |
INEOS Group Holdings SA
5.38%, 8/1/2024(b) | | | EUR | | | | 100,000 | | | | 122,053 | |
Ingevity Corp.
4.50%, 2/1/2026(a) | | | | | | | 7,000 | | | | 6,563 | |
Koppers, Inc.
6.00%, 2/15/2025(a) | | | | | | | 2,000 | | | | 2,010 | |
NOVA Chemicals Corp.
4.88%, 6/1/2024(a) | | | | | | | 15,000 | | | | 14,663 | |
Nufarm Australia Ltd.
5.75%, 4/30/2026(a) | | | | | | | 3,000 | | | | 2,790 | |
Olin Corp.
5.13%, 9/15/2027 | | | | | | | 17,000 | | | | 16,830 | |
PolyOne Corp.
5.25%, 3/15/2023 | | | | | | | 9,000 | | | | 9,261 | |
PQ Corp.
5.75%, 12/15/2025(a) | | | | | | | 2,000 | | | | 1,970 | |
Scotts Miracle-Gro Co. (The)
5.25%, 12/15/2026 | | | | | | | 12,000 | | | | 11,400 | |
Trinseo Materials Operating SCA
5.38%, 9/1/2025(a) | | | | | | | 4,000 | | | | 3,925 | |
Tronox Finance plc
5.75%, 10/1/2025(a) | | | | | | | 18,000 | | | | 17,325 | |
SEE NOTES TO FINANCIAL STATEMENTS.
9
JPMorgan Flexible Long/Short Fund
SCHEDULE OF PORTFOLIO INVESTMENTS
AS OF AUGUST 31, 2018 (Unaudited) (continued)
(Amounts in U.S. Dollars, unless otherwise noted)
| | | | | | | | | | | | |
Investments | | | | | Principal
Amount | | | Value | |
Tronox, Inc. | | | | | | | | | | | | |
6.50%, 4/15/2026(a) | | | | | | | 5,000 | | | | 4,900 | |
Valvoline, Inc. | | | | | | | | | | | | |
4.38%, 8/15/2025 | | | | | | | 16,000 | | | | 15,280 | |
Venator Finance SARL | | | | | | | | | | | | |
5.75%, 7/15/2025(a) | | | | | | | 10,000 | | | | 9,325 | |
| | | | | | | | | | | | |
| | | | | | | | | | | 465,962 | |
| | | | | | | | | | | | |
Commercial Services & Supplies - 1.4% | |
ACCO Brands Corp. | | | | | | | | | | | | |
5.25%, 12/15/2024(a) | | | | | | | 3,000 | | | | 2,985 | |
ADT Corp. (The) | | | | | | | | | | | | |
4.13%, 6/15/2023 | | | | | | | 20,000 | | | | 19,025 | |
Aramark Services, Inc. | | | | | | | | | | | | |
5.00%, 2/1/2028(a) | | | | | | | 8,000 | | | | 7,840 | |
Brink’s Co. (The) | | | | | | | | | | | | |
4.63%, 10/15/2027(a) | | | | | | | 9,000 | | | | 8,415 | |
Covanta Holding Corp. | | | | | | | | | | | | |
5.88%, 3/1/2024 | | | | | | | 15,000 | | | | 15,112 | |
Garda World Security Corp. | | | | | | | | | | | | |
8.75%, 5/15/2025(a) | | | | | | | 40,000 | | | | 39,400 | |
Paprec Holding SA
(EURIBOR 3 Month + 3.50%), 3.50%, 3/31/2025(b)(c) | | | EUR | | | | 100,000 | | | | 116,946 | |
Prime Security Services Borrower LLC | | | | | | | | | | | | |
9.25%, 5/15/2023(a) | | | | | | | 37,000 | | | | 39,638 | |
Verisure Midholding AB | | | | | | | | | | | | |
5.75%, 12/1/2023(b) | | | EUR | | | | 100,000 | | | | 116,860 | |
| | | | | | | | | | | | |
| | | | | | | | | | | 366,221 | |
| | | | | | | | | | | | |
Communications Equipment - 0.1% | |
Avaya, Inc. | | | | | | | | | | | | |
7.00%, 4/1/2019‡(f) | | | | | | | 32,000 | | | | 3 | |
CommScope Technologies LLC | | | | | | | | | | | | |
5.00%, 3/15/2027(a) | | | | | | | 17,000 | | | | 16,533 | |
Nokia OYJ | | | | | | | | | | | | |
3.38%, 6/12/2022 | | | | | | | 5,000 | | | | 4,887 | |
4.38%, 6/12/2027 | | | | | | | 5,000 | | | | 4,806 | |
ViaSat, Inc. | | | | | | | | | | | | |
5.63%, 9/15/2025(a) | | | | | | | 12,000 | | | | 11,280 | |
| | | | | | | | | | | | |
| | | | | | | | | | | 37,509 | |
| | | | | | | | | | | | |
Construction & Engineering - 0.2% | |
AECOM | | | | | | | | | | | | |
5.88%, 10/15/2024 | | | | | | | 37,000 | | | | 39,493 | |
Tutor Perini Corp. | | | | | | | | | | | | |
6.88%, 5/1/2025(a) | | | | | | | 21,000 | | | | 21,368 | |
| | | | | | | | | | | | |
| | | | | | | | | | | 60,861 | |
| | | | | | | | | | | | |
Construction Materials - 0.2% | |
Martin Marietta Materials, Inc. | | | | | | | | | |
3.50%, 12/15/2027 | | | | | | | 25,000 | | | | 23,193 | |
4.25%, 12/15/2047 | | | | | | | 11,000 | | | | 9,704 | |
US Concrete, Inc. | | | | | | | | | | | | |
6.38%, 6/1/2024 | | | | | | | 9,000 | | | | 9,079 | |
| | | | | | | | | | | | |
| | | | | | | | | | | 41,976 | |
| | | | | | | | | | | | |
Consumer Finance - 1.3% | |
Ally Financial, Inc. | | | | | | | | | | | | |
4.63%, 3/30/2025 | | | | | | | 43,000 | | | | 42,946 | |
8.00%, 11/1/2031 | | | | | | | 10,000 | | | | 12,225 | |
Capital One Financial Corp. | | | | | | | | | | | | |
3.75%, 4/24/2024 | | | | | | | 50,000 | | | | 49,322 | |
Caterpillar Financial Services Corp. | | | | | | | | | |
2.00%, 3/5/2020 | | | | | | | 70,000 | | | | 69,136 | |
| | | | | | | | | | | | |
Investments | | | | | Principal
Amount | | | Value | |
Curo Group Holdings Corp. | | | | | | | | | | | | |
8.25%, 9/1/2025(a) | | | | | | | 9,000 | | | | 8,910 | |
FirstCash, Inc. | | | | | | | | | | | | |
5.38%, 6/1/2024(a) | | | | | | | 3,000 | | | | 3,000 | |
General Motors Financial Co., Inc. | | | | | | | | | | | | |
3.95%, 4/13/2024 | | | | | | | 10,000 | | | | 9,783 | |
John Deere Capital Corp. | | | | | | | | | | | | |
1.95%, 6/22/2020 | | | | | | | 70,000 | | | | 68,886 | |
Springleaf Finance Corp. | | | | | | | | | | | | |
8.25%, 12/15/2020 | | | | | | | 42,000 | | | | 45,413 | |
7.13%, 3/15/2026 | | | | | | | 3,000 | | | | 2,985 | |
Synchrony Financial | | | | | | | | | | | | |
3.95%, 12/1/2027 | | | | | | | 28,000 | | | | 25,513 | |
| | | | | | | | | | | | |
| | | | | | | | | | | 338,119 | |
| | | | | | | | | | | | |
Containers & Packaging - 2.0% | |
Ardagh Packaging Finance plc | | | | | | | | | | | | |
6.75%, 5/15/2024(b) | | | EUR | | | | 125,000 | | | | 156,796 | |
Ball Corp. | | | | | | | | | | | | |
4.00%, 11/15/2023 | | | | | | | 12,000 | | | | 11,715 | |
4.88%, 3/15/2026 | | | | | | | 3,000 | | | | 2,977 | |
Berry Global, Inc. | | | | | | | | | | | | |
6.00%, 10/15/2022 | | | | | | | 16,000 | | | | 16,460 | |
4.50%, 2/15/2026(a) | | | | | | | 3,000 | | | | 2,813 | |
Crown Americas LLC | | | | | | | | | | | | |
4.75%, 2/1/2026(a) | | | | | | | 8,000 | | | | 7,680 | |
Crown European Holdings SA | | | | | | | | | | | | |
2.63%, 9/30/2024(b) | | | EUR | | | | 100,000 | | | | 117,477 | |
OI European Group BV | | | | | | | | | | | | |
4.00%, 3/15/2023(a) | | | | | | | 3,000 | | | | 2,846 | |
Owens-Brockway Glass Container, Inc. | | | | | | | | | | | | |
5.00%, 1/15/2022(a) | | | | | | | 7,000 | | | | 7,018 | |
Reynolds Group Issuer, Inc. | | | | | | | | | | | | |
5.75%, 10/15/2020 | | | | | | | 33,919 | | | | 33,961 | |
Sealed Air Corp. | | | | | | | | | | | | |
4.88%, 12/1/2022(a) | | | | | | | 19,000 | | | | 19,095 | |
SIG Combibloc Holdings SCA | | | | | | | | | | | | |
7.75%, 2/15/2023(b) | | | EUR | | | | 125,000 | | | | 151,073 | |
| | | | | | | | | | | | |
| | | | | | | | | | | 529,911 | |
| | | | | | | | | | | | |
Distributors - 0.1% | |
Global Partners LP | | | | | | | | | | | | |
6.25%, 7/15/2022 | | | | | | | 10,000 | | | | 9,925 | |
Performance Food Group, Inc. | | | | | | | | | | | | |
5.50%, 6/1/2024(a) | | | | | | | 8,000 | | | | 7,880 | |
| | | | | | | | | | | | |
| | | | | | | | | | | 17,805 | |
| | | | | | | | | | | | |
Diversified Consumer Services - 0.1% | |
Graham Holdings Co. | | | | | | | | | | | | |
5.75%, 6/1/2026(a) | | | | | | | 3,000 | | | | 3,068 | |
Service Corp. International | | | | | | | | | | | | |
7.50%, 4/1/2027 | | | | | | | 20,000 | | | | 22,300 | |
Sotheby’s | | | | | | | | | | | | |
4.88%, 12/15/2025(a) | | | | | | | 10,000 | | | | 9,548 | |
| | | | | | | | | | | | |
| | | | | | | | | | | 34,916 | |
| | | | | | | | | | | | |
Diversified Financial Services - 1.0% | |
ACE Cash Express, Inc. | | | | | | | | | | | | |
12.00%, 12/15/2022(a) | | | | | | | 10,000 | | | | 10,695 | |
CNG Holdings, Inc. | | | | | | | | | | | | |
9.38%, 5/15/2020(a) | | | | | | | 10,000 | | | | 9,950 | |
EDP Finance BV | | | | | | | | | | | | |
5.25%, 1/14/2021(a) | | | | | | | 200,000 | | | | 206,163 | |
SEE NOTES TO FINANCIAL STATEMENTS.
10
JPMorgan Flexible Long/Short Fund
SCHEDULE OF PORTFOLIO INVESTMENTS
AS OF AUGUST 31, 2018 (Unaudited) (continued)
(Amounts in U.S. Dollars, unless otherwise noted)
| | | | | | | | | | | | |
Investments | | | | | Principal
Amount | | | Value | |
Nationstar Mortgage LLC | | | | | | | | | | | | |
6.50%, 7/1/2021 | | | | | | | 37,000 | | | | 37,000 | |
| | | | | | | | | | | | |
| | | | | | | | | | | 263,808 | |
| | | | | | | | | | | | |
Diversified Telecommunication Services - 3.1% | |
AT&T, Inc. | | | | | | | | | | | | |
5.25%, 3/1/2037 | | | | | | | 40,000 | | | | 39,662 | |
CCO Holdings LLC | | | | | | | | | | | | |
5.88%, 4/1/2024(a) | | | | | | | 18,000 | | | | 18,360 | |
5.75%, 2/15/2026(a) | | | | | | | 16,000 | | | | 16,000 | |
5.50%, 5/1/2026(a) | | | | | | | 10,000 | | | | 9,875 | |
5.13%, 5/1/2027(a) | | | | | | | 49,000 | | | | 46,734 | |
5.88%, 5/1/2027(a) | | | | | | | 8,000 | | | | 7,950 | |
CenturyLink, Inc. | | | | | | | | | | | | |
Series T, 5.80%, 3/15/2022 | | | | | | | 5,000 | | | | 5,111 | |
Cincinnati Bell, Inc. | | | | | | | | | | | | |
7.00%, 7/15/2024(a) | | | | | | | 23,000 | | | | 20,240 | |
Consolidated Communications, Inc. | | | | | | | | | | | | |
6.50%, 10/1/2022 | | | | | | | 10,000 | | | | 9,437 | |
eircom Finance DAC | | | | | | | | | | | | |
4.50%, 5/31/2022(b) | | | EUR | | | | 120,000 | | | | 142,369 | |
Embarq Corp. | | | | | | | | | | | | |
8.00%, 6/1/2036 | | | | | | | 35,000 | | | | 34,125 | |
Frontier Communications Corp. | | | | | | | | | | | | |
11.00%, 9/15/2025 | | | | | | | 8,000 | | | | 6,120 | |
8.50%, 4/1/2026(a) | | | | | | | 5,000 | | | | 4,704 | |
Intelsat Jackson Holdings SA | | | | | | | | | | | | |
7.25%, 10/15/2020 | | | | | | | 11,000 | | | | 11,014 | |
7.50%, 4/1/2021 | | | | | | | 10,000 | | | | 10,062 | |
5.50%, 8/1/2023 | | | | | | | 12,000 | | | | 10,946 | |
8.00%, 2/15/2024(a) | | | | | | | 28,000 | | | | 29,470 | |
9.75%, 7/15/2025(a) | | | | | | | 5,000 | | | | 5,294 | |
Level 3 Financing, Inc. | | | | | | | | | | | | |
5.38%, 5/1/2025 | | | | | | | 24,000 | | | | 23,700 | |
Qwest Corp. | | | | | | | | | | | | |
6.75%, 12/1/2021 | | | | | | | 9,000 | | | | 9,639 | |
7.13%, 11/15/2043 | | | | | | | 30,000 | | | | 29,538 | |
TDC A/S | | | | | | | | | | | | |
3.75%, 3/2/2022(g) | | | EUR | | | | 100,000 | | | | 127,102 | |
Verizon Communications, Inc.
(ICE LIBOR USD 3 Month + 1.00%), 3.33%, 3/16/2022(c) | | | | | | | 20,000 | | | | 20,329 | |
2.63%, 8/15/2026 | | | | | | | 40,000 | | | | 36,225 | |
Virgin Media Finance plc | | | | | | | | | | | | |
4.50%, 1/15/2025(b) | | | EUR | | | | 120,000 | | | | 141,559 | |
Windstream Services LLC | | | | | | | | | | | | |
9.00%, 6/30/2025(a) | | | | | | | 9,000 | | | | 6,503 | |
| | | | | | | | | | | | |
| | | | | | | | | | | 822,068 | |
| | | | | | | | | | | | |
Electric Utilities - 2.1% | |
Duke Energy Corp. | | | | | | | | | | | | |
1.80%, 9/1/2021 | | | | | | | 70,000 | | | | 67,065 | |
Emera US Finance LP | | | | | | | | | | | | |
3.55%, 6/15/2026 | | | | | | | 72,000 | | | | 68,421 | |
Exelon Corp. | | | | | | | | | | | | |
3.40%, 4/15/2026 | | | | | | | 30,000 | | | | 28,898 | |
FirstEnergy Corp. | | | | | | | | | | | | |
Series B, 3.90%, 7/15/2027 | | | | | | | 50,000 | | | | 49,103 | |
Fortis, Inc. | | | | | | | | | | | | |
3.06%, 10/4/2026 | | | | | | | 15,000 | | | | 13,855 | |
Iberdrola Finanzas SA | | | | | | | | | | | | |
7.38%, 1/29/2024 | | | GBP | | | | 50,000 | | | | 81,856 | |
ITC Holdings Corp. | | | | | | | | | | | | |
2.70%, 11/15/2022 | | | | | | | 70,000 | | | | 67,468 | |
| | | | | | | | | | | | |
Investments | | | | | Principal
Amount | | | Value | |
NextEra Energy Operating Partners LP | | | | | | | | | | | | |
4.25%, 9/15/2024(a) | | | | | | | 4,000 | | | | 3,900 | |
4.50%, 9/15/2027(a) | | | | | | | 3,000 | | | | 2,850 | |
Pennsylvania Electric Co. | | | | | | | | | | | | |
3.25%, 3/15/2028(a) | | | | | | | 35,000 | | | | 32,960 | |
PPL Capital Funding, Inc. | | | | | | | | | | | | |
3.10%, 5/15/2026 | | | | | | | 100,000 | | | | 93,658 | |
Public Service Co. of Colorado | | | | | | | | | | | | |
3.20%, 11/15/2020 | | | | | | | 30,000 | | | | 30,063 | |
Terraform Global Operating LLC | | | | | | | | | | | | |
6.13%, 3/1/2026(a) | | | | | | | 4,000 | | | | 3,870 | |
Vistra Operations Co. LLC | | | | | | | | | | | | |
5.50%, 9/1/2026(a) | | | | | | | 14,000 | | | | 14,249 | |
| | | | | | | | | | | | |
| | | | | | | | | | | 558,216 | |
| | | | | | | | | | | | |
Electrical Equipment - 0.6% | |
Orano SA | | | | | | | | | | | | |
3.13%, 3/20/2023(b) | | | EUR | | | | 100,000 | | | | 116,955 | |
Sensata Technologies BV | | | | | | | | | | | | |
4.88%, 10/15/2023(a) | | | | | | | 5,000 | | | | 5,000 | |
5.63%, 11/1/2024(a) | | | | | | | 19,000 | | | | 19,665 | |
Vertiv Group Corp. | | | | | | | | | | | | |
9.25%, 10/15/2024(a) | | | | | | | 33,000 | | | | 33,907 | |
| | | | | | | | | | | | |
| | | | | | | | | | | 175,527 | |
| | | | | | | | | | | | |
Electronic Equipment, Instruments & Components - 0.4% | |
Anixter, Inc. | | | | | | | | | | | | |
5.63%, 5/1/2019 | | | | | | | 32,000 | | | | 32,480 | |
5.50%, 3/1/2023 | | | | | | | 28,000 | | | | 29,260 | |
CDW LLC | | | | | | | | | | | | |
5.50%, 12/1/2024 | | | | | | | 41,000 | | | | 42,640 | |
| | | | | | | | | | | | |
| | | | | | | | | | | 104,380 | |
| | | | | | | | | | | | |
Energy Equipment & Services - 0.6% | |
Baker Hughes a GE Co. LLC | | | | | | | | | | | | |
3.34%, 12/15/2027 | | | | | | | 42,000 | | | | 39,722 | |
Bristow Group, Inc. | | | | | | | | | | | | |
8.75%, 3/1/2023(a) | | | | | | | 3,000 | | | | 2,865 | |
Calfrac Holdings LP | | | | | | | | | | | | |
8.50%, 6/15/2026(a) | | | | | | | 2,000 | | | | 1,905 | |
Diamond Offshore Drilling, Inc. | | | | | | | | | | | | |
7.88%, 8/15/2025 | | | | | | | 5,000 | | | | 5,100 | |
Ensco plc | | | | | | | | | | | | |
5.20%, 3/15/2025 | | | | | | | 2,000 | | | | 1,672 | |
Nabors Industries, Inc. | | | | | | | | | | | | |
5.50%, 1/15/2023 | | | | | | | 13,000 | | | | 12,960 | |
5.75%, 2/1/2025(a) | | | | | | | 7,000 | | | | 6,733 | |
Noble Holding International Ltd. | | | | | | | | | | | | |
7.88%, 2/1/2026(a) | | | | | | | 6,000 | | | | 6,150 | |
Rowan Cos., Inc. | | | | | | | | | | | | |
7.38%, 6/15/2025 | | | | | | | 8,000 | | | | 7,680 | |
Shelf Drilling Holdings Ltd. | | | | | | | | | | | | |
8.25%, 2/15/2025(a) | | | | | | | 18,000 | | | | 18,293 | |
Transocean Guardian Ltd. | | | | | | | | | | | | |
5.88%, 1/15/2024(a) | | | | | | | 4,000 | | | | 4,020 | |
Transocean Pontus Ltd. | | | | | | | | | | | | |
6.13%, 8/1/2025(a) | | | | | | | 2,000 | | | | 2,040 | |
Transocean Proteus Ltd. | | | | | | | | | | | | |
6.25%, 12/1/2024(a) | | | | | | | 11,050 | | | | 11,320 | |
Transocean, Inc. | | | | | | | | | | | | |
9.00%, 7/15/2023(a) | | | | | | | 9,000 | | | | 9,709 | |
7.50%, 1/15/2026(a) | | | | | | | 5,000 | | | | 5,094 | |
6.80%, 3/15/2038 | | | | | | | 11,000 | | | | 9,061 | |
SEE NOTES TO FINANCIAL STATEMENTS.
11
JPMorgan Flexible Long/Short Fund
SCHEDULE OF PORTFOLIO INVESTMENTS
AS OF AUGUST 31, 2018 (Unaudited) (continued)
(Amounts in U.S. Dollars, unless otherwise noted)
| | | | | | | | | | | | |
Investments | | | | | Principal
Amount | | | Value | |
USA Compression Partners LP | | | | | | | | | |
6.88%, 4/1/2026(a) | | | | | | | 3,000 | | | | 3,090 | |
Weatherford International Ltd.
7.75%, 6/15/2021 | | | | | | | 2,000 | | | | 1,960 | |
4.50%, 4/15/2022 | | | | | | | 2,000 | | | | 1,740 | |
6.75%, 9/15/2040 | | | | | | | 15,000 | | | | 11,212 | |
5.95%, 4/15/2042 | | | | | | | 3,000 | | | | 2,108 | |
| | | | | | | | | | | | |
| | | | | | | | | | | 164,434 | |
| | | | | | | | | | | | |
Equity Real Estate Investment Trusts (REITs) - 1.2% | |
American Tower Corp.
REIT, 3.60%, 1/15/2028 | | | | | | | 60,000 | | | | 56,337 | |
CyrusOne LP
REIT, 5.00%, 3/15/2024 | | | | | | | 4,000 | | | | 4,050 | |
REIT, 5.38%, 3/15/2027 | | | | | | | 12,000 | | | | 12,060 | |
Equinix, Inc.
REIT, 5.75%, 1/1/2025 | | | | | | | 14,000 | | | | 14,420 | |
REIT, 2.88%, 10/1/2025 | | | EUR | | | | 100,000 | | | | 113,893 | |
ESH Hospitality, Inc.
REIT, 5.25%, 5/1/2025(a) | | | | | | | 10,000 | | | | 9,687 | |
Iron Mountain, Inc.
REIT, 4.88%, 9/15/2027(a) | | | | | | | 4,000 | | | | 3,707 | |
REIT, 5.25%, 3/15/2028(a) | | | | | | | 5,000 | | | | 4,731 | |
SBA Communications Corp.
REIT, 4.88%, 7/15/2022 | | | | | | | 13,000 | | | | 13,163 | |
VEREIT Operating Partnership LP
REIT, 4.60%, 2/6/2024 | | | | | | | 67,000 | | | | 67,582 | |
REIT, 3.95%, 8/15/2027 | | | | | | | 20,000 | | | | 19,053 | |
| | | | | | | | | | | | |
| | | | | | | | | | | 318,683 | |
| | | | | | | | | | | | |
Food & Staples Retailing - 1.3% | | | | | | | | | | | | |
Albertsons Cos. LLC
6.63%, 6/15/2024 | | | | | | | 21,000 | | | | 20,265 | |
5.75%, 3/15/2025 | | | | | | | 2,000 | | | | 1,810 | |
Iceland Bondco plc
6.75%, 7/15/2024(b) | | | GBP | | | | 100,000 | | | | 134,247 | |
Kroger Co. (The)
2.65%, 10/15/2026 | | | | | | | 45,000 | | | | 40,494 | |
New Albertsons LP
7.45%, 8/1/2029 | | | | | | | 4,000 | | | | 3,360 | |
8.70%, 5/1/2030 | | | | | | | 8,000 | | | | 7,020 | |
8.00%, 5/1/2031 | | | | | | | 5,000 | | | | 4,238 | |
Picard Groupe SAS
(EURIBOR 3 Month + 3.00%), 3.00%, 11/30/2023(b)(c) | | | EUR | | | | 100,000 | | | | 114,235 | |
SUPERVALU, Inc.
6.75%, 6/1/2021 | | | | | | | 11,000 | | | | 11,192 | |
7.75%, 11/15/2022 | | | | | | | 19,000 | | | | 19,713 | |
| | | | | | | | | | | | |
| | | | | | | | | | | 356,574 | |
| | | | | | | | | | | | |
Food Products - 0.8% | | | | | | | | | | | | |
B&G Foods, Inc.
5.25%, 4/1/2025 | | | | | | | 10,000 | | | | 9,712 | |
Dean Foods Co.
6.50%, 3/15/2023(a) | | | | | | | 5,000 | | | | 4,762 | |
Dole Food Co., Inc.
7.25%, 6/15/2025(a) | | | | | | | 11,000 | | | | 10,780 | |
General Mills, Inc.
(ICE LIBOR USD 3 Month + 0.54%), 2.88%, 4/16/2021(c) | | | | | | | 65,000 | | | | 65,290 | |
JBS USA LUX SA
7.25%, 6/1/2021(a) | | | | | | | 40,000 | | | | 40,400 | |
5.88%, 7/15/2024(a) | | | | | | | 13,000 | | | | 12,382 | |
6.75%, 2/15/2028(a) | | | | | | | 10,000 | | | | 9,550 | |
| | | | | | | | | | | | |
Investments | | | | | Principal
Amount | | | Value | |
Kraft Heinz Foods Co.
4.38%, 6/1/2046 | | | | | | | 10,000 | | | | 8,738 | |
Lamb Weston Holdings, Inc.
4.63%, 11/1/2024(a) | | | | | | | 3,000 | | | | 2,948 | |
4.88%, 11/1/2026(a) | | | | | | | 3,000 | | | | 2,955 | |
Pilgrim’s Pride Corp.
5.75%, 3/15/2025(a) | | | | | | | 7,000 | | | | 6,773 | |
5.88%, 9/30/2027(a) | | | | | | | 5,000 | | | | 4,750 | |
Smithfield Foods, Inc.
3.35%, 2/1/2022(a) | | | | | | | 25,000 | | | | 24,171 | |
4.25%, 2/1/2027(a) | | | | | | | 15,000 | | | | 14,170 | |
| | | | | | | | | | | | |
| | | | | | | | | | | 217,381 | |
| | | | | | | | | | | | |
Gas Utilities - 0.0%(h) | | | | | | | | | | | | |
AmeriGas Partners LP
5.50%, 5/20/2025 | | | | | | | 3,000 | | | | 2,940 | |
| | | | | | | | | | | | |
Health Care Equipment & Supplies - 0.1% | | | | | | | | | |
Hologic, Inc.
4.38%, 10/15/2025(a) | | | | | | | 12,000 | | | | 11,550 | |
Mallinckrodt International Finance SA
5.63%, 10/15/2023(a) | | | | | | | 8,000 | | | | 7,130 | |
| | | | | | | | | | | | |
| | | | | | | | | | | 18,680 | |
| | | | | | | | | | | | |
Health Care Providers & Services - 2.3% | | | | | | | | | |
Acadia Healthcare Co., Inc.
6.50%, 3/1/2024 | | | | | | | 25,000 | | | | 25,906 | |
Centene Corp.
6.13%, 2/15/2024 | | | | | | | 11,000 | | | | 11,564 | |
4.75%, 1/15/2025 | | | | | | | 5,000 | | | | 5,025 | |
Community Health Systems, Inc.
5.13%, 8/1/2021 | | | | | | | 3,000 | | | | 2,895 | |
6.25%, 3/31/2023 | | | | | | | 12,000 | | | | 11,400 | |
8.63%, 1/15/2024(a) | | | | | | | 8,000 | | | | 8,340 | |
8.13%, 6/30/2024(a) | | | | | | | 14,000 | | | | 11,515 | |
Constantin Investissement 3 SASU
5.38%, 4/15/2025(b) | | | EUR | | | | 100,000 | | | | 114,944 | |
DaVita, Inc.
5.13%, 7/15/2024 | | | | | | | 33,000 | | | | 31,816 | |
5.00%, 5/1/2025 | | | | | | | 50,000 | | | | 47,375 | |
Elanco Animal Health, Inc.
3.91%, 8/27/2021(a) | | | | | | | 20,000 | | | | 20,058 | |
Envision Healthcare Corp.
5.63%, 7/15/2022 | | | | | | | 24,000 | | | | 24,600 | |
HCA, Inc.
5.88%, 3/15/2022 | | | | | | | 29,000 | | | | 30,812 | |
5.88%, 5/1/2023 | | | | | | | 21,000 | | | | 22,050 | |
5.00%, 3/15/2024 | | | | | | | 54,000 | | | | 55,215 | |
5.88%, 2/15/2026 | | | | | | | 16,000 | | | | 16,540 | |
5.50%, 6/15/2047 | | | | | | | 10,000 | | | | 10,025 | |
MPH Acquisition Holdings LLC
7.13%, 6/1/2024(a) | | | | | | | 20,000 | | | | 20,700 | |
NVA Holdings, Inc.
6.88%, 4/1/2026(a) | | | | | | | 3,000 | | | | 2,981 | |
Polaris Intermediate Corp.
8.50% (cash), 12/1/2022(a)(i) | | | | | | | 7,000 | | | | 7,228 | |
Team Health Holdings, Inc.
6.38%, 2/1/2025(a) | | | | | | | 20,000 | | | | 17,350 | |
Tenet Healthcare Corp.
4.50%, 4/1/2021 | | | | | | | 24,000 | | | | 23,970 | |
4.38%, 10/1/2021 | | | | | | | 20,000 | | | | 19,950 | |
6.75%, 6/15/2023 | | | | | | | 39,000 | | | | 39,000 | |
4.63%, 7/15/2024 | | | | | | | 6,000 | | | | 5,877 | |
SEE NOTES TO FINANCIAL STATEMENTS.
12
JPMorgan Flexible Long/Short Fund
SCHEDULE OF PORTFOLIO INVESTMENTS
AS OF AUGUST 31, 2018 (Unaudited) (continued)
(Amounts in U.S. Dollars, unless otherwise noted)
| | | | | | | | | | | | |
Investments | | | | | Principal
Amount | | | Value | |
5.13%, 5/1/2025 | | | | | | | 25,000 | | | | 24,844 | |
7.00%, 8/1/2025 | | | | | | | 2,000 | | | | 1,996 | |
WellCare Health Plans, Inc.
5.25%, 4/1/2025 | | | | | | | 10,000 | | | | 10,225 | |
| | | | | | | | | | | | |
| | | | | | | | | | | 624,201 | |
| | | | | | | | | | | | |
Health Care Technology - 0.5% | | | | | | | | | | | | |
IQVIA, Inc.
4.88%, 5/15/2023(a) | | | | | | | 11,000 | | | | 11,028 | |
3.25%, 3/15/2025(b) | | | EUR | | | | 100,000 | | | | 117,269 | |
| | | | | | | | | | | | |
| | | | | | | | | | | 128,297 | |
| | | | | | | | | | | | |
Hotels, Restaurants & Leisure - 2.1% | |
1011778 BC ULC
4.25%, 5/15/2024(a) | | | | | | | 8,000 | | | | 7,640 | |
Boyd Gaming Corp.
6.88%, 5/15/2023 | | | | | | | 9,000 | | | | 9,461 | |
Boyne USA, Inc.
7.25%, 5/1/2025(a) | | | | | | | 8,000 | | | | 8,480 | |
Choice Hotels International, Inc.
5.75%, 7/1/2022 | | | | | | | 31,000 | | | | 32,666 | |
Downstream Development Authority of the Quapaw Tribe of Oklahoma
10.50%, 2/15/2023(a) | | | | | | | 3,000 | | | | 2,993 | |
Eldorado Resorts, Inc.
6.00%, 4/1/2025 | | | | | | | 5,000 | | | | 5,081 | |
Enterprise Development Authority (The)
12.00%, 7/15/2024(a) | | | | | | | 10,000 | | | | 9,713 | |
Gateway Casinos & Entertainment Ltd.
8.25%, 3/1/2024(a) | | | | | | | 10,000 | | | | 10,600 | |
GLP Capital LP
5.38%, 11/1/2023 | | | | | | | 154,000 | | | | 162,085 | |
Golden Nugget, Inc.
6.75%, 10/15/2024(a) | | | | | | | 11,000 | | | | 11,179 | |
International Game Technology plc
4.75%, 2/15/2023(b) | | | EUR | | | | 125,000 | | | | 157,434 | |
IRB Holding Corp.
6.75%, 2/15/2026(a) | | | | | | | 4,000 | | | | 3,820 | |
KFC Holding Co.
5.25%, 6/1/2026(a) | | | | | | | 10,000 | | | | 10,000 | |
Marriott Ownership Resorts, Inc.
6.50%, 9/15/2026(a) | | | | | | | 6,000 | | | | 6,120 | |
MGM Resorts International
8.63%, 2/1/2019 | | | | | | | 30,000 | | | | 30,588 | |
6.00%, 3/15/2023 | | | | | | | 39,000 | | | | 40,488 | |
Scientific Games International, Inc.
5.00%, 10/15/2025(a) | | | | | | | 6,000 | | | | 5,700 | |
Six Flags Entertainment Corp.
4.88%, 7/31/2024(a) | | | | | | | 16,000 | | | | 15,720 | |
Stars Group Holdings BV
7.00%, 7/15/2026(a) | | | | | | | 5,000 | | | | 5,200 | |
Station Casinos LLC
5.00%, 10/1/2025(a) | | | | | | | 5,000 | | | | 4,831 | |
Wyndham Destinations, Inc.
4.15%, 4/1/2024(g) | | | | | | | 7,000 | | | | 6,916 | |
5.10%, 10/1/2025(g) | | | | | | | 3,000 | | | | 3,036 | |
4.50%, 4/1/2027(g) | | | | | | | 5,000 | | | | 4,776 | |
Wyndham Hotels & Resorts, Inc.
5.38%, 4/15/2026(a) | | | | | | | 4,000 | | | | 3,970 | |
| | | | | | | | | | | | |
| | | | | | | | | | | 558,497 | |
| | | | | | | | | | | | |
| | | | | | | | | | | | |
Investments | | | | | Principal
Amount | | | Value | |
Household Durables - 0.4% | |
Lennar Corp. | | | | | | | | | | | | |
4.50%, 6/15/2019 | | | | | | | 33,000 | | | | 33,206 | |
4.88%, 12/15/2023 | | | | | | | 15,000 | | | | 15,019 | |
5.88%, 11/15/2024 | | | | | | | 10,000 | | | | 10,376 | |
LGI Homes, Inc.
6.88%, 7/15/2026(a) | | | | | | | 3,000 | | | | 2,981 | |
M/I Homes, Inc.
6.75%, 1/15/2021 | | | | | | | 8,000 | | | | 8,179 | |
Mattamy Group Corp.
6.50%, 10/1/2025(a) | | | | | | | 10,000 | | | | 9,852 | |
New Home Co., Inc. (The)
7.25%, 4/1/2022 | | | | | | | 9,000 | | | | 9,135 | |
Tempur Sealy International, Inc. | | | | | | | | | | | | |
5.50%, 6/15/2026 | | | | | | | 15,000 | | | | 14,625 | |
Toll Brothers Finance Corp.
4.35%, 2/15/2028 | | | | | | | 10,000 | | | | 9,150 | |
| | | | | | | | | | | | |
| | | | | | | | | | | 112,523 | |
| | | | | | | | | | | | |
Household Products - 0.2% | |
Central Garden & Pet Co.
6.13%, 11/15/2023 | | | | | | | 9,000 | | | | 9,281 | |
Kronos Acquisition Holdings, Inc. | |
9.00%, 8/15/2023(a) | | | | | | | 4,000 | | | | 3,660 | |
Spectrum Brands, Inc. | | | | | | | | | | | | |
6.13%, 12/15/2024 | | | | | | | 28,000 | | | | 28,630 | |
| | | | | | | | | | | | |
| | | | | | | | | | | 41,571 | |
| | | | | | | | | | | | |
Independent Power and Renewable Electricity Producers - 0.4% | |
Calpine Corp.
6.00%, 1/15/2022(a) | | | | | | | 14,000 | | | | 14,245 | |
5.25%, 6/1/2026(a) | | | | | | | 39,000 | | | | 36,819 | |
NRG Energy, Inc.
6.63%, 1/15/2027 | | | | | | | 20,000 | | | | 20,925 | |
5.75%, 1/15/2028(a) | | | | | | | 4,000 | | | | 4,040 | |
NRG Yield Operating LLC
5.38%, 8/15/2024 | | | | | | | 9,000 | | | | 9,045 | |
Vistra Energy Corp.
5.88%, 6/1/2023 | | | | | | | 23,000 | | | | 23,661 | |
| | | | | | | | | | | | |
| | | | | | | | | | | 108,735 | |
| | | | | | | | | | | | |
Industrial Conglomerates - 0.1% | |
General Electric Co.
4.50%, 3/11/2044 | | | | | | | 35,000 | | | | 33,869 | |
| | | | | | | | | | | | |
Insurance - 0.7% | |
American International Group, Inc. | |
3.90%, 4/1/2026 | | | | | | | 130,000 | | | | 127,547 | |
AmWINS Group, Inc.
7.75%, 7/1/2026(a) | | | | | | | 8,000 | | | | 8,430 | |
CNO Financial Group, Inc.
5.25%, 5/30/2025 | | | | | | | 5,000 | | | | 5,075 | |
Fidelity & Guaranty Life Holdings, Inc. 5.50%, 5/1/2025(a) | | | | | | | 11,000 | | | | 10,890 | |
MetLife, Inc.
4.72%, 12/15/2044(g) | | | | | | | 30,000 | | | | 31,187 | |
Zurich Finance UK plc
(U.K. Government Bonds 5 Year Note Generic Bid Yield + 2.85%), 6.62%, 10/2/2022(c)(d)(e) | | | GBP | | | | 9,000 | | | | 13,155 | |
| | | | | | | | | | | | |
| | | | | | | | | | | 196,284 | |
| | | | | | | | | | | | |
Internet & Direct Marketing Retail - 0.0%(h) | |
Netflix, Inc.
4.88%, 4/15/2028(a) | | | | | | | 5,000 | | | | 4,738 | |
SEE NOTES TO FINANCIAL STATEMENTS.
13
JPMorgan Flexible Long/Short Fund
SCHEDULE OF PORTFOLIO INVESTMENTS
AS OF AUGUST 31, 2018 (Unaudited) (continued)
(Amounts in U.S. Dollars, unless otherwise noted)
| | | | | | | | | | | | |
Investments | | | | | Principal
Amount | | | Value | |
5.88%, 11/15/2028(a) | | | | | | | 4,000 | | | | 4,009 | |
| | | | | | | | | | | | |
| | | | | | | | | | | 8,747 | |
| | | | | | | | | | | | |
Internet Software & Services - 0.2% | |
Rackspace Hosting, Inc.
8.63%, 11/15/2024(a) | | | | | | | 35,000 | | | | 34,453 | |
Zayo Group LLC
6.38%, 5/15/2025 | | | | | | | 27,000 | | | | 28,215 | |
5.75%, 1/15/2027(a) | | | | | | | 3,000 | | | | 3,008 | |
| | | | | | | | | | | | |
| | | | | | | | | | | 65,676 | |
| | | | | | | | | | | | |
IT Services - 0.4% | | | | | | | | | | | | |
Alliance Data Systems Corp.
5.88%, 11/1/2021(a) | | | | | | | 14,000 | | | | 14,315 | |
5.38%, 8/1/2022(a) | | | | | | | 30,000 | | | | 30,150 | |
First Data Corp.
7.00%, 12/1/2023(a) | | | | | | | 10,000 | | | | 10,405 | |
5.00%, 1/15/2024(a) | | | | | | | 30,000 | | | | 30,061 | |
5.75%, 1/15/2024(a) | | | | | | | 20,000 | | | | 20,400 | |
| | | | | | | | | | | | |
| | | | | | | | | | | 105,331 | |
| | | | | | | | | | | | |
Leisure Products - 0.0%(h) | | | | | | | | | | | | |
Mattel, Inc.
3.15%, 3/15/2023 | | | | | | | 3,000 | | | | 2,622 | |
6.75%, 12/31/2025(a) | | | | | | | 2,000 | | | | 1,959 | |
| | | | | | | | | | | | |
| | | | | | | | | | | 4,581 | |
| | | | | | | | | | | | |
Machinery - 0.2% | | | | | | | | | | | | |
Navistar International Corp.
6.63%, 11/1/2025(a) | | | | | | | 3,000 | | | | 3,120 | |
Novelis Corp.
6.25%, 8/15/2024(a) | | | | | | | 10,000 | | | | 10,125 | |
5.88%, 9/30/2026(a) | | | | | | | 10,000 | | | | 9,738 | |
Oshkosh Corp.
5.38%, 3/1/2025 | | | | | | | 7,000 | | | | 7,227 | |
RBS Global, Inc.
4.88%, 12/15/2025(a) | | | | | | | 2,000 | | | | 1,925 | |
Tennant Co.
5.63%, 5/1/2025 | | | | | | | 3,000 | | | | 3,023 | |
Terex Corp.
5.63%, 2/1/2025(a) | | | | | | | 11,000 | | | | 10,918 | |
Wabash National Corp.
5.50%, 10/1/2025(a) | | | | | | | 17,000 | | | | 16,150 | |
| | | | | | | | | | | | |
| | | | | | | | | | | 62,226 | |
| | | | | | | | | | | | |
Media - 4.8% | | | | | | | | | | | | |
Altice Luxembourg SA
6.25%, 2/15/2025(b) | | | EUR | | | | 200,000 | | | | 221,466 | |
AMC Networks, Inc.
5.00%, 4/1/2024 | | | | | | | 21,000 | | | | 20,659 | |
Cablevision Systems Corp.
8.00%, 4/15/2020 | | | | | | | 30,000 | | | | 31,575 | |
5.88%, 9/15/2022 | | | | | | | 4,000 | | | | 4,070 | |
Charter Communications Operating LLC | | | | | | | | | | | | |
6.48%, 10/23/2045 | | | | | | | 30,000 | | | | 31,983 | |
Cinemark USA, Inc.
4.88%, 6/1/2023 | | | | | | | 19,000 | | | | 18,762 | |
Clear Channel Worldwide Holdings, Inc. | | | | | | | | | | | | |
Series B, 7.63%, 3/15/2020 | | | | | | | 16,000 | | | | 16,060 | |
Cox Communications, Inc.
3.35%, 9/15/2026(a) | | | | | | | 65,000 | | | | 60,952 | |
3.50%, 8/15/2027(a) | | | | | | | 60,000 | | | | 56,634 | |
CSC Holdings LLC
6.75%, 11/15/2021 | | | | | | | 2,000 | | | | 2,120 | |
| | | | | | | | | | | | |
Investments | | | | | Principal
Amount | | | Value | |
5.25%, 6/1/2024 | | | | | | | 42,000 | | | | 40,740 | |
DISH DBS Corp.
7.88%, 9/1/2019 | | | | | | | 14,000 | | | | 14,473 | |
6.75%, 6/1/2021 | | | | | | | 31,000 | | | | 31,465 | |
5.88%, 7/15/2022 | | | | | | | 14,000 | | | | 13,440 | |
5.00%, 3/15/2023 | | | | | | | 9,000 | | | | 8,010 | |
5.88%, 11/15/2024 | | | | | | | 7,000 | | | | 6,090 | |
7.75%, 7/1/2026 | | | | | | | 10,000 | | | | 9,025 | |
EMI Music Publishing Group North America Holdings, Inc.
7.63%, 6/15/2024(a) | | | | | | | 4,000 | | | | 4,305 | |
EW Scripps Co. (The)
5.13%, 5/15/2025(a) | | | | | | | 14,000 | | | | 13,370 | |
Gray Television, Inc.
5.13%, 10/15/2024(a) | | | | | | | 19,000 | | | | 18,620 | |
iHeartCommunications, Inc.
9.00%, 12/15/2019(f) | | | | | | | 25,000 | | | | 18,563 | |
Nexstar Broadcasting, Inc.
6.13%, 2/15/2022(a) | | | | | | | 21,000 | | | | 21,354 | |
SES SA
(EUR Swap Annual 5 Year + 4.66%), 4.62%, 1/2/2022(b)(c)(d)(e) | | | EUR | | | | 100,000 | | | | 120,132 | |
Sinclair Television Group, Inc.
5.63%, 8/1/2024(a) | | | | | | | 29,000 | | | | 28,565 | |
5.13%, 2/15/2027(a) | | | | | | | 30,000 | | | | 27,750 | |
Sirius XM Radio, Inc.
5.38%, 7/15/2026(a) | | | | | | | 14,000 | | | | 13,965 | |
5.00%, 8/1/2027(a) | | | | | | | 5,000 | | | | 4,831 | |
Sky plc
2.25%, 11/17/2025(b) | | | EUR | | | | 150,000 | | | | 186,788 | |
TEGNA, Inc.
5.50%, 9/15/2024(a) | | | | | | | 13,000 | | | | 13,228 | |
Unitymedia GmbH
3.75%, 1/15/2027(b) | | | EUR | | | | 100,000 | | | | 122,524 | |
Univision Communications, Inc.
5.13%, 2/15/2025(a) | | | | | | | 24,000 | | | | 22,020 | |
Viacom, Inc.
4.38%, 3/15/2043 | | | | | | | 4,000 | | | | 3,444 | |
(ICE LIBOR USD 3 Month + 3.90%), 5.88%, 2/28/2057(c) | | | | | | | 13,000 | | | | 12,690 | |
(ICE LIBOR USD 3 Month + 3.90%), 6.25%, 2/28/2057(c) | | | | | | | 7,000 | | | | 6,928 | |
Videotron Ltd.
5.00%, 7/15/2022 | | | | | | | 13,000 | | | | 13,228 | |
5.13%, 4/15/2027(a) | | | | | | | 14,000 | | | | 13,860 | |
Warner Media LLC
2.95%, 7/15/2026 | | | | | | | 16,000 | | | | 14,534 | |
WMG Acquisition Corp.
5.63%, 4/15/2022(a) | | | | | | | 7,000 | | | | 7,105 | |
5.00%, 8/1/2023(a) | | | | | | | 5,000 | | | | 4,963 | |
5.50%, 4/15/2026(a) | | | | | | | 8,000 | | | | 7,860 | |
| | | | | | | | | | | | |
| | | | | | | | | | | 1,288,151 | |
| | | | | | | | | | | | |
Metals & Mining - 1.5% | | | | | | | | | | | | |
AK Steel Corp.
7.50%, 7/15/2023 | | | | | | | 9,000 | | | | 9,405 | |
7.00%, 3/15/2027 | | | | | | | 4,000 | | | | 3,790 | |
Cleveland-Cliffs, Inc.
4.88%, 1/15/2024(a) | | | | | | | 5,000 | | | | 4,875 | |
Commercial Metals Co.
4.88%, 5/15/2023 | | | | | | | 10,000 | | | | 9,750 | |
SEE NOTES TO FINANCIAL STATEMENTS.
14
JPMorgan Flexible Long/Short Fund
SCHEDULE OF PORTFOLIO INVESTMENTS
AS OF AUGUST 31, 2018 (Unaudited) (continued)
(Amounts in U.S. Dollars, unless otherwise noted)
| | | | | | | | | | | | |
Investments | | | | | Principal
Amount | | | Value | |
FMG Resources August 2006 Pty. Ltd.
4.75%, 5/15/2022(a) | | | | | | | 4,000 | | | | 3,925 | |
5.13%, 5/15/2024(a) | | | | | | | 5,000 | | | | 4,838 | |
Freeport-McMoRan, Inc.
3.55%, 3/1/2022 | | | | | | | 87,000 | | | | 83,955 | |
3.88%, 3/15/2023 | | | | | | | 17,000 | | | | 16,363 | |
5.45%, 3/15/2043 | | | | | | | 13,000 | | | | 11,597 | |
Glencore Funding LLC
4.00%, 3/27/2027(a) | | | | | | | 20,000 | | | | 18,774 | |
Hudbay Minerals, Inc.
7.25%, 1/15/2023(a) | | | | | | | 10,000 | | | | 10,175 | |
Kaiser Aluminum Corp.
5.88%, 5/15/2024 | | | | | | | 23,000 | | | | 23,575 | |
Newcrest Finance Pty. Ltd.
5.75%, 11/15/2041(a) | | | | | | | 10,000 | | | | 10,373 | |
Nyrstar Netherlands Holdings BV
6.88%, 3/15/2024(b) | | | EUR | | | | 100,000 | | | | 103,149 | |
Southern Copper Corp.
6.75%, 4/16/2040 | | | | | | | 20,000 | | | | 23,750 | |
Steel Dynamics, Inc.
5.50%, 10/1/2024 | | | | | | | 22,000 | | | | 22,550 | |
thyssenkrupp AG
2.50%, 2/25/2025(b) | | | EUR | | | | 30,000 | | | | 36,572 | |
United States Steel Corp.
6.88%, 8/15/2025 | | | | | | | 5,000 | | | | 5,075 | |
6.25%, 3/15/2026 | | | | | | | 8,000 | | | | 7,970 | |
| | | | | | | | | | | | |
| | | | | | | | | | | 410,461 | |
| | | | | | | | | | | | |
Multi-Utilities - 1.1% | | | | | | | | | | | | |
Consolidated Edison, Inc.
Series A, 2.00%, 3/15/2020 | | | | | | | 30,000 | | | | 29,524 | |
innogy Finance BV
5.63%, 12/6/2023(b) | | | GBP | | | | 15,000 | | | | 22,836 | |
NGG Finance plc
(GBP Swap 12 Year + 3.48%), 5.63%, | | | | | | | | |
6/18/2073(b)(c) | | | GBP | | | | 100,000 | | | | 141,999 | |
NiSource, Inc.
3.49%, 5/15/2027 | | | | | | | 70,000 | | | | 67,607 | |
Sempra Energy
3.80%, 2/1/2038 | | | | | | | 35,000 | | | | 32,140 | |
| | | | | | | | | | | | |
| | | | | | | | | | | 294,106 | |
| | | | | | | | | | | | |
Oil, Gas & Consumable Fuels - 4.5% | | | | | |
Anadarko Petroleum Corp.
3.45%, 7/15/2024 | | | | | | | 30,000 | | | | 29,086 | |
Antero Resources Corp.
5.13%, 12/1/2022 | | | | | | | 24,000 | | | | 24,240 | |
Buckeye Partners LP
4.35%, 10/15/2024 | | | | | | | 40,000 | | | | 39,407 | |
California Resources Corp.
8.00%, 12/15/2022(a) | | | | | | | 4,000 | | | | 3,585 | |
Cenovus Energy, Inc.
4.25%, 4/15/2027 | | | | | | | 5,000 | | | | 4,830 | |
6.75%, 11/15/2039 | | | | | | | 9,000 | | | | 10,283 | |
5.20%, 9/15/2043 | | | | | | | 35,000 | | | | 34,092 | |
Cheniere Corpus Christi Holdings LLC
5.88%, 3/31/2025 | | | | | | | 10,000 | | | | 10,625 | |
Chesapeake Energy Corp.
8.00%, 1/15/2025 | | | | | | | 23,000 | | | | 23,489 | |
CITGO Petroleum Corp.
6.25%, 8/15/2022(a) | | | | | | | 5,000 | | | | 5,037 | |
| | | | | | | | | | | | |
Investments | | | | | Principal
Amount | | | Value | |
Concho Resources, Inc.
3.75%, 10/1/2027 | | | | | | | 12,000 | | | | 11,474 | |
4.88%, 10/1/2047 | | | | | | | 4,000 | | | | 4,037 | |
DCP Midstream Operating LP
3.88%, 3/15/2023 | | | | | | | 36,000 | | | | 35,100 | |
Delek Logistics Partners LP
6.75%, 5/15/2025 | | | | | | | 5,000 | | | | 5,000 | |
Enable Midstream Partners LP
4.95%, 5/15/2028 | | | | | | | 45,000 | | | | 44,674 | |
Enbridge, Inc.
(ICE LIBOR USD 3 Month + 3.64%), 6.25%, 3/1/2078(c) | | | | | | | 20,000 | | | | 19,384 | |
Energy Transfer Equity LP
5.88%, 1/15/2024 | | | | | | | 21,000 | | | | 22,312 | |
EnLink Midstream Partners LP
4.40%, 4/1/2024 | | | | | | | 15,000 | | | | 14,616 | |
4.85%, 7/15/2026 | | | | | | | 5,000 | | | | 4,854 | |
Enterprise Products Operating LLC
Series E, (ICE LIBOR USD 3 Month + 3.03%), 5.25%, 8/16/2077(c) | | | | | | | 80,000 | | | | 75,600 | |
(ICE LIBOR USD 3 Month + 2.57%), 5.38%, 2/15/2078(c) | | | | | | | 7,000 | | | | 6,540 | |
EP Energy LLC
9.38%, 5/1/2024(a) | | | | | | | 16,000 | | | | 12,600 | |
7.75%, 5/15/2026(a) | | | | | | | 12,000 | | | | 12,270 | |
EQT Corp.
3.00%, 10/1/2022 | | | | | | | 55,000 | | | | 53,369 | |
Genesis Energy LP
6.00%, 5/15/2023 | | | | | | | 14,000 | | | | 13,772 | |
Gulfport Energy Corp.
6.38%, 1/15/2026 | | | | | | | 2,000 | | | | 1,950 | |
Hilcorp Energy I LP
5.00%, 12/1/2024(a) | | | | | | | 39,000 | | | | 37,684 | |
Holly Energy Partners LP
6.00%, 8/1/2024(a) | | | | | | | 5,000 | | | | 5,087 | |
MEG Energy Corp.
6.38%, 1/30/2023(a) | | | | | | | 3,000 | | | | 2,722 | |
7.00%, 3/31/2024(a) | | | | | | | 2,000 | | | | 1,818 | |
Noble Energy, Inc.
3.85%, 1/15/2028 | | | | | | | 35,000 | | | | 33,378 | |
Oasis Petroleum, Inc.
6.88%, 3/15/2022 | | | | | | | 5,000 | | | | 5,094 | |
Peabody Energy Corp.
6.00%, 3/31/2022(a) | | | | | | | 5,000 | | | | 5,019 | |
Phillips 66 Partners LP
3.75%, 3/1/2028 | | | | | | | 35,000 | | | | 33,298 | |
QEP Resources, Inc.
5.25%, 5/1/2023 | | | | | | | 20,000 | | | | 19,500 | |
5.63%, 3/1/2026 | | | | | | | 2,000 | | | | 1,913 | |
Repsol International Finance BV
(EUR Swap Annual 10 Year + 4.20%), 4.50%, 3/25/2075(b)(c) | | | EUR | | | | 100,000 | | | | 123,459 | |
Rockies Express Pipeline LLC
6.00%, 1/15/2019(a) | | | | | | | 15,000 | | | | 15,141 | |
SemGroup Corp.
5.63%, 7/15/2022 | | | | | | | 11,000 | | | | 10,904 | |
SM Energy Co.
5.63%, 6/1/2025 | | | | | | | 10,000 | | | | 9,900 | |
Summit Midstream Holdings LLC
5.50%, 8/15/2022 | | | | | | | 10,000 | | | | 9,950 | |
SEE NOTES TO FINANCIAL STATEMENTS.
15
JPMorgan Flexible Long/Short Fund
SCHEDULE OF PORTFOLIO INVESTMENTS
AS OF AUGUST 31, 2018 (Unaudited) (continued)
(Amounts in U.S. Dollars, unless otherwise noted)
| | | | | | | | | | | | |
Investments | | | | | Principal
Amount | | | Value | |
Sunoco LP
4.88%, 1/15/2023(a) | | | | | | | 2,000 | | | | 1,973 | |
5.50%, 2/15/2026(a) | | | | | | | 3,000 | | | | 2,873 | |
Tallgrass Energy Partners LP
5.50%, 9/15/2024(a) | | | | | | | 25,000 | | | | 25,719 | |
Targa Resources Partners LP
5.13%, 2/1/2025 | | | | | | | 5,000 | | | | 5,025 | |
5.00%, 1/15/2028(a) | | | | | | | 5,000 | | | | 4,856 | |
TerraForm Power Operating LLC
4.25%, 1/31/2023(a) | | | | | | | 21,000 | | | | 20,475 | |
6.62%, 6/15/2025(a)(g) | | | | | | | 48,000 | | | | 51,120 | |
5.00%, 1/31/2028(a) | | | | | | | 5,000 | | | | 4,681 | |
TOTAL SA
(EUR Swap Annual 5 Year + 1.86%), 2.25%, 2/26/2021(b)(c)(d)(e) | | | EUR | | | | 100,000 | | | | 118,911 | |
TransCanada PipeLines Ltd.
4.25%, 5/15/2028 | | | | | | | 30,000 | | | | 30,214 | |
Ultra Resources, Inc.
6.88%, 4/15/2022(a) | | | | | | | 11,000 | | | | 5,363 | |
7.13%, 4/15/2025(a) | | | | | | | 28,000 | | | | 12,390 | |
Western Gas Partners LP
4.65%, 7/1/2026 | | | | | | | 50,000 | | | | 50,053 | |
Whiting Petroleum Corp.
5.75%, 3/15/2021 | | | | | | | 8,000 | | | | 8,200 | |
6.63%, 1/15/2026 | | | | | | | 6,000 | | | | 6,240 | |
WPX Energy, Inc.
5.75%, 6/1/2026 | | | | | | | 2,000 | | | | 2,018 | |
YPF SA
6.95%, 7/21/2027(b) | | | | | | | 30,000 | | | | 24,000 | |
| | | | | | | | | | | | |
| | | | | | | | | | | 1,211,204 | |
| | | | | | | | | | | | |
Paper & Forest Products - 0.1% | |
Clearwater Paper Corp.
5.38%, 2/1/2025(a) | | | | | | | 7,000 | | | | 6,422 | |
Fibria Overseas Finance Ltd.
5.50%, 1/17/2027 | | | | | | | 25,000 | | | | 24,715 | |
| | | | | | | | | | | | |
| | | | | | | | | | | 31,137 | |
| | | | | | | | | | | | |
Personal Products - 0.1% | |
Prestige Brands, Inc.
6.38%, 3/1/2024(a) | | | | | | | 9,000 | | | | 9,082 | |
Revlon Consumer Products Corp.
6.25%, 8/1/2024 | | | | | | | 8,000 | | | | 4,640 | |
| | | | | | | | | | | | |
| | | | | | | | | | | 13,722 | |
| | | | | | | | | | | | |
Pharmaceuticals - 1.0% | |
Bausch Health Cos., Inc.
6.50%, 3/15/2022(a) | | | | | | | 8,000 | | | | 8,280 | |
5.88%, 5/15/2023(a) | | | | | | | 3,000 | | | | 2,868 | |
7.00%, 3/15/2024(a) | | | | | | | 6,000 | | | | 6,330 | |
5.50%, 11/1/2025(a) | | | | | | | 9,000 | | | | 8,978 | |
9.00%, 12/15/2025(a) | | | | | | | 8,000 | | | | 8,460 | |
8.50%, 1/31/2027(a) | | | | | | | 4,000 | | | | 4,110 | |
Catalent Pharma Solutions, Inc.
4.88%, 1/15/2026(a) | | | | | | | 2,000 | | | | 1,907 | |
Concordia International Corp.
9.00%, 4/1/2022(a) | | | | | | | 2,000 | | | | 1,820 | |
7.00%, 4/15/2023‡(a)(f) | | | | | | | 32,000 | | | | 1,920 | |
Endo Finance LLC
5.75%, 1/15/2022(a) | | | | | | | 20,000 | | | | 18,500 | |
Mylan NV
3.95%, 6/15/2026 | | | | | | | 50,000 | | | | 47,418 | |
| | | | | | | | | | | | |
Investments | | | | | Principal
Amount | | | Value | |
Nidda Healthcare Holding GmbH
3.50%, 9/30/2024(b) | | | EUR | | | | 100,000 | | | | 115,485 | |
Teva Pharmaceutical Finance Netherlands III BV
3.15%, 10/1/2026 | | | | | | | 50,000 | | | | 41,500 | |
| | | | | | | | | | | | |
| | | | | | | | | | | 267,576 | |
| | | | | | | | | | | | |
Professional Services - 0.5% | |
AMN Healthcare, Inc.
5.13%, 10/1/2024(a) | | | | | | | 12,000 | | | | 11,655 | |
IHS Markit Ltd.
4.00%, 3/1/2026(a) | | | | | | | 6,000 | | | | 5,757 | |
La Financiere Atalian SASU
4.00%, 5/15/2024(b) | | | EUR | | | | 100,000 | | | | 112,651 | |
| | | | | | | | | | | | |
| | | | | | | | | | | 130,063 | |
| | | | | | | | | | | | |
Road & Rail - 1.4% | |
Avis Budget Car Rental LLC
5.25%, 3/15/2025(a) | | | | | | | 8,000 | | | | 7,500 | |
Avolon Holdings Funding Ltd.
5.50%, 1/15/2023(a) | | | | | | | 4,000 | | | | 4,110 | |
DAE Funding LLC
4.50%, 8/1/2022(a) | | | | | | | 3,000 | | | | 2,963 | |
5.00%, 8/1/2024(a) | | | | | | | 3,000 | | | | 2,951 | |
EC Finance plc
2.38%, 11/15/2022(b) | | | EUR | | | | 125,000 | | | | 145,986 | |
Great Rolling Stock Co. Ltd. (The)
6.88%, 7/27/2035(b) | | | GBP | | | | 38,880 | | | | 63,642 | |
Hertz Corp. (The)
7.38%, 1/15/2021 | | | | | | | 2,000 | | | | 1,998 | |
Loxam SAS
4.25%, 4/15/2024(b) | | | EUR | | | | 100,000 | | | | 122,437 | |
Park Aerospace Holdings Ltd.
5.25%, 8/15/2022(a) | | | | | | | 12,000 | | | | 12,225 | |
4.50%, 3/15/2023(a) | | | | | | | 8,000 | | | | 7,910 | |
| | | | | | | | | | | | |
| | | | | | | | | | | 371,722 | |
| | | | | | | | | | | | |
Semiconductors & Semiconductor Equipment - 0.1% | |
Entegris, Inc.
4.63%, 2/10/2026(a) | | | | | | | 2,000 | | | | 1,927 | |
MagnaChip Semiconductor SA
5.00%, 3/1/2021 | | | | | | | 10,000 | | | | 14,950 | |
Versum Materials, Inc.
5.50%, 9/30/2024(a) | | | | | | | 4,000 | | | | 4,090 | |
| | | | | | | | | | | | |
| | | | | | | | | | | 20,967 | |
| | | | | | | | | | | | |
Software - 0.5% | |
Camelot Finance SA
7.88%, 10/15/2024(a) | | | | | | | 6,000 | | | | 5,978 | |
CURO Financial Technologies Corp.
12.00%, 3/1/2022(a) | | | | | | | 5,000 | | | | 5,503 | |
Genesys Telecommunications Laboratories, Inc.
10.00%, 11/30/2024(a) | | | | | | | 17,000 | | | | 18,955 | |
Infor Software Parent LLC
7.13% (cash), 5/1/2021(a)(i) | | | | | | | 6,000 | | | | 6,054 | |
Infor US, Inc.
6.50%, 5/15/2022 | | | | | | | 18,000 | | | | 18,233 | |
Informatica LLC
7.13%, 7/15/2023(a) | | | | | | | 6,000 | | | | 6,105 | |
j2 Cloud Services LLC
6.00%, 7/15/2025(a) | | | | | | | 2,000 | | | | 2,058 | |
Oracle Corp.
3.25%, 11/15/2027 | | | | | | | 65,000 | | | | 62,953 | |
| | | | | | | | | | | | |
| | | | | | | | | | | 125,839 | |
| | | | | | | | | | | | |
SEE NOTES TO FINANCIAL STATEMENTS.
16
JPMorgan Flexible Long/Short Fund
SCHEDULE OF PORTFOLIO INVESTMENTS
AS OF AUGUST 31, 2018 (Unaudited) (continued)
(Amounts in U.S. Dollars, unless otherwise noted)
| | | | | | | | | | | | |
Investments | | | | | Principal
Amount | | | Value | |
Specialty Retail - 0.8% | |
EVOCA SpA
7.00%, 10/15/2023(b) | | | EUR | | | | 100,000 | | | | 123,549 | |
L Brands, Inc.
5.25%, 2/1/2028 | | | | | | | 6,000 | | | | 5,160 | |
Party City Holdings, Inc.
6.63%, 8/1/2026(a) | | | | | | | 10,000 | | | | 10,075 | |
PetSmart, Inc.
7.13%, 3/15/2023(a) | | | | | | | 13,000 | | | | 8,742 | |
5.88%, 6/1/2025(a) | | | | | | | 4,000 | | | | 3,245 | |
8.88%, 6/1/2025(a) | | | | | | | 5,000 | | | | 3,375 | |
Sonic Automotive, Inc.
5.00%, 5/15/2023 | | | | | | | 27,000 | | | | 25,448 | |
6.13%, 3/15/2027 | | | | | | | 2,000 | | | | 1,875 | |
Staples, Inc.
8.50%, 9/15/2025(a) | | | | | | | 20,000 | | | | 18,898 | |
| | | | | | | | | | | | |
| | | | | | | | | | | 200,367 | |
| | | | | | | | | | | | |
Technology Hardware, Storage & Peripherals - 0.3% | |
Dell International LLC
5.88%, 6/15/2021(a) | | | | | | | 3,000 | | | | 3,086 | |
7.13%, 6/15/2024(a) | | | | | | | 3,000 | | | | 3,207 | |
Diebold Nixdorf, Inc.
8.50%, 4/15/2024 | | | | | | | 23,000 | | | | 16,244 | |
EMC Corp.
3.38%, 6/1/2023 | | | | | | | 25,000 | | | | 23,587 | |
Western Digital Corp.
4.75%, 2/15/2026 | | | | | | | 32,000 | | | | 31,374 | |
| | | | | | | | | | | | |
| | | | | | | | | | | 77,498 | |
| | | | | | | | | | | | |
Textiles, Apparel & Luxury Goods - 0.1% | |
Hanesbrands, Inc.
4.63%, 5/15/2024(a) | | | | | | | 15,000 | | | | 14,625 | |
| | | | | | | | | | | | |
Thrifts & Mortgage Finance - 0.2% | |
Ladder Capital Finance Holdings LLLP
5.25%, 3/15/2022(a) | | | | | | | 7,000 | | | | 7,026 | |
5.25%, 10/1/2025(a) | | | | | | | 3,000 | | | | 2,816 | |
Nationstar Mortgage Holdings, Inc.
8.13%, 7/15/2023(a) | | | | | | | 3,000 | | | | 3,113 | |
9.13%, 7/15/2026(a) | | | | | | | 4,000 | | | | 4,165 | |
Quicken Loans, Inc.
5.75%, 5/1/2025(a) | | | | | | | 21,000 | | | | 20,790 | |
Radian Group, Inc.
4.50%, 10/1/2024 | | | | | | | 14,000 | | | | 13,790 | |
| | | | | | | | | | | | |
| | | | | | | | | | | 51,700 | |
| | | | | | | | | | | | |
Tobacco - 0.5% | | | | | | | | | | | | |
Altria Group, Inc.
4.25%, 8/9/2042 | | | | | | | 50,000 | | | | 46,592 | |
BAT Capital Corp.
4.39%, 8/15/2037(a) | | | | | | | 30,000 | | | | 27,915 | |
Philip Morris International, Inc.
2.00%, 2/21/2020 | | | | | | | 70,000 | | | | 69,080 | |
| | | | | | | | | | | | |
| | | | | | | | | | | 143,587 | |
| | | | | | | | | | | | |
Trading Companies & Distributors - 0.8% | |
H&E Equipment Services, Inc.
5.63%, 9/1/2025 | | | | | | | 5,000 | | | | 4,964 | |
United Rentals North America, Inc.
4.63%, 10/15/2025 | | | | | | | 3,000 | | | | 2,933 | |
5.50%, 5/15/2027 | | | | | | | 49,000 | | | | 48,877 | |
4.88%, 1/15/2028 | | | | | | | 5,000 | | | | 4,766 | |
| | | | | | | | | | | | |
Investments | | | | | Principal
Amount | | | Value | |
WESCO Distribution, Inc. | | | | | | | | |
5.38%, 12/15/2021 | | | | | | | 140,000 | | | | 141,750 | |
5.38%, 6/15/2024 | | | | | | | 9,000 | | | | 8,932 | |
| | | | | | | | | | | | |
| | | | | | | | | | | 212,222 | |
| | | | | | | | | | | | |
Water Utilities - 0.0%(h) | | | | | | | | | | | | |
Northumbrian Water Finance plc
6.88%, 2/6/2023(b) | | | GBP | | | | 10,000 | | | | 15,664 | |
| | | | | | | | | | | | |
Wireless Telecommunication Services - 2.2% | |
America Movil SAB de CV
Series B, (EUR Swap Annual 5 Year + 4.55%), 6.37%, 9/6/2073(b)(c) | | | EUR | | | | 100,000 | | | | 136,243 | |
Comunicaciones Celulares SA
6.88%, 2/6/2024(b) | | | | | | | 200,000 | | | | 206,250 | |
Hughes Satellite Systems Corp.
5.25%, 8/1/2026 | | | | | | | 25,000 | | | | 23,906 | |
Intelsat Connect Finance SA
9.50%, 2/15/2023(a) | | | | | | | 4,000 | | | | 3,987 | |
Matterhorn Telecom SA
3.88%, 5/1/2022(b) | | | EUR | | | | 100,000 | | | | 118,231 | |
Sprint Communications, Inc.
9.00%, 11/15/2018(a) | | | | | | | 18,000 | | | | 18,202 | |
9.25%, 4/15/2022 | | | | | | | 21,000 | | | | 23,835 | |
Sprint Corp.
7.88%, 9/15/2023 | | | | | | | 9,000 | | | | 9,686 | |
7.13%, 6/15/2024 | | | | | | | 25,000 | | | | 25,937 | |
7.63%, 2/15/2025 | | | | | | | 20,000 | | | | 21,225 | |
7.63%, 3/1/2026 | | | | | | | 4,000 | | | | 4,201 | |
T-Mobile US, Inc.
4.50%, 2/1/2026‡ | | | | | | | 3,000 | | | | — | |
T-Mobile USA, Inc.
4.50%, 2/1/2026 | | | | | | | 3,000 | | | | 2,861 | |
4.75%, 2/1/2028 | | | | | | | 3,000 | | | | 2,826 | |
4.75%, 2/1/2028‡ | | | | | | | 3,000 | | | | — | |
| | | | | | | | | | | | |
| | | | | | | | | | | 597,390 | |
| | | | | | | | | | | | |
TOTAL CORPORATE BONDS (Cost $17,913,346) | | | | | | | | 17,746,533 | |
| | | | | | | | | | | | |
Investments | | | | | Principal
Amount | | | Value | |
| |
LOAN ASSIGNMENTS - 24.5%(j) | | | | | |
| | |
Aerospace & Defense - 0.2% | | | | | | | | |
Bombardier Recreational Products, Inc., 1st Lien Term Loan B
(ICE LIBOR USD 1 Month + 2.00%), 4.08%, 5/23/2025(c) | | | | | | | 43,500 | | | | 43,365 | |
| | | | | | | | | | | | |
Airlines - 0.4% | | | | | | | | |
American Airlines, Inc., 1st Lien Term Loan B
(ICE LIBOR USD 1 Month + 1.75%), 3.81%, 6/27/2025(c) | | | | | | | 100,000 | | | | 97,859 | |
| | | | | | | | | | | | |
Chemicals - 1.0% | | | | | | | | |
Axalta Coating Systems US Holdings, Inc., Term Loan B
(ICE LIBOR USD 3 Month + 1.75%), 4.08%, 6/1/2024(c) | | | | | | | 97,506 | | | | 97,530 | |
SEE NOTES TO FINANCIAL STATEMENTS.
17
JPMorgan Flexible Long/Short Fund
SCHEDULE OF PORTFOLIO INVESTMENTS
AS OF AUGUST 31, 2018 (Unaudited) (continued)
(Amounts in U.S. Dollars, unless otherwise noted)
| | | | | | | | | | | | |
Investments | | | | | Principal
Amount | | | Value | |
Pelican Products, Inc., 1st Lien Term Loan B | | | | | | | | | | | | |
(ICE LIBOR USD 1 Month + 3.50%), 5.58%, 5/1/2025(c) | | | | | | | 35,000 | | | | 34,847 | |
Trinseo Materials Operating SCA, 1st Lien Term Loan B
(ICE LIBOR USD 1 Month + 2.00%), 4.08%, 9/6/2024(c) | | | | | | | 99,749 | | | | 99,699 | |
Tronox Finance LLC, 1st Lien Term Loan B
(ICE LIBOR USD 1 Month + 3.00%), 5.08%, 9/23/2024(c) | | | | | | | 38,528 | | | | 38,644 | |
(ICE LIBOR USD 1 Month + 3.00%), 5.08%, 9/23/2024(c) | | | | | | | 16,695 | | | | 16,746 | |
| | | | | | | | | | | | |
| | | | | | | | | | | 287,466 | |
| | | | | | | | | | | | |
Commercial Services & Supplies - 1.1% | | | | | | | | | | | | |
Camelot Finance LP, 1st Lien Term Loan
(ICE LIBOR USD 1 Month + 3.25%), 5.33%, 10/3/2023(c) | | | | | | | 75,585 | | | | 75,474 | |
Garda World Security, 1st Lien Term Loan B
(ICE LIBOR USD 3 Month + 2.50%, ICE LIBOR USD 3 Month + 3.50%), 5.80%, 5/24/2024(c) | | | | | | | 84,576 | | | | 84,893 | |
Prime Security Services Borrower LLC, Term B-1 Loan
(ICE LIBOR USD 1 Month + 2.75%), 4.83%, 5/2/2022(c) | | | | | | | 147,882 | | | | 148,185 | |
| | | | | | | | | | | | |
| | | | | | | | | | | 308,552 | |
| | | | | | | | | | | | |
Communications Equipment - 0.3% | | | | | | | | | | | | |
Avaya, Inc., 1st Lien Term Loan B
(ICE LIBOR USD 1 Month + 4.25%), 6.31%, 12/15/2024(c) | | | | | | | 100,000 | | | | 100,613 | |
| | | | | | | | | | | | |
Containers & Packaging - 0.8% | | | | | | | | | | | | |
Berry Global, Inc., 1st Lien Term Loan
(ICE LIBOR USD 2 Month + 1.75%), 4.19%, 1/6/2021(c) | | | | | | | 100,000 | | | | 99,925 | |
Bway Holding Co., 1st Lien Term Loan
(ICE LIBOR USD 3 Month + 3.25%), 5.58%, 4/3/2024(c) | | | | | | | 42,570 | | | | 42,388 | |
Consolidated Container, 1st Lien Term Loan B
(ICE LIBOR USD 1 Month + 2.75%), 4.83%, 5/22/2024(c) | | | | | | | 29,775 | | | | 29,798 | |
Flex Acquisition Co., Inc., Term Loan
(ICE LIBOR USD 3 Month + 3.00%), 5.34%, 12/29/2023(c) | | | | | | | 37,581 | | | | 37,428 | |
| | | | | | | | | | | | |
| | | | | | | | | | | 209,539 | |
| | | | | | | | | | | | |
Diversified Consumer Services - 0.6% | | | | | | | | | | | | |
Altran Technologies SA, 1st Lien Term Loan B
(ICE LIBOR USD 3 Month + 2.25%), 4.57%, 3/20/2025(c) | | | | | | | 12,070 | | | | 12,028 | |
Spin Holdco, Inc., Term Loan B
(ICE LIBOR USD 1 Month + 3.25%), 5.59%, 11/14/2022(c) | | | | | | | 147,369 | | | | 147,696 | |
| | | | | | | | | | | | |
| | | | | | | | | | | 159,724 | |
| | | | | | | | | | | | |
| | | | | | | | | | | | |
Investments | | | | | Principal
Amount | | | Value | |
Diversified Financial Services - 0.2% | |
Telenet Financing LLC, 1st Lien Term Loan
(ICE LIBOR USD 1 Month + 2.25%), 4.31%, 8/15/2026(c)(k) | | | | | | | 60,000 | | | | 59,233 | |
| | | | | | | | | | | | |
Diversified Telecommunication Services - 1.8% | |
Centurylink, Inc., 1st Lien Term Loan B
(ICE LIBOR USD 1 Month + 2.75%), 4.83%, 1/31/2025(c) | | | | | | | 99,500 | | | | 98,306 | |
Hargray Communications Group, Inc., Senior Secured Term Loan B
(ICE LIBOR USD 1 Month + 3.00%), 5.08%, 5/16/2024(c) | | | | | | | 96,525 | | | | 96,766 | |
Intelsat Jackson Holdings, 1st Lien Term Loan
(ICE LIBOR USD 1 Month + 3.75%), 5.81%, 11/27/2023(c) | | | | | | | 150,000 | | | | 150,647 | |
TDC A/S, 1st Lien Term Loan B
(ICE LIBOR USD 3 Month + 3.50%), 5.84%, 6/4/2025(c)(k) | | | | | | | 100,000 | | | | 100,750 | |
Zayo Group LLC, Term B-2 Loan
(ICE LIBOR USD 1 Month + 2.25%), 4.33%, 1/19/2024(c) | | | | | | | 53,622 | | | | 53,799 | |
| | | | | | | | | | | | |
| | | | | | | | | | | 500,268 | |
| | | | | | | | | | | | |
Electric Utilities - 0.9% | | | | | | | | | | | | |
Lightstone Holdco LLC, 1st Lien Term Loan B
(ICE LIBOR USD 1 Month + 3.75%), 5.83%, 1/30/2024(c) | | | | | | | 71,465 | | | | 71,063 | |
Lightstone Holdco LLC, 1st Lien Term Loan C
(ICE LIBOR USD 1 Month + 3.75%), 5.83%, 1/30/2024(c) | | | | | | | 4,305 | | | | 4,281 | |
Vistra Operations Co. LLC, Term Loan
(ICE LIBOR USD 1 Month + 2.00%), 4.08%, 8/4/2023(c) | | | | | | | 160,414 | | | | 160,097 | |
| | | | | | | | | | | | |
| | | | | | | | | | | 235,441 | |
| | | | | | | | | | | | |
Electrical Equipment - 0.5% | | | | | | | | | | | | |
Brookfield WEC Holdings, Inc., 1st Lien Term Loan
(ICE LIBOR USD 1 Month + 3.75%), 5.83%, 8/1/2025(c) | | | | | | | 49,300 | | | | 49,559 | |
Brookfield WEC Holdings, Inc., 2nd Lien Term Loan
(ICE LIBOR USD 3 Month + 6.75%), 8.83%, 8/3/2026(c)(k) | | | | | | | 30,000 | | | | 30,412 | |
Cortes NP Acquisition Corp., Term Loan B
(ICE LIBOR USD 1 Month + 4.00%), 6.31%, 11/30/2023(c) | | | | | | | 50,000 | | | | 49,938 | |
| | | | | | | | | | | | |
| | | | | | | | | | | 129,909 | |
| | | | | | | | | | | | |
Food & Staples Retailing - 1.3% | | | | | | | | | | | | |
Albertson’s LLC, 1st Lien Term Loan
(ICE LIBOR USD 3 Month + 3.00%), 5.34%, 12/21/2022(c) | | | | | | | 98,753 | | | | 98,454 | |
(ICE LIBOR USD 3 Month + 3.00%), 5.31%, 6/22/2023(c) | | | | | | | 29,924 | | | | 29,792 | |
SEE NOTES TO FINANCIAL STATEMENTS.
18
JPMorgan Flexible Long/Short Fund
SCHEDULE OF PORTFOLIO INVESTMENTS
AS OF AUGUST 31, 2018 (Unaudited) (continued)
(Amounts in U.S. Dollars, unless otherwise noted)
| | | | | | | | | | | | |
Investments | | | | | Principal
Amount | | | Value | |
Moran Foods LLC, Term Loan B
(ICE LIBOR USD 1 Month + 6.00%), 8.08%, 12/5/2023(c) | | | | | | | 98,500 | | | | 70,346 | |
SUPERVALU, Inc., Delayed Draw Term Loan
(ICE LIBOR USD 1 Month + 3.50%), 5.58%, 6/8/2024(c) | | | | | | | 54,531 | | | | 54,588 | |
SUPERVALU, Inc., Term Loan B
(ICE LIBOR USD 1 Month + 3.50%), 5.58%, 6/8/2024(c) | | | | | | | 90,885 | | | | 90,980 | |
| | | | | | | | | | | | |
| | | | | | | | | | | 344,160 | |
| | | | | | | | | | | | |
Food Products - 1.2% | | | | | | | | | | | | |
Dole Food Co., 1st Lien Term Loan B (ICE LIBOR USD 1 Month + 2.75%; ICE LIBOR USD 3 Month + 2.75%; US Prime Rate + 5.00%), 4.83%, 4/6/2024(c) | | | | | | | 56,550 | | | | 56,425 | |
Hearthside Group Holdings LLC, 1st Lien Term Loan
(ICE LIBOR USD 1 Month + 3.00%), 5.06%, 5/23/2025(c) | | | | | | | 139,130 | | | | 137,924 | |
JBS USA LLC, Term Loan B
(ICE LIBOR USD 1 Month + 2.50%; ICE LIBOR USD 3 Month + 2.50%), 4.83%, 10/30/2022(c) | | | | | | | 78,952 | | | | 78,876 | |
Pinnacle Foods Finance LLC, 1st Lien Term Loan B
(ICE LIBOR USD 1 Month + 1.75%), 3.84%, 2/2/2024(c) | | | | | | | 43,285 | | | | 43,285 | |
| | | | | | | | | | | | |
| | | | | | | | | | | 316,510 | |
| | | | | | | | | | | | |
Health Care Equipment & Supplies - 0.5% | |
Mallinckrodt International Finance, Term Loan B
(ICE LIBOR USD 3 Month + 2.75%), 5.20%, 9/24/2024(c) | | | | | | | 129,458 | | | | 128,325 | |
| | | | | | | | | | | | |
Health Care Providers & Services - 2.1% | |
CHG Healthcare Services, 1st Lien Term Loan B
(ICE LIBOR USD 1 Month + 3.00%; ICE LIBOR USD 3 Month + 3.00%), 5.34%, 6/7/2023(c) | | | | | | | 65,000 | | | | 65,122 | |
Community Health Systems, Inc., Incremental 2021 Term H Loan (ICE LIBOR USD 3 Month + 3.25%), 5.54%, 1/27/2021(c) | | | | | | | 46,360 | | | | 45,660 | |
Jaguar Holding Co. II, Ist Lien Term Loan
(ICE LIBOR USD 1 Month + 2.50%), 4.58%, 8/18/2022(c) | | | | | | | 98,219 | | | | 98,119 | |
MultiPlan, Inc., 1st Lien Term Loan B
(ICE LIBOR USD 3 Month + 2.75%), 5.08%, 6/7/2023(c) | | | | | | | 168,300 | | | | 168,137 | |
National Mentor Holdings, Inc., Tranche B Term Loan
(ICE LIBOR USD 3 Month + 3.00%), 5.33%, 1/31/2021(c) | | | | | | | 97,954 | | | | 98,223 | |
| | | | | | | | | | | | |
Investments | | | | | Principal
Amount | | | Value | |
Tennessee Merger Sub, Inc., 1st Lien Term Loan B
(ICE LIBOR USD 1 Month + 2.75%), 4.83%, 2/6/2024(c)(k) | | | | | | | 100,000 | | | | 95,417 | |
| | | | | | | | | | | | |
| | | | | | | | | | | 570,678 | |
| | | | | | | | | | | | |
Hotels, Restaurants & Leisure - 1.5% | |
1011778 BC ULC, 1st Lien Term Loan B
(ICE LIBOR USD 1 Month + 2.25%), 4.33%, 2/16/2024(c) | | | | | | | 80,973 | | | | 80,923 | |
Gateway Casinos & Entertainment Ltd., 1st Lien Term Loan
(ICE LIBOR USD 3 Month + 3.00%), 5.47%, 12/1/2023(c)(k) | | | | | | | 35,000 | | | | 35,142 | |
Las Vegas Sands Corp., 1st Lien Senior Secured Term Loan
(ICE LIBOR USD 1 Month + 1.75%), 3.83%, 3/27/2025(c) | | | | | | | 99,750 | | | | 99,539 | |
Penn National Gaming, Inc., 1st Lien Term Loan B
(ICE LIBOR USD 3 Month + 2.50%), 2.50%, 8/14/2025(c)(k) | | | | | | | 85,000 | | | | 85,106 | |
Seminole Hard Rock Entertainment, Inc., Term Loan B
(ICE LIBOR USD 3 Month + 2.75%), 5.09%, 5/14/2020(c) | | | | | | | 73,454 | | | | 73,606 | |
Wyndham Hotels & Resorts, Inc., 1st Lien Senior Secured Term Loan
(ICE LIBOR USD 1 Month + 1.75%), 3.83%, 5/30/2025(c) | | | | | | | 35,168 | | | | 35,203 | |
| | | | | | | | | | | | |
| | | | | | | | | | | 409,519 | |
| | | | | | | | | | | | |
Independent Power and Renewable Electricity Producers - 1.6% | |
Calpine Corp., Term Loan
(ICE LIBOR USD 3 Month + 2.50%), 4.84%, 1/15/2024(c) | | | | | | | 146,970 | | | | 147,098 | |
ExGen Renewables I LLC, 1st Lien Term Loan
(ICE LIBOR USD 3 Month + 3.00%), 5.32%, 11/28/2024(c) | | | | | | | 36,776 | | | | 36,868 | |
NRG Energy, Inc., Term Loan
(ICE LIBOR USD 3 Month + 1.75%), 4.08%, 6/30/2023(c) | | | | | | | 147,000 | | | | 146,834 | |
Talen Energy Supply, Term Loan B-2
(ICE LIBOR USD 1 Month + 4.00%), 6.08%, 4/15/2024(c) | | | | | | | 92,297 | | | | 92,512 | |
| | | | | | | | | | | | |
| | | | | | | | | | | 423,312 | |
| | | | | | | | | | | | |
Insurance - 0.2% | | | | | | | | | | | | |
Asurion LLC, 2nd Lien Term Loan
(ICE LIBOR USD 1 Month + 6.50%), 8.58%, 8/4/2025(c) | | | | | | | 9,100 | | | | 9,358 | |
Asurion LLC, Term Loan B-7
(ICE LIBOR USD 3 Month + 3.00%), 5.08%, 11/3/2024(c) | | | | | | | 45,300 | | | | 45,413 | |
| | | | | | | | | | | | |
| | | | | | | | | | | 54,771 | |
| | | | | | | | | | | | |
Internet Software & Services - 0.5% | |
BMC Software Finance, Inc., 1st Lien Term Loan B
(ICE LIBOR USD 3 Month + 3.50%), 3.50%, 9/1/2025(c)(k) | | | | | | | 50,000 | | | | 50,015 | |
SEE NOTES TO FINANCIAL STATEMENTS.
19
JPMorgan Flexible Long/Short Fund
SCHEDULE OF PORTFOLIO INVESTMENTS
AS OF AUGUST 31, 2018 (Unaudited) (continued)
(Amounts in U.S. Dollars, unless otherwise noted)
| | | | | | | | | | | | |
Investments | | | | | Principal
Amount | | | Value | |
Rackspace Hosting, Inc., 1st Lien Term Loan B
(ICE LIBOR USD 2 Month + 3.00%; ICE LIBOR USD 3 Month + 3.00%), 5.35%, 11/3/2023(c) | | | | | | | 79,002 | | | | 78,459 | |
| | | | | | | | | | | | |
| | | | | | | | | | | 128,474 | |
| | | | | | | | | | | | |
IT Services - 0.3% | | | | | | | | | | | | |
First Data Corp., 1st Lien Term Loan
(ICE LIBOR USD 1 Month + 2.00%), 4.07%, 7/8/2022(c)(k) | | | | | | | 74,185 | | | | 74,134 | |
| | | | | | | | | | | | |
Leisure Products - 0.5% | | | | | | | | | | | | |
Delta 2 SARL, 1st Lien Term loan B
(ICE LIBOR USD 1 Month + 2.50%), 4.58%, 2/1/2024(c) | | | | | | | 131,829 | | | | 130,774 | |
| | | | | | | | | | | | |
Media - 2.9% | | | | | | | | | | | | |
Altice US Finance I Corp., Term Loan (
ICE LIBOR USD 1 Month + 2.25%), 4.33%, 7/28/2025(c) | | | | | | | 89,100 | | | | 88,915 | |
AMC Entertainment, Inc., Term Loan B
(ICE LIBOR USD 1 Month + 2.25%), 4.31%, 12/15/2023(c) | | | | | | | 98,500 | | | | 98,521 | |
CSC Holdings LLC, 1st Lien Term Loan
(ICE LIBOR USD 1 Month + 2.25%), 4.31%, 7/17/2025(c) | | | | | | | 138,250 | | | | 137,633 | |
Gray Television, Inc., 1st Lien Term Loan B
(ICE LIBOR USD 1 Month + 2.25%), 4.33%, 2/7/2024(c) | | | | | | | 47,999 | | | | 48,029 | |
Red Ventures LLC, 1st Lien Term Loan
(ICE LIBOR USD 1 Month + 4.00%), 6.08%, 11/8/2024(c) | | | | | | | 28,613 | | | | 28,899 | |
Sinclair Broadcast Group, Inc., 1st Lien Term Loan B
(ICE LIBOR USD 1 Month + 2.25%), 4.33%, 1/3/2024(c) | | | | | | | 69,727 | | | | 69,692 | |
Tribune Media Co., 1st Lien Term Loan B
(ICE LIBOR USD 1 Month + 3.00%), 5.08%, 1/26/2024(c) | | | | | | | 74,724 | | | | 74,865 | |
Univision Communications, Inc., 1st Lien Term Loan C-5
(ICE LIBOR USD 1 Month + 2.75%), 4.83%, 3/15/2024(c) | | | | | | | 56,486 | | | | 54,170 | |
WMG Acquisition Corp., 1st Lien Term Loan F
(ICE LIBOR USD 1 Month + 2.13%), 4.20%, 11/1/2023(c) | | | | | | | 76,805 | | | | 76,468 | |
Zuffa LLC, 1st Lien Guaranteed Senior Secured Term Loan
(ICE LIBOR USD 1 Month + 3.25%), 5.33%, 8/18/2023(c) | | | | | | | 115,530 | | | | 115,942 | |
| | | | | | | | | | | | |
| | | | | | | | | | | 793,134 | |
| | | | | | | | | | | | |
Oil, Gas & Consumable Fuels - 1.5% | | | | | | | | | | | | |
California Resources Corp., Senior Secured First Out Term Loan
(ICE LIBOR USD 1 Month + 4.75%), 6.82%, 12/31/2022(c) | | | | | | | 100,000 | | | | 101,375 | |
| | | | | | | | | | | | |
Investments | | | | | Principal
Amount | | | Value | |
Chesapeake Energy Corp., 1st Lien Last Out Term Loan
(ICE LIBOR USD 1 Month + 7.50%), 9.58%, 8/23/2021(c) | | | | | | | 10,000 | | | | 10,427 | |
Gulf Finance LLC, 1st Lien Term Loan B
(ICE LIBOR USD 3 Month + 5.25%), 7.59%, 8/25/2023(c) | | | | | | | 188,418 | | | | 156,270 | |
MEG Energy Corp., 1st Lien Term B Loan
(ICE LIBOR USD 1 Month + 3.50%), 5.58%, 12/31/2023(c) | | | | | | | 9,375 | | | | 9,382 | |
Summit Midstream Partners Holdings LLC, Senior Secured Term Loan
(ICE LIBOR USD 1 Month + 6.00%), 8.08%, 5/13/2022(c) | | | | | | | 19,896 | | | | 20,144 | |
Terraform Power Operating LLC, 1st Lien Term Loan B
(ICE LIBOR USD 1 Month + 2.00%), 4.08%, 11/8/2022(c) | | | | | | | 16,915 | | | | 16,915 | |
Ultra Resources, Inc., Term Loan
(ICE LIBOR USD 1 Month + 3.00%), 5.08%, 4/12/2024(c) | | | | | | | 81,400 | | | | 72,836 | |
| | | | | | | | | | | | |
| | | | | | | | | | | 387,349 | |
| | | | | | | | | | | | |
Personal Products - 0.2% | | | | | | | | | | | | |
Prestige Brands, Inc., 1st Lien Term Loan B-4
(ICE LIBOR USD 1 Month + 2.00%), 4.08%, 1/26/2024(c) | | | | | | | 62,747 | | | | 62,639 | |
| | | | | | | | | | | | |
Pharmaceuticals - 1.0% | | | | | | | | | | | | |
Concordia Healthcare Corp., Initial Dollar Term Loan
(ICE LIBOR USD 1 Month + 4.25%), 6.33%, 10/21/2021(c) | | | | | | | 81,369 | | | | 73,345 | |
Grifols Worldwide Operations Ltd., Term Loan B
(1 Week LIBOR + 2.25%), 4.21%, 1/31/2025(c) | | | | | | | 88,875 | | | | 89,219 | |
Valeant Pharmaceuticals International, Inc., 1st Lien Term Loan B
(ICE LIBOR USD 1 Month + 3.00%), 5.08%, 6/2/2025(c) | | | | | | | 98,750 | | | | 99,062 | |
| | | | | | | | | | | | |
| | | | | | | | | | | 261,626 | |
| | | | | | | | | | | | |
Semiconductors & Semiconductor Equipment - 0.2% | |
ON Semiconductor Corp., 1st Lien Term Loan B
(ICE LIBOR USD 1 Month + 1.75%), 3.83%, 3/31/2023(c) | | | | | | | 48,398 | | | | 48,445 | |
| | | | | | | | | | | | |
Software - 0.4% | | | | | | | | | | | | |
Infor US, Inc., Tranche B-6 Term Loan
(ICE LIBOR USD 1 Month + 2.75%), 4.83%, 2/1/2022(c) | | | | | | | 107,765 | | | | 107,823 | |
| | | | | | | | | | | | |
Technology Hardware, Storage & Peripherals - 0.2% | | | | | |
Quest Software US Holdings, Inc., 1st Lien Term Loan | | | | | | | | | | | | |
SEE NOTES TO FINANCIAL STATEMENTS.
20
JPMorgan Flexible Long/Short Fund
SCHEDULE OF PORTFOLIO INVESTMENTS
AS OF AUGUST 31, 2018 (Unaudited) (continued)
(Amounts in U.S. Dollars, unless otherwise noted)
| | | | | | | | | | | | |
Investments | | | | | Principal
Amount | | | Value | |
(ICE LIBOR USD 2 Month + 4.25%), 6.57%, 5/16/2025(c) | | | | | | | 50,000 | | | | 49,766 | |
| | | | | | | | | | | | |
Textiles, Apparel & Luxury Goods - 0.2% | | | | | | | | | | | | |
Samsonite IP Holdings SARL, 1st Lien Term Loan B
(ICE LIBOR USD 1 Month + 1.75%), 3.83%, 4/25/2025(c) | | | | | | | 59,000 | | | | 58,652 | |
| | | | | | | | | | | | |
Wireless Telecommunication Services - 0.4% | | | | | | | | | | | | |
Syniverse Holdings, Inc., 1st Lien Term Loan | | | | | | | | | | | | |
(ICE LIBOR USD 1 Month + 5.00%), 7.07%, 3/9/2023(c) | | | | | | | 99,750 | | | | 98,878 | |
| | | | | | | | | | | | |
TOTAL LOAN ASSIGNMENTS (Cost $6,627,841) | | | | | | | | | | | 6,580,938 | |
| | | | | | | | | | | | |
Investments | | | | | Principal
Amount | | | Value | |
| | | |
CONVERTIBLE BONDS - 2.2% | | | | | | | | | | | | |
| | | |
Auto Components - 0.0%(h) | | | | | | | | | | | | |
Horizon Global Corp.
2.75%, 7/1/2022 | | | | | | | 10,000 | | | | 7,242 | |
| | | | | | | | | | | | |
Communications Equipment - 0.1% | | | | | | | | | | | | |
Finisar Corp.
0.50%, 12/15/2036 | | | | | | | 25,000 | | | | 23,037 | |
| | | | | | | | | | | | |
Electronic Equipment, Instruments & Components - 0.2% | |
II-VI, Inc.
0.25%, 9/1/2022(a) | | | | | | | 20,000 | | | | 24,200 | |
Knowles Corp.
3.25%, 11/1/2021 | | | | | | | 30,000 | | | | 35,744 | |
| | | | | | | | | | | | |
| | | | | | | | | | | 59,944 | |
| | | | | | | | | | | | |
Energy Equipment & Services - 0.1% | | | | | | | | | | | | |
Nabors Industries, Inc.
0.75%, 1/15/2024 | | | | | | | 20,000 | | | | 15,745 | |
| | | | | | | | | | | | |
Health Care Technology - 0.1% | | | | | | | | | | | | |
Vocera Communications, Inc.
1.50%, 5/15/2023(a) | | | | | | | 15,000 | | | | 17,595 | |
| | | | | | | | | | | | |
Hotels, Restaurants & Leisure - 0.1% | | | | | | | | | | | | |
Huazhu Group Ltd.
0.38%, 11/1/2022(a) | | | | | | | 25,000 | | | | 25,500 | |
| | | | | | | | | | | | |
Internet & Direct Marketing Retail - 0.2% | |
Ctrip.com International Ltd.
1.00%, 7/1/2020 | | | | | | | 20,000 | | | | 19,568 | |
Liberty Expedia Holdings, Inc.
1.00%, 6/30/2047(a) | | | | | | | 20,000 | | | | 20,059 | |
| | | | | | | | | | | | |
| | | | | | | | | | | 39,627 | |
| | | | | | | | | | | | |
Internet Software & Services - 0.3% | | | | | | | | | | | | |
Envestnet, Inc.
1.75%, 12/15/2019 | | | | | | | 10,000 | | | | 11,276 | |
Etsy, Inc.
Zero Coupon, 3/1/2023(a) | | | | | | | 20,000 | | | | 29,175 | |
Nutanix, Inc.
Zero Coupon, 1/15/2023(a) | | | | | | | 20,000 | | | | 26,243 | |
| | | | | | | | | | | | |
Investments | | | | | Principal
Amount | | | Value | |
Zillow Group, Inc.
2.00%, 12/1/2021 | | | | | | | 20,000 | | | | 22,525 | |
| | | | | | | | | | | | |
| | | | | | | | | | | 89,219 | |
| | | | | | | | | | | | |
Media - 0.5% | | | | | | | | | | | | |
DISH Network Corp.
3.38%, 8/15/2026 | | | | | | | 10,000 | | | | 9,406 | |
Liberty Interactive LLC
4.00%, 11/15/2029 | | | | | | | 52,000 | | | | 35,880 | |
3.75%, 2/15/2030 | | | | | | | 89,000 | | | | 60,742 | |
Live Nation Entertainment, Inc.
2.50%, 3/15/2023(a) | | | | | | | 30,000 | | | | 31,069 | |
| | | | | | | | | | | | |
| | | | | | | | | | | 137,097 | |
| | | | | | | | | | | | |
Oil, Gas & Consumable Fuels - 0.1% | |
Oasis Petroleum, Inc.
2.63%, 9/15/2023 | | | | | | | 15,000 | | | | 19,719 | |
SM Energy Co.
1.50%, 7/1/2021 | | | | | | | 20,000 | | | | 21,268 | |
| | | | | | | | | | | | |
| | | | | | | | | | | 40,987 | |
| | | | | | | | | | | | |
Real Estate Management & Development - 0.0%(h) | |
Redfin Corp.
1.75%, 7/15/2023 | | | | | | | 15,000 | | | | 13,894 | |
| | | | | | | | | | | | |
Semiconductors & Semiconductor Equipment - 0.3% | |
Cree, Inc.
0.88%, 9/1/2023(a) | | | | | | | 5,000 | | | | 5,133 | |
Cypress Semiconductor Corp.
4.50%, 1/15/2022 | | | | | | | 20,000 | | | | 28,025 | |
ON Semiconductor Corp.
1.00%, 12/1/2020 | | | | | | | 25,000 | | | | 31,753 | |
Teradyne, Inc.
1.25%, 12/15/2023 | | | | | | | 20,000 | | | | 28,016 | |
| | | | | | | | | | | | |
| | | | | | | | | | | 92,927 | |
| | | | | | | | | | | | |
Software - 0.2% | | | | | | | | | | | | |
FireEye, Inc.
0.88%, 6/1/2024(a) | | | | | | | 20,000 | | | | 19,547 | |
Nuance Communications, Inc.
1.50%, 11/1/2035 | | | | | | | 20,000 | | | | 19,822 | |
| | | | | | | | | | | | |
| | | | | | | | | | | 39,369 | |
| | | | | | | | | | | | |
TOTAL CONVERTIBLE BONDS (Cost $568,199) | | | | | | | | | | | 602,183 | |
| | | | | | | | | | | | |
Investments | | | | | Principal
Amount | | | Value | |
|
U.S. TREASURY OBLIGATIONS - 0.6% | |
| | | |
U.S. Treasury Bonds
2.75%, 11/15/2047 | | | | | | | 130,500 | | | | 123,506 | |
3.00%, 2/15/2048 | | | | | | | 15,000 | | | | 14,924 | |
U.S. Treasury Notes
2.75%, 5/31/2023 | | | | | | | 18,000 | | | | 18,004 | |
| | | | | | | | | | | | |
TOTAL U.S. TREASURY OBLIGATIONS (Cost $156,290) | | | | | | | | | | | 156,434 | |
| | | | | | | | | | | | |
Investments | | | | | Principal
Amount | | | Value | |
| | | |
ASSET-BACKED SECURITIES - 0.3% | | | | | | | | | | | | |
| | | |
American Airlines Pass-Through Trust
Series 2017-2, Class AA, | | | | | | | | | | | | |
3.35%, 10/15/2029 | | | | | | | 20,000 | | | | 19,257 | |
SEE NOTES TO FINANCIAL STATEMENTS.
21
JPMorgan Flexible Long/Short Fund
SCHEDULE OF PORTFOLIO INVESTMENTS
AS OF AUGUST 31, 2018 (Unaudited) (continued)
(Amounts in U.S. Dollars, unless otherwise noted)
| | | | | | | | | | | | |
Investments | | | | | Principal
Amount | | | Value | |
United Airlines Pass-Through Trust
Series 2016-2, Class B, | | | | | | | | | | | | |
3.65%, 10/7/2025 | | | | | | | 14,358 | | | | 13,872 | |
Series 2016-1, Class B,
3.65%, 1/7/2026 | | | | | | | 14,358 | | | | 13,893 | |
Series 2018-1, Class B,
4.60%, 3/1/2026 | | | | | | | 35,000 | | | | 35,208 | |
| | | | | | | | | | | | |
TOTAL ASSET-BACKED SECURITIES
(Cost $83,715) | | | | 82,230 | |
| | | | | | | | | | | | |
Investments | | | | | Shares | | | Value | |
| | | |
| COMMON STOCKS - 0.1% | | | | | | | | | | | | |
| | | |
Aerospace & Defense - 0.0%(h) | | | | | | | | | | | | |
Remington Outdoor Co., Inc.*‡ | | | | | | | 199 | | | | 1,638 | |
| | | | | | | | | | | | |
Software - 0.1% | | | | | | | | | | | | |
Avaya Holdings Corp.* | | | | | | | 704 | | | | 16,445 | |
| | | | | | | | | | | | |
TOTAL COMMON STOCKS
(Cost $13,995) | | | | 18,083 | |
| | | | | | | | | | | | |
Investments | | | | | Shares | | | Value | |
|
| SHORT-TERM INVESTMENTS - 6.2% | |
|
| INVESTMENT COMPANIES - 6.2% | |
JPMorgan Prime Money Market Fund Class Institutional Shares, 2.04%(l)(m) | | | | | | | 299,488 | | | | 299,578 | |
JPMorgan U.S. Government Money Market Fund Class Institutional Shares, 1.82%(l)(m) | | | | | | | 1,362,752 | | | | 1,362,752 | |
| | | | | | | | | | | | |
TOTAL SHORT-TERM INVESTMENTS
(Cost $1,662,279) | | | | 1,662,330 | |
| | | | | | | | | | | | |
| |
Total Investments - 99.9%
(Cost $27,025,665) | | | | 26,848,731 | |
Other Assets Less Liabilities - 0.1% | | | | 37,066 | |
| | | | | | | | | | | | |
Net Assets - 100.0% | | | | | | | | | | | 26,885,797 | |
| | | | | | | | | | | | |
| | | |
| | | | | | | | | | | | | |
Percentages indicated are based on net assets.
SEE NOTES TO FINANCIAL STATEMENTS.
22
JPMorgan Flexible Long/Short Fund
SCHEDULE OF PORTFOLIO INVESTMENTS
AS OF AUGUST 31, 2018 (Unaudited)
Over the Counter (“OTC”) Credit default swaptions purchased outstanding as of August 31, 2018:
| | | | | | | | | | | | | | | | | | | | | | | | | | | | | | | | | | | | |
| Description | | Counterparty | | | Expiration
Date | | | Exercise Rate | | | Pay Financing
Rate | | | Receive Floating
Rate Index | | | Implied
Credit
Spread(%)(1) | | | Notional
Amount | | | Value ($) | |
Call Contracts | | | | | | | | | | | | | | | | | | | | | | | | | | | | | | | | | | | | |
| Buy Protection on 5 Year Credit Default Swap Index, expiring 9/19/2018, European Style | |
| Goldman Sachs
International |
| | | 09/19/18 | | | | 1.06% | | | | 5.00% | | |
| CDX.NA.HY.30-
V1.Jun.2023 |
| | | 3.33 | % | | | USD | | | | 2,000,000 | | | | 1,726 | |
| Buy Protection on 5 Year Credit Default Swap Index, expiring 9/19/2018, European Style | |
| Goldman Sachs
International |
| | | 09/19/18 | | | | 3.25% | | | | 5.00% | | |
| iTraxx Europe
Crossover Series 29
V1.Jun.2023 |
| | | 3.00 | % | | | EUR | | | | 1,135,000 | | | | 1,654 | |
| Buy Protection on 5 Year Credit Default Swap Index, expiring 9/19/2018, European Style | |
| Barclays Bank
plc |
| | | 09/19/18 | | | | 0.65% | | | | 1.00% | | |
| iTraxx Europe
Series 29
V1.Jun.2023 |
| | | 0.68 | % | | | EUR | | | | 4,500,000 | | | | 12,727 | |
| | | | | | | | | | | | | | | | | | | | | | | | | | | | | | | | | | | | |
Total OTC Swaptions Purchased (Premiums Paid $54,820) | | | | | | | | | | | | | | | | 16,107 | |
| | | | | | | | | | | | | | | | | | | | | | | | | |
OTC Credit default swaptions written outstanding as of August 31, 2018:
| | | | | | | | | | | | | | | | | | | | | | | | | | | | | | | | | | | | |
| Description | | Counterparty | | | Expiration
Date | | | Exercise Rate | | | Pay Financing
Rate | | | Receive Floating
Rate Index | | | Implied
Credit
Spread(%)(1) | | | Notional
Amount | | | Value ($) | |
Put Contracts | | | | | | | | | | | | | | | | | | | | | | | | | | | | | | | | | | | | |
| Buy Protection on 5 Year Credit Default Swap Index, expiring 9/19/2018, European Style | |
| Goldman Sachs
International |
| | | 09/19/18 | | | | 1.04% | | | | 5.00% | | |
| CDX.NA.HY.30-
V1.Jun.2023 |
| | | 3.33 | % | | | USD | | | | 2,000,000 | | | | (753 | ) |
| Buy Protection on 5 Year Credit Default Swap Index, expiring 9/19/2018, European Style | |
| Goldman Sachs
International |
| | | 09/19/18 | | | | 3.75% | | | | 5.00% | | |
| iTraxx Europe
Crossover Series 29
V1.Jun.2023 |
| | | 3.00 | % | | | EUR | | | | 1,135,000 | | | | (448 | ) |
| Buy Protection on 5 Year Credit Default Swap Index, expiring 9/19/2018, European Style | |
| Barclays Bank
plc |
| | | 09/19/18 | | | | 0.75% | | | | 1.00% | | |
| iTraxx Europe
Series 29
V1.Jun.2023 |
| | | 0.68 | % | | | EUR | | | | 4,500,000 | | | | (2,675 | ) |
| | | | | | | | | | | | | | | | | | | | | | | | | | | | | | | | | | | | |
Total OTC Swaptions Written (Premiums Received $30,299) | | | | | | | | | | | | | | | | (3,876 | ) |
| | | | | | | | | | | | | | | | | | | | | | | | | |
(1) Implied credit spreads are an indication of the seller’s performance risk, related to the likelihood of a credit event occurring that would require a seller to make payment to a buyer. Implied credit spreads are used to determine the value of swap contracts and reflect the cost of buying/selling protection, which may include upfront payments made to enter into the contract. Therefore, higher spreads would indicate a greater likelihood that a seller will be obligated to perform (i.e. make payment) under the swap contract. Increasing values, in absolute terms and relative to notional amounts, are also indicative of greater performance risk. Implied credit spreads for credit default swaps on credit indices are linked to the weighted average spread across the underlying reference obligations included in a particular index.
SEE NOTES TO FINANCIAL STATEMENTS.
23
JPMorgan Flexible Long/Short Fund
SCHEDULE OF PORTFOLIO INVESTMENTS
AS OF AUGUST 31, 2018 (Unaudited) (continued)
Futures contracts outstanding as of August 31, 2018:
| | | | | | | | | | | | | | | | | | | | |
| Description | | Number of
Contracts | | | Expiration
Date | | | Trading Currency | | | Notional Amount
($) | | | Value and
Unrealized
Appreciation
(Depreciation) ($) | |
Long Contracts | | | | | | | | | | | | | | | | | | | | |
Euro-Schatz | | | 2 | | | | 12/2018 | | | | EUR | | | | 259,904 | | | | 32 | |
U.S. Treasury 2 Year Note | | | 3 | | | | 12/2018 | | | | USD | | | | 634,031 | | | | (287) | |
U.S. Treasury 5 Year Note | | | 6 | | | | 12/2018 | | | | USD | | | | 680,109 | | | | (1,044) | |
U.S. Treasury 10 Year Note | | | 2 | | | | 12/2018 | | | | USD | | | | 240,313 | | | | (645) | |
U.S. Treasury Long Bond | | | 2 | | | | 12/2018 | | | | USD | | | | 288,000 | | | | (817) | |
| | | | | | | | | | | | | | | | | | | | |
| | | | | | | | | | | | | | | | | | | (2,761) | |
| | | | | | | | | | | | | | | | | | | | |
Short Contracts | | | | | | | | | | | | | | | | | | | | |
Euro-Bobl | | | (3 | ) | | | 12/2018 | | | | EUR | | | | (458,299 | ) | | | (352) | |
Euro-Bund | | | (1 | ) | | | 12/2018 | | | | EUR | | | | (186,625 | ) | | | (524) | |
Long Gilt | | | (2 | ) | | | 12/2018 | | | | GBP | | | | (317,189 | ) | | | 21 | |
U.S. Treasury 10 Year Note | | | (1 | ) | | | 12/2018 | | | | USD | | | | (120,266 | ) | | | 209 | |
U.S. Treasury 10 Year Ultra Note | | | (2 | ) | | | 12/2018 | | | | USD | | | | (255,844 | ) | | | 902 | |
| | | | | | | | | | | | | | | | | | | | |
| | | | | | | | | | | | | | | | | | | 256 | |
| | | | | | | | | | | | | | | | | | | | |
| | | | | | | | | | | | | | | | | | | (2,505) | |
| | | | | | | | | | | | | | | | | | | | |
| | | | | | | | | | | | | | | | | | | | | | |
Forward foreign currency exchange contracts outstanding as of August 31, 2018: | |
| Currency Purchased | | | Currency Sold | | | Counterparty | | | | Settlement
Date | | | Unrealized
Appreciation
(Depreciation) ($) | |
EUR | | | 274,643 | | | USD | | | 317,415 | | | Barclays Bank plc | | | | | 9/5/2018 | | | | 1,378 | |
EUR | | | 11,327 | | | USD | | | 12,917 | | | Citibank, NA | | | | | 9/5/2018 | | | | 231 | |
EUR | | | 3,066 | | | USD | | | 3,495 | | | Royal Bank of Canada | | | | | 9/5/2018 | | | | 64 | |
GBP | | | 118,316 | | | USD | | | 150,796 | | | Citibank, NA | | | | | 9/5/2018 | | | | 2,595 | |
USD | | | 5,687,334 | | | EUR | | | 4,839,120 | | | Barclays Bank plc | | | | | 9/5/2018 | | | | 70,325 | |
USD | | | 241,638 | | | EUR | | | 206,397 | | | Citibank, NA | | | | | 9/5/2018 | | | | 2,063 | |
USD | | | 133,126 | | | EUR | | | 114,567 | | | HSBC Bank, NA | | | | | 9/5/2018 | | | | 143 | |
USD | | | 14,052 | | | EUR | | | 12,045 | | | Royal Bank of Canada | | | | | 9/5/2018 | | | | 71 | |
USD | | | 2,417 | | | GBP | | | 1,835 | | | Barclays Bank plc | | | | | 9/5/2018 | | | | 38 | |
USD | | | 627,127 | | | GBP | | | 476,162 | | | BNP Paribas | | | | | 9/5/2018 | | | | 9,806 | |
GBP | | | 2,404 | | | USD | | | 3,099 | | | Barclays Bank plc | | | | | 10/3/2018 | | | | 21 | |
USD | | | 5,748,006 | | | EUR | | | 4,905,929 | | | BNP Paribas | | | | | 10/3/2018 | | | | 41,629 | |
USD | | | 3,895 | | | EUR | | | 3,331 | | | Royal Bank of Canada | | | | | 10/3/2018 | | | | 21 | |
USD | | | 339,899 | | | GBP | | | 260,679 | | | BNP Paribas | | | | | 10/3/2018 | | | | 1,559 | |
| | | | | | | | | | | | | | | | | | | | | | |
Total unrealized appreciation | | | | | | | | | 129,944 | |
| | | | | | | | | | | | | | | | | | | |
EUR | | | 9,186 | | | USD | | | 10,670 | | | Barclays Bank plc | | | | | 9/5/2018 | | | | (8 | ) |
EUR | | | 4,905,929 | | | USD | | | 5,736,017 | | | BNP Paribas | | | | | 9/5/2018 | | | | (41,460 | ) |
GBP | | | 260,679 | | | USD | | | 339,513 | | | BNP Paribas | | | | | 9/5/2018 | | | | (1,556 | ) |
GBP | | | 99,002 | | | USD | | | 130,711 | | | HSBC Bank, NA | | | | | 9/5/2018 | | | | (2,360 | ) |
USD | | | 5,105 | | | EUR | | | 4,401 | | | Barclays Bank plc | | | | | 9/5/2018 | | | | (4 | ) |
USD | | | 10,129 | | | EUR | | | 8,881 | | | BNP Paribas | | | | | 9/5/2018 | | | | (180 | ) |
USD | | | 5,011 | | | EUR | | | 4,372 | | | Morgan Stanley | | | | | 9/5/2018 | | | | (63 | ) |
USD | | | 16,552 | | | EUR | | | 14,368 | | | Royal Bank of Canada | | | | | 9/5/2018 | | | | (125 | ) |
EUR | | | 70,280 | | | USD | | | 81,980 | | | Australia & New Zealand Banking Group Ltd. | | | | | 10/3/2018 | | | | (233 | ) |
USD | | | 137,561 | | | GBP | | | 106,744 | | | HSBC Bank, NA | | | | | 10/3/2018 | | | | (983 | ) |
| | | | | | | | | | | | | | | | | | | | | | |
Total unrealized depreciation | | | | | | | | | (46,972 | ) |
| | | | | | | | | | | | | | | | | | | |
Net unrealized appreciation | | | | 82,972 | |
| | | | | | | | | | | | | | | | | | | |
SEE NOTES TO FINANCIAL STATEMENTS.
24
JPMorgan Flexible Long/Short Fund
SCHEDULE OF PORTFOLIO INVESTMENTS
AS OF AUGUST 31, 2018 (Unaudited) (continued)
OTC Credit default swap contracts outstanding - buy protection(1) as of August 31, 2018:
| | | | | | | | | | | | | | | | | | | | | | | | | | |
| Reference Obligation/Index | | Financing
Rate Paid
by the Fund
(%) | | Payments
Frequency | | Counterparty | | Maturity
Date | | Implied
Credit
Spread
(%)(3) | | Notional
Amount(4) | | | Upfront
Payments
(Receipts)
($)(5) | | | Unrealized
Appreciation
(Depreciation)
($) | | | Value ($) | |
| Baxter International, Inc., 1.70, 8/15/2021 | | 1.00 | | Quarterly | | Goldman Sachs
International | | 6/20/2023 | | 0.31 | | | USD 225,000 | | | | (6,390 | ) | | | (1,016 | ) | | | (7,406 | ) |
| BMW Finance NV, 0.13%, 1/12/2021 | | 1.00 | | Quarterly | | Barclays Bank
plc | | 6/20/2023 | | 0.57 | | | EUR 110,000 | | | | (3,865 | ) | | | 970 | | | | (2,895 | ) |
| BMW Finance NV, 0.13%, 1/12/2021 | | 1.00 | | Quarterly | | Merrill Lynch
International | | 6/20/2023 | | 0.57 | | | EUR 120,000 | | | | (1,472 | ) | | | (1,686 | ) | | | (3,158 | ) |
| Carrefour SA, 1.75%, 5/22/2019 | | 1.00 | | Quarterly | | Merrill Lynch
International | | 6/20/2023 | | 0.85 | | | EUR 115,000 | | | | (1,795 | ) | | | 570 | | | | (1,225 | ) |
| Honeywell International, Inc., 5.70%, 3/15/2036 | | 1.00 | | Quarterly | | Goldman Sachs
International | | 6/20/2023 | | 0.35 | | | USD 225,000 | | | | (6,235 | ) | | | (829 | ) | | | (7,064 | ) |
| HP, Inc., 4.65%, 12/9/2021 | | 1.00 | | Quarterly | | Goldman Sachs
International | | 6/20/2023 | | 0.47 | | | USD 225,000 | | | | (5,160 | ) | | | (668 | ) | | | (5,828 | ) |
| Rolls-Royce plc, 6.75%, 4/30/2019 | | 1.00 | | Quarterly | | Goldman Sachs
International | | 6/20/2023 | | 0.85 | | | EUR 110,000 | | | | (2,621 | ) | | | 1,442 | | | | (1,179 | ) |
| Unilever N.V., 1.75%, 8/5/2020 | | 1.00 | | Quarterly | | Barclays Bank
plc | | 6/20/2023 | | 0.30 | | | EUR 65,000 | | | | (2,638 | ) | | | (80 | ) | | | (2,718 | ) |
| United Parcel Service, Inc., 8.38%, 4/01/2030 | | 1.00 | | Quarterly | | Goldman Sachs
International | | 6/20/2023 | | 0.31 | | | USD 225,000 | | | | (6,441 | ) | | | (1,039 | ) | | | (7,480 | ) |
| Valero Energy Corp., 8.75%, 06/15/2030 | | 1.00 | | Quarterly | | Goldman Sachs
International | | 6/20/2023 | | 0.42 | | | USD 200,000 | | | | (4,044 | ) | | | (1,540 | ) | | | (5,584 | ) |
| Vodafone Group plc, 1.00%, 9/11/2020 | | 1.00 | | Quarterly | | Goldman Sachs
International | | 6/20/2023 | | 0.75 | | | EUR 65,000 | | | | (1,053 | ) | | | (16 | ) | | | (1,069 | ) |
| | | | | | | | | | | | | | | | | | |
| | | | | | | | | | | | | | | | | (41,714 | ) | | | (3,892 | ) | | | (45,606 | ) |
| | | | | | | | | | | | | | | | | | |
Centrally Cleared Credit default swap contracts outstanding - buy protection(1) as of August 31, 2018:
| | | | | | | | | | | | | | | | | | | | | | | | | | | | | | | | |
Reference
Obligation/Index | | Financing
Rate Paid by
the Fund (%) | | | Payments
Frequency | | | Maturity
Date | | | Implied
Credit
Spread
(%)(3) | | | Notional
Amount(4) | | | Upfront
Payments
(Receipts)
($)(5) | | | Unrealized
Appreciation
(Depreciation)
($) | | | Value ($) | |
| CDX.NA.IG.30-V1 | | | 1.00 | | | | Quarterly | | | | 6/20/2023 | | | | 0.60 | | | | USD 1,900,000 | | | | (32,335 | ) | | | (4,958 | ) | | | (37,293 | ) |
| iTraxx Europe Senior | | | 1.00 | | | | Quarterly | | | | | | | | | | | | | | | | | | | | | | | | | |
| Financials 29.1 | | | | | | | | | | | 6/20/2023 | | | | 0.85 | | | | EUR 1,055,000 | | | | (12,400 | ) | | | 1,113 | | | | (11,287 | ) |
| | | | | | | | | | | | | | | | | | | | | | | | |
| | | | | | | | | | | | | | | | | | | | | | | (44,735 | ) | | | (3,845 | ) | | | (48,580 | ) |
| | | | | | | | | | | | | | | | | | | | | | | | |
OTC Credit default swap contracts outstanding - sell protection(2) as of August 31, 2018:
| | | | | | | | | | | | | | | | | | | | | | | | | | | | | | | | | | | | |
Reference
Obligation/Index | | Financing
Rate
Received by
the Fund
(%) | | | Payments
Frequency | | | Counterparty | | | Maturity
Date | | | Implied
Credit
Spread
(%)(3) | | | Notional
Amount(4) | | | Upfront
Payments
(Receipts)
($)(5) | | | Unrealized
Appreciation
(Depreciation)
($) | | | Value ($) | |
| Telefonica Emisiones SA, 2.74%, 5/29/2019 | | | 1.00 | | | | Quarterly | | |
| Merrill Lynch
International |
| | | 6/20/2023 | | | | 0.90 | | | | EUR 50,000 | | | | 664 | | | | (271 | ) | | | 393 | |
| | | | | | | | | | | | | | | | | | | | | | | | | | | | |
| | | | | | | | | | | | | | | | | | | | | | | | | | | 664 | | | | (271 | ) | | | 393 | |
| | | | | | | | | | | | | | | | | | | | | | | | | | | | |
SEE NOTES TO FINANCIAL STATEMENTS.
25
JPMorgan Flexible Long/Short Fund
SCHEDULE OF PORTFOLIO INVESTMENTS
AS OF AUGUST 31, 2018 (Unaudited) (continued)
Centrally Cleared Credit default swap contracts outstanding - sell protection(2) as of August 31, 2018:
| | | | | | | | | | | | | | | | | | | | | | | | | | | | | | | | |
Reference
Obligation/Index | | Financing
Rate
Received by
the Fund (%) | | | Payments
Frequency | | | Maturity
Date | | | Implied
Credit
Spread
(%)(3) | | | Notional
Amount(4) | | | Upfront
Payments
(Receipts) ($)(5) | | | Unrealized
Appreciation
(Depreciation)
($) | | | Value ($) | |
iTraxx Europe 29.1 | | | 1.00 | | | | Quarterly | | | | 6/20/2023 | | | | 0.68 | | | | EUR 97,000 | | | | 2,313 | | | | (406 | ) | | | 1,907 | |
| | | | | | | | | | | | | | | | | | | | | | | | |
| | | | | | | | | | | | | | | | | | | | | | | 2,313 | | | | (406 | ) | | | 1,907 | |
| | | | | | | | | | | | | | | | | | | | | | | | |
CDX.NA.IG.30-V1 | | | 1.00 | | | | Quarterly | | | | 6/20/2028 | | | | 1.08 | | | | USD 1,100,000 | | | | (2,988 | ) | | | (1,863 | ) | | | (4,851 | ) |
| | | | | | | | | | | | | | | | | | | | | | | | |
| | | | | | | | | | | | | | | | | | | | | | | (2,988 | ) | | | (1,863 | ) | | | (4,851 | ) |
| | | | | | | | | | | | | | | | | | | | | | | | |
| | | | | | | | | | | | | | | | | | | | | | | (675 | ) | | | (2,269 | ) | | | (2,944 | ) |
| | | | | | | | | | | | | | | | | | | | | | | | |
Centrally Cleared Interest rate swap contracts outstanding as of August 31, 2018:
| | | | | | | | | | | | | | | | | | | | |
Floating Rate Index(a) | | Fixed Rate | | Pay/
Receive
Floating
Rate | | Maturity
Date | | | Notional
Amount | | | Upfront
Payments(Receipts)
($) | | | Value and
Unrealized
Appreciation
(Depreciation)
($) | |
3 months LIBOR | | 2.34% semi-annually | | Receive | | | | | | | | | | | | | | | | |
quarterly | | | | | | | 4/10/2027 | | | | USD 450,000 | | | | – | | | | 17,298 | |
| | | | | | | | | | | | | | | | |
| | | | | | | | | | | | | | | – | | | | 17,298 | |
| | | | | | | | | | | | | | | | |
| (a) | Value of floating rate index at August 31, 2018 was 2.32%. |
| (1) | The Fund, as a buyer of credit protection, is generally obligated to make periodic payments and may also pay or receive an upfront premium to or from the protection seller, in exchange for the right to receive a contingent payment, upon occurrence of a credit event with respect to an underlying reference obligation, as defined under the terms of individual swap contracts. |
| (2) | The Fund, as a seller of credit protection, receives periodic payments and may also receive or pay an upfront premium from or to the protection buyer, and is obligated to make a contingent payment, upon occurrence of a credit event with respect to an underlying reference obligation, as defined under the terms of individual swap contracts. |
| (3) | Implied credit spreads are an indication of the seller’s performance risk, related to the likelihood of a credit event occurring that would require a seller to make payment to a buyer. Implied credit spreads are used to determine the value of swap contracts and reflect the cost of buying/selling protection, which may include upfront payments made to enter into the contract. Therefore, higher spreads would indicate a greater likelihood that a seller will be obligated to perform (i.e. make payment) under the swap contract. Increasing values, in absolute terms and relative to notional amounts, are also indicative of greater performance risk. Implied credit spreads for credit default swaps on credit indices are linked to the weighted average spread across the underlying reference obligations included in a particular index. |
| (4) | The notional amount is the maximum amount that a seller of credit protection would be obligated to pay and a buyer of credit protection would receive, upon occurrence of a credit event. |
| (5) | Upfront payments and receipts generally represent premiums paid or received at the initiation of the agreement to compensate the differences between the stated terms of the swap agreement and current market conditions (credit spreads, interest rates and other relevant factors). |
Summary of total swap contracts outstanding as of August 31, 2018:
| | | | | | | | |
| | | Net Upfront
Payments
(Receipts) ($) | | | Value ($) | |
Assets | | | | | | | | |
OTC Credit default swap contracts outstanding - sell protection | | | 664 | | | | 393 | |
| | | | |
Total OTC swap contracts outstanding | | | 664 | | | | 393 | |
| | | | |
| | |
Liabilities | | | | | | | | |
OTC Credit default swap contracts outstanding - buy protection | | | (41,714 | ) | | | (45,606 | ) |
| | | | |
Total OTC swap contracts outstanding | | | (41,714 | ) | | | (45,606 | ) |
| | | | |
SEE NOTES TO FINANCIAL STATEMENTS.
26
JPMorgan Flexible Long/Short Fund
SCHEDULE OF PORTFOLIO INVESTMENTS
AS OF AUGUST 31, 2018 (Unaudited)
Abbreviations
| | |
CDX | | Credit Default Swap Index |
EUR | | Euro |
EURIBOR | | Euro Interbank Offered Rate |
GBP | | British Pound |
ICE | | Intercontinental Exchange |
LIBOR | | London Interbank Offered Rate |
MSCI | | Morgan Stanley Capital International |
OYJ | | Public Limited Company |
REIT | | Real Estate Investment Trust |
SCA | | Limited partnership with share capital |
USD | | United States Dollar |
| (a) | Securities exempt from registration under Rule 144A or section 4(a)(2), of the Securities Act of 1933, as amended. Under procedures approved by the Board of Trustees, such securities have been determined to be liquid by the investment adviser and may be resold, normally to qualified institutional buyers in transactions exempt from registration. |
| (b) | Security exempt from registration pursuant to Regulation S under the Securities Act of 1933, as amended. Regulation S applies to securities offerings that are made outside of the United States and do not involve direct selling efforts in the United States and as such may have restrictions on resale. |
| (c) | Variable or floating rate security, linked to the referenced benchmark. The interest rate shown is the current rate as of August 31, 2018. |
| (d) | Security is perpetual and thus, does not have a predetermined maturity date. The coupon rate for this security is fixed for a period of time and may be structured to adjust thereafter. The date shown, if applicable, reflects the next call date. The coupon rate shown is the rate in effect as of August 31, 2018. |
| (e) | Security is an interest bearing note with preferred security characteristics. |
| (g) | Step bond. Interest rate is a fixed rate for an initial period that either resets at a specific date or may reset in the future contingent upon a predetermined trigger. The interest rate shown is the current rate as of August 31, 2018. |
| (h) | Amount rounds to less than 0.1% of net assets. |
| (i) | Security has the ability to pay in kind (“PIK”) or pay income in cash. When applicable, separate rates of such payments are disclosed. |
| (j) | Loan assignments are presented by obligor. Each series or loan tranche underlying each obligor may have varying terms. |
| (k) | All or a portion of this security is unsettled as of August 31, 2018. Unless otherwise indicated, the coupon rate is undetermined. The coupon rate shown may not be accrued for the entire position. |
| (l) | Investment in affiliate. Fund is registered under the Investment Company Act of 1940, as amended, and advised by J.P. Morgan Investment Management Inc. |
| (m) | The rate shown is the current yield as of August 31, 2018. |
| * | Non-income producing security. |
| ‡ | Value determined using significant unobservable inputs. |
SEE NOTES TO FINANCIAL STATEMENTS.
27
JPMorgan High Yield Opportunities Fund
SCHEDULE OF PORTFOLIO INVESTMENTS
AS OF AUGUST 31, 2018 (Unaudited)
(Amounts in U.S. Dollars, unless otherwise noted)
| | | | | | | | | | | | |
Investments | | | | | Principal
Amount | | | Value | |
CORPORATE BONDS - 88.3% | | | | | | | | | | | | |
| | | |
Aerospace & Defense - 1.7% | | | | | | | | | | | | |
Arconic, Inc.
5.90%, 2/1/2027 | | | | | | | 150,000 | | | | 151,890 | |
BWX Technologies, Inc.
5.38%, 7/15/2026(a) | | | | | | | 10,000 | | | | 10,100 | |
KLX, Inc.
5.88%, 12/1/2022(a) | | | | | | | 70,000 | | | | 72,450 | |
Kratos Defense & Security Solutions, Inc. | | | | | | | | | | | | |
6.50%, 11/30/2025(a) | | | | | | | 25,000 | | | | 25,812 | |
Leonardo SpA (Italy)
5.25%, 1/21/2022 | | | EUR | | | | 90,000 | | | | 117,941 | |
Triumph Group, Inc.
7.75%, 8/15/2025 | | | | | | | 90,000 | | | | 87,413 | |
| | | | | | | | | | | | |
| | | | | | | | | | | 465,606 | |
| | | | | | | | | | | | |
| | | |
Air Freight & Logistics - 0.3% | | | | | | | | | | | | |
XPO Logistics, Inc.
6.50%, 6/15/2022(a) | | | | | | | 75,000 | | | | 77,473 | |
| | | | | | | | | | | | |
| | | |
Auto Components - 3.2% | | | | | | | | | | | | |
Adient Global Holdings Ltd.
3.50%, 8/15/2024(b) | | | EUR | | | | 150,000 | | | | 162,682 | |
Allison Transmission, Inc.
5.00%, 10/1/2024(a) | | | | | | | 20,000 | | | | 19,700 | |
American Axle & Manufacturing, Inc. | | | | | | | | | |
6.25%, 4/1/2025 | | | | | | | 65,000 | | | | 64,675 | |
6.25%, 3/15/2026 | | | | | | | 75,000 | | | | 73,969 | |
6.50%, 4/1/2027 | | | | | | | 35,000 | | | | 34,650 | |
Cooper-Standard Automotive, Inc.
5.63%, 11/15/2026(a) | | | | | | | 70,000 | | | | 68,950 | |
Dana Financing Luxembourg SARL
6.50%, 6/1/2026(a) | | | | 135,000 | | | | 138,544 | |
Delphi Technologies plc
5.00%, 10/1/2025(a) | | | | | | | 75,000 | | | | 70,841 | |
Goodyear Tire & Rubber Co. (The)
5.13%, 11/15/2023 | | | | 100,000 | | | | 99,750 | |
Kongsberg Actuation Systems BV (Switzerland) | | | | | | | | | | | | |
5.00%, 7/15/2025(a) | | | EUR | | | | 100,000 | | | | 115,845 | |
Tenneco, Inc.
5.38%, 12/15/2024 | | | | | | | 35,000 | | | | 32,769 | |
5.00%, 7/15/2026 | | | | | | | 25,000 | | | | 22,187 | |
| | | | | | | | | | | | |
| | | | | | | | | | | 904,562 | |
| | | | | | | | | | | | |
| | | |
Banks - 0.1% | | | | | | | | | | | | |
Citigroup, Inc. | | | | | | | | | | | | |
Series N, (ICE LIBOR USD 3 Month + 4.09%), 5.80%, | | | | | | | | | | | | |
11/15/2019(c)(d)(e) | | | | | | | 20,000 | | | | 20,450 | |
Series O, (ICE LIBOR USD 3 Month + 4.06%), 5.87%, | | | | | | | | | | | | |
3/27/2020(c)(d)(e) | | | | | | | 25,000 | | | | 25,635 | |
| | | | | | | | | | | | |
| | | | | | | | | | | 46,085 | |
| | | | | | | | | | | | |
| | | |
Building Products - 0.6% | | | | | | | | | | | | |
American Woodmark Corp.
4.88%, 3/15/2026(a) | | | | | | | 40,000 | | | | 38,500 | |
| | | | | | | | | | | | |
Investments | | | | | Principal
Amount | | | Value | |
Jeld-Wen, Inc.
4.63%, 12/15/2025(a) | | | | | | | 25,000 | | | | 23,312 | |
4.88%, 12/15/2027(a) | | | | | | | 10,000 | | | | 9,325 | |
PGT Escrow Issuer, Inc.
6.75%, 8/1/2026(a) | | | | | | | 30,000 | | | | 30,778 | |
Standard Industries, Inc.
4.75%, 1/15/2028(a) | | | | | | | 75,000 | | | | 69,773 | |
| | | | | | | | | | | | |
| | | | | | | | | | | 171,688 | |
| | | | | | | | | | | | |
| | | |
Capital Markets - 0.1% | | | | | | | | | | | | |
MSCI, Inc.
5.38%, 5/15/2027(a) | | | | | | | 30,000 | | | | 30,825 | |
| | | | | | | | | | | | |
| | | |
Chemicals - 3.5% | | | | | | | | | | | | |
Chemours Co. (The)
6.63%, 5/15/2023 | | | | | | | 55,000 | | | | 57,612 | |
CTC BondCo GmbH (Germany)
5.25%, 12/15/2025(a) | | | EUR | | | | 100,000 | | | | 114,624 | |
Gates Global LLC
6.00%, 7/15/2022(a) | | | | | | | 36,000 | | | | 36,360 | |
GCP Applied Technologies, Inc.
5.50%, 4/15/2026(a) | | | | | | | 55,000 | | | | 53,900 | |
Hexion, Inc.
6.63%, 4/15/2020 | | | | | | | 90,000 | | | | 85,162 | |
INEOS Group Holdings SA (Luxembourg) | | | | | | | | | | | | |
5.63%, 8/1/2024(a) | | | | | | | 200,000 | | | | 197,414 | |
Kraton Polymers LLC
5.25%, 5/15/2026(a) | | | EUR | | | | 100,000 | | | | 119,853 | |
NOVA Chemicals Corp. (Canada)
4.88%, 6/1/2024(a) | | | | | | | 45,000 | | | | 43,988 | |
5.25%, 6/1/2027(a) | | | | | | | 20,000 | | | | 19,000 | |
Rain CII Carbon LLC
7.25%, 4/1/2025(a) | | | | | | | 60,000 | | | | 61,500 | |
Scotts Miracle-Gro Co. (The)
6.00%, 10/15/2023 | | | | | | | 100,000 | | | | 101,500 | |
5.25%, 12/15/2026 | | | | | | | 5,000 | | | | 4,750 | |
Trinseo Materials Operating SCA
5.38%, 9/1/2025(a) | | | | | | | 35,000 | | | | 34,344 | |
Venator Finance SARL
5.75%, 7/15/2025(a) | | | | | | | 45,000 | | | | 41,963 | |
| | | | | | | | | | | | |
| | | | | | | | | | | 971,970 | |
| | | | | | | | | | | | |
|
Commercial Services & Supplies - 1.1% | |
ACCO Brands Corp.
5.25%, 12/15/2024(a) | | | | | | | 25,000 | | | | 24,875 | |
Aramark Services, Inc.
5.00%, 2/1/2028(a) | | | | | | | 75,000 | | | | 73,500 | |
Paprec Holding SA (France)
4.00%, 3/31/2025(a) | | | EUR | | | | 100,000 | | | | 117,209 | |
Verisure Holding AB (Sweden)
6.00%, 11/1/2022(b) | | | EUR | | | | 90,000 | | | | 108,526 | |
| | | | | | | | | | | | |
| | | | | | | | | | | 324,110 | |
| | | | | | | | | | | | |
| |
Communications Equipment - 0.6% | | | | | |
CommScope Technologies LLC
6.00%, 6/15/2025(a) | | | | | | | 160,000 | | | | 165,600 | |
| | | | | | | | | | | | |
| | | |
Containers & Packaging - 3.0% | | | | | | | | | | | | |
Ardagh Packaging Finance plc (Ireland) | | | | | | | | | | | | |
6.75%, 5/15/2024(b) | | | EUR | | | | 100,000 | | | | 125,437 | |
7.25%, 5/15/2024(a) | | | | | | | 200,000 | | | | 210,250 | |
SEE NOTES TO FINANCIAL STATEMENTS.
28
JPMorgan High Yield Opportunities Fund
SCHEDULE OF PORTFOLIO INVESTMENTS
AS OF AUGUST 31, 2018 (Unaudited) (continued)
(Amounts in U.S. Dollars, unless otherwise noted)
| | | | | | | | | | | | |
Investments | | | | | Principal
Amount | | | Value | |
Horizon Parent Holdings SARL (France) | | | | | | | | | |
8.25% (cash), 2/15/2022(b)(f) | | | EUR | | | | 100,000 | | | | 121,531 | |
Reynolds Group Issuer, Inc.
5.75%, 10/15/2020 | | | | | | | 96,911 | | | | 97,032 | |
(ICE LIBOR USD 3 Month + 3.50%),
5.84%, 7/15/2021(a)(d) | | | | 50,000 | | | | 50,562 | |
SIG Combibloc Holdings SCA (Luxembourg) | | | | | | | | | |
7.75%, 2/15/2023(b) | | | EUR | | | | 100,000 | | | | 120,858 | |
Silgan Holdings, Inc.
3.25%, 3/15/2025 | | | EUR | | | | 100,000 | | | | 119,174 | |
| | | | | | | | | | | | |
| | | | | | | | | | | 844,844 | |
| | | | | | | | | | | | |
|
Distributors - 0.1% | |
Core & Main LP
6.13%, 8/15/2025(a) | | | | | | | 20,000 | | | | 19,200 | |
| | | | | | | | | | | | |
|
Diversified Consumer Services - 0.4% | |
Service Corp. International
7.50%, 4/1/2027 | | | | | | | 100,000 | | | | 111,500 | |
| | | | | | | | | | | | |
|
Diversified Financial Services - 0.9% | |
ProGroup AG (Germany)
3.00%, 3/31/2026(a) | | | EUR | | | | 100,000 | | | | 116,075 | |
Worldpay Finance plc (United Kingdom) | | | | | | | | | |
3.75%, 11/15/2022(b) | | | EUR | | | | 100,000 | | | | 125,361 | |
| | | | | | | | | | | | |
| | | | | | | | | | | 241,436 | |
| | | | | | | | | | | | |
|
Diversified Telecommunication Services - 8.4% | |
Altice France SA (France)
5.63%, 5/15/2024(b) | | | EUR | | | | 100,000 | | | | 121,322 | |
7.38%, 5/1/2026(a) | | | | | | | 200,000 | | | | 196,500 | |
CCO Holdings LLC
5.88%, 4/1/2024(a) | | | | | | | 240,000 | | | | 244,800 | |
5.75%, 2/15/2026(a) | | | | | | | 465,000 | | | | 465,000 | |
5.50%, 5/1/2026(a) | | | | | | | 40,000 | | | | 39,500 | |
5.13%, 5/1/2027(a) | | | | | | | 35,000 | | | | 33,381 | |
CenturyLink, Inc.
5.63%, 4/1/2025 | | | | | | | 155,000 | | | | 151,512 | |
Frontier Communications Corp.
7.13%, 1/15/2023 | | | | | | | 100,000 | | | | 68,125 | |
8.50%, 4/1/2026(a) | | | | | | | 35,000 | | | | 32,928 | |
Intelsat Jackson Holdings SA (Luxembourg) | | | | | | | | | | | | |
7.25%, 10/15/2020 | | | | | | | 145,000 | | | | 145,182 | |
5.50%, 8/1/2023 | | | | | | | 145,000 | | | | 132,269 | |
8.00%, 2/15/2024(a) | | | | | | | 100,000 | | | | 105,250 | |
9.75%, 7/15/2025(a) | | | | | | | 75,000 | | | | 79,406 | |
Sprint Capital Corp.
8.75%, 3/15/2032 | | | | | | | 245,000 | | | | 270,725 | |
Telecom Italia SpA (Italy)
3.63%, 5/25/2026(b) | | | EUR | | | | 100,000 | | | | 121,272 | |
Windstream Services LLC
10.50%, 6/30/2024(a) | | | | | | | 10,000 | | | | 8,000 | |
9.00%, 6/30/2025(a) | | | | | | | 199,000 | | | | 143,778 | |
| | | | | | | | | | | | |
| | | | | | | | | | | 2,358,950 | |
| | | | | | | | | | | | |
| | | | | | | | | | | | |
Investments | | | | | Principal
Amount | | | Value | |
Electric Utilities - 0.5% | |
EDP - Energias de Portugal SA (Portugal) | | | | | | | | | | | | |
(EUR Swap Annual 5 Year + 5.04%), 5.38%, 9/16/2075(b)(d) | | | EUR | | | | 100,000 | | | | 125,623 | |
| | | | | | | | | | | | |
|
Electrical Equipment - 0.6% | |
Energizer Gamma Acquisition, Inc.
6.38%, 7/15/2026(a) | | | | | | | 25,000 | | | | 25,844 | |
Sensata Technologies BV
4.88%, 10/15/2023(a) | | | | | | | 135,000 | | | | 135,000 | |
| | | | | | | | | | | | |
| | | | | | | | | | | 160,844 | |
| | | | | | | | | | | | |
|
Energy Equipment & Services - 1.0% | |
Nabors Industries, Inc.
5.75%, 2/1/2025(a) | | | | | | | 50,000 | | | | 48,093 | |
Precision Drilling Corp. (Canada)
7.75%, 12/15/2023 | | | | | | | 35,000 | | | | 37,012 | |
7.13%, 1/15/2026(a) | | | | | | | 30,000 | | | | 30,863 | |
Transocean Guardian Ltd.
5.88%, 1/15/2024(a) | | | | | | | 30,000 | | | | 30,150 | |
Transocean Pontus Ltd.
6.13%, 8/1/2025(a) | | | | | | | 13,000 | | | | 13,260 | |
Transocean, Inc.
7.50%, 1/15/2026(a) | | | | | | | 30,000 | | | | 30,562 | |
Vallourec SA (France)
2.25%, 9/30/2024(b) | | | EUR | | | | 100,000 | | | | 95,481 | |
Weatherford International Ltd.
9.88%, 2/15/2024 | | | | | | | 10,000 | | | | 9,450 | |
| | | | | | | | | | | | |
| | | | | | | | | | | 294,871 | |
| | | | | | | | | | | | |
|
Equity Real Estate Investment Trusts (REITs) - 2.4% | |
CoreCivic, Inc.
4.63%, 5/1/2023 | | | | | | | 75,000 | | | | 72,750 | |
ESH Hospitality, Inc.
5.25%, 5/1/2025(a) | | | | | | | 100,000 | | | | 96,875 | |
GEO Group, Inc. (The)
5.13%, 4/1/2023 | | | | | | | 125,000 | | | | 120,625 | |
5.88%, 10/15/2024 | | | | | | | 20,000 | | | | 19,500 | |
MGM Growth Properties Operating Partnership LP | | | | | | | | | | | | |
5.63%, 5/1/2024 | | | | | | | 100,000 | | | | 102,875 | |
4.50%, 1/15/2028 | | | | | | | 10,000 | | | | 9,219 | |
RHP Hotel Properties LP
5.00%, 4/15/2021 | | | | | | | 50,000 | | | | 50,414 | |
Uniti Group LP
6.00%, 4/15/2023(a) | | | | | | | 100,000 | | | | 96,000 | |
8.25%, 10/15/2023 | | | | | | | 30,000 | | | | 28,266 | |
7.13%, 12/15/2024(a) | | | | | | | 15,000 | | | | 13,551 | |
VICI Properties 1 LLC
8.00%, 10/15/2023 | | | | | | | 53,880 | | | | 59,538 | |
| | | | | | | | | | | | |
| | | | | | | | | | | 669,613 | |
| | | | | | | | | | | | |
|
Food & Staples Retailing - 1.8% | |
Albertsons Cos. LLC
5.75%, 3/15/2025 | | | | | | | 40,000 | | | | 36,200 | |
Iceland Bondco plc (United Kingdom) | | | | | | | | | | | | |
4.63%, 3/15/2025(b) GBP | | | | | | | 100,000 | | | | 118,131 | |
Picard Bondco SA (Luxembourg)
5.50%, 11/30/2024(a) | | | EUR | | | | 122,000 | | | | 133,823 | |
Rite Aid Corp. | | | | | | | | | | | | |
6.13%, 4/1/2023(a) | | | | | | | 110,000 | | | | 98,692 | |
SEE NOTES TO FINANCIAL STATEMENTS.
29
JPMorgan High Yield Opportunities Fund
SCHEDULE OF PORTFOLIO INVESTMENTS
AS OF AUGUST 31, 2018 (Unaudited) (continued)
(Amounts in U.S. Dollars, unless otherwise noted)
| | | | | | | | | | | | |
Investments | | | | | Principal
Amount | | | Value | |
Tesco Corporate Treasury Services plc (United Kingdom) | | | | | | | | | | | | |
2.50%, 7/1/2024(b) | | | EUR | | | | 100,000 | | | | 123,129 | |
| | | | | | | | | | | | |
| | | | | | | | | | | 509,975 | |
| | | | | | | | | | | | |
|
Food Products - 1.4% | |
Nomad Foods Bondco plc (United Kingdom) | | | | | | | | | |
3.25%, 5/15/2024(b) | | | EUR | | | | 100,000 | | | | 117,232 | |
Post Holdings, Inc.
5.50%, 3/1/2025(a) | | | | | | | 60,000 | | | | 59,850 | |
5.75%, 3/1/2027(a) | | | | | | | 10,000 | | | | 9,875 | |
5.63%, 1/15/2028(a) | | | | | | | 25,000 | | | | 24,156 | |
Sigma Holdco BV (Netherlands)
5.75%, 5/15/2026(b) | | | EUR | | | | 100,000 | | | | 110,393 | |
TreeHouse Foods, Inc.
6.00%, 2/15/2024(a) | | | | | | | 50,000 | | | | 50,625 | |
| | | | | | | | | | | | |
| | | | | | | | | | | 372,131 | |
| | | | | | | | | | | | |
|
Gas Utilities - 0.1% | |
AmeriGas Partners LP
5.50%, 5/20/2025 | | | | | | | 30,000 | | | | 29,400 | |
| | | | | | | | | | | | |
|
Health Care Equipment & Supplies - 1.8% | |
Auris Luxembourg II SA (Luxembourg) | | | | | | | | | | | | |
8.00%, 1/15/2023(b) | | | EUR | | | | 100,000 | | | | 120,747 | |
Avantor, Inc.
6.00%, 10/1/2024(a) | | | | | | | 35,000 | | | | 35,525 | |
DJO Finance LLC
8.13%, 6/15/2021(a) | | | | | | | 140,000 | | | | 144,592 | |
Hill-Rom Holdings, Inc.
5.00%, 2/15/2025(a) | | | | | | | 90,000 | | | | 87,525 | |
Hologic, Inc.
4.38%, 10/15/2025(a) | | | | | | | 35,000 | | | | 33,687 | |
Mallinckrodt International Finance SA | | | | | | | | | | | | |
5.63%, 10/15/2023(a) | | | | | | | 100,000 | | | | 89,125 | |
| | | | | | | | | | | | |
| | | | | | | | | | | 511,201 | |
| | | | | | | | | | | | |
|
Health Care Providers & Services - 6.7% | |
Air Medical Group Holdings, Inc.
6.38%, 5/15/2023(a) | | | | | | | 70,000 | | | | 63,000 | |
Community Health Systems, Inc.
8.63%, 1/15/2024(a) | | | | | | | 35,000 | | | | 36,487 | |
Constantin Investissement 3 SASU (France) | | | | | | | | | | | | |
5.38%, 4/15/2025(b) | | | EUR | | | | 100,000 | | | | 114,944 | |
DaVita, Inc.
5.00%, 5/1/2025 | | | | | | | 100,000 | | | | 94,750 | |
Elanco Animal Health, Inc.
4.27%, 8/28/2023(a) | | | | | | | 20,000 | | | | 20,084 | |
4.90%, 8/28/2028(a) | | | | | | | 20,000 | | | | 20,152 | |
Encompass Health Corp.
5.75%, 11/1/2024 | | | | | | | 100,000 | | | | 101,250 | |
HCA, Inc.
5.38%, 2/1/2025 | | | | | | | 560,000 | | | | 566,401 | |
5.88%, 2/15/2026 | | | | | | | 220,000 | | | | 227,425 | |
5.25%, 6/15/2026 | | | | | | | 5,000 | | | | 5,150 | |
5.38%, 9/1/2026 | | | | | | | 65,000 | | | | 65,325 | |
Tenet Healthcare Corp.
7.50%, 1/1/2022(a) | | | | | | | 25,000 | | | | 26,180 | |
| | | | | | | | | | | | |
Investments | | | | | Principal
Amount | | | Value | |
8.13%, 4/1/2022 | | | | | | | 130,000 | | | | 137,312 | |
6.75%, 6/15/2023 | | | | | | | 190,000 | | | | 190,000 | |
4.63%, 7/15/2024 | | | | | | | 170,000 | | | | 166,520 | |
7.00%, 8/1/2025 | | | | | | | 20,000 | | | | 19,963 | |
| | | | | | | | | | | | |
| | | | | | | | | | | 1,854,943 | |
| | | | | | | | | | | | |
|
Health Care Technology - 0.2% | |
IQVIA, Inc.
4.88%, 5/15/2023(a) | | | | | | | 50,000 | | | | 50,125 | |
| | | | | | | | | | | | |
|
Hotels, Restaurants & Leisure - 4.1% | |
Boyd Gaming Corp.
6.00%, 8/15/2026 | | | | | | | 35,000 | | | | 35,262 | |
Boyne USA, Inc.
7.25%, 5/1/2025(a) | | | | | | | 15,000 | | | | 15,900 | |
Constellation Merger Sub, Inc.
8.50%, 9/15/2025(a) | | | | | | | 45,000 | | | | 42,525 | |
GLP Capital LP
5.25%, 6/1/2025 | | | | | | | 45,000 | | | | 46,800 | |
5.75%, 6/1/2028 | | | | | | | 45,000 | | | | 47,691 | |
Hilton Domestic Operating Co., Inc.
5.13%, 5/1/2026(a) | | | | | | | 54,000 | | | | 54,067 | |
Hilton Grand Vacations Borrower LLC
6.13%, 12/1/2024 | | | | | | | 10,000 | | | | 10,300 | |
Hilton Worldwide Finance LLC
4.63%, 4/1/2025 | | | | | | | 20,000 | | | | 19,750 | |
4.88%, 4/1/2027 | | | | | | | 30,000 | | | | 29,513 | |
Interval Acquisition Corp.
5.63%, 4/15/2023 | | | | | | | 50,000 | | | | 50,375 | |
Jack Ohio Finance LLC
6.75%, 11/15/2021(a) | | | | | | | 80,000 | | | | 82,800 | |
Marriott Ownership Resorts, Inc.
6.50%, 9/15/2026(a) | | | | | | | 55,000 | | | | 56,100 | |
MGM Resorts International
5.75%, 6/15/2025 | | | | | | | 50,000 | | | | 50,350 | |
4.63%, 9/1/2026 | | | | | | | 390,000 | | | | 367,575 | |
Sabre GLBL, Inc.
5.38%, 4/15/2023(a) | | | | | | | 95,000 | | | | 95,713 | |
Stars Group Holdings BV (Canada)
7.00%, 7/15/2026(a) | | | | | | | 25,000 | | | | 26,000 | |
Wynn Las Vegas LLC
5.50%, 3/1/2025(a) | | | | | | | 100,000 | | | | 98,940 | |
| | | | | | | | | | | | |
| | | | | | | | | | | 1,129,661 | |
| | | | | | | | | | | | |
|
Household Durables - 0.4% | |
Tempur Sealy International, Inc.
5.63%, 10/15/2023 | | | | | | | 120,000 | | | | 120,000 | |
| | | | | | | | | | | | |
|
Household Products - 1.4% | |
Central Garden & Pet Co.
6.13%, 11/15/2023 | | | | | | | 100,000 | | | | 103,125 | |
5.13%, 2/1/2028 | | | | | | | 40,000 | | | | 37,650 | |
Energizer Holdings, Inc.
5.50%, 6/15/2025(a) | | | | | | | 50,000 | | | | 49,875 | |
Kronos Acquisition Holdings, Inc. (Canada) | | | | | | | | | | | | |
9.00%, 8/15/2023(a) | | | | | | | 50,000 | | | | 45,750 | |
Spectrum Brands Holdings, Inc.
7.75%, 1/15/2022 | | | | | | | 100,000 | | | | 102,750 | |
SEE NOTES TO FINANCIAL STATEMENTS.
30
JPMorgan High Yield Opportunities Fund
SCHEDULE OF PORTFOLIO INVESTMENTS
AS OF AUGUST 31, 2018 (Unaudited) (continued)
(Amounts in U.S. Dollars, unless otherwise noted)
| | | | | | | | | | | | |
Investments | | | | | Principal
Amount | | | Value | |
Spectrum Brands, Inc. | | | | | | | | | | | | |
5.75%, 7/15/2025 | | | | | | | 60,000 | | | | 60,600 | |
| | | | | | | | | | | | |
| | | | | | | | | | | 399,750 | |
| | | | | | | | | | | | |
|
Independent Power and Renewable Electricity Producers - 0.5% | |
AES Corp.
4.00%, 3/15/2021 | | | | | | | 45,000 | | | | 45,122 | |
Calpine Corp.
5.25%, 6/1/2026(a) | | | | | | | 25,000 | | | | 23,602 | |
Vistra Energy Corp.
5.88%, 6/1/2023 | | | | | | | 80,000 | | | | 82,300 | |
| | | | | | | | | | | | |
| | | | | | | | | | | 151,024 | |
| | | | | | | | | | | | |
|
Internet & Direct Marketing Retail - 0.8% | |
eDreams ODIGEO SA (Spain)
8.50%, 8/1/2021(a) | | | EUR | | | | 97,701 | | | | 118,212 | |
Netflix, Inc.
4.88%, 4/15/2028(a) | | | | | | | 55,000 | | | | 52,113 | |
5.88%, 11/15/2028(a) | | | | | | | 62,000 | | | | 62,143 | |
| | | | | | | | | | | | |
| | | | | | | | | | | 232,468 | |
| | | | | | | | | | | | |
|
Internet Software & Services - 0.7% | |
Cogent Communications Group, Inc. | | | | | | | | | | | | |
5.38%, 3/1/2022(a) | | | | | | | 60,000 | | | | 61,050 | |
Rackspace Hosting, Inc.
8.63%, 11/15/2024(a) | | | | | | | 30,000 | | | | 29,531 | |
Zayo Group LLC
6.38%, 5/15/2025 | | | | | | | 100,000 | | | | 104,500 | |
| | | | | | | | | | | | |
| | | | | | | | | | | 195,081 | |
| | | | | | | | | | | | |
|
IT Services - 1.6% | |
First Data Corp.
5.38%, 8/15/2023(a) | | | | | | | 10,000 | | | | 10,177 | |
5.75%, 1/15/2024(a) | | | | | | | 295,000 | | | | 300,900 | |
Gartner, Inc.
5.13%, 4/1/2025(a) | | | | | | | 25,000 | | | | 25,312 | |
GCI LLC
6.88%, 4/15/2025 | | | | | | | 95,000 | | | | 98,206 | |
| | | | | | | | | | | | |
| | | | | | | | | | | 434,595 | |
| | | | | | | | | | | | |
|
Leisure Products - 0.8% | |
Mattel, Inc.
6.75%, 12/31/2025(a) | | | | | | | 105,000 | | | | 102,841 | |
Vista Outdoor, Inc.
5.88%, 10/1/2023 | | | | | | | 125,000 | | | | 122,500 | |
| | | | | | | | | | | 225,341 | |
|
Machinery - 2.0% | |
Galapagos SA (Luxembourg)
5.38%, 6/15/2021‡(b) | | | EUR | | | | 100,000 | | | | 104,078 | |
Hillman Group, Inc. (The)
6.38%, 7/15/2022(a) | | | | | | | 55,000 | | | | 52,250 | |
Mueller Water Products, Inc.
5.50%, 6/15/2026(a) | | | | | | | 20,000 | | | | 20,100 | |
Novelis Corp.
5.88%, 9/30/2026(a) | | | | | | | 100,000 | | | | 97,380 | |
RBS Global, Inc.
4.88%, 12/15/2025(a) | | | | | | | 20,000 | | | | 19,250 | |
SPX FLOW, Inc.
5.63%, 8/15/2024(a) | | | | | | | 45,000 | | | | 45,113 | |
5.88%, 8/15/2026(a) | | | | | | | 15,000 | | | | 15,150 | |
Terex Corp.
5.63%, 2/1/2025(a) | | | | | | | 40,000 | | | | 39,700 | |
TriMas Corp.
4.88%, 10/15/2025(a) | | | | | | | 30,000 | | | | 28,875 | |
| | | | | | | | | | | | |
Investments | | | | | Principal
Amount | | | Value | |
Wabash National Corp. | | | | | | | | | | | | |
5.50%, 10/1/2025(a) | | | | | | | 35,000 | | | | 33,250 | |
Welbilt, Inc.
9.50%, 2/15/2024 | | | | | | | 100,000 | | | | 109,500 | |
| | | | | | | | | | | | |
| | | | | | | | | | | 564,646 | |
| | | | | | | | | | | | |
|
Media - 10.0% | |
Altice Luxembourg SA (Luxembourg) | | | | | | | | | | | | |
7.25%, 5/15/2022(b) | | | EUR | | | | 110,000 | | | | 128,516 | |
7.75%, 5/15/2022(a) | | | | | | | 200,000 | | | | 192,750 | |
AMC Entertainment Holdings, Inc.
5.88%, 2/15/2022 | | | | | | | 10,000 | | | | 10,163 | |
5.75%, 6/15/2025 | | | | | | | 45,000 | | | | 43,678 | |
AMC Networks, Inc.
5.00%, 4/1/2024 | | | | | | | 55,000 | | | | 54,106 | |
CBS Radio, Inc.
7.25%, 11/1/2024(a) | | | | | | | 50,000 | | | | 47,875 | |
Clear Channel Worldwide Holdings, Inc.
Series B, 7.63%, 3/15/2020 | | | | | | | 190,000 | | | | 190,712 | |
Series B, 6.50%, 11/15/2022 | | | | | | | 305,000 | | | | 311,863 | |
DISH DBS Corp.
5.88%, 7/15/2022 | | | | | | | 115,000 | | | | 110,400 | |
5.00%, 3/15/2023 | | | | | | | 60,000 | | | | 53,400 | |
5.88%, 11/15/2024 | | | | | | | 465,000 | | | | 404,550 | |
7.75%, 7/1/2026 | | | | | | | 60,000 | | | | 54,150 | |
Meredith Corp.
6.88%, 2/1/2026(a) | | | | | | | 35,000 | | | | 35,438 | |
SES SA (Luxembourg)
(EUR Swap Annual 5 Year + 4.66%), 4.62%, 1/2/2022(b)(c)(d)(e) | | | EUR | | | | 100,000 | | | | 120,133 | |
(EUR Swap Annual 5 Year + 5.40%), 5.63%, 1/29/2024(b)(c)(d)(e) | | | EUR | | | | 100,000 | | | | 123,492 | |
Sinclair Television Group, Inc.
5.63%, 8/1/2024(a) | | | | | | | 100,000 | | | | 98,500 | |
Sirius XM Radio, Inc.
6.00%, 7/15/2024(a) | | | | | | | 175,000 | | | | 181,843 | |
5.38%, 4/15/2025(a) | | | | | | | 120,000 | | | | 121,800 | |
5.00%, 8/1/2027(a) | | | | | | | 10,000 | | | | 9,662 | |
Telenet Finance VI Luxembourg SCA (Luxembourg) | | | | | | | | | | | | |
4.88%, 7/15/2027(b) | | | EUR | | | | 90,000 | | | | 112,010 | |
Videotron Ltd. (Canada)
5.38%, 6/15/2024(a) | | | | | | | 200,000 | | | | 205,500 | |
5.13%, 4/15/2027(a) | | | | | | | 25,000 | | | | 24,750 | |
Ziggo Bond Finance BV (Netherlands) | | | | | | | | | | | | |
4.63%, 1/15/2025(b) | | | EUR | | | | 125,000 | | | | 144,368 | |
| | | | | | | | | | | | |
| | | | | | | | | | | 2,779,659 | |
| | | | | | | | | | | | |
|
Metals & Mining - 0.6% | |
Freeport-McMoRan, Inc.
3.88%, 3/15/2023 | | | | | | | 120,000 | | | | 115,500 | |
4.55%, 11/14/2024 | | | | | | | 40,000 | | | | 38,500 | |
| | | | | | | | | | | | |
| | | | | | | | | | | 154,000 | |
| | | | | | | | | | | | |
|
Multiline Retail - 0.2% | |
Neiman Marcus Group Ltd. LLC
8.75% (cash), | | | | | | | | | | | | |
10/15/2021(a)(f) | | | | | | | 87,780 | | | | 59,910 | |
| | | | | | | | | | | | |
SEE NOTES TO FINANCIAL STATEMENTS.
31
JPMorgan High Yield Opportunities Fund
SCHEDULE OF PORTFOLIO INVESTMENTS
AS OF AUGUST 31, 2018 (Unaudited) (continued)
(Amounts in U.S. Dollars, unless otherwise noted)
| | | | | | | | | | | | |
Investments | | | | | Principal
Amount | | | Value | |
Oil, Gas & Consumable Fuels - 8.3% | |
Andeavor Logistics LP
5.25%, 1/15/2025 | | | | | | | 20,000 | | | | 20,475 | |
Antero Midstream Partners LP
5.38%, 9/15/2024 | | | | | | | 100,000 | | | | 100,750 | |
Blue Racer Midstream LLC
6.13%, 11/15/2022(a) | | | | | | | 80,000 | | | | 81,598 | |
6.63%, 7/15/2026(a) | | | | | | | 25,000 | | | | 25,188 | |
Carrizo Oil & Gas, Inc.
8.25%, 7/15/2025 | | | | | | | 15,000 | | | | 16,087 | |
Cheniere Corpus Christi Holdings LLC
5.88%, 3/31/2025 | | | | | | | 35,000 | | | | 37,187 | |
5.13%, 6/30/2027 | | | | | | | 30,000 | | | | 30,525 | |
Chesapeake Energy Corp.
8.00%, 12/15/2022(a) | | | | | | | 70,000 | | | | 73,587 | |
8.00%, 1/15/2025 | | | | | | | 95,000 | | | | 97,019 | |
8.00%, 6/15/2027 | | | | | | | 50,000 | | | | 50,625 | |
Covey Park Energy LLC
7.50%, 5/15/2025(a) | | | | | | | 30,000 | | | | 30,563 | |
DCP Midstream Operating LP
5.38%, 7/15/2025 | | | | | | | 16,000 | | | | 16,400 | |
Denbury Resources, Inc.
9.25%, 3/31/2022(a) | | | | | | | 48,000 | | | | 51,300 | |
Diamondback Energy, Inc.
5.38%, 5/31/2025 | | | | | | | 20,000 | | | | 20,450 | |
EnLink Midstream Partners LP
4.40%, 4/1/2024 | | | | | | | 40,000 | | | | 38,975 | |
4.85%, 7/15/2026 | | | | | | | 20,000 | | | | 19,415 | |
EP Energy LLC
9.38%, 5/1/2024(a) | | | | | | | 115,000 | | | | 90,563 | |
8.00%, 11/29/2024(a) | | | | | | | 30,000 | | | | 30,075 | |
8.00%, 2/15/2025(a) | | | | | | | 15,000 | | | | 10,837 | |
7.75%, 5/15/2026(a) | | | | | | | 140,000 | | | | 143,150 | |
Gulfport Energy Corp.
6.63%, 5/1/2023 | | | | | | | 25,000 | | | | 25,500 | |
Halcon Resources Corp.
6.75%, 2/15/2025 | | | | | | | 55,000 | | | | 51,356 | |
Hess Infrastructure Partners LP
5.63%, 2/15/2026(a) | | | | | | | 20,000 | | | | 20,150 | |
Jagged Peak Energy LLC
5.88%, 5/1/2026(a) | | | | | | | 20,000 | | | | 19,700 | |
MEG Energy Corp. (Canada)
7.00%, 3/31/2024(a) | | | | | | | 145,000 | | | | 131,769 | |
6.50%, 1/15/2025(a) | | | | | | | 45,000 | | | | 44,775 | |
Newfield Exploration Co.
5.38%, 1/1/2026 | | | | | | | 60,000 | | | | 62,550 | |
NGPL PipeCo LLC
4.38%, 8/15/2022(a) | | | | | | | 35,000 | | | | 35,263 | |
4.88%, 8/15/2027(a) | | | | | | | 10,000 | | | | 10,077 | |
Oasis Petroleum, Inc.
6.88%, 1/15/2023 | | | | | | | 140,000 | | | | 142,975 | |
6.25%, 5/1/2026(a) | | | | | | | 40,000 | | | | 40,700 | |
Parsley Energy LLC
5.38%, 1/15/2025(a) | | | | | | | 20,000 | | | | 20,148 | |
5.25%, 8/15/2025(a) | | | | | | | 30,000 | | | | 29,775 | |
5.63%, 10/15/2027(a) | | | | | | | 20,000 | | | | 20,250 | |
SM Energy Co.
6.63%, 1/15/2027 | | | | | | | 28,000 | | | | 28,876 | |
Southwestern Energy Co.
4.10%, 3/15/2022 | | | | | | | 30,000 | | | | 29,250 | |
| | | | | | | | | | | | |
Investments | | | | | Principal
Amount | | | Value | |
6.20%, 1/23/2025(g) | | | | | | | 75,000 | | | | 75,094 | |
7.50%, 4/1/2026 | | | | | | | 20,000 | | | | 20,950 | |
7.75%, 10/1/2027 | | | | | | | 20,000 | | | | 21,150 | |
Summit Midstream Holdings LLC
5.75%, 4/15/2025 | | | | | | | 25,000 | | | | 24,125 | |
Sunoco LP
4.88%, 1/15/2023(a) | | | | | | | 10,000 | | | | 9,865 | |
5.50%, 2/15/2026(a) | | | | | | | 15,000 | | | | 14,363 | |
Tallgrass Energy Partners LP
5.50%, 1/15/2028(a) | | | | | | | 60,000 | | | | 60,600 | |
Targa Resources Partners LP
4.25%, 11/15/2023 | | | | | | | 100,000 | | | | 97,000 | |
5.88%, 4/15/2026(a) | | | | | | | 35,000 | | | | 35,875 | |
5.00%, 1/15/2028(a) | | | | | | | 30,000 | | | | 29,138 | |
Whiting Petroleum Corp.
5.75%, 3/15/2021 | | | | | | | 85,000 | | | | 87,125 | |
6.63%, 1/15/2026 | | | | | | | 15,000 | | | | 15,600 | |
WildHorse Resource Development Corp.
6.88%, 2/1/2025 | | | | | | | 50,000 | | | | 50,375 | |
6.88%, 2/1/2025(a) | | | | | | | 15,000 | | | | 15,113 | |
WPX Energy, Inc.
6.00%, 1/15/2022 | | | | | | | 15,000 | | | | 15,487 | |
8.25%, 8/1/2023 | | | | | | | 15,000 | | | | 17,025 | |
5.75%, 6/1/2026 | | | | | | | 21,000 | | | | 21,184 | |
| | | | | | | | | | | | |
| | | | | | | | | | | 2,307,952 | |
| | | | | | | | | | | | |
|
Personal Products - 0.4% | |
Coty, Inc.
6.50%, 4/15/2026(a) | | | | | | | 70,000 | | | | 65,844 | |
High Ridge Brands Co.
8.88%, 3/15/2025(a) | | | | | | | 40,000 | | | | 18,800 | |
Prestige Brands, Inc.
6.38%, 3/1/2024(a) | | | | | | | 20,000 | | | | 20,181 | |
| | | | | | | | | | | | |
| | | | | | | | | | | 104,825 | |
| | | | | | | | | | | | |
|
Pharmaceuticals - 3.6% | |
Bausch Health Cos., Inc.
4.50%, 5/15/2023(b) | | | EUR | | | | 435,000 | | | | 492,303 | |
7.00%, 3/15/2024(a) | | | | | | | 45,000 | | | | 47,475 | |
6.13%, 4/15/2025(a) | | | | | | | 225,000 | | | | 209,250 | |
5.50%, 11/1/2025(a) | | | | | | | 25,000 | | | | 24,937 | |
9.00%, 12/15/2025(a) | | | | | | | 55,000 | | | | 58,163 | |
8.50%, 1/31/2027(a) | | | | | | | 26,000 | | | | 26,715 | |
inVentiv Group Holdings, Inc.
7.50%, 10/1/2024(a) | | | | | | | 31,000 | | | | 32,786 | |
Nidda BondCo GmbH (Germany)
5.00%, 9/30/2025(b) | | | EUR | | | | 100,000 | | | | 113,071 | |
| | | | | | | | | | | | |
| | | | | | | | | | | 1,004,700 | |
| | | | | | | | | | | | |
|
Professional Services - 0.4% | |
La Financiere Atalian SASU (France) | | | | | | | | | | | | |
5.13%, 5/15/2025(a) | | | EUR | | | | 100,000 | | | | 114,131 | |
| | | | | | | | | | | | |
|
Road & Rail - 1.7% | |
Avis Budget Car Rental LLC
6.38%, 4/1/2024(a) | | | | | | | 125,000 | | | | 124,375 | |
Herc Rentals, Inc.
7.75%, 6/1/2024(a) | | | | | | | 85,000 | | | | 91,668 | |
Hertz Corp. (The)
7.63%, 6/1/2022(a) | | | | | | | 70,000 | | | | 69,475 | |
6.25%, 10/15/2022 | | | | | | | 45,000 | | | | 41,962 | |
SEE NOTES TO FINANCIAL STATEMENTS.
32
JPMorgan High Yield Opportunities Fund
SCHEDULE OF PORTFOLIO INVESTMENTS
AS OF AUGUST 31, 2018 (Unaudited) (continued)
(Amounts in U.S. Dollars, unless otherwise noted)
| | | | | | | | | | | | |
Investments | | | | | Principal
Amount | | | Value | |
5.50%, 10/15/2024(a) | | | | | | | 185,000 | | | | 154,938 | |
| | | | | | | | | | | | |
| | | | | | | | | | | 482,418 | |
| | | | | | | | | | | | |
|
Semiconductors & Semiconductor Equipment - 0.5% | |
Amkor Technology, Inc.
6.38%, 10/1/2022 | | | | | | | 100,000 | | | | 101,750 | |
Entegris, Inc.
4.63%, 2/10/2026(a) | | | | | | | 45,000 | | | | 43,369 | |
| | | | | | | | | | | | |
| | | | | | | | | | | 145,119 | |
| | | | | | | | | | | | |
| | |
Software - 1.8% | | | | | | | | | |
ACI Worldwide, Inc.
6.38%, 8/15/2020(a) | | | | | | | 100,000 | | | | 100,000 | |
5.75%, 8/15/2026(a) | | | | | | | 41,000 | | | | 41,410 | |
Ascend Learning LLC
6.88%, 8/1/2025(a) | | | | | | | 20,000 | | | | 20,200 | |
Fair Isaac Corp.
5.25%, 5/15/2026(a) | | | | | | | 21,000 | | | | 21,158 | |
Infor US, Inc.
6.50%, 5/15/2022 | | | | | | | 260,000 | | | | 263,372 | |
Informatica LLC
7.13%, 7/15/2023(a) | | | | | | | 70,000 | | | | 71,225 | |
| | | | | | | | | | | | |
| | | | | | | | | | | 517,365 | |
| | | | | | | | | | | | |
|
Specialty Retail - 1.7% | |
EVOCA SpA (Italy)
7.00%, 10/15/2023(b) | | | EUR | | | | 100,000 | | | | 123,550 | |
Hema Bondco I BV (Netherlands)
(EURIBOR 3 Month + | | | | | | | | | | | | |
6.25%), 6.25%, | | | | | | | | | | | | |
7/15/2022(b)(d) | | | EUR | | | | 100,000 | | | | 110,704 | |
PetSmart, Inc.
7.13%, 3/15/2023(a) | | | | | | | 90,000 | | | | 60,525 | |
5.88%, 6/1/2025(a) | | | | | | | 60,000 | | | | 48,675 | |
8.88%, 6/1/2025(a) | | | | | | | 35,000 | | | | 23,625 | |
Staples, Inc.
8.50%, 9/15/2025(a) | | | | | | | 100,000 | | | | 94,490 | |
| | | | | | | | | | | | |
| | | | | | | | | | | 461,569 | |
| | | | | | | | | | | | |
|
Trading Companies & Distributors - 1.3% | |
Rexel SA (France)
2.63%, 6/15/2024(b) | | | EUR | | | | 100,000 | | | | 118,440 | |
United Rentals North America, Inc. | | | | | | | | | | | | |
5.50%, 5/15/2027 | | | | | | | 170,000 | | | | 169,575 | |
4.88%, 1/15/2028 | | | | | | | 75,000 | | | | 71,484 | |
| | | | | | | | | | | | |
| | | | | | | | | | | 359,499 | |
| | | | | | | | | | | | |
|
Wireless Telecommunication Services - 5.0% | |
Crystal Almond SARL (Greece)
10.00%, 11/1/2021(b) | | | EUR | | | | 100,000 | | | | 125,361 | |
Sprint Corp.
7.63%, 2/15/2025 | | | | | | | 680,000 | | | | 721,650 | |
7.63%, 3/1/2026 | | | | | | | 15,000 | | | | 15,753 | |
Telefonica Europe BV (Spain)
(EUR Swap Annual 8 Year + | | | | | | | | | | | | |
2.97%), 3.88%, | | | | | | | | | | | | |
9/22/2026(b)(c)(d)(e) | | | EUR | | | | 100,000 | | | | 107,067 | |
T-Mobile US, Inc.
6.50%, 1/15/2024‡ | | | | | | | 95,000 | | | | — | |
6.50%, 1/15/2026‡ | | | | | | | 160,000 | | | | — | |
T-Mobile USA, Inc.
6.50%, 1/15/2024 | | | | | | | 95,000 | | | | 98,325 | |
6.50%, 1/15/2026 | | | | | | | 160,000 | | | | 169,150 | |
4.75%, 2/1/2028 | | | | | | | 25,000 | | | | 23,545 | |
| | | | | | | | | | | | |
Investments | | | | | Principal
Amount | | | Value | |
4.75%, 2/1/2028‡ | | | | | | | 25,000 | | | | — | |
United States Cellular Corp.
6.70%, 12/15/2033 | | | | | | | 125,000 | | | | 127,656 | |
| | | | | | | | | | | | |
| | | | | | | | | | | 1,388,507 | |
| | | | | | | | | | | | |
TOTAL CORPORATE BONDS
(Cost $24,744,806) | | | | | | | | 24,644,795 | |
| | | | | | | | | | | | |
Investments | | | | | Principal
Amount | | | Value | |
|
LOAN ASSIGNMENTS - 4.2%(h) | |
|
Communications Equipment - 0.2% | |
Plantronics, Inc., 1st Lien Term Loan
(ICE LIBOR USD 3 Month + 2.50%), 4.58%, 7/2/2025(d) | | | | | | | 65,000 | | | | 64,810 | |
| | | | | | | | | | | | |
|
Containers & Packaging - 0.4% | |
Bway Holding Co., 1st Lien Term | | | | | | | | | | | | |
Loan
(ICE LIBOR USD 3 Month + 3.25%), 5.58%, 4/3/2024(d) | | | | | | | 108,900 | | | | 108,433 | |
| | | | | | | | | | | | |
|
Health Care Providers & Services - 0.4% | |
AirMedical Group, 1st Lien Term | | | | | | | | | | | | |
Loan B
(ICE LIBOR USD 1 Month + 4.25%), 6.33%, 3/14/2025(d) | | | | | | | 104,475 | | | | 103,757 | |
| | | | | | | | | | | | |
|
Hotels, Restaurants & Leisure - 0.3% | |
Club Corp Holdings, Inc., Term Loan B
(ICE LIBOR USD 2 Month + 2.75%), 5.08%, 9/18/2024(d) | | | | | | | 93,030 | | | | 91,937 | |
| | | | | | | | | | | | |
|
Household Products - 0.1% | |
Kronos Acquisition Intermediate Inc., | | | | | | | | | | | | |
1st Lien Term B Loan (Canada)
(ICE LIBOR USD 1 Month + 4.00%), 6.06%, 5/15/2023(d) | | | | | | | 30,000 | | | | 29,719 | |
| | | | | | | | | | | | |
|
Leisure Products - 0.5% | |
Steinway Musical Instruments, Inc., 1st Lien Term Loan B
(ICE LIBOR USD 1 Month + 3.75%), 5.81%, 2/14/2025(d) | | | | | | | 134,663 | | | | 134,663 | |
| | | | | | | | | | | | |
|
Machinery - 0.6% | |
Accudyne Industries LLC, Term
Loan B
(ICE LIBOR USD 1 Month + 3.00%), 5.08%, 8/18/2024(d) | | | | | | | 69,352 | | | | 69,526 | |
Titan Acquisition Ltd., 1st Lien Term | | | | | | | | | | | | |
Loan B
(ICE LIBOR USD 1 Month + 3.00%), 5.08%, 3/28/2025(d) | | | | | | | 109,725 | | | | 103,847 | |
| | | | | | | | | | | | |
| | | | | | | | | | | 173,373 | |
| | | | | | | | | | | | |
|
Media - 0.6% | |
iHeartCommunications, Inc., Term | | | | | | | | | | | | |
Loan D(f) | | | | | | | | | | | | |
(ICE LIBOR USD 1 Month + 6.75%), 8.83%, 1/30/2019(d) | | | | | | | 150,000 | | | | 111,626 | |
SEE NOTES TO FINANCIAL STATEMENTS.
33
JPMorgan High Yield Opportunities Fund
SCHEDULE OF PORTFOLIO INVESTMENTS
AS OF AUGUST 31, 2018 (Unaudited) (continued)
(Amounts in U.S. Dollars, unless otherwise noted)
| | | | | | | | | | | | |
Investments | | | | | Principal
Amount | | | Value | |
Meredith Corp., 1st Lien Term Loan B
(ICE LIBOR USD 1 Month + 3.00%),
5.08%, 1/31/2025(d) | | | | | | | 65,936 | | | | 66,082 | |
| | | | | | | | | | | | |
| | | | | | | | | | | 177,708 | |
| | | | | | | | | | | | |
|
Multiline Retail - 0.4% | |
Neiman Marcus Group, Inc., Other Term Loan | | | | | | | | | | | | |
(ICE LIBOR USD 1 Month + 3.25%), 5.33%, 10/25/2020(d) | | | | | | | 113,222 | | | | 104,956 | |
| | | | | | | | | | | | |
|
Oil, Gas & Consumable Fuels - 0.1% | |
MEG Energy Corp., 1st Lien Term B | | | | | | | | | | | | |
Loan (Canada) | | | | | | | | | | | | |
(ICE LIBOR USD 1 Month + 3.50%), 5.58%, 12/31/2023(d) | | | | | | | 9,375 | | | | 9,382 | |
| | | | | | | | | | | | |
|
Real Estate Management & Development - 0.2% | |
CityCenter Holdings LLC, Term Loan B | | | | | | | | | | | | |
(ICE LIBOR USD 1 Month + 2.25%), 4.33%, 4/18/2024(d) | | | | | | | 59,662 | | | | 59,634 | |
| | | | | | | | | | | | |
|
Specialty Retail - 0.4% | |
Staples, Inc., 1st Lien Term Loan | | | | | | | | | | | | |
(ICE LIBOR USD 3 Month + 4.00%), 6.34%, 9/12/2024(d) | | | | | | | 109,175 | | | | 108,805 | |
| | | | | | | | | | | | |
|
| TOTAL LOAN ASSIGNMENTS | |
| (Cost $1,183,113) | | | | | | | | | | | 1,167,177 | |
| | | | | | | | | | | | |
Investments | | | | | Principal
Amount | | | Value | |
| |
CONVERTIBLE BONDS - 2.6% | | | | | |
|
Communications Equipment - 0.3% | |
Finisar Corp.
0.50%, 12/15/2036 | | | | | | | 100,000 | | | | 92,149 | |
| | | | | | | | | | | | |
|
Electronic Equipment, Instruments & Components - 0.4% | |
II-VI, Inc.
0.25%, 9/1/2022(a) | | | | | | | 100,000 | | | | 121,000 | |
| | | | | | | | | | | | |
|
Media - 1.0% | |
DISH Network Corp.
3.38%, 8/15/2026 | | | | | | | 40,000 | | | | 37,624 | |
Live Nation Entertainment, Inc.
2.50%, 5/15/2019 | | | | | | | 100,000 | | | | 145,139 | |
2.50%, 3/15/2023(a) | | | | | | | 100,000 | | | | 103,562 | |
| | | | | | | | | | | | |
| | | | | | | | | | | 286,325 | |
| | | | | | | | | | | | |
|
Oil, Gas & Consumable Fuels - 0.0%(i) | |
Chesapeake Energy Corp.
5.50%, 9/15/2026(g) | | | | | | | 10,000 | | | | 9,679 | |
| | | | | | | | | | | | |
|
Semiconductors & Semiconductor Equipment - 0.9% | |
Cypress Semiconductor Corp.
2.00%, 2/1/2023(a) | | | | | | | 100,000 | | | | 106,958 | |
| | | | | | | | | | | | |
Investments | | | | | Principal
Amount | | | Value | |
ON Semiconductor Corp. | | | | | | | | | | | | |
1.00%, 12/1/2020 | | | | | | | 100,000 | | | | 127,011 | |
| | | | | | | | | | | | |
| | | | | | | | | | | 233,969 | |
| | | | | | | | | | | | |
| TOTAL CONVERTIBLE BONDS | | | | | | | | | | | | |
(Cost $661,111) | | | | | | | | | | | 743,122 | |
| | | | | | | | | | | | |
Investments | | | | | Shares | | | Value | |
| | | |
COMMON STOCKS - 0.8% | | | | | | | | | | | | |
|
Equity Real Estate Investment Trusts (REITs) - 0.6% | |
VICI Properties, Inc.‡ | | | | | | | 6,638 | | | | 138,800 | |
VICI Properties, Inc.*‡ | | | | | | | 1,757 | | | | 36,739 | |
| | | | | | | | | | | | |
| | | | | | | | | | | 175,539 | |
| | | | | | | | | | | | |
|
Hotels, Restaurants & Leisure - 0.2% | |
Caesars Entertainment Corp.* | | | | | | | 4,948 | | | | 50,470 | |
| | | | | | | | | | | | |
| TOTAL COMMON STOCKS | | | | | | | | | | | | |
(Cost $190,641) | | | | | | | | | | | 226,009 | |
| | | | | | | | | | | | |
Investments | | | | | Shares | | | Value | |
|
SHORT-TERM INVESTMENTS - 4.7% | |
|
INVESTMENT COMPANIES - 4.7% | |
JPMorgan U.S. Government Money | | | | | | | | | | | | |
Market Fund Class Institutional | | | | | | | | | | | | |
Shares, 1.82%(j)(k) (Cost $1,301,007) | | | | | | | 1,301,007 | | | | 1,301,007 | |
| | | | | | | | | | | | |
Total Investments - 100.6%
(Cost $28,080,678) | | | | | | | | | | | 28,082,110 | |
Liabilities in Excess of
Other Assets - (0.6%) | | | | | | | | | | | (176,422 | ) |
| | | | | | | | | | | | |
Net Assets - 100.0% | | | | | | | | | | | 27,905,688 | |
| | | | | | | | | | | | |
Percentages indicated are based on net assets.
SEE NOTES TO FINANCIAL STATEMENTS.
34
JPMorgan High Yield Opportunities Fund
SCHEDULE OF PORTFOLIO INVESTMENTS
AS OF AUGUST 31, 2018 (Unaudited)
(Amounts in U.S. Dollars, unless otherwise noted)
Futures contracts outstanding as of August 31, 2018:
| | | | | | | | | | | | | | | | | | | | |
Description | | Number of
Contracts | | | Expiration
Date | | | Trading Currency | | | Notional Amount
($) | | | Value and
Unrealized
Appreciation
(Depreciation) ($) | |
Short Contracts | | | | | | | | | | | | | | | | | | | | |
U.S. Treasury 10 Year Note | | | (4 | ) | | | 12/2018 | | | | USD | | | | (480,625 | ) | | | 616 | |
U.S. Treasury 5 Year Note | | | (6 | ) | | | 12/2018 | | | | USD | | | | (680,109 | ) | | | 34 | |
| | | | | | | | | | | | | | | | | | | | |
| | | | | | | | | | | | | | | | | | | 650 | |
| | | | | | | | | | | | | | | | | | | | |
Forward foreign currency exchange contracts outstanding as of August 31, 2018:
| | | | | | | | | | | | | | | | | | | | |
Currency Purchased | | | Currency Sold | | | Counterparty | | Settlement
Date | | | Unrealized
Appreciation
(Depreciation)
($) | |
EUR | | | 20,940 | | | USD | | | 24,284 | | | Australia & New Zealand Banking | | | | | | | | |
| | | | | | | | | | | | Group Ltd. | | | 9/5/2018 | | | | 21 | |
USD | | | 8,514 | | | EUR | | | 7,278 | | | Barclays Bank plc | | | 9/5/2018 | | | | 66 | |
USD | | | 1,550,644 | | | EUR | | | 1,318,230 | | | Citibank, NA | | | 9/5/2018 | | | | 20,509 | |
USD | | | 2,840,453 | | | EUR | | | 2,416,751 | | | HSBC Bank, NA | | | 9/5/2018 | | | | 35,210 | |
USD | | | 19,907 | | | EUR | | | 17,087 | | | Royal Bank of Canada | | | 9/5/2018 | | | | 73 | |
USD | | | 123,167 | | | GBP | | | 93,506 | | | TD Bank Financial Group | | | 9/5/2018 | | | | 1,942 | |
USD | | | 2,629,320 | | | EUR | | | 2,244,719 | | | Goldman Sachs International | | | 10/3/2018 | | | | 18,354 | |
USD | | | 1,764,612 | | | EUR | | | 1,504,994 | | | HSBC Bank, NA | | | 10/3/2018 | | | | 14,064 | |
USD | | | 146,786 | | | EUR | | | 125,631 | | | National Australia Bank Ltd. | | | 10/3/2018 | | | | 658 | |
USD | | | 121,784 | | | GBP | | | 93,506 | | | Barclays Bank plc | | | 10/3/2018 | | | | 422 | |
| | | | | | | | | | | | | | | | | | | | |
Total unrealized appreciation | | | | 91,319 | |
| | | | | | | | | | | | | | | | | | | | |
EUR | | | 2,244,719 | | | USD | | | 2,623,861 | | | Goldman Sachs International | | | 9/5/2018 | | | | (18,303 | ) |
EUR | | | 1,504,994 | | | USD | | | 1,760,952 | | | HSBC Bank, NA | | | 9/5/2018 | | | | (14,030 | ) |
EUR | | | 4,152 | | | USD | | | 4,820 | | | National Australia Bank Ltd. | | | 9/5/2018 | | | | – | (l) |
GBP | | | 93,506 | | | USD | | | 121,646 | | | Barclays Bank plc | | | 9/5/2018 | | | | (421 | ) |
USD | | | 17,784 | | | EUR | | | 15,460 | | | Royal Bank of Canada | | | 9/5/2018 | | | | (162 | ) |
| | | | | | | | | | | | | | | | | | | | |
Total unrealized depreciation | | | | (32,916 | ) |
| | | | | | | | | | | | | | | | | | | | |
Net unrealized appreciation | | | | 58,403 | |
| | | | | | | | | | | | | | | | | | | | |
SEE NOTES TO FINANCIAL STATEMENTS.
35
JPMorgan High Yield Opportunities Fund
SCHEDULE OF PORTFOLIO INVESTMENTS
AS OF AUGUST 31, 2018 (Unaudited) (continued)
Centrally Cleared Credit default swap contracts outstanding - buy protection(1) as of August 31, 2018:
| | | | | | | | | | | | | | | | |
Reference
Obligation/Index | | Financing
Rate Paid /
(Received) by
the Fund (%) | | Payments
Frequency | | Maturity
Date | | Implied
Credit
Spread (%)(2) | | Notional
Amount(3) | | Upfront
Payments
(Receipts)
($)(4) | | Unrealized
Appreciation
(Depreciation)
($) | | Value ($) |
| CDX.NA.HY.30-V1 | | 5.00 | | Quarterly | | 6/20/2023 | | 3.31 | | USD 1,000,000 | | (62,002) | | (17,230) | | (79,232) |
| | | | | | | | | | | | |
| | | | | | | | | | | | | (62,002) | | (17,230) | | (79,232) |
| | | | | | | | | | | | |
| (1) | The Fund, as a buyer of credit protection, is generally obligated to make periodic payments and may also pay or receive an upfront premium to or from the protection seller, in exchange for the right to receive a contingent payment, upon occurrence of a credit event with respect to an underlying reference obligation, as defined under the terms of individual swap contracts. |
| (2) | Implied credit spreads are an indication of the seller’s performance risk, related to the likelihood of a credit event occurring that would require a seller to make payment to a buyer. Implied credit spreads are used to determine the value of swap contracts and reflect the cost of buying/selling protection, which may include upfront payments made to enter into the contract. Therefore, higher spreads would indicate a greater likelihood that a seller will be obligated to perform (i.e. make payment) under the swap contract. Increasing values, in absolute terms and relative to notional amounts, are also indicative of greater performance risk. Implied credit spreads for credit default swaps on credit indices are linked to the weighted average spread across the underlying reference obligations included in a particular index. |
| (3) | The notional amount is the maximum amount that a seller of credit protection would be obligated to pay and a buyer of credit protection would receive, upon occurrence of a credit event. |
| (4) | Upfront payments and receipts generally represent premiums paid or received at the initiation of the agreement to compensate the differences between the stated terms of the swap agreement and current market conditions (credit spreads, interest rates and other relevant factors). |
| | | | |
Abbreviations | | | | |
CDX | | Credit Default Swap Index | | |
EUR | | Euro | | |
EURIBOR | | Euro Interbank Offered Rate | | |
GBP | | British Pound | | |
ICE | | Intercontinental Exchange | | |
LIBOR | | London Interbank Offered Rate | | |
MSCI | | Morgan Stanley Capital International | | |
SCA | | Limited partnership with share capital | | |
USD | | United States Dollar | | |
| (a) | Securities exempt from registration under Rule 144A or section 4(a)(2), of the Securities Act of 1933, as amended. Under procedures approved by the Board of Trustees, such securities have been determined to be liquid by the investment adviser and may be resold, normally to qualified institutional buyers in transactions exempt from registration. |
| (b) | Security exempt from registration pursuant to Regulation S under the Securities Act of 1933, as amended. Regulation S applies to securities offerings that are made outside of the United States and do not involve direct selling efforts in the United States and as such may have restrictions on resale. |
| (c) | Security is perpetual and thus, does not have a predetermined maturity date. The coupon rate for this security is fixed for a period of time and may be structured to adjust thereafter. The date shown, if applicable, reflects the next call date. The coupon rate shown is the rate in effect as of August 31, 2018. |
| (d) | Variable or floating rate security, linked to the referenced benchmark. The interest rate shown is the current rate as of August 31, 2018. |
| (e) | Security is an interest bearing note with preferred security characteristics. |
SEE NOTES TO FINANCIAL STATEMENTS.
36
JPMorgan High Yield Opportunities Fund
SCHEDULE OF PORTFOLIO INVESTMENTS
AS OF AUGUST 31, 2018 (Unaudited) (continued)
| (f) | Security has the ability to pay in kind (“PIK”) or pay income in cash. When applicable, separate rates of such payments are disclosed. |
| (g) | Step bond. Interest rate is a fixed rate for an initial period that either resets at a specific date or may reset in the future contingent upon a predetermined trigger. The interest rate shown is the current rate as of August 31, 2018. |
| (h) | Loan assignments are presented by obligor. Each series or loan tranche underlying each obligor may have varying terms. (i) Amount rounds to less than 0.1% of net assets. |
| (j) | Investment in affiliate. Fund is registered under the Investment Company Act of 1940, as amended, and advised by J.P. |
Morgan Investment Management Inc.
| (k) | The rate shown is the current yield as of August 31, 2018. (l) Amount rounds to less than 1. |
| * | Non-income producing security. |
| ‡ | Value determined using significant unobservable inputs. |
SEE NOTES TO FINANCIAL STATEMENTS.
37
STATEMENTS OF ASSETS AND LIABILITIES
AS OF AUGUST 31, 2018
| | | | | | | | | | | | |
| | | JPMorgan Flexible
Long/Short Fund | | | JPMorgan High Yield
Opportunities Fund | | | | |
| |
ASSETS: | | | | | | | | | | | | |
Investments in non-affiliates, at value | | $ | 25,186,401 | | | $ | 26,781,103 | | | | | |
Investments in affiliates, at value | | | 1,662,330 | | | | 1,301,007 | | | | | |
Options and swaptions purchased, at value | | | 16,107 | | | | — | | | | | |
Cash | | | 43,443 | | | | 4,975 | | | | | |
Foreign currency, at value | | | 10,640 | | | | — | | | | | |
Deposits at broker for futures contracts | | | 33,000 | | | | 30,000 | | | | | |
Deposits at broker for centrally cleared swaps | | | 34,386 | | | | 45,000 | | | | | |
Receivables: | | | | | | | | | | | | |
Investment securities sold | | | 90,186 | | | | 76,177 | | | | | |
Interest from non-affiliates | | | 284,706 | | | | 379,023 | | | | | |
Dividends from affiliates | | | 2,825 | | | | 2,389 | | | | | |
Tax reclaims | | | 2,483 | | | | — | | | | | |
Unrealized appreciation on forward foreign currency exchange contracts | | | 129,944 | | | | 91,319 | | | | | |
Outstanding OTC swap contracts, at value (net upfront payments of $664 and $0, respectively) | | | 393 | | | | — | | | | | |
Due from Adviser | | | 13,440 | | | | 2,651 | | | | | |
| | | | |
Total Assets | | | 27,510,284 | | | | 28,713,644 | | | | | |
| | | | |
| | | |
LIABILITIES: | | | | | | | | | | | | |
Payables: | | | | | | | | | | | | |
Foreign currency due to custodian, at value | | | — | | | | 482,171 | | | | | |
Investment securities purchased | | | 408,210 | | | | 175,962 | | | | | |
Variation margin on futures contracts | | | 3,942 | | | | 328 | | | | | |
Unrealized depreciation on forward foreign currency exchange contracts | | | 46,972 | | | | 32,916 | | | | | |
Outstanding options and swaptions written, at fair value | | | 3,876 | | | | — | | | | | |
Outstanding OTC swap contracts, at value (net upfront receipts of $41,714 and $0, respectively) | | | 45,606 | | | | — | | | | | |
Variation margin on centrally cleared swaps (net upfront receipts of $45,410 and $62,002 respectively) | | | 385 | | | | 1,999 | | | | | |
Accrued liabilities: | | | | | | | | | | | | |
Distribution fees | | | 18 | | | | 19 | | | | | |
Service fees | | | 5,685 | | | | 4,729 | | | | | |
Custodian and accounting fees | | | 9,063 | | | | 6,858 | | | | | |
Collateral management fees | | | 3,487 | | | | 884 | | | | | |
Trustees’ and Chief Compliance Officer’s fees | | | 132 | | | | 208 | | | | | |
Audit fees | | | 84,098 | | | | 81,649 | | | | | |
Other | | | 13,013 | | | | 20,233 | | | | | |
| | | | |
Total Liabilities | | | 624,487 | | | | 807,956 | | | | | |
| | | | |
Net Assets | | $ | 26,885,797 | | | $ | 27,905,688 | | | | | |
| | | | |
SEE NOTES TO FINANCIAL STATEMENTS.
38
STATEMENTS OF ASSETS AND LIABILITIES
AS OF AUGUST 31, 2018 (continued)
| | | | | | | | |
| | | JPMorgan Flexible
Long/Short Fund | | | JPMorgan High Yield
Opportunities Fund | |
| |
NET ASSETS: | | | | | | | | |
Paid-in-Capital | | $ | 26,574,277 | | | $ | 27,811,533 | |
Accumulated undistributed (distributions in excess of) net investment income | | | (9,695 | ) | | | (15,639) | |
Accumulated net realized gains (losses) | | | 423,972 | | | | 68,543 | |
Net unrealized appreciation (depreciation) | | | (102,757 | ) | | | 41,251 | |
| | | | |
Total Net Assets | | $ | 26,885,797 | | | $ | 27,905,688 | |
| | | | |
| | |
Net Assets: | | | | | | | | |
Class A | | $ | 21,393 | | | $ | 22,293 | |
Class C | | | 21,163 | | | | 22,068 | |
Class I | | | 26,821,616 | | | | 27,838,872 | |
Class R6 | | | 21,625 | | | | 22,455 | |
| | | | |
Total | | $ | 26,885,797 | | | $ | 27,905,688 | |
| | | | |
| | |
Outstanding units of beneficial interest (shares) | | | | | | | | |
($0.0001 par value; unlimited number of shares authorized): | | | | | | | | |
Class A | | | 2,114 | | | | 2,217 | |
Class C | | | 2,099 | | | | 2,195 | |
Class I | | | 2,650,237 | | | | 2,768,819 | |
Class R6 | | | 2,137 | | | | 2,233 | |
| | |
Net Asset Value (a): | | | | | | | | |
Class A - Redemption price per share | | $ | 10.12 | | | $ | 10.06 | |
Class C - Offering price per share (b) | | | 10.08 | | | | 10.05 | |
Class I - Offering and redemption price per share | | | 10.12 | | | | 10.05 | |
Class R6 - Offering and redemption price per share | | | 10.12 | | | | 10.06 | |
Class A maximum sales charge | | | 3.75 | % | | | 3.75% | |
Class A maximum public offering price per share | | | | | | | | |
[net asset value per share/(100% – maximum sales charge)] | | $ | 10.51 | | | $ | 10.45 | |
| | | | |
| | |
Cost of investments in non-affiliates | | $ | 25,363,386 | | | $ | 26,779,671 | |
Cost of investments in affiliates | | | 1,662,279 | | | | 1,301,007 | |
Cost of options and swaptions purchased | | | 54,820 | | | | — | |
Cost of foreign currency | | | 10,634 | | | | (480,673) | |
Premiums received from options and swaptions written | | | 30,299 | | | | — | |
(a) Per share amounts may not recalculate due to rounding of net assets and/or shares outstanding.
(b) Redemption price for Class C Shares varies based upon length of time the shares are held.
SEE NOTES TO FINANCIAL STATEMENTS.
39
STATEMENTS OF OPERATIONS
FOR THE SIX MONTHS ENDED AUGUST 31, 2018 (Unaudited)
| | | | | | | | | | | | |
| | | JPMorgan
Flexible Long/Short
Fund | | | JPMorgan High
Yield
Opportunities
Fund | | | | |
| |
INVESTMENT INCOME: | | | | | | | | | | | | |
Interest income from non-affiliates | | $ | 615,005 | | | $ | �� 830,428 | | | | | |
Interest income from affiliates | | | 3 | | | | — | | | | | |
Dividend income from non-affiliates | | | — | | | | 3,547 | | | | | |
Dividend income from affiliates | | | 9,526 | | | | 7,938 | | | | | |
Foreign taxes withheld | | | (4,830 | ) | | | (2,217 | ) | | | | |
| | | | |
Total investment income | | | 619,704 | | | | 839,696 | | | | | |
| | | | |
| | | |
EXPENSES: | | | | | | | | | | | | |
Investment advisory fees | | | 67,253 | | | | 83,362 | | | | | |
Administration fees | | | 10,907 | | | | 11,266 | | | | | |
Distribution fees: | | | | | | | | | | | | |
Class A | | | 27 | | | | 28 | | | | | |
Class C | | | 79 | | | | 82 | | | | | |
Service fees: | | | | | | | | | | | | |
Class A | | | 27 | | | | 28 | | | | | |
Class C | | | 26 | | | | 27 | | | | | |
Class I | | | 33,546 | | | | 34,651 | | | | | |
Custodian and accounting fees | | | 43,930 | | | | 17,854 | | | | | |
Collateral management fees | | | 6,974 | | | | 1,768 | | | | | |
Interest expense to affiliates | | | 83 | | | | 740 | | | | | |
Professional fees | | | 61,475 | | | | 62,240 | | | | | |
Trustees’ and Chief Compliance Officer’s fees | | | 12,555 | | | | 12,632 | | | | | |
Printing and mailing costs | | | 3,309 | | | | 3,927 | | | | | |
Registration and filing fees | | | 221 | | | | 239 | | | | | |
Transfer agency fees (See Note 2.I.) | | | 87 | | | | 83 | | | | | |
Other | | | 5,406 | | | | 5,784 | | | | | |
| | | | |
Total expenses | | | 245,905 | | | | 234,711 | | | | | |
| | | | |
Less fees waived | | | (79,147 | ) | | | (102,577 | ) | | | | |
Less expense reimbursements | | | (46,253 | ) | | | (21,074 | ) | | | | |
| | | | |
Net expenses | | | 120,505 | | | | 111,060 | | | | | |
| | | | |
Net investment income (loss) | | | 499,199 | | | | 728,636 | | | | | |
| | | | |
| | | |
REALIZED/UNREALIZED GAINS (LOSSES): | | | | | | | | | | | | |
Net realized gain (loss) on transactions from: | | | | | | | | | | | | |
Investments in non-affiliates | | | 9,449 | | | | 124,101 | | | | | |
Investments in affiliates | | | 26 | | | | — | | | | | |
Options and swaptions purchased | | | (36,162 | ) | | | — | | | | | |
Futures contracts | | | (19,339 | ) | | | (3,429 | ) | | | | |
Foreign currency transactions | | | 2,395 | | | | 2,458 | | | | | |
Forward foreign currency exchange contracts | | | 530,607 | | | | 332,765 | | | | | |
Options and swaptions written | | | 33,500 | | | | — | | | | | |
Swaps | | | (4,737 | ) | | | (19,306 | ) | | | | |
| | | | |
Net realized gain (loss) | | | 515,739 | | | | 436,589 | | | | | |
| | | | |
Change in net unrealized appreciation/depreciation on: | | | | | | | | | | | | |
Investments in non-affiliates | | | (710,642 | ) | | | (489,887 | ) | | | | |
Investments in affiliates | | | 60 | | | | — | | | | | |
Options and swaptions purchased | | | (42,690 | ) | | | — | | | | | |
Futures contracts | | | 1,483 | | | | 1,640 | | | | | |
Foreign currency translations | | | (4,043 | ) | | | (2,261 | ) | | | | |
Forward foreign currency exchange contracts | | | (86,445 | ) | | | (42,511 | ) | | | | |
Options and swaptions written | | | 25,450 | | | | — | | | | | |
Swaps | | | (10,201 | ) | | | (9,779 | ) | | | | |
| | | | |
Change in net unrealized appreciation/depreciation | | | (827,028 | ) | | | (542,798 | ) | | | | |
| | | | |
Net realized/unrealized gains (losses) | | | (311,289 | ) | | | (106,209 | ) | | | | |
| | | | |
Change in net assets resulting from operations | | $ | 187,910 | | | $ | 622,427 | | | | | |
| | | | |
SEE NOTES TO FINANCIAL STATEMENTS.
40
STATEMENTS OF CHANGES IN NET ASSETS
FOR THE PERIODS INDICATED
| | | | | | | | | | | | | | | | | | | | |
| | | JPMorgan Flexible Long/Short Fund | | | JPMorgan High Yield Opportunities Fund | | | | |
| | | | |
| | | Six Months Ended
August 31, 2018 | | | Year Ended | | | Six Months Ended
August 31, 2018 | | | Year Ended | | | | |
| | | (Unaudited) | | | February 28, 2018 | | | (Unaudited) | | | February 28, 2018 | | | | |
| |
CHANGE IN NET ASSETS RESULTING FROM OPERATIONS: | | | | | | | | | | | | | | | | | |
Net investment income (loss) | | $ | 499,199 | | | $ | 973,422 | | | $ | 728,636 | | | $ | 1,384,884 | | | | | |
Net realized gain (loss) | | | 515,739 | | | | (726,542 | ) | | | 436,589 | | | | (190,509 | ) | | | | |
Change in net unrealized appreciation/depreciation | | | (827,028 | ) | | | 611,840 | | | | (542,798 | ) | | | (44,278 | ) | | | | |
| | | | |
Change in net assets resulting from operations | | | 187,910 | | | | 858,720 | | | | 622,427 | | | | 1,150,097 | | | | | |
| | | | |
| | | | | |
DISTRIBUTIONS TO SHAREHOLDERS: | | | | | | | | | | | | | | | | | | | | |
Class A | | | | | | | | | | | | | | | | | | | | |
From net investment income | | | (84 | ) | | | (549 | ) | | | (622 | ) | | | (1,108 | ) | | | | |
From net realized gains | | | — | | | | — | | | | — | | | | (196 | ) | | | | |
Class C | | | | | | | | | | | | | | | | | | | | |
From net investment income | | | (53 | ) | | | (495 | ) | | | (556 | ) | | | (986 | ) | | | | |
From net realized gains | | | — | | | | — | | | | — | | | | (194 | ) | | | | |
Class I | | | | | | | | | | | | | | | | | | | | |
From net investment income | | | (140,114 | ) | | | (745,177 | ) | | | (807,797 | ) | | | (1,439,410 | ) | | | | |
From net realized gains | | | — | | | | — | | | | — | | | | (244,505 | ) | | | | |
Class R6 | | | | | | | | | | | | | | | | | | | | |
From net investment income | | | (140 | ) | | | (652 | ) | | | (671 | ) | | | (1,198 | ) | | | | |
From net realized gains | | | — | | | | — | | | | — | | | | (196 | ) | | | | |
| | | | |
Total distributions to shareholders | | | (140,391 | ) | | | (746,873 | ) | | | (809,646 | ) | | | (1,687,793 | ) | | | | |
| | | | |
| | | | | |
CAPITAL TRANSACTIONS: | | | | | | | | | | | | | | | | | | | | |
Change in net assets resulting from capital transactions | | | 140,391 | | | | 746,873 | | | | 703,905 | | | | 1,730,714 | | | | | |
| | | | |
| | | | | |
NET ASSETS: | | | | | | | | | | | | | | | | | | | | |
Change in net assets | | | 187,910 | | | | 858,720 | | | | 516,686 | | | | 1,193,018 | | | | | |
Beginning of period | | | 26,697,887 | | | | 25,839,167 | | | | 27,389,002 | | | | 26,195,984 | | | | | |
| | | | |
End of period | | $ | 26,885,797 | | | $ | 26,697,887 | | | $ | 27,905,688 | | | $ | 27,389,002 | | | | | |
| | | | |
Accumulated undistributed (distributions in excess of) net investment income | | $ | (9,695 | ) | | $ | (368,503 | ) | | $ | (15,639 | ) | | $ | 65,371 | | | | | |
| | | | |
SEE NOTES TO FINANCIAL STATEMENTS.
41
STATEMENTS OF CHANGES IN NET ASSETS
FOR THE PERIODS INDICATED (continued)
| | | | | | | | | | | | | | | | | | | | |
| | | JPMorgan Flexible Long/Short Fund | | | JPMorgan High Yield Opportunities Fund | | | | |
| | | | |
| | | Six Months Ended | | | | | | Six Months Ended | | | | | | | |
| | | August 31, 2018 | | | Year Ended | | | August 31, 2018 | | | Year Ended | | | | |
| | | (Unaudited) | | | February 28, 2018 | | | (Unaudited) | | | February 28, 2018 | | | | |
| |
CAPITAL TRANSACTIONS: | | | | | | | | | | | | | | | | | | | | |
Class A | | | | | | | | | | | | | | | | | | | | |
Distributions reinvested | | | 84 | | | | 549 | | | | 622 | | | | 1,304 | | | | | |
| | | | |
Change in net assets resulting from Class A capital transactions | | $ | 84 | | | $ | 549 | | | $ | 622 | | | $ | 1,304 | | | | | |
| | | | |
Class C | | | | | | | | | | | | | | | | | | | | |
Distributions reinvested | | | 53 | | | | 495 | | | | 556 | | | | 1,180 | | | | | |
| | | | |
Change in net assets resulting from Class C capital transactions | | $ | 53 | | | $ | 495 | | | $ | 556 | | | $ | 1,180 | | | | | |
| | | | |
Class I | | | | | | | | | | | | | | | | | | | | |
Proceeds from shares issued | | $ | — | | | $ | 892,665 | | | $ | 106,373 | | | $ | 1,298,571 | | | | | |
Distributions reinvested | | | 140,114 | | | | 745,177 | | | | 807,797 | | | | 1,683,915 | | | | | |
Cost of shares redeemed | | | — | | | | (892,665 | ) | | | (212,114 | ) | | | (1,255,650) | | | | | |
| | | | |
Change in net assets resulting from Class I capital transactions | | $ | 140,114 | | | $ | 745,177 | | | $ | 702,056 | | | $ | 1,726,836 | | | | | |
| | | | |
Class R6 | | | | | | | | | | | | | | | | | | | | |
Distributions reinvested | | | 140 | | | | 652 | | | | 671 | | | | 1,394 | | | | | |
| | | | |
Change in net assets resulting from Class R6 capital transactions | | $ | 140 | | | $ | 652 | | | $ | 671 | | | $ | 1,394 | | | | | |
| | | | |
Total change in net assets resulting from capital transactions | | $ | 140,391 | | | $ | 746,873 | | | $ | 703,905 | | | $ | 1,730,714 | | | | | |
| | | | |
| | | | | |
SHARE TRANSACTIONS: | | | | | | | | | | | | | | | | | | | | |
Class A | | | | | | | | | | | | | | | | | | | | |
Reinvested | | | 9 | | | | 54 | | | | 62 | | | | 127 | | | | | |
| | | | |
Change in Class A Shares | | | 9 | | | | 54 | | | | 62 | | | | 127 | | | | | |
| | | | |
Class C | | | | | | | | | | | | | | | | | | | | |
Reinvested | | | 5 | | | | 49 | | | | 56 | | | | 114 | | | | | |
| | | | |
Change in Class C Shares | | | 5 | | | | 49 | | | | 56 | | | | 114 | | | | | |
| | | | |
Class I | | | | | | | | | | | | | | | | | | | | |
Issued | | | — | | | | 87,516 | | | | 10,532 | | | | 126,882 | | | | | |
Reinvested | | | 13,927 | | | | 73,657 | | | | 80,724 | | | | 163,503 | | | | | |
Redeemed | | | — | | | | (87,516 | ) | | | (21,064 | ) | | | (122,742) | | | | | |
| | | | |
Change in Class I Shares | | | 13,927 | | | | 73,657 | | | | 70,192 | | | | 167,643 | | | | | |
| | | | |
Class R6 | | | | | | | | | | | | | | | | | | | | |
Reinvested | | | 14 | | | | 65 | | | | 67 | | | | 135 | | | | | |
| | | | |
Change in Class R6 Shares | | | 14 | | | | 65 | | | | 67 | | | | 135 | | | | | |
| | | | |
SEE NOTES TO FINANCIAL STATEMENTS.
42
FINANCIAL HIGHLIGHTS
FOR THE PERIODS INDICATED
| | | | | | | | | | | | | | | | | | | | | | | | | | | | | | | | | | | | | | | | | | | | | | | | | | | | | | | | | | | | |
| | | | | | Per share operating performance | | | Ratios/Supplemental data | |
| | | Net asset
value,
beginning of
period | | | Investment operations | | | | | | Distributions | | | Net asset
value, end of
period | | | Total return (excludes
sales charge)
(c)(d) | | | Net assets, end of
period | | | Ratios to average net assets (a) | | | Portfolio
turnover rate (c) | |
| | | Net
investment income (loss) (b) | | | Net realized and
unrealized gains
(losses) on
investments | | | Total from
investment
operations | | | | | | Net
investment
income | | | Net realized gain | | | Total
distributions | | | Net expenses
(e) | | | Net
investment
income
(loss) | | | Expenses without
waivers,
reimbursements
and earnings
credits | |
JPMorgan Flexible Long/Short Fund | | | | | | | | | | | | | | | | | | | | | | | | | | | | | | | | | | | | | | | | | | | | | | | | | | | | | | | | | | | | |
Class A | | | | | | | | | | | | | | | | | | | | | | | | | | | | | | | | | | | | | | | | | | | | | | | | | | | | | | | | | | | | |
Six Months Ended August 31, 2018 (Unaudited) | | | $10.10 | | | | $0.18 | | | | $(0.12) | | | | $0.06 | | | | | | | | $(0.04) | | | | $ — | | | $ | (0.04) | | | | $10.12 | | | | 0.59 % | | | | $21,393 | | | | 1.16% | | | | 3.46 % | | | | 2.10% | | | | 25 % | |
Year Ended February 28, 2018 | | | 10.06 | | | | 0.35 | | | | (0.05) | | | | 0.30 | | | | | | | | (0.26) | | | | — | | | | (0.26) | | | | 10.10 | | | | 3.05 | | | | 21,270 | | | | 1.14(f) | | | | 3.44(f) | | | | 3.56(f) | | | | 57 | |
June 30, 2016 (g) through February 28, 2017 | | | 10.00 | | | | 0.21 | | | | 0.10 | | | | 0.31 | | | | | | | | (0.24) | | | | (0.01) | | | | (0.25) | | | | 10.06 | | | | 3.18 | | | | 20,638 | | | | 1.13(f) | | | | 3.11(f) | | | | 3.13(f) | | | | 30 | |
Class C | | | | | | | | | | | | | | | | | | | | | | | | | | | | | | | | | | | | | | | | | | | | | | | | | | | | | | | | | | | | |
Six Months Ended August 31, 2018 (Unaudited) | | | 10.07 | | | | 0.15 | | | | (0.11) | | | | 0.04 | | | | | | | | (0.03) | | | | — | | | | (0.03) | | | | 10.08 | | | | 0.35 | | | | 21,163 | | | | 1.63 | | | | 2.97 | | | | 2.61 | | | | 25 | |
Year Ended February 28, 2018 | | | 10.06 | | | | 0.30 | | | | (0.05) | | | | 0.25 | | | | | | | | (0.24) | | | | — | | | | (0.24) | | | | 10.07 | | | | 2.50 | | | | 21,094 | | | | 1.64(f) | | | | 2.94(f) | | | | 4.06(f) | | | | 57 | |
June 30, 2016 (g) through February 28, 2017 | | | 10.00 | | | | 0.17 | | | | 0.11 | | | | 0.28 | | | | | | | | (0.21) | | | | (0.01) | | | | (0.22) | | | | 10.06 | | | | 2.84 | | | | 20,568 | | | | 1.63(f) | | | | 2.61(f) | | | | 3.61(f) | | | | 30 | |
Class I | | | | | | | | | | | | | | | | | | | | | | | | | | | | | | | | | | | | | | | | | | | | | | | | | | | | | | | | | | | | |
Six Months Ended August 31, 2018 (Unaudited) | | | 10.10 | | | | 0.19 | | | | (0.12) | | | | 0.07 | | | | | | | | (0.05) | | | | — | | | | (0.05) | | | | 10.12 | | | | 0.73 | | | | 26,821,616 | | | | 0.90 | | | | 3.71 | | | | 1.83 | | | | 25 | |
Year Ended February 28, 2018 | | | 10.06 | | | | 0.37 | | | | (0.04) | | | | 0.33 | | | | | | | | (0.29) | | | | — | | | | (0.29) | | | | 10.10 | | | | 3.28 | | | | 26,634,076 | | | | 0.89(f) | | | | 3.69(f) | | | | 1.91(f) | | | | 57 | |
June 30, 2016 (g) through February 28, 2017 | | | 10.00 | | | | 0.22 | | | | 0.11 | | | | 0.33 | | | | | | | | (0.26) | | | | (0.01) | | | | (0.27) | | | | 10.06 | | | | 3.37 | | | | 25,777,256 | | | | 0.88(f) | | | | 3.36(f) | | | | 2.01(f) | | | | 30 | |
Class R6 | | | | | | | | | | | | | | | | | | | | | | | | | | | | | | | | | | | | | | | | | | | | | | | | | | | | | | | | | | | | |
Six Months Ended August 31, 2018 (Unaudited) | | | 10.10 | | | | 0.20 | | | | (0.11) | | | | 0.09 | | | | | | | | (0.07) | | | | — | | | | (0.07) | | | | 10.12 | | | | 0.85 | | | | 21,625 | | | | 0.64 | | | | 3.96 | | | | 1.61 | | | | 25 | |
Year Ended February 28, 2018 | | | 10.06 | | | | 0.40 | | | | (0.05) | | | | 0.35 | | | | | | | | (0.31) | | | | — | | | | (0.31) | | | | 10.10 | | | | 3.54 | | | | 21,447 | | | | 0.64(f) | | | | 3.94(f) | | | | 3.05(f) | | | | 57 | |
June 30, 2016 (g) through February 28, 2017 | | | 10.00 | | | | 0.24 | | | | 0.10 | | | | 0.34 | | | | | | | | (0.27) | | | | (0.01) | | | | (0.28) | | | | 10.06 | | | | 3.53 | | | | 20,705 | | | | 0.63(f) | | | | 3.61(f) | | | | 2.61(f) | | | | 30 | |
| (a) | Annualized for periods less than one year, unless otherwise noted. |
| (b) | Calculated based upon average shares outstanding. |
| (c) | Not annualized for periods less than one year. |
| (d) | Includes adjustments in accordance with accounting principles generally accepted in the United States of America and as such, the net asset values for financial reporting purposes and the returns based upon those net asset values may differ from the net asset values and returns for shareholder transactions. |
| (e) | Includes earnings credits and interest expense, if applicable, each of which is less than 0.005% unless otherwise noted. |
| (f) | Certain non-recurring expenses incurred by the Fund were not annualized for the year ended February 28, 2018 and for the period ended February 28, 2017. |
| (g) | Commencement of operations. |
SEE NOTES TO FINANCIAL STATEMENTS.
43
FINANCIAL HIGHLIGHTS
FOR THE PERIODS INDICATED
| | | | | | | | | | | | | | | | | | | | | | | | | | | | | | | | | | | | | | | | | | | | | | | | | | | | | | | | |
| | | | | | Per share operating performance | | | Ratios/Supplemental data | |
| | | Net asset
value,
beginning of
period | | | Investment operations | | | Distributions | | | Net asset
value, end of
period | | | Total return (excludes
sales
charge)
(c)(d) | | | Net assets, end of period | | | Ratios to average net assets (a) | | | Portfolio
turnover rate (c) | |
| | | Net
investment income
(loss) (b) | | | Net realized and
unrealized gains
(losses) on
investments | | | Total from
investment
operations | | | Net
investment
income | | | Net realized gain | | | Total
distributions | | | Net expenses
(e) | | | Net
investment
income (loss) | | | Expenses without
waivers,
reimbursements
and earnings
credits | |
JPMorgan High Yield Opportunities Fund | | | | | | | | | | | | | | | | | | | | | | | | | | | | | | | | | | | | | | | | | | | | | | | | | | | | | | | | |
Class A | | | | | | | | | | | | | | | | | | | | | | | | | | | | | | | | | | | | | | | | | | | | | | | | | | | | | | | | |
Six Months Ended August 31, 2018 (Unaudited) | | | $10.13 | | | | $0.26 | | | | $(0.04) | | | | $0.22 | | | | $(0.29) | | | | $ — | | | $ | (0.29) | | | | $10.06 | | | | 2.18 % | | | | $22,293 | | | | 1.00% | | | | 5.06 % | | | | 1.96% | | | | 20 % | |
Year Ended February 28, 2018 | | | 10.33 | | | | 0.51 | | | | (0.09) | | | | 0.42 | | | | (0.53) | | | | (0.09) | | | | (0.62) | | | | 10.13 | | | | 4.18 | | | | 21,820 | | | | 0.99(f) | | | | 4.95(f) | | | | 3.60(f) | | | | 37 | |
November 1, 2016 (g) through February 28, 2017 | | | 10.00 | | | | 0.15 | | | | 0.32 | | | | 0.47 | | | | (0.14) | | | | — | | | | (0.14) | | | | 10.33 | | | | 4.76 | | | | 20,944 | | | | 0.97(f) | | | | 4.41(f) | | | | 3.73(f) | | | | 6 | |
Class C | | | | | | | | | | | | | | | | | | | | | | | | | | | | | | | | | | | | | | | | | | | | | | | | | | | | | | | | |
Six Months Ended August 31, 2018 (Unaudited) | | | 10.13 | | | | 0.23 | | | | (0.05) | | | | 0.18 | | | | (0.26) | | | | — | | | | (0.26) | | | | 10.05 | | | | 1.79 | | | | 22,068 | | | | 1.55 | | | | 4.49 | | | | 2.47 | | | | 20 | |
Year Ended February 28, 2018 | | | 10.33 | | | | 0.45 | | | | (0.08) | | | | 0.37 | | | | (0.48) | | | | (0.09) | | | | (0.57) | | | | 10.13 | | | | 3.61 | | | | 21,660 | | | | 1.55(f) | | | | 4.40(f) | | | | 4.10(f) | | | | 37 | |
November 1, 2016 (g) through February 28, 2017 | | | 10.00 | | | | 0.13 | | | | 0.32 | | | | 0.45 | | | | (0.12) | | | | — | | | | (0.12) | | | | 10.33 | | | | 4.57 | | | | 20,906 | | | | 1.53(f) | | | | 3.87(f) | | | | 4.25(f) | | | | 6 | |
Class I | | | | | | | | | | | | | | | | | | | | | | | | | | | | | | | | | | | | | | | | | | | | | | | | | | | | | | | | |
Six Months Ended August 31, 2018 (Unaudited) | | | 10.13 | | | | 0.27 | | | | (0.05) | | | | 0.22 | | | | (0.30) | | | | — | | | | (0.30) | | | | 10.05 | | | | 2.18 | | | | 27,838,872 | | | | 0.80 | | | | 5.25 | | | | 1.69 | | | | 20 | |
Year Ended February 28, 2018 | | | 10.33 | | | | 0.53 | | | | (0.09) | | | | 0.44 | | | | (0.55) | | | | (0.09) | | | | (0.64) | | | | 10.13 | | | | 4.39 | | | | 27,323,588 | | | | 0.79(f) | | | | 5.15(f) | | | | 1.86(f) | | | | 37 | |
November 1, 2016 (g) through February 28, 2017 | | | 10.00 | | | | 0.15 | | | | 0.33 | | | | 0.48 | | | | (0.15) | | | | — | | | | (0.15) | | | | 10.33 | | | | 4.83 | | | | 26,133,164 | | | | 0.78(f) | | | | 4.61(f) | | | | 2.67(f) | | | | 6 | |
Class R6 | | | | | | | | | | | | | | | | | | | | | | | | | | | | | | | | | | | | | | | | | | | | | | | | | | | | | | | | |
Six Months Ended August 31, 2018 (Unaudited) | | | 10.13 | | | | 0.28 | | | | (0.04) | | | | 0.24 | | | | (0.31) | | | | — | | | | (0.31) | | | | 10.06 | | | | 2.38 | | | | 22,455 | | | | 0.60 | | | | 5.44 | | | | 1.46 | | | | 20 | |
Year Ended February 28, 2018 | | | 10.33 | | | | 0.55 | | | | (0.09) | | | | 0.46 | | | | (0.57) | | | | (0.09) | | | | (0.66) | | | | 10.13 | | | | 4.60 | | | | 21,934 | | | | 0.59(f) | | | | 5.35(f) | | | | 3.08(f) | | | | 37 | |
November 1, 2016 (g) through February 28, 2017 | | | 10.00 | | | | 0.16 | | | | 0.33 | | | | 0.49 | | | | (0.16) | | | | — | | | | (0.16) | | | | 10.33 | | | | 4.90 | | | | 20,970 | | | | 0.58(f) | | | | 4.82(f) | | | | 3.24(f) | | | | 6 | |
| (a) | Annualized for periods less than one year, unless otherwise noted. |
| (b) | Calculated based upon average shares outstanding. |
| (c) | Not annualized for periods less than one year. |
| (d) | Includes adjustments in accordance with accounting principles generally accepted in the United States of America and as such, the net asset values for financial reporting purposes and the returns based upon those net asset values may differ from the net asset values and returns for shareholder transactions. |
| (e) | Includes earnings credits and interest expense, if applicable, each of which is less than 0.005% unless otherwise noted. |
| (f) | Certain non-recurring expenses incurred by the Fund were not annualized for the year ended February 28, 2018 and for the period ended February 28, 2017. |
| (g) | Commencement of operations. |
SEE NOTES TO FINANCIAL STATEMENTS.
44
NOTES TO FINANCIAL STATEMENTS
AS OF AUGUST 31, 2018 (Unaudited)
1. Organization
JPMorgan Trust IV (the “Trust”) was formed on November 11, 2015, as a Delaware statutory trust, pursuant to a Declaration of Trust dated November 11, 2015 and is registered under the Investment Company Act of 1940, as amended (the “1940 Act”), as an open-end management investment company.
The following are 2 separate funds of the Trust (each, a “Fund” and collectively, the “Funds”) covered by this report:
| | | | |
| | | Classes Offered | | Diversified/Non-Diversified |
JPMorgan Flexible Long/Short Fund | | Class A, Class C, Class I and Class R6 | | Diversified |
JPMorgan High Yield Opportunities Fund | | Class A, Class C, Class I and Class R6 | | Diversified |
The investment objective of the JPMorgan Flexible Long/Short Fund (“Flexible Long/Short Fund”) is to seek to provide total return.
The investment objective of the JPMorgan High Yield Opportunities Fund (“High Yield Opportunities Fund”) is to seek a high level of current income. Capital appreciation is a secondary objective.
The Flexible Long/Short Fund and High Yield Opportunities Fund commenced operations on June 30, 2016 and November 1, 2016, respectively. Currently, the Funds are not publicly offered for investment.
Class A Shares generally provide for a front-end sales charge while Class C Shares provide for a contingent deferred sales charge (“CDSC”). No sales charges are assessed with respect to Class I and Class R6 Shares. Certain Class A Shares, for which front-end sales charges have been waived, may be subject to a CDSC as described in the Funds’ prospectus. Beginning on November 14, 2017, Class C Shares automatically convert to Class A Shares after ten years. All classes of shares have equal rights as to earnings, assets and voting privileges, except that each class may bear different transfer agency, distribution and service fees and each class has exclusive voting rights with respect to its distribution plan and shareholder servicing agreements.
J.P. Morgan Investment Management Inc. (“JPMIM”), an indirect, wholly-owned subsidiary of JPMorgan Chase & Co. (“JPMorgan”), acts as Adviser (the “Adviser”) and Administrator (the “Administrator”) to the Funds.
2. Significant Accounting Policies
The following is a summary of significant accounting policies followed by the Funds in the preparation of their financial statements. The Funds are investment companies and, thus, follow the investment company accounting and reporting guidance of the Financial Accounting Standards Board Accounting Standards Codification Topic 946 - Investment Companies, which is part of U.S. generally accepted accounting principles (“GAAP”). The preparation of financial statements in conformity with GAAP requires management to make estimates and assumptions that affect the reported amounts of assets and liabilities and disclosure of contingent assets and liabilities at the date of the financial statements and the reported amounts of increases and decreases in net assets from operations during the reporting period. Actual results could differ from those estimates.
A. Valuation of Investments — The valuation of investments is in accordance with GAAP and the Funds’ valuation policies set forth by and under the supervision and responsibility of the Board of Trustees (the “Board”), which established the following approach to valuation, as described more fully below: (i) investments for which market quotations are readily available shall be valued at such unadjusted quoted prices and (ii) all other investments for which market quotations are not readily available shall be valued at their fair value as determined in good faith by the Board.
The Administrator has established the J.P. Morgan Asset Management Americas Valuation Committee (“AVC”) to assist the Board with the oversight and monitoring of the valuation of the Funds’ investments. The Administrator implements the valuation policies of the Funds’ investments, as directed by the Board. The AVC oversees and carries out the policies for the valuation of investments held in the Funds. This includes monitoring the appropriateness of fair values based on results of ongoing valuation oversight including, but not limited to, consideration of macro or security specific events, market events and pricing vendor and broker due diligence. The Administrator is responsible for discussing and assessing the potential impacts to the fair values on an ongoing basis, and at least on a quarterly basis with the AVC and the Board.
A market-based approach is primarily used to value the Funds’ investments. Investments for which market quotations are not readily available are fair valued by approved affiliated and unaffiliated pricing vendors or third party broker-dealers (collectively referred to as “Pricing Services”) or may be internally fair valued using methods set forth by the valuation policies approved by the Board. This may include related or comparable assets or liabilities, recent transactions, market multiples, book values and other relevant information for the investment to determine the fair value of the investment. An income-based valuation approach may be used in which the anticipated future cash flows of the investment are discounted to calculate the fair value. Discounts may also be applied due to the nature or duration of any restrictions on the disposition of the investments. Valuations may be based upon current market prices of securities that are comparable in coupon, rating, maturity and industry. It is possible that the estimated values may differ significantly from the values that would have been used, had a ready market for the investments existed, and such differences could be material.
Fixed income instruments are valued based on prices received from Pricing Services. The Pricing Services use multiple valuation techniques to determine the valuation of fixed income instruments. In instances where sufficient market activity exists, the Pricing Services may utilize a market-based approach through which trades or quotes from market makers are used to determine the valuation of these instruments. In instances where sufficient market activity may not exist, the Pricing Services also utilize proprietary valuation models which may consider market transactions in
45
comparable securities and the various relationships between securities in determining fair value and/or market characteristics in order to estimate the relevant cash flows, which are then discounted to calculate the fair values.
Equities and other exchange-traded instruments are valued at the last sale price or official market closing price on the primary exchange on which the instrument is traded before the net asset values (“NAV”) of the Funds are calculated on a valuation date.
Investments in open-end investment companies (the “Underlying Funds”), are valued at each Underlying Fund’s NAV per share as of the report date.
Futures contracts and options are generally valued on the basis of available market quotations. Swaps and forward foreign currency exchange contracts are valued utilizing market quotations from approved Pricing Services.
Valuations reflected in this report are as of the report date. As a result, changes in valuation due to market events and/or issuer related events after the report date and prior to issuance of the report are not reflected herein.
The various inputs that are used in determining the valuation of the Funds’ investments are summarized into the three broad levels listed below.
| • | Level 1 — Unadjusted inputs using quoted prices in active markets for identical investments. |
| • | Level 2 — Other significant observable inputs including, but not limited to, quoted prices for similar investments, inputs other than quoted prices that are observable for investments (such as interest rates, prepayment speeds, credit risk, etc.) or other market corroborated inputs. |
| • | Level 3 — Significant inputs based on the best information available in the circumstances, to the extent observable inputs are not available (including the Funds’ assumptions in determining the fair value of investments). |
A financial instrument’s level within the fair value hierarchy is based on the lowest level of any input, both individually and in the aggregate, that is significant to the fair value measurement. The inputs or methodology used for valuing instruments are not necessarily an indication of the risk associated with investing in those instruments.
The following tables represent each valuation input as presented on the Schedules of Portfolio Investments (“SOIs”):
Flexible Long/Short Fund
| | | | | | | | | | | | | | | | |
| | | Level 1 Quoted prices | | | Level 2 Other significant observable
inputs | | | Level 3
Significant unobservable
inputs | | | Total | |
Investments in Securities | | | | | | | | | | | | | | | | |
Debt Securities | | | | | | | | | | | | | | | | |
Asset-Backed Securities | | $ | – | | | $ | 82,230 | | | $ | – | | | $ | 82,230 | |
Convertible Bonds | | | | | | | | | | | | | | | | |
Other Convertible Bonds | | | – | | | | 602,183 | | | | – | | | | 602,183 | |
Corporate Bonds | | | | | | | | | | | | | | | | |
Communications Equipment | | | – | | | | 37,506 | | | | 3 | | | | 37,509 | |
Pharmaceuticals | | | – | | | | 265,656 | | | | 1,920 | | | | 267,576 | |
Wireless Telecommunication Services | | | – | | | | 597,390 | | | | –(a) | | | | 597,390 | |
Other Corporate Bonds | | | – | | | | 16,844,058 | | | | – | | | | 16,844,058 | |
| | | | | | | | | | | | | | | | |
Total Corporate Bonds | | | – | | | | 17,744,610 | | | | 1,923 | | | | 17,746,533 | |
| | | | | | | | | | | | | | | | |
U.S. Treasury Obligations | | | – | | | | 156,434 | | | | – | | | | 156,434 | |
Common Stock | | | | | | | | | | | | | | | | |
Aerospace & Defense | | | – | | | | – | | | | 1,638 | | | | 1,638 | |
Other Common Stocks | | | 16,445 | | | | – | | | | – | | | | 16,445 | |
| | | | | | | | | | | | | | | | |
Total Common Stocks | | | 16,445 | | | | – | | | | 1,638 | | | | 18,083 | |
| | | | | | | | | | | | | | | | |
| | | | |
Loan Assignments | | | | | | | | | | | | | | | | |
Other Loan Assignments | | | – | | | | 6,580,938 | | | | – | | | | 6,580,938 | |
Short-Term Investments | | | | | | | | | | | | | | | | |
Investment Companies | | | 1,662,330 | | | | – | | | | – | | | | 1,662,330 | |
| | | | | | | | | | | | | | | | |
Total Investments in Securities | | $ | 1,678,775 | | | $ | 25,166,395 | | | $ | 3,561 | | | $ | 26,848,731 | |
| | | | | | | | | | | | | | | | |
46
Flexible Long/Short Fund (continued)
| | | | | | | | | | | | | | | | |
| | | Level 1 Quoted prices | | | Level 2
Other significant observable
inputs | | | Level 3
Significant unobservable
inputs | | | Total | |
| Appreciation in Other Financial Instruments | | | | | | | | | | | | | | | | |
| Forward Foreign Currency Exchange Contracts | | $ | – | | | $ | 129,944 | | | $ | – | | | $ | 129,944 | |
| Futures Contracts | | | 1,164 | | | | – | | | | – | | | | 1,164 | |
| | | | |
| Swaptions Purchased | | | – | | | | 16,107 | | | | – | | | | 16,107 | |
| Swaps | | | – | | | | 21,393 | | | | – | | | | 21,393 | |
| | | | | | | | | | | | | | | | |
| Total Appreciation in Other Financial Instruments | | $ | 1,164 | | | $ | 167,444 | | | $ | – | | | $ | 168,608 | |
| | | | | | | | | | | | | | | | |
| Depreciation in Other Financial Instruments | | | | | | | | | | | | | | | | |
| Forward Foreign Currency Exchange Contracts | | $ | – | | | $ | (46,972) | | | $ | – | | | $ | (46,972) | |
| Futures | | | (3,669) | | | | – | | | | – | | | | (3,669) | |
| Swaptions Written | | | – | | | | (3,876) | | | | – | | | | (3,876) | |
| Swaps | | | – | | | | (14,372) | | | | – | | | | (14,372) | |
| | | | | | | | | | | | | | | | |
| Total Depreciation in Other Financial Instruments | | $ | (3,669) | | | $ | (65,220) | | | $ | – | | | $ | (68,889) | |
| | | | | | | | | | | | | | | | |
47
High Yield Opportunities Fund
| | | | | | | | | | | | | | | | |
| | | Level 1
Quoted prices | | | Level 2
Other significant observable
inputs | | | Level 3 Significant unobservable inputs | | | Total | |
Investments in Securities | | | | | | | | | | | | | | | | |
Debt Securities | | | | | | | | | | | | | | | | |
Convertible Bonds | | | | | | | | | | | | | | | | |
Other Convertible Bonds | | $ | – | | | $ | 743,122 | | | $ | – | | | $ | 743,122 | |
Corporate Bonds Machinery | | | – | | | | 460,568 | | | | 104,078 | | | | 564,646 | |
Wireless Telecommunication Services | | | – | | | | 1,388,507 | | | | –(a) | | | | 1,388,507 | |
Other Corporate Bonds | | | – | | | | 22,691,642 | | | | – | | | | 22,691,642 | |
| | | | | | | | | | | | | | | | |
Total Corporate Bonds | | | – | | | | 24,540,717 | | | | 104,078 | | | | 24,644,795 | |
| | | | | | | | | | | | | | | | |
Common Stocks | | | | | | | | | | | | | | | | |
Equity Real Estate Investment Trusts (REITs) | | | – | | | | – | | | | 175,539 | | | | 175,539 | |
Other Common Stocks | | | 50,470 | | | | – | | | | – | | | | 50,470 | |
| | | | | | | | | | | | | | | | |
Total Common Stocks | | | 50,470 | | | | – | | | | 175,539 | | | | 226,009 | |
| | | | | | | | | | | | | | | | |
Loan Assignments | | | | | | | | | | | | | | | | |
Other Loan Assignments | | | – | | | | 1,167,177 | | | | – | | | | 1,167,177 | |
Short-Term Investments | | | | | | | | | | | | | | | | |
Investment Companies | | | 1,301,007 | | | | – | | | | – | | | | 1,301,007 | |
| | | | | | | | | | | | | | | | |
Total Investments in Securities | | $ | 1,351,477 | | | $ | 26,451,016 | | | $ | 279,617* | | | $ | 28,082,110 | |
| | | | | | | | | | | | | | | | |
Appreciation in Other Financial Instruments | | | | | | | | | | | | | |
| Forward Foreign Currency Exchange Contracts | | $ | – | | | $ | 91,319 | | | $ | – | | | $ | 91,319 | |
Futures Contracts | | | 650 | | | | – | | | | – | | | | 650 | |
| | | | | | | | | | | | | | | | |
| Total Appreciation in Other Financial Instruments | | $ | 650 | | | $ | 91,319 | | | $ | – | | | $ | 91,969 | |
| | | | | | | | | | | | | | | | |
Depreciation in Other Financial Instruments | | | | | | | | | | | | | |
| Forward Foreign Currency Exchange Contracts | | $ | – | | | $ | (32,916) | | | $ | – | | | $ | (32,916) | |
Swaps | | | – | | | | (17,230) | | | | – | | | | (17,230) | |
| | | | | | | | | | | | | | | | |
| Total Depreciation in Other Financial Instruments | | $ | – | | | $ | (50,146) | | | $ | – | | | $ | (50,146) | |
| | | | | | | | | | | | | | | | |
Transfers between fair value levels are valued utilizing values as of the beginning of the period.
There were no significant transfers between any levels during the six months ended August 31, 2018
* Level 3 securities are valued by brokers and pricing services. At August 31, 2018, the value of these securities was approximately $279,617. The inputs for these securities are not readily available or cannot be reasonably estimated and are generally those inputs described in Note 2.A. The appropriateness of fair values for these securities is monitored on an ongoing basis which may include results of back testing, results of broker and vendor due diligence, unchanged price review and consideration of macro or security specific events.
The following is a summary of investments for which significant unobservable inputs (level 3) were used in determining fair value:
| | | | | | | | | | | | | | | | | | | | | | | | | | | | | | | | | | | | |
High Yield
Opportunities Fund | | Balance as of
February 28,
2018 | | | Realized
gain (loss) | | | Change in net
unrealized
appreciation
(depreciation) | | | Net
accretion
(amortization) | | | Purchases 1 | | | Sales 2 | | | Transfers
into Level 3 | | | Transfers
out of Level 3 | | | Balance as of
August 31,
2018 | |
Investments in Securities: | | | | | | | | | | | | | | | | | | | | | | | | | | | | | | | | | | | | |
Common Stocks — Equity Real Estate Investment Trusts (REITs) | | $ | — | | | $ | — | | | $ | 11,417 | | | $ | — | | | $ | — | | | $ | — | | | $ | 164,122 | | | $ | — | | | $ | 175,539 | |
Corporate Bonds — Machinery | | | — | | | | — | | | | (15,039) | | | | 186 | | | | — | | | | — | | | | 118,931 | | | | — | | | | 104,078 | |
Corporate Bonds — Wireless Telecommunication Services | | | — | | | | — | | | | — | | | | — | | | | — | | | | — | | | | — | | | | — | | | | —(a) | |
| | | | | | | | | | | | | | | | | | | | | | | | | | | | | | | | | | | | |
Total | | $ | — | | | $ | — | | | $ | (3,622) | | | $ | 186 | | | $ | — | | | $ | — | | | $ | 283,053 | | | $ | — | | | $ | 279,617 | |
| | | | | | | | | | | | | | | | | | | | | | | | | | | | | | | | | | | | |
1 Purchases include all purchases of securities and securities received in corporate actions.
2 Sales include all sales of securities, maturities, paydowns and securities tendered in corporate actions.
The change in net unrealized appreciation (depreciation) attributable to securities owned at August 31, 2018, which were valued using significant unobservable inputs (level 3), amounted to $(3,622).
48
B. Restricted Securities — Certain securities held by the Funds may be subject to legal or contractual restrictions on resale. Restricted securities generally are resold in transactions exempt from registration under the Securities Act of 1933, as amended (the “Securities Act”). Disposal of these securities may involve time-consuming negotiations and expense. Prompt sale at the current valuation may be difficult and could adversely affect the net asset value of the Funds.
As of August 31, 2018, the Funds had no investments in restricted securities other than securities sold to the Funds under Rule 144A and/or Regulation S under the Securities Act.
C. Loan Assignments — The Funds invested in debt instruments that are interests in amounts owed to lenders or lending syndicates (a “Lender”) by corporate, governmental or other borrowers (a “Borrower”). A loan is often administered by a bank or other financial institution (the “Agent”) that acts as Agent for all holders. The Agent administers the terms of the loan, as specified in the loan agreement. The Funds invest in loan assignments of all or a portion of the loans. When a fund purchases a loan assignment, the fund has direct rights against the Borrower on a loan, provided, however, the fund’s rights may be more limited than the Lender from which it acquired the assignment and the fund may be able to enforce its rights only through the Agent. As a result, a fund assumes the credit risk of the Borrower as well as any other persons interpositioned between the fund and the Borrower (“Intermediate Participants”). A fund may incur certain costs and delays in realizing payment on a loan assignment or suffer a loss of principal and/or interest if assets or interests held by the Agent or other Intermediate Participants are determined to be subject to the claims of the Agent’s or other Intermediate Participant’s creditors. In addition, it is unclear whether loan assignments and other forms of direct indebtedness offer securities law protections against fraud and misrepresentation. Also, because JPMIM may wish to invest in publicly traded securities of a Borrower, it may not have access to material non-public information regarding the Borrower to which other investors have access. Although certain loan assignments are secured by collateral, a fund could experience delays or limitations in realizing the value on such collateral or have its interest subordinated to other indebtedness of the Borrower. Loan assignments are vulnerable to market conditions such that economic conditions or other events may reduce the demand for assignments and certain assignments that were liquid, when purchased, may become illiquid and they may be difficult to value. In addition, the settlement period for loans is uncertain as there is no standardized settlement schedule applicable to such investments. Therefore, a fund may not receive the proceeds from a sale of such investments for a period after the sale.
Certain loan assignments are also subject to the risks associated with high yield securities described under Note 7.
D. Derivatives — The Funds used derivative instruments including futures, forward foreign currency exchange contracts, options (Flexible Long/Short Fund) and swaps, in connection with their investment strategies. Derivative instruments may be used as substitutes for securities in which the Funds can invest, to hedge portfolio investments or to generate income or gain to the Funds. Derivatives may also be used to manage duration, sector and yield curve exposures and credit and spread volatility.
The Funds may be subject to various risks from the use of derivatives including the risk that changes in the value of a derivative may not correlate perfectly with the underlying asset, rate or index; counterparty credit risk related to derivatives counterparties’ failure to perform under contract terms; liquidity risk related to the lack of a liquid market for these contracts allowing the Funds to close out their position(s); and documentation risk relating to disagreement over contract terms. Investing in certain derivatives also results in a form of leverage and as such, the Funds’ risk of loss associated with these instruments may exceed their value, as recorded on the Statements of Assets and Liabilities.
The Funds are party to various derivative contracts governed by International Swaps and Derivatives Association master agreements (“ISDA agreements”). The Funds’ ISDA agreements, which are separately negotiated with each dealer counterparty, may contain provisions allowing, absent other considerations, a counterparty to exercise rights, to the extent not otherwise waived, against the Funds in the event the Funds’ net assets decline over time by a pre-determined percentage or fall below a pre-determined floor. The ISDA agreements may also contain provisions allowing, absent other conditions, the Funds to exercise rights, to the extent not otherwise waived, against a counterparty (e.g., decline in a counterparty’s credit rating below a specified level). Such rights for both a counterparty and the Funds often include the ability to terminate (i.e., close out) open contracts at prices which may favor a counterparty, which could have an adverse effect on the Funds. The ISDA agreements give the Funds and a counterparty the right, upon an event of default, to close out all transactions traded under such agreements and to net amounts owed or due across all transactions and offset such net payable or receivable with collateral posted to a segregated account by one party to the other.
Counterparty credit risk may be mitigated to the extent a counterparty posts collateral for mark to market gains to the Funds.
Notes D(1) — D(4) below describe the various derivatives used by the Funds.
(1). Options — The Flexible Long/Short Fund purchased and sold (“wrote”) put and call options on various instruments including futures, securities and interest rate swaps (“swaptions”) to manage and hedge interest rate risks within its portfolio and also to gain long or short exposure to the underlying instrument, index, currency or rate. A purchaser of a put option has the right, but not the obligation, to sell the underlying instrument at an agreed upon price (“strike price”) to the option seller. A purchaser of a call option has the right, but not the obligation, to purchase the underlying instrument at the strike price from the option seller. Swaptions and Eurodollar options are settled for cash.
Options Purchased — Premiums paid by the Fund for options purchased are included on the Statements of Assets and Liabilities as options purchased. The option is adjusted daily to reflect the current market value of the option and the change is recorded as Change in net unrealized appreciation/depreciation on options purchased on the Statements of Operations. If the option is allowed to expire, the Fund will lose the entire premium they paid and records a realized loss for the premium amount. Premiums paid for options purchased which are exercised or closed are added to the amounts paid or will offset against the proceeds on the underlying investment transaction to determine the realized gain (loss) or cost basis of the underlying investment.
Options Written — Premiums received by the Fund for options written are included on the Statements of Assets and Liabilities as a liability. The amount of the liability is adjusted daily to reflect the current market value of the option written and the change is recorded as Change in net unrealized appreciation/depreciation of Options written on the Statements of Operations. Premiums received from options written that expire are treated as
49
realized gains. If a written option is closed, the Fund records a realized gain or loss on options written based on whether the cost of the closing transaction exceeds the premium received. If a call option is exercised by the option buyer, the premium received by the Fund is added to the proceeds from the sale of the underlying security to the option buyer and compared to the cost of the closing transaction to determine whether there has been a realized gain or loss. If a put option is exercised by an option buyer, the premium received by the option seller reduces the cost basis of the purchased security.
Written uncovered call options subject the Fund to unlimited risk of loss. Written covered call options limit the upside potential of a security above the strike price. Written put options subject the Fund to risk of loss if the value of the security declines below the exercise price minus the put premium.
The Fund’s exchange traded option contracts are not subject to master netting arrangements (the right to close out all transactions traded with a counterparty and net amounts owed or due across transactions).
The Fund may be required to post or receive collateral for over the counter options. Cash collateral posted by the Fund is considered restricted.
(2). Futures Contracts — The Funds used treasury, index or other financial futures contracts to manage and hedge interest rate risk associated with portfolio investments. The Funds also used futures contracts to lengthen or shorten the duration of the overall investment portfolio.
Futures contracts provide for the delayed delivery of the underlying instrument at a fixed price or are settled for a cash amount based on the change in the value of the underlying instrument at a specific date in the future. Upon entering into a futures contract, the Funds is required to deposit with the broker, cash or securities in an amount equal to a certain percentage of the contract amount, which is referred to as the initial margin deposit. Subsequent payments, referred to as variation margin, are made or received by the Funds periodically and are based on changes in the market value of open futures contracts. Changes in the market value of open futures contracts are recorded as Change in net unrealized appreciation/depreciation on the Statements of Operations. Realized gains or losses, representing the difference between the value of the contract at the time it was opened and the value at the time it was closed, are reported on the Statements of Operations at the closing or expiration of the futures contract. Securities deposited as initial margin are designated on the SOI and cash deposited, which is considered restricted, is recorded on the Statements of Assets and Liabilities. A receivable from and/or a payable to brokers for the daily variation margin is also recorded on the Statements of Assets and Liabilities.
The use of futures contracts exposes the Funds to interest rate risk. The Funds may be subject to the risk that the change in the value of the futures contract may not correlate perfectly with the underlying instrument. Use of long futures contracts subjects the Funds to risk of loss in excess of the amounts shown on the Statements of Assets and Liabilities, up to the notional amount of the futures contracts. Use of short futures contracts subjects the Funds to unlimited risk of loss. The Funds may enter into futures contracts only on exchanges or boards of trade. The exchange or board of trade acts as the counterparty to each futures transaction; therefore, the Funds’ credit risk is limited to failure of the exchange or board of trade. Under some circumstances, futures exchanges may establish daily limits on the amount that the price of a futures contract can vary from the previous day’s settlement price, which could effectively prevent liquidation of positions.
The Funds’ futures contracts are not subject to master netting arrangements (the right to close out all transactions traded with a counterparty and net amounts owed or due across transactions).
(3). Forward Foreign Currency Exchange Contracts — The Funds may be exposed to foreign currency risks with some or all of the portfolio investments and used forward foreign currency exchange contracts to hedge or manage certain of these exposures as part of an investment strategy. The Funds also bought forward foreign currency exchange contracts to gain exposure to currencies. Forward foreign currency exchange contracts represent obligations to purchase or sell foreign currency on a specified future date at a price fixed at the time the contracts are entered into. Non-deliverable forward foreign currency exchange contracts are settled with the counterparty in U.S. Dollar without the delivery of foreign currency.
The values of the forward foreign currency exchange contracts are adjusted daily based on the applicable exchange rate of the underlying currency. Changes in the value of these contracts are recorded as unrealized appreciation or depreciation until the contract settlement date. When the forward foreign currency exchange contract is closed, the Funds record a realized gain or loss equal to the difference between the value at the time the contract was opened and the value at the time it was closed. The Funds also record a realized gain or loss when a forward foreign currency exchange contract offsets another forward foreign currency exchange contract with the same counterparty upon settlement.
The Funds’ forward foreign currency exchange contracts are subject to master netting arrangements (the right to close out all transactions with a counterparty and net amounts owed or due across transactions). The Funds may be required to post or receive collateral for non-deliverable forward foreign currency exchange contracts. As of August 31, 2018, the Funds did not receive or post collateral for forward foreign currency exchange contracts.
(4). Swaps — The Funds engaged in various swap transactions, including credit default, interest rate and return swaps, to manage credit and interest rate (e.g., duration, yield curve) risks within its portfolio. The Funds also used swaps as alternatives to direct investments. Swap transactions are negotiated contracts over the counter (“OTC swaps”) between the fund and a counterparty or centrally cleared (“centrally cleared swaps”) with a central clearinghouse through a Futures Commission Merchant (“FCM”), to exchange investment cash flows, assets, foreign currencies or market-linked returns at specified, future intervals.
Upfront payments made and/or received are recorded as assets or liabilities, respectively, on the Statements of Assets and Liabilities and amortized over the term of the swap. The value of an OTC swap agreement is recorded as either an asset or a liability on the Statements of Assets and Liabilities at the beginning of the measurement period. Upon entering into a centrally cleared swap, the Funds is required to deposit with the FCM cash or securities, which is referred to as initial margin deposit. Securities deposited as initial margin are designated on the SOI and cash deposited, which is considered restricted, is recorded on the Statements of Assets and Liabilities. Daily changes in valuation of centrally cleared swaps, if any, are recorded as a variation margin receivable or payable on the Statements of Assets and Liabilities. The change in the value of swaps, including accruals of periodic amounts of interest to be paid or received on swaps, is reported as Change in net unrealized appreciation/depreciation on the
50
Statements of Operations. A realized gain or loss is recorded upon payment or receipt of a periodic payment or payment made upon termination of a swap agreement.
The Funds may be required to post or receive collateral for OTC Swaps.
The central clearing house acts as the counterparty to each centrally cleared swap transaction, therefore credit risk is limited to the failure of the clearing houses.
The Funds’ swap contracts (excluding centrally cleared swaps) are subject to master netting arrangements.
Credit Default Swaps
The Funds entered into credit default swaps to simulate long and short bond positions or to take an active long or short position with respect to the likelihood of a default or credit event by the issuer of the underlying reference obligation.
The underlying reference obligation may be a single issuer of corporate or sovereign debt, a basket of issuers or a credit index. A credit index is a list of credit instruments or exposures that reference a fixed number of obligors with shared characteristics that represents some part of the credit market as a whole. Index credit default swaps have standardized terms including a fixed spread and standard maturity dates. The composition of the obligations within a particular index changes periodically.
Credit default swaps involve one party, the protection buyer, making a stream of payments to another party, the protection seller, in exchange for the right to receive a contingent payment if there is a credit event related to the underlying reference obligation. In the event that the reference obligation matures prior to the termination date of the contract, a similar security will be substituted for the duration of the contract term. Credit events are defined under individual swap agreements and generally include bankruptcy, failure to pay, restructuring, repudiation/moratorium, obligation acceleration and obligation default.
If a credit event occurs, the Funds, as protection seller, would be obligated to make a payment, which may be either: (i) a net cash settlement equal to the notional amount of the swap less the auction value of the reference obligation or (ii) the notional amount of the swap in exchange for the delivery of the reference obligation. Selling protection effectively adds leverage to a Fund’s portfolio up to the notional amount of swap agreements. The notional amount represents the maximum potential liability under a contract and is not reflected on the Statements of Assets and Liabilities. Potential liabilities under these contracts may be reduced by: the auction rates of the underlying reference obligations; upfront payments received at the inception of a swap; and net amounts received from credit default swaps purchased with the identical reference obligation.
(5). Summary of Derivatives Information
The following tables present the value of derivatives held as of August 31, 2018, by their primary underlying risk exposure and respective location on the Statements of Assets and Liabilities:
Flexible Long-Short Fund
| | | | | | | | | | | | | | | | | | | | | | | | | | |
| Derivative Contracts | | Statements of Assets and Liabilities Location | |
| Gross Assets: | | | | Options and
Swaptions (a) | | | Futures
Contracts (b) | | | Forward
Foreign
Currency
Exchange
Contracts | | | Centrally
Cleared
Swaps (c) | | | OTC
Swaps | | | Total | |
Interest rate contracts | | Receivables, Net Assets — Unrealized Appreciation | | | $ — | | | $ | 1,164 | | | | $ — | | | | $ 17,298 | | | $ | — | | | | $ 18,462 | |
Foreign exchange contracts | | Receivables | | | — | | | | — | | | | 129,944 | | | | — | | | | — | | | | 129,944 | |
Credit contracts | | Receivables | | | 16,107 | | | | — | | | | — | | | | 1,907 | | | | 393 | | | | 18,407 | |
| | | | | | | | | | | | | | | | | | | | | | | | | | |
Total | | | | | $ 16,107 | | | $ | 1,164 | | | | $ 129,944 | | | | $ 19,205 | | | $ | 393 | | | | $166,813 | |
| | | | | | | | | | | | | | |
| Gross Liabilities: | | | | | | | | | | | | | | | | | | | | | | | | | | |
Interest rate contracts | | Payables, Net Assets — Unrealized Depreciation | | | $ — | | | $ | (3,669) | | | | $ — | | | | $ — | | | $ | — | | | | $ (3,669) | |
Foreign exchange contracts | | Payables | | | — | | | | — | | | | (46,972) | | | | — | | | | — | | | | (46,972) | |
Credit contracts | | Payables | | | (3,876) | | | | — | | | | — | | | | (53,431) | | | | (45,606) | | | | (102,913) | |
| | | | | | | | | | | | | | |
Total | | | | | $ (3,876) | | | $ | (3,669) | | | | $ (46,972) | | | | $ (53,431) | | | $ | (45,606) | | | | $(153,554) | |
| | | | | | | | | | | | | | |
| (a) | The market value of options purchased is reported as investments in non-affiliates, at value on the Statements of Assets and Liabilities. |
| (b) | This amount represents the cumulative appreciation (depreciation) of futures contracts as reported on the SOI. The Statements of Assets and Liabilities only reflect the current day variation margin receivable/payable from/to brokers. |
| (c) | This amount represents the value of centrally cleared swaps as reported on the SOI. The Statements of Assets and Liabilities only reflect the current day variation margin receivable/payable from/to brokers. |
51
The following tables present the value of derivatives held as of August 31, 2018, by their primary underlying risk exposure and respective location on the Statements of Assets and Liabilities:
High Yield Opportunities Fund
| | | | | | | | | | | | | | | | | | |
| Derivative Contracts | | | | Statements of Assets and Liabilities Location | |
| Gross Assets: | | | | Futures
Contracts (a) | | | Forward Foreign
Currency Exchange
Contracts | | | Centrally Cleared
Swaps (b) | | | Total | |
Interest rate contracts | | Receivable, Net Assets-Unrealized | | | | | | | | | | | | | | | | |
| | Appreciation | | $ | 650 | | | $ | — | | | $ | — | | | $ | 650 | |
Foreign exchange contracts | | Receivable | | | — | | | | 91,319 | | | | — | | | | 91,319 | |
| | | | | | |
| | | | | |
Total | | | | $ | 650 | | | $ | 91,319 | | | $ | — | | | $ | 91,969 | |
| | | | | | | | | | | | | | |
Gross Liabilities: | | | | | | | | | | | | | | | | | | |
Foreign exchange contracts | | Payables | | $ | — | | | $ | (32,916) | | | $ | — | | | $ | (32,916) | |
Credit contracts | | Payables | | | — | | | | — | | | | (79,232) | | | | (79,232) | |
| | | | | | | | | | | | | | |
Total | | | | $ | — | | | $ | (32,916) | | | $ | (79,232) | | | $ | (112,148) | |
| | | | | | | | | | | | | | |
| (a) | This amount represents the cumulative appreciation (depreciation) of futures contracts as reported on the SOI. The Statements of Assets and Liabilities only reflect the current day variation margin receivable/payable from/to brokers. |
| (b) | This amount represents the value of centrally cleared swaps as reported on the SOI. The Statements of Assets and Liabilities only reflect the current day variation margin receivable/payable from/to brokers. |
The following tables present the effect of derivatives on the Statements of Operations for the six months ended August 31, 2018, by primary underlying risk exposure:
Flexible Long/Short Fund
| | | | | | | | | | | | | | | | | | | | |
| Amount of Realized Gain (Loss) on Derivatives Recognized on the Statements of Operations | |
Derivative
Contracts | | Options and
Swaptions | | | Futures Contracts | | | Forward Foreign
Currency Exchange
Contracts | | | Swaps | | | Total | |
Interest rate contracts | | $ | (4,996) | | | $ | (19,339) | | | $ | — | | | $ | (681) | | | $ | (25,016) | |
Foreign exchange contracts | | | — | | | | — | | | | 530,607 | | | | — | | | | 530,607 | |
Credit contracts | | | 2,334 | | | | — | | | | — | | | | (4,056) | | | | (1,722) | |
| | | | | | | | | | | | | | | | | | | | |
Total | | $ | (2,662) | | | $ | (19,339) | | | $ | 530,607 | | | $ | (4,737) | | | $ | 503,869 | |
| | | | | | | | | | | | | | | | | | | | |
| | | | | | | | | | | | | | | | | | | | |
| Amount of Change in Unrealized Appreciation (Depreciation) on Derivatives Recognized on the Statements of Operations | |
Derivative Contracts | | Options and
Swaptions | | | Futures Contracts | | | Forward Foreign
Currency Exchange
Contracts | | | Swaps | | | Total | |
Interest rate contracts | | $ | 1,062 | | | $ | 1,483 | | | $ | — | | | $ | 1,270 | | | $ | 3,815 | |
Foreign exchange contracts | | | — | | | | — | | | | (86,445) | | | | — | | | | (86,445) | |
Credit contracts | | | (18,302) | | | | — | | | | — | | | | (11,471) | | | | (29,773) | |
| | | | | | | | | | | | | | | | | | | | |
Total | | $ | (17,240) | | | $ | 1,483 | | | $ | (86,445) | | | $ | (10,201) | | | $ | (112,403) | |
| | | | |
High Yield Opportunities Fund
| | | | | | | | | | | | | | | | |
| Amount of Realized Gain (Loss) on Derivatives Recognized on the Statements of Operations | |
Derivative Contracts | | Futures Contracts | | | Forward Foreign
Currency Exchange
Contracts | | | Swaps | | | Total | |
Interest rate contracts | | $ | (3,429) | | | $ | — | | | $ | — | | | $ | (3,429) | |
Foreign exchange contracts | | | — | | | | 332,765 | | | | — | | | | 332,765 | |
Credit contracts | | | — | | | | — | | | | (19,306) | | | | (19,306) | |
| | | | | | | | | | | | | | | | |
Total | | $ | (3,429) | | | $ | 332,765 | | | $ | (19,306) | | | $ | 310,030 | |
| | | | | | | | | | | | |
52
| | | | | | | | | | | | | | | | | | | | | | | | | | | | | | | | |
| High Yield Opportunities Fund | |
| Amount of Change in Unrealized Appreciation (Depreciation) on Derivatives Recognized on the Statements of Operations | |
Derivative Contracts | | | | | Futures
Contracts | | | | | | Forward Foreign
Currency Exchange
Contracts | | | | | | Swaps | | | | | | Total | |
Interest rate contracts | | | | | | $ | 1,640 | | | | | | | $ | — | | | | | | | $ | — | | | | | | | $ | 1,640 | |
Foreign exchange contracts | | | | | | | — | | | | | | | | (42,511) | | | | | | | | — | | | | | | | | (42,511) | |
Credit contracts | | | | | | | — | | | | | | | | — | | | | | | | | (9,779) | | | | | | | | (9,779) | |
| | | | | | | | | | | | | | | | | | | | | | | | | | | | | | | | |
Total | | | | | | $ | 1,640 | | | | | | | $ | (42,511) | | | | | | | $ | (9,779) | | | | | | | $ | (50,650) | |
| | | | | | | | | | | | | | | | | | | | | | | | | | | | | | | | |
Derivatives Volume
The tables below disclose the volume of the Funds’ futures contracts, forward foreign currency exchange contracts, options and swaps activity during the six months ended August 31, 2018. Please refer to the tables in the Summary of Derivatives Information for derivative-related gains and losses associated with volume activity.
| | | | | | | | |
| | | Flexible Long/Short
Fund | | | High Yield Opportunities Fund |
Futures Contracts - Interest: | | | | | | | | |
Average Notional Balance Long | | $ | 1,441,823 | | | $ | — | |
Average Notional Balance Short | | | 2,408,129 | | | | 1,162,395 | |
Ending Notional Balance Long | | | 2,102,357 | | | | — | |
Ending Notional Balance Short | | | 1 338 223 | | | | 1,160,734 | |
| | |
Forward Foreign Currency Exchange Contracts: | | | | | | | | |
Average Settlement Value Purchased | | | 3,279,553 | | | | 2,118,723 | |
Average Settlement Value Sold | | | 12,166,289 | | | | 7,997,637 | |
Ending Settlement Value Purchased | | | 6,786,613 | | | | 4,535,563 | |
Ending Settlement Value Sold | | | 12,971,852 | | | | 9,222,971 | |
| | |
Credit Default Swaps: | | | | | | | | |
Average Notional Balance - Buy Protection | | | 4,410,757 | | | | 1,000,000 | |
Average Notional Balance - Sell Protection | | | 1,577,054 | | | | — | |
Ending Notional Balance - Buy Protection | | | 4,903,630 | | | | 1,000,000 | |
Ending Notional Balance - Sell Protection | | | 1,270,630 | | | | — | |
| | |
Exchange-Traded Options: | | | | | | | | |
Average Number of Contracts Purchased | | | 17 | | | | — | |
Average Number of Contracts Written | | | 17 | | | | — | |
Ending Number of Contracts Purchased | | | — | | | | — | |
Ending Number of Contracts Written | | | — | | | | — | |
| | |
Swaptions & OTC Options: | | | | | | | | |
Average Notional Balance Purchased | | | 4,885,000 | | | | — | |
Average Notional Balance Written | | | 4,885,000 | | | | — | |
Ending Notional Balance Purchased | | | 7,635,000 | | | | — | |
Ending Notional Balance Written | | | 7,635,000 | | | | — | |
| | |
Interest Rate-Related Swaps: | | | | | | | | |
Average Notional Balance — Pays Fixed Rate | | | 450,000 | | | | — | |
Ending Notional Balance — Pays Fixed Rate | | | 450,000 | | | | — | |
The Funds may be required to post or receive collateral based on the net value of the Funds’ outstanding OTC swap contracts, non-deliverable Forward Foreign Currency Exchange Contracts and/or OTC options with the counterparty in the form of cash or securities. Daily movement of cash collateral is subject to minimum threshold amounts. Collateral posted by the Funds is held in a segregated account at the Funds’ custodian bank. For certain counterparties, cash collateral posted by the Funds is invested in an affiliated money market fund. Otherwise the cash collateral is included on the Statements of Assets and Liabilities as Restricted cash.
The Funds’ derivatives contracts held at August 31, 2018 are not accounted for as hedging instruments under GAAP.
53
E. Foreign Currency Translation — The books and records of the Funds are maintained in U.S. dollars. Foreign currency amounts are translated into U.S. dollars at the prevailing exchange rates of such currencies against the U.S. dollar. The market value of investment securities and other assets and liabilities are translated at the exchange rate as of the valuation date. Purchases and sales of investment securities, income and expenses are translated at the exchange rate prevailing on the respective dates of such transactions.
The Funds do not isolate the effect of changes in foreign exchange rates from changes in market prices on securities held. Accordingly, such changes are included within Change in net unrealized appreciation/depreciation on investments on the Statements of Operations.
Reported realized foreign currency gains and losses arise from the disposition of foreign currency, currency gains or losses realized between the trade and settlement dates on securities transactions, and the difference between the amounts of dividends, interest and foreign withholding taxes recorded on each Fund’s books on the transaction date and the U.S. dollar equivalent of the amounts actually received or paid. These reported realized foreign currency gains and losses are included in Net realized gain (loss) on foreign currency transactions on the Statements of Operations. Unrealized foreign currency gains and losses arise from changes (due to changes in exchange rates) in the value of foreign currency and other assets and liabilities denominated in foreign currencies, which are held at year end are included in Change in net unrealized appreciation/depreciation on foreign currency translations on the Statements of Operations.
F. Investment Transactions with Affiliates —The Funds invested in Underlying Funds which are advised by the Adviser or its affiliates. An issuer which is under common control with the Fund may be considered an affiliate. For the purposes of the financial statements, the Fund assumes the issuers listed in the table below to be affiliated issuers. Underlying Funds’ distributions may be reinvested into the Underlying Funds. Reinvestment amounts are included in the purchase cost amounts in the table below. Amounts in the table below are in thousands.
Flexible Long/Short Fund
| | | | | | | | | | | | | | | | | | | | | | | | | | | | | | | | | | | | |
| For the six months ended August 31, 2018 | |
Security
Description | | Value at
February
28, 2018 | | | Purchases
at Cost | | | Proceeds
from
Sales | | | Net
Realized
Gain
(Loss) | | | Change
in Unrealized
Appreciation/
(Depreciation) | | | Value at
August 31,
2018 | | | Shares at
August 31,
2018 | | | Dividend
Income | | | Capital Gain
Distributions | |
| JPMorgan Prime Money Market Fund Class Institutional Shares, 2.04%(a)(b) | | | $400,800 | | | | $1,992,173 | | | | $2,093,481 | | | | $26 | | | | $60 | | | | $299,578 | | | | 299,488 | | | | $3,663 | | | | $— | |
| JPMorgan U.S. Government Money Market Fund Class Institutional Shares, 1.82%(a)(b) | | | 44,636 | | | | 2,001,456 | | | | 683,340 | | | | — | | | | — | | | | 1,362,752 | | | | 1,362,752 | | | | 5,863 | | | | $— | |
| | | | |
Total | | | $445,436 | | | | $3,993,629 | | | | $2,776,821 | | | | $26 | | | | $60 | | | | $1,662,330 | | | | | | | | $9,526 | | | | $— | |
| | | | |
High Yield Opportunities Fund
| | | | | | | | | | | | | | | | | | | | | | | | | | | | | | | | | | | | |
| For the six months ended August 31, 2018 | |
Security
Description | | Value at
February
28, 2018 | | | Purchases
at Cost | | | Proceeds
from Sales | | | Net
Realized
Gain
(Loss) | | | Change
in Unrealized
Appreciation/
(Depreciation) | | | Value at
August 31,
2018 | | | Shares at
August 31,
2018 | | | Dividend
Income | | | Capital Gain
Distributions | |
| JPMorgan U.S. Government Money Market Fund Class Institutional Shares, 1.82%(a)(b) | | | $1,311,048 | | | | $7,444,953 | | | | $7,454,994 | | | | $— | | | | $— | | | | $1,301,007 | | | | 1,301,007 | | | | $7,938 | | | | $— | |
| | | | |
(a) Investment in affiliate. Fund is registered under the Investment Company Act of 1940, as amended, and advised by J.P. Morgan Investment Management Inc.
(b) The rate shown is the current yield as of August 31, 2018.
G. Security Transactions and Investment Income — Investment transactions are accounted for on the trade date (the date the order to buy or sell is executed). Securities gains and losses are calculated on a specifically identified cost basis. Interest income and interest expense on securities sold short, if any, is determined on the basis of coupon interest accrued using the effective interest method which adjusts for amortization of premiums and accretion of discounts.
Dividend income net of foreign tax withheld, if any, is recorded on the ex-dividend date or when the Funds first learn of the dividend. Certain Funds may receive other income from investment in loan assignments and/or unfunded commitments, including amendment fees, consent fees and commitment fees. These fees are recorded as income when received by the Funds. These amounts are included in Interest income from non-affiliates on the Statements of Operations.
H. Foreign Taxes — The Funds may be subject to foreign taxes on income, gains on investments or currency purchases/repatriation, a portion of which may be recoverable. The Funds will accrue such taxes and recoveries as applicable, based upon their current interpretation of tax rules and regulations that exist in the markets in which they invest.
I. Allocation of Income and Expenses — Expenses directly attributable to a fund are charged directly to that fund, while the expenses attributable to more than one fund of the Trust are allocated among the respective funds. In calculating the NAV of each class, investment income, realized and unrealized gains and losses and expenses, other than class specific expenses, are allocated daily to each class of shares based upon the proportion of net assets of each class at the beginning of each day.
54
Transfer agency fees are class-specific expenses. The amount of the transfer agency fees charged to each class of the Funds for the six months ended August 31, 2018 are as follows (amounts in thousands):
| | | | | | | | | | | | | | | | | | | | |
| | | Class A | | | Class C | | | Class I | | | Class R6 | | | Total | |
Flexible Long/Short Fund | | | $3 | | | | $3 | | | | $78 | | | | $3 | | | | $87 | |
High Yield Opportunities Fund | | | 3 | | | | 3 | | | | 74 | | | | 3 | | | | 83 | |
J. Federal Income Taxes — Each Fund is treated as a separate taxable entity for Federal income tax purposes. Each Fund’s policy is to comply with the provisions of the Internal Revenue Code (the “Code”), applicable to regulated investment companies and to distribute to shareholders all of its distributable net investment income and net realized capital gains on investments. Accordingly, no provision for Federal income tax is necessary. Management has reviewed the Funds’ tax positions for all open tax years and has determined that as of August 31, 2018, no liability for income tax is required in the Funds’ financial statements for net unrecognized tax benefits. However, management’s conclusions may be subject to future review based on changes in, or the interpretation of, the accounting standards or tax laws and regulations. Each of the Funds’ Federal tax returns for the prior three fiscal years, or since inception if shorter, remains subject to examination by the Internal Revenue Service.
K. Distributions to Shareholders — Distributions from net investment income are generally declared and paid monthly and are declared separately for each class. No class has preferential dividend rights; differences in per share rates are due to differences in separate class expenses. Net realized capital gains, if any, are distributed by each Fund at least annually. The amount of distributions from net investment income and net realized capital gains is determined in accordance with Federal income tax regulations, which may differ from GAAP. To the extent these “book/tax” differences are permanent in nature (i.e., that they result from other than timing of recognition — “temporary differences”), such amounts are reclassified within the capital accounts based on their Federal tax-basis treatment.
3. Fees and Other Transactions with Affiliates
A. Investment Advisory Fee — Pursuant to Investment Advisory Agreements, the Adviser supervises the investments of each Fund and for such services is paid a fee. The fee is accrued daily and paid monthly based on each Fund’s respective average daily net assets. The annual rate for each Fund is as follows:
| | | | |
| | | | |
Flexible Long/Short Fund | | | 0.50 | % |
High Yield Opportunities Fund | | | 0.60 | |
The Adviser waived Investment Advisory fees and/or reimbursed expenses as outlined in Note 3.G.
B. Administration Fee — Pursuant to Administration Agreements, the Administrator provides certain administration services to the Funds. In consideration of these services, the Administrator receives a fee accrued daily and paid monthly at an annual rate of 0.15% of the first $25 billion of the average daily net assets of all funds in the J.P. Morgan Funds Complex covered by the Administration Agreement (excluding certain funds of funds and money market funds) and 0.075% of the average daily net assets in excess of $25 billion of all such funds. For the six months ended August 31, 2018, the effective annualized rate was 0.08% of each Fund’s average daily net assets, notwithstanding any fee waivers and/or expense reimbursements.
The Administrator waived Administration fees as outlined in Note 3.G.
JPMorgan Chase Bank, N.A. (“JPMCB”), a wholly-owned subsidiary of JPMorgan, serves as the Funds’ sub-administrator (the “Sub-administrator”). For its services as Sub-administrator, JPMCB receives a portion of the fees payable to the Administrator.
C. Distribution Fees — Pursuant to a Distribution Agreement, JPMorgan Distribution Services, Inc. (“JPMDS”), an indirect, wholly-owned subsidiary of JPMorgan, serves as the Trust’s exclusive underwriter and promotes and arranges for the sale of each Fund shares.
The Board has adopted a Distribution Plan (the “Distribution Plan”) for Class A and Class C Shares of the Funds in accordance with Rule 12b-1 under the 1940 Act. The Class I and Class R6 do not charge a distribution fee. The Distribution Plan provides that the Funds shall pay distribution fees, including payments to JPMDS, at annual rates of 0.25% and 0.75% of the average daily net assets of Class A and Class C Shares, respectively. In addition, JPMDS is entitled to receive the front-end sales charges from purchases of Class A Shares and the CDSC from redemptions of Class C Shares and certain Class A Shares for which front-end sales charges have been waived. For the six months ended August 31, 2018, JPMDS did not retain any front-end sales charges or CDSC.
D. Service Fees — The Trust, on behalf of the Funds, has entered into a Shareholder Servicing Agreement with JPMDS under which JPMDS provides certain support services to the shareholders. For performing these services, JPMDS receives a fee, except for Class R6 Shares which do not charge a service fee, that is accrued daily and paid monthly equal to a percentage of the average daily net assets as shown in the table below:
| | | | | | | | | | | | |
| | | Class A | | | Class C | | | Class I | |
Flexible Long/Short Fund | | | 0.25 | % | | | 0.25 | % | | | 0.25 | % |
High Yield Opportunities Fund | | | 0.25 | | | | 0.25 | | | | 0.25 | |
JPMDS has entered into shareholder services contracts with affiliated and unaffiliated financial intermediaries who provide shareholder services and other related services to their clients or customers who invest in the Funds under which JPMDS will pay all or a portion of such fees earned to financial intermediaries for performing such services.
JPMDS waived service fees as outlined in Note 3.G.
55
E. Custodian and Accounting Fees — JPMCB provides portfolio custody and accounting services to the Funds. For performing these services, the Funds pay JPMCB transaction and asset-based fees that vary according to the number of transactions and positions, plus out-of-pocket expenses. The amounts paid directly to JPMCB by the Funds for custody and accounting services are included in Custodian and accounting fees on the Statements of Operations. Interest income earned on cash balances at the custodian, if any, is included in Interest income from affiliates on the SOP/Statements of Operations. Prior to March 1, 2018, payments to the custodian were reduced by credits earned by each Fund, based on uninvested cash balances held by the custodian. Such earnings credits, if any, are presented separately on the Statements of Operations.
Interest expense paid to the custodian related to cash overdrafts, if any, is included in Interest expense to affiliates on the Statements of Operations. F. Collateral Management Fees — JPMCB provides derivatives collateral management services for the Funds. The amounts paid directly to JPMCB by the Funds for these services are included in Collateral management fees on the Statements of Operations.
G. Waivers and Reimbursements — The Adviser, Administrator and/or JPMDS have contractually agreed to waive fees and/or reimburse the Funds to the extent that total annual operating expenses (excluding acquired fund fees and expenses other than certain money market fund fees as described below, dividend and interest expenses related to short sales, interest, taxes, expenses related to litigation and potential litigation, and extraordinary expenses) exceed the percentages of the Funds’ average daily net assets as shown in the table below:
| | | | | | | | | | | | | | | | |
| | | Class A | | | Class C | | | Class I | | | Class R6 | |
Flexible Long/Short Fund | | | 1.15 | % | | | 1.65 | % | | | 0.90 | % | | | 0.65 | % |
High Yield Opportunities Fund | | | 1.00 | | | | 1.55 | | | | 0.80 | | | | 0.60 | |
The expense limitation agreements were in effect for the six months ended August 31, 2018 and are in place until at least June 30, 2019.
For the six months ended August 31, 2018, the Funds’ service providers waived fees and/or reimbursed expenses for the Funds as follows. None of these parties expect the Funds to repay any such waived fees and/or reimbursed expenses in future years.
| | | | | | | | | | | | | | | | | | | | |
| | | Contractual Waivers | | | | |
| | | Investment
Advisory Fees | | | Administration
Fees | | | Service Fees | | | Total | | | Contractual
Reimbursements | |
Flexible Long/Short Fund | | | $67,253 | | | | $10,907 | | | | $ 84 | | | $ | 78,244 | | | | $46,253 | |
High Yield Opportunities Fund | | | 83,362 | | | | 11,266 | | | | 7,027 | | | | 101,655 | | | | 21,074 | |
Additionally, the Funds may invest in one or more money market funds advised by the Adviser or its affiliates (affiliated money market funds). The Adviser, Administrator and/or JPMDS, as shareholder servicing agent, have contractually agreed to waive fees and/or reimburse expense in an amount sufficient to offset the respective net fees each collects from the affiliated money market funds on the Fund’s investment in such affiliated money market funds.
The amounts of waivers resulting from investments in these money market funds for the six months ended August 31, 2018 were as follows:
| | | | |
| | | | |
Flexible Long/Short Fund | | $ | 903 | |
High Yield Opportunities Fund | | | 922 | |
H. Other — Certain officers of the Trust are affiliated with the Adviser, the Administrator and JPMDS. Such officers, with the exception of the Chief Compliance Officer, receive no compensation from the Funds for serving in their respective roles.
The Board appointed a Chief Compliance Officer to the Funds in accordance with Federal securities regulations. Each Fund, along with other affiliated funds, makes reimbursement payments, on a pro-rata basis, to the Administrator for a portion of the fees associated with the Office of the Chief
Compliance Officer. Such fees are included in Trustees’ and Chief Compliance Officer’s fees on the Statements of Operations.
The Trust adopted a Trustee Deferred Compensation Plan (the “Plan”) which allows the Independent Trustees to defer the receipt of all or a portion of compensation related to performance of their duties as Trustees. The deferred fees are invested in various J.P. Morgan Funds until distribution in accordance with the Plan.
During the six months ended August 31, 2018, the Funds purchased securities from an underwriting syndicate in which the principal underwriter or members of the syndicate were affiliated with the Adviser.
The Funds may use related party broker-dealers. For the six months ended August 31, 2018, the Funds did not incur any brokerage commissions with broker-dealers affiliated with the Adviser.
The Securities and Exchange Commission (“SEC”) has granted an exemptive order permitting the Funds to engage in principal transactions with J.P. Morgan Securities, Inc., an affiliated broker, involving taxable money market instruments, subject to certain conditions.
56
4. Investment Transactions
During the six months ended August 31, 2018, purchases and sales of investments (excluding short-term investments) were as follows:
| | | | | | | | | | | | | | | | |
| | | Purchases
(excluding
U.S. Government) | | | Sales (excluding
U.S. Government) | | | Purchases of U.S.
Government | | | Sales of U.S.
Government | |
Flexible Long/Short Fund | | | $6,292,124 | | | | $6,013,869 | | | | $325,066 | | | | $186,773 | |
High Yield Opportunities Fund | | | 6,464,973 | | | | 5,193,613 | | | | — | | | | — | |
5. Federal Income Tax Matters
For Federal income tax purposes, the estimated cost and unrealized appreciation (depreciation) in value of investments held at August 31, 2018 were as follows:
| | | | | | | | | | | | | | | | |
| | | Aggregate
Cost | | | Gross Unrealized
Appreciation | | | Gross Unrealized
Depreciation | | | Net Unrealized
Appreciation
(Depreciation) | |
Flexible Long/Short Fund | | | $26,963,726 | | | | $594,963 | | | | $696,699 | | | | $(101,736) | |
High Yield Opportunities Fund | | | 28,018,676 | | | | 682,483 | | | | 639,228 | | | | 43,255 | |
As of February 28, 2018, the following Funds had net capital loss carryforwards:
| | | | | | | | |
| | | Capital Loss Carryforward Character | |
| | | Short-Term | | | Long-Term | |
Flexible Long/Short Fund | | | $ 38,721 | | | | $ — | |
High Yield Opportunities Fund | | | — | | | | 177,390 | |
Specified ordinary losses and net capital losses incurred after October 31 within the taxable year are deemed to arise on the first business day of the Funds’ next taxable year. For the year ended February 28, 2018, the Funds deferred to March 1, 2018 the following specified ordinary losses and net capital losses of:
| | | | | | | | | | | | |
| | | Net capital loss | | | | |
| | | Short-Term | | | Long-Term | | | Specified Loss | |
Flexible Long/Short Fund | | | $ — | | | | $ — | | | | $196,440 | |
High Yield Opportunities Fund | | | 43,552 | | | | 46,926 | | | | — | |
6. Borrowings
The Funds rely upon an exemptive order granted by the SEC (the “Order”) permitting the establishment and operation of an Interfund Lending Facility (the “Facility”). The Facility allows the Funds to directly lend and borrow money to or from any other fund relying upon the Order at rates beneficial to both the borrowing and lending funds. Advances under the Facility are taken primarily for temporary or emergency purposes, including the meeting of redemption requests that otherwise might require the untimely disposition of securities, and are subject to each Fund’s borrowing restrictions. The
Interfund loan rate is determined, as specified in the Order, by averaging the current repurchase agreement rate and the current bank loan rate. The Order was granted to JPMorgan Trust II and may be relied upon by the Funds because the Funds and the series of JPMorgan Trust II are all investment companies in the same “group of investment companies” (as defined in Section 12(d)(1)(G) of the 1940 Act).
The Trust and JPMCB have entered into a financing arrangement. Under this arrangement, JPMCB provides an unsecured, uncommitted credit facility in the aggregate amount of $100 million to certain of the J.P. Morgan Funds, including the Funds. Advances under the arrangement are taken primarily for temporary or emergency purposes, including the meeting of redemption requests that otherwise might require the untimely disposition of securities, and are subject to each Fund’s borrowing restrictions. Interest on borrowings is payable at a rate determined by JPMCB at the time of borrowing. This agreement has been extended until November 5, 2018.
The Funds had no borrowings outstanding from another fund or from the unsecured, uncommitted credit facility at August 31, 2018.
7. Risks, Concentrations and Indemnifications
In the normal course of business, the Funds entered into contracts that contain a variety of representations which provide general indemnifications.
Each Fund’s maximum exposure under these arrangements is unknown. The amount of exposure would depend on future claims that may be brought against each Fund. However, based on experience, the Funds expect the risk of loss to be remote.
As of August 31, 2018, all the Funds’ shares were held by the Adviser.
The Funds’ investments in sovereign and corporate debt obligations within emerging market countries may be subject to potentially higher risks than investments in more developed markets and the prices of such investments may be volatile. The yields of emerging market debt obligations reflect, among other things, perceived credit risk. The consequences of political, social or economic instability in these markets may have disruptive effects on the market prices of the Funds’ investments and the income they generate, as well as the Funds’ ability to repatriate such amounts.
The Funds are subject to interest rate and credit risk. The value of debt securities may decline as interest rates increase. The Funds could lose money if the issuer of a fixed income security is unable to pay interest or repay principal when it is due. The Funds invest in floating rate loans and other floating rate debt securities. Although these investments are generally less sensitive to interest rate changes than other fixed rate instruments, the value of floating rate loans and other floating rate investments may decline if their interest rates do not rise as quickly, or as much, as general interest
57
rates. Many factors can cause interest rates to rise. Some examples include central bank monetary policy, rising inflation rates and general economic conditions. Given that the Federal Reserve has been raising interest rates, the Funds may face a heightened level of interest rate risk. The ability of the issuers of debt to meet their obligations may be affected by the economic and political developments in a specific industry or region.
The Funds invest in high yield securities that are not rated or rated below investment grade (commonly known as “junk bonds”). These securities are considered to be high risk investments. Investments in lower-rated securities or unrated securities of comparable quality tend to be more sensitive to economic conditions than higher rated securities. Junk bonds involve a greater risk of default by the issuer because such securities are generally unsecured and are often subordinated to other creditors’ claims. The market price of these securities can change suddenly and unexpectedly. As a result, the Funds are intended for investors who are able and willing to assume a high degree of risk.
The Funds invest in interest bearing notes with preferred security characteristics. These securities may include provisions that permit the issuer, in its discretion, to defer or omit distributions for a certain period of time.
Investing in securities of foreign countries may include certain risks and considerations not typically associated with investing in U.S. securities. These risks include revaluation of currencies, high rates of inflation, repatriation restrictions on income and currencies, and future and adverse political, social and economic developments.
Derivatives may be riskier than other types of investments because they may be more sensitive to changes in economic and market conditions and could result in losses that significantly exceed the Funds’ original investment. Many derivatives create leverage thereby causing the Funds to be more volatile than they would have been if they had not used derivatives. Certain derivatives also expose the Funds to counterparty risk (the risk that the derivative counterparty will not fulfill its contractual obligations), including credit risk of the derivative counterparty.
The Funds are also subject to counterparty credit risk, which is the risk that a counterparty fails to perform on agreements with the Funds such as swap and option contracts and forward foreign currency exchange contracts.
8. New Accounting Pronouncement
In March 2017, the Financial Accounting Standards Board (“FASB”) issued Accounting Standards Update (“ASU”) 2017-08 (“ASU 2017-08”) Premium Amortization on Purchased Callable Debt Securities, which shortens the premium amortization period for purchased non-contingently callable debt securities. ASU 2017-08 requires that the premium be amortized to the earliest call date, for purchased non-contingently callable debt securities. ASU 2017-08 is effective for the fiscal years, and interim periods within those fiscal years, beginning after December 15, 2018. Management is currently evaluating the implications of these changes on the financial statements, if any.
In August 2018, the FASB issued ASU 2018-13 Fair Value Measurement (Topic 820): Disclosure Framework—Changes to the Disclosure Requirements for Fair Value Measurement, which adds, removes, and modifies certain aspects of the fair value disclosure. ASU 2018-13 amendments are the result of a broader disclosure project, FASB Concepts Statement Conceptual Framework for Financial Reporting — Chapter 8: Notes to Financial Statements, to improve the effectiveness of the fair value disclosure requirements. ASU 2018-13 is effective for the fiscal years, and interim periods within those fiscal years, beginning after December 15, 2019; early adoption is permitted. Management is currently evaluating the implications of these changes.
9. Subsequent Event
Effective October 5, 2018, the Funds may engage in securities lending to broker dealers or other financial institutions approved by the Funds. Citibank N. A. serves as lending agent for the Funds.
58
SCHEDULE OF SHAREHOLDER EXPENSES (Unaudited)
Hypothetical $1,000 Investment
As a shareholder of the Funds, you incur two types of costs: (1) transaction costs, including sales charges (loads) on purchase payments and (2) ongoing costs, including investment advisory fees, administration fees, distribution fees and other Fund expenses. The examples below are intended to help you understand your ongoing costs (in dollars) of investing in the Fund and to compare these ongoing costs with the ongoing costs of investing in other mutual funds. The examples assume that you had a $1,000 investment in each Class at the beginning of the reporting period, March 1, 2018, and continued to hold your shares at the end of the reporting period, August 31, 2018.
Actual Expenses
For each Class of each Fund in the table below, the first line provides information about actual account values and actual expenses. You may use the information in this line, together with the amount you invested, to estimate the expenses that you paid over the period. Simply divide your account value by $1,000 (for example, an $8,600 account value divided by $1,000 = 8.6), then multiply the result by the number in the first line of each Class under the heading entitled “Expenses Paid During the Period” to estimate the expenses you paid on your account during this period.
Hypothetical Example for Comparison Purposes
The second line of each Class in the table below provides information about hypothetical account values and hypothetical expenses based on the Class’ actual expense ratio and an assumed rate of return of 5% per year before expenses, which is not the Class’ actual return. The hypothetical account values and expenses may not be used to estimate the actual ending account balance or expenses you paid for the period. You may use this information to compare the ongoing costs of investing in the Class of the Fund and other funds. To do so, compare this 5% hypothetical example with the 5% hypothetical examples that appear in the shareholder reports of the other funds. Please note that the expenses shown in the table are meant to highlight your ongoing costs only and do not reflect any transaction costs, such as sales charges (loads) or redemption fees. Therefore, the second line for each Class in the table is useful in comparing ongoing costs only, and will not help you determine the relative total costs of owning different funds. In addition, if these transaction costs were included, your costs would have been higher. The examples also assume all dividends and distributions have been reinvested.
| | | | | | | | |
| | | Beginning Account Value March 1, 2018 | | Ending Account Value
August 31, 2018 | | Expenses
Paid During the Period* | | Annualized Expense Ratio |
Flexible Long/Short Fund | | | | | | | | |
Class A | | | | | | | | |
Actual | | $1,000.00 | | $1,005.90 | | $5.86 | | 1.16% |
Hypothetical | | 1,000.00 | | 1,019.36 | | 5.90 | | 1.16 |
Class C | | | | | | | | |
Actual | | 1,000.00 | | 1,003.50 | | 8.23 | | 1.63 |
Hypothetical | | 1,000.00 | | 1,016.99 | | 8.29 | | 1.63 |
Class I | | | | | | | | |
Actual | | 1,000.00 | | 1,007.30 | | 4.55 | | 0.90 |
Hypothetical | | 1,000.00 | | 1,020.67 | | 4.58 | | 0.90 |
Class R6 | | | | | | | | |
Actual | | 1,000.00 | | 1,008.50 | | 3.24 | | 0.64 |
Hypothetical | | 1,000.00 | | 1,021.98 | | 3.26 | | 0.64 |
59
SCHEDULE OF SHAREHOLDER EXPENSES (Unaudited) (continued)
Hypothetical $1,000 Investment
| | | | | | | | |
| | | Beginning Account Value March 1, 2018 | | Ending Account Value
August 31, 2018 | | Expenses
Paid During the Period* | | Annualized Expense Ratio |
High Yield Opportunities Fund | | | | | | | | |
Class A | | | | | | | | |
Actual | | $1,000.00 | | $1,0121.80 | | $5.10 | | 1.00% |
Hypothetical | | 1,000.00 | | 1,020.16 | | 5.09 | | 1.00 |
Class C | | | | | | | | |
Actual | | 1,000.00 | | 1,017.90 | | 7.88 | | 1.55 |
Hypothetical | | 1,000.00 | | 1,017.39 | | 7.88 | | 1.55 |
Class I | | | | | | | | |
Actual | | 1,000.00 | | 1,021.80 | | 4.08 | | 080 |
Hypothetical | | 1,000.00 | | 1,021.17 | | 4.08 | | 0.80 |
Class R6 | | | | | | | | |
Actual | | 1,000.00 | | 1,023.80 | | 3.06 | | 0.60 |
Hypothetical | | 1,000.00 | | 1,022.18 | | 3.06 | | 0.60 |
| * | Expenses are equal to each Class’ respective annualized expense ratio, multiplied by the average account value over the period, multiplied by 184/365 (to reflect the one-half year period). |
60
BOARD APPROVAL OF INVESTMENT ADVISORY AGREEMENTS
(Unaudited)
The Board of Trustees has established various standing committees composed of Trustees with diverse backgrounds, to which the Board of Trustees has assigned specific subject matter responsibilities to further enhance the effectiveness of the Board’s oversight and decision making. The Board of Trustees and its investment committees (money market and alternative products, equity, and fixed income) meet regularly throughout the year and consider factors that are relevant to their annual consideration of investment advisory agreements at each meeting. They also meet for the specific purpose of considering investment advisory agreement annual renewals. The Board of Trustees held meetings in person in June and August 2018 at which the Trustees considered the continuation of the investment advisory agreements for each of the Funds whose semi-annual report is contained herein (each an “Advisory Agreement” and collectively, the “Advisory Agreements”). At the June meeting, the Board’s investment committees met to review and consider performance, expense and related information for the J.P. Morgan Funds. Each investment committee reported to the full Board, which then considered the investment committee’s preliminary findings. At the August meeting, the Trustees continued their review and consideration. The Trustees, including a majority of the Trustees who are not “interested persons” (as defined in the 1940 Act) of any party to the Advisory Agreements or any of their affiliates, approved the continuation of each Advisory Agreement on August 15, 2018.
As part of their review of the Advisory Agreements, the Trustees considered and reviewed performance and other information about the Funds received from the Adviser. This information includes the Funds’ performance as compared to the performance of their peers and benchmarks and analyses by the Adviser of the Funds’ performance. In addition, the Trustees have engaged an independent management consulting firm (“independent consultant”) to report on the performance of certain J.P. Morgan Funds at each of the Trustees’ regular meetings. In addition, in preparation for the June and August meetings, the Trustees requested, received and evaluated extensive materials from the Adviser, including performance and expense information compiled by Broadridge, using data from Lipper Inc., independent providers of investment company data (together, “Broadridge/Lipper”). Before voting on the Advisory Agreements, the Trustees reviewed the Advisory Agreements with representatives of the Adviser, counsel to the Trust, and independent legal counsel and received a memorandum from independent legal counsel to the Trustees discussing the legal standards for their consideration of the Advisory Agreements. The Trustees also discussed the Advisory Agreements in executive sessions with independent legal counsel at which no representatives of the Adviser were present.
A summary of the material factors evaluated by the Trustees in determining whether to approve each Advisory Agreement is provided below. Each Trustee attributed different weights to the various factors and no factor alone was considered determinative. The Trustees considered information provided with respect to the Funds throughout the year, as well as materials furnished specifically in connection with the annual review process. From year to year, the Trustees consider and place emphasis on relevant information in light of changing circumstances in market and economic conditions. After considering and weighing the factors and information they had received, the Trustees found that the compensation to be received by the Adviser from each Fund under the applicable Advisory Agreement was fair and reasonable under the circumstances and determined that the continuance of each Advisory Agreement was in the best interests of each Fund and its shareholder.
Nature, Extent and Quality of Services Provided by the Adviser
The Trustees received and considered information regarding the nature, extent and quality of the services provided to each Fund under the applicable Advisory Agreement. The Trustees took into account information furnished throughout the year at Trustee meetings, as well as the materials furnished specifically in connection with this annual review process. The Trustees considered the background and experience of
61
the Adviser’s senior management and the expertise of, and the amount of attention given to each Fund by, investment personnel of the Adviser. In addition, the Trustees reviewed the qualifications, backgrounds and responsibilities of the portfolio management team primarily responsible for the day-to-day management of each Fund and the infrastructure supporting the team, including personnel changes. The Trustees also considered information provided by the Adviser and JPMorgan Distribution Services, Inc.
(“JPMDS”) about the structure and distribution strategy of each Fund. The Trustees reviewed information relating to the Adviser’s risk governance model and reports showing the Adviser’s compliance structure and ongoing compliance processes. The Trustees also considered the quality of administrative services provided by the Adviser in its role as administrator.
The Trustees also considered their knowledge of the nature and quality of the services provided by the Adviser and its affiliates to the Funds gained from their experience as Trustees of the J.P. Morgan Funds. In addition, they considered the overall reputation and capabilities of the Adviser and its affiliates, the commitment of the Adviser to provide high quality service to the Funds, their overall confidence in the Adviser’s integrity and the Adviser’s responsiveness to questions or concerns raised by them, including the Adviser’s willingness to consider and implement organizational and operational changes designed to improve investment results and the services provided to each Fund.
Based upon these considerations and other factors, the Trustees concluded that they were satisfied with the nature, extent and quality of the investment advisory services provided to the Funds by the Adviser.
Costs of Services Provided and Profitability to the Adviser and its Affiliates
The Trustees received and considered information regarding the profitability to the Adviser and its affiliates in providing services to each Fund. The Trustees reviewed and discussed this information. The Trustees recognized that this information is not audited and represents the Adviser’s determination of its and its affiliates’ revenues from the contractual services provided to the Funds, less expenses of providing such services. Expenses include direct and indirect costs and are calculated using an allocation methodology developed by the Adviser. The Trustees also recognized that it is difficult to make comparisons of profitability from fund investment advisory contracts because comparative information is not generally publicly available and is affected by numerous factors, including the structure of the particular adviser, the types of funds it manages, its business mix, numerous assumptions regarding allocations and the fact that publicly-traded fund managers’ operating profits and net income are net of distribution and marketing expenses. Based upon their review, the Trustees concluded that the profitability to the Adviser under each of the Advisory Agreements was not unreasonable in light of the services and benefits provided to each Fund.
The Trustees also considered that JPMDS, an affiliate of the Adviser, and JPMIM earn fees from the Funds for providing shareholder and administrative services, respectively. These fees were shown separately in the profitability analysis presented to the Trustees. The Trustees also considered the payments of Rule 12b- 1 fees to JPMDS, which also acts as the Funds’ distributor and that these fees are in turn generally will be paid to financial intermediaries that sell the Funds, including financial intermediaries that are affiliates of the Adviser. The Trustees also considered the fees paid to JPMorgan Chase Bank, N.A. (“JPMCB”) for custody and fund accounting, and other related services.
Fall-Out Benefits
The Trustees reviewed information regarding potential “fallout” or ancillary benefits received by the Adviser and its affiliates as a result of their relationship with the Funds. The Trustees also reviewed the Adviser’s allocation of fund brokerage for the J.P. Morgan Funds complex, including allocations to brokers who provide research to the Adviser.
62
Economies of Scale
The Trustees considered the extent to which the Funds may benefit from economies of scale. The Trustees considered that there may not be a direct relationship between economies of scale realized by the Funds and those realized by the Adviser as assets increase. The Trustees considered the extent to which the Funds were priced to scale and whether it would be appropriate to add advisory breakpoints, but noted that each Fund has implemented fee waivers and contractual expense limitations (“Fee Caps”) which allow each Fund’s shareholders to share potential economies of scale from a Fund’s inception and that the fees remain competitive with peer funds. The Trustees also considered that the Adviser has added or enhanced services to the Funds over time, noting the Adviser’s substantial investments in its business in support of the Funds, including investments in trading systems and technology (including cybersecurity improvements), attraction and retention of key talent, additions to analyst and portfolio management teams, and regulatory support enhancements. The Trustees also considered whether it would be appropriate to add advisory fee breakpoints and the Trustees concluded that the current fee structure was reasonable in light of the Fee Caps that the Adviser has in place that serve to limit the overall net expense ratios of each Fund at competitive levels. The Trustees concluded that the Funds’ shareholders received the benefits of potential economies of scale through the Fee Caps and the Adviser’s reinvestment in its operations to serve the Funds and their shareholders
Independent Written Evaluation of the Fund’s Chief Compliance Officer
The Trustees noted that, upon their direction, the Chief Compliance Officer for the Funds had prepared an independent written evaluation in order to assist the Trustees in determining the reasonableness of the proposed management fees. The Trustees considered the written evaluation in determining whether to continue the Advisory Agreements.
Fees Relative to Adviser’s Other Clients
The Trustees received and considered information about the nature and extent of investment advisory services and fee rates offered to other clients of the Adviser, including institutional separate accounts and/or funds sub-advised by the Adviser, and for investment management styles substantially similar to that of each Fund. The Trustees considered the complexity of investment management for registered mutual funds relative to the Adviser’s other clients and noted differences in the regulatory, legal and other risks and responsibilities of providing services to the different clients. The Trustees considered that serving as an adviser to a registered mutual fund involves greater responsibilities and risks than acting as a sub-adviser and observed that sub-advisory fees may be lower than those charged by the Adviser to each Fund. The Trustees also noted that the adviser, not the mutual fund, pays the sub-advisory fee and that many responsibilities related to the advisory function are retained by the primary adviser. The Trustees concluded that the fee rates charged to each Fund in comparison to those charged to the Adviser’s other clients were reasonable.
Investment Performance
The Trustees received and considered absolute and/or relative performance information for the Funds in a report prepared by Broadridge/Lipper. The Trustees considered the total return performance information, which included the ranking of the Funds within a performance universe made up of funds with the same Broadridge/Lipper investment classification and objective (the “Universe”), as well as a subset of funds within the Universe (the “Peer Group”), by total return for applicable one-, three- and five-year periods. The Trustees reviewed a description of Broadridge/Lipper’s methodology for selecting mutual funds in each Fund’s Peer Group and Universe. The Broadridge/Lipper materials provided to the Trustees highlighted information with respect to certain representative classes to assist the Trustees in their review. As part of this review, the Trustees also reviewed each Fund’s performance against its benchmark and considered the performance information provided for the Funds at regular Board meetings by the Adviser and the Trustees’ independent consultant and also considered the special analysis prepared by the Trustees’ independent consultant. For certain Funds, the Trustees and Adviser determined that the Peer Group and/or Universe
63
were less meaningful and the independent consultant prepared an analysis of those Funds across various risk and return metrics including tracking error, volatility, total excess return versus various indices and customized peer groups across groups of funds with similar portfolio objectives (as selected by the independent consultant). The Trustees also engaged with the Adviser to consider what steps might be taken to improve performance, as applicable. The Broadridge/Lipper performance data noted by the Trustees as part of their review and the determinations made by the Trustees with respect to each Fund’s performance for certain representative classes are summarized below:
The Trustees noted that the Flexible Long/Short Fund’s performance for Class A shares was in the third quintile based upon both the Peer Group and Universe for the one-year period ended December 31, 2017. The Trustees noted the performance for Class I shares was in the first and third quintiles based upon the Peer Group and Universe, respectively, for the one-year period ended December 31, 2017. The Trustees discussed the performance and investment strategy of the Fund with the Advisor. Based upon these discussions and various other factors, the Trustees concluded that the Fund’s performance was satisfactory.
The Trustees noted that the High Yield Opportunities Fund’s performance for both Class A and Class I shares was in the second quintile based upon both the Peer Group and Universe for the one-year period ended December 31, 2017. The Trustees discussed the performance and investment strategy of the Fund with the Advisor and, based upon this discussion and various other factors, the Trustees concluded that the Fund’s performance was satisfactory.
Advisory Fees and Expense Ratios
The Trustees considered the contractual advisory fee rate and the administration fee rate paid by each Fund to the Adviser and compared the combined rate to the information prepared by Broadridge/Lipper concerning management fee rates paid by other funds in the same Broadridge/Lipper category as each Fund. The Trustees recognized that Broadridge/Lipper reported each Fund’s management fee rate as the combined contractual advisory fee and administration fee rates. The Trustees also reviewed information about other expenses and the expense ratios for each Fund. The Trustees considered the Fee Caps currently in place for each Fund, the net advisory fee rate after taking into account any waivers and/or reimbursements, and, where deemed appropriate by the Trustees, additional waivers and/or reimbursements. The Trustees recognized that it is difficult to make comparisons of advisory fees because there are variations in the services that are included in the fees paid by other funds. The Trustees’ determination as a result of the review of the Funds’ advisory fees and expense ratios for certain representative classes are summarized below:
The Trustees noted that the Flexible Long/Short Fund’s net advisory fee for Class A shares was in the first quintile based upon both the Peer Group and Universe and the actual total expenses for Class A shares were in the second and third quintile based on the Peer Group and Universe, respectively. The Trustees noted that the net advisory fee and actual total expenses for Class I shares were in the first and third quintiles based upon the Peer Group and Universe, respectively. After considering the factors identified above, in light of this information, the Trustees concluded that the advisory fees were satisfactory in light of the services provided to the Fund.
The Trustees noted that the High Yield Opportunities Fund’s net advisory fee and actual total expenses for Class A shares were in the first and second quintiles based upon the Peer Group and Universe, respectively. The Trustees noted that the net advisory fee for Class I shares was in the first quintile based upon both the Peer Group and Universe and that the actual total expenses for Class I shares were in the first and third quintiles based upon the Peer Group and Universe, respectively. After considering the factors identified above, in light of this information, the Trustees concluded that the advisory fee was satisfactory in light of the services provided to the Fund.
64

Rev. January 2011
| | |
| FACTS | | WHAT DOES J.P. MORGAN FUNDS DO WITH YOUR PERSONAL INFORMATION? |
| | |
| Why? | | Financial companies choose how they share your personal information. Federal law gives consumers the right to limit some but not all sharing. Federal law also requires us to tell you how we collect, share, and protect your personal information. Please read this notice carefully to understand what we do. |
| | |
| What? | | The types of personal information we collect and share depend on the product or service you have with us. This information can include: ◾ Social Security number and account balances ◾ transaction history and account transactions ◾ checking account information and wire transfer instructions When you are no longer our customer, we continue to share your information as described in this notice. |
| | |
| How? | | All financial companies need to share customers’ personal information to run their everyday business. In the section below, we list the reasons financial companies can share their customers’ personal information; the reasons J.P. Morgan Funds chooses to share; and whether you can limit this sharing. |
| | | | |
| Reasons we can share your personal information | | Does J.P. Morgan
Funds share? | | Can you limit this
sharing? |
For our everyday business purposes — such as to process your transactions, maintain your account(s), respond to court orders and legal investigations, or report to credit bureaus | | Yes | | No |
For marketing purposes — to offer our products and services to you | | Yes | | No |
| For joint marketing with other financial companies | | No | | We don’t share |
For our affiliates’ everyday business purposes — information about your transactions and experiences | | No | | We don’t share |
For our affiliates’ everyday business purposes — information about your creditworthiness | | No | | We don’t share |
| For nonaffiliates to market to you | | No | | We don’t share |
| | |
| | |
| Questions? | | Call 1-800-480-4111 or go to www.jpmorganfunds.com |

| | |
| Who we are |
| Who is providing this notice? | | J.P. Morgan Funds |
| | |
| What we do |
| How does J.P. Morgan Funds protect my personal information? | | To protect your personal information from unauthorized access and use, we use security measures that comply with federal law. These measures include computer safeguards and secured files and buildings. We authorize our employees to access your information only when they need it to do their work and we require companies that work for us to protect your information. |
How does J.P. Morgan Funds collect my personal information? | | We collect your personal information, for example, when you: ◾ open an account or provide contact information ◾ give us your account information or pay us by check ◾ make a wire transfer We also collect your personal information from others, such as credit bureaus, affiliates and other companies. |
| Why can’t I limit all sharing? | | Federal law gives you the right to limit only ◾ sharing for affiliates’ everyday business purposes – information about your creditworthiness ◾ affiliates from using your information to market to you ◾ sharing for nonaffiliates to market to you State laws and individual companies may give you additional rights to limit sharing. |
| | |
| Definitions |
| Affiliates | | Companies related by common ownership or control. They can be financial and nonfinancial companies. ◾ J.P. Morgan Funds does not share with our affiliates. |
| Nonaffiliates | | Companies not related by common ownership or control. They can be financial and nonfinancial companies. ◾ J.P. Morgan Funds does not share with nonaffiliates so they can market to you. |
| Joint Marketing | | A formal agreement between nonaffiliated financial companies that together market financial products or services to you. ◾ J.P. Morgan Funds doesn’t jointly market. |
J.P. Morgan Funds are distributed by JPMorgan Distribution Services, Inc., which is an affiliate of JPMorgan Chase & Co. Affiliates of JPMorgan Chase & Co. receive fees for providing various services to the funds.
Contact JPMorgan Distribution Services, Inc. at 1-800-480-4111 for a fund prospectus. Investors should carefully consider the investment objectives and risk as well as charges and expenses of the mutual fund before investing. The prospectus contains this and other information about the mutual fund. Read the prospectus carefully before investing.
Investors may obtain information about the Securities Investor Protection Corporation (SIPC), including the SIPC brochure by visiting www.sipc.org or by calling SIPC at 202-371-8300.
Each Fund files a complete schedule of its fund holdings for the first and third quarters of its fiscal year with the SEC on Form N-Q. The Funds’ Forms N-Q are available on the SEC’s website at http://www.sec.gov and may be reviewed and copied at the SEC’s Public Reference Room in Washington, DC. Information on the operation of the SEC’s Public Reference Room may be obtained by calling 1-800-SEC-0330. Shareholders may request the Form N-Q without charge by calling 1-800-480-4111.
A description of each Fund’s policies and procedures with respect to the disclosure of each Fund’s holdings is available in the prospectus and Statement of Additional Information.
A copy of proxy policies and procedures is available without charge upon request by calling 1-800-480-4111. A description of such policies and procedures is on the SEC’s website at www.sec.gov. The Trustees have delegated the authority to vote proxies for securities owned by the Funds to the Adviser. A copy of the Funds’ voting record for the most recent 12-month period ended June 30 is available on the SEC’s website at www.sec.gov no later than August 31 of each year. The Funds’ proxy voting record will include, among other things, a brief description of the matter voted on for each fund security, and will state how each vote was cast, for example, for or against the proposal.
| | |
| © JPMorgan Chase & Co., 2018. All rights reserved. August 2018. | | |
ITEM 2. CODE OF ETHICS.
Disclose whether, as of the end of the period covered by the report, the registrant has adopted a code of ethics that applies to the registrant’s principal executive officer, principal financial officer, principal accounting officer or controller, or persons performing similar functions, regardless of whether these individuals are employed by the registrant or a third party. If the registrant has not adopted such a code of ethics, explain why it has not done so.
The registrant must briefly describe the nature of any amendment, during the period covered by the report, to a provision of its code of ethics that applies to the registrant’s principal executive officer, principal financial officer, principal accounting officer or controller, or persons performing similar functions, regardless of whether these individuals are employed by the registrant or a third party, and that relates to any element of the code of ethics definition enumerated in paragraph (b) of this Item. The registrant must file a copy of any such amendment as an exhibit pursuant to Item 13(a)(1), unless the registrant has elected to satisfy paragraph (f) of this Item by positing its code of ethics on its website pursuant to paragraph (f)(2) of this Item, or by undertaking to provide its code of ethics to any person without charge, upon request, pursuant to paragraph (f)(3) of this Item.
If the registrant has, during the period covered by the report, granted a waiver, including an implicit waiver, from a provision of the code of ethics that applies to the registrant’s principal executive officer, principal financial officer, principal accounting officer or controller, or persons performing similar functions, regardless of whether these individuals are employed by the registrant or third party, that relates to one or more items set forth in paragraph (b) of this Item, the registrant must briefly describe the nature of the waiver, the name of the person to whom the waiver was granted, and the date of the waiver.
Not applicable to a semi-annual report.
ITEM 3. AUDIT COMMITTEE FINANCIAL EXPERT.
(a) (1) Disclose that the registrant’s board of directors has determined that the registrant either:
(i) Has at least one audit committee financial expert serving on its audit committee; or
(ii) Does not have an audit committee financial expert serving on its audit committee.
(2) If the registrant provides the disclosure required by paragraph (a)(1)(i) of this Item, it must disclose the name of the audit committee financial expert and whether that person is “independent.” In order to be considered “independent” for purposes of this Item, a member of an audit committee may not, other than in his or her capacity as a member of the audit committee, the board of directors, or any other board committee:
(i) Accept directly or indirectly any consulting, advisory, or other compensatory fee from the issuer; or
(ii) Be an “interested person” of the investment company as defined in Section 2(a)(19) of the Act (15 U.S.C. 80a-2(a)(19)).
(3) If the registrant provides the disclosure required by paragraph (a)(1)(ii) of this Item, it must explain why it does not have an audit committee financial expert.
Not applicable to a semi-annual report.
ITEM 4. PRINCIPAL ACCOUNTANT FEES AND SERVICES.
(a) Disclose, under the caption Audit Fees, the aggregate fees billed for each of the last two fiscal years for professional
services rendered by the principal accountant for the audit of the registrant’s annual financial statements or services that are normally provided by the accountant in connection with statutory and regulatory filings or engagements for those fiscal years.
(b) Disclose, under the caption Audit-Related Fees, the aggregate fees billed in each of the last two fiscal years for assurance and related services by the principal accountant that are reasonably related to the performance of the audit of the registrant’s financial statements and are not reported under paragraph (a) of this Item. Registrants shall describe the nature of the services comprising the fees disclosed under this category.
(c) Disclose, under the caption Tax Fees, the aggregate fees billed in each of the last two fiscal years for professional services rendered by the principal accountant for tax compliance, tax advice, and tax planning. Registrants shall describe the nature of the services comprising the fees disclosed under this category.
(d) Disclose, under the caption All Other Fees, the aggregate fees billed in each of the last two fiscal years for products and services provided by the principal accountant, other than the services reported in paragraphs (a) through (c) of this Item. Registrants shall describe the nature of the services comprising the fees disclosed under this category.
(e) (1) Disclose the audit committee’s pre-approval policies and procedures described in paragraph (c)(7) of Rule 2-01 of Regulation S-X.
(2) Disclose the percentage of services described in each of paragraphs (b) through (d) of this Item that were approved by the audit committee pursuant to paragraph (c)(7)(i)(C) of Rule 2-01 of Regulation S-X.
(f) If greater than 50 percent, disclose the percentage of hours expended on the principal accountant’s engagement to audit the registrant’s financial statements for the most recent fiscal year that were attributed to work performed by persons other than the principal accountant’s full-time, permanent employees.
(g) Disclose the aggregate non-audit fees billed by the registrant’s accountant for services rendered to the registrant, and rendered to the registrant’s investment adviser (not including any sub-adviser whose role is primarily portfolio management and is subcontracted with or overseen by another investment adviser), and any entity controlling, controlled by, or under common control with the adviser that provides ongoing services to the registrant for each of the last two fiscal years of the registrant.
(h) Disclose whether the registrant’s audit committee of the board of directors has considered whether the provision of non-audit services that were rendered to the registrant’s investment adviser (not including any subadviser whose role is primarily portfolio management and is subcontracted with or overseen by another investment adviser), and any entity controlling, controlled by, or under common control with the investment adviser that provides ongoing services to the registrant that were not pre-approved pursuant to paragraph (c)(7)(ii) of Rule 2-01 of Regulation S-X is compatible with maintaining the principal accountant’s independence.
Not applicable to a semi-annual report.
ITEM 5. AUDIT COMMITTEE OF LISTED REGISTRANTS.
(a) If the registrant is a listed issuer as defined in Rule 10A-3 under the Exchange Act (17CFR 240.10A-3), state whether or not the registrant has a separately-designated standing audit committee established in accordance with Section 3(a)(58)(A) of the Exchange Act (15 U.S.C. 78c(a)(58)(A)). If the registrant has such a committee, however designated, identify each committee member. If the entire board of directors is acting as the registrant’s audit committee as specified in Section 3(a)(58)(B) of the Exchange Act (15 U.S.C. 78c(a)(58)(B)), so state.
(b) If applicable, provide the disclosure required by Rule 10A-3(d) under the Exchange Act (17CFR 240.10A-3(d)) regarding an exemption from the listing standards for all audit committees.
Not applicable to a semi-annual report.
ITEM 6. INVESTMENTS.
File Schedule I – Investments in securities of unaffiliated issuers as of the close of the reporting period as set forth in Section 210.12-12 of Regulation S-X, unless the schedule is included as part of the report to shareholders filed under Item 1 of this Form.
Included in Item 1.
ITEM 7. DISCLOSURE OF PROXY VOTING POLICIES AND PROCEDURES FOR CLOSED-END MANAGEMENT INVESTMENT COMPANIES.
Not applicable.
ITEM 8. PORTFOLIO MANAGERS OF CLOSED-END MANAGEMENT INVESTMENT COMPANIES.
Not applicable.
ITEM 9. PURCHASE OF EQUITY SECURITIES BY CLOSED-END MANAGEMENT INVESTMENT COMPANY AND AFFILIATED PURCHASERS.
Not applicable.
ITEM 10. SUBMISSION OF MATTERS TO A VOTE OF SECURITY HOLDERS.
Describe any material changes to the procedures by which shareholders may recommend nominees to the registrant’s board of directors, where those changes were implemented after the registrant last provided disclosure in response to the requirements of Item 7(d)(2)(ii)(G) of Schedule 14A (17 CFR 240.14a-101), or this Item.
No material changes to report.
ITEM 11. CONTROLS AND PROCEDURES.
(a) Disclose the conclusions of the registrant’s principal executive and principal financial officers, or persons performing similar functions, regarding the effectiveness of the registrant’s disclosure controls and procedures (as defined in Rule 30a-3(c) under the Act (17 CFR 270.30a-3(c))) as of a date within 90 days of the filing date of the report that includes the disclosure required by this paragraph, based on the evaluation of these controls and procedures required by Rule 30a-3(b) under the Act (17 CFR 270.30a-3(b)) and Rules 13a-15(b) or 15d-15(b) under the Exchange Act (17 CFR 240.13a-15(b) or 240.15d-15(b)).
The Registrant’s principal executive and principal financial officers have concluded, based on their evaluation of the Registrant’s disclosure controls and procedures as of a date within 90 days of the filing date of this report, that the Registrant’s disclosure controls and procedures are reasonably designed to ensure that information required to be disclosed by the Registrant on Form N-CSR is recorded, processed, summarized and reported within the required time periods and that information required to be disclosed by the Registrant in the reports that it files or submits on Form N-CSR is accumulated and communicated to the Registrant’s management, including its principal executive and principal financial officers, as appropriate to allow timely decisions regarding required disclosure.
(b) Disclose any change in the registrant’s internal control over financial reporting (as defined in Rule 30a-3(d) under the Act (17 CFR 270.30a-3(d)) that occurred during the registrant’s second fiscal quarter of the period covered by this report that has materially affected, or is reasonably likely to materially affect, the registrant’s internal control over financial reporting.
There were no changes in the Registrant’s internal control over financial reporting that occurred during the last fiscal quarter covered by this report that have materially affected, or are reasonably likely to materially affect, the Registrant’s internal control over financial reporting.
ITEM 12. DISCLOSURE OF SECURITIES LENDING ACTIVITIES FOR CLOSED-END MANAGEMENT INVESTMENT COMPANIES.
Not applicable.
ITEM 13. EXHIBITS.
| | (a) | File the exhibits listed below as part of this Form. Letter or number the exhibits in the sequence indicated. |
(1) Any code of ethics, or amendment thereto, that is the subject of the disclosure required by Item 2, to the extent that the registrant intends to satisfy the Item 2 requirements through filing of an exhibit.
Not applicable.
(2) A separate certification for each principal executive officer and principal financial officer of the registrant as required by Rule 30a-2(a) under the Act (17 CFR 270.30a-2).
Certifications pursuant to Rule 30a-2(a) under the Investment Company Act of 1940 are attached hereto.
(3) Any written solicitation to purchase securities under Rule 23c-1 under the Act (17 CFR 270.23c-1) sent or given during the period covered by the report by or on behalf of the registrant to 10 or more persons.
Not applicable.
| | (b) | A separate or combined certification for each principal executive officer and principal officer of the registrant as required by Rule 30a-2(b) under the Act of 1940. |
Certifications pursuant to Rule 30a-2(b) under the Investment Company Act of 1940 are attached hereto.
SIGNATURES
Pursuant to the requirements of the Securities Exchange Act of 1934 and the Investment Company Act of 1940, the registrant has duly caused this report to be signed on its behalf by the undersigned, thereunto duly authorized.
JPMorgan Trust IV
| | |
| By: | | /s/ Brian S. Shlissel |
| | Brian S. Shlissel |
| | President and Principal Executive Officer |
| | November 07, 2018 |
Pursuant to the requirements of the Securities Exchange Act of 1934 and the Investment Company Act of 1940, this report has been signed below by the following persons on behalf of the registrant and in the capacities and on the dates indicated.
| | |
| By: | | /s/ Brian S. Shlissel |
| | Brian S. Shlissel |
| | President and Principal Executive Officer |
| | November 07, 2018 |
| |
| By: | | /s/ Timothy J. Clemens |
| | Timothy J. Clemens |
| | Treasurer and Principal Financial Officer |
| | November 07, 2018 |