UNITED STATES
SECURITIES AND EXCHANGE COMMISSION
Washington, D.C. 20549
FORM N-CSR
CERTIFIED SHAREHOLDER REPORT OF REGISTERED
MANAGEMENT INVESTMENT COMPANIES
Investment Company Act file number: 811-23117
JPMorgan Trust IV
(Exact name of registrant as specified in charter)
277 Park Avenue
New York, NY 10172
(Address of principal executive offices) (Zip code)
Gregory S. Samuels
277 Park Avenue
New York, NY 10172
(Name and Address of Agent for Service)
Registrant’s telephone number, including area code: (800) 480-4111
Date of fiscal year end: June 30
Date of reporting period: July 1, 2021 through December 31, 2021
Form N-CSR is to be used by management investment companies to file reports with the Commission not later than 10 days after the transmission to stockholders of any report that is required to be transmitted to stockholders under Rule 30e-1 under the Investment Company Act of 1940 (17 CFR 270.30e-1). The Commission may use the information provided on Form N-CSR in its regulatory, disclosure review, inspection, and policymaking roles.
A registrant is required to disclose the information specified by Form N-CSR, and the Commission will make this information public. A registrant is not required to respond to the collection of information contained in Form N-CSR unless the Form displays a currently valid Office of Management and Budget (“OMB”) control number. Please direct comments concerning the accuracy of the information collection burden estimate and any suggestions for reducing the burden to Secretary, Securities and Exchange Commission, 450 Fifth Street, NW, Washington, DC 20549-0609. The OMB has reviewed this collection of information under the clearance requirements of 44 U.S.C. Section 3507.
ITEM 1. REPORTS TO STOCKHOLDERS.
a.) The following is a copy of the report transmitted to shareholders pursuant to Rule 30e-1 under the Investment Company Act of 1940 (17 CFR 270.30e-1).
b.) A copy of the notice transmitted to shareholders in reliance on Rule 30e-3 under the 1940 Act that contains disclosures specified by paragraph (c)(3) of that rule is included in the Annual Report. Not Applicable. Notices do not incorporate disclosures from the shareholder reports.
Semi-Annual Report
J.P. Morgan Large Cap Funds
December 31, 2021 (Unaudited)
JPMorgan Equity Focus Fund
JPMorgan Equity Income Fund
JPMorgan Equity Premium Income Fund
JPMorgan Hedged Equity Fund
JPMorgan Hedged Equity 2 Fund
JPMorgan Hedged Equity 3 Fund
JPMorgan Large Cap Growth Fund
JPMorgan Large Cap Value Fund
JPMorgan U.S. Applied Data Science Value Fund
(formerly known as JPMorgan Intrepid Value Fund)
JPMorgan U.S. Equity Fund
JPMorgan U.S. GARP Equity Fund
JPMorgan U.S. Large Cap Core Plus Fund
JPMorgan U.S. Research Enhanced Equity Fund
JPMorgan U.S. Sustainable Leaders Fund
JPMorgan U.S. Value Fund

CONTENTS
Investments in a Fund are not deposits or obligations of, or guaranteed or endorsed by, any bank and are not insured or guaranteed by the FDIC, the Federal Reserve Board or any other government agency. You could lose money if you sell when a Fund’s share price is lower than when you invested.
Past performance is no guarantee of future performance. The general market views expressed in this report are opinions based on market and other conditions through the end of the reporting period and are subject to change without notice. These views are not intended to predict the future performance of a Fund or the securities markets.
Prospective investors should refer to the Funds’ prospectuses for a discussion of the Funds’ investment objectives, strategies and risks. Call J.P. Morgan Funds Service Center at 1-800-480-4111 for a prospectus containing more complete information about a Fund, including management fees and other expenses. Please read it carefully before investing.
LETTER TO SHAREHOLDERS
FEBRUARY 8, 2022 (UNAUDITED)
Dear Shareholders,
U.S. equities led the year-long rally in developed market stocks as the global economic rebound advanced through 2021. While financial market volatility, a resurgence in the pandemic and accelerating inflation have carried into 2022, we believe that the outlook for the overall U.S. economy remains positive.
| | |
 | | “Throughout the year ahead, J.P. Morgan Asset Management plans to seek to deliver superior client outcomes across a broad range of innovative solutions and risk management processes built on the same fundamental practices and principles that have driven our success for more than a century.” — Andrea L. Lisher |
A surge in U.S. consumer wealth — partly tied to rising values for homes and autos — and quarterly growth in corporate earnings have helped to bolster U.S. financial markets that were already well-supported by monetary and fiscal policies. Over the course of the past year, the U.S. jobless rate fell to pre-pandemic levels and reached 3.9% in December. At the same time, inflation has climbed significantly. The U.S. Federal Reserve (the “Fed”) has tapered its monthly asset purchasing program and indicated that it’s likely to raise interest rates as early as March 2022.
While rising interest rates may mark another phase of the economic cycle that presents financial markets with new challenges and opportunities, they may also signal a return to a
more normal economic environment following two years of historically low rates. Meanwhile, the path of the pandemic remains a factor in the U.S. economy. Recent data suggest the increase in new infections in late 2021 and into 2022 had some impact on the U.S. economy — though job growth remained strong — but there is hope that the latest pandemic wave may recede in coming months. Additionally, there is hope that rising prices on commodities and goods will moderate as supply chain constraints ease over time and the Fed moves generally to tamp down inflationary pressures. We expect the U.S. economy to continue expanding in 2022, even if the pace of the expansion eases from 2021.
Throughout the year ahead, J.P. Morgan Asset Management plans to seek to deliver superior client outcomes across a broad range of innovative solutions and risk management processes built on the same fundamental practices and principles that have driven our success for more than a century.
On behalf of J.P. Morgan Asset Management, thank you for entrusting us to manage your investment. Should you have any questions, please visit www.jpmorganfunds.com or contact the J.P. Morgan Funds Service Center at 1-800-480-4111.
Sincerely yours,

Andrea L. Lisher
Head of Americas, Client
J.P. Morgan Asset Management
| | | | | | | | | | |
| | | | | |
| DECEMBER 31, 2021 | | J.P. MORGAN LARGE CAP FUNDS | | | | | | | | 1 |
J.P. Morgan Large Cap Funds
MARKET OVERVIEW
SIX MONTHS ENDED DECEMBER 31, 2021 (Unaudited)
Overall, U.S. equity markets generated post positive returns in the second half of 2021 with continued monetary and fiscal support as well as strong consumer spending and record corporate profits. Despite historically high equity valuations in the U.S., the S&P 500 Index posted at least one record-high closing in each month during the period. Notably, the emergence of the omicron variant of COVID-19 in the final months of 2021 led to higher volatility in financial markets and weighed on global petroleum prices.
The first months of the period saw strong upward momentum in U.S. equity prices after second quarter 2021 results showed record-high earnings and revenue from U.S. companies. However, equity markets ended the month of September lower amid investor concerns about global supply chain disruptions, inflationary pressure and the ongoing pandemic. Additionally, the U.S. Federal Reserve set an initial schedule for tapering off its monthly bond purchases and indicated it may raise interest rates in late 2022 or early 2023.
In October, oil prices began to rise and equity markets resumed their broad upward trajectory only to stall again in November and then ended December with higher returns. While a resurgence in pandemic infections raised investor concerns about the reimposition of some social restrictions and their potential impact on specific industries and individual companies, the economic backdrop remained positive overall with a strong labor market, surging corporate profits and a boom in U.S. consumer wealth.
Overall, the real estate and information technology sectors provided the largest returns during the six month period, while communication services and industrials sectors provided the smallest returns but were still positive for the period. Within large cap equity, growth stocks outperformed value stocks. For the six months ended December 31, 2021, the S&P 500 Index returned 11.67%; the Russell 1000 Index returned 10.01%, the Russell 1000 Growth Index returned 12.93% and the Russell 1000 Value Index returned 6.93%.
| | | | | | | | | | |
| | | | | |
| 2 | | | | | | | | J.P. MORGAN LARGE CAP FUNDS | | DECEMBER 31, 2021 |
JPMorgan Equity Focus Fund
FUND COMMENTARY
SIX MONTHS ENDED DECEMBER 31, 2021 (Unaudited)
| | | | |
| REPORTING PERIOD RETURN: | | | |
| Fund (Class I Shares)* | | | 8.77% | |
| S&P 500 Index | | | 11.67% | |
| |
| Net Assets as of 12/31/2021 (In Thousands) | | | $144,338 | |
INVESTMENT OBJECTIVE**
The JPMorgan Equity Focus Fund (the “Fund”) seeks long term capital appreciation.
WHAT WERE THE MAIN DRIVERS OF THE FUND’S PERFORMANCE?
The Fund’s Class I Shares underperformed the S&P 500 Index (the “Benchmark”) for the six months ended December 31, 2021.
The Fund’s security selection in the consumer discretionary and information technology sectors was the leading detractor from performance relative to the Benchmark, while the Fund’s security selection in the health care and real estate sectors was the leading contributor to relative performance.
Leading individual detractors from relative performance included the Fund’s overweight positions in Gap Inc. and Global Payments Inc. and its underweight position in Tesla Inc. Shares of Gap, a retailer of brand name apparel, fell after the company reported lower-than-expected earnings and revenue for the third quarter amid supply chain bottlenecks. Shares of Global Payments, a digital payments platform provider, fell amid a general pullback in financial technology subsector stocks and the company’s lower-than-expected forecast for full year 2021 results. Shares of Tesla, a producer of electric vehicles and battery systems, rose after the company reported better-than-expected production and deliveries during the period.
Leading individual contributors to relative performance included the Fund’s overweight positions in AutoZone Inc., Advanced Micro Devices Inc. and DexCom Inc. Shares of AutoZone, an automotive parts retailer, rose amid consecutive quarters of better-than-expected earnings and revenue, as well as large share repurchase programs during the period. Shares of Advanced Micro Devices, a semiconductor manufacturer, rose after the company reported better-than-expected earnings and sales for the third quarter of 2021 and issued a better-than-expected forecast for the fourth quarter of 2021. Shares of DexCom, a manufacturer of diabetes monitoring devices, rose after the company reported better-than-expected earnings and revenue for both the second and third quarters of 2021, as well as a better-than-expected forecast for full-year 2021 results.
HOW WAS THE FUND POSITIONED?
The Fund’s portfolio managers employed a bottom-up fundamental approach to stock selection. As a result of this approach to stock selection, the Fund’s largest positions were in the information technology and financials sectors and the Fund’s smallest positions were in the utilities and consumer staples sectors.
| | | | | | | | |
TOP TEN EQUITY HOLDINGS OF THE
PORTFOLIO AS OF DECEMBER 31, 2021 | | PERCENT OF
TOTAL
INVESTMENTS | |
| | 1. | | | Apple, Inc. | | | 6.3 | % |
| | 2. | | | Microsoft Corp. | | | 6.0 | |
| | 3. | | | Alphabet, Inc., Class C | | | 4.8 | |
| | 4. | | | Amazon.com, Inc. | | | 3.6 | |
| | 5. | | | Weyerhaeuser Co. | | | 3.3 | |
| | 6. | | | Loews Corp. | | | 3.3 | |
| | 7. | | | Berkshire Hathaway, Inc., Class B | | | 3.1 | |
| | 8. | | | Bank of America Corp. | | | 3.1 | |
| | 9. | | | UnitedHealth Group, Inc. | | | 3.0 | |
| | 10. | | | AutoZone, Inc. | | | 2.9 | |
| | | | |
PORTFOLIO COMPOSITION BY SECTOR
AS OF DECEMBER 31, 2021 | | PERCENT OF
TOTAL
INVESTMENTS | |
| |
| Information Technology | | | 25.4 | % |
| Financials | | | 14.4 | |
| Health Care | | | 12.8 | |
| Consumer Discretionary | | | 12.2 | |
| Communication Services | | | 8.1 | |
| Industrials | | | 6.8 | |
| Real Estate | | | 4.9 | |
| Materials | | | 4.1 | |
| Energy | | | 3.8 | |
| Consumer Staples | | | 2.7 | |
| Utilities | | | 2.0 | |
| Short-Term Investments | | | 2.8 | |
| * | | The return shown is based on net asset values calculated for shareholder transactions and may differ from the return shown in the financial highlights, which reflects adjustments made to the net asset values in accordance with accounting principles generally accepted in the United States of America. |
| ** | | The adviser seeks to achieve the Fund’s objective. There can be no guarantee it will be achieved. |
| | | | | | | | | | |
| | | | | |
| DECEMBER 31, 2021 | | J.P. MORGAN LARGE CAP FUNDS | | | | | | | | 3 |
JPMorgan Equity Focus Fund
FUND COMMENTARY
SIX MONTHS ENDED DECEMBER 31, 2021 (Unaudited) (continued)
| | | | | | | | | | | | | | | | | | |
AVERAGE ANNUAL TOTAL RETURNS AS OF DECEMBER 31, 2021 | |
| | | | | |
| | | INCEPTION DATE OF
CLASS | | 6 MONTH* | | | 1 YEAR | | | 5 YEAR | | | 10 YEAR | |
CLASS A SHARES | | July 29, 2011 | | | | | | | | | | | | | | | | |
With Sales Charge** | | | | | 2.91 | % | | | 18.97 | % | | | 17.43 | % | | | 16.13 | % |
Without Sales Charge | | | | | 8.61 | | | | 25.57 | | | | 18.70 | | | | 16.76 | |
CLASS C SHARES | | July 29, 2011 | | | | | | | | | | | | | | | | |
With CDSC*** | | | | | 7.34 | | | | 23.97 | | | | 18.12 | | | | 16.28 | |
Without CDSC | | | | | 8.34 | | | | 24.97 | | | | 18.12 | | | | 16.28 | |
CLASS I SHARES | | July 29, 2011 | | | 8.77 | | | | 25.90 | | | | 19.00 | | | | 17.05 | |
CLASS R6 SHARES | | October 1, 2018 | | | 8.91 | | | | 26.24 | | | | 19.20 | | | | 17.15 | |
| ** | | Sales Charge for Class A Shares is 5.25%. |
| *** | | Assumes a 1% CDSC (contingent deferred sales charge) for the 6 month and one year periods and 0% CDSC thereafter. |
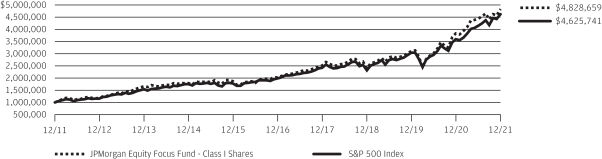
TEN YEAR PERFORMANCE (12/31/11 TO 12/31/21)
The performance quoted is past performance and is not a guarantee of future results. Mutual funds are subject to certain market risks. Investment returns and principal value of an investment will fluctuate so that an investor’s shares, when redeemed, may be worth more or less than their original cost. Current performance may be higher or lower than the performance data shown. For up-to-date month-end performance information please call 1-800-480-4111.
Returns for Class R6 Shares prior to their inception date are based on the performance of Class I Shares. The actual returns of Class R6 Shares would have been different than those shown because Class R6 Shares have different expenses than Class I Shares.
The graph illustrates comparative performance for $1,000,000 invested in Class I Shares of the JPMorgan Equity Focus Fund and the S&P 500 Index from December 31, 2011 to December 31, 2021. The performance of the Fund assumes reinvestment of all dividends and capital gain distributions, if any, and does not include a sales charge. The performance of the S&P 500 Index does not reflect the deduction of expenses or a sales charge associated with a mutual fund and has been adjusted to reflect reinvestment of all dividends and capital gain distributions of securities included in the benchmark, if applicable. The S&P 500 Index is an unmanaged index generally representative of the performance of large companies in the U.S. stock market. Investors cannot invest directly in an index.
Class I Shares have a $1,000,000 minimum initial investment.
Subsequent to the inception date of the Fund and through July 31, 2013, the Fund did not experience any shareholder activity. If such shareholder activity had occurred, the Fund’s performance may have been impacted.
Fund performance may reflect the waiver of the Fund’s fees and reimbursement of expenses for certain periods since the applicable inception date. Without these waivers and reimbursements, performance would have been lower. Also, performance shown in this section does not reflect the deduction of taxes that a shareholder would pay on Fund distributions or on gains resulting from redemptions of Fund shares.
Because Class C Shares automatically convert to Class A Shares after 8 years, the 10 year average annual total return shown above for Class C reflects Class A performance for the period after conversion.
The returns shown are based on net asset values calculated for shareholder transactions and may differ from the returns shown in the financial highlights, which reflect adjustments made to the net asset values in accordance with accounting principles generally accepted in the United States of America.
| | | | | | | | | | |
| | | | | |
| 4 | | | | | | | | J.P. MORGAN LARGE CAP FUNDS | | DECEMBER 31, 2021 |
JPMorgan Equity Income Fund
FUND COMMENTARY
SIX MONTHS ENDED DECEMBER 31, 2021 (Unaudited)
| | | | |
| REPORTING PERIOD RETURN: | | | |
| Fund (Class I Shares)* | | | 7.63% | |
| Russell 1000 Value Index | | | 6.93% | |
| |
| Net Assets as of 12/31/2021 (In Thousands) | | | $51,111,026 | |
INVESTMENT OBJECTIVE**
The JPMorgan Equity Income Fund (the “Fund”) seeks capital appreciation and current income.
WHAT WERE THE MAIN DRIVERS OF THE FUND’S PERFORMANCE?
The Fund’s Class I Shares outperformed the Russell 1000 Value Index (the “Benchmark”) for the six months ended December 31, 2021.
The Fund’s security selection in the industrials sector and its underweight position in the communication services sector were leading contributors to performance relative to the Benchmark, while the Fund’s security selection in the health care sector and its underweight position in the real estate sector were leading detractors from relative performance.
Leading individual contributors to relative performance included the Fund’s out-of-Benchmark positions in Home Depot Inc. and Microsoft Corp., and its overweight position in Dover Corp. Shares of Home Depot, a home improvement retail chain, rose after the company reported strong sales growth and better-than-expected earnings and revenue for the third quarter of 2021. Shares of Microsoft, a software and technology services provider, rose amid investor demand for large technology companies during the period. Shares of Dover, a maker of industrial equipment and sensors, rose after the company reported better-than-expected earnings and revenue for the third quarter of 2021 and raised its forecast for full year 2021 results.
Leading individual detractors from relative performance included the Fund’s overweight positions in Gap Inc., Medtronic PLC and Bristol-Myers Squibb Co. Shares of Gap, a retailer of brand name apparel, fell after the company reported lower-than-expected earnings and revenue for the third quarter amid supply chain bottlenecks. Shares of Medtronic, a medical technology manufacturer, fell after the company reported lower-than-expected revenue for its fiscal second quarter of 2021 and disclosed it had received a warning letter from the U.S. Food and Drug Administration following the company’s recall of insulin infusion pumps. Shares of Bristol-Myers Squibb, a pharmaceutical manufacturer, fell amid investor expectations the company would seek to acquire Aurinia Pharmaceuticals Inc.
HOW WAS THE FUND POSITIONED?
The Fund’s portfolio managers’ focus remained on stock selection, as they believed that quality companies trading at
attractive valuations had the greatest potential to outperform in the long term. As the Fund aimed to purchase stocks with above average dividend yields, the research process was designed to identify companies with predictable and durable business models deemed capable of generating sustainable free cash flow.
| | | | | | | | |
TOP TEN EQUITY HOLDINGS OF THE
PORTFOLIO AS OF DECEMBER 31, 2021 | | PERCENT OF
TOTAL
INVESTMENTS | |
| | | | | | | | |
| | 1. | | | UnitedHealth Group, Inc. | | | 3.0 | % |
| | 2. | | | ConocoPhillips | | | 2.5 | |
| | 3. | | | Bank of America Corp. | | | 2.4 | |
| | 4. | | | BlackRock, Inc. | | | 2.3 | |
| | 5. | | | Comcast Corp., Class A | | | 2.1 | |
| | 6. | | | PNC Financial Services Group, Inc. (The) | | | 2.1 | |
| | 7. | | | Bristol-Myers Squibb Co. | | | 2.0 | |
| | 8. | | | CME Group, Inc. | | | 2.0 | |
| | 9. | | | Raytheon Technologies Corp. | | | 2.0 | |
| | 10. | | | Analog Devices, Inc. | | | 1.9 | |
| | | | |
PORTFOLIO COMPOSITION BY SECTOR
AS OF DECEMBER 31, 2021 | | PERCENT OF
TOTAL
INVESTMENTS | |
| |
| Financials | | | 22.8 | % |
| Health Care | | | 16.6 | |
| Industrials | | | 14.6 | |
| Information Technology | | | 9.1 | |
| Consumer Staples | | | 8.8 | |
| Consumer Discretionary | | | 7.5 | |
| Energy | | | 5.7 | |
| Utilities | | | 4.0 | |
| Materials | | | 3.2 | |
| Communication Services | | | 2.9 | |
| Real Estate | | | 2.8 | |
| Short-Term Investments | | | 2.0 | |
| * | | The return shown is based on net asset values calculated for shareholder transactions and may differ from the return shown in the financial highlights, which reflects adjustments made to the net asset values in accordance with accounting principles generally accepted in the United States of America. |
| ** | | The adviser seeks to achieve the Fund’s objective. There can be no guarantee it will be achieved. |
| | | | | | | | | | |
| | | | | |
| DECEMBER 31, 2021 | | J.P. MORGAN LARGE CAP FUNDS | | | | | | | | 5 |
JPMorgan Equity Income Fund
FUND COMMENTARY
SIX MONTHS ENDED DECEMBER 31, 2021 (Unaudited) (continued)
| | | | | | | | | | | | | | | | | | |
AVERAGE ANNUAL TOTAL RETURNS AS OF DECEMBER 31, 2021 | |
| | | | | |
| | | INCEPTION DATE OF
CLASS | | 6 MONTH* | | | 1 YEAR | | | 5 YEAR | | | 10 YEAR | |
CLASS A SHARES | | February 18, 1992 | | | | | | | | | | | | | | | | |
With Sales Charge** | | | | | 1.85 | % | | | 18.29 | % | | | 11.44 | % | | | 12.46 | % |
Without Sales Charge | | | | | 7.50 | | | | 24.82 | | | | 12.65 | | | | 13.07 | |
CLASS C SHARES | | November 4, 1997 | | | | | | | | | | | | | | | | |
With CDSC*** | | | | | 6.21 | | | | 23.24 | | | | 12.10 | | | | 12.62 | |
Without CDSC | | | | | 7.21 | | | | 24.24 | | | | 12.10 | | | | 12.62 | |
CLASS I SHARES | | July 2, 1987 | | | 7.63 | | | | 25.13 | | | | 12.96 | | | | 13.36 | |
CLASS R2 SHARES | | February 28, 2011 | | | 7.35 | | | | 24.52 | | | | 12.37 | | | | 12.78 | |
CLASS R3 SHARES | | September 9, 2016 | | | 7.50 | | | | 24.84 | | | | 12.67 | | | | 13.07 | |
CLASS R4 SHARES | | September 9, 2016 | | | 7.63 | | | | 25.14 | | | | 12.95 | | | | 13.36 | |
CLASS R5 SHARES | | February 28, 2011 | | | 7.70 | | | | 25.29 | | | | 13.13 | | | | 13.56 | |
CLASS R6 SHARES | | January 31, 2012 | | | 7.76 | | | | 25.44 | | | | 13.23 | | | | 13.64 | |
| ** | | Sales Charge for Class A Shares is 5.25%. |
| *** | | Assumes a 1% CDSC (contingent deferred sales charge) for the 6 month and one year periods and 0% CDSC thereafter. |
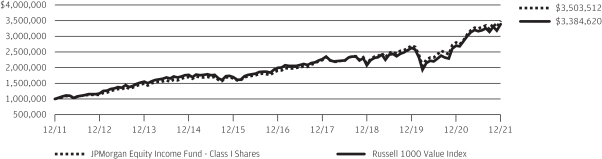
TEN YEAR PERFORMANCE (12/31/11 TO 12/31/21)
The performance quoted is past performance and is not a guarantee of future results. Mutual funds are subject to certain market risks. Investment returns and principal value of an investment will fluctuate so that an investor’s shares, when redeemed, may be worth more or less than their original cost. Current performance may be higher or lower than the performance data shown. For up-to-date month-end performance information please call 1-800-480-4111.
Returns for Class R4 Shares prior to their inception dates are based on the performance of Class I Shares. The actual returns for Class R4 Shares would have been similar to those shown because Class R4 Shares had similar expenses to Class I Shares.
Returns for Class R3 Shares prior to their inception date are based on the performance of Class A Shares. The actual returns for Class R3 Shares would have been similar than those shown because Class R3 Shares currently have the same expenses as Class A Shares.
Returns for Class R6 Shares prior to their inception date are based on the performance of Class R5 Shares and, prior to February 28, 2011, Class I Shares. The actual returns for Class R6 Shares would have been different than those shown because Class R6 Shares have different expenses than Class R5 and Class I Shares.
The graph illustrates comparative performance for $1,000,000 invested in Class I Shares of the JPMorgan Equity Income Fund and the Russell 1000 Value
Index from December 31, 2011 to December 31, 2021. The performance of the Fund assumes reinvestment of all dividends and capital gain distributions, if any, and does not include a sales charge. The performance of the Russell 1000 Value Index does not reflect the deduction of expenses or a sales charge associated with a mutual fund and has been adjusted to reflect reinvestment of all dividends and capital gain distributions of the securities included in the benchmark, if applicable. The Russell 1000 Value Index is an unmanaged index which measures the performance of those Russell 1000 companies with lower price-to-book ratios and lower forecasted growth values. Investors cannot invest directly in an index.
Class I Shares have a $1,000,000 minimum initial investment.
Fund performance may reflect the waiver of the Fund’s fees and reimbursement of expenses for certain periods. Without these waivers and reimbursements, performance would have been lower. Also, performance shown in this section does not reflect the deduction of taxes that a shareholder would pay on Fund distributions or on gains resulting from redemptions of Fund shares.
Because Class C Shares automatically convert to Class A Shares after 8 years, the 10 year average annual total return shown above for Class C reflects Class A Performance for the period after conversion.
The returns shown are based on net asset values calculated for shareholder transactions and may differ from the returns shown in the financial highlights, which reflect adjustments made to the net asset values in accordance with accounting principles generally accepted in the United States of America.
| | | | | | | | | | |
| | | | | |
| 6 | | | | | | | | J.P. MORGAN LARGE CAP FUNDS | | DECEMBER 31, 2021 |
JPMorgan Equity Premium Income Fund
FUND COMMENTARY
SIX MONTHS ENDED DECEMBER 31, 2021 (Unaudited)
| | | | |
| REPORTING PERIOD RETURN: | |
| Fund (Class I Shares)* | | | 8.74% | |
| S&P 500 Index | | | 11.67% | |
| ICE BofAML 3-Month U.S. Treasury Bill Index | | | 0.02% | |
| |
| Net Assets as of 12/31/2021 (In Thousands) | | | $2,141,945 | |
INVESTMENT OBJECTIVE**
The JPMorgan Equity Premium Income Fund (the “Fund”) seeks current income while maintaining prospects for capital appreciation.
WHAT WERE THE MAIN DRIVERS OF THE FUND’S PERFORMANCE?
The Fund’s Class I Shares underperformed the S&P 500 Index (the “Benchmark”) and outperformed the ICE BofAML 3-Month U.S. Treasury Bill Index for the six months ended December 31, 2021.
The Fund’s underweight position in the information technology sector and its security selection in the consumer discretionary sector were leading detractors from performance relative to the Benchmark, while the Fund’s security selection in the industrials and financials sectors was a leading contributor to relative performance.
Leading individual detractors from performance relative to the Benchmark included the Fund’s underweight positions in Tesla Inc., Apple Inc. and Nvidia Corp. Shares of Tesla, a producer of electric vehicles and battery systems that was not held in the Fund, rose after the company reported better-than-expected production and deliveries during the period. Shares of Apple, a provider of computers, mobile devices and related services, rose amid consecutive quarters of record earnings and strong demand for mobile phones. Shares of Nvidia, a semiconductor maker not held in the Fund, rose after the company reported
better-than-expected earnings and revenue for the third quarter of 2021 amid growth in sales to the data center and gaming industries.
Leading individual contributors to relative performance included the Fund’s overweight position in Old Dominion Freight Line Inc. and its underweight positions in PayPal Holdings Inc. and Amazon.com Inc. Shares of Old Dominion Freight Inc., a trucking and transport provider, rose after the company reported better-than-expected earnings and revenue for the third quarter amid a surge in demand for its services. Shares of PayPal Holdings, a digital payments platform provider not held in the Fund, fell after the company issued a lower-than-expected earnings forecast for the third quarter of 2021 and amid general weakness in financial technology stocks. Shares of Amazon.com, an online retailer and services provider, fell after the company reported lower-than-expected earnings and revenue for the third quarter of 2021 and issued a lower-than-expected forecast for the fourth quarter of 2021.
HOW WAS THE FUND POSITIONED?
The Fund seeks to generate income through a combination of selling options and investing in large cap stocks and delivering monthly income from associated option premiums and stock dividends. The Fund’s portfolio managers employed a proprietary research process designed to identify what they believed were overvalued and undervalued stocks with attractive risk/return characteristics.
| | | | | | | | | | |
| | | | | |
| DECEMBER 31, 2021 | | J.P. MORGAN LARGE CAP FUNDS | | | | | | | | 7 |
JPMorgan Equity Premium Income Fund
FUND COMMENTARY
SIX MONTHS ENDED DECEMBER 31, 2021 (Unaudited) (continued)
| | | | | | | | |
TOP TEN EQUITY HOLDINGS OF THE
PORTFOLIO AS OF DECEMBER 31, 2021 | | PERCENT OF
TOTAL
INVESTMENTS | |
| | 1. | | | UBS AG, ELN, 40.24%, 2/7/2022, (linked to S&P 500 Index) (Switzerland) | | | 2.1 | % |
| | 2. | | | Credit Suisse AG, ELN, 42.00%, 2/4/2022, (linked to S&P 500 Index) (Switzerland) | | | 1.9 | |
| | 3. | | | Barclays Bank plc, ELN, 48.30%, 1/14/2022, (linked to S&P 500 Index) (United Kingdom) | | | 1.8 | |
| | 4. | | | Bank of Montreal, ELN, 47.00%, 1/18/2022, (linked to S&P 500 Index) (Canada) | | | 1.7 | |
| | 5. | | | Accenture plc, Class A | | | 1.7 | |
| | 6. | | | Old Dominion Freight Line, Inc. | | | 1.6 | |
| | 7. | | | Microsoft Corp. | | | 1.6 | |
| | 8. | | | GS Finance Corp., ELN, 50.02%, 1/31/2022, (linked to S&P 500 Index) | | | 1.6 | |
| | 9. | | | DTE Energy Co. | | | 1.6 | |
| | 10. | | | Alphabet, Inc., Class A | | | 1.6 | |
| | | | |
PORTFOLIO COMPOSITION BY SECTOR
AS OF DECEMBER 31, 2021 | | PERCENT OF
TOTAL
INVESTMENTS | |
| |
| Health Care | | | 12.1 | % |
| Information Technology | | | 11.9 | |
| Industrials | | | 11.8 | |
| Consumer Staples | | | 10.8 | |
| Financials | | | 8.8 | |
| Consumer Discretionary | | | 7.6 | |
| Utilities | | | 7.2 | |
| Communication Services | | | 6.0 | |
| Materials | | | 3.4 | |
| Real Estate | | | 3.1 | |
| Energy | | | 0.7 | |
| Other*** | | | 16.3 | |
| Short-Term Investments | | | 0.3 | |
| * | | The return shown is based on net asset values calculated for shareholder transactions and may differ from the return shown in the financial highlights, which reflects adjustments made to the net asset values in accordance with accounting principles generally accepted in the United States of America. |
| ** | | The adviser seeks to achieve the Fund’s objective. There can be no guarantee it will be achieved. |
| *** | | Equity-Linked Notes that are linked to the S&P 500 Index. |
| | | | | | | | | | |
| | | | | |
| 8 | | | | | | | | J.P. MORGAN LARGE CAP FUNDS | | DECEMBER 31, 2021 |
| | | | | | | | | | | | | | | | |
AVERAGE ANNUAL TOTAL RETURNS AS OF DECEMBER 31, 2021 | |
| | | | |
| | | INCEPTION DATE OF
CLASS | | | 6 MONTH* | | | 1 YEAR | | | SINCE
INCEPTION | |
CLASS A SHARES | | | August 31, 2018 | | | | | | | | | | | | | |
With Sales Charge** | | | | | | | 2.92 | % | | | 14.64 | % | | | 9.67 | % |
Without Sales Charge | | | | | | | 8.60 | | | | 20.99 | | | | 11.45 | |
CLASS C SHARES | | | August 31, 2018 | | | | | | | | | | | | | |
With CDSC*** | | | | | | | 7.33 | | | | 19.39 | | | | 10.90 | |
Without CDSC | | | | | | | 8.33 | | | | 20.39 | | | | 10.90 | |
CLASS I SHARES | | | August 31, 2018 | | | | 8.74 | | | | 21.28 | | | | 11.71 | |
CLASS R5 SHARES | | | August 31, 2018 | | | | 8.82 | | | | 21.46 | | | | 11.87 | |
CLASS R6 SHARES | | | August 31, 2018 | | | | 8.87 | | | | 21.58 | | | | 11.99 | |
| ** | | Sales Charge for Class A Shares is 5.25%. |
| *** | | Assumes a 1% CDSC (contingent deferred sales charge) for the 6 month and one year periods and 0% CDSC thereafter. |
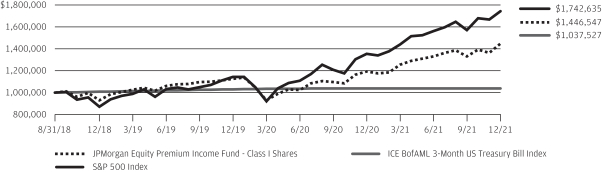
LIFE OF FUND PERFORMANCE (8/31/18 to 12/31/21)
The performance quoted is past performance and is not a guarantee of future results. Mutual funds are subject to certain market risks. Investment returns and principal value of an investment will fluctuate so that an investor’s shares, when redeemed, may be worth more or less than their original cost. Current performance may be higher or lower than the performance data shown. For up-to-date month-end performance information please call 1-800-480-4111.
The Fund commenced operations on August 31, 2018.
The graph illustrates comparative performance for $1,000,000 invested in Class I Shares of the JPMorgan Equity Premium Income Fund, the S&P 500 Index and the ICE BofAML 3-Month US Treasury Bill Index from August 31, 2018 to December 31, 2021. The performance of the Fund assumes reinvestment of all dividends and capital gain distributions, if any, and does not include a sales charge. The performance of the S&P 500 Index and the ICE BofAML 3-Month US Treasury Bill Index does not reflect the deduction of expenses or a sales charge associated with a mutual fund and approximates the minimum possible dividend reinvestment of the securities included in the benchmarks, if applicable. These expenses are not identical to the expenses incurred by the Fund. The S&P 500 Index is an unmanaged index generally representative of the performance of large companies in the U.S. stock market. The ICE BofAML 3-Month US Treasury Bill Index is comprised of a single issue purchased at the
beginning of the month and held for a full month. Each month the ICE BofAML 3-Month US Treasury Bill Index is rebalanced and the issue selected is the outstanding Treasury Bill that matures closest to, but not beyond, 3 months from the rebalancing date. Investors cannot invest directly in an index.
Class I Shares have a $1,000,000 minimum initial investment.
Subsequent to the inception date of the Fund and through April 7, 2019, the Fund did not experience any shareholder activity. If such shareholder activity had occurred, the Fund’s performance may have been impacted.
Fund performance may reflect the waiver of the Fund’s fees and reimbursement of expenses for certain periods since the inception date. Without these waivers and reimbursements, performance would have been lower. Also, performance shown in this section does not reflect the deduction of taxes that a shareholder would pay on Fund distributions or on gains resulting from redemptions of Fund shares.
The returns shown are based on net asset values calculated for shareholder transactions and may differ from the returns shown in the financial highlights, which reflect adjustments made to the net asset values in accordance with accounting principles generally accepted in the United States of America.
| | | | | | | | | | |
| | | | | |
| DECEMBER 31, 2021 | | J.P. MORGAN LARGE CAP FUNDS | | | | | | | | 9 |
JPMorgan Hedged Equity Fund
FUND COMMENTARY
SIX MONTHS ENDED DECEMBER 31, 2021 (Unaudited)
| | | | |
| REPORTING PERIOD RETURN: | |
| Fund (Class I Shares)* | | | 4.32% | |
| S&P 500 Index | | | 11.67% | |
| |
| Net Assets as of 12/31/2021 (In Thousands) | | | $19,555,808 | |
INVESTMENT OBJECTIVE**
The JPMorgan Hedged Equity Fund (the “Fund”) seeks to provide capital appreciation.
WHAT WERE THE MAIN DRIVERS OF THE FUND’S PERFORMANCE?
The Fund’s Class I Shares underperformed the S&P 500 Index (the “Benchmark”) for the six months ended December 31, 2021. The Fund’s security selection in the pharmaceutical/medical technology and telecommunications sectors was a leading detractor from performance relative to the Benchmark, while the Fund’s security selection in the technology and media sectors was a leading contributor to relative performance.
Leading individual detractors from relative performance included the Fund’s underweight position in Pfizer Inc. and its overweight positions in Zimmer Biomet Holdings Inc. and Texas Instruments Inc. Shares of Pfizer, a pharmaceutical manufacturer, rose amid a resurgence in the pandemic in late 2021 and the U.S. Food and Drug Administration’s approval of the company’s COVID-19 pill. Shares of Zimmer Biomet Holdings, a medical device manufacturer, fell amid investor expectations that the resurgence of the pandemic in late 2021 may reduce demand for elective surgeries. Shares of Texas Instruments, a semiconductor manufacturer, fell after the company reported lower-than-expected revenue for the third quarter of 2021.
Leading individual contributors to relative performance included the Fund’s underweight positions in Adobe Inc., PayPal Holdings Inc. and Intel Corp. Shares of Adobe, a digital marketing and media provider not held in the Fund, fell after the company issued a weaker-than-expected forecast in December 2021. Shares of PayPal Holdings, a digital payments platform provider, fell after the company issued a lower-than-expected earnings forecast for the third quarter of 2021 and amid general weakness in financial technology stocks. Shares of Intel, a semiconductor manufacturer, fell after the company issued a weaker-than-expected earnings forecast with its third quarter 2021 results.
HOW WAS THE FUND POSITIONED?
The Fund used an enhanced index strategy that invests primarily in common stocks of large capitalization U.S. companies, while systematically purchasing and selling exchange-traded index put options and selling exchange-traded index call options. The option overlay is known as a Put/Spread Collar strategy. The combination of the diversified portfolio of equity securities,
downside protection from index put options and income from index call options provided the Fund with a portion of the returns associated with equity market investments while exposing the Fund to less risk than traditional long-only equity strategies.
| | | | | | | | |
TOP TEN EQUITY HOLDINGS OF THE
PORTFOLIO AS OF DECEMBER 31, 2021 | | PERCENT OF
TOTAL
INVESTMENTS | |
| | | | | | | | |
| | 1. | | | Microsoft Corp. | | | 6.6 | % |
| | 2. | | | Apple, Inc. | | | 6.4 | |
| | 3. | | | Amazon.com, Inc. | | | 3.7 | |
| | 4. | | | Alphabet, Inc., Class A | | | 2.6 | |
| | 5. | | | Alphabet, Inc., Class C | | | 1.9 | |
| | 6. | | | Tesla, Inc. | | | 1.9 | |
| | 7. | | | Meta Platforms, Inc., Class A | | | 1.9 | |
| | 8. | | | S&P 500 Index 3/31/2022 at USD 4,510.00, European Style | | | 1.7 | |
| | 9. | | | NVIDIA Corp. | | | 1.5 | |
| | 10. | | | UnitedHealth Group, Inc. | | | 1.3 | |
| | | | |
PORTFOLIO COMPOSITION BY SECTOR
AS OF DECEMBER 31, 2021 | | PERCENT OF
TOTAL
INVESTMENTS | |
| |
| Information Technology | | | 26.6 | % |
| Consumer Discretionary | | | 12.9 | |
| Health Care | | | 12.3 | |
| Financials | | | 9.8 | |
| Communication Services | | | 9.2 | |
| Industrials | | | 7.6 | |
| Consumer Staples | | | 4.2 | |
| Energy | | | 2.5 | |
| Real Estate | | | 2.4 | |
| Utilities | | | 2.3 | |
| Materials | | | 2.2 | |
| Put Options Purchased | | | 1.7 | |
| Short-Term Investments | | | 6.3 | |
| * | | The return shown is based on net asset values calculated for shareholder transactions and may differ from the return shown in the financial highlights, which reflects adjustments made to the net asset values in accordance with accounting principles generally accepted in the United States of America. |
| ** | | The adviser seeks to achieve the Fund’s objective. There can be no guarantee it will be achieved. |
| | | | | | | | | | |
| | | | | |
| 10 | | | | | | | | J.P. MORGAN LARGE CAP FUNDS | | DECEMBER 31, 2021 |
| | | | | | | | | | | | | | | | | | |
AVERAGE ANNUAL TOTAL RETURNS AS OF DECEMBER 31, 2021 | |
| | | | | |
| | | INCEPTION DATE OF
CLASS | | 6 MONTH* | | | 1 YEAR | | | 5 YEAR | | | SINCE
INCEPTION | |
CLASS A SHARES | | December 13, 2013 | | | | | | | | | | | | | | | | |
With Sales Charge** | | | | | (1.25 | )% | | | 7.21 | % | | | 8.95 | % | | | 7.83 | % |
Without Sales Charge | | | | | 4.20 | | | | 13.13 | | | | 10.14 | | | | 8.56 | |
CLASS C SHARES | | December 13, 2013 | | | | | | | | | | | | | | | | |
With CDSC*** | | | | | 2.93 | | | | 11.60 | | | | 9.59 | | | | 8.02 | |
Without CDSC | | | | | 3.93 | | | | 12.60 | | | | 9.59 | | | | 8.02 | |
CLASS I SHARES | | December 13, 2013 | | | 4.32 | | | | 13.43 | | | | 10.41 | | | | 8.83 | |
CLASS R5 SHARES | | December 13, 2013 | | | 4.42 | | | | 13.62 | | | | 10.59 | | | | 9.02 | |
CLASS R6 SHARES | | December 13, 2013 | | | 4.48 | | | | 13.72 | | | | 10.68 | | | | 9.10 | |
| ** | | Sales Charge for Class A Shares is 5.25%. |
| *** | | Assumes a 1% CDSC (contingent deferred sales charge) for the 6 month and one year periods and 0% CDSC thereafter. |
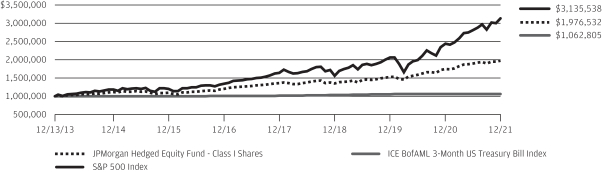
LIFE OF FUND PERFORMANCE (12/13/13 TO 12/31/21)
The performance quoted is past performance and is not a guarantee of future results. Mutual funds are subject to certain market risks. Investment returns and principal value of an investment will fluctuate so that an investor’s shares, when redeemed, may be worth more or less than their original cost. Current performance may be higher or lower than the performance data shown. For up-to-date month-end performance information please call 1-800-480-4111.
The Fund commenced operations on December 13, 2013.
The graph illustrates comparative performance for $1,000,000 invested in Class I Shares of the JPMorgan Hedged Equity Fund, the S&P 500 Index and the ICE BofAML 3-Month US Treasury Bill Index from December 13, 2013 to December 31, 2021. The performance of the Fund assumes reinvestment of all dividends and capital gain distributions, if any, and does not include a sales charge. The performance of the S&P 500 Index and the ICE BofAML 3-Month US Treasury Bill Index does not reflect the deduction of expenses or a sales charge associated with a mutual fund and approximates the minimum possible dividend reinvestment of the securities included in the benchmarks, if applicable. The S&P 500 Index is an unmanaged index generally representative of the performance of large companies in the U.S. stock market. The ICE BofAML 3-Month US Treasury Bill Index is comprised of a single issue purchased at the
beginning of the month and held for a full month. Each month the ICE BofAML 3-Month US Treasury Bill Index is rebalanced and the issue selected is the outstanding Treasury Bill that matures closest to, but not beyond, 3 months from the rebalancing date. Investors cannot invest directly in an index.
Class I Shares have a $1,000,000 minimum initial investment.
Subsequent to the inception date of the Fund and through May 30, 2014, the Fund did not experience any shareholder activity. If such shareholder activity had occurred, the Fund’s performance may have been impacted.
Fund performance may reflect the waiver of the Fund’s fees and reimbursement of expenses for certain periods since the inception date. Without these waivers and reimbursements, performance would have been lower. Also, performance shown in this section does not reflect the deduction of taxes that a shareholder would pay on Fund distributions or on gains resulting from redemptions of Fund shares.
The returns shown are based on net asset values calculated for shareholder transactions and may differ from the returns shown in the financial highlights, which reflect adjustments made to the net asset values in accordance with accounting principles generally accepted in the United States of America.
| | | | | | | | | | |
| | | | | |
| DECEMBER 31, 2021 | | J.P. MORGAN LARGE CAP FUNDS | | | | | | | | 11 |
JPMorgan Hedged Equity 2 Fund
FUND COMMENTARY
SIX MONTHS ENDED DECEMBER 31, 2021 (Unaudited)
| | | | |
| REPORTING PERIOD RETURN: | |
| Fund (Class I Shares)* | | | 7.29% | |
| S&P 500 Index | | | 11.67% | |
| |
| Net Assets as of 12/31/2021 (In Thousands) | | | $3,893,228 | |
INVESTMENT OBJECTIVE**
The JPMorgan Hedged Equity 2 Fund (the “Fund”) seeks to provide capital appreciation.
WHAT WERE THE MAIN DRIVERS OF THE FUND’S PERFORMANCE?
The Fund’s Class I Shares underperformed the S&P 500 Index (the “Benchmark”) for the six months ended December 31, 2021.
The Fund’s security selection in the pharmaceutical/medical technology and telecommunications sectors was a leading detractor from performance relative to the Benchmark, while the Fund’s security selection in the technology and media sectors was a leading contributor to relative performance.
Leading individual detractors from relative performance included the Fund’s underweight position in Pfizer Inc. and its overweight positions in Zimmer Biomet Holdings Inc. and Texas Instruments Inc. Shares of Pfizer, a pharmaceutical manufacturer, rose amid a resurgence in the pandemic in late 2021 and the U.S. Food and Drug Administration’s approval of the company’s COVID-19 pill. Shares of Zimmer Biomet Holdings, a medical device manufacturer, fell amid investor expectations that the resurgence of the pandemic in late 2021 may reduce demand for elective surgeries. Shares of Texas Instruments, a semiconductor manufacturer, fell after the company reported lower-than-expected revenue for the third quarter of 2021.
Leading individual contributors to relative performance included the Fund’s underweight positions in Adobe Inc., PayPal Holdings Inc. and Intel Corp. Shares of Adobe, a digital marketing and media provider not held in the Fund, fell after the company issued a weaker-than-expected forecast in December 2021. Shares of PayPal Holdings, a digital payments platform provider, fell after the company issued a lower-than-expected earnings forecast for the third quarter of 2021 and amid general weakness in financial technology stocks. Shares of Intel, a semiconductor manufacturer, fell after the company issued a weaker-than-expected earnings forecast with its third quarter 2021 results.
HOW WAS THE FUND POSITIONED?
The Fund used an enhanced index strategy that invests primarily in common stocks of large capitalization U.S. companies, while systematically purchasing and selling exchange-traded index put options and selling exchange-traded index call options. The option overlay is known as a Put/Spread Collar
strategy. The combination of the diversified portfolio of equity securities, downside protection from index put options and income from index call options provided the Fund with a portion of the returns associated with equity market investments while exposing the Fund to less risk than traditional long-only equity strategies.
| | | | | | | | |
TOP TEN EQUITY HOLDINGS OF THE
PORTFOLIO AS OF DECEMBER 31, 2021 | | PERCENT OF
TOTAL
INVESTMENTS | |
| | | | | | | | |
| | 1. | | | Microsoft Corp. | | | 6.9 | % |
| | 2. | | | Apple, Inc. | | | 6.7 | |
| | 3. | | | Amazon.com, Inc. | | | 3.8 | |
| | 4. | | | Alphabet, Inc., Class A | | | 2.7 | |
| | 5. | | | Alphabet, Inc., Class C | | | 2.0 | |
| | 6. | | | Tesla, Inc. | | | 2.0 | |
| | 7. | | | Meta Platforms, Inc., Class A | | | 1.9 | |
| | 8. | | | NVIDIA Corp. | | | 1.6 | |
| | 9. | | | UnitedHealth Group, Inc. | | | 1.4 | |
| | 10. | | | Mastercard, Inc., Class A | | | 1.4 | |
| | | | |
PORTFOLIO COMPOSITION BY SECTOR
AS OF DECEMBER 31, 2021 | | PERCENT OF
TOTAL
INVESTMENTS | |
| |
| Information Technology | | | 27.9 | % |
| Consumer Discretionary | | | 13.5 | |
| Health Care | | | 12.8 | |
| Financials | | | 10.3 | |
| Communication Services | | | 9.6 | |
| Industrials | | | 8.0 | |
| Consumer Staples | | | 4.4 | |
| Energy | | | 2.6 | |
| Real Estate | | | 2.5 | |
| Utilities | | | 2.4 | |
| Materials | | | 2.3 | |
| Put Options Purchased | | | 0.2 | |
| Short-Term Investments | | | 3.5 | |
| * | | The return shown is based on net asset values calculated for shareholder transactions and may differ from the return shown in the financial highlights, which reflects adjustments made to the net asset values in accordance with accounting principles generally accepted in the United States of America. |
| ** | | The adviser seeks to achieve the Fund’s objective. There can be no guarantee it will be achieved. |
| | | | | | | | | | |
| | | | | |
| 12 | | | | | | | | J.P. MORGAN LARGE CAP FUNDS | | DECEMBER 31, 2021 |
| | | | | | | | |
TOTAL RETURNS AS OF DECEMBER 31, 2021 | |
| | | |
| | | INCEPTION DATE OF
CLASS | | 6 MONTH* | | SINCE
INCEPTION | |
CLASS A SHARES | | February 26, 2021 | | | | | | |
With Sales Charge** | | | | 1.53% | | | 14.13 | % |
Without Sales Charge | | | | 7.13 | | | 14.13 | |
CLASS C SHARES | | February 26, 2021 | | | | | | |
With CDSC*** | | | | 5.92 | | | 12.71 | |
Without CDSC | | | | 6.92 | | | 13.71 | |
CLASS I SHARES | | February 26, 2021 | | 7.29 | | | 14.41 | |
CLASS R5 SHARES | | February 26, 2021 | | 7.41 | | | 14.57 | |
CLASS R6 SHARES | | February 26, 2021 | | 7.46 | | | 14.71 | |
| ** | | Sales Charge for Class A Shares is 5.25%. |
| *** | | Assumes a 1% CDSC (contingent deferred sales charge) for the 6 month period and 0% CDSC thereafter. |
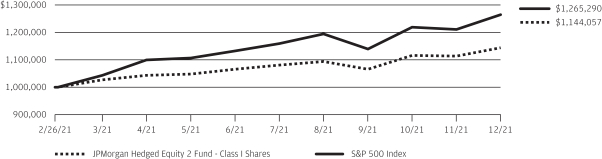
LIFE OF FUND PERFORMANCE (2/26/21 TO 12/31/21)
The performance quoted is past performance and is not a guarantee of future results. Mutual funds are subject to certain market risks. Investment returns and principal value of an investment will fluctuate so that an investor’s shares, when redeemed, may be worth more or less than their original cost. Current performance may be higher or lower than the performance data shown. For up-to-date month-end performance information please call 1-800-480-4111.
The Fund commenced operations on February 26, 2021.
The graph illustrates comparative performance for $1,000,000 invested in Class I Shares of the JPMorgan Hedged Equity 2 Fund and the S&P 500 Index from February 26, 2021 to December 31, 2021. The performance of the Fund assumes reinvestment of all dividends and capital gain distributions, if any, and does not include a sales charge. The performance of the S&P 500 Index does not reflect the deduction of expenses or a sales charge associated with a mutual fund and approximates the minimum possible dividend reinvestment of
the securities included in the benchmarks, if applicable. The S&P 500 Index is an unmanaged index generally representative of the performance of large companies in the U.S. stock market. Investors cannot invest directly in an index.
Class I Shares have a $1,000,000 minimum initial investment.
Fund performance may reflect the waiver of the Fund’s fees and reimbursement of expenses for certain periods since the inception date. Without these waivers and reimbursements, performance would have been lower. Also, performance shown in this section does not reflect the deduction of taxes that a shareholder would pay on Fund distributions or on gains resulting from redemptions of Fund shares.
The returns shown are based on net asset values calculated for shareholder transactions and may differ from the returns shown in the financial highlights, which reflect adjustments made to the net asset values in accordance with accounting principles generally accepted in the United States of America.
| | | | | | | | | | |
| | | | | |
| DECEMBER 31, 2021 | | J.P. MORGAN LARGE CAP FUNDS | | | | | | | | 13 |
JPMorgan Hedged Equity 3 Fund
FUND COMMENTARY
SIX MONTHS ENDED DECEMBER 31, 2021 (Unaudited)
| | | | |
| REPORTING PERIOD RETURN: | |
| Fund (Class I Shares)* | | | 6.12% | |
| S&P 500 Index | | | 11.67% | |
| |
| Net Assets as of 12/31/2021 (In Thousands) | | | $2,317,080 | |
INVESTMENT OBJECTIVE**
The JPMorgan Hedged Equity 3 Fund (the “Fund”) seeks to provide capital appreciation.
WHAT WERE THE MAIN DRIVERS OF THE FUND’S PERFORMANCE?
The Fund’s Class I Shares underperformed the S&P 500 Index (the “Benchmark”) for the six months ended December 31, 2021.
The Fund’s security selection in the pharmaceutical/medical technology and telecommunications sectors was a leading detractor from performance relative to the Benchmark, while the Fund’s security selection in the technology and media sectors was a leading contributor to relative performance.
Leading individual detractors from relative performance included the Fund’s underweight position in Pfizer Inc. and its overweight positions in Zimmer Biomet Holdings Inc. and Texas Instruments Inc. Shares of Pfizer, a pharmaceutical manufacturer, rose amid a resurgence in the pandemic in late 2021 and the U.S. Food and Drug Administration’s approval of the company’s COVID-19 pill. Shares of Zimmer Biomet Holdings, a medical device manufacturer, fell amid investor expectations that the resurgence of the pandemic in late 2021 may reduce demand for elective surgeries. Shares of Texas Instruments, a semiconductor manufacturer, fell after the company reported lower-than-expected revenue for the third quarter of 2021.
Leading individual contributors to relative performance included the Fund’s underweight positions in Adobe Inc., PayPal Holdings Inc. and Intel Corp. Shares of Adobe, a digital marketing and media provider not held in the Fund, fell after the company issued a weaker-than-expected forecast in December 2021. Shares of PayPal Holdings, a digital payments platform provider, fell after the company issued a lower-than-expected earnings forecast for the third quarter of 2021 and amid general weakness in financial technology stocks. Shares of Intel, a semiconductor manufacturer, fell after the company issued a weaker-than-expected earnings forecast with its third quarter 2021 results.
HOW WAS THE FUND POSITIONED?
The Fund used an enhanced index strategy that invests primarily in common stocks of large capitalization U.S. companies, while systematically purchasing and selling exchange-traded index put options and selling exchange-traded index call options. The option overlay is known as a Put/Spread Collar
strategy. The combination of the diversified portfolio of equity securities, downside protection from index put options and income from index call options provided the Fund with a portion of the returns associated with equity market investments while exposing the Fund to less risk than traditional long-only equity strategies.
| | | | | | | | |
TOP TEN EQUITY HOLDINGS OF THE
PORTFOLIO AS OF DECEMBER 31, 2021 | | PERCENT OF
TOTAL
INVESTMENTS | |
| | |
| | 1. | | | Microsoft Corp. | | | 7.1 | % |
| | 2. | | | Apple, Inc. | | | 6.9 | |
| | 3. | | | Amazon.com, Inc. | | | 3.9 | |
| | 4. | | | Alphabet, Inc., Class A | | | 2.7 | |
| | 5. | | | Alphabet, Inc., Class C | | | 2.1 | |
| | 6. | | | Tesla, Inc. | | | 2.1 | |
| | 7. | | | Meta Platforms, Inc., Class A | | | 2.0 | |
| | 8. | | | NVIDIA Corp. | | | 1.6 | |
| | 9. | | | UnitedHealth Group, Inc. | | | 1.4 | |
| | 10. | | | Mastercard, Inc., Class A | | | 1.4 | |
| | | | |
PORTFOLIO COMPOSITION BY SECTOR
AS OF DECEMBER 31, 2021 | | PERCENT OF
TOTAL
INVESTMENTS | |
| |
| Information Technology | | | 28.5 | % |
| Consumer Discretionary | | | 13.8 | |
| Health Care | | | 13.1 | |
| Financials | | | 10.5 | |
| Communication Services | | | 9.9 | |
| Industrials | | | 8.2 | |
| Consumer Staples | | | 4.5 | |
| Energy | | | 2.7 | |
| Real Estate | | | 2.6 | |
| Utilities | | | 2.5 | |
| Materials | | | 2.3 | |
| Put Options Purchased | | | 0.7 | |
| Short-Term Investments | | | 0.7 | |
| * | | The return shown is based on net asset values calculated for shareholder transactions and may differ from the return shown in the financial highlights, which reflects adjustments made to the net asset values in accordance with accounting principles generally accepted in the United States of America. |
| ** | | The adviser seeks to achieve the Fund’s objective. There can be no guarantee it will be achieved. |
| | | | | | | | | | |
| | | | | |
| 14 | | | | | | | | J.P. MORGAN LARGE CAP FUNDS | | DECEMBER 31, 2021 |
| | | | | | | | |
TOTAL RETURNS AS OF DECEMBER 31, 2021 | |
| | | |
| | | INCEPTION DATE OF
CLASS | | 6 MONTH* | | SINCE
INCEPTION | |
CLASS A SHARES | | February 26, 2021 | | | | | | |
With Sales Charge** | | | | 0.44% | | | 12.86 | % |
Without Sales Charge | | | | 5.97 | | | 12.86 | |
CLASS C SHARES | | February 26, 2021 | | | | | | |
With CDSC*** | | | | 4.68 | | | 11.41 | |
Without CDSC | | | | 5.68 | | | 12.41 | |
CLASS I SHARES | | February 26, 2021 | | 6.12 | | | 13.16 | |
CLASS R5 SHARES | | February 26, 2021 | | 6.23 | | | 13.29 | |
CLASS R6 SHARES | | February 26, 2021 | | 6.29 | | | 13.38 | |
| ** | | Sales Charge for Class A Shares is 5.25%. |
| *** | | Assumes a 1% CDSC (contingent deferred sales charge) for the 6 month period and 0% CDSC thereafter. |
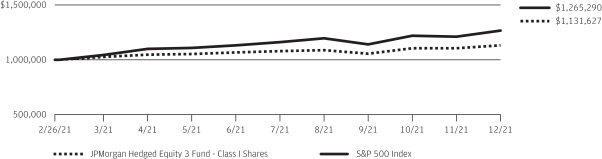
LIFE OF FUND PERFORMANCE (2/26/21 TO 12/31/21)
The performance quoted is past performance and is not a guarantee of future results. Mutual funds are subject to certain market risks. Investment returns and principal value of an investment will fluctuate so that an investor’s shares, when redeemed, may be worth more or less than their original cost. Current performance may be higher or lower than the performance data shown. For up-to-date month-end performance information please call 1-800-480-4111.
The Fund commenced operations on February 26, 2021.
The graph illustrates comparative performance for $1,000,000 invested in Class I Shares of the JPMorgan Hedged Equity 3 Fund and the S&P 500 Index from February 26, 2021 to December 31, 2021. The performance of the Fund assumes reinvestment of all dividends and capital gain distributions, if any, and does not include a sales charge. The performance of the S&P 500 Index does not reflect the deduction of expenses or a sales charge associated with a mutual fund and approximates the minimum possible dividend reinvestment of
the securities included in the benchmarks, if applicable. The S&P 500 Index is an unmanaged index generally representative of the performance of large companies in the U.S. stock market. Investors cannot invest directly in an index.
Class I Shares have a $1,000,000 minimum initial investment.
Fund performance may reflect the waiver of the Fund’s fees and reimbursement of expenses for certain periods since the inception date. Without these waivers and reimbursements, performance would have been lower. Also, performance shown in this section does not reflect the deduction of taxes that a shareholder would pay on Fund distributions or on gains resulting from redemptions of Fund shares.
The returns shown are based on net asset values calculated for shareholder transactions and may differ from the returns shown in the financial highlights, which reflect adjustments made to the net asset values in accordance with accounting principles generally accepted in the United States of America.
| | | | | | | | | | |
| | | | | |
| DECEMBER 31, 2021 | | J.P. MORGAN LARGE CAP FUNDS | | | | | | | | 15 |
JPMorgan Large Cap Growth Fund
FUND COMMENTARY
SIX MONTHS ENDED DECEMBER 31, 2021 (Unaudited)
| | | | |
| REPORTING PERIOD RETURN: | | | |
| Fund (Class I Shares)* | | | 8.65% | |
| Russell 1000 Growth Index | | | 12.93% | |
| |
| Net Assets as of 12/31/2021 (In Thousands) | | | $40,805,094 | |
INVESTMENT OBJECTIVE**
The JPMorgan Large Cap Growth Fund (the “Fund”) seeks long-term capital appreciation.
WHAT WERE THE MAIN DRIVERS OF THE FUND’S PERFORMANCE?
The Fund’s Class I Shares underperformed the Russell 1000 Growth Index (the “Benchmark”) for the six months ended December 31, 2021.
The Fund’s overweight position and security selection in the communication services sector and its security selection and underweight position in the information technology sector were leading detractors from performance relative to the Benchmark, while the Fund’s security selection in the consumer discretionary and financials sectors was the leading contributor to relative performance.
Leading individual detractors from relative performance included the Fund’s out-of-Benchmark position in Snap Inc., its underweight position in Apple Inc. and its overweight position in PayPal Holdings Inc. Shares of Snap, an online camera platform and social media provider, fell after the company reported third quarter 2021 results that were below analysts’ expectations. Shares of Apple, a provider of computers, mobile devices and relative services, rose amid consecutive quarter of record earnings and strong demand for mobile phones. Shares of PayPal Holdings, a digital payments platform provider, fell after the company issued a lower-than-expected earnings forecast for the third quarter of 2021 and amid general weakness in financial technology stocks.
Leading individual contributors to relative performance included the Fund’s underweight position in Amazon.com Inc. and its overweight positions in Advanced Micro Devices Inc. and Blackstone Inc. Shares of Amazon.com, an online retailer and services provider, fell after the company reported lower-than-expected earnings and revenue for the third quarter of 2021 and issued a lower-than-expected forecast for the fourth quarter of 2021. Shares of Advanced Micro Devices, a semiconductor manufacturer, rose after the company reported better-than-expected earnings and sales for the third quarter of 2021 and issued a better-than-expected forecast for the fourth quarter of 2021. Shares of Blackstone, an investment management company, rose after the company reported better-than-expected earnings and revenue for the third quarter of 2021.
HOW WAS THE FUND POSITIONED?
The Fund’s portfolio managers utilized a bottom-up approach to stock selection, rigorously researching individual companies in an effort to construct portfolios of stocks that have strong fundamentals and positive price momentum. The Fund’s portfolio managers sought to invest in companies with attractive fundamentals that, in their view, possessed the potential to significantly exceed expectations for a prolonged period of time.
| | | | | | | | |
TOP TEN EQUITY HOLDINGS OF THE
PORTFOLIO AS OF DECEMBER 31, 2021 | | PERCENT OF
TOTAL
INVESTMENTS | |
| | |
| | 1. | | | Apple, Inc. | | | 9.2 | % |
| | 2. | | | Microsoft Corp. | | | 9.1 | |
| | 3. | | | Alphabet, Inc., Class C | | | 7.4 | |
| | 4. | | | Tesla, Inc. | | | 4.5 | |
| | 5. | | | Amazon.com, Inc. | | | 3.3 | |
| | 6. | | | Advanced Micro Devices, Inc. | | | 3.0 | |
| | 7. | | | NVIDIA Corp. | | | 3.0 | |
| | 8. | | | Blackstone, Inc. | | | 2.8 | |
| | 9. | | | Meta Platforms, Inc., Class A | | | 2.7 | |
| | 10. | | | Deere & Co. | | | 2.3 | |
| | | | |
PORTFOLIO COMPOSITION BY SECTOR
AS OF DECEMBER 31, 2021 | | PERCENT OF
TOTAL
INVESTMENTS | |
| |
| Information Technology | | | 37.1 | % |
| Consumer Discretionary | | | 17.3 | |
| Communication Services | | | 13.4 | |
| Health Care | | | 9.9 | |
| Financials | | | 9.3 | |
| Industrials | | | 6.8 | |
| Materials | | | 2.6 | |
| Consumer Staples | | | 2.5 | |
| Short-Term Investments | | | 1.1 | |
| * | | The return shown is based on net asset values calculated for shareholder transactions and may differ from the return shown in the financial highlights, which reflects adjustments made to the net asset values in accordance with accounting principles generally accepted in the United States of America. |
| ** | | The adviser seeks to achieve the Fund’s objective. There can be no guarantee it will be achieved. |
| | | | | | | | | | |
| | | | | |
| 16 | | | | | | | | J.P. MORGAN LARGE CAP FUNDS | | DECEMBER 31, 2021 |
| | | | | | | | | | | | | | | | | | |
AVERAGE ANNUAL TOTAL RETURNS AS OF DECEMBER 31, 2021 | |
| | | | | |
| | | INCEPTION DATE OF
CLASS | | 6 MONTH* | | | 1 YEAR | | | 5 YEAR | | | 10 YEAR | |
CLASS A SHARES | | February 22, 1994 | | | | | | | | | | | | | | | | |
With Sales Charge** | | | | | 2.82 | % | | | 11.99 | % | | | 27.21 | % | | | 19.10 | % |
Without Sales Charge | | | | | 8.52 | | | | 18.20 | | | | 28.59 | | | | 19.75 | |
CLASS C SHARES | | November 4, 1997 | | | | | | | | | | | | | | | | |
With CDSC*** | | | | | 7.24 | | | | 16.61 | | | | 27.95 | | | | 19.27 | |
Without CDSC | | | | | 8.24 | | | | 17.61 | | | | 27.95 | | | | 19.27 | |
CLASS I SHARES | | February 28, 1992 | | | 8.65 | | | | 18.49 | | | | 28.90 | | | | 19.99 | |
CLASS R2 SHARES | | November 3, 2008 | | | 8.39 | | | | 17.91 | | | | 28.26 | | | | 19.45 | |
CLASS R3 SHARES | | September 9, 2016 | | | 8.51 | | | | 18.20 | | | | 28.58 | | | | 19.72 | |
CLASS R4 SHARES | | September 9, 2016 | | | 8.65 | | | | 18.49 | | | | 28.90 | | | | 19.99 | |
CLASS R5 SHARES | | April 14, 2009 | | | 8.73 | | | | 18.66 | | | | 29.10 | | | | 20.20 | |
CLASS R6 SHARES | | November 30, 2010 | | | 8.79 | | | | 18.79 | | | | 29.23 | | | | 20.30 | |
| ** | | Sales Charge for Class A Shares is 5.25%. |
| *** | | Assumes a 1% CDSC (contingent deferred sales charge) for the 6 month and one year periods and 0% CDSC thereafter. |
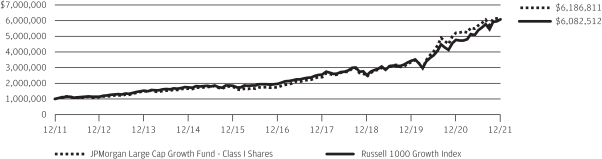
TEN YEAR PERFORMANCE (12/31/11 TO 12/31/21)
The performance quoted is past performance and is not a guarantee of future results. Mutual funds are subject to certain market risks. Investment returns and principal value of an investment will fluctuate so that an investor’s shares, when redeemed, may be worth more or less than their original cost. Current performance may be higher or lower than the performance data shown. For up-to-date month-end performance information please call 1-800-480-4111.
Returns for Class R3 and Class R4 Shares prior to their inception dates are based on the performance of Class I Shares. With respect to Class R3 Shares, prior class performance has been adjusted to reflect the differences in expenses between classes. The actual returns of Class R4 Shares would have been similar to those shown because Class R4 Shares had similar expenses to Class I Shares.
The graph illustrates comparative performance for $1,000,000 invested in Class I Shares of the JPMorgan Large Cap Growth Fund and the Russell 1000 Growth Index from December 31, 2011 to December 31, 2021. The performance of the Fund assumes reinvestment of all dividends and capital gain distributions, if any, and does not include a sales charge. The performance of the Russell 1000 Growth Index does not reflect the deduction of expenses or a sales charge associated with a mutual fund and has been adjusted to reflect
reinvestment of all dividends and capital gain distributions of the securities included in the benchmark, if applicable. The Russell 1000 Growth Index is an unmanaged index which measures the performance of those Russell 1000 companies with higher price-to-book ratios and higher forecasted growth values. Investors cannot invest directly in an index.
Class I Shares have a $1,000,000 minimum initial investment.
Fund performance may reflect the waiver of the Fund’s fees and reimbursement of expenses for certain periods. Without these waivers and reimbursements, performance would have been lower. Also, performance shown in this section does not reflect the deduction of taxes that a shareholder would pay on Fund distributions or on gains resulting from redemptions of Fund shares.
Because Class C Shares automatically convert to Class A Shares after 8 years, the 10 year average annual total return shown above for Class C reflects Class A Performance for the period after conversion.
The returns shown are based on net asset values calculated for shareholder transactions and may differ from the returns shown in the financial highlights, which reflect adjustments made to the net asset values in accordance with accounting principles generally accepted in the United States of America.
| | | | | | | | | | |
| | | | | |
| DECEMBER 31, 2021 | | J.P. MORGAN LARGE CAP FUNDS | | | | | | | | 17 |
JPMorgan Large Cap Value Fund
FUND COMMENTARY
SIX MONTHS ENDED DECEMBER 31, 2021 (Unaudited)
| | | | |
| REPORTING PERIOD RETURN: | |
| Fund (Class I Shares)* | | | 1.94% | |
| Russell 1000 Value Index | | | 6.93% | |
| |
| Net Assets as of 12/31/2021 (In Thousands) | | | $3,113,172 | |
INVESTMENT OBJECTIVE**
The JPMorgan Large Cap Value Fund (the “Fund”) seeks capital appreciation with the incidental goal of achieving current income by investing primarily in equity securities.
WHAT WERE THE MAIN DRIVERS OF THE FUND’S PERFORMANCE?
The Fund’s Class I Shares underperformed the Russell 1000 Value Index (the “Benchmark”) for the six months ended December 31, 2021.
The Fund’s security selection in the industrials and consumer staples sectors was a leading detractor from performance relative to the Benchmark, while the Fund’s security selection in the materials and financials sector was a leading contributor to relative performance.
Leading individual detractors from relative performance included the Fund’s overweight positions in Lamb Weston Holdings Inc., US Foods Holding Corp. and Zimmer Biomet Holdings Inc. Shares of Lamb Weston Holdings, a frozen foods and dairy products provider, fell amid increased input costs and reported lower-than-expected results for the company’s fiscal first quarter of 2021. Shares of U.S. Foods Holding, a distributor of goods to the food services industry, fell after the company reported lower-than-expected earnings for the third quarter of 2021 amid investor concerns about the impact on the restaurant industry of the omicron variant of COVID-19. Shares of Zimmer Biomet Holdings, a medical device manufacturer, fell amid investor expectations that the resurgence of the pandemic in late 2021 may reduce demand for elective surgeries.
Leading individual contributors to relative performance included the Fund’s overweight positions in Alcoa Corp. and Centene Corp. and its out-of-Benchmark position in Seagate Technology Holdings PLC. Shares of Alcoa, an aluminum producer, rose after the company reported better-than-expected earnings and revenue for both the second and third quarters of 2021 and the company was added to the S&P 400 Mid Cap Index late in the period. Shares of Centene, a health insurance provider, rose after the company issued a better-than-expected forecast for earnings and revenue for fiscal 2022. Shares of Seagate Technology Holdings, a data storage products manufacturer, rose after the company reported better-than-expected earnings and revenue for its fiscal second quarter.
HOW WAS THE FUND POSITIONED?
The Fund’s portfolio manager combined a bottom-up fundamental approach to security selection with a systematic valuation process. Overall, the Fund’s portfolio manager looked to take advantage of mispriced stocks that he believed appeared attractive relative to their fair value.
| | | | | | | | |
TOP TEN EQUITY HOLDINGS OF THE
PORTFOLIO AS OF DECEMBER 31, 2021 | | PERCENT OF
TOTAL
INVESTMENTS | |
| | |
| | 1. | | | Bank of America Corp. | | | 3.8 | % |
| | 2. | | | Wells Fargo & Co. | | | 3.8 | |
| | 3. | | | Centene Corp. | | | 3.6 | |
| | 4. | | | US Foods Holding Corp. | | | 3.4 | |
| | 5. | | | Royal Caribbean Cruises Ltd. | | | 3.2 | |
| | 6. | | | Chevron Corp. | | | 2.9 | |
| | 7. | | | Bristol-Myers Squibb Co. | | | 2.9 | |
| | 8. | | | Lamb Weston Holdings, Inc. | | | 2.8 | |
| | 9. | | | State Street Corp. | | | 2.8 | |
| | 10. | | | Seagate Technology Holdings plc | | | 2.6 | |
| | | | |
PORTFOLIO COMPOSITION BY SECTOR
AS OF DECEMBER 31, 2021 | | PERCENT OF
TOTAL
INVESTMENTS | |
| |
| Financials | | | 21.1 | % |
| Health Care | | | 19.8 | |
| Industrials | | | 10.9 | |
| Consumer Discretionary | | | 9.8 | |
| Consumer Staples | | | 9.6 | |
| Materials | | | 8.7 | |
| Energy | | | 7.4 | |
| Communication Services | | | 3.4 | |
| Information Technology | | | 2.9 | |
| Utilities | | | 2.7 | |
| Real Estate | | | 2.5 | |
| Short-Term Investments | | | 1.2 | |
| * | | The return shown is based on net asset values calculated for shareholder transactions and may differ from the return shown in the financial highlights, which reflects adjustments made to the net asset values in accordance with accounting principles generally accepted in the United States of America. |
| ** | | The adviser seeks to achieve the Fund’s objective. There can be no guarantee it will be achieved. |
| | | | | | | | | | |
| | | | | |
| 18 | | | | | | | | J.P. MORGAN LARGE CAP FUNDS | | DECEMBER 31, 2021 |
| | | | | | | | | | | | | | | | | | |
AVERAGE ANNUAL TOTAL RETURNS AS OF DECEMBER 31, 2021 | |
| | | | | |
| | | INCEPTION DATE OF
CLASS | | 6 MONTH* | | | 1 YEAR | | | 5 YEAR | | | 10 YEAR | |
CLASS A SHARES | | February 18, 1992 | | | | | | | | | | | | | | | | |
With Sales Charge** | | | | | (3.50 | )% | | | 16.95 | % | | | 10.25 | % | | | 13.36 | % |
Without Sales Charge | | | | | 1.83 | | | | 23.45 | | | | 11.45 | | | | 13.98 | |
CLASS C SHARES | | March 22, 1999 | | | | | | | | | | | | | | | | |
With CDSC*** | | | | | 0.57 | | | | 21.86 | | | | 10.90 | | | | 13.52 | |
Without CDSC | | | | | 1.57 | | | | 22.86 | | | | 10.90 | | | | 13.52 | |
CLASS I SHARES | | March 1, 1991 | | | 1.94 | | | | 23.73 | | | | 11.71 | | | | 14.19 | |
CLASS R2 SHARES | | November 3, 2008 | | | 1.68 | | | | 23.15 | | | | 11.15 | | | | 13.68 | |
CLASS R3 SHARES | | October 1, 2018 | | | 1.86 | | | | 23.46 | | | | 11.45 | | | | 13.98 | |
CLASS R4 SHARES | | October 1, 2018 | | | 1.96 | | | | 23.69 | | | | 11.71 | | | | 14.19 | |
CLASS R5 SHARES | | May 15, 2006 | | | 2.04 | | | | 23.92 | | | | 11.88 | | | | 14.40 | |
CLASS R6 SHARES | | November 30, 2010 | | | 2.06 | | | | 24.03 | | | | 11.98 | | | | 14.47 | |
| ** | | Sales Charge for Class A Shares is 5.25%. |
| *** | | Assumes a 1% CDSC (contingent deferred sales charge) for the 6 month and one year periods and 0% CDSC thereafter. |
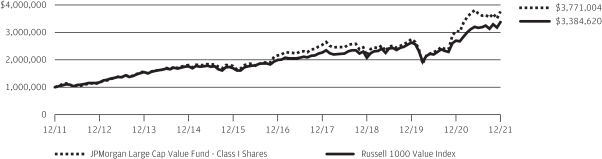
TEN YEAR PERFORMANCE (12/31/11 TO 12/31/21)
The performance quoted is past performance and is not a guarantee of future results. Mutual funds are subject to certain market risks. Investment returns and principal value of an investment will fluctuate so that an investor’s shares, when redeemed, may be worth more or less than their original cost. Current performance may be higher or lower than the performance data shown. For up-to-date month-end performance information please call 1-800-480-4111.
Returns for Class R3 Shares prior to their inception date are based on the performance of Class A Shares. The actual returns of Class R3 Shares would have been different than those shown because Class R3 Shares have different expenses than Class A Shares.
Returns for Class R4 Shares prior to their inception date are based on the performance of Class I Shares. The actual returns for Class R4 Shares would have been similar to those shown because Class R4 Shares have similar expenses than Class I Shares.
The graph illustrates comparative performance for $1,000,000 invested in Class I Shares of the JPMorgan Large Cap Value Fund and the Russell 1000 Value Index from December 31, 2011 to December 31, 2021. The performance of the Fund assumes reinvestment of all dividends and capital gain distributions, if any, and does not include a sales charge. The performance of the Russell 1000 Value Index does not reflect the deduction of expenses or a sales charge asso-
ciated with a mutual fund and has been adjusted to reflect reinvestment of all dividends and capital gain distributions of the securities included in the benchmark, if applicable. The Russell 1000 Value Index is an unmanaged index which measures the performance of those Russell 1000 companies with lower price-to-book ratios and lower forecasted growth values. Investors cannot invest directly in an index.
Class I Shares have a $1,000,000 minimum initial investment.
Fund performance may reflect the waiver of the Fund’s fees and reimbursement of expenses for certain periods. Without these waivers and reimbursements, performance would have been lower. Also, performance shown in this section does not reflect the deduction of taxes that a shareholder would pay on Fund distributions or on gains resulting from redemptions of Fund shares.
Because Class C Shares automatically convert to Class A Shares after 8 years, the 10 year average annual total return shown above for Class C reflects Class A performance for the period after conversion.
The returns shown are based on net asset values calculated for shareholder transactions and may differ from the returns shown in the financial highlights, which reflect adjustments made to the net asset values in accordance with accounting principles generally accepted in the United States of America.
| | | | | | | | | | |
| | | | | |
| DECEMBER 31, 2021 | | J.P. MORGAN LARGE CAP FUNDS | | | | | | | | 19 |
JPMorgan U.S. Applied Data Science Value Fund
(formerly known as JPMorgan Intrepid Value Fund)
FUND COMMENTARY
SIX MONTHS ENDED DECEMBER 31, 2021 (Unaudited)
| | | | |
| REPORTING PERIOD RETURN: | | | |
| Fund (Class I Shares)* | | | 8.55% | |
| Russell 1000 Value Index | | | 6.93% | |
| |
| Net Assets as of 12/31/2021 (In Thousands) | | | $246,452 | |
INVESTMENT OBJECTIVE**
The JPMorgan U.S. Applied Data Science Value Fund (the “Fund”) seeks to provide long-term capital appreciation.
WHAT WERE THE MAIN DRIVERS OF THE FUND’S PERFORMANCE?
The Fund’s Class I Shares outperformed the Russell 1000 Value Index (the “Benchmark”) for the six months ended December 31, 2021.
The Fund’s security selection in the industrials and communication services sectors was a leading contributor to performance relative to the Benchmark, while the Fund’s security selection in the health care and financials sectors was a leading detractor from relative performance.
Leading individual contributors to relative performance included the Fund’s overweight positions in Prologis Inc., AutoZone Inc. and Alphabet Inc. Shares of Prologis, a real estate investment trust not held in the Fund, rose after the company reported better-than-expected cash flow and revenue for the third quarter of 2021 and raised its forecast for the full year 2021. Shares of AutoZone, an automotive parts retailer, rose amid consecutive quarters of better-than-expected earnings and revenue, as well as large share repurchase programs during the period. Shares of Alphabet, parent company of Google Inc., rose amid continued growth in earnings and investor demand for large technology companies during the period.
Leading individual detractors from relative performance included the Fund’s underweight position in Pfizer Inc. and its overweight positions in Medtronic PLC and Jazz Pharmaceuticals PLC. Shares of Pfizer, a pharmaceutical manufacturer, rose amid a resurgence in the pandemic in late 2021 and U.S. Food and Drug Administration approval for the company’s COVID-19 pill. Shares of Medtronic, a medical technology manufacturer, fell after the company reported lower-than-expected revenue for its fiscal second quarter of 2021 and disclosed it had received a warning letter from the U.S. Food and Drug Administration following the company’s recall of insulin infusion pumps. Shares of Jazz Pharmaceuticals, a biopharmaceutical developer, fell after the company declined to raise its earnings forecast for 2021.
HOW WAS THE FUND POSITIONED?
During the period, the Fund’s portfolio managers employed a data science driven investment approach that combines
research, data insights and risk management. The portfolio managers utilize proprietary techniques to process, analyze and combine a wide variety of data sources, including a multi-decade history of proprietary fundamental research, company fundamentals and alternative data.
| | | | | | | | |
TOP TEN EQUITY HOLDINGS OF THE
PORTFOLIO AS OF DECEMBER 31, 2021 | | PERCENT OF
TOTAL
INVESTMENTS | |
| | |
| | 1. | | | Prologis, Inc. | | | 2.9 | % |
| | 2. | | | NextEra Energy, Inc. | | | 2.9 | |
| | 3. | | | Bank of America Corp. | | | 2.6 | |
| | 4. | | | UnitedHealth Group, Inc. | | | 2.5 | |
| | 5. | | | Alphabet, Inc., Class C | | | 2.4 | |
| | 6. | | | BlackRock, Inc. | | | 2.3 | |
| | 7. | | | Eaton Corp. plc | | | 2.3 | |
| | 8. | | | Norfolk Southern Corp. | | | 2.2 | |
| | 9. | | | Coca-Cola Co. (The) | | | 2.2 | |
| | 10. | | | Wells Fargo & Co. | | | 2.2 | |
| | | | |
PORTFOLIO COMPOSITION BY SECTOR
AS OF DECEMBER 31, 2021 | | PERCENT OF
TOTAL
INVESTMENTS | |
| |
| Financials | | | 21.3 | % |
| Health Care | | | 15.7 | |
| Industrials | | | 13.0 | |
| Information Technology | | | 7.6 | |
| Consumer Discretionary | | | 7.3 | |
| Consumer Staples | | | 7.0 | |
| Communication Services | | | 6.5 | |
| Utilities | | | 6.4 | |
| Energy | | | 5.6 | |
| Real Estate | | | 4.6 | |
| Materials | | | 2.9 | |
| Short-Term Investments | | | 2.1 | |
| * | | The return shown is based on net asset values calculated for shareholder transactions and may differ from the return shown in the financial highlights, which reflects adjustments made to the net asset values in accordance with accounting principles generally accepted in the United States of America. |
| ** | | The adviser seeks to achieve the Fund’s objective. There can be no guarantee it will be achieved. |
| | | | | | | | | | |
| | | | | |
| 20 | | | | | | | | J.P. MORGAN LARGE CAP FUNDS | | DECEMBER 31, 2021 |
| | | | | | | | | | | | | | | | | | |
AVERAGE ANNUAL TOTAL RETURNS AS OF DECEMBER 31, 2021 | |
| | | | | |
| | | INCEPTION DATE OF
CLASS | | 6 MONTH* | | | 1 YEAR | | | 5 YEAR | | | 10 YEAR | |
CLASS A SHARES | | February 19, 2005 | | | | | | | | | | | | | | | | |
With Sales Charge** | | | | | 2.72 | % | | | 24.31 | % | | | 10.51 | % | | | 12.10 | % |
Without Sales Charge | | | | | 8.43 | | | | 31.19 | | | | 11.70 | | | | 12.71 | |
CLASS C SHARES | | February 19, 2005 | | | | | | | | | | | | | | | | |
With CDSC*** | | | | | 7.12 | | | | 29.53 | | | | 11.14 | | | | 12.26 | |
Without CDSC | | | | | 8.12 | | | | 30.53 | | | | 11.14 | | | | 12.26 | |
CLASS I SHARES | | February 28, 2003 | | | 8.55 | | | | 31.54 | | | | 11.96 | | | | 12.92 | |
CLASS R2 SHARES | | November 3, 2008 | | | 8.19 | | | | 30.78 | | | | 11.38 | | | | 12.41 | |
CLASS R5 SHARES | | May 15, 2006 | | | 8.59 | | | | 31.63 | | | | 12.12 | | | | 13.12 | |
CLASS R6 SHARES | | November 30, 2010 | | | 8.63 | | | | 31.75 | | | | 12.23 | | | | 13.20 | |
| ** | | Sales Charge for Class A Shares is 5.25%. |
| *** | | Assumes a 1% CDSC (contingent deferred sales charge) for the 6 month and one year periods and 0% CDSC thereafter. |
TEN YEAR PERFORMANCE (12/31/11 TO 12/31/21)
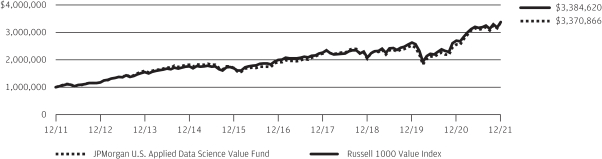
The performance quoted is past performance and is not a guarantee of future results. Mutual funds are subject to certain market risks. Investment returns and principal value of an investment will fluctuate so that an investor’s shares, when redeemed, may be worth more or less than their original cost. Current performance may be higher or lower than the performance data shown. For up-to-date month-end performance information please call 1-800-480-4111.
The graph illustrates comparative performance for $1,000,000 invested in Class I Shares of the JPMorgan U.S. Applied Data Science Value Fund and the Russell 1000 Value Index from December 31, 2011 to December 31, 2021. The performance of the Fund assumes reinvestment of all dividends and capital gain distributions, if any, and does not include a sales charge. The performance of the Russell 1000 Value Index does not reflect the deduction of expenses or a sales charge associated with a mutual fund and has been adjusted to reflect reinvestment of all dividends and capital gain distributions of the securities included in the benchmark, if applicable. The Russell 1000 Value Index is an unmanaged index which measures the performance of those Russell 1000 companies with lower price-to-book ratios and lower forecasted growth values. Investors cannot invest directly in an index.
Class I Shares have a $1,000,000 minimum initial investment.
Fund performance may reflect the waiver of the Fund’s fees and reimbursement of expenses for certain periods. Without these waivers and reimbursements, performance would have been lower. Also, performance shown in this section does not reflect the deduction of taxes that a shareholder would pay on Fund distributions or on gains resulting from redemptions of Fund shares.
Because Class C Shares automatically convert to Class A Shares after 8 years, the 10 year average annual total return shown above for Class C reflects Class A performance for the period after conversion.
The returns shown are based on net asset values calculated for shareholder transactions and may differ from the returns shown in the financial highlights, which reflect adjustments made to the net asset values in accordance with accounting principles generally accepted in the United States of America.
| | | | | | | | | | |
| | | | | |
| DECEMBER 31, 2021 | | J.P. MORGAN LARGE CAP FUNDS | | | | | | | | 21 |
JPMorgan U.S. Equity Fund
FUND COMMENTARY
SIX MONTHS ENDED DECEMBER 31, 2021 (Unaudited)
| | | | |
| REPORTING PERIOD RETURN: | |
| Fund (Class L Shares)* | | | 13.08% | |
| S&P 500 Index | | | 11.67% | |
| |
| Net Assets as of 12/31/2021 (In Thousands) | | $ | 22,514,565 | |
INVESTMENT OBJECTIVE**
The JPMorgan U.S. Equity Fund (the “Fund”) seeks to provide high total return from a portfolio of selected equity securities.
WHAT WERE THE MAIN DRIVERS OF THE FUND’S PERFORMANCE?
The Fund’s Class L Shares outperformed the S&P 500 Index (the “Benchmark”) for the six months ended December 31, 2021.
The Fund’s security selection in the real estate investment trusts and media sectors was a leading contributor to performance relative to the Benchmark, while the Fund’s security selection in the semiconductors & hardware sector and the pharmaceutical/medical technology sector was a leading detractor from relative performance.
Leading individual contributors to relative performance included the Fund’s overweight positions in Prologis Inc., Alphabet Inc. and Eaton Corp. Shares of Prologis, a real estate investment trust, rose after the company reported better-than-expected cash flow and revenue for the third quarter of 2021 and raised its forecast for the full year 2021. Shares of Alphabet, parent company of Google Inc., rose amid continued growth in earnings and investor demand for large technology companies during the period. Shares of Eaton, a provider of industrial power systems, fell after the company reported lower-than-expected revenue for the third quarter of 2021.
Leading individual detractors from relative performance included the Fund’s overweight positions in Analog Devices Inc., Norfolk Southern Corp. and Biogen Inc. Shares of Analog Devices, a semiconductor manufacturer, fell amid investor concerns about the company’s ability to meet surging demand. Shares of Norfolk Southern, a freight railroad operator, fell as floods in British Columbia, Canada, reduced North American rail traffic and amid investor concerns that a resurgence in the pandemic late in the period may decrease demand. Shares of Biogen, a pharmaceuticals developer, fell amid investor concerns about the company’s treatment for Alzheimer’s disease and after Samsung Group denied market speculation that it was negotiating to acquire the company.
HOW WAS THE FUND POSITIONED?
The Fund’s portfolio managers employed a bottom-up fundamental approach to stock selection, researching companies to determine what they believed to be their underlying value and potential for future earnings growth.
| | | | | | | | |
TOP TEN EQUITY HOLDINGS OF THE
PORTFOLIO AS OF DECEMBER 31, 2021 | | PERCENT OF
TOTAL
INVESTMENTS | |
| | |
| | 1. | | | Microsoft Corp. | | | 8.4 | % |
| | 2. | | | Alphabet, Inc., Class A | | | 6.5 | |
| | 3. | | | Amazon.com, Inc. | | | 5.8 | |
| | 4. | | | Apple, Inc. | | | 5.3 | |
| | 5. | | | Prologis, Inc. | | | 3.4 | |
| | 6. | | | Mastercard, Inc., Class A | | | 3.3 | |
| | 7. | | | NXP Semiconductors NV (China) | | | 3.2 | |
| | 8. | | | Eaton Corp. plc | | | 3.0 | |
| | 9. | | | AbbVie, Inc. | | | 2.8 | |
| | 10. | | | NextEra Energy, Inc. | | | 2.7 | |
| | | | |
PORTFOLIO COMPOSITION BY SECTOR
AS OF DECEMBER 31, 2021 | | PERCENT OF
TOTAL
INVESTMENTS | |
| |
| Information Technology | | | 26.6 | % |
| Consumer Discretionary | | | 17.1 | |
| Health Care | | | 13.0 | |
| Industrials | | | 11.3 | |
| Financials | | | 11.2 | |
| Communication Services | | | 7.5 | |
| Utilities | | | 3.9 | |
| Real Estate | | | 3.4 | |
| Materials | | | 3.2 | |
| Consumer Staples | | | 1.2 | |
| Short-Term Investments | | | 1.6 | |
| * | | The return shown is based on net asset values calculated for shareholder transactions and may differ from the return shown in the financial highlights, which reflects adjustments made to the net asset values in accordance with accounting principles generally accepted in the United States of America. |
| ** | | The adviser seeks to achieve the Fund’s objective. There can be no guarantee it will be achieved. |
| | | | | | | | | | |
| | | | | |
| 22 | | | | | | | | J.P. MORGAN LARGE CAP FUNDS | | DECEMBER 31, 2021 |
| | | | | | | | | | | | | | | | | | |
AVERAGE ANNUAL TOTAL RETURNS AS OF DECEMBER 31, 2021 | |
| | | | | |
| | | INCEPTION DATE OF
CLASS | | 6 MONTH* | | | 1 YEAR | | | 5 YEAR | | | 10 YEAR | |
CLASS A SHARES | | September 10, 2001 | | | | | | | | | | | | | | | | |
With Sales Charge** | | | | | 6.93 | % | | | 21.44 | % | | | 17.98 | % | | | 16.39 | % |
Without Sales Charge | | | | | 12.84 | | | | 28.16 | | | | 19.27 | | | | 17.02 | |
CLASS C SHARES | | September 10, 2001 | | | | | | | | | | | | | | | | |
With CDSC*** | | | | | 11.58 | | | | 26.54 | | | | 18.66 | | | | 16.56 | |
Without CDSC | | | | | 12.58 | | | | 27.54 | | | | 18.66 | | | | 16.56 | |
CLASS I SHARES | | September 10, 2001 | | | 12.98 | | | | 28.47 | | | | 19.56 | | | | 17.27 | |
CLASS L SHARES | | September 17, 1993 | | | 13.08 | | | | 28.69 | | | | 19.72 | | | | 17.45 | |
CLASS R2 SHARES | | November 3, 2008 | | | 12.68 | | �� | | 27.87 | | | | 18.95 | | | | 16.74 | |
CLASS R3 SHARES | | September 9, 2016 | | | 12.80 | | | | 28.11 | | | | 19.25 | | | | 17.02 | |
CLASS R4 SHARES | | September 9, 2016 | | | 13.00 | | | | 28.47 | | | | 19.55 | | | | 17.27 | |
CLASS R5 SHARES | | May 15, 2006 | | | 13.07 | | | | 28.69 | | | | 19.75 | | | | 17.49 | |
CLASS R6 SHARES | | November 30, 2010 | | | 13.15 | | | | 28.80 | | | | 19.86 | | | | 17.57 | |
| ** | | Sales Charge for Class A Shares is 5.25%. |
| *** | | Assumes a 1% CDSC (contingent deferred sales charge) for the 6 month and one year periods and 0% CDSC thereafter. |
TEN YEAR PERFORMANCE (12/31/11 TO 12/31/21)
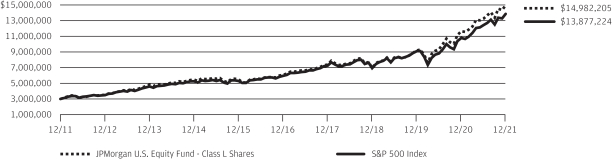
The performance quoted is past performance and is not a guarantee of future results. Mutual funds are subject to certain market risks. Investment returns and principal value of an investment will fluctuate so that an investor’s shares, when redeemed, may be worth more or less than their original cost. Current performance may be higher or lower than the performance data shown. For up-to-date month-end performance information please call 1-800-480-4111.
Returns for Class R3 Shares prior to their inception date are based on the performance of Class A Shares. The actual returns of Class R3 Shares would have been similar to those shown because Class R3 Shares have similar expenses to Class A Shares.
Returns for Class R4 Shares prior to their inception date are based on the performance of Class I Shares. The actual returns for Class R4 Shares would have been similar to those shown because Class R4 Shares have similar expenses than Class I Shares.
The graph illustrates comparative performance for $3,000,000 invested in Class L Shares of the JPMorgan U.S. Equity Fund and the S&P 500 Index from December 31, 2011 to December 31, 2021. The performance of the Fund assumes reinvestment of all dividends and capital gain distributions, if any, and does not include a sales charge. The performance of the S&P 500 Index does not reflect the deduction of expenses or a sales charge associated with a
mutual fund and has been adjusted to reflect reinvestment of all dividends and capital gain distributions of the securities included in the benchmark, if applicable. The S&P 500 Index is an unmanaged index generally representative of the performance of large companies in the U.S. stock market. Investors cannot invest directly in an index.
Class L Shares have a $3,000,000 minimum initial investment.
Fund performance may reflect the waiver of the Fund’s fees and reimbursement of expenses for certain periods. Without these waivers and reimbursements, performance would have been lower. Also, performance shown in this section does not reflect the deduction of taxes that a shareholder would pay on Fund distributions or on gains resulting from redemptions of Fund shares.
Because Class C Shares automatically convert to Class A Shares after 8 years, the 10 year average annual total return shown above for Class C reflects Class A performance for the period after conversion.
The returns shown are based on net asset values calculated for shareholder transactions and may differ from the returns shown in the financial highlights, which reflect adjustments made to the net asset values in accordance with accounting principles generally accepted in the United States of America.
| | | | | | | | | | |
| | | | | |
| DECEMBER 31, 2021 | | J.P. MORGAN LARGE CAP FUNDS | | | | | | | | 23 |
JPMorgan U.S. GARP Equity Fund
FUND COMMENTARY
SIX MONTHS ENDED DECEMBER 31, 2021 (Unaudited)
| | | | |
| REPORTING PERIOD RETURN: | | | |
| Fund (Class I Shares)* | | | 13.14% | |
| Russell 1000 Growth Index | | | 12.93% | |
| |
| Net Assets as of 12/31/2021 (In Thousands) | | | $1,343,544 | |
INVESTMENT OBJECTIVE**
The JPMorgan U.S. GARP Equity Fund (the “Fund”) seeks to provide long-term capital growth.
WHAT WERE THE MAIN DRIVERS OF THE FUND’S PERFORMANCE?
The Fund’s Class I Shares outperformed the Russell 1000 Growth Index (the “Benchmark”) for the six months ended December 31, 2021.
The Fund’s security selection in the information technology and industrials sectors was leading contributor to performance relative to the Benchmark, while the Fund’s security selection in the communication services and financials sectors was a leading detractor from relative performance.
Leading individual contributors to relative performance included the Fund’s underweight positions in PayPal Holdings Inc. and Zoom Video Communications Inc., and its overweight position in Intuit Inc. Shares of PayPal Holdings, a digital payments platform provider, fell after the company issued a lower-than-expected earnings forecast for the third quarter of 2021 and amid general weakness in financial technology stocks. Shares of Zoom Video Communications, a video call and conferencing platform not held in the Fund, fell amid investor concern about the company’s ability to sustain growth in its business. Shares of Intuit, a provider of tax and financial management software, rose after the company reported better-than-expected earnings for its fiscal first quarter and raised its earnings forecast.
Leading individual detractors from relative performance included the Fund’s overweight positions in Altice USA Inc., Zillow Group Inc. and Mastercard Inc. Shares of Altice USA, a communication services and media provider, fell after the company reported a decline in subscribers in the third quarter of 2021. Shares of Zillow Group, a real estate market platform operator, fell after the company reported lower-than-expected earnings and revenue for the third quarter of 2021. Shares of Mastercard, a credit card and payments company, fell amid investor concerns that a resurgence in the pandemic in late 2021 would hurt consumer spending.
HOW WAS THE FUND POSITIONED?
The Fund’s managers sought growth companies that they believed had attractive relative valuations, high quality characteristics and strong momentum.
| | | | | | | | |
TOP TEN EQUITY HOLDINGS OF THE
PORTFOLIO AS OF DECEMBER 31, 2021 | | PERCENT OF
TOTAL
INVESTMENTS | |
| | |
| | 1. | | | Microsoft Corp. | | | 10.3 | % |
| | 2. | | | Apple, Inc. | | | 9.5 | |
| | 3. | | | Amazon.com, Inc. | | | 5.9 | |
| | 4. | | | Meta Platforms, Inc., Class A | | | 4.0 | |
| | 5. | | | Tesla, Inc. | | | 3.3 | |
| | 6. | | | Alphabet, Inc., Class A | | | 2.7 | |
| | 7. | | | Mastercard, Inc., Class A | | | 2.7 | |
| | 8. | | | Alphabet, Inc., Class C | | | 2.7 | |
| | 9. | | | Lowe’s Cos., Inc. | | | 2.2 | |
| | 10. | | | Intuit, Inc. | | | 2.1 | |
| | | | |
PORTFOLIO COMPOSITION BY SECTOR
AS OF DECEMBER 31, 2021 | | PERCENT OF
TOTAL
INVESTMENTS | |
| |
Information Technology | | | 41.4 | % |
| Consumer Discretionary | | | 20.6 | |
| Communication Services | | | 11.7 | |
| Health Care | | | 9.5 | |
| Industrials | | | 6.8 | |
| Consumer Staples | | | 3.6 | |
| Real Estate | | | 2.1 | |
| Financials | | | 1.3 | |
| Others (each less than 1.0%) | | | 1.4 | |
| Short-Term Investments | | | 1.6 | |
| * | | The return shown is based on net asset values calculated for shareholder transactions and may differ from the return shown in the financial highlights, which reflects adjustments made to the net asset values in accordance with accounting principles generally accepted in the United States of America. |
| ** | | The adviser seeks to achieve the Fund’s objective. There can be no guarantee it will be achieved. |
| | | | | | | | | | |
| | | | | |
| 24 | | | | | | | | J.P. MORGAN LARGE CAP FUNDS | | DECEMBER 31, 2021 |
| | | | | | | | | | | | | | | | | | |
AVERAGE ANNUAL TOTAL RETURNS AS OF DECEMBER 31, 2021 | |
| | | | | |
| | | INCEPTION DATE OF
CLASS | | 6 MONTH* | | | 1 YEAR | | | 5 YEAR | | | 10 YEAR | |
CLASS A SHARES | | February 19, 2005 | | | | | | | | | | | | | | | | |
With Sales Charge** | | | | | 7.05 | % | | | 23.81 | % | | | 20.80 | % | | | 17.40 | % |
Without Sales Charge | | | | | 12.98 | | | | 30.68 | | | | 22.11 | | | | 18.03 | |
CLASS C SHARES | | February 19, 2005 | | | | | | | | | | | | | | | | |
With CDSC*** | | | | | 11.70 | | | | 29.04 | | | | 21.51 | | | | 17.57 | |
Without CDSC | | | | | 12.70 | | | | 30.04 | | | | 21.51 | | | | 17.57 | |
CLASS I SHARES | | February 28, 2003 | | | 13.14 | | | | 31.01 | | | | 22.43 | | | | 18.33 | |
CLASS R2 SHARES | | November 3, 2008 | | | 12.85 | | | | 30.36 | | | | 21.81 | | | | 17.74 | |
CLASS R5 SHARES | | May 15, 2006 | | | 13.24 | | | | 31.21 | | | | 22.62 | | | | 18.54 | |
CLASS R6 SHARES | | November 2, 2015 | | | 13.29 | | | | 31.33 | | | | 22.73 | | | | 18.60 | |
| ** | | Sales Charge for Class A Shares is 5.25%. |
| *** | | Assumes a 1% CDSC (contingent deferred sales charge) for the 6 month and one year periods and 0% CDSC thereafter. |
TEN YEAR PERFORMANCE (12/31/11 TO 12/31/21)
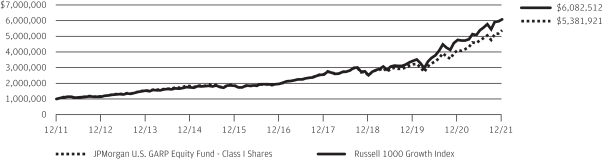
The performance quoted is past performance and is not a guarantee of future results. Mutual funds are subject to certain market risks. Investment returns and principal value of an investment will fluctuate so that an investor’s shares, when redeemed, may be worth more or less than their original cost. Current performance may be higher or lower than the performance data shown. For up-to-date month-end performance information please call 1-800-480-4111.
Returns for Class R6 Shares prior to their inception date are based on the performance of Class R5 Shares. The actual returns for Class R6 Shares would have been different than those shown because Class R6 Shares have different expenses than Class R5 Shares.
The graph illustrates comparative performance for $1,000,000 invested in Class I Shares of the JPMorgan U.S. GARP Equity Fund and the Russell 1000 Growth Index, from December 31, 2011 to December 31, 2021. The performance of the Fund assumes reinvestment of all dividends and capital gain distributions, if any, and does not include a sales charge. The performance of the Russell 1000 Growth Index does not reflect the deduction of expenses or a sales charge associated with a mutual fund and has been adjusted to reflect reinvestment of all dividends and capital gain distributions of the securities included in the
benchmark, if applicable. The Russell 1000 Growth Index is an unmanaged index which measures the performance of those Russell 1000 companies with higher price-to-book ratios and higher forecasted growth values. Investors cannot invest directly in an index.
Class I Shares have a $1,000,000 minimum initial investment.
Fund performance may reflect the waiver of the Fund’s fees and reimbursement of expenses for certain periods. Without these waivers and reimbursements, performance would have been lower. Also, performance shown in this section does not reflect the deduction of taxes that a shareholder would pay on Fund distributions or on gains resulting from redemptions of Fund shares.
Because Class C Shares automatically convert to Class A Shares after 8 years, the 10 year average annual total return shown above for Class C reflects Class A performance for the period after conversion.
The returns shown are based on net asset values calculated for shareholder transactions and may differ from the returns shown in the financial highlights, which reflect adjustments made to the net asset values in accordance with accounting principles generally accepted in the United States of America.
| | | | | | | | | | |
| | | | | |
| DECEMBER 31, 2021 | | J.P. MORGAN LARGE CAP FUNDS | | | | | | | | 25 |
JPMorgan U.S. Large Cap Core Plus Fund
FUND COMMENTARY
SIX MONTHS ENDED DECEMBER 31, 2021 (Unaudited)
| | | | |
| REPORTING PERIOD RETURN: | |
| Fund (Class I Shares)* | | | 12.68% | |
| S&P 500 Index | | | 11.67% | |
| |
| Net Assets as of 12/31/2021 (In Thousands) | | | $2,645,802 | |
INVESTMENT OBJECTIVE**
The JPMorgan U.S. Large Cap Core Plus Fund (the “Fund”) seeks to provide a high total return from a portfolio of selected equity securities.
WHAT WERE THE MAIN DRIVERS OF THE FUND’S PERFORMANCE?
The Fund’s Class I Shares outperformed the S&P 500 Index (the “Benchmark”) for the six months ended December 31, 2021.
The Fund’s overweight position in the energy sector and its underweight position in the media sector were leading contributors to performance relative to the Benchmark, while the Fund’s security selection in the financial services sector and the autos & transportation sector was a leading detractor from relative performance.
Leading individual contributors to relative performance included the Fund’s overweight positions in Ingersoll Rand Inc., Advanced Micro Devices Inc. and Alphabet Inc. Shares of Ingersoll Rand, an industrial and automotive products manufacturer, rose after the company reported better-than-expected earnings and revenue for both the second and third quarters of 2021. Shares of Advanced Micro Devices, a semiconductor manufacturer, rose after the company reported better-than-expected earnings and sales for the third quarter of 2021 and issued a better-than-expected forecast for the fourth quarter of 2021. Shares of Alphabet, parent company of Google Inc., rose amid consecutive quarters of earnings growth and investor demand for large technology companies during the period.
Leading individual detractors from relative performance included the Fund’s underweight position in Tesla Inc., its
out-of-Benchmark position in Lyft Inc. and its overweight position in NXP Semiconductors NV. Shares of Tesla, a producer of electric vehicles and battery systems that was not held in the Fund, rose after the company reported better-than-expected production and deliveries during the period. Shares of Lyft, a ride hailing platform operator, fell amid investor concerns that the resurgence in the pandemic in late 2021 would reduce demand for its services. Shares of NXP Semiconductors, a semiconductor manufacturer, fell amid investor concern about the company’s ability to meet supply demand from the automotive industry.
HOW WAS THE FUND POSITIONED?
The Fund’s portfolio managers employed a bottom-up fundamental approach to stock selection, researching companies to determine their underlying value and potential for future earnings growth. Overall, the Fund’s portfolio managers aimed to take advantage of mispriced stocks that appeared attractive relative to fair value for long positions and looked for overvalued stocks in which to take short positions. The long-to-short exposure ratio at the end of the reporting period was 123% to 23%.
| * | | The return shown is based on net asset values calculated for shareholder transactions and may differ from the return shown in the financial highlights, which reflects adjustments made to the net asset values in accordance with accounting principles generally accepted in the United States of America. |
| ** | | The adviser seeks to achieve the Fund’s objective. There can be no guarantee it will be achieved. |
| | | | | | | | | | |
| | | | | |
| 26 | | | | | | | | J.P. MORGAN LARGE CAP FUNDS | | DECEMBER 31, 2021 |
| | | | | | | | |
TOP TEN LONG POSITIONS OF THE
PORTFOLIO AS OF DECEMBER 31, 2021 | | PERCENT OF
TOTAL
INVESTMENTS | |
| | |
| | 1. | | | Microsoft Corp. | | | 6.1 | % |
| | 2. | | | Amazon.com, Inc. | | | 4.7 | |
| | 3. | | | Apple, Inc. | | | 4.6 | |
| | 4. | | | Alphabet, Inc. Class A | | | 3.4 | |
| | 5. | | | NXP Semiconductors NV (China) | | | 2.6 | |
| | 6. | | | Mastercard, Inc. Class A | | | 2.0 | |
| | 7. | | | UnitedHealth Group, Inc. | | | 2.0 | |
| | 8. | | | Thermo Fisher Scientific, Inc. | | | 1.6 | |
| | 9. | | | Wells Fargo & Co. | | | 1.5 | |
| | 10. | | | Norfolk Southern Corp. | | | 1.4 | |
| | | | | | | | |
TOP TEN SHORT POSITIONS OF THE
PORTFOLIO AS OF DECEMBER 31, 2021 | | PERCENT OF
TOTAL
INVESTMENTS | |
| | |
| | 1. | | | Kroger Co. (The) | | | 3.6 | % |
| | 2. | | | Omnicom Group, Inc. | | | 2.8 | |
| | 3. | | | 3M Co. | | | 2.3 | |
| | 4. | | | Walgreens Boots Alliance, Inc. | | | 2.3 | |
| | 5. | | | Exxon Mobil Corp. | | | 2.2 | |
| | 6. | | | Clorox Co. (The) | | | 2.1 | |
| | 7. | | | Stryker Corp. | | | 2.0 | |
| | 8. | | | Enbridge, Inc. (Canada) (Canada) | | | 1.9 | |
| | 9. | | | Illinois Tool Works, Inc. | | | 1.9 | |
| | 10. | | | Starbucks Corp. | | | 1.8 | |
| | | | |
LONG POSITION PORTFOLIO COMPOSITION
BY SECTOR AS OF DECEMBER 31, 2021 | | PERCENT OF
TOTAL
INVESTMENTS | |
| |
| Information Technology | | | 25.4 | % |
| Consumer Discretionary | | | 14.3 | |
| Health Care | | | 12.5 | |
| Industrials | | | 12.0 | |
| Communication Services | | | 9.1 | |
| Financials | | | 7.9 | |
| Consumer Staples | | | 4.6 | |
| Materials | | | 3.8 | |
| Energy | | | 3.8 | |
| Utilities | | | 3.1 | |
| Real Estate | | | 2.9 | |
| Short-Term Investments | | | 0.6 | |
| | | | |
SHORT POSITION PORTFOLIO COMPOSITION
BY SECTOR AS OF DECEMBER 31, 2021 | | PERCENT OF
TOTAL
INVESTMENTS | |
| |
| Industrials | | | 18.3 | % |
| Information Technology | | | 13.8 | |
| Consumer Staples | | | 12.8 | |
| Communication Services | | | 8.9 | |
| Utilities | | | 8.1 | |
| Health Care | | | 8.0 | |
| Energy | | | 7.8 | |
| Consumer Discretionary | | | 6.2 | |
| Real Estate | | | 5.8 | |
| Materials | | | 5.2 | |
| Financials | | | 5.1 | |
| | | | | | | | | | |
| | | | | |
| DECEMBER 31, 2021 | | J.P. MORGAN LARGE CAP FUNDS | | | | | | | | 27 |
JPMorgan U.S. Large Cap Core Plus Fund
FUND COMMENTARY
SIX MONTHS ENDED DECEMBER 31, 2021 (Unaudited) (continued)
| | | | | | | | | | | | | | | | | | |
AVERAGE ANNUAL TOTAL RETURNS AS OF DECEMBER 31, 2021 | |
| | | | | |
| | | INCEPTION DATE OF
CLASS | | 6 MONTH* | | | 1 YEAR | | | 5 YEAR | | | 10 YEAR | |
CLASS A SHARES | | November 1, 2005 | | | | | | | | | | | | | | | | |
With Sales Charge** | | | | | 6.60 | % | | | 22.12 | % | | | 17.41 | % | | | 16.13 | % |
Without Sales Charge | | | | | 12.52 | | | | 28.89 | | | | 18.68 | | | | 16.76 | |
CLASS C SHARES | | November 1, 2005 | | | | | | | | | | | | | | | | |
With CDSC*** | | | | | 11.28 | | | | 27.25 | | | | 18.09 | | | | 16.29 | |
Without CDSC | | | | | 12.28 | | | | 28.25 | | | | 18.09 | | | | 16.29 | |
CLASS I SHARES | | November 1, 2005 | | | 12.68 | | | | 29.20 | | | | 18.98 | | | | 17.05 | |
CLASS R2 SHARES | | November 3, 2008 | | | 12.30 | | | | 28.40 | | | | 18.28 | | | | 16.42 | |
CLASS R5 SHARES | | May 15, 2006 | | | 12.67 | | | | 29.23 | | | | 19.06 | | | | 17.20 | |
CLASS R6 SHARES | | November 1, 2017 | | | 12.77 | | | | 29.41 | | | | 19.17 | | | | 17.26 | |
| ** | | Sales Charge for Class A Shares is 5.25%. |
| *** | | Assumes a 1% CDSC (contingent deferred sales charge) for the 6 month and one year periods and 0% CDSC thereafter. |
TEN YEAR PERFORMANCE (12/31/11 TO 12/31/21)
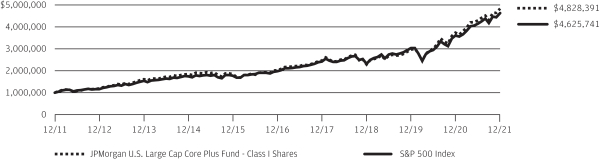
The performance quoted is past performance and is not a guarantee of future results. Mutual funds are subject to certain market risks. Investment returns and principal value of an investment will fluctuate so that an investor’s shares, when redeemed, may be worth more or less than their original cost. Current performance may be higher or lower than the performance data shown. For up-to-date month-end performance information please call 1-800-480-4111.
Returns for Class R6 Shares prior to its inception date are based on the performance of Class R5 Shares. The actual returns of Class R6 Shares would have been different than those shown because Class R6 Shares have different expenses than Class R5 Shares.
The graph illustrates comparative performance for $1,000,000 invested in Class I Shares of the JPMorgan U.S. Large Cap Core Plus Fund and the S&P 500 Index from December 31, 2011 to December 31, 2021. The performance of the Fund assumes reinvestment of all dividends and capital gain distributions, if any, and does not include a sales charge. The performance of the S&P 500 Index does not reflect the deduction of expenses or a sales charge associated with a mutual fund and has been adjusted to reflect reinvestment of all dividends and capital gain distributions of the securities included in the benchmark,
if applicable. The S&P 500 Index is an unmanaged index generally representative of the performance of large companies in the U.S. stock market. Investors cannot invest directly in an index.
Class I Shares have a $1,000,000 minimum initial investment.
Fund performance may reflect the waiver of the Fund’s fees and reimbursement of expenses for certain periods. Without these waivers and reimbursements, performance would have been lower. Also, performance shown in this section does not reflect the deduction of taxes that a shareholder would pay on Fund distributions or on gains resulting from redemptions of Fund shares.
Because Class C Shares automatically convert to Class A Shares after 8 years, the 10 year average annual total return shown above for Class C reflects Class A performance for the period after conversion.
The returns shown are based on net asset values calculated for shareholder transactions and may differ from the returns shown in the financial highlights, which reflect adjustments made to the net asset values in accordance with accounting principles generally accepted in the United States of America.
| | | | | | | | | | |
| | | | | |
| 28 | | | | | | | | J.P. MORGAN LARGE CAP FUNDS | | DECEMBER 31, 2021 |
JPMorgan U.S. Research Enhanced Equity Fund
FUND COMMENTARY
SIX MONTHS ENDED DECEMBER 31, 2021 (Unaudited)
| | | | |
| REPORTING PERIOD RETURN: | | | |
| Fund (Class I Shares)* | | | 12.11% | |
| S&P 500 Index | | | 11.67% | |
| |
| Net Assets as of 12/31/2021 (In Thousands) | | | $5,981,812 | |
INVESTMENT OBJECTIVE**
The JPMorgan U.S. Research Enhanced Equity Fund (the “Fund”) seeks to provide a consistently high total return from a broadly diversified portfolio of equity securities with risk characteristics similar to the S&P 500 Index (the “Benchmark”).
WHAT WERE THE MAIN DRIVERS OF THE FUND’S PERFORMANCE?
The Fund’s Class I Shares outperformed the Benchmark for the six months ended December 31, 2021. The Fund’s security selection in the technology and media sectors was a leading contributor to performance relative to the Benchmark. The Fund’s security selection in the pharmaceutical/medical technology and telecommunications sectors was a leading detractor from relative performance.
Leading individual contributors to relative performance included the Fund’s underweight positions in Adobe Inc., PayPal Holdings Inc. and Intel Corp. Shares of Adobe, a digital marketing and media provider not held in the Fund, fell after the company issued a weaker-than-expected forecast in December 2021. Shares of PayPal Holdings, a digital payments platform provider, fell after the company issued a lower-than-expected earnings forecast for the third quarter of 2021 and amid general weakness in financial technology stocks. Shares of Intel, a semiconductor manufacturer, fell after the company issued a weaker-than-expected earnings forecast with its third quarter 2021 results.
Leading individual detractors from relative performance included the Fund’s underweight position in Pfizer Inc. and its overweight positions in Zimmer Biomet Holdings Inc. and Texas Instruments Inc. Shares of Pfizer, a pharmaceutical manufacturer, rose amid a resurgence in the pandemic in late 2021 and U.S. Food and Drug Administration approval for the company’s COVID-19 pill. Shares of Zimmer Biomet Holdings, a medical device manufacturer, fell amid investor expectations that the resurgence of the pandemic in late 2021 may reduce demand for elective surgeries. Shares of Texas Instruments, a semiconductor manufacturer, fell after the company reported lower-than-expected revenue for the third quarter of 2021.
HOW WAS THE FUND POSITIONED?
The Fund’s portfolio managers attempted to construct the portfolio so that stock selection was the principal source of poten-
tial excess return. The Fund’s portfolio managers sought investment opportunities in companies that they believed were attractive based on valuation and strong fundamentals.
| | | | | | | | |
TOP TEN EQUITY HOLDINGS OF THE
PORTFOLIO AS OF DECEMBER 31, 2021 | | PERCENT OF
TOTAL
INVESTMENTS | |
| | |
| | 1. | | | Microsoft Corp. | | | 7.1 | % |
| | 2. | | | Apple, Inc. | | | 6.9 | |
| | 3. | | | Amazon.com, Inc. | | | 4.0 | |
| | 4. | | | Alphabet, Inc., Class A | | | 2.7 | |
| | 5. | | | Alphabet, Inc., Class C | | | 2.1 | |
| | 6. | | | Tesla, Inc. | | | 2.1 | |
| | 7. | | | Meta Platforms, Inc., Class A | | | 2.0 | |
| | 8. | | | NVIDIA Corp. | | | 1.6 | |
| | 9. | | | UnitedHealth Group, Inc. | | | 1.4 | |
| | 10. | | | Mastercard, Inc., Class A | | | 1.4 | |
| | | | |
PORTFOLIO COMPOSITION BY SECTOR
AS OF DECEMBER 31, 2021 | | PERCENT OF
TOTAL
INVESTMENTS | |
| |
| Information Technology | | | 28.6 | % |
| Consumer Discretionary | | | 13.8 | |
| Health Care | | | 13.2 | |
| Financials | | | 10.5 | |
| Communication Services | | | 9.9 | |
| Industrials | | | 8.2 | |
| Consumer Staples | | | 4.5 | |
| Energy | | | 2.7 | |
| Real Estate | | | 2.6 | |
| Utilities | | | 2.5 | |
| Materials | | | 2.3 | |
| Short-Term Investments | | | 1.2 | |
| * | | The return shown is based on net asset values calculated for shareholder transactions and may differ from the return shown in the financial highlights, which reflects adjustments made to the net asset values in accordance with accounting principles generally accepted in the United States of America. |
| ** | | The adviser seeks to achieve the Fund’s objective. There can be no guarantee it will be achieved. |
| | | | | | | | | | |
| | | | | |
| DECEMBER 31, 2021 | | J.P. MORGAN LARGE CAP FUNDS | | | | | | | | 29 |
JPMorgan U.S. Research Enhanced Equity Fund
FUND COMMENTARY
SIX MONTHS ENDED DECEMBER 31, 2021 (Unaudited) (continued)
| | | | | | | | | | | | | | | | | | |
AVERAGE ANNUAL TOTAL RETURNS AS OF DECEMBER 31, 2021 | |
| | | | | |
| | | INCEPTION DATE OF
CLASS | | 6 MONTH* | | | 1 YEAR | | | 5 YEAR | | | 10 YEAR | |
CLASS A SHARES | | September 28, 2001 | | | | | | | | | | | | | | | | |
With Sales Charge** | | | | | 6.09 | % | | | 23.34 | % | | | 17.30 | % | | | 15.56 | % |
Without Sales Charge | | | | | 11.97 | | | | 30.16 | | | | 18.58 | | | | 16.19 | |
CLASS I SHARES | | September 10, 2001 | | | 12.11 | | | | 30.52 | | | | 18.88 | | | | 16.48 | |
CLASS R6 SHARES | | March 24, 2003 | | | 12.15 | | | | 30.63 | | | | 18.99 | | | | 16.68 | |
| ** | | Sales Charge for Class A Shares is 5.25%. |
TEN YEAR PERFORMANCE (12/31/11 TO 12/31/21)
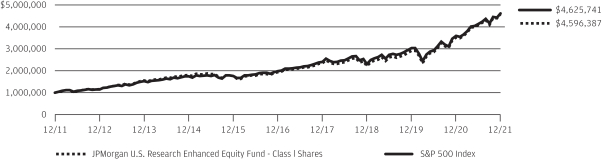
The performance quoted is past performance and is not a guarantee of future results. Mutual funds are subject to certain market risks. Investment returns and principal value of an investment will fluctuate so that an investor’s shares, when redeemed, may be worth more or less than their original cost. Current performance may be higher or lower than the performance data shown. For up-to-date month-end performance information please call 1-800-480-4111.
The graph illustrates comparative performance for $1,000,000 invested in Class I Shares of the JPMorgan U.S. Research Enhanced Equity Fund and the S&P 500 Index from December 31, 2011 to December 31, 2021. The performance of the Fund assumes reinvestment of all dividends and capital gain distributions, if any, and does not include a sales charge. The performance of the S&P 500 Index does not reflect the deduction of expenses or a sales charge associated with a mutual fund and has been adjusted to reflect reinvestment of all dividends and capital gain distributions of the securities included in the
benchmark, if applicable. The S&P 500 Index is an unmanaged index generally representative of the performance of large companies in the U.S. stock market. Investors cannot invest directly in an index.
Class I Shares have a $1,000,000 minimum initial investment.
Fund performance may reflect the waiver of the Fund’s fees and reimbursement of expenses for certain periods. Without these waivers and reimbursements, performance would have been lower. Also, performance shown in this section does not reflect the deduction of taxes that a shareholder would pay on Fund distributions or on gains resulting from redemptions of Fund shares.
The returns shown are based on net asset values calculated for shareholder transactions and may differ from the returns shown in the financial highlights, which reflect adjustments made to the net asset values in accordance with accounting principles generally accepted in the United States of America.
| | | | | | | | | | |
| | | | | |
| 30 | | | | | | | | J.P. MORGAN LARGE CAP FUNDS | | DECEMBER 31, 2021 |
JPMorgan U.S. Sustainable Leaders Fund
FUND COMMENTARY
SIX MONTHS ENDED DECEMBER 31, 2021 (Unaudited)
| | | | |
| REPORTING PERIOD RETURN: | | | |
| Fund (Class I Shares)* | | | 12.13% | |
| S&P 500 Index | | | 11.67% | |
| |
| Net Assets as of 12/31/2021 (In Thousands) | | | $198,102 | |
INVESTMENT OBJECTIVE**
The JPMorgan U.S. Sustainable Leaders Fund (the “Fund”) seeks to provide long-term capital appreciation.
WHAT WERE THE MAIN DRIVERS OF THE FUND’S PERFORMANCE?
The Fund’s Class I Shares outperformed the S&P 500 Index (the “Benchmark”) for the six months ended December 31, 2021. The Fund’s security selection in the industrials and consumer staples sectors was a leading contributor to performance relative to the Benchmark, while the Fund’s security selection in the health care and consumer discretionary sectors was a leading detractor from relative performance.
Leading individual contributors to performance relative to the Benchmark included the Fund’s underweight positions in Amazon.com Inc. and PayPal Holdings Inc., and its overweight position in Costco Wholesale Corp. Shares of Amazon.com, an online retailer and services provider not held in the Fund, fell after the company reported lower-than-expected earnings and revenue for the third quarter of 2021 and issued a lower-than-expected forecast for the fourth quarter of 2021. Shares of PayPal Holdings, a digital payments platform provider not held in the Fund, fell after the company issued a lower-than-expected earnings forecast for the third quarter of 2021 and amid general weakness in financial technology stocks. Shares of Costco Wholesale, a membership retail chain, rose amid consecutive months of sales growth as well as better-than-expected quarterly earnings during the period.
Leading individual detractors from performance relative to the Benchmark included the Fund’s underweight positions in Tesla Inc. and Alphabet Inc. and its overweight position in Mastercard Inc. Shares of Tesla, a producer of electric vehicles and battery systems that was not held in the Fund, rose after the company reported better-than-expected production and deliveries during the period. Shares of Alphabet, parent company of Google Inc., rose amid continued growth in quarterly earnings and investor demand for large technology companies during the period. Shares of Mastercard, a credit card and payments company, fell amid investor concerns that a resurgence in the pandemic in late 2021 would hurt consumer spending.
HOW WAS THE FUND POSITIONED?
During the period, the Fund employed a proprietary scoring methodology to invest in companies that the Fund’s portfolio
managers believed have attractive environmental, social and governance characteristics and potential for long-term capital appreciation. The Fund’s positioning during the period was a result of that process.
| | | | | | | | |
TOP TEN EQUITY HOLDINGS OF THE
PORTFOLIO AS OF DECEMBER 31, 2021 | | PERCENT OF
TOTAL
INVESTMENTS | |
| | |
| | 1. | | | Microsoft Corp. | | | 8.0 | % |
| | 2. | | | Apple, Inc. | | | 5.0 | |
| | 3. | | | Alphabet, Inc., Class A | | | 3.2 | |
| | 4. | | | Mastercard, Inc., Class A | | | 3.2 | |
| | 5. | | | Bank of America Corp. | | | 2.9 | |
| | 6. | | | Costco Wholesale Corp. | | | 2.7 | |
| | 7. | | | Home Depot, Inc. (The) | | | 2.7 | |
| | 8. | | | Eaton Corp. plc | | | 2.5 | |
| | 9. | | | Thermo Fisher Scientific, Inc. | | | 2.4 | |
| | 10. | | | Ingersoll Rand, Inc. | | | 2.2 | |
| | | | |
PORTFOLIO COMPOSITION BY SECTOR
AS OF DECEMBER 31, 2021 | | PERCENT OF
TOTAL
INVESTMENTS | |
| |
| Information Technology | | | 30.0 | % |
| Health Care | | | 15.0 | |
| Financials | | | 13.1 | |
| Industrials | | | 11.2 | |
| Consumer Discretionary | | | 9.8 | |
| Communication Services | | | 6.6 | |
| Consumer Staples | | | 4.5 | |
| Real Estate | | | 4.2 | |
| Utilities | | | 2.5 | |
| Materials | | | 1.5 | |
| Short-Term Investments | | | 1.6 | |
| * | | The return shown is based on net asset values calculated for shareholder transactions and may differ from the return shown in the financial highlights, which reflects adjustments made to the net asset values in accordance with accounting principles generally accepted in the United States of America. |
| ** | | The adviser seeks to achieve the Fund’s objective. There can be no guarantee it will be achieved. |
| | | | | | | | | | |
| | | | | |
| DECEMBER 31, 2021 | | J.P. MORGAN LARGE CAP FUNDS | | | | | | | | 31 |
JPMorgan U.S. Sustainable Leaders Fund
FUND COMMENTARY
SIX MONTHS ENDED DECEMBER 31, 2021 (Unaudited) (continued)
| | | | | | | | | | | | | | | | | | |
AVERAGE ANNUAL TOTAL RETURNS AS OF DECEMBER 31, 2021 | |
| | | | | |
| | | INCEPTION DATE OF
CLASS | | 6 MONTH* | | | 1 YEAR | | | 5 YEAR | | | 10 YEAR | |
CLASS A SHARES | | February 19, 2005 | | | | | | | | | | | | | | | | |
With Sales Charge** | | | | | 6.11 | % | | | 23.80 | % | | | 17.10 | % | | | 15.96 | % |
Without Sales Charge | | | | | 11.98 | | | | 30.66 | | | | 18.37 | | | | 16.59 | |
CLASS C SHARES | | February 19, 2005 | | | | | | | | | | | | | | | | |
With CDSC*** | | | | | 10.70 | | | | 29.02 | | | | 17.78 | | | | 16.13 | |
Without CDSC | | | | | 11.70 | | | | 30.02 | | | | 17.78 | | | | 16.13 | |
CLASS I SHARES | | February 28, 2003 | | | 12.13 | | | | 31.00 | | | | 18.67 | | | | 16.88 | |
CLASS R6 SHARES | | September 30, 2020 | | | 12.17 | | | | 31.05 | | | | 18.69 | | | | 16.89 | |
| ** | | Sales Charge for Class A Shares is 5.25%. |
| *** | | Assumes a 1% CDSC (contingent deferred sales charge) for the 6 month and one year periods and 0% CDSC thereafter. |
TEN YEAR PERFORMANCE (12/31/11 TO 12/31/21)
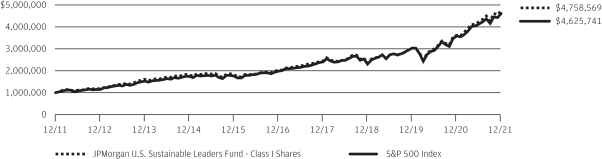
The performance quoted is past performance and is not a guarantee of future results. Mutual funds are subject to certain market risks. Investment returns and principal value of an investment will fluctuate so that an investor’s shares, when redeemed, may be worth more or less than their original cost. Current performance may be higher or lower than the performance data shown. For up-to-date month-end performance information please call 1-800-480-4111.
Returns for Class R6 Shares prior to their inception date are based on the performance of Class I Shares. The actual returns of Class R6 Shares would have been different than those shown because Class R6 Shares have different expenses than Class I Shares.
The graph illustrates comparative performance for $1,000,000 invested in Class I Shares of the JPMorgan U.S. Sustainable Leaders Fund and the S&P 500 Index from December 31, 2011 to December 31, 2021. The performance of the Fund assumes reinvestment of all dividends and capital gain distributions, if any, and does not include a sales charge. The performance of the S&P 500 Index does not reflect the deduction of expenses or a sales charge associated with a mutual fund and has been adjusted to reflect reinvestment of all dividends and capital gain distributions of the securities included in the benchmark, if applicable. The S&P 500 Index is an unmanaged index generally representative of the performance of large companies in the U.S. stock market. Investors cannot invest directly in an index.
Class I Shares have a $1,000,000 minimum initial investment.
Fund performance may reflect the waiver of the Fund’s fees and reimbursement of expenses for certain periods. Without these waivers and reimbursements, performance would have been lower. Also, performance shown in this section does not reflect the deduction of taxes that a shareholder would pay on Fund distributions or on gains resulting from redemptions of Fund shares.
Effective November 1, 2016, the Fund changed its investment strategies. Although past performance is not necessarily an indication of how the Fund will perform in the future, in view of these changes, the Fund’s performance record prior to this date might be less relevant for investors considering whether to purchase shares of the Fund.
Because Class C Shares automatically convert to Class A Shares after 8 years, the 10 year average annual total return shown above for Class C reflects Class A performance for the period after conversion.
The returns shown are based on net asset values calculated for shareholder transactions and may differ from the returns shown in the financial highlights, which reflect adjustments made to the net asset values in accordance with accounting principles generally accepted in the United States of America.
| | | | | | | | | | |
| | | | | |
| 32 | | | | | | | | J.P. MORGAN LARGE CAP FUNDS | | DECEMBER 31, 2021 |
JPMorgan U.S. Value Fund
FUND COMMENTARY
SIX MONTHS ENDED DECEMBER 31, 2021 (Unaudited)
| | | | |
| REPORTING PERIOD RETURN: | | | |
| Fund (Class A Shares, without a sales charge)* | | | 6.83% | |
| Russell 1000 Value Index | | | 6.93% | |
| |
| Net Assets as of 12/31/2021 (In Thousands) | | | $2,156,780 | |
INVESTMENT OBJECTIVE**
The JPMorgan U.S. Value Fund (the “Fund”) seeks to provide capital growth over the long term.
WHAT WERE THE MAIN DRIVERS OF THE FUND’S PERFORMANCE?
The Fund’s Class A Shares, without a sales charge, underperformed the Russell 1000 Value Index (the “Benchmark”) for the six months ended December 31, 2021.
The Fund’s security selection in the health care sector and its underweight position in the real estate sector were leading detractors from performance relative to the Benchmark, while the Fund’s underweight position and security selection in the communication services sector and its security selection in the industrials sector were leading contributors to relative performance.
Leading individual detractors from relative performance included the Fund’s overweight positions in Gap Inc., Citigroup Inc. and Medtronic PLC. Shares of Gap, a retailer of brand name apparel, fell after the company reported lower-than-expected earnings and revenue for the third quarter amid supply chain bottlenecks. Shares of Citigroup, a banking and financial services provider, fell amid investor concerns about the potential for a resurgence in the pandemic in late 2021 to fuel increased delinquencies in consumer loan and credit card payments. Shares of Medtronic, a medical technology manufacturer, fell after the company reported lower-than-expected revenue for its fiscal second quarter of 2021 and disclosed it had received a warning letter from the U.S. Food and Drug Administration following the company’s recall of insulin infusion pumps.
Leading individual contributors to relative performance included the Fund’s out-of-Benchmark positions in Microsoft Corp. and Home Depot Inc., and its overweight position in Alphabet Inc. Shares of Microsoft, a software and technology services provider, rose amid investor demand for large technology companies during the period. Shares of Home Depot, a home improvement retail chain, rose after the company reported strong sales growth and better-than-expected earnings and revenue for the third quarter of 2021. Shares of Alphabet, parent company of Google, rose amid investor demand for large technology companies during the period.
HOW WAS THE FUND POSIIONED?
The Fund’s portfolio managers focused on stock selection and aimed to invest in undervalued companies with durable franchises, strong management and the ability to grow their intrinsic value per share. The portfolio managers employed a bottom-up approach to security selection and fundamental research.
| | | | | | | | |
TOP TEN EQUITY HOLDINGS OF THE
PORTFOLIO AS OF DECEMBER 31, 2021 | | PERCENT OF
TOTAL
INVESTMENTS | |
| | |
| | 1. | | | Wells Fargo & Co. | | | 2.4 | % |
| | 2. | | | ConocoPhillips | | | 2.4 | |
| | 3. | | | BlackRock, Inc. | | | 2.3 | |
| | 4. | | | UnitedHealth Group, Inc. | | | 2.3 | |
| | 5. | | | Bank of America Corp. | | | 2.1 | |
| | 6. | | | Berkshire Hathaway, Inc., Class B | | | 2.0 | |
| | 7. | | | Morgan Stanley | | | 1.9 | |
| | 8. | | | Bristol-Myers Squibb Co. | | | 1.8 | |
| | 9. | | | Alphabet, Inc., Class C | | | 1.7 | |
| | 10. | | | Citigroup, Inc. | | | 1.7 | |
| | | | |
PORTFOLIO COMPOSITION BY SECTOR
AS OF DECEMBER 31, 2021 | | PERCENT OF
TOTAL
INVESTMENTS | |
| |
| Financials | | | 27.0 | % |
| Health Care | | | 15.5 | |
| Industrials | | | 12.7 | |
| Consumer Discretionary | | | 9.9 | |
| Information Technology | | | 8.1 | |
| Energy | | | 5.5 | |
| Consumer Staples | | | 4.7 | |
| Communication Services | | | 4.5 | |
| Materials | | | 4.4 | |
| Utilities | | | 3.1 | |
| Real Estate | | | 1.6 | |
| Short-Term Investments | | | 3.0 | |
| * | | The return shown is based on net asset values calculated for shareholder transactions and may differ from the return shown in the financial highlights, which reflects adjustments made to the net asset values in accordance with accounting principles generally accepted in the United States of America. |
| ** | | The adviser seeks to achieve the Fund’s objective. There can be no guarantee it will be achieved. |
| | | | | | | | | | |
| | | | | |
| DECEMBER 31, 2021 | | J.P. MORGAN LARGE CAP FUNDS | | | | | | | | 33 |
JPMorgan U.S. Value Fund
FUND COMMENTARY
SIX MONTHS ENDED DECEMBER 31, 2021 (Unaudited) (continued)
| | | | | | | | | | | | | | | | | | |
AVERAGE ANNUAL TOTAL RETURNS AS OF DECEMBER 31, 2021 | |
| | | | | |
| | | INCEPTION DATE OF
CLASS | | 6 MONTH* | | | 1 YEAR | | | 5 YEAR | | | 10 YEAR | |
CLASS A SHARES | | September 23, 1987 | | | | | | | | | | | | | | | | |
With Sales Charge** | | | | | 1.22 | % | | | 20.19 | % | | | 11.61 | % | | | 13.48 | % |
Without Sales Charge | | | | | 6.83 | | | | 26.86 | | | | 12.82 | | | | 14.09 | |
CLASS C SHARES | | January 2, 1998 | | | | | | | | | | | | | | | | |
With CDSC*** | | | | | 5.57 | | | | 25.24 | | | | 12.26 | | | | 13.63 | |
Without CDSC | | | | | 6.57 | | | | 26.24 | | | | 12.26 | | | | 13.63 | |
CLASS I SHARES | | January 25, 1996 | | | 6.98 | | | | 27.20 | | | | 13.11 | | | | 14.37 | |
CLASS R2 SHARES | | November 2, 2015 | | | 6.69 | | | | 26.56 | | | | 12.54 | | | | 13.91 | |
CLASS R3 SHARES | | July 31, 2017 | | | 6.82 | | | | 26.85 | | | | 12.83 | | | | 14.09 | |
CLASS R4 SHARES | | July 31, 2017 | | | 6.97 | | | | 27.20 | | | | 13.11 | | | | 14.37 | |
CLASS R5 SHARES | | November 2, 2015 | | | 7.04 | | | | 27.39 | | | | 13.29 | | | | 14.49 | |
CLASS R6 SHARES | | November 2, 2015 | | | 7.11 | | | | 27.50 | | | | 13.39 | | | | 14.55 | |
| ** | | Sales Charge for Class A Shares is 5.25%. |
| *** | | Assumes a 1% CDSC (contingent deferred sales charge) for the 6 month and one year periods and 0% CDSC thereafter. |
TEN YEAR PERFORMANCE (12/31/11 TO 12/31/21)
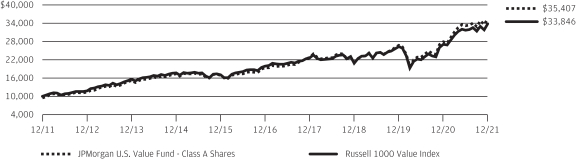
The performance quoted is past performance and is not a guarantee of future results. Mutual funds are subject to certain market risks. Investment returns and principal value of an investment will fluctuate so that an investor’s shares, when redeemed, may be worth more or less than their original cost. Current performance may be higher or lower than the performance data shown. For up-to-date month-end performance information please call 1-800-480-4111.
Returns for Class R2 Shares prior to their inception date are based on the performance of Class A Shares. The actual returns of Class R2 Shares would have been lower than those shown because Class R2 Shares have higher expenses than Class A Shares.
Returns for Class R3 Shares prior to their inception date are based on the performance of the Class A Shares. The actual returns of Class R3 Shares would have been similar to those shown because Class R3 Shares have similar expenses to Class A Shares.
Returns for Class R4 Shares prior to their inception date are based on the performance of the Class I Shares. The actual returns of Class R4 Shares would have been similar to those shown because Class R4 Shares have similar expenses to Class I Shares.
Returns for Class R5 and Class R6 Shares prior to their inception date are based on the performance of Class I Shares. The actual returns of Class R5 and Class R6 Shares would have been different than those shown because Class R5 and Class R6 Shares have different expenses than Class I Shares.
The graph illustrates comparative performance for $10,000 invested in Class A Shares of the JPMorgan U.S. Value Fund and the Russell 1000 Value Index from
December 31, 2011 to December 31, 2021. The performance of the Fund assumes reinvestment of all dividends and capital gain distributions, if any, and includes a sales charge. The performance of the Russell 1000 Value Index does not reflect the deduction of expenses or a sales charge associated with a mutual fund and has been adjusted to reflect reinvestment of all dividends and capital gain distributions of the securities included in the benchmarks, if applicable. The Russell 1000 Value Index is an unmanaged index, which measures the performance of those Russell 1000 companies with lower price-to-book ratios and lower forecasted growth values. Investors cannot invest directly in an index.
Class A Shares have a $1,000 minimum initial investment and carry a 5.25% sales charge.
Fund performance may reflect the waiver of the Fund’s fees and reimbursement of expenses for certain periods. Without these waivers and reimbursements, performance would have been lower. Also, performance shown in this section does not reflect the deduction of taxes that a shareholder would pay on Fund distributions or on gains resulting from redemptions of Fund shares.
Because Class C Shares automatically convert to Class A Shares after 8 years, the 10 year average annual total return shown above for Class C reflects Class A performance for the period after conversion.
The returns shown are based on net asset values calculated for shareholder transactions and may differ from the returns shown in the financial highlights, which reflect adjustments made to the net asset values in accordance with accounting principles generally accepted in the United States of America.
| | | | | | | | | | |
| | | | | |
| 34 | | | | | | | | J.P. MORGAN LARGE CAP FUNDS | | DECEMBER 31, 2021 |
JPMorgan Equity Focus Fund
SCHEDULE OF PORTFOLIO INVESTMENTS
AS OF DECEMBER 31, 2021 (Unaudited)
| | | | | | | | |
| INVESTMENTS | | SHARES (000) | | | VALUE ($000) | |
Common Stocks — 97.3% | |
|
Air Freight & Logistics — 2.1% | |
| | |
FedEx Corp. | | | 12 | | | | 2,986 | |
| | | | | | | | |
|
Automobiles — 2.4% | |
| | |
Tesla, Inc.* | | | 3 | | | | 3,525 | |
| | | | | | | | |
|
Banks — 3.1% | |
| | |
Bank of America Corp. | | | 100 | | | | 4,460 | |
| | | | | | | | |
|
Biotechnology — 4.6% | |
| | |
AbbVie, Inc. | | | 31 | | | | 4,132 | |
| | |
Regeneron Pharmaceuticals, Inc. * | | | 4 | | | | 2,476 | |
| | | | | | | | |
| | |
| | | | | | | 6,608 | |
| | | | | | | | |
|
Building Products — 1.6% | |
| | |
Trane Technologies plc | | | 11 | | | | 2,306 | |
| | | | | | | | |
|
Capital Markets — 2.2% | |
| | |
Charles Schwab Corp. (The) | | | 38 | | | | 3,155 | |
| | | | | | | | |
|
Construction Materials — 1.4% | |
| | |
Martin Marietta Materials, Inc. | | | 5 | | | | 2,066 | |
| | | | | | | | |
|
Consumer Finance — 2.8% | |
| | |
Capital One Financial Corp. | | | 28 | | | | 4,014 | |
| | | | | | | | |
|
Containers & Packaging — 2.6% | |
| | |
Packaging Corp. of America | | | 28 | | | | 3,799 | |
| | | | | | | | |
|
Diversified Financial Services — 3.1% | |
| | |
Berkshire Hathaway, Inc., Class B * | | | 15 | | | | 4,491 | |
| | | | | | | | |
|
Electric Utilities — 2.0% | |
| | |
Xcel Energy, Inc. | | | 42 | | | | 2,845 | |
| | | | | | | | |
|
Electronic Equipment, Instruments & Components — 1.8% | |
| | |
Zebra Technologies Corp., Class A * | | | 4 | | | | 2,582 | |
| | | | | | | | |
|
Equity Real Estate Investment Trusts (REITs) — 4.9% | |
| | |
Public Storage | | | 6 | | | | 2,305 | |
| | |
Weyerhaeuser Co. | | | 117 | | | | 4,820 | |
| | | | | | | | |
| | |
| | | | | | | 7,125 | |
| | | | | | | | |
|
Health Care Equipment & Supplies — 3.1% | |
| | |
Dexcom, Inc. * | | | 3 | | | | 1,833 | |
| | |
Intuitive Surgical, Inc. * | | | 7 | | | | 2,678 | |
| | | | | | | | |
| | |
| | | | | | | 4,511 | |
| | | | | | | | |
|
Health Care Providers & Services — 3.0% | |
| | |
UnitedHealth Group, Inc. | | | 9 | | | | 4,386 | |
| | | | | | | | |
|
Hotels, Restaurants & Leisure — 2.1% | |
| | |
Booking Holdings, Inc. * | | | 1 | | | | 3,059 | |
| | | | | | | | |
|
Household Products — 2.7% | |
| | |
Procter & Gamble Co. (The) | | | 24 | | | | 3,966 | |
| | | | | | | | |
| | | | | | | | |
| INVESTMENTS | | SHARES (000) | | | VALUE ($000) | |
| | | | | | | | |
|
Insurance — 3.3% | |
| | |
Loews Corp. | | | 82 | �� | | | 4,736 | |
| | | | | | | | |
|
Interactive Media & Services — 4.8% | |
| | |
Alphabet, Inc., Class C * | | | 2 | | | | 6,869 | |
| | | | | | | | |
|
Internet & Direct Marketing Retail — 3.6% | |
| | |
Amazon.com, Inc. * | | | 2 | | | | 5,225 | |
| | | | | | | | |
|
IT Services — 5.0% | |
| | |
Global Payments, Inc. | | | 13 | | | | 1,802 | |
| | |
Mastercard, Inc., Class A | | | 10 | | | | 3,750 | |
| | |
PayPal Holdings, Inc. * | | | 9 | | | | 1,718 | |
| | | | | | | | |
| | |
| | | | | | | 7,270 | |
| | | | | | | | |
|
Machinery — 3.2% | |
| | |
Deere & Co. | | | 7 | | | | 2,387 | |
| | |
Ingersoll Rand, Inc. | | | 36 | | | | 2,199 | |
| | | | | | | | |
| | |
| | | | | | | 4,586 | |
| | | | | | | | |
|
Media — 1.7% | |
| | |
Charter Communications, Inc., Class A * | | | 4 | | | | 2,472 | |
| | | | | | | | |
|
Oil, Gas & Consumable Fuels — 3.8% | |
| | |
ConocoPhillips | | | 40 | | | | 2,906 | |
| | |
Kinder Morgan, Inc. | | | 164 | | | | 2,598 | |
| | | | | | | | |
| | |
| | | | | | | 5,504 | |
| | | | | | | | |
|
Pharmaceuticals — 2.1% | |
| | |
Bristol-Myers Squibb Co. | | | 49 | | | | 3,044 | |
| | | | | | | | |
|
Semiconductors & Semiconductor Equipment — 6.4% | |
| | |
Advanced Micro Devices, Inc. * | | | 23 | | | | 3,266 | |
| | |
Lam Research Corp. | | | 4 | | | | 2,526 | |
| | |
QUALCOMM, Inc. | | | 18 | | | | 3,331 | |
| | | | | | | | |
| | |
| | | | | | | 9,123 | |
| | | | | | | | |
|
Software — 6.0% | |
| | |
Microsoft Corp. | | | 26 | | | | 8,614 | |
| | | | | | | | |
|
Specialty Retail — 4.0% | |
| | |
AutoZone, Inc. * | | | 2 | | | | 4,199 | |
| | |
Gap, Inc. (The) | | | 92 | | | | 1,628 | |
| | | | | | | | |
| | |
| | | | | | | 5,827 | |
| | | | | | | | |
|
Technology Hardware, Storage & Peripherals — 6.3% | |
| | |
Apple, Inc. | | | 51 | | | | 9,044 | |
| | | | | | | | |
|
Wireless Telecommunication Services — 1.6% | |
| | |
T-Mobile US, Inc. * | | | 20 | | | | 2,281 | |
| | | | | | | | |
| |
Total Common Stocks
(Cost $84,749) | | | | 140,479 | |
| | | | | |
SEE NOTES TO FINANCIAL STATEMENTS.
| | | | | | | | | | |
| | | | | |
| DECEMBER 31, 2021 | | J.P. MORGAN LARGE CAP FUNDS | | | | | | | | 35 |
JPMorgan Equity Focus Fund
SCHEDULE OF PORTFOLIO INVESTMENTS
AS OF DECEMBER 31, 2021 (Unaudited) (continued)
| | | | | | | | |
| INVESTMENTS | | SHARES (000) | | | VALUE ($000) | |
Short-Term Investments — 2.8% | |
|
Investment Companies — 2.8% | |
| | |
JPMorgan Prime Money Market Fund Class IM Shares, 0.07% (a) (b)
(Cost $3,975) | | | 3,974 | | | | 3,975 | |
| | | | | | | | |
Total Investments — 100.1%
(Cost $88,724) | | | | | | | 144,454 | |
Liabilities in Excess of
Other Assets — (0.1)% | | | | | | | (116 | ) |
| | | | | | | | |
NET ASSETS — 100.0% | | | | | | | 144,338 | |
| | | | | | | | |
Percentages indicated are based on net assets.
| | |
| (a) | | Investment in an affiliated fund, which is registered under the Investment Company Act of 1940, as amended, and is advised by J.P. Morgan Investment Management Inc. |
| (b) | | The rate shown is the current yield as of December 31, 2021. |
| * | | Non-income producing security. |
SEE NOTES TO FINANCIAL STATEMENTS.
| | | | | | | | | | |
| | | | | |
| 36 | | | | | | | | J.P. MORGAN LARGE CAP FUNDS | | DECEMBER 31, 2021 |
JPMorgan Equity Income Fund
SCHEDULE OF PORTFOLIO INVESTMENTS
AS OF DECEMBER 31, 2021 (Unaudited)
| | | | | | | | |
| INVESTMENTS | | SHARES
(000) | | | VALUE
($000) | |
Common Stocks — 98.1% | |
|
Aerospace & Defense — 4.9% | |
| | |
General Dynamics Corp. | | | 4,043 | | | | 842,945 | |
| | |
Northrop Grumman Corp. | | | 1,757 | | | | 680,026 | |
| | |
Raytheon Technologies Corp. | | | 11,595 | | | | 997,831 | |
| | | | | | | | |
| | |
| | | | | | | 2,520,802 | |
| | | | | | | | |
|
Air Freight & Logistics — 1.4% | |
| | |
United Parcel Service, Inc., Class B | | | 3,444 | | | | 738,287 | |
| | | | | | | | |
|
Banks — 7.4% | |
| | |
Bank of America Corp. | | | 27,292 | | | | 1,214,212 | |
| | |
Citigroup, Inc. | | | 8,841 | | | | 533,890 | |
| | |
PNC Financial Services Group, Inc. (The) | | | 5,335 | | | | 1,069,698 | |
| | |
Truist Financial Corp. | | | 7,966 | | | | 466,386 | |
| | |
US Bancorp | | | 8,478 | | | | 476,189 | |
| | | | | | | | |
| | |
| | | | | | | 3,760,375 | |
| | | | | | | | |
|
Beverages — 1.8% | |
| | |
Coca-Cola Co. (The) | | | 7,196 | | | | 426,057 | |
| | |
PepsiCo, Inc. | | | 2,753 | | | | 478,156 | |
| | | | | | | | |
| | |
| | | | | | | 904,213 | |
| | | | | | | | |
|
Biotechnology — 1.7% | |
| | |
AbbVie, Inc. | | | 4,493 | | | | 608,293 | |
| | |
Amgen, Inc. | | | 1,114 | | | | 250,699 | |
| | | | | | | | |
| | |
| | | | | | | 858,992 | |
| | | | | | | | |
|
Building Products — 0.3% | |
| | |
Trane Technologies plc | | | 849 | | | | 171,477 | |
| | | | | | | | |
|
Capital Markets — 8.7% | |
| | |
BlackRock, Inc. | | | 1,264 | | | | 1,156,891 | |
| | |
Charles Schwab Corp. (The) | | | 7,082 | | | | 595,568 | |
| | |
CME Group, Inc. | | | 4,409 | | | | 1,007,360 | |
| | |
Morgan Stanley | | | 9,717 | | | | 953,786 | |
| | |
Northern Trust Corp. | | | 1,907 | | | | 228,073 | |
| | |
T. Rowe Price Group, Inc. | | | 2,445 | | | | 480,874 | |
| | | | | | | | |
| | |
| | | | | | | 4,422,552 | |
| | | | | | | | |
|
Chemicals — 3.2% | |
| | |
Air Products and Chemicals, Inc. | | | 2,538 | | | | 772,105 | |
| | |
PPG Industries, Inc. | | | 4,883 | | | | 842,097 | |
| | | | | | | | |
| | |
| | | | | | | 1,614,202 | |
| | | | | | | | |
|
Commercial Services & Supplies — 0.6% | |
| | |
Republic Services, Inc. | | | 2,318 | | | | 323,247 | |
| | | | | | | | |
|
Consumer Finance — 2.4% | |
| | |
American Express Co. | | | 4,836 | | | | 791,209 | |
| | |
Capital One Financial Corp. | | | 2,931 | | | | 425,249 | |
| | | | | | | | |
| | |
| | | | | | | 1,216,458 | |
| | | | | | | | |
| | | | | | | | |
| INVESTMENTS | | SHARES
(000) | | | VALUE
($000) | |
| | | | | | | | |
|
Diversified Telecommunication Services — 0.8% | |
| | |
Verizon Communications, Inc. | | | 7,991 | | | | 415,226 | |
| | | | | | | | |
|
Electric Utilities — 2.8% | |
| | |
Entergy Corp. | | | 572 | | | | 64,442 | |
| | |
NextEra Energy, Inc. | | | 9,549 | | | | 891,523 | |
| | |
Xcel Energy, Inc. | | | 7,050 | | | | 477,293 | |
| | | | | | | | |
| | |
| | | | | | | 1,433,258 | |
| | | | | | | | |
|
Electrical Equipment — 1.5% | |
| | |
Eaton Corp. plc | | | 4,402 | | | | 760,722 | |
| | | | | | | | |
|
Electronic Equipment, Instruments & Components — 0.5% | |
| | |
Corning, Inc. | | | 7,070 | | | | 263,226 | |
| | | | | | | | |
|
Equity Real Estate Investment Trusts (REITs) — 2.8% | |
| | |
Alexandria Real Estate Equities, Inc. | | | 1,119 | | | | 249,389 | |
| | |
AvalonBay Communities, Inc. | | | 1,176 | | | | 297,012 | |
| | |
Boston Properties, Inc. | | | 1,505 | | | | 173,333 | |
| | |
Prologis, Inc. | | | 2,799 | | | | 471,188 | |
| | |
Realty Income Corp. | | | 597 | | | | 42,712 | |
| | |
Ventas, Inc. | | | 4,055 | | | | 207,305 | |
| | | | | | | | |
| | |
| | | | | | | 1,440,939 | |
| | | | | | | | |
|
Food & Staples Retailing — 2.8% | |
| | |
Sysco Corp. | | | 9,809 | | | | 770,463 | |
| | |
Walmart, Inc. | | | 4,595 | | | | 664,795 | |
| | | | | | | | |
| | |
| | | | | | | 1,435,258 | |
| | | | | | | | |
|
Food Products — 1.2% | |
| | |
Mondelez International, Inc., Class A | | | 8,985 | | | | 595,827 | |
| | | | | | | | |
|
Health Care Equipment & Supplies — 2.8% | |
| | |
Abbott Laboratories | | | 1,520 | | | | 213,860 | |
| | |
Becton Dickinson and Co. | | | 1,990 | | | | 500,347 | |
| | |
Medtronic plc | | | 6,942 | | | | 718,151 | |
| | | | | | | | |
| | |
| | | | | | | 1,432,358 | |
| | | | | | | | |
|
Health Care Providers & Services — 6.0% | |
| | |
AmerisourceBergen Corp. | | | 3,070 | | | | 408,014 | |
| | |
Cigna Corp. | | | 1,409 | | | | 323,622 | |
| | |
CVS Health Corp. | | | 8,095 | | | | 835,051 | |
| | |
UnitedHealth Group, Inc. | | | 3,037 | | | | 1,524,762 | |
| | | | | | | | |
| | |
| | | | | | | 3,091,449 | |
| | | | | | | | |
|
Hotels, Restaurants & Leisure — 1.9% | |
| | |
McDonald’s Corp. | | | 2,520 | | | | 675,652 | |
| | |
Starbucks Corp. | | | 2,621 | | | | 306,561 | |
| | | | | | | | |
| | |
| | | | | | | 982,213 | |
| | | | | | | | |
|
Household Products — 1.3% | |
| | |
Procter & Gamble Co. (The) | | | 4,145 | | | | 678,082 | |
| | | | | | | | |
SEE NOTES TO FINANCIAL STATEMENTS.
| | | | | | | | | | |
| | | | | |
| DECEMBER 31, 2021 | | J.P. MORGAN LARGE CAP FUNDS | | | | | | | | 37 |
JPMorgan Equity Income Fund
SCHEDULE OF PORTFOLIO INVESTMENTS
AS OF DECEMBER 31, 2021 (Unaudited) (continued)
| | | | | | | | |
| INVESTMENTS | | SHARES
(000) | | | VALUE
($000) | |
Common Stocks — continued | |
|
Insurance — 4.4% | |
| | |
Arthur J Gallagher & Co. | | | 2,339 | | | | 396,779 | |
| | |
Chubb Ltd. | | | 2,899 | | | | 560,403 | |
| | |
Hartford Financial Services Group, Inc. (The) | | | 5,417 | | | | 374,009 | |
| | |
Marsh & McLennan Cos., Inc. | | | 1,121 | | | | 194,813 | |
| | |
MetLife, Inc. | | | 6,768 | | | | 422,934 | |
| | |
Progressive Corp. (The) | | | 3,094 | | | | 317,632 | |
| | | | | | | | |
| | |
| | | | | | | 2,266,570 | |
| | | | | | | | |
|
IT Services — 2.2% | |
| | |
Accenture plc, Class A | | | 754 | | | | 312,372 | |
| | |
Fidelity National Information Services, Inc. | | | 4,107 | | | | 448,298 | |
| | |
International Business Machines Corp. | | | 2,605 | | | | 348,124 | |
| | | | | | | | |
| | |
| | | | | | | 1,108,794 | |
| | | | | | | | |
|
Leisure Products — 0.5% | |
| | |
Hasbro, Inc. | | | 2,676 | | | | 272,313 | |
| | | | | | | | |
|
Machinery — 4.3% | |
| | |
Deere & Co. | | | 1,449 | | | | 496,845 | |
| | |
Dover Corp. | | | 5,271 | | | | 957,273 | |
| | |
Parker-Hannifin Corp. | | | 2,270 | | | | 722,057 | |
| | | | | | | | |
| | |
| | | | | | | 2,176,175 | |
| | | | | | | | |
|
Media — 2.1% | |
| | |
Comcast Corp., Class A | | | 21,492 | | | | 1,081,669 | |
| | | | | | | | |
|
Multi-Utilities — 1.2% | |
| | |
CMS Energy Corp. | | | 5,324 | | | | 346,355 | |
| | |
Public Service Enterprise Group, Inc. | | | 3,936 | | | | 262,637 | |
| | | | | | | | |
| | |
| | | | | | | 608,992 | |
| | | | | | | | |
|
Oil, Gas & Consumable Fuels — 5.7% | |
| | |
Chevron Corp. | | | 6,531 | | | | 766,411 | |
| | |
ConocoPhillips | | | 17,508 | | | | 1,263,707 | |
| | |
EOG Resources, Inc. | | | 7,968 | | | | 707,798 | |
| | |
Valero Energy Corp. | | | 2,185 | | | | 164,080 | |
| | | | | | | | |
| | |
| | | | | | | 2,901,996 | |
| | | | | | | | |
|
Pharmaceuticals — 6.0% | |
| | |
Bristol-Myers Squibb Co. | | | 16,604 | | | | 1,035,275 | |
| | |
Eli Lilly & Co. | | | 2,055 | | | | 567,503 | |
| | |
Johnson & Johnson | | | 5,441 | | | | 930,711 | |
| | |
Merck & Co., Inc. | | | 2,430 | | | | 186,218 | |
| | |
Pfizer, Inc. | | | 6,240 | | | | 368,501 | |
| | | | | | | | |
| | |
| | | | | | | 3,088,208 | |
| | | | | | | | |
|
Road & Rail — 1.6% | |
| | |
Norfolk Southern Corp. | | | 2,711 | | | | 807,075 | |
| | | | | | | | |
| | | | | | | | |
| INVESTMENTS | | SHARES
(000) | | | VALUE
($000) | |
| | | | | | | | |
|
Semiconductors & Semiconductor Equipment — 3.9% | |
| | |
Analog Devices, Inc. | | | 5,625 | | | | 988,760 | |
| | |
Intel Corp. | | | 1,384 | | | | 71,298 | |
| | |
Texas Instruments, Inc. | | | 4,916 | | | | 926,520 | |
| | | | | | | | |
| | |
| | | | | | | 1,986,578 | |
| | | | | | | | |
|
Software — 1.5% | |
| | |
Microsoft Corp. | | | 2,266 | | | | 762,006 | |
| | | | | | | | |
|
Specialty Retail — 4.6% | |
| | |
Advance Auto Parts, Inc. | | | 1,264 | | | | 303,232 | |
| | |
Best Buy Co., Inc. | | | 3,615 | | | | 367,238 | |
| | |
Gap, Inc. (The) | | | 10,701 | | | | 188,880 | |
| | |
Home Depot, Inc. (The) | | | 2,018 | | | | 837,289 | |
| | |
TJX Cos., Inc. (The) | | | 8,472 | | | | 643,207 | |
| | | | | | | | |
| | |
| | | | | | | 2,339,846 | |
| | | | | | | | |
|
Technology Hardware, Storage & Peripherals — 1.1% | |
| | |
Apple, Inc. | | | 1,335 | | | | 237,108 | |
| | |
Seagate Technology Holdings plc | | | 2,682 | | | | 303,038 | |
| | | | | | | | |
| | |
| | | | | | | 540,146 | |
| | | | | | | | |
|
Textiles, Apparel & Luxury Goods — 0.4% | |
| | |
VF Corp. | | | 3,065 | | | | 224,432 | |
| | | | | | | | |
|
Tobacco — 1.8% | |
| | |
Philip Morris International, Inc. | | | 9,572 | | | | 909,298 | |
| | | | | | | | |
| |
Total Common Stocks
(Cost $33,181,428) | | | | 50,133,261 | |
| | | | | |
Short-Term Investments — 2.0% | |
|
Investment Companies — 2.0% | |
| | |
JPMorgan Prime Money Market Fund Class IM Shares, 0.07% (a) (b)
(Cost $1,035,032) | | | 1,034,572 | | | | 1,034,986 | |
| | | | | | | | |
Total Investments — 100.1%
(Cost $34,216,460) | | | | | | | 51,168,247 | |
Liabilities in Excess of
Other Assets — (0.1)% | | | | | | | (57,221 | ) |
| | | | | | | | |
NET ASSETS — 100.0% | | | | | | | 51,111,026 | |
| | | | | | | | |
Percentages indicated are based on net assets.
| | |
| (a) | | Investment in an affiliated fund, which is registered under the Investment Company Act of 1940, as amended, and is advised by J.P. Morgan Investment Management Inc. |
| (b) | | The rate shown is the current yield as of December 31, 2021. |
SEE NOTES TO FINANCIAL STATEMENTS.
| | | | | | | | | | |
| | | | | |
| 38 | | | | | | | | J.P. MORGAN LARGE CAP FUNDS | | DECEMBER 31, 2021 |
JPMorgan Equity Premium Income Fund
SCHEDULE OF PORTFOLIO INVESTMENTS
AS OF DECEMBER 31, 2021 (Unaudited)
| | | | | | | | |
| INVESTMENTS | |
SHARES
(000) | | | VALUE
($000) | |
Common Stocks — 82.0% | |
|
Aerospace & Defense — 0.4% | |
| | |
Northrop Grumman Corp. | | | 21 | | | | 8,206 | |
| | | | | | | | |
|
Air Freight & Logistics — 1.3% | |
| | |
United Parcel Service, Inc., Class B | | | 129 | | | | 27,756 | |
| | | | | | | | |
|
Banks — 1.6% | |
| | |
US Bancorp | | | 398 | | | | 22,358 | |
| | |
Wells Fargo & Co. | | | 240 | | | | 11,524 | |
| | | | | | | | |
| | |
| | | | | | | 33,882 | |
| | | | | | | | |
|
Beverages — 3.1% | |
| | |
Coca-Cola Co. (The) | | | 468 | | | | 27,739 | |
| | |
Constellation Brands, Inc., Class A | | | 45 | | | | 11,286 | |
| | |
PepsiCo, Inc. | | | 160 | | | | 27,868 | |
| | | | | | | | |
| | |
| | | | | | | 66,893 | |
| | | | | | | | |
|
Biotechnology — 2.7% | |
| | |
AbbVie, Inc. | | | 225 | | | | 30,473 | |
| | |
Regeneron Pharmaceuticals, Inc. * | | | 20 | | | | 12,372 | |
| | |
Vertex Pharmaceuticals, Inc. * | | | 67 | | | | 14,696 | |
| | | | | | | | |
| | |
| | | | | | | 57,541 | |
| | | | | | | | |
|
Building Products — 1.4% | |
| | |
Trane Technologies plc | | | 146 | | | | 29,476 | |
| | | | | | | | |
|
Capital Markets — 2.1% | |
| | |
Intercontinental Exchange, Inc. | | | 145 | | | | 19,816 | |
| | |
S&P Global, Inc. | | | 55 | | | | 26,094 | |
| | | | | | | | |
| | |
| | | | | | | 45,910 | |
| | | | | | | | |
|
Chemicals — 2.7% | |
| | |
Air Products and Chemicals, Inc. | | | 38 | | | | 11,650 | |
| | |
Corteva, Inc. | | | 272 | | | | 12,847 | |
| | |
Linde plc (United Kingdom) | | | 43 | | | | 14,769 | |
| | |
PPG Industries, Inc. | | | 106 | | | | 18,354 | |
| | | | | | | | |
| | |
| | | | | | | 57,620 | |
| | | | | | | | |
|
Containers & Packaging — 0.6% | |
| | |
Avery Dennison Corp. | | | 63 | | | | 13,581 | |
| | | | | | | | |
|
Diversified Financial Services — 0.9% | |
| | |
Berkshire Hathaway, Inc., Class B * | | | 67 | | | | 20,169 | |
| | | | | | | | |
|
Diversified Telecommunication Services — 1.1% | |
| | |
Verizon Communications, Inc. | | | 449 | | | | 23,320 | |
| | | | | | | | |
|
Electric Utilities — 4.2% | |
| | |
Alliant Energy Corp. | | | 273 | | | | 16,802 | |
| | |
Duke Energy Corp. | | | 162 | | | | 16,959 | |
| | |
Evergy, Inc. | | | 184 | | | | 12,609 | |
| | |
FirstEnergy Corp. | | | 260 | | | | 10,818 | |
| | | | | | | | |
| INVESTMENTS | |
SHARES
(000) | | | VALUE
($000) | |
| | | | | | | | |
Electric Utilities — continued | | | | | | | | |
| | |
NextEra Energy, Inc. | | | 296 | | | | 27,674 | |
| | |
Xcel Energy, Inc. | | | 68 | | | | 4,629 | |
| | | | | | | | |
| | |
| | | | | | | 89,491 | |
| | | | | | | | |
|
Electrical Equipment — 1.0% | |
| | |
Eaton Corp. plc | | | 124 | | | | 21,372 | |
| | | | | | | | |
|
Entertainment — 0.4% | |
| | |
Netflix, Inc. * | | | 15 | | | | 9,250 | |
| | | | | | | | |
|
Equity Real Estate Investment Trusts (REITs) — 3.0% | |
| | |
Camden Property Trust | | | 21 | | | | 3,745 | |
| | |
Equinix, Inc. | | | 17 | | | | 14,190 | |
| | |
Prologis, Inc. | | | 111 | | | | 18,751 | |
| | |
Public Storage | | | 42 | | | | 15,547 | |
| | |
Sun Communities, Inc. | | | 59 | | | | 12,396 | |
| | | | | | | | |
| | |
| | | | | | | 64,629 | |
| | | | | | | | |
|
Food & Staples Retailing — 1.6% | |
| | |
Costco Wholesale Corp. | | | 31 | | | | 17,557 | |
| | |
Walmart, Inc. | | | 123 | | | | 17,780 | |
| | | | | | | | |
| | |
| | | | | | | 35,337 | |
| | | | | | | | |
|
Food Products — 2.5% | |
| | |
Hershey Co. (The) | | | 136 | | | | 26,348 | |
| | |
Mondelez International, Inc., Class A | | | 405 | | | | 26,828 | |
| | | | | | | | |
| | |
| | | | | | | 53,176 | |
| | | | | | | | |
|
Health Care Equipment & Supplies — 1.2% | |
| | |
Abbott Laboratories | | | 63 | | | | 8,894 | |
| | |
Boston Scientific Corp. * | | | 129 | | | | 5,467 | |
| | |
Medtronic plc | | | 105 | | | | 10,884 | |
| | | | | | | | |
| | |
| | | | | | | 25,245 | |
| | | | | | | | |
|
Health Care Providers & Services — 1.9% | |
| | |
Anthem, Inc. | | | 25 | | | | 11,587 | |
| | |
UnitedHealth Group, Inc. | | | 59 | | | | 29,700 | |
| | | | | | | | |
| | |
| | | | | | | 41,287 | |
| | | | | | | | |
|
Hotels, Restaurants & Leisure — 0.8% | |
| | |
McDonald’s Corp. | | | 63 | | | | 16,782 | |
| | | | | | | | |
|
Household Products — 2.4% | |
| | |
Kimberly-Clark Corp. | | | 159 | | | | 22,733 | |
| | |
Procter & Gamble Co. (The) | | | 175 | | | | 28,604 | |
| | | | | | | | |
| | |
| | | | | | | 51,337 | |
| | | | | | | | |
|
Insurance — 4.0% | |
| | |
Arthur J Gallagher & Co. | | | 144 | | | | 24,481 | |
| | |
Chubb Ltd. | | | 123 | | | | 23,722 | |
SEE NOTES TO FINANCIAL STATEMENTS.
| | | | | | | | | | |
| | | | | |
| DECEMBER 31, 2021 | | J.P. MORGAN LARGE CAP FUNDS | | | | | | | | 39 |
JPMorgan Equity Premium Income Fund
SCHEDULE OF PORTFOLIO INVESTMENTS
AS OF DECEMBER 31, 2021 (Unaudited) (continued)
| | | | | | | | |
| INVESTMENTS | |
SHARES
(000) | | | VALUE
($000) | |
Common Stocks — continued | |
|
Insurance — continued | |
| | |
Hartford Financial Services Group, Inc. (The) | | | 121 | | | | 8,358 | |
| | |
Progressive Corp. (The) | | | 282 | | | | 28,962 | |
| | | | | | | | |
| | |
| | | | | | | 85,523 | |
| | | | | | | | |
|
Interactive Media & Services — 1.5% | |
| | |
Alphabet, Inc., Class A * | | | 11 | | | | 32,655 | |
| | | | | | | | |
|
Internet & Direct Marketing Retail — 1.2% | |
| | |
Amazon.com, Inc. * | | | 8 | | | | 26,721 | |
| | | | | | | | |
|
IT Services — 6.1% | |
| | |
Accenture plc, Class A | | | 87 | | | | 35,861 | |
| | |
Automatic Data Processing, Inc. | | | 39 | | | | 9,563 | |
| | |
International Business Machines Corp. | | | 105 | | | | 13,979 | |
| | |
Jack Henry & Associates, Inc. | | | 98 | | | | 16,323 | |
| | |
Kyndryl Holdings, Inc. * | | | — | (a) | | | — | (a) |
| | |
Mastercard, Inc., Class A | | | 80 | | | | 28,805 | |
| | |
Visa, Inc., Class A | | | 111 | | | | 24,042 | |
| | | | | | | | |
| | |
| | | | | | | 128,573 | |
| | | | | | | | |
|
Life Sciences Tools & Services — 1.5% | |
| | |
Thermo Fisher Scientific, Inc. | | | 47 | | | | 31,669 | |
| | | | | | | | |
|
Machinery — 2.8% | |
| | |
Deere & Co. | | | 61 | | | | 20,988 | |
| | |
Otis Worldwide Corp. | | | 160 | | | | 13,902 | |
| | |
Stanley Black & Decker, Inc. | | | 130 | | | | 24,443 | |
| | | | | | | | |
| | |
| | | | | | | 59,333 | |
| | | | | | | | |
|
Media — 1.9% | |
| | |
Charter Communications, Inc., Class A * | | | 20 | | | | 13,339 | |
| | |
Comcast Corp., Class A | | | 563 | | | | 28,358 | |
| | | | | | | | |
| | |
| | | | | | | 41,697 | |
| | | | | | | | |
|
Multiline Retail — 1.3% | |
| | |
Target Corp. | | | 122 | | | | 28,212 | |
| | | | | | | | |
|
Multi-Utilities — 2.9% | |
| | |
CenterPoint Energy, Inc. | | | 501 | | | | 13,975 | |
| | |
DTE Energy Co. | | | 274 | | | | 32,749 | |
| | |
WEC Energy Group, Inc. | | | 163 | | | | 15,815 | |
| | | | | | | | |
| | |
| | | | | | | 62,539 | |
| | | | | | | | |
|
Oil, Gas & Consumable Fuels — 0.7% | |
| | |
TC Energy Corp. (Canada) | | | 313 | | | | 14,583 | |
| | | | | | | | |
|
Personal Products — 0.1% | |
| | |
Estee Lauder Cos., Inc. (The), Class A | | | 8 | | | | 2,886 | |
| | | | | | | | |
|
Pharmaceuticals — 4.7% | |
| | |
Bristol-Myers Squibb Co. | | | 440 | | | | 27,449 | |
| | | | | | | | |
| INVESTMENTS | |
SHARES
(000) | | | VALUE
($000) | |
| | |
| | | | | | | | |
|
Pharmaceuticals — continued | |
| | |
Eli Lilly & Co. | | | 118 | | | | 32,532 | |
| | |
Johnson & Johnson | | | 122 | | | | 20,808 | |
| | |
Merck & Co., Inc. | | | 236 | | | | 18,097 | |
| | | | | | | | |
| | |
| | | | | | | 98,886 | |
| | | | | | | | |
|
Professional Services — 0.5% | |
| | |
Booz Allen Hamilton Holding Corp. | | | 132 | | | | 11,224 | |
| | | | | | | | |
|
Road & Rail — 4.3% | |
| | |
Norfolk Southern Corp. | | | 99 | | | | 29,414 | |
| | |
Old Dominion Freight Line, Inc. | | | 95 | | | | 34,188 | |
| | |
Union Pacific Corp. | | | 107 | | | | 27,004 | |
| | | | | | | | |
| | |
| | | | | | | 90,606 | |
| | | | | | | | |
|
Semiconductors & Semiconductor Equipment — 1.7% | |
| | |
Analog Devices, Inc. | | | 59 | | | | 10,434 | |
| | |
Texas Instruments, Inc. | | | 138 | | | | 25,964 | |
| | | | | | | | |
| | |
| | | | | | | 36,398 | |
| | | | | | | | |
|
Software — 3.1% | |
| | |
Intuit, Inc. | | | 50 | | | | 32,211 | |
| | |
Microsoft Corp. | | | 101 | | | | 33,914 | |
| | | | | | | | |
| | |
| | | | | | | 66,125 | |
| | | | | | | | |
|
Specialty Retail — 3.1% | |
| | |
Best Buy Co., Inc. | | | 72 | | | | 7,299 | |
| | |
Lowe’s Cos., Inc. | | | 118 | | | | 30,448 | |
| | |
O’Reilly Automotive, Inc. * | | | 41 | | | | 29,198 | |
| | | | | | | | |
| | |
| | | | | | | 66,945 | |
| | | | | | | | |
|
Technology Hardware, Storage & Peripherals — 1.0% | |
| | |
Apple, Inc. | | | 61 | | | | 10,795 | |
| | |
Seagate Technology Holdings plc | | | 89 | | | | 10,109 | |
| | | | | | | | |
| | |
| | | | | | | 20,904 | |
| | | | | | | | |
|
Textiles, Apparel & Luxury Goods — 1.0% | |
| | |
NIKE, Inc., Class B | | | 128 | | | | 21,261 | |
| | | | | | | | |
|
Tobacco — 0.8% | |
| | |
Altria Group, Inc. | | | 172 | | | | 8,134 | |
| | |
Philip Morris International, Inc. | | | 102 | | | | 9,685 | |
| | | | | | | | |
| | |
| | | | | | | 17,819 | |
| | | | | | | | |
|
Wireless Telecommunication Services — 0.9% | |
| | |
T-Mobile US, Inc.* | | | 168 | | | | 19,502 | |
| | | | | | | | |
| |
Total Common Stocks
(Cost $1,560,416) | | | | 1,756,321 | |
| | | | | |
SEE NOTES TO FINANCIAL STATEMENTS.
| | | | | | | | | | |
| | | | | |
| 40 | | | | | | | | J.P. MORGAN LARGE CAP FUNDS | | DECEMBER 31, 2021 |
| | | | | | | | |
| INVESTMENTS | | PRINCIPAL
AMOUNT
($000) | | | VALUE
($000) | |
Equity-Linked Notes — 16.1% | |
| | |
Bank of Montreal, ELN, 47.00%, 1/18/2022, (linked to S&P 500 Index) (Canada) (b) | | | 8 | | | | 36,358 | |
| | |
Barclays Bank plc, ELN, 48.30%, 1/14/2022, (linked to S&P 500 Index) (United Kingdom) (c) | | | 8 | | | | 37,193 | |
| | |
BNP Paribas, ELN, 48.00%, 1/21/2022, (linked to S&P 500 Index) (b) | | | 6 | | | | 29,383 | |
| | |
Credit Suisse AG, ELN, 42.00%, 2/4/2022, (linked to S&P 500 Index) (Switzerland) (b) | | | 8 | | | | 40,382 | |
| | |
GS Finance Corp., ELN, 50.02%, 1/31/2022, (linked to S&P 500 Index) (b) | | | 7 | | | | 32,965 | |
| | |
GS Finance Corp., ELN, 60.43%, 1/28/2022, (linked to S&P 500 Index) (b) | | | 7 | | | | 32,427 | |
| | |
Royal Bank of Canada, ELN, 40.85%, 1/24/2022, (linked to S&P 500 Index) (Canada) (b) | | | 6 | | | | 30,193 | |
| | |
Royal Bank of Canada, ELN, 55.31%, 1/7/2022, (linked to S&P 500 Index) (Canada) (b) | | | 7 | | | | 31,562 | |
| | |
UBS AG, ELN, 40.24%, 2/7/2022, (linked to S&P 500 Index) (Switzerland) (b) | | | 9 | | | | 43,256 | |
| | |
UBS AG, ELN, 62.75%, 1/10/2022, (linked to S&P 500 Index) (Switzerland) (b) | | | 8 | | | | 30,743 | |
| | | | | | | | |
| |
Total Equity-Linked Notes
(Cost $348,978) | | | | 344,462 | |
| | | | | |
| | | | | | | | |
| | |
SHARES
(000) | | | VALUE
($000) | |
Short-Term Investments — 0.3% | |
|
Investment Companies — 0.3% | |
| | |
JPMorgan Prime Money Market Fund Class IM Shares, 0.07% (d) (e)
(Cost $7,184) | | | 7,181 | | | | 7,184 | |
| | | | | | | | |
Total Investments — 98.4%
(Cost $1,916,578) | | | | | | | 2,107,967 | |
Other Assets Less Liabilities — 1.6% | | | | | | | 33,978 | |
| | | | | | | | |
NET ASSETS — 100.0% | | | | | | | 2,141,945 | |
| | | | | | | | |
Percentages indicated are based on net assets.
Abbreviations
| | |
| |
| ELN | | Equity-Linked Note |
| |
| (a) | | Amount rounds to less than one thousand. |
| (b) | | Securities exempt from registration under Rule 144A or section 4(a)(2), of the Securities Act of 1933, as amended. |
| (c) | | Security exempt from registration pursuant to Regulation S under the Securities Act of 1933, as amended. Regulation S applies to securities offerings that are made outside of the United States and do not involve direct selling efforts in the United States and as such may have restrictions on resale. |
| (d) | | Investment in an affiliated fund, which is registered under the Investment Company Act of 1940, as amended, and is advised by J.P. Morgan Investment Management Inc. |
| (e) | | The rate shown is the current yield as of December 31, 2021. |
| * | | Non-income producing security. |
| | | | | | | | | | | | | | | | | | | | |
| Futures contracts outstanding as of December 31, 2021 (amounts in thousands, except number of contracts): | |
| DESCRIPTION | | NUMBER OF
CONTRACTS | | | EXPIRATION
DATE | | | TRADING
CURRENCY | | | NOTIONAL
AMOUNT ($) | | | VALUE AND
UNREALIZED
APPRECIATION
(DEPRECIATION) ($) | |
Long Contracts | | | | | | | | | | | | | | | | | | | | |
S&P 500 E-Mini Index | | | 73 | | | | 03/2022 | | | | USD | | | | 17,368 | | | | 15 | |
| | | | | | | | | | | | | | | | | | | | |
Abbreviations
SEE NOTES TO FINANCIAL STATEMENTS.
| | | | | | | | | | |
| | | | | |
| DECEMBER 31, 2021 | | J.P. MORGAN LARGE CAP FUNDS | | | | | | | | 41 |
JPMorgan Hedged Equity Fund
SCHEDULE OF PORTFOLIO INVESTMENTS
AS OF DECEMBER 31, 2021 (Unaudited)
| | | | | | | | |
| INVESTMENTS | | SHARES (000) | | | VALUE ($000) | |
Common Stocks — 97.1% | |
|
Aerospace & Defense — 0.8% | |
| | |
Northrop Grumman Corp. | | | 167 | | | | 64,453 | |
| | |
Raytheon Technologies Corp. | | | 1,042 | | | | 89,703 | |
| | | | | | | | |
| | |
| | | | | | | 154,156 | |
| | | | | | | | |
|
Air Freight & Logistics — 1.1% | |
| | |
FedEx Corp. | | | 253 | | | | 65,480 | |
| | |
United Parcel Service, Inc., Class B | | | 681 | | | | 145,874 | |
| | | | | | | | |
| | |
| | | | | | | 211,354 | |
| | | | | | | | |
|
Airlines — 0.2% | |
| | |
Southwest Airlines Co. * | | | 933 | | | | 39,983 | |
| | | | | | | | |
|
Auto Components — 0.3% | |
| | |
Aptiv plc * | | | 117 | | | | 19,356 | |
| | |
Magna International, Inc. (Canada) | | | 421 | | | | 34,064 | |
| | | | | | | | |
| | |
| | | | | | | 53,420 | |
| | | | | | | | |
|
Automobiles — 2.3% | |
| | |
General Motors Co. * | | | 755 | | | | 44,253 | |
| | |
Rivian Automotive, Inc., Class A * | | | 150 | | | | 15,588 | |
| | |
Tesla, Inc. * (a) | | | 375 | | | | 396,346 | |
| | | | | | | | |
| | |
| | | | | | | 456,187 | |
| | | | | | | | |
|
Banks — 3.7% | |
| | |
Bank of America Corp. (a) | | | 2,238 | | | | 99,586 | |
| | |
Citigroup, Inc. | | | 1,781 | | | | 107,565 | |
| | |
Fifth Third Bancorp | | | 1,041 | | | | 45,340 | |
| | |
Regions Financial Corp. | | | 2,520 | | | | 54,936 | |
| | |
SVB Financial Group * | | | 47 | | | | 31,715 | |
| | |
Truist Financial Corp. | | | 1,172 | | | | 68,614 | |
| | |
US Bancorp | | | 2,066 | | | | 116,027 | |
| | |
Wells Fargo & Co. (a) | | | 4,250 | | | | 203,921 | |
| | | | | | | | |
| | |
| | | | | | | 727,704 | |
| | | | | | | | |
|
Beverages — 1.2% | |
| | |
Coca-Cola Co. (The) (a) | | | 2,870 | | | | 169,938 | |
| | |
Constellation Brands, Inc., Class A | | | 272 | | | | 68,275 | |
| | | | | | | | |
| | |
| | | | | | | 238,213 | |
| | | | | | | | |
|
Biotechnology — 2.3% | |
| | |
AbbVie, Inc. (a) | | | 1,639 | | | | 221,873 | |
| | |
Biogen, Inc. * (a) | | | 149 | | | | 35,711 | |
| | |
BioMarin Pharmaceutical, Inc. * | | | 111 | | | | 9,816 | |
| | |
Moderna, Inc. * | | | 71 | | | | 17,982 | |
| | |
Neurocrine Biosciences, Inc. * | | | 113 | | | | 9,616 | |
| | |
Regeneron Pharmaceuticals, Inc. * | | | 129 | | | | 81,399 | |
| | |
Vertex Pharmaceuticals, Inc. * | | | 339 | | | | 74,529 | |
| | | | | | | | |
| | |
| | | | | | | 450,926 | |
| | | | | | | | |
| | | | | | | | |
| INVESTMENTS | | SHARES (000) | | | VALUE ($000) | |
| | | | | | | | |
|
Building Products — 1.2% | |
| | |
Johnson Controls International plc | | | 729 | | | | 59,314 | |
| | |
Masco Corp. | | | 600 | | | | 42,156 | |
| | |
Trane Technologies plc | | | 635 | | | | 128,258 | |
| | | | | | | | |
| | |
| | | | | | | 229,728 | |
| | | | | | | | |
|
Capital Markets — 3.2% | |
| | |
Goldman Sachs Group, Inc. (The) | | | 260 | | | | 99,372 | |
| | |
Intercontinental Exchange, Inc. | | | 438 | | | | 59,923 | |
| | |
Morgan Stanley | | | 906 | | | | 88,897 | |
| | |
S&P Global, Inc. | | | 350 | | | | 165,131 | |
| | |
State Street Corp. | | | 1,187 | | | | 110,420 | |
| | |
T. Rowe Price Group, Inc. | | | 492 | | | | 96,786 | |
| | | | | | | | |
| | |
| | | | | | | 620,529 | |
| | | | | | | | |
|
Chemicals — 1.9% | |
| | |
Air Products and Chemicals, Inc. | | | 93 | | | | 28,390 | |
| | |
Celanese Corp. | | | 163 | | | | 27,379 | |
| | |
DuPont de Nemours, Inc. | | | 719 | | | | 58,109 | |
| | |
Eastman Chemical Co. | | | 753 | | | | 91,093 | |
| | |
Linde plc (United Kingdom) | | | 176 | | | | 60,982 | |
| | |
PPG Industries, Inc. | | | 576 | | | | 99,304 | |
| | | | | | | | |
| | |
| | | | | | | 365,257 | |
| | | | | | | | |
|
Commercial Services & Supplies — 0.1% | |
| | |
Cintas Corp. (a) | | | 49 | | | | 21,675 | |
| | | | | | | | |
|
Communications Equipment — 0.1% | |
| | |
Motorola Solutions, Inc. | | | 67 | | | | 18,184 | |
| | | | | | | | |
|
Consumer Finance — 0.3% | |
| | |
Capital One Financial Corp. | | | 397 | | | | 57,632 | |
| | | | | | | | |
|
Containers & Packaging — 0.3% | |
| | |
Avery Dennison Corp. | | | 157 | | | | 34,023 | |
| | |
Westrock Co. | | | 495 | | | | 21,975 | |
| | | | | | | | |
| | |
| | | | | | | 55,998 | |
| | | | | | | | |
|
Diversified Financial Services — 1.4% | |
| | |
Berkshire Hathaway, Inc., Class B * (a) | | | 854 | | | | 255,357 | |
| | |
Voya Financial, Inc. | | | 231 | | | | 15,303 | |
| | | | | | | | |
| | |
| | | | | | | 270,660 | |
| | | | | | | | |
|
Diversified Telecommunication Services — 0.3% | |
| | |
Verizon Communications, Inc. (a) | | | 1,119 | | | | 58,124 | |
| | | | | | | | |
|
Electric Utilities — 1.9% | |
| | |
Edison International | | | 534 | | | | 36,473 | |
| | |
Evergy, Inc. | | | 658 | | | | 45,130 | |
| | |
Exelon Corp. | | | 667 | | | | 38,549 | |
| | |
FirstEnergy Corp. | | | 1,639 | | | | 68,149 | |
| | |
NextEra Energy, Inc. (a) | | | 1,888 | | | | 176,231 | |
| | | | | | | | |
| | |
| | | | | | | 364,532 | |
| | | | | | | | |
SEE NOTES TO FINANCIAL STATEMENTS.
| | | | | | | | | | |
| | | | | |
| 42 | | | | | | | | J.P. MORGAN LARGE CAP FUNDS | | DECEMBER 31, 2021 |
| | | | | | | | |
| INVESTMENTS | | SHARES (000) | | | VALUE ($000) | |
Common Stocks — continued | |
|
Electrical Equipment — 0.6% | |
| | |
Eaton Corp. plc | | | 671 | | | | 115,950 | |
| | | | | | | | |
|
Entertainment — 0.9% | |
| | |
Netflix, Inc. * (a) | | | 239 | | | | 143,915 | |
| | |
Walt Disney Co. (The) * | | | 231 | | | | 35,807 | |
| | | | | | | | |
| | |
| | | | | | | 179,722 | |
| | | | | | | | |
|
Equity Real Estate Investment Trusts (REITs) — 2.5% | |
| | |
Camden Property Trust | | | 331 | | | | 59,131 | |
| | |
Equinix, Inc. | | | 72 | | | | 60,494 | |
| | |
Equity LifeStyle Properties, Inc. | | | 442 | | | | 38,741 | |
| | |
Host Hotels & Resorts, Inc. * | | | 911 | | | | 15,848 | |
| | |
Kimco Realty Corp. | | | 1,229 | | | | 30,285 | |
| | |
Prologis, Inc. | | | 861 | | | | 144,890 | |
| | |
SBA Communications Corp. | | | 93 | | | | 36,023 | |
| | |
Sun Communities, Inc. | | | 237 | | | | 49,838 | |
| | |
UDR, Inc. | | | 137 | | | | 8,208 | |
| | |
Ventas, Inc. | | | 947 | | | | 48,392 | |
| | | | | | | | |
| | |
| | | | | | | 491,850 | |
| | | | | | | | |
|
Food Products — 0.5% | |
| | |
Mondelez International, Inc., Class A (a) | | | 1,449 | | | | 96,072 | |
| | | | | | | | |
|
Health Care Equipment & Supplies — 2.7% | |
| | |
Abbott Laboratories | | | 934 | | | | 131,406 | |
| | |
ABIOMED, Inc. * | | | 21 | | | | 7,483 | |
| | |
Baxter International, Inc. | | | 284 | | | | 24,336 | |
| | |
Becton Dickinson and Co. | | | 202 | | | | 50,839 | |
| | |
Boston Scientific Corp. * (a) | | | 1,637 | | | | 69,528 | |
| | |
Dexcom, Inc. * | | | 44 | | | | 23,495 | |
| | |
Intuitive Surgical, Inc. * | | | 94 | | | | 33,719 | |
| | |
Medtronic plc (a) | | | 1,174 | | | | 121,452 | |
| | |
Zimmer Biomet Holdings, Inc. (a) | | | 572 | | | | 72,692 | |
| | | | | | | | |
| | |
| | | | | | | 534,950 | |
| | | | | | | | |
|
Health Care Providers & Services — 2.8% | |
| | |
Anthem, Inc. (a) | | | 288 | | | | 133,580 | |
| | |
Centene Corp. * | | | 1,005 | | | | 82,792 | |
| | |
Humana, Inc. | | | 83 | | | | 38,500 | |
| | |
McKesson Corp. | | | 94 | | | | 23,241 | |
| | |
UnitedHealth Group, Inc. (a) | | | 549 | | | | 275,671 | |
| | | | | | | | |
| | |
| | | | | | | 553,784 | |
| | | | | | | | |
|
Hotels, Restaurants & Leisure — 1.7% | |
| | |
Booking Holdings, Inc. * (a) | | | 32 | | | | 76,456 | |
| | |
Hilton Worldwide Holdings, Inc. * | | | 354 | | | | 55,200 | |
| | |
McDonald’s Corp. | | | 685 | | | | 183,656 | |
| | |
Royal Caribbean Cruises Ltd. * | | | 102 | | | | 7,839 | |
| | | | | | | | |
| | |
| | | | | | | 323,151 | |
| | | | | | | | |
| | | | | | | | |
| INVESTMENTS | | SHARES
(000) | | | VALUE ($000) | |
| | | | | | | | |
|
Household Durables — 0.6% | |
| | |
DR Horton, Inc. | | | 65 | | | | 7,049 | |
| | |
Lennar Corp., Class A | | | 766 | | | | 89,016 | |
| | |
Toll Brothers, Inc. | | | 368 | | | | 26,618 | |
| | | | | | | | |
| | |
| | | | | | | 122,683 | |
| | | | | | | | |
|
Household Products — 1.5% | |
| | |
Kimberly-Clark Corp. | | | 419 | | | | 59,825 | |
| | |
Procter & Gamble Co. (The) (a) | | | 1,430 | | | | 233,913 | |
| | | | | | | | |
| | |
| | | | | | | 293,738 | |
| | | | | | | | |
|
Industrial Conglomerates — 0.3% | |
| | |
Honeywell International, Inc. (a) | | | 323 | | | | 67,244 | |
| | | | | | | | |
|
Insurance — 1.8% | |
| | |
Chubb Ltd. | | | 467 | | | | 90,199 | |
| | |
Hartford Financial Services Group, Inc. (The) | | | 1,123 | | | | 77,555 | |
| | |
Progressive Corp. (The) | | | 1,250 | | | | 128,353 | |
| | |
Prudential Financial, Inc. | | | 357 | | | | 38,695 | |
| | |
Travelers Cos., Inc. (The) | | | 116 | | | | 18,178 | |
| | | | | | | | |
| | |
| | | | | | | 352,980 | |
| | | | | | | | |
|
Interactive Media & Services — 6.8% | |
| | |
Alphabet, Inc., Class A * (a) | | | 181 | | | | 525,775 | |
| | |
Alphabet, Inc., Class C * (a) | | | 138 | | | | 400,444 | |
| | |
Meta Platforms, Inc., Class A * (a) | | | 1,139 | | | | 382,989 | |
| | |
ZoomInfo Technologies, Inc., Class A * | | | 457 | | | | 29,320 | |
| | | | | | | | |
| | |
| | | | | | | 1,338,528 | |
| | | | | | | | |
|
Internet & Direct Marketing Retail — 3.9% | |
| | |
Amazon.com, Inc. * (a) | | | 228 | | | | 759,016 | |
| | | | | | | | |
|
IT Services — 4.6% | |
| | |
Accenture plc, Class A | | | 532 | | | | 220,386 | |
| | |
FleetCor Technologies, Inc. * | | | 211 | | | | 47,170 | |
| | |
International Business Machines Corp. | | | 704 | | | | 94,099 | |
| | |
Mastercard, Inc., Class A (a) | | | 747 | | | | 268,337 | |
| | |
PayPal Holdings, Inc. * | | | 200 | | | | 37,774 | |
| | |
Shopify, Inc., Class A (Canada) * | | | 19 | | | | 25,757 | |
| | |
Visa, Inc., Class A (a) | | | 977 | | | | 211,742 | |
| | | | | | | | |
| | |
| | | | | | | 905,265 | |
| | | | | | | | |
|
Life Sciences Tools & Services — 1.7% | |
| | |
Danaher Corp. | | | 183 | | | | 60,140 | |
| | |
Illumina, Inc. * | | | 68 | | | | 25,874 | |
| | |
PerkinElmer, Inc. | | | 72 | | | | 14,436 | |
| | |
Thermo Fisher Scientific, Inc. (a) | | | 337 | | | | 224,965 | |
| | | | | | | | |
| | |
| | | | | | | 325,415 | |
| | | | | | | | |
SEE NOTES TO FINANCIAL STATEMENTS.
| | | | | | | | | | |
| | | | | |
| DECEMBER 31, 2021 | | J.P. MORGAN LARGE CAP FUNDS | | | | | | | | 43 |
JPMorgan Hedged Equity Fund
SCHEDULE OF PORTFOLIO INVESTMENTS
AS OF DECEMBER 31, 2021 (Unaudited) (continued)
| | | | | | | | |
| INVESTMENTS | | SHARES (000) | | | VALUE ($000) | |
Common Stocks — continued | |
|
Machinery — 2.4% | |
| | |
Deere & Co. | | | 456 | | | | 156,409 | |
| | |
Ingersoll Rand, Inc. | | | 524 | | | | 32,432 | |
| | |
Otis Worldwide Corp. | | | 1,160 | | | | 101,019 | |
| | |
Parker-Hannifin Corp. | | | 219 | | | | 69,517 | |
| | |
Stanley Black & Decker, Inc. | | | 559 | | | | 105,404 | |
| | | | | | | | |
| | |
| | | | | | | 464,781 | |
| | | | | | | | |
|
Media — 1.1% | |
| | |
Charter Communications, Inc., Class A * (a) | | | 104 | | | | 67,924 | |
| | |
Comcast Corp., Class A (a) | | | 2,749 | | | | 138,355 | |
| | |
Fox Corp., Class A | | | 109 | | | | 4,024 | |
| | | | | | | | |
| | |
| | | | | | | 210,303 | |
| | | | | | | | |
|
Metals & Mining — 0.1% | |
| | |
Freeport-McMoRan, Inc. | | | 577 | | | | 24,097 | |
| | | | | | | | |
|
Multiline Retail — 0.6% | |
| | |
Dollar General Corp. | | | 70 | | | | 16,625 | |
| | |
Dollar Tree, Inc. * | | | 156 | | | | 21,973 | |
| | |
Target Corp. | | | 375 | | | | 86,729 | |
| | | | | | | | |
| | |
| | | | | | | 125,327 | |
| | | | | | | | |
|
Multi-Utilities — 0.6% | |
| | |
CenterPoint Energy, Inc. | | | 2,668 | | | | 74,464 | |
| | |
DTE Energy Co. | | | 316 | | | | 37,799 | |
| | | | | | | | |
| | |
| | | | | | | 112,263 | |
| | | | | | | | |
|
Oil, Gas & Consumable Fuels — 2.6% | |
| | |
Cheniere Energy, Inc. | | | 223 | | | | 22,637 | |
| | |
Chevron Corp. (a) | | | 974 | | | | 114,309 | |
| | |
ConocoPhillips | | | 1,923 | | | | 138,779 | |
| | |
Coterra Energy, Inc. | | | 222 | | | | 4,211 | |
| | |
Diamondback Energy, Inc. | | | 726 | | | | 78,331 | |
| | |
EOG Resources, Inc. (a) | | | 516 | | | | 45,797 | |
| | |
Phillips 66 | | | 102 | | | | 7,402 | |
| | |
Pioneer Natural Resources Co. (a) | | | 481 | | | | 87,485 | |
| | |
Williams Cos., Inc. (The) | | | 549 | | | | 14,284 | |
| | | | | | | | |
| | |
| | | | | | | 513,235 | |
| | | | | | | | |
|
Personal Products — 0.3% | |
| | |
Estee Lauder Cos., Inc. (The), Class A | | | 184 | | | | 68,012 | |
| | | | | | | | |
|
Pharmaceuticals — 3.4% | |
| | |
Bristol-Myers Squibb Co. (a) | | | 2,501 | | | | 155,929 | |
| | |
Eli Lilly & Co. (a) | | | 666 | | | | 184,012 | |
| | |
Johnson & Johnson (a) | | | 1,109 | | | | 189,691 | |
| | |
Merck & Co., Inc. | | | 949 | | | | 72,764 | |
| | |
Pfizer, Inc. | | | 1,055 | | | | 62,312 | |
| | | | | | | | |
| | |
| | | | | | | 664,708 | |
| | | | | | | | |
| | | | | | | | |
| INVESTMENTS | | SHARES (000) | | | VALUE ($000) | |
| | | | | | | | |
|
Professional Services — 0.4% | |
| | |
Booz Allen Hamilton Holding Corp. | | | 258 | | | | 21,843 | |
| | |
Leidos Holdings, Inc. | | | 543 | | | | 48,246 | |
| | | | | | | | |
| | |
| | | | | | | 70,089 | |
| | | | | | | | |
|
Road & Rail — 1.0% | |
| | |
Lyft, Inc., Class A * | | | 502 | | | | 21,444 | |
| | |
Norfolk Southern Corp. (a) | | | 354 | | | | 105,503 | |
| | |
Union Pacific Corp. | | | 276 | | | | 69,538 | |
| | | | | | | | |
| | |
| | | | | | | 196,485 | |
| | | | | | | | |
|
Semiconductors & Semiconductor Equipment — 6.9% | |
| | |
Advanced Micro Devices, Inc. * (a) | | | 1,103 | | | | 158,744 | |
| | |
Analog Devices, Inc. | | | 712 | | | | 125,134 | |
| | |
Applied Materials, Inc. | | | 925 | | | | 145,485 | |
| | |
Intel Corp. | | | 279 | | | �� | 14,393 | |
| | |
KLA Corp. | | | 70 | | | | 30,237 | |
| | |
Lam Research Corp. | | | 228 | | | | 163,766 | |
| | |
Microchip Technology, Inc. | | | 446 | | | | 38,809 | |
| | |
Micron Technology, Inc. | | | 208 | | | | 19,348 | |
| | |
NVIDIA Corp. (a) | | | 1,057 | | | | 310,777 | |
| | |
NXP Semiconductors NV (China) | | | 499 | | | | 113,726 | |
| | |
QUALCOMM, Inc. | | | 331 | | | | 60,507 | |
| | |
Texas Instruments, Inc. (a) | | | 932 | | | | 175,653 | |
| | | | | | | | |
| | |
| | | | | | | 1,356,579 | |
| | | | | | | | |
|
Software — 9.2% | |
| | |
Ceridian HCM Holding, Inc. * | | | 84 | | | | 8,816 | |
| | |
Fortinet, Inc. * | | | 66 | | | | 23,816 | |
| | |
Intuit, Inc. (a) | | | 285 | | | | 183,614 | |
| | |
Microsoft Corp. (a) | | | 4,063 | | | | 1,366,592 | |
| | |
Oracle Corp. | | | 774 | | | | 67,509 | |
| | |
salesforce.com, Inc. * (a) | | | 281 | | | | 71,419 | |
| | |
Workday, Inc., Class A * | | | 237 | | | | 64,725 | |
| | | | | | | | |
| | |
| | | | | | | 1,786,491 | |
| | | | | | | | |
|
Specialty Retail — 3.4% | |
| | |
AutoZone, Inc. * (a) | | | 17 | | | | 36,085 | |
| | |
Best Buy Co., Inc. (a) | | | 695 | | | | 70,607 | |
| | |
Home Depot, Inc. (The) (a) | | | 338 | | | | 140,460 | |
| | |
Lowe’s Cos., Inc. (a) | | | 819 | | | | 211,751 | |
| | |
O’Reilly Automotive, Inc. * | | | 190 | | | | 134,102 | |
| | |
TJX Cos., Inc. (The)(a) | | | 994 | | | | 75,434 | |
| | | | | | | | |
| | |
| | | | | | | 668,439 | |
| | | | | | | | |
|
Technology Hardware, Storage & Peripherals — 7.3% | |
| | |
Apple, Inc. (a) | | | 7,459 | | | | 1,324,540 | |
| | |
Seagate Technology Holdings plc | | | 897 | | | | 101,378 | |
| | | | | | | | |
| | |
| | | | | | | 1,425,918 | |
| | | | | | | | |
SEE NOTES TO FINANCIAL STATEMENTS.
| | | | | | | | | | |
| | | | | |
| 44 | | | | | | | | J.P. MORGAN LARGE CAP FUNDS | | DECEMBER 31, 2021 |
| | | | | | | | |
| INVESTMENTS | | SHARES
(000) | | | VALUE ($000) | |
Common Stocks — continued | |
|
Textiles, Apparel & Luxury Goods — 0.8% | |
| | |
NIKE, Inc., Class B | | | 885 | | | | 147,477 | |
| | | | | | | | |
|
Tobacco — 0.9% | |
| | |
Altria Group, Inc. (a) | | | 1,709 | | | | 80,967 | |
| | |
Philip Morris International, Inc. | | | 1,021 | | | | 96,977 | |
| | | | | | | | |
| | |
| | | | | | | 177,944 | |
| | | | | | | | |
|
Wireless Telecommunication Services — 0.6% | |
| | |
T-Mobile US, Inc. * | | | 931 | | | | 107,955 | |
| | | | | | | | |
| |
Total Common Stocks
(Cost $11,725,472) | | | | 18,974,713 | |
| | | | | |
| | |
| | | NO. OF
CONTRACTS | | | | |
Options Purchased — 1.8% | |
|
Put Options Purchased — 1.8% | |
| | |
Index Funds — 1.8% | | | | | | | | |
| | |
S&P 500 Index 3/31/2022 at USD 4,510.00, European Style
Notional Amount: USD 19,411,698
Counterparty: Exchange-Traded *
(Cost $347,125) | | | 40,728 | | | | 354,537 | |
| | | | | | | | |
| | | | | | | | |
| INVESTMENTS | | SHARES
(000) | | | VALUE ($000) | |
Short-Term Investments — 6.6% | |
|
Investment Companies — 6.6% | |
| | |
JPMorgan U.S. Government Money Market Fund Class Institutional Shares, 0.01% (b) (c)
(Cost $1,296,982) | | | 1,296,982 | | | | 1,296,982 | |
| | | | | | | | |
Total Investments — 105.5%
(Cost $13,369,579) | | | | | | | 20,626,232 | |
Liabilities in Excess of
Other Assets — (5.5)% | | | | | | | (1,070,424 | ) |
| | | | | | | | |
NET ASSETS — 100.0% | | | | | | | 19,555,808 | |
| | | | | | | | |
Percentages indicated are based on net assets.
Abbreviations
| | |
| |
| USD | | United States Dollar |
| |
| (a) | | All or a portion of the security is segregated for options written. |
| (b) | | Investment in an affiliated fund, which is registered under the Investment Company Act of 1940, as amended, and is advised by J.P. Morgan Investment Management Inc. |
| (c) | | The rate shown is the current yield as of December 31, 2021. |
| * | | Non-income producing security. |
| | | | | | | | | | | | | | | | | | | | |
| Futures contracts outstanding as of December 31, 2021 (amounts in thousands, except number of contracts): | |
| DESCRIPTION | | NUMBER OF
CONTRACTS | | | EXPIRATION
DATE | | | TRADING
CURRENCY | | | NOTIONAL
AMOUNT ($) | | | VALUE AND
UNREALIZED
APPRECIATION
(DEPRECIATION) ($) | |
Long Contracts | | | | | | | | | | | | | | | | | | | | |
S&P 500 E-Mini Index | | | 2,188 | | | | 03/2022 | | | | USD | | | | 520,553 | | | | 5,808 | |
| | | | | | | | | | | | | | | | | | | | |
Abbreviations
| | | | | | | | | | | | | | | | | | | | | | |
| Written Call Options Contracts as of December 31, 2021 (amounts in thousands, except number of contracts): | | | | |
| | | | | | |
| DESCRIPTION | | COUNTERPARTY | | NUMBER OF
CONTRACTS | | | NOTIONAL
AMOUNT | | | EXERCISE
PRICE | | | EXPIRATION
DATE | | | VALUE ($) | |
| S&P 500 Index | | Exchange-Traded | | | 40,728 | | | | USD 19,411,698 | | | | USD 4,920.00 | | | | 3/31/2022 | | | | (254,958 | ) |
| | | | | | | | | | | | | | | | | | | | | | |
| | | | | | | | | | | | | | | | | | | | | | |
| Written Put Options Contracts as of December 31, 2021 (amounts in thousands, except number of contracts): | | | | |
| | | | | | |
| DESCRIPTION | | COUNTERPARTY | | NUMBER OF
CONTRACTS | | | NOTIONAL
AMOUNT | | | EXERCISE
PRICE | | | EXPIRATION
DATE | | | VALUE ($) | |
| S&P 500 Index | | Exchange-Traded | | | 40,728 | | | | USD 19,411,698 | | | | USD 3,810.00 | | | | 3/31/2022 | | | | (89,805 | ) |
| | | | | | | | | | | | | | | | | | | | | | |
| Total Written Options Contracts (Premiums Received $342,970) | | | | | | | | | | | | | | | | (344,763 | ) |
| | | | | | | | | | | | | | | | | | | | | | |
Abbreviations
SEE NOTES TO FINANCIAL STATEMENTS.
| | | | | | | | | | |
| | | | | |
| DECEMBER 31, 2021 | | J.P. MORGAN LARGE CAP FUNDS | | | | | | | | 45 |
JPMorgan Hedged Equity 2 Fund
SCHEDULE OF PORTFOLIO INVESTMENTS
AS OF DECEMBER 31, 2021 (Unaudited)
| | | | | | | | |
| INVESTMENTS | | SHARES
(000) | | | VALUE
($000) | |
Common Stocks — 100.5% | |
|
Aerospace & Defense — 0.8% | |
| | |
Northrop Grumman Corp. | | | 35 | | | | 13,479 | |
| | |
Raytheon Technologies Corp. | | | 216 | | | | 18,570 | |
| | | | | | | | |
| | |
| | | | | | | 32,049 | |
| | | | | | | | |
|
Air Freight & Logistics — 1.1% | |
| | |
FedEx Corp. | | | 52 | | | | 13,467 | |
| | |
United Parcel Service, Inc., Class B | | | 140 | | | | 29,932 | |
| | | | | | | | |
| | |
| | | | | | | 43,399 | |
| | | | | | | | |
|
Airlines — 0.2% | |
| | |
Southwest Airlines Co. * | | | 196 | | | | 8,414 | |
| | | | | | | | |
|
Auto Components — 0.3% | |
| | |
Aptiv plc * | | | 24 | | | | 3,985 | |
| | |
Magna International, Inc. (Canada) | | | 89 | | | | 7,192 | |
| | | | | | | | |
| | |
| | | | | | | 11,177 | |
| | | | | | | | |
|
Automobiles — 2.4% | |
| | |
General Motors Co. * | | | 158 | | | | 9,291 | |
| | |
Rivian Automotive, Inc., Class A * | | | 32 | | | | 3,293 | |
| | |
Tesla, Inc. * (a) | | | 77 | | | | 81,717 | |
| | | | | | | | |
| | |
| | | | | | | 94,301 | |
| | | | | | | | |
|
Banks — 3.9% | |
| | |
Bank of America Corp. | | | 459 | | | | 20,440 | |
| | |
Citigroup, Inc. | | | 365 | | | | 22,027 | |
| | |
Fifth Third Bancorp | | | 216 | | | | 9,388 | |
| | |
Regions Financial Corp. | | | 523 | | | | 11,409 | |
| | |
SVB Financial Group * | | | 10 | | | | 6,655 | |
| | |
Truist Financial Corp. | | | 242 | | | | 14,140 | |
| | |
US Bancorp | | | 425 | | | | 23,871 | |
| | |
Wells Fargo & Co. | | | 879 | | | | 42,175 | |
| | | | | | | | |
| | |
| | | | | | | 150,105 | |
| | | | | | | | |
|
Beverages — 1.3% | |
| | |
Coca-Cola Co. (The) | | | 595 | | | | 35,250 | |
| | |
Constellation Brands, Inc., Class A | | | 57 | | | | 14,263 | |
| | | | | | | | |
| | |
| | | | | | | 49,513 | |
| | | | | | | | |
|
Biotechnology — 2.4% | |
| | |
AbbVie, Inc. | | | 338 | | | | 45,755 | |
| | |
Biogen, Inc. * | | | 31 | | | | 7,325 | |
| | |
BioMarin Pharmaceutical, Inc. * | | | 22 | | | | 1,943 | |
| | |
Moderna, Inc. * | | | 14 | | | | 3,636 | |
| | |
Neurocrine Biosciences, Inc. * | | | 23 | | | | 1,993 | |
| | |
Regeneron Pharmaceuticals, Inc. * | | | 27 | | | | 16,928 | |
| | |
Vertex Pharmaceuticals, Inc. * | | | 71 | | | | 15,510 | |
| | | | | | | | |
| | |
| | | | | | | 93,090 | |
| | | | | | | | |
| | | | | | | | |
| INVESTMENTS | | SHARES
(000) | | | VALUE
($000) | |
| | | | | | | | |
|
Building Products — 1.2% | |
| | |
Johnson Controls International plc | | | 151 | | | | 12,272 | |
| | |
Masco Corp. | | | 124 | | | | 8,674 | |
| | |
Trane Technologies plc | | | 130 | | | | 26,357 | |
| | | | | | | | |
| | |
| | | | | | | 47,303 | |
| | | | | | | | |
|
Capital Markets — 3.3% | |
| | |
Goldman Sachs Group, Inc. (The) | | | 54 | | | | 20,702 | |
| | |
Intercontinental Exchange, Inc. | | | 89 | | | | 12,182 | |
| | |
Morgan Stanley | | | 188 | | | | 18,426 | |
| | |
S&P Global, Inc. | | | 72 | | | | 34,116 | |
| | |
State Street Corp. | | | 244 | | | | 22,678 | |
| | |
T. Rowe Price Group, Inc. | | | 102 | | | | 20,019 | |
| | | | | | | | |
| | |
| | | | | | | 128,123 | |
| | | | | | | | |
|
Chemicals — 1.9% | |
| | |
Air Products and Chemicals, Inc. | | | 19 | | | | 5,893 | |
| | |
Celanese Corp. | | | 33 | | | | 5,553 | |
| | |
DuPont de Nemours, Inc. | | | 147 | | | | 11,858 | |
| | |
Eastman Chemical Co. | | | 154 | | | | 18,632 | |
| | |
Linde plc (United Kingdom) | | | 37 | | | | 12,656 | |
| | |
PPG Industries, Inc. | | | 120 | | | | 20,651 | |
| | | | | | | | |
| | |
| | | | | | | 75,243 | |
| | | | | | | | |
|
Commercial Services & Supplies — 0.1% | |
| | |
Cintas Corp. | | | 10 | | | | 4,320 | |
| | | | | | | | |
|
Communications Equipment — 0.1% | |
| | |
Motorola Solutions, Inc. | | | 14 | | | | 3,928 | |
| | | | | | | | |
|
Consumer Finance — 0.3% | |
| | |
Capital One Financial Corp. | | | 81 | | | | 11,789 | |
| | | | | | | | |
|
Containers & Packaging — 0.3% | |
| | |
Avery Dennison Corp. | | | 33 | | | | 7,080 | |
| | |
Westrock Co. | | | 98 | | | | 4,345 | |
| | | | | | | | |
| | |
| | | | | | | 11,425 | |
| | | | | | | | |
|
Diversified Financial Services — 1.4% | |
| | |
Berkshire Hathaway, Inc., Class B * | | | 176 | | | | 52,758 | |
| | |
Voya Financial, Inc. | | | 47 | | | | 3,147 | |
| | | | | | | | |
| | |
| | | | | | | 55,905 | |
| | | | | | | | |
|
Diversified Telecommunication Services — 0.3% | |
| | |
Verizon Communications, Inc. | | | 233 | | | | 12,131 | |
| | | | | | | | |
|
Electric Utilities — 1.9% | |
| | |
Edison International | | | 109 | | | | 7,471 | |
| | |
Evergy, Inc. | | | 138 | | | | 9,478 | |
| | |
Exelon Corp. | | | 139 | | | | 8,041 | |
| | |
FirstEnergy Corp. | | | 335 | | | | 13,939 | |
| | |
NextEra Energy, Inc. | | | 390 | | | | 36,417 | |
| | | | | | | | |
| | |
| | | | | | | 75,346 | |
| | | | | | | | |
SEE NOTES TO FINANCIAL STATEMENTS.
| | | | | | | | | | |
| | | | | |
| 46 | | | | | | | | J.P. MORGAN LARGE CAP FUNDS | | DECEMBER 31, 2021 |
| | | | | | | | |
| INVESTMENTS | | SHARES
(000) | | | VALUE
($000) | |
Common Stocks — continued | |
|
Electrical Equipment — 0.6% | |
| | |
Eaton Corp. plc | | | 138 | | | | 23,812 | |
| | | | | | | | |
|
Entertainment — 1.0% | |
| | |
Netflix, Inc. * | | | 49 | | | | 29,571 | |
| | |
Walt Disney Co. (The) * | | | 48 | | | | 7,493 | |
| | | | | | | | |
| | |
| | | | | | | 37,064 | |
| | | | | | | | |
|
Equity Real Estate Investment Trusts (REITs) — 2.6% | |
| | |
Camden Property Trust | | | 69 | | | | 12,294 | |
| | |
Equinix, Inc. | | | 15 | | | | 12,676 | |
| | |
Equity LifeStyle Properties, Inc. | | | 90 | | | | 7,903 | |
| | |
Host Hotels & Resorts, Inc. * | | | 180 | | | | 3,138 | |
| | |
Kimco Realty Corp. | | | 260 | | | | 6,413 | |
| | |
Prologis, Inc. | | | 179 | | | | 30,090 | |
| | |
SBA Communications Corp. | | | 19 | | | | 7,571 | |
| | |
Sun Communities, Inc. | | | 49 | | | | 10,231 | |
| | |
UDR, Inc. | | | 26 | | | | 1,582 | |
| | |
Ventas, Inc. | | | 195 | | | | 9,946 | |
| | | | | | | | |
| | |
| | | | | | | 101,844 | |
| | | | | | | | |
|
Food Products — 0.5% | |
| | |
Mondelez International, Inc., Class A | | | 297 | | | | 19,698 | |
| | | | | | | | |
|
Health Care Equipment & Supplies — 2.8% | |
| | |
Abbott Laboratories | | | 193 | | | | 27,120 | |
| | |
ABIOMED, Inc. * | | | 4 | | | | 1,566 | |
| | |
Baxter International, Inc. | | | 59 | | | | 5,047 | |
| | |
Becton Dickinson and Co. | | | 42 | | | | 10,592 | |
| | |
Boston Scientific Corp. * | | | 338 | | | | 14,357 | |
| | |
Dexcom, Inc. * | | | 9 | | | | 4,746 | |
| | |
Intuitive Surgical, Inc. * | | | 19 | | | | 6,982 | |
| | |
Medtronic plc | | | 243 | | | | 25,115 | |
| | |
Zimmer Biomet Holdings, Inc. | | | 117 | | | | 14,845 | |
| | | | | | | | |
| | |
| | | | | | | 110,370 | |
| | | | | | | | |
|
Health Care Providers & Services — 2.9% | |
| | |
Anthem, Inc. | | | 60 | | | | 27,750 | |
| | |
Centene Corp. * | | | 206 | | | | 16,975 | |
| | |
Humana, Inc. | | | 17 | | | | 7,800 | |
| | |
McKesson Corp. | | | 19 | | | | 4,734 | |
| | |
UnitedHealth Group, Inc. | | | 113 | | | | 56,787 | |
| | | | | | | | |
| | |
| | | | | | | 114,046 | |
| | | | | | | | |
|
Hotels, Restaurants & Leisure — 1.7% | |
| | |
Booking Holdings, Inc. * | | | 7 | | | | 15,869 | |
| | |
Hilton Worldwide Holdings, Inc. * | | | 74 | | | | 11,481 | |
| | |
McDonald’s Corp. | | | 141 | | | | 37,795 | |
| | |
Royal Caribbean Cruises Ltd. * | | | 20 | | | | 1,551 | |
| | | | | | | | |
| | |
| | | | | | | 66,696 | |
| | | | | | | | |
| | | | | | | | |
| INVESTMENTS | | SHARES
(000) | | | VALUE
($000) | |
| | | | | �� | | | |
|
Household Durables — 0.7% | |
| | |
DR Horton, Inc. | | | 15 | | | | 1,579 | |
| | |
Lennar Corp., Class A | | | 160 | | | | 18,542 | |
| | |
Toll Brothers, Inc. | | | 76 | | | | 5,526 | |
| | | | | | | | |
| | |
| | | | | | | 25,647 | |
| | | | | | | | |
|
Household Products — 1.6% | |
| | |
Kimberly-Clark Corp. | | | 87 | | | | 12,384 | |
| | |
Procter & Gamble Co. (The) | | | 295 | | | | 48,322 | |
| | | | | | | | |
| | |
| | | | | | | 60,706 | |
| | | | | | | | |
|
Industrial Conglomerates — 0.4% | |
| | |
Honeywell International, Inc. | | | 67 | | | | 13,867 | |
| | | | | | | | |
|
Insurance — 1.9% | |
| | |
Chubb Ltd. | | | 95 | | | | 18,433 | |
| | |
Hartford Financial Services Group, Inc. (The) | | | 232 | | | | 16,044 | |
| | |
Progressive Corp. (The) | | | 258 | | | | 26,474 | |
| | |
Prudential Financial, Inc. | | | 72 | | | | 7,826 | |
| | |
Travelers Cos., Inc. (The) | | | 25 | | | | 3,916 | |
| | | | | | | | |
| | |
| | | | | | | 72,693 | |
| | | | | | | | |
|
Interactive Media & Services — 7.1% | |
| | |
Alphabet, Inc., Class A * (a) | | | 38 | | | | 108,662 | |
| | |
Alphabet, Inc., Class C * (a) | | | 29 | | | | 82,554 | |
| | |
Meta Platforms, Inc., Class A * | | | 235 | | | | 78,896 | |
| | |
ZoomInfo Technologies, Inc., Class A * | | | 92 | | | | 5,888 | |
| | | | | | | | |
| | |
| | | | | | | 276,000 | |
| | | | | | | | |
|
Internet & Direct Marketing Retail — 4.0% | |
| | |
Amazon.com, Inc. * (a) | | | 47 | | | | 156,577 | |
| | | | | | | | |
|
IT Services — 4.8% | |
| | |
Accenture plc, Class A | | | 110 | | | | 45,645 | |
| | |
FleetCor Technologies, Inc. * | | | 44 | | | | 9,772 | |
| | |
International Business Machines Corp. | | | 145 | | | | 19,367 | |
| | |
Mastercard, Inc., Class A | | | 154 | | | | 55,295 | |
| | |
PayPal Holdings, Inc. * | | | 42 | | | | 7,829 | |
| | |
Shopify, Inc., Class A (Canada) * | | | 4 | | | | 5,463 | |
| | |
Visa, Inc., Class A | | | 202 | | | | 43,869 | |
| | | | | | | | |
| | |
| | | | | | | 187,240 | |
| | | | | | | | |
|
Life Sciences Tools & Services — 1.7% | |
| | |
Danaher Corp. | | | 37 | | | | 12,315 | |
| | |
Illumina, Inc. * | | | 14 | | | | 5,161 | |
| | |
PerkinElmer, Inc. | | | 14 | | | | 2,810 | |
| | |
Thermo Fisher Scientific, Inc. | | | 70 | | | | 46,450 | |
| | | | | | | | |
| | |
| | | | | | | 66,736 | |
| | | | | | | | |
SEE NOTES TO FINANCIAL STATEMENTS.
| | | | | | | | | | |
| | | | | |
| DECEMBER 31, 2021 | | J.P. MORGAN LARGE CAP FUNDS | | | | | | | | 47 |
JPMorgan Hedged Equity 2 Fund
SCHEDULE OF PORTFOLIO INVESTMENTS
AS OF DECEMBER 31, 2021 (Unaudited) (continued)
| | | | | | | | |
| INVESTMENTS | | SHARES
(000) | | | VALUE
($000) | |
Common Stocks — continued | |
|
Machinery — 2.5% | |
| | |
Deere & Co. | | | 95 | | | | 32,462 | |
| | |
Ingersoll Rand, Inc. | | | 109 | | | | 6,755 | |
| | |
Otis Worldwide Corp. | | | 241 | | | | 20,959 | |
| | |
Parker-Hannifin Corp. | | | 45 | | | | 14,174 | |
| | |
Stanley Black & Decker, Inc. | | | 116 | | | | 21,851 | |
| | | | | | | | |
| | |
| | | | | | | 96,201 | |
| | | | | | | | |
|
Media — 1.1% | |
| | |
Charter Communications, Inc., Class A * | | | 22 | | | | 14,102 | |
| | |
Comcast Corp., Class A | | | 569 | | | | 28,637 | |
| | |
Fox Corp., Class A | | | 21 | | | | 785 | |
| | | | | | | | |
| | |
| | | | | | | 43,524 | |
| | | | | | | | |
|
Metals & Mining — 0.1% | |
| | |
Freeport-McMoRan, Inc. | | | 122 | | | | 5,096 | |
| | | | | | | | |
|
Multiline Retail — 0.7% | |
| | |
Dollar General Corp. | | | 15 | | | | 3,583 | |
| | |
Dollar Tree, Inc. * | | | 31 | | | | 4,344 | |
| | |
Target Corp. | | | 78 | | | | 18,019 | |
| | | | | | | | |
| | |
| | | | | | | 25,946 | |
| | | | | | | | |
|
Multi-Utilities — 0.6% | |
| | |
CenterPoint Energy, Inc. | | | 550 | | | | 15,357 | |
| | |
DTE Energy Co. | | | 66 | | | | 7,897 | |
| | | | | | | | |
| | |
| | | | | | | 23,254 | |
| | | | | | | | |
|
Oil, Gas & Consumable Fuels — 2.7% | |
| | |
Cheniere Energy, Inc. | | | 46 | | | | 4,639 | |
| | |
Chevron Corp. | | | 201 | | | | 23,539 | |
| | |
ConocoPhillips | | | 395 | | | | 28,494 | |
| | |
Coterra Energy, Inc. | | | 39 | | | | 749 | |
| | |
Diamondback Energy, Inc. | | | 149 | | | | 16,039 | |
| | |
EOG Resources, Inc. | | | 105 | | | | 9,356 | |
| | |
Phillips 66 | | | 22 | | | | 1,569 | |
| | |
Pioneer Natural Resources Co. | | | 99 | | | | 17,973 | |
| | |
Williams Cos., Inc. (The) | | | 106 | | | | 2,760 | |
| | | | | | | | |
| | |
| | | | | | | 105,118 | |
| | | | | | | | |
|
Personal Products — 0.4% | |
| | |
Estee Lauder Cos., Inc. (The), Class A | | | 38 | | | | 14,200 | |
| | | | | | | | |
|
Pharmaceuticals — 3.5% | |
| | |
Bristol-Myers Squibb Co. | | | 519 | | | | 32,366 | |
| | |
Eli Lilly & Co. | | | 137 | | | | 37,947 | |
| | |
Johnson & Johnson | | | 230 | | | | 39,322 | |
| | |
Merck & Co., Inc. | | | 195 | | | | 14,924 | |
| | |
Pfizer, Inc. | | | 219 | | | | 12,940 | |
| | | | | | | | |
| | |
| | | | | | | 137,499 | |
| | | | | | | | |
| | | | | | | | |
| INVESTMENTS | | SHARES
(000) | | | VALUE
($000) | |
| | | | | | | | |
|
Professional Services — 0.4% | |
| | |
Booz Allen Hamilton Holding Corp. | | | 51 | | | | 4,318 | |
| | |
Leidos Holdings, Inc. | | | 112 | | | | 9,918 | |
| | | | | | | | |
| | |
| | | | | | | 14,236 | |
| | | | | | | | |
|
Road & Rail — 1.0% | |
| | |
Lyft, Inc., Class A * | | | 100 | | | | 4,286 | |
| | |
Norfolk Southern Corp. | | | 73 | | | | 21,832 | |
| | |
Union Pacific Corp. | | | 57 | | | | 14,246 | |
| | | | | | | | |
| | |
| | | | | | | 40,364 | |
| | | | | | | | |
|
Semiconductors & Semiconductor Equipment — 7.2% | |
| | |
Advanced Micro Devices, Inc. * | | | 229 | | | | 32,914 | |
| | |
Analog Devices, Inc. | | | 146 | | | | 25,668 | |
| | |
Applied Materials, Inc. | | | 191 | | | | 30,066 | |
| | |
Intel Corp. | | | 61 | | | | 3,134 | |
| | |
KLA Corp. | | | 15 | | | | 6,237 | |
| | |
Lam Research Corp. | | | 47 | | | | 33,947 | |
| | |
Microchip Technology, Inc. | | | 94 | | | | 8,170 | |
| | |
Micron Technology, Inc. | | | 41 | | | | 3,819 | |
| | |
NVIDIA Corp. | | | 218 | | | | 64,171 | |
| | |
NXP Semiconductors NV (China) | | | 103 | | | | 23,378 | |
| | |
QUALCOMM, Inc. | | | 68 | | | | 12,393 | |
| | |
Texas Instruments, Inc. | | | 192 | | | | 36,222 | |
| | | | | | | | |
| | |
| | | | | | | 280,119 | |
| | | | | | | | |
|
Software — 9.4% | |
| | |
Ceridian HCM Holding, Inc. * | | | 19 | | | | 1,958 | |
| | |
Fortinet, Inc. * | | | 14 | | | | 5,024 | |
| | |
Intuit, Inc. | | | 59 | | | | 37,966 | |
| | |
Microsoft Corp. (a) | | | 838 | | | | 281,953 | |
| | |
Oracle Corp. | | | 161 | | | | 14,035 | |
| | |
salesforce.com, Inc. * | | | 57 | | | | 14,566 | |
| | |
Workday, Inc., Class A * | | | 49 | | | | 13,282 | |
| | | | | | | | |
| | |
| | | | | | | 368,784 | |
| | | | | | | | |
|
Specialty Retail — 3.5% | |
| | |
AutoZone, Inc. * | | | 4 | | | | 7,465 | |
| | |
Best Buy Co., Inc. | | | 145 | | | | 14,697 | |
| | |
Home Depot, Inc. (The) | | | 70 | | | | 29,078 | |
| | |
Lowe’s Cos., Inc. | | | 168 | | | | 43,529 | |
| | |
O’Reilly Automotive, Inc. * | | | 39 | | | | 27,528 | |
| | |
TJX Cos., Inc. (The) | | | 204 | | | | 15,472 | |
| | | | | | | | |
| | |
| | | | | | | 137,769 | |
| | | | | | | | |
|
Technology Hardware, Storage & Peripherals — 7.6% | |
| | |
Apple, Inc. (a) | | | 1,539 | | | | 273,241 | |
| | |
Seagate Technology Holdings plc | | | 185 | | | | 20,920 | |
| | | | | | | | |
| | |
| | | | | | | 294,161 | |
| | | | | | | | |
SEE NOTES TO FINANCIAL STATEMENTS.
| | | | | | | | | | |
| | | | | |
| 48 | | | | | | | | J.P. MORGAN LARGE CAP FUNDS | | DECEMBER 31, 2021 |
| | | | | | | | |
| INVESTMENTS | | SHARES
(000) | | | VALUE
($000) | |
Common Stocks — continued | |
|
Textiles, Apparel & Luxury Goods — 0.8% | |
| | |
NIKE, Inc., Class B | | | 182 | | | | 30,373 | |
| | | | | | | | |
|
Tobacco — 0.9% | |
| | |
Altria Group, Inc. | | | 349 | | | | 16,558 | |
| | |
Philip Morris International, Inc. | | | 209 | | | | 19,862 | |
| | | | | | | | |
| | |
| | | | | | | 36,420 | |
| | | | | | | | |
|
Wireless Telecommunication Services — 0.6% | |
| | |
T-Mobile US, Inc. * | | | 191 | | | | 22,159 | |
| | | | | | | | |
| |
Total Common Stocks
(Cost $3,577,277) | | | | 3,915,780 | |
| | | | | |
| | |
| | | NO. OF
CONTRACTS | | | | |
Options Purchased — 0.3% | |
|
Put Options Purchased — 0.3% | |
|
Index Funds — 0.3% | |
| | |
S&P 500 Index 1/31/2022 at
USD 4,360.00, European Style
Notional Amount: USD 3,946,874
Counterparty: Exchange-Traded *
(Cost $64,016) | | | 8,281 | | | | 10,351 | |
| | | | | | | | |
| | | | | | | | |
| INVESTMENTS | | SHARES
(000) | | | VALUE
($000) | |
Short-Term Investments — 3.7% | |
|
Investment Companies — 3.7% | |
| | |
JPMorgan U.S. Government Money Market Fund Class IM Shares, 0.03% (b) (c)
(Cost $143,550) | | | 143,550 | | | | 143,550 | |
| | | | | | | | |
Total Investments — 104.5%
(Cost $3,784,843) | | | | | | | 4,069,681 | |
Liabilities in Excess of
Other Assets — (4.5)% | | | | | | | (176,453 | ) |
| | | | | | | | |
NET ASSETS — 100.0% | | | | | | | 3,893,228 | |
| | | | | | | | |
Percentages indicated are based on net assets.
Abbreviations
| | |
| |
| USD | | United States Dollar |
| |
| (a) | | All or a portion of the security is segregated for options written. |
| (b) | | Investment in an affiliated fund, which is registered under the Investment Company Act of 1940, as amended, and is advised by J.P. Morgan Investment Management Inc. |
| (c) | | The rate shown is the current yield as of December 31, 2021. |
| * | | Non-income producing security. |
| | | | | | | | | | | | | | | | | | | | |
| Futures contracts outstanding as of December 31, 2021 (amounts in thousands, except number of contracts): | |
| DESCRIPTION | | NUMBER OF
CONTRACTS | | | EXPIRATION
DATE | | | TRADING
CURRENCY | | | NOTIONAL
AMOUNT ($) | | | VALUE AND
UNREALIZED
APPRECIATION
(DEPRECIATION) ($) | |
Long Contracts | | | | | | | | | | | | | | | | | | | | |
S&P 500 E-Mini Index | | | 131 | | | | 03/2022 | | | | USD | | | | 31,167 | | | | 698 | |
| | | | | | | | | | | | | | | | | | | | |
Abbreviations
| | | | | | | | | | | | | | | | | | | | | | |
| Written Call Options Contracts as of December 31, 2021 (amounts in thousands, except number of contracts): | | | | |
| | | | | | |
| DESCRIPTION | | COUNTERPARTY | | NUMBER OF
CONTRACTS | | | NOTIONAL
AMOUNT | | | EXERCISE
PRICE | | | EXPIRATION
DATE | | | VALUE ($) | |
| S&P 500 Index | | Exchange-Traded | | | 8,281 | | | | USD 3,946,873 | | | | USD 4,755.00 | | | | 1/31/2022 | | | | (64,012 | ) |
| | | | | | | | | | | | | | | | | | | | | | |
| | | | | | | | | | | | | | | | | | | | | | |
| Written Put Options Contracts as of December 31, 2021 (amounts in thousands, except number of contracts): | | | | |
| | | | | | |
| DESCRIPTION | | COUNTERPARTY | | NUMBER OF
CONTRACTS | | | NOTIONAL
AMOUNT | | | EXERCISE
PRICE | | | EXPIRATION
DATE | | | VALUE ($) | |
| S&P 500 Index | | Exchange-Traded | | | 8,281 | | | | USD 3,946,874 | | | | USD 3,675.00 | | | | 1/31/2022 | | | | (2,195 | ) |
| | | | | | | | | | | | | | | | | | | | | | |
| Total Written Options Contracts (Premiums Received $65,775) | | | | | | | | | | | | | | | | (66,207 | ) |
| | | | | | | | | | | | | | | | | | | | | | |
Abbreviations
SEE NOTES TO FINANCIAL STATEMENTS.
| | | | | | | | | | |
| | | | | |
| DECEMBER 31, 2021 | | J.P. MORGAN LARGE CAP FUNDS | | | | | | | | 49 |
JPMorgan Hedged Equity 3 Fund
SCHEDULE OF PORTFOLIO INVESTMENTS
AS OF DECEMBER 31, 2021 (Unaudited)
| | | | | | | | |
| INVESTMENTS | | SHARES (000) | | | VALUE ($000) | |
Common Stocks — 100.8% | |
|
Aerospace & Defense — 0.8% | |
| | |
Northrop Grumman Corp. | | | 21 | | | | 8,024 | |
| | |
Raytheon Technologies Corp. | | | 128 | | | | 11,046 | |
| | | | | | | | |
| | |
| | | | | | | 19,070 | |
| | | | | | | | |
|
Air Freight & Logistics — 1.1% | |
| | |
FedEx Corp. | | | 31 | | | | 8,056 | |
| | |
United Parcel Service, Inc., Class B | | | 84 | | | | 18,060 | |
| | | | | | | | |
| | |
| | | | | | | 26,116 | |
| | | | | | | | |
|
Airlines — 0.2% | |
| | |
Southwest Airlines Co. * | | | 117 | | | | 4,998 | |
| | | | | | | | |
|
Auto Components — 0.3% | |
| | |
Aptiv plc * | | | 14 | | | | 2,383 | |
| | |
Magna International, Inc. (Canada) | | | 53 | | | | 4,287 | |
| | | | | | | | |
| | |
| | | | | | | 6,670 | |
| | | | | | | | |
|
Automobiles — 2.4% | |
| | |
General Motors Co. * | | | 95 | | | | 5,547 | |
| | |
Rivian Automotive, Inc., Class A * | | | 18 | | | | 1,894 | |
| | |
Tesla, Inc.* (a) | | | 46 | | | | 48,810 | |
| | | | | | | | |
| | |
| | | | | | | 56,251 | |
| | | | | | | | |
|
Banks — 3.9% | |
| | |
Bank of America Corp. | | | 273 | | | | 12,159 | |
| | |
Citigroup, Inc. | | | 221 | | | | 13,340 | |
| | |
Fifth Third Bancorp | | | 129 | | | | 5,608 | |
| | |
Regions Financial Corp. | | | 312 | | | | 6,797 | |
| | |
SVB Financial Group * | | | 6 | | | | 3,977 | |
| | |
Truist Financial Corp. | | | 144 | | | | 8,436 | |
| | |
US Bancorp | | | 253 | | | | 14,184 | |
| | |
Wells Fargo & Co. | | | 524 | | | | 25,141 | |
| | | | | | | | |
| | |
| | | | | | | 89,642 | |
| | | | | | | | |
|
Beverages — 1.3% | |
| | |
Coca-Cola Co. (The) | | | 355 | | | | 21,026 | |
| | |
Constellation Brands, Inc., Class A | | | 34 | | | | 8,524 | |
| | | | | | | | |
| | |
| | | | | | | 29,550 | |
| | | | | | | | |
|
Biotechnology — 2.4% | |
| | |
AbbVie, Inc. | | | 201 | | | | 27,219 | |
| | |
Biogen, Inc. * | | | 18 | | | | 4,299 | |
| | |
BioMarin Pharmaceutical, Inc. * | | | 13 | | | | 1,160 | |
| | |
Moderna, Inc. * | | | 9 | | | | 2,224 | |
| | |
Neurocrine Biosciences, Inc. * | | | 14 | | | | 1,181 | |
| | |
Regeneron Pharmaceuticals, Inc. * | | | 16 | | | | 9,992 | |
| | |
Vertex Pharmaceuticals, Inc. * | | | 41 | | | | 9,066 | |
| | | | | | | | |
| | |
| | | | | | | 55,141 | |
| | | | | | | | |
| | | | | | | | |
| INVESTMENTS | | SHARES (000) | | | VALUE ($000) | |
| | | | | | | | |
|
Building Products — 1.2% | |
| | |
Johnson Controls International plc | | | 91 | | | | 7,366 | |
| | |
Masco Corp. | | | 74 | | | | 5,217 | |
| | |
Trane Technologies plc | | | 78 | | | | 15,783 | |
| | | | | | | | |
| | |
| | | | | | | 28,366 | |
| | | | | | | | |
|
Capital Markets — 3.3% | |
| | |
Goldman Sachs Group, Inc. (The) | | | 32 | | | | 12,288 | |
| | |
Intercontinental Exchange, Inc. | | | 55 | | | | 7,471 | |
| | |
Morgan Stanley | | | 110 | | | | 10,841 | |
| | |
S&P Global, Inc. | | | 43 | | | | 20,301 | |
| | |
State Street Corp. | | | 145 | | | | 13,524 | |
| | |
T. Rowe Price Group, Inc. | | | 60 | | | | 11,815 | |
| | | | | | | | |
| | |
| | | | | | | 76,240 | |
| | | | | | | | |
|
Chemicals — 1.9% | |
| | |
Air Products and Chemicals, Inc. | | | 12 | | | | 3,527 | |
| | |
Celanese Corp. | | | 20 | | | | 3,340 | |
| | |
DuPont de Nemours, Inc. | | | 88 | | | | 7,077 | |
| | |
Eastman Chemical Co. | | | 92 | | | | 11,144 | |
| | |
Linde plc (United Kingdom) | | | 22 | | | | 7,575 | |
| | |
PPG Industries, Inc. | | | 71 | | | | 12,305 | |
| | | | | | | | |
| | |
| | | | | | | 44,968 | |
| | | | | | | | |
|
Commercial Services & Supplies — 0.1% | |
| | |
Cintas Corp. | | | 6 | | | | 2,579 | |
| | | | | | | | |
|
Communications Equipment — 0.1% | |
| | |
Motorola Solutions, Inc. | | | 8 | | | | 2,129 | |
| | | | | | | | |
|
Consumer Finance — 0.3% | |
| | |
Capital One Financial Corp. | | | 48 | | | | 6,994 | |
| | | | | | | | |
|
Containers & Packaging — 0.3% | |
| | |
Avery Dennison Corp. | | | 20 | | | | 4,264 | |
| | |
Westrock Co. | | | 58 | | | | 2,594 | |
| | | | | | | | |
| | |
| | | | | | | 6,858 | |
| | | | | | | | |
|
Diversified Financial Services — 1.4% | |
| | |
Berkshire Hathaway, Inc., Class B * | | | 106 | | | | 31,555 | |
| | |
Voya Financial, Inc. | | | 28 | | | | 1,866 | |
| | | | | | | | |
| | |
| | | | | | | 33,421 | |
| | | | | | | | |
|
Diversified Telecommunication Services — 0.3% | |
| | |
Verizon Communications, Inc. | | | 138 | | | | 7,178 | |
| | | | | | | | |
|
Electric Utilities — 1.9% | |
| | |
Edison International | | | 65 | | | | 4,467 | |
| | |
Evergy, Inc. | | | 83 | | | | 5,660 | |
| | |
Exelon Corp. | | | 80 | | | | 4,636 | |
| | |
FirstEnergy Corp. | | | 201 | | | | 8,343 | |
SEE NOTES TO FINANCIAL STATEMENTS.
| | | | | | | | | | |
| | | | | |
| 50 | | | | | | | | J.P. MORGAN LARGE CAP FUNDS | | DECEMBER 31, 2021 |
| | | | | | | | |
| INVESTMENTS | | SHARES (000) | | | VALUE ($000) | |
Common Stocks — continued | |
|
Electric Utilities — continued | |
| | |
NextEra Energy, Inc. | | | 233 | | | | 21,722 | |
| | | | | | | | |
| | |
| | | | | | | 44,828 | |
| | | | | | | | |
|
Electrical Equipment — 0.6% | |
| | |
Eaton Corp. plc | | | 82 | | | | 14,229 | |
| | | | | | | | |
|
Entertainment — 1.0% | |
| | |
Netflix, Inc. * | | | 29 | | | | 17,612 | |
| | |
Walt Disney Co. (The) * | | | 29 | | | | 4,455 | |
| | | | | | | | |
| | |
| | | | | | | 22,067 | |
| | | | | | | | |
|
Equity Real Estate Investment Trusts (REITs) — 2.6% | |
| | |
Camden Property Trust | | | 41 | | | | 7,361 | |
| | |
Equinix, Inc. | | | 9 | | | | 7,350 | |
| | |
Equity LifeStyle Properties, Inc. | | | 54 | | | | 4,749 | |
| | |
Host Hotels & Resorts, Inc. * | | | 108 | | | | 1,870 | |
| | |
Kimco Realty Corp. | | | 156 | | | | 3,845 | |
| | |
Prologis, Inc. | | | 106 | | | | 17,893 | |
| | |
SBA Communications Corp. | | | 12 | | | | 4,513 | |
| | |
Sun Communities, Inc. | | | 29 | | | | 6,151 | |
| | |
UDR, Inc. | | | 16 | | | | 948 | |
| | |
Ventas, Inc. | | | 117 | | | | 5,990 | |
| | | | | | | | |
| | |
| | | | | | | 60,670 | |
| | | | | | | | |
|
Food Products — 0.5% | |
| | |
Mondelez International, Inc., Class A | | | 178 | | | | 11,800 | |
| | | | | | | | |
|
Health Care Equipment & Supplies — 2.8% | |
| | |
Abbott Laboratories | | | 115 | | | | 16,240 | |
| | |
ABIOMED, Inc. * | | | 3 | | | | 944 | |
| | |
Baxter International, Inc. | | | 35 | | | | 3,022 | |
| | |
Becton Dickinson and Co. | | | 25 | | | | 6,375 | |
| | |
Boston Scientific Corp. * | | | 201 | | | | 8,539 | |
| | |
Dexcom, Inc. * | | | 5 | | | | 2,859 | |
| | |
Intuitive Surgical, Inc. * | | | 12 | | | | 4,168 | |
| | |
Medtronic plc | | | 144 | | | | 14,880 | |
| | |
Zimmer Biomet Holdings, Inc. | | | 70 | | | | 8,846 | |
| | | | | | | | |
| | |
| | | | | | | 65,873 | |
| | | | | | | | |
|
Health Care Providers & Services — 2.9% | |
| | |
Anthem, Inc. | | | 35 | | | | 16,421 | |
| | |
Centene Corp. * | | | 122 | | | | 10,086 | |
| | |
Humana, Inc. | | | 10 | | | | 4,672 | |
| | |
McKesson Corp. | | | 11 | | | | 2,843 | |
| | |
UnitedHealth Group, Inc. (a) | | | 68 | | | | 34,009 | |
| | | | | | | | |
| | |
| | | | | | | 68,031 | |
| | | | | | | | |
| | | | | | | | |
| INVESTMENTS | | SHARES (000) | | | VALUE ($000) | |
| | | | | | | | |
|
Hotels, Restaurants & Leisure — 1.7% | |
| | |
Booking Holdings, Inc. * | | | 4 | | | | 9,446 | |
| | |
Hilton Worldwide Holdings, Inc. * | | | 44 | | | | 6,855 | |
| | |
McDonald’s Corp. | | | 84 | | | | 22,569 | |
| | |
Royal Caribbean Cruises Ltd. * | | | 12 | | | | 923 | |
| | | | | | | | |
| | |
| | | | | | | 39,793 | |
| | | | | | | | |
|
Household Durables — 0.7% | |
| | |
DR Horton, Inc. | | | 9 | | | | 953 | |
| | |
Lennar Corp., Class A | | | 94 | | | | 10,962 | |
| | |
Toll Brothers, Inc. | | | 46 | | | | 3,328 | |
| | | | | | | | |
| | |
| | | | | | | 15,243 | |
| | | | | | | | |
|
Household Products — 1.6% | |
| | |
Kimberly-Clark Corp. | | | 52 | | | | 7,446 | |
| | |
Procter & Gamble Co. (The) | | | 176 | | | | 28,790 | |
| | | | | | | | |
| | |
| | | | | | | 36,236 | |
| | | | | | | | |
|
Industrial Conglomerates — 0.4% | |
| | |
Honeywell International, Inc. | | | 40 | | | | 8,280 | |
| | | | | | | | |
|
Insurance — 1.9% | |
| | |
Chubb Ltd. | | | 57 | | | | 11,035 | |
| | |
Hartford Financial Services Group, Inc. (The) | | | 139 | | | | 9,618 | |
| | |
Progressive Corp. (The) | | | 155 | | | | 15,866 | |
| | |
Prudential Financial, Inc. | | | 43 | | | | 4,663 | |
| | |
Travelers Cos., Inc. (The) | | | 15 | | | | 2,339 | |
| | | | | | | | |
| | |
| | | | | | | 43,521 | |
| | | | | | | | |
|
Interactive Media & Services — 7.1% | |
| | |
Alphabet, Inc., Class A * (a) | | | 22 | | | | 64,723 | |
| | |
Alphabet, Inc., Class C * (a) | | | 17 | | | | 49,434 | |
| | |
Meta Platforms, Inc., Class A * (a) | | | 140 | | | | 47,243 | |
| | |
ZoomInfo Technologies, Inc., Class A * | | | 54 | | | | 3,495 | |
| | | | | | | | |
| | |
| | | | | | | 164,895 | |
| | | | | | | | |
|
Internet & Direct Marketing Retail — 4.0% | |
| | |
Amazon.com, Inc. * (a) | | | 28 | | | | 93,405 | |
| | | | | | | | |
|
IT Services — 4.8% | |
| | |
Accenture plc, Class A | | | 65 | | | | 27,101 | |
| | |
FleetCor Technologies, Inc. * | | | 26 | | | | 5,848 | |
| | |
International Business Machines Corp. | | | 87 | | | | 11,601 | |
| | |
Mastercard, Inc., Class A | | | 92 | | | | 32,989 | |
| | |
PayPal Holdings, Inc. * | | | 25 | | | | 4,661 | |
| | |
Shopify, Inc., Class A (Canada) * | | | 2 | | | | 3,058 | |
| | |
Visa, Inc., Class A | | | 121 | | | | 26,150 | |
| | | | | | | | |
| | |
| | | | | | | 111,408 | |
| | | | | | | | |
SEE NOTES TO FINANCIAL STATEMENTS.
| | | | | | | | | | |
| | | | | |
| DECEMBER 31, 2021 | | J.P. MORGAN LARGE CAP FUNDS | | | | | | | | 51 |
JPMorgan Hedged Equity 3 Fund
SCHEDULE OF PORTFOLIO INVESTMENTS
AS OF DECEMBER 31, 2021 (Unaudited) (continued)
| | | | | | | | |
| INVESTMENTS | | SHARES (000) | | | VALUE ($000) | |
Common Stocks — continued | |
|
Life Sciences Tools & Services — 1.7% | |
| | |
Danaher Corp. | | | 23 | | | | 7,408 | |
| | |
Illumina, Inc. * | | | 9 | | | | 3,292 | |
| | |
PerkinElmer, Inc. | | | 8 | | | | 1,693 | |
| | |
Thermo Fisher Scientific, Inc. | | | 42 | | | | 27,743 | |
| | | | | | | | |
| | |
| | | | | | | 40,136 | |
| | | | | | | | |
|
Machinery — 2.5% | |
| | |
Deere & Co. | | | 56 | | | | 19,345 | |
| | |
Ingersoll Rand, Inc. | | | 65 | | | | 4,026 | |
| | |
Otis Worldwide Corp. | | | 144 | | | | 12,539 | |
| | |
Parker-Hannifin Corp. | | | 27 | | | | 8,476 | |
| | |
Stanley Black & Decker, Inc. | | | 69 | | | | 13,067 | |
| | | | | | | | |
| | |
| | | | | | | 57,453 | |
| | | | | | | | |
|
Media — 1.1% | |
| | |
Charter Communications, Inc., Class A * | | | 13 | | | | 8,408 | |
| | |
Comcast Corp., Class A | | | 340 | | | | 17,089 | |
| | |
Fox Corp., Class A | | | 13 | | | | 462 | |
| | | | | | | | |
| | |
| | | | | | | 25,959 | |
| | | | | | | | |
|
Metals & Mining — 0.1% | |
| | |
Freeport-McMoRan, Inc. | | | 73 | | | | 3,035 | |
| | | | | | | | |
|
Multiline Retail — 0.7% | |
| | |
Dollar General Corp. | | | 8 | | | | 1,941 | |
| | |
Dollar Tree, Inc. * | | | 19 | | | | 2,607 | |
| | |
Target Corp. | | | 46 | | | | 10,637 | |
| | | | | | | | |
| | |
| | | | | | | 15,185 | |
| | | | | | | | |
|
Multi-Utilities — 0.6% | |
| | |
CenterPoint Energy, Inc. | | | 329 | | | | 9,181 | |
| | |
DTE Energy Co. | | | 40 | | | | 4,731 | |
| | | | | | | | |
| | |
| | | | | | | 13,912 | |
| | | | | | | | |
|
Oil, Gas & Consumable Fuels — 2.7% | |
| | |
Cheniere Energy, Inc. | | | 27 | | | | 2,754 | |
| | |
Chevron Corp. | | | 121 | | | | 14,184 | |
| | |
ConocoPhillips | | | 238 | | | | 17,161 | |
| | |
Coterra Energy, Inc. | | | 24 | | | | 447 | |
| | |
Diamondback Energy, Inc. | | | 90 | | | | 9,660 | |
| | |
EOG Resources, Inc. | | | 62 | | | | 5,551 | |
| | |
Phillips 66 | | | 13 | | | | 921 | |
| | |
Pioneer Natural Resources Co. | | | 59 | | | | 10,693 | |
| | |
Williams Cos., Inc. (The) | | | 72 | | | | 1,871 | |
| | | | | | | | |
| | |
| | | | | | | 63,242 | |
| | | | | | | | |
|
Personal Products — 0.4% | |
| | |
Estee Lauder Cos., Inc. (The), Class A | | | 22 | | | | 8,276 | |
| | | | | | | | |
| | | | | | | | |
| INVESTMENTS | | SHARES (000) | | | VALUE ($000) | |
| | | | | | | | |
|
Pharmaceuticals — 3.5% | |
| | |
Bristol-Myers Squibb Co. | | | 309 | | | | 19,264 | |
| | |
Eli Lilly & Co. | | | 82 | | | | 22,770 | |
| | |
Johnson & Johnson (a) | | | 137 | | | | 23,356 | |
| | |
Merck & Co., Inc. | | | 116 | | | | 8,907 | |
| | |
Pfizer, Inc. | | | 130 | | | | 7,652 | |
| | | | | | | | |
| | |
| | | | | | | 81,949 | |
| | | | | | | | |
|
Professional Services — 0.4% | |
| | |
Booz Allen Hamilton Holding Corp. | | | 31 | | | | 2,588 | |
| | |
Leidos Holdings, Inc. | | | 67 | | | | 5,915 | |
| | | | | | | | |
| | |
| | | | | | | 8,503 | |
| | | | | | | | |
|
Road & Rail — 1.0% | |
| | |
Lyft, Inc., Class A * | | | 59 | | | | 2,537 | |
| | |
Norfolk Southern Corp. | | | 44 | | | | 13,115 | |
| | |
Union Pacific Corp. | | | 34 | | | | 8,549 | |
| | | | | | | | |
| | |
| | | | | | | 24,201 | |
| | | | | | | | |
|
Semiconductors & Semiconductor Equipment — 7.2% | |
| | |
Advanced Micro Devices, Inc. * | | | 137 | | | | 19,645 | |
| | |
Analog Devices, Inc. | | | 88 | | | | 15,392 | |
| | |
Applied Materials, Inc. | | | 113 | | | | 17,831 | |
| | |
Intel Corp. | | | 36 | | | | 1,870 | |
| | |
KLA Corp. | | | 9 | | | | 3,741 | |
| | |
Lam Research Corp. | | | 28 | | | | 20,053 | |
| | |
Microchip Technology, Inc. | | | 56 | | | | 4,879 | |
| | |
Micron Technology, Inc. | | | 25 | | | | 2,355 | |
| | |
NVIDIA Corp. (a) | | | 130 | | | | 38,281 | |
| | |
NXP Semiconductors NV (China) | | | 61 | | | | 13,898 | |
| | |
QUALCOMM, Inc. | | | 41 | | | | 7,438 | |
| | |
Texas Instruments, Inc. | | | 114 | | | | 21,547 | |
| | | | | | | | |
| | |
| | | | | | | 166,930 | |
| | | | | | | | |
|
Software — 9.6% | |
| | |
Ceridian HCM Holding, Inc. * | | | 11 | | | | 1,166 | |
| | |
Fortinet, Inc. * | | | 8 | | | | 2,999 | |
| | |
Intuit, Inc. | | | 35 | | | | 22,558 | |
| | |
Microsoft Corp. (a) | | | 500 | | | | 168,320 | |
| | |
Oracle Corp. | | | 95 | | | | 8,320 | |
| | |
salesforce.com, Inc. * | | | 35 | | | | 8,881 | |
| | |
Workday, Inc., Class A * | | | 29 | | | | 7,912 | |
| | | | | | | | |
| | |
| | | | | | | 220,156 | |
| | | | | | | | |
|
Specialty Retail — 3.5% | |
| | |
AutoZone, Inc. * | | | 2 | | | | 4,543 | |
| | |
Best Buy Co., Inc. | | | 85 | | | | 8,634 | |
| | |
Home Depot, Inc. (The) | | | 42 | | | | 17,281 | |
SEE NOTES TO FINANCIAL STATEMENTS.
| | | | | | | | | | |
| | | | | |
| 52 | | | | | | | | J.P. MORGAN LARGE CAP FUNDS | | DECEMBER 31, 2021 |
| | | | | | | | |
| INVESTMENTS | | SHARES (000) | | | VALUE ($000) | |
Common Stocks — continued | |
|
Specialty Retail — continued | |
| | |
Lowe’s Cos., Inc. | | | 101 | | | | 26,055 | |
| | |
O’Reilly Automotive, Inc. * | | | 23 | | | | 16,428 | |
| | |
TJX Cos., Inc. (The) | | | 123 | | | | 9,303 | |
| | | | | | | | |
| | |
| | | | | | | 82,244 | |
| | | | | | | | |
|
Technology Hardware, Storage & Peripherals — 7.7% | |
| | |
Apple, Inc. (a) | | | 919 | | | | 163,101 | |
| | |
Seagate Technology Holdings plc | | | 111 | | | | 12,590 | |
| | | | | | | | |
| | |
| | | | | | | 175,691 | |
| | | | | | | | |
|
Textiles, Apparel & Luxury Goods — 0.8% | |
| | |
NIKE, Inc., Class B | | | 109 | | | | 18,116 | |
| | | | | | | | |
|
Tobacco — 0.9% | |
| | |
Altria Group, Inc. | | | 208 | | | | 9,869 | |
| | |
Philip Morris International, Inc. | | | 125 | | | | 11,889 | |
| | | | | | | | |
| | |
| | | | | | | 21,758 | |
| | | | | | | | |
|
Wireless Telecommunication Services — 0.6% | |
| | |
T-Mobile US, Inc. * | | | 115 | | | | 13,374 | |
| | | | | | | | |
| |
Total Common Stocks
(Cost $2,137,943) | | | | 2,336,570 | |
| | | | | |
| | |
| | | NO. OF
CONTRACTS | | | | |
Options Purchased — 0.7% | |
|
Put Options Purchased — 0.7% | |
| | |
Index Funds — 0.7% | | | | | | | | |
| | |
S&P 500 Index 2/28/2022 at
USD 4,325.00, European Style
Notional Amount: USD 2,354,016
Counterparty: , European Style *
(Cost $54,814) | | | 4,939 | | | | 15,607 | |
| | | | | | | | |
| | | | | | | | |
| INVESTMENTS | | SHARES (000) | | | VALUE ($000) | |
Short-Term Investments — 0.7% | |
|
Investment Companies — 0.7% | |
| | |
JPMorgan U.S. Government Money Market Fund Class IM Shares, 0.03% (b) (c)
(Cost $16,682) | | | 16,682 | | | | 16,682 | |
| | | | | | | | |
Total Investments — 102.2%
(Cost $2,209,439) | | | | | | | 2,368,859 | |
Liabilities in Excess of
Other Assets — (2.2)% | | | | | | | (51,779 | ) |
| | | | | | | | |
NET ASSETS — 100.0% | | | | | | | 2,317,080 | |
| | | | | | | | |
Percentages indicated are based on net assets.
Abbreviations
| | |
| |
| USD | | United States Dollar |
| |
| (a) | | All or a portion of the security is segregated for options written. |
| (b) | | Investment in an affiliated fund, which is registered under the Investment Company Act of 1940, as amended, and is advised by J.P. Morgan Investment Management Inc. |
| (c) | | The rate shown is the current yield as of December 31, 2021. |
| * | | Non-income producing security. |
| | | | | | | | | | | | | | | | | | | | |
| Futures contracts outstanding as of December 31, 2021 (amounts in thousands, except number of contracts): | |
| DESCRIPTION | | NUMBER OF
CONTRACTS | | | EXPIRATION
DATE | | | TRADING
CURRENCY | | | NOTIONAL
AMOUNT ($) | | | VALUE AND
UNREALIZED
APPRECIATION
(DEPRECIATION) ($) | |
Long Contracts | | | | | | | | | | | | | | | | | | | | |
S&P 500 E-Mini Index | | | 73 | | | | 03/2022 | | | | USD | | | | 17,368 | | | | 433 | |
| | | | | | | | | | | | | | | | | | | | |
Abbreviations
SEE NOTES TO FINANCIAL STATEMENTS.
| | | | | | | | | | |
| | | | | |
| DECEMBER 31, 2021 | | J.P. MORGAN LARGE CAP FUNDS | | | | | | | | 53 |
JPMorgan Hedged Equity 3 Fund
SCHEDULE OF PORTFOLIO INVESTMENTS
AS OF DECEMBER 31, 2021 (Unaudited) (continued)
| | | | | | | | | | | | | | | | | | | | | | |
| Written Call Options Contracts as of December 31, 2021 (amounts in thousands, except number of contracts): | | | | |
| | | | | | |
| DESCRIPTION | | COUNTERPARTY | | NUMBER OF
CONTRACTS | | | NOTIONAL
AMOUNT | | | EXERCISE
PRICE | | | EXPIRATION
DATE | | | VALUE ($) | |
| S&P 500 Index | | Exchange-Traded | | | 4,939 | | | | USD 2,354,017 | | | | USD 4,755.00 | | | | 2/28/2022 | | | | (55,687 | ) |
| | | | | | | | | | | | | | | | | | | | | | |
| | | | | | | | | | | | | | | | | | | | | | |
| Written Put Options Contracts as of December 31, 2021 (amounts in thousands, except number of contracts): | | | | |
| | | | | | |
| DESCRIPTION | | COUNTERPARTY | | NUMBER OF
CONTRACTS | | | NOTIONAL
AMOUNT | | | EXERCISE
PRICE | | | EXPIRATION
DATE | | | VALUE ($) | |
| S&P 500 Index | | Exchange-Traded | | | 4,939 | | | | USD 2,354,016 | | | | USD 3,640.00 | | | | 2/28/2022 | | | | (3,704 | ) |
| | | | | | | | | | | | | | | | | | | | | | |
| Total Written Options Contracts (Premiums Received $58,130) | | | | | | | | | | | | | | | | (59,391 | ) |
| | | | | | | | | | | | | | | | | | | | | | |
Abbreviations
SEE NOTES TO FINANCIAL STATEMENTS.
| | | | | | | | | | |
| | | | | |
| 54 | | | | | | | | J.P. MORGAN LARGE CAP FUNDS | | DECEMBER 31, 2021 |
JPMorgan Large Cap Growth Fund
SCHEDULE OF PORTFOLIO INVESTMENTS
AS OF DECEMBER 31, 2021 (Unaudited)
| | | | | | | | |
| INVESTMENTS | | SHARES
(000) | | | VALUE
($000) | |
Common Stocks — 99.6% | |
|
Automobiles — 4.7% | |
| | |
Rivian Automotive, Inc., Class A * (a) | | | 784 | | | | 81,273 | |
| | |
Tesla, Inc. * | | | 1,749 | | | | 1,848,414 | |
| | | | | | | | |
| | |
| | | | | | | 1,929,687 | |
| | | | | | | | |
|
Banks — 1.5% | |
| | |
SVB Financial Group * | | | 902 | | | | 611,707 | |
| | | | | | | | |
|
Beverages — 1.1% | |
| | |
Monster Beverage Corp. * | | | 4,809 | | | | 461,842 | |
| | | | | | | | |
|
Biotechnology — 2.5% | |
| | |
Alnylam Pharmaceuticals, Inc. * | | | 132 | | | | 22,334 | |
| | |
Biogen, Inc. * | | | 602 | | | | 144,456 | |
| | |
Exact Sciences Corp. * (a) | | | 794 | | | | 61,774 | |
| | |
Moderna, Inc. * | | | 314 | | | | 79,826 | |
| | |
Regeneron Pharmaceuticals, Inc. * | | | 547 | | | | 345,252 | |
| | |
Seagen, Inc. * | | | 2,297 | | | | 355,100 | |
| | | | | | | | |
| | |
| | | | | | | 1,008,742 | |
| | | | | | | | |
|
Building Products — 1.3% | |
| | |
Trane Technologies plc | | | 2,705 | | | | 546,477 | |
| | | | | | | | |
|
Capital Markets — 7.2% | |
| | |
Blackstone, Inc. | | | 8,820 | | | | 1,141,195 | |
| | |
Charles Schwab Corp. (The) | | | 9,739 | | | | 819,034 | |
| | |
Morgan Stanley | | | 8,124 | | | | 797,471 | |
| | |
MSCI, Inc. | | | 314 | | | | 192,078 | |
| | | | | | | | |
| | |
| | | | | | | 2,949,778 | |
| | | | | | | | |
|
Chemicals — 1.2% | |
| | |
Sherwin-Williams Co. (The) | | | 1,443 | | | | 507,991 | |
| | | | | | | | |
|
Consumer Finance — 0.6% | |
| | |
Capital One Financial Corp. | | | 1,743 | | | | 252,935 | |
| | | | | | | | |
|
Electrical Equipment — 1.5% | |
| | |
Rockwell Automation, Inc. | | | 1,768 | | | | 616,907 | |
| | | | | | | | |
|
Electronic Equipment, Instruments & Components — 1.1% | |
| | |
Amphenol Corp., Class A | | | 5,088 | | | | 444,966 | |
| | | | | | | | |
|
Entertainment — 1.8% | |
| | |
Netflix, Inc. * | | | 1,167 | | | | 703,168 | |
| | |
Roku, Inc. * | | | 157 | | | | 35,759 | |
| | | | | | | | |
| | |
| | | | | | | 738,927 | |
| | | | | | | | |
|
Health Care Equipment & Supplies — 3.9% | |
| | |
ABIOMED, Inc. * | | | 283 | | | | 101,537 | |
| | |
Align Technology, Inc. * | | | 1,055 | | | | 693,043 | |
| | |
Dexcom, Inc. * | | | 631 | | | | 338,654 | |
| | |
Intuitive Surgical, Inc. * | | | 1,305 | | | | 469,003 | |
| | | | | | | | |
| | |
| | | | | | | 1,602,237 | |
| | | | | | | | |
| | | | | | | | |
| INVESTMENTS | | SHARES
(000) | | | VALUE
($000) | |
| | | | | | | | |
|
Health Care Providers & Services — 3.3% | |
| | |
HCA Healthcare, Inc. | | | 2,945 | | | | 756,707 | |
| | |
McKesson Corp. | | | 2,293 | | | | 569,973 | |
| | | | | | | | |
| | |
| | | | | | | 1,326,680 | |
| | | | | | | | |
|
Hotels, Restaurants & Leisure — 2.8% | |
| | |
Airbnb, Inc., Class A * | | | 75 | | | | 12,414 | |
| | |
Booking Holdings, Inc. * | | | 165 | | | | 396,593 | |
| | |
Chipotle Mexican Grill, Inc. * | | | 423 | | | | 739,684 | |
| | | | | | | | |
| | |
| | | | | | | 1,148,691 | |
| | | | | | | | |
|
Interactive Media & Services — 11.7% | |
| | |
Alphabet, Inc., Class C * | | | 1,056 | | | | 3,054,941 | |
| | |
Match Group, Inc. * | | | 1,862 | | | | 246,239 | |
| | |
Meta Platforms, Inc., Class A * | | | 3,307 | | | | 1,112,418 | |
| | |
Snap, Inc., Class A * | | | 7,649 | | | | 359,747 | |
| | | | | | | | |
| | |
| | | | | | | 4,773,345 | |
| | | | | | | | |
|
Internet & Direct Marketing Retail — 4.2% | |
| | |
Amazon.com, Inc. * | | | 401 | | | | 1,336,421 | |
| | |
Etsy, Inc. * | | | 1,523 | | | | 333,533 | |
| | |
MercadoLibre, Inc. (Argentina) * | | | 34 | | | | 45,448 | |
| | |
Wayfair, Inc., Class A * (a) | | | 85 | | | | 16,128 | |
| | | | | | | | |
| | |
| | | | | | | 1,731,530 | |
| | | | | | | | |
|
IT Services — 1.8% | |
| | |
Affirm Holdings, Inc. * | | | 862 | | | | 86,723 | |
| | |
Block, Inc., Class A * | | | 1,341 | | | | 216,568 | |
| | |
MongoDB, Inc. * (a) | | | 373 | | | | 197,183 | |
| | |
PayPal Holdings, Inc. * | | | 963 | | | | 181,631 | |
| | |
Shopify, Inc., Class A (Canada) * | | | 7 | | | | 9,504 | |
| | |
Twilio, Inc., Class A * | | | 120 | | | | 31,654 | |
| | | | | | | | |
| | |
| | | | | | | 723,263 | |
| | | | | | | | |
|
Life Sciences Tools & Services — 0.4% | |
| | |
Thermo Fisher Scientific, Inc. | | | 231 | | | | 153,839 | |
| | | | | | | | |
|
Machinery — 2.3% | |
| | |
Deere & Co. | | | 2,741 | | | | 940,005 | |
| | | | | | | | |
|
Metals & Mining — 1.4% | |
| | |
Freeport-McMoRan, Inc. | | | 13,328 | | | | 556,181 | |
| | | | | | | | |
|
Personal Products — 1.4% | |
| | |
Estee Lauder Cos., Inc. (The), Class A | | | 1,504 | | | | 556,846 | |
| | | | | | | | |
|
Professional Services — 1.7% | |
| | |
Equifax, Inc. | | | 1,091 | | | | 319,522 | |
| | |
Verisk Analytics, Inc. | | | 1,570 | | | | 359,152 | |
| | | | | | | | |
| | |
| | | | | | | 678,674 | |
| | | | | | | | |
SEE NOTES TO FINANCIAL STATEMENTS.
| | | | | | | | | | |
| | | | | |
| DECEMBER 31, 2021 | | J.P. MORGAN LARGE CAP FUNDS | | | | | | | | 55 |
JPMorgan Large Cap Growth Fund
SCHEDULE OF PORTFOLIO INVESTMENTS
AS OF DECEMBER 31, 2021 (Unaudited) (continued)
| | | | | | | | |
| INVESTMENTS | | SHARES
(000) | | | VALUE ($000) | |
Common Stocks — continued | |
|
Semiconductors & Semiconductor Equipment — 10.1% | |
| | |
Advanced Micro Devices, Inc. * | | | 8,664 | | | | 1,246,706 | |
| | |
ASML Holding NV (Registered), NYRS (Netherlands) | | | 842 | | | | 670,111 | |
| | |
Enphase Energy, Inc. * | | | 456 | | | | 83,402 | |
| | |
Lam Research Corp. | | | 626 | | | | 449,828 | |
| | |
NVIDIA Corp. | | | 4,130 | | | | 1,214,723 | |
| | |
Texas Instruments, Inc. | | | 2,432 | | | | 458,284 | |
| | | | | | | | |
| | |
| | | | | | | 4,123,054 | |
| | | | | | | | |
|
Software — 15.2% | |
| | |
HubSpot, Inc. * | | | 328 | | | | 216,333 | |
| | |
Intuit, Inc. | | | 1,248 | | | | 802,739 | |
| | |
Microsoft Corp. | | | 11,103 | | | | 3,734,025 | |
| | |
Oracle Corp. | | | 9,134 | | | | 796,550 | |
| | |
Synopsys, Inc. * | | | 1,401 | | | | 516,416 | |
| | |
Trade Desk, Inc. (The), Class A * | | | 302 | | | | 27,693 | |
| | |
Workday, Inc., Class A * | | | 328 | | | | 89,630 | |
| | | | | | | | |
| | |
| | | | | | | 6,183,386 | |
| | | | | | | | |
|
Specialty Retail — 4.6% | |
| | |
AutoZone, Inc. * | | | 341 | | | | 714,689 | |
| | |
Carvana Co. * (a) | | | 1,127 | | | | 261,274 | |
| | |
Lowe’s Cos., Inc. | | | 3,489 | | | | 901,940 | |
| | | | | | | | |
| | |
| | | | | | | 1,877,903 | |
| | | | | | | | |
|
Technology Hardware, Storage & Peripherals — 9.3% | |
| | |
Apple, Inc. | | | 21,337 | | | | 3,788,804 | |
| | | | | | | | |
|
Textiles, Apparel & Luxury Goods — 1.0% | |
| | |
Tapestry, Inc. | | | 10,066 | | | | 408,688 | |
| | | | | | | | |
| |
Total Common Stocks
(Cost $24,052,214) | | | | 40,643,085 | |
| | | | | |
Short-Term Investments — 1.1% | |
|
Investment Companies — 0.8% | |
| | |
JPMorgan Prime Money Market Fund Class IM Shares, 0.07% (b) (c)
(Cost $292,240) | | | 292,134 | | | | 292,250 | |
| | | | | | | | |
| | | | | | | | |
| INVESTMENTS | | SHARES
(000) | | | VALUE ($000) | |
| | | | | | | | |
|
Investment of Cash Collateral from Securities Loaned — 0.3% | |
| | |
JPMorgan Securities Lending Money Market Fund Agency SL Class Shares, 0.08% (b) (c) | | | 116,932 | | | | 116,909 | |
| | |
JPMorgan U.S. Government Money Market Fund Class IM Shares, 0.03% (b) (c) | | | 20,701 | | | | 20,701 | |
| | | | | | | | |
| | |
Total Investment of Cash Collateral from Securities Loaned
(Cost $137,610) | | | | | | | 137,610 | |
| | | | | |
| | |
Total Short-Term Investments
(Cost $429,850) | | | | | | | 429,860 | |
| | | | | | | | |
Total Investments — 100.7%
(Cost $24,482,064) | | | | | | | 41,072,945 | |
Liabilities in Excess of
Other Assets — (0.7)% | | | | | | | (267,851 | ) |
| | | | | | | | |
NET ASSETS — 100.0% | | | | | | | 40,805,094 | |
| | | | | | | | |
Percentages indicated are based on net assets.
Abbreviations
| | |
| |
| NYRS | | New York Registry Shares |
| |
| (a) | | The security or a portion of this security is on loan at December 31, 2021. The total value of securities on loan at December 31, 2021 is $134,368. |
| (b) | | Investment in an affiliated fund, which is registered under the Investment Company Act of 1940, as amended, and is advised by J.P. Morgan Investment Management Inc. |
| (c) | | The rate shown is the current yield as of December 31, 2021. |
| * | | Non-income producing security. |
SEE NOTES TO FINANCIAL STATEMENTS.
| | | | | | | | | | |
| | | | | |
| 56 | | | | | | | | J.P. MORGAN LARGE CAP FUNDS | | DECEMBER 31, 2021 |
JPMorgan Large Cap Value Fund
SCHEDULE OF PORTFOLIO INVESTMENTS
AS OF DECEMBER 31, 2021 (Unaudited)
| | | | | | | | |
| INVESTMENTS | | SHARES (000) | | | VALUE ($000) | |
Common Stocks — 100.2% | |
|
Aerospace & Defense — 2.8% | |
| | |
Boeing Co. (The) * | | | 182 | | | | 36,580 | |
| | |
Raytheon Technologies Corp. | | | 592 | | | | 50,930 | |
| | | | | | | | |
| | |
| | | | | | | 87,510 | |
| | | | | | | | |
|
Air Freight & Logistics — 1.5% | |
| | |
FedEx Corp. | | | 185 | | | | 47,848 | |
| | | | | | | | |
|
Airlines — 1.1% | |
| | |
Delta Air Lines, Inc. * | | | 429 | | | | 16,746 | |
| | |
Southwest Airlines Co. * | | | 392 | | | | 16,776 | |
| | | | | | | | |
| | |
| | | | | | | 33,522 | |
| | | | | | | | |
|
Auto Components — 0.8% | |
| | |
Lear Corp. | | | 130 | | | | 23,710 | |
| | | | | | | | |
|
Automobiles — 2.2% | |
| | |
General Motors Co. * | | | 1,150 | | | | 67,402 | |
| | | | | | | | |
|
Banks — 12.8% | |
| | |
Bank of America Corp. | | | 2,724 | | | | 121,170 | |
| | |
Citigroup, Inc. | | | 517 | | | | 31,205 | |
| | |
People’s United Financial, Inc. | | | 3,419 | | | | 60,927 | |
| | |
Truist Financial Corp. | | | 1,073 | | | | 62,824 | |
| | |
Wells Fargo & Co. | | | 2,495 | | | | 119,710 | |
| | | | | | | | |
| | |
| | | | | | | 395,836 | |
| | | | | | | | |
|
Beverages — 2.1% | |
| | |
Coca-Cola Co. (The) | | | 1,088 | | | | 64,415 | |
| | | | | | | | |
|
Biotechnology — 7.1% | |
| | |
AbbVie, Inc. | | | 415 | | | | 56,191 | |
| | |
Biogen, Inc. * | | | 66 | | | | 15,883 | |
| | |
BioMarin Pharmaceutical, Inc. * | | | 106 | | | | 9,330 | |
| | |
Neurocrine Biosciences, Inc. * (a) | | | 207 | | | | 17,647 | |
| | |
Regeneron Pharmaceuticals, Inc. * | | | 99 | | | | 62,331 | |
| | |
Vertex Pharmaceuticals, Inc. * | | | 275 | | | | 60,456 | |
| | | | | | | | |
| | |
| | | | | | | 221,838 | |
| | | | | | | | |
|
Capital Markets — 4.2% | |
| | |
Intercontinental Exchange, Inc. | | | 309 | | | | 42,262 | |
| | |
State Street Corp. | | | 939 | | | | 87,299 | |
| | | | | | | | |
| | |
| | | | | | | 129,561 | |
| | | | | | | | |
|
Chemicals — 3.9% | |
| | |
Celanese Corp. | | | 229 | | | | 38,553 | |
| | |
Eastman Chemical Co. | | | 264 | | | | 31,866 | |
| | |
FMC Corp. | | | 468 | | | | 51,417 | |
| | | | | | | | |
| | |
| | | | | | | 121,836 | |
| | | | | | | | |
|
Containers & Packaging — 0.4% | |
| | |
Sealed Air Corp. | | | 186 | | | | 12,549 | |
| | | | | | | | |
| | | | | | | | |
| INVESTMENTS | | SHARES (000) | | | VALUE ($000) | |
| | | | | | | | |
|
Diversified Financial Services — 0.5% | |
| | |
Berkshire Hathaway, Inc., Class B * | | | 53 | | | | 15,787 | |
| | | | | | | | |
|
Electric Utilities — 1.7% | |
| | |
Edison International | | | 575 | | | | 39,230 | |
| | |
FirstEnergy Corp. | | | 337 | | | | 14,012 | |
| | | | | | | | |
| | |
| | | | | | | 53,242 | |
| | | | | | | | |
|
Electrical Equipment — 1.0% | |
| | |
Eaton Corp. plc | | | 179 | | | | 30,917 | |
| | | | | | | | |
|
Entertainment — 2.5% | |
| | |
Activision Blizzard, Inc. | | | 776 | | | | 51,654 | |
| | |
Electronic Arts, Inc. | | | 191 | | | | 25,246 | |
| | | | | | | | |
| | |
| | | | | | | 76,900 | |
| | | | | | | | |
|
Equity Real Estate Investment Trusts (REITs) — 2.5% | |
| | |
Host Hotels & Resorts, Inc. * | | | 3,128 | | | | 54,395 | |
| | |
Vornado Realty Trust | | | 360 | | | | 15,061 | |
| | |
Weyerhaeuser Co. | | | 194 | | | | 7,968 | |
| | | | | | | | |
| | |
| | | | | | | 77,424 | |
| | | | | | | | |
|
Food & Staples Retailing — 4.4% | |
| | |
BJ’s Wholesale Club Holdings, Inc. * | | | 308 | | | | 20,627 | |
| | |
Performance Food Group Co. * | | | 214 | | | | 9,820 | |
| | |
US Foods Holding Corp. * | | | 3,075 | | | | 107,110 | |
| | | | | | | | |
| | |
| | | | | | | 137,557 | |
| | | | | | | | |
|
Food Products — 3.0% | |
| | |
Bunge Ltd. | | | 68 | | | | 6,320 | |
| | |
Lamb Weston Holdings, Inc. | | | 1,396 | | | | 88,447 | |
| | | | | | | | |
| | |
| | | | | | | 94,767 | |
| | | | | | | | |
|
Health Care Equipment & Supplies — 2.1% | |
| | |
Zimmer Biomet Holdings, Inc. (a) | | | 515 | | | | 65,464 | |
| | | | | | | | |
|
Health Care Providers & Services — 6.6% | |
| | |
Centene Corp. * | | | 1,366 | | | | 112,525 | |
| | |
Cigna Corp. | | | 254 | | | | 58,303 | |
| | |
McKesson Corp. | | | 143 | | | | 35,546 | |
| | | | | | | | |
| | |
| | | | | | | 206,374 | |
| | | | | | | | |
|
Hotels, Restaurants & Leisure — 4.7% | |
| | |
Booking Holdings, Inc. * | | | 18 | | | | 43,666 | |
| | |
Royal Caribbean Cruises Ltd. * (a) | | | 1,315 | | | | 101,100 | |
| | | | | | | | |
| | |
| | | | | | | 144,766 | |
| | | | | | | | |
|
Household Durables — 0.7% | |
| | |
Newell Brands, Inc. | | | 994 | | | | 21,705 | |
| | | | | | | | |
|
Household Products — 0.2% | |
| | |
Kimberly-Clark Corp. | | | 53 | | | | 7,632 | |
| | | | | | | | |
SEE NOTES TO FINANCIAL STATEMENTS.
| | | | | | | | | | |
| | | | | |
| DECEMBER 31, 2021 | | J.P. MORGAN LARGE CAP FUNDS | | | | | | | | 57 |
JPMorgan Large Cap Value Fund
SCHEDULE OF PORTFOLIO INVESTMENTS
AS OF DECEMBER 31, 2021 (Unaudited) (continued)
| | | | | | | | |
| INVESTMENTS | | SHARES (000) | | | VALUE ($000) | |
Common Stocks — continued | |
|
Industrial Conglomerates — 1.0% | |
| | |
Honeywell International, Inc. | | | 147 | | | | 30,609 | |
| | | | | | | | |
|
Insurance — 4.0% | |
| | |
Allstate Corp. (The) | | | 163 | | | | 19,189 | |
| | |
American International Group, Inc. | | | 877 | | | | 49,866 | |
| | |
Chubb Ltd. | | | 81 | | | | 15,619 | |
| | |
Prudential Financial, Inc. | | | 132 | | | | 14,288 | |
| | |
Travelers Cos., Inc. (The) | | | 173 | | | | 27,031 | |
| | | | | | | | |
| | |
| | | | | | | 125,993 | |
| | | | | | | | |
|
IT Services — 0.2% | |
| | |
WEX, Inc. * | | | 55 | | | | 7,767 | |
| | | | | | | | |
|
Machinery — 2.3% | |
| | |
Parker-Hannifin Corp. | | | 169 | | | | 53,666 | |
| | |
Terex Corp. | | | 136 | | | | 5,982 | |
| | |
Timken Co. (The) | | | 168 | | | | 11,662 | |
| | | | | | | | |
| | |
| | | | | | | 71,310 | |
| | | | | | | | |
|
Media — 1.0% | |
| | |
Comcast Corp., Class A | | | 607 | | | | 30,535 | |
| | | | | | | | |
|
Metals & Mining — 4.5% | |
| | |
Alcoa Corp. | | | 855 | | | | 50,940 | |
| | |
Freeport-McMoRan, Inc. | | | 1,965 | | | | 81,995 | |
| | |
Rio Tinto plc, ADR (Australia) (a) | | | 119 | | | | 7,946 | |
| | | | | | | | |
| | |
| | | | | | | 140,881 | |
| | | | | | | | |
|
Multiline Retail — 0.5% | |
| | |
Kohl’s Corp. (a) | | | 344 | | | | 17,005 | |
| | | | | | | | |
|
Multi-Utilities — 1.0% | |
| | |
CenterPoint Energy, Inc. | | | 1,099 | | | | 30,665 | |
| | | | | | | | |
|
Oil, Gas & Consumable Fuels — 7.5% | |
| | |
Chevron Corp. | | | 791 | | | | 92,777 | |
| | |
Diamondback Energy, Inc. | | | 287 | | | | 30,953 | |
| | |
Hess Corp. | | | 386 | | | | 28,546 | |
| | |
Occidental Petroleum Corp. | | | 986 | | | | 28,578 | |
| | |
Pioneer Natural Resources Co. | | | 297 | | | | 54,005 | |
| | | | | | | | |
| | |
| | | | | | | 234,859 | |
| | | | | | | | |
|
Pharmaceuticals — 4.2% | |
| | |
Bristol-Myers Squibb Co. | | | 1,475 | | | | 91,973 | |
| | |
Johnson & Johnson | | | 167 | | | | 28,500 | |
| | |
Organon & Co. | | | 340 | | | | 10,356 | |
| | | | | | | | |
| | |
| | | | | | | 130,829 | |
| | | | | | | | |
|
Road & Rail — 1.3% | |
| | |
Norfolk Southern Corp. | | | 111 | | | | 33,165 | |
| | |
Union Pacific Corp. | | | 33 | | | | 8,288 | |
| | | | | | | | |
| | |
| | | | | | | 41,453 | |
| | | | | | | | |
| | | | | | | | |
| INVESTMENTS | | SHARES (000) | | | VALUE ($000) | |
| | | | | | | | |
|
Technology Hardware, Storage & Peripherals — 2.7% | |
| | |
Seagate Technology Holdings plc | | | 740 | | | | 83,560 | |
| | | | | | | | |
|
Textiles, Apparel & Luxury Goods — 1.2% | |
| | |
Kontoor Brands, Inc. | | | 220 | | | | 11,295 | |
| | |
Tapestry, Inc. | | | 614 | | | | 24,916 | |
| | | | | | | | |
| | |
| | | | | | | 36,211 | |
| | | | | | | | |
| |
Total Common Stocks
(Cost $2,622,002) | | | | 3,120,239 | |
| | | | | |
Short-Term Investments — 1.3% | |
|
Investment Companies — 0.1% | |
| | |
JPMorgan Prime Money Market Fund Class IM Shares, 0.07% (b) (c)
(Cost $3,146) | | | 3,145 | | | | 3,146 | |
| | | | | | | | |
|
Investment of Cash Collateral from Securities Loaned — 1.2% | |
| | |
JPMorgan Securities Lending Money Market Fund Agency SL Class Shares, 0.08% (b) (c) | | | 29,901 | | | | 29,894 | |
| | |
JPMorgan U.S. Government Money Market Fund Class IM Shares, 0.03% (b) (c) | | | 7,894 | | | | 7,894 | |
| | | | | | | | |
| | |
Total Investment of Cash Collateral from Securities Loaned
(Cost $37,788) | | | | | | | 37,788 | |
| | | | | |
| | |
Total Short-Term Investments
(Cost $40,934) | | | | | | | 40,934 | |
| | | | | | | | |
Total Investments — 101.5%
(Cost $2,662,936) | | | | | | | 3,161,173 | |
Liabilities in Excess of
Other Assets — (1.5)% | | | | | | | (48,001 | ) |
| | | | | | | | |
Net Assets — 100.0% | | | | | | | 3,113,172 | |
| | | | | | | | |
Percentages indicated are based on net assets.
Abbreviations
| | |
| |
| ADR | | American Depositary Receipt |
| |
| (a) | | The security or a portion of this security is on loan at December 31, 2021. The total value of securities on loan at December 31, 2021 is $36,685. |
| (b) | | Investment in an affiliated fund, which is registered under the Investment Company Act of 1940, as amended, and is advised by J.P. Morgan Investment Management Inc. |
| (c) | | The rate shown is the current yield as of December 31, 2021. |
| * | | Non-income producing security. |
SEE NOTES TO FINANCIAL STATEMENTS.
| | | | | | | | | | |
| | | | | |
| 58 | | | | | | | | J.P. MORGAN LARGE CAP FUNDS | | DECEMBER 31, 2021 |
JPMorgan U.S. Applied Data Science Value Fund
(formerly known as JPMorgan Intrepid Value Fund)
SCHEDULE OF PORTFOLIO INVESTMENTS
AS OF DECEMBER 31, 2021 (Unaudited)
| | | | | | | | |
| INVESTMENTS | | SHARES
(000) | | | VALUE
($000) | |
Common Stocks — 97.8% | |
|
Aerospace & Defense — 1.2% | |
| | |
Northrop Grumman Corp. | | | 8 | | | | 2,969 | |
| | | | | | | | |
|
Auto Components — 0.7% | |
| | |
Lear Corp. | | | 9 | | | | 1,635 | |
| | | | | | | | |
|
Banks — 9.8% | |
| | |
Bank of America Corp. | | | 144 | | | | 6,391 | |
| | |
Citigroup, Inc. | | | 57 | | | | 3,451 | |
| | |
Citizens Financial Group, Inc. | | | 43 | | | | 2,021 | |
| | |
M&T Bank Corp. | | | 16 | | | | 2,445 | |
| | |
PNC Financial Services Group, Inc. (The) | | | 20 | | | | 3,987 | |
| | |
Wells Fargo & Co. | | | 111 | | | | 5,342 | |
| | |
Western Alliance Bancorp | | | 4 | | | | 378 | |
| | | | | | | | |
| | |
| | | | | | | 24,015 | |
| | | | | | | | |
|
Beverages — 2.2% | |
| | |
Coca-Cola Co. (The) | | | 91 | | | | 5,374 | |
| | | | | | | | |
|
Biotechnology — 1.9% | |
| | |
AbbVie, Inc. | | | 22 | | | | 2,998 | |
| | |
Vertex Pharmaceuticals, Inc. * | | | 8 | | | | 1,764 | |
| | | | | | | | |
| | |
| | | | | | | 4,762 | |
| | | | | | | | |
|
Building Products — 2.1% | |
| | |
Johnson Controls International plc | | | 32 | | | | 2,578 | |
| | |
Trane Technologies plc | | | 13 | | | | 2,666 | |
| | | | | | | | |
| | |
| | | | | | | 5,244 | |
| | | | | | | | |
|
Capital Markets — 6.2% | |
| | |
BlackRock, Inc. | | | 6 | | | | 5,708 | |
| | |
CME Group, Inc. | | | 6 | | | | 1,461 | |
| | |
Morgan Stanley | | | 53 | | | | 5,248 | |
| | |
T. Rowe Price Group, Inc. | | | 15 | | | | 2,976 | |
| | | | | | | | |
| | |
| | | | | | | 15,393 | |
| | | | | | | | |
|
Chemicals — 2.3% | |
| | |
Axalta Coating Systems Ltd. * | | | 90 | | | | 2,994 | |
| | |
DuPont de Nemours, Inc. | | | 32 | | | | 2,571 | |
| | | | | | | | |
| | |
| | | | | | | 5,565 | |
| | | | | | | | |
|
Consumer Finance — 1.7% | |
| | |
Ally Financial, Inc. | | | 32 | | | | 1,520 | |
| | |
Capital One Financial Corp. | | | 7 | | | | 1,065 | |
| | |
Synchrony Financial | | | 33 | | | | 1,538 | |
| | | | | | | | |
| | |
| | | | | | | 4,123 | |
| | | | | | | | |
|
Containers & Packaging — 0.6% | |
| | |
Berry Global Group, Inc. * | | | 21 | | | | 1,565 | |
| | | | | | | | |
|
Diversified Financial Services — 1.1% | |
| | |
Berkshire Hathaway, Inc., Class B * | | | 9 | | | | 2,660 | |
| | | | | | | | |
| | | | | | | | |
| INVESTMENTS | | SHARES
(000) | | | VALUE
($000) | |
| | | | | | | | |
|
Diversified Telecommunication Services — 2.1% | |
| | |
Verizon Communications, Inc. | | | 98 | | | | 5,103 | |
| | | | | | | | |
|
Electric Utilities — 4.2% | |
| | |
Exelon Corp. | | | 56 | | | | 3,245 | |
| | |
NextEra Energy, Inc. | | | 76 | | | | 7,101 | |
| | | | | | | | |
| | |
| | | | | | | 10,346 | |
| | | | | | | | |
|
Electrical Equipment — 2.3% | |
| | |
Eaton Corp. plc | | | 32 | | | | 5,563 | |
| | | | | | | | |
|
Equity Real Estate Investment Trusts (REITs) — 3.7% | |
| | |
Host Hotels & Resorts, Inc. * | | | 54 | | | | 946 | |
| | |
Prologis, Inc. | | | 43 | | | | 7,177 | |
| | |
Ventas, Inc. | | | 21 | | | | 1,065 | |
| | | | | | | | |
| | |
| | | | | | | 9,188 | |
| | | | | | | | |
|
Food & Staples Retailing — 0.6% | |
| | |
Sysco Corp. | | | 18 | | | | 1,448 | |
| | | | | | | | |
|
Food Products — 1.7% | |
| | |
Mondelez International, Inc., Class A | | | 43 | | | | 2,846 | |
| | |
Tyson Foods, Inc., Class A | | | 15 | | | | 1,345 | |
| | | | | | | | |
| | |
| | | | | | | 4,191 | |
| | | | | | | | |
|
Health Care Equipment & Supplies — 2.3% | |
| | |
Becton Dickinson and Co. | | | 6 | | | | 1,404 | |
| | |
Medtronic plc | | | 41 | | | | 4,202 | |
| | | | | | | | |
| | |
| | | | | | | 5,606 | |
| | | | | | | | |
|
Health Care Providers & Services — 6.2% | |
| | |
Anthem, Inc. | | | 7 | | | | 3,470 | |
| | |
Centene Corp. * | | | 26 | | | | 2,119 | |
| | |
Cigna Corp. | | | 16 | | | | 3,690 | |
| | |
UnitedHealth Group, Inc. | | | 12 | | | | 6,124 | |
| | | | | | | | |
| | |
| | | | | | | 15,403 | |
| | | | | | | | |
|
Hotels, Restaurants & Leisure — 1.2% | |
| | |
Expedia Group, Inc. * | | | 7 | | | | 1,321 | |
| | |
Royal Caribbean Cruises Ltd. * | | | 5 | | | | 417 | |
| | |
Travel + Leisure Co. | | | 21 | | | | 1,188 | |
| | | | | | | | |
| | |
| | | | | | | 2,926 | |
| | | | | | | | |
|
Household Durables — 0.6% | |
| | |
Whirlpool Corp. | | | 7 | | | | 1,570 | |
| | | | | | | | |
|
Household Products — 1.5% | |
| | |
Procter & Gamble Co. (The) | | | 13 | | | | 2,184 | |
| | |
Spectrum Brands Holdings, Inc. | | | 15 | | | | 1,487 | |
| | | | | | | | |
| | |
| | | | | | | 3,671 | |
| | | | | | | | |
SEE NOTES TO FINANCIAL STATEMENTS.
| | | | | | | | | | |
| | | | | |
| DECEMBER 31, 2021 | | J.P. MORGAN LARGE CAP FUNDS | | | | | | | | 59 |
JPMorgan U.S. Applied Data Science Value Fund
(formerly known as JPMorgan Intrepid Value Fund)
SCHEDULE OF PORTFOLIO INVESTMENTS
AS OF DECEMBER 31, 2021 (Unaudited) (continued)
| | | | | | | | |
| INVESTMENTS | | SHARES
(000) | | | VALUE
($000) | |
Common Stocks — continued | |
|
Insurance — 2.6% | |
| | |
Loews Corp. | | | 53 | | | | 3,035 | |
| | |
Travelers Cos., Inc. (The) | | | 21 | | | | 3,279 | |
| | | | | | | | |
| | |
| | | | | | | 6,314 | |
| | | | | | | | |
|
Interactive Media & Services — 3.0% | |
| | |
Alphabet, Inc., Class C * | | | 2 | | | | 5,952 | |
| | |
Meta Platforms, Inc., Class A * | | | 4 | | | | 1,342 | |
| | | | | | | | |
| | |
| | | | | | | 7,294 | |
| | | | | | | | |
|
IT Services — 2.0% | |
| | |
Amdocs Ltd. | | | 14 | | | | 1,070 | |
| | |
Fidelity National Information Services, Inc. | | | 14 | | | | 1,552 | |
| | |
Fiserv, Inc. * | | | 8 | | | | 845 | |
| | |
Mastercard, Inc., Class A | | | 4 | | | | 1,404 | |
| | | | | | | | |
| | |
| | | | | | | 4,871 | |
| | | | | | | | |
|
Life Sciences Tools & Services — 0.7% | |
| | |
Agilent Technologies, Inc. | | | 11 | | | | 1,833 | |
| | | | | | | | |
|
Machinery — 3.7% | |
| | |
Deere & Co. | | | 4 | | | | 1,343 | |
| | |
Dover Corp. | | | 23 | | | | 4,090 | |
| | |
Parker-Hannifin Corp. | | | 11 | | | | 3,645 | |
| | | | | | | | |
| | |
| | | | | | | 9,078 | |
| | | | | | | | |
|
Media — 1.4% | |
| | |
Charter Communications, Inc., Class A * | | | 3 | | | | 1,955 | |
| | |
Comcast Corp., Class A | | | 30 | | | | 1,523 | |
| | | | | | | | |
| | |
| | | | | | | 3,478 | |
| | | | | | | | |
|
Multiline Retail — 0.9% | |
| | |
Target Corp. | | | 10 | | | | 2,212 | |
| | | | | | | | |
|
Multi-Utilities — 2.2% | |
| | |
CMS Energy Corp. | | | 23 | | | | 1,509 | |
| | |
Dominion Energy, Inc. | | | 35 | | | | 2,754 | |
| | |
WEC Energy Group, Inc. | | | 12 | | | | 1,126 | |
| | | | | | | | |
| | |
| | | | | | | 5,389 | |
| | | | | | | | |
|
Oil, Gas & Consumable Fuels — 5.6% | |
| | |
Cheniere Energy, Inc. | | | 15 | | | | 1,500 | |
| | |
Chevron Corp. | | | 17 | | | | 2,004 | |
| | |
ConocoPhillips | | | 71 | | | | 5,141 | |
| | |
Coterra Energy, Inc. | | | 84 | | | | 1,603 | |
| | |
EOG Resources, Inc. | | | 34 | | | | 2,984 | |
| | |
Phillips 66 | | | 8 | | | | 569 | |
| | | | | | | | |
| | |
| | | | | | | 13,801 | |
| | | | | | | | |
| | | | | | | | |
| INVESTMENTS | | SHARES
(000) | | | VALUE
($000) | |
| | | | | | | | |
|
Pharmaceuticals — 4.5% | |
| | |
Bristol-Myers Squibb Co. | | | 82 | | | | 5,125 | |
| | |
Eli Lilly & Co. | | | 11 | | | | 3,027 | |
| | |
Jazz Pharmaceuticals plc * | | | 10 | | | | 1,335 | |
| | |
Merck & Co., Inc. | | | 21 | | | | 1,587 | |
| | | | | | | | |
| | |
| | | | | | | 11,074 | |
| | | | | | | | |
|
Professional Services — 0.3% | |
| | |
Booz Allen Hamilton Holding Corp. | | | 9 | | | | 763 | |
| | | | | | | | |
|
Real Estate Management & Development — 0.8% | |
| | |
CBRE Group, Inc., Class A * | | | 19 | | | | 2,024 | |
| | | | | | | | |
|
Road & Rail — 3.4% | |
| | |
CSX Corp. | | | 77 | | | | 2,905 | |
| | |
Norfolk Southern Corp. | | | 18 | | | | 5,504 | |
| | | | | | | | |
| | |
| | | | | | | 8,409 | |
| | | | | | | | |
|
Semiconductors & Semiconductor Equipment — 3.8% | |
| | |
Analog Devices, Inc. | | | 17 | | | | 3,034 | |
| | |
NXP Semiconductors NV (China) | | | 5 | | | | 1,153 | |
| | |
QUALCOMM, Inc. | | | 9 | | | | 1,569 | |
| | |
Texas Instruments, Inc. | | | 20 | | | | 3,693 | |
| | | | | | | | |
| | |
| | | | | | | 9,449 | |
| | | | | | | | |
|
Software — 1.5% | |
| | |
Microsoft Corp. | | | 9 | | | | 2,909 | |
| | |
SS&C Technologies Holdings, Inc. | | | 9 | | | | 771 | |
| | | | | | | | |
| | |
| | | | | | | 3,680 | |
| | | | | | | | |
|
Specialty Retail — 3.9% | |
| | |
AutoZone, Inc. * | | | 2 | | | | 4,141 | |
| | |
Lowe’s Cos., Inc. | | | 7 | | | | 1,833 | |
| | |
O’Reilly Automotive, Inc. * | | | 5 | | | | 3,677 | |
| | | | | | | | |
| | |
| | | | | | | 9,651 | |
| | | | | | | | |
|
Technology Hardware, Storage & Peripherals — 0.3% | |
| | |
Xerox Holdings Corp. | | | 34 | | | | 759 | |
| | | | | | | | |
|
Tobacco — 1.0% | |
| | |
Altria Group, Inc. | | | 52 | | | | 2,472 | |
| | | | | | | | |
| | |
Total Common Stocks
(Cost $188,731) | | | | | | | 240,871 | |
| | | | | |
Short-Term Investments — 2.1% | |
|
Investment Companies — 2.1% | |
| | |
JPMorgan Prime Money Market Fund Class IM Shares, 0.07% (a) (b)
(Cost $5,269) | | | 5,267 | | | | 5,269 | |
| | | | | | | | |
Total Investments — 99.9%
(Cost $194,000) | | | | | | | 246,140 | |
Other Assets Less Liabilities — 0.1% | | | | | | | 312 | |
| | | | | | | | |
NET ASSETS — 100.0% | | | | | | | 246,452 | |
| | | | | | | | |
Percentages indicated are based on net assets.
SEE NOTES TO FINANCIAL STATEMENTS.
| | | | | | | | | | |
| | | | | |
| 60 | | | | | | | | J.P. MORGAN LARGE CAP FUNDS | | DECEMBER 31, 2021 |
| | |
| (a) | | Investment in an affiliated fund, which is registered under the Investment Company Act of 1940, as amended, and is advised by J.P. Morgan Investment Management Inc. |
| (b) | | The rate shown is the current yield as of December 31, 2021. |
| * | | Non-income producing security. |
| | | | | | | | | | | | | | | | | | | | |
| Futures contracts outstanding as of December 31, 2021 (amounts in thousands, except number of contracts): | |
| DESCRIPTION | | NUMBER OF
CONTRACTS | | | EXPIRATION
DATE | | | TRADING
CURRENCY | | | NOTIONAL
AMOUNT ($) | | | VALUE AND
UNREALIZED
APPRECIATION
(DEPRECIATION) ($) | |
Long Contracts | | | | | | | | | | | | | | | | | | | | |
S&P 500 E-Mini Index | | | 22 | | | | 03/2022 | | | | USD | | | | 5,234 | | | | 100 | |
| | | | | | | | | | | | | | | | | | | | |
Abbreviations
SEE NOTES TO FINANCIAL STATEMENTS.
| | | | | | | | | | |
| | | | | |
| DECEMBER 31, 2021 | | J.P. MORGAN LARGE CAP FUNDS | | | | | | | | 61 |
JPMorgan U.S. Equity Fund
SCHEDULE OF PORTFOLIO INVESTMENTS
AS OF DECEMBER 31, 2021 (Unaudited)
| | | | | | | | |
| INVESTMENTS | | SHARES
(000) | | | VALUE
($000) | |
Common Stocks — 99.1% | |
|
Aerospace & Defense — 1.4% | |
| | |
Northrop Grumman Corp. | | | 811 | | | | 313,743 | |
| | | | | | | | |
|
Automobiles — 2.0% | |
| | |
Rivian Automotive, Inc., Class A * (a) | | | 772 | | | | 80,051 | |
| | |
Tesla, Inc. * | | | 356 | | | | 375,858 | |
| | | | | | | | |
| | |
| | | | | | | 455,909 | |
| | | | | | | | |
|
Banks — 6.3% | |
| | |
Truist Financial Corp. | | | 8,364 | | | | 489,729 | |
| | |
US Bancorp | | | 7,660 | | | | 430,253 | |
| | |
Wells Fargo & Co. | | | 10,528 | | | | 505,126 | |
| | | | | | | | |
| | |
| | | | | | | 1,425,108 | |
| | | | | | | | |
|
Beverages — 1.2% | |
| | |
Coca-Cola Co. (The) | | | 4,732 | | | | 280,166 | |
| | | | | | | | |
|
Biotechnology — 5.1% | |
| | |
AbbVie, Inc. | | | 4,667 | | | | 631,859 | |
| | |
Biogen, Inc. * | | | 670 | | | | 160,643 | |
| | |
Regeneron Pharmaceuticals, Inc. * | | | 565 | | | | 356,527 | |
| | | | | | | | |
| | |
| | | | | | | 1,149,029 | |
| | | | | | | | |
|
Building Products — 0.7% | |
| | |
Trane Technologies plc | | | 820 | | | | 165,625 | |
| | | | | | | | |
|
Capital Markets — 4.3% | |
| | |
Ameriprise Financial, Inc. | | | 990 | | | | 298,640 | |
| | |
Morgan Stanley | | | 2,496 | | | | 244,983 | |
| | |
S&P Global, Inc. | | | 879 | | | | 414,861 | |
| | | | | | | | |
| | |
| | | | | | | 958,484 | |
| | | | | | | | |
|
Chemicals — 2.8% | |
| | |
Eastman Chemical Co. | | | 1,587 | | | | 191,912 | |
| | |
PPG Industries, Inc. | | | 2,548 | | | | 439,354 | |
| | | | | | | | |
| | |
| | | | | | | 631,266 | |
| | | | | | | | |
|
Construction Materials — 0.4% | |
| | |
Vulcan Materials Co. | | | 471 | | | | 97,798 | |
| | | | | | | | |
|
Electric Utilities — 3.9% | |
| | |
NextEra Energy, Inc. | | | 6,641 | | | | 620,007 | |
| | |
Xcel Energy, Inc. | | | 3,761 | | | | 254,608 | |
| | | | | | | | |
| | |
| | | | | | | 874,615 | |
| | | | | | | | |
|
Electrical Equipment — 3.0% | |
| | |
Eaton Corp. plc | | | 3,968 | | | | 685,774 | |
| | | | | | | | |
|
Equity Real Estate Investment Trusts (REITs) — 3.4% | |
| | |
Prologis, Inc. | | | 4,545 | | | | 765,183 | |
| | | | | | | | |
|
Health Care Equipment & Supplies — 2.7% | |
| | |
Boston Scientific Corp. * | | | 8,493 | | | | 360,792 | |
| | |
Intuitive Surgical, Inc. * | | | 696 | | | | 250,203 | |
| | | | | | | | |
| | |
| | | | | | | 610,995 | |
| | | | | | | | |
| | | | | | | | |
| INVESTMENTS | | SHARES
(000) | | | VALUE
($000) | |
| | | | | | | | |
|
Health Care Providers & Services — 1.5% | |
| | |
Centene Corp. * | | | 4,036 | | | | 332,600 | |
| | | | | | | | |
|
Hotels, Restaurants & Leisure — 4.7% | |
| | |
Marriott International, Inc., Class A * | | | 2,697 | | | | 445,726 | |
| | |
McDonald’s Corp. | | | 1,494 | | | | 400,369 | |
| | |
Yum! Brands, Inc. | | | 1,505 | | | | 208,958 | |
| | | | | | | | |
| | |
| | | | | | | 1,055,053 | |
| | | | | | | | |
|
Insurance — 0.6% | |
| | |
Progressive Corp. (The) | | | 1,393 | | | | 142,992 | |
| | | | | | | | |
|
Interactive Media & Services — 7.6% | |
| | |
Alphabet, Inc., Class A * | | | 508 | | | | 1,472,829 | |
| | |
Meta Platforms, Inc., Class A * | | | 349 | | | | 117,291 | |
| | |
Snap, Inc., Class A * | | | 2,502 | | | | 117,686 | |
| | | | | | | | |
| | |
| | | | | | | 1,707,806 | |
| | | | | | | | |
|
Internet & Direct Marketing Retail — 5.9% | |
| | |
Amazon.com, Inc. * | | | 397 | | | | 1,322,132 | |
| | | | | | | | |
|
IT Services — 4.9% | |
| | |
Affirm Holdings, Inc. * | | | 579 | | | | 58,219 | |
| | |
FleetCor Technologies, Inc. * | | | 447 | | | | 99,996 | |
| | |
Mastercard, Inc., Class A | | | 2,086 | | | | 749,641 | |
| | |
Shopify, Inc., Class A (Canada) * | | | 136 | | | | 187,822 | |
| | | | | | | | |
| | |
| | | | | | | 1,095,678 | |
| | | | | | | | |
|
Machinery — 3.0% | |
| | |
Deere & Co. | | | 1,365 | | | | 468,046 | |
| | |
Stanley Black & Decker, Inc. | | | 1,115 | | | | 210,275 | |
| | | | | | | | |
| | |
| | | | | | | 678,321 | |
| | | | | | | | |
|
Pharmaceuticals — 3.8% | |
| | |
Bristol-Myers Squibb Co. | | | 6,964 | | | | 434,178 | |
| | |
Eli Lilly & Co. | | | 1,524 | | | | 420,976 | |
| | | | | | | | |
| | |
| | | | | | | 855,154 | |
| | | | | | | | |
|
Professional Services — 0.8% | |
| | |
Leidos Holdings, Inc. | | | 1,906 | | | | 169,420 | |
| | | | | | | | |
|
Road & Rail — 2.5% | |
| | |
Norfolk Southern Corp. | | | 1,863 | | | | 554,590 | |
| | | | | | | | |
|
Semiconductors & Semiconductor Equipment — 7.7% | |
| | |
Advanced Micro Devices, Inc. * | | | 3,202 | | | | 460,727 | |
| | |
Analog Devices, Inc. | | | 3,176 | | | | 558,330 | |
| | |
NXP Semiconductors NV (China) | | | 3,163 | | | | 720,448 | |
| | | | | | | | |
| | |
| | | | | | | 1,739,505 | |
| | | | | | | | |
|
Software — 9.0% | |
| | |
Ceridian HCM Holding, Inc. * | | | 916 | | | | 95,638 | |
| | |
Microsoft Corp. | | | 5,671 | | | | 1,907,117 | |
| | | | | | | | |
| | |
| | | | | | | 2,002,755 | |
| | | | | | | | |
SEE NOTES TO FINANCIAL STATEMENTS.
| | | | | | | | | | |
| | | | | |
| 62 | | | | | | | | J.P. MORGAN LARGE CAP FUNDS | | DECEMBER 31, 2021 |
| | | | | | | | |
| INVESTMENTS | | SHARES
(000) | | | VALUE
($000) | |
Common Stocks — continued | |
|
Specialty Retail — 3.3% | |
| | |
Lowe’s Cos., Inc. | | | 1,227 | | | | 317,090 | |
| | |
O’Reilly Automotive, Inc. * | | | 265 | | | | 186,989 | |
| | |
Ross Stores, Inc. | | | 2,122 | | | | 242,471 | |
| | | | | | | | |
| | |
| | | | | | | 746,550 | |
| | | | | | | | |
|
Technology Hardware, Storage & Peripherals — 5.3% | |
| | |
Apple, Inc. | | | 6,707 | | | | 1,190,924 | |
| | | | | | | | |
|
Textiles, Apparel & Luxury Goods — 1.3% | |
| | |
NIKE, Inc., Class B | | | 1,759 | | | | 293,201 | |
| | | | | | | | |
| | |
Total Common Stocks
(Cost $12,546,854) | | | | | | | 22,300,376 | |
| | | | | | | | |
Short-Term Investments — 1.6% | |
|
Investment Companies — 1.3% | |
| | |
JPMorgan Prime Money Market Fund Class IM Shares, 0.07% (b) (c)
(Cost $305,526) | | | 305,404 | | | | 305,526 | |
| | | | | | | | |
|
Investment of Cash Collateral from Securities Loaned — 0.3% | |
| | |
JPMorgan Securities Lending Money Market Fund Agency SL Class Shares, 0.08% (b) (c) | | | 55,006 | | | | 54,995 | |
| | | | | | | | |
| INVESTMENTS | | SHARES
(000) | | | VALUE
($000) | |
| | | | | | | | |
|
Investment of Cash Collateral from Securities Loaned — continued | |
| | |
JPMorgan U.S. Government Money Market Fund Class IM Shares, 0.03% (b) (c) | | | 10,209 | | | | 10,209 | |
| | | | | | | | |
| | |
Total Investment of Cash Collateral from Securities Loaned
(Cost $65,204) | | | | | | | 65,204 | |
| | | | | | | | |
| | |
Total Short-Term Investments
(Cost $370,730) | | | | | | | 370,730 | |
| | | | | | | | |
Total Investments — 100.7%
(Cost $12,917,584) | | | | | | | 22,671,106 | |
Liabilities in Excess of
Other Assets — (0.7)% | | | | | | | (156,541 | ) |
| | | | | | | | |
NET ASSETS — 100.0% | | | | | | | 22,514,565 | |
| | | | | | | | |
Percentages indicated are based on net assets.
Abbreviations
| | |
| (a) | | The security or a portion of this security is on loan at December 31, 2021. The total value of securities on loan at December 31, 2021 is $64,031. |
| (b) | | Investment in an affiliated fund, which is registered under the Investment Company Act of 1940, as amended, and is advised by J.P. Morgan Investment Management Inc. |
| (c) | | The rate shown is the current yield as of December 31, 2021. |
| * | | Non-income producing security. |
| | | | | | | | | | | | | | | | | | | | |
| Futures contracts outstanding as of December 31, 2021 (amounts in thousands, except number of contracts): | |
| DESCRIPTION | | NUMBER OF
CONTRACTS | | | EXPIRATION
DATE | | | TRADING
CURRENCY | | | NOTIONAL
AMOUNT ($) | | | VALUE AND
UNREALIZED
APPRECIATION
(DEPRECIATION) ($) | |
Long Contracts | | | | | | | | | | | | | | | | | | | | |
S&P 500 E-Mini Index | | | 813 | | | | 03/2022 | | | | USD | | | | 193,423 | | | | 5,467 | |
| | | | | | | | | | | | | | | | | | | | |
Abbreviations
SEE NOTES TO FINANCIAL STATEMENTS.
| | | | | | | | | | |
| | | | | |
| DECEMBER 31, 2021 | | J.P. MORGAN LARGE CAP FUNDS | | | | | | | | 63 |
JPMorgan U.S. GARP Equity Fund
SCHEDULE OF PORTFOLIO INVESTMENTS
AS OF DECEMBER 31, 2021 (Unaudited)
| | | | | | | | |
| INVESTMENTS | | SHARES
(000) | | | VALUE
($000) | |
Common Stocks — 98.7% | | | | | | | | |
|
Aerospace & Defense — 0.5% | |
| | |
Textron, Inc. | | | 86 | | | | 6,639 | |
| | | | | | | | |
|
Air Freight & Logistics — 0.3% | |
| | |
United Parcel Service, Inc., Class B | | | 19 | | | | 3,987 | |
| | | | | | | | |
|
Automobiles — 3.6% | |
| | |
Rivian Automotive, Inc., Class A * (a) | | | 43 | | | | 4,452 | |
| | |
Tesla, Inc. * | | | 42 | | | | 44,173 | |
| | | | | | | | |
| | |
| | | | | | | 48,625 | |
| | | | | | | | |
|
Beverages — 2.0% | |
| | |
Coca-Cola Co. (The) | | | 173 | | | | 10,220 | |
| | |
Monster Beverage Corp. * | | | 72 | | | | 6,934 | |
| | |
PepsiCo, Inc. | | | 53 | | | | 9,189 | |
| | | | | | | | |
| | |
| | | | | | | 26,343 | |
| | | | | | | | |
|
Biotechnology — 3.0% | |
| | |
AbbVie, Inc. | | | 186 | | | | 25,232 | |
| | |
Regeneron Pharmaceuticals, Inc. * | | | 8 | | | | 5,242 | |
| | |
Seagen, Inc. * | | | 17 | | | | 2,566 | |
| | |
Vertex Pharmaceuticals, Inc. * | | | 36 | | | | 7,928 | |
| | | | | | | | |
| | |
| | | | | | | 40,968 | |
| | | | | | | | |
|
Building Products — 1.3% | |
| | |
Allegion plc | | | 45 | | | | 5,894 | |
| | |
Trane Technologies plc | | | 56 | | | | 11,333 | |
| | | | | | | | |
| | |
| | | | | | | 17,227 | |
| | | | | | | | |
|
Capital Markets — 0.7% | |
| | |
S&P Global, Inc. | | | 19 | | | | 8,778 | |
| | | | | | | | |
|
Commercial Services & Supplies — 0.5% | |
| | |
Waste Management, Inc. | | | 39 | | | | 6,476 | |
| | | | | | | | |
|
Construction & Engineering — 0.2% | |
| | |
Quanta Services, Inc. | | | 21 | | | | 2,431 | |
| | | | | | | | |
|
Consumer Finance — 0.4% | |
| | |
Capital One Financial Corp. | | | 36 | | | | 5,194 | |
| | | | | | | | |
|
Electronic Equipment, Instruments & Components — 0.6% | |
| | |
Keysight Technologies, Inc. * | | | 39 | | | | 8,116 | |
| | | | | | | | |
|
Entertainment — 2.0% | |
| | |
Electronic Arts, Inc. | | | 61 | | | | 8,006 | |
| | |
Netflix, Inc.* | | | 30 | | | | 18,254 | |
| | | | | | | | |
| | |
| | | | | | | 26,260 | |
| | | | | | | | |
|
Equity Real Estate Investment Trusts (REITs) — 2.1% | |
| | |
Equinix, Inc. | | | 6 | | | | 4,990 | |
| | |
Host Hotels & Resorts, Inc.* | | | 285 | | | | 4,953 | |
| | |
Prologis, Inc. | | | 74 | | | | 12,510 | |
| | |
Sun Communities, Inc. | | | 26 | | | | 5,354 | |
| | | | | | | | |
| | |
| | | | | | | 27,807 | |
| | | | | | | | |
| | | | | | | | |
| INVESTMENTS | | SHARES
(000) | | | VALUE
($000) | |
| | | | | | | | |
|
Food & Staples Retailing — 0.5% | |
| | |
Costco Wholesale Corp. | | | 12 | | | | 6,812 | |
| | | | | | | | |
|
Food Products — 0.2% | |
| | |
Hershey Co. (The) | | | 16 | | | | 3,115 | |
| | | | | | | | |
|
Health Care Equipment & Supplies — 2.3% | |
| | |
Align Technology, Inc. * | | | 17 | | | | 11,106 | |
| | |
Boston Scientific Corp. * | | | 281 | | | | 11,937 | |
| | |
Medtronic plc | | | 75 | | | | 7,800 | |
| | | | | | | | |
| | |
| | | | | | | 30,843 | |
| | | | | | | | |
|
Health Care Providers & Services — 1.6% | |
| | |
Anthem, Inc. | | | 15 | | | | 6,999 | |
| | |
Humana, Inc. | | | 13 | | | | 5,984 | |
| | |
UnitedHealth Group, Inc. | | | 17 | | | | 8,336 | |
| | | | | | | | |
| | |
| | | | | | | 21,319 | |
| | | | | | | | |
|
Hotels, Restaurants & Leisure — 3.2% | |
| | |
Airbnb, Inc., Class A * | | | 35 | | | | 5,757 | |
| | |
Booking Holdings, Inc. * | | | 2 | | | | 5,278 | |
| | |
Darden Restaurants, Inc. | | | 34 | | | | 5,062 | |
| | |
Domino’s Pizza, Inc. | | | 9 | | | | 5,079 | |
| | |
Expedia Group, Inc. * | | | 51 | | | | 9,234 | |
| | |
Las Vegas Sands Corp. * | | | 99 | | | | 3,738 | |
| | |
McDonald’s Corp. | | | 32 | | | | 8,605 | |
| | | | | | | | |
| | |
| | | | | | | 42,753 | |
| | | | | | | | |
|
Household Durables — 1.3% | |
| | |
PulteGroup, Inc. | | | 102 | | | | 5,813 | |
| | |
Toll Brothers, Inc. | | | 154 | | | | 11,148 | |
| | | | | | | | |
| | |
| | | | | | | 16,961 | |
| | | | | | | | |
|
Insurance — 0.3% | |
| | |
Arch Capital Group Ltd. * | | | 87 | | | | 3,885 | |
| | | | | | | | |
|
Interactive Media & Services — 9.3% | |
| | |
Alphabet, Inc., Class A * | | | 13 | | | | 36,792 | |
| | |
Alphabet, Inc., Class C * | | | 12 | | | | 35,881 | |
| | |
Meta Platforms, Inc., Class A * | | | 160 | | | | 53,883 | |
| | | | | | | | |
| | |
| | | | | | | 126,556 | |
| | | | | | | | |
|
Internet & Direct Marketing Retail — 5.9% | |
| | |
Amazon.com, Inc. * | | | 24 | | | | 79,357 | |
| | | | | | | | |
|
IT Services — 4.7% | |
| | |
Accenture plc, Class A | | | 32 | | | | 13,307 | |
| | |
Mastercard, Inc., Class A | | | 102 | | | | 36,759 | |
| | |
PayPal Holdings, Inc. * | | | 16 | | | | 3,036 | |
| | |
Visa, Inc., Class A | | | 46 | | | | 10,055 | |
| | | | | | | | |
| | |
| | | | | | | 63,157 | |
| | | | | | | | |
SEE NOTES TO FINANCIAL STATEMENTS.
| | | | | | | | | | |
| | | | | |
| 64 | | | | | | | | J.P. MORGAN LARGE CAP FUNDS | | DECEMBER 31, 2021 |
| | | | | | | | |
| INVESTMENTS | | SHARES
(000) | | | VALUE
($000) | |
Common Stocks — continued | |
|
Life Sciences Tools & Services — 2.4% | |
| | |
Agilent Technologies, Inc. | | | 74 | | | | 11,734 | |
| | |
Thermo Fisher Scientific, Inc. | | | 22 | | | | 14,480 | |
| | |
Waters Corp. * | | | 14 | | | | 5,365 | |
| | | | | | | | |
| | |
| | | | | | | 31,579 | |
| | | | | | | | |
|
Machinery — 1.6% | |
| | |
Deere & Co. | | | 18 | | | | 6,172 | |
| | |
Ingersoll Rand, Inc. | | | 102 | | | | 6,305 | |
| | |
Otis Worldwide Corp. | | | 53 | | | | 4,641 | |
| | |
Parker-Hannifin Corp. | | | 16 | | | | 4,994 | |
| | | | | | | | |
| | |
| | | | | | | 22,112 | |
| | | | | | | | |
|
Media — 0.4% | |
| | |
Charter Communications, Inc., Class A * | | | 8 | | | | 4,955 | |
| | | | | | | | |
|
Metals & Mining — 0.8% | |
| | |
Freeport-McMoRan, Inc. | | | 136 | | | | 5,666 | |
| | |
Steel Dynamics, Inc. | | | 76 | | | | 4,724 | |
| | | | | | | | |
| | |
| | | | | | | 10,390 | |
| | | | | | | | |
|
Oil, Gas & Consumable Fuels — 0.7% | |
| | |
Cheniere Energy, Inc. | | | 87 | | | | 8,803 | |
| | | | | | | | |
|
Personal Products — 0.4% | |
| | |
Estee Lauder Cos., Inc. (The), Class A | | | 15 | | | | 5,479 | |
| | | | | | | | |
|
Pharmaceuticals — 0.3% | |
| | |
Bristol-Myers Squibb Co. | | | 58 | | | | 3,635 | |
| | | | | | | | |
|
Road & Rail — 2.4% | |
| | |
CSX Corp. | | | 255 | | | | 9,599 | |
| | |
Lyft, Inc., Class A * | | | 238 | | | | 10,171 | |
| | |
Norfolk Southern Corp. | | | 15 | | | | 4,495 | |
| | |
Old Dominion Freight Line, Inc. | | | 23 | | | | 8,386 | |
| | | | | | | | |
| | |
| | | | | | | 32,651 | |
| | | | | | | | |
|
Semiconductors & Semiconductor Equipment — 7.1% | |
| | |
Applied Materials, Inc. | | | 31 | | | | 4,878 | |
| | |
Lam Research Corp. | | | 35 | | | | 24,955 | |
| | |
NVIDIA Corp. | | | 84 | | | | 24,676 | |
| | |
NXP Semiconductors NV (China) | | | 59 | | | | 13,325 | |
| | |
Qorvo, Inc. * | | | 22 | | | | 3,425 | |
| | |
QUALCOMM, Inc. | | | 65 | | | | 11,795 | |
| | |
Texas Instruments, Inc. | | | 63 | | | | 11,892 | |
| | | | | | | | |
| | |
| | | | | | | 94,946 | |
| | | | | | | | |
|
Software — 18.5% | |
| | |
Adobe, Inc. * | | | 22 | | | | 12,193 | |
| | |
Cadence Design Systems, Inc. * | | | 67 | | | | 12,541 | |
| | |
Ceridian HCM Holding, Inc. * | | | 95 | | | | 9,882 | |
| | |
Dropbox, Inc., Class A * | | | 320 | | | | 7,841 | |
| | |
Fortinet, Inc. * | | | 23 | | | | 8,374 | |
| | | | | | | | |
| INVESTMENTS | | SHARES
(000) | | | VALUE
($000) | |
| | | | | | | | |
|
Software — continued | |
| | |
HubSpot, Inc. * | | | 3 | | | | 2,241 | |
| | |
Intuit, Inc. | | | 43 | | | | 27,755 | |
| | |
Microsoft Corp. | | | 413 | | | | 139,001 | |
| | |
Palo Alto Networks, Inc. * | | | 25 | | | | 13,752 | |
| | |
PTC, Inc. * | | | 27 | | | | 3,210 | |
| | |
VMware, Inc., Class A | | | 20 | | | | 2,260 | |
| | |
Workday, Inc., Class A * | | | 39 | | | | 10,627 | |
| | | | | | | | |
| | |
| | | | | | | 249,677 | |
| | | | | | | | |
|
Specialty Retail — 5.4% | |
| | |
Bath & Body Works, Inc. | | | 95 | | | | 6,595 | |
| | |
Best Buy Co., Inc. | | | 58 | | | | 5,872 | |
| | |
Burlington Stores, Inc. * | | | 27 | | | | 7,987 | |
| | |
Lowe’s Cos., Inc. | | | 114 | | | | 29,545 | |
| | |
O’Reilly Automotive, Inc. * | | | 26 | | | | 18,221 | |
| | |
TJX Cos., Inc. (The) | | | 56 | | | | 4,267 | |
| | | | | | | | |
| | |
| | | | | | | 72,487 | |
| | | | | | | | |
|
Technology Hardware, Storage & Peripherals — 10.4% | |
| | |
Apple, Inc. | | | 720 | | | | 127,922 | |
| | |
Hewlett Packard Enterprise Co. | | | 335 | | | | 5,281 | |
| | |
Seagate Technology Holdings plc | | | 71 | | | | 8,067 | |
| | | | | | | | |
| | |
| | | | | | | 141,270 | |
| | | | | | | | |
|
Textiles, Apparel & Luxury Goods — 1.3% | |
| | |
NIKE, Inc., Class B | | | 107 | | | | 17,751 | |
| | | | | | | | |
|
Tobacco — 0.5% | |
| | |
Philip Morris International, Inc. | | | 68 | | | | 6,441 | |
| | | | | | | | |
| | |
Total Common Stocks
(Cost $713,220) | | | | | | | 1,325,785 | |
| | | | | | | | |
Short-Term Investments — 1.5% | |
|
Investment Companies — 1.2% | |
| | |
JPMorgan Prime Money Market Fund Class IM Shares, 0.07% (b) (c)
(Cost $17,033) | | | 17,029 | | | | 17,035 | |
| | | | | | | | |
|
Investment of Cash Collateral from Securities Loaned — 0.3% | |
| | |
JPMorgan U.S. Government Money Market Fund
Class IM Shares, 0.03% (b) (c)
(Cost $3,659) | | | 3,659 | | | | 3,659 | |
| | | | | | | | |
| | |
Total Short-Term Investments
(Cost $20,692) | | | | | | | 20,694 | |
| | | | | | | | |
Total Investments — 100.2%
(Cost $733,912) | | | | | | | 1,346,479 | |
Liabilities in Excess of
Other Assets — (0.2)% | | | | | | | (2,935 | ) |
| | | | | | | | |
NET ASSETS — 100.0% | | | | | | | 1,343,544 | |
| | | | | | | | |
Percentages indicated are based on net assets.
SEE NOTES TO FINANCIAL STATEMENTS.
| | | | | | | | | | |
| | | | | |
| DECEMBER 31, 2021 | | J.P. MORGAN LARGE CAP FUNDS | | | | | | | | 65 |
JPMorgan U.S. GARP Equity Fund
SCHEDULE OF PORTFOLIO INVESTMENTS
AS OF DECEMBER 31, 2021 (Unaudited) (continued)
Abbreviations
| | |
| (a) | | The security or a portion of this security is on loan at December 31, 2021. The total value of securities on loan at December 31, 2021 is $3,562. |
| (b) | | Investment in an affiliated fund, which is registered under the Investment Company Act of 1940, as amended, and is advised by J.P. Morgan Investment Management Inc. |
| (c) | | The rate shown is the current yield as of December 31, 2021. |
| * | | Non-income producing security. |
| | | | | | | | | | | | | | | | | | | | |
| Futures contracts outstanding as of December 31, 2021 (amounts in thousands, except number of contracts): | |
| DESCRIPTION | | NUMBER OF
CONTRACTS | | | EXPIRATION
DATE | | | TRADING
CURRENCY | | | NOTIONAL
AMOUNT ($) | | | VALUE AND
UNREALIZED
APPRECIATION
(DEPRECIATION) ($) | |
Long Contracts | | | | | | | | | | | | | | | | | | | | |
S&P 500 E-Mini Index | | | 70 | | | | 03/2022 | | | | USD | | | | 16,654 | | | | 513 | |
| | | | | | | | | | | | | | | | | | | | |
Abbreviations
SEE NOTES TO FINANCIAL STATEMENTS.
| | | | | | | | | | |
| | | | | |
| 66 | | | | | | | | J.P. MORGAN LARGE CAP FUNDS | | DECEMBER 31, 2021 |
JPMorgan U.S. Large Cap Core Plus Fund
SCHEDULE OF PORTFOLIO INVESTMENTS
AS OF DECEMBER 31, 2021 (Unaudited)
| | | | | | | | |
| INVESTMENTS | | SHARES
(000) | | | VALUE
($000) | |
|
Long Positions — 121.7% | |
|
Common Stocks — 121.0% | |
|
Aerospace & Defense — 1.3% | |
| | |
Howmet Aerospace, Inc. | | | 119 | | | | 3,775 | |
| | |
Northrop Grumman Corp. (a) | | | 31 | | | | 11,957 | |
| | |
Raytheon Technologies Corp. | | | 167 | | | | 14,376 | |
| | |
TransDigm Group, Inc. * | | | 9 | | | | 5,466 | |
| | | | | | | | |
| | |
| | | | | | | 35,574 | |
| | | | | | | | |
|
Air Freight & Logistics — 0.5% | |
| | |
United Parcel Service, Inc., Class B | | | 65 | | | | 13,915 | |
| | | | | | | | |
|
Auto Components — 0.3% | |
| | |
Aptiv plc * | | | 16 | | | | 2,691 | |
| | |
Lear Corp. | | | 14 | | | | 2,573 | |
| | |
Magna International, Inc. (Canada) | | | 31 | | | | 2,506 | |
| | | | | | | | |
| | |
| | | | | | | 7,770 | |
| | | | | | | | |
|
Automobiles — 0.9% | |
| | |
General Motors Co. * | | | 105 | | | | 6,142 | |
| | |
Rivian Automotive, Inc., Class A * | | | 173 | | | | 17,979 | |
| | | | | | | | |
| | |
| | | | | | | 24,121 | |
| | | | | | | | |
|
Banks — 5.3% | |
| | |
Bank of America Corp. (a) | | | 603 | | | | 26,849 | |
| | |
Fifth Third Bancorp | | | 292 | | | | 12,735 | |
| | |
SVB Financial Group * | | | 44 | | | | 29,705 | |
| | |
Truist Financial Corp. | | | 375 | | | | 21,946 | |
| | |
Wells Fargo & Co. (a) | | | 1,026 | | | | 49,218 | |
| | | | | | | | |
| | |
| | | | | | | 140,453 | |
| | | | | | | | |
|
Beverages — 1.8% | |
| | |
Coca-Cola Co. (The) (a) | | | 366 | | | | 21,672 | |
| | |
PepsiCo, Inc. (a) | | | 153 | | | | 26,508 | |
| | | | | | | | |
| | |
| | | | | | | 48,180 | |
| | | | | | | | |
|
Biotechnology — 4.3% | |
| | |
AbbVie, Inc. (a) | | | 325 | | | | 43,952 | |
| | |
Alnylam Pharmaceuticals, Inc. * | | | 15 | | | | 2,540 | |
| | |
Biogen, Inc. * (a) | | | 55 | | | | 13,091 | |
| | |
BioMarin Pharmaceutical, Inc. * | | | 97 | | | | 8,574 | |
| | |
Neurocrine Biosciences, Inc. * | | | 101 | | | | 8,639 | |
| | |
Regeneron Pharmaceuticals, Inc. * | | | 31 | | | | 19,529 | |
| | |
Vertex Pharmaceuticals, Inc. * | | | 75 | | | | 16,425 | |
| | | | | | | | |
| | |
| | | | | | | 112,750 | |
| | | | | | | | |
|
Building Products — 1.0% | |
| | |
Trane Technologies plc | | | 136 | | | | 27,407 | |
| | | | | | | | |
|
Capital Markets — 2.7% | |
| | |
Ameriprise Financial, Inc. | | | 9 | | | | 2,695 | |
| | | | | | | | |
| INVESTMENTS | | SHARES
(000) | | | VALUE
($000) | |
| | | | | | | | |
| | | | | | | | |
|
Capital Markets — continued | |
| | |
Charles Schwab Corp. (The) | | | 214 | | | | 17,961 | |
| | |
CME Group, Inc. | | | 45 | | | | 10,360 | |
| | |
Intercontinental Exchange, Inc. | | | 79 | | | | 10,840 | |
| | |
Morgan Stanley (a) | | | 248 | | | | 24,312 | |
| | |
S&P Global, Inc. | | | 9 | | | | 4,452 | |
| | | | | | | | |
| | |
| | | | | | | 70,620 | |
| | | | | | | | |
|
Chemicals — 4.1% | |
| | |
Air Products and Chemicals, Inc. | | | 59 | | | | 17,861 | |
| | |
Celanese Corp. | | | 116 | | | | 19,544 | |
| | |
DuPont de Nemours, Inc. | | | 229 | | | | 18,508 | |
| | |
Eastman Chemical Co. | | | 30 | | | | 3,648 | |
| | |
Linde plc (United Kingdom) | | | 86 | | | | 29,706 | |
| | |
PPG Industries, Inc. | | | 106 | | | | 18,243 | |
| | | | | | | | |
| | |
| | | | | | | 107,510 | |
| | | | | | | | |
|
Commercial Services & Supplies — 0.1% | |
| | |
Waste Connections, Inc. | | | 19 | | | | 2,579 | |
| | | | | | | | |
|
Communications Equipment — 0.1% | |
| | |
Juniper Networks, Inc. | | | 40 | | | | 1,428 | |
| | | | | | | | |
|
Construction Materials — 0.2% | |
| | |
Vulcan Materials Co. | | | 20 | | | | 4,069 | |
| | | | | | | | |
|
Diversified Financial Services — 0.2% | |
| | |
Voya Financial, Inc. | | | 67 | | | | 4,449 | |
| | | | | | | | |
|
Electric Utilities — 2.4% | |
| | |
Alliant Energy Corp. | | | 41 | | | | 2,515 | |
| | |
Edison International | | | 185 | | | | 12,593 | |
| | |
FirstEnergy Corp. | | | 340 | | | | 14,145 | |
| | |
NextEra Energy, Inc. | | | 378 | | | | 35,313 | |
| | | | | | | | |
| | |
| | | | | | | 64,566 | |
| | | | | | | | |
|
Electrical Equipment — 1.1% | |
| | |
Eaton Corp. plc | | | 171 | | | | 29,479 | |
| | | | | | | | |
|
Electronic Equipment, Instruments & Components — 0.4% | |
| | |
Corning, Inc. | | | 148 | | | | 5,518 | |
| | |
Keysight Technologies, Inc. * | | | 26 | | | | 5,447 | |
| | | | | | | | |
| | |
| | | | | | | 10,965 | |
| | | | | | | | |
|
Energy Equipment & Services — 0.2% | |
| | |
Baker Hughes Co. (a) | | | 179 | | | | 4,309 | |
| | | | | | | | |
|
Entertainment — 1.2% | |
| | |
Endeavor Group Holdings, Inc., Class A * | | | 570 | | | | 19,891 | |
| | |
Netflix, Inc. * (a) | | | 18 | | | | 10,883 | |
| | | | | | | | |
| | |
| | | | | | | 30,774 | |
| | | | | | | | |
SEE NOTES TO FINANCIAL STATEMENTS.
| | | | | | | | | | |
| | | | | |
| DECEMBER 31, 2021 | | J.P. MORGAN LARGE CAP FUNDS | | | | | | | | 67 |
JPMorgan U.S. Large Cap Core Plus Fund
SCHEDULE OF PORTFOLIO INVESTMENTS
AS OF DECEMBER 31, 2021 (Unaudited) (continued)
| | | | | | | | |
| INVESTMENTS | | SHARES
(000) | | | VALUE
($000) | |
Long Positions — continued | |
Common Stocks — continued | |
|
Equity Real Estate Investment Trusts (REITs) — 3.5% | |
| | |
American Homes 4 Rent, Class A | | | 148 | | | | 6,456 | |
| | |
Camden Property Trust | | | 18 | | | | 3,259 | |
| | |
Cousins Properties, Inc. | | | 121 | | | | 4,876 | |
| | |
Equinix, Inc. | | | 15 | | | | 12,404 | |
| | |
Host Hotels & Resorts, Inc. * | | | 210 | | | | 3,647 | |
| | |
Invitation Homes, Inc. | | | 118 | | | | 5,354 | |
| | |
Kimco Realty Corp. | | | 363 | | | | 8,959 | |
| | |
Prologis, Inc. | | | 138 | | | | 23,208 | |
| | |
Sun Communities, Inc. | | | 82 | | | | 17,193 | |
| | |
UDR, Inc. | | | 109 | | | | 6,511 | |
| | | | | | | | |
| | |
| | | | | | | 91,867 | |
| | | | | | | | |
|
Food & Staples Retailing — 0.5% | |
| | |
Costco Wholesale Corp. | | | 23 | | | | 13,234 | |
| | | | | | | | |
|
Food Products — 1.0% | |
| | |
Hershey Co. (The) | | | 35 | | | | 6,675 | |
| | |
Mondelez International, Inc., Class A (a) | | | 287 | | | | 18,998 | |
| | | | | | | | |
| | |
| | | | | | | 25,673 | |
| | | | | | | | |
|
Health Care Equipment & Supplies — 2.3% | |
| | |
Abbott Laboratories | | | 76 | | | | 10,764 | |
| | |
Boston Scientific Corp. * (a) | | | 586 | | | | 24,901 | |
| | |
Intuitive Surgical, Inc. * | | | 31 | | | | 11,113 | |
| | |
Zimmer Biomet Holdings, Inc. (a) | | | 110 | | | | 14,002 | |
| | | | | | | | |
| | |
| | | | | | | 60,780 | |
| | | | | | | | |
|
Health Care Providers & Services — 3.8% | |
| | |
Centene Corp. * | | | 275 | | | | 22,643 | |
| | |
CVS Health Corp. (a) | | | 111 | | | | 11,478 | |
| | |
Humana, Inc. | | | 8 | | | | 3,818 | |
| | |
UnitedHealth Group, Inc. (a) | | | 127 | | | | 63,649 | |
| | | | | | | | |
| | |
| | | | | | | 101,588 | |
| | | | | | | | |
|
Hotels, Restaurants & Leisure — 3.3% | |
| | |
Booking Holdings, Inc. * | | | 11 | | | | 27,220 | |
| | |
Domino’s Pizza, Inc. | | | 10 | | | | 5,686 | |
| | |
Expedia Group, Inc. * | | | 14 | | | | 2,596 | |
| | |
Hilton Worldwide Holdings, Inc. * | | | 54 | | | | 8,450 | |
| | |
McDonald’s Corp. | | | 126 | | | | 33,663 | |
| | |
Yum! Brands, Inc. | | | 61 | | | | 8,436 | |
| | | | | | | | |
| | |
| | | | | | | 86,051 | |
| | | | | | | | |
|
Household Durables — 0.7% | |
| | |
KB Home | | | 90 | | | | 4,033 | |
| | |
Mohawk Industries, Inc. * | | | 16 | | | | 2,829 | |
| | |
Toll Brothers, Inc. | | | 158 | | | | 11,410 | |
| | | | | | | | |
| | |
| | | | | | | 18,272 | |
| | | | | | | | |
| | | | | | | | |
| INVESTMENTS | | SHARES
(000) | | | VALUE
($000) | |
| | | | | | | | |
| | | | | | | | |
|
Household Products — 1.3% | |
| | |
Procter & Gamble Co. (The) | | | 215 | | | | 35,148 | |
| | | | | | | | |
|
Insurance — 1.5% | |
| | |
Arthur J Gallagher & Co. | | | 64 | | | | 10,893 | |
| | |
Hartford Financial Services Group, Inc. (The) (a) | | | 145 | | | | 9,994 | |
| | |
Progressive Corp. (The) | | | 107 | | | | 11,021 | |
| | |
Prudential Financial, Inc. | | | 65 | | | | 7,065 | |
| | |
Ryan Specialty Group Holdings, Inc., Class A * | | | 11 | | | | 426 | |
| | | | | | | | |
| | |
| | | | | | | 39,399 | |
| | | | | | | | |
|
Interactive Media & Services — 7.6% | |
| | |
Alphabet, Inc., Class A * (a) | | | 37 | | | | 108,497 | |
| | |
Alphabet, Inc., Class C * (a) | | | 10 | | | | 28,204 | |
| | |
Meta Platforms, Inc., Class A * | | | 112 | | | | 37,574 | |
| | |
Snap, Inc., Class A * | | | 373 | | | | 17,558 | |
| | |
ZoomInfo Technologies, Inc., Class A * (a) | | | 178 | | | | 11,408 | |
| | | | | | | | |
| | |
| | | | | | | 203,241 | |
| | | | | | | | |
|
Internet & Direct Marketing Retail — 5.7% | |
| | |
Amazon.com, Inc. * (a) | | | 45 | | | | 149,932 | |
| | | | | | | | |
|
IT Services — 4.7% | |
| | |
Affirm Holdings, Inc. * | | | 26 | | | | 2,584 | |
| | |
International Business Machines Corp. | | | 60 | | | | 8,013 | |
| | |
Mastercard, Inc., Class A (a) | | | 181 | | | | 64,973 | |
| | |
PayPal Holdings, Inc. * (a) | | | 41 | | | | 7,771 | |
| | |
Shopify, Inc., Class A (Canada) * | | | 19 | | | | 25,727 | |
| | |
WEX, Inc. * | | | 113 | | | | 15,823 | |
| | | | | | | | |
| | |
| | | | | | | 124,891 | |
| | | | | | | | |
|
Life Sciences Tools & Services — 2.5% | |
| | |
Danaher Corp. | | | 22 | | | | 7,114 | |
| | |
PerkinElmer, Inc. | | | 44 | | | | 8,868 | |
| | |
Thermo Fisher Scientific, Inc. (a) | | | 76 | | | | 50,581 | |
| | | | | | | | |
| | |
| | | | | | | 66,563 | |
| | | | | | | | |
|
Machinery — 5.2% | |
| | |
Deere & Co. | | | 97 | | | | 33,106 | |
| | |
Dover Corp. | | | 154 | | | | 27,948 | |
| | |
Ingersoll Rand, Inc. | | | 653 | | | | 40,411 | |
| | |
Otis Worldwide Corp. | | | 67 | | | | 5,827 | |
| | |
Parker-Hannifin Corp. | | | 4 | | | | 1,308 | |
| | |
Stanley Black & Decker, Inc. | | | 157 | | | | 29,607 | |
| | | | | | | | |
| | |
| | | | | | | 138,207 | |
| | | | | | | | |
|
Media — 1.7% | |
| | |
Charter Communications, Inc., Class A * (a) | | | 28 | | | | 18,157 | |
| | |
Comcast Corp., Class A (a) | | | 441 | | | | 22,201 | |
SEE NOTES TO FINANCIAL STATEMENTS.
| | | | | | | | | | |
| | | | | |
| 68 | | | | | | | | J.P. MORGAN LARGE CAP FUNDS | | DECEMBER 31, 2021 |
| | | | | | | | |
| INVESTMENTS | | SHARES
(000) | | | VALUE
($000) | |
Long Positions — continued | |
Common Stocks — continued | |
|
Media — continued | |
| | |
Liberty Media Corp.-Liberty SiriusXM, Class A * | | | 76 | | | | 3,876 | |
| | | | | | | | |
| | |
| | | | | | | 44,234 | |
| | | | | | | | |
|
Metals & Mining — 0.5% | |
| | |
Freeport-McMoRan, Inc. | | | 287 | | | | 11,976 | |
| | | | | | | | |
|
Multiline Retail — 0.7% | |
| | |
Dollar General Corp. | | | 37 | | | | 8,667 | |
| | |
Dollar Tree, Inc. * | | | 64 | | | | 8,926 | |
| | | | | | | | |
| | |
| | | | | | | 17,593 | |
| | | | | | | | |
|
Multi-Utilities — 1.3% | |
| | |
Ameren Corp. | | | 85 | | | | 7,540 | |
| | |
CenterPoint Energy, Inc. | | | 631 | | | | 17,604 | |
| | |
DTE Energy Co. | | | 21 | | | | 2,481 | |
| | |
Public Service Enterprise Group, Inc. | | | 98 | | | | 6,558 | |
| | | | | | | | |
| | |
| | | | | | | 34,183 | |
| | | | | | | | |
|
Oil, Gas & Consumable Fuels — 4.4% | |
| | |
Cheniere Energy, Inc. | | | 37 | | | | 3,791 | |
| | |
Chevron Corp. | | | 213 | | | | 25,038 | |
| | |
ConocoPhillips | | | 410 | | | | 29,610 | |
| | |
Coterra Energy, Inc. | | | 326 | | | | 6,198 | |
| | |
Diamondback Energy, Inc. | | | 200 | | | | 21,580 | |
| | |
EOG Resources, Inc. | | | 44 | | | | 3,886 | |
| | |
ONEOK, Inc. | | | 44 | | | | 2,593 | |
| | |
Phillips 66 | | | 76 | | | | 5,518 | |
| | |
Pioneer Natural Resources Co. (a) | | | 100 | | | | 18,241 | |
| | | | | | | | |
| | |
| | | | | | | 116,455 | |
| | | | | | | | |
|
Personal Products — 1.0% | |
| | |
Estee Lauder Cos., Inc. (The), Class A | | | 70 | | | | 26,032 | |
| | | | | | | | |
|
Pharmaceuticals — 2.3% | |
| | |
Bristol-Myers Squibb Co. (a) | | | 357 | | | | 22,261 | |
| | |
Eli Lilly & Co. | | | 143 | | | | 39,476 | |
| | | | | | | | |
| | |
| | | | | | | 61,737 | |
| | | | | | | | |
|
Professional Services — 1.1% | |
| | |
Booz Allen Hamilton Holding Corp. | | | 110 | | | | 9,365 | |
| | |
IHS Markit Ltd. | | | 41 | | | | 5,401 | |
| | |
Leidos Holdings, Inc. | | | 151 | | | | 13,389 | |
| | | | | | | | |
| | |
| | | | | | | 28,155 | |
| | | | | | | | |
|
Road & Rail — 4.2% | |
| | |
Canadian National Railway Co. (Canada) | | | 43 | | | | 5,341 | |
| | |
CSX Corp. | | | 205 | | | | 7,714 | |
| | |
Knight-Swift Transportation Holdings, Inc. | | | 64 | | | | 3,887 | |
| | | | | | | | |
| INVESTMENTS | | SHARES
(000) | | | VALUE
($000) | |
| | | | | | | | |
| | | | | | | | |
|
Road & Rail — continued | |
| | |
Lyft, Inc., Class A * | | | 548 | | | | 23,414 | |
| | |
Norfolk Southern Corp. (a) | | | 152 | | | | 45,172 | |
| | |
Old Dominion Freight Line, Inc. | | | 36 | | | | 13,028 | |
| | |
Union Pacific Corp. (a) | | | 48 | | | | 12,070 | |
| | | | | | | | |
| | |
| | | | | | | 110,626 | |
| | | | | | | | |
|
Semiconductors & Semiconductor Equipment — 8.6% | |
| | |
Advanced Micro Devices, Inc. * | | | 242 | | | | 34,885 | |
| | |
Analog Devices, Inc. (a) | | | 86 | | | | 15,130 | |
| | |
Lam Research Corp. | | | 31 | | | | 22,609 | |
| | |
Microchip Technology, Inc. | | | 15 | | | | 1,323 | |
| | |
NVIDIA Corp. (a) | | | 146 | | | | 43,032 | |
| | |
NXP Semiconductors NV (China) | | | 370 | | | | 84,242 | |
| | |
ON Semiconductor Corp. * | | | 52 | | | | 3,554 | |
| | |
Taiwan Semiconductor Manufacturing Co. Ltd., ADR (Taiwan) | | | 10 | | | | 1,236 | |
| | |
Teradyne, Inc. | | | 8 | | | | 1,358 | |
| | |
Texas Instruments, Inc. (a) | | | 127 | | | | 23,921 | |
| | | | | | | | |
| | |
| | | | | | | 231,290 | |
| | | | | | | | |
|
Software — 10.5% | |
| | |
Ceridian HCM Holding, Inc. * | | | 240 | | | | 25,043 | |
| | |
HashiCorp, Inc., Class A * | | | 45 | | | | 4,094 | |
| | |
Intuit, Inc. | | | 32 | | | | 20,557 | |
| | |
Microsoft Corp.(a) | | | 580 | | | | 195,031 | |
| | |
salesforce.com, Inc. * (a) | | | 24 | | | | 6,210 | |
| | |
Workday, Inc., Class A * | | | 103 | | | | 28,205 | |
| | | | | | | | |
| | |
| | | | | | | 279,140 | |
| | | | | | | | |
|
Specialty Retail — 4.7% | |
| | |
AutoZone, Inc. * (a) | | | 3 | | | | 6,652 | |
| | |
Best Buy Co., Inc. | | | 25 | | | | 2,574 | |
| | |
Burlington Stores, Inc. * | | | 56 | | | | 16,304 | |
| | |
Home Depot, Inc. (The) (a) | | | 30 | | | | 12,638 | |
| | |
Lowe’s Cos., Inc. | | | 170 | | | | 43,906 | |
| | |
O’Reilly Automotive, Inc. * | | | 60 | | | | 42,387 | |
| | | | | | | | |
| | |
| | | | | | | 124,461 | |
| | | | | | | | |
|
Technology Hardware, Storage & Peripherals — 6.4% | |
| | |
Apple, Inc. (a) | | | 843 | | | | 149,757 | |
| | |
Hewlett Packard Enterprise Co. | | | 383 | | | | 6,042 | |
| | |
Seagate Technology Holdings plc | | | 133 | | | | 15,070 | |
| | | | | | | | |
| | |
| | | | | | | 170,869 | |
| | | | | | | | |
|
Textiles, Apparel & Luxury Goods — 1.3% | |
| | |
NIKE, Inc., Class B | | | 203 | | | | 33,879 | |
| | | | | | | | |
SEE NOTES TO FINANCIAL STATEMENTS.
| | | | | | | | | | |
| | | | | |
| DECEMBER 31, 2021 | | J.P. MORGAN LARGE CAP FUNDS | | | | | | | | 69 |
JPMorgan U.S. Large Cap Core Plus Fund
SCHEDULE OF PORTFOLIO INVESTMENTS
AS OF DECEMBER 31, 2021 (Unaudited) (continued)
| | | | | | | | |
| INVESTMENTS | | SHARES
(000) | | | VALUE
($000) | |
Long Positions — continued | |
Common Stocks — continued | |
|
Wireless Telecommunication Services — 0.6% | |
| | |
T-Mobile US, Inc. * | | | 137 | | | | 15,933 | |
| | | | | | | | |
| | |
Total Common Stocks
(Cost $1,601,517) | | | | | | | 3,202,327 | |
| | | | | | | | |
Short-Term Investments — 0.7% | |
|
Investment Companies — 0.7% | |
| | |
JPMorgan Prime Money Market Fund Class IM Shares, 0.07% (b) (c)
(Cost $18,556) | | | 18,549 | | | | 18,556 | |
| | | | | | | | |
| | |
Total Long Positions
(Cost $1,620,073) | | | | | | | 3,220,883 | |
| | | | | | | | |
Short Positions — (21.6)% | |
Common Stocks — (21.6)% | |
| | |
Aerospace & Defense — (0.4)% | | | | | | | | |
| | |
Boeing Co. (The) * | | | (12 | ) | | | (2,394 | ) |
| | |
Hexcel Corp. * | | | (38 | ) | | | (1,950 | ) |
| | |
Huntington Ingalls Industries, Inc. | | | (34 | ) | | | (6,300 | ) |
| | |
L3Harris Technologies, Inc. | | | (5 | ) | | | (1,098 | ) |
| | | | | | | | |
| | |
| | | | | | | (11,742 | ) |
| | | | | | | | |
|
Air Freight & Logistics — (0.6)% | |
| | |
CH Robinson Worldwide, Inc. | | | (83 | ) | | | (8,893 | ) |
| | |
Expeditors International of Washington, Inc. | | | (55 | ) | | | (7,389 | ) |
| | | | | | | | |
| | |
| | | | | | | (16,282 | ) |
| | | | | | | | |
|
Auto Components — (0.3)% | |
| | |
BorgWarner, Inc. | | | (200 | ) | | | (9,035 | ) |
| | | | | | | | |
|
Automobiles — (0.1)% | |
| | |
Ford Motor Co. | | | (64 | ) | | | (1,332 | ) |
| | | | | | | | |
|
Biotechnology — (0.5)% | |
| | |
Gilead Sciences, Inc. | | | (31 | ) | | | (2,215 | ) |
| | |
Moderna, Inc. * | | | (39 | ) | | | (9,816 | ) |
| | | | | | | | |
| | |
| | | | | | | (12,031 | ) |
| | | | | | | | |
|
Building Products — (0.1)% | |
| | |
Lennox International, Inc. | | | (7 | ) | | | (2,247 | ) |
| | | | | | | | |
|
Capital Markets — (0.8)% | |
| | |
Franklin Resources, Inc. | | | (77 | ) | | | (2,594 | ) |
| | |
Goldman Sachs Group, Inc. (The) | | | (13 | ) | | | (4,888 | ) |
| | |
Moody’s Corp. | | | (10 | ) | | | (3,737 | ) |
| | |
MSCI, Inc. | | | (9 | ) | | | (5,629 | ) |
| | |
Northern Trust Corp. | | | (31 | ) | | | (3,655 | ) |
| | | | | | | | |
| | |
| | | | | | | (20,503 | ) |
| | | | | | | | |
|
Chemicals — (0.2)% | |
| | |
Dow, Inc. | | | (38 | ) | | | (2,150 | ) |
| | |
Ecolab, Inc. | | | (12 | ) | | | (2,851 | ) |
| | | | | | | | |
| | |
| | | | | | | (5,001 | ) |
| | | | | | | | |
| | | | | | | | |
| INVESTMENTS | | SHARES
(000) | | | VALUE
($000) | |
| | | | | | | | |
| | | | | | | | |
|
Commercial Services & Supplies — (0.2)% | |
| | |
Republic Services, Inc. | | | (34 | ) | | | (4,753 | ) |
| | | | | | | | |
|
Communications Equipment — (0.3)% | |
| | |
Cisco Systems, Inc. | | | (145 | ) | | | (9,176 | ) |
| | | | | | | | |
|
Consumer Finance — (0.2)% | |
| | |
Discover Financial Services | | | (55 | ) | | | (6,401 | ) |
| | | | | | | | |
|
Containers & Packaging — (0.9)% | |
| | |
AptarGroup, Inc. | | | (15 | ) | | | (1,823 | ) |
| | |
Ball Corp. | | | (28 | ) | | | (2,692 | ) |
| | |
Crown Holdings, Inc. | | | (34 | ) | | | (3,792 | ) |
| | |
International Paper Co. | | | (116 | ) | | | (5,459 | ) |
| | |
Packaging Corp. of America | | | (10 | ) | | | (1,351 | ) |
| | |
Silgan Holdings, Inc. | | | (146 | ) | | | (6,249 | ) |
| | |
Sonoco Products Co. | | | (60 | ) | | | (3,475 | ) |
| | | | | | | | |
| | |
| | | | | | | (24,841 | ) |
| | | | | | | | |
|
Diversified Telecommunication Services — (0.8)% | |
| | |
AT&T, Inc. | | | (333 | ) | | | (8,197 | ) |
| | |
Lumen Technologies, Inc. | | | (509 | ) | | | (6,389 | ) |
| | |
Verizon Communications, Inc. | | | (130 | ) | | | (6,776 | ) |
| | | | | | | | |
| | |
| | | | | | | (21,362 | ) |
| | | | | | | | |
|
Electric Utilities — (1.1)% | |
| | |
American Electric Power Co., Inc. | | | (93 | ) | | | (8,231 | ) |
| | |
Eversource Energy | | | (74 | ) | | | (6,763 | ) |
| | |
Pinnacle West Capital Corp. | | | (49 | ) | | | (3,481 | ) |
| | |
Southern Co. (The) | | | (141 | ) | | | (9,642 | ) |
| | | | | | | | |
| | |
| | | | | | | (28,117 | ) |
| | | | | | | | |
|
Electrical Equipment — (0.4)% | |
| | |
Acuity Brands, Inc. | | | (18 | ) | | | (3,859 | ) |
| | |
Hubbell, Inc. | | | (21 | ) | | | (4,353 | ) |
| | |
Sensata Technologies Holding plc * | | | (23 | ) | | | (1,393 | ) |
| | | | | | | | |
| | |
| | | | | | | (9,605 | ) |
| | | | | | | | |
|
Electronic Equipment, Instruments & Components — (0.2)% | |
| | |
Cognex Corp. | | | (57 | ) | | | (4,410 | ) |
| | | | | | | | |
|
Energy Equipment & Services — (0.2)% | |
| | |
Halliburton Co. | | | (147 | ) | | | (3,363 | ) |
| | |
Schlumberger NV | | | (86 | ) | | | (2,578 | ) |
| | | | | | | | |
| | |
| | | | | | | (5,941 | ) |
| | | | | | | | |
|
Entertainment — (0.2)% | |
| | |
AMC Entertainment Holdings, Inc., Class A * | | | (157 | ) | | | (4,280 | ) |
| | | | | | | | |
|
Equity Real Estate Investment Trusts (REITs) — (1.2)% | |
| | |
AvalonBay Communities, Inc. | | | (12 | ) | | | (3,023 | ) |
SEE NOTES TO FINANCIAL STATEMENTS.
| | | | | | | | | | |
| | | | | |
| 70 | | | | | | | | J.P. MORGAN LARGE CAP FUNDS | | DECEMBER 31, 2021 |
| | | | | | | | |
| INVESTMENTS | | SHARES
(000) | | | VALUE
($000) | |
Short Positions — continued | |
Common Stocks — continued | |
|
Equity Real Estate Investment Trusts (REITs) — continued | |
| | |
Equity Residential | | | (48 | ) | | | (4,378 | ) |
| | |
Iron Mountain, Inc. | | | (115 | ) | | | (6,001 | ) |
| | |
National Retail Properties, Inc. | | | (149 | ) | | | (7,142 | ) |
| | |
Orion Office REIT, Inc. * | | | (4 | ) | | | (74 | ) |
| | |
Realty Income Corp. | | | (36 | ) | | | (2,610 | ) |
| | |
Simon Property Group, Inc. | | | (23 | ) | | | (3,720 | ) |
| | |
SL Green Realty Corp. | | | (48 | ) | | | (3,409 | ) |
| | |
Welltower, Inc. | | | (31 | ) | | | (2,632 | ) |
| | | | | | | | |
| | |
| | | | | | | (32,989 | ) |
| | | | | | | | |
|
Food & Staples Retailing — (1.6)% | |
| | |
Kroger Co. (The) | | | (450 | ) | | | (20,381 | ) |
| | |
Walgreens Boots Alliance, Inc. | | | (249 | ) | | | (12,979 | ) |
| | |
Walmart, Inc. | | | (63 | ) | | | (9,097 | ) |
| | | | | | | | |
| | |
| | | | | | | (42,457 | ) |
| | | | | | | | |
|
Food Products — (0.6)% | |
| | |
Campbell Soup Co. | | | (132 | ) | | | (5,716 | ) |
| | |
Conagra Brands, Inc. | | | (103 | ) | | | (3,519 | ) |
| | |
General Mills, Inc. | | | (19 | ) | | | (1,250 | ) |
| | |
Kellogg Co. | | | (70 | ) | | | (4,499 | ) |
| | | | | | | | |
| | |
| | | | | | | (14,984 | ) |
| | | | | | | | |
|
Gas Utilities — (0.1)% | |
| | |
National Fuel Gas Co. | | | (47 | ) | | | (2,974 | ) |
| | | | | | | | |
|
Health Care Equipment & Supplies — (0.6)% | |
| | |
Baxter International, Inc. | | | (60 | ) | | | (5,168 | ) |
| | |
Stryker Corp. | | | (44 | ) | | | (11,665 | ) |
| | | | | | | | |
| | |
| | | | | | | (16,833 | ) |
| | | | | | | | |
|
Health Care Providers & Services — (0.1)% | |
| | |
Henry Schein, Inc. * | | | (46 | ) | | | (3,534 | ) |
| | | | | | | | |
|
Hotels, Restaurants & Leisure — (0.4)% | |
| | |
Starbucks Corp. | | | (86 | ) | | | (10,075 | ) |
| | | | | | | | |
|
Household Products — (0.6)% | |
| | |
Clorox Co. (The) | | | (68 | ) | | | (11,851 | ) |
| | |
Colgate-Palmolive Co. | | | (48 | ) | | | (4,097 | ) |
| | | | | | | | |
| | |
| | | | | | | (15,948 | ) |
| | | | | | | | |
|
Industrial Conglomerates — (0.8)% | |
| | |
3M Co. | | | (74 | ) | | | (13,115 | ) |
| | |
General Electric Co. | | | (75 | ) | | | (7,131 | ) |
| | | | | | | | |
| | |
| | | | | | | (20,246 | ) |
| | | | | | | | |
|
Insurance — (0.1)% | |
| | |
Aon plc, Class A | | | (8 | ) | | | (2,340 | ) |
| | | | | | | | |
| | | | | | | | |
| INVESTMENTS | | SHARES
(000) | | | VALUE
($000) | |
| | | | | | | | |
| | | | | | | | |
|
Internet & Direct Marketing Retail — (0.2)% | |
| | |
eBay, Inc. | | | (83 | ) | | | (5,551 | ) |
| | | | | | | | |
|
IT Services — (0.8)% | |
| | |
Cognizant Technology Solutions Corp., Class A | | | (50 | ) | | | (4,450 | ) |
| | |
DXC Technology Co. * | | | (37 | ) | | | (1,183 | ) |
| | |
Jack Henry & Associates, Inc. | | | (23 | ) | | | (3,759 | ) |
| | |
Paychex, Inc. | | | (43 | ) | | | (5,862 | ) |
| | |
Western Union Co. (The) | | | (356 | ) | | | (6,360 | ) |
| | | | | | | | |
| | |
| | | | | | | (21,614 | ) |
| | | | | | | | |
|
Life Sciences Tools & Services — (0.2)% | |
| | |
Waters Corp. * | | | (17 | ) | | | (6,157 | ) |
| | | | | | | | |
|
Machinery — (0.8)% | |
| | |
Caterpillar, Inc. | | | (31 | ) | | | (6,364 | ) |
| | |
Illinois Tool Works, Inc. | | | (43 | ) | | | (10,594 | ) |
| | |
PACCAR, Inc. | | | (56 | ) | | | (4,908 | ) |
| | | | | | | | |
| | |
| | | | | | | (21,866 | ) |
| | | | | | | | |
|
Media — (0.9)% | |
| | |
Interpublic Group of Cos., Inc. (The) | | | (197 | ) | | | (7,381 | ) |
| | |
Omnicom Group, Inc. | | | (223 | ) | | | (16,306 | ) |
| | |
ViacomCBS, Inc. | | | (44 | ) | | | (1,335 | ) |
| | | | | | | | |
| | |
| | | | | | | (25,022 | ) |
| | | | | | | | |
|
Multiline Retail — (0.3)% | |
| | |
Kohl’s Corp. | | | (30 | ) | | | (1,460 | ) |
| | |
Macy’s, Inc. | | | (53 | ) | | | (1,381 | ) |
| | |
Target Corp. | | | (19 | ) | | | (4,381 | ) |
| | | | | | | | |
| | |
| | | | | | | (7,222 | ) |
| | | | | | | | |
|
Multi-Utilities — (0.5)% | |
| | |
CMS Energy Corp. | | | (39 | ) | | | (2,535 | ) |
| | |
Consolidated Edison, Inc. | | | (89 | ) | | | (7,593 | ) |
| | |
Dominion Energy, Inc. | | | (34 | ) | | | (2,661 | ) |
| | | | | | | | |
| | |
| | | | | | | (12,789 | ) |
| | | | | | | | |
|
Oil, Gas & Consumable Fuels — (1.5)% | |
| | |
Enbridge, Inc. (Canada) | | | (282 | ) | | | (11,040 | ) |
| | |
Exxon Mobil Corp. | | | (205 | ) | | | (12,572 | ) |
| | |
Hess Corp. | | | (87 | ) | | | (6,467 | ) |
| | |
HollyFrontier Corp. | | | (53 | ) | | | (1,747 | ) |
| | |
Kinder Morgan, Inc. | | | (66 | ) | | | (1,043 | ) |
| | |
Marathon Oil Corp. | | | (357 | ) | | | (5,858 | ) |
| | | | | | | | |
| | |
| | | | | | | (38,727 | ) |
| | | | | | | | |
|
Pharmaceuticals — (0.3)% | |
| | |
Merck & Co., Inc. | | | (60 | ) | | | (4,636 | ) |
| | |
Pfizer, Inc. | | | (47 | ) | | | (2,755 | ) |
| | | | | | | | |
| | |
| | | | | | | (7,391 | ) |
| | | | | | | | |
SEE NOTES TO FINANCIAL STATEMENTS.
| | | | | | | | | | |
| | | | | |
| DECEMBER 31, 2021 | | J.P. MORGAN LARGE CAP FUNDS | | | | | | | | 71 |
JPMorgan U.S. Large Cap Core Plus Fund
SCHEDULE OF PORTFOLIO INVESTMENTS
AS OF DECEMBER 31, 2021 (Unaudited) (continued)
| | | | | | | | |
| INVESTMENTS | | SHARES
(000) | | | VALUE
($000) | |
Short Positions — continued | |
Common Stocks — continued | |
|
Professional Services — (0.2)% | |
| | |
TransUnion | | | (38 | ) | | | (4,490 | ) |
| | | | | | | | |
|
Road & Rail — (0.3)% | |
| | |
Canadian Pacific Railway Ltd. (Canada) | | | (18 | ) | | | (1,280 | ) |
| | |
JB Hunt Transport Services, Inc. | | | (6 | ) | | | (1,178 | ) |
| | |
Werner Enterprises, Inc. | | | (104 | ) | | | (4,947 | ) |
| | | | | | | | |
| | |
| | | | | | | (7,405 | ) |
| | | | | | | | |
|
Semiconductors & Semiconductor Equipment — (0.8)% | |
| | |
Broadcom, Inc. | | | (12 | ) | | | (7,845 | ) |
| | |
Intel Corp. | �� | | (106 | ) | | | (5,434 | ) |
| | |
QUALCOMM, Inc. | | | (45 | ) | | | (8,203 | ) |
| | | | | | | | |
| | |
| | | | | | | (21,482 | ) |
| | | | | | | | |
|
Software — (0.6)% | |
| | |
Citrix Systems, Inc. | | | (25 | ) | | | (2,335 | ) |
| | |
Oracle Corp. | | | (66 | ) | | | (5,732 | ) |
| | |
Palantir Technologies, Inc., Class A * | | | (57 | ) | | | (1,034 | ) |
| | |
Splunk, Inc. * | | | (35 | ) | | | (4,002 | ) |
| | |
VMware, Inc., Class A | | | (21 | ) | | | (2,407 | ) |
| | | | | | | | |
| | |
| | | | | | | (15,510 | ) |
| | | | | | | | |
|
Specialty Retail — 0.0% (d) | |
| | |
CarMax, Inc. * | | | (10 | ) | | | (1,255 | ) |
| | | | | | | | |
|
Technology Hardware, Storage & Peripherals — (0.3)% | |
| | |
NetApp, Inc. | | | (53 | ) | | | (4,855 | ) |
| | |
Xerox Holdings Corp. | | | (84 | ) | | | (1,905 | ) |
| | | | | | | | |
| | |
| | | | | | | (6,760 | ) |
| | | | | | | | |
| | | | | | | | |
| INVESTMENTS | | SHARES
(000) | | | VALUE
($000) | |
| |
|
Textiles, Apparel & Luxury Goods — 0.0% (d) | |
| | |
VF Corp. | | | (17 | ) | | | (1,276 | ) |
| | | | | | | | |
|
Trading Companies & Distributors — (0.2)% | |
| | |
Fastenal Co. | | | (91 | ) | | | (5,821 | ) |
| | | | | | | | |
|
Water Utilities — (0.1)% | |
| | |
Essential Utilities, Inc. | | | (51 | ) | | | (2,733 | ) |
| | | | | | | | |
| | |
Total Common Stocks
(Proceeds $(553,216)) | | | | | | | (572,510 | ) |
| | | | | | | | |
| | |
Total Short Positions
(Proceeds $(553,216)) | | | | | | | (572,510 | ) |
| | | | | | | | |
Total Investments — 100.1%
(Cost $1,066,857) | | | | | | | 2,648,373 | |
Liabilities in Excess of
Other Assets — (0.1)% | | | | | | | (2,571 | ) |
| | | | | | | | |
NET ASSETS — 100.0% | | | | | | | 2,645,802 | |
| | | | | | | | |
Percentages indicated are based on net assets.
| | |
Abbreviations |
| ADR | | American Depositary Receipt |
| REIT | | Real Estate Investment Trust |
| |
| (a) | | All or a portion of this security is segregated as collateral for short sales. The total value of securities segregated as collateral is $787,357. |
| (b) | | Investment in an affiliated fund, which is registered under the Investment Company Act of 1940, as amended, and is advised by J.P. Morgan Investment Management Inc. |
| (c) | | The rate shown is the current yield as of December 31, 2021. |
| (d) | | Amount rounds to less than 0.1% of net assets. |
| * | | Non-income producing security. |
SEE NOTES TO FINANCIAL STATEMENTS.
| | | | | | | | | | |
| | | | | |
| 72 | | | | | | | | J.P. MORGAN LARGE CAP FUNDS | | DECEMBER 31, 2021 |
JPMorgan U.S. Research Enhanced Equity Fund
SCHEDULE OF PORTFOLIO INVESTMENTS
AS OF DECEMBER 31, 2021 (Unaudited)
| | | | | | | | |
| INVESTMENTS | | SHARES
(000) | | | VALUE
($000) | |
Common Stocks — 98.8% | |
|
Aerospace & Defense — 0.8% | |
| | |
Northrop Grumman Corp. | | | 52 | | | | 20,091 | |
| | |
Raytheon Technologies Corp. | | | 325 | | | | 27,927 | |
| | | | | | | | |
| | |
| | | | | | | 48,018 | |
| | | | | | | | |
|
Air Freight & Logistics — 1.1% | |
| | |
FedEx Corp. | | | 79 | | | | 20,366 | |
| | |
United Parcel Service, Inc., Class B | | | 212 | | | | 45,434 | |
| | | | | | | | |
| | |
| | | | | | | 65,800 | |
| | | | | | | | |
|
Airlines — 0.2% | |
| | |
Southwest Airlines Co. * | | | 291 | | | | 12,449 | |
| | | | | | | | |
|
Auto Components — 0.3% | |
| | |
Aptiv plc * | | | 37 | | | | 6,029 | |
| | |
Magna International, Inc. (Canada) | | | 131 | | | | 10,600 | |
| | | | | | | | |
| | |
| | | | | | | 16,629 | |
| | | | | | | | |
|
Automobiles — 2.4% | |
| | |
General Motors Co. * | | | 235 | | | | 13,773 | |
| | |
Rivian Automotive, Inc., Class A * | | | 44 | | | | 4,539 | |
| | |
Tesla, Inc. * | | | 117 | | | | 123,381 | |
| | | | | | | | |
| | |
| | | | | | | 141,693 | |
| | | | | | | | |
|
Banks — 3.8% | |
| | |
Bank of America Corp. | | | 697 | | | | 31,004 | |
| | |
Citigroup, Inc. | | | 554 | | | | 33,482 | |
| | |
Fifth Third Bancorp | | | 324 | | | | 14,115 | |
| | |
Regions Financial Corp. | | | 785 | | | | 17,103 | |
| | |
SVB Financial Group * | | | 15 | | | | 9,898 | |
| | |
Truist Financial Corp. | | | 365 | | | | 21,365 | |
| | |
US Bancorp | | | 643 | | | | 36,126 | |
| | |
Wells Fargo & Co. | | | 1,323 | | | | 63,484 | |
| | | | | | | | |
| | |
| | | | | | | 226,577 | |
| | | | | | | | |
|
Beverages — 1.2% | |
| | |
Coca-Cola Co. (The) | | | 894 | | | | 52,910 | |
| | |
Constellation Brands, Inc., Class A | | | 85 | | | | 21,212 | |
| | | | | | | | |
| | |
| | | | | | | 74,122 | |
| | | | | | | | |
|
Biotechnology — 2.3% | |
| | |
AbbVie, Inc. | | | 510 | | | | 69,070 | |
| | |
Biogen, Inc. * | | | 46 | | | | 11,111 | |
| | |
BioMarin Pharmaceutical, Inc. * | | | 35 | | | | 3,057 | |
| | |
Moderna, Inc. * | | | 22 | | | | 5,588 | |
| | |
Neurocrine Biosciences, Inc. * | | | 35 | | | | 2,998 | |
| | |
Regeneron Pharmaceuticals, Inc. * | | | 40 | | | | 25,463 | |
| | |
Vertex Pharmaceuticals, Inc. * | | | 106 | | | | 23,248 | |
| | | | | | | | |
| | |
| | | | | | | 140,535 | |
| | | | | | | | |
| | | | | | | | |
| INVESTMENTS | | SHARES
(000) | | | VALUE
($000) | |
| | | | | | | | |
|
Building Products — 1.2% | |
| | |
Johnson Controls International plc | | | 228 | | | | 18,563 | |
| | |
Masco Corp. | | | 187 | | | | 13,127 | |
| | |
Trane Technologies plc | | | 198 | | | | 39,945 | |
| | | | | | | | |
| | |
| | | | | | | 71,635 | |
| | | | | | | | |
|
Capital Markets — 3.2% | |
| | |
Goldman Sachs Group, Inc. (The) | | | 81 | | | | 30,943 | |
| | |
Intercontinental Exchange, Inc. | | | 136 | | | | 18,666 | |
| | |
Morgan Stanley | | | 277 | | | | 27,167 | |
| | |
S&P Global, Inc. | | | 109 | | | | 51,375 | |
| | |
State Street Corp. | | | 370 | | | | 34,374 | |
| | |
T. Rowe Price Group, Inc. | | | 153 | | | | 30,113 | |
| | | | | | | | |
| | |
| | | | | | | 192,638 | |
| | | | | | | | |
|
Chemicals — 1.9% | |
| | |
Air Products and Chemicals, Inc. | | | 29 | | | | 8,856 | |
| | |
Celanese Corp. | | | 51 | | | | 8,527 | |
| | |
DuPont de Nemours, Inc. | | | 224 | | | | 18,089 | |
| | |
Eastman Chemical Co. | | | 235 | | | | 28,372 | |
| | |
Linde plc (United Kingdom) | | | 55 | | | | 18,993 | |
| | |
PPG Industries, Inc. | | | 179 | | | | 30,916 | |
| | | | | | | | |
| | |
| | | | | | | 113,753 | |
| | | | | | | | |
|
Commercial Services & Supplies — 0.1% | |
| | |
Cintas Corp. | | | 15 | | | | 6,741 | |
| | | | | | | | |
|
Communications Equipment — 0.1% | |
| | |
Motorola Solutions, Inc. | | | 21 | | | | 5,660 | |
| | | | | | | | |
|
Consumer Finance — 0.3% | |
| | |
Capital One Financial Corp. | | | 123 | | | | 17,910 | |
| | | | | | | | |
|
Containers & Packaging — 0.3% | |
| | |
Avery Dennison Corp. | | | 49 | | | | 10,612 | |
| | |
Westrock Co. | | | 154 | | | | 6,840 | |
| | | | | | | | |
| | |
| | | | | | | 17,452 | |
| | | | | | | | |
|
Diversified Financial Services — 1.4% | |
| | |
Berkshire Hathaway, Inc., Class B * | | | 266 | | | | 79,480 | |
| | |
Voya Financial, Inc. | | | 72 | | | | 4,755 | |
| | | | | | | | |
| | |
| | | | | | | 84,235 | |
| | | | | | | | |
|
Diversified Telecommunication Services — 0.3% | |
| | |
Verizon Communications, Inc. | | | 348 | | | | 18,095 | |
| | | | | | | | |
|
Electric Utilities — 1.9% | |
| | |
Edison International | | | 166 | | | | 11,357 | |
| | |
Evergy, Inc. | | | 205 | | | | 14,044 | |
| | |
Exelon Corp. | | | 209 | | | | 12,095 | |
| | |
FirstEnergy Corp. | | | 510 | | | | 21,228 | |
| | |
NextEra Energy, Inc. | | | 588 | | | | 54,859 | |
| | | | | | | | |
| | |
| | | | | | | 113,583 | |
| | | | | | | | |
SEE NOTES TO FINANCIAL STATEMENTS.
| | | | | | | | | | |
| | | | | |
| DECEMBER 31, 2021 | | J.P. MORGAN LARGE CAP FUNDS | | | | | | | | 73 |
JPMorgan U.S. Research Enhanced Equity Fund
SCHEDULE OF PORTFOLIO INVESTMENTS
AS OF DECEMBER 31, 2021 (Unaudited) (continued)
| | | | | | | | |
| INVESTMENTS | | SHARES
(000) | | | VALUE
($000) | |
Common Stocks — continued | |
|
Electrical Equipment — 0.6% | |
| | |
Eaton Corp. plc | | | 209 | | | | 36,084 | |
| | | | | | | | |
|
Entertainment — 0.9% | |
| | |
Netflix, Inc. * | | | 74 | | | | 44,862 | |
| | |
Walt Disney Co. (The) * | | | 72 | | | | 11,128 | |
| | | | | | | | |
| | |
| | | | | | | 55,990 | |
| | | | | | | | |
|
Equity Real Estate Investment Trusts (REITs) — 2.6% | |
| | |
Camden Property Trust | | | 103 | | | | 18,403 | |
| | |
Equinix, Inc. | | | 22 | | | | 18,866 | |
| | |
Equity LifeStyle Properties, Inc. | | | 138 | | | | 12,054 | |
| | |
Host Hotels & Resorts, Inc. * | | | 284 | | | | 4,939 | |
| | |
Kimco Realty Corp. | | | 382 | | | | 9,416 | |
| | |
Prologis, Inc. | | | 268 | | | | 45,108 | |
| | |
SBA Communications Corp. | | | 29 | | | | 11,243 | |
| | |
Sun Communities, Inc. | | | 74 | | | | 15,512 | |
| | |
UDR, Inc. | | | 43 | | | | 2,556 | |
| | |
Ventas, Inc. | | | 295 | | | | 15,063 | |
| | | | | | | | |
| | |
| | | | | | | 153,160 | |
| | | | | | | | |
|
Food Products — 0.5% | |
| | |
Mondelez International, Inc., Class A | | | 451 | | | | 29,911 | |
| | | | | | | | |
|
Health Care Equipment & Supplies — 2.8% | |
| | |
Abbott Laboratories | | | 291 | | | | 40,933 | |
| | |
ABIOMED, Inc. * | | | 6 | | | | 2,323 | |
| | |
Baxter International, Inc. | | | 88 | | | | 7,571 | |
| | |
Becton Dickinson and Co. | | | 63 | | | | 15,816 | |
| | |
Boston Scientific Corp. * | | | 509 | | | | 21,642 | |
| | |
Dexcom, Inc. * | | | 14 | | | | 7,292 | |
| | |
Intuitive Surgical, Inc. * | | | 29 | | | | 10,474 | |
| | |
Medtronic plc | | | 365 | | | | 37,806 | |
| | |
Zimmer Biomet Holdings, Inc. | | | 178 | | | | 22,629 | |
| | | | | | | | |
| | |
| | | | | | | 166,486 | |
| | | | | | | | |
|
Health Care Providers & Services — 2.9% | |
| | |
Anthem, Inc. | | | 90 | | | | 41,606 | |
| | |
Centene Corp. * | | | 313 | | | | 25,790 | |
| | |
Humana, Inc. | | | 26 | | | | 12,014 | |
| | |
McKesson Corp. | | | 29 | | | | 7,258 | |
| | |
UnitedHealth Group, Inc. | | | 171 | | | | 85,821 | |
| | | | | | | | |
| | |
| | | | | | | 172,489 | |
| | | | | | | | |
|
Hotels, Restaurants & Leisure — 1.7% | |
| | |
Booking Holdings, Inc. * | | | 10 | | | | 24,031 | |
| | |
Hilton Worldwide Holdings, Inc. * | | | 110 | | | | 17,167 | |
| | |
McDonald’s Corp. | | | 213 | | | | 57,153 | |
| | |
Royal Caribbean Cruises Ltd. * | | | 32 | | | | 2,448 | |
| | | | | | | | |
| | |
| | | | | | | 100,799 | |
| | | | | | | | |
| | | | | | | | |
| INVESTMENTS | | SHARES
(000) | | | VALUE
($000) | |
| | | | | | | | |
|
Household Durables — 0.6% | |
| | |
DR Horton, Inc. | | | 20 | | | | 2,189 | |
| | |
Lennar Corp., Class A | | | 239 | | | | 27,718 | |
| | |
Toll Brothers, Inc. | | | 115 | | | | 8,289 | |
| | | | | | | | |
| | |
| | | | | | | 38,196 | |
| | | | | | | | |
|
Household Products — 1.5% | |
| | |
Kimberly-Clark Corp. | | | 130 | | | | 18,633 | |
| | |
Procter & Gamble Co. (The) | | | 445 | | | | 72,852 | |
| | | | | | | | |
| | |
| | | | | | | 91,485 | |
| | | | | | | | |
|
Industrial Conglomerates — 0.4% | |
| | |
Honeywell International, Inc. | | | 100 | | | | 20,941 | |
| | | | | | | | |
|
Insurance — 1.8% | |
| | |
Chubb Ltd. | | | 146 | | | | 28,207 | |
| | |
Hartford Financial Services Group, Inc. (The) | | | 350 | | | | 24,141 | |
| | |
Progressive Corp. (The) | | | 389 | | | | 39,958 | |
| | |
Prudential Financial, Inc. | | | 111 | | | | 12,034 | |
| | |
Travelers Cos., Inc. (The) | | | 36 | | | | 5,639 | |
| | | | | | | | |
| | |
| | | | | | | 109,979 | |
| | | | | | | | |
|
Interactive Media & Services — 7.0% | |
| | |
Alphabet, Inc., Class A * | | | 57 | | | | 163,907 | |
| | |
Alphabet, Inc., Class C * | | | 43 | | | | 124,647 | |
| | |
Meta Platforms, Inc., Class A * | | | 355 | | | | 119,277 | |
| | |
ZoomInfo Technologies, Inc., Class A* | | | 142 | | | | 9,129 | |
| | | | | | | | |
| | |
| | | | | | | 416,960 | |
| | | | | | | | |
|
Internet & Direct Marketing Retail — 4.0% | |
| | |
Amazon.com, Inc. * | | | 71 | | | | 236,585 | |
| | | | | | | | |
|
IT Services — 4.7% | |
| | |
Accenture plc, Class A | | | 165 | | | | 68,575 | |
| | |
FleetCor Technologies, Inc. * | | | 66 | | | | 14,679 | |
| | |
International Business Machines Corp. | | | 220 | | | | 29,392 | |
| | |
Mastercard, Inc., Class A | | | 232 | | | | 83,540 | |
| | |
PayPal Holdings, Inc. * | | | 62 | | | | 11,746 | |
| | |
Shopify, Inc., Class A (Canada)* | | | 6 | | | | 7,989 | |
| | |
Visa, Inc., Class A | | | 304 | | | | 65,946 | |
| | | | | | | | |
| | |
| | | | | | | 281,867 | |
| | | | | | | | |
|
Life Sciences Tools & Services — 1.7% | |
| | |
Danaher Corp. | | | 57 | | | | 18,721 | |
| | |
Illumina, Inc. * | | | 21 | | | | 8,049 | |
| | |
PerkinElmer, Inc. | | | 22 | | | | 4,504 | |
| | |
Thermo Fisher Scientific, Inc. | | | 105 | | | | 69,980 | |
| | | | | | | | |
| | |
| | | | | | | 101,254 | |
| | | | | | | | |
|
Machinery — 2.4% | |
| | |
Deere & Co. | | | 142 | | | | 48,686 | |
SEE NOTES TO FINANCIAL STATEMENTS.
| | | | | | | | | | |
| | | | | |
| 74 | | | | | | | | J.P. MORGAN LARGE CAP FUNDS | | DECEMBER 31, 2021 |
| | | | | | | | |
| INVESTMENTS | | SHARES
(000) | | | VALUE
($000) | |
Common Stocks — continued | |
|
Machinery — continued | |
| | |
Ingersoll Rand, Inc. | | | 163 | | | | 10,094 | |
| | |
Otis Worldwide Corp. | | | 362 | | | | 31,493 | |
| | |
Parker-Hannifin Corp. | | | 68 | | | | 21,624 | |
| | |
Stanley Black & Decker, Inc. | | | 174 | | | | 32,811 | |
| | | | | | | | |
| | |
| | | | | | | 144,708 | |
| | | | | | | | |
|
Media — 1.1% | |
| | |
Charter Communications, Inc., Class A * | | | 32 | | | | 21,186 | |
| | |
Comcast Corp., Class A | | | 856 | | | | 43,063 | |
| | |
Fox Corp., Class A | | | 34 | | | | 1,258 | |
| | | | | | | | |
| | |
| | | | | | | 65,507 | |
| | | | | | | | |
|
Metals & Mining — 0.1% | |
| | |
Freeport-McMoRan, Inc. | | | 180 | | | | 7,500 | |
| | | | | | | | |
|
Multiline Retail — 0.7% | |
| | |
Dollar General Corp. | | | 22 | | | | 5,193 | |
| | |
Dollar Tree, Inc. * | | | 49 | | | | 6,851 | |
| | |
Target Corp. | | | 117 | | | | 26,970 | |
| | | | | | | | |
| | |
| | | | | | | 39,014 | |
| | | | | | | | |
|
Multi-Utilities — 0.6% | |
| | |
CenterPoint Energy, Inc. | | | 832 | | | | 23,218 | |
| | |
DTE Energy Co. | | | 98 | | | | 11,763 | |
| | | | | | | | |
| | |
| | | | | | | 34,981 | |
| | | | | | | | |
|
Oil, Gas & Consumable Fuels — 2.7% | |
| | |
Cheniere Energy, Inc. | | | 70 | | | | 7,049 | |
| | |
Chevron Corp. | | | 303 | | | | 35,590 | |
| | |
ConocoPhillips | | | 599 | | | | 43,205 | |
| | |
Coterra Energy, Inc. | | | 69 | | | | 1,310 | |
| | |
Diamondback Energy, Inc. | | | 226 | | | | 24,389 | |
| | |
EOG Resources, Inc. | | | 161 | | | | 14,262 | |
| | |
Phillips 66 | | | 29 | | | | 2,137 | |
| | |
Pioneer Natural Resources Co. | | | 150 | | | | 27,232 | |
| | |
Williams Cos., Inc. (The) | | | 171 | | | | 4,443 | |
| | | | | | | | |
| | |
| | | | | | | 159,617 | |
| | | | | | | | |
|
Personal Products — 0.4% | |
| | |
Estee Lauder Cos., Inc. (The), Class A | | | 57 | | | | 21,212 | |
| | | | | | | | |
|
Pharmaceuticals — 3.5% | |
| | |
Bristol-Myers Squibb Co. | | | 779 | | | | 48,543 | |
| | |
Eli Lilly & Co. | | | 207 | | | | 57,278 | |
| | |
Johnson & Johnson | | | 345 | | | | 59,035 | |
| | |
Merck & Co., Inc. | | | 296 | | | | 22,661 | |
| | |
Pfizer, Inc. | | | 328 | | | | 19,396 | |
| | | | | | | | |
| | |
| | | | | | | 206,913 | |
| | | | | | | | |
| | | | | | | | |
| INVESTMENTS | | SHARES
(000) | | | VALUE
($000) | |
| | | | | | | | |
|
Professional Services — 0.4% | |
| | |
Booz Allen Hamilton Holding Corp. | | | 80 | | | | 6,813 | |
| | |
Leidos Holdings, Inc. | | | 169 | | | | 15,024 | |
| | | | | | | | |
| | |
| | | | | | | 21,837 | |
| | | | | | | | |
|
Road & Rail — 1.0% | |
| | |
Lyft, Inc., Class A * | | | 156 | | | | 6,675 | |
| | |
Norfolk Southern Corp. | | | 110 | | | | 32,851 | |
| | |
Union Pacific Corp. | | | 86 | | | | 21,644 | |
| | | | | | | | |
| | |
| | | | | | | 61,170 | |
| | | | | | | | |
|
Semiconductors & Semiconductor Equipment — 7.1% | |
| | |
Advanced Micro Devices, Inc. * | | | 343 | | | | 49,417 | |
| | |
Analog Devices, Inc. | | | 222 | | | | 38,960 | |
| | |
Applied Materials, Inc. | | | 288 | | | | 45,282 | |
| | |
Intel Corp. | | | 87 | | | | 4,478 | |
| | |
KLA Corp. | | | 22 | | | | 9,419 | |
| | |
Lam Research Corp. | | | 71 | | | | 51,040 | |
| | |
Microchip Technology, Inc. | | | 139 | | | | 12,071 | |
| | |
Micron Technology, Inc. | | | 65 | | | | 6,023 | |
| | |
NVIDIA Corp. | | | 329 | | | | 96,697 | |
| | |
NXP Semiconductors NV (China) | | | 155 | | | | 35,389 | |
| | |
QUALCOMM, Inc. | | | 103 | | | | 18,864 | |
| | |
Texas Instruments, Inc. | | | 290 | | | | 54,710 | |
| | | | | | | | |
| | |
| | | | | | | 422,350 | |
| | | | | | | | |
|
Software — 9.2% | |
| | |
Ceridian HCM Holding, Inc. * | | | 26 | | | | 2,747 | |
| | |
Fortinet, Inc. * | | | 21 | | | | 7,394 | |
| | |
Intuit, Inc. | | | 89 | | | | 57,281 | |
| | |
Microsoft Corp. | | | 1,265 | | | | 425,449 | |
| | |
Oracle Corp. | | | 241 | | | | 21,024 | |
| | |
salesforce.com, Inc. * | | | 88 | | | | 22,246 | |
| | |
Workday, Inc., Class A * | | | 74 | | | | 20,098 | |
| | | | | | | | |
| | |
| | | | | | | 556,239 | |
| | | | | | | | |
|
Specialty Retail — 3.5% | |
| | |
AutoZone, Inc. * | | | 5 | | | | 11,430 | |
| | |
Best Buy Co., Inc. | | | 216 | | | | 21,979 | |
| | |
Home Depot, Inc. (The) | | | 105 | | | | 43,727 | |
| | |
Lowe’s Cos., Inc. | | | 255 | | | | 65,944 | |
| | |
O’Reilly Automotive, Inc. * | | | 59 | | | | 41,795 | |
| | |
TJX Cos., Inc. (The) | | | 309 | | | | 23,491 | |
| | | | | | | | |
| | |
| | | | | | | 208,366 | |
| | | | | | | | |
|
Technology Hardware, Storage & Peripherals — 7.3% | |
| | |
Apple, Inc. | | | 2,322 | | | | 412,377 | |
| | |
Seagate Technology Holdings plc | | | 279 | | | | 31,547 | |
| | | | | | | | |
| | |
| | | | | | | 443,924 | |
| | | | | | | | |
SEE NOTES TO FINANCIAL STATEMENTS.
| | | | | | | | | | |
| | | | | |
| DECEMBER 31, 2021 | | J.P. MORGAN LARGE CAP FUNDS | | | | | | | | 75 |
JPMorgan U.S. Research Enhanced Equity Fund
SCHEDULE OF PORTFOLIO INVESTMENTS
AS OF DECEMBER 31, 2021 (Unaudited) (continued)
| | | | | | | | |
| INVESTMENTS | | SHARES
(000) | | | VALUE
($000) | |
Common Stocks — continued | |
|
Textiles, Apparel & Luxury Goods — 0.8% | |
| | |
NIKE, Inc., Class B | | | 276 | | | | 45,926 | |
| | | | | | | | |
|
Tobacco — 0.9% | |
| | |
Altria Group, Inc. | | | 532 | | | | 25,209 | |
| | |
Philip Morris International, Inc. | | | 318 | | | | 30,199 | |
| | | | | | | | |
| | |
| | | | | | | 55,408 | |
| | | | | | | | |
|
Wireless Telecommunication Services — 0.6% | |
| | |
T-Mobile US, Inc.* | | | 290 | | | | 33,606 | |
| | | | | | | | |
| | |
Total Common Stocks
(Cost $3,007,759) | | | | | | | 5,907,989 | |
| | | | | | | | |
Short-Term Investments — 1.2% | |
|
Investment Companies — 1.2% | |
| | |
JPMorgan Prime Money Market Fund Class IM Shares, 0.07% (a) (b)
(Cost $73,488) | | | 73,464 | | | | 73,494 | |
| | | | | | | | |
Total Investments — 100.0%
(Cost $3,081,247) | | | | | | | 5,981,483 | |
Other Assets Less Liabilities — 0.0% (c) | | | | | | | 329 | |
| | | | | | | | |
NET ASSETS — 100.0% | | | | | | | 5,981,812 | |
| | | | | | | | |
Percentages indicated are based on net assets.
Abbreviations
| | |
| (a) | | Investment in an affiliated fund, which is registered under the Investment Company Act of 1940, as amended, and is advised by J.P. Morgan Investment Management Inc. |
| (b) | | The rate shown is the current yield as of December 31, 2021. |
| (c) | | Amount rounds to less than 0.1% of net assets. |
| * | | Non-income producing security. |
| | | | | | | | | | | | | | | | | | | | |
| Futures contracts outstanding as of December 31, 2021 (amounts in thousands, except number of contracts): | |
| DESCRIPTION | | NUMBER OF
CONTRACTS | | | EXPIRATION
DATE | | | TRADING
CURRENCY | | | NOTIONAL
AMOUNT ($) | | | VALUE AND
UNREALIZED
APPRECIATION
(DEPRECIATION) ($) | |
Long Contracts | | | | | | | | | | | | | | | | | | | | |
S&P 500 E-Mini Index | | | 288 | | | | 03/2022 | | | | USD | | | | 68,519 | | | | 1,105 | |
| | | | | | | | | | | | | | | | | | | | |
Abbreviations
SEE NOTES TO FINANCIAL STATEMENTS.
| | | | | | | | | | |
| | | | | |
| 76 | | | | | | | | J.P. MORGAN LARGE CAP FUNDS | | DECEMBER 31, 2021 |
JPMorgan U.S. Sustainable Leaders Fund
SCHEDULE OF PORTFOLIO INVESTMENTS
AS OF DECEMBER 31, 2021 (Unaudited)
| | | | | | | | |
| INVESTMENTS | | SHARES
(000) | | �� | VALUE
($000) | |
Common Stocks — 98.1% | |
|
Auto Components — 1.8% | |
| | |
Aptiv plc * | | | 22 | | | | 3,606 | |
| | | | | | | | |
|
Automobiles — 0.4% | |
| | |
Rivian Automotive, Inc., Class A * (a) | | | 7 | | | | 723 | |
| | | | | | | | |
|
Banks — 5.9% | |
| | |
Bank of America Corp. | | | 128 | | | | 5,709 | |
| | |
Citigroup, Inc. | | | 44 | | | | 2,657 | |
| | |
Fifth Third Bancorp | | | 35 | | | | 1,536 | |
| | |
SVB Financial Group * | | | 2 | | | | 1,682 | |
| | | | | | | | |
| | |
| | | | | | | 11,584 | |
| | | | | | | | |
|
Biotechnology — 1.0% | |
| | |
Amgen, Inc. | | | 9 | | | | 1,939 | |
| | | | | | | | |
|
Building Products — 2.7% | |
| | |
Trane Technologies plc | | | 21 | | | | 4,228 | |
| | |
Trex Co., Inc. * | | | 9 | | | | 1,187 | |
| | | | | | | | |
| | |
| | | | | | | 5,415 | |
| | | | | | | | |
|
Capital Markets — 3.7% | |
| | |
Morgan Stanley | | | 26 | | | | 2,503 | |
| | |
S&P Global, Inc. | | | 5 | | | | 2,289 | |
| | |
State Street Corp. | | | 27 | | | | 2,544 | |
| | | | | | | | |
| | |
| | | | | | | 7,336 | |
| | | | | | | | |
|
Containers & Packaging — 1.5% | |
| | |
Ball Corp. | | | 31 | | | | 2,959 | |
| | | | | | | | |
|
Diversified Financial Services — 1.6% | |
| | |
Voya Financial, Inc. | | | 49 | | | | 3,237 | |
| | | | | | | | |
|
Diversified Telecommunication Services — 1.5% | |
| | |
Verizon Communications, Inc. | | | 56 | | | | 2,928 | |
| | | | | | | | |
|
Electric Utilities — 2.5% | |
| | |
NextEra Energy, Inc. | | | 42 | | | | 3,896 | |
| | |
Xcel Energy, Inc. | | | 14 | | | | 967 | |
| | | | | | | | |
| | |
| | | | | | | 4,863 | |
| | | | | | | | |
|
Electrical Equipment — 2.4% | |
| | |
Eaton Corp. plc | | | 28 | | | | 4,842 | |
| | | | | | | | |
|
Electronic Equipment, Instruments & Components — 0.6% | |
| | |
Itron, Inc. * | | | 19 | | | | 1,277 | |
| | | | | | | | |
|
Entertainment — 1.9% | |
| | |
Walt Disney Co. (The) * | | | 25 | | | | 3,840 | |
| | | | | | | | |
|
Equity Real Estate Investment Trusts (REITs) — 4.2% | |
| | |
American Tower Corp. | | | 7 | | | | 1,971 | |
| | |
Boston Properties, Inc. | | | 15 | | | | 1,773 | |
| | |
Equinix, Inc. | | | 2 | | | | 2,072 | |
| | |
Prologis, Inc. | | | 15 | | | | 2,536 | |
| | | | | | | | |
| | |
| | | | | | | 8,352 | |
| | | | | | | | |
|
Food & Staples Retailing — 2.7% | |
| | |
Costco Wholesale Corp. | | | 10 | | | | 5,393 | |
| | | | | | | | |
| | | | | | | | |
| INVESTMENTS | | SHARES
(000) | | | VALUE
($000) | |
| | | | | | | | |
|
Food Products — 0.4% | |
| | |
General Mills, Inc. | | | 13 | | | | 891 | |
| | | | | | | | |
|
Health Care Equipment & Supplies — 1.9% | |
| | |
Boston Scientific Corp. * | | | 54 | | | | 2,278 | |
| | |
Hologic, Inc. * | | | 21 | | | | 1,578 | |
| | | | | | | | |
| | |
| | | | | | | 3,856 | |
| | | | | | | | |
|
Health Care Providers & Services — 1.9% | |
| | |
UnitedHealth Group, Inc. | | | 8 | | | | 3,861 | |
| | | | | | | | |
|
Insurance — 1.8% | |
| | |
MetLife, Inc. | | | 24 | | | | 1,507 | |
| | |
Progressive Corp. (The) | | | 21 | | | | 2,151 | |
| | | | | | | | |
| | |
| | | | | | | 3,658 | |
| | | | | | | | |
|
Interactive Media & Services — 3.2% | |
| | |
Alphabet, Inc., Class A * | | | 2 | | | | 6,373 | |
| | | | | | | | |
|
Internet & Direct Marketing Retail — 0.7% | |
| | |
Etsy, Inc. * | | | 6 | | | | 1,344 | |
| | | | | | | | |
|
IT Services — 4.8% | |
| | |
Accenture plc, Class A | | | 4 | | | | 1,849 | |
| | |
Affirm Holdings, Inc. * | | | 4 | | | | 395 | |
| | |
Mastercard, Inc., Class A | | | 18 | | | | 6,368 | |
| | |
Shopify, Inc., Class A (Canada) * | | | 1 | | | | 826 | |
| | | | | | | | |
| | |
| | | | | | | 9,438 | |
| | | | | | | | |
|
Life Sciences Tools & Services — 6.5% | |
| | |
Agilent Technologies, Inc. | | | 17 | | | | 2,776 | |
| | |
Illumina, Inc. * | | | 3 | | | | 1,065 | |
| | |
IQVIA Holdings, Inc. * | | | 15 | | | | 4,226 | |
| | |
Thermo Fisher Scientific, Inc. | | | 7 | | | | 4,658 | |
| | | | | | | | |
| | |
| | | | | | | 12,725 | |
| | | | | | | | |
|
Machinery — 4.9% | |
| | |
Deere & Co. | | | 11 | | | | 3,741 | |
| | |
Ingersoll Rand, Inc. | | | 69 | | | | 4,246 | |
| | |
Xylem, Inc. | | | 14 | | | | 1,652 | |
| | | | | | | | |
| | |
| | | | | | | 9,639 | |
| | | | | | | | |
|
Multiline Retail — 1.0% | |
| | |
Target Corp. | | | 9 | | | | 2,061 | |
| | | | | | | | |
|
Personal Products — 1.3% | |
| | |
Estee Lauder Cos., Inc. (The), Class A | | | 7 | | | | 2,625 | |
| | | | | | | | |
|
Pharmaceuticals — 3.6% | |
| | |
Bristol-Myers Squibb Co. | | | 56 | | | | 3,479 | |
| | |
Merck & Co., Inc. | | | 49 | | | | 3,746 | |
| | | | | | | | |
| | |
| | | | | | | 7,225 | |
| | | | | | | | |
|
Road & Rail — 1.1% | |
| | |
Norfolk Southern Corp. | | | 8 | | | | 2,272 | |
| | | | | | | | |
SEE NOTES TO FINANCIAL STATEMENTS.
| | | | | | | | | | |
| | | | | |
| DECEMBER 31, 2021 | | J.P. MORGAN LARGE CAP FUNDS | | | | | | | | 77 |
JPMorgan U.S. Sustainable Leaders Fund
SCHEDULE OF PORTFOLIO INVESTMENTS
AS OF DECEMBER 31, 2021 (Unaudited) (continued)
| | | | | | | | |
| INVESTMENTS | | SHARES
(000) | | | VALUE
($000) | |
Common Stocks — continued | |
|
Semiconductors & Semiconductor Equipment — 6.8% | |
| | |
Lam Research Corp. | | | 5 | | | | 3,262 | |
| | |
NVIDIA Corp. | | | 10 | | | | 3,032 | |
| | |
NXP Semiconductors NV (China) | | | 13 | | | | 3,057 | |
| | |
SolarEdge Technologies, Inc. * | | | 4 | | | | 1,117 | |
| | |
Texas Instruments, Inc. | | | 15 | | | | 2,744 | |
| | | | | | | | |
| | |
| | | | | | | 13,212 | |
| | | | | | | | |
|
Software — 12.9% | |
| | |
Adobe, Inc. * | | | 1 | | | | 641 | |
| | |
Autodesk, Inc. * | | | 4 | | | | 1,130 | |
| | |
Cadence Design Systems, Inc. * | | | 13 | | | | 2,380 | |
| | |
Ceridian HCM Holding, Inc. * | | | 20 | | | | 2,057 | |
| | |
Intuit, Inc. | | | 5 | | | | 3,274 | |
| | |
Microsoft Corp. | | | 47 | | | | 15,877 | |
| | | | | | | | |
| | |
| | | | | | | 25,359 | |
| | | | | | | | |
|
Specialty Retail — 4.8% | |
| | |
Best Buy Co., Inc. | | | 23 | | | | 2,336 | |
| | |
Home Depot, Inc. (The) | | | 13 | | | | 5,390 | |
| | |
TJX Cos., Inc. (The) | | | 24 | | | | 1,840 | |
| | | | | | | | |
| | |
| | | | | | | 9,566 | |
| | | | | | | | |
|
Technology Hardware, Storage & Peripherals — 5.0% | |
| | |
Apple, Inc. | | | 56 | | | | 9,956 | |
| | | | | | | | |
|
Textiles, Apparel & Luxury Goods — 1.1% | |
| | |
VF Corp. | | | 29 | | | | 2,116 | |
| | | | | | | | |
| | |
Total Common Stocks
(Cost $153,421) | | | | | | | 194,471 | |
| | | | | |
| | | | | | | | |
| INVESTMENTS | | SHARES
(000) | | | VALUE
($000) | |
Short-Term Investments — 1.6% | |
|
Investment Companies — 1.3% | |
| | |
JPMorgan Prime Money Market Fund Class IM Shares, 0.07% (b) (c)
(Cost $2,574) | | | 2,573 | | | | 2,574 | |
| | | | | | | | |
|
Investment of Cash Collateral from Securities Loaned — 0.3% | |
| | |
JPMorgan U.S. Government Money Market Fund Class IM Shares, 0.03% (b) ( c)
(Cost $544) | | | 544 | | | | 544 | |
| | | | | | | | |
| | |
Total Short-Term Investments
(Cost $3,118) | | | | | | | 3,118 | |
| | | | | | | | |
Total Investments — 99.7%
(Cost $156,539) | | | | | | | 197,589 | |
Other Assets Less Liabilities — 0.3% | | | | | | | 513 | |
| | | | | |
NET ASSETS — 100.0% | | | | | | | 198,102 | |
| | | | | |
Percentages indicated are based on net assets.
Abbreviations
| | |
| (a) | | The security or a portion of this security is on loan at December 31, 2021. The total value of securities on loan at December 31, 2021 is $532. |
| (b) | | Investment in an affiliated fund, which is registered under the Investment Company Act of 1940, as amended, and is advised by J.P. Morgan Investment Management Inc. |
| (c) | | The rate shown is the current yield as of December 31, 2021. |
| * | | Non-income producing security. |
| | | | | | | | | | | | | | | | | | | | |
| Futures contracts outstanding as of December 31, 2021 (amounts in thousands, except number of contracts): | |
| DESCRIPTION | | NUMBER OF
CONTRACTS | | | EXPIRATION
DATE | | | TRADING
CURRENCY | | | NOTIONAL
AMOUNT ($) | | | VALUE AND
UNREALIZED
APPRECIATION
(DEPRECIATION) ($) | |
Long Contracts | | | | | | | | | | | | | | | | | | | | |
E-Mini S&P 500 ESG Index | | | 14 | | | | 03/2022 | | | | USD | | | | 2,899 | | | | 34 | |
| | | | | | | | | | | | | | | | | | | | |
Abbreviations
SEE NOTES TO FINANCIAL STATEMENTS.
| | | | | | | | | | |
| | | | | |
| 78 | | | | | | | | J.P. MORGAN LARGE CAP FUNDS | | DECEMBER 31, 2021 |
JPMorgan U.S. Value Fund
SCHEDULE OF PORTFOLIO INVESTMENTS
AS OF DECEMBER 31, 2021 (Unaudited)
| | | | | | | | |
| INVESTMENTS | | SHARES
(000) | | | VALUE
($000) | |
Common Stocks — 97.6% | |
|
Aerospace & Defense — 4.0% | |
| | |
General Dynamics Corp. | | | 141 | | | | 29,329 | |
| | |
Northrop Grumman Corp. | | | 65 | | | | 25,245 | |
| | |
Raytheon Technologies Corp. | | | 369 | | | | 31,723 | |
| | | | | | | | |
| | |
| | | | | | | 86,297 | |
| | | | | | | | |
|
Air Freight & Logistics — 1.0% | |
| | |
United Parcel Service, Inc., Class B | | | 96 | | | | 20,577 | |
| | | | | | | | |
|
Airlines — 0.8% | |
| | |
Southwest Airlines Co. * | | | 390 | | | | 16,706 | |
| | | | | | | | |
|
Banks — 10.8% | |
| | |
Bank of America Corp. | | | 1,025 | | | | 45,606 | |
| | |
Citigroup, Inc. | | | 605 | | | | 36,506 | |
| | |
Citizens Financial Group, Inc. | | | 201 | | | | 9,501 | |
| | |
M&T Bank Corp. | | | 79 | | | | 12,197 | |
| | |
PNC Financial Services Group, Inc. (The) | | | 144 | | | | 28,815 | |
| | |
Truist Financial Corp. | | | 541 | | | | 31,689 | |
| | |
US Bancorp | | | 264 | | | | 14,813 | |
| | |
Wells Fargo & Co. | | | 1,102 | | | | 52,857 | |
| | | | | | | | |
| | |
| | | | | | | 231,984 | |
| | | | | | | | |
|
Beverages — 0.5% | |
| | |
PepsiCo, Inc. | | | 65 | | | | 11,371 | |
| | | | | | | | |
|
Biotechnology — 2.3% | |
| | |
AbbVie, Inc. | | | 180 | | | | 24,322 | |
| | |
Amgen, Inc. | | | 46 | | | | 10,397 | |
| | |
Biogen, Inc. * | | | 13 | | | | 3,001 | |
| | |
Vertex Pharmaceuticals, Inc. * | | | 55 | | | | 12,056 | |
| | | | | | | | |
| | |
| | | | | | | 49,776 | |
| | | | | | | | |
|
Building Products — 0.7% | |
| | |
Trane Technologies plc | | | 70 | | | | 14,138 | |
| | | | | | | | |
|
Capital Markets — 8.5% | |
| | |
BlackRock, Inc. | | | 55 | | | | 50,240 | |
| | |
Charles Schwab Corp. (The) | | | 284 | | | | 23,921 | |
| | |
Goldman Sachs Group, Inc. (The) | | | 64 | | | | 24,668 | |
| | |
Morgan Stanley | | | 415 | | | | 40,752 | |
| | |
S&P Global, Inc. | | | 34 | | | | 15,810 | |
| | |
T. Rowe Price Group, Inc. | | | 137 | | | | 27,031 | |
| | | | | | | | |
| | |
| | | | | | | 182,422 | |
| | | | | | | | |
|
Chemicals — 3.1% | |
| | |
Air Products and Chemicals, Inc. | | | 89 | | | | 26,942 | |
| | |
Axalta Coating Systems Ltd. * | | | 977 | | | | 32,365 | |
| | |
DuPont de Nemours, Inc. | | | 82 | | | | 6,648 | |
| | | | | | | | |
| | |
| | | | | | | 65,955 | |
| | | | | | | | |
| | | | | | | | |
| INVESTMENTS | | SHARES
(000) | | | VALUE
($000) | |
| | | | | | | | |
|
Commercial Services & Supplies — 0.6% | |
| | |
Republic Services, Inc. | | | 99 | | | | 13,765 | |
| | | | | | | | |
|
Construction Materials — 1.1% | |
| | |
Vulcan Materials Co. | | | 112 | | | | 23,350 | |
| | | | | | | | |
|
Consumer Finance — 2.1% | |
| | |
American Express Co. | | | 138 | | | | 22,573 | |
| | |
Capital One Financial Corp. | | | 154 | | | | 22,292 | |
| | | | | | | | |
| | |
| | | | | | | 44,865 | |
| | | | | | | | |
|
Containers & Packaging — 0.3% | |
| | |
Ball Corp. | | | 65 | | | | 6,258 | |
| | | | | | | | |
|
Diversified Financial Services — 2.0% | |
| | |
Berkshire Hathaway, Inc., Class B * | | | 142 | | | | 42,547 | |
| | | | | | | | |
|
Electric Utilities — 1.7% | |
| | |
Entergy Corp. | | | 60 | | | | 6,709 | |
| | |
NextEra Energy, Inc. | | | 214 | | | | 20,000 | |
| | |
Xcel Energy, Inc. | | | 158 | | | | 10,718 | |
| | | | | | | | |
| | |
| | | | | | | 37,427 | |
| | | | | | | | |
|
Electrical Equipment — 1.2% | |
| | |
Eaton Corp. plc | | | 155 | | | | 26,705 | |
| | | | | | | | |
|
Entertainment — 0.6% | |
| | |
Walt Disney Co. (The) * | | | 81 | | | | 12,578 | |
| | | | | | | | |
|
Equity Real Estate Investment Trusts (REITs) — 1.6% | |
| | |
AvalonBay Communities, Inc. | | | 33 | | | | 8,375 | |
| | |
Host Hotels & Resorts, Inc. * | | | 694 | | | | 12,060 | |
| | |
Ventas, Inc. | | | 175 | | | | 8,925 | |
| | |
Vornado Realty Trust | | | 110 | | | | 4,619 | |
| | | | | | | | |
| | |
| | | | | | | 33,979 | |
| | | | | | | | |
|
Food & Staples Retailing — 1.0% | |
| | |
Walmart, Inc. | | | 156 | | | | 22,579 | |
| | | | | | | | |
|
Food Products — 0.8% | |
| | |
Mondelez International, Inc., Class A | | | 264 | | | | 17,503 | |
| | | | | | | | |
|
Health Care Equipment & Supplies — 3.1% | |
| | |
Becton Dickinson and Co. | | | 85 | | | | 21,322 | |
| | |
Boston Scientific Corp. * | | | 127 | | | | 5,399 | |
| | |
Medtronic plc | | | 247 | | | | 25,567 | |
| | |
Zimmer Biomet Holdings, Inc. | | | 122 | | | | 15,499 | |
| | | | | | | | |
| | |
| | | | | | | 67,787 | |
| | | | | | | | |
|
Health Care Providers & Services — 4.8% | |
| | |
Anthem, Inc. | | | 30 | | | | 13,785 | |
| | |
Cigna Corp. | | | 109 | | | | 25,086 | |
| | |
Humana, Inc. | | | 34 | | | | 15,757 | |
| | |
UnitedHealth Group, Inc. | | | 99 | | | | 49,807 | |
| | | | | | | | |
| | |
| | | | | | | 104,435 | |
| | | | | | | | |
SEE NOTES TO FINANCIAL STATEMENTS.
| | | | | | | | | | |
| | | | | |
| DECEMBER 31, 2021 | | J.P. MORGAN LARGE CAP FUNDS | | | | | | | | 79 |
JPMorgan U.S. Value Fund
SCHEDULE OF PORTFOLIO INVESTMENTS
AS OF DECEMBER 31, 2021 (Unaudited) (continued)
| | | | | | | | |
| INVESTMENTS | | SHARES
(000) | | | VALUE
($000) | |
Common Stocks — continued | |
|
Hotels, Restaurants & Leisure — 1.7% | |
| | |
Booking Holdings, Inc. * | | | 7 | | | | 16,168 | |
| | |
McDonald’s Corp. | | | 76 | | | | 20,325 | |
| | | | | | | | |
| | |
| | | | | | | 36,493 | |
| | | | | | | | |
|
Household Durables — 0.4% | |
| | |
Newell Brands, Inc. | | | 359 | | | | 7,832 | |
| | | | | | | | |
|
Household Products — 1.1% | |
| | |
Procter & Gamble Co. (The) | | | 151 | | | | 24,620 | |
| | | | | | | | |
|
Insurance — 3.9% | |
| | |
Chubb Ltd. | | | 108 | | | | 20,833 | |
| | |
Hartford Financial Services Group, Inc. (The) | | | 284 | | | | 19,582 | |
| | |
Loews Corp. | | | 151 | | | | 8,728 | |
| | |
Marsh & McLennan Cos., Inc. | | | 58 | | | | 10,020 | |
| | |
MetLife, Inc. | | | 245 | | | | 15,310 | |
| | |
Prudential Financial, Inc. | | | 87 | | | | 9,415 | |
| | | | | | | | |
| | |
| | | | | | | 83,888 | |
| | | | | | | | |
|
Interactive Media & Services — 1.7% | |
| | |
Alphabet, Inc., Class C * | | | 13 | | | | 36,508 | |
| | | | | | | | |
|
IT Services — 1.0% | |
| | |
Fidelity National Information Services, Inc. | | | 90 | | | | 9,862 | |
| | |
International Business Machines Corp. | | | 93 | | | | 12,447 | |
| | | | | | | | |
| | |
| | | | | | | 22,309 | |
| | | | | | | | |
|
Machinery — 3.5% | |
| | |
Dover Corp. | | | 193 | | | | 35,021 | |
| | |
Parker-Hannifin Corp. | | | 106 | | | | 33,716 | |
| | |
Stanley Black & Decker, Inc. | | | 31 | | | | 5,931 | |
| | | | | | | | |
| | |
| | | | | | | 74,668 | |
| | | | | | | | |
|
Media — 1.6% | |
| | |
Comcast Corp., Class A | | | 683 | | | | 34,362 | |
| | | | | | | | |
|
Multiline Retail — 0.9% | |
| | |
Dollar General Corp. | | | 80 | | | | 18,843 | |
| | | | | | | | |
|
Multi-Utilities — 1.4% | |
| | |
CMS Energy Corp. | | | 348 | | | | 22,638 | |
| | |
Public Service Enterprise Group, Inc. | | | 106 | | | | 7,092 | |
| | | | | | | | |
| | |
| | | | | | | 29,730 | |
| | | | | | | | |
|
Oil, Gas & Consumable Fuels — 5.5% | |
| | |
Chevron Corp. | | | 260 | | | | 30,513 | |
| | |
ConocoPhillips | | | 713 | | | | 51,498 | |
| | |
EOG Resources, Inc. | | | 326 | | | | 28,960 | |
| | |
Valero Energy Corp. | | | 112 | | | | 8,421 | |
| | | | | | | | |
| | |
| | | | | | | 119,392 | |
| | | | | | | | |
|
Pharmaceuticals — 5.3% | |
| | |
Bristol-Myers Squibb Co. | | | 613 | | | | 38,229 | |
| | |
Eli Lilly & Co. | | | 91 | | | | 25,151 | |
| | |
Johnson & Johnson | | | 169 | | | | 28,865 | |
| | |
Merck & Co., Inc. | | | 93 | | | | 7,135 | |
| | | | | | | | |
| INVESTMENTS | | SHARES
(000) | | | VALUE
($000) | |
| | | | | | | | |
|
Pharmaceuticals — continued | |
| | |
Pfizer, Inc. | | | 256 | | | | 15,100 | |
| | | | | | | | |
| | |
| | | | | | | 114,480 | |
| | | | | | | | |
|
Road & Rail — 1.1% | |
| | |
CSX Corp. | | | 640 | | | | 24,053 | |
| | | | | | | | |
|
Semiconductors & Semiconductor Equipment — 4.9% | |
| | |
Analog Devices, Inc. | | | 196 | | | | 34,502 | |
| | |
Lam Research Corp. | | | 13 | | | | 9,220 | |
| | |
NXP Semiconductors NV (China) | | | 116 | | | | 26,516 | |
| | |
Texas Instruments, Inc. | | | 192 | | | | 36,105 | |
| | | | | | | | |
| | |
| | | | | | | 106,343 | |
| | | | | | | | |
|
Software — 1.6% | |
| | |
Microsoft Corp. | | | 102 | | | | 34,414 | |
| | | | | | | | |
|
Specialty Retail — 5.8% | |
| | |
AutoZone, Inc. * | | | 12 | | | | 26,201 | |
| | |
Gap, Inc. (The) | | | 442 | | | | 7,800 | |
| | |
Home Depot, Inc. (The) | | | 71 | | | | 29,616 | |
| | |
Lowe’s Cos., Inc. | | | 98 | | | | 25,354 | |
| | |
O’Reilly Automotive, Inc. * | | | 15 | | | | 10,876 | |
| | |
TJX Cos., Inc. (The) | | | 330 | | | | 25,043 | |
| | | | | | | | |
| | |
| | | | | | | 124,890 | |
| | | | | | | | |
|
Technology Hardware, Storage & Peripherals — 0.6% | |
| | |
Apple, Inc. | | | 70 | | | | 12,467 | |
| | | | | | | | |
|
Textiles, Apparel & Luxury Goods — 1.2% | |
| | |
NIKE, Inc., Class B | | | 160 | | | | 26,690 | |
| | | | | | | | |
|
Tobacco — 1.2% | |
| | |
Philip Morris International, Inc. | | | 281 | | | | 26,709 | |
| | | | | | | | |
|
Wireless Telecommunication Services — 0.6% | |
| | |
T-Mobile US, Inc. * | | | 119 | | | | 13,790 | |
| | | | | | | | |
| | |
Total Common Stocks
(Cost $1,479,194) | | | | | | | 2,105,485 | |
| | | | | |
Short-Term Investments — 3.1% | |
|
Investment Companies — 3.1% | |
| | |
JPMorgan Prime Money Market Fund Class IM Shares, 0.07% (a) (b)
(Cost $66,004) | | | 65,978 | | | | 66,004 | |
| | | | | | | | |
Total Investments — 100.7%
(Cost $1,545,198) | | | | | | | 2,171,489 | |
Liabilities in Excess of
Other Assets — (0.7)% | | | | | | | (14,709 | ) |
| | | | | | | | |
NET ASSETS — 100.0% | | | | | | | 2,156,780 | |
| | | | | |
Percentages indicated are based on net assets.
Abbreviations
| | |
| (a) | | Investment in an affiliated fund, which is registered under the Investment Company Act of 1940, as amended, and is advised by J.P. Morgan Investment Management Inc. |
| (b) | | The rate shown is the current yield as of December 31, 2021. |
| * | | Non-income producing security. |
SEE NOTES TO FINANCIAL STATEMENTS.
| | | | | | | | | | |
| | | | | |
| 80 | | | | | | | | J.P. MORGAN LARGE CAP FUNDS | | DECEMBER 31, 2021 |
THIS PAGE IS INTENTIONALLY LEFT BLANK
| | | | | | | | | | |
| | | | | |
| DECEMBER 31, 2021 | | J.P. MORGAN LARGE CAP FUNDS | | | | | | | | 81 |
STATEMENTS OF ASSETS AND LIABILITIES
AS OF DECEMBER 31, 2021 (Unaudited)
(Amounts in thousands, except per share amounts)
| | | | | | | | | | | | | | | | |
| | | | |
| | | JPMorgan
Equity
Focus Fund | | | JPMorgan
Equity
Income Fund | | |
JPMorgan
Equity Premium
Income Fund | | | JPMorgan
Hedged
Equity Fund | |
ASSETS: | |
Investments in non-affiliates, at value | | $ | 140,479 | | | $ | 50,133,261 | | | $ | 2,100,783 | | | $ | 18,974,713 | |
Investments in affiliates, at value | | | 3,975 | | | | 1,034,986 | | | | 7,184 | | | | 1,296,982 | |
Options purchased, at value | | | — | | | | — | | | | — | | | | 354,537 | |
Cash | | | — | (a) | | | 8 | | | | 34,762 | | | | — | |
Deposits at broker for futures contracts | | | — | | | | — | | | | — | | | | 90,446 | |
Receivables: | | | | | | | | | | | | | | | | |
Investment securities sold | | | — | | | | — | | | | 35,586 | | | | 1,521,847 | |
Fund shares sold | | | 5 | | | | 30,340 | | | | 4,157 | | | | 66,266 | |
Interest from non-affiliates | | | — | | | | — | | | | 7,533 | | | | — | |
Dividends from non-affiliates | | | 68 | | | | 75,664 | | | | 2,188 | | | | 15,225 | |
Dividends from affiliates | | | — | (a) | | | 2 | | | | — | (a) | | | 2 | |
Securities lending income (See Note 2.C.) | | | — | | | | — | (a) | | | — | | | | — | |
Variation margin on futures contracts | | | — | | | | — | | | | 709 | | | | — | |
Other assets | | | — | | | | — | | | | 84 | | | | — | |
| | | | | | | | | | | | | | | | |
Total Assets | | | 144,527 | | | | 51,274,261 | | | | 2,192,986 | | | | 22,320,018 | |
| | | | | | | | | | | | | | | | |
LIABILITIES: | |
Payables: | | | | | | | | | | | | | | | | |
Distributions | | | — | | | | — | (a) | | | 489 | | | | — | |
Investment securities purchased | | | — | | | | — | | | | 42,999 | | | | 2,389,608 | |
Fund shares redeemed | | | 19 | | | | 135,776 | | | | 6,215 | | | | 14,335 | |
Variation margin on futures contracts | | | — | | | | — | | | | — | | | | 5,683 | |
Outstanding options written, at fair value | | | — | | | | — | | | | — | | | | 344,763 | |
Accrued liabilities: | | | | | | | | | | | | | | | | |
Investment advisory fees | | | 53 | | | | 16,867 | | | | 413 | | | | 4,095 | |
Administration fees | | | 5 | | | | 1,365 | | | | 124 | | | | 1,035 | |
Distribution fees | | | 5 | | | | 2,071 | | | | 371 | | | | 730 | |
Service fees | | | 22 | | | | 5,688 | | | | 405 | | | | 3,719 | |
Custodian and accounting fees | | | 11 | | | | 517 | | | | 20 | | | | 223 | |
Trustees’ and Chief Compliance Officer’s fees | | | — | (a) | | | — | (a) | | | 4 | | | | — | |
Other | | | 74 | | | | 951 | | | | 1 | | | | 19 | |
| | | | | | | | | | | | | | | | |
Total Liabilities | | | 189 | | | | 163,235 | | | | 51,041 | | | | 2,764,210 | |
| | | | | | | | | | | | | | | | |
Net Assets | | $ | 144,338 | | | $ | 51,111,026 | | | $ | 2,141,945 | | | $ | 19,555,808 | |
| | | | | | | | | | | | | | | | |
| (a) | Amount rounds to less than one thousand. |
SEE NOTES TO FINANCIAL STATEMENTS.
| | | | | | | | | | |
| | | | | |
| 82 | | | | | | | | J.P. MORGAN LARGE CAP FUNDS | | DECEMBER 31, 2021 |
| | | | | | | | | | | | | | | | |
| | | | |
| | | JPMorgan
Equity
Focus Fund | | | JPMorgan
Equity
Income Fund | | |
JPMorgan
Equity Premium
Income Fund | | | JPMorgan
Hedged
Equity Fund | |
NET ASSETS: | |
Paid-in-Capital | | $ | 89,018 | | | $ | 34,147,475 | | | $ | 2,033,006 | | | $ | 15,670,227 | |
Total distributable earnings (loss) | | | 55,320 | | | | 16,963,551 | | | | 108,939 | | | | 3,885,581 | |
| | | | | | | | | | | | | | | | |
Total Net Assets | | $ | 144,338 | | | $ | 51,111,026 | | | $ | 2,141,945 | | | $ | 19,555,808 | |
| | | | | | | | | | | | | | | | |
Net Assets: | |
Class A | | $ | 11,819 | | | $ | 5,069,630 | | | $ | 516,483 | | | $ | 1,913,441 | |
Class C | | | 4,742 | | | | 1,484,655 | | | | 454,267 | | | | 515,143 | |
Class I | | | 91,261 | | | | 19,638,384 | | | | 1,115,036 | | | | 15,257,745 | |
Class R2 | | | — | | | | 76,797 | | | | — | | | | — | |
Class R3 | | | — | | | | 262,607 | | | | — | | | | — | |
Class R4 | | | — | | | | 228,730 | | | | — | | | | — | |
Class R5 | | | — | | | | 1,640,250 | | | | 76 | | | | 6,393 | |
Class R6 | | | 36,516 | | | | 22,709,973 | | | | 56,083 | | | | 1,863,086 | |
| | | | | | | | | | | | | | | | |
Total | | $ | 144,338 | | | $ | 51,111,026 | | | $ | 2,141,945 | | | $ | 19,555,808 | |
| | | | | | | | | | | | | | | | |
Outstanding units of beneficial interest (shares) | |
($0.0001 par value; unlimited number of shares authorized): | | | | | | | | | | | | | | | | |
Class A | | | 347 | | | | 216,609 | | | | 32,371 | | | | 71,197 | |
Class C | | | 149 | | | | 64,862 | | | | 28,471 | | | | 19,299 | |
Class I | | | 2,615 | | | | 823,214 | | | | 69,869 | | | | 565,894 | |
Class R2 | | | — | | | | 3,298 | | | | — | | | | — | |
Class R3 | | | — | | | | 11,230 | | | | — | | | | — | |
Class R4 | | | — | | | | 9,595 | | | | — | | | | — | |
Class R5 | | | — | | | | 68,700 | | | | 5 | | | | 237 | |
Class R6 | | | 1,053 | | | | 951,998 | | | | 3,515 | | | | 68,941 | |
Net Asset Value (a): | | | | | | | | | | | | | | | | |
Class A — Redemption price per share | | $ | 34.05 | | | $ | 23.40 | | | $ | 15.96 | | | $ | 26.88 | |
Class C — Offering price per share (b) | | | 31.91 | | | | 22.89 | | | | 15.96 | | | | 26.69 | |
Class I — Offering and redemption price per share | | | 34.90 | | | | 23.86 | | | | 15.96 | | | | 26.96 | |
Class R2 — Offering and redemption price per share | | | — | | | | 23.28 | | | | — | | | | — | |
Class R3 — Offering and redemption price per share | | | — | | | | 23.39 | | | | — | | | | — | |
Class R4 — Offering and redemption price per share | | | — | | | | 23.84 | | | | — | | | | — | |
Class R5 — Offering and redemption price per share | | | — | | | | 23.88 | | | | 15.96 | | | | 27.01 | |
Class R6 — Offering and redemption price per share | | | 34.67 | | | | 23.86 | | | | 15.96 | | | | 27.02 | |
Class A maximum sales charge | | | 5.25 | % | | | 5.25 | % | | | 5.25 | % | | | 5.25 | % |
Class A maximum public offering price per share
[net asset value per share/(100% — maximum sales charge)] | | $ | 35.94 | | | $ | 24.70 | | | $ | 16.84 | | | $ | 28.37 | |
| | | | | | | | | | | | | | | | |
Cost of investments in non-affiliates | | $ | 84,749 | | | $ | 33,181,428 | | | $ | 1,909,394 | | | $ | 11,725,472 | |
Cost of investments in affiliates | | | 3,975 | | | | 1,035,032 | | | | 7,184 | | | | 1,296,982 | |
Cost of options purchased | | | — | | | | — | | | | — | | | | 347,125 | |
Premiums received from options written | | | — | | | | — | | | | — | | | | 342,970 | |
| (a) | Per share amounts may not recalculate due to rounding of net assets and/or shares outstanding. |
| (b) | Redemption price for Class C Shares varies based upon length of time the shares are held. |
SEE NOTES TO FINANCIAL STATEMENTS.
| | | | | | | | | | |
| | | | | |
| DECEMBER 31, 2021 | | J.P. MORGAN LARGE CAP FUNDS | | | | | | | | 83 |
STATEMENTS OF ASSETS AND LIABILITIES
AS OF DECEMBER 31, 2021 (Unaudited) (continued)
(Amounts in thousands, except per share amounts)
| | | | | | | | | | | | | | | | |
| | | | |
| | | JPMorgan
Hedged
Equity 2 Fund | | | JPMorgan
Hedged
Equity 3 Fund | | |
JPMorgan
Large Cap
Growth Fund | | | JPMorgan
Large Cap
Value Fund | |
ASSETS: | |
Investments in non-affiliates, at value | | $ | 3,915,780 | | | $ | 2,336,570 | | | $ | 40,643,085 | | | $ | 3,120,239 | |
Investments in affiliates, at value | | | 143,550 | | | | 16,682 | | | | 292,250 | | | | 3,146 | |
Investment of cash collateral received from securities loaned, at value (See Note 2.C.) | | | — | | | | — | | | | 137,610 | | | | 37,788 | |
Options purchased, at value | | | 10,351 | | | | 15,607 | | | | — | | | | — | |
Cash | | | 809 | | | | 419 | | | | 24 | | | | 85 | |
Foreign currency, at value | | | 2 | | | | 1 | | | | — | | | | — | |
Deposits at broker for futures contracts | | | 1,005 | | | | 752 | | | | — | | | | — | |
Deferred offering costs (See Note 2.J.) | | | 18 | | | | 18 | | | | — | | | | — | |
Receivables: | | | | | | | | | | | | | | | | |
Investment securities sold | | | 3,180 | | | | 2,358 | | | | — | | | | — | |
Fund shares sold | | | 14,760 | | | | 8,647 | | | | 22,832 | | | | 1,416 | |
Dividends from non-affiliates | | | 2,802 | | | | 1,709 | | | | 5,979 | | | | 2,408 | |
Dividends from affiliates | | | — | (a) | | | — | (a) | | | 1 | | | | — | (a) |
Securities lending income (See Note 2.C.) | | | — | | | | — | | | | 21 | | | | 2 | |
Other assets | | | 391 | | | | 635 | | | | — | | | | 95 | |
| | | | | | | | | | | | | | | | |
Total Assets | | | 4,092,648 | | | | 2,383,398 | | | | 41,101,802 | | | | 3,165,179 | |
| | | | | | | | | | | | | | | | |
|
LIABILITIES: | |
Payables: | | | | | | | | | | | | | | | | |
Investment securities purchased | | | 117,841 | | | | 3,055 | | | | — | | | | — | |
Collateral received on securities loaned (See Note 2.C.) | | | — | | | | — | | | | 137,610 | | | | 37,788 | |
Fund shares redeemed | | | 13,471 | | | | 2,337 | | | | 137,855 | | | | 12,659 | |
Variation margin on futures contracts | | | 73 | | | | 49 | | | | — | | | | — | |
Outstanding options written, at fair value | | | 66,207 | | | | 59,391 | | | | — | | | | — | |
Accrued liabilities: | | | | | | | | | | | | | | | | |
Investment advisory fees | | | 745 | | | | 455 | | | | 14,261 | | | | 934 | |
Administration fees | | | 225 | | | | 141 | | | | 456 | | | | 130 | |
Distribution fees | | | 154 | | | | 64 | | | | 1,767 | | | | 88 | |
Service fees | | | 661 | | | | 374 | | | | 3,966 | | | | 301 | |
Custodian and accounting fees | | | 41 | | | | 25 | | | | 440 | | | | 27 | |
Trustees’ and Chief Compliance Officer’s fees | | | — | (a) | | | — | (a) | | | — | (a) | | | — | (a) |
Other | | | 2 | | | | 427 | | | | 353 | | | | 80 | |
| | | | | | | | | | | | | | | | |
Total Liabilities | | | 199,420 | | | | 66,318 | | | | 296,708 | | | | 52,007 | |
| | | | | | | | | | | | | | | | |
Net Assets | | $ | 3,893,228 | | | $ | 2,317,080 | | | $ | 40,805,094 | | | $ | 3,113,172 | |
| | | | | | | | | | | | | | | | |
| (a) | Amount rounds to less than one thousand. |
SEE NOTES TO FINANCIAL STATEMENTS.
| | | | | | | | | | |
| | | | | |
| 84 | | | | | | | | J.P. MORGAN LARGE CAP FUNDS | | DECEMBER 31, 2021 |
| | | | | | | | | | | | | | | | |
| | | | |
| | | JPMorgan
Hedged
Equity 2 Fund | | | JPMorgan
Hedged
Equity 3 Fund | | |
JPMorgan
Large Cap
Growth Fund | | | JPMorgan
Large Cap
Value Fund | |
NET ASSETS: | |
Paid-in-Capital | | $ | 3,683,067 | | | $ | 2,204,171 | | | $ | 23,647,490 | | | $ | 2,627,814 | |
Total distributable earnings (loss) | | | 210,161 | | | | 112,909 | | | | 17,157,604 | | | | 485,358 | |
| | | | | | | | | | | | | | | | |
Total Net Assets | | $ | 3,893,228 | | | $ | 2,317,080 | | | $ | 40,805,094 | | | $ | 3,113,172 | |
| | | | | | | | | | | | | | | | |
Net Assets: | |
Class A | | $ | 233,103 | | | $ | 94,246 | | | $ | 5,267,927 | | | $ | 212,700 | |
Class C | | | 180,578 | | | | 78,261 | | | | 829,593 | | | | 62,881 | |
Class I | | | 2,970,051 | | | | 1,730,595 | | | | 11,651,360 | | | | 1,262,516 | |
Class R2 | | | — | | | | — | | | | 137,088 | | | | 11,922 | |
Class R3 | | | — | | | | — | | | | 294,369 | | | | 6,182 | |
Class R4 | | | — | | | | — | | | | 245,696 | | | | 191 | |
Class R5 | | | 582 | | | | 20 | | | | 931,637 | | | | 24,769 | |
Class R6 | | | 508,914 | | | | 413,958 | | | | 21,447,424 | | | | 1,532,011 | |
| | | | | | | | | | | | | | | | |
Total | | $ | 3,893,228 | | | $ | 2,317,080 | | | $ | 40,805,094 | | | $ | 3,113,172 | |
| | | | | | | | | | | | | | | | |
Outstanding units of beneficial interest (shares) | |
($0.0001 par value; unlimited number of shares authorized): | | | | | | | | | | | | | | | | |
Class A | | | 13,652 | | | | 5,582 | | | | 87,270 | | | | 11,012 | |
Class C | | | 10,591 | | | | 4,643 | | | | 20,388 | | | | 3,424 | |
Class I | | | 173,771 | | | | 102,347 | | | | 188,135 | | | | 66,722 | |
Class R2 | | | — | | | | — | | | | 2,412 | | | | 623 | |
Class R3 | | | — | | | | — | | | | 4,841 | | | | 328 | |
Class R4 | | | — | | | | — | | | | 3,975 | | | | 10 | |
Class R5 | | | 34 | | | | 1 | | | | 14,544 | | | | 1,293 | |
Class R6 | | | 29,750 | | | | 24,462 | | | | 330,764 | | | | 80,611 | |
Net Asset Value (a): | | | | | | | | | | | | | | | | |
Class A — Redemption price per share | | $ | 17.07 | | | $ | 16.88 | | | $ | 60.36 | | | $ | 19.32 | |
Class C — Offering price per share (b) | | | 17.05 | | | | 16.85 | | | | 40.69 | | | | 18.37 | |
Class I — Offering and redemption price per share | | | 17.09 | | | | 16.91 | | | | 61.93 | | | | 18.92 | |
Class R2 — Offering and redemption price per share | | | — | | | | — | | | | 56.84 | | | | 19.12 | |
Class R3 — Offering and redemption price per share | | | — | | | | — | | | | 60.81 | | | | 18.88 | |
Class R4 — Offering and redemption price per share | | | — | | | | — | | | | 61.80 | | | | 19.34 | |
Class R5 — Offering and redemption price per share | | | 17.10 | | | | 16.92 | | | | 64.06 | | | | 19.15 | |
Class R6 — Offering and redemption price per share | | | 17.11 | | | | 16.92 | | | | 64.84 | | | | 19.00 | |
Class A maximum sales charge | | | 5.25 | % | | | 5.25 | % | | | 5.25 | % | | | 5.25 | % |
Class A maximum public offering price per share
[net asset value per share/(100% — maximum sales charge)] | | $ | 18.02 | | | $ | 17.82 | | | $ | 63.70 | | | $ | 20.39 | |
| | | | | | | | | | | | | | | | |
Cost of investments in non-affiliates | | $ | 3,577,277 | | | $ | 2,137,943 | | | $ | 24,052,214 | | | $ | 2,622,002 | |
Cost of investments in affiliates | | | 143,550 | | | | 16,682 | | | | 292,240 | | | | 3,146 | |
Cost of options purchased | | | 64,016 | | | | 54,814 | | | | — | | | | — | |
Cost of foreign currency | | | 2 | | | | 1 | | | | — | | | | — | |
Investment securities on loan, at value (See Note 2.C.) | | | — | | | | — | | | | 134,368 | | | | 36,685 | |
Cost of investment of cash collateral (See Note 2.C.) | | | — | | | | — | | | | 137,610 | | | | 37,788 | |
Premiums received from options written | | | 65,775 | | | | 58,130 | | | | — | | | | — | |
| (a) | Per share amounts may not recalculate due to rounding of net assets and/or shares outstanding. |
| (b) | Redemption price for Class C Shares varies based upon length of time the shares are held. |
SEE NOTES TO FINANCIAL STATEMENTS.
| | | | | | | | | | |
| | | | | |
| DECEMBER 31, 2021 | | J.P. MORGAN LARGE CAP FUNDS | | | | | | | | 85 |
STATEMENTS OF ASSETS AND LIABILITIES
AS OF DECEMBER 31, 2021 (Unaudited) (continued)
(Amounts in thousands, except per share amounts)
| | | | | | | | | | | | | | | | |
| | | | |
| | | JPMorgan U.S. Applied Data Science Value Fund (formerly known as JPMorgan Intrepid Value Fund) | | | JPMorgan U.S.
Equity Fund | | |
JPMorgan
U.S. GARP
Equity Fund | | | JPMorgan
U.S. Large
Cap Core
Plus Fund | |
ASSETS: | |
Investments in non-affiliates, at value | | $ | 240,871 | | | $ | 22,300,376 | | | $ | 1,325,785 | | | $ | 3,202,327 | |
Investments in affiliates, at value | | | 5,269 | | | | 305,526 | | | | 17,035 | | | | 18,556 | |
Investment of cash collateral received from securities loaned, at value (See Note 2.C.) | | | — | | | | 65,204 | | | | 3,659 | | | | — | |
Cash | | | 4 | | | | 10 | | | | 819 | | | | 4 | |
Deposits at broker for futures contracts | | | 297 | | | | 7,042 | | | | 1,005 | | | | — | |
Receivables: | | | | | | | | | | | | | | | | |
Investment securities sold | | | — | | | | 19,452 | | | | 584 | | | | 16,151 | |
Fund shares sold | | | 95 | | | | 45,147 | | | | 127 | | | | 1,135 | |
Dividends from non-affiliates | | | 178 | | | | 9,099 | | | | 492 | | | | 1,668 | |
Dividends from affiliates | | | — | (a) | | | 1 | | | | — | (a) | | | — | (a) |
Securities lending income (See Note 2.C.) | | | — | (a) | | | 8 | | | | — | (a) | | | — | |
Other assets | | | 95 | | | | — | | | | — | | | | — | |
| | | | | | | | | | | | | | | | |
Total Assets | | | 246,809 | | | | 22,751,865 | | | | 1,349,506 | | | | 3,239,841 | |
| | | | | | | | | | | | | | | | |
|
LIABILITIES: | |
Payables: | | | | | | | | | | | | | | | | |
Securities sold short, at value | | | — | | | | — | | | | — | | | | 572,510 | |
Dividend expense to non-affiliates on securities sold short | | | — | | | | — | | | | — | | | | 948 | |
Investment securities purchased | | | — | | | | 27,491 | | | | 1,553 | | | | 16,118 | |
Interest expense to non-affiliates on securities sold short | | | — | | | | — | | | | — | | | | 276 | |
Collateral received on securities loaned (See Note 2.C.) | | | — | | | | 65,204 | | | | 3,659 | | | | — | |
Fund shares redeemed | | | 12 | | | | 133,507 | | | | 120 | | | | 2,028 | |
Variation margin on futures contracts | | | 15 | | | | 466 | | | | 49 | | | | — | |
Accrued liabilities: | | | | | | | | | | | | | | | | |
Investment advisory fees | | | 47 | | | | 7,179 | | | | 296 | | | | 1,436 | |
Administration fees | | | 6 | | | | 903 | | | | 59 | | | | 141 | |
Distribution fees | | | 20 | | | | 830 | | | | 68 | | | | 102 | |
Service fees | | | 24 | | | | 1,292 | | | | 91 | | | | 269 | |
Custodian and accounting fees | | | 13 | | | | 258 | | | | 19 | | | | 51 | |
Trustees’ and Chief Compliance Officer’s fees | | | — | (a) | | | 1 | | | | — | | | | — | |
Other | | | 220 | | | | 169 | | | | 48 | | | | 160 | |
| | | | | | | | | | | | | | | | |
Total Liabilities | | | 357 | | | | 237,300 | | | | 5,962 | | | | 594,039 | |
| | | | | | | | | | | | | | | | |
Net Assets | | $ | 246,452 | | | $ | 22,514,565 | | | $ | 1,343,544 | | | $ | 2,645,802 | |
| | | | | | | | | | | | | | | | |
| (a) | Amount rounds to less than one thousand. |
SEE NOTES TO FINANCIAL STATEMENTS.
| | | | | | | | | | |
| | | | | |
| 86 | | | | | | | | J.P. MORGAN LARGE CAP FUNDS | | DECEMBER 31, 2021 |
| | | | | | | | | | | | | | | | |
| | | | |
| | | JPMorgan U.S. Applied Data Science Value Fund (formerly known as JPMorgan Intrepid
Value Fund) | | | JPMorgan U.S.
Equity Fund | | | JPMorgan
U.S. GARP
Equity Fund | | | JPMorgan
U.S. Large
Cap Core
Plus Fund | |
NET ASSETS: | |
Paid-in-Capital | | $ | 190,358 | | | $ | 12,408,226 | | | $ | 709,575 | | | $ | 1,000,711 | |
Total distributable earnings (loss) | | | 56,094 | | | | 10,106,339 | | | | 633,969 | | | | 1,645,091 | |
| | | | | | | | | | | | | | | | |
Total Net Assets | | $ | 246,452 | | | $ | 22,514,565 | | | $ | 1,343,544 | | | $ | 2,645,802 | |
| | | | | | | | | | | | | | | | |
Net Assets: | |
Class A | | $ | 60,402 | | | $ | 1,919,539 | | | $ | 130,083 | | | $ | 353,418 | |
Class C | | | 10,260 | | | | 434,291 | | | | 31,372 | | | | 39,493 | |
Class I | | | 124,275 | | | | 2,089,254 | | | | 179,611 | | | | 1,713,370 | |
Class L | | | — | | | | 2,028,197 | | | | — | | | | — | |
Class R2 | | | 2,978 | | | | 283,095 | | | | 49,184 | | | | 6,199 | |
Class R3 | | | — | | | | 192,664 | | | | — | | | | — | |
Class R4 | | | — | | | | 67,096 | | | | — | | | | — | |
Class R5 | | | 4,479 | | | | 1,166,317 | | | | 149,622 | | | | 36,903 | |
Class R6 | | | 44,058 | | | | 14,334,112 | | | | 803,672 | | | | 496,419 | |
| | | | | | | | | | | | | | | | |
Total | | $ | 246,452 | | | $ | 22,514,565 | | | $ | 1,343,544 | | | $ | 2,645,802 | |
| | | | | | | | | | | | | | | | |
|
Outstanding units of beneficial interest (shares) | |
($0.0001 par value; unlimited number of shares authorized): | | | | | | | | | | | | | | | | |
Class A | | | 1,998 | | | | 87,332 | | | | 1,915 | | | | 15,173 | |
Class C | | | 348 | | | | 20,740 | | | | 478 | | | | 1,970 | |
Class I | | | 4,062 | | | | 94,662 | | | | 2,573 | | | | 71,065 | |
Class L | | | — | | | | 91,686 | | | | — | | | | — | |
Class R2 | | | 100 | | | | 13,051 | | | | 753 | | | | 289 | |
Class R3 | | | — | | | | 8,808 | | | | — | | | | — | |
Class R4 | | | — | | | | 3,046 | | | | — | | | | — | |
Class R5 | | | 146 | | | | 52,703 | | | | 2,190 | | | | 1,513 | |
Class R6 | | | 1,436 | | | | 646,054 | | | | 11,767 | | | | 20,364 | |
Net Asset Value (a): | | | | | | | | | | | | | | | | |
Class A — Redemption price per share | | $ | 30.23 | | | $ | 21.98 | | | $ | 67.92 | | | $ | 23.29 | |
Class C — Offering price per share (b) | | | 29.50 | | | | 20.94 | | | | 65.62 | | | | 20.05 | |
Class I — Offering and redemption price per share | | | 30.60 | | | | 22.07 | | | | 69.80 | | | | 24.11 | |
Class L — Offering and redemption price per share | | | — | | | | 22.12 | | | | — | | | | — | |
Class R2 — Offering and redemption price per share | | | 29.80 | | | | 21.69 | | | | 65.31 | | | | 21.48 | |
Class R3 — Offering and redemption price per share | | | — | | | | 21.87 | | | | — | | | | — | |
Class R4 — Offering and redemption price per share | | | — | | | | 22.03 | | | | — | | | | — | |
Class R5 — Offering and redemption price per share | | | 30.67 | | | | 22.13 | | | | 68.34 | | | | 24.40 | |
Class R6 — Offering and redemption price per share | | | 30.67 | | | | 22.19 | | | | 68.30 | | | | 24.38 | |
Class A maximum sales charge | | | 5.25 | % | | | 5.25 | % | | | 5.25 | % | | | 5.25 | % |
Class A maximum public offering price per share
[net asset value per share/(100% — maximum sales charge)] | | $ | 31.91 | | | $ | 23.20 | | | $ | 71.68 | | | $ | 24.58 | |
| | | | | | | | | | | | | | | | |
Cost of investments in non-affiliates | | $ | 188,731 | | | $ | 12,546,854 | | | $ | 713,220 | | | $ | 1,601,517 | |
Cost of investments in affiliates | | | 5,269 | | | | 305,526 | | | | 17,033 | | | | 18,556 | |
Investment securities on loan, at value (See Note 2.C.) | | | — | | | | 64,031 | | | | 3,562 | | | | — | |
Cost of investment of cash collateral (See Note 2.C.) | | | — | | | | 65,204 | | | | 3,659 | | | | — | |
Proceeds from securities sold short | | | — | | | | — | | | | — | | | | 553,216 | |
| (a) | Per share amounts may not recalculate due to rounding of net assets and/or shares outstanding. |
| (b) | Redemption price for Class C Shares varies based upon length of time the shares are held. |
SEE NOTES TO FINANCIAL STATEMENTS.
| | | | | | | | | | |
| | | | | |
| DECEMBER 31, 2021 | | J.P. MORGAN LARGE CAP FUNDS | | | | | | | | 87 |
STATEMENTS OF ASSETS AND LIABILITIES
AS OF DECEMBER 31, 2021 (Unaudited) (continued)
(Amounts in thousands, except per share amounts)
| | | | | | | | | | | | |
| | | |
| | | JPMorgan
U.S. Research
Enhanced
Equity Fund | | | JPMorgan
U.S. Sustainable
Leaders Fund | | |
JPMorgan
U.S. Value
Fund | |
ASSETS: | |
Investments in non-affiliates, at value | | $ | 5,907,989 | | | $ | 194,471 | | | $ | 2,105,485 | |
Investments in affiliates, at value | | | 73,494 | | | | 2,574 | | | | 66,004 | |
Investment of cash collateral received from securities loaned, at value (See Note 2.C.) | | | — | | | | 544 | | | | — | |
Cash | | | 2 | | | | — | (a) | | | 4 | |
Deposits at broker for futures contracts | | | 3,474 | | | | 276 | | | | — | |
Receivables: | | | | | | | | | | | | |
Investment securities sold | | | 7,914 | | | | 1,465 | | | | — | |
Fund shares sold | | | 3,153 | | | | 404 | | | | 8,327 | |
Dividends from non-affiliates | | | 4,489 | | | | 128 | | | | 1,724 | |
Dividends from affiliates | | | — | (a) | | | — | (a) | | | — | (a) |
Securities lending income (See Note 2.C.) | | | — | | | | — | (a) | | | — | |
Other assets | | | — | | | | — | | | | 113 | |
| | | | | | | | | | | | |
Total Assets | | | 6,000,515 | | | | 199,862 | | | | 2,181,657 | |
| | | | | | | | | | | | |
|
LIABILITIES: | |
Payables: | | | | | | | | | | | | |
Investment securities purchased | | | 7,949 | | | | 977 | | | | 22,860 | |
Collateral received on securities loaned (See Note 2.C.) | | | — | | | | 544 | | | | — | |
Fund shares redeemed | | | 9,046 | | | | 119 | | | | 720 | |
Variation margin on futures contracts | | | 212 | | | | 6 | | | | — | |
Accrued liabilities: | | | | | | | | | | | | |
Investment advisory fees | | | 993 | | | | 32 | | | | 618 | |
Administration fees | | | 208 | | | | 2 | | | | 85 | |
Distribution fees | | | 36 | | | | 10 | | | | 159 | |
Service fees | | | 77 | | | | 6 | | | | 346 | |
Custodian and accounting fees | | | 75 | | | | 13 | | | | 21 | |
Trustees’ and Chief Compliance Officer’s fees | | | — | | | | 2 | | | | 1 | |
Other | | | 107 | | | | 49 | | | | 67 | |
| | | | | | | | | | | | |
Total Liabilities | | | 18,703 | | | | 1,760 | | | | 24,877 | |
| | | | | | | | | | | | |
Net Assets | | $ | 5,981,812 | | | $ | 198,102 | | | $ | 2,156,780 | |
| | | | | | | | | | | | |
| (a) | Amount rounds to less than one thousand. |
SEE NOTES TO FINANCIAL STATEMENTS.
| | | | | | | | | | |
| | | | | |
| 88 | | | | | | | | J.P. MORGAN LARGE CAP FUNDS | | DECEMBER 31, 2021 |
| | | | | | | | | | | | |
| | | |
| | | JPMorgan
U.S. Research
Enhanced
Equity Fund | | | JPMorgan
U.S. Sustainable
Leaders Fund | | |
JPMorgan
U.S. Value
Fund | |
NET ASSETS: | |
Paid-in-Capital | | $ | 3,073,239 | | | $ | 157,085 | | | $ | 1,536,875 | |
Total distributable earnings (loss) | | | 2,908,573 | | | | 41,017 | | | | 619,905 | |
| | | | | | | | | | | | |
Total Net Assets | | $ | 5,981,812 | | | $ | 198,102 | | | $ | 2,156,780 | |
| | | | | | | | | | | | |
Net Assets: | |
Class A | | $ | 174,486 | | | $ | 37,610 | | | $ | 616,087 | |
Class C | | | — | | | | 5,257 | | | | 51,032 | |
Class I | | | 777,828 | | | | 118,558 | | | | 1,109,734 | |
Class R2 | | | — | | | | — | | | | 3,434 | |
Class R3 | | | — | | | | — | | | | 9,769 | |
Class R4 | | | — | | | | — | | | | 297 | |
Class R5 | | | — | | | | — | | | | 3,660 | |
Class R6 | | | 5,029,498 | | | | 36,677 | | | | 362,767 | |
| | | | | | | | | | | | |
Total | | $ | 5,981,812 | | | $ | 198,102 | | | $ | 2,156,780 | |
| | | | | | | | | | | | |
Outstanding units of beneficial interest (shares) | |
($0.0001 par value; unlimited number of shares authorized): | | | | | | | | | | | | |
Class A | | | 4,821 | | | | 589 | | | | 9,145 | |
Class C | | | — | | | | 84 | | | | 857 | |
Class I | | | 21,210 | | | | 1,843 | | | | 15,500 | |
Class R2 | | | — | | | | — | | | | 51 | |
Class R3 | | | — | | | | — | | | | 137 | |
Class R4 | | | — | | | | — | | | | 4 | |
Class R5 | | | — | | | | — | | | | 51 | |
Class R6 | | | 137,369 | | | | 570 | | | | 5,026 | |
Net Asset Value (a): | | | | | | | | | | | | |
Class A — Redemption price per share | | $ | 36.20 | | | $ | 63.82 | | | $ | 67.37 | |
Class C — Offering price per share (b) | | | — | | | | 62.40 | | | | 59.55 | |
Class I — Offering and redemption price per share | | | 36.67 | | | | 64.35 | | | | 71.60 | |
Class R2 — Offering and redemption price per share | | | — | | | | — | | | | 67.46 | |
Class R3 — Offering and redemption price per share | | | — | | | | — | | | | 71.38 | |
Class R4 — Offering and redemption price per share | | | — | | | | — | | | | 71.62 | |
Class R5 — Offering and redemption price per share | | | — | | | | — | | | | 72.15 | |
Class R6 — Offering and redemption price per share | | | 36.61 | | | | 64.33 | | | | 72.18 | |
Class A maximum sales charge | | | 5.25 | % | | | 5.25 | % | | | 5.25 | % |
Class A maximum public offering price per share
[net asset value per share/(100% — maximum sales charge)] | | $ | 38.21 | | | $ | 67.36 | | | $ | 71.10 | |
| | | | | | | | | | | | |
Cost of investments in non-affiliates | | $ | 3,007,759 | | | $ | 153,421 | | | $ | 1,479,194 | |
Cost of investments in affiliates | | | 73,488 | | | | 2,574 | | | | 66,004 | |
Investment securities on loan, at value (See Note 2.C.) | | | — | | | | 532 | | | | — | |
Cost of investment of cash collateral (See Note 2.C.) | | | — | | | | 544 | | | | — | |
| (a) | Per share amounts may not recalculate due to rounding of net assets and/or shares outstanding. |
| (b) | Redemption price for Class C Shares varies based upon length of time the shares are held. |
SEE NOTES TO FINANCIAL STATEMENTS.
| | | | | | | | | | |
| | | | | |
| DECEMBER 31, 2021 | | J.P. MORGAN LARGE CAP FUNDS | | | | | | | | 89 |
STATEMENTS OF OPERATIONS
FOR THE SIX MONTHS ENDED DECEMBER 31, 2021 (Unaudited)
(Amounts in thousands)
| | | | | | | | | | | | | | | | |
| | | | |
| | | JPMorgan
Equity
Focus Fund | | | JPMorgan
Equity
Income Fund | | | JPMorgan
Equity Premium
Income Fund | | |
JPMorgan
Hedged
Equity Fund | |
INVESTMENT INCOME: | |
Interest income from non-affiliates | | $ | — | | | $ | — | (a) | | $ | 49,743 | | | $ | — | |
Interest income from affiliates | | | — | | | | — | | | | 1 | | | | — | |
Dividend income from non-affiliates | | | 626 | | | | 561,939 | | | | 10,692 | | | | 125,012 | |
Dividend income from affiliates | | | 1 | | | | 398 | | | | 12 | | | | 11 | |
Income from securities lending (net) (See Note 2.C.) | | | — | | | | — | (a) | | | — | | | | — | |
| | | | | | | | | | | | | | | | |
Total investment income | | | 627 | | | | 562,337 | | | | 60,448 | | | | 125,023 | |
| | | | | | | | | | | | | | | | |
|
EXPENSES: | |
Investment advisory fees | | | 344 | | | | 98,054 | | | | 1,864 | | | | 23,874 | |
Administration fees | | | 52 | | | | 8,201 | | | | 559 | | | | 6,053 | |
Distribution fees: | | | | | | | | | | | | | | | | |
Class A | | | 13 | | | | 6,159 | | | | 420 | | | | 2,320 | |
Class C | | | 17 | | | | 5,614 | | | | 1,147 | | | | 1,922 | |
Class R2 | | | — | | | | 194 | | | | — | | | | — | |
Class R3 | | | — | | | | 358 | | | | — | | | | — | |
Service fees: | | | | | | | | | | | | | | | | |
Class A | | | 13 | | | | 6,159 | | | | 420 | | | | 2,320 | |
Class C | | | 6 | | | | 1,871 | | | | 382 | | | | 641 | |
Class I | | | 109 | | | | 23,726 | | | | 997 | | | | 18,695 | |
Class R2 | | | — | | | | 97 | | | | — | | | | — | |
Class R3 | | | — | | | | 358 | | | | — | | | | — | |
Class R4 | | | — | | | | 303 | | | | — | | | | — | |
Class R5 | | | — | | | | 827 | | | | — | (a) | | | 3 | |
Custodian and accounting fees | | | 12 | | | | 699 | | | | 30 | | | | 290 | |
Interest expense to affiliates | | | — | | | | — | | | | — | (a) | | | — | (a) |
Professional fees | | | 26 | | | | 171 | | | | 54 | | | | 96 | |
Trustees’ and Chief Compliance Officer’s fees | | | 13 | | | | 69 | | | | 18 | | | | 34 | |
Printing and mailing costs | | | 3 | | | | 915 | | | | 13 | | | | 426 | |
Registration and filing fees | | | 26 | | | | 752 | | | | 151 | | | | 477 | |
Transfer agency fees (See Note 2.M.) | | | 2 | | | | 452 | | | | 28 | | | | 125 | |
Other | | | 5 | | | | 577 | | | | 14 | | | | 268 | |
| | | | | | | | | | | | | | | | |
Total expenses | | | 641 | | | | 155,556 | | | | 6,097 | | | | 57,544 | |
| | | | | | | | | | | | | | | | |
Less fees waived | | | (71 | ) | | | (528 | ) | | | (136 | ) | | | (96 | ) |
Less expense reimbursements | | | — | | | | — | | | | — | (a) | | | — | |
| | | | | | | | | | | | | | | | |
Net expenses | | | 570 | | | | 155,028 | | | | 5,961 | | | | 57,448 | |
| | | | | | | | | | | | | | | | |
Net investment income (loss) | | | 57 | | | | 407,309 | | | | 54,487 | | | | 67,575 | |
| | | | | | | | | | | | | | | | |
| | | | |
REALIZED/UNREALIZED GAINS (LOSSES): | | | | | | | | | | | | | | | | |
Net realized gain (loss) on transactions from: | |
Investments in non-affiliates | | | 2,037 | | | | 904,553 | | | | (46,683 | ) | | | 709,979 | |
Investments in affiliates | | | — | (a) | | | 61 | | | | (2 | ) | | | — | |
Options purchased | | | — | | | | — | | | | — | | | | (801,315 | ) |
Futures contracts | | | — | | | | — | | | | 884 | | | | 45,570 | |
Foreign currency transactions | | | — | | | | — | | | | — | | | | — | (a) |
Options written | | | — | | | | — | | | | — | | | | (618,134 | ) |
| | | | | | | | | | | | | | | | |
Net realized gain (loss) | | | 2,037 | | | | 904,614 | | | | (45,801 | ) | | | (663,900 | ) |
| | | | | | | | | | | | | | | | |
Change in net unrealized appreciation/depreciation on: | |
Investments in non-affiliates | | | 9,486 | | | | 2,323,362 | | | | 121,875 | | | | 1,385,488 | |
Investments in affiliates | | | — | (a) | | | (183 | ) | | | — | (a) | | | — | |
Options purchased | | | — | | | | — | | | | — | | | | 1,910 | |
Futures contracts | | | — | | | | — | | | | 12 | | | | 497 | |
Options written | | | — | | | | — | | | | — | | | | (9,640 | ) |
| | | | | | | | | | | | | | | | |
Change in net unrealized appreciation/depreciation | | | 9,486 | | | | 2,323,179 | | | | 121,887 | | | | 1,378,255 | |
| | | | | | | | | | | | | | | | |
Net realized/unrealized gains (losses) | | | 11,523 | | | | 3,227,793 | | | | 76,086 | | | | 714,355 | |
| | | | | | | | | | | | | | | | |
Change in net assets resulting from operations | | $ | 11,580 | | | $ | 3,635,102 | | | $ | 130,573 | | | $ | 781,930 | |
| | | | | | | | | | | | | | | | |
| (a) | Amount rounds to less than one thousand. |
SEE NOTES TO FINANCIAL STATEMENTS.
| | | | | | | | | | |
| | | | | |
| 90 | | | | | | | | J.P. MORGAN LARGE CAP FUNDS | | DECEMBER 31, 2021 |
| | | | | | | | | | | | | | | | |
| | | | |
| | | JPMorgan
Hedged
Equity 2
Fund | | | JPMorgan
Hedged
Equity 3
Fund | | | JPMorgan
Large Cap
Growth Fund | | |
JPMorgan
Large Cap
Value Fund | |
INVESTMENT INCOME: | |
Interest income from non-affiliates | | $ | — | | | $ | — | (a) | | $ | 8 | | | $ | — | |
Interest income from affiliates | | | — | | | | 1 | | | | — | | | | — | |
Dividend income from non-affiliates | | | 16,449 | | | | 9,023 | | | | 109,228 | | | | 30,481 | |
Dividend income from affiliates | | | 10 | | | | 6 | | | | 418 | | | | 16 | |
Income from securities lending (net) (See Note 2.C.) | | | — | | | | — | | | | 111 | | | | 19 | |
| | | | | | | | | | | | | | | | |
Total investment income | | | 16,459 | | | | 9,030 | | | | 109,765 | | | | 30,516 | |
| | | | | | | | | | | | | | | | |
|
EXPENSES: | |
Investment advisory fees | | | 3,145 | | | | 1,725 | | | | 90,461 | | | | 7,035 | |
Administration fees | | | 943 | | | | 518 | | | | 7,829 | | | | 1,319 | |
Distribution fees: | | | | | | | | | | | | | | | | |
Class A | | | 165 | | | | 66 | | | | 6,568 | | | | 264 | |
Class C | | | 451 | | | | 169 | | | | 3,089 | | | | 233 | |
Class R2 | | | — | | | | — | | | | 348 | | | | 27 | |
Class R3 | | | — | | | | — | | | | 360 | | | | 1 | |
Service fees: | | | | | | | | | | | | | | | | |
Class A | | | 165 | | | | 66 | | | | 6,568 | | | | 264 | |
Class C | | | 150 | | | | 56 | | | | 1,030 | | | | 78 | |
Class I | | | 2,461 | | | | 1,370 | | | | 14,565 | | | | 1,628 | |
Class R2 | | | — | | | | — | | | | 174 | | | | 14 | |
Class R3 | | | — | | | | — | | | | 360 | | | | 1 | |
Class R4 | | | — | | | | — | | | | 283 | | | | — | (a) |
Class R5 | | | — | (a) | | | — | (a) | | | 484 | | | | 12 | |
Custodian and accounting fees | | | 51 | | | | 28 | | | | 556 | | | | 50 | |
Interest expense to affiliates | | | — | | | | — | | | | — | | | | 1 | |
Professional fees | | | 47 | | | | 43 | | | | 147 | | | | 32 | |
Trustees’ and Chief Compliance Officer’s fees | | | 15 | | | | 14 | | | | 58 | | | | 16 | |
Printing and mailing costs | | | 20 | | | | 10 | | | | 532 | | | | 31 | |
Registration and filing fees | | | 220 | | | | 135 | | | | 771 | | | | 153 | |
Transfer agency fees (See Note 2.M.) | | | 13 | | | | 6 | | | | 379 | | | | 153 | |
Offering costs (See Note 2.K.) | | | 52 | | | | 52 | | | | — | | | | — | |
Other | | | 14 | | | | 6 | | | | 389 | | | | 37 | |
| | | | | | | | | | | | | | | | |
Total expenses | | | 7,912 | | | | 4,264 | | | | 134,951 | | | | 11,349 | |
| | | | | | | | | | | | | | | | |
Less fees waived | | | (69 | ) | | | (74 | ) | | | (13,073 | ) | | | (1,101 | ) |
Less expense reimbursements | | | (54 | ) | | | (52 | ) | | | — | | | | (6 | ) |
| | | | | | | | | | | | | | | | |
Net expenses | | | 7,789 | | | | 4,138 | | | | 121,878 | | | | 10,242 | |
| | | | | | | | | | | | | | | | |
Net investment income (loss) | | | 8,670 | | | | 4,892 | | | | (12,113 | ) | | | 20,274 | |
| | | | | | | | | | | | | | | | |
| | | | |
REALIZED/UNREALIZED GAINS (LOSSES): | | | | | | | | | | | | | | | | |
Net realized gain (loss) on transactions from: | |
Investments in non-affiliates | | | (1,479 | ) | | | (414 | ) | | | 1,202,422 | | | | 51,892 | |
Investments in affiliates | | | — | | | | — | | | | 133 | | | | (3 | ) |
Options purchased
| | | (63,734 | ) | | | (44,158 | ) | | | — | | | | — | |
Futures contracts | | | 6,114 | | | | 3,077 | | | | — | | | | — | �� |
Foreign currency transactions | | | — | (a) | | | — | (a) | | | — | | | | — | |
Options written | | | (5,652 | ) | | | 3,903 | | | | — | | | | — | |
| | | | | | | | | | | | | | | | |
Net realized gain (loss) | | | (64,751 | ) | | | (37,592 | ) | | | 1,202,555 | | | | 51,889 | |
| | | | | | | | | | | | | | | | |
Change in net unrealized appreciation/depreciation on: | |
Investments in non-affiliates | | | 286,096 | | | | 173,749 | | | | 2,098,934 | | | | (31,379 | ) |
Investments in affiliates | | | — | | | | — | | | | (172 | ) | | | — | (a) |
Options purchased | | | (34,954 | ) | | | (34,695 | ) | | | — | | | | — | |
Futures contracts | | | 653 | | | | 401 | | | | — | | | | — | |
Foreign currency translations | | | — | (a) | | | — | (a) | | | — | | | | — | |
Options written | | | (8,453 | ) | | | (1,581 | ) | | | — | | | | — | |
| | | | | | | | | | | | | | | | |
Change in net unrealized appreciation/depreciation | | | 243,342 | | | | 137,874 | | | | 2,098,762 | | | | (31,379 | ) |
| | | | | | | | | | | | | | | | |
Net realized/unrealized gains (losses) | | | 178,591 | | | | 100,282 | | | | 3,301,317 | | | | 20,510 | |
| | | | | | | | | | | | | | | | |
Change in net assets resulting from operations | | $ | 187,261 | | | $ | 105,174 | | | $ | 3,289,204 | | | $ | 40,784 | |
| | | | | | | | | | | | | | | | |
| (a) | Amount rounds to less than one thousand. |
SEE NOTES TO FINANCIAL STATEMENTS.
| | | | | | | | | | |
| | | | | |
| DECEMBER 31, 2021 | | J.P. MORGAN LARGE CAP FUNDS | | | | | | | | 91 |
STATEMENTS OF OPERATIONS
FOR THE SIX MONTHS ENDED DECEMBER 31, 2021 (Unaudited) (continued)
(Amounts in thousands)
| | | | | | | | | | | | | | | | |
| | | | |
| | | JPMorgan U.S. Applied Data Science Value Fund (formerly known as JPMorgan
Intrepid
Value Fund) | | | JPMorgan
U.S. Equity
Fund | | | JPMorgan
U.S. GARP
Equity Fund | | | JPMorgan
U.S. Large
Cap Core
Plus Fund | |
INVESTMENT INCOME: | |
Interest income from non-affiliates | | $ | — | | | $ | — | | | $ | — | | | $ | — | (a) |
Dividend income from non-affiliates | | | 2,450 | | | | 124,933 | | | | 5,394 | | | | 19,880 | |
Dividend income from affiliates | | | 2 | | | | 82 | | | | 9 | | | | 10 | |
Income from securities lending (net) (See Note 2.C.) | | | — | (a) | | | 21 | | | | 27 | | | | — | |
| | | | | | | | | | | | | | | | |
Total investment income | | | 2,452 | | | | 125,036 | | | | 5,430 | | | | 19,890 | |
| | | | | | | | | | | | | | | | |
|
EXPENSES: | |
Investment advisory fees | | | 374 | | | | 42,690 | | | | 2,013 | | | | 8,901 | |
Administration fees | | | 93 | | | | 6,539 | | | | 503 | | | | 1,027 | |
Distribution fees: | | | | | | | | | | | | | | | | |
Class A | | | 76 | | | | 2,242 | | | | 157 | | | | 436 | |
Class C | | | 41 | | | | 1,514 | | | | 117 | | | | 143 | |
Class R2 | | | 7 | | | | 699 | | | | 119 | | | | 15 | |
Class R3 | | | — | | | | 232 | | | | — | | | | — | |
Service fees: | | | | | | | | | | | | | | | | |
Class A | | | 76 | | | | 2,242 | | | | 157 | | | | 436 | |
Class C | | | 14 | | | | 505 | | | | 39 | | | | 48 | |
Class I | | | 161 | | | | 2,422 | | | | 215 | | | | 2,185 | |
Class L | | | — | | | | 997 | | | | — | | | | — | |
Class R2 | | | 4 | | | | 349 | | | | 59 | | | | 8 | |
Class R3 | | | — | | | | 232 | | | | — | | | | — | |
Class R4 | | | — | | | | 69 | | | | — | | | | — | |
Class R5 | | | 2 | | | | 567 | | | | 82 | | | | 18 | |
Custodian and accounting fees | | | 13 | | | | 316 | | | | 23 | | | | 47 | |
Interest expense to affiliates | | | — | | | | — | | | | — | | | | — | (a) |
Professional fees | | | 36 | | | | 98 | | | | 31 | | | | 37 | |
Trustees’ and Chief Compliance Officer’s fees | | | 13 | | | | 37 | | | | 14 | | | | 16 | |
Printing and mailing costs | | | 8 | | | | 210 | | | | 22 | | | | 55 | |
Registration and filing fees | | | 36 | | | | 258 | | | | 46 | | | | 37 | |
Transfer agency fees (See Note 2.M.) | | | 7 | | | | 166 | | | | 25 | | | | 35 | |
Dividend expense to non-affiliates on securities sold short | | | — | | | | — | | | | — | | | | 8,613 | |
Interest expense to non-affiliates on securities sold short | | | — | | | | — | | | | — | | | | 1,823 | |
Other | | | 10 | | | | 201 | | | | 19 | | | | 46 | |
| | | | | | | | | | | | | | | | |
Total expenses | | | 971 | | | | 62,585 | | | | 3,641 | | | | 23,926 | |
| | | | | | | | | | | | | | | | |
Less fees waived | | | (269 | ) | | | (3,487 | ) | | | (420 | ) | | | (1,667 | ) |
Less expense reimbursements | | | (1 | ) | | | (58 | ) | | | — | | | | (2 | ) |
| | | | | | | | | | | | | | | | |
Net expenses | | | 701 | | | | 59,040 | | | | 3,221 | | | | 22,257 | |
| | | | | | | | | | | | | | | | |
Net investment income (loss) | | | 1,751 | | | | 65,996 | | | | 2,209 | | | | (2,367 | ) |
| | | | | | | | | | | | | | | | |
| | | | |
REALIZED/UNREALIZED GAINS (LOSSES): | | | | | | | | | | | | | | | | |
Net realized gain (loss) on transactions from: | |
Investments in non-affiliates | | | 38,416 | | | | 1,178,407 | | | | 108,626 | | | | 365,988 | |
Investments in affiliates | | | — | (a) | | | (26 | ) | | | (2 | ) | | | (1 | ) |
Futures contracts | | | 590 | | | | 23,662 | | | | 3,177 | | | | (382 | ) |
Securities sold short | | | — | | | | — | | | | — | | | | (35,260 | ) |
Foreign currency transactions | | | — | | | | — | | | | — | (a) | | | — | (a) |
| | | | | | | | | | | | | | | | |
Net realized gain (loss) | | | 39,006 | | | | 1,202,043 | | | | 111,801 | | | | 330,345 | |
| | | | | | | | | | | | | | | | |
Change in net unrealized appreciation/depreciation on: | |
Investments in non-affiliates | | | (20,409 | ) | | | 1,337,715 | | | | 49,779 | | | | (26,906 | ) |
Investments in affiliates | | | — | (a) | | | 3 | | | | (1 | ) | | | — | (a) |
Futures contracts | | | (7 | ) | | | 3,527 | | | | 1 | | | | — | |
Securities sold short | | | — | | | | — | | | | — | | | | 22,487 | |
| | | | | | | | | | | | | | | | |
Change in net unrealized appreciation/depreciation | | | (20,416 | ) | | | 1,341,245 | | | | 49,779 | | | | (4,419 | ) |
| | | | | | | | | | | | | | | | |
Net realized/unrealized gains (losses) | | | 18,590 | | | | 2,543,288 | | | | 161,580 | | | | 325,926 | |
| | | | | | | | | | | | | | | | |
Change in net assets resulting from operations | | $ | 20,341 | | | $ | 2,609,284 | | | $ | 163,789 | | | $ | 323,559 | |
| | | | | | | | | | | | | | | | |
| (a) | Amount rounds to less than one thousand. |
SEE NOTES TO FINANCIAL STATEMENTS.
| | | | | | | | | | |
| | | | | |
| 92 | | | | | | | | J.P. MORGAN LARGE CAP FUNDS | | DECEMBER 31, 2021 |
| | | | | | | | | | | | |
| | | |
| | | JPMorgan
U.S. Research
Enhanced
Equity Fund | | | JPMorgan
U.S. Sustainable
Leaders Fund | | |
JPMorgan
U.S. Value
Fund | |
INVESTMENT INCOME: | |
Dividend income from non-affiliates | | $ | 35,495 | | | $ | 907 | | | $ | 17,583 | |
Dividend income from affiliates | | | 20 | | | | 1 | | | | 17 | |
Income from securities lending (net) (See Note 2.C.) | | | — | | | | — | (a) | | | — | |
| | | | | | | | | | | | |
Total investment income | | | 35,515 | | | | 908 | | �� | | 17,600 | |
| | | | | | | | | | | | |
|
EXPENSES: | |
Investment advisory fees | | | 6,910 | | | | 225 | | | | 3,616 | |
Administration fees | | | 2,073 | | | | 56 | | | | 678 | |
Distribution fees: | | | | | | | | | | | | |
Class A | | | 222 | | | | 37 | | | | 694 | |
Class C | | | — | | | | 16 | | | | 161 | |
Class R2 | | | — | | | | — | | | | 6 | |
Class R3 | | | — | | | | — | | | | 6 | |
Service fees: | | | | | | | | | | | | |
Class A | | | 222 | | | | 37 | | | | 694 | |
Class C | | | — | | | | 5 | | | | 54 | |
Class I | | | 912 | | | | 106 | | | | 1,110 | |
Class R2 | | | — | | | | — | | | | 3 | |
Class R3 | | | — | | | | — | | | | 6 | |
Class R4 | | | — | | | | — | | | | — | (a) |
Class R5 | | | — | | | | — | | | | — | (a) |
Custodian and accounting fees | | | 94 | | | | 16 | | | | 26 | |
Professional fees | | | 47 | | | | 31 | | | | 32 | |
Trustees’ and Chief Compliance Officer’s fees | | | 19 | | | | 14 | | | | 15 | |
Printing and mailing costs | | | 35 | | | | 11 | | | | 46 | |
Registration and filing fees | | | 47 | | | | 49 | | | | 108 | |
Transfer agency fees (See Note 2.M.) | | | 33 | | | | 3 | | | | 79 | |
Other | | | 51 | | | | 6 | | | | 28 | |
| | | | | | | | | | | | |
Total expenses | | | 10,665 | | | | 612 | | | | 7,362 | |
| | | | | | | | | | | | |
Less fees waived | | | (3,087 | ) | | | (276 | ) | | | (656 | ) |
Less expense reimbursements | | | — | | | | — | (a) | | | (1 | ) |
| | | | | | | | | | | | |
Net expenses | | | 7,578 | | | | 336 | | | | 6,705 | |
| | | | | | | | | | | | |
Net investment income (loss) | | | 27,937 | | | | 572 | | | | 10,895 | |
| | | | | | | | | | | | |
| | | |
REALIZED/UNREALIZED GAINS (LOSSES): | | | | | | | | | | | | |
Net realized gain (loss) on transactions from: | |
Investments in non-affiliates | | | 187,880 | | | | 2,239 | | | | (2,088 | ) |
Investments in affiliates | | | (2 | ) | | | — | (a) | | | (5 | ) |
Futures contracts | | | 4,743 | | | | 283 | | | | — | |
Foreign currency transactions | | | — | (a) | | | — | (a) | | | — | |
| | | | | | | | | | | | |
Net realized gain (loss) | | | 192,621 | | | | 2,522 | | | | (2,093 | ) |
| | | | | | | | | | | | |
Change in net unrealized appreciation/depreciation on: | |
Investments in non-affiliates | | | 419,914 | | | | 14,154 | | | | 107,915 | |
Investments in affiliates | | | — | (a) | | | (1 | ) | | | — | (a) |
Futures contracts | | | 140 | | | | (29 | ) | | | — | |
| | | | | | | | | | | | |
Change in net unrealized appreciation/depreciation | | | 420,054 | | | | 14,124 | | | | 107,915 | |
| | | | | | | | | | | | |
Net realized/unrealized gains (losses) | | | 612,675 | | | | 16,646 | | | | 105,822 | |
| | | | | | | | | | | | |
Change in net assets resulting from operations | | $ | 640,612 | | | $ | 17,218 | | | $ | 116,717 | |
| | | | | | | | | | | | |
| (a) | Amount rounds to less than one thousand. |
SEE NOTES TO FINANCIAL STATEMENTS.
| | | | | | | | | | |
| | | | | |
| DECEMBER 31, 2021 | | J.P. MORGAN LARGE CAP FUNDS | | | | | | | | 93 |
STATEMENTS OF CHANGES IN NET ASSETS
FOR THE PERIODS INDICATED
(Amounts in thousands)
| | | | | | | | | | | | | | | | |
| | | JPMorgan Equity Focus Fund | | |
JPMorgan Equity Income Fund | |
| | | Six Months Ended
December 31, 2021
(Unaudited) | | | Year Ended
June 30, 2021 | | | Six Months Ended
December 31, 2021
(Unaudited) | | | Year Ended
June 30, 2021 | |
CHANGE IN NET ASSETS RESULTING FROM OPERATIONS: | |
Net investment income (loss) | | $ | 57 | | | $ | 348 | | | $ | 407,309 | | | $ | 665,372 | |
Net realized gain (loss) | | | 2,037 | | | | 17,317 | | | | 904,614 | | | | 933,009 | |
Change in net unrealized appreciation/depreciation | | | 9,486 | | | | 22,946 | | | | 2,323,179 | | | | 10,722,892 | |
| | | | | | | | | | | | | | | | |
Change in net assets resulting from operations | | | 11,580 | | | | 40,611 | | | | 3,635,102 | | | | 12,321,273 | |
| | | | | | | | | | | | | | | | |
| | | | |
DISTRIBUTIONS TO SHAREHOLDERS: | | | | | | | | | | | | | | | | |
Class A | | | (1,192 | ) | | | (862 | ) | | | (127,700 | ) | | | (59,104 | ) |
Class C | | | (513 | ) | | | (403 | ) | | | (35,105 | ) | | | (14,553 | ) |
Class I | | | (9,277 | ) | | | (7,180 | ) | | | (507,175 | ) | | | (245,584 | ) |
Class R2 | | | — | | | | — | | | | (1,883 | ) | | | (921 | ) |
Class R3 | | | — | | | | — | | | | (6,802 | ) | | | (3,447 | ) |
Class R4 | | | — | | | | — | | | | (6,222 | ) | | | (3,022 | ) |
Class R5 | | | — | | | | — | | | | (44,534 | ) | | | (26,918 | ) |
Class R6 | | | (3,810 | ) | | | (3,356 | ) | | | (608,517 | ) | | | (310,281 | ) |
| | | | | | | | | | | | | | | | |
Total distributions to shareholders | | | (14,792 | ) | | | (11,801 | ) | | | (1,337,938 | ) | | | (663,830 | ) |
| | | | | | | | | | | | | | | | |
|
CAPITAL TRANSACTIONS: | |
Change in net assets resulting from capital transactions | | | 15,656 | | | | 18,030 | | | | 2,408,205 | | | | 5,193,277 | |
| | | | | | | | | | | | | | | | |
|
NET ASSETS: | |
Change in net assets | | | 12,444 | | | | 46,840 | | | | 4,705,369 | | | | 16,850,720 | |
Beginning of period | | | 131,894 | | | | 85,054 | | | | 46,405,657 | | | | 29,554,937 | |
| | | | | | | | | | | | | | | | |
End of period | | $ | 144,338 | | | $ | 131,894 | | | $ | 51,111,026 | | | $ | 46,405,657 | |
| | | | | | | | | | | | | | | | |
SEE NOTES TO FINANCIAL STATEMENTS.
| | | | | | | | | | |
| | | | | |
| 94 | | | | | | | | J.P. MORGAN LARGE CAP FUNDS | | DECEMBER 31, 2021 |
| | | | | | | | | | | | | | | | |
| | | JPMorgan Equity Premium Income Fund | | |
JPMorgan Hedged Equity Fund | |
| | | Six Months Ended
December 31, 2021
(Unaudited) | | | Year Ended
June 30, 2021 | | | Six Months Ended
December 31, 2021
(Unaudited) | | | Year Ended
June 30, 2021 | |
CHANGE IN NET ASSETS RESULTING FROM OPERATIONS: | |
Net investment income (loss) | | $ | 54,487 | | | $ | 34,890 | | | $ | 67,575 | | | $ | 124,937 | |
Net realized gain (loss) | | | (45,801 | ) | | | (4,048 | ) | | | (663,900 | ) | | | (1,966,393 | ) |
Change in net unrealized appreciation/depreciation | | | 121,887 | | | | 61,774 | | | | 1,378,255 | | | | 4,396,300 | |
| | | | | | | | | | | | | | | | |
Change in net assets resulting from operations | | | 130,573 | | | | 92,616 | | | | 781,930 | | | | 2,554,844 | |
| | | | | | | | | | | | | | | | |
| | | | |
DISTRIBUTIONS TO SHAREHOLDERS: | | | | | | | | | | | | | | | | |
Class A | | | (12,290 | ) | | | (3,484 | ) | | | (5,369 | ) | | | (7,417 | ) |
Class C | | | (10,408 | ) | | | (2,300 | ) | | | (218 | ) | | | (1,096 | ) |
Class I | | | (29,879 | ) | | | (25,702 | ) | | | (61,180 | ) | | | (115,685 | ) |
Class R5 | | | (3 | ) | | | (5 | ) | | | (30 | ) | | | (47 | ) |
Class R6 | | | (1,947 | ) | | | (3,425 | ) | | | (9,554 | ) | | | (15,731 | ) |
| | | | | | | | | | | | | | | | |
Total distributions to shareholders | | | (54,527 | ) | | | (34,916 | ) | | | (76,351 | ) | | | (139,976 | ) |
| | | | | | | | | | | | | | | | |
|
CAPITAL TRANSACTIONS: | |
Change in net assets resulting from capital transactions | | | 1,165,095 | | | | 651,374 | | | | 555,306 | | | | 7,138,463 | |
| | | | | | | | | | | | | | | | |
|
NET ASSETS: | |
Change in net assets | | | 1,241,141 | | | | 709,074 | | | | 1,260,885 | | | | 9,553,331 | |
Beginning of period | | | 900,804 | | | | 191,730 | | | | 18,294,923 | | | | 8,741,592 | |
| | | | | | | | | | | | | | | | |
End of period | | $ | 2,141,945 | | | $ | 900,804 | | | $ | 19,555,808 | | | $ | 18,294,923 | |
| | | | | | | | | | | | | | | | |
SEE NOTES TO FINANCIAL STATEMENTS.
| | | | | | | | | | |
| | | | | |
| DECEMBER 31, 2021 | | J.P. MORGAN LARGE CAP FUNDS | | | | | | | | 95 |
STATEMENTS OF CHANGES IN NET ASSETS
FOR THE PERIODS INDICATED (continued)
(Amounts in thousands)
| | | | | | | | | | | | | | | | |
| | | JPMorgan Hedged Equity 2 Fund | | |
JPMorgan Hedged Equity 3 Fund | |
| | | Six Months Ended
December 31, 2021
(Unaudited) | | | Period Ended
June 30, 2021 (a) | | | Six Months Ended
December 31, 2021
(Unaudited) | | | Period Ended
June 30, 2021 (a) | |
CHANGE IN NET ASSETS RESULTING FROM OPERATIONS: | | | | | | | | | | | | | | | | |
Net investment income (loss) | | $ | 8,670 | | | $ | 1,623 | | | $ | 4,892 | | | $ | 641 | |
Net realized gain (loss) | | | (64,751 | ) | | | (9,789 | ) | | | (37,592 | ) | | | (7,884 | ) |
Change in net unrealized appreciation/depreciation | | | 243,342 | | | | 41,762 | | | | 137,874 | | | | 20,718 | |
| | | | | | | | | | | | | | | | |
Change in net assets resulting from operations | | | 187,261 | | | | 33,596 | | | | 105,174 | | | | 13,475 | |
| | | | | | | | | | | | | | | | |
| | | | |
DISTRIBUTIONS TO SHAREHOLDERS: | | | | | | | | | | | | | | | | |
Class A | | | (390 | ) | | | (25 | ) | | | (152 | ) | | | (15 | ) |
Class C | | | (39 | ) | | | (1 | ) | | | (24 | ) | | | (3 | ) |
Class I | | | (7,580 | ) | | | (785 | ) | | | (4,155 | ) | | | (417 | ) |
Class R5 | | | (2 | ) | | | (1 | ) | | | — | (b) | | | — | (b) |
Class R6 | | | (1,606 | ) | | | (305 | ) | | | (977 | ) | | | (2 | ) |
| | | | | | | | | | | | | | | | |
Total distributions to shareholders | | | (9,617 | ) | | | (1,117 | ) | | | (5,308 | ) | | | (437 | ) |
| | | | | | | | | | | | | | | | |
|
CAPITAL TRANSACTIONS: | |
Change in net assets resulting from capital transactions | | | 2,323,716 | | | | 1,359,389 | | | | 1,650,648 | | | | 553,528 | |
| | | | | | | | | | | | | | | | |
|
NET ASSETS: | |
Change in net assets | | | 2,501,360 | | | | 1,391,868 | | | | 1,750,514 | | | | 566,566 | |
Beginning of period | | | 1,391,868 | | | | — | | | | 566,566 | | | | — | |
| | | | | | | | | | | | | | | | |
End of period | | $ | 3,893,228 | | | $ | 1,391,868 | | | $ | 2,317,080 | | | $ | 566,566 | |
| | | | | | | | | | | | | | | | |
| (a) | Commencement of operations was February 26, 2021. |
| (b) | Amount rounds to less than one thousand. |
SEE NOTES TO FINANCIAL STATEMENTS.
| | | | | | | | | | |
| | | | | |
| 96 | | | | | | | | J.P. MORGAN LARGE CAP FUNDS | | DECEMBER 31, 2021 |
| | | | | | | | | | | | | | | | |
| | | JPMorgan Large Cap Growth Fund | | |
JPMorgan Large Cap Value Fund | |
| | | Six Months Ended
December 31, 2021
(Unaudited) | | | Year Ended
June 30, 2021 | | | Six Months Ended
December 31, 2021
(Unaudited) | | | Year Ended
June 30, 2021 | |
CHANGE IN NET ASSETS RESULTING FROM OPERATIONS: | | | | | | | | | | | | | | | | |
Net investment income (loss) | | $ | (12,113 | ) | | $ | (41,950 | ) | | $ | 20,274 | | | $ | 19,708 | |
Net realized gain (loss) | | | 1,202,555 | | | | 5,959,007 | | | | 51,889 | | | | 227,272 | |
Change in net unrealized appreciation/depreciation | | | 2,098,762 | | | | 4,245,115 | | | | (31,379 | ) | | | 529,855 | |
| | | | | | | | | | | | | | | | |
Change in net assets resulting from operations | | | 3,289,204 | | | | 10,162,172 | | | | 40,784 | | | | 776,835 | |
| | | | | | | | | | | | | | | | |
| | | | |
DISTRIBUTIONS TO SHAREHOLDERS: | | | | | | | | | | | | | | | | |
Class A | | | (708,158 | ) | | | (229,243 | ) | | | (15,263 | ) | | | (755 | ) |
Class C | | | (155,323 | ) | | | (49,805 | ) | | | (4,600 | ) | | | (69 | ) |
Class I | | | (1,544,842 | ) | | | (484,046 | ) | | | (97,744 | ) | | | (4,846 | ) |
Class R2 | | | (20,184 | ) | | | (7,546 | ) | | | (847 | ) | | | (42 | ) |
Class R3 | | | (39,213 | ) | | | (8,542 | ) | | | (9 | ) | | | — | (a) |
Class R4 | | | (31,893 | ) | | | (6,602 | ) | | | (13 | ) | | | — | (a) |
Class R5 | | | (117,247 | ) | | | (48,291 | ) | | | (1,834 | ) | | | (193 | ) |
Class R6 | | | (2,685,495 | ) | | | (774,029 | ) | | | (115,746 | ) | | | (12,971 | ) |
| | | | | | | | | | | | | | | | |
Total distributions to shareholders | | | (5,302,355 | ) | | | (1,608,104 | ) | | | (236,056 | ) | | | (18,876 | ) |
| | | | | | | | | | | | | | | | |
|
CAPITAL TRANSACTIONS: | |
Change in net assets resulting from capital transactions | | | 5,401,865 | | | | 5,597,146 | | | | (1,033,026 | ) | | | 2,323,514 | |
| | | | | | | | | | | | | | | | |
|
NET ASSETS: | |
Change in net assets | | | 3,388,714 | | | | 14,151,214 | | | | (1,228,298 | ) | | | 3,081,473 | |
Beginning of period | | | 37,416,380 | | | | 23,265,166 | | | | 4,341,470 | | | | 1,259,997 | |
| | | | | | | | | | | | | | | | |
End of period | | $ | 40,805,094 | | | $ | 37,416,380 | | | $ | 3,113,172 | | | $ | 4,341,470 | |
| | | | | | | | | | | | | | | | |
| (a) | Amount rounds to less than one thousand. |
SEE NOTES TO FINANCIAL STATEMENTS.
| | | | | | | | | | |
| | | | | |
| DECEMBER 31, 2021 | | J.P. MORGAN LARGE CAP FUNDS | | | | | | | | 97 |
STATEMENTS OF CHANGES IN NET ASSETS
FOR THE PERIODS INDICATED (continued)
(Amounts in thousands)
| | | | | | | | | | | | | | | | |
| | | JPMorgan U.S. Applied Data Science
Value Fund (formerly known as
JPMorgan Intrepid Value Fund) | | |
JPMorgan U.S. Equity Fund | |
| | | Six Months Ended
December 31, 2021
(Unaudited) | | | Year Ended
June 30, 2021 | | | Six Months Ended
December 31, 2021
(Unaudited) | | | Year Ended
June 30, 2021 | |
CHANGE IN NET ASSETS RESULTING FROM OPERATIONS: | | | | | | | | | | | | | | | | |
Net investment income (loss) | | $ | 1,751 | | | $ | 4,072 | | | $ | 65,996 | | | $ | 151,578 | |
Net realized gain (loss) | | | 39,006 | | | | 30,613 | | | | 1,202,043 | | | | 2,016,851 | |
Change in net unrealized appreciation/depreciation | | | (20,416 | ) | | | 61,725 | | | | 1,341,245 | | | | 4,026,205 | |
| | | | | | | | | | | | | | | | |
Change in net assets resulting from operations | | | 20,341 | | | | 96,410 | | | | 2,609,284 | | | | 6,194,634 | |
| | | | | | | | | | | | | | | | |
| | | | |
DISTRIBUTIONS TO SHAREHOLDERS: | | | | | | | | | | | | | | | | |
Class A | | | (14,209 | ) | | | (1,695 | ) | | | (177,827 | ) | | | (83,977 | ) |
Class C | | | (2,489 | ) | | | (287 | ) | | | (41,808 | ) | | | (17,652 | ) |
Class I | | | (29,786 | ) | | | (4,082 | ) | | | (195,163 | ) | | | (87,780 | ) |
Class L | | | — | | | | — | | | | (194,971 | ) | | | (164,969 | ) |
Class R2 | | | (674 | ) | | | (85 | ) | | | (26,715 | ) | | | (14,883 | ) |
Class R3 | | | — | | | | — | | | | (18,294 | ) | | | (8,862 | ) |
Class R4 | | | — | | | | — | | | | (6,300 | ) | | | (1,911 | ) |
Class R5 | | | (1,000 | ) | | | (141 | ) | | | (111,370 | ) | | | (60,489 | ) |
Class R6 | | | (10,019 | ) | | | (2,355 | ) | | | (1,346,202 | ) | | | (727,732 | ) |
| | | | | | | | | | | | | | | | |
Total distributions to shareholders | | | (58,177 | ) | | | (8,645 | ) | | | (2,118,650 | ) | | | (1,168,255 | ) |
| | | | | | | | | | | | | | | | |
|
CAPITAL TRANSACTIONS: | |
Change in net assets resulting from capital transactions | | | 8,009 | | | | (67,252 | ) | | | 2,180,280 | | | | (121,490 | ) |
| | | | | | | | | | | | | | | | |
|
NET ASSETS: | |
Change in net assets | | | (29,827 | ) | | | 20,513 | | | | 2,670,914 | | | | 4,904,889 | |
Beginning of period | | | 276,279 | | | | 255,766 | | | | 19,843,651 | | | | 14,938,762 | |
| | | | | | | | | | | | | | | | |
End of period | | $ | 246,452 | | | $ | 276,279 | | | $ | 22,514,565 | | | $ | 19,843,651 | |
| | | | | | | | | | | | | | | | |
SEE NOTES TO FINANCIAL STATEMENTS.
| | | | | | | | | | |
| | | | | |
| 98 | | | | | | | | J.P. MORGAN LARGE CAP FUNDS | | DECEMBER 31, 2021 |
| | | | | | | | | | | | | | | | |
| | | JPMorgan U.S. GARP Equity Fund | | |
JPMorgan U.S. Large Cap Core Plus Fund | |
| | | Six Months Ended
December 31, 2021
(Unaudited) | | | Year Ended
June 30, 2021 | | | Six Months Ended
December 31, 2021
(Unaudited) | | | Year Ended
June 30, 2021 | |
CHANGE IN NET ASSETS RESULTING FROM OPERATIONS: | | | | | | | | | | | | | | | | |
Net investment income (loss) | | $ | 2,209 | | | $ | 4,455 | | | $ | (2,367 | ) | | $ | (4,044 | ) |
Net realized gain (loss) | | | 111,801 | | | | 196,953 | | | | 330,345 | | | | 1,008,393 | |
Change in net unrealized appreciation/depreciation | | | 49,779 | | | | 220,654 | | | | (4,419 | ) | | | 54,134 | |
| | | | | | | | | | | | | | | | |
Change in net assets resulting from operations | | | 163,789 | | | | 422,062 | | | | 323,559 | | | | 1,058,483 | |
| | | | | | | | | | | | | | | | |
| | | | |
DISTRIBUTIONS TO SHAREHOLDERS: | | | | | | | | | | | | | | | | |
Class A | | | (23,478 | ) | | | (9,875 | ) | | | (81,344 | ) | | | (77,084 | ) |
Class C | | | (5,967 | ) | | | (2,514 | ) | | | (10,063 | ) | | | (9,299 | ) |
Class I | | | (31,685 | ) | | | (13,950 | ) | | | (393,194 | ) | | | (515,371 | ) |
Class R2 | | | (9,121 | ) | | | (4,145 | ) | | | (1,484 | ) | | | (1,244 | ) |
Class R5 | | | (26,874 | ) | | | (20,231 | ) | | | (7,963 | ) | | | (9,627 | ) |
Class R6 | | | (145,336 | ) | | | (67,081 | ) | | | (131,817 | ) | | | (147,178 | ) |
| | | | | | | | | | | | | | | | |
Total distributions to shareholders | | | (242,461 | ) | | | (117,796 | ) | | | (625,865 | ) | | | (759,803 | ) |
| | | | | | | | | | | | | | | | |
|
CAPITAL TRANSACTIONS: | |
Change in net assets resulting from capital transactions | | | 114,628 | | | | (111,060 | ) | | | 296,862 | | | | (697,740 | ) |
| | | | | | | | | | | | | | | | |
|
NET ASSETS: | |
Change in net assets | | | 35,956 | | | | 193,206 | | | | (5,444 | ) | | | (399,060 | ) |
Beginning of period | | | 1,307,588 | | | | 1,114,382 | | | | 2,651,246 | | | | 3,050,306 | |
| | | | | | | | | | | | | | | | |
End of period | | $ | 1,343,544 | | | $ | 1,307,588 | | | $ | 2,645,802 | | | $ | 2,651,246 | |
| | | | | | | | | | | | | | | | |
SEE NOTES TO FINANCIAL STATEMENTS.
| | | | | | | | | | |
| | | | | |
| DECEMBER 31, 2021 | | J.P. MORGAN LARGE CAP FUNDS | | | | | | | | 99 |
STATEMENTS OF CHANGES IN NET ASSETS
FOR THE PERIODS INDICATED (continued)
(Amounts in thousands)
| | | | | | | | | | | | | | | | |
| | |
JPMorgan U.S. Research
Enhanced Equity Fund | | | JPMorgan U.S. Sustainable Leaders Fund | |
| | | Six Months Ended
December 31, 2021
(Unaudited) | | | Year Ended
June 30, 2021 | | | Six Months Ended
December 31, 2021
(Unaudited) | | | Year Ended
June 30, 2021 | |
CHANGE IN NET ASSETS RESULTING FROM OPERATIONS: | | | | | | | | | | | | | | | | |
Net investment income (loss) | | $ | 27,937 | | | $ | 58,068 | | | $ | 572 | | | $ | 719 | |
Net realized gain (loss) | | | 192,621 | | | | 562,881 | | | | 2,522 | | | | 4,226 | |
Change in net unrealized appreciation/depreciation | | | 420,054 | | | | 1,148,187 | | | | 14,124 | | | | 19,592 | |
| | | | | | | | | | | | | | | | |
Change in net assets resulting from operations | | | 640,612 | | | | 1,769,136 | | | | 17,218 | | | | 24,537 | |
| | | | | | | | | | | | | | | | |
| | | | |
DISTRIBUTIONS TO SHAREHOLDERS: | | | | | | | | | | | | | | | | |
Class A | | | (19,855 | ) | | | (7,423 | ) | | | (1,320 | ) | | | (235 | ) |
Class C | | | — | | | | — | | | | (170 | ) | | | (30 | ) |
Class I | | | (86,246 | ) | | | (25,017 | ) | | | (4,168 | ) | | | (711 | ) |
Class R6 (a) | | | (563,649 | ) | | | (159,941 | ) | | | (1,394 | ) | | | (247 | ) |
| | | | | | | | | | | | | | | | |
Total distributions to shareholders | | | (669,750 | ) | | | (192,381 | ) | | | (7,052 | ) | | | (1,223 | ) |
| | | | | | | | | | | | | | | | |
|
CAPITAL TRANSACTIONS: | |
Change in net assets resulting from capital transactions | | | 958,908 | | | | (889,477 | ) | | | 72,386 | | | | 51,536 | |
| | | | | | | | | | | | | | | | |
|
NET ASSETS: | |
Change in net assets | | | 929,770 | | | | 687,278 | | | | 82,552 | | | | 74,850 | |
Beginning of period | | | 5,052,042 | | | | 4,364,764 | | | | 115,550 | | | | 40,700 | |
| | | | | | | | | | | | | | | | |
End of period | | $ | 5,981,812 | | | $ | 5,052,042 | | | $ | 198,102 | | | $ | 115,550 | |
| | | | | | | | | | | | | | | | |
| (a) | Commencement of offering of class of shares effective September 30, 2020 for JPMorgan U.S. Sustainable Leaders Fund. |
SEE NOTES TO FINANCIAL STATEMENTS.
| | | | | | | | | | |
| | | | | |
| 100 | | | | | | | | J.P. MORGAN LARGE CAP FUNDS | | DECEMBER 31, 2021 |
| | | | | | | | |
| | |
JPMorgan U.S. Value Fund | |
| | | Six Months Ended
December 31, 2021
(Unaudited) | | | Year Ended
June 30, 2021 | |
CHANGE IN NET ASSETS RESULTING FROM OPERATIONS: | | | | | | | | |
Net investment income (loss) | | $ | 10,895 | | | $ | 14,952 | |
Net realized gain (loss) | | | (2,093 | ) | | | 44,116 | |
Change in net unrealized appreciation/depreciation | | | 107,915 | | | | 351,990 | |
| | | | | | | | |
Change in net assets resulting from operations | | | 116,717 | | | | 411,058 | |
| | | | | | | | |
| | |
DISTRIBUTIONS TO SHAREHOLDERS: | | | | | | | | |
Class A | | | (13,968 | ) | | | (10,335 | ) |
Class C | | | (1,192 | ) | | | (611 | ) |
Class I | | | (23,164 | ) | | | (11,089 | ) |
Class R2 | | | (61 | ) | | | (33 | ) |
Class R3 | | | (206 | ) | | | (16 | ) |
Class R4 | | | (7 | ) | | | (24 | ) |
Class R5 | | | (74 | ) | | | (3 | ) |
Class R6 | | | (8,355 | ) | | | (4,026 | ) |
| | | | | | | | |
Total distributions to shareholders | | | (47,027 | ) | | | (26,137 | ) |
| | | | | | | | |
|
CAPITAL TRANSACTIONS: | |
Change in net assets resulting from capital transactions | | | 380,105 | | | | 595,210 | |
| | | | | | | | |
|
NET ASSETS: | |
Change in net assets | | | 449,795 | | | | 980,131 | |
Beginning of period | | | 1,706,985 | | | | 726,854 | |
| | | | | | | | |
End of period | | $ | 2,156,780 | | | $ | 1,706,985 | |
| | | | | | | | |
SEE NOTES TO FINANCIAL STATEMENTS.
| | | | | | | | | | |
| | | | | |
| DECEMBER 31, 2021 | | J.P. MORGAN LARGE CAP FUNDS | | | | | | | | 101 |
STATEMENTS OF CHANGES IN NET ASSETS
FOR THE PERIODS INDICATED (continued)
(Amounts in thousands)
| | | | | | | | | | | | | | | | |
| | | JPMorgan Equity Focus Fund | | |
JPMorgan Equity Income Fund | |
| | | Six Months Ended
December 31, 2021
(Unaudited) | | | Year Ended
June 30, 2021 | | | Six Months Ended
December 31, 2021
(Unaudited) | | | Year Ended
June 30, 2021 | |
CAPITAL TRANSACTIONS: | | | | | | | | | | | | | | | | |
Class A | | | | | | | | | | | | | | | | |
Proceeds from shares issued | | $ | 2,368 | | | $ | 3,527 | | | $ | 394,289 | | | $ | 1,280,565 | |
Distributions reinvested | | | 1,192 | | | | 862 | | | | 118,722 | | | | 55,042 | |
Cost of shares redeemed | | | (1,379 | ) | | | (2,169 | ) | | | (387,968 | ) | | | (1,092,878 | ) |
| | | | | | | | | | | | | | | | |
Change in net assets resulting from Class A capital transactions | | | 2,181 | | | | 2,220 | | | | 125,043 | | �� | | 242,729 | |
| | | | | | | | | | | | | | | | |
Class C | | | | | | | | | | | | | | | | |
Proceeds from shares issued | | | 152 | | | | 419 | | | | 76,549 | | | | 243,967 | |
Distributions reinvested | | | 513 | | | | 403 | | | | 32,304 | | | | 13,343 | |
Cost of shares redeemed | | | (66 | ) | | | (612 | ) | | | (186,193 | ) | | | (552,490 | ) |
| | | | | | | | | | | | | | | | |
Change in net assets resulting from Class C capital transactions | | | 599 | | | | 210 | | | | (77,340 | ) | | | (295,180 | ) |
| | | | | | | | | | | | | | | | |
Class I | | | | | | | | | | | | | | | | |
Proceeds from shares issued | | | 2,785 | | | | 9,125 | | | | 2,100,796 | | | | 5,967,956 | |
Distributions reinvested | | | 9,276 | | | | 7,180 | | | | 463,572 | | | | 221,627 | |
Cost of shares redeemed | | | (2,454 | ) | | | (3,056 | ) | | | (1,797,333 | ) | | | (3,358,152 | ) |
| | | | | | | | | | | | | | | | |
Change in net assets resulting from Class I capital transactions | | | 9,607 | | | | 13,249 | | | | 767,035 | | | | 2,831,431 | |
| | | | | | | | | | | | | | | | |
Class R2 | | | | | | | | | | | | | | | | |
Proceeds from shares issued | | | — | | | | — | | | | 5,576 | | | | 18,279 | |
Distributions reinvested | | | — | | | | — | | | | 1,846 | | | | 901 | |
Cost of shares redeemed | | | — | | | | — | | | | (12,024 | ) | | | (37,123 | ) |
| | | | | | | | | | | | | | | | |
Change in net assets resulting from Class R2 capital transactions | | | — | | | | — | | | | (4,602 | ) | | | (17,943 | ) |
| | | | | | | | | | | | | | | | |
Class R3 | | | | | | | | | | | | | | | | |
Proceeds from shares issued | | | — | | | | — | | | | 31,266 | | | | 94,161 | |
Distributions reinvested | | | — | | | | — | | | | 5,240 | | | | 2,770 | |
Cost of shares redeemed | | | — | | | | — | | | | (68,390 | ) | | | (57,502 | ) |
| | | | | | | | | | | | | | | | |
Change in net assets resulting from Class R3 capital transactions | | | — | | | | — | | | | (31,884 | ) | | | 39,429 | |
| | | | | | | | | | | | | | | | |
Class R4 | | | | | | | | | | | | | | | | |
Proceeds from shares issued | | | — | | | | — | | | | 29,312 | | | | 153,736 | |
Distributions reinvested | | | — | | | | — | | | | 6,222 | | | | 3,022 | |
Cost of shares redeemed | | | — | | | | — | | | | (67,283 | ) | | | (68,895 | ) |
| | | | | | | | | | | | | | | | |
Change in net assets resulting from Class R4 capital transactions | | | — | | | | — | | | | (31,749 | ) | | | 87,863 | |
| | | | | | | | | | | | | | | | |
Class R5 | | | | | | | | | | | | | | | | |
Proceeds from shares issued | | | — | | | | — | | | | 127,752 | | | | 365,652 | |
Distributions reinvested | | | — | | | | — | | | | 42,782 | | | | 25,988 | |
Cost of shares redeemed | | | — | | | | — | | | | (263,871 | ) | | | (420,221 | ) |
| | | | | | | | | | | | | | | | |
Change in net assets resulting from Class R5 capital transactions | | | — | | | | — | | | | (93,337 | ) | | | (28,581 | ) |
| | | | | | | | | | | | | | | | |
Class R6 | | | | | | | | | | | | | | | | |
Proceeds from shares issued | | | 1,138 | | | | 2,422 | | | | 3,065,865 | | | | 6,385,588 | |
Distributions reinvested | | | 3,808 | | | | 3,353 | | | | 586,527 | | | | 296,277 | |
Cost of shares redeemed | | | (1,677 | ) | | | (3,424 | ) | | | (1,897,353 | ) | | | (4,348,336 | ) |
| | | | | | | | | | | | | | | | |
Change in net assets resulting from Class R6 capital transactions | | | 3,269 | | | | 2,351 | | | | 1,755,039 | | | | 2,333,529 | |
| | | | | | | | | | | | | | | | |
Total change in net assets resulting from capital transactions | | $ | 15,656 | | | $ | 18,030 | | | $ | 2,408,205 | | | $ | 5,193,277 | |
| | | | | | | | | | | | | | | | |
SEE NOTES TO FINANCIAL STATEMENTS.
| | | | | | | | | | |
| | | | | |
| 102 | | | | | | | | J.P. MORGAN LARGE CAP FUNDS | | DECEMBER 31, 2021 |
| | | | | | | | | | | | | | | | |
| | | JPMorgan Equity Focus Fund | | |
JPMorgan Equity Income Fund | |
| | | Six Months Ended
December 31, 2021
(Unaudited) | | | Year Ended
June 30, 2021 | | | Six Months Ended
December 31, 2021
(Unaudited) | | | Year Ended
June 30, 2021 | |
SHARE TRANSACTIONS: | | | | | | | | | | | | | | | | |
Class A | |
Issued | | | 66 | | | | 112 | | | | 17,324 | | | | 66,002 | |
Reinvested | | | 36 | | | | 29 | | | | 5,191 | | | | 2,827 | |
Redeemed | | | (39 | ) | | | (70 | ) | | | (16,967 | ) | | | (57,193 | ) |
| | | | | | | | | | | | | | | | |
Change in Class A Shares | | | 63 | | | | 71 | | | | 5,548 | | | | 11,636 | |
| | | | | | | | | | | | | | | | |
Class C | |
Issued | | | 4 | | | | 13 | | | | 3,448 | | | | 12,513 | |
Reinvested | | | 17 | | | | 15 | | | | 1,445 | | | | 703 | |
Redeemed | | | (2 | ) | | | (21 | ) | | | (8,331 | ) | | | (29,946 | ) |
| | | | | | | | | | | | | | | | |
Change in Class C Shares | | | 19 | | | | 7 | | | | (3,438 | ) | | | (16,730 | ) |
| | | | | | | | | | | | | | | | |
Class I | |
Issued | | | 78 | | | | 283 | | | | 90,565 | | | | 299,334 | |
Reinvested | | | 272 | | | | 239 | | | | 19,889 | | | | 11,118 | |
Redeemed | | | (70 | ) | | | (97 | ) | | | (77,151 | ) | | | (169,937 | ) |
| | | | | | | | | | | | | | | | |
Change in Class I Shares | | | 280 | | | | 425 | | | | 33,303 | | | | 140,515 | |
| | | | | | | | | | | | | | | | |
Class R2 | |
Issued | | | — | | | | — | | | | 245 | | | | 934 | |
Reinvested | | | — | | | | — | | | | 81 | | | | 47 | |
Redeemed | | | — | | | | — | | | | (530 | ) | | | (1,951 | ) |
| | | | | | | | | | | | | | | | |
Change in Class R2 Shares | | | — | | | | — | | | | (204 | ) | | | (970 | ) |
| | | | | | | | | | | | | | | | |
Class R3 | |
Issued | | | — | | | | — | | | | 1,370 | | | | 4,910 | |
Reinvested | | | — | | | | — | | | | 229 | | | | 142 | |
Redeemed | | | — | | | | — | | | | (2,956 | ) | | | (2,969 | ) |
| | | | | | | | | | | | | | | | |
Change in Class R3 Shares | | | — | | | | — | | | | (1,357 | ) | | | 2,083 | |
| | | | | | | | | | | | | | | | |
Class R4 | |
Issued | | | — | | | | — | | | | 1,251 | | | | 7,771 | |
Reinvested | | | — | | | | — | | | | 267 | | | | 150 | |
Redeemed | | | — | | | | — | | | | (2,893 | ) | | | (3,389 | ) |
| | | | | | | | | | | | | | | | |
Change in Class R4 Shares | | | — | | | | — | | | | (1,375 | ) | | | 4,532 | |
| | | | | | | | | | | | | | | | |
Class R5 | |
Issued | | | — | | | | — | | | | 5,489 | | | | 18,235 | |
Reinvested | | | — | | | | — | | | | 1,834 | | | | 1,312 | |
Redeemed | | | — | | | | — | | | | (11,295 | ) | | | (21,287 | ) |
| | | | | | | | | | | | | | | | |
Change in Class R5 Shares | | | — | | | | — | | | | (3,972 | ) | | | (1,740 | ) |
| | | | | | | | | | | | | | | | |
Class R6 | |
Issued | | | 31 | | | | 76 | | | | 131,502 | | | | 319,793 | |
Reinvested | | | 112 | | | | 112 | | | | 25,162 | | | | 14,863 | |
Redeemed | | | (46 | ) | | | (109 | ) | | | (81,230 | ) | | | (224,750 | ) |
| | | | | | | | | | | | | | | | |
Change in Class R6 Shares | | | 97 | | | | 79 | | | | 75,434 | | | | 109,906 | |
| | | | | | | | | | | | | | | | |
SEE NOTES TO FINANCIAL STATEMENTS.
| | | | | | | | | | |
| | | | | |
| DECEMBER 31, 2021 | | J.P. MORGAN LARGE CAP FUNDS | | | | | | | | 103 |
STATEMENTS OF CHANGES IN NET ASSETS
FOR THE PERIODS INDICATED (continued)
(Amounts in thousands)
| | | | | | | | | | | | | | | | |
| | |
JPMorgan Equity Premium Income Fund | | | JPMorgan Hedged Equity Fund | |
| | | Six Months Ended
December 31, 2021
(Unaudited) | | | Year Ended
June 30, 2021 | | | Six Months Ended
December 31, 2021
(Unaudited) | | | Year Ended
June 30, 2021 | |
CAPITAL TRANSACTIONS: | | | | | | | | | | | | | | | | |
Class A | | | | | | | | | | | | | | | | |
Proceeds from shares issued | | $ | 349,786 | | | $ | 177,480 | | | $ | 234,439 | | | $ | 1,460,355 | |
Distributions reinvested | | | 12,240 | | | | 3,413 | | | | 5,340 | | | | 7,380 | |
Cost of shares redeemed | | | (37,597 | ) | | | (25,791 | ) | | | (173,011 | ) | | | (340,811 | ) |
| | | | | | | | | | | | | | | | |
Change in net assets resulting from Class A capital transactions | | | 324,429 | | | | 155,102 | | | | 66,768 | | | | 1,126,924 | |
| | | | | | | | | | | | | | | | |
Class C | | | | | | | | | | | | | | | | |
Proceeds from shares issued | | | 295,047 | | | | 155,434 | | | | 25,224 | | | | 242,865 | |
Distributions reinvested | | | 10,356 | | | | 2,275 | | | | 218 | | | | 1,095 | |
Cost of shares redeemed | | | (25,069 | ) | | | (8,379 | ) | | | (31,312 | ) | | | (53,065 | ) |
| | | | | | | | | | | | | | | | |
Change in net assets resulting from Class C capital transactions | | | 280,334 | | | | 149,330 | | | | (5,870 | ) | | | 190,895 | |
| | | | | | | | | | | | | | | | |
Class I | | | | | | | | | | | | | | | | |
Proceeds from shares issued | | | 638,328 | | | | 413,338 | | | | 1,747,871 | | | | 8,854,409 | |
Distributions reinvested | | | 29,442 | | | | 25,319 | | | | 59,339 | | | | 111,688 | |
Cost of shares redeemed | | | (112,742 | ) | | | (135,112 | ) | | | (1,518,700 | ) | | | (3,681,719 | ) |
| | | | | | | | | | | | | | | | |
Change in net assets resulting from Class I capital transactions | | | 555,028 | | | | 303,545 | | | | 288,510 | | | | 5,284,378 | |
| | | | | | | | | | | | | | | | |
Class R5 | | | | | | | | | | | | | | | | |
Proceeds from shares issued | | | 1 | | | | 54 | | | | 708 | | | | 3,519 | |
Distributions reinvested | | | 3 | | | | 5 | | | | 30 | | | | 47 | |
Cost of shares redeemed | | | (21 | ) | | | — | (a) | | | (601 | ) | | | (1,189 | ) |
| | | | | | | | | | | | | | | | |
Change in net assets resulting from Class R5 capital transactions | | | (17 | ) | | | 59 | | | | 137 | | | | 2,377 | |
| | | | | | | | | | | | | | | | |
Class R6 | | | | | | | | | | | | | | | | |
Proceeds from shares issued | | | 8,273 | | | | 47,093 | | | | 440,902 | | | | 1,000,413 | |
Distributions reinvested | | | 255 | | | | 126 | | | | 4,415 | | | | 7,536 | |
Cost of shares redeemed | | | (3,207 | ) | | | (3,881 | ) | | | (239,556 | ) | | | (474,060 | ) |
| | | | | | | | | | | | | | | | |
Change in net assets resulting from Class R6 capital transactions | | | 5,321 | | | | 43,338 | | | | 205,761 | | | | 533,889 | |
| | | | | | | | | | | | | | | | |
Total change in net assets resulting from capital transactions | | $ | 1,165,095 | | | $ | 651,374 | | | $ | 555,306 | | | $ | 7,138,463 | |
| | | | | | | | | | | | | | | | |
| (a) | Amount rounds to less than one thousand. |
SEE NOTES TO FINANCIAL STATEMENTS.
| | | | | | | | | | |
| | | | | |
| 104 | | | | | | | | J.P. MORGAN LARGE CAP FUNDS | | DECEMBER 31, 2021 |
| | | | | | | | | | | | | | | | |
| | | JPMorgan Equity Premium Income Fund | | |
JPMorgan Hedged Equity Fund | |
| | | Six Months Ended
December 31, 2021
(Unaudited) | | | Year Ended
June 30, 2021 | | | Six Months Ended
December 31, 2021
(Unaudited) | | | Year Ended
June 30, 2021 | |
SHARE TRANSACTIONS: | |
Class A | |
Issued | | | 22,578 | | | | 11,996 | | | | 8,870 | | | | 60,745 | |
Reinvested | | | 790 | | | | 234 | | | | 202 | | | | 303 | |
Redeemed | | | (2,428 | ) | | | (1,795 | ) | | | (6,553 | ) | | | (14,054 | ) |
| | | | | | | | | | | | | | | | |
Change in Class A Shares | | | 20,940 | | | | 10,435 | | | | 2,519 | | | | 46,994 | |
| | | | | | | | | | | | | | | | |
Class C | |
Issued | | | 19,025 | | | | 10,447 | | | | 962 | | | | 10,337 | |
Reinvested | | | 669 | | | | 154 | | | | 8 | | | | 48 | |
Redeemed | | | (1,619 | ) | | | (568 | ) | | | (1,194 | ) | | | (2,234 | ) |
| | | | | | | | | | | | | | | | |
Change in Class C Shares | | | 18,075 | | | | 10,033 | | | | (224 | ) | | | 8,151 | |
| | | | | | | | | | | | | | | | |
Class I | |
Issued | | | 41,110 | | | | 28,524 | | | | 65,912 | | | | 374,344 | |
Reinvested | | | 1,901 | | | | 1,777 | | | | 2,237 | | | | 4,623 | |
Redeemed | | | (7,276 | ) | | | (9,545 | ) | | | (57,263 | ) | | | (151,283 | ) |
| | | | | | | | | | | | | | | | |
Change in Class I Shares | | | 35,735 | | | | 20,756 | | | | 10,886 | | | | 227,684 | |
| | | | | | | | | | | | | | | | |
Class R5 | |
Issued | | | — | (a) | | | 4 | | | | 27 | | | | 144 | |
Reinvested | | | — | (a) | | | — | (a) | | | 1 | | | | 2 | |
Redeemed | | | (1 | ) | | | — | (a) | | | (23 | ) | | | (49 | ) |
| | | | | | | | | | | | | | | | |
Change in Class R5 Shares | | | (1 | ) | | | 4 | | | | 5 | | | | 97 | |
| | | | | | | | | | | | | | | | |
Class R6 | | | | | | | | | | | | | | | | |
Issued | | | 534 | | | | 3,379 | | | | 16,623 | | | | 41,538 | |
Reinvested | | | 16 | | | | 9 | | | | 166 | | | | 308 | |
| | | | | | | | | | | | | | | | |
Redeemed | | | (207 | ) | | | (269 | ) | | | (8,981 | ) | | | (19,494 | ) |
| | | | | | | | | | | | | | | | |
Change in Class R6 Shares | | | 343 | | | | 3,119 | | | | 7,808 | | | | 22,352 | |
| | | | | | | | | | | | | | | | |
| (a) | Amount rounds to less than one thousand. |
SEE NOTES TO FINANCIAL STATEMENTS.
| | | | | | | | | | |
| | | | | |
| DECEMBER 31, 2021 | | J.P. MORGAN LARGE CAP FUNDS | | | | | | | | 105 |
STATEMENTS OF CHANGES IN NET ASSETS
FOR THE PERIODS INDICATED (continued)
(Amounts in thousands)
| | | | | | | | | | | | | | | | |
| | | JPMorgan Hedged Equity 2 Fund | | |
JPMorgan Hedged Equity 3 Fund | |
| | | Six Months Ended
December 31, 2021
(Unaudited) | | | Period Ended
June 30, 2021 (a) | | | Six Months Ended
December 31, 2021
(Unaudited) | | | Period Ended
June 30, 2021 (a) | |
CAPITAL TRANSACTIONS: | | | | | | | | | | | | | | | | |
Class A | | | | | | | | | | | | | | | | |
Proceeds from shares issued | | $ | 184,145 | | | $ | 54,055 | | | $ | 77,126 | | | $ | 22,160 | |
Distributions reinvested | | | 390 | | | | 25 | | | | 152 | | | | 15 | |
Cost of shares redeemed | | | (13,628 | ) | | | (2,233 | ) | | | (7,965 | ) | | | (998 | ) |
| | | | | | | | | | | | | | | | |
Change in net assets resulting from Class A capital transactions | | | 170,907 | | | | 51,847 | | | | 69,313 | | | | 21,177 | |
| | | | | | | | | | | | | | | | |
Class C | | | | | | | | | | | | | | | | |
Proceeds from shares issued | | | 120,214 | | | | 57,384 | | | | 57,914 | | | | 19,425 | |
Distributions reinvested | | | 39 | | | | 1 | | | | 24 | | | | 3 | |
Cost of shares redeemed | | | (5,454 | ) | | | (1,122 | ) | | | (1,835 | ) | | | (464 | ) |
| | | | | | | | | | | | | | | | |
Change in net assets resulting from Class C capital transactions | | | 114,799 | | | | 56,263 | | | | 56,103 | | | | 18,964 | |
| | | | | | | | | | | | | | | | |
Class I | | | | | | | | | | | | | | | | |
Proceeds from shares issued | | | 1,984,302 | | | | 1,069,346 | | | | 1,283,989 | | | | 575,746 | |
Distributions reinvested | | | 7,566 | | | | 783 | | | | 4,139 | | | | 415 | |
Cost of shares redeemed | | | (178,429 | ) | | | (75,413 | ) | | | (152,053 | ) | | | (64,565 | ) |
| | | | | | | | | | | | | | | | |
Change in net assets resulting from Class I capital transactions | | | 1,813,439 | | | | 994,716 | | | | 1,136,075 | | | | 511,596 | |
| | | | | | | | | | | | | | | | |
Class R5 | | | | | | | | | | | | | | | | |
Proceeds from shares issued | | | 11 | | | | 545 | | | | — | (b) | | | 20 | |
Distributions reinvested | | | 2 | | | | 1 | | | | — | (b) | | | — | (b) |
Cost of shares redeemed | | | (3 | ) | | | (21 | ) | | | (3 | ) | | | — | |
| | | | | | | | | | | | | | | | |
Change in net assets resulting from Class R5 capital transactions | | | 10 | | | | 525 | | | | (3 | ) | | | 20 | |
| | | | | | | | | | | | | | | | |
Class R6 | | | | | | | | | | | | | | | | |
Proceeds from shares issued | | | 402,427 | | | | 261,104 | | | | 406,633 | | | | 1,769 | |
Distributions reinvested | | | 1,585 | | | | 300 | | | | 976 | | | | 2 | |
Cost of shares redeemed | | | (179,451 | ) | | | (5,366 | ) | | | (18,449 | ) | | | — | (b) |
| | | | | | | | | | | | | | | | |
Change in net assets resulting from Class R6 capital transactions | | | 224,561 | | | | 256,038 | | | | 389,160 | | | | 1,771 | |
| | | | | | | | | | | | | | | | |
Total change in net assets resulting from capital transactions | | $ | 2,323,716 | | | $ | 1,359,389 | | | $ | 1,650,648 | | | $ | 553,528 | |
| | | | | | | | | | | | | | | | |
| (a) | Commencement of operations was February 26, 2021. |
| (b) | Amount rounds to less than one thousand. |
SEE NOTES TO FINANCIAL STATEMENTS.
| | | | | | | | | | |
| | | | | |
| 106 | | | | | | | | J.P. MORGAN LARGE CAP FUNDS | | DECEMBER 31, 2021 |
| | | | | | | | | | | | | | | | |
| | | JPMorgan Hedged Equity 2 Fund | | |
JPMorgan Hedged Equity 3 Fund | |
| | | Six Months Ended
December 31, 2021
(Unaudited) | | | Period Ended
June 30, 2021 (a) | | | Six Months Ended
December 31, 2021
(Unaudited) | | | Period Ended
June 30, 2021 (a) | |
SHARE TRANSACTIONS: | |
Class A | |
Issued | | | 11,139 | | | | 3,452 | | | | 4,712 | | | | 1,406 | |
Reinvested | | | 24 | | | | 2 | | | | 9 | | | | 1 | |
Redeemed | | | (823 | ) | | | (142 | ) | | | (483 | ) | | | (63 | ) |
| | | | | | | | | | | | | | | | |
Change in Class A Shares | | | 10,340 | | | | 3,312 | | | | 4,238 | | | | 1,344 | |
| | | | | | | | | | | | | | | | |
Class C | |
Issued | | | 7,321 | | | | 3,672 | | | | 3,549 | | | | 1,235 | |
Reinvested | | | 2 | | | | — | (b) | | | 1 | | | | — | (b) |
Redeemed | | | (332 | ) | | | (72 | ) | | | (113 | ) | | | (29 | ) |
| | | | | | | | | | | | | | | | |
Change in Class C Shares | | | 6,991 | | | | 3,600 | | | | 3,437 | | | | 1,206 | |
| | | | | | | | | | | | | | | | |
Class I | |
Issued | | | 120,321 | | | | 68,491 | | | | 78,534 | | | | 36,861 | |
Reinvested | | | 458 | | | | 49 | | | | 253 | | | | 26 | |
Redeemed | | | (10,766 | ) | | | (4,782 | ) | | | (9,242 | ) | | | (4,085 | ) |
| | | | | | | | | | | | | | | | |
Change in Class I Shares | | | 110,013 | | | | 63,758 | | | | 69,545 | | | | 32,802 | |
| | | | | | | | | | | | | | | | |
Class R5 | |
Issued | | | 1 | | | | 34 | | | | — | | | | 1 | |
Reinvested | | | — | (b) | | | — | (b) | | | — | (b) | | | — | (b) |
Redeemed | | | — | (b) | | | (1 | ) | | | — | (b) | | | — | |
| | | | | | | | | | | | | | | | |
Change in Class R5 Shares | | | 1 | | | | 33 | | | | — | (b) | | | 1 | |
| | | | | | | | | | | | | | | | |
Class R6 | |
Issued | | | 24,280 | | | | 16,725 | | | | 25,399 | | | | 112 | |
Reinvested | | | 96 | | | | 19 | | | | 59 | | | | — | (b) |
Redeemed | | | (11,030 | ) | | | (340 | ) | | | (1,108 | ) | | | — | (b) |
| | | | | | | | | | | | | | | | |
Change in Class R6 Shares | | | 13,346 | | | | 16,404 | | | | 24,350 | | | | 112 | |
| | | | | | | | | | | | | | | | |
| (a) | Commencement of operations was February 26, 2021. |
| (b) | Amount rounds to less than one thousand. |
SEE NOTES TO FINANCIAL STATEMENTS.
| | | | | | | | | | |
| | | | | |
| DECEMBER 31, 2021 | | J.P. MORGAN LARGE CAP FUNDS | | | | | | | | 107 |
STATEMENTS OF CHANGES IN NET ASSETS
FOR THE PERIODS INDICATED (continued)
(Amounts in thousands)
| | | | | | | | | | | | | | | | |
| | | JPMorgan Large Cap Growth Fund | | |
JPMorgan Large Cap Value Fund | |
| | | Six Months Ended
December 31, 2021
(Unaudited) | | | Year Ended
June 30, 2021 | | | Six Months Ended
December 31, 2021
(Unaudited) | | | Year Ended
June 30, 2021 | |
CAPITAL TRANSACTIONS: | |
Class A | | | | | | | | | | | | | | | | |
Proceeds from shares issued | | $ | 487,160 | | | $ | 1,542,784 | | | $ | 30,353 | | | $ | 81,668 | |
Distributions reinvested | | | 647,833 | | | | 209,959 | | | | 14,899 | | | | 737 | |
Cost of shares redeemed | | | (552,523 | ) | | | (1,237,783 | ) | | | (39,298 | ) | | | (49,625 | ) |
| | | | | | | | | | | | | | | | |
Change in net assets resulting from Class A capital transactions | | | 582,470 | | | | 514,960 | | | | 5,954 | | | | 32,780 | |
| | | | | | | | | | | | | | | | |
Class C | | | | | | | | | | | | | | | | |
Proceeds from shares issued | | | 93,814 | | | | 263,027 | | | | 6,642 | | | | 24,043 | |
Distributions reinvested | | | 142,887 | | | | 45,342 | | | | 4,596 | | | | 68 | |
Cost of shares redeemed | | | (95,947 | ) | | | (425,827 | ) | | | (7,124 | ) | | | (13,265 | ) |
| | | | | | | | | | | | | | | | |
Change in net assets resulting from Class C capital transactions | | | 140,754 | | | | (117,458 | ) | | | 4,114 | | | | 10,846 | |
| | | | | | | | | | | | | | | | |
Class I | | | | | | | | | | | | | | | | |
Proceeds from shares issued | | | 1,412,270 | | | | 3,946,027 | | | | 300,908 | | | | 1,171,550 | |
Distributions reinvested | | | 1,417,105 | | | | 446,730 | | | | 95,681 | | | | 4,779 | |
Cost of shares redeemed | | | (1,565,945 | ) | | | (3,034,183 | ) | | | (479,495 | ) | | | (229,227 | ) |
| | | | | | | | | | | | | | | | |
Change in net assets resulting from Class I capital transactions | | | 1,263,430 | | | | 1,358,574 | | | | (82,906 | ) | | | 947,102 | |
| | | | | | | | | | | | | | | | |
Class R2 | | | | | | | | | | | | | | | | |
Proceeds from shares issued | | | 19,157 | | | | 43,616 | | | | 2,355 | | | | 3,822 | |
Distributions reinvested | | | 19,387 | | | | 7,039 | | | | 844 | | | | 42 | |
Cost of shares redeemed | | | (21,819 | ) | | | (76,963 | ) | | | (1,802 | ) | | | (18,227 | ) |
| | | | | | | | | | | | | | | | |
Change in net assets resulting from Class R2 capital transactions | | | 16,725 | | | | (26,308 | ) | | | 1,397 | | | | (14,363 | ) |
| | | | | | | | | | | | | | | | |
Class R3 | | | | | | | | | | | | | | | | |
Proceeds from shares issued | | | 55,976 | | | | 184,953 | | | | 6,000 | | | | 1 | |
Distributions reinvested | | | 25,509 | | | | 5,581 | | | | 9 | | | | — | (a) |
Cost of shares redeemed | | | (35,028 | ) | | | (59,342 | ) | | | — | (a) | | | (9 | ) |
| | | | | | | | | | | | | | | | |
Change in net assets resulting from Class R3 capital transactions | | | 46,457 | | | | 131,192 | | | | 6,009 | | | | (8 | ) |
| | | | | | | | | | | | | | | | |
Class R4 | | | | | | | | | | | | | | | | |
Proceeds from shares issued | | | 52,455 | | | | 134,173 | | | | 51 | | | | 291 | |
Distributions reinvested | | | 30,607 | | | | 6,602 | | | | 13 | | | | — | (a) |
Cost of shares redeemed | | | (28,969 | ) | | | (35,061 | ) | | | — | (a) | | | (12,452 | ) |
| | | | | | | | | | | | | | | | |
Change in net assets resulting from Class R4 capital transactions | | | 54,093 | | | | 105,714 | | | | 64 | | | | (12,161 | ) |
| | | | | | | | | | | | | | | | |
Class R5 | | | | | | | | | | | | | | | | |
Proceeds from shares issued | | | 53,084 | | | | 241,401 | | | | 3,899 | | | | 9,493 | |
Distributions reinvested | | | 114,077 | | | | 46,287 | | | | 1,817 | | | | 191 | |
Cost of shares redeemed | | | (156,620 | ) | | | (375,742 | ) | | | (4,233 | ) | | | (13,602 | ) |
| | | | | | | | | | | | | | | | |
Change in net assets resulting from Class R5 capital transactions | | | 10,541 | | | | (88,054 | ) | | | 1,483 | | | | (3,918 | ) |
| | | | | | | | | | | | | | | | |
Class R6 | | | | | | | | | | | | | | | | |
Proceeds from shares issued | | | 2,496,420 | | | | 6,503,315 | | | | 143,413 | | | | 1,547,366 | |
Distributions reinvested | | | 2,586,303 | | | | 744,666 | | | | 111,401 | | | | 12,895 | |
Cost of shares redeemed | | | (1,795,328 | ) | | | (3,529,455 | ) | | | (1,223,955 | ) | | | (197,025 | ) |
| | | | | | | | | | | | | | | | |
Change in net assets resulting from Class R6 capital transactions | | | 3,287,395 | | | | 3,718,526 | | | | (969,141 | ) | | | 1,363,236 | |
| | | | | | | | | | | | | | | | |
Total change in net assets resulting from capital transactions | | $ | 5,401,865 | | | $ | 5,597,146 | | | $ | (1,033,026 | ) | | $ | 2,323,514 | |
| | | | | | | | | | | | | | | | |
| (a) | Amount rounds to less than one thousand. |
SEE NOTES TO FINANCIAL STATEMENTS.
| | | | | | | | | | |
| | | | | |
| 108 | | | | | | | | J.P. MORGAN LARGE CAP FUNDS | | DECEMBER 31, 2021 |
| | | | | | | | | | | | | | | | |
| | | JPMorgan Large Cap Growth Fund | | |
JPMorgan Large Cap Value Fund | |
| | | Six Months Ended
December 31, 2021
(Unaudited) | | | Year Ended
June 30, 2021 | | | Six Months Ended
December 31, 2021
(Unaudited) | | | Year Ended
June 30, 2021 | |
SHARE TRANSACTIONS: | |
Class A | |
Issued | | | 7,466 | | | | 26,713 | | | | 1,535 | | | | 4,245 | |
Reinvested | | | 10,841 | | | | 3,666 | | | | 799 | | | | 46 | |
Redeemed | | | (8,435 | ) | | | (21,267 | ) | | | (1,980 | ) | | | (3,017 | ) |
| | | | | | | | | | | | | | | | |
Change in Class A Shares | | | 9,872 | | | | 9,112 | | | | 354 | | | | 1,274 | |
| | | | | | | | | | | | | | | | |
Class C | |
Issued | | | 2,033 | | | | 6,214 | | | | 347 | | | | 1,298 | |
Reinvested | | | 3,546 | | | | 1,097 | | | | 260 | | | | 5 | |
Redeemed | | | (2,073 | ) | | | (10,236 | ) | | | (378 | ) | | | (883 | ) |
| | | | | | | | | | | | | | | | |
Change in Class C Shares | | | 3,506 | | | | (2,925 | ) | | | 229 | | | | 420 | |
| | | | | | | | | | | | | | | | |
Class I | |
Issued | | | 21,058 | | | | 66,612 | | | | 15,351 | | | | 62,079 | |
Reinvested | | | 23,118 | | | | 7,640 | | | | 5,236 | | | | 273 | |
Redeemed | | | (23,502 | ) | | | (51,094 | ) | | | (24,455 | ) | | | (12,774 | ) |
| | | | | | | | | | | | | | | | |
Change in Class I Shares | | | 20,674 | | | | 23,158 | | | | (3,868 | ) | | | 49,578 | |
| | | | | | | | | | | | | | | | |
Class R2 | |
Issued | | | 305 | | | | 788 | | | | 118 | | | | 222 | |
Reinvested | | | 344 | | | | 129 | | | | 46 | | | | 3 | |
Redeemed | | | (359 | ) | | | (1,379 | ) | | | (92 | ) | | | (1,084 | ) |
| | | | | | | | | | | | | | | | |
Change in Class R2 Shares | | | 290 | | | | (462 | ) | | | 72 | | | | (859 | ) |
| | | | | | | | | | | | | | | | |
Class R3 | |
Issued | | | 856 | | | | 3,136 | | | | 327 | | | | 1 | |
Reinvested | | | 424 | | | | 97 | | | | — | (a) | | | — | (a) |
Redeemed | | | (528 | ) | | | (1,008 | ) | | | — | (a) | | | (1 | ) |
| | | | | | | | | | | | | | | | |
Change in Class R3 Shares | | | 752 | | | | 2,225 | | | | 327 | | | | — | (a) |
| | | | | | | | | | | | | | | | |
Class R4 | |
Issued | | | 780 | | | | 2,275 | | | | 2 | | | | 20 | |
Reinvested | | | 500 | | | | 113 | | | | 1 | | | | — | (a) |
Redeemed | | | (433 | ) | | | (586 | ) | | | — | (a) | | | (942 | ) |
| | | | | | | | | | | | | | | | |
Change in Class R4 Shares | | | 847 | | | | 1,802 | | | | 3 | | | | (922 | ) |
| | | | | | | | | | | | | | | | |
Class R5 | |
Issued | | | 774 | | | | 3,948 | | | | 195 | | | | 517 | |
Reinvested | | | 1,799 | | | | 769 | | | | 98 | | | | 12 | |
Redeemed | | | (2,199 | ) | | | (6,111 | ) | | | (214 | ) | | | (784 | ) |
| | | | | | | | | | | | | | | | |
Change in Class R5 Shares | | | 374 | | | | (1,394 | ) | | | 79 | | | | (255 | ) |
| | | | | | | | | | | | | | | | |
Class R6 | |
Issued | | | 35,544 | | | | 104,867 | | | | 7,285 | | | | 76,592 | |
Reinvested | | | 40,298 | | | | 12,253 | | | | 6,060 | | | | 760 | |
Redeemed | | | (25,617 | ) | | | (57,075 | ) | | | (61,881 | ) | | | (11,736 | ) |
| | | | | | | | | | | | | | | | |
Change in Class R6 Shares | | | 50,225 | | | | 60,045 | | | | (48,536 | ) | | | 65,616 | |
| | | | | | | | | | | | | | | | |
| (a) | Amount rounds to less than one thousand. |
SEE NOTES TO FINANCIAL STATEMENTS.
| | | | | | | | | | |
| | | | | |
| DECEMBER 31, 2021 | | J.P. MORGAN LARGE CAP FUNDS | | | | | | | | 109 |
STATEMENTS OF CHANGES IN NET ASSETS
FOR THE PERIODS INDICATED (continued)
(Amounts in thousands)
| | | | | | | | | | | | | | | | |
| | | JPMorgan U.S. Applied Data Science
Value Fund (formerly known as
JPMorgan Intrepid Value Fund) | | |
JPMorgan U.S. Equity Fund | |
| | | Six Months Ended
December 31, 2021
(Unaudited) | | | Year Ended
June 30, 2021 | | | Six Months Ended
December 31, 2021
(Unaudited) | | | Year Ended
June 30, 2021 | |
CAPITAL TRANSACTIONS: | | | | | | | | | | | | | | | | |
Class A | | | | | | | | | | | | | | | | |
Proceeds from shares issued | | $ | 2,501 | | | $ | 7,017 | | | $ | 232,102 | | | $ | 448,946 | |
Distributions reinvested | | | 13,644 | | | | 1,624 | | | | 165,784 | | | | 78,212 | |
Cost of shares redeemed | | | (7,569 | ) | | | (15,672 | ) | | | (157,273 | ) | | | (1,212,979 | ) |
| | | | | | | | | | | | | | | | |
Change in net assets resulting from Class A capital transactions | | | 8,576 | | | | (7,031 | ) | | | 240,613 | | | | (685,821 | ) |
| | | | | | | | | | | | | | | | |
Class C | | | | | | | | | | | | | | | | |
Proceeds from shares issued | | | 106 | | | | 1,778 | | | | 61,860 | | | | 101,446 | |
Distributions reinvested | | | 2,482 | | | | 283 | | | | 40,795 | | | | 17,249 | |
Cost of shares redeemed | | | (1,887 | ) | | | (5,408 | ) | | | (41,922 | ) | | | (111,778 | ) |
| | | | | | | | | | | | | | | | |
Change in net assets resulting from Class C capital transactions | | | 701 | | | | (3,347 | ) | | | 60,733 | | | | 6,917 | |
| | | | | | | | | | | | | | | | |
Class I | | | | | | | | | | | | | | | | |
Proceeds from shares issued | | | 4,017 | | | | 12,129 | | | | 350,391 | | | | 676,639 | |
Distributions reinvested | | | 29,574 | | | | 4,054 | | | | 187,297 | | | | 83,781 | |
Cost of shares redeemed | | | (17,433 | ) | | | (43,512 | ) | | | (219,844 | ) | | | (445,901 | ) |
| | | | | | | | | | | | | | | | |
Change in net assets resulting from Class I capital transactions | | | 16,158 | | | | (27,329 | ) | | | 317,844 | | | | 314,519 | |
| | | | | | | | | | | | | | | | |
Class L | | | | | | | | | | | | | | | | |
Proceeds from shares issued | | | — | | | | — | | | | 171,980 | | | | 1,503,646 | |
Distributions reinvested | | | — | | | | — | | | | 181,677 | | | | 156,873 | |
Cost of shares redeemed | | | — | | | | — | | | | (280,890 | ) | | | (1,609,341 | ) |
| | | | | | | | | | | | | | | | |
Change in net assets resulting from Class L capital transactions | | | — | | | | — | | | | 72,767 | | | | 51,178 | |
| | | | | | | | | | | | | | | | |
Class R2 | | | | | | | | | | | | | | | | |
Proceeds from shares issued | | | 220 | | | | 546 | | | | 16,917 | | | | 43,197 | |
Distributions reinvested | | | 674 | | | | 78 | | | | 26,602 | | | | 14,784 | |
Cost of shares redeemed | | | (470 | ) | | | (1,206 | ) | | | (36,009 | ) | | | (74,678 | ) |
| | | | | | | | | | | | | | | | |
Change in net assets resulting from Class R2 capital transactions | | | 424 | | | | (582 | ) | | | 7,510 | | | | (16,697 | ) |
| | | | | | | | | | | | | | | | |
Class R3 | | | | | | | | | | | | | | | | |
Proceeds from shares issued | | | — | | | | — | | | | 20,617 | | | | 40,112 | |
Distributions reinvested | | | — | | | | — | | | | 16,641 | | | | 7,878 | |
Cost of shares redeemed | | | — | | | | — | | | | (23,358 | ) | | | (32,479 | ) |
| | | | | | | | | | | | | | | | |
Change in net assets resulting from Class R3 capital transactions | | | — | | | | — | | | | 13,900 | | | | 15,511 | |
| | | | | | | | | | | | | | | | |
Class R4 | | | | | | | | | | | | | | | | |
Proceeds from shares issued | | | — | | | | — | | | | 18,853 | | | | 19,615 | |
Distributions reinvested | | | — | | | | — | | | | 6,300 | | | | 1,911 | |
Cost of shares redeemed | | | — | | | | — | | | | (4,170 | ) | | | (6,093 | ) |
| | | | | | | | | | | | | | | | |
Change in net assets resulting from Class R4 capital transactions | | | — | | | | — | | | | 20,983 | | | | 15,433 | |
| | | | | | | | | | | | | | | | |
Class R5 | | | | | | | | | | | | | | | | |
Proceeds from shares issued | | | 349 | | | | 722 | | | | 71,879 | | | | 152,803 | |
Distributions reinvested | | | 998 | | | | 141 | | | | 104,742 | | | | 56,125 | |
Cost of shares redeemed | | | (272 | ) | | | (2,434 | ) | | | (126,629 | ) | | | (201,053 | ) |
| | | | | | | | | | | | | | | | |
Change in net assets resulting from Class R5 capital transactions | | | 1,075 | | | | (1,571 | ) | | | 49,992 | | | | 7,875 | |
| | | | | | | | | | | | | | | | |
Class R6 | | | | | | | | | | | | | | | | |
Proceeds from shares issued | | | 6,430 | | | | 14,127 | | | | 1,425,668 | | | | 3,065,302 | |
Distributions reinvested | | | 10,014 | | | | 2,353 | | | | 1,329,726 | | | | 720,789 | |
Cost of shares redeemed | | | (35,369 | ) | | | (43,872 | ) | | | (1,359,456 | ) | | | (3,616,496 | ) |
| | | | | | | | | | | | | | | | |
Change in net assets resulting from Class R6 capital transactions | | | (18,925 | ) | | | (27,392 | ) | | | 1,395,938 | | | | 169,595 | |
| | | | | | | | | | | | | | | | |
Total change in net assets resulting from capital transactions | | $ | 8,009 | | | $ | (67,252 | ) | | $ | 2,180,280 | | | $ | (121,490 | ) |
| | | | | | | | | | | | | | | | |
SEE NOTES TO FINANCIAL STATEMENTS.
| | | | | | | | | | |
| | | | | |
| 110 | | | | | | | | J.P. MORGAN LARGE CAP FUNDS | | DECEMBER 31, 2021 |
| | | | | | | | | | | | | | | | |
| | | JPMorgan U.S. Applied Data Science
Value Fund (formerly known as
JPMorgan Intrepid Value Fund) | | |
JPMorgan U.S. Equity Fund | |
| | | Six Months Ended
December 31, 2021
(Unaudited) | | | Year Ended
June 30, 2021 | | | Six Months Ended
December 31, 2021
(Unaudited) | | | Year Ended
June 30, 2021 | |
SHARE TRANSACTIONS: | |
Class A | | | | | | | | | | | | | | | | |
Issued | | | 72 | | | | 230 | | | | 10,336 | | | | 23,673 | |
Reinvested | | | 460 | | | | 56 | | | | 7,666 | | | | 4,247 | |
Redeemed | | | (216 | ) | | | (535 | ) | | | (7,009 | ) | | | (66,851 | ) |
| | | | | | | | | | | | | | | | |
Change in Class A Shares | | | 316 | | | | (249 | ) | | | 10,993 | | | | (38,931 | ) |
| | | | | | | | | | | | | | | | |
Class C | | | | | | | | | | | | | | | | |
Issued | | | 3 | | | | 57 | | | | 2,863 | | | | 5,407 | |
Reinvested | | | 86 | | | | 10 | | | | 1,980 | | | | 981 | |
Redeemed | | | (55 | ) | | | (188 | ) | | | (1,952 | ) | | | (6,150 | ) |
| | | | | | | | | | | | | | | | |
Change in Class C Shares | | | 34 | | | | (121 | ) | | | 2,891 | | | | 238 | |
| | | | | | | | | | | | | | | | |
Class I | | | | | | | | | | | | | | | | |
Issued | | | 115 | | | | 378 | | | | 15,586 | | | | 34,804 | |
Reinvested | | | 985 | | | | 139 | | | | 8,622 | | | | 4,522 | |
Redeemed | | | (512 | ) | | | (1,437 | ) | | | (9,750 | ) | | | (22,963 | ) |
| | | | | | | | | | | | | | | | |
Change in Class I Shares | | | 588 | | | | (920 | ) | | | 14,458 | | | | 16,363 | |
| | | | | | | | | | | | | | | | |
Class L | | | | | | | | | | | | | | | | |
Issued | | | — | | | | — | | | | 7,583 | | | | 82,220 | |
Reinvested | | | — | | | | — | | | | 8,340 | | | | 8,466 | |
Redeemed | | | — | | | | — | | | | (12,420 | ) | | | (82,827 | ) |
| | | | | | | | | | | | | | | | |
Change in Class L Shares | | | — | | | | — | | | | 3,503 | | | | 7,859 | |
| | | | | | | | | | | | | | | | |
Class R2 | | | | | | | | | | | | | | | | |
Issued | | | 7 | | | | 17 | | | | 761 | | | | 2,286 | |
Reinvested | | | 23 | | | | 3 | | | | 1,247 | | | | 815 | |
Redeemed | | | (13 | ) | | | (41 | ) | | | (1,624 | ) | | | (3,942 | ) |
| | | | | | | | | | | | | | | | |
Change in Class R2 Shares | | | 17 | | | | (21 | ) | | | 384 | | | | (841 | ) |
| | | | | | | | | | | | | | | | |
Class R3 | | | | | | | | | | | | | | | | |
Issued | | | — | | | | — | | | | 917 | | | | 2,150 | |
Reinvested | | | — | | | | — | | | | 773 | | | | 430 | |
Redeemed | | | — | | | | — | | | | (1,043 | ) | | | (1,724 | ) |
| | | | | | | | | | | | | | | | |
Change in Class R3 Shares | | | — | | | | — | | | | 647 | | | | 856 | |
| | | | | | | | | | | | | | | | |
Class R4 | | | | | | | | | | | | | | | | |
Issued | | | — | | | | — | | | | 834 | | | | 984 | |
Reinvested | | | — | | | | — | | | | 290 | | | | 103 | |
Redeemed | | | — | | | | — | | | | (186 | ) | | | (311 | ) |
| | | | | | | | | | | | | | | | |
Change in Class R4 Shares | | | — | | | | — | | | | 938 | | | | 776 | |
| | | | | | | | | | | | | | | | |
Class R5 | | | | | | | | | | | | | | | | |
Issued | | | 10 | | | | 22 | | | | 3,167 | | | | 7,725 | |
Reinvested | | | 33 | | | | 5 | | | | 4,806 | | | | 3,019 | |
Redeemed | | | (7 | ) | | | (84 | ) | | | (5,635 | ) | | | (10,515 | ) |
| | | | | | | | | | | | | | | | |
Change in Class R5 Shares | | | 36 | | | | (57 | ) | | | 2,338 | | | | 229 | |
| | | | | | | | | | | | | | | | |
Class R6 | | | | | | | | | | | | | | | | |
Issued | | | 173 | | | | 434 | | | | 63,041 | | | | 159,157 | |
Reinvested | | | 333 | | | | 80 | | | | 60,854 | | | | 38,637 | |
Redeemed | | | (954 | ) | | | (1,493 | ) | | | (59,418 | ) | | | (183,543 | ) |
| | | | | | | | | | | | | | | | |
Change in Class R6 Shares | | | (448 | ) | | | (979 | ) | | | 64,477 | | | | 14,251 | |
| | | | | | | | | | | | | | | | |
SEE NOTES TO FINANCIAL STATEMENTS.
| | | | | | | | | | |
| | | | | |
| DECEMBER 31, 2021 | | J.P. MORGAN LARGE CAP FUNDS | | | | | | | | 111 |
STATEMENTS OF CHANGES IN NET ASSETS
FOR THE PERIODS INDICATED (continued)
(Amounts in thousands)
| | | | | | | | | | | | | | | | |
| | | JPMorgan U.S. GARP Equity Fund | | |
JPMorgan U.S. Large Cap Core Plus Fund | |
| | | Six Months Ended
December 31, 2021
(Unaudited) | | | Year Ended
June 30, 2021 | | | Six Months Ended
December 31, 2021
(Unaudited) | | | Year Ended
June 30, 2021 | |
CAPITAL TRANSACTIONS: | | | | | | | | | | | | | | | | |
Class A | | | | | | | | | | | | | | | | |
Proceeds from shares issued | | $ | 11,217 | | | $ | 20,023 | | | $ | 21,685 | | | $ | 67,074 | |
Distributions reinvested | | | 17,212 | | | | 7,327 | | | | 75,295 | | | | 71,308 | |
Cost of shares redeemed | | | (9,939 | ) | | | (28,020 | ) | | | (38,421 | ) | | | (103,562 | ) |
| | | | | | | | | | | | | | | | |
Change in net assets resulting from Class A capital transactions | | | 18,490 | | | | (670 | ) | | | 58,559 | | | | 34,820 | |
| | | | | | | | | | | | | | | | |
Class C | | | | | | | | | | | | | | | | |
Proceeds from shares issued | | | 745 | | | | 1,789 | | | | 4,619 | | | | 5,606 | |
Distributions reinvested | | | 5,682 | | | | 2,298 | | | | 9,642 | | | | 9,039 | |
Cost of shares redeemed | | | (2,960 | ) | | | (12,341 | ) | | | (5,892 | ) | | | (43,234 | ) |
| | | | | | | | | | | | | | | | |
Change in net assets resulting from Class C capital transactions | | | 3,467 | | | | (8,254 | ) | | | 8,369 | | | | (28,589 | ) |
| | | | | | | | | | | | | | | | |
Class I | | | | | | | | | | | | | | | | |
Proceeds from shares issued | | | 13,449 | | | | 13,566 | | | | 114,064 | | | | 241,025 | |
Distributions reinvested | | | 29,393 | | | | 12,855 | | | | 379,323 | | | | 497,011 | |
Cost of shares redeemed | | | (17,773 | ) | | | (41,096 | ) | | | (296,144 | ) | | | (946,028 | ) |
Redemptions in-kind (See Note 8) | | | — | | | | — | | | | — | | | | (487,288 | ) |
| | | | | | | | | | | | | | | | |
Change in net assets resulting from Class I capital transactions | | | 25,069 | | | | (14,675 | ) | | | 197,243 | | | | (695,280 | ) |
| | | | | | | | | | | | | | | | |
Class R2 | | | | | | | | | | | | | | | | |
Proceeds from shares issued | | | 3,821 | | | | 11,220 | | | | 569 | | | | 614 | |
Distributions reinvested | | | 9,090 | | | | 4,130 | | | | 1,468 | | | | 1,205 | |
Cost of shares redeemed | | | (5,974 | ) | | | (20,777 | ) | | | (892 | ) | | | (1,100 | ) |
| | | | | | | | | | | | | | | | |
Change in net assets resulting from Class R2 capital transactions | | | 6,937 | | | | (5,427 | ) | | | 1,145 | | | | 719 | |
| | | | | | | | | | | | | | | | |
Class R5 | | | | | | | | | | | | | | | | |
Proceeds from shares issued | | | 6,159 | | | | 28,851 | | | | 4,334 | | | | 5,546 | |
Distributions reinvested | | | 26,832 | | | | 20,215 | | | | 7,761 | | | | 9,489 | |
Cost of shares redeemed | | | (43,427 | ) | | | (119,468 | ) | | | (5,611 | ) | | | (23,795 | ) |
| | | | | | | | | | | | | | | | |
Change in net assets resulting from Class R5 capital transactions | | | (10,436 | ) | | | (70,402 | ) | | | 6,484 | | | | (8,760 | ) |
| | | | | | | | | | | | | | | | |
Class R6 | | | | | | | | | | | | | | | | |
Proceeds from shares issued | | | 14,829 | | | | 45,323 | | | | 43,402 | | | | 127,531 | |
Distributions reinvested | | | 140,885 | | | | 61,717 | | | | 95,950 | | | | 112,990 | |
Cost of shares redeemed | | | (84,613 | ) | | | (118,672 | ) | | | (114,290 | ) | | | (241,171 | ) |
| | | | | | | | | | | | | | | | |
Change in net assets resulting from Class R6 capital transactions | | | 71,101 | | | | (11,632 | ) | | | 25,062 | | | | (650 | ) |
| | | | | �� | | | | | | | | | | | |
Total change in net assets resulting from capital transactions | | $ | 114,628 | | | $ | (111,060 | ) | | $ | 296,862 | | | $ | (697,740 | ) |
| | | | | | | | | | | | | | | | |
SEE NOTES TO FINANCIAL STATEMENTS.
| | | | | | | | | | |
| | | | | |
| 112 | | | | | | | | J.P. MORGAN LARGE CAP FUNDS | | DECEMBER 31, 2021 |
| | | | | | | | | | | | | | | | |
| | | JPMorgan U.S. GARP Equity Fund | | |
JPMorgan U.S. Large Cap Core Plus Fund | |
| | | Six Months Ended
December 31, 2021
(Unaudited) | | | Year Ended
June 30, 2021 | | | Six Months Ended
December 31, 2021
(Unaudited) | | | Year Ended
June 30, 2021 | |
SHARE TRANSACTIONS: | | | | | | | | | | | | | | | | |
Class A | | | | | | | | | | | | | | | | |
Issued | | | 158 | | | | 314 | | | | 845 | | | | 2,537 | |
Reinvested | | | 258 | | | | 119 | | | | 3,292 | | | | 3,151 | |
Redeemed | | | (134 | ) | | | (431 | ) | | | (1,453 | ) | | | (4,090 | ) |
| | | | | | | | | | | | | | | | |
Change in Class A Shares | | | 282 | | | | 2 | | | | 2,684 | | | | 1,598 | |
| | | | | | | | | | | | | | | | |
Class C | | | | | | | | | | | | | | | | |
Issued | | | 11 | | | | 28 | | | | 198 | | | | 242 | |
Reinvested | | | 88 | | | | 38 | | | | 490 | | | | 446 | |
Redeemed | | | (42 | ) | | | (200 | ) | | | (250 | ) | | | (1,763 | ) |
| | | | | | | | | | | | | | | | |
Change in Class C Shares | | | 57 | | | | (134 | ) | | | 438 | | | | (1,075 | ) |
| | | | | | | | | | | | | | | | |
Class I | | | | | | | | | | | | | | | | |
Issued | | | 185 | | | | 202 | | | | 4,212 | | | | 9,169 | |
Reinvested | | | 427 | | | | 204 | | | | 16,025 | | | | 21,400 | |
Redeemed | | | (236 | ) | | | (615 | ) | | | (11,010 | ) | | | (36,191 | ) |
Redemptions in-kind (See Note 8) | | | — | | | | — | | | | — | | | | (19,946 | ) |
| | | | | | | | | | | | | | | | |
Change in Class I Shares | | | 376 | | | | (209 | ) | | | 9,227 | | | | (25,568 | ) |
| | | | | | | | | | | | | | | | |
Class R2 | | | | | | | | | | | | | | | | |
Issued | | | 51 | | | | 177 | | | | 21 | | | | 26 | |
Reinvested | | | 142 | | | | 69 | | | | 70 | | | | 56 | |
Redeemed | | | (81 | ) | | | (324 | ) | | | (33 | ) | | | (45 | ) |
| | | | | | | | | | | | | | | | |
Change in Class R2 Shares | | | 112 | | | | (78 | ) | | | 58 | | | | 37 | |
| | | | | | | | | | | | | | | | |
Class R5 | | | | | | | | | | | | | | | | |
Issued | | | 82 | | | | 442 | | | | 171 | | | | 211 | |
Reinvested | | | 398 | | | | 326 | | | | 324 | | | | 405 | |
Redeemed | | | (546 | ) | | | (1,790 | ) | | | (213 | ) | | | (911 | ) |
| | | | | | | | | | | | | | | | |
Change in Class R5 Shares | | | (66 | ) | | | (1,022 | ) | | | 282 | | | | (295 | ) |
| | | | | | | | | | | | | | | | |
Class R6 | | | | | | | | | | | | | | | | |
Issued | | | 202 | | | | 690 | | | | 1,510 | | | | 4,669 | |
Reinvested | | | 2,090 | | | | 993 | | | | 4,010 | | | | 4,828 | |
Redeemed | | | (1,099 | ) | | | (1,768 | ) | | | (4,495 | ) | | | (9,673 | ) |
| | | | | | | | | | | | | | | | |
Change in Class R6 Shares | | | 1,193 | | | | (85 | ) | | | 1,025 | | | | (176 | ) |
| | | | | | | | | | | | | | | | |
SEE NOTES TO FINANCIAL STATEMENTS.
| | | | | | | | | | |
| | | | | |
| DECEMBER 31, 2021 | | J.P. MORGAN LARGE CAP FUNDS | | | | | | | | 113 |
STATEMENTS OF CHANGES IN NET ASSETS
FOR THE PERIODS INDICATED (continued)
(Amounts in thousands)
| | | | | | | | | | | | | | | | |
| | |
JPMorgan U.S. Research Enhanced
Equity Fund | | | JPMorgan U.S. Sustainable Leaders Fund | |
| | | Six Months Ended
December 31, 2021
(Unaudited) | | | Year Ended
June 30, 2021 | | | Six Months Ended
December 31, 2021
(Unaudited) | | | Year Ended
June 30, 2021 | |
CAPITAL TRANSACTIONS: | | | | | | | | | | | | | | | | |
Class A | | | | | | | | | | | | | | | | |
Proceeds from shares issued | | $ | 12,398 | | | $ | 52,721 | | | $ | 12,425 | | | $ | 9,507 | |
Distributions reinvested | | | 19,713 | | | | 7,384 | | | | 1,294 | | | | 226 | |
Cost of shares redeemed | | | (37,804 | ) | | | (123,854 | ) | | | (2,318 | ) | | | (1,965 | ) |
| | | | | | | | | | | | | | | | |
Change in net assets resulting from Class A capital transactions | | | (5,693 | ) | | | (63,749 | ) | | | 11,401 | | | | 7,768 | |
| | | | | | | | | | | | | | | | |
| | | | |
Class C | | | | | | | | | | | | | | | | |
Proceeds from shares issued | | | — | | | | — | | | | 1,742 | | | | 1,229 | |
Distributions reinvested | | | — | | | | — | | | | 170 | | | | 30 | |
Cost of shares redeemed | | | — | | | | — | | | | (749 | ) | | | (1,166 | ) |
| | | | | | | | | | | | | | | | |
Change in net assets resulting from Class C capital transactions | | | — | | | | — | | | | 1,163 | | | | 93 | |
| | | | | | | | | | | | | | | | |
| | | | |
Class I | | | | | | | | | | | | | | | | |
Proceeds from shares issued | | | 107,853 | | | | 127,129 | | | | 52,115 | | | | 51,880 | |
Distributions reinvested | | | 59,323 | | | | 17,371 | | | | 4,010 | | | | 688 | |
Cost of shares redeemed | | | (73,194 | ) | | | (230,638 | ) | | | (5,663 | ) | | | (30,906 | ) |
Conversion from Class L Shares | | | — | | | | 368,073 | | | | — | | | | — | |
| | | | | | | | | | | | | | | | |
Change in net assets resulting from Class I capital transactions | | | 93,982 | | | | 281,935 | | | | 50,462 | | | | 21,662 | |
| | | | | | | | | | | | | | | | |
| | | | |
Class L (a) | | | | | | | | | | | | | | | | |
Proceeds from shares issued | | | — | | | | 534 | | | | — | | | | — | |
Cost of shares redeemed | | | — | | | | (28,170 | ) | | | — | | | | — | |
Conversion to Class I Shares | | | — | | | | (368,073 | ) | | | — | | | | — | |
| | | | | | | | | | | | | | | | |
Change in net assets resulting from Class L capital transactions | | | — | | | | (395,709 | ) | | | — | | | | — | |
| | | | | | | | | | | | | | | | |
| | | | |
Class R6 (b) | | | | | | | | | | | | | | | | |
Proceeds from shares issued | | | 533,428 | | | | 738,779 | | | | 10,232 | | | | 23,682 | |
Distributions reinvested | | | 562,100 | | | | 159,481 | | | | 1,393 | | | | 247 | |
Cost of shares redeemed | | | (224,909 | ) | | | (1,610,214 | ) | | | (2,265 | ) | | | (1,916 | ) |
| | | | | | | | | | | | | | | | |
Change in net assets resulting from Class R6 capital transactions | | | 870,619 | | | | (711,954 | ) | | | 9,360 | | | | 22,013 | |
| | | | | | | | | | | | | | | | |
Total change in net assets resulting from capital transactions | | $ | 958,908 | | | $ | (889,477 | ) | | $ | 72,386 | | | $ | 51,536 | |
| | | | | | | | | | | | | | | | |
| (a) | On July 2, 2020, Class L Shares for JPMorgan U.S. Research Enhanced Equity Fund were converted into Class I Shares. Additionally, as of July 2, 2020, the Class L Shares are no longer offered. |
| (b) | Commencement of offering of class of shares effective September 30, 2020 for JPMorgan U.S. Sustainable Leaders Fund. |
SEE NOTES TO FINANCIAL STATEMENTS.
| | | | | | | | | | |
| | | | | |
| 114 | | | | | | | | J.P. MORGAN LARGE CAP FUNDS | | DECEMBER 31, 2021 |
| | | | | | | | | | | | | | | | |
| | |
JPMorgan U.S. Research Enhanced
Equity Fund | | | JPMorgan U.S. Sustainable Leaders Fund | |
| | | Six Months Ended
December 31, 2021
(Unaudited) | | | Year Ended
June 30, 2021 | | | Six Months Ended
December 31, 2021
(Unaudited) | | | Year Ended
June 30, 2021 | |
SHARE TRANSACTIONS: | | | | | | | | | | | | | | | | |
Class A | | | | | | | | | | | | | | | | |
Issued | | | 329 | | | | 1,755 | | | | 197 | | | | 180 | |
Reinvested | | | 554 | | | | 240 | | | | 21 | | | | 4 | |
Redeemed | | | (1,006 | ) | | | (3,944 | ) | | | (37 | ) | | | (37 | ) |
| | | | | | | | | | | | | | | | |
Change in Class A Shares | | | (123 | ) | | | (1,949 | ) | | | 181 | | | | 147 | |
| | | | | | | | | | | | | | | | |
Class C | | | | | | | | | | | | | | | | |
Issued | | | — | | | | — | | | | 27 | | | | 23 | |
Reinvested | | | — | | | | — | | | | 3 | | | | 1 | |
Redeemed | | | — | | | | — | | | | (12 | ) | | | (24 | ) |
| | | | | | | | | | | | | | | | |
Change in Class C Shares | | | — | | | | — | | | | 18 | | | | — | (a) |
| | | | | | | | | | | | | | | | |
Class I | | | | | | | | | | | | | | | | |
Issued | | | 2,873 | | | | 4,149 | | | | 824 | | | | 1,006 | |
Reinvested | | | 1,646 | | | | 556 | | | | 63 | | | | 14 | |
Redeemed | | | (1,920 | ) | | | (7,272 | ) | | | (90 | ) | | | (595 | ) |
Conversion from Class L Shares | | | — | | | | 13,572 | | | | — | | | | — | |
| | | | | | | | | | | | | | | | |
Change in Class I Shares | | | 2,599 | | | | 11,005 | | | | 797 | | | | 425 | |
| | | | | | | | | | | | | | | | |
Class L | | | | | | | | | | | | | | | | |
Issued | | | — | | | | 20 | | | | — | | | | — | |
Redeemed | | | — | | | | (1,046 | ) | | | — | | | | — | |
Conversion to Class I Shares | | | — | | | | (13,599 | ) | | | — | | | | — | |
| | | | | | | | | | | | | | | | |
Change in Class L Shares | | | — | | | | (14,625 | ) | | | — | | | | — | |
| | | | | | | | | | | | | | | | |
Class R6 (b) | | | | | | | | | | | | | | | | |
Issued | | | 14,035 | | | | 22,714 | | | | 163 | | | | 451 | |
Reinvested | | | 15,619 | | | | 5,100 | | | | 22 | | | | 5 | |
Redeemed | | | (5,899 | ) | | | (47,943 | ) | | | (36 | ) | | | (35 | ) |
| | | | | | | | | | | | | | | | |
Change in Class R6 Shares | | | 23,755 | | | | (20,129 | ) | | | 149 | | | | 421 | |
| | | | | | | | | | | | | | | | |
| (a) | Amount rounds to less than one thousand. |
| (b) | Commencement of offering of class of shares effective September 30, 2020 for JPMorgan U.S. Sustainable Leaders Fund. |
SEE NOTES TO FINANCIAL STATEMENTS.
| | | | | | | | | | |
| | | | | |
| DECEMBER 31, 2021 | | J.P. MORGAN LARGE CAP FUNDS | | | | | | | | 115 |
STATEMENTS OF CHANGES IN NET ASSETS
FOR THE PERIODS INDICATED (continued)
(Amounts in thousands)
| | | | | | | | |
| | |
JPMorgan U.S. Value Fund | |
| | | Six Months Ended
December 31, 2021
(Unaudited) | | | Year Ended
June 30, 2021 | |
CAPITAL TRANSACTIONS: | | | | | | | | |
Class A | | | | | | | | |
Proceeds from shares issued | | $ | 84,175 | | | $ | 43,922 | |
Distributions reinvested | | | 13,325 | | | | 9,932 | |
Cost of shares redeemed | | | (26,644 | ) | | | (188,211 | ) |
| | | | | | | | |
Change in net assets resulting from Class A capital transactions | | | 70,856 | | | | (134,357 | ) |
| | | | | | | | |
Class C | | | | | | | | |
Proceeds from shares issued | | | 15,444 | | | | 11,138 | |
Distributions reinvested | | | 1,067 | | | | 525 | |
Cost of shares redeemed | | | (4,607 | ) | | | (10,570 | ) |
| | | | | | | | |
Change in net assets resulting from Class C capital transactions | | | 11,904 | | | | 1,093 | |
| | | | | | | | |
Class I | | | | | | | | |
Proceeds from shares issued | | | 675,378 | | | | 663,191 | |
Distributions reinvested | | | 20,711 | | | | 10,612 | |
Cost of shares redeemed | | | (486,142 | ) | | | (99,019 | ) |
| | | | | | | | |
Change in net assets resulting from Class I capital transactions | | | 209,947 | | | | 574,784 | |
| | | | | | | | |
Class R2 | | | | | | | | |
Proceeds from shares issued | | | 1,362 | | | | 1,007 | |
Distributions reinvested | | | 61 | | | | 33 | |
Cost of shares redeemed | | | (95 | ) | | | (694 | ) |
| | | | | | | | |
Change in net assets resulting from Class R2 capital transactions | | | 1,328 | | | | 346 | |
| | | | | | | | |
Class R3 | | | | | | | | |
Proceeds from shares issued | | | 9,238 | | | | 943 | |
Distributions reinvested | | | 182 | | | | 10 | |
Cost of shares redeemed | | | (1,112 | ) | | | (166 | ) |
| | | | | | | | |
Change in net assets resulting from Class R3 capital transactions | | | 8,308 | | | | 787 | |
| | | | | | | | |
Class R4 | | | | | | | | |
Proceeds from shares issued | | | 190 | | | | 133 | |
Distributions reinvested | | | 7 | | | | 24 | |
Cost of shares redeemed | | | (15 | ) | | | (1,482 | ) |
| | | | | | | | |
Change in net assets resulting from Class R4 capital transactions | | | 182 | | | | (1,325 | ) |
| | | | | | | | |
Class R5 | | | | | | | | |
Proceeds from shares issued | | | 3,493 | | | | 78 | |
Distributions reinvested | | | 74 | | | | 3 | |
Cost of shares redeemed | | | (50 | ) | | | (23 | ) |
| | | | | | | | |
Change in net assets resulting from Class R5 capital transactions | | | 3,517 | | | | 58 | |
| | | | | | | | |
Class R6 | | | | | | | | |
Proceeds from shares issued | | | 91,542 | | | | 310,989 | |
Distributions reinvested | | | 8,080 | | | | 3,841 | |
Cost of shares redeemed | | | (25,559 | ) | | | (34,999 | ) |
Redemptions in-kind (See Note 8) | | | — | | | | (126,007 | ) |
| | | | | | | | |
Change in net assets resulting from Class R6 capital transactions | | | 74,063 | | | | 153,824 | |
| | | | | | | | |
Total change in net assets resulting from capital transactions | | $ | 380,105 | | | $ | 595,210 | |
| | | | | | | | |
SEE NOTES TO FINANCIAL STATEMENTS.
| | | | | | | | | | |
| | | | | |
| 116 | | | | | | | | J.P. MORGAN LARGE CAP FUNDS | | DECEMBER 31, 2021 |
| | | | | | | | |
| | |
JPMorgan U.S. Value Fund | |
| | | Six Months Ended
December 31, 2021
(Unaudited) | | | Year Ended
June 30, 2021 | |
SHARE TRANSACTIONS: | | | | | | | | |
Class A | | | | | | | | |
Issued | | | 1,262 | | | | 799 | |
Reinvested | | | 203 | | | | 184 | |
Redeemed | | | (402 | ) | | | (3,804 | ) |
| | | | | | | | |
Change in Class A Shares | | | 1,063 | | | | (2,821 | ) |
| | | | | | | | |
Class C | | | | | | | | |
Issued | | | 263 | | | | 216 | |
Reinvested | | | 18 | | | | 11 | |
Redeemed | | | (79 | ) | | | (224 | ) |
| | | | | | | | |
Change in Class C Shares | | | 202 | | | | 3 | |
| | | | | | | | |
Class I | | | | | | | | |
Issued | | | 9,563 | | | | 11,291 | |
Reinvested | | | 296 | | | | 179 | |
Redeemed | | | (7,025 | ) | | | (1,602 | ) |
| | | | | | | | |
Change in Class I Shares | | | 2,834 | | | | 9,868 | |
| | | | | | | | |
Class R2 | | | | | | | | |
Issued | | | 20 | | | | 19 | |
Reinvested | | | 1 | | | | 1 | |
Redeemed | | | (1 | ) | | | (13 | ) |
| | | | | | | | |
Change in Class R2 Shares | | | 20 | | | | 7 | |
| | | | | | | | |
Class R3 | | | | | | | | |
Issued | | | 129 | | | | 16 | |
Reinvested | | | 3 | | | | — | (a) |
Redeemed | | | (16 | ) | | | (3 | ) |
| | | | | | | | |
Change in Class R3 Shares | | | 116 | | | | 13 | |
| | | | | | | | |
Class R4 | | | | | | | | |
Issued | | | 2 | | | | 3 | |
Reinvested | | | — | (a) | | | — | (a) |
Redeemed | | | — | (a) | | | (25 | ) |
| | | | | | | | |
Change in Class R4 Shares | | | 2 | | | | (22 | ) |
| | | | | | | | |
Class R5 | | | | | | | | |
Issued | | | 48 | | | | 1 | |
Reinvested | | | 1 | | | | — | (a) |
Redeemed | | | (1 | ) | | | — | (a) |
| | | | | | | | |
Change in Class R5 Shares | | | 48 | | | | 1 | |
| | | | | | | | |
Class R6 | | | | | | | | |
Issued | | | 1,290 | | | | 5,348 | |
Reinvested | | | 115 | | | | 65 | |
Redeemed | | | (361 | ) | | | (596 | ) |
Redemptions in-kind (See Note 8) | | | — | | | | (2,169 | ) |
| | | | | | | | |
Change in Class R6 Shares | | | 1,044 | | | | 2,648 | |
| | | | | | | | |
| (a) | Amount rounds to less than one thousand. |
SEE NOTES TO FINANCIAL STATEMENTS.
| | | | | | | | | | |
| | | | | |
| DECEMBER 31, 2021 | | J.P. MORGAN LARGE CAP FUNDS | | | | | | | | 117 |
STATEMENT OF CASH FLOWS
FOR THE PERIOD ENDED DECEMBER 31, 2021
| | | | |
| | | JPMorgan U.S.
Large Cap Core
Plus Fund | |
INCREASE (DECREASE) IN CASH | | | | |
Cash flows provided (used) by operating activities: | | | | |
Net increase in net assets resulting from operations | | $ | 323,559 | |
| |
Adjustments to reconcile net increase/decrease in net assets resulting from operations to net cash provided (used) by operating activities: | | | | |
Purchase of investment securities | | | (915,570 | ) |
Proceeds from disposition of investment securities | | | 1,346,796 | |
Covers of investment securities sold short | | | (464,763 | ) |
Proceeds from investment securities sold short | | | 374,485 | |
Purchases of short-term investments — affiliates, net | | | (6,977 | ) |
Change in unrealized (appreciation)/depreciation on investments | | | 26,906 | |
Change in unrealized (appreciation)/depreciation on investment securities sold short | | | (22,487 | ) |
Net realized (gain)/loss on investments in non-affiliates | | | (365,988 | ) |
Net realized (gain)/loss on investments in affiliates | | | 1 | |
Net realized (gain)/loss on securities sold short | | | 35,260 | |
Decrease in dividends receivable from non-affiliates | | | 229 | |
Increase in dividend expense to non-affiliates on securities sold short | | | 174 | |
Decrease in interest expense to non-affiliates on securities sold short | | | (80 | ) |
Decrease in due to broker for securities sold short | | | (20 | ) |
Increase in investment advisory fees payable | | | 73 | |
Increase in administration fees payable | | | 3 | |
Increase in distribution fees payable | | | 9 | |
Increase in service fees payable | | | 23 | |
Increase in custodian and accounting fees payable | | | 13 | |
Decrease in other accrued expenses payable | | | (100 | ) |
| | | | |
Net cash provided (used) by operating activities | | | 331,546 | |
| | | | |
| |
Cash flows provided (used) by financing activities: | | | | |
Due to custodian | | | (21 | ) |
Proceeds from units issued | | | 188,454 | |
Payment for units redeemed | | | (463,569 | ) |
Cash distributions paid to shareholders (net of reinvestments of $569,439) | | | (56,426 | ) |
| | | | |
Net cash provided (used) by financing activities | | | (331,562 | ) |
| | | | |
| |
Cash: | | | | |
Net increase (decrease) in unrestricted and restricted cash, foreign currency and deposits at broker | | | (16 | ) |
Restricted and unrestricted cash and foreign currency at beginning of period | | | 20 | |
| | | | |
Restricted and unrestricted cash and foreign currency at end of period | | $ | 4 | |
| | | | |
Supplemental disclosure of cash flow information:
For the period ended December 31, 2021 the Fund paid $1,903 in interest expense.
For purposes of reporting the Statement of Cash Flows, the Fund considers all cash accounts that are not subject to withdrawal restrictions or penalties to be cash equivalents.
SEE NOTES TO FINANCIAL STATEMENTS.
| | | | | | | | | | |
| | | | | |
| 118 | | | | | | | | J.P. MORGAN LARGE CAP FUNDS | | DECEMBER 31, 2021 |
Reconciliation of restricted and unrestricted cash and foreign currency at the end of period to the Statements of Assets and Liabilities:
| | | | | | | | |
| | | June 30, 2021 | | | December 31, 2021 | |
Cash | | $ | — | | | $ | 4 | |
Foreign currency, at value | | | 20 | | | | — | |
| | | | | | | | |
| | $ | 20 | | | $ | 4 | |
| | | | | | | | |
| | | | | | | | | | |
| | | | | |
| DECEMBER 31, 2021 | | J.P. MORGAN LARGE CAP FUNDS | | | | | | | | 119 |
FINANCIAL HIGHLIGHTS
FOR THE PERIODS INDICATED
| | | | | | | | | | | | | | | | | | | | | | | | | | | | |
| | | Per share operating performance | |
| | | | | | Investment operations | | | Distributions | |
| | | Net asset
value,
beginning
of period | | | Net
investment
income
(loss) (b) | | | Net realized
and unrealized
gains
(losses) on
investments | | | Total from
investment
operations | | | Net
investment
income | | | Net
realized
gain | | | Total
distributions | |
JPMorgan Equity Focus Fund | | | | | | | | | | | | | | | | | | | | | | | | | | | | |
Class A | | | | | | | | | | | | | | | | | | | | | | | | | | | | |
Six Months Ended December 31, 2021 (Unaudited) | | $ | 35.03 | | | $ | (0.03 | ) | | $ | 2.96 | | | $ | 2.93 | | | $ | — | | | $ | (3.91 | ) | | $ | (3.91 | ) |
Year Ended June 30, 2021 | | | 26.88 | | | | 0.01 | | | | 11.90 | | | | 11.91 | | | | (0.11 | ) | | | (3.65 | ) | | | (3.76 | ) |
Year Ended June 30, 2020 | | | 30.15 | | | | 0.15 | | | | 1.68 | | | | 1.83 | | | | (0.12 | ) | | | (4.98 | ) | | | (5.10 | ) |
Year Ended June 30, 2019 | | | 31.83 | | | | 0.13 | | | | 2.32 | | | | 2.45 | | | | (0.41 | ) | | | (3.72 | ) | | | (4.13 | ) |
Year Ended June 30, 2018 | | | 29.09 | | | | 0.08 | | | | 4.23 | | | | 4.31 | | | | (0.01 | ) | | | (1.56 | ) | | | (1.57 | ) |
Year Ended June 30, 2017 | | | 23.73 | | | | (0.01 | ) | | | 5.70 | | | | 5.69 | | | | (0.01 | ) | | | (0.32 | ) | | | (0.33 | ) |
| | | | | | | |
Class C | | | | | | | | | | | | | | | | | | | | | | | | | | | | |
Six Months Ended December 31, 2021 (Unaudited) | | | 33.15 | | | | (0.12 | ) | | | 2.79 | | | | 2.67 | | | | — | | | | (3.91 | ) | | | (3.91 | ) |
Year Ended June 30, 2021 | | | 25.63 | | | | (0.13 | ) | | | 11.30 | | | | 11.17 | | | | — | | | | (3.65 | ) | | | (3.65 | ) |
Year Ended June 30, 2020 | | | 29.01 | | | | 0.01 | | | | 1.60 | | | | 1.61 | | | | (0.01 | ) | | | (4.98 | ) | | | (4.99 | ) |
Year Ended June 30, 2019 | | | 30.75 | | | | (0.03 | ) | | | 2.25 | | | | 2.22 | | | | (0.24 | ) | | | (3.72 | ) | | | (3.96 | ) |
Year Ended June 30, 2018 | | | 28.28 | | | | (0.08 | ) | | | 4.11 | | | | 4.03 | | | | — | | | | (1.56 | ) | | | (1.56 | ) |
Year Ended June 30, 2017 | | | 23.18 | | | | (0.14 | ) | | | 5.56 | | | | 5.42 | | | | — | | | | (0.32 | ) | | | (0.32 | ) |
| | | | | | | |
Class I | | | | | | | | | | | | | | | | | | | | | | | | | | | | |
Six Months Ended December 31, 2021 (Unaudited) | | | 35.80 | | | | 0.01 | | | | 3.03 | | | | 3.04 | | | | (0.03 | ) | | | (3.91 | ) | | | (3.94 | ) |
Year Ended June 30, 2021 | | | 27.38 | | | | 0.10 | | | | 12.13 | | | | 12.23 | | | | (0.16 | ) | | | (3.65 | ) | | | (3.81 | ) |
Year Ended June 30, 2020 | | | 30.60 | | | | 0.23 | | | | 1.70 | | | | 1.93 | | | | (0.17 | ) | | | (4.98 | ) | | | (5.15 | ) |
Year Ended June 30, 2019 | | | 32.13 | | | | 0.18 | | | | 2.38 | | | | 2.56 | | | | (0.37 | ) | | | (3.72 | ) | | | (4.09 | ) |
Year Ended June 30, 2018 | | | 29.34 | | | | 0.16 | | | | 4.27 | | | | 4.43 | | | | (0.08 | ) | | | (1.56 | ) | | | (1.64 | ) |
Year Ended June 30, 2017 | | | 23.92 | | | | 0.06 | | | | 5.75 | | | | 5.81 | | | | (0.07 | ) | | | (0.32 | ) | | | (0.39 | ) |
| | | | | | | |
Class R6 | | | | | | | | | | | | | | | | | | | | | | | | | | | | |
Six Months Ended December 31, 2021 (Unaudited) | | | 35.62 | | | | 0.06 | | | | 3.01 | | | | 3.07 | | | | (0.11 | ) | | | (3.91 | ) | | | (4.02 | ) |
Year Ended June 30, 2021 | | | 27.25 | | | | 0.18 | | | | 12.07 | | | | 12.25 | | | | (0.23 | ) | | | (3.65 | ) | | | (3.88 | ) |
Year Ended June 30, 2020 | | | 30.48 | | | | 0.30 | | | | 1.69 | | | | 1.99 | | | | (0.24 | ) | | | (4.98 | ) | | | (5.22 | ) |
October 1, 2018 (f) through June 30, 2019 | | | 34.55 | | | | 0.23 | | | | (0.05 | ) | | | 0.18 | | | | (0.53 | ) | | | (3.72 | ) | | | (4.25 | ) |
| (a) | Annualized for periods less than one year, unless otherwise noted. |
| (b) | Calculated based upon average shares outstanding. |
| (c) | Not annualized for periods less than one year. |
| (d) | Includes adjustments in accordance with accounting principles generally accepted in the United States of America and as such, the net asset values for financial reporting purposes and the returns based upon those net asset values may differ from the net asset values and returns for shareholder transactions. |
| (e) | Includes earnings credits and interest expense, if applicable, each of which is less than 0.005% unless otherwise noted. |
| (f) | Commencement of offering of class of shares. |
SEE NOTES TO FINANCIAL STATEMENTS.
| | | | | | | | | | |
| | | | | |
| 120 | | | | | | | | J.P. MORGAN LARGE CAP FUNDS | | DECEMBER 31, 2021 |
| | | | | | | | | | | | | | | | | | | | | | | | | | |
| | | Ratios/Supplemental data | |
| | | | | | | Ratios to average net assets (a) | | | | |
Net asset
value,
end of
period | | | Total return
(excludes
sales charge) (c)(d) | | | Net assets,
end of
period
(000’s) | | | Net
expenses (e) | | | Net
investment
income
(loss) | | | Expenses
without waivers,
reimbursements and
earnings credits | | | Portfolio
turnover
rate (c) | |
| | |
| | |
| $ | 34.05 | | | | 8.64 | % | | $ | 11,819 | | | | 1.10 | % | | | (0.19 | )% | | | 1.21 | % | | | 16 | % |
| | 35.03 | | | | 47.07 | | | | 9,949 | | | | 1.09 | | | | 0.05 | | | | 1.24 | | | | 58 | |
| | 26.88 | | | | 5.87 | | | | 5,723 | | | | 1.10 | | | | 0.55 | | | | 1.34 | | | | 44 | |
| | 30.15 | | | | 9.22 | | | | 5,511 | | | | 1.09 | | | | 0.42 | | | | 1.41 | | | | 45 | |
| | 31.83 | | | | 15.02 | | | | 4,077 | | | | 1.11 | | | | 0.26 | | | | 1.31 | | | | 34 | |
| | 29.09 | | | | 24.09 | | | | 3,362 | | | | 1.17 | | | | (0.02 | ) | | | 1.37 | | | | 84 | |
| | | | | | |
| | | | | | | | | | | | | | | | | | | | | | | | | | |
| | 31.91 | | | | 8.34 | | | | 4,742 | | | | 1.60 | | | | (0.69 | ) | | | 1.71 | | | | 16 | |
| | 33.15 | | | | 46.37 | | | | 4,293 | | | | 1.59 | | | | (0.45 | ) | | | 1.74 | | | | 58 | |
| | 25.63 | | | | 5.30 | | | | 3,147 | | | | 1.60 | | | | 0.05 | | | | 1.84 | | | | 44 | |
| | 29.01 | | | | 8.67 | | | | 3,084 | | | | 1.59 | | | | (0.09 | ) | | | 1.89 | | | | 45 | |
| | 30.75 | | | | 14.45 | | | | 3,017 | | | | 1.61 | | | | (0.26 | ) | | | 1.80 | | | | 34 | |
| | 28.28 | | | | 23.49 | | | | 3,331 | | | | 1.66 | | | | (0.51 | ) | | | 1.86 | | | | 84 | |
| | | | | | |
| | | | | | | | | | | | | | | | | | | | | | | | | | |
| | 34.90 | | | | 8.77 | | | | 91,261 | | | | 0.85 | | | | 0.06 | | | | 0.95 | | | | 16 | |
| | 35.80 | | | | 47.46 | | | | 83,598 | | | | 0.85 | | | | 0.30 | | | | 0.98 | | | | 58 | |
| | 27.38 | | | | 6.12 | | | | 52,303 | | | | 0.85 | | | | 0.79 | | | | 1.08 | | | | 44 | |
| | 30.60 | | | | 9.50 | | | | 75,887 | | | | 0.84 | | | | 0.57 | | | | 1.08 | | | | 45 | |
| | 32.13 | | | | 15.31 | | | | 246,276 | | | | 0.86 | | | | 0.52 | | | | 1.03 | | | | 34 | |
| | 29.34 | | | | 24.43 | | | | 180,151 | | | | 0.92 | | | | 0.23 | | | | 1.10 | | | | 84 | |
| | | | | | |
| | | | | | | | | | | | | | | | | | | | | | | | | | |
| | 34.67 | | | | 8.91 | | | | 36,516 | | | | 0.60 | | | | 0.31 | | | | 0.70 | | | | 16 | |
| | 35.62 | | | | 47.82 | | | | 34,054 | | | | 0.60 | | | | 0.55 | | | | 0.73 | | | | 58 | |
| | 27.25 | | | | 6.39 | | | | 23,881 | | | | 0.60 | | | | 1.06 | | | | 0.83 | | | | 44 | |
| | 30.48 | | | | 2.03 | | | | 22,346 | | | | 0.59 | | | | 1.08 | | | | 0.95 | | | | 45 | |
SEE NOTES TO FINANCIAL STATEMENTS.
| | | | | | | | | | |
| | | | | |
| DECEMBER 31, 2021 | | J.P. MORGAN LARGE CAP FUNDS | | | | | | | | 121 |
FINANCIAL HIGHLIGHTS
FOR THE PERIODS INDICATED (continued)
| | | | | | | | | | | | | | | | | | | | | | | | | | | | |
| | | Per share operating performance | |
| | | | | | Investment operations | | | Distributions | |
| | | Net asset
value,
beginning
of period | | | Net
investment
income
(loss) (b) | | | Net realized
and unrealized
gains
(losses) on
investments | | | Total from
investment
operations | | | Net
investment
income | | | Net
realized
gain | | | Total
distributions | |
JPMorgan Equity Income Fund | | | | | | | | | | | | | | | | | | | | | | | | | | | | |
Class A | | | | | | | | | | | | | | | | | | | | | | | | | | | | |
Six Months Ended December 31, 2021 (Unaudited) | | $ | 22.34 | | | $ | 0.16 | | | $ | 1.50 | | | $ | 1.66 | | | $ | (0.16 | ) | | $ | (0.44 | ) | | $ | (0.60 | ) |
Year Ended June 30, 2021 | | | 16.22 | | | | 0.29 | | | | 6.12 | | | | 6.41 | | | | (0.29 | ) | | | — | | | | (0.29 | ) |
Year Ended June 30, 2020 | | | 17.83 | | | | 0.32 | | | | (1.42 | ) | | | (1.10 | ) | | | (0.32 | ) | | | (0.19 | ) | | | (0.51 | ) |
Year Ended June 30, 2019 | | | 16.82 | | | | 0.32 | | | | 1.48 | | | | 1.80 | | | | (0.33 | ) | | | (0.46 | ) | | | (0.79 | ) |
Year Ended June 30, 2018 | | | 15.67 | | | | 0.26 | | | | 1.29 | | | | 1.55 | | | | (0.25 | ) | | | (0.15 | ) | | | (0.40 | ) |
Year Ended June 30, 2017 | | | 14.01 | | | | 0.24 | | | | 1.75 | | | | 1.99 | | | | (0.24 | ) | | | (0.09 | ) | | | (0.33 | ) |
| | | | | | | |
Class C | | | | | | | | | | | | | | | | | | | | | | | | | | | | |
Six Months Ended December 31, 2021 (Unaudited) | | | 21.87 | | | | 0.09 | | | | 1.48 | | | | 1.57 | | | | (0.11 | ) | | | (0.44 | ) | | | (0.55 | ) |
Year Ended June 30, 2021 | | | 15.88 | | | | 0.19 | | | | 6.00 | | | | 6.19 | | | | (0.20 | ) | | | — | | | | (0.20 | ) |
Year Ended June 30, 2020 | | | 17.47 | | | | 0.23 | | | | (1.39 | ) | | | (1.16 | ) | | | (0.24 | ) | | | (0.19 | ) | | | (0.43 | ) |
Year Ended June 30, 2019 | | | 16.50 | | | | 0.23 | | | | 1.46 | | | | 1.69 | | | | (0.26 | ) | | | (0.46 | ) | | | (0.72 | ) |
Year Ended June 30, 2018 | | | 15.41 | | | | 0.17 | | | | 1.26 | | | | 1.43 | | | | (0.19 | ) | | | (0.15 | ) | | | (0.34 | ) |
Year Ended June 30, 2017 | | | 13.80 | | | | 0.16 | | | | 1.72 | | | | 1.88 | | | | (0.18 | ) | | | (0.09 | ) | | | (0.27 | ) |
| | | | | | | |
Class I | | | | | | | | | | | | | | | | | | | | | | | | | | | | |
Six Months Ended December 31, 2021 (Unaudited) | | | 22.76 | | | | 0.19 | | | | 1.54 | | | | 1.73 | | | | (0.19 | ) | | | (0.44 | ) | | | (0.63 | ) |
Year Ended June 30, 2021 | | | 16.52 | | | | 0.35 | | | | 6.23 | | | | 6.58 | | | | (0.34 | ) | | | — | | | | (0.34 | ) |
Year Ended June 30, 2020 | | | 18.14 | | | | 0.37 | | | | (1.43 | ) | | | (1.06 | ) | | | (0.37 | ) | | | (0.19 | ) | | | (0.56 | ) |
Year Ended June 30, 2019 | | | 17.10 | | | | 0.37 | | | | 1.51 | | | | 1.88 | | | | (0.38 | ) | | | (0.46 | ) | | | (0.84 | ) |
Year Ended June 30, 2018 | | | 15.92 | | | | 0.31 | | | | 1.31 | | | | 1.62 | | | | (0.29 | ) | | | (0.15 | ) | | | (0.44 | ) |
Year Ended June 30, 2017 | | | 14.23 | | | | 0.28 | | | | 1.77 | | | | 2.05 | | | | (0.27 | ) | | | (0.09 | ) | | | (0.36 | ) |
| | | | | | | |
Class R2 | | | | | | | | | | | | | | | | | | | | | | | | | | | | |
Six Months Ended December 31, 2021 (Unaudited) | | | 22.23 | | | | 0.12 | | | | 1.50 | | | | 1.62 | | | | (0.13 | ) | | | (0.44 | ) | | | (0.57 | ) |
Year Ended June 30, 2021 | | | 16.14 | | | | 0.23 | | | | 6.10 | | | | 6.33 | | | | (0.24 | ) | | | — | | | | (0.24 | ) |
Year Ended June 30, 2020 | | | 17.74 | | | | 0.27 | | | | (1.40 | ) | | | (1.13 | ) | | | (0.28 | ) | | | (0.19 | ) | | | (0.47 | ) |
Year Ended June 30, 2019 | | | 16.74 | | | | 0.28 | | | | 1.47 | | | | 1.75 | | | | (0.29 | ) | | | (0.46 | ) | | | (0.75 | ) |
Year Ended June 30, 2018 | | | 15.62 | | | | 0.21 | | | | 1.28 | | | | 1.49 | | | | (0.22 | ) | | | (0.15 | ) | | | (0.37 | ) |
Year Ended June 30, 2017 | | | 13.97 | | | | 0.20 | | | | 1.75 | | | | 1.95 | | | | (0.21 | ) | | | (0.09 | ) | | | (0.30 | ) |
| | | | | | | |
Class R3 | | | | | | | | | | | | | | | | | | | | | | | | | | | | |
Six Months Ended December 31, 2021 (Unaudited) | | | 22.32 | | | | 0.15 | | | | 1.52 | | | | 1.67 | | | | (0.16 | ) | | | (0.44 | ) | | | (0.60 | ) |
Year Ended June 30, 2021 | | | 16.21 | | | | 0.29 | | | | 6.11 | | | | 6.40 | | | | (0.29 | ) | | | — | | | | (0.29 | ) |
Year Ended June 30, 2020 | | | 17.81 | | | | 0.32 | | | | (1.41 | ) | | | (1.09 | ) | | | (0.32 | ) | | | (0.19 | ) | | | (0.51 | ) |
Year Ended June 30, 2019 | | | 16.80 | | | | 0.32 | | | | 1.49 | | | | 1.81 | | | | (0.34 | ) | | | (0.46 | ) | | | (0.80 | ) |
Year Ended June 30, 2018 | | | 15.66 | | | | 0.27 | | | | 1.27 | | | | 1.54 | | | | (0.25 | ) | | | (0.15 | ) | | | (0.40 | ) |
September 9, 2016 (f) through June 30, 2017 | | | 14.06 | | | | 0.19 | | | | 1.71 | | | | 1.90 | | | | (0.21 | ) | | | (0.09 | ) | | | (0.30 | ) |
| | | | | | | |
Class R4 | | | | | | | | | | | | | | | | | | | | | | | | | | | | |
Six Months Ended December 31, 2021 (Unaudited) | | | 22.75 | | | | 0.19 | | | | 1.53 | | | | 1.72 | | | | (0.19 | ) | | | (0.44 | ) | | | (0.63 | ) |
Year Ended June 30, 2021 | | | 16.51 | | | | 0.35 | | | | 6.23 | | | | 6.58 | | | | (0.34 | ) | | | — | | | | (0.34 | ) |
Year Ended June 30, 2020 | | | 18.13 | | | | 0.37 | | | | (1.43 | ) | | | (1.06 | ) | | | (0.37 | ) | | | (0.19 | ) | | | (0.56 | ) |
Year Ended June 30, 2019 | | | 17.09 | | | | 0.36 | | | | 1.52 | | | | 1.88 | | | | (0.38 | ) | | | (0.46 | ) | | | (0.84 | ) |
Year Ended June 30, 2018 | | | 15.92 | | | | 0.32 | | | | 1.29 | | | | 1.61 | | | | (0.29 | ) | | | (0.15 | ) | | | (0.44 | ) |
September 9, 2016 (f) through June 30, 2017 | | | 14.28 | | | | 0.29 | | | | 1.67 | | | | 1.96 | | | | (0.23 | ) | | | (0.09 | ) | | | (0.32 | ) |
| | | | | | | |
Class R5 | | | | | | | | | | | | | | | | | | | | | | | | | | | | |
Six Months Ended December 31, 2021 (Unaudited) | | | 22.78 | | | | 0.20 | | | | 1.55 | | | | 1.75 | | | | (0.21 | ) | | | (0.44 | ) | | | (0.65 | ) |
Year Ended June 30, 2021 | | | 16.53 | | | | 0.37 | | | | 6.25 | | | | 6.62 | | | | (0.37 | ) | | | — | | | | (0.37 | ) |
Year Ended June 30, 2020 | | | 18.16 | | | | 0.40 | | | | (1.45 | ) | | | (1.05 | ) | | | (0.39 | ) | | | (0.19 | ) | | | (0.58 | ) |
Year Ended June 30, 2019 | | | 17.11 | | | | 0.40 | | | | 1.51 | | | | 1.91 | | | | (0.40 | ) | | | (0.46 | ) | | | (0.86 | ) |
Year Ended June 30, 2018 | | | 15.93 | | | | 0.34 | | | | 1.30 | | | | 1.64 | | | | (0.31 | ) | | | (0.15 | ) | | | (0.46 | ) |
Year Ended June 30, 2017 | | | 14.23 | | | | 0.31 | | | | 1.78 | | | | 2.09 | | | | (0.30 | ) | | | (0.09 | ) | | | (0.39 | ) |
| | | | | | | |
Class R6 | | | | | | | | | | | | | | | | | | | | | | | | | | | | |
Six Months Ended December 31, 2021 (Unaudited) | | | 22.76 | | | | 0.22 | | | | 1.54 | | | | 1.76 | | | | (0.22 | ) | | | (0.44 | ) | | | (0.66 | ) |
Year Ended June 30, 2021 | | | 16.52 | | | | 0.39 | | | | 6.24 | | | | 6.63 | | | | (0.39 | ) | | | — | | | | (0.39 | ) |
Year Ended June 30, 2020 | | | 18.14 | | | | 0.42 | | | | (1.44 | ) | | | (1.02 | ) | | | (0.41 | ) | | | (0.19 | ) | | | (0.60 | ) |
Year Ended June 30, 2019 | | | 17.10 | | | | 0.42 | | | | 1.50 | | | | 1.92 | | | | (0.42 | ) | | | (0.46 | ) | | | (0.88 | ) |
Year Ended June 30, 2018 | | | 15.92 | | | | 0.35 | | | | 1.31 | | | | 1.66 | | | | (0.33 | ) | | | (0.15 | ) | | | (0.48 | ) |
Year Ended June 30, 2017 | | | 14.22 | | | | 0.32 | | | | 1.78 | | | | 2.10 | | | | (0.31 | ) | | | (0.09 | ) | | | (0.40 | ) |
| (a) | Annualized for periods less than one year, unless otherwise noted. |
| (b) | Calculated based upon average shares outstanding. |
| (c) | Not annualized for periods less than one year. |
| (d) | Includes adjustments in accordance with accounting principles generally accepted in the United States of America and as such, the net asset values for financial reporting purposes and the returns based upon those net asset values may differ from the net asset values and returns for shareholder transactions. |
| (e) | Includes earnings credits and interest expense, if applicable, each of which is less than 0.005% unless otherwise noted. |
| (f) | Commencement of offering of class of shares. |
SEE NOTES TO FINANCIAL STATEMENTS.
| | | | | | | | | | |
| | | | | |
| 122 | | | | | | | | J.P. MORGAN LARGE CAP FUNDS | | DECEMBER 31, 2021 |
| | | | | | | | | | | | | | | | | | | | | | | | | | |
| | | Ratios/Supplemental data | |
| | | | | | | Ratios to average net assets (a) | | | | |
Net asset
value,
end of
period | | | Total return
(excludes
sales charge) (c)(d) | | | Net assets,
end of
period
(000’s) | | | Net
expenses (e) | | | Net
investment
income
(loss) | | | Expenses
without waivers,
reimbursements and
earnings credits | | | Portfolio
turnover
rate (c) | |
| | |
| | |
| $ | 23.40 | | | | 7.55 | % | | $ | 5,069,630 | | | | 0.95 | % | | | 1.35 | % | | | 0.95 | % | | | 5 | % |
| | 22.34 | | | | 39.81 | | | | 4,715,916 | | | | 0.96 | | | | 1.48 | | | | 0.96 | | | | 16 | |
| | 16.22 | | | | (6.36 | ) | | | 3,234,850 | | | | 0.98 | | | | 1.83 | | | | 0.98 | | | | 22 | |
| | 17.83 | | | | 11.17 | | | | 3,277,249 | | | | 0.99 | | | | 1.90 | | | | 1.00 | | | | 23 | |
| | 16.82 | | | | 9.94 | | | | 3,022,879 | | | | 1.00 | | | | 1.55 | | | | 1.01 | | | | 20 | |
| | 15.67 | | | | 14.34 | | | | 3,176,361 | | | | 1.04 | | | | 1.59 | | | | 1.08 | | | | 14 | |
| | | | | | |
| | | | | | | | | | | | | | | | | | | | | | | | | | |
| | 22.89 | | | | 7.21 | | | | 1,484,655 | | | | 1.45 | | | | 0.84 | | | | 1.45 | | | | 5 | |
| | 21.87 | | | | 39.19 | | | | 1,493,408 | | | | 1.45 | | | | 0.99 | | | | 1.46 | | | | 16 | |
| | 15.88 | | | | (6.83 | ) | | | 1,350,402 | | | | 1.47 | | | | 1.34 | | | | 1.47 | | | | 22 | |
| | 17.47 | | | | 10.66 | | | | 1,434,793 | | | | 1.48 | | | | 1.39 | | | | 1.49 | | | | 23 | |
| | 16.50 | | | | 9.35 | | | | 1,303,731 | | | | 1.50 | | | | 1.05 | | | | 1.50 | | | | 20 | |
| | 15.41 | | | | 13.74 | | | | 1,385,115 | | | | 1.54 | | | | 1.09 | | | | 1.55 | | | | 14 | |
| | | | | | |
| | | | | | | | | | | | | | | | | | | | | | | | | | |
| | 23.86 | | | | 7.67 | | | | 19,638,384 | | | | 0.70 | | | | 1.60 | | | | 0.70 | | | | 5 | |
| | 22.76 | | | | 40.16 | | | | 17,980,353 | | | | 0.70 | | | | 1.73 | | | | 0.71 | | | | 16 | |
| | 16.52 | | | | (6.06 | ) | | | 10,727,252 | | | | 0.71 | | | | 2.11 | | | | 0.72 | | | | 22 | |
| | 18.14 | | | | 11.45 | | | | 9,013,293 | | | | 0.73 | | | | 2.12 | | | | 0.74 | | | | 23 | |
| | 17.10 | | | | 10.22 | | | | 6,320,979 | | | | 0.74 | | | | 1.81 | | | | 0.75 | | | | 20 | |
| | 15.92 | | | | 14.57 | | | | 6,542,906 | | | | 0.78 | | | | 1.84 | | | | 0.79 | | | | 14 | |
| | | | | | |
| | | | | | | | | | | | | | | | | | | | | | | | | | |
| | 23.28 | | | | 7.35 | | | | 76,797 | | | | 1.21 | | | | 1.08 | | | | 1.21 | | | | 5 | |
| | 22.23 | | | | 39.47 | | | | 77,859 | | | | 1.22 | | | | 1.22 | | | | 1.22 | | | | 16 | |
| | 16.14 | | | | (6.57 | ) | | | 72,182 | | | | 1.23 | | | | 1.56 | | | | 1.23 | | | | 22 | |
| | 17.74 | | | | 10.90 | | | | 93,453 | | | | 1.24 | | | | 1.64 | | | | 1.25 | | | | 23 | |
| | 16.74 | | | | 9.59 | | | | 80,330 | | | | 1.26 | | | | 1.29 | | | | 1.26 | | | | 20 | |
| | 15.62 | | | | 14.08 | | | | 87,437 | | | | 1.29 | | | | 1.34 | | | | 1.39 | | | | 14 | |
| | | | | | |
| | | | | | | | | | | | | | | | | | | | | | | | | | |
| | 23.39 | | | | 7.55 | | | | 262,607 | | | | 0.95 | | | | 1.33 | | | | 0.95 | | | | 5 | |
| | 22.32 | | | | 39.79 | | | | 280,991 | | | | 0.95 | | | | 1.49 | | | | 0.96 | | | | 16 | |
| | 16.21 | | | | (6.29 | ) | | | 170,246 | | | | 0.97 | | | | 1.86 | | | | 0.97 | | | | 22 | |
| | 17.81 | | | | 11.20 | | | | 137,142 | | | | 0.98 | | | | 1.87 | | | | 0.99 | | | | 23 | |
| | 16.80 | | | | 9.90 | | | | 91,267 | | | | 0.99 | | | | 1.61 | | | | 0.99 | | | | 20 | |
| | 15.66 | | | | 13.62 | | | | 25,209 | | | | 1.03 | | | | 1.55 | | | | 1.05 | | | | 14 | |
| | | | | | |
| | | | | | | | | | | | | | | | | | | | | | | | | | |
| | 23.84 | | | | 7.63 | | | | 228,730 | | | | 0.70 | | | | 1.59 | | | | 0.70 | | | | 5 | |
| | 22.75 | | | | 40.19 | | | | 249,525 | | | | 0.70 | | | | 1.73 | | | | 0.70 | | | | 16 | |
| | 16.51 | | | | (6.07 | ) | | | 106,277 | | | | 0.72 | | | | 2.12 | | | | 0.72 | | | | 22 | |
| | 18.13 | | | | 11.46 | | | | 66,602 | | | | 0.73 | | | | 2.08 | | | | 0.74 | | | | 23 | |
| | 17.09 | | | | 10.18 | | | | 23,451 | | | | 0.74 | | | | 1.90 | | | | 0.75 | | | | 20 | |
| | 15.92 | | | | 13.85 | | | | 1,340 | | | | 0.78 | | | | 2.28 | | | | 0.83 | | | | 14 | |
| | | | | | |
| | | | | | | | | | | | | | | | | | | | | | | | | | |
| | 23.88 | | | | 7.74 | | | | 1,640,250 | | | | 0.55 | | | | 1.74 | | | | 0.55 | | | | 5 | |
| | 22.78 | | | | 40.41 | | | | 1,655,531 | | | | 0.55 | | | | 1.88 | | | | 0.56 | | | | 16 | |
| | 16.53 | | | | (5.98 | ) | | | 1,230,147 | | | | 0.56 | | | | 2.24 | | | | 0.57 | | | | 22 | |
| | 18.16 | | | | 11.67 | | | | 1,422,483 | | | | 0.58 | | | | 2.29 | | | | 0.59 | | | | 23 | |
| | 17.11 | | | | 10.38 | | | | 1,097,476 | | | | 0.59 | | | | 1.98 | | | | 0.60 | | | | 20 | |
| | 15.93 | | | | 14.84 | | | | 912,746 | | | | 0.58 | | | | 2.05 | | | | 0.63 | | | | 14 | |
| | | | | | |
| | | | | | | | | | | | | | | | | | | | | | | | | | |
| | 23.86 | | | | 7.81 | | | | 22,709,973 | | | | 0.45 | | | | 1.85 | | | | 0.45 | | | | 5 | |
| | 22.76 | | | | 40.51 | | | | 19,952,074 | | | | 0.45 | | | | 1.98 | | | | 0.46 | | | | 16 | |
| | 16.52 | | | | (5.83 | ) | | | 12,663,581 | | | | 0.46 | | | | 2.38 | | | | 0.47 | | | | 22 | |
| | 18.14 | | | | 11.72 | | | | 8,217,432 | | | | 0.48 | | | | 2.38 | | | | 0.49 | | | | 23 | |
| | 17.10 | | | | 10.49 | | | | 5,314,382 | | | | 0.49 | | | | 2.08 | | | | 0.50 | | | | 20 | |
| | 15.92 | | | | 14.95 | | | | 2,821,798 | | | | 0.50 | | | | 2.13 | | | | 0.50 | | | | 14 | |
SEE NOTES TO FINANCIAL STATEMENTS.
| | | | | | | | | | |
| | | | | |
| DECEMBER 31, 2021 | | J.P. MORGAN LARGE CAP FUNDS | | | | | | | | 123 |
FINANCIAL HIGHLIGHTS
FOR THE PERIODS INDICATED (continued)
| | | | | | | | | | | | | | | | | | | | |
| | | Per share operating performance | |
| | | | | | Investment operations | | | Distributions | |
| | | Net asset
value,
beginning
of period | | | Net
investment
income
(loss) (b) | | | Net realized
and unrealized
gains
(losses) on
investments | | | Total from
investment
operations | | | Net
investment
income | |
JPMorgan Equity Premium Income Fund | | | | | | | | | | | | | | | | | | | | |
Class A | | | | | | | | | | | | | | | | | | | | |
Six Months Ended December 31, 2021 (Unaudited) | | $ | 15.23 | | | $ | 0.57 | | | $ | 0.71 | | | $ | 1.28 | | | $ | (0.55 | ) |
Year Ended June 30, 2021 | | | 12.96 | | | | 1.26 | | | | 2.40 | | | | 3.66 | | | | (1.39 | ) |
Year Ended June 30, 2020 | | | 14.92 | | | | 1.88 | | | | (2.42 | ) | | | (0.54 | ) | | | (1.42 | ) |
August 31, 2018 (f) through June 30, 2019 | | | 15.00 | | | | 0.95 | | | | (0.11 | ) | | | 0.84 | | | | (0.92 | ) |
| | | | | |
Class C | | | | | | | | | | | | | | | | | | | | |
Six Months Ended December 31, 2021 (Unaudited) | | | 15.23 | | | | 0.53 | | | | 0.71 | | | | 1.24 | | | | (0.51 | ) |
Year Ended June 30, 2021 | | | 12.96 | | | | 1.15 | | | | 2.44 | | | | 3.59 | | | | (1.32 | ) |
Year Ended June 30, 2020 | | | 14.92 | | | | 1.61 | | | | (2.22 | ) | | | (0.61 | ) | | | (1.35 | ) |
August 31, 2018 (f) through June 30, 2019 | | | 15.00 | | | | 0.85 | | | | (0.07 | ) | | | 0.78 | | | | (0.86 | ) |
| | | | | |
Class I | | | | | | | | | | | | | | | | | | | | |
Six Months Ended December 31, 2021 (Unaudited) | | | 15.23 | | | | 0.59 | | | | 0.71 | | | | 1.30 | | | | (0.57 | ) |
Year Ended June 30, 2021 | | | 12.96 | | | | 1.38 | | | | 2.32 | | | | 3.70 | | | | (1.43 | ) |
Year Ended June 30, 2020 | | | 14.92 | | | | 1.59 | | | | (2.10 | ) | | | (0.51 | ) | | | (1.45 | ) |
August 31, 2018 (f) through June 30, 2019 | | | 15.00 | | | | 0.94 | | | | (0.07 | ) | | | 0.87 | | | | (0.95 | ) |
| | | | | |
Class R5 | | | | | | | | | | | | | | | | | | | | |
Six Months Ended December 31, 2021 (Unaudited) | | | 15.23 | | | | 0.58 | | | | 0.73 | | | | 1.31 | | | | (0.58 | ) |
Year Ended June 30, 2021 | | | 12.96 | | | | 1.37 | | | | 2.35 | | | | 3.72 | | | | (1.45 | ) |
Year Ended June 30, 2020 | | | 14.92 | | | | 1.48 | | | | (1.96 | ) | | | (0.48 | ) | | | (1.48 | ) |
August 31, 2018 (f) through June 30, 2019 | | | 15.00 | | | | 0.96 | | | | (0.08 | ) | | | 0.88 | | | | (0.96 | ) |
| | | | | |
Class R6 | | | | | | | | | | | | | | | | | | | | |
Six Months Ended December 31, 2021 (Unaudited) | | | 15.23 | | | | 0.59 | | | | 0.73 | | | | 1.32 | | | | (0.59 | ) |
Year Ended June 30, 2021 | | | 12.96 | | | | 1.43 | | | | 2.30 | | | | 3.73 | | | | (1.46 | ) |
Year Ended June 30, 2020 | | | 14.92 | | | | 1.83 | | | | (2.30 | ) | | | (0.47 | ) | | | (1.49 | ) |
August 31, 2018 (f) through June 30, 2019 | | | 15.00 | | | | 0.97 | | | | (0.07 | ) | | | 0.90 | | | | (0.98 | ) |
| (a) | Annualized for periods less than one year, unless otherwise noted. |
| (b) | Calculated based upon average shares outstanding. |
| (c) | Not annualized for periods less than one year. |
| (d) | Includes adjustments in accordance with accounting principles generally accepted in the United States of America and as such, the net asset values for financial reporting purposes and the returns based upon those net asset values may differ from the net asset values and returns for shareholder transactions. |
| (e) | Includes earnings credits and interest expense, if applicable, each of which is less than 0.005% unless otherwise noted. |
| (f) | Commencement of operations. |
| (g) | Certain non-recurring expenses incurred by the Fund were not annualized for the period indicated. |
SEE NOTES TO FINANCIAL STATEMENTS.
| | | | | | | | | | |
| | | | | |
| 124 | | | | | | | | J.P. MORGAN LARGE CAP FUNDS | | DECEMBER 31, 2021 |
| | | | | | | | | | | | | | | | | | | | | | | | | | |
| | | Ratios/Supplemental data | |
| | | | | | | | | | Ratios to average net assets (a) | | | | |
Net asset
value,
end of
period | | | Total return
(excludes
sales charge) (c)(d) | | | Net assets,
end of
period
(000’s) | | | Net
expenses (e) | | | Net
investment
income
(loss) | | | Expenses
without waivers,
reimbursements and
earnings credits | | | Portfolio
turnover
rate (c) | |
| | | | | | | | | | |
| | | | | | | | | | |
| $ | 15.96 | | | | 8.60 | % | | $ | 516,483 | | | | 0.85 | % | | | 7.30 | % | | | 0.86 | % | | | 94 | % |
| | 15.23 | | | | 29.67 | | | | 174,085 | | | | 0.85 | | | | 8.61 | | | | 0.91 | | | | 217 | |
| | 12.96 | | | | (3.78 | ) | | | 12,904 | | | | 0.85 | | | | 14.21 | | | | 1.11 | | | | 236 | |
| | 14.92 | | | | 5.95 | | | | 125 | | | | 0.85 | (g) | | | 7.90 | (g) | | | 1.80 | (g) | | | 43 | |
| | | | | | |
| | | | | | | | | | | | | | | | | | | | | | | | | | |
| | 15.96 | | | | 8.33 | | | | 454,267 | | | | 1.35 | | | | 6.80 | | | | 1.36 | | | | 94 | |
| | 15.23 | | | | 29.03 | | | | 158,340 | | | | 1.34 | | | | 7.76 | | | | 1.40 | | | | 217 | |
| | 12.96 | | | | (4.26 | ) | | | 4,710 | | | | 1.35 | | | | 11.77 | | | | 1.61 | | | | 236 | |
| | 14.92 | | | | 5.50 | | | | 21 | | | | 1.35 | (g) | | | 7.14 | (g) | | | 2.26 | (g) | | | 43 | |
| | | | | | |
| | | | | | | | | | | | | | | | | | | | | | | | | | |
| | 15.96 | | | | 8.74 | | | | 1,115,036 | | | | 0.60 | | | | 7.48 | | | | 0.62 | | | | 94 | |
| | 15.23 | | | | 29.97 | | | | 519,976 | | | | 0.60 | | | | 9.62 | | | | 0.69 | | | | 217 | |
| | 12.96 | | | | (3.57 | ) | | | 173,409 | | | | 0.60 | | | | 11.40 | | | | 0.91 | | | | 236 | |
| | 14.92 | | | | 6.15 | | | | 54,045 | | | | 0.60 | (g) | | | 7.89 | (g) | | | 1.13 | (g) | | | 43 | |
| | | | | | |
| | | | | | | | | | | | | | | | | | | | | | | | | | |
| | 15.96 | | | | 8.82 | | | | 76 | | | | 0.45 | | | | 7.43 | | | | 0.50 | | | | 94 | |
| | 15.23 | | | | 30.16 | | | | 88 | | | | 0.45 | | | | 9.54 | | | | 0.56 | | | | 217 | |
| | 12.96 | | | | (3.43 | ) | | | 21 | | | | 0.45 | | | | 10.37 | | | | 0.83 | | | | 236 | |
| | 14.92 | | | | 6.28 | | | | 21 | | | | 0.45 | (g) | | | 8.04 | (g) | | | 1.36 | (g) | | | 43 | |
| | | | | | |
| | | | | | | | | | | | | | | | | | | | | | | | | | |
| | 15.96 | | | | 8.87 | | | | 56,083 | | | | 0.35 | | | | 7.60 | | | | 0.37 | | | | 94 | |
| | 15.23 | | | | 30.29 | | | | 48,315 | | | | 0.35 | | | | 9.99 | | | | 0.44 | | | | 217 | |
| | 12.96 | | | | (3.33 | ) | | | 686 | | | | 0.35 | | | | 13.60 | | | | 0.59 | | | | 236 | |
| | 14.92 | | | | 6.37 | | | | 21 | | | | 0.35 | (g) | | | 8.14 | (g) | | | 1.26 | (g) | | | 43 | |
SEE NOTES TO FINANCIAL STATEMENTS.
| | | | | | | | | | |
| | | | | |
| DECEMBER 31, 2021 | | J.P. MORGAN LARGE CAP FUNDS | | | | | | | | 125 |
FINANCIAL HIGHLIGHTS
FOR THE PERIODS INDICATED (continued)
| | | | | | | | | | | | | | | | | | | | |
| | | Per share operating performance | |
| | | | | | Investment operations | | | Distributions | |
| | | Net asset
value,
beginning
of period | | | Net
investment
income
(loss) (b) | | | Net realized
and unrealized
gains
(losses) on
investments | | | Total from
investment
operations | | | Net
investment
income | |
JPMorgan Hedged Equity Fund | | | | | | | | | | | | | | | | | | | | |
Class A | | | | | | | | | | | | | | | | | | | | |
Six Months Ended December 31, 2021 (Unaudited) | | $ | 25.90 | | | $ | 0.06 | | | $ | 1.00 | | | $ | 1.06 | | | $ | (0.08 | ) |
Year Ended June 30, 2021 | | | 21.83 | | | | 0.15 | | | | 4.11 | | | | 4.26 | | | | (0.19 | ) |
Year Ended June 30, 2020 | | | 20.23 | | | | 0.28 | | | | 1.51 | | | | 1.79 | | | | (0.19 | ) |
Year Ended June 30, 2019 | | | 19.43 | | | | 0.20 | | | | 0.79 | | | | 0.99 | | | | (0.19 | ) |
Year Ended June 30, 2018 | | | 18.24 | | | | 0.18 | | | | 1.15 | | | | 1.33 | | | | (0.14 | ) |
Year Ended June 30, 2017 | | | 16.23 | | | | 0.19 | | | | 2.01 | | | | 2.20 | | | | (0.19 | ) |
| | | | | |
Class C | | | | | | | | | | | | | | | | | | | | |
Six Months Ended December 31, 2021 (Unaudited) | | | 25.72 | | | | — | (f) | | | 0.98 | | | | 0.98 | | | | (0.01 | ) |
Year Ended June 30, 2021 | | | 21.70 | | | | 0.03 | | | | 4.07 | | | | 4.10 | | | | (0.08 | ) |
Year Ended June 30, 2020 | | | 20.10 | | | | 0.17 | | | | 1.52 | | | | 1.69 | | | | (0.09 | ) |
Year Ended June 30, 2019 | | | 19.33 | | | | 0.11 | | | | 0.77 | | | | 0.88 | | | | (0.11 | ) |
Year Ended June 30, 2018 | | | 18.16 | | | | 0.08 | | | | 1.15 | | | | 1.23 | | | | (0.06 | ) |
Year Ended June 30, 2017 | | | 16.17 | | | | 0.10 | | | | 2.01 | | | | 2.11 | | | | (0.12 | ) |
| | | | | |
Class I | | | | | | | | | | | | | | | | | | | | |
Six Months Ended December 31, 2021 (Unaudited) | | | 25.98 | | | | 0.10 | | | | 0.99 | | | | 1.09 | | | | (0.11 | ) |
Year Ended June 30, 2021 | | | 21.90 | | | | 0.21 | | | | 4.11 | | | | 4.32 | | | | (0.24 | ) |
Year Ended June 30, 2020 | | | 20.28 | | | | 0.33 | | | | 1.53 | | | | 1.86 | | | | (0.24 | ) |
Year Ended June 30, 2019 | | | 19.47 | | | | 0.26 | | | | 0.78 | | | | 1.04 | | | | (0.23 | ) |
Year Ended June 30, 2018 | | | 18.27 | | | | 0.23 | | | | 1.16 | | | | 1.39 | | | | (0.19 | ) |
Year Ended June 30, 2017 | | | 16.26 | | | | 0.23 | | | | 2.01 | | | | 2.24 | | | | (0.23 | ) |
| | | | | |
Class R5 | | | | | | | | | | | | | | | | | | | | |
Six Months Ended December 31, 2021 (Unaudited) | | | 26.02 | | | | 0.12 | | | | 1.00 | | | | 1.12 | | | | (0.13 | ) |
Year Ended June 30, 2021 | | | 21.93 | | | | 0.25 | | | | 4.11 | | | | 4.36 | | | | (0.27 | ) |
Year Ended June 30, 2020 | | | 20.32 | | | | 0.36 | | | | 1.52 | | | | 1.88 | | | | (0.27 | ) |
Year Ended June 30, 2019 | | | 19.50 | | | | 0.29 | | | | 0.79 | | | | 1.08 | | | | (0.26 | ) |
Year Ended June 30, 2018 | | | 18.30 | | | | 0.26 | | | | 1.16 | | | | 1.42 | | | | (0.22 | ) |
Year Ended June 30, 2017 | | | 16.28 | | | | 0.26 | | | | 2.02 | | | | 2.28 | | | | (0.26 | ) |
| | | | | |
Class R6 | | | | | | | | | | | | | | | | | | | | |
Six Months Ended December 31, 2021 (Unaudited) | | | 26.04 | | | | 0.13 | | | | 0.99 | | | | 1.12 | | | | (0.14 | ) |
Year Ended June 30, 2021 | | | 21.95 | | | | 0.28 | | | | 4.11 | | | | 4.39 | | | | (0.30 | ) |
Year Ended June 30, 2020 | | | 20.32 | | | | 0.39 | | | | 1.53 | | | | 1.92 | | | | (0.29 | ) |
Year Ended June 30, 2019 | | | 19.49 | | | | 0.31 | | | | 0.79 | | | | 1.10 | | | | (0.27 | ) |
Year Ended June 30, 2018 | | | 18.29 | | | | 0.27 | | | | 1.16 | | | | 1.43 | | | | (0.23 | ) |
Year Ended June 30, 2017 | | | 16.28 | | | | 0.25 | | | | 2.03 | | | | 2.28 | | | | (0.27 | ) |
| (a) | Annualized for periods less than one year, unless otherwise noted. |
| (b) | Calculated based upon average shares outstanding. |
| (c) | Not annualized for periods less than one year. |
| (d) | Includes adjustments in accordance with accounting principles generally accepted in the United States of America and as such, the net asset values for financial reporting purposes and the returns based upon those net asset values may differ from the net asset values and returns for shareholder transactions. |
| (e) | Includes earnings credits and interest expense, if applicable, each of which is less than 0.005% unless otherwise noted. |
| (f) | Amount rounds to less than $0.005. |
SEE NOTES TO FINANCIAL STATEMENTS.
| | | | | | | | | | |
| | | | | |
| 126 | | | | | | | | J.P. MORGAN LARGE CAP FUNDS | | DECEMBER 31, 2021 |
| | | | | | | | | | | | | | | | | | | | | | | | | | |
| | | Ratios/Supplemental data | |
| | | | | | | | | | Ratios to average net assets (a) | | | | |
Net asset
value,
end of
period | | | Total return
(excludes
sales charge) (c)(d) | | |
Net assets,
end of period
(000’s) | | | Net
expenses (e) | | | Net
investment
income
(loss) | | | Expenses
without waivers,
reimbursements and
earnings credits | | | Portfolio
turnover
rate (c) | |
| | | | | | | | | | | | | | | | | | | | | | | | | | |
| | | | | | | | | | | | | | | | | | | | | | | | | | |
| $ | 26.88 | | | | 4.08 | % | | $ | 1,913,441 | | | | 0.83 | % | | | 0.48 | % | | | 0.83 | % | | | 16 | % |
| | 25.90 | | | | 19.58 | | | | 1,778,457 | | | | 0.83 | | | | 0.61 | | | | 0.84 | | | | 39 | |
| | 21.83 | | | | 8.89 | | | | 473,314 | | | | 0.85 | | | | 1.35 | | | | 0.86 | | | | 68 | |
| | 20.23 | | | | 5.12 | | | | 296,242 | | | | 0.85 | | | | 1.02 | | | | 0.87 | | | | 48 | |
| | 19.43 | | | | 7.33 | | | | 277,898 | | | | 0.84 | | | | 0.92 | | | | 0.87 | | | | 44 | |
| | 18.24 | | | | 13.60 | | | | 133,789 | | | | 0.84 | | | | 1.06 | | | | 1.05 | | | | 31 | |
| | | | | | |
| | | | | | | | | | | | | | | | | | | | | | | | | | |
| | 26.69 | | | | 3.82 | | | | 515,143 | | | | 1.33 | | | | (0.02 | ) | | | 1.33 | | | | 16 | |
| | 25.72 | | | | 18.93 | | | | 502,120 | | | | 1.33 | | | | 0.14 | | | | 1.33 | | | | 39 | |
| | 21.70 | | | | 8.40 | | | | 246,741 | | | | 1.35 | | | | 0.84 | | | | 1.36 | | | | 68 | |
| | 20.10 | | | | 4.60 | | | | 158,602 | | | | 1.35 | | | | 0.55 | | | | 1.37 | | | | 48 | |
| | 19.33 | | | | 6.79 | | | | 81,030 | | | | 1.34 | | | | 0.42 | | | | 1.38 | | | | 44 | |
| | 18.16 | | | | 13.07 | | | | 29,168 | | | | 1.34 | | | | 0.55 | | | | 1.45 | | | | 31 | |
| | | | | | |
| | | | | | | | | | | | | | | | | | | | | | | | | | |
| | 26.96 | | | | 4.20 | | | | 15,257,745 | | | | 0.58 | | | | 0.73 | | | | 0.58 | | | | 16 | |
| | 25.98 | | | | 19.83 | | | | 14,416,679 | | | | 0.58 | | | | 0.89 | | | | 0.58 | | | | 39 | |
| | 21.90 | | | | 9.21 | | | | 7,167,488 | | | | 0.59 | | | | 1.59 | | | | 0.60 | | | | 68 | |
| | 20.28 | | | | 5.39 | | | | 4,214,453 | | | | 0.60 | | | | 1.30 | | | | 0.61 | | | | 48 | |
| | 19.47 | | | | 7.63 | | | | 1,947,444 | | | | 0.59 | | | | 1.17 | | | | 0.62 | | | | 44 | |
| | 18.27 | | | | 13.86 | | | | 597,013 | | | | 0.59 | | | | 1.30 | | | | 0.69 | | | | 31 | |
| | | | | | |
| | | | | | | | | | | | | | | | | | | | | | | | | | |
| | 27.01 | | | | 4.31 | | | | 6,393 | | | | 0.43 | | | | 0.88 | | | | 0.43 | | | | 16 | |
| | 26.02 | | | | 20.01 | | | | 6,024 | | | | 0.44 | | | | 1.03 | | | | 0.45 | | | | 39 | |
| | 21.93 | | | | 9.30 | | | | 2,964 | | | | 0.45 | | | | 1.74 | | | | 0.59 | | | | 68 | |
| | 20.32 | | | | 5.57 | | | | 1,893 | | | | 0.45 | | | | 1.46 | | | | 0.95 | | | | 48 | |
| | 19.50 | | | | 7.81 | | | | 123 | | | | 0.39 | | | | 1.37 | | | | 0.67 | | | | 44 | |
| | 18.30 | | | | 14.10 | | | | 37 | | | | 0.40 | | | | 1.51 | | | | 1.08 | | | | 31 | |
| | | | | | |
| | | | | | | | | | | | | | | | | | | | | | | | | | |
| | 27.02 | | | | 4.32 | | | | 1,863,086 | | | | 0.33 | | | | 0.98 | | | | 0.33 | | | | 16 | |
| | 26.04 | | | | 20.11 | | | | 1,591,643 | | | | 0.33 | | | | 1.14 | | | | 0.34 | | | | 39 | |
| | 21.95 | | | | 9.50 | | | | 851,085 | | | | 0.35 | | | | 1.87 | | | | 0.35 | | | | 68 | |
| | 20.32 | | | | 5.69 | | | | 384,616 | | | | 0.35 | | | | 1.56 | | | | 0.37 | | | | 48 | |
| | 19.49 | | | | 7.87 | | | | 121,897 | | | | 0.34 | | | | 1.42 | | | | 0.42 | | | | 44 | |
| | 18.29 | | | | 14.09 | | | | 3,289 | | | | 0.34 | | | | 1.41 | | | | 0.42 | | | | 31 | |
SEE NOTES TO FINANCIAL STATEMENTS.
| | | | | | | | | | |
| | | | | |
| DECEMBER 31, 2021 | | J.P. MORGAN LARGE CAP FUNDS | | | | | | | | 127 |
FINANCIAL HIGHLIGHTS
FOR THE PERIODS INDICATED (continued)
| | | | | | | | | | | | | | | | | | | | |
| | | Per share operating performance | |
| | | | | | Investment operations | | | Distributions | |
| | | Net asset
value,
beginning
of period | | | Net
investment
income
(loss) (b) | | | Net realized
and unrealized
gains
(losses) on
investments | | | Total from
investment
operations | | | Net
investment
income | |
JPMorgan Hedged Equity 2 Fund | | | | | | | | | | | | | | | | | | | | |
Class A | | | | | | | | | | | | | | | | | | | | |
Six Months Ended December 31, 2021 (Unaudited) | | $ | 15.97 | | | $ | 0.04 | | | $ | 1.10 | | | $ | 1.14 | | | $ | (0.04 | ) |
February 26, 2021 (f) through June 30, 2021 | | | 15.00 | | | | 0.03 | | | | 0.95 | | | | 0.98 | | | | (0.01 | ) |
| | | | | |
Class C | | | | | | | | | | | | | | | | | | | | |
Six Months Ended December 31, 2021 (Unaudited) | | | 15.95 | | | | — | (h) | | | 1.10 | | | | 1.10 | | | | — | (h) |
February 26, 2021 (f) through June 30, 2021 | | | 15.00 | | | | — | (h) | | | 0.95 | | | | 0.95 | | | | — | (h) |
| | | | | |
Class I | | | | | | | | | | | | | | | | | | | | |
Six Months Ended December 31, 2021 (Unaudited) | | | 15.98 | | | | 0.06 | | | | 1.10 | | | | 1.16 | | | | (0.05 | ) |
February 26, 2021 (f) through June 30, 2021 | | | 15.00 | | | | 0.04 | | | | 0.96 | | | | 1.00 | | | | (0.02 | ) |
| | | | | |
Class R5 | | | | | | | | | | | | | | | | | | | | |
Six Months Ended December 31, 2021 (Unaudited) | | | 15.98 | | | | 0.07 | | | | 1.11 | | | | 1.18 | | | | (0.06 | ) |
February 26, 2021 (f) through June 30, 2021 | | | 15.00 | | | | 0.05 | | | | 0.95 | | | | 1.00 | | | | (0.02 | ) |
| | | | | |
Class R6 | | | | | | | | | | | | | | | | | | | | |
Six Months Ended December 31, 2021 (Unaudited) | | | 15.99 | | | | 0.08 | | | | 1.11 | | | | 1.19 | | | | (0.07 | ) |
February 26, 2021 (f) through June 30, 2021 | | | 15.00 | | | | 0.05 | | | | 0.96 | | | | 1.01 | | | | (0.02 | ) |
| (a) | Annualized for periods less than one year, unless otherwise noted. |
| (b) | Calculated based upon average shares outstanding. |
| (c) | Not annualized for periods less than one year. |
| (d) | Includes adjustments in accordance with accounting principles generally accepted in the United States of America and as such, the net asset values for financial reporting purposes and the returns based upon those net asset values may differ from the net asset values and returns for shareholder transactions. |
| (e) | Includes earnings credits and interest expense, if applicable, each of which is less than 0.005% unless otherwise noted. |
| (f) | Commencement of operations. |
| (g) | Certain non-recurring expenses incurred by the Fund were not annualized for the period indicated. |
| (h) | Amount rounds to less than $0.005. |
SEE NOTES TO FINANCIAL STATEMENTS.
| | | | | | | | | | |
| | | | | |
| 128 | | | | | | | | J.P. MORGAN LARGE CAP FUNDS | | DECEMBER 31, 2021 |
| | | | | | | | | | | | | | | | | | | | | | | | | | |
| | | Ratios/Supplemental data | |
| | | | | | | | | | Ratios to average net assets (a) | | | | |
Net asset
value,
end of
period | | | Total return
(excludes
sales charge) (c)(d) | | | Net assets,
end of
period
(000’s) | | | Net
expenses (e) | | | Net
investment
income
(loss) | | | Expenses
without waivers,
reimbursements and
earnings credits | | | Portfolio
turnover
rate (c) | |
| | | | | | | | | | |
| | | | | | | | | | |
| $ | 17.07 | | | | 7.13 | % | | $ | 233,103 | | | | 0.85 | % | | | 0.48 | % | | | 0.86 | % | | | 13 | % |
| | 15.97 | | | | 6.54 | | | | 52,880 | | | | 0.85 | (g) | | | 0.57 | (g) | | | 0.92 | (g) | | | 6 | |
| | | | | | |
| | | | | | | | | | | | | | | | | | | | | | | | | | |
| | 17.05 | | | | 6.92 | | | | 180,578 | | | | 1.35 | | | | (0.04 | ) | | | 1.36 | | | | 13 | |
| | 15.95 | | | | 6.36 | | | | 57,423 | | | | 1.35 | (g) | | | 0.05 | (g) | | | 1.43 | (g) | | | 6 | |
| | | | | | |
| | | | | | | | | | | | | | | | | | | | | | | | | | |
| | 17.09 | | | | 7.29 | | | | 2,970,051 | | | | 0.60 | | | | 0.71 | | | | 0.61 | | | | 13 | |
| | 15.98 | | | | 6.63 | | | | 1,018,781 | | | | 0.60 | (g) | | | 0.80 | (g) | | | 0.70 | (g) | | | 6 | |
| | | | | | |
| | | | | | | | | | | | | | | | | | | | | | | | | | |
| | 17.10 | | | | 7.41 | | | | 582 | | | | 0.45 | | | | 0.83 | | | | 0.46 | | | | 13 | |
| | 15.98 | | | | 6.66 | | | | 536 | | | | 0.45 | (g) | | | 0.99 | (g) | | | 0.88 | (g) | | | 6 | |
| | | | | | |
| | | | | | | | | | | | | | | | | | | | | | | | | | |
| | 17.11 | | | | 7.46 | | | | 508,914 | | | | 0.35 | | | | 0.94 | | | | 0.36 | | | | 13 | |
| | 15.99 | | | | 6.75 | | | | 262,248 | | | | 0.35 | (g) | | | 1.04 | (g) | | | 0.43 | (g) | | | 6 | |
SEE NOTES TO FINANCIAL STATEMENTS.
| | | | | | | | | | |
| | | | | |
| DECEMBER 31, 2021 | | J.P. MORGAN LARGE CAP FUNDS | | | | | | | | 129 |
FINANCIAL HIGHLIGHTS
FOR THE PERIODS INDICATED (continued)
| | | | | | | | | | | | | | | | | | | | |
| | | Per share operating performance | |
| | | | | | Investment operations | | | Distributions | |
| | | Net asset
value,
beginning
of period | | | Net
investment
income
(loss) (b) | | | Net realized
and unrealized
gains
(losses) on
investments | | | Total from
investment
operations | | | Net
investment
income | |
JPMorgan Hedged Equity 3 Fund | | | | | | | | | | | | | | | | | | | | |
Class A | | | | | | | | | | | | | | | | | | | | |
Six Months Ended December 31, 2021 (Unaudited) | | $ | 15.96 | | | $ | 0.04 | | | $ | 0.91 | | | $ | 0.95 | | | $ | (0.03 | ) |
February 26, 2021 (f) through June 30, 2021 | | | 15.00 | | | | 0.03 | | | | 0.95 | | | | 0.98 | | | | (0.02 | ) |
| | | | | |
Class C | | | | | | | | | | | | | | | | | | | | |
Six Months Ended December 31, 2021 (Unaudited) | | | 15.95 | | | | — | (h) | | | 0.91 | | | | 0.91 | | | | (0.01 | ) |
February 26, 2021 (f) through June 30, 2021 | | | 15.00 | | | | — | (h) | | | 0.96 | | | | 0.96 | | | | (0.01 | ) |
| | | | | |
Class I | | | | | | | | | | | | | | | | | | | | |
Six Months Ended December 31, 2021 (Unaudited) | | | 15.98 | | | | 0.06 | | | | 0.92 | | | | 0.98 | | | | (0.05 | ) |
February 26, 2021 (f) through June 30, 2021 | | | 15.00 | | | | 0.04 | | | | 0.96 | | | | 1.00 | | | | (0.02 | ) |
| | | | | |
Class R5
| | | | | | | | | | | | | | | | | | | | |
Six Months Ended December 31, 2021 (Unaudited) | | | 15.98 | | | | 0.07 | | | | 0.92 | | | | 0.99 | | | | (0.05 | ) |
February 26, 2021 (f) through June 30, 2021 | | | 15.00 | | | | 0.05 | | | | 0.95 | | | | 1.00 | | | | (0.02 | ) |
| | | | | |
Class R6 | | | | | | | | | | | | | | | | | | | | |
Six Months Ended December 31, 2021 (Unaudited) | | | 15.98 | | | | 0.08 | | | | 0.92 | | | | 1.00 | | | | (0.06 | ) |
February 26, 2021 (f) through June 30, 2021 | | | 15.00 | | | | 0.06 | | | | 0.94 | | | | 1.00 | | | | (0.02 | ) |
| (a) | Annualized for periods less than one year, unless otherwise noted. |
| (b) | Calculated based upon average shares outstanding. |
| (c) | Not annualized for periods less than one year. |
| (d) | Includes adjustments in accordance with accounting principles generally accepted in the United States of America and as such, the net asset values for financial reporting purposes and the returns based upon those net asset values may differ from the net asset values and returns for shareholder transactions. |
| (e) | Includes earnings credits and interest expense, if applicable, each of which is less than 0.005% unless otherwise noted. |
| (f) | Commencement of operations. |
| (g) | Certain non-recurring expenses incurred by the Fund were not annualized for the period indicated. |
| (h) | Amount rounds to less than $0.005. |
SEE NOTES TO FINANCIAL STATEMENTS.
| | | | | | | | | | |
| | | | | |
| 130 | | | | | | | | J.P. MORGAN LARGE CAP FUNDS | | DECEMBER 31, 2021 |
| | | | | | | | | | | | | | | | | | | | | | | | | | |
| | | Ratios/Supplemental data | |
| | | | | | | | | | Ratios to average net assets (a) | | | | |
Net asset
value,
end of
period | | | Total return
(excludes
sales charge) (c)(d) | | | Net assets,
end of
period
(000’s) | | | Net
expenses (e) | | | Net
investment
income
(loss) | | | Expenses
without waivers,
reimbursements and
earnings credits | | | Portfolio
turnover
rate (c) | |
| | | | | | | | | | | | | | | | | | | | | | | | | | |
| | | | | | | | | | | | | | | | | | | | | | | | | | |
| $ | 16.88 | | | | 5.97 | % | | $ | 94,246 | | | | 0.85 | % | | | 0.47 | % | | | 0.86 | % | | | 12 | % |
| | 15.96 | | | | 6.50 | | | | 21,446 | | | | 0.85 | (g) | | | 0.60 | (g) | | | 1.00 | (g) | | | 7 | |
| | | | | | |
| | | | | | | | | | | | | | | | | | | | | | | | | | |
| | 16.85 | | | | 5.68 | | | | 78,261 | | | | 1.35 | | | | (0.03 | ) | | | 1.36 | | | | 12 | |
| | 15.95 | | | | 6.37 | | | | 19,229 | | | | 1.35 | (g) | | | 0.09 | (g) | | | 1.51 | (g) | | | 7 | |
| | | | | | |
| | | | | | | | | | | | | | | | | | | | | | | | | | |
| | 16.91 | | | | 6.12 | | | | 1,730,595 | | | | 0.60 | | | | 0.71 | | | | 0.62 | | | | 12 | |
| | 15.98 | | | | 6.64 | | | | 524,074 | | | | 0.60 | (g) | | | 0.81 | (g) | | | 0.80 | (g) | | | 7 | |
| | | | | | |
| | | | | | | | | | | | | | | | | | | | | | | | | | |
| | 16.92 | | | | 6.23 | | | | 20 | | | | 0.45 | | | | 0.82 | | | | 0.50 | | | | 12 | |
| | 15.98 | | | | 6.64 | | | | 21 | | | | 0.45 | (g) | | | 0.96 | (g) | | | 3.22 | (g) | | | 7 | |
| | | | | | |
| | | | | | | | | | | | | | | | | | | | | | | | | | |
| | 16.92 | | | | 6.29 | | | | 413,958 | | | | 0.35 | | | | 0.94 | | | | 0.35 | | | | 12 | |
| | 15.98 | | | | 6.68 | | | | 1,796 | | | | 0.35 | (g) | | | 1.10 | (g) | | | 0.64 | (g) | | | 7 | |
SEE NOTES TO FINANCIAL STATEMENTS.
| | | | | | | | | | |
| | | | | |
| DECEMBER 31, 2021 | | J.P. MORGAN LARGE CAP FUNDS | | | | | | | | 131 |
FINANCIAL HIGHLIGHTS
FOR THE PERIODS INDICATED (continued)
| | | | | | | | | | | | | | | | | | | | | | | | | | | | |
| | | Per share operating performance | |
| | | | | | Investment operations | | | Distributions | |
| | | Net asset
value,
beginning
of period | | | Net
investment
income
(loss) (b) | | | Net realized
and unrealized
gains
(losses) on
investments | | | Total from
investment
operations | | | Net
investment
income | | | Net
realized
gain | | | Total
distributions | |
JPMorgan Large Cap Growth Fund | | | | | | | | | | | | | | | | | | | | | | | | | | | | |
Class A | | | | | | | | | | | | | | | | | | | | | | | | | | | | |
Six Months Ended December 31, 2021 (Unaudited) | | $ | 64.22 | | | $ | (0.13 | ) | | $ | 5.51 | | | $ | 5.38 | | | $ | — | | | $ | (9.24 | ) | | $ | (9.24 | ) |
Year Ended June 30, 2021 | | | 48.04 | | | | (0.27 | ) | | | 19.59 | | | | 19.32 | | | | — | | | | (3.14 | ) | | | (3.14 | ) |
Year Ended June 30, 2020 | | | 41.87 | | | | (0.01 | ) | | | 11.39 | | | | 11.38 | | | | — | | | | (5.21 | ) | | | (5.21 | ) |
Year Ended June 30, 2019 | | | 42.44 | | | | (0.09 | ) | | | 4.80 | | | | 4.71 | | | | — | | | | (5.28 | ) | | | (5.28 | ) |
Year Ended June 30, 2018 | | | 38.23 | | | | (0.10 | ) | | | 9.92 | | | | 9.82 | | | | — | | | | (5.61 | ) | | | (5.61 | ) |
Year Ended June 30, 2017 | | | 32.93 | | | | (0.07 | ) | | | 8.51 | | | | 8.44 | | | | — | | | | (3.14 | ) | | | (3.14 | ) |
| | | | | | | |
Class C | | | | | | | | | | | | | | | | | | | | | | | | | | | | |
Six Months Ended December 31, 2021 (Unaudited) | | | 46.21 | | | | (0.21 | ) | | | 3.93 | | | | 3.72 | | | | — | | | | (9.24 | ) | | | (9.24 | ) |
Year Ended June 30, 2021 | | | 35.43 | | | | (0.41 | ) | | | 14.33 | | | | 13.92 | | | | — | | | | (3.14 | ) | | | (3.14 | ) |
Year Ended June 30, 2020 | | | 32.33 | | | | (0.17 | ) | | | 8.48 | | | | 8.31 | | | | — | | | | (5.21 | ) | | | (5.21 | ) |
Year Ended June 30, 2019 | | | 34.20 | | | | (0.23 | ) | | | 3.64 | | | | 3.41 | | | | — | | | | (5.28 | ) | | | (5.28 | ) |
Year Ended June 30, 2018 | | | 31.95 | | | | (0.25 | ) | | | 8.11 | | | | 7.86 | | | | — | | | | (5.61 | ) | | | (5.61 | ) |
Year Ended June 30, 2017 | | | 28.15 | | | | (0.20 | ) | | | 7.14 | | | | 6.94 | | | | — | | | | (3.14 | ) | | | (3.14 | ) |
| | | | | | | |
Class I | | | | | | | | | | | | | | | | | | | | | | | | | | | | |
Six Months Ended December 31, 2021 (Unaudited) | | | 65.59 | | | | (0.05 | ) | | | 5.63 | | | | 5.58 | | | | — | | | | (9.24 | ) | | | (9.24 | ) |
Year Ended June 30, 2021 | | | 48.91 | | | | (0.12 | ) | | | 19.97 | | | | 19.85 | | | | (0.03 | ) | | | (3.14 | ) | | | (3.17 | ) |
Year Ended June 30, 2020 | | | 42.46 | | | | 0.09 | | | | 11.59 | | | | 11.68 | | | | (0.02 | ) | | | (5.21 | ) | | | (5.23 | ) |
Year Ended June 30, 2019 | | | 42.86 | | | | 0.01 | | | | 4.87 | | | | 4.88 | | | | — | | | | (5.28 | ) | | | (5.28 | ) |
Year Ended June 30, 2018 | | | 38.47 | | | | (0.01 | ) | | | 10.01 | | | | 10.00 | | | | — | | | | (5.61 | ) | | | (5.61 | ) |
Year Ended June 30, 2017 | | | 33.08 | | | | (0.02 | ) | | | 8.55 | | | | 8.53 | | | | — | | | | (3.14 | ) | | | (3.14 | ) |
| | | | | | | |
Class R2 | | | | | | | | | | | | | | | | | | | | | | | | | | | | |
Six Months Ended December 31, 2021 (Unaudited) | | | 61.05 | | | | (0.20 | ) | | | 5.23 | | | | 5.03 | | | | — | | | | (9.24 | ) | | | (9.24 | ) |
Year Ended June 30, 2021 | | | 45.90 | | | | (0.39 | ) | | | 18.68 | | | | 18.29 | | | | — | | | | (3.14 | ) | | | (3.14 | ) |
Year Ended June 30, 2020 | | | 40.32 | | | | (0.11 | ) | | | 10.90 | | | | 10.79 | | | | — | | | | (5.21 | ) | | | (5.21 | ) |
Year Ended June 30, 2019 | | | 41.17 | | | | (0.18 | ) | | | 4.61 | | | | 4.43 | | | | — | | | | (5.28 | ) | | | (5.28 | ) |
Year Ended June 30, 2018 | | | 37.33 | | | | (0.20 | ) | | | 9.65 | | | | 9.45 | | | | — | | | | (5.61 | ) | | | (5.61 | ) |
Year Ended June 30, 2017 | | | 32.31 | | | | (0.16 | ) | | | 8.32 | | | | 8.16 | | | | — | | | | (3.14 | ) | | | (3.14 | ) |
| | | | | | | |
Class R3 | | | | | | | | | | | | | | | | | | | | | | | | | | | | |
Six Months Ended December 31, 2021 (Unaudited) | | | 64.64 | | | | (0.13 | ) | | | 5.54 | | | | 5.41 | | | | — | | | | (9.24 | ) | | | (9.24 | ) |
Year Ended June 30, 2021 | | | 48.34 | | | | (0.27 | ) | | | 19.72 | | | | 19.45 | | | | (0.01 | ) | | | (3.14 | ) | | | (3.15 | ) |
Year Ended June 30, 2020 | | | 42.10 | | | | (0.01 | ) | | | 11.46 | | | | 11.45 | | | | — | | | | (5.21 | ) | | | (5.21 | ) |
Year Ended June 30, 2019 | | | 42.64 | | | | (0.08 | ) | | | 4.82 | | | | 4.74 | | | | — | | | | (5.28 | ) | | | (5.28 | ) |
Year Ended June 30, 2018 | | | 38.39 | | | | (0.08 | ) | | | 9.94 | | | | 9.86 | | | | — | | | | (5.61 | ) | | | (5.61 | ) |
September 9, 2016 (f) through June 30, 2017 | | | 33.97 | | | | (0.06 | ) | | | 7.62 | | | | 7.56 | | | | — | | | | (3.14 | ) | | | (3.14 | ) |
| | | | | | | |
Class R4 | | | | | | | | | | | | | | | | | | | | | | | | | | | | |
Six Months Ended December 31, 2021 (Unaudited) | | | 65.47 | | | | (0.05 | ) | | | 5.62 | | | | 5.57 | | | | — | | | | (9.24 | ) | | | (9.24 | ) |
Year Ended June 30, 2021 | | | 48.84 | | | | (0.12 | ) | | | 19.94 | | | | 19.82 | | | | (0.05 | ) | | | (3.14 | ) | | | (3.19 | ) |
Year Ended June 30, 2020 | | | 42.45 | | | | 0.08 | | | | 11.58 | | | | 11.66 | | | | (0.06 | ) | | | (5.21 | ) | | | (5.27 | ) |
Year Ended June 30, 2019 | | | 42.85 | | | | 0.01 | | | | 4.87 | | | | 4.88 | | | | — | | | | (5.28 | ) | | | (5.28 | ) |
Year Ended June 30, 2018 | | | 38.47 | | | | 0.01 | | | | 9.98 | | | | 9.99 | | | | — | | | | (5.61 | ) | | | (5.61 | ) |
September 9, 2016 (f) through June 30, 2017 | | | 33.97 | | | | 0.04 | | | | 7.60 | | | | 7.64 | | | | — | | | | (3.14 | ) | | | (3.14 | ) |
| | | | | | | |
Class R5 | | | | | | | | | | | | | | | | | | | | | | | | | | | | |
Six Months Ended December 31, 2021 (Unaudited) | | | 67.49 | | | | — | (g) | | | 5.81 | | | | 5.81 | | | | — | | | | (9.24 | ) | | | (9.24 | ) |
Year Ended June 30, 2021 | | | 50.20 | | | | (0.04 | ) | | | 20.52 | | | | 20.48 | | | | (0.05 | ) | | | (3.14 | ) | | | (3.19 | ) |
Year Ended June 30, 2020 | | | 43.44 | | | | 0.16 | | | | 11.88 | | | | 12.04 | | | | (0.07 | ) | | | (5.21 | ) | | | (5.28 | ) |
Year Ended June 30, 2019 | | | 43.65 | | | | 0.07 | | | | 5.00 | | | | 5.07 | | | | — | | | | (5.28 | ) | | | (5.28 | ) |
Year Ended June 30, 2018 | | | 39.04 | | | | 0.06 | | | | 10.16 | | | | 10.22 | | | | — | | | | (5.61 | ) | | | (5.61 | ) |
Year Ended June 30, 2017 | | | 33.46 | | | | 0.05 | | | | 8.67 | | | | 8.72 | | | | — | | | | (3.14 | ) | | | (3.14 | ) |
| | | | | | | |
Class R6 | | | | | | | | | | | | | | | | | | | | | | | | | | | | |
Six Months Ended December 31, 2021 (Unaudited) | | | 68.18 | | | | 0.04 | | | | 5.86 | | | | 5.90 | | | | — | | | | (9.24 | ) | | | (9.24 | ) |
Year Ended June 30, 2021 | | | 50.66 | | | | 0.03 | | | | 20.71 | | | | 20.74 | | | | (0.08 | ) | | | (3.14 | ) | | | (3.22 | ) |
Year Ended June 30, 2020 | | | 43.78 | | | | 0.21 | | | | 11.99 | | | | 12.20 | | | | (0.11 | ) | | | (5.21 | ) | | | (5.32 | ) |
Year Ended June 30, 2019 | | | 43.95 | | | | 0.11 | | | | 5.03 | | | | 5.14 | | | | (0.03 | ) | | | (5.28 | ) | | | (5.31 | ) |
Year Ended June 30, 2018 | | | 39.23 | | | | 0.10 | | | | 10.23 | | | | 10.33 | | | | — | | | | (5.61 | ) | | | (5.61 | ) |
Year Ended June 30, 2017 | | | 33.58 | | | | 0.09 | | | | 8.70 | | | | 8.79 | | | | — | | | | (3.14 | ) | | | (3.14 | ) |
| (a) | Annualized for periods less than one year, unless otherwise noted. |
| (b) | Calculated based upon average shares outstanding. |
| (c) | Not annualized for periods less than one year. |
| (d) | Includes adjustments in accordance with accounting principles generally accepted in the United States of America and as such, the net asset values for financial reporting purposes and the returns based upon those net asset values may differ from the net asset values and returns for shareholder transactions. |
| (e) | Includes earnings credits and interest expense, if applicable, each of which is less than 0.005% unless otherwise noted. |
| (f) | Commencement of offering of class of shares. |
| (g) | Amount rounds to less than $0.005. |
SEE NOTES TO FINANCIAL STATEMENTS.
| | | | | | | | | | |
| | | | | |
| 132 | | | | | | | | J.P. MORGAN LARGE CAP FUNDS | | DECEMBER 31, 2021 |
| | | | | | | | | | | | | | | | | | | | | | | | | | |
| | | Ratios/Supplemental data | |
| | | | | | | Ratios to average net assets (a) | | | | |
Net asset
value,
end of
period | | | Total return
(excludes
sales charge) (c)(d) | | | Net assets,
end of period
(000’s) | | | Net
expenses (e) | | | Net
investment
income
(loss) | | | Expenses
without waivers,
reimbursements and
earnings credits | | | Portfolio
turnover
rate (c) | |
| | |
| | |
| $ | 60.36 | | | | 8.52 | % | | $ | 5,267,927 | | | | 0.94 | % | | | (0.39 | )% | | | 1.01 | % | | | 21 | % |
| | 64.22 | | | | 41.00 | | | | 4,970,767 | | | | 0.93 | | | | (0.46 | ) | | | 1.02 | | | | 58 | |
| | 48.04 | | | | 30.09 | | | | 3,280,463 | | | | 0.94 | | | | (0.03 | ) | | | 1.04 | | | | 47 | |
| | 41.87 | | | | 13.67 | | | | 2,466,910 | | | | 0.93 | | | | (0.23 | ) | | | 1.10 | | | | 50 | |
| | 42.44 | | | | 28.45 | | | | 2,481,816 | | | | 0.97 | | | | (0.25 | ) | | | 1.11 | | | | 24 | |
| | 38.23 | | | | 27.50 | | | | 2,462,957 | | | | 1.05 | | | | (0.19 | ) | | | 1.25 | | | | 22 | |
| | | | | | |
| | | | | | | | | | | | | | | | | | | | | | | | | | |
| | 40.69 | | | | 8.24 | | | | 829,593 | | | | 1.44 | | | | (0.89 | ) | | | 1.51 | | | | 21 | |
| | 46.21 | | | | 40.32 | | | | 780,132 | | | | 1.43 | | | | (0.96 | ) | | | 1.51 | | | | 58 | |
| | 35.43 | | | | 29.42 | | | | 701,820 | | | | 1.44 | | | | (0.53 | ) | | | 1.54 | | | | 47 | |
| | 32.33 | | | | 13.11 | | | | 518,116 | | | | 1.43 | | | | (0.73 | ) | | | 1.59 | | | | 50 | |
| | 34.20 | | | | 27.83 | | | | 534,199 | | | | 1.47 | | | | (0.75 | ) | | | 1.60 | | | | 24 | |
| | 31.95 | | | | 26.79 | | | | 487,702 | | | | 1.55 | | | | (0.69 | ) | | | 1.67 | | | | 22 | |
| | | | | | |
| | | | | | | | | | | | | | | | | | | | | | | | | | |
| | 61.93 | | | | 8.65 | | | | 11,651,360 | | | | 0.69 | | | | (0.14 | ) | | | 0.75 | | | | 21 | |
| | 65.59 | | | | 41.37 | | | | 10,983,173 | | | | 0.68 | | | | (0.21 | ) | | | 0.76 | | | | 58 | |
| | 48.91 | | | | 30.40 | | | | 7,058,308 | | | | 0.69 | | | | 0.22 | | | | 0.78 | | | | 47 | |
| | 42.46 | | | | 13.95 | | | | 4,691,515 | | | | 0.68 | | | | 0.02 | | | | 0.84 | | | | 50 | |
| | 42.86 | | | | 28.77 | | | | 4,413,908 | | | | 0.74 | | | | (0.03 | ) | | | 0.85 | | | | 24 | |
| | 38.47 | | | | 27.65 | | | | 4,771,428 | | | | 0.89 | | | | (0.05 | ) | | | 0.90 | | | | 22 | |
| | | | | | |
| | | | | | | | | | | | | | | | | | | | | | | | | | |
| | 56.84 | | | | 8.39 | | | | 137,088 | | | | 1.19 | | | | (0.64 | ) | | | 1.26 | | | | 21 | |
| | 61.05 | | | | 40.65 | | | | 129,541 | | | | 1.18 | | | | (0.71 | ) | | | 1.26 | | | | 58 | |
| | 45.90 | | | | 29.76 | | | | 118,628 | | | | 1.19 | | | | (0.27 | ) | | | 1.29 | | | | 47 | |
| | 40.32 | | | | 13.39 | | | | 138,030 | | | | 1.18 | | | | (0.47 | ) | | | 1.34 | | | | 50 | |
| | 41.17 | | | | 28.11 | | | | 156,775 | | | | 1.24 | | | | (0.52 | ) | | | 1.35 | | | | 24 | |
| | 37.33 | | | | 27.14 | | | | 147,902 | | | | 1.31 | | | | (0.46 | ) | | | 1.47 | | | | 22 | |
| | | | | | |
| | | | | | | | | | | | | | | | | | | | | | | | | | |
| | 60.81 | | | | 8.51 | | | | 294,369 | | | | 0.94 | | | | (0.39 | ) | | | 1.00 | | | | 21 | |
| | 64.64 | | | | 41.01 | | | | 264,318 | | | | 0.93 | | | | (0.45 | ) | | | 1.01 | | | | 58 | |
| | 48.34 | | | | 30.09 | | | | 90,107 | | | | 0.94 | | | | (0.02 | ) | | | 1.03 | | | | 47 | |
| | 42.10 | | | | 13.68 | | | | 45,376 | | | | 0.93 | | | | (0.21 | ) | | | 1.08 | | | | 50 | |
| | 42.64 | | | | 28.43 | | | | 6,865 | | | | 0.96 | | | | (0.21 | ) | | | 1.10 | | | | 24 | |
| | 38.39 | | | | 24.05 | | | | 992 | | | | 1.12 | | | | (0.20 | ) | | | 1.20 | | | | 22 | |
| | | | | | |
| | | | | | | | | | | | | | | | | | | | | | | | | | |
| | 61.80 | | | | 8.65 | | | | 245,696 | | | | 0.69 | | | | (0.14 | ) | | | 0.75 | | | | 21 | |
| | 65.47 | | | | 41.37 | | | | 204,814 | | | | 0.68 | | | | (0.20 | ) | | | 0.76 | | | | 58 | |
| | 48.84 | | | | 30.40 | | | | 64,792 | | | | 0.69 | | | | 0.19 | | | | 0.78 | | | | 47 | |
| | 42.45 | | | | 13.96 | | | | 10,740 | | | | 0.68 | | | | 0.02 | | | | 0.83 | | | | 50 | |
| | 42.85 | | | | 28.74 | | | | 5,930 | | | | 0.73 | | | | 0.02 | | | | 0.85 | | | | 24 | |
| | 38.47 | | | | 24.31 | | | | 440 | | | | 0.89 | | | | 0.12 | | | | 1.07 | | | | 22 | |
| | | | | | |
| | | | | | | | | | | | | | | | | | | | | | | | | | |
| | 64.06 | | | | 8.75 | | | | 931,637 | | | | 0.54 | | | | 0.01 | | | | 0.60 | | | | 21 | |
| | 67.49 | | | | 41.57 | | | | 956,386 | | | | 0.53 | | | | (0.06 | ) | | | 0.61 | | | | 58 | |
| | 50.20 | | | | 30.59 | | | | 781,380 | | | | 0.54 | | | | 0.38 | | | | 0.63 | | | | 47 | |
| | 43.44 | | | | 14.15 | | | | 702,536 | | | | 0.53 | | | | 0.17 | | | | 0.69 | | | | 50 | |
| | 43.65 | | | | 28.93 | | | | 788,766 | | | | 0.59 | | | | 0.14 | | | | 0.70 | | | | 24 | |
| | 39.04 | | | | 27.92 | | | | 799,190 | | | | 0.70 | | | | 0.15 | | | | 0.72 | | | | 22 | |
| | | | | | |
| | | | | | | | | | | | | | | | | | | | | | | | | | |
| | 64.84 | | | | 8.79 | | | | 21,447,424 | | | | 0.44 | | | | 0.11 | | | | 0.50 | | | | 21 | |
| | 68.18 | | | | 41.70 | | | | 19,127,249 | | | | 0.43 | | | | 0.04 | | | | 0.51 | | | | 58 | |
| | 50.66 | | | | 30.75 | | | | 11,169,668 | | | | 0.44 | | | | 0.47 | | | | 0.53 | | | | 47 | |
| | 43.78 | | | | 14.23 | | | | 7,339,387 | | | | 0.43 | | | | 0.27 | | | | 0.58 | | | | 50 | |
| | 43.95 | | | | 29.08 | | | | 5,962,328 | | | | 0.48 | | | | 0.24 | | | | 0.60 | | | | 24 | |
| | 39.23 | | | | 28.03 | | | | 3,606,093 | | | | 0.60 | | | | 0.25 | | | | 0.60 | | | | 22 | |
SEE NOTES TO FINANCIAL STATEMENTS.
| | | | | | | | | | |
| | | | | |
| DECEMBER 31, 2021 | | J.P. MORGAN LARGE CAP FUNDS | | | | | | | | 133 |
FINANCIAL HIGHLIGHTS
FOR THE PERIODS INDICATED (continued)
| | | | | | | | | | | | | | | | | | | | | | | | | | | | |
| | | Per share operating performance | |
| | | | | | Investment operations | | | Distributions | |
| | | Net asset
value,
beginning
of period | | | Net
investment
income
(loss) (b) | | | Net realized
and unrealized
gains
(losses) on
investments | | | Total from
investment
operations | | | Net
investment
income | | | Net
realized
gain | | | Total
distributions | |
JPMorgan Large Cap Value Fund | | | | | | | | | | | | | | | | | | | | | | | | | | | | |
Class A | | | | | | | | | | | | | | | | | | | | | | | | | | | | |
Six Months Ended December 31, 2021 (Unaudited) | | $ | 20.48 | | | $ | 0.08 | | | $ | 0.24 | | | $ | 0.32 | | | $ | (0.10 | ) | | $ | (1.38 | ) | | $ | (1.48 | ) |
Year Ended June 30, 2021 | | | 12.72 | | | | 0.11 | | | | 7.73 | | | | 7.84 | | | | (0.08 | ) | | | — | | | | (0.08 | ) |
Year Ended June 30, 2020 | | | 14.11 | | | | 0.18 | | | | (1.40 | ) | | | (1.22 | ) | | | (0.17 | ) | | | — | | | | (0.17 | ) |
Year Ended June 30, 2019 | | | 15.11 | | | | 0.17 | | | | (0.09 | ) | | | 0.08 | | | | (0.17 | ) | | | (0.91 | ) | | | (1.08 | ) |
Year Ended June 30, 2018 | | | 15.48 | | | | 0.15 | | | | 0.89 | | | | 1.04 | | | | (0.13 | ) | | | (1.28 | ) | | | (1.41 | ) |
Year Ended June 30, 2017 | | | 12.71 | | | | 0.15 | | | | 3.42 | | | | 3.57 | | | | (0.14 | ) | | | (0.66 | ) | | | (0.80 | ) |
| | | | | | | |
Class C | | | | | | | | | | | | | | | | | | | | | | | | | | | | |
Six Months Ended December 31, 2021 (Unaudited) | | | 19.55 | | | | 0.03 | | | | 0.22 | | | | 0.25 | | | | (0.05 | ) | | | (1.38 | ) | | | (1.43 | ) |
Year Ended June 30, 2021 | | | 12.17 | | | | 0.02 | | | | 7.39 | | | | 7.41 | | | | (0.03 | ) | | | — | | | | (0.03 | ) |
Year Ended June 30, 2020 | | | 13.49 | | | | 0.11 | | | | (1.32 | ) | | | (1.21 | ) | | | (0.11 | ) | | | — | | | | (0.11 | ) |
Year Ended June 30, 2019 | | | 14.51 | | | | 0.10 | | | | (0.10 | ) | | | — | (f) | | | (0.11 | ) | | | (0.91 | ) | | | (1.02 | ) |
Year Ended June 30, 2018 | | | 14.93 | | | | 0.06 | | | | 0.86 | | | | 0.92 | | | | (0.06 | ) | | | (1.28 | ) | | | (1.34 | ) |
Year Ended June 30, 2017 | | | 12.30 | | | | 0.07 | | | | 3.30 | | | | 3.37 | | | | (0.08 | ) | | | (0.66 | ) | | | (0.74 | ) |
| | | | | | | |
Class I | | | | | | | | | | | | | | | | | | | | | | | | | | | | |
Six Months Ended December 31, 2021 (Unaudited) | | | 20.10 | | | | 0.10 | | | | 0.22 | | | | 0.32 | | | | (0.12 | ) | | | (1.38 | ) | | | (1.50 | ) |
Year Ended June 30, 2021 | | | 12.49 | | | | 0.15 | | | | 7.59 | | | | 7.74 | | | | (0.13 | ) | | | — | | | | (0.13 | ) |
Year Ended June 30, 2020 | | | 13.85 | | | | 0.21 | | | | (1.36 | ) | | | (1.15 | ) | | | (0.21 | ) | | | — | | | | (0.21 | ) |
Year Ended June 30, 2019 | | | 14.85 | | | | 0.20 | | | | (0.09 | ) | | | 0.11 | | | | (0.20 | ) | | | (0.91 | ) | | | (1.11 | ) |
Year Ended June 30, 2018 | | | 15.24 | | | | 0.18 | | | | 0.87 | | | | 1.05 | | | | (0.16 | ) | | | (1.28 | ) | | | (1.44 | ) |
Year Ended June 30, 2017 | | | 12.53 | | | | 0.17 | | | | 3.37 | | | | 3.54 | | | | (0.17 | ) | | | (0.66 | ) | | | (0.83 | ) |
| | | | | | | |
Class R2 | | | | | | | | | | | | | | | | | | | | | | | | | | | | |
Six Months Ended December 31, 2021 (Unaudited) | | | 20.30 | | | | 0.06 | | | | 0.22 | | | | 0.28 | | | | (0.08 | ) | | | (1.38 | ) | | | (1.46 | ) |
Year Ended June 30, 2021 | | | 12.61 | | | | 0.06 | | | | 7.67 | | | | 7.73 | | | | (0.04 | ) | | | — | | | | (0.04 | ) |
Year Ended June 30, 2020 | | | 13.98 | | | | 0.15 | | | | (1.38 | ) | | | (1.23 | ) | | | (0.14 | ) | | | — | | | | (0.14 | ) |
Year Ended June 30, 2019 | | | 14.99 | | | | 0.14 | | | | (0.10 | ) | | | 0.04 | | | | (0.14 | ) | | | (0.91 | ) | | | (1.05 | ) |
Year Ended June 30, 2018 | | | 15.39 | | | | 0.11 | | | | 0.86 | | | | 0.97 | | | | (0.09 | ) | | | (1.28 | ) | | | (1.37 | ) |
Year Ended June 30, 2017 | | | 12.64 | | | | 0.10 | | | | 3.41 | | | | 3.51 | | | | (0.10 | ) | | | (0.66 | ) | | | (0.76 | ) |
| | | | | | | |
Class R3 | | | | | | | | | | | | | | | | | | | | | | | | | | | | |
Six Months Ended December 31, 2021 (Unaudited) | | | 20.09 | | | | 0.08 | | | | 0.23 | | | | 0.31 | | | | (0.14 | ) | | | (1.38 | ) | | | (1.52 | ) |
Year Ended June 30, 2021 | | | 12.48 | | | | 0.10 | | | | 7.59 | | | | 7.69 | | | | (0.08 | ) | | | — | | | | (0.08 | ) |
Year Ended June 30, 2020 | | | 13.84 | | | | 0.18 | | | | (1.36 | ) | | | (1.18 | ) | | | (0.18 | ) | | | — | | | | (0.18 | ) |
October 1, 2018 (g) through June 30, 2019 | | | 15.63 | | | | 0.13 | | | | (0.88 | ) | | | (0.75 | ) | | | (0.13 | ) | | | (0.91 | ) | | | (1.04 | ) |
| | | | | | | |
Class R4 | | | | | | | | | | | | | | | | | | | | | | | | | | | | |
Six Months Ended December 31, 2021 (Unaudited) | | | 20.50 | | | | 0.11 | | | | 0.24 | | | | 0.35 | | | | (0.13 | ) | | | (1.38 | ) | | | (1.51 | ) |
Year Ended June 30, 2021 | | | 12.73 | | | | 0.12 | | | | 7.77 | | | | 7.89 | | | | (0.12 | ) | | | — | | | | (0.12 | ) |
Year Ended June 30, 2020 | | | 14.11 | | | | 0.22 | | | | (1.39 | ) | | | (1.17 | ) | | | (0.21 | ) | | | — | | | | (0.21 | ) |
October 1, 2018 (g) through June 30, 2019 | | | 15.90 | | | | 0.16 | | | | (0.89 | ) | | | (0.73 | ) | | | (0.15 | ) | | | (0.91 | ) | | | (1.06 | ) |
| | | | | | | |
Class R5 | | | | | | | | | | | | | | | | | | | | | | | | | | | | |
Six Months Ended December 31, 2021 (Unaudited) | | | 20.32 | | | | 0.12 | | | | 0.23 | | | | 0.35 | | | | (0.14 | ) | | | (1.38 | ) | | | (1.52 | ) |
Year Ended June 30, 2021 | | | 12.62 | | | | 0.17 | | | | 7.68 | | | | 7.85 | | | | (0.15 | ) | | | — | | | | (0.15 | ) |
Year Ended June 30, 2020 | | | 14.00 | | | | 0.24 | | | | (1.39 | ) | | | (1.15 | ) | | | (0.23 | ) | | | — | | | | (0.23 | ) |
Year Ended June 30, 2019 | | | 14.99 | | | | 0.23 | | | | (0.09 | ) | | | 0.14 | | | | (0.22 | ) | | | (0.91 | ) | | | (1.13 | ) |
Year Ended June 30, 2018 | | | 15.37 | | | | 0.21 | | | | 0.88 | | | | 1.09 | | | | (0.19 | ) | | | (1.28 | ) | | | (1.47 | ) |
Year Ended June 30, 2017 | | | 12.63 | | | | 0.20 | | | | 3.39 | | | | 3.59 | | | | (0.19 | ) | | | (0.66 | ) | | | (0.85 | ) |
| | | | | | | |
Class R6 | | | | | | | | | | | | | | | | | | | | | | | | | | | | |
Six Months Ended December 31, 2021 (Unaudited) | | | 20.18 | | | | 0.13 | | | | 0.22 | | | | 0.35 | | | | (0.15 | ) | | | (1.38 | ) | | | (1.53 | ) |
Year Ended June 30, 2021 | | | 12.53 | | | | 0.19 | | | | 7.63 | | | | 7.82 | | | | (0.17 | ) | | | — | | | | (0.17 | ) |
Year Ended June 30, 2020 | | | 13.90 | | | | 0.25 | | | | (1.37 | ) | | | (1.12 | ) | | | (0.25 | ) | | | — | | | | (0.25 | ) |
Year Ended June 30, 2019 | | | 14.90 | | | | 0.24 | | | | (0.10 | ) | | | 0.14 | | | | (0.23 | ) | | | (0.91 | ) | | | (1.14 | ) |
Year Ended June 30, 2018 | | | 15.28 | | | | 0.22 | | | | 0.88 | | | | 1.10 | | | | (0.20 | ) | | | (1.28 | ) | | | (1.48 | ) |
Year Ended June 30, 2017 | | | 12.56 | | | | 0.20 | | | | 3.38 | | | | 3.58 | | | | (0.20 | ) | | | (0.66 | ) | | | (0.86 | ) |
| (a) | Annualized for periods less than one year, unless otherwise noted. |
| (b) | Calculated based upon average shares outstanding. |
| (c) | Not annualized for periods less than one year. |
| (d) | Includes adjustments in accordance with accounting principles generally accepted in the United States of America and as such, the net asset values for financial reporting purposes and the returns based upon those net asset values may differ from the net asset values and returns for shareholder transactions. |
| (e) | Includes earnings credits and interest expense, if applicable, each of which is less than 0.005% unless otherwise noted. |
| (f) | Amount rounds to less than $0.005. |
| (g) | Commencement of offering of class of shares. |
SEE NOTES TO FINANCIAL STATEMENTS.
| | | | | | | | | | |
| | | | | |
| 134 | | | | | | | | J.P. MORGAN LARGE CAP FUNDS | | DECEMBER 31, 2021 |
| | | | | | | | | | | | | | | | | | | | | | | | | | |
| | | Ratios/Supplemental data | |
| | | | | | | Ratios to average net assets (a) | | | | |
Net asset
value,
end of
period | | | Total return
(excludes
sales charge) (c)(d) | | | Net assets,
end of
period
(000’s) | | | Net
expenses (e) | | | Net
investment
income
(loss) | | | Expenses
without waivers,
reimbursements and
earnings credits | | | Portfolio
turnover
rate (c) | |
| | |
| | |
| $ | 19.32 | | | | 1.88 | % | | $ | 212,700 | | | | 0.93 | % | | | 0.81 | % | | | 1.01 | % | | | 44 | % |
| | 20.48 | | | | 61.86 | | | | 218,302 | | | | 0.93 | | | | 0.62 | | | | 1.04 | | | | 93 | |
| | 12.72 | | | | (8.66 | ) | | | 119,402 | | | | 0.93 | | | | 1.33 | | | | 1.04 | | | | 177 | |
| | 14.11 | | | | 1.07 | | | | 153,809 | | | | 0.93 | | | | 1.19 | | | | 1.04 | | | | 162 | |
| | 15.11 | | | | 6.52 | | | | 236,470 | | | | 0.93 | | | | 0.92 | | | | 1.04 | | | | 130 | |
| | 15.48 | | | | 28.47 | | | | 215,017 | | | | 0.92 | | | | 1.01 | | | | 1.08 | | | | 145 | |
| | | | | | |
| | | | | | | | | | | | | | | | | | | | | | | | | | |
| | 18.37 | | | | 1.62 | | | | 62,881 | | | | 1.44 | | | | 0.31 | | | | 1.50 | | | | 44 | |
| | 19.55 | | | | 60.96 | | | | 62,488 | | | | 1.43 | | | | 0.11 | | | | 1.50 | | | | 93 | |
| | 12.17 | | | | (9.04 | ) | | | 33,769 | | | | 1.44 | | | | 0.81 | | | | 1.52 | | | | 177 | |
| | 13.49 | | | | 0.57 | | | | 55,009 | | | | 1.44 | | | | 0.70 | | | | 1.52 | | | | 162 | |
| | 14.51 | | | | 5.94 | | | | 69,445 | | | | 1.44 | | | | 0.42 | | | | 1.52 | | | | 130 | |
| | 14.93 | | | | 27.72 | | | | 48,028 | | | | 1.44 | | | | 0.50 | | | | 1.57 | | | | 145 | |
| | | | | | |
| | | | | | | | | | | | | | | | | | | | | | | | | | |
| | 18.92 | | | | 1.94 | | | | 1,262,516 | | | | 0.69 | | | | 1.06 | | | | 0.76 | | | | 44 | |
| | 20.10 | | | | 62.22 | | | | 1,418,653 | | | | 0.69 | | | | 0.84 | | | | 0.76 | | | | 93 | |
| | 12.49 | | | | (8.35 | ) | | | 262,414 | | | | 0.69 | | | | 1.57 | | | | 0.76 | | | | 177 | |
| | 13.85 | | | | 1.31 | | | | 301,663 | | | | 0.69 | | | | 1.44 | | | | 0.77 | | | | 162 | |
| | 14.85 | | | | 6.74 | | | | 378,058 | | | | 0.70 | | | | 1.19 | | | | 0.77 | | | | 130 | |
| | 15.24 | | | | 28.61 | | | | 161,494 | | | | 0.79 | | | | 1.15 | | | | 0.80 | | | | 145 | |
| | | | | | |
| | | | | | | | | | | | | | | | | | | | | | | | | | |
| | 19.12 | | | | 1.68 | | | | 11,922 | | | | 1.19 | | | | 0.56 | | | | 1.27 | | | | 44 | |
| | 20.30 | | | | 61.40 | | | | 11,175 | | | | 1.18 | | | | 0.38 | | | | 1.27 | | | | 93 | |
| | 12.61 | | | | (8.83 | ) | | | 17,777 | | | | 1.19 | | | | 1.09 | | | | 1.28 | | | | 177 | |
| | 13.98 | | | | 0.83 | | | | 21,489 | | | | 1.19 | | | | 0.97 | | | | 1.29 | | | | 162 | |
| | 14.99 | | | | 6.14 | | | | 17,046 | | | | 1.21 | | | | 0.68 | | | | 1.30 | | | | 130 | |
| | 15.39 | | | | 28.11 | | | | 6,775 | | | | 1.23 | | | | 0.71 | | | | 1.43 | | | | 145 | |
| | | | | | |
| | | | | | | | | | | | | | | | | | | | | | | | | | |
| | 18.88 | | | | 1.86 | | | | 6,182 | | | | 0.94 | | | | 0.80 | | | | 1.00 | | | | 44 | |
| | 20.09 | | | | 61.83 | | | | 16 | | | | 0.94 | | | | 0.63 | | | | 1.04 | | | | 93 | |
| | 12.48 | | | | (8.59 | ) | | | 18 | | | | 0.94 | | | | 1.36 | | | | 2.24 | | | | 177 | |
| | 13.84 | | | | (4.25 | ) | | | 19 | | | | 0.94 | | | | 1.28 | | | | 1.17 | | | | 162 | |
| | | | | | |
| | | | | | | | | | | | | | | | | | | | | | | | | | |
| | 19.34 | | | | 2.02 | | | | 191 | | | | 0.69 | | | | 1.06 | | | | 0.76 | | | | 44 | |
| | 20.50 | | | | 62.16 | | | | 135 | | | | 0.69 | | | | 0.87 | | | | 0.76 | | | | 93 | |
| | 12.73 | | | | (8.34 | ) | | | 11,823 | | | | 0.69 | | | | 1.60 | | | | 0.76 | | | | 177 | |
| | 14.11 | | | | (4.05 | ) | | | 14,545 | | | | 0.68 | | | | 1.51 | | | | 0.77 | | | | 162 | |
| | | | | | |
| | | | | | | | | | | | | | | | | | | | | | | | | | |
| | 19.15 | | | | 2.04 | | | | 24,769 | | | | 0.54 | | | | 1.21 | | | | 0.60 | | | | 44 | |
| | 20.32 | | | | 62.47 | | | | 24,668 | | | | 0.54 | | | | 1.02 | | | | 0.61 | | | | 93 | |
| | 12.62 | | | | (8.26 | ) | | | 18,535 | | | | 0.54 | | | | 1.72 | | | | 0.62 | | | | 177 | |
| | 14.00 | | | | 1.50 | | | | 30,522 | | | | 0.54 | | | | 1.61 | | | | 0.63 | | | | 162 | |
| | 14.99 | | | | 6.90 | | | | 23,166 | | | | 0.55 | | | | 1.33 | | | | 0.63 | | | | 130 | |
| | 15.37 | | | | 28.82 | | | | 10,218 | | | | 0.59 | | | | 1.35 | | | | 0.62 | | | | 145 | |
| | | | | | |
| | | | | | | | | | | | | | | | | | | | | | | | | | |
| | 19.00 | | | | 2.06 | | | | 1,532,011 | | | | 0.44 | | | | 1.29 | | | | 0.49 | | | | 44 | |
| | 20.18 | | | | 62.68 | | | | 2,606,033 | | | | 0.44 | | | | 1.10 | | | | 0.50 | | | | 93 | |
| | 12.53 | | | | (8.14 | ) | | | 796,259 | | | | 0.44 | | | | 1.86 | | | | 0.51 | | | | 177 | |
| | 13.90 | | | | 1.52 | | | | 834,072 | | | | 0.44 | | | | 1.70 | | | | 0.52 | | | | 162 | |
| | 14.90 | | | | 7.04 | | | | 928,167 | | | | 0.46 | | | | 1.41 | | | | 0.52 | | | | 130 | |
| | 15.28 | | | | 28.90 | | | | 610,732 | | | | 0.51 | | | | 1.43 | | | | 0.52 | | | | 145 | |
SEE NOTES TO FINANCIAL STATEMENTS.
| | | | | | | | | | |
| | | | | |
| DECEMBER 31, 2021 | | J.P. MORGAN LARGE CAP FUNDS | | | | | | | | 135 |
FINANCIAL HIGHLIGHTS
FOR THE PERIODS INDICATED (continued)
| | | | | | | | | | | | | | | | | | | | | | | | | | | | |
| | | Per share operating performance | |
| | | | | | Investment operations | | | Distributions | |
| | | Net asset
value,
beginning
of period | | | Net
investment
income
(loss) (b) | | | Net realized
and unrealized
gains
(losses) on
investments | | | Total from
investment
operations | | | Net
investment
income | | | Net
realized
gain | | | Total
distributions | |
JPMorgan U.S. Applied Data Science Value Fund (formerly known as JPMorgan Intrepid Value Fund) | |
Class A | | | | | | | | | | | | | | | | | | | | | | | | | | | | |
Six Months Ended December 31, 2021 (Unaudited) | | $ | 36.38 | | | $ | 0.23 | | | $ | 2.60 | | | $ | 2.83 | | | $ | (0.23 | ) | | $ | (8.75 | ) | | $ | (8.98 | ) |
Year Ended June 30, 2021 | | | 25.83 | | | | 0.42 | | | | 11.10 | | | | 11.52 | | | | (0.64 | ) | | | (0.33 | ) | | | (0.97 | ) |
Year Ended June 30, 2020 | | | 31.42 | | | | 0.55 | (f) | | | (3.38 | ) | | | (2.83 | ) | | | (0.63 | ) | | | (2.13 | ) | | | (2.76 | ) |
Year Ended June 30, 2019 | | | 34.53 | | | | 0.49 | | | | 0.55 | | | | 1.04 | | | | (0.51 | ) | | | (3.64 | ) | | | (4.15 | ) |
Year Ended June 30, 2018 | | | 35.54 | | | | 0.53 | | | | 4.10 | | | | 4.63 | | | | (0.55 | ) | | | (5.09 | ) | | | (5.64 | ) |
Year Ended June 30, 2017 | | | 31.20 | | | | 0.47 | | | | 4.66 | | | | 5.13 | | | | (0.52 | ) | | | (0.27 | ) | | | (0.79 | ) |
| | | | | | | |
Class C | | | | | | | | | | | | | | | | | | | | | | | | | | | | |
Six Months Ended December 31, 2021 (Unaudited) | | | 35.72 | | | | 0.13 | | | | 2.54 | | | | 2.67 | | | | (0.14 | ) | | | (8.75 | ) | | | (8.89 | ) |
Year Ended June 30, 2021 | | | 25.36 | | | | 0.28 | | | | 10.90 | | | | 11.18 | | | | (0.49 | ) | | | (0.33 | ) | | | (0.82 | ) |
Year Ended June 30, 2020 | | | 30.90 | | | | 0.40 | (f) | | | (3.33 | ) | | | (2.93 | ) | | | (0.48 | ) | | | (2.13 | ) | | | (2.61 | ) |
Year Ended June 30, 2019 | | | 34.06 | | | | 0.32 | | | | 0.54 | | | | 0.86 | | | | (0.38 | ) | | | (3.64 | ) | | | (4.02 | ) |
Year Ended June 30, 2018 | | | 35.14 | | | | 0.35 | | | | 4.05 | | | | 4.40 | | | | (0.39 | ) | | | (5.09 | ) | | | (5.48 | ) |
Year Ended June 30, 2017 | | | 30.87 | | | | 0.30 | | | | 4.60 | | | | 4.90 | | | | (0.36 | ) | | | (0.27 | ) | | | (0.63 | ) |
| | | | | | | |
Class I | | | | | | | | | | | | | | | | | | | | | | | | | | | | |
Six Months Ended December 31, 2021 (Unaudited) | | | 36.72 | | | | 0.27 | | | | 2.63 | | | | 2.90 | | | | (0.27 | ) | | | (8.75 | ) | | | (9.02 | ) |
Year Ended June 30, 2021 | | | 25.79 | | | | 0.50 | | | | 11.48 | | | | 11.98 | | | | (0.72 | ) | | | (0.33 | ) | | | (1.05 | ) |
Year Ended June 30, 2020 | | | 31.62 | | | | 0.62 | (f) | | | (3.66 | ) | | | (3.04 | ) | | | (0.66 | ) | | | (2.13 | ) | | | (2.79 | ) |
Year Ended June 30, 2019 | | | 34.71 | | | | 0.57 | | | | 0.55 | | | | 1.12 | | | | (0.57 | ) | | | (3.64 | ) | | | (4.21 | ) |
Year Ended June 30, 2018 | | | 35.69 | | | | 0.62 | | | | 4.11 | | | | 4.73 | | | | (0.62 | ) | | | (5.09 | ) | | | (5.71 | ) |
Year Ended June 30, 2017 | | | 31.34 | | | | 0.53 | | | | 4.67 | | | | 5.20 | | | | (0.58 | ) | | | (0.27 | ) | | | (0.85 | ) |
| | | | | | | |
Class R2 | | | | | | | | | | | | | | | | | | | | | | | | | | | | |
Six Months Ended December 31, 2021 (Unaudited) | | | 35.99 | | | | 0.16 | | | | 2.57 | | | | 2.73 | | | | (0.17 | ) | | | (8.75 | ) | | | (8.92 | ) |
Year Ended June 30, 2021 | | | 25.55 | | | | 0.33 | | | | 11.01 | | | | 11.34 | | | | (0.57 | ) | | | (0.33 | ) | | | (0.90 | ) |
Year Ended June 30, 2020 | | | 31.12 | | | | 0.47 | (f) | | | (3.35 | ) | | | (2.88 | ) | | | (0.56 | ) | | | (2.13 | ) | | | (2.69 | ) |
Year Ended June 30, 2019 | | | 34.26 | | | | 0.40 | | | | 0.54 | | | | 0.94 | | | | (0.44 | ) | | | (3.64 | ) | | | (4.08 | ) |
Year Ended June 30, 2018 | | | 35.33 | | | | 0.46 | | | | 4.03 | | | | 4.49 | | | | (0.47 | ) | | | (5.09 | ) | | | (5.56 | ) |
Year Ended June 30, 2017 | | | 31.04 | | | | 0.38 | | | | 4.62 | | | | 5.00 | | | | (0.44 | ) | | | (0.27 | ) | | | (0.71 | ) |
| | | | | | | |
Class R5 | | | | | | | | | | | | | | | | | | | | | | | | | | | | |
Six Months Ended December 31, 2021 (Unaudited) | | | 36.78 | | | | 0.28 | | | | 2.64 | | | | 2.92 | | | | (0.28 | ) | | | (8.75 | ) | | | (9.03 | ) |
Year Ended June 30, 2021 | | | 25.66 | | | | 0.59 | | | | 11.63 | | | | 12.22 | | | | (0.77 | ) | | | (0.33 | ) | | | (1.10 | ) |
Year Ended June 30, 2020 | | | 31.73 | | | | 0.67 | (f) | | | (3.87 | ) | | | (3.20 | ) | | | (0.74 | ) | | | (2.13 | ) | | | (2.87 | ) |
Year Ended June 30, 2019 | | | 34.80 | | | | 0.62 | | | | 0.56 | | | | 1.18 | | | | (0.61 | ) | | | (3.64 | ) | | | (4.25 | ) |
Year Ended June 30, 2018 | | | 35.78 | | | | 0.66 | | | | 4.13 | | | | 4.79 | | | | (0.68 | ) | | | (5.09 | ) | | | (5.77 | ) |
Year Ended June 30, 2017 | | | 31.42 | | | | 0.59 | | | | 4.69 | | | | 5.28 | | | | (0.65 | ) | | | (0.27 | ) | | | (0.92 | ) |
| | | | | | | |
Class R6 | | | | | | | | | | | | | | | | | | | | | | | | | | | | |
Six Months Ended December 31, 2021 (Unaudited) | | | 36.78 | | | | 0.31 | | | | 2.62 | | | | 2.93 | | | | (0.29 | ) | | | (8.75 | ) | | | (9.04 | ) |
Year Ended June 30, 2021 | | | 26.06 | | | | 0.57 | | | | 11.28 | | | | 11.85 | | | | (0.80 | ) | | | (0.33 | ) | | | (1.13 | ) |
Year Ended June 30, 2020 | | | 31.74 | | | | 0.70 | (f) | | | (3.47 | ) | | | (2.77 | ) | | | (0.78 | ) | | | (2.13 | ) | | | (2.91 | ) |
Year Ended June 30, 2019 | | | 34.80 | | | | 0.65 | | | | 0.57 | | | | 1.22 | | | | (0.64 | ) | | | (3.64 | ) | | | (4.28 | ) |
Year Ended June 30, 2018 | | | 35.78 | | | | 0.69 | | | | 4.13 | | | | 4.82 | | | | (0.71 | ) | | | (5.09 | ) | | | (5.80 | ) |
Year Ended June 30, 2017 | | | 31.42 | | | | 0.61 | | | | 4.69 | | | | 5.30 | | | | (0.67 | ) | | | (0.27 | ) | | | (0.94 | ) |
| (a) | Annualized for periods less than one year, unless otherwise noted. |
| (b) | Calculated based upon average shares outstanding. |
| (c) | Not annualized for periods less than one year. |
| (d) | Includes adjustments in accordance with accounting principles generally accepted in the United States of America and as such, the net asset values for financial reporting purposes and the returns based upon those net asset values may differ from the net asset values and returns for shareholder transactions. |
| (e) | Includes earnings credits and interest expense, if applicable, each of which is less than 0.005% unless otherwise noted. |
| (f) | Reflects special dividends paid out during the year by several of the Fund’s holdings. Had the Fund not received the special dividends, the net investment income (loss) per share would have been $0.46, $0.30, $0.53, $0.38, $0.57 and $0.60 for Class A, Class C, Class I, Class R2, Class R5 and Class R6 Shares, respectively, and the net investment income (loss) ratio would have been 1.56%, 1.05%, 1.70%, 1.30%, 1.85% and 2.04% for Class A, Class C, Class I, Class R2, Class R5 and Class R6 Shares, respectively. |
SEE NOTES TO FINANCIAL STATEMENTS.
| | | | | | | | | | |
| | | | | |
| 136 | | | | | | | | J.P. MORGAN LARGE CAP FUNDS | | DECEMBER 31, 2021 |
| | | | | | | | | | | | | | | | | | | | | | | | | | |
| | | Ratios/Supplemental data | |
| | | | | | | Ratios to average net assets (a) | | | | |
Net asset
value,
end of
period | | | Total return
(excludes
sales charge) (c)(d) | | | Net assets,
end of
period
(000’s) | | | Net
expenses (e) | | | Net
investment
income
(loss) | | | Expenses
without waivers,
reimbursements and
earnings credits | | | Portfolio
turnover
rate (c) | |
| | |
| | | |
| $ | 30.23 | | | | 8.43 | % | | $ | 60,402 | | | | 0.73 | % | | | 1.23 | % | | | 0.97 | % | | | 47 | % |
| | 36.38 | | | | 45.65 | | | | 61,187 | | | | 0.83 | | | | 1.37 | | | | 0.99 | | | | 72 | |
| | 25.83 | | | | (9.96 | ) | | | 49,876 | | | | 0.83 | | | | 1.88 | (f) | | | 0.95 | | | | 79 | |
| | 31.42 | | | | 4.08 | | | | 72,888 | | | | 0.82 | | | | 1.49 | | | | 1.01 | | | | 88 | |
| | 34.53 | | | | 13.39 | | | | 86,400 | | | | 0.83 | | | | 1.48 | | | | 1.02 | | | | 68 | |
| | 35.54 | | | | 16.55 | | | | 95,891 | | | | 0.83 | | | | 1.41 | | | | 1.16 | | | | 81 | |
| | | | | | |
| | | | | | | | | | | | | | | | | | | | | | | | | | |
| | 29.50 | | | | 8.12 | | | | 10,260 | | | | 1.23 | | | | 0.73 | | | | 1.48 | | | | 47 | |
| | 35.72 | | | | 45.02 | | | | 11,211 | | | | 1.33 | | | | 0.91 | | | | 1.50 | | | | 72 | |
| | 25.36 | | | | (10.46 | ) | | | 11,038 | | | | 1.33 | | | | 1.37 | (f) | | | 1.46 | | | | 79 | |
| | 30.90 | | | | 3.57 | | | | 19,139 | | | | 1.32 | | | | 0.99 | | | | 1.52 | | | | 88 | |
| | 34.06 | | | | 12.84 | | | | 23,686 | | | | 1.33 | | | | 1.00 | | | | 1.53 | | | | 68 | |
| | 35.14 | | | | 15.97 | | | | 35,999 | | | | 1.32 | | | | 0.89 | | | | 1.59 | | | | 81 | |
| | | | | | |
| | | | | | | | | | | | | | | | | | | | | | | | | | |
| | 30.60 | | | | 8.55 | | | | 124,275 | | | | 0.49 | | | | 1.47 | | | | 0.72 | | | | 47 | |
| | 36.72 | | | | 47.54 | | | | 127,530 | | | | 0.59 | | | | 1.62 | | | | 0.74 | | | | 72 | |
| | 25.79 | | | | (10.69 | ) | | | 113,316 | | | | 0.59 | | | | 2.01 | (f) | | | 0.68 | | | | 79 | |
| | 31.62 | | | | 4.33 | | | | 698,989 | | | | 0.58 | | | | 1.74 | | | | 0.76 | | | | 88 | |
| | 34.71 | | | | 13.65 | | | | 772,556 | | | | 0.62 | | | | 1.71 | | | | 0.76 | | | | 68 | |
| | 35.69 | | | | 16.72 | | | | 886,602 | | | | 0.68 | | | | 1.56 | | | | 0.90 | | | | 81 | |
| | | | | | |
| | | | | | | | | | | | | | | | | | | | | | | | | | |
| | 29.80 | | | | 8.23 | | | | 2,978 | | | | 1.09 | | | | 0.87 | | | | 1.41 | | | | 47 | |
| | 35.99 | | | | 45.36 | | | | 3,000 | | | | 1.09 | | | | 1.08 | | | | 1.34 | | | | 72 | |
| | 25.55 | | | | (10.24 | ) | | | 2,664 | | | | 1.09 | | | | 1.62 | (f) | | | 1.30 | | | | 79 | |
| | 31.12 | | | | 3.81 | | | | 4,438 | | | | 1.08 | | | | 1.22 | | | | 1.62 | | | | 88 | |
| | 34.26 | | | | 13.04 | | | | 5,781 | | | | 1.12 | | | | 1.28 | | | | 1.52 | | | | 68 | |
| | 35.33 | | | | 16.24 | | | | 19,693 | | | | 1.10 | | | | 1.12 | | | | 1.59 | | | | 81 | |
| | | | | | |
| | | | | | | | | | | | | | | | | | | | | | | | | | |
| | 30.67 | | | | 8.59 | | | | 4,479 | | | | 0.44 | | | | 1.53 | | | | 0.58 | | | | 47 | |
| | 36.78 | | | | 48.74 | | | | 4,053 | | | | 0.44 | | | | 1.91 | | | | 0.59 | | | | 72 | |
| | 25.66 | | | | (11.16 | ) | | | 4,269 | | | | 0.44 | | | | 2.16 | (f) | | | 0.55 | | | | 79 | |
| | 31.73 | | | | 4.50 | | | | 48,910 | | | | 0.43 | | | | 1.89 | | | | 0.61 | | | | 88 | |
| | 34.80 | | | | 13.80 | | | | 90,714 | | | | 0.45 | | | | 1.82 | | | | 0.62 | | | | 68 | |
| | 35.78 | | | | 16.97 | | | | 86,134 | | | | 0.48 | | | | 1.73 | | | | 0.61 | | | | 81 | |
| | | | | | |
| | | | | | | | | | | | | | | | | | | | | | | | | | |
| | 30.67 | | | | 8.63 | | | | 44,058 | | | | 0.34 | | | | 1.65 | | | | 0.47 | | | | 47 | |
| | 36.78 | | | | 46.60 | | | | 69,298 | | | | 0.34 | | | | 1.82 | | | | 0.49 | | | | 72 | |
| | 26.06 | | | | (9.68 | ) | | | 74,603 | | | | 0.34 | | | | 2.37 | (f) | | | 0.44 | | | | 79 | |
| | 31.74 | | | | 4.63 | | | | 133,014 | | | | 0.33 | | | | 1.99 | | | | 0.51 | | | | 88 | |
| | 34.80 | | | | 13.90 | | | | 118,726 | | | | 0.37 | | | | 1.90 | | | | 0.52 | | | | 68 | |
| | 35.78 | | | | 17.03 | | | | 108,525 | | | | 0.43 | | | | 1.79 | | | | 0.52 | | | | 81 | |
SEE NOTES TO FINANCIAL STATEMENTS.
| | | | | | | | | | |
| | | | | |
| DECEMBER 31, 2021 | | J.P. MORGAN LARGE CAP FUNDS | | | | | | | | 137 |
FINANCIAL HIGHLIGHTS
FOR THE PERIODS INDICATED (continued)
| | | | | | | | | | | | | | | | | | | | | | | | | | | | |
| | | Per share operating performance | |
| | | | | | Investment operations | | | Distributions | |
| | | Net asset
value,
beginning
of period | | | Net
investment
income
(loss) (b) | | | Net realized
and unrealized
gains
(losses) on
investments | | | Total from
investment
operations | | | Net
investment
income | | | Net
realized
gain | | | Total
distributions | |
JPMorgan U.S. Equity Fund | | | | | | | | | | | | | | | | | | | | | | | | | | | | |
Class A | | | | | | | | | | | | | | | | | | | | | | | | | | | | |
Six Months Ended December 31, 2021 (Unaudited) | | $ | 21.51 | | | $ | 0.03 | | | $ | 2.70 | | | $ | 2.73 | | | $ | (0.03 | ) | | $ | (2.23 | ) | | $ | (2.26 | ) |
Year Ended June 30, 2021 | | | 16.22 | | | | 0.09 | | | | 6.39 | | | | 6.48 | | | | (0.08 | ) | | | (1.11 | ) | | | (1.19 | ) |
Year Ended June 30, 2020 | | | 15.86 | | | | 0.11 | | | | 1.82 | | | | 1.93 | | | | (0.11 | ) | | | (1.46 | ) | | | (1.57 | ) |
Year Ended June 30, 2019 | | | 16.48 | | | | 0.12 | | | | 1.17 | | | | 1.29 | | | | (0.12 | ) | | | (1.79 | ) | | | (1.91 | ) |
Year Ended June 30, 2018 | | | 15.80 | | | | 0.11 | | | | 1.94 | | | | 2.05 | | | | (0.11 | ) | | | (1.26 | ) | | | (1.37 | ) |
Year Ended June 30, 2017 | | | 13.76 | | | | 0.11 | | | | 2.57 | | | | 2.68 | | | | (0.11 | ) | | | (0.53 | ) | | | (0.64 | ) |
| | | | | | | |
Class C | | | | | | | | | | | | | | | | | | | | | | | | | | | | |
Six Months Ended December 31, 2021 (Unaudited) | | | 20.61 | | | | (0.03 | ) | | | 2.59 | | | | 2.56 | | | | — | | | | (2.23 | ) | | | (2.23 | ) |
Year Ended June 30, 2021 | | | 15.60 | | | | (0.01 | ) | | | 6.14 | | | | 6.13 | | | | (0.01 | ) | | | (1.11 | ) | | | (1.12 | ) |
Year Ended June 30, 2020 | | | 15.31 | | | | 0.03 | | | | 1.75 | | | | 1.78 | | | | (0.03 | ) | | | (1.46 | ) | | | (1.49 | ) |
Year Ended June 30, 2019 | | | 15.99 | | | | 0.04 | | | | 1.13 | | | | 1.17 | | | | (0.06 | ) | | | (1.79 | ) | | | (1.85 | ) |
Year Ended June 30, 2018 | | | 15.37 | | | | 0.03 | | | | 1.89 | | | | 1.92 | | | | (0.04 | ) | | | (1.26 | ) | | | (1.30 | ) |
Year Ended June 30, 2017 | | | 13.41 | | | | 0.04 | | | | 2.49 | | | | 2.53 | | | | (0.04 | ) | | | (0.53 | ) | | | (0.57 | ) |
| | | | | | | |
Class I | | | | | | | | | | | | | | | | | | | | | | | | | | | | |
Six Months Ended December 31, 2021 (Unaudited) | | | 21.59 | | | | 0.06 | | | | 2.70 | | | | 2.76 | | | | (0.05 | ) | | | (2.23 | ) | | | (2.28 | ) |
Year Ended June 30, 2021 | | | 16.27 | | | | 0.13 | | | | 6.43 | | | | 6.56 | | | | (0.13 | ) | | | (1.11 | ) | | | (1.24 | ) |
Year Ended June 30, 2020 | | | 15.91 | | | | 0.15 | | | | 1.82 | | | | 1.97 | | | | (0.15 | ) | | | (1.46 | ) | | | (1.61 | ) |
Year Ended June 30, 2019 | | | 16.51 | | | | 0.16 | | | | 1.18 | | | | 1.34 | | | | (0.15 | ) | | | (1.79 | ) | | | (1.94 | ) |
Year Ended June 30, 2018 | | | 15.83 | | | | 0.15 | | | | 1.94 | | | | 2.09 | | | | (0.15 | ) | | | (1.26 | ) | | | (1.41 | ) |
Year Ended June 30, 2017 | | | 13.79 | | | | 0.14 | | | | 2.57 | | | | 2.71 | | | | (0.14 | ) | | | (0.53 | ) | | | (0.67 | ) |
| | | | | | | |
Class L | | | | | | | | | | | | | | | | | | | | | | | | | | | | |
Six Months Ended December 31, 2021 (Unaudited) | | | 21.63 | | | | 0.07 | | | | 2.72 | | | | 2.79 | | | | (0.07 | ) | | | (2.23 | ) | | | (2.30 | ) |
Year Ended June 30, 2021 | | | 16.30 | | | | 0.16 | | | | 6.44 | | | | 6.60 | | | | (0.16 | ) | | | (1.11 | ) | | | (1.27 | ) |
Year Ended June 30, 2020 | | | 15.93 | | | | 0.17 | | | | 1.83 | | | | 2.00 | | | | (0.17 | ) | | | (1.46 | ) | | | (1.63 | ) |
Year Ended June 30, 2019 | | | 16.53 | | | | 0.18 | | | | 1.18 | | | | 1.36 | | | | (0.17 | ) | | | (1.79 | ) | | | (1.96 | ) |
Year Ended June 30, 2018 | | | 15.85 | | | | 0.17 | | | | 1.94 | | | | 2.11 | | | | (0.17 | ) | | | (1.26 | ) | | | (1.43 | ) |
Year Ended June 30, 2017 | | | 13.80 | | | | 0.16 | | | | 2.58 | | | | 2.74 | | | | (0.16 | ) | | | (0.53 | ) | | | (0.69 | ) |
| | | | | | | |
Class R2 | | | | | | | | | | | | | | | | | | | | | | | | | | | | |
Six Months Ended December 31, 2021 (Unaudited) | | | 21.26 | | | | — | (f) | | | 2.66 | | | | 2.66 | | | | — | (f) | | | (2.23 | ) | | | (2.23 | ) |
Year Ended June 30, 2021 | | | 16.04 | | | | 0.04 | | | | 6.33 | | | | 6.37 | | | | (0.04 | ) | | | (1.11 | ) | | | (1.15 | ) |
Year Ended June 30, 2020 | | | 15.70 | | | | 0.07 | | | | 1.80 | | | | 1.87 | | | | (0.07 | ) | | | (1.46 | ) | | | (1.53 | ) |
Year Ended June 30, 2019 | | | 16.34 | | | | 0.08 | | | | 1.16 | | | | 1.24 | | | | (0.09 | ) | | | (1.79 | ) | | | (1.88 | ) |
Year Ended June 30, 2018 | | | 15.68 | | | | 0.07 | | | | 1.92 | | | | 1.99 | | | | (0.07 | ) | | | (1.26 | ) | | | (1.33 | ) |
Year Ended June 30, 2017 | | | 13.66 | | | | 0.07 | | | | 2.55 | | | | 2.62 | | | | (0.07 | ) | | | (0.53 | ) | | | (0.60 | ) |
| | | | | | | |
Class R3 | | | | | | | | | | | | | | | | | | | | | | | | | | | | |
Six Months Ended December 31, 2021 (Unaudited) | | | 21.42 | | | | 0.03 | | | | 2.68 | | | | 2.71 | | | | (0.03 | ) | | | (2.23 | ) | | | (2.26 | ) |
Year Ended June 30, 2021 | | | 16.15 | | | | 0.09 | | | | 6.38 | | | | 6.47 | | | | (0.09 | ) | | | (1.11 | ) | | | (1.20 | ) |
Year Ended June 30, 2020 | | | 15.80 | | | | 0.11 | | | | 1.81 | | | | 1.92 | | | | (0.11 | ) | | | (1.46 | ) | | | (1.57 | ) |
Year Ended June 30, 2019 | | | 16.43 | | | | 0.12 | | | | 1.16 | | | | 1.28 | | | | (0.12 | ) | | | (1.79 | ) | | | (1.91 | ) |
Year Ended June 30, 2018 | | | 15.76 | | | | 0.11 | | | | 1.93 | | | | 2.04 | | | | (0.11 | ) | | | (1.26 | ) | | | (1.37 | ) |
September 9, 2016 (g) through June 30, 2017 | | | 14.11 | | | | 0.08 | | | | 2.24 | | | | 2.32 | | | | (0.14 | ) | | | (0.53 | ) | | | (0.67 | ) |
| | | | | | | |
Class R4 | | | | | | | | | | | | | | | | | | | | | | | | | | | | |
Six Months Ended December 31, 2021 (Unaudited) | | | 21.55 | | | | 0.06 | | | | 2.70 | | | | 2.76 | | | | (0.05 | ) | | | (2.23 | ) | | | (2.28 | ) |
Year Ended June 30, 2021 | | | 16.25 | | | | 0.13 | | | | 6.41 | | | | 6.54 | | | | (0.13 | ) | | | (1.11 | ) | | | (1.24 | ) |
Year Ended June 30, 2020 | | | 15.89 | | | | 0.15 | | | | 1.82 | | | | 1.97 | | | | (0.15 | ) | | | (1.46 | ) | | | (1.61 | ) |
Year Ended June 30, 2019 | | | 16.50 | | | | 0.17 | | | | 1.16 | | | | 1.33 | | | | (0.15 | ) | | | (1.79 | ) | | | (1.94 | ) |
Year Ended June 30, 2018 | | | 15.82 | | | | 0.16 | | | | 1.93 | | | | 2.09 | | | | (0.15 | ) | | | (1.26 | ) | | | (1.41 | ) |
September 9, 2016 (g) through June 30, 2017 | | | 14.15 | | | | 0.13 | | | | 2.22 | | | | 2.35 | | | | (0.15 | ) | | | (0.53 | ) | | | (0.68 | ) |
| | | | | | | |
Class R5 | | | | | | | | | | | | | | | | | | | | | | | | | | | | |
Six Months Ended December 31, 2021 (Unaudited) | | | 21.64 | | | | 0.07 | | | | 2.72 | | | | 2.79 | | | | (0.07 | ) | | | (2.23 | ) | | | (2.30 | ) |
Year Ended June 30, 2021 | | | 16.31 | | | | 0.16 | | | | 6.44 | | | | 6.60 | | | | (0.16 | ) | | | (1.11 | ) | | | (1.27 | ) |
Year Ended June 30, 2020 | | | 15.94 | | | | 0.17 | | | | 1.83 | | | | 2.00 | | | | (0.17 | ) | | | (1.46 | ) | | | (1.63 | ) |
Year Ended June 30, 2019 | | | 16.54 | | | | 0.19 | | | | 1.17 | | | | 1.36 | | | | (0.17 | ) | | | (1.79 | ) | | | (1.96 | ) |
Year Ended June 30, 2018 | | | 15.85 | | | | 0.18 | | | | 1.95 | | | | 2.13 | | | | (0.18 | ) | | | (1.26 | ) | | | (1.44 | ) |
Year Ended June 30, 2017 | | | 13.81 | | | | 0.17 | | | | 2.57 | | | | 2.74 | | | | (0.17 | ) | | | (0.53 | ) | | | (0.70 | ) |
| | | | | | | |
Class R6 | | | | | | | | | | | | | | | | | | | | | | | | | | | | |
Six Months Ended December 31, 2021 (Unaudited) | | | 21.69 | | | | 0.08 | | | | 2.73 | | | | 2.81 | | | | (0.08 | ) | | | (2.23 | ) | | | (2.31 | ) |
Year Ended June 30, 2021 | | | 16.34 | | | | 0.18 | | | | 6.46 | | | | 6.64 | | | | (0.18 | ) | | | (1.11 | ) | | | (1.29 | ) |
Year Ended June 30, 2020 | | | 15.97 | | | | 0.19 | | | | 1.83 | | | | 2.02 | | | | (0.19 | ) | | | (1.46 | ) | | | (1.65 | ) |
Year Ended June 30, 2019 | | | 16.56 | | | | 0.20 | | | | 1.19 | | | | 1.39 | | | | (0.19 | ) | | | (1.79 | ) | | | (1.98 | ) |
Year Ended June 30, 2018 | | | 15.87 | | | | 0.19 | | | | 1.95 | | | | 2.14 | | | | (0.19 | ) | | | (1.26 | ) | | | (1.45 | ) |
Year Ended June 30, 2017 | | | 13.82 | | | | 0.18 | | | | 2.58 | | | | 2.76 | | | | (0.18 | ) | | | (0.53 | ) | | | (0.71 | ) |
| (a) | Annualized for periods less than one year, unless otherwise noted. |
| (b) | Calculated based upon average shares outstanding. |
| (c) | Not annualized for periods less than one year. |
| (d) | Includes adjustments in accordance with accounting principles generally accepted in the United States of America and as such, the net asset values for financial reporting purposes and the returns based upon those net asset values may differ from the net asset values and returns for shareholder transactions. |
| (e) | Includes earnings credits and interest expense, if applicable, each of which is less than 0.005% unless otherwise noted. |
| (f) | Amount rounds to less than $0.005. |
| (g) | Commencement of offering of class of shares. |
SEE NOTES TO FINANCIAL STATEMENTS.
| | | | | | | | | | |
| | | | | |
| 138 | | | | | | | | J.P. MORGAN LARGE CAP FUNDS | | DECEMBER 31, 2021 |
| | | | | | | | | | | | | | | | | | | | | | | | | | |
| | | Ratios/Supplemental data | |
| | | | | | | Ratios to average net assets (a) | | | | |
Net asset
value,
end of
period | | | Total return
(excludes
sales charge) (c)(d) | | | Net assets,
end of period
(000’s) | | | Net
expenses (e) | | | Net
investment
income
(loss) | | | Expenses
without waivers,
reimbursements and
earnings credits | | | Portfolio
turnover
rate (c) | |
| | |
| | |
| $ | 21.98 | | | | 12.84 | % | | $ | 1,919,539 | | | | 0.94 | % | | | 0.23 | % | | | 0.98 | % | | | 26 | % |
| | 21.51 | | | | 41.18 | | | | 1,642,046 | | | | 0.94 | | | | 0.46 | | | | 0.98 | | | | 60 | |
| | 16.22 | | | | 12.59 | | | | 1,869,111 | | | | 0.94 | | | | 0.70 | | | | 0.99 | | | | 84 | |
| | 15.86 | | | | 9.18 | | | | 1,556,392 | | | | 0.94 | | | | 0.76 | | | | 0.99 | | | | 91 | |
| | 16.48 | | | | 13.20 | | | | 1,340,858 | | | | 0.94 | | | | 0.69 | | | | 1.01 | | | | 97 | |
| | 15.80 | | | | 19.86 | | | | 1,371,821 | | | | 0.94 | | | | 0.75 | | | | 1.10 | | | | 86 | |
| | | | | | |
| | | | | | | | | | | | | | | | | | | | | | | | | | |
| | 20.94 | | | | 12.58 | | | | 434,291 | | | | 1.44 | | | | (0.27 | ) | | | 1.47 | | | | 26 | |
| | 20.61 | | | | 40.52 | | | | 367,940 | | | | 1.44 | | | | (0.05 | ) | | | 1.47 | | | | 60 | |
| | 15.60 | | | | 12.01 | | | | 274,741 | | | | 1.44 | | | | 0.19 | | | | 1.49 | | | | 84 | |
| | 15.31 | | | | 8.63 | | | | 289,675 | | | | 1.44 | | | | 0.27 | | | | 1.49 | | | | 91 | |
| | 15.99 | | | | 12.66 | | | | 302,297 | | | | 1.44 | | | | 0.19 | | | | 1.50 | | | | 97 | |
| | 15.37 | | | | 19.23 | | | | 318,369 | | | | 1.44 | | | | 0.25 | | | | 1.55 | | | | 86 | |
| | | | | | |
| | | | | | | | | | | | | | | | | | | | | | | | | | |
| | 22.07 | | | | 12.98 | | | | 2,089,254 | | | | 0.69 | | | | 0.48 | | | | 0.72 | | | | 26 | |
| | 21.59 | | | | 41.64 | | | | 1,731,572 | | | | 0.69 | | | | 0.69 | | | | 0.72 | | | | 60 | |
| | 16.27 | | | | 12.82 | | | | 1,038,998 | | | | 0.69 | | | | 0.94 | | | | 0.73 | | | | 84 | |
| | 15.91 | | | | 9.47 | | | | 1,121,609 | | | | 0.69 | | | | 1.03 | | | | 0.74 | | | | 91 | |
| | 16.51 | | | | 13.44 | | | | 1,521,535 | | | | 0.71 | | | | 0.92 | | | | 0.75 | | | | 97 | |
| | 15.83 | | | | 20.05 | | | | 1,287,300 | | | | 0.76 | | | | 0.93 | | | | 0.81 | | | | 86 | |
| | | | | | |
| | | | | | | | | | | | | | | | | | | | | | | | | | |
| | 22.12 | | | | 13.08 | | | | 2,028,197 | | | | 0.54 | | | | 0.63 | | | | 0.57 | | | | 26 | |
| | 21.63 | | | | 41.81 | | | | 1,907,620 | | | | 0.54 | | | | 0.83 | | | | 0.58 | | | | 60 | |
| | 16.30 | | | | 13.03 | | | | 1,309,531 | | | | 0.55 | | | | 1.08 | | | | 0.59 | | | | 84 | |
| | 15.93 | | | | 9.60 | | | | 1,552,520 | | | | 0.55 | | | | 1.16 | | | | 0.60 | | | | 91 | |
| | 16.53 | | | | 13.56 | | | | 1,679,995 | | | | 0.57 | | | | 1.05 | | | | 0.60 | | | | 97 | |
| | 15.85 | | | | 20.27 | | | | 3,391,256 | | | | 0.61 | | | | 1.07 | | | | 0.67 | | | | 86 | |
| | | | | | |
| | | | | | | | | | | | | | | | | | | | | | | | | | |
| | 21.69 | | | | 12.68 | | | | 283,095 | | | | 1.19 | | | | (0.02 | ) | | | 1.22 | | | | 26 | |
| | 21.26 | | | | 40.92 | | | | 269,266 | | | | 1.19 | | | | 0.20 | | | | 1.22 | | | | 60 | |
| | 16.04 | | | | 12.29 | | | | 216,689 | | | | 1.19 | | | | 0.44 | | | | 1.23 | | | | 84 | |
| | 15.70 | | | | 8.89 | | | | 244,356 | | | | 1.19 | | | | 0.52 | | | | 1.24 | | | | 91 | |
| | 16.34 | | | | 12.88 | | | | 265,675 | | | | 1.21 | | | | 0.42 | | | | 1.25 | | | | 97 | |
| | 15.68 | | | | 19.58 | | | | 260,589 | | | | 1.20 | | | | 0.48 | | | | 1.40 | | | | 86 | |
| | | | | | |
| | | | | | | | | | | | | | | | | | | | | | | | | | |
| | 21.87 | | | | 12.80 | | | | 192,664 | | | | 0.94 | | | | 0.23 | | | | 0.97 | | | | 26 | |
| | 21.42 | | | | 41.30 | | | | 174,770 | | | | 0.94 | | | | 0.44 | | | | 0.97 | | | | 60 | |
| | 16.15 | | | | 12.57 | | | | 117,991 | | | | 0.94 | | | | 0.70 | | | | 0.98 | | | | 84 | |
| | 15.80 | | | | 9.14 | | | | 111,902 | | | | 0.94 | | | | 0.79 | | | | 0.99 | | | | 91 | |
| | 16.43 | | | | 13.18 | | | | 61,413 | | | | 0.95 | | | | 0.69 | | | | 1.00 | | | | 97 | |
| | 15.76 | | | | 16.83 | | | | 25,050 | | | | 1.00 | | | | 0.67 | | | | 1.03 | | | | 86 | |
| | | | | | |
| | | | | | | | | | | | | | | | | | | | | | | | | | |
| | 22.03 | | | | 13.00 | | | | 67,096 | | | | 0.69 | | | | 0.48 | | | | 0.72 | | | | 26 | |
| | 21.55 | | | | 41.58 | | | | 45,443 | | | | 0.69 | | | | 0.69 | | | | 0.72 | | | | 60 | |
| | 16.25 | | | | 12.84 | | | | 21,651 | | | | 0.69 | | | | 0.95 | | | | 0.73 | | | | 84 | |
| | 15.89 | | | | 9.44 | | | | 22,870 | | | | 0.69 | | | | 1.08 | | | | 0.75 | | | | 91 | |
| | 16.50 | | | | 13.48 | | | | 10,531 | | | | 0.70 | | | | 0.94 | | | | 0.75 | | | | 97 | |
| | 15.82 | | | | 16.99 | | | | 1,030 | | | | 0.75 | | | | 1.03 | | | | 0.81 | | | | 86 | |
| | | | | | |
| | | | | | | | | | | | | | | | | | | | | | | | | | |
| | 22.13 | | | | 13.07 | | | | 1,166,317 | | | | 0.54 | | | | 0.63 | | | | 0.57 | | | | 26 | |
| | 21.64 | | | | 41.79 | | | | 1,089,931 | | | | 0.54 | | | | 0.84 | | | | 0.57 | | | | 60 | |
| | 16.31 | | | | 13.04 | | | | 817,671 | | | | 0.54 | | | | 1.09 | | | | 0.58 | | | | 84 | |
| | 15.94 | | | | 9.60 | | | | 842,888 | | | | 0.54 | | | | 1.17 | | | | 0.59 | | | | 91 | |
| | 16.54 | | | | 13.66 | | | | 938,744 | | | | 0.54 | | | | 1.08 | | | | 0.60 | | | | 97 | |
| | 15.85 | | | | 20.24 | | | | 890,105 | | | | 0.56 | | | | 1.12 | | | | 0.62 | | | | 86 | |
| | | | | | |
| | | | | | | | | | | | | | | | | | | | | | | | | | |
| | 22.19 | | | | 13.15 | | | | 14,334,112 | | | | 0.44 | | | | 0.73 | | | | 0.47 | | | | 26 | |
| | 21.69 | | | | 41.98 | | | | 12,615,063 | | | | 0.44 | | | | 0.95 | | | | 0.47 | | | | 60 | |
| | 16.34 | | | | 13.13 | | | | 9,272,379 | | | | 0.44 | | | | 1.20 | | | | 0.48 | | | | 84 | |
| | 15.97 | | | | 9.74 | | | | 8,559,285 | | | | 0.44 | | | | 1.27 | | | | 0.49 | | | | 91 | |
| | 16.56 | | | | 13.75 | | | | 8,937,049 | | | | 0.46 | | | | 1.17 | | | | 0.50 | | | | 97 | |
| | 15.87 | | | | 20.37 | | | | 6,751,473 | | | | 0.50 | | | | 1.19 | | | | 0.50 | | | | 86 | |
SEE NOTES TO FINANCIAL STATEMENTS.
| | | | | | | | | | |
| | | | | |
| DECEMBER 31, 2021 | | J.P. MORGAN LARGE CAP FUNDS | | | | | | | | 139 |
FINANCIAL HIGHLIGHTS
FOR THE PERIODS INDICATED (continued)
| | | | | | | | | | | | | | | | | | | | | | | | | | | | |
| | | Per share operating performance | |
| | | | | | Investment operations | | | Distributions | |
| | | Net asset
value,
beginning
of period | | | Net
investment
income
(loss) (b) | | | Net realized
and unrealized
gains
(losses) on
investments | | | Total from
investment
operations | | | Net
investment
income | | | Net
realized
gain | | | Total
distributions | |
JPMorgan U.S. GARP Equity Fund | | | | | | | | | | | | | | | | | | | | | | | | | | | | |
Class A | | | | | | | | | | | | | | | | | | | | | | | | | | | | |
Six Months Ended December 31, 2021 (Unaudited) | | $ | 73.40 | | | $ | (0.01 | ) | | $ | 9.31 | | | $ | 9.30 | | | $ | — | | | $ | (14.78 | ) | | $ | (14.78 | ) |
Year Ended June 30, 2021 | | | 57.64 | | | | (0.01 | ) | | | 21.89 | | | | 21.88 | | | | (0.52 | ) | | | (5.60 | ) | | | (6.12 | ) |
Year Ended June 30, 2020 | | | 56.61 | | | | 0.63 | (f) | | | 7.41 | | | | 8.04 | | | | (0.34 | ) | | | (6.67 | ) | | | (7.01 | ) |
Year Ended June 30, 2019 | | | 59.09 | | | | 0.45 | | | | 3.01 | | | | 3.46 | | | | (0.30 | ) | | | (5.64 | ) | | | (5.94 | ) |
Year Ended June 30, 2018 | | | 48.60 | | | | 0.23 | | | | 10.51 | | | | 10.74 | | | | (0.25 | ) | | | — | | | | (0.25 | ) |
Year Ended June 30, 2017 | | | 40.37 | | | | 0.22 | | | | 8.27 | | | | 8.49 | | | | (0.26 | ) | | | — | | | | (0.26 | ) |
| | | | | | | |
Class C | | | | | | | | | | | | | | | | | | | | | | | | | | | | |
Six Months Ended December 31, 2021 (Unaudited) | | | 71.55 | | | | (0.20 | ) | | | 9.05 | | | | 8.85 | | | | — | | | | (14.78 | ) | | | (14.78 | ) |
Year Ended June 30, 2021 | | | 56.26 | | | | (0.32 | ) | | | 21.36 | | | | 21.04 | | | | (0.15 | ) | | | (5.60 | ) | | | (5.75 | ) |
Year Ended June 30, 2020 | | | 55.45 | | | | 0.35 | | | | 7.22 | | | | 7.57 | | | | (0.09 | ) | | | (6.67 | ) | | | (6.76 | ) |
Year Ended June 30, 2019 | | | 58.00 | | | | 0.16 | | | | 2.97 | | | | 3.13 | | | | (0.04 | ) | | | (5.64 | ) | | | (5.68 | ) |
Year Ended June 30, 2018 | | | 47.72 | | | | (0.04 | ) | | | 10.32 | | | | 10.28 | | | | — | | | | — | | | | — | |
Year Ended June 30, 2017 | | | 39.63 | | | | — | (g) | | | 8.13 | | | | 8.13 | | | | (0.04 | ) | | | — | | | | (0.04 | ) |
| | | | | | | |
Class I | | | | | | | | | | | | | | | | | | | | | | | | | | | | |
Six Months Ended December 31, 2021 (Unaudited) | | | 75.08 | | | | 0.09 | | | | 9.53 | | | | 9.62 | | | | (0.12 | ) | | | (14.78 | ) | | | (14.90 | ) |
Year Ended June 30, 2021 | | | 58.80 | | | | 0.16 | | | | 22.37 | | | | 22.53 | | | | (0.65 | ) | | | (5.60 | ) | | | (6.25 | ) |
Year Ended June 30, 2020 | | | 57.60 | | | | 0.79 | (f) | | | 7.54 | | | | 8.33 | | | | (0.46 | ) | | | (6.67 | ) | | | (7.13 | ) |
Year Ended June 30, 2019 | | | 60.04 | | | | 0.60 | | | | 3.05 | | | | 3.65 | | | | (0.45 | ) | | | (5.64 | ) | | | (6.09 | ) |
Year Ended June 30, 2018 | | | 49.34 | | | | 0.38 | | | | 10.68 | | | | 11.06 | | | | (0.36 | ) | | | — | | | | (0.36 | ) |
Year Ended June 30, 2017 | | | 40.99 | | | | 0.34 | | | | 8.40 | | | | 8.74 | | | | (0.39 | ) | | | — | | | | (0.39 | ) |
| | | | | | | |
Class R2 | | | | | | | | | | | | | | | | | | | | | | | | | | | | |
Six Months Ended December 31, 2021 (Unaudited) | | | 71.18 | | | | (0.10 | ) | | | 9.01 | | | | 8.91 | | | | — | | | | (14.78 | ) | | | (14.78 | ) |
Year Ended June 30, 2021 | | | 56.08 | | | | (0.17 | ) | | | 21.26 | | | | 21.09 | | | | (0.39 | ) | | | (5.60 | ) | | | (5.99 | ) |
Year Ended June 30, 2020 | | | 55.27 | | | | 0.48 | (f) | | | 7.22 | | | | 7.70 | | | | (0.22 | ) | | | (6.67 | ) | | | (6.89 | ) |
Year Ended June 30, 2019 | | | 57.95 | | | | 0.30 | | | | 2.93 | | | | 3.23 | | | | (0.27 | ) | | | (5.64 | ) | | | (5.91 | ) |
Year Ended June 30, 2018 | | | 47.66 | | | | 0.09 | | | | 10.31 | | | | 10.40 | | | | (0.11 | ) | | | — | | | | (0.11 | ) |
Year Ended June 30, 2017 | | | 39.66 | | | | 0.11 | | | | 8.12 | | | | 8.23 | | | | (0.23 | ) | | | — | | | | (0.23 | ) |
| | | | | | | |
Class R5 | | | | | | | | | | | | | | | | | | | | | | | | | | | | |
Six Months Ended December 31, 2021 (Unaudited) | | | 73.80 | | | | 0.14 | | | | 9.37 | | | | 9.51 | | | | (0.19 | ) | | | (14.78 | ) | | | (14.97 | ) |
Year Ended June 30, 2021 | | | 57.93 | | | | 0.26 | | | | 21.96 | | | | 22.22 | | | | (0.75 | ) | | | (5.60 | ) | | | (6.35 | ) |
Year Ended June 30, 2020 | | | 56.82 | | | | 0.86 | (f) | | | 7.47 | | | | 8.33 | | | | (0.55 | ) | | | (6.67 | ) | | | (7.22 | ) |
Year Ended June 30, 2019 | | | 59.32 | | | | 0.68 | | | | 2.99 | | | | 3.67 | | | | (0.53 | ) | | | (5.64 | ) | | | (6.17 | ) |
Year Ended June 30, 2018 | | | 48.76 | | | | 0.46 | | | | 10.56 | | | | 11.02 | | | | (0.46 | ) | | | — | | | | (0.46 | ) |
Year Ended June 30, 2017 | | | 40.51 | | | | 0.42 | | | | 8.29 | | | | 8.71 | | | | (0.46 | ) | | | — | | | | (0.46 | ) |
| | | | | | | |
Class R6 | | | | | | | | | | | | | | | | | | | | | | | | | | | | |
Six Months Ended December 31, 2021 (Unaudited) | | | 73.81 | | | | 0.18 | | | | 9.37 | | | | 9.55 | | | | (0.28 | ) | | | (14.78 | ) | | | (15.06 | ) |
Year Ended June 30, 2021 | | | 57.93 | | | | 0.33 | | | | 21.96 | | | | 22.29 | | | | (0.81 | ) | | | (5.60 | ) | | | (6.41 | ) |
Year Ended June 30, 2020 | | | 56.81 | | | | 0.91 | (f) | | | 7.49 | | | | 8.40 | | | | (0.61 | ) | | | (6.67 | ) | | | (7.28 | ) |
Year Ended June 30, 2019 | | | 59.32 | | | | 0.74 | | | | 2.98 | | | | 3.72 | | | | (0.59 | ) | | | (5.64 | ) | | | (6.23 | ) |
Year Ended June 30, 2018 | | | 48.74 | | | | 0.51 | | | | 10.56 | | | | 11.07 | | | | (0.49 | ) | | | — | | | | (0.49 | ) |
Year Ended June 30, 2017 | | | 40.50 | | | | 0.44 | | | | 8.29 | | | | 8.73 | | | | (0.49 | ) | | | — | | | | (0.49 | ) |
| (a) | Annualized for periods less than one year, unless otherwise noted. |
| (b) | Calculated based upon average shares outstanding. |
| (c) | Not annualized for periods less than one year. |
| (d) | Includes adjustments in accordance with accounting principles generally accepted in the United States of America and as such, the net asset values for financial reporting purposes and the returns based upon those net asset values may differ from the net asset values and returns for shareholder transactions. |
| (e) | Includes earnings credits and interest expense, if applicable, each of which is less than 0.005% unless otherwise noted. |
| (f) | Reflects special dividends paid out during the year by several of the Fund’s holdings. Had the Fund not received the special dividends, the net investment income (loss) per share would have been $0.27, $(0.01), $0.41, $0.13, $0.49 and $0.55 for Class A, Class C, Class I, Class R2, Class R5 and Class R6 Shares, respectively,and the net investment income (loss) ratio would have been 0.48%, (0.02)%, 0.73%, 0.23%, 0.88% and 0.99% for Class A, Class C, Class I, Class R2, Class R5 and Class R6 Shares, respectively. |
| (g) | Amount rounds to less than $0.005. |
| (h) | Amount rounds to less than 0.005%. |
SEE NOTES TO FINANCIAL STATEMENTS.
| | | | | | | | | | |
| | | | | |
| 140 | | | | | | | | J.P. MORGAN LARGE CAP FUNDS | | DECEMBER 31, 2021 |
| | | | | | | | | | | | | | | | | | | | | | | | | | |
| | | Ratios/Supplemental data | |
| | | | | | | Ratios to average net assets (a) | | | | |
Net asset
value,
end of
period | | | Total return
(excludes
sales charge) (c)(d) | | | Net assets,
end of
period
(000’s) | | | Net
expenses (e) | | | Net
investment
income
(loss) | | | Expenses
without waivers,
reimbursements and
earnings credits | | | Portfolio
turnover
rate (c) | |
| | |
| | |
| $ | 67.92 | | | | 13.00 | % | | $ | 130,083 | | | | 0.84 | % | | | (0.03 | )% | | | 0.90 | % | | | 28 | % |
| | 73.40 | | | | 40.08 | | | | 119,893 | | | | 0.84 | | | | (0.01 | ) | | | 0.90 | | | | 64 | |
| | 57.64 | | | | 15.11 | | | | 94,017 | | | | 0.84 | | | | 1.15 | (f) | | | 0.94 | | | | 96 | |
| | 56.61 | | | | 7.06 | | | | 106,993 | | | | 0.84 | | | | 0.79 | | | | 1.12 | | | | 95 | |
| | 59.09 | | | | 22.13 | | | | 104,167 | | | | 0.86 | | | | 0.42 | | | | 1.11 | | | | 69 | |
| | 48.60 | | | | 21.12 | | | | 90,633 | | | | 0.92 | | | | 0.50 | | | | 1.20 | | | | 68 | |
| | | | | | |
| | | | | | | | | | | | | | | | | | | | | | | | | | |
| | 65.62 | | | | 12.70 | | | | 31,372 | | | | 1.34 | | | | (0.53 | ) | | | 1.40 | | | | 28 | |
| | 71.55 | | | | 39.44 | | | | 30,159 | | | | 1.34 | | | | (0.50 | ) | | | 1.40 | | | | 64 | |
| | 56.26 | | | | 14.50 | | | | 31,216 | | | | 1.34 | | | | 0.65 | (f) | | | 1.42 | | | | 96 | |
| | 55.45 | | | | 6.51 | | | | 35,931 | | | | 1.34 | | | | 0.29 | | | | 1.61 | | | | 95 | |
| | 58.00 | | | | 21.54 | | | | 37,416 | | | | 1.36 | | | | (0.08 | ) | | | 1.61 | | | | 69 | |
| | 47.72 | | | | 20.52 | | | | 42,811 | | | | 1.41 | | | | 0.00 | (h) | | | 1.67 | | | | 68 | |
| | | | | | |
| | | | | | | | | | | | | | | | | | | | | | | | | | |
| | 69.80 | | | | 13.14 | | | | 179,611 | | | | 0.59 | | | | 0.22 | | | | 0.65 | | | | 28 | |
| | 75.08 | | | | 40.46 | | | | 164,959 | | | | 0.59 | | | | 0.25 | | | | 0.65 | | | | 64 | |
| | 58.80 | | | | 15.38 | | | | 141,497 | | | | 0.59 | | | | 1.40 | (f) | | | 0.67 | | | | 96 | |
| | 57.60 | | | | 7.33 | | | | 163,324 | | | | 0.59 | | | | 1.04 | | | | 0.86 | | | | 95 | |
| | 60.04 | | | | 22.45 | | | | 196,798 | | | | 0.61 | | | | 0.67 | | | | 0.86 | | | | 69 | |
| | 49.34 | | | | 21.43 | | | | 183,265 | | | | 0.68 | | | | 0.75 | | | | 0.89 | | | | 68 | |
| | | | | | |
| | | | | | | | | | | | | | | | | | | | | | | | | | |
| | 65.31 | | | | 12.85 | | | | 49,184 | | | | 1.09 | | | | (0.28 | ) | | | 1.21 | | | | 28 | |
| | 71.18 | | | | 39.73 | | | | 45,629 | | | | 1.09 | | | | (0.26 | ) | | | 1.21 | | | | 64 | |
| | 56.08 | | | | 14.84 | | | | 40,305 | | | | 1.09 | | | | 0.90 | (f) | | | 1.25 | | | | 96 | |
| | 55.27 | | | | 6.78 | | | | 45,086 | | | | 1.09 | | | | 0.54 | | | | 1.49 | | | | 95 | |
| | 57.95 | | | | 21.84 | | | | 40,763 | | | | 1.10 | | | | 0.16 | | | | 1.37 | | | | 69 | |
| | 47.66 | | | | 20.82 | | | | 5,277 | | | | 1.17 | | | | 0.26 | | | | 1.68 | | | | 68 | |
| | | | | | |
| | | | | | | | | | | | | | | | | | | | | | | | | | |
| | 68.34 | | | | 13.24 | | | | 149,622 | | | | 0.44 | | | | 0.36 | | | | 0.50 | | | | 28 | |
| | 73.80 | | | | 40.57 | | | | 166,478 | | | | 0.44 | | | | 0.39 | | | | 0.50 | | | | 64 | |
| | 57.93 | | | | 15.63 | | | | 189,889 | | | | 0.44 | | | | 1.55 | (f) | | | 0.52 | | | | 96 | |
| | 56.82 | | | | 7.48 | | | | 194,550 | | | | 0.44 | | | | 1.19 | | | | 0.71 | | | | 95 | |
| | 59.32 | | | | 22.66 | | | | 201,539 | | | | 0.45 | | | | 0.83 | | | | 0.71 | | | | 69 | |
| | 48.76 | | | | 21.65 | | | | 192,164 | | | | 0.48 | | | | 0.94 | | | | 0.72 | | | | 68 | |
| | | | | | |
| | | | | | | | | | | | | | | | | | | | | | | | | | |
| | 68.30 | | | | 13.29 | | | | 803,672 | | | | 0.34 | | | | 0.47 | | | | 0.40 | | | | 28 | |
| | 73.81 | | | | 40.70 | | | | 780,470 | | | | 0.34 | | | | 0.50 | | | | 0.40 | | | | 64 | |
| | 57.93 | | | | 15.76 | | | | 617,458 | | | | 0.34 | | | | 1.65 | (f) | | | 0.42 | | | | 96 | |
| | 56.81 | | | | 7.59 | | | | 602,454 | | | | 0.34 | | | | 1.29 | | | | 0.61 | | | | 95 | |
| | 59.32 | | | | 22.78 | | | | 588,911 | | | | 0.36 | | | | 0.92 | | | | 0.61 | | | | 69 | |
| | 48.74 | | | | 21.70 | | | | 504,973 | | | | 0.43 | | | | 0.99 | | | | 0.61 | | | | 68 | |
SEE NOTES TO FINANCIAL STATEMENTS.
| | | | | | | | | | |
| | | | | |
| DECEMBER 31, 2021 | | J.P. MORGAN LARGE CAP FUNDS | | | | | | | | 141 |
FINANCIAL HIGHLIGHTS
FOR THE PERIODS INDICATED (continued)
| | | | | | | | | | | | | | | | | | | | | | | | | | | | |
| | | Per share operating performance | |
| | | | | | Investment operations | | | Distributions | |
| | | Net asset
value,
beginning
of period | | | Net
investment
income
(loss) (b) | | | Net realized
and unrealized
gains
(losses) on
investments | | | Total from
investment
operations | | | Net
investment
income | | | Net
realized
gain | | | Total
distributions | |
JPMorgan U.S. Large Cap Core Plus Fund | | | | | | | | | | | | | | | | | | | | | | | | | | | | |
Class A | | | | | | | | | | | | | | | | | | | | | | | | | | | | |
Six Months Ended December 31, 2021 (Unaudited) | | $ | 26.84 | | | $ | (0.06 | ) | | $ | 3.29 | | | $ | 3.23 | | | $ | — | | | $ | (6.78 | ) | | $ | (6.78 | ) |
Year Ended June 30, 2021 | | | 24.58 | | | | (0.10 | ) | | | 9.21 | | | | 9.11 | | | | (0.03 | ) | | | (6.82 | ) | | | (6.85 | ) |
Year Ended June 30, 2020 | | | 27.51 | | | | 0.04 | | | | 2.65 | | | | 2.69 | | | | (0.03 | ) | | | (5.59 | ) | | | (5.62 | ) |
Year Ended June 30, 2019 | | | 30.10 | | | | 0.05 | | | | 1.53 | | | | 1.58 | | | | (0.05 | ) | | | (4.12 | ) | | | (4.17 | ) |
Year Ended June 30, 2018 | | | 30.35 | | | | — | (i) | | | 3.87 | | | | 3.87 | | | | — | | | | (4.12 | ) | | | (4.12 | ) |
Year Ended June 30, 2017 | | | 26.06 | | | | — | (i) | | | 5.54 | | | | 5.54 | | | | (0.01 | ) | | | (1.24 | ) | | | (1.25 | ) |
| | | | | | | |
Class C | | | | | | | | | | | | | | | | | | | | | | | | | | | | |
Six Months Ended December 31, 2021 (Unaudited) | | | 24.01 | | | | (0.11 | ) | | | 2.93 | | | | 2.82 | | | | — | | | | (6.78 | ) | | | (6.78 | ) |
Year Ended June 30, 2021 | | | 22.67 | | | | (0.21 | ) | | | 8.37 | | | | 8.16 | | | | — | | | | (6.82 | ) | | | (6.82 | ) |
Year Ended June 30, 2020 | | | 25.88 | | | | (0.08 | ) | | | 2.46 | | | | 2.38 | | | | — | | | | (5.59 | ) | | | (5.59 | ) |
Year Ended June 30, 2019 | | | 28.65 | | | | (0.08 | ) | | | 1.43 | | | | 1.35 | | | | — | | | | (4.12 | ) | | | (4.12 | ) |
Year Ended June 30, 2018 | | | 29.21 | | | | (0.15 | ) | | | 3.71 | | | | 3.56 | | | | — | | | | (4.12 | ) | | | (4.12 | ) |
Year Ended June 30, 2017 | | | 25.23 | | | | (0.14 | ) | | | 5.36 | | | | 5.22 | | | | — | | | | (1.24 | ) | | | (1.24 | ) |
| | | | | | | |
Class I | | | | | | | | | | | | | | | | | | | | | | | | | | | | |
Six Months Ended December 31, 2021 (Unaudited) | | | 27.53 | | | | (0.02 | ) | | | 3.38 | | | | 3.36 | | | | — | | | | (6.78 | ) | | | (6.78 | ) |
Year Ended June 30, 2021 | | | 25.04 | | | | (0.03 | ) | | | 9.41 | | | | 9.38 | | | | (0.07 | ) | | | (6.82 | ) | | | (6.89 | ) |
Year Ended June 30, 2020 | | | 27.94 | | | | 0.10 | | | | 2.69 | | | | 2.79 | | | | (0.10 | ) | | | (5.59 | ) | | | (5.69 | ) |
Year Ended June 30, 2019 | | | 30.51 | | | | 0.13 | | | | 1.54 | | | | 1.67 | | | | (0.12 | ) | | | (4.12 | ) | | | (4.24 | ) |
Year Ended June 30, 2018 | | | 30.66 | | | | 0.08 | | | | 3.92 | | | | 4.00 | | | | (0.03 | ) | | | (4.12 | ) | | | (4.15 | ) |
Year Ended June 30, 2017 | | | 26.32 | | | | 0.08 | | | | 5.59 | | | | 5.67 | | | | (0.09 | ) | | | (1.24 | ) | | | (1.33 | ) |
| | | | | | | |
Class R2 | | | | | | | | | | | | | | | | | | | | | | | | | | | | |
Six Months Ended December 31, 2021 (Unaudited) | | | 25.27 | | | | (0.10 | ) | | | 3.09 | | | | 2.99 | | | | — | | | | (6.78 | ) | | | (6.78 | ) |
Year Ended June 30, 2021 | | | 23.54 | | | | (0.18 | ) | | | 8.74 | | | | 8.56 | | | | (0.01 | ) | | | (6.82 | ) | | | (6.83 | ) |
Year Ended June 30, 2020 | | | 26.62 | | | | (0.04 | ) | | | 2.55 | | | | 2.51 | | | | — | | | | (5.59 | ) | | | (5.59 | ) |
Year Ended June 30, 2019 | | | 29.31 | | | | (0.04 | ) | | | 1.47 | | | | 1.43 | | | | — | | | | (4.12 | ) | | | (4.12 | ) |
Year Ended June 30, 2018 | | | 29.74 | | | | (0.09 | ) | | | 3.78 | | | | 3.69 | | | | — | | | | (4.12 | ) | | | (4.12 | ) |
Year Ended June 30, 2017 | | | 25.61 | | | | (0.07 | ) | | | 5.44 | | | | 5.37 | | | | — | | | | (1.24 | ) | | | (1.24 | ) |
| | | | | | | |
Class R5 | | | | | | | | | | | | | | | | | | | | | | | | | | | | |
Six Months Ended December 31, 2021 (Unaudited) | | | 27.78 | | | | (0.02 | ) | | | 3.42 | | | | 3.40 | | | | — | | | | (6.78 | ) | | | (6.78 | ) |
Year Ended June 30, 2021 | | | 25.20 | | | | (0.02 | ) | | | 9.49 | | | | 9.47 | | | | (0.07 | ) | | | (6.82 | ) | | | (6.89 | ) |
Year Ended June 30, 2020 | | | 28.08 | | | | 0.11 | | | | 2.71 | | | | 2.82 | | | | (0.11 | ) | | | (5.59 | ) | | | (5.70 | ) |
Year Ended June 30, 2019 | | | 30.65 | | | | 0.14 | | | | 1.55 | | | | 1.69 | | | | (0.14 | ) | | | (4.12 | ) | | | (4.26 | ) |
Year Ended June 30, 2018 | | | 30.81 | | | | 0.11 | | | | 3.93 | | | | 4.04 | | | | (0.08 | ) | | | (4.12 | ) | | | (4.20 | ) |
Year Ended June 30, 2017 | | | 26.44 | | | | 0.13 | | | | 5.62 | | | | 5.75 | | | | (0.14 | ) | | | (1.24 | ) | | | (1.38 | ) |
| | | | | | | |
Class R6 | | | | | | | | | | | | | | | | | | | | | | | | | | | | |
Six Months Ended December 31, 2021 (Unaudited) | | | 27.75 | | | | — | (i) | | | 3.41 | | | | 3.41 | | | | — | | | | (6.78 | ) | | | (6.78 | ) |
Year Ended June 30, 2021 | | | 25.18 | | | | — | (i) | | | 9.47 | | | | 9.47 | | | | (0.08 | ) | | | (6.82 | ) | | | (6.90 | ) |
Year Ended June 30, 2020 | | | 28.07 | | | | 0.14 | | | | 2.70 | | | | 2.84 | | | | (0.14 | ) | | | (5.59 | ) | | | (5.73 | ) |
Year Ended June 30, 2019 | | | 30.63 | | | | 0.17 | | | | 1.56 | | | | 1.73 | | | | (0.17 | ) | | | (4.12 | ) | | | (4.29 | ) |
November 1, 2017 (k) through June 30, 2018 | | | 32.99 | | | | 0.09 | | | | 1.79 | | | | 1.88 | | | | (0.12 | ) | | | (4.12 | ) | | | (4.24 | ) |
| (a) | Annualized for periods less than one year, unless otherwise noted. |
| (b) | Calculated based upon average shares outstanding. |
| (c) | Not annualized for periods less than one year. |
| (d) | Includes adjustments in accordance with accounting principles generally accepted in the United States of America and as such, the net asset values for financial reporting purposes and the returns based upon those net asset values may differ from the net asset values and returns for shareholder transactions. |
| (e) | Includes earnings credits and interest expense, if applicable, each of which is less than 0.005% unless otherwise noted. |
| (f) | The net expenses and expenses without waivers, reimbursements and earnings credits (excluding dividend and interest expense for securities sold short) for Class A are 1.11% and 1.25% for the six months ended December 31, 2021, 1.10% and 1.25% for the year ended June 30, 2021, 1.10% and 1.26% for the year ended June 30, 2020, 1.09% and 1.34% for the year ended June 30,2019, 1.15% and 1.40% for the year ended June 30, 2018 and 1.25% and 1.43% for the year ended June 30, 2017, for Class C are 1.60% and 1.75% for the six months ended December 31, 2021, 1.59% and 1.74% for the year ended June 30, 2021, 1.60% and 1.76% for the year ended June 30, 2020, 1.60% and 1.85% for the year ended June 30, 2019, 1.65% and 1.90% for the year ended June 30, 2018 and 1.75% and 1.94% for the year ended June 30, 2017, for Class I are 0.86% and 1.00% for the six months ended December 31, 2021, 0.85% and 0.99% for the year ended June 30, 2021, 0.85% and 1.01% for the year ended June 30, 2020, 0.85% and 1.09% for the year ended June 30, 2019, 0.90% and 1.15% for the year ended June 30, 2018 and 0.98% and 1.16% for the year ended June 30, 2017, for Class R2 are 1.45% and 1.51% for the six months ended December 31, 2021, 1.45% and 1.50% for the year ended June 30, 2021, 1.45% and 1.52% for the year ended June 30, 2020, 1.45% and 1.63% for the year ended June 30, 2019, 1.47% and 1.67% for the year ended June 30, 2018 and 1.50% and 1.76% for the year ended June 30, 2017, for Class R5 are 0.80% and 0.84% for the six months ended December 31, 2021, 0.80% and 0.84% for the year ended June 30, 2021, 0.80% and 0.85% for the year ended June 30, 2020, 0.80% and 0.94% for the year ended June 30, 2019, 0.79% and 1.00% for the year ended June 30, 2018 and 0.80% and 0.96% for the year ended June 30, 2017 and for Class R6 are 0.70% and 0.74% for the six months ended December 31, 2021, 0.70% and 0.74% for the year ended June 30, 2021, 0.70% and 0.75% for the year ended June 30, 2020, 0.70% and 0.85% for the year ended June 30, 2019 and 0.70% and 0.90% for the period ended June 30, 2018, respectively. |
| (g) | Interest expense on securities sold short is 0.07%. |
| (h) | Interest expense on securities sold short is 0.16%. |
| (i) | Amount rounds to less than $0.005. |
| (j) | Amount rounds to less than 0.005%. |
| (k) | Commencement of offering of class of shares. |
SEE NOTES TO FINANCIAL STATEMENTS.
| | | | | | | | | | |
| | | | | |
| 142 | | | | | | | | J.P. MORGAN LARGE CAP FUNDS | | DECEMBER 31, 2021 |
| | | | | | | | | | | | | | | | | | | | | | | | | | | | | | |
| | | Ratios/Supplemental data | |
| | | | | | | Ratios to average net assets (a) | | | | | | | |
Net asset
value,
end of
period | | | Total return
(excludes
sales charge) (c)(d) | | | Net assets,
end of
period
(000’s) | | | Net expenses
(including dividend and
interest expense for
securities sold
short) (e)(f) | | | Net
investment
income (loss) | | | Expenses without waivers,
reimbursements and
earnings credits (including dividend
and interest expense for securities
sold short) (f) | | | Portfolio
turnover
rate (c) | | | Portfolio turnover
rate (including
securities sold
short) (c) | |
| | |
| | |
| $ | 23.29 | | | | 12.52 | % | | $ | 353,418 | | | | 1.87 | %(g) | | | (0.42 | )% | | | 2.01 | % | | | 28 | % | | | 42 | % |
| | 26.84 | | | | 42.30 | | | | 335,206 | | | | 1.94 | (h) | | | (0.39 | ) | | | 2.09 | | | | 57 | | | | 96 | |
| | 24.58 | | | | 11.66 | | | | 267,701 | | | | 1.92 | | | | 0.19 | | | | 2.08 | | | | 85 | | | | 134 | |
| | 27.51 | | | | 6.84 | | | | 678,071 | | | | 1.91 | | | | 0.22 | | | | 2.16 | | | | 98 | | | | 148 | |
| | 30.10 | | | | 13.16 | | | | 772,656 | | | | 2.01 | | | | 0.01 | | | | 2.26 | | | | 110 | | | | 161 | |
| | 30.35 | | | | 21.64 | | | | 791,067 | | | | 2.20 | | | | 0.00 | (j) | | | 2.39 | | | | 94 | | | | 131 | |
| | | | | | | |
| | | | | | | | | | | | | | | | | | | | | | | | | | | | | | |
| | 20.05 | | | | 12.28 | | | | 39,493 | | | | 2.36 | (g) | | | (0.91 | ) | | | 2.51 | | | | 28 | | | | 42 | |
| | 24.01 | | | | 41.55 | | | | 36,784 | | | | 2.43 | (h) | | | (0.88 | ) | | | 2.58 | | | | 57 | | | | 96 | |
| | 22.67 | | | | 11.11 | | | | 59,105 | | | | 2.42 | | | | (0.32 | ) | | | 2.58 | | | | 85 | | | | 134 | |
| | 25.88 | | | | 6.31 | | | | 108,332 | | | | 2.42 | | | | (0.29 | ) | | | 2.67 | | | | 98 | | | | 148 | |
| | 28.65 | | | | 12.58 | | | | 158,677 | | | | 2.50 | | | | (0.50 | ) | | | 2.75 | | | | 110 | | | | 161 | |
| | 29.21 | | | | 21.05 | | | | 201,031 | | | | 2.70 | | | | (0.50 | ) | | | 2.89 | | | | 94 | | | | 131 | |
| | | | | | | |
| | | | | | | | | | | | | | | | | | | | | | | | | | | | | | |
| | 24.11 | | | | 12.68 | | | | 1,713,370 | | | | 1.62 | (g) | | | (0.17 | ) | | | 1.76 | | | | 28 | | | | 42 | |
| | 27.53 | | | | 42.65 | | | | 1,702,566 | | | | 1.69 | (h) | | | (0.12 | ) | | | 1.83 | | | | 57 | | | | 96 | |
| | 25.04 | | | | 11.93 | | | | 2,189,079 | | | | 1.67 | | | | 0.40 | | | | 1.83 | | | | 85 | | | | 134 | |
| | 27.94 | | | | 7.11 | | | | 4,740,691 | | | | 1.67 | | | | 0.46 | | | | 1.91 | | | | 98 | | | | 148 | |
| | 30.51 | | | | 13.46 | | | | 6,169,553 | | | | 1.75 | | | | 0.27 | | | | 2.00 | | | | 110 | | | | 161 | |
| | 30.66 | | | | 21.95 | | | | 8,075,047 | | | | 1.94 | | | | 0.27 | | | | 2.12 | | | | 94 | | | | 131 | |
| | | | | | | |
| | | | | | | | | | | | | | | | | | | | | | | | | | | | | | |
| | 21.48 | | | | 12.35 | | | | 6,199 | | | | 2.21 | (g) | | | (0.76 | ) | | | 2.27 | | | | 28 | | | | 42 | |
| | 25.27 | | | | 41.77 | | | | 5,838 | | | | 2.29 | (h) | | | (0.74 | ) | | | 2.34 | | | | 57 | | | | 96 | |
| | 23.54 | | | | 11.32 | | | | 4,560 | | | | 2.27 | | | | (0.13 | ) | | | 2.34 | | | | 85 | | | | 134 | |
| | 26.62 | | | | 6.45 | | | | 5,304 | | | | 2.27 | | | | (0.14 | ) | | | 2.45 | | | | 98 | | | | 148 | |
| | 29.31 | | | | 12.81 | | | | 6,528 | | | | 2.31 | | | | (0.30 | ) | | | 2.52 | | | | 110 | | | | 161 | |
| | 29.74 | | | | 21.33 | | | | 6,207 | | | | 2.45 | | | | (0.24 | ) | | | 2.71 | | | | 94 | | | | 131 | |
| | | | | | | |
| | | | | | | | | | | | | | | | | | | | | | | | | | | | | | |
| | 24.40 | | | | 12.72 | | | | 36,903 | | | | 1.56 | (g) | | | (0.11 | ) | | | 1.60 | | | | 28 | | | | 42 | |
| | 27.78 | | | | 42.75 | | | | 34,191 | | | | 1.64 | (h) | | | (0.08 | ) | | | 1.68 | | | | 57 | | | | 96 | |
| | 25.20 | | | | 11.99 | | | | 38,447 | | | | 1.62 | | | | 0.46 | | | | 1.67 | | | | 85 | | | | 134 | |
| | 28.08 | | | | 7.14 | | | | 99,113 | | | | 1.62 | | | | 0.51 | | | | 1.76 | | | | 98 | | | | 148 | |
| | 30.65 | | | | 13.57 | | | | 126,084 | | | | 1.65 | | | | 0.37 | | | | 1.85 | | | | 110 | | | | 161 | |
| | 30.81 | | | | 22.18 | | | | 168,526 | | | | 1.76 | | | | 0.47 | | | | 1.92 | | | | 94 | | | | 131 | |
| | | | | | | |
| | | | | | | | | | | | | | | | | | | | | | | | | | | | | | |
| | 24.38 | | | | 12.77 | | | | 496,419 | | | | 1.46 | (g) | | | 0.00 | (j) | | | 1.50 | | | | 28 | | | | 42 | |
| | 27.75 | | | | 42.86 | | | | 536,661 | | | | 1.54 | (h) | | | 0.01 | | | | 1.58 | | | | 57 | | | | 96 | |
| | 25.18 | | | | 12.10 | | | | 491,414 | | | | 1.52 | | | | 0.58 | | | | 1.57 | | | | 85 | | | | 134 | |
| | 28.07 | | | | 7.30 | | | | 787,497 | | | | 1.52 | | | | 0.59 | | | | 1.67 | | | | 98 | | | | 148 | |
| | 30.63 | | | | 6.10 | | | | 1,795,125 | | | | 1.54 | | | | 0.44 | | | | 1.74 | | | | 110 | | | | 161 | |
SEE NOTES TO FINANCIAL STATEMENTS.
| | | | | | | | | | |
| | | | | |
| DECEMBER 31, 2021 | | J.P. MORGAN LARGE CAP FUNDS | | | | | | | | 143 |
FINANCIAL HIGHLIGHTS
FOR THE PERIODS INDICATED (continued)
| | | | | | | | | | | | | | | | | | | | | | | | | | | | | | | | |
| | | Per share operating performance | |
| | | | | | Investment operations | | | Distributions | |
| | | Net asset
value,
beginning
of period | | | Net
investment
income
(loss) (b) | | | Net realized
and unrealized
gains
(losses) on
investments | | | Total from
investment
operations | | | Net
investment
income | | | Net
realized
gain | | | Return
of
capital | | | Total
distributions | |
JPMorgan U.S. Research Enhanced Equity Fund | | | | | | | | | | | | | | | | | | | | | | | | | | | | | | | | |
Class A | | | | | | | | | | | | | | | | | | | | | | | | | | | | | | | | |
Six Months Ended December 31, 2021 (Unaudited) | | $ | 36.46 | | | $ | 0.13 | | | $ | 4.15 | | | $ | 4.28 | | | $ | (0.14 | ) | | $ | (4.40 | ) | | $ | — | | | $ | (4.54 | ) |
Year Ended June 30, 2021 | | | 26.55 | | | | 0.27 | | | | 10.81 | | | | 11.08 | | | | (0.34 | ) | | | (0.83 | ) | | | — | | | | (1.17 | ) |
Year Ended June 30, 2020 | | | 27.38 | | | | 0.38 | | | | 1.80 | | | | 2.18 | | | | (0.31 | ) | | | (2.70 | ) | | | — | | | | (3.01 | ) |
Year Ended June 30, 2019 | | | 28.37 | | | | 0.34 | | | | 1.96 | | | | 2.30 | | | | (0.36 | ) | | | (2.93 | ) | | | — | | | | (3.29 | ) |
Year Ended June 30, 2018 | | | 25.40 | | | | 0.31 | | | | 2.96 | | | | 3.27 | | | | (0.30 | ) | | | — | | | | — | | | | (0.30 | ) |
Year Ended June 30, 2017 | | | 21.74 | | | | 0.28 | | | | 3.72 | | | | 4.00 | | | | (0.32 | ) | | | — | | | | (0.02 | ) | | | (0.34 | ) |
| | | | | | | | |
Class I | | | | | | | | | | | | | | | | | | | | | | | | | | | | | | | | |
Six Months Ended December 31, 2021 (Unaudited) | | | 36.89 | | | | 0.18 | | | | 4.18 | | | | 4.36 | | | | (0.18 | ) | | | (4.40 | ) | | | — | | | | (4.58 | ) |
Year Ended June 30, 2021 | | | 26.85 | | | | 0.35 | | | | 10.94 | | | | 11.29 | | | | (0.42 | ) | | | (0.83 | ) | | | — | | | | (1.25 | ) |
Year Ended June 30, 2020 | | | 27.65 | | | | 0.45 | | | | 1.83 | | | | 2.28 | | | | (0.38 | ) | | | (2.70 | ) | | | — | | | | (3.08 | ) |
Year Ended June 30, 2019 | | | 28.61 | | | | 0.41 | | | | 1.98 | | | | 2.39 | | | | (0.42 | ) | | | (2.93 | ) | | | — | | | | (3.35 | ) |
Year Ended June 30, 2018 | | | 25.62 | | | | 0.39 | | | | 2.98 | | | | 3.37 | | | | (0.38 | ) | | | — | | | | — | | | | (0.38 | ) |
Year Ended June 30, 2017 | | | 21.92 | | | | 0.35 | | | | 3.76 | | | | 4.11 | | | | (0.39 | ) | | | — | | | | (0.02 | ) | | | (0.41 | ) |
| | | | | | | | |
Class R6 | | | | | | | | | | | | | | | | | | | | | | | | | | | | | | | | |
Six Months Ended December 31, 2021 (Unaudited) | | | 36.84 | | | | 0.20 | | | | 4.17 | | | | 4.37 | | | | (0.20 | ) | | | (4.40 | ) | | | — | | | | (4.60 | ) |
Year Ended June 30, 2021 | | | 26.81 | | | | 0.38 | | | | 10.93 | | | | 11.31 | | | | (0.45 | ) | | | (0.83 | ) | | | — | | | | (1.28 | ) |
Year Ended June 30, 2020 | | | 27.62 | | | | 0.48 | | | | 1.81 | | | | 2.29 | | | | (0.40 | ) | | | (2.70 | ) | | | — | | | | (3.10 | ) |
Year Ended June 30, 2019 | | | 28.57 | | | | 0.44 | | | | 1.98 | | | | 2.42 | | | | (0.44 | ) | | | (2.93 | ) | | | — | | | | (3.37 | ) |
Year Ended June 30, 2018 | | | 25.59 | | | | 0.41 | | | | 2.97 | | | | 3.38 | | | | (0.40 | ) | | | — | | | | — | | | | (0.40 | ) |
Year Ended June 30, 2017 | | | 21.90 | | | | 0.38 | | | | 3.75 | | | | 4.13 | | | | (0.42 | ) | | | — | | | | (0.02 | ) | | | (0.44 | ) |
| (a) | Annualized for periods less than one year, unless otherwise noted. |
| (b) | Calculated based upon average shares outstanding. |
| (c) | Not annualized for periods less than one year. |
| (d) | Includes adjustments in accordance with accounting principles generally accepted in the United States of America and as such, the net asset values for financial reporting purposes and the returns based upon those net asset values may differ from the net asset values and returns for shareholder transactions. |
| (e) | Includes earnings credits and interest expense, if applicable, each of which is less than 0.005% unless otherwise noted. |
SEE NOTES TO FINANCIAL STATEMENTS.
| | | | | | | | | | |
| | | | | |
| 144 | | | | | | | | J.P. MORGAN LARGE CAP FUNDS | | DECEMBER 31, 2021 |
| | | | | | | | | | | | | | | | | | | | | | | | | | |
| | | Ratios/Supplemental data | |
| | | | | | | | | | Ratios to average net assets (a) | | | | |
Net asset
value,
end of
period | | | Total return
(excludes
sales charge) (c)(d) | | | Net assets,
end of
period
(000’s) | | | Net
expenses (e) | | | Net
investment
income
(loss) | | | Expenses
without waivers,
reimbursements and
earnings credits | | | Portfolio
turnover
rate (c) | |
| | |
| | |
| $ | 36.20 | | | | 12.00 | % | | $ | 174,486 | | | | 0.60 | % | | | 0.68 | % | | | 0.84 | % | | | 15 | % |
| | 36.46 | | | | 42.55 | | | | 180,296 | | | | 0.60 | | | | 0.85 | | | | 0.84 | | | | 35 | |
| | 26.55 | | | | 9.08 | | | | 183,005 | | | | 0.60 | | | | 1.45 | | | | 0.85 | | | | 59 | |
| | 27.38 | | | | 9.39 | | | | 207,809 | | | | 0.60 | | | | 1.24 | | | | 0.85 | | | | 42 | |
| | 28.37 | | | | 12.92 | | | | 278,766 | | | | 0.60 | | | | 1.13 | | | | 0.85 | | | | 45 | |
| | 25.40 | | | | 18.52 | | | | 422,719 | | | | 0.69 | | | | 1.19 | | | | 0.96 | | | | 40 | |
| | | | | | |
| | | | | | | | | | | | | | | | | | | | | | | | | | |
| | 36.67 | | | | 12.11 | | | | 777,828 | | | | 0.35 | | | | 0.93 | | | | 0.59 | | | | 15 | |
| | 36.89 | | | | 42.92 | | | | 686,545 | | | | 0.35 | | | | 1.09 | | | | 0.58 | | | | 35 | |
| | 26.85 | | | | 9.38 | | | | 204,193 | | | | 0.35 | | | | 1.70 | | | | 0.59 | | | | 59 | |
| | 27.65 | | | | 9.65 | | | | 232,077 | | | | 0.35 | | | | 1.50 | | | | 0.59 | | | | 42 | |
| | 28.61 | | | | 13.19 | | | | 268,898 | | | | 0.35 | | | | 1.39 | | | | 0.60 | | | | 45 | |
| | 25.62 | | | | 18.85 | | | | 285,141 | | | | 0.43 | | | | 1.45 | | | | 0.69 | | | | 40 | |
| | | | | | |
| | | | | | | | | | | | | | | | | | | | | | | | | | |
| | 36.61 | | | | 12.15 | | | | 5,029,498 | | | | 0.25 | | | | 1.04 | | | | 0.34 | | | | 15 | |
| | 36.84 | | | | 43.09 | | | | 4,185,201 | | | | 0.25 | | | | 1.19 | | | | 0.33 | | | | 35 | |
| | 26.81 | | | | 9.47 | | | | 3,585,672 | | | | 0.25 | | | | 1.79 | | | | 0.34 | | | | 59 | |
| | 27.62 | | | | 9.78 | | | | 4,953,109 | | | | 0.25 | | | | 1.60 | | | | 0.34 | | | | 42 | |
| | 28.57 | | | | 13.28 | | | | 5,712,617 | | | | 0.25 | | | | 1.50 | | | | 0.34 | | | | 45 | |
| | 25.59 | | | | 19.00 | | | | 5,863,138 | | | | 0.28 | | | | 1.60 | | | | 0.34 | | | | 40 | |
SEE NOTES TO FINANCIAL STATEMENTS.
| | | | | | | | | | |
| | | | | |
| DECEMBER 31, 2021 | | J.P. MORGAN LARGE CAP FUNDS | | | | | | | | 145 |
FINANCIAL HIGHLIGHTS
FOR THE PERIODS INDICATED (continued)
| | | | | | | | | | | | | | | | | | | | | | | | | | | | |
| | | Per share operating performance | |
| | | | | | Investment operations | | | Distributions | |
| | | Net asset
value,
beginning
of period | | | Net
investment
income
(loss) (b) | | | Net realized
and unrealized
gains
(losses) on
investments | | | Total from
investment
operations | | | Net
investment
income | | | Net
realized
gain | | | Total
distributions | |
JPMorgan U.S. Sustainable Leaders Fund | | | | | | | | | | | | | |
Class A | | | | | | | | | | | | | | | | | | | | | | | | | | | | |
Six Months Ended December 31, 2021 (Unaudited) | | $ | 59.20 | | | $ | 0.18 | | | $ | 6.88 | | | $ | 7.06 | | | $ | (0.23 | ) | | $ | (2.21 | ) | | $ | (2.44 | ) |
Year Ended June 30, 2021 | | | 42.76 | | | | 0.42 | | | | 16.81 | | | | 17.23 | | | | (0.30 | ) | | | (0.49 | ) | | | (0.79 | ) |
Year Ended June 30, 2020 | | | 41.85 | | | | 0.47 | | | | 3.52 | | | | 3.99 | | | | (0.43 | ) | | | (2.65 | ) | | | (3.08 | ) |
Year Ended June 30, 2019 | | | 41.28 | | | | 0.50 | | | | 3.21 | | | | 3.71 | | | | (0.41 | ) | | | (2.73 | ) | | | (3.14 | ) |
Year Ended June 30, 2018 | | | 39.35 | | | | 0.58 | | | | 4.05 | | | | 4.63 | | | | (0.48 | ) | | | (2.22 | ) | | | (2.70 | ) |
Year Ended June 30, 2017 | | | 33.20 | | | | 0.29 | | | | 6.20 | | | | 6.49 | | | | (0.34 | ) | | | — | | | | (0.34 | ) |
| | | | | | | |
Class C | | | | | | | | | | | | | | | | | | | | | | | | | | | | |
Six Months Ended December 31, 2021 (Unaudited) | | | 57.87 | | | | 0.02 | | | | 6.72 | | | | 6.74 | | | | — | | | | (2.21 | ) | | | (2.21 | ) |
Year Ended June 30, 2021 | | | 41.80 | | | | 0.16 | | | | 16.43 | | | | 16.59 | | | | (0.03 | ) | | | (0.49 | ) | | | (0.52 | ) |
Year Ended June 30, 2020 | | | 40.98 | | | | 0.25 | | | | 3.44 | | | | 3.69 | | | | (0.22 | ) | | | (2.65 | ) | | | (2.87 | ) |
Year Ended June 30, 2019 | | | 40.44 | | | | 0.29 | | | | 3.16 | | | | 3.45 | | | | (0.18 | ) | | | (2.73 | ) | | | (2.91 | ) |
Year Ended June 30, 2018 | | | 38.51 | | | | 0.41 | | | | 3.92 | | | | 4.33 | | | | (0.18 | ) | | | (2.22 | ) | | | (2.40 | ) |
Year Ended June 30, 2017 | | | 32.48 | | | | 0.11 | | | | 6.06 | | | | 6.17 | | | | (0.14 | ) | | | — | | | | (0.14 | ) |
| | | | | | | |
Class I | | | | | | | | | | | | | | | | | | | | | | | | | | | | |
Six Months Ended December 31, 2021 (Unaudited) | | | 59.71 | | | | 0.26 | | | | 6.93 | | | | 7.19 | | | | (0.34 | ) | | | (2.21 | ) | | | (2.55 | ) |
Year Ended June 30, 2021 | | | 43.11 | | | | 0.55 | | | | 16.95 | | | | 17.50 | | | | (0.41 | ) | | | (0.49 | ) | | | (0.90 | ) |
Year Ended June 30, 2020 | | | 42.15 | | | | 0.57 | | | | 3.56 | | | | 4.13 | | | | (0.52 | ) | | | (2.65 | ) | | | (3.17 | ) |
Year Ended June 30, 2019 | | | 41.56 | | | | 0.60 | | | | 3.23 | | | | 3.83 | | | | (0.51 | ) | | | (2.73 | ) | | | (3.24 | ) |
Year Ended June 30, 2018 | | | 39.59 | | | | 0.66 | | | | 4.10 | | | | 4.76 | | | | (0.57 | ) | | | (2.22 | ) | | | (2.79 | ) |
Year Ended June 30, 2017 | | | 33.40 | | | | 0.38 | | | | 6.25 | | | | 6.63 | | | | (0.44 | ) | | | — | | | | (0.44 | ) |
| | | | | | | |
Class R6 | | | | | | | | | | | | | | | | | | | | | | | | | | | | |
Six Months Ended December 31, 2021 (Unaudited) | | | 59.69 | | | | 0.28 | | | | 6.93 | | | | 7.21 | | | | (0.36 | ) | | | (2.21 | ) | | | (2.57 | ) |
September 30, 2020 (f) through June 30, 2021 | | | 46.79 | | | | 0.43 | | | | 13.40 | | | | 13.83 | | | | (0.44 | ) | | | (0.49 | ) | | | (0.93 | ) |
| (a) | Annualized for periods less than one year, unless otherwise noted. |
| (b) | Calculated based upon average shares outstanding. |
| (c) | Not annualized for periods less than one year. |
| (d) | Includes adjustments in accordance with accounting principles generally accepted in the United States of America and as such, the net asset values for financial reporting purposes and the returns based upon those net asset values may differ from the net asset values and returns for shareholder transactions. |
| (e) | Includes earnings credits and interest expense, if applicable, each of which is less than 0.005% unless otherwise noted. |
| (f) | Commencement of operations. |
SEE NOTES TO FINANCIAL STATEMENTS.
| | | | | | | | | | |
| | | | | |
| 146 | | | | | | | | J.P. MORGAN LARGE CAP FUNDS | | DECEMBER 31, 2021 |
| | | | | | | | | | | | | | | | | | | | | | | | | | |
| | | Ratios/Supplemental data | |
| | | | | | | | | | Ratios to average net assets (a) | | | | |
Net asset
value,
end of
period | | | Total return
(excludes
sales charge) (c)(d) | | | Net assets,
end of
period
(000’s) | | | Net
expenses (e) | | |
Net
investment
income
(loss) | | | Expenses
without waivers,
reimbursements and
earnings credits | | | Portfolio
turnover
rate (c) | |
| | | | | | | | | | | | | | | | | | | | | | | | | | |
| | | | | | | | | | | | | | | | | | | | | | | | | | |
| $ | 63.82 | | | | 12.00 | % | | $ | 37,610 | | | | 0.64 | % | | | 0.57 | % | | | 1.05 | % | | | 21 | % |
| | 59.20 | | | | 40.64 | | | | 24,169 | | | | 0.64 | | | | 0.80 | | | | 1.23 | | | | 44 | |
| | 42.76 | | | | 9.57 | | | | 11,178 | | | | 0.82 | | | | 1.12 | | | | 1.53 | | | | 99 | |
| | 41.85 | | | | 9.90 | | | | 10,828 | | | | 0.83 | | | | 1.22 | | | | 1.73 | | | | 97 | |
| | 41.28 | | | | 11.88 | | | | 9,497 | | | | 0.90 | | | | 1.41 | | | | 1.92 | | | | 38 | |
| | 39.35 | | | | 19.64 | | | | 7,943 | | | | 1.08 | | | | 0.80 | | | | 2.29 | | | | 53 | |
| | | | | | |
| | | | | | | | | | | | | | | | | | | | | | | | | | |
| | 62.40 | | | | 11.70 | | | | 5,257 | | | | 1.14 | | | | 0.07 | | | | 1.56 | | | | 21 | |
| | 57.87 | | | | 39.94 | | | | 3,794 | | | | 1.13 | | | | 0.32 | | | | 1.72 | | | | 44 | |
| | 41.80 | | | | 9.03 | | | | 2,735 | | | | 1.32 | | | | 0.62 | | | | 2.07 | | | | 99 | |
| | 40.98 | | | | 9.34 | | | | 2,949 | | | | 1.33 | | | | 0.73 | | | | 2.22 | | | | 97 | |
| | 40.44 | | | | 11.35 | | | | 3,277 | | | | 1.42 | | | | 1.01 | | | | 2.45 | | | | 38 | |
| | 38.51 | | | | 19.02 | | | | 5,063 | | | | 1.58 | | | | 0.30 | | | | 2.79 | | | | 53 | |
| | | | | | |
| | | | | | | | | | | | | | | | | | | | | | | | | | |
| | 64.35 | | | | 12.13 | | | | 118,558 | | | | 0.39 | | | | 0.82 | | | | 0.80 | | | | 21 | |
| | 59.71 | | | | 40.99 | | | | 62,431 | | | | 0.39 | | | | 1.06 | | | | 0.96 | | | | 44 | |
| | 43.11 | | | | 9.86 | | | | 26,787 | | | | 0.57 | | | | 1.37 | | | | 1.25 | | | | 99 | |
| | 42.15 | | | | 10.18 | | | | 16,908 | | | | 0.58 | | | | 1.46 | | | | 1.45 | | | | 97 | |
| | 41.56 | | | | 12.16 | | | | 9,172 | | | | 0.64 | | | | 1.59 | | | | 1.63 | | | | 38 | |
| | 39.59 | | | | 19.95 | | | | 5,038 | | | | 0.83 | | | | 1.04 | | | | 2.03 | | | | 53 | |
| | | | | | |
| | | | | | | | | | | | | | | | | | | | | | | | | | |
| | 64.33 | | | | 12.17 | | | | 36,677 | | | | 0.34 | | | | 0.87 | | | | 0.55 | | | | 21 | |
| | 59.69 | | | | 29.93 | | | | 25,156 | | | | 0.34 | | | | 1.05 | | | | 0.70 | | | | 44 | |
SEE NOTES TO FINANCIAL STATEMENTS.
| | | | | | | | | | |
| | | | | |
| DECEMBER 31, 2021 | | J.P. MORGAN LARGE CAP FUNDS | | | | | | | | 147 |
FINANCIAL HIGHLIGHTS
FOR THE PERIODS INDICATED (continued)
| | | | | | | | | | | | | | | | | | | | | | | | | | | | |
| | | Per share operating performance | |
| | | | | | Investment operations | | | Distributions | |
| | | Net asset
value,
beginning
of period | | | Net
investment
income
(loss) (b) | | | Net realized
and unrealized
gains
(losses) on
investments | | | Total from
investment
operations | | | Net
investment
income | | | Net
realized
gain | | | Total
distributions | |
JPMorgan U.S. Value Fund | |
Class A | |
Six Months Ended December 31, 2021 (Unaudited) | | $ | 64.61 | | | $ | 0.33 | | | $ | 4.04 | | | $ | 4.37 | | | $ | (0.40 | ) | | $ | (1.21 | ) | | $ | (1.61 | ) |
Year Ended June 30, 2021 | | | 45.62 | | | | 0.64 | | | | 19.59 | | | | 20.23 | | | | (0.60 | ) | | | (0.64 | ) | | | (1.24 | ) |
Year Ended June 30, 2020 | | | 49.84 | | | | 0.79 | | | | (3.18 | ) | | | (2.39 | ) | | | (0.76 | ) | | | (1.07 | ) | | | (1.83 | ) |
Year Ended June 30, 2019 | | | 49.77 | | | | 0.85 | | | | 2.21 | | | | 3.06 | | | | (0.85 | ) | | | (2.14 | ) | | | (2.99 | ) |
Year Ended June 30, 2018 | | | 46.85 | | | | 0.64 | | | | 4.98 | | | | 5.62 | | | | (0.62 | ) | | | (2.08 | ) | | | (2.70 | ) |
Year Ended June 30, 2017 | | | 42.75 | | | | 0.57 | | | | 6.31 | | | | 6.88 | | | | (0.57 | ) | | | (2.21 | ) | | | (2.78 | ) |
| | | | | | | |
Class C | | | | | | | | | | | | | | | | | | | | | | | | | | | | |
Six Months Ended December 31, 2021 (Unaudited) | | | 57.32 | | | | 0.15 | | | | 3.57 | | | | 3.72 | | | | (0.28 | ) | | | (1.21 | ) | | | (1.49 | ) |
Year Ended June 30, 2021 | | | 40.63 | | | | 0.32 | | | | 17.40 | | | | 17.72 | | | | (0.39 | ) | | | (0.64 | ) | | | (1.03 | ) |
Year Ended June 30, 2020 | | | 44.59 | | | | 0.48 | | | | (2.81 | ) | | | (2.33 | ) | | | (0.56 | ) | | | (1.07 | ) | | | (1.63 | ) |
Year Ended June 30, 2019 | | | 44.91 | | | | 0.53 | | | | 1.98 | | | | 2.51 | | | | (0.69 | ) | | | (2.14 | ) | | | (2.83 | ) |
Year Ended June 30, 2018 | | | 42.54 | | | | 0.35 | | | | 4.51 | | | | 4.86 | | | | (0.41 | ) | | | (2.08 | ) | | | (2.49 | ) |
Year Ended June 30, 2017 | | | 39.07 | | | | 0.31 | | | | 5.76 | | | | 6.07 | | | | (0.39 | ) | | | (2.21 | ) | | | (2.60 | ) |
| | | | | | | |
Class I | | | | | | | | | | | | | | | | | | | | | | | | | | | | |
Six Months Ended December 31, 2021 (Unaudited) | | | 68.55 | | | | 0.45 | | | | 4.28 | | | | 4.73 | | | | (0.47 | ) | | | (1.21 | ) | | | (1.68 | ) |
Year Ended June 30, 2021 | | | 48.34 | | | | 0.83 | | | | 20.76 | | | | 21.59 | | | | (0.74 | ) | | | (0.64 | ) | | | (1.38 | ) |
Year Ended June 30, 2020 | | | 52.69 | | | | 0.96 | | | | (3.36 | ) | | | (2.40 | ) | | | (0.88 | ) | | | (1.07 | ) | | | (1.95 | ) |
Year Ended June 30, 2019 | | | 52.41 | | | | 1.00 | | | | 2.36 | | | | 3.36 | | | | (0.94 | ) | | | (2.14 | ) | | | (3.08 | ) |
Year Ended June 30, 2018 | | | 49.21 | | | | 0.81 | | | | 5.21 | | | | 6.02 | | | | (0.74 | ) | | | (2.08 | ) | | | (2.82 | ) |
Year Ended June 30, 2017 | | | 44.77 | | | | 0.72 | | | | 6.62 | | | | 7.34 | | | | (0.69 | ) | | | (2.21 | ) | | | (2.90 | ) |
| | | | | | | |
Class R2 | | | | | | | | | | | | | | | | | | | | | | | | | | | | |
Six Months Ended December 31, 2021 (Unaudited) | | | 64.73 | | | | 0.25 | | | | 4.03 | | | | 4.28 | | | | (0.34 | ) | | | (1.21 | ) | | | (1.55 | ) |
Year Ended June 30, 2021 | | | 45.72 | | | | 0.50 | | | | 19.63 | | | | 20.13 | | | | (0.48 | ) | | | (0.64 | ) | | | (1.12 | ) |
Year Ended June 30, 2020 | | | 50.01 | | | | 0.69 | | | | (3.19 | ) | | | (2.50 | ) | | | (0.72 | ) | | | (1.07 | ) | | | (1.79 | ) |
Year Ended June 30, 2019 | | | 49.98 | | | | 0.63 | | | | 2.31 | | | | 2.94 | | | | (0.77 | ) | | | (2.14 | ) | | | (2.91 | ) |
Year Ended June 30, 2018 | | | 47.06 | | | | 0.53 | | | | 4.99 | | | | 5.52 | | | | (0.52 | ) | | | (2.08 | ) | | | (2.60 | ) |
Year Ended June 30, 2017 | | | 42.94 | | | | 0.46 | | | | 6.33 | | | | 6.79 | | | | (0.46 | ) | | | (2.21 | ) | | | (2.67 | ) |
| | | | | | | |
Class R3 | | | | | | | | | | | | | | | | | | | | | | | | | | | | |
Six Months Ended December 31, 2021 (Unaudited) | | | 68.41 | | | | 0.36 | | | | 4.26 | | | | 4.62 | | | | (0.44 | ) | | | (1.21 | ) | | | (1.65 | ) |
Year Ended June 30, 2021 | | | 48.25 | | | | 0.68 | | | | 20.73 | | | | 21.41 | | | | (0.61 | ) | | | (0.64 | ) | | | (1.25 | ) |
Year Ended June 30, 2020 | | | 52.66 | | | | 0.75 | | | | (3.29 | ) | | | (2.54 | ) | | | (0.80 | ) | | | (1.07 | ) | | | (1.87 | ) |
Year Ended June 30, 2019 | | | 52.41 | | | | 0.89 | | | | 2.33 | | | | 3.22 | | | | (0.83 | ) | | | (2.14 | ) | | | (2.97 | ) |
July 31, 2017 (f) through June 30, 2018 | | | 49.99 | | | | 0.68 | | | | 4.46 | | | | 5.14 | | | | (0.64 | ) | | | (2.08 | ) | | | (2.72 | ) |
| | | | | | | |
Class R4 | | | | | | | | | | | | | | | | | | | | | | | | | | | | |
Six Months Ended December 31, 2021 (Unaudited) | | | 68.60 | | | | 0.43 | | | | 4.29 | | | | 4.72 | | | | (0.49 | ) | | | (1.21 | ) | | | (1.70 | ) |
Year Ended June 30, 2021 | | | 48.31 | | | | 0.79 | | | | 20.81 | | | | 21.60 | | | | (0.67 | ) | | | (0.64 | ) | | | (1.31 | ) |
Year Ended June 30, 2020 | | | 52.69 | | | | 1.04 | | | | (3.46 | ) | | | (2.42 | ) | | | (0.89 | ) | | | (1.07 | ) | | | (1.96 | ) |
Year Ended June 30, 2019 | | | 52.41 | | | | 1.02 | | | | 2.34 | | | | 3.36 | | | | (0.94 | ) | | | (2.14 | ) | | | (3.08 | ) |
July 31, 2017 (f) through June 30, 2018 | | | 49.99 | | | | 0.79 | | | | 4.46 | | | | 5.25 | | | | (0.75 | ) | | | (2.08 | ) | | | (2.83 | ) |
| | | | | | | |
Class R5 | | | | | | | | | | | | | | | | | | | | | | | | | | | | |
Six Months Ended December 31, 2021 (Unaudited) | | | 69.09 | | | | 0.55 | | | | 4.26 | | | | 4.81 | | | | (0.54 | ) | | | (1.21 | ) | | | (1.75 | ) |
Year Ended June 30, 2021 | | | 48.69 | | | | 0.93 | | | | 20.93 | | | | 21.86 | | | | (0.82 | ) | | | (0.64 | ) | | | (1.46 | ) |
Year Ended June 30, 2020 | | | 53.06 | | | | 1.04 | | | | (3.39 | ) | | | (2.35 | ) | | | (0.95 | ) | | | (1.07 | ) | | | (2.02 | ) |
Year Ended June 30, 2019 | | | 52.74 | | | | 1.09 | | | | 2.38 | | | | 3.47 | | | | (1.01 | ) | | | (2.14 | ) | | | (3.15 | ) |
Year Ended June 30, 2018 | | | 49.50 | | | | 0.91 | | | | 5.23 | | | | 6.14 | | | | (0.82 | ) | | | (2.08 | ) | | | (2.90 | ) |
Year Ended June 30, 2017 | | | 45.01 | | | | 0.83 | | | | 6.65 | | | | 7.48 | | | | (0.78 | ) | | | (2.21 | ) | | | (2.99 | ) |
| | | | | | | |
Class R6 | | | | | | | | | | | | | | | | | | | | | | | | | | | | |
Six Months Ended December 31, 2021 (Unaudited) | | | 69.10 | | | | 0.54 | | | | 4.31 | | | | 4.85 | | | | (0.56 | ) | | | (1.21 | ) | | | (1.77 | ) |
Year Ended June 30, 2021 | | | 48.70 | | | | 1.02 | | | | 20.89 | | | | 21.91 | | | | (0.87 | ) | | | (0.64 | ) | | | (1.51 | ) |
Year Ended June 30, 2020 | | | 53.08 | | | | 1.11 | | | | (3.42 | ) | | | (2.31 | ) | | | (1.00 | ) | | | (1.07 | ) | | | (2.07 | ) |
Year Ended June 30, 2019 | | | 52.75 | | | | 1.16 | | | | 2.36 | | | | 3.52 | | | | (1.05 | ) | | | (2.14 | ) | | | (3.19 | ) |
Year Ended June 30, 2018 | | | 49.50 | | | | 1.04 | | | | 5.16 | | | | 6.20 | | | | (0.87 | ) | | | (2.08 | ) | | | (2.95 | ) |
Year Ended June 30, 2017 | | | 45.01 | | | | 0.81 | | | | 6.69 | | | | 7.50 | | | | (0.80 | ) | | | (2.21 | ) | | | (3.01 | ) |
| (a) | Annualized for periods less than one year, unless otherwise noted. |
| (b) | Calculated based upon average shares outstanding. |
| (c) | Not annualized for periods less than one year. |
| (d) | Includes adjustments in accordance with accounting principles generally accepted in the United States of America and as such, the net asset values for financial reporting purposes and the returns based upon those net asset values may differ from the net asset values and returns for shareholder transactions. |
| (e) | Includes earnings credits and interest expense, if applicable, each of which is less than 0.005% unless otherwise noted. |
| (f) | Commencement of offering of class of shares. |
SEE NOTES TO FINANCIAL STATEMENTS.
| | | | | | | | | | |
| | | | | |
| 148 | | | | | | | | J.P. MORGAN LARGE CAP FUNDS | | DECEMBER 31, 2021 |
| | | | | | | | | | | | | | | | | | | | | | | | | | |
| | | Ratios/Supplemental data | |
| | | | | | | | | | Ratios to average net assets (a) | | | | |
Net asset
value,
end of
period | | | Total return
(excludes
sales charge) (c)(d) | | | Net assets,
end of
period
(000’s) | | | Net
expenses (e) | | | Net
investment
income
(loss) | | |
Expenses
without waivers,
reimbursements and
earnings credits | | | Portfolio
turnover
rate (c) | |
| | | | | | | | | | | | | | | | | | | | | | | | | | |
| | | | | | | | | | | | | | | | | | | | | | | | | | |
| $ | 67.37 | | | | 6.84 | % | | $ | 616,087 | | | | 0.94 | % | | | 1.00 | % | | | 1.03 | % | | | 20 | % |
| | 64.61 | | | | 44.88 | | | | 522,230 | | | | 0.93 | | | | 1.17 | | | | 1.03 | | | | 14 | |
| | 45.62 | | | | (5.11 | ) | | | 497,399 | | | | 0.94 | | | | 1.61 | | | | 1.06 | | | | 22 | |
| | 49.84 | | | | 6.68 | | | | 490,597 | | | | 0.93 | | | | 1.73 | | | | 1.06 | | | | 26 | |
| | 49.77 | | | | 12.04 | | | | 476,090 | | | | 0.97 | | | | 1.29 | | | | 1.08 | | | | 32 | |
| | 46.85 | | | | 16.34 | | | | 445,078 | | | | 1.03 | | | | 1.26 | | | | 1.10 | | | | 28 | |
| | | | | | |
| | | | | | | | | | | | | | | | | | | | | | | | | | |
| | 59.55 | | | | 6.57 | | | | 51,032 | | | | 1.44 | | | | 0.51 | | | | 1.51 | | | | 20 | |
| | 57.32 | | | | 44.13 | | | | 37,539 | | | | 1.43 | | | | 0.66 | | | | 1.51 | | | | 14 | |
| | 40.63 | | | | (5.57 | ) | | | 26,487 | | | | 1.44 | | | | 1.11 | | | | 1.53 | | | | 22 | |
| | 44.59 | | | | 6.15 | | | | 26,032 | | | | 1.43 | | | | 1.21 | | | | 1.54 | | | | 26 | |
| | 44.91 | | | | 11.45 | | | | 23,034 | | | | 1.47 | | | | 0.77 | | | | 1.55 | | | | 32 | |
| | 42.54 | | | | 15.76 | | | | 28,290 | | | | 1.53 | | | | 0.76 | | | | 1.59 | | | | 28 | |
| | | | | | |
| | | | | | | | | | | | | | | | | | | | | | | | | | |
| | 71.60 | | | | 6.98 | | | | 1,109,734 | | | | 0.69 | | | | 1.26 | | | | 0.75 | | | | 20 | |
| | 68.55 | | | | 45.22 | | | | 868,339 | | | | 0.69 | | | | 1.35 | | | | 0.75 | | | | 14 | |
| | 48.34 | | | | (4.85 | ) | | | 135,234 | | | | 0.69 | | | | 1.88 | | | | 0.78 | | | | 22 | |
| | 52.69 | | | | 6.94 | | | | 94,500 | | | | 0.68 | | | | 1.93 | | | | 0.79 | | | | 26 | |
| | 52.41 | | | | 12.29 | | | | 77,737 | | | | 0.72 | | | | 1.55 | | | | 0.79 | | | | 32 | |
| | 49.21 | | | | 16.64 | | | | 64,148 | | | | 0.78 | | | | 1.50 | | | | 0.83 | | | | 28 | |
| | | | | | |
| | | | | | | | | | | | | | | | | | | | | | | | | | |
| | 67.46 | | | | 6.69 | | | | 3,434 | | | | 1.19 | | | | 0.75 | | | | 1.26 | | | | 20 | |
| | 64.73 | | | | 44.51 | | | | 2,005 | | | | 1.18 | | | | 0.90 | | | | 1.25 | | | | 14 | |
| | 45.72 | | | | (5.34 | ) | | | 1,126 | | | | 1.19 | | | | 1.46 | | | | 1.98 | | | | 22 | |
| | 50.01 | | | | 6.41 | | | | 108 | | | | 1.18 | | | | 1.30 | | | | 2.77 | | | | 26 | |
| | 49.98 | | | | 11.76 | | | | 41 | | | | 1.21 | | | | 1.06 | | | | 1.49 | | | | 32 | |
| | 47.06 | | | | 16.04 | | | | 23 | | | | 1.28 | | | | 1.01 | | | | 2.06 | | | | 28 | |
| | | | | | |
| | | | | | | | | | | | | | | | | | | | | | | | | | |
| | 71.38 | | | | 6.83 | | | | 9,769 | | | | 0.94 | | | | 1.03 | | | | 1.01 | | | | 20 | |
| | 68.41 | | | | 44.89 | | | | 1,402 | | | | 0.94 | | | | 1.15 | | | | 1.01 | | | | 14 | |
| | 48.25 | | | | (5.10 | ) | | | 398 | | | | 0.94 | | | | 1.50 | | | | 1.03 | | | | 22 | |
| | 52.66 | | | | 6.66 | | | | 24 | | | | 0.93 | | | | 1.73 | | | | 1.84 | | | | 26 | |
| | 52.41 | | | | 10.33 | | | | 22 | | | | 0.94 | | | | 1.42 | | | | 1.12 | | | | 32 | |
| | | | | | |
| | | | | | | | | | | | | | | | | | | | | | | | | | |
| | 71.62 | | | | 6.97 | | | | 297 | | | | 0.69 | | | | 1.21 | | | | 0.76 | | | | 20 | |
| | 68.60 | | | | 45.26 | | | | 106 | | | | 0.68 | | | | 1.46 | | | | 0.76 | | | | 14 | |
| | 48.31 | | | | (4.88 | ) | | | 1,159 | | | | 0.69 | | | | 2.15 | | | | 0.77 | | | | 22 | |
| | 52.69 | | | | 6.94 | | | | 24 | | | | 0.68 | | | | 1.98 | | | | 1.60 | | | | 26 | |
| | 52.41 | | | | 10.56 | | | | 22 | | | | 0.71 | | | | 1.64 | | | | 0.87 | | | | 32 | |
| | | | | | |
| | | | | | | | | | | | | | | | | | | | | | | | | | |
| | 72.15 | | | | 7.04 | | | | 3,660 | | | | 0.54 | | | | 1.52 | | | | 0.61 | | | | 20 | |
| | 69.09 | | | | 45.47 | | | | 178 | | | | 0.54 | | | | 1.56 | | | | 0.61 | | | | 14 | |
| | 48.69 | | | | (4.72 | ) | | | 83 | | | | 0.54 | | | | 2.02 | | | | 5.20 | | | | 22 | |
| | 53.06 | | | | 7.10 | | | | 74 | | | | 0.53 | | | | 2.10 | | | | 1.01 | | | | 26 | |
| | 52.74 | | | | 12.48 | | | | 43 | | | | 0.55 | | | | 1.72 | | | | 0.80 | | | | 32 | |
| | 49.50 | | | | 16.88 | | | | 37 | | | | 0.59 | | | | 1.72 | | | | 1.23 | | | | 28 | |
| | | | | | |
| | | | | | | | | | | | | | | | | | | | | | | | | | |
| | 72.18 | | | | 7.11 | | | | 362,767 | | | | 0.44 | | | | 1.50 | | | | 0.50 | | | | 20 | |
| | 69.10 | | | | 45.60 | | | | 275,186 | | | | 0.44 | | | | 1.74 | | | | 0.50 | | | | 14 | |
| | 48.70 | | | | (4.64 | ) | | | 64,968 | | | | 0.44 | | | | 2.14 | | | | 0.53 | | | | 22 | |
| | 53.08 | | | | 7.21 | | | | 41,144 | | | | 0.43 | | | | 2.22 | | | | 0.53 | | | | 26 | |
| | 52.75 | | | | 12.59 | | | | 33,774 | | | | 0.44 | | | | 1.95 | | | | 0.52 | | | | 32 | |
| | 49.50 | | | | 16.94 | | | | 2,129 | | | | 0.53 | | | | 1.66 | | | | 0.55 | | | | 28 | |
SEE NOTES TO FINANCIAL STATEMENTS.
| | | | | | | | | | |
| | | | | |
| DECEMBER 31, 2021 | | J.P. MORGAN LARGE CAP FUNDS | | | | | | | | 149 |
NOTES TO FINANCIAL STATEMENTS
AS OF DECEMBER 31, 2021 (Unaudited)
(Dollar values in thousands)
1. Organization
JPMorgan Trust I (“JPM I”), JPMorgan Trust II (“JPM II”) and JPMorgan Trust IV (“JPM IV”) (collectively, the “Trusts”) were formed on November 12, 2004 for JPM I and JPM II and November 11, 2015 for JPM IV, as Delaware statutory trusts, pursuant to Declarations of Trust dated November 5, 2004 and November 11, 2015, respectively, and are registered under the Investment Company Act of 1940, as amended (the “1940 Act”), as open-end management investment companies.
The following are 15 separate funds of the Trusts (each, a “Fund” and collectively, the “Funds”) covered by this report:
| | | | | | |
| | | Classes Offered | | Trust | | Diversification Classification |
| JPMorgan Equity Focus Fund | | Class A, Class C, Class I and Class R6 | | JPM I | | Diversified |
| JPMorgan Equity Income Fund | | Class A, Class C, Class I, Class R2, Class R3, Class R4, Class R5 and Class R6 | | JPM II | | Diversified |
| JPMorgan Equity Premium Income Fund | | Class A, Class C, Class I, Class R5 and Class R6 | | JPM IV | | Diversified |
| JPMorgan Hedged Equity Fund | | Class A, Class C, Class I, Class R5 and Class R6 | | JPM I | | Diversified |
| JPMorgan Hedged Equity 2 Fund | | Class A, Class C, Class I, Class R5 and Class R6 | | JPM IV | | Diversified |
| JPMorgan Hedged Equity 3 Fund | | Class A, Class C, Class I, Class R5 and Class R6 | | JPM IV | | Diversified |
| JPMorgan Large Cap Growth Fund | | Class A, Class C, Class I, Class R2, Class R3, Class R4, Class R5 and Class R6 | | JPM II | | Diversified |
| JPMorgan Large Cap Value Fund | | Class A, Class C, Class I, Class R2, Class R3, Class R4, Class R5 and Class R6 | | JPM II | | Diversified |
| JPMorgan U.S. Applied Data Science Value Fund(1) | | Class A, Class C, Class I, Class R2, Class R5 and Class R6 | | JPM I | | Diversified |
| JPMorgan U.S. Equity Fund | | Class A, Class C, Class I, Class L, Class R2, Class R3, Class R4, Class R5 and Class R6 | | JPM I | | Diversified |
| JPMorgan U.S. GARP Equity Fund | | Class A, Class C, Class I, Class R2, Class R5 and Class R6 | | JPM I | | Diversified |
| JPMorgan U.S. Large Cap Core Plus Fund | | Class A, Class C, Class I, Class R2, Class R5 and Class R6 | | JPM I | | Diversified |
| JPMorgan U.S. Research Enhanced Equity Fund | | Class A, Class I and Class R6 | | JPM I | | Diversified |
| JPMorgan U.S. Sustainable Leaders Fund | | Class A, Class C, Class I and Class R6 | | JPM I | | Diversified |
| JPMorgan U.S. Value Fund | | Class A, Class C, Class I, Class R2, Class R3, Class R4, Class R5 and Class R6 | | JPM I | | Diversified |
| (1) | Effective July 1, 2021, JPMorgan Intrepid Value Fund changed its name to JPMorgan U.S. Applied Data Science Value Fund. |
The investment objective of JPMorgan Equity Focus Fund (“Equity Focus Fund”) and JPMorgan Large Cap Growth Fund (“Large Cap Growth Fund”) is to seek long-term capital appreciation.
The investment objective of JPMorgan Equity Income Fund (“Equity Income Fund”) is to seek capital appreciation and current income.
The investment objective of JPMorgan Equity Premium Income Fund (“Equity Premium Income Fund”) is to seek current income while maintaining prospects for capital appreciation.
The investment objective of JPMorgan Hedged Equity Fund (“Hedged Equity Fund”), JPMorgan Hedged Equity 2 Fund (“Hedged Equity 2 Fund”) and JPMorgan Hedged Equity 3 Fund (“Hedged Equity 3 Fund”) is to seek to provide capital appreciation.
The investment objective of JPMorgan Large Cap Value Fund (“Large Cap Value Fund”) is to seek capital appreciation with the incidental goal of achieving current income by investing primarily in equity securities.
The investment objective of JPMorgan U.S. Applied Data Science Value Fund (“U.S. Applied Data Science Value Fund”) and JPMorgan U.S. Sustainable Leaders Fund (“U.S. Sustainable Leaders Fund”) is to seek to provide long-term capital appreciation.
The investment objective of JPMorgan U.S. Equity Fund (“U.S. Equity Fund”) is to seek to provide high total return from a portfolio of selected equity securities.
The investment objective of JPMorgan U.S. GARP Equity Fund (“U.S. GARP Equity Fund”) is to seek to provide long-term capital growth.
The investment objective of JPMorgan U.S. Large Cap Core Plus Fund (“U.S. Large Cap Core Plus Fund”) is to seek to provide a high total return from a portfolio of selected equity securities.
| | | | | | | | | | |
| | | | | |
| 150 | | | | | | | | J.P. MORGAN LARGE CAP FUNDS | | DECEMBER 31, 2021 |
The investment objective of JPMorgan U.S. Research Enhanced Equity Fund (“U.S. Research Enhanced Equity Fund”) is to seek to provide a consistently high total return from a broadly diversified portfolio of equity securities with risk characteristics similar to the Standard and Poor’s 500 Composite Stock Price Index.
The investment objective of JPMorgan U.S. Value Fund (“U.S. Value Fund”) is to seek to provide capital growth over the long-term and to earn income from dividends.
Class L Shares of U.S. Equity Fund and Class A Shares of U.S. Research Enhanced Equity Fund are publicly offered on a limited basis. Investors are not eligible to purchase Class L Shares of the Funds unless they meet certain requirements as described in the Funds’ prospectus.
All share classes of Hedged Equity Fund are publicly offered on a limited basis. JPMorgan Equity Income Fund is offered on a limited basis. Investors are not eligible to purchase shares of the Fund unless they meet certain requirements as described in the Fund’s prospectuses.
Class A Shares generally provide for a front-end sales charge while Class C Shares provide for a contingent deferred sales charge (“CDSC”). No sales charges are assessed with respect to Class I, Class L, Class R2, Class R3, Class R4, Class R5 and Class R6 Shares. Certain Class A Shares, for which front-end sales charges have been waived, may be subject to a CDSC as described in the Funds’ prospectus. Effective October 1, 2020, Class C Shares automatically convert to Class A Shares after eight years. Prior to October 1, 2020, Class C Shares automatically converted to Class A Shares after ten years. All classes of shares have equal rights as to earnings, assets and voting privileges, except that each class may bear different transfer agency, distribution and service fees and each class has exclusive voting rights with respect to its distribution plan and shareholder servicing agreements.
J.P. Morgan Investment Management Inc. (“JPMIM”), an indirect, wholly-owned subsidiary of JPMorgan Chase & Co. (“JPMorgan”), acts as Adviser (the “Adviser”) and Administrator (the “Administrator”) to the Funds.
2. Significant Accounting Policies
The following is a summary of significant accounting policies followed by the Funds in the preparation of their financial statements. The Funds are investment companies and, accordingly, follow the investment company accounting and reporting guidance of the Financial Accounting Standards Board (“FASB”) Accounting Standards Codification Topic 946 — Investment Companies, which is part of U.S. generally accepted accounting principles (“GAAP”). The preparation of financial statements in conformity with GAAP requires management to make estimates and assumptions that affect (i) the reported amounts of assets and liabilities, (ii) disclosure of contingent assets and liabilities at the date of the financial statements, and (iii) the reported amounts of increases and decreases in net assets from operations during the reporting period. Actual results could differ from those estimates.
A. Valuation of Investments — Investments are valued in accordance with GAAP and the Funds’ valuation policies set forth by, and under the supervision and responsibility of, the Boards of Trustees of the Trusts (the “Boards”), which established the following approach to valuation, as described more fully below: (i) investments for which market quotations are readily available shall be valued at their market value and (ii) all other investments for which market quotations are not readily available shall be valued at their fair value as determined in good faith by the Boards.
The Administrator has established the J.P. Morgan Asset Management Americas Valuation Committee (“AVC”) to assist the Boards with the oversight and monitoring of the valuation of the Funds’ investments. The Administrator implements the valuation policies of the Funds’ investments, as directed by the Boards. The AVC oversees and carries out the policies for the valuation of investments held in the Funds. This includes monitoring the appropriateness of fair values based on results of ongoing valuation oversight including, but not limited to, consideration of macro or security specific events, market events, and pricing vendor and broker due diligence. The Administrator is responsible for discussing and assessing the potential impacts to the fair values on an ongoing basis, and, at least on a quarterly basis, with the AVC and the Boards.
Fixed income instruments are valued based on prices received from approved affiliated and unaffiliated pricing vendors or third party broker-dealers (collectively referred to as “Pricing Services”). The Pricing Services use multiple valuation techniques to determine the valuation of fixed income instruments. In instances where sufficient market activity exists, the Pricing Services may utilize a market-based approach through which trades or quotes from market makers are used to determine the valuation of these instruments. In instances where sufficient market activity may not exist, the Pricing Services also utilize proprietary valuation models which may consider market transactions in comparable securities and the various relationships between securities in determining fair value and/or market characteristics in order to estimate the relevant cash flows, which are then discounted to calculate the fair values.
Equities and other exchange-traded instruments are valued at the last sale price or official market closing price on the primary exchange on which the instrument is traded before the net asset values (“NAV”) of the Funds are calculated on a valuation date.
Investments in open-end investment companies (“Underlying Funds”) are valued at each Underlying Fund’s NAV per share as of the report date.
Futures contracts and options are generally valued on the basis of available market quotations.
Valuations reflected in this report are as of the report date. As a result, changes in valuation due to market events and/or issuer-related events after the report date and prior to issuance of the report are not reflected herein.
| | | | | | | | | | |
| | | | | |
| DECEMBER 31, 2021 | | J.P. MORGAN LARGE CAP FUNDS | | | | | | | | 151 |
NOTES TO FINANCIAL STATEMENTS
AS OF DECEMBER 31, 2021 (Unaudited) (continued)
(Dollar values in thousands)
The various inputs that are used in determining the valuation of the Funds’ investments are summarized into the three broad levels listed below.
| • | | Level 1 — Unadjusted inputs using quoted prices in active markets for identical investments. |
| • | | Level 2 — Other significant observable inputs including, but not limited to, quoted prices for similar investments, inputs other than quoted prices that are observable for investments (such as interest rates, prepayment speeds, credit risk, etc.) or other market corroborated inputs. |
| • | | Level 3 — Significant inputs based on the best information available in the circumstances, to the extent observable inputs are not available (including the Funds’ assumptions in determining the fair value of investments). |
A financial instrument’s level within the fair value hierarchy is based on the lowest level of any input, both individually and in the aggregate, that is significant to the fair value measurement. The inputs or methodology used for valuing instruments are not necessarily an indication of the risk associated with investing in those instruments.
The following tables represent each valuation input as presented on the Schedules of Portfolio Investments (“SOIs”):
Equity Focus Fund
| | | | | | | | | | | | | | | | |
| | | Level 1
Quoted prices | | | Level 2
Other significant
observable inputs | | | Level 3
Significant
unobservable inputs | | | Total | |
Total Investments in Securities (a) | | $ | 144,454 | | | $ | — | | | $ | — | | | $ | 144,454 | |
| | | | | | | | | | | | | | | | |
| (a) | Please refer to the SOI for specifics of portfolio holdings. |
| | | | | | | | | | | | | | | | |
| | | | |
| Equity Income Fund | | | | | | | | | | | | | | | | |
| | | Level 1
Quoted prices | | | Level 2
Other significant
observable inputs | | | Level 3
Significant
unobservable inputs | | | Total | |
Total Investments in Securities (a) | | $ | 51,168,247 | | | $ | — | | | $ | — | | | $ | 51,168,247 | |
| | | | | | | | | | | | | | | | |
| (a) | Please refer to the SOI for specifics of portfolio holdings. |
| | | | | | | | | | | | | | | | |
| | | | |
| Equity Premium Income Fund | | | | | | | | | | | | | | | | |
| | | Level 1
Quoted prices | | | Level 2
Other significant
observable inputs | | | Level 3
Significant
unobservable inputs | | | Total | |
Investments in Securities | | | | | | | | | | | | | | | | |
Common Stocks | | $ | 1,756,321 | | | $ | — | | | $ | — | | | $ | 1,756,321 | |
Equity-Linked Notes | | | — | | | | 344,462 | | | | — | | | | 344,462 | |
Short-Term Investments | | | | | | | | | | | | | | | | |
Investment Companies | | | 7,184 | | | | — | | | | — | | | | 7,184 | |
| | | | | | | | | | | | | | | | |
Total Investments in Securities | | $ | 1,763,505 | | | $ | 344,462 | | | $ | — | | | $ | 2,107,967 | |
| | | | | | | | | | | | | | | | |
Appreciation in Other Financial Instruments | | | | | | | | | |
Futures Contracts | | $ | 15 | | | $ | — | | | $ | — | | | $ | 15 | |
| | | | | | | | | | | | | | | | |
| | | | |
| Hedged Equity Fund | | | | | | | | | | | | | | | | |
| | | Level 1
Quoted prices | | | Level 2
Other significant
observable inputs | | | Level 3
Significant
unobservable inputs | | | Total | |
Total Investments in Securities (a) | | $ | 20,626,232 | | | $ | — | | | $ | — | | | $ | 20,626,232 | |
| | | | | | | | | | | | | | | | |
Appreciation in Other Financial Instruments | | | | | | | | | | | | | | | | |
Futures Contracts (a) | | $ | 5,808 | | | $ | — | | | $ | — | | | $ | 5,808 | |
Depreciation in Other Financial Instruments | | | | | | | | | | | | | | | | |
Options Written (a) | |
Call Options Written | | | (254,958 | ) | | | — | | | | — | | | | (254,958 | ) |
Put Options Written | | | (89,805 | ) | | | — | | | | — | | | | (89,805 | ) |
| | | | | | | | | | | | | | | | |
Total Net Appreciation/Depreciation in Other Financial Instruments | | $ | (338,955 | ) | | $ | — | | | $ | — | | | $ | (338,955 | ) |
| | | | | | | | | | | | | | | | |
| (a) | Please refer to the SOI for specifics of portfolio holdings. |
| | | | | | | | | | |
| | | | | |
| 152 | | | | | | | | J.P. MORGAN LARGE CAP FUNDS | | DECEMBER 31, 2021 |
| | | | | | | | | | | | | | | | |
| | | | |
| Hedged Equity 2 Fund | | | | | | | | | | | | | | | | |
| | | Level 1
Quoted prices | | | Level 2
Other significant
observable inputs | | | Level 3
Significant
unobservable inputs | | | Total | |
Total Investments in Securities (a) | | $ | 4,069,681 | | | $ | — | | | $ | — | | | $ | 4,069,681 | |
| | | | | | | | | | | | | | | | |
Appreciation in Other Financial Instruments | | | | | | | | | | | | | | | | |
Futures Contracts (a) | | $ | 698 | | | $ | — | | | $ | — | | | $ | 698 | |
| | | | | | | | | | | | | | | | |
Depreciation in Other Financial Instruments | | | | | | | | | | | | | | | | |
Options Written (a) | |
Call Options Written | | | (64,012 | ) | | | — | | | | — | | | | (64,012 | ) |
Put Options Written | | | (2,195 | ) | | | — | | | | — | | | | (2,195 | ) |
| | | | | | | | | | | | | | | | |
Total Net Appreciation/Depreciation in Other Financial Instruments | | $ | (65,509 | ) | | $ | — | | | $ | — | | | $ | (65,509 | ) |
| | | | | | | | | | | | | | | | |
| (a) | Please refer to the SOI for specifics of portfolio holdings. |
| | | | | | | | | | | | | | | | |
| | | | |
| Hedged Equity 3 Fund | | | | | | | | | | | | | | | | |
| | | Level 1
Quoted prices | | | Level 2
Other significant
observable inputs | | | Level 3
Significant
unobservable inputs | | | Total | |
Total Investments in Securities (a) | | $ | 2,368,859 | | | $ | — | | | $ | — | | | $ | 2,368,859 | |
| | | | | | | | | | | | | | | | |
Appreciation in Other Financial Instruments | | | | | | | | | | | | | | | | |
Futures Contracts (a) | | $ | 433 | | | $ | — | | | $ | — | | | $ | 433 | |
| | | | | | | | | | | | | | | | |
Depreciation in Other Financial Instruments | | | | | | | | | | | | | | | | |
Options Written (a) | |
Call Options Written | | | (55,687 | ) | | | — | | | | — | | | | (55,687 | ) |
Put Options Written | | | (3,704 | ) | | | — | | | | — | | | | (3,704 | ) |
| | | | | | | | | | | | | | | | |
Total Net Appreciation/Depreciation in Other Financial Instruments | | $ | (58,958 | ) | | $ | — | | | $ | — | | | $ | (58,958 | ) |
| | | | | | | | | | | | | | | | |
| (a) | Please refer to the SOI for specifics of portfolio holdings. |
| | | | | | | | | | | | | | | | |
| | | | |
| Large Cap Growth Fund | | | | | | | | | | | | | | | | |
| | | Level 1
Quoted prices | | | Level 2
Other significant
observable inputs | | | Level 3
Significant
unobservable inputs | | | Total | |
Total Investments in Securities (a) | | $ | 41,072,945 | | | $ | — | | | $ | — | | | $ | 41,072,945 | |
| | | | | | | | | | | | | | | | |
| (a) | Please refer to the SOI for specifics of portfolio holdings. |
| | | | | | | | | | | | | | | | |
| | | | |
| Large Cap Value Fund | | | | | | | | | | | | | | | | |
| | | Level 1
Quoted prices | | | Level 2
Other significant
observable inputs | | | Level 3
Significant
unobservable inputs | | | Total | |
Total Investments in Securities (a) | | $ | 3,161,173 | | | $ | — | | | $ | — | | | $ | 3,161,173 | |
| | | | | | | | | | | | | | | | |
| (a) | Please refer to the SOI for specifics of portfolio holdings. |
| | | | | | | | | | |
| | | | | |
| DECEMBER 31, 2021 | | J.P. MORGAN LARGE CAP FUNDS | | | | | | | | 153 |
NOTES TO FINANCIAL STATEMENTS
AS OF DECEMBER 31, 2021 (Unaudited) (continued)
(Dollar values in thousands)
| | | | | | | | | | | | | | | | |
| | | | |
| U.S. Applied Data Science Value Fund | | | | | | | | | | | | | | | | |
| | | Level 1
Quoted prices | | | Level 2
Other significant
observable inputs | | | Level 3
Significant
unobservable inputs | | | Total | |
Total Investments in Securities (a) | | $ | 246,140 | | | $ | — | | | $ | — | | | $ | 246,140 | |
| | | | | | | | | | | | | | | | |
Appreciation in Other Financial Instruments | | | | | | | | | | | | | | | | |
Futures Contracts (a) | | $ | 100 | | | $ | — | | | $ | — | | | $ | 100 | |
| | | | | | | | | | | | | | | | |
| (a) | Please refer to the SOI for specifics of portfolio holdings. |
| | | | | | | | | | | | | | | | |
| | | | |
| U.S. Equity Fund | | | | | | | | | | | | | | | | |
| | | Level 1
Quoted prices | | | Level 2
Other significant
observable inputs | | | Level 3
Significant
unobservable inputs | | | Total | |
Total Investments in Securities (a) | | $ | 22,671,106 | | | $ | — | | | $ | — | | | $ | 22,671,106 | |
| | | | | | | | | | | | | | | | |
Appreciation in Other Financial Instruments | | | | | | | | | | | | | | | | |
Futures Contracts (a) | | $ | 5,467 | | | $ | — | | | $ | — | | | $ | 5,467 | |
| | | | | | | | | | | | | | | | |
| (a) | Please refer to the SOI for specifics of portfolio holdings. |
| | | | | | | | | | | | | | | | |
| | | | |
| U.S. GARP Equity Fund | | | | | | | | | | | | | | | | |
| | | Level 1
Quoted prices | | | Level 2
Other significant
observable inputs | | | Level 3
Significant
unobservable inputs | | | Total | |
Total Investments in Securities (a) | | $ | 1,346,479 | | | $ | — | | | $ | — | | | $ | 1,346,479 | |
| | | | | | | | | | | | | | | | |
Appreciation in Other Financial Instruments | | | | | | | | | | | | | | | | |
Futures Contracts (a) | | $ | 513 | | | $ | — | | | $ | — | | | $ | 513 | |
| | | | | | | | | | | | | | | | |
| (a) | Please refer to the SOI for specifics of portfolio holdings. |
| | | | | | | | | | | | | | | | |
| U.S. Large Cap Core Plus Fund | | | | | | | | | | | | | | | | |
| | | Level 1
Quoted prices | | | Level 2
Other significant
observable inputs | | | Level 3
Significant
unobservable inputs | | | Total | |
Total Investments in Securities (a) | | $ | 3,220,883 | | | $ | — | | | $ | — | | | $ | 3,220,883 | |
| | | | | | | | | | | | | | | | |
Total Liabilities for Securities Sold Short (a) | | $ | (572,510 | ) | | $ | — | | | $ | — | | | $ | (572,510 | ) |
| | | | | | | | | | | | | | | | |
| (a) | Please refer to the SOI for specifics of portfolio holdings. |
| | | | | | | | | | | | | | | | |
| | | | |
| U.S. Research Enhanced Equity Fund | | | | | | | | | | | | | | | | |
| | | Level 1
Quoted prices | | | Level 2
Other significant
observable inputs | | | Level 3
Significant
unobservable inputs | | | Total | |
Total Investments in Securities (a) | | $ | 5,981,483 | | | $ | — | | | $ | — | | | $ | 5,981,483 | |
| | | | | | | | | | | | | | | | |
Appreciation in Other Financial Instruments | | | | | | | | | | | | | | | | |
Futures Contracts (a) | | $ | 1,105 | | | $ | — | | | $ | — | | | $ | 1,105 | |
| | | | | | | | | | | | | | | | |
| (a) | Please refer to the SOI for specifics of portfolio holdings. |
| | | | | | | | | | |
| | | | | |
| 154 | | | | | | | | J.P. MORGAN LARGE CAP FUNDS | | DECEMBER 31, 2021 |
| | | | | | | | | | | | | | | | |
| | | | |
| U.S. Sustainable Leaders Fund | | | | | | | | | | | | | | | | |
| | | Level 1
Quoted prices | | | Level 2
Other significant
observable inputs | | | Level 3
Significant
unobservable inputs | | | Total | |
Total Investments in Securities (a) | | $ | 197,589 | | | $ | — | | | $ | — | | | $ | 197,589 | |
| | | | | | | | | | | | | | | | |
Appreciation in Other Financial Instruments | | | | | | | | | | | | | | | | |
Futures Contracts (a) | | $ | 34 | | | $ | — | | | $ | — | | | $ | 34 | |
| | | | | | | | | | | | | | | | |
| (a) | Please refer to the SOI for specifics of portfolio holdings. |
| | | | | | | | | | | | | | | | |
| | | | |
| U.S. Value Fund | | | | | | | | | | | | | | | | |
| | | Level 1
Quoted prices | | | Level 2
Other significant
observable inputs | | | Level 3
Significant
unobservable inputs | | | Total | |
Total Investments in Securities (a) | | $ | 2,171,489 | | | $ | — | | | $ | — | | | $ | 2,171,489 | |
| | | | | | | | | | | | | | | | |
| (a) | Please refer to the SOI for specifics of portfolio holdings. |
B. Restricted Securities — Certain securities held by the Funds may be subject to legal or contractual restrictions on resale. Restricted securities generally are resold in transactions exempt from registration under the Securities Act of 1933, as amended (the “Securities Act”). Disposal of these securities may involve time-consuming negotiations and expense. Prompt sale at the current valuation may be difficult and could adversely affect the NAVs of the Funds.
As of December 31, 2021, the Funds had no investments in restricted securities other than securities sold to the Funds under Rule 144A and/or Regulation S under the Securities Act.
C. Securities Lending — The Funds are authorized to engage in securities lending in order to generate additional income. The Funds are able to lend to approved borrowers. Citibank N.A. (“Citibank”) serves as lending agent for the Funds, pursuant to a Securities Lending Agency Agreement (the “Securities Lending Agency Agreement”). Securities loaned are collateralized by cash equal to at least 100% of the market value plus accrued interest on the securities lent, which is invested in the Class IM Shares of the JPMorgan U.S. Government Money Market Fund, the Class IM Shares of the JPMorgan Prime Money Market Fund and the Agency SL Class Shares of the JPMorgan Securities Lending Money Market Fund. The Funds retain the interest earned on cash collateral investments but are required to pay the borrower a rebate for the use of the cash collateral. In cases where the lent security is of high value to borrowers, there may be a negative rebate (i.e., a net payment from the borrower to the Funds). Upon termination of a loan, the Funds are required to return to the borrower an amount equal to the cash collateral, plus any rebate owed to the borrowers. The remaining maturities of the securities lending transactions are considered overnight and continuous. Loans are subject to termination by the Funds or the borrower at any time.
The net income earned on the securities lending (after payment of rebates and Citibank’s fee) is included on the Statements of Operations as Income from securities lending (net). The Funds also receive payments from the borrower during the period of the loan, equivalent to dividends and interest earned on the securities loaned, which are recorded as Dividend or Interest income, respectively, on the Statements of Operations.
Under the Securities Lending Agency Agreement, Citibank marks to market the loaned securities on a daily basis. In the event the cash received from the borrower is less than 102% of the value of the loaned securities (105% for loans of non-U.S. securities), Citibank requests additional cash from the borrower so as to maintain a collateralization level of at least 102% of the value of the loaned securities plus accrued interest (105% for loans of non-U.S. securities), subject to certain de minimis amounts.
The value of securities out on loan is recorded as an asset on the Statements of Assets and Liabilities. The value of the cash collateral received is recorded as a liability on the Statements of Assets and Liabilities and details of collateral investments are disclosed on the SOIs.
The Funds bear the risk of loss associated with the collateral investments and are not entitled to additional collateral from the borrower to cover any such losses. To the extent that the value of the collateral investments declines below the amount owed to a borrower, the Funds may incur losses that exceed the amount they earned on lending the security. Upon termination of a loan, the Funds may use leverage (borrow money) to repay the borrower for cash collateral posted if the Adviser does not believe that it is prudent to sell the collateral investments to fund the payment of this liability. Securities lending activity is subject to master netting arrangements.
| | | | | | | | | | |
| | | | | |
| DECEMBER 31, 2021 | | J.P. MORGAN LARGE CAP FUNDS | | | | | | | | 155 |
NOTES TO FINANCIAL STATEMENTS
AS OF DECEMBER 31, 2021 (Unaudited) (continued)
(Dollar values in thousands)
The following table presents for each lending Fund, the value of the securities on loan with Citibank, net of amounts available for offset under the master netting arrangements and any related collateral received or posted by the Funds as of December 31, 2021.
| | | | | | | | | | | | |
| | | Investment Securities
on Loan, at value,
Presented on the
Statements of Assets
and Liabilities | | | Cash
Collateral
Posted by
Borrower* | | | Net Amount Due
to Counterparty
(not less than zero) | |
Large Cap Growth Fund | | $ | 134,368 | | | $ | (134,368 | ) | | $ | — | |
Large Cap Value Fund | | | 36,685 | | | | (36,685 | ) | | | — | |
U.S. Equity Fund | | | 64,031 | | | | (64,031 | ) | | | — | |
U.S. GARP Equity Fund | | | 3,562 | | | | (3,562 | ) | | | — | |
U.S. Sustainable Leaders Fund | | | 532 | | | | (532 | ) | | | — | |
| * | Collateral posted reflects the value of securities on loan and does not include any additional amounts received from the borrower. |
Securities lending also involves counterparty risks, including the risk that the loaned securities may not be returned in a timely manner or at all. Subject to certain conditions, Citibank has agreed to indemnify the Funds from losses resulting from a borrower’s failure to return a loaned security.
JPMIM voluntarily waived investment advisory fees charged to the Funds to reduce the impact of the cash collateral investment in the JPMorgan U.S. Government Money Market Fund from 0.12% to 0.06%. For the six months ended December 31, 2021, JPMIM waived fees associated with the Funds’ investment in the JPMorgan U.S. Government Money Market Fund as follows:
| | | | |
Equity Income Fund | | $ | — | (a) |
Large Cap Growth Fund | | | 10 | |
Large Cap Value Fund | | | 1 | |
U.S. Applied Data Science Value Fund | | | — | (a) |
U.S. Equity Fund | | | 2 | |
U.S. GARP Equity Fund | | | — | (a) |
U.S. Sustainable Leaders Fund | | | — | (a) |
U.S. Value Fund | | | — | (a) |
| (a) | Amount rounds to less than one thousand. |
The above waiver is included in the determination of earnings on cash collateral investment and in the calculation of Citibank’s compensation and is included on the Statements of Operations as Income from securities lending (net).
D. Investment Transactions with Affiliates — The Funds invested in Underlying Funds, which are advised by the Adviser. An issuer which is under common control with a Fund may be considered an affiliate. For the purposes of the financial statements, the Funds assume the issuers listed in the tables below to be affiliated issuers. Underlying Funds’ distributions may be reinvested into such Underlying Fund. Reinvestment amounts are included in the purchases at cost amounts in the tables below.
| | | | | | | | | | | | | | | | | | | | | | | | | | | | | | | | | | | | |
| | | | | |
| Equity Focus Fund | | | | | | | | | | | | | | | | | | | | | |
| For the six months ended December 31, 2021 | |
| Security Description | | Value at
June 30,
2021 | | | Purchases
at Cost | | | Proceeds
from Sales | | | Net
Realized
Gain
(Loss) | | | Change in
Unrealized
Appreciation/
(Depreciation) | | | Value at
December 31,
2021 | | | Shares at
December 31,
2021 | | | Dividend
Income | | | Capital Gain
Distributions | |
JPMorgan Prime Money Market Fund Class IM Shares, 0.07% (a) (b) | | $ | 3,582 | | | $ | 10,962 | | | $ | 10,569 | | | $ | — | (c) | | $ | — | (c) | | $ | 3,975 | | | | 3,974 | | | $ | 1 | | | $ | — | |
| | | | | | | | | | | | | | | | | | | | | | | | | | | | | | | | | | | | |
| (a) | Investment in an affiliated fund, which is registered under the Investment Company Act of 1940, as amended, and is advised by J.P. Morgan Investment Management Inc. |
| (b) | The rate shown is the current yield as of December 31, 2021. |
| (c) | Amount rounds to less than one thousand. |
| | | | | | | | | | |
| | | | | |
| 156 | | | | | | | | J.P. MORGAN LARGE CAP FUNDS | | DECEMBER 31, 2021 |
| | | | | | | | | | | | | | | | | | | | | | | | | | | | | | | | | | | | |
| | | | | |
| Equity Income Fund | | | | | | | | | | | | | | | | | | | | | |
| For the six months ended December 31, 2021 | |
| Security Description | | Value at
June 30,
2021 | | | Purchases
at Cost | | | Proceeds
from Sales | | | Net
Realized
Gain
(Loss) | | | Change in
Unrealized
Appreciation/
(Depreciation) | | | Value at
December 31,
2021 | | | Shares at
December 31,
2021 | | | Dividend
Income | | | Capital Gain
Distributions | |
JPMorgan Prime Money Market Fund Class IM Shares, 0.07% (a) (b) | | $ | 1,108,433 | | | $ | 3,230,672 | | | $ | 3,303,997 | | | $ | 61 | | | $ | (183 | ) | | $ | 1,034,986 | | | | 1,034,572 | | | $ | 398 | | | $ | — | |
| | | | | | | | | | | | | | | | | | | | | | | | | | | | | | | | | | | | |
| (a) | Investment in an affiliated fund, which is registered under the Investment Company Act of 1940, as amended, and is advised by J.P. Morgan Investment Management Inc. |
| (b) | The rate shown is the current yield as of December 31, 2021. |
| | | | | | | | | | | | | | | | | | | | | | | | | | | | | | | | | | | | |
| | | | | |
| Equity Premium Income Fund | | | | | | | | | | | | | | | | | | | | | |
| For the six months ended December 31, 2021 | |
| Security Description | | Value at
June 30,
2021 | | | Purchases
at Cost | | | Proceeds
from Sales | | | Net
Realized
Gain
(Loss) | | | Change in
Unrealized
Appreciation/
(Depreciation) | | | Value at
December 31,
2021 | | | Shares at
December 31,
2021 | | | Dividend
Income | | | Capital Gain
Distributions | |
JPMorgan Prime Money Market Fund Class IM Shares, 0.07% (a) (b) | | $ | 43,928 | | | $ | 1,503,918 | | | $ | 1,540,660 | | | $ | (2 | ) | | $ | — | (c) | | $ | 7,184 | | | | 7,181 | | | $ | 12 | | | $ | — | |
| | | | | | | | | | | | | | | | | | | | | | | | | | | | | | | | | | | | |
| (a) | Investment in an affiliated fund, which is registered under the Investment Company Act of 1940, as amended, and is advised by J.P. Morgan Investment Management Inc. |
| (b) | The rate shown is the current yield as of December 31, 2021. |
| (c) | Amount rounds to less than one thousand. |
| | | | | | | | | | | | | | | | | | | | | | | | | | | | | | | | | | | | |
| | | | | |
| Hedged Equity Fund | | | | | | | | | | | | | | | | | | | | | |
| For the six months ended December 31, 2021 | |
| Security Description | | Value at
June 30,
2021 | | | Purchases
at Cost | | | Proceeds
from Sales | | | Net
Realized
Gain
(Loss) | | | Change in
Unrealized
Appreciation/
(Depreciation) | | | Value at
December 31,
2021 | | | Shares at
December 31,
2021 | | | Dividend
Income | | | Capital Gain
Distributions | |
JPMorgan U.S. Government Money Market Fund Class Institutional Shares, 0.01% (a) (b) | | $ | 312,969 | | | $ | 1,864,040 | | | $ | 880,027 | | | $ | — | | | $ | — | | | $ | 1,296,982 | | | | 1,296,982 | | | $ | 11 | | | $ | — | |
| | | | | | | | | | | | | | | | | | | | | | | | | | | | | | | | | | | | |
| (a) | Investment in an affiliated fund, which is registered under the Investment Company Act of 1940, as amended, and is advised by J.P. Morgan Investment Management Inc. |
| (b) | The rate shown is the current yield as of December 31, 2021. |
| | | | | | | | | | | | | | | | | | | | | | | | | | | | | | | | | | | | |
| | | | | |
| Hedged Equity 2 Fund | | | | | | | | | | | | | | | | | | | | | |
| For the six months ended December 31, 2021 | |
| Security Description | | Value at
June 30,
2021 | | | Purchases
at Cost | | | Proceeds
from Sales | | | Net
Realized
Gain
(Loss) | | | Change in
Unrealized
Appreciation/
(Depreciation) | | | Value at
December 31,
2021 | | | Shares at
December 31,
2021 | | | Dividend
Income | | | Capital Gain
Distributions | |
JPMorgan U.S. Government Money Market Fund Class IM Shares, 0.03% (a) (b) | | $ | 82,933 | | | $ | 1,891,506 | | | $ | 1,830,889 | | | $ | — | | | $ | — | | | $ | 143,550 | | | | 143,550 | | | $ | 10 | | | $ | — | |
| | | | | | | | | | | | | | | | | | | | | | | | | | | | | | | | | | | | |
| (a) | Investment in an affiliated fund, which is registered under the Investment Company Act of 1940, as amended, and is advised by J.P. Morgan Investment Management Inc. |
| (b) | The rate shown is the current yield as of December 31, 2021. |
| | | | | | | | | | |
| | | | | |
| DECEMBER 31, 2021 | | J.P. MORGAN LARGE CAP FUNDS | | | | | | | | 157 |
NOTES TO FINANCIAL STATEMENTS
AS OF DECEMBER 31, 2021 (Unaudited) (continued)
(Dollar values in thousands)
| | | | | | | | | | | | | | | | | | | | | | | | | | | | | | | | | | | | |
| | | | | |
| Hedged Equity 3 Fund | | | | | | | | | | | | | | | | | | | | | |
| For the six months ended December 31, 2021 | |
| Security Description | | Value at
June 30,
2021 | | | Purchases
at Cost | | | Proceeds
from Sales | | | Net
Realized
Gain
(Loss) | | | Change in
Unrealized
Appreciation/
(Depreciation) | | | Value at
December 31,
2021 | | | Shares at
December 31,
2021 | | | Dividend
Income | | | Capital Gain
Distributions | |
JPMorgan U.S. Government Money Market Fund Class IM Shares, 0.03% (a) (b) | | $ | 17,690 | | | $ | 1,249,877 | | | $ | 1,250,885 | | | $ | — | | | $ | — | | | $ | 16,682 | | | | 16,682 | | | $ | 6 | | | $ | — | |
| | | | | | | | | | | | | | | | | | | | | | | | | | | | | | | | | | | | |
| (a) | Investment in an affiliated fund, which is registered under the Investment Company Act of 1940, as amended, and is advised by J.P. Morgan Investment Management Inc. |
| (b) | The rate shown is the current yield as of December 31, 2021. |
| | | | | | | | | | | | | | | | | | | | | | | | | | | | | | | | | | | | |
| | | | | |
| Large Cap Growth Fund | | | | | | | | | | | | | | | | | | | | | |
| For the six months ended December 31, 2021 | |
| Security Description | | Value at
June 30,
2021 | | | Purchases
at Cost | | | Proceeds
from Sales | | | Net
Realized
Gain
(Loss) | | | Change in
Unrealized
Appreciation/
(Depreciation) | | | Value at
December 31,
2021 | | | Shares at
December 31,
2021 | | | Dividend
Income | | | Capital Gain
Distributions | |
JPMorgan Prime Money Market Fund Class IM Shares, 0.07% (a) (b) | | $ | 1,501,233 | | | $ | 4,886,466 | | | $ | 6,095,394 | | | $ | 133 | | | $ | (188 | ) | | $ | 292,250 | | | | 292,134 | | | $ | 418 | | | $ | — | |
JPMorgan Securities Lending Money Market Fund Agency SL Class Shares, 0.08% (a) (b) | | | 314,119 | | | | 924,800 | | | | 1,122,000 | | | | (26 | )* | | | 16 | | | | 116,909 | | | | 116,932 | | | | 78 | * | | | — | |
JPMorgan U.S. Government Money Market Fund Class IM Shares, 0.03% (a) (b) | | | 113,675 | | | | 706,353 | | | | 799,327 | | | | — | | | | — | | | | 20,701 | | | | 20,701 | | | | 4 | * | | | — | |
| | | | | | | | | | | | | | | | | | | | | | | | | | | | | | | | | | | | |
Total | | $ | 1,929,027 | | | $ | 6,517,619 | | | $ | 8,016,721 | | | $ | 107 | | | $ | (172 | ) | | $ | 429,860 | | | | | | | $ | 500 | | | $ | — | |
| | | | | | | | | | | | | | | | | | | | | | | | | | | | | | | | | | | | |
| (a) | Investment in an affiliated fund, which is registered under the Investment Company Act of 1940, as amended, and is advised by J.P. Morgan Investment Management Inc. |
| (b) | The rate shown is the current yield as of December 31, 2021. |
| * | Amount is included on the Statements of Operations as Income from securities lending (net) (after payments of rebates and Citibank’s fee). |
| | | | | | | | | | | | | | | | | | | | | | | | | | | | | | | | | | | | |
| | | | | |
| Large Cap Value Fund | | | | | | | | | | | | | | | | | | | | | |
| For the six months ended December 31, 2021 | |
| Security Description | | Value at
June 30,
2021 | | | Purchases
at Cost | | | Proceeds
from Sales | | | Net
Realized
Gain
(Loss) | | | Change in
Unrealized
Appreciation/
(Depreciation) | | | Value at
December 31,
2021 | | | Shares at
December 31,
2021 | | | Dividend
Income | | | Capital Gain
Distributions | |
JPMorgan Prime Money Market Fund Class IM Shares, 0.07% (a) (b) | | $ | 57,325 | | | $ | 1,281,130 | | | $ | 1,335,305 | | | $ | (4 | ) | | $ | — | (c) | | $ | 3,146 | | | | 3,145 | | | $ | 16 | | | $ | — | |
JPMorgan Securities Lending Money Market Fund Agency SL Class Shares, 0.08% (a) (b) | | | 7,897 | | | | 277,000 | | | | 255,000 | | | | (3 | )* | | | — | (c) | | | 29,894 | | | | 29,901 | | | | 14 | * | | | — | |
JPMorgan U.S. Government Money Market Fund Class IM Shares, 0.03% (a) (b) | | | 23,462 | | | | 77,545 | | | | 93,113 | | | | — | | | | — | | | | 7,894 | | | | 7,894 | | | | 1 | * | | | — | |
| | | | | | | | | | | | | | | | | | | | | | | | | | | | | | | | | | | | |
Total | | $ | 88,684 | | | $ | 1,635,675 | | | $ | 1,683,418 | | | $ | (7 | ) | | $ | — | (c) | | $ | 40,934 | | | | | | | $ | 31 | | | $ | — | |
| | | | | | | | | | | | | | | | | | | | | | | | | | | | | | | | | | | | |
| (a) | Investment in an affiliated fund, which is registered under the Investment Company Act of 1940, as amended, and is advised by J.P. Morgan Investment Management Inc. |
| (b) | The rate shown is the current yield as of December 31, 2021. |
| (c) | Amount rounds to less than one thousand. |
| * | Amount is included on the Statements of Operations as Income from securities lending (net) (after payments of rebates and Citibank’s fee). |
| | | | | | | | | | |
| | | | | |
| 158 | | | | | | | | J.P. MORGAN LARGE CAP FUNDS | | DECEMBER 31, 2021 |
| | | | | | | | | | | | | | | | | | | | | | | | | | | | | | | | | | | | |
| | | | | |
| U.S. Applied Data Science Value Fund | | | | | | | | | | | | | | | | | | | | | |
| For the six months ended December 31, 2021 | |
| Security Description | | Value at
June 30,
2021 | | | Purchases
at Cost | | | Proceeds
from Sales | | | Net
Realized
Gain
(Loss) | | | Change in
Unrealized
Appreciation/
(Depreciation) | | | Value at
December 31,
2021 | | | Shares at
December 31,
2021 | | | Dividend
Income | | | Capital Gain
Distributions | |
JPMorgan Prime Money Market Fund Class IM Shares, 0.07% (a) (b) | | $ | 9,182 | | | $ | 11,480 | | | $ | 15,393 | | | $ | — | (c) | | $ | — | (c) | | $ | 5,269 | | | | 5,267 | | | $ | 2 | | | $ | — | |
JPMorgan U.S. Government Money Market Fund Class IM Shares, 0.03% (a) (b) | | | — | | | | 468 | | | | 468 | | | | — | | | | — | | | | — | | | | — | | | | — | *(c) | | | — | |
| | | | | | | | | | | | | | | | | | | | | | | | | | | | | | | | | | | | |
Total | | $ | 9,182 | | | $ | 11,948 | | | $ | 15,861 | | | $ | — | (c) | | $ | — | (c) | | $ | 5,269 | | | | | | | $ | 2 | | | $ | — | |
| | | | | | | | | | | | | | | | | | | | | | | | | | | | | | | | | | | | |
| (a) | Investment in an affiliated fund, which is registered under the Investment Company Act of 1940, as amended, and is advised by J.P. Morgan Investment Management Inc. |
| (b) | The rate shown is the current yield as of December 31, 2021. |
| (c) | Amount rounds to less than one thousand. |
| * | Amount is included on the Statements of Operations as Income from securities lending (net) (after payments of rebates and Citibank’s fee). |
| | | | | | | | | | | | | | | | | | | | | | | | | | | | | | | | | | | | |
| | | | | |
| U.S. Equity Fund | | | | | | | | | | | | | | | | | | | | | |
| For the six months ended December 31, 2021 | |
| Security Description | | Value at
June 30,
2021 | | | Purchases
at Cost | | | Proceeds
from Sales | | | Net
Realized
Gain
(Loss) | | | Change in
Unrealized
Appreciation/
(Depreciation) | | | Value at
December 31,
2021 | | | Shares at
December 31,
2021 | | | Dividend
Income | | | Capital Gain
Distributions | |
JPMorgan Prime Money Market Fund Class IM Shares, 0.07% (a) (b) | | $ | 228,846 | | | $ | 2,599,678 | | | $ | 2,522,972 | | | $ | (26 | ) | | $ | — | (c) | | $ | 305,526 | | | | 305,404 | | | $ | 82 | | | $ | — | |
JPMorgan Securities Lending Money Market Fund Agency SL Class Shares, 0.08% (a) (b) | | | 26,995 | | | | 373,000 | | | | 344,995 | | | | (8 | )* | | | 3 | | | | 54,995 | | | | 55,006 | | | | 10 | * | | | — | |
JPMorgan U.S. Government Money Market Fund Class IM Shares, 0.03% (a) (b) | | | 3,506 | | | | 357,504 | | | | 350,801 | | | | — | | | | — | | | | 10,209 | | | | 10,209 | | | | 1 | * | | | — | |
| | | | | | | | | | | | | | | | | | | | | | | | | | | | | | | | | | | | |
Total | | $ | 259,347 | | | $ | 3,330,182 | | | $ | 3,218,768 | | | $ | (34 | ) | | $ | 3 | | | $ | 370,730 | | | | | | | $ | 93 | | | $ | — | |
| | | | | | | | | | | | | | | | | | | | | | | | | | | | | | | | | | | | |
| (a) | Investment in an affiliated fund, which is registered under the Investment Company Act of 1940, as amended, and is advised by J.P. Morgan Investment Management Inc. |
| (b) | The rate shown is the current yield as of December 31, 2021. |
| (c) | Amount rounds to less than one thousand. |
| * | Amount is included on the Statements of Operations as Income from securities lending (net) (after payments of rebates and Citibank’s fee). |
| | | | | | | | | | | | | | | | | | | | | | | | | | | | | | | | | | | | |
| | | | | |
| U.S. GARP Equity Fund | | | | | | | | | | | | | | | | | | | | | |
| For the six months ended December 31, 2021 | |
| Security Description | | Value at
June 30,
2021 | | | Purchases
at Cost | | | Proceeds
from Sales | | | Net
Realized
Gain
(Loss) | | | Change in
Unrealized
Appreciation/
(Depreciation) | | | Value at
December 31,
2021 | | | Shares at
December 31,
2021 | | | Dividend
Income | | | Capital Gain
Distributions | |
JPMorgan Prime Money Market Fund Class IM Shares, 0.07% (a) (b) | | $ | 31,110 | | | $ | 99,954 | | | $ | 114,026 | | | $ | (2 | ) | | $ | (1 | ) | | $ | 17,035 | | | | 17,029 | | | $ | 9 | | | $ | — | |
JPMorgan Securities Lending Money Market Fund Agency SL Class Shares, 0.08% (a) (b) | | | 1,994 | | | | 23,000 | | | | 24,994 | | | | — | (c) | | | — | (c) | | | — | | | | — | | | | 1 | * | | | — | |
JPMorgan U.S. Government Money Market Fund Class IM Shares, 0.03% (a) (b) | | | 915 | | | | 23,289 | | | | 20,545 | | | | — | | | | — | | | | 3,659 | | | | 3,659 | | | | — | *(c) | | | — | |
| | | | | | | | | | | | | | | | | | | | | | | | | | | | | | | | | | | | |
Total | | $ | 34,019 | | | $ | 146,243 | | | $ | 159,565 | | | $ | (2 | ) | | $ | (1 | ) | | $ | 20,694 | | | | | | | $ | 10 | | | $ | — | |
| | | | | | | | | | | | | | | | | | | | | | | | | | | | | | | | | | | | |
| | | | | | | | | | |
| | | | | |
| DECEMBER 31, 2021 | | J.P. MORGAN LARGE CAP FUNDS | | | | | | | | 159 |
NOTES TO FINANCIAL STATEMENTS
AS OF DECEMBER 31, 2021 (Unaudited) (continued)
(Dollar values in thousands)
| (a) | Investment in an affiliated fund, which is registered under the Investment Company Act of 1940, as amended, and is advised by J.P. Morgan Investment Management Inc. |
| (b) | The rate shown is the current yield as of December 31, 2021. |
| (c) | Amount rounds to less than one thousand. |
| * | Amount is included on the Statements of Operations as Income from securities lending (net) (after payments of rebates and Citibank’s fee). |
| | | | | | | | | | | | | | | | | | | | | | | | | | | | | | | | | | | | |
| | | | | |
| U.S. Large Cap Core Plus Fund | | | | | | | | | | | | | | | | | | | | | |
| For the six months ended December 31, 2021 | |
| Security Description | | Value at
June 30,
2021 | | | Purchases
at Cost | | | Proceeds
from Sales | | | Net
Realized
Gain
(Loss) | | | Change in
Unrealized
Appreciation/
(Depreciation) | | | Value at
December 31,
2021 | | | Shares at
December 31,
2021 | | | Dividend
Income | | | Capital Gain
Distributions | |
JPMorgan Prime Money Market Fund Class IM Shares, 0.07% (a) (b) | | $ | 11,580 | | | $ | 275,896 | | | $ | 268,919 | | | $ | (1 | ) | | $ | — | (c) | | $ | 18,556 | | | | 18,549 | | | $ | 10 | | | $ | — | |
| | | | | | | | | | | | | | | | | | | | | | | | | | | | | | | | | | | | |
| (a) | Investment in an affiliated fund, which is registered under the Investment Company Act of 1940, as amended, and is advised by J.P. Morgan Investment Management Inc. |
| (b) | The rate shown is the current yield as of December 31, 2021. |
| (c) | Amount rounds to less than one thousand. |
| | | | | | | | | | | | | | | | | | | | | | | | | | | | | | | | | | | | |
| | | | | |
| U.S. Research Enhanced Equity Fund | | | | | | | | | | | | | | | | | | | | | |
| For the six months ended December 31, 2021 | |
| Security Description | | Value at
June 30,
2021 | | | Purchases
at Cost | | | Proceeds
from Sales | | | Net
Realized
Gain
(Loss) | | | Change in
Unrealized
Appreciation/
(Depreciation) | | | Value at
December 31,
2021 | | | Shares at
December 31,
2021 | | | Dividend
Income | | | Capital Gain
Distributions | |
JPMorgan Prime Money Market Fund Class IM Shares, 0.07% (a) (b) | | $ | 66,914 | | | $ | 637,406 | | | $ | 630,824 | | | $ | (2 | ) | | $ | — | (c) | | $ | 73,494 | | | | 73,464 | | | $ | 20 | | | $ | — | |
| | | | | | | | | | | | | | | | | | | | | | | | | | | | | | | | | | | | |
| (a) | Investment in an affiliated fund, which is registered under the Investment Company Act of 1940, as amended, and is advised by J.P. Morgan Investment Management Inc. |
| (b) | The rate shown is the current yield as of December 31, 2021. |
| (c) | Amount rounds to less than one thousand. |
| | | | | | | | | | | | | | | | | | | | | | | | | | | | | | | | | | | | |
| | | | | |
| U.S. Sustainable Leaders Fund | | | | | | | | | | | | | | | | | | | | | |
| For the six months ended December 31, 2021 | |
| Security Description | | Value at
June 30,
2021 | | | Purchases
at Cost | | | Proceeds
from Sales | | | Net
Realized
Gain
(Loss) | | | Change in
Unrealized
Appreciation/
(Depreciation) | | | Value at
December 31,
2021 | | | Shares at
December 31,
2021 | | | Dividend
Income | | | Capital Gain
Distributions | |
JPMorgan Prime Money Market Fund Class IM Shares, 0.07% (a) (b) | | $ | 4,580 | | | $ | 54,422 | | | $ | 56,426 | | | $ | (1 | ) | | $ | (1 | ) | | $ | 2,574 | | | | 2,573 | | | $ | 1 | | | $ | — | |
JPMorgan U.S. Government Money Market Fund Class IM Shares, 0.03% (a) (b) | | | — | | | | 2,982 | | | | 2,438 | | | | — | | | | — | | | | 544 | | | | 544 | | | | — | *(c) | | | — | |
| | | | | | | | | | | | | | | | | | | | | | | | | | | | | | | | | | | | |
Total | | $ | 4,580 | | | $ | 57,404 | | | $ | 58,864 | | | $ | (1 | ) | | $ | (1 | ) | | $ | 3,118 | | | | | | | $ | 1 | | | $ | — | |
| | | | | | | | | | | | | | | | | | | | | | | | | | | | | | | | | | | | |
| (a) | Investment in an affiliated fund, which is registered under the Investment Company Act of 1940, as amended, and is advised by J.P. Morgan Investment Management Inc. |
| (b) | The rate shown is the current yield as of December 31, 2021. |
| (c) | Amount rounds to less than one thousand. |
| * | Amount is included on the Statements of Operations as Income from securities lending (net) (after payments of rebates and Citibank’s fee). |
| | | | | | | | | | |
| | | | | |
| 160 | | | | | | | | J.P. MORGAN LARGE CAP FUNDS | | DECEMBER 31, 2021 |
| | | | | | | | | | | | | | | | | | | | | | | | | | | | | | | | | | | | |
| | | | | |
| U.S. Value Fund | | | | | | | | | | | | | | | | | | | | | |
| For the six months ended December 31, 2021 | |
| Security Description | | Value at
June 30,
2021 | | | Purchases
at Cost | | | Proceeds
from Sales | | | Net
Realized
Gain
(Loss) | | | Change in
Unrealized
Appreciation/
(Depreciation) | | | Value at
December 31,
2021 | | | Shares at
December 31,
2021 | | | Dividend
Income | | | Capital Gain
Distributions | |
JPMorgan Prime Money Market Fund Class IM Shares, 0.07% (a) (b) | | $ | 38,028 | | | $ | 822,021 | | | $ | 794,040 | | | $ | (5 | ) | | $ | — | (c) | | $ | 66,004 | | | | 65,978 | | | $ | 17 | | | $ | — | |
| | | | | | | | | | | | | | | | | | | | | | | | | | | | | | | | | | | | |
| (a) | Investment in an affiliated fund, which is registered under the Investment Company Act of 1940, as amended, and is advised by J.P. Morgan Investment Management Inc. |
| (b) | The rate shown is the current yield as of December 31, 2021. |
| (c) | Amount rounds to less than one thousand. |
E. Foreign Currency Translation — The books and records of the Funds are maintained in U.S. dollars. Foreign currency amounts are translated into U.S. dollars at the prevailing exchange rates of such currencies against the U.S. dollar. The market value of investment securities and other assets and liabilities are translated at the exchange rate as of the valuation date. Purchases and sales of investment securities, income and expenses are translated at the exchange rate prevailing on the respective dates of such transactions.
The Funds do not isolate the effect of changes in foreign exchange rates from changes in market prices on securities held. Accordingly, such changes are included within Change in net unrealized appreciation/depreciation on investments in non-affiliates on the Statements of Operations.
Reported realized foreign currency gains and losses arise from the disposition of foreign currency, currency gains or losses realized between the trade and settlement dates on securities transactions, and the difference between the amounts of dividends, interest and foreign withholding taxes recorded on each Fund’s books on the transaction date and the U.S. dollar equivalent of the amounts actually received or paid. These reported realized foreign currency gains and losses are included in Net realized gain (loss) on foreign currency transactions on the Statements of Operations. Unrealized foreign currency gains and losses arise from changes (due to changes in exchange rates) in the value of foreign currency and other assets and liabilities denominated in foreign currencies, which are held at period end and are included in Change in net unrealized appreciation/depreciation on foreign currency translations on the Statements of Operations.
F. Options — Hedged Equity Fund, Hedged Equity 2 Fund and Hedged Equity 3 Fund purchased and sold (“wrote”) put and call options on various instruments including options on indices to manage and hedge interest rate risks within their portfolios and also to gain long or short exposure to the underlying instrument, index, currency or rate. A purchaser of a put option has the right, but not the obligation, to sell the underlying instrument at an agreed upon price (“strike price”) to the option seller. A purchaser of a call option has the right, but not the obligation, to purchase the underlying instrument at the strike price from the option seller.
Options Purchased — Premiums paid by the Funds for options purchased are included on the Statements of Assets and Liabilities as Options purchased. The option is adjusted daily to reflect the current market value of the option and the change is recorded as Change in net unrealized appreciation/depreciation on options purchased on the Statements of Operations. If the option is allowed to expire, the Funds will lose the entire premium they paid and record a realized loss for the premium amount. Premiums paid for options purchased which are exercised or closed are added to the amounts paid or offset against the proceeds on the underlying investment transaction to determine the realized gain (loss) or cost basis of the underlying investment.
Options Written — Premiums received by the Funds for options written are included on the Statements of Assets and Liabilities as a liability. The amount of the liability is adjusted daily to reflect the current market value of the option written and the change in market value is recorded as Change in net unrealized appreciation/depreciation on options written on the Statements of Operations. Premiums received from options written that expire are treated as realized gains. If a written option is closed, the Funds record a realized gain or loss on options written based on whether the cost of the closing transaction exceeds the premium received. If a call option is exercised by the option buyer, the premium received by the Funds is added to the proceeds from the sale of the underlying security to the option buyer and compared to the cost of the closing transaction to determine whether there has been a realized gain or loss. If a put option is exercised by an option buyer, the premium received by the option seller reduces the cost basis of the purchased security.
The Funds pledge collateral to the counterparty in the form of securities for options written. Securities designated as collateral are denoted on the SOIs.
Written uncovered call options subject the Funds to unlimited risk of loss. Written covered call options limit the upside potential of a security above the strike price. Written put options subject the Funds to risk of loss if the value of the security declines below the exercise price minus the put premium.
| | | | | | | | | | |
| | | | | |
| DECEMBER 31, 2021 | | J.P. MORGAN LARGE CAP FUNDS | | | | | | | | 161 |
NOTES TO FINANCIAL STATEMENTS
AS OF DECEMBER 31, 2021 (Unaudited) (continued)
(Dollar values in thousands)
The Funds are not subject to credit risk on options written as the counterparty has already performed its obligation by paying the premium at the inception of the contract.
The Funds’ exchange-traded option contracts are not subject to master netting arrangements (the right to close out all transactions traded with a counterparty and net amounts owed or due across transactions).
G. Futures Contracts — Equity Premium Income Fund, Hedged Equity Fund, Hedged Equity 2 Fund, Hedged Equity 3 Fund, U.S. Applied Data Science Value Fund, U.S. Equity Fund, U.S. GARP Equity Fund, U.S. Large Cap Core Plus Fund, U.S. Research Enhanced Equity Fund and U.S. Sustainable Leaders Fund used index futures contracts to gain or reduce exposure to the stock market, or maintain liquidity or minimize transaction costs. The Funds also purchased futures contracts to invest incoming cash in the market or sold futures in response to cash outflows, thereby simulating an invested position in the underlying index while maintaining a cash balance for liquidity.
Futures contracts provide for the delayed delivery of the underlying instrument at a fixed price or are settled for a cash amount based on the change in the value of the underlying instrument at a specific date in the future. Upon entering into a futures contract, the Funds are required to deposit with the broker, cash or securities in an amount equal to a certain percentage of the contract amount, which is referred to as the initial margin deposit. Subsequent payments, referred to as variation margin, are made or received by the Funds periodically and are based on changes in the market value of open futures contracts. Changes in the market value of open futures contracts are recorded as Change in net unrealized appreciation/depreciation on futures contracts on the Statements of Operations. Realized gains or losses, representing the difference between the value of the contract at the time it was opened and the value at the time it was closed, are reported on the Statements of Operations at the closing or expiration of the futures contract. Securities deposited as initial margin are designated on the SOIs, while cash deposited, which is considered restricted, is recorded on the Statements of Assets and Liabilities. A receivable from and/or a payable to brokers for the daily variation margin is also recorded on the Statements of Assets and Liabilities.
The use of futures contracts exposes the Funds to equity price risk. The Funds may be subject to the risk that the change in the value of the futures contract may not correlate perfectly with the underlying instrument. Use of long futures contracts subjects the Funds to risk of loss in excess of the amounts shown on the Statements of Assets and Liabilities, up to the notional amount of the futures contracts. Use of short futures contracts subjects the Funds to unlimited risk of loss. The Funds may enter into futures contracts only on exchanges or boards of trade. The exchange or board of trade acts as the counterparty to each futures transaction; therefore, the Funds’ credit risk is limited to failure of the exchange or board of trade. Under some circumstances, futures exchanges may establish daily limits on the amount that the price of a futures contract can vary from the previous day’s settlement price, which could effectively prevent liquidation of positions.
The Funds’ futures contracts are not subject to master netting arrangements (the right to close out all transactions traded with a counterparty and net amounts owed or due across transactions).
H. Summary of Derivatives Information
Derivatives Volume
The table below discloses the volume of the Funds’ options and futures contracts activity during the six months ended December 31, 2021. Please refer to the tables in the Summary of Derivatives Information for derivative-related gains and losses associated with volume activity:
| | | | | | | | | | | | | | | | | | | | | | | | | | | | | | | | | | | | | | | | |
| | | Equity
Premium
Income
Fund | | | Hedged
Equity
Fund | | | Hedged
Equity 2
Fund | | | Hedged
Equity 3
Fund | | | U.S.
Applied Data
Science
Value Fund | | | U.S.
Equity
Fund | | | U.S.
GARP
Equity
Fund | | | U.S.
Large Cap
Core Plus
Fund | | | U.S.
Research
Enhanced
Equity
Fund | | | U.S.
Sustainable
Leaders
Fund | |
Futures Contracts | | | | | | | | | | | | | | | | | | | | | | | | | | | | | | | | | | | | | | | | |
Average Notional Balance Long | | $ | 20,897 | | | $ | 364,232 | | | $ | 52,571 | | | $ | 20,817 | | | $ | 5,193 | | | $ | 148,722 | | | $ | 25,008 | | | $ | 1,794 | | | $ | 55,615 | | | $ | 2,679 | |
Ending Notional Balance Long | | | 17,368 | | | | 520,553 | | | | 31,167 | | | | 17,368 | | | | 5,234 | | | | 193,423 | | | | 16,654 | | | | — | | | | 68,519 | | | | 2,899 | |
| | | | | | | | | | |
Exchange-Traded Options: | | | | | | | | | | | | | | | | | | | | | | | | | | | | | | | | | | | | | | | | |
Average Number of Contracts Purchased | | | — | | | | 42,758 | | | | 5,538 | | | | 2,995 | | | | — | | | | — | | | | — | | | | — | | | | — | | | | — | |
Average Number of Contracts Written | | | — | | | | 85,515 | | | | 11,075 | | | | 5,989 | | | | — | | | | — | | | | — | | | | — | | | | — | | | | — | |
Ending Number of Contracts Purchased | | | — | | | | 40,728 | | | | 8,281 | | | | 4,939 | | | | — | | | | — | | | | — | | | | — | | | | — | | | | — | |
Ending Number of Contracts Written | | | — | | | | 81,456 | | | | 16,562 | | | | 9,878 | | | | — | | | | — | | | | — | | | | — | | | | — | | | | — | |
The Funds’ derivatives contracts held at December 31, 2021 are not accounted for as hedging instruments under GAAP.
I. Equity-Linked Notes — Equity Premium Income Fund invested in Equity-Linked Notes (“ELNs”). These are hybrid instruments which combine both debt and equity characteristics into a single note form. ELNs’ values are linked to the performance of an underlying index. ELNs are unsecured debt
| | | | | | | | | | |
| | | | | |
| 162 | | | | | | | | J.P. MORGAN LARGE CAP FUNDS | | DECEMBER 31, 2021 |
obligations of an issuer and may not be publicly listed or traded on an exchange. ELNs are valued daily, under procedures adopted by the Board of JPM IV, based on values provided by an approved pricing source. These notes have a coupon which is accrued and recorded as interest income on the Statements of Operations. Changes in the market value of ELNs are recorded as Change in net unrealized appreciation or depreciation on the Statements of Operations. The Fund realizes a gain or loss when an ELN is sold or matures, which is recorded as Net realized gain (loss) on transactions from investments in non-affiliates on the Statements of Operations.
As of December 31, 2021, Equity Premium Income Fund had outstanding ELNs as listed on the SOI.
J. Short Sales — U.S. Large Cap Core Plus Fund engaged in short sales as part of its normal investment activities. In a short sale, the Fund sells securities it does not own in anticipation of a decline in the market value of those securities. In order to deliver securities to the purchaser, the Funds borrow securities from a broker. To close out a short position, the Funds deliver the same securities to the broker.
The Fund is required to pledge cash or securities to the broker as collateral for the securities sold short. Collateral requirements are calculated daily based on the current market value of the short positions. Securities segregated as collateral are denoted on the SOIs. The Fund may receive or pay the net of the following amounts: (i) a portion of the income from the investment of cash collateral; (ii) the broker’s fee on the borrowed securities (calculated daily based upon the market value of each borrowed security and a variable rate that is dependent on availability of the security); and (iii) a financing charge for the difference between the market value of the short position and cash collateral deposited with the broker. The net amounts of income or fees are included as interest income or interest expense on securities sold short on the Statements of Operations.
The Fund is obligated to pay the broker dividends declared on short positions when a position is open on the record date. Dividends on short positions are reported on ex-dividend date on the Statements of Operations as Dividend expense on securities sold short. The Fund is obligated to pay the broker interest accrued on short positions while the position is outstanding. Interest expense on short positions is reported as Interest expense to non-affiliates on securities sold short on the Statements of Operations. Liabilities for securities sold short are reported at market value on the Statements of Assets and Liabilities and the change in market value is recorded as Change in net unrealized appreciation/depreciation on the Statements of Operations. Short sale transactions may result in unlimited losses as the security’s price increases and the short position loses value. There is no upward limit on the price a borrowed security could attain. The Fund is also subject to risk of loss if the broker were to fail to perform its obligations under the contractual terms.
The Fund will record a realized loss if the price of the borrowed security increases between the date of the short sale and the date on which the Fund replaces the borrowed security. The Fund will record a realized gain if the price of the borrowed security declines between those dates.
As of December 31, 2021, Large Cap Core Plus Fund had outstanding short sales as listed on its SOI.
K. Offering and Organization Costs — Total offering costs of $104 and $104 incurred in connection with the offering of shares of Hedged Equity 2 Fund and Hedged Equity 3 Fund are amortized on a straight line basis over 12 months from the date the Funds commenced operations. Costs paid in connection with the organization of the Funds, if any, are recorded as an expense at the time the Funds commenced operations. For the six months ended December 31, 2021, total offering costs amortized were $52 and $52, respectively.
L. Security Transactions and Investment Income — Investment transactions are accounted for on the trade date (the date the order to buy or sell is executed). Securities gains and losses are calculated on a specifically identified cost basis. Interest income and interest expense on securities sold short, if any, is determined on the basis of coupon interest accrued using the effective interest method, which adjusts for amortization of premiums and accretion of discounts. Dividend income and dividend expense on securities sold short are recorded on the ex-dividend date or when a Fund first learns of the dividend.
To the extent such information is publicly available, the Funds record distributions received in excess of income earned from underlying investments as a reduction of cost of investments and/or realized gain. Such amounts are based on estimates if actual amounts are not available and actual amounts of income, realized gain and return of capital may differ from the estimated amounts. The Funds adjust the estimated amounts of the components of distributions (and consequently their net investment income) as necessary, once the issuers provide information about the actual composition of the distributions.
M. Allocation of Income and Expenses — Expenses directly attributable to a Fund are charged directly to that Fund, while the expenses attributable to more than one fund of the Trusts are allocated among the applicable funds. Investment income, realized and unrealized gains and losses and expenses, other than class-specific expenses, are allocated daily to each class of shares based upon the proportion of net assets of each class at the beginning of each day.
| | | | | | | | | | |
| | | | | |
| DECEMBER 31, 2021 | | J.P. MORGAN LARGE CAP FUNDS | | | | | | | | 163 |
NOTES TO FINANCIAL STATEMENTS
AS OF DECEMBER 31, 2021 (Unaudited) (continued)
(Dollar values in thousands)
Transfer agency fees are class-specific expenses. The amount of the transfer agency fees charged to each share class of the Funds for the six months ended December 31, 2021 are as follows:
| | | | | | | | | | | | | | | | | | | | | | | | | | | | | | | | | | | | | | | | |
| | | Class A | | | Class C | | | Class I | | | Class L | | | Class R2 | | | Class R3 | | | Class R4 | | | Class R5 | | | Class R6 | | | Total | |
Equity Focus Fund | | | | | | | | | | | | | | | | | | | | | | | | | | | | | | | | | | | | | | | | |
Transfer agency fees | | $ | 1 | | | $ | — | (a) | | $ | 1 | | | | n/a | | | | n/a | | | | n/a | | | | n/a | | | | n/a | | | $ | — | (a) | | $ | 2 | |
Equity Income Fund | | | | | | | | | | | | | | | | | | | | | | | | | | | | | | | | | | | | | | | | |
Transfer agency fees | | | 28 | | | | 26 | | | | 213 | | | | n/a | | | $ | 6 | | | $ | 4 | | | $ | 2 | | | $ | 16 | | | | 157 | | | | 452 | |
Equity Premium Income Fund | | | | | | | | | | | | | | | | | | | | | | | | | | | | | | | | | | | | | | | | |
Transfer agency fees | | | 3 | | | | 2 | | | | 23 | | | | n/a | | | | n/a | | | | n/a | | | | n/a | | | | — | (a) | | | — | (a) | | | 28 | |
Hedged Equity Fund | | | | | | | | | | | | | | | | | | | | | | | | | | | | | | | | | | | | | | | | |
Transfer agency fees | | | 13 | | | | 6 | | | | 90 | | | | n/a | | | | n/a | | | | n/a | | | | n/a | | | | — | (a) | | | 16 | | | | 125 | |
Hedged Equity 2 Fund | | | | | | | | | | | | | | | | | | | | | | | | | | | | | | | | | | | | | | | | |
Transfer agency fees | | | 1 | | | | 1 | | | | 9 | | | | n/a | | | | n/a | | | | n/a | | | | n/a | | | | — | (a) | | | 2 | | | | 13 | |
Hedged Equity 3 Fund | | | | | | | | | | | | | | | | | | | | | | | | | | | | | | | | | | | | | | | | |
Transfer agency fees | | | — | (a) | | | — | (a) | | | 6 | | | | n/a | | | | n/a | | | | n/a | | | | n/a | | | | — | (a) | | | — | (a) | | | 6 | |
Large Cap Growth Fund | | | | | | | | | | | | | | | | | | | | | | | | | | | | | | | | | | | | | | | | |
Transfer agency fees | | | 186 | | | | 12 | | | | 66 | | | | n/a | | | | 5 | | | | 2 | | | | 2 | | | | 7 | | | | 99 | | | | 379 | |
Large Cap Value Fund | | | | | | | | | | | | | | | | | | | | | | | | | | | | | | | | | | | | | | | | |
Transfer agency fees | | | 15 | | | | 2 | | | | 123 | | | | n/a | | | | 2 | | | | — | (a) | | | — | (a) | | | 1 | | | | 10 | | | | 153 | |
U.S. Applied Data Science Value Fund | | | | | | | | | | | | | | | | | | | | | | | | | | | | | | | | | | | | | | | | |
Transfer agency fees | | | 1 | | | | — | (a) | | | 2 | | | | n/a | | | | 3 | | | | n/a | | | | n/a | | | | — | (a) | | | 1 | | | | 7 | |
U.S. Equity Fund | | | | | | | | | | | | | | | | | | | | | | | | | | | | | | | | | | | | | | | | |
Transfer agency fees | | | 45 | | | | 6 | | | | 19 | | | $ | 27 | | | | 4 | | | | 2 | | | | — | (a) | | | 5 | | | | 58 | | | | 166 | |
U.S. GARP Equity Fund | | | | | | | | | | | | | | | | | | | | | | | | | | | | | | | | | | | | | | | | |
Transfer agency fees | | | 4 | | | | — | (a) | | | 3 | | | | n/a | | | | 14 | | | | n/a | | | | n/a | | | | 1 | | | | 3 | | | | 25 | |
U.S. Large Cap Core Plus Fund | | | | | | | | | | | | | | | | | | | | | | | | | | | | | | | | | | | | | | | | |
Transfer agency fees | | | 5 | | | | 1 | | | | 26 | | | | n/a | | | | 1 | | | | n/a | | | | n/a | | | | — | (a) | | | 2 | | | | 35 | |
U.S. Research Enhanced Equity Fund | | | | | | | | | | | | | | | | | | | | | | | | | | | | | | | | | | | | | | | | |
Transfer agency fees | | | 6 | | | | n/a | | | | 7 | | | | n/a | | | | n/a | | | | n/a | | | | n/a | | | | n/a | | | | 20 | | | | 33 | |
U.S. Sustainable Leaders Fund | | | | | | | | | | | | | | | | | | | | | | | | | | | | | | | | | | | | | | | | |
Transfer agency fees | | | 1 | | | | — | (a) | | | 2 | | | | n/a | | | | n/a | | | | n/a | | | | n/a | | | | n/a | | | | — | (a) | | | 3 | |
U.S. Value Fund | | | | | | | | | | | | | | | | | | | | | | | | | | | | | | | | | | | | | | | | |
Transfer agency fees | | | 68 | | | | 1 | | | | 8 | | | | n/a | | | | — | (a) | | | — | (a) | | | — | (a) | | | — | (a) | | | 2 | | | | 79 | |
| (a) | Amount rounds to less than one thousand. |
N. Federal Income Taxes — Each Fund is treated as a separate taxable entity for Federal income tax purposes. Each Fund’s policy is to comply with the provisions of the Internal Revenue Code (the “Code”) applicable to regulated investment companies and to distribute to shareholders all of its distributable net investment income and net realized capital gains on investments. Accordingly, no provision for Federal income tax is necessary. Management has reviewed the Funds’ tax positions for all open tax years and has determined that as of December 31, 2021, no liability for Federal income tax is required in the Funds’ financial statements for net unrecognized tax benefits. However, management’s conclusions may be subject to future review based on changes in, or the interpretation of, the accounting standards or tax laws and regulations. Each Fund’s Federal tax returns for the prior three fiscal years, or since inception if shorter, remain subject to examination by the Internal Revenue Service.
O. Distributions to Shareholders — Distributions from net investment income, if any, are generally declared and paid at least quarterly, except for Equity Focus Fund, Large Cap Growth Fund, U.S. GARP Equity Fund, U.S. Large Cap Core Plus Fund and U.S. Sustainable Leaders Fund, for which distributions are generally declared and paid at least annually, and Equity Income Fund and Equity Premium Income Fund, for which distributions are generally declared and paid at least monthly. Distributions are declared separately for each class. No class has preferential dividend rights; differences in per share rates are due to differences in separate class expenses. Net realized capital gains, if any, are distributed by each Fund at least annually. The amount of distributions from net investment income and net realized capital gains is determined in accordance with Federal income tax regulations, which may differ from GAAP. To the extent these “book/tax” differences are permanent in nature (i.e., that they result from other than timing of recognition — “temporary differences”), such amounts are reclassified within the capital accounts based on their Federal tax basis treatment.
| | | | | | | | | | |
| | | | | |
| 164 | | | | | | | | J.P. MORGAN LARGE CAP FUNDS | | DECEMBER 31, 2021 |
3. Fees and Other Transactions with Affiliates
A. Investment Advisory Fee — Pursuant to an Investment Advisory Agreement, the Adviser manages the investments of each Fund and for such services is paid a fee. The investment advisory fee is accrued daily and paid monthly at an annual rate based on each Fund’s respective average daily net assets. The annual rate for each Fund is as follows:
| | | | |
Equity Focus Fund | | | 0.50 | % |
Equity Income Fund | | | 0.40 | |
Equity Premium Income Fund | | | 0.25 | |
Hedged Equity Fund | | | 0.25 | |
Hedged Equity 2 Fund | | | 0.25 | |
Hedged Equity 3 Fund | | | 0.25 | |
Large Cap Growth Fund | | | 0.45 | |
Large Cap Value Fund | | | 0.40 | |
U.S. Applied Data Science Value Fund | | | 0.30 | |
U.S. Equity Fund | | | 0.40 | |
U.S. GARP Equity Fund | | | 0.30 | |
U.S. Large Cap Core Plus Fund | | | 0.65 | |
U.S. Research Enhanced Equity Fund | | | 0.25 | |
U.S. Sustainable Leaders Fund | | | 0.30 | |
U.S. Value Fund | | | 0.40 | |
The Adviser waived investment advisory fees and/or reimbursed expenses as outlined in Note 3.F.
B. Administration Fee — Pursuant to an Administration Agreement, the Administrator provides certain administration services to each Fund. In consideration of these services, the Administrator receives a fee accrued daily and paid monthly at an annual rate of 0.075% of the first $10 billion of each Fund’s respective average daily net assets, plus 0.050% of each Fund’s respective average daily net assets between $10 billion and $20 billion, plus 0.025% of each Fund’s respective average daily net assets between $20 billion and $25 billion, plus 0.01% of each Fund’s respective average daily net assets in excess of $25 billion. For the six months ended December 31, 2021, the effective annualized rate for Equity Focus Fund, Equity Income Fund, Equity Premium Income Fund, Hedged Equity Fund, Hedged Equity 2 Fund, Hedged Equity 3 Fund, Large Cap Growth Fund, Large Cap Value Fund, U.S. Applied Data Science Value Fund, U.S. Equity Fund, U.S. GARP Equity Fund, U.S. Large Cap Core Plus Fund, U.S. Research Enhanced Equity Fund, U.S. Sustainable Leaders Fund and U.S. Value Fund was 0.075%, 0.033%, 0.075%, 0.063%, 0.075%, 0.075%, 0.039%, 0.075%, 0.075%, 0.061%, 0.075%, 0.038%, 0.075%, 0.075% and 0.075%, respectively, of each Fund’s average daily net assets, notwithstanding any fee waivers and/or expense reimbursements.
The Administrator waived administration fees as outlined in Note 3.F.
JPMorgan Chase Bank, N.A. (“JPMCB”), a wholly-owned subsidiary of JPMorgan, serves as the Funds’ sub-administrator (the “Sub-administrator”). For its services as Sub-administrator, JPMCB receives a portion of the fees payable to the Administrator.
C. Distribution Fees — Pursuant to a Distribution Agreement, JPMorgan Distribution Services, Inc. (“JPMDS”), an indirect, wholly-owned subsidiary of JPMorgan, serves as each Fund’s principal underwriter and promotes and arranges for the sale of each Fund’s shares.
The Boards have adopted a Distribution Plan (the “Distribution Plan”) for Class A, Class C, Class R2 and Class R3 Shares of the Funds, as applicable, pursuant to Rule 12b-1 under the 1940 Act. Class I, Class L, Class R4, Class R5 and Class R6 Shares of the Funds do not charge a distribution fee. The Distribution Plan provides that each Fund shall pay, with respect to the applicable share classes, distribution fees, including payments to JPMDS, at annual rates of the average daily net assets as shown in the table below:
| | | | | | | | | | | | | | | | |
| | | Class A | | | Class C | | | Class R2 | | | Class R3 | |
Equity Focus Fund | | | 0.25 | % | | | 0.75 | % | | | n/a | | | | n/a | |
Equity Income Fund | | | 0.25 | | | | 0.75 | | | | 0.50 | % | | | 0.25 | % |
Equity Premium Income Fund | | | 0.25 | | | | 0.75 | | | | n/a | | | | n/a | |
Hedged Equity Fund | | | 0.25 | | | | 0.75 | | | | n/a | | | | n/a | |
Hedged Equity 2 Fund | | | 0.25 | | | | 0.75 | | | | n/a | | | | n/a | |
Hedged Equity 3 Fund | | | 0.25 | | | | 0.75 | | | | n/a | | | | n/a | |
Large Cap Growth Fund | | | 0.25 | | | | 0.75 | | | | 0.50 | | | | 0.25 | |
Large Cap Value Fund | | | 0.25 | | | | 0.75 | | | | 0.50 | | | | 0.25 | |
U.S. Applied Data Science Value Fund | | | 0.25 | | | | 0.75 | | | | 0.50 | | | | n/a | |
U.S. Equity Fund | | | 0.25 | | | | 0.75 | | | | 0.50 | | | | 0.25 | |
U.S. GARP Equity Fund | | | 0.25 | | | | 0.75 | | | | 0.50 | | | | n/a | |
U.S. Large Cap Core Plus Fund | | | 0.25 | | | | 0.75 | | | | 0.50 | | | | n/a | |
U.S. Research Enhanced Equity Fund | | | 0.25 | | | | n/a | | | | n/a | | | | n/a | |
U.S. Sustainable Leaders Fund | | | 0.25 | | | | 0.75 | | | | n/a | | | | n/a | |
U.S. Value Fund | | | 0.25 | | | | 0.75 | | | | 0.50 | | | | 0.25 | |
| | | | | | | | | | |
| | | | | |
| DECEMBER 31, 2021 | | J.P. MORGAN LARGE CAP FUNDS | | | | | | | | 165 |
NOTES TO FINANCIAL STATEMENTS
AS OF DECEMBER 31, 2021 (Unaudited) (continued)
(Dollar values in thousands)
In addition, JPMDS is entitled to receive the front-end sales charges from purchases of Class A Shares and the CDSC from redemptions of Class C Shares and certain Class A Shares for which front-end sales charges have been waived. For the six months ended December 31, 2021, JPMDS retained the following:
| | | | | | | | |
| | | Front-End Sales Charge | | | CDSC | |
Equity Focus Fund | | $ | 2 | | | $ | — | |
Equity Income Fund | | | 231 | | | | — | (a) |
Equity Premium Income Fund | | | 269 | | | | — | |
Hedged Equity Fund | | | 23 | | | | — | (a) |
Hedged Equity 2 Fund | | | 95 | | | | — | (a) |
Hedged Equity 3 Fund | | | 41 | | | | — | |
Large Cap Growth Fund | | | 310 | | | | — | (a) |
Large Cap Value Fund | | | 19 | | | | — | (a) |
U.S. Applied Data Science Value Fund | | | — | (a) | | | — | |
U.S. Equity Fund | | | 129 | | | | — | |
U.S. GARP Equity Fund | | | 3 | | | | — | |
U.S. Large Cap Core Plus Fund | | | 9 | | | | — | (a) |
U.S. Research Enhanced Equity Fund | | | — | (a) | | | — | |
U.S. Sustainable Leaders Fund | | | 9 | | | | — | |
U.S. Value Fund | | | 60 | | | | — | |
| (a) | Amount rounds to less than one thousand. |
D. Service Fees — The Trusts, on behalf of the Funds, have entered into a Shareholder Servicing Agreement with JPMDS under which JPMDS provides certain support services to fund shareholders. For performing these services, JPMDS receives a fee with respect to all share classes, except Class R6 Shares which do not charge a service fee, that is accrued daily and paid monthly equal to a percentage of the average daily net assets as shown in the table below:
| | | | | | | | | | | | | | | | | | | | | | | | | | | | | | | | |
| | | Class A | | | Class C | | | Class I | | | Class L | | | Class R2 | | | Class R3 | | | Class R4 | | | Class R5 | |
Equity Focus Fund | | | 0.25 | % | | | 0.25 | % | | | 0.25 | % | | | n/a | | | | n/a | | | | n/a | | | | n/a | | | | n/a | |
Equity Income Fund | | | 0.25 | | | | 0.25 | | | | 0.25 | | | | n/a | | | | 0.25 | % | | | 0.25 | % | | | 0.25 | % | | | 0.10 | % |
Equity Premium Income Fund | | | 0.25 | | | | 0.25 | | | | 0.25 | | | | n/a | | | | n/a | | | | n/a | | | | n/a | | | | 0.10 | |
Hedged Equity Fund | | | 0.25 | | | | 0.25 | | | | 0.25 | | | | n/a | | | | n/a | | | | n/a | | | | n/a | | | | 0.10 | |
Hedged Equity 2 Fund | | | 0.25 | | | | 0.25 | | | | 0.25 | | | | n/a | | | | n/a | | | | n/a | | | | n/a | | | | 0.10 | |
Hedged Equity 3 Fund | | | 0.25 | | | | 0.25 | | | | 0.25 | | | | n/a | | | | n/a | | | | n/a | | | | n/a | | | | 0.10 | |
Large Cap Growth Fund | | | 0.25 | | | | 0.25 | | | | 0.25 | | | | n/a | | | | 0.25 | | | | 0.25 | | | | 0.25 | | | | 0.10 | |
Large Cap Value Fund | | | 0.25 | | | | 0.25 | | | | 0.25 | | | | n/a | | | | 0.25 | | | | 0.25 | | | | 0.25 | | | | 0.10 | |
U.S. Applied Data Science Value Fund | | | 0.25 | | | | 0.25 | | | | 0.25 | | | | n/a | | | | 0.25 | | | | n/a | | | | n/a | | | | 0.10 | |
U.S. Equity Fund | | | 0.25 | | | | 0.25 | | | | 0.25 | | | | 0.10 | % | | | 0.25 | | | | 0.25 | | | | 0.25 | | | | 0.10 | |
U.S. GARP Equity Fund | | | 0.25 | | | | 0.25 | | | | 0.25 | | | | n/a | | | | 0.25 | | | | n/a | | | | n/a | | | | 0.10 | |
U.S. Large Cap Core Plus Fund | | | 0.25 | | | | 0.25 | | | | 0.25 | | | | n/a | | | | 0.25 | | | | n/a | | | | n/a | | | | 0.10 | |
U.S. Research Enhanced Equity Fund | | | 0.25 | | | | n/a | | | | 0.25 | | | | n/a | | | | n/a | | | | n/a | | | | n/a | | | | n/a | |
U.S. Sustainable Leaders Fund | | | 0.25 | | | | 0.25 | | | | 0.25 | | | | n/a | | | | n/a | | | | n/a | | | | n/a | | | | n/a | |
U.S. Value Fund | | | 0.25 | | | | 0.25 | | | | 0.25 | | | | n/a | | | | 0.25 | | | | 0.25 | | | | 0.25 | | | | 0.10 | |
JPMDS has entered into shareholder services contracts with affiliated and unaffiliated financial intermediaries who provide shareholder services and other related services to their clients or customers who invest in the Funds. Pursuant to such contracts, JPMDS will pay all or a portion of such fees earned to financial intermediaries for performing such services.
JPMDS waived service fees as outlined in Note 3.F.
E. Custodian and Accounting Fees — JPMCB provides portfolio custody and accounting services to the Funds. For performing these services, the Funds pay JPMCB transaction and asset-based fees that vary according to the number of transactions and positions, plus out-of-pocket expenses. The amounts paid directly to JPMCB by the Funds for custody and accounting services are included in Custodian and accounting fees on the Statements of Operations.
Interest income earned on cash balances at the custodian, if any, is included in Interest income from affiliates on the Statements of Operations.
Interest expense paid to the custodian related to cash overdrafts, if any, is included in Interest expense to affiliates on the Statements of Operations.
| | | | | | | | | | |
| | | | | |
| 166 | | | | | | | | J.P. MORGAN LARGE CAP FUNDS | | DECEMBER 31, 2021 |
F. Waivers and Reimbursements — The Adviser, Administrator and/or JPMDS have contractually agreed to waive fees and/or reimburse the Funds (excluding Equity Income Fund) to the extent that total annual operating expenses (excluding acquired fund fees and expenses other than certain money market fund fees as described below, dividend and interest expenses related to short sales, interest, taxes, expenses related to litigation and potential litigation, expenses related to trustee elections and extraordinary expenses) exceed the percentages of the Funds’ respective average daily net assets as shown in the table below:
| | | | | | | | | | | | | | | | | | | | | | | | | | | | | | | | | | | | |
| | | Class A | | | Class C | | | Class I | | | Class L | | | Class R2 | | | Class R3 | | | Class R4 | | | Class R5 | | | Class R6 | |
Equity Focus Fund | | | 1.10 | % | | | 1.60 | % | | | 0.85 | % | | | n/a | | | | n/a | | | | n/a | | | | n/a | | | | n/a | | | | 0.60 | % |
Equity Premium Income Fund | | | 0.85 | | | | 1.35 | | | | 0.60 | | | | n/a | | | | n/a | | | | n/a | | | | n/a | | | | 0.45 | % | | | 0.35 | |
Hedged Equity Fund | | | 0.85 | | | | 1.35 | | | | 0.60 | | | | n/a | | | | n/a | | | | n/a | | | | n/a | | | | 0.45 | | | | 0.35 | |
Hedged Equity 2 Fund | | | 0.85 | | | | 1.35 | | | | 0.60 | | | | n/a | | | | n/a | | | | n/a | | | | n/a | | | | 0.45 | | | | 0.35 | |
Hedged Equity 3 Fund | | | 0.85 | | | | 1.35 | | | | 0.60 | | | | n/a | | | | n/a | | | | n/a | | | | n/a | | | | 0.45 | | | | 0.35 | |
Large Cap Growth Fund | | | 0.94 | | | | 1.44 | | | | 0.69 | | | | n/a | | | | 1.19 | % | | | 0.94 | % | | | 0.69 | % | | | 0.54 | | | | 0.44 | |
Large Cap Value Fund | | | 0.93 | | | | 1.44 | | | | 0.69 | | | | n/a | | | | 1.19 | | | | 0.94 | | | | 0.69 | | | | 0.54 | | | | 0.44 | |
U.S. Applied Data Science Value Fund | | | 0.83 | (1) | | | 1.33 | (1) | | | 0.59 | (1) | | | n/a | | | | 1.09 | | | | n/a | | | | n/a | | | | 0.44 | | | | 0.34 | |
U.S. Equity Fund | | | 0.94 | | | | 1.44 | | | | 0.69 | | | | n/a | | | | 1.19 | | | | 0.94 | | | | 0.69 | | | | 0.54 | | | | 0.44 | |
U.S. GARP Equity Fund | | | 0.84 | | | | 1.34 | | | | 0.59 | | | | n/a | | | | 1.09 | | | | n/a | | | | n/a | | | | 0.44 | | | | 0.34 | |
U.S. Large Cap Core Plus Fund | | | 1.10 | | | | 1.60 | | | | 0.85 | | | | n/a | | | | 1.45 | | | | n/a | | | | n/a | | | | 0.80 | | | | 0.70 | |
U.S. Research Enhanced Equity Fund | | | 0.60 | | | | n/a | | | | 0.35 | | | | n/a | | | | n/a | | | | n/a | | | | n/a | | | | n/a | | | | 0.25 | |
U.S. Sustainable Leaders Fund | | | 0.64 | | | | 1.14 | | | | 0.39 | | | | n/a | | | | n/a | | | | n/a | | | | n/a | | | | n/a | | | | 0.34 | |
U.S. Value Fund | | | 0.94 | | | | 1.44 | | | | 0.69 | | | | n/a | | | | 1.19 | | | | 0.94 | | | | 0.69 | | | | 0.54 | | | | 0.44 | |
| (1) | Effective July 1, 2021, the contractual expense limitations changed to 0.73%, 1.23% and 0.49% for Class A, Class C and Class I Shares, respectively. |
Except as noted above, the expense limitation agreements were in effect for the six months ended December 31, 2021 and the contractual expense limitation percentages in the table above are in place until at least October 31, 2022.
For the six months ended December 31, 2021, the Funds’ service providers waived fees and/or reimbursed expenses for each of the Funds as follows. None of these parties expect the Funds to repay any such waived fees and/or reimbursed expenses in future years.
The amounts of these waivers resulting from investments in these money market funds for the six months ended December 31, 2021 were as follows:
| | | | | | | | | | | | | | | | | | | | |
| | | Contractual Waivers | | | Contractual
Reimbursements | |
| | | Investment
Advisory Fees | | | Administration
Fees | | | Service
Fees | | | Total | |
Equity Focus Fund | | $ | 41 | | | $ | 27 | | | $ | 1 | | | $ | 69 | | | $ | — | |
Equity Income Fund | | | 3 | | | | — | | | | — | | | | 3 | | | | — | |
Equity Premium Income Fund | | | 57 | | | | 38 | | | | 23 | | | | 118 | | | | — | (a) |
Hedged Equity Fund | | | — | | | | — | | | | — | | | | — | | | | — | |
Hedged Equity 2 Fund | | | 28 | | | | 18 | | | | 11 | | | | 57 | | | | 54 | |
Hedged Equity 3 Fund | | | 38 | | | | 24 | | | | 5 | | | | 67 | | | | 52 | |
Large Cap Growth Fund | | | 7,364 | | | | 4,904 | | | | 188 | | | | 12,456 | | | | — | |
Large Cap Value Fund | | | 553 | | | | 369 | | | | 151 | | | | 1,073 | | | | 6 | |
U.S. Applied Data Science Value Fund | | | 94 | | | | 63 | | | | 109 | | | | 266 | | | | 1 | |
U.S. Equity Fund | | | 1,980 | | | | 1,319 | | | | 81 | | | | 3,380 | | | | 58 | |
U.S. GARP Equity Fund | | | 233 | | | | 155 | | | | 20 | | | | 408 | | | | — | |
U.S. Large Cap Core Plus Fund | | | 335 | | | | 223 | | | | 1,097 | | | | 1,655 | | | | 2 | |
U.S. Research Enhanced Equity Fund | | | 1,423 | | | | 947 | | | | 690 | | | | 3,060 | | | | — | |
U.S. Sustainable Leaders Fund | | | 98 | | | | 54 | | | | 122 | | | | 274 | | | | — | |
U.S. Value Fund | | | 337 | | | | 225 | | | | 73 | | | | 635 | | | | 1 | |
| (a) | Amount rounds to less than one thousand. |
Additionally, the Funds may invest in one or more money market funds advised by the Adviser (affiliated money market funds). The Adviser, Administrator and/or JPMDS, as shareholder servicing agent, have contractually agreed to waive fees and/or reimburse expenses in an amount sufficient to offset the respective net fees each collects from the affiliated money market fund on the applicable Fund’s investment in such affiliated money market fund, except for investments of securities lending cash collateral. None of these parties expect the Funds to repay any such waived fees and/or reimbursed expenses in future years.
| | | | | | | | | | |
| | | | | |
| DECEMBER 31, 2021 | | J.P. MORGAN LARGE CAP FUNDS | | | | | | | | 167 |
NOTES TO FINANCIAL STATEMENTS
AS OF DECEMBER 31, 2021 (Unaudited) (continued)
(Dollar values in thousands)
| | | | |
Equity Focus Fund | | $ | 2 | |
Equity Income Fund | | | 525 | |
Equity Premium Income Fund | | | 18 | |
Hedged Equity Fund | | | 96 | |
Hedged Equity 2 Fund | | | 12 | |
Hedged Equity 3 Fund | | | 7 | |
Large Cap Growth Fund | | | 617 | |
Large Cap Value Fund | | | 28 | |
U.S. Applied Data Science Value Fund | | | 3 | |
U.S. Equity Fund | | | 107 | |
U.S. GARP Equity Fund | | | 12 | |
U.S. Large Cap Core Plus Fund | | | 12 | |
U.S. Research Enhanced Equity Fund | | | 27 | |
U.S. Sustainable Leaders Fund | | | 2 | |
U.S. Value Fund | | | 21 | |
G. Other — Certain officers of the Trusts are affiliated with the Adviser, the Administrator and JPMDS. Such officers, with the exception of the Chief Compliance Officer, receive no compensation from the Funds for serving in their respective roles.
The Boards designated and appointed a Chief Compliance Officer to the Funds pursuant to Rule 38a-1 under the 1940 Act. Each Fund, along with affiliated funds, makes reimbursement payments, on a pro-rata basis, to the Administrator for a portion of the fees associated with the office of the Chief Compliance Officer. Such fees are included in Trustees’ and Chief Compliance Officer’s fees on the Statements of Operations.
The Trusts adopted a Trustee Deferred Compensation Plan (the “Plan”) which allows the independent Trustees to defer the receipt of all or a portion of compensation related to performance of their duties as Trustees. The deferred fees are invested in various J.P. Morgan Funds until distribution in accordance with the Plan.
During the six months ended December 31, 2021, Hedged Equity Fund, Hedged Equity 2 Fund, Large Cap Growth Fund, U.S. Equity Fund, U.S. GARP Equity Fund, U.S. Large Cap Core Plus Fund, U.S. Research Enhanced Equity Fund and U.S. Sustainable Leaders Fund purchased securities from an underwriting syndicate in which the principal underwriter or members of the syndicate were affiliated with the Adviser.
The Securities and Exchange Commission (“SEC”) has granted an exemptive order permitting the Funds to engage in principal transactions with J.P. Morgan Securities LLC, an affiliated broker, involving taxable money market instruments, subject to certain conditions.
4. Investment Transactions
During the six months ended December 31, 2021, purchases and sales of investments (excluding short-term investments and transfers in-kind) were as follows:
| | | | | | | | | | | | | | | | |
| | | Purchases
(excluding U.S.
Government) | | | Sales
(excluding U.S.
Government) | | | Securities
Sold Short | | | Covers on
Securities
Sold Short | |
Equity Focus Fund | | $ | 21,931 | | | $ | 21,301 | | | $ | — | | | $ | — | |
Equity Income Fund | | | 4,218,772 | | | | 2,549,258 | | | | — | | | | — | |
Equity Premium Income Fund | | | 2,492,797 | | | | 1,350,701 | | | | — | | | | — | |
Hedged Equity Fund | | | 3,030,903 | | | | 4,073,493 | | | | — | | | | — | |
Hedged Equity 2 Fund | | | 2,591,993 | | | | 322,751 | | | | — | | | | — | |
Hedged Equity 3 Fund | | | 1,763,347 | | | | 163,567 | | | | — | | | | — | |
Large Cap Growth Fund | | | 9,694,628 | | | | 8,246,074 | | | | — | | | | — | |
Large Cap Value Fund | | | 1,552,468 | | | | 2,726,943 | | | | — | | | | — | |
U.S. Applied Data Science Value Fund | | | 115,080 | | | | 160,044 | | | | — | | | | — | |
U.S. Equity Fund | | | 5,493,964 | | | | 5,355,908 | | | | — | | | | — | |
U.S. GARP Equity Fund | | | 362,477 | | | | 470,763 | | | | — | | | | — | |
U.S. Large Cap Core Plus Fund | | | 917,329 | | | | 1,357,547 | | | | 365,807 | | | | 470,702 | |
U.S. Research Enhanced Equity Fund | | | 1,097,065 | | | | 796,307 | | | | — | | | | — | |
U.S. Sustainable Leaders Fund | | | 97,180 | | | | 30,024 | | | | — | | | | — | |
U.S. Value Fund | | | 675,900 | | | | 343,816 | | | | — | | | | — | |
During the six months ended December 31, 2021, there were no purchases or sales of U.S. Government securities.
| | | | | | | | | | |
| | | | | |
| 168 | | | | | | | | J.P. MORGAN LARGE CAP FUNDS | | DECEMBER 31, 2021 |
5. Federal Income Tax Matters
For Federal income tax purposes, the estimated cost and unrealized appreciation (depreciation) in value of investments held at December 31, 2021 were as follows:
| | | | | | | | | | | | | | | | |
| | | Aggregate
Cost | | | Gross
Unrealized
Appreciation | | | Gross
Unrealized Depreciation | | | Net Unrealized
Appreciation
(Depreciation) | |
Equity Focus Fund | | $ | 88,724 | | | $ | 57,158 | | | $ | 1,428 | | | $ | 55,730 | |
Equity Income Fund | | | 34,216,460 | | | | 17,216,322 | | | | 264,535 | | | | 16,951,787 | |
Equity Premium Income Fund | | | 1,916,578 | | | | 206,130 | | | | 14,726 | | | | 191,404 | |
Hedged Equity Fund | | | 13,026,609 | | | | 7,299,063 | | | | 38,395 | | | | 7,260,668 | |
Hedged Equity 2 Fund | | | 3,719,068 | | | | 394,370 | | | | 109,266 | | | | 285,104 | |
Hedged Equity 3 Fund | | | 2,151,309 | | | | 236,506 | | | | 77,914 | | | | 158,592 | |
Large Cap Growth Fund | | | 24,482,064 | | | | 16,745,761 | | | | 154,880 | | | | 16,590,881 | |
Large Cap Value Fund | | | 2,662,936 | | | | 527,688 | | | | 29,451 | | | | 498,237 | |
U.S. Applied Data Science Value Fund | | | 194,000 | | | | 53,773 | | | | 1,533 | | | | 52,240 | |
U.S. Equity Fund | | | 12,917,584 | | | | 9,851,171 | | | | 92,182 | | | | 9,758,989 | |
U.S. GARP Equity Fund | | | 733,912 | | | | 621,793 | | | | 8,713 | | | | 613,080 | |
U.S. Large Cap Core Plus Fund* | | | 1,066,857 | | | | 1,636,783 | | | | 55,267 | | | | 1,581,516 | |
U.S. Research Enhanced Equity Fund | | | 3,081,247 | | | | 2,911,718 | | | | 10,377 | | | | 2,901,341 | |
U.S. Sustainable Leaders Fund | | | 156,539 | | | | 41,805 | | | | 721 | | | | 41,084 | |
U.S. Value Fund | | | 1,545,198 | | | | 633,341 | | | | 7,050 | | | | 626,291 | |
| * | The tax cost includes the proceeds from short sales which may result in a net negative cost. |
As of June 30, 2021, the following Funds had net capital loss carryforwards:
| | | | | | | | |
| | | Capital Loss Carryforward Character | |
| | | Short-Term | | | Long-Term | |
Equity Premium Income Fund | | $ | 33,857 | * | | $ | — | |
Hedged Equity Fund | | | 239,515 | | | | 291,140 | |
Hedged Equity 2 Fund | | | 7,867 | * | | | 12,060 | * |
Hedged Equity 3 Fund | | | 4,547 | | | | 7,258 | |
| * | Amount includes capital loss carryforwards which are limited in future years under Internal Revenue Code sections 381-384. |
Late year ordinary losses incurred after December 31 as well as net capital losses incurred after October 31, and within the taxable year are deemed to arise on the first business day of the Funds’ next taxable year. For the year ended June 30, 2021, the following Funds deferred to July 1, 2021 the following net capital losses of:
| | | | | | | | | | | | |
| | | Net Capital Losses (Gains) | | | Late Year Ordinary
Loss Deferral | |
| | | Short-Term | | | Long-Term | |
Hedged Equity Fund | | $ | 582,316 | | | $ | 1,228,621 | | | $ | — | |
Large Cap Growth Fund | | | — | | | | — | | | | 22,352 | |
U.S. Large Cap Core Plus Fund | | | — | | | | — | | | | 2,396 | |
During the year ended June 30, 2021, the following Fund utilized capital loss carryforwards as follows:
| | | | | | | | |
| | | Capital Loss Utilized | |
| | | Short-Term | | | Long-Term | |
Large Cap Value Fund | | $ | 24,093 | | | $ | — | |
6. Borrowings
The Funds rely upon an exemptive order granted by the SEC (the “Order”) permitting the establishment and operation of an Interfund Lending Facility (the “Facility”). The Facility allows the Funds to directly lend and borrow money to or from any other fund relying upon the Order at rates beneficial to both the borrowing and lending funds. Advances under the Facility are taken primarily for temporary or emergency purposes, including the meeting of redemption requests that otherwise might require the untimely disposition of securities, and are subject to each Fund’s borrowing restrictions. The Interfund loan rate is determined, as specified in the Order, by averaging the current repurchase agreement rate and the current bank loan rate. The Order was granted to JPM II and may be relied upon by the Funds because the Funds and the series of JPM II are all investment companies in the same “group of investment companies” (as defined in Section 12(d)(1)(G) of the 1940 Act).
| | | | | | | | | | |
| | | | | |
| DECEMBER 31, 2021 | | J.P. MORGAN LARGE CAP FUNDS | | | | | | | | 169 |
NOTES TO FINANCIAL STATEMENTS
AS OF DECEMBER 31, 2021 (Unaudited) (continued)
(Dollar values in thousands)
The Funds had no borrowings outstanding from another fund during the six months ended December 31, 2021. Average borrowings from the Facility during the six months ended December 31, 2021, were as follows:
| | | | | | | | | | | | | | | | |
| | | Average
Borrowings | | | Average
Interest
Rate Paid | | | Number of
Days
Outstanding | | | Interest
Paid | |
Large Cap Value Fund | | $ | 47,781 | | | | 0.81 | % | | | 1 | | | $ | 1 | |
The Trusts and JPMCB have entered into a financing arrangement. Under this arrangement, JPMCB provides an unsecured, uncommitted credit facility in the aggregate amount of $100 million to certain of the J.P. Morgan Funds, including the Funds. Advances under the arrangement are taken primarily for temporary or emergency purposes, including the meeting of redemption requests that otherwise might require the untimely disposition of securities, and are subject to each Fund’s borrowing restrictions. Interest on borrowings is payable at a rate determined by JPMCB at the time of borrowing. This agreement has been extended until October 31, 2022.
The Funds had no borrowings outstanding from the unsecured, uncommitted credit facility during the six months ended December 31, 2021.
The Trusts, along with certain other trusts for J.P. Morgan Funds (“Borrowers”), have entered into a joint syndicated senior unsecured revolving credit facility totaling $1.5 billion (“Credit Facility”) with various lenders and The Bank of New York Mellon, as administrative agent for the lenders. This Credit Facility provides a source of funds to the Borrowers for temporary and emergency purposes, including the meeting of redemption requests that otherwise might require the untimely disposition of securities. Under the terms of the Credit Facility, a borrowing fund must have a minimum of $25,000,000 in adjusted net asset value and not exceed certain adjusted net asset coverage ratios prior to and during the time in which any borrowings are outstanding. If a fund does not comply with the aforementioned requirements, the fund must remediate within three business days with respect to the $25,000,000 minimum adjusted net asset value or within one business day with respect to certain asset coverage ratios or the administrative agent at the request of, or with the consent of, the lenders may terminate the Credit Facility and declare any outstanding borrowings to be due and payable immediately.
Interest associated with any borrowing under the Credit Facility is charged to the borrowing fund at a rate of interest equal to 1.25%, which has decreased to 1.00% pursuant to the amendment referenced below (the “Applicable Margin”), plus the greater of the federal funds effective rate or one month London Interbank Offered Rate (“LIBOR”). The annual commitment fee to maintain the Credit Facility is 0.15% and is incurred on the unused portion of the Credit Facility and is allocated to all participating funds pro rata based on their respective net assets. Effective August 10, 2021, the Credit Facility has been amended and restated for a term of 364 days, unless extended, and to include a reduction of the Applicable Margin charged for borrowing under the Credit Facility from 1.25% to 1.00%.
The Funds did not utilize the Credit Facility during the six months ended December 31, 2021.
7. Risks, Concentrations and Indemnifications
In the normal course of business, the Funds enter into contracts that contain a variety of representations which provide general indemnifications. Each Fund’s maximum exposure under these arrangements is unknown. The amount of exposure would depend on future claims that may be brought against each Fund. However, based on experience, the Funds expect the risk of loss to be remote.
As of December 31, 2021, the following Funds had individual shareholder and/or omnibus accounts each owning more than 10% of the respective Fund’s outstanding shares as follows:
| | | | | | | | | | | | | | | | |
| | | Number of
Individual Shareholder
and/or
Affiliated
Omnibus
Accounts | | | % of the Fund | | | Number of
Individual Shareholder
and/or
Non-Affiliated
Omnibus
Accounts | | | % of the Fund | |
Equity Focus Fund | | | 1 | | | | 63.7 | % | | | 1 | | | | 20.1 | % |
Equity Income Fund | | | 1 | | | | 10.9 | | | | 2 | | | | 29.6 | |
Equity Premium Income Fund | | | 1 | | | | 48.4 | | | | 1 | | | | 10.8 | |
Hedged Equity Fund | | | — | | | | — | | | | 2 | | | | 38.1 | |
Hedged Equity 2 Fund | | | 1 | | | | 16.8 | | | | 3 | | | | 39.6 | |
Hedged Equity 3 Fund | | | 1 | | | | 21.7 | | | | 2 | | | | 22.6 | |
Large Cap Growth Fund | | | — | | | | — | | | | 2 | | | | 28.2 | |
Large Cap Value Fund | | | 1 | | | | 14.4 | | | | 1 | | | | 13.4 | |
U.S. Applied Data Science Value Fund | | | — | | | | — | | | | 2 | | | | 24.6 | |
U.S. Equity Fund | | | — | | | | — | | | | 1 | | | | 13.2 | |
U.S. GARP Equity Fund | | | 3 | | | | 45.4 | | | | — | | | | — | |
| | | | | | | | | | |
| | | | | |
| 170 | | | | | | | | J.P. MORGAN LARGE CAP FUNDS | | DECEMBER 31, 2021 |
| | | | | | | | | | | | | | | | |
| | | Number of
Individual Shareholder
and/or
Affiliated
Omnibus
Accounts | | | % of the Fund | | | Number of
Individual Shareholder
and/or
Non-Affiliated
Omnibus
Accounts | | | % of the Fund | |
U.S. Large Cap Core Plus Fund | | | 1 | | | | 26.6 | % | | | 1 | | | | 14.3 | % |
U.S. Research Enhanced Equity Fund | | | — | | | | — | | | | 1 | | | | 15.7 | |
U.S. Sustainable Leaders Fund | | | — | | | | — | | | | 4 | | | | 63.6 | |
U.S. Value Fund | | | — | | | | — | | | | 1 | | | | 20.5 | |
As of December 31, 2021, J.P. Morgan Investor Funds and JPMorgan SmartRetirement Funds which are affiliated funds of funds, each owned in the aggregate, shares representing more than 10% of the net assets of the Funds as follows:
| | | | | | | | |
| | | J.P. Morgan
Investor Funds | | | JPMorgan
SmartRetirement
Funds | |
Large Cap Value Fund | | | 31.3 | % | | | n/a | |
U.S. Equity Fund | | | n/a | | | | 19.6 | % |
U.S. GARP Equity Fund | | | 55.0 | | | | n/a | |
U.S. Research Enhanced Equity Fund | | | 18.2 | | | | 34.2 | |
Significant shareholder transactions by these shareholders may impact the Funds’ performance and liquidity.
Equity Premium Income Fund’s investments in ELNs entail varying degrees of risks. The Fund is subject to loss of their full principal amount. In addition, the ELNs are subject to a stated maximum return which may limit the payment at maturity. The Fund may also be exposed to additional risks associated with structured notes including: counterparty credit risk related to the issuer’s ability to make payment at maturity; liquidity risk related to a lack of liquid market for these notes, preventing the Fund from trading or selling the notes easily; and a greater degree of market risk than other types of debt securities because the investor bears the risk associated with the underlying financial instruments.
LIBOR is intended to represent the rate at which contributing banks may obtain short-term borrowings from each other in the London interbank market. On March 5, 2021, the U.K. Financial Conduct Authority (“FCA”) publicly announced that (i) immediately after December 31, 2021, publication of the 1-week and 2-month U.S. Dollar LIBOR settings will permanently cease; (ii) immediately after June 30, 2023, publication of the overnight and 12-month U.S. Dollar LIBOR settings will permanently cease; and (iii) immediately after June 30, 2023, the 1-month, 3-month and 6-month U.S. Dollar LIBOR settings will cease to be provided or, subject to the FCA’s consideration of the case, be provided on a synthetic basis and no longer be representative of the underlying market and economic reality they are intended to measure and that representativeness will not be restored. There is no assurance that the dates announced by the FCA will not change or that the administrator of LIBOR and/or regulators will not take further action that could impact the availability, composition or characteristics of LIBOR or the currencies and/or tenors for which LIBOR is published. Public and private sector industry initiatives are currently underway to implement new or alternative reference rates to be used in place of LIBOR. There is no assurance that any such alternative reference rate will be similar to or produce the same value or economic equivalence as LIBOR or that it will have the same volume or liquidity as did LIBOR prior to its discontinuance or unavailability, which may affect the value or liquidity or return on certain of a Fund’s loans, notes, derivatives and other instruments or investments comprising some or all of a Fund’s investments and result in costs incurred in connection with closing out positions and entering into new trades. These risks may also apply with respect to changes in connection with other interbank offering rates (e.g., Euribor) and a wide range of other index levels, rates and values that are treated as “benchmarks” and are the subject of recent regulatory reform.
The Funds are subject to infectious disease epidemics/pandemics risk. The worldwide outbreak of COVID-19, a novel coronavirus disease, has negatively affected economies, markets and individual companies throughout the world. The effects of this COVID-19 pandemic to public health, and business and market conditions, including exchange trading suspensions and closures may continue to have a significant negative impact on the performance of a Fund’s investments, increase a Fund’s volatility, exacerbate other pre-existing political, social and economic risks to the Funds and negatively impact broad segments of businesses and populations. The Funds’ operations may be interrupted as a result, which may have a significant negative impact on investment performance. In addition, governments, their regulatory agencies, or self-regulatory organizations may take actions in response to the pandemic that affect the instruments in which the Funds invest, or the issuers of such instruments, in ways that could also have a significant negative impact on a Fund’s investment performance. The full impact of this COVID-19 pandemic, or other future epidemics/pandemics, is currently unknown.
| | | | | | | | | | |
| | | | | |
| DECEMBER 31, 2021 | | J.P. MORGAN LARGE CAP FUNDS | | | | | | | | 171 |
SCHEDULE OF SHAREHOLDER EXPENSES
(Unaudited)
Hypothetical $1,000 Investment
As a shareholder of the Funds, you incur two types of costs: (1) transaction costs, including sales charges (loads) on purchase payments and (2) ongoing costs, including investment advisory fees, administration fees, distribution fees and other Fund expenses. The examples below are intended to help you understand your ongoing costs (in dollars) of investing in the Funds and to compare these ongoing costs with the ongoing costs of investing in other mutual funds. The examples assume that you had a $1,000 investment in each Class at the beginning of the reporting period, July 1, 2021, and continued to hold your shares at the end of the reporting period, December 31, 2021.
Actual Expenses
For each Class of each Fund in the table below, the first line provides information about actual account values and actual expenses. You may use the information in this line, together with the amount you invested, to estimate the expenses that you paid over the period. Simply divide your account value by $1,000 (for example, an $8,600 account value divided by $1,000 = 8.6), then multiply the result by the number in the first line of each Class under the heading titled “Expenses Paid During the Period” to estimate the expenses you paid on your account during this period.
Hypothetical Example for Comparison Purposes
The second line of each Class in the table below provides information about hypothetical account values and hypothetical expenses based on the Class’ actual expense ratio and an assumed rate of return of 5% per year before expenses, which is not the Class’ actual return. The hypothetical account values and expenses may not be used to estimate the actual ending account balance or expenses you paid for the period. You may use this information to compare the ongoing costs of investing in the Class of the Funds and other funds. To do so, compare this 5% hypothetical example with the 5% hypothetical examples that appear in the shareholder reports of the other funds. Please note that the expenses shown in the table are meant to highlight your ongoing costs only and do not reflect any transaction costs, such as sales charges (loads) or redemption fees. Therefore, the second line for each Class in the table is useful in comparing ongoing costs only, and will not help you determine the relative total costs of owning different funds. In addition, if these transaction costs were included, your costs would have been higher. The examples also assume all dividends and distributions have been reinvested.
| | | | | | | | | | | | | | | | |
| | | Beginning Account Value
July 1, 2021 | | | Ending
Account Value
December 31, 2021 | | | Expenses
Paid During
the Period* | | | Annualized
Expense
Ratio | |
JPMorgan Equity Focus Fund | | | | | | | | | | | | | | | | |
Class A | | | | | | | | | | | | | | | | |
Actual | | $ | 1,000.00 | | | $ | 1,086.40 | | | $ | 5.78 | | | | 1.10 | % |
Hypothetical | | | 1,000.00 | | | | 1,019.66 | | | | 5.60 | | | | 1.10 | |
Class C | | | | | | | | | | | | | | | | |
Actual | | | 1,000.00 | | | | 1,083.40 | | | | 8.40 | | | | 1.60 | |
Hypothetical | | | 1,000.00 | | | | 1,017.14 | | | | 8.13 | | | | 1.60 | |
Class I | | | | | | | | | | | | | | | | |
Actual | | | 1,000.00 | | | | 1,087.70 | | | | 4.47 | | | | 0.85 | |
Hypothetical | | | 1,000.00 | | | | 1,020.92 | | | | 4.33 | | | | 0.85 | |
Class R6 | | | | | | | | | | | | | | | | |
Actual | | | 1,000.00 | | | | 1,089.10 | | | | 3.16 | | | | 0.60 | |
Hypothetical | | | 1,000.00 | | | | 1,022.18 | | | | 3.06 | | | | 0.60 | |
| | | | |
JPMorgan Equity Income Fund | | | | | | | | | | | | | | | | |
Class A | | | | | | | | | | | | | | | | |
Actual | | | 1,000.00 | | | | 1,075.50 | | | | 4.97 | | | | 0.95 | |
Hypothetical | | | 1,000.00 | | | | 1,020.42 | | | | 4.84 | | | | 0.95 | |
Class C | | | | | | | | | | | | | | | | |
Actual | | | 1,000.00 | | | | 1,072.10 | | | | 7.57 | | | | 1.45 | |
Hypothetical | | | 1,000.00 | | | | 1,017.90 | | | | 7.38 | | | | 1.45 | |
Class I | | | | | | | | | | | | | | | | |
Actual | | | 1,000.00 | | | | 1,076.70 | | | | 3.66 | | | | 0.70 | |
Hypothetical | | | 1,000.00 | | | | 1,021.68 | | | | 3.57 | | | | 0.70 | |
Class R2 | | | | | | | | | | | | | | | | |
Actual | | | 1,000.00 | | | | 1,073.50 | | | | 6.32 | | | | 1.21 | |
Hypothetical | | | 1,000.00 | | | | 1,019.11 | | | | 6.16 | | | | 1.21 | |
Class R3 | | | | | | | | | | | | | | | | |
Actual | | | 1,000.00 | | | | 1,075.50 | | | | 4.97 | | | | 0.95 | |
Hypothetical | | | 1,000.00 | | | | 1,020.42 | | | | 4.84 | | | | 0.95 | |
| | | | | | | | | | |
| | | | | |
| 172 | | | | | | | | J.P. MORGAN LARGE CAP FUNDS | | DECEMBER 31, 2021 |
| | | | | | | | | | | | | | | | |
| | | Beginning Account Value
July 1, 2021 | | | Ending
Account Value
December 31, 2021 | | | Expenses
Paid During
the Period* | | | Annualized
Expense
Ratio | |
JPMorgan Equity Income Fund (continued) | | | | | | | | | | | | | | | | |
Class R4 | | | | | | | | | | | | | | | | |
Actual | | $ | 1,000.00 | | | $ | 1,076.30 | | | $ | 3.66 | | | | 0.70 | % |
Hypothetical | | | 1,000.00 | | | | 1,021.68 | | | | 3.57 | | | | 0.70 | |
Class R5 | | | | | | | | | | | | | | | | |
Actual | | | 1,000.00 | | | | 1,077.40 | | | | 2.88 | | | | 0.55 | |
Hypothetical | | | 1,000.00 | | | | 1,022.43 | | | | 2.80 | | | | 0.55 | |
Class R6 | | | | | | | | | | | | | | | | |
Actual | | | 1,000.00 | | | | 1,078.10 | | | | 2.36 | | | | 0.45 | |
Hypothetical | | | 1,000.00 | | | | 1,022.94 | | | | 2.29 | | | | 0.45 | |
| | | | |
JPMorgan Equity Premium Income Fund | | | | | | | | | | | | | | | | |
Class A | | | | | | | | | | | | | | | | |
Actual | | | 1,000.00 | | | | 1,086.00 | | | | 4.47 | | | | 0.85 | |
Hypothetical | | | 1,000.00 | | | | 1,020.92 | | | | 4.33 | | | | 0.85 | |
Class C | | | | | | | | | | | | | | | | |
Actual | | | 1,000.00 | | | | 1,083.30 | | | | 7.09 | | | | 1.35 | |
Hypothetical | | | 1,000.00 | | | | 1,018.40 | | | | 6.87 | | | | 1.35 | |
Class I | | | | | | | | | | | | | | | | |
Actual | | | 1,000.00 | | | | 1,087.40 | | | | 3.16 | | | | 0.60 | |
Hypothetical | | | 1,000.00 | | | | 1,022.18 | | | | 3.06 | | | | 0.60 | |
Class R5 | | | | | | | | | | | | | | | | |
Actual | | | 1,000.00 | | | | 1,088.20 | | | | 2.37 | | | | 0.45 | |
Hypothetical | | | 1,000.00 | | | | 1,022.94 | | | | 2.29 | | | | 0.45 | |
Class R6 | | | | | | | | | | | | | | | | |
Actual | | | 1,000.00 | | | | 1,088.70 | | | | 1.84 | | | | 0.35 | |
Hypothetical | | | 1,000.00 | | | | 1,023.44 | | | | 1.79 | | | | 0.35 | |
| | | | |
JPMorgan Hedged Equity Fund | | | | | | | | | | | | | | | | |
Class A | | | | | | | | | | | | | | | | |
Actual | | | 1,000.00 | | | | 1,040.80 | | | | 4.27 | | | | 0.83 | |
Hypothetical | | | 1,000.00 | | | | 1,021.02 | | | | 4.23 | | | | 0.83 | |
Class C | | | | | | | | | | | | | | | | |
Actual | | | 1,000.00 | | | | 1,038.20 | | | | 6.83 | | | | 1.33 | |
Hypothetical | | | 1,000.00 | | | | 1,018.50 | | | | 6.77 | | | | 1.33 | |
Class I | | | | | | | | | | | | | | | | |
Actual | | | 1,000.00 | | | | 1,042.00 | | | | 2.99 | | | | 0.58 | |
Hypothetical | | | 1,000.00 | | | | 1,022.28 | | | | 2.96 | | | | 0.58 | |
Class R5 | | | | | | | | | | | | | | | | |
Actual | | | 1,000.00 | | | | 1,043.10 | | | | 2.21 | | | | 0.43 | |
Hypothetical | | | 1,000.00 | | | | 1,023.04 | | | | 2.19 | | | | 0.43 | |
Class R6 | | | | | | | | | | | | | | | | |
Actual | | | 1,000.00 | | | | 1,043.20 | | | | 1.70 | | | | 0.33 | |
Hypothetical | | | 1,000.00 | | | | 1,023.54 | | | | 1.68 | | | | 0.33 | |
| | | | |
JPMorgan Hedged Equity 2 Fund | | | | | | | | | | | | | | | | |
Class A | | | | | | | | | | | | | | | | |
Actual | | | 1,000.00 | | | | 1,071.30 | | | | 4.44 | | | | 0.85 | |
Hypothetical | | | 1,000.00 | | | | 1,020.92 | | | | 4.33 | | | | 0.85 | |
Class C | | | | | | | | | | | | | | | | |
Actual | | | 1,000.00 | | | | 1,069.20 | | | | 7.04 | | | | 1.35 | |
Hypothetical | | | 1,000.00 | | | | 1,018.40 | | | | 6.87 | | | | 1.35 | |
Class I | | | | | | | | | | | | | | | | |
Actual | | | 1,000.00 | | | | 1,072.90 | | | | 3.13 | | | | 0.60 | |
Hypothetical | | | 1,000.00 | | | | 1,022.18 | | | | 3.06 | | | | 0.60 | |
| | | | | | | | | | |
| | | | | |
| DECEMBER 31, 2021 | | J.P. MORGAN LARGE CAP FUNDS | | | | | | | | 173 |
SCHEDULE OF SHAREHOLDER EXPENSES
(Unaudited) (continued)
Hypothetical $1,000 Investment
| | | | | | | | | | | | | | | | |
| | | Beginning Account Value
July 1, 2021 | | | Ending
Account Value
December 31, 2021 | | | Expenses
Paid During
the Period* | | | Annualized
Expense
Ratio | |
JPMorgan Hedged Equity 2 Fund (continued) | | | | | | | | | | | | | | | | |
Class R5 | | | | | | | | | | | | | | | | |
Actual | | $ | 1,000.00 | | | $ | 1,074.10 | | | $ | 2.35 | | | | 0.45 | % |
Hypothetical | | | 1,000.00 | | | | 1,022.94 | | | | 2.29 | | | | 0.45 | |
Class R6 | | | | | | | | | | | | | | | | |
Actual | | | 1,000.00 | | | | 1,074.60 | | | | 1.83 | | | | 0.35 | |
Hypothetical | | | 1,000.00 | | | | 1,023.44 | | | | 1.79 | | | | 0.35 | |
| | | | |
JPMorgan Hedged Equity 3 Fund | | | | | | | | | | | | | | | | |
Class A | | | | | | | | | | | | | | | | |
Actual | | | 1,000.00 | | | | 1,059.70 | | | | 4.41 | | | | 0.85 | |
Hypothetical | | | 1,000.00 | | | | 1,020.92 | | | | 4.33 | | | | 0.85 | |
Class C | | | | | | | | | | | | | | | | |
Actual | | | 1,000.00 | | | | 1,056.80 | | | | 7.00 | | | | 1.35 | |
Hypothetical | | | 1,000.00 | | | | 1,018.40 | | | | 6.87 | | | | 1.35 | |
Class I | | | | | | | | | | | | | | | | |
Actual | | | 1,000.00 | | | | 1,061.20 | | | | 3.12 | | | | 0.60 | |
Hypothetical | | | 1,000.00 | | | | 1,022.18 | | | | 3.06 | | | | 0.60 | |
Class R5 | | | | | | | | | | | | | | | | |
Actual | | | 1,000.00 | | | | 1,062.30 | | | | 2.34 | | | | 0.45 | |
Hypothetical | | | 1,000.00 | | | | 1,022.94 | | | | 2.29 | | | | 0.45 | |
Class R6 | | | | | | | | | | | | | | | | |
Actual | | | 1,000.00 | | | | 1,062.90 | | | | 1.82 | | | | 0.35 | |
Hypothetical | | | 1,000.00 | | | | 1,023.44 | | | | 1.79 | | | | 0.35 | |
| | | | |
JPMorgan Large Cap Growth Fund | | | | | | | | | | | | | | | | |
Class A | | | | | | | | | | | | | | | | |
Actual | | | 1,000.00 | | | | 1,085.20 | | | | 4.94 | | | | 0.94 | |
Hypothetical | | | 1,000.00 | | | | 1,020.47 | | | | 4.79 | | | | 0.94 | |
Class C | | | | | | | | | | | | | | | | |
Actual | | | 1,000.00 | | | | 1,082.40 | | | | 7.56 | | | | 1.44 | |
Hypothetical | | | 1,000.00 | | | | 1,017.95 | | | | 7.32 | | | | 1.44 | |
Class I | | | | | | | | | | | | | | | | |
Actual | | | 1,000.00 | | | | 1,086.50 | | | | 3.63 | | | | 0.69 | |
Hypothetical | | | 1,000.00 | | | | 1,021.73 | | | | 3.52 | | | | 0.69 | |
Class R2 | | | | | | | | | | | | | | | | |
Actual | | | 1,000.00 | | | | 1,083.90 | | | | 6.25 | | | | 1.19 | |
Hypothetical | �� | | 1,000.00 | | | | 1,019.21 | | | | 6.06 | | | | 1.19 | |
Class R3 | | | | | | | | | | | | | | | | |
Actual | | | 1,000.00 | | | | 1,085.10 | | | | 4.94 | | | | 0.94 | |
Hypothetical | | | 1,000.00 | | | | 1,020.47 | | | | 4.79 | | | | 0.94 | |
Class R4 | | | | | | | | | | | | | | | | |
Actual | | | 1,000.00 | | | | 1,086.50 | | | | 3.63 | | | | 0.69 | |
Hypothetical | | | 1,000.00 | | | | 1,021.73 | | | | 3.52 | | | | 0.69 | |
Class R5 | | | | | | | | | | | | | | | | |
Actual | | | 1,000.00 | | | | 1,087.50 | | | | 2.84 | | | | 0.54 | |
Hypothetical | | | 1,000.00 | | | | 1,022.48 | | | | 2.75 | | | | 0.54 | |
Class R6 | | | | | | | | | | | | | | | | |
Actual | | | 1,000.00 | | | | 1,087.90 | | | | 2.32 | | | | 0.44 | |
Hypothetical | | | 1,000.00 | | | | 1,022.99 | | | | 2.24 | | | | 0.44 | |
| | | | |
JPMorgan Large Cap Value Fund | | | | | | | | | | | | | | | | |
Class A | | | | | | | | | | | | | | | | |
Actual | | | 1,000.00 | | | | 1,018.80 | | | | 4.73 | | | | 0.93 | |
Hypothetical | | | 1,000.00 | | | | 1,020.52 | | | | 4.74 | | | | 0.93 | |
| | | | | | | | | | |
| | | | | |
| 174 | | | | | | | | J.P. MORGAN LARGE CAP FUNDS | | DECEMBER 31, 2021 |
| | | | | | | | | | | | | | | | |
| | | Beginning Account Value
July 1, 2021 | | | Ending
Account Value
December 31, 2021 | | | Expenses
Paid During
the Period* | | | Annualized
Expense
Ratio | |
JPMorgan Large Cap Value Fund (continued) | | | | | | | | | | | | | | | | |
Class C | | | | | | | | | | | | | | | | |
Actual | | $ | 1,000.00 | | | $ | 1,016.20 | | | $ | 7.32 | | | | 1.44 | % |
Hypothetical | | | 1,000.00 | | | | 1,017.95 | | | | 7.32 | | | | 1.44 | |
Class I | | | | | | | | | | | | | | | | |
Actual | | | 1,000.00 | | | | 1,019.40 | | | | 3.51 | | | | 0.69 | |
Hypothetical | | | 1,000.00 | | | | 1,021.73 | | | | 3.52 | | | | 0.69 | |
Class R2 | | | | | | | | | | | | | | | | |
Actual | | | 1,000.00 | | | | 1,016.80 | | | | 6.05 | | | | 1.19 | |
Hypothetical | | | 1,000.00 | | | | 1,019.21 | | | | 6.06 | | | | 1.19 | |
Class R3 | | | | | | | | | | | | | | | | |
Actual | | | 1,000.00 | | | | 1,018.60 | | | | 4.78 | | | | 0.94 | |
Hypothetical | | | 1,000.00 | | | | 1,020.47 | | | | 4.79 | | | | 0.94 | |
Class R4 | | | | | | | | | | | | | | | | |
Actual | | | 1,000.00 | | | | 1,020.20 | | | | 3.51 | | | | 0.69 | |
Hypothetical | | | 1,000.00 | | | | 1,021.73 | | | | 3.52 | | | | 0.69 | |
Class R5 | | | | | | | | | | | | | | | | |
Actual | | | 1,000.00 | | | | 1,020.40 | | | | 2.75 | | | | 0.54 | |
Hypothetical | | | 1,000.00 | | | | 1,022.48 | | | | 2.75 | | | | 0.54 | |
Class R6 | | | | | | | | | | | | | | | | |
Actual | | | 1,000.00 | | | | 1,020.60 | | | | 2.24 | | | | 0.44 | |
Hypothetical | | | 1,000.00 | | | | 1,022.99 | | | | 2.24 | | | | 0.44 | |
| | | | |
JPMorgan U.S. Applied Data Science Value Fund
(formerly known as JPMorgan Intrepid Value Fund) | | | | | | | | | | | | | | | | |
Class A | | | | | | | | | | | | | | | | |
Actual | | | 1,000.00 | | | | 1,084.30 | | | | 3.84 | | | | 0.73 | |
Hypothetical | | | 1,000.00 | | | | 1,021.53 | | | | 3.72 | | | | 0.73 | |
Class C | | | | | | | | | | | | | | | | |
Actual | | | 1,000.00 | | | | 1,081.20 | | | | 6.45 | | | | 1.23 | |
Hypothetical | | | 1,000.00 | | | | 1,019.00 | | | | 6.26 | | | | 1.23 | |
Class I | | | | | | | | | | | | | | | | |
Actual | | | 1,000.00 | | | | 1,085.50 | | | | 2.58 | | | | 0.49 | |
Hypothetical | | | 1,000.00 | | | | 1,022.74 | | | | 2.50 | | | | 0.49 | |
Class R2 | | | | | | | | | | | | | | | | |
Actual | | | 1,000.00 | | | | 1,082.30 | | | | 5.72 | | | | 1.09 | |
Hypothetical | | | 1,000.00 | | | | 1,019.71 | | | | 5.55 | | | | 1.09 | |
Class R5 | | | | | | | | | | | | | | | | |
Actual | | | 1,000.00 | | | | 1,085.90 | | | | 2.31 | | | | 0.44 | |
Hypothetical | | | 1,000.00 | | | | 1,022.99 | | | | 2.24 | | | | 0.44 | |
Class R6 | | | | | | | | | | | | | | | | |
Actual | | | 1,000.00 | | | | 1,086.30 | | | | 1.79 | | | | 0.34 | |
Hypothetical | | | 1,000.00 | | | | 1,023.49 | | | | 1.73 | | | | 0.34 | |
| | | | |
JPMorgan U.S. Equity Fund | | | | | | | | | | | | | | | | |
Class A | | | | | | | | | | | | | | | | |
Actual | | | 1,000.00 | | | | 1,128.40 | | | | 5.04 | | | | 0.94 | |
Hypothetical | | | 1,000.00 | | | | 1,020.47 | | | | 4.79 | | | | 0.94 | |
Class C | | | | | | | | | | | | | | | | |
Actual | | | 1,000.00 | | | | 1,125.80 | | | | 7.72 | | | | 1.44 | |
Hypothetical | | | 1,000.00 | | | | 1,017.95 | | | | 7.32 | | | | 1.44 | |
Class I | | | | | | | | | | | | | | | | |
Actual | | | 1,000.00 | | | | 1,129.80 | | | | 3.70 | | | | 0.69 | |
Hypothetical | | | 1,000.00 | | | | 1,021.73 | | | | 3.52 | | | | 0.69 | |
Class L | | | | | | | | | | | | | | | | |
Actual | | | 1,000.00 | | | | 1,130.80 | | | | 2.90 | | | | 0.54 | |
Hypothetical | | | 1,000.00 | | | | 1,022.48 | | | | 2.75 | | | | 0.54 | |
| | | | | | | | | | |
| | | | | |
| DECEMBER 31, 2021 | | J.P. MORGAN LARGE CAP FUNDS | | | | | | | | 175 |
SCHEDULE OF SHAREHOLDER EXPENSES
(Unaudited) (continued)
Hypothetical $1,000 Investment
| | | | | | | | | | | | | | | | |
| | | Beginning Account Value
July 1, 2021 | | | Ending
Account Value
December 31, 2021 | | | Expenses
Paid During
the Period* | | | Annualized
Expense
Ratio | |
JPMorgan U.S. Equity Fund (continued) | | | | | | | | | | | | | | | | |
Class R2 | | | | | | | | | | | | | | | | |
Actual | | $ | 1,000.00 | | | $ | 1,126.80 | | | $ | 6.38 | | | | 1.19 | % |
Hypothetical | | | 1,000.00 | | | | 1,019.21 | | | | 6.06 | | | | 1.19 | |
Class R3 | | | | | | | | | | | | | | | | |
Actual | | | 1,000.00 | | | | 1,128.00 | | | | 5.04 | | | | 0.94 | |
Hypothetical | | | 1,000.00 | | | | 1,020.47 | | | | 4.79 | | | | 0.94 | |
Class R4 | | | | | | | | | | | | | | | | |
Actual | | | 1,000.00 | | | | 1,130.00 | | | | 3.70 | | | | 0.69 | |
Hypothetical | | | 1,000.00 | | | | 1,021.73 | | | | 3.52 | | | | 0.69 | |
Class R5 | | | | | | | | | | | | | | | | |
Actual | | | 1,000.00 | | | | 1,130.70 | | | | 2.90 | | | | 0.54 | |
Hypothetical | | | 1,000.00 | | | | 1,022.48 | | | | 2.75 | | | | 0.54 | |
Class R6 | | | | | | | | | | | | | | | | |
Actual | | | 1,000.00 | | | | 1,131.50 | | | | 2.36 | | | | 0.44 | |
Hypothetical | | | 1,000.00 | | | | 1,022.99 | | | | 2.24 | | | | 0.44 | |
| | | | |
JPMorgan U.S. GARP Equity Fund | | | | | | | | | | | | | | | | |
Class A | | | | | | | | | | | | | | | | |
Actual | | | 1,000.00 | | | | 1,130.00 | | | | 4.51 | | | | 0.84 | |
Hypothetical | | | 1,000.00 | | | | 1,020.97 | | | | 4.28 | | | | 0.84 | |
Class C | | | | | | | | | | | | | | | | |
Actual | | | 1,000.00 | | | | 1,127.00 | | | | 7.18 | | | | 1.34 | |
Hypothetical | | | 1,000.00 | | | | 1,018.45 | | | | 6.82 | | | | 1.34 | |
Class I | | | | | | | | | | | | | | | | |
Actual | | | 1,000.00 | | | | 1,131.40 | | | | 3.17 | | | | 0.59 | |
Hypothetical | | | 1,000.00 | | | | 1,022.23 | | | | 3.01 | | | | 0.59 | |
Class R2 | | | | | | | | | | | | | | | | |
Actual | | | 1,000.00 | | | | 1,128.50 | | | | 5.85 | | | | 1.09 | |
Hypothetical | | | 1,000.00 | | | | 1,019.71 | | | | 5.55 | | | | 1.09 | |
Class R5 | | | | | | | | | | | | | | | | |
Actual | | | 1,000.00 | | | | 1,132.40 | | | | 2.36 | | | | 0.44 | |
Hypothetical | | | 1,000.00 | | | | 1,022.99 | | | | 2.24 | | | | 0.44 | |
Class R6 | | | | | | | | | | | | | | | | |
Actual | | | 1,000.00 | | | | 1,132.90 | | | | 1.83 | | | | 0.34 | |
Hypothetical | | | 1,000.00 | | | | 1,023.49 | | | | 1.73 | | | | 0.34 | |
| | | | |
JPMorgan U.S. Large Cap Core Plus Fund | | | | | | | | | | | | | | | | |
Class A | | | | | | | | | | | | | | | | |
Actual | | | 1,000.00 | | | | 1,125.20 | | | | 10.02 | | | | 1.87 | |
Hypothetical | | | 1,000.00 | | | | 1,015.78 | | | | 9.50 | | | | 1.87 | |
Class C | | | | | | | | | | | | | | | | |
Actual | | | 1,000.00 | | | | 1,122.80 | | | | 12.63 | | | | 2.36 | |
Hypothetical | | | 1,000.00 | | | | 1,013.31 | | | | 11.98 | | | | 2.36 | |
Class I | | | | | | | | | | | | | | | | |
Actual | | | 1,000.00 | | | | 1,126.80 | | | | 8.68 | | | | 1.62 | |
Hypothetical | | | 1,000.00 | | | | 1,017.04 | | | | 8.24 | | | | 1.62 | |
Class R2 | | | | | | | | | | | | | | | | |
Actual | | | 1,000.00 | | | | 1,123.50 | | | | 11.83 | | | | 2.21 | |
Hypothetical | | | 1,000.00 | | | | 1,014.06 | | | | 11.22 | | | | 2.21 | |
Class R5 | | | | | | | | | | | | | | | | |
Actual | | | 1,000.00 | | | | 1,127.20 | | | | 8.36 | | | | 1.56 | |
Hypothetical | | | 1,000.00 | | | | 1,017.34 | | | | 7.93 | | | | 1.56 | |
Class R6 | | | | | | | | | | | | | | | | |
Actual | | | 1,000.00 | | | | 1,127.70 | | | | 7.83 | | | | 1.46 | |
Hypothetical | | | 1,000.00 | | | | 1,017.85 | | | | 7.43 | | | | 1.46 | |
| | | | | | | | | | |
| | | | | |
| 176 | | | | | | | | J.P. MORGAN LARGE CAP FUNDS | | DECEMBER 31, 2021 |
| | | | | | | | | | | | | | | | |
| | | Beginning Account Value
July 1, 2021 | | | Ending
Account Value
December 31, 2021 | | | Expenses
Paid During
the Period* | | | Annualized
Expense
Ratio | |
JPMorgan U.S. Research Enhanced Equity Fund | | | | | | | | | | | | | | | | |
Class A | | | | | | | | | | | | | | | | |
Actual | | $ | 1,000.00 | | | $ | 1,120.00 | | | $ | 3.21 | | | | 0.60 | % |
Hypothetical | | | 1,000.00 | | | | 1,022.18 | | | | 3.06 | | | | 0.60 | |
Class I | | | | | | | | | | | | | | | | |
Actual | | | 1,000.00 | | | | 1,121.10 | | | | 1.87 | | | | 0.35 | |
Hypothetical | | | 1,000.00 | | | | 1,023.44 | | | | 1.79 | | | | 0.35 | |
Class R6 | | | | | | | | | | | | | | | | |
Actual | | | 1,000.00 | | | | 1,121.50 | | | | 1.34 | | | | 0.25 | |
Hypothetical | | | 1,000.00 | | | | 1,023.95 | | | | 1.28 | | | | 0.25 | |
| | | | |
JPMorgan U.S. Sustainable Leaders Fund | | | | | | | | | | | | | | | | |
Class A | | | | | | | | | | | | | | | | |
Actual | | | 1,000.00 | | | | 1,120.00 | | | | 3.42 | | | | 0.64 | |
Hypothetical | | | 1,000.00 | | | | 1,021.98 | | | | 3.26 | | | | 0.64 | |
Class C | | | | | | | | | | | | | | | | |
Actual | | | 1,000.00 | | | | 1,117.00 | | | | 6.08 | | | | 1.14 | |
Hypothetical | | | 1,000.00 | | | | 1,019.46 | | | | 5.80 | | | | 1.14 | |
Class I | | | | | | | | | | | | | | | | |
Actual | | | 1,000.00 | | | | 1,121.30 | | | | 2.09 | | | | 0.39 | |
Hypothetical | | | 1,000.00 | | | | 1,023.24 | | | | 1.99 | | | | 0.39 | |
Class R6 | | | | | | | | | | | | | | | | |
Actual | | | 1,000.00 | | | | 1,121.70 | | | | 1.82 | | | | 0.34 | |
Hypothetical | | | 1,000.00 | | | | 1,023.49 | | | | 1.73 | | | | 0.34 | |
| | | | |
JPMorgan U.S. Value Fund | | | | | | | | | | | | | | | | |
Class A | | | | | | | | | | | | | | | | |
Actual | | | 1,000.00 | | | | 1,068.40 | | | | 4.90 | | | | 0.94 | |
Hypothetical | | | 1,000.00 | | | | 1,020.47 | | | | 4.79 | | | | 0.94 | |
Class C | | | | | | | | | | | | | | | | |
Actual | | | 1,000.00 | | | | 1,065.70 | | | | 7.50 | | | | 1.44 | |
Hypothetical | | | 1,000.00 | | | | 1,017.95 | | | | 7.32 | | | | 1.44 | |
Class I | | | | | | | | | | | | | | | | |
Actual | | | 1,000.00 | | | | 1,069.80 | | | | 3.60 | | | | 0.69 | |
Hypothetical | | | 1,000.00 | | | | 1,021.73 | | | | 3.52 | | | | 0.69 | |
Class R2 | | | | | | | | | | | | | | | | |
Actual | | | 1,000.00 | | | | 1,066.90 | | | | 6.20 | | | | 1.19 | |
Hypothetical | | | 1,000.00 | | | | 1,019.21 | | | | 6.06 | | | | 1.19 | |
Class R3 | | | | | | | | | | | | | | | | |
Actual | | | 1,000.00 | | | | 1,068.30 | | | | 4.90 | | | | 0.94 | |
Hypothetical | | | 1,000.00 | | | | 1,020.47 | | | | 4.79 | | | | 0.94 | |
Class R4 | | | | | | | | | | | | | | | | |
Actual | | | 1,000.00 | | | | 1,069.70 | | | | 3.60 | | | | 0.69 | |
Hypothetical | | | 1,000.00 | | | | 1,021.73 | | | | 3.52 | | | | 0.69 | |
Class R5 | | | | | | | | | | | | | | | | |
Actual | | | 1,000.00 | | | | 1,070.40 | | | | 2.82 | | | | 0.54 | |
Hypothetical | | | 1,000.00 | | | | 1,022.48 | | | | 2.75 | | | | 0.54 | |
Class R6 | | | | | | | | | | | | | | | | |
Actual | | | 1,000.00 | | | | 1,071.10 | | | | 2.30 | | | | 0.44 | |
Hypothetical | | | 1,000.00 | | | | 1,022.99 | | | | 2.24 | | | | 0.44 | |
| * | Expenses are equal to each Class’ respective annualized expense ratio, multiplied by the average account value over the period, multiplied by 184/365 (to reflect the one-half year period). |
| | | | | | | | | | |
| | | | | |
| DECEMBER 31, 2021 | | J.P. MORGAN LARGE CAP FUNDS | | | | | | | | 177 |
BOARD APPROVAL OF INVESTMENT ADVISORY AGREEMENTS
(Unaudited)
J.P. Morgan Large Cap Funds — JPMorgan Equity Focus Fund, JPMorgan Equity Income Fund, JPMorgan Equity Premium Income Fund, JPMorgan Hedged Equity Fund, JPMorgan Large Cap Growth Fund, JPMorgan Large Cap Value Fund, JPMorgan U.S. Applied Data Science Value Fund (formerly known as JPMorgan Intrepid Value Fund), JPMorgan U.S. Equity Fund, JPMorgan U.S. GARP Equity Fund, JPMorgan U.S. Large Cap Core Plus Fund, JPMorgan U.S. Research Enhanced Equity Fund, JPMorgan U. S. Sustainable Leaders Fund and JPMorgan U.S. Value Fund
The Board of Trustees has established various standing committees composed of Trustees with diverse backgrounds, to which the Board of Trustees has assigned specific subject matter responsibilities to further enhance the effectiveness of the Board’s oversight and decision making. The Board of Trustees and its investment committees (money market and alternative products, equity, and fixed income) meet regularly throughout the year and consider factors that are relevant to their annual consideration of investment advisory agreements at each meeting. They also meet for the specific purpose of considering investment advisory agreement annual renewals. The Board of Trustees held meetings in June and August 2021, at which the Trustees considered the continuation of the investment advisory agreements for JPMorgan Equity Focus Fund, JPMorgan Equity Income Fund, JPMorgan Equity Premium Income Fund, JPMorgan Hedged Equity Fund, JPMorgan Large Cap Growth Fund, JPMorgan Large Cap Value Fund, JPMorgan U.S. Applied Data Science Value Fund (formerly known as JPMorgan Intrepid Value Fund), JPMorgan U.S. Equity Fund, JPMorgan U.S. GARP Equity Fund, JPMorgan U.S. Large Cap Core Plus Fund, JPMorgan U.S. Research Enhanced Equity Fund, JPMorgan U. S. Sustainable Leaders Fund and JPMorgan U.S. Value Fund, whose semi-annual report is contained herein (each an “Advisory Agreement” and collectively, the “Advisory Agreements”). In accordance with SEC guidance, due to the COVID-19 pandemic, the meetings were conducted through video conference. At the June meeting, the Board’s investment committees met to review and consider performance, expense and related information for the J.P. Morgan Funds. Each investment committee reported to the full Board, which then considered the investment committee’s preliminary findings. At the August meeting, the Trustees continued their review and consideration. The Trustees, including a majority of the Trustees who are not parties to an Advisory Agreement or “interested persons” (as defined in the 1940 Act) of any party to an Advisory Agreement or any of their affiliates, approved the continuation of each Advisory Agreement on August 11, 2021.
As part of their review of the Advisory Agreements, the Trustees considered and reviewed performance and other information about the Funds received from the Adviser. This information includes the Funds’ performance as compared to the performance of their peers and benchmarks and analyses by the Adviser of the Funds’ performance. In addition, at each
of their regular meetings throughout the year, the Trustees considered reports on the performance of certain J.P. Morgan Funds provided by an independent investment consulting firm (“independent consultant”). In addition, in preparation for the June and August meetings, the Trustees requested, received and evaluated extensive materials from the Adviser, including performance and expense information compiled by Broadridge, using data from Lipper Inc. and/or Morningstar Inc., independent providers of investment company data (together, “Broadridge”). The Trustees’ independent consultant also provided additional quantitative and statistical analyses of certain Funds, including risk and performance return assessment as compared to the Funds’ objectives, benchmarks, and peers. Before voting on the Advisory Agreements, the Trustees reviewed the Advisory Agreements with representatives of the Adviser, counsel to the Trusts and independent legal counsel and received a memorandum from independent legal counsel to the Trustees discussing the legal standards for their consideration of the Advisory Agreements. The Trustees also discussed the Advisory Agreements in executive sessions with independent legal counsel at which no representatives of the Adviser were present.
A summary of the material factors evaluated by the Trustees in determining whether to approve each Advisory Agreement is provided below. Each Trustee attributed different weights to the various factors, and no factor alone was considered determinative. The Trustees considered information provided with respect to the Funds throughout the year, including additional reporting and information provided in connection with the COVID-19 pandemic, as well as materials furnished specifically in connection with the annual review process. From year to year, the Trustees consider and place emphasis on relevant information in light of changing circumstances in market and economic conditions.
After considering and weighing the factors and information they had received, the Trustees found that the compensation to be received by the Adviser from each Fund under the applicable Advisory Agreement was fair and reasonable under the circumstances and determined that the continuance of each Advisory Agreement was in the best interests of each Fund and its shareholders.
Nature, Extent and Quality of Services Provided by the Adviser
The Trustees received and considered information regarding the nature, extent and quality of services provided to each Fund under the applicable Advisory Agreement. The Trustees took into account information furnished throughout the year at Trustee meetings, as well as the materials furnished specifically in connection with this annual review process. The Trustees considered the background and experience of the Adviser’s senior management, personnel changes, if any, and the expertise of, and the amount of attention given to each Fund
| | | | | | | | | | |
| | | | | |
| 178 | | | | | | | | J.P. MORGAN LARGE CAP FUNDS | | DECEMBER 31, 2021 |
by, investment personnel of the Adviser. In addition, the Trustees reviewed the qualifications, backgrounds and responsibilities of the portfolio management team primarily responsible for the day-to-day management of each Fund and the infrastructure supporting the team, including personnel changes, if any. In addition, the Board considered its discussions with the Adviser regarding the Adviser’s business continuity plan and steps the Adviser was taking to provide ongoing services to the Funds during the COVID-19 pandemic, and the Adviser’s success in continuing to provide services to the Funds and their shareholders throughout this period. The Trustees also considered information provided by the Adviser and JPMorgan Distribution Services, Inc. (“JPMDS”) about the structure and distribution strategy of each Fund. The Trustees reviewed information relating to the Adviser’s risk governance model and reports showing the Adviser’s compliance structure and ongoing compliance processes. The Trustees also considered quality of the quality of administration services provided by the Adviser in its role as administrator.
The Trustees also considered their knowledge of the nature and quality of services provided by the Adviser and its affiliates to the Funds gained from their experience as Trustees of the J.P. Morgan Funds. In addition, they considered the overall reputation and capabilities of the Adviser and its affiliates, the commitment of the Adviser to provide high quality service to the Funds, their overall confidence in the Adviser’s integrity and the Adviser’s responsiveness to questions or concerns raised by them, including the Adviser’s willingness to consider and implement organizational and operational changes designed to improve investment results and the services provided to each Fund.
Based upon these considerations and other factors, the Trustees concluded that they were satisfied with the nature, extent and quality of the investment advisory services provided to each Fund by the Adviser.
Costs of Services Provided and Profitability to the Adviser and its Affiliates
The Trustees received and considered information regarding the profitability to the Adviser and its affiliates in providing services to each Fund. The Trustees reviewed and discussed this information. The Trustees recognized that this information is not audited and represents the Adviser’s determination of its and its affiliates’ revenues from the contractual services provided to the Funds, less expenses of providing such services. Expenses include direct and indirect costs and are calculated using an allocation methodology developed by the Adviser. The Trustees also recognized that it is difficult to make comparisons of profitability from fund investment advisory contracts because comparative information is not generally publicly available and is affected by numerous factors, including the structure of the particular adviser, the types of funds it manages, its business mix,
numerous assumptions regarding allocations and the fact that publicly-traded fund managers’ operating profits and net income are net of distribution and marketing expenses. Based upon their review, and taking into consideration the factors noted above, the Trustees concluded that the profitability to the Adviser under each Advisory Agreement was not unreasonable in light of the services and benefits provided to each Fund.
The Trustees also considered that JPMDS, an affiliate of the Adviser, and the Adviser earn fees from the Funds for providing shareholder and administration services, respectively. These fees were shown separately in the profitability analysis presented to the Trustees. The Trustees also considered the payments of Rule 12b-1 fees to JPMDS, which also acts as the Funds’ distributor and that these fees are in turn generally paid to financial intermediaries that sell the Funds, including financial intermediaries that are affiliates of the Adviser (although they are retained by JPMDS in certain instances). The Trustees also considered the fees paid to JPMorgan Chase Bank, N.A. (“JPMCB”) for custody and fund accounting, and other related services.
Fall-Out Benefits
The Trustees reviewed information regarding potential “fall-out” or ancillary benefits received by the Adviser and its affiliates as a result of their relationship with the Funds. The Trustees considered that the J.P. Morgan Funds’ operating accounts are held at JPMCB, which, as a result, will receive float benefits for certain J.P. Morgan Funds, as applicable. The Trustees also noted that the Adviser supports a diverse set of products and services, which benefits the Adviser by allowing it to leverage its infrastructure to serve additional clients, including benefits that may be received by the Adviser and its affiliates in connection with the Funds’ potential investments in other funds advised by the Adviser. The Trustees also reviewed the Adviser’s allocation of fund brokerage for the J.P. Morgan Funds complex, including allocations to brokers who provide research to the Adviser, as well as the Adviser’s use of affiliates to provide other services and the benefits to such affiliates of doing so.
Economies of Scale
The Trustees considered the extent to which the Funds may benefit from economies of scale. The Trustees considered that there may not be a direct relationship between economies of scale realized by the Funds and those realized by the Adviser as assets increase. The Trustees considered the extent to which the Funds were priced to scale and whether it would be appropriate to add advisory fee breakpoints. The Trustees noted certain Funds with contractual expense limitations and fee waivers (“Fee Caps”) which allow a Fund’s shareholders to share potential economies of scale from a Fund’s inception, prior to reaching scale. The Trustees also noted that other Funds which had achieved scale as asset levels had increased,
| | | | | | | | | | |
| | | | | |
| DECEMBER 31, 2021 | | J.P. MORGAN LARGE CAP FUNDS | | | | | | | | 179 |
BOARD APPROVAL OF INVESTMENT ADVISORY AGREEMENTS
(Unaudited) (continued)
no longer had Fee Caps in place for some or all of their share classes, but shared economies of scale through lower average expenses. The Trustees noted that the fees remain satisfactory relative to peer funds. The Trustees considered the benefits to the Funds of the use of an affiliated distributor and custodian, including the ability to rely on existing infrastructure supporting distribution, custodial and transfer agent services and the ability to negotiate competitive fees for the Funds. The Trustees further considered the Adviser’s and JPMDS’s ongoing investments in their business in support of the Funds, including the Adviser’s and/or JPMDS’s investments in trading systems, technology (including improvements to the J.P. Morgan Funds’ website, and cybersecurity improvements), retention of key talent, and regulatory support enhancements. The Trustees concluded that the current fee structure for each Fund, including any Fee Caps the Adviser has in place that serve to limit the overall net expense ratios of each Fund at competitive levels, was reasonable. The Trustees concluded that, for Funds with Fee Caps in place for some or all of their share classes, the relevant Fund’s shareholders received the benefits of potential economies of scale through the Fee Caps and, for Funds that achieved scale and no longer had Fee Caps in place for some or all of their share classes, the relevant Fund’s shareholders benefited from lower average expenses resulting from increased assets. The Trustees also concluded that all Funds benefited from the Adviser’s reinvestment in its operations to serve the Funds and their shareholders. The Trustees noted that the Adviser’s reinvestment ensures sufficient resources in terms of personnel and infrastructure to support the Funds.
Independent Written Evaluation of the Funds’ Senior Officer
The Trustees noted that, upon their direction, the Senior Officer for the Equity Income Fund, Large Cap Growth Fund, Large Cap Value Fund and U.S. Equity Fund had prepared an independent written evaluation in order to assist the Trustees in determining the reasonableness of the proposed management fees. In determining whether to continue the Advisory Agreements, the Trustees considered the Senior Officer’s report.
Fees Relative to Adviser’s Other Clients
The Trustees received and considered information about the nature and extent of investment advisory services and fee rates offered to other clients of the Adviser, including institutional separate accounts, collective investment trusts, ETFs and/or funds sub-advised by the Adviser, for investment management styles substantially similar to that of each Fund. The Trustees considered the complexity of investment management for registered mutual funds relative to the Adviser’s other clients and noted differences, as applicable, in the fee structure and the regulatory, legal and other risks and responsibilities of providing services to the different clients. The Trustees considered that serving as an adviser to a registered mutual fund involves greater responsibilities and risks than acting as a sub-adviser
and observed that sub-advisory fees may be lower than those charged by the Adviser to each Fund. The Trustees also noted that the adviser, not the mutual fund, pays the sub-advisory fee and that many responsibilities related to the advisory function are retained by the primary adviser. The Trustees concluded that the fee rates charged to each Fund in comparison to those charged to the Adviser’s other clients were reasonable.
Investment Performance
The Trustees received and considered absolute and/or relative performance information for the Funds in a report prepared by Broadridge. The Trustees considered the total return performance information, which included the ranking of the Funds within a performance universe made up of funds with the same Broadridge investment classification and objective (the “Universe”), as well as a subset of funds within the Universe (the “Peer Group”), by total return for the applicable one-, three- and five-year periods. The Trustees reviewed a description of Broadridge’s methodology for selecting mutual funds in each Fund’s Universe and Peer Group and noted that Universe and Peer Group rankings were not calculated if the number of funds in the Universe and/or Peer Group did not meet a predetermined minimum. The Broadridge materials provided to the Trustees highlighted information with respect to certain representative classes to assist the Trustees in their review. As part of this review, the Trustees also reviewed each Fund’s performance against its benchmark and considered the performance information provided for the Funds at regular Board meetings by the Adviser and the Trustees’ independent consultant and also considered the special analysis prepared for certain Funds by the Trustees’ independent consultant. The special analysis includes a multi-factor quantitative scoring system for summarizing a Fund’s historical investment performance. The approach relies on multiple metrics, incorporates several time periods, adjusts for risk and considers how a fund’s customized peer group (as selected by the independent consultant) has performed. The Trustees also engaged with the Adviser to consider what steps might be taken to improve performance, as applicable. The Broadridge performance data noted by the Trustees as part of their review and the determinations made by the Trustees with respect to each Fund’s performance for certain representative classes are summarized below:
The Trustees noted that the Equity Focus Fund’s performance for Class A and Class I shares was in the first quintile based upon both the Peer Group and Universe, for each of the one-, three- and five-year periods ended December 31, 2020. The Trustees noted that the performance for Class R6 shares was in the first quintile based upon both the Peer Group and Universe for the one-year period ended December 31, 2020. The Trustees discussed the performance and investment strategy of the Fund with the Adviser and reviewed the performance analysis and evaluation prepared by the independent consultant. Based
| | | | | | | | | | |
| | | | | |
| 180 | | | | | | | | J.P. MORGAN LARGE CAP FUNDS | | DECEMBER 31, 2021 |
upon these discussions and various other factors, the Trustees concluded that the Fund’s performance was satisfactory.
The Trustees noted that the Equity Income Fund’s performance for Class A shares was in the third, second and second quintiles based upon the Peer Group, and in the third, first and first quintiles based upon the Universe, for the one-, three- and five-year periods ended December 31, 2020, respectively. The Trustees noted that the performance for Class I shares was in the third, third and second quintiles based upon the Peer Group, and in the second, first and first quintiles based upon the Universe, for the one-, three- and five-year periods ended December 31, 2020, respectively. The Trustees noted that the performance for Class R6 shares was in the third, second and third quintiles based upon the Peer Group, and in the second, first and first quintiles based upon the Universe, for the one-, three- and five-year periods ended December 31, 2020, respectively. The Trustees discussed the performance and investment strategy of the Fund with the Adviser and reviewed the performance analysis and evaluation prepared by the independent consultant. Based upon these discussions and various other factors, the Trustees concluded that the Fund’s performance was satisfactory.
The Trustees noted that the Equity Premium Income Fund’s performance for Class A and Class R6 shares was in the third quintile based upon both the Peer Group and Universe, for the one-year period ended December 31, 2020. The Trustees noted that the performance for Class I shares was in the third quintile based upon the Universe for the one-year period ended December 31, 2020. The Trustees discussed the performance and investment strategy of the Fund with the Advisor and reviewed the performance analysis and evaluation prepared by the independent consultant. Based upon these discussions and various other factors, the Trustees concluded that the Fund’s performance was satisfactory.
The Trustees noted that the Hedged Equity Fund’s performance for Class A shares was in the first quintile based upon both the Peer Group and Universe, for each of the one-, three- and five-year periods ended December 31, 2020. The Trustees noted that the performance for Class I shares was in the first quintile based upon the Universe for each of the one-, three- and five-year periods ended December 31, 2020. The Trustees noted that the performance for Class R6 shares was in the first quintile based upon the Peer Group for both the one- and three-year periods ended December 31, 2020, and in the first quintile based upon the Universe for each of the one-, three- and five-year periods ended December 31, 2020. The Trustees discussed the performance and investment strategy of the Fund with the Adviser and reviewed the performance analysis and evaluation prepared by the independent consultant. Based upon these discussions and various other factors, the Trustees concluded that the Fund’s performance was satisfactory.
The Trustees noted that the Large Cap Growth Fund’s performance for Class A, Class I and Class R6 shares was in the first quintile based upon both the Peer Group and Universe, for each of the one-, three- and five-year periods ended December 31, 2020. The Trustees discussed the performance and investment strategy of the Fund with the Adviser and reviewed the performance analysis and evaluation prepared by the independent consultant. Based upon these discussions and various other factors, the Trustees concluded that the Fund’s performance was satisfactory.
The Trustees noted that the Large Cap Value Fund’s performance for Class A and Class I shares was in the first, second and first quintiles based upon the Peer Group, and in the first, third and first quintiles based upon the Universe, for the one-, three- and five-year periods ended December 31, 2020, respectively. The Trustees noted that the performance for Class R6 shares was in the first quintile based upon the Peer Group for each of the one-, three- and five-year periods ended December 31, 2020, and in the first, second and first quintiles based upon the Universe for the one-, three-, and five-year periods ended December 31, 2020, respectively. The Trustees discussed the performance and investment strategy of the Fund with the Adviser and reviewed the performance analysis and evaluation prepared by the independent consultant. Based upon these discussions and various other factors, the Trustees concluded that the Fund’s performance was satisfactory.
The Trustees noted that the U.S. Applied Data Science Value Fund’s performance for Class A shares was in the fourth quintile based upon the Peer Group for each of the one-, three- and five-year periods ended December 31, 2020, and in the third, fourth and fourth quintiles based upon the Universe for the one-, three- and five-year periods ended December 31, 2020, respectively. The Trustees noted that the performance for Class I shares was in the third, third and fourth quintiles based upon both the Peer Group and Universe, for the one-, three- and five-year periods ended December 31, 2020, respectively. The Trustees noted that the performance for Class R6 shares was in the third quintile based upon both the Peer Group and Universe, for each of the one-, three- and five-year periods ended December 31, 2020. The Trustees discussed the performance and investment strategy of the Fund with the Adviser and reviewed the performance analysis and evaluation prepared by the independent consultant. Based upon these discussions and various other factors, the Trustees concluded that the Fund’s performance was satisfactory under the circumstances.
The Trustees noted that the U.S. Equity Fund’s performance for Class A, Class I and Class R6 shares was in the first quintile based upon the Peer Group and Universe, for each of the one-, three and five-year periods ended December 31, 2020. The Trustees discussed the performance and investment strategy of the Fund with the Adviser and reviewed the performance analysis and evaluation prepared by the independent consultant. Based upon
| | | | | | | | | | |
| | | | | |
| DECEMBER 31, 2021 | | J.P. MORGAN LARGE CAP FUNDS | | | | | | | | 181 |
BOARD APPROVAL OF INVESTMENT ADVISORY AGREEMENTS
(Unaudited) (continued)
these discussions and various other factors, the Trustees concluded that the Fund’s performance was satisfactory.
The Trustees noted that the U.S. GARP Equity Fund’s performance for Class A and Class I shares was in the fifth, fifth and fourth quintiles based upon the Peer Group for the one-, three- and five-year periods ended December 31, 2020, respectively, and in the fourth quintile based upon the Universe for each of the one-, three- and five-year periods ended December 31, 2020. The Trustees noted that the performance for Class R6 shares was in the fifth, fourth and fourth quintiles based upon the Peer Group for the one-, three- and five-year periods ended December 31, 2020, respectively, and in the fourth quintile based upon the Universe, for each of the one-, three- and five-year periods ended December 31, 2020. The Trustees discussed the performance and investment strategy of the Fund with the Adviser and reviewed the performance analysis and evaluation prepared by the independent consultant. Based upon these discussions and various other factors, the Trustees concluded that the Fund’s performance was satisfactory under the circumstances. The Trustees requested, however, that the Fund’s Adviser provide additional Fund performance information to be reviewed with the members of the Board’s equity committee at each of its regularly scheduled meetings over the course of the next year.
The Trustees noted that the U.S. Large Cap Core Plus Fund’s performance for Class A shares was in the first quintile based upon the Peer Group for each of the one-, three- and five-year periods ended December 31, 2020, and in the first, first and second quintiles based upon the Universe for the one-, three- and five-year periods ended December 31, 2020, respectively. The Trustees noted that the performance for Class I shares was in the first quintile based upon both the Peer Group and Universe, for each of the one-, three- and five-year periods ended December 31, 2020. The Trustees noted that the performance for Class R6 shares was in the first quintile based upon both the Peer Group and Universe, for both the one- and three-year periods ended December 31, 2020. The Trustees discussed the performance and investment strategy of the Fund with the Adviser and reviewed the performance analysis prepared by the independent consultant. Based upon these discussions, and various other factors, the Trustees concluded that the Fund’s performance was satisfactory.
The Trustees noted that the U.S. Research Enhanced Equity Fund’s performance for Class A shares was in the first, first and second quintiles based upon the Peer Group, and in the first, second and second quintiles based upon the Universe, for the one-, three- and five-year periods ended December 31, 2020, respectively. The Trustees noted that the performance for Class I shares was in the first, first and second quintiles based upon both the Peer Group and Universe for the one-, three- and five-year periods ended December 31, 2020, respectively. The Trustees noted that the performance for Class R6 shares was in
the second and first quintiles based upon the Peer Group for the one- and three-year periods ended December 31, 2020, respectively, and in the first, first and second quintiles based upon the Universe for the one-, three- and five-year periods ended December 31, 2020, respectively. The Trustees discussed the performance and investment strategy of the Fund with the Adviser and reviewed the performance analysis and evaluation prepared by the independent consultant. Based upon these discussions and various other factors, the Trustees concluded that the Fund’s performance was satisfactory under the circumstances.
The Trustees noted that the U.S. Sustainable Leaders Fund’s performance for Class A shares was in the first, third and second quintiles based upon the Peer Group for the one-, three- and five-year periods ended December 31, 2020, respectively, and in the second quintile based upon the Universe for each of the one-, three- and five-year periods ended December 31, 2020. The Trustees noted that the performance for Class I shares was in the first, first and second quintiles based upon the Peer Group for the one-, three- and five-year periods ended December 31, 2020, respectively, and in the second quintile based upon the Universe for each of the one-, three- and five-year periods ended December 31, 2020. The Trustees discussed the performance and investment strategy of the Fund with the Adviser, and reviewed the performance analysis and evaluation prepared by the independent consultant. Based upon these discussions and various other factors, the Trustees concluded that the Fund’s performance was satisfactory.
The Trustees noted that the U.S. Value Fund’s performance for Class A shares was in the second, second and first quintiles based upon the Peer Group for the one-, three- and five-year periods ended December 31, 2020, respectively, and in the second quintile based upon the Universe for each of the one-, three- and five-year periods ended December 31, 2020. The Trustees noted that the performance for Class I shares was in the second, first and first quintiles based upon the Peer Group and in the second, second and first quintiles based upon the Universe, for the one-, three- and five-year periods ended December 31, 2020, respectively. The Trustees noted that the performance for Class R6 shares was in the first quintile based upon the Peer Group for each of the one-, three- and five-year periods ended December 31, 2020, and in the second, first and first quintiles based upon the Universe for the one-, three- and five-year periods ended December 31, 2020, respectively. The Trustees discussed the performance and investment strategy of the Fund with the Adviser and reviewed the performance analysis and evaluation prepared by the independent consultant. Based upon these discussions and various other factors, the Trustees concluded that the Fund’s performance was satisfactory.
| | | | | | | | | | |
| | | | | |
| 182 | | | | | | | | J.P. MORGAN LARGE CAP FUNDS | | DECEMBER 31, 2021 |
Advisory Fees and Expense Ratios
The Trustees considered the contractual advisory fee rate and administration fee rate paid by each Fund to the Adviser and compared the combined rate to the information prepared by Broadridge concerning management fee rates paid by other funds in the same Broadridge category as each Fund. The Trustees recognized that Broadridge reported each Fund’s management fee rate as the combined contractual advisory fee and administration fee rates. The Trustees also reviewed information about other expenses and the expense ratios for each Fund and noted that Universe and Peer Group rankings were not calculated if the number of funds in the Universe and/or Peer Groups did not meet a predetermined minimum. For each Fund that had a Fee Cap in place, the Trustees considered the net advisory fee rate and net expense ratio for each share class, as applicable, taking into account any waivers and/or reimbursements. The Trustees also considered any proposed changes to a Fee Cap, and, where deemed appropriate by the Trustees, additional waivers and/or reimbursements. The Trustees recognized that it is difficult to make comparisons of advisory fees because there are variations in the services that are included in the fees paid by other funds. The Trustees’ determinations as a result of the review of each Fund’s advisory fees and expense ratios for certain representative classes are summarized below:
The Trustees noted that the Equity Focus Fund’s net advisory fee for Class A shares was in the first quintile based upon both the Peer Group and Universe, and that the actual total expenses for Class A shares were in the second and third quintiles based upon the Peer Group and Universe. The Trustees noted that the net advisory fee for Class I shares was in the third and second quintiles based upon the Peer Group and Universe, respectively, and that the actual total expenses for Class I shares were in the first and third quintiles based upon the Peer Group and Universe, respectively. The Trustees noted that the net advisory fee for Class R6 shares was in the second quintile based upon both the Peer Group and Universe, and that the actual total expenses for Class R6 shares were in the first and second quintiles based upon the Peer Group and Universe, respectively. After considering the factors identified above, in light of this information, the Trustees concluded that the advisory fee was satisfactory in light of the services provided to the Fund.
The Trustees noted that the Equity Income Fund’s net advisory fee for Class A shares was in the first and second quintiles based upon the Peer Group and Universe, respectively, and that the actual total expenses for Class A shares were in the fourth and second quintiles based upon the Peer Group and Universe, respectively. The Trustees noted that the net advisory fee for Class I shares was in the first and second quintiles based upon the Peer Group and Universe, respectively, and that the actual total expenses for Class I shares were in the first and second
quintiles based upon the Peer Group and Universe, respectively. The Trustees noted that the net advisory fee for Class R6 shares was in the first and second quintiles based upon the Peer Group and Universe, respectively, and that the actual total expenses for Class R shares were in the first quintile based upon both the Peer Group and Universe. After considering the factors identified above, in light of this information, the Trustees concluded that the advisory fee was satisfactory in light of the services provided to the Fund.
The Trustees noted that the Equity Premium Income Fund’s net advisory fee and actual total expenses for Class A and Class R6 shares were in the first quintile based upon both the Peer Group and Universe. The Trustees noted that the net advisory fee and actual total expenses for Class I shares were in the first quintile based upon the Universe. After considering the factors identified above, in light of this information, the Trustees concluded that the advisory fee was satisfactory in light of the services provided to the Fund.
The Trustees noted that the Hedged Equity Fund’s net advisory fee and actual total expenses for Class A and Class R6 shares were in the first quintile based upon both the Peer Group and Universe. The Trustees noted that the net advisory fee and actual total expenses for Class I shares were in the first quintile based upon the Universe. After considering the factors identified above, in light of this information, the Trustees concluded that the advisory fee was satisfactory in light of the services provided to the Fund.
The Trustees noted that the Large Cap Growth Fund’s net advisory fee for Class A shares was in the first quintile based upon both the Peer Group and Universe, and that the actual total expenses for Class A shares were in the second and first quintiles based upon the Peer Group and Universe, respectively. The Trustees noted that the net advisory fee for Class I shares was in the first quintile based upon both the Peer Group and Universe, and that the actual total expenses for Class I shares were in the first and second quintiles based upon the Peer Group and Universe, respectively. The Trustees noted that the net advisory fee and actual total expenses for Class R6 shares were in the first quintile based upon both the Peer Group and Universe. After considering the factors identified above, in light of this information, the Trustees concluded that the advisory fee was satisfactory in light of the services provided to the Fund.
The Trustees noted that the Large Cap Value Fund’s net advisory fee and actual total expenses for Class A shares were in the first quintile based upon both the Peer Group and Universe. The Trustees noted that the net advisory fee for Class I shares was in the first and second quintiles based upon the Peer Group and Universe, respectively, and that the actual total expenses for Class I shares were also in the first and second quintiles based upon the Peer Group and Universe, respectively. The Trustees noted that the net advisory fee for Class R6 shares
| | | | | | | | | | |
| | | | | |
| DECEMBER 31, 2021 | | J.P. MORGAN LARGE CAP FUNDS | | | | | | | | 183 |
BOARD APPROVAL OF INVESTMENT ADVISORY AGREEMENTS
(Unaudited) (continued)
was in the first and second quintiles based upon the Peer Group and Universe, respectively, and that the actual total expenses for Class R6 shares were in the first quintile based upon both the Peer Group and Universe. After considering the factors identified above, in light of this information, the Trustees concluded that the advisory fee was satisfactory in light of the services provided to the Fund.
The Trustees noted that the U.S. Applied Data Science Value Fund’s net advisory fee and actual total expenses for Class A, Class I and Class R6 shares were in the first quintile based upon both the Peer Group and the Universe. After considering the factors identified above, in light of this information, the Trustees concluded that the advisory fee was satisfactory in light of the services provided to the Fund.
The Trustees noted that the U.S. Equity Fund’s net advisory fee for Class A shares was in the first and second quintile based upon the Peer Group and Universe, respectively, and that the actual total expenses for Class A shares were in the third and second quintiles based upon the Peer Group and Universe, respectively. The Trustees noted that the net advisory fee for Class I shares was in the second quintile based upon both the Peer Group and Universe, and that the actual total expenses for Class I shares were in the first and second quintiles based upon the Peer Group and Universe, respectively. The Trustees noted that the net advisory fee for Class R6 shares was in the first and second quintiles based upon the Peer Group and Universe, respectively, and that the actual total expenses for Class R6 shares were in the first quintile based upon both the Peer Group and Universe. After considering the factors identified above, in light of this information, the Trustees concluded that the advisory fee was satisfactory in light of the services provided to the Fund.
The Trustees noted that the U.S. GARP Equity Fund’s net advisory fee and actual total expenses for Class A, Class I and Class R6 shares were in the first quintile based upon both the Peer Group and Universe. After considering the factors identified above, in light of this information, the Trustees concluded that the advisory fee was satisfactory in light of the services provided to the Fund.
The Trustees noted that the U.S. Large Cap Core Plus Fund’s net advisory fee for Class A shares was in the fifth and fourth quintiles based upon the Peer Group and Universe, respectively, and that the actual total expenses for Class A shares were also in the fifth and fourth quintiles based upon the Peer Group and
Universe, respectively. The Trustees noted that the net advisory fee for Class I shares was in fifth quintile based upon both the Peer Group and Universe, and that the actual total expenses for Class I shares were in the first and fourth quintiles based upon the Peer Group and Universe, respectively. The Trustees noted that the net advisory fee for Class R6 shares was in the fifth quintile based upon both the Peer Group and Universe, and that the actual total expenses for Class R6 shares were in the fourth and third quintiles based upon the Peer Group and Universe, respectively. After considering all of the factors identified above, in light of this information, the Trustees concluded that the advisory fee was satisfactory in light of the services provided to the Fund.
The Trustees noted that the U.S. Research Enhanced Equity Fund’s net advisory fee and actual total expenses for Class A, Class I and Class R6 shares were in the first quintile based upon both the Peer Group and Universe. After considering the factors identified above, in light of this information, the Trustees concluded that the advisory fee was satisfactory in light of the services provided to the Fund.
The Trustees noted that the U.S. Sustainable Leader Fund’s net advisory fee and actual total expenses for Class A, Class I and Class R6 shares were in the first quintile based upon both the Peer Group and Universe. After considering the factors identified above, in light of this information, the Trustees concluded that the advisory fee was satisfactory in light of the services provided to the Fund.
The Trustees noted that the U.S. Value Fund’s net advisory fee for Class A shares was in the first quintile based upon both the Peer Group and Universe, and that the actual total expenses for Class A shares were in the first and second quintiles based upon the Peer Group and Universe, respectively. The Trustees noted that the net advisory fee for Class I shares was in the first and second quintiles based upon the Peer Group and Universe, respectively, and that the actual total expenses for Class I shares were also in the first and second quintiles based upon the Peer Group and Universe, respectively. The Trustees noted that the net advisory fee for Class R6 shares was in the first and second quintiles based upon the Peer Group and Universe, respectively, and that the actual total expenses for Class R6 shares were in the first quintile based upon both the Peer Group and Universe. After considering the factors identified above, in light of this information, the Trustees concluded that the advisory fee was satisfactory in light of the services provided to the Fund.
| | | | | | | | | | |
| | | | | |
| 184 | | | | | | | | J.P. MORGAN LARGE CAP FUNDS | | DECEMBER 31, 2021 |
SPECIAL SHAREHOLDER MEETING RESULTS
(Unaudited)
JPMorgan Trust I (“JPM I”)
JPM I held a special meeting of shareholders on October 27, 2021, for the purpose of considering and voting upon the election of Trustees, which meeting was adjourned to November 23, 2021 to allow shareholders to vote on the proposal.
When the special meeting reconvened on November 23, 2021, Trustees were elected by the shareholders of all of the series of JPM I, including Equity Focus Fund, Hedged Equity Fund, U.S. Applied Data Science Value Fund, U.S. Equity Fund, U.S. GARP Equity Fund, U.S. Large Cap Core Plus Fund, U.S. Research Enhanced Equity Fund, U.S. Sustainable Leaders Fund and U.S. Value Fund.
The results of the voting were as follows:
| | | | |
| | | Votes Received
(Amounts in
thousands) | |
Independent Nominee | | | | |
| |
| John F. Finn | | | | |
In Favor | | | 218,161,076 | |
Withheld | | | 3,798,560 | |
| |
| Steven P. Fisher | | | | |
In Favor | | | 219,683,469 | |
Withheld | | | 2,276,167 | |
| |
| Gary L. French | | | | |
In Favor | | | 219,573,994 | |
Withheld | | | 2,385,642 | |
| |
| Kathleen M. Gallagher | | | | |
In Favor | | | 219,614,901 | |
Withheld | | | 2,344,735 | |
| |
| Robert J. Grassi | | | | |
In Favor | | | 219,652,125 | |
Withheld | | | 2,307,510 | |
| |
| Frankie D. Hughes | | | | |
In Favor | | | 219,173,958 | |
Withheld | | | 2,785,677 | |
| |
| Raymond Kanner | | | | |
In Favor | | | 219,638,172 | |
Withheld | | | 2,321,463 | |
| |
| Thomas P. Lemke | | | | |
In Favor | | | 219,600,003 | |
Withheld | | | 2,359,633 | |
| |
| Lawrence R. Maffia | | | | |
In Favor | | | 219,558,283 | |
Withheld | | | 2,401,353 | |
| | | | |
| | | Votes Received
(Amounts in
thousands) | |
| Mary E. Martinez | | | | |
In Favor | | | 219,188,002 | |
Withheld | | | 2,771,634 | |
| |
| Marilyn McCoy | | | | |
In Favor | | | 218,775,511 | |
Withheld | | | 3,184,125 | |
| |
| Dr. Robert A. Oden, Jr. | | | | |
In Favor | | | 218,109,306 | |
Withheld | | | 3,850,330 | |
| |
| Marian U. Pardo | | | | |
In Favor | | | 219,504,107 | |
Withheld | | | 2,445,528 | |
| |
| Emily A. Youssouf | | | | |
In Favor | | | 219,549,573 | |
Withheld | | | 2,410,062 | |
| |
Interested Nominee | | | | |
| |
| Robert F. Deutsch | | | | |
In Favor | | | 219,143,836 | |
Withheld | | | 2,815,799 | |
| |
| Nina O. Shenker | | | | |
In Favor | | | 219,183,139 | |
Withheld | | | 2,776,497 | |
| | | | | | | | | | |
| | | | | |
| DECEMBER 31, 2021 | | J.P. MORGAN LARGE CAP FUNDS | | | | | | | | 185 |
SPECIAL SHAREHOLDER MEETING RESULTS
(Unaudited) (continued)
JPMorgan Trust II (“JPM II”)
JPM II held a special meeting of shareholders on October 27, 2021, for the purpose considering and voting upon the election of Trustees, which meeting was adjourned to November 23, 2021 to allow shareholders to vote on the proposal.
When the special meeting reconvened on November 23, 2021, Trustees were elected by the shareholders of all of the series of JPM II, including Equity Income Fund, Large Cap Growth Fund and Large Cap Value Fund.
The results of the voting were as follows:
| | | | |
| | | Votes Received
(Amounts in
thousands) | |
Independent Nominee | | | | |
| |
| John F. Finn | | | | |
In Favor | | | 288,983,507 | |
Withheld | | | 6,732,052 | |
| |
| Steven P. Fisher | | | | |
In Favor | | | 289,598,586 | |
Withheld | | | 6,116,973 | |
| |
| Gary L. French | | | | |
In Favor | | | 289,542,085 | |
Withheld | | | 6,173,474 | |
| |
| Kathleen M. Gallagher | | | | |
In Favor | | | 289,773,673 | |
Withheld | | | 5,941,887 | |
| |
| Robert J. Grassi | | | | |
In Favor | | | 289,609,331 | |
Withheld | | | 6,106,229 | |
| |
| Frankie D. Hughes | | | | |
In Favor | | | 289,641,174 | |
Withheld | | | 6,074,386 | |
| |
| Raymond Kanner | | | | |
In Favor | | | 289,603,025 | |
Withheld | | | 6,112,535 | |
| |
| Thomas P. Lemke | | | | |
In Favor | | | 289,581,867 | |
Withheld | | | 6,133,692 | |
| | | | |
| | | Votes Received
(Amounts in
thousands) | |
| Lawrence R. Maffia | | | | |
In Favor | | | 289,544,612 | |
Withheld | | | 6,170,947 | |
| |
| Mary E. Martinez | | | | |
In Favor | | | 289,745,394 | |
Withheld | | | 5,970,165 | |
| |
| Marilyn McCoy | | | | |
In Favor | | | 289,336,040 | |
Withheld | | | 6,379,520 | |
| |
| Dr. Robert A. Oden, Jr. | | | | |
In Favor | | | 288,968,016 | |
Withheld | | | 6,747,543 | |
| |
| Marian U. Pardo | | | | |
In Favor | | | 289,619,985 | |
Withheld | | | 6,095,575 | |
| |
| Emily A. Youssouf | | | | |
In Favor | | | 289,555,396 | |
Withheld | | | 6,160,163 | |
| |
Interested Nominee | | | | |
| |
| Robert F. Deutsch | | | 289,562,178 | |
In Favor | | | 6,153,382 | |
Withheld | | | | |
| |
| Nina O. Shenker | | | | |
In Favor | | | 289,698,757 | |
Withheld | | | 6,016,803 | |
| | | | | | | | | | |
| | | | | |
| 186 | | | | | | | | J.P. MORGAN LARGE CAP FUNDS | | DECEMBER 31, 2021 |
JPMorgan Trust IV (“JPM IIV”)
JPM IV held a special meeting of shareholders on October 27, 2021, for the purpose of considering and voting upon the election of Trustees.
Trustees were elected by the shareholders of all of the series of JPM IV, including Equity Premium Income Fund, Hedged Equity 2 Fund and Hedged Equity 3 Fund.
The results of the voting were as follows:
| | | | |
| | | Votes Received
(Amounts in
thousands) | |
Independent Nominee | | | | |
| |
| John F. Finn | | | | |
In Favor | | | 2,308,022 | |
Withheld | | | 4,313 | |
| |
| Steven P. Fisher | | | | |
In Favor | | | 2,309,583 | |
Withheld | | | 2,752 | |
| |
| Gary L. French | | | | |
In Favor | | | 2,309,620 | |
Withheld | | | 2,715 | |
| |
| Kathleen M. Gallagher | | | | |
In Favor | | | 2,309,789 | |
Withheld | | | 2,546 | |
| |
| Robert J. Grassi | | | | |
In Favor | | | 2,309,623 | |
Withheld | | | 2,712 | |
| |
| Frankie D. Hughes | | | | |
In Favor | | | 2,309,543 | |
Withheld | | | 2,791 | |
| |
| Raymond Kanner | | | | |
In Favor | | | 2,309,644 | |
Withheld | | | 2,691 | |
| |
| Thomas P. Lemke | | | | |
In Favor | | | 2,309,600 | |
Withheld | | | 2,735 | |
| |
| Lawrence R. Maffia | | | | |
In Favor | | | 2,309,585 | |
Withheld | | | 2,750 | |
| | | | |
| | | Votes Received
(Amounts in
thousands) | |
| Mary E. Martinez | | | | |
In Favor | | | 2,309,800 | |
Withheld | | | 2,534 | |
| |
| Marilyn McCoy | | | | |
In Favor | | | 2,309,821 | |
Withheld | | | 2,514 | |
| |
| Dr. Robert A. Oden, Jr. | | | | |
In Favor | | | 2,308,857 | |
Withheld | | | 3,478 | |
| |
| Marian U. Pardo | | | | |
In Favor | | | 2,309,743 | |
Withheld | | | 2,591 | |
| |
| Emily A. Youssouf | | | | |
In Favor | | | 2,309,749 | |
Withheld | | | 2,586 | |
| |
Interested Nominee | | | | |
| |
| Robert F. Deutsch | | | | |
In Favor | | | 2,309,524 | |
Withheld | | | 2,811 | |
| |
| Nina O. Shenker | | | | |
In Favor | | | 2,309,718 | |
Withheld | | | 2,616 | |
| | | | | | | | | | |
| | | | | |
| DECEMBER 31, 2021 | | J.P. MORGAN LARGE CAP FUNDS | | | | | | | | 187 |
J.P. Morgan Funds are distributed by JPMorgan Distribution Services, Inc., which is an affiliate of JPMorgan Chase & Co. Affiliates of JPMorgan Chase & Co. receive fees for providing various services to the funds.
Contact JPMorgan Distribution Services, Inc. at 1-800-480-4111 for a fund prospectus. You can also visit us at www.jpmorganfunds.com. Investors should carefully consider the investment objectives and risk as well as charges and expenses of the mutual fund before investing. The prospectus contains this and other information about the mutual fund. Read the prospectus carefully before investing.
Investors may obtain information about the Securities Investor Protection Corporation (SIPC), including the SIPC brochure, by visiting www.sipc.org or by calling SIPC at 202-371-8300.
Each Fund files a complete schedule of its fund holdings for the first and third quarters of its fiscal year with the SEC as an exhibit to its report on Form N-PORT. The Funds’ Form N-PORT reports are available on the SEC’s website at http://www.sec.gov. Each Fund’s quarterly holdings can be found by visiting the J.P. Morgan Funds’ website at www.jpmorganfunds.com.
A description of each Fund’s policies and procedures with respect to the disclosure of each Fund’s holdings is available in the prospectuses and Statement of Additional Information.
A copy of proxy policies and procedures is available without charge upon request by calling 1-800-480-4111 and on the Funds’ website at www.jpmorganfunds.com. A description of such policies and procedures is on the SEC’s website at www.sec.gov. The Trustees have delegated the authority to vote proxies for securities owned by the Funds to the Adviser. A copy of the Funds’ voting record for the most recent 12-month period ended June 30 is available on the SEC’s website at www.sec.gov or at the Funds’ website at www.jpmorganfunds.com no later than August 31 of each year. The Funds’ proxy voting record will include, among other things, a brief description of the matter voted on for each fund security, and will state how each vote was cast, for example, for or against the proposal.


J.P. Morgan Asset Management is the brand name for the asset management business of JPMorgan Chase & Co. and its affiliates worldwide.
| | | | |
| | © JPMorgan Chase & Co., 2021. All rights reserved. December 2021. | | SAN-LCE-1221 |
Semi-Annual Report
J.P. Morgan Funds
December 31, 2021 (Unaudited)
JPMorgan SmartSpendingSM 2015 Fund
JPMorgan SmartSpendingSM 2020 Fund

CONTENTS
Investments in a Fund are not deposits or obligations of, or guaranteed or endorsed by, any bank and are not insured or guaranteed by the FDIC, the Federal Reserve Board or any other government agency. You could lose money if you sell when the Fund’s share price is lower than when you invested.
Past performance is no guarantee of future performance. The general market views expressed in this report are opinions based on market and other conditions through the end of the reporting period and are subject to change without notice. These views are not intended to predict the future performance of a Fund or the securities markets.
Prospective investors should refer to the Funds’ prospectuses for a discussion of the Funds’ investment objective, strategies and risks. Call J.P. Morgan Funds Service Center at 1-800-480-4111 for a prospectus containing more complete information about a Fund, including management fees and other expenses. Please read it carefully before investing.
LETTER TO SHAREHOLDERS
February 8, 2022 (Unaudited)
Dear Shareholders,
U.S. equities led the year-long rally in developed market stocks as the global economic rebound advanced through 2021. While financial market volatility, a resurgence in the pandemic and accelerating inflation have carried into 2022, we believe that the outlook for the overall U.S. economy remains positive.
| | |
 | | “Throughout the year ahead, J.P. Morgan Asset Management plans to seek to deliver superior client outcomes across a broad range of innovative solutions and risk management processes built on the same fundamental practices and principles that have driven our success for more than a century.” — Andrea L. Lisher |
A surge in U.S. consumer wealth — partly tied to rising values for homes and autos — and quarterly growth in corporate earnings have helped to bolster U.S. financial markets that were already well-supported by monetary and fiscal policies. Over the course of the past year, the U.S. jobless rate fell to pre-pandemic levels and reached 3.9% in December. At the same time, inflation has climbed significantly. The U.S. Federal Reserve (the “Fed”) has tapered its monthly asset purchasing program and indicated that it’s likely to raise interest rates as early as March 2022.
While rising interest rates may mark another phase of the economic cycle that presents financial markets with new challenges and opportunities, they may also signal a return to a
more normal economic environment following two years of historically low rates. Meanwhile, the path of the pandemic remains a factor in the U.S. economy. Recent data suggest the increase in new infections in late 2021 and into 2022 had some impact on the U.S. economy — though job growth remained strong — but there is hope that the latest pandemic wave may recede in coming months. Additionally, there is hope that rising prices on commodities and goods will moderate as supply chain constraints ease over time and the Fed moves generally to tamp down inflationary pressures. We expect the U.S. economy to continue expanding in 2022, even if the pace of the expansion eases from 2021.
Throughout the year ahead, J.P. Morgan Asset Management plans to seek to deliver superior client outcomes across a broad range of innovative solutions and risk management processes built on the same fundamental practices and principles that have driven our success for more than a century.
On behalf of J.P. Morgan Asset Management, thank you for entrusting us to manage your investment. Should you have any questions, please visit www.jpmorganfunds.com or contact the J.P. Morgan Funds Service Center at 1-800-480-4111.
Sincerely yours,

Andrea L. Lisher
Head of Americas, Client
J.P. Morgan Asset Management
| | | | | | | | | | |
| | | | | |
| DECEMBER 31, 2021 | | J.P. MORGAN FUNDS | | | | | | | | 1 |
J.P. Morgan Funds
MARKET OVERVIEW
SIX MONTHS ENDED DECEMBER 31, 2021 (Unaudited)
Overall, U.S. equity markets generated positive returns in the second half of 2021, bolstered by continued monetary and fiscal support as well as strong consumer spending and record corporate profits. Despite historically high equity valuations in the U.S., the S&P 500 Index posted at least one record-high closing in each month during the period. Fixed income markets underperformed equity markets during the period and generally had mixed results during the period amid relatively low yields and investor expectations for rising interest rate.
Notably, the emergence of the omicron variant of COVID-19 and a global resurgence of the pandemic in the final months of 2021 led to higher volatility in financial markets and weighed on global petroleum prices.
The first months of the period saw upward momentum in U.S. equity prices following record high earnings and revenue reports from U.S. companies for the second quarter of 2021. However, equity markets slumped toward the end of September amid investor concerns about global supply chain disruptions, inflationary pressures and some weakening in U.S. consumer spending. During that month, the U.S. Federal Reserve (the “Fed”) set an initial schedule for tapering off its monthly bond purchases and indicated it may raise interest rates in late 2022 or early 2023.
Equity markets see-sawed in the final three months of the 2021. Stronger-than-expected corporate earnings and revenue for the third quarter of 2021, along with growth in jobs and consumer spending and a boom in U.S. consumer wealth, provided support for equity prices. In response to rising inflation and falling unemployment, the Fed accelerated its reduction in net asset purchases and indicated it may raise interest rates three times over 2022 and 2023.
Within U.S. equity, large cap stocks generally outperformed both mid cap and small cap stocks. Growth stocks led returns in the large cap indexes but value stocks outperformed growth stocks within mid cap and small cap indexes. Within fixed income markets, high yield bonds (also known as “junk bonds”) outperformed corporate bonds and U.S. Treasury securities.
| | | | | | | | | | |
| | | | | |
| 2 | | | | | | | | J.P. MORGAN FUNDS | | DECEMBER 31, 2021 |
JPMorgan SmartSpendingSM 2015 Fund
FUND COMMENTARY
SIX MONTHS ENDED DECEMBER 31, 2021 (Unaudited)
| | | | |
| REPORTING PERIOD RETURN: | |
| Fund (Class I Shares)* | | | 2.01% | |
| Bloomberg U.S. Aggregate Index | | | 0.06% | |
| MSCI World Index (net of foreign withholding taxes) | | | 7.76% | |
| SmartSpending Composite Benchmark | | | 3.17% | |
| |
| Net Assets as of 12/31/2021 (In Thousands) | | $ | 30,704 | |
INVESTMENT OBJECTIVE**
The JPMorgan SmartSpendingSM 2015 Fund (the “Fund”) seeks to provide total return consisting of current income and some capital appreciation.
WHAT WERE THE MAIN DRIVERS OF THE PORTFOLIO’S PERFORMANCE?
The Fund’s Class I Shares outperformed the Bloomberg U.S. Aggregate Index (the “Benchmark”) and underperformed the MSCI World Index (net of foreign withholding taxes) for the six months ended December 31, 2021. The Fund underperformed the SmartSpending Composite Benchmark (the “Composite Benchmark”), which consists of 40% MSCI World Index (net of foreign withholding taxes) and 60% Bloomberg U.S. Aggregate Index, over the same period.
Relative to the Benchmark, which does not include equity securities, the Fund’s allocation to global equity markets was a leading contributor to performance, mostly due to the underperformance of core fixed income and emerging markets fixed income during the reporting period.
Relative to the MSCI World Index, which includes exposure primarily to developed market equities, the Fund’s allocation to fixed income securities detracted from performance as equity outperformed fixed income during the period. The Fund’s more broadly diversified equity exposure, including real estate investment trusts, contributed to relative performance.
Relative to the Composite Benchmark, the Fund’s overweight positions in U.S. large cap and high yield debt (also known as “junk bonds”) were leading contributors to performance.
HOW WAS THE PORTFOLIO POSITIONED?
The Fund invested in underlying J.P. Morgan Funds and third party exchange-traded funds to implement the Fund managers’ asset allocation decisions. The Fund’s portfolio managers used futures contracts in general to implement tactical asset allocations. The Fund’s portfolio managers used a systematic screening and selection process to choose the underlying funds in their construction of the Fund’s portfolio. Relative to its Composite Benchmark, the Fund invested in a broader range of asset classes.
| | | | |
PORTFOLIO COMPOSITION
AS OF DECEMBER 31, 2021 | | PERCENT OF
TOTAL
INVESTMENTS | |
| Investment Companies | | | 39.3 | % |
| Exchange-Traded Funds | | | 29.5 | |
| Corporate Bonds | | | 7.8 | |
| U.S. Treasury Obligations | | | 7.1 | |
| Mortgage-Backed Securities | | | 6.0 | |
| Asset-Backed Securities | | | 4.0 | |
| Others (each less than 1.0%) | | | 1.0 | |
| Short-Term Investments | | | 5.3 | |
| * | | The return shown is based on net asset values calculated for shareholder transactions and may differ from the return shown in the financial highlights, which reflects adjustments made to the net asset values in accordance with accounting principles generally accepted in the United States of America. |
| ** | | The adviser seeks to achieve the Fund’s objective. There can be no guarantee it will be achieved. |
| | | | | | | | | | |
| | | | | |
| DECEMBER 31, 2021 | | J.P. MORGAN FUNDS | | | | | | | | 3 |
JPMorgan SmartSpendingSM 2015 Fund
FUND COMMENTARY
SIX MONTHS ENDED DECEMBER 31, 2021 (Unaudited) (continued)
| | | | | | | | | | | | | | | | | | |
AVERAGE ANNUAL TOTAL RETURNS AS OF DECEMBER 31, 2021 | |
| | | | | |
| | | INCEPTION DATE OF
CLASS | | 6 MONTH* | | | 1 YEAR | | | 5 YEAR | | | SINCE
INCEPTION | |
CLASS I SHARES | | December 30, 2016 | | | 2.01 | % | | | 6.49 | % | | | 5.97 | % | | | 5.96 | % |
CLASS R2 SHARES | | December 30, 2016 | | | 1.79 | | | | 6.00 | | | | 5.33 | | | | 5.33 | |
CLASS R3 SHARES | | December 30, 2016 | | | 1.91 | | | | 6.32 | | | | 5.59 | | | | 5.59 | |
CLASS R4 SHARES | | December 30, 2016 | | | 1.96 | | | | 6.50 | | | | 5.85 | | | | 5.84 | |
CLASS R5 SHARES | | December 30, 2016 | | | 2.11 | | | | 6.71 | | | | 6.01 | | | | 6.01 | |
CLASS R6 SHARES | | December 30, 2016 | | | 2.20 | | | | 6.81 | | | | 6.13 | | | | 6.12 | |
LIFE OF FUND PERFORMANCE (12/30/16 to 12/31/21)
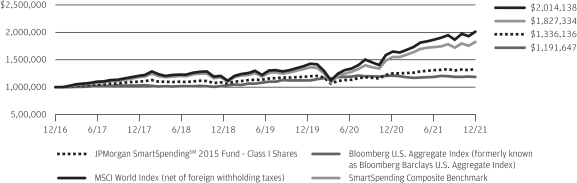
The performance quoted is past performance and is not a guarantee of future results. Mutual funds are subject to certain market risks. Investment returns and principal value of an investment will fluctuate so that an investor’s shares, when redeemed, may be worth more or less than their original cost. Current performance may be higher or lower than the performance data shown. For up-to-date month-end performance information please call 1-800-480-4111.
The Fund commenced operations on December 30, 2016.
The graph illustrates comparative performance for $1,000,000 invested in Class I Shares of the JPMorgan SmartSpendingSM 2015 Fund, the MSCI World Index (net of foreign withholding taxes), the Bloomberg U.S. Aggregate Index and the SmartSpending Composite Benchmark from December 30, 2016 to December 31, 2021. The performance of the Fund assumes reinvestment of all dividends and capital gain distributions, if any, and does not include a sales charge. The performance of the MSCI World Index, the Bloomberg U.S. Aggregate Index and the SmartSpending Composite Benchmark does not reflect the deduction of expenses or a sales charge associated with a mutual fund and has been adjusted to reflect reinvestment of all dividends and capital gain distributions of the securities included in the benchmark, if applicable. The Bloomberg U.S. Aggregate Index is an unmanaged index representing SEC-registered taxable and dollar denominated securities. It covers the U.S.
investment grade fixed rate bond market, with index components for government and corporate securities, mortgage pass-through, and asset-backed securities. The MSCI World Index (net of foreign withholding taxes) is a broad measure of the performance of developed countries’ equity markets. The SmartSpending Composite Benchmark is a composite benchmark of unmanaged indexes that includes 40% MSCI World Index (net of foreign withholding taxes) and 60% Bloomberg U.S. Aggregate Index. Investors cannot invest directly in an index.
Class I Shares have a $1,000,000 minimum initial investment.
Fund performance may reflect the waiver of the Fund’s fees and reimbursement of expenses for certain periods since the inception date. Without these waivers and reimbursements, performance would have been lower. Also, performance shown in this section does not reflect the deduction of taxes that a shareholder would pay on Fund distributions or on gains resulting from redemptions of Fund shares.
The returns shown are based on net asset values calculated for shareholder transactions and may differ from the returns shown in the financial highlights, which reflect adjustments made to the net asset values in accordance with accounting principles generally accepted in the United States of America.
| | | | | | | | | | |
| | | | | |
| 4 | | | | | | | | J.P. MORGAN FUNDS | | DECEMBER 31, 2021 |
JPMorgan SmartSpendingSM 2020 Fund
FUND COMMENTARY
SIX MONTHS ENDED DECEMBER 31, 2021 (Unaudited)
| | | | |
| REPORTING PERIOD RETURN: | |
| Fund (Class I Shares)* | | | 1.95% | |
| Bloomberg U.S. Aggregate Index | | | 0.06% | |
| MSCI World Index (net of foreign withholding taxes) | | | 7.76% | |
| SmartSpending Composite Benchmark | | | 3.17% | |
| |
| Net Assets as of 12/31/2021 (In Thousands) | | $ | 27,762 | |
INVESTMENT OBJECTIVE**
The JPMorgan SmartSpendingSM 2020 Fund (the “Fund”) seeks to provide total return consisting of current income and some capital appreciation.
WHAT WERE THE MAIN DRIVERS OF THE PORTFOLIO’S PERFORMANCE?
The Fund’s Class I Shares outperformed the Bloomberg U.S. Aggregate Index (the “Benchmark”) and underperformed the MSCI World Index (net of foreign withholding taxes) for the six months ended December 31, 2021. The Fund underperformed the SmartSpending Composite Benchmark (the “Composite Benchmark”), which consists of 40% MSCI World Index (net of foreign withholding taxes) and 60% Bloomberg U.S. Aggregate Index, over the same period.
Relative to the Benchmark, which does not include equity securities, the Fund’s allocation to global equity markets was a leading contributor to performance, mostly due to the underperformance of core fixed income and emerging markets fixed income during the reporting period.
Relative to the MSCI World Index, which includes exposure primarily to developed market equities, the Fund’s allocation to fixed income securities detracted from performance as equity outperformed fixed income during the period. The Fund’s more broadly diversified equity exposure, including real estate investment trusts, contributed to relative performance.
Relative to the Composite Benchmark, the Fund’s overweight positions in U.S. large cap and high yield debt (also known as “junk bonds”) were leading contributors to performance.
HOW WAS THE PORTFOLIO POSITIONED?
The Fund invested in underlying J.P. Morgan Funds and third party exchange-traded funds to implement the Fund managers’ asset allocation decisions. The Fund’s portfolio managers used futures contracts in general to implement tactical asset allocations. The Fund’s portfolio managers used a systematic screening and selection process to choose the underlying funds in their construction of the Fund’s portfolio. Relative to its Composite Benchmark, the Fund invested in a broader range of asset classes.
| | | | |
PORTFOLIO COMPOSITION
AS OF DECEMBER 31, 2021 | | PERCENT OF
TOTAL
INVESTMENTS | |
| Investment Companies | | | 41.4 | % |
| Exchange-Traded Funds | | | 28.9 | |
| Corporate Bonds | | | 8.0 | |
| U.S. Treasury Obligations | | | 7.3 | |
| Mortgage-Backed Securities | | | 5.9 | |
| Asset-Backed Securities | | | 3.3 | |
| Others (each less than 1.0%) | | | 1.0 | |
| Short-Term Investments | | | 4.2 | |
| * | | The return shown is based on net asset values calculated for shareholder transactions and may differ from the return shown in the financial highlights, which reflects adjustments made to the net asset values in accordance with accounting principles generally accepted in the United States of America. |
| ** | | The adviser seeks to achieve the Fund’s objective. There can be no guarantee it will be achieved. |
| | | | | | | | | | |
| | | | | |
| DECEMBER 31, 2021 | | J.P. MORGAN FUNDS | | | | | | | | 5 |
JPMorgan SmartSpendingSM 2020 Fund
FUND COMMENTARY
SIX MONTHS ENDED DECEMBER 31, 2021 (Unaudited) (continued)
| | | | | | | | | | | | | | | | |
AVERAGE ANNUAL TOTAL RETURNS AS OF DECEMBER 31, 2021 | |
| | | | |
| | | INCEPTION DATE OF
CLASS | | | 6 MONTH* | | | 1 YEAR | | | SINCE
INCEPTION | |
CLASS I SHARES | | | July 1, 2020 | | | | 1.95 | % | | | 6.02 | % | | | 10.81 | % |
CLASS R2 SHARES | | | July 1, 2020 | | | | 1.66 | | | | 5.46 | | | | 10.25 | |
CLASS R3 SHARES | | | July 1, 2020 | | | | 1.84 | | | | 5.78 | | | | 10.55 | |
CLASS R4 SHARES | | | July 1, 2020 | | | | 1.96 | | | | 6.03 | | | | 10.81 | |
CLASS R5 SHARES | | | July 1, 2020 | | | | 2.05 | | | | 6.18 | | | | 10.97 | |
CLASS R6 SHARES | | | July 1, 2020 | | | | 2.08 | | | | 6.28 | | | | 11.07 | |
LIFE OF FUND PERFORMANCE (7/1/20 to 12/31/21)
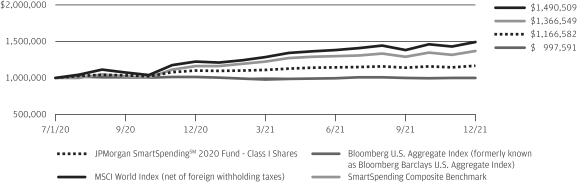
The performance quoted is past performance and is not a guarantee of future results. Mutual funds are subject to certain market risks. Investment returns and principal value of an investment will fluctuate so that an investor’s shares, when redeemed, may be worth more or less than their original cost. Current performance may be higher or lower than the performance data shown. For up-to-date month-end performance information please call 1-800-480-4111.
The Fund commenced operations on July 1, 2020.
The graph illustrates comparative performance for $1,000,000 invested in Class I Shares of the JPMorgan SmartSpendingSM 2020 Fund, the MSCI World Index (net of foreign withholding taxes), the Bloomberg U.S. Aggregate Index and the SmartSpending Composite Benchmark from July 1, 2020 to December 31, 2021. The performance of the Fund assumes reinvestment of all dividends and capital gain distributions, if any, and does not include a sales charge. The performance of the MSCI World Index, the Bloomberg U.S. Aggregate Index and the SmartSpending Composite Benchmark does not reflect the deduction of expenses or a sales charge associated with a mutual fund and has been adjusted to reflect reinvestment of all dividends and capital gain distributions of the securities included in the benchmark, if applicable. The Bloomberg U.S. Aggregate Index is an unmanaged index representing SEC-registered taxable and dollar denominated securities. It covers the U.S.
investment grade fixed rate bond market, with index components for government and corporate securities, mortgage pass-through, and asset-backed securities. The MSCI World Index (net of foreign withholding taxes) is a broad measure of the performance of developed countries’ equity markets. The SmartSpending Composite Benchmark is a composite benchmark of unmanaged indexes that includes 40% MSCI World Index (net of foreign withholding taxes) and 60% Bloomberg U.S. Aggregate Index. Investors cannot invest directly in an index.
Class I Shares have a $1,000,000 minimum initial investment.
Fund performance may reflect the waiver of the Fund’s fees and reimbursement of expenses for certain periods since the inception date. Without these waivers and reimbursements, performance would have been lower. Also, performance shown in this section does not reflect the deduction of taxes that a shareholder would pay on Fund distributions or on gains resulting from redemptions of Fund shares.
The returns shown are based on net asset values calculated for shareholder transactions and may differ from the returns shown in the financial highlights, which reflect adjustments made to the net asset values in accordance with accounting principles generally accepted in the United States of America.
| | | | | | | | | | |
| | | | | |
| 6 | | | | | | | | J.P. MORGAN FUNDS | | DECEMBER 31, 2021 |
JPMorgan SmartSpendingSM 2015 Fund
SCHEDULE OF PORTFOLIO INVESTMENTS
AS OF DECEMBER 31, 2021 (Unaudited)
| | | | | | | | |
| INVESTMENTS | |
SHARES
(000) | | | VALUE
($000) | |
Investment Companies — 39.6% | |
|
Fixed Income — 26.9% | |
| | |
JPMorgan Emerging Markets Debt Fund Class R6 Shares (a) | | | 75 | | | | 579 | |
| | |
JPMorgan Emerging Markets Strategic Debt Fund Class R6 Shares (a) | | | 76 | | | | 585 | |
| | |
JPMorgan Floating Rate Income Fund Class R6 Shares (a) | | | 44 | | | | 395 | |
| | |
JPMorgan High Yield Fund Class R6 Shares (a) | | | 153 | | | | 1,107 | |
| | |
JPMorgan Income Fund Class R6 Shares (a) | | | 82 | | | | 770 | |
| | |
JPMorgan Inflation Managed Bond Fund Class R6 Shares (a) | | | 210 | | | | 2,310 | |
| | |
JPMorgan Short Duration Core Plus Fund Class R6 Shares (a) | | | 259 | | | | 2,520 | |
| | | | | | | | |
| | |
Total Fixed Income | | | | | | | 8,266 | |
| | | | | | | | |
|
U.S. Equity — 12.7% | |
| | |
JPMorgan Equity Index Fund Class R6 Shares (a) | | | 54 | | | | 3,889 | |
| | | | | | | | |
| | |
Total Investment Companies
(Cost $10,812) | | | | | | | 12,155 | |
| | | | | | | | |
Exchange-Traded Funds — 29.7% | |
|
Alternative Assets — 1.9% | |
| | |
JPMorgan BetaBuilders MSCI US REIT ETF (a) | | | 5 | | | | 589 | |
| | | | | | | | |
|
Fixed Income — 11.3% | |
| | |
JPMorgan High Yield Research Enhanced ETF (a) | | | 25 | | | | 1,288 | |
| | |
JPMorgan U.S. Aggregate Bond ETF (a) | | | 40 | | | | 2,177 | |
| | | | | | | | |
| | |
Total Fixed Income | | | | | | | 3,465 | |
| | | | | | | | |
|
International Equity — 13.1% | |
| | |
iShares Core MSCI Emerging Markets ETF | | | 17 | | | | 1,021 | |
| | |
JPMorgan BetaBuilders International Equity ETF (a) | | | 50 | | | | 2,990 | |
| | | | | | | | |
| | |
Total International Equity | | | | | | | 4,011 | |
| | | | | | | | |
|
U.S. Equity — 3.4% | |
| | |
iShares Russell 2000 ETF | | | 2 | | | | 412 | |
| | |
iShares Russell Mid-Cap ETF | | | 8 | | | | 644 | |
| | | | | | | | |
| | |
Total U.S. Equity | | | | | | | 1,056 | |
| | | | | | | | |
| | |
Total Exchange-Traded Funds
(Cost $7,999) | | | | | | | 9,121 | |
| | | | | | | | |
| | |
| | | PRINCIPAL
AMOUNT
($000) | | | | |
Corporate Bonds — 7.9% | |
|
Aerospace & Defense — 0.2% | |
| | |
Boeing Co. (The) | | | | | | | | |
| | |
1.17%, 2/4/2023 | | | 5 | | | | 5 | |
| | |
1.43%, 2/4/2024 | | | 5 | | | | 5 | |
| | | | | | | | |
| INVESTMENTS | | PRINCIPAL
AMOUNT
($000) | | | VALUE
($000) | |
| | | | | | | | |
|
Aerospace & Defense — continued | |
| | |
2.70%, 2/1/2027 | | | 32 | | | | 32 | |
| | |
3.45%, 11/1/2028 | | | 3 | | | | 3 | |
| | |
Leidos, Inc. 2.30%, 2/15/2031 | | | 11 | | | | 11 | |
| | |
Northrop Grumman Corp. 3.85%, 4/15/2045 | | | 7 | | | | 8 | |
| | |
Raytheon Technologies Corp. 2.25%, 7/1/2030 | | | 11 | | | | 11 | |
| | | | | | | | |
| | |
| | | | | | | 75 | |
| | | | | | | | |
|
Airlines — 0.0% (b) | |
| | |
American Airlines Pass-Through Trust Series 2021-1, Class A Shares, 2.88%, 7/11/2034 | | | 12 | | | | 12 | |
| | | | | | | | |
|
Auto Components — 0.0% (b) | |
| | |
Lear Corp. 2.60%, 1/15/2032 | | | 5 | | | | 5 | |
| | | | | | | | |
|
Automobiles — 0.3% | |
| | |
General Motors Co. 6.80%, 10/1/2027 | | | 15 | | | | 18 | |
| | |
Hyundai Capital America | | | | | | | | |
| | |
1.15%, 11/10/2022 (c) | | | 17 | | | | 17 | |
| | |
2.65%, 2/10/2025 (c) | | | 5 | | | | 5 | |
| | |
1.30%, 1/8/2026 (c) | | | 5 | | | | 5 | |
| | |
2.38%, 10/15/2027 (c) | | | 14 | | | | 14 | |
| | |
1.80%, 1/10/2028 (c) | | | 5 | | | | 5 | |
| | |
Nissan Motor Acceptance Co. LLC 2.80%, 1/13/2022 (c) | | | 22 | | | | 22 | |
| | | | | | | | |
| | |
| | | | | | | 86 | |
| | | | | | | | |
|
Banks — 0.8% | |
| | |
Bank of America Corp. | | | | | | | | |
| | |
4.00%, 1/22/2025 | | | 21 | | | | 22 | |
| | |
(SOFR + 1.01%), 1.20%, 10/24/2026 (d) | | | 11 | | | | 11 | |
| | |
(ICE LIBOR USD 3 Month + 1.51%), 3.71%, 4/24/2028 (d) | | | 23 | | | | 25 | |
| | |
(SOFR + 1.21%), 2.57%, 10/20/2032 (d) | | | 5 | | | | 5 | |
| | |
(SOFR + 1.93%), 2.68%, 6/19/2041 (d) | | | 21 | | | | 20 | |
| | |
Citigroup, Inc. | | | | | | | | |
| | |
3.88%, 3/26/2025 | | | 34 | | | | 36 | |
| | |
(ICE LIBOR USD 3 Month + 1.39%), 3.67%, 7/24/2028 (d) | | | 5 | | | | 5 | |
| | |
(ICE LIBOR USD 3 Month + 1.15%), 3.52%, 10/27/2028 (d) | | | 11 | | | | 12 | |
| | |
(SOFR + 1.18%), 2.52%, 11/3/2032 (d) | �� | | 5 | | | | 5 | |
| | |
(ICE LIBOR USD 3 Month + 1.17%), 3.88%, 1/24/2039 (d) | | | 7 | | | | 8 | |
| | |
HSBC Holdings plc (United Kingdom) 6.10%, 1/14/2042 | | | 12 | | | | 17 | |
| | |
KeyCorp 2.25%, 4/6/2027 | | | 11 | | | | 11 | |
| | |
Mitsubishi UFJ Financial Group, Inc. (Japan) 3.74%, 3/7/2029 | | | 11 | | | | 12 | |
SEE NOTES TO FINANCIAL STATEMENTS.
| | | | | | | | | | |
| | | | | |
| DECEMBER 31, 2021 | | J.P. MORGAN FUNDS | | | | | | | | 7 |
JPMorgan SmartSpendingSM 2015 Fund
SCHEDULE OF PORTFOLIO INVESTMENTS
AS OF DECEMBER 31, 2021 (Unaudited) (continued)
| | | | | | | | |
| INVESTMENTS | | PRINCIPAL
AMOUNT
($000) | | | VALUE
($000) | |
Corporate Bonds — continued | |
|
Banks — continued | |
| | |
Wells Fargo & Co. | | | | | | | | |
| | |
4.10%, 6/3/2026 | | | 11 | | | | 12 | |
| | |
(SOFR + 2.53%), 3.07%, 4/30/2041 (d) | | | 12 | | | | 12 | |
| | |
Westpac Banking Corp. (Australia) 3.13%, 11/18/2041 | | | 4 | | | | 4 | |
| | | | | | | | |
| | |
| | | | | | | 217 | |
| | | | | | | | |
|
Beverages — 0.1% | |
| | |
Anheuser-Busch InBev Worldwide, Inc. (Belgium) 3.75%, 7/15/2042 | | | 14 | | | | 15 | |
| | |
Keurig Dr Pepper, Inc. 3.20%, 5/1/2030 | | | 11 | | | | 12 | |
| | | | | | | | |
| | |
| | | | | | | 27 | |
| | | | | | | | |
|
Biotechnology — 0.2% | |
| | |
AbbVie, Inc. | | | | | | | | |
| | |
2.95%, 11/21/2026 | | | 3 | | | | 3 | |
| | |
3.20%, 11/21/2029 | | | 4 | | | | 4 | |
| | |
4.05%, 11/21/2039 | | | 32 | | | | 37 | |
| | |
Amgen, Inc. 3.15%, 2/21/2040 | | | 7 | | | | 7 | |
| | |
Gilead Sciences, Inc. 2.60%, 10/1/2040 | | | 11 | | | | 11 | |
| | |
Regeneron Pharmaceuticals, Inc. 1.75%, 9/15/2030 | | | 7 | | | | 7 | |
| | | | | | | | |
| | |
| | | | | | | 69 | |
| | | | | | | | |
|
Building Products — 0.0% (b) | |
| | |
Masco Corp. 2.00%, 10/1/2030 | | | 7 | | | | 7 | |
| | | | | | | | |
|
Capital Markets — 0.4% | |
| | |
Goldman Sachs Group, Inc. (The) | | | | | | | | |
| | |
(SOFR + 0.57%), 0.67%, 3/8/2024 (d) | | | 13 | | | | 13 | |
| | |
4.25%, 10/21/2025 | | | 46 | | | | 50 | |
| | |
(SOFR + 0.91%), 1.95%, 10/21/2027 (d) | | | 5 | | | | 5 | |
| | |
(ICE LIBOR USD 3 Month + 1.51%), 3.69%, 6/5/2028 (d) | | | 16 | | | | 17 | |
| | |
Macquarie Group Ltd. (Australia) | | | | | | | | |
| | |
(SOFR + 1.07%), 1.34%, 1/12/2027 (c) (d) | | | 10 | | | | 10 | |
| | |
Morgan Stanley 3.95%, 4/23/2027 | | | 14 | | | | 16 | |
| | |
(ICE LIBOR USD 3 Month + 1.43%), 4.46%, 4/22/2039 (d) | | | 12 | | | | 14 | |
| | | | | | | | |
| | |
| | | | | | | 125 | |
| | | | | | | | |
|
Chemicals — 0.1% | |
| | |
International Flavors & Fragrances, Inc. 3.47%, 12/1/2050 (c) | | | 11 | | | | 11 | |
| | |
LYB International Finance III LLC 1.25%, 10/1/2025 | | | 11 | | | | 11 | |
| | | | | | | | |
| | |
| | | | | | | 22 | |
| | | | | | | | |
| | | | | | | | |
| INVESTMENTS | | PRINCIPAL
AMOUNT
($000) | | | VALUE
($000) | |
| | | | | | | | |
|
Commercial Services & Supplies — 0.0% (b) | |
| | |
Republic Services, Inc. 1.75%, 2/15/2032 | | | 15 | | | | 14 | |
| | | | | | | | |
|
Construction & Engineering — 0.0% (b) | |
| | |
Quanta Services, Inc. 2.35%, 1/15/2032 | | | 10 | | | | 10 | |
| | | | | | | | |
|
Construction Materials — 0.0% (b) | |
| | |
Martin Marietta Materials, Inc. Series CB, 2.50%, 3/15/2030 | | | 7 | | | | 7 | |
| | | | | | | | |
|
Consumer Finance — 0.3% | |
| | |
Avolon Holdings Funding Ltd. (Ireland) | | | | | | | | |
| | |
3.63%, 5/1/2022 (c) | | | 5 | | | | 5 | |
| | |
2.88%, 2/15/2025 (c) | | | 5 | | | | 5 | |
| | |
5.50%, 1/15/2026 (c) | | | 19 | | | | 21 | |
| | |
2.13%, 2/21/2026 (c) | | | 5 | | | | 5 | |
| | |
2.53%, 11/18/2027 (c) | | | 13 | | | | 13 | |
| | |
Capital One Financial Corp. | | | | | | | | |
| | |
3.80%, 1/31/2028 | | | 11 | | | | 12 | |
| | |
(SOFR + 1.27%), 2.62%, 11/2/2032 (d) | | | 5 | | | | 5 | |
| | |
General Motors Financial Co., Inc. | | | | | | | | |
| | |
1.25%, 1/8/2026 | | | 7 | | | | 7 | |
| | |
4.35%, 1/17/2027 | | | 2 | | | | 2 | |
| | |
Park Aerospace Holdings Ltd. (Ireland) 4.50%, 3/15/2023 (c) | | | 5 | | | | 5 | |
| | | | | | | | |
| | |
| | | | | | | 80 | |
| | | | | | | | |
|
Containers & Packaging — 0.0% (b) | |
| | |
Graphic Packaging International LLC 1.51%, 4/15/2026 (c) | | | 6 | | | | 6 | |
| | | | | | | | |
|
Diversified Financial Services — 0.0% (b) | |
| | |
Shell International Finance BV (Netherlands) | | | | | | | | |
| | |
2.38%, 11/7/2029 | | | 7 | | | | 7 | |
| | |
3.13%, 11/7/2049 | | | 5 | | | | 5 | |
| | | | | | | | |
| | |
| | | | | | | 12 | |
| | | | | | | | |
|
Diversified Telecommunication Services — 0.2% | |
| | |
AT&T, Inc. | | | | | | | | |
| | |
2.75%, 6/1/2031 | | | 21 | | | | 21 | |
| | |
3.50%, 6/1/2041 | | | 11 | | | | 11 | |
| | |
3.55%, 9/15/2055 | | | 4 | | | | 4 | |
| | |
Verizon Communications, Inc. | | | | | | | | |
| | |
2.10%, 3/22/2028 | | | 5 | | | | 5 | |
| | |
3.15%, 3/22/2030 | | | 10 | | | | 11 | |
| | |
2.65%, 11/20/2040 | | | 5 | | | | 5 | |
| | |
3.85%, 11/1/2042 | | | 11 | | | | 12 | |
| | | | | | | | |
| | |
| | | | | | | 69 | |
| | | | | | | | |
|
Electric Utilities — 0.5% | |
| | |
Duke Energy Corp. 3.40%, 6/15/2029 | | | 11 | | | | 12 | |
SEE NOTES TO FINANCIAL STATEMENTS.
| | | | | | | | | | |
| | | | | |
| 8 | | | | | | | | J.P. MORGAN FUNDS | | DECEMBER 31, 2021 |
| | | | | | | | |
| INVESTMENTS | | PRINCIPAL
AMOUNT
($000) | | | VALUE
($000) | |
Corporate Bonds — continued | |
|
Electric Utilities — continued | |
| | |
Edison International 5.75%, 6/15/2027 | | | 6 | | | | 7 | |
| | |
Emera US Finance LP (Canada) 4.75%, 6/15/2046 | | | 12 | | | | 14 | |
| | |
Evergy, Inc. 2.90%, 9/15/2029 | | | 11 | | | | 11 | |
| | |
Indiana Michigan Power Co. 3.25%, 5/1/2051 | | | 5 | | | | 5 | |
| | |
Jersey Central Power & Light Co. 4.30%, 1/15/2026 (c) | | | 7 | | | | 8 | |
| | |
New England Power Co. (United Kingdom) 2.81%, 10/6/2050 (c) | | | 7 | | | | 6 | |
| | |
NRG Energy, Inc. | | | | | | | | |
| | |
2.00%, 12/2/2025 (c) | | | 5 | | | | 5 | |
| | |
2.45%, 12/2/2027 (c) | | | 24 | | | | 23 | |
| | |
OGE Energy Corp. 0.70%, 5/26/2023 | | | 5 | | | | 5 | |
| | |
Oklahoma Gas and Electric Co. 0.55%, 5/26/2023 | | | 5 | | | | 5 | |
| | |
Pacific Gas and Electric Co. | | | | | | | | |
| | |
1.37%, 3/10/2023 | | | 10 | | | | 10 | |
| | |
1.70%, 11/15/2023 | | | 5 | | | | 5 | |
| | |
2.95%, 3/1/2026 | | | 4 | | | | 4 | |
| | |
3.75%, 8/15/2042 (e) | | | 4 | | | | 4 | |
| | |
4.30%, 3/15/2045 | | | 1 | | | | 1 | |
| | |
PacifiCorp 4.15%, 2/15/2050 | | | 12 | | | | 14 | |
| | |
Southern California Edison Co. Series 20C, 1.20%, 2/1/2026 | | | 12 | | | | 12 | |
| | | | | | | | |
| | |
| | | | | | | 151 | |
| | | | | | | | |
|
Electrical Equipment — 0.0% (b) | |
| | |
Eaton Corp. 4.15%, 11/2/2042 | | | 7 | | | | 8 | |
| | | | | | | | |
|
Energy Equipment & Services — 0.0% (b) | |
| | |
Baker Hughes Holdings LLC 3.34%, 12/15/2027 | | | 7 | | | | 7 | |
| | |
Schlumberger Holdings Corp. 4.00%, 12/21/2025 (c) | | | 7 | | | | 8 | |
| | | | | | | | |
| | |
| | | | | | | 15 | |
| | | | | | | | |
|
Entertainment — 0.1% | |
| | |
Activision Blizzard, Inc. 1.35%, 9/15/2030 | | | 4 | | | | 4 | |
| | |
Walt Disney Co. (The) 3.50%, 5/13/2040 | | | 11 | | | | 12 | |
| | | | | | | | |
| | |
| | | | | | | 16 | |
| | | | | | | | |
|
Equity Real Estate Investment Trusts (REITs) — 0.8% | |
| | |
Alexandria Real Estate Equities, Inc. 3.38%, 8/15/2031 | | | 7 | | | | 8 | |
| | |
American Tower Corp. | | | | | | | | |
| | |
1.50%, 1/31/2028 | | | 5 | | | | 5 | |
| | |
1.88%, 10/15/2030 | | | 27 | | | | 25 | |
| | |
3.10%, 6/15/2050 | | | 7 | | | | 6 | |
| | |
2.95%, 1/15/2051 | | | 4 | | | | 4 | |
| | | | | | | | |
| INVESTMENTS | | PRINCIPAL
AMOUNT
($000) | | | VALUE
($000) | |
| | | | | | | | |
|
Equity Real Estate Investment Trusts (REITs) — continued | |
| | |
Brixmor Operating Partnership LP | | | | | | | | |
| | |
2.25%, 4/1/2028 | | | 10 | | | | 10 | |
| | |
2.50%, 8/16/2031 | | | 5 | | | | 5 | |
| | |
Corporate Office Properties LP 2.75%, 4/15/2031 | | | 5 | | | | 5 | |
| | |
Crown Castle International Corp. 3.10%, 11/15/2029 | | | 7 | | | | 7 | |
| | |
CubeSmart LP 2.00%, 2/15/2031 | | | 11 | | | | 11 | |
| | |
Digital Realty Trust LP 3.70%, 8/15/2027 | | | 7 | | | | 8 | |
| | |
Equinix, Inc. 2.90%, 11/18/2026 | | | 11 | | | | 11 | |
| | |
Federal Realty Investment Trust 1.25%, 2/15/2026 | | | 7 | | | | 7 | |
| | |
Healthcare Trust of America Holdings LP 2.00%, 3/15/2031 | | | 7 | | | | 7 | |
| | |
Healthpeak Properties, Inc. | | | | | | | | |
| | |
2.13%, 12/1/2028 | | | 6 | | | | 6 | |
| | |
2.88%, 1/15/2031 | | | 7 | | | | 7 | |
| | |
Life Storage LP 2.40%, 10/15/2031 | | | 5 | | | | 5 | |
| | |
Mid-America Apartments LP 3.60%, 6/1/2027 | | | 3 | | | | 3 | |
| | |
Office Properties Income Trust 2.40%, 2/1/2027 | | | 10 | | | | 10 | |
| | |
Physicians Realty LP 2.63%, 11/1/2031 | | | 5 | | | | 5 | |
| | |
Public Storage | | | | | | | | |
| | |
1.95%, 11/9/2028 | | | 3 | | | | 3 | |
| | |
2.25%, 11/9/2031 | | | 3 | | | | 3 | |
| | |
Realty Income Corp. 1.80%, 3/15/2033 | | | 5 | | | | 5 | |
| | |
Sabra Health Care LP 3.20%, 12/1/2031 | | | 5 | | | | 5 | |
| | |
Safehold Operating Partnership LP 2.85%, 1/15/2032 | | | 7 | | | | 7 | |
| | |
Scentre Group Trust 1 (Australia) 3.63%, 1/28/2026 (c) | | | 14 | | | | 14 | |
| | |
UDR, Inc. | | | | | | | | |
| | |
2.10%, 8/1/2032 | | | 7 | | | | 6 | |
| | |
1.90%, 3/15/2033 | | | 5 | | | | 5 | |
| | |
WP Carey, Inc. | | | | | | | | |
| | |
2.40%, 2/1/2031 | | | 11 | | | | 10 | |
| | |
2.45%, 2/1/2032 | | | 10 | | | | 10 | |
| | | | | | | | |
| | |
| | | | | | | 223 | |
| | | | | | | | |
|
Food & Staples Retailing — 0.2% | |
| | |
7-Eleven, Inc. | | | | | | | | |
| | |
0.63%, 2/10/2023 (c) | | | 15 | | | | 14 | |
| | |
0.95%, 2/10/2026 (c) | | | 2 | | | | 2 | |
| | |
1.30%, 2/10/2028 (c) | | | 2 | | | | 2 | |
| | |
2.50%, 2/10/2041 (c) | | | 3 | | | | 3 | |
| | |
Alimentation Couche-Tard, Inc. (Canada) | | | | | | | | |
| | |
2.95%, 1/25/2030 (c) | | | 7 | | | | 8 | |
SEE NOTES TO FINANCIAL STATEMENTS.
| | | | | | | | | | |
| | | | | |
| DECEMBER 31, 2021 | | J.P. MORGAN FUNDS | | | | | | | | 9 |
JPMorgan SmartSpendingSM 2015 Fund
SCHEDULE OF PORTFOLIO INVESTMENTS
AS OF DECEMBER 31, 2021 (Unaudited) (continued)
| | | | | | | | |
| INVESTMENTS | | PRINCIPAL
AMOUNT
($000) | | | VALUE
($000) | |
Corporate Bonds — continued | |
|
Food & Staples Retailing — continued | |
| | |
3.44%, 5/13/2041 (c) | | | 5 | | | | 5 | |
| | |
3.63%, 5/13/2051 (c) | | | 5 | | | | 5 | |
| | |
Kroger Co. (The) 3.95%, 1/15/2050 | | | 7 | | | | 8 | |
| | |
Sysco Corp. 2.40%, 2/15/2030 | | | 11 | | | | 11 | |
| | | | | | | | |
| | |
| | | | | | | 58 | |
| | | | | | | | |
|
Food Products — 0.2% | |
| | |
Bunge Ltd. Finance Corp. 2.75%, 5/14/2031 | | | 5 | | | | 5 | |
| | |
Conagra Brands, Inc. 1.38%, 11/1/2027 | | | 11 | | | | 11 | |
| | |
Mondelez International, Inc. 1.88%, 10/15/2032 | | | 11 | | | | 10 | |
| | |
Smithfield Foods, Inc. 3.00%, 10/15/2030 (c) | | | 11 | | | | 11 | |
| | |
Tyson Foods, Inc. 3.55%, 6/2/2027 | | | 11 | | | | 12 | |
| | | | | | | | |
| | |
| | | | | | | 49 | |
| | | | | | | | |
|
Gas Utilities — 0.1% | |
| | |
Atmos Energy Corp. | | | | | | | | |
| | |
0.63%, 3/9/2023 | | | 5 | | | | 5 | |
| | |
1.50%, 1/15/2031 | | | 6 | | | | 6 | |
| | |
CenterPoint Energy Resources Corp. 1.75%, 10/1/2030 | | | 11 | | | | 10 | |
| | | | | | | | |
| | |
| | | | | | | 21 | |
| | | | | | | | |
|
Health Care Equipment & Supplies — 0.1% | |
| | |
Becton Dickinson and Co. 4.67%, 6/6/2047 | | | 12 | | | | 15 | |
| | |
Zimmer Biomet Holdings, Inc. 2.60%, 11/24/2031 | | | 5 | | | | 5 | |
| | | | | | | | |
| | |
| | | | | | | 20 | |
| | | | | | | | |
|
Health Care Providers & Services — 0.3% | |
| | |
Anthem, Inc. 2.25%, 5/15/2030 | | | 7 | | | | 7 | |
| | |
Banner Health 1.90%, 1/1/2031 | | | 4 | | | | 4 | |
| | |
Bon Secours Mercy Health, Inc. Series 20-2, 3.21%, 6/1/2050 | | | 5 | | | | 5 | |
| | |
CVS Health Corp. 4.88%, 7/20/2035 | | | 5 | | | | 6 | |
| | |
HCA, Inc. 5.25%, 6/15/2026 | | | 23 | | | | 26 | |
| | |
MedStar Health, Inc. Series 20A, 3.63%, 8/15/2049 | | | 5 | | | | 5 | |
| | |
MultiCare Health System 2.80%, 8/15/2050 | | | 2 | | | | 2 | |
| | |
Piedmont Healthcare, Inc. 2.86%, 1/1/2052 | | | 5 | | | | 5 | |
| | |
Quest Diagnostics, Inc. 2.80%, 6/30/2031 | | | 7 | | | | 7 | |
| | |
Universal Health Services, Inc. 2.65%, 1/15/2032 (c) | | | 5 | | | | 5 | |
| | |
West Virginia United Health System Obligated Group Series 2020, 3.13%, 6/1/2050 | | | 20 | | | | 20 | |
| | | | | | | | |
| | |
| | | | | | | 92 | |
| | | | | | | | |
| | | | | | | | |
| INVESTMENTS | | PRINCIPAL
AMOUNT
($000) | | | VALUE
($000) | |
| | | | | | | | |
|
Hotels, Restaurants & Leisure — 0.0% (b) | |
| | |
Starbucks Corp. 3.35%, 3/12/2050 | | | 7 | | | | 7 | |
| | | | | | | | |
|
Household Durables — 0.0% (b) | |
| | |
Lennar Corp. | | | | | | | | |
| | |
4.50%, 4/30/2024 | | | 2 | | | | 2 | |
| | |
5.00%, 6/15/2027 | | | 11 | | | | 13 | |
| | | | | | | | |
| | |
| | | | | | | 15 | |
| | | | | | | | |
|
Household Products — 0.0% (b) | |
| | |
Kimberly-Clark Corp. 3.70%, 6/1/2043 | | | 7 | | | | 8 | |
| | | | | | | | |
|
Independent Power and Renewable Electricity Producers — 0.2% | |
| | |
Alexander Funding Trust 1.84%, 11/15/2023 (c) | | | 15 | | | | 15 | |
| | |
Exelon Generation Co. LLC 3.25%, 6/1/2025 | | | 21 | | | | 22 | |
| | |
Southern Power Co. 5.15%, 9/15/2041 | | | 16 | | | | 20 | |
| | | | | | | | |
| | |
| | | | | | | 57 | |
| | | | | | | | |
|
Industrial Conglomerates — 0.0% (b) | |
| | |
Roper Technologies, Inc. 1.75%, 2/15/2031 | | | 7 | | | | 7 | |
| | | | | | | | |
|
Insurance — 0.3% | |
| | |
American International Group, Inc. 4.38%, 6/30/2050 | | | 7 | | | | 9 | |
| | |
Athene Global Funding | | | | | | | | |
| | |
0.95%, 1/8/2024 (c) | | | 11 | | | | 11 | |
| | |
2.75%, 6/25/2024 (c) | | | 7 | | | | 7 | |
| | |
2.50%, 1/14/2025 (c) | | | 4 | | | | 4 | |
| | |
1.45%, 1/8/2026 (c) | | | 10 | | | | 10 | |
| | |
Brown & Brown, Inc. 2.38%, 3/15/2031 | | | 7 | | | | 7 | |
| | |
Empower Finance 2020 LP (Canada) 3.08%, 9/17/2051 (c) | | | 7 | | | | 7 | |
| | |
F&G Global Funding 1.75%, 6/30/2026 (c) | | | 5 | | | | 5 | |
| | |
New York Life Insurance Co. 3.75%, 5/15/2050 (c) | | | 7 | | | | 8 | |
| | |
Northwestern Mutual Global Funding 1.70%, 6/1/2028 (c) | | | 5 | | | | 5 | |
| | |
Teachers Insurance & Annuity Association of America 3.30%, 5/15/2050 (c) | | | 7 | | | | 7 | |
| | | | | | | | |
| | |
| | | | | | | 80 | |
| | | | | | | | |
|
IT Services — 0.0% (b) | |
| | |
CGI, Inc. (Canada) 2.30%, 9/14/2031 (c) | | | 6 | | | | 6 | |
| | |
Global Payments, Inc. 3.20%, 8/15/2029 | | | 4 | | | | 4 | |
| | | | | | | | |
| | |
| | | | | | | 10 | |
| | | | | | | | |
|
Leisure Products — 0.0% (b) | |
| | |
Hasbro, Inc. 3.90%, 11/19/2029 | | | 5 | | | | 6 | |
| | | | | | | | |
|
Life Sciences Tools & Services — 0.0% (b) | |
| | |
Thermo Fisher Scientific, Inc. 2.00%, 10/15/2031 | | | 10 | | | | 10 | |
| | | | | | | | |
SEE NOTES TO FINANCIAL STATEMENTS.
| | | | | | | | | | |
| | | | | |
| 10 | | | | | | | | J.P. MORGAN FUNDS | | DECEMBER 31, 2021 |
| | | | | | | | |
| INVESTMENTS | | PRINCIPAL
AMOUNT
($000) | | | VALUE
($000) | |
Corporate Bonds — continued | |
|
Machinery — 0.0% (b) | |
| | |
Otis Worldwide Corp. 3.11%, 2/15/2040 | | | 7 | | | | 7 | |
| | | | | | | | |
|
Media — 0.3% | |
| | |
Charter Communications Operating LLC | | | | | | | | |
| | |
2.80%, 4/1/2031 | | | 21 | | | | 21 | |
| | |
3.50%, 6/1/2041 | | | 10 | | | | 10 | |
| | |
Comcast Corp. | | | | | | | | |
| | |
3.25%, 11/1/2039 | | | 11 | | | | 11 | |
| | |
2.80%, 1/15/2051 | | | 3 | | | | 3 | |
| | |
Cox Communications, Inc. 1.80%, 10/1/2030 (c) | | | 11 | | | | 10 | |
| | |
Discovery Communications LLC 3.63%, 5/15/2030 | | | 11 | | | | 12 | |
| | |
ViacomCBS, Inc. | | | | | | | | |
| | |
4.38%, 3/15/2043 | | | 11 | | | | 13 | |
| | |
5.85%, 9/1/2043 | | | 3 | | | | 4 | |
| | | | | | | | |
| | |
| | | | | | | 84 | |
| | | | | | | | |
|
Metals & Mining — 0.1% | |
| | |
Glencore Funding LLC (Australia) 2.50%, 9/1/2030 (c) | | | 12 | | | | 12 | |
| | |
Steel Dynamics, Inc. 1.65%, 10/15/2027 | | | 5 | | | | 5 | |
| | |
Vale Overseas Ltd. (Brazil) 3.75%, 7/8/2030 | | | 6 | | | | 6 | |
| | | | | | | | |
| | |
| | | | | | | 23 | |
| | | | | | | | |
|
Multiline Retail — 0.1% | |
| | |
Kohl’s Corp. 3.38%, 5/1/2031 | | | 6 | | | | 6 | |
| | |
Nordstrom, Inc. 4.25%, 8/1/2031 | | | 10 | | | | 10 | |
| | | | | | | | |
| | |
| | | | | | | 16 | |
| | | | | | | | |
|
Multi-Utilities — 0.0% (b) | |
| | |
WEC Energy Group, Inc. 1.38%, 10/15/2027 | | | 11 | | | | 11 | |
| | | | | | | | |
|
Oil, Gas & Consumable Fuels — 0.8% | |
| | |
Boardwalk Pipelines LP 4.45%, 7/15/2027 | | | 5 | | | | 5 | |
| | |
BP Capital Markets America, Inc. | | | | | | | | |
| | |
3.63%, 4/6/2030 | | | 7 | | | | 8 | |
| | |
2.77%, 11/10/2050 | | | 11 | | | | 10 | |
| | |
Chevron USA, Inc. 3.25%, 10/15/2029 | | | 5 | | | | 5 | |
| | |
ConocoPhillips 3.75%, 10/1/2027 (c) | | | 7 | | | | 8 | |
| | |
Coterra Energy, Inc. 3.90%, 5/15/2027 (c) | | | 5 | | | | 5 | |
| | |
Diamondback Energy, Inc. 3.25%, 12/1/2026 | | | 9 | | | | 9 | |
| | |
Enable Midstream Partners LP 5.00%, 5/15/2044 (e) | | | 10 | | | | 11 | |
| | |
Energy Transfer LP 3.90%, 7/15/2026 | | | 11 | | | | 12 | |
| | |
Enterprise Products Operating LLC 4.45%, 2/15/2043 | | | 7 | | | | 8 | |
| | |
Exxon Mobil Corp. 3.00%, 8/16/2039 | | | 11 | | | | 11 | |
| | | | | | | | |
| INVESTMENTS | | PRINCIPAL
AMOUNT
($000) | | | VALUE
($000) | |
| | | | | | | | |
|
Oil, Gas & Consumable Fuels — continued | |
| | |
Flex Intermediate Holdco LLC | | | | | | | | |
| | |
3.36%, 6/30/2031 (c) | | | 5 | | | | 5 | |
| | |
4.32%, 12/30/2039 (c) | | | 5 | | | | 5 | |
| | |
Gray Oak Pipeline LLC | | | | | | | | |
| | |
2.60%, 10/15/2025 (c) | | | 14 | | | | 15 | |
| | |
3.45%, 10/15/2027 (c) | | | 6 | | | | 6 | |
| | |
HollyFrontier Corp. 2.63%, 10/1/2023 | | | 7 | | | | 7 | |
| | |
MPLX LP 2.65%, 8/15/2030 | | | 11 | | | | 11 | |
| | |
NGPL PipeCo LLC 3.25%, 7/15/2031 (c) | | | 5 | | | | 5 | |
| | |
Phillips 66 Partners LP 3.55%, 10/1/2026 | | | 7 | | | | 7 | |
| | |
Pioneer Natural Resources Co. 1.90%, 8/15/2030 | | | 7 | | | | 7 | |
| | |
Plains All American Pipeline LP 4.65%, 10/15/2025 | | | 11 | | | | 12 | |
| | |
Sabine Pass Liquefaction LLC 5.63%, 3/1/2025 | | | 7 | | | | 8 | |
| | |
TotalEnergies Capital International SA (France) 2.99%, 6/29/2041 | | | 7 | | | | 7 | |
| | |
TransCanada PipeLines Ltd. (Canada) 4.10%, 4/15/2030 | | | 7 | | | | 8 | |
| | |
Williams Cos., Inc. (The) 2.60%, 3/15/2031 | | | 5 | | | | 5 | |
| | | | | | | | |
| | |
| | | | | | | 200 | |
| | | | | | | | |
|
Pharmaceuticals — 0.2% | |
| | |
Bristol-Myers Squibb Co. | | | | | | | | |
| | |
3.40%, 7/26/2029 | | | 2 | | | | 2 | |
| | |
4.13%, 6/15/2039 | | | 5 | | | | 6 | |
| | |
2.35%, 11/13/2040 | | | 9 | | | | 8 | |
| | |
Merck & Co., Inc. 2.35%, 6/24/2040 | | | 7 | | | | 7 | |
| | |
Royalty Pharma plc 3.30%, 9/2/2040 | | | 11 | | | | 11 | |
| | |
Utah Acquisition Sub, Inc. 3.95%, 6/15/2026 | | | 11 | | | | 12 | |
| | |
Viatris, Inc. 3.85%, 6/22/2040 | | | 11 | | | | 12 | |
| | | | | | | | |
| | |
| | | | | | | 58 | |
| | | | | | | | |
|
Professional Services — 0.0% (b) | |
| | |
IHS Markit Ltd. 4.25%, 5/1/2029 | | | 10 | | | | 11 | |
| | | | | | | | |
|
Road & Rail — 0.1% | |
| | |
CSX Corp. 3.80%, 11/1/2046 | | | 5 | | | | 6 | |
| | |
Kansas City Southern 4.70%, 5/1/2048 | | | 3 | | | | 4 | |
| | |
Norfolk Southern Corp. 3.05%, 5/15/2050 | | | 5 | | | | 5 | |
| | |
Penske Truck Leasing Co. LP 1.20%, 11/15/2025 (c) | | | 11 | | | | 11 | |
| | |
Triton Container International Ltd. (Bermuda) 2.05%, 4/15/2026 (c) | | | 15 | | | | 14 | |
| | |
Union Pacific Corp. 3.55%, 8/15/2039 | | | 5 | | | | 6 | |
| | | | | | | | |
| | |
| | | | | | | 46 | |
| | | | | | | | |
SEE NOTES TO FINANCIAL STATEMENTS.
| | | | | | | | | | |
| | | | | |
| DECEMBER 31, 2021 | | J.P. MORGAN FUNDS | | | | | | | | 11 |
JPMorgan SmartSpendingSM 2015 Fund
SCHEDULE OF PORTFOLIO INVESTMENTS
AS OF DECEMBER 31, 2021 (Unaudited) (continued)
| | | | | | | | |
| INVESTMENTS | | PRINCIPAL
AMOUNT
($000) | | | VALUE
($000) | |
Corporate Bonds — continued | |
|
Semiconductors & Semiconductor Equipment — 0.3% | |
| | |
Analog Devices, Inc. 2.80%, 10/1/2041 | | | 4 | | | | 4 | |
| | |
Broadcom, Inc. | | | | | | | | |
| | |
1.95%, 2/15/2028 (c) | | | 9 | | | | 9 | |
| | |
4.15%, 11/15/2030 | | | 23 | | | | 26 | |
| | |
KLA Corp. 3.30%, 3/1/2050 | | | 6 | | | | 6 | |
| | |
Microchip Technology, Inc. | | | | | | | | |
| | |
0.97%, 2/15/2024 | | | 10 | | | | 10 | |
| | |
0.98%, 9/1/2024 (c) | | | 5 | | | | 5 | |
| | |
NXP BV (China) | | | | | | | | |
| | |
2.50%, 5/11/2031 (c) | | | 5 | | | | 5 | |
| | |
3.25%, 5/11/2041 (c) | | | 5 | | | | 5 | |
| | |
Xilinx, Inc. 2.38%, 6/1/2030 | | | 12 | | | | 12 | |
| | | | | | | | |
| | |
| | | | | | | 82 | |
| | | | | | | | |
|
Software — 0.1% | |
| | |
Citrix Systems, Inc. 1.25%, 3/1/2026 | | | 5 | | | | 5 | |
| | |
Oracle Corp. 3.80%, 11/15/2037 | | | 17 | | | | 18 | |
| | |
VMware, Inc. | | | | | | | | |
| | |
1.40%, 8/15/2026 | | | 7 | | | | 7 | |
| | |
4.70%, 5/15/2030 | | | 11 | | | | 12 | |
| | | | | | | | |
| | |
| | | | | | | 42 | |
| | | | | | | | |
|
Specialty Retail — 0.1% | |
| | |
AutoZone, Inc. 3.63%, 4/15/2025 | | | 11 | | | | 12 | |
| | |
Lowe’s Cos., Inc. 3.70%, 4/15/2046 | | | 7 | | | | 8 | |
| | |
O’Reilly Automotive, Inc. 3.90%, 6/1/2029 | | | 7 | | | | 8 | |
| | |
Tractor Supply Co. 1.75%, 11/1/2030 | | | 8 | | | | 7 | |
| | | | | | | | |
| | |
| | | | | | | 35 | |
| | | | | | | | |
|
Technology Hardware, Storage & Peripherals — 0.1% | |
| | |
Dell International LLC 6.20%, 7/15/2030 | | | 18 | | | | 23 | |
| | | | | | | | |
|
Tobacco — 0.1% | |
| | |
Altria Group, Inc. 2.45%, 2/4/2032 | | | 10 | | | | 9 | |
| | |
BAT Capital Corp. (United Kingdom) | | | | | | | | |
| | |
2.26%, 3/25/2028 | | | 13 | | | | 13 | |
| | |
4.39%, 8/15/2037 | | | 5 | | | | 5 | |
| | |
3.73%, 9/25/2040 | | | 6 | | | | 6 | |
| | | | | | | | |
| | |
| | | | | | | 33 | |
| | | | | | | | |
|
Trading Companies & Distributors — 0.1% | |
| | |
Air Lease Corp. | | | | | | | | |
| | |
3.38%, 7/1/2025 | | | 5 | | | | 5 | |
| | |
1.88%, 8/17/2026 | | | 15 | | | | 15 | |
| | | | | | | | |
| | |
| | | | | | | 20 | |
| | | | | | | | |
| | | | | | | | |
| INVESTMENTS | | PRINCIPAL
AMOUNT
($000) | | | VALUE
($000) | |
| | | | | | | | |
|
Wireless Telecommunication Services — 0.1% | |
| | |
Rogers Communications, Inc. (Canada) 3.70%, 11/15/2049 | | | 7 | | | | 7 | |
| | |
T-Mobile USA, Inc. | | | | | | | | |
| | |
2.55%, 2/15/2031 | | | 17 | | | | 17 | |
| | |
3.00%, 2/15/2041 | | | 11 | | | | 11 | |
| | | | | | | | |
| | |
| | | | | | | 35 | |
| | | | | | | | |
| |
Total Corporate Bonds
(Cost $2,478) | | | | 2,422 | |
| | | | | |
U.S. Treasury Obligations — 7.1% | |
| | |
U.S. Treasury Bonds | | | | | | | | |
| | |
1.13%, 5/15/2040 | | | 49 | | | | 43 | |
| | |
1.13%, 8/15/2040 | | | 67 | | | | 58 | |
| | |
1.38%, 11/15/2040 | | | 7 | | | | 6 | |
| | |
2.25%, 5/15/2041 | | | 8 | | | | 8 | |
| | |
2.25%, 8/15/2046 | | | 15 | | | | 16 | |
| | |
1.38%, 8/15/2050 | | | 260 | | | | 229 | |
| | |
1.63%, 11/15/2050 | | | 58 | | | | 54 | |
| | |
1.88%, 2/15/2051 | | | 6 | | | | 6 | |
| | |
U.S. Treasury Notes | | | | | | | | |
| | |
1.38%, 1/31/2022 (f) | | | 508 | | | | 509 | |
| | |
0.13%, 9/15/2023 | | | 307 | | | | 304 | |
| | |
0.25%, 8/31/2025 | | | 291 | | | | 282 | |
| | |
0.38%, 11/30/2025 | | | 226 | | | | 219 | |
| | |
0.50%, 8/31/2027 | | | 179 | | | | 171 | |
| | |
0.63%, 11/30/2027 | | | 45 | | | | 43 | |
| | |
1.25%, 3/31/2028 | | | 65 | | | | 64 | |
| | |
1.00%, 7/31/2028 | | | 35 | | | | 34 | |
| | |
0.63%, 8/15/2030 | | | 2 | | | | 2 | |
| | |
1.13%, 2/15/2031 | | | 25 | | | | 24 | |
| | |
1.63%, 5/15/2031 | | | 10 | | | | 10 | |
| | |
U.S. Treasury STRIPS Bonds | | | | | | | | |
| | |
1.02%, 8/15/2026 (g) | | | 40 | | | | 38 | |
| | |
1.15%, 5/15/2027 (g) | | | 40 | | | | 37 | |
| | |
2.35%, 5/15/2041 (g) | | | 55 | | | | 37 | |
| | | | | | | | |
| |
Total U.S. Treasury Obligations
(Cost $2,220) | | | | 2,194 | |
| | | | | |
Mortgage-Backed Securities — 6.0% | |
| |
FHLMC UMBS, 30 Year | | | | | |
| | |
Pool # ZL3032, 3.50%, 5/1/2042 | | | 10 | | | | 10 | |
| | |
Pool # QB4026, 2.50%, 10/1/2050 | | | 27 | | | | 28 | |
| | |
Pool # QB4045, 2.50%, 10/1/2050 | | | 17 | | | | 17 | |
| | |
Pool # QB4484, 2.50%, 10/1/2050 | | | 10 | | | | 10 | |
| | |
Pool # QB4542, 2.50%, 10/1/2050 | | | 8 | | | | 9 | |
SEE NOTES TO FINANCIAL STATEMENTS.
| | | | | | | | | | |
| | | | | |
| 12 | | | | | | | | J.P. MORGAN FUNDS | | DECEMBER 31, 2021 |
| | | | | | | | |
| INVESTMENTS | | PRINCIPAL
AMOUNT
($000) | | | VALUE
($000) | |
Mortgage-Backed Securities — continued | |
| | |
Pool # RA4224, 3.00%, 11/1/2050 | | | 5 | | | | 5 | |
| | |
Pool # QB8503, 2.50%, 2/1/2051 | | | 15 | | | | 15 | |
| |
FNMA | | | | | |
| | |
Pool # BS4290, 1.95%, 10/1/2029 | | | 100 | | | | 101 | |
| |
FNMA UMBS, 30 Year | | | | | |
| | |
Pool # CA2826, 5.50%, 12/1/2048 | | | 20 | | | | 22 | |
| | |
Pool # FM3118, 3.00%, 5/1/2050 | | | 7 | | | | 7 | |
| | |
Pool # BQ2894, 3.00%, 9/1/2050 | | | 13 | | | | 14 | |
| | |
Pool # BQ3996, 2.50%, 10/1/2050 | | | 11 | | | | 12 | |
| | |
Pool # BQ5243, 3.50%, 10/1/2050 | | | 4 | | | | 4 | |
| | |
Pool # CA7398, 3.50%, 10/1/2050 | | | 15 | | | | 16 | |
| | |
Pool # CA8637, 4.00%, 1/1/2051 | | | 36 | | | | 39 | |
| | |
Pool # BU1805, 2.50%, 12/1/2051 | | | 25 | | | | 26 | |
| |
FNMA, Other | | | | | |
| | |
Pool # AN2009, 2.70%, 7/1/2026 | | | 19 | | | | 20 | |
| | |
Pool # AM3010, 5.07%, 3/1/2028 | | | 9 | | | | 10 | |
| | |
Pool # BL8639, 1.09%, 4/1/2028 | | | 10 | | | | 10 | |
| | |
Pool # AM5319, 4.34%, 1/1/2029 | | | 9 | | | | 10 | |
| | |
Pool # BL5457, 2.57%, 7/1/2029 | | | 10 | | | | 11 | |
| | |
Pool # BS0448, 1.27%, 12/1/2029 | | | 20 | | | | 19 | |
| | |
Pool # BL9748, 1.60%, 12/1/2029 | | | 5 | | | | 5 | |
| | |
Pool # AN7593, 2.99%, 12/1/2029 | | | 5 | | | | 5 | |
| | |
Pool # AN8285, 3.11%, 3/1/2030 | | | 5 | | | | 5 | |
| | |
Pool # AM8544, 3.08%, 4/1/2030 | | | 5 | | | | 5 | |
| | |
Pool # BL9045, 1.58%, 7/1/2030 | | | 15 | | | | 15 | |
| | |
Pool # BL9251, 1.45%, 10/1/2030 | | | 20 | | | | 19 | |
| | |
Pool # BL9891, 1.37%, 12/1/2030 | | | 10 | | | | 10 | |
| | |
Pool # AN6149, 3.14%, 7/1/2032 | | | 15 | | | | 17 | |
| | |
Pool # BM3226, 3.44%, 10/1/2032 (h) | | | 29 | | | | 32 | |
| | |
Pool # AN7923, 3.33%, 1/1/2033 | | | 10 | | | | 11 | |
| | |
Pool # AN9067, 3.51%, 5/1/2033 | | | 5 | | | | 6 | |
| | |
Pool # BL1012, 4.03%, 12/1/2033 | | | 5 | | | | 6 | |
| | |
Pool # BL0900, 4.08%, 2/1/2034 | | | 5 | | | | 6 | |
| | |
Pool # AN4430, 3.61%, 1/1/2037 | | | 8 | | | | 9 | |
| | |
Pool # BF0230, 5.50%, 1/1/2058 | | | 24 | | | | 29 | |
| | |
Pool # BF0497, 3.00%, 7/1/2060 | | | 12 | | | | 13 | |
| | |
FNMA/FHLMC UMBS, Single Family, 30 Year TBA, 2.50%, 2/25/2052 (i) | | | 240 | | | | 244 | |
| | |
GNMA II, 30 Year | | | | | | | | |
| | |
Pool # BY3432, 3.50%, 9/20/2050 | | | 17 | | | | 19 | |
| | |
Pool # BR3929, 3.50%, 10/20/2050 | | | 9 | | | | 9 | |
| | |
Pool # BW1726, 3.50%, 10/20/2050 | | | 17 | | | | 18 | |
| | |
Pool # BS8546, 2.50%, 12/20/2050 | | | 32 | | | | 32 | |
| | |
Pool # BR3928, 3.00%, 12/20/2050 | | | 15 | | | | 16 | |
| | |
Pool # BU7538, 3.00%, 12/20/2050 | | | 13 | | | | 15 | |
| | | | | | | | |
| INVESTMENTS | | PRINCIPAL
AMOUNT
($000) | | | VALUE
($000) | |
| | | | | | | | |
| | |
Pool # 785294, 3.50%, 1/20/2051 | | | 32 | | | | 35 | |
| | |
Pool # CA8452, 3.00%, 2/20/2051 | | | 39 | | | | 41 | |
| | |
Pool # CB1543, 3.00%, 2/20/2051 | | | 30 | | | | 31 | |
| | |
Pool # CA3588, 3.50%, 2/20/2051 | | | 28 | | | | 30 | |
| | |
Pool # CB1536, 3.50%, 2/20/2051 | | | 30 | | | | 32 | |
| | |
Pool # CB1542, 3.00%, 3/20/2051 | | | 20 | | | | 21 | |
| | |
Pool # CB4433, 3.00%, 3/20/2051 | | | 33 | | | | 35 | |
| | |
Pool # CC0070, 3.00%, 3/20/2051 | | | 4 | | | | 5 | |
| | |
Pool # CC8726, 3.00%, 3/20/2051 | | | 5 | | | | 5 | |
| | |
Pool # CC8738, 3.00%, 3/20/2051 | | | 5 | | | | 5 | |
| | |
Pool # CC8723, 3.50%, 3/20/2051 | | | 34 | | | | 37 | |
| | |
Pool # CC0088, 4.00%, 3/20/2051 | | | 4 | | | | 4 | |
| | |
Pool # CC0092, 4.00%, 3/20/2051 | | | 4 | | | | 4 | |
| | |
Pool # CC8727, 3.00%, 4/20/2051 | | | 9 | | | | 10 | |
| | |
Pool # CC8739, 3.00%, 4/20/2051 | | | 25 | | | | 26 | |
| | |
Pool # CC8740, 3.00%, 4/20/2051 | | | 20 | | | | 21 | |
| | |
Pool # CC8751, 3.00%, 4/20/2051 | | | 5 | | | | 5 | |
| | |
Pool # CA3563, 3.50%, 7/20/2051 | | | 15 | | | | 16 | |
| | |
Pool # CE2586, 3.50%, 7/20/2051 | | | 25 | | | | 27 | |
| | |
Pool # MA7534, 2.50%, 8/20/2051 | | | 402 | | | | 411 | |
| | |
Pool # MA7649, 2.50%, 10/20/2051 | | | 35 | | | | 36 | |
| | |
Pool # CK1527, 3.50%, 12/20/2051 | | | 20 | | | | 22 | |
| | |
GNMA II, Other Pool # 785183, 2.94%, 10/20/2070 (h) | | | 24 | | | | 24 | |
| | | | | | | | |
| | |
Total Mortgage-Backed Securities
(Cost $1,870) | | | | | | | 1,844 | |
| | | | | |
Asset-Backed Securities — 4.0% | |
| | |
ACC Auto Trust Series 2021-A, Class A, 1.08%, 4/15/2027 (c) | | | 75 | | | | 75 | |
| | |
Aligned Data Centers Issuer LLC Series 2021-1A, Class A2, 1.94%, 8/15/2046 (c) | | | 25 | | | | 25 | |
| | |
American Airlines Pass-Through Trust | | | | | | | | |
| | |
Series 2016-2, Class AA, 3.20%, 6/15/2028 | | | 19 | | | | 19 | |
| | |
Series 2016-3, Class AA, 3.00%, 10/15/2028 | | | 19 | | | | 19 | |
| | |
Series 2021-1, Class B, 3.95%, 7/11/2030 | | | 14 | | | | 14 | |
| | |
Series 2019-1, Class AA, 3.15%, 2/15/2032 | | | 26 | | | | 25 | |
| | |
American Credit Acceptance Receivables Trust | | | | | | | | |
| | |
Series 2021-1, Class A, 0.35%, 5/13/2024 (c) | | | 6 | | | | 6 | |
| | |
Series 2021-1, Class B, 0.61%, 3/13/2025 (c) | | | 10 | | | | 10 | |
| | |
Series 2020-4, Class C, 1.31%, 12/14/2026 (c) | | | 15 | | | | 15 | |
| |
AmeriCredit Automobile Receivables Trust | | | | | |
| | |
Series 2018-3, Class D, 4.04%, 11/18/2024 | | | 15 | | | | 16 | |
| | |
Series 2020-3, Class B, 0.76%, 12/18/2025 | | | 10 | | | | 10 | |
| | |
Series 2020-3, Class C, 1.06%, 8/18/2026 | | | 5 | | | | 5 | |
SEE NOTES TO FINANCIAL STATEMENTS.
| | | | | | | | | | |
| | | | | |
| DECEMBER 31, 2021 | | J.P. MORGAN FUNDS | | | | | | | | 13 |
JPMorgan SmartSpendingSM 2015 Fund
SCHEDULE OF PORTFOLIO INVESTMENTS
AS OF DECEMBER 31, 2021 (Unaudited) (continued)
| | | | | | | | |
| INVESTMENTS | | PRINCIPAL
AMOUNT
($000) | | | VALUE
($000) | |
Asset-Backed Securities — continued | |
| | |
Business Jet Securities LLC Series 2021-1A, Class A, 2.16%, 4/15/2036 (c) | | | 84 | | | | 82 | |
| | |
CarMax Auto Owner Trust | | | | | | | | |
| | |
Series 2019-3, Class C, 2.60%, 6/16/2025 | | | 15 | | | | 15 | |
| | |
Series 2020-4, Class C, 1.30%, 8/17/2026 | | | 5 | | | | 5 | |
| | |
Carvana Auto Receivables Trust | | | | | | | | |
| | |
Series 2019-4A, Class D, 3.07%, 7/15/2025 (c) | | | 35 | | | | 36 | |
| | |
Series 2020-P1, Class C, 1.32%, 11/9/2026 | | | 15 | | | | 15 | |
| | |
DataBank Issuer Series 2021-1A, Class A2, 2.06%, 2/27/2051 (c) | | | 25 | | | | 25 | |
| | |
Delta Air Lines Pass-Through Trust Series 2020-1, Class A, 2.50%, 6/10/2028 | | | 9 | | | | 9 | |
| | |
Drive Auto Receivables Trust Series 2020-1, Class D, 2.70%, 5/17/2027 | | | 35 | | | | 36 | |
| | |
DT Auto Owner Trust | | | | | | | | |
| | |
Series 2021-1A, Class C, 0.84%, 10/15/2026 (c) | | | 10 | | | | 10 | |
| | |
Series 2021-2A, Class C, 1.10%, 2/16/2027 (c) | | | 25 | | | | 25 | |
| | |
Series 2021-4A, Class D, 1.99%, 9/15/2027 (c) | | | 25 | | | | 25 | |
| | |
Exeter Automobile Receivables Trust | | | | | | | | |
| | |
Series 2021-1A, Class A3, 0.34%, 3/15/2024 | | | 6 | | | | 6 | |
| | |
Series 2021-1A, Class B, 0.50%, 2/18/2025 | | | 20 | | | | 20 | |
| | |
Series 2021-2A, Class C, 0.98%, 6/15/2026 | | | 15 | | | | 15 | |
| | |
FHF Trust Series 2021-1A, Class A, 1.27%, 3/15/2027 (c) | | | 25 | | | | 25 | |
| | |
First Investors Auto Owner Trust Series 2021-1A, Class B, 0.89%, 3/15/2027 (c) | | | 10 | | | | 10 | |
| | |
Flagship Credit Auto Trust | | | | | | | | |
| | |
Series 2021-2, Class A, 0.37%, 12/15/2026 (c) | | | 23 | | | | 23 | |
| | |
Series 2021-1, Class B, 0.68%, 2/16/2027 (c) | | | 10 | | | | 10 | |
| | |
Series 2020-4, Class C, 1.28%, 2/16/2027 (c) | | | 10 | | | | 10 | |
| | |
GLS Auto Receivables Issuer Trust Series 2020-4A, Class B, 0.87%, 12/16/2024 (c) | | | 10 | | | | 10 | |
| | |
GLS Auto Receivables Trust Series 2021-2A, Class B, 0.77%, 9/15/2025 (c) | | | 10 | | | | 10 | |
| | |
JetBlue Pass-Through Trust Series 2020-1, Class B, 7.75%, 11/15/2028 | | | 6 | | | | 7 | |
| | |
Pagaya AI Debt Selection Trust | | | | | | | | |
| | |
Series 2021-1, Class A, 1.18%, 11/15/2027 (c) | | | 77 | | | | 77 | |
| | |
Series 2021-HG1, Class A, 1.22%, 1/16/2029 (c) | | | 93 | | | | 92 | |
| | |
Series 2021-3, Class A, 1.15%, 5/15/2029 (c) | | | 92 | | | | 92 | |
| | | | | | | | |
| INVESTMENTS | | PRINCIPAL
AMOUNT
($000) | | | VALUE
($000) | |
| | | | | | | | |
| | |
Prestige Auto Receivables Trust Series 2020-1A, Class C, 1.31%, 11/16/2026 (c) | | | 15 | | | | 15 | |
| | |
Santander Consumer Auto Receivables Trust Series 2021-AA, Class B, 0.71%, 8/17/2026 (c) | | | 10 | | | | 10 | |
| | |
Santander Drive Auto Receivables Trust | | | | | | | | |
| | |
Series 2019-3, Class D, 2.68%, 10/15/2025 | | | 19 | | | | 19 | |
| | |
Series 2020-4, Class C, 1.01%, 1/15/2026 | | | 10 | | | | 10 | |
| | |
United Airlines Pass-Through Trust | | | | | | | | |
| | |
Series 2016-2, Class B, 3.65%, 10/7/2025 | | | 3 | | | | 3 | |
| | |
Series 2019-2, Class B, 3.50%, 5/1/2028 | | | 8 | | | | 8 | |
| | |
Series 2016-2, Class A, 3.10%, 10/7/2028 | | | 4 | | | | 4 | |
| | |
Series 2018-1, Class A, 3.70%, 3/1/2030 | | | 9 | | | | 9 | |
| | |
United Auto Credit Securitization Trust Series 2021-1, Class C, 0.84%, 6/10/2026 (c) | | | 20 | | | | 20 | |
| | |
Veros Auto Receivables Trust Series 2021-1, Class A, 0.92%, 10/15/2026 (c) | | | 46 | | | | 46 | |
| | |
VOLT XCIII LLC Series 2021-NPL2, Class A1, 1.89%, 2/27/2051 (c) (e) | | | 76 | | | | 76 | |
| | |
VOLT XCVII LLC Series 2021-NPL6, Class A1, 2.24%, 4/25/2051 (c) (e) | | | 28 | | | | 28 | |
| | |
Westlake Automobile Receivables Trust | | | | | | | | |
| | |
Series 2020-3A, Class C, 1.24%, 11/17/2025 (c) | | | 10 | | | | 10 | |
| | |
Series 2020-3A, Class D, 1.65%, 2/17/2026 (c) | | | 10 | | | | 10 | |
| | |
Series 2021-1A, Class C, 0.95%, 3/16/2026 (c) | | | 30 | | | | 30 | |
| | | | | | | | |
| |
Total Asset-Backed Securities
(Cost $1,233) | | | | 1,227 | |
| | | | | |
Collateralized Mortgage Obligations — 0.6% | |
| | |
Bayview Finance LLC 0.00%, 7/12/2033 ‡ | | | 20 | | | | 20 | |
| | |
FNMA Trust, Whole Loan Series 2002-W8, Class A1, 6.50%, 6/25/2042 | | | 7 | | | | 8 | |
| | |
FNMA, Grantor Trust, Whole Loan Series 2001-T12, Class A1, 6.50%, 8/25/2041 | | | 3 | | | | 3 | |
| | |
FNMA, REMIC | | | | | | | | |
| | |
Series 2018-72, Class VB, 3.50%, 10/25/2031 | | | 8 | | | | 8 | |
| | |
Series 2019-7, Class CA, 3.50%, 11/25/2057 | | | 38 | | | | 40 | |
| | |
FNMA, REMIC Trust, Whole Loan | | | | | | | | |
| | |
Series 2002-W3, Class A4, 6.50%, 11/25/2041 | | | 14 | | | | 16 | |
| | |
Seasoned Credit Risk Transfer Trust | | | | | | | | |
| | |
Series 2018-1, Class M60C, 3.50%, 5/25/2057 | | | 9 | | | | 10 | |
| | |
Series 2019-2, Class M55D, 4.00%, 8/25/2058 | | | 12 | | | | 13 | |
| | |
Series 2019-3, Class M55D, 4.00%, 10/25/2058 | | | 12 | | | | 13 | |
SEE NOTES TO FINANCIAL STATEMENTS.
| | | | | | | | | | |
| | | | | |
| 14 | | | | | | | | J.P. MORGAN FUNDS | | DECEMBER 31, 2021 |
| | | | | | | | |
| INVESTMENTS | | PRINCIPAL
AMOUNT
($000) | | | VALUE
($000) | |
Collateralized Mortgage Obligations — continued | |
| | |
Series 2020-3, Class M5TW, 3.00%, 5/25/2060 ‡ | | | 17 | | | | 18 | |
| | |
Series 2020-3, Class TTW, 3.00%, 5/25/2060 ‡ | | | 21 | | | | 20 | |
| | | | | | | | |
| |
Total Collateralized Mortgage Obligations
(Cost $169) | | | | 169 | |
| | | | | |
Commercial Mortgage-Backed Securities — 0.5% | |
| | |
ACRE Commercial Mortgage Ltd. (Cayman Islands) | | | | | | | | |
| | |
Series 2021-FL4, Class A, 0.93%, 12/18/2037 (c) (h) | | | 10 | | | | 10 | |
| | |
Series 2021-FL4, Class AS, 1.20%, 12/18/2037 (c) (h) | | | 10 | | | | 10 | |
| | |
BPR Trust Series 2021-KEN, Class A, 1.36%, 2/15/2029 (c) (h) | | | 20 | | | | 20 | |
| | |
FHLMC, Multi-Family Structured Credit Risk Series 2021-MN2, Class M1, 1.85%, 7/25/2041 (c) (h) | | | 15 | | | | 15 | |
| | |
FHLMC, Multi-Family Structured Pass-Through Certificates | | | | | | | | |
| | |
Series K-1511, Class A1, 3.28%, 10/25/2030 | | | 14 | | | | 15 | |
| | |
Series K-1510, Class A2, 3.72%, 1/25/2031 | | | 5 | | | | 6 | |
| | |
FNMA ACES | | | | | | | | |
| | |
Series 2021-M3, Class 1A1, 1.00%, 11/25/2033 | | | 7 | | | | 7 | |
| | |
Series 2021-M3, Class X1, IO, 2.00%, 11/25/2033 (h) | | | 96 | | | | 12 | |
| | |
FREMF Mortgage Trust | | | | | | | | |
| | |
Series 2017-KGX1, Class BFX, 3.59%, 10/25/2027 (c) (h) | | | 10 | | | | 10 | |
| | |
Series 2016-K56, Class B, 3.94%, 6/25/2049 (c) (h) | | | 5 | | | | 5 | |
| | |
Series 2016-K58, Class B, 3.74%, 9/25/2049 (c) (h) | | | 25 | | | | 28 | |
| | |
Series 2017-K728, Class C, 3.65%, 11/25/2050 (c) (h) | | | 10 | | | | 10 | |
| | |
KKR Industrial Portfolio Trust Series 2021-KDIP, Class B, 0.91%, 12/15/2037 ‡ (c) (h) | | | 8 | | | | 7 | |
| | | | | | | | |
| |
Total Commercial Mortgage-Backed Securities
(Cost $157) | | | | 155 | |
| | | | | |
| | | | | | | | |
| Investments | |
SHARES
(000) | | | VALUE
($000) | |
Short-term Investments — 5.4% | |
|
Investment Companies — 5.4% | |
| | |
JPMorgan U.S. Government Money Market Fund Class IM Shares, 0.03% (a) (j)
(Cost $1,648) | | | 1,648 | | | | 1,648 | |
| | | | | | | | |
Total Investments — 100.8%
(Cost $28,586) | | | | 30,935 | |
Liabilities in Excess of
Other Assets — (0.8)% | | | | (231 | ) |
| | | | | |
Net Assets — 100.0% | | | | 30,704 | |
| | | | | |
Percentages indicated are based on net assets.
Abbreviations
| | |
| ACES | | Alternative Credit Enhancement Securities |
| ETF | | Exchange-Traded Fund |
| FHLMC | | Federal Home Loan Mortgage Corp. |
| FNMA | | Federal National Mortgage Association |
| GNMA | | Government National Mortgage Association |
| ICE | | Intercontinental Exchange |
| IO | | Interest Only represents the right to receive the monthly interest payments on an underlying pool of mortgage loans. The principal amount shown represents the par value on the underlying pool. The yields on these securities are subject to accelerated principal paydowns as a result of prepayment or refinancing of the underlying pool of mortgage instruments. As a result, interest income may be reduced considerably. |
| LIBOR | | London Interbank Offered Rate |
| REIT | | Real Estate Investment Trust |
| REMIC | | Real Estate Mortgage Investment Conduit |
| SOFR | | Secured Overnight Financing Rate |
| STRIPS | | Separate Trading of Registered Interest and Principal of Securities. The STRIPS Program lets investors hold and trade individual interest and principal components of eligible notes and bonds as separate securities. |
| TBA | | To Be Announced; Security is subject to delayed delivery. |
| UMBS | | Uniform Mortgage-Backed Securities |
| USD | | United States Dollar |
| (a) | | Investment in an affiliated fund, which is registered under the Investment Company Act of 1940, as amended, and is advised by J.P. Morgan Investment Management Inc. |
| (b) | | Amount rounds to less than 0.1% of net assets. |
| (c) | | Securities exempt from registration under Rule 144A or section 4(a)(2), of the Securities Act of 1933, as amended. |
| (d) | | Variable or floating rate security, linked to the referenced benchmark. The interest rate shown is the current rate as of December 31, 2021. |
| (e) | | Step bond. Interest rate is a fixed rate for an initial period that either resets at a specific date or may reset in the future contingent upon a predetermined trigger. The interest rate shown is the current rate as of December 31, 2021. |
| (f) | | All or a portion of this security is deposited with the broker as initial margin for futures contracts. |
SEE NOTES TO FINANCIAL STATEMENTS.
| | | | | | | | | | |
| | | | | |
| DECEMBER 31, 2021 | | J.P. MORGAN FUNDS | | | | | | | | 15 |
JPMorgan SmartSpendingSM 2015 Fund
SCHEDULE OF PORTFOLIO INVESTMENTS
AS OF DECEMBER 31, 2021 (Unaudited) (continued)
| | |
| (g) | | The rate shown is the effective yield as of December 31, 2021. |
| (h) | | Variable or floating rate security, the interest rate of which adjusts periodically based on changes in current interest rates and prepayments on the underlying pool of assets. The interest rate shown is the current rate as of December 31, 2021. |
| (i) | | All or a portion of the security is a when-issued security, delayed delivery security, or forward commitment. |
| (j) | | The rate shown is the current yield as of December 31, 2021. |
| ‡ | | Value determined using significant unobservable inputs. |
Detailed information about investment portfolios of the underlying funds and ETFs can be found in shareholder reports filed with the Securities and Exchange Commission (SEC) by each such underlying fund semi-annually on Form N-CSR and in portfolio holdings filed quarterly on Form N-PORT, and are available for download from both the SEC’s as well as the respective underlying fund’s website. Detailed information about underlying J.P. Morgan Funds can also be found at www.jpmorganfunds.com or by calling 1-800-480-4111.
| | | | | | | | | | | | | | | | | | |
| Futures contracts outstanding as of December 31, 2021 (amounts in thousands, except number of contracts): | |
| DESCRIPTION | | NUMBER OF
CONTRACTS | | EXPIRATION
DATE | | | TRADING
CURRENCY | | | NOTIONAL
AMOUNT
($) | | | VALUE AND
UNREALIZED
APPRECIATION
(DEPRECIATION)
($) | |
|
Long Contracts | |
EURO STOXX 50 Index | | 6 | | | 03/2022 | | | | EUR | | | | 292 | | | | 10 | |
MSCI EAFE E-Mini Index | | 2 | | | 03/2022 | | | | USD | | | | 232 | | | | 6 | |
Russell 2000 E-Mini Index | | 1 | | | 03/2022 | | | | USD | | | | 112 | | | | 3 | |
S&P 500 E-Mini Index | | 5 | | | 03/2022 | | | | USD | | | | 1,190 | | | | 25 | |
U.S. Treasury 10 Year Note | | 11 | | | 03/2022 | | | | USD | | | | 1,434 | | | | 11 | |
| | | | | | | | | | | | | | | | | | |
| | | | | | | | | | | | | | | | | 55 | |
| | | | | | | | | | | | | | | | | | |
Abbreviations
| | |
| EAFE | | Europe, Australasia and Far East |
| EUR | | Euro |
| MSCI | | Morgan Stanley Capital International |
| USD | | United States Dollar |
SEE NOTES TO FINANCIAL STATEMENTS.
| | | | | | | | | | |
| | | | | |
| 16 | | | | | | | | J.P. MORGAN FUNDS | | DECEMBER 31, 2021 |
JPMorgan SmartSpendingSM 2020 Fund
SCHEDULE OF PORTFOLIO INVESTMENTS
AS OF DECEMBER 31, 2021 (Unaudited)
| | | | | | | | |
| INVESTMENTS | |
SHARES
(000) | | | VALUE
($000) | |
| | | | | | | | |
Investment Companies — 41.6% | |
| | |
Fixed Income — 26.8% | | | | | | | | |
| | |
JPMorgan Emerging Markets Debt Fund Class R6 Shares (a) | | | 72 | | | | 553 | |
| | |
JPMorgan Emerging Markets Strategic Debt Fund Class R6 Shares (a) | | | 66 | | | | 508 | |
| | |
JPMorgan Floating Rate Income Fund Class R6 Shares (a) | | | 40 | | | | 354 | |
| | |
JPMorgan High Yield Fund Class R6 Shares (a) | | | 137 | | | | 993 | |
| | |
JPMorgan Income Fund Class R6 Shares (a) | | | 74 | | | | 694 | |
| | |
JPMorgan Inflation Managed Bond Fund Class R6 Shares (a) | | | 191 | | | | 2,100 | |
| | |
JPMorgan Short Duration Core Plus Fund Class R6 Shares (a) | | | 230 | | | | 2,236 | |
| | | | | | | | |
| | |
Total Fixed Income | | | | | | | 7,438 | |
| | | | | | | | |
| | |
U.S. Equity — 14.8% | | | | | | | | |
| | |
JPMorgan Equity Index Fund Class R6 Shares (a) | | | 57 | | | | 4,105 | |
| | | | | | | | |
| |
Total Investment Companies
(Cost $10,183) | | | | 11,543 | |
| | | | | |
Exchange-Traded Funds — 29.1% | |
| | |
Alternative Assets — 2.0% | | | | | | | | |
| | |
JPMorgan BetaBuilders MSCI US REIT ETF (a) | | | 5 | | | | 568 | |
| | | | | | | | |
| | |
Fixed Income — 11.0% | | | | | | | | |
| | |
JPMorgan High Yield Research Enhanced ETF (a) | | | 22 | | | | 1,155 | |
| | |
JPMorgan U.S. Aggregate Bond ETF (a) | | | 35 | | | | 1,876 | |
| | | | | | | | |
| | |
Total Fixed Income | | | | | | | 3,031 | |
| | | | | | | | |
| | |
International Equity — 12.8% | | | | | | | | |
| | |
iShares Core MSCI Emerging Markets ETF | | | 15 | | | | 883 | |
| | |
JPMorgan BetaBuilders International Equity ETF (a) | | | 45 | | | | 2,680 | |
| | | | | | | | |
| | |
Total International Equity | | | | | | | 3,563 | |
| | | | | | | | |
| | |
U.S. Equity — 3.3% | | | | | | | | |
| | |
iShares Russell 2000 ETF | | | 2 | | | | 359 | |
| | |
iShares Russell Mid-Cap ETF | | | 7 | | | | 548 | |
| | | | | | | | |
| | |
Total U.S. Equity | | | | | | | 907 | |
| | | | | | | | |
| |
Total Exchange-Traded Funds
(Cost $6,941) | | | | 8,069 | |
| | | | | |
| | |
| | | PRINCIPAL
AMOUNT
($000) | | | | |
Corporate Bonds — 8.0% | |
|
Aerospace & Defense — 0.3% | |
| | |
Boeing Co. (The) | | | | | | | | |
| | |
1.17%, 2/4/2023 | | | 5 | | | | 5 | |
| | |
1.43%, 2/4/2024 | | | 5 | | | | 5 | |
| | | | | | | | |
| INVESTMENTS | | PRINCIPAL
AMOUNT
($000) | | | VALUE
($000) | |
| | | | | | | | |
| | | | | | | | |
|
Aerospace & Defense — continued | |
| | |
2.70%, 2/1/2027 | | | 29 | | | | 30 | |
| | |
3.45%, 11/1/2028 | | | 2 | | | | 2 | |
| | |
Leidos, Inc. 2.30%, 2/15/2031 | | | 15 | | | | 14 | |
| | |
Northrop Grumman Corp. 3.85%, 4/15/2045 | | | 7 | | | | 8 | |
| | |
Raytheon Technologies Corp. 2.25%, 7/1/2030 | | | 9 | | | | 9 | |
| | | | | | | | |
| | |
| | | | | | | 73 | |
| | | | | | | | |
|
Airlines — 0.0% (b) | |
| | |
American Airlines Pass-Through Trust
Series 2021-1, Class A Shares, 2.88%, 7/11/2034 | | | 10 | | | | 10 | |
| | | | | | | | |
|
Auto Components — 0.0% (b) | |
| | |
Lear Corp. 2.60%, 1/15/2032 | | | 5 | | | | 5 | |
| | | | | | | | |
|
Automobiles — 0.3% | |
| | |
General Motors Co. 6.80%, 10/1/2027 | | | 13 | | | | 16 | |
| | |
Hyundai Capital America | | | | | | | | |
| | |
1.15%, 11/10/2022 (c) | | | 15 | | | | 15 | |
| | |
1.30%, 1/8/2026 (c) | | | 5 | | | | 5 | |
| | |
2.38%, 10/15/2027 (c) | | | 13 | | | | 13 | |
| | |
1.80%, 1/10/2028 (c) | | | 5 | | | | 5 | |
| | |
Nissan Motor Acceptance Co. LLC
2.80%, 1/13/2022 (c) | | | 20 | | | | 20 | |
| | | | | | | | |
| | |
| | | | | | | 74 | |
| | | | | | | | |
|
Banks — 0.6% | |
| | |
Bank of America Corp. 4.00%, 1/22/2025 | | | 33 | | | | 36 | |
| | |
(ICE LIBOR USD 3 Month + 1.51%), 3.71%, 4/24/2028 (d) | | | 16 | | | | 17 | |
| | |
(SOFR + 1.21%), 2.57%, 10/20/2032 (d) | | | 5 | | | | 5 | |
| | |
(SOFR + 1.93%), 2.68%, 6/19/2041 (d) | | | 15 | | | | 14 | |
| | |
Citigroup, Inc. 3.88%, 3/26/2025 | | | 29 | | | | 31 | |
| | |
(ICE LIBOR USD 3 Month + 1.39%),
3.67%, 7/24/2028 (d) | | | 5 | | | | 5 | |
| | |
(SOFR + 1.18%), 2.52%, 11/3/2032 (d) | | | 5 | | | | 5 | |
| | |
(ICE LIBOR USD 3 Month + 1.17%),
3.88%, 1/24/2039 (d) | | | 7 | | | | 8 | |
| | |
HSBC Holdings plc (United Kingdom)
6.10%, 1/14/2042 | | | 10 | | | | 14 | |
| | |
KeyCorp 2.25%, 4/6/2027 | | | 15 | | | | 15 | |
| | |
Mitsubishi UFJ Financial Group, Inc. (Japan)
3.74%, 3/7/2029 | | | 17 | | | | 19 | |
| | |
Wells Fargo & Co. 4.10%, 6/3/2026 | | | 14 | | | | 15 | |
| | |
Westpac Banking Corp. (Australia)
3.13%, 11/18/2041 | | | 4 | | | | 4 | |
| | | | | | | | |
| | |
| | | | | | | 188 | |
| | | | | | | | |
SEE NOTES TO FINANCIAL STATEMENTS.
| | | | | | | | | | |
| | | | | |
| DECEMBER 31, 2021 | | J.P. MORGAN FUNDS | | | | | | | | 17 |
JPMorgan SmartSpendingSM 2020 Fund
SCHEDULE OF PORTFOLIO INVESTMENTS
AS OF DECEMBER 31, 2021 (Unaudited) (continued)
| | | | | | | | |
| INVESTMENTS | | PRINCIPAL
AMOUNT
($000) | | | VALUE
($000) | |
| | | | | | | | |
Corporate Bonds — continued | |
|
Beverages — 0.1% | |
| | |
Anheuser-Busch InBev Worldwide, Inc. (Belgium)
3.75%, 7/15/2042 | | | 25 | | | | 27 | |
| | |
Keurig Dr Pepper, Inc. 3.20%, 5/1/2030 | | | 10 | | | | 11 | |
| | | | | | | | |
| | |
| | | | | | | 38 | |
| | | | | | | | |
|
Biotechnology — 0.2% | |
AbbVie, Inc. | | | | | | | | |
| | |
2.95%, 11/21/2026 | | | 2 | | | | 2 | |
| | |
3.20%, 11/21/2029 | | | 5 | | | | 5 | |
| | |
4.05%, 11/21/2039 | | | 29 | | | | 34 | |
| | |
Amgen, Inc. 3.15%, 2/21/2040 | | | 7 | | | | 7 | |
| | |
Gilead Sciences, Inc. 2.60%, 10/1/2040 | | | 15 | | | | 14 | |
| | |
Regeneron Pharmaceuticals, Inc.
1.75%, 9/15/2030 | | | 6 | | | | 6 | |
| | | | | | | | |
| | |
| | | | | | | 68 | |
| | | | | | | | |
|
Building Products — 0.0% (b) | |
| | |
Masco Corp. 2.00%, 10/1/2030 | | | 6 | | | | 6 | |
| | | | | | | | |
|
Capital Markets — 0.5% | |
| | |
Goldman Sachs Group, Inc. (The) | | | | | | | | |
| | |
(SOFR + 0.57%), 0.67%, 3/8/2024 (d) | | | 12 | | | | 12 | |
| | |
4.25%, 10/21/2025 | | | 47 | | | | 50 | |
| | |
(SOFR + 0.80%), 1.43%, 3/9/2027 (d) | | | 5 | | | | 5 | |
| | |
(SOFR + 0.91%), 1.95%, 10/21/2027 (d) | | | 5 | | | | 5 | |
| | |
(ICE LIBOR USD 3 Month + 1.51%),
3.69%, 6/5/2028 (d) | | | 5 | | | | 5 | |
| | |
Macquarie Group Ltd. (Australia) (SOFR + 1.07%), 1.34%, 1/12/2027 (c) (d) | | | 10 | | | | 10 | |
| | |
Morgan Stanley 3.95%, 4/23/2027 | | | 16 | | | | 18 | |
| | |
(ICE LIBOR USD 3 Month + 1.43%),
4.46%, 4/22/2039 (d) | | | 18 | | | | 21 | |
| | | | | | | | |
| | |
| | | | | | | 126 | |
| | | | | | | | |
|
Chemicals — 0.1% | |
| | |
International Flavors & Fragrances, Inc.
3.47%, 12/1/2050 (c) | | | 16 | | | | 17 | |
| | |
LYB International Finance III LLC
1.25%, 10/1/2025 | | | 15 | | | | 15 | |
| | | | | | | | |
| | |
| | | | | | | 32 | |
| | | | | | | | |
|
Construction & Engineering — 0.0% (b) | |
| | |
Quanta Services, Inc. 2.35%, 1/15/2032 | | | 5 | | | | 5 | |
| | | | | | | | |
|
Construction Materials — 0.0% (b) | |
| | |
Martin Marietta Materials, Inc. | | | | | | | | |
| | |
Series CB, 2.50%, 3/15/2030 | | | 6 | | | | 6 | |
| | | | | | | | |
| | | | | | | | |
| INVESTMENTS | | PRINCIPAL
AMOUNT
($000) | | | VALUE
($000) | |
| | | | | | | | |
| | | | | | | | |
|
Consumer Finance — 0.2% | |
Avolon Holdings Funding Ltd. (Ireland) | | | | | | | | |
| | |
5.50%, 1/15/2023 (c) | | | 2 | | | | 2 | |
| | |
2.88%, 2/15/2025 (c) | | | 5 | | | | 5 | |
| | |
5.50%, 1/15/2026 (c) | | | 21 | | | | 24 | |
| | |
2.13%, 2/21/2026 (c) | | | 5 | | | | 5 | |
| | |
4.25%, 4/15/2026 (c) | | | 5 | | | | 5 | |
| | |
2.53%, 11/18/2027 (c) | | | 4 | | | | 4 | |
| | |
Capital One Financial Corp. 3.80%, 1/31/2028 | | | 10 | | | | 11 | |
| | |
General Motors Financial Co., Inc.
4.35%, 1/17/2027 | | | 2 | | | | 2 | |
| | |
Park Aerospace Holdings Ltd. (Ireland)
4.50%, 3/15/2023 (c) | | | 5 | | | | 5 | |
| | | | | | | | |
| | |
| | | | | | | 63 | |
| | | | | | | | |
|
Containers & Packaging — 0.0% (b) | |
| | |
Graphic Packaging International LLC
1.51%, 4/15/2026 (c) | | | 6 | | | | 6 | |
| | | | | | | | |
|
Diversified Financial Services — 0.0% (b) | |
| | |
Shell International Finance BV (Netherlands)
2.38%, 11/7/2029 | | | 9 | | | | 9 | |
| | | | | | | | |
|
Diversified Telecommunication Services — 0.3% | |
| | |
AT&T, Inc. | | | | | | | | |
| | |
2.75%, 6/1/2031 | | | 19 | | | | 19 | |
| | |
3.50%, 6/1/2041 | | | 9 | | | | 9 | |
| | |
3.55%, 9/15/2055 | | | 8 | | | | 8 | |
| | |
Verizon Communications, Inc. | | | | | | | | |
| | |
3.15%, 3/22/2030 | | | 16 | | | | 17 | |
| | |
2.65%, 11/20/2040 | | | 6 | | | | 6 | |
| | |
3.85%, 11/1/2042 | | | 10 | | | | 11 | |
| | | | | | | | |
| | |
| | | | | | | 70 | |
| | | | | | | | |
|
Electric Utilities — 0.6% | |
| | |
Duke Energy Corp. 3.40%, 6/15/2029 | | | 17 | | | | 18 | |
| | |
Edison International 5.75%, 6/15/2027 | | | 4 | | | | 5 | |
| | |
Emera US Finance LP (Canada)
4.75%, 6/15/2046 | | | 18 | | | | 21 | |
| | |
Evergy, Inc. 2.90%, 9/15/2029 | | | 16 | | | | 16 | |
| | |
Jersey Central Power & Light Co.
4.30%, 1/15/2026 (c) | | | 7 | | | | 8 | |
| | |
New England Power Co. (United Kingdom)
2.81%, 10/6/2050 (c) | | | 6 | | | | 6 | |
| | |
NRG Energy, Inc.
2.00%, 12/2/2025 (c) | | | 5 | | | | 5 | |
| | |
2.45%, 12/2/2027 (c) | | | 33 | | | | 32 | |
| | |
OGE Energy Corp. 0.70%, 5/26/2023 | | | 5 | | | | 5 | |
SEE NOTES TO FINANCIAL STATEMENTS.
| | | | | | | | | | |
| | | | | |
| 18 | | | | | | | | J.P. MORGAN FUNDS | | DECEMBER 31, 2021 |
| | | | | | | | |
| INVESTMENTS | | PRINCIPAL
AMOUNT
($000) | | | VALUE
($000) | |
| | | | | | | | |
Corporate Bonds — continued | |
|
Electric Utilities — continued | |
| | |
Oklahoma Gas and Electric Co.
0.55%, 5/26/2023 | | | 5 | | | | 5 | |
| | |
Pacific Gas and Electric Co. | | | | | | | | |
| | |
1.70%, 11/15/2023 | | | 5 | | | | 5 | |
| | |
2.95%, 3/1/2026 | | | 4 | | | | 4 | |
| | |
3.75%, 8/15/2042 (e) | | | 5 | | | | 5 | |
| | |
4.30%, 3/15/2045 | | | 1 | | | | 1 | |
| | |
PacifiCorp 4.15%, 2/15/2050 | | | 19 | | | | 22 | |
| | |
Southern California Edison Co. | | | | | | | | |
| | |
Series 20C, 1.20%, 2/1/2026 | | | 12 | | | | 12 | |
| | | | | | | | |
| | |
| | | | | | | 170 | |
| | | | | | | | |
|
Electrical Equipment — 0.0% (b) | |
| | |
Eaton Corp. 4.15%, 11/2/2042 | | | 7 | | | | 8 | |
| | | | | | | | |
|
Energy Equipment & Services — 0.1% | |
| | |
Baker Hughes Holdings LLC 3.34%, 12/15/2027 | | | 7 | | | | 7 | |
| | |
Schlumberger Holdings Corp.
4.00%, 12/21/2025 (c) | | | 7 | | | | 8 | |
| | | | | | | | |
| | |
| | | | | | | 15 | |
| | | | | | | | |
|
Entertainment — 0.1% | |
| | |
Activision Blizzard, Inc. 1.35%, 9/15/2030 | | | 5 | | | | 5 | |
| | |
Walt Disney Co. (The) 3.50%, 5/13/2040 | | | 10 | | | | 11 | |
| | | | | | | | |
| | |
| | | | | | | 16 | |
| | | | | | | | |
|
Equity Real Estate Investment Trusts (REITs) — 0.6% | |
| | |
Alexandria Real Estate Equities, Inc.
3.38%, 8/15/2031 | | | 7 | | | | 8 | |
| | |
American Tower Corp. | | | | | | | | |
| | |
1.50%, 1/31/2028 | | | 5 | | | | 5 | |
| | |
1.88%, 10/15/2030 | | | 26 | | | | 24 | |
| | |
3.10%, 6/15/2050 | | | 10 | | | | 9 | |
| | |
2.95%, 1/15/2051 | | | 5 | | | | 5 | |
| | |
Brixmor Operating Partnership LP | | | | | | | | |
| | |
2.25%, 4/1/2028 | | | 10 | | | | 10 | |
| | |
2.50%, 8/16/2031 | | | 5 | | | | 5 | |
| | |
Corporate Office Properties LP
2.75%, 4/15/2031 | | | 5 | | | | 5 | |
| | |
Crown Castle International Corp.
3.10%, 11/15/2029 | | | 7 | | | | 7 | |
| | |
CubeSmart LP 2.00%, 2/15/2031 | | | 9 | | | | 9 | |
| | |
Equinix, Inc. 2.90%, 11/18/2026 | | | 9 | | | | 9 | |
| | |
Healthcare Trust of America Holdings LP
2.00%, 3/15/2031 | | | 6 | | | | 6 | |
| | |
Healthpeak Properties, Inc.
| | | | | | | | |
| | |
2.13%, 12/1/2028 | | | 5 | | | | 5 | |
| | |
2.88%, 1/15/2031 | | | 6 | | | | 6 | |
| | | | | | | | |
| INVESTMENTS | | PRINCIPAL
AMOUNT
($000) | | | VALUE
($000) | |
| | | | | | | | |
| | | | | | | | |
|
Equity Real Estate Investment Trusts (REITs) — continued | |
| | |
Life Storage LP 2.40%, 10/15/2031 | | | 5 | | | | 5 | |
| | |
Mid-America Apartments LP 3.60%, 6/1/2027 | | | 2 | | | | 2 | |
| | |
Office Properties Income Trust 2.40%, 2/1/2027 | | | 5 | | | | 5 | |
| | |
Physicians Realty LP 2.63%, 11/1/2031 | | | 5 | | | | 5 | |
| | |
Public Storage | | | | | | | | |
| | |
1.95%, 11/9/2028 | | | 3 | | | | 3 | |
| | |
2.25%, 11/9/2031 | | | 2 | | | | 2 | |
| | |
Sabra Health Care LP 3.20%, 12/1/2031 | | | 5 | | | | 5 | |
| | |
Safehold Operating Partnership LP
2.85%, 1/15/2032 | | | 6 | | | | 6 | |
| | |
Scentre Group Trust 1 (Australia)
3.63%, 1/28/2026 (c) | | | 15 | | | �� | 15 | |
| | |
UDR, Inc. 2.10%, 8/1/2032 | | | 6 | | | | 6 | |
| | |
WP Carey, Inc. 2.40%, 2/1/2031 | | | 15 | | | | 15 | |
| | | | | | | | |
| | |
| | | | | | | 182 | |
| | | | | | | | |
|
Food & Staples Retailing — 0.2% | |
| | |
7-Eleven, Inc. | | | | | | | | |
| | |
0.63%, 2/10/2023 (c) | | | 15 | | | | 14 | |
| | |
0.95%, 2/10/2026 (c) | | | 2 | | | | 2 | |
| | |
1.30%, 2/10/2028 (c) | | | 2 | | | | 2 | |
| | |
2.50%, 2/10/2041 (c) | | | 3 | | | | 3 | |
| | |
Alimentation Couche-Tard, Inc. (Canada) | | | | | | | | |
| | |
2.95%, 1/25/2030 (c) | | | 6 | | | | 7 | |
| | |
3.44%, 5/13/2041 (c) | | | 5 | | | | 5 | |
| | |
3.63%, 5/13/2051 (c) | | | 5 | | | | 5 | |
| | |
Sysco Corp. 2.40%, 2/15/2030 | | | 13 | | | | 13 | |
| | | | | | | | |
| | |
| | | | | | | 51 | |
| | | | | | | | |
|
Food Products — 0.2% | |
| | |
Bunge Ltd. Finance Corp. 2.75%, 5/14/2031 | | | 5 | | | | 5 | |
| | |
Conagra Brands, Inc. 1.38%, 11/1/2027 | | | 15 | | | | 14 | |
| | |
Smithfield Foods, Inc. 3.00%, 10/15/2030 (c) | | | 13 | | | | 13 | |
| | |
Tyson Foods, Inc. 3.55%, 6/2/2027 | | | 10 | | | | 11 | |
| | | | | | | | |
| | |
| | | | | | | 43 | |
| | | | | | | | |
|
Gas Utilities — 0.1% | |
| | |
Atmos Energy Corp. | | | | | | | | |
| | |
0.63%, 3/9/2023 | | | 5 | | | | 5 | |
| | |
1.50%, 1/15/2031 | | | 10 | | | | 10 | |
| | |
CenterPoint Energy Resources Corp.
1.75%, 10/1/2030 | | | 15 | | | | 14 | |
| | | | | | | | |
| | |
| | | | | | | 29 | |
| | | | | | | | |
|
Health Care Equipment & Supplies — 0.1% | |
| | |
Becton Dickinson and Co. 4.67%, 6/6/2047 | | | 19 | | | | 24 | |
| | | | | | | | |
SEE NOTES TO FINANCIAL STATEMENTS.
| | | | | | | | | | |
| | | | | |
| DECEMBER 31, 2021 | | J.P. MORGAN FUNDS | | | | | | | | 19 |
JPMorgan SmartSpendingSM 2020 Fund
SCHEDULE OF PORTFOLIO INVESTMENTS
AS OF DECEMBER 31, 2021 (Unaudited) (continued)
| | | | | | | | |
| INVESTMENTS | | PRINCIPAL
AMOUNT
($000) | | | VALUE
($000) | |
| | | | | | | | |
Corporate Bonds — continued | |
|
Health Care Providers & Services — 0.3% | |
| | |
Anthem, Inc. 2.25%, 5/15/2030 | | | 6 | | | | 6 | |
| | |
CVS Health Corp. | | | | | | | | |
| | |
4.88%, 7/20/2035 | | | 5 | | | | 6 | |
| | |
2.70%, 8/21/2040 | | | 9 | | | | 9 | |
| | |
HCA, Inc. | | | | | | | | |
| | |
5.25%, 6/15/2026 | | | 17 | | | | 19 | |
| | |
3.50%, 7/15/2051 | | | 5 | | | | 5 | |
| | |
MedStar Health, Inc. | | | | | | | | |
| | |
Series 20A, 3.63%, 8/15/2049 | | | 5 | | | | 5 | |
| | |
Piedmont Healthcare, Inc. 2.86%, 1/1/2052 | | | 5 | | | | 5 | |
| | |
Universal Health Services, Inc.
2.65%, 1/15/2032 (c) | | | 5 | | | | 5 | |
| | |
West Virginia United Health System Obligated Group | | | | | | | | |
| | |
Series 2020, 3.13%, 6/1/2050 | | | 20 | | | | 20 | |
| | | | | | | | |
| | |
| | | | | | | 80 | |
| | | | | | | | |
|
Household Durables — 0.0% (b) | |
| | |
Lennar Corp. 5.00%, 6/15/2027 | | | 9 | | | | 10 | |
| | | | | | | | |
|
Independent Power and Renewable Electricity Producers — 0.3% | |
| | |
Alexander Funding Trust 1.84%, 11/15/2023 (c) | | | 8 | | | | 8 | |
| | |
Exelon Generation Co. LLC 3.25%, 6/1/2025 | | | 32 | | | | 34 | |
| | |
Southern Power Co. 5.15%, 9/15/2041 | | | 29 | | | | 35 | |
| | | | | | | | |
| | |
| | | | | | | 77 | |
| | | | | | | | |
|
Industrial Conglomerates — 0.0% (b) | |
| | |
Roper Technologies, Inc. 1.75%, 2/15/2031 | | | 6 | | | | 6 | |
| | | | | | | | |
|
Insurance — 0.3% | |
| | |
American International Group, Inc.
4.38%, 6/30/2050 | | | 8 | | | | 10 | |
| | |
Athene Global Funding | | | | | | | | |
| | |
0.95%, 1/8/2024 (c) | | | 7 | | | | 7 | |
| | |
2.75%, 6/25/2024 (c) | | | 6 | | | | 6 | |
| | |
2.50%, 1/14/2025 (c) | | | 2 | | | | 2 | |
| | |
1.45%, 1/8/2026 (c) | | | 10 | | | | 10 | |
| | |
Brown & Brown, Inc. 2.38%, 3/15/2031 | | | 6 | | | | 6 | |
| | |
Empower Finance 2020 LP (Canada)
3.08%, 9/17/2051 (c) | | | 7 | | | | 7 | |
| | |
F&G Global Funding
1.75%, 6/30/2026 (c) | | | 5 | | | | 5 | |
| | |
New York Life Insurance Co.
3.75%, 5/15/2050 (c) | | | 7 | | | | 8 | |
| | |
Northwestern Mutual Global Funding
1.70%, 6/1/2028 (c) | | | 5 | | | | 5 | |
| | | | | | | | |
| INVESTMENTS | | PRINCIPAL
AMOUNT
($000) | | | VALUE
($000) | |
| | | | | | | | |
| | | | | | | | |
|
Insurance — continued | |
| | |
Teachers Insurance & Annuity Association of America 3.30%, 5/15/2050 (c) | | | 6 | | | | 6 | |
| | | | | | | | |
| | |
| | | | | | | 72 | |
| | | | | | | | |
|
IT Services — 0.0% (b) | |
| | |
CGI, Inc. (Canada) 2.30%, 9/14/2031 (c) | | | 6 | | | | 6 | |
| | |
Global Payments, Inc. 3.20%, 8/15/2029 | | | 4 | | | | 4 | |
| | | | | | | | |
| | |
| | | | | | | 10 | |
| | | | | | | | |
|
Leisure Products — 0.0% (b) | |
| | |
Hasbro, Inc. 3.90%, 11/19/2029 | | | 5 | | | | 6 | |
| | | | | | | | |
|
Media — 0.4% | |
| | |
Charter Communications Operating LLC
| | | | | | | | |
| | |
2.80%, 4/1/2031 | | | 19 | | | | 19 | |
| | |
3.50%, 6/1/2041 | | | 5 | | | | 5 | |
| | |
Comcast Corp. 3.25%, 11/1/2039 | | | 16 | | | | 17 | |
| | |
Cox Communications, Inc. 1.80%, 10/1/2030 (c) | | | 15 | | | | 14 | |
| | |
Discovery Communications LLC
3.63%, 5/15/2030 | | | 10 | | | | 11 | |
| | |
ViacomCBS, Inc. | | | | | | | | |
| | |
4.38%, 3/15/2043 | | | 10 | | | | 11 | |
| | |
5.85%, 9/1/2043 | | | 25 | | | | 33 | |
| | | | | | | | |
| | |
| | | | | | | 110 | |
| | | | | | | | |
|
Metals & Mining — 0.1% | |
| | |
Glencore Funding LLC (Australia)
2.50%, 9/1/2030 (c) | | | 8 | | | | 8 | |
| | |
Steel Dynamics, Inc. 1.65%, 10/15/2027 | | | 6 | | | | 6 | |
| | |
Vale Overseas Ltd. (Brazil) 3.75%, 7/8/2030 | | | 4 | | | | 4 | |
| | | | | | | | |
| | |
| | | | | | | 18 | |
| | | | | | | | |
|
Multiline Retail — 0.1% | |
| | |
Kohl’s Corp. 3.38%, 5/1/2031 | | | 6 | | | | 6 | |
| | |
Nordstrom, Inc. 4.25%, 8/1/2031 | | | 9 | | | | 9 | |
| | | | | | | | |
| | |
| | | | | | | 15 | |
| | | | | | | | |
|
Multi-Utilities — 0.1% | |
| | |
WEC Energy Group, Inc. 1.38%, 10/15/2027 | | | 15 | | | | 14 | |
| | | | | | | | |
|
Oil, Gas & Consumable Fuels — 0.6% | |
| | |
BP Capital Markets America, Inc.
2.77%, 11/10/2050 | | | 15 | | | | 14 | |
| | |
Chevron USA, Inc. 3.25%, 10/15/2029 | | | 5 | | | | 5 | |
| | |
ConocoPhillips 3.75%, 10/1/2027 (c) | | | 7 | | | | 8 | |
| | |
Coterra Energy, Inc. 3.90%, 5/15/2027 (c) | | | 5 | | | | 5 | |
| | |
Diamondback Energy, Inc. 3.25%, 12/1/2026 | | | 8 | | | | 8 | |
SEE NOTES TO FINANCIAL STATEMENTS.
| | | | | | | | | | |
| | | | | |
| 20 | | | | | | | | J.P. MORGAN FUNDS | | DECEMBER 31, 2021 |
| | | | | | | | |
| INVESTMENTS | | PRINCIPAL
AMOUNT
($000) | | | VALUE
($000) | |
| | | | | | | | |
Corporate Bonds — continued | |
|
Oil, Gas & Consumable Fuels — continued | |
| | |
Enable Midstream Partners LP | | | | | | | | |
| | |
4.40%, 3/15/2027 | | | 10 | | | | 11 | |
| | |
5.00%, 5/15/2044 (e) | | | 5 | | | | 5 | |
| | |
Energy Transfer LP 3.90%, 7/15/2026 | | | 9 | | | | 10 | |
| | |
Enterprise Products Operating LLC
4.45%, 2/15/2043 | | | 7 | | | | 8 | |
| | |
Exxon Mobil Corp. 3.00%, 8/16/2039 | | | 9 | | | | 9 | |
| | |
Flex Intermediate Holdco LLC | | | | | | | | |
| | |
3.36%, 6/30/2031 (c) | | | 5 | | | | 5 | |
| | |
4.32%, 12/30/2039 (c) | | | 5 | | | | 5 | |
| | |
Gray Oak Pipeline LLC | | | | | | | | |
| | |
2.60%, 10/15/2025 (c) | | | 15 | | | | 16 | |
| | |
3.45%, 10/15/2027 (c) | | | 5 | | | | 5 | |
| | |
HollyFrontier Corp. 2.63%, 10/1/2023 | | | 6 | | | | 6 | |
| | |
MPLX LP 2.65%, 8/15/2030 | | | 15 | | | | 15 | |
| | |
NGPL PipeCo LLC 3.25%, 7/15/2031 (c) | | | 5 | | | | 5 | |
| | |
Pioneer Natural Resources Co.
1.90%, 8/15/2030 | | | 6 | | | | 6 | |
| | |
Plains All American Pipeline LP
4.65%, 10/15/2025 | | | 9 | | | | 10 | |
| | |
Sabine Pass Liquefaction LLC 5.63%, 3/1/2025 | | | 7 | | | | 8 | |
| | |
TotalEnergies Capital International SA (France) 2.99%, 6/29/2041 | | | 6 | | | | 6 | |
| | | | | | | | |
| | |
| | | | | | | 170 | |
| | | | | | | | |
|
Pharmaceuticals — 0.2% | |
| | |
Bristol-Myers Squibb Co. 3.40%, 7/26/2029 | | | 2 | | | | 2 | |
| | |
Royalty Pharma plc 3.30%, 9/2/2040 | | | 15 | | | | 15 | |
| | |
Utah Acquisition Sub, Inc. 3.95%, 6/15/2026 | | | 17 | | | | 18 | |
| | |
Viatris, Inc. 3.85%, 6/22/2040 | | | 16 | | | | 17 | |
| | | | | | | | |
| | |
| | | | | | | 52 | |
| | | | | | | | |
|
Professional Services — 0.0% (b) | |
| | |
IHS Markit Ltd. 4.25%, 5/1/2029 | | | 10 | | | | 11 | |
| | | | | | | | |
|
Road & Rail — 0.1% | |
| | |
Kansas City Southern 4.70%, 5/1/2048 | | | 3 | | | | 4 | |
| | |
Triton Container International Ltd. (Bermuda) 2.05%, 4/15/2026 (c) | | | 15 | | | | 15 | |
| | | | | | | | |
| | |
| | | | | | | 19 | |
| | | | | | | | |
|
Semiconductors & Semiconductor Equipment — 0.3% | |
| | |
Analog Devices, Inc. 2.80%, 10/1/2041 | | | 4 | | | | 4 | |
| | |
Broadcom, Inc. | | | | | | | | |
| | |
1.95%, 2/15/2028 (c) | | | 8 | | | | 8 | |
| | |
4.15%, 11/15/2030 | | | 21 | | | | 24 | |
| | | | | | | | |
| INVESTMENTS | | PRINCIPAL
AMOUNT
($000) | | | VALUE
($000) | |
| | | | | | | | |
| | | | | | | | |
|
Semiconductors & Semiconductor Equipment — continued | |
| | |
KLA Corp. 3.30%, 3/1/2050 | | | 5 | | | | 5 | |
| | |
Microchip Technology, Inc. | | | | | | | | |
| | |
0.97%, 2/15/2024 | | | 5 | | | | 5 | |
| | |
0.98%, 9/1/2024 (c) | | | 5 | | | | 5 | |
| | |
NXP BV (China) | | | | | | | | |
| | |
2.50%, 5/11/2031 (c) | | | 5 | | | | 5 | |
| | |
3.25%, 5/11/2041 (c) | | | 5 | | | | 5 | |
| | |
Xilinx, Inc. 2.38%, 6/1/2030 | | | 11 | | | | 11 | |
| | | | | | | | |
| | |
| | | | | | | 72 | |
| | | | | | | | |
|
Software — 0.1% | |
| | |
Citrix Systems, Inc. 1.25%, 3/1/2026 | | | 5 | | | | 5 | |
| | |
Oracle Corp. 3.80%, 11/15/2037 | | | 17 | | | | 17 | |
| | |
VMware, Inc. | | | | | | | | |
| | |
1.40%, 8/15/2026 | | | 6 | | | | 6 | |
| | |
4.70%, 5/15/2030 | | | 10 | | | | 12 | |
| | | | | | | | |
| | |
| | | | | | | 40 | |
| | | | | | | | |
|
Specialty Retail — 0.1% | |
| | |
AutoZone, Inc. 3.63%, 4/15/2025 | | | 9 | | | | 9 | |
| | |
Lowe’s Cos., Inc. 3.70%, 4/15/2046 | | | 7 | | | | 8 | |
| | |
O’Reilly Automotive, Inc. 3.90%, 6/1/2029 | | | 7 | | | | 8 | |
| | | | | | | | |
| | |
| | | | | | | 25 | |
| | | | | | | | |
|
Technology Hardware, Storage & Peripherals — 0.1% | |
| | |
Dell International LLC 6.20%, 7/15/2030 | | | 15 | | | | 19 | |
| | | | | | | | |
|
Tobacco — 0.1% | |
| | |
Altria Group, Inc. 2.45%, 2/4/2032 | | | 10 | | | | 9 | |
| | |
BAT Capital Corp. (United Kingdom)
| | | | | | | | |
| | |
2.26%, 3/25/2028 | | | 12 | | | | 12 | |
| | |
4.39%, 8/15/2037 | | | 5 | | | | 5 | |
| | |
3.73%, 9/25/2040 | | | 4 | | | | 4 | |
| | | | | | | | |
| | |
| | | | | | | 30 | |
| | | | | | | | |
|
Trading Companies & Distributors — 0.1% | |
| | |
Air Lease Corp.
| | | | | | | | |
| | |
3.38%, 7/1/2025 | | | 5 | | | | 5 | |
| | |
2.88%, 1/15/2026 | | | 5 | | | | 5 | |
| | |
1.88%, 8/17/2026 | | | 10 | | | | 10 | |
| | | | | | | | |
| | |
| | | | | | | 20 | |
| | | | | | | | |
SEE NOTES TO FINANCIAL STATEMENTS.
| | | | | | | | | | |
| | | | | |
| DECEMBER 31, 2021 | | J.P. MORGAN FUNDS | | | | | | | | 21 |
JPMorgan SmartSpendingSM 2020 Fund
SCHEDULE OF PORTFOLIO INVESTMENTS
AS OF DECEMBER 31, 2021 (Unaudited) (continued)
| | | | | | | | |
| INVESTMENTS | | PRINCIPAL
AMOUNT
($000) | | | VALUE
($000) | |
| | | | | | | | |
Corporate Bonds — continued | |
|
Wireless Telecommunication Services — 0.1% | |
| | |
Rogers Communications, Inc. (Canada)
3.70%, 11/15/2049 | | | 7 | | | | 7 | |
| | |
T-Mobile USA, Inc. | | | | | | | | |
| | |
2.55%, 2/15/2031 | | | 15 | | | | 15 | |
| | |
3.00%, 2/15/2041 | | | 9 | | | | 9 | |
| | | | | | | | |
| | |
| | | | | | | 31 | |
| | | | | | | | |
| |
Total Corporate Bonds
(Cost $2,279) | | | | 2,224 | |
| | | | | |
U.S. Treasury Obligations — 7.4% | |
| | |
U.S. Treasury Bonds | | | | | | | | |
| | |
1.13%, 5/15/2040 | | | 61 | | | | 53 | |
| | |
1.13%, 8/15/2040 | | | 56 | | | | 49 | |
| | |
1.38%, 11/15/2040 | | | 15 | | | | 14 | |
| | |
2.25%, 5/15/2041 | | | 8 | | | | 8 | |
| | |
2.25%, 8/15/2046 | | | 15 | | | | 16 | |
| | |
1.38%, 8/15/2050 | | | 177 | | | | 155 | |
| | |
1.63%, 11/15/2050 | | | 64 | | | | 60 | |
| | |
U.S. Treasury Notes | | | | | | | | |
| | |
1.38%, 1/31/2022 (f) | | | 268 | | | | 268 | |
| | |
0.13%, 9/15/2023 | | | 132 | | | | 131 | |
| | |
1.75%, 7/31/2024 | | | 355 | | | | 362 | |
| | |
0.25%, 8/31/2025 | | | 228 | | | | 221 | |
| | |
0.38%, 11/30/2025 | | | 311 | | | | 302 | |
| | |
0.50%, 8/31/2027 | | | 97 | | | | 93 | |
| | |
0.63%, 11/30/2027 | | | 125 | | | | 120 | |
| | |
1.25%, 3/31/2028 | | | 61 | | | | 60 | |
| | |
1.00%, 7/31/2028 | | | 20 | | | | 19 | |
| | |
0.63%, 8/15/2030 | | | 2 | | | | 2 | |
| | |
1.13%, 2/15/2031 | | | 15 | | | | 15 | |
| | |
U.S. Treasury STRIPS Bonds
| | | | | | | | |
| | |
1.01%, 8/15/2026 (g) | | | 35 | | | | 33 | |
| | |
1.15%, 5/15/2027 (g) | | | 35 | | | | 33 | |
| | |
2.35%, 5/15/2041 (g) | | | 50 | | | | 33 | |
| | | | | | | | |
| |
Total U.S. Treasury Obligations
(Cost $2,076) | | | | 2,047 | |
| | | | | |
Mortgage-Backed Securities — 5.9% | |
| |
FHLMC UMBS, 30 Year | | | | | |
| | |
Pool # ZL3032, 3.50%, 5/1/2042 | | | 8 | | | | 8 | |
| | |
Pool # QB4026, 2.50%, 10/1/2050 | | | 18 | | | | 19 | |
| | |
Pool # QB4045, 2.50%, 10/1/2050 | | | 13 | | | | 13 | |
| | |
Pool # QB4484, 2.50%, 10/1/2050 | | | 7 | | | | 7 | |
| | |
Pool # QB4542, 2.50%, 10/1/2050 | | | 5 | | | | 5 | |
| | |
Pool # RA4224, 3.00%, 11/1/2050 | | | 5 | | | | 5 | |
| | |
Pool # QB8503, 2.50%, 2/1/2051 | | | 15 | | | | 15 | |
| | | | | | | | |
| INVESTMENTS | | PRINCIPAL
AMOUNT
($000) | | | VALUE
($000) | |
| | | | | | | | |
| | | | | | | | |
| |
FNMA | | | | | |
| | |
Pool # BS4290, 1.95%, 10/1/2029 | | | 100 | | | | 101 | |
| |
FNMA UMBS, 30 Year | | | | | |
| | |
Pool # CA2826, 5.50%, 12/1/2048 | | | 12 | | | | 13 | |
| | |
Pool # FM3118, 3.00%, 5/1/2050 | | | 7 | | | | 7 | |
| | |
Pool # BQ2894, 3.00%, 9/1/2050 | | | 9 | | | | 9 | |
| | |
Pool # BQ3996, 2.50%, 10/1/2050 | | | 7 | | | | 7 | |
| | |
Pool # BQ5243, 3.50%, 10/1/2050 | | | 4 | | | | 4 | |
| | |
Pool # CA7398, 3.50%, 10/1/2050 | | | 11 | | | | 12 | |
| | |
Pool # CA8637, 4.00%, 1/1/2051 | | | 32 | | | | 36 | |
| | |
Pool # BU1805, 2.50%, 12/1/2051 | | | 20 | | | | 20 | |
| |
FNMA, Other | | | | | |
| | |
Pool # AN2009, 2.70%, 7/1/2026 | | | 19 | | | | 20 | |
| | |
Pool # AM3010, 5.07%, 3/1/2028 | | | 9 | | | | 10 | |
| | |
Pool # BL8639, 1.09%, 4/1/2028 | | | 5 | | | | 5 | |
| | |
Pool # AM5319, 4.34%, 1/1/2029 | | | 9 | | | | 10 | |
| | |
Pool # BL5457, 2.57%, 7/1/2029 | | | 5 | | | | 5 | |
| | |
Pool # BS0448, 1.27%, 12/1/2029 | | | 20 | | | | 19 | |
| | |
Pool # BL9748, 1.60%, 12/1/2029 | | | 5 | | | | 5 | |
| | |
Pool # AN7593, 2.99%, 12/1/2029 | | | 5 | | | | 5 | |
| | |
Pool # AN8285, 3.11%, 3/1/2030 | | | 5 | | | | 5 | |
| | |
Pool # AM8544, 3.08%, 4/1/2030 | | | 5 | | | | 5 | |
| | |
Pool # BL9045, 1.58%, 7/1/2030 | | | 10 | | | | 10 | |
| | |
Pool # BL9251, 1.45%, 10/1/2030 | | | 15 | | | | 15 | |
| | |
Pool # BL9891, 1.37%, 12/1/2030 | | | 10 | | | | 10 | |
| | |
Pool # AN6149, 3.14%, 7/1/2032 | | | 15 | | | | 17 | |
| | |
Pool # BM3226, 3.44%, 10/1/2032 (h) | | | 29 | | | | 32 | |
| | |
Pool # AN7923, 3.33%, 1/1/2033 | | | 10 | | | | 11 | |
| | |
Pool # AN9067, 3.51%, 5/1/2033 | | | 5 | | | | 6 | |
| | |
Pool # BL1012, 4.03%, 12/1/2033 | | | 5 | | | | 6 | |
| | |
Pool # BL0900, 4.08%, 2/1/2034 | | | 5 | | | | 6 | |
| | |
Pool # AN4430, 3.61%, 1/1/2037 | | | 4 | | | | 5 | |
| | |
Pool # BF0230, 5.50%, 1/1/2058 | | | 21 | | | | 25 | |
| | |
Pool # BF0497, 3.00%, 7/1/2060 | | | 12 | | | | 13 | |
| |
FNMA/FHLMC UMBS, Single Family, 30 Year | | | | | |
| | |
TBA, 2.50%, 2/25/2052 (i) | | | 200 | | | | 204 | |
| |
GNMA II, 30 Year | | | | | |
| | |
Pool # BY3432, 3.50%, 9/20/2050 | | | 9 | | | | 9 | |
| | |
Pool # BR3929, 3.50%, 10/20/2050 | | | 9 | | | | 9 | |
| | |
Pool # BW1726, 3.50%, 10/20/2050 | | | 17 | | | | 18 | |
| | |
Pool # BS8546, 2.50%, 12/20/2050 | | | 27 | | | | 28 | |
| | |
Pool # BR3928, 3.00%, 12/20/2050 | | | 15 | | | | 16 | |
| | |
Pool # BU7538, 3.00%, 12/20/2050 | | | 9 | | | | 10 | |
| | |
Pool # 785294, 3.50%, 1/20/2051 | | | 27 | | | | 30 | |
| | |
Pool # CA8452, 3.00%, 2/20/2051 | | | 34 | | | | 36 | |
SEE NOTES TO FINANCIAL STATEMENTS.
| | | | | | | | | | |
| | | | | |
| 22 | | | | | | | | J.P. MORGAN FUNDS | | DECEMBER 31, 2021 |
| | | | | | | | |
| INVESTMENTS | | PRINCIPAL
AMOUNT
($000) | | | VALUE
($000) | |
| | | | | | | | |
Mortgage-Backed Securities — continued | |
| | |
Pool # CB1543, 3.00%, 2/20/2051 | | | 25 | | | | 26 | |
| | |
Pool # CA3588, 3.50%, 2/20/2051 | | | 23 | | | | 25 | |
| | |
Pool # CB1536, 3.50%, 2/20/2051 | | | 30 | | | | 32 | |
| | |
Pool # CB1542, 3.00%, 3/20/2051 | | | 20 | | | | 21 | |
| | |
Pool # CB4433, 3.00%, 3/20/2051 | | | 29 | | | | 30 | |
| | |
Pool # CC0070, 3.00%, 3/20/2051 | | | 4 | | | | 5 | |
| | |
Pool # CC8726, 3.00%, 3/20/2051 | | | 5 | | | | 5 | |
| | |
Pool # CC8738, 3.00%, 3/20/2051 | | | 5 | | | | 5 | |
| | |
Pool # CC8723, 3.50%, 3/20/2051 | | | 29 | | | | 32 | |
| | |
Pool # CC0088, 4.00%, 3/20/2051 | | | 4 | | | | 4 | |
| | |
Pool # CC0092, 4.00%, 3/20/2051 | | | 4 | | | | 4 | |
| | |
Pool # CC8727, 3.00%, 4/20/2051 | | | 9 | | | | 10 | |
| | |
Pool # CC8739, 3.00%, 4/20/2051 | | | 20 | | | | 21 | |
| | |
Pool # CC8740, 3.00%, 4/20/2051 | | | 20 | | | | 21 | |
| | |
Pool # CC8751, 3.00%, 4/20/2051 | | | 5 | | | | 5 | |
| | |
Pool # CA3563, 3.50%, 7/20/2051 | | | 15 | | | | 16 | |
| | |
Pool # CE2586, 3.50%, 7/20/2051 | | | 25 | | | | 27 | |
| | |
Pool # MA7534, 2.50%, 8/20/2051 | | | 412 | | | | 422 | |
| | |
Pool # MA7649, 2.50%, 10/20/2051 | | | 15 | | | | 15 | |
| | |
Pool # CK1527, 3.50%, 12/20/2051 | | | 15 | | | | 16 | |
| |
GNMA II, Other | | | | | |
| | |
Pool # 785183, 2.94%, 10/20/2070 (h) | | | 19 | | | | 19 | |
| | | | | | | | |
| |
Total Mortgage-Backed Securities
(Cost $1,669) | | | | 1,647 | |
| | | | | |
Asset-Backed Securities — 3.3% | |
| |
ACC Auto Trust | | | | | |
| | |
Series 2021-A, Class A, 1.08%, 4/15/2027 (c) | | | 75 | | | | 75 | |
| |
Aligned Data Centers Issuer LLC | | | | | |
| | |
Series 2021-1A, Class A2, 1.94%, 8/15/2046 (c) | | | 25 | | | | 25 | |
| |
American Airlines Pass-Through Trust | | | | | |
| | |
Series 2016-2, Class AA, 3.20%, 6/15/2028 | | | 19 | | | | 19 | |
| | |
Series 2016-3, Class AA, 3.00%, 10/15/2028 | | | 19 | | | | 19 | |
| | |
Series 2021-1, Class B, 3.95%, 7/11/2030 | | | 13 | | | | 13 | |
| | |
Series 2019-1, Class AA, 3.15%, 2/15/2032 | | | 23 | | | | 23 | |
| |
American Credit Acceptance Receivables Trust | | | | | |
| | |
Series 2021-1, Class A, 0.35%, 5/13/2024 (c) | | | 5 | | | | 5 | |
| | |
Series 2021-1, Class B, 0.61%, 3/13/2025 (c) | | | 5 | | | | 5 | |
| | |
Series 2020-4, Class C, 1.31%, 12/14/2026 (c) | | | 10 | | | | 10 | |
| |
AmeriCredit Automobile Receivables Trust | | | | | |
| | |
Series 2018-3, Class D, 4.04%, 11/18/2024 | | | 10 | | | | 10 | |
| | |
Series 2020-3, Class B, 0.76%, 12/18/2025 | | | 10 | | | | 10 | |
| | |
Series 2020-3, Class C, 1.06%, 8/18/2026 | | | 5 | | | | 5 | |
| | | | | | | | |
| INVESTMENTS | | PRINCIPAL
AMOUNT
($000) | | | VALUE
($000) | |
| | | | | | | | |
| | | | | | | | |
| |
Business Jet Securities LLC | | | | | |
| | |
Series 2021-1A, Class A, 2.16%, 4/15/2036 (c) | | | 84 | | | | 83 | |
| |
CarMax Auto Owner Trust | | | | | |
| | |
Series 2019-3, Class C, 2.60%, 6/16/2025 | | | 10 | | | | 10 | |
| | |
Series 2020-4, Class C, 1.30%, 8/17/2026 | | | 5 | | | | 5 | |
| |
Carvana Auto Receivables Trust | | | | | |
| | |
Series 2019-4A, Class D, 3.07%, 7/15/2025 (c) | | | 30 | | | | 31 | |
| | |
Series 2020-P1, Class C, 1.32%, 11/9/2026 | | | 10 | | | | 10 | |
| |
Delta Air Lines Pass-Through Trust | | | | | |
| | |
Series 2020-1, Class A, 2.50%, 6/10/2028 | | | 8 | | | | 8 | |
| |
Drive Auto Receivables Trust | | | | | |
| | |
Series 2020-1, Class D, 2.70%, 5/17/2027 | | | 30 | | | | 31 | |
| |
DT Auto Owner Trust | | | | | |
| | |
Series 2019-4A, Class D, 2.85%, 7/15/2025 (c) | | | 20 | | | | 20 | |
| | |
Series 2021-1A, Class C, 0.84%, 10/15/2026 (c) | | | 10 | | | | 10 | |
| | |
Series 2021-2A, Class C, 1.10%, 2/16/2027 (c) | | | 20 | | | | 20 | |
| | |
Series 2021-4A, Class D, 1.99%, 9/15/2027 (c) | | | 25 | | | | 25 | |
| |
Exeter Automobile Receivables Trust | | | | | |
| | |
Series 2021-1A, Class A3, 0.34%, 3/15/2024 | | | 6 | | | | 6 | |
| | |
Series 2021-1A, Class B, 0.50%, 2/18/2025 | | | 20 | | | | 20 | |
| | |
Series 2021-2A, Class C, 0.98%, 6/15/2026 | | | 15 | | | | 15 | |
| |
FHF Trust | | | | | |
| | |
Series 2021-2A, Class A, 0.83%, 12/15/2026 (c) | | | 19 | | | | 19 | |
| | |
Series 2021-1A, Class A, 1.27%, 3/15/2027 (c) | | | 25 | | | | 24 | |
| |
First Investors Auto Owner Trust | | | | | |
| | |
Series 2021-1A, Class B, 0.89%, 3/15/2027 (c) | | | 10 | | | | 10 | |
| |
Flagship Credit Auto Trust | | | | | |
| | |
Series 2021-2, Class A, 0.37%, 12/15/2026 (c) | | | 23 | | | | 23 | |
| | |
Series 2021-1, Class B, 0.68%, 2/16/2027 (c) | | | 10 | | | | 10 | |
| | |
Series 2020-4, Class C, 1.28%, 2/16/2027 (c) | | | 10 | | | | 10 | |
| |
GLS Auto Receivables Issuer Trust | | | | | |
| | |
Series 2020-4A, Class B, 0.87%, 12/16/2024 (c) | | | 10 | | | | 10 | |
| |
GLS Auto Receivables Trust | | | | | |
| | |
Series 2021-2A, Class B, 0.77%, 9/15/2025 (c) | | | 25 | | | | 25 | |
SEE NOTES TO FINANCIAL STATEMENTS.
| | | | | | | | | | |
| | | | | |
| DECEMBER 31, 2021 | | J.P. MORGAN FUNDS | | | | | | | | 23 |
JPMorgan SmartSpendingSM 2020 Fund
SCHEDULE OF PORTFOLIO INVESTMENTS
AS OF DECEMBER 31, 2021 (Unaudited) (continued)
| | | | | | | | |
| INVESTMENTS | | PRINCIPAL
AMOUNT
($000) | | | VALUE
($000) | |
| | | | | | | | |
Asset-Backed Securities — continued | |
| |
JetBlue Pass-Through Trust | | | | | |
| | |
Series 2020-1, Class B, 7.75%, 11/15/2028 | | | 6 | | | | 7 | |
| |
Nissan Auto Receivables Owner Trust | | | | | |
| | |
Series 2019-B, Class A3, 2.50%, 11/15/2023 | | | — | (j) | | | — | (j) |
| |
Pagaya AI Debt Selection Trust | | | | | |
| | |
Series 2021-1, Class A, 1.18%, 11/15/2027 (c) | | | 77 | | | | 77 | |
| |
Prestige Auto Receivables Trust | | | | | |
| | |
Series 2020-1A, Class C, 1.31%, 11/16/2026 (c) | | | 10 | | | | 10 | |
| |
Santander Consumer Auto Receivables Trust | | | | | |
| | |
Series 2021-AA, Class B, 0.71%, 8/17/2026 (c) | | | 10 | | | | 10 | |
| |
Santander Drive Auto Receivables Trust | | | | | |
| | |
Series 2019-3, Class D, 2.68%, 10/15/2025 | | | 11 | | | | 11 | |
| | |
Series 2020-4, Class C, 1.01%, 1/15/2026 | | | 5 | | | | 5 | |
| |
United Airlines Pass-Through Trust | | | | | |
| | |
Series 2016-2, Class B, 3.65%, 10/7/2025 | | | 3 | | | | 3 | |
| | |
Series 2019-2, Class B, 3.50%, 5/1/2028 | | | 6 | | | | 6 | |
| | |
Series 2016-2, Class A, 3.10%, 10/7/2028 | | | 4 | | | | 4 | |
| | |
Series 2018-1, Class A, 3.70%, 3/1/2030 | | | 9 | | | | 9 | |
| |
United Auto Credit Securitization Trust | | | | | |
| | |
Series 2021-1, Class C, 0.84%, 6/10/2026 (c) | | | 15 | | | | 15 | |
| |
Veros Auto Receivables Trust | | | | | |
| | |
Series 2021-1, Class A, 0.92%, 10/15/2026 (c) | | | 43 | | | | 43 | |
| |
VOLT XCVII LLC | | | | | |
| | |
Series 2021-NPL6, Class A1, 2.24%, 4/25/2051 (c) (e) | | | 24 | | | | 24 | |
| |
Westlake Automobile Receivables Trust | | | | | |
| | |
Series 2020-3A, Class C, 1.24%, 11/17/2025 (c) | | | 10 | | | | 10 | |
| | |
Series 2020-3A, Class D, 1.65%, 2/17/2026 (c) | | | 10 | | | | 10 | |
| | |
Series 2021-1A, Class C, 0.95%, 3/16/2026 (c) | | | 25 | | | | 25 | |
| | | | | | | | |
| |
Total Asset-Backed Securities
(Cost $917) | | | | 913 | |
| | | | | |
Collateralized Mortgage Obligations — 0.5% | |
| | |
Bayview Finance LLC 0.00%, 7/12/2033 ‡ | | | 20 | | | | 20 | |
| |
FNMA Trust, Whole Loan | | | | | |
| | |
Series 2002-W8, Class A1, 6.50%, 6/25/2042 | | | 6 | | | | 7 | |
| |
FNMA, Grantor Trust, Whole Loan | | | | | |
| | |
Series 2001-T12, Class A1, 6.50%, 8/25/2041 | | | 3 | | | | 3 | |
| |
FNMA, REMIC | | | | | |
| | |
Series 2018-72, Class VB, 3.50%, 10/25/2031 | | | 8 | | | | 8 | |
| | |
Series 2019-7, Class CA, 3.50%, 11/25/2057 | | | 33 | | | | 35 | |
| | | | | | | | |
| INVESTMENTS | | PRINCIPAL
AMOUNT
($000) | | | VALUE
($000) | |
| | | | | | | | |
| | | | | | | | |
| |
FNMA, REMIC Trust, Whole Loan | | | | | |
| | |
Series 2002-W3, Class A4, 6.50%, 11/25/2041 | | | 13 | | | | 15 | |
| |
Seasoned Credit Risk Transfer Trust | | | | | |
| | |
Series 2018-1, Class M60C, 3.50%, 5/25/2057 | | | 9 | | | | 10 | |
| | |
Series 2019-2, Class M55D, 4.00%, 8/25/2058 | | | 12 | | | | 13 | |
| | |
Series 2019-3, Class M55D, 4.00%, 10/25/2058 | | | 12 | | | | 13 | |
| | |
Series 2020-3, Class M5TW, 3.00%, 5/25/2060 ‡ | | | 12 | | | | 12 | |
| | |
Series 2020-3, Class TTW, 3.00%,
5/25/2060 ‡ | | | 14 | | | | 13 | |
| | | | | | | | |
| |
Total Collateralized Mortgage Obligations
(Cost $148) | | | | 149 | |
| | | | | |
Commercial Mortgage-Backed Securities — 0.5% | |
| |
ACRE Commercial Mortgage Ltd. (Cayman Islands) | | | | | |
| | |
Series 2021-FL4, Class A, 0.93%, 12/18/2037 (c) (h) | | | 10 | | | | 10 | |
| | |
Series 2021-FL4, Class AS, 1.20%, 12/18/2037 (c) (h) | | | 10 | | | | 10 | |
| |
BPR Trust | | | | | |
| | |
Series 2021-KEN, Class A, 1.36%, 2/15/2029 (c) (h) | | | 15 | | | | 15 | |
| |
FHLMC, Multi-Family Structured Credit Risk | | | | | |
| | |
Series 2021-MN2, Class M1, 1.85%, 7/25/2041 (c) (h) | | | 15 | | | | 15 | |
| |
FHLMC, Multi-Family Structured Pass-Through Certificates | | | | | |
| | |
Series K-1511, Class A1, 3.28%, 10/25/2030 | | | 9 | | | | 10 | |
| | |
Series K-1510, Class A2, 3.72%, 1/25/2031 | | | 5 | | | | 6 | |
| |
FNMA ACES | | | | | |
| | |
Series 2021-M3, Class 1A1, 1.00%, 11/25/2033 | | | 4 | | | | 4 | |
| | |
Series 2021-M3, Class X1, IO, 2.00%, 11/25/2033 (h) | | | 96 | | | | 12 | |
| |
FREMF Mortgage Trust | | | | | |
| | |
Series 2017-KGX1, Class BFX, 3.59%, 10/25/2027 (c) (h) | | | 10 | | | | 10 | |
| | |
Series 2016-K56, Class B, 3.94%, 6/25/2049 (c) (h) | | | 5 | | | | 5 | |
| | |
Series 2016-K58, Class B, 3.74%, 9/25/2049 (c) (h) | | | 20 | | | | 22 | |
| | | | | | | | |
| |
KKR Industrial Portfolio Trust | | | | | |
| | |
Series 2021-KDIP, Class B, 0.91%, 12/15/2037 ‡ (c) (h) | | | 8 | | | | 7 | |
| | | | | | | | |
| |
Total Commercial Mortgage-Backed Securities
(Cost $128) | | | | 126 | |
| | | | | | | | |
SEE NOTES TO FINANCIAL STATEMENTS.
| | | | | | | | | | |
| | | | | |
| 24 | | | | | | | | J.P. MORGAN FUNDS | | DECEMBER 31, 2021 |
| | | | | | | | |
| | |
| INVESTMENTS | |
Shares
(000) | | | VALUE
($000) | |
Short-Term Investments — 4.2% | |
|
Investment Companies — 4.2% | |
| | |
JPMorgan U.S. Government Money Market Fund Class IM Shares, 0.03% (a) (k)
(Cost $1,170) | | | 1,170 | | | | 1,170 | |
| | | | | | | | |
Total Investments — 100.5%
(Cost $25,511) | | | | 27,888 | |
Liabilities in Excess of
Other Assets — (0.5)% | | | | (126 | ) |
| | | | | | | | |
NET ASSETS — 100.0% | | | | 27,762 | |
| | | | | | | | |
Percentages indicated are based on net assets.
Abbreviations
| | |
| ACES | | Alternative Credit Enhancement Securities |
| ETF | | Exchange-Traded Fund |
| FHLMC | | Federal Home Loan Mortgage Corp. |
| FNMA | | Federal National Mortgage Association |
| GNMA | | Government National Mortgage Association |
| ICE | | Intercontinental Exchange |
| IO | | Interest Only represents the right to receive the monthly interest payments on an underlying pool of mortgage loans. The principal amount shown represents the par value on the underlying pool. The yields on these securities are subject to accelerated principal paydowns as a result of prepayment or refinancing of the underlying pool of mortgage instruments. As a result, interest income may be reduced considerably. |
| LIBOR | | London Interbank Offered Rate |
| REIT | | Real Estate Investment Trust |
| REMIC | | Real Estate Mortgage Investment Conduit |
| SOFR | | Secured Overnight Financing Rate |
| STRIPS | | Separate Trading of Registered Interest and Principal of Securities. The STRIPS Program lets investors hold and trade individual interest and principal components of eligible notes and bonds as separate securities. |
| TBA | | To Be Announced; Security is subject to delayed delivery. |
| UMBS | | Uniform Mortgage-Backed Securities |
| USD | | United States Dollar |
| | |
| (a) | | Investment in an affiliated fund, which is registered under the Investment Company Act of 1940, as amended, and is advised by J.P. Morgan Investment Management Inc. |
| (b) | | Amount rounds to less than 0.1% of net assets. |
| (c) | | Securities exempt from registration under Rule 144A or section 4(a)(2), of the Securities Act of 1933, as amended. |
| (d) | | Variable or floating rate security, linked to the referenced benchmark. The interest rate shown is the current rate as of December 31, 2021. |
| (e) | | Step bond. Interest rate is a fixed rate for an initial period that either resets at a specific date or may reset in the future contingent upon a predetermined trigger. The interest rate shown is the current rate as of December 31, 2021. |
| (f) | | All or a portion of this security is deposited with the broker as initial margin for futures contracts. |
| (g) | | The rate shown is the effective yield as of December 31, 2021. |
| (h) | | Variable or floating rate security, the interest rate of which adjusts periodically based on changes in current interest rates and prepayments on the underlying pool of assets. The interest rate shown is the current rate as of December 31, 2021. |
| (i) | | All or a portion of the security is a when-issued security, delayed delivery security, or forward commitment. |
| (j) | | Amount rounds to less than one thousand. |
| (k) | | The rate shown is the current yield as of December 31, 2021. |
| ‡ | | Value determined using significant unobservable inputs. |
Detailed information about investment portfolios of the underlying funds and ETFs can be found in shareholder reports filed with the Securities and Exchange Commission (SEC) by each such underlying fund semi-annually on Form N-CSR and in portfolio holdings filed quarterly on Form N-PORT, and are available for download from both the SEC’s as well as the respective underlying fund’s website. Detailed information about underlying J.P. Morgan Funds can also be found at www.jpmorganfunds.com or by calling 1-800-480-4111.
SEE NOTES TO FINANCIAL STATEMENTS.
| | | | | | | | | | |
| | | | | |
| DECEMBER 31, 2021 | | J.P. MORGAN FUNDS | | | | | | | | 25 |
JPMorgan SmartSpendingSM 2020 Fund
SCHEDULE OF PORTFOLIO INVESTMENTS
AS OF DECEMBER 31, 2021 (Unaudited) (continued)
| | | | | | | | | | | | | | | | | | | | |
| Futures contracts outstanding as of December 31, 2021 (amounts in thousands, except number of contracts): | |
| DESCRIPTION | | NUMBER OF
CONTRACTS | | | EXPIRATION
DATE | | | TRADING
CURRENCY | | | NOTIONAL
AMOUNT
($) | | | VALUE AND
UNREALIZED
APPRECIATION
(DEPRECIATION)
($) | |
|
Long Contracts | |
EURO STOXX 50 Index | | | 6 | | | | 03/2022 | | | | EUR | | | | 292 | | | | 10 | |
MSCI EAFE E-Mini Index | | | 2 | | | | 03/2022 | | | | USD | | | | 232 | | | | 6 | |
Russell 2000 E-Mini Index | | | 1 | | | | 03/2022 | | | | USD | | | | 112 | | | | 3 | |
S&P 500 E-Mini Index | | | 2 | | | | 03/2022 | | | | USD | | | | 476 | | | | 10 | |
U.S. Treasury 10 Year Note | | | 10 | | | | 03/2022 | | | | USD | | | | 1,304 | | | | 9 | |
| | | | | | | | | | | | | | | | | | | | |
| | | | | | | | | | | | | | | | | | | 38 | |
| | | | | | | | | | | | | | | | | | | | |
Abbreviations
| | |
| EAFE | | Europe, Australasia and Far East |
| EUR | | Euro |
| MSCI | | Morgan Stanley Capital International |
| USD | | United States Dollar |
SEE NOTES TO FINANCIAL STATEMENTS.
| | | | | | | | | | |
| | | | | |
| 26 | | | | | | | | J.P. MORGAN FUNDS | | DECEMBER 31, 2021 |
STATEMENTS OF ASSETS AND LIABILITIES
AS OF DECEMBER 31, 2021 (Unaudited)
(Amounts in thousands, except per share amounts)
| | | | | | | | |
| | |
| | |
JPMorgan
SmartSpendingSM
2015 Fund | | | JPMorgan
SmartSpendingSM
2020 Fund | |
ASSETS: | | | | | | | | |
Investments in non-affiliates, at value | | $ | 10,088 | | | $ | 8,896 | |
Investments in affiliates, at value | | | 20,847 | | | | 18,992 | |
Cash | | | 1 | | | | — | |
Receivables: | | | | | | | | |
Investment securities sold | | | 433 | | | | 276 | |
Investment securities sold — delayed delivery securities | | | 26 | | | | 20 | |
Interest from non-affiliates | | | 29 | | | | 28 | |
Dividends from affiliates | | | 10 | | | | 8 | |
Variation margin on futures contracts | | | 60 | | | | 161 | |
Due from adviser | | | 15 | | | | 25 | |
Other assets | | | — | | | | 33 | |
| | | | | | | | |
Total Assets | | | 31,509 | | | | 28,439 | |
| | | | | | | | |
| | |
LIABILITIES: | | | | | | | | |
Payables: | | | | | | | | |
Due to custodian | | | — | | | | 2 | |
Investment securities purchased | | | 317 | | | | 303 | |
Investment securities purchased — delayed delivery securities | | | 270 | | | | 224 | |
Fund shares redeemed | | | 138 | | | | 110 | |
Accrued liabilities: | | | | | | | | |
Distribution fees | | | — | (a) | | | — | (a) |
Service fees | | | 6 | | | | 6 | |
Custodian and accounting fees | | | 13 | | | | 12 | |
Other | | | 61 | | | | 20 | |
| | | | | | | | |
Total Liabilities | | | 805 | | | | 677 | |
| | | | | | | | |
Net Assets | | $ | 30,704 | | | $ | 27,762 | |
| | | | | | | | |
| (a) | Amount rounds to less than one thousand. |
SEE NOTES TO FINANCIAL STATEMENTS.
| | | | | | | | | | |
| | | | | |
| DECEMBER 31, 2021 | | J.P. MORGAN FUNDS | | | | | | | | 27 |
STATEMENTS OF ASSETS AND LIABILITIES
AS OF DECEMBER 31, 2021 (Unaudited) (continued)
(Amounts in thousands, except per share amounts)
| | | | | | | | |
| | |
| | |
JPMorgan
SmartSpendingSM
2015 Fund | | | JPMorgan
SmartSpendingSM
2020 Fund | |
NET ASSETS: | | | | | | | | |
Paid-in-Capital | | $ | 28,598 | | | $ | 25,443 | |
Total distributable earnings (loss) | | | 2,106 | | | | 2,319 | |
| | | | | | | | |
Total Net Assets | | $ | 30,704 | | | $ | 27,762 | |
| | | | | | | | |
| | |
Net Assets: | | | | | | | | |
Class I | | $ | 30,561 | | | $ | 27,558 | |
Class R2 | | | 26 | | | | 23 | |
Class R3 | | | 26 | | | | 23 | |
Class R4 | | | 27 | | | | 23 | |
Class R5 | | | 27 | | | | 24 | |
Class R6 | | | 37 | | | | 111 | |
| | | | | | | | |
Total | | $ | 30,704 | | | $ | 27,762 | |
| | | | | | | | |
| | |
Outstanding units of beneficial interest (shares) ($0.0001 par value; unlimited number of shares authorized): | | | | | | | | |
Class I | | | 1,904 | | | | 1,682 | |
Class R2 | | | 1 | | | | 1 | |
Class R3 | | | 2 | | | | 1 | |
Class R4 | | | 2 | | | | 2 | |
Class R5 | | | 2 | | | | 2 | |
Class R6 | | | 2 | | | | 7 | |
| | |
Net Asset Value (a): | | | | | | | | |
Class I — Offering and redemption price per share | | $ | 16.05 | | | $ | 16.38 | |
Class R2 — Offering and redemption price per share | | | 16.03 | | | | 16.37 | |
Class R3 — Offering and redemption price per share | | | 16.03 | | | | 16.38 | |
Class R4 — Offering and redemption price per share | | | 16.04 | | | | 16.38 | |
Class R5 — Offering and redemption price per share | | | 16.05 | | | | 16.38 | |
Class R6 — Offering and redemption price per share | | | 16.05 | | | | 16.38 | |
| | |
Cost of investments in non-affiliates | | $ | 9,795 | | | $ | 8,571 | |
Cost of investments in affiliates | | | 18,791 | | | | 16,940 | |
| (a) | Per share amounts may not recalculate due to rounding of net assets and/or shares outstanding. |
SEE NOTES TO FINANCIAL STATEMENTS.
| | | | | | | | | | |
| | | | | |
| 28 | | | | | | | | J.P. MORGAN FUNDS | | DECEMBER 31, 2021 |
STATEMENTS OF OPERATIONS
FOR THE SIX MONTHS ENDED DECEMBER 31, 2021 (Unaudited)
(Amounts in thousands)
| | | | | | | | |
| | |
| | |
JPMorgan
SmartSpendingSM
2015 Fund | | | JPMorgan
SmartSpendingSM
2020 Fund | |
INVESTMENT INCOME: | | | | | | | | |
Interest income from non-affiliates | | $ | 57 | | | $ | 51 | |
Dividend income from non-affiliates | | | 28 | | | | 26 | |
Dividend income from affiliates | | | 278 | | | | 255 | |
| | | | | | | | |
Total investment income | | | 363 | | | | 332 | |
| | | | | | | | |
| | |
EXPENSES: | | | | | | | | |
Investment advisory fees | | | 23 | | | | 21 | |
Administration fees | | | 12 | | | | 11 | |
Distribution fees: | | | | | | | | |
Class A (a) | | | — | (b) | | | — | (b) |
Class R2 | | | — | (b) | | | — | (b) |
Class R3 | | | — | (b) | | | — | (b) |
Service fees: | | | | | | | | |
Class A (a) | | | — | (b) | | | — | (b) |
Class I | | | 39 | | | | 35 | |
Class R2 | | | — | (b) | | | — | (b) |
Class R3 | | | — | (b) | | | — | (b) |
Class R4 | | | — | (b) | | | — | (b) |
Class R5 | | | — | (b) | | | — | (b) |
Custodian and accounting fees | | | 18 | | | | 16 | |
Professional fees | | | 18 | | | | 18 | |
Trustees’ and Chief Compliance Officer’s fees | | | 13 | | | | 13 | |
Printing and mailing costs | | | 5 | | | | 3 | |
Registration and filing fees | | | 45 | | | | 63 | |
Transfer agency fees (See Note 2.L.) | | | — | (b) | | | — | (b) |
Other | | | 8 | | | | 10 | |
| | | | | | | | |
Total expenses | | | 181 | | | | 190 | |
| | | | | | | | |
Less fees waived | | | (35 | ) | | | (32 | ) |
Less expense reimbursements | | | (102 | ) | | | (118 | ) |
| | | | | | | | |
Net expenses | | | 44 | | | | 40 | |
| | | | | | | | |
Net investment income (loss) | | | 319 | | | | 292 | |
| | | | | | | | |
| | |
REALIZED/UNREALIZED GAINS (LOSSES): | | | | | | | | |
Net realized gain (loss) on transactions from: | | | | | | | | |
Investments in non-affiliates | | | — | (b) | | | 18 | |
Investments in affiliates | | | 287 | | | | 312 | |
Futures contracts | | | (65 | ) | | | (113 | ) |
Foreign currency transactions | | | (1 | ) | | | — | (b) |
| | | | | | | | |
Net realized gain (loss) | | | 221 | | | | 217 | |
| | | | | | | | |
Distributions of capital gains received from investment company affiliates | | | 60 | | | | 63 | |
Change in net unrealized appreciation/depreciation on: | | | | | | | | |
Investments in non-affiliates | | | (141 | ) | | | (158 | ) |
Investments in affiliates | | | 45 | | | | 46 | |
Futures contracts | | | 111 | | | | 90 | |
Foreign currency translations | | | (1 | ) | | | (7 | ) |
| | | | | | | | |
Change in net unrealized appreciation/depreciation | | | 14 | | | | (29 | ) |
| | | | | | | | |
Net realized/unrealized gains (losses) | | | 295 | | | | 251 | |
| | | | | | | | |
Change in net assets resulting from operations | | $ | 614 | | | $ | 543 | |
| | | | | | | | |
| (a) | Liquidated on October 14, 2021. |
| (b) | Amount rounds to less than one thousand. |
SEE NOTES TO FINANCIAL STATEMENTS.
| | | | | | | | | | |
| | | | | |
| DECEMBER 31, 2021 | | J.P. MORGAN FUNDS | | | | | | | | 29 |
STATEMENTS OF CHANGES IN NET ASSETS
FOR THE PERIODS INDICATED
(Amounts in thousands)
| | | | | | | | | | | | | | | | |
| | | JPMorgan SmartSpendingSM 2015 Fund | | | JPMorgan SmartSpendingSM 2020 Fund | |
| | | Six Months Ended
December 31, 2021
(Unaudited) | | | Year Ended
June 30, 2021 | | | Six Months Ended
December 31, 2021
(Unaudited) | | | Year Ended
June 30, 2021 (a) | |
CHANGE IN NET ASSETS RESULTING FROM OPERATIONS: | | | | | | | | | | | | | | | | |
Net investment income (loss) | | $ | 319 | | | $ | 529 | | | $ | 292 | | | $ | 456 | |
Net realized gain (loss) | | | 221 | | | | 1,618 | | | | 217 | | | | 645 | |
Distributions of capital gains received from investment company affiliates | | | 60 | | | | 48 | | | | 63 | | | | 41 | |
Change in net unrealized appreciation/depreciation | | | 14 | | | | 2,028 | | | | (29 | ) | | | 2,442 | |
| | | | | | | | | | | | | | | | |
Change in net assets resulting from operations | | | 614 | | | | 4,223 | | | | 543 | | | | 3,584 | |
| | | | | | | | | | | | | | | | |
| | | | |
DISTRIBUTIONS TO SHAREHOLDERS: | | | | | | | | | | | | | | | | |
Class A (b) | | | — | | | | — | (c) | | | — | | | | — | (c) |
Class I | | | (1,740 | ) | | | (598 | ) | | | (1,438 | ) | | | (357 | ) |
Class R2 | | | (1 | ) | | | — | (c) | | | (1 | ) | | | — | (c) |
Class R3 | | | (1 | ) | | | — | (c) | | | (1 | ) | | | — | (c) |
Class R4 | | | (2 | ) | | | — | (c) | | | (2 | ) | | | — | (c) |
Class R5 | | | (2 | ) | | | (1 | ) | | | (2 | ) | | | — | (c) |
Class R6 | | | (2 | ) | | | (1 | ) | | | (6 | ) | | | (1 | ) |
| | | | | | | | | | | | | | | | |
Total distributions to shareholders | | | (1,748 | ) | | | (600 | ) | | | (1,450 | ) | | | (358 | ) |
| | | | | | | | | | | | | | | | |
| | | | |
CAPITAL TRANSACTIONS: | | | | | | | | | | | | | | | | |
Change in net assets resulting from capital transactions | | | 903 | | | | (1,047 | ) | | | 511 | | | | 24,932 | |
| | | | | | | | | | | | | | | | |
| | | | |
NET ASSETS: | | | | | | | | | | | | | | | | |
Change in net assets | | | (231 | ) | | | 2,576 | | | | (396 | ) | | | 28,158 | |
Beginning of period | | | 30,935 | | | | 28,359 | | | | 28,158 | | | | — | |
| | | | | | | | | | | | | | | | |
End of period | | $ | 30,704 | | | $ | 30,935 | | | $ | 27,762 | | | $ | 28,158 | |
| | | | | | | | | | | | | | | | |
| (a) | Commencement of operations was July 1, 2020. |
| (b) | Liquidated on October 14, 2021. |
| (c) | Amount rounds to less than one thousand. |
SEE NOTES TO FINANCIAL STATEMENTS.
| | | | | | | | | | |
| | | | | |
| 30 | | | | | | | | J.P. MORGAN FUNDS | | DECEMBER 31, 2021 |
| | | | | | | | | | | | | | | | |
| | | JPMorgan SmartSpendingSM 2015 Fund | | | JPMorgan SmartSpendingSM 2020 Fund | |
| | | Six Months Ended
December 31, 2021
(Unaudited) | | | Year Ended
June 30, 2021 | | | Six Months Ended
December 31, 2021
(Unaudited) | | | Year Ended
June 30, 2021 (a) | |
CAPITAL TRANSACTIONS: | | | | | | | | | | | | | | | | |
Class A (b) | | | | | | | | | | | | | | | | |
Proceeds from shares issued | | $ | 1 | | | $ | — | (c) | | $ | — | | | $ | 361 | |
Distributions reinvested | | | — | | | | — | (c) | | | — | | | | — | (c) |
Cost of shares redeemed | | | (29 | ) | | | — | | | | (361 | ) | | | — | |
| | | | | | | | | | | | | | | | |
Change in net assets resulting from Class A capital transactions | | | (28 | ) | | | — | (c) | | | (361 | ) | | | 361 | |
| | | | | | | | | | | | | | | | |
Class I | | | | | | | | | | | | | | | | |
Proceeds from shares issued | | | — | | | | — | (c) | | | — | | | | 24,880 | |
Distributions reinvested | | | 1,740 | | | | 598 | | | | 1,438 | | | | 357 | |
Cost of shares redeemed | | | (825 | ) | | | (1,647 | ) | | | (658 | ) | | | (767 | ) |
| | | | | | | | | | | | | | | | |
Change in net assets resulting from Class I capital transactions | | | 915 | | | | (1,049 | ) | | | 780 | | | | 24,470 | |
| | | | | | | | | | | | | | | | |
Class R2 | | | | | | | | | | | | | | | | |
Proceeds from shares issued | | | — | | | | — | | | | — | | | | 20 | |
Distributions reinvested | | | 1 | | | | — | (c) | | | 1 | | | | — | (c) |
| | | | | | | | | | | | | | | | |
Change in net assets resulting from Class R2 capital transactions | | | 1 | | | | — | (c) | | | 1 | | | | 20 | |
| | | | | | | | | | | | | | | | |
Class R3 | | | | | | | | | | | | | | | | |
Proceeds from shares issued | | | — | | | | — | | | | — | | | | 20 | |
Distributions reinvested | | | 1 | | | | — | (c) | | | 1 | | | | — | (c) |
| | | | | | | | | | | | | | | | |
Change in net assets resulting from Class R3 capital transactions | | | 1 | | | | — | (c) | | | 1 | | | | 20 | |
| | | | | | | | | | | | | | | | |
Class R4 | | | | | | | | | | | | | | | | |
Proceeds from shares issued | | | — | | | | — | | | | — | | | | 20 | |
Distributions reinvested | | | 2 | | | | — | (c) | | | 1 | | | | — | (c) |
| | | | | | | | | | | | | | | | |
Change in net assets resulting from Class R4 capital transactions | | | 2 | | | | — | (c) | | | 1 | | | | 20 | |
| | | | | | | | | | | | | | | | |
Class R5 | | | | | | | | | | | | | | | | |
Proceeds from shares issued | | | — | | | | — | | | | — | | | | 20 | |
Distributions reinvested | | | 2 | | | | 1 | | | | 1 | | | | — | (c) |
| | | | | | | | | | | | | | | | |
Change in net assets resulting from Class R5 capital transactions | | | 2 | | | | 1 | | | | 1 | | | | 20 | |
| | | | | | | | | | | | | | | | |
Class R6 | | | | | | | | | | | | | | | | |
Proceeds from shares issued | | | 426 | | | | — | | | | 811 | | | | 20 | |
Distributions reinvested | | | 2 | | | | 1 | | | | 6 | | | | 1 | |
Cost of shares redeemed | | | (418 | ) | | | — | | | | (729 | ) | | | — | |
| | | | | | | | | | | | | | | | |
Change in net assets resulting from Class R6 capital transactions | | | 10 | | | | 1 | | | | 88 | | | | 21 | |
| | | | | | | | | | | | | | | | |
Total change in net assets resulting from capital transactions | | $ | 903 | | | $ | (1,047 | ) | | $ | 511 | | | $ | 24,932 | |
| | | | | | | | | | | | | | | | |
| (a) | Commencement of operations was July 1, 2020. |
| (b) | Liquidated on October 14, 2021. |
| (c) | Amount rounds to less than one thousand. |
SEE NOTES TO FINANCIAL STATEMENTS.
| | | | | | | | | | |
| | | | | |
| DECEMBER 31, 2021 | | J.P. MORGAN FUNDS | | | | | | | | 31 |
STATEMENTS OF CHANGES IN NET ASSETS
FOR THE PERIODS INDICATED (continued)
(Amounts in thousands)
| | | | | | | | | | | | | | | | |
| | | JPMorgan SmartSpendingSM 2015 Fund | | | JPMorgan SmartSpendingSM 2020 Fund | |
| | | Six Months Ended
December 31, 2021
(Unaudited) | | | Year Ended
June 30, 2021 | | | Six Months Ended
December 31, 2021
(Unaudited) | | | Year Ended
June 30, 2021 (a) | |
SHARE TRANSACTIONS: | | | | | | | | | | | | | | | | |
Class A (b) | | | | | | | | | | | | | | | | |
Issued | | | — | (c) | | | — | (c) | | | — | | | | 22 | |
Reinvested | | | — | | | | — | (c) | | | — | | | | — | (c) |
Redeemed | | | (2 | ) | | | — | | | | (22 | ) | | | — | |
| | | | | | | | | | | | | | | | |
Change in Class A Shares | | | (2 | ) | | | — | (c) | | | (22 | ) | | | 22 | |
| | | | | | | | | | | | | | | | |
Class I | | | | | | | | | | | | | | | | |
Issued | | | — | | | | — | (c) | | | — | | | | 1,659 | |
Reinvested | | | 108 | | | | 37 | | | | 87 | | | | 22 | |
Redeemed | | | (50 | ) | | | (104 | ) | | | (39 | ) | | | (47 | ) |
| | | | | | | | | | | | | | | | |
Change in Class I Shares | | | 58 | | | | (67 | ) | | | 48 | | | | 1,634 | |
| | | | | | | | | | | | | | | | |
Class R2 | | | | | | | | | | | | | | | | |
Issued | | | — | | | | — | | | | — | | | | 1 | |
Reinvested | | | — | (c) | | | — | (c) | | | — | (c) | | | — | (c) |
| | | | | | | | | | | | | | | | |
Change in Class R2 Shares | | | — | (c) | | | — | (c) | | | — | (c) | | | 1 | |
| | | | | | | | | | | | | | | | |
Class R3 | | | | | | | | | | | | | | | | |
Issued | | | — | | | | — | | | | — | | | | 1 | |
Reinvested | | | 1 | | | | — | (c) | | | — | (c) | | | — | (c) |
| | | | | | | | | | | | | | | | |
Change in Class R3 Shares | | | 1 | | | | — | (c) | | | — | (c) | | | 1 | |
| | | | | | | | | | | | | | | | |
Class R4 | | | | | | | | | | | | | | | | |
Issued | | | — | | | | — | | | | 1 | | | | 1 | |
Reinvested | | | — | (c) | | | 1 | | | | — | (c) | | | — | (c) |
| | | | | | | | | | | | | | | | |
Change in Class R4 Shares | | | — | (c) | | | 1 | | | | 1 | | | | 1 | |
| | | | | | | | | | | | | | | | |
Class R5 | | | | | | | | | | | | | | | | |
Issued | | | — | | | | — | | | | 1 | | | | 1 | |
Reinvested | | | — | (c) | | | — | (c) | | | — | (c) | | | — | (c) |
| | | | | | | | | | | | | | | | |
Change in Class R5 Shares | | | — | (c) | | | — | (c) | | | 1 | | | | 1 | |
| | | | | | | | | | | | | | | | |
Class R6 | | | | | | | | | | | | | | | | |
Issued | | | 25 | | | | — | | | | 46 | | | | 2 | |
Reinvested | | | — | (c) | | | — | (c) | | | 1 | | | | — | (c) |
Redeemed | | | (25 | ) | | | — | | | | (42 | ) | | | — | |
| | | | | | | | | | | | | | | | |
Change in Class R6 Shares | | | — | (c) | | | — | (c) | | | 5 | | | | 2 | |
| | | | | | | | | | | | | | | | |
| (a) | Commencement of operations was July 1, 2020. |
| (b) | Liquidated on October 14, 2021. |
| (b) | Amount rounds to less than one thousand. |
SEE NOTES TO FINANCIAL STATEMENTS.
| | | | | | | | | | |
| | | | | |
| 32 | | | | | | | | J.P. MORGAN FUNDS | | DECEMBER 31, 2021 |
THIS PAGE IS INTENTIONALLY LEFT BLANK
| | | | | | | | | | |
| | | | | |
| DECEMBER 31, 2021 | | J.P. MORGAN FUNDS | | | | | | | | 33 |
FINANCIAL HIGHLIGHTS
FOR THE PERIODS INDICATED
| | | | | | | | | | | | | | | | | | | | | | | | | | | | |
| | | Per share operating performance | |
| | | | | | Investment operations | | | Distributions | |
| | | Net asset
value,
beginning
of period | | | Net
investment
income
(loss) (b)(c) | | | Net realized
and unrealized
gains
(losses) on
investments | | | Total from
investment
operations | | | Net
investment
income | | | Net
realized
gain | | | Total
distributions | |
JPMorgan SmartSpendingSM 2015 Fund | | | | | | | | | | | | | | | | | | | | | | | | | | | | |
Class I | | | | | | | | | | | | | | | | | | | | | | | | | | | | |
Six Months Ended December 31, 2021 (Unaudited) | | $ | 16.67 | | | $ | 0.17 | | | $ | 0.16 | | | $ | 0.33 | | | $ | (0.32 | ) | | $ | (0.63 | ) | | $ | (0.95 | ) |
Year Ended June 30, 2021 | | | 14.75 | | | | 0.28 | | | | 1.96 | | | | 2.24 | | | | (0.32 | ) | | | — | | | | (0.32 | ) |
Year Ended June 30, 2020 | | | 15.99 | | | | 0.38 | | | | (0.67 | ) | | | (0.29 | ) | | | (0.45 | ) | | | (0.50 | ) | | | (0.95 | ) |
Year Ended June 30, 2019 | | | 15.87 | | | | 0.44 | | | | 0.42 | | | | 0.86 | | | | (0.43 | ) | | | (0.31 | ) | | | (0.74 | ) |
Year Ended June 30, 2018 | | | 15.66 | | | | 0.39 | | | | 0.25 | | | | 0.64 | | | | (0.26 | ) | | | (0.17 | ) | | | (0.43 | ) |
December 30, 2016 (h) through June 30, 2017 | | | 15.00 | | | | 0.16 | | | | 0.64 | | | | 0.80 | | | | (0.14 | ) | | | — | | | | (0.14 | ) |
| | | | | | | |
Class R2 | | | | | | | | | | | | | | | | | | | | | | | | | | | | |
Six Months Ended December 31, 2021 (Unaudited) | | | 16.61 | | | | 0.13 | | | | 0.16 | | | | 0.29 | | | | (0.24 | ) | | | (0.63 | ) | | | (0.87 | ) |
Year Ended June 30, 2021 | | | 14.70 | | | | 0.20 | | | | 1.95 | | | | 2.15 | | | | (0.24 | ) | | | — | | | | (0.24 | ) |
Year Ended June 30, 2020 | | | 15.94 | | | | 0.28 | | | | (0.67 | ) | | | (0.39 | ) | | | (0.35 | ) | | | (0.50 | ) | | | (0.85 | ) |
Year Ended June 30, 2019 | | | 15.83 | | | | 0.33 | | | | 0.42 | | | | 0.75 | | | | (0.33 | ) | | | (0.31 | ) | | | (0.64 | ) |
Year Ended June 30, 2018 | | | 15.66 | | | | 0.29 | | | | 0.25 | | | | 0.54 | | | | (0.20 | ) | | | (0.17 | ) | | | (0.37 | ) |
December 30, 2016 (h) through June 30, 2017 | | | 15.00 | | | | 0.11 | | | | 0.64 | | | | 0.75 | | | | (0.09 | ) | | | — | | | | (0.09 | ) |
| | | | | | | |
Class R3 | | | | | | | | | | | | | | | | | | | | | | | | | | | | |
Six Months Ended December 31, 2021 (Unaudited) | | | 16.64 | | | | 0.15 | | | | 0.15 | | | | 0.30 | | | | (0.28 | ) | | | (0.63 | ) | | | (0.91 | ) |
Year Ended June 30, 2021 | | | 14.72 | | | | 0.24 | | | | 1.95 | | | | 2.19 | | | | (0.27 | ) | | | — | | | | (0.27 | ) |
Year Ended June 30, 2020 | | | 15.96 | | | | 0.32 | | | | (0.67 | ) | | | (0.35 | ) | | | (0.39 | ) | | | (0.50 | ) | | | (0.89 | ) |
Year Ended June 30, 2019 | | | 15.85 | | | | 0.37 | | | | 0.42 | | | | 0.79 | | | | (0.37 | ) | | | (0.31 | ) | | | (0.68 | ) |
Year Ended June 30, 2018 | | | 15.66 | | | | 0.33 | | | | 0.25 | | | | 0.58 | | | | (0.22 | ) | | | (0.17 | ) | | | (0.39 | ) |
December 30, 2016 (h) through June 30, 2017 | | | 15.00 | | | | 0.13 | | | | 0.64 | | | | 0.77 | | | | (0.11 | ) | | | — | | | | (0.11 | ) |
| | | | | | | |
Class R4 | | | | | | | | | | | | | | | | | | | | | | | | | | | | |
Six Months Ended December 31, 2021 (Unaudited) | | | 16.67 | | | | 0.17 | | | | 0.15 | | | | 0.32 | | | | (0.32 | ) | | | (0.63 | ) | | | (0.95 | ) |
Year Ended June 30, 2021 | | | 14.75 | | | | 0.28 | | | | 1.95 | | | | 2.23 | | | | (0.31 | ) | | | — | | | | (0.31 | ) |
Year Ended June 30, 2020 | | | 15.98 | | | | 0.36 | | | | (0.66 | ) | | | (0.30 | ) | | | (0.43 | ) | | | (0.50 | ) | | | (0.93 | ) |
Year Ended June 30, 2019 | | | 15.86 | | | | 0.41 | | | | 0.43 | | | | 0.84 | | | | (0.41 | ) | | | (0.31 | ) | | | (0.72 | ) |
Year Ended June 30, 2018 | | | 15.66 | | | | 0.37 | | | | 0.25 | | | | 0.62 | | | | (0.25 | ) | | | (0.17 | ) | | | (0.42 | ) |
December 30, 2016 (h) through June 30, 2017 | | | 15.00 | | | | 0.15 | | | | 0.64 | | | | 0.79 | | | | (0.13 | ) | | | — | | | | (0.13 | ) |
| | | | | | | |
Class R5 | | | | | | | | | | | | | | | | | | | | | | | | | | | | |
Six Months Ended December 31, 2021 (Unaudited) | | | 16.68 | | | | 0.19 | | | | 0.16 | | | | 0.35 | | | | (0.35 | ) | | | (0.63 | ) | | | (0.98 | ) |
Year Ended June 30, 2021 | | | 14.76 | | | | 0.30 | | | | 1.95 | | | | 2.25 | | | | (0.33 | ) | | | — | | | | (0.33 | ) |
Year Ended June 30, 2020 | | | 15.99 | | | | 0.38 | | | | (0.66 | ) | | | (0.28 | ) | | | (0.45 | ) | | | (0.50 | ) | | | (0.95 | ) |
Year Ended June 30, 2019 | | | 15.87 | | | | 0.44 | | | | 0.42 | | | | 0.86 | | | | (0.43 | ) | | | (0.31 | ) | | | (0.74 | ) |
Year Ended June 30, 2018 | | | 15.66 | | | | 0.39 | | | | 0.25 | | | | 0.64 | | | | (0.26 | ) | | | (0.17 | ) | | | (0.43 | ) |
December 30, 2016 (h) through June 30, 2017 | | | 15.00 | | | | 0.16 | | | | 0.64 | | | | 0.80 | | | | (0.14 | ) | | | — | | | | (0.14 | ) |
| | | | | | | |
Class R6 | | | | | | | | | | | | | | | | | | | | | | | | | | | | |
Six Months Ended December 31, 2021 (Unaudited) | | | 16.69 | | | | 0.25 | | | | 0.10 | | | | 0.35 | | | | (0.36 | ) | | | (0.63 | ) | | | (0.99 | ) |
Year Ended June 30, 2021 | | | 14.77 | | | | 0.32 | | | | 1.95 | | | | 2.27 | | | | (0.35 | ) | | | — | | | | (0.35 | ) |
Year Ended June 30, 2020 | | | 16.00 | | | | 0.40 | | | | (0.66 | ) | | | (0.26 | ) | | | (0.47 | ) | | | (0.50 | ) | | | (0.97 | ) |
Year Ended June 30, 2019 | | | 15.88 | | | | 0.45 | | | | 0.42 | | | | 0.87 | | | | (0.44 | ) | | | (0.31 | ) | | | (0.75 | ) |
Year Ended June 30, 2018 | | | 15.66 | | | | 0.41 | | | | 0.25 | | | | 0.66 | | | | (0.27 | ) | | | (0.17 | ) | | | (0.44 | ) |
December 30, 2016 (h) through June 30, 2017 | | | 15.00 | | | | 0.17 | | | | 0.64 | | | | 0.81 | | | | (0.15 | ) | | | — | | | | (0.15 | ) |
| (a) | Annualized for periods less than one year, unless otherwise noted. |
| (b) | Net investment income (loss) is affected by timing of distributions from Underlying Funds. |
| (c) | Calculated based upon average shares outstanding. |
| (d) | Not annualized for periods less than one year. |
| (e) | Includes adjustments in accordance with accounting principles generally accepted in the United States of America and as such, the net asset values for financial reporting purposes and the returns based upon those net asset values may differ from the net asset values and returns for shareholder transactions. |
| (f) | Does not include expenses of Underlying Funds. |
| (g) | Certain non-recurring expenses incurred by the Fund were not annualized for the period indicated. |
| (h) | Commencement of operations. |
SEE NOTES TO FINANCIAL STATEMENTS.
| | | | | | | | | | |
| | | | | |
| 34 | | | | | | | | J.P. MORGAN FUNDS | | DECEMBER 31, 2021 |
| | | | | | | | | | | | | | | | | | | | | | | | | | |
| | | Ratios/Supplemental data | |
| | | | | | | | | | Ratios to average net assets (a) | | | | |
Net asset
value,
end of
period | | | Total return
(excludes
sales charge) (d)(e) | | | Net assets,
end of
period
(000’s) | | | Net
expenses (f) | | | Net
investment
income
(loss) (b) | | |
Expenses
without waivers,
reimbursements and
earnings credits (f) | | | Portfolio
turnover
rate (d) | |
| | | | | | | | | | | | | | | | | | | | | | | | | | |
| | | | | | | | | | | | | | | | | | | | | | | | | | |
| $ | 16.05 | | | | 2.01 | % | | $ | 30,561 | | | | 0.28 | % | | | 2.06 | % | | | 1.16 | % | | | 14 | % |
| | 16.67 | | | | 15.28 | | | | 30,778 | | | | 0.27 | | | | 1.76 | | | | 1.26 | | | | 107 | |
| | 14.75 | | | | (2.06 | ) | | | 28,222 | | | | 0.22 | | | | 2.46 | | | | 1.41 | | | | 125 | |
| | 15.99 | | | | 5.75 | | | | 30,411 | | | | 0.19 | | | | 2.79 | | | | 1.44 | | | | 50 | |
| | 15.87 | | | | 4.12 | | | | 30,323 | | | | 0.19 | (g) | | | 2.46 | (g) | | | 1.36 | (g) | | | 30 | |
| | 15.66 | | | | 5.36 | | | | 30,795 | | | | 0.19 | (g) | | | 2.09 | (g) | | | 1.26 | (g) | | | 8 | |
| | | | | | |
| | | | | | | | | | | | | | | | | | | | | | | | | | |
| | 16.03 | | | | 1.79 | | | | 26 | | | | 0.77 | | | | 1.57 | | | | 1.69 | | | | 14 | |
| | 16.61 | | | | 14.67 | | | | 26 | | | | 0.78 | | | | 1.25 | | | | 1.82 | | | | 107 | |
| | 14.70 | | | | (2.68 | ) | | | 22 | | | | 0.85 | | | | 1.83 | | | | 2.08 | | | | 125 | |
| | 15.94 | | | | 5.05 | | | | 23 | | | | 0.85 | | | | 2.13 | | | | 1.97 | | | | 50 | |
| | 15.83 | | | | 3.46 | | | | 21 | | | | 0.85 | (g) | | | 1.80 | (g) | | | 2.00 | (g) | | | 30 | |
| | 15.66 | | | | 5.02 | | | | 21 | | | | 0.84 | (g) | | | 1.44 | (g) | | | 4.09 | (g) | | | 8 | |
| | | | | | |
| | | | | | | | | | | | | | | | | | | | | | | | | | |
| | 16.03 | | | | 1.84 | | | | 26 | | | | 0.53 | | | | 1.81 | | | | 1.45 | | | | 14 | |
| | 16.64 | | | | 14.98 | | | | 26 | | | | 0.53 | | | | 1.50 | | | | 2.01 | | | | 107 | |
| | 14.72 | | | | (2.45 | ) | | | 22 | | | | 0.60 | | | | 2.08 | | | | 4.58 | | | | 125 | |
| | 15.96 | | | | 5.29 | | | | 23 | | | | 0.60 | | | | 2.38 | | | | 1.72 | | | | 50 | |
| | 15.85 | | | | 3.74 | | | | 22 | | | | 0.60 | (g) | | | 2.05 | (g) | | | 1.75 | (g) | | | 30 | |
| | 15.66 | | | | 5.15 | | | | 21 | | | | 0.59 | (g) | | | 1.69 | (g) | | | 3.82 | (g) | | | 8 | |
| | | | | | |
| | | | | | | | | | | | | | | | | | | | | | | | | | |
| | 16.04 | | | | 1.96 | | | | 27 | | | | 0.28 | | | | 2.06 | | | | 1.19 | | | | 14 | |
| | 16.67 | | | | 15.22 | | | | 26 | | | | 0.28 | | | | 1.75 | | | | 1.54 | | | | 107 | |
| | 14.75 | | | | (2.14 | ) | | | 23 | | | | 0.35 | | | | 2.33 | | | | 3.05 | | | | 125 | |
| | 15.98 | | | | 5.60 | | | | 23 | | | | 0.35 | | | | 2.63 | | | | 1.47 | | | | 50 | |
| | 15.86 | | | | 3.96 | | | | 22 | | | | 0.35 | (g) | | | 2.30 | (g) | | | 1.50 | (g) | | | 30 | |
| | 15.66 | | | | 5.27 | | | | 21 | | | | 0.35 | (g) | | | 1.94 | (g) | | | 3.57 | (g) | | | 8 | |
| | | | | | |
| | | | | | | | | | | | | | | | | | | | | | | | | | |
| | 16.05 | | | | 2.11 | | | | 27 | | | | 0.13 | | | | 2.21 | | | | 1.03 | | | | 14 | |
| | 16.68 | | | | 15.37 | | | | 26 | | | | 0.13 | | | | 1.90 | | | | 1.75 | | | | 107 | |
| | 14.76 | | | | (2.00 | ) | | | 23 | | | | 0.20 | | | | 2.48 | | | | 5.06 | | | | 125 | |
| | 15.99 | | | | 5.74 | | | | 23 | | | | 0.20 | | | | 2.78 | | | | 1.32 | | | | 50 | |
| | 15.87 | | | | 4.11 | | | | 22 | | | | 0.21 | (g) | | | 2.44 | (g) | | | 1.36 | (g) | | | 30 | |
| | 15.66 | | | | 5.35 | | | | 21 | | | | 0.20 | (g) | | | 2.09 | (g) | | | 3.43 | (g) | | | 8 | |
| | | | | | |
| | | | | | | | | | | | | | | | | | | | | | | | | | |
| | 16.05 | | | | 2.14 | | | | 37 | | | | 0.03 | | | | 2.94 | | | | 0.94 | | | | 14 | |
| | 16.69 | | | | 15.47 | | | | 26 | | | | 0.04 | | | | 2.00 | | | | 1.09 | | | | 107 | |
| | 14.77 | | | | (1.91 | ) | | | 23 | | | | 0.10 | | | | 2.58 | | | | 1.21 | | | | 125 | |
| | 16.00 | | | | 5.84 | | | | 23 | | | | 0.10 | | | | 2.88 | | | | 1.23 | | | | 50 | |
| | 15.88 | | | | 4.24 | | | | 22 | | | | 0.10 | (g) | | | 2.55 | (g) | | | 1.25 | (g) | | | 30 | |
| | 15.66 | | | | 5.40 | | | | 21 | | | | 0.10 | (g) | | | 2.19 | (g) | | | 3.33 | (g) | | | 8 | |
SEE NOTES TO FINANCIAL STATEMENTS.
| | | | | | | | | | |
| | | | | |
| DECEMBER 31, 2021 | | J.P. MORGAN FUNDS | | | | | | | | 35 |
FINANCIAL HIGHLIGHTS
FOR THE PERIODS INDICATED (continued)
| | | | | | | | | | | | | | | | | | | | | | | | | | | | |
| | | Per share operating performance | |
| | | | | | Investment operations | | | Distributions | |
| | | Net asset
value,
beginning
of period | | | Net
investment
income
(loss) (b)(c) | | | Net realized
and unrealized
gains
(losses) on
investments | | | Total from
investment
operations | | | Net
investment
income | | | Net
realized
gain | | | Total
distributions | |
JPMorgan SmartSpendingSM 2020 Fund | | | | | | | | | | | | | | | | | | | | | | | | | | | | |
Class I | | | | | | | | | | | | | | | | | | | | | | | | | | | | |
Six Months Ended December 31, 2021 (Unaudited) | | $ | 16.94 | | | $ | 0.18 | | | $ | 0.15 | | | $ | 0.33 | | | $ | (0.34 | ) | | $ | (0.55 | ) | | $ | (0.89 | ) |
July 1, 2020 (g) through June 30, 2021 | | | 15.00 | | | | 0.27 | | | | 1.88 | | | | 2.15 | | | | (0.15 | ) | | | (0.06 | ) | | | (0.21 | ) |
| | | | | | | |
Class R2 | | | | | | | | | | | | | | | | | | | | | | | | | | | | |
Six Months Ended December 31, 2021 (Unaudited) | | | 16.90 | | | | 0.13 | | | | 0.15 | | | | 0.28 | | | | (0.26 | ) | | | (0.55 | ) | | | (0.81 | ) |
July 1, 2020 (g) through June 30, 2021 | | | 15.00 | | | | 0.19 | | | | 1.88 | | | | 2.07 | | | | (0.11 | ) | | | (0.06 | ) | | | (0.17 | ) |
| | | | | | | |
Class R3 | | | | | | | | | | | | | | | | | | | | | | | | | | | | |
Six Months Ended December 31, 2021 (Unaudited) | | | 16.92 | | | | 0.16 | | | | 0.15 | | | | 0.31 | | | | (0.30 | ) | | | (0.55 | ) | | | (0.85 | ) |
July 1, 2020 (g) through June 30, 2021 | | | 15.00 | | | | 0.23 | | | | 1.88 | | | | 2.11 | | | | (0.13 | ) | | | (0.06 | ) | | | (0.19 | ) |
| | | | | | | |
Class R4 | | | | | | | | | | | | | | | | | | | | | | | | | | | | |
Six Months Ended December 31, 2021 (Unaudited) | | | 16.94 | | | | 0.18 | | | | 0.15 | | | | 0.33 | | | | (0.34 | ) | | | (0.55 | ) | | | (0.89 | ) |
July 1, 2020 (g) through June 30, 2021 | | | 15.00 | | | | 0.27 | | | | 1.88 | | | | 2.15 | | | | (0.15 | ) | | | (0.06 | ) | | | (0.21 | ) |
| | | | | | | |
Class R5 | | | | | | | | | | | | | | | | | | | | | | | | | | | | |
Six Months Ended December 31, 2021 (Unaudited) | | | 16.95 | | | | 0.19 | | | | 0.15 | | | | 0.34 | | | | (0.36 | ) | | | (0.55 | ) | | | (0.91 | ) |
July 1, 2020 (g) through June 30, 2021 | | | 15.00 | | | | 0.30 | | | | 1.87 | | | | 2.17 | | | | (0.16 | ) | | | (0.06 | ) | | | (0.22 | ) |
| | | | | | | |
Class R6 | | | | | | | | | | | | | | | | | | | | | | | | | | | | |
Six Months Ended December 31, 2021 (Unaudited) | | | 16.96 | | | | 0.19 | | | | 0.16 | | | | 0.35 | | | | (0.38 | ) | | | (0.55 | ) | | | (0.93 | ) |
July 1, 2020 (g) through June 30, 2021 | | | 15.00 | | | | 0.31 | | | | 1.88 | | | | 2.19 | | | | (0.17 | ) | | | (0.06 | ) | | | (0.23 | ) |
| (a) | Annualized for periods less than one year, unless otherwise noted. |
| (b) | Net investment income (loss) is affected by timing of distributions from Underlying Funds. |
| (c) | Calculated based upon average shares outstanding. |
| (d) | Not annualized for periods less than one year. |
| (e) | Includes adjustments in accordance with accounting principles generally accepted in the United States of America and as such, the net asset values for financial reporting purposes and the returns based upon those net asset values may differ from the net asset values and returns for shareholder transactions. |
| (f) | Does not include expenses of Underlying Funds. |
| (g) | Commencement of operations. |
| (h) | Certain non-recurring expenses incurred by the Fund were not annualized for the period indicated. |
SEE NOTES TO FINANCIAL STATEMENTS.
| | | | | | | | | | |
| | | | | |
| 36 | | | | | | | | J.P. MORGAN FUNDS | | DECEMBER 31, 2021 |
| | | | | | | | | | | | | | | | | | | | | | | | | | |
| | | Ratios/Supplemental data | |
| | | | | | | | | | Ratios to average net assets (a) | | | | |
Net asset
value,
end of
period | | | Total return
(excludes
sales charge) (d)(e) | | | Net assets,
end of
period
(000’s) | | | Net
expenses (f) | | | Net
investment
income
(loss) (b) | | |
Expenses
without waivers,
reimbursements and
earnings credits (f) | | | Portfolio
turnover
rate (d) | |
| | | | | | | | | | | | | | | | | | | | | | | | | | |
| | | | | | | | | | | | | | | | | | | | | | | | | | |
| $ | 16.38 | | | | 1.95 | % | | $ | 27,558 | | | | 0.28 | % | | | 2.07 | % | | | 1.35 | % | | | 15 | % |
| | 16.94 | | | | 14.42 | | | | 27,681 | | | | 0.29 | (h) | | | 1.69 | (h) | | | 1.47 | (h) | | | 95 | |
| | | | | | |
| | | | | | | | | | | | | | | | | | | | | | | | | | |
| | 16.37 | | | | 1.66 | | | | 23 | | | | 0.79 | | | | 1.57 | | | | 1.87 | | | | 15 | |
| | 16.90 | | | | 13.89 | | | | 22 | | | | 0.78 | (h) | | | 1.19 | (h) | | | 2.14 | (h) | | | 95 | |
| | | | | | |
| | | | | | | | | | | | | | | | | | | | | | | | | | |
| | 16.38 | | | | 1.84 | | | | 23 | | | | 0.54 | | | | 1.82 | | | | 1.62 | | | | 15 | |
| | 16.92 | | | | 14.15 | | | | 23 | | | | 0.54 | (h) | | | 1.44 | (h) | | | 1.89 | (h) | | | 95 | |
| | | | | | |
| | | | | | | | | | | | | | | | | | | | | | | | | | |
| | 16.38 | | | | 1.96 | | | | 23 | | | | 0.29 | | | | 2.08 | | | | 1.37 | | | | 15 | |
| | 16.94 | | | | 14.42 | | | | 23 | | | | 0.29 | (h) | | | 1.69 | (h) | | | 1.64 | (h) | | | 95 | |
| | | | | | |
| | | | | | | | | | | | | | | | | | | | | | | | | | |
| | 16.38 | | | | 2.05 | | | | 24 | | | | 0.13 | | | | 2.24 | | | | 1.21 | | | | 15 | |
| | 16.95 | | | | 14.57 | | | | 23 | | | | 0.14 | (h) | | | 1.84 | (h) | | | 1.50 | (h) | | | 95 | |
| | | | | | |
| | | | | | | | | | | | | | | | | | | | | | | | | | |
| | 16.38 | | | | 2.08 | | | | 111 | | | | 0.03 | | | | 2.16 | | | | 1.18 | | | | 15 | |
| | 16.96 | | | | 14.69 | | | | 23 | | | | 0.04 | (h) | | | 1.94 | (h) | | | 1.40 | (h) | | | 95 | |
SEE NOTES TO FINANCIAL STATEMENTS.
| | | | | | | | | | |
| | | | | |
| DECEMBER 31, 2021 | | J.P. MORGAN FUNDS | | | | | | | | 37 |
NOTES TO FINANCIAL STATEMENTS
AS OF DECEMBER 31, 2021 (Unaudited)
(Dollar values in thousands)
1. Organization
JPMorgan Trust IV (the “Trust”) was formed on November 11, 2015, as a Delaware statutory trust, pursuant to a Declaration of Trust dated November 11, 2015 and is registered under the Investment Company Act of 1940, as amended (the “1940 Act”), as an open-end management investment company.
The following are 2 separate funds of the Trust (each, a “Fund” and collectively, the “Funds”) covered by this report:
| | | | |
| | | Classes Offered | | Diversification Classification |
| JPMorgan SmartSpendingSM 2015 Fund | | Class A(1), Class I, Class R2, Class R3, Class R4, Class R5 and Class R6 | | Diversified |
| JPMorgan SmartSpendingSM 2020 Fund(2) | | Class A(1), Class I, Class R2, Class R3, Class R4, Class R5 and Class R6 | | Diversified |
| (1) | Class was liquidated on October 14, 2021. |
| (2) | Commenced operations on July 1, 2020. |
The investment objective of JPMorgan SmartSpendingSM 2015 Fund (“SmartSpendingSM 2015 Fund”) and JPMorgan SmartSpendingSM 2020 Fund (“SmartSpendingSM 2020 Fund”) is to seek to provide total return consisting of current income and some capital appreciation.
Effective as of close of business on November 21, 2021, all share classes of SmartSpendingSM 2020 Fund, with the exception of Class A Shares, are publicly offered on a limited basis. Investors are not eligible to purchase shares of the Fund unless they meet certain requirements as described in the Fund’s prospectuses.
Class A Shares generally provided for a front-end sales charge. No sales charges are assessed with respect to Class I, Class R2, Class R3, Class R4, Class R5 and Class R6 Shares. Certain Class A Shares, for which front-end sales charges have been waived, may have been subject to a CDSC as described in the Funds’ prospectus. All classes of shares have equal rights as to earnings, assets and voting privileges, except that each class may bear different transfer agency, distribution and service fees and each class has exclusive voting rights with respect to its distribution plan and shareholder servicing agreements.
J.P. Morgan Investment Management Inc. (“JPMIM”), an indirect, wholly-owned subsidiary of JPMorgan Chase & Co. (“JPMorgan”), acts as Adviser (the “Adviser”) and Administrator (the “Administrator”) to the Funds.
2. Significant Accounting Policies
The following is a summary of significant accounting policies followed by the Funds in the preparation of their financial statements. The Funds are investment companies and, accordingly, follow the investment company accounting and reporting guidance of the Financial Accounting Standards Board (“FASB”) Accounting Standards Codification Topic 946 — Investment Companies, which is part of U.S. generally accepted accounting principles (“GAAP”). The preparation of financial statements in conformity with GAAP requires management to make estimates and assumptions that affect (i) the reported amounts of assets and liabilities, (ii) disclosure of contingent assets and liabilities at the date of the financial statements, and (iii) the reported amounts of increases and decreases in net assets from operations during the reporting period. Actual results could differ from those estimates.
A. Valuation of Investments — Investments are valued in accordance with GAAP and the Funds’ valuation policies set forth by, and under the supervision and responsibility of, the Board of Trustees of the Trust (the “Board”), which established the following approach to valuation, as described more fully below: (i) investments for which market quotations are readily available shall be valued at their market value and (ii) all other investments for which market quotations are not readily available shall be valued at their fair value as determined in good faith by the Board.
The Administrator has established the J.P. Morgan Asset Management Americas Valuation Committee (“AVC”) to assist the Board with the oversight and monitoring of the valuation of the Funds’ investments. The Administrator implements the valuation policies of the Funds’ investments, as directed by the Board. The AVC oversees and carries out the policies for the valuation of investments held in the Funds. This includes monitoring the appropriateness of fair values based on results of ongoing valuation oversight including, but not limited to, consideration of macro or security specific events, market events, and pricing vendor and broker due diligence. The Administrator is responsible for discussing and assessing the potential impacts to the fair values on an ongoing basis, and, at least on a quarterly basis, with the AVC and the Board.
A market-based approach is primarily used to value the Funds’ investments. Investments for which market quotations are not readily available are fair valued by approved affiliated and/or unaffiliated pricing vendors or third party broker-dealers (collectively referred to as “Pricing Services”) or may be internally fair valued using methods set forth by the valuation policies approved by the Board. This may include the use of related or comparable assets or liabilities, recent transactions, market multiples, book values and other relevant information for the investment. An income-based valuation approach may be used in which the anticipated future cash flows of the investment are discounted to calculate the fair value. Discounts may also be applied due to the nature or duration of any restrictions on the disposition of the investments. Valuations may be based upon current market prices of securities that are comparable in coupon, rating, maturity and industry. It is possible that the estimated values may differ significantly from the values that would have been used had a ready market for the investments existed, and such differences could be material.
Fixed income instruments are valued based on prices received from Pricing Services. The Pricing Services use multiple valuation techniques to determine the valuation of fixed income instruments. In instances where sufficient market activity exists, the Pricing Services may utilize a market-based approach through which trades or quotes from market makers are used to determine the valuation of these instruments. In instances where
| | | | | | | | | | |
| | | | | |
| 38 | | | | | | | | J.P. MORGAN FUNDS | | DECEMBER 31, 2021 |
sufficient market activity may not exist, the Pricing Services also utilize proprietary valuation models which may consider market transactions in comparable securities and the various relationships between securities in determining fair value and/or market characteristics in order to estimate the relevant cash flows, which are then discounted to calculate the fair values.
Equities and other exchange-traded instruments are valued at the last sale price or official market closing price on the primary exchange on which the instrument is traded before the net asset values (“NAV”) of the Funds are calculated on a valuation date.
Investments in open-end investment companies, excluding exchange-traded funds (“ETFs”) (“Underlying Funds”), are valued at each Underlying Fund’s NAV per share as of the report date.
Futures contracts are generally valued on the basis of available market quotations.
Valuations reflected in this report are as of the report date. As a result, changes in valuation due to market events and/or issuer-related events after the report date and prior to issuance of the report are not reflected herein.
The various inputs that are used in determining the valuation of the Funds’ investments are summarized into the three broad levels listed below.
| • | | Level 1 — Unadjusted inputs using quoted prices in active markets for identical investments. |
| • | | Level 2 — Other significant observable inputs including, but not limited to, quoted prices for similar investments, inputs other than quoted prices that are observable for investments (such as interest rates, prepayment speeds, credit risk, etc.) or other market corroborated inputs. |
| • | | Level 3 — Significant inputs based on the best information available in the circumstances, to the extent observable inputs are not available (including the Funds’ assumptions in determining the fair value of investments). |
A financial instrument’s level within the fair value hierarchy is based on the lowest level of any input, both individually and in the aggregate, that is significant to the fair value measurement. The inputs or methodology used for valuing instruments are not necessarily an indication of the risk associated with investing in those instruments.
The following tables represent each valuation input as presented on the Schedules of Portfolio Investments (“SOIs”):
SmartSpendingSM 2015 Fund
| | | | | | | | | | | | | | | | |
| | | Level 1
Quoted prices | | | Level 2
Other significant
observable inputs | | | Level 3
Significant
unobservable inputs | | | Total | |
Investments in Securities | | | | | | | | | | | | | | | | |
Asset-Backed Securities | | $ | — | | | $ | 1,227 | | | $ | — | | | $ | 1,227 | |
Collateralized Mortgage Obligations | | | — | | | | 111 | | | | 58 | | | | 169 | |
Commercial Mortgage-Backed Securities | | | — | | | | 148 | | | | 7 | | | | 155 | |
Corporate Bonds | | | — | | | | 2,422 | | | | — | | | | 2,422 | |
Exchange-Traded Funds | | | 9,121 | | | | — | | | | — | | | | 9,121 | |
Investment Companies | | | 12,155 | | | | — | | | | — | | | | 12,155 | |
Mortgage-Backed Securities | | | — | | | | 1,844 | | | | — | | | | 1,844 | |
U.S. Treasury Obligations | | | — | | | | 2,194 | | | | — | | | | 2,194 | |
Short-Term Investments | | | | | | | | | | | | | | | | |
Investment Companies | | | 1,648 | | | | — | | | | — | | | | 1,648 | |
| | | | | | | | | | | | | | | | |
Total Investments in Securities | | $ | 22,924 | | | $ | 7,946 | | | $ | 65 | | | $ | 30,935 | |
| | | | | | | | | | | | | | | | |
Appreciation in Other Financial Instruments | | | | | | | | | | | | | |
Futures Contracts | | $ | 55 | | | $ | — | | | $ | — | | | $ | 55 | |
| | | | | | | | | | | | | | | | |
| | | | | | | | | | |
| | | | | |
| DECEMBER 31, 2021 | | J.P. MORGAN FUNDS | | | | | | | | 39 |
NOTES TO FINANCIAL STATEMENTS
AS OF DECEMBER 31, 2021 (Unaudited) (continued)
(Dollar values in thousands)
| | | | | | | | | | | | | | | | |
SmartSpendingSM 2020 Fund | | | | | | | | | | | | | | | | |
| | | Level 1
Quoted prices | | | Level 2
Other significant
observable inputs | | | Level 3
Significant
unobservable inputs | | | Total | |
Investments in Securities | | | | | | | | | | | | | | | | |
Asset-Backed Securities | | $ | — | | | $ | 913 | | | $ | — | | | $ | 913 | |
Collateralized Mortgage Obligations | | | — | | | | 104 | | | | 45 | | | | 149 | |
Commercial Mortgage-Backed Securities | | | — | | | | 119 | | | | 7 | | | | 126 | |
Corporate Bonds | | | — | | | | 2,224 | | | | — | | | | 2,224 | |
Exchange-Traded Funds | | | 8,069 | | | | — | | | | — | | | | 8,069 | |
Investment Companies | | | 11,543 | | | | — | | | | — | | | | 11,543 | |
Mortgage-Backed Securities | | | — | | | | 1,647 | | | | — | | | | 1,647 | |
U.S. Treasury Obligations | | | — | | | | 2,047 | | | | — | | | | 2,047 | |
Short-Term Investments | | | | | | | | | | | | | | | | |
Investment Companies | | | 1,170 | | | | — | | | | — | | | | 1,170 | |
| | | | | | | | | | | | | | | | |
Total Investments in Securities | | $ | 20,782 | | | $ | 7,054 | | | $ | 52 | | | $ | 27,888 | |
| | | | | | | | | | | | | | | | |
Appreciation in Other Financial Instruments | | | | | | | | | | | | | |
Futures Contracts | | $ | 38 | | | $ | — | | | $ | — | | | $ | 38 | |
| | | | | | | | | | | | | | | | |
B. Restricted Securities — Certain securities held by the Funds may be subject to legal or contractual restrictions on resale. Restricted securities generally are resold in transactions exempt from registration under the Securities Act of 1933, as amended (the “Securities Act”). Disposal of these securities may involve time-consuming negotiations and expense. Prompt sale at the current valuation may be difficult and could adversely affect the NAVs of the Funds.
As of December 31, 2021, the Funds had no investments in restricted securities other than securities sold to the Funds under Rule 144A and/or Regulation S under the Securities Act.
C. When-Issued Securities, Delayed Delivery Securities and Forward Commitments — The Funds purchased when-issued securities, including To Be Announced (“TBA”) securities, and entered into contracts to purchase or sell securities for a fixed price that may be settled a month or more after the trade date, or purchased delayed delivery securities which generally settle seven days after the trade date. When-issued securities are securities that have been authorized, but not issued in the market. A forward commitment involves entering into a contract to purchase or sell securities for a fixed price at a future date that may be settled a month or more after the trade date. A delayed delivery security is agreed upon in advance between the buyer and the seller of the security and is generally delivered beyond seven days of the agreed upon date. The purchase of securities on a when-issued, delayed delivery or forward commitment basis involves the risk that the value of the security to be purchased declines before the settlement date. The sale of securities on a forward commitment basis involves the risk that the value of the securities sold may increase before the settlement date. The Funds may be exposed to credit risk if the counterparty fails to perform under the terms of the transaction. Interest income for securities purchased on a when-issued, delayed delivery or forward commitment basis is not accrued until the settlement date.
The Funds had when-issued securities, delayed delivery securities or forward commitments outstanding as of December 31, 2021, which are shown as a Receivable for Investment securities sold — delayed delivery securities and a Payable for Investment securities purchased — delayed delivery securities, respectively, on the Statements of Assets and Liabilities. The values of these securities held at December 31, 2021 are detailed on the SOIs.
D. Investment Transactions with Affiliates — The Funds invested in /Underlying Funds and ETFs, which are advised by the Adviser. An issuer which is under common control with a Fund may be considered an affiliate. For the purposes of the financial statements, the Funds assume the issuers
| | | | | | | | | | |
| | | | | |
| 40 | | | | | | | | J.P. MORGAN FUNDS | | DECEMBER 31, 2021 |
listed in the tables below to be affiliated issuers. The Underlying Funds’ and ETFs’ distributions may be reinvested into such Underlying Funds and ETFs. Reinvestment amounts are included in the purchases at cost amounts in the tables below.
SmartSpendingSM 2015 Fund
| | | | | | | | | | | | | | | | | | | | | | | | | | | | | | | | | | | | |
For the six months ended December 31, 2021 | |
| Security Description | | Value at
June 30,
2021 | | | Purchases
at Cost | | | Proceeds
from Sales | | | Net
Realized
Gain
(Loss) | | | Change in
Unrealized
Appreciation/
(Depreciation) | | | Value at
December 31,
2021 | | | Shares at
December 31,
2021 | | | Dividend
Income | | | Capital Gain
Distributions | |
JPMorgan BetaBuilders International Equity ETF (a) | | $ | 3,012 | | | $ | 138 | | | $ | 157 | | | $ | 33 | | | $ | (36 | ) | | $ | 2,990 | | | | 50 | | | $ | 65 | | | $ | — | |
JPMorgan BetaBuilders MSCI US REIT ETF (a) | | | 591 | | | | — | | | | 93 | | | | 20 | | | | 71 | | | | 589 | | | | 5 | | | | 8 | | | | — | |
JPMorgan Emerging Markets Debt Fund Class R6 Shares (a) | | | 593 | | | | 13 | | | | — | | | | — | | | | (27 | ) | | | 579 | | | | 75 | | | | 13 | | | | — | |
JPMorgan Emerging Markets Strategic Debt Fund Class R6 Shares (a) | | | 593 | | | | 20 | | | | — | | | | — | | | | (28 | ) | | | 585 | | | | 76 | | | | 20 | | | | — | |
JPMorgan Equity Index Fund Class R6 Shares (a) | | | 3,989 | | | | 295 | | | | 760 | | | | 222 | | | | 143 | | | | 3,889 | | | | 54 | | | | 26 | | | | 52 | |
JPMorgan Floating Rate Income Fund Class R6 Shares (a) | | | 389 | | | | 6 | | | | — | | | | — | | | | — | (b) | | | 395 | | | | 44 | | | | 6 | | | | — | |
JPMorgan High Yield Fund Class R6 Shares (a) | | | 1,112 | | | | 73 | | | | 67 | | | | 3 | | | | (14 | ) | | | 1,107 | | | | 153 | | | | 26 | | | | — | |
JPMorgan High Yield Research Enhanced ETF (a) | | | 1,301 | | | | — | | | | — | | | | — | | | | (13 | ) | | | 1,288 | | | | 25 | | | | 32 | | | | — | |
JPMorgan Income Fund Class R6 Shares (a) | | | 769 | | | | 15 | | | | — | | | | — | | | | (14 | ) | | | 770 | | | | 82 | | | | 15 | | | | — | |
JPMorgan Inflation Managed Bond Fund Class R6 Shares (a) | | | 2,345 | | | | 29 | | | | 90 | | | | 5 | | | | 21 | | | | 2,310 | | | | 210 | | | | 30 | | | | — | |
JPMorgan Managed Income Fund Class L Shares(a) | | | 20 | | | | — | | | | 20 | | | | — | (b) | | | — | (b) | | | — | | | | — | | | | — | (b) | | | — | |
JPMorgan Short Duration Core Plus Fund Class R6 Shares (a) | | | 2,528 | | | | 28 | | | | — | | | | — | | | | (36 | ) | | | 2,520 | | | | 259 | | | | 21 | | | | 6 | |
JPMorgan U.S. Aggregate Bond ETF (a) | | | 2,262 | | | | 391 | | | | 458 | | | | 4 | | | | (22 | ) | | | 2,177 | | | | 40 | | | | 16 | | | | 2 | |
JPMorgan U.S. Government Money Market Fund Class IM Shares, 0.03% (a) (c) | | | 1,788 | | | | 2,376 | | | | 2,516 | | | | — | | | | — | | | | 1,648 | | | | 1,648 | | | | — | (b) | | | — | |
| | | | | | | | | | | | | | | | | | | | | | | | | | | | | | | | | | | | |
Total | | $ | 21,292 | | | $ | 3,384 | | | $ | 4,161 | | | $ | 287 | | | $ | 45 | | | $ | 20,847 | | | | | | | $ | 278 | | | $ | 60 | |
| | | | | | | | | | | | | | | | | | | | | | | | | | | | | | | | | | | | |
| (a) | Investment in an affiliated fund, which is registered under the Investment Company Act of 1940, as amended, and is advised by J.P. Morgan Investment Management Inc. |
| (b) | Amount rounds to less than one thousand. |
| (c) | The rate shown is the current yield as of December 31, 2021. |
| | | | | | | | | | |
| | | | | |
| DECEMBER 31, 2021 | | J.P. MORGAN FUNDS | | | | | | | | 41 |
NOTES TO FINANCIAL STATEMENTS
AS OF DECEMBER 31, 2021 (Unaudited) (continued)
(Dollar values in thousands)
SmartSpendingSM 2020 Fund
| | | | | | | | | | | | | | | | | | | | | | | | | | | | | | | | | | | | |
For the six months ended December 31, 2021 | |
| Security Description | | Value at
July 2,
2020 | | | Purchases
at Cost | | | Proceeds
from Sales | | | Net
Realized
Gain
(Loss) | | | Change in
Unrealized
Appreciation/
(Depreciation) | | | Value at
December 31,
2021 | | | Shares at
December 31,
2021 | | | Dividend
Income | | | Capital Gain
Distributions | |
JPMorgan BetaBuilders International Equity ETF (a) | | $ | 2,633 | | | $ | 281 | | | $ | 233 | | | $ | 49 | | | $ | (50 | ) | | $ | 2,680 | | | | 45 | | | $ | 59 | | | $ | — | |
JPMorgan BetaBuilders MSCI US REIT ETF (a) | | | 528 | | | | — | | | | 41 | | | | 11 | | | | 70 | | | | 568 | | | | 5 | | | | 8 | | | | — | |
JPMorgan Emerging Markets Debt Fund Class R6 Shares (a) | | | 514 | | | | 63 | | | | — | | | | — | | | | (24 | ) | | | 553 | | | | 72 | | | | 12 | | | | — | |
JPMorgan Emerging Markets Strategic Debt Fund Class R6 Shares (a) | | | 514 | | | | 38 | | | | 19 | | | | — | (b) | | | (25 | ) | | | 508 | | | | 66 | | | | 18 | | | | — | |
JPMorgan Equity Index Fund Class R6 Shares (a) | | | 4,111 | | | | 462 | | | | 855 | | | | 242 | | | | 145 | | | | 4,105 | | | | 57 | | | | 27 | | | | 55 | |
JPMorgan Floating Rate Income Fund Class R6 Shares (a) | | | 349 | | | | 5 | | | | — | | | | — | | | | — | (b) | | | 354 | | | | 40 | | | | 5 | | | | — | |
JPMorgan High Yield Fund Class R6 Shares (a) | | | 1,001 | | | | 76 | | | | 75 | | | | 7 | | | | (16 | ) | | | 993 | | | | 137 | | | | 23 | | | | — | |
JPMorgan High Yield Research Enhanced ETF (a) | | | 1,219 | | | | 47 | | | | 99 | | | | — | (b) | | | (12 | ) | | | 1,155 | | | | 22 | | | | 30 | | | | — | |
JPMorgan Income Fund Class R6 Shares (a) | | | 693 | | | | 13 | | | | — | | | | — | | | | (12 | ) | | | 694 | | | | 74 | | | | 13 | | | | — | |
JPMorgan Inflation Managed Bond Fund Class R6 Shares (a) | | | 2,096 | | | | 26 | | | | 45 | | | | 2 | | | | 21 | | | | 2,100 | | | | 191 | | | | 27 | | | | — | |
JPMorgan Short Duration Core Plus Fund Class R6 Shares (a) | | | 2,313 | | | | 66 | | | | 111 | | | | 1 | | | | (33 | ) | | | 2,236 | | | | 230 | | | | 19 | | | | 6 | |
JPMorgan U.S. Aggregate Bond ETF (a) | | | 1,924 | | | | 467 | | | | 497 | | | | — | (b) | | | (18 | ) | | | 1,876 | | | | 35 | | | | 14 | | | | 2 | |
JPMorgan U.S. Government Money Market Fund Class IM Shares, 0.03% (a) (c) | | | 1,396 | | | | 2,591 | | | | 2,817 | | | | — | | | | — | | | | 1,170 | | | | 1,170 | | | | — | (b) | | | — | |
| | | | | | | | | | | | | | | | | | | | | | | | | | | | | | | | | | | | |
Total | | $ | 19,291 | | | $ | 4,135 | | | $ | 4,792 | | | $ | 312 | | | $ | 46 | | | $ | 18,992 | | | | | | | $ | 255 | | | $ | 63 | |
| | | | | | | | | | | | | | | | | | | | | | | | | | | | | | | | | | | | |
| (a) | Investment in an affiliated fund, which is registered under the Investment Company Act of 1940, as amended, and is advised by J.P. Morgan Investment Management Inc. |
| (b) | Amount rounds to less than one thousand. |
| (c) | The rate shown is the current yield as of December 31, 2021. |
E. Foreign Currency Translation — The books and records of the Funds are maintained in U.S. dollars. Foreign currency amounts are translated into U.S. dollars at the prevailing exchange rates of such currencies against the U.S. dollar. The market value of investment securities and other assets and liabilities are translated at the exchange rate as of the valuation date. Purchases and sales of investment securities, income and expenses are translated at the exchange rate prevailing on the respective dates of such transactions.
The Funds do not isolate the effect of changes in foreign exchange rates from changes in market prices on securities held. Accordingly, such changes are included within Change in net unrealized appreciation/depreciation on investments in non-affiliates on the Statements of Operations.
Reported realized foreign currency gains and losses arise from the disposition of foreign currency, currency gains or losses realized between the trade and settlement dates on securities transactions, and the difference between the amounts of dividends, interest and foreign withholding taxes recorded on each Fund’s books on the transaction date and the U.S. dollar equivalent of the amounts actually received or paid. These reported realized foreign currency gains and losses are included in Net realized gain (loss) on foreign currency transactions on the Statements of Operations. Unrealized foreign currency gains and losses arise from changes (due to changes in exchange rates) in the value of foreign currency and other assets and liabilities denominated in foreign currencies, which are held at period end and are included in Change in net unrealized appreciation/depreciation on foreign currency translations on the Statements of Operations.
| | | | | | | | | | |
| | | | | |
| 42 | | | | | | | | J.P. MORGAN FUNDS | | DECEMBER 31, 2021 |
F. Futures Contracts — The Funds used index and treasury futures contracts to gain exposure to or to overweight or underweight allocations among various sectors or markets, or maintain liquidity or minimize transaction costs. The Funds also purchased futures contracts to invest incoming cash in the market or sold futures in response to cash outflows, thereby simulating an invested position in the underlying index while maintaining a cash balance for liquidity.
Futures contracts provide for the delayed delivery of the underlying instrument at a fixed price or are settled for a cash amount based on the change in the value of the underlying instrument at a specific date in the future. Upon entering into a futures contract, the Funds are required to deposit with the broker, cash or securities in an amount equal to a certain percentage of the contract amount, which is referred to as the initial margin deposit. Subsequent payments, referred to as variation margin, are made or received by the Funds periodically and are based on changes in the market value of open futures contracts. Changes in the market value of open futures contracts are recorded as Change in net unrealized appreciation/depreciation on futures contracts on the Statements of Operations. Realized gains or losses, representing the difference between the value of the contract at the time it was opened and the value at the time it was closed, are reported on the Statements of Operations at the closing or expiration of the futures contract. Securities deposited as initial margin are designated on the SOIs, while cash deposited, which is considered restricted, is recorded on the Statements of Assets and Liabilities. A receivable from and/or a payable to brokers for the daily variation margin is also recorded on the Statements of Assets and Liabilities.
The use of futures contracts exposes the Funds to equity priceand interest rate risks. The Funds may be subject to the risk that the change in the value of the futures contract may not correlate perfectly with the underlying instrument. Use of long futures contracts subjects the Funds to risk of loss in excess of the amounts shown on the Statements of Assets and Liabilities, up to the notional amount of the futures contracts. Use of short futures contracts subjects the Funds to unlimited risk of loss. The Funds may enter into futures contracts only on exchanges or boards of trade. The exchange or board of trade acts as the counterparty to each futures transaction; therefore, the Funds’ credit risk is limited to failure of the exchange or board of trade. Under some circumstances, futures exchanges may establish daily limits on the amount that the price of a futures contract can vary from the previous day’s settlement price, which could effectively prevent liquidation of positions.
The Funds’ futures contracts are not subject to master netting arrangements (the right to close out all transactions traded with a counterparty and net amounts owed or due across transactions).
The table below discloses the volume of the Funds’ futures contracts activity during the six months ended December 31, 2021:
| | | | | | | | |
| | | SmartSpendingSM
2015 Fund | | | SmartSpendingSM
2020 Fund | |
Futures Contracts: | | | | | | | | |
Average Notional Balance Long | | $ | 2,842 | | | $ | 1,977 | |
Average Notional Balance Short | | | 729 | | | | 638 | |
Ending Notional Balance Long | | | 3,260 | | | | 2,416 | |
G. Summary of Derivatives Information
The following tables present the value of derivatives held as of December 31, 2021 by their primary underlying risk exposure and respective location on the Statements of Assets and Liabilities:
| | | | | | | | |
| | | SmartSpendingSM
2015 Fund | | | SmartSpendingSM
2020 Fund | |
Equity Risk Exposure: | | | | | | | | |
Unrealized Depreciation on Futures Contracts* | | $ | 44 | | | $ | 29 | |
| | |
Interest Rate Risk Exposure: | | | | | | | | |
Unrealized Appreciation on Futures Contracts* | | | 11 | | | | 9 | |
| | |
Net Fair Value of Derivative Contracts: | | | | | | | | |
Unrealized Appreciation (Depreciation) on Futures Contracts* | | | 55 | | | | 38 | |
| * | Includes cumulative appreciation/(depreciation) on futures contracts, if any, as reported on the SOIs. Only current day’s variation margin is reported within the Statements of Assets and Liabilities. |
| | | | | | | | | | |
| | | | | |
| DECEMBER 31, 2021 | | J.P. MORGAN FUNDS | | | | | | | | 43 |
NOTES TO FINANCIAL STATEMENTS
AS OF DECEMBER 31, 2021 (Unaudited) (continued)
(Dollar values in thousands)
The following tables present the effect of derivatives on the Statements of Operations for the six months ended December 31, 2021, by primary underlying risk exposure:
| | | | | | | | |
| | | SmartSpendingSM
2015 Fund | | | SmartSpendingSM
2020 Fund | |
Realized Gain (Loss) on Derivatives Recognized as a Result From Operations: | | | | | | | | |
Equity Risk Exposure: | | | | | | | | |
Futures Contracts | | $ | (4 | ) | | $ | (69 | ) |
| | |
Interest Rate Risk Exposure: | | | | | | | | |
Futures Contracts | | | (61 | ) | | | (44 | ) |
| | |
Net Change in Unrealized Appreciation (Depreciation) on Derivatives Recognized as a Result of Operations: | | | | | | | | |
Equity Risk Exposure: | | | | | | | | |
Futures Contracts | | | 85 | | | | 70 | |
| | |
Interest Rate Risk Exposure: | | | | | | | | |
Futures Contracts | | | 26 | | | | 20 | |
The Funds’ derivatives contracts held at December 31, 2021 are not accounted for as hedging instruments under GAAP.
I. Security Transactions and Investment Income — Investment transactions are accounted for on the trade date (the date the order to buy or sell is executed). Securities gains and losses are calculated on a specifically identified cost basis. Interest income is determined on the basis of coupon interest accrued using the effective interest method, which adjusts for amortization of premiums and accretion of discounts. Distributions of net investment income and realized capital gains from the Underlying Funds and ETFs are recorded on the ex-dividend date.
To the extent such information is publicly available, the Funds record distributions received in excess of income earned from underlying investments as a reduction of cost of investments and/or realized gain. Such amounts are based on estimates if actual amounts are not available and actual amounts of income, realized gain and return of capital may differ from the estimated amounts. The Funds adjust the estimated amounts of the components of distributions (and consequently their net investment income) as necessary, once the issuers provide information about the actual composition of the distributions.
J. Allocation of Income and Expenses — Expenses directly attributable to a Fund are charged directly to that Fund, while the expenses attributable to more than one fund of the Trust are allocated among the applicable funds. Investment income, realized and unrealized gains and losses and expenses, other than class-specific expenses, are allocated daily to each class of shares based upon the proportion of net assets of each class at the beginning of each day.
Transfer agency fees are class-specific expenses. The amount of the transfer agency fees charged to each share class of the Funds for the six months ended December 31, 2021 are as follows:
| | | | | | | | | | | | | | | | | | | | | | | | | | | | | | | | |
| | | Class A | | | Class I | | | Class R2 | | | Class R3 | | | Class R4 | | | Class R5 | | | Class R6 | | | Total | |
SmartSpendingSM 2015 Fund | | | | | | | | | | | | | | | | | | | | | | | | | |
Transfer agency fees | | $ | — | (a) | | $ | — | (a) | | $ | — | (a) | | $ | — | (a) | | $ | — | (a) | | $ | — | (a) | | $ | — | (a) | | $ | — | (a) |
| | | | | | |
SmartSpendingSM 2020 Fund | | | | | | | | | | | | | | | | | | | | | | | | | |
Transfer agency fees | | | — | (a) | | | — | (a) | | | — | (a) | | | — | (a) | | | — | (a) | | | — | (a) | | | — | (a) | | | — | (a) |
| (a) | Amount rounds to less than one thousand. |
The Funds invested in Underlying Funds and ETFs and, as a result, bear a portion of the expenses incurred by these Underlying Funds and ETFs. These expenses are not reflected in the expenses shown on the Statements of Operations and are not included in the ratios to average net assets shown in the Financial Highlights. Certain expenses of affiliated Underlying Funds and ETFs are waived as described in Note 3.F.
K. Federal Income Taxes — Each Fund is treated as a separate taxable entity for Federal income tax purposes. Each Fund’s policy is to comply with the provisions of the Internal Revenue Code (the “Code”) applicable to regulated investment companies and to distribute to shareholders all of its distributable net investment income and net realized capital gains on investments. Accordingly, no provision for Federal income tax is necessary. Management has reviewed the Funds’ tax positions for all open tax years and has determined that as of December 31, 2021, no liability for Federal income tax is required in the Funds’ financial statements for net unrecognized tax benefits. However, management’s conclusions may be subject to future review based on changes in, or the interpretation of, the accounting standards or tax laws and regulations. Each Fund’s Federal tax returns for the prior three fiscal yearsremain subject to examination by the Internal Revenue Service.
L. Distributions to Shareholders — Distributions from net investment income, if any, are generally declared and paid at least annually and are declared separately for each class. No class has preferential dividend rights; differences in per share rates are due to differences in separate class expenses. Net realized capital gains, if any, are distributed by each Fund at least annually. The amount of distributions from net investment income
| | | | | | | | | | |
| | | | | |
| 44 | | | | | | | | J.P. MORGAN FUNDS | | DECEMBER 31, 2021 |
and net realized capital gains is determined in accordance with Federal income tax regulations, which may differ from GAAP. To the extent these “book/tax” differences are permanent in nature (i.e., that they result from other than timing of recognition — “temporary differences”), such amounts are reclassified within the capital accounts based on their Federal tax basis treatment.
3. Fees and Other Transactions with Affiliates
A. Investment Advisory Fee — Pursuant to an Investment Advisory Agreement, the Adviser manages the investments of each Fund and for such services is paid a fee. The investment advisory fee is accrued daily and paid monthly at an annual rate of 0.15% of each Fund’s respective average daily net assets.
The Adviser waived investment advisory fees and/or reimbursed expenses as outlined in Note 3.F.
B. Administration Fee — Pursuant to an Administration Agreement, the Administrator provides certain administration services to each Fund. In consideration of these services, the Administrator receives a fee accrued daily and paid monthly at an annual rate of 0.075% of the first $10 billion of each Fund’s respective average daily net assets, plus 0.050% of each Fund’s respective average daily net assets between $10 billion and $20 billion, plus 0.025% of each Fund’s respective average daily net assets between $20 billion and $25 billion, plus 0.01% of each Fund’s respective average daily net assets in excess of $25 billion. For the six months ended December 31, 2021, the effective annualized rate was 0.07% of each Fund’s average daily net assets, notwithstanding any fee waivers and/or expense reimbursements.
The Administrator waived administration fees as outlined in Note 3.F.
JPMorgan Chase Bank, N.A. (“JPMCB”), a wholly-owned subsidiary of JPMorgan, serves as the Funds’ sub-administrator (the “Sub-administrator”). For its services as Sub-administrator, JPMCB receives a portion of the fees payable to the Administrator.
C. Distribution Fees — Pursuant to a Distribution Agreement, JPMorgan Distribution Services, Inc. (“JPMDS”), an indirect, wholly-owned subsidiary of JPMorgan, serves as each Fund’s principal underwriter and promotes and arranges for the sale of each Fund’s shares.
The Board has adopted a Distribution Plan (the “Distribution Plan”) for Class A, Class C, Class R2 and Class R3 Shares of the Funds, as applicable, pursuant to Rule 12b-1 under the 1940 Act. Class I, Class L, Class R4, Class R5 and Class R6 Shares of the Funds do not charge a distribution fee. The Distribution Plan provides that each Fund shall pay, with respect to the applicable share classes, distribution fees, including payments to JPMDS, at annual rates of the average daily net assets as shown in the table below:
| | | | | | | | |
| | | Class R2 | | | Class R3 | |
| | | 0.50 | % | | | 0.25 | % |
In addition, JPMDS is entitled to receive the front-end sales charges from purchases of Class A Shares and the CDSC from redemptions of certain Class A Shares for which front-end sales charges have been waived. For the six months ended December 31, 2021, JPMDS did not retain any front-end sales charges or CDSC.
D. Service Fees — The Trust, on behalf of the Funds, has entered into a Shareholder Servicing Agreement with JPMDS under which JPMDS provides certain support services to fund shareholders. For performing these services, JPMDS receives a fee with respect to all share classes, except Class R6 Shares which do not charge a service fee, that is accrued daily and paid monthly equal to a percentage of the average daily net assets as shown in the table below:
| | | | | | | | | | | | | | | | |
| | | Class I | | Class R2 | | Class R3 | | | Class R4 | | | Class R5 | |
| | 0.25% | | 0.25% | | | 0.25 | % | | | 0.25 | % | | | 0.10 | % |
JPMDS has entered into shareholder services contracts with affiliated and unaffiliated financial intermediaries who provide shareholder services and other related services to their clients or customers who invest in the Funds. Pursuant to such contracts, JPMDS will pay all or a portion of such fees earned to financial intermediaries for performing such services.
JPMDS waived service fees as outlined in Note 3.F.
E. Custodian and Accounting Fees — JPMCB provides portfolio custody and accounting services to the Funds. For performing these services, the Funds pay JPMCB transaction and asset-based fees that vary according to the number of transactions and positions, plus out-of-pocket expenses. The amounts paid directly to JPMCB by the Funds for custody and accounting services are included in Custodian and accounting fees on the Statements of Operations.
Interest income earned on cash balances at the custodian, if any, is included in Interest income from affiliates on the Statements of Operations.
Interest expense paid to the custodian related to cash overdrafts, if any, is included in Interest expense to affiliates on the Statements of Operations.
F. Waivers and Reimbursements — The Adviser, Administrator and JPMDS have contractually agreed to waive fees and/or reimburse the Funds to the extent that total annual operating expenses of the Funds, Underlying Funds and ETFs (excluding dividend and interest expenses related to short sales, interest, taxes, expenses related to litigation and potential litigation, expenses related to trustee elections and extraordinary expenses
| | | | | | | | | | |
| | | | | |
| DECEMBER 31, 2021 | | J.P. MORGAN FUNDS | | | | | | | | 45 |
NOTES TO FINANCIAL STATEMENTS
AS OF DECEMBER 31, 2021 (Unaudited) (continued)
(Dollar values in thousands)
incurred by the Funds and any Underlying Fund and ETFs and acquired fund fees incurred by an Underlying Fund and ETFs) exceed the percentages of the Funds’ respective average daily net assets as shown in the table below:
| | | | | | | | | | | | | | | | | | | | | | | | |
| | | Class I | | | Class R2 | | | Class R3 | | | Class R4 | | | Class R5 | | | Class R6 | |
SmartSpendingSM 2015 Fund | | | 0.44 | % | | | 0.94 | % | | | 0.69 | % | | | 0.44 | % | | | 0.29 | % | | | 0.19 | % |
SmartSpendingSM 2020 Fund | | | 0.44 | | | | 0.94 | | | | 0.69 | | | | 0.44 | | | | 0.29 | | | | 0.19 | |
The expense limitation agreements were in effect for the six months ended December 31, 2021 and the contractual expense limitation percentages in the table above are in place until at least October 31, 2022.
The Underlying Funds and ETFs may impose separate advisory and service fees. To avoid charging a service fee at an effective rate above 0.25% for Class A, Class I, Class R2, Class R3 and Class R4 Shares and above 0.10% for Class R5 Shares, JPMDS will waive service fees with respect to the Fund in an amount equal to the weighted average pro-rata amount of service fees charged by the Underlying Funds and ETFs. These waivers may be in addition to any waivers required to meet the Fund’s contractual expense limitations, but will not exceed the Fund’s service fees.
For the six months ended December 31, 2021, the Funds’ service providers waived fees and/or reimbursed expenses for each of the Funds as follows. None of these parties expect the Funds to repay any such waived fees and/or reimbursed expenses in future years.
| | | | | | | | | | | | | | | | | | | | |
| | | Contractual Waivers | | | | |
| | | Investment
Advisory Fees | | | Administration
Fees | | | Service Fees | | | Total | | | Contractual
Reimbursement | |
SmartSpendingSM 2015 Fund | | $ | 23 | | | $ | 12 | | | $ | — | (a) | | $ | 35 | | | $ | 102 | |
SmartSpendingSM 2020 Fund | | | 21 | | | | 11 | | | | — | (a) | | | 32 | | | | 118 | |
| (a) | Amount rounds to less than one thousand. |
Additionally, the Funds may invest in one or more money market funds advised by the Adviser (affiliated money market funds). The Adviser, Administrator and/or JPMDS, as shareholder servicing agent, have contractually agreed to waive fees and/or reimburse expenses in an amount sufficient to offset the respective net fees each collects from the affiliated money market fund on the applicable Fund’s investment in such affiliated money market fund, except for investments of securities lending cash collateral. None of these parties expect the Funds to repay any such waived fees and/or reimbursed expenses in future years.
G. Other — Certain officers of the Trust are affiliated with the Adviser, the Administrator and JPMDS. Such officers, with the exception of the Chief Compliance Officer, receive no compensation from the Funds for serving in their respective roles.
The Board designated and appointed a Chief Compliance Officer to the Funds pursuant to Rule 38a-1 under the 1940 Act. Each Fund, along with affiliated funds, makes reimbursement payments, on a pro-rata basis, to the Administrator for a portion of the fees associated with the office of the Chief Compliance Officer. Such fees are included in Trustees’ and Chief Compliance Officer’s fees on the Statements of Operations.
The Trust adopted a Trustee Deferred Compensation Plan (the “Plan”) which allows the independent Trustees to defer the receipt of all or a portion of compensation related to performance of their duties as Trustees. The deferred fees are invested in various J.P. Morgan Funds until distribution in accordance with the Plan.
During the six months ended December 31, 2021, SmartSpendingSM 2020 Fund purchased securities from an underwriting syndicate in which the principal underwriter or members of the syndicate were affiliated with the Adviser.
The Securities and Exchange Commission (“SEC”) has granted an exemptive order permitting the Funds to engage in principal transactions with J.P. Morgan Securities LLC, an affiliated broker, involving taxable money market instruments, subject to certain conditions.
4. Investment Transactions
During the six months ended December 31, 2021, purchases and sales of investments (excluding short-term investments) were as follows:
| | | | | | | | | | | | | | | | |
| | | Purchases
(excluding
U.S. Government) | | | Sales
(excluding
U.S. Government) | | | Purchases
of U.S.
Government | | | Sales of U.S.
Government | |
SmartSpendingSM 2015 Fund | | $ | 3,869 | | | $ | 3,891 | | | $ | 281 | | | $ | 732 | |
SmartSpendingSM 2020 Fund | | | 3,859 | | | | 4,088 | | | | 253 | | | | 419 | |
| | | | | | | | | | |
| | | | | |
| 46 | | | | | | | | J.P. MORGAN FUNDS | | DECEMBER 31, 2021 |
5. Federal Income Tax Matters
For Federal income tax purposes, the estimated cost and unrealized appreciation (depreciation) in value of investments held at December 31, 2021 were as follows:
| | | | | | | | | | | | | | | | |
| | | Aggregate
Cost | | | Gross
Unrealized
Appreciation | | | Gross
Unrealized
Depreciation | | | Net Unrealized
Appreciation
(Depreciation) | |
SmartSpendingSM 2015 Fund | | $ | 28,586 | | | $ | 2,607 | | | $ | 203 | | | $ | 2,404 | |
SmartSpendingSM 2020 Fund | | | 25,511 | | | | 2,601 | | | | 186 | | | | 2,415 | |
At June 30, 2021, the Funds did not have any net capital loss carryforwards.
Specified ordinary losses incurred after October 31, and within the taxable year are deemed to arise on the first business day of the Funds’ next taxable year. For the year ended June 30, 2021, the Funds deferred to July 1, 2021 the following specified ordinary losses of:
| | | | |
| | | Specified Ordinary Losses | |
SmartSpendingSM 2015 Fund | | $ | 1 | |
SmartSpendingSM 2020 Fund | | | 2 | |
6. Borrowings
The Funds rely upon an exemptive order granted by the SEC (the “Order”) permitting the establishment and operation of an Interfund Lending Facility (the “Facility”). The Facility allows the Funds to directly lend and borrow money to or from any other fund relying upon the Order at rates beneficial to both the borrowing and lending funds. Advances under the Facility are taken primarily for temporary or emergency purposes, including the meeting of redemption requests that otherwise might require the untimely disposition of securities, and are subject to each Fund’s borrowing restrictions. The Interfund loan rate is determined, as specified in the Order, by averaging the current repurchase agreement rate and the current bank loan rate. The Order was granted to JPMorgan Trust II and may be relied upon by the Funds because the Funds and the series of JPMorgan Trust II are all investment companies in the same “group of investment companies” (as defined in Section 12(d)(1)(G) of the 1940 Act).
The Funds had no borrowings outstanding from another fund during the six months ended December 31, 2021.
The Trust and JPMCB have entered into a financing arrangement. Under this arrangement, JPMCB provides an unsecured, uncommitted credit facility in the aggregate amount of $100 million to certain of the J.P. Morgan Funds, including the Funds. Advances under the arrangement are taken primarily for temporary or emergency purposes, including the meeting of redemption requests that otherwise might require the untimely disposition of securities, and are subject to each Fund’s borrowing restrictions. Interest on borrowings is payable at a rate determined by JPMCB at the time of borrowing. This agreement has been extended until October 31, 2022.
The Funds had no borrowings outstanding from the unsecured, uncommitted credit facility during the six months ended December 31, 2021.
The Trust, along with certain other trusts for J.P. Morgan Funds (“Borrowers”), has entered into a joint syndicated senior unsecured revolving credit facility totaling $1.5 billion (“Credit Facility”) with various lenders and The Bank of New York Mellon, as administrative agent for the lenders. This Credit Facility provides a source of funds to the Borrowers for temporary and emergency purposes, including the meeting of redemption requests that otherwise might require the untimely disposition of securities. Under the terms of the Credit Facility, a borrowing fund must have a minimum of $25,000,000 in adjusted net asset value and not exceed certain adjusted net asset coverage ratios prior to and during the time in which any borrowings are outstanding. If a fund does not comply with the aforementioned requirements, the fund must remediate within three business days with respect to the $25,000,000 minimum adjusted net asset value or within one business day with respect to certain asset coverage ratios or the administrative agent at the request of, or with the consent of, the lenders may terminate the Credit Facility and declare any outstanding borrowings to be due and payable immediately.
Interest associated with any borrowing under the Credit Facility is charged to the borrowing fund at a rate of interest equal to 1.25%, which has decreased to 1.00% pursuant to the amendment referenced below (the “Applicable Margin”), plus the greater of the federal funds effective rate or one month London Interbank Offered Rate (“LIBOR”). The annual commitment fee to maintain the Credit Facility is 0.15% and is incurred on the unused portion of the Credit Facility and is allocated to all participating funds pro rata based on their respective net assets. Effective August 10, 2021, the Credit Facility has been amended and restated for a term of 364 days, unless extended, and to include a reduction of the Applicable Margin charged for borrowing under the Credit Facility from 1.25% to 1.00%.
The Funds did not utilize the Credit Facility during the six months ended December 31, 2021.
7. Risks, Concentrations and Indemnifications
In the normal course of business, the Funds enter into contracts that contain a variety of representations which provide general indemnifications. Each Fund’s maximum exposure under these arrangements is unknown. The amount of exposure would depend on future claims that may be brought against each Fund. However, based on experience, the Funds expect the risk of loss to be remote.
| | | | | | | | | | |
| | | | | |
| DECEMBER 31, 2021 | | J.P. MORGAN FUNDS | | | | | | | | 47 |
NOTES TO FINANCIAL STATEMENTS
AS OF DECEMBER 31, 2021 (Unaudited) (continued)
(Dollar values in thousands)
As of December 31, 2021, the Adviser owned shares representing more than 10% of net assets of the following Funds:
| | | | | | | | |
| | | Number of
Individual Shareholder
and/or Affiliated Omnibus Accounts | | | % of the Fund | |
SmartSpendingSM 2015 Fund | | | 1 | | | | 99.9 | % |
SmartSpendingSM 2020 Fund | | | 1 | | | | 99.7 | |
The Funds are subject to risks associated with securities with contractual cash flows including asset-backed and mortgage-related securities such as collateralized mortgage obligations, mortgage-pass-through securities and commercial mortgage-backed securities, including securities backed by sub-prime mortgage loans. The value, liquidity and related income of these securities are sensitive to changes in economic conditions, including real estate value, pre-payments, delinquencies and/or defaults, and may be adversely affected by shifts in the market’s perception of the issuers and changes in interest rates.
The Funds are subject to interest rate and credit risk. The value of debt securities may decline as interest rates increase. The Funds could lose money if the issuer of a fixed income security is unable to pay interest or repay principal when it is due. The Funds invest in floating rate loans and other floating rate debt securities. Although these investments are generally less sensitive to interest rate changes than other fixed rate instruments, the value of floating rate loans and other floating rate investments may decline if their interest rates do not rise as quickly, or as much, as general interest rates. Many factors can cause interest rates to rise. Some examples include central bank monetary policy, rising inflation rates and general economic conditions. The Funds may face a heightened level of interest rate risk due to certain changes in monetary policy, such as an interest rate increase by the Federal Reserve. The ability of the issuers of debt to meet their obligations may be affected by the economic and political developments in a specific industry or region.
Derivatives may be riskier than other types of investments because they may be more sensitive to changes in economic and market conditions and could result in losses that significantly exceed the Funds’ original investment. Many derivatives create leverage thereby causing the Funds to be more volatile than they would have been if they had not used derivatives. Derivatives also expose the Funds to counterparty risk (the risk that the derivative counterparty will not fulfill its contractual obligations), including credit risk of the derivative counterparty. The possible lack of a liquid secondary market for derivatives and the resulting inability of the Funds to sell or otherwise close a derivatives position could expose the Funds to losses.
Each Fund invests in ETFs. ETFs are pooled investment vehicles whose ownership interests are purchased and sold on a securities exchange. ETFs may be structured as investment companies, depositary receipts or other pooled investment vehicles and may be passively or actively managed. Passively managed ETFs generally seek to track the performance of a particular market index, including broad-based market indexes, as well as indexes relating to particular sectors, markets, regions or industries. Actively managed ETFs do not seek to track the performance of a particular market index. The price movement of an index-based ETF may not track the underlying index and may result in a loss. In addition, ETFs may trade at a price below or above their NAV (also known as a discount or premium, respectively).
Because of the Funds’ investments in the Underlying Funds and ETFs, the Funds indirectly pay a portion of the expenses incurred by the Underlying Funds and ETFs. As a result, the cost of investing in the Funds may be higher than the cost of investing in a mutual fund that invests directly in individual securities and financial instruments. The Funds are also subject to certain risks related to the Underlying Funds’ and ETFs’ investments in securities and financial instruments such as fixed income securities including high yield, asset-backed and mortgage-related securities, equity securities, foreign and emerging markets securities, commodities and real estate securities. These securities are subject to risks specific to their structure, sector or market.
In addition, the Underlying Funds and ETFs may use derivative instruments in connection with their individual investment strategies including futures contracts, forward foreign currency exchange contracts, options, swaps and other derivatives, which are also subject to specific risks related to their structure, sector or market and may be riskier than investments in other types of securities. Specific risks and concentrations present in the Underlying Funds and ETFs are disclosed within their individual financial statements and registration statements, as appropriate.
LIBOR is intended to represent the rate at which contributing banks may obtain short-term borrowings from each other in the London interbank market. On March 5, 2021, the U.K. Financial Conduct Authority (“FCA”) publicly announced that (i) immediately after December 31, 2021, publication of the 1-week and 2-month U.S. Dollar LIBOR settings will permanently cease; (ii) immediately after June 30, 2023, publication of the overnight and 12-month U.S. Dollar LIBOR settings will permanently cease; and (iii) immediately after June 30, 2023, the 1-month, 3-month and 6-month U.S. Dollar LIBOR settings will cease to be provided or, subject to the FCA’s consideration of the case, be provided on a synthetic basis and no longer be representative of the underlying market and economic reality they are intended to measure and that representativeness will not be restored. There is no assurance that the dates announced by the FCA will not change or that the administrator of LIBOR and/or regulators will not take further action that could impact the availability, composition or characteristics of LIBOR or the currencies and/or tenors for which LIBOR is published. Public and private sector industry initiatives are currently underway to implement new or alternative reference rates to be used in place of LIBOR. There is no assurance that any such alternative reference rate will be similar to or produce the same value or economic equivalence as LIBOR or that it will have the same volume or liquidity as did LIBOR prior to its discontinuance or unavailability, which may affect the value or liquidity or return on certain of a Fund’s loans, notes, derivatives and other instruments or investments comprising some or all of a Fund’s investments and result in costs incurred in connection with closing out positions and entering into new trades. These risks may also apply with respect to changes in connection with other interbank offering rates (e.g., Euribor) and a wide range of other index levels, rates and values that are treated as “benchmarks” and are the subject of recent regulatory reform.
| | | | | | | | | | |
| | | | | |
| 48 | | | | | | | | J.P. MORGAN FUNDS | | DECEMBER 31, 2021 |
The Funds are subject to infectious disease epidemics/pandemics risk. The worldwide outbreak of COVID-19, a novel coronavirus disease, has negatively affected economies, markets and individual companies throughout the world. The effects of this COVID-19 pandemic to public health, and business and market conditions, including exchange trading suspensions and closures may continue to have a significant negative impact on the performance of a Fund’s investments, increase a Fund’s volatility, exacerbate other pre-existing political, social and economic risks to the Funds and negatively impact broad segments of businesses and populations. The Funds’ operations may be interrupted as a result, which may have a significant negative impact on investment performance. In addition, governments, their regulatory agencies, or self-regulatory organizations may take actions in response to the pandemic that affect the instruments in which the Funds invest, or the issuers of such instruments, in ways that could also have a significant negative impact on a Fund’s investment performance. The full impact of this COVID-19 pandemic, or other future epidemics/pandemics, is currently unknown.
8. Other Matters
SmartSpendingSM 2015 Fund will change its fund name to SmartRetirement 2015 Fund on or about March 18, 2022.
At their meeting on November 17, 2021, the Board approved the liquidation of the SmartSpendingSM 2020 Fund which is expected to occur on or about April 22, 2022.
| | | | | | | | | | |
| | | | | |
| DECEMBER 31, 2021 | | J.P. MORGAN FUNDS | | | | | | | | 49 |
SCHEDULE OF SHAREHOLDER EXPENSES
(Unaudited)
Hypothetical $1,000 Investment
As a shareholder of the Funds, you incur two types of costs: (1) transaction costs, including sales charges (loads) on purchase payments and (2) ongoing costs, including investment advisory fees, administration fees, distribution fees and other Fund expenses. The examples below are intended to help you understand your ongoing costs (in dollars) of investing in the Funds (not including expenses of the Underlying Funds and ETFs) and to compare these ongoing costs with the ongoing costs of investing in other mutual funds. The examples assume that you had a $1,000 investment in each Class at the beginning of the reporting period, July 1, 2021, and continued to hold your shares at the end of the reporting period, December 31, 2021.
Actual Expenses
For each Class of each Fund in the table below, the first line provides information about actual account values and actual expenses. You may use the information in this line, together with the amount you invested, to estimate the expenses that you paid over the period. Simply divide your account value by $1,000 (for example, an $8,600 account value divided by $1,000 = 8.6), then multiply the result by the number in the first line of each Class under the heading titled “Expenses Paid During the Period” to estimate the expenses you paid on your account during this period.
Hypothetical Example for Comparison Purposes
The second line of each Class in the table below provides information about hypothetical account values and hypothetical expenses based on the Class’ actual expense ratio and an assumed rate of return of 5% per year before expenses, which is not the Class’ actual return. The hypothetical account values and expenses may not be used to estimate the actual ending account balance or expenses you paid for the period. You may use this information to compare the ongoing costs of investing in the Class of the Fund and other funds. To do so, compare this 5% hypothetical example with the 5% hypothetical examples that appear in the shareholder reports of the other funds. Please note that the expenses shown in the table are meant to highlight your ongoing costs only and do not reflect any transaction costs, such as sales charges (loads) or redemption fees, and expenses of the Underlying Funds and ETFs. Therefore, the second line for each Class in the table is useful in comparing ongoing costs only, and will not help you determine the relative total costs of owning different funds. In addition, if these transaction costs were included, your costs would have been higher. The examples also assume all dividends and distributions have been reinvested.
| | | | | | | | | | | | | | | | |
| | | Beginning
Account Value
July 1, 2021 | | | Ending
Account Value
December 31, 2021 | | | Expenses
Paid During
the Period* | | | Annualized
Expense
Ratio | |
JPMorgan SmartSpendingSM 2015 Fund | | | | | | | | | | | | | | | | |
Class I | | | | | | | | | | | | | | | | |
Actual | | $ | 1,000.00 | | | $ | 1,020.10 | | | $ | 1.43 | | | | 0.28 | % |
Hypothetical | | | 1,000.00 | | | | 1,023.79 | | | | 1.43 | | | | 0.28 | |
Class R2 | | | | | | | | | | | | | | | | |
Actual | | | 1,000.00 | | | | 1,017.90 | | | | 3.92 | | | | 0.77 | |
Hypothetical | | | 1,000.00 | | | | 1,021.32 | | | | 3.92 | | | | 0.77 | |
Class R3 | | | | | | | | | | | | | | | | |
Actual | | | 1,000.00 | | | | 1,018.40 | | | | 2.70 | | | | 0.53 | |
Hypothetical | | | 1,000.00 | | | | 1,022.53 | | | | 2.70 | | | | 0.53 | |
Class R4 | | | | | | | | | | | | | | | | |
Actual | | | 1,000.00 | | | | 1,019.60 | | | | 1.43 | | | | 0.28 | |
Hypothetical | | | 1,000.00 | | | | 1,023.79 | | | | 1.43 | | | | 0.28 | |
Class R5 | | | | | | | | | | | | | | | | |
Actual | | | 1,000.00 | | | | 1,021.10 | | | | 0.66 | | | | 0.13 | |
Hypothetical | | | 1,000.00 | | | | 1,024.55 | | | | 0.66 | | | | 0.13 | |
Class R6 | | | | | | | | | | | | | | | | |
Actual | | | 1,000.00 | | | | 1,021.40 | | | | 0.15 | | | | 0.03 | |
Hypothetical | | | 1,000.00 | | | | 1,025.05 | | | | 0.15 | | | | 0.03 | |
| | | | | | | | | | |
| | | | | |
| 50 | | | | | | | | J.P. MORGAN FUNDS | | DECEMBER 31, 2021 |
| | | | | | | | | | | | | | | | |
| | | Beginning
Account Value
July 1, 2021 | | | Ending
Account Value
December 31, 2021 | | | Expenses
Paid During
the Period* | | | Annualized
Expense
Ratio | |
JPMorgan SmartSpendingSM 2020 Fund | | | | | | | | | | | | | | | | |
Class I | | | | | | | | | | | | | | | | |
Actual | | $ | 1,000.00 | | | $ | 1,019.50 | | | $ | 1.43 | | | | 0.28 | % |
Hypothetical | | | 1,000.00 | | | | 1,023.79 | | | | 1.43 | | | | 0.28 | |
Class R2 | | | | | | | | | | | | | | | | |
Actual | | | 1,000.00 | | | | 1,016.60 | | | | 4.02 | | | | 0.79 | |
Hypothetical | | | 1,000.00 | | | | 1,021.22 | | | | 4.02 | | | | 0.79 | |
Class R3 | | | | | | | | | | | | | | | | |
Actual | | | 1,000.00 | | | | 1,018.40 | | | | 2.75 | | | | 0.54 | |
Hypothetical | | | 1,000.00 | | | | 1,022.48 | | | | 2.75 | | | | 0.54 | |
Class R4 | | | | | | | | | | | | | | | | |
Actual | | | 1,000.00 | | | | 1,019.60 | | | | 1.48 | | | | 0.29 | |
Hypothetical | | | 1,000.00 | | | | 1,023.74 | | | | 1.48 | | | | 0.29 | |
Class R5 | | | | | | | | | | | | | | | | |
Actual | | | 1,000.00 | | | | 1,020.50 | | | | 0.66 | | | | 0.13 | |
Hypothetical | | | 1,000.00 | | | | 1,024.55 | | | | 0.66 | | | | 0.13 | |
Class R6 | | | | | | | | | | | | | | | | |
Actual | | | 1,000.00 | | | | 1,020.80 | | | | 0.15 | | | | 0.03 | |
Hypothetical | | | 1,000.00 | | | | 1,025.05 | | | | 0.15 | | | | 0.03 | |
| * | Expenses are equal to each Class’ respective annualized expense ratio, multiplied by the average account value over the period, multiplied by 184/365 (to reflect the one-half year period). |
| | | | | | | | | | |
| | | | | |
| DECEMBER 31, 2021 | | J.P. MORGAN FUNDS | | | | | | | | 51 |
BOARD APPROVAL OF INVESTMENT ADVISORY AGREEMENTS
(Unaudited)
The Board of Trustees has established various standing committees composed of Trustees with diverse backgrounds, to which the Board of Trustees has assigned specific subject matter responsibilities to further enhance the effectiveness of the Board’s oversight and decision making. The Board of Trustees and its investment committees (money market and alternative products, equity, and fixed income) meet regularly throughout the year and consider factors that are relevant to their annual consideration of investment advisory agreements at each meeting. They also meet for the specific purpose of considering investment advisory agreement annual renewals. The Board of Trustees held meetings in June and August 2021, at which the Trustees considered the continuation of the investment advisory agreement for each Fund whose semi-annual report is contained herein ( each an “Advisory Agreement” and collectively, the “Advisory Agreements”). In accordance with SEC guidance, due to the COVID-19 pandemic, the meetings were conducted through video conference. At the June meeting, the Board’s investment committees met to review and consider performance, expense and related information for each Fund and the other J.P. Morgan Funds overseen by the Board in which each Fund may invest (“Underlying Funds”). Each investment committee reported to the full Board, which then considered the investment committee’s preliminary findings. At the August meeting, the Trustees continued their review and consideration. The Trustees, including a majority of the Trustees who are not parties to an Advisory Agreement or “interested persons” (as defined in the 1940 Act) of any party to an Advisory Agreement or any of their affiliates, approved the continuation of each Advisory Agreement on August 11, 2021.
As part of their review of the Advisory Agreements, the Trustees considered and reviewed performance and other information about the Funds and Underlying Funds received from the Adviser. This information includes the Funds’ and Underlying Funds’ performance as compared to the performance of the Funds’ and the Underlying Funds’ peers and benchmarks and analyses by the Adviser of the Funds’ and Underlying Funds’ performance. In addition, at each of their regular meetings throughout the year, the Trustees considered reports on the performance of certain J.P. Morgan Funds provided by an independent management investment firm (“independent consultant”). In addition, in preparation for the June and August meetings, the Trustees requested, received and evaluated extensive materials from the Adviser, including, with respect to the Funds and/or Underlying Funds, performance and expense information compiled by Broadridge, using data from Lipper Inc. and/or Morningstar Inc., independent providers of investment company data (together, “Broadridge”). The Trustees’ independent consultant also provided additional quantitative and statistical analyses of certain Funds and/or Underlying Funds, including risk and performance return assessment as compared to the Funds’ and/or
Underlying Funds’ objectives, benchmarks, and peers. Before voting on the Advisory Agreements, the Trustees reviewed the Advisory Agreements with representatives of the Adviser, counsel to the Trust and independent legal counsel and received a memorandum from independent legal counsel to the Trustees discussing the legal standards for their consideration of the Advisory Agreements. The Trustees also discussed the Advisory Agreements in executive sessions with independent legal counsel at which no representatives of the Adviser were present.
A summary of the material factors evaluated by the Trustees in determining whether to approve each Advisory Agreement is provided below. Each Trustee attributed different weights to the various factors and no factor alone was considered determinative. The Trustees considered information provided with respect to the Funds and Underlying Funds throughout the year, including additional reporting and information provided in connection with the COVID-19 pandemic, as well as materials furnished specifically in connection with the annual review process. From year to year, the Trustees consider and place emphasis on relevant information in light of changing circumstances in market and economic conditions.
After considering and weighing the factors and information they had received, the Trustees found that the compensation to be received by the Adviser from each Fund under the applicable Advisory Agreement was fair and reasonable under the circumstances and determined that the continuance of each Advisory Agreement was in the best interests of each Fund and its shareholders.
Nature, Extent and Quality of Services Provided by the Adviser
The Trustees received and considered information regarding the nature, extent and quality of services provided to each Fund under the applicable Advisory Agreements. The Trustees took into account information furnished throughout the year at Trustee meetings, as well as the materials furnished specifically in connection with this annual review process. The Trustees considered the background and experience of the Adviser’s senior management, personnel changes, if any, and the expertise of, and the amount of attention given to each Fund by, investment personnel of the Adviser. In addition, the Trustees reviewed the qualifications, backgrounds and responsibilities of the portfolio management team primarily responsible for the day-to-day management of each Fund and the infrastructure supporting the team, including personnel changes, if any. In addition, the Board considered its discussions with the Adviser regarding the Adviser’s business continuity plan and steps the Adviser was taking to provide ongoing services to the Funds during the COVID-19 pandemic, and the Adviser’s success in continuing to provide services to the Funds and their shareholders throughout this period. The Trustees also considered information provided by the Adviser
| | | | | | | | | | |
| | | | | |
| 52 | | | | | | | | J.P. MORGAN FUNDS | | DECEMBER 31, 2021 |
and JPMorgan Distribution Services, Inc. (“JPMDS”) about the structure and distribution strategy of each Fund. The Trustees reviewed information relating to the Adviser’s risk governance model and reports showing the Adviser’s compliance structure and ongoing compliance processes. The Trustees also considered the quality of the administration services provided by the Adviser in its role as administrator.
The Trustees also considered their knowledge of the nature and quality of services provided by the Adviser and its affiliates to the Funds and Underlying Funds gained from their experience as Trustees of the J.P. Morgan Funds. In addition, they considered the overall reputation and capabilities of the Adviser and its affiliates, the commitment of the Adviser to provide high quality service to the Funds and Underlying Funds, their overall confidence in the Adviser’s integrity and the Adviser’s responsiveness to questions or concerns raised by them, including the Adviser’s willingness to consider and implement organizational and operational changes designed to improve investment results and the services provided to each Fund and Underlying Fund.
Based upon these considerations and other factors, the Trustees concluded that they were satisfied with the nature, extent and quality of the investment advisory services provided to each Fund by the Adviser.
Costs of Services Provided and Profitability to the Adviser and its Affiliates
The Trustees received and considered information regarding the profitability to the Adviser and its affiliates in providing services to the Funds and Underlying Funds. The Trustees reviewed and discussed this information. The Trustees recognized that this information is not audited and represents the Adviser’s determination of its and its affiliates’ revenues from the contractual services provided to the Funds and Underlying Funds, less expenses of providing such services. Expenses include direct and indirect costs and are calculated using an allocation methodology developed by the Adviser. The Trustees also recognized that it is difficult to make comparisons of profitability from fund investment advisory contracts because comparative information is not generally publicly available and is affected by numerous factors, including the structure of the particular adviser, the types of funds it manages, its business mix, numerous assumptions regarding allocations and the fact that publicly-traded fund managers’ operating profits and net income are net of distribution and marketing expenses. Based upon their review, and taking into consideration the factors noted above, the Trustees concluded that the profitability to the Adviser under each Advisory Agreement was not unreasonable in light of the services and benefits provided to each Fund and Underlying Fund.
The Trustees also considered that JPMDS, an affiliate of the Adviser, and the Adviser earn fees from the Funds and/or
Underlying Funds for providing shareholder and administration services, respectively. These fees were shown separately in the profitability analysis presented to the Trustees. The Trustees also considered the payments of Rule 12b-1 fees to JPMDS, which also acts as the Funds’ distributor and that these fees are in turn generally paid to financial intermediaries that sell the Funds, including financial intermediaries that are affiliates of the Adviser (although they are retained by JPMDS in certain instances). The Trustees also considered the fees paid to JPMorgan Chase Bank, N.A. (“JPMCB”) for custody and fund accounting and other related services for the Fund and/or Underlying Funds.
Fall-Out Benefits
The Trustees reviewed information regarding potential “fall-out” or ancillary benefits received by the Adviser and its affiliates as a result of their relationship with the Funds. The Trustees considered that the J.P. Morgan Funds’ operating accounts are held at JPMCB, which, as a result, will receive float benefits for certain J.P. Morgan Funds, as applicable. The Trustees also noted that the Adviser supports a diverse set of products and services, which benefits the Adviser by allowing it to leverage its infrastructure to serve additional clients, including the benefits received by the Adviser and its affiliates in connection with each Fund’s investments in the Underlying Funds. The Trustees also reviewed the Adviser’s allocation of fund brokerage for the J.P. Morgan Funds complex, including allocations to brokers who provide research to the Adviser, as well as the Adviser’s use of affiliates to provide other services and the benefits to such affiliates of doing so.
Economies of Scale
The Trustees considered the extent to which the Funds may benefit from economies of scale. The Trustees considered that there may not be a direct relationship between economies of scale realized by the Funds and those realized by the Adviser as assets increase. The Trustees considered the extent to which the Funds were priced to scale and whether it would be appropriate to add advisory fee breakpoints. The Trustees noted certain Funds with contractual expense limitations and fee waivers (“Fee Caps”), which allow a Fund’s shareholders to share potential economies of scale from a Fund’s inception, prior to reaching scale. The Trustees also noted that other Funds which had achieved scale as asset levels had increased, no longer had Fee Caps in place for some or all of their share classes, but shared economies of scale through lower average expenses. The Trustees noted that the fees remain satisfactory relative to peer funds. The Trustees considered the benefits to the Funds of the use of an affiliated distributor and custodian, including the ability to rely on existing infrastructure supporting distribution, custodial and transfer agent services and the ability to negotiate competitive fees for the Funds. The Trustees further considered the Adviser’s and JPMDS’s ongoing
| | | | | | | | | | |
| | | | | |
| DECEMBER 31, 2021 | | J.P. MORGAN FUNDS | | | | | | | | 53 |
BOARD APPROVAL OF INVESTMENT ADVISORY AGREEMENTS
(Unaudited) (continued)
investments in their business in support of the Funds, including the Adviser’s and/or JPMDS’s investments in trading systems, technology (including improvements to the J.P. Morgan Funds’ website, and cybersecurity improvements), retention of key talent, and regulatory support enhancements. The Trustees concluded that the current fee structure for each Fund, including any Fee Caps the Adviser has in place that serve to limit the overall net expense ratios of each Fund at competitive levels, was reasonable. The Trustees concluded that, for Funds with Fee Caps in place for some or all of their share classes, the relevant Fund’s shareholders received the benefits of potential economies of scale through the Fee Caps and, for Funds that achieved scale and no longer had Fee Caps in place for some or all of their share classes, the relevant Fund’s shareholders benefited from lower average expenses resulting from increased assets. The Trustees also concluded that all Funds benefited from the Adviser’s reinvestment in its operations to serve the Funds and their shareholders. The Trustees noted that the Adviser’s reinvestment ensures sufficient resources in terms of personnel and infrastructure to support the Funds.
Fees Relative to Adviser’s Other Clients
The Trustees received and considered information about the nature and extent of investment advisory services and fee rates offered to other clients of the Adviser, including institutional separate accounts, collective investment trusts, ETFs and/or funds sub-advised by the Adviser, for investment management styles substantially similar to that of each Fund. The Trustees considered the complexity of investment management for registered mutual funds relative to the Adviser’s other clients and noted differences, as applicable, in the fee structure and the regulatory, legal and other risks and responsibilities of providing services to the different clients. The Trustees considered that serving as an adviser to a registered mutual fund involves greater responsibilities and risks than acting as a sub-adviser and observed that sub-advisory fees may be lower than those charged by the Adviser to each Fund. The Trustees also noted that the adviser, not the mutual fund, pays the sub-advisory fee and that many responsibilities related to the advisory function are retained by the primary adviser. The Trustees concluded that the fee rates charged to each Fund in comparison to those charged to the Adviser’s other clients were reasonable.
Investment Performance
The Trustees received and considered absolute and/or relative performance information for the Funds in a report prepared by Broadridge. The Trustees considered the total return performance information, which included the ranking of the Funds within a performance universe made up of funds with the same Broadridge investment classification and objective (the “Universe”), as well as a subset of funds within the Universe (the “Peer Group”), by total return for the applicable one- and
three-year periods. The Trustees reviewed a description of Broadridge’s methodology for selecting mutual funds in each Fund’s Universe and Peer Group and noted that Universe and Peer Group rankings were not calculated if the number of funds in the Universe and/or Peer Group did not meet a predetermined minimum. The Broadridge materials provided to the Trustees highlighted information with respect to certain representative classes to assist the Trustees in their review. As part of this review, the Trustees also reviewed each Fund’s performance against its benchmark and considered the performance information provided for the Funds at regular Board meetings by the Adviser and the Trustees’ independent consultant and also considered the special analysis prepared for certain Funds by the Trustees’ independent consultant.. The special analysis includes a multi-factor quantitative scoring system for summarizing a Fund’s historical investment performance. The approach relies on multiple metrics, incorporates several time periods, adjusts for risk and considers how a fund’s customized peer group (as selected by the independent consultant) has performed. The Trustees also engaged with the Adviser to consider what steps might be taken to improve performance, as applicable. The Broadridge performance data noted by the Trustees as part of their review and the determinations made by the Trustees with respect to each Fund’s performance for certain representative classes are summarized below:
The Trustees noted that based upon the Universe, the SmartSpendingSM 2015 Fund’s performance for Class A, Class I and Class R6 shares was in the fifth quintile for both the one- and three-year periods ended December 31, 2020, respectively. The Trustees discussed the performance and investment strategy of the Fund with the Adviser and, based upon these discussions and various other factors, the Trustees concluded that the Fund’s performance was satisfactory under the circumstances. The Trustees requested, however, that the Fund’s Adviser provide additional Fund performance information to be reviewed with the members of the Board’s money market and alternative products committee at each of its regularly scheduled meetings over the course of the next year.
The Trustees noted the performance of the SmartSpendingSM 2020 Fund’s since its inception on July 1, 2020, as compared with that of its benchmark index. The Trustees discussed the performance and investment strategy of the Fund with the Advisor and, based upon this discussion and various other factors, the Trustees concluded that the Fund’s performance was satisfactory under the circumstances. At its November 2021 meeting, the Board approved the Fund’s liquidation on or about April 25, 2022.
Advisory Fees and Expense Ratios
The Trustees considered the contractual advisory fee rate and administration fee rate paid by each Fund to the Adviser and
| | | | | | | | | | |
| | | | | |
| 54 | | | | | | | | J.P. MORGAN FUNDS | | DECEMBER 31, 2021 |
compared the combined rate to the information prepared by Broadridge concerning management fee rates paid by other funds in the same Broadridge category as each Fund. The Trustees recognized that Broadridge reported each Fund’s management fee rate as the combined contractual advisory fee and administration fee rates. The Trustees also reviewed information about other expenses and the expense ratios for each Fund and noted that Universe and Peer Group rankings were not calculated if the number of funds in the Universe and/or Peer Groups did not meet a predetermined minimum. The Trustees considered the Fee Caps currently in place for each Fund, the net advisory fee rate and net expense ratio for each share class, as applicable, taking into account any waivers and/or reimbursements and, where deemed appropriate by the Trustees, additional waivers and/or reimbursements. The Trustees recognized that it is difficult to make comparisons of advisory fees because there are variations in the services that are included in the fees paid by other funds. The Trustees’ determinations as a result of the review of each Fund’s advisory fees and expense ratios for certain representative classes are summarized below:
The Trustees noted that based upon the Universe, the SmartSpending 2015 Fund’s net advisory fee and actual total
expenses for Class A and Class R6 shares were both in the first quintile. The Trustees noted that based upon the Universe, the net advisory fee for Class I shares was in the first quintile, and that the actual total expenses for Class I shares were in the second quintile. After considering the factors identified above, in light of this information, the Trustees concluded that the advisory fee was satisfactory in light of the services provided to the Fund and that such fees would be for services provided in addition to, rather than duplicative of, services provided under the advisory agreements of the Underlying Funds in which the Fund invests.
The Trustees noted that based upon the Universe, the SmartSpending 2020 Fund’s net advisory fee and actual total expenses for Class A and Class R6 shares were both in the first quintile. The Trustees noted that based upon the Universe, the net advisory fee for Class I shares was in the first quintile, and that the actual total expenses were in the second quintile. After considering the factors identified above, in light of this information, the Trustees concluded that the advisory fee was satisfactory in light of the services provided to the Fund and that such fees would be for services provided in addition to, rather than duplicative of, services provided under the advisory agreements of the Underlying Funds in which the Fund invests.
| | | | | | | | | | |
| | | | | |
| DECEMBER 31, 2021 | | J.P. MORGAN FUNDS | | | | | | | | 55 |
SPECIAL SHAREHOLDER MEETING RESULTS
(Unaudited)
JPMorgan Trust IV (the “Trust”) held a special meeting of shareholders on October 27, 2021, for the purpose of considering and voting upon the election of Trustees.
Trustees were elected by the shareholders of all of the series of the Trust, including the Funds. The results of the voting were as follows:
| | | | |
| | | Votes Received
(Amounts in
thousands) | |
Independent Nominee | | | | |
| |
| John F. Finn | | | | |
In Favor | | | 6,478,459 | |
Withheld | | | 59,314 | |
| |
| Steven P. Fisher | | | | |
In Favor | | | 6,504,144 | |
Withheld | | | 33,629 | |
| |
| Gary L. French | | | | |
In Favor | | | 6,504,712 | |
Withheld | | | 33,061 | |
| |
| Kathleen M. Gallagher | | | | |
In Favor | | | 6,506,726 | |
Withheld | | | 31,047 | |
| |
| Robert J. Grassi | | | | |
In Favor | | | 6,504,765 | |
Withheld | | | 33,008 | |
| |
| Frankie D. Hughes | | | | |
In Favor | | | 6,503,505 | |
Withheld | | | 34,269 | |
| |
| Raymond Kanner | | | | |
In Favor | | | 6,505,098 | |
Withheld | | | 32,675 | |
| |
| Thomas P. Lemke | | | | |
In Favor | | | 6,504,411 | |
Withheld | | | 33,363 | |
| | | | |
| | | Votes Received
(Amounts in
thousands) | |
| Lawrence R. Maffia | | | | |
In Favor | | | 6,504,157 | |
Withheld | | | 33,616 | |
| |
| Mary E. Martinez | | | | |
In Favor | | | 6,506,889 | |
Withheld | | | 30,885 | |
| |
| Marilyn McCoy | | | | |
In Favor | | | 6,507,227 | |
Withheld | | | 30,546 | |
| |
| Dr. Robert A. Oden, Jr. | | | | |
In Favor | | | 6,492,324 | |
Withheld | | | 45,450 | |
| |
| Marian U. Pardo | | | | |
In Favor | | | 6,505,978 | |
Withheld | | | 31,796 | |
| |
| Emily A. Youssouf | | | | |
In Favor | | | 6,506,064 | |
Withheld | | | 31,710 | |
| |
Interested Nominee | | | | |
| |
| Robert F. Deutsch | | | | |
In Favor | | | 6,503,180 | |
Withheld | | | 34,594 | |
| |
| Nina O. Shenker | | | | |
In Favor | | | 6,505,581 | |
Withheld | | | 32,193 | |
| | | | | | | | | | |
| | | | | |
| 56 | | | | | | | | J.P. MORGAN FUNDS | | DECEMBER 31, 2021 |
J.P. Morgan Funds are distributed by JPMorgan Distribution Services, Inc., which is an affiliate of JPMorgan Chase & Co. Affiliates of JPMorgan Chase & Co. receive fees for providing various services to the funds.
Contact JPMorgan Distribution Services, Inc. at 1-800-480-4111 for a fund prospectus. You can also visit us at www.jpmorganfunds.com. Investors should carefully consider the investment objectives and risk as well as charges and expenses of the mutual fund before investing. The prospectus contains this and other information about the mutual fund. Read the prospectus carefully before investing.
Investors may obtain information about the Securities Investor Protection Corporation (SIPC), including the SIPC brochure, by visiting www.sipc.org or by calling SIPC at 202-371-8300.
Each Fund files a complete schedule of its fund holdings for the first and third quarters of its fiscal year with the SEC as an exhibit to its report on Form N-PORT. The Funds’ Form N-PORT reports are available on the SEC’s website at http://www.sec.gov. Each Fund’s quarterly holdings can be found by visiting the J.P. Morgan Funds’ website at www.jpmorganfunds.com.
A description of each Fund’s policies and procedures with respect to the disclosure of each Fund’s holdings is available in the prospectuses and Statement of Additional Information.
A copy of proxy policies and procedures is available without charge upon request by calling 1-800-480-4111 and on the Funds’ website at www.jpmorganfunds.com. A description of such policies and procedures is on the SEC’s website at www.sec.gov. The Trustees have delegated the authority to vote proxies for securities owned by the Funds to the Adviser. A copy of the Funds’ voting record for the most recent 12-month period ended June 30 is available on the SEC’s website at www.sec.gov or at the Funds’ website at www.jpmorganfunds.com no later than August 31 of each year. The Funds’ proxy voting record will include, among other things, a brief description of the matter voted on for each fund security, and will state how each vote was cast, for example, for or against the proposal.

J.P. Morgan Asset Management is the brand name for the asset management business of JPMorgan Chase & Co. and its affiliates worldwide.
| | | | |
| | © JPMorgan Chase & Co., 2021. All rights reserved. December 2021. | | SAN-SS-1221 |
ITEM 2. CODE OF ETHICS.
Disclose whether, as of the end of the period covered by the report, the registrant has adopted a code of ethics that applies to the registrant’s principal executive officer, principal financial officer, principal accounting officer or controller, or persons performing similar functions, regardless of whether these individuals are employed by the registrant or a third party. If the registrant has not adopted such a code of ethics, explain why it has not done so.
The registrant must briefly describe the nature of any amendment, during the period covered by the report, to a provision of its code of ethics that applies to the registrant’s principal executive officer, principal financial officer, principal accounting officer or controller, or persons performing similar functions, regardless of whether these individuals are employed by the registrant or a third party, and that relates to any element of the code of ethics definition enumerated in paragraph (b) of this Item. The registrant must file a copy of any such amendment as an exhibit pursuant to Item 13(a)(1), unless the registrant has elected to satisfy paragraph (f) of this Item by positing its code of ethics on its website pursuant to paragraph (f)(2) of this Item, or by undertaking to provide its code of ethics to any person without charge, upon request, pursuant to paragraph (f)(3) of this Item.
If the registrant has, during the period covered by the report, granted a waiver, including an implicit waiver, from a provision of the code of ethics that applies to the registrant’s principal executive officer, principal financial officer, principal accounting officer or controller, or persons performing similar functions, regardless of whether these individuals are employed by the registrant or third party, that relates to one or more items set forth in paragraph (b) of this Item, the registrant must briefly describe the nature of the waiver, the name of the person to whom the waiver was granted, and the date of the waiver.
Not applicable to a semi-annual report.
ITEM 3. AUDIT COMMITTEE FINANCIAL EXPERT.
(a) (1) Disclose that the registrant’s board of directors has determined that the registrant either:
(i) Has at least one audit committee financial expert serving on its audit committee; or
(ii) Does not have an audit committee financial expert serving on its audit committee.
(2) If the registrant provides the disclosure required by paragraph (a)(1)(i) of this Item, it must disclose the name of the audit committee financial expert and whether that person is “independent.” In order to be considered “independent” for purposes of this Item, a member of an audit committee may not, other than in his or her capacity as a member of the audit committee, the board of directors, or any other board committee:
(i) Accept directly or indirectly any consulting, advisory, or other compensatory fee from the issuer; or
(ii) Be an “interested person” of the investment company as defined in Section 2(a)(19) of the Act (15 U.S.C. 80a-2(a)(19)).
(3) If the registrant provides the disclosure required by paragraph (a)(1)(ii) of this Item, it must explain why it does not have an audit committee financial expert.
Not applicable to a semi-annual report.
ITEM 4. PRINCIPAL ACCOUNTANT FEES AND SERVICES.
(a) Disclose, under the caption Audit Fees, the aggregate fees billed for each of the last two fiscal years for professional
services rendered by the principal accountant for the audit of the registrant’s annual financial statements or services that are normally provided by the accountant in connection with statutory and regulatory filings or engagements for those fiscal years.
(b) Disclose, under the caption Audit-Related Fees, the aggregate fees billed in each of the last two fiscal years for assurance and related services by the principal accountant that are reasonably related to the performance of the audit of the registrant’s financial statements and are not reported under paragraph (a) of this Item. Registrants shall describe the nature of the services comprising the fees disclosed under this category.
(c) Disclose, under the caption Tax Fees, the aggregate fees billed in each of the last two fiscal years for professional services rendered by the principal accountant for tax compliance, tax advice, and tax planning. Registrants shall describe the nature of the services comprising the fees disclosed under this category.
(d) Disclose, under the caption All Other Fees, the aggregate fees billed in each of the last two fiscal years for products and services provided by the principal accountant, other than the services reported in paragraphs (a) through (c) of this Item. Registrants shall describe the nature of the services comprising the fees disclosed under this category.
(e) (1) Disclose the audit committee’s pre-approval policies and procedures described in paragraph (c)(7) of Rule 2-01 of Regulation S-X.
(2) Disclose the percentage of services described in each of paragraphs (b) through (d) of this Item that were approved by the audit committee pursuant to paragraph (c)(7)(i)(C) of Rule 2-01 of Regulation S-X.
(f) If greater than 50 percent, disclose the percentage of hours expended on the principal accountant’s engagement to audit the registrant’s financial statements for the most recent fiscal year that were attributed to work performed by persons other than the principal accountant’s full-time, permanent employees.
(g) Disclose the aggregate non-audit fees billed by the registrant’s accountant for services rendered to the registrant, and rendered to the registrant’s investment adviser (not including any sub-adviser whose role is primarily portfolio management and is subcontracted with or overseen by another investment adviser), and any entity controlling, controlled by, or under common control with the adviser that provides ongoing services to the registrant for each of the last two fiscal years of the registrant.
(h) Disclose whether the registrant’s audit committee of the board of directors has considered whether the provision of non-audit services that were rendered to the registrant’s investment adviser (not including any subadviser whose role is primarily portfolio management and is subcontracted with or overseen by another investment adviser), and any entity controlling, controlled by, or under common control with the investment adviser that provides ongoing services to the registrant that were not pre-approved pursuant to paragraph (c)(7)(ii) of Rule 2-01 of Regulation S-X is compatible with maintaining the principal accountant’s independence.
Not applicable to a semi-annual report.
ITEM 5. AUDIT COMMITTEE OF LISTED REGISTRANTS.
(a) If the registrant is a listed issuer as defined in Rule 10A-3 under the Exchange Act (17CFR 240.10A-3), state whether or not the registrant has a separately-designated standing audit committee established in accordance with Section 3(a)(58)(A) of the Exchange Act (15 U.S.C. 78c(a)(58)(A)). If the registrant has such a committee, however designated, identify each committee member. If the entire board of directors is acting as the registrant’s audit committee as specified in Section 3(a)(58)(B) of the Exchange Act (15 U.S.C. 78c(a)(58)(B)), so state.
(b) If applicable, provide the disclosure required by Rule 10A-3(d) under the Exchange Act (17CFR 240.10A-3(d)) regarding an exemption from the listing standards for all audit committees.
Not applicable to a semi-annual report.
ITEM 6. INVESTMENTS.
File Schedule I – Investments in securities of unaffiliated issuers as of the close of the reporting period as set forth in Section 210.12-12 of Regulation S-X, unless the schedule is included as part of the report to shareholders filed under Item 1 of this Form.
Included in Item 1.
ITEM 7. DISCLOSURE OF PROXY VOTING POLICIES AND PROCEDURES FOR CLOSED-END MANAGEMENT INVESTMENT COMPANIES.
Not applicable.
ITEM 8. PORTFOLIO MANAGERS OF CLOSED-END MANAGEMENT INVESTMENT COMPANIES.
Not applicable.
ITEM 9. PURCHASE OF EQUITY SECURITIES BY CLOSED-END MANAGEMENT INVESTMENT COMPANY AND AFFILIATED PURCHASERS.
Not applicable.
ITEM 10. SUBMISSION OF MATTERS TO A VOTE OF SECURITY HOLDERS.
Describe any material changes to the procedures by which shareholders may recommend nominees to the registrant’s board of directors, where those changes were implemented after the registrant last provided disclosure in response to the requirements of Item 7(d)(2)(ii)(G) of Schedule 14A (17 CFR 240.14a-101), or this Item.
No material changes to report.
ITEM 11. CONTROLS AND PROCEDURES.
(a) Disclose the conclusions of the registrant’s principal executive and principal financial officers, or persons performing similar functions, regarding the effectiveness of the registrant’s disclosure controls and procedures (as defined in Rule 30a-3(c) under the Act (17 CFR 270.30a-3(c))) as of a date within 90 days of the filing date of the report that includes the disclosure required by this paragraph, based on the evaluation of these controls and procedures required by Rule 30a-3(b) under the Act (17 CFR 270.30a-3(b)) and Rules 13a-15(b) or 15d-15(b) under the Exchange Act (17 CFR 240.13a-15(b) or 240.15d-15(b)).
The Registrant’s principal executive and principal financial officers have concluded, based on their evaluation of the Registrant’s disclosure controls and procedures as of a date within 90 days of the filing date of this report, that the Registrant’s disclosure controls and procedures are reasonably designed to ensure that information required to be disclosed by the Registrant on Form N-CSR is recorded, processed, summarized and reported within the required time periods and that information required to be disclosed by the Registrant in the reports that it files or submits on Form N-CSR is accumulated and communicated to the Registrant’s management, including its principal executive and principal financial officers, as appropriate to allow timely decisions regarding required disclosure.
(b) Disclose any change in the registrant’s internal control over financial reporting (as defined in Rule 30a-3(d) under the Act (17 CFR 270.30a-3(d)) that occurred during the registrant’s second fiscal quarter of the period covered by this report that has materially affected, or is reasonably likely to materially affect, the registrant’s internal control over financial reporting.
There were no changes in the Registrant’s internal control over financial reporting that occurred during the last fiscal quarter covered by this report that have materially affected, or are reasonably likely to materially affect, the Registrant’s internal control over financial reporting.
ITEM 12. DISCLOSURE OF SECURITIES LENDING ACTIVITIES FOR CLOSED-END MANAGEMENT INVESTMENT COMPANIES.
Not applicable.
ITEM 13. EXHIBITS.
| | (a) | File the exhibits listed below as part of this Form. Letter or number the exhibits in the sequence indicated. |
(1) Any code of ethics, or amendment thereto, that is the subject of the disclosure required by Item 2, to the extent that the registrant intends to satisfy the Item 2 requirements through filing of an exhibit.
Not applicable.
(2) A separate certification for each principal executive officer and principal financial officer of the registrant as required by Rule 30a-2(a) under the Act (17 CFR 270.30a-2).
Certifications pursuant to Rule 30a-2(a) under the Investment Company Act of 1940 are attached hereto.
(3) Any written solicitation to purchase securities under Rule 23c-1 under the Act (17 CFR 270.23c-1) sent or given during the period covered by the report by or on behalf of the registrant to 10 or more persons.
Not applicable.
| | (b) | A separate or combined certification for each principal executive officer and principal officer of the registrant as required by Rule 30a-2(b) under the Act of 1940. |
Certifications pursuant to Rule 30a-2(b) under the Investment Company Act of 1940 are attached hereto.
SIGNATURES
Pursuant to the requirements of the Securities Exchange Act of 1934 and the Investment Company Act of 1940, the registrant has duly caused this report to be signed on its behalf by the undersigned, thereunto duly authorized.
JPMorgan Trust IV
| | |
| By: | | /s/ Brian S. Shlissel |
| | Brian S. Shlissel |
| | President and Principal Executive Officer |
| | March 3, 2022 |
Pursuant to the requirements of the Securities Exchange Act of 1934 and the Investment Company Act of 1940, this report has been signed below by the following persons on behalf of the registrant and in the capacities and on the dates indicated.
| | |
| By: | | /s/ Brian S. Shlissel |
| | Brian S. Shlissel |
| | President and Principal Executive Officer |
| | March 3, 2022 |
| |
| By: | | /s/ Timothy J. Clemens |
| | Timothy J. Clemens |
| | Treasurer and Principal Financial Officer |
| | March 3, 2022 |