UNITED STATES
SECURITIES AND EXCHANGE COMMISSION
Washington, D.C. 20549
FORM N-CSR
CERTIFIED SHAREHOLDER REPORT OF REGISTERED
MANAGEMENT INVESTMENT COMPANIES
Investment Company Act file number: 811-23117
JPMorgan Trust IV
(Exact name of registrant as specified in charter)
277 Park Avenue
New York, NY 10172
(Address of principal executive offices) (Zip code)
Gregory S. Samuels
277 Park Avenue
New York, NY 10172
(Name and Address of Agent for Service)
Registrant’s telephone number, including area code: (800) 480-4111
Date of fiscal year end: October 31
Date of reporting period: November 1, 2021 through April 30, 2022
Form N-CSR is to be used by management investment companies to file reports with the Commission not later than 10 days after the transmission to stockholders of any report that is required to be transmitted to stockholders under Rule 30e-1 under the Investment Company Act of 1940 (17 CFR 270.30e-1). The Commission may use the information provided on Form N-CSR in its regulatory, disclosure review, inspection, and policymaking roles.
A registrant is required to disclose the information specified by Form N-CSR, and the Commission will make this information public. A registrant is not required to respond to the collection of information contained in Form N-CSR unless the Form displays a currently valid Office of Management and Budget (“OMB”) control number. Please direct comments concerning the accuracy of the information collection burden estimate and any suggestions for reducing the burden to Secretary, Securities and Exchange Commission, 450 Fifth Street, NW, Washington, DC 20549-0609. The OMB has reviewed this collection of information under the clearance requirements of 44 U.S.C. Section 3507.
ITEM 1. REPORTS TO STOCKHOLDERS.
a.) The following is a copy of the report transmitted to shareholders pursuant to Rule 30e-1 under the Investment Company Act of 1940 (17 CFR 270.30e-1).
b.) A copy of the notice transmitted to shareholders in reliance on Rule 30e-3 under the 1940 Act that contains disclosures specified by paragraph (c)(3) of that rule is included in the Annual Report. Not Applicable. Notices do not incorporate disclosures from the shareholder reports.
Semi-Annual Report
J.P. Morgan International Equity Funds
April 30, 2022 (Unaudited)
| JPMorgan Emerging Markets Equity Fund |
| JPMorgan Emerging Markets Research Enhanced Equity Fund |
| JPMorgan Europe Dynamic Fund |
| JPMorgan International Equity Fund |
| JPMorgan International Focus Fund |
| JPMorgan International Hedged Equity Fund |
| JPMorgan International Research Enhanced Equity Fund |
| JPMorgan International Value Fund |
CONTENTS
Investments in a Fund are not deposits or obligations of, or guaranteed or endorsed by, any bank and are not insured or guaranteed by the FDIC, the Federal Reserve Board or any other government agency. You could lose money if you sell when a Fund’s share price is lower than when you invested.
Past performance is no guarantee of future performance. The general market views expressed in this report are opinions based on market and other conditions through the end of the reporting period and are subject to change without notice. These views are not intended to predict the future performance of a Fund or the securities markets.
Prospective investors should refer to the Funds’ prospectuses for a discussion of the Funds’ investment objectives, strategies and risks. Call J.P. Morgan Funds Service Center at 1-800-480-4111 for a prospectus containing more complete information about a Fund, including management fees and other expenses. Please read it carefully before investing.
Letter to Shareholders
June 21, 2022, 2022(Unaudited)
Dear Shareholders,
 |
“The market environment remains challenging; investors should recognize the risks in trying to time market movements, as well as the potential long-term benefits of portfolio diversification.”
— Andrea L. Lisher
|
Global economic growth has been hindered by accelerating inflation, the conflict in Ukraine and regional surges in pandemic infections. While equity markets largely rallied in the final months of 2021 and continued to outperform bond markets, a more hawkish U.S. Federal Reserve (the “Fed”) and Russia’s invasion of Ukraine in late February 2022 set off a cascade of weakening investor sentiment.
In the U.S., continued job growth, strong consumer spending and resilient corporate earnings in the first quarter of 2022 helped to offset a contraction in real economic growth. Meanwhile, in response to the highest levels of inflation in nearly 40 years, the Fed raised its benchmark interest rate in March 2022 for the first time since 2018 and then raised it again in both May and June.
Elsewhere, the Bank of England has raised interest rates multiple times since the start of 2022 and the European Central Bank has signaled it is poised to raise interest rates in July 2022, which would mark the first rate increase in the European Union in 11 years.
Meanwhile, emerging markets generally struggled during the six months ended April 30, 2022 as rising prices for energy and food weighed on economic growth. Additionally, a pandemic resurgence in China in early 2022 led to strict lockdowns in several large cities, which hurt manufacturing and other economic activity and had a spillover effect on other emerging market economies.
The market environment remains challenging; investors should recognize the risks in trying to time market movements, as well as the potential long-term benefits of portfolio diversification. J.P. Morgan Asset Management will seek to deliver superior client outcomes across a broad range of innovative solutions and risk management processes built on the same fundamental practices and principles that have driven our success for more than a century.
On behalf of J.P. Morgan Asset Management, thank you for entrusting us to manage your investment. Should you have any questions, please visit www.jpmorganfunds.com or contact the J.P. Morgan Funds Service Center at 1-800-480-4111.
Sincerely yours,
Andrea L. Lisher
Head of Americas, Client
J.P. Morgan Asset Management
| April 30, 2022 | J.P. Morgan International Equity Funds | 1 |
J.P. Morgan International Equity Funds
MARKET OVERVIEW
SIX MONTHS ENDED April 30, 2022 (Unaudited)
While developed market equities rallied in the final months of 2021, a resurgence in the pandemic, surging inflation and Russia’s invasion of Ukraine in late February 2022 dented the global economic outlook and erased equity market gains for the six month period. Overall, both global equity and fixed income markets largely generated negative returns for the period, with emerging markets largely underperforming developed markets.
U.S. equity prices largely maintained upward momentum in the final months of 2021 amid low interest rates, a boom in household wealth and record corporate earnings and revenues. However, investor concerns about the emergence of the Omicron variant of COVID-19 and surging inflationary pressure fueled market volatility in 2022 and Russia’s military build-up and invasion of Ukraine in February 2022 put further pressure on U.S. equity prices.
In mid-March 2022, the U.S. Federal Reserve followed through on its stated plan and raised interest rates for the first time since December 2018, and pledged to raise rates six more times in 2022. While U.S. equity prices rebounded somewhat for the month, both equity and bond markets slumped in April as negotiations to end the Ukraine conflict failed and global supply-chain disruptions increased. Notably, the U.S. dollar strengthened against other major currencies in early 2022, which provided a significant drag on both the domestic economy and corporate earnings. However, job growth in the U.S. continued throughout the six month period.
European and U.K. equities largely ended 2021 with gains but the reimposition of social restrictions in response to the spread of Omicron and the outbreak of fighting in Ukraine weighed on financial markets in early 2022. While initial multilateral trade and financial sanctions against Russia excluded its energy sector, prices for natural gas and petroleum rose sharply across Europe and the potential disruption of energy supplies hurt investor sentiment.
Unemployment in both the Euro area and the U.K. had fallen to near multi-decade lows by the end of April 2022 but consumer sentiment across both regions tumbled lower in 2022. During the six month period, the European Central Bank maintained its ultra-low interest rate policy, while the Bank of England raised rates three times during the period amid the highest annual inflation rate in 30 years.
Within emerging markets, both equities and bonds underperformed throughout the six month period. China proved be the largest drag on emerging markets during the period as investor concerns about tighter regulatory scrutiny of large technology companies in 2021 gave way to strict lockdowns in several large cities amid a resurgence in COVID-19 infections throughout the country. The expected slowdown in China’s economy, and in its manufacturing sector in particular, weighed down financial markets in its emerging market trading partners. Rising prices for energy and a range of other commodities also raised investor concerns about economic growth across emerging market nations, particularly net importers of petroleum and natural gas. Additionally, the prospect of rising U.S. interest rates weighed on emerging market bond prices.
The S&P 500 Index returned -9.65%, the MSCI EAFE Index returned -11.58% and the MSCI Emerging Markets Index returned -14.04% for the six months ended April 30, 2022.
| 2 | J.P. Morgan International Equity Funds | April 30, 2022 |
JPMorgan Emerging Markets Equity Fund
FUND COMMENTARY
SIX MONTHS ENDED April 30, 2022 (Unaudited)
| REPORTING PERIOD RETURN: | |
Fund (Class L Shares) *
| (26.17)% |
MSCI Emerging Markets Index (net total return)
| (14.15)% |
Net Assets as of 4/30/2022 (In Thousands)
| $9,678,228 |
INVESTMENT OBJECTIVE**
The JPMorgan Emerging Markets Equity Fund (the “Fund”) seeks to provide high total return.
WHAT WERE THE MAIN DRIVERS OF THE FUND’S PERFORMANCE?
The Fund’s Class L Shares underperformed the MSCI Emerging Markets Index (net total return) (the “Benchmark”) for the six months ended April 30, 2022.
The Fund’s security selection in the financials and information technology sectors was a leading detractor from performance relative to the Benchmark. The Fund’s security selection in the energy sector was the sole sector contributor to relative performance.
By country, the Fund’s security selections in China and Taiwan were leading detractors from relative performance, while the Fund’s underweight position in Russia and overweight position in Indonesia were leading contributors to relative performance. By the end of the period, the Fund had no holdings in Russia.
Leading individual detractors from relative performance included the Fund’s out-of-Benchmark positions in Sea Ltd., EPAM Systems Inc. and Delivery Hero SE. Shares of Sea, a Singapore internet and mobile platform provider, fell after Tencent Holdings Ltd. reduced its stake in the company to about 19% from 21%. Shares of EPAM Systems, a global provider of software development and digital platform services that largely operates from Belarus, fell after the company withdrew its earnings forecasts due to uncertainty and business disruptions stemming from the military conflict in Ukraine.
Shares of Delivery Hero, a German food ordering and delivery service, fell after the company forecast breakeven results for its food delivery business in the first half of 2022.
Leading individual contributors to relative performance included the Fund’s underweight positions in Gazprom PJSC and PJSC Lukoil and its overweight position Bank Rakyat Indonesia PT. Shares of both Gazprom and Lukoil, Russian natural gas and petroleum producers, fell after the imposition of multilateral economic sanctions in response to Russia’s invasion of Ukraine. Shares of Bank Rakyat, an Indonesian financial services provider, rose amid strong commodity exports and consumer demand in Indonesia.
HOW WAS THE FUND POSITIONED?
The Fund’s portfolio managers employed an active strategy in which portfolio construction was focused on the highest-conviction ideas found at the security level. The Fund’s portfolio managers used bottom-up fundamental research to determine the Fund’s security weightings, researching companies in an attempt to determine their underlying value and potential for future earnings growth.
As a result of this process, the Fund’s largest sector overweight allocations relative to the Benchmark during the period were in the information technology and consumer staples sectors and its largest relative underweight allocations were in the materials and energy sectors. The Fund’s largest country overweight allocations relative to the Benchmark during the period were in Hong Kong and India and its largest relative underweight allocations were in South Korea and Taiwan.
| April 30, 2022 | J.P. Morgan International Equity Funds | 3 |
JPMorgan Emerging Markets Equity Fund
FUND COMMENTARY
SIX MONTHS ENDED April 30, 2022 (Unaudited) (continued)
TOP TEN POSITIONS OF THE
PORTFOLIO AS OF April 30, 2022 | | PERCENT OF
TOTAL
INVESTMENTS |
| 1. | Taiwan Semiconductor Manufacturing Co. Ltd., ADR (Taiwan)
| | 8.0% |
| 2. | Samsung Electronics Co. Ltd. (South Korea)
| | 6.4 |
| 3. | Tencent Holdings Ltd. (China)
| | 4.8 |
| 4. | Tata Consultancy Services Ltd. (India)
| | 3.3 |
| 5. | MercadoLibre, Inc. (Brazil)
| | 3.0 |
| 6. | Housing Development Finance Corp. Ltd. (India)
| | 3.0 |
| 7. | Reliance Industries Ltd. (India)
| | 2.8 |
| 8. | JD.com, Inc., Class A (China)
| | 2.6 |
| 9. | AIA Group Ltd. (Hong Kong)
| | 2.6 |
| 10. | NetEase, Inc. (China)
| | 2.5 |
PORTFOLIO COMPOSTION BY COUNTRY
AS OF April 30, 2022 | | PERCENT OF
TOTAL
INVESTMENTS |
China
| | 30.5% |
India
| | 21.9 |
Taiwan
| | 11.5 |
South Korea
| | 8.1 |
Brazil
| | 5.7 |
Hong Kong
| | 4.9 |
Indonesia
| | 4.4 |
Mexico
| | 3.1 |
United States
| | 2.0 |
South Africa
| | 1.5 |
United Kingdom
| | 1.1 |
Others (each less than 1.0%)
| | 2.5 |
Short-Term Investments
| | 2.8 |
| * | The return shown is based on net asset values calculated for shareholder transactions and may differ from the return shown in the financial highlights, which reflects adjustments made to the net asset values in accordance with accounting principles generally accepted in the United States of America. |
| ** | The adviser seeks to achieve the Fund’s objective. There can be no guarantee it will be achieved. |
| 4 | J.P. Morgan International Equity Funds | April 30, 2022 |
AVERAGE ANNUAL TOTAL RETURNS AS OF April 30, 2022
| | INCEPTION DATE OF
CLASS | | 6 MONTH* | | 1 YEAR | | 5 YEAR | | 10 YEAR |
| CLASS A SHARES | September 28, 2001 | | | | | | | | |
| With Sales Charge ** | | | (30.18)% | | (33.58)% | | 3.75% | | 2.85% |
| Without Sales Charge | | | (26.30) | | (29.90) | | 4.87 | | 3.40 |
| CLASS C SHARES | February 28, 2006 | | | | | | | | |
| With CDSC *** | | | (27.47) | | (31.25) | | 4.36 | | 2.99 |
| Without CDSC | | | (26.47) | | (30.25) | | 4.36 | | 2.99 |
| Class I SHARES | September 10, 2001 | | (26.18) | | (29.71) | | 5.15 | | 3.66 |
| Class L SHARES | November 15, 1993 | | (26.17) | | (29.65) | | 5.26 | | 3.79 |
| Class R2 SHARES | July 31, 2017 | | (26.41) | | (30.12) | | 4.57 | | 3.22 |
| Class R3 SHARES | July 31, 2017 | | (26.29) | | (29.91) | | 4.84 | | 3.38 |
| Class R4 SHARES | July 31, 2017 | | (26.22) | | (29.76) | | 5.09 | | 3.63 |
| Class R5 SHARES | September 9, 2016 | | (26.15) | | (29.63) | | 5.26 | | 3.80 |
| Class R6 SHARES | December 23, 2013 | | (26.14) | | (29.58) | | 5.36 | | 3.88 |
|
| * | Not annualized. |
| ** | Sales Charge for Class A Shares is 5.25%. |
| *** | Assumes a 1% CDSC (contingent deferred sales charge) for the 6 month and one year periods and 0% CDSC thereafter. |
TEN YEAR FUND PERFORMANCE (4/30/12 TO 4/30/22)
The performance quoted is past performance and is not a guarantee of future results. Mutual funds are subject to certain market risks. Investment returns and principal value of an investment will fluctuate so that an investor’s shares, when redeemed, may be worth more or less than their original cost. Current performance may be higher or lower than the performance data shown. For up-to-date month-end performance information please call 1-800-480-4111.
Returns for Class R5 Shares and Class R6 Shares prior to their inception dates are based on the performance of Class L Shares. The actual returns of Class R5 Shares and Class R6 Shares would have been different than those shown because Class R5 Shares and Class R6 Shares have different expenses than Class L Shares.
Returns shown for Class R2 Shares and Class R3 Shares prior to their inception dates are based on the performance of Class A Shares. The actual returns of Class R2 Shares and Class R3 Shares would have been lower than those shown because Class R2 Shares and Class R3 Shares have higher expenses than Class A Shares.
Returns for Class R4 Shares prior to its inception date are based on the performance of Class I Shares. The actual returns of Class R4 Shares would have been lower than those shown because Class R4 Shares have higher expenses than Class I Shares.
The graph illustrates comparative performance for $3,000,000 invested in Class L Shares of the JPMorgan Emerging Markets Equity Fund and the MSCI Emerging Markets Index (net total return) from April 30, 2012 to April 30, 2022. The performance of the Fund assumes reinvestment of all dividends and capital gain distributions, if any, and does not include a sales charge. The performance of the MSCI Emerging Markets Index (net total return) does not reflect the deduction of expenses or a sales charge associated with a mutual fund and approximates the minimum possible dividend reinvestment of the securities included in the benchmark, if applicable. The MSCI Emerging Markets Index (net total return) is a free float-adjusted market capitalization weighted index that is designed to measure the performance of large- and mid- cap stocks in emerging markets. Net total return figures assume the reinvestment of dividends after deduction of withholding tax, applying the maximum rate to nonresident individual investors who do not benefit from double taxation treaties. Investors cannot invest directly in an index.
Class L Shares have a $3,000,000 minimum initial investment.
Fund performance may reflect the waiver of the Fund’s fees and reimbursement of expenses for certain periods since the applicable inception date. Without these waivers and reimbursements, performance would have been lower. Also, performance shown in this section does not reflect the deduction of taxes that a shareholder would pay on Fund distributions or on gains resulting from redemptions of Fund shares.
| April 30, 2022 | J.P. Morgan International Equity Funds | 5 |
JPMorgan Emerging Markets Equity Fund
FUND COMMENTARY
SIX MONTHS ENDED April 30, 2022 (Unaudited) (continued)
International investing involves a greater degree of risk and increased volatility. Changes in currency exchange rates and differences in accounting and taxation policies outside the U.S. can raise or lower returns. Also, some overseas markets may not be as politically and economically stable as the U.S. and other nations.
Because Class C Shares automatically convert to Class A Shares after 8 years, the 10 year average annual total return shown above for Class C reflects Class A performance for the period after conversion.
The returns shown are based on net asset values calculated for shareholder transactions and may differ from the returns shown in the financial highlights, which reflect adjustments made to the net asset values in accordance with accounting principles generally accepted in the United States of America.
| 6 | J.P. Morgan International Equity Funds | April 30, 2022 |
JPMorgan Emerging Markets Research Enhanced Equity Fund
FUND COMMENTARY
SIX MONTHS ENDED April 30, 2022 (Unaudited)
| REPORTING PERIOD RETURN: | |
Fund (Class R6 Shares) *
| (15.89)% |
MSCI Emerging Markets Index (net total return)
| (14.15)% |
Net Assets as of 4/30/2022 (In Thousands)
| $2,946,092 |
INVESTMENT OBJECTIVE**
The JPMorgan Emerging Markets Research Enhanced Equity Fund (the “Fund”) seeks to provide long-term capital appreciation.
WHAT WERE THE MAIN DRIVERS OF THE FUND’S PERFORMANCE?
The Fund’s Class R6 Shares underperformed the MSCI Emerging Markets Index (net total return) (the “Benchmark”) for the six months ended April 30, 2022.
By sector, the Fund’s security selection in the financials and materials sectors was a leading detractor from performance relative to the Benchmark, while the Fund’s security selection in the information technology and communication services sectors was a leading contributor to relative performance.
By country, the Fund’s security selections in India and Taiwan were leading detractors from relative performance, while the Fund’s overweight position in Russia early in the period and its overweight position in Mexico were leading contributors to relative performance.
Leading individual detractors from relative performance included the Fund’s overweight positions in PJSC Sberbank, PJSC Lukoil and X5 Retail Group. Shares of Sberbank, a Russian bank and financial services provider, Lukoil, a Russian natural gas and petroleum producer and X5 Retail Group, a Russian food retailer, all fell after the imposition of multilateral economic sanctions in response to Russia’s invasion of Ukraine.
Leading individual contributors to relative performance included the Fund’s underweight positions in Yandex NV and PAO Novatek and its overweight position in Alinma Bank.
Shares of Yandex, a Dutch e-commerce and taxi service provider not held in the Fund, fell amid investor concerns about its larger exposure to Russia and the potential impact of multilateral sanctions on its business. Shares of Novatek, a Russian natural gas and petroleum producer, fell after the imposition of multilateral economic sanctions in response to Russia’s invasion of Ukraine. Shares of Alinma, a Saudi Arabian bank, rose amid investor expectations that rising global energy prices would benefit the broader Saudi Arabian economy.
HOW WAS THE FUND POSITIONED?
The Fund’s portfolio managers employed a combination of a disciplined portfolio construction process with in-depth fundamental research into individual securities conducted by a global network of research analysts to identify what they believed to be their relative value.
As a result of this process, by sector, the Fund’s largest overweight allocations relative to the Benchmark during the period were in the energy and consumer staples sectors and its largest underweight allocations were in the communication services and utilities sectors. By country, the Fund’s largest overweight allocations relative to the Benchmark during the period were in Mexico and Hong Kong and its largest relative underweight allocations were in China and India.
| April 30, 2022 | J.P. Morgan International Equity Funds | 7 |
JPMorgan Emerging Markets Research Enhanced Equity Fund
FUND COMMENTARY
SIX MONTHS ENDED April 30, 2022 (Unaudited) (continued)
TOP TEN POSITIONS OF THE
PORTFOLIO AS OF April 30, 2022 | | PERCENT OF
TOTAL
INVESTMENTS |
| 1. | Taiwan Semiconductor Manufacturing Co. Ltd. (Taiwan)
| | 5.8 % |
| 2. | Samsung Electronics Co. Ltd. (South Korea)
| | 4.5 |
| 3. | Tencent Holdings Ltd. (China)
| | 4.2 |
| 4. | Alibaba Group Holding Ltd. (China)
| | 2.9 |
| 5. | Reliance Industries Ltd. (India)
| | 1.8 |
| 6. | Meituan (China)(a)
| | 1.4 |
| 7. | China Construction Bank Corp., Class H (China)
| | 1.2 |
| 8. | Infosys Ltd., ADR (India)
| | 1.2 |
| 9. | JD.com, Inc., Class A (China)
| | 1.2 |
| 10. | Vale SA, ADR (Brazil)
| | 1.2 |
PORTFOLIO COMPOSTION BY COUNTRY
AS OF April 30, 2022 | | PERCENT OF
TOTAL
INVESTMENTS |
China
| | 30.2% |
Taiwan
| | 14.6 |
South Korea
| | 13.2 |
India
| | 12.7 |
Brazil
| | 6.1 |
Saudi Arabia
| | 4.2 |
South Africa
| | 4.2 |
Mexico
| | 2.9 |
Thailand
| | 2.1 |
Indonesia
| | 1.8 |
Malaysia
| | 1.2 |
Others (each less than 1.0%)
| | 4.8 |
Short-Term Investments
| | 2.0 |
| * | The return shown is based on net asset values calculated for shareholder transactions and may differ from the return shown in the financial highlights, which reflects adjustments made to the net asset values in accordance with accounting principles generally accepted in the United States of America. |
| ** | The adviser seeks to achieve the Fund’s objective. There can be no guarantee it will be achieved. |
| 8 | J.P. Morgan International Equity Funds | April 30, 2022 |
AVERAGE ANNUAL TOTAL RETURNS AS OF April 30, 2022
| | INCEPTION DATE OF
CLASS | | 6 MONTH* | | 1 YEAR | | SINCE
INCEPTION |
| Class I SHARES | January 30, 2019 | | (15.95)% | | (20.37)% | | 5.42% |
| Class R6 SHARES | December 11, 2018 | | (15.89) | | (20.26) | | 5.54 |
LIFE OF FUND PERFORMANCE (12/11/18 TO 4/30/22)
The performance quoted is past performance and is not a guarantee of future results. Mutual funds are subject to certain market risks. Investment returns and principal value of an investment will fluctuate so that an investor’s shares, when redeemed, may be worth more or less than their original cost. Current performance may be higher or lower than the performance data shown. For up-to-date month-end performance information please call 1-800-480-4111.
The Fund commenced operations on December 11, 2018.
Returns for Class I Shares prior to its inception date are based on the performance of Class R6 Shares. The actual returns of Class I Shares would have been lower than those shown because Class I Shares have higher expenses than Class R6 Shares.
The graph illustrates comparative performance for $15,000,000 invested in Class R6 Shares of the JPMorgan Emerging Markets Research Enhanced Equity Fund and the MSCI Emerging Markets Index (net total return) from December 11, 2018 to April 30, 2022. The performance of the Fund assumes reinvestment of all dividends and capital gain distributions, if any, and does not include a sales charge. The performance of the MSCI Emerging Markets Index (net total return) does not reflect the deduction of expenses or a sales charge associated with a mutual fund and approximates the minimum possible dividend reinvestment of the securities included in the benchmark, if applicable, The MSCI Emerging Markets Index (net total return) is a free float-adjusted market capitalization weighted index that is designed to measure the performance of large- and mid- cap stocks in emerging markets. Net total return figures assume the reinvestment of dividends after deduction of withholding tax, applying the maximum rate to nonresident individual investors who do not benefit from double taxation treaties.
Class R6 Shares have a $15,000,000 minimum initial investment.
Fund performance may reflect the waiver of the Fund’s fees and reimbursement of expenses for certain periods since the applicable inception date.
Without these waivers and reimbursements, performance would have been lower. Also, performance shown in this section does not reflect the deduction of taxes that a shareholder would pay on Fund distributions or on gains resulting from redemptions of Fund shares.
International investing involves a greater degree of risk and increased volatility. Changes in currency exchange rates and differences in accounting and taxation policies outside the U.S. can raise or lower returns. Also, some overseas markets may not be as politically and economically stable as the U.S. and other nations.
The returns shown are based on net asset values calculated for shareholder transactions and may differ from the returns shown in the financial highlights, which reflect adjustments made to the net asset values in accordance with accounting principles generally accepted in the United States of America.
The MSCI information may only be used for your internal use, may not be reproduced or redisseminated in any form and may not be used as a basis for or a component of any financial instruments or products or indices. None of the MSCI information is intended to constitute investment advice or a recommendation to make (or refrain from making) any kind of investment decision and may not be relied on as such. Historical data and analysis should not be taken as an indication or guarantee of any future performance analysis, forecast or prediction. The MSCI information is provided on an “as is” basis and the user of this information assumes the entire risk of any use made of this information. MSCI, each of its affiliates and each other person involved in or related to compiling, computing or creating any MSCI information (collectively, the “MSCI Parties”) expressly disclaims all warranties (including, without limitation, any warranties of originality, accuracy, completeness, timeliness, noninfringement, merchantability and fitness for a particular purpose) with respect to this information. Without limiting any of the foregoing, in no event shall any MSCI Party have any liability for any direct, indirect, special, incidental, punitive, consequential (including, without limitation, lost profits) or any other damages. (www.msci.com)
| April 30, 2022 | J.P. Morgan International Equity Funds | 9 |
JPMorgan Europe Dynamic Fund
FUND COMMENTARY
SIX MONTHS ENDED April 30, 2022 (Unaudited)
| REPORTING PERIOD RETURN: | |
Fund (Class A Shares, without a sales charge) *
| (14.34)% |
MSCI Europe Index (net total return)
| (11.73)% |
Net Assets as of 4/30/2022 (In Thousands)
| $606,542 |
INVESTMENT OBJECTIVE**
The JPMorgan Europe Dynamic Fund (the “Fund”) seeks total return from long-term capital growth. Total return consists of capital growth and current income.
WHAT WERE THE MAIN DRIVERS OF THE FUND’S PERFORMANCE?
The Fund’s Class A Shares, without a sales charge, underperformed the MSCI Europe Index (net total return) (the “Benchmark”) for the six months ended April 30, 2022.
Relative to the Benchmark, the Fund’s security selection in the industrials sector and its underweight position in the health care sector were leading detractors from performance, while the Fund’s security selection in the information technology and utilities sectors was a leading contributor to relative performance.
Leading individual detractors from relative performance included the Fund’s underweight positions in Shell PLC and AstraZeneca PLC and its out-of-Benchmark position in Eckert & Ziegler Strahlen -und Medizintechnik AG. Shares of Shell, a U.K. integrated petroleum and natural gas company not held in the Fund, rose amid rising global energy prices. Shares of AstraZeneca, a U.K. pharmaceuticals company, rose amid investor expectations for regulator approval of the company’s treatment for Covid-19 and its variants. Shares of Eckert & Ziegler, a German, medical radiation therapies developer, fell as investors sold the stock following runup in the share price in 2021.
Leading individual contributors to relative performance included the Fund’s overweight positions in BP PLC and Equinor ASA, and its underweight position in ASML Holding NV. Shares of BP, a U.K. integrated petroleum and natural gas company, rose amid rising global energy prices. Shares of Equinor, a Norwegian petroleum and natural gas producer, rose amid rising global energy prices. Shares of ASML Holding, a Dutch semiconductor manufacturer, fell after the company reported lower-than-expected revenue for the fourth quarter of 2021.
HOW WAS THE FUND POSITIONED?
The Fund’s portfolio managers believe that attractively valued, high quality securities with positive momentum have the potential to outperform the market. During the reporting period, the Fund’s portfolio managers invested in securities
that they believed had these style characteristics. Portfolio positions were based on bottom-up security selection rather than top-down asset allocation decisions.
TOP TEN POSITIONS OF THE
PORTFOLIO AS OF April 30, 2022 | | PERCENT OF
TOTAL
INVESTMENTS |
| 1. | Nestle SA (Registered) (Switzerland)
| | 4.7 % |
| 2. | Novo Nordisk A/S, Class B (Denmark)
| | 3.7 |
| 3. | Roche Holding AG (Switzerland)
| | 3.7 |
| 4. | TotalEnergies SE (France)
| | 2.9 |
| 5. | BP plc (United Kingdom)
| | 2.8 |
| 6. | Novartis AG (Registered) (Switzerland)
| | 2.8 |
| 7. | LVMH Moet Hennessy Louis Vuitton SE (France)
| | 2.4 |
| 8. | Koninklijke Ahold Delhaize NV (Netherlands)
| | 2.2 |
| 9. | Allianz SE (Registered) (Germany)
| | 2.1 |
| 10. | Diageo plc (United Kingdom)
| | 2.0 |
PORTFOLIO COMPOSTION BY COUNTRY
AS OF April 30, 2022 | | PERCENT OF
TOTAL
INVESTMENTS |
United Kingdom
| | 18.2% |
Switzerland
| | 16.1 |
France
| | 15.0 |
Germany
| | 14.2 |
Denmark
| | 7.2 |
Netherlands
| | 5.8 |
Finland
| | 3.2 |
United States
| | 2.2 |
Australia
| | 2.0 |
Ireland
| | 1.4 |
Norway
| | 1.3 |
Spain
| | 1.2 |
Italy
| | 1.1 |
Austria
| | 1.0 |
Luxembourg
| | 0.9 |
Short-Term Investments
| | 9.2 |
| * | The return shown is based on net asset values calculated for shareholder transactions and may differ from the return shown in the financial highlights, which reflects adjustments made to the net asset values in accordance with accounting principles generally accepted in the United States of America. |
| 10 | J.P. Morgan International Equity Funds | April 30, 2022 |
| ** | The adviser seeks to achieve the Fund’s objective. There can be no guarantee it will be achieved. |
| April 30, 2022 | J.P. Morgan International Equity Funds | 11 |
JPMorgan Europe Dynamic Fund
FUND COMMENTARY
SIX MONTHS ENDED April 30, 2022 (Unaudited) (continued)
AVERAGE ANNUAL TOTAL RETURNS AS OF April 30, 2022
| | INCEPTION DATE OF
CLASS | | 6 MONTH* | | 1 YEAR | | 5 YEAR | | 10 YEAR |
| CLASS A SHARES | November 2, 1995 | | | | | | | | |
| With Sales Charge ** | | | (18.83)% | | (15.94)% | | 1.75% | | 5.31% |
| Without Sales Charge | | | (14.34) | | (11.29) | | 2.85 | | 5.88 |
| CLASS C SHARES | November 1, 1998 | | | | | | | | |
| With CDSC *** | | | (15.58) | | (12.73) | | 2.34 | | 5.45 |
| Without CDSC | | | (14.58) | | (11.73) | | 2.34 | | 5.45 |
| Class I SHARES | September 10, 2001 | | (14.22) | | (11.03) | | 3.12 | | 6.16 |
| Class L SHARES | September 10, 2001 | | (14.19) | | (10.93) | | 3.24 | | 6.34 |
| Class R6 SHARES | October 1, 2018 | | (14.13) | | (10.83) | | 3.32 | | 6.38 |
|
| * | Not annualized. |
| ** | Sales Charge for Class A Shares is 5.25%. |
| *** | Assumes a 1% CDSC (contingent deferred sales charge) for the 6 month and one year periods and 0% CDSC thereafter. |
TEN YEAR FUND PERFORMANCE (4/30/12 TO 4/30/22)
The performance quoted is past performance and is not a guarantee of future results. Mutual funds are subject to certain market risks. Investment returns and principal value of an investment will fluctuate so that an investor’s shares, when redeemed, may be worth more or less than their original cost. Current performance may be higher or lower than the performance data shown. For up-to-date month-end performance information please call 1-800-480-4111.
Returns for Class R6 Shares prior to its inception date are based on the performance of Class L Shares. The actual returns of Class R6 Shares would have been different than those shown because Class R6 Shares have different expenses than Class L Shares.
The graph illustrates comparative performance for $10,000 invested in Class A Shares of the JPMorgan Europe Dynamic Fund and the MSCI Europe Index (net total return) from April 30, 2012 to April 30, 2022. The performance of the Fund assumes reinvestment of all dividends and capital gain distributions, if any, and includes a sales charge. The performance of the MSCI Europe Index (net total return) does not reflect the deduction of expenses or a sales charge associated with a mutual fund and approximates the minimum possible dividend reinvestment of the securities included in the benchmark, if applicable. The MSCI Europe Index (net total return) is a free float-adjusted market capitalization weighted index that is designed to measure the performance of large- and mid- cap stocks in the developed markets countries in Europe. Net total return figures assume the reinvestment of dividends after deduction of withholding tax, applying the maximum rate to nonresident individual investors
who do not benefit from double taxation treaties. Investors cannot invest directly in an index.
Class A Shares have a $1,000 minimum initial investment and carry a 5.25% sales charge.
Fund performance may reflect the waiver of the Fund’s fees and reimbursement of expenses for certain periods since the applicable inception date. Without these waivers and reimbursements, performance would have been lower. Also, performance shown in this section does not reflect the deduction of taxes that a shareholder would pay on Fund distributions or on gains resulting from redemptions of Fund shares.
International investing involves a greater degree of risk and increased volatility. Changes in currency exchange rates and differences in accounting and taxation policies outside the U.S. can raise or lower returns. Also, some overseas markets may not be as politically and economically stable as the U.S. and other nations.
Because Class C Shares automatically convert to Class A Shares after 8 years, the 10 year average annual total return shown above for Class C reflects Class A performance for the period after conversion.
The returns shown are based on net asset values calculated for shareholder transactions and may differ from the returns shown in the financial highlights, which reflect adjustments made to the net asset values in accordance with accounting principles generally accepted in the United States of America.
| 12 | J.P. Morgan International Equity Funds | April 30, 2022 |
JPMorgan International Equity Fund
FUND COMMENTARY
SIX MONTHS ENDED April 30, 2022 (Unaudited)
| REPORTING PERIOD RETURN: | |
Fund (Class I Shares) *
| (16.85)% |
MSCI EAFE Index (net total return)
| (11.80)% |
Net Assets as of 4/30/2022 (In Thousands)
| $4,483,386 |
INVESTMENT OBJECTIVE**
The JPMorgan International Equity Fund (the “Fund”) seeks total return from long-term capital growth and income. Total return consists of capital growth and current income.
WHAT WERE THE MAIN DRIVERS OF THE FUND’S PERFORMANCE?
The Fund’s Class I Shares underperformed the MSCI EAFE Index (net of total return) (the “Benchmark”) for the six months ended April 30, 2022.
The Fund’s security selections in the health care and communication services sectors were leading detractors from relative performance, while the Fund’s security selections in the materials and utilities sectors were leading contributors to relative performance.
By region, the Fund’s security selection in Japan and the Pacific, excluding Japan, were leading detractors from relative performance, while the Fund’s underweight position in the U.K. and its out-of-Benchmark position in emerging markets were the smallest detractors from relative performance and no sectors made a positive contribution to relative performance.
Leading individual detractors from relative performance included the Fund’s overweight positions in Sea Ltd., Delivery Hero SE and Keyence Corp. Shares of Sea, a Singapore internet
and mobile platform provider, fell after Tencent Holdings Ltd. reduced its stake in the company to about 19% from 21%. Shares of Delivery Hero, a German food ordering service, fell after the company forecast breakeven results for its food delivery business in the first half of 2022. Shares of Keyence, a Japanese automation technology provider, fell amid investor concerns about the impact of a slowing global economy and China’s pandemic lockdowns during the period.
Leading individual contributors to relative performance included the Fund’s overweight positions in BHP Group Ltd., Anglo American PLC and DBS Group Holdings Ltd. Shares of both BHP Group, an Australian mining and metals company, and Anglo American PLC, a U.K. mining and metals company, rose amid surging global prices for commodities. Shares of DBS Group Holdings, a Singapore financial services provider, rose amid consecutive quarters of better-than-expected earnings during the period.
HOW WAS THE FUND POSITIONED?
The Fund’s portfolio managers continued to focus on security selection to build a portfolio of international equities. They used bottom-up fundamental research to identify what they believed were attractively priced securities of companies with solid financial positions that possessed the potential to increase their earnings faster than their industry peers.
| April 30, 2022 | J.P. Morgan International Equity Funds | 13 |
JPMorgan International Equity Fund
FUND COMMENTARY
SIX MONTHS ENDED April 30, 2022 (Unaudited) (continued)
TOP TEN POSITIONS OF THE
PORTFOLIO AS OF April 30, 2022 | | PERCENT OF
TOTAL
INVESTMENTS |
| 1. | Nestle SA (Registered) (Switzerland)
| | 4.0 % |
| 2. | Roche Holding AG (Switzerland)
| | 3.3 |
| 3. | TotalEnergies SE (France)
| | 3.3 |
| 4. | Novo Nordisk A/S, Class B (Denmark)
| | 2.7 |
| 5. | BHP Group Ltd. (Australia)
| | 2.5 |
| 6. | Diageo plc (United Kingdom)
| | 2.4 |
| 7. | ASML Holding NV (Netherlands)
| | 2.3 |
| 8. | LVMH Moet Hennessy Louis Vuitton SE (France)
| | 2.2 |
| 9. | DBS Group Holdings Ltd. (Singapore)
| | 2.0 |
| 10. | Shell plc (Netherlands)
| | 1.9 |
PORTFOLIO COMPOSTION BY COUNTRY
AS OF April 30, 2022 | | PERCENT OF
TOTAL
INVESTMENTS |
France
| | 14.9% |
Japan
| | 11.8 |
Switzerland
| | 10.1 |
United Kingdom
| | 9.9 |
Germany
| | 8.3 |
Denmark
| | 5.7 |
Netherlands
| | 5.6 |
United States
| | 4.1 |
Sweden
| | 3.6 |
Hong Kong
| | 3.4 |
Australia
| | 2.5 |
Spain
| | 2.0 |
Singapore
| | 2.0 |
South Korea
| | 1.7 |
PORTFOLIO COMPOSTION BY COUNTRY
AS OF April 30, 2022 | | PERCENT OF
TOTAL
INVESTMENTS |
South Africa
| | 1.5% |
Taiwan
| | 1.3 |
Belgium
| | 1.3 |
Others (each less than 1.0%)
| | 3.1 |
Short-Term Investments
| | 7.2 |
| * | The return shown is based on net asset values calculated for shareholder transactions and may differ from the return shown in the financial highlights, which reflects adjustments made to the net asset values in accordance with accounting principles generally accepted in the United States of America. |
| ** | The adviser seeks to achieve the Fund’s objective. There can be no guarantee it will be achieved. |
| 14 | J.P. Morgan International Equity Funds | April 30, 2022 |
AVERAGE ANNUAL TOTAL RETURNS AS OF April 30, 2022
| | INCEPTION DATE OF
CLASS | | 6 MONTH* | | 1 YEAR | | 5 YEAR | | 10 YEAR |
| CLASS A SHARES | February 28, 2002 | | | | | | | | |
| With Sales Charge ** | | | (21.34)% | | (17.40)% | | 3.32% | | 4.21% |
| Without Sales Charge | | | (16.98) | | (12.83) | | 4.43 | | 4.78 |
| CLASS C SHARES | January 31, 2003 | | | | | | | | |
| With CDSC *** | | | (18.16) | | (14.25) | | 3.92 | | 4.35 |
| Without CDSC | | | (17.16) | | (13.25) | | 3.92 | | 4.35 |
| Class I SHARES | January 1, 1997 | | (16.85) | | (12.60) | | 4.72 | | 5.04 |
| Class R2 SHARES | November 3, 2008 | | (17.06) | | (13.06) | | 4.14 | | 4.49 |
| Class R5 SHARES | May 15, 2006 | | (16.83) | | (12.52) | | 4.82 | | 5.20 |
| Class R6 SHARES | November 30, 2010 | | (16.77) | | (12.41) | | 4.93 | | 5.28 |
|
| * | Not annualized. |
| ** | Sales Charge for Class A Shares is 5.25%. |
| *** | Assumes a 1% CDSC (contingent deferred sales charge) for the 6 month and one year periods and 0% CDSC thereafter. |
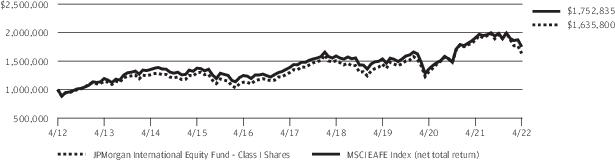
TEN YEAR FUND PERFORMANCE (4/30/12 TO 4/30/22)
The performance quoted is past performance and is not a guarantee of future results. Mutual funds are subject to certain market risks. Investment returns and principal value of an investment will fluctuate so that an investor’s shares, when redeemed, may be worth more or less than their original cost. Current performance may be higher or lower than the performance data shown. For up-to-date month-end performance information please call 1-800-480-4111.
The graph illustrates comparative performance for $1,000,000 invested in Class I Shares of the JPMorgan International Equity Fund and the MSCI EAFE Index (net total return) from April 30, 2012 to April 30, 2022. The performance of the Fund assumes reinvestment of all dividends and capital gain distributions, if any, and does not include a sales charge. The performance of the MSCI EAFE Index (net total return) does not reflect the deduction of expenses or a sales charge associated with a mutual fund and approximates the minimum possible dividend reinvestment of the securities included in the benchmark, if applicable. The MSCI EAFE Index (net total return) is a free float-adjusted market capitalization weighted index that is designed to measure the performance of large- and mid- cap stocks in developed markets, excluding the U.S. and Canada. Net total return figures assume the reinvestment of dividends after deduction of withholding tax, applying the maximum rate to nonresident individual investors who do not benefit from double taxation treaties. Investors cannot invest directly in an index.
Class I Shares have a $1,000,000 minimum initial investment.
Fund performance may reflect the waiver of the Fund’s fees and reimbursement of expenses for certain periods since the applicable inception date. Without these waivers and reimbursements, performance would have been lower. Also, performance shown in this section does not reflect the deduction of taxes that a shareholder would pay on Fund distributions or on gains resulting from redemptions of Fund shares.
International investing involves a greater degree of risk and increased volatility. Changes in currency exchange rates and differences in accounting and taxation policies outside the U.S. can raise or lower returns. Also, some overseas markets may not be as politically and economically stable as the U.S. and other nations.
Because Class C Shares automatically convert to Class A Shares after 8 years, the 10 year average annual total return shown above for Class C reflects Class A performance for the period after conversion.
The returns shown are based on net asset values calculated for shareholder transactions and may differ from the returns shown in the financial highlights, which reflect adjustments made to the net asset values in accordance with accounting principles generally accepted in the United States of America.
| April 30, 2022 | J.P. Morgan International Equity Funds | 15 |
JPMorgan International Focus Fund
FUND COMMENTARY
SIX MONTHS ENDED April 30, 2022 (Unaudited)
| REPORTING PERIOD RETURN: | |
Fund (Class I Shares) *
| (16.59)% |
MSCI ACWI ex USA Index (net total return)
| (11.87)% |
Net Assets as of 4/30/2022 (In Thousands)
| $1,406,947 |
INVESTMENT OBJECTIVE**
The JPMorgan International Focus Fund (the “Fund”) seeks to provide long-term capital appreciation.
WHAT WERE THE MAIN DRIVERS OF THE FUND’S PERFORMANCE?
The Fund’s Class I Shares underperformed the MSCI ACWI ex USA Index (net total return) (the “Benchmark”) for the six months ended April 30, 2022.
The Fund’s security selection in the communication services and financials sectors was a leading detractors from performance relative to the Benchmark, while the Fund’s security selection in the materials and consumer staples sectors was a leading contributor to relative performance.
By region, the Fund’s security selections in the Pacific, excluding Japan, and in emerging markets were leading detractors from relative performance, while the Fund’s overweight position in the U.K. was the sole regional contributor to relative performance.
Leading individual detractors from relative performance included the Fund’s overweight positions in Sea Ltd., PJSC Sberbank and Delivery Hero SE. Shares of Sea, a Singapore-based internet and mobile platform provider, fell after Tencent Holdings Ltd. reduced its stake in the company to about 19% from 21%. Shares of Sberbank, a Russian bank and financial services provider, fell after multilateral financial sanctions were imposed on Russia in response to its February 2022 invasion of Ukraine. Shares of Delivery Hero, a German food ordering service, fell after the company forecast breakeven results for its food delivery business in the first half of 2022.
Leading individual contributors to relative performance included the Fund’s overweight positions in BHP Group Ltd., Anglo American PLC and Shell PLC. Shares of both BHP Group, an Australian mining and metals company, and Anglo American PLC, a U.K. mining and metals company, rose amid surging global prices for commodities. Shares of Shell, a U.K. integrated petroleum and natural gas company, rose amid rising global energy prices.
| 16 | J.P. Morgan International Equity Funds | April 30, 2022 |
HOW WAS THE FUND POSITIONED?
By harnessing their team’s global sector specialists, the Fund’s portfolio managers sought to build a high-conviction, benchmark-agnostic portfolio of growth, value and unique companies, whose future prospects, the portfolio managers believed, were under-appreciated by the market and thus possessed the potential to deliver higher-than-expected earnings that could have a positive effect on their share prices.
TOP TEN POSITIONS OF THE
PORTFOLIO AS OF April 30, 2022 | | PERCENT OF
TOTAL
INVESTMENTS |
| 1. | Nestle SA (Registered) (Switzerland)
| | 4.8 % |
| 2. | Shell plc (Netherlands)
| | 4.0 |
| 3. | Novo Nordisk A/S, Class B (Denmark)
| | 3.9 |
| 4. | Samsung Electronics Co. Ltd. (South Korea)
| | 3.8 |
| 5. | Diageo plc (United Kingdom)
| | 3.6 |
| 6. | BHP Group Ltd. (Australia)
| | 3.5 |
| 7. | Roche Holding AG (Switzerland)
| | 3.2 |
| 8. | Anglo American plc (South Africa)
| | 3.2 |
| 9. | Toronto-Dominion Bank (The) (Canada)
| | 3.1 |
| 10. | AIA Group Ltd. (Hong Kong)
| | 2.9 |
PORTFOLIO COMPOSTION BY COUNTRY
AS OF April 30, 2022 | | PERCENT OF
TOTAL
INVESTMENTS |
Switzerland
| | 11.2% |
United Kingdom
| | 9.9 |
France
| | 9.8 |
Netherlands
| | 7.4 |
Canada
| | 5.7 |
Germany
| | 5.4 |
Denmark
| | 5.3 |
Hong Kong
| | 4.9 |
Japan
| | 4.7 |
South Korea
| | 4.5 |
Australia
| | 3.5 |
United States
| | 3.3 |
Taiwan
| | 3.3 |
South Africa
| | 3.2 |
PORTFOLIO COMPOSTION BY COUNTRY
AS OF April 30, 2022 | | PERCENT OF
TOTAL
INVESTMENTS |
Singapore
| | 2.7% |
China
| | 2.4 |
India
| | 2.4 |
Spain
| | 2.2 |
Belgium
| | 2.1 |
Indonesia
| | 1.9 |
Sweden
| | 1.4 |
Short-Term Investments
| | 2.8 |
| * | The return shown is based on net asset values calculated for shareholder transactions and may differ from the return shown in the financial highlights, which reflects adjustments made to the net asset values in accordance with accounting principles generally accepted in the United States of America. |
| ** | The adviser seeks to achieve the Fund’s objective. There can be no guarantee it will be achieved. |
| April 30, 2022 | J.P. Morgan International Equity Funds | 17 |
JPMorgan International Focus Fund
FUND COMMENTARY
SIX MONTHS ENDED April 30, 2022 (Unaudited) (continued)
AVERAGE ANNUAL TOTAL RETURNS AS OF April 30, 2022
| | INCEPTION DATE OF
CLASS | | 6 MONTH* | | 1 YEAR | | 5 YEAR | | 10 YEAR |
| CLASS A SHARES | November 30, 2011 | | | | | | | | |
| With Sales Charge ** | | | (21.10)% | | (19.86)% | | 3.62% | | 5.06% |
| Without Sales Charge | | | (16.72) | | (15.43) | | 4.74 | | 5.63 |
| CLASS C SHARES | November 30, 2011 | | | | | | | | |
| With CDSC *** | | | (17.91) | | (16.82) | | 4.22 | | 5.20 |
| Without CDSC | | | (16.91) | | (15.82) | | 4.22 | | 5.20 |
| Class I SHARES | November 30, 2011 | | (16.59) | | (15.20) | | 5.02 | | 5.92 |
| Class R2 SHARES | November 30, 2011 | | (16.83) | | (15.68) | | 4.43 | | 5.34 |
| Class R5 SHARES | November 30, 2011 | | (16.57) | | (15.11) | | 5.12 | | 6.06 |
| Class R6 SHARES | November 30, 2011 | | (16.50) | | (15.01) | | 5.22 | | 6.14 |
|
| * | Not annualized. |
| ** | Sales Charge for Class A Shares is 5.25%. |
| *** | Assumes a 1% CDSC (contingent deferred sales charge) for the 6 month and one year periods and 0% CDSC thereafter. |
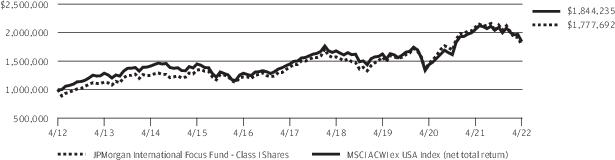
TEN YEAR FUND PERFORMANCE (4/30/12 TO 4/30/22)
The performance quoted is past performance and is not a guarantee of future results. Mutual funds are subject to certain market risks. Investment returns and principal value of an investment will fluctuate so that an investor’s shares, when redeemed, may be worth more or less than their original cost. Current performance may be higher or lower than the performance data shown. For up-to-date month-end performance information please call 1-800-480-4111.
The Fund commenced operations on November 30, 2011.
The graph illustrates comparative performance for $1,000,000 invested in Class I Shares of the JPMorgan International Focus Fund and the MSCI ACWI ex USA Index (net total return) from April 30, 2012 to April 30, 2022. The performance of the Fund assumes reinvestment of all dividends and capital gain distributions, if any, and does not include a sales charge. The performance of the MSCI ACWI ex USA Index (net total return) does not reflect the deduction of expenses or a sales charge associated with a mutual fund and approximates the minimum possible dividend reinvestment of the securities included in the benchmark, if applicable. The MSCI ACWI ex USA Index (net total return) is a free float-adjusted market capitalization weighted index that is designed to measure the performance of large- and mid- cap stocks in developed and emerging markets, excluding the U.S.. Net total return figures assume the reinvestment of dividends after deduction of withholding tax, applying the maximum rate to nonresident individual investors who do not benefit from double taxation treaties. Investors cannot invest directly in an index.
Class I Shares have a $1,000,000 minimum initial investment.
Subsequent to the inception date of the Fund and through May 30, 2013, the Fund did not experience any shareholder activity. If such shareholder activity had occurred, the Fund’s performance may have been impacted.
Fund performance may reflect the waiver of the Fund’s fees and reimbursement of expenses for certain periods since the applicable inception date. Without these waivers and reimbursements, performance would have been lower. Also, performance shown in this section does not reflect the deduction of taxes that a shareholder would pay on Fund distributions or on gains resulting from redemptions of Fund shares.
International investing involves a greater degree of risk and increased volatility. Changes in currency exchange rates and differences in accounting and taxation policies outside the U.S. can raise or lower returns. Also, some overseas markets may not be as politically and economically stable as the U.S. and other nations.
Because Class C Shares automatically convert to Class A Shares after 8 years, the 10 year average annual total return shown above for Class C reflects Class A performance for the period after conversion.
The returns shown are based on net asset values calculated for shareholder transactions and may differ from the returns shown in the financial highlights, which reflect adjustments made to the net asset values in accordance with accounting principles generally accepted in the United States of America.
| 18 | J.P. Morgan International Equity Funds | April 30, 2022 |
JPMorgan International Hedged Equity Fund
FUND COMMENTARY
SIX MONTHS ENDED April 30, 2022 (Unaudited)
| REPORTING PERIOD RETURN: | |
Fund (Class I Shares) *
| (10.08)% |
MSCI EAFE Index (net total return)
| (11.80)% |
ICE BofAML 3-Month US Treasury Bill Index
| 0.07% |
Net Assets as of 4/30/2022 (In Thousands)
| $171,223 |
INVESTMENT OBJECTIVE**
The JPMorgan International Hedged Equity Fund (the “Fund”) seeks to provide capital appreciation.
WHAT WERE THE MAIN DRIVERS OF THE FUND’S PERFORMANCE?
The Fund’s Class I Shares outperformed the MSCI EAFE Index (net total return) (the “Benchmark”) and underperformed the ICE BofAML 3-Month U.S. Treasury Bill Index for the six months ended April 30, 2022. The Fund’s options hedge allowed the Fund to generally perform as designed during the reporting period with about 58% of the Benchmark’s volatility.
The Fund’s security selection in the communication services and health care sectors was a leading contributor to performance relative to the Benchmark, while the Fund’s underweight positions in the materials and energy sectors were leading detractors from relative performance.
By country, the Fund’s security selection in Switzerland and Singapore was a leading contributor to performance relative to the Benchmark, while the Fund’s security selection and underweight position in the U.K. and its security selection in Italy were leading detractors from relative performance.
Leading individual contributors to relative performance included the Fund’s underweight position in Sea Ltd. and its overweight positions in Rio Tinto PLC and RWE AG. Shares of
Sea, a Singapore-based internet and mobile platform provider, fell after Tencent Holdings Ltd. reduced its stake in the company to about 19% from 21%. Shares of Rio Tinto, a U.K. mining and metals company, rose after the company forecast growth in iron ore shipments in the second half of 2022. Shares of RWE, a German electric utility, rose amid rising energy prices across Europe.
Leading individual detractors from relative performance included the Fund’s overweight positions in Ryochin Keikaku Co. and Infineon Technologies AG and its underweight position in Glencore PLC. Shares of Ryochin Keikaku, an apparel and household goods retailer operating under the Muji brand, fell after the company reported lower-than-expected earnings amid increased pandemic-related expenses and lower sales in Japan and China. Shares of Infineon Technologies, a semiconductor manufacturer, fell amid slowing demand from the automotive subsector. Shares of Glencore, a U.K. mining and minerals company not held in the Fund, rose amid surging global commodities prices.
HOW WAS THE FUND POSITIONED?
The Fund’s portfolio managers continued to focus on security selection to build a portfolio of international equities. They used bottom-up fundamental research to identify what they believed were attractively priced securities of companies with solid financial positions that possessed the potential to increase
| April 30, 2022 | J.P. Morgan International Equity Funds | 19 |
JPMorgan International Hedged Equity Fund
FUND COMMENTARY
SIX MONTHS ENDED April 30, 2022 (Unaudited) (continued)
their earnings faster than their industry peers.
TOP TEN POSITIONS OF THE
PORTFOLIO AS OF April 30, 2022 | | PERCENT OF
TOTAL
INVESTMENTS |
| 1. | MSCI EAFE E-Mini Index 6/17/2022 at USD 2,015.00, European Style
| | 3.6 % |
| 2. | Nestle SA (Registered) (Switzerland)
| | 2.8 |
| 3. | Roche Holding AG (Switzerland)
| | 2.4 |
| 4. | ASML Holding NV (Netherlands)
| | 2.0 |
| 5. | Novo Nordisk A/S, Class B (Denmark)
| | 1.9 |
| 6. | LVMH Moet Hennessy Louis Vuitton SE (France)
| | 1.7 |
| 7. | Novartis AG (Registered) (Switzerland)
| | 1.7 |
| 8. | AstraZeneca plc (United Kingdom)
| | 1.6 |
| 9. | Diageo plc (United Kingdom)
| | 1.4 |
| 10. | Allianz SE (Registered) (Germany)
| | 1.3 |
PORTFOLIO COMPOSTION BY COUNTRY
AS OF April 30, 2022 | | PERCENT OF
TOTAL
INVESTMENTS |
Japan
| | 20.9% |
United Kingdom
| | 12.8 |
Switzerland
| | 10.9 |
France
| | 10.7 |
Germany
| | 8.7 |
Australia
| | 6.1 |
Netherlands
| | 5.9 |
United States
| | 5.4 |
Denmark
| | 3.2 |
Spain
| | 2.7 |
Hong Kong
| | 2.4 |
Sweden
| | 1.9 |
Others (each less than 1.0%)
| | 3.9 |
Short-Term Investments
| | 4.5 |
| * | The return shown is based on net asset values calculated for shareholder transactions and may differ from the return shown in the financial highlights, which reflects adjustments made to the net asset values in accordance with accounting principles generally accepted in the United States of America. |
| ** | The adviser seeks to achieve the Fund’s objective. There can be no guarantee it will be achieved. |
| 20 | J.P. Morgan International Equity Funds | April 30, 2022 |
AVERAGE ANNUAL TOTAL RETURNS AS OF April 30, 2022
| | INCEPTION DATE OF
CLASS | | 6 MONTH* | | 1 YEAR | | SINCE
INCEPTION |
| CLASS A SHARES | March 15, 2019 | | | | | | |
| With Sales Charge ** | | | (14.88)% | | (10.37)% | | (0.61)% |
| Without Sales Charge | | | (10.15) | | (5.40) | | 1.11 |
| CLASS C SHARES | March 15, 2019 | | | | | | |
| With CDSC *** | | | (11.38) | | (6.87) | | 0.60 |
| Without CDSC | | | (10.38) | | (5.87) | | 0.60 |
| Class I SHARES | March 15, 2019 | | (10.08) | | (5.18) | | 1.36 |
| Class R5 SHARES | March 15, 2019 | | (9.97) | | (5.01) | | 1.52 |
| Class R6 SHARES | March 15, 2019 | | (9.99) | | (4.98) | | 1.61 |
|
| * | Not annualized. |
| ** | Sales Charge for Class A Shares is 5.25%. |
| *** | Assumes a 1% CDSC (contingent deferred sales charge) for the 6 month and one year periods and 0% CDSC thereafter. |
LIFE OF FUND PERFORMANCE (2/22/19 TO 4/30/22)
The performance quoted is past performance and is not a guarantee of future results. Mutual funds are subject to certain market risks. Investment returns and principal value of an investment will fluctuate so that an investor’s shares, when redeemed, may be worth more or less than their original cost. Current performance may be higher or lower than the performance data shown. For up-to-date month-end performance information please call 1-800-480-4111.
The Fund commenced operations on March 15, 2019.
The graph illustrates comparative performance for $1,000,000 invested in Class I Shares of the JPMorgan International Hedged Equity Fund, the MSCI EAFE Index (net total return) and the ICE BofAML 3-Month US Treasury Bill Index from March 15, 2019 to April 30, 2022. The performance of the Fund assumes reinvestment of all dividends and capital gain distributions, if any, and does not include a sales charge. The performance of the MSCI EAFE Index (net total return) does not reflect the deduction of expenses or a sales charge associated with a mutual fund and approximates the minimum possible dividend reinvestment of the securities included in the benchmark, if applicable. The performance of the ICE BofAML 3-Month US Treasury Bill Index does not reflect the deduction of expenses or a sales charge associated with a mutual fund and has been adjusted to reflect reinvestment of all dividends and capital gain distributions of securities included in the benchmarks, if applicable. The MSCI EAFE Index (net total return) is a free float-adjusted market capitalization weighted index that is designed to measure the performance of large- and mid- cap stocks in developed markets, excluding the U.S. and Canada. Net total return figures assume the reinvestment of dividends after deduction of withholding tax, applying the maximum rate to nonresident individual investors who do not benefit from double taxation treaties. The ICE
BofAML 3-Month US Treasury Bill Index is comprised of a single issue purchased at the beginning of the month and held for a full month. Each month the index is rebalanced and the issue selected is the outstanding Treasury Bill that matures closest to, but not beyond, 3 months from the rebalancing date. Investors cannot invest directly in an index.
Class I Shares have a $1,000,000 minimum initial investment.
Fund performance may reflect the waiver of the Fund’s fees and reimbursement of expenses for certain periods since the applicable inception date. Without these waivers and reimbursements, performance would have been lower. Also, performance shown in this section does not reflect the deduction of taxes that a shareholder would pay on Fund distributions or on gains resulting from redemptions of Fund shares.
International investing involves a greater degree of risk and increased volatility. Changes in currency exchange rates and differences in accounting and taxation policies outside the U.S. can raise or lower returns. Also, some overseas markets may not be as politically and economically stable as the U.S. and other nations.
The returns shown are based on net asset values calculated for shareholder transactions and may differ from the returns shown in the financial highlights, which reflect adjustments made to the net asset values in accordance with accounting principles generally accepted in the United States of America.
The MSCI information may only be used for your internal use, may not be reproduced or redisseminated in any form and may not be used as a basis for or a component of any financial instruments or products or indices. None of the MSCI information is intended to constitute investment advice or a
| April 30, 2022 | J.P. Morgan International Equity Funds | 21 |
JPMorgan International Hedged Equity Fund
FUND COMMENTARY
SIX MONTHS ENDED April 30, 2022 (Unaudited) (continued)
recommendation to make (or refrain from making) any kind of investment decision and may not be relied on as such. Historical data and analysis should not be taken as an indication or guarantee of any future performance analysis, forecast or prediction. The MSCI information is provided on an “as is” basis and the user of this information assumes the entire risk of any use made of this information. MSCI, each of its affiliates and each other person involved in or related to compiling, computing or creating any MSCI information (collectively,
the “MSCI Parties”) expressly disclaims all warranties (including, without limitation, any warranties of originality, accuracy, completeness, timeliness, noninfringement, merchantability and fitness for a particular purpose) with respect to this information. Without limiting any of the foregoing, in no event shall any MSCI Party have any liability for any direct, indirect, special, incidental, punitive, consequential (including, without limitation, lost profits) or any other damages. (www.msci.com)
| 22 | J.P. Morgan International Equity Funds | April 30, 2022 |
JPMorgan International Research Enhanced Equity Fund
FUND COMMENTARY
SIX MONTHS ENDED April 30, 2022 (Unaudited)
| REPORTING PERIOD RETURN: | |
Fund (Class I Shares) *
| (12.16)% |
MSCI EAFE Index (net total return)
| (11.80)% |
Net Assets as of 4/30/2022 (In Thousands)
| $5,523,040 |
INVESTMENT OBJECTIVE**
The JPMorgan International Research Enhanced Equity Fund (the “Fund”) seeks to provide long-term capital appreciation.
WHAT WERE THE MAIN DRIVERS OF THE FUND’S PERFORMANCE?
The Fund’s Class I Shares underperformed the MSCI EAFE Index (net total return) (the “Benchmark”) for the six months ended April 30, 2022.
The Fund’s underweight positions in the materials and energy sectors were leading detractors from performance relative to the Benchmark, while the Fund’s security selection in the communication services and health care sectors were leading contributors to relative performance.
By region, the Fund��s security selection in the U.K. was the sole regional detractor from performance relative to the Benchmark, while the Fund’s security selection in Europe, excluding the U.K., and in the Pacific, excluding Japan, was a leading contributor to relative performance.
Due to the Fund holding a relatively large number of securities during the reporting period, the impact of individual holdings on the Fund’s relative performance tended to be small.
HOW WAS THE FUND POSITIONED?
Using the fundamental equity insights generated by analysts, the Fund’s portfolio managers took overweight positions in securities included within the universe of the Benchmark that they considered undervalued, while underweighting or not holding securities in the Benchmark that they considered overvalued.
TOP TEN POSITIONS OF THE
PORTFOLIO AS OF April 30, 2022 | | PERCENT OF
TOTAL
INVESTMENTS |
| 1. | Nestle SA (Registered) (Switzerland)
| | 2.9 % |
| 2. | Roche Holding AG (Switzerland)
| | 2.5 |
| 3. | ASML Holding NV (Netherlands)
| | 2.0 |
| 4. | Novo Nordisk A/S, Class B (Denmark)
| | 2.0 |
| 5. | LVMH Moet Hennessy Louis Vuitton SE (France)
| | 1.8 |
| 6. | Novartis AG (Registered) (Switzerland)
| | 1.7 |
| 7. | AstraZeneca plc (United Kingdom)
| | 1.6 |
| 8. | Diageo plc (United Kingdom)
| | 1.4 |
| 9. | BP plc (United Kingdom)
| | 1.3 |
| 10. | Allianz SE (Registered) (Germany)
| | 1.3 |
PORTFOLIO COMPOSTION BY COUNTRY
AS OF April 30, 2022 | | PERCENT OF
TOTAL
INVESTMENTS |
Japan
| | 19.0% |
United Kingdom
| | 13.6 |
Switzerland
| | 11.4 |
France
| | 11.4 |
Germany
| | 9.1 |
Netherlands
| | 6.3 |
Australia
| | 5.8 |
Denmark
| | 3.4 |
Spain
| | 2.7 |
Hong Kong
| | 2.2 |
Sweden
| | 1.9 |
United States
| | 1.9 |
Others (each less than 1.0%)
| | 4.0 |
Short-Term Investments
| | 7.3 |
| * | The return shown is based on net asset values calculated for shareholder transactions and may differ from the return shown in the financial highlights, which reflects adjustments made to the net asset values in accordance with accounting principles generally accepted in the United States of America. |
| ** | The adviser seeks to achieve the Fund’s objective. There can be no guarantee it will be achieved. |
| April 30, 2022 | J.P. Morgan International Equity Funds | 23 |
JPMorgan International Research Enhanced Equity Fund
FUND COMMENTARY
SIX MONTHS ENDED April 30, 2022 (Unaudited) (continued)
AVERAGE ANNUAL TOTAL RETURNS AS OF April 30, 2022
| | INCEPTION DATE OF
CLASS | | 6 MONTH* | | 1 YEAR | | 5 YEAR | | 10 YEAR |
| CLASS A SHARES | April 23, 1993 | | | | | | | | |
| With Sales Charge ** | | | (16.83)% | | (12.46)% | | 2.48% | | 4.74% |
| Without Sales Charge | | | (12.21) | | (7.61) | | 3.60 | | 5.31 |
| Class I SHARES | October 28, 1992 | | (12.16) | | (7.45) | | 3.83 | | 5.57 |
| Class R6 SHARES | November 1, 2017 | | (12.14) | | (7.36) | | 3.93 | | 5.62 |
|
| * | Not annualized. |
| ** | Sales Charge for Class A Shares is 5.25%. |
TEN YEAR FUND PERFORMANCE (4/30/12 TO 4/30/22)
The performance quoted is past performance and is not a guarantee of future results. Mutual funds are subject to certain market risks. Investment returns and principal value of an investment will fluctuate so that an investor’s shares, when redeemed, may be worth more or less than their original cost. Current performance may be higher or lower than the performance data shown. For up-to-date month-end performance information please call 1-800-480-4111.
Returns for Class R6 Shares prior to its inception date are based on the performance of Class I Shares. The actual returns of Class R6 Shares would have been different than those shown because Class R6 Shares have different expenses than Class I Shares.
The graph illustrates comparative performance for $1,000,000 invested in Class I Shares of the JPMorgan International Research Enhanced Equity Fund and the MSCI EAFE Index (net total return) from April 30, 2012 to April 30, 2022. The performance of the Fund assumes reinvestment of all dividends and capital gain distributions, if any, and does not include a sales charge. The performance of the MSCI EAFE Index (net total return) does not reflect the deduction of expenses or a sales charge associated with a mutual fund and approximates the minimum possible dividend reinvestment of the securities included in the benchmark, if applicable. The MSCI EAFE Index (net total return) is a free float-adjusted market capitalization weighted index that is designed to measure the performance of large- and mid- cap stocks in developed markets, excluding the U.S. and Canada. Net total return figures assume the reinvestment of dividends after deduction of withholding tax, applying the maximum rate to nonresident individual investors who do not benefit from double taxation treaties. Investors cannot invest directly in an index.
Class I Shares have a $1,000,000 minimum initial investment.
Fund performance may reflect the waiver of the Fund’s fees and reimbursement of expenses for certain periods since the applicable inception date. Without these waivers and reimbursements, performance would have been lower.
Also, performance shown in this section does not reflect the deduction of taxes that a shareholder would pay on Fund distributions or on gains resulting from redemptions of Fund shares.
International investing involves a greater degree of risk and increased volatility. Changes in currency exchange rates and differences in accounting and taxation policies outside the U.S. can raise or lower returns. Also, some overseas markets may not be as politically and economically stable as the U.S. and other nations.
The returns shown are based on net asset values calculated for shareholder transactions and may differ from the returns shown in the financial highlights, which reflect adjustments made to the net asset values in accordance with accounting principles generally accepted in the United States of America.
The MSCI information may only be used for your internal use, may not be reproduced or redisseminated in any form and may not be used as a basis for or a component of any financial instruments or products or indices. None of the MSCI information is intended to constitute investment advice or a recommendation to make (or refrain from making) any kind of investment decision and may not be relied on as such. Historical data and analysis should not be taken as an indication or guarantee of any future performance analysis, forecast or prediction. The MSCI information is provided on an “as is” basis and the user of this information assumes the entire risk of any use made of this information. MSCI, each of its affiliates and each other person involved in or related to compiling, computing or creating any MSCI information (collectively, the “MSCI Parties”) expressly disclaims all warranties (including, without limitation, any warranties of originality, accuracy, completeness, timeliness, noninfringement, merchantability and fitness for a particular purpose) with respect to this information. Without limiting any of the foregoing, in no event shall any MSCI Party have any liability for any direct, indirect, special, incidental, punitive, consequential (including, without limitation, lost profits) or any other damages. (www.msci.com)
| 24 | J.P. Morgan International Equity Funds | April 30, 2022 |
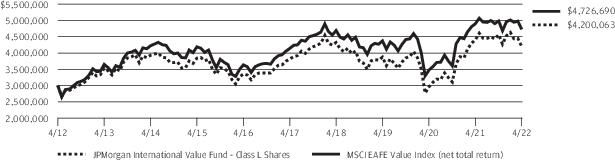
JPMorgan International Value Fund
FUND COMMENTARY
SIX MONTHS ENDED April 30, 2022 (Unaudited)
| REPORTING PERIOD RETURN: | |
Fund (Class L Shares) *
| (7.92)% |
MSCI EAFE Value Index (net total return)
| (5.14)% |
Net Assets as of 4/30/2022 (In Thousands)
| $387,700 |
INVESTMENT OBJECTIVE**
The JPMorgan International Value Fund (the “Fund”) seeks to provide long-term capital appreciation.
WHAT WERE THE MAIN DRIVERS OF THE FUND’S PERFORMANCE?
The Fund’s Class L Shares underperformed the MSCI EAFE Value Index (net total return) (the “Benchmark”) for the six months ended April 30, 2022.
The Fund’s security selection in the consumer discretionary and industrials sectors was a leading detractor from performance relative to the Benchmark, while the Fund’s underweight positions in the information technology and real estate sectors were leading detractors from relative performance.
By region, the Fund’s security selection in the U.K. and Europe was a leading detractor from relative performance, while the Fund’s security selection in Japan was the sole regional contributor to relative performance.
Leading individual detractors from relative performance included the Fund’s underweight positions in Shell PLC, British American Tobacco PLC and AstraZeneca PLC. Shares of Shell, a U.K. integrated petroleum and natural gas company, rose amid rising global energy prices. Shares of British American Tobacco, a U.K. tobacco products maker not held in the Fund, rose amid
the company’s efforts to enter the retail market for cannabis products. Shares of AstraZeneca, a U.K. pharmaceuticals company not held in the Fund, rose amid investor expectations of regulatory approvals of the company’s treatment for Covid-19 and its variants.
Leading individual contributors to relative performance included the Fund’s underweight positions in SAP SE, BASF AG and SoftBank Group Corp. Shares of SAP, a German software and services company not held in the Fund, fell amid a sell-off in the broader European information technology sector. Shares of BASF, a German chemicals and materials manufacturer not held in the Fund, fell after the company forecast lower-than-expected sales and revenue in 2022. Shares of SoftBank Group, a Japanese technology sector holding company not held in the Fund, fell amid investor concerns about the company’s exposure to technology businesses in China.
HOW WAS THE FUND POSITIONED?
The Fund’s portfolio managers employed behavioral-based and quantitative screens in addition to conducting fundamental analysis to seek out companies that they believed had attractive valuations. As a result of this process, the Fund’s largest overweight positions relative to the Benchmark during the period were in the financials and consumer discretionary sectors, while the largest underweight positions were in the
| April 30, 2022 | J.P. Morgan International Equity Funds | 25 |
JPMorgan International Value Fund
FUND COMMENTARY
SIX MONTHS ENDED April 30, 2022 (Unaudited) (continued)
consumer staples and utilities sectors.
TOP TEN POSITIONS OF THE
PORTFOLIO AS OF April 30, 2022 | | PERCENT OF
TOTAL
INVESTMENTS |
| 1. | Shell plc (Netherlands)
| | 2.8 % |
| 2. | Novartis AG (Registered) (Switzerland)
| | 2.4 |
| 3. | Toyota Motor Corp. (Japan)
| | 2.3 |
| 4. | BHP Group Ltd. (Australia)
| | 2.2 |
| 5. | TotalEnergies SE (France)
| | 1.7 |
| 6. | HSBC Holdings plc (United Kingdom)
| | 1.6 |
| 7. | GlaxoSmithKline plc
| | 1.5 |
| 8. | BP plc (United Kingdom)
| | 1.4 |
| 9. | Siemens AG (Registered) (Germany)
| | 1.2 |
| 10. | Allianz SE (Registered) (Germany)
| | 1.2 |
PORTFOLIO COMPOSTION BY COUNTRY
AS OF April 30, 2022 | | PERCENT OF
TOTAL
INVESTMENTS |
Japan
| | 20.1% |
United Kingdom
| | 13.6 |
Germany
| | 9.4 |
Australia
| | 8.1 |
France
| | 7.7 |
Switzerland
| | 5.9 |
Netherlands
| | 5.8 |
Italy
| | 3.2 |
Spain
| | 3.1 |
Sweden
| | 2.6 |
Norway
| | 2.4 |
United States
| | 2.3 |
Denmark
| | 1.6 |
Finland
| | 1.5 |
PORTFOLIO COMPOSTION BY COUNTRY
AS OF April 30, 2022 | | PERCENT OF
TOTAL
INVESTMENTS |
Singapore
| | 1.4% |
Austria
| | 1.3 |
Hong Kong
| | 1.0 |
Others (each less than 1.0%)
| | 2.7 |
Short-Term Investments
| | 6.3 |
| * | The return shown is based on net asset values calculated for shareholder transactions and may differ from the return shown in the financial highlights, which reflects adjustments made to the net asset values in accordance with accounting principles generally accepted in the United States of America. |
| ** | The adviser seeks to achieve the Fund’s objective. There can be no guarantee it will be achieved. |
| 26 | J.P. Morgan International Equity Funds | April 30, 2022 |
AVERAGE ANNUAL TOTAL RETURNS AS OF April 30, 2022
| | INCEPTION DATE OF
CLASS | | 6 MONTH* | | 1 YEAR | | 5 YEAR | | 10 YEAR |
| CLASS A SHARES | September 28, 2001 | | | | | | | | |
| With Sales Charge ** | | | (12.90)% | | (9.86)% | | 0.46% | | 2.46% |
| Without Sales Charge | | | (8.05) | | (4.87) | | 1.55 | | 3.02 |
| CLASS C SHARES | July 11, 2006 | | | | | | | | |
| With CDSC *** | | | (9.34) | | (6.36) | | 1.03 | | 2.61 |
| Without CDSC | | | (8.34) | | (5.36) | | 1.03 | | 2.61 |
| Class I SHARES | September 10, 2001 | | (7.97) | | (4.66) | | 1.81 | | 3.29 |
| Class L SHARES | November 4, 1993 | | (7.92) | | (4.53) | | 1.92 | | 3.42 |
| Class R2 SHARES | November 3, 2008 | | (8.22) | | (5.13) | | 1.25 | | 2.74 |
| Class R5 SHARES | September 9, 2016 | | (7.85) | | (4.50) | | 1.92 | | 3.42 |
| Class R6 SHARES | November 30, 2010 | | (7.93) | | (4.44) | | 2.02 | | 3.53 |
|
| * | Not annualized. |
| ** | Sales Charge for Class A Shares is 5.25%. |
| *** | Assumes a 1% CDSC (contingent deferred sales charge) for the 6 month and one year periods and 0% CDSC thereafter. |
TEN YEAR FUND PERFORMANCE (4/30/12 TO 4/30/22)
The performance quoted is past performance and is not a guarantee of future results. Mutual funds are subject to certain market risks. Investment returns and principal value of an investment will fluctuate so that an investor’s shares, when redeemed, may be worth more or less than their original cost. Current performance may be higher or lower than the performance data shown. For up-to-date month-end performance information please call 1-800-480-4111. Effective May 2018, some of the Fund’s investment strategies changed. The Fund’s past performance would have been different if the Fund was managed under the current strategies.
Returns for Class R5 Shares prior to their inception dates are based on the performance of Class L Shares. The actual returns of Class R5 Shares would have been different than those shown because Class R5 Shares have different expenses than Class L Shares.
The graph illustrates comparative performance for $3,000,000 invested in Class L Shares of the JPMorgan International Value Fund and the MSCI EAFE Value Index (net total return) from April 30, 2012 to April 30, 2022. The performance of the Fund assumes reinvestment of all dividends and capital gain distributions, if any, and does not include a sales charge. The performance of the MSCI EAFE Value Index (net total return) does not reflect the deduction of expenses or a sales charge associated with a mutual fund and approximates the minimum possible dividend reinvestment of the securities included in the benchmark, if applicable. The MSCI EAFE Value Index (net total return) is a free float-adjusted market capitalization weighted index that is designed to measure the performance of value-oriented large- and mid- cap stocks in developed markets, excluding the U.S. and Canada. Net total return figures
assume the reinvestment of dividends after deduction of withholding tax, applying the maximum rate to nonresident individual investors who do not benefit from double taxation treaties. Investors cannot invest directly in an index.
Class L Shares have a $3,000,000 minimum initial investment.
Fund performance may reflect the waiver of the Fund’s fees and reimbursement of expenses for certain periods since the applicable inception date. Without these waivers and reimbursements, performance would have been lower. Also, performance shown in this section does not reflect the deduction of taxes that a shareholder would pay on Fund distributions or on gains resulting from redemptions of Fund shares.
International investing involves a greater degree of risk and increased volatility. Changes in currency exchange rates and differences in accounting and taxation policies outside the U.S. can raise or lower returns. Also, some overseas markets may not be as politically and economically stable as the U.S. and other nations.
Because Class C Shares automatically convert to Class A Shares after 8 years, the 10 year average annual total return shown above for Class C reflects Class A performance for the period after conversion.
The returns shown are based on net asset values calculated for shareholder transactions and may differ from the returns shown in the financial highlights, which reflect adjustments made to the net asset values in accordance with accounting principles generally accepted in the United States of America.
| April 30, 2022 | J.P. Morgan International Equity Funds | 27 |
JPMorgan Emerging Markets Equity Fund
SCHEDULE OF PORTFOLIO INVESTMENTS
AS OF April 30, 2022 (Unaudited)
| INVESTMENTS | SHARES
(000) | VALUE
($000) |
| Common Stocks — 97.3% |
| Brazil — 5.7% |
| B3 SA - Brasil Bolsa Balcao | 36,160 | 97,275 |
| Magazine Luiza SA * | 35,416 | 35,388 |
| MercadoLibre, Inc. * | 290 | 282,412 |
| Raia Drogasil SA | 12,592 | 53,284 |
| XP, Inc., Class A * | 3,372 | 82,972 |
| | | 551,331 |
| China — 30.5% |
| Alibaba Group Holding Ltd. * | 2,185 | 26,658 |
| Beijing Oriental Yuhong Waterproof Technology Co. Ltd., Class A | 14,621 | 99,270 |
| Budweiser Brewing Co. APAC Ltd. (a) | 36,765 | 91,478 |
| Dada Nexus Ltd., ADR * | 3,482 | 26,570 |
| Foshan Haitian Flavouring & Food Co. Ltd., Class A | 10,770 | 131,311 |
| JD.com, Inc., ADR * | 1,020 | 62,922 |
| JD.com, Inc., Class A * | 7,921 | 246,959 |
| Jiangsu Hengli Hydraulic Co. Ltd., Class A | 14,368 | 98,604 |
| KE Holdings, Inc., ADR * | 3,440 | 48,775 |
| Kingdee International Software Group Co. Ltd. * | 33,349 | 68,052 |
| Meituan * (a) | 7,797 | 167,056 |
| Midea Group Co. Ltd., Class A | 3,256 | 27,705 |
| NetEase, Inc. | 12,341 | 236,401 |
| Pharmaron Beijing Co. Ltd., Class A | 5,886 | 110,397 |
| Ping An Bank Co. Ltd., Class A | 24,427 | 55,982 |
| Shenzhen Mindray Bio-Medical Electronics Co. Ltd., Class A | 1,917 | 89,874 |
| Shenzhou International Group Holdings Ltd. | 8,462 | 114,817 |
| Sichuan Swellfun Co. Ltd., Class A | 1,990 | 20,973 |
| Silergy Corp. | 1,455 | 129,542 |
| Sunny Optical Technology Group Co. Ltd. | 6,003 | 87,494 |
| Tencent Holdings Ltd. | 9,578 | 451,358 |
| Wanhua Chemical Group Co. Ltd., Class A | 8,751 | 101,801 |
| Wuliangye Yibin Co. Ltd., Class A | 2,814 | 68,187 |
| Wuxi Biologics Cayman, Inc. * (a) | 19,748 | 145,760 |
| Xinyi Solar Holdings Ltd. | 90,630 | 134,715 |
| Yum China Holdings, Inc. | 2,605 | 108,882 |
| | | 2,951,543 |
| Hong Kong — 4.9% |
| AIA Group Ltd. | 24,585 | 241,514 |
| Hong Kong Exchanges & Clearing Ltd. | 1,598 | 67,802 |
| Techtronic Industries Co. Ltd. | 1,220 | 16,254 |
| Techtronic Industries Co. Ltd. | 11,206 | 149,579 |
| | | 475,149 |
| INVESTMENTS | SHARES
(000) | VALUE
($000) |
| |
| India — 21.9% |
| Apollo Hospitals Enterprise Ltd. | 1,562 | 90,468 |
| Asian Paints Ltd. | 2,104 | 88,691 |
| Britannia Industries Ltd. | 1,516 | 64,701 |
| HDFC Bank Ltd. | 13,065 | 234,234 |
| HDFC Bank Ltd., ADR | 2,799 | 154,522 |
| HDFC Life Insurance Co. Ltd. (a) | 16,679 | 126,468 |
| Hindustan Unilever Ltd. | 5,256 | 152,715 |
| Housing Development Finance Corp. Ltd. | 9,711 | 280,190 |
| Infosys Ltd. | 3,073 | 62,281 |
| Infosys Ltd., ADR | 6,857 | 136,239 |
| Kotak Mahindra Bank Ltd. | 6,895 | 159,883 |
| Reliance Industries Ltd. | 7,350 | 266,303 |
| Tata Consultancy Services Ltd. | 6,652 | 306,584 |
| | | 2,123,279 |
| Indonesia — 4.4% |
| Bank Central Asia Tbk. PT | 366,933 | 205,802 |
| Bank Rakyat Indonesia Persero Tbk. PT | 655,689 | 218,467 |
| | | 424,269 |
| Macau — 0.5% |
| Sands China Ltd. * | 22,195 | 48,921 |
| Mexico — 3.1% |
| Grupo Financiero Banorte SAB de CV, Class O | 17,815 | 117,418 |
| Wal-Mart de Mexico SAB de CV | 52,447 | 185,898 |
| | | 303,316 |
| Panama — 0.7% |
| Copa Holdings SA, Class A * | 879 | 66,264 |
| Poland — 0.4% |
| Allegro.eu SA * (a) | 6,701 | 34,466 |
| Portugal — 0.9% |
| Jeronimo Martins SGPS SA | 4,290 | 89,295 |
| South Africa — 1.5% |
| Bid Corp. Ltd. | 3,452 | 72,233 |
| Capitec Bank Holdings Ltd. | 525 | 73,285 |
| | | 145,518 |
| South Korea — 8.2% |
| Delivery Hero SE * (a) (b) | 1,063 | 37,355 |
| LG Chem Ltd. | 225 | 92,259 |
| NCSoft Corp. | 162 | 53,683 |
| Samsung Electronics Co. Ltd. | 11,386 | 606,785 |
| | | 790,082 |
SEE NOTES TO FINANCIAL STATEMENTS.
| 28 | J.P. Morgan International Equity Funds | April 30, 2022 |
| INVESTMENTS | SHARES
(000) | VALUE
($000) |
| Common Stocks — continued |
| Taiwan — 11.5% |
| Chailease Holding Co. Ltd. | 16,230 | 128,975 |
| Delta Electronics, Inc. | 9,230 | 77,048 |
| Realtek Semiconductor Corp. | 3,104 | 42,120 |
| Taiwan Semiconductor Manufacturing Co. Ltd. | 6,120 | ���110,666 |
| Taiwan Semiconductor Manufacturing Co. Ltd., ADR | 8,142 | 756,695 |
| | | 1,115,504 |
| United Kingdom — 1.1% |
| Prudential plc | 8,808 | 109,652 |
| United States — 2.0% |
| EPAM Systems, Inc. * | 544 | 144,031 |
| JS Global Lifestyle Co. Ltd. (a) | 41,166 | 48,836 |
| | | 192,867 |
Total Common Stocks
(Cost $8,504,575) | | 9,421,456 |
| Short-Term Investments — 2.8% |
| Investment Companies — 2.8% |
| JPMorgan Prime Money Market Fund Class Institutional Shares, 0.36% (c) (d)(Cost $267,802) | 267,753 | 267,806 |
| Investment of Cash Collateral from Securities Loaned — 0.0% ^ |
| JPMorgan Securities Lending Money Market Fund Agency SL Class Shares, 0.37% (c) (d) | 8 | 8 |
| JPMorgan U.S. Government Money Market Fund Class IM Shares, 0.37% (c) (d) | 99 | 99 |
Total Investment of Cash Collateral from Securities Loaned
(Cost $107) | | 107 |
Total Short-Term Investments
(Cost $267,909) | | 267,913 |
Total Investments — 100.1%
(Cost $8,772,484) | | 9,689,369 |
| Liabilities in Excess of Other Assets — (0.1)% | | (11,141) |
| NET ASSETS — 100.0% | | 9,678,228 |
Percentages indicated are based on net assets. |
| Abbreviations | |
| ADR | American Depositary Receipt |
| APAC | Asia Pacific |
| PT | Limited liability company |
| SGPS | Holding company |
| ^ | Amount rounds to less than 0.1% of net assets. |
| * | Non-income producing security. | |
| (a) | Security exempt from registration pursuant to Regulation S under the Securities Act of 1933, as amended. Regulation S applies to securities offerings that are made outside of the United States and do not involve direct selling efforts in the United States and as such may have restrictions on resale. | |
| (b) | The security or a portion of this security is on loan at April 30, 2022. The total value of securities on loan at April 30, 2022 is $106. | |
| (c) | Investment in an affiliated fund, which is registered under the Investment Company Act of 1940, as amended, and is advised by J.P. Morgan Investment Management Inc. | |
| (d) | The rate shown is the current yield as of April 30, 2022. | |
Summary of Investments by Industry, April 30, 2022
The following table represents the portfolio investments of the Fund by industry classifications as a percentage of total investments:
| INDUSTRY | PERCENT OF
TOTAL
INVESTMENTS |
| Banks | 12.7% |
| Semiconductors & Semiconductor Equipment | 12.1 |
| Internet & Direct Marketing Retail | 9.3 |
| IT Services | 6.7 |
| Technology Hardware, Storage & Peripherals | 6.3 |
| Insurance | 4.9 |
| Interactive Media & Services | 4.7 |
| Food & Staples Retailing | 4.0 |
| Entertainment | 2.9 |
| Chemicals | 2.9 |
| Thrifts & Mortgage Finance | 2.9 |
| Oil, Gas & Consumable Fuels | 2.7 |
| Machinery | 2.7 |
| Life Sciences Tools & Services | 2.6 |
| Capital Markets | 2.6 |
| Food Products | 2.1 |
| Beverages | 1.8 |
| Electronic Equipment, Instruments & Components | 1.7 |
| Hotels, Restaurants & Leisure | 1.6 |
| Personal Products | 1.6 |
| Diversified Financial Services | 1.3 |
| Textiles, Apparel & Luxury Goods | 1.2 |
| Construction Materials | 1.0 |
| Others (each less than 1.0%) | 4.9 |
| Short-Term Investments | 2.8 |
SEE NOTES TO FINANCIAL STATEMENTS.
| April 30, 2022 | J.P. Morgan International Equity Funds | 29 |
JPMorgan Emerging Markets Research Enhanced Equity Fund
SCHEDULE OF PORTFOLIO INVESTMENTS
AS OF April 30, 2022 (Unaudited)
| INVESTMENTS | SHARES
(000) | VALUE
($000) |
| Common Stocks — 98.7% |
| Brazil — 6.2% |
| Atacadao SA | 1,245 | 5,192 |
| B3 SA - Brasil Bolsa Balcao | 1,593 | 4,285 |
| Cia Energetica de Minas Gerais (Preference) | 959 | 2,918 |
| EDP - Energias do Brasil SA | 936 | 4,026 |
| Gerdau SA (Preference) | 2,097 | 11,972 |
| Itau Unibanco Holding SA (Preference) * | 3,198 | 15,485 |
| Itausa SA (Preference) | 6,219 | 11,610 |
| Localiza Rent a Car SA | 436 | 4,701 |
| Lojas Renner SA * | 1,656 | 7,992 |
| Magazine Luiza SA * | 3,785 | 3,782 |
| MercadoLibre, Inc. * | 4 | 4,281 |
| Petroleo Brasileiro SA (Preference) | 4,981 | 30,721 |
| Porto Seguro SA | 470 | 1,950 |
| Raia Drogasil SA | 2,012 | 8,511 |
| Suzano SA | 975 | 9,858 |
| TIM SA, ADR * | 466 | 6,360 |
| Vale SA, ADR | 2,078 | 35,104 |
| WEG SA | 1,854 | 11,365 |
| XP, Inc., Receipts * | 85 | 2,096 |
| | | 182,209 |
| Chile — 0.4% |
| Banco Santander Chile, ADR | 383 | 7,452 |
| Cencosud SA | 1,448 | 2,317 |
| Cia Cervecerias Unidas SA, ADR | 118 | 1,578 |
| | | 11,347 |
| China — 30.4% |
| Alibaba Group Holding Ltd. * | 7,028 | 85,726 |
| Amoy Diagnostics Co. Ltd., Class A | 204 | 1,393 |
| Anhui Conch Cement Co. Ltd., Class H | 903 | 4,910 |
| Anjoy Foods Group Co. Ltd., Class A | 136 | 2,635 |
| ANTA Sports Products Ltd. | 718 | 8,247 |
| Baidu, Inc., ADR * | 92 | 11,375 |
| Baoshan Iron & Steel Co. Ltd., Class A | 6,679 | 6,444 |
| BeiGene Ltd., ADR * (a) | 17 | 2,677 |
| Beijing Oriental Yuhong Waterproof Technology Co. Ltd., Class A | 589 | 3,999 |
| BOE Technology Group Co. Ltd., Class A | 10,123 | 5,750 |
| BYD Co. Ltd., Class H | 159 | 4,642 |
| Chacha Food Co. Ltd., Class A | 651 | 5,179 |
| China Conch Environment Protection Holdings Ltd. * | 1,321 | 1,131 |
| China Conch Venture Holdings Ltd. | 1,321 | 3,430 |
| China Construction Bank Corp., Class H | 51,389 | 36,609 |
| China International Capital Corp. Ltd., Class H (b) | 3,397 | 6,809 |
| INVESTMENTS | SHARES
(000) | VALUE
($000) |
| |
| China — continued |
| China Lesso Group Holdings Ltd. | 3,062 | 3,829 |
| China Life Insurance Co. Ltd., Class H | 6,444 | 9,364 |
| China Merchants Bank Co. Ltd., Class H | 3,374 | 20,336 |
| China Molybdenum Co. Ltd., Class H | 12,579 | 6,256 |
| China Oilfield Services Ltd., Class H | 8,198 | 8,393 |
| China Pacific Insurance Group Co. Ltd., Class H | 3,075 | 6,818 |
| China Petroleum & Chemical Corp., Class H | 12,884 | 6,306 |
| China Resources Land Ltd. | 2,594 | 11,585 |
| China Resources Mixc Lifestyle Services Ltd. (b) | 644 | 3,096 |
| China Vanke Co. Ltd., Class H | 4,356 | 10,272 |
| China Yangtze Power Co. Ltd., Class A | 2,446 | 8,336 |
| Chongqing Brewery Co. Ltd., Class A * | 192 | 3,590 |
| Chongqing Fuling Zhacai Group Co. Ltd., Class A | 602 | 3,142 |
| Contemporary Amperex Technology Co. Ltd., Class A | 117 | 7,085 |
| COSCO SHIPPING Holdings Co. Ltd., Class H * | 1,890 | 2,941 |
| Country Garden Services Holdings Co. Ltd. | 1,560 | 6,575 |
| CSPC Pharmaceutical Group Ltd. | 5,804 | 5,934 |
| ENN Energy Holdings Ltd. | 681 | 9,118 |
| Foshan Haitian Flavouring & Food Co. Ltd., Class A | 712 | 8,681 |
| Fuyao Glass Industry Group Co. Ltd., Class H (b) | 965 | 3,942 |
| Ganfeng Lithium Co. Ltd., Class H (b) | 221 | 2,648 |
| Guangzhou Automobile Group Co. Ltd., Class H | 11,024 | 9,347 |
| Guangzhou Kingmed Diagnostics Group Co. Ltd., Class A | 282 | 3,452 |
| Haier Smart Home Co. Ltd., Class H | 3,563 | 12,586 |
| Hangzhou Tigermed Consulting Co. Ltd., Class H (b) | 271 | 2,625 |
| Han's Laser Technology Industry Group Co. Ltd., Class A | 605 | 2,497 |
| Hefei Meiya Optoelectronic Technology, Inc., Class A | 535 | 1,814 |
| Huatai Securities Co. Ltd., Class H (b) | 2,480 | 3,408 |
| Huayu Automotive Systems Co. Ltd., Class A | 978 | 2,861 |
| Huazhu Group Ltd. | 1,647 | 5,183 |
| Hundsun Technologies, Inc., Class A | 327 | 1,862 |
| Hutchmed China Ltd., ADR * (a) | 64 | 972 |
| Industrial & Commercial Bank of China Ltd., Class H | 27,366 | 16,496 |
| Inner Mongolia Yili Industrial Group Co. Ltd., Class A | 1,589 | 9,157 |
| JD.com, Inc., Class A * | 1,127 | 35,144 |
| Jiangsu Hengli Hydraulic Co. Ltd., Class A | 273 | 1,873 |
| Jiangsu Hengrui Medicine Co. Ltd., Class A | 949 | 4,191 |
| Kuaishou Technology * (b) | 315 | 2,576 |
| Kunlun Energy Co. Ltd. | 7,742 | 6,425 |
| Kweichow Moutai Co. Ltd., Class A | 31 | 8,375 |
| Laobaixing Pharmacy Chain JSC, Class A | 670 | 3,232 |
| Lenovo Group Ltd. | 3,448 | 3,348 |
SEE NOTES TO FINANCIAL STATEMENTS.
| 30 | J.P. Morgan International Equity Funds | April 30, 2022 |
| INVESTMENTS | SHARES
(000) | VALUE
($000) |
| Common Stocks — continued |
| China — continued |
| Longfor Group Holdings Ltd. (b) | 2,086 | 10,331 |
| Maxscend Microelectronics Co. Ltd., Class A * | 66 | 1,805 |
| Meituan * (b) | 1,866 | 39,984 |
| Minth Group Ltd. | 1,506 | 3,548 |
| NetEase, Inc. | 1,352 | 25,906 |
| NIO, Inc., ADR * (a) | 437 | 7,302 |
| Nongfu Spring Co. Ltd., Class H (b) | 740 | 3,917 |
| Oppein Home Group, Inc., Class A | 348 | 6,074 |
| Pharmaron Beijing Co. Ltd., Class H (b) | 572 | 7,190 |
| PICC Property & Casualty Co. Ltd., Class H | 10,226 | 10,459 |
| Pinduoduo, Inc., ADR * | 222 | 9,573 |
| Ping An Bank Co. Ltd., Class A | 3,403 | 7,798 |
| Ping An Insurance Group Co. of China Ltd., Class H | 3,821 | 24,155 |
| Poly Developments and Holdings Group Co. Ltd., Class A | 1,188 | 3,243 |
| Postal Savings Bank of China Co. Ltd., Class H (b) | 8,595 | 6,517 |
| Qingdao Haier Biomedical Co. Ltd., Class A | 387 | 3,744 |
| Shanghai Baosight Software Co. Ltd., Class A | 513 | 3,641 |
| Shenzhen Mindray Bio-Medical Electronics Co. Ltd., Class A | 128 | 6,009 |
| Silergy Corp. | 77 | 6,856 |
| Skshu Paint Co. Ltd., Class A | 323 | 3,589 |
| Sunny Optical Technology Group Co. Ltd. | 533 | 7,771 |
| Tencent Holdings Ltd. | 2,663 | 125,503 |
| Tongwei Co. Ltd., Class A | 792 | 4,842 |
| Trip.com Group Ltd., ADR * | 152 | 3,606 |
| Wanhua Chemical Group Co. Ltd., Class A | 562 | 6,534 |
| Wuliangye Yibin Co. Ltd., Class A | 101 | 2,437 |
| WuXi AppTec Co. Ltd., Class H (b) | 534 | 7,259 |
| Wuxi Biologics Cayman, Inc. * (b) | 1,988 | 14,677 |
| Xiaomi Corp., Class B * (b) | 3,225 | 4,910 |
| Xinyi Solar Holdings Ltd. | 6,168 | 9,168 |
| XPeng, Inc., Class A * (a) | 485 | 6,024 |
| Yum China Holdings, Inc. | 71 | 2,925 |
| Yum China Holdings, Inc. | 167 | 6,962 |
| Yunnan Energy New Material Co. Ltd. * | 94 | 2,837 |
| Zai Lab Ltd., ADR * | 24 | 966 |
| Zhejiang Dingli Machinery Co. Ltd., Class A | 355 | 1,975 |
| Zhejiang Weixing New Building Materials Co. Ltd., Class A | 1,651 | 4,693 |
| Zhongji Innolight Co. Ltd., Class A | 507 | 2,323 |
| Zijin Mining Group Co. Ltd., Class H | 8,426 | 12,269 |
| | | 895,949 |
| INVESTMENTS | SHARES
(000) | VALUE
($000) |
| |
| Colombia — 0.2% |
| Ecopetrol SA, ADR (a) | 330 | 5,352 |
| Greece — 0.5% |
| Hellenic Telecommunications Organization SA | 384 | 7,388 |
| OPAP SA | 465 | 6,886 |
| | | 14,274 |
| Hong Kong — 0.2% |
| Techtronic Industries Co. Ltd. | 418 | 5,579 |
| Hungary — 0.4% |
| OTP Bank Nyrt. * | 252 | 7,514 |
| Richter Gedeon Nyrt. | 185 | 3,684 |
| | | 11,198 |
| India — 12.8% |
| ACC Ltd. | 153 | 4,626 |
| Apollo Hospitals Enterprise Ltd. | 187 | 10,818 |
| Axis Bank Ltd. * | 994 | 9,375 |
| Bharat Petroleum Corp. Ltd. | 1,760 | 8,285 |
| Biocon Ltd. * | 913 | 4,381 |
| Britannia Industries Ltd. | 233 | 9,936 |
| Dabur India Ltd. | 643 | 4,652 |
| Dr. Reddy's Laboratories Ltd. | 53 | 2,880 |
| Eicher Motors Ltd. | 124 | 4,220 |
| GAIL India Ltd. | 1,461 | 3,020 |
| HDFC Bank Ltd., ADR | 128 | 7,076 |
| HDFC Life Insurance Co. Ltd. (b) | 1,385 | 10,501 |
| Hindalco Industries Ltd. | 1,589 | 9,891 |
| Hindustan Unilever Ltd. | 657 | 19,080 |
| Housing Development Finance Corp. Ltd. | 987 | 28,464 |
| ICICI Bank Ltd. | 3,010 | 28,932 |
| Infosys Ltd., ADR | 1,773 | 35,227 |
| Kotak Mahindra Bank Ltd. | 577 | 13,383 |
| Larsen & Toubro Ltd. | 552 | 12,122 |
| Maruti Suzuki India Ltd. | 135 | 13,556 |
| NTPC Ltd. | 4,763 | 9,668 |
| Oil & Natural Gas Corp. Ltd. | 3,278 | 6,793 |
| Petronet LNG Ltd. | 2,227 | 5,903 |
| Power Grid Corp. of India Ltd. | 2,429 | 7,198 |
| Reliance Industries Ltd. | 1,486 | 53,838 |
| Shriram Transport Finance Co. Ltd. | 446 | 6,927 |
| Tata Consultancy Services Ltd. | 573 | 26,392 |
| Tata Consumer Products Ltd. | 325 | 3,487 |
| Tata Steel Ltd. | 375 | 6,162 |
SEE NOTES TO FINANCIAL STATEMENTS.
| April 30, 2022 | J.P. Morgan International Equity Funds | 31 |
JPMorgan Emerging Markets Research Enhanced Equity Fund
SCHEDULE OF PORTFOLIO INVESTMENTS
AS OF April 30, 2022 (Unaudited) (continued)
| INVESTMENTS | SHARES
(000) | VALUE
($000) |
| Common Stocks — continued |
| India — continued |
| UltraTech Cement Ltd. | 89 | 7,709 |
| Wipro Ltd. | 474 | 3,113 |
| | | 377,615 |
| Indonesia — 1.8% |
| Bank Central Asia Tbk. PT | 36,002 | 20,192 |
| Bank Rakyat Indonesia Persero Tbk. PT | 53,968 | 17,982 |
| Telkom Indonesia Persero Tbk. PT | 50,760 | 16,177 |
| | | 54,351 |
| Malaysia — 1.2% |
| CIMB Group Holdings Bhd. | 3,823 | 4,557 |
| Malayan Banking Bhd. | 1,818 | 3,781 |
| Petronas Chemicals Group Bhd. | 3,999 | 9,388 |
| Public Bank Bhd. | 11,430 | 12,286 |
| Tenaga Nasional Bhd. | 2,208 | 4,584 |
| | | 34,596 |
| Mexico — 2.9% |
| America Movil SAB de CV | 18,099 | 17,650 |
| Fomento Economico Mexicano SAB de CV, ADR | 91 | 6,823 |
| Grupo Aeroportuario del Pacifico SAB de CV, Class B * | 628 | 9,670 |
| Grupo Aeroportuario del Sureste SAB de CV, Class B | 426 | 9,284 |
| Grupo Financiero Banorte SAB de CV, Class O | 1,963 | 12,942 |
| Grupo Mexico SAB de CV | 2,202 | 10,313 |
| Kimberly-Clark de Mexico SAB de CV, Class A | 2,133 | 2,969 |
| Wal-Mart de Mexico SAB de CV | 4,209 | 14,919 |
| | | 84,570 |
| Peru — 0.4% |
| Credicorp Ltd. | 80 | 11,094 |
| Philippines — 0.5% |
| Ayala Corp. | 253 | 3,554 |
| Ayala Land, Inc. | 5,924 | 3,616 |
| International Container Terminal Services, Inc. | 1,500 | 6,160 |
| | | 13,330 |
| Poland — 0.4% |
| Dino Polska SA * (b) | 119 | 7,666 |
| Powszechny Zaklad Ubezpieczen SA | 809 | 5,596 |
| | | 13,262 |
| INVESTMENTS | SHARES
(000) | VALUE
($000) |
| |
| Qatar — 0.6% |
| Industries Qatar QSC | 1,191 | 6,142 |
| Qatar National Bank QPSC | 1,977 | 12,624 |
| | | 18,766 |
| Russia — 0.0% ^ |
| Gazprom PJSC, ADR ‡ | 2,290 | 256 |
| Magnitogorsk Iron & Steel Works PJSC ‡ | 3,146 | 36 |
| MMC Norilsk Nickel PJSC, ADR ‡ | 410 | 197 |
| Novatek PJSC ‡ | 165 | 50 |
| Rosneft Oil Co. PJSC, GDR ‡ (b) | 833 | 78 |
| Sberbank of Russia PJSC, ADR ‡ | 793 | 70 |
| Severstal PAO, GDR ‡ (b) | 329 | 105 |
| TCS Group Holding plc, GDR ‡ * (b) | 69 | 50 |
| X5 Retail Group NV, GDR ‡ (b) | 207 | 50 |
| | | 892 |
| Saudi Arabia — 4.2% |
| Al Rajhi Bank | 703 | 32,930 |
| Alinma Bank | 1,338 | 14,673 |
| Almarai Co. JSC | 380 | 5,234 |
| BinDawood Holding Co. | 132 | 3,596 |
| Etihad Etisalat Co. | 368 | 4,249 |
| SABIC Agri-Nutrients Co. | 148 | 6,359 |
| Saudi Arabian Oil Co. (b) | 478 | 5,716 |
| Saudi Basic Industries Corp. | 431 | 14,944 |
| Saudi National Bank (The) | 1,380 | 28,935 |
| Saudi Telecom Co. | 271 | 8,327 |
| | | 124,963 |
| Singapore — 0.1% |
| BOC Aviation Ltd. (b) | 347 | 2,718 |
| South Africa — 4.2% |
| Bid Corp. Ltd. | 537 | 11,244 |
| Bidvest Group Ltd. (The) | 233 | 3,196 |
| Capitec Bank Holdings Ltd. | 76 | 10,660 |
| Clicks Group Ltd. | 385 | 7,572 |
| FirstRand Ltd. | 4,291 | 18,479 |
| Foschini Group Ltd. (The) | 366 | 3,218 |
| Gold Fields Ltd. | 206 | 2,783 |
| Impala Platinum Holdings Ltd. | 375 | 4,856 |
| MTN Group Ltd. | 359 | 3,809 |
| Naspers Ltd., Class N | 112 | 11,315 |
| Nedbank Group Ltd. | 599 | 8,360 |
| Sanlam Ltd. | 2,676 | 11,085 |
| Sasol Ltd. * | 226 | 5,522 |
SEE NOTES TO FINANCIAL STATEMENTS.
| 32 | J.P. Morgan International Equity Funds | April 30, 2022 |
| INVESTMENTS | SHARES
(000) | VALUE
($000) |
| Common Stocks — continued |
| South Africa — continued |
| SPAR Group Ltd. (The) | 620 | 6,500 |
| Standard Bank Group Ltd. | 791 | 8,380 |
| Vodacom Group Ltd. | 644 | 6,201 |
| | | 123,180 |
| South Korea — 13.3% |
| BGF retail Co. Ltd. | 18 | 2,506 |
| Hana Financial Group, Inc. | 218 | 8,087 |
| Hankook Tire & Technology Co. Ltd. | 127 | 3,476 |
| Hyundai Glovis Co. Ltd. | 56 | 9,235 |
| Hyundai Mobis Co. Ltd. | 30 | 4,870 |
| Hyundai Motor Co. | 40 | 5,736 |
| JYP Entertainment Corp. | 101 | 4,695 |
| Kakao Corp. | 168 | 11,763 |
| KB Financial Group, Inc. | 370 | 17,204 |
| Kia Corp. | 244 | 16,007 |
| KIWOOM Securities Co. Ltd. | 41 | 3,057 |
| LG Chem Ltd. | 37 | 15,001 |
| LG Household & Health Care Ltd. | 10 | 7,057 |
| Mando Corp. | 73 | 3,119 |
| NAVER Corp. | 81 | 18,023 |
| NCSoft Corp. | 22 | 7,358 |
| POSCO Holdings, Inc. | 63 | 14,461 |
| Samsung Biologics Co. Ltd. * (b) | 11 | 7,480 |
| Samsung Electro-Mechanics Co. Ltd. | 51 | 6,605 |
| Samsung Electronics Co. Ltd. | 2,482 | 132,276 |
| Samsung Fire & Marine Insurance Co. Ltd. | 46 | 7,548 |
| Samsung SDI Co. Ltd. | 12 | 5,813 |
| Shinhan Financial Group Co. Ltd. | 461 | 15,312 |
| SK Hynix, Inc. | 326 | 28,580 |
| SK Innovation Co. Ltd. * | 58 | 9,290 |
| SK Telecom Co. Ltd. | 137 | 6,169 |
| SK, Inc. | 22 | 4,716 |
| SKC Co. Ltd. | 60 | 6,956 |
| S-Oil Corp. | 125 | 10,200 |
| | | 392,600 |
| Taiwan — 14.7% |
| Accton Technology Corp. | 686 | 5,351 |
| Advantech Co. Ltd. | 860 | 10,698 |
| ASE Technology Holding Co. Ltd. | 3,092 | 9,865 |
| AU Optronics Corp. | 9,025 | 5,155 |
| Cathay Financial Holding Co. Ltd. | 2,757 | 5,797 |
| Chailease Holding Co. Ltd. | 1,731 | 13,754 |
| CTBC Financial Holding Co. Ltd. | 9,129 | 8,979 |
| INVESTMENTS | SHARES
(000) | VALUE
($000) |
| |
| Taiwan — continued |
| Delta Electronics, Inc. | 1,908 | 15,927 |
| Eclat Textile Co. Ltd. | 404 | 6,629 |
| Evergreen Marine Corp. Taiwan Ltd. | 786 | 3,778 |
| Fubon Financial Holding Co. Ltd. | 5,983 | 15,022 |
| Giant Manufacturing Co. Ltd. | 457 | 3,821 |
| Hon Hai Precision Industry Co. Ltd. | 3,760 | 12,882 |
| MediaTek, Inc. | 352 | 9,704 |
| Nan Ya Plastics Corp. | 3,282 | 9,589 |
| Nanya Technology Corp. | 3,229 | 7,066 |
| Nien Made Enterprise Co. Ltd. | 368 | 3,876 |
| Novatek Microelectronics Corp. | 744 | 9,842 |
| Powertech Technology, Inc. | 914 | 2,872 |
| Quanta Computer, Inc. | 2,491 | 7,016 |
| Realtek Semiconductor Corp. | 642 | 8,712 |
| Sea Ltd., ADR * | 19 | 1,558 |
| Taiwan Semiconductor Manufacturing Co. Ltd. | 9,455 | 170,970 |
| Taiwan Semiconductor Manufacturing Co. Ltd., ADR | 290 | 26,934 |
| Taiwan Union Technology Corp. | 1,420 | 3,667 |
| Uni-President Enterprises Corp. | 4,552 | 10,531 |
| United Microelectronics Corp. | 2,699 | 4,287 |
| Vanguard International Semiconductor Corp. | 1,277 | 4,493 |
| Wiwynn Corp. | 229 | 7,831 |
| Yageo Corp. | 616 | 8,314 |
| Yang Ming Marine Transport Corp. * | 1,354 | 5,649 |
| Yuanta Financial Holding Co. Ltd. | 13,913 | 12,246 |
| | | 432,815 |
| Thailand — 2.1% |
| Airports of Thailand PCL * | 3,921 | 7,578 |
| Airports of Thailand PCL, NVDR * | 104 | 201 |
| Indorama Ventures PCL | 2,247 | 2,942 |
| Minor International PCL * | 5,464 | 5,522 |
| Minor International PCL, NVDR * | 145 | 147 |
| PTT Exploration & Production PCL, NVDR | 85 | 371 |
| PTT Exploration & Production PCL | 2,319 | 10,145 |
| PTT Global Chemical PCL | 4,788 | 6,942 |
| PTT Global Chemical PCL, NVDR | 127 | 185 |
| PTT PCL | 5,171 | 5,621 |
| PTT PCL, NVDR | 138 | 149 |
| SCB X PCL | 2,933 | 9,849 |
| Siam Cement PCL (The), NVDR | 18 | 192 |
| Siam Cement PCL (The) (Registered) | 674 | 7,243 |
SEE NOTES TO FINANCIAL STATEMENTS.
| April 30, 2022 | J.P. Morgan International Equity Funds | 33 |
JPMorgan Emerging Markets Research Enhanced Equity Fund
SCHEDULE OF PORTFOLIO INVESTMENTS
AS OF April 30, 2022 (Unaudited) (continued)
| INVESTMENTS | SHARES
(000) | VALUE
($000) |
| Common Stocks — continued |
| Thailand — continued |
| Thai Oil PCL, NVDR | 76 | 124 |
| Thai Oil PCL | 2,864 | 4,686 |
| | | 61,897 |
| Turkey — 0.2% |
| Ford Otomotiv Sanayi A/S | 330 | 6,651 |
| United Arab Emirates — 1.0% |
| Dubai Islamic Bank PJSC | 3,613 | 6,320 |
| Emaar Properties PJSC | 4,464 | 7,699 |
| Emirates Telecommunications Group Co. PJSC | 767 | 7,335 |
| First Abu Dhabi Bank PJSC | 1,100 | 6,720 |
| | | 28,074 |
| United States — 0.0% ^ |
| JS Global Lifestyle Co. Ltd. (b) | 1,179 | 1,399 |
Total Common Stocks
(Cost $2,859,310) | | 2,908,681 |
| Short-Term Investments — 2.0% |
| Investment Companies — 1.5% |
| JPMorgan Prime Money Market Fund Class Institutional Shares, 0.36% (c) (d)(Cost $43,823) | 43,814 | 43,823 |
| Investment of Cash Collateral from Securities Loaned — 0.5% |
| JPMorgan Securities Lending Money Market Fund Agency SL Class Shares, 0.37% (c) (d) | 6,491 | 6,486 |
| JPMorgan U.S. Government Money Market Fund Class IM Shares, 0.37% (c) (d) | 7,576 | 7,576 |
Total Investment of Cash Collateral from Securities Loaned
(Cost $14,061) | | 14,062 |
Total Short-Term Investments
(Cost $57,884) | | 57,885 |
Total Investments — 100.7%
(Cost $2,917,194) | | 2,966,566 |
| Liabilities in Excess of Other Assets — (0.7)% | | (20,474) |
| NET ASSETS — 100.0% | | 2,946,092 |
Percentages indicated are based on net assets. |
| Abbreviations | |
| ADR | American Depositary Receipt |
| GDR | Global Depositary Receipt |
| JSC | Joint Stock Company |
| NVDR | Non-Voting Depositary Receipt |
| PJSC | Public Joint Stock Company |
| Preference | A special type of equity investment that shares in the earnings of the company, has limited voting rights, and may have a dividend preference. Preference shares may also have liquidation preference. |
| PT | Limited liability company |
| ^ | Amount rounds to less than 0.1% of net assets. |
| ‡ | Value determined using significant unobservable inputs. | |
| * | Non-income producing security. | |
| (a) | The security or a portion of this security is on loan at April 30, 2022. The total value of securities on loan at April 30, 2022 is $13,480. | |
| (b) | Security exempt from registration pursuant to Regulation S under the Securities Act of 1933, as amended. Regulation S applies to securities offerings that are made outside of the United States and do not involve direct selling efforts in the United States and as such may have restrictions on resale. | |
| (c) | Investment in an affiliated fund, which is registered under the Investment Company Act of 1940, as amended, and is advised by J.P. Morgan Investment Management Inc. | |
| (d) | The rate shown is the current yield as of April 30, 2022. | |
SEE NOTES TO FINANCIAL STATEMENTS.
| 34 | J.P. Morgan International Equity Funds | April 30, 2022 |
Summary of Investments by Industry, April 30, 2022
The following table represents the portfolio investments of the Fund by industry classifications as a percentage of total investments:
| INDUSTRY | PERCENT OF
TOTAL
INVESTMENTS |
| Banks | 15.5% |
| Semiconductors & Semiconductor Equipment | 10.1 |
| Internet & Direct Marketing Retail | 6.3 |
| Interactive Media & Services | 5.7 |
| Technology Hardware, Storage & Peripherals | 5.6 |
| Oil, Gas & Consumable Fuels | 5.5 |
| Metals & Mining | 4.2 |
| Insurance | 3.6 |
| Chemicals | 3.1 |
| Electronic Equipment, Instruments & Components | 2.5 |
| Automobiles | 2.5 |
| Food & Staples Retailing | 2.5 |
| IT Services | 2.2 |
| Food Products | 2.1 |
| Real Estate Management & Development | 1.9 |
| Diversified Financial Services | 1.5 |
| Wireless Telecommunication Services | 1.5 |
| Entertainment | 1.3 |
| Life Sciences Tools & Services | 1.3 |
| Diversified Telecommunication Services | 1.3 |
| Transportation Infrastructure | 1.1 |
| Hotels, Restaurants & Leisure | 1.1 |
| Personal Products | 1.0 |
| Construction Materials | 1.0 |
| Thrifts & Mortgage Finance | 1.0 |
| Others (each less than 1.0%) | 12.6 |
| Short-Term Investments | 2.0 |
Futures contracts outstanding as of April 30, 2022 (amounts in thousands, except number of contracts):
| DESCRIPTION | NUMBER OF
CONTRACTS | EXPIRATION DATE | TRADING CURRENCY | NOTIONAL
AMOUNT ($) | VALUE AND
UNREALIZED
APPRECIATION
(DEPRECIATION) ($) |
| Long Contracts | | | | | |
| MSCI Emerging Markets E-Mini Index | 78 | 06/17/2022 | USD | 4,119 | 77 |
| Abbreviations | |
| MSCI | Morgan Stanley Capital International |
| USD | United States Dollar |
SEE NOTES TO FINANCIAL STATEMENTS.
| April 30, 2022 | J.P. Morgan International Equity Funds | 35 |
JPMorgan Europe Dynamic Fund
SCHEDULE OF PORTFOLIO INVESTMENTS
AS OF April 30, 2022 (Unaudited)
| INVESTMENTS | SHARES
(000) | VALUE
($000) |
| Common Stocks — 97.8% |
| Australia — 2.1% |
| Glencore plc * | 2,081 | 12,823 |
| Austria — 1.1% |
| Erste Group Bank AG | 125 | 3,879 |
| Wienerberger AG | 97 | 2,738 |
| | | 6,617 |
| Denmark — 7.8% |
| Carlsberg A/S, Class B | 39 | 4,924 |
| Genmab A/S * | 20 | 7,172 |
| Jyske Bank A/S (Registered) * | 93 | 5,161 |
| Novo Nordisk A/S, Class B | 213 | 24,325 |
| Pandora A/S (a) | 36 | 3,164 |
| Royal Unibrew A/S | 28 | 2,381 |
| | | 47,127 |
| Finland — 3.5% |
| Neste OYJ | 105 | 4,527 |
| Nokia OYJ * | 1,783 | 9,038 |
| Nordea Bank Abp | 742 | 7,394 |
| | | 20,959 |
| France — 16.1% |
| Airbus SE | 81 | 8,872 |
| Arkema SA | 56 | 6,404 |
| BNP Paribas SA | 136 | 7,066 |
| Capgemini SE | 50 | 10,114 |
| LVMH Moet Hennessy Louis Vuitton SE | 24 | 15,446 |
| Pernod Ricard SA | 43 | 8,818 |
| Teleperformance | 15 | 5,339 |
| Thales SA | 31 | 3,967 |
| TotalEnergies SE (a) | 386 | 18,952 |
| Veolia Environnement SA | 180 | 5,266 |
| Vinci SA (a) | 78 | 7,559 |
| | | 97,803 |
| Germany — 15.2% |
| Allianz SE (Registered) | 62 | 13,987 |
| Bayer AG (Registered) * | 106 | 6,974 |
| Brenntag SE | 84 | 6,461 |
| Deutsche Boerse AG | 56 | 9,739 |
| Deutsche Telekom AG (Registered) | 567 | 10,446 |
| DWS Group GmbH & Co. KGaA (b) | 68 | 2,257 |
| Mercedes-Benz Group AG * | 133 | 9,309 |
| Muenchener Rueckversicherungs-Gesellschaft AG (Registered) | 31 | 7,392 |
| INVESTMENTS | SHARES
(000) | VALUE
($000) |
| |
| Germany — continued |
| RWE AG | 267 | 11,073 |
| Siemens AG (Registered) | 81 | 9,938 |
| Volkswagen AG (Preference) | 31 | 4,809 |
| | | 92,385 |
| Ireland — 1.5% |
| AIB Group plc | 1,699 | 3,705 |
| AIB Group plc | 10 | 21 |
| Bank of Ireland Group plc * | 883 | 5,463 |
| Bank of Ireland Group plc * | 14 | 87 |
| | | 9,276 |
| Italy — 1.2% |
| UniCredit SpA | 762 | 7,051 |
| Luxembourg — 1.0% |
| ArcelorMittal SA | 210 | 6,134 |
| Netherlands — 6.3% |
| Adyen NV * (b) | 3 | 4,653 |
| ASM International NV | 20 | 6,075 |
| ASML Holding NV (a) | 8 | 4,670 |
| Koninklijke Ahold Delhaize NV | 496 | 14,618 |
| NN Group NV | 163 | 8,014 |
| | | 38,030 |
| Norway — 1.4% |
| Equinor ASA | 257 | 8,688 |
| Spain — 1.3% |
| Corp. ACCIONA Energias Renovables SA | 133 | 4,917 |
| Fluidra SA | 105 | 2,836 |
| | | 7,753 |
| Switzerland — 17.3% |
| Cie Financiere Richemont SA (Registered) | 73 | 8,448 |
| Nestle SA (Registered) | 236 | 30,416 |
| Novartis AG (Registered) | 206 | 18,206 |
| Roche Holding AG | 65 | 24,249 |
| Schindler Holding AG | 20 | 3,890 |
| Sika AG (Registered) | 23 | 7,124 |
| Zurich Insurance Group AG | 28 | 12,730 |
| | | 105,063 |
| United Kingdom — 19.6% |
| 3i Group plc | 304 | 4,973 |
| Ashtead Group plc | 111 | 5,737 |
| Auto Trader Group plc (b) | 643 | 5,075 |
SEE NOTES TO FINANCIAL STATEMENTS.
| 36 | J.P. Morgan International Equity Funds | April 30, 2022 |
| INVESTMENTS | SHARES
(000) | VALUE
($000) |
| Common Stocks — continued |
| United Kingdom — continued |
| Barclays plc | 4,715 | 8,666 |
| BP plc | 3,787 | 18,283 |
| Centrica plc * | 6,057 | 6,002 |
| Computacenter plc | 92 | 3,110 |
| Diageo plc | 260 | 12,950 |
| Future plc | 108 | 2,969 |
| Intermediate Capital Group plc | 145 | 2,770 |
| JD Sports Fashion plc | 2,102 | 3,463 |
| Linde plc (a) | 40 | 12,406 |
| Lloyds Banking Group plc | 14,092 | 8,004 |
| Marks & Spencer Group plc * | 2,091 | 3,570 |
| Petershill Partners plc * (b) | 582 | 1,867 |
| RELX plc | 298 | 8,865 |
| Segro plc, REIT | 384 | 6,425 |
| Taylor Wimpey plc | 2,410 | 3,791 |
| | | 118,926 |
| United States — 2.4% |
| Schneider Electric SE (a) | 61 | 8,829 |
| Stellantis NV | 413 | 5,552 |
| | | 14,381 |
Total Common Stocks
(Cost $575,629) | | 593,016 |
| Short-Term Investments — 9.9% |
| Investment Companies — 2.0% |
| JPMorgan Prime Money Market Fund Class Institutional Shares, 0.36% (c) (d)(Cost $12,092) | 12,089 | 12,091 |
| Investment of Cash Collateral from Securities Loaned — 7.9% |
| JPMorgan Securities Lending Money Market Fund Agency SL Class Shares, 0.37% (c) (d) | 34,025 | 34,001 |
| JPMorgan U.S. Government Money Market Fund Class IM Shares, 0.37% (c) (d) | 14,177 | 14,177 |
Total Investment of Cash Collateral from Securities Loaned
(Cost $48,178) | | 48,178 |
Total Short-Term Investments
(Cost $60,270) | | 60,269 |
| INVESTMENTS | SHARES
(000) | VALUE
($000) |
Total Investments — 107.7%
(Cost $635,899) | | 653,285 |
| Liabilities in Excess of Other Assets — (7.7)% | | (46,743) |
| NET ASSETS — 100.0% | | 606,542 |
Percentages indicated are based on net assets. |
| Abbreviations | |
| OYJ | Public Limited Company |
| Preference | A special type of equity investment that shares in the earnings of the company, has limited voting rights, and may have a dividend preference. Preference shares may also have liquidation preference. |
| REIT | Real Estate Investment Trust |
| * | Non-income producing security. |
| (a) | The security or a portion of this security is on loan at April 30, 2022. The total value of securities on loan at April 30, 2022 is $44,177. |
| (b) | Security exempt from registration pursuant to Regulation S under the Securities Act of 1933, as amended. Regulation S applies to securities offerings that are made outside of the United States and do not involve direct selling efforts in the United States and as such may have restrictions on resale. |
| (c) | Investment in an affiliated fund, which is registered under the Investment Company Act of 1940, as amended, and is advised by J.P. Morgan Investment Management Inc. |
| (d) | The rate shown is the current yield as of April 30, 2022. |
SEE NOTES TO FINANCIAL STATEMENTS.
| April 30, 2022 | J.P. Morgan International Equity Funds | 37 |
JPMorgan Europe Dynamic Fund
SCHEDULE OF PORTFOLIO INVESTMENTS
AS OF April 30, 2022 (Unaudited) (continued)
Summary of Investments by Industry, April 30, 2022
The following table represents the portfolio investments of the Fund by industry classifications as a percentage of total investments:
| INDUSTRY | PERCENT OF
TOTAL
INVESTMENTS |
| Pharmaceuticals | 11.3% |
| Banks | 8.6 |
| Oil, Gas & Consumable Fuels | 7.7 |
| Insurance | 6.4 |
| Food Products | 4.7 |
| Beverages | 4.4 |
| Textiles, Apparel & Luxury Goods | 4.2 |
| Chemicals | 4.0 |
| Multi-Utilities | 3.4 |
| Capital Markets | 3.4 |
| Automobiles | 2.9 |
| Metals & Mining | 2.9 |
| Food & Staples Retailing | 2.8 |
| IT Services | 2.7 |
| Professional Services | 2.2 |
| Aerospace & Defense | 2.0 |
| Trading Companies & Distributors | 1.9 |
| Semiconductors & Semiconductor Equipment | 1.6 |
| Diversified Telecommunication Services | 1.6 |
| Industrial Conglomerates | 1.5 |
| Communications Equipment | 1.4 |
| Electrical Equipment | 1.4 |
| Construction & Engineering | 1.2 |
| Biotechnology | 1.1 |
| Machinery | 1.0 |
| Equity Real Estate Investment Trusts (REITs) | 1.0 |
| Others (each less than 1.0%) | 3.5 |
| Short-Term Investments | 9.2 |
SEE NOTES TO FINANCIAL STATEMENTS.
| 38 | J.P. Morgan International Equity Funds | April 30, 2022 |
Futures contracts outstanding as of April 30, 2022 (amounts in thousands, except number of contracts):
| DESCRIPTION | NUMBER OF
CONTRACTS | EXPIRATION DATE | TRADING CURRENCY | NOTIONAL
AMOUNT ($) | VALUE AND
UNREALIZED
APPRECIATION
(DEPRECIATION) ($) |
| Long Contracts | | | | | |
| EURO STOXX 50 Index | 128 | 06/17/2022 | EUR | 4,971 | (200) |
| FTSE 100 Index | 29 | 06/17/2022 | GBP | 2,704 | (64) |
| | | | | | (264) |
| Abbreviations | |
| EUR | Euro |
| FTSE | Financial Times and the London Stock Exchange |
| GBP | British Pound |
SEE NOTES TO FINANCIAL STATEMENTS.
| April 30, 2022 | J.P. Morgan International Equity Funds | 39 |
JPMorgan International Equity Fund
SCHEDULE OF PORTFOLIO INVESTMENTS
AS OF April 30, 2022 (Unaudited)
| INVESTMENTS | SHARES
(000) | VALUE
($000) |
| Common Stocks — 94.4% |
| Australia — 2.5% |
| BHP Group Ltd. | 1,060 | 35,532 |
| BHP Group Ltd. | 2,303 | 76,945 |
| | | 112,477 |
| Austria — 0.8% |
| Erste Group Bank AG | 1,184 | 36,856 |
| Belgium — 1.3% |
| KBC Group NV | 877 | 59,685 |
| China — 0.8% |
| Tencent Holdings Ltd. | 736 | 34,693 |
| Denmark — 5.8% |
| Carlsberg A/S, Class B | 347 | 44,053 |
| Coloplast A/S, Class B | 247 | 33,286 |
| Genmab A/S * | 92 | 32,495 |
| Novo Nordisk A/S, Class B | 1,070 | 122,268 |
| Orsted A/S (a) | 256 | 28,261 |
| | | 260,363 |
| Finland — 0.7% |
| Kone OYJ, Class B | 609 | 29,279 |
| France — 15.1% |
| AXA SA (b) | 2,268 | 60,007 |
| BNP Paribas SA (b) | 836 | 43,352 |
| Capgemini SE | 288 | 58,640 |
| Kering SA | 87 | 46,403 |
| L'Oreal SA | 202 | 73,510 |
| LVMH Moet Hennessy Louis Vuitton SE | 158 | 101,950 |
| Pernod Ricard SA | 245 | 50,532 |
| Safran SA | 398 | 42,710 |
| TotalEnergies SE | 3,029 | 148,725 |
| Vinci SA (b) | 550 | 53,374 |
| | | 679,203 |
| Germany — 8.4% |
| adidas AG | 173 | 34,829 |
| Allianz SE (Registered) | 363 | 81,953 |
| Deutsche Boerse AG | 363 | 63,267 |
| Muenchener Rueckversicherungs-Gesellschaft AG (Registered) | 198 | 47,179 |
| RWE AG | 1,171 | 48,636 |
| Symrise AG | 454 | 53,977 |
| Volkswagen AG (Preference) | 314 | 48,622 |
| | | 378,463 |
| INVESTMENTS | SHARES
(000) | VALUE
($000) |
| |
| Hong Kong — 3.5% |
| AIA Group Ltd. | 8,860 | 87,043 |
| Hong Kong Exchanges & Clearing Ltd. | 1,054 | 44,705 |
| Techtronic Industries Co. Ltd. | 1,922 | 25,655 |
| | | 157,403 |
| India — 0.9% |
| HDFC Bank Ltd., ADR | 745 | 41,122 |
| Japan — 12.0% |
| Daikin Industries Ltd. | 270 | 41,200 |
| Hoya Corp. | ��490 | 48,589 |
| Keyence Corp. | 174 | 70,109 |
| Kubota Corp. | 2,272 | 38,597 |
| Kyowa Kirin Co. Ltd. | 1,486 | 31,331 |
| Makita Corp. | 962 | 28,425 |
| Nidec Corp. | 514 | 33,262 |
| Recruit Holdings Co. Ltd. | 949 | 34,438 |
| Shin-Etsu Chemical Co. Ltd. | 428 | 58,849 |
| SMC Corp. | 79 | 38,253 |
| Sony Group Corp. | 826 | 71,250 |
| Tokyo Electron Ltd. | 102 | 42,828 |
| | | 537,131 |
| Netherlands — 5.7% |
| Adyen NV * (a) | 18 | 30,916 |
| ASML Holding NV | 185 | 104,758 |
| ING Groep NV (b) | 3,197 | 30,290 |
| Shell plc | 3,256 | 87,406 |
| | | 253,370 |
| Singapore — 2.1% |
| DBS Group Holdings Ltd. | 3,797 | 92,118 |
| South Africa — 1.5% |
| Anglo American plc | 1,554 | 68,826 |
| South Korea — 1.7% |
| Delivery Hero SE * (a) (b) | 396 | 13,936 |
| Samsung Electronics Co. Ltd., GDR (a) | 25 | 32,765 |
| Samsung Electronics Co. Ltd., GDR (a) | 23 | 29,669 |
| | | 76,370 |
| Spain — 2.1% |
| Iberdrola SA | 6,265 | 71,993 |
| Industria de Diseno Textil SA (b) | 992 | 20,788 |
| | | 92,781 |
SEE NOTES TO FINANCIAL STATEMENTS.
| 40 | J.P. Morgan International Equity Funds | April 30, 2022 |
| INVESTMENTS | SHARES
(000) | VALUE
($000) |
| Common Stocks — continued |
| Sweden — 3.6% |
| Assa Abloy AB, Class B | 1,591 | 40,208 |
| Atlas Copco AB, Class A | 930 | 42,144 |
| Svenska Handelsbanken AB, Class A | 5,071 | 51,153 |
| Volvo AB, Class B | 1,854 | 29,581 |
| | | 163,086 |
| Switzerland — 10.3% |
| Lonza Group AG (Registered) | 95 | 56,105 |
| Nestle SA (Registered) | 1,420 | 183,305 |
| Roche Holding AG | 412 | 152,801 |
| SGS SA (Registered) | 18 | 45,352 |
| Straumann Holding AG (Registered) | 196 | 23,128 |
| | | 460,691 |
| Taiwan — 1.3% |
| Sea Ltd., ADR * | 246 | 20,331 |
| Taiwan Semiconductor Manufacturing Co. Ltd., ADR | 430 | 39,958 |
| | | 60,289 |
| United Kingdom — 10.1% |
| Diageo plc | 2,236 | 111,562 |
| Legal & General Group plc | 10,911 | 34,011 |
| Linde plc (b) | 231 | 72,341 |
| London Stock Exchange Group plc | 545 | 53,750 |
| Persimmon plc | 1,277 | 33,264 |
| Prudential plc | 3,233 | 40,249 |
| RELX plc | 2,401 | 71,562 |
| Smith & Nephew plc | 2,147 | 34,799 |
| | | 451,538 |
| United States — 4.2% |
| Ferguson plc | 362 | 45,438 |
| GlaxoSmithKline plc | 3,571 | 80,497 |
| Schneider Electric SE (b) | 440 | 63,049 |
| | | 188,984 |
Total Common Stocks
(Cost $3,767,366) | | 4,234,728 |
| Short-Term Investments — 7.4% |
| Investment Companies — 2.9% |
| JPMorgan Prime Money Market Fund Class Institutional Shares, 0.36% (c) (d)(Cost $127,784) | 127,777 | 127,803 |
| Investment of Cash Collateral from Securities Loaned — 4.5% |
| JPMorgan Securities Lending Money Market Fund Agency SL Class Shares, 0.37% (c) (d) | 136,104 | 136,009 |
| INVESTMENTS | SHARES
(000) | VALUE
($000) |
| |
| Investment of Cash Collateral from Securities Loaned — continued |
| JPMorgan U.S. Government Money Market Fund Class IM Shares, 0.37% (c) (d) | 66,362 | 66,362 |
Total Investment of Cash Collateral from Securities Loaned
(Cost $202,371) | | 202,371 |
Total Short-Term Investments
(Cost $330,155) | | 330,174 |
Total Investments — 101.8%
(Cost $4,097,521) | | 4,564,902 |
| Liabilities in Excess of Other Assets — (1.8)% | | (81,516) |
| NET ASSETS — 100.0% | | 4,483,386 |
Percentages indicated are based on net assets. |
| Abbreviations | |
| ADR | American Depositary Receipt |
| GDR | Global Depositary Receipt |
| OYJ | Public Limited Company |
| Preference | A special type of equity investment that shares in the earnings of the company, has limited voting rights, and may have a dividend preference. Preference shares may also have liquidation preference. |
| * | Non-income producing security. |
| (a) | Security exempt from registration pursuant to Regulation S under the Securities Act of 1933, as amended. Regulation S applies to securities offerings that are made outside of the United States and do not involve direct selling efforts in the United States and as such may have restrictions on resale. |
| (b) | The security or a portion of this security is on loan at April 30, 2022. The total value of securities on loan at April 30, 2022 is $169,016. |
| (c) | Investment in an affiliated fund, which is registered under the Investment Company Act of 1940, as amended, and is advised by J.P. Morgan Investment Management Inc. |
| (d) | The rate shown is the current yield as of April 30, 2022. |
SEE NOTES TO FINANCIAL STATEMENTS.
| April 30, 2022 | J.P. Morgan International Equity Funds | 41 |
JPMorgan International Equity Fund
SCHEDULE OF PORTFOLIO INVESTMENTS
AS OF April 30, 2022 (Unaudited) (continued)
Summary of Investments by Industry, April 30, 2022
The following table represents the portfolio investments of the Fund by industry classifications as a percentage of total investments:
| INDUSTRY | PERCENT OF
TOTAL
INVESTMENTS |
| Pharmaceuticals | 8.5% |
| Banks | 7.8 |
| Insurance | 7.6 |
| Oil, Gas & Consumable Fuels | 5.2 |
| Machinery | 5.0 |
| Beverages | 4.5 |
| Semiconductors & Semiconductor Equipment | 4.1 |
| Chemicals | 4.1 |
| Food Products | 4.0 |
| Textiles, Apparel & Luxury Goods | 4.0 |
| Metals & Mining | 3.9 |
| Capital Markets | 3.6 |
| Professional Services | 3.4 |
| Health Care Equipment & Supplies | 3.1 |
| Household Durables | 2.3 |
| Electric Utilities | 2.2 |
| Electrical Equipment | 2.1 |
| IT Services | 2.0 |
| Building Products | 1.8 |
| Personal Products | 1.6 |
| Electronic Equipment, Instruments & Components | 1.5 |
| Technology Hardware, Storage & Peripherals | 1.4 |
| Life Sciences Tools & Services | 1.2 |
| Construction & Engineering | 1.2 |
| Multi-Utilities | 1.1 |
| Automobiles | 1.1 |
| Trading Companies & Distributors | 1.0 |
| Others (each less than 1.0%) | 3.5 |
| Short-Term Investments | 7.2 |
SEE NOTES TO FINANCIAL STATEMENTS.
| 42 | J.P. Morgan International Equity Funds | April 30, 2022 |
JPMorgan International Focus Fund
SCHEDULE OF PORTFOLIO INVESTMENTS
AS OF April 30, 2022 (Unaudited)
| INVESTMENTS | SHARES
(000) | VALUE
($000) |
| Common Stocks — 96.9% |
| Australia — 3.5% |
| BHP Group Ltd. | 1,474 | 49,409 |
| Belgium — 2.1% |
| KBC Group NV | 426 | 28,987 |
| Canada — 5.7% |
| Canadian National Railway Co. | 312 | 36,711 |
| Toronto-Dominion Bank (The) | 608 | 43,874 |
| | | 80,585 |
| China — 2.4% |
| Tencent Holdings Ltd. | 714 | 33,657 |
| Denmark — 5.3% |
| Coloplast A/S, Class B | 147 | 19,794 |
| Novo Nordisk A/S, Class B | 475 | 54,270 |
| | | 74,064 |
| France — 9.8% |
| Capgemini SE | 114 | 23,256 |
| L'Oreal SA | 80 | 29,111 |
| LVMH Moet Hennessy Louis Vuitton SE | 55 | 35,515 |
| TotalEnergies SE | 412 | 20,205 |
| Vinci SA | 310 | 30,091 |
| | | 138,178 |
| Germany — 5.4% |
| adidas AG | 83 | 16,655 |
| Allianz SE (Registered) | 171 | 38,640 |
| Volkswagen AG (Preference) | 131 | 20,265 |
| | | 75,560 |
| Hong Kong — 4.8% |
| AIA Group Ltd. | 4,197 | 41,227 |
| Hong Kong Exchanges & Clearing Ltd. | 638 | 27,063 |
| | | 68,290 |
| India — 2.4% |
| HDFC Bank Ltd., ADR | 605 | 33,384 |
| Indonesia — 1.9% |
| Bank Central Asia Tbk. PT | 47,320 | 26,541 |
| Japan — 4.7% |
| Hoya Corp. | 154 | 15,293 |
| Keyence Corp. | 54 | 21,548 |
| Sony Group Corp. | 337 | 29,066 |
| | | 65,907 |
| INVESTMENTS | SHARES
(000) | VALUE
($000) |
| |
| Netherlands — 7.4% |
| Adyen NV * (a) | 8 | 14,007 |
| ASML Holding NV | 60 | 34,215 |
| Shell plc | 2,100 | 56,372 |
| | | 104,594 |
| Singapore — 2.6% |
| DBS Group Holdings Ltd. | 1,538 | 37,318 |
| South Africa — 3.2% |
| Anglo American plc | 1,004 | 44,450 |
| South Korea — 4.5% |
| Delivery Hero SE * (a) | 269 | 9,472 |
| Samsung Electronics Co. Ltd. | 1,003 | 53,456 |
| | | 62,928 |
| Spain — 2.1% |
| Iberdrola SA | 2,638 | 30,314 |
| Sweden — 1.4% |
| Atlas Copco AB, Class A | 439 | 19,881 |
| Switzerland — 11.2% |
| Lonza Group AG (Registered) | 39 | 23,191 |
| Nestle SA (Registered) | 519 | 67,010 |
| Roche Holding AG | 123 | 45,449 |
| SGS SA (Registered) | 8 | 21,499 |
| | | 157,149 |
| Taiwan — 3.3% |
| Sea Ltd., ADR * | 119 | 9,817 |
| Taiwan Semiconductor Manufacturing Co. Ltd., ADR | 388 | 36,074 |
| | | 45,891 |
| United Kingdom — 9.9% |
| Diageo plc | 1,000 | 49,915 |
| Linde plc | 117 | 36,728 |
| Persimmon plc | 641 | 16,686 |
| RELX plc | 1,187 | 35,377 |
| | | 138,706 |
| United States — 3.3% |
| Ferguson plc | 189 | 23,702 |
| Schneider Electric SE | 159 | 22,866 |
| | | 46,568 |
Total Common Stocks
(Cost $1,191,605) | | 1,362,361 |
SEE NOTES TO FINANCIAL STATEMENTS.
| April 30, 2022 | J.P. Morgan International Equity Funds | 43 |
JPMorgan International Focus Fund
SCHEDULE OF PORTFOLIO INVESTMENTS
AS OF April 30, 2022 (Unaudited) (continued)
| INVESTMENTS | SHARES
(000) | VALUE
($000) |
| Short-Term Investments — 2.8% |
| Investment Companies — 2.8% |
| JPMorgan Prime Money Market Fund Class Institutional Shares, 0.36% (b) (c)(Cost $39,692) | 39,681 | 39,689 |
Total Investments — 99.7%
(Cost $1,231,297) | | 1,402,050 |
| Other Assets Less Liabilities — 0.3% | | 4,897 |
| NET ASSETS — 100.0% | | 1,406,947 |
Percentages indicated are based on net assets. |
| Abbreviations | |
| ADR | American Depositary Receipt |
| Preference | A special type of equity investment that shares in the earnings of the company, has limited voting rights, and may have a dividend preference. Preference shares may also have liquidation preference. |
| PT | Limited liability company |
| * | Non-income producing security. |
| (a) | Security exempt from registration pursuant to Regulation S under the Securities Act of 1933, as amended. Regulation S applies to securities offerings that are made outside of the United States and do not involve direct selling efforts in the United States and as such may have restrictions on resale. |
| (b) | Investment in an affiliated fund, which is registered under the Investment Company Act of 1940, as amended, and is advised by J.P. Morgan Investment Management Inc. |
| (c) | The rate shown is the current yield as of April 30, 2022. |
Summary of Investments by Industry, April 30, 2022
The following table represents the portfolio investments of the Fund by industry classifications as a percentage of total investments:
| INDUSTRY | PERCENT OF
TOTAL
INVESTMENTS |
| Banks | 12.2% |
| Pharmaceuticals | 7.1 |
| Metals & Mining | 6.7 |
| Insurance | 5.8 |
| Oil, Gas & Consumable Fuels | 5.4 |
| Semiconductors & Semiconductor Equipment | 5.0 |
| Food Products | 4.8 |
| Professional Services | 4.0 |
| Technology Hardware, Storage & Peripherals | 3.8 |
| Textiles, Apparel & Luxury Goods | 3.7 |
| Beverages | 3.6 |
| Household Durables | 3.3 |
| IT Services | 2.7 |
| Chemicals | 2.6 |
| Road & Rail | 2.6 |
| Health Care Equipment & Supplies | 2.5 |
| Interactive Media & Services | 2.4 |
| Electric Utilities | 2.2 |
| Construction & Engineering | 2.1 |
| Personal Products | 2.1 |
| Capital Markets | 1.9 |
| Trading Companies & Distributors | 1.7 |
| Life Sciences Tools & Services | 1.7 |
| Electrical Equipment | 1.6 |
| Electronic Equipment, Instruments & Components | 1.5 |
| Automobiles | 1.4 |
| Machinery | 1.4 |
| Others (each less than 1.0%) | 1.4 |
| Short-Term Investments | 2.8 |
SEE NOTES TO FINANCIAL STATEMENTS.
| 44 | J.P. Morgan International Equity Funds | April 30, 2022 |
JPMorgan International Hedged Equity Fund
SCHEDULE OF PORTFOLIO INVESTMENTS
AS OF April 30, 2022 (Unaudited)
| INVESTMENTS | SHARES
(000) | VALUE
($000) |
| Common Stocks — 91.2% |
| Australia — 6.0% |
| Aurizon Holdings Ltd. | 61 | 172 |
| Australia & New Zealand Banking Group Ltd. | 13 | 253 |
| BHP Group Ltd. | 43 | 1,444 |
| Commonwealth Bank of Australia | 12 | 885 |
| CSL Ltd. | 5 | 958 |
| Dexus, REIT | 63 | 490 |
| Goodman Group, REIT | 48 | 800 |
| GPT Group (The), REIT | 41 | 147 |
| Insurance Australia Group Ltd. | 47 | 150 |
| Macquarie Group Ltd. | 3 | 411 |
| Mirvac Group, REIT | 145 | 244 |
| National Australia Bank Ltd. | 19 | 434 |
| Newcrest Mining Ltd. | 8 | 155 |
| Rio Tinto Ltd. | 19 | 1,528 |
| Rio Tinto plc | 9 | 632 |
| Wesfarmers Ltd. | 10 | 360 |
| Westpac Banking Corp. | 55 | 914 |
| Woolworths Group Ltd. | 12 | 327 |
| | | 10,304 |
| Belgium — 0.4% |
| KBC Group NV | 10 | 689 |
| China — 0.5% |
| BOC Hong Kong Holdings Ltd. | 117 | 423 |
| Prosus NV * | 9 | 406 |
| | | 829 |
| Denmark — 3.2% |
| Carlsberg A/S, Class B | 7 | 858 |
| Genmab A/S * | — | 189 |
| Novo Nordisk A/S, Class B | 28 | 3,161 |
| Orsted A/S (a) | 10 | 1,085 |
| Vestas Wind Systems A/S | 7 | 174 |
| | | 5,467 |
| Finland — 0.8% |
| Kone OYJ, Class B | 4 | 216 |
| Nokia OYJ * | 60 | 302 |
| Nordea Bank Abp | 77 | 763 |
| | | 1,281 |
| France — 10.7% |
| Air Liquide SA | 11 | 1,890 |
| Airbus SE | 4 | 433 |
| Alstom SA | 14 | 316 |
| INVESTMENTS | SHARES
(000) | VALUE
($000) |
| |
| France — continued |
| AXA SA | 8 | 220 |
| BNP Paribas SA | 28 | 1,474 |
| Capgemini SE | 7 | 1,474 |
| Kering SA | 1 | 633 |
| L'Oreal SA | 6 | 2,116 |
| LVMH Moet Hennessy Louis Vuitton SE | 5 | 2,922 |
| Pernod Ricard SA | 2 | 409 |
| Safran SA | 7 | 708 |
| Sanofi | 5 | 580 |
| Societe Generale SA | 18 | 421 |
| TotalEnergies SE | 42 | 2,055 |
| Veolia Environnement SA | 38 | 1,096 |
| Vinci SA | 15 | 1,488 |
| | | 18,235 |
| Germany — 8.6% |
| adidas AG | 4 | 870 |
| Allianz SE (Registered) | 10 | 2,143 |
| BASF SE * | 2 | 86 |
| Bayer AG (Registered) * | 7 | 479 |
| Brenntag SE | 2 | 152 |
| Deutsche Boerse AG | 1 | 153 |
| Deutsche Post AG (Registered) | 23 | 964 |
| Deutsche Telekom AG (Registered) | 92 | 1,686 |
| Infineon Technologies AG | 36 | 1,028 |
| Mercedes-Benz Group AG * | 2 | 163 |
| Merck KGaA | 3 | 518 |
| Muenchener Rueckversicherungs-Gesellschaft AG (Registered) | 4 | 1,014 |
| RWE AG | 34 | 1,417 |
| SAP SE | 11 | 1,124 |
| Siemens AG (Registered) | 8 | 985 |
| Volkswagen AG (Preference) | 5 | 827 |
| Vonovia SE * | 20 | 812 |
| Zalando SE * (a) | 7 | 282 |
| | | 14,703 |
| Hong Kong — 2.4% |
| AIA Group Ltd. | 171 | 1,682 |
| CK Asset Holdings Ltd. | 51 | 349 |
| CLP Holdings Ltd. | 20 | 195 |
| Hong Kong Exchanges & Clearing Ltd. | 18 | 742 |
| Link, REIT | 20 | 173 |
| Sun Hung Kai Properties Ltd. | 22 | 253 |
SEE NOTES TO FINANCIAL STATEMENTS.
| April 30, 2022 | J.P. Morgan International Equity Funds | 45 |
JPMorgan International Hedged Equity Fund
SCHEDULE OF PORTFOLIO INVESTMENTS
AS OF April 30, 2022 (Unaudited) (continued)
| INVESTMENTS | SHARES
(000) | VALUE
($000) |
| Common Stocks — continued |
| Hong Kong — continued |
| Techtronic Industries Co. Ltd. | 29 | 387 |
| Xinyi Glass Holdings Ltd. | 143 | 317 |
| | | 4,098 |
| Ireland — 0.5% |
| Kingspan Group plc | 3 | 294 |
| Kingspan Group plc | 5 | 467 |
| | | 761 |
| Italy — 0.6% |
| Enel SpA | 27 | 174 |
| FinecoBank Banca Fineco SpA | 48 | 672 |
| UniCredit SpA | 26 | 243 |
| | | 1,089 |
| Japan — 20.8% |
| AGC, Inc. | 11 | 397 |
| Asahi Group Holdings Ltd. | 23 | 878 |
| Asahi Kasei Corp. | 69 | 566 |
| Bridgestone Corp. | 22 | 817 |
| Capcom Co. Ltd. | 13 | 333 |
| Central Japan Railway Co. | 5 | 655 |
| Daiichi Sankyo Co. Ltd. | 35 | 894 |
| Daikin Industries Ltd. | 3 | 504 |
| Daito Trust Construction Co. Ltd. | 1 | 87 |
| Daiwa House Industry Co. Ltd. | 27 | 661 |
| Dentsu Group, Inc. | 24 | 872 |
| Fast Retailing Co. Ltd. | — | 92 |
| Hitachi Ltd. | 24 | 1,143 |
| Honda Motor Co. Ltd. | 38 | 1,000 |
| Hoya Corp. | 11 | 1,042 |
| ITOCHU Corp. | 29 | 884 |
| Japan Airlines Co. Ltd. * | 12 | 205 |
| Kao Corp. | 11 | 425 |
| Keyence Corp. | 4 | 1,407 |
| Konami Holdings Corp. | 7 | 449 |
| Kubota Corp. | 30 | 517 |
| Kyowa Kirin Co. Ltd. | 18 | 390 |
| Mitsubishi Corp. | 26 | 876 |
| Mitsubishi Electric Corp. | 15 | 159 |
| Mitsubishi UFJ Financial Group, Inc. | 88 | 510 |
| Mitsui Fudosan Co. Ltd. | 24 | 517 |
| Murata Manufacturing Co. Ltd. | 12 | 715 |
| Nidec Corp. | 5 | 304 |
| Nintendo Co. Ltd. | 1 | 320 |
| INVESTMENTS | SHARES
(000) | VALUE
($000) |
| |
| Japan — continued |
| NIPPON EXPRESS HOLDINGS, Inc. | 7 | 428 |
| Nippon Steel Corp. | 11 | 175 |
| Nippon Telegraph & Telephone Corp. | 33 | 975 |
| Nitori Holdings Co. Ltd. | 4 | 401 |
| Nomura Research Institute Ltd. | 18 | 495 |
| Ono Pharmaceutical Co. Ltd. | 21 | 529 |
| ORIX Corp. | 37 | 673 |
| Otsuka Corp. | 13 | 416 |
| Recruit Holdings Co. Ltd. | 16 | 573 |
| Rohm Co. Ltd. | 6 | 391 |
| Ryohin Keikaku Co. Ltd. | 49 | 440 |
| Seven & i Holdings Co. Ltd. | 13 | 593 |
| Shimadzu Corp. | 2 | 62 |
| Shin-Etsu Chemical Co. Ltd. | 7 | 948 |
| Shionogi & Co. Ltd. | 10 | 528 |
| SoftBank Group Corp. | 10 | 399 |
| Sony Group Corp. | 19 | 1,683 |
| Sumitomo Electric Industries Ltd. | 41 | 441 |
| Sumitomo Metal Mining Co. Ltd. | 12 | 531 |
| Sumitomo Mitsui Financial Group, Inc. | 34 | 1,027 |
| Suzuki Motor Corp. | 12 | 374 |
| T&D Holdings, Inc. | 36 | 464 |
| Takeda Pharmaceutical Co. Ltd. | 10 | 290 |
| Terumo Corp. | 22 | 649 |
| Tokio Marine Holdings, Inc. | 22 | 1,190 |
| Tokyo Electron Ltd. | 3 | 1,266 |
| Toyota Motor Corp. | 111 | 1,898 |
| Yamato Holdings Co. Ltd. | 6 | 107 |
| | | 35,565 |
| Luxembourg — 0.1% |
| ArcelorMittal SA | 7 | 216 |
| Netherlands — 5.9% |
| Adyen NV * (a) | — | 431 |
| Akzo Nobel NV | 8 | 689 |
| ASML Holding NV | 6 | 3,389 |
| ING Groep NV | 21 | 202 |
| Koninklijke Ahold Delhaize NV | 18 | 516 |
| Koninklijke DSM NV | 4 | 734 |
| Koninklijke KPN NV | 234 | 808 |
| Koninklijke Philips NV | 6 | 149 |
| NN Group NV | 19 | 915 |
SEE NOTES TO FINANCIAL STATEMENTS.
| 46 | J.P. Morgan International Equity Funds | April 30, 2022 |
| INVESTMENTS | SHARES
(000) | VALUE
($000) |
| Common Stocks — continued |
| Netherlands — continued |
| Shell plc | 62 | 1,674 |
| Wolters Kluwer NV | 6 | 547 |
| | | 10,054 |
| Singapore — 0.9% |
| DBS Group Holdings Ltd. | 45 | 1,087 |
| Oversea-Chinese Banking Corp. Ltd. | 39 | 345 |
| United Overseas Bank Ltd. | 8 | 171 |
| | | 1,603 |
| Spain — 2.6% |
| Banco Bilbao Vizcaya Argentaria SA | 239 | 1,256 |
| Banco Santander SA | 72 | 211 |
| Endesa SA | 23 | 486 |
| Iberdrola SA | 179 | 2,051 |
| Industria de Diseno Textil SA | 24 | 507 |
| | | 4,511 |
| Sweden — 1.8% |
| Atlas Copco AB, Class A | 19 | 869 |
| Lundin Energy AB | 18 | 754 |
| SKF AB, Class B | 35 | 567 |
| Volvo AB, Class B | 61 | 965 |
| | | 3,155 |
| Switzerland — 10.8% |
| Cie Financiere Richemont SA (Registered) | 3 | 344 |
| Givaudan SA (Registered) | — | 1,220 |
| Julius Baer Group Ltd. | 3 | 129 |
| Lonza Group AG (Registered) | 2 | 1,325 |
| Nestle SA (Registered) | 37 | 4,758 |
| Novartis AG (Registered) | 32 | 2,844 |
| Roche Holding AG | 11 | 4,002 |
| SGS SA (Registered) | — | 750 |
| Sika AG (Registered) | 4 | 1,211 |
| UBS Group AG (Registered) | 37 | 630 |
| Zurich Insurance Group AG | 3 | 1,313 |
| | | 18,526 |
| Taiwan — 0.1% |
| Sea Ltd., ADR * | 2 | 119 |
| United Kingdom — 12.7% |
| 3i Group plc | 79 | 1,288 |
| AstraZeneca plc | 21 | 2,763 |
| Barclays plc | 619 | 1,137 |
| Berkeley Group Holdings plc * | 15 | 759 |
| INVESTMENTS | SHARES
(000) | VALUE
($000) |
| |
| United Kingdom — continued |
| BP plc | 422 | 2,039 |
| British American Tobacco plc | 16 | 660 |
| CK Hutchison Holdings Ltd. | 17 | 123 |
| DCC plc | 4 | 339 |
| Diageo plc | 47 | 2,340 |
| HSBC Holdings plc | 131 | 819 |
| InterContinental Hotels Group plc | 15 | 955 |
| Intertek Group plc | 2 | 126 |
| Lloyds Banking Group plc | 2,027 | 1,151 |
| London Stock Exchange Group plc | 1 | 131 |
| Prudential plc | 41 | 510 |
| Reckitt Benckiser Group plc | 16 | 1,250 |
| RELX plc | 53 | 1,572 |
| SSE plc | 34 | 785 |
| Standard Chartered plc | 141 | 965 |
| Taylor Wimpey plc | 132 | 208 |
| Tesco plc | 239 | 811 |
| Unilever plc | 23 | 1,069 |
| | | 21,800 |
| United States — 1.8% |
| Ferguson plc | 1 | 118 |
| GlaxoSmithKline plc | 17 | 378 |
| Schneider Electric SE | 12 | 1,760 |
| Stellantis NV | 64 | 861 |
| | | 3,117 |
Total Common Stocks
(Cost $147,593) | | 156,122 |
| INVESTMENTS | NO. OF CONTRACTS | |
| Options Purchased — 3.5% |
| Put Options Purchased — 3.5% |
| United States — 3.5% |
| MSCI EAFE E-Mini Index | | |
| 6/17/2022 at USD 2,015.00, European Style | | |
| Notional Amount: USD 166,560 | | |
| Counterparty: Exchange-Traded * (Cost $4,108) | 819 | 6,077 |
SEE NOTES TO FINANCIAL STATEMENTS.
| April 30, 2022 | J.P. Morgan International Equity Funds | 47 |
JPMorgan International Hedged Equity Fund
SCHEDULE OF PORTFOLIO INVESTMENTS
AS OF April 30, 2022 (Unaudited) (continued)
| INVESTMENTS | SHARES
(000) | VALUE
($000) |
| Short-Term Investments — 4.5% |
| Investment Companies — 4.5% |
| JPMorgan U.S. Government Money Market Fund Class Institutional Shares, 0.29% (b) (c)(Cost $7,724) | 7,724 | 7,724 |
Total Investments — 99.2%
(Cost $159,425) | | 169,923 |
| Other Assets Less Liabilities — 0.8% | | 1,300 |
| NET ASSETS — 100.0% | | 171,223 |
Percentages indicated are based on net assets. |
Amounts presented as a dash (“-“) represent amounts that round to less than a thousand. |
| Abbreviations | |
| ADR | American Depositary Receipt |
| EAFE | Europe, Australasia, and Far East |
| MSCI | Morgan Stanley Capital International |
| OYJ | Public Limited Company |
| Preference | A special type of equity investment that shares in the earnings of the company, has limited voting rights, and may have a dividend preference. Preference shares may also have liquidation preference. |
| REIT | Real Estate Investment Trust |
| USD | United States Dollar |
| * | Non-income producing security. |
| (a) | Security exempt from registration pursuant to Regulation S under the Securities Act of 1933, as amended. Regulation S applies to securities offerings that are made outside of the United States and do not involve direct selling efforts in the United States and as such may have restrictions on resale. |
| (b) | Investment in an affiliated fund, which is registered under the Investment Company Act of 1940, as amended, and is advised by J.P. Morgan Investment Management Inc. |
| (c) | The rate shown is the current yield as of April 30, 2022. |
Summary of Investments by Industry, April 30, 2022
The following table represents the portfolio investments of the Fund by industry classifications as a percentage of total investments:
| INDUSTRY | PERCENT OF
TOTAL
INVESTMENTS |
| Pharmaceuticals | 10.2% |
| Banks | 9.5 |
| Insurance | 5.6 |
| Chemicals | 4.3 |
| Oil, Gas & Consumable Fuels | 3.8 |
| Index Funds | 3.6 |
| Semiconductors & Semiconductor Equipment | 3.6 |
| Automobiles | 3 |
| Electric Utilities | 2.8 |
| Textiles, Apparel & Luxury Goods | 2.8 |
| Food Products | 2.8 |
| Metals & Mining | 2.7 |
| Beverages | 2.6 |
| Machinery | 2.3 |
| Personal Products | 2.1 |
| Professional Services | 2.1 |
| Capital Markets | 2.1 |
| Diversified Telecommunication Services | 2 |
| IT Services | 1.7 |
| Real Estate Management & Development | 1.6 |
| Household Durables | 1.6 |
| Industrial Conglomerates | 1.5 |
| Multi-Utilities | 1.5 |
| Electrical Equipment | 1.4 |
| Food & Staples Retailing | 1.3 |
| Electronic Equipment, Instruments & Components | 1.3 |
| Trading Companies & Distributors | 1.2 |
| Building Products | 1.2 |
| Equity Real Estate Investment Trusts (REITs) | 1.1 |
| Health Care Equipment & Supplies | 1.1 |
| Others (each less than 1.0%) | 11.1 |
| Short-Term Investments | 4.5 |
SEE NOTES TO FINANCIAL STATEMENTS.
| 48 | J.P. Morgan International Equity Funds | April 30, 2022 |
Futures contracts outstanding as of April 30, 2022 (amounts in thousands, except number of contracts):
| DESCRIPTION | NUMBER OF
CONTRACTS | EXPIRATION DATE | TRADING CURRENCY | NOTIONAL
AMOUNT ($) | VALUE AND
UNREALIZED
APPRECIATION
(DEPRECIATION) ($) |
| Long Contracts | | | | | |
| SPI 200 Index | 27 | 06/16/2022 | AUD | 3,484 | 100 |
| MSCI EAFE E-Mini Index | 52 | 06/17/2022 | USD | 5,188 | (323) |
| | | | | | (223) |
| Abbreviations | |
| AUD | Australian Dollar |
| EAFE | Europe, Australasia, and Far East |
| MSCI | Morgan Stanley Capital International |
| SPI | Australian Securities Exchange |
| USD | United States Dollar |
Written Call Options Contracts as of April 30, 2022 (amounts in thousands, except number of contracts):
|
| DESCRIPTION | COUNTERPARTY | NUMBER OF
CONTRACTS | NOTIONAL
AMOUNT | EXERCISE
PRICE | EXPIRATION
DATE | VALUE ($) |
| MSCI EAFE E-Mini Index | Exchange-Traded | 819 | USD 166,560 | USD 2,240.00 | 6/17/2022 | (156) |
Written Put Options Contracts as of April 30, 2022 (amounts in thousands, except number of contracts):
|
| DESCRIPTION | COUNTERPARTY | NUMBER OF
CONTRACTS | NOTIONAL
AMOUNT | EXERCISE
PRICE | EXPIRATION
DATE | VALUE ($) |
| MSCI EAFE E-Mini Index | Exchange-Traded | 819 | USD 166,560 | USD 1,700.00 | 6/17/2022 | (880) |
| Total Written Options Contracts (Premiums Received $3,954) | (1,036) |
| Abbreviations | |
| EAFE | Europe, Australasia, and Far East |
| MSCI | Morgan Stanley Capital International |
| USD | United States Dollar |
SEE NOTES TO FINANCIAL STATEMENTS.
| April 30, 2022 | J.P. Morgan International Equity Funds | 49 |
JPMorgan International Research Enhanced Equity Fund
SCHEDULE OF PORTFOLIO INVESTMENTS
AS OF April 30, 2022 (Unaudited)
| INVESTMENTS | SHARES
(000) | VALUE
($000) |
| Common Stocks — 93.0% |
| Australia — 5.8% |
| Aurizon Holdings Ltd. | 1,806 | 5,100 |
| Australia & New Zealand Banking Group Ltd. | 473 | 8,996 |
| BHP Group Ltd. | 1,252 | 41,822 |
| Commonwealth Bank of Australia (a) | 378 | 27,468 |
| CSL Ltd. (a) | 156 | 29,779 |
| Dexus, REIT | 2,082 | 16,277 |
| Goodman Group, REIT | 1,551 | 25,816 |
| GPT Group (The), REIT | 1,310 | 4,657 |
| Insurance Australia Group Ltd. | 1,434 | 4,579 |
| Macquarie Group Ltd. | 92 | 13,239 |
| Mirvac Group, REIT | 4,262 | 7,203 |
| National Australia Bank Ltd. | 610 | 13,915 |
| Newcrest Mining Ltd. (a) | 254 | 4,775 |
| Rio Tinto Ltd. | 563 | 44,554 |
| Rio Tinto plc | 321 | 22,717 |
| Wesfarmers Ltd. | 322 | 11,149 |
| Westpac Banking Corp. | 1,724 | 28,856 |
| Woolworths Group Ltd. | 370 | 10,019 |
| | | 320,921 |
| Belgium — 0.4% |
| KBC Group NV | 345 | 23,440 |
| China — 0.5% |
| BOC Hong Kong Holdings Ltd. | 3,436 | 12,438 |
| Prosus NV * | 295 | 14,253 |
| | | 26,691 |
| Denmark — 3.4% |
| Carlsberg A/S, Class B | 238 | 30,226 |
| Genmab A/S * | 18 | 6,300 |
| Novo Nordisk A/S, Class B | 947 | 108,177 |
| Orsted A/S (b) | 334 | 36,979 |
| Vestas Wind Systems A/S (a) | 228 | 5,808 |
| | | 187,490 |
| Finland — 0.8% |
| Kone OYJ, Class B | 154 | 7,422 |
| Nokia OYJ * | 2,127 | 10,783 |
| Nordea Bank Abp | 2,605 | 25,967 |
| | | 44,172 |
| France — 11.4% |
| Air Liquide SA | 376 | 64,981 |
| Airbus SE | 156 | 17,120 |
| Alstom SA | 509 | 11,199 |
| INVESTMENTS | SHARES
(000) | VALUE
($000) |
| |
| France — continued |
| AXA SA (a) | 322 | 8,524 |
| BNP Paribas SA (a) | 961 | 49,812 |
| Capgemini SE | 253 | 51,500 |
| Kering SA | 42 | 22,324 |
| L'Oreal SA | 195 | 70,811 |
| LVMH Moet Hennessy Louis Vuitton SE | 153 | 98,992 |
| Pernod Ricard SA | 69 | 14,212 |
| Safran SA | 234 | 25,190 |
| Sanofi (a) | 188 | 19,901 |
| Societe Generale SA | 601 | 14,446 |
| TotalEnergies SE (a) | 1,445 | 70,937 |
| Veolia Environnement SA | 1,299 | 37,914 |
| Vinci SA (a) | 537 | 52,073 |
| | | 629,936 |
| Germany — 9.2% |
| adidas AG | 150 | 30,244 |
| Allianz SE (Registered) | 315 | 71,064 |
| BASF SE * | 67 | 3,506 |
| Bayer AG (Registered) * | 266 | 17,549 |
| Brenntag SE | 84 | 6,465 |
| Deutsche Boerse AG | 34 | 5,976 |
| Deutsche Post AG (Registered) | 803 | 34,324 |
| Deutsche Telekom AG (Registered) | 3,203 | 59,011 |
| Infineon Technologies AG | 1,184 | 33,593 |
| Mercedes-Benz Group AG * | 76 | 5,298 |
| Merck KGaA | 98 | 18,147 |
| Muenchener Rueckversicherungs-Gesellschaft AG (Registered) | 147 | 34,965 |
| RWE AG | 1,158 | 48,082 |
| SAP SE | 372 | 37,723 |
| Siemens AG (Registered) | 271 | 33,291 |
| Volkswagen AG (Preference) | 191 | 29,548 |
| Vonovia SE * | 708 | 28,201 |
| Zalando SE * (a) (b) | 242 | 9,538 |
| | | 506,525 |
| Hong Kong — 2.2% |
| AIA Group Ltd. | 4,937 | 48,498 |
| CK Asset Holdings Ltd. | 1,527 | 10,353 |
| CLP Holdings Ltd. | 589 | 5,748 |
| Hong Kong Exchanges & Clearing Ltd. | 533 | 22,622 |
| Link, REIT | 597 | 5,158 |
| Sun Hung Kai Properties Ltd. | 658 | 7,572 |
SEE NOTES TO FINANCIAL STATEMENTS.
| 50 | J.P. Morgan International Equity Funds | April 30, 2022 |
| INVESTMENTS | SHARES
(000) | VALUE
($000) |
| Common Stocks — continued |
| Hong Kong — continued |
| Techtronic Industries Co. Ltd. | 812 | 10,839 |
| Xinyi Glass Holdings Ltd. | 4,214 | 9,325 |
| | | 120,115 |
| Ireland — 0.5% |
| Kingspan Group plc | 119 | 10,938 |
| Kingspan Group plc | 163 | 15,188 |
| | | 26,126 |
| Italy — 0.7% |
| Enel SpA | 1,060 | 6,894 |
| FinecoBank Banca Fineco SpA | 1,750 | 24,323 |
| UniCredit SpA | 890 | 8,236 |
| | | 39,453 |
| Japan — 19.1% |
| AGC, Inc. | 309 | 11,603 |
| Asahi Group Holdings Ltd. | 677 | 25,537 |
| Asahi Kasei Corp. | 2,082 | 17,083 |
| Bridgestone Corp. | 657 | 24,089 |
| Capcom Co. Ltd. | 382 | 10,082 |
| Central Japan Railway Co. | 140 | 17,611 |
| Daiichi Sankyo Co. Ltd. | 1,032 | 25,987 |
| Daikin Industries Ltd. | 89 | 13,613 |
| Daito Trust Construction Co. Ltd. | 21 | 1,974 |
| Daiwa House Industry Co. Ltd. | 831 | 19,973 |
| Dentsu Group, Inc. | 690 | 24,876 |
| Fast Retailing Co. Ltd. | 10 | 4,558 |
| Hitachi Ltd. | 744 | 35,271 |
| Honda Motor Co. Ltd. | 1,113 | 29,270 |
| Hoya Corp. | 297 | 29,524 |
| ITOCHU Corp. | 888 | 26,804 |
| Japan Airlines Co. Ltd. * | 380 | 6,277 |
| Kao Corp. | 331 | 13,266 |
| Keyence Corp. | 87 | 34,934 |
| Konami Holdings Corp. | 219 | 13,436 |
| Kubota Corp. | 928 | 15,762 |
| Kyowa Kirin Co. Ltd. | 560 | 11,797 |
| Mitsubishi Corp. | 782 | 26,263 |
| Mitsubishi Electric Corp. | 459 | 4,808 |
| Mitsubishi UFJ Financial Group, Inc. | 2,758 | 16,033 |
| Mitsui Fudosan Co. Ltd. | 748 | 15,847 |
| Murata Manufacturing Co. Ltd. | 362 | 21,578 |
| Nidec Corp. | 151 | 9,743 |
| Nintendo Co. Ltd. | 22 | 10,086 |
| INVESTMENTS | SHARES
(000) | VALUE
($000) |
| |
| Japan — continued |
| NIPPON EXPRESS HOLDINGS, Inc. | 217 | 12,723 |
| Nippon Steel Corp. | 289 | 4,597 |
| Nippon Telegraph & Telephone Corp. | 1,259 | 37,093 |
| Nitori Holdings Co. Ltd. | 115 | 11,852 |
| Nomura Research Institute Ltd. | 526 | 14,862 |
| Ono Pharmaceutical Co. Ltd. | 629 | 16,167 |
| ORIX Corp. | 1,122 | 20,460 |
| Otsuka Corp. | 465 | 15,242 |
| Recruit Holdings Co. Ltd. | 455 | 16,504 |
| Rohm Co. Ltd. | 161 | 11,276 |
| Ryohin Keikaku Co. Ltd. | 1,423 | 12,790 |
| Seven & i Holdings Co. Ltd. | 401 | 17,722 |
| Shimadzu Corp. | 88 | 2,864 |
| Shin-Etsu Chemical Co. Ltd. | 205 | 28,119 |
| Shionogi & Co. Ltd. | 271 | 15,063 |
| SoftBank Group Corp. | 278 | 11,438 |
| Sony Group Corp. | 552 | 47,657 |
| Sumitomo Electric Industries Ltd. | 1,231 | 13,232 |
| Sumitomo Metal Mining Co. Ltd. | 355 | 15,565 |
| Sumitomo Mitsui Financial Group, Inc. | 1,008 | 30,447 |
| Suzuki Motor Corp. | 373 | 11,253 |
| T&D Holdings, Inc. | 1,084 | 13,929 |
| Takeda Pharmaceutical Co. Ltd. | 297 | 8,627 |
| Terumo Corp. | 639 | 19,029 |
| Tokio Marine Holdings, Inc. | 650 | 35,161 |
| Tokyo Electron Ltd. | 84 | 35,317 |
| Toyota Motor Corp. | 3,162 | 54,180 |
| Yamato Holdings Co. Ltd. | 160 | 2,990 |
| | | 1,053,844 |
| Luxembourg — 0.1% |
| ArcelorMittal SA | 290 | 8,453 |
| Malta — 0.0% ^ |
| BGP Holdings plc ‡ * | 449 | 2 |
| Netherlands — 6.3% |
| Adyen NV * (b) | 9 | 14,794 |
| Akzo Nobel NV (a) | 273 | 23,721 |
| ASML Holding NV | 199 | 112,793 |
| ING Groep NV (a) | 877 | 8,309 |
| Koninklijke Ahold Delhaize NV | 619 | 18,252 |
| Koninklijke DSM NV | 147 | 24,723 |
| Koninklijke KPN NV | 8,306 | 28,659 |
| Koninklijke Philips NV | 206 | 5,380 |
SEE NOTES TO FINANCIAL STATEMENTS.
| April 30, 2022 | J.P. Morgan International Equity Funds | 51 |
JPMorgan International Research Enhanced Equity Fund
SCHEDULE OF PORTFOLIO INVESTMENTS
AS OF April 30, 2022 (Unaudited) (continued)
| INVESTMENTS | SHARES
(000) | VALUE
($000) |
| Common Stocks — continued |
| Netherlands — continued |
| NN Group NV | 659 | 32,293 |
| Shell plc | 2,241 | 60,167 |
| Wolters Kluwer NV | 189 | 19,088 |
| | | 348,179 |
| Singapore — 0.9% |
| DBS Group Holdings Ltd. | 1,397 | 33,884 |
| Oversea-Chinese Banking Corp. Ltd. | 1,225 | 10,880 |
| United Overseas Bank Ltd. | 250 | 5,356 |
| | | 50,120 |
| Spain — 2.8% |
| Banco Bilbao Vizcaya Argentaria SA | 8,143 | 42,731 |
| Banco Santander SA (a) | 2,814 | 8,224 |
| Endesa SA | 778 | 16,303 |
| Iberdrola SA | 5,930 | 68,136 |
| Industria de Diseno Textil SA (a) | 814 | 17,073 |
| | | 152,467 |
| Sweden — 1.9% |
| Atlas Copco AB, Class A | 669 | 30,337 |
| Lundin Energy AB (a) | 578 | 23,917 |
| SKF AB, Class B | 1,240 | 20,244 |
| Volvo AB, Class B | 2,103 | 33,550 |
| | | 108,048 |
| Switzerland — 11.4% |
| Cie Financiere Richemont SA (Registered) | 107 | 12,489 |
| Givaudan SA (Registered) | 10 | 41,518 |
| Julius Baer Group Ltd. | 90 | 4,313 |
| Lonza Group AG (Registered) | 77 | 45,174 |
| Nestle SA (Registered) | 1,260 | 162,612 |
| Novartis AG (Registered) | 1,075 | 94,988 |
| Roche Holding AG | 367 | 136,056 |
| SGS SA (Registered) | 10 | 25,973 |
| Sika AG (Registered) | 133 | 40,771 |
| UBS Group AG (Registered) | 1,302 | 22,099 |
| Zurich Insurance Group AG | 100 | 45,432 |
| | | 631,425 |
| Taiwan — 0.1% |
| Sea Ltd., ADR * | 48 | 3,953 |
| United Kingdom — 13.6% |
| 3i Group plc | 2,813 | 46,037 |
| AstraZeneca plc | 662 | 88,261 |
| Barclays plc | 21,163 | 38,900 |
| INVESTMENTS | SHARES
(000) | VALUE
($000) |
| |
| United Kingdom — continued |
| Berkeley Group Holdings plc * | 504 | 25,577 |
| BP plc | 14,904 | 71,951 |
| British American Tobacco plc | 611 | 25,623 |
| CK Hutchison Holdings Ltd. | 535 | 3,752 |
| DCC plc | 149 | 11,282 |
| Diageo plc | 1,581 | 78,866 |
| HSBC Holdings plc | 4,651 | 29,061 |
| InterContinental Hotels Group plc | 517 | 33,011 |
| Intertek Group plc | 71 | 4,443 |
| Lloyds Banking Group plc | 67,039 | 38,076 |
| London Stock Exchange Group plc | 50 | 4,967 |
| Prudential plc | 1,474 | 18,350 |
| Reckitt Benckiser Group plc | 554 | 43,232 |
| RELX plc | 1,858 | 55,359 |
| SSE plc | 1,153 | 26,774 |
| Standard Chartered plc | 5,017 | 34,300 |
| Taylor Wimpey plc | 5,072 | 7,977 |
| Tesco plc | 8,523 | 28,956 |
| Unilever plc | 813 | 37,750 |
| | | 752,505 |
| United States — 1.9% |
| Ferguson plc | 42 | 5,303 |
| GlaxoSmithKline plc | 528 | 11,898 |
| Schneider Electric SE (a) | 411 | 59,012 |
| Stellantis NV | 2,140 | 28,726 |
| | | 104,939 |
Total Common Stocks
(Cost $4,625,226) | | 5,138,804 |
| Short-Term Investments — 7.4% |
| Investment Companies — 3.7% |
| JPMorgan Prime Money Market Fund Class Institutional Shares, 0.36% (c) (d)(Cost $204,860) | 204,821 | 204,862 |
| Investment of Cash Collateral from Securities Loaned — 3.7% |
| JPMorgan Securities Lending Money Market Fund Agency SL Class Shares, 0.37% (c) (d) | 127,422 | 127,333 |
| JPMorgan U.S. Government Money Market Fund Class IM Shares, 0.37% (c) (d) | 73,567 | 73,567 |
Total Investment of Cash Collateral from Securities Loaned
(Cost $200,904) | | 200,900 |
Total Short-Term Investments
(Cost $405,764) | | 405,762 |
SEE NOTES TO FINANCIAL STATEMENTS.
| 52 | J.P. Morgan International Equity Funds | April 30, 2022 |
| INVESTMENTS | SHARES
(000) | VALUE
($000) |
Total Investments — 100.4%
(Cost $5,030,990) | | 5,544,566 |
| Liabilities in Excess of Other Assets — (0.4)% | | (21,526) |
| NET ASSETS — 100.0% | | 5,523,040 |
Percentages indicated are based on net assets. |
| Abbreviations | |
| ADR | American Depositary Receipt |
| OYJ | Public Limited Company |
| Preference | A special type of equity investment that shares in the earnings of the company, has limited voting rights, and may have a dividend preference. Preference shares may also have liquidation preference. |
| REIT | Real Estate Investment Trust |
| ^ | Amount rounds to less than 0.1% of net assets. |
| ‡ | Value determined using significant unobservable inputs. | |
| * | Non-income producing security. | |
| (a) | The security or a portion of this security is on loan at April 30, 2022. The total value of securities on loan at April 30, 2022 is $177,073. | |
| (b) | Security exempt from registration pursuant to Regulation S under the Securities Act of 1933, as amended. Regulation S applies to securities offerings that are made outside of the United States and do not involve direct selling efforts in the United States and as such may have restrictions on resale. | |
| (c) | Investment in an affiliated fund, which is registered under the Investment Company Act of 1940, as amended, and is advised by J.P. Morgan Investment Management Inc. | |
| (d) | The rate shown is the current yield as of April 30, 2022. | |
Summary of Investments by Industry, April 30, 2022
The following table represents the portfolio investments of the Fund by industry classifications as a percentage of total investments:
| INDUSTRY | PERCENT OF
TOTAL
INVESTMENTS |
| Pharmaceuticals | 10.5% |
| Banks | 9.6 |
| Insurance | 5.6 |
| Chemicals | 4.5 |
| Oil, Gas & Consumable Fuels | 4.1 |
| Semiconductors & Semiconductor Equipment | 3.4 |
| Textiles, Apparel & Luxury Goods | 2.9 |
| Food Products | 2.9 |
| Electric Utilities | 2.9 |
| Automobiles | 2.8 |
| Beverages | 2.7 |
| Metals & Mining | 2.6 |
| Machinery | 2.3 |
| Diversified Telecommunication Services | 2.3 |
| Personal Products | 2.2 |
| Professional Services | 2.2 |
| Capital Markets | 2.1 |
| IT Services | 1.8 |
| Multi-Utilities | 1.6 |
| Real Estate Management & Development | 1.5 |
| Industrial Conglomerates | 1.5 |
| Household Durables | 1.5 |
| Electrical Equipment | 1.5 |
| Food & Staples Retailing | 1.3 |
| Trading Companies & Distributors | 1.2 |
| Building Products | 1.1 |
| Electronic Equipment, Instruments & Components | 1.1 |
| Equity Real Estate Investment Trusts (REITs) | 1.1 |
| Others (each less than 1.0%) | 11.9 |
| Short-Term Investments | 7.3 |
SEE NOTES TO FINANCIAL STATEMENTS.
| April 30, 2022 | J.P. Morgan International Equity Funds | 53 |
JPMorgan International Research Enhanced Equity Fund
SCHEDULE OF PORTFOLIO INVESTMENTS
AS OF April 30, 2022 (Unaudited) (continued)
Futures contracts outstanding as of April 30, 2022 (amounts in thousands, except number of contracts):
| DESCRIPTION | NUMBER OF
CONTRACTS | EXPIRATION DATE | TRADING CURRENCY | NOTIONAL
AMOUNT ($) | VALUE AND
UNREALIZED
APPRECIATION
(DEPRECIATION) ($) |
| Long Contracts | | | | | |
| SPI 200 Index | 607 | 06/16/2022 | AUD | 78,334 | 2,036 |
| MSCI EAFE E-Mini Index | 826 | 06/17/2022 | USD | 82,402 | (1,379) |
| | | | | | 657 |
| Abbreviations | |
| AUD | Australian Dollar |
| EAFE | Europe, Australasia, and Far East |
| MSCI | Morgan Stanley Capital International |
| SPI | Australian Securities Exchange |
| USD | United States Dollar |
SEE NOTES TO FINANCIAL STATEMENTS.
| 54 | J.P. Morgan International Equity Funds | April 30, 2022 |
JPMorgan International Value Fund
SCHEDULE OF PORTFOLIO INVESTMENTS
AS OF April 30, 2022 (Unaudited)
| INVESTMENTS | SHARES
(000) | VALUE
($000) |
| Common Stocks — 98.2% |
| Australia — 8.5% |
| Australia & New Zealand Banking Group Ltd. | 177 | 3,371 |
| BHP Group Ltd. | 266 | 8,877 |
| BlueScope Steel Ltd. | 29 | 416 |
| Glencore plc * | 695 | 4,283 |
| Harvey Norman Holdings Ltd. | 141 | 502 |
| JB Hi-Fi Ltd. | 11 | 419 |
| Metcash Ltd. | 136 | 455 |
| National Australia Bank Ltd. | 200 | 4,557 |
| Rio Tinto Ltd. | 24 | 1,923 |
| Rio Tinto plc | 54 | 3,797 |
| South32 Ltd. | 291 | 969 |
| Super Retail Group Ltd. | 62 | 456 |
| Westpac Banking Corp. | 113 | 1,897 |
| Worley Ltd. | 109 | 1,062 |
| | | 32,984 |
| Austria — 1.3% |
| ANDRITZ AG | 12 | 520 |
| BAWAG Group AG * (a) | 14 | 680 |
| Erste Group Bank AG | 25 | 768 |
| OMV AG | 32 | 1,608 |
| Telekom Austria AG * | 59 | 419 |
| voestalpine AG | 34 | 886 |
| Wienerberger AG | 13 | 376 |
| | | 5,257 |
| Belgium — 0.5% |
| Ageas SA | 18 | 885 |
| Bekaert SA | 19 | 703 |
| Telenet Group Holding NV | 9 | 266 |
| | | 1,854 |
| China — 0.5% |
| BOC Hong Kong Holdings Ltd. | 316 | 1,142 |
| Yangzijiang Shipbuilding Holdings Ltd. | 1,259 | 822 |
| | | 1,964 |
| Denmark — 1.7% |
| AP Moller - Maersk A/S, Class B | — | 776 |
| D/S Norden A/S | 6 | 210 |
| Drilling Co. of 1972 A/S (The) * | 18 | 910 |
| H+H International A/S, Class B * | 24 | 582 |
| Jyske Bank A/S (Registered) * | 11 | 609 |
| Matas A/S | 38 | 532 |
| Solar A/S, Class B | 9 | 1,043 |
| INVESTMENTS | SHARES
(000) | VALUE
($000) |
| |
| Denmark — continued |
| Spar Nord Bank A/S | 83 | 1,055 |
| Sydbank A/S | 23 | 784 |
| | | 6,501 |
| Egypt — 0.3% |
| Energean plc * | 74 | 1,100 |
| Finland — 1.6% |
| Cargotec OYJ, Class B | 12 | 421 |
| Konecranes OYJ | 13 | 374 |
| Nokia OYJ * | 370 | 1,878 |
| Nordea Bank Abp | 202 | 2,007 |
| Outokumpu OYJ (b) | 132 | 647 |
| TietoEVRY OYJ (b) | 10 | 257 |
| Valmet OYJ | 18 | 486 |
| | | 6,070 |
| France — 8.1% |
| AXA SA (b) | 117 | 3,096 |
| BNP Paribas SA | 62 | 3,221 |
| Carrefour SA | 81 | 1,723 |
| Cie de Saint-Gobain | 25 | 1,436 |
| Coface SA | 41 | 495 |
| Credit Agricole SA | 91 | 985 |
| Eiffage SA | 11 | 1,131 |
| Eutelsat Communications SA | 84 | 928 |
| IPSOS | 18 | 870 |
| Metropole Television SA | 32 | 594 |
| Orange SA | 177 | 2,102 |
| Publicis Groupe SA | 20 | 1,205 |
| Renault SA * | 35 | 846 |
| Rothschild & Co. | 28 | 1,102 |
| SCOR SE | 18 | 516 |
| Societe Generale SA | 70 | 1,677 |
| Sopra Steria Group SACA | 3 | 496 |
| SPIE SA | 25 | 596 |
| Technip Energies NV * | 79 | 955 |
| Television Francaise 1 (b) | 56 | 473 |
| TotalEnergies SE (b) | 138 | 6,797 |
| | | 31,244 |
| Germany — 9.8% |
| Allianz SE (Registered) | 21 | 4,730 |
| Aurubis AG | 7 | 819 |
| Bayer AG (Registered) * | 64 | 4,214 |
| Bayerische Motoren Werke AG | 19 | 1,505 |
SEE NOTES TO FINANCIAL STATEMENTS.
| April 30, 2022 | J.P. Morgan International Equity Funds | 55 |
JPMorgan International Value Fund
SCHEDULE OF PORTFOLIO INVESTMENTS
AS OF April 30, 2022 (Unaudited) (continued)
| INVESTMENTS | SHARES
(000) | VALUE
($000) |
| Common Stocks — continued |
| Germany — continued |
| Continental AG * | 7 | 471 |
| Covestro AG (a) | 18 | 786 |
| Daimler Truck Holding AG * | 26 | 684 |
| Deutsche Bank AG (Registered) * | 148 | 1,484 |
| Deutsche Pfandbriefbank AG (a) | 77 | 974 |
| Deutsche Post AG (Registered) | 60 | 2,561 |
| Deutsche Telekom AG (Registered) | 152 | 2,805 |
| DWS Group GmbH & Co. KGaA (a) | 10 | 324 |
| E.ON SE | 127 | 1,324 |
| Freenet AG | 21 | 580 |
| HeidelbergCement AG | 12 | 697 |
| HOCHTIEF AG | 4 | 267 |
| Kloeckner & Co. SE * | 71 | 914 |
| Mercedes-Benz Group AG * | 51 | 3,553 |
| Muenchener Rueckversicherungs-Gesellschaft AG (Registered) | 7 | 1,599 |
| ProSiebenSat.1 Media SE | 27 | 308 |
| Siemens AG (Registered) | 40 | 4,942 |
| Talanx AG | 10 | 405 |
| Volkswagen AG (Preference) | 14 | 2,097 |
| | | 38,043 |
| Hong Kong — 1.0% |
| Hongkong Land Holdings Ltd. | 287 | 1,341 |
| Kerry Properties Ltd. | 420 | 1,136 |
| Pacific Basin Shipping Ltd. | 2,195 | 1,007 |
| VTech Holdings Ltd. | 57 | 402 |
| | | 3,886 |
| Italy — 3.4% |
| Anima Holding SpA (a) | 104 | 508 |
| Assicurazioni Generali SpA | 84 | 1,593 |
| Azimut Holding SpA | 22 | 460 |
| Credito Emiliano SpA | 68 | 417 |
| Eni SpA | 209 | 2,923 |
| Intesa Sanpaolo SpA | 935 | 1,904 |
| Maire Tecnimont SpA (b) | 252 | 737 |
| Mediobanca Banca di Credito Finanziario SpA | 73 | 735 |
| Pirelli & C SpA (a) | 196 | 971 |
| Poste Italiane SpA (a) | 50 | 488 |
| UniCredit SpA | 137 | 1,267 |
| Unipol Gruppo SpA | 214 | 1,169 |
| | | 13,172 |
| INVESTMENTS | SHARES
(000) | VALUE
($000) |
| |
| Japan — 21.0% |
| Acom Co. Ltd. | 98 | 251 |
| AGC, Inc. | 26 | 978 |
| Aiful Corp. | 138 | 394 |
| Aozora Bank Ltd. | 23 | 450 |
| Arcs Co. Ltd. | 17 | 269 |
| Bridgestone Corp. | 36 | 1,301 |
| Brother Industries Ltd. | 40 | 690 |
| Chiba Bank Ltd. (The) | 98 | 567 |
| Concordia Financial Group Ltd. | 147 | 537 |
| Cosmo Energy Holdings Co. Ltd. | 58 | 1,438 |
| Credit Saison Co. Ltd. (b) | 92 | 1,034 |
| Dai-ichi Life Holdings, Inc. | 102 | 2,048 |
| Daiwa Securities Group, Inc. | 125 | 613 |
| Fuyo General Lease Co. Ltd. | 16 | 866 |
| Hachijuni Bank Ltd. (The) | 96 | 316 |
| Hitachi Ltd. | 43 | 2,020 |
| Honda Motor Co. Ltd. | 105 | 2,767 |
| Isuzu Motors Ltd. | 115 | 1,340 |
| ITOCHU Corp. | 49 | 1,482 |
| Japan Post Holdings Co. Ltd. | 193 | 1,355 |
| Japan Post Insurance Co. Ltd. | 74 | 1,195 |
| Kamigumi Co. Ltd. | 23 | 389 |
| Kandenko Co. Ltd. | 41 | 261 |
| KDDI Corp. | 105 | 3,474 |
| Kinden Corp. | 22 | 265 |
| Mitsubishi Chemical Holdings Corp. | 137 | 837 |
| Mitsubishi Corp. | 68 | 2,266 |
| Mitsubishi Gas Chemical Co., Inc. | 22 | 314 |
| Mitsubishi UFJ Financial Group, Inc. | 731 | 4,250 |
| Mitsui & Co. Ltd. | 95 | 2,288 |
| Mitsui Fudosan Co. Ltd. | 74 | 1,575 |
| Mizuho Financial Group, Inc. | 178 | 2,159 |
| MS&AD Insurance Group Holdings, Inc. | 44 | 1,319 |
| Nichias Corp. | 14 | 253 |
| Nippon Telegraph & Telephone Corp. | 98 | 2,900 |
| Nippon Television Holdings, Inc. | 33 | 314 |
| Nomura Holdings, Inc. | 274 | 1,055 |
| Nomura Real Estate Holdings, Inc. | 54 | 1,318 |
| ORIX Corp. | 119 | 2,174 |
| Rengo Co. Ltd. | 36 | 215 |
| Resona Holdings, Inc. | 190 | 827 |
| Sanwa Holdings Corp. | 37 | 333 |
| SBI Holdings, Inc. | 23 | 521 |
| Sekisui House Ltd. | 64 | 1,105 |
SEE NOTES TO FINANCIAL STATEMENTS.
| 56 | J.P. Morgan International Equity Funds | April 30, 2022 |
| INVESTMENTS | SHARES
(000) | VALUE
($000) |
| Common Stocks — continued |
| Japan — continued |
| Shizuoka Bank Ltd. (The) | 91 | 587 |
| SoftBank Corp. | 211 | 2,452 |
| Sojitz Corp. | 71 | 1,075 |
| Sompo Holdings, Inc. | 23 | 949 |
| Sumitomo Corp. | 94 | 1,486 |
| Sumitomo Forestry Co. Ltd. | 66 | 1,007 |
| Sumitomo Mitsui Financial Group, Inc. | 93 | 2,807 |
| Sumitomo Mitsui Trust Holdings, Inc. | 50 | 1,558 |
| T&D Holdings, Inc. | 92 | 1,182 |
| Takeda Pharmaceutical Co. Ltd. | 115 | 3,349 |
| Tokyo Steel Manufacturing Co. Ltd. | 53 | 551 |
| Tokyo Tatemono Co. Ltd. | 35 | 495 |
| Tosoh Corp. | 38 | 518 |
| Toyota Motor Corp. | 535 | 9,175 |
| Toyota Tsusho Corp. | 19 | 672 |
| UBE Corp. | 16 | 253 |
| Yamaha Motor Co. Ltd. | 55 | 1,144 |
| | | 81,583 |
| Luxembourg — 0.5% |
| ArcelorMittal SA | 57 | 1,658 |
| RTL Group SA | 7 | 387 |
| | | 2,045 |
| Malta — 0.1% |
| Kindred Group plc, SDR | 57 | 504 |
| Netherlands — 6.1% |
| ABN AMRO Bank NV, CVA (a) (b) | 91 | 1,133 |
| Aegon NV | 337 | 1,747 |
| ASR Nederland NV | 27 | 1,218 |
| Flow Traders (a) (b) | 21 | 692 |
| Heijmans NV, CVA | 56 | 764 |
| ING Groep NV | 211 | 2,002 |
| Koninklijke Ahold Delhaize NV | 63 | 1,870 |
| NN Group NV | 26 | 1,288 |
| PostNL NV (b) | 116 | 381 |
| Randstad NV | 13 | 667 |
| Shell plc | 420 | 11,262 |
| Signify NV (a) | 14 | 601 |
| | | 23,625 |
| Norway — 2.5% |
| DNB Bank ASA (b) | 70 | 1,354 |
| Elkem ASA (a) | 230 | 953 |
| Equinor ASA | 80 | 2,707 |
| INVESTMENTS | SHARES
(000) | VALUE
($000) |
| |
| Norway — continued |
| Europris ASA (a) | 59 | 300 |
| Norsk Hydro ASA | 170 | 1,427 |
| Olav Thon Eiendomsselskap ASA | 24 | 493 |
| Selvaag Bolig ASA | 12 | 56 |
| SpareBank 1 Nord Norge | 80 | 854 |
| SpareBank 1 SMN | 42 | 597 |
| SpareBank 1 SR-Bank ASA | 46 | 588 |
| Storebrand ASA | 60 | 518 |
| | | 9,847 |
| Singapore — 1.5% |
| DBS Group Holdings Ltd. | 64 | 1,560 |
| Oversea-Chinese Banking Corp. Ltd. | 207 | 1,836 |
| StarHub Ltd. | 378 | 343 |
| United Overseas Bank Ltd. | 68 | 1,449 |
| Yangzijiang Financial Holding Pte. Ltd. * | 1,260 | 497 |
| | | 5,685 |
| South Africa — 0.9% |
| Anglo American plc | 76 | 3,373 |
| Spain — 3.3% |
| Acerinox SA | 40 | 427 |
| Atresmedia Corp. de Medios de Comunicacion SA | 190 | 726 |
| Banco Bilbao Vizcaya Argentaria SA | 518 | 2,718 |
| Banco Santander SA (b) | 944 | 2,758 |
| CaixaBank SA (b) | 293 | 945 |
| Mediaset Espana Comunicacion SA * | 96 | 431 |
| Repsol SA | 148 | 2,209 |
| Telefonica SA | 401 | 1,950 |
| Unicaja Banco SA (a) | 541 | 510 |
| | | 12,674 |
| Sweden — 2.7% |
| Bilia AB, Class A | 24 | 330 |
| Boliden AB (b) | 25 | 1,092 |
| Bonava AB, Class B | 42 | 204 |
| Humana AB * | 52 | 274 |
| Intrum AB * (b) | 24 | 574 |
| Inwido AB | 42 | 573 |
| Loomis AB | 31 | 777 |
| Lundin Energy AB (b) | 27 | 1,124 |
| Mekonomen AB * | 34 | 392 |
| Securitas AB, Class B | 60 | 709 |
| Skandinaviska Enskilda Banken AB, Class A | 125 | 1,402 |
| Skanska AB, Class B | 29 | 544 |
SEE NOTES TO FINANCIAL STATEMENTS.
| April 30, 2022 | J.P. Morgan International Equity Funds | 57 |
JPMorgan International Value Fund
SCHEDULE OF PORTFOLIO INVESTMENTS
AS OF April 30, 2022 (Unaudited) (continued)
| INVESTMENTS | SHARES
(000) | VALUE
($000) |
| Common Stocks — continued |
| Sweden — continued |
| SSAB AB, Class B (b) | 189 | 1,110 |
| Svenska Handelsbanken AB, Class A | 105 | 1,061 |
| Volvo AB, Class B | 14 | 230 |
| | | 10,396 |
| Switzerland — 6.2% |
| Adecco Group AG (Registered) | 16 | 604 |
| Julius Baer Group Ltd. | 15 | 734 |
| Mobilezone Holding AG (Registered) | 51 | 824 |
| Novartis AG (Registered) | 108 | 9,584 |
| Roche Holding AG | 3 | 1,144 |
| Swiss Life Holding AG (Registered) | 2 | 1,479 |
| Swisscom AG (Registered) (b) | 2 | 1,153 |
| UBS Group AG (Registered) | 237 | 4,024 |
| Vontobel Holding AG (Registered) | 8 | 555 |
| Zurich Insurance Group AG | 9 | 4,063 |
| | | 24,164 |
| United Kingdom — 14.2% |
| 3i Group plc | 59 | 969 |
| Aviva plc | 276 | 1,481 |
| Balfour Beatty plc | 249 | 753 |
| Barclays plc | 969 | 1,782 |
| Barratt Developments plc | 139 | 852 |
| Bellway plc | 9 | 267 |
| Berkeley Group Holdings plc * | 10 | 513 |
| BP plc | 1,192 | 5,755 |
| BT Group plc | 575 | 1,276 |
| Centrica plc * | 1,490 | 1,476 |
| CK Hutchison Holdings Ltd. | 276 | 1,937 |
| Crest Nicholson Holdings plc | 84 | 265 |
| Drax Group plc | 122 | 1,237 |
| easyJet plc * | 111 | 766 |
| Halfords Group plc | 239 | 681 |
| HSBC Holdings plc | 1,071 | 6,693 |
| IG Group Holdings plc | 56 | 569 |
| Inchcape plc | 43 | 387 |
| Investec plc | 278 | 1,639 |
| ITV plc | 437 | 404 |
| J Sainsbury plc | 236 | 689 |
| JET2 plc * | 55 | 835 |
| Johnson Matthey plc | 50 | 1,366 |
| Keller Group plc | 44 | 468 |
| Kier Group plc * | 253 | 252 |
| Land Securities Group plc, REIT | 157 | 1,471 |
| INVESTMENTS | SHARES
(000) | VALUE
($000) |
| |
| United Kingdom — continued |
| Legal & General Group plc | 427 | 1,331 |
| Lloyds Banking Group plc | 4,177 | 2,372 |
| Man Group plc | 271 | 788 |
| Marks & Spencer Group plc * | 530 | 905 |
| Morgan Sindall Group plc | 20 | 531 |
| NatWest Group plc | 399 | 1,071 |
| OSB Group plc | 172 | 1,203 |
| Paragon Banking Group plc | 75 | 462 |
| Premier Foods plc | 451 | 630 |
| Rathbones Group plc | 16 | 412 |
| Reach plc | 208 | 426 |
| Redrow plc | 48 | 314 |
| Royal Mail plc | 263 | 1,125 |
| Standard Chartered plc | 163 | 1,114 |
| Taylor Wimpey plc | 325 | 511 |
| Tesco plc | 599 | 2,034 |
| Vistry Group plc | 77 | 801 |
| Vodafone Group plc | 1,914 | 2,898 |
| WPP plc | 106 | 1,322 |
| | | 55,033 |
| United States — 2.5% |
| GlaxoSmithKline plc | 278 | 6,276 |
| Stellantis NV | 97 | 1,303 |
| Stellantis NV | 62 | 836 |
| Tenaris SA | 74 | 1,124 |
| | | 9,539 |
Total Common Stocks
(Cost $361,439) | | 380,543 |
| Short-Term Investments — 6.6% |
| Investment Companies — 1.5% |
| JPMorgan Prime Money Market Fund Class Institutional Shares, 0.36% (c) (d)(Cost $5,752) | 5,751 | 5,753 |
| Investment of Cash Collateral from Securities Loaned — 5.1% |
| JPMorgan Securities Lending Money Market Fund Agency SL Class Shares, 0.37% (c) (d) | 14,709 | 14,699 |
| JPMorgan U.S. Government Money Market Fund Class IM Shares, 0.37% (c) (d) | 5,183 | 5,183 |
Total Investment of Cash Collateral from Securities Loaned
(Cost $19,881) | | 19,882 |
Total Short-Term Investments
(Cost $25,633) | | 25,635 |
SEE NOTES TO FINANCIAL STATEMENTS.
| 58 | J.P. Morgan International Equity Funds | April 30, 2022 |
| INVESTMENTS | SHARES
(000) | VALUE
($000) |
Total Investments — 104.8%
(Cost $387,072) | | 406,178 |
| Liabilities in Excess of Other Assets — (4.8)% | | (18,478) |
| NET ASSETS — 100.0% | | 387,700 |
Percentages indicated are based on net assets. |
Amounts presented as a dash (“-“) represent amounts that round to less than a thousand. |
| Abbreviations | |
| CVA | Dutch Certification |
| OYJ | Public Limited Company |
| Preference | A special type of equity investment that shares in the earnings of the company, has limited voting rights, and may have a dividend preference. Preference shares may also have liquidation preference. |
| REIT | Real Estate Investment Trust |
| SDR | Swedish Depositary Receipt |
| * | Non-income producing security. |
| (a) | Security exempt from registration pursuant to Regulation S under the Securities Act of 1933, as amended. Regulation S applies to securities offerings that are made outside of the United States and do not involve direct selling efforts in the United States and as such may have restrictions on resale. |
| (b) | The security or a portion of this security is on loan at April 30, 2022. The total value of securities on loan at April 30, 2022 is $18,772. |
| (c) | Investment in an affiliated fund, which is registered under the Investment Company Act of 1940, as amended, and is advised by J.P. Morgan Investment Management Inc. |
| (d) | The rate shown is the current yield as of April 30, 2022. |
Summary of Investments by Industry, April 30, 2022
The following table represents the portfolio investments of the Fund by industry classifications as a percentage of total investments:
| INDUSTRY | PERCENT OF
TOTAL
INVESTMENTS |
| Banks | 18.4% |
| Oil, Gas & Consumable Fuels | 9.1 |
| Insurance | 8.9 |
| Metals & Mining | 8.1 |
| Pharmaceuticals | 6 |
| Automobiles | 6 |
| Capital Markets | 4.2 |
| Diversified Telecommunication Services | 3.1 |
| Trading Companies & Distributors | 2.8 |
| Wireless Telecommunication Services | 2.4 |
| Industrial Conglomerates | 2.2 |
| Media | 2.1 |
| Food & Staples Retailing | 2 |
| Real Estate Management & Development | 1.6 |
| Construction & Engineering | 1.5 |
| Household Durables | 1.4 |
| Chemicals | 1.2 |
| Air Freight & Logistics | 1 |
| Energy Equipment & Services | 1 |
| Others (each less than 1.0%) | 10.7 |
| Short-Term Investments | 6.3 |
SEE NOTES TO FINANCIAL STATEMENTS.
| April 30, 2022 | J.P. Morgan International Equity Funds | 59 |
STATEMENTS OF ASSETS AND LIABILITIES
AS OF April 30, 2022 (Unaudited)
(Amounts in thousands, except per share amounts)
| | JPMorgan
Emerging
Markets
Equity Fund | | JPMorgan
Emerging
Markets
Research
Enhanced
Equity Fund | | JPMorgan
Europe
Dynamic
Fund |
| ASSETS: | | | | | |
| Investments in non-affiliates, at value | $9,421,456 | | $2,908,681 | | $ 593,016 |
| Investments in affiliates, at value | 267,806 | | 43,823 | | 12,091 |
| Investments of cash collateral received from securities loaned, at value (See Note 2.C) | 107 | | 14,062 | | 48,178 |
| Cash | — | | 4,238 | | 98 |
| Foreign currency, at value | 4,775 | | 1,131 | | — |
| Deposits at broker for futures contracts | — | | 12,043 | | 834 |
| Receivables: | | | | | |
| Investment securities sold | 10,291 | | 155,227 | | 931 |
| Fund shares sold | 131,113 | | 137,432 | | 59 |
| Dividends from non-affiliates | 4,182 | | 6,028 | | 2,369 |
| Dividends from affiliates | 59 | | 10 | | 2 |
| Tax reclaims | 230 | | 122 | | 3,350 |
| Securities lending income (See Note 2.C) | —(a) | | 3 | | 8 |
| Variation margin on futures contracts | — | | 3,769 | | 34 |
| Total Assets | 9,840,019 | | 3,286,569 | | 660,970 |
| LIABILITIES: | | | | | |
| Payables: | | | | | |
| Due to custodian | 10,241 | | — | | — |
| Foreign currency due to custodian, at value | — | | — | | 460 |
| Investment securities purchased | — | | — | | 5,093 |
| Collateral received on securities loaned (See Note 2.C) | 107 | | 14,063 | | 48,178 |
| Fund shares redeemed | 94,084 | | 317,760 | | 250 |
| Accrued liabilities: | | | | | |
| Investment advisory fees | 5,472 | | 569 | | 312 |
| Administration fees | 523 | | 140 | | 39 |
| Distribution fees | 138 | | — | | 21 |
| Service fees | 746 | | 19 | | 40 |
| Custodian and accounting fees | 143 | | 180 | | 14 |
| Trustees’ and Chief Compliance Officer’s fees | — | | — | | —(a) |
| Deferred foreign capital gains tax | 49,934 | | 7,716 | | — |
| Other | 403 | | 30 | | 21 |
| Total Liabilities | 161,791 | | 340,477 | | 54,428 |
| Net Assets | $9,678,228 | | $2,946,092 | | $ 606,542
(a) Amount rounds to less than one thousand. |
SEE NOTES TO FINANCIAL STATEMENTS.
| 60 | J.P. Morgan International Equity Funds | April 30, 2022 |
| | JPMorgan
Emerging
Markets
Equity Fund | | JPMorgan
Emerging
Markets
Research
Enhanced
Equity Fund | | JPMorgan
Europe
Dynamic
Fund |
| NET ASSETS: | | | | | |
| Paid-in-Capital | $8,828,888 | | $3,082,344 | | $ 712,608 |
| Total distributable earnings (loss) | 849,340 | | (136,252) | | (106,066) |
| Total Net Assets: | $9,678,228 | | $2,946,092 | | $ 606,542 |
| Net Assets: | | | | | |
| Class A | $ 476,166 | | $ — | | $ 73,397 |
| Class C | 51,142 | | — | | 7,015 |
| Class I | 2,901,502 | | 236,318 | | 69,744 |
| Class L | 1,804,078 | | — | | 75,636 |
| Class R2 | 465 | | — | | — |
| Class R3 | 12,570 | | — | | — |
| Class R4 | 2,908 | | — | | — |
| Class R5 | 15,147 | | — | | — |
| Class R6 | 4,414,250 | | 2,709,774 | | 380,750 |
| Total | $9,678,228 | | $2,946,092 | | $ 606,542 |
Outstanding units of beneficial interest (shares)
($0.0001 par value; unlimited number of shares authorized): | | | | | |
| Class A | 16,507 | | — | | 2,832 |
| Class C | 1,848 | | — | | 307 |
| Class I | 98,095 | | 14,208 | | 2,638 |
| Class L | 60,492 | | — | | 2,823 |
| Class R2 | 16 | | — | | — |
| Class R3 | 439 | | — | | — |
| Class R4 | 99 | | — | | — |
| Class R5 | 508 | | — | | — |
| Class R6 | 148,159 | | 163,851 | | 14,277 |
| Net Asset Value (a): | | | | | |
| Class A — Redemption price per share | $ 28.85 | | $ — | | $ 25.92 |
| Class C — Offering price per share (b) | 27.67 | | — | | 22.86 |
| Class I — Offering and redemption price per share | 29.58 | | 16.63 | | 26.43 |
| Class L — Offering and redemption price per share | 29.82 | | — | | 26.79 |
| Class R2 — Offering and redemption price per share | 28.45 | | — | | — |
| Class R3 — Offering and redemption price per share | 28.64 | | — | | — |
| Class R4 — Offering and redemption price per share | 29.47 | | — | | — |
| Class R5 — Offering and redemption price per share | 29.82 | | — | | — |
| Class R6 — Offering and redemption price per share | 29.79 | | 16.54 | | 26.67 |
| Class A maximum sales charge | 5.25% | | —% | | 5.25% |
Class A maximum public offering price per share
[net asset value per share/(100% – maximum sales charge)] | $ 30.45 | | $ — | | $ 27.36 |
| Cost of investments in non-affiliates | $8,504,575 | | $2,859,310 | | $ 575,629 |
| Cost of investments in affiliates | 267,802 | | 43,823 | | 12,092 |
| Cost of foreign currency | 3,472 | | 1,131 | | — |
| Investment securities on loan, at value (See Note 2.C) | 106 | | 13,480 | | 44,177 |
| Cost of investment of cash collateral (See Note 2.C) | 107 | | 14,061 | | 48,178 |
| (a) | Per share amounts may not recalculate due to rounding of net assets and/or shares outstanding. |
| (b) | Redemption price for Class C Shares varies based upon length of time the shares are held. |
SEE NOTES TO FINANCIAL STATEMENTS.
| April 30, 2022 | J.P. Morgan International Equity Funds | 61 |
STATEMENTS OF ASSETS AND LIABILITIES
AS OF April 30, 2022 (Unaudited) (continued)
(Amounts in thousands, except per share amounts)
| | JPMorgan
International
Equity Fund | | JPMorgan
International
Focus Fund | | JPMorgan
International
Hedged
Equity Fund |
| ASSETS: | | | | | |
| Investments in non-affiliates, at value | $4,234,728 | | $1,362,361 | | $156,122 |
| Investments in affiliates, at value | 127,803 | | 39,689 | | 7,724 |
| Investments of cash collateral received from securities loaned, at value (See Note 2.C) | 202,371 | | — | | — |
| Options purchased, at value | — | | — | | 6,077 |
| Cash | 51 | | 50 | | 751 |
| Foreign currency, at value | 2,745 | | 967 | | 204 |
| Deposits at broker for futures contracts | — | | — | | 642 |
| Receivables: | | | | | |
| Investment securities sold | — | | — | | 995 |
| Fund shares sold | 312,065 | | 1,544 | | 635 |
| Dividends from non-affiliates | 12,176 | | 1,739 | | 636 |
| Dividends from affiliates | 39 | | 20 | | 1 |
| Tax reclaims | 7,971 | | 5,603 | | 424 |
| Securities lending income (See Note 2.C) | 126 | | 5 | | — |
| Other assets | — | | 69 | | — |
| Total Assets | 4,900,075 | | 1,412,047 | | 174,211 |
| LIABILITIES: | | | | | |
| Payables: | | | | | |
| Investment securities purchased | 95,972 | | 2,937 | | 1,215 |
| Collateral received on securities loaned (See Note 2.C) | 202,371 | | — | | — |
| Fund shares redeemed | 116,207 | | 848 | | 615 |
| Variation margin on futures contracts | — | | — | | 39 |
| Outstanding options written, at fair value | — | | — | | 1,036 |
| Accrued liabilities: | | | | | |
| Investment advisory fees | 1,610 | | 959 | | 16 |
| Administration fees | 123 | | 9 | | — |
| Distribution fees | 93 | | 71 | | 1 |
| Service fees | 173 | | 161 | | 36 |
| Custodian and accounting fees | 85 | | 73 | | 12 |
| Trustees’ and Chief Compliance Officer’s fees | — | | — | | 1 |
| Other | 55 | | 42 | | 17 |
| Total Liabilities | 416,689 | | 5,100 | | 2,988 |
| Net Assets | $4,483,386 | | $1,406,947 | | $171,223 |
SEE NOTES TO FINANCIAL STATEMENTS.
| 62 | J.P. Morgan International Equity Funds | April 30, 2022 |
| | JPMorgan
International
Equity Fund | | JPMorgan
International
Focus Fund | | JPMorgan
International
Hedged
Equity Fund |
| NET ASSETS: | | | | | |
| Paid-in-Capital | $4,036,997 | | $1,118,469 | | $179,991 |
| Total distributable earnings (loss) | 446,389 | | 288,478 | | (8,768) |
| Total Net Assets: | $4,483,386 | | $1,406,947 | | $171,223 |
| Net Assets: | | | | | |
| Class A | $ 365,217 | | $ 268,558 | | $ 5,203 |
| Class C | 8,331 | | 18,734 | | 284 |
| Class I | 623,210 | | 654,222 | | 165,497 |
| Class R2 | 20,627 | | 1,783 | | — |
| Class R5 | 9,074 | | 2,216 | | 21 |
| Class R6 | 3,456,927 | | 461,434 | | 218 |
| Total | $4,483,386 | | $1,406,947 | | $171,223 |
Outstanding units of beneficial interest (shares)
($0.0001 par value; unlimited number of shares authorized): | | | | | |
| Class A | 21,721 | | 11,896 | | 354 |
| Class C | 526 | | 843 | | 19 |
| Class I | 36,411 | | 28,583 | | 11,216 |
| Class R2 | 1,244 | | 79 | | — |
| Class R5 | 527 | | 97 | | 2 |
| Class R6 | 201,358 | | 20,152 | | 15 |
| Net Asset Value (a): | | | | | |
| Class A — Redemption price per share | $ 16.81 | | $ 22.57 | | $ 14.68 |
| Class C — Offering price per share (b) | 15.85 | | 22.23 | | 14.65 |
| Class I — Offering and redemption price per share | 17.12 | | 22.89 | | 14.76 |
| Class R2 — Offering and redemption price per share | 16.59 | | 22.40 | | — |
| Class R5 — Offering and redemption price per share | 17.21 | | 22.89 | | 14.78 |
| Class R6 — Offering and redemption price per share | 17.17 | | 22.90 | | 14.79 |
| Class A maximum sales charge | 5.25% | | 5.25% | | 5.25% |
Class A maximum public offering price per share
[net asset value per share/(100% – maximum sales charge)] | $ 17.74 | | $ 23.82 | | $ 15.49 |
| Cost of investments in non-affiliates | $3,767,366 | | $1,191,605 | | $147,593 |
| Cost of investments in affiliates | 127,784 | | 39,692 | | 7,724 |
| Cost of options purchased | — | | — | | 4,108 |
| Cost of foreign currency | 2,748 | | 967 | | 206 |
| Investment securities on loan, at value (See Note 2.C) | 169,016 | | — | | — |
| Cost of investment of cash collateral (See Note 2.C) | 202,371 | | — | | — |
| Premiums received from options written | — | | — | | 3,954 |
| (a) | Per share amounts may not recalculate due to rounding of net assets and/or shares outstanding. |
| (b) | Redemption price for Class C Shares varies based upon length of time the shares are held. |
SEE NOTES TO FINANCIAL STATEMENTS.
| April 30, 2022 | J.P. Morgan International Equity Funds | 63 |
STATEMENTS OF ASSETS AND LIABILITIES
AS OF April 30, 2022 (Unaudited) (continued)
(Amounts in thousands, except per share amounts)
| | JPMorgan
International
Research
Enhanced
Equity Fund | | JPMorgan
International
Value Fund |
| ASSETS: | | | |
| Investments in non-affiliates, at value | $5,138,804 | | $380,543 |
| Investments in affiliates, at value | 204,862 | | 5,753 |
| Investments of cash collateral received from securities loaned, at value (See Note 2.C) | 200,900 | | 19,882 |
| Cash | 4,433 | | — |
| Foreign currency, at value | 606 | | — |
| Deposits at broker for futures contracts | 11,765 | | — |
| Receivables: | | | |
| Investment securities sold | 29,816 | | 658 |
| Fund shares sold | 567,563 | | 818 |
| Dividends from non-affiliates | 18,416 | | 2,851 |
| Dividends from affiliates | 57 | | 3 |
| Tax reclaims | 10,118 | | 2,232 |
| Securities lending income (See Note 2.C) | 187 | | 20 |
| Total Assets | 6,187,527 | | 412,760 |
| LIABILITIES: | | | |
| Payables: | | | |
| Due to custodian | — | | 266 |
| Foreign currency due to custodian, at value | — | | 289 |
| Investment securities purchased | 461,303 | | 2,647 |
| Collateral received on securities loaned (See Note 2.C) | 200,899 | | 19,882 |
| Fund shares redeemed | 309 | | 587 |
| Variation margin on futures contracts | 382 | | — |
| Accrued liabilities: | | | |
| Investment advisory fees | 714 | | 148 |
| Administration fees | 240 | | 3 |
| Distribution fees | 8 | | 40 |
| Service fees | 27 | | 37 |
| Custodian and accounting fees | 132 | | 24 |
| Trustees’ and Chief Compliance Officer’s fees | —(a) | | —(a) |
| Other | 473 | | 1,137 |
| Total Liabilities | 664,487 | | 25,060 |
| Net Assets | $5,523,040 | | $387,700
(a) Amount rounds to less than one thousand. |
SEE NOTES TO FINANCIAL STATEMENTS.
| 64 | J.P. Morgan International Equity Funds | April 30, 2022 |
| | JPMorgan
International
Research
Enhanced
Equity Fund | | JPMorgan
International
Value Fund |
| NET ASSETS: | | | |
| Paid-in-Capital | $5,318,902 | | $451,151 |
| Total distributable earnings (loss) | 204,138 | | (63,451) |
| Total Net Assets: | $5,523,040 | | $387,700 |
| Net Assets: | | | |
| Class A | $ 37,317 | | $177,422 |
| Class C | — | | 2,490 |
| Class I | 313,629 | | 37,651 |
| Class L | — | | 6,285 |
| Class R2 | — | | 500 |
| Class R5 | — | | 33 |
| Class R6 | 5,172,094 | | 163,319 |
| Total | $5,523,040 | | $387,700 |
Outstanding units of beneficial interest (shares)
($0.0001 par value; unlimited number of shares authorized): | | | |
| Class A | 2,080 | | 15,053 |
| Class C | — | | 217 |
| Class I | 17,407 | | 3,106 |
| Class L | — | | 521 |
| Class R2 | — | | 43 |
| Class R5 | — | | 3 |
| Class R6 | 288,141 | | 13,630 |
| Net Asset Value (a): | | | |
| Class A — Redemption price per share | $ 17.94 | | $ 11.79 |
| Class C — Offering price per share (b) | — | | 11.44 |
| Class I — Offering and redemption price per share | 18.02 | | 12.12 |
| Class L — Offering and redemption price per share | — | | 12.05 |
| Class R2 — Offering and redemption price per share | — | | 11.59 |
| Class R5 — Offering and redemption price per share | — | | 11.97 |
| Class R6 — Offering and redemption price per share | 17.95 | | 11.98 |
| Class A maximum sales charge | 5.25% | | 5.25% |
Class A maximum public offering price per share
[net asset value per share/(100% – maximum sales charge)] | $ 18.93 | | $ 12.44 |
| Cost of investments in non-affiliates | $4,625,226 | | $361,439 |
| Cost of investments in affiliates | 204,860 | | 5,752 |
| Cost of foreign currency | 631 | | — |
| Investment securities on loan, at value | 177,073 | | 18,772 |
| Cost of investment of cash collateral (See Note 2.C) | 200,904 | | 19,881 |
| (a) | Per share amounts may not recalculate due to rounding of net assets and/or shares outstanding. |
| (b) | Redemption price for Class C Shares varies based upon length of time the shares are held. |
SEE NOTES TO FINANCIAL STATEMENTS.
| April 30, 2022 | J.P. Morgan International Equity Funds | 65 |
STATEMENTS OF OPERATIONS
FOR THE SIX MONTHS ENDED April 30, 2022 (Unaudited)
(Amounts in thousands)
| | JPMorgan
Emerging
Markets
Equity Fund | | JPMorgan
Emerging
Markets
Research
Enhanced
Equity Fund | | JPMorgan
Europe
Dynamic
Fund |
| INVESTMENT INCOME: | | | | | |
| Interest income from non-affiliates | $ — | | $ 3 | | $ 1 |
| Dividend income from non-affiliates | 49,549 | | 46,566 | | 11,865 |
| Dividend income from affiliates | 90 | | 34 | | 10 |
| Non-cash dividend income from non-affiliates | 13,536 | | 4,198 | | 2,368 |
| Income from securities lending (net) (See Note 2.C) | 85 | | 20 | | 86 |
| Foreign taxes withheld (net) | (5,770) | | (3,902) | | (1,485) |
| Total investment income | 57,490 | | 46,919 | | 12,845 |
| EXPENSES: | | | | | |
| Investment advisory fees | 40,116 | | 4,495 | | 2,764 |
| Administration fees | 4,115 | | 1,348 | | 346 |
| Distribution fees: | | | | | |
| Class A | 729 | | — | | 103 |
| Class C | 250 | | — | | 36 |
| Class R2 | 2 | | — | | — |
| Class R3 | 17 | | — | | — |
| Service fees: | | | | | |
| Class A | 729 | | — | | 103 |
| Class C | 83 | | — | | 12 |
| Class I | 4,859 | | 137 | | 397 |
| Class L | 1,103 | | — | | 41 |
| Class R3 | 17 | | — | | — |
| Class R4 | 4 | | — | | — |
| Class R5 | 9 | | — | | — |
| Custodian and accounting fees | 2,119 | | 959 | | 76 |
| Interest expense to affiliates | 14 | | — | | 9 |
| Professional fees | 143 | | 49 | | 46 |
| Trustees’ and Chief Compliance Officer’s fees | 31 | | 18 | | 14 |
| Printing and mailing costs | 358 | | 15 | | 30 |
| Registration and filing fees | 222 | | 46 | | 35 |
| Transfer agency fees (See Note 2.I) | 130 | | 13 | | 20 |
| Other | 333 | | 39 | | 27 |
| Total expenses | 55,383 | | 7,119 | | 4,059 |
| Less fees waived | (1,804) | | (796) | | (20) |
| Less expense reimbursements | (55) | | — | | — |
| Net expenses | 53,524 | | 6,323 | | 4,039 |
| Net investment income (loss) | $ 3,966 | | $ 40,596 | | $ 8,806 |
SEE NOTES TO FINANCIAL STATEMENTS.
| 66 | J.P. Morgan International Equity Funds | April 30, 2022 |
| | JPMorgan
Emerging
Markets
Equity Fund | | JPMorgan
Emerging
Markets
Research
Enhanced
Equity Fund | | JPMorgan
Europe
Dynamic
Fund |
| REALIZED/UNREALIZED GAINS (LOSSES): | | | | | |
| Net realized gain (loss) on transactions from: | | | | | |
| Investments in non-affiliates | $ 58,730(a) | | $(144,648)(b) | | $ (51,787) |
| Investments in affiliates | (21) | | (14) | | (7) |
| Futures contracts | — | | (420) | | 2,066 |
| Foreign currency transactions | (3,457) | | (1,113) | | (2,159) |
| Forward foreign currency exchange contracts | — | | — | | — |
| Net realized gain (loss) | 55,252 | | (146,195) | | (51,887) |
| Distribution of capital gain received from investment company affiliates | — | | — | | — |
| Change in net unrealized appreciation/depreciation on: | | | | | |
| Investments in non-affiliates | (3,600,687)(c) | | (502,838)(d) | | (112,693) |
| Investments in affiliates | 4 | | 1 | | (1) |
| Futures contracts | — | | 77 | | (1,615) |
| Foreign currency translations | 1,104 | | 119 | | (314) |
| Change in net unrealized appreciation/depreciation | (3,599,579) | | (502,641) | | (114,623) |
| Net realized/unrealized gains (losses) | (3,544,327) | | (648,836) | | (166,510) |
| Change in net assets resulting from operations | $(3,540,361) | | $(608,240) | | $(157,704) |
| (a) | Net of foreign capital gains tax of $(250). |
| (b) | Net of foreign capital gains tax of $(2,160). |
| (c) | Net of change in foreign capital gains tax of $(89). |
| (d) | Net of change in foreign capital gains tax of $5,322. |
SEE NOTES TO FINANCIAL STATEMENTS.
| April 30, 2022 | J.P. Morgan International Equity Funds | 67 |
STATEMENTS OF OPERATIONS
FOR THE SIX MONTHS ENDED April 30, 2022 (Unaudited) (continued)
(Amounts in thousands)
| | JPMorgan
International
Equity Fund | | JPMorgan
International
Focus Fund | | JPMorgan
International
Hedged
Equity Fund |
| INVESTMENT INCOME: | | | | | |
| Interest income from non-affiliates | $ — | | $ — | | $ — |
| Interest income from affiliates | — | | —(a) | | — |
| Dividend income from non-affiliates | 65,897 | | 36,677 | | 2,708 |
| Dividend income from affiliates | 69 | | 34 | | 2 |
| Non-cash dividend income from non-affiliates | — | | 3,517 | | — |
| Income from securities lending (net) (See Note 2.C) | 347 | | 84 | | — |
| Foreign taxes withheld (net) | (6,505) | | (3,253) | | (270) |
| Total investment income | 59,808 | | 37,059 | | 2,440 |
| EXPENSES: | | | | | |
| Investment advisory fees | 11,777 | | 9,993 | | 210 |
| Administration fees | 1,766 | | 1,249 | | 63 |
| Distribution fees: | | | | | |
| Class A | 515 | | 394 | | 6 |
| Class C | 37 | | 82 | | 1 |
| Class R2 | 57 | | 5 | | — |
| Service fees: | | | | | |
| Class A | 515 | | 394 | | 6 |
| Class C | 12 | | 28 | | — |
| Class I | 776 | | 970 | | 204 |
| Class R2 | 28 | | 2 | | — |
| Class R5 | 5 | | 1 | | — |
| Custodian and accounting fees | 307 | | 290 | | 41 |
| Interest expense to affiliates | 8 | | 5 | | — |
| Professional fees | 67 | | 52 | | 46 |
| Trustees’ and Chief Compliance Officer’s fees | 20 | | 17 | | 13 |
| Printing and mailing costs | 60 | | 49 | | 13 |
| Registration and filing fees | 88 | | 92 | | 55 |
| Transfer agency fees (See Note 2.I) | 56 | | 33 | | 1 |
| Other | 62 | | 44 | | 9 |
| Total expenses | 16,156 | | 13,700 | | 668 |
| Less fees waived | (2,706) | | (2,941) | | (158) |
| Less expense reimbursements | — | | — | | —(a) |
| Net expenses | 13,450 | | 10,759 | | 510 |
| Net investment income (loss) | $ 46,358 | | $ 26,300 | | $ 1,930
(a) Amount rounds to less than one thousand. |
SEE NOTES TO FINANCIAL STATEMENTS.
| 68 | J.P. Morgan International Equity Funds | April 30, 2022 |
| | JPMorgan
International
Equity Fund | | JPMorgan
International
Focus Fund | | JPMorgan
International
Hedged
Equity Fund |
| REALIZED/UNREALIZED GAINS (LOSSES): | | | | | |
| Net realized gain (loss) on transactions from: | | | | | |
| Investments in non-affiliates | $ (36,377) | | $ 224,853 | | $ 879 |
| Investments in affiliates | (44) | | (5) | | — |
| Options purchased | — | | — | | (6,076) |
| Futures contracts | — | | 71 | | (604) |
| Foreign currency transactions | (859) | | (345) | | (40) |
| Options written | — | | — | | 5,505 |
| Net realized gain (loss) | (37,280) | | 224,574 | | (336) |
| Change in net unrealized appreciation/depreciation on: | | | | | |
| Investments in non-affiliates | (884,227) | | (803,012) | | (24,366) |
| Investments in affiliates | 19 | | (3) | | — |
| Options purchased | — | | — | | 3,612 |
| Futures contracts | — | | — | | (233) |
| Foreign currency translations | (1,171) | | (384) | | (57) |
| Options written | — | | — | | 1,199 |
| Change in net unrealized appreciation/depreciation | (885,379) | | (803,399) | | (19,845) |
| Net realized/unrealized gains (losses) | (922,659) | | (578,825) | | (20,181) |
| Change in net assets resulting from operations | $(876,301) | | $(552,525) | | $(18,251) |
SEE NOTES TO FINANCIAL STATEMENTS.
| April 30, 2022 | J.P. Morgan International Equity Funds | 69 |
STATEMENTS OF OPERATIONS
FOR THE SIX MONTHS ENDED April 30, 2022 (Unaudited) (continued)
(Amounts in thousands)
| | JPMorgan
International
Research
Enhanced
Equity Fund | | JPMorgan
International
Value Fund |
| INVESTMENT INCOME: | | | |
| Interest income from non-affiliates | $ 2 | | $ — |
| Interest income from affiliates | —(a) | | — |
| Dividend income from non-affiliates | 80,992 | | 8,938 |
| Dividend income from affiliates | 96 | | 5 |
| Non-cash dividend income from non-affiliates | — | | 871 |
| Income from securities lending (net) (See Note 2.C) | 526 | | 48 |
| Foreign taxes withheld (net) | (7,756) | | (805) |
| Total investment income | 73,860 | | 9,057 |
| EXPENSES: | | | |
| Investment advisory fees | 4,904 | | 1,088 |
| Administration fees | 1,839 | | 148 |
| Distribution fees: | | | |
| Class A | 53 | | 231 |
| Class C | — | | 12 |
| Class R2 | — | | 1 |
| Service fees: | | | |
| Class A | 53 | | 231 |
| Class C | — | | 4 |
| Class I | 453 | | 48 |
| Class L | — | | 3 |
| Class R2 | — | | 1 |
| Custodian and accounting fees | 330 | | 49 |
| Interest expense to affiliates | 36 | | 1 |
| Professional fees | 82 | | 49 |
| Trustees’ and Chief Compliance Officer’s fees | 20 | | 13 |
| Printing and mailing costs | 13 | | 8 |
| Registration and filing fees | 65 | | 67 |
| Transfer agency fees (See Note 2.I) | 33 | | 9 |
| Other | 78 | | 25 |
| Total expenses | 7,959 | | 1,988 |
| Less fees waived | (1,570) | | (409) |
| Less expense reimbursements | — | | (1) |
| Net expenses | 6,389 | | 1,578 |
| Net investment income (loss) | $ 67,471 | | $ 7,479
(a) Amount rounds to less than one thousand. |
SEE NOTES TO FINANCIAL STATEMENTS.
| 70 | J.P. Morgan International Equity Funds | April 30, 2022 |
| | JPMorgan
International
Research
Enhanced
Equity Fund | | JPMorgan
International
Value Fund |
| REALIZED/UNREALIZED GAINS (LOSSES): | | | |
| Net realized gain (loss) on transactions from: | | | |
| Investments in non-affiliates | $ 40,943 | | $ (76) |
| Investments in affiliates | (36) | | (1) |
| Futures contracts | (2,412) | | (367) |
| Foreign currency transactions | (1,473) | | 109 |
| Net realized gain (loss) | 37,022 | | (335) |
| Change in net unrealized appreciation/depreciation on: | | | |
| Investments in non-affiliates | (745,853) | | (40,325) |
| Investments in affiliates | (3) | | 1 |
| Futures contracts | 501 | | (50) |
| Foreign currency translations | (1,597) | | (266) |
| Change in net unrealized appreciation/depreciation | (746,952) | | (40,640) |
| Net realized/unrealized gains (losses) | (709,930) | | (40,975) |
| Change in net assets resulting from operations | $(642,459) | | $(33,496) |
SEE NOTES TO FINANCIAL STATEMENTS.
| April 30, 2022 | J.P. Morgan International Equity Funds | 71 |
STATEMENTS OF CHANGES IN NET ASSETS
FOR THE PERIODS INDICIATED
(Amounts in thousands)
| | JPMorgan Emerging Markets
Equity Fund | | JPMorgan Emerging Markets Research
Enhanced Equity Fund |
| | Six Months Ended
April 30, 2022
(Unaudited) | | Year Ended
October 31, 2021 | | Six Months Ended
April 30, 2022
(Unaudited) | | Year Ended
October 31, 2021 |
| CHANGE IN NET ASSETS RESULTING FROM OPERATIONS: | | | | | | | |
| Net investment income (loss) | $ 3,966 | | $ (660) | | $ 40,596 | | $ 70,642 |
| Net realized gain (loss) | 55,252 | | 570,100 | | (146,195) | | 184,068 |
| Distributions of capital gains received from investment company affiliates | — | | — | | — | | — |
| Change in net unrealized appreciation/depreciation | (3,599,579) | | 749,583 | | (502,641) | | 221,738 |
| Change in net assets resulting from operations | (3,540,361) | | 1,319,023 | | (608,240) | | 476,448 |
| DISTRIBUTIONS TO SHAREHOLDERS: | | | | | | | |
| Class A | (22,535) | | — | | — | | — |
| Class C | (2,610) | | — | | — | | — |
| Class I | (162,208) | | (4,875) | | (231) | | (1) |
| Class L | (91,277) | | (3,336) | | — | | — |
| Class R2 | (19) | | — | | — | | — |
| Class R3 | (504) | | — | | — | | — |
| Class R4 | (135) | | (1) | | — | | — |
| Class R5 | (704) | | (80) | | — | | — |
| Class R6 | (206,914) | | (10,851) | | (199,236) | | (50,836) |
| Total distributions to shareholders | (486,906) | | (19,143) | | (199,467) | | (50,837) |
| CAPITAL TRANSACTIONS: | | | | | | | |
| Change in net assets resulting from capital transactions | (130,289) | | 1,315,679 | | (39,589) | | 527,435 |
| NET ASSETS: | | | | | | | |
| Change in net assets | (4,157,556) | | 2,615,559 | | (847,296) | | 953,046 |
| Beginning of period | 13,835,784 | | 11,220,225 | | 3,793,388 | | 2,840,342 |
| End of period | $ 9,678,228 | | $13,835,784 | | $2,946,092 | | $3,793,388 |
SEE NOTES TO FINANCIAL STATEMENTS.
| 72 | J.P. Morgan International Equity Funds | April 30, 2022 |
| | JPMorgan Europe Dynamic Fund | | JPMorgan International Equity Fund |
| | Six Months Ended
April 30, 2022
(Unaudited) | | Year Ended
October 31, 2021 | | Six Months Ended
April 30, 2022
(Unaudited) | | Year Ended
October 31, 2021 |
| CHANGE IN NET ASSETS RESULTING FROM OPERATIONS: | | | | | | | |
| Net investment income (loss) | $ 8,806 | | $ 12,685 | | $ 46,358 | | $ 80,677 |
| Net realized gain (loss) | (51,887) | | 65,264 | | (37,280) | | 332,125 |
| Change in net unrealized appreciation/depreciation | (114,623) | | 119,032 | | (885,379) | | 630,933 |
| Change in net assets resulting from operations | (157,704) | | 196,981 | | (876,301) | | 1,043,735 |
| DISTRIBUTIONS TO SHAREHOLDERS: | | | | | | | |
| Class A | (1,773) | | (839) | | (27,845) | | (3,040) |
| Class C | (188) | | (80) | | (669) | | (42) |
| Class I | (9,923) | | (772) | | (38,399) | | (4,786) |
| Class L | (2,043) | | (920) | | — | | — |
| Class R2 | — | | — | | (1,477) | | (292) |
| Class R5 | — | | — | | (678) | | (99) |
| Class R6 | (11,157) | | (4,405) | | (256,785) | | (33,732) |
| Total distributions to shareholders | (25,084) | | (7,016) | | (325,853) | | (41,991) |
| CAPITAL TRANSACTIONS: | | | | | | | |
| Change in net assets resulting from capital transactions | (285,188) | | 445,725 | | 839,823 | | 913,051 |
| NET ASSETS: | | | | | | | |
| Change in net assets | (467,976) | | 635,690 | | (362,331) | | 1,914,795 |
| Beginning of period | 1,074,518 | | 438,828 | | 4,845,717 | | 2,930,922 |
| End of period | $ 606,542 | | $1,074,518 | | $4,483,386 | | $4,845,717 |
SEE NOTES TO FINANCIAL STATEMENTS.
| April 30, 2022 | J.P. Morgan International Equity Funds | 73 |
STATEMENTS OF CHANGES IN NET ASSETS
FOR THE PERIODS INDICIATED (continued)
(Amounts in thousands)
| | International Focus Fund | | JPMorgan International Hedged Equity Fund |
| | Six Months Ended
April 30, 2022
(Unaudited) | | Year Ended
October 31, 2021 | | Six Months Ended
April 30, 2022
(Unaudited) | | Year Ended
October 31, 2021 |
| CHANGE IN NET ASSETS RESULTING FROM OPERATIONS: | | | | | | | |
| Net investment income (loss) | $ 26,300 | | $ 58,536 | | $ 1,930 | | $ 2,600 |
| Net realized gain (loss) | 224,574 | | 75,956 | | (336) | | (5,465) |
| Change in net unrealized appreciation/depreciation | (803,399) | | 610,179 | | (19,845) | | 26,744 |
| Change in net assets resulting from operations | (552,525) | | 744,671 | | (18,251) | | 23,879 |
| DISTRIBUTIONS TO SHAREHOLDERS: | | | | | | | |
| Class A | (5,362) | | (1,160) | | (77) | | (29) |
| Class C | (261) | | (42) | | (6) | | (1) |
| Class I | (14,693) | | (4,486) | | (4,049) | | (2,175) |
| Class R2 | (21) | | (9) | | — | | — |
| Class R5 | (56) | | (32) | | (1) | | (1) |
| Class R6 | (50,762) | | (28,297) | | (4) | | (1) |
| Total distributions to shareholders | (71,155) | | (34,026) | | (4,137) | | (2,207) |
| CAPITAL TRANSACTIONS: | | | | | | | |
| Change in net assets resulting from capital transactions | (1,889,661) | | 407,973 | | 40,835 | | (6,164) |
| NET ASSETS: | | | | | | | |
| Change in net assets | (2,513,341) | | 1,118,618 | | 18,447 | | 15,508 |
| Beginning of period | 3,920,288 | | 2,801,670 | | 152,776 | | 137,268 |
| End of period | $ 1,406,947 | | $3,920,288 | | $171,223 | | $152,776 |
SEE NOTES TO FINANCIAL STATEMENTS.
| 74 | J.P. Morgan International Equity Funds | April 30, 2022 |
| | JPMorgan International Research
Enhanced Equity Fund | | JPMorgan International Value Fund |
| | Six Months Ended
April 30, 2022
(Unaudited) | | Year Ended
October 31, 2021 | | Six Months Ended
April 30, 2022
(Unaudited) | | Year Ended
October 31, 2021 |
| CHANGE IN NET ASSETS RESULTING FROM OPERATIONS: | | | | | | | |
| Net investment income (loss) | $ 67,471 | | $ 126,966 | | $ 7,479 | | $ 13,022 |
| Net realized gain (loss) | 37,022 | | 283,157 | | (335) | | 4,345 |
| Change in net unrealized appreciation/depreciation | (746,952) | | 1,196,412 | | (40,640) | | 104,838 |
| Change in net assets resulting from operations | (642,459) | | 1,606,535 | | (33,496) | | 122,205 |
| DISTRIBUTIONS TO SHAREHOLDERS: | | | | | | | |
| Class A | (1,695) | | (402) | | (8,496) | | (4,156) |
| Class C | — | | — | | (136) | | (106) |
| Class I | (15,314) | | (10,216) | | (1,804) | | (914) |
| Class L | — | | — | | (331) | | (192) |
| Class R2 | — | | — | | (22) | | (11) |
| Class R5 | — | | — | | (2) | | (3) |
| Class R6 | (182,288) | | (95,880) | | (7,825) | | (3,877) |
| Total distributions to shareholders | (199,297) | | (106,498) | | (18,616) | | (9,259) |
| CAPITAL TRANSACTIONS: | | | | | | | |
| Change in net assets resulting from capital transactions | 1,368,954 | | (1,366,544) | | 43,113 | | 15,889 |
| NET ASSETS: | | | | | | | |
| Change in net assets | 527,198 | | 133,493 | | (8,999) | | 128,835 |
| Beginning of period | 4,995,842 | | 4,862,349 | | 396,699 | | 267,864 |
| End of period | $5,523,040 | | $ 4,995,842 | | $387,700 | | $396,699 |
SEE NOTES TO FINANCIAL STATEMENTS.
| April 30, 2022 | J.P. Morgan International Equity Funds | 75 |
STATEMENTS OF CHANGES IN NET ASSETS
FOR THE PERIODS INDICIATED (continued)
(Amounts in thousands)
| | JPMorgan Emerging Markets
Equity Fund | | JPMorgan Emerging Markets Research
Enhanced Equity Fund |
| | Six Months Ended
April 30, 2022
(Unaudited) | | Year Ended
October 31, 2021 | | Six Months Ended
April 30, 2022
(Unaudited) | | Year Ended
October 31, 2021 |
| CAPITAL TRANSACTIONS: | | | | | | | |
| Class A | | | | | | | |
| Proceeds from shares issued | $ 72,542 | | $ 254,285 | | $ — | | $ — |
| Distributions reinvested | 21,957 | | — | | — | | — |
| Cost of shares redeemed | (124,291) | | (192,488) | | — | | — |
| Change in net assets resulting from Class A capital transactions | (29,792) | | 61,797 | | — | | — |
| Class C | | | | | | | |
| Proceeds from shares issued | 1,419 | | 21,002 | | — | | — |
| Distributions reinvested | 2,464 | | — | | — | | — |
| Cost of shares redeemed | (12,578) | | (18,983) | | — | | — |
| Change in net assets resulting from Class C capital transactions | (8,695) | | 2,019 | | — | | — |
| Class I | | | | | | | |
| Proceeds from shares issued | 737,549 | | 2,529,253 | | 289,005 | | 6,294 |
| Distributions reinvested | 152,054 | | 4,534 | | 232 | | 1 |
| Cost of shares redeemed | (1,413,676) | | (2,287,926) | | (28,388) | | (466) |
| Change in net assets resulting from Class I capital transactions | (524,073) | | 245,861 | | 260,849 | | 5,829 |
| Class L | | | | | | | |
| Proceeds from shares issued | 375,238 | | 1,202,345 | | — | | — |
| Distributions reinvested | 90,633 | | 3,299 | | — | | — |
| Cost of shares redeemed | (510,665) | | (693,103) | | — | | — |
| Change in net assets resulting from Class L capital transactions | (44,794) | | 512,541 | | — | | — |
| Class R2 | | | | | | | |
| Proceeds from shares issued | 80 | | 415 | | — | | — |
| Distributions reinvested | 19 | | — | | — | | — |
| Cost of shares redeemed | (36) | | (288) | | — | | — |
| Change in net assets resulting from Class R2 capital transactions | 63 | | 127 | | — | | — |
| Class R3 | | | | | | | |
| Proceeds from shares issued | 3,296 | | 13,765 | | — | | — |
| Distributions reinvested | 227 | | — | | — | | — |
| Cost of shares redeemed | (1,233) | | (5,183) | | — | | — |
| Change in net assets resulting from Class R3 capital transactions | 2,290 | | 8,582 | | — | | — |
| Class R4 | | | | | | | |
| Proceeds from shares issued | 574 | | 2,383 | | — | | — |
| Distributions reinvested | 135 | | 1 | | — | | — |
| Cost of shares redeemed | (464) | | (1,833) | | — | | — |
| Change in net assets resulting from Class R4 capital transactions | 245 | | 551 | | — | | — |
SEE NOTES TO FINANCIAL STATEMENTS.
| 76 | J.P. Morgan International Equity Funds | April 30, 2022 |
| | JPMorgan Emerging Markets
Equity Fund | | JPMorgan Emerging Markets Research
Enhanced Equity Fund |
| | Six Months Ended
April 30, 2022
(Unaudited) | | Year Ended
October 31, 2021 | | Six Months Ended
April 30, 2022
(Unaudited) | | Year Ended
October 31, 2021 |
| CAPITAL TRANSACTIONS: (continued) | | | | | | | |
| Class R5 | | | | | | | |
| Proceeds from shares issued | $ 2,496 | | $ 18,329 | | $ — | | $ — |
| Distributions reinvested | 651 | | 79 | | — | | — |
| Cost of shares redeemed | (2,589) | | (63,474) | | — | | — |
| Change in net assets resulting from Class R5 capital transactions | 558 | | (45,066) | | — | | — |
| Class R6 | | | | | | | |
| Proceeds from shares issued | 1,170,304 | | 2,782,507 | | 626,445 | | 1,383,412 |
| Distributions reinvested | 189,279 | | 9,925 | | 199,236 | | 50,835 |
| Cost of shares redeemed | (885,674) | | (2,263,165) | | (1,126,119) | | (912,641) |
| Change in net assets resulting from Class R6 capital transactions | 473,909 | | 529,267 | | (300,438) | | 521,606 |
| Total change in net assets resulting from capital transactions | $ (130,289) | | $ 1,315,679 | | $ (39,589) | | $ 527,435 |
| SHARE TRANSACTIONS: | | | | | | | |
| Class A | | | | | | | |
| Issued | 2,151 | | 6,043 | | — | | — |
| Reinvested | 591 | | — | | — | | — |
| Redeemed | (3,559) | | (4,582) | | — | | — |
| Change in Class A Shares | (817) | | 1,461 | | — | | — |
| Class C | | | | | | | |
| Issued | 44 | | 523 | | — | | — |
| Reinvested | 69 | | — | | — | | — |
| Redeemed | (380) | | (464) | | — | | — |
| Change in Class C Shares | (267) | | 59 | | — | | — |
| Class I | | | | | | | |
| Issued | 20,934 | | 58,966 | | 15,500 | | 281 |
| Reinvested | 3,999 | | 106 | | 12 | | — |
| Redeemed | (41,117) | | (52,366) | | (1,565) | | (22) |
| Change in Class I Shares | (16,184) | | 6,706 | | 13,947 | | 259 |
| Class L | | | | | | | |
| Issued | 10,537 | | 27,731 | | — | | — |
| Reinvested | 2,366 | | 77 | | — | | — |
| Redeemed | (14,334) | | (15,762) | | — | | — |
| Change in Class L Shares | (1,431) | | 12,046 | | — | | — |
| Class R2 | | | | | | | |
| Issued | 2 | | 10 | | — | | — |
| Reinvested | 1 | | — | | — | | — |
| Redeemed | (1) | | (7) | | — | | — |
| Change in Class R2 Shares | 2 | | 3 | | — | | — |
SEE NOTES TO FINANCIAL STATEMENTS.
| April 30, 2022 | J.P. Morgan International Equity Funds | 77 |
STATEMENTS OF CHANGES IN NET ASSETS
FOR THE PERIODS INDICIATED (continued)
(Amounts in thousands)
| | JPMorgan Emerging Markets
Equity Fund | | JPMorgan Emerging Markets Research
Enhanced Equity Fund |
| | Six Months Ended
April 30, 2022
(Unaudited) | | Year Ended
October 31, 2021 | | Six Months Ended
April 30, 2022
(Unaudited) | | Year Ended
October 31, 2021 |
| SHARE TRANSACTIONS: (continued) | | | | | | | |
| Class R3 | | | | | | | |
| Issued | 98 | | 334 | | — | | — |
| Reinvested | 6 | | — | | — | | — |
| Redeemed | (35) | | (124) | | — | | — |
| Change in Class R3 Shares | 69 | | 210 | | — | | — |
| Class R4 | | | | | | | |
| Issued | 16 | | 54 | | — | | — |
| Reinvested | 4 | | — | | — | | — |
| Redeemed | (13) | | (42) | | — | | — |
| Change in Class R4 Shares | 7 | | 12 | | — | | — |
| Class R5 | | | | | | | |
| Issued | 70 | | 416 | | — | | — |
| Reinvested | 17 | | 2 | | — | | — |
| Redeemed | (73) | | (1,466) | | — | | — |
| Change in Class R5 Shares | 14 | | (1,048) | | — | | — |
| Class R6 | | | | | | | |
| Issued | 34,215 | | 63,838 | | 35,237 | | 64,804 |
| Reinvested | 4,950 | | 232 | | 10,435 | | 2,474 |
| Redeemed | (25,924) | | (51,699) | | (64,205) | | (42,567) |
| Change in Class R6 Shares | 13,241 | | 12,371 | | (18,533) | | 24,711 |
SEE NOTES TO FINANCIAL STATEMENTS.
| 78 | J.P. Morgan International Equity Funds | April 30, 2022 |
| | JPMorgan Europe Dynamic Fund | | JPMorgan International Equity Fund |
| | Six Months Ended
April 30, 2022
(Unaudited) | | Year Ended
October 31, 2021 | | Six Months Ended
April 30, 2022
(Unaudited) | | Year Ended
October 31, 2021 |
| CAPITAL TRANSACTIONS: | | | | | | | |
| Class A | | | | | | | |
| Proceeds from shares issued | $ 3,798 | | $ 6,061 | | $ 45,611 | | $ 128,373 |
| Distributions reinvested | 1,698 | | 805 | | 27,642 | | 3,017 |
| Cost of shares redeemed | (6,159) | | (15,952) | | (37,996) | | (50,637) |
| Change in net assets resulting from Class A capital transactions | (663) | | (9,086) | | 35,257 | | 80,753 |
| Class C | | | | | | | |
| Proceeds from shares issued | 65 | | 543 | | 817 | | 2,112 |
| Distributions reinvested | 183 | | 79 | | 669 | | 42 |
| Cost of shares redeemed | (2,942) | | (4,769) | | (1,587) | | (3,467) |
| Change in net assets resulting from Class C capital transactions | (2,694) | | (4,147) | | (101) | | (1,313) |
| Class I | | | | | | | |
| Proceeds from shares issued | 51,229 | | 412,233 | | 265,574 | | 217,953 |
| Distributions reinvested | 9,021 | | 721 | | 38,299 | | 4,774 |
| Cost of shares redeemed | (358,634) | | (48,189) | | (110,519) | | (91,184) |
| Change in net assets resulting from Class I capital transactions | (298,384) | | 364,765 | | 193,354 | | 131,543 |
| Class L | | | | | | | |
| Proceeds from shares issued | 7,945 | | 11,606 | | — | | — |
| Distributions reinvested | 2,037 | | 917 | | — | | — |
| Cost of shares redeemed | (5,871) | | (6,155) | | — | | — |
| Change in net assets resulting from Class L capital transactions | 4,111 | | 6,368 | | — | | — |
| Class R2 | | | | | | | |
| Proceeds from shares issued | — | | — | | 3,053 | | 5,946 |
| Distributions reinvested | — | | — | | 1,474 | | 289 |
| Cost of shares redeemed | — | | — | | (2,833) | | (9,508) |
| Change in net assets resulting from Class R2 capital transactions | — | | — | | 1,694 | | (3,273) |
| Class R5 | | | | | | | |
| Proceeds from shares issued | — | | — | | 1,886 | | 4,537 |
| Distributions reinvested | — | | — | | 650 | | 95 |
| Cost of shares redeemed | — | | — | | (1,596) | | (3,471) |
| Change in net assets resulting from Class R5 capital transactions | — | | — | | 940 | | 1,161 |
| Class R6 | | | | | | | |
| Proceeds from shares issued | 38,473 | | 135,760 | | 1,034,724 | | 1,637,397 |
| Distributions reinvested | 10,393 | | 4,405 | | 256,061 | | 33,605 |
| Cost of shares redeemed | (36,424) | | (52,340) | | (682,106) | | (966,822) |
| Change in net assets resulting from Class R6 capital transactions | 12,442 | | 87,825 | | 608,679 | | 704,180 |
| Total change in net assets resulting from capital transactions | $(285,188) | | $445,725 | | $ 839,823 | | $ 913,051 |
SEE NOTES TO FINANCIAL STATEMENTS.
| April 30, 2022 | J.P. Morgan International Equity Funds | 79 |
STATEMENTS OF CHANGES IN NET ASSETS
FOR THE PERIODS INDICIATED (continued)
(Amounts in thousands)
| | JPMorgan Europe Dynamic Fund | | JPMorgan International Equity Fund |
| | Six Months Ended
April 30, 2022
(Unaudited) | | Year Ended
October 31, 2021 | | Six Months Ended
April 30, 2022
(Unaudited) | | Year Ended
October 31, 2021 |
| SHARE TRANSACTIONS: | | | | | | | |
| Class A | | | | | | | |
| Issued | 131 | | 204 | | 2,323 | | 6,338 |
| Reinvested | 58 | | 31 | | 1,370 | | 155 |
| Redeemed | (215) | | (561) | | (1,993) | | (2,491) |
| Change in Class A Shares | (26) | | (326) | | 1,700 | | 4,002 |
| Class C | | | | | | | |
| Issued | 2 | | 21 | | 44 | | 108 |
| Reinvested | 7 | | 3 | | 35 | | 2 |
| Redeemed | (118) | | (189) | | (87) | | (179) |
| Change in Class C Shares | (109) | | (165) | | (8) | | (69) |
| Class I | | | | | | | |
| Issued | 1,685 | | 13,177 | | 13,925 | | 10,466 |
| Reinvested | 301 | | 27 | | 1,865 | | 242 |
| Redeemed | (13,380) | | (1,563) | | (5,912) | | (4,423) |
| Change in Class I Shares | (11,394) | | 11,641 | | 9,878 | | 6,285 |
| Class L | | | | | | | |
| Issued | 264 | | 384 | | — | | — |
| Reinvested | 67 | | 34 | | — | | — |
| Redeemed | (198) | | (212) | | — | | — |
| Change in Class L Shares | 133 | | 206 | | — | | — |
| Class R2 | | | | | | | |
| Issued | — | | — | | 164 | | 296 |
| Reinvested | — | | — | | 74 | | 15 |
| Redeemed | — | | — | | (148) | | (468) |
| Change in Class R2 Shares | — | | — | | 90 | | (157) |
| Class R5 | | | | | | | |
| Issued | — | | — | | 101 | | 219 |
| Reinvested | — | | — | | 31 | | 5 |
| Redeemed | — | | — | | (78) | | (165) |
| Change in Class R5 Shares | — | | — | | 54 | | 59 |
| Class R6 | | | | | | | |
| Issued | 1,288 | | 4,263 | | 55,539 | | 79,648 |
| Reinvested | 344 | | 163 | | 12,433 | | 1,702 |
| Redeemed | (1,348) | | (1,668) | | (37,798) | | (46,388) |
| Change in Class R6 Shares | 284 | | 2,758 | | 30,174 | | 34,962 |
SEE NOTES TO FINANCIAL STATEMENTS.
| 80 | J.P. Morgan International Equity Funds | April 30, 2022 |
| | International Focus Fund | | JPMorgan International Hedged Equity Fund |
| | Six Months Ended
April 30, 2022
(Unaudited) | | Year Ended
October 31, 2021 | | Six Months Ended
April 30, 2022
(Unaudited) | | Year Ended
October 31, 2021 |
| CAPITAL TRANSACTIONS: | | | | | | | |
| Class A | | | | | | | |
| Proceeds from shares issued | $ 55,948 | | $ 195,801 | | $ 3,689 | | $ 3,079 |
| Distributions reinvested | 5,307 | | 1,132 | | 77 | | 29 |
| Cost of shares redeemed | (67,045) | | (32,379) | | (1,511) | | (1,473) |
| Change in net assets resulting from Class A capital transactions | (5,790) | | 164,554 | | 2,255 | | 1,635 |
| Class C | | | | | | | |
| Proceeds from shares issued | 1,461 | | 8,415 | | 131 | | 184 |
| Distributions reinvested | 260 | | 42 | | 6 | | 1 |
| Cost of shares redeemed | (3,033) | | (3,542) | | (132) | | (7) |
| Change in net assets resulting from Class C capital transactions | (1,312) | | 4,915 | | 5 | | 178 |
| Class I | | | | | | | |
| Proceeds from shares issued | 190,812 | | 534,780 | | 89,078 | | 57,032 |
| Distributions reinvested | 14,119 | | 4,249 | | 3,842 | | 2,032 |
| Cost of shares redeemed | (224,640) | | (182,797) | | (54,423) | | (67,180) |
| Change in net assets resulting from Class I capital transactions | (19,709) | | 356,232 | | 38,497 | | (8,116) |
| Class R2 | | | | | | | |
| Proceeds from shares issued | 417 | | 947 | | — | | — |
| Distributions reinvested | 21 | | 9 | | — | | — |
| Cost of shares redeemed | (363) | | (716) | | — | | — |
| Change in net assets resulting from Class R2 capital transactions | 75 | | 240 | | — | | — |
| Class R5 | | | | | | | |
| Proceeds from shares issued | 217 | | 424 | | — | | — |
| Distributions reinvested | 56 | | 32 | | 1 | | — |
| Cost of shares redeemed | (691) | | (749) | | — | | — |
| Change in net assets resulting from Class R5 capital transactions | (418) | | (293) | | 1 | | — |
| Class R6 | | | | | | | |
| Proceeds from shares issued | 85,526 | | 452,976 | | 112 | | 151 |
| Distributions reinvested | 50,271 | | 28,297 | | 5 | | 1 |
| Cost of shares redeemed | (566,706) | | (598,948) | | (40) | | (13) |
| Redemptions in-kind | (1,431,598) | | — | | — | | — |
| Change in net assets resulting from Class R6 capital transactions | (1,862,507) | | (117,675) | | 77 | | 139 |
| Total change in net assets resulting from capital transactions | $(1,889,661) | | $ 407,973 | | $ 40,835 | | $ (6,164) |
| SHARE TRANSACTIONS: | | | | | | | |
| Class A | | | | | | | |
| Issued | 2,189 | | 7,283 | | 232 | | 192 |
| Reinvested | 205 | | 45 | | 5 | | 2 |
| Redeemed | (2,748) | | (1,217) | | (96) | | (92) |
| Change in Class A Shares | (354) | | 6,111 | | 141 | | 102 |
SEE NOTES TO FINANCIAL STATEMENTS.
| April 30, 2022 | J.P. Morgan International Equity Funds | 81 |
STATEMENTS OF CHANGES IN NET ASSETS
FOR THE PERIODS INDICIATED (continued)
(Amounts in thousands)
| | International Focus Fund | | JPMorgan International Hedged Equity Fund |
| | Six Months Ended
April 30, 2022
(Unaudited) | | Year Ended
October 31, 2021 | | Six Months Ended
April 30, 2022
(Unaudited) | | Year Ended
October 31, 2021 |
| SHARE TRANSACTIONS: (continued) | | | | | | | |
| Class C | | | | | | | |
| Issued | 57 | | 316 | | 8 | | 11 |
| Reinvested | 10 | | 2 | | — | | — |
| Redeemed | (122) | | (134) | | (8) | | — |
| Change in Class C Shares | (55) | | 184 | | — | | 11 |
| Class I | | | | | | | |
| Issued | 7,441 | | 19,663 | | 5,596 | | 3,560 |
| Reinvested | 538 | | 165 | | 241 | | 135 |
| Redeemed | (9,166) | | (6,676) | | (3,457) | | (4,418) |
| Change in Class I Shares | (1,187) | | 13,152 | | 2,380 | | (723) |
| Class R2 | | | | | | | |
| Issued | 17 | | 36 | | — | | — |
| Reinvested | 1 | | — | | — | | — |
| Redeemed | (14) | | (26) | | — | | — |
| Change in Class R2 Shares | 4 | | 10 | | — | | — |
| Class R5 | | | | | | | |
| Issued | 8 | | 15 | | — | | — |
| Reinvested | 2 | | 1 | | — | | — |
| Redeemed | (27) | | (27) | | — | | — |
| Change in Class R5 Shares | (17) | | (11) | | — | | — |
| Class R6 | | | | | | | |
| Issued | 3,340 | | 16,687 | | 7 | | 9 |
| Reinvested | 1,917 | | 1,099 | | — | | — |
| Redeemed | (21,797) | | (22,086) | | (2) | | (1) |
| Redemptions in-kind | (60,558) | | — | | — | | — |
| Change in Class R6 Shares | (77,098) | | (4,300) | | 5 | | 8 |
SEE NOTES TO FINANCIAL STATEMENTS.
| 82 | J.P. Morgan International Equity Funds | April 30, 2022 |
| | JPMorgan International Research
Enhanced Equity Fund | | JPMorgan International Value Fund |
| | Six Months Ended
April 30, 2022
(Unaudited) | | Year Ended
October 31, 2021 | | Six Months Ended
April 30, 2022
(Unaudited) | | Year Ended
October 31, 2021 |
| CAPITAL TRANSACTIONS: | | | | | | | |
| Class A | | | | | | | |
| Proceeds from shares issued | $ 712 | | $ 1,989 | | $ 21,599 | | $ 39,262 |
| Distributions reinvested | 1,642 | | 389 | | 8,400 | | 4,095 |
| Cost of shares redeemed | (4,775) | | (22,274) | | (16,228) | | (34,717) |
| Change in net assets resulting from Class A capital transactions | (2,421) | | (19,896) | | 13,771 | | 8,640 |
| Class C | | | | | | | |
| Proceeds from shares issued | — | | — | | 127 | | 165 |
| Distributions reinvested | — | | — | | 135 | | 104 |
| Cost of shares redeemed | — | | — | | (1,309) | | (2,175) |
| Change in net assets resulting from Class C capital transactions | — | | — | | (1,047) | | (1,906) |
| Class I | | | | | | | |
| Proceeds from shares issued | 75,161 | | 105,581 | | 7,674 | | 12,348 |
| Distributions reinvested | 15,288 | | 10,212 | | 1,784 | | 829 |
| Cost of shares redeemed | (103,229) | | (342,012) | | (5,847) | | (11,848) |
| Change in net assets resulting from Class I capital transactions | (12,780) | | (226,219) | | 3,611 | | 1,329 |
| Class L | | | | | | | |
| Proceeds from shares issued | — | | — | | 349 | | 2,881 |
| Distributions reinvested | — | | — | | 310 | | 179 |
| Cost of shares redeemed | — | | — | | (554) | | (3,956) |
| Change in net assets resulting from Class L capital transactions | — | | — | | 105 | | (896) |
| Class R2 | | | | | | | |
| Proceeds from shares issued | — | | — | | 32 | | 175 |
| Distributions reinvested | — | | — | | 22 | | 11 |
| Cost of shares redeemed | — | | — | | (2) | | (252) |
| Change in net assets resulting from Class R2 capital transactions | — | | — | | 52 | | (66) |
| Class R5 | | | | | | | |
| Proceeds from shares issued | — | | — | | 24 | | 21 |
| Distributions reinvested | — | | — | | 2 | | 3 |
| Cost of shares redeemed | — | | — | | (52) | | (64) |
| Change in net assets resulting from Class R5 capital transactions | — | | — | | (26) | | (40) |
| Class R6 | | | | | | | |
| Proceeds from shares issued | 1,424,432 | | 359,932 | | 37,644 | | 52,793 |
| Distributions reinvested | 181,166 | | 95,880 | | 7,790 | | 3,621 |
| Cost of shares redeemed | (221,443) | | (1,576,241) | | (18,787) | | (47,586) |
| Change in net assets resulting from Class R6 capital transactions | 1,384,155 | | (1,120,429) | | 26,647 | | 8,828 |
| Total change in net assets resulting from capital transactions | $1,368,954 | | $(1,366,544) | | $ 43,113 | | $ 15,889 |
SEE NOTES TO FINANCIAL STATEMENTS.
| April 30, 2022 | J.P. Morgan International Equity Funds | 83 |
STATEMENTS OF CHANGES IN NET ASSETS
FOR THE PERIODS INDICIATED (continued)
(Amounts in thousands)
| | JPMorgan International Research
Enhanced Equity Fund | | JPMorgan International Value Fund |
| | Six Months Ended
April 30, 2022
(Unaudited) | | Year Ended
October 31, 2021 | | Six Months Ended
April 30, 2022
(Unaudited) | | Year Ended
October 31, 2021 |
| SHARE TRANSACTIONS: | | | | | | | |
| Class A | | | | | | | |
| Issued | 36 | | 100 | | 1,690 | | 3,054 |
| Reinvested | 83 | | 21 | | 685 | | 356 |
| Redeemed | (238) | | (1,211) | | (1,270) | | (2,757) |
| Change in Class A Shares | (119) | | (1,090) | | 1,105 | | 653 |
| Class C | | | | | | | |
| Issued | — | | — | | 10 | | 12 |
| Reinvested | — | | — | | 11 | | 10 |
| Redeemed | — | | — | | (105) | | (181) |
| Change in Class C Shares | — | | — | | (84) | | (159) |
| Class I | | | | | | | |
| Issued | 3,788 | | 5,301 | | 582 | | 923 |
| Reinvested | 765 | | 540 | | 141 | | 70 |
| Redeemed | (5,228) | | (17,195) | | (449) | | (921) |
| Change in Class I Shares | (675) | | (11,354) | | 274 | | 72 |
| Class L | | | | | | | |
| Issued | — | | — | | 28 | | 219 |
| Reinvested | — | | — | | 25 | | 15 |
| Redeemed | — | | — | | (43) | | (301) |
| Change in Class L Shares | — | | — | | 10 | | (67) |
| Class R2 | | | | | | | |
| Issued | — | | — | | 3 | | 14 |
| Reinvested | — | | — | | 2 | | 1 |
| Redeemed | — | | — | | (—)(a) | | (20) |
| Change in Class R2 Shares | — | | — | | 5 | | (5) |
| Class R5 | | | | | | | |
| Issued | — | | — | | 2 | | 2 |
| Redeemed | — | | — | | (4) | | (5) |
| Change in Class R5 Shares | — | | — | | (2) | | (3) |
| Class R6 | | | | | | | |
| Issued | 76,037 | | 17,749 | | 2,914 | | 4,060 |
| Reinvested | 9,108 | | 5,089 | | 626 | | 310 |
| Redeemed | (10,933) | | (80,049) | | (1,451) | | (3,744) |
| Change in Class R6 Shares | 74,212 | | (57,211) | | 2,089 | | 626 |
| (a) | Amount rounds to less than one thousand. |
SEE NOTES TO FINANCIAL STATEMENTS.
| 84 | J.P. Morgan International Equity Funds | April 30, 2022 |
THIS PAGE IS INTENTIONALLY LEFT BLANK
FINANCIAL HIGHLIGHTS
FOR THE PERIODS INDICATED
| | Per share operating performance |
| | | Investment operations | | Distributions |
| | Net asset
value,
beginning
of period | Net
investment
income
(loss)(b) | Net realized
and unrealized
gains
(losses) on
investments | Total from
investment
operations | | Net
investment
income | Net
realized
gain | Total
distributions |
| JPMorgan Emerging Markets Equity Fund | | | | | | | | |
| Class A | | | | | | | | |
| Six Months Ended April 30, 2022(Unaudited) | $40.54 | $(0.04) | $(10.32) | $(10.36) | | $(0.07) | $(1.26) | $(1.33) |
| Year Ended October 31, 2021 | 36.44 | (0.14) | 4.24 | 4.10 | | — | — | — |
| Year Ended October 31, 2020 | 30.07 | (0.02) | 6.56 | 6.54 | | (0.17) | — | (0.17) |
| Year Ended October 31, 2019 | 23.84 | 0.19 | 6.16 | 6.35 | | (0.12) | — | (0.12) |
| Year Ended October 31, 2018 | 27.58 | 0.14 | (3.84) | (3.70) | | (0.04) | — | (0.04) |
| Year Ended October 31, 2017 | 21.79 | 0.09 | 5.80 | 5.89 | | (0.10) | — | (0.10) |
| Class C | | | | | | | | |
| Six Months Ended April 30, 2022(Unaudited) | 38.96 | (0.13) | (9.90) | (10.03) | | — | (1.26) | (1.26) |
| Year Ended October 31, 2021 | 35.20 | (0.34) | 4.10 | 3.76 | | — | — | — |
| Year Ended October 31, 2020 | 29.07 | (0.18) | 6.35 | 6.17 | | (0.04) | — | (0.04) |
| Year Ended October 31, 2019 | 23.08 | 0.04 | 5.98 | 6.02 | | (0.03) | — | (0.03) |
| Year Ended October 31, 2018 | 26.80 | 0.02 | (3.74) | (3.72) | | —(g) | — | — |
| Year Ended October 31, 2017 | 21.18 | (0.04) | 5.67 | 5.63 | | (0.01) | — | (0.01) |
| Class I | | | | | | | | |
| Six Months Ended April 30, 2022(Unaudited) | 41.60 | (0.01) | (10.58) | (10.59) | | (0.17) | (1.26) | (1.43) |
| Year Ended October 31, 2021 | 37.34 | (0.04) | 4.34 | 4.30 | | (0.04) | — | (0.04) |
| Year Ended October 31, 2020 | 30.79 | 0.05 | 6.75 | 6.80 | | (0.25) | — | (0.25) |
| Year Ended October 31, 2019 | 24.45 | 0.27 | 6.29 | 6.56 | | (0.22) | — | (0.22) |
| Year Ended October 31, 2018 | 28.29 | 0.24 | (3.96) | (3.72) | | (0.12) | — | (0.12) |
| Year Ended October 31, 2017 | 22.33 | 0.16 | 5.94 | 6.10 | | (0.14) | — | (0.14) |
| Class L | | | | | | | | |
| Six Months Ended April 30, 2022(Unaudited) | 41.96 | 0.02 | (10.68) | (10.66) | | (0.22) | (1.26) | (1.48) |
| Year Ended October 31, 2021 | 37.64 | 0.01 | 4.37 | 4.38 | | (0.06) | — | (0.06) |
| Year Ended October 31, 2020 | 31.03 | 0.08 | 6.80 | 6.88 | | (0.27) | — | (0.27) |
| Year Ended October 31, 2019 | 24.63 | 0.29 | 6.35 | 6.64 | | (0.24) | — | (0.24) |
| Year Ended October 31, 2018 | 28.49 | 0.26 | (3.99) | (3.73) | | (0.13) | — | (0.13) |
| Year Ended October 31, 2017 | 22.49 | 0.21 | 5.96 | 6.17 | | (0.17) | — | (0.17) |
| Class R2 | | | | | | | | |
| Six Months Ended April 30, 2022(Unaudited) | 39.99 | (0.09) | (10.19) | (10.28) | | — | (1.26) | (1.26) |
| Year Ended October 31, 2021 | 36.06 | (0.26) | 4.19 | 3.93 | | — | — | — |
| Year Ended October 31, 2020 | 29.78 | (0.13) | 6.52 | 6.39 | | (0.11) | — | (0.11) |
| Year Ended October 31, 2019 | 23.73 | 0.08 | 6.13 | 6.21 | | (0.16) | — | (0.16) |
| Year Ended October 31, 2018 | 27.57 | 0.07 | (3.83) | (3.76) | | (0.08) | — | (0.08) |
| July 31, 2017(h) through October 31, 2017 | 26.40 | (0.01) | 1.18 | 1.17 | | — | — | — |
| Class R3 | | | | | | | | |
| Six Months Ended April 30, 2022(Unaudited) | 40.30 | (0.05) | (10.24) | (10.29) | | (0.11) | (1.26) | (1.37) |
| Year Ended October 31, 2021 | 36.25 | (0.15) | 4.20 | 4.05 | | — | — | — |
| Year Ended October 31, 2020 | 29.96 | (0.05) | 6.55 | 6.50 | | (0.21) | — | (0.21) |
| Year Ended October 31, 2019 | 23.78 | 0.25 | 6.06 | 6.31 | | (0.13) | — | (0.13) |
| Year Ended October 31, 2018 | 27.59 | 0.22 | (3.92) | (3.70) | | (0.11) | — | (0.11) |
| July 31, 2017(h) through October 31, 2017 | 26.40 | 0.01 | 1.18 | 1.19 | | — | — | — |
SEE NOTES TO FINANCIAL STATEMENTS.
| 86 | J.P. Morgan International Equity Funds | April 30, 2022 |
| | Ratios/Supplemental data | |
| | | | Ratios to average net assets(a) | | |
Net asset
value,
end of
period | Total return
(excludes
sales charge)(c)(d) | Net assets,
end of
period
(000's) | Net
expenses(e) | Net
investment
income
(loss) | Expenses without
waivers and reimbursements | Portfolio
turnover
rate(d) | |
| | | | | | | | |
| | | | | | | | |
| $28.85 | (26.28)% | $ 476,166 | 1.24(f)% | (0.26)(f)% | 1.31(f)% | 11% | |
| 40.54 | 11.25 | 702,288 | 1.24 | (0.33) | 1.30 | 25 | |
| 36.44 | 21.84 | 578,112 | 1.24 | (0.06) | 1.33 | 15 | |
| 30.07 | 26.77 | 524,357 | 1.24 | 0.69 | 1.47 | 34 | |
| 23.84 | (13.44) | 369,490 | 1.24 | 0.51 | 1.52 | 13 | |
| 27.58 | 27.22 | 525,451 | 1.35 | 0.36 | 1.58 | 22 | |
| | | | | | | | |
| 27.67 | (26.47) | 51,142 | 1.74(f) | (0.78)(f) | 1.81(f) | 11 | |
| 38.96 | 10.68 | 82,409 | 1.74 | (0.83) | 1.80 | 25 | |
| 35.20 | 21.24 | 72,364 | 1.74 | (0.58) | 1.83 | 15 | |
| 29.07 | 26.12 | 56,830 | 1.74 | 0.15 | 1.98 | 34 | |
| 23.08 | (13.87) | 43,612 | 1.74 | 0.06 | 2.02 | 13 | |
| 26.80 | 26.58 | 48,497 | 1.85 | (0.15) | 2.09 | 22 | |
| | | | | | | | |
| 29.58 | (26.20) | 2,901,502 | 0.99(f) | (0.04)(f) | 1.05(f) | 11 | |
| 41.60 | 11.51 | 4,753,438 | 0.99 | (0.09) | 1.05 | 25 | |
| 37.34 | 22.19 | 4,016,180 | 0.99 | 0.15 | 1.07 | 15 | |
| 30.79 | 27.04 | 1,725,882 | 0.99 | 0.94 | 1.21 | 34 | |
| 24.45 | (13.23) | 773,142 | 0.99 | 0.84 | 1.26 | 13 | |
| 28.29 | 27.54 | 629,451 | 1.10 | 0.62 | 1.30 | 22 | |
| | | | | | | | |
| 29.82 | (26.17) | 1,804,078 | 0.89(f) | 0.09(f) | 0.90(f) | 11 | |
| 41.96 | 11.63 | 2,598,326 | 0.89 | 0.02 | 0.90 | 25 | |
| 37.64 | 22.29 | 1,877,489 | 0.89 | 0.25 | 0.92 | 15 | |
| 31.03 | 27.20 | 926,781 | 0.89 | 1.00 | 1.06 | 34 | |
| 24.63 | (13.16) | 475,997 | 0.89 | 0.91 | 1.11 | 13 | |
| 28.49 | 27.72 | 430,860 | 0.95 | 0.84 | 1.14 | 22 | |
| | | | | | | | |
| 28.45 | (26.41) | 465 | 1.54(f) | (0.54)(f) | 1.81(f) | 11 | |
| 39.99 | 10.90 | 585 | 1.54 | (0.63) | 1.78 | 25 | |
| 36.06 | 21.51 | 414 | 1.54 | (0.41) | 2.00 | 15 | |
| 29.78 | 26.35 | 145 | 1.54 | 0.31 | 2.26 | 34 | |
| 23.73 | (13.69) | 95 | 1.54 | 0.26 | 2.04 | 13 | |
| 27.57 | 4.43 | 21 | 1.60 | (0.17) | 1.80 | 22 | |
| | | | | | | | |
| 28.64 | (26.29) | 12,570 | 1.29(f) | (0.29)(f) | 1.31(f) | 11 | |
| 40.30 | 11.17 | 14,918 | 1.29 | (0.36) | 1.30 | 25 | |
| 36.25 | 21.80 | 5,797 | 1.29 | (0.15) | 1.33 | 15 | |
| 29.96 | 26.67 | 2,151 | 1.29 | 0.90 | 1.49 | 34 | |
| 23.78 | (13.49) | 341 | 1.29 | 0.81 | 1.59 | 13 | |
| 27.59 | 4.51 | 21 | 1.35 | 0.08 | 1.55 | 22 | |
SEE NOTES TO FINANCIAL STATEMENTS.
| April 30, 2022 | J.P. Morgan International Equity Funds | 87 |
FINANCIAL HIGHLIGHTS
FOR THE PERIODS INDICATED (continued)
| | Per share operating performance |
| | | Investment operations | | Distributions |
| | Net asset
value,
beginning
of period | Net
investment
income
(loss)(b) | Net realized
and unrealized
gains
(losses) on
investments | Total from
investment
operations | | Net
investment
income | Net
realized
gain | Total
distributions |
| Class R4 | | | | | | | | |
| Six Months Ended April 30, 2022(Unaudited) | $41.45 | $(0.01) | $(10.55) | $(10.56) | | $(0.16) | $(1.26) | $(1.42) |
| Year Ended October 31, 2021 | 37.20 | (0.05) | 4.32 | 4.27 | | (0.02) | — | (0.02) |
| Year Ended October 31, 2020 | 30.68 | 0.04 | 6.70 | 6.74 | | (0.22) | — | (0.22) |
| Year Ended October 31, 2019 | 24.42 | 0.27 | 6.25 | 6.52 | | (0.26) | — | (0.26) |
| Year Ended October 31, 2018 | 28.28 | 0.18 | (3.91) | (3.73) | | (0.13) | — | (0.13) |
| July 31, 2017(h) through October 31, 2017 | 27.05 | 0.02 | 1.21 | 1.23 | | — | — | — |
| Class R5 | | | | | | | | |
| Six Months Ended April 30, 2022(Unaudited) | 41.88 | 0.02 | (10.67) | (10.65) | | (0.15) | (1.26) | (1.41) |
| Year Ended October 31, 2021 | 37.56 | 0.01 | 4.36 | 4.37 | | (0.05) | — | (0.05) |
| Year Ended October 31, 2020 | 30.96 | 0.08 | 6.78 | 6.86 | | (0.26) | — | (0.26) |
| Year Ended October 31, 2019 | 24.60 | 0.31 | 6.31 | 6.62 | | (0.26) | — | (0.26) |
| Year Ended October 31, 2018 | 28.47 | 0.39 | (4.11) | (3.72) | | (0.15) | — | (0.15) |
| Year Ended October 31, 2017 | 22.49 | 0.15 | 6.01 | 6.16 | | (0.18) | — | (0.18) |
| Class R6 | | | | | | | | |
| Six Months Ended April 30, 2022(Unaudited) | 41.95 | 0.04 | (10.68) | (10.64) | | (0.26) | (1.26) | (1.52) |
| Year Ended October 31, 2021 | 37.61 | 0.05 | 4.37 | 4.42 | | (0.08) | — | (0.08) |
| Year Ended October 31, 2020 | 31.00 | 0.12 | 6.78 | 6.90 | | (0.29) | — | (0.29) |
| Year Ended October 31, 2019 | 24.60 | 0.31 | 6.35 | 6.66 | | (0.26) | — | (0.26) |
| Year Ended October 31, 2018 | 28.46 | 0.29 | (3.99) | (3.70) | | (0.16) | — | (0.16) |
| Year Ended October 31, 2017 | 22.46 | 0.21 | 5.98 | 6.19 | | (0.19) | — | (0.19) |
|
| (a) | Annualized for periods less than one year, unless otherwise noted. |
| (b) | Calculated based upon average shares outstanding. |
| (c) | Includes adjustments in accordance with accounting principles generally accepted in the United States of America and as such, the net asset values for financial reporting purposes and the returns based upon those net asset values may differ from the net asset values and returns for shareholder transactions. |
| (d) | Not annualized for periods less than one year. |
| (e) | Includes interest expense, if applicable, which is less than 0.005% unless otherwise noted. |
| (f) | Certain non-recurring expenses incurred by the Fund were not annualized for the period indicated. |
| (g) | Amount rounds to less than $0.005. |
| (h) | Commencement of offering of class of shares. |
SEE NOTES TO FINANCIAL STATEMENTS.
| 88 | J.P. Morgan International Equity Funds | April 30, 2022 |
FINANCIAL HIGHLIGHTS
FOR THE PERIODS INDICATED
| | Ratios/Supplemental data | |
| | | | Ratios to average net assets(a) | | |
Net asset
value,
end of
period | Total return
(excludes
sales charge)(c)(d) | Net assets,
end of
period
(000's) | Net
expenses(e) | Net
investment
income
(loss) | Expenses without
waivers and reimbursements | Portfolio
turnover
rate(d) | |
| | | | | | | | |
| $29.47 | (26.22)% | $ 2,908 | 1.04(f)% | (0.03)(f)% | 1.06(f)% | 11% | |
| 41.45 | 11.48 | 3,810 | 1.04 | (0.12) | 1.06 | 25 | |
| 37.20 | 22.09 | 2,962 | 1.04 | 0.12 | 1.08 | 15 | |
| 30.68 | 26.98 | 1,300 | 1.04 | 0.94 | 1.23 | 34 | |
| 24.42 | (13.25) | 26 | 1.04 | 0.63 | 1.62 | 13 | |
| 28.28 | 4.55 | 21 | 1.10 | 0.33 | 1.30 | 22 | |
| | | | | | | | |
| 29.82 | (26.15) | 15,147 | 0.89(f) | 0.10(f) | 0.92(f) | 11 | |
| 41.88 | 11.64 | 20,676 | 0.89 | 0.02 | 0.91 | 25 | |
| 37.56 | 22.29 | 57,909 | 0.89 | 0.26 | 0.93 | 15 | |
| 30.96 | 27.19 | 41,872 | 0.89 | 1.08 | 1.08 | 34 | |
| 24.60 | (13.14) | 1,672 | 0.89 | 1.37 | 1.11 | 13 | |
| 28.47 | 27.72 | 217 | 0.95 | 0.58 | 3.36 | 22 | |
| | | | | | | | |
| 29.79 | (26.14) | 4,414,250 | 0.79(f) | 0.20(f) | 0.80(f) | 11 | |
| 41.95 | 11.75 | 5,659,334 | 0.79 | 0.11 | 0.80 | 25 | |
| 37.61 | 22.39 | 4,608,998 | 0.79 | 0.37 | 0.82 | 15 | |
| 31.00 | 27.36 | 3,034,359 | 0.79 | 1.09 | 0.96 | 34 | |
| 24.60 | (13.08) | 2,936,830 | 0.79 | 1.00 | 1.01 | 13 | |
| 28.46 | 27.87 | 2,813,349 | 0.85 | 0.85 | 1.01 | 22 | |
SEE NOTES TO FINANCIAL STATEMENTS.
| April 30, 2022 | J.P. Morgan International Equity Funds | 89 |
FINANCIAL HIGHLIGHTS
FOR THE PERIODS INDICATED (continued)
| | Per share operating performance |
| | | Investment operations | | Distributions |
| | Net asset
value,
beginning
of period | Net
investment
income
(loss)(b) | Net realized
and unrealized
gains
(losses) on
investments | Total from
investment
operations | | Net
investment
income | Net
realized
gain | Total
distributions |
| JPMorgan Emerging Markets Research Enhanced Equity Fund | | | | | | | | |
| Class I | | | | | | | | |
| Six Months Ended April 30, 2022(Unaudited) | $20.87 | $0.19 | $(3.38) | $(3.19) | | $(0.52) | $(0.53) | $(1.05) |
| Year Ended October 31, 2021 | 18.11 | 0.51 | 2.56 | 3.07 | | (0.31) | — | (0.31) |
| Year Ended October 31, 2020 | 16.78 | 0.33 | 1.04 | 1.37 | | — | (0.04) | (0.04) |
| January 30, 2019(g) through October 31, 2019 | 16.22 | 0.31 | 0.25 | 0.56 | | — | — | — |
| Class R6 | | | | | | | | |
| Six Months Ended April 30, 2022(Unaudited) | 20.77 | 0.21 | (3.37) | (3.16) | | (0.54) | (0.53) | (1.07) |
| Year Ended October 31, 2021 | 18.01 | 0.42 | 2.65 | 3.07 | | (0.31) | — | (0.31) |
| Year Ended October 31, 2020 | 16.80 | 0.31 | 1.07 | 1.38 | | (0.13) | (0.04) | (0.17) |
| December 11, 2018(h) through October 31, 2019 | 15.00 | 0.42 | 1.46 | 1.88 | | (0.08) | — | (0.08) |
|
| (a) | Annualized for periods less than one year, unless otherwise noted. |
| (b) | Calculated based upon average shares outstanding. |
| (c) | Includes adjustments in accordance with accounting principles generally accepted in the United States of America and as such, the net asset values for financial reporting purposes and the returns based upon those net asset values may differ from the net asset values and returns for shareholder transactions. |
| (d) | Not annualized for periods less than one year. |
| (e) | Includes interest expense, if applicable, which is less than 0.005% unless otherwise noted. |
| (f) | Certain non-recurring expenses incurred by the Fund were not annualized for the period indicated. |
| (g) | Commencement of offering of class of shares. |
| (h) | Commencement of operations. |
SEE NOTES TO FINANCIAL STATEMENTS.
| 90 | J.P. Morgan International Equity Funds | April 30, 2022 |
FINANCIAL HIGHLIGHTS
FOR THE PERIODS INDICATED
| | Ratios/Supplemental data | |
| | | | Ratios to average net assets(a) | | |
Net asset
value,
end of
period | Total return(c)(d) | Net assets,
end of
period
(000's) | Net
expenses(e) | Net
investment
income
(loss) | Expenses without
waivers | Portfolio
turnover
rate(d) | |
| | | | | | | | |
| | | | | | | | |
| $16.63 | (15.90)% | $ 236,318 | 0.45(f)% | 2.21(f)% | 0.64(f)% | 16% | |
| 20.87 | 16.95 | 5,435 | 0.45 | 2.36 | 0.69 | 53 | |
| 18.11 | 8.15 | 33 | 0.45 | 1.98 | 1.39 | 47 | |
| 16.78 | 3.45 | 5 | 0.44(f) | 2.52(f) | 0.70(f) | 28 | |
| | | | | | | | |
| 16.54 | (15.84) | 2,709,774 | 0.35(f) | 2.26(f) | 0.39(f) | 16 | |
| 20.77 | 17.09 | 3,787,953 | 0.35 | 1.97 | 0.40 | 53 | |
| 18.01 | 8.22 | 2,840,309 | 0.35 | 1.87 | 0.41 | 47 | |
| 16.80 | 12.60 | 2,090,569 | 0.34(f) | 2.90(f) | 0.46(f) | 28 | |
SEE NOTES TO FINANCIAL STATEMENTS.
| April 30, 2022 | J.P. Morgan International Equity Funds | 91 |
FINANCIAL HIGHLIGHTS
FOR THE PERIODS INDICATED (continued)
| | Per share operating performance |
| | | Investment operations | | Distributions |
| | Net asset
value,
beginning
of period | Net
investment
income
(loss)(b) | Net realized
and unrealized
gains
(losses) on
investments | Total from
investment
operations | | Net
investment
income |
| JPMorgan Europe Dynamic Fund | | | | | | |
| Class A | | | | | | |
| Six Months Ended April 30, 2022(Unaudited) | $30.91 | $0.28 | $(4.65) | $(4.37) | | $(0.62) |
| Year Ended October 31, 2021 | 21.64 | 0.40(g) | 9.14 | 9.54 | | (0.27) |
| Year Ended October 31, 2020 | 24.25 | 0.25 | (2.16) | (1.91) | | (0.70) |
| Year Ended October 31, 2019 | 23.01 | 0.61 | 1.18 | 1.79 | | (0.55) |
| Year Ended October 31, 2018 | 27.04 | 0.42 | (4.08) | (3.66) | | (0.37) |
| Year Ended October 31, 2017 | 21.94 | 0.37 | 5.15 | 5.52 | | (0.42) |
| Class C | | | | | | |
| Six Months Ended April 30, 2022(Unaudited) | 27.25 | 0.16 | (4.08) | (3.92) | | (0.47) |
| Year Ended October 31, 2021 | 19.10 | 0.22(g) | 8.08 | 8.30 | | (0.15) |
| Year Ended October 31, 2020 | 21.47 | 0.12 | (1.91) | (1.79) | | (0.58) |
| Year Ended October 31, 2019 | 20.39 | 0.44 | 1.06 | 1.50 | | (0.42) |
| Year Ended October 31, 2018 | 24.00 | 0.25 | (3.62) | (3.37) | | (0.24) |
| Year Ended October 31, 2017 | 19.52 | 0.23 | 4.58 | 4.81 | | (0.33) |
| Class I | | | | | | |
| Six Months Ended April 30, 2022(Unaudited) | 31.57 | 0.16 | (4.57) | (4.41) | | (0.73) |
| Year Ended October 31, 2021 | 22.10 | 0.47(g) | 9.33 | 9.80 | | (0.33) |
| Year Ended October 31, 2020 | 24.75 | 0.31 | (2.19) | (1.88) | | (0.77) |
| Year Ended October 31, 2019 | 23.48 | 0.67 | 1.21 | 1.88 | | (0.61) |
| Year Ended October 31, 2018 | 27.60 | 0.49 | (4.17) | (3.68) | | (0.44) |
| Year Ended October 31, 2017 | 22.37 | 0.46 | 5.25 | 5.71 | | (0.48) |
| Class L | | | | | | |
| Six Months Ended April 30, 2022(Unaudited) | 31.99 | 0.36 | (4.81) | (4.45) | | (0.75) |
| Year Ended October 31, 2021 | 22.38 | 0.54(g) | 9.44 | 9.98 | | (0.37) |
| Year Ended October 31, 2020 | 25.05 | 0.35 | (2.23) | (1.88) | | (0.79) |
| Year Ended October 31, 2019 | 23.70 | 0.65 | 1.27 | 1.92 | | (0.57) |
| Year Ended October 31, 2018 | 27.85 | 0.51 | (4.18) | (3.67) | | (0.48) |
| Year Ended October 31, 2017 | 22.61 | 0.52 | 5.27 | 5.79 | | (0.55) |
| Class R6 | | | | | | |
| Six Months Ended April 30, 2022(Unaudited) | 31.86 | 0.36 | (4.77) | (4.41) | | (0.78) |
| Year Ended October 31, 2021 | 22.29 | 0.55(g) | 9.41 | 9.96 | | (0.39) |
| Year Ended October 31, 2020 | 24.96 | 0.37 | (2.22) | (1.85) | | (0.82) |
| Year Ended October 31, 2019 | 23.70 | 0.75 | 1.19 | 1.94 | | (0.68) |
| October 1, 2018(h) through October 31, 2018 | 26.32 | 0.01 | (2.63) | (2.62) | | — |
|
| (a) | Annualized for periods less than one year, unless otherwise noted. |
| (b) | Calculated based upon average shares outstanding. |
| (c) | Includes adjustments in accordance with accounting principles generally accepted in the United States of America and as such, the net asset values for financial reporting purposes and the returns based upon those net asset values may differ from the net asset values and returns for shareholder transactions. |
| (d) | Not annualized for periods less than one year. |
| (e) | Includes interest expense, if applicable, which is less than 0.005% unless otherwise noted. |
| (f) | Certain non-recurring expenses incurred by the Fund were not annualized for the period indicated. |
| (g) | Reflects income from foreign withholding tax claims, including related interest income. Had the Fund not received these proceeds, the net investment income (loss) per share would have been $0.38, $0.20, $0.45, $0.52 and $0.53 for Class A, Class C, Class I, Class L and Class R6, respectively, and the net investment income (loss) ratios would have been 1.29%, 0.78%, 1.44%, 1.70% and 1.75% for Class A, Class C, Class I, Class L and Class R6, respectively. |
| (h) | Commencement of offering of class of shares. |
SEE NOTES TO FINANCIAL STATEMENTS.
| 92 | J.P. Morgan International Equity Funds | April 30, 2022 |
FINANCIAL HIGHLIGHTS
FOR THE PERIODS INDICATED
| | Ratios/Supplemental data | |
| | | | Ratios to average net assets(a) | | |
Net asset
value,
end of
period | Total return
(excludes
sales charge)(c)(d) | Net assets,
end of
period
(000's) | Net
expenses(e) | Net
investment
income
(loss) | Expenses without
waivers | Portfolio
turnover
rate(d) | |
| | | | | | | | |
| | | | | | | | |
| $25.92 | (14.36)% | $ 73,397 | 1.24(f)% | 1.98(f)% | 1.24(f)% | 43% | |
| 30.91 | 44.30 | 88,315 | 1.24 | 1.37(g) | 1.26 | 92 | |
| 21.64 | (8.21) | 68,882 | 1.24 | 1.09 | 1.28 | 159 | |
| 24.25 | 8.14 | 98,294 | 1.24 | 2.67 | 1.31 | 83 | |
| 23.01 | (13.72) | 124,681 | 1.24 | 1.58 | 1.29 | 149 | |
| 27.04 | 25.65 | 165,020 | 1.36 | 1.52 | 1.36 | 189 | |
| | | | | | | | |
| 22.86 | (14.58) | 7,015 | 1.74(f) | 1.27(f) | 1.75(f) | 43 | |
| 27.25 | 43.56 | 11,313 | 1.74 | 0.86(g) | 1.77 | 92 | |
| 19.10 | (8.68) | 11,082 | 1.74 | 0.59 | 1.77 | 159 | |
| 21.47 | 7.64 | 19,798 | 1.74 | 2.15 | 1.80 | 83 | |
| 20.39 | (14.18) | 31,125 | 1.74 | 1.08 | 1.79 | 149 | |
| 24.00 | 25.02 | 46,615 | 1.85 | 1.07 | 1.86 | 189 | |
| | | | | | | | |
| 26.43 | (14.25) | 69,744 | 0.98(f) | 1.07(f) | 0.98(f) | 43 | |
| 31.57 | 44.61 | 443,053 | 0.98 | 1.52(g) | 0.99 | 92 | |
| 22.10 | (7.98) | 52,841 | 0.99 | 1.33 | 1.01 | 159 | |
| 24.75 | 8.44 | 86,582 | 0.99 | 2.86 | 1.05 | 83 | |
| 23.48 | (13.53) | 139,858 | 0.99 | 1.84 | 1.04 | 149 | |
| 27.60 | 26.06 | 187,678 | 1.06 | 1.85 | 1.07 | 189 | |
| | | | | | | | |
| 26.79 | (14.19) | 75,636 | 0.82(f) | 2.43(f) | 0.83(f) | 43 | |
| 31.99 | 44.88 | 86,054 | 0.84 | 1.78(g) | 0.85 | 92 | |
| 22.38 | (7.86) | 55,597 | 0.85 | 1.49 | 0.86 | 159 | |
| 25.05 | 8.49 | 65,686 | 0.89 | 2.77 | 0.90 | 83 | |
| 23.70 | (13.41) | 389,665 | 0.88 | 1.88 | 0.89 | 149 | |
| 27.85 | 26.22 | 578,183 | 0.90 | 2.07 | 0.91 | 189 | |
| | | | | | | | |
| 26.67 | (14.13) | 380,750 | 0.72(f) | 2.45(f) | 0.73(f) | 43 | |
| 31.86 | 45.01 | 445,783 | 0.74 | 1.83(g) | 0.75 | 92 | |
| 22.29 | (7.79) | 250,426 | 0.75 | 1.61 | 0.76 | 159 | |
| 24.96 | 8.65 | 271,885 | 0.79 | 3.17 | 0.79 | 83 | |
| 23.70 | (9.95) | 18 | 0.82 | 0.67 | 0.83 | 149 | |
SEE NOTES TO FINANCIAL STATEMENTS.
| April 30, 2022 | J.P. Morgan International Equity Funds | 93 |
FINANCIAL HIGHLIGHTS
FOR THE PERIODS INDICATED (continued)
| | Per share operating performance |
| | | Investment operations | | Distributions |
| | Net asset
value,
beginning
of period | Net
investment
income
(loss)(b) | Net realized
and unrealized
gains
(losses) on
investments | Total from
investment
operations | | Net
investment
income | Net
realized
gain | Total
distributions |
| JPMorgan International Equity Fund | | | | | | | | |
| Class A | | | | | | | | |
| Six Months Ended April 30, 2022(Unaudited) | $21.63 | $0.15 | $(3.61) | $(3.46) | | $(0.37) | $(0.99) | $(1.36) |
| Year Ended October 31, 2021 | 16.47 | 0.30(g) | 5.04 | 5.34 | | (0.18) | — | (0.18) |
| Year Ended October 31, 2020 | 17.27 | 0.19 | (0.49) | (0.30) | | (0.50) | — | (0.50) |
| Year Ended October 31, 2019 | 15.56 | 0.33 | 1.89 | 2.22 | | (0.33) | (0.18) | (0.51) |
| Year Ended October 31, 2018 | 17.81 | 0.33 | (2.33) | (2.00) | | (0.25) | — | (0.25) |
| Year Ended October 31, 2017 | 14.24 | 0.22 | 3.39 | 3.61 | | (0.04) | — | (0.04) |
| Class C | | | | | | | | |
| Six Months Ended April 30, 2022(Unaudited) | 20.41 | 0.09 | (3.39) | (3.30) | | (0.27) | (0.99) | (1.26) |
| Year Ended October 31, 2021 | 15.53 | 0.18(g) | 4.77 | 4.95 | | (0.07) | — | (0.07) |
| Year Ended October 31, 2020 | 16.29 | 0.09 | (0.45) | (0.36) | | (0.40) | — | (0.40) |
| Year Ended October 31, 2019 | 14.68 | 0.23 | 1.80 | 2.03 | | (0.24) | (0.18) | (0.42) |
| Year Ended October 31, 2018 | 16.83 | 0.25 | (2.23) | (1.98) | | (0.17) | — | (0.17) |
| Year Ended October 31, 2017 | 13.50 | 0.12 | 3.22 | 3.34 | | (0.01) | — | (0.01) |
| Class I | | | | | | | | |
| Six Months Ended April 30, 2022(Unaudited) | 22.02 | 0.20 | (3.69) | (3.49) | | (0.42) | (0.99) | (1.41) |
| Year Ended October 31, 2021 | 16.76 | 0.36(g) | 5.13 | 5.49 | | (0.23) | — | (0.23) |
| Year Ended October 31, 2020 | 17.56 | 0.21 | (0.47) | (0.26) | | (0.54) | — | (0.54) |
| Year Ended October 31, 2019 | 15.82 | 0.36 | 1.93 | 2.29 | | (0.37) | (0.18) | (0.55) |
| Year Ended October 31, 2018 | 18.09 | 0.41 | (2.40) | (1.99) | | (0.28) | — | (0.28) |
| Year Ended October 31, 2017 | 14.45 | 0.26 | 3.44 | 3.70 | | (0.06) | — | (0.06) |
| Class R2 | | | | | | | | |
| Six Months Ended April 30, 2022(Unaudited) | 21.31 | 0.12 | (3.55) | (3.43) | | (0.30) | (0.99) | (1.29) |
| Year Ended October 31, 2021 | 16.31 | 0.23(g) | 4.99 | 5.22 | | (0.22) | — | (0.22) |
| Year Ended October 31, 2020 | 17.14 | 0.13 | (0.48) | (0.35) | | (0.48) | — | (0.48) |
| Year Ended October 31, 2019 | 15.44 | 0.28 | 1.88 | 2.16 | | (0.28) | (0.18) | (0.46) |
| Year Ended October 31, 2018 | 17.70 | 0.29 | (2.33) | (2.04) | | (0.22) | — | (0.22) |
| Year Ended October 31, 2017 | 14.17 | 0.17 | 3.38 | 3.55 | | (0.02) | — | (0.02) |
| Class R5 | | | | | | | | |
| Six Months Ended April 30, 2022(Unaudited) | 22.14 | 0.19 | (3.69) | (3.50) | | (0.44) | (0.99) | (1.43) |
| Year Ended October 31, 2021 | 16.85 | 0.39(g) | 5.15 | 5.54 | | (0.25) | — | (0.25) |
| Year Ended October 31, 2020 | 17.60 | 0.24 | (0.48) | (0.24) | | (0.51) | — | (0.51) |
| Year Ended October 31, 2019 | 15.85 | 0.38 | 1.94 | 2.32 | | (0.39) | (0.18) | (0.57) |
| Year Ended October 31, 2018 | 18.13 | 0.41 | (2.40) | (1.99) | | (0.29) | — | (0.29) |
| Year Ended October 31, 2017 | 14.47 | 0.21 | 3.52 | 3.73 | | (0.07) | — | (0.07) |
SEE NOTES TO FINANCIAL STATEMENTS.
| 94 | J.P. Morgan International Equity Funds | April 30, 2022 |
| | Ratios/Supplemental data | |
| | | | Ratios to average net assets(a) | | |
Net asset
value,
end of
period | Total return
(excludes
sales charge)(c)(d) | Net assets,
end of
period
(000's) | Net
expenses(e) | Net
investment
income
(loss) | Expenses without
waivers | Portfolio
turnover
rate(d) | |
| | | | | | | | |
| | | | | | | | |
| $16.81 | (16.98)% | $365,217 | 0.95(f)% | 1.58(f)% | 1.11(f)% | 18% | |
| 21.63 | 32.56 | 433,033 | 0.95 | 1.47(g) | 1.11 | 35 | |
| 16.47 | (1.88) | 263,791 | 0.95 | 1.17 | 1.12 | 28 | |
| 17.27 | 14.93 | 328,312 | 0.95 | 2.03 | 1.22 | 25 | |
| 15.56 | (11.42) | 240,394 | 0.95 | 1.88 | 1.32 | 33 | |
| 17.81 | 25.43 | 302,130 | 1.23 | 1.39 | 1.35 | 17 | |
| | | | | | | | |
| 15.85 | (17.16) | 8,331 | 1.45(f) | 1.02(f) | 1.62(f) | 18 | |
| 20.41 | 31.94 | 10,899 | 1.45 | 0.91(g) | 1.62 | 35 | |
| 15.53 | (2.38) | 9,358 | 1.45 | 0.61 | 1.62 | 28 | |
| 16.29 | 14.39 | 14,549 | 1.45 | 1.51 | 1.74 | 25 | |
| 14.68 | (11.89) | 18,899 | 1.45 | 1.48 | 1.83 | 33 | |
| 16.83 | 24.79 | 24,281 | 1.74 | 0.83 | 1.88 | 17 | |
| | | | | | | | |
| 17.12 | (16.85) | 623,210 | 0.70(f) | 2.03(f) | 0.85(f) | 18 | |
| 22.02 | 32.94 | 584,191 | 0.70 | 1.71(g) | 0.86 | 35 | |
| 16.76 | (1.64) | 339,416 | 0.70 | 1.26 | 0.86 | 28 | |
| 17.56 | 15.20 | 190,885 | 0.70 | 2.22 | 0.96 | 25 | |
| 15.82 | (11.20) | 179,831 | 0.70 | 2.30 | 1.06 | 33 | |
| 18.09 | 25.69 | 139,715 | 0.99 | 1.59 | 1.10 | 17 | |
| | | | | | | | |
| 16.59 | (17.06) | 20,627 | 1.25(f) | 1.27(f) | 1.46(f) | 18 | |
| 21.31 | 32.18 | 24,598 | 1.25 | 1.13(g) | 1.47 | 35 | |
| 16.31 | (2.21) | 21,379 | 1.25 | 0.79 | 1.37 | 28 | |
| 17.14 | 14.58 | 2,099 | 1.25 | 1.75 | 1.57 | 25 | |
| 15.44 | (11.68) | 1,833 | 1.25 | 1.64 | 1.60 | 33 | |
| 17.70 | 25.12 | 2,096 | 1.49 | 1.07 | 1.71 | 17 | |
| | | | | | | | |
| 17.21 | (16.83) | 9,074 | 0.60(f) | 1.97(f) | 0.71(f) | 18 | |
| 22.14 | 33.04 | 10,463 | 0.60 | 1.85(g) | 0.71 | 35 | |
| 16.85 | (1.52) | 6,970 | 0.60 | 1.41 | 0.72 | 28 | |
| 17.60 | 15.38 | 3,778 | 0.60 | 2.31 | 0.83 | 25 | |
| 15.85 | (11.16) | 19,516 | 0.60 | 2.31 | 0.91 | 33 | |
| 18.13 | 25.88 | 21,891 | 0.84 | 1.36 | 0.93 | 17 | |
SEE NOTES TO FINANCIAL STATEMENTS.
| April 30, 2022 | J.P. Morgan International Equity Funds | 95 |
FINANCIAL HIGHLIGHTS
FOR THE PERIODS INDICATED (continued)
| | Per share operating performance |
| | | Investment operations | | Distributions |
| | Net asset
value,
beginning
of period | Net
investment
income
(loss)(b) | Net realized
and unrealized
gains
(losses) on
investments | Total from
investment
operations | | Net
investment
income | Net
realized
gain | Total
distributions |
| Class R6 | | | | | | | | |
| Six Months Ended April 30, 2022(Unaudited) | $22.10 | $0.20 | $(3.68) | $(3.48) | | $(0.46) | $(0.99) | $(1.45) |
| Year Ended October 31, 2021 | 16.81 | 0.42(g) | 5.13 | 5.55 | | (0.26) | — | (0.26) |
| Year Ended October 31, 2020 | 17.61 | 0.26 | (0.49) | (0.23) | | (0.57) | — | (0.57) |
| Year Ended October 31, 2019 | 15.86 | 0.40 | 1.93 | 2.33 | | (0.40) | (0.18) | (0.58) |
| Year Ended October 31, 2018 | 18.13 | 0.43 | (2.39) | (1.96) | | (0.31) | — | (0.31) |
| Year Ended October 31, 2017 | 14.46 | 0.29 | 3.46 | 3.75 | | (0.08) | — | (0.08) |
|
| (a) | Annualized for periods less than one year, unless otherwise noted. |
| (b) | Calculated based upon average shares outstanding. |
| (c) | Includes adjustments in accordance with accounting principles generally accepted in the United States of America and as such, the net asset values for financial reporting purposes and the returns based upon those net asset values may differ from the net asset values and returns for shareholder transactions. |
| (d) | Not annualized for periods less than one year. |
| (e) | Includes interest expense, if applicable, which is less than 0.005% unless otherwise noted. |
| (f) | Certain non-recurring expenses incurred by the Fund were not annualized for the period indicated. |
| (g) | Reflects income from foreign withholding tax claims. Had the Fund not received these proceeds, the net investment income (loss) per share and the net investment income (loss) ratios for each share class would have remained the same. |
SEE NOTES TO FINANCIAL STATEMENTS.
| 96 | J.P. Morgan International Equity Funds | April 30, 2022 |
FINANCIAL HIGHLIGHTS
FOR THE PERIODS INDICATED
| | Ratios/Supplemental data | |
| | | | Ratios to average net assets(a) | | |
Net asset
value,
end of
period | Total return
(excludes
sales charge)(c)(d) | Net assets,
end of
period
(000's) | Net
expenses(e) | Net
investment
income
(loss) | Expenses without
waivers | Portfolio
turnover
rate(d) | |
| | | | | | | | |
| $17.17 | (16.77)% | $3,456,927 | 0.50(f)% | 2.01(f)% | 0.60(f)% | 18% | |
| 22.10 | 33.20 | 3,782,533 | 0.50 | 1.98(g) | 0.60 | 35 | |
| 16.81 | (1.46) | 2,290,008 | 0.50 | 1.56 | 0.61 | 28 | |
| 17.61 | 15.50 | 2,457,383 | 0.50 | 2.46 | 0.72 | 25 | |
| 15.86 | (11.04) | 3,808,621 | 0.50 | 2.42 | 0.81 | 33 | |
| 18.13 | 26.04 | 3,516,978 | 0.74 | 1.84 | 0.81 | 17 | |
SEE NOTES TO FINANCIAL STATEMENTS.
| April 30, 2022 | J.P. Morgan International Equity Funds | 97 |
FINANCIAL HIGHLIGHTS
FOR THE PERIODS INDICATED (continued)
| | Per share operating performance |
| | | Investment operations | | Distributions |
| | Net asset
value,
beginning
of period | Net
investment
income
(loss)(b) | Net realized
and unrealized
gains
(losses) on
investments | Total from
investment
operations | | Net
investment
income |
| JPMorgan International Focus Fund | | | | | | |
| Class A | | | | | | |
| Six Months Ended April 30, 2022(Unaudited) | $27.55 | $0.18 | $(4.73) | $(4.55) | | $(0.43) |
| Year Ended October 31, 2021 | 22.07 | 0.35(g) | 5.32 | 5.67 | | (0.19) |
| Year Ended October 31, 2020 | 21.15 | 0.18 | 0.75 | 0.93 | | (0.01) |
| Year Ended October 31, 2019 | 18.24 | 0.26 | 3.02 | 3.28 | | (0.37) |
| Year Ended October 31, 2018 | 21.14 | 0.36 | (3.13) | (2.77) | | (0.13) |
| Year Ended October 31, 2017 | 17.24 | 0.16 | 4.09 | 4.25 | | (0.35) |
| Class C | | | | | | |
| Six Months Ended April 30, 2022(Unaudited) | 27.06 | 0.11 | (4.65) | (4.54) | | (0.29) |
| Year Ended October 31, 2021 | 21.68 | 0.20(g) | 5.24 | 5.44 | | (0.06) |
| Year Ended October 31, 2020 | 20.86 | 0.07 | 0.75 | 0.82 | | — |
| Year Ended October 31, 2019 | 17.98 | 0.16 | 2.97 | 3.13 | | (0.25) |
| Year Ended October 31, 2018 | 20.90 | 0.26 | (3.09) | (2.83) | | (0.09) |
| Year Ended October 31, 2017 | 17.04 | 0.05 | 4.06 | 4.11 | | (0.25) |
| Class I | | | | | | |
| Six Months Ended April 30, 2022(Unaudited) | 27.95 | 0.21 | (4.79) | (4.58) | | (0.48) |
| Year Ended October 31, 2021 | 22.39 | 0.42(g) | 5.39 | 5.81 | | (0.25) |
| Year Ended October 31, 2020 | 21.43 | 0.23 | 0.78 | 1.01 | | (0.05) |
| Year Ended October 31, 2019 | 18.49 | 0.31 | 3.04 | 3.35 | | (0.41) |
| Year Ended October 31, 2018 | 21.41 | 0.44 | (3.19) | (2.75) | | (0.17) |
| Year Ended October 31, 2017 | 17.45 | 0.23 | 4.13 | 4.36 | | (0.40) |
| Class R2 | | | | | | |
| Six Months Ended April 30, 2022(Unaudited) | 27.25 | 0.14 | (4.69) | (4.55) | | (0.30) |
| Year Ended October 31, 2021 | 21.85 | 0.27(g) | 5.26 | 5.53 | | (0.13) |
| Year Ended October 31, 2020 | 20.99 | 0.13 | 0.73 | 0.86 | | — |
| Year Ended October 31, 2019 | 18.14 | 0.21 | 2.98 | 3.19 | | (0.34) |
| Year Ended October 31, 2018 | 21.11 | 0.35 | (3.17) | (2.82) | | (0.15) |
| Year Ended October 31, 2017 | 17.21 | 0.06 | 4.14 | 4.20 | | (0.30) |
| Class R5 | | | | | | |
| Six Months Ended April 30, 2022(Unaudited) | 27.96 | 0.22 | (4.79) | (4.57) | | (0.50) |
| Year Ended October 31, 2021 | 22.38 | 0.44(g) | 5.40 | 5.84 | | (0.26) |
| Year Ended October 31, 2020 | 21.42 | 0.25 | 0.78 | 1.03 | | (0.07) |
| Year Ended October 31, 2019 | 18.49 | 0.34 | 3.03 | 3.37 | | (0.44) |
| Year Ended October 31, 2018 | 21.39 | 0.53 | (3.25) | (2.72) | | (0.18) |
| Year Ended October 31, 2017 | 17.44 | 0.20 | 4.17 | 4.37 | | (0.42) |
SEE NOTES TO FINANCIAL STATEMENTS.
| 98 | J.P. Morgan International Equity Funds | April 30, 2022 |
| | Ratios/Supplemental data | |
| | | | Ratios to average net assets(a) | | |
Net asset
value,
end of
period | Total return
(excludes
sales charge)(c)(d) | Net assets,
end of
period
(000's) | Net
expenses(e) | Net
investment
income
(loss) | Expenses without
waivers | Portfolio
turnover
rate(d) | |
| | | | | | | | |
| | | | | | | | |
| $22.57 | (16.72)% | $268,558 | 1.00(f)% | 1.39(f)% | 1.21(f)% | 16% | |
| 27.55 | 25.74 | 337,503 | 1.00 | 1.31(g) | 1.21 | 32 | |
| 22.07 | 4.39 | 135,527 | 1.00 | 0.86 | 1.22 | 38 | |
| 21.15 | 18.41 | 114,629 | 1.00 | 1.33 | 1.32 | 34 | |
| 18.24 | (13.20) | 84,325 | 1.00 | 1.75 | 1.38 | 63 | |
| 21.14 | 25.16 | 67,684 | 1.24 | 0.83 | 1.46 | 38 | |
| | | | | | | | |
| 22.23 | (16.91) | 18,734 | 1.50(f) | 0.89(f) | 1.73(f) | 16 | |
| 27.06 | 25.11 | 24,272 | 1.50 | 0.77(g) | 1.72 | 32 | |
| 21.68 | 3.93 | 15,463 | 1.50 | 0.32 | 1.73 | 38 | |
| 20.86 | 17.73 | 18,447 | 1.50 | 0.83 | 1.84 | 34 | |
| 17.98 | (13.60) | 22,532 | 1.50 | 1.29 | 1.89 | 63 | |
| 20.90 | 24.51 | 14,534 | 1.74 | 0.27 | 2.00 | 38 | |
| | | | | | | | |
| 22.89 | (16.59) | 654,222 | 0.75(f) | 1.63(f) | 0.96(f) | 16 | |
| 27.95 | 26.04 | 832,039 | 0.75 | 1.54(g) | 0.96 | 32 | |
| 22.39 | 4.71 | 372,068 | 0.75 | 1.05 | 0.96 | 38 | |
| 21.43 | 18.62 | 177,764 | 0.75 | 1.57 | 1.08 | 34 | |
| 18.49 | (12.96) | 189,061 | 0.75 | 2.09 | 1.13 | 63 | |
| 21.41 | 25.60 | 131,356 | 0.89 | 1.14 | 1.19 | 38 | |
| | | | | | | | |
| 22.40 | (16.83) | 1,783 | 1.30(f) | 1.13(f) | 1.50(f) | 16 | |
| 27.25 | 25.35 | 2,078 | 1.30 | 1.00(g) | 1.48 | 32 | |
| 21.85 | 4.10 | 1,441 | 1.30 | 0.61 | 1.51 | 38 | |
| 20.99 | 18.01 | 1,049 | 1.30 | 1.05 | 1.74 | 34 | |
| 18.14 | (13.46) | 773 | 1.30 | 1.70 | 1.72 | 63 | |
| 21.11 | 24.85 | 97 | 1.49 | 0.31 | 2.79 | 38 | |
| | | | | | | | |
| 22.89 | (16.57) | 2,216 | 0.65(f) | 1.69(f) | 0.87(f) | 16 | |
| 27.96 | 26.19 | 3,172 | 0.65 | 1.61(g) | 0.87 | 32 | |
| 22.38 | 4.79 | 2,772 | 0.65 | 1.16 | 0.88 | 38 | |
| 21.42 | 18.76 | 3,082 | 0.65 | 1.71 | 1.04 | 34 | |
| 18.49 | (12.84) | 3,341 | 0.65 | 2.56 | 1.07 | 63 | |
| 21.39 | 25.67 | 90 | 0.79 | 1.01 | 2.44 | 38 | |
SEE NOTES TO FINANCIAL STATEMENTS.
| April 30, 2022 | J.P. Morgan International Equity Funds | 99 |
FINANCIAL HIGHLIGHTS
FOR THE PERIODS INDICATED (continued)
| | Per share operating performance |
| | | Investment operations | | Distributions |
| | Net asset
value,
beginning
of period | Net
investment
income
(loss)(b) | Net realized
and unrealized
gains
(losses) on
investments | Total from
investment
operations | | Net
investment
income |
| Class R6 | | | | | | |
| Six Months Ended April 30, 2022(Unaudited) | $27.98 | $0.21 | $(4.76) | $(4.55) | | $(0.53) |
| Year Ended October 31, 2021 | 22.40 | 0.46(g) | 5.40 | 5.86 | | (0.28) |
| Year Ended October 31, 2020 | 21.44 | 0.28 | 0.77 | 1.05 | | (0.09) |
| Year Ended October 31, 2019 | 18.50 | 0.27 | 3.13 | 3.40 | | (0.46) |
| Year Ended October 31, 2018 | 21.40 | 0.44 | (3.16) | (2.72) | | (0.18) |
| Year Ended October 31, 2017 | 17.45 | 0.26 | 4.12 | 4.38 | | (0.43) |
|
| (a) | Annualized for periods less than one year, unless otherwise noted. |
| (b) | Calculated based upon average shares outstanding. |
| (c) | Includes adjustments in accordance with accounting principles generally accepted in the United States of America and as such, the net asset values for financial reporting purposes and the returns based upon those net asset values may differ from the net asset values and returns for shareholder transactions. |
| (d) | Not annualized for periods less than one year. |
| (e) | Includes interest expense, if applicable, which is less than 0.005% unless otherwise noted. |
| (f) | Certain non-recurring expenses incurred by the Fund were not annualized for the period indicated. |
| (g) | Reflects income from foreign withholding tax claims. Had the Fund not received these proceeds, the net investment income (loss) per share and the net investment income (loss) ratios for each share class would have remained the same. |
SEE NOTES TO FINANCIAL STATEMENTS.
| 100 | J.P. Morgan International Equity Funds | April 30, 2022 |
FINANCIAL HIGHLIGHTS
FOR THE PERIODS INDICATED
| | Ratios/Supplemental data | |
| | | | Ratios to average net assets(a) | | |
Net asset
value,
end of
period | Total return
(excludes
sales charge)(c)(d) | Net assets,
end of
period
(000's) | Net
expenses(e) | Net
investment
income
(loss) | Expenses without
waivers | Portfolio
turnover
rate(d) | |
| | | | | | | | |
| $22.90 | (16.50)% | $ 461,434 | 0.55(f)% | 1.60(f)% | 0.71(f)% | 16% | |
| 27.98 | 26.28 | 2,721,224 | 0.55 | 1.68(g) | 0.71 | 32 | |
| 22.40 | 4.89 | 2,274,399 | 0.55 | 1.31 | 0.71 | 38 | |
| 21.44 | 18.95 | 2,284,670 | 0.55 | 1.32 | 0.77 | 34 | |
| 18.50 | (12.81) | 175,198 | 0.55 | 2.12 | 0.87 | 63 | |
| 21.40 | 25.72 | 143,868 | 0.74 | 1.37 | 0.95 | 38 | |
SEE NOTES TO FINANCIAL STATEMENTS.
| April 30, 2022 | J.P. Morgan International Equity Funds | 101 |
FINANCIAL HIGHLIGHTS
FOR THE PERIODS INDICATED (continued)
| | Per share operating performance |
| | | Investment operations | | Distributions |
| | Net asset
value,
beginning
of period | Net
investment
income
(loss)(b) | Net realized
and unrealized
gains
(losses) on
investments | Total from
investment
operations | | Net
investment
income |
| JPMorgan International Hedged Equity Fund | | | | | | |
| Class A | | | | | | |
| Six Months Ended April 30, 2022(Unaudited) | $16.73 | $0.18 | $(1.85) | $(1.67) | | $(0.38) |
| Year Ended October 31, 2021 | 14.12 | 0.30 | 2.58 | 2.88 | | (0.27) |
| Year Ended October 31, 2020 | 15.58 | 0.27 | (1.49) | (1.22) | | (0.24) |
| March 15, 2019(g) through October 31, 2019 | 15.00 | 0.19 | 0.39 | 0.58 | | — |
| Class C | | | | | | |
| Six Months Ended April 30, 2022(Unaudited) | 16.68 | 0.10 | (1.81) | (1.71) | | (0.32) |
| Year Ended October 31, 2021 | 14.06 | 0.22 | 2.57 | 2.79 | | (0.17) |
| Year Ended October 31, 2020 | 15.53 | 0.20 | (1.50) | (1.30) | | (0.17) |
| March 15, 2019(g) through October 31, 2019 | 15.00 | 0.16 | 0.37 | 0.53 | | — |
| Class I | | | | | | |
| Six Months Ended April 30, 2022(Unaudited) | 16.83 | 0.18 | (1.84) | (1.66) | | (0.41) |
| Year Ended October 31, 2021 | 14.18 | 0.32 | 2.61 | 2.93 | | (0.28) |
| Year Ended October 31, 2020 | 15.61 | 0.31 | (1.50) | (1.19) | | (0.24) |
| March 15, 2019(g) through October 31, 2019 | 15.00 | 0.32 | 0.29 | 0.61 | | — |
| Class R5 | | | | | | |
| Six Months Ended April 30, 2022(Unaudited) | 16.86 | 0.19 | (1.84) | (1.65) | | (0.43) |
| Year Ended October 31, 2021 | 14.20 | 0.35 | 2.61 | 2.96 | | (0.30) |
| Year Ended October 31, 2020 | 15.62 | 0.31 | (1.48) | (1.17) | | (0.25) |
| March 15, 2019(g) through October 31, 2019 | 15.00 | 0.34 | 0.28 | 0.62 | | — |
| Class R6 | | | | | | |
| Six Months Ended April 30, 2022(Unaudited) | 16.88 | 0.21 | (1.85) | (1.64) | | (0.45) |
| Year Ended October 31, 2021 | 14.22 | 0.39 | 2.59 | 2.98 | | (0.32) |
| Year Ended October 31, 2020 | 15.63 | 0.34 | (1.49) | (1.15) | | (0.26) |
| March 15, 2019(g) through October 31, 2019 | 15.00 | 0.35 | 0.28 | 0.63 | | — |
|
| (a) | Annualized for periods less than one year, unless otherwise noted. |
| (b) | Calculated based upon average shares outstanding. |
| (c) | Includes adjustments in accordance with accounting principles generally accepted in the United States of America and as such, the net asset values for financial reporting purposes and the returns based upon those net asset values may differ from the net asset values and returns for shareholder transactions. |
| (d) | Not annualized for periods less than one year. |
| (e) | Includes interest expense, if applicable, which is less than 0.005% unless otherwise noted. |
| (f) | Certain non-recurring expenses incurred by the Fund were not annualized for the period indicated. |
| (g) | Commencement of offering of class of shares. |
SEE NOTES TO FINANCIAL STATEMENTS.
| 102 | J.P. Morgan International Equity Funds | April 30, 2022 |
FINANCIAL HIGHLIGHTS
FOR THE PERIODS INDICATED
| | Ratios/Supplemental data | |
| | | | Ratios to average net assets(a) | | |
Net asset
value,
end of
period | Total return
(excludes
sales charge)(c)(d) | Net assets,
end of
period
(000's) | Net
expenses(e) | Net
investment
income
(loss) | Expenses without
waivers | Portfolio
turnover
rate(d) | |
| | | | | | | | |
| | | | | | | | |
| $14.68 | (10.15)% | $ 5,203 | 0.85(f)% | 2.33(f)% | 1.04(f)% | 9% | |
| 16.73 | 20.60 | 3,561 | 0.85 | 1.85 | 1.05 | 50 | |
| 14.12 | (8.02) | 1,573 | 0.85 | 1.84 | 1.30 | 85 | |
| 15.58 | 3.87 | 330 | 0.85(f) | 1.95(f) | 1.31(f) | 9 | |
| | | | | | | | |
| 14.65 | (10.38) | 284 | 1.35(f) | 1.33(f) | 1.55(f) | 9 | |
| 16.68 | 19.97 | 320 | 1.35 | 1.35 | 1.55 | 50 | |
| 14.06 | (8.47) | 115 | 1.35 | 1.34 | 1.81 | 85 | |
| 15.53 | 3.53 | 119 | 1.35(f) | 1.73(f) | 1.92(f) | 9 | |
| | | | | | | | |
| 14.76 | (10.02) | 165,497 | 0.60(f) | 2.30(f) | 0.79(f) | 9 | |
| 16.83 | 20.90 | 148,703 | 0.60 | 2.02 | 0.79 | 50 | |
| 14.18 | (7.78) | 135,542 | 0.60 | 2.12 | 1.03 | 85 | |
| 15.61 | 4.07 | 59,751 | 0.60(f) | 3.38(f) | 1.19(f) | 9 | |
| | | | | | | | |
| 14.78 | (9.97) | 21 | 0.45(f) | 2.35(f) | 0.70(f) | 9 | |
| 16.86 | 21.10 | 23 | 0.45 | 2.19 | 0.71 | 50 | |
| 14.20 | (7.68) | 19 | 0.45 | 2.08 | 1.04 | 85 | |
| 15.62 | 4.13 | 21 | 0.45(f) | 3.59(f) | 1.03(f) | 9 | |
| | | | | | | | |
| 14.79 | (9.92) | 218 | 0.35(f) | 2.66(f) | 0.56(f) | 9 | |
| 16.88 | 21.19 | 169 | 0.35 | 2.42 | 0.58 | 50 | |
| 14.22 | (7.53) | 19 | 0.35 | 2.33 | 0.94 | 85 | |
| 15.63 | 4.20 | 21 | 0.35(f) | 3.69(f) | 0.93(f) | 9 | |
SEE NOTES TO FINANCIAL STATEMENTS.
| April 30, 2022 | J.P. Morgan International Equity Funds | 103 |
FINANCIAL HIGHLIGHTS
FOR THE PERIODS INDICATED (continued)
| | Per share operating performance |
| | | Investment operations | | Distributions |
| | Net asset
value,
beginning
of period | Net
investment
income
(loss)(b) | Net realized
and unrealized
gains
(losses) on
investments | Total from
investment
operations | | Net
investment
income | Net
realized
gain | Total
distributions |
| JPMorgan International Research Enhanced Equity Fund | | | | | | | | |
| Class A | | | | | | | | |
| Six Months Ended April 30, 2022(Unaudited) | $21.26 | $0.24 | $(2.78) | $(2.54) | | $(0.78) | $ — | $(0.78) |
| Year Ended October 31, 2021 | 15.84 | 0.43(g) | 5.16 | 5.59 | | (0.17) | — | (0.17) |
| Year Ended October 31, 2020 | 17.93 | 0.36 | (1.96) | (1.60) | | (0.49) | — | (0.49) |
| Year Ended October 31, 2019 | 16.79 | 0.51 | 1.15 | 1.66 | | (0.52) | — | (0.52) |
| Year Ended October 31, 2018 | 18.76 | 0.45 | (2.04) | (1.59) | | (0.19) | (0.19) | (0.38) |
| Year Ended October 31, 2017 | 15.54 | 0.34 | 3.23 | 3.57 | | (0.35) | — | (0.35) |
| Class I | | | | | | | | |
| Six Months Ended April 30, 2022(Unaudited) | 21.39 | 0.25 | (2.79) | (2.54) | | (0.83) | — | (0.83) |
| Year Ended October 31, 2021 | 16.05 | 0.47(g) | 5.23 | 5.70 | | (0.36) | — | (0.36) |
| Year Ended October 31, 2020 | 18.17 | 0.36 | (1.94) | (1.58) | | (0.54) | — | (0.54) |
| Year Ended October 31, 2019 | 17.01 | 0.56 | 1.16 | 1.72 | | (0.56) | — | (0.56) |
| Year Ended October 31, 2018 | 18.92 | 0.35 | (1.91) | (1.56) | | (0.16) | (0.19) | (0.35) |
| Year Ended October 31, 2017 | 15.68 | 0.41 | 3.23 | 3.64 | | (0.40) | — | (0.40) |
| Class R6 | | | | | | | | |
| Six Months Ended April 30, 2022(Unaudited) | 21.33 | 0.27 | (2.80) | (2.53) | | (0.85) | — | (0.85) |
| Year Ended October 31, 2021 | 16.00 | 0.49(g) | 5.21 | 5.70 | | (0.37) | — | (0.37) |
| Year Ended October 31, 2020 | 18.11 | 0.39 | (1.94) | (1.55) | | (0.56) | — | (0.56) |
| Year Ended October 31, 2019 | 16.97 | 0.57 | 1.16 | 1.73 | | (0.59) | — | (0.59) |
| November 1, 2017(h) through October 31, 2018 | 18.98 | 0.56 | (2.16) | (1.60) | | (0.22) | (0.19) | (0.41) |
|
| (a) | Annualized for periods less than one year, unless otherwise noted. |
| (b) | Calculated based upon average shares outstanding. |
| (c) | Includes adjustments in accordance with accounting principles generally accepted in the United States of America and as such, the net asset values for financial reporting purposes and the returns based upon those net asset values may differ from the net asset values and returns for shareholder transactions. |
| (d) | Not annualized for periods less than one year. |
| (e) | Includes interest expense, if applicable, which is less than 0.005% unless otherwise noted. |
| (f) | Certain non-recurring expenses incurred by the Fund were not annualized for the period indicated. |
| (g) | Reflects income from foreign withholding tax claims, including related interest income. Had the Fund not received these proceeds, the net investment income (loss) per share for each share class would have remained the same and the net investment income (loss) ratios would have been 2.13%, 2.33%, and 2.44% for Class A, Class I and Class R6, respectively. |
| (h) | Commencement of offering of class of shares. |
SEE NOTES TO FINANCIAL STATEMENTS.
| 104 | J.P. Morgan International Equity Funds | April 30, 2022 |
FINANCIAL HIGHLIGHTS
FOR THE PERIODS INDICATED
| | Ratios/Supplemental data | |
| | | | Ratios to average net assets(a) | | |
Net asset
value,
end of
period | Total return
(excludes
sales charge)(c)(d) | Net assets,
end of
period
(000's) | Net
expenses(e) | Net
investment
income
(loss) | Expenses without
waivers | Portfolio
turnover
rate(d) | |
| | | | | | | | |
| | | | | | | | |
| $17.94 | (12.31)% | $ 37,317 | 0.47(f)% | 2.38(f)% | 0.84(f)% | 9% | |
| 21.26 | 35.44 | 46,779 | 0.60 | 2.15(g) | 0.88 | 20 | |
| 15.84 | (9.26) | 52,118 | 0.60 | 2.21 | 0.83 | 52 | |
| 17.93 | 10.39 | 213,256 | 0.60 | 3.00 | 0.83 | 22 | |
| 16.79 | (8.66) | 203,437 | 0.60 | 2.40 | 0.84 | 42 | |
| 18.76 | 23.41 | 298,112 | 0.59 | 1.98 | 0.90 | 33 | |
| | | | | | | | |
| 18.02 | (12.26) | 313,629 | 0.35(f) | 2.48(f) | 0.56(f) | 9 | |
| 21.39 | 35.78 | 386,797 | 0.35 | 2.35(g) | 0.56 | 20 | |
| 16.05 | (9.05) | 472,455 | 0.34 | 2.15 | 0.56 | 52 | �� |
| 18.17 | 10.65 | 185,680 | 0.35 | 3.28 | 0.56 | 22 | |
| 17.01 | (8.42) | 152,610 | 0.35 | 1.85 | 0.56 | 42 | |
| 18.92 | 23.71 | 4,740,590 | 0.34 | 2.37 | 0.58 | 33 | |
| | | | | | | | |
| 17.95 | (12.24) | 5,172,094 | 0.25(f) | 2.78(f) | 0.30(f) | 9 | |
| 21.33 | 35.93 | 4,562,266 | 0.25 | 2.46(g) | 0.31 | 20 | |
| 16.00 | (8.96) | 4,337,776 | 0.24 | 2.35 | 0.30 | 52 | |
| 18.11 | 10.78 | 4,435,538 | 0.25 | 3.37 | 0.31 | 22 | |
| 16.97 | (8.60) | 4,344,571 | 0.25 | 3.00 | 0.32 | 42 | |
SEE NOTES TO FINANCIAL STATEMENTS.
| April 30, 2022 | J.P. Morgan International Equity Funds | 105 |
FINANCIAL HIGHLIGHTS
FOR THE PERIODS INDICATED (continued)
| | Per share operating performance |
| | | Investment operations | | Distributions |
| | Net asset
value,
beginning
of period | Net
investment
income
(loss)(b) | Net realized
and unrealized
gains
(losses) on
investments | Total from
investment
operations | | Net
investment
income |
| JPMorgan International Value Fund | | | | | | |
| Class A | | | | | | |
| Six Months Ended April 30, 2022(Unaudited) | $13.46 | $0.23 | $(1.29) | $(1.06) | | $(0.61) |
| Year Ended October 31, 2021 | 9.46 | 0.43(g) | 3.89 | 4.32 | | (0.32) |
| Year Ended October 31, 2020 | 12.22 | 0.28 | (2.55) | (2.27) | | (0.49) |
| Year Ended October 31, 2019 | 12.44 | 0.44 | (0.20) | 0.24 | | (0.46) |
| Year Ended October 31, 2018 | 14.26 | 0.36 | (1.87) | (1.51) | | (0.31) |
| Year Ended October 31, 2017 | 12.23 | 0.22 | 2.50 | 2.72 | | (0.69) |
| Class C | | | | | | |
| Six Months Ended April 30, 2022(Unaudited) | 13.02 | 0.17 | (1.23) | (1.06) | | (0.52) |
| Year Ended October 31, 2021 | 9.14 | 0.33(g) | 3.79 | 4.12 | | (0.24) |
| Year Ended October 31, 2020 | 11.81 | 0.21 | (2.47) | (2.26) | | (0.41) |
| Year Ended October 31, 2019 | 12.02 | 0.36 | (0.18) | 0.18 | | (0.39) |
| Year Ended October 31, 2018 | 13.78 | 0.28 | (1.82) | (1.54) | | (0.22) |
| Year Ended October 31, 2017 | 11.88 | 0.15 | 2.42 | 2.57 | | (0.67) |
| Class I | | | | | | |
| Six Months Ended April 30, 2022(Unaudited) | 13.84 | 0.25 | (1.33) | (1.08) | | (0.64) |
| Year Ended October 31, 2021 | 9.72 | 0.47(g) | 3.99 | 4.46 | | (0.34) |
| Year Ended October 31, 2020 | 12.54 | 0.31 | (2.61) | (2.30) | | (0.52) |
| Year Ended October 31, 2019 | 12.76 | 0.48 | (0.20) | 0.28 | | (0.50) |
| Year Ended October 31, 2018 | 14.62 | 0.41 | (1.92) | (1.51) | | (0.35) |
| Year Ended October 31, 2017 | 12.57 | 0.28 | 2.55 | 2.83 | | (0.78) |
| Class L | | | | | | |
| Six Months Ended April 30, 2022(Unaudited) | 13.78 | 0.25 | (1.33) | (1.08) | | (0.65) |
| Year Ended October 31, 2021 | 9.66 | 0.47(g) | 3.99 | 4.46 | | (0.34) |
| Year Ended October 31, 2020 | 12.47 | 0.30 | (2.58) | (2.28) | | (0.53) |
| Year Ended October 31, 2019 | 12.70 | 0.46 | (0.17) | 0.29 | | (0.52) |
| Year Ended October 31, 2018 | 14.55 | 0.41 | (1.90) | (1.49) | | (0.36) |
| Year Ended October 31, 2017 | 12.50 | 0.27 | 2.57 | 2.84 | | (0.79) |
| Class R2 | | | | | | |
| Six Months Ended April 30, 2022(Unaudited) | 13.22 | 0.20 | (1.26) | (1.06) | | (0.57) |
| Year Ended October 31, 2021 | 9.29 | 0.39(g) | 3.82 | 4.21 | | (0.28) |
| Year Ended October 31, 2020 | 11.96 | 0.24 | (2.51) | (2.27) | | (0.40) |
| Year Ended October 31, 2019 | 12.20 | 0.40 | (0.20) | 0.20 | | (0.44) |
| Year Ended October 31, 2018 | 14.01 | 0.31 | (1.84) | (1.53) | | (0.28) |
| Year Ended October 31, 2017 | 12.04 | 0.19 | 2.46 | 2.65 | | (0.68) |
| Class R5 | | | | | | |
| Six Months Ended April 30, 2022(Unaudited) | 13.67 | 0.28 | (1.34) | (1.06) | | (0.64) |
| Year Ended October 31, 2021 | 9.60 | 0.41(g) | 4.02 | 4.43 | | (0.36) |
| Year Ended October 31, 2020 | 12.40 | 0.33 | (2.59) | (2.26) | | (0.54) |
| Year Ended October 31, 2019 | 12.65 | 0.49 | (0.21) | 0.28 | | (0.53) |
| Year Ended October 31, 2018 | 14.51 | 0.42 | (1.91) | (1.49) | | (0.37) |
| Year Ended October 31, 2017 | 12.51 | 0.23 | 2.59 | 2.82 | | (0.82) |
SEE NOTES TO FINANCIAL STATEMENTS.
| 106 | J.P. Morgan International Equity Funds | April 30, 2022 |
| | Ratios/Supplemental data | |
| | | | Ratios to average net assets(a) | | |
Net asset
value,
end of
period | Total return
(excludes
sales charge)(c)(d) | Net assets,
end of
period
(000's) | Net
expenses(e) | Net
investment
income
(loss) | Expenses without
waivers and reimbursements(f) | Portfolio
turnover
rate(d) | |
| | | | | | | | |
| | | | | | | | |
| $11.79 | (8.05)% | $177,422 | 1.00(f)% | 3.55(f)% | 1.23(f)% | 11% | |
| 13.46 | 46.20 | 187,774 | 1.00 | 3.39(g) | 1.24 | 33 | |
| 9.46 | (19.51) | 125,744 | 1.00 | 2.66 | 1.26 | 59 | |
| 12.22 | 2.30 | 181,458 | 1.00 | 3.69 | 1.28 | 61 | |
| 12.44 | (10.88) | 242,231 | 1.00 | 2.59 | 1.27 | 90 | |
| 14.26 | 23.30 | 316,510 | 1.35 | 1.71 | 1.35 | 31 | |
| | | | | | | | |
| 11.44 | (8.34) | 2,490 | 1.50(f) | 2.79(f) | 1.76(f) | 11 | |
| 13.02 | 45.54 | 3,923 | 1.50 | 2.70(g) | 1.77 | 33 | |
| 9.14 | (19.94) | 4,202 | 1.50 | 2.07 | 1.78 | 59 | |
| 11.81 | 1.82 | 9,358 | 1.50 | 3.15 | 1.80 | 61 | |
| 12.02 | (11.37) | 14,055 | 1.50 | 2.06 | 1.78 | 90 | |
| 13.78 | 22.67 | 20,997 | 1.85 | 1.21 | 1.87 | 31 | |
| | | | | | | | |
| 12.12 | (7.97) | 37,651 | 0.75(f) | 3.86(f) | 0.98(f) | 11 | |
| 13.84 | 46.51 | 39,188 | 0.75 | 3.58(g) | 0.99 | 33 | |
| 9.72 | (19.31) | 26,805 | 0.75 | 2.88 | 1.02 | 59 | |
| 12.54 | 2.56 | 45,503 | 0.75 | 3.91 | 1.03 | 61 | |
| 12.76 | (10.62) | 66,291 | 0.75 | 2.84 | 1.02 | 90 | |
| 14.62 | 23.66 | 144,875 | 1.04 | 2.07 | 1.04 | 31 | |
| | | | | | | | |
| 12.05 | (8.00) | 6,285 | 0.66(f) | 3.88(f) | 0.84(f) | 11 | |
| 13.78 | 46.77 | 7,042 | 0.66 | 3.66(g) | 0.84 | 33 | |
| 9.66 | (19.25) | 5,585 | 0.65 | 2.72 | 0.85 | 59 | |
| 12.47 | 2.69 | 30,256 | 0.65 | 3.81 | 0.87 | 61 | |
| 12.70 | (10.57) | 73,651 | 0.65 | 2.84 | 0.87 | 90 | |
| 14.55 | 23.88 | 201,672 | 0.87 | 2.03 | 0.88 | 31 | |
| | | | | | | | |
| 11.59 | (8.22) | 500 | 1.30(f) | 3.25(f) | 1.59(f) | 11 | |
| 13.22 | 45.84 | 514 | 1.30 | 3.14(g) | 1.59 | 33 | |
| 9.29 | (19.74) | 412 | 1.30 | 2.27 | 1.61 | 59 | |
| 11.96 | 2.00 | 722 | 1.30 | 3.47 | 1.69 | 61 | |
| 12.20 | (11.19) | 1,025 | 1.30 | 2.27 | 1.59 | 90 | |
| 14.01 | 23.02 | 1,369 | 1.58 | 1.52 | 1.73 | 31 | |
| | | | | | | | |
| 11.97 | (7.93) | 33 | 0.65(f) | 4.35(f) | 0.84(f) | 11 | |
| 13.67 | 46.74 | 67 | 0.65 | 3.24(g) | 0.85 | 33 | |
| 9.60 | (19.26) | 77 | 0.65 | 3.13 | 0.86 | 59 | |
| 12.40 | 2.64 | 88 | 0.65 | 4.08 | 0.87 | 61 | |
| 12.65 | (10.58) | 70 | 0.65 | 2.97 | 0.91 | 90 | |
| 14.51 | 23.81 | 62 | 0.93 | 1.69 | 4.00 | 31 | |
SEE NOTES TO FINANCIAL STATEMENTS.
| April 30, 2022 | J.P. Morgan International Equity Funds | 107 |
FINANCIAL HIGHLIGHTS
FOR THE PERIODS INDICATED (continued)
| | Per share operating performance |
| | | Investment operations | | Distributions |
| | Net asset
value,
beginning
of period | Net
investment
income
(loss)(b) | Net realized
and unrealized
gains
(losses) on
investments | Total from
investment
operations | | Net
investment
income |
| Class R6 | | | | | | |
| Six Months Ended April 30, 2022(Unaudited) | $13.71 | $0.26 | $(1.32) | $(1.06) | | $(0.67) |
| Year Ended October 31, 2021 | 9.62 | 0.49(g) | 3.97 | 4.46 | | (0.37) |
| Year Ended October 31, 2020 | 12.43 | 0.34 | (2.60) | (2.26) | | (0.55) |
| Year Ended October 31, 2019 | 12.67 | 0.51 | (0.21) | 0.30 | | (0.54) |
| Year Ended October 31, 2018 | 14.53 | 0.43 | (1.91) | (1.48) | | (0.38) |
| Year Ended October 31, 2017 | 12.51 | 0.31 | 2.53 | 2.84 | | (0.82) |
|
| (a) | Annualized for periods less than one year, unless otherwise noted. |
| (b) | Calculated based upon average shares outstanding. |
| (c) | Includes adjustments in accordance with accounting principles generally accepted in the United States of America and as such, the net asset values for financial reporting purposes and the returns based upon those net asset values may differ from the net asset values and returns for shareholder transactions. |
| (d) | Not annualized for periods less than one year. |
| (e) | Includes interest expense, if applicable, which is less than 0.005% unless otherwise noted. |
| (f) | Certain non-recurring expenses incurred by the Fund were not annualized for the period indicated. |
| (g) | Reflects income from foreign withholding tax claims, including related interest income, less IRS compliance fees. Without these proceeds, the net investment income (loss) per share would have been $0.38, $0.28, $0.42, $0.41, $0.34, $0.35 and $0.44 for Class A, Class C, Class I, Class L, Class R2, Class R5, and Class R6,respectively, and the net investment income (loss) ratios would have been 3.00%, 2.26%, 3.19%, 3.23%, 2.72%, 2.80% and 3.44% for Class A, Class C, Class I, Class L, Class R2, Class R5, and Class R6, respectively. |
SEE NOTES TO FINANCIAL STATEMENTS.
| 108 | J.P. Morgan International Equity Funds | April 30, 2022 |
| | Ratios/Supplemental data | |
| | | | Ratios to average net assets(a) | | |
Net asset
value,
end of
period | Total return
(excludes
sales charge)(c)(d) | Net assets,
end of
period
(000's) | Net
expenses(e) | Net
investment
income
(loss) | Expenses without
waivers and reimbursements(f) | Portfolio
turnover
rate(d) | |
| | | | | | | | |
| $11.98 | (7.93)% | $163,319 | 0.55(f)% | 4.07(f)% | 0.73(f)% | 11% | |
| 13.71 | 46.99 | 158,191 | 0.55 | 3.83(g) | 0.73 | 33 | |
| 9.62 | (19.22) | 105,039 | 0.55 | 3.18 | 0.76 | 59 | |
| 12.43 | 2.83 | 125,887 | 0.55 | 4.22 | 0.77 | 61 | |
| 12.67 | (10.49) | 124,246 | 0.55 | 3.06 | 0.77 | 90 | |
| 14.53 | 23.99 | 108,302 | 0.80 | 2.28 | 0.82 | 31 | |
SEE NOTES TO FINANCIAL STATEMENTS.
| April 30, 2022 | J.P. Morgan International Equity Funds | 109 |
NOTES TO FINANCIAL STATEMENTS
AS OF April 30, 2022 (Unaudited)
(Dollar values in thousands)
1. Organization
JPMorgan Trust I (“JPM I”), JPMorgan Trust II (“JPM II”) and JPMorgan Trust IV (“JPM IV”) (collectively, the “Trusts”) were formed on November 12, 2004 for JPM I and JPM II and November 11, 2015 for JPM IV, as Delaware statutory trusts, pursuant to Declarations of Trust dated November 5, 2004 and November 11, 2015, respectively, and are registered under the Investment Company Act of 1940, as amended (the “1940 Act”), as open-end management investment companies.
The following are 8 separate funds of the Trusts (each, a "Fund" and collectively, the "Funds") covered by this report:
| | Classes Offered | Trust | Diversification Classification |
| JPMorgan Emerging Markets Equity Fund | Class A, Class C, Class I, Class L, Class R2, Class R3, Class R4, Class R5 and Class R6 | JPM I | Diversified |
| JPMorgan Emerging Markets Research Enhanced Equity Fund | Class I and Class R6 | JPM IV | Diversified |
| JPMorgan Europe Dynamic Fund | Class A, Class C, Class I, Class L and Class R6 | JPM I | Diversified |
| JPMorgan International Equity Fund | Class A, Class C, Class I, Class R2, Class R5 and Class R6 | JPM I | Diversified |
| JPMorgan International Focus Fund | Class A, Class C, Class I, Class R2, Class R5 and Class R6 | JPM I | Diversified |
| JPMorgan International Hedged Equity Fund | Class A, Class C, Class I, Class R5 and Class R6 | JPM IV | Diversified |
| JPMorgan International Research Enhanced Equity Fund | Class A, Class I and Class R6 | JPM II | Diversified |
| JPMorgan International Value Fund | Class A, Class C, Class I, Class L, Class R2, Class R5 and Class R6 | JPM I | Diversified |
The investment objective of JPMorgan Emerging Markets Equity Fund (“Emerging Markets Equity Fund”) is to seek to provide high total return.
The investment objective of JPMorgan Emerging Markets Research Enhanced Equity Fund (“Emerging Markets Research Enhanced Equity Fund”),
JPMorgan International Focus Fund (“International Focus Fund”), JPMorgan International Research Enhanced Equity Fund (“International Research Enhanced Equity Fund”) and JPMorgan International Value Fund (“International Value Fund”) is to seek to provide long-term capital appreciation.
The investment objective of JPMorgan Europe Dynamic Fund (“Europe Dynamic Fund”) is to seek total return from long-term capital growth. Total return consists of capital growth and current income.
The investment objective of JPMorgan International Equity Fund (“International Equity Fund”) is to seek total return from long-term capital growth and income. Total return consists of capital growth and current income.
The investment objective of JPMorgan International Hedged Equity Fund (“International Hedged Equity Fund”) is to seek to provide capital appreciation.
Class L Shares of Europe Dynamic Fund and International Value Fund are publicly offered on a limited basis. Class A Shares of International Research Enhanced Equity Fund are publicly offered on a limited basis. Investors are not eligible to purchase Class L Shares of Europe Dynamic Fund and International Value Fund and Class A Shares of International Research Enhanced Equity Fund unless they meet certain requirements as described in the Funds' prospectuses.
Effective as of the close of business on December 31, 2020, all share classes of Emerging Markets Equity Fund are publicly offered on a limited basis. Investors are not eligible to purchase shares of the Fund unless they meet certain requirements as described in the Fund's prospectuses.
Class A Shares generally provide for a front-end sales charge while Class C Shares provide for a contingent deferred sales charge ("CDSC"). No sales charges are assessed with respect to Class I, Class L, Class R2, Class R3, Class R4, Class R5 and Class R6 Shares. Certain Class A Shares, for which front-end sales charges have been waived, may be subject to a CDSC as described in the Funds' prospectus. Effective October 1, 2020, Class C Shares automatically convert to Class A Shares after eight years. Prior to October 1, 2020, Class C Shares automatically converted to Class A Shares after ten years. All classes of shares have equal rights as to earnings, assets and voting privileges, except that each class may bear different transfer agency, distribution and service fees and each class has exclusive voting rights with respect to its distribution plan and shareholder servicing agreements.
J.P. Morgan Investment Management Inc. ("JPMIM"), an indirect, wholly-owned subsidiary of JPMorgan Chase & Co. ("JPMorgan"), acts as Adviser (the "Adviser") and Administrator (the "Administrator") to the Funds.
| 110 | J.P. Morgan International Equity Funds | April 30, 2022 |
2. Significant Accounting Policies
The following is a summary of significant accounting policies followed by the Funds in the preparation of their financial statements. The Funds are investment companies and, accordingly, follow the investment company accounting and reporting guidance of the Financial Accounting Standards Board (“FASB”) Accounting Standards Codification Topic 946 — Investment Companies, which is part of U.S. generally accepted accounting principles (“GAAP”). The preparation of financial statements in conformity with GAAP requires management to make estimates and assumptions that affect (i) the reported amounts of assets and liabilities, (ii) disclosure of contingent assets and liabilities at the date of the financial statements, and (iii) the reported amounts of increases and decreases in net assets from operations during the reporting period. Actual results could differ from those estimates.
A. Valuation of Investments — Investments are valued in accordance with GAAP and the Funds' valuation policies set forth by, and under the supervision and responsibility of, the Boards of Trustees of the Trusts (the "Boards"), which established the following approach to valuation, as described more fully below: (i) investments for which market quotations are readily available shall be valued at their market value and (ii) all other investments for which market quotations are not readily available shall be valued at their fair value as determined in good faith by the Boards.
The Administrator has established the J.P. Morgan Asset Management Americas Valuation Committee (“AVC”) to assist the Boards with the oversight and monitoring of the valuation of the Funds' investments. The Administrator implements the valuation policies of the Funds' investments, as directed by the Boards. The AVC oversees and carries out the policies for the valuation of investments held in the Funds. This includes monitoring the appropriateness of fair values based on results of ongoing valuation oversight including, but not limited to, consideration of macro or security specific events, market events, and pricing vendor and broker due diligence. The Administrator is responsible for discussing and assessing the potential impacts to the fair values on an ongoing basis, and, at least on a quarterly basis, with the AVC and the Boards.
A market-based approach is primarily used to value the Funds' investments. Investments for which market quotations are not readily available are fair valued by approved affiliated and/or unaffiliated pricing vendors or third party broker-dealers (collectively referred to as “Pricing Services”) or may be internally fair valued using methods set forth by the valuation policies approved by the Boards. This may include the use of related or comparable assets or liabilities, recent transactions, market multiples, book values and other relevant information for the investment. An income-based valuation approach may be used in which the anticipated future cash flows of the investment are discounted to calculate the fair value. Discounts may also be applied due to the nature or duration of any restrictions on the disposition of the investments. Valuations may be based upon current market prices of securities that are comparable in coupon, rating, maturity and industry. It is possible that the estimated values may differ significantly from the values that would have been used had a ready market for the investments existed, and such differences could be material.
Equities and other exchange-traded instruments are valued at the last sale price or official market closing price on the primary exchange on which the instrument is traded before the net asset values ("NAV") of the Funds are calculated on a valuation date. Certain foreign equity instruments are valued by applying international fair value factors provided by approved Pricing Services. The factors seek to adjust the local closing price for movements of local markets post-closing, but prior to the time the NAVs are calculated.
Investments in open-end investment companies (“Underlying Funds”) are valued at each Underlying Fund’s NAV per share as of the report date.
Futures contracts are generally valued on the basis of available market quotations. Forward foreign currency exchange contracts are valued utilizing market quotations from approved Pricing Services.
Valuations reflected in this report are as of the report date. As a result, changes in valuation due to market events and/or issuer-related events after the report date and prior to issuance of the report are not reflected herein.
The various inputs that are used in determining the valuation of the Funds' investments are summarized into the three broad levels listed below.
| • | Level 1 — Unadjusted inputs using quoted prices in active markets for identical investments. |
| • | Level 2 — Other significant observable inputs including, but not limited to, quoted prices for similar investments, inputs other than quoted prices that are observable for investments (such as interest rates, prepayment speeds, credit risk, etc.) or other market corroborated inputs. |
| • | Level 3 — Significant inputs based on the best information available in the circumstances, to the extent observable inputs are not available (including the Funds' assumptions in determining the fair value of investments). |
A financial instrument’s level within the fair value hierarchy is based on the lowest level of any input, both individually and in the aggregate, that is significant to the fair value measurement. The inputs or methodology used for valuing instruments are not necessarily an indication of the risk associated with investing in those instruments.
The following tables represent each valuation input as presented on the Schedules of Portfolio Investments ("SOIs"):
| April 30, 2022 | J.P. Morgan International Equity Funds | 111 |
NOTES TO FINANCIAL STATEMENTS
AS OF April 30, 2022 (Unaudited) (continued)
(Dollar values in thousands)
| Emerging Markets Equity Fund | | | | |
| | Level 1
Quoted prices | | Level 2
Other significant
observable inputs | | Level 3
Significant
unobservable inputs | | Total |
| Investments in Securities | | | | | | | |
| Common Stocks | | | | | | | |
| Brazil | $ 551,331 | | $ — | | $— | | $ 551,331 |
| China | 247,149 | | 2,704,394 | | — | | 2,951,543 |
| Hong Kong | — | | 475,149 | | — | | 475,149 |
| India | 290,761 | | 1,832,518 | | — | | 2,123,279 |
| Indonesia | — | | 424,269 | | — | | 424,269 |
| Macau | — | | 48,921 | | — | | 48,921 |
| Mexico | 303,316 | | — | | — | | 303,316 |
| Panama | 66,264 | | — | | — | | 66,264 |
| Poland | — | | 34,466 | | — | | 34,466 |
| Portugal | — | | 89,295 | | — | | 89,295 |
| South Africa | 72,233 | | 73,285 | | — | | 145,518 |
| South Korea | — | | 790,082 | | — | | 790,082 |
| Taiwan | 756,695 | | 358,809 | | — | | 1,115,504 |
| United Kingdom | — | | 109,652 | | — | | 109,652 |
| United States | 144,031 | | 48,836 | | — | | 192,867 |
| Total Common Stocks | 2,431,780 | | 6,989,676 | | — | | 9,421,456 |
| Short-Term Investments | | | | | | | |
| Investment Companies | 267,806 | | — | | — | | 267,806 |
| Investment of Cash Collateral from Securities Loaned | 107 | | — | | — | | 107 |
| Total Short-Term Investments | 267,913 | | — | | — | | 267,913 |
| Total Investments in Securities | $2,699,693 | | $6,989,676 | | $— | | $9,689,369 |
| Emerging Markets Research Enhanced Equity Fund | | |
| | Level 1
Quoted prices | Level 2
Other significant
observable inputs | Level 3
Significant
unobservable inputs | Total |
| Investments in Securities | | | | |
| Common Stocks | | | | |
| Brazil | $182,209 | $ — | $ — | $ 182,209 |
| Chile | 11,347 | — | — | 11,347 |
| China | 48,016 | 847,933 | — | 895,949 |
| Colombia | 5,352 | — | — | 5,352 |
| Greece | — | 14,274 | — | 14,274 |
| Hong Kong | — | 5,579 | — | 5,579 |
| Hungary | — | 11,198 | — | 11,198 |
| India | 42,303 | 335,312 | — | 377,615 |
| Indonesia | 16,177 | 38,174 | — | 54,351 |
| Malaysia | 13,972 | 20,624 | — | 34,596 |
| Mexico | 84,570 | — | — | 84,570 |
| Peru | 11,094 | — | — | 11,094 |
| Philippines | — | 13,330 | — | 13,330 |
| Poland | — | 13,262 | — | 13,262 |
| Qatar | 12,624 | 6,142 | — | 18,766 |
| Russia | — | — | 892 | 892 |
| Saudi Arabia | 4,249 | 120,714 | — | 124,963 |
| Singapore | — | 2,718 | — | 2,718 |
| 112 | J.P. Morgan International Equity Funds | April 30, 2022 |
| Emerging Markets Research Enhanced Equity Fund (continued) | | | | |
| | Level 1
Quoted prices | | Level 2
Other significant
observable inputs | | Level 3
Significant
unobservable inputs | | Total |
| South Africa | $ 34,735 | | $ 88,445 | | $ — | | $ 123,180 |
| South Korea | — | | 392,600 | | — | | 392,600 |
| Taiwan | 28,492 | | 404,323 | | — | | 432,815 |
| Thailand | 54,907 | | 6,990 | | — | | 61,897 |
| Turkey | 6,651 | | — | | — | | 6,651 |
| United Arab Emirates | 6,720 | | 21,354 | | — | | 28,074 |
| United States | — | | 1,399 | | — | | 1,399 |
| Total Common Stocks | 563,418 | | 2,344,371 | | 892 | | 2,908,681 |
| Short-Term Investments | | | | | | | |
| Investment Companies | 43,823 | | — | | — | | 43,823 |
| Investment of Cash Collateral from Securities Loaned | 14,062 | | — | | — | | 14,062 |
| Total Short-Term Investments | 57,885 | | — | | — | | 57,885 |
| Total Investments in Securities | $621,303 | | $2,344,371 | | $892 | | $2,966,566 |
| Appreciation in Other Financial Instruments | | | | | | | |
| Futures Contracts | $ 77 | | $ — | | $ — | | $ 77 |
Transfers between level 1 and level 3 are due to a decline or an increase in market activity (e.g. frequency of trades), which resulted in a lack or increase of available market inputs to determine the price for the six months ended April 30, 2022.
Transfers between level 2 and level 3 are due to a decline or an increase in market activity (e.g. frequency of trades), which resulted in a lack or increase of available market inputs to determine the price for the six months ended April 30, 2022.
| Europe Dynamic Fund | | | | |
| | Level 1
Quoted prices | | Level 2
Other significant
observable inputs | | Level 3
Significant
unobservable inputs | | Total |
| Investments in Securities | | | | | | | |
| Common Stocks | | | | | | | |
| Australia | $ — | | $ 12,823 | | $— | | $ 12,823 |
| Austria | — | | 6,617 | | — | | 6,617 |
| Denmark | — | | 47,127 | | — | | 47,127 |
| Finland | — | | 20,959 | | — | | 20,959 |
| France | — | | 97,803 | | — | | 97,803 |
| Germany | — | | 92,385 | | — | | 92,385 |
| Ireland | 9,168 | | 108 | | — | | 9,276 |
| Italy | — | | 7,051 | | — | | 7,051 |
| Luxembourg | — | | 6,134 | | — | | 6,134 |
| Netherlands | — | | 38,030 | | — | | 38,030 |
| Norway | — | | 8,688 | | — | | 8,688 |
| Spain | — | | 7,753 | | — | | 7,753 |
| Switzerland | — | | 105,063 | | — | | 105,063 |
| United Kingdom | 1,867 | | 117,059 | | — | | 118,926 |
| United States | — | | 14,381 | | — | | 14,381 |
| Total Common Stocks | 11,035 | | 581,981 | | — | | 593,016 |
| Short-Term Investments | | | | | | | |
| Investment Companies | 12,091 | | — | | — | | 12,091 |
| Investment of Cash Collateral from Securities Loaned | 48,178 | | — | | — | | 48,178 |
| Total Short-Term Investments | 60,269 | | — | | — | | 60,269 |
| April 30, 2022 | J.P. Morgan International Equity Funds | 113 |
NOTES TO FINANCIAL STATEMENTS
AS OF April 30, 2022 (Unaudited) (continued)
(Dollar values in thousands)
| Europe Dynamic Fund (continued) | | | | |
| | Level 1
Quoted prices | | Level 2
Other significant
observable inputs | | Level 3
Significant
unobservable inputs | | Total |
| Total Investments in Securities | $71,304 | | $581,981 | | $— | | $653,285 |
| Depreciation in Other Financial Instruments | | | | | | | |
| Futures Contracts | $ (264) | | $ — | | $— | | $ (264) |
| International Equity Fund | | | | |
| | Level 1
Quoted prices | | Level 2
Other significant
observable inputs | | Level 3
Significant
unobservable inputs | | Total |
| Investments in Securities | | | | | | | |
| Common Stocks | | | | | | | |
| Australia | $ — | | $ 112,477 | | $— | | $ 112,477 |
| Austria | — | | 36,856 | | — | | 36,856 |
| Belgium | — | | 59,685 | | — | | 59,685 |
| China | — | | 34,693 | | — | | 34,693 |
| Denmark | — | | 260,363 | | — | | 260,363 |
| Finland | — | | 29,279 | | — | | 29,279 |
| France | — | | 679,203 | | — | | 679,203 |
| Germany | — | | 378,463 | | — | | 378,463 |
| Hong Kong | — | | 157,403 | | — | | 157,403 |
| India | 41,122 | | — | | — | | 41,122 |
| Japan | — | | 537,131 | | — | | 537,131 |
| Netherlands | — | | 253,370 | | — | | 253,370 |
| Singapore | — | | 92,118 | | — | | 92,118 |
| South Africa | — | | 68,826 | | — | | 68,826 |
| South Korea | — | | 76,370 | | — | | 76,370 |
| Spain | — | | 92,781 | | — | | 92,781 |
| Sweden | — | | 163,086 | | — | | 163,086 |
| Switzerland | — | | 460,691 | | — | | 460,691 |
| Taiwan | 60,289 | | — | | — | | 60,289 |
| United Kingdom | — | | 451,538 | | — | | 451,538 |
| United States | — | | 188,984 | | — | | 188,984 |
| Total Common Stocks | 101,411 | | 4,133,317 | | — | | 4,234,728 |
| Short-Term Investments | | | | | | | |
| Investment Companies | 127,803 | | — | | — | | 127,803 |
| Investment of Cash Collateral from Securities Loaned | 202,371 | | — | | — | | 202,371 |
| Total Short-Term Investments | 330,174 | | — | | — | | 330,174 |
| Total Investments in Securities | $431,585 | | $4,133,317 | | $— | | $4,564,902 |
| International Focus Fund | | |
| | Level 1
Quoted prices | Level 2
Other significant
observable inputs | Level 3
Significant
unobservable inputs | Total |
| Investments in Securities | | | | |
| Common Stocks | | | | |
| Australia | $ — | $ 49,409 | $— | $ 49,409 |
| Belgium | — | 28,987 | — | 28,987 |
| Canada | 80,585 | — | — | 80,585 |
| 114 | J.P. Morgan International Equity Funds | April 30, 2022 |
| International Focus Fund (continued) | | | | |
| | Level 1
Quoted prices | | Level 2
Other significant
observable inputs | | Level 3
Significant
unobservable inputs | | Total |
| China | $ — | | $ 33,657 | | $— | | $ 33,657 |
| Denmark | — | | 74,064 | | — | | 74,064 |
| France | — | | 138,178 | | — | | 138,178 |
| Germany | — | | 75,560 | | — | | 75,560 |
| Hong Kong | — | | 68,290 | | — | | 68,290 |
| India | 33,384 | | — | | — | | 33,384 |
| Indonesia | — | | 26,541 | | — | | 26,541 |
| Japan | — | | 65,907 | | — | | 65,907 |
| Netherlands | — | | 104,594 | | — | | 104,594 |
| Singapore | — | | 37,318 | | — | | 37,318 |
| South Africa | — | | 44,450 | | — | | 44,450 |
| South Korea | — | | 62,928 | | — | | 62,928 |
| Spain | — | | 30,314 | | — | | 30,314 |
| Sweden | — | | 19,881 | | — | | 19,881 |
| Switzerland | — | | 157,149 | | — | | 157,149 |
| Taiwan | 45,891 | | — | | — | | 45,891 |
| United Kingdom | — | | 138,706 | | — | | 138,706 |
| United States | — | | 46,568 | | — | | 46,568 |
| Total Common Stocks | 159,860 | | 1,202,501 | | — | | 1,362,361 |
| Short-Term Investments | | | | | | | |
| Investment Companies | 39,689 | | — | | — | | 39,689 |
| Total Investments in Securities | $199,549 | | $1,202,501 | | $— | | $1,402,050 |
| International Hedged Equity Fund | | |
| | Level 1
Quoted prices | Level 2
Other significant
observable inputs | Level 3
Significant
unobservable inputs | Total |
| Investments in Securities | | | | |
| Common Stocks | | | | |
| Australia | $ — | $ 10,304 | $— | $ 10,304 |
| Belgium | — | 689 | — | 689 |
| China | — | 829 | — | 829 |
| Denmark | — | 5,467 | — | 5,467 |
| Finland | — | 1,281 | — | 1,281 |
| France | — | 18,235 | — | 18,235 |
| Germany | — | 14,703 | — | 14,703 |
| Hong Kong | — | 4,098 | — | 4,098 |
| Ireland | — | 761 | — | 761 |
| Italy | — | 1,089 | — | 1,089 |
| Japan | — | 35,565 | — | 35,565 |
| Luxembourg | — | 216 | — | 216 |
| Netherlands | — | 10,054 | — | 10,054 |
| Singapore | — | 1,603 | — | 1,603 |
| Spain | — | 4,511 | — | 4,511 |
| Sweden | — | 3,155 | — | 3,155 |
| Switzerland | — | 18,526 | — | 18,526 |
| Taiwan | 119 | — | — | 119 |
| United Kingdom | — | 21,800 | — | 21,800 |
| April 30, 2022 | J.P. Morgan International Equity Funds | 115 |
NOTES TO FINANCIAL STATEMENTS
AS OF April 30, 2022 (Unaudited) (continued)
(Dollar values in thousands)
| International Hedged Equity Fund (continued) | | | | |
| | Level 1
Quoted prices | | Level 2
Other significant
observable inputs | | Level 3
Significant
unobservable inputs | | Total |
| United States | $ — | | $ 3,117 | | $— | | $ 3,117 |
| Total Common Stocks | 119 | | 156,003 | | — | | 156,122 |
| Options Purchased | | | | | | | |
| Put Options Purchased | 6,077 | | — | | — | | 6,077 |
| Short-Term Investments | | | | | | | |
| Investment Companies | 7,724 | | — | | — | | 7,724 |
| Total Investments in Securities | $13,920 | | $156,003 | | $— | | $169,923 |
| Appreciation in Other Financial Instruments | | | | | | | |
| Futures Contracts | $ 100 | | $ — | | $— | | $ 100 |
| Depreciation in Other Financial Instruments | | | | | | | |
| Futures Contracts | (323) | | — | | — | | (323) |
| Options Written | | | | | | | |
| Call Options Written | (156) | | — | | — | | (156) |
| Put Options Written | (880) | | — | | — | | (880) |
Total Net Appreciation/ Depreciation in Other
Financial Instruments | $ (1,259) | | $ — | | $— | | $ (1,259) |
| International Research Enhanced Equity Fund | | | | |
| | Level 1
Quoted prices | | Level 2
Other significant
observable inputs | | Level 3
Significant
unobservable inputs | | Total |
| Investments in Securities | | | | | | | |
| Common Stocks | | | | | | | |
| Australia | $ — | | $ 320,921 | | $— | | $ 320,921 |
| Belgium | — | | 23,440 | | — | | 23,440 |
| China | — | | 26,691 | | — | | 26,691 |
| Denmark | — | | 187,490 | | — | | 187,490 |
| Finland | — | | 44,172 | | — | | 44,172 |
| France | — | | 629,936 | | — | | 629,936 |
| Germany | — | | 506,525 | | — | | 506,525 |
| Hong Kong | — | | 120,115 | | — | | 120,115 |
| Ireland | — | | 26,126 | | — | | 26,126 |
| Italy | — | | 39,453 | | — | | 39,453 |
| Japan | — | | 1,053,844 | | — | | 1,053,844 |
| Luxembourg | — | | 8,453 | | — | | 8,453 |
| Malta | — | | — | | 2 | | 2 |
| Netherlands | — | | 348,179 | | — | | 348,179 |
| Singapore | — | | 50,120 | | — | | 50,120 |
| Spain | — | | 152,467 | | — | | 152,467 |
| Sweden | — | | 108,048 | | — | | 108,048 |
| Switzerland | — | | 631,425 | | — | | 631,425 |
| Taiwan | 3,953 | | — | | — | | 3,953 |
| United Kingdom | — | | 752,505 | | — | | 752,505 |
| United States | — | | 104,939 | | — | | 104,939 |
| Total Common Stocks | 3,953 | | 5,134,849 | | 2 | | 5,138,804 |
| Short-Term Investments | | | | | | | |
| Investment Companies | 204,862 | | — | | — | | 204,862 |
| 116 | J.P. Morgan International Equity Funds | April 30, 2022 |
| International Research Enhanced Equity Fund (continued) | | | | |
| | Level 1
Quoted prices | | Level 2
Other significant
observable inputs | | Level 3
Significant
unobservable inputs | | Total |
| Investment of Cash Collateral from Securities Loaned | $200,900 | | $ — | | $— | | $ 200,900 |
| Total Short-Term Investments | 405,762 | | — | | — | | 405,762 |
| Total Investments in Securities | $409,715 | | $5,134,849 | | $ 2 | | $5,544,566 |
| Appreciation in Other Financial Instruments | | | | | | | |
| Futures Contracts | $ 2,036 | | $ — | | $— | | $ 2,036 |
| Depreciation in Other Financial Instruments | | | | | | | |
| Futures Contracts | (1,379) | | — | | — | | (1,379) |
Total Net Appreciation/ Depreciation in Other
Financial Instruments | $ 657 | | $ — | | $— | | $ 657 |
| International Value Fund | | | | |
| | Level 1
Quoted prices | | Level 2
Other significant
observable inputs | | Level 3
Significant
unobservable inputs | | Total |
| Investments in Securities | | | | | | | |
| Common Stocks | | | | | | | |
| Australia | $ — | | $ 32,984 | | $— | | $ 32,984 |
| Austria | — | | 5,257 | | — | | 5,257 |
| Belgium | — | | 1,854 | | — | | 1,854 |
| China | — | | 1,964 | | — | | 1,964 |
| Denmark | 532 | | 5,969 | | — | | 6,501 |
| Egypt | 1,100 | | — | | — | | 1,100 |
| Finland | — | | 6,070 | | — | | 6,070 |
| France | — | | 31,244 | | — | | 31,244 |
| Germany | — | | 38,043 | | — | | 38,043 |
| Hong Kong | — | | 3,886 | | — | | 3,886 |
| Italy | — | | 13,172 | | — | | 13,172 |
| Japan | — | | 81,583 | | — | | 81,583 |
| Luxembourg | — | | 2,045 | | — | | 2,045 |
| Malta | — | | 504 | | — | | 504 |
| Netherlands | — | | 23,625 | | — | | 23,625 |
| Norway | 1,403 | | 8,444 | | — | | 9,847 |
| Singapore | 497 | | 5,188 | | — | | 5,685 |
| South Africa | — | | 3,373 | | — | | 3,373 |
| Spain | — | | 12,674 | | — | | 12,674 |
| Sweden | 274 | | 10,122 | | — | | 10,396 |
| Switzerland | — | | 24,164 | | — | | 24,164 |
| United Kingdom | 2,401 | | 52,632 | | — | | 55,033 |
| United States | — | | 9,539 | | — | | 9,539 |
| Total Common Stocks | 6,207 | | 374,336 | | — | | 380,543 |
| Short-Term Investments | | | | | | | |
| Investment Companies | 5,753 | | — | | — | | 5,753 |
| Investment of Cash Collateral from Securities Loaned | 19,882 | | — | | — | | 19,882 |
| Total Short-Term Investments | 25,635 | | — | | — | | 25,635 |
| Total Investments in Securities | $31,842 | | $374,336 | | $— | | $406,178 |
| April 30, 2022 | J.P. Morgan International Equity Funds | 117 |
NOTES TO FINANCIAL STATEMENTS
AS OF April 30, 2022 (Unaudited) (continued)
(Dollar values in thousands)
B. Restricted Securities — Certain securities held by the Funds may be subject to legal or contractual restrictions on resale. Restricted securities generally are resold in transactions exempt from registration under the Securities Act of 1933, as amended (the “Securities Act”). Disposal of these securities may involve time-consuming negotiations and expense. Prompt sale at the current valuation may be difficult and could adversely affect the NAVs of the Funds.
As of April 30, 2022, the Funds had no investments in restricted securities other than securities sold to the Funds under Rule 144A and/or Regulation S under the Securities Act.
C. Securities Lending — The Funds are authorized to engage in securities lending in order to generate additional income. The Funds are able to lend to approved borrowers. Citibank N.A. (“Citibank”) serves as lending agent for the Funds, pursuant to a Securities Lending Agency Agreement (the “Securities Lending Agency Agreement”). Securities loaned are collateralized by cash equal to at least 100% of the market value plus accrued interest on the securities lent, which is invested in the Class IM Shares of the JPMorgan U.S. Government Money Market Fund and the Agency SL Class Shares of the JPMorgan Securities Lending Money Market Fund. The Funds retain the interest earned on cash collateral investments but are required to pay the borrower a rebate for the use of the cash collateral. In cases where the lent security is of high value to borrowers, there may be a negative rebate (i.e., a net payment from the borrower to the Funds). Upon termination of a loan, the Funds are required to return to the borrower an amount equal to the cash collateral, plus any rebate owed to the borrowers. The remaining maturities of the securities lending transactions are considered overnight and continuous. Loans are subject to termination by the Funds or the borrower at any time.
The net income earned on the securities lending (after payment of rebates and Citibank’s fee) is included on the Statements of Operations as Income from securities lending (net). The Funds also receive payments from the borrower during the period of the loan, equivalent to dividends and interest earned on the securities loaned, which are recorded as Dividend or Interest income, respectively, on the Statements of Operations.
Under the Securities Lending Agency Agreement, Citibank marks to market the loaned securities on a daily basis. In the event the cash received from the borrower is less than 102% of the value of the loaned securities (105% for loans of non-U.S. securities), Citibank requests additional cash from the borrower so as to maintain a collateralization level of at least 102% of the value of the loaned securities plus accrued interest (105% for loans of non-U.S. securities), subject to certain de minimis amounts.
The value of securities out on loan is recorded as an asset on the Statements of Assets and Liabilities. The value of the cash collateral received is recorded as a liability on the Statements of Assets and Liabilities and details of collateral investments are disclosed on the SOIs.
The Funds bear the risk of loss associated with the collateral investments and are not entitled to additional collateral from the borrower to cover any such losses. To the extent that the value of the collateral investments declines below the amount owed to a borrower, the Funds may incur losses that exceed the amount they earned on lending the security. Upon termination of a loan, the Funds may use leverage (borrow money) to repay the borrower for cash collateral posted if the Adviser does not believe that it is prudent to sell the collateral investments to fund the payment of this liability. Securities lending activity is subject to master netting arrangements.
The following table presents for each lending Fund, the value of the securities on loan with Citibank, net of amounts available for offset under the master netting arrangements and any related collateral received or posted by the as of April 30, 2022.
| | Investment Securities
on Loan, at value,
Presented on the
Statements of Assets
and Liabilities | Cash Collateral
Posted by Borrower* | Net Amount Due
to Counterparty
(not less than zero) |
| Emerging Markets Equity Fund | $ 106 | $ (106) | $— |
| Emerging Markets Research Enhanced Equity Fund | 13,480 | (13,480) | — |
| Europe Dynamic Fund | 44,177 | (44,177) | — |
| International Equity Fund | 169,016 | (169,016) | — |
| International Research Enhanced Equity Fund | 177,073 | (177,073) | — |
| International Value Fund | 18,772 | (18,772) | — |
|
| * | Collateral posted reflects the value of securities on loan and does not include any additional amounts received from the borrower. |
Securities lending also involves counterparty risks, including the risk that the loaned securities may not be returned in a timely manner or at all. Subject to certain conditions, Citibank has agreed to indemnify the Funds from losses resulting from a borrower’s failure to return a loaned security.
| 118 | J.P. Morgan International Equity Funds | April 30, 2022 |
JPMIM voluntarily waived investment advisory fees charged to the Funds to reduce the impact of the cash collateral investment in the JPMorgan U.S. Government Money Market Fund from 0.13% to 0.06%. For the six months ended April 30, 2022, JPMIM waived fees associated with the Funds' investment in the JPMorgan U.S. Government Money Market Fund as follows:
| Emerging Markets Equity Fund | $6 |
| Emerging Markets Research Enhanced Equity Fund | 2 |
| Europe Dynamic Fund | 2 |
| International Equity Fund | 8 |
| International Focus Fund | 3 |
| International Research Enhanced Equity Fund | 4 |
| International Value Fund | 1 |
The above waiver is included in the determination of earnings on cash collateral investment and in the calculation of Citibank’s compensation and is included on the Statements of Operations as Income from securities lending (net).
D. Investment Transactions with Affiliates — The Funds invested in Underlying Funds and ETFs which are advised by the Adviser. An issuer which is under common control with a Fund may be considered an affiliate. For the purposes of the financial statements, the Funds assume the issuers listed in the tables below to be affiliated issuers. Underlying Funds’ and ETFs’ distributions may be reinvested into the Underlying Funds and ETFs. Reinvestment amounts are included in the purchases at cost amounts in the tables below.
| Emerging Markets Equity Fund |
| | For the six months ended April 30, 2022 |
| Security Description | Value at
October 31,
2021 | | Purchases at
Cost | | Proceeds from
Sales | | Net Realized
Gain (Loss) | | Change in
Unrealized
Appreciation/
(Depreciation) | | Value at
April 30,
2022 | Shares at
April 30,
2022 | Dividend
Income | | Capital Gain
Distributions |
| JPMorgan Prime Money Market Fund Class Institutional Shares, 0.36% (a) (b) | $ 24,800 | | $1,675,531 | | $1,432,508 | | $(21) | | $ 4 | | $267,806 | 267,753 | $ 90 | | $— |
| JPMorgan Securities Lending Money Market Fund Agency SL Class Shares, 0.37% (a) (b) | 222,040 | | 150,500 | | 372,500 | | (32)* | | —(c) | | 8 | 8 | 26* | | — |
| JPMorgan U.S. Government Money Market Fund Class IM Shares, 0.37% (a) (b) | 25,886 | | 319,665 | | 345,452 | | — | | — | | 99 | 99 | 2* | | — |
| Total | $272,726 | | $2,145,696 | | $2,150,460 | | $(53) | | $ 4 | | $267,913 | | $118 | | $— |
|
| (a) | Investment in an affiliated fund, which is registered under the Investment Company Act of 1940, as amended, and is advised by J.P. Morgan Investment Management Inc. |
| (b) | The rate shown is the current yield as of April 30, 2022. |
| (c) | Amount rounds to less than one thousand. |
| * | Amount is included on the Statements of Operations as Income from securities lending (net) (after payments of rebates and Citibank’s fee). |
| April 30, 2022 | J.P. Morgan International Equity Funds | 119 |
NOTES TO FINANCIAL STATEMENTS
AS OF April 30, 2022 (Unaudited) (continued)
(Dollar values in thousands)
| Emerging Markets Research Enhanced Equity Fund |
| | For the six months ended April 30, 2022 |
| Security Description | Value at
October 31,
2021 | | Purchases at
Cost | | Proceeds from
Sales | | Net Realized
Gain (Loss) | | Change in
Unrealized
Appreciation/
(Depreciation) | | Value at
April 30,
2022 | Shares at
April 30,
2022 | Dividend
Income | | Capital Gain
Distributions |
| JPMorgan Prime Money Market Fund Class Institutional Shares, 0.36% (a) (b) | $ 3,718 | | $745,224 | | $705,105 | | $(14) | | $—(c) | | $43,823 | 43,814 | $34 | | $— |
| JPMorgan Securities Lending Money Market Fund Agency SL Class Shares, 0.37% (a) (b) | 22,493 | | 48,000 | | 64,000 | | (8)* | | 1 | | 6,486 | 6,491 | 7* | | — |
| JPMorgan U.S. Government Money Market Fund Class IM Shares, 0.37% (a) (b) | 2,859 | | 98,486 | | 93,769 | | — | | — | | 7,576 | 7,576 | 2* | | — |
| Total | $29,070 | | $891,710 | | $862,874 | | $(22) | | $ 1 | | $57,885 | | $43 | | $— |
|
| (a) | Investment in an affiliated fund, which is registered under the Investment Company Act of 1940, as amended, and is advised by J.P. Morgan Investment Management Inc. |
| (b) | The rate shown is the current yield as of April 30, 2022. |
| (c) | Amount rounds to less than one thousand. |
| * | Amount is included on the Statements of Operations as Income from securities lending (net) (after payments of rebates and Citibank’s fee). |
| Europe Dynamic Fund |
| | For the six months ended April 30, 2022 |
| Security Description | Value at
October 31,
2021 | | Purchases at
Cost | | Proceeds from
Sales | | Net Realized
Gain (Loss) | | Change in
Unrealized
Appreciation/
(Depreciation) | | Value at
April 30,
2022 | Shares at
April 30,
2022 | Dividend
Income | | Capital Gain
Distributions |
| JPMorgan Prime Money Market Fund Class Institutional Shares, 0.36% (a) (b) | $46,060 | | $253,946 | | $287,907 | | $(7) | | $(1) | | $12,091 | 12,089 | $10 | | $— |
| JPMorgan Securities Lending Money Market Fund Agency SL Class Shares, 0.37% (a) (b) | — | | 73,000 | | 39,000 | | 1* | | —(c) | | 34,001 | 34,025 | 8* | | — |
| JPMorgan U.S. Government Money Market Fund Class IM Shares, 0.37% (a) (b) | 7,173 | | 129,488 | | 122,484 | | — | | — | | 14,177 | 14,177 | 4* | | — |
| Total | $53,233 | | $456,434 | | $449,391 | | $(6) | | $(1) | | $60,269 | | $22 | | $— |
|
| (a) | Investment in an affiliated fund, which is registered under the Investment Company Act of 1940, as amended, and is advised by J.P. Morgan Investment Management Inc. |
| (b) | The rate shown is the current yield as of April 30, 2022. |
| (c) | Amount rounds to less than one thousand. |
| * | Amount is included on the Statements of Operations as Income from securities lending (net) (after payments of rebates and Citibank’s fee). |
| 120 | J.P. Morgan International Equity Funds | April 30, 2022 |
| International Equity Fund |
| | For the six months ended April 30, 2022 |
| Security Description | Value at
October 31,
2021 | | Purchases at
Cost | | Proceeds from
Sales | | Net Realized
Gain (Loss) | | Change in
Unrealized
Appreciation/
(Depreciation) | | Value at
April 30,
2022 | Shares at
April 30,
2022 | Dividend
Income | | Capital Gain
Distributions |
| JPMorgan Prime Money Market Fund Class Institutional Shares, 0.36% (a) (b) | $123,785 | | $ 968,511 | | $ 964,468 | | $(44) | | $19 | | $127,803 | 127,777 | $ 69 | | $— |
| JPMorgan Securities Lending Money Market Fund Agency SL Class Shares, 0.37% (a) (b) | 111,000 | | 561,000 | | 535,975 | | (16)* | | —(c) | | 136,009 | 136,104 | 59* | | — |
| JPMorgan U.S. Government Money Market Fund Class IM Shares, 0.37% (a) (b) | 13,466 | | 609,509 | | 556,613 | | — | | — | | 66,362 | 66,362 | 16* | | — |
| Total | $248,251 | | $2,139,020 | | $2,057,056 | | $(60) | | $19 | | $330,174 | | $144 | | $— |
|
| (a) | Investment in an affiliated fund, which is registered under the Investment Company Act of 1940, as amended, and is advised by J.P. Morgan Investment Management Inc. |
| (b) | The rate shown is the current yield as of April 30, 2022. |
| (c) | Amount rounds to less than one thousand. |
| * | Amount is included on the Statements of Operations as Income from securities lending (net) (after payments of rebates and Citibank’s fee). |
| International Focus Fund |
| | For the six months ended April 30, 2022 |
| Security Description | Value at
October 31,
2021 | | Purchases at
Cost | | Proceeds from
Sales | | Net Realized
Gain (Loss) | | Change in
Unrealized
Appreciation/
(Depreciation) | | Value at
April 30,
2022 | Shares at
April 30,
2022 | Dividend
Income | | Capital Gain
Distributions |
| JPMorgan Prime Money Market Fund Class Institutional Shares, 0.36% (a) (b) | $47,837 | | $595,620 | | $ 603,760 | | $ (5) | | $(3) | | $39,689 | 39,681 | $34 | | $— |
| JPMorgan Securities Lending Money Market Fund Agency SL Class Shares, 0.37% (a) (b) | 33,000 | | 234,000 | | 266,986 | | (14)* | | — | | — | — | 8* | | — |
| JPMorgan U.S. Government Money Market Fund Class IM Shares, 0.37% (a) (b) | 3,469 | | 160,401 | | 163,870 | | — | | — | | — | — | 5* | | — |
| Total | $84,306 | | $990,021 | | $1,034,616 | | $(19) | | $(3) | | $39,689 | | $47 | | $— |
|
| (a) | Investment in an affiliated fund, which is registered under the Investment Company Act of 1940, as amended, and is advised by J.P. Morgan Investment Management Inc. |
| (b) | The rate shown is the current yield as of April 30, 2022. |
| * | Amount is included on the Statements of Operations as Income from securities lending (net) (after payments of rebates and Citibank’s fee). |
| International Hedged Equity Fund |
| | For the six months ended April 30, 2022 |
| Security Description | Value at
October 31,
2021 | | Purchases at
Cost | | Proceeds from
Sales | | Net Realized
Gain (Loss) | | Change in
Unrealized
Appreciation/
(Depreciation) | | Value at
April 30,
2022 | Shares at
April 30,
2022 | Dividend
Income | | Capital Gain
Distributions |
| JPMorgan U.S. Government Money Market Fund Class Institutional Shares, 0.29% (a) (b) | $3,536 | | $54,734 | | $50,546 | | $— | | $— | | $7,724 | 7,724 | $2 | | $— |
|
| (a) | Investment in an affiliated fund, which is registered under the Investment Company Act of 1940, as amended, and is advised by J.P. Morgan Investment Management Inc. |
| (b) | The rate shown is the current yield as of April 30, 2022. |
| April 30, 2022 | J.P. Morgan International Equity Funds | 121 |
NOTES TO FINANCIAL STATEMENTS
AS OF April 30, 2022 (Unaudited) (continued)
(Dollar values in thousands)
| International Research Enhanced Equity Fund |
| | For the six months ended April 30, 2022 |
| Security Description | Value at
October 31,
2021 | | Purchases at
Cost | | Proceeds from
Sales | | Net Realized
Gain (Loss) | | Change in
Unrealized
Appreciation/
(Depreciation) | | Value at
April 30,
2022 | Shares at
April 30,
2022 | Dividend
Income | | Capital Gain
Distributions |
| JPMorgan Prime Money Market Fund Class Institutional Shares, 0.36% (a) (b) | $ 93,239 | | $ 936,459 | | $ 824,801 | | $(36) | | $ 1 | | $204,862 | 204,821 | $ 96 | | $— |
| JPMorgan Securities Lending Money Market Fund Agency SL Class Shares, 0.37% (a) (b) | 82,347 | | 399,000 | | 354,000 | | (10)* | | (4) | | 127,333 | 127,422 | 47* | | — |
| JPMorgan U.S. Government Money Market Fund Class IM Shares, 0.37% (a) (b) | 10,123 | | 411,295 | | 347,851 | | — | | — | | 73,567 | 73,567 | 18* | | — |
| Total | $185,709 | | $1,746,754 | | $1,526,652 | | $(46) | | $(3) | | $405,762 | | $161 | | $— |
|
| (a) | Investment in an affiliated fund, which is registered under the Investment Company Act of 1940, as amended, and is advised by J.P. Morgan Investment Management Inc. |
| (b) | The rate shown is the current yield as of April 30, 2022. |
| * | Amount is included on the Statements of Operations as Income from securities lending (net) (after payments of rebates and Citibank’s fee). |
| International Value Fund |
| | For the six months ended April 30, 2022 |
| Security Description | Value at
October 31,
2021 | | Purchases at
Cost | | Proceeds from
Sales | | Net Realized
Gain (Loss) | | Change in
Unrealized
Appreciation/
(Depreciation) | | Value at
April 30,
2022 | Shares at
April 30,
2022 | Dividend
Income | | Capital Gain
Distributions |
| JPMorgan Prime Money Market Fund Class Institutional Shares, 0.36% (a) (b) | $2,400 | | $ 40,191 | | $ 36,838 | | $(1) | | $ 1 | | $ 5,753 | 5,751 | $ 5 | | $— |
| JPMorgan Securities Lending Money Market Fund Agency SL Class Shares, 0.37% (a) (b) | 3,199 | | 41,501 | | 30,000 | | (1)* | | — | | 14,699 | 14,709 | 6* | | — |
| JPMorgan U.S. Government Money Market Fund Class IM Shares, 0.37% (a) (b) | 945 | | 52,091 | | 47,853 | | — | | — | | 5,183 | 5,183 | 2* | | — |
| Total | $6,544 | | $133,783 | | $114,691 | | $(2) | | $ 1 | | $25,635 | | $13 | | $— |
|
| (a) | Investment in an affiliated fund, which is registered under the Investment Company Act of 1940, as amended, and is advised by J.P. Morgan Investment Management Inc. |
| (b) | The rate shown is the current yield as of April 30, 2022. |
| * | Amount is included on the Statements of Operations as Income from securities lending (net) (after payments of rebates and Citibank’s fee). |
E. Foreign Currency Translation — The books and records of the Funds are maintained in U.S. dollars. Foreign currency amounts are translated into U.S. dollars at the prevailing exchange rates of such currencies against the U.S. dollar. The market value of investment securities and other assets and liabilities are translated at the exchange rate as of the valuation date. Purchases and sales of investment securities, income and expenses are translated at the exchange rate prevailing on the respective dates of such transactions.
The Funds do not isolate the effect of changes in foreign exchange rates from changes in market prices on securities held. Accordingly, such changes are included within Change in net unrealized appreciation/depreciation on investments in non-affiliates on the Statements of Operations.
Reported realized foreign currency gains and losses arise from the disposition of foreign currency, currency gains or losses realized between the trade and settlement dates on securities transactions, and the difference between the amounts of dividends, interest and foreign withholding taxes recorded on each Fund's books on the transaction date and the U.S. dollar equivalent of the amounts actually received or paid. These reported realized foreign currency gains and losses are included in Net realized gain (loss) on foreign currency transactions on the Statements of Operations. Unrealized foreign currency gains and losses arise from changes (due to changes in exchange rates) in the value of foreign currency and other assets
| 122 | J.P. Morgan International Equity Funds | April 30, 2022 |
and liabilities denominated in foreign currencies, which are held at period end and are included in Change in net unrealized appreciation/depreciation on foreign currency translations on the Statements of Operations.
F. Options — International Hedged Equity Fund purchased put and call options on securities to gain long or short exposure to the underlying instrument. A purchaser of a put option has the right, but not the obligation, to sell the underlying instrument at an agreed upon price (“strike price”) to the option seller. A purchaser of a call option has the right, but not the obligation, to purchase the underlying instrument at the strike price from the option seller.
Options Purchased — Premiums paid by the Funds for options purchased are included on the Statements of Assets and Liabilities as Options purchased. The option is adjusted daily to reflect the current market value of the option and the change is recorded as Change in net unrealized appreciation/depreciation on options purchased on the Statements of Operations. If the option is allowed to expire, the Funds will lose the entire premium they paid and record a realized loss for the premium amount. Premiums paid for options purchased which are exercised or closed are added to the amounts paid or offset against the proceeds on the underlying investment transaction to determine the realized gain (loss) or cost basis of the underlying investment.
Options Written — Premiums received by the Funds for options written are included on the Statements of Assets and Liabilities as a liability. The amount of the liability is adjusted daily to reflect the current market value of the option written and the change in market value is recorded as Change in net unrealized appreciation/depreciation on options written on the Statements of Operations. Premiums received from options written that expire are treated as realized gains. If a written option is closed, the Funds record a realized gain or loss on options written based on whether the cost of the closing transaction exceeds the premium received. If a call option is exercised by the option buyer, the premium received by the Funds is added to the proceeds from the sale of the underlying security to the option buyer and compared to the cost of the closing transaction to determine whether there has been a realized gain or loss. If a put option is exercised by an option buyer, the premium received by the option seller reduces the cost basis of the purchased security.
Written uncovered call options subject the Funds to unlimited risk of loss. Written covered call options limit the upside potential of a security above the strike price. Written put options subject the Funds to risk of loss if the value of the security declines below the exercise price minus the put premium.
The Funds are not subject to credit risk on options written as the counterparty has already performed its obligation by paying the premium at the inception of the contract.
The Funds' exchange-traded option contracts are not subject to master netting arrangements (the right to close out all transactions traded with a counterparty and net amounts owed or due across transactions).
G. Futures Contracts — Emerging Markets Research Enhanced Equity Fund, Europe Dynamic Fund, International Hedged Equity Fund, International Research Enhanced Equity Fund and International Value Fund used index futures contracts to gain or reduce exposure to the stock market, or maintain liquidity or minimize transaction costs. The Funds also purchased futures contracts to invest incoming cash in the market or sold futures in response to cash outflows, thereby simulating an invested position in the underlying index while maintaining a cash balance for liquidity.
Futures contracts provide for the delayed delivery of the underlying instrument at a fixed price or are settled for a cash amount based on the change in the value of the underlying instrument at a specific date in the future. Upon entering into a futures contract, the Funds are required to deposit with the broker, cash or securities in an amount equal to a certain percentage of the contract amount, which is referred to as the initial margin deposit. Subsequent payments, referred to as variation margin, are made or received by the Funds periodically and are based on changes in the market value of open futures contracts. Changes in the market value of open futures contracts are recorded as Change in net unrealized appreciation/depreciation on futures contracts on the Statements of Operations. Realized gains or losses, representing the difference between the value of the contract at the time it was opened and the value at the time it was closed, are reported on the Statements of Operations at the closing or expiration of the futures contract. Securities deposited as initial margin are designated on the SOIs, while cash deposited, which is considered restricted, is recorded on the Statements of Assets and Liabilities. A receivable from and/or a payable to brokers for the daily variation margin is also recorded on the Statements of Assets and Liabilities.
The use of futures contracts exposes the Funds to equity price risk. The Funds may be subject to the risk that the change in the value of the futures contract may not correlate perfectly with the underlying instrument. Use of long futures contracts subjects the Funds to risk of loss in excess of the amounts shown on the Statements of Assets and Liabilities, up to the notional amount of the futures contracts. Use of short futures contracts subjects the Funds to unlimited risk of loss. The Funds may enter into futures contracts only on exchanges or boards of trade. The exchange or board of trade acts as the counterparty to each futures transaction; therefore, the Funds' credit risk is limited to failure of the exchange or board of trade. Under some circumstances, futures exchanges may establish daily limits on the amount that the price of a futures contract can vary from the previous day’s settlement price, which could effectively prevent liquidation of positions.
| April 30, 2022 | J.P. Morgan International Equity Funds | 123 |
NOTES TO FINANCIAL STATEMENTS
AS OF April 30, 2022 (Unaudited) (continued)
(Dollar values in thousands)
The Funds' futures contracts are not subject to master netting arrangements (the right to close out all transactions traded with a counterparty and net amounts owed or due across transactions).
Derivatives Volume
The table below discloses the volume of the Funds’ options, futures contracts, forward foreign currency exchange contracts and swaps activity during the six months ended April 30, 2022. Please refer to the tables in the Summary of Derivatives Information for derivative-related gains and losses associated with volume activity:
| | Emerging
Markets
Research
Enhanced
Equity Fund | Europe
Dynamic
Fund | International
Focus Fund | International
Hedged
Equity Fund | International
Research
Enhanced
Equity Fund | International
Value Fund |
| Futures Contracts: | | | | | | |
| Average Notional Balance Long | $82,512 | $20,389 | $ 14,652 | $ 7,409 | $108,795 | $3,581 |
| Average Notional Balance Short | — | — | (14,662) | — | — | — |
| Ending Notional Balance Long | 4,119 | 7,675 | — | 8,672 | 160,736 | — |
| Exchange-Traded Options: | | | | | | |
| Average Number of Contracts Purchased | — | — | — | 747 | — | — |
| Average Number of Contracts Written | — | — | — | (1,494) | — | — |
| Ending Number of Contracts Purchased | — | — | — | 819 | — | — |
| Ending Number of Contracts Written | — | — | — | (1,638) | — | — |
The Funds' derivatives contracts held at April 30, 2022 are not accounted for as hedging instruments under GAAP.
H. Security Transactions and Investment Income— Investment transactions are accounted for on the trade date (the date the order to buy or sell is executed). Securities gains and losses are calculated on a specifically identified cost basis.
Interest income and interest expense on securities sold short, if any, is determined on the basis of coupon interest accrued using the effective interest method, which adjusts for amortization of premiums and accretion of discounts.
Dividend income, net of foreign taxes withheld, if any, is recorded on the ex-dividend date or when the Fund first learns of the dividend.
To the extent such information is publicly available, the Funds record distributions received in excess of income earned from underlying investments as a reduction of cost of investments and/or realized gain. Such amounts are based on estimates if actual amounts are not available and actual amounts of income, realized gain and return of capital may differ from the estimated amounts. The Funds adjust the estimated amounts of the components of distributions (and consequently their net investment income) as necessary, once the issuers provide information about the actual composition of the distributions.
I. Allocation of Income and Expenses— Expenses directly attributable to a Fund are charged directly to that Fund, while the expenses attributable to more than one fund of the Trusts are allocated among the applicable funds. Investment income, realized and unrealized gains and losses and expenses, other than class-specific expenses, are allocated daily to each class of shares based upon the proportion of net assets of each class at the beginning of each day.
Transfer agency fees are class-specific expenses. The amount of the transfer agency fees charged to each share class of the Funds for the six months ended April 30, 2022 are as follows:
| | Class A | Class C | Class I | Class L | Class R2 | Class R3 | Class R4 | Class R5 | Class R6 | Total |
| Emerging Markets Equity Fund | | | | | | | | | | |
| Transfer agency fees | $ 16 | $ 2 | $42 | $ 12 | $ 1 | $ —(a) | $ —(a) | $ 2 | $55 | $130 |
| Emerging Markets Research Enhanced Equity Fund | | | | | | | | | | |
| Transfer agency fees | n/a | n/a | 2 | n/a | n/a | n/a | n/a | n/a | 11 | 13 |
| Europe Dynamic Fund | | | | | | | | | | |
| Transfer agency fees | 6 | 1 | 11 | 1 | n/a | n/a | n/a | n/a | 1 | 20 |
| International Equity Fund | | | | | | | | | | |
| Transfer agency fees | 11 | 1 | 14 | n/a | 12 | n/a | n/a | —(a) | 18 | 56 |
| International Focus Fund | | | | | | | | | | |
| Transfer agency fees | 4 | 2 | 16 | n/a | —(a) | n/a | n/a | 1 | 10 | 33 |
| International Hedged Equity Fund | | | | | | | | | | |
| Transfer agency fees | —(a) | —(a) | 1 | n/a | n/a | n/a | n/a | —(a) | —(a) | 1 |
| 124 | J.P. Morgan International Equity Funds | April 30, 2022 |
| | Class A | Class C | Class I | Class L | Class R2 | Class R3 | Class R4 | Class R5 | Class R6 | Total |
| International Research Enhanced Equity Fund | | | | | | | | | | |
| Transfer agency fees | $ 9 | n/a | $12 | n/a | n/a | n/a | n/a | n/a | $12 | $ 33 |
| International Value Fund | | | | | | | | | | |
| Transfer agency fees | 6 | $ 1 | 1 | $ —(a) | $ —(a) | n/a | n/a | $ —(a) | 1 | 9 |
|
| (a) | Amount rounds to less than one thousand. |
J. Federal Income Taxes— Each Fund is treated as a separate taxable entity for Federal income tax purposes. Each Fund's policy is to comply with the provisions of the Internal Revenue Code (the “Code”) applicable to regulated investment companies and to distribute to shareholders all of its distributable net investment income and net realized capital gains on investments. Accordingly, no provision for Federal income tax is necessary. Management has reviewed the Funds' tax positions for all open tax years and has determined that as of April 30, 2022, no liability for Federal income tax is required in the Funds' financial statements for net unrecognized tax benefits. However, management’s conclusions may be subject to future review based on changes in, or the interpretation of, the accounting standards or tax laws and regulations. Each Fund's Federal tax returns for the prior three fiscal years, or since inception if shorter, remain subject to examination by the Internal Revenue Service.
K. Foreign Taxes —The Funds may be subject to foreign taxes on income, gains on investments or currency purchases/repatriation, a portion of which may be recoverable. The Funds will accrue such taxes and recoveries as applicable, based upon their current interpretation of tax rules and regulations that exist in the markets in which they invest. When a capital gains tax is determined to apply, the Funds record an estimated deferred tax liability in an amount that would be payable if the securities were disposed of on the valuation date.
As a result of several court rulings in certain European countries, the tax authorities of each of these countries, recently paid European Dynamic Fund (Finland & Sweden), International Equity Fund (Sweden), International Focus Fund (Finland), International Research Enhanced Equity Fund (Finland & Sweden) and International Value Fund (Finland, Spain & Sweden) tax reclaims for prior tax withholding. These tax reclaim payments are included in Foreign withholding tax reclaims on the Statements of Operations. Interest income, if any, related to these tax reclaim payments is included in Interest income from non-affiliates on the Statements of Operations.
In the event that tax reclaims received by the Funds during the fiscal year ending October 31, 2021 exceed the foreign withholding taxes paid by the Funds for other foreign investments, and the Funds have previously passed foreign tax credits on to their shareholders, the Funds will have a U.S. tax liability. The Funds will enter into a closing agreement with the Internal Revenue Service (IRS) in order to pay the associated tax liability (fees) on behalf of the Funds' shareholders. These IRS fees are estimated through the year ended October 31, 2021 and are included in IRS Compliance Fees for foreign withholding tax reclaims on the Statements of Operations, if applicable.
L. Distributions to Shareholders — Distributions from net investment income, if any, are generally declared and paid at least annually and are declared separately for each class. No class has preferential dividend rights; differences in per share rates are due to differences in separate class expenses. Net realized capital gains, if any, are distributed by each Fund at least annually. The amount of distributions from net investment income and net realized capital gains is determined in accordance with Federal income tax regulations, which may differ from GAAP. To the extent these “book/tax” differences are permanent in nature (i.e., that they result from other than timing of recognition — “temporary differences”), such amounts are reclassified within the capital accounts based on their Federal tax basis treatment.
3. Fees and Other Transactions with Affiliates
A. Investment Advisory Fee — Pursuant to an Investment Advisory Agreement, the Adviser manages the investments of each Fund and for such services is paid a fee. The investment advisory fee is accrued daily and paid monthly at an annual rate based on each Fund's respective average daily net assets. The annual rate for each Fund is as follows:
| Emerging Markets Equity Fund | 0.68% |
| Emerging Markets Research Enhanced Equity Fund | 0.25 |
| Europe Dynamic Fund | 0.60 |
| International Equity Fund | 0.50 |
| International Focus Fund | 0.60 |
| International Hedged Equity Fund | 0.25 |
| International Research Enhanced Equity Fund | 0.20 |
| International Value Fund | 0.55 |
| April 30, 2022 | J.P. Morgan International Equity Funds | 125 |
NOTES TO FINANCIAL STATEMENTS
AS OF April 30, 2022 (Unaudited) (continued)
(Dollar values in thousands)
The Adviser waived investment advisory fees and/or reimbursed expenses as outlined in Note 3.F.
B. Administration Fee — Pursuant to an Administration Agreement, the Administrator provides certain administration services to each Fund. In consideration of these services, the Administrator receives a fee accrued daily and paid monthly at an annual rate of 0.075% of the first $10 billion of each Fund’s respective average daily net assets, plus 0.050% of each Fund’s respective average daily net assets between $10 billion and $20 billion, plus 0.025% of each Fund’s respective average daily net assets between $20 billion and $25 billion, plus 0.01% of each Fund’s respective average daily net assets in excess of $25 billion. For the six months ended April 30, 2022, the effective annualized rate for Emerging Markets Equity Fund, Emerging Markets Research Enhanced Equity Fund, Europe Dynamic Fund, International Equity Fund, International Focus Fund, International Hedged Equity Fund, International Research Enhanced Equity Fund and International Value Fund was 0.07%, 0.075%, 0.075%, 0.075%, 0.075%, 0.075%, 0.075% and 0.075%, respectively of each Fund's average daily net assets, notwithstanding any fee waivers and/or expense reimbursements.
The Administrator waived administration fees as outlined in Note 3.F.
JPMorgan Chase Bank, N.A. ("JPMCB"), a wholly-owned subsidiary of JPMorgan, serves as the Funds' sub-administrator (the “Sub-administrator”). For its services as Sub-administrator, JPMCB receives a portion of the fees payable to the Administrator.
C. Distribution Fees — Pursuant to a Distribution Agreement, JPMorgan Distribution Services, Inc. (“JPMDS”), an indirect, wholly-owned subsidiary of JPMorgan, serves as each Fund's principal underwriter and promotes and arranges for the sale of each Fund's shares.
The Boards have adopted a Distribution Plan (the “Distribution Plan”) for Class A, Class C, Class R2 and Class R3 Shares of the Funds, as applicable, pursuant to Rule 12b-1 under the 1940 Act. Class I, Class L, Class R4, Class R5 and Class R6 Shares of the Funds do not charge a distribution fee. The Distribution Plan provides that the following Funds shall pay, with respect to the applicable share classes, distribution fees, including payments to JPMDS, at annual rates of the average daily net assets as shown in the table below:
| | Class A | Class C | Class R2 | Class R3 |
| Emerging Markets Equity Fund | 0.25% | 0.75% | 0.50% | 0.25% |
| Europe Dynamic Fund | 0.25 | 0.75 | n/a | n/a |
| International Equity Fund | 0.25 | 0.75 | 0.50 | n/a |
| International Focus Fund | 0.25 | 0.75 | 0.50 | n/a |
| International Hedged Equity Fund | 0.25 | 0.75 | n/a | n/a |
| International Research Enhanced Equity Fund | 0.25 | n/a | n/a | n/a |
| International Value Fund | 0.25 | 0.75 | 0.50 | n/a |
In addition, JPMDS is entitled to receive the front-end sales charges from purchases of Class A Shares and the CDSC from redemptions of Class C Shares and certain Class A Shares for which front-end sales charges have been waived. For the six months ended ended April 30, 2022, JPMDS retained the following:
| | Front-End Sales Charge | CDSC |
| Emerging Markets Equity Fund | $ 7 | $—(a) |
| Europe Dynamic Fund | 1 | — |
| International Equity Fund | 26 | 1 |
| International Focus Fund | 39 | —(a) |
| International Hedged Equity Fund | 1 | — |
| International Research Enhanced Equity Fund | —(a) | — |
| International Value Fund | 19 | — |
|
| (a) | Amount rounds to less than one thousand. |
D. Service Fees — The Trusts, on behalf of the Funds, have entered into a Shareholder Servicing Agreement with JPMDS under which JPMDS provides certain support services to fund shareholders. For performing these services, JPMDS receives a fee with respect to all share classes, except Class R6 Shares which do not charge a service fee, that is accrued daily and paid monthly equal to a percentage of the average daily net assets as shown in the table below:
| | Class A | Class C | Class I | Class L | Class R2 | Class R3 | Class R4 | Class R5 |
| Emerging Markets Equity Fund | 0.25% | 0.25% | 0.25% | 0.10% | 0.25% | 0.25% | 0.25% | 0.10% |
| Emerging Markets Research Enhanced Equity Fund | n/a | n/a | 0.25 | n/a | n/a | n/a | n/a | n/a |
| Europe Dynamic Fund | 0.25 | 0.25 | 0.25 | 0.10 | n/a | n/a | n/a | n/a |
| International Equity Fund | 0.25 | 0.25 | 0.25 | n/a | 0.25 | n/a | n/a | 0.10 |
| 126 | J.P. Morgan International Equity Funds | April 30, 2022 |
| | Class A | Class C | Class I | Class L | Class R2 | Class R3 | Class R4 | Class R5 |
| International Focus Fund | 0.25% | 0.25% | 0.25% | n/a% | 0.25% | n/a% | n/a% | 0.10% |
| International Hedged Equity Fund | 0.25 | 0.25 | 0.25 | n/a | n/a | n/a | n/a | 0.10 |
| International Research Enhanced Equity Fund | 0.25 | n/a | 0.25 | n/a | n/a | n/a | n/a | n/a |
| International Value Fund | 0.25 | 0.25 | 0.25 | 0.10 | 0.25 | n/a | n/a | 0.10 |
JPMDS has entered into shareholder services contracts with affiliated and unaffiliated financial intermediaries who provide shareholder services and other related services to their clients or customers who invest in the Funds. Pursuant to such contracts, JPMDS will pay all or a portion of such fees earned to financial intermediaries for performing such services.
JPMDS waived service fees as outlined in Note 3.F.
E. Custodian and Accounting Fees — JPMCB provides portfolio custody and accounting services to the Funds. For performing these services, the Funds pay JPMCB transaction and asset-based fees that vary according to the number of transactions and positions, plus out-of-pocket expenses. The amounts paid directly to JPMCB by the Funds for custody and accounting services are included in Custodian and accounting fees on the Statements of Operations.
Interest income earned on cash balances at the custodian, if any, is included in Interest income from affiliates on the Statements of Operations.
Interest expense paid to the custodian related to cash overdrafts, if any, is included in Interest expense to affiliates on the Statements of Operations.
F. Waivers and Reimbursements — The Adviser, Administrator and/or JPMDS have contractually agreed to waive fees and/or reimburse the Funds to the extent that total annual operating expenses (excluding acquired fund fees and expenses other than certain money market fund fees as described below, dividend and interest expenses related to short sales, interest, taxes, expenses related to litigation and potential litigation, expenses related to trustee elections and extraordinary expenses) exceed the percentages of the Funds' respective average daily net assets as shown in the table below:
| | Class A | Class C | Class I | Class R2 | Class R3 | Class R4 | Class R5 | Class R6 |
| Emerging Markets Equity Fund | 1.24% | 1.74% | 0.99% | 1.54% | 1.29% | 1.04% | 0.89% | 0.79% |
| Emerging Markets Research Enhanced Equity Fund | n/a | n/a | 0.45 | n/a | n/a | n/a | n/a | 0.35 |
| Europe Dynamic Fund | 1.24 | 1.74 | 0.99 | n/a | n/a | n/a | n/a | n/a |
| International Equity Fund | 0.95 | 1.45 | 0.70 | 1.25 | n/a | n/a | 0.60 | 0.50 |
| International Focus Fund | 1.00 | 1.50 | 0.75 | 1.30 | n/a | n/a | 0.65 | 0.55 |
| International Hedged Equity Fund | 0.85 | 1.35 | 0.60 | n/a | n/a | n/a | 0.45 | 0.35 |
| International Research Enhanced Equity Fund | 0.60 | n/a | 0.35 | n/a | n/a | n/a | n/a | 0.25 |
| International Value Fund | 1.00 | 1.50 | 0.75 | 1.30 | n/a | n/a | 0.65 | 0.55 |
The expense limitation agreements were in effect for the six months ended April 30, 2022 and the contractual expense limitation percentages in the table above are in place until at least February 28, 2023.
| April 30, 2022 | J.P. Morgan International Equity Funds | 127 |
NOTES TO FINANCIAL STATEMENTS
AS OF April 30, 2022 (Unaudited) (continued)
(Dollar values in thousands)
For the six months ended April 30, 2022, the Funds’ service providers waived fees and/or reimbursed expenses for each of the Funds as follows. None of these parties expect the Funds to repay any such waived fees and/or reimbursed expenses in future years.
| | Contractual Waivers | | Voluntary Waivers |
| | Investment
Advisory Fees | Administration
Fees | Service
Fees | Total | Contractual
Reimbursements | 12b-1 |
| Emerging Markets Equity Fund | $ 326 | $ 219 | $1,197 | $1,742 | $55 | $ — |
| Emerging Markets Research Enhanced Equity Fund | 402 | 268 | 84 | 754 | — | — |
| International Equity Fund | 1,412 | 941 | 293 | 2,646 | — | — |
| International Focus Fund | 1,568 | 1,045 | 297 | 2,910 | — | — |
| International Hedged Equity Fund | 95 | 60 | —(a) | 155 | — | — |
| International Research Enhanced Equity Fund | 691 | 459 | 324 | 1,474 | — | 29 |
| International Value Fund | 205 | 137 | 64 | 406 | 1 | — |
|
| (a) | Amount rounds to less than one thousand. |
Additionally, the Funds may invest in one or more money market funds advised by the Adviser (affiliated money market funds). The Adviser, Administrator and/or JPMDS, as shareholder servicing agent, have contractually agreed to waive fees and/or reimburse expenses in an amount sufficient to offset the respective net fees each collects from the affiliated money market fund on the applicable Fund's investment in such affiliated money market fund, except for investments of securities lending cash collateral. None of these parties expect the Funds to repay any such waived fees and/or reimbursed expenses in future years.
The amounts of these waivers resulting from investments in these money market funds for the six months ended April 30, 2022 were as follows:
| Emerging Markets Equity Fund | $61 |
| Emerging Markets Research Enhanced Equity Fund | 42 |
| Europe Dynamic Fund | 19 |
| International Equity Fund | 59 |
| International Focus Fund | 30 |
| International Hedged Equity Fund | 2 |
| International Research Enhanced Equity Fund | 66 |
| International Value Fund | 3 |
Effective January 1, 2022, JPMIM voluntarily agreed to reimburse the Funds for the Trustee Fees paid to one of the interested Trustees. For the period January 1, 2022 through April 30, 2022 the amount of these waivers were as follows:
| Emerging Markets Equity Fund | 1 |
| Emerging Markets Research Enhanced Equity Fund | 1 |
| Europe Dynamic Fund | 1 |
| International Equity Fund | 1 |
| International Focus Fund | 1 |
| International Hedged Equity Fund | 1 |
| International Research Enhanced Equity Fund | 1 |
G. Other — Certain officers of the Trusts are affiliated with the Adviser, the Administrator and JPMDS. Such officers, with the exception of the Chief Compliance Officer, receive no compensation from the Funds for serving in their respective roles.
The Boards designated and appointed a Chief Compliance Officer to the Funds pursuant to Rule 38a-1 under the 1940 Act. Each Fund, along with affiliated funds, makes reimbursement payments, on a pro-rata basis, to the Administrator for a portion of the fees associated with the office of the Chief Compliance Officer. Such fees are included in Trustees’ and Chief Compliance Officer’s fees on the Statements of Operations.
The Trusts adopted a Trustee Deferred Compensation Plan (the “Plan”) which allows the independent Trustees to defer the receipt of all or a portion of compensation related to performance of their duties as Trustees. The deferred fees are invested in various J.P. Morgan Funds until distribution in accordance with the Plan.
The Securities and Exchange Commission ("SEC") has granted an exemptive order permitting the Funds to engage in principal transactions with J.P. Morgan Securities LLC, an affiliated broker, involving taxable money market instruments, subject to certain conditions.
| 128 | J.P. Morgan International Equity Funds | April 30, 2022 |
4. Investment Transactions
During the six months ended April 30, 2022, purchases and sales of investments (excluding short-term investments) were as follows:
| | Purchases
(excluding
U.S. Government) | Sales
(excluding
U.S. Government) |
| Emerging Markets Equity Fund | $1,308,784 | $2,177,166 |
| Emerging Markets Research Enhanced Equity Fund | 571,098 | 737,155 |
| Europe Dynamic Fund | 385,041 | 642,085 |
| International Equity Fund | 1,248,185 | 836,829 |
| International Focus Fund | 512,049 | 1,301,728 |
| International Hedged Equity Fund | 46,086 | 13,376 |
| International Research Enhanced Equity Fund | 1,412,392 | 422,408 |
| International Value Fund | 69,376 | 44,096 |
During the six months ended April 30, 2022, there were no purchases or sales of U.S. Government securities.
5. Federal Income Tax Matters
For Federal income tax purposes, the estimated cost and unrealized appreciation (depreciation) in value of investments held at April 30, 2022 were as follows:
| | Aggregate
Cost | Gross
Unrealized
Appreciation | Gross
Unrealized
Depreciation | Net Unrealized
Appreciation
(Depreciation) |
| Emerging Markets Equity Fund | $8,772,484 | $2,384,515 | $1,467,630 | $916,885 |
| Emerging Markets Research Enhanced Equity Fund | 2,917,194 | 408,925 | 359,476 | 49,449 |
| Europe Dynamic Fund | 635,899 | 55,515 | 38,393 | 17,122 |
| International Equity Fund | 4,097,521 | 741,897 | 274,516 | 467,381 |
| International Focus Fund | 1,231,297 | 257,687 | 86,934 | 170,753 |
| International Hedged Equity Fund | 155,471 | 23,579 | 10,386 | 13,193 |
| International Research Enhanced Equity Fund | 5,030,990 | 808,857 | 294,624 | 514,233 |
| International Value Fund | 387,072 | 45,483 | 26,377 | 19,106 |
At October 31, 2021, the following Funds had net capital loss carryforwards which are available to offset future realized gains:
| | Capital Loss Carryforward Character |
| | Short-Term | Long-Term |
| Europe Dynamic Fund | $ 60,459 | $ — |
| International Focus Fund | 113,809 | — |
| International Hedged Equity Fund | 4,593* | 13,223* |
| International Research Enhanced Equity Fund | — | 285,015 |
| International Value Fund | 48,944 | 31,961 |
|
| * | Amount includes capital loss carryforwards which are limited in future years under Internal Revenue Code sections 381-384. |
| April 30, 2022 | J.P. Morgan International Equity Funds | 129 |
NOTES TO FINANCIAL STATEMENTS
AS OF April 30, 2022 (Unaudited) (continued)
(Dollar values in thousands)
During the year ended October 31, 2021, the following Funds utilized capital loss carryforwards as follows:
| | Capital Loss Utilized |
| | Short-Term | Long-Term |
| Emerging Markets Equity Fund | $ — | $151,019 |
| Emerging Markets Research Enhanced Equity Fund | 64,286 | 18,842 |
| Europe Dynamic Fund | 58,188 | — |
| International Equity Fund | 56,023 | 54,962 |
| International Focus Fund | 51,636 | 21,707 |
| International Research Enhanced Equity Fund | 33,296 | 211,502 |
| International Value Fund | 4,721 | — |
6. Borrowings
The Funds rely upon an exemptive order granted by the SEC (the “Order”) permitting the establishment and operation of an Interfund Lending Facility (the “Facility”). The Facility allows the Funds to directly lend and borrow money to or from any other fund relying upon the Order at rates beneficial to both the borrowing and lending funds. Advances under the Facility are taken primarily for temporary or emergency purposes, including the meeting of redemption requests that otherwise might require the untimely disposition of securities, and are subject to each Fund's borrowing restrictions. The Interfund loan rate is determined, as specified in the Order, by averaging the current repurchase agreement rate and the current bank loan rate. The Order was granted to JPM II and may be relied upon by the Funds because the Funds and the series of JPM II are all investment companies in the same “group of investment companies” (as defined in Section 12(d)(1)(G) of the 1940 Act).
The Funds had no borrowings outstanding from another fund, or loans outstanding to another fund, during the six months ended April 30, 2022. Average borrowings from the Facility during the six months ended April 30, 2022 were as follows:
| | Average
Borrowings | Average
Interest
Rate paid | Number of
Days
Outstanding | Interest
Paid |
| Emerging Markets Equity Fund | $45,389 | 0.83% | 20 | $14 |
| Emerging Markets Research Enhanced Equity Fund | 12,242 | 0.81 | 2 | 1 |
| Europe Dynamic Fund | 45,914 | 0.81 | 5 | 5 |
| International Equity Fund | 90,091 | 0.81 | 2 | 4 |
| International Focus Fund | 23,839 | 0.80 | 3 | 2 |
| International Value Fund | 1,651 | 0.82 | 2 | —(a) |
|
| (a) | Amount rounds to less than one thousand. |
The Trusts and JPMCB have entered into a financing arrangement. Under this arrangement, JPMCB provides an unsecured, uncommitted credit facility in the aggregate amount of $100 million to certain of the J.P. Morgan Funds, including the Funds. Advances under the arrangement are taken primarily for temporary or emergency purposes, including the meeting of redemption requests that otherwise might require the untimely disposition of securities, and are subject to each Fund’s borrowing restrictions. Interest on borrowings is payable at a rate determined by JPMCB at the time of borrowing. This agreement has been extended until October 31, 2022.
The Funds had no borrowings outstanding from the unsecured, uncommitted credit facility during the six months ended April 30, 2022.
The Trusts, along with certain other trusts for J.P. Morgan Funds (“Borrowers”), have entered into a joint syndicated senior unsecured revolving credit facility totaling $1.5 billion (“Credit Facility”) with various lenders and The Bank of New York Mellon, as administrative agent for the lenders. This Credit Facility provides a source of funds to the Borrowers for temporary and emergency purposes, including the meeting of redemption requests that otherwise might require the untimely disposition of securities. Under the terms of the Credit Facility, a borrowing fund must have a minimum of $25,000,000 in adjusted net asset value and not exceed certain adjusted net asset coverage ratios prior to and during the time in which any borrowings are outstanding. If a fund does not comply with the aforementioned requirements, the fund must remediate within three business days with respect to the $25,000,000 minimum adjusted net asset value or within one business day with respect to certain asset coverage ratios or the administrative agent at the request of, or with the consent of, the lenders may terminate the Credit Facility and declare any outstanding borrowings to be due and payable immediately.
Interest associated with any borrowing under the Credit Facility is charged to the borrowing fund at a rate of interest equal to 1.00%, which has decreased from 1.25% pursuant to the amendment referenced below (the "Applicable Margin"), plus the greater of the federal funds effective rate or one month London Interbank Offered Rate ("LIBOR"). The annual commitment fee to maintain the Credit Facility is 0.15% and is incurred on the
| 130 | J.P. Morgan International Equity Funds | April 30, 2022 |
unused portion of the Credit Facility and is allocated to all participating funds pro rata based on their respective net assets. Effective August 10, 2021, the Credit Facility has been amended and restated for a term of 364 days, unless extended, and to include a reduction of the Applicable Margin charged for borrowing under the Credit Facility from 1.25% to 1.00%.
The Fund did not utilize the Credit Facility during the six months ended April 30, 2022.
7. Risks, Concentrations and Indemnifications
In the normal course of business, the Funds enter into contracts that contain a variety of representations which provide general indemnifications. Each Fund’s maximum exposure under these arrangements is unknown. The amount of exposure would depend on future claims that may be brought against each Fund. However, based on experience, the Funds expect the risk of loss to be remote.
As of April 30, 2022, the Funds had individual shareholder and/or omnibus accounts each owning more than 10% of the respective Fund’s outstanding shares as follows:
| | Number of
Individual
Shareholder and/or
Affiliated
Omnibus Accounts | % of
the Fund | Number of
Individual
Shareholder and/or
Non-Affiliated
Omnibus Accounts | % of the Fund |
| Emerging Markets Equity Fund | — | —% | 3 | 43.4% |
| Europe Dynamic Fund | 3 | 45.3 | 1 | 11.6 |
| International Focus Fund | — | — | 2 | 35.5 |
| International Hedged Equity Fund | 1 | 13.9 | 3 | 57.7 |
| International Research Enhanced Equity Fund | 1 | 10.4 | 1 | 10.4 |
| International Value Fund | — | — | 1 | 80.8 |
As of April 30, 2022, J.P. Morgan Investor Funds, JPMorgan SmartRetirement Funds and JPMorgan SmartRetirement Blend Funds, which are affiliated fund of funds, each owned in the aggregate, shares representing more than 10% of the net assets of the Funds as follows:
| | J.P. Morgan
Investor
Funds | JPMorgan
SmartRetirement
Funds | JPMorgan
SmartRetirement
Blend Funds |
| Emerging Markets Research Enhanced Equity Fund | 10.5% | 31.5% | 39.9% |
| Europe Dynamic Fund | 50.5 | — | — |
| International Equity Fund | — | 49.8 | — |
| International Focus Fund | 11.6 | — | — |
| International Research Enhanced Equity Fund | 19.3 | 60.5 | — |
Significant shareholder transactions by these shareholders may impact the Funds’ performance and liquidity.
The Funds may have elements of risk not typically associated with investments in the United States of America due to concentrated investments in a limited number of foreign countries or regions, which may vary throughout the period. Such concentrations may subject each of these Funds to additional risks resulting from political or economic conditions in such countries or regions and the possible imposition of adverse governmental laws or currency exchange restrictions could cause the securities and their markets to be less liquid and their prices to be more volatile than those of comparable U.S. securities.
| April 30, 2022 | J.P. Morgan International Equity Funds | 131 |
NOTES TO FINANCIAL STATEMENTS
AS OF April 30, 2022 (Unaudited) (continued)
(Dollar values in thousands)
As of April 30, 2022, the following Funds had non-U.S. country allocations representing greater than 10% of total investments (excluding investment of cash collateral from securities loaned) as follows:
| | Emerging
Markets
Equity Fund | Emerging
Markets
Research
Enhanced
Equity Fund | Europe
Dynamic
Fund | International
Equity Fund | International
Focus Fund | International
Hedged
Equity Fund | International
Research
Enhanced
Equity Fund | International
Value Fund |
| China | 30.5% | 30.3% | —% | —% | —% | —% | —% | —% |
| France | — | — | 16.2 | 15.6 | — | 10.7 | 11.8 | — |
| Germany | — | — | 15.3 | — | — | — | — | — |
| India | 21.9 | 12.8 | — | — | — | — | — | — |
| Japan | — | — | — | 12.3 | — | 20.9 | 19.7 | 21.1 |
| South Korea | — | 13.3 | — | — | — | — | — | — |
| Switzerland | — | — | 17.4 | 10.6 | 11.2 | 10.9 | 11.8 | — |
| Taiwan | 11.5 | 14.7 | — | — | — | — | — | — |
| United Kingdom | — | — | 19.7 | 10.4 | — | 12.8 | 14.1 | 14.2 |
As of April 30, 2022, a significant portion of each Fund's investments consisted of securities that were denominated in foreign currencies. Changes in currency exchange rates will affect the value of, and investment income from, such securities.
Derivatives may be riskier than other types of investments because they may be more sensitive to changes in economic and market conditions and could result in losses that significantly exceed the Funds' original investment. Many derivatives create leverage thereby causing the Funds to be more volatile than they would have been if they had not used derivatives. Derivatives also expose the Funds to counterparty risk (the risk that the derivative counterparty will not fulfill its contractual obligations), including credit risk of the derivative counterparty. The possible lack of a liquid secondary market for derivatives and the resulting inability of the Funds to sell or otherwise close a derivatives position could expose the Funds to losses.
The Funds invest in foreign issuers and foreign securities (including depositary receipts) are subject to additional risks, including political and economic risks, civil conflicts and war, greater volatility, expropriation and nationalization risks, sanctions or other measures by the United States or other governments, currency fluctuations, higher transaction costs, delayed settlement, possible foreign controls on investment, liquidity risks and less stringent investor protection and disclosure standards of foreign markets. In certain markets where securities and other instruments are not traded “delivery versus payment,” a Fund may not receive timely payment for securities or other instruments it has delivered or receive delivery of securities paid for and may be subject to increased risk that the counterparty will fail to make payments or delivery when due or default completely.
Events and evolving conditions in certain economies or markets may alter the risks associated with investments tied to countries or regions that historically were perceived as comparatively stable becoming riskier and more volatile. Emerging Markets Equity Fund and Emerging Markets Research Enhanced Equity Fund each invests a substantial portion of their assets in emerging market countries. These risks are magnified in countries in emerging markets. Emerging market countries typically have less established market economies than developed countries and may face greater social, economic, regulatory and political uncertainties. In addition, emerging markets typically present greater illiquidity and price volatility concerns due to smaller or limited local capital markets and greater difficulty in determining market valuations of securities due to limited public information on issuers. Certain emerging market countries may be subject to less stringent requirements regarding accounting, auditing, financial reporting and record keeping and therefore, material information related to an investment may not be available or reliable.
In addition, a Fund is limited in its ability to exercise its legal rights or enforce a counterparty’s legal obligations in certain jurisdictions outside of the United States, in particular, in emerging market countries.
LIBOR is intended to represent the rate at which contributing banks may obtain short-term borrowings from each other in the London interbank market. On March 5, 2021, the U.K. Financial Conduct Authority ("FCA") publicly announced that (i) immediately after December 31, 2021, publication of the 1-week and 2-month U.S. Dollar LIBOR settings will permanently cease; (ii) immediately after June 30, 2023, publication of the overnight and 12-month U.S. Dollar LIBOR settings will permanently cease; and (iii) immediately after June 30, 2023, the 1-month, 3-month and 6-month U.S. Dollar LIBOR settings will cease to be provided or, subject to the FCA's consideration of the case, be provided on a synthetic basis and no longer be representative of the underlying market and economic reality they are intended to measure and that representativeness will not be restored. There is no assurance that the dates announced by the FCA will not change or that the administrator of LIBOR and/or regulators will not take further action that could impact the availability, composition or characteristics of LIBOR or the currencies and/or tenors for which LIBOR is published. In addition, certain regulated entities ceased entering into most new LIBOR contracts in connection with regulatory guidance or prohibitions. Public and private sector industry initiatives are currently underway to implement new or alternative reference rates to be used in place of LIBOR. There is no assurance that any such alternative reference rate will be similar to or produce the same value or economic equivalence as LIBOR or that it will have the same volume or liquidity as did LIBOR prior to its discontinuance, unavailability or replacement, all of which may affect the value, volatility, liquidity or return on certain of a Fund's loans, notes, derivatives and other instruments or investments comprising some or all of a Fund's investments and
| 132 | J.P. Morgan International Equity Funds | April 30, 2022 |
result in costs incurred in connection with changing reference rates used for positions, closing out positions and entering into new trades. Certain of a Fund's investments may transition from LIBOR prior to the dates announced by the FCA. The transition from LIBOR to alternative reference rates may result in operational issues for a Fund or its investments. No assurances can be given as to the impact of the LIBOR transition (and the timing of any such impact) on a Fund and its investments. These risks may also apply with respect to changes in connection with other interbank offering rates (e.g., Euribor) and a wide range of other index levels, rates and values that are treated as “benchmarks” and are the subject of recent regulatory reform.
The Funds are subject to infectious disease epidemics/pandemics risk. The worldwide outbreak of COVID-19 has negatively affected economies, markets and individual companies throughout the world. The effects of this COVID-19 pandemic to public health, and business and market conditions, including among other things, reduced consumer demand and economic output, supply chain disruptions and increased government spending may continue to have a significant negative impact on the performance of a Fund’s investments, increase a Fund’s volatility, exacerbate other pre-existing political, social and economic risks to the Funds and negatively impact broad segments of businesses and populations. In addition, governments, their regulatory agencies, or self-regulatory organizations have taken or may take actions in response to the pandemic that affect the instruments in which the Funds invest, or the issuers of such instruments, in ways that could also have a significant negative impact on a Fund’s investment performance. The duration and extent of COVID-19 and associated economic and market conditions and uncertainty over the long-term cannot be reasonably estimated at this time. The ultimate impact of COVID-19 and the extent to which the associated conditions impact a Fund will also depend on future developments, which are highly uncertain, difficult to accurately predict and subject to frequent changes.
8. Redemptions in-kind
On April 21, 2022, certain shareholders sold Class R6 Shares of International Focus Fund. The portfolio securities were delivered primarily by means of a redemption in-kind in exchange for shares of the Fund. Cash and portfolio securities were transferred as detailed below:
| Fund | Value | Type |
| International Focus Fund | $1,236,430(a) | Redemption in-kind |
|
| (a) | This amount includes cash of $99,867 associated with the redemption in-kind. |
9. Subsequent Event
At a meeting held on January 13, 2022, the Board approved the reorganization (the “Reorganization”) of International Research Enhanced Equity Fund into a newly created exchange-traded fund, JPMorgan International Research Enhanced Equity ETF (“JPM International Research Enhanced Equity ETF”), a series of J.P. Morgan Exchange-Traded Fund Trust. The Reorganization occurred as of the close of business on June 10, 2022 (the “Closing Date”). Following the Reorganization, International Research Enhanced Equity Fund’s performance and financial history were adopted by JPM International Research Enhanced Equity ETF. In connection with the Reorganization, each shareholder of International Research Enhanced Equity Fund (except as noted below) received shares of JPM International Research Enhanced Equity ETF equal in value to the number of shares of International Research Enhanced Equity Fund they owned on the Closing Date, including a cash payment in lieu of fractional shares of JPM International Research Enhanced Equity ETF, which cash payment may be taxable. Shareholders of International Research Enhanced Equity Fund who did not hold their shares through a brokerage account that could accept shares of JPM International Research Enhanced Equity ETF on the Closing Date had their Fund shares liquidated, and such shareholders received cash equal in value to their International Research Enhanced Equity Fund shares, which cash payment may be taxable. Shareholders of International Research Enhanced Equity Fund who held their shares through a fund direct individual retirement account and did not take action prior to the Reorganization had their Fund shares exchanged for Morgan Shares of JPMorgan U.S. Government Money Market Fund equal in value to their International Research Enhanced Equity Fund shares. JPM International Research Enhanced Equity ETF has the same investment adviser, investment objective and fundamental investment policies and substantially similar investment strategies as International Research Enhanced Equity Fund. Effective as of the close of business on June 10, 2022, International Research Enhanced Equity Fund ceased operations in connection with the consummation of the Reorganization.
| April 30, 2022 | J.P. Morgan International Equity Funds | 133 |
SCHEDULE OF SHAREHOLDER EXPENSES
(Unaudited)
As a shareholder of the Funds, you incur two types of costs: (1) transaction costs, including sales charges (loads) on purchase payments and (2) ongoing costs, including investment advisory fees, administration fees, distribution fees and other Fund expenses. The examples below are intended to help you understand your ongoing costs (in dollars) of investing in the Funds (not including expenses of the Underlying Funds and ETFs) and to compare these ongoing costs with the ongoing costs of investing in other mutual funds. The examples assume that you had a $1,000 investment in each Class at the beginning of the reporting period, November 1, 2021, and continued to hold your shares at the end of the reporting period, April 30, 2022.
Actual Expenses
For each Class of each Fund in the table below, the first line provides information about actual account values and actual expenses. You may use the information in this line, together with the amount you invested, to estimate the expenses that you paid over the period. Simply divide your account value by $1,000 (for example, an $8,600 account value divided by $1,000 = 8.6), then multiply the result by the number in the first line of each Class under the heading titled “Expenses Paid During the Period” to estimate the expenses you paid on your account during this period.
Hypothetical Example for Comparison Purposes
The second line of each Class in the table below provides information about hypothetical account values and hypothetical expenses based on the Class’ actual expense ratio and an assumed rate of return of 5% per year before expenses, which is not the Class’ actual return. The hypothetical account values and expenses may not be used to estimate the actual ending account balance or expenses you paid for the period. You may use this information to compare the ongoing costs of investing in the Class of the Funds and other funds. To do so, compare this 5% hypothetical example with the 5% hypothetical examples that appear in the shareholder reports of the other funds. Please note that the expenses shown in the table are meant to highlight your ongoing costs only and do not reflect any transaction costs, such as sales charges (loads), or redemption fees, and expenses of the Underlying Funds and ETFs. Therefore, the second line for each Class in the table is useful in comparing ongoing costs only, and will not help you determine the relative total costs of owning different funds. In addition, if these transaction costs were included, your costs would have been higher. The examples also assume all dividends and distributions have been reinvested.
| | Beginning
Account Value
November 1, 2021 | Ending
Account Value
April 30, 2022 | Expenses
Paid During
the Period* | Annualized
Expense
Ratio |
| JPMorgan Emerging Markets Equity Fund | | | | |
| Class A | | | | |
| Actual | $1,000.00 | $ 737.20 | $5.34 | 1.24% |
| Hypothetical | 1,000.00 | 1,018.65 | 6.21 | 1.24 |
| Class C | | | | |
| Actual | 1,000.00 | 735.30 | 7.49 | 1.74 |
| Hypothetical | 1,000.00 | 1,016.17 | 8.70 | 1.74 |
| Class I | | | | |
| Actual | 1,000.00 | 738.00 | 4.27 | 0.99 |
| Hypothetical | 1,000.00 | 1,019.89 | 4.96 | 0.99 |
| Class R2 | | | | |
| Actual | 1,000.00 | 735.90 | 6.63 | 1.54 |
| Hypothetical | 1,000.00 | 1,017.16 | 7.70 | 1.54 |
| Class R3 | | | | |
| Actual | 1,000.00 | 737.10 | 5.56 | 1.29 |
| Hypothetical | 1,000.00 | 1,018.40 | 6.46 | 1.29 |
| Class R4 | | | | |
| Actual | 1,000.00 | 737.80 | 4.48 | 1.04 |
| Hypothetical | 1,000.00 | 1,019.64 | 5.21 | 1.04 |
| Class R5 | | | | |
| Actual | 1,000.00 | 738.50 | 3.84 | 0.89 |
| Hypothetical | 1,000.00 | 1,020.38 | 4.46 | 0.89 |
| Class R6 | | | | |
| Actual | 1,000.00 | 738.60 | 3.41 | 0.79 |
| Hypothetical | 1,000.00 | 1,020.88 | 3.96 | 0.79 |
| 134 | J.P. Morgan International Equity Funds | April 30, 2022 |
| | Beginning
Account Value
November 1, 2021 | Ending
Account Value
April 30, 2022 | Expenses
Paid During
the Period* | Annualized
Expense
Ratio |
| JPMorgan Emerging Markets Research Enhanced Equity Fund | | | | |
| Class I | | | | |
| Actual | $1,000.00 | $ 841.00 | $2.05 | 0.45% |
| Hypothetical | 1,000.00 | 1,022.56 | 2.26 | 0.45 |
| Class R6 | | | | |
| Actual | 1,000.00 | 841.60 | 1.60 | 0.35 |
| Hypothetical | 1,000.00 | 1,023.06 | 1.76 | 0.35 |
| JPMorgan Europe Dynamic Fund | | | | |
| Class A | | | | |
| Actual | 1,000.00 | 856.40 | 5.71 | 1.24 |
| Hypothetical | 1,000.00 | 1,018.65 | 6.21 | 1.24 |
| Class C | | | | |
| Actual | 1,000.00 | 854.20 | 8.00 | 1.74 |
| Hypothetical | 1,000.00 | 1,016.17 | 8.70 | 1.74 |
| Class I | | | | |
| Actual | 1,000.00 | 857.50 | 4.51 | 0.98 |
| Hypothetical | 1,000.00 | 1,019.94 | 4.91 | 0.98 |
| Class R6 | | | | |
| Actual | 1,000.00 | 858.70 | 3.32 | 0.72 |
| Hypothetical | 1,000.00 | 1,021.22 | 3.61 | 0.72 |
| JPMorgan International Equity Fund | | | | |
| Class A | | | | |
| Actual | 1,000.00 | 830.20 | 4.31 | 0.95 |
| Hypothetical | 1,000.00 | 1,020.08 | 4.76 | 0.95 |
| Class C | | | | |
| Actual | 1,000.00 | 828.40 | 6.57 | 1.45 |
| Hypothetical | 1,000.00 | 1,017.60 | 7.25 | 1.45 |
| Class I | | | | |
| Actual | 1,000.00 | 831.50 | 3.18 | 0.70 |
| Hypothetical | 1,000.00 | 1,021.32 | 3.51 | 0.70 |
| Class R2 | | | | |
| Actual | 1,000.00 | 829.40 | 5.67 | 1.25 |
| Hypothetical | 1,000.00 | 1,018.60 | 6.26 | 1.25 |
| Class R5 | | | | |
| Actual | 1,000.00 | 831.70 | 2.72 | 0.60 |
| Hypothetical | 1,000.00 | 1,021.82 | 3.01 | 0.60 |
| Class R6 | | | | |
| Actual | 1,000.00 | 832.30 | 2.27 | 0.50 |
| Hypothetical | 1,000.00 | 1,022.32 | 2.51 | 0.50 |
| JPMorgan International Focus Fund | | | | |
| Class A | | | | |
| Actual | 1,000.00 | 832.80 | 4.54 | 1.00 |
| Hypothetical | 1,000.00 | 1,019.84 | 5.01 | 1.00 |
| Class C | | | | |
| Actual | 1,000.00 | 830.90 | 6.81 | 1.50 |
| Hypothetical | 1,000.00 | 1,017.36 | 7.50 | 1.50 |
| Class I | | | | |
| Actual | 1,000.00 | 834.10 | 3.41 | 0.75 |
| Hypothetical | 1,000.00 | 1,021.08 | 3.76 | 0.75 |
| Class R2 | | | | |
| Actual | 1,000.00 | 831.70 | 5.90 | 1.30 |
| Hypothetical | 1,000.00 | 1,018.35 | 6.51 | 1.30 |
| April 30, 2022 | J.P. Morgan International Equity Funds | 135 |
SCHEDULE OF SHAREHOLDER EXPENSES
(Unaudited) (continued)
| | Beginning
Account Value
November 1, 2021 | Ending
Account Value
April 30, 2022 | Expenses
Paid During
the Period* | Annualized
Expense
Ratio |
| JPMorgan International Focus Fund (continued) | | | | |
| Class R5 | | | | |
| Actual | $1,000.00 | $ 834.30 | $2.96 | 0.65% |
| Hypothetical | 1,000.00 | 1,021.57 | 3.26 | 0.65 |
| Class R6 | | | | |
| Actual | 1,000.00 | 835.00 | 2.50 | 0.55 |
| Hypothetical | 1,000.00 | 1,022.07 | 2.76 | 0.55 |
| JPMorgan International Hedged Equity Fund | | | | |
| Class A | | | | |
| Actual | 1,000.00 | 898.50 | 4.00 | 0.85 |
| Hypothetical | 1,000.00 | 1,020.58 | 4.26 | 0.85 |
| Class C | | | | |
| Actual | 1,000.00 | 896.20 | 6.35 | 1.35 |
| Hypothetical | 1,000.00 | 1,018.10 | 6.76 | 1.35 |
| Class I | | | | |
| Actual | 1,000.00 | 899.80 | 2.83 | 0.60 |
| Hypothetical | 1,000.00 | 1,021.82 | 3.01 | 0.60 |
| Class R5 | | | | |
| Actual | 1,000.00 | 900.30 | 2.12 | 0.45 |
| Hypothetical | 1,000.00 | 1,022.56 | 2.26 | 0.45 |
| Class R6 | | | | |
| Actual | 1,000.00 | 900.80 | 1.65 | 0.35 |
| Hypothetical | 1,000.00 | 1,023.06 | 1.76 | 0.35 |
| JPMorgan International Research Enhanced Equity Fund | | | | |
| Class A | | | | |
| Actual | 1,000.00 | 876.90 | 2.19 | 0.47 |
| Hypothetical | 1,000.00 | 1,022.46 | 2.36 | 0.47 |
| Class I | | | | |
| Actual | 1,000.00 | 877.40 | 1.63 | 0.35 |
| Hypothetical | 1,000.00 | 1,023.06 | 1.76 | 0.35 |
| Class R6 | | | | |
| Actual | 1,000.00 | 877.60 | 1.16 | 0.25 |
| Hypothetical | 1,000.00 | 1,023.56 | 1.25 | 0.25 |
| JPMorgan International Value Fund | | | | |
| Class A | | | | |
| Actual | 1,000.00 | 919.50 | 4.76 | 1.00 |
| Hypothetical | 1,000.00 | 1,019.84 | 5.01 | 1.00 |
| Class C | | | | |
| Actual | 1,000.00 | 916.60 | 7.13 | 1.50 |
| Hypothetical | 1,000.00 | 1,017.36 | 7.50 | 1.50 |
| Class I | | | | |
| Actual | 1,000.00 | 920.30 | 3.57 | 0.75 |
| Hypothetical | 1,000.00 | 1,021.08 | 3.76 | 0.75 |
| Class R2 | | | | |
| Actual | 1,000.00 | 917.80 | 6.18 | 1.30 |
| Hypothetical | 1,000.00 | 1,018.35 | 6.51 | 1.30 |
| Class R5 | | | | |
| Actual | 1,000.00 | 920.70 | 3.10 | 0.65 |
| Hypothetical | 1,000.00 | 1,021.57 | 3.26 | 0.65 |
| 136 | J.P. Morgan International Equity Funds | April 30, 2022 |
| | Beginning
Account Value
November 1, 2021 | Ending
Account Value
April 30, 2022 | Expenses
Paid During
the Period* | Annualized
Expense
Ratio |
| JPMorgan International Value Fund (continued) | | | | |
| Class R6 | | | | |
| Actual | $1,000.00 | $ 920.70 | $2.62 | 0.55% |
| Hypothetical | 1,000.00 | 1,022.07 | 2.76 | 0.55 |
|
| * | Expenses are equal to each Class’ respective annualized expense ratio, multiplied by the average account value over the period, multiplied by 181/365 (to reflect the one-half year period). |
| April 30, 2022 | J.P. Morgan International Equity Funds | 137 |
LIQUIDITY RISK MANAGEMENT PROGRAM
(Unaudited)
Each of the Funds covered in this report have adopted the J.P. Morgan Funds and J.P. Morgan Exchange-Traded Funds Amended and Restated Liquidity Risk Management Program (the “Program”) under Rule 22e-4 under the Investment Company Act of 1940, as amended (the “Liquidity Rule”). The Program seeks to assess, manage and review each Fund’s Liquidity Risk. “Liquidity Risk” is defined as the risk that a fund could not meet requests to redeem shares issued by the fund without significant dilution of remaining investors’ interests in the fund. Among other things, the Liquidity Rule requires that a written report be provided to the Board of Trustees (the “Board”) on an annual basis that addresses the operation of the Program and assesses the adequacy and effectiveness of its implementation, including the operation of any Highly Liquid Investment Minimum (“HLIM”), where applicable, and any material changes to the Program.
The Board has appointed J.P. Morgan Asset Management’s Liquidity Risk Forum to be the program administrator for the Program (the “Program Administrator”). In addition to regular reporting at each of its quarterly meetings, on February 8, 2022, the Board reviewed the Program Administrator’s annual written report (the “Report”) concerning the operation of the Program for the period from January 1, 2021 through December 31, 2021 (the “Program Reporting Period”). The Report addressed the operation of the Program and assessed its adequacy and effectiveness of implementation, including, where applicable, the operation of a Fund’s HLIM. During the Program Reporting Period, the Program was amended, pursuant to an exemptive order from the Securities and Exchange Commission, to permit the Funds to use liquidity definitions and classification methodologies that differ from the requirements under the Liquidity Rule in some respects. The
Report discussed the implementation of these changes. No other material changes were made to the Program during the Program Reporting Period.
The Report summarized the operation of the Program and the information and factors considered by the Program Administrator in assessing whether the Program has been adequately and effectively implemented with respect to each Fund. Such information and factors included, among other things: (1) the liquidity risk framework used to assess, manage, and periodically review each Fund’s Liquidity Risk and the results of this assessment; (2) the methodology and inputs for classifying the investments of a Fund into one of the required liquidity categories that reflect an estimate of the liquidity of those investments under current market conditions; (3) whether a Fund invested primarily in “Highly Liquid Investments” (as defined or modified under the Program), as well as whether an HLIM should be established for a Fund (and, for Funds that have adopted an HLIM, whether the HLIM continues to be appropriate or whether a Fund has invested below its HLIM) and the procedures for monitoring for any HLIM; (4) whether a Fund invested more than 15% of its assets in “Illiquid Investments” (as defined or modified under the Program) and the procedures for monitoring for this limit; and (5) specific liquidity events arising during the Program Reporting Period. The Report further summarized the conditions of the exemptive order.
Based on this review, the Report concluded that: (1) the Program continues to be reasonably designed to effectively assess and manage each Fund’s Liquidity Risk; and (2) the Program has been adequately and effectively implemented with respect to each Fund during the Program Reporting Period.
| 138 | J.P. Morgan International Equity Funds | April 30, 2022 |
J.P. Morgan Funds are distributed by JPMorgan Distribution Services, Inc., which is an affiliate of JPMorgan Chase & Co. Affiliates of JPMorgan Chase & Co. receive fees for providing various services to the funds.
Contact JPMorgan Distribution Services, Inc. at 1-800-480-4111 for a fund prospectus. You can also visit us at www.jpmorganfunds.com. Investors should carefully consider the investment objectives and risk as well as charges and expenses of the mutual fund before investing. The prospectus contains this and other information about the mutual fund. Read the prospectus carefully before investing.
Investors may obtain information about the Securities Investor Protection Corporation (SIPC), including the SIPC brochure, by visiting www.sipc.org or by calling SIPC at 202-371-8300.
Each Fund files a complete schedule of its fund holdings for the first and third quarters of its fiscal year with the SEC as an exhibit to its report on Form N-PORT. The Funds' Form N-PORT reports are available on the SEC’s website at http://www.sec.gov. Each Fund's quarterly holdings can be found by visiting the J.P. Morgan Funds’ website at www.jpmorganfunds.com.
A description of the Fund's policies and procedures with respect to the disclosure of each Fund's holdings is available in the prospectuses and Statement of Additional Information.
A copy of proxy policies and procedures is available without charge upon request by calling 1-800-480-4111 and on the Fund’s website at www.jpmorganfunds.com. A description of such policies and procedures is on the SEC’s website at www.sec.gov. The Trustees have delegated the authority to vote proxies for securities owned by the Funds to the Adviser. A copy of the Fund’s voting record for the most recent 12-month period ended June 30 is available on the SEC’s website at www.sec.gov or at the Fund’s website at www.jpmorganfunds.com no later than August 31 of each year. The Fund’s proxy voting record will include, among other things, a brief description of the matter voted on for each fund security, and will state how each vote was cast, for example, for or against the proposal.
J.P. Morgan Asset Management is the brand name for the asset management business of JPMorgan Chase & Co. and its affiliates worldwide.
| © JPMorgan Chase & Co., 2022. All rights reserved. April 2022. | SAN-INTEQ-422 |
Semi-Annual Report
J.P. Morgan Specialty Funds
April 30, 2022 (Unaudited)
| JPMorgan Macro Opportunities Fund |
| JPMorgan Opportunistic Equity Long/Short Fund |
| JPMorgan Research Market Neutral Fund |
CONTENTS
Investments in a Fund are not deposits or obligations of, or guaranteed or endorsed by, any bank and are not insured or guaranteed by the FDIC, the Federal Reserve Board or any other government agency. You could lose money if you sell when a Fund’s share price is lower than when you invested.
Past performance is no guarantee of future performance. The general market views expressed in this report are opinions based on market and other conditions through the end of the reporting period and are subject to change without notice. These views are not intended to predict the future performance of a Fund or the securities markets.
Prospective investors should refer to the Funds’ prospectuses for a discussion of the Funds’ investment objectives, strategies and risks. Call J.P. Morgan Funds Service Center at 1-800-480-4111 for a prospectus containing more complete information about a Fund, including management fees and other expenses. Please read it carefully before investing.
Letter to Shareholders
June 21, 2022, 2022(Unaudited)
Dear Shareholders,
 |
“The market environment remains challenging; investors should recognize the risks in trying to time market movements, as well as the potential long-term benefits of portfolio diversification.”
— Andrea L. Lisher
|
Global economic growth has been hindered by accelerating inflation, the conflict in Ukraine and regional surges in pandemic infections. While equity markets largely rallied in the final months of 2021 and continued to outperform bond markets, a more hawkish U.S. Federal Reserve (the “Fed”) and Russia’s invasion of Ukraine in late February 2022 set off a cascade of weakening investor sentiment.
In the U.S., continued job growth, strong consumer spending and resilient corporate earnings in the first quarter of 2022 helped to offset a contraction in real economic growth. Meanwhile, in response to the highest levels of inflation in nearly 40 years, the Fed raised its benchmark interest rate in March 2022 for the first time since 2018 and then raised it again in both May and June.
Elsewhere, the Bank of England has raised interest rates multiple times since the start of 2022 and the European Central Bank has signaled it is poised to raise interest rates in July 2022, which would mark the first rate increase in the European Union in 11 years.
Meanwhile, emerging markets generally struggled during the six months ended April 30, 2022 as rising prices for energy and food weighed on economic growth. Additionally, a pandemic resurgence in China in early 2022 led to strict lockdowns in several large cities, which hurt manufacturing and other economic activity and had a spillover effect on other emerging market economies.
The market environment remains challenging; investors should recognize the risks in trying to time market movements, as well as the potential long-term benefits of portfolio diversification. J.P. Morgan Asset Management will seek to deliver superior client outcomes across a broad range of innovative solutions and risk management processes built on the same fundamental practices and principles that have driven our success for more than a century.
On behalf of J.P. Morgan Asset Management, thank you for entrusting us to manage your investment. Should you have any questions, please visit www.jpmorganfunds.com or contact the J.P. Morgan Funds Service Center at 1-800-480-4111.
Sincerely yours,
Andrea L. Lisher
Head of Americas, Client
J.P. Morgan Asset Management
| April 30, 2022 | J.P. Morgan Specialty Funds | 1 |
J.P. Morgan Specialty Funds
MARKET OVERVIEW
SIX MONTHS ENDED April 30, 2022 (Unaudited)
While developed market equities rallied in the final months of 2021, a resurgence in the pandemic, surging inflation and Russia’s invasion of Ukraine in late February 2022 dented the global economic outlook and erased equity market gains for the six month period. Overall, both global equity and fixed income markets largely generated negative returns for the period, with emerging markets largely underperforming developed markets.
U.S. equity prices largely maintained upward momentum in the final months of 2021 amid low interest rates, a boom in household wealth and record corporate earnings and revenues. However, investor concerns about the emergence of the Omicron variant of COVID-19 and surging inflationary pressure fueled market volatility in 2022 and Russia’s military build-up and invasion of Ukraine in February 2022 put further pressure on U.S. equity prices.
In mid-March 2022, the U.S. Federal Reserve followed through on its stated plan and raised interest rates for the first time since December 2018, and pledged to raise rates six more times in 2022. While U.S. equity prices rebounded somewhat for the month, both equity and bond markets slumped in April as negotiations to end the Ukraine conflict failed and global supply-chain disruptions increased. Notably, the U.S. dollar strengthened against other major currencies in early 2022, which provided a significant drag on both the domestic economy and corporate earnings. However, job growth in the U.S. continued throughout the six month period.
European and U.K. equities largely ended 2021 with gains but the reimposition of social restrictions in response to the spread of Omicron and the outbreak of fighting in Ukraine weighed on financial markets in early 2022. While initial multilateral trade and financial sanctions against Russia excluded its energy sector, prices for natural gas and petroleum rose sharply across Europe and the potential disruption of energy supplies hurt investor sentiment.
Unemployment in both the Euro area and the U.K. had fallen to near multi-decade lows by the end of April 2022 but consumer sentiment across both regions tumbled lower in 2022. During the six month period, the European Central Bank maintained its ultra-low interest rate policy, while the Bank of England raised rates three times during the period amid the highest annual inflation rate in 30 years.
Within emerging markets, both equities and bonds underperformed throughout the six month period. China proved be the largest drag on emerging markets during the period as investor concerns about tighter regulatory scrutiny of large technology companies in 2021 gave way to strict lockdowns in several large cities amid a resurgence in COVID-19 infections throughout the country. The expected slowdown in China’s economy, and in its manufacturing sector in particular, weighed down financial markets in its emerging market trading partners. Rising prices for energy and a range of other commodities also raised investor concerns about economic growth across emerging market nations, particularly net importers of petroleum and natural gas. Additionally, the prospect of rising U.S. interest rates weighed on emerging market bond prices.
The S&P 500 Index returned -9.65%, the MSCI EAFE Index returned -11.58% and the MSCI Emerging Markets Index returned 14.04% for the six months ended April 30, 2022.
| 2 | J.P. Morgan Specialty Funds | April 30, 2022 |
JPMorgan Macro Opportunities Fund
FUND COMMENTARY
SIX MONTHS ENDED April 30, 2022 (Unaudited)
| REPORTING PERIOD RETURN: | |
Fund (Class I Shares) *
| (9.22)% |
ICE BofAML 3-Month US Treasury Bill Index
| 0.07% |
Net Assets as of 4/30/2022 (In Thousands)
| $18,222 |
INVESTMENT OBJECTIVE**
The JPMorgan Macro Opportunities Fund (the “Fund”) seeks to provide long-term capital appreciation.
WHAT WERE THE MAIN DRIVERS OF THE FUND’S PERFORMANCE?
The Fund’s Class I Shares posted a negative absolute performance and underperformed the ICE BofAML 3-Month U.S. Treasury Bill Index(the “Benchmark”) for the six months ended April 30, 2022.
Within equity, the Fund’s long exposures to the technology and consumer discretionary sectors were leading detractors from absolute performance during the period, largely due to investor expectations for rising U.S. interest rates. Within the technology sector, shares of companies involved in digital transformation and cloud computing were hurt by investor concerns about the rising costs of capital borrowing amid rising interest rates. The Fund’s global media streaming strategy also detracted from absolute performance amid weaker-than-expected earnings updates within the subsector.
The Fund’s defensive sector exposures, including in the health care and utilities sectors, which were held to reflect the cyclical economic slowdown, contributed to absolute performance. The Fund’s short positions in U.S. and European equities via options and futures also contributed to absolute performance. The Fund’s short position in the Nasdaq Composite Index via futures, which was held to hedge some of the Fund’s long technology sector exposure also contributed to absolute performance. The Fund’s long U.S. dollar positions against currencies that are generally sensitive to the strength of China’s
economy, including the Australian dollar, also contributed to absolute performance.
Within fixed income, the Fund’s long Australian government bond strategy was a leading detractor from absolute performance amid the Bank of Australia’s accelerated path toward interest rate policy normalization.
Relative to the Benchmark, the Fund’s allocation to equity was the leading detractor from performance relative to the Benchmark, which is a fixed income index that contains no equity.
HOW WAS THE FUND POSITIONED?
Against a cyclical economic slowdown backdrop and with increased risk of moving into economic contraction, the Fund’s portfolio managers sought a lower level of portfolio risk and reduced the Fund’s cyclical exposure by adding short positions in equity futures and options across U.S., European and emerging markets, as well as a greater weighting toward defensive areas of the equity market. Given near term geopolitical risk in the region, the portfolio managers removed the Fund’s long position in Chinese renminbi vs. a short position in the Taiwanese dollar strategy, which had been established through foreign exchange forward contracts.
In February 2022, prior to Russia’s invasion of Ukraine, the portfolio managers removed the Fund’s exposure to PJSC Sberbank, resulting in the Fund holding no assets in Russia, Ukraine or Belarus. Due to Europe’s greater reliance on Russian commodities, the portfolio managers reduced the Fund’s exposure to European financials during the period.
| April 30, 2022 | J.P. Morgan Specialty Funds | 3 |
JPMorgan Macro Opportunities Fund
FUND COMMENTARY
SIX MONTHS ENDED April 30, 2022 (Unaudited) (continued)
TOP TEN HOLDINGS OF THE
PORTFOLIO AS OF April 30, 2022 | | PERCENT OF
TOTAL
INVESTMENTS |
| 1. | HDFC Bank Ltd.,ADR (India)
| | 3.0% |
| 2. | Thermo Fisher Scientific, Inc.
| | 2.8 |
| 3. | Microsoft Corp.
| | 2.7 |
| 4. | Alphabet, Inc., Class A
| | 2.3 |
| 5. | Amazon.com, Inc.
| | 2.2 |
| 6. | Mastercard, Inc., Class A
| | 2.0 |
| 7. | LVMH Moet Hennessy Louis Vuitton SE (France)
| | 1.7 |
| 8. | ServiceNow, Inc.
| | 1.7 |
| 9. | Lululemon Athletica, Inc.
| | 1.7 |
| 10. | NIKE, Inc., Class B
| | 1.7 |
PORTFOLIO COMPOSTION BY SECTOR
AS OF April 30, 2022 | | PERCENT OF
TOTAL
INVESTMENTS |
Information Technology
| | 12.9% |
Financials
| | 11.0 |
Consumer Discretionary
| | 7.4 |
Health Care
| | 6.3 |
Communication Services
| | 2.3 |
Consumer Staples
| | 1.4 |
Industrials
| | 1.3 |
Utilities
| | 1.1 |
Others
| | 1.3 |
Short-Term Investments
| | 55.0 |
| * | The return shown is based on net asset values calculated for shareholder transactions and may differ from the return shown in the financial highlights, which reflects adjustments made to the net asset values in accordance with accounting principles generally accepted in the United States of America. |
| ** | The adviser seeks to achieve the Fund’s objective. There can be no guarantee it will be achieved. |
| 4 | J.P. Morgan Specialty Funds | April 30, 2022 |
AVERAGE ANNUAL TOTAL RETURNS AS OF April 30, 2022
| | INCEPTION DATE OF
CLASS | | 6 MONTH* | | 1 YEAR | | SINCE
INCEPTION |
| CLASS A SHARES | April 15, 2020 | | | | | | |
| With Sales Charge ** | | | (14.13)% | | (12.58)% | | (1.14)% |
| Without Sales Charge | | | (9.35) | | (7.73) | | 1.51 |
| CLASS C SHARES | April 15, 2020 | | | | | | |
| With CDSC *** | | | (10.56) | | (9.20) | | 1.01 |
| Without CDSC | | | (9.56) | | (8.20) | | 1.01 |
| Class I SHARES | April 15, 2020 | | (9.22) | | (7.49) | | 1.78 |
| Class R6 SHARES | September 30, 2020 | | (9.15) | | (7.26) | | 1.96 |
|
| * | Not annualized. |
| ** | Sales Charge for Class A Shares is 5.25%. |
| *** | Assumes a 1% CDSC (contingent deferred sales charge) for the 6 month and one year periods and 0% CDSC thereafter. |
LIFE OF FUND PERFORMANCE (4/15/20 TO 4/30/22)
The performance quoted is past performance and is not a guarantee of future results. Mutual funds are subject to certain market risks. Investment returns and principal value of an investment will fluctuate so that an investor’s shares, when redeemed, may be worth more or less than their original cost. Current performance may be higher or lower than the performance data shown. For up-to-date month-end performance information please call 1-800-480-4111.
The Fund commenced operations on April 15, 2020.
Returns for Class R6 Shares prior to its inception are based on the performance of Class I Shares. The actual returns of Class R6 Shares would have been different than those shown because Class R6 Shares have different expenses than Class I Shares.
The graph illustrates comparative performance for $1,000,000 invested in Class I Shares of the JPMorgan Macro Opportunities Fund and the ICE BofAML 3-Month US Treasury Bill Index from April 15, 2020 to April 30, 2022. The performance of the Fund assumes reinvestment of all dividends and capital gain distributions, if any, and does not include a sales charge. The performance of the ICE BofAML 3-Month US Treasury Bill Index does not reflect the deduction of expenses or a sales charge associated with a mutual fund and has
been adjusted to reflect reinvestment of all dividends and capital gains distributions of the securities included in the benchmark, if applicable. The ICE BofAML 3-Month US Treasury Bill Index is comprised of a single issue purchased at the beginning of the month and held for a full month. Each month the index is rebalanced and the issue selected is the outstanding Treasury Bill that matures closest to, but not beyond, 3 months from the rebalancing date. Investors cannot invest directly in an index.
Class I Shares have a $1,000,000 minimum initial investment.
Fund performance may reflect the waiver of the Fund’s fees and reimbursement of expenses for certain periods since the applicable inception date. Without these waivers and reimbursements, performance would have been lower. Also, performance shown in this section does not reflect the deduction of taxes that a shareholder would pay on Fund distributions or on gains resulting from redemptions of Fund shares.
The returns shown are based on net asset values calculated for shareholder transactions and may differ from the returns shown in the financial highlights, which reflect adjustments made to the net asset values in accordance with accounting principles generally accepted in the United States of America.
| April 30, 2022 | J.P. Morgan Specialty Funds | 5 |
JPMorgan Opportunistic Equity Long/Short Fund
FUND COMMENTARY
SIX MONTHS ENDED April 30, 2022 (Unaudited)
| REPORTING PERIOD RETURN: | |
Fund (Class I Shares) *
| (12.51)% |
S&P 500 Index
| (9.65)% |
ICE BofAML 3-Month US Treasury Bill Index
| 0.07% |
Net Assets as of 4/30/2022 (In Thousands)
| $615,906 |
INVESTMENT OBJECTIVE**
The JPMorgan Opportunistic Equity Long/Short Fund (the “Fund”) seeks capital appreciation.
WHAT WERE THE MAIN DRIVERS OF THE FUND’S PERFORMANCE?
The Fund’s Class I Shares underperformed the S&P 500 Index (the “Benchmark”) for the six months ended April 30, 2022.
The Fund’s short positions in the communication services sector and its long positions in the industrials sector were leading detractors from performance relative to the Benchmark. The Fund’s long positions in the health care sector and its short positions in the consumer discretionary sector were leading contributors to relative performance.
Leading individual detractors from absolute performance included the Fund’s long positions in Tempur Sealy International Inc. and Zscaler Inc. and shares of Seagate Technology Inc. Shares of Tempur Sealy International, a beds and bedding products maker, fell after the company reported lower-than-expected earnings and revenue for the fourth quarter of 2021. Shares of Zscaler, a cloud internet security platform provider, fell after the company issued a lower-than-expected earnings forecast in late February 2022.
Shares of Seagate Technology, a data storage provider, fell after the company lowered its outlook for the third quarter of 2022.
Leading individual contributors to absolute performance included the Fund’s long positions in UnitedHealth Group Inc. and CF Industries Holdings Inc., and its short position in 3M Co. Shares of UnitedHealth Group, a health insurance provider, rose after the company reported better-than-expected results for the first quarter of 2022. Shares of CF Industries, a fertilizer manufacturer, rose amid improved pricing and after the company issued a positive outlook. Shares of 3M, an industrial, safety and consumer products manufacturer, fell amid inflationary pressure and weaker-than-expected profit margins.
HOW WAS THE FUND POSITIONED?
During the six months ended April 30, 2022, the Fund invested the majority of its assets in long and short positions in equity securities, selecting from a universe of equity securities with market capitalizations similar to those included in the S& P 500 Index. The Fund’s portfolio managers sought to achieve lower volatility than the Benchmark through a disciplined research process, security selection and risk management. For the six month reporting period, the Fund’s average gross exposure was 93% and its average net exposure was 41%.
| 6 | J.P. Morgan Specialty Funds | April 30, 2022 |
TOP TEN LONG POSITIONS OF THE
PORTFOLIO AS OF April 30, 2022 | | PERCENT OF
TOTAL
INVESTMENTS |
| 1. | Target Corp.
| | 6.7% |
| 2. | Zimmer Biomet Holdings, Inc.
| | 5.7 |
| 3. | Tesla, Inc.
| | 5.4 |
| 4. | NXP Semiconductors NV (China)
| | 4.7 |
| 5. | PACCAR, Inc.
| | 4.4 |
| 6. | Centene Corp.
| | 4.4 |
| 7. | Old Dominion Freight Line, Inc.
| | 4.1 |
| 8. | UnitedHealth Group, Inc.
| | 4.0 |
| 9. | Dollar General Corp.
| | 3.2 |
| 10. | Advanced Micro Devices, Inc.
| | 3.2 |
TOP TEN SHORT POSITIONS OF THE
PORTFOLIO AS OF April 30, 2022 | | PERCENT OF
TOTAL
INVESTMENTS |
| 1. | Kimberly-Clark Corp.
| | 26.8% |
| 2. | 3M Co.
| | 16.2 |
| 3. | SPDR S&P 500 ETF Trust
| | 13.5 |
| 4. | SoFi Technologies, Inc.
| | 7.8 |
| 5. | Apple, Inc.
| | 7.5 |
| 6. | Johnson Controls International plc
| | 7.2 |
| 7. | Altria Group, Inc.
| | 7.1 |
| 8. | Wynn Resorts Ltd.
| | 7.0 |
| 9. | Conagra Brands, Inc.
| | 2.9 |
| 10. | ManpowerGroup, Inc.
| | 2.1 |
LONG POSITION PORTFOLIO COMPOSITION
BY SECTOR AS OF April 30, 2022 | | PERCENT OF
TOTAL
INVESTMENTS |
Consumer Discretionary
| | 19.0% |
Health Care
| | 14.0 |
Information Technology
| | 10.3 |
Industrials
| | 9.8 |
Financials
| | 1.9 |
Utilities
| | 1.6 |
Real Estate
| | 1.4 |
Exchange-Traded Fund
| | 1.0 |
Communication Services
| | 0.6 |
Short-Term Investments
| | 40.4 |
SHORT POSITION PORTFOLIO COMPOSITION
BY SECTOR AS OF April 30, 2022 | | PERCENT OF
TOTAL
INVESTMENTS |
Consumer Staples
| | 38.2% |
Industrials
| | 25.5 |
Exchange-Traded Fund
| | 13.5 |
Financials
| | 8.2 |
Information Technology
| | 7.5 |
Consumer Discretionary
| | 7.1 |
| * | The return shown is based on net asset values calculated for shareholder transactions and may differ from the return shown in the financial highlights, which reflects adjustments made to the net asset values in accordance with accounting principles generally accepted in the United States of America. |
| ** | The adviser seeks to achieve the Fund’s objective. There can be no guarantee it will be achieved. |
| April 30, 2022 | J.P. Morgan Specialty Funds | 7 |
JPMorgan Opportunistic Equity Long/Short Fund
FUND COMMENTARY
SIX MONTHS ENDED April 30, 2022 (Unaudited) (continued)
AVERAGE ANNUAL TOTAL RETURNS AS OF April 30, 2022
| | INCEPTION DATE OF
CLASS | | 6 MONTH* | | 1 YEAR | | 5 YEAR | | SINCE
INCEPTION |
| CLASS A SHARES | August 29, 2014 | | | | | | | | |
| With Sales Charge ** | | | (17.21)% | | (14.00)% | | 4.40% | | 5.65% |
| Without Sales Charge | | | (12.62) | | (9.24) | | 5.53 | | 6.40 |
| CLASS C SHARES | August 29, 2014 | | | | | | | | |
| With CDSC *** | | | (13.83) | | (10.69) | | 5.01 | | 5.87 |
| Without CDSC | | | (12.83) | | (9.69) | | 5.01 | | 5.87 |
| Class I SHARES | August 29, 2014 | | (12.51) | | (9.03) | | 5.80 | | 6.66 |
| Class R6 SHARES | August 29, 2014 | | (12.38) | | (8.80) | | 6.07 | | 6.93 |
|
| * | Not annualized. |
| ** | Sales Charge for Class A Shares is 5.25%. |
| *** | Assumes a 1% CDSC (contingent deferred sales charge) for the 6 month and one year periods and 0% CDSC thereafter. |
LIFE OF FUND PERFORMANCE (8/29/14 TO 4/30/22)
The performance quoted is past performance and is not a guarantee of future results. Mutual funds are subject to certain market risks. Investment returns and principal value of an investment will fluctuate so that an investor’s shares, when redeemed, may be worth more or less than their original cost. Current performance may be higher or lower than the performance data shown. For up-to-date month-end performance information please call 1-800-480-4111.
The Fund commenced operations on August 29, 2014.
The graph illustrates comparative performance for $1,000,000 invested in Class I Shares of the JPMorgan Opportunistic Equity Long/Short Fund, the S&P 500 Index and the ICE BofAML 3-Month US Treasury Bill Index from August 29, 2014 to April 30, 2022. The performance of the Fund assumes reinvestment of all dividends and capital gain distributions, if any, and does not include a sales charge. The performance of the S&P 500 Index and ICE BofAML 3-Month US Treasury Bill Index does not reflect the deduction of expenses or a sales charge associated with a mutual fund and has been adjusted to reflect reinvestment of all dividends and capital gain distributions of securities included in the benchmarks, if applicable. The S&P 500 Index is an unmanaged index generally representative of the performance of large companies in the U.S. stock market. The ICE BofAML 3-Month US Treasury Bill Index is comprised of a single issue
purchased at the beginning of the month and held for a full month. Each month the index is rebalanced and the issue selected is the outstanding Treasury Bill that matures closest to, but not beyond, 3 months from the rebalancing date. Investors cannot invest directly in an index.
From the inception of the Fund through January 23, 2015, the Fund did not experience any shareholder activity. If such activity had occurred, the Fund’s performance may have been impacted.
Class I Shares have a $1,000,000 minimum initial investment.
Fund performance may reflect the waiver of the Fund’s fees and reimbursement of expenses for certain periods since the inception date. Without these waivers and reimbursements, performance would have been lower. Also, performance shown in this section does not reflect the deduction of taxes that a shareholder would pay on Fund distributions or on gains resulting from redemptions of Fund shares.
The returns shown are based on net asset values calculated for shareholder transactions and may differ from the returns shown in the financial highlights, which reflect adjustments made to the net asset values in accordance with accounting principles generally accepted in the United States of America.
| 8 | J.P. Morgan Specialty Funds | April 30, 2022 |
JPMorgan Research Market Neutral Fund
FUND COMMENTARY
SIX MONTHS ENDED April 30, 2022 (Unaudited)
| REPORTING PERIOD RETURN: | |
Fund (Class I Shares) *
| (2.64)% |
ICE BofAML 3-Month US Treasury Bill Index
| 0.07% |
Net Assets as of 4/30/2022 (In Thousands)
| $124,347 |
INVESTMENT OBJECTIVE**
The JPMorgan Research Market Neutral Fund (the “Fund”) seeks to provide long-term capital appreciation from a broadly diversified portfolio of U.S. stocks while neutralizing the general risks associated with stock market investing.
WHAT WERE THE MAIN DRIVERS OF THE FUND’S PERFORMANCE?
The Fund’s Class I Shares underperformed the ICE BofAML 3-Month US Treasury Bill Index (the “Benchmark”) for the six months ended April 30, 2022.
The Fund’s security selection and overweight position in the media sector and its security selection in the retail sector were leading detractors from performance relative to the Benchmark, while the Fund’s security selection in the pharmaceuticals & health care sector and industrial cyclical sectors was a leading contributor to relative performance.
Leading individual detractors from relative performance included the Fund’s short positions in Kroger Co. and Omnicom Group Inc. and its long position in Shopify Inc. Shares of Kroger, a supermarket and department store chain, rose after the company reported better-than-expected earnings and revenue for the fourth quarter of 2021. Shares of Omicron Group, an advertising and marketing company, rose after the company reported better-than-expected earnings and revenue for the fourth quarter of 2021 and the first quarter of 2022. Shares of Shopify, an online merchant sales platform provider, fell after
the company reported declining growth amid reduced online spending by consumers during the period.
Leading individual contributors to relative performance included the Fund’s short position in Moderna Inc., and its long positions in Mastercard Inc. and Vertex Pharmaceuticals Inc.
Shares of Moderna, a pharmaceutical maker, underperformed amid investor concerns about disappointing clinical data for the company’s flu vaccine and slowing demand for its COVID-19 vaccine. Shares of Mastercard, a payment processing provider, rose after the company reported better-than-expected earnings and revenue for the fourth quarter of 2021. Shares of Vertex Pharmaceuticals, a biotechnology company, rose after the company reported better-than-expected earnings and revenue for the fourth quarter of 2021.
HOW WAS THE FUND POSITIONED?
The Fund’s portfolio managers aimed to construct a portfolio of long and short positions with a low correlation to the broader market for stocks and bonds. The Fund’s portfolio managers used fundamental research to estimate companies’ long-term earnings forecasts, ranking approximately 600 large and mid-cap stocks into five quintiles. The Fund’s portfolio managers looked to the top two quintiles for potential long positions in stocks that they believed were undervalued and the bottom two quintiles for potential short positions in stocks that they believed were overvalued.
| April 30, 2022 | J.P. Morgan Specialty Funds | 9 |
JPMorgan Research Market Neutral Fund
FUND COMMENTARY
SIX MONTHS ENDED April 30, 2022 (Unaudited) (continued)
TOP TEN LONG POSITIONS OF THE
PORTFOLIO AS OF April 30, 2022 | | PERCENT OF
TOTAL
INVESTMENTS |
| 1. | Mastercard, Inc., Class A
| | 2.5% |
| 2. | NXP Semiconductors NV (China)
| | 2.0 |
| 3. | Amazon.com, Inc.
| | 1.4 |
| 4. | Diamondback Energy, Inc.
| | 1.4 |
| 5. | Deere & Co.
| | 1.2 |
| 6. | AbbVie, Inc.
| | 1.2 |
| 7. | Exelon Corp.
| | 1.1 |
| 8. | Wells Fargo & Co.
| | 1.0 |
| 9. | Advanced Micro Devices, Inc.
| | 1.0 |
| 10. | FleetCor Technologies, Inc.
| | 1.0 |
TOP TEN SHORT POSITIONS OF THE
PORTFOLIO AS OF April 30, 2022 | | PERCENT OF
TOTAL
INVESTMENTS |
| 1. | Kroger Co. (The)
| | 3.3% |
| 2. | Omnicom Group, Inc.
| | 3.1 |
| 3. | 3M Co.
| | 2.3 |
| 4. | Enbridge, Inc.
| | 2.2 |
| 5. | Paramount Global, Class B
| | 2.1 |
| 6. | Intel Corp.
| | 1.9 |
| 7. | Walmart, Inc.
| | 1.8 |
| 8. | Apple, Inc.
| | 1.8 |
| 9. | NetApp, Inc.
| | 1.6 |
| 10. | Cisco Systems, Inc.
| | 1.6 |
LONG POSITION PORTFOLIO COMPOSITION
BY SECTOR AS OF April 30, 2022 | | PERCENT OF
TOTAL
INVESTMENTS |
Information Technology
| | 13.4% |
Industrials
| | 11.7 |
Health Care
| | 9.9 |
Consumer Discretionary
| | 8.0 |
Financials
| | 6.2 |
Energy
| | 4.7 |
Communication Services
| | 4.5 |
Utilities
| | 3.8 |
Real Estate
| | 2.3 |
Consumer Staples
| | 2.2 |
Materials
| | 1.9 |
Short-Term Investments
| | 31.4 |
SHORT POSITION PORTFOLIO COMPOSITION
BY SECTOR AS OF April 30, 2022 | | PERCENT OF
TOTAL
INVESTMENTS |
Information Technology
| | 16.8% |
Industrials
| | 16.4 |
Health Care
| | 11.3 |
Financials
| | 10.9 |
Consumer Staples
| | 10.2 |
Communication Services
| | 9.9 |
Energy
| | 5.9 |
Utilities
| | 5.8 |
Consumer Discretionary
| | 5.7 |
Real Estate
| | 4.4 |
Materials
| | 2.7 |
| * | The return shown is based on net asset values calculated for shareholder transactions and may differ from the return shown in the financial highlights, which reflects adjustments made to the net asset values in accordance with accounting principles generally accepted in the United States of America. |
| ** | The adviser seeks to achieve the Fund’s objective. There can be no guarantee it will be achieved. |
| 10 | J.P. Morgan Specialty Funds | April 30, 2022 |
AVERAGE ANNUAL TOTAL RETURNS AS OF April 30, 2022
| | INCEPTION DATE OF
CLASS | | 6 MONTH* | | 1 YEAR | | 5 YEAR | | 10 YEAR |
| CLASS A SHARES | February 28, 2002 | | | | | | | | |
| With Sales Charge ** | | | (7.86)% | | (6.94)% | | 1.97% | | 1.27% |
| Without Sales Charge | | | (2.74) | | (1.79) | | 3.08 | | 1.82 |
| CLASS C SHARES | November 2, 2009 | | | | | | | | |
| With CDSC *** | | | (3.98) | | (3.18) | | 2.58 | | 1.41 |
| Without CDSC | | | (2.98) | | (2.18) | | 2.58 | | 1.41 |
| Class I SHARES | November 2, 2009 | | (2.64) | | (1.52) | | 3.35 | | 2.08 |
|
| * | Not annualized. |
| ** | Sales Charge for Class A Shares is 5.25%. |
| *** | Assumes a 1% CDSC (contingent deferred sales charge) for the 6 month and one year periods and 0% CDSC thereafter. |
TEN YEAR FUND PERFORMANCE (4/30/12 TO 4/30/22)
The performance quoted is past performance and is not a guarantee of future results. Mutual funds are subject to certain market risks. Investment returns and principal value of an investment will fluctuate so that an investor’s shares, when redeemed, may be worth more or less than their original cost. Current performance may be higher or lower than the performance data shown. For up-to-date month-end performance information please call 1-800-480-4111.
The graph illustrates comparative performance for $1,000,000 invested in Class I Shares of the JPMorgan Research Market Neutral Fund and ICE BofAML 3-Month US Treasury Bill Index from April 30, 2012 to April 30, 2022. The performance of the Fund assumes reinvestment of all dividends and capital gain distributions, if any, and does not include a sales charge. The performance of the ICE BofAML 3-Month US Treasury Bill Index does not reflect the deduction of expenses or a sales charge associated with a mutual fund and has been adjusted to reflect reinvestment of all dividends and capital gain distributions of the securities included in the benchmark, if applicable. The ICE BofAML 3-Month US Treasury Bill Index is comprised of a single issue purchased at the beginning of the month and held for a full month. Each month the index
is rebalanced and the issue selected is the outstanding Treasury Bill that matures closest to, but not beyond, 3 months from the rebalancing date. Investors cannot invest directly in an index.
Class I Shares have a $1,000,000 minimum initial investment.
Fund performance may reflect the waiver of the Fund’s fees and reimbursement of expenses for certain periods. Without these waivers and reimbursements, performance would have been lower. Also, performance shown in this section does not reflect the deduction of taxes that a shareholder would pay on Fund distributions or on gains resulting from redemptions of Fund shares.
Because Class C Shares automatically convert to Class A Shares after 8 years, the 10 year average annual total return shown above for Class C reflects Class A performance for the period after conversion.
The returns shown are based on net asset values calculated for shareholder transactions and may differ from the returns shown in the financial highlights, which reflect adjustments made to the net asset values in accordance with accounting principles generally accepted in the United States of America.
| April 30, 2022 | J.P. Morgan Specialty Funds | 11 |
JPMorgan Macro Opportunities Fund
SCHEDULE OF PORTFOLIO INVESTMENTS
AS OF April 30, 2022 (Unaudited)
| INVESTMENTS | SHARES
(000) | VALUE
($000) |
| Common Stocks — 34.3% |
| Banks — 6.4% |
| Bank Central Asia Tbk. PT (Indonesia) | 102 | 58 |
| Bank Mandiri Persero Tbk. PT (Indonesia) | 139 | 85 |
| Bank Negara Indonesia Persero Tbk. PT (Indonesia) | 68 | 43 |
| Bank Rakyat Indonesia Persero Tbk. PT (Indonesia) | 519 | 173 |
| East West Bancorp, Inc. | 1 | 88 |
| First Republic Bank | 1 | 104 |
| HDFC Bank Ltd., ADR (India) | 8 | 435 |
| Signature Bank | 1 | 172 |
| | | 1,158 |
| Building Products — 1.0% |
| Allegion plc | 2 | 191 |
| Electric Utilities — 0.9% |
| Orsted A/S (Denmark) (a) | 1 | 163 |
| Electronic Equipment, Instruments & Components — 1.1% |
| Keyence Corp. (Japan) | 1 | 201 |
| Insurance — 2.3% |
| AIA Group Ltd. (Hong Kong) | 24 | 236 |
| Arthur J Gallagher & Co. | 1 | 175 |
| | | 411 |
| Interactive Media & Services — 1.8% |
| Alphabet, Inc., Class A * | — | 335 |
| Internet & Direct Marketing Retail — 1.7% |
| Amazon.com, Inc. * | — | 316 |
| IT Services — 2.0% |
| Mastercard, Inc., Class A | 1 | 280 |
| PayPal Holdings, Inc. * | 1 | 86 |
| | | 366 |
| Life Sciences Tools & Services — 2.2% |
| Thermo Fisher Scientific, Inc. | 1 | 396 |
| Personal Products — 1.1% |
| Estee Lauder Cos., Inc. (The), Class A | 1 | 193 |
| Pharmaceuticals — 2.8% |
| AstraZeneca plc (United Kingdom) | 1 | 132 |
| Eli Lilly & Co. | 1 | 230 |
| Novo Nordisk A/S, Class B (Denmark) | 1 | 147 |
| | | 509 |
| Semiconductors & Semiconductor Equipment — 0.4% |
| NVIDIA Corp. | — | 74 |
| INVESTMENTS | SHARES
(000) | VALUE
($000) |
| |
| Software — 6.6% |
| Adobe, Inc. * | 1 | 219 |
| Atlassian Corp. plc, Class A* | — | 136 |
| Microsoft Corp. | 1 | 386 |
| Salesforce, Inc. * | 1 | 221 |
| ServiceNow, Inc. * | 1 | 244 |
| | | 1,206 |
| Textiles, Apparel & Luxury Goods — 4.0% |
| Lululemon Athletica, Inc. * | 1 | 244 |
| LVMH Moet Hennessy Louis Vuitton SE (France) | — | 248 |
| NIKE, Inc., Class B | 2 | 242 |
| | | 734 |
Total Common Stocks
(Cost $5,724) | | 6,253 |
| | PRINCIPAL
AMOUNT
($000) | |
| Foreign Government Securities — 0.6% |
| Romania Government Bond | | |
| 2.75%, 2/26/2026 (a) | EUR 60 | 63 |
| 3.62%, 5/26/2030 (a) | EUR 58 | 55 |
Total Foreign Government Securities
(Cost $149) | | 118 |
| | NO. OF CONTRACTS | |
| Options Purchased — 0.4% |
| Call Options Purchased — 0.1% |
| Banks — 0.1% |
| Standard Chartered plc (United Kingdom) | | |
| 5/20/2022 at GBP 520.00, American Style | | |
| Notional Amount: GBP 60 | | |
| Counterparty: Exchange-Traded * | GBP 11 | 5 |
| Wells Fargo & Co. | | |
| 6/17/2022 at USD 52.50, American Style | | |
| Notional Amount: USD 96 | | |
| Counterparty: Exchange-Traded * | 22 | 1 |
| | | 6 |
SEE NOTES TO FINANCIAL STATEMENTS.
| 12 | J.P. Morgan Specialty Funds | April 30, 2022 |
| INVESTMENTS | NO. OF CONTRACTS | VALUE
($000) |
| Call Options Purchased — continued |
| Foreign Exchange Currency Options — 0.0% ^ |
| Foreign Exchange EUR / USD (European Union) | | |
| 5/5/2022 at EUR 1.15, Vanilla, European Style | | |
| Notional Amount: EUR 1,149 | | |
| Counterparty: Barclays Bank plc * | EUR 1,149,000 | — |
| 5/5/2022 at EUR 1.19, Vanilla, European Style | | |
| Notional Amount: EUR 575 | | |
| Counterparty: Barclays Bank plc * | EUR 575,000 | —(b) |
| 5/5/2022 at EUR 1.19, Vanilla, European Style | | |
| Notional Amount: EUR 574 | | |
| Counterparty: Barclays Bank plc * | EUR 574,000 | —(b) |
| 5/5/2022 at EUR 1.19, Vanilla, European Style | | |
| Notional Amount: EUR 575 | | |
| Counterparty: Barclays Bank plc * | EUR 575,000 | —(b) |
| | | — |
| Total Call Options Purchased | | 6 |
| Put Options Purchased — 0.3% |
| Foreign Exchange Currency Options — 0.1% |
| Foreign Exchange USD / JPY | | |
| 10/26/2022 at USD 123.00, Vanilla, European Style | | |
| Notional Amount: USD 1,841 | | |
| Counterparty: Goldman Sachs International * | 1,841,000 | 25 |
| Index Funds — 0.2% |
| S&P 500 Index | | |
| 5/6/2022 at USD 4,150.00, European Style | | |
| Notional Amount: USD 1,653 | | |
| Counterparty: Exchange-Traded * | 4 | 33 |
| Total Put Options Purchased | | 58 |
Total Options Purchased
(Cost $93) | | 64 |
| | PRINCIPAL
AMOUNT
($000) | |
| Short Term Investments — 43.1% |
| Foreign Government Treasury Bills — 23.1% |
| German Treasury Bills (Germany) | | |
| (0.74)%, 5/18/2022 (a) (c) | EUR 254 | 269 |
| INVESTMENTS | PRINCIPAL
AMOUNT
($000) | VALUE
($000) |
| |
| Foreign Government Treasury Bills — continued |
| (0.67)%, 6/22/2022 (a) (c) | EUR 841 | 888 |
| (0.68)%, 7/20/2022 (a) (c) | EUR 831 | 878 |
| Japan Treasury Bills (Japan) | | |
| (0.08)%, 6/6/2022 (c) | JPY 107,700 | 830 |
| (0.14)%, 7/25/2022 (c) | JPY 115,400 | 889 |
| (0.25)%, 8/1/2022 (c) | JPY 59,050 | 455 |
Total Foreign Government Treasury Bills
(Cost $4,438) | | 4,209 |
| | SHARES
(000) | |
| Investment Companies — 20.0% |
JPMorgan Prime Money Market Fund Class IM Shares, 0.42% (d) (e)
(Cost $3,640) | 3,639 | 3,639 |
Total Short Term Investments
(Cost $8,078) | | 7,848 |
Total Investments — 78.4%
(Cost $14,044) | | 14,283 |
| Other Assets Less Liabilities — 21.6% | | 3,939 |
| NET ASSETS — 100.0% | | 18,222 |
Percentages indicated are based on net assets. |
Amounts presented as a dash (“-“) represent amounts that round to less than a thousand. |
| Abbreviations | |
| ADR | American Depositary Receipt |
| EUR | Euro |
| GBP | British Pound |
| JPY | Japanese Yen |
| PT | Limited liability company |
| USD | United States Dollar |
| ^ | Amount rounds to less than 0.1% of net assets. |
| * | Non-income producing security. | |
| (a) | Security exempt from registration pursuant to Regulation S under the Securities Act of 1933, as amended. Regulation S applies to securities offerings that are made outside of the United States and do not involve direct selling efforts in the United States and as such may have restrictions on resale. | |
| (b) | Value is zero. | |
| (c) | The rate shown is the effective yield as of April 30, 2022. | |
SEE NOTES TO FINANCIAL STATEMENTS.
| April 30, 2022 | J.P. Morgan Specialty Funds | 13 |
JPMorgan Macro Opportunities Fund
SCHEDULE OF PORTFOLIO INVESTMENTS
AS OF April 30, 2022 (Unaudited) (continued)
| (d) | Investment in an affiliated fund, which is registered under the Investment Company Act of 1940, as amended, and is advised by J.P. Morgan Investment Management Inc. | |
| (e) | The rate shown is the current yield as of April 30, 2022. | |
Futures contracts outstanding as of April 30, 2022 (amounts in thousands, except number of contracts):
| DESCRIPTION | NUMBER OF
CONTRACTS | EXPIRATION DATE | TRADING CURRENCY | NOTIONAL
AMOUNT ($) | VALUE AND
UNREALIZED
APPRECIATION
(DEPRECIATION) ($) |
| Long Contracts | | | | | |
| Euro-Bund | 6 | 06/08/2022 | EUR | 973 | (29) |
| NASDAQ 100 E-Mini Index | 2 | 06/17/2022 | USD | 514 | (54) |
| STOXX Europe 600 Health Care Index | 6 | 06/17/2022 | EUR | 339 | 13 |
| STOXX 600 Insurance Index | 11 | 06/17/2022 | EUR | 179 | (1) |
| STOXX Europe 600 Utilities Equity Index | 13 | 06/17/2022 | EUR | 271 | 11 |
| XAU Utilities Index | 2 | 06/17/2022 | USD | 143 | 3 |
| XAV Health Care Index | 2 | 06/17/2022 | USD | 263 | 2 |
| | | | | | (55) |
| Short Contracts | | | | | |
| Euro-Bobl | (14) | 06/08/2022 | EUR | (1,879) | 22 |
| EURO STOXX 50 Index | (23) | 06/17/2022 | EUR | (893) | 37 |
| MSCI Emerging Markets E-Mini Index | (3) | 06/17/2022 | USD | (158) | 9 |
| S&P 500 E-Mini Index | (6) | 06/17/2022 | USD | (1,239) | 92 |
| STOXX 600 Banks Index | (63) | 06/17/2022 | EUR | (428) | 5 |
| U.S. Treasury 10 Year Note | (1) | 06/21/2022 | USD | (119) | 8 |
| | | | | | 173 |
| | | | | | 118 |
| Abbreviations | |
| EUR | Euro |
| MSCI | Morgan Stanley Capital International |
| NASDAQ | National Assosiation of Securities Dealers Automate Quotation |
| USD | United States Dollar |
SEE NOTES TO FINANCIAL STATEMENTS.
| 14 | J.P. Morgan Specialty Funds | April 30, 2022 |
Forward foreign currency exchange contracts outstanding as of April 30, 2022 (amounts in thousands):
CURRENCY
PURCHASED | CURRENCY
SOLD | COUNTERPARTY | SETTLEMENT
DATE | UNREALIZED
APPRECIATION
(DEPRECIATION ($) |
| USD | 727 | CNY | 4,799 | HSBC Bank, NA** | 5/24/2022 | 3 |
| USD | 177 | COP | 703,288 | BNP Paribas** | 5/24/2022 | —(a) |
| USD | 484 | DKK | 3,296 | BNP Paribas | 5/24/2022 | 16 |
| USD | 262 | HKD | 2,055 | Barclays Bank plc | 5/24/2022 | —(a) |
| USD | 45 | IDR | 650,899 | Bank of America NA** | 5/24/2022 | —(a) |
| USD | 1,099 | INR | 84,043 | BNP Paribas** | 5/24/2022 | 4 |
| USD | 729 | TWD | 21,082 | BNP Paribas** | 5/24/2022 | 12 |
| USD | 1,278 | ZAR | 18,843 | Goldman Sachs International | 5/24/2022 | 88 |
| GBP | 77 | USD | 96 | Goldman Sachs International | 7/25/2022 | 1 |
| USD | 1,452 | AUD | 1,965 | Goldman Sachs International | 7/25/2022 | 61 |
| USD | 3,460 | EUR | 3,160 | Goldman Sachs International | 7/25/2022 | 112 |
| USD | 251 | GBP | 191 | Goldman Sachs International | 7/25/2022 | 11 |
| USD | 2,434 | JPY | 307,559 | Goldman Sachs International | 7/25/2022 | 56 |
| Total unrealized appreciation | 364 |
| CNY | 4,732 | USD | 739 | Citibank, NA** | 5/24/2022 | (26) |
| DKK | 300 | USD | 44 | BNP Paribas | 5/24/2022 | (1) |
| DKK | 430 | USD | 64 | Merrill Lynch International | 5/24/2022 | (2) |
| DKK | 250 | USD | 36 | State Street Corp. | 5/24/2022 | (1) |
| IDR | 3,383,574 | USD | 235 | Standard Chartered Bank** | 5/24/2022 | (3) |
| INR | 5,509 | USD | 72 | Bank of America NA** | 5/24/2022 | —(a) |
| INR | 4,059 | USD | 53 | Citibank, NA** | 5/24/2022 | —(a) |
| KRW | 32,676 | USD | 27 | Barclays Bank plc** | 5/24/2022 | (1) |
| MXN | 3,739 | USD | 183 | Goldman Sachs International | 5/24/2022 | (1) |
| TWD | 21,522 | USD | 736 | HSBC Bank, NA** | 5/24/2022 | (4) |
| ZAR | 1,433 | USD | 93 | Goldman Sachs International | 5/24/2022 | (3) |
| ZAR | 2,688 | USD | 185 | HSBC Bank, NA | 5/24/2022 | (15) |
| ZAR | 3,392 | USD | 229 | Merrill Lynch International | 5/24/2022 | (16) |
| EUR | 756 | USD | 823 | Goldman Sachs International | 7/25/2022 | (21) |
| JPY | 175,822 | USD | 1,379 | Goldman Sachs International | 7/25/2022 | (19) |
| USD | 1,379 | JPY | 179,429 | Goldman Sachs International | 7/25/2022 | (8) |
| Total unrealized depreciation | (121) |
| Net unrealized appreciation | 243 |
| Abbreviations | |
| AUD | Australian Dollar |
| CNY | China Yuan |
| COP | Columbian Peso |
| DKK | Danish Krone |
| EUR | Euro |
| GBP | British Pound |
| HKD | Hong Kong Dollar |
| IDR | Indonesian Rupiah |
| INR | Indian Rupee |
| JPY | Japanese Yen |
| KRW | Korean Republic Won |
| MXN | Mexican Peso |
| TWD | Taiwan Dollar |
SEE NOTES TO FINANCIAL STATEMENTS.
| April 30, 2022 | J.P. Morgan Specialty Funds | 15 |
JPMorgan Macro Opportunities Fund
SCHEDULE OF PORTFOLIO INVESTMENTS
AS OF April 30, 2022 (Unaudited) (continued)
| USD | United States Dollar |
| ZAR | South African Rand |
| (a) | Amount rounds to less than one thousand. |
| ** | Non-deliverable forward. |
Written Call Options Contracts as of April 30, 2022 (amounts in thousands, except number of contracts):
|
| DESCRIPTION | COUNTERPARTY | NUMBER OF
CONTRACTS | NOTIONAL
AMOUNT | EXERCISE
PRICE | EXPIRATION
DATE | VALUE ($) |
| Foreign Exchange EUR / USD | Barclays Bank plc | 1,724,000 | EUR 1,724 | EUR 1.19 | 5/05/2022 | —(a) |
| Foreign Exchange EUR / USD | Barclays Bank plc | 1,149,000 | EUR 1,149 | EUR 1.15 | 5/05/2022 | —(a) |
| Total Written Options Contracts | —(a) |
Written Put Options Contracts as of April 30, 2022 (amounts in thousands, except number of contracts):
|
| DESCRIPTION | COUNTERPARTY | NUMBER OF
CONTRACTS | NOTIONAL
AMOUNT | EXERCISE
PRICE | EXPIRATION
DATE | VALUE ($) |
| Foreign Exchange USD / JPY | Goldman Sachs International | 1,841,000 | USD 1,841 | USD 120.00 | 10/26/2022 | (16) |
| Total Written Options Contracts (Premiums Received $32) | (16) |
|
| (a) | Amount rounds to less than one thousand. |
| Abbreviations | |
| EUR | Euro |
| JPY | Japanese Yen |
| USD | United States Dollar |
SEE NOTES TO FINANCIAL STATEMENTS.
| 16 | J.P. Morgan Specialty Funds | April 30, 2022 |
JPMorgan Opportunistic Equity Long/Short Fund
SCHEDULE OF PORTFOLIO INVESTMENTS
AS OF April 30, 2022 (Unaudited)
| INVESTMENTS | SHARES
(000) | VALUE
($000) |
| Long Positions — 102.1% |
| Common Stocks — 59.9% |
| Automobiles — 6.0% |
| Ferrari NV (Italy) | 15 | 3,150 |
| Tesla, Inc. * (a) | 39 | 33,988 |
| | | 37,138 |
| Diversified Financial Services — 2.0% |
| Berkshire Hathaway, Inc., Class B * (a) | 37 | 12,091 |
| Electric Utilities — 1.6% |
| Exelon Corp. | 215 | 10,079 |
| Equity Real Estate Investment Trusts (REITs) — 1.4% |
| Welltower, Inc. | 95 | 8,584 |
| Health Care Equipment & Supplies — 5.8% |
| Zimmer Biomet Holdings, Inc. (a) | 297 | 35,836 |
| Health Care Providers & Services — 8.5% |
| Centene Corp. * (a) | 342 | 27,530 |
| UnitedHealth Group, Inc. (a) | 49 | 24,942 |
| | | 52,472 |
| Interactive Media & Services — 0.7% |
| Alphabet, Inc., Class A * | 2 | 4,062 |
| Machinery — 4.5% |
| PACCAR, Inc. (a) | 335 | 27,790 |
| Multiline Retail — 10.1% |
| Dollar General Corp. | 85 | 20,129 |
| Target Corp. | 185 | 42,279 |
| | | 62,408 |
| Road & Rail — 5.5% |
| Old Dominion Freight Line, Inc. (a) | 93 | 25,862 |
| Union Pacific Corp. (a) | 33 | 7,793 |
| | | 33,655 |
| Semiconductors & Semiconductor Equipment — 8.1% |
| Advanced Micro Devices, Inc. * | 233 | 19,899 |
| NXP Semiconductors NV (China) | 173 | 29,654 |
| | | 49,553 |
| Software — 2.4% |
| Microsoft Corp. (a) | 53 | 14,829 |
| Specialty Retail — 3.2% |
| O'Reilly Automotive, Inc. * (a) | 33 | 19,809 |
| INVESTMENTS | SHARES
(000) | VALUE
($000) |
| |
| |
| Technology Hardware, Storage & Peripherals — 0.1% |
| Seagate Technology Holdings plc | 7 | 617 |
Total Common Stocks
(Cost $368,112) | | 368,923 |
| Exchange-Traded Funds — 1.0% |
| U.S. Equity — 1.0% |
| Invesco Trust (Cost $6,126) | 19 | 5,981 |
| Short-Term Investments — 41.2% |
| Investment Companies — 41.2% |
| JPMorgan Prime Money Market Fund Class Institutional Shares, 0.36% (b) (c)(Cost $253,878) | 253,821 | 253,872 |
Total Long Positions
(Cost $628,116) | | 628,776 |
| Short Positions — (21.8)% |
| Common Stocks — (18.8)% |
| Automobiles — (0.0)% ^ |
| Rivian Automotive, Inc., Class A * | (2) | (62) |
| Building Products — (1.6)% |
| Johnson Controls International plc | (161) | (9,649) |
| Consumer Finance — (1.8)% |
| SoFi Technologies, Inc. * | (1,702) | (10,416) |
| Upstart Holdings, Inc. * | (7) | (543) |
| | | (10,959) |
| Food Products — (0.9)% |
| Conagra Brands, Inc. | (110) | (3,856) |
| Kellogg Co. | (27) | (1,826) |
| | | (5,682) |
| Hotels, Restaurants & Leisure — (1.5)% |
| Wynn Resorts Ltd. * | (134) | (9,437) |
| Household Products — (5.8)% |
| Kimberly-Clark Corp. | (259) | (35,957) |
| Industrial Conglomerates — (3.5)% |
| 3M Co. | (150) | (21,643) |
| Internet & Direct Marketing Retail — (0.0)% ^ |
| Wayfair, Inc., Class A * | (1) | (58) |
| Professional Services — (0.5)% |
| ManpowerGroup, Inc. | (32) | (2,849) |
| Technology Hardware, Storage & Peripherals — (1.6)% |
| Apple, Inc. | (64) | (10,071) |
SEE NOTES TO FINANCIAL STATEMENTS.
| April 30, 2022 | J.P. Morgan Specialty Funds | 17 |
JPMorgan Opportunistic Equity Long/Short Fund
SCHEDULE OF PORTFOLIO INVESTMENTS
AS OF April 30, 2022 (Unaudited) (continued)
| INVESTMENTS | SHARES
(000) | VALUE
($000) |
| Short Positions — continued |
| Common Stocks — continued |
| Tobacco — (1.6)% |
| Altria Group, Inc. | (172) | (9,568) |
Total Common Stocks
(Proceeds $(118,017)) | | (115,935) |
| Exchange-Traded Funds — (3.0)% |
| U.S. Equity — (3.0)% |
SPDR S&P 500 ETF Trust
(Proceeds $(18,095)) | (44) | (18,124) |
Total Short Positions
(Proceeds $(136,112)) | | (134,059) |
Total Investments — 80.3%
(Cost $492,004) | | 494,717 |
| Other Assets Less Liabilities — 19.7% | | 121,189 |
| Net Assets — 100.0% | | 615,906 |
Percentages indicated are based on net assets. |
| Abbreviations | |
| ETF | Exchange Traded Fund |
| SPDR | Standard & Poor's Depositary Receipt |
| ^ | Amount rounds to less than 0.1% of net assets. |
| * | Non-income producing security. | |
| (a) | All or a portion of this security is segregated as collateral for short sales. The total value of securities and cash segregated as collateral is $70,910 and $154,144, respectively. | |
| (b) | Investment in an affiliated fund, which is registered under the Investment Company Act of 1940, as amended, and is advised by J.P. Morgan Investment Management Inc. | |
| (c) | The rate shown is the current yield as of April 30, 2022. | |
SEE NOTES TO FINANCIAL STATEMENTS.
| 18 | J.P. Morgan Specialty Funds | April 30, 2022 |
JPMorgan Research Market Neutral Fund
SCHEDULE OF PORTFOLIO INVESTMENTS
AS OF April 30, 2022 (Unaudited)
| INVESTMENTS | SHARES
(000) | VALUE
($000) |
| Long Positions — 98.4% |
| Common Stocks — 67.5% |
| Aerospace & Defense — 1.6% |
| Howmet Aerospace, Inc. | 12 | 417 |
| Northrop Grumman Corp. | 2 | 719 |
| Raytheon Technologies Corp. | 6 | 562 |
| Textron, Inc. | 3 | 243 |
| TransDigm Group, Inc. * | — | 97 |
| | | 2,038 |
| Air Freight & Logistics — 0.5% |
| FedEx Corp. | — | 70 |
| United Parcel Service, Inc., Class B | 3 | 500 |
| | | 570 |
| Auto Components — 0.7% |
| Aptiv plc * | 2 | 237 |
| Lear Corp. | 1 | 137 |
| Magna International, Inc. (Canada) | 9 | 498 |
| | | 872 |
| Automobiles — 0.1% |
| Rivian Automotive, Inc., Class A * | 4 | 133 |
| Banks — 2.4% |
| Fifth Third Bancorp | 18 | 657 |
| M&T Bank Corp. | 2 | 345 |
| SVB Financial Group * | 1 | 359 |
| Truist Financial Corp. | 6 | 293 |
| Wells Fargo & Co. (a) | 29 | 1,278 |
| | | 2,932 |
| Beverages — 1.2% |
| Coca-Cola Co. (The) | 6 | 362 |
| Constellation Brands, Inc., Class A | 1 | 280 |
| Monster Beverage Corp. * | 4 | 341 |
| PepsiCo, Inc. | 3 | 529 |
| | | 1,512 |
| Biotechnology — 3.9% |
| AbbVie, Inc. (a) | 10 | 1,423 |
| Biogen, Inc. * | 3 | 610 |
| BioMarin Pharmaceutical, Inc. * | 4 | 373 |
| Neurocrine Biosciences, Inc. * | 3 | 272 |
| Regeneron Pharmaceuticals, Inc. * | 1 | 674 |
| Sarepta Therapeutics, Inc. * | 5 | 335 |
| Vertex Pharmaceuticals, Inc. * | 4 | 1,217 |
| | | 4,904 |
| INVESTMENTS | SHARES
(000) | VALUE
($000) |
| |
| |
| Building Products — 0.8% |
| Fortune Brands Home & Security, Inc. | — | 23 |
| Trane Technologies plc | 7 | 952 |
| | | 975 |
| Capital Markets — 1.4% |
| Charles Schwab Corp. (The) | 9 | 590 |
| CME Group, Inc. | 1 | 188 |
| Morgan Stanley | 1 | 68 |
| S&P Global, Inc. | 2 | 744 |
| State Street Corp. | 1 | 120 |
| | | 1,710 |
| Chemicals — 1.0% |
| Air Products and Chemicals, Inc. (a) | 1 | 157 |
| DuPont de Nemours, Inc. (a) | 5 | 368 |
| Eastman Chemical Co. (a) | 2 | 182 |
| Linde plc (United Kingdom) | 1 | 389 |
| PPG Industries, Inc. | 1 | 102 |
| | | 1,198 |
| Commercial Services & Supplies — 0.8% |
| Republic Services, Inc. | 4 | 561 |
| Waste Connections, Inc. | 4 | 483 |
| | | 1,044 |
| Communications Equipment — 0.1% |
| Juniper Networks, Inc. | 5 | 154 |
| Construction Materials — 0.5% |
| Martin Marietta Materials, Inc. | 1 | 445 |
| Vulcan Materials Co. | 1 | 190 |
| | | 635 |
| Consumer Finance — 0.8% |
| American Express Co. | 5 | 962 |
| Electric Utilities — 1.9% |
| Alliant Energy Corp. | 1 | 72 |
| Exelon Corp. | 29 | 1,376 |
| FirstEnergy Corp. | 14 | 593 |
| Xcel Energy, Inc. | 5 | 366 |
| | | 2,407 |
| Electrical Equipment — 0.6% |
| Eaton Corp. plc | 5 | 706 |
SEE NOTES TO FINANCIAL STATEMENTS.
| April 30, 2022 | J.P. Morgan Specialty Funds | 19 |
JPMorgan Research Market Neutral Fund
SCHEDULE OF PORTFOLIO INVESTMENTS
AS OF April 30, 2022 (Unaudited) (continued)
| INVESTMENTS | SHARES
(000) | VALUE
($000) |
| Long Positions — continued |
| Common Stocks — continued |
| Electronic Equipment, Instruments & Components — 0.6% |
| Corning, Inc. | 10 | 371 |
| Keysight Technologies, Inc. * | 3 | 410 |
| | | 781 |
| Energy Equipment & Services — 0.5% |
| Baker Hughes Co. | 18 | 565 |
| Entertainment — 0.7% |
| Endeavor Group Holdings, Inc., Class A * | 40 | 914 |
| Equity Real Estate Investment Trusts (REITs) — 2.3% |
| American Homes 4 Rent, Class A | 6 | 250 |
| Camden Property Trust | 2 | 373 |
| Equinix, Inc. | — | 136 |
| Host Hotels & Resorts, Inc. | 3 | 63 |
| Invitation Homes, Inc. | 9 | 334 |
| Kimco Realty Corp. | 12 | 288 |
| Prologis, Inc. | 2 | 355 |
| Sun Communities, Inc. | 2 | 341 |
| UDR, Inc. | 5 | 271 |
| Ventas, Inc. | 1 | 69 |
| WP Carey, Inc. | 1 | 88 |
| Cousins Properties, Inc. | 9 | 306 |
| | | 2,874 |
| Food Products — 0.7% |
| Hershey Co. (The) | 3 | 679 |
| Mondelez International, Inc., Class A | 3 | 196 |
| | | 875 |
| Health Care Equipment & Supplies — 1.3% |
| Becton Dickinson and Co. | 1 | 215 |
| Boston Scientific Corp. * | 16 | 685 |
| Intuitive Surgical, Inc. * | 2 | 433 |
| Zimmer Biomet Holdings, Inc. | 2 | 238 |
| | | 1,571 |
| Health Care Providers & Services — 2.4% |
| Centene Corp. * | 8 | 643 |
| CVS Health Corp. (a) | 9 | 927 |
| Humana, Inc. | 1 | 365 |
| UnitedHealth Group, Inc. (a) | 2 | 1,005 |
| | | 2,940 |
| Hotels, Restaurants & Leisure — 2.7% |
| Booking Holdings, Inc. * | — | 170 |
| INVESTMENTS | SHARES
(000) | VALUE
($000) |
| |
| |
| Hotels, Restaurants & Leisure — continued |
| Chipotle Mexican Grill, Inc. * | 1 | 672 |
| Domino's Pizza, Inc. | 1 | 315 |
| Expedia Group, Inc. * | 2 | 361 |
| Hilton Worldwide Holdings, Inc. * | — | 47 |
| Marriott International, Inc., Class A * | 2 | 397 |
| McDonald's Corp. | 4 | 901 |
| Yum! Brands, Inc. (a) | 4 | 501 |
| | | 3,364 |
| Household Durables — 0.3% |
| Toll Brothers, Inc. | 7 | 333 |
| Household Products — 0.2% |
| Procter & Gamble Co. (The) | 1 | 207 |
| Industrial Conglomerates — 0.0% ^ |
| Roper Technologies, Inc. | — | 47 |
| Insurance — 1.5% |
| Arthur J Gallagher & Co. | 3 | 487 |
| Hartford Financial Services Group, Inc. (The) | 5 | 318 |
| Progressive Corp. (The) (a) | 10 | 1,118 |
| | | 1,923 |
| Interactive Media & Services — 1.9% |
| Alphabet, Inc., Class C * | — | 561 |
| Alphabet, Inc., Class A * | — | 301 |
| Meta Platforms, Inc., Class A * | 3 | 624 |
| Snap, Inc., Class A * | 31 | 861 |
| | | 2,347 |
| Internet & Direct Marketing Retail — 1.4% |
| Amazon.com, Inc. * (a) | — | 1,748 |
| DoorDash, Inc., Class A * | 1 | 57 |
| | | 1,805 |
| IT Services — 4.9% |
| Affirm Holdings, Inc. * | 9 | 273 |
| Automatic Data Processing, Inc. | 1 | 185 |
| Fidelity National Information Services, Inc. | 1 | 129 |
| FleetCor Technologies, Inc. * | 5 | 1,233 |
| Mastercard, Inc., Class A (a) | 9 | 3,097 |
| Shopify, Inc., Class A (Canada) * (a) | 1 | 542 |
| Visa, Inc., Class A | 1 | 171 |
| WEX, Inc. * | 3 | 446 |
| | | 6,076 |
SEE NOTES TO FINANCIAL STATEMENTS.
| 20 | J.P. Morgan Specialty Funds | April 30, 2022 |
| INVESTMENTS | SHARES
(000) | VALUE
($000) |
| Long Positions — continued |
| Common Stocks — continued |
| Life Sciences Tools & Services — 1.2% |
| Danaher Corp. | 2 | 413 |
| PerkinElmer, Inc. | 3 | 383 |
| Thermo Fisher Scientific, Inc. (a) | 1 | 709 |
| | | 1,505 |
| Machinery — 3.2% |
| Deere & Co. (a) | 4 | 1,464 |
| Dover Corp. | 8 | 1,067 |
| Ingersoll Rand, Inc. | 5 | 225 |
| Otis Worldwide Corp. | 11 | 819 |
| Parker-Hannifin Corp. | 2 | 363 |
| | | 3,938 |
| Media — 1.1% |
| Charter Communications, Inc., Class A * | 1 | 401 |
| Comcast Corp., Class A | 7 | 262 |
| Liberty Media Corp.-Liberty SiriusXM, Class A * | 17 | 723 |
| | | 1,386 |
| Metals & Mining — 0.4% |
| Freeport-McMoRan, Inc. | 11 | 448 |
| Multiline Retail — 0.4% |
| Dollar General Corp. | 2 | 446 |
| Multi-Utilities — 1.8% |
| Ameren Corp. (a) | 13 | 1,218 |
| CenterPoint Energy, Inc. | 16 | 478 |
| NiSource, Inc. | 9 | 274 |
| Sempra Energy | 2 | 232 |
| | | 2,202 |
| Oil, Gas & Consumable Fuels — 4.2% |
| Cheniere Energy, Inc. | 3 | 466 |
| ConocoPhillips (a) | 11 | 1,014 |
| Coterra Energy, Inc. | 5 | 146 |
| Diamondback Energy, Inc. (a) | 13 | 1,686 |
| EOG Resources, Inc. | 5 | 565 |
| ONEOK, Inc. | 5 | 290 |
| Phillips 66 | 8 | 703 |
| Pioneer Natural Resources Co. (a) | 1 | 318 |
| | | 5,188 |
| Personal Products — 0.1% |
| Estee Lauder Cos., Inc. (The), Class A | — | 123 |
| INVESTMENTS | SHARES
(000) | VALUE
($000) |
| |
| |
| Pharmaceuticals — 1.0% |
| Bristol-Myers Squibb Co. | 12 | 892 |
| Eli Lilly & Co. | 1 | 316 |
| | | 1,208 |
| Professional Services — 0.9% |
| Booz Allen Hamilton Holding Corp. | 5 | 406 |
| Leidos Holdings, Inc. (a) | 7 | 697 |
| | | 1,103 |
| Road & Rail — 3.1% |
| Canadian National Railway Co. (Canada) | 2 | 235 |
| CSX Corp. | 9 | 303 |
| Knight-Swift Transportation Holdings, Inc. | 5 | 243 |
| Lyft, Inc., Class A * (a) | 35 | 1,146 |
| Norfolk Southern Corp. (a) | 3 | 825 |
| Old Dominion Freight Line, Inc. | 2 | 620 |
| Uber Technologies, Inc. * (a) | 12 | 379 |
| Union Pacific Corp. | 1 | 55 |
| XPO Logistics, Inc. * | 2 | 100 |
| | | 3,906 |
| Semiconductors & Semiconductor Equipment — 5.5% |
| Advanced Micro Devices, Inc. * (a) | 15 | 1,261 |
| Analog Devices, Inc. | 3 | 519 |
| Lam Research Corp. (a) | 1 | 525 |
| Marvell Technology, Inc. | 3 | 150 |
| Microchip Technology, Inc. | 5 | 293 |
| NXP Semiconductors NV (China) | 14 | 2,418 |
| ON Semiconductor Corp. * | 7 | 346 |
| Taiwan Semiconductor Manufacturing Co. Ltd., ADR (Taiwan) | 3 | 270 |
| Teradyne, Inc. | 4 | 449 |
| Texas Instruments, Inc. | 3 | 554 |
| | | 6,785 |
| Software — 1.1% |
| Autodesk, Inc. * | 1 | 250 |
| Coupa Software, Inc. * | 4 | 299 |
| DocuSign, Inc. * | 3 | 213 |
| Intuit, Inc. | — | 140 |
| Microsoft Corp. | 1 | 326 |
| Workday, Inc., Class A * | 1 | 183 |
| | | 1,411 |
SEE NOTES TO FINANCIAL STATEMENTS.
| April 30, 2022 | J.P. Morgan Specialty Funds | 21 |
JPMorgan Research Market Neutral Fund
SCHEDULE OF PORTFOLIO INVESTMENTS
AS OF April 30, 2022 (Unaudited) (continued)
| INVESTMENTS | SHARES
(000) | VALUE
($000) |
| Long Positions — continued |
| Common Stocks — continued |
| Specialty Retail — 2.3% |
| AutoZone, Inc. * | — | 430 |
| Best Buy Co., Inc. | 4 | 325 |
| Burlington Stores, Inc. * | 3 | 597 |
| Lowe's Cos., Inc. (a) | 4 | 797 |
| O'Reilly Automotive, Inc. * (a) | 1 | 745 |
| | | 2,894 |
| Technology Hardware, Storage & Peripherals — 0.9% |
| Hewlett Packard Enterprise Co. | 22 | 339 |
| Seagate Technology Holdings plc | 10 | 836 |
| | | 1,175 |
| Wireless Telecommunication Services — 0.6% |
| T-Mobile US, Inc. * | 7 | 812 |
Total Common Stocks
(Cost $73,623) | | 83,904 |
| Short-Term Investments — 30.9% |
| Investment Companies — 30.9% |
| JPMorgan Prime Money Market Fund Class Institutional Shares, 0.36% (b) (c)(Cost $38,464) | 38,460 | 38,468 |
Total Long Positions
(Cost $112,087) | | 122,372 |
| Short Positions — (63.5)% |
| Common Stocks — (63.5)% |
| Aerospace & Defense — (0.9)% |
| Hexcel Corp. | (3) | (152) |
| Huntington Ingalls Industries, Inc. | (4) | (795) |
| L3Harris Technologies, Inc. | — | (142) |
| | | (1,089) |
| Air Freight & Logistics — (1.0)% |
| CH Robinson Worldwide, Inc. | (7) | (737) |
| Expeditors International of Washington, Inc. | (5) | (542) |
| | | (1,279) |
| Auto Components — (0.8)% |
| Autoliv, Inc. (Sweden) | (6) | (438) |
| BorgWarner, Inc. | (16) | (575) |
| | | (1,013) |
| Automobiles — (0.1)% |
| Harley-Davidson, Inc. | (2) | (81) |
| INVESTMENTS | SHARES
(000) | VALUE
($000) |
| |
| |
| Banks — (2.1)% |
| First Republic Bank | (4) | (623) |
| Huntington Bancshares, Inc. | (56) | (734) |
| KeyCorp | (38) | (727) |
| PNC Financial Services Group, Inc. (The) | (3) | (493) |
| | | (2,577) |
| Beverages — (0.1)% |
| Brown-Forman Corp., Class B | (2) | (125) |
| Biotechnology — (2.0)% |
| Amgen, Inc. | (2) | (448) |
| Gilead Sciences, Inc. | (15) | (888) |
| Moderna, Inc. * | (9) | (1,197) |
| | | (2,533) |
| Building Products — (1.3)% |
| Allegion plc | (3) | (359) |
| Carrier Global Corp. | (15) | (557) |
| Johnson Controls International plc | (10) | (614) |
| Masco Corp. | (2) | (130) |
| | | (1,660) |
| Capital Markets — (2.3)% |
| BlackRock, Inc. | (1) | (443) |
| Franklin Resources, Inc. | (24) | (602) |
| Goldman Sachs Group, Inc. (The) | (1) | (351) |
| Moody's Corp. | (2) | (672) |
| MSCI, Inc. | (1) | (311) |
| Northern Trust Corp. | (5) | (527) |
| | | (2,906) |
| Chemicals — (0.5)% |
| Dow, Inc. | (7) | (432) |
| Ecolab, Inc. | (1) | (150) |
| Sherwin-Williams Co. (The) | — | (65) |
| | | (647) |
| Commercial Services & Supplies — (0.2)% |
| Waste Management, Inc. | (1) | (224) |
| Communications Equipment — (1.0)% |
| Cisco Systems, Inc. | (26) | (1,266) |
| Consumer Finance — (1.0)% |
| Capital One Financial Corp. | (9) | (1,073) |
| Discover Financial Services | (1) | (172) |
| | | (1,245) |
SEE NOTES TO FINANCIAL STATEMENTS.
| 22 | J.P. Morgan Specialty Funds | April 30, 2022 |
| INVESTMENTS | SHARES
(000) | VALUE
($000) |
| Short Positions — continued |
| Common Stocks — continued |
| Containers & Packaging — (1.2)% |
| AptarGroup, Inc. | �� (3) | (386) |
| Ball Corp. | (4) | (311) |
| International Paper Co. | (7) | (307) |
| Packaging Corp. of America | (1) | (112) |
| Silgan Holdings, Inc. | (8) | (376) |
| | | (1,492) |
| Diversified Telecommunication Services — (1.6)% |
| AT&T, Inc. | (36) | (684) |
| Lumen Technologies, Inc. | (60) | (599) |
| Verizon Communications, Inc. | (16) | (741) |
| | | (2,024) |
| Electric Utilities — (3.1)% |
| American Electric Power Co., Inc. | (12) | (1,140) |
| Duke Energy Corp. | (7) | (739) |
| Eversource Energy | (5) | (416) |
| Pinnacle West Capital Corp. | (6) | (461) |
| PPL Corp. | (13) | (361) |
| Southern Co. (The) | (10) | (758) |
| | | (3,875) |
| Electrical Equipment — (1.4)% |
| Acuity Brands, Inc. | (3) | (478) |
| Emerson Electric Co. | (5) | (464) |
| Hubbell, Inc. | (3) | (677) |
| Sensata Technologies Holding plc * | (2) | (93) |
| | | (1,712) |
| Electronic Equipment, Instruments & Components — (0.1)% |
| Cognex Corp. | (3) | (176) |
| Energy Equipment & Services — (0.5)% |
| Schlumberger NV | (17) | (651) |
| Entertainment — (0.3)% |
| AMC Entertainment Holdings, Inc., Class A * | (22) | (339) |
| Warner Bros Discovery, Inc. * | — | — |
| | | (339) |
| Equity Real Estate Investment Trusts (REITs) — (2.8)% |
| AvalonBay Communities, Inc. | — | (101) |
| Duke Realty Corp. | (6) | (331) |
| Equity Residential | (1) | (98) |
| Iron Mountain, Inc. | (19) | (996) |
| National Retail Properties, Inc. | (14) | (592) |
| INVESTMENTS | SHARES
(000) | VALUE
($000) |
| |
| |
| Equity Real Estate Investment Trusts (REITs) — continued |
| Orion Office REIT, Inc. | — | — |
| Realty Income Corp. | (3) | (221) |
| Simon Property Group, Inc. | (6) | (735) |
| SL Green Realty Corp. | (4) | (239) |
| Vornado Realty Trust | (5) | (200) |
| | | (3,513) |
| Food & Staples Retailing — (4.1)% |
| Costco Wholesale Corp. | — | (100) |
| Kroger Co. (The) | (48) | (2,574) |
| Walgreens Boots Alliance, Inc. | (23) | (987) |
| Walmart, Inc. | (10) | (1,448) |
| | | (5,109) |
| Food Products — (1.3)% |
| Campbell Soup Co. | (9) | (429) |
| Conagra Brands, Inc. | (6) | (226) |
| General Mills, Inc. | (6) | (401) |
| Kellogg Co. | (9) | (585) |
| | | (1,641) |
| Gas Utilities — (0.4)% |
| National Fuel Gas Co. | (6) | (438) |
| Health Care Equipment & Supplies — (1.2)% |
| Baxter International, Inc. | (9) | (652) |
| Stryker Corp. | (3) | (774) |
| | | (1,426) |
| Health Care Providers & Services — (1.0)% |
| Henry Schein, Inc. * | (5) | (390) |
| Quest Diagnostics, Inc. | (5) | (630) |
| Universal Health Services, Inc., Class B | (1) | (198) |
| | | (1,218) |
| Hotels, Restaurants & Leisure — (0.9)% |
| Starbucks Corp. | (15) | (1,132) |
| Household Durables — (0.3)% |
| Mohawk Industries, Inc. * | (1) | (106) |
| NVR, Inc. * | — | (171) |
| PulteGroup, Inc. | (3) | (137) |
| | | (414) |
| Household Products — (1.0)% |
| Church & Dwight Co., Inc. | (2) | (233) |
SEE NOTES TO FINANCIAL STATEMENTS.
| April 30, 2022 | J.P. Morgan Specialty Funds | 23 |
JPMorgan Research Market Neutral Fund
SCHEDULE OF PORTFOLIO INVESTMENTS
AS OF April 30, 2022 (Unaudited) (continued)
| INVESTMENTS | SHARES
(000) | VALUE
($000) |
| Short Positions — continued |
| Common Stocks — continued |
| Household Products — continued |
| Clorox Co. (The) | (4) | (587) |
| Kimberly-Clark Corp. | (3) | (377) |
| | | (1,197) |
| Industrial Conglomerates — (2.1)% |
| 3M Co. | (13) | (1,829) |
| General Electric Co. | (11) | (830) |
| | | (2,659) |
| Insurance — (1.5)% |
| Allstate Corp. (The) | (4) | (500) |
| Aon plc, Class A | — | (119) |
| Chubb Ltd. | (3) | (639) |
| Ryan Specialty Group Holdings, Inc., Class A * | (7) | (273) |
| W R Berkley Corp. | (3) | (188) |
| Willis Towers Watson plc | (1) | (138) |
| | | (1,857) |
| Internet & Direct Marketing Retail — (0.6)% |
| eBay, Inc. | (15) | (796) |
| IT Services — (2.5)% |
| Cognizant Technology Solutions Corp., Class A | (7) | (531) |
| DXC Technology Co. * | (4) | (107) |
| Global Payments, Inc. | (3) | (385) |
| Jack Henry & Associates, Inc. | (1) | (207) |
| Paychex, Inc. | (5) | (607) |
| PayPal Holdings, Inc. * | (1) | (100) |
| Western Union Co. (The) | (70) | (1,179) |
| | | (3,116) |
| Life Sciences Tools & Services — (0.8)% |
| Agilent Technologies, Inc. | (3) | (438) |
| Waters Corp. * | (2) | (533) |
| | | (971) |
| Machinery — (1.6)% |
| Caterpillar, Inc. | (2) | (451) |
| Donaldson Co., Inc. | (4) | (206) |
| IDEX Corp. | (1) | (210) |
| Illinois Tool Works, Inc. | (4) | (674) |
| PACCAR, Inc. | (5) | (406) |
| | | (1,947) |
| Media — (4.4)% |
| Interpublic Group of Cos., Inc. (The) | (27) | (888) |
| INVESTMENTS | SHARES
(000) | VALUE
($000) |
| |
| |
| Media — continued |
| Omnicom Group, Inc. | (32) | (2,426) |
| Paramount Global, Class B | (57) | (1,650) |
| Sirius XM Holdings, Inc. | (83) | (499) |
| | | (5,463) |
| Multiline Retail — (0.3)% |
| Macy's, Inc. | (6) | (151) |
| Target Corp. | (1) | (215) |
| | | (366) |
| Multi-Utilities — (0.2)% |
| Dominion Energy, Inc. | (3) | (231) |
| Oil, Gas & Consumable Fuels — (3.2)% |
| Enbridge, Inc. (Canada) | (40) | (1,733) |
| Exxon Mobil Corp. | (11) | (948) |
| Hess Corp. | (10) | (1,037) |
| Marathon Oil Corp. | (11) | (269) |
| | | (3,987) |
| Pharmaceuticals — (2.2)% |
| Johnson & Johnson | (3) | (571) |
| Merck & Co., Inc. | (10) | (845) |
| Pfizer, Inc. | (16) | (806) |
| Zoetis, Inc. | (3) | (526) |
| | | (2,748) |
| Professional Services — (0.5)% |
| Equifax, Inc. | — | (48) |
| TransUnion | (4) | (349) |
| Verisk Analytics, Inc. | (1) | (211) |
| | | (608) |
| Road & Rail — (1.0)% |
| Canadian Pacific Railway Ltd. (Canada) | (2) | (162) |
| Heartland Express, Inc. | (19) | (257) |
| JB Hunt Transport Services, Inc. | (2) | (289) |
| Werner Enterprises, Inc. | (13) | (515) |
| | | (1,223) |
| Semiconductors & Semiconductor Equipment — (3.0)% |
| Broadcom, Inc. | (3) | (1,244) |
| Intel Corp. | (34) | (1,491) |
| QUALCOMM, Inc. | (6) | (847) |
| Universal Display Corp. | (1) | (135) |
| | | (3,717) |
SEE NOTES TO FINANCIAL STATEMENTS.
| 24 | J.P. Morgan Specialty Funds | April 30, 2022 |
| INVESTMENTS | SHARES
(000) | VALUE
($000) |
| Short Positions — continued |
| Common Stocks — continued |
| Software — (1.4)% |
| Ceridian HCM Holding, Inc. * | (10) | (558) |
| Oracle Corp. | (1) | (46) |
| Palantir Technologies, Inc., Class A * | (13) | (135) |
| Paycom Software, Inc. * | (2) | (504) |
| Salesforce, Inc. * | (1) | (270) |
| VMware, Inc., Class A | (2) | (231) |
| | | (1,744) |
| Specialty Retail — (0.4)% |
| CarMax, Inc. * | (3) | (268) |
| Williams-Sonoma, Inc. | (1) | (162) |
| | | (430) |
| Technology Hardware, Storage & Peripherals — (2.6)% |
| Apple, Inc. | (9) | (1,410) |
| HP, Inc. | (13) | (488) |
| NetApp, Inc. | (17) | (1,275) |
| Xerox Holdings Corp. | (5) | (79) |
| | | (3,252) |
| Textiles, Apparel & Luxury Goods — (0.2)% |
| VF Corp. | (5) | (280) |
| Trading Companies & Distributors — (0.5)% |
| Fastenal Co. | (10) | (566) |
Total Common Stocks
(Proceeds $(84,734)) | | (78,963) |
Total Short Positions
(Proceeds $(84,734)) | | (78,963) |
Total Investments — 34.9%
(Cost $27,353) | | 43,409 |
| Other Assets Less Liabilities — 65.1% | | 80,938 |
| Net Assets — 100.0% | | 124,347 |
Percentages indicated are based on net assets. |
Amounts presented as a dash (“-“) represent amounts that round to less than a thousand. |
| Abbreviations | |
| ADR | American Depositary Receipt |
| ^ | Amount rounds to less than 0.1% of net assets. |
| * | Non-income producing security. | |
| (a) | All or a portion of this security is segregated as collateral for short sales. The total value of securities and cash segregated as collateral is $14,707 and $80,921, respectively. | |
| (b) | Investment in an affiliated fund, which is registered under the Investment Company Act of 1940, as amended, and is advised by J.P. Morgan Investment Management Inc. | |
| (c) | The rate shown is the current yield as of April 30, 2022. | |
SEE NOTES TO FINANCIAL STATEMENTS.
| April 30, 2022 | J.P. Morgan Specialty Funds | 25 |
STATEMENTS OF ASSETS AND LIABILITIES
AS OF April 30, 2022 (Unaudited)
(Amounts in thousands, except per share amounts)
| | JPMorgan
Macro
Opportunities
Fund | | JPMorgan
Opportunistic
Equity
Long/Short Fund | | JPMorgan
Research
Market
Neutral Fund |
| ASSETS: | | | | | |
| Investments in non-affiliates, at value | $10,580 | | $374,904 | | $ 83,904 |
| Investments in affiliates, at value | 3,639 | | 253,872 | | 38,468 |
| Options purchased, at value | 64 | | — | | — |
| Restricted cash for exchange-traded options | 813 | | — | | — |
| Cash | 2,503 | | — | | — |
| Foreign currency, at value | 88 | | — | | — |
| Deposits at broker for futures contracts | — | | — | | 72 |
| Deposits at broker for securities sold short | — | | 154,144 | | 80,921 |
| Receivables: | | | | | |
| Due from custodian | — | | 9,881 | | — |
| Investment securities sold | — | | 67,190 | | 3,524 |
| Fund shares sold | — | | 597 | | 271 |
| Interest from non-affiliates | 2 | | — | | 5 |
| Dividends from non-affiliates | 2 | | 68 | | 54 |
| Dividends from affiliates | —(a) | | 78 | | 10 |
| Tax reclaims | 4 | | — | | — |
| Variation margin on futures contracts | 425 | | — | | — |
| Unrealized appreciation on forward foreign currency exchange contracts | 364 | | — | | — |
| Due from adviser | 15 | | — | | — |
| Total Assets | 18,499 | | 860,734 | | 207,229 |
| LIABILITIES: | | | | | |
| Payables: | | | | | |
| Due to custodian | — | | — | | 9 |
| Securities sold short, at value | — | | 134,059 | | 78,963 |
| Dividend expense to non-affiliates on securities sold short | — | | 34 | | 72 |
| Investment securities purchased | — | | 108,906 | | 3,634 |
| Interest expense to non-affiliates on securities sold short | — | | 2 | | — |
| Fund shares redeemed | — | | 1,062 | | 54 |
| Variation margin on futures contracts | — | | — | | 2 |
| Unrealized depreciation on forward foreign currency exchange contracts | 121 | | — | | — |
| Outstanding options written, at fair value | 16 | | — | | — |
| Accrued liabilities: | | | | | |
| Investment advisory fees | — | | 612 | | 26 |
| Administration fees | — | | 40 | | 3 |
| Distribution fees | —(a) | | 9 | | 5 |
| Service fees | 4 | | 77 | | 25 |
| Custodian and accounting fees | 7 | | 3 | | 8 |
| Trustees’ and Chief Compliance Officer’s fees | — | | — | | 1 |
| Other | 129 | | 24 | | 80 |
| Total Liabilities | 277 | | 244,828 | | 82,882 |
| Net Assets | $18,222 | | $615,906 | | $124,347
(a) Amount rounds to less than one thousand. |
SEE NOTES TO FINANCIAL STATEMENTS.
| 26 | J.P. Morgan Specialty Funds | April 30, 2022 |
| | JPMorgan
Macro
Opportunities
Fund | | JPMorgan
Opportunistic
Equity
Long/Short Fund | | JPMorgan
Research
Market
Neutral Fund |
| NET ASSETS: | | | | | |
| Paid-in-Capital | $17,857 | | $626,090 | | $144,805 |
| Total distributable earnings (loss) | 365 | | (10,184) | | (20,458) |
| Total Net Assets: | $18,222 | | $615,906 | | $124,347 |
| Net Assets: | | | | | |
| Class A | $ 338 | | $ 25,474 | | $ 19,566 |
| Class C | 293 | | 5,566 | | 1,128 |
| Class I | 17,571 | | 327,760 | | 103,653 |
| Class R6 | 20 | | 257,106 | | — |
| Total | $18,222 | | $615,906 | | $124,347 |
Outstanding units of beneficial interest (shares)
($0.0001 par value; unlimited number of shares authorized): | | | | | |
| Class A | 22 | | 1,369 | | 1,621 |
| Class C | 19 | | 313 | | 105 |
| Class I | 1,146 | | 17,239 | | 8,015 |
| Class R6 | 1 | | 13,257 | | — |
| Net Asset Value (a): | | | | | |
| Class A — Redemption price per share | $ 15.25 | | $ 18.61 | | $ 12.07 |
| Class C — Offering price per share (b) | 15.16 | | 17.78 | | 10.76 |
| Class I — Offering and redemption price per share | 15.34 | | 19.01 | | 12.93 |
| Class R6 — Offering and redemption price per share | 15.37 | | 19.39 | | — |
| Class A maximum sales charge | 5.25% | | 5.25% | | 5.25% |
Class A maximum public offering price per share
[net asset value per share/(100% – maximum sales charge)] | $ 16.09 | | $ 19.64 | | $ 12.74 |
| Cost of investments in non-affiliates | $10,311 | | $374,238 | | $ 73,623 |
| Cost of investments in affiliates | 3,640 | | 253,878 | | 38,464 |
| Cost of options purchased | 93 | | — | | — |
| Cost of foreign currency | 88 | | — | | — |
| Premiums received from options written | 32 | | — | | — |
| Proceeds from securities sold short | — | | 136,112 | | 84,734 |
| (a) | Per share amounts may not recalculate due to rounding of net assets and/or shares outstanding. |
| (b) | Redemption price for Class C Shares varies based upon length of time the shares are held. |
SEE NOTES TO FINANCIAL STATEMENTS.
| April 30, 2022 | J.P. Morgan Specialty Funds | 27 |
STATEMENTS OF OPERATIONS
FOR THE SIX MONTHS ENDED April 30, 2022 (Unaudited)
(Amounts in thousands)
| | JPMorgan
Macro
Opportunities
Fund | | JPMorgan
Opportunistic
Equity
Long/Short Fund | | JPMorgan
Research
Market
Neutral Fund |
| INVESTMENT INCOME: | | | | | |
| Interest income from non-affiliates | $ 3 | | $ — | | $ — |
| Interest income from affiliates | 5 | | — | | — |
| Dividend income from non-affiliates | 30 | | 1,978 | | 606 |
| Dividend income from affiliates | 3 | | 145 | | 17 |
| Foreign taxes withheld (net) | (3) | | — | | — |
| Total investment income | 38 | | 2,123 | | 623 |
| EXPENSES: | | | | | |
| Investment advisory fees | 56 | | 4,215 | | 195 |
| Administration fees | 7 | | 264 | | 42 |
| Distribution fees: | | | | | |
| Class A | —(a) | | 36 | | 23 |
| Class C | 1 | | 24 | | 5 |
| Service fees: | | | | | |
| Class A | —(a) | | 36 | | 23 |
| Class C | —(a) | | 8 | | 2 |
| Class I | 23 | | 474 | | 115 |
| Custodian and accounting fees | 21 | | 18 | | 21 |
| Interest expense to affiliates | 5 | | — | | — |
| Professional fees | 82 | | 45 | | 35 |
| Trustees’ and Chief Compliance Officer’s fees | 12 | | 13 | | 13 |
| Printing and mailing costs | 9 | | 23 | | 3 |
| Registration and filing fees | 31 | | 45 | | 34 |
| Transfer agency fees (See Note 2.I) | —(a) | | 10 | | 3 |
| Dividend expense to non-affiliates on securities sold short | — | | 2,194 | | 1,110 |
| Interest expense to non-affiliates on securities sold short | — | | 374 | | 49 |
| Other | 5 | | 16 | | 6 |
| Total expenses | 252 | | 7,795 | | 1,679 |
| Less fees waived | (64) | | (120) | | (115) |
| Less expense reimbursements | (95) | | — | | — |
| Net expenses | 93 | | 7,675 | | 1,564 |
| Net investment income (loss) | $ (55) | | $ (5,552) | | $ (941)
(a) Amount rounds to less than one thousand. |
SEE NOTES TO FINANCIAL STATEMENTS.
| 28 | J.P. Morgan Specialty Funds | April 30, 2022 |
| | JPMorgan
Macro
Opportunities
Fund | | JPMorgan
Opportunistic
Equity
Long/Short Fund | | JPMorgan
Research
Market
Neutral Fund |
| REALIZED/UNREALIZED GAINS (LOSSES): | | | | | |
| Net realized gain (loss) on transactions from: | | | | | |
| Investments in non-affiliates | $ (493) | | $ 34,101 | | $ 5,115 |
| Investments in affiliates | —(a) | | (75) | | (7) |
| Options purchased | (127) | | (72) | | — |
| Futures contracts | 189 | | — | | (485) |
| Securities sold short | — | | (18,960) | | (3,669) |
| Foreign currency transactions | (6) | | —(a) | | — |
| Forward foreign currency exchange contracts | 353 | | — | | — |
| Options written | 31 | | — | | — |
| Net realized gain (loss) | (53) | | 14,994 | | 954 |
| Change in net unrealized appreciation/depreciation on: | | | | | |
| Investments in non-affiliates | (2,093) | | (105,657) | | (12,965) |
| Investments in affiliates | (1) | | (6) | | 1 |
| Options purchased | 4 | | (21) | | — |
| Futures contracts | 207 | | — | | 7 |
| Securities sold short | — | | 1,934 | | 9,626 |
| Foreign currency translations | (2) | | — | | — |
| Forward foreign currency exchange contracts | 170 | | — | | — |
| Options written | 16 | | — | | — |
| Change in net unrealized appreciation/depreciation | (1,699) | | (103,750) | | (3,331) |
| Net realized/unrealized gains (losses) | (1,752) | | (88,756) | | (2,377) |
| Change in net assets resulting from operations | $(1,807) | | $ (94,308) | | $ (3,318) |
| (a) | Amount rounds to less than one thousand. |
SEE NOTES TO FINANCIAL STATEMENTS.
| April 30, 2022 | J.P. Morgan Specialty Funds | 29 |
STATEMENTS OF CHANGES IN NET ASSETS
FOR THE PERIODS INDICIATED
(Amounts in thousands)
| | JPMorgan Macro
Opportunities Fund | | JPMorgan Opportunistic
Equity Long/Short Fund |
| | Six Months Ended
April 30, 2022
(Unaudited) | | Year Ended
October 31, 2021 | | Six Months Ended
April 30, 2022
(Unaudited) | | Year Ended
October 31, 2021 |
| CHANGE IN NET ASSETS RESULTING FROM OPERATIONS: | | | | | | | |
| Net investment income (loss) | $ (55) | | $ (5) | | $ (5,552) | | $ (11,007) |
| Net realized gain (loss) | (53) | | 762 | | 14,994 | | 78,034 |
| Change in net unrealized appreciation/depreciation | (1,699) | | 1,024 | | (103,750) | | 42,356 |
| Change in net assets resulting from operations | (1,807) | | 1,781 | | (94,308) | | 109,383 |
| DISTRIBUTIONS TO SHAREHOLDERS: | | | | | | | |
| Class A | (5) | | — | | (3,030) | | (918) |
| Class C | (1) | | — | | (702) | | (222) |
| Class I | (243) | | — | | (38,675) | | (10,347) |
| Class R6 | (1) | | — | | (29,311) | | (9,883) |
| Total distributions to shareholders | (250) | | — | | (71,718) | | (21,370) |
| CAPITAL TRANSACTIONS: | | | | | | | |
| Change in net assets resulting from capital transactions | 1,092 | | 1,974 | | 36,278 | | 172,125 |
| NET ASSETS: | | | | | | | |
| Change in net assets | (965) | | 3,755 | | (129,748) | | 260,138 |
| Beginning of period | 19,187 | | 15,432 | | 745,654 | | 485,516 |
| End of period | $18,222 | | $19,187 | | $ 615,906 | | $745,654 |
SEE NOTES TO FINANCIAL STATEMENTS.
| 30 | J.P. Morgan Specialty Funds | April 30, 2022 |
| | JPMorgan
Research Market
Neutral Fund |
| | Six Months Ended
April 30, 2022
(Unaudited) | | Year Ended
October 31, 2021 |
| CHANGE IN NET ASSETS RESULTING FROM OPERATIONS: | | | |
| Net investment income (loss) | $ (941) | | $ (1,566) |
| Net realized gain (loss) | 954 | | 5,737 |
| Change in net unrealized appreciation/depreciation | (3,331) | | (2,033) |
| Change in net assets resulting from operations | (3,318) | | 2,138 |
| DISTRIBUTIONS TO SHAREHOLDERS: | | | |
| Class A | — | | (1,124) |
| Class C | — | | (159) |
| Class I | — | | (6,901) |
| Total distributions to shareholders | — | | (8,184) |
| CAPITAL TRANSACTIONS: | | | |
| Change in net assets resulting from capital transactions | 35,475 | | (43,203) |
| NET ASSETS: | | | |
| Change in net assets | 32,157 | | (49,249) |
| Beginning of period | 92,190 | | 141,439 |
| End of period | $124,347 | | $ 92,190 |
SEE NOTES TO FINANCIAL STATEMENTS.
| April 30, 2022 | J.P. Morgan Specialty Funds | 31 |
STATEMENTS OF CHANGES IN NET ASSETS
FOR THE PERIODS INDICIATED (continued)
(Amounts in thousands)
| | JPMorgan Macro
Opportunities Fund | | JPMorgan Opportunistic
Equity Long/Short Fund |
| | Six Months Ended
April 30, 2022
(Unaudited) | | Year Ended
October 31, 2021 | | Six Months Ended
April 30, 2022
(Unaudited) | | Year Ended
October 31, 2021 |
| CAPITAL TRANSACTIONS: | | | | | | | |
| Class A | | | | | | | |
| Proceeds from shares issued | $ 98 | | $ 337 | | $ 3,227 | | $ 16,519 |
| Distributions reinvested | 5 | | — | | 2,956 | | 913 |
| Cost of shares redeemed | (16) | | (80) | | (4,264) | | (11,337) |
| Change in net assets resulting from Class A capital transactions | 87 | | 257 | | 1,919 | | 6,095 |
| Class C | | | | | | | |
| Proceeds from shares issued | 225 | | 54 | | 493 | | 2,019 |
| Distributions reinvested | 1 | | — | | 692 | | 218 |
| Cost of shares redeemed | — | | — | | (1,135) | | (537) |
| Change in net assets resulting from Class C capital transactions | 226 | | 54 | | 50 | | 1,700 |
| Class I | | | | | | | |
| Proceeds from shares issued | 1,501 | | 1,682 | | 109,246 | | 242,796 |
| Distributions reinvested | 243 | | — | | 38,027 | | 10,199 |
| Cost of shares redeemed | (965) | | (19) | | (127,958) | | (124,700) |
| Change in net assets resulting from Class I capital transactions | 779 | | 1,663 | | 19,315 | | 128,295 |
| Class R6 | | | | | | | |
| Proceeds from shares issued | — | | — | | 53,852 | | 76,310 |
| Distributions reinvested | — | | — | | 6,999 | | 2,265 |
| Cost of shares redeemed | — | | — | | (45,857) | | (42,540) |
| Change in net assets resulting from Class R6 capital transactions | — | | — | | 14,994 | | 36,035 |
| Total change in net assets resulting from capital transactions | $1,092 | | $1,974 | | $ 36,278 | | $ 172,125 |
| SHARE TRANSACTIONS: | | | | | | | |
| Class A | | | | | | | |
| Issued | 6 | | 20 | | 151 | | 742 |
| Reinvested | — | | — | | 139 | | 43 |
| Redeemed | (1) | | (5) | | (212) | | (512) |
| Change in Class A Shares | 5 | | 15 | | 78 | | 273 |
| Class C | | | | | | | |
| Issued | 14 | | 4 | | 25 | | 94 |
| Reinvested | — | | — | | 34 | | 11 |
| Redeemed | — | | — | | (57) | | (25) |
| Change in Class C Shares | 14 | | 4 | | 2 | | 80 |
| Class I | | | | | | | |
| Issued | 94 | | 101 | | 5,156 | | 10,786 |
| Reinvested | 15 | | — | | 1,747 | | 471 |
| Redeemed | (61) | | (1) | | (6,228) | | (5,539) |
| Change in Class I Shares | 48 | | 100 | | 675 | | 5,718 |
| Class R6 | | | | | | | |
| Issued | — | | — | | 2,517 | | 3,324 |
| Reinvested | — | | — | | 315 | | 103 |
| Redeemed | (—) | | (—) | | (2,208) | | (1,866) |
| Change in Class R6 Shares | — | | — | | 624 | | 1,561 |
SEE NOTES TO FINANCIAL STATEMENTS.
| 32 | J.P. Morgan Specialty Funds | April 30, 2022 |
| | JPMorgan
Research Market
Neutral Fund |
| | Six Months Ended
April 30, 2022
(Unaudited) | | Year Ended
October 31, 2021 |
| CAPITAL TRANSACTIONS: | | | |
| Class A | | | |
| Proceeds from shares issued | $ 5,623 | | $ 6,793 |
| Distributions reinvested | — | | 1,075 |
| Cost of shares redeemed | (2,357) | | (8,506) |
| Change in net assets resulting from Class A capital transactions | 3,266 | | (638) |
| Class C | | | |
| Proceeds from shares issued | 132 | | 417 |
| Distributions reinvested | — | | 159 |
| Cost of shares redeemed | (180) | | (1,175) |
| Change in net assets resulting from Class C capital transactions | (48) | | (599) |
| Class I | | | |
| Proceeds from shares issued | 62,710 | | 41,158 |
| Distributions reinvested | — | | 6,758 |
| Cost of shares redeemed | (30,453) | | (89,882) |
| Change in net assets resulting from Class I capital transactions | 32,257 | | (41,966) |
| Total change in net assets resulting from capital transactions | $ 35,475 | | $(43,203) |
| SHARE TRANSACTIONS: | | | |
| Class A | | | |
| Issued | 453 | | 559 |
| Reinvested | — | | 90 |
| Redeemed | (191) | | (689) |
| Change in Class A Shares | 262 | | (40) |
| Class C | | | |
| Issued | 12 | | 37 |
| Reinvested | — | | 15 |
| Redeemed | (16) | | (109) |
| Change in Class C Shares | (4) | | (57) |
| Class I | | | |
| Issued | 4,740 | | 3,149 |
| Reinvested | — | | 532 |
| Redeemed | (2,306) | | (6,877) |
| Change in Class I Shares | 2,434 | | (3,196) |
SEE NOTES TO FINANCIAL STATEMENTS.
| April 30, 2022 | J.P. Morgan Specialty Funds | 33 |
FINANCIAL HIGHLIGHTS
FOR THE PERIODS INDICATED
| | Per share operating performance |
| | | Investment operations |
| | Net asset
value,
beginning
of period | Net
investment
income
(loss)(b) | Net realized
and unrealized
gains
(losses) on
investments | Total from
investment
operations |
| JPMorgan Macro Opportunities Fund | | | | |
| Class A | | | | |
| Six Months Ended April 30, 2022(Unaudited) | $17.05 | $(0.07) | $(1.50) | $(1.57) |
| Year Ended October 31, 2021 | 15.38 | (0.08) | 1.75 | 1.67 |
| April 15, 2020(g) through October 31, 2020 | 15.00 | (0.01) | 0.39 | 0.38 |
| Class C | | | | |
| Six Months Ended April 30, 2022(Unaudited) | 16.93 | (0.10) | (1.51) | (1.61) |
| Year Ended October 31, 2021 | 15.34 | (0.15) | 1.74 | 1.59 |
| April 15, 2020(g) through October 31, 2020 | 15.00 | (0.06) | 0.40 | 0.34 |
| Class I | | | | |
| Six Months Ended April 30, 2022(Unaudited) | 17.12 | (0.05) | (1.51) | (1.56) |
| Year Ended October 31, 2021 | 15.40 | (0.01) | 1.73 | 1.72 |
| April 15, 2020(g) through October 31, 2020 | 15.00 | —(h) | 0.40 | 0.40 |
| Class R6 | | | | |
| Six Months Ended April 30, 2022(Unaudited) | 17.17 | (0.03) | (1.51) | (1.54) |
| Year Ended October 31, 2021 | 15.41 | 0.04 | 1.72 | 1.76 |
| September 30, 2020(i) through October 31, 2020 | 15.35 | 0.01 | 0.05 | 0.06 |
|
| (a) | Annualized for periods less than one year, unless otherwise noted. |
| (b) | Calculated based upon average shares outstanding. |
| (c) | Includes adjustments in accordance with accounting principles generally accepted in the United States of America and as such, the net asset values for financial reporting purposes and the returns based upon those net asset values may differ from the net asset values and returns for shareholder transactions. |
| (d) | Not annualized for periods less than one year. |
| (e) | Includes earnings credits and interest expense, if applicable, each of which is less than 0.005% unless otherwise noted. |
| (f) | Certain non-recurring expenses incurred by the Fund were not annualized for the period indicated. |
| (g) | Commencement of operations. |
| (h) | Amount rounds to less than $0.005. |
| (i) | Commencement of offering of class of shares. |
SEE NOTES TO FINANCIAL STATEMENTS.
| 34 | J.P. Morgan Specialty Funds | April 30, 2022 |
FINANCIAL HIGHLIGHTS
FOR THE PERIODS INDICATED
| | | Ratios/Supplemental data |
| Distributions | | | | Ratios to average net assets(a) | |
Net
investment
income | Net asset
value,
end of
period | Total return
(excludes
sales charge)(c)(d) | Net assets,
end of
period
(000's) | Net
expenses(e) | Net
investment
income
(loss) | Expenses without
waivers and reimbursements(e) | Portfolio
turnover
rate(d) |
| | | | | | | | |
| | | | | | | | |
| $(0.23) | $15.25 | (9.30)% | $ 338 | 1.23(f)% | (0.84)(f)% | 2.96(f)% | 48% |
| — | 17.05 | 10.86 | 290 | 1.21 | (0.48) | 3.28 | 99 |
| — | 15.38 | 2.53 | 27 | 1.20(f) | (0.18)(f) | 5.12(f) | 49 |
| | | | | | | | |
| (0.16) | 15.16 | (9.56) | 293 | 1.73(f) | (1.30)(f) | 3.45(f) | 48 |
| — | 16.93 | 10.37 | 77 | 1.71 | (0.89) | 3.83 | 99 |
| — | 15.34 | 2.27 | 20 | 1.70(f) | (0.70)(f) | 5.76(f) | 49 |
| | | | | | | | |
| (0.22) | 15.34 | (9.16) | 17,571 | 0.98(f) | (0.59)(f) | 2.70(f) | 48 |
| — | 17.12 | 11.17 | 18,798 | 0.96 | (0.04) | 3.11 | 99 |
| — | 15.40 | 2.67 | 15,365 | 0.95(f) | 0.05(f) | 4.24(f) | 49 |
| | | | | | | | |
| (0.26) | 15.37 | (9.10) | 20 | 0.73(f) | (0.35)(f) | 2.52(f) | 48 |
| — | 17.17 | 11.42 | 22 | 0.71 | 0.22 | 2.93 | 99 |
| — | 15.41 | 0.39 | 20 | 0.77(f) | 0.84(f) | 7.24(f) | 49 |
SEE NOTES TO FINANCIAL STATEMENTS.
| April 30, 2022 | J.P. Morgan Specialty Funds | 35 |
FINANCIAL HIGHLIGHTS
FOR THE PERIODS INDICATED (continued)
| | Per share operating performance |
| | | Investment operations | | Distributions |
| | Net asset
value,
beginning
of period | Net
investment
income
(loss)(b) | Net realized
and unrealized
gains
(losses) on
investments | Total from
investment
operations | | Net
investment
income | Net
realized
gain | Total
distributions |
| JPMorgan Opportunistic Equity Long/Short Fund | | | | | | | | |
| Class A | | | | | | | | |
| Six Months Ended April 30, 2022(Unaudited) | $23.65 | $(0.20) | $(2.52) | $(2.72) | | $ — | $(2.32) | $(2.32) |
| Year Ended October 31, 2021 | 20.54 | (0.46) | 4.46 | 4.00 | | — | (0.89) | (0.89) |
| Year Ended October 31, 2020 | 17.34 | (0.29) | 3.49 | 3.20 | | — | — | — |
| Year Ended October 31, 2019 | 18.22 | —(j) | (0.55) | (0.55) | | — | (0.33) | (0.33) |
| Year Ended October 31, 2018 | 18.13 | (0.21) | 0.53 | 0.32 | | — | (0.23) | (0.23) |
| Year Ended October 31, 2017 | 17.12 | (0.19) | 2.46 | 2.27 | | — | (1.26) | (1.26) |
| Class C | | | | | | | | |
| Six Months Ended April 30, 2022(Unaudited) | 22.75 | (0.24) | (2.41) | (2.65) | | — | (2.32) | (2.32) |
| Year Ended October 31, 2021 | 19.88 | (0.56) | 4.32 | 3.76 | | — | (0.89) | (0.89) |
| Year Ended October 31, 2020 | 16.87 | (0.39) | 3.40 | 3.01 | | — | — | — |
| Year Ended October 31, 2019 | 17.83 | (0.08) | (0.55) | (0.63) | | — | (0.33) | (0.33) |
| Year Ended October 31, 2018 | 17.83 | (0.29) | 0.52 | 0.23 | | — | (0.23) | (0.23) |
| Year Ended October 31, 2017 | 16.94 | (0.27) | 2.42 | 2.15 | | — | (1.26) | (1.26) |
| Class I | | | | | | | | |
| Six Months Ended April 30, 2022(Unaudited) | 24.08 | (0.18) | (2.57) | (2.75) | | — | (2.32) | (2.32) |
| Year Ended October 31, 2021 | 20.84 | (0.42) | 4.55 | 4.13 | | — | (0.89) | (0.89) |
| Year Ended October 31, 2020 | 17.58 | (0.27) | 3.56 | 3.29 | | (0.03) | — | (0.03) |
| Year Ended October 31, 2019 | 18.43 | 0.07 | (0.59) | (0.52) | | — | (0.33) | (0.33) |
| Year Ended October 31, 2018 | 18.28 | (0.16) | 0.54 | 0.38 | | — | (0.23) | (0.23) |
| Year Ended October 31, 2017 | 17.21 | (0.14) | 2.47 | 2.33 | | — | (1.26) | (1.26) |
SEE NOTES TO FINANCIAL STATEMENTS.
| 36 | J.P. Morgan Specialty Funds | April 30, 2022 |
| | Ratios/Supplemental data | |
| | | | Ratios to average net assets(a) | | | |
Net asset
value,
end of
period | Total return
(excludes
sales charge)(c)(d) | Net assets,
end of
period
(000's) | Net
expenses
(including dividend
and interest expense
for securities sold
short)(e)(f) | Net
investment
income
(loss) | Expenses without
waivers
(including dividend
and interest expense
for securities sold
short)(f) | Portfolio
turnover rate
(excluding securities
sold short)(d) | Portfolio
turnover rate
(including securities
sold short)(d) | |
| | | | | | | | | |
| | | | | | | | | |
| $18.61 | (12.76)% | $ 25,474 | 2.51(g)(h)% | (1.91)(h)% | 2.55(h)% | 457% | 914% | |
| 23.65 | 19.94 | 30,516 | 2.66(i) | (2.08) | 2.67 | 548 | 1,013 | |
| 20.54 | 18.45 | 20,914 | 2.28 | (1.54) | 2.33 | 511 | 1,058 | |
| 17.34 | (3.10) | 19,352 | 2.25 | —(k) | 2.36 | 636 | 1,232 | |
| 18.22 | 1.80 | 50,803 | 2.55 | (1.11) | 2.63 | 548 | 995 | |
| 18.13 | 13.58 | 49,338 | 2.42 | (1.05) | 2.61 | 493 | 795 | |
| | | | | | | | | |
| 17.78 | (12.97) | 5,566 | 3.02(g)(h) | (2.41)(h) | 3.05(h) | 457 | 914 | |
| 22.75 | 19.37 | 7,079 | 3.15(i) | (2.57) | 3.16 | 548 | 1,013 | |
| 19.88 | 17.84 | 4,596 | 2.79 | (2.12) | 2.85 | 511 | 1,058 | |
| 16.87 | (3.62) | 2,599 | 2.74 | (0.45) | 2.85 | 636 | 1,232 | |
| 17.83 | 1.32 | 3,544 | 3.05 | (1.61) | 3.13 | 548 | 995 | |
| 17.83 | 13.00 | 2,594 | 2.90 | (1.53) | 3.11 | 493 | 795 | |
| | | | | | | | | |
| 19.01 | (12.65) | 327,760 | 2.27(g)(h) | (1.67)(h) | 2.31(h) | 457 | 914 | |
| 24.08 | 20.28 | 398,771 | 2.41(i) | (1.84) | 2.42 | 548 | 1,013 | |
| 20.84 | 18.71 | 226,048 | 2.04 | (1.38) | 2.08 | 511 | 1,058 | |
| 17.58 | (2.89) | 132,665 | 1.99 | 0.40 | 2.10 | 636 | 1,232 | |
| 18.43 | 2.12 | 151,261 | 2.30 | (0.87) | 2.38 | 548 | 995 | |
| 18.28 | 13.86 | 103,091 | 2.15 | (0.81) | 2.32 | 493 | 795 | |
SEE NOTES TO FINANCIAL STATEMENTS.
| April 30, 2022 | J.P. Morgan Specialty Funds | 37 |
FINANCIAL HIGHLIGHTS
FOR THE PERIODS INDICATED (continued)
| | Per share operating performance |
| | | Investment operations | | Distributions |
| | Net asset
value,
beginning
of period | Net
investment
income
(loss)(b) | Net realized
and unrealized
gains
(losses) on
investments | Total from
investment
operations | | Net
investment
income | Net
realized
gain | Total
distributions |
| Class R6 | | | | | | | | |
| Six Months Ended April 30, 2022(Unaudited) | $24.48 | $(0.15) | $(2.62) | $(2.77) | | $ — | $(2.32) | $(2.32) |
| Year Ended October 31, 2021 | 21.13 | (0.37) | 4.61 | 4.24 | | — | (0.89) | (0.89) |
| Year Ended October 31, 2020 | 17.83 | (0.21) | 3.59 | 3.38 | | (0.08) | — | (0.08) |
| Year Ended October 31, 2019 | 18.63 | 0.17 | (0.64) | (0.47) | | — | (0.33) | (0.33) |
| Year Ended October 31, 2018 | 18.44 | (0.12) | 0.54 | 0.42 | | — | (0.23) | (0.23) |
| Year Ended October 31, 2017 | 17.31 | (0.10) | 2.49 | 2.39 | | — | (1.26) | (1.26) |
|
| (a) | Annualized for periods less than one year, unless otherwise noted. |
| (b) | Calculated based upon average shares outstanding. |
| (c) | Includes adjustments in accordance with accounting principles generally accepted in the United States of America and as such, the net asset values for financial reporting purposes and the returns based upon those net asset values may differ from the net asset values and returns for shareholder transactions. |
| (d) | Not annualized for periods less than one year. |
| (e) | Includes earnings credits and interest expense, if applicable, each of which is less than 0.005% unless otherwise noted. |
| (f) | |
| April 30, 2022 | October 31, 2021 | October 31, 2020 | October 31, 2019 | October 31, 2018 | October 31, 2017 |
| Net expenses (excluding dividend and interest expense for securities sold short) | | | | | | |
| Class A | 1.78% | 1.82% | 1.81% | 1.79% | 1.82% | 1.83% |
| Class C | 2.29% | 2.31% | 2.32% | 2.28% | 2.32% | 2.31% |
| Class I | 1.53% | 1.57% | 1.57% | 1.53% | 1.57% | 1.56% |
| Class R6 | 1.29% | 1.31% | 1.31% | 1.29% | 1.32% | 1.31% |
| Expenses without waivers (excluding dividend and interest expense for securities sold short) | | | | | | |
| Class A | 1.82% | 1.83% | 1.86% | 1.90% | 1.90% | 2.02% |
| Class C | 2.32% | 2.32% | 2.38% | 2.39% | 2.40% | 2.52% |
| Class I | 1.57% | 1.58% | 1.61% | 1.64% | 1.65% | 1.73% |
| Class R6 | 1.32% | 1.32% | 1.35% | 1.39% | 1.38% | 1.47% |
|
| (g) | Interest expense on securities sold short is 0.11%. |
| (h) | Certain non-recurring expenses incurred by the Fund were not annualized for the period indicated. |
| (i) | Interest expense on securities sold short is 0.21%. |
| (j) | Amount rounds to less than $0.005. |
| (k) | Amount rounds to less than 0.005%. |
SEE NOTES TO FINANCIAL STATEMENTS.
| 38 | J.P. Morgan Specialty Funds | April 30, 2022 |
FINANCIAL HIGHLIGHTS
FOR THE PERIODS INDICATED
| | Ratios/Supplemental data | |
| | | | Ratios to average net assets(a) | | | |
Net asset
value,
end of
period | Total return
(excludes
sales charge)(c)(d) | Net assets,
end of
period
(000's) | Net
expenses
(including dividend
and interest expense
for securities sold
short)(e)(f) | Net
investment
income
(loss) | Expenses without
waivers
(including dividend
and interest expense
for securities sold
short)(f) | Portfolio
turnover rate
(excluding securities
sold short)(d) | Portfolio
turnover rate
(including securities
sold short)(d) | |
| | | | | | | | | |
| $19.39 | (12.52)% | $257,106 | 2.02(g)(h)% | (1.41)(h)% | 2.05(h)% | 457% | 914% | |
| 24.48 | 20.54 | 309,288 | 2.15(i) | (1.57) | 2.16 | 548 | 1,013 | |
| 21.13 | 19.01 | 233,958 | 1.78 | (1.09) | 1.82 | 511 | 1,058 | |
| 17.83 | (2.59) | 164,419 | 1.75 | 0.91 | 1.85 | 636 | 1,232 | |
| 18.63 | 2.32 | 56,436 | 2.05 | (0.66) | 2.11 | 548 | 995 | |
| 18.44 | 14.13 | 6,350 | 1.90 | (0.56) | 2.06 | 493 | 795 | |
SEE NOTES TO FINANCIAL STATEMENTS.
| April 30, 2022 | J.P. Morgan Specialty Funds | 39 |
FINANCIAL HIGHLIGHTS
FOR THE PERIODS INDICATED (continued)
| | Per share operating performance |
| | | Investment operations | | Distributions |
| | Net asset
value,
beginning
of period | Net
investment
income
(loss)(b) | Net realized
and unrealized
gains
(losses) on
investments | Total from
investment
operations | | Net
realized
gain |
| JPMorgan Research Market Neutral Fund | | | | | | |
| Class A | | | | | | |
| Six Months Ended April 30, 2022(Unaudited) | $12.41 | $(0.12) | $(0.22) | $(0.34) | | $ — |
| Year Ended October 31, 2021 | 13.01 | (0.21) | 0.52 | 0.31 | | (0.91) |
| Year Ended October 31, 2020 | 13.11 | (0.20) | 1.59 | 1.39 | | (1.49) |
| Year Ended October 31, 2019 | 14.29 | (0.04) | 0.31 | 0.27 | | (1.45) |
| Year Ended October 31, 2018 | 14.69 | (0.11) | 0.10 | (0.01) | | (0.39) |
| Year Ended October 31, 2017 | 13.84 | (0.22) | 1.07 | 0.85 | | — |
| Class C | | | | | | |
| Six Months Ended April 30, 2022(Unaudited) | 11.09 | (0.13) | (0.20) | (0.33) | | — |
| Year Ended October 31, 2021 | 11.77 | (0.25) | 0.48 | 0.23 | | (0.91) |
| Year Ended October 31, 2020 | 12.06 | (0.23) | 1.43 | 1.20 | | (1.49) |
| Year Ended October 31, 2019 | 13.32 | (0.10) | 0.29 | 0.19 | | (1.45) |
| Year Ended October 31, 2018 | 13.79 | (0.17) | 0.09 | (0.08) | | (0.39) |
| Year Ended October 31, 2017 | 13.06 | (0.27) | 1.00 | 0.73 | | — |
| Class I | | | | | | |
| Six Months Ended April 30, 2022(Unaudited) | 13.28 | (0.11) | (0.24) | (0.35) | | — |
| Year Ended October 31, 2021 | 13.82 | (0.20) | 0.57 | 0.37 | | (0.91) |
| Year Ended October 31, 2020 | 13.80 | (0.19) | 1.70 | 1.51 | | (1.49) |
| Year Ended October 31, 2019 | 14.93 | —(j) | 0.32 | 0.32 | | (1.45) |
| Year Ended October 31, 2018 | 15.30 | (0.07) | 0.09 | 0.02 | | (0.39) |
| Year Ended October 31, 2017 | 14.37 | (0.18) | 1.11 | 0.93 | | — |
|
| (a) | Annualized for periods less than one year, unless otherwise noted. |
| (b) | Calculated based upon average shares outstanding. |
| (c) | Includes adjustments in accordance with accounting principles generally accepted in the United States of America and as such, the net asset values for financial reporting purposes and the returns based upon those net asset values may differ from the net asset values and returns for shareholder transactions. |
| (d) | Not annualized for periods less than one year. |
| (e) | Includes earnings credits and interest expense, if applicable, each of which is less than 0.005% unless otherwise noted. |
| (f) | |
| April 30, 2022 | October 31, 2021 | October 31, 2020 | October 31, 2019 | October 31, 2018 | October 31, 2017 |
| Net expenses (excluding dividend and interest expense for securities sold short) | | | | | | |
| Class A | 0.93% | 0.93% | 1.08% | 1.22% | 1.22% | 1.24% |
| Class C | 1.44% | 1.43% | 1.60% | 1.73% | 1.73% | 1.72% |
| Class I | 0.67% | 0.68% | 0.76% | 0.96% | 0.96% | 0.96% |
| Expenses without waivers (excluding dividend and interest expense for securities sold short) | | | | | | |
| Class A | 1.14% | 1.16% | 1.46% | 1.62% | 1.55% | 1.53% |
| Class C | 1.65% | 1.67% | 1.95% | 2.09% | 2.02% | 2.07% |
| Class I | 0.87% | 0.89% | 1.13% | 1.32% | 1.25% | 1.25% |
|
| (g) | Interest expense on securities sold short is 0.09%. |
| (h) | Certain non-recurring expenses incurred by the Fund were not annualized for the period indicated. |
| (i) | Interest expense on securities sold short is 0.16%. |
| (j) | Amount rounds to less than $0.005. |
SEE NOTES TO FINANCIAL STATEMENTS.
| 40 | J.P. Morgan Specialty Funds | April 30, 2022 |
| | Ratios/Supplemental data | |
| | | | Ratios to average net assets(a) | | | |
Net asset
value,
end of
period | Total return
(excludes
sales charge)(c)(d) | Net assets,
end of
period
(000's) | Net
expenses
(including dividend
and interest expense
for securities sold
short)(e)(f) | Net
investment
income
(loss) | Expenses without
waivers
(including dividend
and interest expense
for securities sold
short)(f) | Portfolio
turnover rate
(excluding securities
sold short)(d) | Portfolio
turnover rate
(including securities
sold short)(d) | |
| | | | | | | | | |
| | | | | | | | | |
| $12.07 | (2.74)% | $ 19,566 | 3.01(g)(h)% | (1.89)(h)% | 3.22(h)% | 58% | 130% | |
| 12.41 | 2.72 | 16,867 | 2.99(i) | (1.77) | 3.22 | 119 | 307 | |
| 13.01 | 11.97 | 18,205 | 3.23 | (1.57) | 3.61 | 224 | 531 | |
| 13.11 | 2.01 | 14,276 | 3.69 | (0.26) | 4.09 | 125 | 356 | |
| 14.29 | (0.01) | 14,973 | 3.50 | (0.73) | 3.83 | 131 | 252 | |
| 14.69 | 6.14 | 17,932 | 3.66 | (1.51) | 3.95 | 109 | 278 | |
| | | | | | | | | |
| 10.76 | (2.98) | 1,128 | 3.55(g)(h) | (2.42)(h) | 3.76(h) | 58 | 130 | |
| 11.09 | 2.29 | 1,211 | 3.49(i) | (2.25) | 3.73 | 119 | 307 | |
| 11.77 | 11.36 | 1,949 | 3.75 | (2.00) | 4.10 | 224 | 531 | |
| 12.06 | 1.52 | 3,731 | 4.20 | (0.74) | 4.56 | 125 | 356 | |
| 13.32 | (0.53) | 6,155 | 4.01 | (1.26) | 4.30 | 131 | 252 | |
| 13.79 | 5.59 | 10,920 | 4.14 | (2.01) | 4.49 | 109 | 278 | |
| | | | | | | | | |
| 12.93 | (2.64) | 103,653 | 2.75(g)(h) | (1.63)(h) | 2.95(h) | 58 | 130 | |
| 13.28 | 3.01 | 74,112 | 2.74(i) | (1.50) | 2.95 | 119 | 307 | |
| 13.82 | 12.26 | 121,285 | 2.91 | (1.42) | 3.28 | 224 | 531 | |
| 13.80 | 2.27 | 27,694 | 3.43 | 0.01 | 3.79 | 125 | 356 | |
| 14.93 | 0.20 | 34,927 | 3.24 | (0.47) | 3.53 | 131 | 252 | |
| 15.30 | 6.47 | 44,219 | 3.37 | (1.24) | 3.68 | 109 | 278 | |
SEE NOTES TO FINANCIAL STATEMENTS.
| April 30, 2022 | J.P. Morgan Specialty Funds | 41 |
NOTES TO FINANCIAL STATEMENTS
AS OF April 30, 2022 (Unaudited)
(Dollar values in thousands)
1. Organization
JPMorgan Trust I (“JPM I") and JPMorgan Trust IV (“JPM IV") (collectively, the “Trusts”) were formed on November 12, 2004 and November 11, 2015, respectively, as Delaware statutory trusts, pursuant to Declarations of Trust dated November 5, 2004 and November 11, 2015, respectively, and are registered under the Investment Company Act of 1940, as amended (the “1940 Act”), as open-end management investment companies.
The following are 3 separate funds of the Trusts (each, a "Fund" and collectively, the "Funds") covered by this report:
| | Classes Offered | Trust | Diversification Classification |
| JPMorgan Macro Opportunities Fund | Class A, Class C, Class I and Class R6 | JPM IV | Diversified |
| JPMorgan Opportunistic Equity Long/Short Fund | Class A, Class C, Class I and Class R6 | JPM I | Non-Diversified |
| JPMorgan Research Market Neutral Fund | Class A, Class C and Class I | JPM I | Diversified |
The investment objective of JPMorgan Macro Opportunities Fund (“Macro Opportunities Fund”) is to seek to provide long-term capital appreciation.
The investment objective of JPMorgan Opportunistic Equity Long/Short Fund (“Opportunistic Equity Long/Short Fund”) is to seek capital appreciation.
The investment objective of JPMorgan Research Market Neutral Fund (“Research Market Neutral Fund”) is to seek to provide long-term capital appreciation from a broadly diversified portfolio of U.S. stocks while neutralizing the general risks associated with stock market investing.
Class A Shares generally provide for a front-end sales charge while Class C Shares provide for a contingent deferred sales charge ("CDSC"). No sales charges are assessed with respect to Class I and Class R6 Shares. Certain Class A Shares, for which front-end sales charges have been waived, may be subject to a CDSC as described in the Funds' prospectus. Effective October 1, 2020, Class C Shares automatically convert to Class A Shares after eight years. Prior to October 1, 2020, Class C Shares automatically converted to Class A Shares after ten years. All classes of shares have equal rights as to earnings, assets and voting privileges, except that each class may bear different transfer agency, distribution and service fees and each class has exclusive voting rights with respect to its distribution plan and shareholder servicing agreements.
J.P. Morgan Investment Management Inc. (“JPMIM”), an indirect, wholly-owned subsidiary of JPMorgan Chase & Co. (“JPMorgan”), acts as Adviser (the “Adviser”) and Administrator (the “Administrator”) to the Funds.
2. Significant Accounting Policies
The following is a summary of significant accounting policies followed by the Funds in the preparation of their financial statements. The Funds are investment companies and, accordingly, follow the investment company accounting and reporting guidance of the Financial Accounting Standards Board (“FASB”) Accounting Standards Codification Topic 946 — Investment Companies, which is part of U.S. generally accepted accounting principles (“GAAP”). The preparation of financial statements in conformity with GAAP requires management to make estimates and assumptions that affect (i) the reported amounts of assets and liabilities, (ii) disclosure of contingent assets and liabilities at the date of the financial statements, and (iii) the reported amounts of increases and decreases in net assets from operations during the reporting period. Actual results could differ from those estimates.
A. Valuation of Investments — Investments are valued in accordance with GAAP and the Funds' valuation policies set forth by, and under the supervision and responsibility of, the Boards of Trustees of the Trusts (the "Boards"), which established the following approach to valuation, as described more fully below: (i) investments for which market quotations are readily available shall be valued at their market value and (ii) all other investments for which market quotations are not readily available shall be valued at their fair value as determined in good faith by the Boards.
The Administrator has established the J.P. Morgan Asset Management Americas Valuation Committee (“AVC”) to assist the Boards with the oversight and monitoring of the valuation of the Funds' investments. The Administrator implements the valuation policies of the Funds' investments, as directed by the Boards. The AVC oversees and carries out the policies for the valuation of investments held in the Funds. This includes monitoring the appropriateness of fair values based on results of ongoing valuation oversight including, but not limited to, consideration of macro or security specific events, market events, and pricing vendor and broker due diligence. The Administrator is responsible for discussing and assessing the potential impacts to the fair values on an ongoing basis, and, at least on a quarterly basis, with the AVC and the Boards.
Fixed income instruments are valued based on prices received from approved affiliated and unaffiliated pricing vendors or third party broker-dealers (collectively referred to as “Pricing Services”). The Pricing Services use multiple valuation techniques to determine the valuation of fixed income instruments. In instances where sufficient market activity exists, the Pricing Services may utilize a market-based approach through which trades or quotes from market makers are used to determine the valuation of these instruments. In instances where sufficient market activity may not exist, the Pricing Services also utilize proprietary valuation models which may consider market transactions in comparable securities and the various relationships between securities in determining fair value and/or market characteristics in order to estimate the relevant cash flows, which are then discounted to calculate the fair values.
Equities and other exchange-traded instruments are valued at the last sale price or official market closing price on the primary exchange on which the instrument is traded before the net asset values ("NAV") of the Funds are calculated on a valuation date.
| 42 | J.P. Morgan Specialty Funds | April 30, 2022 |
Certain foreign equity instruments are valued by applying international fair value factors provided by approved Pricing Services. The factors seek to adjust the local closing price for movements of local markets post-closing, but prior to the time the NAVs are calculated.
Investments in open-end investment companies, excluding exchange-traded funds ("ETFs") (“Underlying Funds”), are valued at each Underlying Fund’s NAV per share as of the report date.
Futures contracts and options are generally valued on the basis of available market quotations. Forward foreign currency exchange contracts are valued utilizing market quotations from approved Pricing Services.
Valuations reflected in this report are as of the report date. As a result, changes in valuation due to market events and/or issuer-related events after the report date and prior to issuance of the report are not reflected herein.
The various inputs that are used in determining the valuation of the Funds' investments are summarized into the three broad levels listed below.
| • | Level 1 — Unadjusted inputs using quoted prices in active markets for identical investments. |
| • | Level 2 — Other significant observable inputs including, but not limited to, quoted prices for similar investments, inputs other than quoted prices that are observable for investments (such as interest rates, prepayment speeds, credit risk, etc.) or other market corroborated inputs. |
| • | Level 3 — Significant inputs based on the best information available in the circumstances, to the extent observable inputs are not available (including the Funds' assumptions in determining the fair value of investments). |
A financial instrument’s level within the fair value hierarchy is based on the lowest level of any input, both individually and in the aggregate, that is significant to the fair value measurement. The inputs or methodology used for valuing instruments are not necessarily an indication of the risk associated with investing in those instruments.
The following tables represent each valuation input as presented on the Schedules of Portfolio Investments ("SOIs"):
| Macro Opportunities Fund | | | | | | | |
| | Level 1
Quoted prices | | Level 2
Other significant
observable inputs | | Level 3
Significant
unobservable inputs | | Total |
| Investments in Securities | | | | | | | |
| Common Stocks | | | | | | | |
| Banks | $ 799 | | $ 359 | | $— | | $ 1,158 |
| Building Products | 191 | | — | | — | | 191 |
| Electric Utilities | — | | 163 | | — | | 163 |
| Electronic Equipment, Instruments & Components | — | | 201 | | — | | 201 |
| Insurance | 175 | | 236 | | — | | 411 |
| Interactive Media & Services | 335 | | — | | — | | 335 |
| Internet & Direct Marketing Retail | 316 | | — | | — | | 316 |
| IT Services | 366 | | — | | — | | 366 |
| Life Sciences Tools & Services | 396 | | — | | — | | 396 |
| Personal Products | 193 | | — | | — | | 193 |
| Pharmaceuticals | 230 | | 279 | | — | | 509 |
| Semiconductors & Semiconductor Equipment | 74 | | — | | — | | 74 |
| Software | 1,206 | | — | | — | | 1,206 |
| Textiles, Apparel & Luxury Goods | 486 | | 248 | | — | | 734 |
| Total Common Stocks | 4,767 | | 1,486 | | — | | 6,253 |
| Foreign Government Securities | — | | 118 | | — | | 118 |
| Options Purchased | | | | | | | |
| Call Options Purchased | 1 | | 5 | | — | | 6 |
| Put Options Purchased | 33 | | 25 | | — | | 58 |
| Total Options Purchased | 34 | | 30 | | — | | 64 |
| Short-Term Investments | | | | | | | |
| Foreign Government Treasury Bills | — | | 4,209 | | — | | 4,209 |
| Investment Companies | 3,639 | | — | | — | | 3,639 |
| Total Short-Term Investments | 3,639 | | 4,209 | | — | | 7,848 |
| Total Investments in Securities | $8,440 | | $5,843 | | $— | | $14,283 |
| April 30, 2022 | J.P. Morgan Specialty Funds | 43 |
NOTES TO FINANCIAL STATEMENTS
AS OF April 30, 2022 (Unaudited) (continued)
(Dollar values in thousands)
| Macro Opportunities Fund (continued) | | | | | | | |
| | Level 1
Quoted prices | | Level 2
Other significant
observable inputs | | Level 3
Significant
unobservable inputs | | Total |
| Appreciation in Other Financial Instruments | | | | | | | |
| Forward Foreign Currency Exchange Contracts | $ — | | $ 364 | | $— | | $ 364 |
| Futures Contracts | 202 | | — | | — | | 202 |
| Depreciation in Other Financial Instruments | | | | | | | |
| Forward Foreign Currency Exchange Contracts | — | | (121) | | — | | (121) |
| Futures Contracts | (84) | | — | | — | | (84) |
| Options Written | | | | | | | |
| Call Options Written | — | | — | | — | | — |
| Put Options Written | — | | (16) | | — | | (16) |
Total Net Appreciation/ Depreciation in Other
Financial Instruments | $ 118 | | $ 227 | | $— | | $ 345 |
| Opportunistic Equity Long/Short Fund | | | | | | | |
| | Level 1
Quoted prices | | Level 2
Other significant
observable inputs | | Level 3
Significant
unobservable inputs | | Total |
| Total Investments in Securities (a) | $ 628,776 | | $— | | $— | | $ 628,776 |
| Total Liabilities for Securities Sold Short (a) | $(134,059) | | $— | | $— | | $(134,059) |
|
| (a) | Please refer to the SOI for specific of portfolio holdings. |
| Research Market Neutral Fund | | | | | | | |
| | Level 1
Quoted prices | | Level 2
Other significant
observable inputs | | Level 3
Significant
unobservable inputs | | Total |
| Total Investments in Securities (a) | $122,372 | | $— | | $— | | $122,372 |
| Total Liabilities for Securities Sold Short (a) | $ (78,963) | | $— | | $— | | $ (78,963) |
|
| (a) | Please refer to the SOI for specific of portfolio holdings. |
B. Restricted Securities — Certain securities held by the Funds may be subject to legal or contractual restrictions on resale. Restricted securities generally are resold in transactions exempt from registration under the Securities Act of 1933, as amended (the “Securities Act”). Disposal of these securities may involve time-consuming negotiations and expense. Prompt sale at the current valuation may be difficult and could adversely affect the NAVs of the Funds.
As of April 30, 2022, the Funds had no investments in restricted securities other than securities sold to the Funds under Rule 144A and/or Regulation S under the Securities Act.
C. Securities Lending — The Funds are authorized to engage in securities lending in order to generate additional income. The Funds are able to lend to approved borrowers. Citibank N.A. (“Citibank”) serves as lending agent for the Funds, pursuant to a Securities Lending Agency Agreement (the “Securities Lending Agency Agreement”). Securities loaned are collateralized by cash equal to at least 100% of the market value plus accrued interest on the securities lent, which is invested in an affiliated money market fund. The Funds retain the interest earned on cash collateral investments but are required to pay the borrower a rebate for the use of the cash collateral. In cases where the lent security is of high value to borrowers, there may be a negative rebate (i.e., a net payment from the borrower to the Funds). Upon termination of a loan, the Funds are required to return to the borrower an amount equal to the cash collateral, plus any rebate owed to the borrowers. The remaining maturities of the securities lending transactions are considered overnight and continuous. Loans are subject to termination by the Funds or the borrower at any time.
The net income earned on the securities lending (after payment of rebates and Citibank’s fee) is included on the Statements of Operations as Income from securities lending (net). The Funds also receive payments from the borrower during the period of the loan, equivalent to dividends and interest earned on the securities loaned, which are recorded as Dividend or Interest income, respectively, on the Statements of Operations.
| 44 | J.P. Morgan Specialty Funds | April 30, 2022 |
Under the Securities Lending Agency Agreement, Citibank marks to market the loaned securities on a daily basis. In the event the cash received from the borrower is less than 102% of the value of the loaned securities (105% for loans of non-U.S. securities), Citibank requests additional cash from the borrower so as to maintain a collateralization level of at least 102% of the value of the loaned securities plus accrued interest (105% for loans of non-U.S. securities), subject to certain de minimis amounts.
The value of securities out on loan is recorded as an asset on the Statements of Assets and Liabilities. The value of the cash collateral received is recorded as a liability on the Statements of Assets and Liabilities and details of collateral investments are disclosed on the SOIs.
The Funds bear the risk of loss associated with the collateral investments and are not entitled to additional collateral from the borrower to cover any such losses. To the extent that the value of the collateral investments declines below the amount owed to a borrower, the Funds may incur losses that exceed the amount they earned on lending the security. Upon termination of a loan, the Funds may use leverage (borrow money) to repay the borrower for cash collateral posted if the Adviser does not believe that it is prudent to sell the collateral investments to fund the payment of this liability. Securities lending activity is subject to master netting arrangements.
Securities lending also involves counterparty risks, including the risk that the loaned securities may not be returned in a timely manner or at all. Subject to certain conditions, Citibank has agreed to indemnify the Funds from losses resulting from a borrower’s failure to return a loaned security.
The Funds did not lend out any securities during the six months ended April 30, 2022.
D. Investment Transactions with Affiliates — The Funds invested in Underlying Funds and ETFs which are advised by the Adviser. An issuer which is under common control with a Fund may be considered an affiliate. For the purposes of the financial statements, the Funds assume the issuers listed in the tables below to be affiliated issuers. Underlying Funds’ and ETFs’ distributions may be reinvested into the Underlying Funds and ETFs. Reinvestment amounts are included in the purchases at cost amounts in the tables below.
| Macro Opportunities Fund |
| | For the six months ended April 30, 2022 |
| Security Description | Value at
October 31,
2021 | | Purchases at
Cost | | Proceeds from
Sales | | Net Realized
Gain (Loss) | | Change in
Unrealized
Appreciation/
(Depreciation) | | Value at
April 30,
2022 | Shares at
April 30,
2022 | Dividend
Income | | Capital Gain
Distributions |
| JPMorgan Prime Money Market Fund Class IM Shares, 0.42% (a) (b) | $2,529 | | $1,768 | | $657 | | $—(c) | | $(1) | | $3,639 | 3,639 | $3 | | $— |
|
| (a) | Investment in an affiliated fund, which is registered under the Investment Company Act of 1940, as amended, and is advised by J.P. Morgan Investment Management Inc. |
| (b) | The rate shown is the current yield as of April 30, 2022. |
| (c) | Amount rounds to less than one thousand. |
| Opportunistic Equity Long/Short Fund |
| | For the six months ended April 30, 2022 |
| Security Description | Value at
October 31,
2021 | | Purchases at
Cost | | Proceeds from
Sales | | Net Realized
Gain (Loss) | | Change in
Unrealized
Appreciation/
(Depreciation) | | Value at
April 30,
2022 | Shares at
April 30,
2022 | Dividend
Income | | Capital Gain
Distributions |
| JPMorgan Prime Money Market Fund Class Institutional Shares, 0.36% (a) (b) | $119,946 | | $1,475,991 | | $1,341,984 | | $(75) | | $(6) | | $253,872 | 253,821 | $145 | | $— |
|
| (a) | Investment in an affiliated fund, which is registered under the Investment Company Act of 1940, as amended, and is advised by J.P. Morgan Investment Management Inc. |
| (b) | The rate shown is the current yield as of April 30, 2022. |
| April 30, 2022 | J.P. Morgan Specialty Funds | 45 |
NOTES TO FINANCIAL STATEMENTS
AS OF April 30, 2022 (Unaudited) (continued)
(Dollar values in thousands)
| Research Market Neutral Fund |
| | For the six months ended April 30, 2022 |
| Security Description | Value at
October 31,
2021 | | Purchases at
Cost | | Proceeds from
Sales | | Net Realized
Gain (Loss) | | Change in
Unrealized
Appreciation/
(Depreciation) | | Value at
April 30,
2022 | Shares at
April 30,
2022 | Dividend
Income | | Capital Gain
Distributions |
| JPMorgan Prime Money Market Fund Class Institutional Shares, 0.36% (a) (b) | $9,752 | | $98,675 | | $69,953 | | $(7) | | $1 | | $38,468 | 38,460 | $17 | | $— |
|
| (a) | Investment in an affiliated fund, which is registered under the Investment Company Act of 1940, as amended, and is advised by J.P. Morgan Investment Management Inc. |
| (b) | The rate shown is the current yield as of April 30, 2022. |
E. Foreign Currency Translation — The books and records of the Funds are maintained in U.S. dollars. Foreign currency amounts are translated into U.S. dollars at the prevailing exchange rates of such currencies against the U.S. dollar. The market value of investment securities and other assets and liabilities are translated at the exchange rate as of the valuation date. Purchases and sales of investment securities, income and expenses are translated at the exchange rate prevailing on the respective dates of such transactions.
The Funds do not isolate the effect of changes in foreign exchange rates from changes in market prices on securities held. Accordingly, such changes are included within Change in net unrealized appreciation/depreciation on investments in non-affiliates on the Statements of Operations.
Reported realized foreign currency gains and losses arise from the disposition of foreign currency, currency gains or losses realized between the trade and settlement dates on securities transactions, and the difference between the amounts of dividends, interest and foreign withholding taxes recorded on each Fund's books on the transaction date and the U.S. dollar equivalent of the amounts actually received or paid. These reported realized foreign currency gains and losses are included in Net realized gain (loss) on foreign currency transactions on the Statements of Operations. Unrealized foreign currency gains and losses arise from changes (due to changes in exchange rates) in the value of foreign currency and other assets and liabilities denominated in foreign currencies, which are held at period end and are included in Change in net unrealized appreciation/depreciation on foreign currency translations on the Statements of Operations.
F. Derivatives — The Funds used derivative instruments including options, futures contracts and forward foreign currency exchange contracts, in connection with their respective investment strategies. Derivative instruments may be used as substitutes for securities in which the Funds can invest, to hedge portfolio investments or to generate income or gain to the Funds. Derivatives may also be used to effectively manage the long and short equity exposures in the portfolio, manage duration, sector and yield curve exposures and credit and spread volatility.
The Funds may be subject to various risks from the use of derivatives, including the risk that changes in the value of a derivative may not correlate perfectly with the underlying asset, rate or index; counterparty credit risk related to derivatives counterparties’ failure to perform under contract terms; liquidity risk related to the potential lack of a liquid market for these contracts allowing a Fund to close out its position(s); and documentation risk relating to disagreement over contract terms. Investing in certain derivatives also results in a form of leverage and as such, the Funds’ risk of loss associated with these instruments may exceed their value, as recorded on the Statements of Assets and Liabilities.
The Funds are party to various derivative contracts governed by International Swaps and Derivatives Association master agreements (“ISDA agreements”). The Funds’ ISDA agreements, which are separately negotiated with each dealer counterparty, may contain provisions allowing, absent other considerations, a counterparty to exercise rights, to the extent not otherwise waived, against the Funds in the event the Funds’ net assets decline over time by a pre-determined percentage or fall below a pre-determined floor. The ISDA agreements may also contain provisions allowing, absent other conditions, the Funds to exercise rights, to the extent not otherwise waived, against a counterparty (e.g., decline in a counterparty’s credit rating below a specified level). Such rights for both a counterparty and the Funds often include the ability to terminate (i.e., close out) open contracts at prices which may favor a counterparty, which could have an adverse effect on the Funds. The ISDA agreements give the Funds and a counterparty the right, upon an event of default, to close out all transactions traded under such agreements and to net amounts owed or due across all transactions and offset such net payable or receivable against collateral posted to a segregated account by one party for the benefit of the other.
Counterparty credit risk may be mitigated to the extent a counterparty posts additional collateral for mark-to-market gains to the Funds.
| 46 | J.P. Morgan Specialty Funds | April 30, 2022 |
Notes F(1) - F(3) below describe the various derivatives used by the Funds.
(1) Options — Macro Opportunities Fund and Opportunistic Equity Long/Short Fund purchased and/or sold ("wrote") put and call options on various instruments including currencies, futures, securities, options on indices and interest rate swaps ("swaptions") to manage and hedge interest rate risks within their portfolios and also to gain long or short exposure to the underlying instrument, index, currency or rate. A purchaser of a put option has the right, but not the obligation, to sell the underlying instrument at an agreed upon price (“strike price”) to the option seller. A purchaser of a call option has the right, but not the obligation, to purchase the underlying instrument at the strike price from the option seller.
Options Purchased — Premiums paid by the Funds for options purchased are included on the Statements of Assets and Liabilities as Options purchased. The option is adjusted daily to reflect the current market value of the option and the change is recorded as Change in net unrealized appreciation/depreciation on options purchased on the Statements of Operations. If the option is allowed to expire, the Funds will lose the entire premium they paid and record a realized loss for the premium amount. Premiums paid for options purchased which are exercised or closed are added to the amounts paid or offset against the proceeds on the underlying investment transaction to determine the realized gain (loss) or cost basis of the underlying investment.
Options Written — Premiums received by the Funds for options written are included on the Statements of Assets and Liabilities as a liability. The amount of the liability is adjusted daily to reflect the current market value of the option written and the change in market value is recorded as Change in net unrealized appreciation/depreciation on options written on the Statements of Operations. Premiums received from options written that expire are treated as realized gains. If a written option is closed, the Funds record a realized gain or loss on options written based on whether the cost of the closing transaction exceeds the premium received. If a call option is exercised by the option buyer, the premium received by the Funds is added to the proceeds from the sale of the underlying security to the option buyer and compared to the cost of the closing transaction to determine whether there has been a realized gain or loss. If a put option is exercised by an option buyer, the premium received by the option seller reduces the cost basis of the purchased security.
Written uncovered call options subject the Funds to unlimited risk of loss. Written covered call options limit the upside potential of a security above the strike price. Written put options subject the Funds to risk of loss if the value of the security declines below the exercise price minus the put premium.
The Funds are not subject to credit risk on options written as the counterparty has already performed its obligation by paying the premium at the inception of the contract.
The Funds' exchange-traded option contracts are not subject to master netting arrangements (the right to close out all transactions traded with a counterparty and net amounts owed or due across transactions). The Funds' over-the-counter ("OTC") options are subject to master netting agreements.
The Funds may be required to post or receive collateral for OTC options. Cash collateral posted by the Funds is considered restricted.
(2) Futures Contracts — Macro Opportunities Fund and Research Market Neutral Fund used index, interest rate and treasury futures contracts to gain or reduce exposure to the stock market, or maintain liquidity or minimize transaction costs. The Funds also used index futures contracts to more effectively manage the long and short equity exposures in the portfolio. The Funds also purchased futures contracts to invest incoming cash in the market or sold futures in response to cash outflows, thereby simulating an invested position in the underlying index while maintaining a cash balance for liquidity.
Futures contracts provide for the delayed delivery of the underlying instrument at a fixed price or are settled for a cash amount based on the change in the value of the underlying instrument at a specific date in the future. Upon entering into a futures contract, the Funds are required to deposit with the broker, cash or securities in an amount equal to a certain percentage of the contract amount, which is referred to as the initial margin deposit. Subsequent payments, referred to as variation margin, are made or received by the Funds periodically and are based on changes in the market value of open futures contracts. Changes in the market value of open futures contracts are recorded as Change in net unrealized appreciation/depreciation on futures contracts on the Statements of Operations. Realized gains or losses, representing the difference between the value of the contract at the time it was opened and the value at the time it was closed, are reported on the Statements of Operations at the closing or expiration of the futures contract. Securities deposited as initial margin are designated on the SOIs, while cash deposited, which is considered restricted, is recorded on the Statements of Assets and Liabilities. A receivable from and/or a payable to brokers for the daily variation margin is also recorded on the Statements of Assets and Liabilities.
The use of futures contracts exposes the Funds to equity price and interest rate risks. The Funds may be subject to the risk that the change in the value of the futures contract may not correlate perfectly with the underlying instrument. Use of long futures contracts subjects the Funds to risk of loss in excess of the amounts shown on the Statements of Assets and Liabilities, up to the notional amount of the futures contracts. Use of short futures contracts subjects the Funds to unlimited risk of loss. The Funds may enter into futures contracts only on exchanges or boards of trade. The exchange or board of trade acts as the counterparty to each futures transaction; therefore, the Funds' credit risk is limited to failure of the exchange or board of trade. Under some circumstances, futures exchanges may establish daily limits on the amount that the price of a futures contract can vary from the previous day’s settlement price, which could effectively prevent liquidation of positions.
| April 30, 2022 | J.P. Morgan Specialty Funds | 47 |
NOTES TO FINANCIAL STATEMENTS
AS OF April 30, 2022 (Unaudited) (continued)
(Dollar values in thousands)
The Funds' futures contracts are not subject to master netting arrangements (the right to close out all transactions traded with a counterparty and net amounts owed or due across transactions).
(3) Forward Foreign Currency Exchange Contracts — Macro Opportunities Fund is exposed to foreign currency risks associated with some or all of the portfolio investments and used forward foreign currency exchange contracts to hedge or manage certain of these exposures as part of the investment strategy. The Fund also bought forward foreign currency exchange contracts to gain exposure to currencies. Forward foreign currency exchange contracts represent obligations to purchase or sell foreign currency on a specified future date at a price fixed at the time the contracts are entered into. Non-deliverable forward foreign currency exchange contracts are settled with the counterparty in U.S. dollars without the delivery of the foreign currency.
The values of the forward foreign currency exchange contracts are adjusted daily based on the applicable exchange rate of the underlying currency. Changes in the value of these contracts are recorded as unrealized appreciation or depreciation until the contract settlement date. When the forward foreign currency exchange contract is closed, the Fund records a realized gain or loss equal to the difference between the value at the time the contract was opened and the value at the time it was closed. The Fund also records a realized gain or loss, upon settlement, when a forward foreign currency exchange contract offsets another forward foreign currency exchange contract with the same counterparty.
The Fund’s forward foreign currency exchange contracts are subject to master netting arrangements (the right to close out all transactions with a counterparty and net amounts owed or due across transactions).
The Fund may be required to post or receive collateral for non-deliverable forward foreign currency exchange contracts.
(4) Summary of Derivatives Information —The following tables present the value of derivatives held as of April 30, 2022, by their primary underlying risk exposure and respective location on the Statements of Assets and Liabilities:
| | Macro
Opportunities
Fund |
| Equity Risk Exposure: | |
| Unrealized Appreciation on Futures Contracts * | $ 172 |
| Purchased Options at Market Value | 39 |
| Unrealized Depreciation on Futures Contracts * | (55) |
| Foreign Exchange Rate Risk Exposure: | |
| Unrealized Appreciation on Forward Foreign Currency Exchange Contracts | 364 |
| Purchased Options at Market Value | 25 |
| Unrealized Depreciation on Forward Foreign Currency Exchange Contracts | (121) |
| Written Options at Market Value | (16) |
| Interest Rate Risk Exposure: | |
| Unrealized Appreciation on Futures Contracts * | 30 |
| Unrealized Depreciation on Futures Contracts * | (29) |
| | |
| Net Fair Value of Derivative Contracts: | |
| Unrealized Appreciation (Depreciation) on Futures Contracts * | 118 |
| Unrealized Appreciation (Depreciation) on Forward Foreign Currency Exchange Contracts | 243 |
| Purchased Options at Market Value | 64 |
| Written Options at Market Value | (16) |
|
| * | Includes cumulative appreciation/(depreciation) on futures contracts, if any, as reported on the SOIs. Only current day’s variation margin is reported within the Statements of Assets and Liabilities. |
The following table presents Macro Opportunities Fund’s gross derivative assets and liabilities by counterparty net of amounts available for offset under netting arrangements and any related collateral received or posted by the Fund as of April 30, 2022:
| 48 | J.P. Morgan Specialty Funds | April 30, 2022 |
| Counterparty | Gross Amount of Derivative Assets
Subject to Netting Arrangements
Presented on the Statement of Assets
and Liabilities (a) | | Derivatives
Available
for offset | | Collateral
Received | | Net Amount Due
From Counterparty
(Not less than zero) |
| BNP Paribas | $ 32 | | $ (1) | | $— | | $ 31 |
| Goldman Sachs International | 354 | | (68) | | — | | 286 |
| HSBC Bank, NA | 3 | | (3) | | — | | — |
| | $389 | | $(72) | | $— | | $317 |
| Counterparty | Gross Amount of Derivative Liabilities
Subject to Netting Arrangements
Presented on the Statement of Assets
and Liabilities (a) | | Derivative Available
for Offset | | Collateral Posted | | Net Amount Due to
Counterparty
(Not less than zero) |
| Barclays Bank plc | $ 1 | | $ — | | $— | | $ 1 |
| BNP Paribas | 1 | | (1) | | — | | — |
| Citibank, NA | 26 | | — | | — | | 26 |
| Goldman Sachs International | 68 | | (68) | | — | | — |
| HSBC Bank, NA | 19 | | (3) | | — | | 16 |
| Merrill Lynch International | 18 | | — | | — | | 18 |
| Standard Chartered Bank | 3 | | — | | — | | 3 |
| State Street Corp. | 1 | | — | | — | | 1 |
| | $137 | | $(72) | | $— | | $65 |
|
| (a) | For financial reporting purposes the Fund does not offset derivative assets and derivative liabilities subject to master netting arrangements on the Statement of Assets and Liabilities. |
The following tables present the effect of derivatives on the Statements of Operations for the year ended April 30, 2022, by primary underlying risk exposure:
| | Macro
Opportunities
Fund | Opportunistic
Equity Long/
Short Fund | Research
Market Neutral
Fund |
| Realized Gain (Loss) on Derivatives Recognized as a Result From Operations: | | | |
| Equity Risk Exposure: | | | |
| Futures Contracts | $ 289 | $ — | $(485) |
| Purchased Options | (100) | (72) | — |
| Written Options | 16 | — | — |
| Foreign Exchange Rate Risk Exposure: | | | |
| Forward Foreign Currency Exchange Contracts | 353 | — | — |
| Purchased Options | (27) | — | — |
| Written Options | 15 | — | — |
| Interest Rate Risk Exposure: | | | |
| Futures Contracts | (100) | — | — |
| Net Change in Unrealized Appreciation (Depreciation) on Derivatives Recognized as a Result of Operations: | | | |
| Equity Risk Exposure: | | | |
| Futures Contracts | 198 | — | 7 |
| Purchased Options | 32 | (21) | — |
| April 30, 2022 | J.P. Morgan Specialty Funds | 49 |
NOTES TO FINANCIAL STATEMENTS
AS OF April 30, 2022 (Unaudited) (continued)
(Dollar values in thousands)
| | Macro
Opportunities
Fund | Opportunistic
Equity Long/
Short Fund | Research
Market Neutral
Fund |
| Foreign Exchange Rate Risk Exposure: | | | |
| Forward Foreign Currency Exchange Contracts | $ 170 | $ — | $ — |
| Purchased Options | (28) | — | — |
| Written Options | 16 | — | — |
| Interest Rate Risk Exposure: | | | |
| Futures Contracts | 9 | — | — |
Derivatives Volume
The table below discloses the volume of the Funds’ options, futures contracts and forward foreign currency exchange contracts activity during the six months ended April 30, 2022. Please refer to the tables in the Summary of Derivatives Information for derivative-related gains and losses associated with volume activity:
| | Macro
Opportunities
Fund | Opportunistic
Equity Long/
Short Fund | Research
Market Neutral
Fund |
| Futures Contracts: | | | |
| Average Notional Balance Long | $ 3,711 | $ — | $4,574 |
| Average Notional Balance Short | (4,819) | — | (131) |
| Ending Notional Balance Long | 2,682 | — | — |
| Ending Notional Balance Short | (4,716) | — | — |
| Forward Foreign Currency Exchange Contracts: | | | |
| Average Settlement Value Purchased | (4,952) | — | — |
| Average Settlement Value Sold | 12,435 | — | — |
| Ending Settlement Value Purchased | (4,994) | — | — |
| Ending Settlement Value Sold | 13,777 | — | — |
| Exchange-Traded Options: | | | |
| Average Number of Contracts Purchased | 128 | 82 | — |
| Average Number of Contracts Written | (2) | — | — |
| Ending Number of Contracts Purchased | 37 | — | — |
| OTC Options: | | | |
| Average Number of Contracts Purchased | 2,111,429 | — | — |
| Average Number of Contracts Written | (1,469,429) | — | — |
| Ending Number of Contracts Purchased | 4,714,000 | — | — |
| Ending Number of Contracts Written | (4,714,000) | — | — |
The Funds may be required to post or receive collateral based on the net value of the Funds’ outstanding OTC options and non-deliverable forward foreign currency exchange contracts with the counterparty in the form of cash or securities. Daily movement of cash collateral is subject to minimum threshold amounts. Collateral posted by the Funds is held in a segregated account at the Funds’ custodian bank. For certain counterparties cash collateral posted by the Funds is invested in an affiliated money market fund (See Note 3.F.), otherwise the cash collateral is included on the Statements of Assets and Liabilities as Restricted cash for OTC derivatives. Collateral received by the Funds is held in a separate segregated account maintained by JPMorgan Chase Bank, N.A. (“JPMCB”), an affiliate of the Funds.
The Funds' derivatives contracts held at April 30, 2022 are not accounted for as hedging instruments under GAAP.
G. Short Sales — Opportunistic Equity Long/Short Fund and Research Market Neutral Fund engaged in short sales as part of their normal investment activities. In a short sale, the Funds sell securities they do not own in anticipation of a decline in the market value of those securities. In order to deliver securities to the purchaser, the Funds borrow securities from a broker. To close out a short position, the Funds deliver the same securities to the broker.
The Funds are required to pledge cash or securities to the broker as collateral for the securities sold short. Collateral requirements are calculated daily based on the current market value of the short positions. Cash collateral deposited with the broker is recorded as Deposits at broker for securities sold short, while cash collateral deposited at the Funds' custodian for the benefit of the broker is recorded as Restricted cash for securities sold short on the Statements of Assets and Liabilities. Securities segregated as collateral are denoted on the SOIs. The Funds may receive or pay the net of the following amounts: (i) a portion of the income from the investment of cash collateral; (ii) the broker’s fee on the borrowed securities
| 50 | J.P. Morgan Specialty Funds | April 30, 2022 |
(calculated daily based upon the market value of each borrowed security and a variable rate that is dependent on availability of the security); and (iii) a financing charge for the difference between the market value of the short position and cash collateral deposited with the broker. The net amounts of income or fees are included as interest income or interest expense on securities sold short on the Statements of Operations.
The Funds are obligated to pay the broker dividends declared on short positions when a position is open on the record date. Dividends on short positions are reported on ex-dividend date on the Statements of Operations as Dividend expense on securities sold short. The Funds are obligated to pay the broker interest accrued on short positions while the position is outstanding. Interest expense on short positions is reported as Interest expense to non-affiliates on securities sold short on the Statements of Operations. Liabilities for securities sold short are reported at market value on the Statements of Assets and Liabilities and the change in market value is recorded as Change in net unrealized appreciation/depreciation on the Statements of Operations. Short sale transactions may result in unlimited losses as the security’s price increases and the short position loses value. There is no upward limit on the price a borrowed security could attain. The Funds are also subject to risk of loss if the broker were to fail to perform its obligations under the contractual terms.
The Funds will record a realized loss if the price of the borrowed security increases between the date of the short sale and the date on which the Funds replace the borrowed security. The Funds will record a realized gain if the price of the borrowed security declines between those dates.
As of April 30, 2022, Opportunistic Equity Long/Short Fund and Research Market Neutral Fund had outstanding short sales as listed on their SOIs.
H. Security Transactions and Investment Income — Investment transactions are accounted for on the trade date (the date the order to buy or sell is executed). Securities gains and losses are calculated on a specifically identified cost basis. Interest income and interest expense on securities sold short, if any, is determined on the basis of coupon interest accrued using the effective interest method, which adjusts for amortization of premiums and accretion of discounts. Dividend income, net of foreign taxes withheld, if any, and dividend expense on securities sold short are recorded on the ex-dividend date or when a Fund first learns of the dividend.
To the extent such information is publicly available, the Funds record distributions received in excess of income earned from underlying investments as a reduction of cost of investments and/or realized gain. Such amounts are based on estimates if actual amounts are not available and actual amounts of income, realized gain and return of capital may differ from the estimated amounts. The Funds adjust the estimated amounts of the components of distributions (and consequently their net investment income) as necessary, once the issuers provide information about the actual composition of the distributions.
I. Allocation of Income and Expenses— Expenses directly attributable to a Fund are charged directly to that Fund, while the expenses attributable to more than one fund of the Trusts are allocated among the applicable funds. Investment income, realized and unrealized gains and losses and expenses, other than class-specific expenses, are allocated daily to each class of shares based upon the proportion of net assets of each class at the beginning of each day.
Transfer agency fees are class-specific expenses. The amount of the transfer agency fees charged to each share class of the Funds for the six months ended April 30, 2022 are as follows:
| | Class A | Class C | Class I | Class R6 | Total |
| Macro Opportunities Fund | | | | | |
| Transfer agency fees | $—(a) | $—(a) | $—(a) | $ —(a) | $ —(a) |
| Opportunistic Equity Long/Short Fund | | | | | |
| Transfer agency fees | 1 | —(a) | 9 | —(a) | 10 |
| Research Market Neutral Fund | | | | | |
| Transfer agency fees | 1 | —(a) | 2 | n/a | 3 |
|
| (a) | Amount rounds to less than one thousand. |
| April 30, 2022 | J.P. Morgan Specialty Funds | 51 |
NOTES TO FINANCIAL STATEMENTS
AS OF April 30, 2022 (Unaudited) (continued)
(Dollar values in thousands)
J. Federal Income Taxes — Each Fund is treated as a separate taxable entity for Federal income tax purposes. Each Fund's policy is to comply with the provisions of the Internal Revenue Code (the “Code”) applicable to regulated investment companies and to distribute to shareholders all of its distributable net investment income and net realized capital gains on investments. Accordingly, no provision for Federal income tax is necessary. Management has reviewed the Funds' tax positions for all open tax years and has determined that as of April 30, 2022, no liability for Federal income tax is required in the Funds' financial statements for net unrecognized tax benefits. However, management’s conclusions may be subject to future review based on changes in, or the interpretation of, the accounting standards or tax laws and regulations. Opportunistic Equity Long/Short Fund's and Research Market Neutral Fund's Federal tax returns for the prior three fiscal years remain subject to examination by the Internal Revenue Service. When filed, Macro Opportunities Fund's Federal tax return since inception will be subject to examination by the Internal Revenue Service.
K. Foreign Taxes —The Funds may be subject to foreign taxes on income, gains on investments or currency purchases/repatriation, a portion of which may be recoverable. The Funds will accrue such taxes and recoveries as applicable, based upon their current interpretation of tax rules and regulations that exist in the markets in which they invest. When a capital gains tax is determined to apply, the Funds record an estimated deferred tax liability in an amount that would be payable if the securities were disposed of on the valuation date.
L. Distributions to Shareholders — Distributions from net investment income, if any, are generally declared and paid at least annually and are declared separately for each class. No class has preferential dividend rights; differences in per share rates are due to differences in separate class expenses. Net realized capital gains, if any, are distributed by each Fund at least annually. The amount of distributions from net investment income and net realized capital gains is determined in accordance with Federal income tax regulations, which may differ from GAAP. To the extent these “book/tax” differences are permanent in nature (i.e., that they result from other than timing of recognition — “temporary differences”), such amounts are reclassified within the capital accounts based on their Federal tax basis treatment.
3. Fees and Other Transactions with Affiliates
A. Investment Advisory Fee — Pursuant to an Investment Advisory Agreement, the Adviser manages the investments of each Fund and for such services is paid a fee. The investment advisory fee is accrued daily and paid monthly at an annual rate based on each Fund's respective average daily net assets. The annual rate for each Fund is as follows:
| Macro Opportunities Fund | 0.60% |
| Opportunistic Equity Long/Short Fund | 1.20 |
| Research Market Neutral Fund | 0.35 |
The Adviser waived investment advisory fees and/or reimbursed expenses as outlined in Note 3.F.
B. Administration Fee — Pursuant to an Administration Agreement, the Administrator provides certain administration services to each Fund. In consideration of these services, the Administrator receives a fee accrued daily and paid monthly at an annual rate of 0.075% of the first $10 billion of each Fund’s respective average daily net assets, plus 0.050% of each Fund’s respective average daily net assets between $10 billion and $20 billion, plus 0.025% of each Fund’s respective average daily net assets between $20 billion and $25 billion, plus 0.01% of each Fund’s respective average daily net assets in excess of $25 billion. For the six months ended April 30, 2022, the effective annualized rate for the Funds was 0.075% of each Fund's average daily net assets, notwithstanding any fee waivers and/or expense reimbursements.
The Administrator waived administration fees as outlined in Note 3.F.
JPMCB, a wholly-owned subsidiary of JPMorgan, serves as the Funds' sub-administrator (the “Sub-administrator”). For its services as Sub-administrator, JPMCB receives a portion of the fees payable to the Administrator.
C. Distribution Fees — Pursuant to a Distribution Agreement, JPMorgan Distribution Services, Inc. (“JPMDS”), an indirect, wholly-owned subsidiary of JPMorgan, serves as each Fund's principal underwriter and promotes and arranges for the sale of each Fund's shares.
The Boards have adopted a Distribution Plan (the “Distribution Plan”) for Class A and Class C Shares of the Funds pursuant to Rule 12b-1 under the 1940 Act. Class I and Class R6 Shares of the Funds do not charge a distribution fee. The Distribution Plan provides that each Fund shall pay, with respect to the applicable share classes, distribution fees, including payments to JPMDS, at annual rates of the average daily net assets as shown in the table below:
| | Class A | Class C |
| Macro Opportunities Fund | 0.25% | 0.75% |
| Opportunistic Equity Long/Short Fund | 0.25 | 0.75 |
| Research Market Neutral Fund | 0.25 | 0.75 |
| 52 | J.P. Morgan Specialty Funds | April 30, 2022 |
In addition, JPMDS is entitled to receive the front-end sales charges from purchases of Class A Shares and the CDSC from redemptions of Class C Shares and certain Class A Shares for which front-end sales charges have been waived. For the six months ended April 30, 2022, JPMDS retained the following:
| | Front-End Sales Charge | CDSC |
| Macro Opportunities Fund | $—(a) | $— |
| Opportunistic Equity Long/Short Fund | 2 | — |
| Research Market Neutral Fund | —(a) | — |
|
| (a) | Amount rounds to less than one thousand. |
D. Service Fees — The Trusts, on behalf of the Funds, have entered into a Shareholder Servicing Agreement with JPMDS under which JPMDS provides certain support services to fund shareholders. For performing these services, JPMDS receives a fee with respect to all share classes, except Class R6 Shares which do not charge a service fee, that is accrued daily and paid monthly equal to a percentage of the average daily net assets as shown in the table below:
| | Class A | Class C | Class I |
| Macro Opportunities Fund | 0.25% | 0.25% | 0.25% |
| Opportunistic Equity Long/Short Fund | 0.25 | 0.25 | 0.25 |
| Research Market Neutral Fund | 0.25 | 0.25 | 0.25 |
JPMDS has entered into shareholder services contracts with affiliated and unaffiliated financial intermediaries who provide shareholder services and other related services to their clients or customers who invest in the Funds. Pursuant to such contracts, JPMDS will pay all or a portion of such fees earned to financial intermediaries for performing such services.
JPMDS waived service fees as outlined in Note 3.F.
E. Custodian and Accounting Fees — JPMCB provides portfolio custody and accounting services to the Funds. For performing these services, the Funds pay JPMCB transaction and asset-based fees that vary according to the number of transactions and positions, plus out-of-pocket expenses. The amounts paid directly to JPMCB by the Funds for custody and accounting services are included in Custodian and accounting fees on the Statements of Operations.
Interest income earned on cash balances at the custodian, if any, is included in Interest income from affiliates on the Statements of Operations.
Interest expense paid to the custodian related to cash overdrafts, if any, is included in Interest expense to affiliates on the Statements of Operations.
F. Waivers and Reimbursements— The Adviser, Administrator and/or JPMDS have contractually agreed to waive fees and/or reimburse the Funds to the extent that total annual operating expenses (excluding acquired fund fees and expenses other than certain money market fund fees as described below, dividend and interest expenses related to short sales, interest, taxes, expenses related to litigation and potential litigation, expenses related to trustee elections and extraordinary expenses) exceed the percentages of the Funds’ respective average daily net assets as shown in the table below:
| | Class A | Class C | Class I | Class R6 |
| Macro Opportunities Fund | 1.20% | 1.70% | 0.95% | 0.70% |
| Opportunistic Equity Long/Short Fund | 1.85 | 2.35 | 1.60 | 1.35 |
| Research Market Neutral Fund | 0.95 | 1.45 | 0.69 | n/a |
The expense limitation agreements were in effect for the six months ended April 30, 2022 and the contractual expense limitation percentages in the table above are in place until at least February 28, 2023.
| April 30, 2022 | J.P. Morgan Specialty Funds | 53 |
NOTES TO FINANCIAL STATEMENTS
AS OF April 30, 2022 (Unaudited) (continued)
(Dollar values in thousands)
For the six months ended April 30, 2022, the Funds’ service providers waived fees and/or reimbursed expenses for each of the Funds as follows. None of these parties expect the Funds to repay any such waived fees and/or reimbursed expenses in future years.
| | Contractual Waivers | |
| | Investment
Advisory Fees | Administration
Fees | Service
Fees | Total | Contractual
Reimbursements |
| Macro Opportunities Fund | $56 | $ 7 | $—(a) | $ 63 | $95 |
| Research Market Neutral Fund | 63 | 37 | 3 | 103 | — |
|
| (a) | Amount rounds to less than one thousand. |
Additionally, the Funds may invest in one or more money market funds advised by the Adviser (affiliated money market funds). The Adviser, Administrator and/or JPMDS, as shareholder servicing agent, have contractually agreed to waive fees and/or reimburse expenses in an amount sufficient to offset the respective net fees each collects from the affiliated money market fund on the applicable Fund’s investment in such affiliated money market fund, except for investments of securities lending cash collateral. None of these parties expect the Funds to repay any such waived fees and/ or reimbursed expenses in future years.
The amounts of these waivers resulting from investments in these money market funds for the six months ended April 30, 2022 were as follows:
| Macro Opportunities Fund | $ 1 |
| Opportunistic Equity Long/Short Fund | 119 |
| Research Market Neutral Fund | 11 |
Effective January 1, 2022, JPMIM voluntarily agreed to reimburse the Funds for the Trustee Fees paid to one of the interested Trustees. For the period January 1, 2022 through April 30, 2022 the amount of these waivers were as follows:
| Opportunistic Equity Long/Short Fund | 1 |
| Research Market Neutral Fund | 1 |
G. Other — Certain officers of the Trusts are affiliated with the Adviser, the Administrator and JPMDS. Such officers, with the exception of the Chief Compliance Officer, receive no compensation from the Funds for serving in their respective roles.
The Boards designated and appointed a Chief Compliance Officer to the Funds pursuant to Rule 38a-1 under the 1940 Act. Each Fund, along with affiliated funds, makes reimbursement payments, on a pro-rata basis, to the Administrator for a portion of the fees associated with the office of the Chief Compliance Officer. Such fees are included in Trustees’ and Chief Compliance Officer’s fees on the Statements of Operations.
The Trusts adopted a Trustee Deferred Compensation Plan (the “Plan”) which allows the independent Trustees to defer the receipt of all or a portion of compensation related to performance of their duties as Trustees. The deferred fees are invested in various J.P. Morgan Funds until distribution in accordance with the Plan.
During the six months ended April 30, 2022, Research Market Neutral Fund purchased securities from an underwriting syndicate in which the principal underwriter or members of the syndicate were affiliated with the Adviser.
The Securities and Exchange Commission ("SEC") has granted an exemptive order permitting the Funds to engage in principal transactions with J.P. Morgan Securities LLC, an affiliated broker, involving taxable money market instruments, subject to certain conditions.
4. Investment Transactions
During the six months ended April 30, 2022, purchases and sales of investments (excluding short-term investments) were as follows:
| | Purchases
(excluding
U.S. Government) | Sales
(excluding
U.S. Government) | Securities
Sold Short | Covers on
Securities
Sold Short |
| Macro Opportunities Fund | $ 4,290 | $ 5,642 | $ — | $ — |
| Opportunistic Equity Long/Short Fund | 2,298,155 | 2,459,635 | 2,323,122 | 2,300,548 |
| Research Market Neutral Fund | 60,833 | 50,642 | 66,945 | 53,812 |
During the six months ended April 30, 2022, there were no purchases or sales of U.S. Government securities.
| 54 | J.P. Morgan Specialty Funds | April 30, 2022 |
5. Federal Income Tax Matters
For Federal income tax purposes, the estimated cost and unrealized appreciation (depreciation) in value of investments held at April 30, 2022 were as follows:
| | Aggregate
Cost | Gross
Unrealized
Appreciation | Gross
Unrealized
Depreciation | Net Unrealized
Appreciation
(Depreciation) |
| Macro Opportunities Fund | $ 14,012 | $ 1,431 | $ 815 | $ 616 |
| Opportunistic Equity Long/Short Fund * | 492,004 | 18,252 | 15,539 | 2,713 |
| Research Market Neutral Fund * | 27,353 | 23,556 | 7,500 | 16,056 |
|
| * | The tax cost includes the proceeds from short sales which may result in a net negative cost. |
At October 31, 2021, the following Funds had net capital loss carryforwards which are available to offset future realized gains:
| | Capital Loss Carryforward Character |
| | Short-Term | Long-Term |
| Macro Opportunities Fund | $ — | $132 |
| Research Market Neutral Fund | 29,216* | — |
|
| * | Amount includes capital loss carryforwards which are limited in future years under Internal Revenue Code sections 381-384. |
Late year ordinary losses incurred after December 31, and within the taxable year are deemed to arise on the first business day of the Funds’ next taxable year. For the year ended October 31, 2021, the following Fund deferred to November 1, 2021 the following late year ordinary loss of:
| | |
| | Late Year Ordinary Loss Deferral |
| Research Market Neutral Fund | $1,186 |
During the year ended October 31, 2021, the following Funds utilized capital loss carryforwards as follows:
| | Capital Loss Utilized |
| | Short-Term | Long-Term |
| Macro Opportunities Fund | $ — | $274 |
| Research Market Neutral Fund | 2,164 | — |
6. Borrowings
The Funds rely upon an exemptive order granted by the SEC (the “Order”) permitting the establishment and operation of an Interfund Lending Facility (the “Facility”). The Facility allows the Funds to directly lend and borrow money to or from any other fund relying upon the Order at rates beneficial to both the borrowing and lending funds. Advances under the Facility are taken primarily for temporary or emergency purposes, including the meeting of redemption requests that otherwise might require the untimely disposition of securities, and are subject to each Fund's borrowing restrictions. The Interfund loan rate is determined, as specified in the Order, by averaging the current repurchase agreement rate and the current bank loan rate. The Order was granted to JPMorgan Trust II and may be relied upon by the Funds because the Funds and the series of JPMorgan Trust II are all investment companies in the same “group of investment companies” (as defined in Section 12(d)(1)(G) of the 1940 Act).
The Funds had no borrowings outstanding from another fund, or loans outstanding to another fund, during the six months ended April 30, 2022.
The Trusts and JPMCB have entered into a financing arrangement. Under this arrangement, JPMCB provides an unsecured, uncommitted credit facility in the aggregate amount of $100 million to certain of the J.P. Morgan Funds, including the Funds. Advances under the arrangement are taken primarily for temporary or emergency purposes, including the meeting of redemption requests that otherwise might require the untimely disposition of securities, and are subject to each Fund's borrowing restrictions. Interest on borrowings is payable at a rate determined by JPMCB at the time of borrowing. This agreement has been extended until October 31, 2022.
The Funds had no borrowings outstanding from the unsecured, uncommitted credit facility during the six months ended April 30, 2022.
| April 30, 2022 | J.P. Morgan Specialty Funds | 55 |
NOTES TO FINANCIAL STATEMENTS
AS OF April 30, 2022 (Unaudited) (continued)
(Dollar values in thousands)
The Trusts, along with certain other trusts for J.P. Morgan Funds (“Borrowers”), have entered into a joint syndicated senior unsecured revolving credit facility totaling $1.5 billion (“Credit Facility”) with various lenders and The Bank of New York Mellon, as administrative agent for the lenders. This Credit Facility provides a source of funds to the Borrowers for temporary and emergency purposes, including the meeting of redemption requests that otherwise might require the untimely disposition of securities. Under the terms of the Credit Facility, a borrowing fund must have a minimum of $25,000,000 in adjusted net asset value and not exceed certain adjusted net asset coverage ratios prior to and during the time in which any borrowings are outstanding. If a fund does not comply with the aforementioned requirements, the fund must remediate within three business days with respect to the $25,000,000 minimum adjusted net asset value or within one business day with respect to certain asset coverage ratios or the administrative agent at the request of, or with the consent of, the lenders may terminate the Credit Facility and declare any outstanding borrowings to be due and payable immediately.
Interest associated with any borrowing under the Credit Facility is charged to the borrowing fund at a rate of interest equal to 1.00%, which was decreased from 1.25% pursuant to the amendment referenced below (the “Applicable Margin”), plus the greater of the federal funds effective rate or one month LIBOR. The annual commitment fee to maintain the Credit Facility is 0.15% and is incurred on the unused portion of the Credit Facility and is allocated to all participating funds pro rata based on their respective net assets. Effective August 10, 2021, the Credit Facility has been amended and restated for a term of 364 days, unless extended, and to include a reduction of the Applicable Margin charged for borrowing under the Credit Facility from 1.25% to 1.00%.
The Funds did not utilize the Credit Facility during the six months ended April 30, 2022.
7. Risks, Concentrations and Indemnifications
In the normal course of business, the Funds enter into contracts that contain a variety of representations which provide general indemnifications. Each Fund’s maximum exposure under these arrangements is unknown. The amount of exposure would depend on future claims that may be brought against each Fund. However, based on experience, the Funds expect the risk of loss to be remote.
As of April 30, 2022, the Funds had individual shareholder and/or omnibus accounts each owning more than 10% of the respective Fund’s outstanding shares as follows:
| | Number of
Individual
Shareholder and/or
Affiliated
Omnibus Accounts | % of
the Fund | Number of
Individual
Shareholder and/or
Non-Affiliated
Omnibus Accounts | % of the Fund |
| Macro Opportunities Fund | 1 | 85.4% | — | —% |
| Opportunistic Equity Long/Short Fund | — | — | 4 | 70.9 |
| Research Market Neutral Fund | — | — | 3 | 47.1 |
Significant shareholder transactions by these shareholders may impact the Funds’ performance and liquidity.
Macro Opportunities Fund may have elements of risk not typically associated with investments in the United States of America due to concentrated investments in a limited number of foreign countries or regions, which may vary throughout the period. Such concentrations may subject the Fund to additional risks resulting from political or economic conditions in such countries or regions and the possible imposition of adverse governmental laws or currency exchange restrictions could cause the securities and their markets to be less liquid and their prices to be more volatile than those of comparable U.S. securities.
As of April 30, 2022, a significant portion of the investments of Macro Opportunities Fund consisted of securities that were denominated in foreign currencies. Changes in currency exchange rates will affect the value of, and investment income from, such securities.
As of April 30, 2022, the Fund had non-U.S. country allocations representing greater than 10% of total investments (excluding investment of cash collateral from securities loaned) as follows:
| | Macro
Opportunities
Fund |
| Germany | 14.2% |
| Japan | 16.6 |
Derivatives may be riskier than other types of investments because they may be more sensitive to changes in economic and market conditions and could result in losses that significantly exceed the Funds’ original investment. Many derivatives create leverage thereby causing the Funds to be more volatile than they would have been if they had not used derivatives. Derivatives also expose the Funds to counterparty risk (the risk that the
| 56 | J.P. Morgan Specialty Funds | April 30, 2022 |
derivative counterparty will not fulfill its contractual obligations), including credit risk of the derivative counterparty. The possible lack of a liquid secondary market for derivatives and the resulting inability of the Funds to sell or otherwise close a derivatives position could expose the Funds to losses.
The Funds are also subject to counterparty credit risk, which is the risk that a counterparty fails to perform on agreements with the Funds.
Since Opportunistic Equity Long/Short Fund is non-diversified, it may invest a greater percentage of its assets in a particular issuer or group of issuers than a diversified fund would. This increased investment in fewer issuers may result in the Fund's shares being more sensitive to economic results of those issuing the securities.
As of April 30, 2022, Opportunistic Equity Long/Short Fund and Research Market Neutral Fund pledged substantially all of their assets to Citigroup Global Markets, Inc. for securities sold short. For the Funds, deposits at broker for securities sold short, as noted on the Statements of Assets and Liabilities, are held at Citigroup Global Markets, Inc.
LIBOR is intended to represent the rate at which contributing banks may obtain short-term borrowings from each other in the London interbank market. On March 5, 2021, the U.K. Financial Conduct Authority ("FCA") publicly announced that (i) immediately after December 31, 2021, publication of the 1-week and 2-month U.S. Dollar LIBOR settings will permanently cease; (ii) immediately after June 30, 2023, publication of the overnight and 12-month U.S. Dollar LIBOR settings will permanently cease; and (iii) immediately after June 30, 2023, the 1-month, 3-month and 6-month U.S. Dollar LIBOR settings will cease to be provided or, subject to the FCA's consideration of the case, be provided on a synthetic basis and no longer be representative of the underlying market and economic reality they are intended to measure and that representativeness will not be restored. There is no assurance that the dates announced by the FCA will not change or that the administrator of LIBOR and/or regulators will not take further action that could impact the availability, composition or characteristics of LIBOR or the currencies and/or tenors for which LIBOR is published. In addition, certain regulated entities ceased entering into most new LIBOR contracts in connection with regulatory guidance or prohibitions. Public and private sector industry initiatives are currently underway to implement new or alternative reference rates to be used in place of LIBOR. There is no assurance that any such alternative reference rate will be similar to or produce the same value or economic equivalence as LIBOR or that it will have the same volume or liquidity as did LIBOR prior to its discontinuance, unavailability or replacement, all of which may affect the value, volatility, liquidity or return on certain of a Fund's loans, notes, derivatives and other instruments or investments comprising some or all of a Fund's investments and result in costs incurred in connection with changing reference rates used for positions closing out positions and entering into new trades. Certain of a Fund's investments may transition from LIBOR prior to the dates announced by the FCA. The transition from LIBOR to alternative reference rates may result in operational issues for a Fund or its investments. No assurances can be given as to the impact of the LIBOR transition (and the timing of any such impact) on a Fund and its investments.
The Funds are subject to infectious disease epidemics/pandemics risk. The worldwide outbreak of COVID-19 has negatively affected economies, markets and individual companies throughout the world. The effects of this COVID-19 pandemic to public health, and business and market conditions, including among other things, reduced consumer demand and economic output, supply chain disruptions and increased government spending may continue to have a significant negative impact on the performance of a Fund’s investments, increase a Fund’s volatility, exacerbate other pre-existing political, social and economic risks to the Funds and negatively impact broad segments of businesses and populations. In addition, governments, their regulatory agencies, or self-regulatory organizations have taken or may take actions in response to the pandemic that affect the instruments in which the Funds invest, or the issuers of such instruments, in ways that could also have a significant negative impact on a Fund’s investment performance. The duration and extent of COVID-19 and associated economic and market conditions and uncertainty over the long-term cannot be reasonably estimated at this time. The ultimate impact of COVID-19 and the extent to which the associated conditions impact a Fund will also depend on future developments, which are highly uncertain, difficult to accurately predict and subject to frequent changes.
| April 30, 2022 | J.P. Morgan Specialty Funds | 57 |
SCHEDULE OF SHAREHOLDER EXPENSES
(Unaudited)
As a shareholder of the Funds, you incur two types of costs: (1) transaction costs, including sales charges (loads) on purchase payments and (2) ongoing costs, including investment advisory fees, administration fees, distribution fees and other Fund expenses. The examples below are intended to help you understand your ongoing costs (in dollars) of investing in the Funds (not including expenses of the Underlying Funds and ETFs) and to compare these ongoing costs with the ongoing costs of investing in other mutual funds. The examples assume that you had a $1,000 investment in each Class at the beginning of the reporting period, November 1, 2021, and continued to hold your shares at the end of the reporting period, April 30, 2022.
Actual Expenses
For each Class of each Fund in the table below, the first line provides information about actual account values and actual expenses. You may use the information in this line, together with the amount you invested, to estimate the expenses that you paid over the period. Simply divide your account value by $1,000 (for example, an $8,600 account value divided by $1,000 = 8.6), then multiply the result by the number in the first line of each Class under the heading titled “Expenses Paid During the Period” to estimate the expenses you paid on your account during this period.
Hypothetical Example for Comparison Purposes
The second line of each Class in the table below provides information about hypothetical account values and hypothetical expenses based on the Class’ actual expense ratio and an assumed rate of return of 5% per year before expenses, which is not the Class’ actual return. The hypothetical account values and expenses may not be used to estimate the actual ending account balance or expenses you paid for the period. You may use this information to compare the ongoing costs of investing in the Class of the Funds and other funds. To do so, compare this 5% hypothetical example with the 5% hypothetical examples that appear in the shareholder reports of the other funds. Please note that the expenses shown in the table are meant to highlight your ongoing costs only and do not reflect any transaction costs, such as sales charges (loads), or redemption fees, and expenses of the Underlying Funds and ETFs. Therefore, the second line for each Class in the table is useful in comparing ongoing costs only, and will not help you determine the relative total costs of owning different funds. In addition, if these transaction costs were included, your costs would have been higher. The examples also assume all dividends and distributions have been reinvested.
| | Beginning
Account Value
November 1, 2021 | Ending
Account Value
April 30, 2022 | Expenses
Paid During
the Period* | Annualized
Expense
Ratio |
| JPMorgan Macro Opportunities Fund | | | | |
| Class A | | | | |
| Actual | $1,000.00 | $ 907.00 | $ 5.82 | 1.23% |
| Hypothetical | 1,000.00 | 1,018.70 | 6.16 | 1.23 |
| Class C | | | | |
| Actual | 1,000.00 | 904.40 | 8.17 | 1.73 |
| Hypothetical | 1,000.00 | 1,016.22 | 8.65 | 1.73 |
| Class I | | | | |
| Actual | 1,000.00 | 908.40 | 4.64 | 0.98 |
| Hypothetical | 1,000.00 | 1,019.94 | 4.91 | 0.98 |
| Class R6 | | | | |
| Actual | 1,000.00 | 909.00 | 3.46 | 0.73 |
| Hypothetical | 1,000.00 | 1,021.18 | 3.66 | 0.73 |
| JPMorgan Opportunistic Equity Long/Short Fund | | | | |
| Class A | | | | |
| Actual | 1,000.00 | 872.40 | 11.65 | 2.51 |
| Hypothetical | 1,000.00 | 1,012.35 | 12.52 | 2.51 |
| Class C | | | | |
| Actual | 1,000.00 | 870.30 | 14.00 | 3.02 |
| Hypothetical | 1,000.00 | 1,009.82 | 15.05 | 3.02 |
| Class I | | | | |
| Actual | 1,000.00 | 873.50 | 10.54 | 2.27 |
| Hypothetical | 1,000.00 | 1,013.54 | 11.33 | 2.27 |
| Class R6 | | | | |
| Actual | 1,000.00 | 874.80 | 9.39 | 2.02 |
| Hypothetical | 1,000.00 | 1,014.78 | 10.09 | 2.02 |
| 58 | J.P. Morgan Specialty Funds | April 30, 2022 |
| | Beginning
Account Value
November 1, 2021 | Ending
Account Value
April 30, 2022 | Expenses
Paid During
the Period* | Annualized
Expense
Ratio |
| JPMorgan Research Market Neutral Fund | | | | |
| Class A | | | | |
| Actual | $1,000.00 | $ 972.60 | $14.72 | 3.01% |
| Hypothetical | 1,000.00 | 1,009.87 | 15.00 | 3.01 |
| Class C | | | | |
| Actual | 1,000.00 | 970.20 | 17.34 | 3.55 |
| Hypothetical | 1,000.00 | 1,007.19 | 17.67 | 3.55 |
| Class I | | | | |
| Actual | 1,000.00 | 973.60 | 13.46 | 2.75 |
| Hypothetical | 1,000.00 | 1,011.16 | 13.71 | 2.75 |
|
| * | Expenses are equal to each Class’ respective annualized expense ratio, multiplied by the average account value over the period, multiplied by 181/365 (to reflect the one-half year period). |
| April 30, 2022 | J.P. Morgan Specialty Funds | 59 |
LIQUIDITY RISK MANAGEMENT PROGRAM
(Unaudited)
Each of the Funds covered in this report have adopted the J.P. Morgan Funds and J.P. Morgan Exchange-Traded Funds Amended and Restated Liquidity Risk Management Program (the “Program”) under Rule 22e-4 under the Investment Company Act of 1940, as amended (the “Liquidity Rule”). The Program seeks to assess, manage and review each Fund’s Liquidity Risk. “Liquidity Risk” is defined as the risk that a fund could not meet requests to redeem shares issued by the fund without significant dilution of remaining investors’ interests in the fund. Among other things, the Liquidity Rule requires that a written report be provided to the Board of Trustees (the “Board”) on an annual basis that addresses the operation of the Program and assesses the adequacy and effectiveness of its implementation, including the operation of any Highly Liquid Investment Minimum (“HLIM”), where applicable, and any material changes to the Program.
The Board has appointed J.P. Morgan Asset Management’s Liquidity Risk Forum to be the program administrator for the Program (the “Program Administrator”). In addition to regular reporting at each of its quarterly meetings, on February 8, 2022, the Board reviewed the Program Administrator’s annual written report (the “Report”) concerning the operation of the Program for the period from January 1, 2021 through December 31, 2021 (the “Program Reporting Period”). The Report addressed the operation of the Program and assessed its adequacy and effectiveness of implementation, including, where applicable, the operation of a Fund’s HLIM. During the Program Reporting Period, the Program was amended, pursuant to an exemptive order from the Securities and Exchange Commission, to permit the Funds to use liquidity definitions and classification methodologies that differ from the requirements under the Liquidity Rule in some respects. The
Report discussed the implementation of these changes. No other material changes were made to the Program during the Program Reporting Period.
The Report summarized the operation of the Program and the information and factors considered by the Program Administrator in assessing whether the Program has been adequately and effectively implemented with respect to each Fund. Such information and factors included, among other things: (1) the liquidity risk framework used to assess, manage, and periodically review each Fund’s Liquidity Risk and the results of this assessment; (2) the methodology and inputs for classifying the investments of a Fund into one of the required liquidity categories that reflect an estimate of the liquidity of those investments under current market conditions; (3) whether a Fund invested primarily in “Highly Liquid Investments” (as defined or modified under the Program), as well as whether an HLIM should be established for a Fund (and, for Funds that have adopted an HLIM, whether the HLIM continues to be appropriate or whether a Fund has invested below its HLIM) and the procedures for monitoring for any HLIM; (4) whether a Fund invested more than 15% of its assets in “Illiquid Investments” (as defined or modified under the Program) and the procedures for monitoring for this limit; and (5) specific liquidity events arising during the Program Reporting Period. The Report further summarized the conditions of the exemptive order.
Based on this review, the Report concluded that: (1) the Program continues to be reasonably designed to effectively assess and manage each Fund’s Liquidity Risk; and (2) the Program has been adequately and effectively implemented with respect to each Fund during the Program Reporting Period.
| 60 | J.P. Morgan Specialty Funds | April 30, 2022 |
J.P. Morgan Funds are distributed by JPMorgan Distribution Services, Inc., which is an affiliate of JPMorgan Chase & Co. Affiliates of JPMorgan Chase & Co. receive fees for providing various services to the funds.
Contact JPMorgan Distribution Services, Inc. at 1-800-480-4111 for a fund prospectus. You can also visit us at www.jpmorganfunds.com. Investors should carefully consider the investment objectives and risk as well as charges and expenses of the mutual fund before investing. The prospectus contains this and other information about the mutual fund. Read the prospectus carefully before investing.
Investors may obtain information about the Securities Investor Protection Corporation (SIPC), including the SIPC brochure, by visiting www.sipc.org or by calling SIPC at 202-371-8300.
Each Fund files a complete schedule of its fund holdings for the first and third quarters of its fiscal year with the SEC as an exhibit to its report on Form N-PORT. The Funds' Form N-PORT reports are available on the SEC’s website at http://www.sec.gov. Each Fund's quarterly holdings can be found by visiting the J.P. Morgan Funds’ website at www.jpmorganfunds.com.
A description of the Fund's policies and procedures with respect to the disclosure of each Fund's holdings is available in the prospectuses and Statement of Additional Information.
A copy of proxy policies and procedures is available without charge upon request by calling 1-800-480-4111 and on the Fund’s website at www.jpmorganfunds.com. A description of such policies and procedures is on the SEC’s website at www.sec.gov. The Trustees have delegated the authority to vote proxies for securities owned by the Funds to the Adviser. A copy of the Fund’s voting record for the most recent 12-month period ended June 30 is available on the SEC’s website at www.sec.gov or at the Fund’s website at www.jpmorganfunds.com no later than August 31 of each year. The Fund’s proxy voting record will include, among other things, a brief description of the matter voted on for each fund security, and will state how each vote was cast, for example, for or against the proposal.
J.P. Morgan Asset Management is the brand name for the asset management business of JPMorgan Chase & Co. and its affiliates worldwide.
| © JPMorgan Chase & Co., 2022. All rights reserved. April 2022. | SAN-SPEC-422 |
ITEM 2. CODE OF ETHICS.
Disclose whether, as of the end of the period covered by the report, the registrant has adopted a code of ethics that applies to the registrant’s principal executive officer, principal financial officer, principal accounting officer or controller, or persons performing similar functions, regardless of whether these individuals are employed by the registrant or a third party. If the registrant has not adopted such a code of ethics, explain why it has not done so.
The registrant must briefly describe the nature of any amendment, during the period covered by the report, to a provision of its code of ethics that applies to the registrant’s principal executive officer, principal financial officer, principal accounting officer or controller, or persons performing similar functions, regardless of whether these individuals are employed by the registrant or a third party, and that relates to any element of the code of ethics definition enumerated in paragraph (b) of this Item. The registrant must file a copy of any such amendment as an exhibit pursuant to Item 13(a)(1), unless the registrant has elected to satisfy paragraph (f) of this Item by positing its code of ethics on its website pursuant to paragraph (f)(2) of this Item, or by undertaking to provide its code of ethics to any person without charge, upon request, pursuant to paragraph (f)(3) of this Item.
If the registrant has, during the period covered by the report, granted a waiver, including an implicit waiver, from a provision of the code of ethics that applies to the registrant’s principal executive officer, principal financial officer, principal accounting officer or controller, or persons performing similar functions, regardless of whether these individuals are employed by the registrant or third party, that relates to one or more items set forth in paragraph (b) of this Item, the registrant must briefly describe the nature of the waiver, the name of the person to whom the waiver was granted, and the date of the waiver.
Not applicable to a semi-annual report.
ITEM 3. AUDIT COMMITTEE FINANCIAL EXPERT.
(a) (1) Disclose that the registrant’s board of directors has determined that the registrant either:
(i) Has at least one audit committee financial expert serving on its audit committee; or
(ii) Does not have an audit committee financial expert serving on its audit committee.
(2) If the registrant provides the disclosure required by paragraph (a)(1)(i) of this Item, it must disclose the name of the audit committee financial expert and whether that person is “independent.” In order to be considered “independent” for purposes of this Item, a member of an audit committee may not, other than in his or her capacity as a member of the audit committee, the board of directors, or any other board committee:
(i) Accept directly or indirectly any consulting, advisory, or other compensatory fee from the issuer; or
(ii) Be an “interested person” of the investment company as defined in Section 2(a)(19) of the Act (15 U.S.C. 80a-2(a)(19)).
(3) If the registrant provides the disclosure required by paragraph (a)(1)(ii) of this Item, it must explain why it does not have an audit committee financial expert.
Not applicable to a semi-annual report.
ITEM 4. PRINCIPAL ACCOUNTANT FEES AND SERVICES.
(a) Disclose, under the caption Audit Fees, the aggregate fees billed for each of the last two fiscal years for professional
services rendered by the principal accountant for the audit of the registrant’s annual financial statements or services that are normally provided by the accountant in connection with statutory and regulatory filings or engagements for those fiscal years.
(b) Disclose, under the caption Audit-Related Fees, the aggregate fees billed in each of the last two fiscal years for assurance and related services by the principal accountant that are reasonably related to the performance of the audit of the registrant’s financial statements and are not reported under paragraph (a) of this Item. Registrants shall describe the nature of the services comprising the fees disclosed under this category.
(c) Disclose, under the caption Tax Fees, the aggregate fees billed in each of the last two fiscal years for professional services rendered by the principal accountant for tax compliance, tax advice, and tax planning. Registrants shall describe the nature of the services comprising the fees disclosed under this category.
(d) Disclose, under the caption All Other Fees, the aggregate fees billed in each of the last two fiscal years for products and services provided by the principal accountant, other than the services reported in paragraphs (a) through (c) of this Item. Registrants shall describe the nature of the services comprising the fees disclosed under this category.
(e) (1) Disclose the audit committee’s pre-approval policies and procedures described in paragraph (c)(7) of Rule 2-01 of Regulation S-X.
(2) Disclose the percentage of services described in each of paragraphs (b) through (d) of this Item that were approved by the audit committee pursuant to paragraph (c)(7)(i)(C) of Rule 2-01 of Regulation S-X.
(f) If greater than 50 percent, disclose the percentage of hours expended on the principal accountant’s engagement to audit the registrant’s financial statements for the most recent fiscal year that were attributed to work performed by persons other than the principal accountant’s full-time, permanent employees.
(g) Disclose the aggregate non-audit fees billed by the registrant’s accountant for services rendered to the registrant, and rendered to the registrant’s investment adviser (not including any sub-adviser whose role is primarily portfolio management and is subcontracted with or overseen by another investment adviser), and any entity controlling, controlled by, or under common control with the adviser that provides ongoing services to the registrant for each of the last two fiscal years of the registrant.
(h) Disclose whether the registrant’s audit committee of the board of directors has considered whether the provision of non-audit services that were rendered to the registrant’s investment adviser (not including any subadviser whose role is primarily portfolio management and is subcontracted with or overseen by another investment adviser), and any entity controlling, controlled by, or under common control with the investment adviser that provides ongoing services to the registrant that were not pre-approved pursuant to paragraph (c)(7)(ii) of Rule 2-01 of Regulation S-X is compatible with maintaining the principal accountant’s independence.
Not applicable to a semi-annual report.
ITEM 5. AUDIT COMMITTEE OF LISTED REGISTRANTS.
(a) If the registrant is a listed issuer as defined in Rule 10A-3 under the Exchange Act (17CFR 240.10A-3), state whether or not the registrant has a separately-designated standing audit committee established in accordance with Section 3(a)(58)(A) of the Exchange Act (15 U.S.C. 78c(a)(58)(A)). If the registrant has such a committee, however designated, identify each committee member. If the entire board of directors is acting as the registrant’s audit committee as specified in Section 3(a)(58)(B) of the Exchange Act (15 U.S.C. 78c(a)(58)(B)), so state.
(b) If applicable, provide the disclosure required by Rule 10A-3(d) under the Exchange Act (17CFR 240.10A-3(d)) regarding an exemption from the listing standards for all audit committees.
Not applicable to a semi-annual report.
ITEM 6. INVESTMENTS.
File Schedule I – Investments in securities of unaffiliated issuers as of the close of the reporting period as set forth in Section 210.12-12 of Regulation S-X, unless the schedule is included as part of the report to shareholders filed under Item 1 of this Form.
Included in Item 1.
ITEM 7. DISCLOSURE OF PROXY VOTING POLICIES AND PROCEDURES FOR CLOSED-END MANAGEMENT INVESTMENT COMPANIES.
Not applicable.
ITEM 8. PORTFOLIO MANAGERS OF CLOSED-END MANAGEMENT INVESTMENT COMPANIES.
Not applicable.
ITEM 9. PURCHASE OF EQUITY SECURITIES BY CLOSED-END MANAGEMENT INVESTMENT COMPANY AND AFFILIATED PURCHASERS.
Not applicable.
ITEM 10. SUBMISSION OF MATTERS TO A VOTE OF SECURITY HOLDERS.
Describe any material changes to the procedures by which shareholders may recommend nominees to the registrant’s board of directors, where those changes were implemented after the registrant last provided disclosure in response to the requirements of Item 7(d)(2)(ii)(G) of Schedule 14A (17 CFR 240.14a-101), or this Item.
No material changes to report.
ITEM 11. CONTROLS AND PROCEDURES.
(a) Disclose the conclusions of the registrant’s principal executive and principal financial officers, or persons performing similar functions, regarding the effectiveness of the registrant’s disclosure controls and procedures (as defined in Rule 30a-3(c) under the Act (17 CFR 270.30a-3(c))) as of a date within 90 days of the filing date of the report that includes the disclosure required by this paragraph, based on the evaluation of these controls and procedures required by Rule 30a-3(b) under the Act (17 CFR 270.30a-3(b)) and Rules 13a-15(b) or 15d-15(b) under the Exchange Act (17 CFR 240.13a-15(b) or 240.15d-15(b)).
The Registrant’s principal executive and principal financial officers have concluded, based on their evaluation of the Registrant’s disclosure controls and procedures as of a date within 90 days of the filing date of this report, that the Registrant’s disclosure controls and procedures are reasonably designed to ensure that information required to be disclosed by the Registrant on Form N-CSR is recorded, processed, summarized and reported within the required time periods and that information required to be disclosed by the Registrant in the reports that it files or submits on Form N-CSR is accumulated and communicated to the Registrant’s management, including its principal executive and principal financial officers, as appropriate to allow timely decisions regarding required disclosure.
(b) Disclose any change in the registrant’s internal control over financial reporting (as defined in Rule 30a-3(d) under the Act (17 CFR 270.30a-3(d)) that occurred during the registrant’s second fiscal quarter of the period covered by this report that has materially affected, or is reasonably likely to materially affect, the registrant’s internal control over financial reporting.
There were no changes in the Registrant’s internal control over financial reporting that occurred during the last fiscal quarter covered by this report that have materially affected, or are reasonably likely to materially affect, the Registrant’s internal control over financial reporting.
ITEM 12. DISCLOSURE OF SECURITIES LENDING ACTIVITIES FOR CLOSED-END MANAGEMENT INVESTMENT COMPANIES.
Not applicable.
ITEM 13. EXHIBITS.
| | (a) | File the exhibits listed below as part of this Form. Letter or number the exhibits in the sequence indicated. |
(1) Any code of ethics, or amendment thereto, that is the subject of the disclosure required by Item 2, to the extent that the registrant intends to satisfy the Item 2 requirements through filing of an exhibit.
Not applicable.
(2) A separate certification for each principal executive officer and principal financial officer of the registrant as required by Rule 30a-2(a) under the Act (17 CFR 270.30a-2).
Certifications pursuant to Rule 30a-2(a) under the Investment Company Act of 1940 are attached hereto.
(3) Any written solicitation to purchase securities under Rule 23c-1 under the Act (17 CFR 270.23c-1) sent or given during the period covered by the report by or on behalf of the registrant to 10 or more persons.
Not applicable.
| | (b) | A separate or combined certification for each principal executive officer and principal officer of the registrant as required by Rule 30a-2(b) under the Act of 1940. |
Certifications pursuant to Rule 30a-2(b) under the Investment Company Act of 1940 are attached hereto.
SIGNATURES
Pursuant to the requirements of the Securities Exchange Act of 1934 and the Investment Company Act of 1940, the registrant has duly caused this report to be signed on its behalf by the undersigned, thereunto duly authorized.
| | |
| JPMorgan Trust IV |
| |
| By: | | /s/ Brian S. Shlissel |
| | Brian S. Shlissel |
| | President and Principal Executive Officer |
| | July 5, 2022 |
Pursuant to the requirements of the Securities Exchange Act of 1934 and the Investment Company Act of 1940, this report has been signed below by the following persons on behalf of the registrant and in the capacities and on the dates indicated.
| | |
| By: | | /s/ Brian S. Shlissel |
| | Brian S. Shlissel |
| | President and Principal Executive Officer |
| | July 5, 2022 |
| |
| By: | | /s/ Timothy J. Clemens |
| | Timothy J. Clemens |
| | Treasurer and Principal Financial Officer |
| | July 5, 2022 |