UNITED STATES
SECURITIES AND EXCHANGE COMMISSION
Washington, D.C. 20549
FORM N-CSR
CERTIFIED SHAREHOLDER REPORT OF REGISTERED
MANAGEMENT INVESTMENT COMPANIES
Investment Company Act file number: 811-23117
JPMorgan Trust IV
(Exact name of registrant as specified in charter)
277 Park Avenue
New York, NY 10172
(Address of principal executive offices) (Zip code)
Gregory S. Samuels
277 Park Avenue
New York, NY 10172
(Name and Address of Agent for Service)
Registrant’s telephone number, including area code: (800) 480-4111
Date of fiscal year end: October 31
Date of reporting period: November 1, 2022 through April 30, 2023
Form N-CSR is to be used by management investment companies to file reports with the Commission not later than 10 days after the transmission to stockholders of any report that is required to be transmitted to stockholders under Rule 30e-1 under the Investment Company Act of 1940 (17 CFR 270.30e-1). The Commission may use the information provided on Form N-CSR in its regulatory, disclosure review, inspection, and policymaking roles.
A registrant is required to disclose the information specified by Form N-CSR, and the Commission will make this information public. A registrant is not required to respond to the collection of information contained in Form N-CSR unless the Form displays a currently valid Office of Management and Budget (“OMB”) control number. Please direct comments concerning the accuracy of the information collection burden estimate and any suggestions for reducing the burden to Secretary, Securities and Exchange Commission, 450 Fifth Street, NW, Washington, DC 20549-0609. The OMB has reviewed this collection of information under the clearance requirements of 44 U.S.C. Section 3507.
ITEM 1. REPORTS TO STOCKHOLDERS.
a.) The following is a copy of the report transmitted to shareholders pursuant to Rule 30e-1 under the Investment Company Act of 1940 (17 CFR 270.30e-1).
b.) A copy of the notice transmitted to shareholders in reliance on Rule 30e-3 under the 1940 Act that contains disclosures specified by paragraph (c)(3) of that rule is included in the Annual Report. Not Applicable. Notices do not incorporate disclosures from the shareholder reports.
Semi-Annual Report
J.P. Morgan International Equity Funds
April 30, 2023 (Unaudited)
JPMorgan Emerging Markets Equity Fund |
JPMorgan Emerging Markets Research Enhanced Equity Fund |
JPMorgan Europe Dynamic Fund |
JPMorgan International Equity Fund |
JPMorgan International Focus Fund |
JPMorgan International Hedged Equity Fund |
JPMorgan International Value Fund |
CONTENTS
Investments in a Fund are not deposits or obligations of, or guaranteed or endorsed by, any bank and are not insured or guaranteed by the FDIC, the Federal Reserve Board or any other government agency. You could lose money if you sell when a Fund’s share price is lower than when you invested.
Past performance is no guarantee of future performance. The general market views expressed in this report are opinions based on market and other conditions through the end of the reporting period and are subject to change without notice. These views are not intended to predict the future performance of a Fund or the securities markets.
Prospective investors should refer to the Funds’ prospectuses for a discussion of the Funds’ investment objectives, strategies and risks. Call J.P. Morgan Funds Service Center at 1-800-480-4111 for a prospectus containing more complete information about a Fund, including management fees and other expenses. Please read it carefully before investing.
Letter to Shareholders
June 15, 2023 (Unaudited)
Dear Shareholder,
Financial markets largely generated positive returns for the six months ended April 30, 2023, even as rising interest rates, weaker corporate earnings and geopolitical uncertainty weighed on global economic growth. Overall, global equity markets – led by European stocks – generally outperformed bond markets for the reporting period.
|
“While the effects of rising interest rates is likely to adversely impact economic growth in the months ahead, other factors may aid the global economic outlook, as energy prices have trended downward in recent months and the re-opening of China’s economy may provide support for increased global trade.” — Brian S. Shlissel
|
While economic growth has slowed in recent quarters, to date, the U.S. has avoided formal entry into a recession. Moreover, inflation has decelerated from last year’s historical highs as energy and electricity prices receded in 2023, allowing the U.S. Federal Reserve in June 2023 to refrain from further raising interest rates for the first time since January 2022, though the central bank stated it may find it necessary to raise rates in the future. The job market in the U.S. remained strong throughout the period as the reported monthly unemployment rate ranged between 3.6% and 3.4% for the six months ended April 30, 2023.
Across Europe, inflationary pressures remained high and both the European Central Bank and the Bank of England continued to raise interest rates during the period. Unemployment across the EU stood at 6%, while the U.K. jobless rate fell to 3.8% in
April 2023. Notably, European equity markets generally outperformed other developed markets during the period, potentially driven by more attractive valuations relative to U.S. companies.
The International Monetary Fund’s (IMF) April 2023 economic outlook warned that global output is likely to decline to 2.8% for 2023, amid weakness in parts of the financial sector, continued inflationary pressures and the ongoing war in Ukraine. Further, the IMF forecast developed market economies to decelerate at a faster pace than emerging market economies.
While the effects of rising interest rates is likely to adversely impact economic growth in the months ahead, other factors may aid the global economic outlook, as energy prices have trended downward in recent months and the re-opening of China’s economy may provide support for increased global trade. Regardless of the economic backdrop, we believe investors who hold a well-diversified portfolio and a long-term outlook may be better positioned to benefit from opportunities presented by global financial markets. Our suite of investment solutions seeks to provide investors with ability to build durable portfolios that can meet their financial goals.
Sincerely,
Brian S. Shlissel
President, J.P. Morgan Funds
J.P. Morgan Asset Management
1-800-480-4111 or www.jpmorganfunds.com for more information
| J.P. Morgan International Equity Funds | |
J.P. Morgan International Equity Funds
MARKET OVERVIEW
SIX MONTHS ENDED April 30, 2023 (Unaudited)
Global financial markets largely generated positive returns for the period and completed a rebound from the sell-offs that marked the middle of 2022. Developed markets equity generally outperformed emerging markets equity, while European equity markets outperformed U.S. equity.
However, equity markets performance was mixed on a month-to-month basis, even if the overall trend was upward. For the six months ended April 30, 2023, the MSCI EAFE Index returned 24.19%, the MSCI Emerging Markets Index returned 16.36% and the S&P 500 Index returned 8.63%.
Leading central banks continued to raise interest rates throughout the six-month period, though the size of increases narrowed in 2023 as the policy response to inflationary pressure grew less aggressive. Notably, the Bank of Japan maintained its negative interest rate policy amid weak consumption data and marginal economic growth.
While global inflation rates remained elevated during the period, they retreated from the 40-year highs reached in 2022, and price data in the U.S. and the Euro Area indicated a slowing trend. Though inflation in the U.K. declined in the final months of 2022, the U.K. consumer price index rose more than expected in 2023.
Lower energy prices were a leading contributor to declining global inflation in the second half of the period. Following Russia’s invasion of Ukraine in late February 2022, the European Union and the U.K. largely avoided an extended energy crisis by securing alternative sources to Russian natural gas and moved to build up reserves of both natural gas and petroleum ahead of the winter months.
Meanwhile, economic activity and aggregate demand in China accelerated after the country’s leadership lifted strict anti-pandemic policies in late 2022. The rebound in China helped to lift equity prices in China and its leading emerging market trading partners.
| J.P. Morgan International Equity Funds | |
JPMorgan Emerging Markets Equity Fund
FUND COMMENTARY
SIX MONTHS ENDED April 30, 2023 (Unaudited)
| |
| |
MSCI Emerging Markets Index (net total return) | |
Net Assets as of 4/30/2023 (In Thousands) | |
INVESTMENT OBJECTIVE**
The JPMorgan Emerging Markets Equity Fund (the “Fund”) seeks to provide high total return.
WHAT WERE THE MAIN DRIVERS OF THE FUND’S PERFORMANCE?
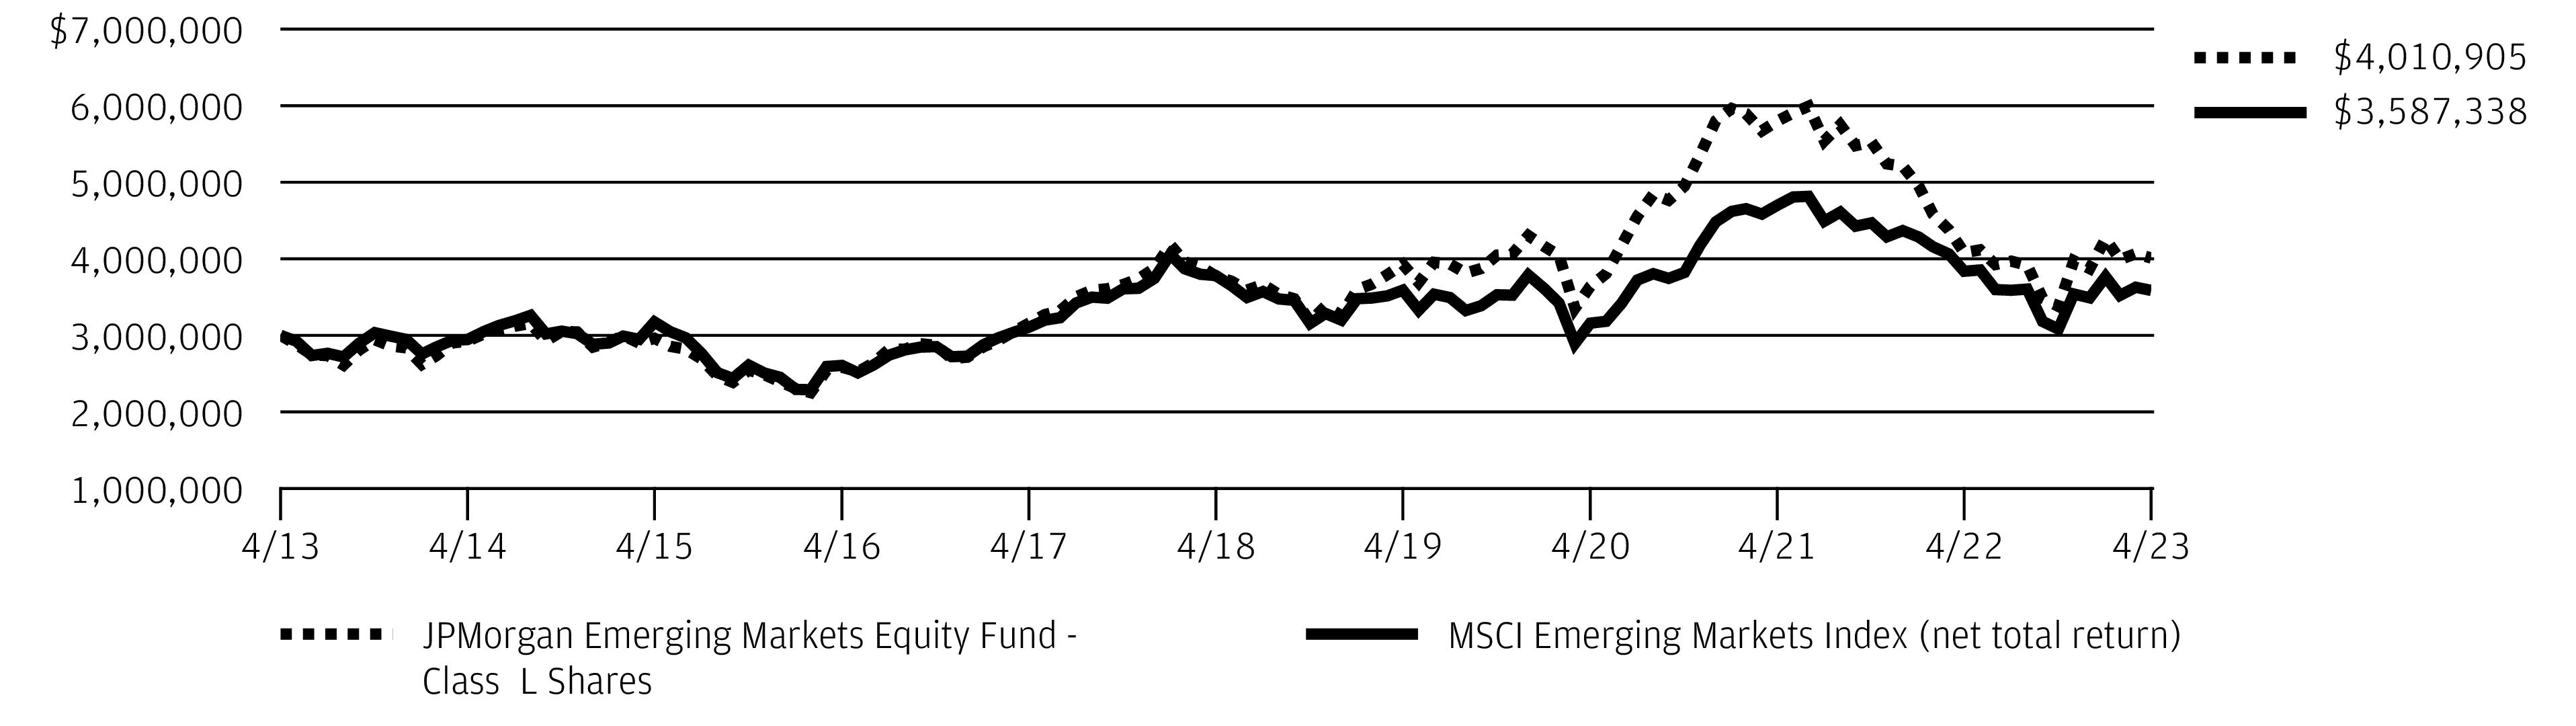
The Fund’s Class L Shares outperformed the MSCI Emerging Markets Index (the “Benchmark”) for the six months ended April 30, 2023.
The Fund’s security selection in the financials and consumer staples sectors was a leading contributor to performance relative to the Benchmark, while the Fund’s security selection in the information technology and energy sectors was a leading detractor form relative performance.
By country, the Fund’s security selection in Taiwan and underweight position in Saudi Arabia were leading contributors to performance relative to the Benchmark, while the Fund’s security selection in China and its out-of-Benchmark allocation to Belarus were leading detractors from relative performance.
Leading individual contributors to relative performance included the Fund’s out-of-Benchmark positions in AIA Group Ltd. and MercadoLibre Inc., and its overweight position in Taiwan Semiconductor Manufacturing Co. Shares of AIA Group, a Hong Kong investment holding company and life insurance provider, rose as business activity resumed in China following the end of strict anti-pandemic policies in the second half of 2022. Shares of MercadoLibre, an e-commerce provider based in Uruguay, rose after reporting consecutive quarters of better-than-expected earnings and revenue. Shares of Taiwan Semiconductor Manufacturing rose after the company reported better-than-expected earnings for the fourth quarter of 2022 and outlined plans to reduce spending in 2023.
Leading individual detractors from relative performance included the Fund’s out-of-Benchmark position in EPAM Systems Inc. and its overweight positions in JD.com Inc. and Infosys Inc. Shares of EPAM Systems, a global provider of software development and digital platform services that largely operates from Belarus, fell after the company issued a weaker-than-expected earnings forecast for 2023. Shares of JD.com, a Chinese e-commerce provider, fell after the company reported slowing growth in sales during the period. Shares of Infosys, an Indian digital services and consulting company, fell after the company reported lower-than-expected earnings and revenue for the fourth quarter of 2022.
HOW WAS THE FUND POSITIONED?
The Fund’s portfolio managers employed an active strategy in which portfolio construction was focused on the highest-conviction ideas found at the security level. The Fund’s portfolio managers used bottom-up fundamental research to determine the Fund’s security weightings, researching companies in an attempt to determine their underlying value and potential for future earnings growth.
As a result of this process, the Fund’s largest sector overweight allocations relative to the Benchmark during the period were in the information technology and consumer staples sectors and its largest relative underweight allocations were in the materials and communication services sectors. The Fund’s largest country overweight allocations relative to the Benchmark during the period were in India and Argentina and its largest relative underweight allocations were in Saudi Arabia
and South Korea.
| J.P. Morgan International Equity Funds | |
JPMorgan Emerging Markets Equity Fund
FUND COMMENTARY
SIX MONTHS ENDED April 30, 2023 (Unaudited) (continued)
*
The return shown is based on net asset values calculated for shareholder transactions and may differ from the return shown in the financial highlights, which reflects adjustments made to the net asset values in accordance with accounting principles generally accepted in the United States of America.
**
The adviser seeks to achieve the Fund’s objective. There can be no guarantee it will be achieved.
TOP TEN HOLDINGS OF THE
PORTFOLIO AS OF April 30, 2023 | PERCENT OF
TOTAL
INVESTMENTS |
| Taiwan Semiconductor Manufacturing Co. Ltd., ADR (Taiwan) | |
| Samsung Electronics Co. Ltd. (South Korea) | |
| Tencent Holdings Ltd. (China) | |
| MercadoLibre, Inc. (Brazil) | |
| | |
| Housing Development Finance Corp. Ltd. (India) | |
| AIA Group Ltd. (Hong Kong) | |
| Bank Rakyat Indonesia Persero Tbk. PT (Indonesia) | |
| Kotak Mahindra Bank Ltd. (India) | |
| Bank Central Asia Tbk. PT (Indonesia) | |
PORTFOLIO COMPOSITION BY COUNTRY
AS OF April 30, 2023 | PERCENT OF
TOTAL
INVESTMENTS |
| |
| |
| |
| |
| |
| |
| |
| |
| |
| |
| |
| |
Others (each less than 1.0%) | |
| |
| J.P. Morgan International Equity Funds | |
AVERAGE ANNUAL TOTAL RETURNS AS OF April 30, 2023
|
| |
| Sales Charge for Class A Shares is 5.25%. |
| Assumes a 1% CDSC (contingent deferred sales charge) for the 6 month and one year periods and 0% CDSC thereafter. |
TEN YEAR FUND PERFORMANCE (4/30/13 TO 4/30/23)
The performance quoted is past performance and is not a guarantee of future results. Mutual funds are subject to certain market risks. Investment returns and principal value of an investment will fluctuate so that an investor’s shares, when redeemed, may be worth more or less than their original cost. Current performance may be higher or lower than the performance data shown. For up-to-date month-end performance information, please call 1-800-480-4111.
Returns for Class R5 Shares and Class R6 Shares prior to their inception dates are based on the performance of Class L Shares. The actual returns of Class R5 Shares and Class R6 Shares would have been different than those shown because Class R5 Shares and Class R6 Shares have different expenses than Class L Shares.
Returns shown for Class R2 Shares and Class R3 Shares prior to their inception dates are based on the performance of Class A Shares. The actual returns of Class R2 Shares and Class R3 Shares would have been lower than those shown because Class R2 Shares and Class R3 Shares have higher expenses than Class A Shares.
Returns for Class R4 Shares prior to its inception date are based on the performance of Class I Shares. The actual returns of Class R4 Shares would have been lower than those shown because Class R4 Shares have higher expenses than Class I Shares.
The graph illustrates comparative performance for $3,000,000 invested in Class L Shares of the JPMorgan Emerging Markets Equity Fund and the MSCI Emerging Markets Index (net total return) from April 30, 2013 to April 30, 2023. The performance of the Fund assumes reinvestment of all dividends and capital gain distributions, if any, and does not include a sales charge. The performance of the MSCI Emerging Markets Index (net total return) does not reflect the deduction of expenses or a sales charge associated with a mutual fund and approximates the minimum possible dividend reinvestment of the securities included in the benchmark, if applicable. The MSCI Emerging Markets Index (net total return) is a free float-adjusted market capitalization weighted index that is designed to measure the performance of large- and mid- cap stocks in emerging markets. Net total return figures assume the reinvestment of dividends after deduction of withholding tax, applying the maximum rate to nonresident individual investors who do not benefit from double taxation treaties. Investors cannot invest directly in an index.
Class L Shares have a $3,000,000 minimum initial investment.
Fund performance may reflect the waiver of the Fund’s fees and reimbursement of expenses for certain periods since the applicable inception date. Without these waivers and reimbursements, performance would have been lower. Also, performance shown in this section does not reflect the deduction of taxes that a shareholder would pay on Fund distributions or on gains resulting from redemptions of Fund shares.
| J.P. Morgan International Equity Funds | |
JPMorgan Emerging Markets Equity Fund
FUND COMMENTARY
SIX MONTHS ENDED April 30, 2023 (Unaudited) (continued)
International investing involves a greater degree of risk and increased volatility. Changes in currency exchange rates and differences in accounting and taxation policies outside the U.S. can raise or lower returns. Also, some overseas markets may not be as politically and economically stable as the U.S. and other nations.
Because Class C Shares automatically convert to Class A Shares after 8 years, the 10 year average annual total return shown above for Class C reflects Class A performance for the period after conversion.
The returns shown are based on net asset values calculated for shareholder transactions and may differ from the returns shown in the financial highlights, which reflect adjustments made to the net asset values in accordance with accounting principles generally accepted in the United States of America.
| J.P. Morgan International Equity Funds | |
JPMorgan Emerging Markets Research Enhanced Equity Fund
FUND COMMENTARY
SIX MONTHS ENDED April 30, 2023 (Unaudited)
| |
| |
MSCI Emerging Markets Index (net total return) | |
Net Assets as of 4/30/2023 (In Thousands) | |
INVESTMENT OBJECTIVE**
The JPMorgan Emerging Markets Research Enhanced Equity Fund (the “Fund”) seeks to provide long-term capital appreciation.
WHAT WERE THE MAIN DRIVERS OF THE FUND’S PERFORMANCE?
The Fund’s Class R6 Shares outperformed the MSCI Emerging Markets Index (the “Benchmark”) for the six months ended April 30, 2023.
By sector, the Fund’s security selection in the financials and utilities sectors was a leading contributor to performance relative to the Benchmark, while the Fund’s security selection in the industrials and energy sectors was a leading detractor from relative performance.
By country, the Fund’s security selection in India and Taiwan was a leading contributor to relative performance, while the Fund’s security selection in China and Thailand was a leading detractor to relative performance.
Leading individual contributors to relative performance included the Fund’s underweight positions in Adani Total Gas Ltd. and Banco Bradesco S/A and its overweight position in Tencent Holdings Ltd. Shares of Adani Total Gas, an Indian natural gas utility not held in the Fund, fell sharply in the second half of the period amid investor concerns about business practices across the parent Adani Group of companies. Shares of Banco Bradesco, a Brazilian financial services company not held in the Fund, fell amid investor concerns about the economic outlook for Brazil. Shares of Tencent Holdings, a Chinese e-commerce provider, rose amid sales
growth and a broad rebound in China’s technology sector during the second half of the period.
Leading individual detractors from relative performance included the Fund’s overweight positions in Lojas Renner SA and Alinma Bank, and its underweight position in PetroChina Co. Shares of Lojas Renner, a Brazilian department store chain, fell amid investor concerns about the company’s outlook for growth. Shares of Alinma, a Saudi Arabian bank, fell after the company reported lower-than-expected growth in annual net income. Shares of PetroChina, a Chinese state-owned petroleum and natural gas producer not held in the Fund, rose amid investor demand for lower valuation stocks in the global energy sector.
HOW WAS THE FUND POSITIONED?
The Fund’s portfolio managers employed a combination of a disciplined portfolio construction process with in-depth fundamental research into individual securities conducted by a global network of research analysts to identify what they believed to be their relative value.
As a result of this process, by sector, the Fund’s largest overweight allocations relative to the Benchmark during the period were in the financials and consumer staples sectors and its largest underweight allocations were in the health care and industrials sectors.
By country, the Fund’s largest overweight allocations relative to the Benchmark during the period were in Mexico and South Korea and its largest relative underweight allocations were in Turkey and Kuwait.
| J.P. Morgan International Equity Funds | |
JPMorgan Emerging Markets Research Enhanced Equity Fund
FUND COMMENTARY
SIX MONTHS ENDED April 30, 2023 (Unaudited) (continued)
*
The return shown is based on net asset values calculated for shareholder transactions and may differ from the return shown in the financial highlights, which reflects adjustments made to the net asset values in accordance with accounting principles generally accepted in the United States of America.
**
The adviser seeks to achieve the Fund’s objective. There can be no guarantee it will be achieved.
TOP TEN HOLDINGS OF THE
PORTFOLIO AS OF April 30, 2023 | PERCENT OF
TOTAL
INVESTMENTS |
| Taiwan Semiconductor Manufacturing Co. Ltd. (Taiwan) | |
| Tencent Holdings Ltd. (China) | |
| Samsung Electronics Co. Ltd. (South Korea) | |
| Alibaba Group Holding Ltd. (China) | |
| Reliance Industries Ltd. (India) | |
| China Construction Bank Corp., Class H (China) | |
| | |
| Housing Development Finance Corp. Ltd. (India) | |
| Ping An Insurance Group Co. of China Ltd., Class H (China) | |
| | |
PORTFOLIO COMPOSITION BY COUNTRY
AS OF April 30, 2023 | PERCENT OF
TOTAL
INVESTMENTS |
| |
| |
| |
| |
| |
| |
| |
| |
| |
| |
| |
Others (each less than 1.0%) | |
| |
| J.P. Morgan International Equity Funds | |
AVERAGE ANNUAL TOTAL RETURNS AS OF April 30, 2023
LIFE OF FUND PERFORMANCE (12/11/18 TO 4/30/23)

The performance quoted is past performance and is not a guarantee of future results. Mutual funds are subject to certain market risks. Investment returns and principal value of an investment will fluctuate so that an investor’s shares, when redeemed, may be worth more or less than their original cost. Current performance may be higher or lower than the performance data shown. For up-to-date month-end performance information, please call 1-800-480-4111.
The Fund commenced operations on December 11, 2018.
Returns for Class I Shares prior to its inception date are based on the performance of Class R6 Shares. The actual returns of Class I Shares would have been lower than those shown because Class I Shares have higher expenses than Class R6 Shares.
The graph illustrates comparative performance for $15,000,000 invested in Class R6 Shares of the JPMorgan Emerging Markets Research Enhanced Equity Fund and the MSCI Emerging Markets Index (net total return) from December 11, 2018 to April 30, 2023. The performance of the Fund assumes reinvestment of all dividends and capital gain distributions, if any, and does not include a sales charge. The performance of the MSCI Emerging Markets Index (net total return) does not reflect the deduction of expenses or a sales charge associated with a mutual fund and approximates the minimum possible dividend reinvestment of the securities included in the benchmark, if applicable. The MSCI Emerging Markets Index (net total return) is a free float-adjusted market capitalization weighted index that is designed to measure the performance of large- and mid- cap stocks in emerging markets. Net total return figures assume the reinvestment of dividends after deduction of withholding tax, applying the maximum rate to nonresident individual investors who do not benefit from double taxation treaties. Investors cannot invest directly in an index.
Class R6 Shares have a $15,000,000 minimum initial investment.
Fund performance may reflect the waiver of the Fund’s fees and reimbursement of expenses for certain periods since the applicable inception date.
Without these waivers and reimbursements, performance would have been lower. Also, performance shown in this section does not reflect the deduction of taxes that a shareholder would pay on Fund distributions or on gains resulting from redemptions of Fund shares.
International investing involves a greater degree of risk and increased volatility. Changes in currency exchange rates and differences in accounting and taxation policies outside the U.S. can raise or lower returns. Also, some overseas markets may not be as politically and economically stable as the U.S. and other nations.
The returns shown are based on net asset values calculated for shareholder transactions and may differ from the returns shown in the financial highlights, which reflect adjustments made to the net asset values in accordance with accounting principles generally accepted in the United States of America.
The MSCI information may only be used for your internal use, may not be reproduced or redisseminated in any form and may not be used as a basis for or a component of any financial instruments or products or indices. None of the MSCI information is intended to constitute investment advice or a recommendation to make (or refrain from making) any kind of investment decision and may not be relied on as such. Historical data and analysis should not be taken as an indication or guarantee of any future performance analysis, forecast or prediction. The MSCI information is provided on an “as is” basis and the user of this information assumes the entire risk of any use made of this information. MSCI, each of its affiliates and each other person involved in or related to compiling, computing or creating any MSCI information (collectively, the “MSCI Parties”) expressly disclaims all warranties (including, without limitation, any warranties of originality, accuracy, completeness, timeliness, noninfringement, merchantability and fitness for a particular purpose) with respect to this information. Without limiting any of the foregoing, in no event shall any MSCI Party have any liability for any direct, indirect, special, incidental, punitive, consequential (including, without limitation, lost profits) or any other damages. (www.msci.com)
| J.P. Morgan International Equity Funds | |
JPMorgan Europe Dynamic Fund
FUND COMMENTARY
SIX MONTHS ENDED April 30, 2023 (Unaudited)
| |
Fund (Class A Shares, without a sales charge) * | |
MSCI Europe Index (net total return) | |
Net Assets as of 4/30/2023 (In Thousands) | |
INVESTMENT OBJECTIVE**
The JPMorgan Europe Dynamic Fund (the “Fund”) seeks total return from long-term capital growth. Total return consists of capital growth and current income.
WHAT WERE THE MAIN DRIVERS OF THE FUND’S PERFORMANCE?
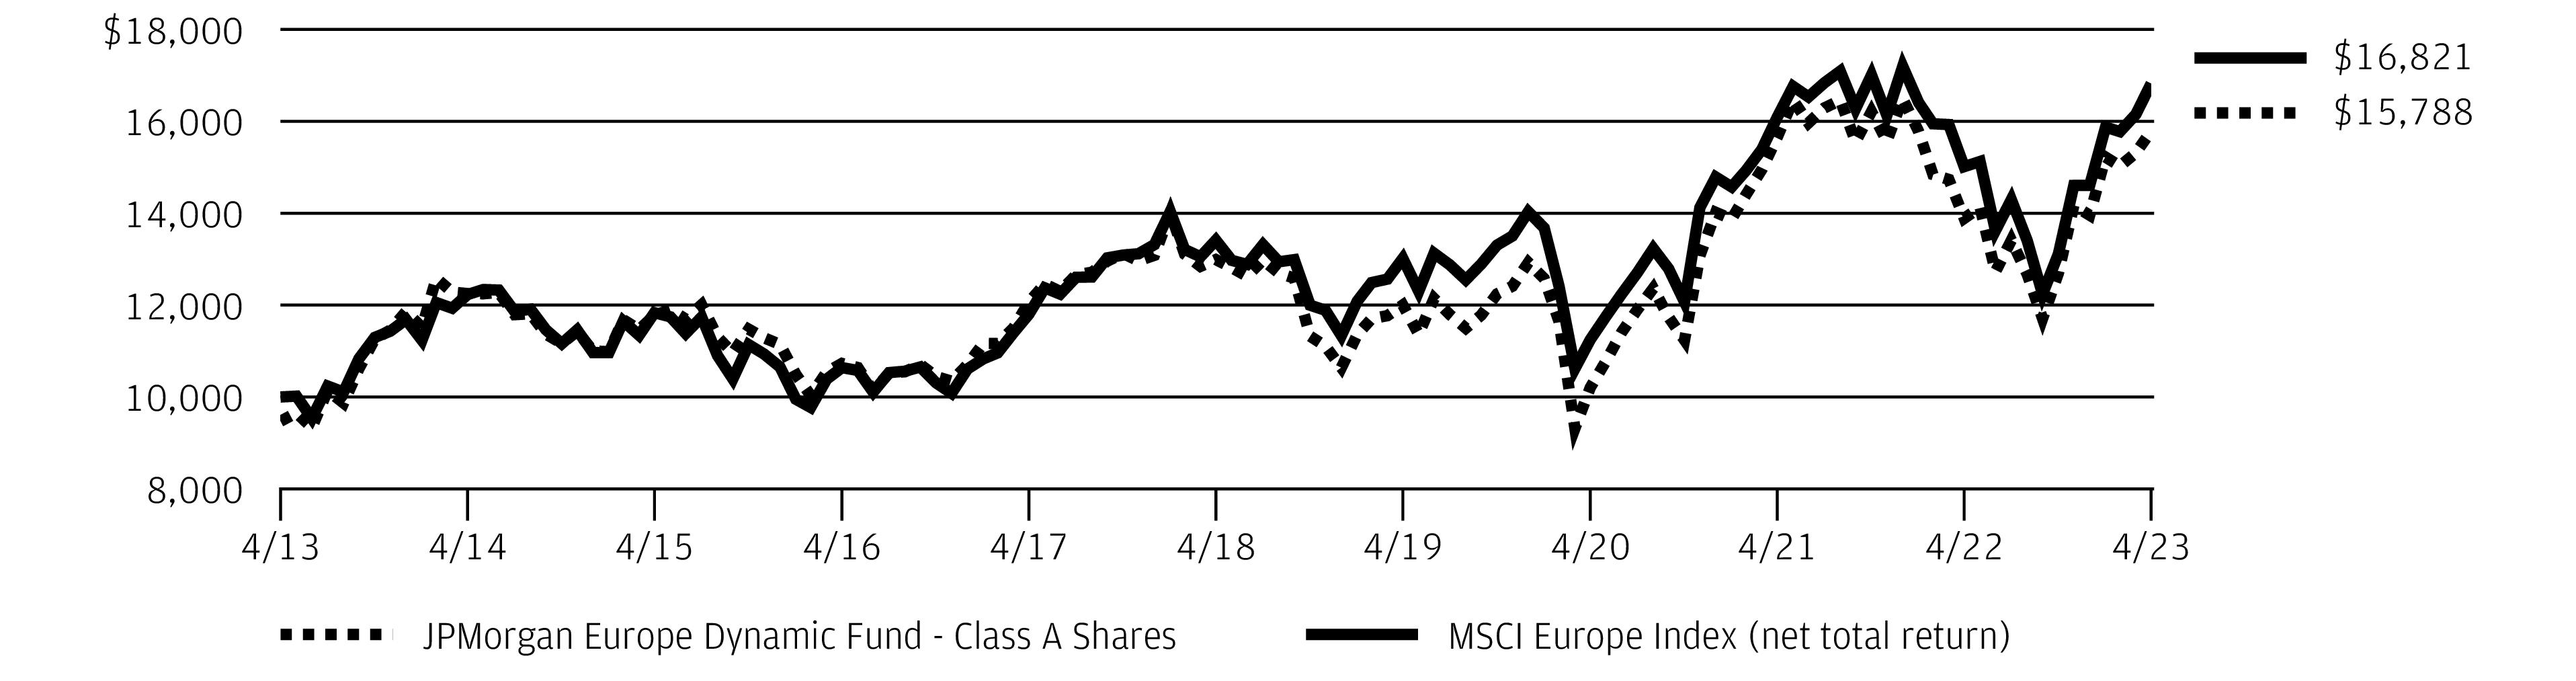
The Fund’s Class A Shares, without a sales charge, underperformed the MSCI Europe Index (net total return) (the “Benchmark”) for the six months ended April 30, 2023.
Relative to the Benchmark, the Fund’s security selection in the industrials and information technology sectors was a leading detractor from performance, while the Fund’s security selection in the financials and health care sectors was a leading contributor to relative performance.
Leading individual detractors from relative performance included the Fund’s out-of-Benchmark positions in Hexatronic Group AB and Verbio Vereinigte BioEnergie AG, and its overweight position in NN Group NV. Shares of Hexatronic, a Swedish fiber optic equipment provider, fell amid investor concerns about the broader fiber-optic sector’s ability to raise capital. Shares of Verbio Vereinigte BioEnergie, a German biofuels manufacturer, fell after the company lowered its earnings forecast amid lower prices for bioethanol and higher input costs during the period. Shares of NN Group, a Dutch insurance and financial services provider, fell after the company reported lower operating profit for the second half of its fiscal year.
Leading individual contributors to relative performance included the Fund’s overweight positions in UniCredit SpA, Novo Nordisk A/S and LVMH Moet Hennessey Louis Vuitton SE. Shares of UniCredit, an Italian banking and financial services company, rose after the company reported better-than-expected results for the first quarter of 2023. Shares of Novo Nordisk, a Danish pharmaceuticals and health care products provider, rose amid consumer demand for the company’s weight-loss drug and after the company reported revenue growth for the first quarter of 2023. Shares of LVMH Moet Hennessey Louis Vuitton, a luxury goods manufacturer, rose amid strong consumer demand and record revenue through the first quarter of 2023.
HOW WAS THE FUND POSITIONED?
The Fund’s portfolio managers believe that attractively valued, high quality securities with positive momentum have the potential to outperform the market. During the reporting period, the Fund’s portfolio managers invested in securities that they believed had these style characteristics. Portfolio positions were based on bottom-up security selection rather
than top-down asset allocation decisions.
TOP TEN HOLDINGS OF THE
PORTFOLIO AS OF April 30, 2023 | PERCENT OF
TOTAL
INVESTMENTS |
| LVMH Moet Hennessy Louis Vuitton SE (France) | |
| Novo Nordisk A/S, Class B (Denmark) | |
| | |
| Novartis AG (Registered) (Switzerland) | |
| TotalEnergies SE (France) | |
| | |
| Siemens AG (Registered) (Germany) | |
| Allianz SE (Registered) (Germany) | |
| Koninklijke Ahold Delhaize NV (Netherlands) | |
| | |
PORTFOLIO COMPOSITION BY COUNTRY
AS OF April 30, 2023 | PERCENT OF
TOTAL
INVESTMENTS |
| |
| |
| |
| |
| |
| |
| |
| |
| |
| |
| |
| |
| |
| |
Others (each less than 1.0%) | |
| |
| J.P. Morgan International Equity Funds | |
*
The return shown is based on net asset values calculated for shareholder transactions and may differ from the return shown in the financial highlights, which reflects adjustments made to the net asset values in accordance with accounting principles generally accepted in the United States of America.
**
The adviser seeks to achieve the Fund’s objective. There can be no guarantee it will be achieved.
| J.P. Morgan International Equity Funds | |
JPMorgan Europe Dynamic Fund
FUND COMMENTARY
SIX MONTHS ENDED April 30, 2023 (Unaudited) (continued)
AVERAGE ANNUAL TOTAL RETURNS AS OF April 30, 2023
|
| |
| Sales Charge for Class A Shares is 5.25%. |
| Assumes a 1% CDSC (contingent deferred sales charge) for the 6 month and one year periods and 0% CDSC thereafter. |
TEN YEAR FUND PERFORMANCE (4/30/13 TO 4/30/23)
The performance quoted is past performance and is not a guarantee of future results. Mutual funds are subject to certain market risks. Investment returns and principal value of an investment will fluctuate so that an investor’s shares, when redeemed, may be worth more or less than their original cost. Current performance may be higher or lower than the performance data shown. For up-to-date month-end performance information, please call 1-800-480-4111.
Returns for Class R6 Shares prior to its inception date are based on the performance of Class L Shares. The actual returns of Class R6 Shares would have been different than those shown because Class R6 Shares have different expenses than Class L Shares.
The graph illustrates comparative performance for $10,000 invested in Class A Shares of the JPMorgan Europe Dynamic Fund and the MSCI Europe Index (net total return) from April 30, 2013 to April 30, 2023. The performance of the Fund assumes reinvestment of all dividends and capital gain distributions, if any, and includes a sales charge. The performance of the MSCI Europe Index (net total return) does not reflect the deduction of expenses or a sales charge associated with a mutual fund and approximates the minimum possible dividend reinvestment of the securities included in the benchmark, if applicable. The MSCI Europe Index (net total return) is a free float-adjusted market capitalization weighted index that is designed to measure the performance of large- and mid- cap stocks in the developed markets countries in Europe. Net total return figures assume the reinvestment of dividends after deduction of withholding tax, applying the maximum rate to nonresident individual investors
who do not benefit from double taxation treaties. Investors cannot invest directly in an index.
Class A Shares have a $1,000 minimum initial investment and carry a 5.25% sales charge.
Fund performance may reflect the waiver of the Fund’s fees and reimbursement of expenses for certain periods since the applicable inception date. Without these waivers and reimbursements, performance would have been lower. Also, performance shown in this section does not reflect the deduction of taxes that a shareholder would pay on Fund distributions or on gains resulting from redemptions of Fund shares.
International investing involves a greater degree of risk and increased volatility. Changes in currency exchange rates and differences in accounting and taxation policies outside the U.S. can raise or lower returns. Also, some overseas markets may not be as politically and economically stable as the U.S. and other nations.
Because Class C Shares automatically convert to Class A Shares after 8 years, the 10 year average annual total return shown above for Class C reflects Class A performance for the period after conversion.
The returns shown are based on net asset values calculated for shareholder transactions and may differ from the returns shown in the financial highlights, which reflect adjustments made to the net asset values in accordance with accounting principles generally accepted in the United States of America.
| J.P. Morgan International Equity Funds | |
JPMorgan International Equity Fund
FUND COMMENTARY
SIX MONTHS ENDED April 30, 2023 (Unaudited)
| |
| |
MSCI EAFE Index (net total return) | |
Net Assets as of 4/30/2023 (In Thousands) | |
INVESTMENT OBJECTIVE**
The JPMorgan International Equity Fund (the “Fund”) seeks total return from long-term capital growth and income. Total return consists of capital growth and current income.
WHAT WERE THE MAIN DRIVERS OF THE FUND’S PERFORMANCE?
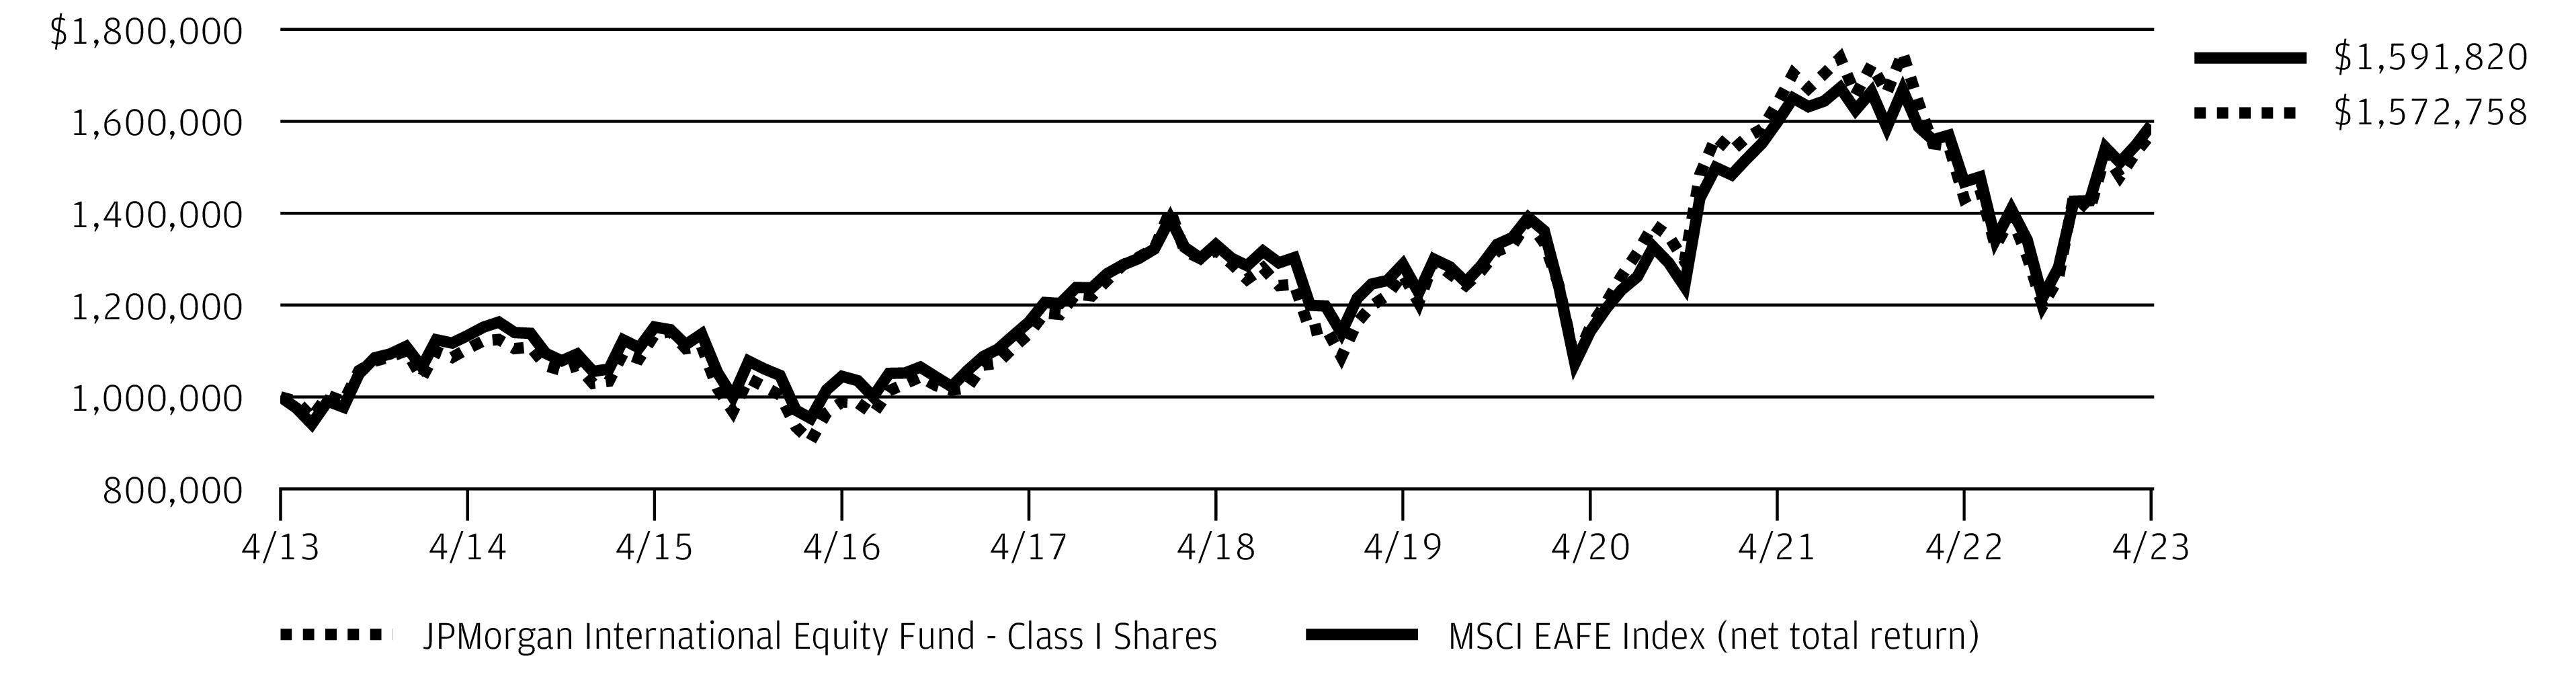
The Fund’s Class I Shares outperformed the MSCI EAFE Index (net of total return) (the “Benchmark”) for the six months ended April 30, 2023.
Relative to the Benchmark, the Fund’s security selection in the financials sector and its underweight position in the real estate sector, where the Fund had no holdings, were leading contributors to relative performance, while the Fund’s security selection in the industrials and utilities sectors was a leading detractor from relative performance.
By region, the Fund’s security selection in Europe, excluding the U.K., and in the Pacific, excluding Japan, was a leading contributor to performance. The Fund’s security selection in the U.K. and its out-of-Benchmark allocation to emerging markets were the leading detractors from relative performance.
Leading individual contributors to relative performance included the Fund’s overweight positions in Novo Nordisk A/S and LVMH Moet Hennessey Louis Vuitton SE, and its underweight position in Toyota Motor Corp. Shares of Novo Nordisk, a Danish pharmaceuticals and health care products provider, rose amid consumer demand for the company’s
weight-loss drug and after the company reported revenue growth for the first quarter of 2023. Shares of LVMH Moet Hennessey Louis Vuitton, a luxury goods manufacturer, rose amid strong consumer demand and record revenue through the first quarter of 2023. Shares of Toyota Motor, a Japanese automobile manufacturer, fell after the company named a new chief executive and chairman, and after it reported a decline in North American sales.
Leading individual detractors from relative performance included the Fund’s overweight positions in Roche Holding AG, DBS Group Holdings Ltd. and Kyowa Kirin Co. Shares of Roche Holdings, a Swiss pharmaceutical and diagnostics company, fell after the company forecast weaker earnings in 2023 amid a drop in sales of Covid treatments. Shares of DBS Group Holdings, a Singapore financial services provider, fell after the company reported a disruption in its digital services to customers. Shares of Kyowa Kirin, a Japanese maker of pharmaceuticals and other medical products, fell after the company lowered its forecast for 2023 earnings.
HOW WAS THE FUND POSITIONED?
The Fund’s portfolio managers continued to focus on security selection to build a portfolio of international equities. They used bottom-up fundamental research to identify what they believed were attractively priced securities of companies with solid financial positions that possessed the potential to increase their earnings faster than their industry peers.
| J.P. Morgan International Equity Funds | |
JPMorgan International Equity Fund
FUND COMMENTARY
SIX MONTHS ENDED April 30, 2023 (Unaudited) (continued)
*
The return shown is based on net asset values calculated for shareholder transactions and may differ from the return shown in the financial highlights, which reflects adjustments made to the net asset values in accordance with accounting principles generally accepted in the United States of America.
**
The adviser seeks to achieve the Fund’s objective. There can be no guarantee it will be achieved.
TOP TEN HOLDINGS OF THE
PORTFOLIO AS OF April 30, 2023 | PERCENT OF
TOTAL
INVESTMENTS |
| | |
| | |
| AstraZeneca plc (United Kingdom) | |
| LVMH Moet Hennessy Louis Vuitton SE (France) | |
| Novo Nordisk A/S, Class B (Denmark) | |
| TotalEnergies SE (France) | |
| | |
| ASML Holding NV (Netherlands) | |
| | |
| DBS Group Holdings Ltd. (Singapore) | |
PORTFOLIO COMPOSITION BY COUNTRY
AS OF April 30, 2023 | PERCENT OF
TOTAL
INVESTMENTS |
| |
| |
| |
| |
| |
| |
| |
| |
| |
| |
| |
| |
| |
| |
| |
| |
Others (each less than 1.0%) | |
| |
| J.P. Morgan International Equity Funds | |
AVERAGE ANNUAL TOTAL RETURNS AS OF April 30, 2023
|
| |
| Sales Charge for Class A Shares is 5.25%. |
| Assumes a 1% CDSC (contingent deferred sales charge) for the 6 month and one year periods and 0% CDSC thereafter. |
TEN YEAR FUND PERFORMANCE (4/30/13 TO 4/30/23)
The performance quoted is past performance and is not a guarantee of future results. Mutual funds are subject to certain market risks. Investment returns and principal value of an investment will fluctuate so that an investor’s shares, when redeemed, may be worth more or less than their original cost. Current performance may be higher or lower than the performance data shown. For up-to-date month-end performance information, please call 1-800-480-4111.
The graph illustrates comparative performance for $1,000,000 invested in Class I Shares of the JPMorgan International Equity Fund and the MSCI EAFE Index (net total return) from April 30, 2013 to April 30, 2023. The performance of the Fund assumes reinvestment of all dividends and capital gain distributions, if any, and does not include a sales charge. The performance of the MSCI EAFE Index (net total return) does not reflect the deduction of expenses or a sales charge associated with a mutual fund and approximates the minimum possible dividend reinvestment of the securities included in the benchmark, if applicable. The MSCI EAFE Index (net total return) is a free float-adjusted market capitalization weighted index that is designed to measure the performance of large- and mid- cap stocks in developed markets, excluding the U.S. and Canada. Net total return figures assume the reinvestment of dividends after deduction of withholding tax, applying the maximum rate to nonresident individual investors who do not benefit from double taxation treaties. Investors cannot invest directly in an index.
Class I Shares have a $1,000,000 minimum initial investment.
Fund performance may reflect the waiver of the Fund’s fees and reimbursement of expenses for certain periods since the applicable inception date. Without these waivers and reimbursements, performance would have been lower. Also, performance shown in this section does not reflect the deduction of taxes that a shareholder would pay on Fund distributions or on gains resulting from redemptions of Fund shares.
International investing involves a greater degree of risk and increased volatility. Changes in currency exchange rates and differences in accounting and taxation policies outside the U.S. can raise or lower returns. Also, some overseas markets may not be as politically and economically stable as the U.S. and other nations.
Because Class C Shares automatically convert to Class A Shares after 8 years, the 10 year average annual total return shown above for Class C reflects Class A performance for the period after conversion.
The returns shown are based on net asset values calculated for shareholder transactions and may differ from the returns shown in the financial highlights, which reflect adjustments made to the net asset values in accordance with accounting principles generally accepted in the United States of America.
| J.P. Morgan International Equity Funds | |
JPMorgan International Focus Fund
FUND COMMENTARY
SIX MONTHS ENDED April 30, 2023 (Unaudited)
| |
| |
MSCI ACWI ex USA Index (net total return) | |
Net Assets as of 4/30/2023 (In Thousands) | |
INVESTMENT OBJECTIVE**
The JPMorgan International Focus Fund (the “Fund”) seeks to provide long-term capital appreciation.
WHAT WERE THE MAIN DRIVERS OF THE FUND’S PERFORMANCE?
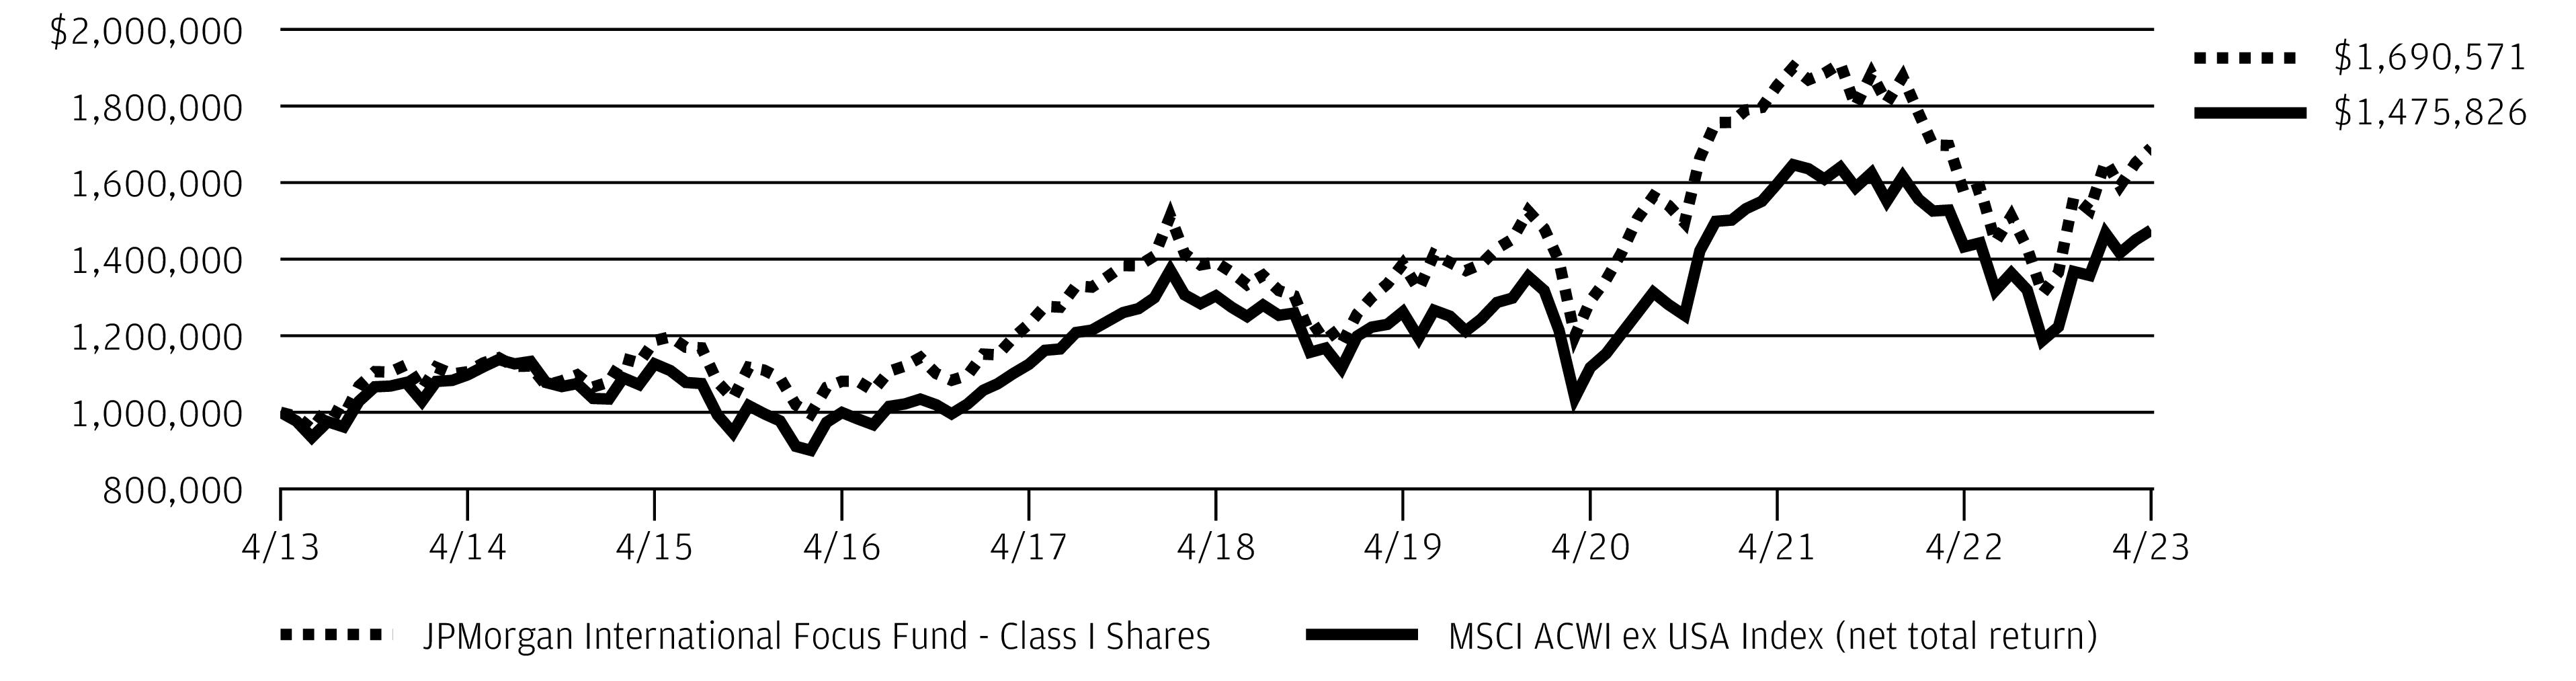
The Fund’s Class I Shares outperformed the MSCI ACWI ex USA Index (net total return) (the “Benchmark”) for the six months ended April 30, 2023.
The Fund’s security selection in the communication services and consumer discretionary sectors was a leading contributor to performance relative to the Benchmark, while the Fund’s security selection in the consumer staples sector was the sole sector detractor from relative performance.
By region, the Fund’s security selection in emerging markets and continental Europe was a leading contributor to relative performance, while the Fund’s security selection in the U.K. and its overweight position in North America (Canada) were leading detractors from relative performance.
Leading individual contributors to relative performance included the Fund’s overweight positions in LVMH Moet Hennessey Louis Vuitton SE, Novo Nordisk AS and Tencent Holdings Ltd. Shares of LVMH Moet Hennessey Louis Vuitton, a luxury goods manufacturer, rose amid strong consumer demand and record revenue through the first quarter of 2023. Shares of Novo Nordisk, a Danish pharmaceuticals and health care products provider, rose amid consumer demand for the
company’s weight-loss drug and after the company reported revenue growth for the first quarter of 2023. Shares of Tencent Holdings, a Chinese e-commerce provider, rose after the company reported a surge in sales during the period and amid a broader economic recovery in China.
Leading individual detractors from relative performance included the Fund’s overweight positions in Toronto-Dominion Bank, Canadian National Railway Co. and Roche Holding AG. Shares of Toronto-Dominion, a Canadian banking and financial services provider, fell amid the company’s failed negotiations to acquire First Horizon Corp. Shares of Canadian National Railway, a freight rail operator, underperformed amid a retreat in commodities prices during the period and investor expectations for lower 2023 earnings among large freight railroads. Shares of Roche Holdings, a Swiss pharmaceutical and diagnostics company, fell after the company forecast weaker earnings in 2023 amid a drop in sales of Covid treatments.
HOW WAS THE FUND POSITIONED?
By harnessing their team’s global sector specialists, the Fund’s portfolio managers sought to build a high-conviction, benchmark-agnostic portfolio of growth, value and unique companies, whose future prospects, the portfolio managers believed, were under-appreciated by the market and thus possessed the potential to deliver higher-than-expected earnings that could have a positive effect on their share prices.
| J.P. Morgan International Equity Funds | |
*
The return shown is based on net asset values calculated for shareholder transactions and may differ from the return shown in the financial highlights, which reflects adjustments made to the net asset values in accordance with accounting principles generally accepted in the United States of America.
**
The adviser seeks to achieve the Fund’s objective. There can be no guarantee it will be achieved.
TOP TEN HOLDINGS OF THE
PORTFOLIO AS OF April 30, 2023 | PERCENT OF
TOTAL
INVESTMENTS |
| | |
| | |
| Samsung Electronics Co. Ltd. (South Korea) | |
| Taiwan Semiconductor Manufacturing Co. Ltd., ADR (Taiwan) | |
| Allianz SE (Registered) (Germany) | |
| TotalEnergies SE (France) | |
| HDFC Bank Ltd., ADR (India) | |
| LVMH Moet Hennessy Louis Vuitton SE (France) | |
| Canadian National Railway Co. (Canada) | |
| ASML Holding NV (Netherlands) | |
PORTFOLIO COMPOSITION BY COUNTRY
AS OF April 30, 2023 | PERCENT OF
TOTAL
INVESTMENTS |
| |
| |
| |
| |
| |
| |
| |
| |
| |
| |
| |
| |
| |
| |
| |
| |
| |
| |
| |
| |
| |
| |
| J.P. Morgan International Equity Funds | |
JPMorgan International Focus Fund
FUND COMMENTARY
SIX MONTHS ENDED April 30, 2023 (Unaudited) (continued)
AVERAGE ANNUAL TOTAL RETURNS AS OF April 30, 2023
|
| |
| Sales Charge for Class A Shares is 5.25%. |
| Assumes a 1% CDSC (contingent deferred sales charge) for the 6 month and one year periods and 0% CDSC thereafter. |
TEN YEAR FUND PERFORMANCE (4/30/13 TO 4/30/23)
The performance quoted is past performance and is not a guarantee of future results. Mutual funds are subject to certain market risks. Investment returns and principal value of an investment will fluctuate so that an investor’s shares, when redeemed, may be worth more or less than their original cost. Current performance may be higher or lower than the performance data shown. For up-to-date month-end performance information, please call 1-800-480-4111.
The Fund commenced operations on November 30, 2011.
The graph illustrates comparative performance for $1,000,000 invested in Class I Shares of the JPMorgan International Focus Fund and the MSCI ACWI ex USA Index (net total return) from April 30, 2013 to April 30, 2023. The performance of the Fund assumes reinvestment of all dividends and capital gain distributions, if any, and does not include a sales charge. The performance of the MSCI ACWI ex USA Index (net total return) does not reflect the deduction of expenses or a sales charge associated with a mutual fund and approximates the minimum possible dividend reinvestment of the securities included in the benchmark, if applicable. The MSCI ACWI ex USA Index (net total return) is a free float-adjusted market capitalization weighted index that is designed to measure the performance of large- and mid- cap stocks in developed and emerging markets, excluding the U.S. Net total return figures assume the reinvestment of dividends after deduction of withholding tax, applying the maximum rate to nonresident individual investors who do not benefit from double taxation treaties. Investors cannot invest directly in an index.
Class I Shares have a $1,000,000 minimum initial investment.
Subsequent to the inception date of the Fund and through May 30, 2013, the Fund did not experience any shareholder activity. If such shareholder activity had occurred, the Fund’s performance may have been impacted.
Fund performance may reflect the waiver of the Fund’s fees and reimbursement of expenses for certain periods since the applicable inception date. Without these waivers and reimbursements, performance would have been lower. Also, performance shown in this section does not reflect the deduction of taxes that a shareholder would pay on Fund distributions or on gains resulting from redemptions of Fund shares.
International investing involves a greater degree of risk and increased volatility. Changes in currency exchange rates and differences in accounting and taxation policies outside the U.S. can raise or lower returns. Also, some overseas markets may not be as politically and economically stable as the U.S. and other nations.
Because Class C Shares automatically convert to Class A Shares after 8 years, the 10 year average annual total return shown above for Class C reflects Class A performance for the period after conversion.
The returns shown are based on net asset values calculated for shareholder transactions and may differ from the returns shown in the financial highlights, which reflect adjustments made to the net asset values in accordance with accounting principles generally accepted in the United States of America.
| J.P. Morgan International Equity Funds | |
JPMorgan International Hedged Equity Fund
FUND COMMENTARY
SIX MONTHS ENDED April 30, 2023 (Unaudited)
| |
| |
MSCI EAFE Index (net total return) | |
ICE BofA 3-Month US Treasury Bill Index | |
Net Assets as of 4/30/2023 (In Thousands) | |
INVESTMENT OBJECTIVE**
The JPMorgan International Hedged Equity Fund (the “Fund”) seeks to provide capital appreciation.
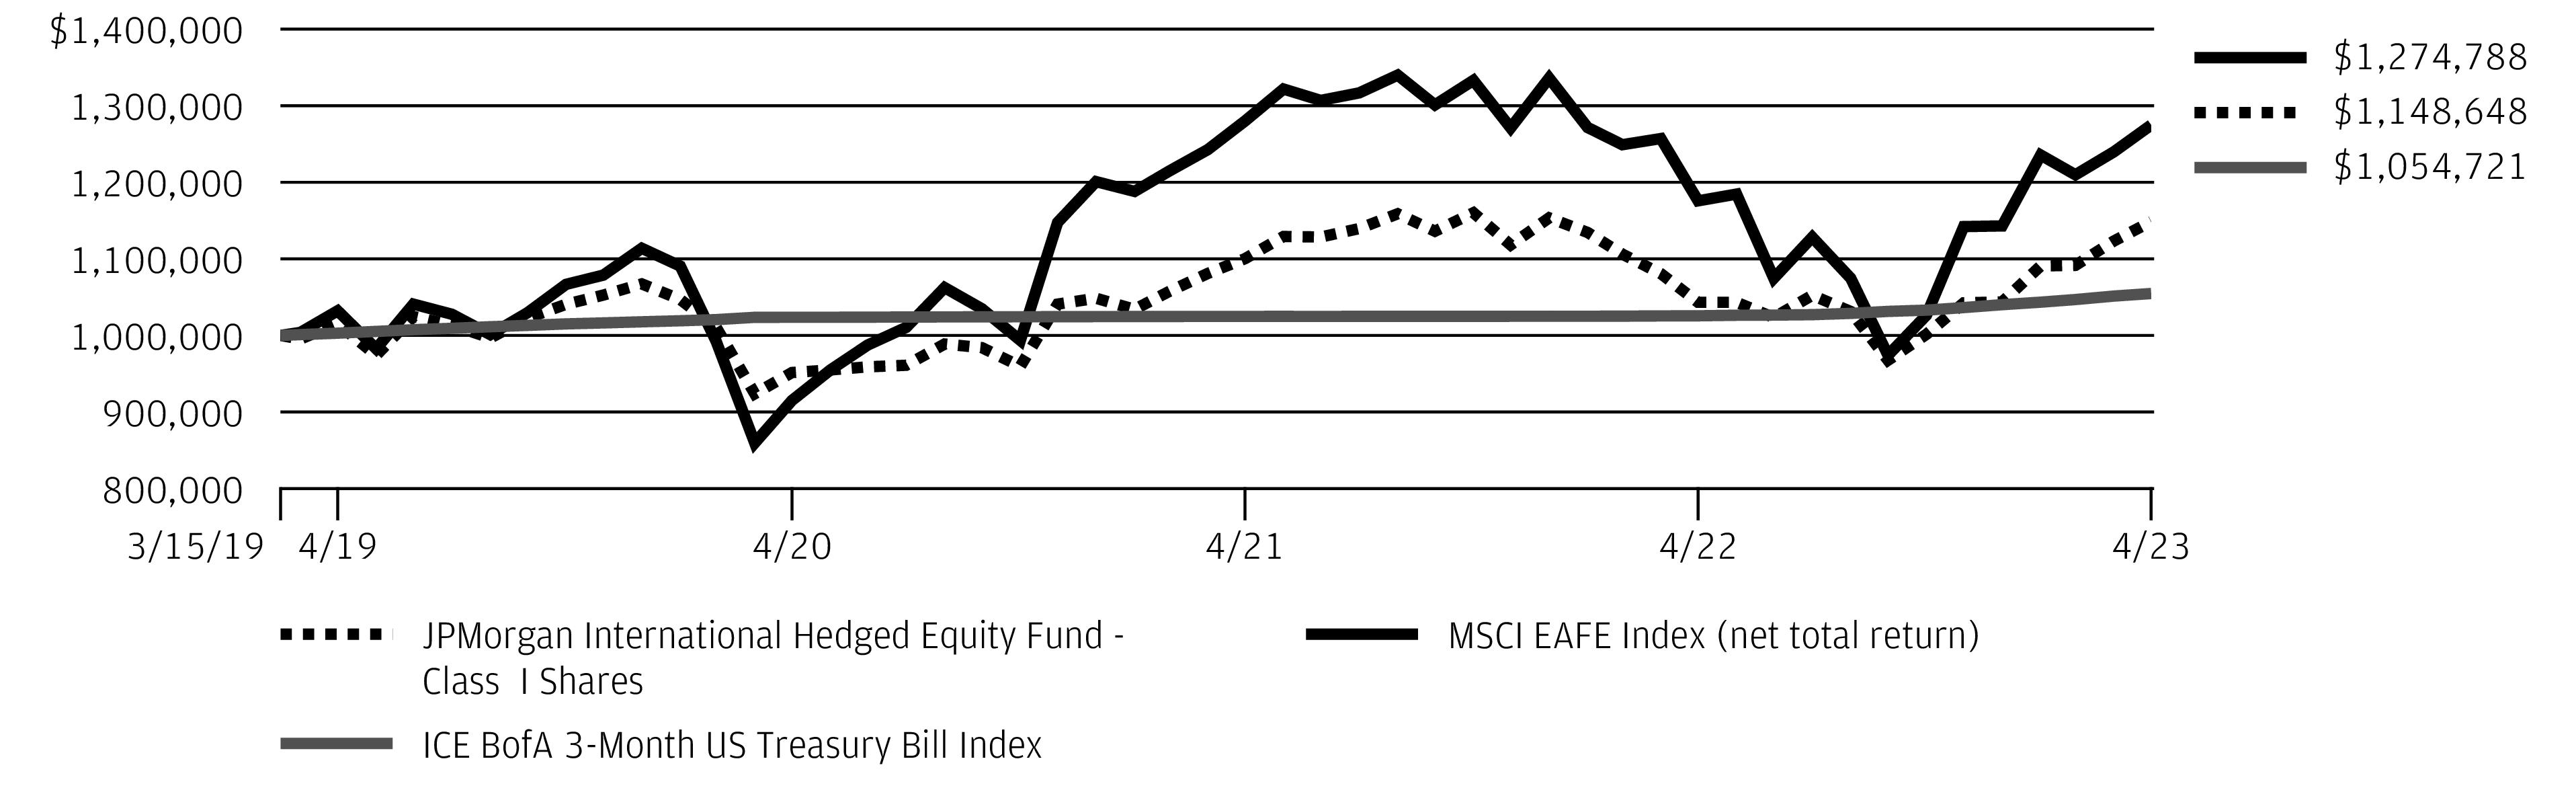
WHAT WERE THE MAIN DRIVERS OF THE FUND’S PERFORMANCE?
The Fund’s Class I Shares underperformed the MSCI EAFE Index (net total return) (the “Benchmark”) and outperformed the ICE BofA 3-Month U.S. Treasury Bill Index for the six months ended April 30, 2023. The Fund’s options hedge allowed the Fund to generally perform as designed during the reporting period with about 46% of the Benchmark’s volatility.
The Fund’s security selection in the pharmaceutical/medical technology and industrial cyclicals sectors was a leading detractor from performance relative to the Benchmark. The Fund’s security selection in the banks and financial services sectors was a leading contributor to relative performance.
By country, the Fund’s security selection in Switzerland and the Netherlands was a leading detractor from performance relative to the Benchmark, while the Fund’s security selection in the U.K. and its overweight allocation to France were leading contributors to relative performance.
Leading individual detractors from relative performance included the Fund’s overweight positions in NN Group NV and Roche Holding AG, and its underweight position in HSBC Holdings PLC. Shares of NN Group, a Dutch insurance and
financial services provider, fell after the company reported lower operating profit for the second half of its fiscal year. Shares of Roche Holdings, a Swiss pharmaceutical and diagnostics company, fell after the company forecast weaker earnings in 2023 amid a drop in sales of Covid treatments. Shares of HSBC, a U.K. banking and financial services provider, underperformed amid investor concerns about the broader banking sector following the collapse of Credit Suisse.
Leading individual contributors to relative performance included the Fund’s overweight positions in 3i Group PLC, Novo Nordisk AS and L’Oreal SA. Shares of 3i Group, a U.K. private equity and venture capital investment company, rose amid positive performance from its portfolio holdings. Shares of Novo Nordisk, a Danish pharmaceuticals and health care products provider, rose amid consumer demand for the company’s weight-loss drug and after the company reported revenue growth for the first quarter of 2023. Shares of L’Oreal, a French hair products and cosmetics manufacturer, rose after the company reports strong sales growth during the period.
HOW WAS THE FUND POSITIONED?
The Fund’s portfolio managers continued to focus on security selection to build a portfolio of international equities. They used bottom-up fundamental research to identify what they believed were attractively priced securities of companies with solid financial positions that possessed the potential to increase
their earnings faster than their industry peers.
| J.P. Morgan International Equity Funds | |
JPMorgan International Hedged Equity Fund
FUND COMMENTARY
SIX MONTHS ENDED April 30, 2023 (Unaudited) (continued)
*
The return shown is based on net asset values calculated for shareholder transactions and may differ from the return shown in the financial highlights, which reflects adjustments made to the net asset values in accordance with accounting principles generally accepted in the United States of America.
**
The adviser seeks to achieve the Fund’s objective. There can be no guarantee it will be achieved.
TOP TEN HOLDINGS OF THE
PORTFOLIO AS OF April 30, 2023 | PERCENT OF
TOTAL
INVESTMENTS |
| | |
| LVMH Moet Hennessy Louis Vuitton SE (France) | |
| Novo Nordisk A/S, Class B (Denmark) | |
| ASML Holding NV (Netherlands) | |
| | |
| AstraZeneca plc (United Kingdom) | |
| | |
| Novartis AG (Registered) (Switzerland) | |
| | |
| | |
PORTFOLIO COMPOSITION BY COUNTRY
AS OF April 30, 2023 | PERCENT OF
TOTAL
INVESTMENTS |
| |
| |
| |
| |
| |
| |
| |
| |
| |
| |
| |
| |
| |
| |
| |
Others (each less than 1.0%) | |
| |
| J.P. Morgan International Equity Funds | |
AVERAGE ANNUAL TOTAL RETURNS AS OF April 30, 2023
|
| |
| Sales Charge for Class A Shares is 5.25%. |
| Assumes a 1% CDSC (contingent deferred sales charge) for the 6 month and one year periods and 0% CDSC thereafter. |
LIFE OF FUND PERFORMANCE (3/15/19 TO 4/30/23)
The performance quoted is past performance and is not a guarantee of future results. Mutual funds are subject to certain market risks. Investment returns and principal value of an investment will fluctuate so that an investor’s shares, when redeemed, may be worth more or less than their original cost. Current performance may be higher or lower than the performance data shown. For up-to-date month-end performance information, please call 1-800-480-4111.
The Fund commenced operations on March 15, 2019.
The graph illustrates comparative performance for $1,000,000 invested in Class I Shares of the JPMorgan International Hedged Equity Fund, the MSCI EAFE Index (net total return) and the ICE BofA 3-Month US Treasury Bill Index from March 15, 2019 to April 30, 2023. The performance of the Fund assumes reinvestment of all dividends and capital gain distributions, if any, and does not include a sales charge. The performance of the MSCI EAFE Index (net total return) does not reflect the deduction of expenses or a sales charge associated with a mutual fund and approximates the minimum possible dividend reinvestment of the securities included in the benchmark, if applicable. The performance of the ICE BofA 3-Month US Treasury Bill Index does not reflect the deduction of expenses or a sales charge associated with a mutual fund and has been adjusted to reflect reinvestment of all dividends and capital gain distributions of securities included in the benchmarks, if applicable. The MSCI EAFE Index (net total return) is a free float-adjusted market capitalization weighted index that is designed to measure the performance of large- and mid- cap stocks in developed markets, excluding the U.S. and Canada. Net total return figures assume the reinvestment of dividends after deduction of withholding tax, applying the maximum rate to nonresident individual investors
who do not benefit from double taxation treaties. The ICE BofA 3-Month US Treasury Bill Index is comprised of a single issue purchased at the beginning of the month and held for a full month. Each month the index is rebalanced and the issue selected is the outstanding Treasury Bill that matures closest to, but not beyond, 3 months from the rebalancing date. Investors cannot invest directly in an index.
Class I Shares have a $1,000,000 minimum initial investment.
Fund performance may reflect the waiver of the Fund’s fees and reimbursement of expenses for certain periods since the applicable inception date. Without these waivers and reimbursements, performance would have been lower. Also, performance shown in this section does not reflect the deduction of taxes that a shareholder would pay on Fund distributions or on gains resulting from redemptions of Fund shares.
International investing involves a greater degree of risk and increased volatility. Changes in currency exchange rates and differences in accounting and taxation policies outside the U.S. can raise or lower returns. Also, some overseas markets may not be as politically and economically stable as the U.S. and other nations.
The returns shown are based on net asset values calculated for shareholder transactions and may differ from the returns shown in the financial highlights, which reflect adjustments made to the net asset values in accordance with accounting principles generally accepted in the United States of America.
The MSCI information may only be used for your internal use, may not be reproduced or redisseminated in any form and may not be used as a basis for
| J.P. Morgan International Equity Funds | |
JPMorgan International Hedged Equity Fund
FUND COMMENTARY
SIX MONTHS ENDED April 30, 2023 (Unaudited) (continued)
or a component of any financial instruments or products or indices. None of the MSCI information is intended to constitute investment advice or a recommendation to make (or refrain from making) any kind of investment decision and may not be relied on as such. Historical data and analysis should not be taken as an indication or guarantee of any future performance analysis, forecast or prediction. The MSCI information is provided on an “as is” basis and the user of this information assumes the entire risk of any use made of this information. MSCI, each of its affiliates and each other person involved in or
related to compiling, computing or creating any MSCI information (collectively, the “MSCI Parties”) expressly disclaims all warranties (including, without limitation, any warranties of originality, accuracy, completeness, timeliness, noninfringement, merchantability and fitness for a particular purpose) with respect to this information. Without limiting any of the foregoing, in no event shall any MSCI Party have any liability for any direct, indirect, special, incidental, punitive, consequential (including, without limitation, lost profits) or any other damages. (www.msci.com)
| J.P. Morgan International Equity Funds | |
JPMorgan International Value Fund
FUND COMMENTARY
SIX MONTHS ENDED April 30, 2023 (Unaudited)
| |
| |
MSCI EAFE Value Index (net total return) | |
Net Assets as of 4/30/2023 (In Thousands) | |
INVESTMENT OBJECTIVE**
The JPMorgan International Value Fund (the “Fund”) seeks to provide long-term capital appreciation.
WHAT WERE THE MAIN DRIVERS OF THE FUND’S PERFORMANCE?
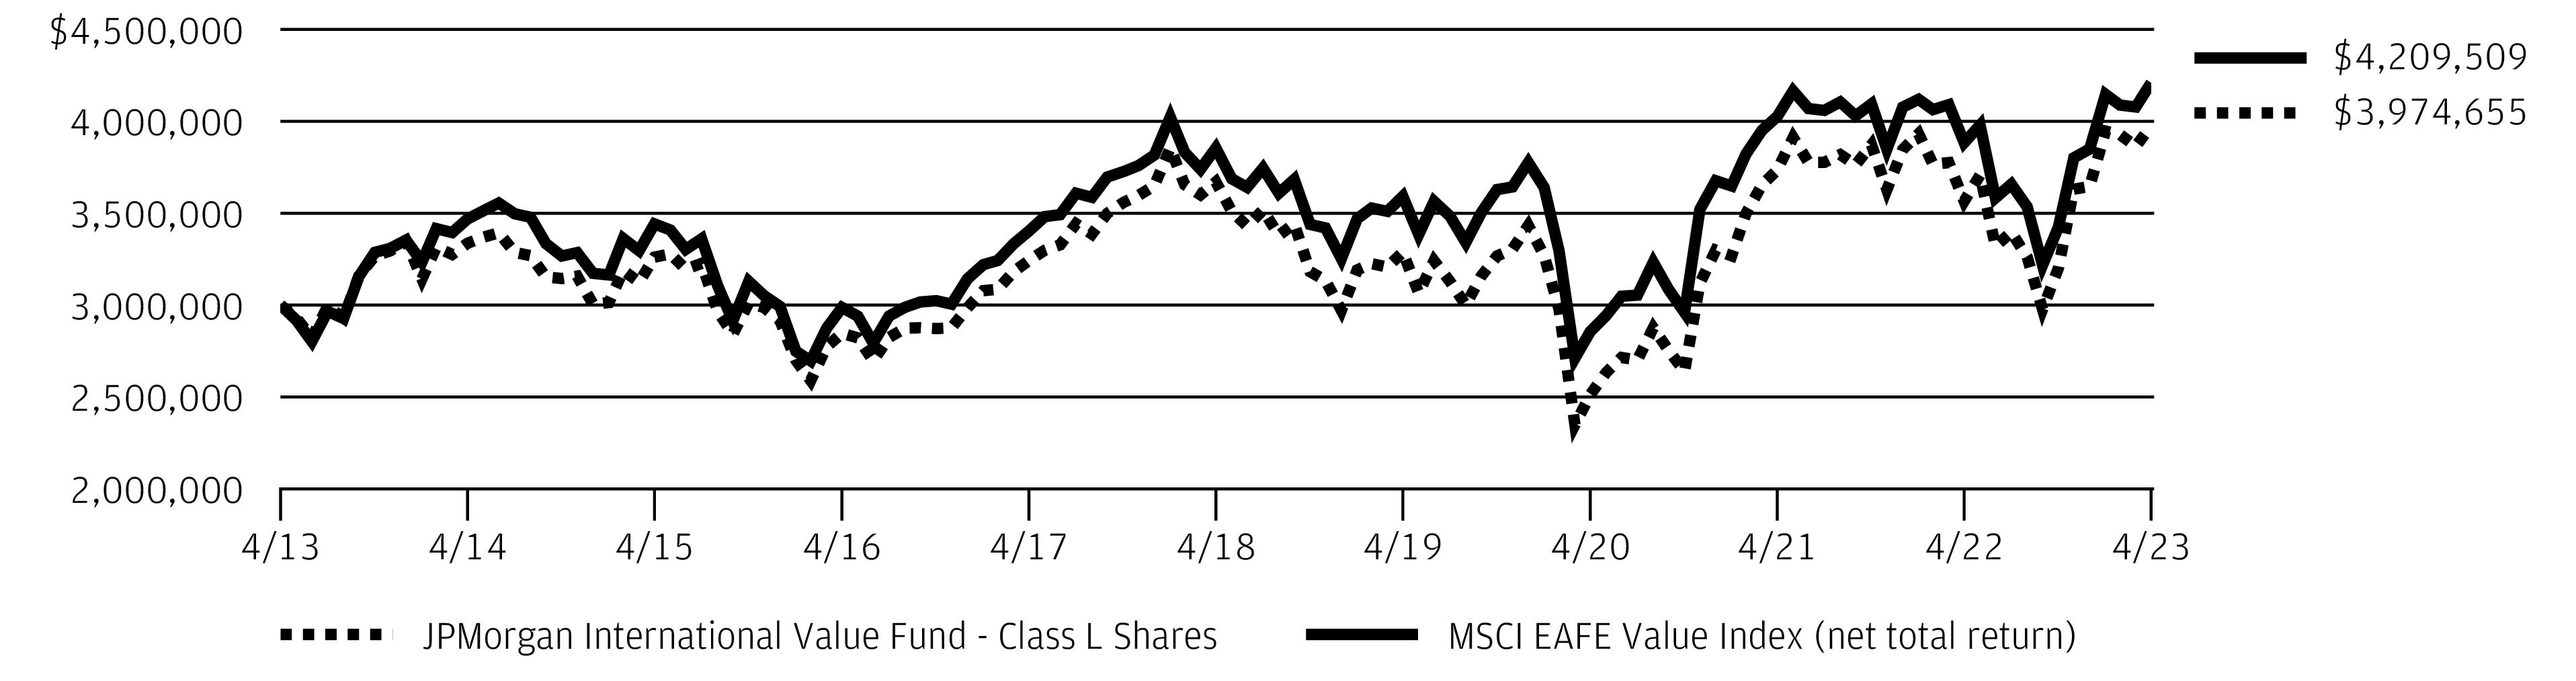
The Fund’s Class L Shares outperformed the MSCI EAFE Value Index (net total return) (the “Benchmark”) for the six months ended April 30, 2023.
The Fund’s security selection in the telecommunications services and industrials sectors was a leading contributor to performance relative to the Benchmark, while the Fund’s overweight position in the energy sector and its underweight position in the utilities sector were leading detractors from relative performance.
By region, the Fund’s security selection in Japan and the U.K. was a leading contributor to performance relative to the Benchmark, while its security selection in continental Europe and the Pacific Rim was a leading detractor from relative performance.
Leading individual contributors to relative performance included the Fund’s underweight positions in Toyota Motor Corp., British American Tobacco PLC and Softbank Corp., Shares of Toyota Motor, a Japanese automobile manufacturer, fell after the company named a new chief executive and chairman, and after it reported a decline in North American sales. Shares of
British American Tobacco, a U.K. tobacco and nicotine products manufacturer not held in the Fund, fell amid increased U.S. regulatory efforts to reduce smoking and nicotine use. Shares of SoftBank, a Japanese investment company not held in the Fund, fell after the company reported a loss for its fiscal third quarter.
Leading individual detractors from relative performance included the Fund’s underweight positions in Enel SpA and SAP SE, and its overweight position in Equinor ASA. Shares of Enel, an Italian electricity and natural gas utility, rose after the company reported earnings and revenue growth during the period. Shares of SAP, a German software provider, rose after the company reported better-than-expected results during the period. Shares of Equinor, a Norwegian oil and gas producer, fell amid weaker global energy prices during the period.
HOW WAS THE FUND POSITIONED?
The Fund’s portfolio managers employed behavioral-based and quantitative screens in addition to conducting fundamental analysis to seek out companies that they believed had attractive valuations. As a result of this process, the Fund’s largest overweight positions relative to the Benchmark during the period were in the energy and banks sectors, while the largest underweight positions were in the food, beverage & tobacco sector and the utilities sector.
| J.P. Morgan International Equity Funds | |
JPMorgan International Value Fund
FUND COMMENTARY
SIX MONTHS ENDED April 30, 2023 (Unaudited) (continued)
*
The return shown is based on net asset values calculated for shareholder transactions and may differ from the return shown in the financial highlights, which reflects adjustments made to the net asset values in accordance with accounting principles generally accepted in the United States of America.
**
The adviser seeks to achieve the Fund’s objective. There can be no guarantee it will be achieved.
TOP TEN HOLDINGS OF THE
PORTFOLIO AS OF April 30, 2023 | PERCENT OF
TOTAL
INVESTMENTS |
| Novartis AG (Registered) (Switzerland) | |
| | |
| TotalEnergies SE (France) | |
| BHP Group Ltd. (Australia) | |
| | |
| HSBC Holdings plc (United Kingdom) | |
| | |
| Allianz SE (Registered) (Germany) | |
| Mitsubishi UFJ Financial Group, Inc. (Japan) | |
| | |
PORTFOLIO COMPOSITION BY COUNTRY
AS OF April 30, 2023 | PERCENT OF
TOTAL
INVESTMENTS |
| |
| |
| |
| |
| |
| |
| |
| |
| |
| |
| |
| |
| |
| |
| |
| |
| |
Others (each less than 1.0%) | |
| |
| J.P. Morgan International Equity Funds | |
AVERAGE ANNUAL TOTAL RETURNS AS OF April 30, 2023
|
| |
| Sales Charge for Class A Shares is 5.25%. |
| Assumes a 1% CDSC (contingent deferred sales charge) for the 6 month and one year periods and 0% CDSC thereafter. |
TEN YEAR FUND PERFORMANCE (4/30/13 TO 4/30/23)
The performance quoted is past performance and is not a guarantee of future results. Mutual funds are subject to certain market risks. Investment returns and principal value of an investment will fluctuate so that an investor’s shares, when redeemed, may be worth more or less than their original cost. Current performance may be higher or lower than the performance data shown. For up-to-date month-end performance information please call 1-800-480-4111. Effective May 2018, some of the Fund’s investment strategies changed. The Fund’s past performance would have been different if the Fund was managed under the current strategies.
Returns for Class R5 Shares prior to its inception date are based on the performance of Class L Shares. The actual returns of Class R5 Shares would have been different than those shown because Class R5 Shares have different expenses than Class L Shares.
The graph illustrates comparative performance for $3,000,000 invested in Class L Shares of the JPMorgan International Value Fund and the MSCI EAFE Value Index (net total return) from April 30, 2013 to April 30, 2023. The performance of the Fund assumes reinvestment of all dividends and capital gain distributions, if any, and does not include a sales charge. The performance of the MSCI EAFE Value Index (net total return) does not reflect the deduction of expenses or a sales charge associated with a mutual fund and approximates the minimum possible dividend reinvestment of the securities included in the benchmark, if applicable. The MSCI EAFE Value Index (net total return) is a free float-adjusted market capitalization weighted index that is designed to measure the performance of value-oriented large- and mid- cap stocks in developed markets, excluding the U.S. and Canada. Net total return figures
assume the reinvestment of dividends after deduction of withholding tax, applying the maximum rate to nonresident individual investors who do not benefit from double taxation treaties. Investors cannot invest directly in an index.
Class L Shares have a $3,000,000 minimum initial investment.
Fund performance may reflect the waiver of the Fund’s fees and reimbursement of expenses for certain periods since the applicable inception date. Without these waivers and reimbursements, performance would have been lower. Also, performance shown in this section does not reflect the deduction of taxes that a shareholder would pay on Fund distributions or on gains resulting from redemptions of Fund shares.
International investing involves a greater degree of risk and increased volatility. Changes in currency exchange rates and differences in accounting and taxation policies outside the U.S. can raise or lower returns. Also, some overseas markets may not be as politically and economically stable as the U.S. and other nations.
Because Class C Shares automatically convert to Class A Shares after 8 years, the 10 year average annual total return shown above for Class C reflects Class A performance for the period after conversion.
The returns shown are based on net asset values calculated for shareholder transactions and may differ from the returns shown in the financial highlights, which reflect adjustments made to the net asset values in accordance with accounting principles generally accepted in the United States of America.
| J.P. Morgan International Equity Funds | |
JPMorgan Emerging Markets Equity Fund
SCHEDULE OF PORTFOLIO INVESTMENTS
AS OF April 30, 2023 (Unaudited)
| | |
|
|
B3 SA - Brasil Bolsa Balcao | | |
Itau Unibanco Holding SA, ADR | | |
| | |
NU Holdings Ltd., Class A * | | |
| | |
| | |
| | |
|
Beijing Oriental Yuhong Waterproof Technology Co. Ltd., Class A * | | |
Budweiser Brewing Co. APAC Ltd. (a) | | |
| | |
Foshan Haitian Flavouring & Food Co. Ltd., Class A * | | |
Fuyao Glass Industry Group Co. Ltd., Class A * | | |
| | |
| | |
Jiangsu Hengli Hydraulic Co. Ltd., Class A * | | |
Kingdee International Software Group Co. Ltd. * | | |
| | |
Midea Group Co. Ltd., Class A | | |
| | |
| | |
Shenzhen Mindray Bio-Medical Electronics Co. Ltd., Class A * | | |
Shenzhou International Group Holdings Ltd. | | |
| | |
| | |
Wanhua Chemical Group Co. Ltd., Class A * | | |
Wuliangye Yibin Co. Ltd., Class A | | |
WuXi AppTec Co. Ltd., Class A * | | |
Wuxi Biologics Cayman, Inc. * (a) | | |
| | |
| | |
|
| | |
Hong Kong Exchanges & Clearing Ltd. | | |
| | |
Techtronic Industries Co. Ltd. | | |
Techtronic Industries Co. Ltd. | | |
| | |
|
Apollo Hospitals Enterprise Ltd. | | |
| | |
|
|
| | |
Britannia Industries Ltd. | | |
| | |
| | |
HDFC Life Insurance Co. Ltd. * (a) | | |
| | |
Housing Development Finance Corp. Ltd. | | |
| | |
| | |
| | |
| | |
| | |
Tata Consultancy Services Ltd. * | | |
| | |
|
Bank Central Asia Tbk. PT | | |
Bank Rakyat Indonesia Persero Tbk. PT | | |
| | |
|
| | |
|
Grupo Financiero Banorte SAB de CV, Class O | | |
Wal-Mart de Mexico SAB de CV | | |
| | |
|
Copa Holdings SA, Class A | | |
|
| | |
|
| | |
Capitec Bank Holdings Ltd. | | |
| | |
| | |
|
| | |
| | |
| | |
Samsung Electronics Co. Ltd. | | |
| | |
SEE NOTES TO FINANCIAL STATEMENTS.
| J.P. Morgan International Equity Funds | |
| | |
Common Stocks — continued |
|
Chailease Holding Co. Ltd. * | | |
Delta Electronics, Inc. * | | |
Realtek Semiconductor Corp. * | | |
Taiwan Semiconductor Manufacturing Co. Ltd., ADR | | |
Taiwan Semiconductor Manufacturing Co. Ltd. | | |
| | |
|
| | |
Estee Lauder Cos., Inc. (The), Class A | | |
| | |
JS Global Lifestyle Co. Ltd. * (a) | | |
| | |
Total Common Stocks
(Cost $7,041,777) | | |
Short-Term Investments — 0.0% ^ |
Investment Companies — 0.0% ^ |
JPMorgan Prime Money Market Fund Class Institutional Shares, 4.88% (b) (c)(Cost $5,306) | | |
Total Investments — 100.5%
(Cost $7,047,083) | | |
Liabilities in Excess of Other Assets — (0.5)% | | |
| | |
Percentages indicated are based on net assets. |
| |
| American Depositary Receipt |
| |
| Limited liability company |
| |
| Amount rounds to less than 0.1% of net assets. |
| Non-income producing security. | |
| Security exempt from registration pursuant to Regulation S under the Securities Act of 1933, as amended. Regulation S applies to securities offerings that are made outside of the United States and do not involve direct selling efforts in the United States and as such may have restrictions on resale. | |
| Investment in an affiliated fund, which is registered under the Investment Company Act of 1940, as amended, and is advised by J.P. Morgan Investment Management Inc. | |
| The rate shown is the current yield as of April 30, 2023. | |
Summary of Investments by Industry, April 30, 2023
The following table represents the portfolio investments of the Fund by industry classifications as a percentage of total investments:
| PERCENT OF
TOTAL
INVESTMENTS |
| |
Semiconductors & Semiconductor Equipment | |
Technology Hardware, Storage & Peripherals | |
| |
Consumer Staples Distribution & Retail | |
| |
| |
| |
Interactive Media & Services | |
| |
Hotels, Restaurants & Leisure | |
| |
| |
| |
Oil, Gas & Consumable Fuels | |
| |
Life Sciences Tools & Services | |
| |
| |
Electronic Equipment, Instruments & Components | |
Textiles, Apparel & Luxury Goods | |
Health Care Equipment & Supplies | |
| |
| |
Health Care Providers & Services | |
Others (each less than 1.0%) | |
| |
SEE NOTES TO FINANCIAL STATEMENTS.
| J.P. Morgan International Equity Funds | |
JPMorgan Emerging Markets Research Enhanced Equity Fund
SCHEDULE OF PORTFOLIO INVESTMENTS
AS OF April 30, 2023 (Unaudited)
| | |
|
|
B3 SA - Brasil Bolsa Balcao | | |
Centrais Eletricas Brasileiras SA | | |
Cia Energetica de Minas Gerais (Preference) | | |
| | |
Itau Unibanco Holding SA (Preference) | | |
| | |
| | |
| | |
| | |
NU Holdings Ltd., Class A * | | |
Petroleo Brasileiro SA (Preference) | | |
| | |
| | |
| | |
| | |
| | |
| | |
|
Banco Santander Chile, ADR | | |
| | |
| | |
|
Aier Eye Hospital Group Co. Ltd., Class A * | | |
Alibaba Group Holding Ltd. * | | |
Amoy Diagnostics Co. Ltd., Class A * | | |
Angel Yeast Co. Ltd., Class A * | | |
Anhui Conch Cement Co. Ltd., Class H | | |
ANTA Sports Products Ltd. | | |
| | |
| | |
Baoshan Iron & Steel Co. Ltd., Class A * | | |
| | |
| | |
Beijing Oriental Yuhong Waterproof Technology Co. Ltd., Class A * | | |
| | |
BOE Technology Group Co. Ltd., Class A * | | |
| | |
CGN Power Co. Ltd., Class H (b) | | |
Chacha Food Co. Ltd., Class A * | | |
China Construction Bank Corp., Class H | | |
China International Capital Corp. Ltd., Class H * (b) | | |
China Life Insurance Co. Ltd., Class H | | |
| | |
|
|
China Longyuan Power Group Corp. Ltd., Class H | | |
China Merchants Bank Co. Ltd., Class H * | | |
China Oilfield Services Ltd., Class H | | |
China Overseas Land & Investment Ltd. | | |
China Pacific Insurance Group Co. Ltd., Class H | | |
China Petroleum & Chemical Corp., Class H | | |
China Resources Land Ltd. | | |
China Resources Mixc Lifestyle Services Ltd. (b) | | |
China Vanke Co. Ltd., Class H * | | |
China Yangtze Power Co. Ltd., Class A * | | |
Chongqing Fuling Zhacai Group Co. Ltd., Class A * | | |
Country Garden Services Holdings Co. Ltd. | | |
CSPC Pharmaceutical Group Ltd. | | |
Dongguan Yiheda Automation Co. Ltd., Class A * | | |
| | |
Flat Glass Group Co. Ltd., Class H | | |
Foshan Haitian Flavouring & Food Co. Ltd., Class A * | | |
Fuyao Glass Industry Group Co. Ltd., Class H * (b) | | |
Ganfeng Lithium Group Co. Ltd. * (b) | | |
Guangzhou Automobile Group Co. Ltd., Class H * | | |
Guangzhou Kingmed Diagnostics Group Co. Ltd., Class A * | | |
| | |
Haier Smart Home Co. Ltd., Class H * | | |
Han's Laser Technology Industry Group Co. Ltd., Class A * | | |
Hefei Meiya Optoelectronic Technology, Inc., Class A * | | |
Huatai Securities Co. Ltd., Class H * (b) | | |
Huayu Automotive Systems Co. Ltd., Class A * | | |
Hundsun Technologies, Inc., Class A * | | |
Industrial & Commercial Bank of China Ltd., Class H | | |
Inner Mongolia Yili Industrial Group Co. Ltd., Class A * | | |
Jade Bird Fire Co. Ltd., Class A * | | |
JD Health International, Inc. * (b) | | |
| | |
| | |
Jiangsu Hengli Hydraulic Co. Ltd., Class A * | | |
Joinn Laboratories China Co. Ltd., Class H * (b) | | |
| | |
Kingdee International Software Group Co. Ltd. * | | |
| | |
Kweichow Moutai Co. Ltd., Class A * | | |
Laobaixing Pharmacy Chain JSC, Class A * | | |
LONGi Green Energy Technology Co. Ltd., Class A * | | |
SEE NOTES TO FINANCIAL STATEMENTS.
| J.P. Morgan International Equity Funds | |
| | |
Common Stocks — continued |
|
| | |
Midea Group Co. Ltd., Class A | | |
| | |
Montage Technology Co. Ltd., Class A * | | |
NARI Technology Co. Ltd., Class A * | | |
| | |
| | |
| | |
Oppein Home Group, Inc., Class A * | | |
PDD Holdings, Inc., ADR * | | |
Pharmaron Beijing Co. Ltd., Class H * (b) | | |
PICC Property & Casualty Co. Ltd., Class H * | | |
Ping An Bank Co. Ltd., Class A * | | |
Ping An Insurance Group Co. of China Ltd., Class H | | |
Postal Savings Bank of China Co. Ltd., Class H (b) | | |
Qingdao Haier Biomedical Co. Ltd., Class A * | | |
Sany Heavy Industry Co. Ltd., Class A * | | |
Shanghai Baosight Software Co. Ltd., Class A * | | |
Shanghai Liangxin Electrical Co. Ltd., Class A | | |
Shanghai Putailai New Energy Technology Co. Ltd., Class A | | |
Shenzhen Mindray Bio-Medical Electronics Co. Ltd., Class A * | | |
Shenzhou International Group Holdings Ltd. | | |
| | |
Skshu Paint Co. Ltd., Class A * | | |
StarPower Semiconductor Ltd., Class A * | | |
Sunny Optical Technology Group Co. Ltd. | | |
Suzhou Maxwell Technologies Co. Ltd., Class A * | | |
| | |
Tingyi Cayman Islands Holding Corp. | | |
Trip.com Group Ltd., ADR * | | |
| | |
Wanhua Chemical Group Co. Ltd., Class A * | | |
Wuliangye Yibin Co. Ltd., Class A | | |
WuXi AppTec Co. Ltd., Class H (b) | | |
Wuxi Biologics Cayman, Inc. * (b) | | |
Xinyi Solar Holdings Ltd. | | |
| | |
| | |
| | |
Zhejiang Dingli Machinery Co. Ltd., Class A * | | |
Zhejiang Jingsheng Mechanical & Electrical Co. Ltd., Class A * | | |
| | |
|
|
Zhejiang Weixing New Building Materials Co. Ltd., Class A * | | |
Zhuzhou CRRC Times Electric Co. Ltd. * | | |
Zijin Mining Group Co. Ltd., Class H * | | |
| | |
| | |
|
| | |
|
Hellenic Telecommunications Organization SA | | |
| | |
| | |
|
Techtronic Industries Co. Ltd. | | |
|
| | |
| | |
| | |
|
Apollo Hospitals Enterprise Ltd. | | |
| | |
| | |
| | |
| | |
Bharat Petroleum Corp. Ltd. | | |
| | |
Britannia Industries Ltd. | | |
| | |
Dr Reddy's Laboratories Ltd. | | |
| | |
| | |
| | |
| | |
HDFC Life Insurance Co. Ltd. * (b) | | |
| | |
Housing Development Finance Corp. Ltd. | | |
| | |
ICICI Prudential Life Insurance Co. Ltd. * (b) | | |
| | |
| | |
| | |
| | |
SEE NOTES TO FINANCIAL STATEMENTS.
| J.P. Morgan International Equity Funds | |
JPMorgan Emerging Markets Research Enhanced Equity Fund
SCHEDULE OF PORTFOLIO INVESTMENTS
AS OF April 30, 2023 (Unaudited) (continued)
| | |
Common Stocks — continued |
|
| | |
| | |
Oil & Natural Gas Corp. Ltd. | | |
| | |
Power Grid Corp. of India Ltd. | | |
| | |
| | |
Tata Consultancy Services Ltd. * | | |
Tata Consumer Products Ltd. | | |
| | |
| | |
| | |
|
Bank Central Asia Tbk. PT | | |
Bank Mandiri Persero Tbk. PT | | |
Bank Rakyat Indonesia Persero Tbk. PT | | |
Telkom Indonesia Persero Tbk. PT | | |
| | |
| | |
|
| | |
| | |
Petronas Chemicals Group Bhd. | | |
| | |
| | |
| | |
|
| | |
| | |
Grupo Aeroportuario del Pacifico SAB de CV, Class B | | |
Grupo Aeroportuario del Sureste SAB de CV, Class B | | |
Grupo Financiero Banorte SAB de CV, Class O | | |
| | |
Kimberly-Clark de Mexico SAB de CV, Class A | | |
| | |
Wal-Mart de Mexico SAB de CV | | |
| | |
|
Copa Holdings SA, Class A | | |
|
| | |
| | |
|
|
| | |
| | |
| | |
| | |
|
| | |
Powszechny Zaklad Ubezpieczen SA | | |
| | |
|
| | |
| | |
| | |
|
| | |
Magnitogorsk Iron & Steel Works PJSC ‡ * | | |
MMC Norilsk Nickel PJSC, ADR ‡ * | | |
MMC Norilsk Nickel PJSC ‡ | | |
| | |
| | |
Sberbank of Russia PJSC ‡ * | | |
Severstal PAO, GDR ‡ * (b) | | |
TCS Group Holding plc, GDR ‡ * (b) | | |
X5 Retail Group NV, GDR ‡ * (b) | | |
| | |
|
| | |
| | |
| | |
| | |
Mouwasat Medical Services Co. | | |
| | |
Saudi Arabian Mining Co. * | | |
Saudi Arabian Oil Co. (b) | | |
Saudi Basic Industries Corp. | | |
Saudi National Bank (The) | | |
| | |
| | |
|
| | |
| | |
Capitec Bank Holdings Ltd. | | |
SEE NOTES TO FINANCIAL STATEMENTS.
| J.P. Morgan International Equity Funds | |
| | |
Common Stocks — continued |
|
| | |
| | |
| | |
Foschini Group Ltd. (The) | | |
| | |
Impala Platinum Holdings Ltd. | | |
| | |
| | |
| | |
| | |
| | |
| | |
| | |
|
| | |
Hana Financial Group, Inc. | | |
Hankook Tire & Technology Co. Ltd. | | |
| | |
| | |
| | |
| | |
| | |
| | |
| | |
| | |
KIWOOM Securities Co. Ltd. | | |
| | |
| | |
| | |
| | |
| | |
| | |
Samsung Biologics Co. Ltd. * (b) | | |
Samsung Electronics Co. Ltd. | | |
Samsung Fire & Marine Insurance Co. Ltd. | | |
| | |
Shinhan Financial Group Co. Ltd. | | |
| | |
| | |
| | |
| | |
| | |
|
|
| | |
| | |
| | |
|
Accton Technology Corp. * | | |
| | |
ASE Technology Holding Co. Ltd. * | | |
| | |
Chailease Holding Co. Ltd. * | | |
Chunghwa Telecom Co. Ltd. * | | |
CTBC Financial Holding Co. Ltd. | | |
Delta Electronics, Inc. * | | |
E.Sun Financial Holding Co. Ltd. * | | |
| | |
eMemory Technology, Inc. * | | |
Evergreen Marine Corp. Taiwan Ltd. * | | |
Fubon Financial Holding Co. Ltd. * | | |
Giant Manufacturing Co. Ltd. * | | |
Hon Hai Precision Industry Co. Ltd. * | | |
Largan Precision Co. Ltd. | | |
| | |
| | |
Nien Made Enterprise Co. Ltd. * | | |
Novatek Microelectronics Corp. * | | |
Powertech Technology, Inc. * | | |
President Chain Store Corp. * | | |
Realtek Semiconductor Corp. * | | |
| | |
Taiwan Semiconductor Manufacturing Co. Ltd., ADR | | |
Taiwan Semiconductor Manufacturing Co. Ltd. | | |
Uni-President Enterprises Corp. * | | |
United Microelectronics Corp. * | | |
Vanguard International Semiconductor Corp. * | | |
| | |
Yuanta Financial Holding Co. Ltd. * | | |
| | |
|
Airports of Thailand PCL * | | |
| | |
| | |
| | |
PTT Exploration & Production PCL | | |
PTT Exploration & Production PCL, NVDR | | |
SEE NOTES TO FINANCIAL STATEMENTS.
| J.P. Morgan International Equity Funds | |
JPMorgan Emerging Markets Research Enhanced Equity Fund
SCHEDULE OF PORTFOLIO INVESTMENTS
AS OF April 30, 2023 (Unaudited) (continued)
| | |
Common Stocks — continued |
|
| | |
PTT Global Chemical PCL, NVDR | | |
| | |
| | |
| | |
| | |
Siam Cement PCL (The), NVDR | | |
Siam Cement PCL (The) (Registered) | | |
| | |
| | |
Thai Union Group PCL, Class F | | |
| | |
United Arab Emirates — 0.8% |
| | |
| | |
Emirates Telecommunications Group Co. PJSC | | |
First Abu Dhabi Bank PJSC | | |
| | |
|
| | |
| | |
JS Global Lifestyle Co. Ltd. * (b) | | |
| | |
| | |
Total Common Stocks
(Cost $2,292,495) | | |
| | |
|
|
Localiza Rent a Car SA, expiring 5/11/2023*(Cost $—) (c) | | |
| | |
Short-Term Investments — 0.9% |
Investment Companies — 0.6% |
JPMorgan Prime Money Market Fund Class Institutional Shares, 4.88% (d) (e)(Cost $13,958) | | |
| | |
|
Investment of Cash Collateral from Securities Loaned — 0.3% |
JPMorgan Securities Lending Money Market Fund Agency SL Class Shares, 5.01% (d) (e) | | |
JPMorgan U.S. Government Money Market Fund Class IM Shares, 4.78% (d) (e) | | |
Total Investment of Cash Collateral from Securities Loaned
(Cost $7,129) | | |
Total Short-Term Investments
(Cost $21,087) | | |
Total Investments — 97.6%
(Cost $2,313,582) | | |
Other Assets Less Liabilities — 2.4% | | |
| | |
Percentages indicated are based on net assets. |
Amounts presented as a dash ("-") represent amounts that round to less than a thousand. |
| |
| American Depositary Receipt |
| Global Depositary Receipt |
| |
| Non-Voting Depositary Receipt |
| Public Joint Stock Company |
| A special type of equity investment that shares in the earnings of the company, has limited voting rights, and may have a dividend preference. Preference shares may also have liquidation preference. |
| Limited liability company |
| Amount rounds to less than 0.1% of net assets. |
| Value determined using significant unobservable inputs. | |
| Non-income producing security. | |
| The security or a portion of this security is on loan at April 30, 2023. The total value of securities on loan at April 30, 2023 is $6,883. | |
| Security exempt from registration pursuant to Regulation S under the Securities Act of 1933, as amended. Regulation S applies to securities offerings that are made outside of the United States and do not involve direct selling efforts in the United States and as such may have restrictions on resale. | |
| | |
SEE NOTES TO FINANCIAL STATEMENTS.
| J.P. Morgan International Equity Funds | |
| Investment in an affiliated fund, which is registered under the Investment Company Act of 1940, as amended, and is advised by J.P. Morgan Investment Management Inc. | |
| The rate shown is the current yield as of April 30, 2023. | |
Summary of Investments by Industry, April 30, 2023
The following table represents the portfolio investments of the Fund by industry classifications as a percentage of total investments:
| PERCENT OF
TOTAL
INVESTMENTS |
| |
Semiconductors & Semiconductor Equipment | |
Interactive Media & Services | |
Technology Hardware, Storage & Peripherals | |
Oil, Gas & Consumable Fuels | |
| |
| |
| |
| |
Consumer Staples Distribution & Retail | |
| |
Hotels, Restaurants & Leisure | |
| |
Electronic Equipment, Instruments & Components | |
Wireless Telecommunication Services | |
| |
| |
Real Estate Management & Development | |
Diversified Telecommunication Services | |
| |
Life Sciences Tools & Services | |
| |
| |
| |
Others (each less than 1.0%) | |
| |
SEE NOTES TO FINANCIAL STATEMENTS.
| J.P. Morgan International Equity Funds | |
JPMorgan Emerging Markets Research Enhanced Equity Fund
SCHEDULE OF PORTFOLIO INVESTMENTS
AS OF April 30, 2023 (Unaudited) (continued)
Futures contracts outstanding as of April 30, 2023 (amounts in thousands, except number of contracts):
| | | | | VALUE AND
UNREALIZED
APPRECIATION
(DEPRECIATION) ($) |
| | | | | |
MSCI Emerging Markets E-Mini Index | | | | | |
| |
| Morgan Stanley Capital International |
| |
SEE NOTES TO FINANCIAL STATEMENTS.
| J.P. Morgan International Equity Funds | |
JPMorgan Europe Dynamic Fund
SCHEDULE OF PORTFOLIO INVESTMENTS
AS OF April 30, 2023 (Unaudited)
| | |
|
|
| | |
|
| | |
|
| | |
|
| | |
Novo Nordisk A/S, Class B | | |
| | |
|
| | |
| | |
| | |
|
| | |
| | |
| | |
| | |
LVMH Moet Hennessy Louis Vuitton SE (a) | | |
| | |
| | |
| | |
| | |
| | |
| | |
| | |
| | |
|
| | |
| | |
CTS Eventim AG & Co. KGaA * | | |
| | |
Deutsche Lufthansa AG (Registered) * | | |
Dr Ing hc F Porsche AG (Preference) * (c) | | |
| | |
| | |
| | |
| | |
Muenchener Rueckversicherungs-Gesellschaft AG (Registered) | | |
| | |
|
|
| | |
| | |
| | |
|
| | |
Bank of Ireland Group plc | | |
Bank of Ireland Group plc | | |
Ryanair Holdings plc, ADR * | | |
| | |
| | |
|
| | |
|
| | |
Koninklijke Ahold Delhaize NV | | |
| | |
|
| | |
|
| | |
Industria de Diseno Textil SA (a) | | |
| | |
|
| | |
| | |
| | |
| | |
|
Cie Financiere Richemont SA (Registered) | | |
| | |
Zurich Insurance Group AG | | |
| | |
|
| | |
| | |
| | |
| | |
| | |
| | |
| | |
SEE NOTES TO FINANCIAL STATEMENTS.
| J.P. Morgan International Equity Funds | |
JPMorgan Europe Dynamic Fund
SCHEDULE OF PORTFOLIO INVESTMENTS
AS OF April 30, 2023 (Unaudited) (continued)
| | |
Common Stocks — continued |
United Kingdom — continued |
| | |
| | |
| | |
| | |
|
| | |
| | |
| | |
| | |
Total Common Stocks
(Cost $499,501) | | |
Short-Term Investments — 8.3% |
Investment Companies — 1.5% |
JPMorgan Prime Money Market Fund Class Institutional Shares, 4.88% (d) (e)(Cost $9,307) | | |
Investment of Cash Collateral from Securities Loaned — 6.8% |
JPMorgan Securities Lending Money Market Fund Agency SL Class Shares, 5.01% (d) (e) | | |
JPMorgan U.S. Government Money Market Fund Class IM Shares, 4.78% (d) (e) | | |
Total Investment of Cash Collateral from Securities Loaned
(Cost $43,681) | | |
Total Short-Term Investments
(Cost $52,988) | | |
Total Investments — 104.4%
(Cost $552,489) | | |
Liabilities in Excess of Other Assets — (4.4)% | | |
| | |
Percentages indicated are based on net assets. |
| |
| American Depositary Receipt |
| |
| A special type of equity investment that shares in the earnings of the company, has limited voting rights, and may have a dividend preference. Preference shares may also have liquidation preference. |
| Non-income producing security. |
| The security or a portion of this security is on loan at April 30, 2023. The total value of securities on loan at April 30, 2023 is $37,040. |
| Security exempt from registration pursuant to Regulation S under the Securities Act of 1933, as amended. Regulation S applies to securities offerings that are made outside of the United States and do not involve direct selling efforts in the United States and as such may have restrictions on resale. |
| Securities exempt from registration under Rule 144A or section 4(a)(2), of the Securities Act of 1933, as amended. |
| Investment in an affiliated fund, which is registered under the Investment Company Act of 1940, as amended, and is advised by J.P. Morgan Investment Management Inc. |
| The rate shown is the current yield as of April 30, 2023. |
Summary of Investments by Industry, April 30, 2023
The following table represents the portfolio investments of the Fund by industry classifications as a percentage of total investments:
| PERCENT OF
TOTAL
INVESTMENTS |
| |
| |
Oil, Gas & Consumable Fuels | |
Textiles, Apparel & Luxury Goods | |
| |
| |
| |
| |
Hotels, Restaurants & Leisure | |
| |
Construction & Engineering | |
| |
| |
| |
| |
Semiconductors & Semiconductor Equipment | |
Consumer Staples Distribution & Retail | |
Commercial Services & Supplies | |
| |
| |
| |
| |
Independent Power and Renewable Electricity Producers | |
| |
| |
Trading Companies & Distributors | |
Others (each less than 1.0%) | |
| |
SEE NOTES TO FINANCIAL STATEMENTS.
| J.P. Morgan International Equity Funds | |
Futures contracts outstanding as of April 30, 2023 (amounts in thousands, except number of contracts):
| | | | | VALUE AND
UNREALIZED
APPRECIATION
(DEPRECIATION) ($) |
| | | | | |
| | | | | |
| | | | | |
| | | | | |
| |
| |
| Financial Times and the London Stock Exchange |
| |
SEE NOTES TO FINANCIAL STATEMENTS.
| J.P. Morgan International Equity Funds | |
JPMorgan International Equity Fund
SCHEDULE OF PORTFOLIO INVESTMENTS
AS OF April 30, 2023 (Unaudited)
| | |
|
|
| | |
| | |
Woodside Energy Group Ltd. | | |
Woodside Energy Group Ltd. | | |
| | |
|
| | |
|
| | |
|
| | |
| | |
| | |
Novo Nordisk A/S, Class B | | |
| | |
|
| | |
| | |
| | |
| | |
| | |
| | |
| | |
LVMH Moet Hennessy Louis Vuitton SE (a) | | |
| | |
| | |
| | |
| | |
| | |
|
| | |
| | |
| | |
Deutsche Telekom AG (Registered) | | |
| | |
Muenchener Rueckversicherungs-Gesellschaft AG (Registered) | | |
| | |
| | |
|
| | |
| | |
|
|
Hong Kong Exchanges & Clearing Ltd. | | |
| | |
Techtronic Industries Co. Ltd. | | |
| | |
|
| | |
|
| | |
|
| | |
| | |
| | |
| | |
| | |
| | |
Mitsubishi UFJ Financial Group, Inc. | | |
Nippon Telegraph & Telephone Corp. | | |
Recruit Holdings Co. Ltd. | | |
Shin-Etsu Chemical Co. Ltd. | | |
| | |
| | |
Sumitomo Mitsui Financial Group, Inc. | | |
Tokio Marine Holdings, Inc. | | |
| | |
| | |
|
| | |
|
| | |
| | |
| | |
|
| | |
|
| | |
|
| | |
Samsung Electronics Co. Ltd., GDR (b) | | |
Samsung Electronics Co. Ltd., GDR (b) | | |
| | |
SEE NOTES TO FINANCIAL STATEMENTS.
| J.P. Morgan International Equity Funds | |
| | |
Common Stocks — continued |
|
| | |
|
| | |
Svenska Handelsbanken AB, Class A (a) | | |
| | |
| | |
|
Cie Financiere Richemont SA (Registered) | | |
Lonza Group AG (Registered) | | |
Straumann Holding AG (Registered) | | |
| | |
|
Taiwan Semiconductor Manufacturing Co. Ltd., ADR | | |
|
| | |
| | |
| | |
| | |
London Stock Exchange Group plc | | |
| | |
| | |
|
| | |
| | |
| | |
| | |
| | |
| | |
| | |
Total Common Stocks
(Cost $3,278,553) | | |
Short-Term Investments — 8.0% |
Investment Companies — 3.3% |
JPMorgan Prime Money Market Fund Class Institutional Shares, 4.88% (c) (d)(Cost $145,799) | | |
Investment of Cash Collateral from Securities Loaned — 4.7% |
JPMorgan Securities Lending Money Market Fund Agency SL Class Shares, 5.01% (c) (d) | | |
| | |
|
Investment of Cash Collateral from Securities Loaned — continued |
JPMorgan U.S. Government Money Market Fund Class IM Shares, 4.78% (c) (d) | | |
Total Investment of Cash Collateral from Securities Loaned
(Cost $204,494) | | |
Total Short-Term Investments
(Cost $350,293) | | |
Total Investments — 105.5%
(Cost $3,628,846) | | |
Liabilities in Excess of Other Assets — (5.5)% | | |
| | |
Percentages indicated are based on net assets. |
| |
| American Depositary Receipt |
| Global Depositary Receipt |
| Non-income producing security. |
| The security or a portion of this security is on loan at April 30, 2023. The total value of securities on loan at April 30, 2023 is $196,340. |
| Security exempt from registration pursuant to Regulation S under the Securities Act of 1933, as amended. Regulation S applies to securities offerings that are made outside of the United States and do not involve direct selling efforts in the United States and as such may have restrictions on resale. |
| Investment in an affiliated fund, which is registered under the Investment Company Act of 1940, as amended, and is advised by J.P. Morgan Investment Management Inc. |
| The rate shown is the current yield as of April 30, 2023. |
SEE NOTES TO FINANCIAL STATEMENTS.
| J.P. Morgan International Equity Funds | |
JPMorgan International Equity Fund
SCHEDULE OF PORTFOLIO INVESTMENTS
AS OF April 30, 2023 (Unaudited) (continued)
Summary of Investments by Industry, April 30, 2023
The following table represents the portfolio investments of the Fund by industry classifications as a percentage of total investments:
| PERCENT OF
TOTAL
INVESTMENTS |
| |
| |
| |
Oil, Gas & Consumable Fuels | |
Textiles, Apparel & Luxury Goods | |
Semiconductors & Semiconductor Equipment | |
| |
| |
| |
| |
| |
Diversified Telecommunication Services | |
| |
Health Care Equipment & Supplies | |
| |
| |
| |
| |
Independent Power and Renewable Electricity Producers | |
Electronic Equipment, Instruments & Components | |
| |
| |
| |
Construction & Engineering | |
| |
Technology Hardware, Storage & Peripherals | |
| |
| |
Life Sciences Tools & Services | |
Others (each less than 1.0%) | |
| |
SEE NOTES TO FINANCIAL STATEMENTS.
| J.P. Morgan International Equity Funds | |
JPMorgan International Focus Fund
SCHEDULE OF PORTFOLIO INVESTMENTS
AS OF April 30, 2023 (Unaudited)
| | |
|
|
| | |
|
| | |
|
Alimentation Couche-Tard, Inc. | | |
Canadian National Railway Co. | | |
Toronto-Dominion Bank (The) | | |
| | |
|
| | |
|
| | |
Novo Nordisk A/S, Class B | | |
| | |
|
| | |
| | |
| | |
LVMH Moet Hennessy Louis Vuitton SE (a) | | |
| | |
| | |
| | |
| | |
|
| | |
| | |
| | |
Deutsche Telekom AG (Registered) | | |
| | |
| | |
|
| | |
|
| | |
|
Bank Central Asia Tbk. PT | | |
Telkom Indonesia Persero Tbk. PT | | |
| | |
|
| | |
| | |
|
|
| | |
Mitsubishi UFJ Financial Group, Inc. | | |
Nippon Telegraph & Telephone Corp. | | |
Shin-Etsu Chemical Co. Ltd. | | |
| | |
Tokio Marine Holdings, Inc. | | |
| | |
|
Wal-Mart de Mexico SAB de CV | | |
|
| | |
| | |
| | |
|
| | |
|
| | |
|
Samsung Electronics Co. Ltd. | | |
|
| | |
|
| | |
|
Taiwan Semiconductor Manufacturing Co. Ltd., ADR | | |
|
| | |
| | |
| | |
| | |
| | |
| | |
|
| | |
| | |
| | |
SEE NOTES TO FINANCIAL STATEMENTS.
| J.P. Morgan International Equity Funds | |
JPMorgan International Focus Fund
SCHEDULE OF PORTFOLIO INVESTMENTS
AS OF April 30, 2023 (Unaudited) (continued)
| | |
Common Stocks — continued |
United States — continued |
| | |
| | |
| | |
Total Common Stocks
(Cost $1,043,513) | | |
Short-Term Investments — 3.2% |
Investment of Cash Collateral from Securities Loaned — 3.2% |
JPMorgan Securities Lending Money Market Fund Agency SL Class Shares, 5.01% (b) (c) | | |
JPMorgan U.S. Government Money Market Fund Class IM Shares, 4.78% (b) (c) | | |
Total Investment of Cash Collateral from Securities Loaned
(Cost $43,176) | | |
Total Investments — 100.4%
(Cost $1,086,689) | | |
Liabilities in Excess of Other Assets — (0.4)% | | |
| | |
Percentages indicated are based on net assets. |
| |
| American Depositary Receipt |
| Limited liability company |
| Non-income producing security. |
| The security or a portion of this security is on loan at April 30, 2023. The total value of securities on loan at April 30, 2023 is $41,008. |
| Investment in an affiliated fund, which is registered under the Investment Company Act of 1940, as amended, and is advised by J.P. Morgan Investment Management Inc. |
| The rate shown is the current yield as of April 30, 2023. |
Summary of Investments by Industry, April 30, 2023
The following table represents the portfolio investments of the Fund by industry classifications as a percentage of total investments:
| PERCENT OF
TOTAL
INVESTMENTS |
| |
Oil, Gas & Consumable Fuels | |
| |
| |
Semiconductors & Semiconductor Equipment | |
| |
| |
Textiles, Apparel & Luxury Goods | |
Diversified Telecommunication Services | |
Technology Hardware, Storage & Peripherals | |
| |
Consumer Staples Distribution & Retail | |
| |
| |
Construction & Engineering | |
| |
| |
Interactive Media & Services | |
Health Care Equipment & Supplies | |
| |
Independent Power and Renewable Electricity Producers | |
| |
| |
Electronic Equipment, Instruments & Components | |
| |
Trading Companies & Distributors | |
| |
| |
| |
| |
SEE NOTES TO FINANCIAL STATEMENTS.
| J.P. Morgan International Equity Funds | |
JPMorgan International Hedged Equity Fund
SCHEDULE OF PORTFOLIO INVESTMENTS
AS OF April 30, 2023 (Unaudited)
| | |
|
|
| | |
| | |
| | |
Commonwealth Bank of Australia | | |
| | |
| | |
| | |
| | |
| | |
Insurance Australia Group Ltd. | | |
| | |
| | |
| | |
National Australia Bank Ltd. | | |
| | |
| | |
| | |
| | |
| | |
| | |
| | |
Woodside Energy Group Ltd. | | |
| | |
| | |
|
| | |
|
BOC Hong Kong Holdings Ltd. | | |
| | |
Xinyi Glass Holdings Ltd. | | |
| | |
|
| | |
| | |
Novo Nordisk A/S, Class B | | |
Vestas Wind Systems A/S * | | |
| | |
|
| | |
| | |
|
|
| | |
| | |
| | |
|
| | |
| | |
| | |
| | |
| | |
| | |
| | |
| | |
| | |
| | |
LVMH Moet Hennessy Louis Vuitton SE | | |
| | |
| | |
| | |
| | |
| | |
| | |
| | |
| | |
|
| | |
| | |
| | |
| | |
| | |
Deutsche Post AG (Registered) | | |
Deutsche Telekom AG (Registered) | | |
Dr Ing hc F Porsche AG (Preference) * (a) | | |
| | |
| | |
| | |
Muenchener Rueckversicherungs-Gesellschaft AG (Registered) | | |
| | |
| | |
| | |
| | |
SEE NOTES TO FINANCIAL STATEMENTS.
| J.P. Morgan International Equity Funds | |
JPMorgan International Hedged Equity Fund
SCHEDULE OF PORTFOLIO INVESTMENTS
AS OF April 30, 2023 (Unaudited) (continued)
| | |
Common Stocks — continued |
|
Volkswagen AG (Preference) | | |
| | |
| | |
|
| | |
| | |
| | |
Hong Kong Exchanges & Clearing Ltd. | | |
| | |
| | |
Sun Hung Kai Properties Ltd. | | |
Techtronic Industries Co. Ltd. | | |
| | |
|
| | |
| | |
| | |
|
| | |
FinecoBank Banca Fineco SpA | | |
| | |
| | |
|
| | |
| | |
Asahi Group Holdings Ltd. | | |
| | |
| | |
| | |
Central Japan Railway Co. | | |
| | |
| | |
Daiwa House Industry Co. Ltd. | | |
| | |
| | |
| | |
| | |
| | |
| | |
| | |
| | |
| | |
| | |
|
|
| | |
| | |
| | |
| | |
| | |
| | |
Mitsubishi UFJ Financial Group, Inc. | | |
| | |
Murata Manufacturing Co. Ltd. | | |
| | |
| | |
Nippon Express Holdings, Inc. | | |
Nippon Paint Holdings Co. Ltd. | | |
| | |
Nippon Telegraph & Telephone Corp. | | |
Nomura Research Institute Ltd. | | |
Ono Pharmaceutical Co. Ltd. | | |
| | |
| | |
Recruit Holdings Co. Ltd. | | |
Renesas Electronics Corp. * | | |
Seven & i Holdings Co. Ltd. | | |
| | |
Shin-Etsu Chemical Co. Ltd. | | |
| | |
| | |
| | |
| | |
Sumitomo Electric Industries Ltd. | | |
Sumitomo Metal Mining Co. Ltd. | | |
Sumitomo Mitsui Financial Group, Inc. | | |
| | |
| | |
Takeda Pharmaceutical Co. Ltd. | | |
| | |
Tokio Marine Holdings, Inc. | | |
| | |
| | |
| | |
|
| | |
|
| | |
SEE NOTES TO FINANCIAL STATEMENTS.
| J.P. Morgan International Equity Funds | |
| | |
Common Stocks — continued |
|
| | |
| | |
Koninklijke Ahold Delhaize NV | | |
| | |
| | |
| | |
| | |
| | |
|
| | |
Oversea-Chinese Banking Corp. Ltd. | | |
| | |
United Overseas Bank Ltd. | | |
| | |
|
| | |
|
Banco Bilbao Vizcaya Argentaria SA | | |
| | |
| | |
Industria de Diseno Textil SA | | |
| | |
|
| | |
| | |
| | |
| | |
|
Cie Financiere Richemont SA (Registered) | | |
| | |
| | |
| | |
Lonza Group AG (Registered) | | |
| | |
| | |
| | |
UBS Group AG (Registered) * | | |
Zurich Insurance Group AG | | |
| | |
|
| | |
| | |
|
United Kingdom — continued |
| | |
| | |
Berkeley Group Holdings plc | | |
| | |
British American Tobacco plc | | |
| | |
| | |
| | |
InterContinental Hotels Group plc | | |
| | |
| | |
London Stock Exchange Group plc | | |
Reckitt Benckiser Group plc | | |
| | |
| | |
| | |
| | |
| | |
| | |
| | |
|
| | |
| | |
| | |
| | |
| | |
| | |
| | |
| | |
Total Common Stocks
(Cost $110,784) | | |
| | |
|
Put Options Purchased — 0.4% |
|
| | |
6/30/2023 at USD 1,970.00, European Style | | |
Notional Amount: USD 146,425 | | |
Counterparty: Exchange-Traded * (Cost $1,765) | | |
SEE NOTES TO FINANCIAL STATEMENTS.
| J.P. Morgan International Equity Funds | |
JPMorgan International Hedged Equity Fund
SCHEDULE OF PORTFOLIO INVESTMENTS
AS OF April 30, 2023 (Unaudited) (continued)
| | |
Short-Term Investments — 3.5% |
Investment Companies — 3.5% |
JPMorgan U.S. Government Money Market Fund Class Institutional Shares, 4.71% (c) (d)(Cost $5,126) | | |
Total Investments — 99.5%
(Cost $117,675) | | |
Other Assets Less Liabilities — 0.5% | | |
| | |
Percentages indicated are based on net assets. |
Amounts presented as a dash ("-") represent amounts that round to less than a thousand. |
| |
| American Depositary Receipt |
| Europe, Australasia and Far East |
| Morgan Stanley Capital International |
| |
| A special type of equity investment that shares in the earnings of the company, has limited voting rights, and may have a dividend preference. Preference shares may also have liquidation preference. |
| Real Estate Investment Trust |
| Amount rounds to less than 0.1% of net assets. |
| Non-income producing security. | |
| Securities exempt from registration under Rule 144A or section 4(a)(2), of the Securities Act of 1933, as amended. | |
| Security exempt from registration pursuant to Regulation S under the Securities Act of 1933, as amended. Regulation S applies to securities offerings that are made outside of the United States and do not involve direct selling efforts in the United States and as such may have restrictions on resale. | |
| Investment in an affiliated fund, which is registered under the Investment Company Act of 1940, as amended, and is advised by J.P. Morgan Investment Management Inc. | |
| The rate shown is the current yield as of April 30, 2023. | |
Summary of Investments by Industry, April 30, 2023
The following table represents the portfolio investments of the Fund by industry classifications as a percentage of total investments:
| PERCENT OF
TOTAL
INVESTMENTS |
| |
| |
| |
Oil, Gas & Consumable Fuels | |
Semiconductors & Semiconductor Equipment | |
Textiles, Apparel & Luxury Goods | |
| |
| |
| |
| |
| |
Diversified Telecommunication Services | |
| |
| |
| |
| |
| |
| |
Consumer Staples Distribution & Retail | |
| |
Electronic Equipment, Instruments & Components | |
| |
Trading Companies & Distributors | |
| |
| |
| |
Real Estate Management & Development | |
Construction & Engineering | |
Health Care Equipment & Supplies | |
| |
| |
Life Sciences Tools & Services | |
Others (each less than 1.0%) | |
| |
SEE NOTES TO FINANCIAL STATEMENTS.
| J.P. Morgan International Equity Funds | |
Futures contracts outstanding as of April 30, 2023 (amounts in thousands, except number of contracts):
| | | | | VALUE AND
UNREALIZED
APPRECIATION
(DEPRECIATION) ($) |
| | | | | |
| | | | | |
| | | | | |
| | | | | |
| |
| |
| Europe, Australasia and Far East |
| Morgan Stanley Capital International |
| Australian Securities Exchange |
| |
Written Call Options Contracts as of April 30, 2023 (amounts in thousands, except number of contracts):
|
| | | | | | |
| | | | | | |
Written Put Options Contracts as of April 30, 2023 (amounts in thousands, except number of contracts):
|
| | | | | | |
| | | | | | |
Total Written Options Contracts (Premiums Received $1,689) | |
| |
| Europe, Australasia and Far East |
| Morgan Stanley Capital International |
| |
SEE NOTES TO FINANCIAL STATEMENTS.
| J.P. Morgan International Equity Funds | |
JPMorgan International Value Fund
SCHEDULE OF PORTFOLIO INVESTMENTS
AS OF April 30, 2023 (Unaudited)
| | |
|
|
| | |
| | |
| | |
Coronado Global Resources, Inc., CHDI (a) | | |
| | |
| | |
| | |
| | |
| | |
| | |
| | |
| | |
| | |
| | |
| | |
| | |
|
| | |
| | |
| | |
| | |
| | |
|
| | |
| | |
| | |
|
BOC Hong Kong Holdings Ltd. | | |
Yangzijiang Shipbuilding Holdings Ltd. | | |
| | |
|
| | |
| | |
| | |
Jyske Bank A/S (Registered) * | | |
| | |
| | |
| | |
| | |
|
| | |
| | |
|
|
| | |
| | |
| | |
| | |
| | |
|
| | |
| | |
| | |
| | |
| | |
| | |
| | |
| | |
| | |
| | |
| | |
| | |
| | |
| | |
| | |
| | |
| | |
| | |
| | |
| | |
| | |
| | |
|
| | |
Bayerische Motoren Werke AG | | |
| | |
| | |
Daimler Truck Holding AG * | | |
Deutsche Bank AG (Registered) | | |
Deutsche Lufthansa AG (Registered) * | | |
Deutsche Telekom AG (Registered) | | |
| | |
| | |
| | |
| | |
| | |
SEE NOTES TO FINANCIAL STATEMENTS.
| J.P. Morgan International Equity Funds | |
| | |
Common Stocks — continued |
|
Muenchener Rueckversicherungs-Gesellschaft AG (Registered) | | |
| | |
Schaeffler AG (Preference) | | |
| | |
| | |
Volkswagen AG (Preference) | | |
| | |
|
Hongkong Land Holdings Ltd. | | |
| | |
Pacific Basin Shipping Ltd. | | |
| | |
Sun Hung Kai Properties Ltd. | | |
| | |
|
Bank of Ireland Group plc | | |
|
Assicurazioni Generali SpA | | |
| | |
| | |
| | |
| | |
Mediobanca Banca di Credito Finanziario SpA | | |
| | |
| | |
| | |
| | |
| | |
| | |
| | |
|
| | |
| | |
Concordia Financial Group Ltd. | | |
Cosmo Energy Holdings Co. Ltd. | | |
| | |
| | |
| | |
Fuyo General Lease Co. Ltd. | | |
Hachijuni Bank Ltd. (The) | | |
| | |
| | |
|
|
| | |
| | |
| | |
Japan Post Holdings Co. Ltd. | | |
Japan Post Insurance Co. Ltd. | | |
| | |
| | |
| | |
| | |
| | |
| | |
| | |
Mitsubishi Estate Co. Ltd. | | |
Mitsubishi UFJ Financial Group, Inc. | | |
| | |
| | |
Mizuho Financial Group, Inc. | | |
Nippon Express Holdings, Inc. | | |
| | |
Nippon Telegraph & Telephone Corp. | | |
Nomura Real Estate Holdings, Inc. | | |
| | |
| | |
Shizuoka Financial Group, Inc. | | |
| | |
| | |
| | |
Sumitomo Forestry Co. Ltd. | | |
Sumitomo Mitsui Financial Group, Inc. | | |
Sumitomo Mitsui Trust Holdings, Inc. | | |
Sumitomo Warehouse Co. Ltd. (The) | | |
Takeda Pharmaceutical Co. Ltd. | | |
Tokyo Steel Manufacturing Co. Ltd. | | |
Tokyu Fudosan Holdings Corp. | | |
| | |
| | |
| | |
|
| | |
|
ABN AMRO Bank NV, CVA (a) | | |
| | |
| | |
SEE NOTES TO FINANCIAL STATEMENTS.
| J.P. Morgan International Equity Funds | |
JPMorgan International Value Fund
SCHEDULE OF PORTFOLIO INVESTMENTS
AS OF April 30, 2023 (Unaudited) (continued)
| | |
Common Stocks — continued |
|
| | |
Koninklijke Ahold Delhaize NV | | |
| | |
| | |
| | |
| | |
| | |
| | |
|
| | |
| | |
| | |
| | |
| | |
| | |
Olav Thon Eiendomsselskap ASA | | |
| | |
| | |
| | |
| | |
| | |
| | |
|
| | |
Oversea-Chinese Banking Corp. Ltd. | | |
United Overseas Bank Ltd. | | |
| | |
|
| | |
|
| | |
| | |
Banco Bilbao Vizcaya Argentaria SA | | |
| | |
| | |
Gestamp Automocion SA (a) | | |
| | |
| | |
| | |
|
| | |
| | |
|
|
| | |
| | |
| | |
Skandinaviska Enskilda Banken AB, Class A | | |
| | |
Svenska Handelsbanken AB, Class A | | |
| | |
|
| | |
Mobilezone Holding AG (Registered) | | |
| | |
Swiss Life Holding AG (Registered) | | |
| | |
Zurich Insurance Group AG | | |
| | |
|
| | |
| | |
| | |
| | |
| | |
| | |
| | |
Berkeley Group Holdings plc | | |
| | |
| | |
| | |
CK Hutchison Holdings Ltd. | | |
| | |
| | |
| | |
| | |
| | |
| | |
| | |
| | |
| | |
| | |
Legal & General Group plc | | |
| | |
| | |
| | |
| | |
SEE NOTES TO FINANCIAL STATEMENTS.
| J.P. Morgan International Equity Funds | |
| | |
Common Stocks — continued |
United Kingdom — continued |
| | |
Paragon Banking Group plc | | |
| | |
| | |
| | |
| | |
| | |
| | |
| | |
|
| | |
| | |
| | |
| | |
| | |
| | |
| | |
| | |
Total Common Stocks
(Cost $385,523) | | |
Short-Term Investments — 3.9% |
Investment Companies — 3.9% |
JPMorgan Prime Money Market Fund Class Institutional Shares, 4.88% (c) (d)(Cost $17,885) | | |
Total Investments — 100.5%
(Cost $403,408) | | |
Liabilities in Excess of Other Assets — (0.5)% | | |
| | |
Percentages indicated are based on net assets. |
| |
| Clearing House Electronic Subregister System (CHESS) Depository Interest |
| |
| |
| A special type of equity investment that shares in the earnings of the company, has limited voting rights, and may have a dividend preference. Preference shares may also have liquidation preference. |
| Non-income producing security. |
| Security exempt from registration pursuant to Regulation S under the Securities Act of 1933, as amended. Regulation S applies to securities offerings that are made outside of the United States and do not involve direct selling efforts in the United States and as such may have restrictions on resale. |
| Securities exempt from registration under Rule 144A or section 4(a)(2), of the Securities Act of 1933, as amended. |
| Investment in an affiliated fund, which is registered under the Investment Company Act of 1940, as amended, and is advised by J.P. Morgan Investment Management Inc. |
| The rate shown is the current yield as of April 30, 2023. |
Summary of Investments by Industry, April 30, 2023
The following table represents the portfolio investments of the Fund by industry classifications as a percentage of total investments:
| PERCENT OF
TOTAL
INVESTMENTS |
| |
Oil, Gas & Consumable Fuels | |
| |
| |
| |
| |
Trading Companies & Distributors | |
Diversified Telecommunication Services | |
Real Estate Management & Development | |
| |
| |
| |
Construction & Engineering | |
Consumer Staples Distribution & Retail | |
| |
Commercial Services & Supplies | |
Wireless Telecommunication Services | |
| |
| |
| |
| |
Others (each less than 1.0%) | |
| |
SEE NOTES TO FINANCIAL STATEMENTS.
| J.P. Morgan International Equity Funds | |
STATEMENTS OF ASSETS AND LIABILITIES
AS OF April 30, 2023 (Unaudited)
(Amounts in thousands, except per share amounts)
| JPMorgan
Emerging
Markets
Equity Fund | JPMorgan
Emerging
Markets
Research
Enhanced
Equity Fund | |
| | | |
Investments in non-affiliates, at value | | | |
Investments in affiliates, at value | | | |
Investments of cash collateral received from securities loaned, at value (See Note 2.C.) | | | |
| | | |
Foreign currency, at value | | | |
Deposits at broker for futures contracts | | | |
| | | |
Investment securities sold | | | |
| | | |
Dividends from non-affiliates | | | |
Dividends from affiliates | | | |
| | | |
Securities lending income (See Note 2.C.) | | | |
Variation margin on futures contracts | | | |
| | | |
| | | |
| | | |
Foreign currency due to custodian, at value | | | |
Investment securities purchased | | | |
Collateral received on securities loaned (See Note 2.C.) | | | |
| | | |
| | | |
| | | |
| | | |
| | | |
| | | |
Custodian and accounting fees | | | |
Trustees’ and Chief Compliance Officer’s fees | | | |
Deferred foreign capital gains tax | | | |
| | | |
| | | |
| | | |
(a)
Amount rounds to less than one thousand.
SEE NOTES TO FINANCIAL STATEMENTS.
| J.P. Morgan International Equity Funds | |
| JPMorgan Emerging Markets Equity Fund | JPMorgan Emerging Markets Research Enhanced Equity Fund | |
| | | |
| | | |
Total distributable earnings (loss) | | | |
| | | |
| | | |
| | | |
| | | |
| | | |
| | | |
| | | |
| | | |
| | | |
| | | |
| | | |
| | | |
Outstanding units of beneficial interest (shares)
($0.0001 par value; unlimited number of shares authorized): | | | |
| | | |
| | | |
| | | |
| | | |
| | | |
| | | |
| | | |
| | | |
| | | |
| | | |
Class A — Redemption price per share | | | |
Class C — Offering price per share (b) | | | |
Class I — Offering and redemption price per share | | | |
Class L — Offering and redemption price per share | | | |
Class R2 — Offering and redemption price per share | | | |
Class R3 — Offering and redemption price per share | | | |
Class R4 — Offering and redemption price per share | | | |
Class R5 — Offering and redemption price per share | | | |
Class R6 — Offering and redemption price per share | | | |
Class A maximum sales charge | | | |
Class A maximum public offering price per share
[net asset value per share/(100% – maximum sales charge)] | | | |
Cost of investments in non-affiliates | | | |
Cost of investments in affiliates | | | |
| | | |
Investment securities on loan, at value (See Note 2.C.) | | | |
Cost of investment of cash collateral (See Note 2.C.) | | | |
(a)
Per share amounts may not recalculate due to rounding of net assets and/or shares outstanding.
(b)
Redemption price for Class C Shares varies based upon length of time the shares are held.
SEE NOTES TO FINANCIAL STATEMENTS.
| J.P. Morgan International Equity Funds | |
STATEMENTS OF ASSETS AND LIABILITIES
AS OF April 30, 2023 (Unaudited) (continued)
(Amounts in thousands, except per share amounts)
| JPMorgan
International
Equity Fund | JPMorgan
International
Focus Fund | JPMorgan
International
Hedged
Equity Fund | |
| | | | |
Investments in non-affiliates, at value | | | | |
Investments in affiliates, at value | | | | |
Investments of cash collateral received from securities loaned, at value (See Note 2.C.) | | | | |
Options purchased, at value | | | | |
| | | | |
Foreign currency, at value | | | | |
Deposits at broker for futures contracts | | | | |
Deposits at broker for options contracts | | | | |
| | | | |
Investment securities sold | | | | |
| | | | |
Dividends from non-affiliates | | | | |
Dividends from affiliates | | | | |
| | | | |
Securities lending income (See Note 2.C.) | | | | |
Variation margin on futures contracts | | | | |
| | | | |
| | | | |
| | | | |
| | | | |
Foreign currency due to custodian, at value | | | | |
Investment securities purchased | | | | |
Collateral received on securities loaned (See Note 2.C.) | | | | |
| | | | |
Outstanding options written, at fair value | | | | |
| | | | |
| | | | |
| | | | |
| | | | |
| | | | |
Custodian and accounting fees | | | | |
Trustees’ and Chief Compliance Officer’s fees | | | | |
| | | | |
| | | | |
| | | | |
(a)
Amount rounds to less than one thousand.
SEE NOTES TO FINANCIAL STATEMENTS.
| J.P. Morgan International Equity Funds | |
| JPMorgan International Equity Fund | JPMorgan International Focus Fund | JPMorgan International Hedged Equity Fund | |
| | | | |
| | | | |
Total distributable earnings (loss) | | | | |
| | | | |
| | | | |
| | | | |
| | | | |
| | | | |
| | | | |
| | | | |
| | | | |
| | | | |
| | | | |
Outstanding units of beneficial interest (shares)
($0.0001 par value; unlimited number of shares authorized): | | | | |
| | | | |
| | | | |
| | | | |
| | | | |
| | | | |
| | | | |
| | | | |
| | | | |
Class A — Redemption price per share | | | | |
Class C — Offering price per share (b) | | | | |
Class I — Offering and redemption price per share | | | | |
Class L — Offering and redemption price per share | | | | |
Class R2 — Offering and redemption price per share | | | | |
Class R5 — Offering and redemption price per share | | | | |
Class R6 — Offering and redemption price per share | | | | |
Class A maximum sales charge | | | | |
Class A maximum public offering price per share
[net asset value per share/(100% – maximum sales charge)] | | | | |
Cost of investments in non-affiliates | | | | |
Cost of investments in affiliates | | | | |
Cost of options purchased | | | | |
| | | | |
Investment securities on loan, at value (See Note 2.C.) | | | | |
Cost of investment of cash collateral (See Note 2.C.) | | | | |
Premiums received from options written | | | | |
(a)
Per share amounts may not recalculate due to rounding of net assets and/or shares outstanding.
(b)
Redemption price for Class C Shares varies based upon length of time the shares are held.
SEE NOTES TO FINANCIAL STATEMENTS.
| J.P. Morgan International Equity Funds | |
STATEMENTS OF OPERATIONS
FOR THE SIX MONTHS ENDED April 30, 2023 (Unaudited)
(Amounts in thousands)
| JPMorgan
Emerging
Markets
Equity Fund | JPMorgan
Emerging
Markets
Research
Enhanced
Equity Fund | |
| | | |
Interest income from non-affiliates | | | |
Interest income from affiliates | | | |
Dividend income from non-affiliates | | | |
Dividend income from affiliates | | | |
Income from securities lending (net) (See Note 2.C.) | | | |
Foreign taxes withheld (net) | | | |
Foreign withholding tax claims | | | |
| | | |
| | | |
| | | |
| | | |
| | | |
| | | |
| | | |
| | | |
| | | |
| | | |
| | | |
| | | |
| | | |
| | | |
| | | |
| | | |
| | | |
| | | |
Custodian and accounting fees | | | |
Interest expense to affiliates | | | |
| | | |
Trustees’ and Chief Compliance Officer’s fees | | | |
Printing and mailing costs | | | |
Registration and filing fees | | | |
Transfer agency fees (See Note 2.I.) | | | |
| | | |
| | | |
| | | |
Less expense reimbursements | | | |
| | | |
Net investment income (loss) | | | |
(a)
Amount rounds to less than one thousand.
SEE NOTES TO FINANCIAL STATEMENTS.
| J.P. Morgan International Equity Funds | |
| JPMorgan Emerging Markets Equity Fund | JPMorgan Emerging Markets Research Enhanced Equity Fund | |
REALIZED/UNREALIZED GAINS (LOSSES): | | | |
Net realized gain (loss) on transactions from: | | | |
Investments in non-affiliates | | | |
Investments in affiliates | | | |
| | | |
Foreign currency transactions | | | |
| | | |
Change in net unrealized appreciation/depreciation on: | | | |
Investments in non-affiliates | | | |
Investments in affiliates | | | |
| | | |
Foreign currency translations | | | |
Change in net unrealized appreciation/depreciation | | | |
Net realized/unrealized gains (losses) | | | |
Change in net assets resulting from operations | | | |
(a)
Net of foreign capital gains tax of $(2,776).
(b)
Net of foreign capital gains tax of $(2,884).
(c)
Net of change in foreign capital gains tax of $(5,542).
(d)
Net of change in foreign capital gains tax of $2,597.
(e)
Amount rounds to less than one thousand.
SEE NOTES TO FINANCIAL STATEMENTS.
| J.P. Morgan International Equity Funds | |
STATEMENTS OF OPERATIONS
FOR THE SIX MONTHS ENDED April 30, 2023 (Unaudited) (continued)
(Amounts in thousands)
| JPMorgan
International
Equity Fund | JPMorgan
International
Focus Fund | JPMorgan
International
Hedged
Equity Fund | |
| | | | |
Interest income from non-affiliates | | | | |
Interest income from affiliates | | | | |
Dividend income from non-affiliates | | | | |
Dividend income from affiliates | | | | |
Income from securities lending (net) (See Note 2.C.) | | | | |
Foreign taxes withheld (net) | | | | |
Foreign withholding tax claims | | | | |
| | | | |
| | | | |
| | | | |
| | | | |
| | | | |
| | | | |
| | | | |
| | | | |
| | | | |
| | | | |
| | | | |
| | | | |
| | | | |
| | | | |
| | | | |
Custodian and accounting fees | | | | |
Interest expense to affiliates | | | | |
| | | | |
Trustees’ and Chief Compliance Officer’s fees | | | | |
Printing and mailing costs | | | | |
Registration and filing fees | | | | |
Transfer agency fees (See Note 2.I.) | | | | |
| | | | |
| | | | |
| | | | |
Less expense reimbursements | | | | |
| | | | |
Net investment income (loss) | | | | |
(a)
Amount rounds to less than one thousand.
SEE NOTES TO FINANCIAL STATEMENTS.
| J.P. Morgan International Equity Funds | |
| JPMorgan International Equity Fund | JPMorgan International Focus Fund | JPMorgan International Hedged Equity Fund | |
REALIZED/UNREALIZED GAINS (LOSSES): | | | | |
Net realized gain (loss) on transactions from: | | | | |
Investments in non-affiliates | | | | |
Investments in affiliates | | | | |
| | | | |
| | | | |
Foreign currency transactions | | | | |
| | | | |
| | | | |
Change in net unrealized appreciation/depreciation on: | | | | |
Investments in non-affiliates | | | | |
Investments in affiliates | | | | |
| | | | |
| | | | |
Foreign currency translations | | | | |
| | | | |
Change in net unrealized appreciation/depreciation | | | | |
Net realized/unrealized gains (losses) | | | | |
Change in net assets resulting from operations | | | | |
(a)
Amount rounds to less than one thousand.
SEE NOTES TO FINANCIAL STATEMENTS.
| J.P. Morgan International Equity Funds | |
STATEMENTS OF CHANGES IN NET ASSETS
FOR THE PERIODS INDICATED
(Amounts in thousands)
| JPMorgan Emerging Markets
Equity Fund | JPMorgan Emerging Markets Research
Enhanced Equity Fund |
| Six Months Ended
April 30, 2023
(Unaudited) | Year Ended
October 31, 2022 | Six Months Ended
April 30, 2023
(Unaudited) | Year Ended
October 31, 2022 |
CHANGE IN NET ASSETS RESULTING FROM OPERATIONS: | | | | |
Net investment income (loss) | | | | |
| | | | |
Change in net unrealized appreciation/depreciation | | | | |
Change in net assets resulting from operations | | | | |
DISTRIBUTIONS TO SHAREHOLDERS: | | | | |
| | | | |
| | | | |
| | | | |
| | | | |
| | | | |
| | | | |
| | | | |
| | | | |
| | | | |
Total distributions to shareholders | | | | |
| | | | |
Change in net assets resulting from capital transactions | | | | |
| | | | |
| | | | |
| | | | |
| | | | |
SEE NOTES TO FINANCIAL STATEMENTS.
| J.P. Morgan International Equity Funds | |
| JPMorgan Europe Dynamic Fund | JPMorgan International Equity Fund |
| Six Months Ended
April 30, 2023
(Unaudited) | Year Ended
October 31, 2022 | Six Months Ended
April 30, 2023
(Unaudited) | Year Ended
October 31, 2022 |
CHANGE IN NET ASSETS RESULTING FROM OPERATIONS: | | | | |
Net investment income (loss) | | | | |
| | | | |
Change in net unrealized appreciation/depreciation | | | | |
Change in net assets resulting from operations | | | | |
DISTRIBUTIONS TO SHAREHOLDERS: | | | | |
| | | | |
| | | | |
| | | | |
| | | | |
| | | | |
| | | | |
| | | | |
Total distributions to shareholders | | | | |
| | | | |
Change in net assets resulting from capital transactions | | | | |
| | | | |
| | | | |
| | | | |
| | | | |
SEE NOTES TO FINANCIAL STATEMENTS.
| J.P. Morgan International Equity Funds | |
STATEMENTS OF CHANGES IN NET ASSETS
FOR THE PERIODS INDICATED (continued)
(Amounts in thousands)
| JPMorgan International Focus Fund | JPMorgan International Hedged Equity Fund |
| Six Months Ended
April 30, 2023
(Unaudited) | Year Ended
October 31, 2022 | Six Months Ended
April 30, 2023
(Unaudited) | |
CHANGE IN NET ASSETS RESULTING FROM OPERATIONS: | | | | |
Net investment income (loss) | | | | |
| | | | |
Change in net unrealized appreciation/depreciation | | | | |
Change in net assets resulting from operations | | | | |
DISTRIBUTIONS TO SHAREHOLDERS: | | | | |
| | | | |
| | | | |
| | | | |
| | | | |
| | | | |
| | | | |
Total distributions to shareholders | | | | |
| | | | |
Change in net assets resulting from capital transactions | | | | |
| | | | |
| | | | |
| | | | |
| | | | |
(a)
Amount rounds to less than one thousand.
SEE NOTES TO FINANCIAL STATEMENTS.
| J.P. Morgan International Equity Funds | |
| JPMorgan International Value Fund |
| Six Months Ended
April 30, 2023
(Unaudited) | Year Ended
October 31, 2022 |
CHANGE IN NET ASSETS RESULTING FROM OPERATIONS: | | |
Net investment income (loss) | | |
| | |
Change in net unrealized appreciation/depreciation | | |
Change in net assets resulting from operations | | |
DISTRIBUTIONS TO SHAREHOLDERS: | | |
| | |
| | |
| | |
| | |
| | |
| | |
| | |
Total distributions to shareholders | | |
| | |
Change in net assets resulting from capital transactions | | |
| | |
| | |
| | |
| | |
SEE NOTES TO FINANCIAL STATEMENTS.
| J.P. Morgan International Equity Funds | |
STATEMENTS OF CHANGES IN NET ASSETS
FOR THE PERIODS INDICATED (continued)
(Amounts in thousands)
| JPMorgan Emerging Markets
Equity Fund | JPMorgan Emerging Markets Research
Enhanced Equity Fund |
| Six Months Ended April 30, 2023
(Unaudited) | Year Ended October 31, 2022 | Six Months Ended April 30, 2023
(Unaudited) | |
| | | | |
| | | | |
Proceeds from shares issued | | | | |
| | | | |
| | | | |
Change in net assets resulting from Class A capital transactions | | | | |
| | | | |
Proceeds from shares issued | | | | |
| | | | |
| | | | |
Change in net assets resulting from Class C capital transactions | | | | |
| | | | |
Proceeds from shares issued | | | | |
| | | | |
| | | | |
Change in net assets resulting from Class I capital transactions | | | | |
| | | | |
Proceeds from shares issued | | | | |
| | | | |
| | | | |
Change in net assets resulting from Class L capital transactions | | | | |
| | | | |
Proceeds from shares issued | | | | |
| | | | |
| | | | |
Change in net assets resulting from Class R2 capital transactions | | | | |
| | | | |
Proceeds from shares issued | | | | |
| | | | |
| | | | |
Change in net assets resulting from Class R3 capital transactions | | | | |
| | | | |
Proceeds from shares issued | | | | |
| | | | |
| | | | |
Change in net assets resulting from Class R4 capital transactions | | | | |
SEE NOTES TO FINANCIAL STATEMENTS.
| J.P. Morgan International Equity Funds | |
| JPMorgan Emerging Markets Equity Fund | JPMorgan Emerging Markets Research Enhanced Equity Fund |
| Six Months Ended April 30, 2023 (Unaudited) | Year Ended October 31, 2022 | Six Months Ended April 30, 2023 (Unaudited) | |
CAPITAL TRANSACTIONS: (continued) | | | | |
| | | | |
Proceeds from shares issued | | | | |
| | | | |
| | | | |
Change in net assets resulting from Class R5 capital transactions | | | | |
| | | | |
Proceeds from shares issued | | | | |
| | | | |
| | | | |
Change in net assets resulting from Class R6 capital transactions | | | | |
Total change in net assets resulting from capital transactions | | | | |
| | | | |
| | | | |
| | | | |
| | | | |
| | | | |
| | | | |
| | | | |
| | | | |
| | | | |
| | | | |
| | | | |
| | | | |
| | | | |
| | | | |
| | | | |
| | | | |
| | | | |
| | | | |
| | | | |
| | | | |
| | | | |
| | | | |
| | | | |
| | | | |
| | | | |
Change in Class R2 Shares | | | | |
SEE NOTES TO FINANCIAL STATEMENTS.
| J.P. Morgan International Equity Funds | |
STATEMENTS OF CHANGES IN NET ASSETS
FOR THE PERIODS INDICATED (continued)
(Amounts in thousands)
| JPMorgan Emerging Markets Equity Fund | JPMorgan Emerging Markets Research Enhanced Equity Fund |
| Six Months Ended April 30, 2023 (Unaudited) | Year Ended October 31, 2022 | Six Months Ended April 30, 2023 (Unaudited) | |
SHARE TRANSACTIONS: (continued) | | | | |
| | | | |
| | | | |
| | | | |
| | | | |
Change in Class R3 Shares | | | | |
| | | | |
| | | | |
| | | | |
| | | | |
Change in Class R4 Shares | | | | |
| | | | |
| | | | |
| | | | |
| | | | |
Change in Class R5 Shares | | | | |
| | | | |
| | | | |
| | | | |
| | | | |
Change in Class R6 Shares | | | | |
(a)
Amount rounds to less than one thousand.
SEE NOTES TO FINANCIAL STATEMENTS.
| J.P. Morgan International Equity Funds | |
| JPMorgan Europe Dynamic Fund | JPMorgan International Equity Fund |
| Six Months Ended April 30, 2023
(Unaudited) | Year Ended October 31, 2022 | Six Months Ended April 30, 2023
(Unaudited) | |
| | | | |
| | | | |
Proceeds from shares issued | | | | |
| | | | |
| | | | |
Change in net assets resulting from Class A capital transactions | | | | |
| | | | |
Proceeds from shares issued | | | | |
| | | | |
| | | | |
Change in net assets resulting from Class C capital transactions | | | | |
| | | | |
Proceeds from shares issued | | | | |
| | | | |
| | | | |
Change in net assets resulting from Class I capital transactions | | | | |
| | | | |
Proceeds from shares issued | | | | |
| | | | |
| | | | |
Change in net assets resulting from Class L capital transactions | | | | |
| | | | |
Proceeds from shares issued | | | | |
| | | | |
| | | | |
Change in net assets resulting from Class R2 capital transactions | | | | |
| | | | |
Proceeds from shares issued | | | | |
| | | | |
| | | | |
Change in net assets resulting from Class R5 capital transactions | | | | |
| | | | |
Proceeds from shares issued | | | | |
| | | | |
| | | | |
Change in net assets resulting from Class R6 capital transactions | | | | |
Total change in net assets resulting from capital transactions | | | | |
SEE NOTES TO FINANCIAL STATEMENTS.
| J.P. Morgan International Equity Funds | |
STATEMENTS OF CHANGES IN NET ASSETS
FOR THE PERIODS INDICATED (continued)
(Amounts in thousands)
| JPMorgan Europe Dynamic Fund | JPMorgan International Equity Fund |
| Six Months Ended April 30, 2023 (Unaudited) | Year Ended October 31, 2022 | Six Months Ended April 30, 2023 (Unaudited) | |
| | | | |
| | | | |
| | | | |
| | | | |
| | | | |
| | | | |
| | | | |
| | | | |
| | | | |
| | | | |
| | | | |
| | | | |
| | | | |
| | | | |
| | | | |
| | | | |
| | | | |
| | | | |
| | | | |
| | | | |
| | | | |
| | | | |
| | | | |
| | | | |
| | | | |
Change in Class R2 Shares | | | | |
| | | | |
| | | | |
| | | | |
| | | | |
Change in Class R5 Shares | | | | |
| | | | |
| | | | |
| | | | |
| | | | |
Change in Class R6 Shares | | | | |
(a)
Amount rounds to less than one thousand.
SEE NOTES TO FINANCIAL STATEMENTS.
| J.P. Morgan International Equity Funds | |
| JPMorgan International Focus Fund | JPMorgan International Hedged Equity Fund |
| Six Months Ended April 30, 2023
(Unaudited) | Year Ended October 31, 2022 | Six Months Ended April 30, 2023
(Unaudited) | |
| | | | |
| | | | |
Proceeds from shares issued | | | | |
| | | | |
| | | | |
Change in net assets resulting from Class A capital transactions | | | | |
| | | | |
Proceeds from shares issued | | | | |
| | | | |
| | | | |
Change in net assets resulting from Class C capital transactions | | | | |
| | | | |
Proceeds from shares issued | | | | |
| | | | |
| | | | |
Change in net assets resulting from Class I capital transactions | | | | |
| | | | |
Proceeds from shares issued | | | | |
| | | | |
| | | | |
Change in net assets resulting from Class R2 capital transactions | | | | |
| | | | |
Proceeds from shares issued | | | | |
| | | | |
| | | | |
Change in net assets resulting from Class R5 capital transactions | | | | |
| | | | |
Proceeds from shares issued | | | | |
| | | | |
| | | | |
| | | | |
Change in net assets resulting from Class R6 capital transactions | | | | |
Total change in net assets resulting from capital transactions | | | | |
(a)
Amount rounds to less than one thousand.
SEE NOTES TO FINANCIAL STATEMENTS.
| J.P. Morgan International Equity Funds | |
STATEMENTS OF CHANGES IN NET ASSETS
FOR THE PERIODS INDICATED (continued)
(Amounts in thousands)
| JPMorgan International Focus Fund | JPMorgan International Hedged Equity Fund |
| Six Months Ended April 30, 2023 (Unaudited) | Year Ended October 31, 2022 | Six Months Ended April 30, 2023 (Unaudited) | |
| | | | |
| | | | |
| | | | |
| | | | |
| | | | |
| | | | |
| | | | |
| | | | |
| | | | |
| | | | |
| | | | |
| | | | |
| | | | |
| | | | |
| | | | |
| | | | |
| | | | |
| | | | |
| | | | |
| | | | |
Change in Class R2 Shares | | | | |
| | | | |
| | | | |
| | | | |
| | | | |
Change in Class R5 Shares | | | | |
| | | | |
| | | | |
| | | | |
| | | | |
| | | | |
Change in Class R6 Shares | | | | |
(a)
Amount rounds to less than one thousand.
SEE NOTES TO FINANCIAL STATEMENTS.
| J.P. Morgan International Equity Funds | |
| JPMorgan International Value Fund |
| Six Months Ended April 30, 2023
(Unaudited) | |
| | |
| | |
Proceeds from shares issued | | |
| | |
| | |
Change in net assets resulting from Class A capital transactions | | |
| | |
Proceeds from shares issued | | |
| | |
| | |
Change in net assets resulting from Class C capital transactions | | |
| | |
Proceeds from shares issued | | |
| | |
| | |
Change in net assets resulting from Class I capital transactions | | |
| | |
Proceeds from shares issued | | |
| | |
| | |
Change in net assets resulting from Class L capital transactions | | |
| | |
Proceeds from shares issued | | |
| | |
| | |
Change in net assets resulting from Class R2 capital transactions | | |
| | |
Proceeds from shares issued | | |
| | |
| | |
Change in net assets resulting from Class R5 capital transactions | | |
| | |
Proceeds from shares issued | | |
| | |
| | |
Change in net assets resulting from Class R6 capital transactions | | |
Total change in net assets resulting from capital transactions | | |
SEE NOTES TO FINANCIAL STATEMENTS.
| J.P. Morgan International Equity Funds | |
STATEMENTS OF CHANGES IN NET ASSETS
FOR THE PERIODS INDICATED (continued)
(Amounts in thousands)
| JPMorgan International Value Fund |
| Six Months Ended April 30, 2023 (Unaudited) | |
| | |
| | |
| | |
| | |
| | |
| | |
| | |
| | |
| | |
| | |
| | |
| | |
| | |
| | |
| | |
| | |
| | |
| | |
| | |
| | |
| | |
| | |
| | |
| | |
| | |
Change in Class R2 Shares | | |
| | |
| | |
| | |
| | |
Change in Class R5 Shares | | |
| | |
| | |
| | |
| | |
Change in Class R6 Shares | | |
(a)
Amount rounds to less than one thousand.
SEE NOTES TO FINANCIAL STATEMENTS.
| J.P. Morgan International Equity Funds | |
THIS PAGE IS INTENTIONALLY LEFT BLANK
FINANCIAL HIGHLIGHTS
FOR THE PERIODS INDICATED
| Per share operating performance |
| | | |
| Net asset
value,
beginning
of period | Net
investment
income
(loss)(b) | Net realized
and unrealized
gains
(losses) on
investments | Total from
investment
operations | | | |
JPMorgan Emerging Markets Equity Fund | | | | | | | |
| | | | | | | |
Six Months Ended April 30, 2023 (Unaudited) | | | | | | | |
Year Ended October 31, 2022 | | | | | | | |
Year Ended October 31, 2021 | | | | | | | |
Year Ended October 31, 2020 | | | | | | | |
Year Ended October 31, 2019 | | | | | | | |
Year Ended October 31, 2018 | | | | | | | |
| | | | | | | |
Six Months Ended April 30, 2023 (Unaudited) | | | | | | | |
Year Ended October 31, 2022 | | | | | | | |
Year Ended October 31, 2021 | | | | | | | |
Year Ended October 31, 2020 | | | | | | | |
Year Ended October 31, 2019 | | | | | | | |
Year Ended October 31, 2018 | | | | | | | |
| | | | | | | |
Six Months Ended April 30, 2023 (Unaudited) | | | | | | | |
Year Ended October 31, 2022 | | | | | | | |
Year Ended October 31, 2021 | | | | | | | |
Year Ended October 31, 2020 | | | | | | | |
Year Ended October 31, 2019 | | | | | | | |
Year Ended October 31, 2018 | | | | | | | |
| | | | | | | |
Six Months Ended April 30, 2023 (Unaudited) | | | | | | | |
Year Ended October 31, 2022 | | | | | | | |
Year Ended October 31, 2021 | | | | | | | |
Year Ended October 31, 2020 | | | | | | | |
Year Ended October 31, 2019 | | | | | | | |
Year Ended October 31, 2018 | | | | | | | |
| | | | | | | |
Six Months Ended April 30, 2023 (Unaudited) | | | | | | | |
Year Ended October 31, 2022 | | | | | | | |
Year Ended October 31, 2021 | | | | | | | |
Year Ended October 31, 2020 | | | | | | | |
Year Ended October 31, 2019 | | | | | | | |
Year Ended October 31, 2018 | | | | | | | |
| | | | | | | |
Six Months Ended April 30, 2023 (Unaudited) | | | | | | | |
Year Ended October 31, 2022 | | | | | | | |
Year Ended October 31, 2021 | | | | | | | |
Year Ended October 31, 2020 | | | | | | | |
Year Ended October 31, 2019 | | | | | | | |
Year Ended October 31, 2018 | | | | | | | |
SEE NOTES TO FINANCIAL STATEMENTS.
| J.P. Morgan International Equity Funds | |
| |
| | | Ratios to average net assets(a) |
Net asset
value,
end of
period | Total return
(excludes
sales charge)(c)(d) | Net assets,
end of
period
(000's) | | Net
investment
income
(loss) | Expenses without
waivers and reimbursements | |
| | | | | | |
| | | | | | |
| | | | | | |
| | | | | | |
| | | | | | |
| | | | | | |
| | | | | | |
| | | | | | |
| | | | | | |
| | | | | | |
| | | | | | |
| | | | | | |
| | | | | | |
| | | | | | |
| | | | | | |
| | | | | | |
| | | | | | |
| | | | | | |
| | | | | | |
| | | | | | |
| | | | | | |
| | | | | | |
| | | | | | |
| | | | | | |
| | | | | | |
| | | | | | |
| | | | | | |
| | | | | | |
| | | | | | |
| | | | | | |
| | | | | | |
| | | | | | |
| | | | | | |
| | | | | | |
| | | | | | |
| | | | | | |
| | | | | | |
| | | | | | |
| | | | | | |
| | | | | | |
| | | | | | |
| | | | | | |
| | | | | | |
SEE NOTES TO FINANCIAL STATEMENTS.
| J.P. Morgan International Equity Funds | |
FINANCIAL HIGHLIGHTS
FOR THE PERIODS INDICATED (continued)
| Per share operating performance |
| | | |
| Net asset
value,
beginning
of period | Net
investment
income
(loss)(b) | Net realized
and unrealized
gains
(losses) on
investments | Total from
investment
operations | | | |
JPMorgan Emerging Markets Equity Fund (continued) | | | | | | | |
| | | | | | | |
Six Months Ended April 30, 2023 (Unaudited) | | | | | | | |
Year Ended October 31, 2022 | | | | | | | |
Year Ended October 31, 2021 | | | | | | | |
Year Ended October 31, 2020 | | | | | | | |
Year Ended October 31, 2019 | | | | | | | |
Year Ended October 31, 2018 | | | | | | | |
| | | | | | | |
Six Months Ended April 30, 2023 (Unaudited) | | | | | | | |
Year Ended October 31, 2022 | | | | | | | |
Year Ended October 31, 2021 | | | | | | | |
Year Ended October 31, 2020 | | | | | | | |
Year Ended October 31, 2019 | | | | | | | |
Year Ended October 31, 2018 | | | | | | | |
| | | | | | | |
Six Months Ended April 30, 2023 (Unaudited) | | | | | | | |
Year Ended October 31, 2022 | | | | | | | |
Year Ended October 31, 2021 | | | | | | | |
Year Ended October 31, 2020 | | | | | | | |
Year Ended October 31, 2019 | | | | | | | |
Year Ended October 31, 2018 | | | | | | | |
|
| Annualized for periods less than one year, unless otherwise noted. |
| Calculated based upon average shares outstanding. |
| Not annualized for periods less than one year. |
| Includes adjustments in accordance with accounting principles generally accepted in the United States of America and as such, the net asset values for financial reporting purposes and the returns based upon those net asset values may differ from the net asset values and returns for shareholder transactions. |
| Includes interest expense, if applicable, which is less than 0.005% unless otherwise noted. |
| Amount rounds to less than $0.005. |
SEE NOTES TO FINANCIAL STATEMENTS.
| J.P. Morgan International Equity Funds | |
| |
| | | Ratios to average net assets(a) |
Net asset
value,
end of
period | Total return
(excludes
sales charge)(c)(d) | Net assets,
end of
period
(000's) | | Net
investment
income
(loss) | Expenses without
waivers and reimbursements | |
|
| | | | | | |
| | | | | | |
| | | | | | |
| | | | | | |
| | | | | | |
| | | | | | |
| | | | | | |
| | | | | | |
| | | | | | |
| | | | | | |
| | | | | | |
| | | | | | |
| | | | | | |
| | | | | | |
| | | | | | |
| | | | | | |
| | | | | | |
| | | | | | |
| | | | | | |
| | | | | | |
| | | | | | |
SEE NOTES TO FINANCIAL STATEMENTS.
| J.P. Morgan International Equity Funds | |
FINANCIAL HIGHLIGHTS
FOR THE PERIODS INDICATED
| Per share operating performance |
| | | |
| Net asset
value,
beginning
of period | Net
investment
income
(loss)(b) | Net realized
and unrealized
gains
(losses) on
investments | Total from
investment
operations | | | |
JPMorgan Emerging Markets Research Enhanced Equity Fund | | | | | | | |
| | | | | | | |
Six Months Ended April 30, 2023 (Unaudited) | | | | | | | |
Year Ended October 31, 2022 | | | | | | | |
Year Ended October 31, 2021 | | | | | | | |
Year Ended October 31, 2020 | | | | | | | |
January 30, 2019 (f) through October 31, 2019 | | | | | | | |
| | | | | | | |
Six Months Ended April 30, 2023 (Unaudited) | | | | | | | |
Year Ended October 31, 2022 | | | | | | | |
Year Ended October 31, 2021 | | | | | | | |
Year Ended October 31, 2020 | | | | | | | |
December 11, 2018 (h) through October 31, 2019 | | | | | | | |
|
| Annualized for periods less than one year, unless otherwise noted. |
| Calculated based upon average shares outstanding. |
| Not annualized for periods less than one year. |
| Includes adjustments in accordance with accounting principles generally accepted in the United States of America and as such, the net asset values for financial reporting purposes and the returns based upon those net asset values may differ from the net asset values and returns for shareholder transactions. |
| Includes interest expense, if applicable, which is less than 0.005% unless otherwise noted. |
| Commencement of offering of class of shares. |
| Certain non-recurring expenses incurred by the Fund were not annualized for the period indicated. |
| Commencement of operations. |
SEE NOTES TO FINANCIAL STATEMENTS.
| J.P. Morgan International Equity Funds | |
| |
| | | Ratios to average net assets(a) |
Net asset
value,
end of
period | | Net assets,
end of
period
(000's) | | Net
investment
income
(loss) | Expenses without
waivers and reimbursements | |
| | | | | | |
| | | | | | |
| | | | | | |
| | | | | | |
| | | | | | |
| | | | | | |
| | | | | | |
| | | | | | |
| | | | | | |
| | | | | | |
| | | | | | |
| | | | | | |
| | | | | | |
SEE NOTES TO FINANCIAL STATEMENTS.
| J.P. Morgan International Equity Funds | |
FINANCIAL HIGHLIGHTS
FOR THE PERIODS INDICATED
| Per share operating performance |
| | | |
| Net asset
value,
beginning
of period | Net
investment
income
(loss)(b) | Net realized
and unrealized
gains
(losses) on
investments | Total from
investment
operations | |
JPMorgan Europe Dynamic Fund | | | | | |
| | | | | |
Six Months Ended April 30, 2023 (Unaudited) | | | | | |
Year Ended October 31, 2022 | | | | | |
Year Ended October 31, 2021 | | | | | |
Year Ended October 31, 2020 | | | | | |
Year Ended October 31, 2019 | | | | | |
Year Ended October 31, 2018 | | | | | |
| | | | | |
Six Months Ended April 30, 2023 (Unaudited) | | | | | |
Year Ended October 31, 2022 | | | | | |
Year Ended October 31, 2021 | | | | | |
Year Ended October 31, 2020 | | | | | |
Year Ended October 31, 2019 | | | | | |
Year Ended October 31, 2018 | | | | | |
| | | | | |
Six Months Ended April 30, 2023 (Unaudited) | | | | | |
Year Ended October 31, 2022 | | | | | |
Year Ended October 31, 2021 | | | | | |
Year Ended October 31, 2020 | | | | | |
Year Ended October 31, 2019 | | | | | |
Year Ended October 31, 2018 | | | | | |
| | | | | |
Six Months Ended April 30, 2023 (Unaudited) | | | | | |
Year Ended October 31, 2022 | | | | | |
Year Ended October 31, 2021 | | | | | |
Year Ended October 31, 2020 | | | | | |
Year Ended October 31, 2019 | | | | | |
Year Ended October 31, 2018 | | | | | |
| | | | | |
Six Months Ended April 30, 2023 (Unaudited) | | | | | |
Year Ended October 31, 2022 | | | | | |
Year Ended October 31, 2021 | | | | | |
Year Ended October 31, 2020 | | | | | |
Year Ended October 31, 2019 | | | | | |
October 1, 2018 (h) through October 31, 2018 | | | | | |
|
| Annualized for periods less than one year, unless otherwise noted. |
| Calculated based upon average shares outstanding. |
| Not annualized for periods less than one year. |
| Includes adjustments in accordance with accounting principles generally accepted in the United States of America and as such, the net asset values for financial reporting purposes and the returns based upon those net asset values may differ from the net asset values and returns for shareholder transactions. |
| Includes interest expense, if applicable, which is less than 0.005% unless otherwise noted. |
| Reflects income from foreign withholding tax claims, including related interest income. Had the Fund not received these proceeds, the net investment income (loss) per share would have been $0.29, $0.17, $0.35, $0.37 and $0.36 for Class A, Class C, Class I, Class L and Class R6, respectively, and the net investment income (loss) ratios would have been 2.23%, 1.56%, 2.60%, 2.69% and 2.70% for Class A, Class C, Class I, Class L and Class R6, respectively. |
| Reflects income from foreign withholding tax claims, including related interest income. Had the Fund not received these proceeds, the net investment income (loss) per share would have been $0.38, $0.20, $0.45, $0.52 and $0.53 for Class A, Class C, Class I, Class L and Class R6, respectively, and the net investment income (loss) ratios would have been 1.29%, 0.78%, 1.44%, 1.70% and 1.75% for Class A, Class C, Class I, Class L and Class R6, respectively. |
| Commencement of offering of class of shares. |
SEE NOTES TO FINANCIAL STATEMENTS.
| J.P. Morgan International Equity Funds | |
| |
| | | Ratios to average net assets(a) |
Net asset
value,
end of
period | Total return
(excludes
sales charge)(c)(d) | Net assets,
end of
period
(000's) | | Net
investment
income
(loss) | Expenses without
waivers and reimbursements | |
| | | | | | |
| | | | | | |
| | | | | | |
| | | | | | |
| | | | | | |
| | | | | | |
| | | | | | |
| | | | | | |
| | | | | | |
| | | | | | |
| | | | | | |
| | | | | | |
| | | | | | |
| | | | | | |
| | | | | | |
| | | | | | |
| | | | | | |
| | | | | | |
| | | | | | |
| | | | | | |
| | | | | | |
| | | | | | |
| | | | | | |
| | | | | | |
| | | | | | |
| | | | | | |
| | | | | | |
| | | | | | |
| | | | | | |
| | | | | | |
| | | | | | |
| | | | | | |
| | | | | | |
| | | | | | |
| | | | | | |
| | | | | | |
SEE NOTES TO FINANCIAL STATEMENTS.
| J.P. Morgan International Equity Funds | |
FINANCIAL HIGHLIGHTS
FOR THE PERIODS INDICATED
| Per share operating performance |
| | | |
| Net asset
value,
beginning
of period | Net
investment
income
(loss)(b) | Net realized
and unrealized
gains
(losses) on
investments | Total from
investment
operations | | | |
JPMorgan International Equity Fund | | | | | | | |
| | | | | | | |
Six Months Ended April 30, 2023 (Unaudited) | | | | | | | |
Year Ended October 31, 2022 | | | | | | | |
Year Ended October 31, 2021 | | | | | | | |
Year Ended October 31, 2020 | | | | | | | |
Year Ended October 31, 2019 | | | | | | | |
Year Ended October 31, 2018 | | | | | | | |
| | | | | | | |
Six Months Ended April 30, 2023 (Unaudited) | | | | | | | |
Year Ended October 31, 2022 | | | | | | | |
Year Ended October 31, 2021 | | | | | | | |
Year Ended October 31, 2020 | | | | | | | |
Year Ended October 31, 2019 | | | | | | | |
Year Ended October 31, 2018 | | | | | | | |
| | | | | | | |
Six Months Ended April 30, 2023 (Unaudited) | | | | | | | |
Year Ended October 31, 2022 | | | | | | | |
Year Ended October 31, 2021 | | | | | | | |
Year Ended October 31, 2020 | | | | | | | |
Year Ended October 31, 2019 | | | | | | | |
Year Ended October 31, 2018 | | | | | | | |
| | | | | | | |
Six Months Ended April 30, 2023 (Unaudited) | | | | | | | |
Year Ended October 31, 2022 | | | | | | | |
Year Ended October 31, 2021 | | | | | | | |
Year Ended October 31, 2020 | | | | | | | |
Year Ended October 31, 2019 | | | | | | | |
Year Ended October 31, 2018 | | | | | | | |
| | | | | | | |
Six Months Ended April 30, 2023 (Unaudited) | | | | | | | |
Year Ended October 31, 2022 | | | | | | | |
Year Ended October 31, 2021 | | | | | | | |
Year Ended October 31, 2020 | | | | | | | |
Year Ended October 31, 2019 | | | | | | | |
Year Ended October 31, 2018 | | | | | | | |
SEE NOTES TO FINANCIAL STATEMENTS.
| J.P. Morgan International Equity Funds | |
| |
| | | Ratios to average net assets(a) |
Net asset
value,
end of
period | Total return
(excludes
sales charge)(c)(d) | Net assets,
end of
period
(000's) | | Net
investment
income
(loss) | Expenses without
waivers and reimbursements | |
| | | | | | |
| | | | | | |
| | | | | | |
| | | | | | |
| | | | | | |
| | | | | | |
| | | | | | |
| | | | | | |
| | | | | | |
| | | | | | |
| | | | | | |
| | | | | | |
| | | | | | |
| | | | | | |
| | | | | | |
| | | | | | |
| | | | | | |
| | | | | | |
| | | | | | |
| | | | | | |
| | | | | | |
| | | | | | |
| | | | | | |
| | | | | | |
| | | | | | |
| | | | | | |
| | | | | | |
| | | | | | |
| | | | | | |
| | | | | | |
| | | | | | |
| | | | | | |
| | | | | | |
| | | | | | |
| | | | | | |
| | | | | | |
SEE NOTES TO FINANCIAL STATEMENTS.
| J.P. Morgan International Equity Funds | |
FINANCIAL HIGHLIGHTS
FOR THE PERIODS INDICATED (continued)
| Per share operating performance |
| | | |
| Net asset
value,
beginning
of period | Net
investment
income
(loss)(b) | Net realized
and unrealized
gains
(losses) on
investments | Total from
investment
operations | | | |
JPMorgan International Equity Fund (continued) | | | | | | | |
| | | | | | | |
Six Months Ended April 30, 2023 (Unaudited) | | | | | | | |
Year Ended October 31, 2022 | | | | | | | |
Year Ended October 31, 2021 | | | | | | | |
Year Ended October 31, 2020 | | | | | | | |
Year Ended October 31, 2019 | | | | | | | |
Year Ended October 31, 2018 | | | | | | | |
|
| Annualized for periods less than one year, unless otherwise noted. |
| Calculated based upon average shares outstanding. |
| Not annualized for periods less than one year. |
| Includes adjustments in accordance with accounting principles generally accepted in the United States of America and as such, the net asset values for financial reporting purposes and the returns based upon those net asset values may differ from the net asset values and returns for shareholder transactions. |
| Includes interest expense, if applicable, which is less than 0.005% unless otherwise noted. |
| Reflects income from foreign withholding tax claims, including related interest income. Had the Fund not received these proceeds, the net investment income (loss) per share would have been $0.18, $0.13, $0.21, $0.15, $0.19 and $0.22 for Class A, Class C, Class I, Class R2, Class R5 and Class R6, respectively, and the net investment income (loss) ratios would have been 2.24%, 1.67%, 2.57%, 1.93%, 2.24% and 2.61% for Class A, Class C, Class I, Class R2, Class R5 and Class R6, respectively. |
| Reflects income from foreign withholding tax claims. Had the Fund not received these proceeds, the net investment income (loss) per share and the net investment income (loss) ratios for each share class would have remained the same. |
SEE NOTES TO FINANCIAL STATEMENTS.
| J.P. Morgan International Equity Funds | |
| |
| | | Ratios to average net assets(a) |
Net asset
value,
end of
period | Total return
(excludes
sales charge)(c)(d) | Net assets,
end of
period
(000's) | | Net
investment
income
(loss) | Expenses without
waivers and reimbursements | |
|
| | | | | | |
| | | | | | |
| | | | | | |
| | | | | | |
| | | | | | |
| | | | | | |
| | | | | | |
SEE NOTES TO FINANCIAL STATEMENTS.
| J.P. Morgan International Equity Funds | |
FINANCIAL HIGHLIGHTS
FOR THE PERIODS INDICATED
| Per share operating performance |
| | | |
| Net asset
value,
beginning
of period | Net
investment
income
(loss)(b) | Net realized
and unrealized
gains
(losses) on
investments | Total from
investment
operations | |
JPMorgan International Focus Fund | | | | | |
| | | | | |
Six Months Ended April 30, 2023 (Unaudited) | | | | | |
Year Ended October 31, 2022 | | | | | |
Year Ended October 31, 2021 | | | | | |
Year Ended October 31, 2020 | | | | | |
Year Ended October 31, 2019 | | | | | |
Year Ended October 31, 2018 | | | | | |
| | | | | |
Six Months Ended April 30, 2023 (Unaudited) | | | | | |
Year Ended October 31, 2022 | | | | | |
Year Ended October 31, 2021 | | | | | |
Year Ended October 31, 2020 | | | | | |
Year Ended October 31, 2019 | | | | | |
Year Ended October 31, 2018 | | | | | |
| | | | | |
Six Months Ended April 30, 2023 (Unaudited) | | | | | |
Year Ended October 31, 2022 | | | | | |
Year Ended October 31, 2021 | | | | | |
Year Ended October 31, 2020 | | | | | |
Year Ended October 31, 2019 | | | | | |
Year Ended October 31, 2018 | | | | | |
| | | | | |
Six Months Ended April 30, 2023 (Unaudited) | | | | | |
Year Ended October 31, 2022 | | | | | |
Year Ended October 31, 2021 | | | | | |
Year Ended October 31, 2020 | | | | | |
Year Ended October 31, 2019 | | | | | |
Year Ended October 31, 2018 | | | | | |
| | | | | |
Six Months Ended April 30, 2023 (Unaudited) | | | | | |
Year Ended October 31, 2022 | | | | | |
Year Ended October 31, 2021 | | | | | |
Year Ended October 31, 2020 | | | | | |
Year Ended October 31, 2019 | | | | | |
Year Ended October 31, 2018 | | | | | |
SEE NOTES TO FINANCIAL STATEMENTS.
| J.P. Morgan International Equity Funds | |
| |
| | | Ratios to average net assets(a) |
Net asset
value,
end of
period | Total return
(excludes
sales charge)(c)(d) | Net assets,
end of
period
(000's) | | Net
investment
income
(loss) | Expenses without
waivers and reimbursements | |
| | | | | | |
| | | | | | |
| | | | | | |
| | | | | | |
| | | | | | |
| | | | | | |
| | | | | | |
| | | | | | |
| | | | | | |
| | | | | | |
| | | | | | |
| | | | | | |
| | | | | | |
| | | | | | |
| | | | | | |
| | | | | | |
| | | | | | |
| | | | | | |
| | | | | | |
| | | | | | |
| | | | | | |
| | | | | | |
| | | | | | |
| | | | | | |
| | | | | | |
| | | | | | |
| | | | | | |
| | | | | | |
| | | | | | |
| | | | | | |
| | | | | | |
| | | | | | |
| | | | | | |
| | | | | | |
| | | | | | |
| | | | | | |
SEE NOTES TO FINANCIAL STATEMENTS.
| J.P. Morgan International Equity Funds | |
FINANCIAL HIGHLIGHTS
FOR THE PERIODS INDICATED (continued)
| Per share operating performance |
| | | |
| Net asset
value,
beginning
of period | Net
investment
income
(loss)(b) | Net realized
and unrealized
gains
(losses) on
investments | Total from
investment
operations | |
JPMorgan International Focus Fund (continued) | | | | | |
| | | | | |
Six Months Ended April 30, 2023 (Unaudited) | | | | | |
Year Ended October 31, 2022 | | | | | |
Year Ended October 31, 2021 | | | | | |
Year Ended October 31, 2020 | | | | | |
Year Ended October 31, 2019 | | | | | |
Year Ended October 31, 2018 | | | | | |
|
| Annualized for periods less than one year, unless otherwise noted. |
| Calculated based upon average shares outstanding. |
| Not annualized for periods less than one year. |
| Includes adjustments in accordance with accounting principles generally accepted in the United States of America and as such, the net asset values for financial reporting purposes and the returns based upon those net asset values may differ from the net asset values and returns for shareholder transactions. |
| Includes interest expense, if applicable, which is less than 0.005% unless otherwise noted. |
| Reflects income from foreign withholding tax claims. Had the Fund not received these proceeds, the net investment income (loss) per share and the net investment income (loss) ratios for each share class would have remained the same. |
SEE NOTES TO FINANCIAL STATEMENTS.
| J.P. Morgan International Equity Funds | |
| |
| | | Ratios to average net assets(a) |
Net asset
value,
end of
period | Total return
(excludes
sales charge)(c)(d) | Net assets,
end of
period
(000's) | | Net
investment
income
(loss) | Expenses without
waivers and reimbursements | |
|
| | | | | | |
| | | | | | |
| | | | | | |
| | | | | | |
| | | | | | |
| | | | | | |
| | | | | | |
SEE NOTES TO FINANCIAL STATEMENTS.
| J.P. Morgan International Equity Funds | |
FINANCIAL HIGHLIGHTS
FOR THE PERIODS INDICATED
| Per share operating performance |
| | | |
| Net asset
value,
beginning
of period | Net
investment
income
(loss)(b) | Net realized
and unrealized
gains
(losses) on
investments | Total from
investment
operations | |
JPMorgan International Hedged Equity Fund | | | | | |
| | | | | |
Six Months Ended April 30, 2023 (Unaudited) | | | | | |
Year Ended October 31, 2022 | | | | | |
Year Ended October 31, 2021 | | | | | |
Year Ended October 31, 2020 | | | | | |
March 15, 2019 (f) through October 31, 2019 | | | | | |
| | | | | |
Six Months Ended April 30, 2023 (Unaudited) | | | | | |
Year Ended October 31, 2022 | | | | | |
Year Ended October 31, 2021 | | | | | |
Year Ended October 31, 2020 | | | | | |
March 15, 2019 (f) through October 31, 2019 | | | | | |
| | | | | |
Six Months Ended April 30, 2023 (Unaudited) | | | | | |
Year Ended October 31, 2022 | | | | | |
Year Ended October 31, 2021 | | | | | |
Year Ended October 31, 2020 | | | | | |
March 15, 2019 (f) through October 31, 2019 | | | | | |
| | | | | |
Six Months Ended April 30, 2023 (Unaudited) | | | | | |
Year Ended October 31, 2022 | | | | | |
Year Ended October 31, 2021 | | | | | |
Year Ended October 31, 2020 | | | | | |
March 15, 2019 (f) through October 31, 2019 | | | | | |
| | | | | |
Six Months Ended April 30, 2023 (Unaudited) | | | | | |
Year Ended October 31, 2022 | | | | | |
Year Ended October 31, 2021 | | | | | |
Year Ended October 31, 2020 | | | | | |
March 15, 2019 (f) through October 31, 2019 | | | | | |
|
| Annualized for periods less than one year, unless otherwise noted. |
| Calculated based upon average shares outstanding. |
| Not annualized for periods less than one year. |
| Includes adjustments in accordance with accounting principles generally accepted in the United States of America and as such, the net asset values for financial reporting purposes and the returns based upon those net asset values may differ from the net asset values and returns for shareholder transactions. |
| Includes interest expense, if applicable, which is less than 0.005% unless otherwise noted. |
| Commencement of operations. |
| Certain non-recurring expenses incurred by the Fund were not annualized for the period indicated. |
SEE NOTES TO FINANCIAL STATEMENTS.
| J.P. Morgan International Equity Funds | |
| |
| | | Ratios to average net assets(a) |
Net asset
value,
end of
period | Total return
(excludes
sales charge)(c)(d) | Net assets,
end of
period
(000's) | | Net
investment
income
(loss) | Expenses without
waivers and reimbursements | |
| | | | | | |
| | | | | | |
| | | | | | |
| | | | | | |
| | | | | | |
| | | | | | |
| | | | | | |
| | | | | | |
| | | | | | |
| | | | | | |
| | | | | | |
| | | | | | |
| | | | | | |
| | | | | | |
| | | | | | |
| | | | | | |
| | | | | | |
| | | | | | |
| | | | | | |
| | | | | | |
| | | | | | |
| | | | | | |
| | | | | | |
| | | | | | |
| | | | | | |
| | | | | | |
| | | | | | |
| | | | | | |
| | | | | | |
| | | | | | |
| | | | | | |
SEE NOTES TO FINANCIAL STATEMENTS.
| J.P. Morgan International Equity Funds | |
FINANCIAL HIGHLIGHTS
FOR THE PERIODS INDICATED
| Per share operating performance |
| | | |
| Net asset
value,
beginning
of period | Net
investment
income
(loss)(b) | Net realized
and unrealized
gains
(losses) on
investments | Total from
investment
operations | |
JPMorgan International Value Fund | | | | | |
| | | | | |
Six Months Ended April 30, 2023 (Unaudited) | | | | | |
Year Ended October 31, 2022 | | | | | |
Year Ended October 31, 2021 | | | | | |
Year Ended October 31, 2020 | | | | | |
Year Ended October 31, 2019 | | | | | |
Year Ended October 31, 2018 | | | | | |
| | | | | |
Six Months Ended April 30, 2023 (Unaudited) | | | | | |
Year Ended October 31, 2022 | | | | | |
Year Ended October 31, 2021 | | | | | |
Year Ended October 31, 2020 | | | | | |
Year Ended October 31, 2019 | | | | | |
Year Ended October 31, 2018 | | | | | |
| | | | | |
Six Months Ended April 30, 2023 (Unaudited) | | | | | |
Year Ended October 31, 2022 | | | | | |
Year Ended October 31, 2021 | | | | | |
Year Ended October 31, 2020 | | | | | |
Year Ended October 31, 2019 | | | | | |
Year Ended October 31, 2018 | | | | | |
| | | | | |
Six Months Ended April 30, 2023 (Unaudited) | | | | | |
Year Ended October 31, 2022 | | | | | |
Year Ended October 31, 2021 | | | | | |
Year Ended October 31, 2020 | | | | | |
Year Ended October 31, 2019 | | | | | |
Year Ended October 31, 2018 | | | | | |
| | | | | |
Six Months Ended April 30, 2023 (Unaudited) | | | | | |
Year Ended October 31, 2022 | | | | | |
Year Ended October 31, 2021 | | | | | |
Year Ended October 31, 2020 | | | | | |
Year Ended October 31, 2019 | | | | | |
Year Ended October 31, 2018 | | | | | |
| | | | | |
Six Months Ended April 30, 2023 (Unaudited) | | | | | |
Year Ended October 31, 2022 | | | | | |
Year Ended October 31, 2021 | | | | | |
Year Ended October 31, 2020 | | | | | |
Year Ended October 31, 2019 | | | | | |
Year Ended October 31, 2018 | | | | | |
SEE NOTES TO FINANCIAL STATEMENTS.
| J.P. Morgan International Equity Funds | |
| |
| | | Ratios to average net assets(a) |
Net asset
value,
end of
period | Total return
(excludes
sales charge)(c)(d) | Net assets,
end of
period
(000's) | | Net
investment
income
(loss) | Expenses without
waivers and reimbursements | |
| | | | | | |
| | | | | | |
| | | | | | |
| | | | | | |
| | | | | | |
| | | | | | |
| | | | | | |
| | | | | | |
| | | | | | |
| | | | | | |
| | | | | | |
| | | | | | |
| | | | | | |
| | | | | | |
| | | | | | |
| | | | | | |
| | | | | | |
| | | | | | |
| | | | | | |
| | | | | | |
| | | | | | |
| | | | | | |
| | | | | | |
| | | | | | |
| | | | | | |
| | | | | | |
| | | | | | |
| | | | | | |
| | | | | | |
| | | | | | |
| | | | | | |
| | | | | | |
| | | | | | |
| | | | | | |
| | | | | | |
| | | | | | |
| | | | | | |
| | | | | | |
| | | | | | |
| | | | | | |
| | | | | | |
| | | | | | |
| | | | | | |
SEE NOTES TO FINANCIAL STATEMENTS.
| J.P. Morgan International Equity Funds | |
FINANCIAL HIGHLIGHTS
FOR THE PERIODS INDICATED (continued)
| Per share operating performance |
| | | |
| Net asset
value,
beginning
of period | Net
investment
income
(loss)(b) | Net realized
and unrealized
gains
(losses) on
investments | Total from
investment
operations | |
JPMorgan International Value Fund (continued) | | | | | |
| | | | | |
Six Months Ended April 30, 2023 (Unaudited) | | | | | |
Year Ended October 31, 2022 | | | | | |
Year Ended October 31, 2021 | | | | | |
Year Ended October 31, 2020 | | | | | |
Year Ended October 31, 2019 | | | | | |
Year Ended October 31, 2018 | | | | | |
|
| Annualized for periods less than one year, unless otherwise noted. |
| Calculated based upon average shares outstanding. |
| Not annualized for periods less than one year. |
| Includes adjustments in accordance with accounting principles generally accepted in the United States of America and as such, the net asset values for financial reporting purposes and the returns based upon those net asset values may differ from the net asset values and returns for shareholder transactions. |
| Includes interest expense, if applicable, which is less than 0.005% unless otherwise noted. |
| Reflects income from foreign withholding tax claims, including related interest income. Had the Fund not received these proceeds, the net investment income (loss) per share would have been $0.11, $0.06, $0.13, $0.13, $0.08, $0.18 and $0.14 for Class A, Class C, Class I, Class L, Class R2, Class R5 and Class R6, respectively, and the net investment income (loss) ratios would have been 3.18%, 2.58%, 3.44%, 3.52%, 2.84%, 4.18% and 3.65% for Class A, Class C, Class I, Class L, Class R2, Class R5 and Class R6, respectively. |
| Reflects income from foreign withholding tax claims, including related interest income, less IRS compliance fees. Without these proceeds, the net investment income (loss) per share would have been $0.38, $0.28, $0.42, $0.41, $0.34, $0.35 and $0.44 for Class A, Class C, Class I, Class L, Class R2, Class R5, and Class R6,respectively, and the net investment income (loss) ratios would have been 3.00%, 2.26%, 3.19%, 3.23%, 2.72%, 2.80% and 3.44% for Class A, Class C, Class I, Class L, Class R2, Class R5, and Class R6, respectively. |
SEE NOTES TO FINANCIAL STATEMENTS.
| J.P. Morgan International Equity Funds | |
| |
| | | Ratios to average net assets(a) |
Net asset
value,
end of
period | Total return
(excludes
sales charge)(c)(d) | Net assets,
end of
period
(000's) | | Net
investment
income
(loss) | Expenses without
waivers and reimbursements | |
|
| | | | | | |
| | | | | | |
| | | | | | |
| | | | | | |
| | | | | | |
| | | | | | |
| | | | | | |
SEE NOTES TO FINANCIAL STATEMENTS.
| J.P. Morgan International Equity Funds | |
NOTES TO FINANCIAL STATEMENTS
AS OF April 30, 2023 (Unaudited)
(Dollar values in thousands)
1. Organization
JPMorgan Trust I (“JPM I") and JPMorgan Trust IV (“JPM IV") (collectively, the “Trusts”) were formed on November 12, 2004 and November 11, 2015, respectively, as Delaware statutory trusts, pursuant to Declarations of Trust dated November 5, 2004 and November 11, 2015, respectively, and are registered under the Investment Company Act of 1940, as amended (the “1940 Act”), as open-end management investment companies.
The following are 7 separate funds of the Trusts (each, a "Fund" and collectively, the "Funds") covered by this report:
| | | Diversification Classification |
JPMorgan Emerging Markets Equity Fund | Class A, Class C, Class I, Class L, Class R2, Class R3, Class R4, Class R5 and Class R6 | | |
JPMorgan Emerging Markets Research Enhanced Equity Fund | | | |
JPMorgan Europe Dynamic Fund | Class A, Class C, Class I, Class L and Class R6 | | |
JPMorgan International Equity Fund | Class A, Class C, Class I, Class R2, Class R5 and Class R6 | | |
JPMorgan International Focus Fund | Class A, Class C, Class I, Class R2, Class R5 and Class R6 | | |
JPMorgan International Hedged Equity Fund | Class A, Class C, Class I, Class R5 and Class R6 | | |
JPMorgan International Value Fund | Class A, Class C, Class I, Class L, Class R2, Class R5 and Class R6 | | |
The investment objective of JPMorgan Emerging Markets Equity Fund (“Emerging Markets Equity Fund”) is to seek to provide high total return.
The investment objective of JPMorgan Emerging Markets Research Enhanced Equity Fund (“Emerging Markets Research Enhanced Equity Fund”), JPMorgan International Focus Fund (“International Focus Fund”) and JPMorgan International Value Fund (“International Value Fund”) is to seek to provide long-term capital appreciation.
The investment objective of JPMorgan Europe Dynamic Fund (“Europe Dynamic Fund”) is to seek total return from long-term capital growth. Total return consists of capital growth and current income.
The investment objective of JPMorgan International Equity Fund (“International Equity Fund”) is to seek total return from long-term capital growth and income. Total return consists of capital growth and current income.
The investment objective of JPMorgan International Hedged Equity Fund (“International Hedged Equity Fund”) is to seek to provide capital appreciation.
Class L Shares of Europe Dynamic Fund and International Value Fund are publicly offered on a limited basis. Investors are not eligible to purchase Class L Shares of Europe Dynamic Fund and International Value Fund unless they meet certain requirements as described in the Funds' prospectuses.
Effective as of the close of business on December 31, 2020, all share classes of Emerging Markets Equity Fund are publicly offered on a limited basis. Investors are not eligible to purchase shares of the Fund unless they meet certain requirements as described in the Fund's prospectuses.
Class A Shares generally provide for a front-end sales charge while Class C Shares provide for a contingent deferred sales charge ("CDSC"). No sales charges are assessed with respect to Class I, Class L, Class R2, Class R3, Class R4, Class R5 and Class R6 Shares. Certain Class A Shares, for which front-end sales charges have been waived, may be subject to a CDSC as described in the Funds' prospectus. Effective October 1, 2020, Class C Shares automatically convert to Class A Shares after eight years. Prior to October 1, 2020, Class C Shares automatically converted to Class A Shares after ten years. All classes of shares have equal rights as to earnings, assets and voting privileges, except that each class may bear different transfer agency, distribution and service fees and each class has exclusive voting rights with respect to its distribution plan and shareholder servicing agreements.
J.P. Morgan Investment Management Inc. ("JPMIM"), an indirect, wholly-owned subsidiary of JPMorgan Chase & Co. ("JPMorgan"), acts as Adviser (the "Adviser") and Administrator (the "Administrator") to the Funds.
2. Significant Accounting Policies
The following is a summary of significant accounting policies followed by the Funds in the preparation of their financial statements. The Funds are investment companies and, accordingly, follow the investment company accounting and reporting guidance of the Financial Accounting Standards Board (“FASB”) Accounting Standards Codification Topic 946 — Investment Companies, which is part of U.S. generally accepted accounting principles (“GAAP”). The preparation of financial statements in conformity with GAAP requires management to make estimates and assumptions that affect (i)
| J.P. Morgan International Equity Funds | |
the reported amounts of assets and liabilities, (ii) disclosure of contingent assets and liabilities at the date of the financial statements, and (iii) the reported amounts of increases and decreases in net assets from operations during the reporting period. Actual results could differ from those estimates.
A. Valuation of Investments — Investments are valued in accordance with GAAP and the Funds' valuation policies set forth by, and under the supervision and responsibility of, the Boards of Trustees of the Trusts (the "Boards"), which established the following approach to valuation, as described more fully below: (i) investments for which market quotations are readily available shall be valued at their market value and (ii) all other investments for which market quotations are not readily available shall be valued at their fair value as determined in good faith by the Boards.
Under Section 2(a)(41) of the 1940 Act, the Boards are required to determine fair value for securities that do not have readily available market quotations. Under SEC Rule 2a-5 (Good Faith Determinations of Fair Value), the Boards may designate the performance of these fair valuation determinations to a valuation designee. The Boards have designated the Adviser as the “Valuation Designee” to perform fair valuation determinations for the Funds on behalf of the Boards subject to appropriate oversight by the Boards. The Adviser, as Valuation Designee, leverages the J.P. Morgan Asset Management Americas Valuation Committee (“AVC”) to help oversee and carry out the policies for the valuation of investments held in the Funds. The Adviser, as Valuation Designee, remains responsible for the valuation determinations.
This oversight by the AVC includes monitoring the appropriateness of fair values based on results of ongoing valuation oversight including, but not limited to, consideration of macro or security specific events, market events, and pricing vendor and broker due diligence. The Administrator is responsible for discussing and assessing the potential impacts to the fair values on an ongoing basis, and, at least on a quarterly basis, with the AVC and the Boards.
A market-based approach is primarily used to value the Funds' investments. Investments for which market quotations are not readily available are fair valued using prices supplied by approved affiliated and/or unaffiliated pricing vendors or third party broker-dealers (collectively referred to as “Pricing Services”) or may be internally fair valued using methods set forth by the valuation policies approved by the Boards. This may include the use of related or comparable assets or liabilities, recent transactions, market multiples, book values and other relevant information for the investment. An income-based valuation approach may be used in which the anticipated future cash flows of the investment are discounted to calculate the fair value. Discounts may also be applied due to the nature or duration of any restrictions on the disposition of the investments. Valuations may be based upon current market prices of securities that are comparable in coupon, rating, maturity and industry. It is possible that the estimated values may differ significantly from the values that would have been used had a ready market for the investments existed, and such differences could be material.
Equities and other exchange-traded instruments are valued at the last sale price or official market closing price on the primary exchange on which the instrument is traded before the net asset values ("NAV") of the Funds are calculated on a valuation date. Certain foreign equity instruments are valued by applying international fair value factors provided by approved Pricing Services. The factors seek to adjust the local closing price for movements of local markets post-closing, but prior to the time the NAV is calculated.
Investments in open-end investment companies (“Underlying Funds”) are valued at each Underlying Fund’s NAV per share as of the report date.
Futures contracts and options are generally valued on the basis of available market quotations.
Valuations reflected in this report are as of the report date. As a result, changes in valuation due to market events and/or issuer-related events after the report date and prior to issuance of the report are not reflected herein.
The various inputs that are used in determining the valuation of the Funds' investments are summarized into the three broad levels listed below.
•
Level 1 — Unadjusted inputs using quoted prices in active markets for identical investments.
•
Level 2 — Other significant observable inputs including, but not limited to, quoted prices for similar investments, inputs other than quoted prices that are observable for investments (such as interest rates, prepayment speeds, credit risk, etc.) or other market corroborated inputs.
•
Level 3 — Significant inputs based on the best information available in the circumstances, to the extent observable inputs are not available (including the Funds' assumptions in determining the fair value of investments).
A financial instrument’s level within the fair value hierarchy is based on the lowest level of any input, both individually and in the aggregate, that is significant to the fair value measurement. The inputs or methodology used for valuing instruments are not necessarily an indication of the risk associated with investing in those instruments.
| J.P. Morgan International Equity Funds | |
NOTES TO FINANCIAL STATEMENTS
AS OF April 30, 2023 (Unaudited) (continued)
(Dollar values in thousands)
The following tables represent each valuation input as presented on the Schedules of Portfolio Investments ("SOIs"):
Emerging Markets Equity Fund | | |
| | Level 2
Other significant
observable inputs | Level 3
Significant
unobservable inputs | |
Investments in Securities | | | | |
| | | | |
| | | | |
| | | | |
| | | | |
| | | | |
| | | | |
| | | | |
| | | | |
| | | | |
| | | | |
| | | | |
| | | | |
| | | | |
| | | | |
| | | | |
| | | | |
| | | | |
Total Investments in Securities | | | | |
Emerging Markets Research Enhanced Equity Fund | | |
| | Level 2
Other significant
observable inputs | Level 3
Significant
unobservable inputs | |
Investments in Securities | | | | |
| | | | |
| | | | |
| | | | |
| | | | |
| | | | |
| | | | |
| | | | |
| | | | |
| | | | |
| | | | |
| | | | |
| | | | |
| | | | |
| | | | |
| | | | |
| | | | |
| | | | |
| | | | |
| | | | |
| | | | |
| | | | |
| | | | |
| J.P. Morgan International Equity Funds | |
Emerging Markets Research Enhanced Equity Fund (continued) | | |
| | Level 2 Other significant observable inputs | Level 3 Significant unobservable inputs | |
| | | | |
| | | | |
| | | | |
| | | | |
| | | | |
| | | | |
| | | | |
Investment of Cash Collateral from Securities Loaned | | | | |
Total Short-Term Investments | | | | |
Total Investments in Securities | | | | |
Appreciation in Other Financial Instruments | | | | |
| | | | |
| | |
| | Level 2
Other significant
observable inputs | Level 3
Significant
unobservable inputs | |
Investments in Securities | | | | |
| | | | |
| | | | |
| | | | |
| | | | |
| | | | |
| | | | |
| | | | |
| | | | |
| | | | |
| | | | |
| | | | |
| | | | |
| | | | |
| | | | |
| | | | |
| | | | |
| | | | |
| | | | |
| | | | |
| | | | |
Investment of Cash Collateral from Securities Loaned | | | | |
Total Short-Term Investments | | | | |
Total Investments in Securities | | | | |
Appreciation in Other Financial Instruments | | | | |
| | | | |
| J.P. Morgan International Equity Funds | |
NOTES TO FINANCIAL STATEMENTS
AS OF April 30, 2023 (Unaudited) (continued)
(Dollar values in thousands)
Europe Dynamic Fund (continued) | | |
| | Level 2 Other significant observable inputs | Level 3 Significant unobservable inputs | |
Depreciation in Other Financial Instruments | | | | |
| | | | |
Total Net Appreciation/ Depreciation in Other Financial Instruments | | | | |
International Equity Fund | | |
| | Level 2
Other significant
observable inputs | Level 3
Significant
unobservable inputs | |
Investments in Securities | | | | |
| | | | |
| | | | |
| | | | |
| | | | |
| | | | |
| | | | |
| | | | |
| | | | |
| | | | |
| | | | |
| | | | |
| | | | |
| | | | |
| | | | |
| | | | |
| | | | |
| | | | |
| | | | |
| | | | |
| | | | |
| | | | |
| | | | |
| | | | |
| | | | |
| | | | |
Investment of Cash Collateral from Securities Loaned | | | | |
Total Short-Term Investments | | | | |
Total Investments in Securities | | | | |
| | |
| | Level 2
Other significant
observable inputs | Level 3
Significant
unobservable inputs | |
Investments in Securities | | | | |
| | | | |
| | | | |
| | | | |
| | | | |
| J.P. Morgan International Equity Funds | |
International Focus Fund (continued) | | |
| | Level 2 Other significant observable inputs | Level 3 Significant unobservable inputs | |
| | | | |
| | | | |
| | | | |
| | | | |
| | | | |
| | | | |
| | | | |
| | | | |
| | | | |
| | | | |
| | | | |
| | | | |
| | | | |
| | | | |
| | | | |
| | | | |
| | | | |
| | | | |
| | | | |
| | | | |
Investment of Cash Collateral from Securities Loaned | | | | |
Total Investments in Securities | | | | |
International Hedged Equity Fund | | |
| | Level 2
Other significant
observable inputs | Level 3
Significant
unobservable inputs | |
Investments in Securities | | | | |
| | | | |
| | | | |
| | | | |
| | | | |
| | | | |
| | | | |
| | | | |
| | | | |
| | | | |
| | | | |
| | | | |
| | | | |
| | | | |
| | | | |
| | | | |
| | | | |
| | | | |
| | | | |
| | | | |
| | | | |
| J.P. Morgan International Equity Funds | |
NOTES TO FINANCIAL STATEMENTS
AS OF April 30, 2023 (Unaudited) (continued)
(Dollar values in thousands)
International Hedged Equity Fund (continued) | | |
| | Level 2 Other significant observable inputs | Level 3 Significant unobservable inputs | |
| | | | |
| | | | |
| | | | |
| | | | |
| | | | |
| | | | |
Total Investments in Securities | | | | |
Appreciation in Other Financial Instruments | | | | |
| | | | |
Depreciation in Other Financial Instruments | | | | |
| | | | |
| | | | |
| | | | |
Total Net Appreciation/ Depreciation in Other Financial Instruments | | | | |
| | |
| | Level 2
Other significant
observable inputs | Level 3
Significant
unobservable inputs | |
Investments in Securities | | | | |
| | | | |
| | | | |
| | | | |
| | | | |
| | | | |
| | | | |
| | | | |
| | | | |
| | | | |
| | | | |
| | | | |
| | | | |
| | | | |
| | | | |
| | | | |
| | | | |
| | | | |
| | | | |
| | | | |
| | | | |
| | | | |
| | | | |
| | | | |
| | | | |
| | | | |
| J.P. Morgan International Equity Funds | |
International Value Fund (continued) | | |
| | Level 2 Other significant observable inputs | Level 3 Significant unobservable inputs | |
| | | | |
| | | | |
Total Investments in Securities | | | | |
B. Restricted Securities — Certain securities held by the Funds may be subject to legal or contractual restrictions on resale. Restricted securities generally are resold in transactions exempt from registration under the Securities Act of 1933, as amended (the “Securities Act”). Disposal of these securities may involve time-consuming negotiations and expense. Prompt sale at the current valuation may be difficult and could adversely affect the NAVs of the Funds.
As of April 30, 2023, the Funds had no investments in restricted securities other than securities sold to the Funds under Rule 144A and/or Regulation S under the Securities Act.
C. Securities Lending — The Funds are authorized to engage in securities lending in order to generate additional income. The Funds are able to lend to approved borrowers. Citibank N.A. (“Citibank”) serves as lending agent for the Funds, pursuant to a Securities Lending Agency Agreement (the “Securities Lending Agency Agreement”). Securities loaned are collateralized by cash equal to at least 100% of the market value plus accrued interest on the securities lent, which is invested in the Class IM Shares of the JPMorgan U.S. Government Money Market Fund and the Agency SL Class Shares of the JPMorgan Securities Lending Money Market Fund. The Funds retain the interest earned on cash collateral investments but are required to pay the borrower a rebate for the use of the cash collateral. In cases where the lent security is of high value to borrowers, there may be a negative rebate (i.e., a net payment from the borrower to the Funds). Upon termination of a loan, the Funds are required to return to the borrower an amount equal to the cash collateral, plus any rebate owed to the borrowers. The remaining maturities of the securities lending transactions are considered overnight and continuous. Loans are subject to termination by the Funds or the borrower at any time.
The net income earned on the securities lending (after payment of rebates and Citibank’s fee) is included on the Statements of Operations as Income from securities lending (net). The Funds also receive payments from the borrower during the period of the loan, equivalent to dividends and interest earned on the securities loaned, which are recorded as Dividend or Interest income, respectively, on the Statements of Operations.
Under the Securities Lending Agency Agreement, Citibank marks to market the loaned securities on a daily basis. In the event the cash received from the borrower is less than 102% of the value of the loaned securities (105% for loans of non-U.S. securities), Citibank requests additional cash from the borrower so as to maintain a collateralization level of at least 102% of the value of the loaned securities plus accrued interest (105% for loans of non-U.S. securities), subject to certain de minimis amounts.
The value of securities out on loan is recorded as an asset on the Statements of Assets and Liabilities. The value of the cash collateral received is recorded as a liability on the Statements of Assets and Liabilities and details of collateral investments are disclosed on the SOIs.
The Funds bear the risk of loss associated with the collateral investments and are not entitled to additional collateral from the borrower to cover any such losses. To the extent that the value of the collateral investments declines below the amount owed to a borrower, the Funds may incur losses that exceed the amount they earned on lending the security. Upon termination of a loan, the Funds may use leverage (borrow money) to repay the borrower for cash collateral posted if the Adviser does not believe that it is prudent to sell the collateral investments to fund the payment of this liability. Securities lending activity is subject to master netting arrangements.
The following table presents for each lending Fund, the value of the securities on loan with Citibank, net of amounts available for offset under the master netting arrangements and any related collateral received or posted by the Funds as of April 30, 2023.
| Investment Securities
on Loan, at value,
Presented on the
Statements of Assets
and Liabilities | Cash Collateral
Posted by Borrower* | Net Amount Due
to Counterparty
(not less than zero) |
Emerging Markets Research Enhanced Equity Fund | | | |
| | | |
International Equity Fund | | | |
| | | |
|
| Collateral posted reflects the value of securities on loan and does not include any additional amounts received from the borrower. |
| J.P. Morgan International Equity Funds | |
NOTES TO FINANCIAL STATEMENTS
AS OF April 30, 2023 (Unaudited) (continued)
(Dollar values in thousands)
Securities lending also involves counterparty risks, including the risk that the loaned securities may not be returned in a timely manner or at all. Subject to certain conditions, Citibank has agreed to indemnify the Funds from losses resulting from a borrower’s failure to return a loaned security.
JPMIM voluntarily waived investment advisory fees charged to the Funds to reduce the impact of the cash collateral investment in the JPMorgan U.S. Government Money Market Fund from 0.13% to 0.06%. For the six months ended April 30, 2023, JPMIM waived fees associated with the Funds' investment in the JPMorgan U.S. Government Money Market Fund as follows:
Emerging Markets Equity Fund | |
Emerging Markets Research Enhanced Equity Fund | |
| |
International Equity Fund | |
| |
| |
|
| Amount rounds to less than one thousand. |
The above waiver is included in the determination of earnings on cash collateral investment and in the calculation of Citibank’s compensation and is included on the Statements of Operations as Income from securities lending (net).
International Hedged Equity Fund did not lend out any securities during the six months ended April 30, 2023.
D. Investment Transactions with Affiliates — The Funds invested in Underlying Funds, which are advised by the Adviser. An issuer which is under common control with a Fund may be considered an affiliate. For the purposes of the financial statements, the Funds assume the issuers listed in the tables below to be affiliated issuers. The Underlying Funds’ distributions may be reinvested into such Underlying Funds. Reinvestment amounts are included in the purchases at cost amounts in the tables below.
Emerging Markets Equity Fund |
For the six months ended April 30, 2023 |
| | | | | Change in
Unrealized
Appreciation/
(Depreciation) | | | | Capital Gain
Distributions |
JPMorgan Prime Money Market Fund Class Institutional Shares, 4.88% (a) (b) | | | | | | | | | |
JPMorgan Securities Lending Money Market Fund Agency SL Class Shares, 5.01% (a) (b) | | | | | | | | | |
JPMorgan U.S. Government Money Market Fund Class IM Shares, 4.78% (a) (b) | | | | | | | | | |
| | | | | | | | | |
|
| Investment in an affiliated fund, which is registered under the Investment Company Act of 1940, as amended, and is advised by J.P. Morgan Investment Management Inc. |
| The rate shown is the current yield as of April 30, 2023. |
| Amount rounds to less than one thousand. |
| Amount is included on the Statements of Operations as Income from securities lending (net) (after payments of rebates and Citibank’s fee). |
Emerging Markets Research Enhanced Equity Fund |
For the six months ended April 30, 2023 |
| | | | | Change in
Unrealized
Appreciation/
(Depreciation) | | | | Capital Gain
Distributions |
JPMorgan Prime Money Market Fund Class Institutional Shares, 4.88% (a) (b) | | | | | | | | | |
| J.P. Morgan International Equity Funds | |
Emerging Markets Research Enhanced Equity Fund (continued) |
For the six months ended April 30, 2023 |
| | | | | Change in Unrealized Appreciation/ (Depreciation) | | | | Capital Gain Distributions |
JPMorgan Securities Lending Money Market Fund Agency SL Class Shares, 5.01% (a) (b) | | | | | | | | | |
JPMorgan U.S. Government Money Market Fund Class IM Shares, 4.78% (a) (b) | | | | | | | | | |
| | | | | | | | | |
|
| Investment in an affiliated fund, which is registered under the Investment Company Act of 1940, as amended, and is advised by J.P. Morgan Investment Management Inc. |
| The rate shown is the current yield as of April 30, 2023. |
| Amount is included on the Statements of Operations as Income from securities lending (net) (after payments of rebates and Citibank’s fee). |
|
For the six months ended April 30, 2023 |
| | | | | Change in
Unrealized
Appreciation/
(Depreciation) | | | | Capital Gain
Distributions |
JPMorgan Prime Money Market Fund Class Institutional Shares, 4.88% (a) (b) | | | | | | | | | |
JPMorgan Securities Lending Money Market Fund Agency SL Class Shares, 5.01% (a) (b) | | | | | | | | | |
JPMorgan U.S. Government Money Market Fund Class IM Shares, 4.78% (a) (b) | | | | | | | | | |
| | | | | | | | | |
|
| Investment in an affiliated fund, which is registered under the Investment Company Act of 1940, as amended, and is advised by J.P. Morgan Investment Management Inc. |
| The rate shown is the current yield as of April 30, 2023. |
| Amount rounds to less than one thousand. |
| Amount is included on the Statements of Operations as Income from securities lending (net) (after payments of rebates and Citibank’s fee). |
International Equity Fund |
For the six months ended April 30, 2023 |
| | | | | Change in
Unrealized
Appreciation/
(Depreciation) | | | | Capital Gain
Distributions |
JPMorgan Prime Money Market Fund Class Institutional Shares, 4.88% (a) (b) | | | | | | | | | |
JPMorgan Securities Lending Money Market Fund Agency SL Class Shares, 5.01% (a) (b) | | | | | | | | | |
JPMorgan U.S. Government Money Market Fund Class IM Shares, 4.78% (a) (b) | | | | | | | | | |
| | | | | | | | | |
|
| Investment in an affiliated fund, which is registered under the Investment Company Act of 1940, as amended, and is advised by J.P. Morgan Investment Management Inc. |
| The rate shown is the current yield as of April 30, 2023. |
| Amount is included on the Statements of Operations as Income from securities lending (net) (after payments of rebates and Citibank’s fee). |
| J.P. Morgan International Equity Funds | |
NOTES TO FINANCIAL STATEMENTS
AS OF April 30, 2023 (Unaudited) (continued)
(Dollar values in thousands)
|
For the six months ended April 30, 2023 |
| | | | | Change in
Unrealized
Appreciation/
(Depreciation) | | | | Capital Gain
Distributions |
JPMorgan Prime Money Market Fund Class Institutional Shares, 4.88% (a) (b) | | | | | | | | | |
JPMorgan Securities Lending Money Market Fund Agency SL Class Shares, 5.01% (a) (b) | | | | | | | | | |
JPMorgan U.S. Government Money Market Fund Class IM Shares, 4.78% (a) (b) | | | | | | | | | |
| | | | | | | | | |
|
| Investment in an affiliated fund, which is registered under the Investment Company Act of 1940, as amended, and is advised by J.P. Morgan Investment Management Inc. |
| The rate shown is the current yield as of April 30, 2023. |
| Amount rounds to less than one thousand. |
| Amount is included on the Statements of Operations as Income from securities lending (net) (after payments of rebates and Citibank’s fee). |
International Hedged Equity Fund |
For the six months ended April 30, 2023 |
| | | | | Change in
Unrealized
Appreciation/
(Depreciation) | | | | Capital Gain
Distributions |
JPMorgan U.S. Government Money Market Fund Class Institutional Shares, 4.71% (a) (b) | | | | | | | | | |
|
| Investment in an affiliated fund, which is registered under the Investment Company Act of 1940, as amended, and is advised by J.P. Morgan Investment Management Inc. |
| The rate shown is the current yield as of April 30, 2023. |
|
For the six months ended April 30, 2023 |
| | | | | Change in
Unrealized
Appreciation/
(Depreciation) | | | | Capital Gain
Distributions |
JPMorgan Prime Money Market Fund Class Institutional Shares, 4.88% (a) (b) | | | | | | | | | |
JPMorgan Securities Lending Money Market Fund Agency SL Class Shares, 5.01% (a) (b) | | | | | | | | | |
JPMorgan U.S. Government Money Market Fund Class IM Shares, 4.78% (a) (b) | | | | | | | | | |
| | | | | | | | | |
|
| Investment in an affiliated fund, which is registered under the Investment Company Act of 1940, as amended, and is advised by J.P. Morgan Investment Management Inc. |
| The rate shown is the current yield as of April 30, 2023. |
| Amount rounds to less than one thousand. |
| Amount is included on the Statements of Operations as Income from securities lending (net) (after payments of rebates and Citibank’s fee). |
| J.P. Morgan International Equity Funds | |
E. Foreign Currency Translation — The books and records of the Funds are maintained in U.S. dollars. Foreign currency amounts are translated into U.S. dollars at the prevailing exchange rates of such currencies against the U.S. dollar. The market value of investment securities and other assets and liabilities are translated at the exchange rate as of the valuation date. Purchases and sales of investment securities, income and expenses are translated at the exchange rate prevailing on the respective dates of such transactions.
The Funds do not isolate the effect of changes in foreign exchange rates from changes in market prices on securities held. Accordingly, such changes are included within Change in net unrealized appreciation/depreciation on investments in non-affiliates on the Statements of Operations.
Reported realized foreign currency gains and losses arise from the disposition of foreign currency, currency gains or losses realized between the trade and settlement dates on securities transactions, and the difference between the amounts of dividends, interest and foreign withholding taxes recorded on each Fund's books on the transaction date and the U.S. dollar equivalent of the amounts actually received or paid. These reported realized foreign currency gains and losses are included in Net realized gain (loss) on foreign currency transactions on the Statements of Operations. Unrealized foreign currency gains and losses arise from changes (due to changes in exchange rates) in the value of foreign currency and other assets and liabilities denominated in foreign currencies, which are held at period end and are included in Change in net unrealized appreciation/depreciation on foreign currency translations on the Statements of Operations.
F. Options — International Hedged Equity Fund purchased put and call options on securities to gain long or short exposure to the underlying instrument. A purchaser of a put option has the right, but not the obligation, to sell the underlying instrument at an agreed upon price (“strike price”) to the option seller. A purchaser of a call option has the right, but not the obligation, to purchase the underlying instrument at the strike price from the option seller.
Options Purchased — Premiums paid by the Fund for options purchased are included on the Statements of Assets and Liabilities as Options purchased. The option is adjusted daily to reflect the current market value of the option and the change is recorded as Change in net unrealized appreciation/depreciation on options purchased on the Statements of Operations. If the option is allowed to expire, the Fund will lose the entire premium it paid and record a realized loss for the premium amount. Premiums paid for options purchased which are exercised or closed are added to the amounts paid or offset against the proceeds on the underlying investment transaction to determine the realized gain (loss) or cost basis of the underlying investment.
Options Written — Premiums received by the Fund for options written are included on the Statement of Assets and Liabilities as a liability. The amount of the liability is adjusted daily to reflect the current market value of the option written and the change in market value is recorded as Change in net unrealized appreciation/depreciation of options written on the Statement of Operations. Premiums received from options written that expire are treated as realized gains. If a written option is closed, the Fund records a realized gain or loss on options written based on whether the cost of the closing transaction exceeds the premium received. If a call option is exercised by the option buyer, the premium received by the Fund is added to the proceeds from the sale of the underlying security to the option buyer and compared to the cost of the closing transaction to determine whether there has been a realized gain or loss. If a put option is exercised by an option buyer, the premium received by the option seller reduces the cost basis of the purchased security.
Written uncovered call options subject the Fund to unlimited risk of loss. Written covered call options limit the upside potential of a security above the strike price. Written put options subject the Fund to risk of loss if the value of the security declines below the exercise price minus the put premium.
The Fund is not subject to credit risk on options written as the counterparty has already performed its obligation by paying the premium at the inception of the contract.
The Fund's exchange-traded option contracts are not subject to master netting arrangements (the right to close out all transactions traded with a counterparty and net amounts owed or due across transactions).
G. Futures Contracts — Emerging Markets Research Enhanced Equity Fund, Europe Dynamic Fund and International Hedged Equity Fund used index futures contracts to gain or reduce exposure to the stock market, or maintain liquidity or minimize transaction costs. The Funds also purchased futures contracts to invest incoming cash in the market or sold futures in response to cash outflows, thereby simulating an invested position in the underlying index while maintaining a cash balance for liquidity.
Futures contracts provide for the delayed delivery of the underlying instrument at a fixed price or are settled for a cash amount based on the change in the value of the underlying instrument at a specific date in the future. Upon entering into a futures contract, the Funds are required to deposit with the broker, cash or securities in an amount equal to a certain percentage of the contract amount, which is referred to as the initial margin deposit. Subsequent payments, referred to as variation margin, are made or received by the Funds periodically and are based on changes in the market value of open futures contracts. Changes in the market value of open futures contracts are recorded as Change in net unrealized appreciation/depreciation on futures contracts on the Statements of Operations. Realized gains or losses, representing the difference between the value of the contract at the time it was opened and the value at the time it was closed, are reported on the Statements of Operations at the closing or expiration of the futures contract. Securities deposited as initial margin are designated on the SOIs, while cash deposited, which is considered restricted, is recorded on the Statements of Assets and Liabilities. A receivable from and/or a payable to brokers for the daily variation margin is also recorded on the Statements of Assets and Liabilities.
| J.P. Morgan International Equity Funds | |
NOTES TO FINANCIAL STATEMENTS
AS OF April 30, 2023 (Unaudited) (continued)
(Dollar values in thousands)
The use of futures contracts exposes the Funds to equity price risk. The Funds may be subject to the risk that the change in the value of the futures contract may not correlate perfectly with the underlying instrument. Use of long futures contracts subjects the Funds to risk of loss in excess of the amounts shown on the Statements of Assets and Liabilities, up to the notional amount of the futures contracts. Use of short futures contracts subjects the Funds to unlimited risk of loss. The Funds may enter into futures contracts only on exchanges or boards of trade. The exchange or board of trade acts as the counterparty to each futures transaction; therefore, the Funds' credit risk is limited to failure of the exchange or board of trade. Under some circumstances, futures exchanges may establish daily limits on the amount that the price of a futures contract can vary from the previous day’s settlement price, which could effectively prevent liquidation of positions.
The Funds' futures contracts are not subject to master netting arrangements (the right to close out all transactions traded with a counterparty and net amounts owed or due across transactions).
Derivatives Volume
The table below discloses the volume of the Funds' options and futures contracts activity during the six months ended April 30, 2023.
| Emerging
Markets
Research
Enhanced
Equity Fund | | International
Hedged
Equity Fund |
| | | |
Average Notional Balance Long | | | |
Ending Notional Balance Long | | | |
| | | |
Average Number of Contracts Purchased | | | |
Average Number of Contracts Written | | | |
Ending Number of Contracts Purchased | | | |
Ending Number of Contracts Written | | | |
The Funds' derivatives contracts held at April 30, 2023 are not accounted for as hedging instruments under GAAP.
H. Security Transactions and Investment Income — Investment transactions are accounted for on the trade date (the date the order to buy or sell is executed). Securities gains and losses are calculated on a specifically identified cost basis.
Interest income and interest expense on securities sold short, if any, is determined on the basis of coupon interest accrued using the effective interest method, which adjusts for amortization of premiums and accretion of discounts.
Dividend income, net of foreign taxes withheld, if any, is recorded on the ex-dividend date or when the Fund first learns of the dividend.
To the extent such information is publicly available, the Funds record distributions received in excess of income earned from underlying investments as a reduction of cost of investments and/or realized gain. Such amounts are based on estimates if actual amounts are not available and actual amounts of income, realized gain and return of capital may differ from the estimated amounts. The Funds adjust the estimated amounts of the components of distributions (and consequently their net investment income) as necessary, once the issuers provide information about the actual composition of the distributions.
I. Allocation of Income and Expenses— Expenses directly attributable to a Fund are charged directly to that Fund, while the expenses attributable to more than one fund of the Trusts are allocated among the applicable funds. Investment income, realized and unrealized gains and losses and expenses, other than class-specific expenses, are allocated daily to each class of shares based upon the proportion of net assets of each class at the beginning of each day.
Transfer agency fees are class-specific expenses. The amount of the transfer agency fees charged to each share class of the Funds for the six months ended April 30, 2023 are as follows:
| | | | | | | | | | |
Emerging Markets Equity Fund | | | | | | | | | | |
| | | | | | | | | | |
Emerging Markets Research Enhanced Equity Fund | | | | | | | | | | |
| | | | | | | | | | |
| | | | | | | | | | |
| | | | | | | | | | |
International Equity Fund | | | | | | | | | | |
| | | | | | | | | | |
| J.P. Morgan International Equity Funds | |
| | | | | | | | | | |
| | | | | | | | | | |
| | | | | | | | | | |
International Hedged Equity Fund | | | | | | | | | | |
| | | | | | | | | | |
| | | | | | | | | | |
| | | | | | | | | | |
|
| Amount rounds to less than one thousand. |
J. Federal Income Taxes — Each Fund is treated as a separate taxable entity for Federal income tax purposes. Each Fund's policy is to comply with the provisions of the Internal Revenue Code (the “Code”) applicable to regulated investment companies and to distribute to shareholders all of its distributable net investment income and net realized capital gains on investments. Accordingly, no provision for Federal income tax is necessary. Management has reviewed the Funds' tax positions for all open tax years and has determined that as of April 30, 2023, no liability for Federal income tax is required in the Funds' financial statements for net unrecognized tax benefits. However, management’s conclusions may be subject to future review based on changes in, or the interpretation of, the accounting standards or tax laws and regulations. Each Fund's Federal tax returns for the prior three fiscal years remain subject to examination by the Internal Revenue Service.
K. Foreign Taxes —The Funds may be subject to foreign taxes on income, gains on investments or currency purchases/repatriation, a portion of which may be recoverable. The Funds will accrue such taxes and recoveries as applicable, based upon their current interpretation of tax rules and regulations that exist in the markets in which they invest. When a capital gains tax is determined to apply, the Funds record an estimated deferred tax liability in an amount that would be payable if the securities were disposed of on the valuation date.
As a result of court rulings in certain European countries, the tax authorities of each of these countries, recently paid Europe Dynamic Fund (France), International Equity Fund (France) and International Value Fund (France & Sweden) tax reclaims for prior tax withholding. These tax reclaim payments are included in Foreign withholding tax reclaims on the Statements of Operations. Interest income, if any, related to these tax reclaim payments is included in Interest income from non-affiliates on the Statements of Operations.
In the event that tax reclaims received by the Funds during the fiscal year ending October 31, 2023 exceed the foreign withholding taxes paid by the Funds for other foreign investments, and the Funds have previously passed foreign tax credits on to their shareholders, the Funds will have a U.S. tax liability. The Funds will enter into a closing agreement with the Internal Revenue Service (IRS) in order to pay the associated tax liability (fees) on behalf of the Funds’ shareholders. These IRS fees are estimated through the year ended October 31, 2023 and are included in IRS Compliance Fees for foreign withholding tax reclaims on the Statements of Operations, if applicable.
L. Distributions to Shareholders — Distributions from net investment income, if any, are generally declared and paid at least annually and are declared separately for each class. No class has preferential dividend rights; differences in per share rates are due to differences in separate class expenses. Net realized capital gains, if any, are distributed by each Fund at least annually. The amount of distributions from net investment income and net realized capital gains is determined in accordance with Federal income tax regulations, which may differ from GAAP. To the extent these “book/tax” differences are permanent in nature (i.e., that they result from other than timing of recognition — “temporary differences”), such amounts are reclassified within the capital accounts based on their Federal tax basis treatment.
3. Fees and Other Transactions with Affiliates
A. Investment Advisory Fee — Pursuant to an Investment Advisory Agreement, the Adviser manages the investments of each Fund and for such services is paid a fee. The investment advisory fee is accrued daily and paid monthly at an annual rate based on each Fund's respective average daily net assets. The annual rate for each Fund is as follows:
| |
Emerging Markets Equity Fund | |
Emerging Markets Research Enhanced Equity Fund | |
| |
International Equity Fund | |
| |
International Hedged Equity Fund | |
| |
The Adviser waived investment advisory fees and/or reimbursed expenses as outlined in Note 3.F.
| J.P. Morgan International Equity Funds | |
NOTES TO FINANCIAL STATEMENTS
AS OF April 30, 2023 (Unaudited) (continued)
(Dollar values in thousands)
B. Administration Fee — Pursuant to an Administration Agreement, the Administrator provides certain administration services to each Fund. In consideration of these services, the Administrator receives a fee accrued daily and paid monthly at an annual rate of 0.075% of the first $10 billion of each Fund’s respective average daily net assets, plus 0.050% of each Fund’s respective average daily net assets between $10 billion and $20 billion, plus 0.025% of each Fund’s respective average daily net assets between $20 billion and $25 billion, plus 0.01% of each Fund’s respective average daily net assets in excess of $25 billion. For the six months ended April 30, 2023, the effective annualized rate was 0.07% of each Fund's average daily net assets, notwithstanding any fee waivers and/or expense reimbursements.
The Administrator waived administration fees as outlined in Note 3.F.
JPMorgan Chase Bank, N.A. ("JPMCB"), a wholly-owned subsidiary of JPMorgan, serves as the Funds' sub-administrator (the “Sub-administrator”). For its services as Sub-administrator, JPMCB receives a portion of the fees payable to JPMIM.
C. Distribution Fees — Pursuant to a Distribution Agreement, JPMorgan Distribution Services, Inc. (“JPMDS”), an indirect, wholly-owned subsidiary of JPMorgan, serves as each Fund's principal underwriter and promotes and arranges for the sale of each Fund's shares.
The Boards have adopted a Distribution Plan (the “Distribution Plan”) for Class A, Class C, Class R2 and Class R3 Shares of the Funds, as applicable, pursuant to Rule 12b-1 under the 1940 Act. Class I, Class L, Class R4, Class R5 and Class R6 Shares of the Funds do not charge a distribution fee. The Distribution Plan provides that the following Funds shall pay, with respect to the applicable share classes, distribution fees, including payments to JPMDS, at annual rates of the average daily net assets as shown in the table below:
| | | | |
Emerging Markets Equity Fund | | | | |
| | | | |
International Equity Fund | | | | |
| | | | |
International Hedged Equity Fund | | | | |
| | | | |
In addition, JPMDS is entitled to receive the front-end sales charges from purchases of Class A Shares and the CDSC from redemptions of Class C Shares and certain Class A Shares for which front-end sales charges have been waived. For the six months ended April 30, 2023, JPMDS retained the following:
| | |
Emerging Markets Equity Fund | | |
| | |
International Equity Fund | | |
| | |
International Hedged Equity Fund | | |
| | |
|
| Amount rounds to less than one thousand. |
D. Service Fees — The Trusts, on behalf of the Funds, has entered into a Shareholder Servicing Agreement with JPMDS under which JPMDS provides certain support services to fund shareholders. For performing these services, JPMDS receives a fee with respect to all share classes, except Class R6 Shares which do not charge a service fee, that is accrued daily and paid monthly equal to a percentage of the average daily net assets as shown in the table below:
| | | | | | | | |
Emerging Markets Equity Fund | | | | | | | | |
Emerging Markets Research Enhanced Equity Fund | | | | | | | | |
| | | | | | | | |
International Equity Fund | | | | | | | | |
| | | | | | | | |
International Hedged Equity Fund | | | | | | | | |
| | | | | | | | |
| J.P. Morgan International Equity Funds | |
JPMDS has entered into shareholder services contracts with affiliated and unaffiliated financial intermediaries who provide shareholder services and other related services to their clients or customers who invest in the Funds. Pursuant to such contracts, JPMDS will pay all or a portion of such fees earned to financial intermediaries for performing such services.
JPMDS waived service fees as outlined in Note 3.F.
E. Custodian and Accounting Fees — JPMCB provides portfolio custody and accounting services to the Funds. For performing these services, the Funds pay JPMCB transaction and asset-based fees that vary according to the number of transactions and positions, plus out-of-pocket expenses. The amounts paid directly to JPMCB by the Funds for custody and accounting services are included in Custodian and accounting fees on the Statements of Operations.
Interest income earned on cash balances at the custodian, if any, is included in Interest income from affiliates on the Statements of Operations.
Interest expense paid to the custodian related to cash overdrafts, if any, is included in Interest expense to affiliates on the Statements of Operations.
F. Waivers and Reimbursements —The Adviser, Administrator and/or JPMDS have contractually agreed to waive fees and/or reimburse the Funds to the extent that total annual operating expenses (excluding acquired fund fees and expenses other than certain money market fund fees as described below, dividend and interest expenses related to short sales, interest, taxes, expenses related to litigation and potential litigation, expenses related to trustee elections and extraordinary expenses) exceed the percentages of the Funds' respective average daily net assets as shown in the table below:
| | | | | | | | | |
Emerging Markets Equity Fund | | | | | | | | | |
Emerging Markets Research Enhanced Equity Fund | | | | | | | | | |
| | | | | | | | | |
International Equity Fund | | | | | | | | | |
| | | | | | | | | |
International Hedged Equity Fund | | | | | | | | | |
| | | | | | | | | |
The expense limitation agreements were in effect for the six months ended April 30, 2023 and the contractual expense limitation percentages in the table above are in place until at least February 29, 2024.
For the six months ended April 30, 2023, the Funds' service providers waived fees and/or reimbursed expenses for each of the Funds as follows. None of these parties expect the Funds to repay any such waived fees and/or reimbursed expenses in future years.
| | |
| | | | | Contractual
Reimbursements |
Emerging Markets Equity Fund | | | | | |
Emerging Markets Research Enhanced Equity Fund | | | | | |
| | | | | |
International Equity Fund | | | | | |
| | | | | |
International Hedged Equity Fund | | | | | |
| | | | | |
|
| Amount rounds to less than one thousand. |
Additionally, the Funds may invest in one or more money market funds advised by the Adviser (affiliated money market funds). The Adviser, Administrator and/or JPMDS, as shareholder servicing agent, have contractually agreed to waive fees and/or reimburse expenses in an amount sufficient to offset the respective net fees each collects from the affiliated money market fund on the applicable Fund's investment in such affiliated money market fund, except for investments of securities lending cash collateral. None of these parties expect the Funds to repay any such waived fees and/or reimbursed expenses in future years.
The amounts of these waivers resulting from investments in these money market funds for the six months ended April 30, 2023 were as follows:
| J.P. Morgan International Equity Funds | |
NOTES TO FINANCIAL STATEMENTS
AS OF April 30, 2023 (Unaudited) (continued)
(Dollar values in thousands)
| |
Emerging Markets Equity Fund | |
Emerging Markets Research Enhanced Equity Fund | |
| |
International Equity Fund | |
| |
International Hedged Equity Fund | |
| |
JPMIM voluntarily agreed to reimburse the Funds for the Trustee Fees paid to one of the interested Trustees. For the six months ended April 30, 2023, the amount of these reimbursements were as follows:
| |
Emerging Markets Equity Fund | |
Emerging Markets Research Enhanced Equity Fund | |
| |
International Equity Fund | |
| |
International Hedged Equity Fund | |
| |
G. Other — Certain officers of the Trusts are affiliated with the Adviser, the Administrator and JPMDS. Such officers, with the exception of the Chief Compliance Officer, receive no compensation from the Funds for serving in their respective roles.
The Boards designated and appointed a Chief Compliance Officer to the Funds pursuant to Rule 38a-1 under the 1940 Act. Each Fund, along with affiliated funds, makes reimbursement payments, on a pro-rata basis, to the Administrator for a portion of the fees associated with the office of the Chief Compliance Officer. Such fees are included in Trustees’ and Chief Compliance Officer’s fees on the Statements of Operations.
The Trusts adopted a Trustee Deferred Compensation Plan (the “Plan”) which allows the independent Trustees to defer the receipt of all or a portion of compensation related to performance of their duties as Trustees. The deferred fees are invested in various J.P. Morgan Funds until distribution in accordance with the Plan.
The Securities and Exchange Commission ("SEC") has granted an exemptive order permitting the Funds to engage in principal transactions with J.P. Morgan Securities LLC, an affiliated broker, involving taxable money market instruments, subject to certain conditions.
4. Investment Transactions
During the six months ended April 30, 2023, purchases and sales of investments (excluding short-term investments) were as follows:
| Purchases
(excluding
U.S. Government) | Sales
(excluding
U.S. Government) |
Emerging Markets Equity Fund | | |
Emerging Markets Research Enhanced Equity Fund | | |
| | |
International Equity Fund | | |
| | |
International Hedged Equity Fund | | |
| | |
During the six months ended April 30, 2023, there were no purchases or sales of U.S. Government securities.
| J.P. Morgan International Equity Funds | |
5. Federal Income Tax Matters
For Federal income tax purposes, the estimated cost and unrealized appreciation (depreciation) in value of investments held at April 30, 2023 were as follows:
| | Gross
Unrealized
Appreciation | Gross
Unrealized
Depreciation | Net Unrealized
Appreciation
(Depreciation) |
Emerging Markets Equity Fund | | | | |
Emerging Markets Research Enhanced Equity Fund | | | | |
| | | | |
International Equity Fund | | | | |
| | | | |
International Hedged Equity Fund | | | | |
| | | | |
At October 31, 2022, the following Funds had net capital loss carryforwards which are available to offset future realized gains:
| Capital Loss Carryforward Character |
| | |
Emerging Markets Equity Fund | | |
Emerging Markets Research Enhanced Equity Fund | | |
| | |
International Equity Fund | | |
| | |
International Hedged Equity Fund | | |
| | |
|
| Amount includes capital loss carryforwards which are limited in future years under Internal Revenue Code sections 381-384. |
During the year ended October 31, 2022, the following Fund utilized capital loss carryforwards as follows:
| |
| | |
International Hedged Equity Fund | | |
6. Borrowings
The Funds rely upon an exemptive order granted by the SEC (the “Order”) permitting the establishment and operation of an Interfund Lending Facility (the “Facility”). The Facility allows the Funds to directly lend and borrow money to or from any other fund relying upon the Order at rates beneficial to both the borrowing and lending funds. Advances under the Facility are taken primarily for temporary or emergency purposes, including the meeting of redemption requests that otherwise might require the untimely disposition of securities, and are subject to each Fund's borrowing restrictions. The interfund loan rate is determined, as specified in the Order, by averaging the current repurchase agreement rate and the current bank loan rate. The Order was granted to JPMorgan Trust II ("JPM II") and may be relied upon by the Funds because the Funds and the series of JPM II are all investment companies in the same “group of investment companies” (as defined in Section 12(d)(1)(G) of the 1940 Act).
| J.P. Morgan International Equity Funds | |
NOTES TO FINANCIAL STATEMENTS
AS OF��April 30, 2023 (Unaudited) (continued)
(Dollar values in thousands)
The Funds had no borrowings outstanding from another fund, or loans outstanding to another fund, during the six months ended April 30, 2023. Average borrowings from the Facility during the six months ended April 30, 2023 were as follows:
| | | | |
Emerging Markets Equity Fund | | | | |
Emerging Markets Research Enhanced Equity Fund | | | | |
International Equity Fund | | | | |
| | | | |
International Hedged Equity Fund | | | | |
The Trusts and JPMCB have entered into a financing arrangement. Under this arrangement, JPMCB provides an unsecured, uncommitted credit facility in the aggregate amount of $100 million to certain of the J.P. Morgan Funds, including the Funds. Advances under the arrangement are taken primarily for temporary or emergency purposes, including the meeting of redemption requests that otherwise might require the untimely disposition of securities, and are subject to each Fund’s borrowing restrictions. Interest on borrowings is payable at a rate determined by JPMCB at the time of borrowing. This agreement has been extended until October 30, 2023.
The Funds had no borrowings outstanding from the unsecured, uncommitted credit facility during the six months ended April 30, 2023.
The Trusts, along with certain other trusts for J.P. Morgan Funds (“Borrowers”), have entered into a joint syndicated senior unsecured revolving credit facility totaling $1.5 billion (“Credit Facility”) with various lenders and The Bank of New York Mellon, as administrative agent for the lenders. This Credit Facility provides a source of funds to the Borrowers for temporary and emergency purposes, including the meeting of redemption requests that otherwise might require the untimely disposition of securities. Under the terms of the Credit Facility, a borrowing fund must have a minimum of $25 million in adjusted net asset value and not exceed certain adjusted net asset coverage ratios prior to and during the time in which any borrowings are outstanding. If a fund does not comply with the aforementioned requirements, the fund must remediate within three business days with respect to the $25 million minimum adjusted net asset value or within one business day with respect to certain asset coverage ratios or the administrative agent at the request of, or with the consent of, the lenders may terminate the Credit Facility and declare any outstanding borrowings to be due and payable immediately.
Interest associated with any borrowing under the Credit Facility is charged to the borrowing fund at a rate of interest equal to 1.00% (the "Applicable Margin"), plus the greater on the day of the borrowing, of the federal funds effective rate, or the Adjusted Daily Simple SOFR Rate. Prior to August 9, 2022, interest associated with any borrowing under the Credit Facility was charged to the borrowing fund at a rate of interest equal to the Applicable Margin, plus the greater of the federal funds effective rate or one month London Interbank Offered Rate ("LIBOR"). Effective August 9, 2022, the Credit Facility was amended and restated for a term of 364 days, unless extended, and included a change in the interest associated with any borrowing as mentioned above.
The Funds had no borrowings outstanding from the Credit Facility at April 30, 2023. Average borrowings from the Credit Facility for, or at any time during the six months ended April 30, 2023 were as follows (amounts in thousands, except number of days outstanding):
| | | | |
Emerging Markets Research Enhanced Equity Fund | | | | |
| | | | |
7. Risks, Concentrations and Indemnifications
In the normal course of business, the Funds enter into contracts that contain a variety of representations which provide general indemnifications. Each Fund's maximum exposure under these arrangements is unknown. The amount of exposure would depend on future claims that may be brought against each Fund. However, based on experience, the Funds expect the risk of loss to be remote.
| J.P. Morgan International Equity Funds | |
As of April 30, 2023, the Funds had individual shareholder and/or omnibus accounts each owning more than 10% of the respective Fund's outstanding shares as follows:
| Number of
Individual Shareholder
and/or Affiliated
Omnibus Accounts | | Number of
Individual Shareholder
and/or Non-Affiliated
Omnibus Accounts | |
Emerging Markets Equity Fund | | | | |
| | | | |
International Equity Fund | | | | |
| | | | |
International Hedged Equity Fund | | | | |
| | | | |
As of April 30, 2023, J.P. Morgan Investor Funds, JPMorgan SmartRetirement Funds and JPMorgan SmartRetirement Blend Funds, which are affiliated fund of funds, each owned in the aggregate, shares representing more than 10% of the net assets of the Funds as follows:
| | JPMorgan
SmartRetirement
Funds | JPMorgan
SmartRetirement
Blend Funds |
Emerging Markets Research Enhanced Equity Fund | | | |
| | | |
International Equity Fund | | | |
| | | |
Significant shareholder transactions by these shareholders may impact the Funds' performance and liquidity.
The Funds may have elements of risk not typically associated with investments in the United States of America due to concentrated investments in a limited number of foreign countries or regions, which may vary throughout the period. Such concentrations may subject each of these Funds to additional risks resulting from political or economic conditions in such countries or regions and the possible imposition of adverse governmental laws or currency exchange restrictions could cause the securities and their markets to be less liquid and their prices to be more volatile than those of comparable U.S. securities.
As of April 30, 2023, the following Funds had non-U.S. country allocations representing greater than 10% of total investments (excluding investment of cash collateral from securities loaned) as follows:
| Emerging
Markets
Equity Fund | Emerging
Markets
Research
Enhanced
Equity Fund | | | | International
Hedged
Equity Fund | |
| | | | | | | |
| | | | | | | |
| | | | | | | |
| | | | | | | |
| | | | | | | |
| | | | | | | |
| | | | | | | |
| | | | | | | |
As of April 30, 2023, a significant portion of each Fund's investments consisted of securities that were denominated in foreign currencies. Changes in currency exchange rates will affect the value of, and investment income from, such securities.
Derivatives may be riskier than other types of investments because they may be more sensitive to changes in economic and market conditions and could result in losses that significantly exceed the Funds' original investment. Many derivatives create leverage thereby causing the Funds to be more volatile than they would have been if they had not used derivatives. Derivatives also expose the Funds to counterparty risk (the risk that the derivative counterparty will not fulfill its contractual obligations), including credit risk of the derivative counterparty. The possible lack of a liquid secondary market for derivatives and the resulting inability of the Funds to sell or otherwise close a derivatives position could expose the Funds to losses.
| J.P. Morgan International Equity Funds | |
NOTES TO FINANCIAL STATEMENTS
AS OF April 30, 2023 (Unaudited) (continued)
(Dollar values in thousands)
The Funds invest in foreign issuers and foreign securities (including depositary receipts) are subject to additional risks, including political and economic risks, civil conflicts and war, greater volatility, expropriation and nationalization risks, sanctions or other measures by the United States or other governments, currency fluctuations, higher transaction costs, delayed settlement, possible foreign controls on investment, liquidity risks and less stringent investor protection and disclosure standards of foreign markets. In certain markets where securities and other instruments are not traded “delivery versus payment,” a Fund may not receive timely payment for securities or other instruments it has delivered or receive delivery of securities paid for and may be subject to increased risk that the counterparty will fail to make payments or delivery when due or default completely.
Events and evolving conditions in certain economies or markets may alter the risks associated with investments tied to countries or regions that historically were perceived as comparatively stable becoming riskier and more volatile. Emerging Markets Equity Fund and Emerging Markets Research Enhanced Equity Fund each invests a substantial portion of their assets in emerging market countries. These risks are magnified in countries in emerging markets. Emerging market countries typically have less established market economies than developed countries and may face greater social, economic, regulatory and political uncertainties. In addition, emerging markets typically present greater illiquidity and price volatility concerns due to smaller or limited local capital markets and greater difficulty in determining market valuations of securities due to limited public information on issuers. Certain emerging market countries may be subject to less stringent requirements regarding accounting, auditing, financial reporting and record keeping and therefore, material information related to an investment may not be available or reliable.
In addition, a Fund is limited in its ability to exercise its legal rights or enforce a counterparty’s legal obligations in certain jurisdictions outside of the United States, in particular, in emerging market countries.
LIBOR is intended to represent the rate at which contributing banks may obtain short-term borrowings from each other in the London interbank market. On March 5, 2021, the U.K. Financial Conduct Authority ("FCA") publicly announced that (i) immediately after December 31, 2021, publication of the 1-week and 2-month U.S. Dollar LIBOR settings will permanently cease; (ii) immediately after June 30, 2023, publication of the overnight and 12-month U.S. Dollar LIBOR settings will permanently cease; and (iii) immediately after June 30, 2023, the 1-month, 3-month and 6-month U.S. Dollar LIBOR settings will cease to be provided or, subject to the FCA's consideration of the case, be provided on a synthetic basis and no longer be representative of the underlying market and economic reality they are intended to measure and that representativeness will not be restored. There is no assurance that the dates announced by the FCA will not change or that the administrator of LIBOR and/or regulators will not take further action that could impact the availability, composition or characteristics of LIBOR or the currencies and/or tenors for which LIBOR is published. In addition, certain regulated entities ceased entering into most new LIBOR contracts in connection with regulatory guidance or prohibitions. Public and private sector industry initiatives are currently underway to implement new or alternative reference rates to be used in place of LIBOR. There is no assurance that any such alternative reference rate will be similar to or produce the same value or economic equivalence as LIBOR or that it will have the same volume or liquidity as did LIBOR prior to its discontinuance, unavailability or replacement, all of which may affect the value, volatility, liquidity or return on certain of a Fund's loans, notes, derivatives and other instruments or investments comprising some or all of a Fund's investments and result in costs incurred in connection with changing reference rates used for positions, closing out positions and entering into new trades. Certain of a Fund's investments may transition from LIBOR prior to the dates announced by the FCA. The transition from LIBOR to alternative reference rates may result in operational issues for a Fund or its investments. No assurances can be given as to the impact of the LIBOR transition (and the timing of any such impact) on a Fund and its investments. These risks may also apply with respect to changes in connection with other interbank offering rates (e.g., Euribor) and a wide range of other index levels, rates and values that are treated as “benchmarks” and are the subject of recent regulatory reform.
The Funds are subject to infectious disease epidemics/pandemics risk. The worldwide outbreak of COVID-19 negatively affected economies, markets and individual companies throughout the world. The effects of this, or any future, pandemic to public health and business and market conditions may have a significant negative impact on the performance of a Fund's investments, increase a Fund's volatility, exacerbate other pre-existing political, social and economic risks to the Funds and negatively impact broad segments of businesses and populations. In addition, governments, their regulatory agencies, or self-regulatory organizations have taken or may take actions in response to a pandemic that affect the instruments in which the Funds invest, or the issuers of such instruments, in ways that could also have a significant negative impact on a Fund’s investment performance. The ultimate impact of any pandemic and the extent to which the associated conditions and governmental responses impact a Fund will also depend on future developments, which are highly uncertain, difficult to accurately predict and subject to frequent changes.
8. Redemptions in-kind
On April 21, 2022, certain shareholders sold Class R6 Shares of International Focus Fund. The portfolio securities were delivered primarily by means of a redemption in-kind in exchange for shares of the Fund. Cash and portfolio securities were transferred as detailed below:
|
| This amount includes cash of $99,867 associated with the redemption in-kind. |
| J.P. Morgan International Equity Funds | |
SCHEDULE OF SHAREHOLDER EXPENSES
(Unaudited)
Hypothetical $1,000 Investment
As a shareholder of the Funds, you incur two types of costs: (1) transaction costs, including sales charges (loads) on purchase payments and (2) ongoing costs, including investment advisory fees, administration fees, distribution fees and other Fund expenses. The examples below are intended to help you understand your ongoing costs (in dollars) of investing in the Funds (not including expenses of the Underlying Funds and ETFs) and to compare these ongoing costs with the ongoing costs of investing in other mutual funds. The examples assume that you had a $1,000 investment in each Class at the beginning of the reporting period, November 1, 2022, and continued to hold your shares at the end of the reporting period, April 30, 2023.
Actual Expenses
For each Class of each Fund in the table below, the first line provides information about actual account values and actual expenses. You may use the information in this line, together with the amount you invested, to estimate the expenses that you paid over the period. Simply divide your account value by $1,000 (for example, an $8,600 account value divided by $1,000 = 8.6), then multiply the result by the number in the first line of each Class under the heading titled “Expenses Paid During the Period” to estimate the expenses you paid on your account during this period.
Hypothetical Example for Comparison Purposes
The second line of each Class in the table below provides information about hypothetical account values and hypothetical expenses based on the Class’ actual expense ratio and an assumed rate of return of 5% per year before expenses, which is not the Class’ actual return. The hypothetical account values and expenses may not be used to estimate the actual ending account balance or expenses you paid for the period. You may use this information to compare the ongoing costs of investing in the Class of the Funds and other funds. To do so, compare this 5% hypothetical example with the 5% hypothetical examples that appear in the shareholder reports of the other funds. Please note that the expenses shown in the table are meant to highlight your ongoing costs only and do not reflect any transaction costs, such as sales charges (loads), or redemption fees, and expenses of the Underlying Funds and ETFs. Therefore, the second line for each Class in the table is useful in comparing ongoing costs only, and will not help you determine the relative total costs of owning different funds. In addition, if these transaction costs were included, your costs would have been higher. The examples also assume all dividends and distributions have been reinvested.
| Beginning
Account Value
November 1, 2022 | Ending
Account Value
April 30, 2023 | Expenses
Paid During
the Period* | |
JPMorgan Emerging Markets Equity Fund | | | | |
| | | | |
| | | | |
| | | | |
| | | | |
| | | | |
| | | | |
| | | | |
| | | | |
| | | | |
| | | | |
| | | | |
| | | | |
| | | | |
| | | | |
| | | | |
| | | | |
| | | | |
| | | | |
| | | | |
| | | | |
| | | | |
| | | | |
| | | | |
| | | | |
| J.P. Morgan International Equity Funds | |
SCHEDULE OF SHAREHOLDER EXPENSES
(Unaudited) (continued)
Hypothetical $1,000 Investment
| Beginning Account Value November 1, 2022 | Ending Account Value April 30, 2023 | Expenses Paid During the Period* | |
JPMorgan Emerging Markets Equity Fund (continued) | | | | |
| | | | |
| | | | |
| | | | |
JPMorgan Emerging Markets Research Enhanced Equity Fund | | | | |
| | | | |
| | | | |
| | | | |
| | | | |
| | | | |
| | | | |
JPMorgan Europe Dynamic Fund | | | | |
| | | | |
| | | | |
| | | | |
| | | | |
| | | | |
| | | | |
| | | | |
| | | | |
| | | | |
| | | | |
| | | | |
| | | | |
| | | | |
| | | | |
| | | | |
JPMorgan International Equity Fund | | | | |
| | | | |
| | | | |
| | | | |
| | | | |
| | | | |
| | | | |
| | | | |
| | | | |
| | | | |
| | | | |
| | | | |
| | | | |
| | | | |
| | | | |
| | | | |
| | | | |
| | | | |
| | | | |
JPMorgan International Focus Fund | | | | |
| | | | |
| | | | |
| | | | |
| J.P. Morgan International Equity Funds | |
| Beginning Account Value November 1, 2022 | Ending Account Value April 30, 2023 | Expenses Paid During the Period* | |
JPMorgan International Focus Fund (continued) | | | | |
| | | | |
| | | | |
| | | | |
| | | | |
| | | | |
| | | | |
| | | | |
| | | | |
| | | | |
| | | | |
| | | | |
| | | | |
| | | | |
| | | | |
| | | | |
JPMorgan International Hedged Equity Fund | | | | |
| | | | |
| | | | |
| | | | |
| | | | |
| | | | |
| | | | |
| | | | |
| | | | |
| | | | |
| | | | |
| | | | |
| | | | |
| | | | |
| | | | |
| | | | |
JPMorgan International Value Fund | | | | |
| | | | |
| | | | |
| | | | |
| | | | |
| | | | |
| | | | |
| | | | |
| | | | |
| | | | |
| | | | |
| | | | |
| | | | |
| | | | |
| | | | |
| | | | |
| | | | |
| | | | |
| | | | |
| J.P. Morgan International Equity Funds | |
SCHEDULE OF SHAREHOLDER EXPENSES
(Unaudited) (continued)
Hypothetical $1,000 Investment
| Beginning Account Value November 1, 2022 | Ending Account Value April 30, 2023 | Expenses Paid During the Period* | |
JPMorgan International Value Fund (continued) | | | | |
| | | | |
| | | | |
| | | | |
|
| Expenses are equal to each Class’ respective annualized expense ratio, multiplied by the average account value over the period, multiplied by 181/365 (to reflect the one-half year period). |
| J.P. Morgan International Equity Funds | |
LIQUIDITY RISK MANAGEMENT PROGRAM
(Unaudited)
Each of the Funds covered in this report has adopted the J.P. Morgan Funds and J.P. Morgan Exchange-Traded Funds Amended and Restated Liquidity Risk Management Program (the “Program”) under Rule 22e-4 under the Investment Company Act of 1940, as amended (the “Liquidity Rule”). The Program seeks to assess, manage and review each Fund’s Liquidity Risk. “Liquidity Risk” is defined as the risk that a fund could not meet requests to redeem shares issued by the fund without significant dilution of remaining investors’ interests in the fund. Pursuant to an exemptive order (the “Exemptive Order”) from the Securities and Exchange Commission, the Program permits the Funds to use liquidity definitions and classification methodologies that differ from the requirements under the Liquidity Rule in some respects. Among other things, the Liquidity Rule requires that a written report be provided to the Board of Trustees (the “Board”) on an annual basis that addresses the operation of the Program and assesses the adequacy and effectiveness of its implementation, including the operation of any Highly Liquid Investment Minimum (“HLIM”), where applicable, and any material changes to the Program.
The Board has appointed J.P. Morgan Asset Management’s Liquidity Risk Forum to be the program administrator for the Program (the “Program Administrator”). In addition to regular reporting at each of its quarterly meetings, on February 7, 2023, the Board reviewed the Program Administrator’s annual written report (the “Report”) concerning the operation of the Program for the period from January 1, 2022 through December 31, 2022 (the “Program Reporting Period”). The Report addressed the operation of the Program and assessed its adequacy and effectiveness of implementation, including, where applicable, the operation of a Fund’s HLIM. There were no material changes to the Program during the Program Reporting Period.
The Report summarized the operation of the Program and the information and factors considered by the Program Administrator in assessing whether the Program has been adequately and effectively implemented with respect to each Fund. Such information and factors included, among other things: (1) the liquidity risk framework used to assess, manage, and periodically review each Fund’s Liquidity Risk and the results of this assessment; (2) the methodology and inputs for classifying the investments of a Fund into one of the required liquidity categories that reflect an estimate of the liquidity of those investments under current market conditions; (3) whether a Fund invested primarily in “Highly Liquid Investments” (as defined or modified under the Program), as well as whether an HLIM should be established for a Fund (and, for Funds that have adopted an HLIM, whether the HLIM continues to be appropriate or whether a Fund has invested below its HLIM) and the procedures for monitoring for any HLIM; (4) whether a Fund invested more than 15% of its assets in “Illiquid Investments” (as defined or modified under the Program) and the procedures for monitoring for this limit; and (5) specific liquidity events arising during the Program Reporting Period. The Report further summarized the conditions of the Exemptive Order and whether all applicable Funds were in compliance with the terms of the Exemptive Order.
Based on this review, the Report concluded that: (1) the Program continues to be reasonably designed to effectively assess and manage each Fund’s Liquidity Risk; and (2) the Program has been adequately and effectively implemented with respect to each Fund during the Program Reporting Period.
| J.P. Morgan International Equity Funds | |
THIS PAGE IS INTENTIONALLY LEFT BLANK
THIS PAGE IS INTENTIONALLY LEFT BLANK
THIS PAGE IS INTENTIONALLY LEFT BLANK
J.P. Morgan Funds are distributed by JPMorgan Distribution Services, Inc., which is an affiliate of JPMorgan Chase & Co. Affiliates of JPMorgan Chase & Co. receive fees for providing various services to the funds.
Contact JPMorgan Distribution Services, Inc. at 1-800-480-4111 for a fund prospectus. You can also visit us at www.jpmorganfunds.com. Investors should carefully consider the investment objectives and risk as well as charges and expenses of the mutual fund before investing. The prospectus contains this and other information about the mutual fund. Read the prospectus carefully before investing.
Investors may obtain information about the Securities Investor Protection Corporation (SIPC), including the SIPC brochure, by visiting www.sipc.org or by calling SIPC at 202-371-8300.
Each Fund files a complete schedule of its fund holdings for the first and third quarters of its fiscal year with the SEC as an exhibit to its report on Form N-PORT. The Funds' Form N-PORT reports are available on the SEC’s website at http://www.sec.gov. Each Fund's quarterly holdings can be found by visiting the J.P. Morgan Funds’ website at www.jpmorganfunds.com.
A description of each Fund's policies and procedures with respect to the disclosure of each Fund's holdings is available in the prospectuses and Statement of Additional Information.
A copy of proxy policies and procedures is available without charge upon request by calling 1-800-480-4111 and on the Funds' website at www.jpmorganfunds.com. A description of such policies and procedures is on the SEC’s website at www.sec.gov. The Trustees have delegated the authority to vote proxies for securities owned by the Funds to the Adviser. A copy of the Funds' voting record for the most recent 12-month period ended June 30 is available on the SEC’s website at www.sec.gov or at the Funds' website at www.jpmorganfunds.com no later than August 31 of each year. The Funds' proxy voting record will include, among other things, a brief description of the matter voted on for each fund security, and will state how each vote was cast, for example, for or against the proposal.
J.P. Morgan Asset Management is the brand name for the asset management business of JPMorgan Chase & Co. and its affiliates worldwide.
© JPMorgan Chase & Co., 2023. All rights reserved. April 2023.
SAN-INTEQ-423
Semi-Annual Report
J.P. Morgan Specialty Funds
April 30, 2023 (Unaudited)
JPMorgan Opportunistic Equity Long/Short Fund |
JPMorgan Research Market Neutral Fund |
CONTENTS
Investments in a Fund are not deposits or obligations of, or guaranteed or endorsed by, any bank and are not insured or guaranteed by the FDIC, the Federal Reserve Board or any other government agency. You could lose money if you sell when a Fund’s share price is lower than when you invested.
Past performance is no guarantee of future performance. The general market views expressed in this report are opinions based on market and other conditions through the end of the reporting period and are subject to change without notice. These views are not intended to predict the future performance of a Fund or the securities markets.
Prospective investors should refer to the Funds’ prospectuses for a discussion of the Funds’ investment objectives, strategies and risks. Call J.P. Morgan Funds Service Center at 1-800-480-4111 for a prospectus containing more complete information about a Fund, including management fees and other expenses. Please read it carefully before investing.
Letter to Shareholders
June 15, 2023 (Unaudited)
Dear Shareholder,
Financial markets largely generated positive returns for the six months ended April 30, 2023, even as rising interest rates, weaker corporate earnings and geopolitical uncertainty weighed on global economic growth. Overall, global equity markets – led by European stocks – generally outperformed bond markets for the reporting period.
|
“While the effects of rising interest rates is likely to adversely impact economic growth in the months ahead, other factors may aid the global economic outlook, as energy prices have trended downward in recent months and the re-opening of China’s economy may provide support for increased global trade.” — Brian S. Shlissel
|
While economic growth has slowed in recent quarters, to date, the U.S. has avoided formal entry into a recession. Moreover, inflation has decelerated from last year’s historical highs as energy and electricity prices receded in 2023, allowing the U.S. Federal Reserve in June 2023 to refrain from further raising interest rates for the first time since January 2022, though the central bank stated it may find it necessary to raise rates in the future. The job market in the U.S. remained strong throughout the period as the reported monthly unemployment rate ranged between 3.6% and 3.4% for the six months ended April 30, 2023.
Across Europe, inflationary pressures remained high and both the European Central Bank and the Bank of England continued to raise interest rates during the period. Unemployment across the EU stood at 6%, while the U.K. jobless rate fell to 3.8% in
April 2023. Notably, European equity markets generally outperformed other developed markets during the period, potentially driven by more attractive valuations relative to U.S. companies.
The International Monetary Fund’s (IMF) April 2023 economic outlook warned that global output is likely to decline to 2.8% for 2023, amid weakness in parts of the financial sector, continued inflationary pressures and the ongoing war in Ukraine. Further, the IMF forecast developed market economies to decelerate at a faster pace than emerging market economies.
While the effects of rising interest rates is likely to adversely impact economic growth in the months ahead, other factors may aid the global economic outlook, as energy prices have trended downward in recent months and the re-opening of China’s economy may provide support for increased global trade. Regardless of the economic backdrop, we believe investors who hold a well-diversified portfolio and a long-term outlook may be better positioned to benefit from opportunities presented by global financial markets. Our suite of investment solutions seeks to provide investors with ability to build durable portfolios that can meet their financial goals.
Sincerely,
Brian S. Shlissel
President, J.P. Morgan Funds
J.P. Morgan Asset Management
1-800-480-4111 or www.jpmorganfunds.com for more information
| J.P. Morgan Specialty Funds | |
J.P. Morgan Specialty Funds
MARKET OVERVIEW
SIX MONTHS ENDED April 30, 2023 (Unaudited)
Global financial markets largely generated positive returns for the period and completed a rebound from the sell-offs that marked the middle of 2022. Developed markets equity generally outperformed emerging markets equity, while European equity markets outperformed U.S. equity.
However, equity markets performance was mixed on a month-to-month basis, even if the overall trend was upward. For the six months ended April 30, 2023, the MSCI EAFE Index returned 24.19%, the MSCI Emerging Markets Index returned 16.36% and the S&P 500 Index returned 8.63%.
Leading central banks continued to raise interest rates throughout the six-month period, though the size of increases narrowed in 2023 as the policy response to inflationary pressure grew less aggressive. Notably, the Bank of Japan maintained its negative interest rate policy amid weak consumption data and marginal economic growth.
While global inflation rates remained elevated during the period, they retreated from the 40-year highs reached in 2022, and price data in the U.S. and the Euro Area indicated a slowing trend. Though inflation in the U.K. declined in the final months of 2022, the U.K. consumer price index rose more than expected in 2023.
Lower energy prices were a leading contributor to declining global inflation in the second half of the period. Following Russia’s invasion of Ukraine in late February 2022, the European Union and the U.K. largely avoided an extended energy crisis by securing alternative sources to Russian natural gas and moved to build up reserves of both natural gas and petroleum ahead of the winter months.
Meanwhile, economic activity and aggregate demand in China accelerated after the country’s leadership lifted strict anti-pandemic policies in late 2022. The rebound in China helped to lift equity prices in China and its leading emerging market trading partners.
| J.P. Morgan Specialty Funds | |
JPMorgan Opportunistic Equity Long/Short Fund
FUND COMMENTARY
SIX MONTHS ENDED April 30, 2023 (Unaudited)
| |
| |
| |
ICE BofA 3-Month US Treasury Bill Index | |
Net Assets as of 4/30/2023 (In Thousands) | |
INVESTMENT OBJECTIVE**
The JPMorgan Opportunistic Equity Long/Short Fund (the “Fund”) seeks capital appreciation.
WHAT WERE THE MAIN DRIVERS OF THE FUND’S PERFORMANCE?
The Fund’s Class I Shares underperformed the S&P 500 Index (the “Benchmark”) for the six months ended April 30, 2023.
The Fund’s long position in the information technology sector and its short position in the industrials sector were leading detractors from performance relative to the Benchmark. The Fund’s long position in the financials sector and its short position in the real estate sector were leading contributors to relative performance.
Leading individual detractors from absolute performance included the Fund’s long positions in NIO Inc., and short positions in Old Dominion Freight Line Inc. and CarMax Inc. Shares of NIO, a Chinese electric vehicle manufacturer, fell amid investor concerns about increased price competition within the electric vehicle market. Old Dominion Freight Line, a shipping company, rose amid favorable pricing trends in the industry and the company’s expense controls. CarMax, an online vehicle wholesaler, rose as prices for used automobiles stabilized during the period.
Leading individual contributors to absolute performance included the Fund’s long positions in Tesla Inc., Fiserv Inc. and Charter Communications Inc. Shares of Tesla, a manufacturer of electric automobiles and battery storage systems, rose amid better-than-expected results during the period. Shares of Fiserv, a financial transactions and payment services provider, rose after the company reported better-than-expected earnings and revenue for the first quarter of 2023 and raised its forecast for the rest of the year. Shares of Charter, a broadband provider, rose early in the period along with rising equity prices in the broader U.S. market.
HOW WAS THE FUND POSITIONED?
During the period, the Fund invested the majority of its assets in long and short positions in equity securities, selecting from a universe of equity securities with market capitalizations similar to those included in the S&P 500 Index. The Fund’s portfolio managers sought to achieve lower volatility than the Benchmark through a disciplined research process, security selection and risk management. For the six-month period, the Fund’s average gross exposure was 89% and its average net exposure was 37%.
| J.P. Morgan Specialty Funds | |
JPMorgan Opportunistic Equity Long/Short Fund
FUND COMMENTARY
SIX MONTHS ENDED April 30, 2023 (Unaudited) (continued)
TOP TEN LONG POSITIONS OF THE
PORTFOLIO AS OF April 30, 2023 | PERCENT OF
TOTAL
INVESTMENTS |
| | |
| | |
| | |
| | |
| | |
| NXP Semiconductors NV (China) | |
| Berkshire Hathaway, Inc., Class B | |
| Taiwan Semiconductor Manufacturing Co. Ltd. (Taiwan) | |
| | |
| Marriott International, Inc., Class A | |
TOP TEN SHORT POSITIONS OF THE
PORTFOLIO AS OF April 30, 2023 | PERCENT OF
TOTAL
INVESTMENTS |
| JB Hunt Transport Services, Inc. | |
| | |
| CF Industries Holdings, Inc. | |
| | |
| | |
| | |
| | |
| | |
| | |
| | |
LONG POSITION PORTFOLIO COMPOSITION
BY SECTOR AS OF April 30, 2023 | PERCENT OF
TOTAL
INVESTMENTS |
| |
| |
| |
| |
| |
| |
| |
| |
| |
| |
SHORT POSITION PORTFOLIO COMPOSITION
BY SECTOR AS OF April 30, 2023 | PERCENT OF
TOTAL
INVESTMENTS |
| |
| |
| |
| |
| |
| |
| |
| |
*
The return shown is based on net asset values calculated for shareholder transactions and may differ from the return shown in the financial highlights, which reflects adjustments made to the net asset values in accordance with accounting principles generally accepted in the United States of America.
**
The adviser seeks to achieve the Fund’s objective. There can be no guarantee it will be achieved.
| J.P. Morgan Specialty Funds | |
AVERAGE ANNUAL TOTAL RETURNS AS OF April 30, 2023
|
| |
| Sales Charge for Class A Shares is 5.25%. |
| Assumes a 1% CDSC (contingent deferred sales charge) for the 6 month and one year periods and 0% CDSC thereafter. |
LIFE OF FUND PERFORMANCE (8/29/14 TO 4/30/23)

The performance quoted is past performance and is not a guarantee of future results. Mutual funds are subject to certain market risks. Investment returns and principal value of an investment will fluctuate so that an investor’s shares, when redeemed, may be worth more or less than their original cost. Current performance may be higher or lower than the performance data shown. For up-to-date month-end performance information, please call 1-800-480-4111.
The Fund commenced operations on August 29, 2014.
The graph illustrates comparative performance for $1,000,000 invested in Class I Shares of the JPMorgan Opportunistic Equity Long/Short Fund, the S&P 500 Index and the ICE BofA 3-Month US Treasury Bill Index from August 29, 2014 to April 30, 2023. The performance of the Fund assumes reinvestment of all dividends and capital gain distributions, if any, and does not include a sales charge. The performance of the S&P 500 Index and ICE BofA 3-Month US Treasury Bill Index does not reflect the deduction of expenses or a sales charge associated with a mutual fund and has been adjusted to reflect reinvestment of all dividends and capital gain distributions of securities included in the benchmarks, if applicable. The S&P 500 Index is an unmanaged index generally representative of the performance of large companies in the U.S. stock market. The ICE BofA 3-Month US Treasury Bill Index is comprised of a single issue purchased at the beginning of the month and held for a full month. Each month the index is rebalanced and the issue selected is the outstanding Treasury Bill
that matures closest to, but not beyond, 3 months from the rebalancing date. Investors cannot invest directly in an index.
From the inception of the Fund through January 23, 2015, the Fund did not experience any shareholder activity. If such activity had occurred, the Fund’s performance may have been impacted.
Class I Shares have a $1,000,000 minimum initial investment.
Fund performance may reflect the waiver of the Fund’s fees and reimbursement of expenses for certain periods since the inception date. Without these waivers and reimbursements, performance would have been lower. Also, performance shown in this section does not reflect the deduction of taxes that a shareholder would pay on Fund distributions or on gains resulting from redemptions of Fund shares.
Because Class C Shares automatically convert to Class A Shares after 8 years, the since inception annual total return shown above for Class C reflects Class A performance for the period after conversion.
The returns shown are based on net asset values calculated for shareholder transactions and may differ from the returns shown in the financial highlights, which reflect adjustments made to the net asset values in accordance with accounting principles generally accepted in the United States of America.
| J.P. Morgan Specialty Funds | |
JPMorgan Research Market Neutral Fund
FUND COMMENTARY
SIX MONTHS ENDED April 30, 2023 (Unaudited)
| |
| |
ICE BofA 3-Month US Treasury Bill Index | |
Net Assets as of 4/30/2023 (In Thousands) | |
INVESTMENT OBJECTIVE**
The JPMorgan Research Market Neutral Fund (the “Fund”) seeks to provide long-term capital appreciation from a broadly diversified portfolio of U.S. stocks while neutralizing the general risks associated with stock market investing.
WHAT WERE THE MAIN DRIVERS OF THE FUND’S PERFORMANCE?
The Fund’s Class I Shares outperformed the ICE BofA 3-Month US Treasury Bill Index (the “Benchmark”) for the six months ended April 30, 2023.
The Fund’s security selection in the media sector and the software & hardware sector was a leading contributor to performance relative to the Benchmark, while the Fund’s security selection in the industrial cyclical and utilities sector was a leading detractor from relative performance.
Leading individual contributors to relative performance included the Fund’s long position in Meta Platforms Inc. and its short positions in Lumen Technologies Inc. and Roblox Corp. Shares of Meta Platforms, an interactive media and services provider, rose after the company reported better-than-expected earnings, revenue and Facebook advertising sales for the first quarter of 2023. Shares of Lumen Technologies, a communications technology provider, fell after the company lowered its cash flow forecast for 2023. Shares of Roblox, an interactive home entertainment provider, fell after the company reported it had financial exposure to the failed Silicon
Valley Bank and after the release of weaker-than-expected user metrics for March 2023.
Leading individual detractors from relative performance included the Fund’s short positions in General Electric Co. an Boeing Co., and its long position in Liberty SiriusXM Group
Shares of General Electric, an industrial conglomerate, rose after the company reported better-than-expected earnings and revenue for the first quarter of 2023 and revised upward its full-year earnings forecast. Shares of Boeing, an aerospace and defense manufacturer, rose after the company reported better-than-expected revenue for the first quarter of 2023 and maintained its production targets for 2023. Shares of Liberty SiriusXM Group, a cable and satellite TV and radio provider, fell amid broader weakness in the telecommunications sector.
HOW WAS THE FUND POSITIONED?
The Fund’s portfolio managers aimed to construct a portfolio of long and short positions with a low correlation to the broader market for stocks and bonds. The Fund’s portfolio managers used fundamental research to estimate companies’ long-term earnings forecasts, ranking approximately 600 large and mid-cap stocks into five quintiles. The Fund’s portfolio managers looked to the top two quintiles for potential long positions in stocks that they believed were undervalued and the bottom two quintiles for potential short positions in stocks that they believed were overvalued.
| J.P. Morgan Specialty Funds | |
TOP TEN LONG POSITIONS OF THE
PORTFOLIO AS OF April 30, 2023 | PERCENT OF
TOTAL
INVESTMENTS |
| Meta Platforms, Inc., Class A | |
| Mastercard, Inc., Class A | |
| Taiwan Semiconductor Manufacturing Co. Ltd. (Taiwan) | |
| Endeavor Group Holdings, Inc., Class A | |
| Seagate Technology Holdings plc | |
| | |
| | |
| | |
| | |
| | |
TOP TEN SHORT POSITIONS OF THE
PORTFOLIO AS OF April 30, 2023 | PERCENT OF
TOTAL
INVESTMENTS |
| | |
| Microchip Technology, Inc. | |
| | |
| | |
| Hewlett Packard Enterprise Co. | |
| | |
| | |
| | |
| Paramount Global, Class B | |
| Stanley Black & Decker, Inc. | |
LONG POSITION PORTFOLIO COMPOSITION
BY SECTOR AS OF April 30, 2023 | PERCENT OF
TOTAL
INVESTMENTS |
| |
| |
| |
| |
| |
| |
| |
| |
| |
| |
| |
| |
SHORT POSITION PORTFOLIO COMPOSITION
BY SECTOR AS OF April 30, 2023 | PERCENT OF
TOTAL
INVESTMENTS |
| |
| |
| |
| |
| |
| |
| |
| |
| |
| |
| |
*
The return shown is based on net asset values calculated for shareholder transactions and may differ from the return shown in the financial highlights, which reflects adjustments made to the net asset values in accordance with accounting principles generally accepted in the United States of America.
**
The adviser seeks to achieve the Fund’s objective. There can be no guarantee it will be achieved.
| J.P. Morgan Specialty Funds | |
JPMorgan Research Market Neutral Fund
FUND COMMENTARY
SIX MONTHS ENDED April 30, 2023 (Unaudited) (continued)
AVERAGE ANNUAL TOTAL RETURNS AS OF April 30, 2023
|
| |
| Sales Charge for Class A Shares is 5.25%. |
| Amount rounds to less than 0.005%. |
| Assumes a 1% CDSC (contingent deferred sales charge) for the 6 month and one year periods and 0% CDSC thereafter. |
TEN YEAR FUND PERFORMANCE (4/30/13 TO 4/30/23)

The performance quoted is past performance and is not a guarantee of future results. Mutual funds are subject to certain market risks. Investment returns and principal value of an investment will fluctuate so that an investor’s shares, when redeemed, may be worth more or less than their original cost. Current performance may be higher or lower than the performance data shown. For up-to-date month-end performance information, please call 1-800-480-4111.
The graph illustrates comparative performance for $1,000,000 invested in Class I Shares of the JPMorgan Research Market Neutral Fund and ICE BofA 3-Month US Treasury Bill Index from April 30, 2013 to April 30, 2023. The performance of the Fund assumes reinvestment of all dividends and capital gain distributions, if any, and does not include a sales charge. The performance of the ICE BofA 3-Month US Treasury Bill Index does not reflect the deduction of expenses or a sales charge associated with a mutual fund and has been adjusted to reflect reinvestment of all dividends and capital gain distributions of the securities included in the benchmark, if applicable. The ICE BofA 3-Month US Treasury Bill Index is comprised of a single issue purchased at the beginning of the month and held for a full month. Each month the index is rebalanced and
the issue selected is the outstanding Treasury Bill that matures closest to, but not beyond, 3 months from the rebalancing date. Investors cannot invest directly in an index.
Class I Shares have a $1,000,000 minimum initial investment.
Fund performance may reflect the waiver of the Fund’s fees and reimbursement of expenses for certain periods. Without these waivers and reimbursements, performance would have been lower. Also, performance shown in this section does not reflect the deduction of taxes that a shareholder would pay on Fund distributions or on gains resulting from redemptions of Fund shares.
Because Class C Shares automatically convert to Class A Shares after 8 years, the 10 year average annual total return shown above for Class C reflects Class A performance for the period after conversion.
The returns shown are based on net asset values calculated for shareholder transactions and may differ from the returns shown in the financial highlights, which reflect adjustments made to the net asset values in accordance with accounting principles generally accepted in the United States of America.
| J.P. Morgan Specialty Funds | |
JPMorgan Opportunistic Equity Long/Short Fund
SCHEDULE OF PORTFOLIO INVESTMENTS
AS OF April 30, 2023 (Unaudited)
| | |
|
|
|
| | |
| | |
| | |
|
Brown-Forman Corp., Class B | | |
|
Alibaba Group Holding Ltd., ADR (China) * | | |
| | |
| | |
Consumer Staples Distribution & Retail — 4.6% |
| | |
Electric Utilities — 8.9% |
| | |
| | |
| | |
Financial Services — 12.5% |
Berkshire Hathaway, Inc., Class B * | | |
| | |
| | |
| | |
Health Care Equipment & Supplies — 0.9% |
Zimmer Biomet Holdings, Inc. | | |
Health Care Providers & Services — 11.0% |
| | |
UnitedHealth Group, Inc. (a) | | |
| | |
Hotels, Restaurants & Leisure — 5.6% |
Marriott International, Inc., Class A | | |
Royal Caribbean Cruises Ltd. * | | |
| | |
Household Products — 1.0% |
Procter & Gamble Co. (The) | | |
Interactive Media & Services — 1.1% |
Alphabet, Inc., Class A * | | |
Meta Platforms, Inc., Class A * | | |
| | |
Semiconductors & Semiconductor Equipment — 10.6% |
| | |
| | |
|
|
Semiconductors & Semiconductor Equipment — continued |
NXP Semiconductors NV (China) | | |
Taiwan Semiconductor Manufacturing Co. Ltd., ADR (Taiwan) | | |
| | |
|
| | |
|
O'Reilly Automotive, Inc. * | | |
Technology Hardware, Storage & Peripherals — 2.1% |
Seagate Technology Holdings plc | | |
Total Common Stocks
(Cost $149,198) | | |
Exchange-Traded Funds — 4.2% |
Exchange-Traded Fund — 4.2% |
SPDR S&P 500 ETF Trust (Cost $10,476) | | |
| | |
Options Purchased — 0.1% ^ |
Put Options Purchased — 0.1% |
|
| | |
6/16/2023 at USD 11,800.00, European Style | | |
Notional Amount: USD 46,620,875 | | |
Counterparty: Exchange-Traded * | | |
| | |
6/16/2023 at USD 4,000.00, European Style | | |
Notional Amount: USD 12,091,492 | | |
Counterparty: Exchange-Traded * | | |
Total Options Purchased
(Cost $802) | | |
| | |
Short-Term Investments — 31.7% |
Investment Companies — 31.7% |
JPMorgan Prime Money Market Fund Class Institutional Shares, 4.88% (b) (c)(Cost $81,647) | | |
Total Long Positions
(Cost $242,123) | | |
SEE NOTES TO FINANCIAL STATEMENTS.
| J.P. Morgan Specialty Funds | |
JPMorgan Opportunistic Equity Long/Short Fund
SCHEDULE OF PORTFOLIO INVESTMENTS
AS OF April 30, 2023 (Unaudited) (continued)
| | |
Short Positions — (17.3)% |
|
Air Freight & Logistics — (1.1)% |
| | |
|
Rivian Automotive, Inc., Class A * | | |
Building Products — (1.9)% |
| | |
Johnson Controls International plc | | |
| | |
| | |
|
CF Industries Holdings, Inc. | | |
Sherwin-Williams Co. (The) | | |
| | |
Consumer Finance — (0.4)% |
| | |
Consumer Staples Distribution & Retail — (0.5)% |
Walgreens Boots Alliance, Inc. | | |
|
| | |
Ground Transportation — (1.9)% |
JB Hunt Transport Services, Inc. | | |
Household Durables — (1.7)% |
Mohawk Industries, Inc. * | | |
Household Products — (0.2)% |
| | |
Life Sciences Tools & Services — (1.0)% |
| | |
|
Stanley Black & Decker, Inc. | | |
|
| | |
| | |
| | |
| | |
| | |
|
|
Residential REITs — (0.3)% |
AvalonBay Communities, Inc. | | |
Specialty Retail — (1.8)% |
| | |
Technology Hardware, Storage & Peripherals — (0.8)% |
| | |
Total Common Stocks
(Proceeds $(44,281)) | | |
Total Short Positions
(Proceeds $(44,281)) | | |
Total Investments — 83.8%
(Cost $197,842) | | |
Other Assets Less Liabilities — 16.2% | | |
| | |
Percentages indicated are based on net assets. |
| |
| American Depositary Receipt |
| |
| Real Estate Investment Trust |
| Standard & Poor's Depositary Receipt |
| Non-income producing security. |
| All or a portion of this security is segregated as collateral for short sales. The total value of securities and cash segregated as collateral is $24,492 and $59,856, respectively. |
| Investment in an affiliated fund, which is registered under the Investment Company Act of 1940, as amended, and is advised by J.P. Morgan Investment Management Inc. |
| The rate shown is the current yield as of April 30, 2023. |
SEE NOTES TO FINANCIAL STATEMENTS.
| J.P. Morgan Specialty Funds | |
JPMorgan Research Market Neutral Fund
SCHEDULE OF PORTFOLIO INVESTMENTS
AS OF April 30, 2023 (Unaudited)
| | |
|
|
Aerospace & Defense — 2.9% |
| | |
Northrop Grumman Corp. (a) | | |
Raytheon Technologies Corp. | | |
| | |
| | |
Air Freight & Logistics — 0.3% |
| | |
United Parcel Service, Inc., Class B | | |
| | |
Automobile Components — 0.6% |
| | |
| | |
Mobileye Global, Inc., Class A (Israel) * | | |
| | |
|
Rivian Automotive, Inc., Class A * | | |
| | |
| | |
|
| | |
| | |
| | |
| | |
| | |
| | |
|
| | |
Constellation Brands, Inc., Class A | | |
| | |
| | |
| | |
| | |
|
| | |
| | |
BioMarin Pharmaceutical, Inc. * | | |
Regeneron Pharmaceuticals, Inc. * | | |
| | |
|
|
Biotechnology — continued |
Sarepta Therapeutics, Inc. * | | |
Vertex Pharmaceuticals, Inc. * (a) | | |
| | |
|
| | |
|
| | |
|
Charles Schwab Corp. (The) | | |
| | |
| | |
Raymond James Financial, Inc. | | |
| | |
| | |
| | |
|
Air Products and Chemicals, Inc. (a) | | |
| | |
DuPont de Nemours, Inc. (a) | | |
| | |
| | |
| | |
Commercial Services & Supplies — 0.8% |
| | |
Communications Equipment — 0.4% |
| | |
Construction Materials — 0.1% |
Martin Marietta Materials, Inc. | | |
|
| | |
Consumer Staples Distribution & Retail — 0.9% |
| | |
| | |
| | |
|
| | |
Electric Utilities — 1.8% |
| | |
SEE NOTES TO FINANCIAL STATEMENTS.
| J.P. Morgan Specialty Funds | |
JPMorgan Research Market Neutral Fund
SCHEDULE OF PORTFOLIO INVESTMENTS
AS OF April 30, 2023 (Unaudited) (continued)
| | |
Long Positions — continued |
Common Stocks — continued |
Electric Utilities — continued |
| | |
| | |
| | |
Electrical Equipment — 0.5% |
| | |
Electronic Equipment, Instruments & Components — 1.5% |
| | |
Keysight Technologies, Inc. * | | |
| | |
Energy Equipment & Services — 0.5% |
| | |
|
Endeavor Group Holdings, Inc., Class A * (a) | | |
| | |
Take-Two Interactive Software, Inc. * | | |
| | |
Financial Services — 4.4% |
| | |
Fidelity National Information Services, Inc. | | |
| | |
FleetCor Technologies, Inc. * | | |
Jack Henry & Associates, Inc. | | |
Mastercard, Inc., Class A (a) | | |
| | |
| | |
|
| | |
Mondelez International, Inc., Class A | | |
| | |
Ground Transportation — 2.0% |
Canadian National Railway Co. (Canada) | | |
| | |
Knight-Swift Transportation Holdings, Inc. | | |
| | |
Old Dominion Freight Line, Inc. | | |
Uber Technologies, Inc. * (a) | | |
| | |
| | |
| | |
|
|
Health Care Equipment & Supplies — 1.4% |
Boston Scientific Corp. * | | |
Intuitive Surgical, Inc. * | | |
| | |
Zimmer Biomet Holdings, Inc. | | |
| | |
Health Care Providers & Services — 1.6% |
| | |
| | |
| | |
| | |
UnitedHealth Group, Inc. (a) | | |
| | |
Health Care REITs — 0.0% ^ |
| | |
Hotel & Resort REITs — 0.0% ^ |
Host Hotels & Resorts, Inc. | | |
Hotels, Restaurants & Leisure — 3.0% |
| | |
Chipotle Mexican Grill, Inc. * | | |
DoorDash, Inc., Class A * | | |
Hilton Worldwide Holdings, Inc. | | |
| | |
| | |
| | |
Household Products — 0.1% |
Procter & Gamble Co. (The) | | |
Industrial Conglomerates — 1.2% |
Honeywell International, Inc. (a) | | |
|
| | |
|
| | |
Progressive Corp. (The) (a) | | |
Travelers Cos., Inc. (The) | | |
| | |
Interactive Media & Services — 2.7% |
Alphabet, Inc., Class A * | | |
Meta Platforms, Inc., Class A * (a) | | |
| | |
SEE NOTES TO FINANCIAL STATEMENTS.
| J.P. Morgan Specialty Funds | |
| | |
Long Positions — continued |
Common Stocks — continued |
|
Cognizant Technology Solutions Corp., Class A | | |
| | |
Snowflake, Inc., Class A * | | |
| | |
Life Sciences Tools & Services — 0.3% |
| | |
Thermo Fisher Scientific, Inc. | | |
| | |
|
| | |
| | |
| | |
| | |
|
Charter Communications, Inc., Class A * | | |
| | |
Liberty Media Corp.-Liberty SiriusXM, Class A * | | |
| | |
|
| | |
|
| | |
| | |
| | |
Public Service Enterprise Group, Inc. | | |
| | |
| | |
Oil, Gas & Consumable Fuels — 2.2% |
| | |
| | |
| | |
| | |
| | |
| | |
| | |
| | |
| | |
Passenger Airlines — 0.0% ^ |
| | |
| | |
|
|
Personal Care Products — 0.3% |
Estee Lauder Cos., Inc. (The), Class A | | |
|
Bristol-Myers Squibb Co. (a) | | |
Elanco Animal Health, Inc. * | | |
| | |
Professional Services — 0.7% |
Booz Allen Hamilton Holding Corp. | | |
Leidos Holdings, Inc. (a) | | |
| | |
|
| | |
| | |
| | |
|
| | |
Semiconductors & Semiconductor Equipment — 8.0% |
Advanced Micro Devices, Inc. * (a) | | |
| | |
| | |
| | |
NXP Semiconductors NV (China) | | |
| | |
Taiwan Semiconductor Manufacturing Co. Ltd., ADR (Taiwan) | | |
| | |
| | |
|
| | |
| | |
| | |
| | |
| | |
| | |
| | |
| | |
| | |
| | |
| | |
|
| | |
SEE NOTES TO FINANCIAL STATEMENTS.
| J.P. Morgan Specialty Funds | |
JPMorgan Research Market Neutral Fund
SCHEDULE OF PORTFOLIO INVESTMENTS
AS OF April 30, 2023 (Unaudited) (continued)
| | |
Long Positions — continued |
Common Stocks — continued |
|
| | |
| | |
Burlington Stores, Inc. * | | |
| | |
O'Reilly Automotive, Inc. * (a) | | |
| | |
Technology Hardware, Storage & Peripherals — 2.1% |
Dell Technologies, Inc., Class C | | |
Seagate Technology Holdings plc | | |
| | |
Textiles, Apparel & Luxury Goods — 0.8% |
| | |
Wireless Telecommunication Services — 0.3% |
| | |
Total Common Stocks
(Cost $110,060) | | |
Short-Term Investments — 21.9% |
Investment Companies — 21.9% |
JPMorgan Prime Money Market Fund Class Institutional Shares, 4.88% (b) (c)(Cost $35,790) | | |
Total Long Positions
(Cost $145,850) | | |
Short Positions — (74.8)% |
|
Aerospace & Defense — (2.8)% |
| | |
| | |
Huntington Ingalls Industries, Inc. | | |
L3Harris Technologies, Inc. | | |
| | |
Air Freight & Logistics — (0.9)% |
CH Robinson Worldwide, Inc. | | |
Expeditors International of Washington, Inc. | | |
| | |
Automobile Components — (0.3)% |
| | |
| | |
| | |
| | |
|
|
|
| | |
| | |
| | |
| | |
|
| | |
Huntington Bancshares, Inc. | | |
PNC Financial Services Group, Inc. (The) | | |
| | |
| | |
|
Brown-Forman Corp., Class B | | |
Molson Coors Beverage Co., Class B | | |
| | |
|
| | |
| | |
| | |
| | |
Broadline Retail — (1.0)% |
| | |
Building Products — (1.8)% |
| | |
Johnson Controls International plc | | |
Lennox International, Inc. | | |
| | |
| | |
|
| | |
Coinbase Global, Inc., Class A * | | |
FactSet Research Systems, Inc. | | |
| | |
LPL Financial Holdings, Inc. | | |
| | |
| | |
| | |
| | |
T. Rowe Price Group, Inc. | | |
| | |
SEE NOTES TO FINANCIAL STATEMENTS.
| J.P. Morgan Specialty Funds | |
| | |
Short Positions — continued |
Common Stocks — continued |
|
| | |
| | |
| | |
Commercial Services & Supplies — (0.1)% |
| | |
Communications Equipment — (1.8)% |
| | |
Consumer Finance — (1.0)% |
Capital One Financial Corp. | | |
| | |
| | |
Consumer Staples Distribution & Retail — (4.1)% |
| | |
| | |
| | |
Walgreens Boots Alliance, Inc. | | |
| | |
| | |
Containers & Packaging — (0.6)% |
| | |
Packaging Corp. of America | | |
| | |
Diversified Telecommunication Services — (1.3)% |
| | |
| | |
Verizon Communications, Inc. | | |
| | |
Electric Utilities — (3.2)% |
American Electric Power Co., Inc. | | |
| | |
| | |
| | |
| | |
| | |
| | |
| | |
Electrical Equipment — (0.5)% |
| | |
| | |
|
|
Electrical Equipment — continued |
| | |
Rockwell Automation, Inc. | | |
| | |
|
| | |
| | |
Warner Bros Discovery, Inc. * | | |
| | |
Financial Services — (1.7)% |
| | |
| | |
| | |
| | |
| | |
|
| | |
| | |
| | |
| | |
| | |
| | |
|
| | |
Ground Transportation — (0.6)% |
Canadian Pacific Kansas City Ltd. (Canada) | | |
| | |
JB Hunt Transport Services, Inc. | | |
| | |
| | |
Health Care Equipment & Supplies — (0.2)% |
Edwards Lifesciences Corp. * | | |
| | |
| | |
Health Care Providers & Services — (0.8)% |
| | |
| | |
| | |
Hotels, Restaurants & Leisure — (0.7)% |
| | |
SEE NOTES TO FINANCIAL STATEMENTS.
| J.P. Morgan Specialty Funds | |
JPMorgan Research Market Neutral Fund
SCHEDULE OF PORTFOLIO INVESTMENTS
AS OF April 30, 2023 (Unaudited) (continued)
| | |
Short Positions — continued |
Common Stocks — continued |
Household Durables — (0.8)% |
Mohawk Industries, Inc. * | | |
| | |
| | |
| | |
| | |
Household Products — (0.2)% |
| | |
Industrial Conglomerates — (1.5)% |
| | |
| | |
| | |
|
| | |
| | |
American International Group, Inc. | | |
| | |
| | |
Marsh & McLennan Cos., Inc. | | |
Principal Financial Group, Inc. | | |
Ryan Specialty Holdings, Inc. * | | |
| | |
| | |
Interactive Media & Services — (0.3)% |
Alphabet, Inc., Class C * | | |
ZoomInfo Technologies, Inc. * | | |
| | |
|
| | |
| | |
| | |
| | |
International Business Machines Corp. | | |
| | |
Life Sciences Tools & Services — (0.8)% |
Agilent Technologies, Inc. | | |
| | |
| | |
| | |
| | |
|
|
|
| | |
| | |
| | |
Illinois Tool Works, Inc. | | |
| | |
Stanley Black & Decker, Inc. | | |
| | |
|
| | |
Interpublic Group of Cos., Inc. (The) | | |
| | |
Paramount Global, Class B | | |
| | |
| | |
|
| | |
|
| | |
| | |
| | |
Oil, Gas & Consumable Fuels — (2.2)% |
| | |
| | |
| | |
| | |
| | |
| | |
| | |
Williams Cos., Inc. (The) | | |
| | |
Passenger Airlines — (0.1)% |
United Airlines Holdings, Inc. * | | |
|
| | |
| | |
| | |
| | |
| | |
| | |
SEE NOTES TO FINANCIAL STATEMENTS.
| J.P. Morgan Specialty Funds | |
| | |
Short Positions — continued |
Common Stocks — continued |
Professional Services — (3.3)% |
Automatic Data Processing, Inc. | | |
Ceridian HCM Holding, Inc. * | | |
| | |
| | |
| | |
Robert Half International, Inc. | | |
| | |
| | |
Residential REITs — (0.4)% |
AvalonBay Communities, Inc. | | |
Equity LifeStyle Properties, Inc. | | |
| | |
|
National Retail Properties, Inc. | | |
Simon Property Group, Inc. | | |
| | |
Semiconductors & Semiconductor Equipment — (6.8)% |
| | |
| | |
| | |
| | |
| | |
Microchip Technology, Inc. | | |
| | |
| | |
|
Palantir Technologies, Inc., Class A * | | |
| | |
| | |
Specialized REITs — (1.1)% |
Extra Space Storage, Inc. | | |
| | |
| | |
Specialty Retail — (1.1)% |
| | |
| | |
| | |
| | |
| | |
|
|
Technology Hardware, Storage & Peripherals — (3.4)% |
| | |
Hewlett Packard Enterprise Co. | | |
| | |
| | |
| | |
Textiles, Apparel & Luxury Goods — (0.2)% |
| | |
Trading Companies & Distributors — (0.4)% |
| | |
Total Common Stocks
(Proceeds $(127,615)) | | |
Total Short Positions
(Proceeds $(127,615)) | | |
Total Investments — 26.0%
(Cost $18,235) | | |
Other Assets Less Liabilities — 74.0% | | |
| | |
Percentages indicated are based on net assets. |
Amounts presented as a dash ("-") represent amounts that round to less than a thousand. |
| |
| American Depositary Receipt |
| Real Estate Investment Trust |
| Amount rounds to less than 0.1% of net assets. |
| Non-income producing security. | |
| All or a portion of this security is segregated as collateral for short sales. The total value of securities and cash segregated as collateral is $22,338 and $120,196, respectively. | |
| Investment in an affiliated fund, which is registered under the Investment Company Act of 1940, as amended, and is advised by J.P. Morgan Investment Management Inc. | |
| The rate shown is the current yield as of April 30, 2023. | |
SEE NOTES TO FINANCIAL STATEMENTS.
| J.P. Morgan Specialty Funds | |
JPMorgan Research Market Neutral Fund
SCHEDULE OF PORTFOLIO INVESTMENTS
AS OF April 30, 2023 (Unaudited) (continued)
Futures contracts outstanding as of April 30, 2023 (amounts in thousands, except number of contracts):
| | | | | VALUE AND
UNREALIZED
APPRECIATION
(DEPRECIATION) ($) |
| | | | | |
| | | | | |
SEE NOTES TO FINANCIAL STATEMENTS.
| J.P. Morgan Specialty Funds | |
STATEMENTS OF ASSETS AND LIABILITIES
AS OF April 30, 2023 (Unaudited)
(Amounts in thousands, except per share amounts)
| JPMorgan
Opportunistic
Equity
Long/Short Fund | |
| | |
Investments in non-affiliates, at value | | |
Investments in affiliates, at value | | |
Options purchased, at value | | |
Deposits at broker for futures contracts | | |
Deposits at broker for securities sold short | | |
| | |
Investment securities sold | | |
| | |
Interest from non-affiliates | | |
Dividends from non-affiliates | | |
Dividends from affiliates | | |
| | |
| | |
| | |
| | |
Securities sold short, at value | | |
Dividend expense to non-affiliates on securities sold short | | |
Investment securities purchased | | |
| | |
Variation margin on futures contracts | | |
| | |
| | |
| | |
| | |
| | |
Custodian and accounting fees | | |
| | |
| | |
| | |
SEE NOTES TO FINANCIAL STATEMENTS.
| J.P. Morgan Specialty Funds | |
STATEMENTS OF ASSETS AND LIABILITIES
AS OF April 30, 2023 (Unaudited) (continued)
(Amounts in thousands, except per share amounts)
| JPMorgan Opportunistic Equity Long/Short Fund | |
| | |
| | |
Total distributable earnings (loss) | | |
| | |
| | |
| | |
| | |
| | |
| | |
| | |
Outstanding units of beneficial interest (shares)
($0.0001 par value; unlimited number of shares authorized): | | |
| | |
| | |
| | |
| | |
| | |
Class A — Redemption price per share | | |
Class C — Offering price per share (b) | | |
Class I — Offering and redemption price per share | | |
Class R6 — Offering and redemption price per share | | |
Class A maximum sales charge | | |
Class A maximum public offering price per share
[net asset value per share/(100% – maximum sales charge)] | | |
Cost of investments in non-affiliates | | |
Cost of investments in affiliates | | |
Cost of options purchased | | |
Proceeds from securities sold short | | |
(a)
Per share amounts may not recalculate due to rounding of net assets and/or shares outstanding.
(b)
Redemption price for Class C Shares varies based upon length of time the shares are held.
SEE NOTES TO FINANCIAL STATEMENTS.
| J.P. Morgan Specialty Funds | |
STATEMENTS OF OPERATIONS
FOR THE SIX MONTHS ENDED April 30, 2023 (Unaudited)
(Amounts in thousands)
| JPMorgan
Opportunistic
Equity
Long/Short Fund | |
| | |
Interest income from non-affiliates | | |
Interest income from affiliates | | |
Dividend income from non-affiliates | | |
Dividend income from affiliates | | |
| | |
| | |
| | |
| | |
| | |
| | |
| | |
| | |
| | |
| | |
| | |
Custodian and accounting fees | | |
Interest expense to affiliates | | |
| | |
Trustees’ and Chief Compliance Officer’s fees | | |
Printing and mailing costs | | |
Registration and filing fees | | |
Transfer agency fees (See Note 2.I.) | | |
Dividend expense to non-affiliates on securities sold short | | |
| | |
| | |
| | |
Less expense reimbursements | | |
| | |
Net investment income (loss) | | |
(a)
Amount rounds to less than one thousand.
SEE NOTES TO FINANCIAL STATEMENTS.
| J.P. Morgan Specialty Funds | |
STATEMENTS OF OPERATIONS
FOR THE SIX MONTHS ENDED April 30, 2023 (Unaudited) (continued)
(Amounts in thousands)
| JPMorgan Opportunistic Equity Long/Short Fund | |
REALIZED/UNREALIZED GAINS (LOSSES): | | |
Net realized gain (loss) on transactions from: | | |
Investments in non-affiliates | | |
Investments in affiliates | | |
| | |
| | |
| | |
| | |
Change in net unrealized appreciation/depreciation on: | | |
Investments in non-affiliates | | |
Investments in affiliates | | |
| | |
| | |
| | |
Change in net unrealized appreciation/depreciation | | |
Net realized/unrealized gains (losses) | | |
Change in net assets resulting from operations | | |
(a)
Amount rounds to less than one thousand.
SEE NOTES TO FINANCIAL STATEMENTS.
| J.P. Morgan Specialty Funds | |
STATEMENTS OF CHANGES IN NET ASSETS
FOR THE PERIODS INDICATED
(Amounts in thousands)
| JPMorgan Opportunistic
Equity Long/Short Fund | JPMorgan
Research Market
Neutral Fund |
| Six Months Ended
April 30, 2023
(Unaudited) | Year Ended
October 31, 2022 | Six Months Ended
April 30, 2023
(Unaudited) | Year Ended
October 31, 2022 |
CHANGE IN NET ASSETS RESULTING FROM OPERATIONS: | | | | |
Net investment income (loss) | | | | |
| | | | |
Change in net unrealized appreciation/depreciation | | | | |
Change in net assets resulting from operations | | | | |
DISTRIBUTIONS TO SHAREHOLDERS: | | | | |
| | | | |
| | | | |
| | | | |
| | | | |
Total distributions to shareholders | | | | |
| | | | |
Change in net assets resulting from capital transactions | | | | |
| | | | |
| | | | |
| | | | |
| | | | |
SEE NOTES TO FINANCIAL STATEMENTS.
| J.P. Morgan Specialty Funds | |
STATEMENTS OF CHANGES IN NET ASSETS
FOR THE PERIODS INDICATED (continued)
(Amounts in thousands)
| JPMorgan Opportunistic
Equity Long/Short Fund | JPMorgan
Research Market
Neutral Fund |
| Six Months Ended April 30, 2023
(Unaudited) | Year Ended October 31, 2022 | Six Months Ended April 30, 2023
(Unaudited) | Year Ended October 31, 2022 |
| | | | |
| | | | |
Proceeds from shares issued | | | | |
| | | | |
| | | | |
Change in net assets resulting from Class A capital transactions | | | | |
| | | | |
Proceeds from shares issued | | | | |
| | | | |
| | | | |
Change in net assets resulting from Class C capital transactions | | | | |
| | | | |
Proceeds from shares issued | | | | |
| | | | |
| | | | |
Change in net assets resulting from Class I capital transactions | | | | |
| | | | |
Proceeds from shares issued | | | | |
| | | | |
| | | | |
Change in net assets resulting from Class R6 capital transactions | | | | |
Total change in net assets resulting from capital transactions | | | | |
| | | | |
| | | | |
| | | | |
| | | | |
| | | | |
| | | | |
| | | | |
| | | | |
| | | | |
| | | | |
| | | | |
| | | | |
| | | | |
| | | | |
| | | | |
| | | | |
SEE NOTES TO FINANCIAL STATEMENTS.
| J.P. Morgan Specialty Funds | |
| JPMorgan Opportunistic Equity Long/Short Fund | JPMorgan Research Market Neutral Fund |
| Six Months Ended April 30, 2023 (Unaudited) | Year Ended October 31, 2022 | Six Months Ended April 30, 2023 (Unaudited) | Year Ended October 31, 2022 |
SHARE TRANSACTIONS: (continued) | | | | |
| | | | |
| | | | |
| | | | |
| | | | |
Change in Class R6 Shares | | | | |
SEE NOTES TO FINANCIAL STATEMENTS.
| J.P. Morgan Specialty Funds | |
FINANCIAL HIGHLIGHTS
FOR THE PERIODS INDICATED
| Per share operating performance |
| | | |
| Net asset
value,
beginning
of period | Net
investment
income
(loss)(b) | Net realized
and unrealized
gains
(losses) on
investments | Total from
investment
operations | | | |
JPMorgan Opportunistic Equity Long/Short Fund | | | | | | | |
| | | | | | | |
Six Months Ended April 30, 2023 (Unaudited) | | | | | | | |
Year Ended October 31, 2022 | | | | | | | |
Year Ended October 31, 2021 | | | | | | | |
Year Ended October 31, 2020 | | | | | | | |
Year Ended October 31, 2019 | | | | | | | |
Year Ended October 31, 2018 | | | | | | | |
| | | | | | | |
Six Months Ended April 30, 2023 (Unaudited) | | | | | | | |
Year Ended October 31, 2022 | | | | | | | |
Year Ended October 31, 2021 | | | | | | | |
Year Ended October 31, 2020 | | | | | | | |
Year Ended October 31, 2019 | | | | | | | |
Year Ended October 31, 2018 | | | | | | | |
| | | | | | | |
Six Months Ended April 30, 2023 (Unaudited) | | | | | | | |
Year Ended October 31, 2022 | | | | | | | |
Year Ended October 31, 2021 | | | | | | | |
Year Ended October 31, 2020 | | | | | | | |
Year Ended October 31, 2019 | | | | | | | |
Year Ended October 31, 2018 | | | | | | | |
| | | | | | | |
Six Months Ended April 30, 2023 (Unaudited) | | | | | | | |
Year Ended October 31, 2022 | | | | | | | |
Year Ended October 31, 2021 | | | | | | | |
Year Ended October 31, 2020 | | | | | | | |
Year Ended October 31, 2019 | | | | | | | |
Year Ended October 31, 2018 | | | | | | | |
|
| Annualized for periods less than one year, unless otherwise noted. |
| Calculated based upon average shares outstanding. |
| Not annualized for periods less than one year. |
| Includes adjustments in accordance with accounting principles generally accepted in the United States of America and as such, the net asset values for financial reporting purposes and the returns based upon those net asset values may differ from the net asset values and returns for shareholder transactions. |
| Includes earnings credits and interest expense, if applicable, each of which is less than 0.005% unless otherwise noted. |
| |
| | | | | | |
Net expenses (excluding dividend and interest expense for securities sold short) | | | | | | |
| | | | | | |
| | | | | | |
| | | | | | |
| | | | | | |
Expenses without waivers and reimbursements (excluding dividend and interest expense for securities sold short) | | | | | | |
| | | | | | |
| | | | | | |
| | | | | | |
| | | | | | |
|
| Interest expense on securities sold short is 0.21%. |
| Amount rounds to less than $0.005. |
| Amount rounds to less than 0.005%. |
SEE NOTES TO FINANCIAL STATEMENTS.
| J.P. Morgan Specialty Funds | |
| |
| | | Ratios to average net assets(a) |
Net asset
value,
end of
period | Total return
(excludes
sales charge)(c)(d) | Net assets,
end of
period
(000's) | Net
expenses
(including dividend
and interest expense
for securities sold
short)(e)(f) | Net
investment
income
(loss) | Expenses without
waivers and reimbursements
(including dividend
and interest expense
for securities sold
short)(f) | Portfolio
turnover rate
(excluding securities
sold short)(c) | Portfolio
turnover rate
(including securities
sold short)(c) |
| | | | | | | |
| | | | | | | |
| | | | | | | |
| | | | | | | |
| | | | | | | |
| | | | | | | |
| | | | | | | |
| | | | | | | |
| | | | | | | |
| | | | | | | |
| | | | | | | |
| | | | | | | |
| | | | | | | |
| | | | | | | |
| | | | | | | |
| | | | | | | |
| | | | | | | |
| | | | | | | |
| | | | | | | |
| | | | | | | |
| | | | | | | |
| | | | | | | |
| | | | | | | |
| | | | | | | |
| | | | | | | |
| | | | | | | |
| | | | | | | |
| | | | | | | |
| | | | | | | |
SEE NOTES TO FINANCIAL STATEMENTS.
| J.P. Morgan Specialty Funds | |
FINANCIAL HIGHLIGHTS
FOR THE PERIODS INDICATED
| Per share operating performance |
| | | |
| Net asset
value,
beginning
of period | Net
investment
income
(loss)(b) | Net realized
and unrealized
gains
(losses) on
investments | Total from
investment
operations | |
JPMorgan Research Market Neutral Fund | | | | | |
| | | | | |
Six Months Ended April 30, 2023 (Unaudited) | | | | | |
Year Ended October 31, 2022 | | | | | |
Year Ended October 31, 2021 | | | | | |
Year Ended October 31, 2020 | | | | | |
Year Ended October 31, 2019 | | | | | |
Year Ended October 31, 2018 | | | | | |
| | | | | |
Six Months Ended April 30, 2023 (Unaudited) | | | | | |
Year Ended October 31, 2022 | | | | | |
Year Ended October 31, 2021 | | | | | |
Year Ended October 31, 2020 | | | | | |
Year Ended October 31, 2019 | | | | | |
Year Ended October 31, 2018 | | | | | |
| | | | | |
Six Months Ended April 30, 2023 (Unaudited) | | | | | |
Year Ended October 31, 2022 | | | | | |
Year Ended October 31, 2021 | | | | | |
Year Ended October 31, 2020 | | | | | |
Year Ended October 31, 2019 | | | | | |
Year Ended October 31, 2018 | | | | | |
|
| Annualized for periods less than one year, unless otherwise noted. |
| Calculated based upon average shares outstanding. |
| Not annualized for periods less than one year. |
| Includes adjustments in accordance with accounting principles generally accepted in the United States of America and as such, the net asset values for financial reporting purposes and the returns based upon those net asset values may differ from the net asset values and returns for shareholder transactions. |
| Includes earnings credits and interest expense, if applicable, each of which is less than 0.005% unless otherwise noted. |
| |
| | | | | | |
Net expenses (excluding dividend and interest expense for securities sold short) | | | | | | |
| | | | | | |
| | | | | | |
| | | | | | |
Expenses without waivers and reimbursements (excluding dividend and interest expense for securities sold short) | | | | | | |
| | | | | | |
| | | | | | |
| | | | | | |
|
| Interest expense on securities sold short is 0.16%. |
| Amount rounds to less than $0.005. |
SEE NOTES TO FINANCIAL STATEMENTS.
| J.P. Morgan Specialty Funds | |
| |
| | | Ratios to average net assets(a) |
Net asset
value,
end of
period | Total return
(excludes
sales charge)(c)(d) | Net assets,
end of
period
(000's) | Net
expenses
(including dividend
expense for
securities sold
short)(e)(f) | Net
investment
income
(loss) | Expenses without
waivers and reimbursements
(including dividend
expense for
securities sold
short)(f) | Portfolio
turnover rate
(excluding securities
sold short)(c) | Portfolio
turnover rate
(including securities
sold short)(c) |
| | | | | | | |
| | | | | | | |
| | | | | | | |
| | | | | | | |
| | | | | | | |
| | | | | | | |
| | | | | | | |
| | | | | | | |
| | | | | | | |
| | | | | | | |
| | | | | | | |
| | | | | | | |
| | | | | | | |
| | | | | | | |
| | | | | | | |
| | | | | | | |
| | | | | | | |
| | | | | | | |
| | | | | | | |
| | | | | | | |
| | | | | | | |
| | | | | | | |
SEE NOTES TO FINANCIAL STATEMENTS.
| J.P. Morgan Specialty Funds | |
NOTES TO FINANCIAL STATEMENTS
AS OF April 30, 2023 (Unaudited)
(Dollar values in thousands)
1. Organization
JPMorgan Trust I (the “Trust”) was formed on November 12, 2004, as a Delaware statutory trust, pursuant to a Declaration of Trust dated November 5, 2004 and is registered under the Investment Company Act of 1940, as amended (the “1940 Act”), as an open-end management investment company.
The following are 2 separate funds of the Trust (each, a "Fund" and collectively, the "Funds") covered by this report:
| | Diversification Classification |
JPMorgan Opportunistic Equity Long/Short Fund | Class A, Class C, Class I and Class R6 | |
JPMorgan Research Market Neutral Fund | Class A, Class C and Class I | |
The investment objective of JPMorgan Opportunistic Equity Long/Short Fund (“Opportunistic Equity Long/Short Fund”) is to seek capital appreciation.
The investment objective of JPMorgan Research Market Neutral Fund (“Research Market Neutral Fund”) is to seek to provide long-term capital appreciation from a broadly diversified portfolio of U.S. stocks while neutralizing the general risks associated with stock market investing.
Class A Shares generally provide for a front-end sales charge while Class C Shares provide for a contingent deferred sales charge ("CDSC"). No sales charges are assessed with respect to Class I and Class R6 Shares. Certain Class A Shares, for which front-end sales charges have been waived, may be subject to a CDSC as described in the Funds' prospectus. Class C Shares automatically convert to Class A Shares after eight years. All classes of shares have equal rights as to earnings, assets and voting privileges, except that each class may bear different transfer agency, distribution and service fees and each class has exclusive voting rights with respect to its distribution plan and shareholder servicing agreements.
J.P. Morgan Investment Management Inc. (“JPMIM”), an indirect, wholly-owned subsidiary of JPMorgan Chase & Co. (“JPMorgan”), acts as adviser (the “Adviser”) and administrator (the “Administrator”) to the Funds.
2. Significant Accounting Policies
The following is a summary of significant accounting policies followed by the Funds in the preparation of their financial statements. The Funds are investment companies and, accordingly, follow the investment company accounting and reporting guidance of the Financial Accounting Standards Board (“FASB”) Accounting Standards Codification Topic 946 — Investment Companies, which is part of U.S. generally accepted accounting principles (“GAAP”). The preparation of financial statements in conformity with GAAP requires management to make estimates and assumptions that affect (i) the reported amounts of assets and liabilities, (ii) disclosure of contingent assets and liabilities at the date of the financial statements, and (iii) the reported amounts of increases and decreases in net assets from operations during the reporting period. Actual results could differ from those estimates.
A. Valuation of Investments — Investments are valued in accordance with GAAP and the Funds' valuation policies set forth by, and under the supervision and responsibility of, the Board of Trustees of the Trust (the "Board"), which established the following approach to valuation, as described more fully below: (i) investments for which market quotations are readily available shall be valued at their market value and (ii) all other investments for which market quotations are not readily available shall be valued at their fair value as determined in good faith by the Board.
Under Section 2(a)(41) of the 1940 Act, the Board is required to determine fair value for securities that do not have readily available market quotations. Under SEC Rule 2a-5 (Good Faith Determinations of Fair Value), the Board may designate the performance of these fair valuation determinations to a valuation designee. The Board has designated the Adviser as the “Valuation Designee” to perform fair valuation determinations for the Funds on behalf of the Board subject to appropriate oversight by the Board. The Adviser, as Valuation Designee, leverages the J.P. Morgan Asset Management Americas Valuation Committee (“AVC”) to help oversee and carry out the policies for the valuation of investments held in the Funds. The Adviser, as Valuation Designee, remains responsible for the valuation determinations.
This oversight by the AVC includes monitoring the appropriateness of fair values based on results of ongoing valuation oversight including, but not limited to, consideration of macro or security specific events, market events, and pricing vendor and broker due diligence. The Administrator is responsible for discussing and assessing the potential impacts to the fair values on an ongoing basis, and, at least on a quarterly basis, with the AVC and the Board.
Fixed income instruments are valued based on prices received from approved affiliated and unaffiliated pricing vendors or third party broker-dealers (collectively referred to as “Pricing Services”). The Pricing Services use multiple valuation techniques to determine the valuation of fixed income instruments. In instances where sufficient market activity exists, the Pricing Services may utilize a market-based approach through which trades or quotes from market makers are used to determine the valuation of these instruments. In instances where sufficient market activity may not exist, the Pricing Services also utilize proprietary valuation models which may consider market transactions in comparable securities and the various relationships between securities in determining fair value and/or market characteristics in order to estimate the relevant cash flows, which are then discounted to calculate the fair values.
| J.P. Morgan Specialty Funds | |
Equities and other exchange-traded instruments are valued at the last sale price or official market closing price on the primary exchange on which the instrument is traded before the net asset values ("NAV") of the Funds are calculated on a valuation date.
Certain foreign equity instruments are valued by applying international fair value factors provided by approved Pricing Services. The factors seek to adjust the local closing price for movements of local markets post-closing, but prior to the time the NAVs are calculated.
Investments in open-end investment companies, excluding exchange-traded funds (“ETFs”) (“Underlying Funds”), are valued at each Underlying Fund’s NAV per share as of the report date.
Futures contracts and options are generally valued on the basis of available market quotations. Forward foreign currency exchange contracts are valued utilizing market quotations from approved Pricing Services.
Valuations reflected in this report are as of the report date. As a result, changes in valuation due to market events and/or issuer-related events after the report date and prior to issuance of the report are not reflected herein.
The various inputs that are used in determining the valuation of the Funds' investments are summarized into the three broad levels listed below.
•
Level 1 — Unadjusted inputs using quoted prices in active markets for identical investments.
•
Level 2 — Other significant observable inputs including, but not limited to, quoted prices for similar investments, inputs other than quoted prices that are observable for investments (such as interest rates, prepayment speeds, credit risk, etc.) or other market corroborated inputs.
•
Level 3 — Significant inputs based on the best information available in the circumstances, to the extent observable inputs are not available (including the Funds' assumptions in determining the fair value of investments).
A financial instrument’s level within the fair value hierarchy is based on the lowest level of any input, both individually and in the aggregate, that is significant to the fair value measurement. The inputs or methodology used for valuing instruments are not necessarily an indication of the risk associated with investing in those instruments.
The following tables represent each valuation input as presented on the Schedules of Portfolio Investments ("SOIs"):
Opportunistic Equity Long/Short Fund | | | | |
| | Level 2
Other significant
observable inputs | Level 3
Significant
unobservable inputs | |
Total Investments in Securities (a) | | | | |
Total Liabilities for Securities Sold Short (a) | | | | |
|
| Please refer to the SOI for specifics of portfolio holdings. |
Research Market Neutral Fund | | | | |
| | Level 2
Other significant
observable inputs | Level 3
Significant
unobservable inputs | |
Total Investments in Securities (a) | | | | |
Total Liabilities for Securities Sold Short (a) | | | | |
Depreciation in Other Financial Instruments | | | | |
| | | | |
|
| Please refer to the SOI for specifics of portfolio holdings. |
B. Restricted Securities — Certain securities held by the Funds may be subject to legal or contractual restrictions on resale. Restricted securities generally are resold in transactions exempt from registration under the Securities Act of 1933, as amended (the “Securities Act”). Disposal of these securities may involve time-consuming negotiations and expense. Prompt sale at the current valuation may be difficult and could adversely affect the NAVs of the Funds.
As of April 30, 2023, the Funds had no investments in restricted securities other than securities sold to the Funds under Rule 144A and/or Regulation S under the Securities Act.
| J.P. Morgan Specialty Funds | |
NOTES TO FINANCIAL STATEMENTS
AS OF April 30, 2023 (Unaudited) (continued)
(Dollar values in thousands)
C. Securities Lending — The Funds are authorized to engage in securities lending in order to generate additional income. The Funds are able to lend to approved borrowers. Citibank N.A. (“Citibank”) serves as lending agent for the Funds, pursuant to a Securities Lending Agency Agreement (the “Securities Lending Agency Agreement”). Securities loaned are collateralized by cash equal to at least 100% of the market value plus accrued interest on the securities lent, which is invested in an affiliated money market fund. The Funds retain the interest earned on cash collateral investments but are required to pay the borrower a rebate for the use of the cash collateral. In cases where the lent security is of high value to borrowers, there may be a negative rebate (i.e., a net payment from the borrower to the Funds). Upon termination of a loan, the Funds are required to return to the borrower an amount equal to the cash collateral, plus any rebate owed to the borrowers. The remaining maturities of the securities lending transactions are considered overnight and continuous. Loans are subject to termination by the Funds or the borrower at any time.
The net income earned on the securities lending (after payment of rebates and Citibank’s fee) is included on the Statements of Operations as Income from securities lending (net). The Funds also receive payments from the borrower during the period of the loan, equivalent to dividends and interest earned on the securities loaned, which are recorded as Dividend or Interest income, respectively, on the Statements of Operations.
Under the Securities Lending Agency Agreement, Citibank marks to market the loaned securities on a daily basis. In the event the cash received from the borrower is less than 102% of the value of the loaned securities (105% for loans of non-U.S. securities), Citibank requests additional cash from the borrower so as to maintain a collateralization level of at least 102% of the value of the loaned securities plus accrued interest (105% for loans of non-U.S. securities), subject to certain de minimis amounts.
The value of securities out on loan is recorded as an asset on the Statements of Assets and Liabilities. The value of the cash collateral received is recorded as a liability on the Statements of Assets and Liabilities and details of collateral investments are disclosed on the SOIs.
The Funds bear the risk of loss associated with the collateral investments and are not entitled to additional collateral from the borrower to cover any such losses. To the extent that the value of the collateral investments declines below the amount owed to a borrower, the Funds may incur losses that exceed the amount they earned on lending the security. Upon termination of a loan, the Funds may use leverage (borrow money) to repay the borrower for cash collateral posted if the Adviser does not believe that it is prudent to sell the collateral investments to fund the payment of this liability. Securities lending activity is subject to master netting arrangements.
Securities lending also involves counterparty risks, including the risk that the loaned securities may not be returned in a timely manner or at all. Subject to certain conditions, Citibank has agreed to indemnify the Funds from losses resulting from a borrower’s failure to return a loaned security.
The Funds did not lend out any securities during the six months ended April 30, 2023.
D. Investment Transactions with Affiliates — The Funds invested in Underlying Funds and ETFs, which are advised by the Adviser. An issuer which is under common control with a Fund may be considered an affiliate. For the purposes of the financial statements, the Funds assume the issuers listed in the tables below to be affiliated issuers. The Underlying Funds’ and ETFs' distributions may be reinvested into such Underlying Funds and ETFs. Reinvestment amounts are included in the purchases at cost amounts in the tables below.
Opportunistic Equity Long/Short Fund |
For the six months ended April 30, 2023 |
| | | | | Change in
Unrealized
Appreciation/
(Depreciation) | | | | Capital Gain
Distributions |
JPMorgan Prime Money Market Fund Class Institutional Shares, 4.88% (a) (b) | | | | | | | | | |
|
| Investment in an affiliated fund, which is registered under the Investment Company Act of 1940, as amended, and is advised by J.P. Morgan Investment Management Inc. |
| The rate shown is the current yield as of April 30, 2023. |
| J.P. Morgan Specialty Funds | |
Research Market Neutral Fund |
For the six months ended April 30, 2023 |
| | | | | Change in
Unrealized
Appreciation/
(Depreciation) | | | | Capital Gain
Distributions |
JPMorgan Prime Money Market Fund Class Institutional Shares, 4.88% (a) (b) | | | | | | | | | |
|
| Investment in an affiliated fund, which is registered under the Investment Company Act of 1940, as amended, and is advised by J.P. Morgan Investment Management Inc. |
| The rate shown is the current yield as of April 30, 2023. |
| Amount rounds to less than one thousand. |
E. Foreign Currency Translation — The books and records of the Funds are maintained in U.S. dollars. Foreign currency amounts are translated into U.S. dollars at the prevailing exchange rates of such currencies against the U.S. dollar. The market value of investment securities and other assets and liabilities are translated at the exchange rate as of the valuation date. Purchases and sales of investment securities, income and expenses are translated at the exchange rate prevailing on the respective dates of such transactions.
The Funds do not isolate the effect of changes in foreign exchange rates from changes in market prices on securities held. Accordingly, such changes are included within Change in net unrealized appreciation/depreciation on investments in non-affiliates on the Statements of Operations.
Reported realized foreign currency gains and losses arise from the disposition of foreign currency, currency gains or losses realized between the trade and settlement dates on securities transactions, and the difference between the amounts of dividends, interest and foreign withholding taxes recorded on each Fund's books on the transaction date and the U.S. dollar equivalent of the amounts actually received or paid. These reported realized foreign currency gains and losses are included in Net realized gain (loss) on foreign currency transactions on the Statements of Operations. Unrealized foreign currency gains and losses arise from changes (due to changes in exchange rates) in the value of foreign currency and other assets and liabilities denominated in foreign currencies, which are held at period end and are included in Change in net unrealized appreciation/depreciation on foreign currency translations on the Statements of Operations.
F. Derivatives — The Funds used derivative instruments including options and futures contracts in connection with their respective investment strategies. Derivative instruments may be used as substitutes for securities in which the Funds can invest, to hedge portfolio investments or to generate income or gain to the Funds. Derivatives may also be used to effectively manage the long and short equity exposures in the portfolio, manage duration, sector and yield curve exposures and credit and spread volatility.
The Funds may be subject to various risks from the use of derivatives, including the risk that changes in the value of a derivative may not correlate perfectly with the underlying asset, rate or index; counterparty credit risk related to derivatives counterparties’ failure to perform under contract terms; liquidity risk related to the potential lack of a liquid market for these contracts allowing a Fund to close out its position(s); and documentation risk relating to disagreement over contract terms. Investing in certain derivatives also results in a form of leverage and as such, the Funds’ risk of loss associated with these instruments may exceed their value, as recorded on the Statements of Assets and Liabilities.
The Funds are party to various derivative contracts governed by International Swaps and Derivatives Association master agreements (“ISDA agreements”). The Funds’ ISDA agreements, which are separately negotiated with each dealer counterparty, may contain provisions allowing, absent other considerations, a counterparty to exercise rights, to the extent not otherwise waived, against the Funds in the event the Funds’ net assets decline over time by a pre-determined percentage or fall below a pre-determined floor. The ISDA agreements may also contain provisions allowing, absent other conditions, the Funds to exercise rights, to the extent not otherwise waived, against a counterparty (e.g., decline in a counterparty’s credit rating below a specified level). Such rights for both a counterparty and the Funds often include the ability to terminate (i.e., close out) open contracts at prices which may favor a counterparty, which could have an adverse effect on the Funds. The ISDA agreements give the Funds and a counterparty the right, upon an event of default, to close out all transactions traded under such agreements and to net amounts owed or due across all transactions and offset such net payable or receivable against collateral posted to a segregated account by one party for the benefit of the other.
Counterparty credit risk may be mitigated to the extent a counterparty posts additional collateral for mark-to-market gains to the Funds.
| J.P. Morgan Specialty Funds | |
NOTES TO FINANCIAL STATEMENTS
AS OF April 30, 2023 (Unaudited) (continued)
(Dollar values in thousands)
Notes F(1) - F(2) below describe the various derivatives used by the Funds.
(1) Options — Opportunistic Equity Long/Short Fund purchased and/or sold ("wrote") put and call options on various instruments including currencies, futures, securities, options on indices and interest rate swaps ("swaptions") to manage and hedge interest rate risks within its portfolio and also to gain long or short exposure to the underlying instrument, index, currency or rate. A purchaser of a put option has the right, but not the obligation, to sell the underlying instrument at an agreed upon price (“strike price”) to the option seller. A purchaser of a call option has the right, but not the obligation, to purchase the underlying instrument at the strike price from the option seller.
Options Purchased — Premiums paid by the Fund for options purchased are included on the Statements of Assets and Liabilities as Options purchased. The option is adjusted daily to reflect the current market value of the option and the change is recorded as Change in net unrealized appreciation/depreciation on options purchased on the Statements of Operations. If the option is allowed to expire, the Fund will lose the entire premium it paid and record a realized loss for the premium amount. Premiums paid for options purchased which are exercised or closed are added to the amounts paid or offset against the proceeds on the underlying investment transaction to determine the realized gain (loss) or cost basis of the underlying investment.
Options Written — Premiums received by the Fund for options written are included on the Statements of Assets and Liabilities as a liability. The amount of the liability is adjusted daily to reflect the current market value of the option written and the change in market value is recorded as Change in net unrealized appreciation/depreciation of options written on the Statements of Operations. Premiums received from options written that expire are treated as realized gains. If a written option is closed, the Fund records a realized gain or loss on options written based on whether the cost of the closing transaction exceeds the premium received. If a call option is exercised by the option buyer, the premium received by the Fund is added to the proceeds from the sale of the underlying security to the option buyer and compared to the cost of the closing transaction to determine whether there has been a realized gain or loss. If a put option is exercised by an option buyer, the premium received by the option seller reduces the cost basis of the purchased security.
Written uncovered call options subject the Fund to unlimited risk of loss. Written covered call options limit the upside potential of a security above the strike price. Written put options subject the Fund to risk of loss if the value of the security declines below the exercise price minus the put premium.
The Fund is not subject to credit risk on options written as the counterparty has already performed its obligation by paying the premium at the inception of the contract.
The Fund's exchange-traded option contracts are not subject to master netting arrangements (the right to close out all transactions traded with a counterparty and net amounts owed or due across transactions). The Fund's over-the-counter ("OTC") options are subject to master netting agreements.
The Fund may be required to post or receive collateral for OTC options. Cash collateral posted by the Fund is considered restricted.
(2) Futures Contracts — Research Market Neutral Fund used index futures contracts to gain or reduce exposure to the stock market, or maintain liquidity or minimize transaction costs. The Fund also used index futures contracts to more effectively manage the long and short equity exposures in the portfolio. The Fund also purchased futures contracts to invest incoming cash in the market or sold futures in response to cash outflows, thereby simulating an invested position in the underlying index while maintaining a cash balance for liquidity.
Futures contracts provide for the delayed delivery of the underlying instrument at a fixed price or are settled for a cash amount based on the change in the value of the underlying instrument at a specific date in the future. Upon entering into a futures contract, the Fund is required to deposit with the broker, cash or securities in an amount equal to a certain percentage of the contract amount, which is referred to as the initial margin deposit. Subsequent payments, referred to as variation margin, are made or received by the Fund periodically and are based on changes in the market value of open futures contracts. Changes in the market value of open futures contracts are recorded as Change in net unrealized appreciation/depreciation on futures contracts on the Statements of Operations. Realized gains or losses, representing the difference between the value of the contract at the time it was opened and the value at the time it was closed, are reported on the Statements of Operations at the closing or expiration of the futures contract. Securities deposited as initial margin are designated on the SOIs, while cash deposited, which is considered restricted, is recorded on the Statements of Assets and Liabilities. A receivable from and/or a payable to brokers for the daily variation margin is also recorded on the Statements of Assets and Liabilities.
The use of futures contracts exposes the Fund to equity price risk. The Fund may be subject to the risk that the change in the value of the futures contract may not correlate perfectly with the underlying instrument. Use of long futures contracts subjects the Fund to risk of loss in excess of the amounts shown on the Statements of Assets and Liabilities, up to the notional amount of the futures contracts. Use of short futures contracts subjects the Fund to unlimited risk of loss. The Fund may enter into futures contracts only on exchanges or boards of trade. The exchange or board of trade acts as the counterparty to each futures transaction; therefore, the Fund's credit risk is limited to failure of the exchange or board of trade. Under some circumstances, futures exchanges may establish daily limits on the amount that the price of a futures contract can vary from the previous day’s settlement price, which could effectively prevent liquidation of positions.
| J.P. Morgan Specialty Funds | |
The Fund's futures contracts are not subject to master netting arrangements (the right to close out all transactions traded with a counterparty and net amounts owed or due across transactions).
Derivatives Volume
The table below discloses the volume of the Funds’ options and futures contracts activity during the six months ended April 30, 2023. Please refer to the tables in the Summary of Derivatives Information for derivative-related gains and losses associated with volume activity:
| Opportunistic
Equity Long/
Short Fund | Research
Market Neutral
Fund |
| | |
Average Notional Balance Short | | |
Ending Notional Balance Short | | |
| | |
Average Number of Contracts Purchased | | |
Ending Number of Contracts Purchased | | |
The Funds may be required to post or receive collateral based on the net value of the Funds’ outstanding OTC options with the counterparty in the form of cash or securities. Daily movement of cash collateral is subject to minimum threshold amounts. Collateral posted by the Funds is held in a segregated account at the Funds’ custodian bank. For certain counterparties cash collateral posted by the Funds is invested in an affiliated money market fund (See Note 3.F.), otherwise the cash collateral is included on the Statements of Assets and Liabilities as Restricted cash for OTC derivatives. Collateral received by the Funds is held in a separate segregated account maintained by JPMorgan Chase Bank, N.A. (“JPMCB”), an affiliate of the Funds.
The Funds' derivatives contracts held at April 30, 2023 are not accounted for as hedging instruments under GAAP.
G. Short Sales — Opportunistic Equity Long/Short Fund and Research Market Neutral Fund engaged in short sales as part of their normal investment activities. In a short sale, the Funds sell securities they do not own in anticipation of a decline in the market value of those securities. In order to deliver securities to the purchaser, the Funds borrow securities from a broker. To close out a short position, the Funds deliver the same securities to the broker.
The Funds are required to pledge cash or securities to the broker as collateral for the securities sold short. Collateral requirements are calculated daily based on the current market value of the short positions. Cash collateral deposited with the broker is recorded as Deposits at broker for securities sold short, while cash collateral deposited at the Funds' custodian for the benefit of the broker is recorded as Restricted cash for securities sold short on the Statements of Assets and Liabilities. Securities segregated as collateral are denoted on the SOIs. The Funds may receive or pay the net of the following amounts: (i) a portion of the income from the investment of cash collateral; (ii) the broker’s fee on the borrowed securities (calculated daily based upon the market value of each borrowed security and a variable rate that is dependent on availability of the security); and (iii) a financing charge for the difference between the market value of the short position and cash collateral deposited with the broker. The net amounts of income or fees are included as interest income or interest expense on securities sold short on the Statements of Operations.
The Funds are obligated to pay the broker dividends declared on short positions when a position is open on the record date. Dividends on short positions are reported on ex-dividend date on the Statements of Operations as Dividend expense on securities sold short. The Funds are obligated to pay the broker interest accrued on short positions while the position is outstanding. Interest expense on short positions is reported as Interest expense to non-affiliates on securities sold short on the Statements of Operations. Liabilities for securities sold short are reported at market value on the Statements of Assets and Liabilities and the change in market value is recorded as Change in net unrealized appreciation/depreciation on the Statements of Operations. Short sale transactions may result in unlimited losses as the security’s price increases and the short position loses value. There is no upward limit on the price a borrowed security could attain. The Funds are also subject to risk of loss if the broker were to fail to perform its obligations under the contractual terms.
The Funds will record a realized loss if the price of the borrowed security increases between the date of the short sale and the date on which the Funds replace the borrowed security. The Funds will record a realized gain if the price of the borrowed security declines between those dates.
As of April 30, 2023, Opportunistic Equity Long/Short Fund and Research Market Neutral Fund had outstanding short sales as listed on their SOIs.
H. Security Transactions and Investment Income — Investment transactions are accounted for on the trade date (the date the order to buy or sell is executed). Securities gains and losses are calculated on a specifically identified cost basis. Interest income and interest expense on securities sold short, if any, is determined on the basis of coupon interest accrued using the effective interest method, which adjusts for amortization of premiums and accretion of discounts. Dividend income, net of foreign taxes withheld, if any, and dividend expense on securities sold short are recorded on the ex-dividend date or when a Fund first learns of the dividend.
To the extent such information is publicly available, the Funds record distributions received in excess of income earned from underlying investments as a reduction of cost of investments and/or realized gain. Such amounts are based on estimates if actual amounts are not available and actual amounts of income, realized gain and return of capital may differ from the estimated amounts. The Funds adjust the estimated amounts of the
| J.P. Morgan Specialty Funds | |
NOTES TO FINANCIAL STATEMENTS
AS OF April 30, 2023 (Unaudited) (continued)
(Dollar values in thousands)
components of distributions (and consequently their net investment income) as necessary, once the issuers provide information about the actual composition of the distributions.
I. Allocation of Income and Expenses— Expenses directly attributable to a Fund are charged directly to that Fund, while the expenses attributable to more than one fund of the Trust are allocated among the applicable funds. Investment income, realized and unrealized gains and losses and expenses, other than class-specific expenses, are allocated daily to each class of shares based upon the proportion of net assets of each class at the beginning of each day.
Transfer agency fees are class-specific expenses. The amount of the transfer agency fees charged to each share class of the Funds for the six months ended April 30, 2023 are as follows:
| | | | | |
Opportunistic Equity Long/Short Fund | | | | | |
| | | | | |
Research Market Neutral Fund | | | | | |
| | | | | |
|
| Amount rounds to less than one thousand. |
J. Federal Income Taxes — Each Fund is treated as a separate taxable entity for Federal income tax purposes. Each Fund's policy is to comply with the provisions of the Internal Revenue Code (the “Code”) applicable to regulated investment companies and to distribute to shareholders all of its distributable net investment income and net realized capital gains on investments. Accordingly, no provision for Federal income tax is necessary. Management has reviewed the Funds' tax positions for all open tax years and has determined that as of April 30, 2023, no liability for Federal income tax is required in the Funds' financial statements for net unrecognized tax benefits. However, management’s conclusions may be subject to future review based on changes in, or the interpretation of, the accounting standards or tax laws and regulations. Opportunistic Equity Long/Short Fund's and Research Market Neutral Fund's Federal tax returns for the prior three fiscal years remain subject to examination by the Internal Revenue Service.
K. Foreign Taxes —The Funds may be subject to foreign taxes on income, gains on investments or currency purchases/repatriation, a portion of which may be recoverable. The Funds will accrue such taxes and recoveries as applicable, based upon their current interpretation of tax rules and regulations that exist in the markets in which they invest. When a capital gains tax is determined to apply, the Funds record an estimated deferred tax liability in an amount that would be payable if the securities were disposed of on the valuation date.
L. Distributions to Shareholders — Distributions from net investment income, if any, are generally declared and paid at least annually and are declared separately for each class. No class has preferential dividend rights; differences in per share rates are due to differences in separate class expenses. Net realized capital gains, if any, are distributed by each Fund at least annually. The amount of distributions from net investment income and net realized capital gains is determined in accordance with Federal income tax regulations, which may differ from GAAP. To the extent these “book/tax” differences are permanent in nature (i.e., that they result from other than timing of recognition — “temporary differences”), such amounts are reclassified within the capital accounts based on their Federal tax basis treatment.
3. Fees and Other Transactions with Affiliates
A. Investment Advisory Fee — Pursuant to an Investment Advisory Agreement, the Adviser manages the investments of each Fund and for such services is paid a fee. The investment advisory fee is accrued daily and paid monthly at an annual rate based on each Fund's respective average daily net assets. The annual rate for each Fund is as follows:
| |
Opportunistic Equity Long/Short Fund | |
Research Market Neutral Fund | |
|
| Prior to November 1, 2022, the investment advisory fee was 1.20%. |
The Adviser waived investment advisory fees and/or reimbursed expenses as outlined in Note 3.F.
| J.P. Morgan Specialty Funds | |
B. Administration Fee — Pursuant to an Administration Agreement, the Administrator provides certain administration services to each Fund. In consideration of these services, the Administrator receives a fee accrued daily and paid monthly at an annual rate of 0.075% of the first $10 billion of each Fund’s respective average daily net assets, plus 0.050% of each Fund’s respective average daily net assets between $10 billion and $20 billion, plus 0.025% of each Fund’s respective average daily net assets between $20 billion and $25 billion, plus 0.01% of each Fund’s respective average daily net assets in excess of $25 billion. For the six months ended April 30, 2023, the effective annualized rate for the Funds was 0.075% of each Fund's average daily net assets, notwithstanding any fee waivers and/or expense reimbursements.
The Administrator waived administration fees as outlined in Note 3.F.
JPMCB, a wholly-owned subsidiary of JPMorgan, serves as the Funds' sub-administrator (the “Sub-administrator”). For its services as Sub-administrator, JPMCB receives a portion of the fees payable to the Administrator.
C. Distribution Fees — Pursuant to a Distribution Agreement, JPMorgan Distribution Services, Inc. (“JPMDS”), an indirect, wholly-owned subsidiary of JPMorgan, serves as each Fund's principal underwriter and promotes and arranges for the sale of each Fund's shares.
The Board has adopted a Distribution Plan (the “Distribution Plan”) for Class A and Class C Shares of the Funds pursuant to Rule 12b-1 under the 1940 Act. Class I and Class R6 Shares of the Funds do not charge a distribution fee. The Distribution Plan provides that each Fund shall pay, with respect to the applicable share classes, distribution fees, including payments to JPMDS, at annual rates of the average daily net assets as shown in the table below:
| | |
Opportunistic Equity Long/Short Fund | | |
Research Market Neutral Fund | | |
In addition, JPMDS is entitled to receive the front-end sales charges from purchases of Class A Shares and the CDSC from redemptions of Class C Shares and certain Class A Shares for which front-end sales charges have been waived. For the six months ended April 30, 2023, JPMDS retained the following:
| | |
Opportunistic Equity Long/Short Fund | | |
Research Market Neutral Fund | | |
D. Service Fees — The Trust, on behalf of the Funds, has entered into a Shareholder Servicing Agreement with JPMDS under which JPMDS provides certain support services to fund shareholders. For performing these services, JPMDS receives a fee with respect to all share classes, except Class R6 Shares which do not charge a service fee, that is accrued daily and paid monthly equal to a percentage of the average daily net assets as shown in the table below:
| | | |
Opportunistic Equity Long/Short Fund | | | |
Research Market Neutral Fund | | | |
JPMDS has entered into shareholder services contracts with affiliated and unaffiliated financial intermediaries who provide shareholder services and other related services to their clients or customers who invest in the Funds. Pursuant to such contracts, JPMDS will pay all or a portion of such fees earned to financial intermediaries for performing such services.
JPMDS waived service fees as outlined in Note 3.F.
E. Custodian and Accounting Fees — JPMCB provides portfolio custody and accounting services to the Funds. For performing these services, the Funds pay JPMCB transaction and asset-based fees that vary according to the number of transactions and positions, plus out-of-pocket expenses. The amounts paid directly to JPMCB by the Funds for custody and accounting services are included in Custodian and accounting fees on the Statements of Operations.
Interest income earned on cash balances at the custodian, if any, is included in Interest income from affiliates on the Statements of Operations.
Interest expense paid to the custodian related to cash overdrafts, if any, is included in Interest expense to affiliates on the Statements of Operations.
| J.P. Morgan Specialty Funds | |
NOTES TO FINANCIAL STATEMENTS
AS OF April 30, 2023 (Unaudited) (continued)
(Dollar values in thousands)
F. Waivers and Reimbursements— The Adviser, Administrator and/or JPMDS have contractually agreed to waive fees and/or reimburse the Funds to the extent that total annual operating expenses (excluding acquired fund fees and expenses other than certain money market fund fees as described below, dividend and interest expenses related to short sales, interest, taxes, expenses related to litigation and potential litigation, expenses related to trustee elections and extraordinary expenses) exceed the percentages of the Funds’ respective average daily net assets as shown in the table below:
| | | | |
Opportunistic Equity Long/Short Fund | | | | |
Research Market Neutral Fund | | | | |
|
| Prior to November 1, 2022, the contractual expense limitation was 1.85%, 2.35%, 1.60%, and 1.35% for Class A, Class C, Class I, and Class R6, respectively. |
The expense limitation agreements were in effect for the six months ended April 30, 2023 and the contractual expense limitation percentages in the table above are in place until at least February 29, 2024.
For the six months ended April 30, 2023, the Funds' service providers waived fees and/or reimbursed expenses for each of the Funds as follows. None of these parties expect the Funds to repay any such waived fees and/or reimbursed expenses in future years.
| |
| | | | |
Opportunistic Equity Long/Short Fund | | | | |
Research Market Neutral Fund | | | | |
Additionally, the Funds may invest in one or more money market funds advised by the Adviser (affiliated money market funds). The Adviser, Administrator and/or JPMDS, as shareholder servicing agent, have contractually agreed to waive fees and/or reimburse expenses in an amount sufficient to offset the respective net fees each collects from the affiliated money market fund on the applicable Fund’s investment in such affiliated money market fund, except for investments of securities lending cash collateral. None of these parties expect the Funds to repay any such waived fees and/ or reimbursed expenses in future years.
The amounts of these waivers resulting from investments in these money market funds for the six months ended April 30, 2023 were as follows:
| |
Opportunistic Equity Long/Short Fund | |
Research Market Neutral Fund | |
JPMIM voluntarily agreed to reimburse the Funds for the Trustee Fees paid to one of the interested Trustees. For the six months ended April 30, 2023, the amount of these reimbursements were as follows:
| |
Opportunistic Equity Long/Short Fund | |
Research Market Neutral Fund | |
G. Other — Certain officers of the Trust are affiliated with the Adviser, the Administrator and JPMDS. Such officers, with the exception of the Chief Compliance Officer, receive no compensation from the Funds for serving in their respective roles.
The Board designated and appointed a Chief Compliance Officer to the Funds pursuant to Rule 38a-1 under the 1940 Act. Each Fund, along with affiliated funds, makes reimbursement payments, on a pro-rata basis, to the Administrator for a portion of the fees associated with the office of the Chief Compliance Officer. Such fees are included in Trustees’ and Chief Compliance Officer’s fees on the Statements of Operations.
The Trust adopted a Trustee Deferred Compensation Plan (the “Plan”) which allows the independent Trustees to defer the receipt of all or a portion of compensation related to performance of their duties as Trustees. The deferred fees are invested in various J.P. Morgan Funds until distribution in accordance with the Plan.
During the six months ended April 30, 2023, Research Market Neutral Fund purchased securities from an underwriting syndicate in which the principal underwriter or members of the syndicate were affiliated with the Adviser.
The Securities and Exchange Commission ("SEC") has granted an exemptive order permitting the Funds to engage in principal transactions with J.P. Morgan Securities LLC, an affiliated broker, involving taxable money market instruments, subject to certain conditions.
| J.P. Morgan Specialty Funds | |
4. Investment Transactions
During the six months ended April 30, 2023, purchases and sales of investments (excluding short-term investments) were as follows:
| Purchases
(excluding
U.S. Government) | Sales
(excluding
U.S. Government) | | Covers on
Securities
Sold Short |
Opportunistic Equity Long/Short Fund | | | | |
Research Market Neutral Fund | | | | |
5. Federal Income Tax Matters
For Federal income tax purposes, the estimated cost and unrealized appreciation (depreciation) in value of investments held at April 30, 2023 were as follows:
| | Gross
Unrealized
Appreciation | Gross
Unrealized
Depreciation | Net Unrealized
Appreciation
(Depreciation) |
Opportunistic Equity Long/Short Fund * | | | | |
Research Market Neutral Fund * | | | | |
|
| The tax cost includes the proceeds from short sales which may result in a net negative cost. |
At October 31, 2022, the following Funds had net capital loss carryforwards which are available to offset future realized gains:
| Capital Loss Carryforward Character |
| |
Opportunistic Equity Long/Short Fund | |
Research Market Neutral Fund | |
|
| Amount includes capital loss carryforwards which are limited in future years under Internal Revenue Code sections 381-384. |
Late year ordinary losses incurred after December 31 and within the taxable year are deemed to arise on the first business day of the Funds' next taxable year. For the year ended October 31, 2022, the following Funds deferred to November 1, 2022 late year ordinary losses of:
| Late Year Ordinary Loss Deferral |
|
Opportunistic Equity Long/Short Fund | |
Research Market Neutral Fund | |
During the year ended October 31, 2022, the following Fund utilized capital loss carryforwards as follows:
| |
| |
Research Market Neutral Fund | |
6. Borrowings
The Funds rely upon an exemptive order granted by the SEC (the “Order”) permitting the establishment and operation of an Interfund Lending Facility (the “Facility”). The Facility allows the Funds to directly lend and borrow money to or from any other fund relying upon the Order at rates beneficial to both the borrowing and lending funds. Advances under the Facility are taken primarily for temporary or emergency purposes, including the meeting of redemption requests that otherwise might require the untimely disposition of securities, and are subject to each Fund's borrowing restrictions. The interfund loan rate is determined, as specified in the Order, by averaging the current repurchase agreement rate and the current bank loan rate. The Order was granted to JPMorgan Trust II ("JPM II") and may be relied upon by the Funds because the Funds and the series of JPM II are all investment companies in the same “group of investment companies” (as defined in Section 12(d)(1)(G) of the 1940 Act).
The Funds had no borrowings outstanding from another fund, or loans outstanding to another fund, during the six months ended April 30, 2023.
| J.P. Morgan Specialty Funds | |
NOTES TO FINANCIAL STATEMENTS
AS OF April 30, 2023 (Unaudited) (continued)
(Dollar values in thousands)
The Trust and JPMCB have entered into a financing arrangement. Under this arrangement, JPMCB provides an unsecured, uncommitted credit facility in the aggregate amount of $100 million to certain of the J.P. Morgan Funds, including the Funds. Advances under the arrangement are taken primarily for temporary or emergency purposes, including the meeting of redemption requests that otherwise might require the untimely disposition of securities, and are subject to each Fund's borrowing restrictions. Interest on borrowings is payable at a rate determined by JPMCB at the time of borrowing. This agreement has been extended until October 30, 2023.
The Funds had no borrowings outstanding from the unsecured, uncommitted credit facility during the six months ended April 30, 2023.
The Trust, along with certain other trusts for J.P. Morgan Funds (“Borrowers”), has entered into a joint syndicated senior unsecured revolving credit facility totaling $1.5 billion (“Credit Facility”) with various lenders and The Bank of New York Mellon, as administrative agent for the lenders. This Credit Facility provides a source of funds to the Borrowers for temporary and emergency purposes, including the meeting of redemption requests that otherwise might require the untimely disposition of securities. Under the terms of the Credit Facility, a borrowing fund must have a minimum of $25 million in adjusted net asset value and not exceed certain adjusted net asset coverage ratios prior to and during the time in which any borrowings are outstanding. If a fund does not comply with the aforementioned requirements, the fund must remediate within three business days with respect to the $25 million minimum adjusted net asset value or within one business day with respect to certain asset coverage ratios or the administrative agent at the request of, or with the consent of, the lenders may terminate the Credit Facility and declare any outstanding borrowings to be due and payable immediately.
Interest associated with any borrowing under the Credit Facility is charged to the borrowing fund at a rate of interest equal to 1.00% (the "Applicable Margin"), plus the greater on the day of the borrowing, of the federal funds effective rate, or the Adjusted Daily Simple SOFR Rate. Prior to August 9, 2022, interest associated with any borrowing under the Credit Facility was charged to the borrowing fund at a rate of interest equal to the Applicable Margin, plus the greater of the federal funds effective rate or one month London Interbank Offered Rate ("LIBOR"). Effective August 9, 2022, the Credit Facility was amended and restated for a term of 364 days, unless extended, and included a change in the interest associated with any borrowing as mentioned above.
The Funds did not utilize the Credit Facility during the six months ended April 30, 2023.
7. Risks, Concentrations and Indemnifications
In the normal course of business, the Funds enter into contracts that contain a variety of representations which provide general indemnifications. Each Fund's maximum exposure under these arrangements is unknown. The amount of exposure would depend on future claims that may be brought against each Fund. However, based on experience, the Funds expect the risk of loss to be remote.
As of April 30, 2023, the Funds had individual shareholder and/or omnibus accounts each owning more than 10% of the respective Fund's outstanding shares as follows:
| Number of
Individual Shareholder
and/or Non-Affiliated
Omnibus Accounts | |
Opportunistic Equity Long/Short Fund | | |
Research Market Neutral Fund | | |
Significant shareholder transactions by these shareholders may impact the Funds' performance and liquidity.
Derivatives may be riskier than other types of investments because they may be more sensitive to changes in economic and market conditions and could result in losses that significantly exceed the Funds’ original investment. Many derivatives create leverage thereby causing the Funds to be more volatile than they would have been if they had not used derivatives. Derivatives also expose the Funds to counterparty risk (the risk that the derivative counterparty will not fulfill its contractual obligations), including credit risk of the derivative counterparty. The possible lack of a liquid secondary market for derivatives and the resulting inability of the Funds to sell or otherwise close a derivatives position could expose the Funds to losses.
The Funds are also subject to counterparty credit risk, which is the risk that a counterparty fails to perform on agreements with the Funds.
Since Opportunistic Equity Long/Short Fund is non-diversified, it may invest a greater percentage of its assets in a particular issuer or group of issuers than a diversified fund would. This increased investment in fewer issuers may result in the Fund's shares being more sensitive to economic results of those issuing the securities.
As of April 30, 2023, Opportunistic Equity Long/Short Fund and Research Market Neutral Fund pledged substantially all of their assets to Citigroup Global Markets, Inc. for securities sold short. For the Funds, deposits at broker for securities sold short, as noted on the Statements of Assets and Liabilities, are held at Citigroup Global Markets, Inc.
| J.P. Morgan Specialty Funds | |
LIBOR is intended to represent the rate at which contributing banks may obtain short-term borrowings from each other in the London interbank market. On March 5, 2021, the U.K. Financial Conduct Authority ("FCA") publicly announced that (i) immediately after December 31, 2021, publication of the 1-week and 2-month U.S. Dollar LIBOR settings will permanently cease; (ii) immediately after June 30, 2023, publication of the overnight and 12-month U.S. Dollar LIBOR settings will permanently cease; and (iii) immediately after June 30, 2023, the 1-month, 3-month and 6-month U.S. Dollar LIBOR settings will cease to be provided or, subject to the FCA's consideration of the case, be provided on a synthetic basis and no longer be representative of the underlying market and economic reality they are intended to measure and that representativeness will not be restored. There is no assurance that the dates announced by the FCA will not change or that the administrator of LIBOR and/or regulators will not take further action that could impact the availability, composition or characteristics of LIBOR or the currencies and/or tenors for which LIBOR is published. In addition, certain regulated entities ceased entering into most new LIBOR contracts in connection with regulatory guidance or prohibitions. Public and private sector industry initiatives are currently underway to implement new or alternative reference rates to be used in place of LIBOR. There is no assurance that any such alternative reference rate will be similar to or produce the same value or economic equivalence as LIBOR or that it will have the same volume or liquidity as did LIBOR prior to its discontinuance, unavailability or replacement, all of which may affect the value, volatility, liquidity or return on certain of a Fund's loans, notes, derivatives and other instruments or investments comprising some or all of a Fund's investments and result in costs incurred in connection with changing reference rates used for positions, closing out positions and entering into new trades. Certain of a Fund's investments may transition from LIBOR prior to the dates announced by the FCA. The transition from LIBOR to alternative reference rates may result in operational issues for a Fund or its investments. No assurances can be given as to the impact of the LIBOR transition (and the timing of any such impact) on a Fund and its investments.
The Funds are subject to infectious disease epidemics/pandemics risk. The worldwide outbreak of COVID-19 negatively affected economies, markets and individual companies throughout the world. The effects of this, or any future, pandemic to public health and business and market conditions may have a significant negative impact on the performance of a Fund's investments, increase a Fund's volatility, exacerbate other pre-existing political, social and economic risks to the Funds and negatively impact broad segments of businesses and populations. In addition, governments, their regulatory agencies, or self-regulatory organizations have taken or may take actions in response to a pandemic that affect the instruments in which the Funds invest, or the issuers of such instruments, in ways that could also have a significant negative impact on a Fund’s investment performance. The ultimate impact of any pandemic and the extent to which the associated conditions and governmental responses impact a Fund will also depend on future developments, which are highly uncertain, difficult to accurately predict and subject to frequent changes.
| J.P. Morgan Specialty Funds | |
SCHEDULE OF SHAREHOLDER EXPENSES
(Unaudited)
Hypothetical $1,000 Investment
As a shareholder of the Funds, you incur two types of costs: (1) transaction costs, including sales charges (loads) on purchase payments and (2) ongoing costs, including investment advisory fees, administration fees, distribution fees and other Fund expenses. The examples below are intended to help you understand your ongoing costs (in dollars) of investing in the Funds (not including expenses of the Underlying Funds) and to compare these ongoing costs with the ongoing costs of investing in other mutual funds. The examples assume that you had a $1,000 investment in each Class at the beginning of the reporting period, November 1, 2022, and continued to hold your shares at the end of the reporting period, April 30, 2023.
Actual Expenses
For each Class of each Fund in the table below, the first line provides information about actual account values and actual expenses. You may use the information in this line, together with the amount you invested, to estimate the expenses that you paid over the period. Simply divide your account value by $1,000 (for example, an $8,600 account value divided by $1,000 = 8.6), then multiply the result by the number in the first line of each Class under the heading titled “Expenses Paid During the Period” to estimate the expenses you paid on your account during this period.
Hypothetical Example for Comparison Purposes
The second line of each Class in the table below provides information about hypothetical account values and hypothetical expenses based on the Class’ actual expense ratio and an assumed rate of return of 5% per year before expenses, which is not the Class’ actual return. The hypothetical account values and expenses may not be used to estimate the actual ending account balance or expenses you paid for the period. You may use this information to compare the ongoing costs of investing in the Class of the Funds and other funds. To do so, compare this 5% hypothetical example with the 5% hypothetical examples that appear in the shareholder reports of the other funds. Please note that the expenses shown in the table are meant to highlight your ongoing costs only and do not reflect any transaction costs, such as sales charges (loads) or redemption fees, and expenses of the Underlying Funds. Therefore, the second line for each Class in the table is useful in comparing ongoing costs only, and will not help you determine the relative total costs of owning different funds. In addition, if these transaction costs were included, your costs would have been higher. The examples also assume all dividends and distributions have been reinvested.
| Beginning
Account Value
November 1, 2022 | Ending
Account Value
April 30, 2023 | Expenses
Paid During
the Period* | |
JPMorgan Opportunistic Equity Long/Short Fund | | | | |
| | | | |
| | | | |
| | | | |
| | | | |
| | | | |
| | | | |
| | | | |
| | | | |
| | | | |
| | | | |
| | | | |
| | | | |
JPMorgan Research Market Neutral Fund | | | | |
| | | | |
| | | | |
| | | | |
| | | | |
| | | | |
| | | | |
| | | | |
| | | | |
| | | | |
|
| Expenses are equal to each Class’ respective annualized expense ratio, multiplied by the average account value over the period, multiplied by 181/365 (to reflect the one-half year period). |
| J.P. Morgan Specialty Funds | |
LIQUIDITY RISK MANAGEMENT PROGRAM
(Unaudited)
Each of the Funds covered in this report has adopted the J.P. Morgan Funds and J.P. Morgan Exchange-Traded Funds Amended and Restated Liquidity Risk Management Program (the “Program”) under Rule 22e-4 under the Investment Company Act of 1940, as amended (the “Liquidity Rule”). The Program seeks to assess, manage and review each Fund’s Liquidity Risk. “Liquidity Risk” is defined as the risk that a fund could not meet requests to redeem shares issued by the fund without significant dilution of remaining investors’ interests in the fund. Pursuant to an exemptive order (the “Exemptive Order”) from the Securities and Exchange Commission, the Program permits the Funds to use liquidity definitions and classification methodologies that differ from the requirements under the Liquidity Rule in some respects. Among other things, the Liquidity Rule requires that a written report be provided to the Board of Trustees (the “Board”) on an annual basis that addresses the operation of the Program and assesses the adequacy and effectiveness of its implementation, including the operation of any Highly Liquid Investment Minimum (“HLIM”), where applicable, and any material changes to the Program.
The Board has appointed J.P. Morgan Asset Management’s Liquidity Risk Forum to be the program administrator for the Program (the “Program Administrator”). In addition to regular reporting at each of its quarterly meetings, on February 7, 2023, the Board reviewed the Program Administrator’s annual written report (the “Report”) concerning the operation of the Program for the period from January 1, 2022 through December 31, 2022 (the “Program Reporting Period”). The Report addressed the operation of the Program and assessed its adequacy and effectiveness of implementation, including, where applicable, the operation of a Fund’s HLIM. There were no material changes to the Program during the Program Reporting Period.
The Report summarized the operation of the Program and the information and factors considered by the Program Administrator in assessing whether the Program has been adequately and effectively implemented with respect to each Fund. Such information and factors included, among other things: (1) the liquidity risk framework used to assess, manage, and periodically review each Fund’s Liquidity Risk and the results of this assessment; (2) the methodology and inputs for classifying the investments of a Fund into one of the required liquidity categories that reflect an estimate of the liquidity of those investments under current market conditions; (3) whether a Fund invested primarily in “Highly Liquid Investments” (as defined or modified under the Program), as well as whether an HLIM should be established for a Fund (and, for Funds that have adopted an HLIM, whether the HLIM continues to be appropriate or whether a Fund has invested below its HLIM) and the procedures for monitoring for any HLIM; (4) whether a Fund invested more than 15% of its assets in “Illiquid Investments” (as defined or modified under the Program) and the procedures for monitoring for this limit; and (5) specific liquidity events arising during the Program Reporting Period. The Report further summarized the conditions of the Exemptive Order and whether all applicable Funds were in compliance with the terms of the Exemptive Order.
Based on this review, the Report concluded that: (1) the Program continues to be reasonably designed to effectively assess and manage each Fund’s Liquidity Risk; and (2) the Program has been adequately and effectively implemented with respect to each Fund during the Program Reporting Period.
| J.P. Morgan Specialty Funds | |
THIS PAGE IS INTENTIONALLY LEFT BLANK
J.P. Morgan Funds are distributed by JPMorgan Distribution Services, Inc., which is an affiliate of JPMorgan Chase & Co. Affiliates of JPMorgan Chase & Co. receive fees for providing various services to the funds.
Contact JPMorgan Distribution Services, Inc. at 1-800-480-4111 for a fund prospectus. You can also visit us at www.jpmorganfunds.com. Investors should carefully consider the investment objectives and risk as well as charges and expenses of the mutual fund before investing. The prospectus contains this and other information about the mutual fund. Read the prospectus carefully before investing.
Investors may obtain information about the Securities Investor Protection Corporation (SIPC), including the SIPC brochure, by visiting www.sipc.org or by calling SIPC at 202-371-8300.
Each Fund files a complete schedule of its fund holdings for the first and third quarters of its fiscal year with the SEC as an exhibit to its report on Form N-PORT. The Funds' Form N-PORT reports are available on the SEC’s website at http://www.sec.gov. Each Fund's quarterly holdings can be found by visiting the J.P. Morgan Funds’ website at www.jpmorganfunds.com.
A description of each Fund's policies and procedures with respect to the disclosure of each Fund's holdings is available in the prospectuses and Statement of Additional Information.
A copy of proxy policies and procedures is available without charge upon request by calling 1-800-480-4111 and on the Funds' website at www.jpmorganfunds.com. A description of such policies and procedures is on the SEC’s website at www.sec.gov. The Trustees have delegated the authority to vote proxies for securities owned by the Funds to the Adviser. A copy of the Funds' voting record for the most recent 12-month period ended June 30 is available on the SEC’s website at www.sec.gov or at the Funds' website at www.jpmorganfunds.com no later than August 31 of each year. The Funds' proxy voting record will include, among other things, a brief description of the matter voted on for each fund security, and will state how each vote was cast, for example, for or against the proposal.
J.P. Morgan Asset Management is the brand name for the asset management business of JPMorgan Chase & Co. and its affiliates worldwide.
© JPMorgan Chase & Co., 2023. All rights reserved. April 2023.
SAN-SPEC-423
ITEM 2. CODE OF ETHICS.
Not applicable to a semi-annual report.
ITEM 3. AUDIT COMMITTEE FINANCIAL EXPERT.
Not applicable to a semi-annual report.
ITEM 4. PRINCIPAL ACCOUNTANT FEES AND SERVICES.
Not applicable to a semi-annual report.
ITEM 5. AUDIT COMMITTEE OF LISTED REGISTRANTS.
Not applicable to a semi-annual report.
ITEM 6. INVESTMENTS.
File Schedule I – Investments in securities of unaffiliated issuers as of the close of the reporting period as set forth in Section 210.12-12 of Regulation S-X, unless the schedule is included as part of the report to shareholders filed under Item 1 of this Form.
Included in Item 1.
ITEM 7. DISCLOSURE OF PROXY VOTING POLICIES AND PROCEDURES FOR CLOSED-END MANAGEMENT INVESTMENT COMPANIES.
Not applicable.
ITEM 8. PORTFOLIO MANAGERS OF CLOSED-END MANAGEMENT INVESTMENT COMPANIES.
Not applicable.
ITEM 9. PURCHASE OF EQUITY SECURITIES BY CLOSED-END MANAGEMENT INVESTMENT COMPANY AND AFFILIATED PURCHASERS.
Not applicable.
ITEM 10. SUBMISSION OF MATTERS TO A VOTE OF SECURITY HOLDERS.
Describe any material changes to the procedures by which shareholders may recommend nominees to the registrant’s board of directors, where those changes were implemented after the registrant last provided disclosure in response to the requirements of Item 7(d)(2)(ii)(G) of Schedule 14A (17 CFR 240.14a-101), or this Item.
No material changes to report.
ITEM 11. CONTROLS AND PROCEDURES.
(a) Disclose the conclusions of the registrant’s principal executive and principal financial officers, or persons performing similar functions, regarding the effectiveness of the registrant’s disclosure controls and procedures (as defined in Rule 30a-3(c) under the Act (17 CFR 270.30a-3(c))) as of a date within 90 days of the filing date of the report that includes the disclosure required by this paragraph, based on the evaluation of these controls and procedures required by Rule 30a-3(b) under the Act (17 CFR 270.30a-3(b)) and Rules 13a-15(b) or 15d-15(b) under the Exchange Act (17 CFR 240.13a-15(b) or 240.15d-15(b)).
The Registrant’s principal executive and principal financial officers have concluded, based on their evaluation of the Registrant’s disclosure controls and procedures as of a date within 90 days of the filing date of this report, that the Registrant’s disclosure controls and procedures are reasonably designed to ensure that information required to be disclosed by the Registrant on Form N-CSR is recorded, processed, summarized and reported within the required time periods and that information required to be disclosed by the Registrant in the reports that it files or submits on Form N-CSR is accumulated and communicated to the Registrant’s management, including its principal executive and principal financial officers, as appropriate to allow timely decisions regarding required disclosure.
(b) Disclose any change in the registrant’s internal control over financial reporting (as defined in Rule 30a-3(d) under the Act (17 CFR 270.30a-3(d)) that occurred during the period covered by this report that has materially affected, or is reasonably likely to materially affect, the registrant’s internal control over financial reporting.
There were no changes in the Registrant’s internal control over financial reporting that occurred during period covered by this report that have materially affected, or are reasonably likely to materially affect, the Registrant’s internal control over financial reporting.
ITEM 12. DISCLOSURE OF SECURITIES LENDING ACTIVITIES FOR CLOSED-END MANAGEMENT INVESTMENT COMPANIES.
Not applicable.
ITEM 13. EXHIBITS.
| | (a) | File the exhibits listed below as part of this Form. Letter or number the exhibits in the sequence indicated. |
(1) Any code of ethics, or amendment thereto, that is the subject of the disclosure required by Item 2, to the extent that the registrant intends to satisfy the Item 2 requirements through filing of an exhibit.
Not applicable.
(2) A separate certification for each principal executive officer and principal financial officer of the registrant as required by Rule 30a-2(a) under the Act (17 CFR 270.30a-2), exactly as set forth below:
Certifications pursuant to Rule 30a-2(a) under the Investment Company Act of 1940 are attached hereto.
(1) Any written solicitation to purchase securities under Rule 23c-1 under the Act (17 CFR 270.23c-1) sent or given during the period covered by the report by or on behalf of the registrant to 10 or more persons.
Not applicable.
(2) Change in the registrant’s independent public accountant. Provide the information called for by Item 4 of Form 8-K under the Exchange Act (17 CFR 249.308). Unless otherwise specified by Item 4, or related to and necessary for a complete understanding of information not previously disclosed, the information should relate to events occurring during the reporting period.
Not applicable.
| | (b) | A separate or combined certification for each principal executive officer and principal officer of the registrant as required by Rule 30a-2(b) under the Act of 1940. |
Certifications pursuant to Rule 30a-2(b) under the Investment Company Act of 1940 are attached hereto.
SIGNATURES
Pursuant to the requirements of the Securities Exchange Act of 1934 and the Investment Company Act of 1940, the registrant has duly caused this report to be signed on its behalf by the undersigned, thereunto duly authorized.
| | |
| JPMorgan Trust IV |
| |
| By: | | /s/ Brian S. Shlissel |
| | Brian S. Shlissel |
| | President and Principal Executive Officer |
| | July 5, 2023 |
Pursuant to the requirements of the Securities Exchange Act of 1934 and the Investment Company Act of 1940, this report has been signed below by the following persons on behalf of the registrant and in the capacities and on the dates indicated.
| | |
| By: | | /s/ Brian S. Shlissel |
| | Brian S. Shlissel |
| | President and Principal Executive Officer |
| | July 5, 2023 |
| |
| By: | | /s/ Timothy J. Clemens |
| | Timothy J. Clemens |
| | Treasurer and Principal Financial Officer |
| | July 5, 2023 |