UNITED STATES
SECURITIES AND EXCHANGE COMMISSION
Washington, D.C. 20549
FORM N-CSR
CERTIFIED SHAREHOLDER REPORT OF REGISTERED
MANAGEMENT INVESTMENT COMPANIES
Investment Company Act file number: 811-23117
JPMorgan Trust IV
(Exact name of registrant as specified in charter)
277 Park Avenue
New York, NY 10172
(Address of principal executive offices) (Zip code)
Gregory S. Samuels
277 Park Avenue
New York, NY 10172
(Name and Address of Agent for Service)
Registrant’s telephone number, including area code: (800) 480-4111
Date of fiscal year end: Last day of February
Date of reporting period: March 1, 2023 through August 31, 2023
Form N-CSR is to be used by management investment companies to file reports with the Commission not later than 10 days after the transmission to stockholders of any report that is required to be transmitted to stockholders under Rule 30e-1 under the Investment Company Act of 1940 (17 CFR 270.30e-1). The Commission may use the information provided on Form N-CSR in its regulatory, disclosure review, inspection, and policymaking roles.
A registrant is required to disclose the information specified by Form N-CSR, and the Commission will make this information public. A registrant is not required to respond to the collection of information contained in Form N-CSR unless the Form displays a currently valid Office of Management and Budget (“OMB”) control number. Please direct comments concerning the accuracy of the information collection burden estimate and any suggestions for reducing the burden to Secretary, Securities and Exchange Commission, 450 Fifth Street, NW, Washington, DC 20549-0609. The OMB has reviewed this collection of information under the clearance requirements of 44 U.S.C. Section 3507.
ITEM 1. REPORTS TO STOCKHOLDERS.
a.) The following is a copy of the report transmitted to shareholders pursuant to Rule 30e-1 under the Investment Company Act of 1940 (17 CFR 270.30e-1).
b.) A copy of the notice transmitted to shareholders in reliance on Rule 30e-3 under the 1940 Act that contains disclosures specified by paragraph (c)(3) of that rule is included in the Annual Report. Not Applicable. Notices do not incorporate disclosures from the shareholder reports.
JPMorgan Prime Money Market Fund |
JPMorgan Institutional Tax Free Money Market Fund |
JPMorgan Securities Lending Money Market Fund |
JPMorgan Liquid Assets Money Market Fund |
JPMorgan U.S. Government Money Market Fund |
JPMorgan U.S. Treasury Plus Money Market Fund |
JPMorgan Federal Money Market Fund |
JPMorgan 100% U.S. Treasury Securities Money Market Fund |
JPMorgan Tax Free Money Market Fund |
JPMorgan Municipal Money Market Fund |
JPMorgan California Municipal Money Market Fund |
JPMorgan New York Municipal Money Market Fund |

1 | |
2 | |
3 | |
4 | |
5 | |
6 | |
7 | |
8 | |
9 | |
10 | |
11 | |
12 | |
13 | |
14 | |
100 | |
137 | |
171 | |
187 | |
193 |
October 19, 2023 (Unaudited)
 | “Regardless of the market environ- ment, JPMorgan Global Liquidity will strive to continue to provide investors with quality short-term fixed income solutions, supported by our global expertise and resources.” John T. Donohue |

CEO Asset Management Americas & Head of Global Liquidity
J.P. Morgan Asset Management
1 | J.P. Morgan Money Market Funds | August 31, 2023 |
SIX MONTHS ENDED August 31, 2023 (Unaudited)
Objective† | Seeks current income while seeking to maintain liquidity and a low volatility of principal |
Primary Investments | High quality, short-term, U.S. dollar-denominated money market instruments |
Suggested investment time frame | Short-term |
Share classes offered | Academy, Agency, Capital, Empower, IM, Institutional Class, Morgan, Premier and Reserve |
Net Assets as of August 31, 2023 | $77.4 Billion |
Weighted Average Maturity(a) | 28 calendar days |
Weighted Average Life(b) | 57 calendar days |
MATURITY SCHEDULE(a) (c) | |
1 calendar day | 60.3 % |
2–7 calendar days | 13.4 |
8–30 calendar days | 3.4 |
31–60 calendar days | 6.3 |
61–90 calendar days | 5.8 |
91–180 calendar days | 6.4 |
181+ calendar days | 4.4 |
7-DAY SEC YIELD AS OF August 31, 2023(d) | |
Academy Shares | 5.55 % |
Agency Shares | 5.46 |
Capital Shares | 5.55 |
Empower Shares | 5.55 |
IM Shares | 5.61 |
Institutional Class Shares | 5.51 |
Morgan Shares | 5.23 |
Premier Shares | 5.29 |
Reserve Shares | 5.00 |
† | The adviser seeks to achieve the Fund’s objective. There can be no guarantee it will be achieved. |
(a) | The calculation takes into account the period remaining until the date on which, in accordance with the terms of the security, the principal amount must unconditionally be paid, or in the case of a security called for redemption, the date on which the redemption payment must be made and may utilize the interest rate reset date for variable or floating rate securities. |
(b) | The calculation takes into account the period remaining until the date on which, in accordance with the terms of the security, the principal amount must unconditionally be paid, or in the case of a security called for redemption, the date on which the redemption payment must be made. |
(c) | Percentages indicated are based upon total investments as of August 31, 2023. |
(d) | The yields for Academy Shares, Agency Shares, Capital Shares, Empower Shares, IM Shares, Institutional Class Shares, Morgan Shares, Premier Shares and Reserve Shares reflect the reimbursements and/or waivers of certain expenses. Without these reimbursements and/or waivers, the yields would have been 5.55%, 5.44%, 5.55%, 5.55%, 5.61%, 5.50%, 5.23%, 5.29% and 4.19% for Academy Shares, Agency Shares, Capital Shares, Empower Shares, IM Shares, Institutional Class Shares, Morgan Shares, Premier Shares and Reserve Shares, respectively. |
August 31, 2023 | J.P. Morgan Money Market Funds | 2 |
SIX MONTHS ENDED August 31, 2023 (Unaudited)
Objective† | Aims to provide current income, while seeking to maintain liquidity and a low volatility of principal(a) |
Primary Investments | High quality short-term municipal securities, the interest on which is excluded from federal income taxes |
Suggested investment time frame | Short-term |
Share classes offered | Agency, Capital, IM and Institutional Class |
Net Assets as of August 31, 2023 | $1.2 Billion |
Weighted Average Maturity(b) | 18 calendar days |
Weighted Average Life(c) | 18 calendar days |
MATURITY SCHEDULE(b) (d) | |
1 calendar day | 35.1 % |
2–7 calendar days | 40.8 |
8–30 calendar days | 9.8 |
31–60 calendar days | 6.0 |
61–90 calendar days | 3.1 |
91–180 calendar days | 3.9 |
181+ calendar days | 1.3 |
7-DAY SEC YIELD AS OF August 31, 2023(e) | |
Agency Shares | 3.93 % |
Capital Shares | 4.01 |
IM Shares | 4.03 |
Institutional Class Shares | 3.98 |
† | The adviser seeks to achieve the Fund’s objective. There can be no guarantee it will be achieved. |
(a) | A portion of the Fund’s income distributions may be subject to the Alternative Minimum Tax (AMT), and some investors may be subject to certain state and local taxes. |
(b) | The calculation takes into account the period remaining until the date on which, in accordance with the terms of the security, the principal amount must unconditionally be paid, or in the case of a security called for redemption, the date on which the redemption payment must be made and may utilize the interest rate reset date for variable or floating rate securities. |
(c) | The calculation takes into account the period remaining until the date on which, in accordance with the terms of the security, the principal amount must unconditionally be paid, or in the case of a security called for redemption, the date on which the redemption payment must be made. |
(d) | Percentages indicated are based upon total investments as of August 31, 2023. |
(e) | The yields for Agency Shares, Capital Shares, IM Shares and Institutional Class Shares reflect the reimbursements and/or waivers of certain expenses. Without these reimbursements and/or waivers, the yields would have been 3.86%, 3.97%, 4.02% and 3.92% for Agency Shares, Capital Shares, IM Shares and Institutional Class Shares, respectively. |
3 | J.P. Morgan Money Market Funds | August 31, 2023 |
SIX MONTHS ENDED August 31, 2023 (Unaudited)
Objective† | Seeks current income while seeking to maintain liquidity and a low volatility of principal |
Primary Investments | High quality, short-term, U.S. dollar-denominated money market instruments |
Suggested investment time frame | Short-term |
Share classes offered | Agency SL |
Net Assets as of August 31, 2023 | $2.9 Billion |
Weighted Average Maturity(a) | 13 calendar days |
Weighted Average Life(b) | 48 calendar days |
MATURITY SCHEDULE(a) (c) | |
1 calendar day | 76.8 % |
2–7 calendar days | 10.3 |
8–30 calendar days | 1.4 |
31–60 calendar days | 4.4 |
61–90 calendar days | 2.9 |
91–180 calendar days | 2.6 |
181+ calendar days | 1.6 |
7-DAY SEC YIELD AS OF August 31, 2023(d) | |
Agency SL Shares | 5.65 % |
† | The adviser seeks to achieve the Fund’s objective. There can be no guarantee it will be achieved. |
(a) | The calculation takes into account the period remaining until the date on which, in accordance with the terms of the security, the principal amount must unconditionally be paid, or in the case of a security called for redemption, the date on which the redemption payment must be made and may utilize the interest rate reset date for variable or floating rate securities. |
(b) | The calculation takes into account the period remaining until the date on which, in accordance with the terms of the security, the principal amount must unconditionally be paid, or in the case of a security called for redemption, the date on which the redemption payment must be made. |
(c) | Percentages indicated are based upon total investments as of August 31, 2023. |
(d) | The yield for Agency SL Shares reflects the reimbursements and/or waivers of certain expenses. Without these reimbursements and/or waivers, the yield would have been 5.58% for Agency SL Shares. |
August 31, 2023 | J.P. Morgan Money Market Funds | 4 |
SIX MONTHS ENDED August 31, 2023 (Unaudited)
Objective† | Seeks current income with liquidity and stability of principal |
Primary Investments | High quality, short-term instruments including corporate notes, U.S.government securities, asset-backed securities, repurchase agreements, commercial paper, funding agreements, certificates of deposit, municipal obligations and bank obligations |
Suggested investment time frame | Short-term |
Share classes offered | Agency, Capital, E*Trade(a), Institutional Class, Investor, Morgan, Premier and Reserve |
Net Assets as of August 31, 2023 | $50.8 Billion |
Weighted Average Maturity(b) | 24 calendar days |
Weighted Average Life(c) | 51 calendar days |
MATURITY SCHEDULE(b) (d) | |
1 calendar day | 62.8 % |
2–7 calendar days | 13.9 |
8–30 calendar days | 3.3 |
31–60 calendar days | 6.1 |
61–90 calendar days | 5.5 |
91–180 calendar days | 4.8 |
181+ calendar days | 3.6 |
7-DAY SEC YIELD AS OF August 31, 2023(e) | |
Agency Shares | 5.44 % |
Capital Shares | 5.53 |
Institutional Class Shares | 5.50 |
Investor Shares | 5.21 |
Morgan Shares | 5.10 |
Premier Shares | 5.26 |
Reserve Shares | 5.00 |
† | The adviser seeks to achieve the Fund’s objective. There can be no guarantee it will be achieved. |
(a) | E*Trade Shares had no assets from the close of business on October 19, 2016. |
(b) | The calculation takes into account the period remaining until the date on which, in accordance with the terms of the security, the principal amount must unconditionally be paid, or in the case of a security called for redemption, the date on which the redemption payment must be made and may utilize the interest rate reset date for variable or floating rate securities. |
(c) | The calculation takes into account the period remaining until the date on which, in accordance with the terms of the security, the principal amount must unconditionally be paid, or in the case of a security called for redemption, the date on which the redemption payment must be made. |
(d) | Percentages indicated are based upon total investments as of August 31, 2023. |
(e) | The yields for Agency Shares, Capital Shares, Institutional Class Shares, Investor Shares, Morgan Shares, Premier Shares and Reserve Shares reflect the reimbursements and/or waivers of certain expenses. Without these reimbursements and/or waivers, the yields would have been 5.42%, 5.53%, 5.48%, 5.21%, 5.10%, 5.26% and 5.00% for Agency Shares, Capital Shares, Institutional Class Shares, Investor Shares, Morgan Shares, Premier Shares and Reserve Shares, respectively. |
5 | J.P. Morgan Money Market Funds | August 31, 2023 |
SIX MONTHS ENDED August 31, 2023 (Unaudited)
Objective† | Seeks high current income with liquidity and stability of principal |
Primary Investments | High quality, short-term securities issued or guaranteed by the U.S. government or by U.S. government agencies or instrumentalities and repurchase agreements collateralized by such obligations |
Suggested investment time frame | Short-term |
Share classes offered | Academy, Agency, Capital, E*Trade, Empower, IM, Institutional Class, Investor, Morgan, Premier, Reserve and Service |
Net Assets as of August 31, 2023 | $268.4 Billion |
Weighted Average Maturity(a) | 26 calendar days |
Weighted Average Life(b) | 62 calendar days |
MATURITY SCHEDULE(a) (c) | |
1 calendar day | 77.8 % |
2–7 calendar days | 4.2 |
8–30 calendar days | 5.3 |
31–60 calendar days | 1.2 |
61–90 calendar days | 1.7 |
91–180 calendar days | 3.3 |
181+ calendar days | 6.5 |
7-DAY SEC YIELD AS OF August 31, 2023(d) | |
Academy Shares | 5.35 % |
Agency Shares | 5.26 |
Capital Shares | 5.35 |
E*Trade Shares | 4.49 |
Empower Shares | 5.35 |
IM Shares | 5.40 |
Institutional Class Shares | 5.32 |
Investor Shares | 5.04 |
Morgan Shares | 4.93 |
Premier Shares | 5.09 |
Reserve Shares | 4.83 |
Service Shares | 4.46 |
† | The adviser seeks to achieve the Fund’s objective. There can be no guarantee it will be achieved. |
(a) | The calculation takes into account the period remaining until the date on which, in accordance with the terms of the security, the principal amount must unconditionally be paid, or in the case of a security called for redemption, the date on which the redemption payment must be made and may utilize the interest rate reset date for variable or floating rate securities. |
(b) | The calculation takes into account the period remaining until the date on which, in accordance with the terms of the security, the principal amount must unconditionally be paid, or in the case of a security called for redemption, the date on which the redemption payment must be made. |
(c) | Percentages indicated are based upon total investments as of August 31, 2023. |
(d) | The yields for Academy Shares, Agency Shares, Capital Shares, E*Trade Shares, Empower Shares, IM Shares, Institutional Class Shares, Investor Shares, Morgan Shares, Premier Shares, Reserve Shares and Service Shares reflect the reimbursements and/or waivers of certain expenses. Without these reimbursements and/or waivers, the yields would have been 5.35%, 5.25%, 5.35%, 4.46%, 5.35%, 5.40%, 5.31%, 5.04%, 4.93%, 5.09%, 4.83% and 4.46% for Academy Shares, Agency Shares, Capital Shares, E*Trade Shares, Empower Shares, IM Shares, Institutional Class Shares, Investor Shares, Morgan Shares, Premier Shares, Reserve Shares and Service Shares, respectively. |
August 31, 2023 | J.P. Morgan Money Market Funds | 6 |
SIX MONTHS ENDED August 31, 2023 (Unaudited)
Objective† | Seeks current income with liquidity and stability of principal |
Primary Investments | Direct obligations of the U.S. Treasury including Treasury bills, bonds and notes and other obligations issued or guaranteed by the U.S.Treasury and repurchase agreements collateralized by U.S. Treasury securities |
Suggested investment time frame | Short-term |
Share classes offered | Academy, Agency, Capital, Empower, IM, Institutional Class, Investor, Morgan, Premier and Reserve |
Net Assets as of August 31, 2023 | $39.1 Billion |
Weighted Average Maturity(a) | 11 calendar days |
Weighted Average Life(b) | 19 calendar days |
MATURITY SCHEDULE(a) (c) | |
1 calendar day | 86.0 % |
2–7 calendar days | 0.9 |
8–30 calendar days | 4.0 |
31–60 calendar days | 2.0 |
61–90 calendar days | 3.6 |
91–180 calendar days | 2.7 |
181+ calendar days | 0.8 |
7-DAY SEC YIELD AS OF August 31, 2023(d) | |
Academy Shares | 5.35 % |
Agency Shares | 5.27 |
Capital Shares | 5.35 |
Empower Shares | 5.35 |
IM Shares | 5.41 |
Institutional Class Shares | 5.32 |
Investor Shares | 5.04 |
Morgan Shares | 4.93 |
Premier Shares | 5.09 |
Reserve Shares | 4.83 |
† | The adviser seeks to achieve the Fund’s objective. There can be no guarantee it will be achieved. |
(a) | The calculation takes into account the period remaining until the date on which, in accordance with the terms of the security, the principal amount must unconditionally be paid, or in the case of a security called for redemption, the date on which the redemption payment must be made and may utilize the interest rate reset date for variable or floating rate securities. |
(b) | The calculation takes into account the period remaining until the date on which, in accordance with the terms of the security, the principal amount must unconditionally be paid, or in the case of a security called for redemption, the date on which the redemption payment must be made. |
(c) | Percentages indicated are based upon total investments as of August 31, 2023. |
(d) | The yields for Academy Shares, Agency Shares, Capital Shares, Empower Shares, IM Shares, Institutional Class Shares, Investor Shares, Morgan Shares, Premier Shares and Reserve Shares reflect the reimbursements and/or waivers of certain expenses. Without these reimbursements and/or waivers, the yields would have been 5.35%, 5.25%, 5.35%, 5.34%, 5.41%, 5.30%, 5.04%, 4.93%, 5.09% and 4.83% for Academy Shares, Agency Shares, Capital Shares, Empower Shares, IM Shares, Institutional Class Shares, Investor Shares, Morgan Shares, Premier Shares and Reserve Shares, respectively. |
7 | J.P. Morgan Money Market Funds | August 31, 2023 |
SIX MONTHS ENDED August 31, 2023 (Unaudited)
Objective† | Aims to provide current income while still preserving capital and maintaining liquidity |
Primary Investments | Direct obligations of the U.S. Treasury including Treasury bills, bonds and notes as well as debt obligations issued or guaranteed by U.S. government agencies or instrumentalities |
Suggested investment time frame | Short-term |
Share classes offered | Agency, Institutional Class, Morgan and Premier |
Net Assets as of August 31, 2023 | $7.1 Billion |
Weighted Average Maturity(a) | 29 calendar days |
Weighted Average Life(b) | 88 calendar days |
MATURITY SCHEDULE(a) (c) | |
1 calendar day | 47.7 % |
2–7 calendar days | 3.5 |
8–30 calendar days | 21.5 |
31–60 calendar days | 12.3 |
61–90 calendar days | 7.8 |
91–180 calendar days | 4.4 |
181+ calendar days | 2.8 |
7-DAY SEC YIELD AS OF August 31, 2023(d) | |
Agency Shares | 5.26 % |
Institutional Class Shares | 5.31 |
Morgan Shares | 4.91 |
Premier Shares | 5.08 |
† | The adviser seeks to achieve the Fund’s objective. There can be no guarantee it will be achieved. |
(a) | The calculation takes into account the period remaining until the date on which, in accordance with the terms of the security, the principal amount must unconditionally be paid, or in the case of a security called for redemption, the date on which the redemption payment must be made and may utilize the interest rate reset date for variable or floating rate securities. |
(b) | The calculation takes into account the period remaining until the date on which, in accordance with the terms of the security, the principal amount must unconditionally be paid, or in the case of a security called for redemption, the date on which the redemption payment must be made. |
(c) | Percentages indicated are based upon total investments as of August 31, 2023. |
(d) | The yields for Agency Shares, Institutional Class Shares, Morgan Shares and Premier Shares reflect the reimbursements and/or waivers of certain expenses. Without these reimbursements and/or waivers, the yields would have been 5.24%, 5.29%, 4.91% and 5.08% for Agency Shares, Institutional Class Shares, Morgan Shares and Premier Shares, respectively. |
August 31, 2023 | J.P. Morgan Money Market Funds | 8 |
SIX MONTHS ENDED August 31, 2023 (Unaudited)
Objective† | Aims to provide the highest possible level of current income while still maintaining liquidity and providing maximum safety of principal |
Primary Investments | Direct obligations of the U.S. Treasury including Treasury bills, bonds and notes |
Suggested investment time frame | Short-term |
Share classes offered | Academy, Agency, Capital, Empower, IM, Institutional Class, Morgan, Premier and Reserve |
Net Assets as of August 31, 2023 | $145.9 Billion |
Weighted Average Maturity(a) | 39 calendar days |
Weighted Average Life(b) | 74 calendar days |
MATURITY SCHEDULE(a) (c) | |
1 calendar day | 10.5 % |
2–7 calendar days | 9.4 |
8–30 calendar days | 30.0 |
31–60 calendar days | 33.0 |
61–90 calendar days | 9.3 |
91–180 calendar days | 7.1 |
181+ calendar days | 0.7 |
7-DAY SEC YIELD AS OF August 31, 2023(d) | |
Academy Shares | 5.32 % |
Agency Shares | 5.23 |
Capital Shares | 5.32 |
Empower Shares | 5.32 |
IM Shares | 5.38 |
Institutional Class Shares | 5.29 |
Morgan Shares | 4.90 |
Premier Shares | 5.06 |
Reserve Shares | 4.80 |
† | The adviser seeks to achieve the Fund’s objective. There can be no guarantee it will be achieved. |
(a) | The calculation takes into account the period remaining until the date on which, in accordance with the terms of the security, the principal amount must unconditionally be paid, or in the case of a security called for redemption, the date on which the redemption payment must be made and may utilize the interest rate reset date for variable or floating rate securities. |
(b) | The calculation takes into account the period remaining until the date on which, in accordance with the terms of the security, the principal amount must unconditionally be paid, or in the case of a security called for redemption, the date on which the redemption payment must be made. |
(c) | Percentages indicated are based upon total investments as of August 31, 2023. |
(d) | The yields for Academy Shares, Agency Shares, Capital Shares, Empower Shares, IM Shares, Institutional Class Shares, Morgan Shares, Premier Shares and Reserve Shares reflect the reimbursements and/or waivers of certain expenses. Without these reimbursements and/or waivers, the yields would have been 5.32%, 5.21%, 5.32%, 5.32%, 5.38%, 5.27%, 4.90%, 5.06% and 4.80% for Academy Shares, Agency Shares, Capital Shares, Empower Shares, IM Shares, Institutional Class Shares, Morgan Shares, Premier Shares and Reserve Shares, respectively. |
9 | J.P. Morgan Money Market Funds | August 31, 2023 |
SIX MONTHS ENDED August 31, 2023 (Unaudited)
Objective† | Aims to provide the highest possible level of current income which is excluded from gross income, while still preserving capital and maintaining liquidity(a) |
Primary Investments | High quality short-term municipal securities, the interest on which is excluded from federal income taxes |
Suggested investment time frame | Short-term |
Share classes offered | Agency, Institutional Class, Morgan, Premier and Reserve |
Net Assets as of August 31, 2023 | $10.3 Billion |
Weighted Average Maturity(b) | 23 calendar days |
Weighted Average Life(c) | 23 calendar days |
MATURITY SCHEDULE(b) (d) | |
1 calendar day | 15.6 % |
2–7 calendar days | 63.6 |
8–30 calendar days | 6.1 |
31–60 calendar days | 5.3 |
61–90 calendar days | 2.3 |
91–180 calendar days | 5.1 |
181+ calendar days | 2.0 |
7-DAY SEC YIELD AS OF August 31, 2023(e) | |
Agency Shares | 3.98 % |
Institutional Class Shares | 4.03 |
Morgan Shares | 3.64 |
Premier Shares | 3.81 |
Reserve Shares | 3.55 |
† | The adviser seeks to achieve the Fund’s objective. There can be no guarantee it will be achieved. |
(a) | A portion of the Fund’s income distributions may be subject to the Alternative Minimum Tax (AMT), and some investors may be subject to certain state and local taxes. |
(b) | The calculation takes into account the period remaining until the date on which, in accordance with the terms of the security, the principal amount must unconditionally be paid, or in the case of a security called for redemption, the date on which the redemption payment must be made and may utilize the interest rate reset date for variable or floating rate securities. |
(c) | The calculation takes into account the period remaining until the date on which, in accordance with the terms of the security, the principal amount must unconditionally be paid, or in the case of a security called for redemption, the date on which the redemption payment must be made. |
(d) | Percentages indicated are based upon total investments as of August 31, 2023. |
(e) | The yields for Agency Shares, Institutional Class Shares, Morgan Shares, Premier Shares and Reserve Shares reflect the reimbursements and/or waivers of certain expenses. Without these reimbursements and/or waivers, the yields would have been 3.96%, 4.01%, 3.64%, 3.81% and 3.55% for Agency Shares, Institutional Class Shares, Morgan Shares, Premier Shares and Reserve Shares, respectively. |
August 31, 2023 | J.P. Morgan Money Market Funds | 10 |
SIX MONTHS ENDED August 31, 2023 (Unaudited)
Objective† | Seeks as high a level of current interest income exempt from federal income tax as is consistent with liquidity and stability of principal(a) |
Primary Investments | High quality short-term municipal securities, the interest on which is excluded from federal income taxes |
Suggested investment time frame | Short-term |
Share classes offered | Agency, E*Trade(b), Institutional Class, Morgan, Premier and Service |
Net Assets as of August 31, 2023 | $1.6 Billion |
Weighted Average Maturity(c) | 25 calendar days |
Weighted Average Life(d) | 25 calendar days |
MATURITY SCHEDULE(c) (e) | |
1 calendar day | 37.8 % |
2–7 calendar days | 48.5 |
8–30 calendar days | 4.5 |
31–60 calendar days | 0.9 |
61–90 calendar days | 2.3 |
91–180 calendar days | 1.0 |
181+ calendar days | 5.0 |
7-DAY SEC YIELD AS OF August 31, 2023(f) | |
Agency Shares | 4.11 % |
Institutional Class Shares | 4.16 |
Morgan Shares | 3.77 |
Premier Shares | 3.91 |
Service Shares | 3.30 |
† | The adviser seeks to achieve the Fund’s objective. There can be no guarantee it will be achieved. |
(a) | A portion of the Fund’s income distributions may be subject to the Alternative Minimum Tax (AMT), and some investors may be subject to certain state and local taxes. |
(b) | E*Trade Shares had no assets from the close of business on September 21, 2016. |
(c) | The calculation takes into account the period remaining until the date on which, in accordance with the terms of the security, the principal amount must unconditionally be paid, or in the case of a security called for redemption, the date on which the redemption payment must be made and may utilize the interest rate reset date for variable or floating rate securities. |
(d) | The calculation takes into account the period remaining until the date on which, in accordance with the terms of the security, the principal amount must unconditionally be paid, or in the case of a security called for redemption, the date on which the redemption payment must be made. |
(e) | Percentages indicated are based upon total investments as of August 31, 2023. |
(f) | The yields for Agency Shares, Institutional Class Shares, Morgan Shares, Premier Shares and Service Shares reflect the reimbursements and/or waivers of certain expenses. Without these reimbursements and/or waivers, the yields would have been 4.08%, 4.13%, 3.77%, 3.91% and 3.30% for Agency Shares, Institutional Class Shares, Morgan Shares, Premier Shares and Service Shares, respectively. |
11 | J.P. Morgan Money Market Funds | August 31, 2023 |
SIX MONTHS ENDED August 31, 2023 (Unaudited)
Objective† | Aims to provide the highest possible level of current income which is exempt from federal and California personal income taxes, while still preserving capital and maintaining liquidity(a) |
Primary Investments | California short-term municipal obligations, the interest on which is excluded from gross income for federal income tax purposes, exempt from California personal income taxes and is not subject to the federal alternative minimum tax on individuals. |
Suggested investment time frame | Short-term |
Share classes offered | Agency, E*Trade(b), Institutional Class, Morgan, Premier and Service |
Net Assets as of August 31, 2023 | $0.5 Billion |
Weighted Average Maturity(c) | 22 calendar days |
Weighted Average Life(d) | 22 calendar days |
MATURITY SCHEDULE(c) (e) | |
1 calendar day | 23.5 % |
2–7 calendar days | 50.4 |
8–30 calendar days | 8.7 |
31–60 calendar days | 11.4 |
61–90 calendar days | 0.7 |
91–180 calendar days | 2.7 |
181+ calendar days | 2.6 |
7-DAY SEC YIELD AS OF August 31, 2023(f) | |
Agency Shares | 3.41 % |
Institutional Class Shares | 3.46 |
Morgan Shares | 3.07 |
Premier Shares | 3.22 |
Service Shares | 2.60 |
† | The adviser seeks to achieve the Fund’s objective. There can be no guarantee it will be achieved. |
(a) | A portion of the Fund’s income distributions may be subject to the Alternative Minimum Tax (AMT), and some investors may be subject to certain state and local taxes. |
(b) | E*Trade Shares had no assets from the close of business on September 21, 2016. |
(c) | The calculation takes into account the period remaining until the date on which, in accordance with the terms of the security, the principal amount must unconditionally be paid, or in the case of a security called for redemption, the date on which the redemption payment must be made and may utilize the interest rate reset date for variable or floating rate securities. |
(d) | The calculation takes into account the period remaining until the date on which, in accordance with the terms of the security, the principal amount must unconditionally be paid, or in the case of a security called for redemption, the date on which the redemption payment must be made. |
(e) | Percentages indicated are based upon total investments as of August 31, 2023. |
(f) | The yields for Agency Shares, Institutional Class Shares, Morgan Shares, Premier Shares and Service Shares reflect the reimbursements and/or waivers of certain expenses. Without these reimbursements and/or waivers, the yields would have been 3.36%, 3.41%, 3.05%, 3.21% and 2.59% for Agency Shares, Institutional Class Shares, Morgan Shares, Premier Shares and Service Shares, respectively. |
August 31, 2023 | J.P. Morgan Money Market Funds | 12 |
SIX MONTHS ENDED August 31, 2023 (Unaudited)
Objective† | Aims to provide the highest possible level of current income which is excluded from gross income and exempt from New York State and New York City personal income taxes, while still preserving capital and maintaining liquidity(a) |
Primary Investments | New York short-term municipal obligations, the interest on which is excluded from gross income for federal income tax purposes, exempt from New York personal income taxes and is not subject to the federal alternative minimum tax on individuals. |
Suggested investment time frame | Short-term |
Share classes offered | Agency, E*Trade(b), Institutional Class, Morgan, Premier, Reserve and Service |
Net Assets as of August 31, 2023 | $2.1 Billion |
Weighted Average Maturity(c) | 26 calendar days |
Weighted Average Life(d) | 26 calendar days |
MATURITY SCHEDULE(c) (e) | |
1 calendar day | 23.7 % |
2–7 calendar days | 68.7 |
8–30 calendar days | 0.3 |
31–60 calendar days | 0.3 |
61–90 calendar days | 0.2 |
91–180 calendar days | 0.6 |
181+ calendar days | 6.2 |
7-DAY SEC YIELD AS OF August 31, 2023(f) | |
Agency Shares | 4.15 % |
Institutional Class Shares | 4.20 |
Morgan Shares | 3.81 |
Premier Shares | 3.96 |
Reserve Shares | 3.71 |
Service Shares | 3.34 |
† | The adviser seeks to achieve the Fund’s objective. There can be no guarantee it will be achieved. |
(a) | A portion of the Fund’s income distributions may be subject to the Alternative Minimum Tax (AMT), and some investors may be subject to certain state and local taxes. |
(b) | E*Trade Shares had no assets from the close of business on September 21, 2016. |
(c) | The calculation takes into account the period remaining until the date on which, in accordance with the terms of the security, the principal amount must unconditionally be paid, or in the case of a security called for redemption, the date on which the redemption payment must be made and may utilize the interest rate reset date for variable or floating rate securities. |
(d) | The calculation takes into account the period remaining until the date on which, in accordance with the terms of the security, the principal amount must unconditionally be paid, or in the case of a security called for redemption, the date on which the redemption payment must be made. |
(e) | Percentages indicated are based upon total investments as of August 31, 2023. |
(f) | The yields for Agency Shares, Institutional Class Shares, Morgan Shares, Premier Shares, Reserve Shares and Service Shares reflect the reimbursements and/or waivers of certain expenses. Without these reimbursements and/or waivers, the yields would have been 4.12%, 4.17%, 3.79%, 3.96%, 3.71% and 3.34% for Agency Shares, Institutional Class Shares, Morgan Shares, Premier Shares, Reserve Shares and Service Shares, respectively. |
13 | J.P. Morgan Money Market Funds | August 31, 2023 |
AS OF August 31, 2023 (Unaudited)
INVESTMENTS †† | PRINCIPAL AMOUNT ($000) | VALUE ($000) |
Repurchase Agreements — 28.7% | ||
Barclays Capital, Inc., 5.60%, dated 8/31/2023, due 10/5/2023, repurchase price $150,817, collateralized by Collateralized Mortgage Obligations, 0.00% - 6.50%, due 11/17/2036 - 9/17/2064, with a value of $162,000. | 150,000 | 150,000 |
Barclays Capital, Inc., 5.62%, dated 8/31/2023, due 10/5/2023, repurchase price $296,612, collateralized by Collateralized Mortgage Obligations, 0.00% - 11.08%, due 5/15/2028 - 4/25/2065 and FNMA, 1.50% - 11.40%, due 12/26/2030 - 8/25/2050, with a value of $318,600. | 295,000 | 295,000 |
BMO Capital Markets Corp., 5.41%, dated 8/31/2023, due 9/7/2023, repurchase price $80,084, collateralized by Asset-Backed Securities, 0.96% - 12.05%, due 12/16/2024 - 8/25/2067, Collateralized Mortgage Obligations, 0.14% - 6.68%, due 2/25/2025 - 11/25/2061, Corporate Notes and Bonds, 4.25% - 8.25%, due 5/1/2025 - 12/1/2049, FHLMC, 5.00%, due 8/1/2052, FNMA, 12.29% - 16.29%, due 3/25/2042 and GNMA, 5.50%, due 6/20/2053, with a value of $86,131. | 80,000 | 80,000 |
BMO Capital Markets Corp., 5.41%, dated 8/31/2023, due 9/7/2023, repurchase price $80,084, collateralized by Asset-Backed Securities, 0.47% - 11.59%, due 6/15/2026 - 7/25/2063, Collateralized Mortgage Obligations, 0.00% - 6.96%, due 1/25/2035 - 1/18/2063, Corporate Notes and Bonds, 2.00% - 10.50%, due 6/12/2024 - 3/9/2034, FNMA, 4.75% - 12.29%, due 9/25/2041 - 8/26/2058 and U.S. Treasury Securities, 0.88% - 4.13%, due 6/30/2026 - 9/30/2027, with a value of $85,875. | 80,000 | 80,000 |
BMO Capital Markets Corp., 5.43%, dated 8/31/2023, due 9/7/2023, repurchase price $100,105, collateralized by Asset-Backed Securities, 0.96% - 12.07%, due 5/19/2026 - 8/25/2067, Collateralized Mortgage Obligations, 0.00% - 6.00%, due 9/25/2035 - 3/25/2067, Corporate Notes and Bonds, 2.65% - 8.25%, due 10/13/2023 - 8/15/2034, FNMA, 2.96% - 12.29%, due 2/25/2027 - 3/25/2042, GNMA, 4.33% - 4.45%, due 6/20/2068 - 8/20/2069 and Sovereign Government Securities, 3.00% - 3.88%, due 6/13/2024 - 2/14/2028, with a value of $107,998. | 100,000 | 100,000 |
INVESTMENTS †† | PRINCIPAL AMOUNT ($000) | VALUE ($000) |
BNP Paribas SA, 5.40%, dated 8/31/2023, due 9/7/2023, repurchase price $525,551, collateralized by Asset-Backed Securities, 0.60% - 8.48%, due 3/20/2026 - 2/25/2068, Collateralized Mortgage Obligations, 4.55% - 8.24%, due 1/25/2045 - 8/25/2068, Corporate Notes and Bonds, 2.30% - 9.25%, due 1/17/2024 - 12/31/2079^^, FHLMC, 4.41%, due 3/25/2030, FNMA, 4.00% - 17.65%, due 8/25/2031 - 8/25/2056 and Sovereign Government Securities, 0.50% - 7.63%, due 9/25/2023 - 5/24/2061, with a value of $563,348. | 525,000 | 525,000 |
BNP Paribas SA, 5.46%, dated 8/31/2023, due 9/7/2023, repurchase price $350,372, collateralized by Asset-Backed Securities, 3.98% - 11.76%, due 9/15/2026 - 1/25/2047, with a value of $385,674. | 350,000 | 350,000 |
BNP Paribas SA, 5.51%, dated 8/31/2023, due 10/5/2023, repurchase price $281,500, collateralized by Asset-Backed Securities, 0.48% - 7.54%, due 11/15/2024 - 7/16/2035, Collateralized Mortgage Obligations, 0.16% - 9.12%, due 10/27/2024 - 8/25/2068, Corporate Notes and Bonds, 0.80% - 9.31%, due 1/15/2024 - 10/15/2097^^ and FNMA, 4.50% - 14.65%, due 11/25/2039 - 2/25/2059, with a value of $299,043. | 280,000 | 280,000 |
BNP Paribas SA, 5.56%, dated 8/31/2023, due 10/5/2023, repurchase price $346,865, collateralized by Asset-Backed Securities, 5.16% - 12.66%, due 4/20/2026 - 2/15/2040, Collateralized Mortgage Obligations, 5.86% - 6.13%, due 5/25/2035 - 8/25/2067, Corporate Notes and Bonds, 1.55% - 11.50%, due 5/11/2025 - 12/6/2052, FNMA, 11.29%, due 10/25/2041 and U.S. Treasury Securities, 4.38%, due 8/31/2028, with a value of $364,869. | 345,000 | 345,000 |
BNP Paribas SA, 5.58%, dated 8/31/2023, due 10/5/2023, repurchase price $165,895, collateralized by Asset-Backed Securities, 3.90% - 14.31%, due 7/15/2027 - 8/25/2067, with a value of $184,031. | 165,000 | 165,000 |
BofA Securities, Inc., 5.35%, dated 8/31/2023, due 9/1/2023, repurchase price $75,011, collateralized by FNMA, 2.52% - 6.95%, due 1/1/2024 - 8/1/2053, with a value of $76,500. | 75,000 | 75,000 |
August 31, 2023 | J.P. Morgan Money Market Funds | 14 |
AS OF August 31, 2023 (Unaudited) (continued)
INVESTMENTS †† | PRINCIPAL AMOUNT ($000) | VALUE ($000) |
Repurchase Agreements — continued | ||
BofA Securities, Inc., 5.39%, dated 8/31/2023, due 9/1/2023, repurchase price $100,015, collateralized by Corporate Notes and Bonds, 1.00% - 6.29%, due 3/8/2024 - 4/1/2053, with a value of $105,000. | 100,000 | 100,000 |
BofA Securities, Inc., 5.44%, dated 8/31/2023, due 9/1/2023, repurchase price $100,015, collateralized by Corporate Notes and Bonds, 0.00% - 9.13%, due 11/15/2026 - 7/15/2031, with a value of $108,001. | 100,000 | 100,000 |
BofA Securities, Inc., 5.44%, dated 8/31/2023, due 9/6/2023, repurchase price $150,136, collateralized by Corporate Notes and Bonds, 2.88% - 6.50%, due 1/10/2024 - 12/31/2079, with a value of $157,500. | 150,000 | 150,000 |
BofA Securities, Inc., 5.39%, dated 8/31/2023, due 9/7/2023, repurchase price $300,314, collateralized by Commercial Paper, 0.00%, due 9/26/2023 - 10/3/2023 and Corporate Notes and Bonds, 0.75% - 10.75%, due 9/1/2023 - 12/31/2079, with a value of $315,000. | 300,000 | 300,000 |
BofA Securities, Inc., 5.44%, dated 8/31/2023, due 9/7/2023, repurchase price $100,106, collateralized by Corporate Notes and Bonds, 0.00% - 10.38%, due 9/21/2023 - 7/17/2045, with a value of $108,001. | 100,000 | 100,000 |
BofA Securities, Inc., 5.69%, dated 8/31/2023, due 10/5/2023, repurchase price $402,213, collateralized by Collateralized Mortgage Obligations, 0.71% - 10.42%, due 1/25/2034 - 12/16/2072 and Corporate Notes and Bonds, 0.00% - 10.25%, due 10/24/2023 - 7/2/2064^^, with a value of $425,318. | 400,000 | 400,000 |
Credit Agricole Corporate and Investment Bank, 5.38%, dated 8/31/2023, due 9/7/2023, repurchase price $100,105, collateralized by Asset-Backed Securities, 1.18% - 7.96%, due 2/15/2029 - 3/9/2042, Collateralized Mortgage Obligations, 2.97% - 3.15%, due 2/12/2047 - 10/13/2049, Corporate Notes and Bonds, 2.17% - 8.75%, due 2/12/2024 - 3/30/2051^^, FHLB, 5.00%, due 1/19/2024, FHLMC, 4.38%, due 12/25/2028, GNMA, 5.50% - 6.50%, due 12/20/2052, Sovereign Government Securities, 2.88% - 5.50%, due 1/25/2027 - 1/21/2030 and U.S. Treasury Securities, 0.00%, due 8/15/2029 - 5/15/2031, with a value of $105,274. | 100,000 | 100,000 |
INVESTMENTS †† | PRINCIPAL AMOUNT ($000) | VALUE ($000) |
Credit Agricole Corporate and Investment Bank, 5.38%, dated 8/31/2023, due 9/7/2023, repurchase price $200,209, collateralized by Asset-Backed Securities, 1.35% - 6.79%, due 7/20/2034 - 2/1/2062, Collateralized Mortgage Obligations, 4.15% - 6.73%, due 3/17/2036 - 12/16/2050, Corporate Notes and Bonds, 1.46% - 8.25%, due 4/15/2024 - 3/30/2051 and Sovereign Government Securities, 3.24%, due 2/6/2028, with a value of $210,245. | 200,000 | 200,000 |
Credit Agricole Corporate and Investment Bank, 5.38%, dated 8/31/2023, due 9/7/2023, repurchase price $260,272, collateralized by Asset-Backed Securities, 0.01% - 8.69%, due 5/17/2027 - 2/1/2062, Collateralized Mortgage Obligations, 3.32% - 6.83%, due 7/15/2032 - 9/12/2050, Corporate Notes and Bonds, 1.05% - 7.00%, due 1/15/2024 - 6/1/2054^^, GNMA, 5.00%, due 2/20/2053 and Sovereign Government Securities, 0.55% - 5.50%, due 1/16/2024 - 1/17/2042, with a value of $274,149. | 260,000 | 260,000 |
Federal Reserve Bank of New York, 5.30%, dated 8/31/2023, due 9/1/2023, repurchase price $8,901,310, collateralized by U.S. Treasury Securities, 1.75% - 2.88%, due 11/15/2029 - 2/15/2041, with a value of $8,901,310. | 8,900,000 | 8,900,000 |
Fixed Income Clearing Corp., 5.30%, dated 8/31/2023, due 9/1/2023, repurchase price $2,200,324, collateralized by U.S. Treasury Securities, 0.13% - 2.88%, due 1/15/2032 - 7/15/2032, with a value of $2,244,000. | 2,200,000 | 2,200,000 |
Goldman Sachs & Co. LLC, 5.66%, dated 8/31/2023, due 10/16/2023, repurchase price $604,339, collateralized by Asset-Backed Securities, 0.00% - 13.53%, due 3/22/2025 - 11/25/2069, Collateralized Mortgage Obligations, 0.02% - 11.54%, due 8/17/2026 - 1/25/2053, Corporate Notes and Bonds, 0.00% - 17.50%, due 9/21/2023 - 12/31/2079^^, FHLMC, 3.80% - 5.80%, due 11/25/2030 - 8/15/2046 and FNMA, 3.00% - 5.90%, due 4/25/2029 - 1/25/2050, with a value of $644,880. | 600,000 | 600,000 |
HSBC Securities USA, Inc., 5.43%, dated 8/31/2023, due 9/1/2023, repurchase price $20,003, collateralized by Asset-Backed Securities, 2.44% - 6.23%, due 9/15/2026 - 4/20/2062, with a value of $21,203. | 20,000 | 20,000 |
15 | J.P. Morgan Money Market Funds | August 31, 2023 |
INVESTMENTS †† | PRINCIPAL AMOUNT ($000) | VALUE ($000) |
Repurchase Agreements — continued | ||
HSBC Securities USA, Inc., 5.43%, dated 8/31/2023, due 9/1/2023, repurchase price $350,053, collateralized by Corporate Notes and Bonds, 0.98% - 8.75%, due 2/4/2025 - 12/31/2079^^ and Sovereign Government Securities, 2.38% - 6.40%, due 8/14/2024 - 1/18/2053, with a value of $367,555. | 350,000 | 350,000 |
ING Financial Markets LLC, 5.40%, dated 8/31/2023, due 9/1/2023, repurchase price $45,007, collateralized by Corporate Notes and Bonds, 0.25% - 7.13%, due 9/15/2023 - 12/31/2079, with a value of $47,257. | 45,000 | 45,000 |
ING Financial Markets LLC, 5.40%, dated 8/31/2023, due 9/1/2023, repurchase price $100,015, collateralized by Corporate Notes and Bonds, 1.15% - 6.00%, due 6/26/2024 - 12/31/2079, with a value of $105,017. | 100,000 | 100,000 |
ING Financial Markets LLC, 5.43%, dated 8/31/2023, due 9/1/2023, repurchase price $98,015, collateralized by Corporate Notes and Bonds, 0.55% - 13.25%, due 3/15/2024 - 12/31/2079^^ and Sovereign Government Securities, 5.00% - 5.65%, due 6/15/2045 - 9/27/2047, with a value of $105,548. | 98,000 | 98,000 |
ING Financial Markets LLC, 5.55%, dated 8/31/2023, due 9/1/2023, repurchase price $500,077, collateralized by Common Stocks, with a value of $544,995. | 500,000 | 500,000 |
Mitsubishi UFJ Trust & Banking Corp., 5.45%, dated 8/31/2023, due 9/7/2023, repurchase price $1,001,060, collateralized by Corporate Notes and Bonds, 0.00% - 4.70%, due 4/1/2024 - 2/25/2032, with a value of $1,050,159. | 1,000,000 | 1,000,000 |
Pershing LLC, 5.71%, dated 8/31/2023, due 11/8/2023, repurchase price $151,642, collateralized by FNMA, 2.00%, due 11/25/2051, GNMA, 5.00% - 6.09%, due 2/20/2045 - 4/20/2053 and U.S. Treasury Securities, 0.00% - 6.75%, due 9/7/2023 - 5/15/2053, with a value of $155,241. | 150,000 | 150,000 |
INVESTMENTS †† | PRINCIPAL AMOUNT ($000) | VALUE ($000) |
RBC Capital Markets LLC, 5.42%, dated 8/31/2023, due 9/7/2023, repurchase price $300,316, collateralized by Certificates of Deposit, 5.39% - 5.56%, due 11/16/2023 - 12/22/2023, Commercial Paper, 0.00%, due 10/25/2023, Corporate Notes and Bonds, 1.25% - 9.02%, due 9/9/2024 - 6/1/2077, FHLB, 0.25% - 6.33%, due 12/29/2023 - 8/23/2038, FHLMC, 1.50% - 5.00%, due 8/25/2049 - 12/1/2052, FNMA, 4.48% - 5.50%, due 6/25/2024 - 11/1/2052 and GNMA, 1.25% - 7.50%, due 4/16/2039 - 8/20/2053, with a value of $314,451. | 300,000 | 300,000 |
Societe Generale SA, 5.38%, dated 8/31/2023, due 9/1/2023, repurchase price $500,075, collateralized by Asset-Backed Securities, 8.25%, due 2/25/2068, Collateralized Mortgage Obligations, 2.50%, due 7/25/2056, Corporate Notes and Bonds, 0.78% - 8.75%, due 3/25/2024 - 7/15/2080^^, FNMA, 8.19% - 10.29%, due 3/25/2042 - 9/25/2042 and Sovereign Government Securities, 1.75% - 10.63%, due 11/22/2023 - 12/1/2060, with a value of $525,931. | 500,000 | 500,000 |
Societe Generale SA, 5.40%, dated 8/31/2023, due 9/1/2023, repurchase price $135,020, collateralized by Asset-Backed Securities, 2.70% - 6.17%, due 11/1/2033 - 8/25/2035, Collateralized Mortgage Obligations, 3.32% - 4.67%, due 11/25/2048 - 12/25/2051, Corporate Notes and Bonds, 0.78% - 8.48%, due 6/26/2024 - 12/31/2079^^, FNMA, 8.99% - 10.29%, due 9/25/2042 and Sovereign Government Securities, 0.75% - 10.63%, due 1/14/2024 - 12/1/2060^^, with a value of $142,254. | 135,000 | 135,000 |
Societe Generale SA, 5.45%, dated 8/31/2023, due 9/1/2023, repurchase price $140,021, collateralized by Collateralized Mortgage Obligations, 2.50% - 8.77%, due 10/15/2036 - 7/25/2056, Corporate Notes and Bonds, 1.49% - 9.38%, due 4/1/2024 - 1/23/2046, FNMA, 8.79% - 11.04%, due 2/25/2042 - 3/25/2043 and Sovereign Government Securities, 2.78% - 9.88%, due 1/26/2026 - 12/1/2060, with a value of $150,900. | 140,000 | 140,000 |
August 31, 2023 | J.P. Morgan Money Market Funds | 16 |
AS OF August 31, 2023 (Unaudited) (continued)
INVESTMENTS †† | PRINCIPAL AMOUNT ($000) | VALUE ($000) |
Repurchase Agreements — continued | ||
Societe Generale SA, 5.47%, dated 8/31/2023, due 9/6/2023, repurchase price $475,433, collateralized by Asset-Backed Securities, 3.00% - 7.45%, due 4/15/2030 - 4/25/2037, Collateralized Mortgage Obligations, 2.50% - 9.16%, due 8/17/2034 - 7/25/2056, Corporate Notes and Bonds, 1.38% - 13.38%, due 11/17/2023 - 1/28/2060^^, FNMA, 9.30% - 11.04%, due 4/25/2042 - 9/25/2048 and Sovereign Government Securities, 2.78% - 11.88%, due 1/7/2025 - 12/1/2060, with a value of $512,034. | 475,000 | 475,000 |
Societe Generale SA, 5.40%, dated 8/31/2023, due 9/7/2023, repurchase price $215,226, collateralized by Asset-Backed Securities, 8.25%, due 2/25/2068, Collateralized Mortgage Obligations, 2.50% - 3.50%, due 10/25/2051 - 7/25/2056, Corporate Notes and Bonds, 0.00% - 8.54%, due 9/21/2023 - 12/31/2079^^, FNMA, 8.19% - 8.99%, due 3/25/2042 - 9/25/2042 and Sovereign Government Securities, 2.25% - 5.50%, due 11/13/2024 - 4/4/2053, with a value of $226,484. | 215,000 | 215,000 |
Societe Generale SA, 5.65%, dated 8/31/2023, due 12/1/2023, repurchase price $507,219, collateralized by Collateralized Mortgage Obligations, 4.32% - 9.46%, due 9/15/2034 - 12/25/2046, Corporate Notes and Bonds, 3.88% - 9.25%, due 6/25/2024 - 1/28/2060, FNMA, 10.80%, due 3/25/2043 and Sovereign Government Securities, 4.63% - 8.88%, due 4/15/2024 - 2/14/2034, with a value of $546,417. | 500,000 | 500,000 |
TD Securities (USA) LLC, 5.40%, dated 8/31/2023, due 9/7/2023, repurchase price $600,630, collateralized by Corporate Notes and Bonds, 0.95% - 6.50%, due 1/15/2024 - 12/1/2053 and Municipal Debt Securities, 4.00% - 7.55%, due 6/1/2029 - 4/1/2057, with a value of $630,662. | 600,000 | 600,000 |
TD Securities (USA) LLC, 5.43%, dated 8/31/2023, due 9/7/2023, repurchase price $390,412, collateralized by Asset-Backed Securities, 2.06%, due 2/27/2051 and Corporate Notes and Bonds, 3.15% - 12.25%, due 10/18/2023 - 12/14/2051, with a value of $419,902. | 390,000 | 390,000 |
INVESTMENTS †† | PRINCIPAL AMOUNT ($000) | VALUE ($000) |
TD Securities (USA) LLC, 5.66%, dated 8/31/2023, due 10/10/2023, repurchase price $100,629, collateralized by Asset-Backed Securities, 2.23% - 5.98%, due 2/20/2026 - 1/22/2029 and Corporate Notes and Bonds, 1.60% - 9.38%, due 3/15/2024 - 4/15/2031, with a value of $109,066. | 100,000 | 100,000 |
UBS Securities LLC, 5.42%, dated 8/31/2023, due 9/7/2023, repurchase price $100,105, collateralized by Asset-Backed Securities, 0.00% - 10.00%, due 3/26/2035 - 12/26/2046, Collateralized Mortgage Obligations, 6.18%, due 10/25/2035, FHLMC, 2.00% - 8.00%, due 10/1/2023 - 2/1/2052, FNMA, 2.00% - 9.00%, due 9/25/2023 - 8/1/2053, GNMA, 0.50% - 9.50%, due 9/20/2023 - 6/20/2063 and U.S. Treasury Securities, 0.00%, due 8/8/2024, with a value of $104,706. | 100,000 | 100,000 |
UBS Securities LLC, 5.50%, dated 8/31/2023, due 9/7/2023, repurchase price $400,428, collateralized by Certificates of Deposit, 5.00% - 5.40%, due 11/20/2023 - 11/30/2027, Corporate Notes and Bonds, 0.50% - 11.75%, due 9/12/2023 - 1/15/2083^^, FHLB, 0.00%, due 9/19/2023 - 10/18/2023, Sovereign Government Securities, 5.63%, due 1/7/2041 and U.S. Treasury Securities, 0.00% - 4.38%, due 2/15/2024 - 5/15/2043, with a value of $422,178. | 400,000 | 400,000 |
Wells Fargo Securities LLC, 5.76%, dated 8/31/2023, due 11/21/2023, repurchase price $202,624, collateralized by Certificates of Deposit, 0.00% - 6.20%, due 10/2/2023 - 8/28/2028, with a value of $212,957. | 200,000 | 200,000 |
Total Repurchase Agreements (Cost $22,173,000) | 22,173,000 | |
Corporate Bonds — 0.7% | ||
Banks — 0.7% | ||
Bank of America NA(SOFR + 0.45%), 5.75%, 9/1/2023 (a) | 275,000 | 275,061 |
Barclays Bank plc (United Kingdom) | ||
(OBFR + 0.30%), 5.61%, 9/1/2023 (a) (b) | 170,000 | 170,000 |
(OBFR + 0.30%), 5.61%, 9/1/2023 (a) (b) | 120,000 | 120,000 |
Total Corporate Bonds (Cost $565,000) | 565,061 | |
17 | J.P. Morgan Money Market Funds | August 31, 2023 |
INVESTMENTS †† | PRINCIPAL AMOUNT ($000) | VALUE ($000) |
Municipal Bonds — 0.4% | ||
Alaska — 0.1% | ||
Alaska Housing Finance Corp., State Capital Project Series 2022A, Rev., VRDO, LOC : Barclays Bank plc, 5.37%, 9/8/2023 (c) | 73,000 | 73,000 |
Georgia — 0.1% | ||
Macon-Bibb County Industrial Authority, Kumho Tire Georgia Inc. Project, Rev., VRDO, LOC : Korea Development Bank, 5.49%, 9/8/2023 (b) (c) | 55,000 | 55,000 |
Iowa — 0.1% | ||
Iowa Student Loan Liquidity Corp., Student Loan Series 2023-1, Rev., VRDO, LOC : Royal Bank of Canada, 5.37%, 9/8/2023 (c) | 94,700 | 94,700 |
New Hampshire — 0.0% ^ | ||
New Hampshire Business Finance Authority, University of Nevada Reno Project Series 2023, Rev., VRDO, LOC : Korea Development Bank, 5.49%, 9/8/2023 (b) (c) | 26,700 | 26,700 |
Texas — 0.1% | ||
State of Texas Series 2023A, GO, VRDO, LIQ : Texas State Comptroller, 5.42%, 9/8/2023 (c) | 35,000 | 35,000 |
Total Municipal Bonds (Cost $284,400) | 284,400 | |
Short Term Investments — 69.0% | ||
Certificates of Deposits — 29.7% | ||
ABN AMRO Bank NV (Netherlands) | ||
5.31%, 10/2/2023 (d) | 175,000 | 174,182 |
5.30%, 10/2/2023 (d) | 221,000 | 219,981 |
Bank of America NA | ||
5.33%, 9/7/2023 | 150,000 | 150,000 |
5.74%, 2/9/2024 | 210,000 | 209,971 |
5.79%, 2/14/2024 | 160,000 | 160,007 |
5.85%, 2/28/2024 | 170,000 | 170,038 |
Bank of Montreal (Canada) | ||
(SOFR + 0.53%), 5.83%, 9/1/2023 (a) | 56,000 | 56,021 |
(SOFR + 0.63%), 5.93%, 9/1/2023 (a) | 77,300 | 77,372 |
(SOFR + 0.64%), 5.94%, 9/1/2023 (a) | 20,000 | 20,008 |
(SOFR + 0.75%), 6.05%, 9/1/2023 (a) | 118,000 | 118,164 |
Bank of Nova Scotia (The) (Canada) | ||
(SOFR + 0.50%), 5.80%, 9/1/2023 (a) | 225,000 | 225,125 |
(SOFR + 0.60%), 5.90%, 9/1/2023 (a) | 146,000 | 146,108 |
(SOFR + 0.66%), 5.96%, 9/1/2023 (a) | 80,000 | 80,093 |
(SOFR + 0.70%), 6.00%, 9/1/2023 (a) | 70,000 | 70,096 |
5.70%, 12/1/2023 | 88,000 | 88,020 |
INVESTMENTS †† | PRINCIPAL AMOUNT ($000) | VALUE ($000) |
Certificates of Deposits — continued | ||
Barclays Bank plc (United Kingdom) | ||
(SOFR + 0.44%), 5.74%, 9/1/2023 (a) | 180,000 | 180,095 |
5.84%, 2/9/2024 | 175,000 | 175,030 |
BNP Paribas SA (France) | ||
(SOFR + 0.35%), 5.65%, 9/1/2023 (a) | 100,000 | 100,035 |
(SOFR + 0.43%), 5.73%, 9/1/2023 (a) | 120,500 | 120,525 |
(SOFR + 0.47%), 5.77%, 9/1/2023 (a) | 145,000 | 145,087 |
(SOFR + 0.50%), 5.80%, 9/1/2023 (a) | 158,000 | 158,098 |
(SOFR + 0.55%), 5.85%, 9/1/2023 (a) | 110,000 | 110,103 |
(SOFR + 0.55%), 5.85%, 9/1/2023 (a) | 95,000 | 95,088 |
5.71%, 3/4/2024 | 275,000 | 274,820 |
Canadian Imperial Bank of Commerce (Canada) | ||
(SOFR + 0.50%), 5.80%, 9/1/2023 (a) | 54,000 | 54,039 |
(SOFR + 0.50%), 5.80%, 9/1/2023 (a) | 61,000 | 61,059 |
(SOFR + 0.54%), 5.84%, 9/1/2023 (a) | 155,000 | 155,191 |
(SOFR + 0.60%), 5.90%, 9/1/2023 (a) | 148,000 | 148,186 |
(SOFR + 0.60%), 5.90%, 9/1/2023 (a) | 86,000 | 86,109 |
(SOFR + 0.81%), 6.11%, 9/1/2023 (a) | 120,000 | 120,144 |
5.70%, 12/1/2023 | 118,000 | 118,050 |
5.42%, 4/10/2024 | 156,000 | 155,566 |
China Construction Bank Corp. (China) | ||
5.38%, 9/6/2023 | 75,000 | 75,000 |
5.38%, 9/7/2023 | 150,000 | 150,000 |
Citibank NA | ||
5.70%, 12/18/2023 | 200,000 | 200,032 |
5.76%, 1/29/2024 | 75,000 | 75,017 |
Cooperatieve Rabobank UA (Netherlands) | ||
(SOFR + 0.69%), 6.01%, 9/1/2023 (a) | 117,000 | 117,053 |
5.39%, 11/20/2023 | 85,000 | 84,970 |
5.26%, 12/18/2023 (d) | 320,000 | 314,681 |
5.26%, 12/18/2023 | 90,000 | 89,879 |
5.77%, 2/12/2024 (d) | 170,000 | 165,756 |
5.30%, 2/13/2024 | 90,000 | 89,753 |
5.76%, 6/5/2024 (d) | 197,000 | 188,498 |
5.91%, 8/14/2024 (d) | 160,000 | 151,406 |
Credit Agricole Corporate and Investment Bank (France) | ||
(SOFR + 0.30%), 5.60%, 9/1/2023 (a) | 130,000 | 130,055 |
(SOFR + 0.42%), 5.72%, 9/1/2023 (a) | 88,000 | 88,050 |
(SOFR + 0.50%), 5.80%, 9/1/2023 (a) | 171,000 | 171,126 |
(SOFR + 0.50%), 5.80%, 9/1/2023 (a) | 95,000 | 95,039 |
5.53%, 9/7/2023 | 250,000 | 250,007 |
5.55%, 9/13/2023 | 130,000 | 130,007 |
5.63%, 11/6/2023 | 99,000 | 99,034 |
August 31, 2023 | J.P. Morgan Money Market Funds | 18 |
AS OF August 31, 2023 (Unaudited) (continued)
INVESTMENTS †† | PRINCIPAL AMOUNT ($000) | VALUE ($000) |
Short Term Investments — continued | ||
Certificates of Deposits — continued | ||
5.77%, 2/5/2024 | 225,000 | 225,109 |
5.80%, 3/12/2024 | 220,000 | 220,009 |
Credit Industriel et Commercial (France) | ||
(SOFR + 0.38%), 5.68%, 9/1/2023 (a) | 77,000 | 77,029 |
(SOFR + 0.50%), 5.80%, 9/1/2023 (a) | 171,000 | 171,100 |
(SOFR + 0.52%), 5.82%, 9/1/2023 (a) | 171,000 | 171,094 |
5.07%, 10/17/2023 (d) | 385,000 | 382,296 |
5.10%, 10/19/2023 (d) | 362,000 | 359,348 |
5.07%, 11/1/2023 (d) | 309,000 | 306,124 |
5.75%, 1/9/2024 (d) | 170,000 | 166,553 |
5.37%, 2/5/2024 (d) | 155,000 | 151,157 |
5.11%, 2/6/2024 (d) | 212,000 | 206,708 |
5.90%, 5/13/2024 (d) | 335,000 | 321,529 |
5.98%, 5/29/2024 (d) | 387,000 | 370,500 |
DNB Bank ASA (Norway) , 5.40%, 11/10/2023 | 120,000 | 119,983 |
DZ Bank AG (Germany) (SOFR + 0.36%), 5.66%, 9/1/2023 (a) | 154,000 | 154,052 |
ING Bank NV (Netherlands) | ||
5.35%, 9/19/2023 | 162,000 | 161,987 |
5.32%, 1/17/2024 | 449,000 | 448,048 |
5.96%, 5/29/2024 | 195,000 | 194,983 |
Mitsubishi UFJ Trust & Banking Corp. (Japan) | ||
(SOFR + 0.17%), 5.47%, 9/1/2023 (a) | 143,000 | 143,001 |
(SOFR + 0.24%), 5.54%, 9/1/2023 (a) | 45,000 | 45,002 |
(SOFR + 0.41%), 5.71%, 9/1/2023 (a) | 80,000 | 80,004 |
Mizuho Bank Ltd. (Japan) | ||
5.55%, 10/16/2023 | 228,000 | 228,043 |
5.55%, 10/17/2023 | 200,000 | 200,038 |
5.58%, 11/17/2023 | 160,000 | 160,032 |
MUFG Bank Ltd. (Japan) | ||
(SOFR + 0.32%), 5.62%, 9/1/2023 (a) | 225,000 | 225,015 |
(SOFR + 0.34%), 5.64%, 9/1/2023 (a) | 81,000 | 81,022 |
(SOFR + 0.50%), 5.80%, 9/1/2023 (a) | 84,000 | 84,025 |
5.67%, 12/12/2023 | 175,000 | 174,994 |
National Australia Bank Ltd. (Australia) | ||
5.17%, 2/13/2024 (d) | 60,000 | 58,481 |
5.74%, 3/7/2024 (d) | 293,000 | 284,593 |
5.75%, 3/18/2024 (d) | 113,000 | 109,530 |
Natixis SA (France) | ||
(SOFR + 0.15%), 5.45%, 9/1/2023 (a) | 70,500 | 70,500 |
(SOFR + 0.42%), 5.72%, 9/1/2023 (a) | 220,000 | 220,152 |
(SOFR + 0.45%), 5.75%, 9/1/2023 (a) | 132,000 | 132,062 |
(SOFR + 0.50%), 5.80%, 9/1/2023 (a) | 249,000 | 249,154 |
(SOFR + 0.50%), 5.80%, 9/1/2023 (a) | 155,000 | 155,018 |
INVESTMENTS †† | PRINCIPAL AMOUNT ($000) | VALUE ($000) |
Certificates of Deposits — continued | ||
5.22%, 10/13/2023 | 105,000 | 104,960 |
5.32%, 11/7/2023 | 209,000 | 208,884 |
5.45%, 11/17/2023 | 150,000 | 149,946 |
5.70%, 12/1/2023 | 108,000 | 107,998 |
5.40%, 1/18/2024 | 160,000 | 159,736 |
Nordea Bank Abp (Finland) | ||
(SOFR + 0.51%), 5.81%, 9/1/2023 (a) | 64,000 | 64,044 |
(SOFR + 0.60%), 5.90%, 9/1/2023 (a) | 15,450 | 15,469 |
5.40%, 11/16/2023 | 130,000 | 129,961 |
Norinchukin Bank (The) (Japan) | ||
5.31%, 9/5/2023 | 50,000 | 50,000 |
5.31%, 9/7/2023 | 175,000 | 175,000 |
5.36%, 9/8/2023 | 140,000 | 140,000 |
5.34%, 9/20/2023 | 50,000 | 49,999 |
Oversea-Chinese Banking Corp., Ltd. (Singapore) (SOFR + 0.50%), 5.80%, 9/1/2023 (a) | 98,000 | 98,055 |
Royal Bank of Canada (Canada) | ||
(SOFR + 0.50%), 5.80%, 9/1/2023 (a) | 127,000 | 127,070 |
(SOFR + 0.53%), 5.83%, 9/1/2023 (a) | 89,000 | 89,069 |
(SOFR + 0.57%), 5.87%, 9/1/2023 (a) | 65,000 | 65,009 |
(SOFR + 0.60%), 5.90%, 9/1/2023 (a) | 64,000 | 64,073 |
Skandinaviska Enskilda Banken AB (Sweden) | ||
(SOFR + 0.65%), 5.95%, 9/1/2023 (a) | 85,000 | 85,088 |
(SOFR + 0.70%), 6.00%, 9/1/2023 (a) | 175,000 | 175,324 |
Standard Chartered Bank (United Kingdom) | ||
(SOFR + 0.41%), 5.71%, 9/1/2023 (a) | 150,000 | 149,991 |
(SOFR + 0.45%), 5.75%, 9/1/2023 (a) | 140,000 | 140,032 |
(SOFR + 0.47%), 5.77%, 9/1/2023 (a) | 98,000 | 98,024 |
(SOFR + 0.48%), 5.78%, 9/1/2023 (a) | 152,000 | 152,105 |
(SOFR + 0.50%), 5.80%, 9/1/2023 (a) | 149,000 | 149,048 |
(SOFR + 0.50%), 5.80%, 9/1/2023 (a) | 70,000 | 70,023 |
(SOFR + 0.52%), 5.82%, 9/1/2023 (a) | 195,000 | 195,087 |
5.45%, 10/20/2023 | 49,000 | 48,999 |
5.57%, 11/8/2023 | 4,000 | 4,000 |
5.57%, 11/8/2023 | 150,000 | 150,015 |
5.47%, 11/15/2023 | 294,000 | 293,948 |
5.52%, 11/24/2023 | 113,000 | 112,977 |
5.70%, 12/8/2023 | 200,000 | 200,042 |
State Street Bank and Trust Co. | ||
(SOFR + 0.40%), 5.70%, 9/1/2023 (a) | 133,000 | 133,041 |
(SOFR + 0.45%), 5.75%, 9/1/2023 (a) | 158,000 | 158,047 |
(SOFR + 0.50%), 5.80%, 9/1/2023 (a) | 160,000 | 160,006 |
(SOFR + 0.52%), 5.82%, 9/1/2023 (a) | 160,000 | 160,086 |
19 | J.P. Morgan Money Market Funds | August 31, 2023 |
INVESTMENTS †† | PRINCIPAL AMOUNT ($000) | VALUE ($000) |
Short Term Investments — continued | ||
Certificates of Deposits — continued | ||
Sumitomo Mitsui Banking Corp. (Japan) | ||
(SOFR + 0.15%), 5.45%, 9/1/2023 (a) | 88,000 | 88,000 |
(SOFR + 0.18%), 5.48%, 9/1/2023 (a) | 122,000 | 122,000 |
(SOFR + 0.34%), 5.64%, 9/1/2023 (a) | 98,000 | 98,030 |
(SOFR + 0.40%), 5.70%, 9/1/2023 (a) | 98,000 | 98,049 |
(SOFR + 0.41%), 5.71%, 9/1/2023 (a) | 120,000 | 120,037 |
(SOFR + 0.41%), 5.71%, 9/1/2023 (a) | 10,000 | 10,003 |
(SOFR + 0.45%), 5.75%, 9/1/2023 (a) | 155,000 | 155,073 |
(SOFR + 0.47%), 5.77%, 9/1/2023 (a) | 93,000 | 93,033 |
(SOFR + 0.50%), 5.80%, 9/1/2023 (a) | 200,000 | 200,045 |
(SOFR + 0.50%), 5.80%, 9/1/2023 (a) | 189,000 | 189,043 |
(SOFR + 0.50%), 5.80%, 9/1/2023 (a) | 80,000 | 80,019 |
(SOFR + 0.50%), 5.80%, 9/1/2023 (a) | 200,000 | 200,055 |
(SOFR + 0.50%), 5.80%, 9/1/2023 (a) | 50,000 | 50,018 |
(SOFR + 0.50%), 5.80%, 9/1/2023 (a) | 96,000 | 96,044 |
Sumitomo Mitsui Trust Bank Ltd. (Japan) | ||
(SOFR + 0.23%), 1.00%, 9/1/2023 (a) | 120,000 | 119,999 |
(SOFR + 0.27%), 5.57%, 9/1/2023 (a) | 91,000 | 91,015 |
(SOFR + 0.31%), 5.61%, 9/1/2023 (a) | 95,000 | 95,019 |
(SOFR + 0.31%), 5.61%, 9/1/2023 (a) | 100,000 | 100,019 |
5.31%, 9/5/2023 | 150,000 | 150,000 |
5.56%, 10/27/2023 | 166,000 | 166,027 |
5.58%, 11/16/2023 | 280,000 | 280,024 |
Svenska Handelsbanken AB (Sweden) | ||
(SOFR + 0.35%), 5.65%, 9/1/2023 (a) | 200,000 | 200,070 |
(SOFR + 0.40%), 5.70%, 9/1/2023 (a) | 74,000 | 74,024 |
(SOFR + 0.52%), 5.82%, 9/1/2023 (a) | 93,000 | 93,074 |
Toronto-Dominion Bank (The) (Canada) | ||
(SOFR + 0.50%), 5.80%, 9/1/2023 (a) | 75,000 | 75,048 |
(SOFR + 0.50%), 5.80%, 9/1/2023 (a) | 140,000 | 140,004 |
(SOFR + 0.65%), 5.95%, 9/1/2023 (a) | 83,000 | 83,063 |
(SOFR + 0.70%), 6.00%, 9/1/2023 (a) | 50,000 | 50,074 |
5.00%, 11/7/2023 (d) | 150,000 | 148,490 |
5.09%, 11/8/2023 (d) | 100,000 | 98,978 |
5.42%, 11/21/2023 | 151,000 | 150,941 |
5.70%, 11/30/2023 | 73,000 | 73,014 |
5.35%, 2/5/2024 (d) | 95,000 | 92,709 |
5.70%, 3/13/2024 (d) | 165,000 | 160,078 |
6.00%, 8/23/2024 | 100,000 | 100,090 |
Wells Fargo Bank NA | ||
(SOFR + 0.52%), 5.82%, 9/1/2023 (a) | 125,000 | 125,005 |
(SOFR + 0.52%), 5.82%, 9/1/2023 (a) | 75,000 | 75,002 |
(SOFR + 0.53%), 5.83%, 9/1/2023 (a) | 91,000 | 91,059 |
(SOFR + 0.60%), 5.90%, 9/1/2023 (a) | 63,000 | 63,008 |
INVESTMENTS †† | PRINCIPAL AMOUNT ($000) | VALUE ($000) |
Certificates of Deposits — continued | ||
(SOFR + 0.60%), 5.90%, 9/1/2023 (a) | 65,000 | 65,008 |
(SOFR + 0.65%), 5.95%, 9/1/2023 (a) | 158,000 | 158,151 |
Westpac Banking Corp. (Australia) | ||
5.30%, 2/9/2024 | 43,000 | 42,902 |
5.30%, 2/13/2024 | 50,000 | 49,881 |
Total Certificates of Deposit (Cost $23,041,493) | 23,042,430 | |
Commercial Paper — 23.0% | ||
Agricultural Bank of China Ltd. (China) | ||
Series A, 5.58%, 9/14/2023 (d) | 100,000 | 99,789 |
Series A, 5.58%, 9/15/2023 (d) | 19,000 | 18,957 |
ANZ New Zealand Int'l Ltd. (New Zealand) | ||
(SOFR + 0.15%), 5.45%, 9/1/2023 (a) (b) | 51,000 | 51,000 |
Atlantic Asset Securitization LLC | ||
5.62%, 12/5/2023 (d) | 40,000 | 39,411 |
Australia & New Zealand Banking Group Ltd. (Australia) | ||
(SOFR + 0.15%), 5.45%, 9/1/2023 (a) (b) | 132,000 | 131,994 |
(SOFR + 0.27%), 5.57%, 9/1/2023 (a) (b) | 40,000 | 40,007 |
Banco Santander SA (Spain) | ||
5.52%, 9/5/2023 (d) | 185,000 | 184,862 |
Bank of China Ltd. (China) | ||
5.58%, 9/6/2023 (d) | 50,000 | 49,956 |
5.58%, 9/12/2023 (d) | 115,000 | 114,796 |
5.58%, 9/13/2023 (d) | 86,000 | 85,834 |
5.65%, 10/5/2023 (d) | 93,000 | 92,515 |
5.72%, 10/25/2023 (d) | 57,000 | 56,530 |
Bank of Montreal (Canada) | ||
(SOFR + 0.17%), 5.47%, 9/1/2023 (a) | 83,000 | 82,998 |
(SOFR + 0.35%), 5.65%, 9/1/2023 (a) | 150,000 | 150,049 |
(SOFR + 0.49%), 5.79%, 9/1/2023 (a) | 80,000 | 80,000 |
(SOFR + 0.49%), 5.79%, 9/1/2023 (a) | 15,000 | 15,000 |
(SOFR + 0.53%), 5.83%, 9/1/2023 (a) | 30,000 | 30,009 |
(SOFR + 0.57%), 5.87%, 9/1/2023 (a) | 97,000 | 97,011 |
(SOFR + 0.60%), 5.90%, 9/1/2023 (a) | 89,000 | 89,065 |
(SOFR + 0.75%), 6.05%, 9/1/2023 (a) | 25,000 | 25,035 |
5.90%, 8/12/2024 (d) | 60,500 | 57,257 |
Bank of Nova Scotia (The) (Canada) | ||
(SOFR + 0.33%), 5.63%, 9/1/2023 (a) (b) | 87,000 | 87,012 |
(SOFR + 0.35%), 5.65%, 9/1/2023 (a) (b) | 90,000 | 89,986 |
(SOFR + 0.42%), 5.72%, 9/1/2023 (a) (b) | 43,000 | 43,014 |
(SOFR + 0.42%), 5.72%, 9/1/2023 (a) (b) | 65,000 | 65,021 |
(SOFR + 0.42%), 5.72%, 9/1/2023 (a) (b) | 98,000 | 98,016 |
August 31, 2023 | J.P. Morgan Money Market Funds | 20 |
AS OF August 31, 2023 (Unaudited) (continued)
INVESTMENTS †† | PRINCIPAL AMOUNT ($000) | VALUE ($000) |
Short Term Investments — continued | ||
Commercial Paper — continued | ||
(SOFR + 0.50%), 5.80%, 9/1/2023 (a) (b) | 70,000 | 70,052 |
(SOFR + 0.50%), 5.80%, 9/1/2023 (a) (b) | 33,000 | 33,020 |
(SOFR + 0.52%), 5.82%, 9/1/2023 (a) (b) | 35,000 | 35,029 |
(SOFR + 0.53%), 5.83%, 9/1/2023 (a) (b) | 90,000 | 90,031 |
(SOFR + 0.66%), 5.96%, 9/1/2023 (a) (b) | 107,000 | 107,110 |
(SOFR + 0.81%), 6.11%, 9/1/2023 (a) (b) | 20,000 | 20,021 |
5.98%, 6/28/2024 (d) | 76,000 | 72,427 |
Banner Health | ||
Series 2015, 5.35%, 9/6/2023 | 23,800 | 23,800 |
Barclays Bank plc (United Kingdom) | ||
5.36%, 9/1/2023 (d) | 524,168 | 524,091 |
Series 2023, (SOFR + 0.45%), 5.75%, 9/1/2023 (a) (b) | 55,000 | 55,030 |
5.56%, 10/19/2023 (b) (d) | 100,000 | 99,261 |
Barton Capital SA (France) | ||
5.44%, 9/21/2023 (d) | 50,000 | 49,843 |
Bedford Row Funding Corp. | ||
5.97%, 8/21/2024 (d) | 90,000 | 85,032 |
BNP Paribas SA (France) | ||
(SOFR + 0.35%), 5.65%, 9/1/2023 (a) | 43,000 | 43,015 |
BNZ International Funding Ltd. (New Zealand) | ||
(SOFR + 0.32%), 5.68%, 9/1/2023 (a) (b) | 80,000 | 80,003 |
BofA Securities, Inc. | ||
5.31%, 10/10/2023 (d) | 74,000 | 73,554 |
BPCE SA (France) | ||
(SOFR + 0.65%), 5.95%, 9/1/2023 (a) (b) | 100,000 | 100,019 |
5.63%, 12/7/2023 (d) | 165,000 | 162,502 |
Canadian Imperial Bank of Commerce (Canada) | ||
(SOFR + 0.44%), 5.74%, 9/1/2023 (a) (b) | 206,000 | 206,048 |
(SOFR + 0.50%), 5.80%, 9/1/2023 (a) (b) | 150,000 | 150,108 |
5.27%, 10/10/2023 (d) | 135,000 | 134,204 |
4.99%, 10/12/2023 (d) | 120,000 | 119,257 |
5.90%, 8/13/2024 (d) | 70,000 | 66,257 |
Cancara Asset Securitisation LLC | ||
5.41%, 9/14/2023 (b) (d) | 52,000 | 51,892 |
5.41%, 9/15/2023 (b) (d) | 120,000 | 119,732 |
Chesham Finance Ltd. (Cayman Islands) | ||
Series 2, 5.39%, 9/1/2023 (b) (d) | 130,000 | 129,981 |
Cooperatieve Rabobank UA (Netherlands) | ||
5.31%, 9/1/2023 (d) | 86,000 | 85,987 |
Credit Agricole Corporate and Investment Bank (France) | ||
5.30%, 9/1/2023 (d) | 105,000 | 104,985 |
INVESTMENTS †† | PRINCIPAL AMOUNT ($000) | VALUE ($000) |
Commercial Paper — continued | ||
Dexia Credit Local SA (France) | ||
5.76%, 2/16/2024 (b) (d) | 50,000 | 48,695 |
DNB Bank ASA (Norway) | ||
(SOFR + 0.35%), 5.65%, 9/1/2023 (a) (b) | 75,000 | 75,030 |
5.32%, 11/16/2023 (d) | 227,000 | 224,408 |
DZ Bank AG (Germany) | ||
5.32%, 9/6/2023 (d) | 435,000 | 434,621 |
European Investment Bank | ||
5.33%, 9/18/2023 (d) | 300,000 | 299,225 |
Federation des Caisses Desjardins du Quebec (Canada) | ||
5.41%, 9/14/2023 (d) | 90,000 | 89,813 |
First Abu Dhabi Bank PJSC | ||
5.44%, 9/26/2023 (d) | 327,000 | 325,737 |
5.47%, 10/6/2023 (d) | 200,000 | 198,928 |
5.54%, 10/19/2023 (d) | 380,000 | 377,213 |
5.56%, 10/24/2023 (d) | 254,000 | 251,943 |
5.11%, 11/6/2023 (d) | 140,000 | 138,584 |
Glencove Funding DAC (Ireland) | ||
5.45%, 9/27/2023 (b) (d) | 51,500 | 51,293 |
5.50%, 10/5/2023 (b) (d) | 30,000 | 29,843 |
Gotham Funding Corp. | ||
5.48%, 9/28/2023 (d) | 140,000 | 139,416 |
5.52%, 10/20/2023 (d) | 125,000 | 124,058 |
5.40%, 10/30/2023 (d) | 75,000 | 74,316 |
Industrial & Commercial Bank of China Ltd. (China) | ||
5.71%, 11/3/2023 (d) | 125,000 | 123,765 |
5.71%, 11/8/2023 (d) | 55,000 | 54,413 |
ING US Funding LLC (Netherlands) | ||
(SOFR + 0.15%), 5.45%, 9/1/2023 (a) (b) | 254,000 | 254,001 |
(SOFR + 0.36%), 5.66%, 9/1/2023 (a) (b) | 200,000 | 200,007 |
(SOFR + 0.44%), 5.74%, 9/1/2023 (a) (b) | 174,000 | 174,178 |
(SOFR + 0.53%), 5.83%, 9/1/2023 (a) (b) | 130,000 | 130,039 |
(SOFR + 0.57%), 5.87%, 9/1/2023 (a) (b) | 250,000 | 250,205 |
(SOFR + 0.70%), 6.00%, 9/1/2023 (a) (b) | 37,000 | 37,004 |
5.34%, 11/9/2023 (d) | 300,000 | 296,828 |
5.79%, 3/1/2024 (d) | 93,000 | 90,347 |
5.84%, 4/1/2024 (d) | 92,000 | 88,928 |
Liberty Street Funding LLC | ||
5.47%, 9/27/2023 (d) | 122,000 | 121,509 |
5.47%, 9/28/2023 (d) | 100,000 | 99,583 |
5.35%, 10/27/2023 (d) | 85,224 | 84,488 |
5.36%, 11/6/2023 (d) | 55,000 | 54,440 |
21 | J.P. Morgan Money Market Funds | August 31, 2023 |
INVESTMENTS †† | PRINCIPAL AMOUNT ($000) | VALUE ($000) |
Short Term Investments — continued | ||
Commercial Paper — continued | ||
5.35%, 11/10/2023 (d) | 25,000 | 24,730 |
Lloyds Bank plc (United Kingdom) | ||
(SOFR + 0.30%), 5.60%, 9/1/2023 (a) | 152,000 | 152,033 |
5.31%, 10/10/2023 (d) | 35,000 | 34,789 |
5.31%, 10/11/2023 (d) | 200,000 | 198,760 |
5.38%, 10/18/2023 (d) | 145,000 | 143,939 |
5.38%, 10/19/2023 (d) | 40,000 | 39,701 |
5.36%, 11/13/2023 (d) | 95,000 | 93,923 |
5.62%, 12/8/2023 (d) | 145,000 | 142,794 |
LMA SA | ||
5.35%, 11/15/2023 (d) | 50,000 | 49,418 |
LMA-Americas LLC | ||
(SOFR + 0.37%), 5.67%, 9/1/2023 (a) (b) | 100,000 | 100,029 |
(SOFR + 0.46%), 5.76%, 9/1/2023 (a) (b) | 30,000 | 30,015 |
5.51%, 10/11/2023 (d) | 35,750 | 35,528 |
5.29%, 10/12/2023 (d) | 41,000 | 40,739 |
5.52%, 10/18/2023 (d) | 49,492 | 49,131 |
Macquarie Bank Ltd. (Australia) | ||
(SOFR + 0.40%), 5.70%, 9/1/2023 (a) (b) | 145,000 | 145,058 |
(SOFR + 0.40%), 5.70%, 9/1/2023 (a) (b) | 158,000 | 158,026 |
(SOFR + 0.43%), 5.73%, 9/1/2023 (a) (b) | 164,000 | 164,074 |
(SOFR + 0.43%), 5.73%, 9/1/2023 (a) (b) | 150,000 | 150,068 |
Matchpoint Finance plc (Ireland) | ||
Series A, (SOFR + 0.42%), 5.72%, 9/1/2023 (a) (b) | 75,000 | 75,022 |
Mitsubishi UFJ Trust and Banking Corp. (Japan) | ||
5.43%, 9/15/2023 (d) | 57,000 | 56,874 |
Mizuho Bank Ltd. (Japan) | ||
5.48%, 9/8/2023 (d) | 155,000 | 154,815 |
National Australia Bank Ltd. (Australia) | ||
(SOFR + 0.50%), 5.80%, 9/1/2023 (a) (b) | 150,000 | 150,114 |
National Bank of Canada (Canada) | ||
5.51%, 10/23/2023 (d) | 150,000 | 148,808 |
5.32%, 11/16/2023 (d) | 143,000 | 141,333 |
5.75%, 2/2/2024 (d) | 102,000 | 99,556 |
Natixis SA (France) | ||
5.16%, 9/1/2023 (d) | 33,069 | 33,064 |
NatWest Markets plc (United Kingdom) | ||
Series G, 5.33%, 9/7/2023 (b) (d) | 280,000 | 279,703 |
5.36%, 11/15/2023 (b) (d) | 136,000 | 134,410 |
Nieuw Amsterdam Receivables Corp. | ||
5.61%, 12/4/2023 (d) | 150,000 | 147,824 |
5.69%, 1/8/2024 (d) | 15,000 | 14,700 |
INVESTMENTS †† | PRINCIPAL AMOUNT ($000) | VALUE ($000) |
Commercial Paper — continued | ||
Nordea Bank Abp (Finland) | ||
(SOFR + 0.27%), 5.57%, 9/1/2023 (a) (b) | 156,000 | 156,025 |
(SOFR + 0.45%), 5.75%, 9/1/2023 (a) (b) | 30,000 | 30,015 |
Old Line Funding Corp. | ||
(SOFR + 0.24%), 5.54%, 9/1/2023 (a) (b) | 75,000 | 75,000 |
(SOFR + 0.36%), 5.66%, 9/1/2023 (a) (b) | 125,000 | 125,012 |
(SOFR + 0.40%), 5.70%, 9/1/2023 (a) (b) | 164,000 | 164,019 |
(SOFR + 0.41%), 5.71%, 9/1/2023 (a) (b) | 100,000 | 100,045 |
Old Line Funding LLC | ||
5.81%, 3/4/2024 (b) (d) | 70,000 | 67,971 |
Oversea-Chinese Banking Corp., Ltd. (Singapore) | ||
(SOFR + 0.36%), 5.66%, 9/1/2023 (a) (b) | 88,000 | 88,029 |
Podium Funding Trust (Canada) | ||
(SOFR + 0.50%), 5.80%, 9/1/2023 (a) | 80,000 | 79,983 |
Royal Bank of Canada (Canada) | ||
(SOFR + 0.60%), 5.90%, 9/1/2023 (a) (b) | 86,000 | 86,091 |
(SOFR + 0.65%), 5.95%, 9/1/2023 (a) (b) | 37,000 | 37,049 |
(SOFR + 0.65%), 5.95%, 9/1/2023 (a) (b) | 63,000 | 63,083 |
(SOFR + 0.71%), 6.01%, 9/1/2023 (a) (b) | 60,000 | 60,026 |
(SOFR + 0.81%), 6.11%, 9/1/2023 (a) (b) | 32,000 | 32,031 |
Sheffield Receivables Co. LLC (United Kingdom) | ||
5.48%, 10/5/2023 (d) | 50,000 | 49,735 |
Skandinaviska Enskilda Banken AB (Sweden) | ||
(SOFR + 0.35%), 5.65%, 9/1/2023 (a) (b) | 73,000 | 73,024 |
(SOFR + 0.40%), 5.70%, 9/1/2023 (a) (b) | 55,000 | 55,018 |
(SOFR + 0.42%), 5.72%, 9/1/2023 (a) (b) | 103,000 | 103,021 |
(SOFR + 0.53%), 5.83%, 9/1/2023 (a) (b) | 39,000 | 39,031 |
(SOFR + 0.60%), 5.90%, 9/1/2023 (a) (b) | 62,000 | 61,999 |
(SOFR + 0.65%), 5.95%, 9/1/2023 (a) (b) | 50,000 | 50,052 |
5.32%, 11/16/2023 (d) | 135,000 | 133,445 |
5.32%, 11/17/2023 (d) | 87,000 | 85,983 |
Societe Generale SA (France) | ||
(SOFR + 0.37%), 5.67%, 9/1/2023 (a) (b) | 50,000 | 50,018 |
Starbird Funding Corp. | ||
5.61%, 12/1/2023 (d) | 200,000 | 197,192 |
Sumitomo Mitsui Trust Bank Ltd. (Japan) | ||
5.56%, 10/27/2023 (d) | 76,000 | 75,352 |
5.58%, 11/15/2023 (d) | 240,000 | 237,239 |
5.59%, 11/17/2023 (d) | 140,000 | 138,344 |
Svenska Handelsbanken AB (Sweden) | ||
(SOFR + 0.40%), 5.70%, 9/1/2023 (a) (b) | 55,000 | 55,011 |
Texas Public Finance Authority | ||
Series 16-A, 5.45%, 9/12/2023 | 46,500 | 46,494 |
August 31, 2023 | J.P. Morgan Money Market Funds | 22 |
AS OF August 31, 2023 (Unaudited) (continued)
INVESTMENTS †† | PRINCIPAL AMOUNT ($000) | VALUE ($000) |
Short Term Investments — continued | ||
Commercial Paper — continued | ||
Thunder Bay Funding LLC | ||
(SOFR + 0.32%), 5.62%, 9/1/2023 (a) (b) | 35,000 | 35,001 |
(SOFR + 0.41%), 5.71%, 9/1/2023 (a) (b) | 50,000 | 50,003 |
Toronto-Dominion Bank (The) (Canada) | ||
(SOFR + 0.43%), 5.73%, 9/1/2023 (a) (b) | 12,600 | 12,602 |
(SOFR + 0.72%), 6.02%, 9/1/2023 (a) | 120,000 | 120,064 |
5.29%, 2/13/2024 (d) | 50,000 | 48,722 |
5.90%, 8/13/2024 (d) | 70,000 | 66,232 |
5.99%, 8/23/2024 (d) | 102,500 | 96,830 |
TotalEnergies Capital Canada Ltd. (France) | ||
5.37%, 9/1/2023 (d) | 150,000 | 149,978 |
Toyota Motor Finance Netherlands BV (Japan) | ||
5.50%, 10/16/2023 (d) | 67,000 | 66,526 |
UBS AG (Switzerland) | ||
(SOFR + 0.28%), 5.58%, 9/1/2023 (a) (b) | 194,000 | 194,000 |
(SOFR + 0.36%), 5.68%, 9/1/2023 (a) (b) | 50,000 | 50,000 |
(SOFR + 0.37%), 5.69%, 9/1/2023 (a) (b) | 117,000 | 117,001 |
(SOFR + 0.46%), 5.78%, 9/1/2023 (a) (b) | 51,000 | 51,011 |
(SOFR + 0.45%), 5.78%, 9/1/2023 (a) (b) | 100,000 | 100,010 |
(SOFR + 0.45%), 5.78%, 9/1/2023 (a) (b) | 61,000 | 61,007 |
(SOFR + 0.44%), 5.79%, 9/1/2023 (a) (b) | 45,000 | 45,006 |
(SOFR + 0.45%), 5.79%, 9/1/2023 (a) (b) | 35,000 | 35,004 |
(SOFR + 0.45%), 5.79%, 9/1/2023 (a) (b) | 87,000 | 87,009 |
5.37%, 10/16/2023 (d) | 130,000 | 129,101 |
5.86%, 2/1/2024 (d) | 65,000 | 63,443 |
United Overseas Bank Ltd. (Singapore) | ||
5.41%, 9/18/2023 (d) | 175,000 | 174,533 |
5.48%, 10/11/2023 (d) | 175,000 | 173,929 |
Versailles Commercial Paper LLC | ||
5.81%, 2/1/2024 (b) (d) | 57,000 | 55,637 |
Versailles LLC | ||
(SOFR + 0.36%), 5.66%, 9/1/2023 (a) (b) | 100,000 | 100,015 |
Westpac Banking Corp. (Australia) | ||
(SOFR + 0.50%), 5.80%, 9/1/2023 (a) (b) | 31,000 | 31,016 |
(SOFR + 0.54%), 5.84%, 9/1/2023 (a) (b) | 65,000 | 65,000 |
Total Commercial Paper (Cost $17,792,538) | 17,793,268 | |
Time Deposits — 16.3% | ||
Agricultural Bank of China Ltd. | ||
5.35%, 9/1/2023 | 250,000 | 250,000 |
5.38%, 9/1/2023 | 170,000 | 170,000 |
5.38%, 9/6/2023 | 170,000 | 170,000 |
INVESTMENTS †† | PRINCIPAL AMOUNT ($000) | VALUE ($000) |
Time Deposits — continued | ||
Australia & New Zealand Banking Group Ltd. | ||
5.32%, 9/1/2023 | 300,000 | 300,000 |
5.32%, 9/6/2023 | 300,000 | 300,000 |
5.32%, 9/7/2023 | 300,000 | 300,000 |
Credit Agricole Corporate and Investment Bank | ||
5.31%, 9/1/2023 | 301,650 | 301,650 |
5.34%, 9/6/2023 | 500,000 | 500,000 |
Erste Group Bank AG 5.32%, 9/1/2023 | 1,300,000 | 1,300,000 |
First Abu Dhabi Bank NV | ||
5.32%, 9/1/2023 | 1,000,000 | 1,000,000 |
5.34%, 9/1/2023 | 500,000 | 500,000 |
5.34%, 9/6/2023 | 800,000 | 800,000 |
Industrial & Commercial Bank of China Ltd. 5.35%, 9/1/2023 | 400,000 | 400,000 |
ING Bank NV 5.32%, 9/6/2023 | 700,000 | 700,000 |
Mizuho Bank Ltd. | ||
5.32%, 9/1/2023 | 1,230,000 | 1,230,000 |
5.33%, 9/1/2023 | 1,700,000 | 1,700,000 |
National Bank of Canada (Canada) 9/1/2023 (c) | 500,000 | 500,000 |
Royal Bank of Canada 5.32%, 9/1/2023 | 500,000 | 500,000 |
Skandinaviska Enskilda Banken AB | ||
5.32%, 9/1/2023 | 1,200,000 | 1,200,000 |
5.32%, 9/7/2023 | 500,000 | 500,000 |
Total Time Deposits (Cost $12,621,650) | 12,621,650 | |
Total Short Term Investments (Cost $53,455,681) | 53,457,348 | |
Total Investments — 98.8% (Cost $76,478,081) | 76,479,809 | |
Other Assets Less Liabilities — 1.2% | 966,675 | |
NET ASSETS — 100.0% | 77,446,484 | |
Percentages indicated are based on net assets. |
Abbreviations | |
FHLB | Federal Home Loan Bank |
FHLMC | Federal Home Loan Mortgage Corp. |
FNMA | Federal National Mortgage Association |
GNMA | Government National Mortgage Association |
GO | General Obligation |
LIQ | Liquidity Agreement |
LOC | Letter of Credit |
OBFR | Overnight Bank Funding Rate |
PJSC | Public Joint Stock Company |
23 | J.P. Morgan Money Market Funds | August 31, 2023 |
Rev. | Revenue |
SOFR | Secured Overnight Financing Rate |
VRDO | Variable Rate Demand Obligation |
^ | Amount rounds to less than 0.1% of net assets. | |
†† | The date shown represents the earliest of the next put date, next demand date or final maturity date. | |
^^ | Certain securities are perpetual and thus, do not have predetermined maturity dates. The coupon rates for these securities are fixed for a period of time and may be structured to adjust thereafter. The coupon rates shown are the rates in effect as of August 31, 2023. | |
(a) | Variable or floating rate security, linked to the referenced benchmark. The interest rate shown is the current rate as of August 31, 2023. | |
(b) | Securities exempt from registration under Rule 144A or section 4(a)(2), of the Securities Act of 1933, as amended. | |
(c) | Variable or floating rate security, the interest rate of which adjusts periodically based on changes in current interest rates and prepayments on the underlying pool of assets. The interest rate shown is the current rate as of August 31, 2023. | |
(d) | The rate shown is the effective yield as of August 31, 2023. |
August 31, 2023 | J.P. Morgan Money Market Funds | 24 |
AS OF August 31, 2023 (Unaudited)
INVESTMENTS †† | PRINCIPAL AMOUNT ($000) | VALUE ($000) |
Municipal Bonds — 65.4% | ||
Alaska — 2.7% | ||
Alaska Housing Finance Corp., Home Mortgage Series 2007A, Rev., VRDO, LIQ : FHLB, 4.02%, 9/8/2023 (a) | 5,300 | 5,300 |
City of Valdez, Exxon Pipeline Co. Project | ||
Series 1993A, Rev., VRDO, 3.80%, 9/1/2023 (a) | 9,400 | 9,400 |
Series 1993C, Rev., VRDO, 3.80%, 9/1/2023 (a) | 8,930 | 8,930 |
Tender Option Bond Trust Receipts/Certificates Series 2023-XG0518, Rev., VRDO, LIQ : Royal Bank of Canada, 4.10%, 9/8/2023 (a) (b) | 8,605 | 8,605 |
32,235 | ||
California — 0.9% | ||
Tender Option Bond Trust Receipts/Certificates | ||
Series 2022-XM1064, Rev., VRDO, LIQ : Morgan Stanley Bank NA, 4.09%, 9/8/2023 (a) (b) | 605 | 605 |
Series 2023-007, Rev., VRDO, LOC : Barclays Bank plc, 4.10%, 9/8/2023 (a) (b) | 10,000 | 10,000 |
10,605 | ||
Colorado — 1.1% | ||
RIB Floater Trust Various States Series 2022-038, COP, VRDO, LIQ : Barclays Bank plc, 4.07%, 9/1/2023 (a) (b) | 2,395 | 2,395 |
Tender Option Bond Trust Receipts/Certificates | ||
Series 2022-XG0420, Rev., VRDO, LIQ : Wells Fargo Bank NA, 4.09%, 9/8/2023 (a) (b) | 4,000 | 4,000 |
Series 2015-XF0239, Rev., VRDO, LIQ : TD Bank NA, 4.14%, 9/8/2023 (a) (b) | 3,175 | 3,175 |
Series 2018-XG0195, COP, VRDO, LIQ : Bank of America NA, 4.15%, 9/8/2023 (a) (b) | 3,615 | 3,615 |
13,185 | ||
Connecticut — 1.2% | ||
Connecticut Housing Finance Authority, Housing Mortgage Series 2022, Subseries E-2, Rev., VRDO, GNMA / FNMA / FHLMC COLL, LOC : Sumitomo Mitsui Banking Corp., 4.01%, 9/8/2023 (a) | 4,750 | 4,750 |
RBC Municipal Products, Inc. Trust, Floater Certificates Series G110, Rev., VRDO, LOC : Royal Bank of Canada, 4.65%, 10/2/2023 (a) (b) | 5,300 | 5,300 |
INVESTMENTS †† | PRINCIPAL AMOUNT ($000) | VALUE ($000) |
Connecticut — continued | ||
State of Connecticut Series 2022D, GO, 5.00%, 9/15/2023 | 1,075 | 1,076 |
Tender Option Bond Trust Receipts/Certificates Series 2022-YX1255, Rev., VRDO, LIQ : Barclays Bank plc, 4.09%, 9/8/2023 (a) (b) | 3,010 | 3,010 |
14,136 | ||
Delaware — 0.0% ^ | ||
University of Delaware Series 2004B, Rev., VRDO, LIQ : Bank of America NA, 3.77%, 9/1/2023 (a) | 475 | 475 |
District of Columbia — 2.8% | ||
Metropolitan Washington Airports Authority Aviation Subseries, 2009 D-2, Rev., VRDO, LOC : TD Bank NA, 3.90%, 9/1/2023 (a) | 12,590 | 12,590 |
Tender Option Bond Trust Receipts/Certificates | ||
Series 2022-YX1195, Rev., VRDO, LIQ : Barclays Bank plc, 4.09%, 9/8/2023 (a) (b) | 1,790 | 1,790 |
Series 2022-ZL0319, Rev., VRDO, LIQ : Royal Bank of Canada, 4.09%, 9/8/2023 (a) (b) | 10,000 | 10,000 |
Series 2023-XG0515, Rev., VRDO, LIQ : Wells Fargo Bank NA, 4.09%, 9/8/2023 (a) (b) | 8,000 | 8,000 |
32,380 | ||
Florida — 3.7% | ||
County of Escambia, Gulf Power Co., Project | ||
Series 2, Rev., VRDO, 4.25%, 9/1/2023 (a) | 2,900 | 2,900 |
Series R, Rev., VRDO, 3.95%, 9/8/2023 (a) | 10,000 | 10,000 |
Florida Gulf Coast University Financing Corp., Housing Project Series 2008A, Rev., VRDO, LOC : TD Bank NA, 4.01%, 9/8/2023 (a) | 1,150 | 1,150 |
JEA Water and Sewer System Series 2008A-1, Rev., VRDO, LIQ : US Bank NA, 4.20%, 9/1/2023 (a) | 8,825 | 8,825 |
RBC Municipal Products, Inc. Trust, Floater Certificates Series 2018-G-41, Rev., VRDO, LOC : Royal Bank of Canada, 4.67%, 9/1/2023 (a) (b) | 2,985 | 2,985 |
Tender Option Bond Trust Receipts/Certificates | ||
Series 2019-XF2808, Rev., VRDO, LIQ : Barclays Bank plc, 4.09%, 9/8/2023 (a) (b) | 7,500 | 7,500 |
Series 2021-XG0345, Rev., VRDO, LIQ : Wells Fargo Bank NA, 4.09%, 9/8/2023 (a) (b) | 4,355 | 4,355 |
Series 2023-XF3080, Rev., VRDO, LIQ : Barclays Bank plc, 4.09%, 9/8/2023 (a) (b) | 5,995 | 5,995 |
43,710 | ||
25 | J.P. Morgan Money Market Funds | August 31, 2023 |
INVESTMENTS †† | PRINCIPAL AMOUNT ($000) | VALUE ($000) |
Municipal Bonds — continued | ||
Georgia — 2.4% | ||
Development Authority of Monroe County (The),Georgia Pollution Control, Gulf Power Co.Plant Schere Project Series 2002-1, Rev., VRDO, 4.15%, 9/1/2023 (a) | 20,000 | 20,000 |
Tender Option Bond Trust Receipts/Certificates | ||
Series 2021-XM0961, Rev., VRDO, GTD, LIQ : Wells Fargo Bank NA, 4.09%, 9/8/2023 (a) (b) | 3,715 | 3,715 |
Series 2022-ZL0308, Rev., VRDO, LOC : Royal Bank of Canada, 4.11%, 9/8/2023 (a) (b) | 1,875 | 1,875 |
Series 2022-ZL0309, Rev., VRDO, LOC : Royal Bank of Canada, 4.11%, 9/8/2023 (a) (b) | 2,380 | 2,380 |
27,970 | ||
Idaho — 0.3% | ||
Idaho Health Facilities Authority, St. Luke's Health System Project Series 2018C, Rev., VRDO, LOC : US Bank NA, 4.20%, 9/1/2023 (a) | 3,685 | 3,685 |
Illinois — 1.1% | ||
Illinois Development Finance Authority, St. Ignatius College Project, Rev., VRDO, LOC : PNC Bank NA, 4.04%, 9/8/2023 (a) | 1,000 | 1,000 |
Illinois Finance Authority, The University of Chicago Medical Center Series 2009E-1, Rev., VRDO, LOC : Sumitomo Mitsui Banking Corp., 4.09%, 9/8/2023 (a) | 8,000 | 8,000 |
Illinois Housing Development Authority, Rev., VRDO, LOC : BMO Harris Bank NA, 4.06%, 9/8/2023 (a) | 2,845 | 2,845 |
Tender Option Bond Trust Receipts/Certificates Series 2015-XF1009, Rev., VRDO, AGM, LOC : Barclays Bank plc, 4.10%, 9/8/2023 (a) (b) | 900 | 900 |
12,745 | ||
Indiana — 0.5% | ||
Indiana Finance Authority, Parkview Health System, Inc. | ||
Series 2009B, Rev., VRDO, LOC : Wells Fargo Bank NA, 3.80%, 9/1/2023 (a) | 240 | 240 |
Series 2009D, Rev., VRDO, LOC : Wells Fargo Bank NA, 3.80%, 9/1/2023 (a) | 2,165 | 2,165 |
Indiana Housing and Community Development Authority | ||
Series 2017B-3, Rev., VRDO, LIQ : TD Bank NA, 3.93%, 9/1/2023 (a) | 700 | 700 |
Series 2017C-3, Rev., VRDO, LIQ : TD Bank NA, 3.93%, 9/1/2023 (a) | 2,965 | 2,965 |
6,070 | ||
INVESTMENTS †† | PRINCIPAL AMOUNT ($000) | VALUE ($000) |
Iowa — 1.2% | ||
Iowa Finance Authority, Single Family Mortgage, Social Bonds Series 2022H, Rev., VRDO, GNMA / FNMA / FHLMC COLL, LIQ : US Bank NA, 4.20%, 9/1/2023 (a) | 7,000 | 7,000 |
Tender Option Bond Trust Receipts/Certificates Series 2022-YX1196, Rev., VRDO, FNMA COLL, LIQ : Barclays Bank plc, 4.09%, 9/8/2023 (a) (b) | 7,260 | 7,260 |
14,260 | ||
Louisiana — 0.4% | ||
Louisiana Public Facilities Authority, Children Medical Center Project Series 2017A, Rev., VRDO, LOC : UBS AG, 4.05%, 9/8/2023 (a) | 5,000 | 5,000 |
Maryland — 1.9% | ||
County of Montgomery, Trinity Health Credit Group Series 2013MD, Rev., VRDO, 3.70%, 9/1/2023 (a) | 5,910 | 5,910 |
Maryland Health and Higher Educational Facilities Authority, University of Maryland Medical System Series 2008D, Rev., VRDO, LOC : TD Bank NA, 3.93%, 9/1/2023 (a) | 8,570 | 8,570 |
RBC Municipal Products, Inc. Trust, Floater Certificates | ||
Series 2018-G-28, Rev., VRDO, LOC : Royal Bank of Canada, 4.67%, 1/2/2024 (a) (b) | 5,310 | 5,310 |
Series 2018G-42, Rev., VRDO, LOC : Royal Bank of Canada, 4.67%, 1/2/2024 (a) (b) | 2,700 | 2,700 |
22,490 | ||
Massachusetts — 1.6% | ||
Massachusetts Health and Educational Facilities Authority, Museum of Fine Arts Issue Series 2007A-1, Rev., VRDO, LIQ : Bank of America NA, 3.87%, 9/1/2023 (a) | 3,200 | 3,200 |
Massachusetts Housing Finance Agency, Single Family Housing | ||
Series 196, Rev., VRDO, LIQ : UBS AG, 4.04%, 9/8/2023 (a) | 1,250 | 1,250 |
Series 200, Rev., VRDO, LIQ : UBS AG, 4.04%, 9/8/2023 (a) | 100 | 100 |
Tender Option Bond Trust Receipts/Certificates | ||
Series 2022-XL0370, Rev., VRDO, LIQ : Morgan Stanley Bank NA, 4.06%, 9/8/2023 (a) (b) | 5,625 | 5,625 |
August 31, 2023 | J.P. Morgan Money Market Funds | 26 |
AS OF August 31, 2023 (Unaudited) (continued)
INVESTMENTS †† | PRINCIPAL AMOUNT ($000) | VALUE ($000) |
Municipal Bonds — continued | ||
Massachusetts — continued | ||
Series 2022-XL0365, Rev., VRDO, LIQ : UBS AG, 4.09%, 9/8/2023 (a) (b) | 4,340 | 4,340 |
Series 2022-ZL0339, GO, VRDO, LIQ : Morgan Stanley Bank NA, 4.09%, 9/8/2023 (a) (b) | 4,500 | 4,500 |
19,015 | ||
Michigan — 1.1% | ||
Michigan Finance Authority, Trinity Health Credit Group Series 2013MI-1, Rev., VRDO, 3.50%, 9/1/2023 (a) | 3,750 | 3,750 |
Tender Option Bond Trust Receipts/Certificates | ||
Series 2022-XX1259, Rev., VRDO, LIQ : Barclays Bank plc, 4.09%, 9/8/2023 (a) (b) | 3,605 | 3,605 |
Series 2022-ZL0379, Rev., VRDO, LIQ : Wells Fargo Bank NA, 4.09%, 9/8/2023 (a) (b) | 2,020 | 2,020 |
Series 2023-XF1581, Rev., VRDO, LIQ : TD Bank NA, 4.11%, 9/8/2023 (a) (b) | 2,400 | 2,400 |
University of Michigan Series 2012D-1, Rev., VRDO, 3.75%, 9/1/2023 (a) | 1,475 | 1,475 |
13,250 | ||
Minnesota — 0.8% | ||
City of Minneapolis, Health Care System, Fairview Health Services Series 2018C, Rev., VRDO, LOC : Wells Fargo Bank NA, 3.80%, 9/1/2023 (a) | 8,900 | 8,900 |
Mississippi — 4.5% | ||
Mississippi Business Finance Corp., Chevron USA, Inc. Project Series 2007D, Rev., VRDO, 3.90%, 9/1/2023 (a) | 325 | 325 |
Mississippi Business Finance Corp., Gulf Opportunity Zone Industrial Development, Chevron USA, Inc., Project | ||
Series 2007B, Rev., VRDO, 3.80%, 9/1/2023 (a) | 6,885 | 6,885 |
Series 2007C, Rev., VRDO, 3.80%, 9/1/2023 (a) | 300 | 300 |
Series 2009A, Rev., VRDO, 3.80%, 9/1/2023 (a) | 1,000 | 1,000 |
Series 2009B, Rev., VRDO, 3.80%, 9/1/2023 (a) | 1,818 | 1,818 |
Series 2009C, Rev., VRDO, 3.80%, 9/1/2023 (a) | 1,500 | 1,500 |
Series 2009E, Rev., VRDO, 3.80%, 9/1/2023 (a) | 10,500 | 10,500 |
Series 2009F, Rev., VRDO, 3.80%, 9/1/2023 (a) | 3,130 | 3,130 |
Series 2009G, Rev., VRDO, 3.80%, 9/1/2023 (a) | 3,825 | 3,825 |
INVESTMENTS †† | PRINCIPAL AMOUNT ($000) | VALUE ($000) |
Mississippi — continued | ||
Series 2010I, Rev., VRDO, 3.80%, 9/1/2023 (a) | 16,595 | 16,595 |
Series 2011G, Rev., VRDO, 3.80%, 9/1/2023 (a) | 6,095 | 6,095 |
Series 2010J, Rev., VRDO, 3.90%, 9/1/2023 (a) | 1,120 | 1,120 |
Series 2011B, Rev., VRDO, 4.00%, 9/1/2023 (a) | 280 | 280 |
53,373 | ||
Missouri — 5.2% | ||
Health and Educational Facilities Authority of the State of Missouri, Ranken Technical College Series 2011B, Rev., VRDO, LOC : Northern Trust Co. (The), 3.93%, 9/1/2023 (a) | 1,055 | 1,055 |
Health and Educational Facilities Authority of the State of Missouri, St. Louis University Series 2008B, Rev., VRDO, LOC : Wells Fargo Bank NA, 3.75%, 9/1/2023 (a) | 2,800 | 2,800 |
Industrial Development Authority of the City of St. Louis Missouri (The), Mid-America Transplant Services Project, Rev., VRDO, LOC : BMO Harris Bank NA, 4.15%, 9/1/2023 (a) | 100 | 100 |
Missouri Development Finance Board, Cultural Facilities Nelson Gallery Series 2004A, Rev., VRDO, LIQ : Northern Trust Co. (The), 4.20%, 9/1/2023 (a) | 6,375 | 6,375 |
Missouri Development Finance Board, Cultural Facilities, Kauffman Center for The Performing Arts Project Series 2007A, Rev., VRDO, LIQ : PNC Bank NA, 4.15%, 9/1/2023 (a) | 21,600 | 21,600 |
Missouri Development Finance Board, The Nelson Gallery Foundation Series 2008A, Rev., VRDO, LIQ : US Bank NA, 4.20%, 9/1/2023 (a) | 9,925 | 9,925 |
RBC Municipal Products, Inc. Trust, Floater Certificates | ||
Series C-16, Rev., VRDO, LOC : Royal Bank of Canada, 4.11%, 9/8/2023 (a) (b) | 11,450 | 11,450 |
Series G-121, Rev., VRDO, LOC : Royal Bank of Canada, 4.67%, 12/1/2023 (a) (b) | 8,220 | 8,220 |
61,525 | ||
Nebraska — 1.3% | ||
Tender Option Bond Trust Receipts/Certificates Series 2023-XM1097, Rev., VRDO, LIQ : UBS AG, 4.12%, 9/8/2023 (a) (b) | 15,680 | 15,680 |
27 | J.P. Morgan Money Market Funds | August 31, 2023 |
INVESTMENTS †† | PRINCIPAL AMOUNT ($000) | VALUE ($000) |
Municipal Bonds — continued | ||
Nevada — 0.4% | ||
Tender Option Bond Trust Receipts/Certificates | ||
Series 2020-XM0866, Rev., VRDO, LOC : Royal Bank of Canada, 4.09%, 9/8/2023 (a) (b) | 1,000 | 1,000 |
Series 2023-XG0494, Rev., VRDO, LIQ : UBS AG, 4.09%, 9/8/2023 (a) (b) | 3,995 | 3,995 |
4,995 | ||
New Hampshire — 0.0% ^ | ||
New Hampshire Health and Education Facilities Authority Act, Trustees of Dartmouth College Series 2007B, Rev., VRDO, LIQ : Bank of New York Mellon (The), 3.80%, 9/1/2023 (a) | 460 | 460 |
New Jersey — 1.1% | ||
Borough of South Plainfield,Pool Sewer Utility Series 2023A, GO, BAN, 4.50%, 4/11/2024 | 7,463 | 7,503 |
Tender Option Bond Trust Receipts/Certificates Series 2022-ZL0342, Rev., VRDO, LIQ : Wells Fargo Bank NA, 4.09%, 9/8/2023 (a) (b) | 2,025 | 2,025 |
Township of Lacey Series 2023A, GO, BAN, 5.00%, 5/9/2024 | 3,000 | 3,027 |
12,555 | ||
New York — 10.1% | ||
City of New York, Fiscal Year 2006 Series 2006I, GO, VRDO, LIQ : State Street Bank & Trust Co., 4.00%, 9/1/2023 (a) | 3,400 | 3,400 |
City of New York, Fiscal Year 2012 Series 2012D-3A, GO, VRDO, LIQ : Bank of New York Mellon (The), 3.97%, 9/1/2023 (a) | 3,015 | 3,015 |
City of New York, Fiscal Year 2013 Series 2013, Subseries A-2, GO, VRDO, LOC : Mizuho Bank Ltd., 4.00%, 9/1/2023 (a) | 2,100 | 2,100 |
City of New York, Fiscal Year 2017 Series 2017, Subseries A-7, GO, VRDO, LOC : Bank of the West, 3.99%, 9/1/2023 (a) | 2,850 | 2,850 |
City of New York, Fiscal Year 2023 | ||
Series 2023A, Subseries A-3, GO, VRDO, LIQ : Bank of Montreal, 3.90%, 9/1/2023 (a) | 19,250 | 19,250 |
Series 2023A, Subseries A-4, GO, VRDO, LIQ : TD Bank NA, 3.90%, 9/1/2023 (a) | 5,865 | 5,865 |
Metropolitan Transportation Authority | ||
Series 2015, Subseries E-3, Rev., VRDO, LOC : Bank of America NA, 3.92%, 9/1/2023 (a) | 10,000 | 10,000 |
Series 2015, Subseries E-1, Rev., VRDO, LOC : Barclays Bank plc, 3.95%, 9/1/2023 (a) | 2,995 | 2,995 |
Series 2005D-2, Rev., VRDO, LOC : Bank of Montreal, 4.00%, 9/1/2023 (a) | 8,700 | 8,700 |
INVESTMENTS †† | PRINCIPAL AMOUNT ($000) | VALUE ($000) |
New York — continued | ||
Metropolitan Transportation Authority, Dedicated Tax Fund Series 2008A-1, Rev., VRDO, LOC : TD Bank NA, 3.90%, 9/1/2023 (a) | 1,450 | 1,450 |
New York City Municipal Water Finance Authority Series 2003F-2, Rev., VRDO, LOC : Citibank NA, 4.25%, 9/1/2023 (a) | 500 | 500 |
New York City Municipal Water Finance Authority, Second General Resolution | ||
Series 2010CC, Rev., VRDO, LIQ : State Street Bank & Trust Co., 3.90%, 9/1/2023 (a) | 7,050 | 7,050 |
Series 2009BB-1, Rev., VRDO, LIQ : UBS AG, 4.05%, 9/1/2023 (a) | 7,500 | 7,500 |
New York City Municipal Water Finance Authority, Second General Resolution, Fiscal year 2023 Series 2023, Subseries BB-2, Rev., VRDO, LIQ : Mizuho Bank Ltd., 3.85%, 9/1/2023 (a) | 2,275 | 2,275 |
New York City Municipal Water Finance Authority, Water and Sewer System, Second General Resolution Series 2009BB-2, Rev., VRDO, LIQ : UBS AG, 4.05%, 9/1/2023 (a) | 4,100 | 4,100 |
New York City Municipal Water Finance Authority, Water and Sewer System, Second General Resolution, Fiscal year 2014 Series AA-5, Rev., VRDO, LIQ : Mizuho Bank Ltd., 3.90%, 9/1/2023 (a) | 10,200 | 10,200 |
New York City Municipal Water Finance Authority, Water and Sewer System, Second General Resolution, Fiscal year 2021 Series 2021EE-2, Rev., VRDO, LIQ : State Street Bank & Trust Co., 4.25%, 9/1/2023 (a) | 2,000 | 2,000 |
New York City Municipal Water Finance Authority, Water and Sewer System, Second Resolution Series 2007, Subseries CC-2, Rev., VRDO, LIQ : State Street Bank & Trust Co., 3.90%, 9/1/2023 (a) | 400 | 400 |
New York City Transitional Finance Authority, Future Tax Secured | ||
Rev., VRDO, LIQ : Bank of America NA, 3.92%, 9/1/2023 (a) | 8,010 | 8,010 |
Series B-5, Rev., VRDO, LIQ : US Bank NA, 4.25%, 9/1/2023 (a) | 3,150 | 3,150 |
New York City Transitional Finance Authority, Future Tax Secured, Fiscal Year 2003 Series 2003A-4, Rev., VRDO, LIQ : TD Bank NA, 3.90%, 9/1/2023 (a) | 150 | 150 |
New York City Transitional Finance Authority, Future Tax Secured, Fiscal Year 2011 Series 2011, Subseries A-4, Rev., VRDO, LIQ : Barclays Bank plc, 3.95%, 9/1/2023 (a) | 4,700 | 4,700 |
August 31, 2023 | J.P. Morgan Money Market Funds | 28 |
AS OF August 31, 2023 (Unaudited) (continued)
INVESTMENTS †† | PRINCIPAL AMOUNT ($000) | VALUE ($000) |
Municipal Bonds — continued | ||
New York — continued | ||
New York City Transitional Finance Authority, Future Tax Secured, Fiscal Year 2023 Series 2023, Subseries A3, Rev., VRDO, LIQ : Bank of New York Mellon (The), 3.97%, 9/1/2023 (a) | 1,260 | 1,260 |
New York State Dormitory Authority, Cornell University Series 2019B, Rev., VRDO, LIQ : US Bank NA, 4.10%, 9/1/2023 (a) | 200 | 200 |
Tender Option Bond Trust Receipts/Certificates | ||
Series 2022-XL0381, Rev., VRDO, LIQ : Wells Fargo Bank NA, 4.09%, 9/8/2023 (a) (b) | 1,875 | 1,875 |
Series 2022-ZL0393, Rev., VRDO, LIQ : Morgan Stanley Bank NA, 4.09%, 9/8/2023 (a) (b) | 2,050 | 2,050 |
Series 2017-XF2419, Rev., VRDO, LOC : Barclays Bank plc, 4.10%, 9/8/2023 (a) (b) | 1,215 | 1,215 |
Triborough Bridge and Tunnel Authority Series 2005B-3, Rev., VRDO, LOC : Bank of America NA, 3.92%, 9/1/2023 (a) | 2,950 | 2,950 |
Triborough Bridge and Tunnel Authority, MTA Bridges and Tunnels Series 2005B-4C, Rev., VRDO, LOC : US Bank NA, 4.25%, 9/1/2023 (a) | 325 | 325 |
119,535 | ||
North Carolina — 0.7% | ||
Charlotte-Mecklenburg Hospital Authority (The) Series 2007E, Rev., VRDO, AGM, LOC : TD Bank NA, 3.93%, 9/1/2023 (a) | 250 | 250 |
Person County Industrial Facilities and Pollution Control Financing Authority, Recovery Zone Facility, Certainteed Gypsum, Inc., Rev., VRDO, LOC : Credit Industriel et Commercial, 4.18%, 9/8/2023 (a) | 5,750 | 5,750 |
University of North Carolina, Hospital at Chapel Hill | ||
Series A, Rev., VRDO, LIQ : TD Bank NA, 3.93%, 9/1/2023 (a) | 2,185 | 2,185 |
Series B, Rev., VRDO, LIQ : TD Bank NA, 3.93%, 9/1/2023 (a) | 200 | 200 |
8,385 | ||
Ohio — 2.8% | ||
City of Blue Ash, Economic Development, Ursuline Academy of Cincinnati Project, Rev., VRDO, LOC : PNC Bank NA, 4.48%, 9/8/2023 (a) | 1,165 | 1,165 |
Ohio Higher Educational Facility Commission, Cleveland Clinic Health System | ||
Series 2013B-2, Rev., VRDO, LIQ : TD Bank NA, 3.90%, 9/1/2023 (a) | 9,150 | 9,150 |
Series 2013B-3, Rev., VRDO, LIQ : US Bank NA, 4.15%, 9/1/2023 (a) | 6,150 | 6,150 |
INVESTMENTS †† | PRINCIPAL AMOUNT ($000) | VALUE ($000) |
Ohio — continued | ||
RBC Municipal Products, Inc. Trust, Floater Certificates | ||
Series E132, Rev., VRDO, LOC : Royal Bank of Canada, 4.09%, 9/8/2023 (a) (b) | 2,065 | 2,065 |
Series C-18, Rev., VRDO, LOC : Royal Bank of Canada, 4.10%, 9/8/2023 (a) (b) | 9,000 | 9,000 |
Tender Option Bond Trust Receipts/Certificates | ||
Series 2022-ZL0355, Rev., VRDO, LIQ : Morgan Stanley Bank NA, 4.09%, 9/8/2023 (a) (b) | 3,815 | 3,815 |
Series 2022-XL0321, Rev., VRDO, LIQ : Bank of America NA, 4.10%, 9/8/2023 (a) (b) | 2,100 | 2,100 |
33,445 | ||
Oregon — 1.2% | ||
Oregon State Facilities Authority, Peacehealth Series 2018A, Rev., VRDO, LOC : US Bank NA, 4.20%, 9/1/2023 (a) | 8,725 | 8,725 |
State of Oregon, Veterans Welfare | ||
Series 2020J, GO, VRDO, LIQ : US Bank NA, 4.20%, 9/1/2023 (a) | 1,060 | 1,060 |
Series 2015P-9, GO, VRDO, LIQ : US Bank NA, 3.85%, 9/8/2023 (a) | 4,150 | 4,150 |
13,935 | ||
Pennsylvania — 2.4% | ||
Delaware County Industrial Development Authority, United Parcel Service Project, Rev., VRDO, 4.10%, 9/1/2023 (a) | 1,000 | 1,000 |
General Authority of Southcentral Pennsylvania, Wellspan Health Obligation Series 2019E, Rev., VRDO, LIQ : US Bank NA, 4.25%, 9/1/2023 (a) | 6,800 | 6,800 |
Pennsylvania Turnpike Commission, Rev., VRDO, LOC : TD Bank NA, 4.01%, 9/8/2023 (a) | 50 | 50 |
Philadelphia Gas Works Co. Series E, Rev., VRDO, LOC : TD Bank NA, 4.01%, 9/8/2023 (a) | 1,600 | 1,600 |
Philadelphia Gas Works Co., 1998 General Ordinance Series A-2, Rev., VRDO, LOC : TD Bank NA, 4.01%, 9/8/2023 (a) | 3,400 | 3,400 |
RIB Floater Trust Various States Series 2022-030, GO, VRDO, LIQ : Barclays Bank plc, 4.06%, 9/1/2023 (a) (b) | 11,225 | 11,225 |
Tender Option Bond Trust Receipts/Certificates Series 2023-BAML5029, Rev., VRDO, LOC : Bank of America NA, 4.05%, 9/1/2023 (a) (b) | 4,465 | 4,465 |
28,540 | ||
Rhode Island — 0.4% | ||
City of Cranston Series 2023-1, GO, BAN, 4.25%, 8/21/2024 | 5,000 | 5,032 |
29 | J.P. Morgan Money Market Funds | August 31, 2023 |
INVESTMENTS †† | PRINCIPAL AMOUNT ($000) | VALUE ($000) |
Municipal Bonds — continued | ||
South Carolina — 0.4% | ||
City of Columbia, Waterworks and Sewer System, Rev., VRDO, LOC : Sumitomo Mitsui Banking Corp., 4.05%, 9/8/2023 (a) | 560 | 560 |
RBC Municipal Products, Inc. Trust, Floater Certificates Series G109, Rev., VRDO, LOC : Royal Bank of Canada, 4.67%, 10/2/2023 (a) (b) | 2,600 | 2,600 |
South Carolina Public Service Authority Series 2019A, Rev., VRDO, LOC : Bank of America NA, 4.17%, 9/8/2023 (a) | 1,145 | 1,145 |
4,305 | ||
Tennessee — 1.8% | ||
Clarksville Public Building Authority Series 2001, Rev., VRDO, LOC : Bank of America NA, 4.01%, 9/1/2023 (a) | 3,885 | 3,885 |
Montgomery County Public Building Authority, Pooled Financing, Tennessee Country Pool Series 2006, Rev., VRDO, LOC : Bank of America NA, 3.94%, 9/1/2023 (a) | 3,350 | 3,350 |
Tender Option Bond Trust Receipts/Certificates | ||
Series 2022-XF1421, Rev., VRDO, LIQ : Bank of America NA, 4.09%, 9/8/2023 (a) (b) | 6,600 | 6,600 |
Series 2022-XL0369, Rev., VRDO, LIQ : Morgan Stanley Bank NA, 4.09%, 9/8/2023 (a) (b) | 5,000 | 5,000 |
Series 2018-XF2576, Rev., VRDO, LOC : Barclays Bank plc, 4.10%, 9/8/2023 (a) (b) | 2,000 | 2,000 |
20,835 | ||
Texas — 6.5% | ||
Harris County Cultural Education Facilities Finance Corp., Memorial Hermann Health System Series 2014D, Rev., VRDO, 4.11%, 9/8/2023 (a) | 255 | 255 |
Harris County Industrial Development Corp., Exxon Corp Project Series 1984B, Rev., VRDO, 3.90%, 9/1/2023 (a) | 148 | 148 |
Lower Neches Valley Authority Industrial Development Corp., ExxonMobil Project, Rev., VRDO, 3.85%, 9/1/2023 (a) | 2,262 | 2,262 |
State of Texas, Transportation Commission Series A, GO, 5.00%, 10/1/2023 | 1,100 | 1,101 |
State of Texas, Veterans | ||
Series 2011A, GO, VRDO, LIQ : State Street Bank & Trust Co., 4.15%, 9/8/2023 (a) | 3,145 | 3,145 |
Series 2015A, GO, VRDO, LIQ : State Street Bank & Trust Co., 4.15%, 9/8/2023 (a) | 3,010 | 3,010 |
State of Texas, Veterans Housing Assistance Program Series 2010C, GO, VRDO, LIQ : State Street Bank & Trust Co., 4.15%, 9/8/2023 (a) | 5,640 | 5,640 |
INVESTMENTS †† | PRINCIPAL AMOUNT ($000) | VALUE ($000) |
Texas — continued | ||
Tarrant County Cultural Education Facilities Finance Corp., Baylor Healthcare System Project Series 2011C, Rev., VRDO, LOC : TD Bank NA, 3.93%, 9/1/2023 (a) | 300 | 300 |
Tarrant County Cultural Education Facilities Finance Corp., Methodist Hospitals of Dallas Project | ||
Series 2008B, Rev., VRDO, LOC : TD Bank NA, 3.90%, 9/1/2023 (a) | 13,300 | 13,300 |
Series 2008-A, Rev., VRDO, LOC : TD Bank NA, 3.93%, 9/1/2023 (a) | 1,000 | 1,000 |
Tender Option Bond Trust Receipts/Certificates | ||
Series 2023-XF3121, Rev., VRDO, LOC : Barclays Bank plc, 4.25%, 9/1/2023 (a) (b) | 4,976 | 4,976 |
Series 2023-XF3128, GO, VRDO, PSF-GTD, LIQ : UBS AG, 4.08%, 9/8/2023 (a) (b) | 4,000 | 4,000 |
Series 2022-XL0282, GO, VRDO, LIQ : Bank of America NA, 4.09%, 9/8/2023 (a) (b) | 3,440 | 3,440 |
Series 2022-XL0334, GO, VRDO, PSF-GTD, LIQ : Bank of America NA, 4.09%, 9/8/2023 (a) (b) | 2,915 | 2,915 |
Series 2022-XL0335, Rev., VRDO, LIQ : Bank of America NA, 4.09%, 9/8/2023 (a) (b) | 1,875 | 1,875 |
Series 2022-XL0360, Rev., VRDO, LIQ : Wells Fargo Bank NA, 4.09%, 9/8/2023 (a) (b) | 2,760 | 2,760 |
Series 2022-XL0362, GO, VRDO, PSF-GTD, LIQ : Bank of America NA, 4.09%, 9/8/2023 (a) (b) | 3,110 | 3,110 |
Series 2022-XM1050, Rev., VRDO, LIQ : Citibank NA, 4.09%, 9/8/2023 (a) (b) | 2,675 | 2,675 |
Series 2023-XF3134, Rev., VRDO, LIQ : Morgan Stanley Bank NA, 4.09%, 9/8/2023 (a) (b) | 11,120 | 11,120 |
Series 2023-XM1125, GO, VRDO, PSF-GTD, LIQ : Wells Fargo Bank NA, 4.09%, 9/8/2023 (a) (b) | 3,500 | 3,500 |
Series 2023-XG0505, GO, VRDO, PSF-GTD, LIQ : TD Bank NA, 4.11%, 9/8/2023 (a) (b) | 4,000 | 4,000 |
Texas Transportation Commission State Highway Fund Series 2014-B, Rev., VRDO, LIQ : Sumitomo Mitsui Banking Corp., 4.07%, 9/8/2023 (a) | 2,000 | 2,000 |
76,532 | ||
Utah — 0.7% | ||
City of Murray, IHC Health Services, Inc. Series 2005D, Rev., VRDO, LIQ : Wells Fargo Bank NA, 3.75%, 9/1/2023 (a) | 7,595 | 7,595 |
August 31, 2023 | J.P. Morgan Money Market Funds | 30 |
AS OF August 31, 2023 (Unaudited) (continued)
INVESTMENTS †† | PRINCIPAL AMOUNT ($000) | VALUE ($000) |
Municipal Bonds — continued | ||
Virginia — 1.0% | ||
RBC Municipal Products, Inc. Trust, Floater Certificates Series C-19, Rev., VRDO, LOC : Royal Bank of Canada, 4.10%, 9/8/2023 (a) (b) | 5,000 | 5,000 |
Roanoke Economic Development Authority, Carilion Health System Obligated Group Series 2005A, Rev., VRDO, LIQ : PNC Bank NA, 4.05%, 9/8/2023 (a) | 4,000 | 4,000 |
Tender Option Bond Trust Receipts/Certificates Series 2022-ZL0267, Rev., VRDO, LIQ : Wells Fargo Bank NA, 4.09%, 9/8/2023 (a) (b) | 2,250 | 2,250 |
11,250 | ||
Washington — 0.2% | ||
Tender Option Bond Trust Receipts/Certificates Series 2015-XF1017, Rev., VRDO, LOC : Barclays Bank plc, 4.10%, 9/8/2023 (a) (b) | 2,800 | 2,800 |
Wisconsin — 1.0% | ||
Tender Option Bond Trust Receipts/Certificates | ||
Series 2022-XL0296, Rev., VRDO, LIQ : Morgan Stanley Bank NA, 4.09%, 9/8/2023 (a) (b) | 5,530 | 5,530 |
Series 2023-XF3076, Rev., VRDO, LIQ : Wells Fargo Bank NA, 4.09%, 9/8/2023 (a) (b) | 3,895 | 3,895 |
Series 2023-XF3124, Rev., VRDO, LIQ : Barclays Bank plc, 4.09%, 9/8/2023 (a) (b) | 2,000 | 2,000 |
Wisconsin Health and Educational Facilities Authority, Medical College of Wisconsin, Inc., (The) Series 2008B, Rev., VRDO, LOC : TD Bank NA, 3.93%, 9/1/2023 (a) | 525 | 525 |
11,950 | ||
Total Municipal Bonds (Cost $772,849) | 772,838 | |
SHARES (000) | ||
Variable Rate Demand Preferred Shares — 9.7% | ||
California — 0.6% | ||
Nuveen California AMT - Free Quality Municipal Income Fund Series 6, LIQ : Sumitomo Mitsui Banking Corp., 4.09%, 9/8/2023# (b) | 7,000 | 7,000 |
New York — 1.2% | ||
Nuveen New York AMT - Free Quality Municipal Income Fund Series 2, LIQ : Royal Bank of Canada, 4.11%, 9/8/2023# (b) | 13,600 | 13,600 |
Other — 7.9% | ||
Nuveen AMT - Free Municipal Credit Income Fund | ||
Series 6, LIQ : Sumitomo Mitsui Banking Corp., 4.11%, 9/8/2023# (b) | 21,700 | 21,700 |
INVESTMENTS †† | SHARES (000) | VALUE ($000) |
Other — continued | ||
Series 5, LIQ : Societe Generale, 4.11%, 9/8/2023# (b) | 17,400 | 17,400 |
Nuveen AMT - Free Quality Municipal Income Fund | ||
Series 5-100, LOC : Sumitomo Mitsui Banking Corp., 4.11%, 9/8/2023# (b) | 5,000 | 5,000 |
Series 4-4895, LIQ : Barclays Bank plc, 4.11%, 9/8/2023# (b) | 39,400 | 39,400 |
Series 3-PFD, LIQ : TD Bank NA, 4.11%, 9/8/2023# (b) | 10,000 | 10,000 |
93,500 | ||
Total Variable Rate Demand Preferred Shares (Cost $114,100) | 114,100 | |
PRINCIPAL AMOUNT ($000) | ||
Short Term Investments — 25.2% | ||
Commercial Paper — 25.2% | ||
Board of Regents of the University of Texas System | ||
Series A, 3.15%, 9/13/2023 | 10,000 | 9,998 |
Series A, 3.30%, 9/14/2023 | 5,000 | 4,999 |
Series A, 3.10%, 9/15/2023 | 5,000 | 4,999 |
Series A, 3.30%, 9/20/2023 | 5,000 | 5,000 |
Series A, 3.25%, 9/21/2023 | 5,000 | 4,999 |
Series A, 3.65%, 10/26/2023 | 5,000 | 5,000 |
Series A, 3.50%, 1/17/2024 | 5,000 | 4,997 |
Board of Trustees Michigan State University | ||
Series G, 3.10%, 9/12/2023 | 7,500 | 7,499 |
Brownsville Texas Utilities System | ||
Series A, 3.65%, 11/1/2023 | 4,000 | 4,000 |
California Statewide Communities Development Authority | ||
Series 9-D, 3.27%, 9/13/2023 | 11,400 | 11,398 |
Series 09-D, 3.35%, 9/20/2023 | 1,700 | 1,700 |
City of Houston | ||
Series E-1, 3.57%, 9/14/2023 | 10,000 | 9,999 |
Series E-1, 3.70%, 10/3/2023 | 5,000 | 5,000 |
City of Jacksonville | ||
Series 2016, 3.60%, 11/7/2023 | 10,000 | 9,993 |
City of Rochester | ||
Series 2011, 3.60%, 11/7/2023 | 10,000 | 9,993 |
Series 2011, 3.47%, 1/25/2024 | 8,000 | 7,993 |
City of San Antonio Electric & Gas Systems | ||
Series C, 3.30%, 9/12/2023 | 20,000 | 19,996 |
Series B, 3.40%, 9/12/2023 | 10,000 | 9,998 |
31 | J.P. Morgan Money Market Funds | August 31, 2023 |
INVESTMENTS †† | PRINCIPAL AMOUNT ($000) | VALUE ($000) |
Short Term Investments — continued | ||
Commercial Paper — continued | ||
County of Harris | ||
Series A-1, 3.27%, 9/6/2023 | 2,810 | 2,810 |
Series B, 3.45%, 9/6/2023 | 4,659 | 4,659 |
Series C, 3.45%, 9/6/2023 | 10,730 | 10,729 |
Series A-1, 3.45%, 9/6/2023 | 2,655 | 2,655 |
County of Harris Toll Road | ||
3.70%, 2/14/2024 | 2,500 | 2,498 |
County of Montgomery | ||
Series 10-A, 3.50%, 10/3/2023 | 10,000 | 9,999 |
Dallas Independent School District | ||
Series IA, 3.70%, 2/15/2024 | 10,000 | 9,991 |
Indiana Finance Authority | ||
Series D-2, 3.25%, 9/7/2023 | 5,000 | 4,999 |
Jacksonville Aviation Authority | ||
Series 92, 3.30%, 9/7/2023 | 8,300 | 8,299 |
Lower Colorado River Authority | ||
Series B, 3.50%, 9/28/2023 | 5,000 | 4,999 |
Massachusetts Bay Transportation Authority Sales Tax | ||
Series C, 3.15%, 10/5/2023 | 10,000 | 9,996 |
Metropolitan Government Nashville and Davidson County Health and Educational Facilities Board | ||
3.20%, 1/25/2024 | 5,000 | 4,991 |
Metropolitan Government of Nashville and Davidson County | ||
Series 2021, 3.18%, 10/11/2023 | 10,000 | 9,995 |
Omaha Public Power District | ||
Series A, 3.75%, 9/21/2023 | 5,270 | 5,270 |
Series A, 3.47%, 10/13/2023 | 5,000 | 4,999 |
Series A, 3.50%, 10/17/2023 | 7,000 | 6,999 |
Rutgers The State University of New Jersey | ||
Series B, 3.30%, 9/12/2023 | 5,000 | 4,999 |
Salt River Project Agricultural Improvement & Power District | ||
Series C, 3.27%, 9/5/2023 | 5,000 | 5,000 |
Series C, 3.40%, 9/6/2023 | 10,000 | 9,999 |
San Francisco City & County Airport Comm-San Francisco International Airport | ||
Series B-5, 3.35%, 9/6/2023 | 5,200 | 5,200 |
Series B-5, 3.23%, 9/13/2023 | 9,000 | 8,999 |
Texas Public Finance Authority | ||
Series 19, 3.50%, 11/9/2023 | 7,500 | 7,498 |
Series 19, 3.70%, 11/9/2023 | 5,000 | 5,000 |
INVESTMENTS †† | PRINCIPAL AMOUNT ($000) | VALUE ($000) |
Commercial Paper — continued | ||
University of Pittsburgh-of the Commonwealth System of Higher Education | ||
Series B-2, 3.20%, 10/11/2023 | 10,000 | 9,995 |
Total Commercial Paper (Cost $298,224) | 298,139 | |
Total Short Term Investments (Cost $298,224) | 298,139 | |
Total Investments — 100.3% (Cost $1,185,173) | 1,185,077 | |
Liabilities in Excess of Other Assets — (0.3)% | (4,058 ) | |
NET ASSETS — 100.0% | 1,181,019 | |
Percentages indicated are based on net assets. |
Abbreviations | |
AGM | Insured by Assured Guaranty Municipal Corp. |
AMT | Alternative Minimum Tax |
BAN | Bond Anticipation Note |
COLL | Collateral |
COP | Certificate of Participation |
FHLB | Federal Home Loan Bank |
FHLMC | Federal Home Loan Mortgage Corp. |
FNMA | Federal National Mortgage Association |
GNMA | Government National Mortgage Association |
GO | General Obligation |
GTD | Guaranteed |
LIQ | Liquidity Agreement |
LOC | Letter of Credit |
MTA | Metropolitan Transportation Authority |
PSF-GTD | Permanent School Fund Guaranteed |
Rev. | Revenue |
VRDO | Variable Rate Demand Obligation |
^ | Amount rounds to less than 0.1% of net assets. | |
†† | The date shown represents the earliest of the next put date, next demand date or final maturity date. | |
# | Variable Rate Demand Preferred Shares of a closed-end investment company which has a weekly demand feature. The interest rate shown is the rate in effect as of August 31, 2023. | |
(a) | Variable or floating rate security, the interest rate of which adjusts periodically based on changes in current interest rates and prepayments on the underlying pool of assets. The interest rate shown is the current rate as of August 31, 2023. | |
(b) | Securities exempt from registration under Rule 144A or section 4(a)(2), of the Securities Act of 1933, as amended. | |
August 31, 2023 | J.P. Morgan Money Market Funds | 32 |
AS OF August 31, 2023 (Unaudited)
INVESTMENTS †† | PRINCIPAL AMOUNT ($000) | VALUE ($000) |
Municipal Bonds — 5.4% | ||
Alaska — 1.2% | ||
Alaska Housing Finance Corp., State Capital Project | ||
Series 2018A, Rev., VRDO, 5.37%, 9/8/2023 (a) | 20,000 | 20,000 |
Series 2017B, Rev., VRDO, 5.40%, 9/8/2023 (a) | 13,985 | 13,985 |
33,985 | ||
Colorado — 1.4% | ||
Colorado Housing and Finance Authority | ||
Series 2023E-2, Rev., VRDO, GNMA, LIQ : FHLB, 5.35%, 9/8/2023 (a) | 27,210 | 27,210 |
Series 2023K-2, Rev., VRDO, GNMA COLL, LIQ : FHLB, 5.35%, 9/8/2023 (a) | 10,000 | 10,000 |
Colorado Housing and Finance Authority, Single Family Mortgage Series 2022L2, Class II, Rev., VRDO, GNMA COLL, LIQ : FHLB, 5.36%, 9/8/2023 (a) | 3,530 | 3,530 |
40,740 | ||
Georgia — 1.0% | ||
Macon-Bibb County Industrial Authority, Kumho Tire Georgia Inc. Project, Rev., VRDO, LOC : Korea Development Bank, 5.49%, 9/8/2023 (a) (b) | 30,000 | 30,000 |
Illinois — 0.1% | ||
Illinois Housing Development Authority Series 2023J, Rev., VRDO, FNMA / GNMA / FHLMC COLL, LIQ : Royal Bank of Canada, 5.35%, 9/8/2023 (a) | 3,500 | 3,500 |
Massachusetts — 0.4% | ||
Massachusetts Housing Finance Agency, Social Bonds Series 229, Rev., VRDO, GNMA / FNMA / FHLMC COLL, LIQ : UBS AG, 5.35%, 9/8/2023 (a) | 10,000 | 10,000 |
Minnesota — 0.7% | ||
Minnesota Housing Finance Agency Series 2023K, Rev., VRDO, GNMA / FNMA / FHLMC COLL, LIQ : Royal Bank of Canada, 5.35%, 9/8/2023 (a) | 20,000 | 20,000 |
New York — 0.2% | ||
Triborough Bridge and Tunnel Authority Series 2018E, Rev., VRDO, LOC : UBS AG, 5.35%, 9/8/2023 (a) | 7,000 | 7,000 |
INVESTMENTS †† | PRINCIPAL AMOUNT ($000) | VALUE ($000) |
Rhode Island — 0.4% | ||
Rhode Island Housing and Mortgage Finance Corp. Series 79-T2, Rev., VRDO, GNMA, LIQ : Royal Bank of Canada, 5.35%, 9/8/2023 (a) | 11,000 | 11,000 |
Total Municipal Bonds (Cost $156,225) | 156,225 | |
Repurchase Agreements — 2.6% | ||
Agency Joint Trading Account II, J.P. Morgan Investment Management Inc., as agent, 5.30%, dated 8/31/2023, due 9/1/2023, repurchase price $60,009. (c) | 60,000 | 60,000 |
Pershing LLC, 5.71%, dated 8/31/2023, due 11/8/2023, repurchase price $5,055, collateralized by U.S. Treasury Securities, 0.00% - 4.63%, due 9/28/2023 - 11/15/2052, with a value of $5,173. | 5,000 | 5,000 |
Societe Generale SA, 5.47%, dated 8/31/2023, due 9/6/2023, repurchase price $10,009, collateralized by Collateralized Mortgage Obligations, 2.50% - 9.46%, due 9/15/2034 - 7/25/2056, Corporate Notes and Bonds, 3.88% - 9.00%, due 4/1/2024 - 9/30/2039, Sovereign Government Securities, 3.75% - 5.00%, due 1/11/2028 - 9/12/2031 and U.S. Treasury Securities, 3.38%, due 11/15/2048, with a value of $10,806. | 10,000 | 10,000 |
Total Repurchase Agreements (Cost $75,000) | 75,000 | |
Short Term Investments — 92.2% | ||
Commercial Paper — 50.6% | ||
Australia & New Zealand Banking Group Ltd. (Australia) | ||
5.73%, 3/25/2024 (d) | 5,000 | 4,840 |
Autobahn Funding Co. LLC | ||
5.33%, 9/1/2023 (b) (d) | 20,000 | 19,997 |
5.32%, 9/5/2023 (b) (d) | 31,000 | 30,977 |
5.40%, 10/5/2023 (b) (d) | 10,000 | 9,948 |
Banco Santander SA (Spain) | ||
5.55%, 11/2/2023 (d) | 2,400 | 2,377 |
Bank of Montreal (Canada) | ||
(SOFR + 0.60%), 5.90%, 9/1/2023 (e) | 8,000 | 8,006 |
(SOFR + 0.66%), 5.96%, 9/1/2023 (e) | 10,000 | 10,010 |
(SOFR + 0.75%), 6.05%, 9/1/2023 (e) | 25,000 | 25,034 |
5.90%, 8/12/2024 (d) | 2,500 | 2,366 |
Bank of Nova Scotia (The) (Canada) | ||
(SOFR + 0.33%), 5.63%, 9/1/2023 (b) (e) | 3,000 | 3,000 |
(SOFR + 0.42%), 5.72%, 9/1/2023 (b) (e) | 2,000 | 2,001 |
33 | J.P. Morgan Money Market Funds | August 31, 2023 |
INVESTMENTS †† | PRINCIPAL AMOUNT ($000) | VALUE ($000) |
Short Term Investments — continued | ||
Commercial Paper — continued | ||
(SOFR + 0.42%), 5.72%, 9/1/2023 (b) (e) | 2,000 | 2,001 |
(SOFR + 0.42%), 5.72%, 9/1/2023 (b) (e) | 2,500 | 2,500 |
(SOFR + 0.45%), 5.75%, 9/1/2023 (b) (e) | 5,000 | 5,003 |
(SOFR + 0.50%), 5.80%, 9/1/2023 (b) (e) | 7,000 | 7,004 |
(SOFR + 0.52%), 5.82%, 9/1/2023 (b) (e) | 10,000 | 10,008 |
(SOFR + 0.66%), 5.96%, 9/1/2023 (b) (e) | 10,000 | 10,012 |
(SOFR + 0.66%), 5.96%, 9/1/2023 (b) (e) | 3,000 | 3,003 |
Barclays Bank plc (United Kingdom) | ||
5.36%, 9/1/2023 (d) | 120,000 | 119,982 |
Barton Capital SA (France) | ||
5.32%, 9/1/2023 (d) | 74,000 | 73,989 |
Bedford Row Funding Corp. | ||
(SOFR + 0.44%), 5.74%, 9/1/2023 (b) (e) | 2,500 | 2,501 |
BNP Paribas SA (France) | ||
5.31%, 9/1/2023 (d) | 75,000 | 74,989 |
(SOFR + 0.35%), 5.65%, 9/1/2023 (e) | 5,000 | 5,002 |
5.75%, 2/15/2024 (d) | 11,000 | 10,714 |
Board of Regents of the University of Texas System | ||
Series B, 5.38%, 9/26/2023 | 9,000 | 9,000 |
Series B, 5.41%, 9/28/2023 | 4,500 | 4,500 |
BPCE SA (France) | ||
5.63%, 12/12/2023 (d) | 5,000 | 4,920 |
Cabot Trail Funding LLC | ||
5.34%, 11/1/2023 (d) | 10,000 | 9,906 |
Canadian Imperial Bank of Commerce (Canada) | ||
(SOFR + 0.44%), 5.74%, 9/1/2023 (b) (e) | 5,000 | 5,001 |
(SOFR + 0.54%), 5.84%, 9/1/2023 (b) (e) | 7,000 | 7,009 |
(SOFR + 0.66%), 5.96%, 9/1/2023 (b) (e) | 10,000 | 10,016 |
5.90%, 8/13/2024 (d) | 2,500 | 2,366 |
CDP Financial, Inc. (Canada) | ||
(SOFR + 0.47%), 5.77%, 9/1/2023 (b) (e) | 10,000 | 10,004 |
(SOFR + 0.80%), 6.10%, 9/1/2023 (b) (e) | 15,000 | 15,015 |
China Construction Bank Corp. (China) | ||
5.34%, 9/1/2023 (d) | 120,000 | 119,982 |
Cooperatieve Rabobank UA (Netherlands) | ||
5.31%, 9/1/2023 (d) | 100,000 | 99,985 |
Credit Industriel et Commercial (France) | ||
(SOFR + 0.44%), 5.74%, 9/1/2023 (b) (e) | 10,000 | 10,006 |
DBS Bank Ltd. (Singapore) | ||
5.31%, 9/1/2023 (d) | 300 | 300 |
DCAT LLC | ||
5.34%, 9/5/2023 (d) | 36,000 | 35,973 |
5.36%, 9/6/2023 (d) | 5,000 | 4,996 |
5.39%, 9/8/2023 (d) | 3,600 | 3,596 |
INVESTMENTS †† | PRINCIPAL AMOUNT ($000) | VALUE ($000) |
Commercial Paper — continued | ||
DNB Bank ASA (Norway) | ||
5.32%, 11/16/2023 (d) | 8,000 | 7,909 |
Great Bear Funding LLC | ||
5.33%, 9/5/2023 (b) (d) | 10,000 | 9,993 |
5.34%, 9/6/2023 (b) (d) | 10,000 | 9,991 |
5.46%, 10/2/2023 (b) (d) | 1,000 | 995 |
Industrial & Commercial Bank of China Ltd. (China) | ||
5.34%, 9/1/2023 (d) | 120,000 | 119,982 |
ING US Funding LLC (Netherlands) | ||
(SOFR + 0.44%), 5.74%, 9/1/2023 (b) (e) | 7,000 | 7,007 |
(SOFR + 0.50%), 5.80%, 9/1/2023 (b) (e) | 10,000 | 10,008 |
(SOFR + 0.53%), 5.83%, 9/1/2023 (b) (e) | 5,000 | 5,002 |
(SOFR + 0.57%), 5.87%, 9/1/2023 (b) (e) | 15,000 | 15,012 |
5.84%, 4/1/2024 (d) | 5,000 | 4,833 |
Kaiser Foundation Hospitals | ||
5.45%, 10/4/2023 (d) | 10,000 | 9,949 |
5.45%, 10/5/2023 (d) | 14,104 | 14,030 |
5.47%, 10/11/2023 (d) | 10,000 | 9,938 |
Landesbank Baden-Wurttemberg (Germany) | ||
5.31%, 9/1/2023 (d) | 120,000 | 119,982 |
Lloyds Bank plc (United Kingdom) | ||
5.62%, 12/8/2023 (d) | 5,000 | 4,924 |
LMA-Americas LLC | ||
5.32%, 9/1/2023 (d) | 10,000 | 9,999 |
(SOFR + 0.46%), 5.76%, 9/1/2023 (b) (e) | 10,000 | 10,005 |
Macquarie Bank Ltd. (Australia) | ||
5.34%, 9/1/2023 (d) | 5,000 | 4,999 |
(SOFR + 0.40%), 5.70%, 9/1/2023 (b) (e) | 8,000 | 8,003 |
(SOFR + 0.43%), 5.73%, 9/1/2023 (b) (e) | 10,000 | 10,005 |
(SOFR + 0.43%), 5.73%, 9/1/2023 (b) (e) | 10,000 | 10,005 |
5.78%, 2/12/2024 (d) | 7,500 | 7,306 |
Massachusetts Bay Transportation Authority | ||
Series A, 5.47%, 9/14/2023 | 5,000 | 4,999 |
Massachusetts Educational Financing Authority | ||
Series A, 5.43%, 9/14/2023 | 6,000 | 5,999 |
Series A, 5.48%, 10/11/2023 | 3,000 | 2,999 |
Series A, 5.48%, 10/11/2023 | 4,000 | 4,000 |
Series A, 5.48%, 10/11/2023 | 4,000 | 4,000 |
National Australia Bank Ltd. (Australia) | ||
(SOFR + 0.20%), 5.50%, 9/1/2023 (b) (e) | 28,750 | 28,750 |
(SOFR + 0.35%), 5.65%, 9/1/2023 (b) (e) | 2,000 | 2,001 |
(SOFR + 0.52%), 5.82%, 9/1/2023 (b) (e) | 5,000 | 5,004 |
(SOFR + 0.52%), 5.82%, 9/1/2023 (b) (e) | 15,000 | 15,013 |
August 31, 2023 | J.P. Morgan Money Market Funds | 34 |
AS OF August 31, 2023 (Unaudited) (continued)
INVESTMENTS †† | PRINCIPAL AMOUNT ($000) | VALUE ($000) |
Short Term Investments — continued | ||
Commercial Paper — continued | ||
Nationwide Building Society (United Kingdom) | ||
5.31%, 9/6/2023 (b) (d) | 10,000 | 9,991 |
Natixis SA (France) | ||
5.88%, 5/10/2024 (d) | 10,000 | 9,603 |
NatWest Markets plc (United Kingdom) | ||
Series G, 5.33%, 9/7/2023 (b) (d) | 25,000 | 24,973 |
5.36%, 11/15/2023 (b) (d) | 3,000 | 2,965 |
Old Line Funding Corp. | ||
5.35%, 9/15/2023 (d) | 1,000 | 998 |
Oversea-Chinese Banking Corp., Ltd. (Singapore) | ||
(SOFR + 0.36%), 5.66%, 9/1/2023 (b) (e) | 2,500 | 2,501 |
(SOFR + 0.40%), 5.70%, 9/1/2023 (b) (e) | 10,000 | 10,004 |
Royal Bank of Canada (Canada) | ||
(SOFR + 0.40%), 5.70%, 9/1/2023 (b) (e) | 4,000 | 4,002 |
(SOFR + 0.60%), 5.90%, 9/1/2023 (b) (e) | 3,000 | 3,003 |
Rutgers The State University of New Jersey | ||
Series C, 5.45%, 9/21/2023 | 10,000 | 9,998 |
Skandinaviska Enskilda Banken AB (Sweden) | ||
(SOFR + 0.35%), 5.65%, 9/1/2023 (b) (e) | 2,000 | 2,001 |
(SOFR + 0.42%), 5.72%, 9/1/2023 (b) (e) | 2,500 | 2,501 |
(SOFR + 0.70%), 6.00%, 9/1/2023 (b) (e) | 10,000 | 10,019 |
5.32%, 11/17/2023 (d) | 5,000 | 4,942 |
Societe Generale SA (France) | ||
5.61%, 11/10/2023 (d) | 2,300 | 2,275 |
Sumitomo Mitsui Trust Bank Ltd. (Japan) | ||
5.31%, 9/5/2023 (d) | 2,735 | 2,733 |
5.61%, 12/1/2023 (d) | 5,000 | 4,930 |
Svenska Handelsbanken AB (Sweden) | ||
(SOFR + 0.35%), 5.65%, 9/1/2023 (b) (e) | 7,000 | 7,002 |
(SOFR + 0.40%), 5.70%, 9/1/2023 (b) (e) | 5,000 | 5,001 |
(SOFR + 0.63%), 5.93%, 9/1/2023 (b) (e) | 10,000 | 10,011 |
Toronto-Dominion Bank (The) (Canada) | ||
(SOFR + 0.70%), 6.00%, 9/1/2023 (e) | 10,000 | 10,015 |
(US Federal Funds Effective Rate (continuous series) + 0.74%), 6.07%, 9/1/2023 (b) (e) | 10,000 | 10,010 |
5.90%, 8/13/2024 (d) | 2,500 | 2,365 |
5.99%, 8/23/2024 (d) | 2,500 | 2,362 |
UBS AG (Switzerland) | ||
(SOFR + 0.36%), 5.68%, 9/1/2023 (b) (e) | 10,000 | 10,000 |
(SOFR + 0.37%), 5.69%, 9/1/2023 (b) (e) | 5,000 | 5,000 |
(SOFR + 0.46%), 5.78%, 9/1/2023 (b) (e) | 2,000 | 2,000 |
(SOFR + 0.44%), 5.79%, 9/1/2023 (b) (e) | 4,000 | 4,001 |
5.37%, 10/16/2023 (d) | 5,000 | 4,965 |
INVESTMENTS †† | PRINCIPAL AMOUNT ($000) | VALUE ($000) |
Commercial Paper — continued | ||
Westpac Banking Corp. (Australia) | ||
(SOFR + 0.52%), 5.82%, 9/1/2023 (b) (e) | 5,000 | 5,000 |
Total Commercial Paper (Cost $1,465,545) | 1,465,652 | |
Time Deposits — 22.8% | ||
Canadian Imperial Bank of Commerce 5.31%, 9/1/2023 | 26,577 | 26,577 |
Credit Agricole Corporate and Investment Bank 5.31%, 9/1/2023 | 103,568 | 103,568 |
Erste Group Bank AG | ||
5.32%, 9/1/2023 | 100,000 | 100,000 |
5.32%, 9/1/2023 | 10,000 | 10,000 |
First Abu Dhabi Bank NV 5.32%, 9/1/2023 | 125,000 | 125,000 |
Mizuho Bank Ltd. | ||
5.32%, 9/1/2023 | 100,000 | 100,000 |
5.32%, 9/1/2023 | 10,000 | 10,000 |
Royal Bank of Canada | ||
5.32%, 9/1/2023 | 50,000 | 50,000 |
5.32%, 9/1/2023 | 5,000 | 5,000 |
Skandinaviska Enskilda Banken AB 5.32%, 9/1/2023 | 80,000 | 80,000 |
Toronto-Dominion Bank (The) 5.32%, 9/1/2023 | 50,000 | 50,000 |
Total Time Deposits (Cost $660,145) | 660,145 | |
Certificates of Deposits — 18.1% | ||
Banco Santander SA (Spain) , 5.53%, 10/6/2023 | 10,000 | 10,001 |
Bank of America NA | ||
5.57%, 11/10/2023 | 19,000 | 19,002 |
5.79%, 2/14/2024 | 10,000 | 10,000 |
5.80%, 2/23/2024 | 10,000 | 10,000 |
5.85%, 2/28/2024 | 5,000 | 5,001 |
Bank of Montreal (Canada) (SOFR + 0.64%), 5.94%, 9/1/2023 (e) | 2,500 | 2,501 |
Bank of Nova Scotia (The) (Canada) | ||
(SOFR + 0.60%), 5.90%, 9/1/2023 (e) | 6,000 | 6,004 |
(SOFR + 0.66%), 5.96%, 9/1/2023 (e) | 15,000 | 15,001 |
(SOFR + 0.66%), 5.96%, 9/1/2023 (e) | 10,000 | 10,011 |
(SOFR + 0.70%), 6.00%, 9/1/2023 (e) | 2,000 | 2,003 |
BNP Paribas SA (France) | ||
(SOFR + 0.43%), 5.73%, 9/1/2023 (e) | 2,500 | 2,500 |
(SOFR + 0.47%), 5.77%, 9/1/2023 (e) | 4,000 | 4,002 |
(SOFR + 0.50%), 5.80%, 9/1/2023 (e) | 5,000 | 5,003 |
Canadian Imperial Bank of Commerce (Canada) | ||
(SOFR + 0.15%), 5.45%, 9/1/2023 (e) | 17,500 | 17,500 |
35 | J.P. Morgan Money Market Funds | August 31, 2023 |
INVESTMENTS †† | PRINCIPAL AMOUNT ($000) | VALUE ($000) |
Short Term Investments — continued | ||
Certificates of Deposits — continued | ||
(SOFR + 0.50%), 5.80%, 9/1/2023 (e) | 3,000 | 3,003 |
(SOFR + 0.60%), 5.90%, 9/1/2023 (e) | 6,000 | 6,008 |
(SOFR + 0.70%), 6.00%, 9/1/2023 (e) | 10,000 | 10,023 |
(SOFR + 0.81%), 6.11%, 9/1/2023 (e) | 5,000 | 5,006 |
Citibank NA , 5.70%, 12/18/2023 | 7,000 | 7,001 |
Cooperatieve Rabobank UA (Netherlands) | ||
(SOFR + 0.69%), 6.01%, 9/1/2023 (e) | 5,000 | 5,002 |
5.39%, 11/20/2023 | 2,500 | 2,499 |
5.30%, 2/13/2024 | 2,000 | 1,994 |
5.91%, 8/14/2024 (d) | 2,500 | 2,366 |
Credit Agricole Corporate and Investment Bank (France) | ||
(SOFR + 0.50%), 5.80%, 9/1/2023 (e) | 5,000 | 5,004 |
(SOFR + 0.50%), 5.80%, 9/1/2023 (e) | 10,000 | 10,004 |
Credit Industriel et Commercial (France) | ||
(SOFR + 0.37%), 5.67%, 9/1/2023 (e) | 7,500 | 7,503 |
(SOFR + 0.38%), 5.68%, 9/1/2023 (e) | 4,000 | 4,001 |
(SOFR + 0.50%), 5.80%, 9/1/2023 (e) | 5,000 | 5,003 |
5.37%, 2/5/2024 (d) | 6,000 | 5,851 |
5.99%, 5/29/2024 (d) | 2,500 | 2,393 |
DZ Bank AG (Germany) (SOFR + 0.36%), 5.66%, 9/1/2023 (e) | 5,000 | 5,002 |
Goldman Sachs Bank USA (SOFR + 0.45%), 5.75%, 9/1/2023 (e) | 15,000 | 15,004 |
Mizuho Bank Ltd. (Japan) , 5.52%, 10/17/2023 | 3,400 | 3,401 |
MUFG Bank Ltd. (Japan) | ||
(SOFR + 0.32%), 5.62%, 9/1/2023 (e) | 10,000 | 10,001 |
(SOFR + 0.50%), 5.80%, 9/1/2023 (e) | 3,000 | 3,001 |
5.67%, 12/12/2023 | 5,000 | 5,000 |
National Australia Bank Ltd. (Australia) | ||
5.17%, 2/13/2024 (d) | 2,000 | 1,949 |
5.74%, 3/7/2024 (d) | 5,000 | 4,857 |
5.75%, 3/18/2024 (d) | 4,000 | 3,877 |
Natixis SA (France) | ||
(SOFR + 0.42%), 5.72%, 9/1/2023 (e) | 8,000 | 8,006 |
(SOFR + 0.44%), 5.74%, 9/1/2023 (e) | 10,000 | 10,006 |
(SOFR + 0.50%), 5.80%, 9/1/2023 (e) | 7,000 | 7,004 |
(SOFR + 0.50%), 5.80%, 9/1/2023 (e) | 5,000 | 5,001 |
5.38%, 10/5/2023 | 2,500 | 2,500 |
5.32%, 11/7/2023 | 5,000 | 4,997 |
Nordea Bank Abp (Finland) | ||
(SOFR + 0.51%), 5.81%, 9/1/2023 (e) | 2,500 | 2,502 |
(SOFR + 0.57%), 5.87%, 9/1/2023 (e) | 10,000 | 10,004 |
4.14%, 9/5/2023 | 3,480 | 3,479 |
INVESTMENTS †† | PRINCIPAL AMOUNT ($000) | VALUE ($000) |
Certificates of Deposits — continued | ||
5.40%, 11/16/2023 | 4,000 | 3,999 |
Oversea-Chinese Banking Corp., Ltd. (Singapore) | ||
(SOFR + 0.42%), 5.72%, 9/1/2023 (e) | 5,000 | 5,001 |
(SOFR + 0.45%), 5.75%, 9/1/2023 (e) | 17,000 | 17,004 |
(SOFR + 0.50%), 5.80%, 9/1/2023 (e) | 3,000 | 3,002 |
5.50%, 10/6/2023 | 9,750 | 9,751 |
Skandinaviska Enskilda Banken AB (Sweden) (SOFR + 0.65%), 5.95%, 9/1/2023 (e) | 10,000 | 10,010 |
Standard Chartered Bank (United Kingdom) | ||
(SOFR + 0.41%), 5.71%, 9/1/2023 (e) | 5,000 | 5,000 |
(SOFR + 0.45%), 5.75%, 9/1/2023 (e) | 2,500 | 2,501 |
(SOFR + 0.48%), 5.78%, 9/1/2023 (e) | 5,000 | 5,003 |
5.57%, 11/8/2023 | 6,000 | 6,001 |
5.47%, 11/15/2023 | 8,500 | 8,498 |
5.52%, 11/24/2023 | 5,000 | 4,999 |
State Street Bank and Trust Co. (SOFR + 0.33%), 5.63%, 9/1/2023 (e) | 7,350 | 7,352 |
Sumitomo Mitsui Banking Corp. (Japan) | ||
(SOFR + 0.40%), 5.70%, 9/1/2023 (e) | 5,000 | 5,001 |
(SOFR + 0.45%), 5.75%, 9/1/2023 (e) | 10,000 | 10,005 |
(SOFR + 0.50%), 5.80%, 9/1/2023 (e) | 7,000 | 7,002 |
(SOFR + 0.50%), 5.80%, 9/1/2023 (e) | 25,000 | 25,006 |
5.00%, 10/6/2023 | 2,500 | 2,499 |
Svenska Handelsbanken AB (Sweden) | ||
(SOFR + 0.52%), 5.82%, 9/1/2023 (e) | 2,500 | 2,502 |
(SOFR + 0.64%), 5.94%, 9/1/2023 (e) | 2,500 | 2,502 |
Toronto-Dominion Bank (The) (Canada) | ||
(SOFR + 0.43%), 5.73%, 9/1/2023 (e) | 2,500 | 2,500 |
(SOFR + 0.50%), 5.80%, 9/1/2023 (e) | 5,000 | 5,000 |
(SOFR + 0.66%), 5.96%, 9/1/2023 (e) | 12,000 | 12,013 |
5.42%, 11/21/2023 | 5,000 | 4,998 |
Wells Fargo Bank NA | ||
(SOFR + 0.52%), 5.82%, 9/1/2023 (e) | 10,000 | 10,000 |
(SOFR + 0.60%), 5.90%, 9/1/2023 (e) | 10,000 | 10,001 |
(SOFR + 0.60%), 5.90%, 9/1/2023 (e) | 10,000 | 9,999 |
Woori Bank (South Korea) , 5.60%, 10/2/2023 (b) | 20,000 | 20,003 |
Total Certificates of Deposit (Cost $523,784) | 523,933 | |
U.S. Treasury Obligations — 0.7% | ||
U.S. Treasury Bills, 5.31%, 10/5/2023 (d)(Cost $19,900) | 20,000 | 19,900 |
Total Short Term Investments (Cost $2,669,374) | 2,669,630 | |
August 31, 2023 | J.P. Morgan Money Market Funds | 36 |
AS OF August 31, 2023 (Unaudited) (continued)
INVESTMENTS †† | PRINCIPAL AMOUNT ($000) | VALUE ($000) |
Total Investments — 100.2% (Cost $2,900,599) | 2,900,855 | |
Liabilities in Excess of Other Assets — (0.2)% | (4,596 ) | |
NET ASSETS — 100.0% | 2,896,259 |
Percentages indicated are based on net assets. |
Abbreviations | |
COLL | Collateral |
FHLB | Federal Home Loan Bank |
FHLMC | Federal Home Loan Mortgage Corp. |
FNMA | Federal National Mortgage Association |
GNMA | Government National Mortgage Association |
LIQ | Liquidity Agreement |
LOC | Letter of Credit |
Rev. | Revenue |
SOFR | Secured Overnight Financing Rate |
VRDO | Variable Rate Demand Obligation |
†† | The date shown represents the earliest of the next put date, next demand date or final maturity date. | |
(a) | Variable or floating rate security, the interest rate of which adjusts periodically based on changes in current interest rates and prepayments on the underlying pool of assets. The interest rate shown is the current rate as of August 31, 2023. | |
(b) | Securities exempt from registration under Rule 144A or section 4(a)(2), of the Securities Act of 1933, as amended. | |
(c) | Agency Joint Trading Account II - At August 31, 2023, certain Funds had undivided interests in the Agency Joint Trading Account II with a maturity date of September 1, 2023, as follows for JPMorgan Securities Lending Money Market Fund (amounts in thousands): | |
Principal Amount | Repurchase Price | Collateral Value Allocation | |
Agency Joint Trading Account II | $60,000 | $60,009 | $61,200 |
Repurchase Agreements - At August 31, 2023, the Principal Amounts of certain Funds' interests in the Agency Joint Trading Account II were as follows (amounts in thousands): |
Counterparty | Interest Rate | Securities Lending Money Market Fund |
Agency Joint Trading Account II | ||
BofA Securities, Inc. | 5.30% | $41,311 |
Citigroup Global Markets Holdings, Inc. | 5.30% | 18,689 |
Total | 60,000 |
At August 31, 2023, the Agency Joint Trading Account II was fully collateralized by: |
Issuer | Interest Rates | Maturity Dates |
Agency Joint Trading Account II | ||
FNMA | 1.50-6.50% | 5/1/2035-11/1/2061 |
U.S. Treasury Securities | 0.00% | 5/15/2025-5/15/2053 |
(d) | The rate shown is the effective yield as of August 31, 2023. |
(e) | Variable or floating rate security, linked to the referenced benchmark. The interest rate shown is the current rate as of August 31, 2023. |
37 | J.P. Morgan Money Market Funds | August 31, 2023 |
AS OF August 31, 2023 (Unaudited)
INVESTMENTS †† | PRINCIPAL AMOUNT ($000) | VALUE ($000) |
Repurchase Agreements — 29.6% | ||
Barclays Capital, Inc., 5.60%, dated 8/31/2023, due 10/5/2023, repurchase price $50,272, collateralized by Asset-Backed Securities, 0.00% - 14.07%, due 6/25/2024 - 10/25/2059^^, with a value of $55,000. | 50,000 | 50,000 |
Barclays Capital, Inc., 5.62%, dated 8/31/2023, due 10/5/2023, repurchase price $135,738, collateralized by Collateralized Mortgage Obligations, 2.00% - 6.31%, due 5/15/2036 - 7/17/2056, with a value of $145,800. | 135,000 | 135,000 |
BMO Capital Markets Corp., 5.41%, dated 8/31/2023, due 9/7/2023, repurchase price $20,021, collateralized by Asset-Backed Securities, 2.10% - 8.93%, due 5/25/2035 - 7/25/2063, Collateralized Mortgage Obligations, 0.18% - 6.27%, due 10/18/2030 - 1/18/2063, Corporate Notes and Bonds, 3.50% - 9.50%, due 1/17/2025 - 8/15/2034, FHLMC, 5.59%, due 5/25/2024, FNMA, 6.30% - 15.14%, due 6/25/2031 - 3/25/2042, GNMA, 4.87% - 5.50%, due 6/20/2053 - 5/20/2061, Sovereign Government Securities, 0.52% - 3.00%, due 5/26/2024 - 6/13/2024 and U.S. Treasury Securities, 0.00%, due 11/15/2023, with a value of $21,672. | 20,000 | 20,000 |
BMO Capital Markets Corp., 5.41%, dated 8/31/2023, due 9/7/2023, repurchase price $20,021, collateralized by Asset-Backed Securities, 0.96% - 12.07%, due 10/15/2026 - 7/25/2063, Collateralized Mortgage Obligations, 1.02% - 6.27%, due 4/25/2033 - 11/18/2055, Corporate Notes and Bonds, 4.30% - 6.25%, due 8/23/2025 - 8/15/2053, FHLMC, 4.50%, due 9/1/2048 - 1/25/2055, FNMA, 10.94% - 12.29%, due 3/25/2042 - 4/25/2042 and GNMA, 3.50%, due 6/20/2053, with a value of $21,308. | 20,000 | 20,000 |
BNP Paribas SA, 5.40%, dated 8/31/2023, due 9/7/2023, repurchase price $200,210, collateralized by Asset-Backed Securities, 0.51% - 7.27%, due 11/15/2024 - 7/16/2035, Collateralized Mortgage Obligations, 0.16% - 6.25%, due 5/25/2035 - 3/25/2051, Corporate Notes and Bonds, 1.05% - 8.81%, due 3/8/2024 - 12/31/2079^^, FHLMC, 2.65% - 3.82%, due 8/25/2026 - 12/25/2032, FNMA, 8.64% - 12.79%, due 10/25/2041 - 6/25/2043 and Sovereign Government Securities, 1.00% - 5.38%, due 3/25/2024 - 3/11/2041, with a value of $210,811. | 200,000 | 200,000 |
INVESTMENTS †† | PRINCIPAL AMOUNT ($000) | VALUE ($000) |
BNP Paribas SA, 5.46%, dated 8/31/2023, due 9/7/2023, repurchase price $190,202, collateralized by Asset-Backed Securities, 2.80% - 11.28%, due 1/1/2030 - 7/25/2045 and Corporate Notes and Bonds, 6.25% - 7.25%, due 6/15/2025 - 2/15/2028, with a value of $209,220. | 190,000 | 190,000 |
BNP Paribas SA, 5.51%, dated 8/31/2023, due 10/5/2023, repurchase price $90,482, collateralized by Corporate Notes and Bonds, 2.75% - 9.25%, due 1/9/2028 - 4/8/2068, with a value of $95,797. | 90,000 | 90,000 |
BNP Paribas SA, 5.51%, dated 8/31/2023, due 10/5/2023, repurchase price $120,643, collateralized by Corporate Notes and Bonds, 2.85% - 9.25%, due 2/1/2025 - 12/31/2079, with a value of $127,293. | 120,000 | 120,000 |
BNP Paribas SA, 5.56%, dated 8/31/2023, due 10/5/2023, repurchase price $191,027, collateralized by Asset-Backed Securities, 3.90% - 14.57%, due 11/22/2027 - 5/25/2067, with a value of $211,884. | 190,000 | 190,000 |
BNP Paribas SA, 5.58%, dated 8/31/2023, due 10/5/2023, repurchase price $35,190, collateralized by Asset-Backed Securities, 10.73%, due 2/5/2031, Corporate Notes and Bonds, 3.13% - 17.50%, due 11/1/2023 - 9/30/2039 and Sovereign Government Securities, 3.50%, due 7/9/2041, with a value of $38,323. | 35,000 | 35,000 |
BofA Securities, Inc., 5.39%, dated 8/31/2023, due 9/7/2023, repurchase price $100,105, collateralized by Corporate Notes and Bonds, 0.80% - 6.25%, due 3/10/2025 - 3/17/2052, with a value of $105,000. | 100,000 | 100,000 |
BofA Securities, Inc., 5.69%, dated 8/31/2023, due 10/5/2023, repurchase price $246,355, collateralized by Asset-Backed Securities, 0.89% - 8.79%, due 12/20/2025 - 1/27/2070, Collateralized Mortgage Obligations, 6.48% - 9.01%, due 7/16/2035 - 8/15/2039 and Sovereign Government Securities, 3.00% - 10.13%, due 4/15/2024 - 5/15/2051, with a value of $261,681. | 245,000 | 245,000 |
August 31, 2023 | J.P. Morgan Money Market Funds | 38 |
AS OF August 31, 2023 (Unaudited) (continued)
INVESTMENTS †† | PRINCIPAL AMOUNT ($000) | VALUE ($000) |
Repurchase Agreements — continued | ||
Credit Agricole Corporate and Investment Bank, 5.38%, dated 8/31/2023, due 9/7/2023, repurchase price $50,052, collateralized by Asset-Backed Securities, 2.95% - 6.76%, due 10/25/2034 - 11/16/2041, Collateralized Mortgage Obligations, 3.00% - 6.73%, due 7/15/2032 - 12/16/2050, Corporate Notes and Bonds, 1.05% - 7.25%, due 1/15/2024 - 12/31/2079, FHLB, 5.63%, due 3/14/2036, FHLMC, 3.00% - 5.44%, due 3/25/2025 - 8/26/2058 and Sovereign Government Securities, 0.55% - 5.95%, due 10/21/2025 - 2/14/2050, with a value of $52,536. | 50,000 | 50,000 |
Credit Agricole Corporate and Investment Bank, 5.38%, dated 8/31/2023, due 9/7/2023, repurchase price $100,105, collateralized by Asset-Backed Securities, 0.01% - 7.96%, due 12/17/2035 - 3/9/2042, Collateralized Mortgage Obligations, 3.32% - 6.83%, due 7/15/2032 - 9/12/2050, Corporate Notes and Bonds, 0.75% - 7.00%, due 1/15/2024 - 9/9/2052^^ and Sovereign Government Securities, 2.30% - 6.88%, due 9/27/2023 - 2/14/2050, with a value of $105,962. | 100,000 | 100,000 |
Credit Agricole Corporate and Investment Bank, 5.38%, dated 8/31/2023, due 9/7/2023, repurchase price $130,136, collateralized by Asset-Backed Securities, 1.18% - 8.00%, due 7/10/2028 - 3/9/2042, Collateralized Mortgage Obligations, 3.32% - 9.05%, due 3/17/2036 - 12/16/2050, Corporate Notes and Bonds, 1.25% - 8.13%, due 9/9/2023 - 5/15/2060^^, GNMA, 7.00%, due 12/15/2026 and Sovereign Government Securities, 2.88% - 6.88%, due 9/27/2023 - 1/30/2043, with a value of $136,790. | 130,000 | 130,000 |
Federal Reserve Bank of New York, 5.30%, dated 8/31/2023, due 9/1/2023, repurchase price $9,201,354, collateralized by U.S. Treasury Securities, 1.13% - 4.25%, due 11/15/2029 - 11/15/2049, with a value of $9,201,354. | 9,200,000 | 9,200,000 |
Fixed Income Clearing Corp., 5.30%, dated 8/31/2023, due 9/1/2023, repurchase price $1,500,221, collateralized by U.S. Treasury Securities, 0.63% - 4.13%, due 7/15/2032 - 8/15/2053, with a value of $1,530,000. | 1,500,000 | 1,500,000 |
INVESTMENTS †† | PRINCIPAL AMOUNT ($000) | VALUE ($000) |
Goldman Sachs & Co. LLC, 5.63%, dated 8/31/2023, due 10/16/2023, repurchase price $251,798, collateralized by Asset-Backed Securities, 3.65% - 12.58%, due 11/15/2026 - 7/17/2046, Corporate Notes and Bonds, 0.00% - 15.00%, due 9/21/2023 - 5/15/2097^^, FHLMC, 2.15% - 3.82%, due 10/25/2031 - 12/25/2032 and FNMA, 4.57%, due 8/25/2044, with a value of $268,866. (a) | 250,000 | 250,000 |
Goldman Sachs & Co. LLC, 5.66%, dated 8/31/2023, due 10/16/2023, repurchase price $624,484, collateralized by Asset-Backed Securities, 0.00% - 14.27%, due 1/22/2025 - 5/15/2069, Collateralized Mortgage Obligations, 0.00% - 7.38%, due 7/8/2033 - 1/25/2052, Corporate Notes and Bonds, 0.00% - 15.50%, due 9/13/2023 - 6/4/2081^^, FHLMC, 5.70%, due 7/25/2026 and FNMA, 2.00% - 6.00%, due 2/25/2042 - 10/25/2050, with a value of $664,814. | 620,000 | 620,000 |
ING Financial Markets LLC, 5.40%, dated 8/31/2023, due 9/1/2023, repurchase price $50,008, collateralized by Corporate Notes and Bonds, 1.95% - 5.70%, due 3/22/2024 - 8/15/2053, with a value of $52,508. | 50,000 | 50,000 |
ING Financial Markets LLC, 5.43%, dated 8/31/2023, due 9/1/2023, repurchase price $15,002, collateralized by Corporate Notes and Bonds, 0.55% - 5.88%, due 7/12/2024 - 11/2/2051, with a value of $15,898. | 15,000 | 15,000 |
ING Financial Markets LLC, 5.55%, dated 8/31/2023, due 9/1/2023, repurchase price $200,031, collateralized by Common Stocks, with a value of $217,998. | 200,000 | 200,000 |
Pershing LLC, 5.71%, dated 8/31/2023, due 11/8/2023, repurchase price $85,930, collateralized by U.S. Treasury Securities, 1.13% - 3.38%, due 8/31/2024 - 8/15/2052, with a value of $87,938. | 85,000 | 85,000 |
39 | J.P. Morgan Money Market Funds | August 31, 2023 |
INVESTMENTS †† | PRINCIPAL AMOUNT ($000) | VALUE ($000) |
Repurchase Agreements — continued | ||
Societe Generale SA, 5.38%, dated 8/31/2023, due 9/1/2023, repurchase price $200,030, collateralized by Asset-Backed Securities, 8.25%, due 2/25/2068, Collateralized Mortgage Obligations, 2.90% - 5.40%, due 10/17/2050 - 5/25/2060, Corporate Notes and Bonds, 0.75% - 7.40%, due 10/1/2023 - 3/15/2054^^, FNMA, 8.19%, due 4/25/2042, Sovereign Government Securities, 0.88% - 10.63%, due 3/16/2025 - 12/1/2060 and U.S. Treasury Securities, 3.38%, due 11/15/2048, with a value of $210,454. | 200,000 | 200,000 |
Societe Generale SA, 5.40%, dated 8/31/2023, due 9/1/2023, repurchase price $90,014, collateralized by Corporate Notes and Bonds, 0.66% - 7.75%, due 4/29/2024 - 12/31/2079, FNMA, 8.19% - 10.29%, due 3/25/2042 - 9/25/2042 and Sovereign Government Securities, 1.25% - 10.63%, due 1/14/2024 - 12/1/2060, with a value of $94,663. | 90,000 | 90,000 |
Societe Generale SA, 5.45%, dated 8/31/2023, due 9/1/2023, repurchase price $60,009, collateralized by Collateralized Mortgage Obligations, 2.50% - 8.77%, due 7/25/2036 - 7/25/2056, Corporate Notes and Bonds, 3.11% - 13.38%, due 6/26/2024 - 1/28/2060^^, FNMA, 10.80% - 11.04%, due 9/25/2042 - 3/25/2043 and Sovereign Government Securities, 4.88% - 9.88%, due 10/14/2025 - 2/17/2045, with a value of $64,764. | 60,000 | 60,000 |
Societe Generale SA, 5.47%, dated 8/31/2023, due 9/6/2023, repurchase price $65,059, collateralized by Asset-Backed Securities, 5.67%, due 1/25/2037, Collateralized Mortgage Obligations, 2.50% - 8.77%, due 10/15/2036 - 7/25/2056, Corporate Notes and Bonds, 1.85% - 11.50%, due 12/1/2024 - 12/31/2079, FNMA, 10.80%, due 3/25/2043 and Sovereign Government Securities, 2.78% - 6.00%, due 6/6/2025 - 12/1/2060, with a value of $70,223. | 65,000 | 65,000 |
INVESTMENTS †† | PRINCIPAL AMOUNT ($000) | VALUE ($000) |
Societe Generale SA, 5.40%, dated 8/31/2023, due 9/7/2023, repurchase price $135,142, collateralized by Asset-Backed Securities, 3.00% - 3.38%, due 11/1/2028 - 8/15/2033, Collateralized Mortgage Obligations, 2.50%, due 7/25/2056, Corporate Notes and Bonds, 0.00% - 7.50%, due 4/29/2024 - 9/15/2063^^, FNMA, 8.79% - 10.29%, due 3/25/2042 - 9/25/2042 and Sovereign Government Securities, 2.78% - 7.75%, due 1/14/2024 - 12/1/2060, with a value of $142,308. | 135,000 | 135,000 |
Societe Generale SA, 5.65%, dated 8/31/2023, due 12/1/2023, repurchase price $152,166, collateralized by Asset-Backed Securities, 7.38%, due 7/25/2035 and Corporate Notes and Bonds, 0.70% - 10.00%, due 11/23/2023 - 12/10/2061, with a value of $161,928. | 150,000 | 150,000 |
TD Securities (USA) LLC, 5.42%, dated 8/31/2023, due 9/1/2023, repurchase price $100,015, collateralized by Corporate Notes and Bonds, 2.65% - 7.00%, due 5/15/2024 - 12/1/2049, with a value of $105,016. | 100,000 | 100,000 |
TD Securities (USA) LLC, 5.40%, dated 8/31/2023, due 9/7/2023, repurchase price $300,315, collateralized by Corporate Notes and Bonds, 1.45% - 8.15%, due 8/13/2024 - 6/1/2077, with a value of $315,331. | 300,000 | 300,000 |
TD Securities (USA) LLC, 5.43%, dated 8/31/2023, due 9/7/2023, repurchase price $110,116, collateralized by Corporate Notes and Bonds, 2.50% - 6.60%, due 7/30/2024 - 12/14/2051, with a value of $115,622. | 110,000 | 110,000 |
TD Securities (USA) LLC, 5.66%, dated 8/31/2023, due 10/10/2023, repurchase price $25,157, collateralized by Asset-Backed Securities, 2.06%, due 2/27/2051 and Corporate Notes and Bonds, 3.10% - 10.50%, due 10/18/2023 - 6/1/2051, with a value of $27,221. | 25,000 | 25,000 |
August 31, 2023 | J.P. Morgan Money Market Funds | 40 |
AS OF August 31, 2023 (Unaudited) (continued)
INVESTMENTS †† | PRINCIPAL AMOUNT ($000) | VALUE ($000) |
Repurchase Agreements — continued | ||
Wells Fargo Securities LLC, 5.44%, dated 8/31/2023, due 9/7/2023, repurchase price $85,090, collateralized by Certificates of Deposit, 0.00% - 5.91%, due 1/9/2024 - 5/3/2030, with a value of $89,345. | 85,000 | 85,000 |
Wells Fargo Securities LLC, 5.76%, dated 8/31/2023, due 11/21/2023, repurchase price $101,312, collateralized by Certificates of Deposit, 5.87%, due 5/15/2024, with a value of $106,479. | 100,000 | 100,000 |
Total Repurchase Agreements (Cost $15,015,000) | 15,015,000 | |
Corporate Bonds — 0.6% | ||
Banks — 0.6% | ||
Bank of America NA(SOFR + 0.45%), 5.75%, 9/1/2023 (a) | 160,000 | 160,000 |
Barclays Bank plc (United Kingdom) | ||
(OBFR + 0.30%), 5.61%, 9/1/2023 (a) (b) | 105,000 | 105,000 |
(OBFR + 0.30%), 5.61%, 9/1/2023 (a) (b) | 50,000 | 50,000 |
Total Corporate Bonds (Cost $315,000) | 315,000 | |
Municipal Bonds — 0.1% | ||
Georgia — 0.0% ^ | ||
Macon-Bibb County Industrial Authority, Kumho Tire Georgia Inc. Project, Rev., VRDO, LOC : Korea Development Bank, 5.49%, 9/8/2023 (b) (c) | 10,000 | 10,000 |
Iowa — 0.1% | ||
Iowa Student Loan Liquidity Corp., Student Loan Series 2023-1, Rev., VRDO, LOC : Royal Bank of Canada, 5.37%, 9/8/2023 (c) | 47,300 | 47,300 |
Texas — 0.0% ^ | ||
State of Texas Series 2023A, GO, VRDO, LIQ : Texas State Comptroller, 5.42%, 9/8/2023 (c) | 21,000 | 21,000 |
Total Municipal Bonds (Cost $78,300) | 78,300 | |
Short Term Investments — 68.5% | ||
Certificates of Deposits — 27.6% | ||
ABN AMRO Bank NV (Netherlands) | ||
5.31%, 10/2/2023 (d) | 100,000 | 99,545 |
5.30%, 10/2/2023 (d) | 125,000 | 124,432 |
Bank of America NA | ||
5.33%, 9/7/2023 | 100,000 | 100,000 |
5.74%, 2/9/2024 | 125,000 | 125,000 |
5.79%, 2/14/2024 | 100,000 | 100,000 |
INVESTMENTS †† | PRINCIPAL AMOUNT ($000) | VALUE ($000) |
Certificates of Deposits — continued | ||
5.85%, 2/28/2024 | 100,000 | 100,000 |
Bank of Montreal (Canada) | ||
(SOFR + 0.53%), 5.83%, 9/1/2023 (a) | 33,000 | 33,000 |
(SOFR + 0.63%), 5.93%, 9/1/2023 (a) | 42,300 | 42,300 |
(SOFR + 0.64%), 5.94%, 9/1/2023 (a) | 17,500 | 17,500 |
(SOFR + 0.75%), 6.05%, 9/1/2023 (a) | 40,000 | 40,000 |
Bank of Nova Scotia (The) (Canada) | ||
(SOFR + 0.42%), 5.72%, 9/1/2023 (a) | 100,000 | 100,000 |
(SOFR + 0.50%), 5.80%, 9/1/2023 (a) | 25,000 | 25,000 |
(SOFR + 0.60%), 5.90%, 9/1/2023 (a) | 84,000 | 84,000 |
(SOFR + 0.66%), 5.96%, 9/1/2023 (a) | 36,000 | 36,000 |
(SOFR + 0.70%), 6.00%, 9/1/2023 (a) | 39,000 | 39,000 |
(SOFR + 0.75%), 6.05%, 9/1/2023 (a) | 15,000 | 15,000 |
5.70%, 12/1/2023 | 67,000 | 67,000 |
Barclays Bank plc (United Kingdom) | ||
(SOFR + 0.44%), 5.74%, 9/1/2023 (a) | 105,000 | 105,000 |
5.84%, 2/9/2024 | 100,000 | 100,000 |
BNP Paribas SA (France) | ||
(SOFR + 0.35%), 5.65%, 9/1/2023 (a) | 80,000 | 80,000 |
(SOFR + 0.43%), 5.73%, 9/1/2023 (a) | 60,000 | 60,000 |
(SOFR + 0.47%), 5.77%, 9/1/2023 (a) | 80,000 | 80,000 |
(SOFR + 0.50%), 5.80%, 9/1/2023 (a) | 89,000 | 89,000 |
(SOFR + 0.55%), 5.85%, 9/1/2023 (a) | 66,000 | 66,000 |
(SOFR + 0.55%), 5.85%, 9/1/2023 (a) | 55,000 | 55,000 |
5.71%, 3/4/2024 | 25,000 | 25,000 |
Canadian Imperial Bank of Commerce (Canada) | ||
(SOFR + 0.50%), 5.80%, 9/1/2023 (a) | 35,000 | 35,000 |
(SOFR + 0.54%), 5.84%, 9/1/2023 (a) | 95,000 | 95,000 |
(SOFR + 0.60%), 5.90%, 9/1/2023 (a) | 84,000 | 84,000 |
(SOFR + 0.60%), 5.90%, 9/1/2023 (a) | 49,000 | 49,000 |
(SOFR + 0.81%), 6.11%, 9/1/2023 (a) | 33,000 | 33,000 |
5.70%, 12/1/2023 | 90,000 | 90,000 |
5.42%, 4/10/2024 | 89,000 | 89,000 |
China Construction Bank Corp. (China) | ||
5.38%, 9/6/2023 | 50,000 | 50,000 |
5.38%, 9/7/2023 | 90,000 | 90,000 |
Citibank NA | ||
5.70%, 12/18/2023 | 163,000 | 163,000 |
5.76%, 1/29/2024 | 125,000 | 125,000 |
Cooperatieve Rabobank UA (Netherlands) | ||
(SOFR + 0.69%), 6.01%, 9/1/2023 (a) | 48,000 | 48,000 |
5.39%, 11/20/2023 | 50,000 | 50,000 |
5.26%, 12/18/2023 (d) | 120,000 | 118,137 |
5.26%, 12/18/2023 | 10,000 | 10,000 |
41 | J.P. Morgan Money Market Funds | August 31, 2023 |
INVESTMENTS †† | PRINCIPAL AMOUNT ($000) | VALUE ($000) |
Short Term Investments — continued | ||
Certificates of Deposits — continued | ||
5.77%, 2/12/2024 (d) | 100,000 | 97,439 |
5.30%, 2/13/2024 | 43,000 | 43,000 |
5.76%, 6/5/2024 (d) | 85,000 | 81,381 |
5.91%, 8/14/2024 (d) | 100,000 | 94,592 |
Credit Agricole Corporate and Investment Bank (France) | ||
(SOFR + 0.30%), 5.60%, 9/1/2023 (a) | 77,000 | 77,000 |
(SOFR + 0.42%), 5.72%, 9/1/2023 (a) | 48,000 | 48,000 |
(SOFR + 0.50%), 5.80%, 9/1/2023 (a) | 96,000 | 96,000 |
(SOFR + 0.50%), 5.80%, 9/1/2023 (a) | 89,000 | 89,000 |
(SOFR + 0.50%), 5.80%, 9/1/2023 (a) | 60,000 | 60,000 |
5.53%, 9/7/2023 | 125,000 | 125,000 |
5.55%, 9/13/2023 | 100,000 | 100,000 |
5.63%, 11/6/2023 | 58,000 | 58,000 |
5.77%, 2/5/2024 | 100,000 | 100,000 |
5.80%, 3/5/2024 | 100,000 | 100,000 |
Credit Industriel et Commercial (France) | ||
(SOFR + 0.38%), 5.68%, 9/1/2023 (a) | 45,000 | 45,000 |
(SOFR + 0.50%), 5.80%, 9/1/2023 (a) | 90,000 | 90,000 |
(SOFR + 0.52%), 5.82%, 9/1/2023 (a) | 96,000 | 96,000 |
5.07%, 10/17/2023 (d) | 160,000 | 158,972 |
5.10%, 10/19/2023 (d) | 154,000 | 152,961 |
5.07%, 11/1/2023 (d) | 138,000 | 136,826 |
5.75%, 1/9/2024 (d) | 94,000 | 92,087 |
5.37%, 2/5/2024 (d) | 90,000 | 87,943 |
5.11%, 2/6/2024 (d) | 99,000 | 96,834 |
5.90%, 5/13/2024 (d) | 210,000 | 201,576 |
5.98%, 5/29/2024 (d) | 245,000 | 234,446 |
DNB Bank ASA (Norway) , 5.40%, 11/10/2023 | 50,000 | 50,000 |
DZ Bank AG (Germany) (SOFR + 0.36%), 5.66%, 9/1/2023 (a) | 88,000 | 88,000 |
ING Bank NV (Netherlands) | ||
5.35%, 9/19/2023 | 62,000 | 62,000 |
5.32%, 1/17/2024 | 187,000 | 187,000 |
5.96%, 5/29/2024 | 120,000 | 120,000 |
Keb Hana Bank (South Korea) (SOFR + 0.35%), 5.65%, 9/1/2023 (a) | 25,000 | 25,000 |
Landesbank Baden-Wurttemberg (Germany) , 5.33%, 9/5/2023 | 335,000 | 335,000 |
Mitsubishi UFJ Trust & Banking Corp. (Japan) | ||
(SOFR + 0.17%), 5.47%, 9/1/2023 (a) | 74,000 | 74,000 |
(SOFR + 0.24%), 5.54%, 9/1/2023 (a) | 100,000 | 100,000 |
(SOFR + 0.41%), 5.71%, 9/1/2023 (a) | 50,000 | 50,000 |
INVESTMENTS †† | PRINCIPAL AMOUNT ($000) | VALUE ($000) |
Certificates of Deposits — continued | ||
Mizuho Bank Ltd. (Japan) | ||
5.55%, 10/16/2023 | 135,000 | 135,000 |
5.55%, 10/17/2023 | 150,000 | 150,000 |
5.58%, 11/17/2023 | 100,000 | 100,000 |
MUFG Bank Ltd. (Japan) | ||
(SOFR + 0.32%), 5.62%, 9/1/2023 (a) | 105,000 | 105,000 |
(SOFR + 0.34%), 5.64%, 9/1/2023 (a) | 50,000 | 50,000 |
(SOFR + 0.50%), 5.80%, 9/1/2023 (a) | 48,000 | 48,000 |
5.67%, 12/12/2023 | 96,000 | 96,000 |
National Australia Bank Ltd. (Australia) | ||
5.17%, 2/13/2024 (d) | 28,000 | 27,353 |
5.74%, 3/7/2024 (d) | 130,000 | 126,217 |
5.75%, 3/18/2024 (d) | 65,000 | 62,998 |
Natixis SA (France) | ||
(SOFR + 0.15%), 5.45%, 9/1/2023 (a) | 36,000 | 36,000 |
(SOFR + 0.42%), 5.72%, 9/1/2023 (a) | 123,000 | 123,000 |
(SOFR + 0.45%), 5.75%, 9/1/2023 (a) | 77,000 | 77,000 |
(SOFR + 0.50%), 5.80%, 9/1/2023 (a) | 37,000 | 37,000 |
(SOFR + 0.50%), 5.80%, 9/1/2023 (a) | 100,000 | 100,000 |
(SOFR + 0.50%), 5.80%, 9/1/2023 (a) | 100,000 | 100,000 |
5.22%, 10/13/2023 | 44,000 | 44,000 |
5.32%, 11/7/2023 | 100,000 | 100,000 |
5.45%, 11/17/2023 | 100,000 | 100,000 |
5.70%, 12/1/2023 | 63,000 | 63,000 |
5.40%, 1/18/2024 | 85,000 | 85,000 |
Nordea Bank Abp (Finland) | ||
(SOFR + 0.51%), 5.81%, 9/1/2023 (a) | 38,000 | 38,000 |
5.40%, 11/16/2023 | 50,000 | 50,000 |
Norinchukin Bank (The) (Japan) | ||
5.31%, 9/5/2023 | 100,000 | 100,000 |
5.31%, 9/7/2023 | 125,000 | 125,000 |
5.36%, 9/8/2023 | 100,000 | 100,000 |
5.34%, 9/20/2023 | 125,000 | 125,000 |
Oversea-Chinese Banking Corp., Ltd. (Singapore) (SOFR + 0.50%), 5.80%, 9/1/2023 (a) | 57,000 | 57,000 |
Royal Bank of Canada (Canada) | ||
(SOFR + 0.50%), 5.80%, 9/1/2023 (a) | 71,000 | 71,000 |
(SOFR + 0.53%), 5.83%, 9/1/2023 (a) | 55,000 | 55,000 |
(SOFR + 0.57%), 5.87%, 9/1/2023 (a) | 14,000 | 14,000 |
(SOFR + 0.60%), 5.90%, 9/1/2023 (a) | 36,000 | 36,000 |
Shinhan Bank (South Korea) (SOFR + 0.33%), 5.63%, 9/1/2023 (a) | 45,000 | 45,000 |
Skandinaviska Enskilda Banken AB (Sweden) | ||
(SOFR + 0.56%), 5.86%, 9/1/2023 (a) | 75,000 | 75,000 |
August 31, 2023 | J.P. Morgan Money Market Funds | 42 |
AS OF August 31, 2023 (Unaudited) (continued)
INVESTMENTS †† | PRINCIPAL AMOUNT ($000) | VALUE ($000) |
Short Term Investments — continued | ||
Certificates of Deposits — continued | ||
(SOFR + 0.65%), 5.95%, 9/1/2023 (a) | 45,000 | 45,000 |
(SOFR + 0.70%), 6.00%, 9/1/2023 (a) | 100,000 | 100,000 |
Standard Chartered Bank (United Kingdom) | ||
(SOFR + 0.41%), 5.71%, 9/1/2023 (a) | 20,000 | 20,000 |
(SOFR + 0.45%), 5.75%, 9/1/2023 (a) | 75,000 | 75,000 |
(SOFR + 0.47%), 5.77%, 9/1/2023 (a) | 58,000 | 58,000 |
(SOFR + 0.48%), 5.78%, 9/1/2023 (a) | 88,000 | 88,000 |
(SOFR + 0.50%), 5.80%, 9/1/2023 (a) | 80,000 | 80,000 |
(SOFR + 0.50%), 5.80%, 9/1/2023 (a) | 100,000 | 100,000 |
(SOFR + 0.50%), 5.80%, 9/1/2023 (a) | 28,000 | 28,011 |
(SOFR + 0.52%), 5.82%, 9/1/2023 (a) | 142,000 | 142,000 |
5.45%, 10/20/2023 | 25,000 | 25,000 |
5.57%, 11/8/2023 | 87,000 | 87,000 |
5.47%, 11/15/2023 | 168,000 | 168,000 |
5.52%, 11/24/2023 | 65,000 | 65,000 |
State Street Bank and Trust Co. | ||
(SOFR + 0.40%), 5.70%, 9/1/2023 (a) | 78,000 | 78,000 |
(SOFR + 0.45%), 5.75%, 9/1/2023 (a) | 90,000 | 90,000 |
(SOFR + 0.50%), 5.80%, 9/1/2023 (a) | 97,000 | 97,000 |
(SOFR + 0.52%), 5.82%, 9/1/2023 (a) | 95,000 | 95,000 |
Sumitomo Mitsui Banking Corp. (Japan) | ||
(SOFR + 0.15%), 5.45%, 9/1/2023 (a) | 45,000 | 45,000 |
(SOFR + 0.18%), 5.48%, 9/1/2023 (a) | 57,000 | 57,000 |
(SOFR + 0.34%), 5.64%, 9/1/2023 (a) | 58,000 | 58,000 |
(SOFR + 0.40%), 5.70%, 9/1/2023 (a) | 58,000 | 58,000 |
(SOFR + 0.41%), 5.71%, 9/1/2023 (a) | 80,000 | 80,000 |
(SOFR + 0.45%), 5.75%, 9/1/2023 (a) | 85,000 | 85,000 |
(SOFR + 0.47%), 5.77%, 9/1/2023 (a) | 53,000 | 53,000 |
(SOFR + 0.50%), 5.80%, 9/1/2023 (a) | 210,000 | 210,000 |
(SOFR + 0.50%), 5.80%, 9/1/2023 (a) | 50,000 | 50,000 |
(SOFR + 0.50%), 5.80%, 9/1/2023 (a) | 75,000 | 75,000 |
(SOFR + 0.50%), 5.80%, 9/1/2023 (a) | 100,000 | 100,000 |
(SOFR + 0.50%), 5.80%, 9/1/2023 (a) | 107,000 | 107,000 |
(SOFR + 0.50%), 5.80%, 9/1/2023 (a) | 53,000 | 53,000 |
Sumitomo Mitsui Trust Bank Ltd. (Japan) | ||
(SOFR + 0.23%), 1.00%, 9/1/2023 (a) | 50,000 | 50,000 |
(SOFR + 0.27%), 5.57%, 9/1/2023 (a) | 53,000 | 53,000 |
(SOFR + 0.31%), 5.61%, 9/1/2023 (a) | 120,000 | 120,000 |
5.31%, 9/5/2023 | 100,000 | 100,000 |
5.31%, 9/5/2023 | 125,000 | 125,000 |
5.55%, 10/17/2023 | 300,000 | 300,000 |
5.56%, 10/27/2023 | 95,000 | 95,000 |
5.58%, 11/16/2023 | 170,000 | 170,000 |
INVESTMENTS †† | PRINCIPAL AMOUNT ($000) | VALUE ($000) |
Certificates of Deposits — continued | ||
Svenska Handelsbanken AB (Sweden) | ||
(SOFR + 0.40%), 5.70%, 9/1/2023 (a) | 40,000 | 40,000 |
(SOFR + 0.52%), 5.82%, 9/1/2023 (a) | 55,000 | 55,000 |
(SOFR + 0.56%), 5.86%, 9/1/2023 (a) | 65,000 | 65,000 |
(SOFR + 0.64%), 5.94%, 9/1/2023 (a) | 17,500 | 17,500 |
Toronto-Dominion Bank (The) (Canada) | ||
(SOFR + 0.43%), 5.73%, 9/1/2023 (a) | 50,000 | 50,000 |
(SOFR + 0.50%), 5.80%, 9/1/2023 (a) | 35,000 | 35,000 |
(SOFR + 0.50%), 5.80%, 9/1/2023 (a) | 86,000 | 86,000 |
(SOFR + 0.65%), 5.95%, 9/1/2023 (a) | 49,000 | 49,000 |
(SOFR + 0.66%), 5.96%, 9/1/2023 (a) | 8,000 | 8,000 |
(SOFR + 0.70%), 6.00%, 9/1/2023 (a) | 50,000 | 50,000 |
(SOFR + 0.70%), 6.00%, 9/1/2023 (a) | 44,000 | 44,000 |
5.00%, 11/7/2023 (d) | 70,000 | 69,356 |
5.09%, 11/8/2023 (d) | 25,000 | 24,762 |
5.42%, 11/21/2023 | 88,000 | 88,000 |
5.70%, 11/30/2023 | 6,000 | 6,000 |
5.35%, 2/5/2024 (d) | 55,000 | 53,747 |
5.70%, 3/13/2024 (d) | 105,000 | 101,871 |
Wells Fargo Bank NA | ||
(SOFR + 0.52%), 5.82%, 9/1/2023 (a) | 80,000 | 80,000 |
(SOFR + 0.52%), 5.82%, 9/1/2023 (a) | 100,000 | 100,000 |
(SOFR + 0.53%), 5.83%, 9/1/2023 (a) | 54,000 | 54,000 |
(SOFR + 0.60%), 5.90%, 9/1/2023 (a) | 40,000 | 40,000 |
(SOFR + 0.60%), 5.90%, 9/1/2023 (a) | 40,000 | 40,000 |
(SOFR + 0.65%), 5.95%, 9/1/2023 (a) | 96,000 | 96,000 |
Westpac Banking Corp. (Australia) , 5.30%, 2/9/2024 | 5,000 | 5,000 |
Total Certificates of Deposit (Cost $13,989,786) | 13,989,786 | |
Commercial Paper — 23.7% | ||
Agricultural Bank of China Ltd. (China) | ||
Series A, 5.58%, 9/15/2023 (d) | 50,000 | 49,892 |
Antalis SA (France) | ||
5.56%, 10/10/2023 (d) | 40,000 | 39,760 |
5.61%, 11/2/2023 (d) | 35,000 | 34,665 |
ANZ New Zealand Int'l Ltd. (New Zealand) | ||
(SOFR + 0.15%), 5.45%, 9/1/2023 (a) (b) | 28,000 | 28,000 |
Australia & New Zealand Banking Group Ltd. (Australia) | ||
(SOFR + 0.15%), 5.45%, 9/1/2023 (a) (b) | 70,000 | 70,000 |
(SOFR + 0.27%), 5.57%, 9/1/2023 (a) (b) | 28,000 | 28,000 |
Banco Santander SA (Spain) | ||
5.52%, 9/5/2023 (d) | 80,000 | 79,951 |
43 | J.P. Morgan Money Market Funds | August 31, 2023 |
INVESTMENTS †† | PRINCIPAL AMOUNT ($000) | VALUE ($000) |
Short Term Investments — continued | ||
Commercial Paper — continued | ||
5.41%, 9/15/2023 (d) | 50,000 | 49,895 |
5.54%, 10/23/2023 (d) | 50,000 | 49,603 |
Bank of China Ltd. (China) | ||
5.58%, 9/6/2023 (d) | 25,000 | 24,981 |
5.58%, 9/12/2023 (d) | 65,000 | 64,889 |
5.58%, 9/13/2023 (d) | 49,000 | 48,909 |
5.65%, 10/5/2023 (d) | 57,000 | 56,697 |
5.72%, 10/25/2023 (d) | 34,000 | 33,711 |
Bank of Montreal (Canada) | ||
(SOFR + 0.17%), 5.47%, 9/1/2023 (a) | 41,000 | 41,000 |
(SOFR + 0.35%), 5.65%, 9/1/2023 (a) | 50,000 | 50,000 |
(SOFR + 0.49%), 5.79%, 9/1/2023 (a) | 55,000 | 55,000 |
(SOFR + 0.53%), 5.83%, 9/1/2023 (a) | 19,000 | 19,000 |
(SOFR + 0.57%), 5.87%, 9/1/2023 (a) | 20,000 | 20,000 |
(SOFR + 0.60%), 5.90%, 9/1/2023 (a) | 50,000 | 50,000 |
(SOFR + 0.75%), 6.05%, 9/1/2023 (a) | 10,000 | 10,000 |
5.90%, 8/12/2024 (d) | 42,000 | 39,748 |
Bank of Nova Scotia (The) (Canada) | ||
(SOFR + 0.33%), 5.63%, 9/1/2023 (a) (b) | 51,000 | 51,000 |
(SOFR + 0.35%), 5.65%, 9/1/2023 (a) (b) | 43,000 | 43,000 |
(SOFR + 0.42%), 5.72%, 9/1/2023 (a) (b) | 20,000 | 20,000 |
(SOFR + 0.42%), 5.72%, 9/1/2023 (a) (b) | 55,000 | 55,000 |
(SOFR + 0.50%), 5.80%, 9/1/2023 (a) (b) | 20,000 | 20,000 |
(SOFR + 0.50%), 5.80%, 9/1/2023 (a) (b) | 93,000 | 93,000 |
(SOFR + 0.50%), 5.80%, 9/1/2023 (a) (b) | 24,000 | 24,000 |
(SOFR + 0.52%), 5.82%, 9/1/2023 (a) (b) | 25,000 | 25,000 |
(SOFR + 0.53%), 5.83%, 9/1/2023 (a) (b) | 53,000 | 53,000 |
(SOFR + 0.66%), 5.96%, 9/1/2023 (a) (b) | 60,000 | 60,000 |
(SOFR + 0.81%), 6.11%, 9/1/2023 (a) (b) | 20,000 | 20,000 |
5.98%, 6/28/2024 (d) | 46,000 | 43,808 |
Barclays Bank plc (United Kingdom) | ||
5.36%, 9/1/2023 (d) | 400,000 | 400,000 |
Series 2023, (SOFR + 0.44%), 5.74%, 9/1/2023 (a) (b) | 20,000 | 20,000 |
Barton Capital SA (France) | ||
(SOFR + 0.15%), 5.45%, 9/1/2023 (a) (b) | 50,000 | 50,000 |
Bedford Row Funding Corp. | ||
5.97%, 8/21/2024 (d) | 40,000 | 37,775 |
BNG Bank NV (Netherlands) | ||
5.32%, 9/6/2023 (d) | 200,000 | 199,852 |
BNP Paribas SA (France) | ||
5.31%, 9/1/2023 (d) | 475,000 | 475,000 |
(SOFR + 0.51%), 5.81%, 9/1/2023 (a) | 33,000 | 33,000 |
INVESTMENTS †† | PRINCIPAL AMOUNT ($000) | VALUE ($000) |
Commercial Paper — continued | ||
BofA Securities, Inc. | ||
5.31%, 10/10/2023 (d) | 42,000 | 41,760 |
BPCE SA (France) | ||
(SOFR + 0.50%), 5.80%, 9/1/2023 (a) (b) | 103,000 | 103,000 |
5.63%, 12/7/2023 (d) | 35,000 | 34,478 |
5.63%, 12/12/2023 (d) | 50,000 | 49,215 |
Cabot Trail Funding LLC | ||
5.34%, 11/1/2023 (d) | 10,000 | 9,910 |
Canadian Imperial Bank of Commerce (Canada) | ||
(SOFR + 0.43%), 5.73%, 9/1/2023 (a) (b) | 75,000 | 75,000 |
(SOFR + 0.44%), 5.74%, 9/1/2023 (a) (b) | 115,000 | 115,000 |
(SOFR + 0.50%), 5.80%, 9/1/2023 (a) (b) | 150,000 | 150,000 |
(SOFR + 0.54%), 5.84%, 9/1/2023 (a) (b) | 10,000 | 10,000 |
(SOFR + 0.80%), 6.10%, 9/1/2023 (a) (b) | 5,000 | 5,000 |
5.27%, 10/10/2023 (d) | 50,000 | 49,716 |
4.99%, 10/12/2023 (d) | 25,000 | 24,859 |
5.90%, 8/13/2024 (d) | 40,000 | 37,849 |
Cancara Asset Securitisation LLC | ||
5.41%, 9/14/2023 (b) (d) | 97,000 | 96,811 |
CDP Financial, Inc. (Canada) | ||
(SOFR + 0.47%), 5.77%, 9/1/2023 (a) (b) | 10,000 | 10,000 |
Chesham Finance Ltd. (Cayman Islands) | ||
Series 2, 5.39%, 9/1/2023 (b) (d) | 85,000 | 85,000 |
DNB Bank ASA (Norway) | ||
(SOFR + 0.35%), 5.65%, 9/1/2023 (a) (b) | 45,000 | 45,000 |
5.32%, 11/16/2023 (d) | 133,000 | 131,525 |
DZ Bank AG (Germany) | ||
5.32%, 9/6/2023 (d) | 250,000 | 249,816 |
European Investment Bank | ||
5.33%, 9/18/2023 (d) | 200,000 | 199,498 |
Fairway Finance Co. LLC | ||
5.34%, 11/15/2023 (d) | 70,000 | 69,230 |
Federation des Caisses Desjardins du Quebec (Canada) | ||
5.41%, 9/14/2023 (d) | 52,000 | 51,899 |
5.72%, 1/17/2024 (d) | 50,000 | 48,927 |
Federation des caisses Desjardins du Quebec (The) (Canada) | ||
5.33%, 9/7/2023 (d) | 100,000 | 99,911 |
First Abu Dhabi Bank PJSC | ||
5.44%, 9/26/2023 (d) | 192,000 | 191,277 |
5.47%, 10/6/2023 (d) | 95,000 | 94,498 |
5.54%, 10/19/2023 (d) | 220,000 | 218,387 |
5.56%, 10/24/2023 (d) | 149,000 | 147,790 |
August 31, 2023 | J.P. Morgan Money Market Funds | 44 |
AS OF August 31, 2023 (Unaudited) (continued)
INVESTMENTS †† | PRINCIPAL AMOUNT ($000) | VALUE ($000) |
Short Term Investments — continued | ||
Commercial Paper — continued | ||
5.11%, 11/6/2023 (d) | 63,000 | 62,416 |
Glencove Funding DAC (Ireland) | ||
5.50%, 10/5/2023 (b) (d) | 11,000 | 10,943 |
Gotham Funding Corp. | ||
5.48%, 9/28/2023 (d) | 80,000 | 79,672 |
5.52%, 10/20/2023 (d) | 40,000 | 39,702 |
5.40%, 11/2/2023 (d) | 50,000 | 49,539 |
5.58%, 12/1/2023 (d) | 45,000 | 44,374 |
Great Bear Funding LLC | ||
5.33%, 9/1/2023 (b) (d) | 150,000 | 150,000 |
Industrial & Commercial Bank of China Ltd. (China) | ||
5.34%, 9/1/2023 (d) | 65,000 | 65,000 |
5.71%, 11/3/2023 (d) | 50,000 | 49,506 |
5.71%, 11/8/2023 (d) | 35,000 | 34,626 |
ING US Funding LLC (Netherlands) | ||
(SOFR + 0.15%), 5.45%, 9/1/2023 (a) (b) | 122,500 | 122,500 |
(SOFR + 0.36%), 5.66%, 9/1/2023 (a) (b) | 125,000 | 125,000 |
(SOFR + 0.44%), 5.74%, 9/1/2023 (a) (b) | 102,000 | 102,000 |
(SOFR + 0.48%), 5.78%, 9/1/2023 (a) | 30,000 | 30,000 |
(SOFR + 0.50%), 5.80%, 9/1/2023 (a) (b) | 115,000 | 115,000 |
(SOFR + 0.53%), 5.83%, 9/1/2023 (a) (b) | 80,000 | 80,000 |
(SOFR + 0.57%), 5.87%, 9/1/2023 (a) (b) | 100,000 | 100,000 |
(SOFR + 0.70%), 6.00%, 9/1/2023 (a) (b) | 13,000 | 13,000 |
5.34%, 11/9/2023 (d) | 170,000 | 168,278 |
5.79%, 3/1/2024 (d) | 62,000 | 60,238 |
5.84%, 4/1/2024 (d) | 61,000 | 58,964 |
Kaiser Foundation Hospitals | ||
5.45%, 10/4/2023 (d) | 15,158 | 15,083 |
5.47%, 10/11/2023 (d) | 22,242 | 22,108 |
Lexington Parker Capital Co. LLC | ||
Series A, 5.36%, 9/7/2023 (b) (d) | 63,114 | 63,058 |
Liberty Street Funding LLC | ||
5.47%, 9/27/2023 (d) | 78,000 | 77,693 |
5.47%, 9/28/2023 (d) | 55,000 | 54,775 |
5.49%, 10/5/2023 (d) | 40,000 | 39,794 |
5.35%, 10/27/2023 (d) | 20,000 | 19,835 |
5.36%, 11/9/2023 (d) | 25,000 | 24,746 |
5.34%, 11/16/2023 (d) | 60,000 | 59,331 |
Lloyds Bank plc (United Kingdom) | ||
(SOFR + 0.30%), 5.60%, 9/1/2023 (a) | 95,000 | 95,000 |
5.31%, 10/10/2023 (d) | 134,000 | 133,234 |
5.38%, 10/18/2023 (d) | 105,000 | 104,268 |
5.34%, 11/13/2023 (d) | 50,000 | 49,465 |
INVESTMENTS †† | PRINCIPAL AMOUNT ($000) | VALUE ($000) |
Commercial Paper — continued | ||
5.62%, 12/8/2023 (d) | 35,000 | 34,473 |
LMA-Americas LLC | ||
5.51%, 10/11/2023 (d) | 15,000 | 14,909 |
5.54%, 10/23/2023 (d) | 50,000 | 49,603 |
5.63%, 11/28/2023 (d) | 50,000 | 49,322 |
Macquarie Bank Ltd. (Australia) | ||
(SOFR + 0.40%), 5.70%, 9/1/2023 (a) (b) | 85,000 | 85,000 |
(SOFR + 0.40%), 5.70%, 9/1/2023 (a) (b) | 95,000 | 95,000 |
(SOFR + 0.43%), 5.73%, 9/1/2023 (a) (b) | 93,000 | 93,000 |
(SOFR + 0.43%), 5.73%, 9/1/2023 (a) (b) | 86,000 | 86,000 |
5.56%, 11/1/2023 (d) | 85,000 | 84,207 |
Mitsubishi UFJ Trust and Banking Corp. (Japan) | ||
5.43%, 9/15/2023 (d) | 33,000 | 32,930 |
Mizuho Bank Ltd. (Japan) | ||
5.48%, 9/8/2023 (d) | 75,000 | 74,920 |
National Australia Bank Ltd. (Australia) | ||
(SOFR + 0.50%), 5.80%, 9/1/2023 (a) (b) | 89,000 | 89,000 |
National Bank of Canada (Canada) | ||
5.51%, 10/23/2023 (d) | 93,000 | 92,265 |
5.32%, 11/16/2023 (d) | 83,000 | 82,079 |
5.75%, 2/2/2024 (d) | 65,000 | 63,440 |
Natixis SA (France) | ||
5.16%, 9/1/2023 (d) | 59,000 | 59,000 |
5.37%, 11/15/2023 (d) | 30,000 | 29,668 |
NatWest Markets plc (United Kingdom) | ||
Series G, 5.33%, 9/7/2023 (b) (d) | 200,000 | 199,823 |
5.36%, 11/15/2023 (b) (d) | 78,000 | 77,139 |
Nieuw Amsterdam Receivables Corp. | ||
5.69%, 1/8/2024 (d) | 25,000 | 24,500 |
Nordea Bank Abp (Finland) | ||
(SOFR + 0.27%), 5.57%, 9/1/2023 (a) (b) | 93,000 | 93,000 |
(SOFR + 0.45%), 5.75%, 9/1/2023 (a) (b) | 13,000 | 13,000 |
5.32%, 11/16/2023 (d) | 25,000 | 24,723 |
Old Line Funding Corp. | ||
(SOFR + 0.24%), 5.54%, 9/1/2023 (a) (b) | 30,000 | 30,000 |
(SOFR + 0.36%), 5.66%, 9/1/2023 (a) (b) | 50,000 | 50,000 |
(SOFR + 0.40%), 5.70%, 9/1/2023 (a) (b) | 95,000 | 95,000 |
Old Line Funding LLC | ||
5.81%, 3/4/2024 (b) (d) | 50,000 | 48,551 |
Oversea-Chinese Banking Corp., Ltd. (Singapore) | ||
(SOFR + 0.15%), 5.45%, 9/1/2023 (a) (b) | 31,000 | 31,000 |
(SOFR + 0.36%), 5.66%, 9/1/2023 (a) (b) | 50,000 | 50,000 |
Podium Funding Trust (Canada) | ||
(SOFR + 0.50%), 5.80%, 9/1/2023 (a) | 20,000 | 20,000 |
45 | J.P. Morgan Money Market Funds | August 31, 2023 |
INVESTMENTS †† | PRINCIPAL AMOUNT ($000) | VALUE ($000) |
Short Term Investments — continued | ||
Commercial Paper — continued | ||
Royal Bank of Canada (Canada) | ||
(SOFR + 0.60%), 5.90%, 9/1/2023 (a) (b) | 50,000 | 50,000 |
(SOFR + 0.65%), 5.95%, 9/1/2023 (a) (b) | 38,000 | 38,000 |
(SOFR + 0.71%), 6.01%, 9/1/2023 (a) (b) | 20,000 | 20,000 |
(SOFR + 0.81%), 6.11%, 9/1/2023 (a) (b) | 5,000 | 5,000 |
Sheffield Receivables Co. LLC (United Kingdom) | ||
5.29%, 9/12/2023 (d) | 75,000 | 74,879 |
5.48%, 10/5/2023 (d) | 50,000 | 49,743 |
5.55%, 10/31/2023 (d) | 100,000 | 99,083 |
Skandinaviska Enskilda Banken AB (Sweden) | ||
(SOFR + 0.35%), 5.65%, 9/1/2023 (a) (b) | 42,000 | 42,000 |
(SOFR + 0.40%), 5.70%, 9/1/2023 (a) (b) | 30,000 | 30,000 |
(SOFR + 0.42%), 5.72%, 9/1/2023 (a) (b) | 55,000 | 55,000 |
(SOFR + 0.53%), 5.83%, 9/1/2023 (a) (b) | 25,000 | 25,000 |
(SOFR + 0.60%), 5.90%, 9/1/2023 (a) (b) | 38,000 | 38,000 |
5.32%, 11/16/2023 (d) | 65,000 | 64,279 |
5.32%, 11/17/2023 (d) | 50,000 | 49,438 |
Societe Generale SA (France) | ||
(SOFR + 0.37%), 5.67%, 9/1/2023 (a) (b) | 36,000 | 35,999 |
Starbird Funding Corp. | ||
(SOFR + 0.50%), 5.80%, 9/1/2023 (a) (b) | 90,000 | 90,000 |
(SOFR + 0.52%), 5.82%, 9/1/2023 (a) (b) | 60,000 | 60,000 |
Sumitomo Mitsui Trust Bank Ltd. (Japan) | ||
5.56%, 10/27/2023 (d) | 45,000 | 44,614 |
5.59%, 11/17/2023 (d) | 100,000 | 98,819 |
Svenska Handelsbanken AB (Sweden) | ||
(SOFR + 0.35%), 5.65%, 9/1/2023 (a) (b) | 115,000 | 115,000 |
(SOFR + 0.40%), 5.70%, 9/1/2023 (a) (b) | 28,000 | 28,000 |
Thunder Bay Funding LLC | ||
(SOFR + 0.32%), 5.62%, 9/1/2023 (a) (b) | 25,000 | 25,000 |
(SOFR + 0.36%), 5.66%, 9/1/2023 (a) (b) | 25,000 | 25,000 |
(SOFR + 0.36%), 5.66%, 9/1/2023 (a) (b) | 40,000 | 40,000 |
Toronto-Dominion Bank (The) (Canada) | ||
(SOFR + 0.43%), 5.73%, 9/1/2023 (a) (b) | 112,000 | 112,000 |
(SOFR + 0.72%), 6.02%, 9/1/2023 (a) | 40,000 | 40,000 |
5.62%, 12/1/2023 (d) | 50,000 | 49,300 |
5.29%, 2/13/2024 (d) | 15,000 | 14,646 |
5.90%, 8/13/2024 (d) | 35,000 | 33,118 |
5.99%, 8/23/2024 (d) | 125,000 | 117,984 |
TotalEnergies Capital Canada Ltd. (France) | ||
5.37%, 9/1/2023 (d) | 100,000 | 100,000 |
Toyota Credit de Puerto Rico Corp. | ||
5.79%, 2/5/2024 (d) | 20,000 | 19,507 |
INVESTMENTS †† | PRINCIPAL AMOUNT ($000) | VALUE ($000) |
Commercial Paper — continued | ||
Toyota Finance Australia Ltd. (Australia) | ||
5.62%, 11/1/2023 (d) | 48,000 | 47,547 |
Toyota Motor Finance Netherlands BV (Japan) | ||
5.50%, 10/16/2023 (d) | 40,000 | 39,727 |
UBS AG (Switzerland) | ||
(SOFR + 0.19%), 5.53%, 9/1/2023 (a) (b) | 15,000 | 15,000 |
(SOFR + 0.19%), 5.53%, 9/1/2023 (a) (b) | 10,000 | 10,000 |
(SOFR + 0.28%), 5.58%, 9/1/2023 (a) (b) | 95,000 | 95,000 |
(SOFR + 0.36%), 5.68%, 9/1/2023 (a) (b) | 20,000 | 20,000 |
(SOFR + 0.37%), 5.69%, 9/1/2023 (a) (b) | 56,000 | 56,000 |
(SOFR + 0.46%), 5.78%, 9/1/2023 (a) (b) | 30,000 | 30,000 |
(SOFR + 0.45%), 5.78%, 9/1/2023 (a) (b) | 38,000 | 38,000 |
(SOFR + 0.44%), 5.79%, 9/1/2023 (a) (b) | 26,000 | 26,000 |
(SOFR + 0.45%), 5.79%, 9/1/2023 (a) (b) | 20,000 | 20,000 |
(SOFR + 0.45%), 5.79%, 9/1/2023 (a) (b) | 52,000 | 52,000 |
5.37%, 10/16/2023 (d) | 75,000 | 74,500 |
5.86%, 2/1/2024 (d) | 50,000 | 48,784 |
United Overseas Bank Ltd. (Singapore) | ||
5.41%, 9/18/2023 (d) | 100,000 | 99,745 |
5.48%, 10/11/2023 (d) | 75,000 | 74,546 |
5.48%, 10/17/2023 (d) | 200,000 | 198,608 |
Versailles Commercial Paper LLC | ||
5.81%, 2/1/2024 (b) (d) | 35,000 | 34,157 |
Victory Receivables Corp. | ||
5.58%, 12/1/2023 (d) | 15,000 | 14,791 |
Westpac Banking Corp. (Australia) | ||
(SOFR + 0.50%), 5.80%, 9/1/2023 (a) (b) | 19,000 | 19,000 |
(SOFR + 0.54%), 5.84%, 9/1/2023 (a) (b) | 25,000 | 25,000 |
Total Commercial Paper (Cost $12,031,006) | 12,031,006 | |
Time Deposits — 17.2% | ||
Agricultural Bank of China Ltd. | ||
5.35%, 9/1/2023 | 250,000 | 250,000 |
5.38%, 9/1/2023 | 50,000 | 50,000 |
5.38%, 9/6/2023 | 50,000 | 50,000 |
Australia & New Zealand Banking Group Ltd. | ||
5.32%, 9/1/2023 | 200,000 | 200,000 |
5.32%, 9/6/2023 | 200,000 | 200,000 |
5.32%, 9/7/2023 | 200,000 | 200,000 |
Credit Agricole Corporate and Investment Bank | ||
5.31%, 9/1/2023 | 411,362 | 411,362 |
5.34%, 9/6/2023 | 300,000 | 300,000 |
August 31, 2023 | J.P. Morgan Money Market Funds | 46 |
AS OF August 31, 2023 (Unaudited) (continued)
INVESTMENTS †† | PRINCIPAL AMOUNT ($000) | VALUE ($000) |
Short Term Investments — continued | ||
Time Deposits — continued | ||
First Abu Dhabi Bank NV | ||
5.32%, 9/1/2023 | 800,000 | 800,000 |
5.34%, 9/6/2023 | 800,000 | 800,000 |
Industrial & Commercial Bank of China Ltd. 5.35%, 9/1/2023 | 360,000 | 360,000 |
ING Bank NV 5.32%, 9/6/2023 | 295,000 | 295,000 |
Landesbank Hessen Thueringen Girozentrale | ||
5.33%, 9/5/2023 | 400,000 | 400,000 |
5.33%, 9/6/2023 | 425,000 | 425,000 |
5.33%, 9/7/2023 | 450,000 | 450,000 |
Mizuho Bank Ltd. | ||
5.32%, 9/1/2023 | 600,000 | 600,000 |
5.33%, 9/1/2023 | 1,300,000 | 1,300,000 |
Royal Bank of Canada 5.32%, 9/1/2023 | 400,000 | 400,000 |
Skandinaviska Enskilda Banken AB | ||
5.32%, 9/1/2023 | 640,000 | 640,000 |
5.32%, 9/7/2023 | 500,000 | 500,000 |
Toronto-Dominion Bank (The) 5.32%, 9/1/2023 | 100,000 | 100,000 |
Total Time Deposits (Cost $8,731,362) | 8,731,362 | |
Total Short Term Investments (Cost $34,752,154) | 34,752,154 | |
Total Investments — 98.8% (Cost $50,160,454) * | 50,160,454 | |
Other Assets Less Liabilities — 1.2% | 602,806 | |
NET ASSETS — 100.0% | 50,763,260 | |
Percentages indicated are based on net assets. |
Abbreviations | |
FHLB | Federal Home Loan Bank |
FHLMC | Federal Home Loan Mortgage Corp. |
FNMA | Federal National Mortgage Association |
GNMA | Government National Mortgage Association |
GO | General Obligation |
LIQ | Liquidity Agreement |
LOC | Letter of Credit |
OBFR | Overnight Bank Funding Rate |
PJSC | Public Joint Stock Company |
Rev. | Revenue |
SOFR | Secured Overnight Financing Rate |
VRDO | Variable Rate Demand Obligation |
^ | Amount rounds to less than 0.1% of net assets. | |
†† | The date shown represents the earliest of the next put date, next demand date or final maturity date. | |
* | The cost of securities is substantially the same for federal income tax purposes. | |
^^ | Certain securities are perpetual and thus, do not have predetermined maturity dates. The coupon rates for these securities are fixed for a period of time and may be structured to adjust thereafter. The coupon rates shown are the rates in effect as of August 31, 2023. | |
(a) | Variable or floating rate security, linked to the referenced benchmark. The interest rate shown is the current rate as of August 31, 2023. | |
(b) | Securities exempt from registration under Rule 144A or section 4(a)(2), of the Securities Act of 1933, as amended. | |
(c) | Variable or floating rate security, the interest rate of which adjusts periodically based on changes in current interest rates and prepayments on the underlying pool of assets. The interest rate shown is the current rate as of August 31, 2023. | |
(d) | The rate shown is the effective yield as of August 31, 2023. | |
47 | J.P. Morgan Money Market Funds | August 31, 2023 |
AS OF August 31, 2023 (Unaudited)
INVESTMENTS †† | PRINCIPAL AMOUNT ($000) | VALUE ($000) |
Repurchase Agreements — 71.5% | ||
Agency Joint Trading Account I, J.P. Morgan Investment Management Inc., as agent, 5.30%, dated 8/31/2023, due 9/1/2023, repurchase price $1,050,155. (a) | 1,050,000 | 1,050,000 |
Agency Joint Trading Account II, J.P. Morgan Investment Management Inc., as agent, 5.30%, dated 8/31/2023, due 9/1/2023, repurchase price $161,412. (a) | 161,388 | 161,388 |
Agency Joint Trading Account III, J.P. Morgan Investment Management Inc., as agent, 5.30%, dated 8/31/2023, due 9/1/2023, repurchase price $2,948,200. (a) | 2,947,766 | 2,947,766 |
Bank of America NA, 5.30%, dated 8/31/2023, due 9/1/2023, repurchase price $1,000,147, collateralized by GNMA, 2.00% - 4.00%, due 12/20/2040 - 5/20/2052, with a value of $1,020,000. | 1,000,000 | 1,000,000 |
Bank of Montreal, 5.30%, dated 8/31/2023, due 9/1/2023, repurchase price $1,450,213, collateralized by FHLMC, 2.00% - 4.00%, due 9/15/2026 - 5/25/2052, FNMA, 1.25% - 6.00%, due 4/25/2025 - 5/25/2052 and GNMA, 2.00% - 6.64%, due 1/20/2042 - 2/20/2073, with a value of $1,493,720. | 1,450,000 | 1,450,000 |
Barclays Capital, Inc., 5.30%, dated 8/31/2023, due 9/1/2023, repurchase price $1,379,865, collateralized by U.S. Treasury Securities, 0.00% - 4.00%, due 11/30/2023 - 3/31/2030, with a value of $1,407,255. | 1,379,662 | 1,379,662 |
Barclays Capital, Inc., 5.30%, dated 8/31/2023, due 9/1/2023, repurchase price $2,000,294, collateralized by U.S. Treasury Securities, 0.00% - 3.63%, due 11/15/2023 - 8/15/2053, with a value of $2,040,000. | 2,000,000 | 2,000,000 |
BMO Capital Markets Corp., 5.35%, dated 8/31/2023, due 9/21/2023, repurchase price $501,560, collateralized by FHLB, 0.00%, due 9/5/2023 - 2/26/2024, FHLMC, 1.50% - 5.95%, due 5/25/2025 - 8/25/2052, FNMA, 0.72% - 6.30%, due 1/1/2029 - 8/25/2052, GNMA, 2.25% - 6.74%, due 6/16/2039 - 5/20/2071 and U.S. Treasury Securities, 0.13% - 3.88%, due 2/15/2024 - 1/31/2028, with a value of $518,584. | 500,000 | 500,000 |
INVESTMENTS †† | PRINCIPAL AMOUNT ($000) | VALUE ($000) |
BNP Paribas SA, 5.28%, dated 8/31/2023, due 9/1/2023, repurchase price $1,150,169, collateralized by U.S. Treasury Securities, 0.00% - 4.38%, due 11/15/2025 - 2/15/2053, with a value of $1,173,172. | 1,150,000 | 1,150,000 |
BofA Securities, Inc., 5.28%, dated 8/31/2023, due 9/1/2023, repurchase price $92,013, collateralized by U.S. Treasury Securities, 0.13%, due 10/15/2024 - 4/15/2027, with a value of $93,840. | 92,000 | 92,000 |
Canadian Imperial Bank of Commerce, 5.30%, dated 8/31/2023, due 9/1/2023, repurchase price $425,063, collateralized by FHLMC, 2.00% - 7.00%, due 10/1/2038 - 8/1/2053 and FNMA, 1.50% - 6.50%, due 6/1/2028 - 8/1/2053, with a value of $433,564. | 425,000 | 425,000 |
Citigroup Global Markets Holdings, Inc., 5.28%, dated 8/31/2023, due 9/1/2023, repurchase price $500,073, collateralized by U.S. Treasury Securities, 0.00% - 4.00%, due 2/29/2024 - 10/31/2029, with a value of $510,000. | 500,000 | 500,000 |
Citigroup Global Markets Holdings, Inc., 5.28%, dated 8/31/2023, due 9/1/2023, repurchase price $600,088, collateralized by U.S. Treasury Securities, 0.50% - 3.88%, due 10/31/2024 - 3/31/2028, with a value of $612,000. | 600,000 | 600,000 |
Citigroup Global Markets Holdings, Inc., 5.31%, dated 8/31/2023, due 9/1/2023, repurchase price $3,500,516, collateralized by U.S. Treasury Securities, 0.00% - 3.00%, due 2/29/2024 - 8/15/2049, with a value of $3,570,000. | 3,500,000 | 3,500,000 |
Citigroup Global Markets Holdings, Inc., 5.31%, dated 8/31/2023, due 9/5/2023, repurchase price $2,667,966, collateralized by U.S. Treasury Securities, 0.13% - 4.00%, due 10/31/2024 - 5/15/2030, with a value of $2,719,320. | 2,666,000 | 2,666,000 |
Citigroup Global Markets Holdings, Inc., 5.34%, dated 8/31/2023, due 9/21/2023, repurchase price $1,253,894, collateralized by U.S. Treasury Securities, 0.38% - 3.88%, due 10/31/2024 - 11/30/2027, with a value of $1,275,000. | 1,250,000 | 1,250,000 |
August 31, 2023 | J.P. Morgan Money Market Funds | 48 |
AS OF August 31, 2023 (Unaudited) (continued)
INVESTMENTS †† | PRINCIPAL AMOUNT ($000) | VALUE ($000) |
Repurchase Agreements — continued | ||
Daiwa Capital Markets America, Inc., 5.30%, dated 8/31/2023, due 9/1/2023, repurchase price $2,500,368, collateralized by FHLB, 5.55%, due 8/14/2024, FHLMC, 2.00% - 6.50%, due 7/26/2027 - 8/1/2053, FNMA, 1.50% - 7.00%, due 5/1/2025 - 9/1/2053, GNMA, 2.00% - 6.50%, due 4/20/2048 - 8/20/2053 and U.S. Treasury Securities, 0.00% - 5.45%, due 10/31/2023 - 11/15/2051, with a value of $2,550,375. | 2,500,000 | 2,500,000 |
Deutsche Bank Securities, Inc., 5.30%, dated 8/31/2023, due 9/1/2023, repurchase price $1,250,184, collateralized by U.S. Treasury Securities, 0.00% - 2.75%, due 11/15/2023 - 8/15/2053, with a value of $1,275,000. | 1,250,000 | 1,250,000 |
Deutsche Bank Securities, Inc., 5.30%, dated 8/31/2023, due 9/1/2023, repurchase price $2,000,294, collateralized by FFCB, 0.20% - 5.55%, due 9/1/2023 - 11/26/2036, FHLB, 0.00% - 5.55%, due 9/1/2023 - 9/14/2029, FHLMC, 0.00% - 5.50%, due 9/8/2023 - 6/1/2053, FNMA, 0.00% - 6.50%, due 9/12/2023 - 8/1/2053, Other Instrument, Tennessee Valley Authority, 0.75% - 7.13%, due 9/15/2024 - 12/15/2042 and U.S. Treasury Securities, 0.00% - 6.25%, due 9/7/2023 - 11/15/2052, with a value of $2,039,488. | 2,000,000 | 2,000,000 |
Deutsche Bank Securities, Inc., 5.30%, dated 8/31/2023, due 9/1/2023, repurchase price $4,000,589, collateralized by FNMA, 2.50% - 6.50%, due 2/1/2026 - 9/1/2062 and GNMA, 1.25% - 3.95%, due 2/16/2048 - 1/16/2054, with a value of $4,080,001. | 4,000,000 | 4,000,000 |
Deutsche Bank Securities, Inc., 5.31%, dated 8/31/2023, due 9/1/2023, repurchase price $500,074, collateralized by U.S. Treasury Securities, 0.00% - 5.50%, due 8/15/2028 - 11/15/2051, with a value of $510,000. | 500,000 | 500,000 |
Federal Reserve Bank of New York, 5.30%, dated 8/31/2023, due 9/1/2023, repurchase price $100,314,766, collateralized by U.S. Treasury Securities, 0.63% - 4.50%, due 12/31/2026 - 5/15/2052, with a value of $100,314,766. | 100,300,000 | 100,300,000 |
INVESTMENTS †† | PRINCIPAL AMOUNT ($000) | VALUE ($000) |
Fixed Income Clearing Corp., 5.30%, dated 8/31/2023, due 9/1/2023, repurchase price $6,000,883, collateralized by U.S. Treasury Securities, 0.00% - 4.50%, due 10/12/2023 - 8/15/2049, with a value of $6,120,000. | 6,000,000 | 6,000,000 |
Fixed Income Clearing Corp., 5.31%, dated 8/31/2023, due 9/1/2023, repurchase price $1,000,148, collateralized by U.S. Treasury Securities, 1.63% - 2.75%, due 10/15/2027 - 8/15/2032, with a value of $1,020,000. | 1,000,000 | 1,000,000 |
Fixed Income Clearing Corp., 5.31%, dated 8/31/2023, due 9/1/2023, repurchase price $7,001,032, collateralized by U.S. Treasury Securities, 0.00% - 5.00%, due 10/3/2023 - 2/15/2053, with a value of $7,140,000. | 7,000,000 | 7,000,000 |
Goldman Sachs & Co. LLC, 5.30%, dated 8/31/2023, due 9/1/2023, repurchase price $4,750,699, collateralized by GNMA, 2.50% - 6.50%, due 8/20/2049 - 6/20/2053 and U.S. Treasury Securities, 0.50%, due 11/30/2023, with a value of $4,845,000. | 4,750,000 | 4,750,000 |
Goldman Sachs & Co. LLC, 5.31%, dated 8/31/2023, due 9/1/2023, repurchase price $5,000,738, collateralized by FHLMC, 1.50% - 7.00%, due 6/1/2025 - 9/1/2053, FNMA, 1.50% - 7.00%, due 12/1/2024 - 9/1/2057 and GNMA, 2.50% - 6.50%, due 12/20/2028 - 7/20/2053, with a value of $5,100,000. | 5,000,000 | 5,000,000 |
Goldman Sachs & Co. LLC, 5.31%, dated 8/31/2023, due 9/1/2023, repurchase price $6,000,885, collateralized by FHLMC, 1.50% - 6.00%, due 5/1/2033 - 7/1/2053, FNMA, 1.50% - 6.50%, due 12/1/2024 - 3/1/2060, GNMA, 2.50% - 6.50%, due 10/20/2036 - 8/20/2053 and U.S. Treasury Securities, 1.63% - 2.50%, due 2/28/2026 - 5/15/2026, with a value of $6,120,000. | 6,000,000 | 6,000,000 |
Goldman Sachs & Co. LLC, 5.31%, dated 8/31/2023, due 9/6/2023, repurchase price $2,502,213, collateralized by FHLMC, 1.50% - 6.00%, due 6/1/2030 - 5/1/2053, FNMA, 1.50% - 7.50%, due 2/1/2026 - 7/1/2056 and GNMA, 2.00% - 6.50%, due 2/20/2034 - 12/15/2059, with a value of $2,550,000. | 2,500,000 | 2,500,000 |
49 | J.P. Morgan Money Market Funds | August 31, 2023 |
INVESTMENTS †† | PRINCIPAL AMOUNT ($000) | VALUE ($000) |
Repurchase Agreements — continued | ||
Goldman Sachs & Co. LLC, 5.31%, dated 8/31/2023, due 9/7/2023, repurchase price $2,502,581, collateralized by FHLMC, 1.50% - 7.00%, due 4/1/2025 - 8/1/2053, FNMA, 1.50% - 6.50%, due 9/1/2024 - 6/1/2062 and GNMA, 2.00% - 6.50%, due 10/20/2024 - 6/15/2063, with a value of $2,550,000. | 2,500,000 | 2,500,000 |
ING Financial Markets LLC, 5.30%, dated 8/31/2023, due 9/1/2023, repurchase price $400,059, collateralized by FHLMC, 4.15% - 6.00%, due 7/1/2036 - 8/1/2053 and FNMA, 1.50% - 6.50%, due 11/1/2032 - 8/1/2053, with a value of $408,060. | 400,000 | 400,000 |
Metropolitan Life Insurance Co., 5.31%, dated 8/31/2023, due 9/1/2023, repurchase price $1,000,148, collateralized by U.S. Treasury Securities, 0.00% - 2.25%, due 8/15/2027 - 2/15/2051, with a value of $1,020,150. | 1,000,000 | 1,000,000 |
Mitsubishi UFJ Trust & Banking Corp., 5.31%, dated 8/31/2023, due 9/5/2023, repurchase price $800,590, collateralized by GNMA, 2.50% - 5.00%, due 9/20/2041 - 6/20/2052, with a value of $816,361. | 800,000 | 800,000 |
Morgan Stanley & Co. LLC, 5.31%, dated 8/31/2023, due 9/1/2023, repurchase price $1,000, collateralized by FHLB, 2.60%, due 12/4/2025, FNMA, 2.50% - 4.50%, due 4/1/2024 - 9/1/2052 and GNMA, 3.00% - 7.50%, due 3/20/2024 - 8/20/2053, with a value of $1,020. | 1,000 | 1,000 |
Natixis SA, 5.30%, dated 8/31/2023, due 9/1/2023, repurchase price $2,000,294, collateralized by FFCB, 1.73% - 3.70%, due 10/26/2035 - 3/24/2042, FHLMC, 2.00% - 6.50%, due 5/15/2027 - 8/1/2053, FNMA, 2.00% - 7.00%, due 12/1/2027 - 12/25/2058, GNMA, 2.00% - 6.00%, due 5/20/2032 - 5/20/2052, Tennessee Valley Authority, 0.00% - 5.38%, due 1/15/2038 - 9/15/2065 and U.S. Treasury Securities, 0.00% - 4.75%, due 8/15/2024 - 8/15/2053, with a value of $2,044,042. | 2,000,000 | 2,000,000 |
Natixis SA, 5.34%, dated 8/31/2023, due 9/21/2023, repurchase price $1,003,115, collateralized by U.S. Treasury Securities, 0.00% - 6.63%, due 10/26/2023 - 2/15/2053, with a value of $1,028,473. | 1,000,000 | 1,000,000 |
INVESTMENTS †† | PRINCIPAL AMOUNT ($000) | VALUE ($000) |
Nomura Securities Co. Ltd., 5.30%, dated 8/31/2023, due 9/1/2023, repurchase price $4,000,589, collateralized by FHLB, 5.40%, due 5/20/2024, FHLMC, 1.50% - 6.50%, due 7/1/2038 - 9/1/2053, FNMA, 1.50% - 7.00%, due 5/1/2027 - 8/1/2053, GNMA, 2.50% - 6.00%, due 4/20/2048 - 10/15/2064, Tennessee Valley Authority, 4.88%, due 1/15/2048 and U.S. Treasury Securities, 0.00% - 3.50%, due 11/15/2023 - 2/15/2046, with a value of $4,080,601. | 4,000,000 | 4,000,000 |
Norinchukin Bank (The), 5.34%, dated 8/31/2023, due 9/6/2023, repurchase price $500,445, collateralized by U.S. Treasury Securities, 0.00%, due 4/30/2028 - 4/30/2030, with a value of $510,000. | 500,000 | 500,000 |
RBC Capital Markets LLC, 5.30%, dated 8/31/2023, due 9/1/2023, repurchase price $1,500,221, collateralized by FFCB, 0.67% - 5.71%, due 9/8/2023 - 12/23/2030, FHLB, 0.25% - 6.00%, due 12/28/2023 - 1/8/2029, FHLMC, 0.81% - 8.50%, due 10/15/2023 - 9/25/2051, FNMA, 1.00% - 7.00%, due 9/25/2023 - 7/1/2052, GNMA, 1.25% - 9.00%, due 11/20/2023 - 11/20/2069 and Tennessee Valley Authority, 2.88%, due 2/1/2027, with a value of $1,540,612. | 1,500,000 | 1,500,000 |
Societe Generale SA, 5.34%, dated 8/31/2023, due 9/15/2023, repurchase price $1,503,338, collateralized by U.S. Treasury Securities, 0.13% - 4.63%, due 3/31/2024 - 7/15/2032, with a value of $1,530,000. | 1,500,000 | 1,500,000 |
Societe Generale SA, 5.34%, dated 8/31/2023, due 9/18/2023, repurchase price $802,136, collateralized by U.S. Treasury Securities, 1.13% - 4.63%, due 9/15/2025 - 12/31/2029, with a value of $816,000. | 800,000 | 800,000 |
Societe Generale SA, 5.34%, dated 8/31/2023, due 9/19/2023, repurchase price $802,255, collateralized by U.S. Treasury Securities, 2.75% - 4.25%, due 12/31/2024 - 12/31/2029, with a value of $816,000. | 800,000 | 800,000 |
August 31, 2023 | J.P. Morgan Money Market Funds | 50 |
AS OF August 31, 2023 (Unaudited) (continued)
INVESTMENTS †† | PRINCIPAL AMOUNT ($000) | VALUE ($000) |
Repurchase Agreements — continued | ||
Societe Generale SA, 5.34%, dated 8/31/2023, due 9/20/2023, repurchase price $870,575, collateralized by U.S. Treasury Securities, 1.88% - 4.63%, due 6/30/2025 - 2/15/2032, with a value of $885,360. | 868,000 | 868,000 |
Societe Generale SA, 5.34%, dated 8/31/2023, due 9/20/2023, repurchase price $1,303,857, collateralized by U.S. Treasury Securities, 0.25% - 4.50%, due 4/30/2024 - 5/15/2031, with a value of $1,326,000. | 1,300,000 | 1,300,000 |
Societe Generale SA, 5.34%, dated 8/31/2023, due 9/21/2023, repurchase price $1,504,673, collateralized by U.S. Treasury Securities, 0.00% - 5.61%, due 9/21/2023 - 1/15/2032, with a value of $1,530,000. | 1,500,000 | 1,500,000 |
Societe Generale SA, 5.38%, dated 8/31/2023, due 10/3/2023, repurchase price $703,452, collateralized by GNMA, 2.00% - 6.00%, due 6/20/2027 - 4/20/2053, with a value of $714,000. | 700,000 | 700,000 |
The Northwestern Mutual Life Insurance Co., 5.31%, dated 8/31/2023, due 9/1/2023, repurchase price $1,000,148, collateralized by FHLMC, 3.50%, due 9/1/2042 and FNMA, 0.00% - 5.00%, due 12/1/2039 - 12/1/2052, with a value of $1,020,150. | 1,000,000 | 1,000,000 |
Treasury Joint Trading Account I, J.P. Morgan Investment Management Inc., as agent, 5.28%, dated 8/31/2023, due 9/1/2023, repurchase price $1,207,104. (a) | 1,206,927 | 1,206,927 |
Wells Fargo Bank NA, 5.38%, dated 8/31/2023, due 9/21/2023, repurchase price $1,003,138, collateralized by FHLMC, 4.50% - 6.00%, due 9/1/2052 - 7/1/2053, FNMA, 4.00% - 5.00%, due 11/1/2040 - 7/1/2053 and Tennessee Valley Authority, 0.00%, due 3/15/2036, with a value of $1,025,640. | 1,000,000 | 1,000,000 |
INVESTMENTS †† | PRINCIPAL AMOUNT ($000) | VALUE ($000) |
Wells Fargo Securities LLC, 5.31%, dated 8/31/2023, due 9/1/2023, repurchase price $2,200,325, collateralized by FHLMC, 1.50% - 7.00%, due 11/1/2024 - 9/1/2053 and GNMA, 4.50%, due 4/20/2053 - 5/20/2053, with a value of $2,244,331. | 2,200,000 | 2,200,000 |
Wells Fargo Securities LLC, 5.32%, dated 8/31/2023, due 9/5/2023, repurchase price $2,001,478, collateralized by GNMA, 1.50% - 6.50%, due 10/20/2030 - 8/20/2053, with a value of $2,042,110. | 2,000,000 | 2,000,000 |
Total Repurchase Agreements (Cost $192,047,743) | 192,047,743 | |
U.S. Government Agency Securities — 11.0% | ||
FFCB Funding Corp. | ||
(Federal Reserve Bank Prime Loan Rate US + (3.15)%), 5.36%, 9/1/2023 (b) | 200,000 | 199,997 |
(Federal Reserve Bank Prime Loan Rate US + (3.15)%), 5.36%, 9/1/2023 (b) | 100,000 | 99,998 |
(US Treasury 3 Month Bill Money Market Yield + (0.04)%), 5.37%, 9/1/2023 (b) | 450,000 | 449,992 |
(Federal Reserve Bank Prime Loan Rate US + (3.13)%), 5.37%, 9/1/2023 (b) | 100,000 | 99,997 |
(Federal Reserve Bank Prime Loan Rate US + (3.14)%), 5.37%, 9/1/2023 (b) | 150,000 | 150,000 |
(Federal Reserve Bank Prime Loan Rate US + (3.10)%), 5.40%, 9/1/2023 (b) | 325,000 | 325,000 |
(SOFR + 0.14%), 5.44%, 9/1/2023 (b) | 297,000 | 296,953 |
(SOFR + 0.15%), 5.45%, 9/1/2023 (b) | 250,000 | 249,978 |
(SOFR + 0.16%), 5.46%, 9/1/2023 (b) | 625,000 | 625,000 |
(SOFR + 0.17%), 5.47%, 9/1/2023 (b) | 450,000 | 450,000 |
(SOFR + 0.19%), 5.49%, 9/1/2023 (b) | 475,000 | 474,963 |
(SOFR + 0.20%), 5.50%, 9/1/2023 (b) | 255,000 | 255,000 |
FHLB | ||
DN, 5.17%, 9/1/2023 (c) | 165,633 | 165,633 |
(SOFR + 0.12%), 5.42%, 9/1/2023 (b) | 2,000,000 | 2,000,000 |
(SOFR + 0.16%), 5.46%, 9/1/2023 (b) | 250,000 | 250,000 |
(SOFR + 0.16%), 5.46%, 9/1/2023 (b) | 1,000,000 | 1,000,000 |
(SOFR + 0.16%), 5.46%, 9/1/2023 (b) | 325,000 | 325,000 |
(SOFR + 0.16%), 5.46%, 9/1/2023 (b) | 1,350,000 | 1,350,000 |
(SOFR + 0.16%), 5.47%, 9/10/2023 (b) | 1,000,000 | 1,000,000 |
DN, 4.83%, 9/15/2023 (c) | 100,000 | 99,813 |
DN, 5.00%, 9/22/2023 (c) | 1,900,000 | 1,894,480 |
DN, 4.90%, 1/12/2024 (c) | 500,000 | 491,115 |
DN, 4.89%, 2/9/2024 (c) | 1,390,000 | 1,360,286 |
5.00%, 2/16/2024 | 475,000 | 475,000 |
51 | J.P. Morgan Money Market Funds | August 31, 2023 |
INVESTMENTS †† | PRINCIPAL AMOUNT ($000) | VALUE ($000) |
U.S. Government Agency Securities — continued | ||
5.35%, 5/3/2024 | 1,900,000 | 1,900,000 |
5.35%, 5/3/2024 | 2,000,000 | 2,000,000 |
5.28%, 5/10/2024 | 950,000 | 950,000 |
5.36%, 5/10/2024 | 950,000 | 950,000 |
5.30%, 5/14/2024 | 1,000,000 | 1,000,000 |
5.23%, 5/17/2024 | 1,000,000 | 1,000,000 |
5.36%, 6/11/2024 | 1,000,000 | 1,000,000 |
5.45%, 6/18/2024 | 975,000 | 975,000 |
5.46%, 6/18/2024 | 975,000 | 975,000 |
5.51%, 7/12/2024 | 1,000,000 | 1,000,000 |
5.58%, 8/14/2024 | 1,000,000 | 1,000,000 |
5.62%, 8/26/2024 | 1,350,000 | 1,350,000 |
FHLMC, 5.42%, 6/17/2024 | 975,000 | 975,000 |
FNMA, 4.99%, 2/16/2024 | 475,000 | 475,000 |
Total U.S. Government Agency Securities (Cost $29,638,205) | 29,638,205 | |
U.S. Treasury Obligations — 9.8% | ||
U.S. Treasury Floating Rate Notes | ||
(US Treasury 3 Month Bill Money Market Yield + (0.08)%), 5.34%, 9/1/2023 (b) | 5,480,460 | 5,477,791 |
(US Treasury 3 Month Bill Money Market Yield + (0.02)%), 5.40%, 9/1/2023 (b) | 12,656,000 | 12,657,244 |
(US Treasury 3 Month Bill Money Market Yield + 0.04%), 5.45%, 9/1/2023 (b) | 4,939,625 | 4,939,737 |
(US Treasury 3 Month Bill Money Market Yield + 0.14%), 5.55%, 9/1/2023 (b) | 1,652,900 | 1,650,999 |
U.S. Treasury Notes, (US Treasury 3 Month Bill Money Market Yield + 0.17%), 5.58%, 9/1/2023 (b) | 1,500,000 | 1,500,780 |
Total U.S. Treasury Obligations (Cost $26,226,551) | 26,226,551 | |
Short Term Investments — 5.8% | ||
U.S. Treasury Obligations — 5.8% | ||
U.S. Treasury Bills | ||
5.29%, 9/14/2023 (c) | 390,650 | 389,905 |
5.31%, 10/3/2023 (c) | 50,000 | 49,765 |
5.24%, 10/10/2023 (c) | 2,485,000 | 2,470,977 |
5.27%, 10/31/2023 (c) | 660,000 | 654,252 |
5.33%, 11/2/2023 (c) | 1,300,000 | 1,288,179 |
5.33%, 11/21/2023 (c) | 2,634,300 | 2,603,062 |
5.37%, 11/28/2023 (c) | 100,000 | 98,704 |
5.39%, 12/12/2023 (c) | 1,500,000 | 1,477,433 |
5.25%, 12/14/2023 (c) | 1,340,000 | 1,319,984 |
5.39%, 12/19/2023 (c) | 569,000 | 559,861 |
5.39%, 2/1/2024 (c) | 1,300,000 | 1,270,883 |
INVESTMENTS †† | PRINCIPAL AMOUNT ($000) | VALUE ($000) |
U.S. Treasury Obligations — continued | ||
5.42%, 2/15/2024 (c) | 1,305,000 | 1,272,976 |
4.83%, 4/18/2024 (c) | 1,058,000 | 1,026,467 |
5.19%, 6/13/2024 (c) | 380,000 | 364,966 |
5.32%, 8/8/2024 (c) | 655,000 | 623,514 |
Total U.S. Treasury Obligations (Cost $15,470,928) | 15,470,928 | |
Total Short Term Investments (Cost $15,470,928) | 15,470,928 | |
Total Investments — 98.1% (Cost $263,383,427) * | 263,383,427 | |
Other Assets Less Liabilities — 1.9% | 5,010,509 | |
NET ASSETS — 100.0% | 268,393,936 | |
Percentages indicated are based on net assets. |
Abbreviations | |
DN | Discount Notes |
FFCB | Federal Farm Credit Bank |
FHLB | Federal Home Loan Bank |
FHLMC | Federal Home Loan Mortgage Corp. |
FNMA | Federal National Mortgage Association |
GNMA | Government National Mortgage Association |
SOFR | Secured Overnight Financing Rate |
†† | The date shown represents the earliest of the next put date, next demand date or final maturity date. | |
* | The cost of securities is substantially the same for federal income tax purposes. | |
(a) | Agency Joint Trading Account I, II, III - At August 31, 2023, certain Funds had undivided interests in the Agency Joint Trading Account I, II and III with a maturity date of September 1, 2023, as follows for JPMorgan U.S. Government Money Market Fund (amounts in thousands): | |
Principal Amount | Repurchase Price | Collateral Value Allocation | |
Agency Joint Trading Account I | $1,050,000 | $1,050,155 | $1,071,158 |
Agency Joint Trading Account II | 161,388 | 161,412 | 164,616 |
Agency Joint Trading Account III | 2,947,766 | 2,948,200 | 3,008,379 |
Treasury Joint Trading Account I | 1,206,927 | 1,207,104 | 1,231,237 |
August 31, 2023 | J.P. Morgan Money Market Funds | 52 |
AS OF August 31, 2023 (Unaudited) (continued)
Repurchase Agreements - At August 31, 2023, the Principal Amounts of certain Funds' interests in the Agency Joint Trading Account I, II, III were as follows (amounts in thousands): |
Counterparty | Interest Rate | U.S. Government Money Market Fund |
Agency Joint Trading Account I | ||
TD Securities (USA) LLC | 5.30% | $1,050,000 |
Agency Joint Trading Account II | ||
BofA Securities, Inc. | 5.30% | 111,120 |
Citigroup Global Markets Holdings, Inc. | 5.30% | 50,268 |
Total | 161,388 | |
Agency Joint Trading Account III | ||
BNP Paribas SA | 5.30% | 2,947,766 |
Treasury Joint Trading Account I | ||
BNP Paribas SA | 5.28% | 1,147,178 |
Citibank NA | 5.28% | 59,749 |
Total | 1,206,927 |
At August 31, 2023, the Agency Joint Trading Account I, II, III was fully collateralized by: |
Issuer | Interest Rates | Maturity Dates |
Agency Joint Trading Account I | ||
FNMA | 2.00-6.00% | 8/1/2050-8/1/2053 |
Agency Joint Trading Account II | ||
FNMA | 1.50-6.50% | 5/1/2035-11/1/2061 |
U.S. Treasury Securities | 0.00% | 5/15/2025-5/15/2053 |
Agency Joint Trading Account III | ||
FHLMC | 1.22-7.00% | 3/1/2024-9/1/2053 |
FNMA | 1.50-7.50% | 6/1/2024-11/25/2058 |
Treasury Joint Trading Account I | ||
U.S. Treasury Securities | 0.00-7.50% | 9/14/2023-11/15/2052 |
(b) | Variable or floating rate security, linked to the referenced benchmark. The interest rate shown is the current rate as of August 31, 2023. |
(c) | The rate shown is the effective yield as of August 31, 2023. |
53 | J.P. Morgan Money Market Funds | August 31, 2023 |
AS OF August 31, 2023 (Unaudited)
INVESTMENTS †† | PRINCIPAL AMOUNT ($000) | VALUE ($000) |
Repurchase Agreements — 83.6% | ||
BNP Paribas SA, 5.28%, dated 8/31/2023, due 9/1/2023, repurchase price $450,066, collateralized by U.S. Treasury Securities, 0.00% - 4.00%, due 2/15/2026 - 5/15/2052, with a value of $459,067. | 450,000 | 450,000 |
Citigroup Global Markets Holdings, Inc., 5.31%, dated 8/31/2023, due 9/1/2023, repurchase price $500,074, collateralized by U.S. Treasury Securities, 3.88% - 4.63%, due 3/15/2026 - 11/30/2027, with a value of $510,000. | 500,000 | 500,000 |
Citigroup Global Markets Holdings, Inc., 5.31%, dated 8/31/2023, due 9/5/2023, repurchase price $334,246, collateralized by U.S. Treasury Securities, 0.38% - 3.88%, due 9/30/2027 - 11/30/2027, with a value of $340,680. | 334,000 | 334,000 |
Citigroup Global Markets Holdings, Inc., 5.34%, dated 8/31/2023, due 9/21/2023, repurchase price $752,336, collateralized by U.S. Treasury Securities, 0.38% - 3.88%, due 9/30/2027 - 11/30/2027, with a value of $765,000. | 750,000 | 750,000 |
Federal Reserve Bank of New York, 5.30%, dated 8/31/2023, due 9/1/2023, repurchase price $25,003,681, collateralized by U.S. Treasury Securities, 1.63% - 2.75%, due 2/15/2024 - 5/15/2031, with a value of $25,003,681. | 25,000,000 | 25,000,000 |
Fixed Income Clearing Corp., 5.30%, dated 8/31/2023, due 9/1/2023, repurchase price $1,000,147, collateralized by U.S. Treasury Securities, 1.63%, due 10/15/2027 - 5/15/2031, with a value of $1,020,000. | 1,000,000 | 1,000,000 |
Fixed Income Clearing Corp., 5.31%, dated 8/31/2023, due 9/1/2023, repurchase price $2,000,295, collateralized by U.S. Treasury Securities, 0.13% - 4.63%, due 10/15/2025 - 5/15/2052, with a value of $2,040,000. | 2,000,000 | 2,000,000 |
ING Financial Markets LLC, 5.30%, dated 8/31/2023, due 9/1/2023, repurchase price $200,029, collateralized by U.S. Treasury Securities, 0.00% - 4.75%, due 12/15/2023 - 2/15/2053, with a value of $204,030. | 200,000 | 200,000 |
Morgan Stanley & Co. LLC, 5.30%, dated 8/31/2023, due 9/1/2023, repurchase price $1,000, collateralized by U.S. Treasury Securities, 0.00%, due 11/15/2026 - 8/15/2048, with a value of $1,020. | 1,000 | 1,000 |
INVESTMENTS †† | PRINCIPAL AMOUNT ($000) | VALUE ($000) |
Societe Generale SA, 5.34%, dated 8/31/2023, due 9/18/2023, repurchase price $200,534, collateralized by U.S. Treasury Securities, 4.13%, due 11/15/2032, with a value of $204,000. | 200,000 | 200,000 |
Societe Generale SA, 5.34%, dated 8/31/2023, due 9/19/2023, repurchase price $200,564, collateralized by U.S. Treasury Securities, 4.00%, due 6/30/2028, with a value of $204,000. | 200,000 | 200,000 |
Societe Generale SA, 5.34%, dated 8/31/2023, due 9/20/2023, repurchase price $132,392, collateralized by U.S. Treasury Securities, 4.00% - 4.38%, due 6/30/2028 - 8/31/2028, with a value of $134,640. | 132,000 | 132,000 |
Societe Generale SA, 5.34%, dated 8/31/2023, due 9/20/2023, repurchase price $200,593, collateralized by U.S. Treasury Securities, 4.00% - 4.13%, due 6/30/2028 - 11/15/2032, with a value of $204,000. | 200,000 | 200,000 |
Treasury Joint Trading Account I, J.P. Morgan Investment Management Inc., as agent, 5.28%, dated 8/31/2023, due 9/1/2023, repurchase price $1,743,329. (a) | 1,743,073 | 1,743,073 |
Total Repurchase Agreements (Cost $32,710,073) | 32,710,073 | |
U.S. Treasury Obligations — 5.4% | ||
U.S. Treasury Floating Rate Notes | ||
(US Treasury 3 Month Bill Money Market Yield + (0.08)%), 5.34%, 9/1/2023 (b) | 347,000 | 346,833 |
(US Treasury 3 Month Bill Money Market Yield + (0.02)%), 5.40%, 9/1/2023 (b) | 668,000 | 668,100 |
(US Treasury 3 Month Bill Money Market Yield + 0.04%), 5.45%, 9/1/2023 (b) | 910,800 | 910,979 |
(US Treasury 3 Month Bill Money Market Yield + 0.14%), 5.55%, 9/1/2023 (b) | 163,000 | 162,813 |
Total U.S. Treasury Obligations (Cost $2,088,725) | 2,088,725 | |
Short Term Investments — 9.1% | ||
U.S. Treasury Obligations — 9.1% | ||
U.S. Treasury Bills | ||
5.29%, 9/14/2023 (c) | 60,000 | 59,886 |
5.35%, 10/3/2023 (c) | 195,000 | 194,077 |
5.32%, 10/5/2023 (c) | 250,000 | 248,751 |
5.24%, 10/10/2023 (c) | 345,000 | 343,053 |
5.27%, 10/31/2023 (c) | 130,000 | 128,868 |
5.33%, 11/2/2023 (c) | 200,000 | 198,181 |
4.97%, 11/9/2023 (c) | 70,000 | 69,340 |
August 31, 2023 | J.P. Morgan Money Market Funds | 54 |
AS OF August 31, 2023 (Unaudited) (continued)
INVESTMENTS †† | PRINCIPAL AMOUNT ($000) | VALUE ($000) |
Short Term Investments — continued | ||
U.S. Treasury Obligations — continued | ||
5.34%, 11/21/2023 (c) | 600,000 | 592,881 |
5.37%, 11/28/2023 (c) | 400,000 | 394,818 |
5.38%, 12/5/2023 (c) | 200,000 | 197,203 |
5.39%, 12/12/2023 (c) | 200,000 | 196,991 |
5.25%, 12/14/2023 (c) | 259,000 | 255,131 |
5.39%, 2/8/2024 (c) | 200,000 | 195,322 |
5.42%, 2/15/2024 (c) | 200,000 | 195,092 |
4.83%, 4/18/2024 (c) | 156,000 | 151,350 |
5.19%, 6/13/2024 (c) | 57,000 | 54,745 |
5.32%, 8/8/2024 (c) | 100,000 | 95,193 |
Total U.S. Treasury Obligations (Cost $3,570,882) | 3,570,882 | |
Total Short Term Investments (Cost $3,570,882) | 3,570,882 | |
Total Investments — 98.1% (Cost $38,369,680) * | 38,369,680 | |
Other Assets Less Liabilities — 1.9% | 738,577 | |
NET ASSETS — 100.0% | 39,108,257 | |
Percentages indicated are based on net assets. |
†† | The date shown represents the earliest of the next put date, next demand date or final maturity date. | |
* | The cost of securities is substantially the same for federal income tax purposes. | |
(a) | Treasury Joint Trading Account I - At August 31, 2023, certain Funds had undivided interests in the Treasury Joint Trading Account I with a maturity date of September 1, 2023, as follows for JPMorgan U.S. Treasury Plus Money Market Fund (amounts in thousands): | |
Principal Amount | Repurchase Price | Collateral Value Allocation | |
Treasury Joint Trading Account I | $1,743,073 | $1,743,329 | $1,778,183 |
Repurchase Agreements - At August 31, 2023, the Principal Amounts of certain Funds' interests in the Treasury Joint Trading Account I were as follows (amounts in thousands): |
Counterparty | Interest Rate | U.S. Treasury Plus Money Market Fund |
Treasury Joint Trading Account I | ||
BNP Paribas SA | 5.28% | $1,656,782 |
Citibank NA | 5.28% | 86,291 |
Total | 1,743,073 |
At August 31, 2023, the Treasury Joint Trading Account I was fully collateralized by: |
Issuer | Interest Rates | Maturity Dates |
Treasury Joint Trading Account I | ||
U.S. Treasury Securities | 0.00-7.50% | 9/14/2023-11/15/2052 |
(b) | Variable or floating rate security, linked to the referenced benchmark. The interest rate shown is the current rate as of August 31, 2023. |
(c) | The rate shown is the effective yield as of August 31, 2023. |
55 | J.P. Morgan Money Market Funds | August 31, 2023 |
AS OF August 31, 2023 (Unaudited)
INVESTMENTS †† | PRINCIPAL AMOUNT ($000) | VALUE ($000) |
U.S. Government Agency Securities — 55.0% | ||
FFCB Funding Corp. | ||
(US Treasury 3 Month Bill Money Market Yield + 0.05%), 5.46%, 9/1/2023 (a) | 40,000 | 39,998 |
(Federal Reserve Bank Prime Loan Rate US + (3.00)%), 5.51%, 9/1/2023 (a) | 50,000 | 50,000 |
FHLB | ||
DN, 5.20%, 9/1/2023 (b) | 70,000 | 70,000 |
(SOFR + 0.01%), 5.31%, 9/1/2023 (a) | 200,000 | 200,000 |
(SOFR + 0.02%), 5.32%, 9/1/2023 (c) | 400,000 | 400,000 |
(SOFR + 0.02%), 5.32%, 9/1/2023 (a) | 200,000 | 200,000 |
(SOFR + 0.02%), 5.32%, 9/1/2023 (a) | 100,000 | 100,000 |
(SOFR + 0.02%), 5.32%, 9/1/2023 (a) | 100,000 | 100,000 |
(SOFR + 0.03%), 5.33%, 9/1/2023 (a) | 200,000 | 200,000 |
(SOFR + 0.03%), 5.33%, 9/1/2023 (a) | 200,000 | 200,000 |
(SOFR + 0.03%), 5.33%, 9/1/2023 (a) | 100,000 | 100,000 |
(SOFR + 0.03%), 5.33%, 9/1/2023 (a) | 100,000 | 100,000 |
(SOFR + 0.03%), 5.33%, 9/1/2023 (a) | 400,000 | 400,000 |
(SOFR + 0.05%), 5.35%, 9/1/2023 (a) | 200,000 | 200,000 |
(SOFR + 0.06%), 5.36%, 9/1/2023 (a) | 100,000 | 100,000 |
(SOFR + 0.06%), 5.36%, 9/1/2023 (a) | 200,000 | 200,000 |
(SOFR + 0.07%), 5.37%, 9/1/2023 (a) | 100,000 | 100,000 |
(SOFR + 0.14%), 5.44%, 9/1/2023 (a) | 25,000 | 25,000 |
(SOFR + 0.16%), 5.46%, 9/1/2023 (a) | 25,000 | 25,000 |
(SOFR + 0.04%), 5.35%, 9/4/2023 (a) | 100,000 | 100,000 |
DN, 5.29%, 9/21/2023 (b) | 200,000 | 199,414 |
DN, 5.00%, 9/22/2023 (b) | 25,000 | 24,927 |
DN, 5.28%, 9/29/2023 (b) | 50,000 | 49,796 |
DN, 4.95%, 10/18/2023 (b) | 25,000 | 24,839 |
DN, 5.02%, 10/20/2023 (b) | 25,000 | 24,831 |
DN, 5.04%, 10/24/2023 (b) | 100,000 | 99,264 |
DN, 4.96%, 10/25/2023 (b) | 25,000 | 24,815 |
DN, 4.96%, 10/31/2023 (b) | 25,000 | 24,795 |
DN, 5.35%, 11/3/2023 (b) | 200,000 | 198,263 |
DN, 5.06%, 11/15/2023 (b) | 27,000 | 26,718 |
DN, 5.42%, 12/20/2023 (b) | 50,000 | 49,186 |
DN, 4.99%, 1/4/2024 (b) | 25,000 | 24,575 |
DN, 4.90%, 1/12/2024 (b) | 10,000 | 9,822 |
DN, 4.89%, 2/9/2024 (b) | 10,000 | 9,786 |
5.35%, 5/3/2024 | 25,000 | 25,000 |
5.28%, 5/6/2024 | 25,000 | 25,000 |
5.28%, 5/10/2024 | 25,000 | 25,000 |
5.36%, 5/10/2024 | 25,000 | 25,000 |
5.30%, 5/22/2024 | 25,000 | 25,000 |
5.51%, 7/12/2024 | 25,000 | 25,000 |
5.58%, 8/14/2024 | 25,000 | 25,000 |
INVESTMENTS †† | PRINCIPAL AMOUNT ($000) | VALUE ($000) |
5.62%, 8/26/2024 | 25,000 | 25,000 |
Total U.S. Government Agency Securities (Cost $3,901,029) | 3,901,029 | |
U.S. Treasury Obligations — 9.5% | ||
U.S. Treasury Floating Rate Notes | ||
(US Treasury 3 Month Bill Money Market Yield + (0.08)%), 5.34%, 9/1/2023 (a) | 150,000 | 149,875 |
(US Treasury 3 Month Bill Money Market Yield + (0.02)%), 5.40%, 9/1/2023 (a) | 225,000 | 225,007 |
(US Treasury 3 Month Bill Money Market Yield + 0.04%), 5.45%, 9/1/2023 (a) | 72,000 | 72,012 |
(US Treasury 3 Month Bill Money Market Yield + 0.14%), 5.55%, 9/1/2023 (a) | 100,000 | 100,146 |
U.S. Treasury Notes | ||
(US Treasury 3 Month Bill Money Market Yield + 0.04%), 5.45%, 9/1/2023 (a) | 100,000 | 100,012 |
(US Treasury 3 Month Bill Money Market Yield + 0.20%), 5.61%, 9/1/2023 (a) | 25,000 | 24,996 |
Total U.S. Treasury Obligations (Cost $672,048) | 672,048 | |
Short Term Investments — 38.4% | ||
U.S. Treasury Obligations — 38.4% | ||
U.S. Treasury Bills | ||
5.28%, 9/5/2023 (b) | 55,000 | 54,968 |
5.27%, 9/7/2023 (b) | 100,214 | 100,126 |
5.26%, 9/12/2023 (b) | 200,000 | 199,679 |
5.29%, 9/14/2023 (b) | 100,000 | 99,809 |
5.29%, 9/19/2023 (b) | 400,000 | 398,945 |
5.24%, 9/21/2023 (b) | 300,000 | 299,129 |
5.30%, 9/26/2023 (b) | 200,000 | 199,266 |
5.31%, 9/28/2023 (b) | 100,000 | 99,604 |
5.28%, 10/3/2023 (b) | 200,000 | 199,065 |
5.31%, 10/5/2023 (b) | 100,000 | 99,501 |
5.30%, 10/10/2023 (b) | 225,000 | 223,715 |
5.32%, 10/17/2023 (b) | 100,000 | 99,325 |
5.33%, 10/24/2023 (b) | 100,000 | 99,221 |
5.33%, 10/31/2023 (b) | 100,000 | 99,177 |
5.33%, 11/2/2023 (b) | 100,000 | 99,091 |
5.36%, 11/16/2023 (b) | 25,000 | 24,721 |
5.33%, 11/21/2023 (b) | 100,000 | 98,814 |
5.36%, 12/7/2023 (b) | 25,000 | 24,644 |
5.39%, 12/12/2023 (b) | 50,000 | 49,248 |
5.41%, 12/26/2023 (b) | 100,000 | 98,287 |
August 31, 2023 | J.P. Morgan Money Market Funds | 56 |
AS OF August 31, 2023 (Unaudited) (continued)
INVESTMENTS †† | PRINCIPAL AMOUNT ($000) | VALUE ($000) |
Short Term Investments — continued | ||
U.S. Treasury Obligations — continued | ||
5.43%, 1/2/2024 (b) | 33,000 | 32,419 |
5.42%, 2/15/2024 (b) | 25,000 | 24,387 |
Total U.S. Treasury Obligations (Cost $2,723,141) | 2,723,141 | |
Total Short Term Investments (Cost $2,723,141) | 2,723,141 | |
Total Investments — 102.9% (Cost $7,296,218) * | 7,296,218 | |
Liabilities in Excess of Other Assets — (2.9)% | (204,333 ) | |
NET ASSETS — 100.0% | 7,091,885 | |
Percentages indicated are based on net assets. |
Abbreviations | |
DN | Discount Notes |
FFCB | Federal Farm Credit Bank |
FHLB | Federal Home Loan Bank |
SOFR | Secured Overnight Financing Rate |
†† | The date shown represents the earliest of the next put date, next demand date or final maturity date. | |
* | The cost of securities is substantially the same for federal income tax purposes. | |
(a) | Variable or floating rate security, linked to the referenced benchmark. The interest rate shown is the current rate as of August 31, 2023. | |
(b) | The rate shown is the effective yield as of August 31, 2023. | |
(c) | Variable or floating rate security, the interest rate of which adjusts periodically based on changes in current interest rates and prepayments on the underlying pool of assets. The interest rate shown is the current rate as of August 31, 2023. | |
57 | J.P. Morgan Money Market Funds | August 31, 2023 |
AS OF August 31, 2023 (Unaudited)
INVESTMENTS †† | PRINCIPAL AMOUNT ($000) | VALUE ($000) |
U.S. Treasury Obligations — 11.2% | ||
U.S. Treasury Floating Rate Notes | ||
(US Treasury 3 Month Bill Money Market Yield + (0.08)%), 5.34%, 9/1/2023 (a) | 2,045,000 | 2,044,082 |
(US Treasury 3 Month Bill Money Market Yield + (0.02)%), 5.40%, 9/1/2023 (a) | 4,621,000 | 4,621,571 |
(US Treasury 3 Month Bill Money Market Yield + 0.04%), 5.45%, 9/1/2023 (a) | 2,861,000 | 2,861,085 |
(US Treasury 3 Month Bill Money Market Yield + 0.14%), 5.55%, 9/1/2023 (a) | 1,473,000 | 1,472,016 |
U.S. Treasury Notes | ||
(US Treasury 3 Month Bill Money Market Yield + 0.04%), 5.45%, 9/1/2023 (a) | 350,000 | 350,089 |
(US Treasury 3 Month Bill Money Market Yield + 0.13%), 5.54%, 9/1/2023 (a) | 1,100,000 | 1,099,153 |
(US Treasury 3 Month Bill Money Market Yield + 0.17%), 5.58%, 9/1/2023 (a) | 1,613,120 | 1,613,526 |
(US Treasury 3 Month Bill Money Market Yield + 0.20%), 5.61%, 9/1/2023 (a) | 2,282,200 | 2,282,777 |
Total U.S. Treasury Obligations (Cost $16,344,299) | 16,344,299 | |
Short Term Investments — 95.4% | ||
U.S. Treasury Obligations — 95.4% | ||
U.S. Treasury Bills | ||
5.19%, 9/5/2023 (b) | 10,365,000 | 10,359,022 |
5.24%, 9/7/2023 (b) | 4,261,101 | 4,257,387 |
5.20%, 9/12/2023 (b) | 12,300,000 | 12,280,499 |
5.16%, 9/14/2023 (b) | 3,125,000 | 3,119,188 |
5.23%, 9/19/2023 (b) | 11,405,000 | 11,375,262 |
5.05%, 9/21/2023 (b) | 4,625,000 | 4,612,057 |
5.30%, 9/26/2023 (b) | 10,100,000 | 10,062,992 |
5.14%, 9/28/2023 (b) | 5,170,000 | 5,150,145 |
5.31%, 10/3/2023 (b) | 11,990,000 | 11,937,132 |
5.30%, 10/5/2023 (b) | 5,300,000 | 5,273,585 |
5.29%, 10/10/2023 (b) | 11,275,000 | 11,210,704 |
5.31%, 10/12/2023 (b) | 4,500,000 | 4,472,943 |
5.29%, 10/17/2023 (b) | 10,500,000 | 10,429,492 |
5.16%, 10/19/2023 (b) | 2,250,000 | 2,234,640 |
5.32%, 10/24/2023 (b) | 5,775,000 | 5,730,155 |
5.32%, 10/31/2023 (b) | 6,300,000 | 6,247,542 |
5.33%, 11/2/2023 (b) | 1,500,000 | 1,486,360 |
INVESTMENTS †† | PRINCIPAL AMOUNT ($000) | VALUE ($000) |
U.S. Treasury Obligations — continued | ||
5.30%, 11/7/2023 (b) | 500,000 | 495,122 |
5.16%, 11/9/2023 (b) | 2,750,000 | 2,723,061 |
5.32%, 11/14/2023 (b) | 500,000 | 494,596 |
5.33%, 11/21/2023 (b) | 1,700,000 | 1,679,839 |
5.37%, 11/28/2023 (b) | 1,339,700 | 1,322,343 |
5.38%, 12/5/2023 (b) | 1,480,000 | 1,459,300 |
5.33%, 12/7/2023 (b) | 500,000 | 492,927 |
5.38%, 12/12/2023 (b) | 2,200,000 | 2,166,949 |
5.23%, 12/14/2023 (b) | 1,250,000 | 1,231,385 |
5.39%, 12/19/2023 (b) | 750,000 | 737,953 |
5.41%, 12/26/2023 (b) | 1,500,000 | 1,474,311 |
5.43%, 1/2/2024 (b) | 1,400,000 | 1,375,334 |
5.39%, 2/1/2024 (b) | 1,500,000 | 1,466,404 |
5.42%, 2/15/2024 (b) | 730,000 | 712,086 |
4.82%, 4/18/2024 (b) | 575,000 | 557,870 |
5.19%, 6/13/2024 (b) | 190,000 | 182,483 |
5.32%, 8/8/2024 (b) | 375,000 | 356,974 |
Total U.S. Treasury Obligations (Cost $139,168,042) | 139,168,042 | |
Total Short Term Investments (Cost $139,168,042) | 139,168,042 | |
Total Investments — 106.6% (Cost $155,512,341) * | 155,512,341 | |
Liabilities in Excess of Other Assets — (6.6)% | (9,616,870 ) | |
NET ASSETS — 100.0% | 145,895,471 | |
Percentages indicated are based on net assets. |
†† | The date shown represents the earliest of the next put date, next demand date or final maturity date. | |
* | The cost of securities is substantially the same for federal income tax purposes. | |
(a) | Variable or floating rate security, linked to the referenced benchmark. The interest rate shown is the current rate as of August 31, 2023. | |
(b) | The rate shown is the effective yield as of August 31, 2023. | |
August 31, 2023 | J.P. Morgan Money Market Funds | 58 |
AS OF August 31, 2023 (Unaudited)
INVESTMENTS †† | PRINCIPAL AMOUNT ($000) | VALUE ($000) |
Municipal Bonds — 67.4% | ||
Alabama — 0.1% | ||
Alabama Housing Finance Authority, Multi-Family, Alison Pointe Apartments Project Series 2007B, Rev., VRDO, LOC : US Bank NA, 4.28%, 9/8/2023 (a) | 5,490 | 5,490 |
Mobile County Industrial Development Authority, Pollution Control, Exxon Mobil Corp. Project, Rev., VRDO, 3.80%, 9/1/2023 (a) | 1,325 | 1,325 |
6,815 | ||
Alaska — 1.3% | ||
Alaska Housing Finance Corp., Home Mortgage | ||
Series 2009B, Rev., LIQ : Wells Fargo Bank NA, 4.00%, 9/8/2023 (a) | 56,725 | 56,725 |
Series 2007B, Rev., VRDO, LIQ : FHLB, 4.01%, 9/8/2023 (a) | 15,700 | 15,700 |
Series 2007A, Rev., VRDO, LIQ : FHLB, 4.02%, 9/8/2023 (a) | 24,175 | 24,175 |
City of Valdez, Exxon Pipeline Co. Project | ||
Series 1993A, Rev., VRDO, 3.80%, 9/1/2023 (a) | 10,180 | 10,180 |
Series 1993-B, Rev., VRDO, 3.80%, 9/1/2023 (a) | 25,650 | 25,650 |
132,430 | ||
Arizona — 0.6% | ||
Arizona Health Facilities Authority Series 2015-XF2050, Rev., VRDO, LIQ : Morgan Stanley Bank NA, 4.09%, 9/8/2023 (a) (b) | 21,000 | 21,000 |
RBC Municipal Products, Inc. Trust, Floater Certificates Series E-147, Rev., VRDO, LOC : Royal Bank of Canada, 4.09%, 9/8/2023 (a) (b) | 21,000 | 21,000 |
Salt River Pima-Maricopa Indian Community, Rev., VRDO, LOC : Bank of America NA, 4.18%, 9/8/2023 (a) | 16,205 | 16,205 |
58,205 | ||
California — 1.2% | ||
Alameda County Industrial Development Authority, Plyproperties Project Series 1997A, Rev., VRDO, LOC : Wells Fargo Bank NA, 4.11%, 9/8/2023 (a) | 1,370 | 1,370 |
City of San Jose, Multi-Family Housing, Almaden Lake Village Apartments Series 1997A, Rev., VRDO, LOC : FNMA, 4.15%, 9/8/2023 (a) | 8,500 | 8,500 |
County of Sacramento, Special Facilities Apartment, Cessna Aircraft Co. Project, Rev., VRDO, LOC : Bank of America NA, 4.05%, 9/8/2023 (a) | 3,200 | 3,200 |
INVESTMENTS †† | PRINCIPAL AMOUNT ($000) | VALUE ($000) |
California — continued | ||
Tender Option Bond Trust Receipts/Certificates | ||
Series 2022-BAML5025, Rev., VRDO, LIQ : Bank of America NA, 3.59%, 9/1/2023 (a) (b) | 25,500 | 25,500 |
Series 2021-XF2962, Rev., VRDO, LIQ : Barclays Bank plc, 4.09%, 9/8/2023 (a) (b) | 640 | 640 |
Series 2022-XM0991, Rev., VRDO, LIQ : Barclays Bank plc, 4.09%, 9/8/2023 (a) (b) | 28,000 | 28,000 |
Series 2022-YX1200, Rev., VRDO, LIQ : Barclays Bank plc, 4.09%, 9/8/2023 (a) (b) | 19,870 | 19,870 |
Series 2023-007, Rev., VRDO, LOC : Barclays Bank plc, 4.10%, 9/8/2023 (a) (b) | 32,465 | 32,465 |
119,545 | ||
Colorado — 1.6% | ||
City of Colorado Springs, Utilities System Improvement Series 2009C, Rev., VRDO, LIQ : Sumitomo Mitsui Banking Corp., 4.01%, 9/8/2023 (a) | 24,240 | 24,240 |
Colorado Housing and Finance Authority, Multi-Family, Greentree Village Apartments Project, Rev., VRDO, LOC : US Bank NA, 4.18%, 9/8/2023 (a) | 4,250 | 4,250 |
Colorado Housing and Finance Authority, Single Family Mortgage Series 2019D, Class I-S, Rev., AMT, VRDO, LIQ : Royal Bank of Canada, 4.10%, 9/8/2023 (a) | 30,000 | 30,000 |
County of Arapahoe, Multi-Family Rental Housing, Hunter's Run Holdings LP, Rev., VRDO, LOC : FHLMC, 4.12%, 9/8/2023 (a) | 12,300 | 12,300 |
Tender Option Bond Trust Receipts/Certificates | ||
Series 2022-YX1254, Rev., VRDO, LOC : Barclays Bank plc, 4.10%, 9/8/2023 (a) (b) | 3,905 | 3,905 |
Series 2016-ZF0467, Rev., VRDO, LOC : Royal Bank of Canada, 4.12%, 9/8/2023 (a) (b) | 3,675 | 3,675 |
Series 2015-XF0239, Rev., VRDO, LIQ : TD Bank NA, 4.14%, 9/8/2023 (a) (b) | 4,000 | 4,000 |
University of Colorado, Hospital Authority | ||
Series 2018B, Rev., VRDO, LIQ : TD Bank NA, 4.00%, 9/8/2023 (a) | 39,760 | 39,760 |
Series 2018C, Rev., VRDO, LIQ : TD Bank NA, 4.00%, 9/8/2023 (a) | 39,065 | 39,065 |
161,195 | ||
Connecticut — 0.8% | ||
City of Danbury, GO, BAN, 5.00%, 1/24/2024 | 31,400 | 31,560 |
59 | J.P. Morgan Money Market Funds | August 31, 2023 |
INVESTMENTS †† | PRINCIPAL AMOUNT ($000) | VALUE ($000) |
Municipal Bonds — continued | ||
Connecticut — continued | ||
Connecticut Housing Finance Authority, Housing Mortgage | ||
Series 2022, Subseries E-2, Rev., VRDO, GNMA / FNMA / FHLMC COLL, LOC : Sumitomo Mitsui Banking Corp., 4.01%, 9/8/2023 (a) | 12,050 | 12,050 |
Series A, Subseries A-3, Rev., VRDO, LIQ : TD Bank NA, 4.01%, 9/8/2023 (a) | 10,000 | 10,000 |
Subseries 2020A-3, Rev., VRDO, LIQ : UBS AG, 4.06%, 9/8/2023 (a) | 24,000 | 24,000 |
77,610 | ||
Delaware — 0.0% ^ | ||
Delaware State Economic Development Authority, YMCA Delaware Project, Rev., VRDO, LOC : PNC Bank NA, 4.04%, 9/8/2023 (a) | 3,190 | 3,190 |
District of Columbia — 0.9% | ||
District of Columbia, Medlantic/Helix Issue, Tranche II Series 1998A, Rev., VRDO, LOC : TD Bank NA, 4.00%, 9/8/2023 (a) | 18,135 | 18,135 |
Metropolitan Washington Airports Authority Aviation | ||
Series 2010D, Rev., VRDO, LOC : TD Bank NA, 4.06%, 9/8/2023 (a) | 10,000 | 10,000 |
Subseries A-3, Rev., AMT, VRDO, LOC : TD Bank NA, 4.08%, 9/8/2023 (a) | 3,200 | 3,200 |
RBC Municipal Products, Inc. Trust, Floater Certificates Series E-108, GO, VRDO, LOC : Royal Bank of Canada, 4.09%, 9/8/2023 (a) (b) | 50,000 | 50,000 |
Tender Option Bond Trust Receipts/Certificates Series 2023-XF3140, Rev., VRDO, LIQ : Wells Fargo Bank NA, 4.09%, 9/8/2023 (a) (b) | 7,500 | 7,500 |
88,835 | ||
Florida — 4.6% | ||
Alachua County Housing Finance Authority, Multi-Family, Santa Fe Apartments Project | ||
Series 2008, Rev., VRDO, LOC : FNMA, 4.05%, 9/8/2023 (a) | 1,350 | 1,350 |
Rev., VRDO, LOC : Citibank NA, 4.10%, 9/8/2023 (a) | 2,630 | 2,630 |
City of Jacksonville, Health Care Facilities, Baptist Health | ||
Series 2019B, Rev., VRDO, 4.05%, 9/8/2023 (a) | 27,605 | 27,605 |
Series 2019C, Rev., VRDO, 4.05%, 9/8/2023 (a) | 40,240 | 40,240 |
INVESTMENTS †† | PRINCIPAL AMOUNT ($000) | VALUE ($000) |
Florida — continued | ||
Collier County Industrial Development Authority, Allete Inc., Project, Rev., VRDO, LOC : Wells Fargo Bank NA, 4.08%, 9/8/2023 (a) | 27,800 | 27,800 |
Collier County Industrial Development Authority, Ave Maria Utility Co. Project, Rev., AMT, VRDO, LOC : Northern Trust Co. (The), 4.10%, 9/8/2023 (a) | 11,310 | 11,310 |
County of Escambia, Gulf Power Co., Project | ||
Series 2, Rev., VRDO, 4.25%, 9/1/2023 (a) | 34,700 | 34,700 |
Series R, Rev., VRDO, 3.95%, 9/8/2023 (a) | 25,600 | 25,600 |
County of Martin, Florida Power and Light Co. Project, Rev., VRDO, 4.12%, 9/8/2023 (a) | 43,900 | 43,900 |
County of Miami-Dade, Juvenile Courthouse Series 2003B, Rev., VRDO, AMBAC, LOC : TD Bank NA, 4.00%, 9/8/2023 (a) | 9,600 | 9,600 |
County of St. Lucie, Power and Light Co. Project | ||
Rev., VRDO, 4.05%, 9/1/2023 (a) | 9,000 | 9,000 |
Rev., VRDO, 4.10%, 9/1/2023 (a) | 20,900 | 20,900 |
Florida Housing Finance Agency, Sun Pointe Cove Apartments Series 85 XX, Rev., VRDO, FNMA, LIQ : FNMA, 4.26%, 9/8/2023 (a) | 8,500 | 8,500 |
Florida Housing Finance Corp., Multi-Family Mortgage, Kings Terrace LLC Series 2013B, Rev., VRDO, LIQ : FHLMC, 4.09%, 9/8/2023 (a) | 12,000 | 12,000 |
Highlands County Health Facilities Authority, Adventist Health System | ||
Series 2012I-2, Rev., VRDO, 4.00%, 9/8/2023 (a) | 49,100 | 49,100 |
Series 2007A, Rev., VRDO, 4.06%, 9/8/2023 (a) | 11,450 | 11,450 |
Hillsborough County Industrial Development Authority, Baycare Health System | ||
Series 2020B, Rev., VRDO, LOC : TD Bank NA, 3.93%, 9/1/2023 (a) | 7,800 | 7,800 |
Series 2020C, Rev., VRDO, LOC : TD Bank NA, 4.00%, 9/8/2023 (a) | 33,515 | 33,515 |
Hillsborough County, Housing Finance Authority, Multi-Family Housing, Brandywine Apartments, Rev., VRDO, LOC : Citibank NA, 4.10%, 9/8/2023 (a) | 5,370 | 5,370 |
JEA Water and Sewer System | ||
Series 2008A-1, Rev., VRDO, LIQ : US Bank NA, 4.20%, 9/1/2023 (a) | 1,500 | 1,500 |
Series 2008A-2, Rev., VRDO, LOC : Sumitomo Mitsui Banking Corp., 4.10%, 9/8/2023 (a) | 18,350 | 18,350 |
August 31, 2023 | J.P. Morgan Money Market Funds | 60 |
AS OF August 31, 2023 (Unaudited) (continued)
INVESTMENTS †† | PRINCIPAL AMOUNT ($000) | VALUE ($000) |
Municipal Bonds — continued | ||
Florida — continued | ||
Lee County Industrial Development Authority, Florida Power and Light Co. Project Series 2016B, Rev., AMT, VRDO, 4.60%, 9/8/2023 (a) | 15,000 | 15,000 |
Orange County Housing Finance Authority, Multi-Family, Post Fountains, Rev., VRDO, FNMA, LIQ : FNMA, 4.00%, 9/8/2023 (a) | 9,220 | 9,220 |
Pinellas County Housing Finance Authority, Booker Creek Apartments, Rev., VRDO, LOC : FHLMC, 4.05%, 9/8/2023 (a) | 3,970 | 3,970 |
Sumter County Industrial Development Authority, Solid Waste Disposal, American Cement Co., LLC Project, Rev., VRDO, LOC : Bank of America NA, 4.30%, 9/8/2023 (a) | 6,350 | 6,350 |
Tender Option Bond Trust Receipts/Certificates | ||
Series 2021-XG0345, Rev., VRDO, LIQ : Wells Fargo Bank NA, 4.09%, 9/8/2023 (a) (b) | 2,775 | 2,775 |
Series 2023-XF3100, Rev., VRDO, LIQ : Barclays Bank plc, 4.09%, 9/8/2023 (a) (b) | 4,265 | 4,265 |
Series 2022-XX1279, Rev., VRDO, LIQ : Barclays Bank plc, 4.10%, 9/8/2023 (a) (b) | 8,845 | 8,845 |
Series 2022-YX1182, Rev., VRDO, LIQ : Barclays Bank plc, 4.11%, 9/8/2023 (a) (b) | 22,105 | 22,105 |
474,750 | ||
Georgia — 1.5% | ||
Bartow-Cartersville Joint Development Authority Series 2023A, Rev., AMT, VRDO, LOC : Korea Development Bank, 4.37%, 9/8/2023 (a) (b) | 140,000 | 140,000 |
Development Authority of Monroe County (The), Gulf Power Co. Project, Rev., AMT, VRDO, 4.20%, 9/1/2023 (a) | 17,475 | 17,475 |
Griffin-Spalding County Development Authority, Industrial Development, Norcom, Inc. Project, Rev., VRDO, LOC : Bank of America NA, 4.24%, 9/8/2023 (a) | 530 | 530 |
158,005 | ||
Idaho — 0.3% | ||
Idaho Health Facilities Authority, St. Luke's Health System Project Series 2018C, Rev., VRDO, LOC : US Bank NA, 4.20%, 9/1/2023 (a) | 21,300 | 21,300 |
Idaho Housing and Finance Association, Single Family Mortgage Series 2016A-3, Class I, Rev., AMT, VRDO, LIQ : FHLB, 4.08%, 9/8/2023 (a) | 7,380 | 7,380 |
28,680 | ||
INVESTMENTS †† | PRINCIPAL AMOUNT ($000) | VALUE ($000) |
Illinois — 2.7% | ||
County of Kane, Glenwood School for Boys, Rev., VRDO, LOC : Northern Trust Co. (The), 4.21%, 9/8/2023 (a) | 3,450 | 3,450 |
County of Lake, A L Hansen Manufacturing Co. Project, Rev., VRDO, LOC : BMO Harris Bank NA, 4.10%, 9/8/2023 (a) | 395 | 395 |
County of Will, ExxonMobil Project, Rev., VRDO, 3.85%, 9/1/2023 (a) | 2,140 | 2,140 |
Illinois Development Finance Authority, Wheaton Academy, Rev., VRDO, LOC : BMO Harris Bank NA, 4.25%, 9/8/2023 (a) | 6,500 | 6,500 |
Illinois Educational Facilities Authority, University of Chicago Series 2003B, Rev., VRDO, 4.00%, 9/7/2023 (a) | 2,048 | 2,048 |
Illinois Finance Authority, American Youth Hostels Project, Rev., VRDO, LOC : BMO Harris Bank NA, 4.06%, 9/8/2023 (a) | 2,200 | 2,200 |
Illinois Finance Authority, Hospital Sisters Services, Inc., Obligated Group Series 2012G, Rev., VRDO, LOC : Bank of Montreal, 4.04%, 9/8/2023 (a) | 15,480 | 15,480 |
Illinois Finance Authority, Northwestern Memorial Healthcare | ||
Series 2021B, Rev., VRDO, LIQ : Royal Bank of Canada, 3.95%, 9/1/2023 (a) | 48,100 | 48,100 |
Series 2021C, Rev., VRDO, LIQ : Barclays Bank plc, 3.95%, 9/1/2023 (a) | 4,900 | 4,900 |
Illinois Finance Authority, Northwestern University | ||
Series 2008-B, Rev., VRDO, 4.12%, 9/8/2023 (a) | 15,540 | 15,540 |
Series 2004C, Rev., VRDO, 4.13%, 9/8/2023 (a) | 145 | 145 |
Illinois Finance Authority, The University of Chicago Medical Center | ||
Series 2011B, Rev., VRDO, LOC : Sumitomo Mitsui Banking Corp., 4.05%, 9/8/2023 (a) | 30,760 | 30,760 |
Series 2009E-1, Rev., VRDO, LOC : Sumitomo Mitsui Banking Corp., 4.09%, 9/8/2023 (a) | 34,250 | 34,250 |
Illinois Finance Authority, The Wbez Alliance, Inc., Project, Rev., VRDO, LOC : BMO Harris Bank NA, 4.04%, 9/8/2023 (a) | 2,825 | 2,825 |
Illinois Finance Authority, University of Chicago Series 2004C, Rev., VRDO, 4.00%, 9/8/2023 (a) | 12,010 | 12,010 |
Illinois Finance Authority, University of Wesleyan, Rev., VRDO, LOC : PNC Bank NA, 4.10%, 9/8/2023 (a) | 10,400 | 10,400 |
61 | J.P. Morgan Money Market Funds | August 31, 2023 |
INVESTMENTS †† | PRINCIPAL AMOUNT ($000) | VALUE ($000) |
Municipal Bonds — continued | ||
Illinois — continued | ||
Illinois Finance Authority,The University Of Chicago Medical Center Series 2006E-2, Rev., VRDO, LOC : Sumitomo Mitsui Banking Corp., 4.09%, 9/8/2023 (a) | 4,100 | 4,100 |
Illinois Housing Development Authority | ||
Rev., VRDO, LOC : BMO Harris Bank NA, 4.06%, 9/8/2023 (a) | 2,000 | 2,000 |
Series 2019B, Rev., VRDO, LIQ : FHLB, 4.16%, 9/8/2023 (a) | 500 | 500 |
Illinois Housing Development Authority, Homeowner Mortgage Series C-3, Rev., AMT, VRDO, LIQ : FHLB, 4.00%, 9/8/2023 (a) | 4,200 | 4,200 |
Jackson-Union Counties Regional Port District, Port Facility, Enron Transportation Services, Rev., VRDO, LOC : Wells Fargo Bank NA, 4.15%, 9/6/2023 (a) | 2,050 | 2,050 |
Joliet Regional Port District, ExxonMobil Project, Rev., VRDO, 3.90%, 9/1/2023 (a) | 1,885 | 1,885 |
Tender Option Bond Trust Receipts/Certificates | ||
Series 2015-XF1009, Rev., VRDO, AGM, LOC : Barclays Bank plc, 4.10%, 9/8/2023 (a) (b) | 15,740 | 15,740 |
Series 2020-XL0145, Rev., VRDO, LOC : Barclays Bank plc, 4.10%, 9/8/2023 (a) (b) | 2,110 | 2,110 |
Series 2022-XF3042, GO, VRDO, LIQ : Barclays Bank plc, 4.10%, 9/8/2023 (a) (b) | 21,150 | 21,150 |
Series 2022-XF3045, GO, VRDO, LOC : Barclays Bank plc, 4.10%, 9/8/2023 (a) (b) | 35,075 | 35,075 |
279,953 | ||
Indiana — 1.5% | ||
Gary Chicago International Airport Authority, Special Purpose Facilities, Jet Center Project, Rev., VRDO, LOC : BMO Harris Bank NA, 4.10%, 9/8/2023 (a) | 2,000 | 2,000 |
Indiana Finance Authority, Ascension Health SR. Credit Group Series 2008E-5, Rev., VRDO, 4.10%, 9/8/2023 (a) | 23,425 | 23,425 |
Indiana Finance Authority, Duke Energy Indiana, Inc., Project Series 2009A-5, Rev., VRDO, LOC : Sumitomo Mitsui Banking Corp., 3.75%, 9/1/2023 (a) | 5,215 | 5,215 |
Indiana Finance Authority, Parkview Health System, Inc. | ||
Series 2009B, Rev., VRDO, LOC : Wells Fargo Bank NA, 3.80%, 9/1/2023 (a) | 12,810 | 12,810 |
Series 2009D, Rev., VRDO, LOC : Wells Fargo Bank NA, 3.80%, 9/1/2023 (a) | 7,200 | 7,200 |
Series 2009-C, Rev., VRDO, LOC : Sumitomo Mitsui Banking Corp., 4.20%, 9/8/2023 (a) | 1,875 | 1,875 |
INVESTMENTS †† | PRINCIPAL AMOUNT ($000) | VALUE ($000) |
Indiana — continued | ||
Indiana Finance Authority, Trinity Health Obligated Group Series 2008D-1, Rev., VRDO, 4.04%, 9/8/2023 (a) | 58,215 | 58,215 |
Indiana Health Facility Financing Authority, Ascension Health Credit Group | ||
Series 2003E-6, Rev., VRDO, 4.10%, 9/8/2023 (a) | 18,180 | 18,180 |
Series 2005A-2, Rev., VRDO, 4.10%, 9/8/2023 (a) | 6,225 | 6,225 |
Indiana Housing and Community Development Authority Series 2017B-3, Rev., VRDO, LIQ : TD Bank NA, 3.93%, 9/1/2023 (a) | 2,590 | 2,590 |
Indiana Municipal Power Agency Series 2019B, Rev., VRDO, LOC : US Bank NA, 4.20%, 9/1/2023 (a) | 4,110 | 4,110 |
Tender Option Bond Trust Receipts/Certificates Series 2022-XX1220, Rev., VRDO, LIQ : Barclays Bank plc, 4.10%, 9/8/2023 (a) (b) | 9,750 | 9,750 |
151,595 | ||
Iowa — 3.7% | ||
County of Louisa, Pollution Control, Midwest Power System, Inc., Rev., VRDO, 4.15%, 9/8/2023 (a) | 34,700 | 34,700 |
Iowa Finance Authority, CJ Bio America, Inc., Project, Rev., VRDO, LOC : Korea Development Bank, 4.23%, 9/8/2023 (a) (b) | 117,800 | 117,800 |
Iowa Finance Authority, Midwestern Disaster Area, Archer-Daniels-Midland Co. Project, Rev., VRDO, 4.15%, 9/8/2023 (a) | 80,395 | 80,395 |
Iowa Finance Authority, Midwestern Disaster Area, Cargill, Inc. Project Series 2011A, Rev., VRDO, 4.09%, 9/8/2023 (a) | 29,100 | 29,100 |
Iowa Finance Authority, Multi-Family Housing Series A, Rev., AMT, VRDO, LIQ : Wells Fargo Bank NA, 4.08%, 9/8/2023 (a) | 11,030 | 11,030 |
Iowa Finance Authority, Single Family Mortgage Series 2016B, Rev., AMT, VRDO, GNMA / FNMA / FHLMC, LIQ : FHLB, 4.03%, 9/8/2023 (a) | 20,000 | 20,000 |
Iowa Finance Authority, Single Family Mortgage, Social Bonds Series 2022B, Rev., VRDO, GNMA / FNMA / FHLMC, LIQ : Royal Bank of Canada, 4.03%, 9/8/2023 (a) | 10,000 | 10,000 |
Iowa Finance Authority, Single Family Mortgage-Backed Securities Program | ||
Series 2018B, Rev., VRDO, GNMA / FNMA / FHLMC, LIQ : TD Bank NA, 4.04%, 9/8/2023 (a) | 19,750 | 19,750 |
August 31, 2023 | J.P. Morgan Money Market Funds | 62 |
AS OF August 31, 2023 (Unaudited) (continued)
INVESTMENTS †† | PRINCIPAL AMOUNT ($000) | VALUE ($000) |
Municipal Bonds — continued | ||
Iowa — continued | ||
Series 2019E, Rev., VRDO, GNMA / FNMA / FHLMC, LIQ : TD Bank NA, 4.04%, 9/8/2023 (a) | 7,760 | 7,760 |
Series 2020B, Rev., VRDO, GNMA / FNMA / FHLMC, LIQ : TD Bank NA, 4.04%, 9/8/2023 (a) | 15,500 | 15,500 |
Series 2020E, Rev., VRDO, GNMA / FNMA / FHLMC, LIQ : TD Bank NA, 4.04%, 9/8/2023 (a) | 5,200 | 5,200 |
Iowa Finance Authority, Solid Waste Facilities, Midamerican Energy Co. Project, Rev., AMT, VRDO, 4.30%, 9/8/2023 (a) | 18,650 | 18,650 |
Iowa Finance Authority, Trinity Health Corp. Series 2000D, Rev., VRDO, 4.12%, 9/8/2023 (a) | 230 | 230 |
Tender Option Bond Trust Receipts/Certificates Series 2022-YX1196, Rev., VRDO, FNMA COLL, LIQ : Barclays Bank plc, 4.09%, 9/8/2023 (a) (b) | 14,800 | 14,800 |
384,915 | ||
Kansas — 0.3% | ||
Kansas Development Finance Authority, Health System Series 2011J, Rev., VRDO, LOC : US Bank NA, 3.95%, 9/1/2023 (a) | 8,425 | 8,425 |
RBC Municipal Products, Inc. Trust, Floater Certificates Series G-23, GO, VRDO, LOC : Royal Bank of Canada, 3.35%, 9/8/2023 (a) (b) | 12,500 | 12,500 |
University of Kansas Hospital Authority, Health System, Rev., VRDO, LOC : US Bank NA, 3.95%, 9/1/2023 (a) | 9,815 | 9,815 |
30,740 | ||
Kentucky — 0.4% | ||
City of Berea, Berea College Project | ||
Series 2002A, Rev., VRDO, 4.05%, 9/1/2023 (a) | 900 | 900 |
Series 2003B, Rev., VRDO, 4.05%, 9/1/2023 (a) | 800 | 800 |
County of Daviess, Scott Paper Co., Project Series 1993-A, Rev., VRDO, 4.10%, 9/6/2023 (a) | 23,900 | 23,900 |
Kentucky Economic Development Finance Authority, St. Elizabeth Medical Center Series 2009B, Rev., VRDO, LOC : TD Bank NA, 4.00%, 9/8/2023 (a) | 7,410 | 7,410 |
Louisville Regional Airport Authority, UPS Worldwide Forwarding, Inc. Series 1999C, Rev., VRDO, 4.15%, 9/1/2023 (a) | 11,505 | 11,505 |
44,515 | ||
INVESTMENTS †† | PRINCIPAL AMOUNT ($000) | VALUE ($000) |
Louisiana — 0.4% | ||
East Baton Rouge Parish Industrial Development Board, Inc., ExxonMobil Project, Gulf Opportunity Zone Series 2010B, Rev., VRDO, 3.90%, 9/1/2023 (a) | 1,500 | 1,500 |
Louisiana Public Facilities Authority, Children Medical Center Project | ||
Series 2017A, Rev., VRDO, LOC : UBS AG, 4.05%, 9/8/2023 (a) | 15,000 | 15,000 |
Series 2017B, Rev., VRDO, LOC : UBS AG, 4.06%, 9/8/2023 (a) | 10,000 | 10,000 |
Parish of St. Bernard, Mobil Oil Corp., Rev., VRDO, 3.85%, 9/1/2023 (a) | 125 | 125 |
State of Louisiana Gasoline and Fuels Tax, Second Lien Series 2023A-1, Rev., VRDO, LOC : TD Bank NA, 3.93%, 9/1/2023 (a) | 14,600 | 14,600 |
41,225 | ||
Maryland — 1.2% | ||
County of Montgomery, Trinity Health Credit Group Series 2013MD, Rev., VRDO, 3.70%, 9/1/2023 (a) | 26,000 | 26,000 |
Maryland Community Development Administration Series 2006J, Rev., AMT, VRDO, LIQ : Wells Fargo Bank NA, 4.08%, 9/8/2023 (a) | 22,700 | 22,700 |
Maryland Health and Higher Educational Facilities Authority, Pooled Loan Program Series 1985B, Rev., VRDO, LOC : TD Bank NA, 4.00%, 9/8/2023 (a) | 9,550 | 9,550 |
Maryland State Transportation Authority Passenger Facility Charge Series 2012C, Rev., AMT, VRDO, LOC : Wells Fargo Bank NA, 4.20%, 9/8/2023 (a) | 2,200 | 2,200 |
Montgomery County Housing Opportunities Commission Series 2023A, Rev., VRDO, FNMA, LOC : TD Bank NA, 3.93%, 9/1/2023 (a) | 3,550 | 3,550 |
Montgomery County Housing Opportunities Commission, Single Family Mortgage Series 2018B, Rev., AMT, VRDO, LOC : PNC Bank NA, 4.11%, 9/8/2023 (a) | 7,475 | 7,475 |
Tender Option Bond Trust Receipts/Certificates | ||
Series 2023-ZF3082, Rev., VRDO, LIQ : Morgan Stanley Bank NA, 4.09%, 9/8/2023 (a) (b) | 3,750 | 3,750 |
Series 2018-XF0605, Rev., VRDO, LIQ : Bank of America NA, 4.11%, 9/8/2023 (a) (b) | 2,500 | 2,500 |
Washington Suburban Sanitary Commission Series B, GO, BAN, VRDO, GTD, LIQ : State Street Bank & Trust Co., 3.97%, 9/1/2023 (a) | 48,200 | 48,200 |
125,925 | ||
63 | J.P. Morgan Money Market Funds | August 31, 2023 |
INVESTMENTS †† | PRINCIPAL AMOUNT ($000) | VALUE ($000) |
Municipal Bonds — continued | ||
Massachusetts — 0.7% | ||
Massachusetts Health and Educational Facilities Authority, Capital Asset Program | ||
Series 2002M-2, Rev., VRDO, LOC : Bank of America NA, 4.20%, 9/8/2023 (a) | 440 | 440 |
Series 2004M-4A, Rev., VRDO, LOC : Bank of America NA, 4.22%, 9/8/2023 (a) | 350 | 350 |
Massachusetts Housing Finance Agency, Single Family Housing | ||
Series 196, Rev., VRDO, LIQ : UBS AG, 4.04%, 9/8/2023 (a) | 11,800 | 11,800 |
Series 200, Rev., VRDO, LIQ : UBS AG, 4.04%, 9/8/2023 (a) | 4,900 | 4,900 |
Series 204, Rev., VRDO, LIQ : UBS AG, 4.04%, 9/8/2023 (a) | 10,000 | 10,000 |
Series 208, Rev., VRDO, LIQ : Royal Bank of Canada, 4.05%, 9/8/2023 (a) | 3,400 | 3,400 |
Massachusetts Transportation Trust Fund Metropolitan Highway System, Commonwealth Contract Assistance Secured, Subordinated Series 2022A-3, Rev., VRDO, LIQ : US Bank NA, 3.85%, 9/8/2023 (a) | 12,450 | 12,450 |
RBC Municipal Products, Inc. Trust, Floater Certificates | ||
Series E-144, GO, RAN, VRDO, LOC : Royal Bank of Canada, 4.09%, 9/8/2023 (a) (b) | 18,800 | 18,800 |
Series E-148, GO, VRDO, LOC : Royal Bank of Canada, 4.09%, 9/8/2023 (a) (b) | 10,000 | 10,000 |
Tender Option Bond Trust Receipts/Certificates Series 2018-XF2692, Rev., VRDO, LIQ : Citibank NA, 4.07%, 9/8/2023 (a) (b) | 4,190 | 4,190 |
76,330 | ||
Michigan — 2.2% | ||
Michigan State Housing Development Authority, Rental Housing | ||
Series 2016C, Rev., AMT, VRDO, LIQ : TD Bank NA, 4.05%, 9/8/2023 (a) | 26,635 | 26,635 |
Series 2000A, Rev., AMT, VRDO, LIQ : FHLB, 4.08%, 9/8/2023 (a) | 9,215 | 9,215 |
Series 2016E, Rev., AMT, VRDO, LIQ : UBS AG, 4.08%, 9/8/2023 (a) | 4,150 | 4,150 |
Series 2022B, Rev., VRDO, LOC : Bank of America NA, 4.12%, 9/8/2023 (a) | 37,400 | 37,400 |
Michigan State Housing Development Authority, Single Family Mortgage | ||
Series 2006C, Rev., VRDO, LIQ : TD Bank NA, 4.00%, 9/8/2023 (a) | 22,305 | 22,305 |
INVESTMENTS †† | PRINCIPAL AMOUNT ($000) | VALUE ($000) |
Michigan — continued | ||
Series 2009D, Rev., VRDO, LIQ : TD Bank NA, 4.00%, 9/8/2023 (a) | 8,420 | 8,420 |
Series 2022B, Rev., VRDO, LOC : Barclays Bank plc, 4.05%, 9/8/2023 (a) | 30,000 | 30,000 |
Series 2007E, Rev., AMT, VRDO, LIQ : Royal Bank of Canada, 4.08%, 9/8/2023 (a) | 18,010 | 18,010 |
RIB Floater Trust Various States | ||
Series 2022-048, Rev., VRDO, LIQ : Barclays Bank plc, 4.07%, 9/1/2023 (a) (b) | 27,695 | 27,695 |
Series 46, Rev., VRDO, LOC : Barclays Bank plc, 4.07%, 9/1/2023 (a) (b) | 17,950 | 17,950 |
University of Michigan | ||
Series 2012D-1, Rev., VRDO, 3.75%, 9/1/2023 (a) | 6,485 | 6,485 |
Series 2008A, Rev., VRDO, LIQ : Wells Fargo Bank NA, 3.76%, 9/1/2023 (a) | 18,000 | 18,000 |
Series 2012B, Rev., VRDO, 3.85%, 9/1/2023 (a) | 10 | 10 |
226,275 | ||
Minnesota — 1.2% | ||
City of Minneapolis, University Gateway Corp., Rev., VRDO, LIQ : Wells Fargo Bank NA, 4.05%, 9/8/2023 (a) | 3,790 | 3,790 |
City of Oakdale, Housing Cottage Homesteads, Rev., VRDO, LOC : FHLMC, 4.08%, 9/8/2023 (a) | 4,785 | 4,785 |
City of Rochester, Health Care Facilities, Mayo Clinic, Rev., VRDO, 4.17%, 9/8/2023 (a) | 1,300 | 1,300 |
City of Rochester, Mayo Clinic Series 2011B, Rev., VRDO, 4.20%, 9/8/2023 (a) | 32,025 | 32,025 |
County of Hennepin Series 2018B, GO, VRDO, LIQ : TD Bank NA, 4.05%, 9/8/2023 (a) | 12,200 | 12,200 |
Minnesota Higher Education Facilities Authority, Concordia University, St. Paul Series 6Q, Rev., VRDO, LOC : US Bank NA, 4.15%, 9/1/2023 (a) | 5,420 | 5,420 |
Minnesota Housing Finance Agency, Residential Housing Finance | ||
Series 2015G, Rev., AMT, VRDO, GNMA / FNMA / FHLMC, LIQ : Royal Bank of Canada, 4.05%, 9/8/2023 (a) | 3,535 | 3,535 |
Series 2017F, Rev., AMT, VRDO, GNMA / FNMA / FHLMC, LIQ : Royal Bank of Canada, 4.05%, 9/8/2023 (a) | 25,010 | 25,010 |
Series 2019D, Rev., VRDO, GNMA / FNMA / FHLMC, LIQ : Royal Bank of Canada, 4.05%, 9/8/2023 (a) | 22,000 | 22,000 |
August 31, 2023 | J.P. Morgan Money Market Funds | 64 |
AS OF August 31, 2023 (Unaudited) (continued)
INVESTMENTS †† | PRINCIPAL AMOUNT ($000) | VALUE ($000) |
Municipal Bonds — continued | ||
Minnesota — continued | ||
Series 2015D, Rev., AMT, VRDO, GNMA / FNMA / FHLMC, LIQ : Royal Bank of Canada, 4.08%, 9/8/2023 (a) | 3,760 | 3,760 |
Series 2016F, Rev., AMT, VRDO, GNMA / FNMA / FHLMC COLL, LIQ : FHLB, 4.10%, 9/8/2023 (a) | 6,860 | 6,860 |
Series 2017C, Rev., AMT, VRDO, GNMA / FNMA / FHLMC COLL, LIQ : FHLB, 4.10%, 9/8/2023 (a) | 3,800 | 3,800 |
124,485 | ||
Mississippi — 2.4% | ||
Mississippi Business Finance Corp., Chevron USA, Inc. Project Series 2007D, Rev., VRDO, 3.90%, 9/1/2023 (a) | 50,300 | 50,300 |
Mississippi Business Finance Corp., Gulf Opportunity Zone Industrial Development, Chevron USA, Inc., Project | ||
Series 2007B, Rev., VRDO, 3.80%, 9/1/2023 (a) | 17,450 | 17,450 |
Series 2007C, Rev., VRDO, 3.80%, 9/1/2023 (a) | 30,440 | 30,440 |
Series 2007E, Rev., VRDO, 3.80%, 9/1/2023 (a) | 32,220 | 32,220 |
Series 2009A, Rev., VRDO, 3.80%, 9/1/2023 (a) | 4,040 | 4,040 |
Series 2009B, Rev., VRDO, 3.80%, 9/1/2023 (a) | 5,905 | 5,905 |
Series 2009C, Rev., VRDO, 3.80%, 9/1/2023 (a) | 5,450 | 5,450 |
Series 2009F, Rev., VRDO, 3.80%, 9/1/2023 (a) | 3,450 | 3,450 |
Series 2009G, Rev., VRDO, 3.80%, 9/1/2023 (a) | 13,255 | 13,255 |
Series 2011G, Rev., VRDO, 3.80%, 9/1/2023 (a) | 3,015 | 3,015 |
Series 2009D, Rev., VRDO, 3.90%, 9/1/2023 (a) | 852 | 852 |
Series 2011F, Rev., VRDO, 3.90%, 9/1/2023 (a) | 3,100 | 3,100 |
Series 2010L, Rev., VRDO, 4.00%, 9/1/2023 (a) | 1,100 | 1,100 |
Series 2011B, Rev., VRDO, 4.00%, 9/1/2023 (a) | 5,740 | 5,740 |
Series 2011C, Rev., VRDO, 4.00%, 9/1/2023 (a) | 740 | 740 |
Series 2011D, Rev., VRDO, 4.00%, 9/1/2023 (a) | 3,175 | 3,175 |
INVESTMENTS †† | PRINCIPAL AMOUNT ($000) | VALUE ($000) |
Mississippi — continued | ||
Series 2010A, Rev., VRDO, 4.08%, 9/8/2023 (a) | 29,435 | 29,435 |
Series 2010C, Rev., VRDO, 4.13%, 9/8/2023 (a) | 21,015 | 21,015 |
Series 2010D, Rev., VRDO, 4.13%, 9/8/2023 (a) | 650 | 650 |
Series 2010E, Rev., VRDO, 4.13%, 9/8/2023 (a) | 11,275 | 11,275 |
Mississippi Development Bank, Jackson County Industrial Water System Project Series 2009, Rev., VRDO, 3.80%, 9/1/2023 (a) | 3,345 | 3,345 |
245,952 | ||
Missouri — 2.4% | ||
Health and Educational Facilities Authority of the State of Missouri Series 2003B, Rev., VRDO, LIQ : US Bank NA, 4.20%, 9/1/2023 (a) | 6,900 | 6,900 |
Health and Educational Facilities Authority of the State of Missouri, BJC Health System | ||
Series C, Rev., VRDO, LIQ : BJC Health System, 4.00%, 9/8/2023 (a) | 44,295 | 44,295 |
Series 2008A, Rev., VRDO, LIQ : US Bank NA, 4.05%, 9/8/2023 (a) | 48,765 | 48,765 |
Health and Educational Facilities Authority of the State of Missouri, Ranken Technical College Series 2011B, Rev., VRDO, LOC : Northern Trust Co. (The), 3.93%, 9/1/2023 (a) | 400 | 400 |
Health and Educational Facilities Authority of the State of Missouri, SSM Health Care Corp. | ||
Series 2018F, Rev., VRDO, 3.95%, 9/1/2023 (a) | 6,070 | 6,070 |
Series 2014F, Rev., VRDO, 4.25%, 9/8/2023 (a) | 37,645 | 37,645 |
Health and Educational Facilities Authority of the State of Missouri, St. Louis University | ||
Series 2008B, Rev., VRDO, LOC : Wells Fargo Bank NA, 3.75%, 9/1/2023 (a) | 4,500 | 4,500 |
Series 1999B, Rev., VRDO, LOC : US Bank NA, 4.20%, 9/1/2023 (a) | 9,215 | 9,215 |
Industrial Development Authority of the City of St. Louis Missouri (The), Mid-America Transplant Services Project, Rev., VRDO, LOC : BMO Harris Bank NA, 4.15%, 9/1/2023 (a) | 6,470 | 6,470 |
Industrial Development Authority of the City of St. Louis Missouri (The), St. Luke's Preservation Partners LP, Rev., VRDO, LOC : FHLMC, 4.05%, 9/8/2023 (a) | 1,550 | 1,550 |
65 | J.P. Morgan Money Market Funds | August 31, 2023 |
INVESTMENTS †† | PRINCIPAL AMOUNT ($000) | VALUE ($000) |
Municipal Bonds — continued | ||
Missouri — continued | ||
Missouri Development Finance Board, Cultural Facilities, Kauffman Center for The Performing Arts Project Series 2007A, Rev., VRDO, LIQ : PNC Bank NA, 4.15%, 9/1/2023 (a) | 2,500 | 2,500 |
RBC Municipal Products, Inc. Trust, Floater Certificates | ||
Series C17, Rev., VRDO, LOC : Royal Bank of Canada, 4.10%, 9/8/2023 (a) (b) | 14,000 | 14,000 |
Series C-16, Rev., VRDO, LOC : Royal Bank of Canada, 4.11%, 9/8/2023 (a) (b) | 43,250 | 43,250 |
Tender Option Bond Trust Receipts/Certificates | ||
Series 2022-XG0382, Rev., VRDO, LIQ : Wells Fargo Bank NA, 4.09%, 9/8/2023 (a) (b) | 10,640 | 10,640 |
Series 2022-YX1193, Rev., VRDO, LOC : Barclays Bank plc, 4.10%, 9/8/2023 (a) (b) | 6,605 | 6,605 |
242,805 | ||
Nebraska — 0.4% | ||
County of Washington, Cargill, Inc., Recovery Zone Facility Project Series 2010B, Rev., VRDO, 4.09%, 9/8/2023 (a) | 9,800 | 9,800 |
Douglas County Hospital Authority No. 2, Health Facilities Series 2008-A, Rev., VRDO, LOC : US Bank NA, 3.95%, 9/1/2023 (a) | 10,950 | 10,950 |
Tender Option Bond Trust Receipts/Certificates | ||
Series 2022-XX1253, Rev., VRDO, LIQ : Barclays Bank plc, 4.09%, 9/8/2023 (a) (b) | 4,670 | 4,670 |
Series 2023-XL0415, Rev., VRDO, LIQ : Barclays Bank plc, 4.09%, 9/8/2023 (a) (b) | 9,180 | 9,180 |
Series 2021-XL0174, Rev., VRDO, LIQ : Bank of America NA, 4.11%, 9/8/2023 (a) (b) | 4,165 | 4,165 |
38,765 | ||
Nevada — 0.2% | ||
County of Clark, Industrial Development, Southwest Gas Corp. Project Series 2003A, Rev., AMT, VRDO, LOC : Wells Fargo Bank NA, 4.35%, 9/8/2023 (a) | 8,200 | 8,200 |
Tender Option Bond Trust Receipts/Certificates | ||
Series 2020-XM0866, Rev., VRDO, LOC : Royal Bank of Canada, 4.09%, 9/8/2023 (a) (b) | 5,000 | 5,000 |
Series 2023-XG0511, GO, VRDO, LIQ : Bank of America NA, 4.09%, 9/8/2023 (a) (b) | 9,000 | 9,000 |
22,200 | ||
New Hampshire — 0.2% | ||
Tender Option Bond Trust Receipts/Certificates Series 2022-YX1190, Rev., VRDO, LIQ : Barclays Bank plc, 4.09%, 9/8/2023 (a) (b) | 21,715 | 21,715 |
INVESTMENTS †† | PRINCIPAL AMOUNT ($000) | VALUE ($000) |
New Jersey — 1.6% | ||
Borough of Glassboro Series 2023A, GO, BAN, 5.00%, 8/16/2024 | 8,755 | 8,871 |
Borough of South Plainfield,Pool Sewer Utility Series 2023B, GO, BAN, 4.25%, 8/15/2024 | 9,505 | 9,563 |
City of Hackensack,Improvement Parking Utility, GO, BAN, 4.25%, 5/28/2024 | 17,808 | 17,897 |
City of Rahway, General Water Utility, GO, BAN, 5.00%, 7/26/2024 | 11,345 | 11,488 |
New Jersey Health Care Facilities Financing Authority, Hospital Capital Asset Financing Program Series 1985A, Rev., VRDO, LOC : TD Bank NA, 4.01%, 9/8/2023 (a) | 17,525 | 17,525 |
RIB Floater Trust Various States | ||
Series 43, Rev., VRDO, LIQ : Barclays Bank plc, 4.06%, 9/1/2023 (a) (b) | 2,660 | 2,660 |
Series 2023-005, GO, BAN, VRDO, LIQ : Barclays Bank plc, 4.10%, 9/1/2023 (a) (b) | 19,070 | 19,070 |
Series 20, Rev., VRDO, LIQ : Barclays Bank plc, 4.12%, 9/8/2023 (a) (b) | 40,000 | 40,000 |
Tender Option Bond Trust Receipts/Certificates | ||
Series 2018-XX1093, Rev., VRDO, LOC : Barclays Bank plc, 4.10%, 9/8/2023 (a) (b) | 9,300 | 9,300 |
Series 2022-YX1256, Rev., VRDO, LOC : Barclays Bank plc, 4.10%, 9/8/2023 (a) (b) | 6,060 | 6,060 |
Township of Lacey Series 2023A, GO, BAN, 5.00%, 5/9/2024 | 9,038 | 9,140 |
Township of Monroe Series 2023A, GO, BAN, 4.25%, 9/11/2024 (c) | 17,499 | 17,595 |
169,169 | ||
New Mexico — 0.1% | ||
New Mexico Mortgage Finance Authority, Multi-Family Housing Series 2008B, Rev., VRDO, LOC : FHLMC, 4.05%, 9/8/2023 (a) | 2,675 | 2,675 |
University of New Mexico (The), Subordinate Lien System | ||
Rev., VRDO, LIQ : US Bank NA, 3.85%, 9/8/2023 (a) | 1,960 | 1,960 |
Series 2002C, Rev., VRDO, LIQ : US Bank NA, 3.85%, 9/8/2023 (a) | 10,855 | 10,855 |
15,490 | ||
New York — 10.3% | ||
Altmar-Parish-Williamstown Central School District, GO, BAN, 4.25%, 8/16/2024 | 15,000 | 15,094 |
Battery Park City Authority | ||
Series 2019D-1, Rev., VRDO, LIQ : TD Bank NA, 4.00%, 9/8/2023 (a) | 5,300 | 5,300 |
August 31, 2023 | J.P. Morgan Money Market Funds | 66 |
AS OF August 31, 2023 (Unaudited) (continued)
INVESTMENTS †† | PRINCIPAL AMOUNT ($000) | VALUE ($000) |
Municipal Bonds — continued | ||
New York — continued | ||
Series 2019D-2, Rev., VRDO, LIQ : TD Bank NA, 4.00%, 9/8/2023 (a) | 2,620 | 2,620 |
City of New York, Fiscal Year 2006 | ||
Series 2006, Subseries I-4, GO, VRDO, LOC : TD Bank NA, 3.90%, 9/1/2023 (a) | 21,845 | 21,845 |
Series 2006I, GO, VRDO, LIQ : State Street Bank & Trust Co., 4.00%, 9/1/2023 (a) | 27,600 | 27,600 |
City of New York, Fiscal Year 2012 | ||
Series 2012, Subseries G-6, GO, VRDO, LOC : Mizuho Bank Ltd., 3.89%, 9/1/2023 (a) | 62,695 | 62,695 |
Series 2012D-3A, GO, VRDO, LIQ : Bank of New York Mellon (The), 3.97%, 9/1/2023 (a) | 3,800 | 3,800 |
Series 2012A-4, GO, VRDO, LOC : Sumitomo Mitsui Banking Corp., 4.05%, 9/8/2023 (a) | 39,140 | 39,140 |
City of New York, Fiscal Year 2013 | ||
Series 2013F-3, GO, VRDO, LIQ : Bank of America NA, 3.92%, 9/1/2023 (a) | 3,000 | 3,000 |
Series 2013, Subseries A-2, GO, VRDO, LOC : Mizuho Bank Ltd., 4.00%, 9/1/2023 (a) | 21,700 | 21,700 |
Series 2013A-3, GO, VRDO, LOC : Mizuho Bank Ltd., 4.00%, 9/1/2023 (a) | 10,330 | 10,330 |
City of New York, Fiscal Year 2015 Series 2015F-5, GO, VRDO, LIQ : Barclays Bank plc, 3.95%, 9/1/2023 (a) | 24,200 | 24,200 |
City of New York, Fiscal Year 2017 Series 2017, Subseries A-7, GO, VRDO, LOC : Bank of the West, 3.99%, 9/1/2023 (a) | 6,295 | 6,295 |
City of New York, Fiscal Year 2018 | ||
Series 2018E, GO, VRDO, LOC : TD Bank NA, 3.90%, 9/1/2023 (a) | 14,710 | 14,710 |
Series B, Subseries B-5, GO, VRDO, LIQ : Barclays Bank plc, 3.95%, 9/1/2023 (a) | 20,430 | 20,430 |
City of New York, Fiscal Year 2022 Subseries D-4, GO, VRDO, LIQ : State Street Bank & Trust Co., 4.05%, 9/1/2023 (a) | 19,600 | 19,600 |
City of New York, Fiscal Year 2023 Series 2023A, Subseries A-4, GO, VRDO, LIQ : TD Bank NA, 3.90%, 9/1/2023 (a) | 665 | 665 |
Gloversville Enlarged School District, GO, BAN, 4.75%, 6/27/2024 | 31,650 | 31,928 |
Hamilton Central School District, GO, BAN, 4.75%, 7/5/2024 | 13,943 | 14,057 |
Metropolitan Transportation Authority | ||
Series 2015, Subseries E-1, Rev., VRDO, LOC : Barclays Bank plc, 3.95%, 9/1/2023 (a) | 26,090 | 26,090 |
Subseries 2012G-2, Rev., VRDO, LOC : TD Bank NA, 4.00%, 9/8/2023 (a) | 31,610 | 31,610 |
INVESTMENTS †† | PRINCIPAL AMOUNT ($000) | VALUE ($000) |
New York — continued | ||
Metropolitan Transportation Authority, Dedicated Tax Fund | ||
Series 2008A-1, Rev., VRDO, LOC : TD Bank NA, 3.90%, 9/1/2023 (a) | 32,865 | 32,865 |
Series 2008A-2B, Rev., VRDO, LOC : PNC Bank NA, 4.04%, 9/8/2023 (a) | 13,900 | 13,900 |
New York City Housing Development Corp., Multi-Family Rental Housing, West 89th Street Development Series 2006A, Rev., VRDO, LOC : FNMA, 3.85%, 9/8/2023 (a) | 4,000 | 4,000 |
New York City Municipal Water Finance Authority Series 2003F-2, Rev., VRDO, LOC : Citibank NA, 4.25%, 9/1/2023 (a) | 10,260 | 10,260 |
New York City Municipal Water Finance Authority, Second General Resolution Series DD-1, Rev., VRDO, LIQ : TD Bank NA, 3.90%, 9/1/2023 (a) | 4,675 | 4,675 |
New York City Municipal Water Finance Authority, Second General Resolution, Fiscal Year 2008 | ||
Series 2008BB-5, Rev., VRDO, LIQ : Bank of America NA, 3.85%, 9/1/2023 (a) | 2,610 | 2,610 |
Series 2008BB-2, Rev., VRDO, LIQ : Bank of America NA, 3.92%, 9/1/2023 (a) | 365 | 365 |
New York City Municipal Water Finance Authority, Second General Resolution, Fiscal Year 2011 Series DD-3B, Rev., VRDO, LIQ : State Street Bank & Trust Co., 4.25%, 9/1/2023 (a) | 7,000 | 7,000 |
New York City Municipal Water Finance Authority, Second General Resolution, Fiscal Year 2013 Series 2013AA-1, Rev., VRDO, LIQ : PNC Bank NA, 4.05%, 9/8/2023 (a) | 1,165 | 1,165 |
New York City Municipal Water Finance Authority, Second General Resolution, Fiscal Year 2019 Series BB, Rev., VRDO, LIQ : TD Bank NA, 4.00%, 9/8/2023 (a) | 59,175 | 59,175 |
New York City Municipal Water Finance Authority, Second Generation, Fiscal Year 2008 Series 2008BB-1, Rev., VRDO, LIQ : TD Bank NA, 4.00%, 9/8/2023 (a) | 22,545 | 22,545 |
New York City Municipal Water Finance Authority, Water and Sewer System, Second General Resolution Series 2009BB-2, Rev., VRDO, LIQ : UBS AG, 4.05%, 9/1/2023 (a) | 8,235 | 8,235 |
New York City Municipal Water Finance Authority, Water and Sewer System, Second General Resolution, Fiscal Year 2011 Series 2011FF-1, Rev., VRDO, LIQ : Bank of America NA, 3.92%, 9/1/2023 (a) | 3,900 | 3,900 |
67 | J.P. Morgan Money Market Funds | August 31, 2023 |
INVESTMENTS †† | PRINCIPAL AMOUNT ($000) | VALUE ($000) |
Municipal Bonds — continued | ||
New York — continued | ||
New York City Municipal Water Finance Authority, Water and Sewer System, Second General Resolution, Fiscal year 2014 Series 2014AA-3, Rev., VRDO, LIQ : TD Bank NA, 3.90%, 9/1/2023 (a) | 39,910 | 39,910 |
New York City Municipal Water Finance Authority, Water and Sewer System, Second General Resolution, Fiscal Year 2021 Series 2021EE-1, Rev., VRDO, LIQ : US Bank NA, 4.25%, 9/1/2023 (a) | 13,075 | 13,075 |
New York City Municipal Water Finance Authority, Water and Sewer System, Second General Resolution, Fiscal Year 2023 Series 2023CC, Rev., VRDO, LIQ : Barclays Bank plc, 3.95%, 9/1/2023 (a) | 30,635 | 30,635 |
New York City Transitional Finance Authority, Future Tax Secured | ||
Series 2015E-4, Rev., VRDO, LIQ : Bank of America NA, 3.92%, 9/1/2023 (a) | 5,700 | 5,700 |
Series A-4, Rev., VRDO, LIQ : Mizuho Bank Ltd., 3.95%, 9/1/2023 (a) | 56,025 | 56,025 |
Series B-5, Rev., VRDO, LIQ : US Bank NA, 4.25%, 9/1/2023 (a) | 6,950 | 6,950 |
New York City Transitional Finance Authority, Future Tax Secured, Fiscal Year 2013 Series 2013C-5, Rev., VRDO, LOC : Sumitomo Mitsui Banking Corp., 4.00%, 9/8/2023 (a) | 6,290 | 6,290 |
New York City Transitional Finance Authority, Future Tax Secured, Fiscal Year 2015 Series 2015A-3, Rev., VRDO, LIQ : Mizuho Bank Ltd., 3.98%, 9/1/2023 (a) | 4,000 | 4,000 |
New York City Transitional Finance Authority, Future Tax Secured, Fiscal Year 2019 Series 2019C-4, Rev., VRDO, LIQ : Barclays Bank plc, 3.95%, 9/1/2023 (a) | 18,490 | 18,490 |
New York State Housing Finance Agency, 10 Barclay Street Series 2004A, Rev., VRDO, LOC : FNMA, 4.00%, 9/8/2023 (a) | 20,700 | 20,700 |
RBC Municipal Products, Inc. Trust, Floater Certificates | ||
Series E-118, GO, VRDO, LOC : Royal Bank of Canada, 4.05%, 9/1/2023 (a) (b) | 71,975 | 71,975 |
Series E-120, Rev., VRDO, LOC : Royal Bank of Canada, 4.05%, 9/1/2023 (a) (b) | 19,800 | 19,800 |
Series E-124, Rev., VRDO, LOC : Royal Bank of Canada, 4.05%, 9/1/2023 (a) (b) | 17,605 | 17,605 |
Series 2018-E129, Rev., VRDO, LOC : Royal Bank of Canada, 4.09%, 9/6/2023 (a) (b) | 35,000 | 35,000 |
INVESTMENTS †† | PRINCIPAL AMOUNT ($000) | VALUE ($000) |
New York — continued | ||
Series E-146, Rev., VRDO, LOC : Royal Bank of Canada, 4.09%, 9/8/2023 (a) (b) | 46,325 | 46,325 |
Series E-86, GO, VRDO, LOC : Royal Bank of Canada, 4.09%, 9/8/2023 (a) (b) | 19,165 | 19,165 |
Series E-87, GO, VRDO, LOC : Royal Bank of Canada, 4.09%, 9/8/2023 (a) (b) | 14,600 | 14,600 |
Series E-88, GO, VRDO, LOC : Royal Bank of Canada, 4.09%, 9/8/2023 (a) (b) | 25,835 | 25,835 |
Series 2018-E126, Rev., VRDO, LOC : Royal Bank of Canada, 4.11%, 9/8/2023 (a) (b) | 12,150 | 12,150 |
Schalmont Central School District, GO, BAN, 5.00%, 6/21/2024 | 16,123 | 16,298 |
Tender Option Bond Trust Receipts/Certificates | ||
Series 2022-XF1420, Rev., VRDO, LIQ : Bank of America NA, 4.09%, 9/8/2023 (a) (b) | 4,800 | 4,800 |
Series 2022-XF1444, GO, VRDO, LIQ : Bank of America NA, 4.09%, 9/8/2023 (a) (b) | 1,875 | 1,875 |
Series 2022-XM1009, Rev., VRDO, LIQ : Bank of America NA, 4.09%, 9/8/2023 (a) (b) | 4,445 | 4,445 |
Series 2023-XL0441, GO, VRDO, LIQ : Royal Bank of Canada, 4.09%, 9/8/2023 (a) (b) | 3,800 | 3,800 |
1,068,852 | ||
North Carolina — 1.2% | ||
City of Raleigh, Downtown Improvement Projects | ||
Series 2005-B-1, COP, VRDO, LIQ : PNC Bank NA, 4.20%, 9/8/2023 (a) | 36,685 | 36,685 |
Series 2005B-2, COP, VRDO, LIQ : PNC Bank NA, 4.20%, 9/8/2023 (a) | 23,575 | 23,575 |
Durham County Industrial Facilities and Pollution Control Financing Authority, Research Triangle, Rev., VRDO, LOC : TD Bank NA, 4.02%, 9/8/2023 (a) | 5,425 | 5,425 |
Lower Cape Fear Water and Sewer Authority, Bladen Bluffs Project, Rev., VRDO, LOC : Cooperatieve Rabobank, 4.23%, 9/8/2023 (a) | 13,445 | 13,445 |
North Carolina Medical Care Commission, Catholic Health, Rev., VRDO, 4.28%, 9/8/2023 (a) | 2,000 | 2,000 |
Person County Industrial Facilities and Pollution Control Financing Authority, Recovery Zone Facility, Certainteed Gypsum, Inc., Rev., VRDO, LOC : Credit Industriel et Commercial, 4.18%, 9/8/2023 (a) | 23,985 | 23,985 |
August 31, 2023 | J.P. Morgan Money Market Funds | 68 |
AS OF August 31, 2023 (Unaudited) (continued)
INVESTMENTS †† | PRINCIPAL AMOUNT ($000) | VALUE ($000) |
Municipal Bonds — continued | ||
North Carolina — continued | ||
Raleigh Durham Airport Authority Series 2008C, Rev., VRDO, LOC : TD Bank NA, 4.03%, 9/8/2023 (a) | 15,720 | 15,720 |
University of North Carolina, Hospital at Chapel Hill Series 2003B, Rev., VRDO, LIQ : TD Bank NA, 4.00%, 9/8/2023 (a) | 1,970 | 1,970 |
122,805 | ||
North Dakota — 0.3% | ||
North Dakota Housing Finance Agency, Home Mortgage Finance Program | ||
Series 2017H, Rev., VRDO, LIQ : Royal Bank of Canada, 4.05%, 9/8/2023 (a) | 18,930 | 18,930 |
Series 2015C, Rev., VRDO, LIQ : TD Bank NA, 4.06%, 9/8/2023 (a) | 8,400 | 8,400 |
27,330 | ||
Ohio — 2.9% | ||
City of Blue Ash, Economic Development, Ursuline Academy of Cincinnati Project, Rev., VRDO, LOC : PNC Bank NA, 4.48%, 9/8/2023 (a) | 4,285 | 4,285 |
County of Allen Hospital Facilities,Catholic Healthcare Series 2010C, Rev., VRDO, LOC : Bank of Montreal, 4.00%, 9/1/2023 (a) | 19,840 | 19,840 |
Ohio Higher Educational Facility Commission, Cleveland Clinic Health System | ||
Series 2013B-2, Rev., VRDO, LIQ : TD Bank NA, 3.90%, 9/1/2023 (a) | 29,625 | 29,625 |
Series 2008B-4, Rev., VRDO, LIQ : Barclays Bank plc, 3.95%, 9/1/2023 (a) | 21,160 | 21,160 |
Series 2013B-3, Rev., VRDO, LIQ : US Bank NA, 4.15%, 9/1/2023 (a) | 3,150 | 3,150 |
Ohio State University (The) | ||
Series 2014B-2, Rev., VRDO, 4.05%, 9/7/2023 (a) | 18,155 | 18,155 |
Series 2014B-2, Rev., VRDO, 4.05%, 9/7/2023 (a) | 11,700 | 11,700 |
Ohio Water Development Authority, Water Pollution Control Loan Fund Series 2016A, Rev., VRDO, LIQ : TD Bank NA, 4.00%, 9/8/2023 (a) | 70,935 | 70,935 |
RBC Municipal Products, Inc. Trust, Floater Certificates | ||
Series 2019-E134, Rev., VRDO, LOC : Royal Bank of Canada, 4.09%, 9/8/2023 (a) (b) | 21,170 | 21,170 |
Series E132, Rev., VRDO, LOC : Royal Bank of Canada, 4.09%, 9/8/2023 (a) (b) | 42,350 | 42,350 |
Series C-18, Rev., VRDO, LOC : Royal Bank of Canada, 4.10%, 9/8/2023 (a) (b) | 8,000 | 8,000 |
INVESTMENTS †† | PRINCIPAL AMOUNT ($000) | VALUE ($000) |
Ohio — continued | ||
State of Ohio, Capital Facilities Lease Appropriation Park and Recreation Improvement Fund Projects Series 2020B, Rev., VRDO, 4.00%, 9/8/2023 (a) | 32,615 | 32,615 |
State of Ohio, University Hospitals Health System, Inc. Series 2018B, Rev., VRDO, LOC : PNC Bank NA, 4.04%, 9/8/2023 (a) | 5,470 | 5,470 |
Tender Option Bond Trust Receipts/Certificates Series 2022-XX1247, Rev., VRDO, LOC : Barclays Bank plc, 4.09%, 9/8/2023 (a) (b) | 11,250 | 11,250 |
299,705 | ||
Oklahoma — 0.6% | ||
RBC Municipal Products, Inc. Trust, Floater Certificates Series E-140, Rev., VRDO, LOC : Royal Bank of Canada, 4.09%, 9/8/2023 (a) (b) | 24,610 | 24,610 |
Tender Option Bond Trust Receipts/Certificates Series 2022-XX1224, Rev., VRDO, LOC : Barclays Bank plc, 4.18%, 9/8/2023 (a) (b) | 33,400 | 33,400 |
58,010 | ||
Oregon — 0.1% | ||
Oregon State Facilities Authority, Peacehealth Series 2018B, Rev., VRDO, LOC : TD Bank NA, 3.93%, 9/1/2023 (a) | 1,020 | 1,020 |
State of Oregon Housing and Community Services Department Series 2020B, Rev., VRDO, LOC : Sumitomo Mitsui Banking Corp., 4.22%, 9/8/2023 (a) | 700 | 700 |
State of Oregon, Veterans Welfare | ||
Series 2020J, GO, VRDO, LIQ : US Bank NA, 4.20%, 9/1/2023 (a) | 1,540 | 1,540 |
Series 2020M, GO, VRDO, LIQ : US Bank NA, 4.20%, 9/1/2023 (a) | 2,500 | 2,500 |
Tender Option Bond Trust Receipts/Certificates Series 2023-XF3102, Rev., VRDO, LIQ : Wells Fargo Bank NA, 4.14%, 9/8/2023 (a) (b) | 7,405 | 7,405 |
13,165 | ||
Other — 1.8% | ||
FHLMC, Multi-Family VRD Certificates | ||
Series M017, Rev., VRDO, LIQ : FHLMC, 4.09%, 9/8/2023 (a) (b) | 150,253 | 150,253 |
Series M028, Rev., VRDO, LIQ : FHLMC, 4.14%, 9/8/2023 (a) (b) | 15,445 | 15,445 |
Series M019, Rev., VRDO, LIQ : FHLMC, 4.50%, 9/8/2023 (a) (b) | 2,796 | 2,796 |
69 | J.P. Morgan Money Market Funds | August 31, 2023 |
INVESTMENTS †† | PRINCIPAL AMOUNT ($000) | VALUE ($000) |
Municipal Bonds — continued | ||
Other — continued | ||
Series M025, Rev., VRDO, LIQ : FHLMC, 4.63%, 9/8/2023 (a) (b) | 5,630 | 5,630 |
Series M026, Rev., VRDO, LIQ : FHLMC, 4.63%, 9/8/2023 (a) (b) | 10,265 | 10,265 |
184,389 | ||
Pennsylvania — 3.3% | ||
County of Allegheny | ||
Series 2000C-50, GO, VRDO, LOC : PNC Bank NA, 4.04%, 9/8/2023 (a) | 12,260 | 12,260 |
Series C-51, GO, VRDO, LOC : PNC Bank NA, 4.04%, 9/8/2023 (a) | 9,710 | 9,710 |
Delaware Valley Regional Finance Authority, Local Government | ||
Series 2020D, Rev., VRDO, LOC : TD Bank NA, 4.00%, 9/8/2023 (a) | 26,510 | 26,510 |
Series 2022E, Rev., VRDO, LOC : TD Bank NA, 4.00%, 9/8/2023 (a) | 12,500 | 12,500 |
General Authority of Southcentral Pennsylvania, WellSpan Health Obligated Group Series D, Rev., VRDO, LIQ : Bank of America NA, 4.05%, 9/1/2023 (a) | 1,075 | 1,075 |
General Authority of Southcentral Pennsylvania, Wellspan Health Obligation Series 2019E, Rev., VRDO, LIQ : US Bank NA, 4.25%, 9/1/2023 (a) | 30,000 | 30,000 |
Montgomery County Redevelopment Authority, Multi-Family Housing, Brookside Manors Apartments Project Series 2001A, Rev., VRDO, LOC : FNMA, 4.09%, 9/8/2023 (a) | 15,210 | 15,210 |
Montgomery County Redevelopment Authority, Multi-Family Housing, Kingswood Apartments Project Series 2001A, Rev., VRDO, LOC : FNMA, 4.15%, 9/8/2023 (a) | 15,220 | 15,220 |
Pennsylvania Higher Educational Facilities Authority, Susquehanna University Project Series 2001H-9, Rev., VRDO, LOC : PNC Bank NA, 4.04%, 9/8/2023 (a) | 2,600 | 2,600 |
Pennsylvania Higher Educational Facilities Authority, University of Pennsylvania Health System Series 2008A, Rev., VRDO, LOC : Bank of America NA, 4.09%, 9/8/2023 (a) | 39,885 | 39,885 |
Pennsylvania Housing Finance Agency, Single Family Mortgage Series 2020-132B, Rev., VRDO, LIQ : TD Bank NA, 4.00%, 9/8/2023 (a) | 12,075 | 12,075 |
Pennsylvania Turnpike Commission | ||
Rev., VRDO, LOC : TD Bank NA, 4.01%, 9/8/2023 (a) | 40,625 | 40,625 |
Series 2019, Rev., VRDO, LOC : TD Bank NA, 4.01%, 9/8/2023 (a) | 44,870 | 44,870 |
INVESTMENTS †† | PRINCIPAL AMOUNT ($000) | VALUE ($000) |
Pennsylvania — continued | ||
Philadelphia Gas Works Co. | ||
Series 8B, Rev., VRDO, LOC : TD Bank NA, 4.01%, 9/8/2023 (a) | 18,115 | 18,115 |
Series 8D, Rev., VRDO, LOC : TD Bank NA, 4.01%, 9/8/2023 (a) | 3,560 | 3,560 |
Series C, Rev., VRDO, LOC : TD Bank NA, 4.01%, 9/8/2023 (a) | 11,115 | 11,115 |
RIB Floater Trust Various States Series 44, Rev., VRDO, LIQ : Barclays Bank plc, 4.06%, 9/1/2023 (a) (b) | 3,640 | 3,640 |
Tender Option Bond Trust Receipts/Certificates Series 2018-XG0201, Rev., VRDO, GTD, LOC : Barclays Bank plc, 4.10%, 9/8/2023 (a) (b) | 45,000 | 45,000 |
343,970 | ||
Rhode Island — 0.3% | ||
City of Cranston Series 2023-1, GO, BAN, 4.25%, 8/21/2024 | 30,000 | 30,197 |
Rhode Island Health and Educational Building Corp., Educational Institution, International Institute of Rhode Island, Rev., VRDO, LOC : Bank of America NA, 4.17%, 9/8/2023 (a) | 1,015 | 1,015 |
Rhode Island Industrial Facilities Corp., Marine Terminal, ExxonMobil Project, Rev., VRDO, 3.80%, 9/1/2023 (a) | 1,295 | 1,295 |
32,507 | ||
South Carolina — 0.6% | ||
Orangeburg County School District, GO, BAN, 5.00%, 8/16/2024 | 15,660 | 15,870 |
South Carolina Jobs-Economic Development Authority, Prisma Health Obligated Group Series 2018B, Rev., VRDO, LOC : TD Bank NA, 3.93%, 9/1/2023 (a) | 5,650 | 5,650 |
South Carolina Public Service Authority Series 2019A, Rev., VRDO, LOC : Bank of America NA, 4.17%, 9/8/2023 (a) | 42,955 | 42,955 |
64,475 | ||
Tennessee — 0.5% | ||
Clarksville Public Building Authority, Rev., VRDO, LOC : Bank of America NA, 4.00%, 9/1/2023 (a) | 12,695 | 12,695 |
Health Educational and Housing Facility Board of the City of Memphis (The), Ashland Lakes Apartments Series 2006A, Rev., VRDO, LOC : US Bank NA, 4.28%, 9/8/2023 (a) | 2,200 | 2,200 |
August 31, 2023 | J.P. Morgan Money Market Funds | 70 |
AS OF August 31, 2023 (Unaudited) (continued)
INVESTMENTS †† | PRINCIPAL AMOUNT ($000) | VALUE ($000) |
Municipal Bonds — continued | ||
Tennessee — continued | ||
Metropolitan Government Nashville and Davidson County Health and Educational Facilities Board, Multi-Family Housing, Retreat Dry, Rev., VRDO, LOC : Citibank NA, 4.27%, 9/8/2023 (a) | 4,390 | 4,390 |
Montgomery County Public Building Authority, Pooled Financing, Rev., VRDO, LOC : Bank of America NA, 4.18%, 9/8/2023 (a) | 2,595 | 2,595 |
Tender Option Bond Trust Receipts/Certificates | ||
Series 2022-XL0369, Rev., VRDO, LIQ : Morgan Stanley Bank NA, 4.09%, 9/8/2023 (a) (b) | 10,000 | 10,000 |
Series 2018-XF2576, Rev., VRDO, LOC : Barclays Bank plc, 4.10%, 9/8/2023 (a) (b) | 18,515 | 18,515 |
50,395 | ||
Texas — 6.1% | ||
Calhoun Port Authority, Formosa Plastics Corp. Project Series 20188B, Rev., VRDO, LOC : Sumitomo Mitsui Banking Corp., 4.16%, 9/8/2023 (a) (b) | 10,000 | 10,000 |
City of Austin, Hotel Occupancy Tax, Subordinate Lien Series 2008A, Rev., VRDO, LOC : UBS AG, 4.05%, 9/8/2023 (a) | 25,980 | 25,980 |
City of Austin, Texas Hotel Occupancy Tax, Subordinate Lien Series 2008-B, Rev., VRDO, LOC : Sumitomo Mitsui Banking Corp., 4.21%, 9/8/2023 (a) | 250 | 250 |
Collin County Housing Finance Corp., Multi-Family Housing, Huntington Apartments Project, Rev., VRDO, LOC : Northern Trust Co. (The), 4.16%, 9/8/2023 (a) | 12,305 | 12,305 |
Converse Housing Finance Corp., Town Square Apartments Project, Rev., VRDO, LOC : Citibank NA, 4.13%, 9/8/2023 (a) | 11,480 | 11,480 |
Gulf Coast Authority, American Acryl LP Project, Rev., AMT, VRDO, LOC : Bank of Tokyo-Mitsubishi UFJ Ltd., 4.10%, 9/8/2023 (a) | 12,000 | 12,000 |
Gulf Coast Authority, Waste Disposal Environmental Facilities, ExxonMobil Project, Rev., VRDO, 3.85%, 9/1/2023 (a) | 1,525 | 1,525 |
Harris County Cultural Education Facilities Finance Corp., Memorial Hermann Health System | ||
Series 2014D, Rev., VRDO, 4.11%, 9/8/2023 (a) | 5,430 | 5,430 |
Series 2019F, Rev., VRDO, 4.11%, 9/8/2023 (a) | 35,000 | 35,000 |
Series D, Rev., VRDO, 4.11%, 9/8/2023 (a) | 9,510 | 9,510 |
INVESTMENTS †† | PRINCIPAL AMOUNT ($000) | VALUE ($000) |
Texas — continued | ||
Harris County Industrial Development Corp., Exxon Corp Project Series 1984B, Rev., VRDO, 3.90%, 9/1/2023 (a) | 2,852 | 2,852 |
Harris County Industrial Development Corp., ExxonMobil Corp. Project Series 1984A, Rev., VRDO, 3.90%, 9/1/2023 (a) | 300 | 300 |
Harris County Industrial Development Corp., Solid Waste Disposal,ExxonMobil Corp. Project Series 1997, Rev., VRDO, 3.87%, 9/1/2023 (a) | 11,000 | 11,000 |
Houston Higher Education Finance Corp., Rice University Project Series 2010B, Rev., VRDO, 4.00%, 9/8/2023 (a) | 4,795 | 4,795 |
Houston Housing Finance Corp., Regency Park Apartments, Rev., VRDO, LOC : FNMA, 4.10%, 9/8/2023 (a) | 11,895 | 11,895 |
Lower Neches Valley Authority Industrial Development Corp., ExxonMobil Project | ||
Series 2001B-2, Rev., VRDO, 3.85%, 9/1/2023 (a) | 500 | 500 |
Series 2002B, Rev., VRDO, 3.85%, 9/1/2023 (a) | 370 | 370 |
Series 2010, Rev., VRDO, 3.85%, 9/1/2023 (a) | 8,350 | 8,350 |
Series 2012, Rev., VRDO, 3.85%, 9/1/2023 (a) | 7,050 | 7,050 |
Lower Neches Valley Authority Industrial Development Corp., Mobil Oil Refining Corp. Project, Rev., VRDO, 3.99%, 9/1/2023 (a) | 11,205 | 11,205 |
Midlothian Industrial Development Corp, Holcim Project, Rev., VRDO, LOC : UBS AG, 3.90%, 9/8/2023 (a) | 14,200 | 14,200 |
Port of Port Arthur Navigation District, Texaco, Inc, Project, Rev., VRDO, 3.90%, 9/1/2023 (a) | 2,000 | 2,000 |
RBC Municipal Products, Inc. Trust, Floater Certificates | ||
Series E141, Rev., VRDO, LOC : Royal Bank of Canada, 4.09%, 9/8/2023 (a) (b) | 28,000 | 28,000 |
Series E-149, Rev., VRDO, LOC : Royal Bank of Canada, 4.09%, 9/8/2023 (a) (b) | 10,000 | 10,000 |
Series E-150, Rev., VRDO, LOC : Royal Bank of Canada, 4.09%, 9/8/2023 (a) (b) | 5,000 | 5,000 |
Southeast Texas Housing Finance Corp., Piedmont Apartments, Rev., VRDO, LOC : FNMA, 4.14%, 9/8/2023 (a) | 11,335 | 11,335 |
Southeast Texas Housing Finance Corp., Wyndham Park Apartments, Rev., VRDO, LOC : FNMA, 4.10%, 9/8/2023 (a) | 7,500 | 7,500 |
71 | J.P. Morgan Money Market Funds | August 31, 2023 |
INVESTMENTS †† | PRINCIPAL AMOUNT ($000) | VALUE ($000) |
Municipal Bonds — continued | ||
Texas — continued | ||
State of Texas, GO, VRDO, LIQ : State Street Bank & Trust Co., 4.25%, 9/7/2023 (a) | 25,000 | 25,000 |
State of Texas, Veterans | ||
Series 2011C, GO, VRDO, LIQ : FHLB, 4.08%, 9/8/2023 (a) | 38,815 | 38,815 |
Series 2011A, GO, VRDO, LIQ : State Street Bank & Trust Co., 4.15%, 9/8/2023 (a) | 14,470 | 14,470 |
Series 2012B, GO, VRDO, LIQ : State Street Bank & Trust Co., 4.15%, 9/8/2023 (a) | 14,065 | 14,065 |
Series 2013B, GO, VRDO, LIQ : State Street Bank & Trust Co., 4.15%, 9/8/2023 (a) | 11,460 | 11,460 |
Series 2015A, GO, VRDO, LIQ : State Street Bank & Trust Co., 4.15%, 9/8/2023 (a) | 21,250 | 21,250 |
State of Texas, Veterans Housing Assistance Program Series 2008B, GO, VRDO, LIQ : State Street Bank & Trust Co., 4.15%, 9/8/2023 (a) | 17,195 | 17,195 |
Tarrant County Cultural Education Facilities Finance Corp., Baylor Healthcare System Project Series 2011C, Rev., VRDO, LOC : TD Bank NA, 3.93%, 9/1/2023 (a) | 3,800 | 3,800 |
Tarrant County Cultural Education Facilities Finance Corp., Methodist Hospitals of Dallas Project Series 2008-A, Rev., VRDO, LOC : TD Bank NA, 3.93%, 9/1/2023 (a) | 14,460 | 14,460 |
Tarrant County Cultural Education Facilities Finance Corp., Texas Health Resources System | ||
Series 2008A, Rev., VRDO, 4.10%, 9/8/2023 (a) | 33,600 | 33,600 |
Series 2012B, Rev., VRDO, 4.10%, 9/8/2023 (a) | 27,710 | 27,710 |
Tender Option Bond Trust Receipts/Certificates | ||
Series 2018-XG019, Rev., VRDO, GNMA COLL, LIQ : Royal Bank of Canada, 4.09%, 9/8/2023 (a) (b) | 2,550 | 2,550 |
Series 2023-XF3101, GO, VRDO, LIQ : Morgan Stanley Bank NA, 4.09%, 9/8/2023 (a) (b) | 6,665 | 6,665 |
Series 2023-XL0446, Rev., VRDO, LIQ : Wells Fargo Bank NA, 4.09%, 9/8/2023 (a) (b) | 5,905 | 5,905 |
Series 2023-XM1105, Rev., VRDO, AGM, LIQ : Royal Bank of Canada, 4.09%, 9/8/2023 (a) (b) | 6,265 | 6,265 |
Series 2022-XF1372, GO, VRDO, PSF-GTD, LIQ : Bank of America NA, 4.10%, 9/8/2023 (a) (b) | 3,075 | 3,075 |
Series 2023-XF1480, GO, VRDO, LIQ : TD Bank NA, 4.11%, 9/8/2023 (a) (b) | 3,000 | 3,000 |
Series 2023-XL0455, GO, VRDO, LIQ : Wells Fargo Bank NA, 4.11%, 9/8/2023 (a) (b) | 7,435 | 7,435 |
INVESTMENTS †† | PRINCIPAL AMOUNT ($000) | VALUE ($000) |
Texas — continued | ||
Texas Department of Housing and Community Affairs, Lancaster Apartments, Rev., VRDO, LOC : FNMA, 4.14%, 9/8/2023 (a) | 11,480 | 11,480 |
Texas Department of Housing and Community Affairs, Pinnacle Apartments, Rev., VRDO, LOC : FNMA, 4.14%, 9/8/2023 (a) | 11,465 | 11,465 |
Texas Department of Housing and Community Affairs, West Oaks Senior Apartments Series 2008, Rev., VRDO, LIQ : FHLMC, 4.10%, 9/8/2023 (a) | 10,675 | 10,675 |
Texas Transportation Commission State Highway Fund Series 2014-B, Rev., VRDO, LIQ : Sumitomo Mitsui Banking Corp., 4.07%, 9/8/2023 (a) | 82,300 | 82,300 |
632,472 | ||
Utah — 0.0% ^ | ||
City of Murray, IHC Health Services, Inc. Series 2005D, Rev., VRDO, LIQ : Wells Fargo Bank NA, 3.75%, 9/1/2023 (a) | 2,650 | 2,650 |
Virginia — 1.7% | ||
Albemarle County Economic Development Authority, Sentara Martha Jeffers Series 2018B, Rev., VRDO, LIQ : TD Bank NA, 3.93%, 9/1/2023 (a) | 2,725 | 2,725 |
Fairfax County Industrial Development Authority, Virginia Health Care, Inova Health System Project Series 2016C, Rev., VRDO, 4.05%, 9/8/2023 (a) | 4,255 | 4,255 |
Loudoun County Economic Development Authority, Howard Hughes Medical Institute | ||
Series 2003A, Rev., VRDO, 3.95%, 9/8/2023 (a) | 22,755 | 22,755 |
Series 2003F, Rev., VRDO, 4.06%, 9/8/2023 (a) | 700 | 700 |
Series 2003D, Rev., VRDO, 4.15%, 9/8/2023 (a) | 100 | 100 |
Series 2009B, Rev., VRDO, 4.15%, 9/8/2023 (a) | 250 | 250 |
Norfolk Economic Development Authority, Sentara Health Care Series 2016B, Rev., VRDO, 4.00%, 9/8/2023 (a) | 25,000 | 25,000 |
RBC Municipal Products, Inc. Trust, Floater Certificates Series 2022C-20, Rev., VRDO, LOC : Royal Bank of Canada, 4.10%, 9/8/2023 (a) (b) | 6,000 | 6,000 |
August 31, 2023 | J.P. Morgan Money Market Funds | 72 |
AS OF August 31, 2023 (Unaudited) (continued)
INVESTMENTS †† | PRINCIPAL AMOUNT ($000) | VALUE ($000) |
Municipal Bonds — continued | ||
Virginia — continued | ||
Roanoke Economic Development Authority, Carilion Health System Obligated Group | ||
Series 2005A, Rev., VRDO, LIQ : PNC Bank NA, 4.05%, 9/8/2023 (a) | 64,515 | 64,515 |
Series 2020B, Rev., VRDO, LIQ : PNC Bank NA, 4.05%, 9/8/2023 (a) | 43,890 | 43,890 |
Tender Option Bond Trust Receipts/Certificates Series 2018-XF0606, Rev., VRDO, LIQ : Bank of America NA, 4.12%, 9/8/2023 (a) (b) | 1,705 | 1,705 |
171,895 | ||
Washington — 1.5% | ||
Chelan County Public Utility District No.1 Series 2008B, Rev., VRDO, LIQ : Barclays Bank plc, 4.05%, 9/8/2023 (a) | 2,400 | 2,400 |
Port of Tacoma, Subordinate Lien | ||
Rev., AMT, VRDO, LOC : PNC Bank NA, 4.10%, 9/8/2023 (a) | 45,695 | 45,695 |
Series 2008B, Rev., VRDO, LOC : Bank of America NA, 4.10%, 9/8/2023 (a) | 25,850 | 25,850 |
Series 2019A, Rev., AMT, VRDO, LOC : PNC Bank NA, 4.10%, 9/8/2023 (a) | 18,500 | 18,500 |
Port of Vancouver, United Grain Corp., of Oregon Project, Rev., VRDO, LOC : Bank of America NA, 4.18%, 9/8/2023 (a) | 10,000 | 10,000 |
Tender Option Bond Trust Receipts/Certificates Series 2022-XG0400, GO, VRDO, LIQ : Barclays Bank plc, 4.10%, 9/8/2023 (a) (b) | 7,890 | 7,890 |
Washington State Housing Finance Commission, Echo Lake Senior Apartments Project, Rev., VRDO, LOC : FNMA, 4.14%, 9/8/2023 (a) | 17,970 | 17,970 |
Washington State Housing Finance Commission, Fairwinds Redmond Project Series 2005A, Rev., VRDO, LOC : FHLB, 4.14%, 9/8/2023 (a) | 19,250 | 19,250 |
Washington State Housing Finance Commission, Pinehurst Apartments Project Series 2005A, Rev., VRDO, LOC : FNMA, 4.14%, 9/8/2023 (a) | 12,000 | 12,000 |
159,555 | ||
West Virginia — 0.1% | ||
West Virginia Hospital Finance Authority, University Health System Series 2018C, Rev., VRDO, LOC : TD Bank NA, 4.01%, 9/8/2023 (a) | 12,350 | 12,350 |
Wisconsin — 1.5% | ||
Public Finance Authority, Health Care Systems Project Series 2023C, Rev., VRDO, LOC : TD Bank NA, 3.84%, 9/1/2023 (a) | 1,080 | 1,080 |
INVESTMENTS †† | PRINCIPAL AMOUNT ($000) | VALUE ($000) |
Wisconsin — continued | ||
Tender Option Bond Trust Receipts/Certificates Series 2023-XF3117, Rev., VRDO, LOC : Barclays Bank plc, 4.28%, 9/1/2023 (a) (b) | 8,000 | 8,000 |
Town of Red Cedar, Fairmount Minerals Ltd., Rev., VRDO, LOC : PNC Bank NA, 4.14%, 9/8/2023 (a) | 10,000 | 10,000 |
Wisconsin Health and Educational Facilities Authority, Froedtert Health, Inc., Obligated Group Series 2021B, Rev., VRDO, LIQ : US Bank NA, 3.90%, 9/8/2023 (a) | 69,000 | 69,000 |
Wisconsin Health and Educational Facilities Authority, Medical College of Wisconsin, Inc., (The) Series 2008B, Rev., VRDO, LOC : TD Bank NA, 3.93%, 9/1/2023 (a) | 21,300 | 21,300 |
Wisconsin Housing and Economic Development Authority, Home Ownership | ||
Series 2015C, Rev., AMT, VRDO, LIQ : Royal Bank of Canada, 4.05%, 9/8/2023 (a) | 19,205 | 19,205 |
Series 2019B, Rev., VRDO, FNMA COLL, LIQ : FHLB, 4.05%, 9/8/2023 (a) | 17,400 | 17,400 |
Series 2021B, Rev., VRDO, LIQ : FHLB, 4.05%, 9/8/2023 (a) | 4,000 | 4,000 |
149,985 | ||
Wyoming — 0.1% | ||
County of Lincoln, Pollution Control, ExxonMobil Project, Rev., AMT, VRDO, 3.90%, 9/1/2023 (a) | 1,340 | 1,340 |
Wyoming Community Development Authority | ||
Series 2021-2, Rev., VRDO, LIQ : Royal Bank of Canada, 4.05%, 9/8/2023 (a) | 9,500 | 9,500 |
Series 2019-4, Rev., VRDO, LIQ : Bank of America NA, 4.13%, 9/8/2023 (a) | 2,500 | 2,500 |
13,340 | ||
Total Municipal Bonds (Cost $6,959,164) | 6,959,164 | |
SHARES (000) | ||
Variable Rate Demand Preferred Shares — 7.8% | ||
California — 1.3% | ||
Nuveen California AMT - Free Quality Municipal Income Fund Series 6, LIQ : Sumitomo Mitsui Banking Corp., 4.09%, 9/8/2023# (b) | 7,500 | 7,500 |
Nuveen California Quality Municipal Income Fund | ||
Series 7, LIQ : Royal Bank of Canada, 4.13%, 9/8/2023# (b) | 21,000 | 21,000 |
73 | J.P. Morgan Money Market Funds | August 31, 2023 |
INVESTMENTS †† | SHARES (000) | VALUE ($000) |
Variable Rate Demand Preferred Shares — continued | ||
California — continued | ||
Series 4, LIQ : Royal Bank of Canada, 4.13%, 9/8/2023# (b) | 58,500 | 58,500 |
Series 1-1362, LIQ : Societe Generale, 4.15%, 9/8/2023# (b) | 41,200 | 41,200 |
128,200 | ||
Other — 6.5% | ||
Nuveen AMT - Free Municipal Credit Income Fund | ||
Series 6, LIQ : Sumitomo Mitsui Banking Corp., 4.11%, 9/8/2023# (b) | 135,300 | 135,300 |
Series 5, LIQ : Societe Generale, 4.11%, 9/8/2023# (b) | 110,200 | 110,200 |
Nuveen AMT - Free Quality Municipal Income Fund | ||
Series 4-4895, LIQ : Barclays Bank plc, 4.11%, 9/8/2023# (b) | 15,000 | 15,000 |
Series 3-PFD, LIQ : TD Bank NA, 4.11%, 9/8/2023# (b) | 211,000 | 211,000 |
Nuveen Quality Municipal Income Fund | ||
Series 2-2525, LIQ : Barclays Bank plc, 4.16%, 9/8/2023# (b) | 151,900 | 151,900 |
Series 1-2118, LIQ : Barclays Bank plc, 4.16%, 9/8/2023# (b) | 51,600 | 51,600 |
675,000 | ||
Total Variable Rate Demand Preferred Shares (Cost $803,200) | 803,200 | |
PRINCIPAL AMOUNT ($000) | ||
Short Term Investments — 22.2% | ||
Commercial Paper — 22.2% | ||
Board of Regents of the University of Texas System | ||
Series A, 3.25%, 9/7/2023 | 25,000 | 25,000 |
Series A, 3.55%, 9/7/2023 | 20,000 | 20,000 |
Series A, 3.07%, 9/12/2023 | 22,300 | 22,300 |
Series A, 3.15%, 9/13/2023 | 15,000 | 15,000 |
Series A, 3.25%, 9/14/2023 | 25,000 | 25,000 |
Series A, 3.27%, 9/14/2023 | 25,000 | 25,000 |
Series A, 3.28%, 9/14/2023 | 15,500 | 15,500 |
Series A, 3.30%, 9/14/2023 | 13,000 | 13,000 |
Series A, 3.37%, 9/14/2023 | 6,500 | 6,500 |
Series A, 3.10%, 9/15/2023 | 20,000 | 20,000 |
Series A, 3.30%, 9/20/2023 | 10,000 | 10,000 |
Series A, 3.25%, 9/21/2023 | 20,000 | 20,000 |
Series A, 3.75%, 9/22/2023 | 25,000 | 25,000 |
INVESTMENTS †† | PRINCIPAL AMOUNT ($000) | VALUE ($000) |
Commercial Paper — continued | ||
Series A, 3.75%, 10/10/2023 | 16,000 | 16,000 |
Series A, 3.45%, 10/11/2023 | 25,000 | 25,000 |
Series A, 3.45%, 10/16/2023 | 25,000 | 25,000 |
Series A, 3.50%, 10/17/2023 | 15,000 | 15,000 |
3.50%, 10/17/2023 | 10,500 | 10,500 |
Series A, 3.50%, 10/17/2023 | 10,000 | 10,000 |
Series A, 3.50%, 10/17/2023 | 17,200 | 17,200 |
Series A, 3.60%, 10/24/2023 | 25,000 | 25,000 |
Series A, 3.65%, 10/26/2023 | 20,000 | 20,000 |
Series A, 3.40%, 11/8/2023 | 25,000 | 25,000 |
Series A, 3.50%, 1/10/2024 | 25,000 | 25,000 |
Series A, 3.50%, 1/11/2024 | 25,000 | 25,000 |
3.50%, 1/11/2024 | 25,000 | 25,000 |
Series A, 3.50%, 1/17/2024 | 17,500 | 17,500 |
Series A, 3.55%, 2/7/2024 | 14,653 | 14,653 |
Series A, 3.70%, 2/22/2024 | 10,000 | 10,000 |
Board of Trustees Michigan State University | ||
Series G, 3.10%, 9/12/2023 | 20,759 | 20,759 |
California Statewide Communities Development Authority | ||
Series B-6, 3.02%, 10/4/2023 | 4,050 | 4,050 |
Series B-5, 3.00%, 10/11/2023 | 10,750 | 10,750 |
Series D, 3.07%, 10/11/2023 | 10,000 | 10,000 |
Series 9B-2, 3.45%, 10/18/2023 | 37,000 | 37,000 |
Series 9B-1, 3.50%, 1/10/2024 | 23,000 | 23,000 |
Series 9B-3, 3.50%, 1/10/2024 | 19,000 | 19,000 |
City of Atlanta | ||
Series M-1, 3.60%, 9/7/2023 | 300 | 300 |
Series N-2, 3.60%, 9/7/2023 | 43,630 | 43,630 |
Series M-2, 3.65%, 9/7/2023 | 23,635 | 23,635 |
City of Houston | ||
Series B-1, 3.50%, 9/7/2023 | 20,000 | 20,000 |
Series B-1, 3.55%, 9/7/2023 | 25,000 | 25,000 |
Series E-1, 3.10%, 9/14/2023 | 15,000 | 15,000 |
Series G-2, 3.57%, 9/14/2023 | 40,000 | 40,000 |
Series H-2, 3.40%, 9/21/2023 | 76,000 | 76,000 |
City of Jacksonville | ||
Series 94, 3.50%, 9/6/2023 | 10,000 | 10,000 |
Series 2016, 3.60%, 11/7/2023 | 100,000 | 100,000 |
City of Rochester | ||
Series 2014, 3.10%, 9/13/2023 | 25,000 | 25,000 |
Series 2011, 3.60%, 11/7/2023 | 40,000 | 40,000 |
Series 2011, 3.47%, 1/25/2024 | 80,000 | 80,000 |
August 31, 2023 | J.P. Morgan Money Market Funds | 74 |
AS OF August 31, 2023 (Unaudited) (continued)
INVESTMENTS †† | PRINCIPAL AMOUNT ($000) | VALUE ($000) |
Short Term Investments — continued | ||
Commercial Paper — continued | ||
City of San Antonio | ||
Series A, 3.70%, 1/26/2024 | 20,000 | 20,000 |
City of San Antonio Electric & Gas Systems | ||
Series C, 3.30%, 9/12/2023 | 65,000 | 65,000 |
Series B, 3.40%, 9/12/2023 | 49,500 | 49,500 |
County of Harris | ||
Series C, 3.45%, 9/6/2023 | 17,000 | 17,000 |
County of King | ||
Series A, 3.10%, 9/12/2023 | 25,000 | 25,000 |
County of Montgomery | ||
Series 10-A, 3.50%, 10/3/2023 | 80,000 | 80,000 |
Health and Educational Facilities Authority of the State of Missouri | ||
Series 14-C, 3.60%, 1/9/2024 | 50,000 | 50,000 |
Series 14-D, 3.50%, 2/1/2024 | 50,000 | 50,000 |
Series 14-E, 3.50%, 2/1/2024 | 50,000 | 50,000 |
Series 14-B, 3.68%, 2/6/2024 | 50,000 | 50,000 |
Indiana Finance Authority | ||
Series D-2, 3.25%, 9/7/2023 | 110,500 | 110,500 |
Jacksonville Aviation Authority | ||
Series 92, 3.30%, 9/7/2023 | 20,000 | 20,000 |
Louisville and Jefferson County Metropolitan Sewer District | ||
Series A-1, 3.40%, 9/13/2023 | 20,000 | 20,000 |
Series A-1, 3.50%, 10/4/2023 | 20,000 | 20,000 |
Lower Colorado River Authority | ||
Series B, 3.50%, 9/28/2023 | 17,000 | 17,000 |
Series B, 3.55%, 10/30/2023 | 9,557 | 9,557 |
Maryland Health and Higher Educational Facilities Authority | ||
Series B, 3.10%, 9/13/2023 | 8,290 | 8,290 |
Massachusetts Bay Transportation Authority | ||
Series A, 3.16%, 10/3/2023 | 8,750 | 8,750 |
Massachusetts Bay Transportation Authority Sales Tax | ||
Series C, 3.15%, 10/5/2023 | 10,000 | 10,000 |
Metropolitan Government Nashville and Davidson County Health and Educational Facilities Board | ||
3.20%, 1/25/2024 | 10,000 | 10,000 |
Metropolitan Government of Nashville and Davidson County | ||
Series 2021, 3.18%, 10/11/2023 | 15,000 | 15,000 |
Omaha Public Power District | ||
Series A, 3.35%, 9/12/2023 | 15,000 | 15,000 |
Series A, 3.10%, 9/13/2023 | 12,500 | 12,500 |
INVESTMENTS †† | PRINCIPAL AMOUNT ($000) | VALUE ($000) |
Commercial Paper — continued | ||
Series A, 3.40%, 10/11/2023 | 15,000 | 15,000 |
Series A, 3.47%, 10/13/2023 | 10,000 | 10,000 |
Series A, 3.22%, 11/8/2023 | 12,500 | 12,500 |
Series A, 3.44%, 12/5/2023 | 13,700 | 13,700 |
Regents of the University of Michigan | ||
Series B, 3.45%, 10/6/2023 | 11,000 | 11,000 |
Rutgers The State University of New Jersey | ||
Series B, 3.30%, 9/12/2023 | 13,000 | 13,000 |
Salt River Project Agricultural Improvement & Power District | ||
Series C, 3.27%, 9/5/2023 | 35,000 | 35,000 |
San Francisco City & County Public Utilities Commission | ||
Series A-1, 3.05%, 9/7/2023 | 5,000 | 5,000 |
Southwestern Illinois Development Authority | ||
Series 17-B, 3.28%, 9/7/2023 | 49,870 | 49,870 |
Series 17-B, 3.35%, 10/12/2023 | 15,000 | 15,000 |
State of Oregon Department of Administrative Services | ||
Series A-2, 3.35%, 9/13/2023 | 14,426 | 14,426 |
State of Oregon Department of Transportation | ||
Series A-1, 3.70%, 10/26/2023 | 24,620 | 24,620 |
Texas Public Finance Authority | ||
Series 16-B, 3.50%, 10/3/2023 | 12,000 | 12,000 |
Series 19, 3.50%, 11/9/2023 | 58,295 | 58,295 |
Trustees of Indiana University | ||
Series 2018, 3.30%, 9/6/2023 | 13,463 | 13,462 |
Series 2018, 3.55%, 9/6/2023 | 18,852 | 18,852 |
University of Minnesota | ||
Series 07-B, 3.35%, 10/4/2023 | 9,300 | 9,300 |
Series 07-C, 3.35%, 10/4/2023 | 12,000 | 12,000 |
Series G, 3.35%, 10/5/2023 | 12,168 | 12,168 |
University of Pittsburgh-of the Commonwealth System of Higher Education | ||
Series B-2, 3.20%, 10/11/2023 | 13,000 | 13,000 |
University of Washington | ||
Series A, 3.70%, 10/4/2023 | 26,000 | 26,000 |
Total Commercial Paper (Cost $2,298,567) | 2,298,567 | |
Total Short Term Investments (Cost $2,298,567) | 2,298,567 | |
75 | J.P. Morgan Money Market Funds | August 31, 2023 |
INVESTMENTS †† | PRINCIPAL AMOUNT ($000) | VALUE ($000) |
Total Investments — 97.4% (Cost $10,060,931) * | 10,060,931 | |
Other Assets Less Liabilities — 2.6% | 266,669 | |
NET ASSETS — 100.0% | 10,327,600 |
Percentages indicated are based on net assets. |
Abbreviations | |
AGM | Insured by Assured Guaranty Municipal Corp. |
AMBAC | Insured by American Municipal Bond Assurance Corp. |
AMT | Alternative Minimum Tax |
BAN | Bond Anticipation Note |
COLL | Collateral |
COP | Certificate of Participation |
FHLB | Federal Home Loan Bank |
FHLMC | Federal Home Loan Mortgage Corp. |
FNMA | Federal National Mortgage Association |
GNMA | Government National Mortgage Association |
GO | General Obligation |
GTD | Guaranteed |
LIQ | Liquidity Agreement |
LOC | Letter of Credit |
PSF-GTD | Permanent School Fund Guaranteed |
RAN | Revenue Anticipation Note |
Rev. | Revenue |
VRDO | Variable Rate Demand Obligation |
^ | Amount rounds to less than 0.1% of net assets. | |
†† | The date shown represents the earliest of the next put date, next demand date or final maturity date. | |
# | Variable Rate Demand Preferred Shares of a closed-end investment company which has a weekly demand feature. The interest rate shown is the rate in effect as of August 31, 2023. | |
* | The cost of securities is substantially the same for federal income tax purposes. | |
(a) | Variable or floating rate security, the interest rate of which adjusts periodically based on changes in current interest rates and prepayments on the underlying pool of assets. The interest rate shown is the current rate as of August 31, 2023. | |
(b) | Securities exempt from registration under Rule 144A or section 4(a)(2), of the Securities Act of 1933, as amended. | |
(c) | All or a portion of the security is a when-issued security, delayed delivery security, or forward commitment. | |
August 31, 2023 | J.P. Morgan Money Market Funds | 76 |
AS OF August 31, 2023 (Unaudited)
INVESTMENTS †† | PRINCIPAL AMOUNT ($000) | VALUE ($000) |
Municipal Bonds — 85.6% | ||
Alaska — 2.6% | ||
Alaska Housing Finance Corp., Home Mortgage Series 2002A, Rev., AMT, VRDO, LIQ : FHLB, 3.95%, 9/1/2023 (a) | 25,760 | 25,760 |
City of Valdez, Exxon Pipeline Co. Project Series 1993A, Rev., VRDO, 3.80%, 9/1/2023 (a) | 15,600 | 15,600 |
City of Valdez, ExxonMobil Project, Rev., VRDO, 3.90%, 9/1/2023 (a) | 200 | 200 |
41,560 | ||
Arizona — 0.2% | ||
Tender Option Bond Trust Receipts/Certificates Series 2023-YX1272, Rev., VRDO, LOC : Barclays Bank plc, 4.11%, 9/8/2023 (a) (b) | 2,755 | 2,755 |
California — 0.9% | ||
Mizuho Floater Series 2023-MIZ9122, Rev., VRDO, LIQ : Mizuho Capital Mkts LLC, 4.65%, 9/1/2023 (a) (b) | 10,680 | 10,680 |
Tender Option Bond Trust Receipts/Certificates Series 2022-YX1229, Rev., VRDO, LIQ : Barclays Bank plc, 4.10%, 9/8/2023 (a) (b) | 3,000 | 3,000 |
13,680 | ||
Colorado — 3.3% | ||
County of Arapahoe, Multi-Family Rental Housing, Hunter's Run Holdings LP, Rev., VRDO, LOC : FHLMC, 4.12%, 9/8/2023 (a) | 325 | 325 |
RIB Floater Trust Various States Series 2022-038, COP, VRDO, LIQ : Barclays Bank plc, 4.07%, 9/1/2023 (a) (b) | 2,395 | 2,395 |
Tender Option Bond Trust Receipts/Certificates | ||
Series 2022-XF3053, Rev., VRDO, LIQ : Morgan Stanley Bank NA, 4.11%, 9/8/2023 (a) (b) | 10,125 | 10,125 |
Series 2022-XX1260, Rev., VRDO, LIQ : Barclays Bank plc, 4.11%, 9/8/2023 (a) (b) | 9,120 | 9,120 |
Series 2022-ZF3061, Rev., VRDO, LIQ : Morgan Stanley Bank NA, 4.11%, 9/8/2023 (a) (b) | 3,335 | 3,335 |
Series XX1261, Rev., VRDO, LIQ : Barclays Bank plc, 4.11%, 9/8/2023 (a) (b) | 3,750 | 3,750 |
Series 2016-ZF0467, Rev., VRDO, LOC : Royal Bank of Canada, 4.12%, 9/8/2023 (a) (b) | 3,200 | 3,200 |
Series 2023-XF3141, Rev., VRDO, LIQ : Morgan Stanley Bank NA, 4.12%, 9/8/2023 (a) (b) | 11,250 | 11,250 |
Series 2022-XG0424, Rev., VRDO, LIQ : Royal Bank of Canada, 4.13%, 9/8/2023 (a) (b) | 4,800 | 4,800 |
University of Colorado, Hospital Authority Series 2018C, Rev., VRDO, LIQ : TD Bank NA, 4.00%, 9/8/2023 (a) | 2,900 | 2,900 |
51,200 | ||
INVESTMENTS †† | PRINCIPAL AMOUNT ($000) | VALUE ($000) |
Delaware — 0.1% | ||
Delaware State Economic Development Authority, Rev., VRDO, LOC : PNC Bank NA, 4.04%, 9/8/2023 (a) | 2,160 | 2,160 |
District of Columbia — 0.3% | ||
Tender Option Bond Trust Receipts/Certificates Series 2023-XL0454, Rev., VRDO, LIQ : Morgan Stanley Bank NA, 4.11%, 9/8/2023 (a) (b) | 4,935 | 4,935 |
Florida — 5.2% | ||
County of Broward, Power and Light Co., Project | ||
Series 2018A, Rev., AMT, VRDO, 4.10%, 9/1/2023 (a) | 8,400 | 8,400 |
Rev., VRDO, 4.20%, 9/1/2023 (a) | 15,815 | 15,815 |
County of Escambia, Gulf Power Co., Project Series R, Rev., VRDO, 3.95%, 9/8/2023 (a) | 10,000 | 10,000 |
County of St. Lucie, Power and Light Co. Project, Rev., VRDO, 4.10%, 9/1/2023 (a) | 13,000 | 13,000 |
Florida Housing Finance Corp., Valencia Village Apartments Series 1999G-1, Rev., VRDO, FNMA, LIQ : FNMA, 4.10%, 9/8/2023 (a) | 60 | 60 |
Hillsborough County Housing Finance Authority, Hunters Run Partners Ltd. Series 2002A, Rev., VRDO, LOC : FNMA, 4.10%, 9/8/2023 (a) | 5,525 | 5,525 |
JEA Water and Sewer System Series 2008A-1, Rev., VRDO, LIQ : US Bank NA, 4.20%, 9/1/2023 (a) | 2,200 | 2,200 |
Sumter County Industrial Development Authority, Solid Waste Disposal, American Cement Co., LLC Project, Rev., VRDO, LOC : Bank of America NA, 4.30%, 9/8/2023 (a) | 4,250 | 4,250 |
Tender Option Bond Trust Receipts/Certificates | ||
Series 2022-XL0324, Rev., VRDO, LIQ : Royal Bank of Canada, 4.09%, 9/8/2023 (a) (b) | 4,650 | 4,650 |
Series 2022-YX1216, Rev., VRDO, LOC : Barclays Bank plc, 4.10%, 9/8/2023 (a) (b) | 8,735 | 8,735 |
Series 2023-XL0430, Rev., VRDO, LIQ : Barclays Bank plc, 4.11%, 9/8/2023 (a) (b) | 3,750 | 3,750 |
Series 2023-XF1523, Rev., VRDO, LOC : Royal Bank of Canada, 4.12%, 9/8/2023 (a) (b) | 2,440 | 2,440 |
Series 2023-XF1463, Rev., VRDO, LIQ : TD Bank NA, 4.16%, 9/8/2023 (a) (b) | 2,775 | 2,775 |
81,600 | ||
Georgia — 7.3% | ||
Atlanta Development Authority (The), Rev., VRDO, LOC : BMO Harris Bank NA, 4.06%, 9/8/2023 (a) | 1,560 | 1,560 |
77 | J.P. Morgan Money Market Funds | August 31, 2023 |
INVESTMENTS †† | PRINCIPAL AMOUNT ($000) | VALUE ($000) |
Municipal Bonds — continued | ||
Georgia — continued | ||
Bartow-Cartersville Joint Development Authority Series 2023A, Rev., AMT, VRDO, LOC : Korea Development Bank, 4.37%, 9/8/2023 (a) (b) | 60,000 | 60,000 |
Development Authority of Douglas County, Pandosia LLC Project Series A, Rev., VRDO, LOC : Wells Fargo Bank NA, 4.08%, 9/8/2023 (a) | 1,900 | 1,900 |
Development Authority of Monroe County (The), Florida Power and Light Co. Project | ||
Rev., AMT, VRDO, 4.20%, 9/1/2023 (a) | 49,310 | 49,310 |
Series 2019, Rev., AMT, VRDO, 4.10%, 9/8/2023 (a) | 2,720 | 2,720 |
115,490 | ||
Hawaii — 0.2% | ||
Tender Option Bond Trust Receipts/Certificates Series 2022-YX1252, Rev., VRDO, LOC : Barclays Bank plc, 4.11%, 9/8/2023 (a) (b) | 2,945 | 2,945 |
Idaho — 0.2% | ||
Idaho Health Facilities Authority, St. Luke's Health System Project Series 2018C, Rev., VRDO, LOC : US Bank NA, 4.20%, 9/1/2023 (a) | 3,800 | 3,800 |
Illinois — 4.0% | ||
Chicago Midway International Airport, Second Lien Series 2004C-1, Rev., AMT, VRDO, LOC : Bank of Montreal, 4.09%, 9/8/2023 (a) | 2,440 | 2,440 |
County of Will, ExxonMobil Project | ||
Rev., VRDO, 3.85%, 9/1/2023 (a) | 2,630 | 2,630 |
Rev., VRDO, 3.85%, 9/1/2023 (a) | 1,405 | 1,405 |
Illinois Development Finance Authority, Uhlich Children's Home Project, Rev., VRDO, LOC : US Bank NA, 4.06%, 9/8/2023 (a) | 2,825 | 2,825 |
Illinois Development Finance Authority, Wheaton Academy, Rev., VRDO, LOC : BMO Harris Bank NA, 4.25%, 9/8/2023 (a) | 2,500 | 2,500 |
Illinois Finance Authority, Housing Hidden Glen Apartments Project Series 2007, Rev., VRDO, LOC : US Bank NA, 4.20%, 9/8/2023 (a) | 5,765 | 5,765 |
Illinois Finance Authority, St. Ignatius College Prep Project, Rev., VRDO, LOC : PNC Bank NA, 4.04%, 9/8/2023 (a) | 2,000 | 2,000 |
Illinois Finance Authority, The University of Chicago Medical Center Series 2010B, Rev., VRDO, LOC : Wells Fargo Bank NA, 3.80%, 9/1/2023 (a) | 2,000 | 2,000 |
Illinois Finance Authority, Toyal America, Inc. Project, Rev., VRDO, LOC : MUFG Union Bank NA, 4.10%, 9/8/2023 (a) | 6,000 | 6,000 |
INVESTMENTS †† | PRINCIPAL AMOUNT ($000) | VALUE ($000) |
Illinois — continued | ||
Illinois Housing Development Authority, Rev., VRDO, LOC : BMO Harris Bank NA, 4.06%, 9/8/2023 (a) | 1,000 | 1,000 |
RIB Floater Trust Various States Series 41, Rev., VRDO, LIQ : Barclays Bank plc, 4.07%, 9/1/2023 (a) (b) | 1,560 | 1,560 |
Tender Option Bond Trust Receipts/Certificates | ||
Series 2023-XG0434, GO, VRDO, LOC : Royal Bank of Canada, 4.09%, 9/8/2023 (a) (b) | 2,750 | 2,750 |
Series 2022-XF3042, GO, VRDO, LIQ : Barclays Bank plc, 4.10%, 9/8/2023 (a) (b) | 15,050 | 15,050 |
Series 2022-XX1264, GO, VRDO, LOC : Barclays Bank plc, 4.10%, 9/8/2023 (a) (b) | 6,035 | 6,035 |
Series 2022-XX1265, GO, VRDO, LOC : Barclays Bank plc, 4.10%, 9/8/2023 (a) (b) | 2,660 | 2,660 |
Series 2016-XG0093, Rev., VRDO, GNMA COLL, LIQ : TD Bank NA, 4.21%, 9/8/2023 (a) (b) | 5,970 | 5,970 |
62,590 | ||
Indiana — 1.6% | ||
City of Indianapolis, Multi-Family Housing, Nora Commons, Limited Obligations Series 2004B, Rev., VRDO, LOC : US Bank NA, 4.25%, 9/8/2023 (a) | 560 | 560 |
Indiana Finance Authority, Parkview Health System, Inc. | ||
Series 2009B, Rev., VRDO, LOC : Wells Fargo Bank NA, 3.80%, 9/1/2023 (a) | 6,835 | 6,835 |
Series 2009D, Rev., VRDO, LOC : Wells Fargo Bank NA, 3.80%, 9/1/2023 (a) | 10,985 | 10,985 |
Indiana Finance Authority, Solid Waste Disposal, Four-Leaf Clover Dairy LLC, Rev., VRDO, LOC : Bank of America NA, 4.21%, 9/8/2023 (a) | 4,100 | 4,100 |
Indiana Finance Authority, Solid Waste Disposal, New Holland Dairy Leasing, Rev., VRDO, LOC : Bank of America NA, 4.22%, 9/8/2023 (a) | 2,100 | 2,100 |
Indiana Housing and Community Development Authority | ||
Series 2017B-3, Rev., VRDO, LIQ : TD Bank NA, 3.93%, 9/1/2023 (a) | 320 | 320 |
Series 2017C-3, Rev., VRDO, LIQ : TD Bank NA, 3.93%, 9/1/2023 (a) | 240 | 240 |
25,140 | ||
Iowa — 2.2% | ||
Iowa Finance Authority, Multi-Family Housing Series B, Rev., AMT, VRDO, LIQ : Wells Fargo Bank NA, 4.08%, 9/8/2023 (a) | 7,875 | 7,875 |
August 31, 2023 | J.P. Morgan Money Market Funds | 78 |
AS OF August 31, 2023 (Unaudited) (continued)
INVESTMENTS †† | PRINCIPAL AMOUNT ($000) | VALUE ($000) |
Municipal Bonds — continued | ||
Iowa — continued | ||
Iowa Finance Authority, Single Family Mortgage, Social Bonds Series 2022H, Rev., VRDO, GNMA / FNMA / FHLMC COLL, LIQ : US Bank NA, 4.20%, 9/1/2023 (a) | 3,000 | 3,000 |
Iowa Finance Authority, Single Family Mortgage-Backed Securities Program | ||
Series 2019E, Rev., VRDO, GNMA / FNMA / FHLMC, LIQ : TD Bank NA, 4.04%, 9/8/2023 (a) | 4,295 | 4,295 |
Series 2020E, Rev., VRDO, GNMA / FNMA / FHLMC, LIQ : TD Bank NA, 4.04%, 9/8/2023 (a) | 850 | 850 |
Iowa Finance Authority, Solid Waste Facilities, Midamerican Energy Co. Project, Rev., AMT, VRDO, 4.30%, 9/8/2023 (a) | 18,490 | 18,490 |
34,510 | ||
Kansas — 0.0% ^ | ||
University of Kansas Hospital Authority, Health System, Rev., VRDO, LOC : US Bank NA, 3.95%, 9/1/2023 (a) | 780 | 780 |
Kentucky — 3.3% | ||
Louisville Regional Airport Authority, UPS Worldwide Forwarding, Inc. | ||
Series 1999A, Rev., VRDO, 4.15%, 9/1/2023 (a) | 21,600 | 21,600 |
Series 1999C, Rev., VRDO, 4.15%, 9/1/2023 (a) | 30,995 | 30,995 |
52,595 | ||
Louisiana — 0.6% | ||
East Baton Rouge Parish Industrial Development Board, Inc., ExxonMobil Project, Gulf Opportunity Zone Series 2010, Rev., VRDO, 3.90%, 9/1/2023 (a) | 9,200 | 9,200 |
Maryland — 2.2% | ||
Howard County, Housing Commission, Beech's Farm Apartments, Rev., VRDO, LOC : PNC Bank NA, 4.04%, 9/8/2023 (a) | 10,350 | 10,350 |
Maryland Community Development Administration Series 2006J, Rev., AMT, VRDO, LIQ : Wells Fargo Bank NA, 4.08%, 9/8/2023 (a) | 6,700 | 6,700 |
Maryland Community Development Administration, Housing and Community Development Series 2006G, Rev., AMT, VRDO, LIQ : Wells Fargo Bank NA, 4.08%, 9/8/2023 (a) | 7,690 | 7,690 |
INVESTMENTS †† | PRINCIPAL AMOUNT ($000) | VALUE ($000) |
Maryland — continued | ||
Maryland Community Development Administration, The Residences at Ellicott Gardens LLC Series 2008C, Rev., VRDO, LIQ : FHLMC, 4.08%, 9/8/2023 (a) | 5,575 | 5,575 |
Montgomery County Housing Opportunities Commission Series 2023A, Rev., VRDO, FNMA, LOC : TD Bank NA, 3.93%, 9/1/2023 (a) | 200 | 200 |
RBC Municipal Products, Inc. Trust, Floater Certificates Series 2023-G122, Rev., VRDO, LOC : Royal Bank of Canada, 4.67%, 9/8/2023 (a) (b) | 3,800 | 3,800 |
34,315 | ||
Massachusetts — 3.6% | ||
Cape Ann Transportation Authority, Rev., RAN, GTD, 4.50%, 7/3/2024 | 2,000 | 2,010 |
Dudley Charlton Regional School District, GO, BAN, 4.50%, 7/25/2024 | 895 | 900 |
Greater Attleboro-Taunton Regional Transit Authority, Rev., RAN, 4.25%, 8/16/2024 | 8,200 | 8,234 |
Lowell Regional Transit Authority, Rev., RAN, 4.50%, 8/16/2024 | 3,200 | 3,220 |
Massachusetts Development Finance Agency, Boston University Issue Series 2008-U6E, Rev., VRDO, LOC : TD Bank NA, 3.80%, 9/1/2023 (a) | 3,580 | 3,580 |
Massachusetts Health and Educational Facilities Authority, Baystate Medical Centre Series 2009K-1, Rev., VRDO, LOC : TD Bank NA, 3.80%, 9/1/2023 (a) | 5,100 | 5,100 |
Metrowest Regional Transit Authority, Rev., TRAN, 4.50%, 9/13/2024 (c) | 8,895 | 8,946 |
RBC Municipal Products, Inc. Trust, Floater Certificates Series E-144, GO, RAN, VRDO, LOC : Royal Bank of Canada, 4.09%, 9/8/2023 (a) (b) | 725 | 725 |
RIB Floater Trust Various States Series 39, Rev., VRDO, LIQ : Barclays Bank plc, 4.08%, 9/1/2023 (a) (b) | 1,235 | 1,235 |
Southeastern Regional Transit Authority, Rev., RAN, 4.50%, 8/16/2024 | 6,000 | 6,037 |
Tender Option Bond Trust Receipts/Certificates Series 2022-XM0986, Rev., VRDO, LIQ : Royal Bank of Canada, 4.09%, 9/8/2023 (a) (b) | 4,835 | 4,835 |
Worcester Regional Transit Authority, Rev., RAN, 4.50%, 6/21/2024 | 11,400 | 11,462 |
56,284 | ||
79 | J.P. Morgan Money Market Funds | August 31, 2023 |
INVESTMENTS †† | PRINCIPAL AMOUNT ($000) | VALUE ($000) |
Municipal Bonds — continued | ||
Michigan — 3.7% | ||
Michigan State Housing Development Authority, Rental Housing | ||
Series 2016C, Rev., AMT, VRDO, LIQ : TD Bank NA, 4.05%, 9/8/2023 (a) | 23,000 | 23,000 |
Series 2016E, Rev., AMT, VRDO, LIQ : UBS AG, 4.08%, 9/8/2023 (a) | 7,110 | 7,110 |
Michigan State Housing Development Authority, Single Family Mortgage Series 2009D, Rev., VRDO, LIQ : TD Bank NA, 4.00%, 9/8/2023 (a) | 1,450 | 1,450 |
RIB Floater Trust Various States | ||
Series 2022-048, Rev., VRDO, LIQ : Barclays Bank plc, 4.07%, 9/1/2023 (a) (b) | 14,800 | 14,800 |
Series 46, Rev., VRDO, LOC : Barclays Bank plc, 4.07%, 9/1/2023 (a) (b) | 11,890 | 11,890 |
58,250 | ||
Minnesota — 0.4% | ||
City of Minneapolis, Health Care System, Fairview Health Services Series 2018C, Rev., VRDO, LOC : Wells Fargo Bank NA, 3.80%, 9/1/2023 (a) | 5,315 | 5,315 |
Minnesota Higher Education Facilities Authority, Concordia University, St. Paul Series 6Q, Rev., VRDO, LOC : US Bank NA, 4.15%, 9/1/2023 (a) | 1,300 | 1,300 |
6,615 | ||
Mississippi — 3.5% | ||
Mississippi Business Finance Corp., Chevron USA, Inc. Project Series 2007D, Rev., VRDO, 3.90%, 9/1/2023 (a) | 5,000 | 5,000 |
Mississippi Business Finance Corp., Gulf Opportunity Zone Industrial Development, Chevron USA, Inc., Project | ||
Series 2007B, Rev., VRDO, 3.80%, 9/1/2023 (a) | 8,075 | 8,075 |
Series 2007C, Rev., VRDO, 3.80%, 9/1/2023 (a) | 645 | 645 |
Series 2009B, Rev., VRDO, 3.80%, 9/1/2023 (a) | 1,375 | 1,375 |
Series 2009C, Rev., VRDO, 3.80%, 9/1/2023 (a) | 1,225 | 1,225 |
Series 2009F, Rev., VRDO, 3.80%, 9/1/2023 (a) | 1,850 | 1,850 |
Series 2009G, Rev., VRDO, 3.80%, 9/1/2023 (a) | 250 | 250 |
Series 2010I, Rev., VRDO, 3.80%, 9/1/2023 (a) | 10,675 | 10,675 |
Series 2011G, Rev., VRDO, 3.80%, 9/1/2023 (a) | 9,210 | 9,210 |
INVESTMENTS †† | PRINCIPAL AMOUNT ($000) | VALUE ($000) |
Mississippi — continued | ||
Series 2007A, Rev., VRDO, 3.90%, 9/1/2023 (a) | 10,000 | 10,000 |
Series 2010J, Rev., VRDO, 3.90%, 9/1/2023 (a) | 1,185 | 1,185 |
Series 2010H, Rev., VRDO, 4.00%, 9/1/2023 (a) | 3,250 | 3,250 |
Series 2010L, Rev., VRDO, 4.00%, 9/1/2023 (a) | 925 | 925 |
Series 2011B, Rev., VRDO, 4.00%, 9/1/2023 (a) | 695 | 695 |
Series 2011D, Rev., VRDO, 4.00%, 9/1/2023 (a) | 300 | 300 |
54,660 | ||
Missouri — 2.6% | ||
Health and Educational Facilities Authority of the State of Missouri, BJC Health System Series C, Rev., VRDO, LIQ : BJC Health System, 4.00%, 9/8/2023 (a) | 250 | 250 |
Health and Educational Facilities Authority of the State of Missouri, St. Louis University Series 2008B, Rev., VRDO, LOC : Wells Fargo Bank NA, 3.75%, 9/1/2023 (a) | 1,380 | 1,380 |
Missouri Development Finance Board, The Nelson Gallery Foundation Series 2008A, Rev., VRDO, LIQ : US Bank NA, 4.20%, 9/1/2023 (a) | 38,850 | 38,850 |
40,480 | ||
Nebraska — 0.3% | ||
Douglas County Hospital Authority No. 2, Health Facilities Series 2008-A, Rev., VRDO, LOC : US Bank NA, 3.95%, 9/1/2023 (a) | 350 | 350 |
Tender Option Bond Trust Receipts/Certificates Series 2022-XX1253, Rev., VRDO, LIQ : Barclays Bank plc, 4.09%, 9/8/2023 (a) (b) | 4,670 | 4,670 |
5,020 | ||
Nevada — 1.7% | ||
County of Clark, Industrial Development, Southwest Gas Corp., Project Series 2008A, Rev., AMT, VRDO, LOC : MUFG Union Bank NA, 4.03%, 9/8/2023 (a) | 20,000 | 20,000 |
Tender Option Bond Trust Receipts/Certificates Series 2023-XF3103, Rev., VRDO, LIQ : Morgan Stanley Bank NA, 4.09%, 9/8/2023 (a) (b) | 6,660 | 6,660 |
26,660 | ||
New Jersey — 3.7% | ||
Borough of Ringwood, GO, BAN, 5.75%, 4/5/2024 | 100 | 102 |
City of Long Branch, GO, BAN, 5.50%, 1/30/2024 | 129 | 130 |
August 31, 2023 | J.P. Morgan Money Market Funds | 80 |
AS OF August 31, 2023 (Unaudited) (continued)
INVESTMENTS †† | PRINCIPAL AMOUNT ($000) | VALUE ($000) |
Municipal Bonds — continued | ||
New Jersey — continued | ||
City of Plainfield, GO, BAN, 4.50%, 8/9/2024 | 4,099 | 4,126 |
RIB Floater Trust Various States | ||
Series 2023-005, GO, BAN, VRDO, LIQ : Barclays Bank plc, 4.10%, 9/1/2023 (a) (b) | 19,070 | 19,070 |
Series 20, Rev., VRDO, LIQ : Barclays Bank plc, 4.12%, 9/8/2023 (a) (b) | 5,110 | 5,110 |
Tender Option Bond Trust Receipts/Certificates | ||
Series 2023-XF1480, Rev., VRDO, LOC : Barclays Bank plc, 4.10%, 9/8/2023 (a) (b) | 5,440 | 5,440 |
Series 2020-XF0957, Rev., VRDO, LOC : Royal Bank of Canada, 4.13%, 9/8/2023 (a) (b) | 2,500 | 2,500 |
Township of Cranbury, GO, BAN, 4.25%, 4/30/2024 | 4,304 | 4,317 |
Township of Howell, GO, TAN, 4.00%, 2/21/2024 | 10,000 | 10,024 |
Township of Manchester Series 2023A, GO, BAN, 4.50%, 5/10/2024 | 3,750 | 3,768 |
Township of Upper Series 2023A, GO, BAN, 4.25%, 8/14/2024 | 3,000 | 3,012 |
57,599 | ||
New York — 11.9% | ||
Batavia City School District, GO, BAN, 4.25%, 6/11/2024 | 6,525 | 6,539 |
City of Ithaca, GO, BAN, 4.75%, 7/19/2024 | 2,000 | 2,014 |
City of New York, Fiscal Year 2006 Series 2006, Subseries I-4, GO, VRDO, LOC : TD Bank NA, 3.90%, 9/1/2023 (a) | 2,535 | 2,535 |
City of New York, Fiscal Year 2008 Series 2008, Subseries L-4, GO, VRDO, LOC : US Bank NA, 4.25%, 9/1/2023 (a) | 500 | 500 |
City of New York, Fiscal Year 2013 Series 2013A-3, GO, VRDO, LOC : Mizuho Bank Ltd., 4.00%, 9/1/2023 (a) | 30,135 | 30,135 |
City of New York, Fiscal Year 2022 Subseries D-4, GO, VRDO, LIQ : State Street Bank & Trust Co., 4.05%, 9/1/2023 (a) | 8,000 | 8,000 |
City of New York, Fiscal Year 2023 Series 2023A, Subseries A-3, GO, VRDO, LIQ : Bank of Montreal, 3.90%, 9/1/2023 (a) | 1,800 | 1,800 |
Metropolitan Transportation Authority Subseries 2012G-2, Rev., VRDO, LOC : TD Bank NA, 4.00%, 9/8/2023 (a) | 1,000 | 1,000 |
Metropolitan Transportation Authority, Dedicated Tax Fund Series 2008A-1, Rev., VRDO, LOC : TD Bank NA, 3.90%, 9/1/2023 (a) | 7,205 | 7,205 |
New York City Housing Development Corp., Fifth Avenue Apartments Series 2006A, Rev., VRDO, LOC : Citibank NA, 4.15%, 9/8/2023 (a) | 1,550 | 1,550 |
INVESTMENTS †† | PRINCIPAL AMOUNT ($000) | VALUE ($000) |
New York — continued | ||
New York City Housing Development Corp., Multi-Family Mortgage, La Casa Del Sol Series 2005A, Rev., VRDO, LOC : Citibank NA, 4.16%, 9/8/2023 (a) | 1,555 | 1,555 |
New York City Housing Development Corp., Multi-Family Mortgage, Urban Horizons II LP Series 2005A, Rev., BAN, VRDO, LOC : Citibank NA, 4.16%, 9/8/2023 (a) | 1,365 | 1,365 |
New York City Municipal Water Finance Authority, Second General Resolution | ||
Series 2010CC, Rev., VRDO, LIQ : State Street Bank & Trust Co., 3.90%, 9/1/2023 (a) | 12,620 | 12,620 |
Series BB 1A, Rev., VRDO, LIQ : State Street Bank & Trust Co., 3.90%, 9/1/2023 (a) | 5,300 | 5,300 |
Series DD-1, Rev., VRDO, LIQ : TD Bank NA, 3.90%, 9/1/2023 (a) | 1,255 | 1,255 |
Series 2014AA-4, Rev., VRDO, LIQ : State Street Bank & Trust Co., 4.00%, 9/1/2023 (a) | 5,900 | 5,900 |
Series 2009BB-1, Rev., VRDO, LIQ : UBS AG, 4.05%, 9/1/2023 (a) | 650 | 650 |
New York City Municipal Water Finance Authority, Second General Resolution, Fiscal year 2023 Series 2023, Subseries BB-2, Rev., VRDO, LIQ : Mizuho Bank Ltd., 3.85%, 9/1/2023 (a) | 8,585 | 8,585 |
New York City Municipal Water Finance Authority, Water and Sewer System, Second General Resolution, Fiscal year 2014 | ||
Series 2014AA-3, Rev., VRDO, LIQ : TD Bank NA, 3.90%, 9/1/2023 (a) | 930 | 930 |
Series AA-5, Rev., VRDO, LIQ : Mizuho Bank Ltd., 3.90%, 9/1/2023 (a) | 10,000 | 10,000 |
New York City Municipal Water Finance Authority, Water and Sewer System, Second General Resolution, Fiscal year 2021 Series 2021EE-2, Rev., VRDO, LIQ : State Street Bank & Trust Co., 4.25%, 9/1/2023 (a) | 20,000 | 20,000 |
New York City Transitional Finance Authority Future Tax Secured Series 2010G-6, Rev., VRDO, LIQ : Barclays Bank plc, 3.95%, 9/1/2023 (a) | 1,010 | 1,010 |
New York City Transitional Finance Authority, Future Tax Secured, Fiscal Year 2013 Series 2013C-5, Rev., VRDO, LOC : Sumitomo Mitsui Banking Corp., 4.00%, 9/8/2023 (a) | 225 | 225 |
New York City Transitional Finance Authority, Future Tax Secured, Fiscal Year 2015 Series 2015A-3, Rev., VRDO, LIQ : Mizuho Bank Ltd., 3.98%, 9/1/2023 (a) | 1,000 | 1,000 |
81 | J.P. Morgan Money Market Funds | August 31, 2023 |
INVESTMENTS †† | PRINCIPAL AMOUNT ($000) | VALUE ($000) |
Municipal Bonds — continued | ||
New York — continued | ||
New York State Housing Finance Agency, 160 Madison Avenue LLC | ||
Series 2013A, Rev., VRDO, LOC : Landesbank Hessen-Thuringen Girozentrale, 3.89%, 9/1/2023 (a) | 1,220 | 1,220 |
Series 2014A, Rev., VRDO, LOC : Landesbank Hessen-Thuringen Girozentrale, 3.89%, 9/1/2023 (a) | 150 | 150 |
New York State Housing Finance Agency, 350 West 43rd Street Housing | ||
Series 2001A, Rev., VRDO, LOC : Landesbank Hessen-Thuringen Girozentrale, 3.92%, 9/1/2023 (a) | 5,000 | 5,000 |
Series 2002A, Rev., VRDO, LOC : Landesbank Hessen-Thuringen Girozentrale, 3.92%, 9/1/2023 (a) | 19,400 | 19,400 |
RBC Municipal Products, Inc. Trust, Floater Certificates | ||
Series E-120, Rev., VRDO, LOC : Royal Bank of Canada, 4.05%, 9/1/2023 (a) (b) | 5,300 | 5,300 |
Series E-146, Rev., VRDO, LOC : Royal Bank of Canada, 4.09%, 9/8/2023 (a) (b) | 10,000 | 10,000 |
Springville-Griffith Institute Central School District, GO, BAN, 4.75%, 6/28/2024 | 3,800 | 3,829 |
Tender Option Bond Trust Receipts/Certificates | ||
Series 2022-XF1339, GO, VRDO, LIQ : Bank of America NA, 4.09%, 9/8/2023 (a) (b) | 2,045 | 2,045 |
Series 2022-XF1420, Rev., VRDO, LIQ : Bank of America NA, 4.09%, 9/8/2023 (a) (b) | 4,800 | 4,800 |
Triborough Bridge and Tunnel Authority | ||
Series 2005B-3, Rev., VRDO, LOC : Bank of America NA, 3.92%, 9/1/2023 (a) | 2,050 | 2,050 |
Series 2001C, Rev., VRDO, LOC : Barclays Bank plc, 3.95%, 9/1/2023 (a) | 1,300 | 1,300 |
186,767 | ||
North Carolina — 0.6% | ||
Tender Option Bond Trust Receipts/Certificates | ||
Series 2022-ZL0341, Rev., VRDO, LIQ : Wells Fargo Bank NA, 4.09%, 9/8/2023 (a) (b) | 2,130 | 2,130 |
Series 2022-ZL0405, Rev., VRDO, LIQ : Morgan Stanley Bank NA, 4.11%, 9/8/2023 (a) (b) | 3,330 | 3,330 |
Series 2022-XM1011, Rev., VRDO, AGM, LOC : Royal Bank of Canada, 4.13%, 9/8/2023 (a) (b) | 4,200 | 4,200 |
9,660 | ||
INVESTMENTS †† | PRINCIPAL AMOUNT ($000) | VALUE ($000) |
North Dakota — 0.4% | ||
North Dakota Housing Finance Agency, Home Mortgage Finance Program Series 2015E, Rev., VRDO, LIQ : TD Bank NA, 4.06%, 9/8/2023 (a) | 5,530 | 5,530 |
Ohio — 1.9% | ||
City of Delaware, GO, BAN, 4.63%, 7/3/2024 | 3,550 | 3,571 |
City of Westlake, Community Services Improvement Notes, GO, BAN, 4.25%, 8/29/2024 | 2,500 | 2,511 |
County of Belmont, Various Purpose General Obligation Limited Tax, GO, BAN, 4.50%, 8/15/2024 | 3,590 | 3,613 |
County of Hamilton, Hospital Facilities, The Elizabeth Gamble Deaconess Home Association Series 2002A, Rev., VRDO, LOC : Northern Trust Co. (The), 4.04%, 9/8/2023 (a) | 2,400 | 2,400 |
Ohio Housing Finance Agency, Mortgage-Backed Securities Program | ||
Series F, Rev., AMT, VRDO, GNMA / FNMA / FHLMC, LIQ : TD Bank NA, 4.03%, 9/8/2023 (a) | 4,105 | 4,105 |
Series I, Rev., AMT, VRDO, GNMA / FNMA / FHLMC, LIQ : TD Bank NA, 4.03%, 9/8/2023 (a) | 4,540 | 4,540 |
Tender Option Bond Trust Receipts/Certificates | ||
Series 2023-XG0507, Rev., VRDO, LIQ : Royal Bank of Canada, 4.09%, 9/8/2023 (a) (b) | 2,800 | 2,800 |
Series 2022-XX1266, Rev., VRDO, LOC : Barclays Bank plc, 4.10%, 9/8/2023 (a) (b) | 6,750 | 6,750 |
30,290 | ||
Oklahoma — 0.1% | ||
Tender Option Bond Trust Receipts/Certificates Series 2023-XF1572, Rev., VRDO, LIQ : Royal Bank of Canada, 4.09%, 9/8/2023 (a) (b) | 2,220 | 2,220 |
Oregon — 1.8% | ||
Marion County Housing Authority, Residence at Marian, Rev., VRDO, LOC : US Bank NA, 4.11%, 9/8/2023 (a) | 210 | 210 |
Port of Portland Airport Series 18B, Rev., AMT, VRDO, LOC : Industrial & Commercial Bank of China, 4.10%, 9/8/2023 (a) | 10,785 | 10,785 |
Port of Portland, International Airport Subseries 18A, Rev., AMT, VRDO, LOC : Industrial & Commercial Bank of China, 4.05%, 9/8/2023 (a) | 10,680 | 10,680 |
August 31, 2023 | J.P. Morgan Money Market Funds | 82 |
AS OF August 31, 2023 (Unaudited) (continued)
INVESTMENTS †† | PRINCIPAL AMOUNT ($000) | VALUE ($000) |
Municipal Bonds — continued | ||
Oregon — continued | ||
Port of Portland, Special Obligation, Horizon Air Industries, Inc., Project, Rev., VRDO, LOC : Bank of America NA, 4.13%, 9/1/2023 (a) | 4,325 | 4,325 |
Tender Option Bond Trust Receipts/Certificates Series 2023-XF1493, Rev., VRDO, LIQ : Bank of America NA, 4.18%, 9/8/2023 (a) (b) | 2,085 | 2,085 |
28,085 | ||
Other — 3.2% | ||
FHLMC, Multi-Family VRD Certificates | ||
Series M017, Rev., VRDO, LIQ : FHLMC, 4.09%, 9/8/2023 (a) (b) | 31,557 | 31,557 |
Series M028, Rev., VRDO, LIQ : FHLMC, 4.14%, 9/8/2023 (a) (b) | 7,495 | 7,495 |
Series M019, Rev., VRDO, LIQ : FHLMC, 4.50%, 9/8/2023 (a) (b) | 2,226 | 2,226 |
Series M025, Rev., VRDO, LIQ : FHLMC, 4.63%, 9/8/2023 (a) (b) | 5,630 | 5,630 |
Series M026, Rev., VRDO, LIQ : FHLMC, 4.63%, 9/8/2023 (a) (b) | 3,365 | 3,365 |
50,273 | ||
Pennsylvania — 2.5% | ||
Fayette County Hospital Authority Series B, Rev., VRDO, LOC : PNC Bank NA, 4.04%, 9/8/2023 (a) | 1,800 | 1,800 |
General Authority of Southcentral Pennsylvania, WellSpan Health Obligated Group Series D, Rev., VRDO, LIQ : Bank of America NA, 4.05%, 9/1/2023 (a) | 2,550 | 2,550 |
Pennsylvania Turnpike Commission, Rev., VRDO, LOC : TD Bank NA, 4.01%, 9/8/2023 (a) | 5,600 | 5,600 |
Philadelphia Authority for Industrial Development Series B-2, Rev., VRDO, LOC : TD Bank NA, 4.01%, 9/8/2023 (a) | 100 | 100 |
Tender Option Bond Trust Receipts/Certificates | ||
Series 2022-XF3041, Rev., VRDO, LIQ : Morgan Stanley Bank NA, 4.09%, 9/8/2023 (a) (b) | 4,000 | 4,000 |
Series 2022-XG0412, Rev., VRDO, LIQ : Royal Bank of Canada, 4.09%, 9/8/2023 (a) (b) | 3,115 | 3,115 |
Series 2022-XG0413, Rev., VRDO, LIQ : Royal Bank of Canada, 4.09%, 9/8/2023 (a) (b) | 2,665 | 2,665 |
Series 2022-XG0437, Rev., VRDO, LOC : Barclays Bank plc, 4.11%, 9/8/2023 (a) (b) | 5,000 | 5,000 |
INVESTMENTS †† | PRINCIPAL AMOUNT ($000) | VALUE ($000) |
Pennsylvania — continued | ||
Series 2022-XM1057, Rev., VRDO, LIQ : Bank of America NA, 4.11%, 9/8/2023 (a) (b) | 2,500 | 2,500 |
Series 2022-XM1083, Rev., VRDO, AGM, LOC : Royal Bank of Canada, 4.14%, 9/8/2023 (a) (b) | 11,375 | 11,375 |
38,705 | ||
Tennessee — 1.5% | ||
Metropolitan Government Nashville and Davidson County Health and Educational Facilities Board, Multi-Family Housing, Retreat Dry, Rev., VRDO, LOC : Citibank NA, 4.27%, 9/8/2023 (a) | 4,030 | 4,030 |
Montgomery County Public Building Authority, Pooled Financing, Tennessee Country Pool Series 2006, Rev., VRDO, LOC : Bank of America NA, 3.94%, 9/1/2023 (a) | 8,350 | 8,350 |
Tender Option Bond Trust Receipts/Certificates | ||
Series 2023-YX1289, Rev., VRDO, LOC : Barclays Bank plc, 4.11%, 9/8/2023 (a) (b) | 5,210 | 5,210 |
Series 2022-XL0382, Rev., VRDO, LOC : Royal Bank of Canada, 4.13%, 9/8/2023 (a) (b) | 5,400 | 5,400 |
22,990 | ||
Texas — 4.1% | ||
Calhoun Port Authority, Formosa Plastics Corp. Project Series 2011A, Rev., VRDO, LOC : Sumitomo Mitsui Banking Corp., 4.16%, 9/8/2023 (a) (b) | 10,000 | 10,000 |
Gilmer Industrial Development Corp., Duoline Technologies LP Series 2008A, Rev., VRDO, LOC : Wells Fargo Bank NA, 4.15%, 9/8/2023 (a) | 4,780 | 4,780 |
Gulf Coast Authority, Waste Disposal Environmental Facilities, ExxonMobil Project | ||
Rev., VRDO, 3.99%, 9/1/2023 (a) | 1,095 | 1,095 |
Rev., VRDO, 3.99%, 9/1/2023 (a) | 5,000 | 5,000 |
Harris County Industrial Development Corp., Exxon Corp Project, Rev., VRDO, 3.85%, 9/1/2023 (a) | 2,600 | 2,600 |
Lower Neches Valley Authority Industrial Development Corp., ExxonMobil Project Series 2001, Subseries B-3, Rev., VRDO, 3.85%, 9/1/2023 (a) | 100 | 100 |
Lower Neches Valley Authority Industrial Development Corp., Mobil Oil Refining Corp. Project, Rev., VRDO, 3.99%, 9/1/2023 (a) | 395 | 395 |
State of Texas, Veterans, GO, AMT, VRDO, LIQ : State Street Bank & Trust Co., 4.20%, 9/8/2023 (a) | 5,645 | 5,645 |
83 | J.P. Morgan Money Market Funds | August 31, 2023 |
INVESTMENTS †† | PRINCIPAL AMOUNT ($000) | VALUE ($000) |
Municipal Bonds — continued | ||
Texas — continued | ||
State of Texas, Veterans Housing Assistance Program Series 2002A-2, GO, AMT, VRDO, LIQ : State Street Bank & Trust Co., 4.20%, 9/8/2023 (a) | 2,955 | 2,955 |
Tarrant County Cultural Education Facilities Finance Corp., Methodist Hospitals of Dallas Project Series 2008B, Rev., VRDO, LOC : TD Bank NA, 3.90%, 9/1/2023 (a) | 5,700 | 5,700 |
Tender Option Bond Trust Receipts/Certificates | ||
Series 2022-XF1448, GO, VRDO, PSF-GTD, LIQ : Bank of America NA, 4.09%, 9/8/2023 (a) (b) | 2,050 | 2,050 |
Series 2022-XM1050, Rev., VRDO, LIQ : Citibank NA, 4.09%, 9/8/2023 (a) (b) | 950 | 950 |
Series 2022-XM1056, GO, VRDO, LIQ : Morgan Stanley Bank NA, 4.09%, 9/8/2023 (a) (b) | 3,750 | 3,750 |
Series 2023-XF1447, Rev., VRDO, LIQ : Bank of America NA, 4.09%, 9/8/2023 (a) (b) | 2,000 | 2,000 |
Series 2023-XG0444, Rev., VRDO, LOC : Royal Bank of Canada, 4.09%, 9/8/2023 (a) (b) | 1,875 | 1,875 |
Series 2022-XF1392, Rev., VRDO, LIQ : TD Bank NA, 4.10%, 9/8/2023 (a) (b) | 5,000 | 5,000 |
Series 2023-XF1480, GO, VRDO, LIQ : TD Bank NA, 4.11%, 9/8/2023 (a) (b) | 4,890 | 4,890 |
Texas Transportation Commission State Highway Fund Series 2014-B, Rev., VRDO, LIQ : Sumitomo Mitsui Banking Corp., 4.07%, 9/8/2023 (a) | 6,000 | 6,000 |
64,785 | ||
Utah — 0.9% | ||
County of Utah, IHC Health Services, Inc. Series 2018C, Rev., VRDO, LIQ : TD Bank NA, 3.75%, 9/1/2023 (a) | 7,500 | 7,500 |
Tender Option Bond Trust Receipts/Certificates | ||
Series 2022-XX1249, Rev., VRDO, LOC : Barclays Bank plc, 4.11%, 9/8/2023 (a) (b) | 2,920 | 2,920 |
Series 2022-XG0364, Rev., VRDO, LIQ : Bank of America NA, 4.12%, 9/8/2023 (a) (b) | 4,505 | 4,505 |
14,925 | ||
Virginia — 0.9% | ||
Botetourt County Industrial Development Authority, Altec Industries, Rev., VRDO, LOC : Bank of America NA, 4.25%, 9/8/2023 (a) | 7,400 | 7,400 |
INVESTMENTS †† | PRINCIPAL AMOUNT ($000) | VALUE ($000) |
Virginia — continued | ||
Harrisonburg Economic Development Authority, Health Care Facility, Sentara Health Series 2023, Rev., VRDO, LOC : US Bank NA, 3.85%, 9/8/2023 (a) | 4,200 | 4,200 |
Virginia College Building Authority, University of Richmond Project Series 2006, Rev., VRDO, LIQ : US Bank NA, 4.20%, 9/1/2023 (a) | 2,100 | 2,100 |
13,700 | ||
Washington — 0.9% | ||
Port of Tacoma, Subordinate Lien | ||
Rev., AMT, VRDO, LOC : PNC Bank NA, 4.10%, 9/8/2023 (a) | 6,920 | 6,920 |
Series 2019A, Rev., AMT, VRDO, LOC : PNC Bank NA, 4.10%, 9/8/2023 (a) | 5,000 | 5,000 |
Tender Option Bond Trust Receipts/Certificates Series 2022-XG0400, GO, VRDO, LIQ : Barclays Bank plc, 4.10%, 9/8/2023 (a) (b) | 2,630 | 2,630 |
14,550 | ||
Wisconsin — 1.2% | ||
Tender Option Bond Trust Receipts/Certificates Series 2023-XL0447, Rev., VRDO, LIQ : Barclays Bank plc, 4.10%, 9/8/2023 (a) (b) | 6,750 | 6,750 |
Wisconsin Health and Educational Facilities Authority, Medical College of Wisconsin, Inc., (The) Series 2008B, Rev., VRDO, LOC : TD Bank NA, 3.93%, 9/1/2023 (a) | 8,000 | 8,000 |
Wisconsin Housing and Economic Development Authority Housing Series 2022C, Rev., VRDO, LIQ : FHLB, 4.05%, 9/8/2023 (a) | 4,650 | 4,650 |
19,400 | ||
Total Municipal Bonds (Cost $1,346,703) | 1,346,703 | |
SHARES (000) | ||
Variable Rate Demand Preferred Shares — 3.0% | ||
Other — 3.0% | ||
Nuveen AMT - Free Quality Municipal Income Fund | ||
Series 4-4895, LIQ : Barclays Bank plc, 4.11%, 9/8/2023# (b) | 20,000 | 20,000 |
Series 3-PFD, LIQ : TD Bank NA, 4.11%, 9/8/2023# (b) | 7,500 | 7,500 |
August 31, 2023 | J.P. Morgan Money Market Funds | 84 |
AS OF August 31, 2023 (Unaudited) (continued)
INVESTMENTS †† | SHARES (000) | VALUE ($000) |
Variable Rate Demand Preferred Shares — continued | ||
Other — continued | ||
Nuveen Quality Municipal Income Fund Series 2-2525, LIQ : Barclays Bank plc, 4.16%, 9/8/2023# (b) | 20,000 | 20,000 |
Total Variable Rate Demand Preferred Shares (Cost $47,500) | 47,500 | |
PRINCIPAL AMOUNT ($000) | ||
Short Term Investments — 11.6% | ||
Commercial Paper — 11.6% | ||
Board of Regents of the University of Texas System | ||
Series A, 3.30%, 9/20/2023 | 10,000 | 10,000 |
City of Atlanta | ||
Series N-2, 3.60%, 9/7/2023 | 15,900 | 15,900 |
Series M-2, 3.65%, 9/7/2023 | 25,700 | 25,700 |
City of Houston | ||
Series G-2, 3.25%, 9/14/2023 | 5,000 | 5,000 |
Series H-2, 3.40%, 9/21/2023 | 13,000 | 13,000 |
Series E-1, 3.70%, 10/3/2023 | 5,000 | 5,000 |
City of Jacksonville | ||
Series 94, 3.50%, 9/6/2023 | 5,000 | 5,000 |
Series 2016, 3.60%, 11/7/2023 | 11,000 | 11,000 |
City of San Antonio Electric & Gas Systems | ||
Series C, 3.30%, 9/12/2023 | 10,000 | 10,000 |
Series B, 3.40%, 9/12/2023 | 10,000 | 10,000 |
County of Harris Toll Road | ||
3.70%, 2/14/2024 | 5,330 | 5,330 |
County of Montgomery | ||
Series 10-A, 3.50%, 10/3/2023 | 10,000 | 10,000 |
Health Care Authority of the City of Huntsville (The) | ||
3.60%, 9/26/2023 | 10,000 | 10,000 |
Lower Colorado River Authority | ||
Series B, 3.50%, 9/28/2023 | 4,913 | 4,913 |
Miami Dade College Foundation, Inc. | ||
Series 2021, 3.40%, 9/7/2023 | 8,000 | 8,000 |
Omaha Public Power District | ||
Series A, 3.70%, 11/28/2023 | 12,500 | 12,500 |
San Francisco City & County Airport Comm-San Francisco International Airport | ||
Series A-3, 3.30%, 9/13/2023 | 8,000 | 8,000 |
INVESTMENTS †† | PRINCIPAL AMOUNT ($000) | VALUE ($000) |
Commercial Paper — continued | ||
University of North Texas System | ||
Series A, 3.58%, 11/15/2023 | 13,650 | 13,650 |
Total Commercial Paper (Cost $182,993) | 182,993 | |
Total Short Term Investments (Cost $182,993) | 182,993 | |
Total Investments — 100.2% (Cost $1,577,196) * | 1,577,196 | |
Liabilities in Excess of Other Assets — (0.2)% | (3,466 ) | |
NET ASSETS — 100.0% | 1,573,730 | |
Percentages indicated are based on net assets. |
Abbreviations | |
AGM | Insured by Assured Guaranty Municipal Corp. |
AMT | Alternative Minimum Tax |
BAN | Bond Anticipation Note |
COLL | Collateral |
COP | Certificate of Participation |
FHLB | Federal Home Loan Bank |
FHLMC | Federal Home Loan Mortgage Corp. |
FNMA | Federal National Mortgage Association |
GNMA | Government National Mortgage Association |
GO | General Obligation |
GTD | Guaranteed |
LIQ | Liquidity Agreement |
LOC | Letter of Credit |
PSF-GTD | Permanent School Fund Guaranteed |
RAN | Revenue Anticipation Note |
Rev. | Revenue |
TAN | Tax Anticipation Note |
TRAN | Tax & Revenue Anticipation Note |
VRDO | Variable Rate Demand Obligation |
^ | Amount rounds to less than 0.1% of net assets. | |
†† | The date shown represents the earliest of the next put date, next demand date or final maturity date. | |
# | Variable Rate Demand Preferred Shares of a closed-end investment company which has a weekly demand feature. The interest rate shown is the rate in effect as of August 31, 2023. | |
* | The cost of securities is substantially the same for federal income tax purposes. | |
(a) | Variable or floating rate security, the interest rate of which adjusts periodically based on changes in current interest rates and prepayments on the underlying pool of assets. The interest rate shown is the current rate as of August 31, 2023. | |
85 | J.P. Morgan Money Market Funds | August 31, 2023 |
(b) | Securities exempt from registration under Rule 144A or section 4(a)(2), of the Securities Act of 1933, as amended. | |
(c) | All or a portion of the security is a when-issued security, delayed delivery security, or forward commitment. |
August 31, 2023 | J.P. Morgan Money Market Funds | 86 |
AS OF August 31, 2023 (Unaudited)
INVESTMENTS †† | PRINCIPAL AMOUNT ($000) | VALUE ($000) |
Municipal Bonds — 65.4% | ||
California — 65.4% | ||
Abag Finance Authority for Nonprofit Corps., Sharp Healthcare Series 2009A, Rev., VRDO, LOC : Bank of America NA, 2.82%, 9/6/2023 (a) | 635 | 635 |
Alameda County Industrial Development Authority, JMS Family Partnership Series 1995A, Rev., VRDO, LOC : Wells Fargo Bank NA, 4.00%, 9/8/2023 (a) | 3,330 | 3,330 |
Alameda County Industrial Development Authority, Plyproperties Project Series 1997A, Rev., VRDO, LOC : Wells Fargo Bank NA, 4.11%, 9/8/2023 (a) | 1,760 | 1,760 |
Alameda Public Financing Authority Series 2003A, Rev., VRDO, LOC : Wells Fargo Bank NA, 3.95%, 9/8/2023 (a) | 300 | 300 |
Bay Area Toll Authority | ||
Series 2023B, Rev., VRDO, LOC : Barclays Bank plc, 3.02%, 9/1/2023 (a) | 11,520 | 11,520 |
Series 2019D, Rev., VRDO, LOC : Sumitomo Mitsui Banking Corp., 2.00%, 9/8/2023 (a) | 4,500 | 4,500 |
Series 2007C-2, Rev., VRDO, LOC : Bank of Tokyo-Mitsubishi UFJ Ltd., 2.35%, 9/8/2023 (a) | 600 | 600 |
Series 2007G-1, Rev., VRDO, LOC : Bank of America NA, 2.75%, 9/8/2023 (a) | 910 | 910 |
California Economic Development Financing Authority, Killion Industries Project, Rev., VRDO, LOC : Union Bank of California, 4.00%, 9/8/2023 (a) | 3,700 | 3,700 |
California Educational Facilities Authority, Institute of Technology | ||
Rev., VRDO, 2.80%, 9/8/2023 (a) | 7,650 | 7,650 |
Series A, Rev., VRDO, 3.07%, 9/8/2023 (a) | 5,600 | 5,600 |
California Health Facilities Financing Authority, Adventist Health System Series 2009B, Rev., VRDO, LOC : US Bank NA, 2.45%, 9/1/2023 (a) | 4,315 | 4,315 |
California Health Facilities Financing Authority, Memorial Health Services | ||
Rev., VRDO, 2.80%, 9/8/2023 (a) | 400 | 400 |
Series 2013A, Rev., VRDO, 2.80%, 9/8/2023 (a) | 100 | 100 |
California Health Facilities Financing Authority, Scripps Health | ||
Series 2010B, Rev., VRDO, 2.15%, 9/8/2023 (a) | 600 | 600 |
Series 2010C, Rev., VRDO, 2.15%, 9/8/2023 (a) | 1,280 | 1,280 |
California Health Facilities Financing Authority, Stanford Hospital and Clinics Series 2008B-2, Rev., VRDO, 3.05%, 10/4/2023 (a) | 3,650 | 3,650 |
California Housing Finance Agency, Montecito Village Affordable LP Series 2009B, Rev., VRDO, LIQ : FHLMC, 4.00%, 9/8/2023 (a) | 350 | 350 |
INVESTMENTS †† | PRINCIPAL AMOUNT ($000) | VALUE ($000) |
California — continued | ||
California Infrastructure and Economic Development Bank, Industrial Development, Silva Corks USA LLC Project Series 2006, Rev., VRDO, LOC : Bank of America NA, 3.84%, 9/8/2023 (a) | 990 | 990 |
California Infrastructure and Economic Development Bank, Pleasant Mattress Inc. Series 2000A, Rev., VRDO, LOC : Wells Fargo Bank NA, 4.00%, 9/8/2023 (a) | 280 | 280 |
California Municipal Finance Authority, Chevron USA, Inc., Project Series 2005, Rev., VRDO, 2.47%, 9/1/2023 (a) | 9,850 | 9,850 |
California Municipal Finance Authority, Mult-Family Housing,Garden Brook Senior Series 2018A, Rev., VRDO, LOC : FHLB, 2.82%, 9/8/2023 (a) | 100 | 100 |
California Municipal Finance Authority, Multi-Family Housing, Pacific Meadows Apartments Series 2010A, Rev., VRDO, LIQ : FHLMC, 4.05%, 9/8/2023 (a) | 580 | 580 |
California Municipal Finance Authority, Recovery Zone Facility, Chevron USA, Inc., Project | ||
Series 2010B, Rev., VRDO, 2.45%, 9/1/2023 (a) | 770 | 770 |
Series 2010C, Rev., VRDO, 2.50%, 9/1/2023 (a) | 4,115 | 4,115 |
California Pollution Control Financing Authority, Big Bear Disposal, Inc., Project, Rev., VRDO, LOC : Union Bank NA, 3.00%, 9/8/2023 (a) | 420 | 420 |
California Pollution Control Financing Authority, ExxonMobil Project Series 2001, Rev., VRDO, 2.59%, 9/1/2023 (a) | 305 | 305 |
California Public Finance Authority, Sharp Healthcare | ||
Series 2017B, Rev., VRDO, LOC : Barclays Bank plc, 2.80%, 9/1/2023 (a) | 300 | 300 |
Series 2017C, Rev., VRDO, LOC : Barclays Bank plc, 2.80%, 9/1/2023 (a) | 6,390 | 6,390 |
California School Cash Reserve Program Authority Series 2024A, Rev., 5.00%, 6/28/2024 | 3,000 | 3,044 |
California Statewide Communities Development Authority, American Modular System Series 2001A, Rev., VRDO, LOC : Bank of the West, 3.77%, 9/8/2023 (a) | 800 | 800 |
California Statewide Communities Development Authority, HSG Foxwood Series 1999J, Rev., VRDO, LOC : Wells Fargo Bank NA, 2.74%, 9/8/2023 (a) | 1,200 | 1,200 |
California Statewide Communities Development Authority, Multifamily Horizons Indio Series 2005F, Rev., VRDO, LOC : Citibank NA, 2.95%, 9/8/2023 (a) | 910 | 910 |
87 | J.P. Morgan Money Market Funds | August 31, 2023 |
INVESTMENTS †† | PRINCIPAL AMOUNT ($000) | VALUE ($000) |
Municipal Bonds — continued | ||
California — continued | ||
California Statewide Communities Development Authority, Olen Jones Senior Apartments Series 2002BB, Rev., VRDO, LOC : Citibank NA, 2.95%, 9/8/2023 (a) | 595 | 595 |
California Statewide Communities Development Authority, Rady Children's Hospital | ||
Series 2008B, Rev., VRDO, LOC : Wells Fargo Bank NA, 2.65%, 9/1/2023 (a) | 300 | 300 |
Series 2008C, Rev., VRDO, LOC : Northern Trust Co. (The), 3.00%, 9/8/2023 (a) | 2,100 | 2,100 |
California Statewide Communities Development Authority, Salvation Army Series 2003EEE, Rev., VRDO, LOC : FNMA, 3.44%, 9/8/2023 (a) | 3,800 | 3,800 |
California Statewide Communities Development Authority, Sweep Loan Program Series 2007A, Rev., VRDO, LOC : US Bank NA, 2.35%, 9/8/2023 (a) | 925 | 925 |
Central Contra Costa Sanitary District, COP, 5.00%, 9/1/2023 | 5,125 | 5,125 |
City of Big Bear Lake, Southwest Gas Corp., Project Series 1993A, Rev., AMT, VRDO, LOC : Bank of America NA, 3.90%, 9/8/2023 (a) | 850 | 850 |
City of Irvine, Assessment District No. 00-18, Limited Obligation Improvement Series 2001A, VRDO, LOC : State Street Bank & Trust Co., 2.56%, 9/1/2023 (a) | 400 | 400 |
City of Irvine, Assessment District No. 03-19, Limited Obligation Improvement Series A, VRDO, LOC : US Bank NA, 2.45%, 9/1/2023 (a) | 3,925 | 3,925 |
City of Irvine, Assessment District No. 07-22, Limited Obligation Improvement Series A, VRDO, LOC : Sumitomo Mitsui Banking Corp., 2.61%, 9/1/2023 (a) | 1,000 | 1,000 |
City of Irvine, Assessment District No. 93-14, Limited Obligation Improvement, VRDO, LOC : Sumitomo Mitsui Banking Corp., 2.61%, 9/1/2023 (a) | 2,100 | 2,100 |
City of Irvine, Reassessment District No. 05-21, Limited Obligation Improvement Series A, VRDO, LOC : Sumitomo Mitsui Banking Corp., 2.45%, 9/1/2023 (a) | 1,412 | 1,412 |
City of Los Angeles, Rev., TRAN, 5.00%, 6/27/2024 | 7,000 | 7,100 |
City of Riverside | ||
Series 2008A, Rev., VRDO, LOC : Barclays Bank plc, 2.85%, 9/8/2023 (a) | 550 | 550 |
COP, VRDO, LOC : Bank of America NA, 3.11%, 9/8/2023 (a) | 4,150 | 4,150 |
City of San Jose, Multi-Family Housing, Almaden Lake Village Apartments Series 2000A, Rev., VRDO, LOC : FNMA, 4.15%, 9/8/2023 (a) | 2,000 | 2,000 |
INVESTMENTS †† | PRINCIPAL AMOUNT ($000) | VALUE ($000) |
California — continued | ||
County of San Bernardino, Evergreen Apartments Series 1999A, Rev., VRDO, LOC : FNMA, 2.72%, 9/8/2023 (a) | 2,900 | 2,900 |
County of San Bernardino, Green Valley Apartments Series 1999A, Rev., VRDO, LOC : FNMA, 2.72%, 9/8/2023 (a) | 2,515 | 2,515 |
County of San Bernardino, Somerset Apartments LLC Series 1999A, Rev., VRDO, LOC : FNMA, 2.72%, 9/8/2023 (a) | 950 | 950 |
County of San Bernardino, Sycamore Terrace Apartments Series 1999A, Rev., VRDO, LOC : FNMA, 2.72%, 9/8/2023 (a) | 700 | 700 |
County of San Diego | ||
COP, VRDO, LOC : Northern Trust Co. (The), 3.21%, 9/8/2023 (a) | 3,450 | 3,450 |
COP, VRDO, LOC : Wells Fargo Bank NA, 3.33%, 9/8/2023 (a) | 100 | 100 |
Los Angeles County Schools, Pooled Financing Program Series A, Rev., TRAN, 5.00%, 6/28/2024 (b) | 3,000 | 3,043 |
Los Angeles Department of Water and Power, Power System | ||
Series 2001B-3, Rev., VRDO, LIQ : Barclays Bank plc, 2.75%, 9/1/2023 (a) | 795 | 795 |
Series 2021A-1, Rev., VRDO, LIQ : Royal Bank of Canada, 2.75%, 9/1/2023 (a) | 2,110 | 2,110 |
Series 2023C-2, Rev., VRDO, LIQ : TD Bank NA, 2.90%, 9/1/2023 (a) | 3,500 | 3,500 |
Series A-6, Rev., VRDO, LIQ : Bank of America NA, 3.00%, 9/1/2023 (a) | 1,650 | 1,650 |
Series 2001B, Subseries B1, Rev., VRDO, LIQ : Barclays Bank plc, 2.85%, 9/8/2023 (a) | 2,000 | 2,000 |
Series 2001B, Subseries B-7, Rev., VRDO, LIQ : Barclays Bank plc, 2.85%, 9/8/2023 (a) | 750 | 750 |
Los Angeles Department of Water and Power, Water System | ||
Series 2019A-1, Rev., VRDO, LIQ : Barclays Bank plc, 2.56%, 9/1/2023 (a) | 3,000 | 3,000 |
Series 2019A, Subseries A-2, Rev., VRDO, LIQ : Barclays Bank plc, 2.75%, 9/1/2023 (a) | 2,830 | 2,830 |
Series 2021A-1, Rev., VRDO, LIQ : TD Bank NA, 2.90%, 9/1/2023 (a) | 100 | 100 |
Series 2001B-3, Rev., VRDO, LIQ : UBS AG, 2.95%, 9/8/2023 (a) | 50 | 50 |
Metropolitan Water District of Southern California Series 2017A, Rev., VRDO, LIQ : PNC Bank NA, 2.72%, 9/1/2023 (a) | 450 | 450 |
August 31, 2023 | J.P. Morgan Money Market Funds | 88 |
AS OF August 31, 2023 (Unaudited) (continued)
INVESTMENTS †† | PRINCIPAL AMOUNT ($000) | VALUE ($000) |
Municipal Bonds — continued | ||
California — continued | ||
Mizuho Floater Series 2023-MIZ9122, Rev., VRDO, LIQ : Mizuho Capital Mkts LLC, 4.65%, 9/1/2023 (a) (c) | 4,000 | 4,000 |
Orange County Water District Series 2003A, COP, VRDO, LOC : Bank of America NA, 2.80%, 9/8/2023 (a) | 6,110 | 6,110 |
Rancho Water District Community Facilities District No. 89-5, VRDO, LOC : Wells Fargo Bank NA, 3.16%, 9/8/2023 (a) | 260 | 260 |
RBC Municipal Products, Inc. Trust, Floater Certificates Series G118, VRDO, LOC : Royal Bank of Canada, 4.01%, 10/2/2023 (a) (c) | 1,050 | 1,050 |
Regents of the University of California Medical Center Pooled | ||
Series 2007B-1, Rev., VRDO, 2.80%, 9/1/2023 (a) | 1,550 | 1,550 |
Series 2013K, Rev., VRDO, 2.80%, 9/1/2023 (a) | 11,100 | 11,100 |
RIB Floater Trust Various States | ||
Series 2022-042, Rev., VRDO, LIQ : Barclays Bank plc, 4.02%, 9/1/2023 (a) (c) | 1,850 | 1,850 |
Series 45, GO, VRDO, LIQ : Barclays Bank plc, 4.02%, 9/1/2023 (a) (c) | 1,975 | 1,975 |
Series 40, Rev., VRDO, LIQ : Barclays Bank plc, 3.95%, 9/8/2023 (a) (c) | 1,625 | 1,625 |
Riverside County Housing Authority, Tyler Springs Apartments Series 1999C, Rev., VRDO, LOC : FNMA, 2.72%, 9/8/2023 (a) | 425 | 425 |
Sacramento County Housing Authority Series 1996D, Rev., VRDO, FNMA, LIQ : FNMA, 2.78%, 9/8/2023 (a) | 3,200 | 3,200 |
Sacramento County Housing Authority, Terrace Apartments, Rev., VRDO, FNMA, LIQ : FNMA, 2.72%, 9/8/2023 (a) | 1,175 | 1,175 |
Sacramento Municipal Utility District Series 2023C, Rev., VRDO, LIQ : TD Bank NA, 2.70%, 9/1/2023 (a) | 6,000 | 6,000 |
San Diego Housing Authority, Multi-Family Housing Series 2006B, Rev., VRDO, LOC : Citibank NA, 4.17%, 9/8/2023 (a) | 2,445 | 2,445 |
San Diego Unified School District Series A, Rev., TRAN, 5.00%, 6/28/2024 | 1,250 | 1,269 |
San Francisco City and County Redevelopment Agency Successor Agency, Maria Manor Apartments Series 2000F, Rev., VRDO, LOC : Citibank NA, 3.09%, 9/8/2023 (a) | 725 | 725 |
Santa Clara County Financing Authority, El Camino Hospital Series 2009A, Rev., VRDO, LOC : Wells Fargo Bank NA, 2.84%, 9/8/2023 (a) | 200 | 200 |
INVESTMENTS †† | PRINCIPAL AMOUNT ($000) | VALUE ($000) |
California — continued | ||
Santa Clara County Financing Authority, Multiple Facilities Projects Series 2008M, Rev., VRDO, LOC : Bank of America NA, 3.14%, 9/8/2023 (a) | 6,300 | 6,300 |
Sequoia Union High School District, Rev., TRAN, 3.50%, 1/31/2024 | 7,905 | 7,915 |
Southern California Public Power Authority, Magnolia Power Project Series 2020-3, Rev., VRDO, LIQ : Bank of America NA, 3.89%, 9/1/2023 (a) | 16,450 | 16,450 |
State of California Series 2003C-1, GO, VRDO, LOC : TD Bank NA, 2.80%, 9/8/2023 (a) | 1,385 | 1,385 |
Tender Option Bond Trust Receipts/Certificates | ||
Series 2022-XM1040, Rev., VRDO, LIQ : UBS AG, 4.08%, 9/8/2023 (a) (c) | 4,325 | 4,325 |
Series 2022-XX1258, Rev., VRDO, LIQ : Barclays Bank plc, 4.08%, 9/8/2023 (a) (c) | 2,000 | 2,000 |
Series 2022-XX1262, Rev., VRDO, LIQ : Barclays Bank plc, 4.08%, 9/8/2023 (a) (c) | 1,875 | 1,875 |
Series 2022-XX1263, Rev., VRDO, LIQ : Barclays Bank plc, 4.08%, 9/8/2023 (a) (c) | 1,875 | 1,875 |
Series 2022-ZL0410, Rev., VRDO, LIQ : Morgan Stanley Bank NA, 4.08%, 9/8/2023 (a) (c) | 5,000 | 5,000 |
Series 2021-XF2962, Rev., VRDO, LIQ : Barclays Bank plc, 4.09%, 9/8/2023 (a) (c) | 470 | 470 |
Series 2022-XF1323, Rev., VRDO, LIQ : TD Bank NA, 4.09%, 9/8/2023 (a) (c) | 2,650 | 2,650 |
Series 2022-XF1326, GO, VRDO, LIQ : TD Bank NA, 4.09%, 9/8/2023 (a) (c) | 4,000 | 4,000 |
Series 2022-XF1386, GO, VRDO, LIQ : Bank of America NA, 4.09%, 9/8/2023 (a) (c) | 2,915 | 2,915 |
Series 2022-XF1415, Rev., VRDO, LIQ : TD Bank NA, 4.09%, 9/8/2023 (a) (c) | 1,705 | 1,705 |
Series 2022-XF1438, GO, VRDO, LOC : Bank of America NA, 4.09%, 9/8/2023 (a) (c) | 1,485 | 1,485 |
Series 2022-XF3006, Rev., VRDO, LIQ : Barclays Bank plc, 4.09%, 9/8/2023 (a) (c) | 4,000 | 4,000 |
Series 2022-XF3025, Rev., VRDO, LIQ : Morgan Stanley Bank NA, 4.09%, 9/8/2023 (a) (c) | 7,750 | 7,750 |
Series 2022-XG0372, COP, VRDO, LIQ : Wells Fargo Bank NA, 4.09%, 9/8/2023 (a) (c) | 3,130 | 3,130 |
Series 2022-XG0393, GO, VRDO, LOC : Barclays Bank plc, 4.09%, 9/8/2023 (a) (c) | 2,400 | 2,400 |
Series 2022-XG0430, Rev., VRDO, LIQ : Wells Fargo Bank NA, 4.09%, 9/8/2023 (a) (c) | 3,105 | 3,105 |
Series 2022-XL0384, GO, VRDO, LOC : Royal Bank of Canada, 4.09%, 9/8/2023 (a) (c) | 1,900 | 1,900 |
Series 2022-XM1007, Rev., VRDO, LIQ : Royal Bank of Canada, 4.09%, 9/8/2023 (a) (c) | 3,840 | 3,840 |
89 | J.P. Morgan Money Market Funds | August 31, 2023 |
INVESTMENTS †† | PRINCIPAL AMOUNT ($000) | VALUE ($000) |
Municipal Bonds — continued | ||
California — continued | ||
Series 2022-XM1014, GO, VRDO, LIQ : Royal Bank of Canada, 4.09%, 9/8/2023 (a) (c) | 5,270 | 5,270 |
Series 2022-XM1036, Rev., VRDO, LIQ : Bank of America NA, 4.09%, 9/8/2023 (a) (c) | 2,665 | 2,665 |
Series 2022-XM1064, Rev., VRDO, LIQ : Morgan Stanley Bank NA, 4.09%, 9/8/2023 (a) (c) | 6,700 | 6,700 |
Series 2022-XX1239, GO, VRDO, LIQ : Barclays Bank plc, 4.09%, 9/8/2023 (a) (c) | 4,675 | 4,675 |
Series 2022-YX1200, Rev., VRDO, LIQ : Barclays Bank plc, 4.09%, 9/8/2023 (a) (c) | 2,500 | 2,500 |
Series 2022-ZL0231, Rev., VRDO, LIQ : Royal Bank of Canada, 4.09%, 9/8/2023 (a) (c) | 1,330 | 1,330 |
Series 2022-ZL0233, Rev., VRDO, LIQ : Royal Bank of Canada, 4.09%, 9/8/2023 (a) (c) | 1,000 | 1,000 |
Series 2022-ZL0242, GO, VRDO, LOC : Royal Bank of Canada, 4.09%, 9/8/2023 (a) (c) | 1,800 | 1,800 |
Series 2022-ZL0287, Rev., VRDO, LIQ : Royal Bank of Canada, 4.09%, 9/8/2023 (a) (c) | 5,905 | 5,905 |
Series 2023-XF1524, Rev., VRDO, LOC : Royal Bank of Canada, 4.09%, 9/8/2023 (a) (c) | 1,000 | 1,000 |
Series 2023-XG0501, GO, VRDO, LIQ : Wells Fargo Bank NA, 4.09%, 9/8/2023 (a) (c) | 1,360 | 1,360 |
Series 2023-XG0502, Rev., VRDO, LIQ : Barclays Bank plc, 4.09%, 9/8/2023 (a) (c) | 5,285 | 5,285 |
Series 2023-XL0445, Rev., VRDO, LIQ : Royal Bank of Canada, 4.09%, 9/8/2023 (a) (c) | 3,750 | 3,750 |
Series 2023-XM1114, Rev., VRDO, LIQ : Royal Bank of Canada, 4.09%, 9/8/2023 (a) (c) | 3,335 | 3,335 |
Series 2022-XX1215, Rev., VRDO, LOC : Barclays Bank plc, 4.10%, 9/8/2023 (a) (c) | 1,500 | 1,500 |
Series 2022-YX1229, Rev., VRDO, LIQ : Barclays Bank plc, 4.10%, 9/8/2023 (a) (c) | 1,880 | 1,880 |
Series 2022-XF1376, Rev., VRDO, LIQ : Bank of America NA, 4.11%, 9/8/2023 (a) (c) | 2,500 | 2,500 |
Series 2022-XF1384, Rev., VRDO, LIQ : TD Bank NA, 4.12%, 9/8/2023 (a) (c) | 1,500 | 1,500 |
Series 2022-XG0363, GO, VRDO, LOC : Bank of America NA, 4.14%, 9/8/2023 (a) (c) | 4,690 | 4,690 |
University of California | ||
Series 2013AL-4, Rev., VRDO, 2.85%, 9/1/2023 (a) | 11,070 | 11,070 |
INVESTMENTS †† | PRINCIPAL AMOUNT ($000) | VALUE ($000) |
California — continued | ||
Series 2013AL-3, Rev., VRDO, 2.90%, 9/1/2023 (a) | 8,950 | 8,950 |
Western Municipal Water District Facilities Authority Series 2012A, Rev., VRDO, LOC : TD Bank NA, 2.90%, 9/8/2023 (a) | 300 | 300 |
358,878 | ||
Total Municipal Bonds (Cost $358,878) | 358,878 | |
SHARES (000) | ||
Variable Rate Demand Preferred Shares — 9.3% | ||
California — 9.3% | ||
Nuveen California AMT - Free Quality Municipal Income Fund Series 6, LIQ : Sumitomo Mitsui Banking Corp., 4.09%, 9/8/2023# (c) | 12,000 | 12,000 |
Nuveen California Quality Municipal Income Fund | ||
Series 4, LIQ : Royal Bank of Canada, 4.13%, 9/8/2023# (c) | 14,000 | 14,000 |
Series 1-1362, LIQ : Societe Generale, 4.15%, 9/8/2023# (c) | 25,000 | 25,000 |
Total Variable Rate Demand Preferred Shares (Cost $51,000) | 51,000 | |
PRINCIPAL AMOUNT ($000) | ||
Short Term Investments — 25.6% | ||
Commercial Paper — 25.6% | ||
California Educational Facilities Authority | ||
3.05%, 10/23/2023 | 1,000 | 1,000 |
California Statewide Communities Development Authority | ||
Series 08-C, 3.28%, 9/14/2023 | 5,000 | 5,000 |
Series 9B-4, 3.35%, 9/19/2023 | 6,000 | 6,000 |
Series 09-D, 3.35%, 9/20/2023 | 6,000 | 6,000 |
Series B-6, 3.02%, 10/4/2023 | 7,000 | 7,000 |
Series B-5, 3.00%, 10/11/2023 | 3,000 | 3,000 |
Series D, 3.07%, 10/11/2023 | 10,000 | 10,000 |
Series 9B-1, 3.50%, 1/10/2024 | 7,000 | 7,000 |
City & County of San Francisco | ||
Series A-4, 3.15%, 9/13/2023 | 5,000 | 5,000 |
County of Los Angeles | ||
3.30%, 10/17/2023 | 20,000 | 20,000 |
Municipal Improvement Corp. of Los Angeles | ||
Series A-3, 3.00%, 9/13/2023 | 5,000 | 5,000 |
August 31, 2023 | J.P. Morgan Money Market Funds | 90 |
AS OF August 31, 2023 (Unaudited) (continued)
INVESTMENTS †† | PRINCIPAL AMOUNT ($000) | VALUE ($000) |
Short Term Investments — continued | ||
Commercial Paper — continued | ||
Series A-1, 3.10%, 10/17/2023 | 2,000 | 2,000 |
San Diego County Water Authority | ||
Series 10, 3.04%, 9/6/2023 | 11,000 | 11,000 |
Series 10, 3.30%, 10/17/2023 | 14,900 | 14,900 |
San Francisco City & County Airport Comm-San Francisco International Airport | ||
Series A-1, Rev., AMT, 3.10%, 9/13/2023 | 5,000 | 5,000 |
State of California | ||
Series A-7, 2.80%, 9/6/2023 | 500 | 500 |
Series A-3, 3.20%, 9/6/2023 | 12,000 | 12,000 |
Series A-1, 3.52%, 9/21/2023 | 7,000 | 7,000 |
Series 11A5, 3.18%, 11/7/2023 | 4,000 | 4,000 |
University of California | ||
Series A, 3.00%, 9/13/2023 | 7,000 | 7,000 |
Series A, 3.05%, 9/27/2023 | 2,000 | 2,000 |
Total Commercial Paper (Cost $140,400) | 140,400 | |
Total Short Term Investments (Cost $140,400) | 140,400 | |
Total Investments — 100.3% (Cost $550,278) * | 550,278 | |
Liabilities in Excess of Other Assets — (0.3)% | (1,392 ) | |
NET ASSETS — 100.0% | 548,886 | |
Percentages indicated are based on net assets. |
Abbreviations | |
AMT | Alternative Minimum Tax |
COP | Certificate of Participation |
FHLB | Federal Home Loan Bank |
FHLMC | Federal Home Loan Mortgage Corp. |
FNMA | Federal National Mortgage Association |
GO | General Obligation |
LIQ | Liquidity Agreement |
LOC | Letter of Credit |
Rev. | Revenue |
TRAN | Tax & Revenue Anticipation Note |
VRDO | Variable Rate Demand Obligation |
†† | The date shown represents the earliest of the next put date, next demand date or final maturity date. | |
# | Variable Rate Demand Preferred Shares of a closed-end investment company which has a weekly demand feature. The interest rate shown is the rate in effect as of August 31, 2023. | |
* | The cost of securities is substantially the same for federal income tax purposes. | |
(a) | Variable or floating rate security, the interest rate of which adjusts periodically based on changes in current interest rates and prepayments on the underlying pool of assets. The interest rate shown is the current rate as of August 31, 2023. | |
(b) | All or a portion of the security is a when-issued security, delayed delivery security, or forward commitment. | |
(c) | Securities exempt from registration under Rule 144A or section 4(a)(2), of the Securities Act of 1933, as amended. | |
91 | J.P. Morgan Money Market Funds | August 31, 2023 |
AS OF August 31, 2023 (Unaudited)
INVESTMENTS †† | PRINCIPAL AMOUNT ($000) | VALUE ($000) |
Municipal Bonds — 94.4% | ||
New York — 94.4% | ||
Albany Industrial Development Agency, Civic Facility, Living Resources Corp., Project Series 2007A, Rev., VRDO, LOC : HSBC Bank USA NA, 4.08%, 9/8/2023 (a) | 2,245 | 2,245 |
Alfred Almond Central School District, GO, BAN, 4.75%, 7/17/2024 | 4,255 | 4,287 |
Amherst Development Corp., Student Housing Facility, South Lake Village Project Series 2010B, Rev., VRDO, LOC : HSBC Bank USA NA, 4.10%, 9/8/2023 (a) | 10,405 | 10,405 |
Ballston Spa Central School District, GO, BAN, 4.25%, 9/13/2024 (b) | 2,915 | 2,926 |
Batavia City School District, GO, BAN, 4.25%, 6/11/2024 | 8,000 | 8,017 |
Battery Park City Authority | ||
Series 2019D-1, Rev., VRDO, LIQ : TD Bank NA, 4.00%, 9/8/2023 (a) | 5,150 | 5,150 |
Series 2019D-2, Rev., VRDO, LIQ : TD Bank NA, 4.00%, 9/8/2023 (a) | 22,780 | 22,780 |
Bemus Point Central School District, GO, BAN, 4.50%, 7/25/2024 | 246 | 248 |
Build NYC Resource Corp., Rev., VRDO, LOC : TD Bank NA, 4.00%, 9/8/2023 (a) | 150 | 150 |
Byron-Bergen Central School District, GO, BAN, 4.75%, 6/14/2024 | 8,000 | 8,051 |
Cato-Meridian Central School District, GO, BAN, 4.00%, 9/22/2023 | 365 | 365 |
Chenango Valley Central School District, GO, BAN, 4.60%, 6/27/2024 | 9,000 | 9,063 |
City of Hudson, GO, BAN, 4.60%, 6/21/2024 | 4,996 | 5,029 |
City of Ithaca, GO, BAN, 4.75%, 7/19/2024 | 3,954 | 3,982 |
City of New York, Fiscal Year 2006 Series 2006I, GO, VRDO, LIQ : State Street Bank & Trust Co., 4.00%, 9/1/2023 (a) | 2,100 | 2,100 |
City of New York, Fiscal Year 2012 Series 2012D-3A, GO, VRDO, LIQ : Bank of New York Mellon (The), 3.97%, 9/1/2023 (a) | 375 | 375 |
City of New York, Fiscal Year 2013 Series 2013, Subseries A-2, GO, VRDO, LOC : Mizuho Bank Ltd., 4.00%, 9/1/2023 (a) | 4,875 | 4,875 |
City of New York, Fiscal Year 2014 Series 2014D-4, GO, VRDO, LOC : TD Bank NA, 3.90%, 9/1/2023 (a) | 5,115 | 5,115 |
City of New York, Fiscal Year 2018 | ||
Series 2018E, GO, VRDO, LOC : TD Bank NA, 3.90%, 9/1/2023 (a) | 600 | 600 |
Series B, Subseries B-5, GO, VRDO, LIQ : Barclays Bank plc, 3.95%, 9/1/2023 (a) | 4,250 | 4,250 |
INVESTMENTS †† | PRINCIPAL AMOUNT ($000) | VALUE ($000) |
New York — continued | ||
City of New York, Fiscal Year 2022 | ||
Series 2022D-3, GO, VRDO, LIQ : State Street Bank & Trust Co., 4.05%, 9/1/2023 (a) | 800 | 800 |
Subseries D-4, GO, VRDO, LIQ : State Street Bank & Trust Co., 4.05%, 9/1/2023 (a) | 8,935 | 8,935 |
City of New York, Fiscal Year 2023 | ||
Series 2023A, Subseries A-3, GO, VRDO, LIQ : Bank of Montreal, 3.90%, 9/1/2023 (a) | 10,000 | 10,000 |
Series 2023A, Subseries A-4, GO, VRDO, LIQ : TD Bank NA, 3.90%, 9/1/2023 (a) | 2,435 | 2,435 |
City of Peekskill, GO, BAN, 4.25%, 8/23/2024 | 1,650 | 1,657 |
City of Rome, GO, BAN, 4.75%, 6/12/2024 | 7,523 | 7,568 |
Clarkstown Central School District, GO, TAN, 3.75%, 12/1/2023 (b) | 13,000 | 13,011 |
Erie County Industrial Development Agency (The), Our Lady Victory Corp. Series 2007A, Rev., VRDO, LOC : HSBC Bank USA NA, 4.09%, 9/8/2023 (a) | 2,365 | 2,365 |
Glen Cove City School District, GO, BAN, 4.25%, 6/27/2024 (b) | 7,715 | 7,743 |
Haldane Central School District Series 2023B, GO, BAN, 4.50%, 8/23/2024 | 365 | 367 |
Hornell City School District, GO, BAN, 4.25%, 6/28/2024 | 6,000 | 6,024 |
Long Island Power Authority, Electric System Series 2023D, Rev., VRDO, LOC : Barclays Bank plc, 4.05%, 9/8/2023 (a) | 11,000 | 11,000 |
Metropolitan Transportation Authority | ||
Series 2015, Subseries E-3, Rev., VRDO, LOC : Bank of America NA, 3.92%, 9/1/2023 (a) | 2,630 | 2,630 |
Series 2012G-1, Rev., VRDO, LOC : Barclays Bank plc, 3.95%, 9/1/2023 (a) | 4,700 | 4,700 |
Series 2005D-2, Rev., VRDO, LOC : Bank of Montreal, 4.00%, 9/1/2023 (a) | 1,000 | 1,000 |
Subseries G-4, Rev., VRDO, LOC : Bank of Montreal, 4.00%, 9/1/2023 (a) | 13,030 | 13,030 |
Series 2020, Subseries B-2, Rev., VRDO, LOC : PNC Bank NA, 4.04%, 9/8/2023 (a) | 3,700 | 3,700 |
Series 2020B, Subseries B-1, Rev., VRDO, LOC : PNC Bank NA, 4.04%, 9/8/2023 (a) | 32,540 | 32,540 |
Metropolitan Transportation Authority, Dedicated Tax Fund | ||
Series 2008A-1, Rev., VRDO, LOC : TD Bank NA, 3.90%, 9/1/2023 (a) | 5,950 | 5,950 |
Series 2008A-2A, Rev., VRDO, LOC : TD Bank NA, 3.90%, 9/1/2023 (a) | 13,660 | 13,660 |
August 31, 2023 | J.P. Morgan Money Market Funds | 92 |
AS OF August 31, 2023 (Unaudited) (continued)
INVESTMENTS †† | PRINCIPAL AMOUNT ($000) | VALUE ($000) |
Municipal Bonds — continued | ||
New York — continued | ||
Series 2008A-2B, Rev., VRDO, LOC : PNC Bank NA, 4.04%, 9/8/2023 (a) | 32,695 | 32,695 |
Series 2005, Subseries E-2, Rev., VRDO, LOC : Bank of America NA, 4.09%, 9/8/2023 (a) | 4,241 | 4,242 |
Mineola Union Free School District, GO, TAN, 4.25%, 6/26/2024 (b) | 6,000 | 6,023 |
Nassau County Industrial Development Agency, Clinton Plaza Senior Housing Project, Rev., VRDO, LOC : FNMA, 4.01%, 9/8/2023 (a) | 4,100 | 4,100 |
New York City Housing Development Corp., Rev., VRDO, LOC : FNMA, 3.95%, 9/8/2023 (a) | 3,200 | 3,200 |
New York City Housing Development Corp., 92nd Realty LLC Series 1999A, Rev., VRDO, FNMA, LOC : FNMA, 3.98%, 9/8/2023 (a) | 5,000 | 5,000 |
New York City Housing Development Corp., Fifth Avenue Apartments Series 2006A, Rev., VRDO, LOC : Citibank NA, 4.15%, 9/8/2023 (a) | 6,440 | 6,440 |
New York City Housing Development Corp., Multi-Family Mortgage, Elliott Chelsea Development Series 2010A, Rev., VRDO, LIQ : FHLMC, 4.05%, 9/8/2023 (a) | 30,095 | 30,095 |
New York City Housing Development Corp., Multi-Family Mortgage, Manhattan Court Series 2004A, Rev., VRDO, LOC : Citibank NA, 4.14%, 9/8/2023 (a) | 3,250 | 3,250 |
New York City Housing Development Corp., Multi-Family Mortgage, West 26th Street Development Series 2011B, Rev., VRDO, 4.00%, 9/8/2023 (a) | 800 | 800 |
New York City Housing Development Corp., Multi-Family Rent Housing, Gold Street Series 2006A, Rev., VRDO, LOC : FNMA, 4.12%, 9/8/2023 (a) | 51,500 | 51,500 |
New York City Housing Development Corp., Multi-Family Rental Housing Series 2009A, Rev., VRDO, LOC : FHLMC, 4.05%, 9/8/2023 (a) | 2,315 | 2,315 |
New York City Housing Development Corp., Multi-Family Rental Housing, West 89th Street Development | ||
Series 2006A, Rev., VRDO, LOC : FNMA, 3.85%, 9/8/2023 (a) | 25,050 | 25,050 |
Series 2000A, Rev., VRDO, LOC : FNMA, 3.95%, 9/8/2023 (a) | 30 | 30 |
New York City Housing Development Corp., Multi-Family, 201 Pearl LLC Series 2006A, Rev., VRDO, LOC : FNMA, 4.12%, 9/8/2023 (a) | 3,550 | 3,550 |
INVESTMENTS †† | PRINCIPAL AMOUNT ($000) | VALUE ($000) |
New York — continued | ||
New York City Housing Development Corp., Multi-Family, 90 Washington Street Series 2005A, Rev., VRDO, LOC : FNMA, 4.08%, 9/8/2023 (a) | 26,600 | 26,600 |
New York City Housing Development Corp., Nagle Courtyard Apartments Series 2004A, Rev., VRDO, LOC : FNMA, 4.15%, 9/8/2023 (a) | 3,800 | 3,800 |
New York City Housing Development Corp., Ogden Ave Ltd. Partnership Series 2004A, Rev., VRDO, LOC : FNMA, 4.15%, 9/8/2023 (a) | 1,160 | 1,160 |
New York City Housing Development Corp., West 26th Street Development | ||
Series 2012A, Rev., VRDO, LIQ : FHLMC, 4.00%, 9/8/2023 (a) | 3,650 | 3,650 |
Series 2011A, Rev., AMT, VRDO, LIQ : FHLMC, 4.06%, 9/8/2023 (a) | 7,300 | 7,300 |
New York City Industrial Development Agency, Civic Facility, Rev., VRDO, LOC : TD Bank NA, 4.06%, 9/8/2023 (a) | 4,825 | 4,825 |
New York City Industrial Development Agency, Washington LLC Project, Rev., VRDO, LOC : Bank of China Ltd., 4.65%, 9/1/2023 (a) | 16,195 | 16,195 |
New York City Municipal Water Finance Authority, Second General Resolution | ||
Series 2010CC, Rev., VRDO, LIQ : State Street Bank & Trust Co., 3.90%, 9/1/2023 (a) | 3,330 | 3,330 |
Series DD-1, Rev., VRDO, LIQ : TD Bank NA, 3.90%, 9/1/2023 (a) | 75 | 75 |
Series 2014AA-4, Rev., VRDO, LIQ : State Street Bank & Trust Co., 4.00%, 9/1/2023 (a) | 14,450 | 14,450 |
New York City Municipal Water Finance Authority, Second General Resolution, Fiscal Year 2011 Series DD-3B, Rev., VRDO, LIQ : State Street Bank & Trust Co., 4.25%, 9/1/2023 (a) | 2,800 | 2,800 |
New York City Municipal Water Finance Authority, Second General Resolution, Fiscal Year 2013 Series 2013AA-1, Rev., VRDO, LIQ : PNC Bank NA, 4.05%, 9/8/2023 (a) | 15,250 | 15,250 |
New York City Municipal Water Finance Authority, Second General Resolution, Fiscal Year 2016 Series 2016AA-1, Rev., VRDO, LIQ : Bank of America NA, 3.92%, 9/1/2023 (a) | 500 | 500 |
New York City Municipal Water Finance Authority, Second General Resolution, Fiscal year 2023 Series 2023, Subseries BB-2, Rev., VRDO, LIQ : Mizuho Bank Ltd., 3.85%, 9/1/2023 (a) | 15,425 | 15,425 |
93 | J.P. Morgan Money Market Funds | August 31, 2023 |
INVESTMENTS †† | PRINCIPAL AMOUNT ($000) | VALUE ($000) |
Municipal Bonds — continued | ||
New York — continued | ||
New York City Municipal Water Finance Authority, Water and Sewer System, Second General Resolution Series 2009BB-2, Rev., VRDO, LIQ : UBS AG, 4.05%, 9/1/2023 (a) | 4,050 | 4,050 |
New York City Municipal Water Finance Authority, Water and Sewer System, Second General Resolution, Fiscal year 2014 Series AA-5, Rev., VRDO, LIQ : Mizuho Bank Ltd., 3.90%, 9/1/2023 (a) | 22,845 | 22,845 |
New York City Municipal Water Finance Authority, Water and Sewer System, Second General Resolution, Fiscal Year 2016 Series 2016AA-2, Rev., VRDO, LIQ : PNC Bank NA, 4.05%, 9/8/2023 (a) | 9,930 | 9,930 |
New York City Municipal Water Finance Authority, Water and Sewer System, Second General Resolution, Fiscal year 2021 Series 2021EE-2, Rev., VRDO, LIQ : State Street Bank & Trust Co., 4.25%, 9/1/2023 (a) | 5,000 | 5,000 |
New York City Municipal Water Finance Authority, Water and Sewer System, Second Resolution Series 2007, Subseries CC-2, Rev., VRDO, LIQ : State Street Bank & Trust Co., 3.90%, 9/1/2023 (a) | 3,800 | 3,800 |
New York City Transitional Finance Authority Future Tax Secured Series 2014B-3, Rev., VRDO, LIQ : Barclays Bank plc, 3.95%, 9/1/2023 (a) | 13,275 | 13,275 |
New York City Transitional Finance Authority, Future Tax Secured | ||
Rev., VRDO, LIQ : Bank of America NA, 3.92%, 9/1/2023 (a) | 3,000 | 3,000 |
Series 2015E-4, Rev., VRDO, LIQ : Bank of America NA, 3.92%, 9/1/2023 (a) | 3,925 | 3,925 |
Series A-4, Rev., VRDO, LIQ : Mizuho Bank Ltd., 3.95%, 9/1/2023 (a) | 10,280 | 10,280 |
Series B-5, Rev., VRDO, LIQ : US Bank NA, 4.25%, 9/1/2023 (a) | 18,335 | 18,335 |
New York City Transitional Finance Authority, Future Tax Secured, Fiscal Year 2003 Series 2003A-4, Rev., VRDO, LIQ : TD Bank NA, 3.90%, 9/1/2023 (a) | 10,500 | 10,500 |
New York City Transitional Finance Authority, Future Tax Secured, Fiscal Year 2011 Series 2011, Subseries A-4, Rev., VRDO, LIQ : Barclays Bank plc, 3.95%, 9/1/2023 (a) | 700 | 700 |
New York City Transitional Finance Authority, Future Tax Secured, Fiscal Year 2013 Series 2013C-5, Rev., VRDO, LOC : Sumitomo Mitsui Banking Corp., 4.00%, 9/8/2023 (a) | 10,305 | 10,305 |
INVESTMENTS †† | PRINCIPAL AMOUNT ($000) | VALUE ($000) |
New York — continued | ||
New York City Transitional Finance Authority, Future Tax Secured, Fiscal Year 2014 Series D-3, Rev., VRDO, LIQ : Mizuho Bank Ltd., 3.95%, 9/1/2023 (a) | 2,575 | 2,575 |
New York City Transitional Finance Authority, Future Tax Secured, Fiscal Year 2023 Series 2023, Subseries A3, Rev., VRDO, LIQ : Bank of New York Mellon (The), 3.97%, 9/1/2023 (a) | 1,100 | 1,100 |
New York State Dormitory Authority, Columbia University | ||
Series 2009A, Rev., VRDO, 3.65%, 9/8/2023 (a) | 4,985 | 4,985 |
Series 2003B, Rev., VRDO, 3.85%, 9/8/2023 (a) | 3,885 | 3,885 |
New York State Dormitory Authority, Cornell University | ||
Series 2019B, Rev., VRDO, LIQ : US Bank NA, 4.10%, 9/1/2023 (a) | 4,300 | 4,300 |
Series 2004A, Rev., VRDO, LIQ : Bank of New York Mellon (The), 3.99%, 9/8/2023 (a) | 600 | 600 |
Series 2004B, Rev., VRDO, LIQ : Bank of New York Mellon (The), 3.99%, 9/8/2023 (a) | 100 | 100 |
New York State Dormitory Authority, Fordham University Series 2008A-1, Rev., VRDO, LOC : Bank of America NA, 4.07%, 9/8/2023 (a) | 550 | 550 |
New York State Dormitory Authority, Northern Westchester Hospital, Rev., VRDO, LOC : TD Bank NA, 4.00%, 9/8/2023 (a) | 1,555 | 1,555 |
New York State Dormitory Authority, Personal Income Tax Series 2020A, Rev., 5.00%, 9/15/2023 | 5,000 | 5,003 |
New York State Dormitory Authority, Royal Charter Properties, Rev., VRDO, LOC : FNMA, 3.95%, 9/8/2023 (a) | 780 | 780 |
New York State Energy Research and Development Authority, Consolidated Edison Co. of New York, Inc. Project | ||
Series 2005A-3, Rev., VRDO, LOC : Mizuho Bank Ltd., 3.75%, 9/8/2023 (a) | 20,900 | 20,900 |
Series 2004, Subseries C3, Rev., VRDO, LOC : Mizuho Bank Ltd., 3.80%, 9/8/2023 (a) | 17,000 | 17,000 |
Series 2005A-1, Rev., VRDO, LOC : Mizuho Bank Ltd., 4.03%, 9/8/2023 (a) | 400 | 400 |
Series 2005, Subseries A3, Rev., VRDO, LOC : Mizuho Bank Ltd., 4.05%, 9/8/2023 (a) | 920 | 920 |
Series 2004, Subseries C1, Rev., VRDO, LOC : Mizuho Bank Ltd., 4.07%, 9/8/2023 (a) | 150 | 150 |
August 31, 2023 | J.P. Morgan Money Market Funds | 94 |
AS OF August 31, 2023 (Unaudited) (continued)
INVESTMENTS †† | PRINCIPAL AMOUNT ($000) | VALUE ($000) |
Municipal Bonds — continued | ||
New York — continued | ||
Series 2004, Subseries C2, Rev., VRDO, LOC : Mizuho Bank Ltd., 4.08%, 9/8/2023 (a) | 32,310 | 32,310 |
Series 2010A-1, Rev., VRDO, LOC : Scotiabank, 4.08%, 9/8/2023 (a) | 400 | 400 |
Series 2010A-3, Rev., VRDO, LOC : Scotiabank, 4.08%, 9/8/2023 (a) | 200 | 200 |
New York State Housing Finance Agency Series 2009A, Rev., VRDO, LOC : FNMA, 4.00%, 9/8/2023 (a) | 10,940 | 10,940 |
New York State Housing Finance Agency, 10 Barclay Street Series 2004A, Rev., VRDO, LOC : FNMA, 4.00%, 9/8/2023 (a) | 40,400 | 40,400 |
New York State Housing Finance Agency, 160 Madison Avenue LLC | ||
Series 2013A, Rev., VRDO, LOC : Landesbank Hessen-Thuringen Girozentrale, 3.89%, 9/1/2023 (a) | 21,815 | 21,815 |
Series 2014A, Rev., VRDO, LOC : Landesbank Hessen-Thuringen Girozentrale, 3.89%, 9/1/2023 (a) | 36,025 | 36,025 |
New York State Housing Finance Agency, 29 Flatbush Avenue Housing | ||
Series 2010A, Rev., VRDO, LOC : Landesbank Hessen-Thuringen Girozentrale, 4.10%, 9/8/2023 (a) | 27,875 | 27,875 |
Series A, Rev., VRDO, LOC : Landesbank Hessen-Thuringen Girozentrale, 4.10%, 9/8/2023 (a) | 1,165 | 1,165 |
New York State Housing Finance Agency, 316 Eleventh Avenue Housing Series 2009A, Rev., VRDO, LOC : FNMA, 3.85%, 9/8/2023 (a) | 5,550 | 5,550 |
New York State Housing Finance Agency, 330 West 39th Street Housing Series 2010A, Rev., VRDO, LOC : Landesbank Hessen-Thuringen Girozentrale, 4.27%, 9/8/2023 (a) | 7,825 | 7,825 |
New York State Housing Finance Agency, 350 West 43rd Street Housing | ||
Series 2001A, Rev., VRDO, LOC : Landesbank Hessen-Thuringen Girozentrale, 3.92%, 9/1/2023 (a) | 5,970 | 5,970 |
Series 2002A, Rev., VRDO, LOC : Landesbank Hessen-Thuringen Girozentrale, 3.92%, 9/1/2023 (a) | 35,800 | 35,800 |
New York State Housing Finance Agency, 360 West 43rd Street Housing, Rev., VRDO, LOC : FNMA, 3.95%, 9/8/2023 (a) | 2,400 | 2,400 |
INVESTMENTS †† | PRINCIPAL AMOUNT ($000) | VALUE ($000) |
New York — continued | ||
New York State Housing Finance Agency, 435 East 13th Street Housing Series 2016A, Rev., VRDO, LOC : Landesbank Hessen-Thuringen Girozentrale, 4.27%, 9/8/2023 (a) | 6,820 | 6,820 |
New York State Housing Finance Agency, 8 East 102nd Street Housing Series 2010A, Rev., VRDO, LOC : TD Bank NA, 4.00%, 9/8/2023 (a) | 650 | 650 |
New York State Housing Finance Agency, Clarkstown Maplewood Gardens Series 2009A, Rev., VRDO, LOC : FHLMC, 4.11%, 9/8/2023 (a) | 1,000 | 1,000 |
New York State Housing Finance Agency, Clinton Park Housing Series 2010A, Rev., VRDO, LIQ : FHLMC, 4.10%, 9/8/2023 (a) | 27,510 | 27,510 |
New York State Housing Finance Agency, College ARMS Apartments Series 2008A, Rev., VRDO, LIQ : FHLMC, 4.09%, 9/8/2023 (a) | 2,045 | 2,045 |
New York State Housing Finance Agency, East 102nd Street Realty LLC Series 2002A, Rev., VRDO, LOC : Federal Home Loan Mtg, 3.98%, 9/8/2023 (a) | 12,000 | 12,000 |
New York State Housing Finance Agency, Grace Towers Housing II LLC Series 2007A, Rev., VRDO, LOC : FHLMC, 3.98%, 9/8/2023 (a) | 4,440 | 4,440 |
New York State Housing Finance Agency, Historic Front Street Series 2003A, Rev., VRDO, LOC : Landesbank Hessen-Thuringen Girozentrale, 4.12%, 9/8/2023 (a) | 10,100 | 10,100 |
New York State Housing Finance Agency, Liberty Street Realty LLC Series 2003A, Rev., VRDO, LOC : FHLMC, 3.95%, 9/8/2023 (a) | 37,700 | 37,700 |
New York State Housing Finance Agency, Maiden Lane Properties LLC Series 2004A, Rev., VRDO, LOC : FNMA, 4.00%, 9/8/2023 (a) | 500 | 500 |
New York State Housing Finance Agency, North End Series 2004A, Rev., VRDO, LOC : FNMA, 3.85%, 9/8/2023 (a) | 400 | 400 |
New York State Housing Finance Agency, Weyant Green Apartments Series 2007A, Rev., VRDO, LOC : FNMA, 3.95%, 9/8/2023 (a) | 100 | 100 |
New York State Housing Finance Agency, Worth Street, 23rd Chelsea Assocs LLC | ||
Rev., VRDO, LOC : FNMA, 3.95%, 9/8/2023 (a) | 3,400 | 3,400 |
Rev., VRDO, LOC : FNMA, 3.95%, 9/8/2023 (a) | 2,100 | 2,100 |
Newark Valley Central School District, GO, BAN, 4.00%, 9/1/2023 | 1,107 | 1,107 |
Oneida County Industrial Development Agency, Champion Home Builders Co., Rev., VRDO, LOC : Wells Fargo Bank NA, 4.10%, 9/8/2023 (a) | 6,820 | 6,820 |
95 | J.P. Morgan Money Market Funds | August 31, 2023 |
INVESTMENTS †† | PRINCIPAL AMOUNT ($000) | VALUE ($000) |
Municipal Bonds — continued | ||
New York — continued | ||
Onondaga County Industrial Development Agency, Civic Facility, Syracuse Home Association Project, Rev., VRDO, LOC : HSBC Bank USA NA, 4.10%, 9/8/2023 (a) | 7,110 | 7,110 |
Owego Apalachin Central School District, GO, BAN, 4.50%, 8/16/2024 | 2,439 | 2,456 |
Penn Yan Central School District, GO, BAN, 4.50%, 9/13/2024 (b) | 565 | 568 |
Port Authority of New York and New Jersey Series 186, Rev., AMT, 5.00%, 10/15/2023 | 7,000 | 7,013 |
RBC Municipal Products, Inc. Trust, Floater Certificates | ||
Series 23, Rev., VRDO, LIQ : Barclays Bank plc, 3.21%, 9/1/2023 (a) (c) | 2,225 | 2,225 |
Series E-118, GO, VRDO, LOC : Royal Bank of Canada, 4.05%, 9/1/2023 (a) (c) | 16,420 | 16,420 |
Series 2018-E126, Rev., VRDO, LOC : Royal Bank of Canada, 4.11%, 9/8/2023 (a) (c) | 22,850 | 22,850 |
Series G-120, Rev., VRDO, LOC : Royal Bank of Canada, 4.12%, 9/8/2023 (a) (c) | 7,600 | 7,600 |
Series 2022-E154, Rev., VRDO, LOC : Royal Bank of Canada, 4.16%, 9/8/2023 (a) (c) | 61,825 | 61,825 |
RIB Floater Trust Various States | ||
Series 12, Rev., VRDO, LIQ : Barclays Bank plc, 2.89%, 9/1/2023 (a) (c) | 10,305 | 10,305 |
Series 2022-009, Rev., VRDO, LIQ : Barclays Bank plc, 3.24%, 9/1/2023 (a) (c) | 22,960 | 22,960 |
Roslyn Union Free School District, GO, BAN, 4.25%, 8/29/2024 | 1,458 | 1,464 |
Skaneateles Central School District, GO, BAN, 4.50%, 8/15/2024 | 1,370 | 1,379 |
Springville-Griffith Institiute Central School District Series 2023A, GO, BAN, 4.50%, 8/16/2024 | 2,096 | 2,110 |
Springville-Griffith Institute Central School District, GO, BAN, 4.75%, 6/28/2024 | 8,000 | 8,060 |
State of New York Mortgage Agency Homeowner Mortgage | ||
Series 247, Rev., VRDO, LIQ : TD Bank NA, 3.95%, 9/8/2023 (a) | 23,060 | 23,060 |
Series 249, Rev., AMT, VRDO, LIQ : TD Bank NA, 4.00%, 9/8/2023 (a) | 7,125 | 7,125 |
Series 207, Rev., VRDO, LIQ : Royal Bank of Canada, 4.05%, 9/8/2023 (a) | 200 | 200 |
Series 234, Rev., VRDO, LIQ : UBS AG, 4.05%, 9/8/2023 (a) | 38,795 | 38,795 |
Tender Option Bond Trust Receipts/Certificates | ||
Series 2023-XF3090, Rev., VRDO, LIQ : Citibank NA, 4.07%, 9/8/2023 (a) (c) | 3,970 | 3,970 |
INVESTMENTS †† | PRINCIPAL AMOUNT ($000) | VALUE ($000) |
New York — continued | ||
Series 2022-XF2996, Rev., VRDO, LIQ : Citibank NA, 4.08%, 9/8/2023 (a) (c) | 9,565 | 9,565 |
Series 2022-XG0428, Rev., VRDO, LIQ : Citibank NA, 4.08%, 9/8/2023 (a) (c) | 4,000 | 4,000 |
Series 2022-XM1058, Rev., VRDO, LIQ : Citibank NA, 4.08%, 9/8/2023 (a) (c) | 2,870 | 2,870 |
Series 2022-XM1070, Rev., VRDO, LIQ : Citibank NA, 4.08%, 9/8/2023 (a) (c) | 3,280 | 3,280 |
Series 2023-XF3078, Rev., VRDO, LIQ : Morgan Stanley Bank NA, 4.08%, 9/8/2023 (a) (c) | 9,215 | 9,215 |
Series 2023-XL0414, Rev., VRDO, LIQ : Citibank NA, 4.08%, 9/8/2023 (a) (c) | 2,000 | 2,000 |
Series 2018-XM0692, Rev., VRDO, LIQ : Royal Bank of Canada, 4.09%, 9/8/2023 (a) (c) | 9,600 | 9,600 |
Series 2019-XF0847, Rev., VRDO, LOC : Royal Bank of Canada, 4.09%, 9/8/2023 (a) (c) | 7,220 | 7,220 |
Series 2020-XG0276, Rev., VRDO, LOC : Bank of America NA, 4.09%, 9/8/2023 (a) (c) | 1,545 | 1,545 |
Series 2022-XF1312, Rev., VRDO, LIQ : TD Bank NA, 4.09%, 9/8/2023 (a) (c) | 3,665 | 3,665 |
Series 2022-XF1339, GO, VRDO, LIQ : Bank of America NA, 4.09%, 9/8/2023 (a) (c) | 2,045 | 2,045 |
Series 2022-XF1354, Rev., VRDO, LIQ : Bank of America NA, 4.09%, 9/8/2023 (a) (c) | 2,325 | 2,325 |
Series 2022-XF1374, Rev., VRDO, LIQ : Bank of America NA, 4.09%, 9/8/2023 (a) (c) | 13,575 | 13,575 |
Series 2022-XF1377, Rev., VRDO, LIQ : Bank of America NA, 4.09%, 9/8/2023 (a) (c) | 11,590 | 11,590 |
Series 2022-XF1382, Rev., VRDO, LIQ : Bank of America NA, 4.09%, 9/8/2023 (a) (c) | 2,100 | 2,100 |
Series 2022-XF1383, Rev., VRDO, LIQ : Bank of America NA, 4.09%, 9/8/2023 (a) (c) | 3,050 | 3,050 |
Series 2022-XF1393, Rev., VRDO, LIQ : TD Bank NA, 4.09%, 9/8/2023 (a) (c) | 3,500 | 3,500 |
Series 2022-XF1399, Rev., VRDO, LIQ : Bank of America NA, 4.09%, 9/8/2023 (a) (c) | 1,835 | 1,835 |
Series 2022-XF1400, Rev., VRDO, LIQ : Bank of America NA, 4.09%, 9/8/2023 (a) (c) | 3,750 | 3,750 |
Series 2022-XF1402, Rev., VRDO, LIQ : Bank of America NA, 4.09%, 9/8/2023 (a) (c) | 3,285 | 3,285 |
Series 2022-XF1443, Rev., VRDO, LIQ : Bank of America NA, 4.09%, 9/8/2023 (a) (c) | 2,825 | 2,825 |
Series 2022-XF1444, GO, VRDO, LIQ : Bank of America NA, 4.09%, 9/8/2023 (a) (c) | 1,875 | 1,875 |
Series 2022-XF2985, Rev., VRDO, LIQ : Citibank NA, 4.09%, 9/8/2023 (a) (c) | 2,630 | 2,630 |
Series 2022-XF3002, Rev., VRDO, LIQ : Morgan Stanley Bank NA, 4.09%, 9/8/2023 (a) (c) | 10,700 | 10,700 |
August 31, 2023 | J.P. Morgan Money Market Funds | 96 |
AS OF August 31, 2023 (Unaudited) (continued)
INVESTMENTS †† | PRINCIPAL AMOUNT ($000) | VALUE ($000) |
Municipal Bonds — continued | ||
New York — continued | ||
Series 2022-XF3013, Rev., VRDO, LIQ : Morgan Stanley Bank NA, 4.09%, 9/8/2023 (a) (c) | 13,520 | 13,520 |
Series 2022-XF3016, Rev., VRDO, LIQ : Morgan Stanley Bank NA, 4.09%, 9/8/2023 (a) (c) | 19,705 | 19,705 |
Series 2022-XF3021, Rev., VRDO, LIQ : Citibank NA, 4.09%, 9/8/2023 (a) (c) | 3,600 | 3,600 |
Series 2022-XF3043, Rev., VRDO, LIQ : Morgan Stanley Bank NA, 4.09%, 9/8/2023 (a) (c) | 9,000 | 9,000 |
Series 2022-XF3047, Rev., VRDO, LIQ : Wells Fargo Bank NA, 4.09%, 9/8/2023 (a) (c) | 2,400 | 2,400 |
Series 2022-XG0383, Rev., VRDO, LIQ : Bank of America NA, 4.09%, 9/8/2023 (a) (c) | 3,305 | 3,305 |
Series 2022-XG0405, Rev., VRDO, LIQ : Bank of America NA, 4.09%, 9/8/2023 (a) (c) | 8,625 | 8,625 |
Series 2022-XL0274, Rev., VRDO, LIQ : Bank of America NA, 4.09%, 9/8/2023 (a) (c) | 1,670 | 1,670 |
Series 2022-XL0322, Rev., VRDO, LIQ : Morgan Stanley Bank NA, 4.09%, 9/8/2023 (a) (c) | 6,700 | 6,700 |
Series 2022-XL0353, GO, VRDO, LIQ : Citibank NA, 4.09%, 9/8/2023 (a) (c) | 2,860 | 2,860 |
Series 2022-XM1006, Rev., VRDO, LIQ : Bank of America NA, 4.09%, 9/8/2023 (a) (c) | 2,400 | 2,400 |
Series 2022-XM1010, Rev., VRDO, LIQ : Royal Bank of Canada, 4.09%, 9/8/2023 (a) (c) | 6,315 | 6,315 |
Series 2022-XM1015, Rev., VRDO, LIQ : Morgan Stanley Bank NA, 4.09%, 9/8/2023 (a) (c) | 18,750 | 18,750 |
Series 2022-XM1031, Rev., VRDO, LIQ : Morgan Stanley Bank NA, 4.09%, 9/8/2023 (a) (c) | 3,750 | 3,750 |
Series 2022-XM1052, Rev., VRDO, LIQ : Royal Bank of Canada, 4.09%, 9/8/2023 (a) (c) | 5,625 | 5,625 |
Series 2022-XM1069, Rev., VRDO, LIQ : Wells Fargo Bank NA, 4.09%, 9/8/2023 (a) (c) | 2,750 | 2,750 |
Series 2022-XM1073, Rev., VRDO, LIQ : Morgan Stanley Bank NA, 4.09%, 9/8/2023 (a) (c) | 3,250 | 3,250 |
Series 2022-XX1212, Rev., VRDO, LIQ : Barclays Bank plc, 4.09%, 9/8/2023 (a) (c) | 22,355 | 22,355 |
Series 2022-XX1227, Rev., VRDO, LIQ : Barclays Bank plc, 4.09%, 9/8/2023 (a) (c) | 5,500 | 5,500 |
Series 2022-XX1232, GO, VRDO, LIQ : Barclays Bank plc, 4.09%, 9/8/2023 (a) (c) | 1,500 | 1,500 |
Series 2022-XX1282, Rev., VRDO, LIQ : Barclays Bank plc, 4.09%, 9/8/2023 (a) (c) | 4,970 | 4,970 |
Series 2022-YX1183, Rev., VRDO, LIQ : Barclays Bank plc, 4.09%, 9/8/2023 (a) (c) | 2,245 | 2,245 |
Series 2022-YX1208, Rev., VRDO, LIQ : Barclays Bank plc, 4.09%, 9/8/2023 (a) (c) | 12,050 | 12,050 |
Series 2022-YX1242, Rev., VRDO, LIQ : Barclays Bank plc, 4.09%, 9/8/2023 (a) (c) | 5,630 | 5,630 |
INVESTMENTS †† | PRINCIPAL AMOUNT ($000) | VALUE ($000) |
New York — continued | ||
Series 2022-YX1250, Rev., VRDO, LIQ : Barclays Bank plc, 4.09%, 9/8/2023 (a) (c) | 1,730 | 1,730 |
Series 2022-YX1257, Rev., VRDO, LIQ : Barclays Bank plc, 4.09%, 9/8/2023 (a) (c) | 3,440 | 3,440 |
Series 2022-YX1277, Rev., VRDO, LIQ : Barclays Bank plc, 4.09%, 9/8/2023 (a) (c) | 2,985 | 2,985 |
Series 2022-ZF1417, Rev., VRDO, LIQ : Royal Bank of Canada, 4.09%, 9/8/2023 (a) (c) | 1,635 | 1,635 |
Series 2022-ZL0250, GO, VRDO, LIQ : Barclays Bank plc, 4.09%, 9/8/2023 (a) (c) | 5,000 | 5,000 |
Series 2022-ZL0263, Rev., VRDO, LIQ : Royal Bank of Canada, 4.09%, 9/8/2023 (a) (c) | 2,240 | 2,240 |
Series 2022-ZL0350, GO, VRDO, LIQ : Morgan Stanley Bank NA, 4.09%, 9/8/2023 (a) (c) | 5,000 | 5,000 |
Series 2023-XF0524, Rev., VRDO, LIQ : Wells Fargo Bank NA, 4.09%, 9/8/2023 (a) (c) | 1,840 | 1,840 |
Series 2023-XF1442, Rev., VRDO, LIQ : TD Bank NA, 4.09%, 9/8/2023 (a) (c) | 3,565 | 3,565 |
Series 2023-XF1450, Rev., VRDO, LIQ : TD Bank NA, 4.09%, 9/8/2023 (a) (c) | 4,790 | 4,790 |
Series 2023-XF1455, Rev., VRDO, AGM-CR, LOC : Royal Bank of Canada, 4.09%, 9/8/2023 (a) (c) | 1,800 | 1,800 |
Series 2023-XF1495, Rev., VRDO, LIQ : TD Bank NA, 4.09%, 9/8/2023 (a) (c) | 1,565 | 1,565 |
Series 2023-XF1505, Rev., VRDO, LIQ : Bank of America NA, 4.09%, 9/8/2023 (a) (c) | 3,350 | 3,350 |
Series 2023-XF1506, Rev., VRDO, LIQ : Bank of America NA, 4.09%, 9/8/2023 (a) (c) | 8,900 | 8,900 |
Series 2023-XF1507, Rev., VRDO, LIQ : Bank of America NA, 4.09%, 9/8/2023 (a) (c) | 11,110 | 11,110 |
Series 2023-XF1543, Rev., VRDO, LIQ : TD Bank NA, 4.09%, 9/8/2023 (a) (c) | 1,600 | 1,600 |
Series 2023-XF1589, GO, VRDO, LIQ : TD Bank NA, 4.09%, 9/8/2023 (a) (c) | 2,000 | 2,000 |
Series 2023-XF3107, Rev., VRDO, LIQ : Morgan Stanley Bank NA, 4.09%, 9/8/2023 (a) (c) | 4,525 | 4,525 |
Series 2023-XF3135, Rev., VRDO, LIQ : Wells Fargo Bank NA, 4.09%, 9/8/2023 (a) (c) | 4,000 | 4,000 |
Series 2023-XL0416, Rev., VRDO, LIQ : Barclays Bank plc, 4.09%, 9/8/2023 (a) (c) | 6,710 | 6,710 |
Series 2023-XL0434, Rev., VRDO, LIQ : Bank of America NA, 4.09%, 9/8/2023 (a) (c) | 20,000 | 20,000 |
Series 2023-XL0441, GO, VRDO, LIQ : Royal Bank of Canada, 4.09%, 9/8/2023 (a) (c) | 2,000 | 2,000 |
Series 2023-XL0463, Rev., VRDO, LIQ : Barclays Bank plc, 4.09%, 9/8/2023 (a) (c) | 5,210 | 5,210 |
97 | J.P. Morgan Money Market Funds | August 31, 2023 |
INVESTMENTS †† | PRINCIPAL AMOUNT ($000) | VALUE ($000) |
Municipal Bonds — continued | ||
New York — continued | ||
Series 2023-XX1281, Rev., VRDO, LIQ : Barclays Bank plc, 4.09%, 9/8/2023 (a) (c) | 8,290 | 8,290 |
Series 2017-XF2419, Rev., VRDO, LOC : Barclays Bank plc, 4.10%, 9/8/2023 (a) (c) | 3,285 | 3,285 |
Series 2020-XF2868, Rev., VRDO, LOC : Barclays Bank plc, 4.10%, 9/8/2023 (a) (c) | 1,900 | 1,900 |
Series 2020-XF2878, Rev., VRDO, LOC : Barclays Bank plc, 4.10%, 9/8/2023 (a) (c) | 9,320 | 9,320 |
Series 2020-XX1127, Rev., VRDO, AGM, LOC : Barclays Bank plc, 4.10%, 9/8/2023 (a) (c) | 5,220 | 5,220 |
Series 2022-XF1357, Rev., VRDO, LIQ : TD Bank NA, 4.10%, 9/8/2023 (a) (c) | 3,750 | 3,750 |
Series 2022-XF1358, Rev., VRDO, LIQ : TD Bank NA, 4.10%, 9/8/2023 (a) (c) | 12,000 | 12,000 |
Series 2022-XF1370, Rev., VRDO, LIQ : Bank of America NA, 4.10%, 9/8/2023 (a) (c) | 3,330 | 3,330 |
Series 2022-XF3065, Rev., VRDO, LOC : Barclays Bank plc, 4.11%, 9/8/2023 (a) (c) | 5,995 | 5,995 |
Series 2023-XF1480, Rev., VRDO, LIQ : Morgan Stanley Bank NA, 4.11%, 9/8/2023 (a) (c) | 5,840 | 5,840 |
Series 2023-XF1496, Rev., VRDO, LIQ : TD Bank NA, 4.11%, 9/8/2023 (a) (c) | 2,150 | 2,150 |
Series 2022-XG0379, Rev., VRDO, LIQ : Bank of America NA, 4.13%, 9/8/2023 (a) (c) | 800 | 800 |
Series 2022-XG0394, Rev., VRDO, LIQ : Bank of America NA, 4.13%, 9/8/2023 (a) (c) | 5,040 | 5,040 |
Series 2022-XG0438, Rev., VRDO, LIQ : Bank of America NA, 4.13%, 9/8/2023 (a) (c) | 5,350 | 5,350 |
Series 2022-ZL0270, Rev., VRDO, LIQ : Barclays Bank plc, 4.13%, 9/8/2023 (a) (c) | 2,070 | 2,070 |
Series 2022-ZL0273, Rev., VRDO, LIQ : Bank of America NA, 4.13%, 9/8/2023 (a) (c) | 930 | 930 |
Town of Amherst, GO, BAN, 4.75%, 11/3/2023 | 5,000 | 5,011 |
Town of Lewisboro, GO, BAN, 5.75%, 4/12/2024 | 3,048 | 3,085 |
Triborough Bridge and Tunnel Authority | ||
Series 2005B-3, Rev., VRDO, LOC : Bank of America NA, 3.92%, 9/1/2023 (a) | 37,900 | 37,900 |
Series 2001C, Rev., VRDO, LOC : Barclays Bank plc, 3.95%, 9/1/2023 (a) | 5,000 | 5,000 |
Triborough Bridge and Tunnel Authority, MTA Bridges and Tunnels | ||
Series 2003B1, Rev., VRDO, LOC : US Bank NA, 4.25%, 9/1/2023 (a) | 49,925 | 49,925 |
Series 2005B-4C, Rev., VRDO, LOC : US Bank NA, 4.25%, 9/1/2023 (a) | 30,340 | 30,340 |
Series 2005A, Rev., VRDO, LOC : Barclays Bank plc, 4.05%, 9/8/2023 (a) | 300 | 300 |
INVESTMENTS †† | PRINCIPAL AMOUNT ($000) | VALUE ($000) |
New York — continued | ||
Trust for Cultural Resources of The City of New York (The), American Museum Series 2014B-2, Rev., VRDO, 4.10%, 4/29/2024 (a) | 9,895 | 9,895 |
Trust for Cultural Resources of The City of New York, American Museum of Natural History Series 2008B-3, Rev., VRDO, LIQ : Wells Fargo Bank NA, 3.90%, 9/8/2023 (a) | 2,715 | 2,715 |
Trust for Cultural Resources of The City of New York, The Museum of Modern Art | ||
Series 2006A-1, Rev., VRDO, 3.85%, 9/8/2023 (a) | 34,475 | 34,475 |
Series 2006A-2, Rev., VRDO, 3.85%, 9/8/2023 (a) | 14,145 | 14,145 |
Village of Endicott, GO, BAN, 4.25%, 8/23/2024 | 13,378 | 13,431 |
Village of Pelham NY, GO, BAN, 4.25%, 9/13/2024 (b) | 9,449 | 9,491 |
Village of Scotia, GO, BAN, 4.75%, 6/28/2024 | 3,800 | 3,826 |
West Genesee Central School District Series 2023B, GO, BAN, 4.75%, 7/19/2024 | 4,862 | 4,899 |
Westchester County Industrial Development Agency, Northern Westchester Hospital, Rev., VRDO, LOC : TD Bank NA, 4.00%, 9/8/2023 (a) | 1,260 | 1,260 |
Windham-Ashland-Jewett Central School District, GO, BAN, 5.00%, 6/21/2024 | 2,300 | 2,321 |
2,011,192 | ||
Total Municipal Bonds (Cost $2,011,192) | 2,011,192 | |
SHARES (000) | ||
Variable Rate Demand Preferred Shares — 7.0% | ||
New York — 7.0% | ||
Nuveen New York AMT - Free Quality Municipal Income Fund | ||
Series 5, LIQ : TD Bank NA, 4.10%, 9/8/2023# (c) | 40,000 | 40,000 |
Series 1, LIQ : Societe Generale, 4.11%, 9/8/2023# (c) | 18,600 | 18,600 |
Series 2, LIQ : Royal Bank of Canada, 4.11%, 9/8/2023# (c) | 26,800 | 26,800 |
Series 3, LIQ : Sumitomo Mitsui Banking Corp., 4.11%, 9/8/2023# (c) | 43,200 | 43,200 |
Nuveen New York Quality Municipal Income Fund Series 1-PFD, LIQ : TD Bank NA, 4.15%, 9/8/2023# (c) | 20,500 | 20,500 |
Total Variable Rate Demand Preferred Shares (Cost $149,100) | 149,100 | |
August 31, 2023 | J.P. Morgan Money Market Funds | 98 |
AS OF August 31, 2023 (Unaudited) (continued)
INVESTMENTS †† | SHARES (000) | VALUE ($000) |
Total Investments — 101.4% (Cost $2,160,292) * | 2,160,292 | |
Liabilities in Excess of Other Assets — (1.4)% | (29,510 ) | |
NET ASSETS — 100.0% | 2,130,782 |
Percentages indicated are based on net assets. |
Abbreviations | |
AGM | Insured by Assured Guaranty Municipal Corp. |
AMT | Alternative Minimum Tax |
BAN | Bond Anticipation Note |
CR | Custodial Receipts |
FHLMC | Federal Home Loan Mortgage Corp. |
FNMA | Federal National Mortgage Association |
GO | General Obligation |
LIQ | Liquidity Agreement |
LOC | Letter of Credit |
MTA | Metropolitan Transportation Authority |
Rev. | Revenue |
TAN | Tax Anticipation Note |
VRDO | Variable Rate Demand Obligation |
†† | The date shown represents the earliest of the next put date, next demand date or final maturity date. | |
# | Variable Rate Demand Preferred Shares of a closed-end investment company which has a weekly demand feature. The interest rate shown is the rate in effect as of August 31, 2023. | |
* | The cost of securities is substantially the same for federal income tax purposes. | |
(a) | Variable or floating rate security, the interest rate of which adjusts periodically based on changes in current interest rates and prepayments on the underlying pool of assets. The interest rate shown is the current rate as of August 31, 2023. | |
(b) | All or a portion of the security is a when-issued security, delayed delivery security, or forward commitment. | |
(c) | Securities exempt from registration under Rule 144A or section 4(a)(2), of the Securities Act of 1933, as amended. | |
99 | J.P. Morgan Money Market Funds | August 31, 2023 |
AS OF August 31, 2023 (Unaudited)
(Amounts in thousands, except per share amounts)
JPMorgan Prime Money Market Fund | JPMorgan Institutional Tax Free Money Market Fund | JPMorgan Securities Lending Money Market Fund | |
ASSETS: | |||
Investments in non-affiliates, at value | $54,306,809 | $1,185,077 | $2,825,855 |
Repurchase agreements, at value | 22,173,000 | — | 75,000 |
Cash | 1,125,010 | 2 | 3 |
Receivables: | |||
Interest from non-affiliates | 205,456 | 5,532 | 7,383 |
Total Assets | 77,810,275 | 1,190,611 | 2,908,241 |
LIABILITIES: | |||
Payables: | |||
Distributions | 229,847 | 2,879 | 11,789 |
Investment securities purchased | 120,000 | 6,500 | — |
Accrued liabilities: | |||
Investment advisory fees | 5,314 | 73 | 77 |
Administration fees | 2,551 | 34 | 19 |
Distribution fees | 1 | — | — |
Service fees | 4,877 | 29 | — |
Custodian and accounting fees | 119 | 10 | 32 |
Trustees’ and Chief Compliance Officer’s fees | 22 | — | 4 |
Other | 1,060 | 67 | 61 |
Total Liabilities | 363,791 | 9,592 | 11,982 |
Net Assets | $77,446,484 | $1,181,019 | $2,896,259 |
August 31, 2023 | J.P. Morgan Money Market Funds | 100 |
AS OF August 31, 2023 (Unaudited) (continued)
(Amounts in thousands, except per share amounts)
JPMorgan Prime Money Market Fund | JPMorgan Institutional Tax Free Money Market Fund | JPMorgan Securities Lending Money Market Fund | |
NET ASSETS: | |||
Paid-in-Capital | $77,451,476 | $1,181,115 | $2,896,164 |
Total distributable earnings (loss) | (4,992 ) | (96 ) | 95 |
Total Net Assets | $77,446,484 | $1,181,019 | $2,896,259 |
Net Assets: | |||
Academy | $647,802 | $— | $— |
Agency | 3,084,572 | 105,028 | — |
Agency SL | — | — | 2,896,259 |
Capital | 38,476,887 | 228,669 | — |
Empower | 349,908 | — | — |
IM | 12,549,608 | 425,709 | — |
Institutional Class | 16,365,788 | 421,613 | — |
Morgan | 3,224,170 | — | — |
Premier | 2,744,504 | — | — |
Reserve | 3,245 | — | — |
Total | $77,446,484 | $1,181,019 | $2,896,259 |
Outstanding units of beneficial interest (shares) ($0.0001 par value; unlimited number of shares authorized): | |||
Academy | 647,599 | — | — |
Agency | 3,082,576 | 105,014 | — |
Agency SL | — | — | 2,895,634 |
Capital | 38,465,913 | 228,629 | — |
Empower | 349,814 | — | — |
IM | 12,545,501 | 425,687 | — |
Institutional Class | 16,360,457 | 421,572 | — |
Morgan | 3,221,785 | — | — |
Premier | 2,743,262 | — | — |
Reserve | 3,243 | — | — |
Net Asset Value offering and redemption price per share | |||
Academy | $1.0003 | $— | $— |
Agency | 1.0006 | 1.0001 | — |
Agency SL | — | — | 1.0002 |
Capital | 1.0003 | 1.0002 | — |
Empower | 1.0003 | — | — |
IM | 1.0003 | 1.0001 | — |
Institutional Class | 1.0003 | 1.0001 | — |
Morgan | 1.0007 | — | — |
Premier | 1.0005 | — | — |
Reserve | 1.0006 | — | — |
Cost of investments in non-affiliates | $54,305,081 | $1,185,173 | $2,825,599 |
Cost of repurchase agreements | 22,173,000 | — | 75,000 |
101 | J.P. Morgan Money Market Funds | August 31, 2023 |
JPMorgan Liquid Assets Money Market Fund | JPMorgan U.S. Government Money Market Fund | JPMorgan U.S. Treasury Plus Money Market Fund | |
ASSETS: | |||
Investments in non-affiliates, at value | $35,145,454 | $71,335,684 | $5,659,607 |
Repurchase agreements, at value | 15,015,000 | 192,047,743 | 32,710,073 |
Cash | 675,018 | 6,167,069 | 824,578 |
Receivables: | |||
Fund shares sold | — | 2,218 | — |
Interest from non-affiliates | 109,614 | 534,771 | 21,187 |
Prepaid expenses | 1,541 | — | — |
Total Assets | 50,946,627 | 270,087,485 | 39,215,445 |
LIABILITIES: | |||
Payables: | |||
Distributions | 105,194 | 642,664 | 98,381 |
Investment securities purchased | 64,791 | 1,000,000 | — |
Fund shares redeemed | — | 571 | — |
Accrued liabilities: | |||
Investment advisory fees | 3,425 | 17,754 | 2,625 |
Administration fees | 1,644 | 8,522 | 1,260 |
Distribution fees | 377 | 1,368 | 530 |
Service fees | 7,834 | 17,819 | 4,024 |
Custodian and accounting fees | — | 600 | 29 |
Trustees’ and Chief Compliance Officer’s fees | 2 | 58 | 2 |
Other | 100 | 4,193 | 337 |
Total Liabilities | 183,367 | 1,693,549 | 107,188 |
Net Assets | $50,763,260 | $268,393,936 | $39,108,257 |
August 31, 2023 | J.P. Morgan Money Market Funds | 102 |
AS OF August 31, 2023 (Unaudited) (continued)
(Amounts in thousands, except per share amounts)
JPMorgan Liquid Assets Money Market Fund | JPMorgan U.S. Government Money Market Fund | JPMorgan U.S. Treasury Plus Money Market Fund | |
NET ASSETS: | |||
Paid-in-Capital | $50,763,366 | $268,471,412 | $39,112,237 |
Total distributable earnings (loss) | (106 ) | (77,476 ) | (3,980 ) |
Total Net Assets | $50,763,260 | $268,393,936 | $39,108,257 |
Net Assets: | |||
Academy | $— | $11,550,930 | $157,332 |
Agency | 3,688,300 | 12,841,291 | 2,068,506 |
Capital | 12,322,971 | 164,622,049 | 17,772,739 |
E*Trade | — | 142,019 | — |
Empower | — | 11,552,029 | 216,513 |
IM | — | 8,090,920 | 18,610 |
Institutional Class | 10,044,300 | 36,573,113 | 9,682,892 |
Investor | 4,873 | 2,264,193 | 13,007 |
Morgan | 4,659,512 | 6,946,528 | 3,488,718 |
Premier | 20,020,067 | 10,587,829 | 4,381,035 |
Reserve | 23,237 | 2,947,650 | 1,308,905 |
Service | — | 275,385 | — |
Total | $50,763,260 | $268,393,936 | $39,108,257 |
Outstanding units of beneficial interest (shares) ($0.0001 par value; unlimited number of shares authorized): | |||
Academy | — | 11,554,263 | 157,348 |
Agency | 3,688,295 | 12,845,001 | 2,068,717 |
Capital | 12,322,955 | 164,669,549 | 17,774,549 |
E*Trade | — | 142,060 | — |
Empower | — | 11,555,363 | 216,535 |
IM | — | 8,093,259 | 18,612 |
Institutional Class | 10,044,286 | 36,583,670 | 9,683,878 |
Investor | 4,873 | 2,264,846 | 13,008 |
Morgan | 4,659,506 | 6,948,533 | 3,489,074 |
Premier | 20,020,041 | 10,590,886 | 4,381,481 |
Reserve | 23,237 | 2,948,499 | 1,309,038 |
Service | — | 275,464 | — |
Net Asset Value offering and redemption price per share (all classes) | $1.00 | $1.00 | $1.00 |
Cost of investments in non-affiliates | $35,145,454 | $71,335,684 | $5,659,607 |
Cost of repurchase agreements | 15,015,000 | 192,047,743 | 32,710,073 |
103 | J.P. Morgan Money Market Funds | August 31, 2023 |
JPMorgan Federal Money Market Fund | JPMorgan 100% U.S. Treasury Securities Money Market Fund | JPMorgan Tax Free Money Market Fund | |
ASSETS: | |||
Investments in non-affiliates, at value | $7,296,218 | $155,512,341 | $10,060,931 |
Cash | 122,631 | 3,115,059 | 104 |
Receivables: | |||
Due from custodian | — | — | 25,694 |
Investment securities sold | 100,000 | 499,563 | 285,180 |
Investment securities sold — delayed delivery securities | — | — | 1,430 |
Fund shares sold | 14 | — | — |
Interest from non-affiliates | 23,989 | 79,266 | 42,045 |
Total Assets | 7,542,852 | 159,206,229 | 10,415,384 |
LIABILITIES: | |||
Payables: | |||
Distributions | 19,354 | 474,045 | 26,125 |
Investment securities purchased | 429,859 | 12,807,725 | 41,694 |
Investment securities purchased — delayed delivery securities | — | — | 17,595 |
Fund shares redeemed | 19 | — | — |
Accrued liabilities: | |||
Investment advisory fees | 488 | 9,813 | 700 |
Administration fees | 234 | 4,711 | 336 |
Distribution fees | 20 | 642 | 152 |
Service fees | 903 | 11,866 | 1,086 |
Custodian and accounting fees | — | 186 | 17 |
Trustees’ and Chief Compliance Officer’s fees | 3 | 26 | 2 |
Other | 87 | 1,744 | 77 |
Total Liabilities | 450,967 | 13,310,758 | 87,784 |
Net Assets | $7,091,885 | $145,895,471 | $10,327,600 |
August 31, 2023 | J.P. Morgan Money Market Funds | 104 |
AS OF August 31, 2023 (Unaudited) (continued)
(Amounts in thousands, except per share amounts)
JPMorgan Federal Money Market Fund | JPMorgan 100% U.S. Treasury Securities Money Market Fund | JPMorgan Tax Free Money Market Fund | |
NET ASSETS: | |||
Paid-in-Capital | $7,091,935 | $145,901,976 | $10,327,755 |
Total distributable earnings (loss) | (50 ) | (6,505 ) | (155 ) |
Total Net Assets | $7,091,885 | $145,895,471 | $10,327,600 |
Net Assets: | |||
Academy | $— | $50,019 | $— |
Agency | 813,097 | 10,665,521 | 575,491 |
Capital | — | 75,482,900 | — |
Empower | — | 448,463 | — |
IM | — | 42,380 | — |
Institutional Class | 4,239,875 | 41,939,493 | 7,975,417 |
Morgan | 236,912 | 4,340,853 | 59,535 |
Premier | 1,802,001 | 11,679,465 | 1,059,788 |
Reserve | — | 1,246,377 | 657,369 |
Total | $7,091,885 | $145,895,471 | $10,327,600 |
Outstanding units of beneficial interest (shares) ($0.0001 par value; unlimited number of shares authorized): | |||
Academy | — | 50,021 | — |
Agency | 813,136 | 10,665,990 | 575,468 |
Capital | — | 75,486,218 | — |
Empower | — | 448,483 | — |
IM | — | 42,381 | — |
Institutional Class | 4,240,081 | 41,941,338 | 7,975,100 |
Morgan | 236,923 | 4,341,044 | 59,533 |
Premier | 1,802,089 | 11,679,979 | 1,059,746 |
Reserve | — | 1,246,431 | 657,343 |
Net Asset Value offering and redemption price per share (all classes) | $1.00 | $1.00 | $1.00 |
Cost of investments in non-affiliates | $7,296,218 | $155,512,341 | $10,060,931 |
105 | J.P. Morgan Money Market Funds | August 31, 2023 |
JPMorgan Municipal Money Market Fund | JPMorgan California Municipal Money Market Fund | JPMorgan New York Municipal Money Market Fund | |
ASSETS: | |||
Investments in non-affiliates, at value | $1,577,196 | $550,278 | $2,160,292 |
Cash | — | 3 | 22 |
Receivables: | |||
Due from custodian | — | — | 20,861 |
Investment securities sold | — | 150 | — |
Investment securities sold — delayed delivery securities | 230 | 438 | 5,970 |
Interest from non-affiliates | 7,789 | 2,244 | 11,924 |
Total Assets | 1,585,215 | 553,113 | 2,199,069 |
LIABILITIES: | |||
Payables: | |||
Due to custodian | 14 | — | — |
Distributions | 1,885 | 983 | 5,329 |
Investment securities purchased | — | — | 22,702 |
Investment securities purchased — delayed delivery securities | 8,946 | 3,043 | 39,762 |
Accrued liabilities: | |||
Investment advisory fees | 105 | 34 | 140 |
Administration fees | 50 | 16 | 67 |
Distribution fees | 7 | 3 | 5 |
Service fees | 161 | 71 | 241 |
Custodian and accounting fees | 11 | 10 | 9 |
Trustees’ and Chief Compliance Officer’s fees | 1 | 2 | 1 |
Other | 305 | 65 | 31 |
Total Liabilities | 11,485 | 4,227 | 68,287 |
Net Assets | $1,573,730 | $548,886 | $2,130,782 |
August 31, 2023 | J.P. Morgan Money Market Funds | 106 |
AS OF August 31, 2023 (Unaudited) (continued)
(Amounts in thousands, except per share amounts)
JPMorgan Municipal Money Market Fund | JPMorgan California Municipal Money Market Fund | JPMorgan New York Municipal Money Market Fund | |
NET ASSETS: | |||
Paid-in-Capital | $1,573,739 | $548,893 | $2,130,795 |
Total distributable earnings (loss) | (9 ) | (7 ) | (13 ) |
Total Net Assets | $1,573,730 | $548,886 | $2,130,782 |
Net Assets: | |||
Agency | $157,259 | $61,854 | $294,804 |
Institutional Class | 1,080,908 | 298,772 | 1,313,472 |
Morgan | 50,169 | 8,093 | 53,182 |
Premier | 278,606 | 174,910 | 468,051 |
Reserve | — | — | 266 |
Service | 6,788 | 5,257 | 1,007 |
Total | $1,573,730 | $548,886 | $2,130,782 |
Outstanding units of beneficial interest (shares) ($0.0001 par value; unlimited number of shares authorized): | |||
Agency | 157,244 | 61,842 | 294,800 |
Institutional Class | 1,080,811 | 298,715 | 1,313,453 |
Morgan | 50,165 | 8,092 | 53,181 |
Premier | 278,581 | 174,876 | 468,045 |
Reserve | — | — | 266 |
Service | 6,787 | 5,256 | 1,006 |
Net Asset Value offering and redemption price per share (all classes) | $1.00 | $1.00 | $1.00 |
Cost of investments in non-affiliates | $1,577,196 | $550,278 | $2,160,292 |
107 | J.P. Morgan Money Market Funds | August 31, 2023 |
FOR THE SIX MONTHS ENDED August 31, 2023 (Unaudited)
(Amounts in thousands)
JPMorgan Prime Money Market Fund | JPMorgan Institutional Tax Free Money Market Fund | JPMorgan Securities Lending Money Market Fund | |
INVESTMENT INCOME: | |||
Interest income from non-affiliates | $1,946,185 | $22,191 | $66,123 |
Interest income from affiliates | 27,712 | 2 | 9 |
Total investment income | 1,973,897 | 22,193 | 66,132 |
EXPENSES: | |||
Investment advisory fees | 29,972 | 555 | 1,005 |
Administration fees | 15,337 | 288 | 515 |
Distribution fees (See Note 4) | 4 | — | — |
Service fees (See Note 4) | 28,766 | 366 | — |
Custodian and accounting fees | 727 | 60 | 96 |
Interest expense to affiliates | — | — (a) | — (a) |
Professional fees | 211 | 26 | 29 |
Trustees’ and Chief Compliance Officer’s fees | 170 | 15 | 18 |
Printing and mailing costs | 12 | 11 | 8 |
Registration and filing fees | — | 43 | 28 |
Transfer agency fees (See Note 2.F.) | 952 | 66 | 32 |
Other | 302 | 9 | 14 |
Total expenses | 76,453 | 1,439 | 1,745 |
Less fees waived | (2,343 ) | (169 ) | (990 ) |
Less expense reimbursements | (15 ) | (1 ) | (1 ) |
Net expenses | 74,095 | 1,269 | 754 |
Net investment income (loss) | 1,899,802 | 20,924 | 65,378 |
REALIZED/UNREALIZED GAINS (LOSSES): | |||
Net realized gain (loss) on transactions from investments in non-affiliates | 21 | — | (30 ) |
Change in net unrealized appreciation/depreciation on investments in non-affiliates | (9,443 ) | 73 | (432 ) |
Net realized/unrealized gains (losses) | (9,422 ) | 73 | (462 ) |
Change in net assets resulting from operations | $1,890,380 | $20,997 | $64,916 |
August 31, 2023 | J.P. Morgan Money Market Funds | 108 |
FOR THE SIX MONTHS ENDED August 31, 2023 (Unaudited) (continued)
(Amounts in thousands)
JPMorgan Liquid Assets Money Market Fund | JPMorgan U.S. Government Money Market Fund | JPMorgan U.S. Treasury Plus Money Market Fund | |
INVESTMENT INCOME: | |||
Interest income from non-affiliates | $1,138,109 | $6,203,186 | $882,470 |
Interest income from affiliates | 17,119 | 125,354 | 18,586 |
Income from interfund lending (net) | 208 | — | — |
Total investment income | 1,155,436 | 6,328,540 | 901,056 |
EXPENSES: | |||
Investment advisory fees | 17,589 | 99,417 | 14,176 |
Administration fees | 8,973 | 50,840 | 7,239 |
Distribution fees (See Note 4) | 1,728 | 6,570 | 2,191 |
Service fees (See Note 4) | 41,110 | 100,169 | 21,321 |
Custodian and accounting fees | 275 | 1,417 | 239 |
Professional fees | 143 | 674 | 84 |
Trustees’ and Chief Compliance Officer’s fees | 87 | 491 | 74 |
Printing and mailing costs | 126 | 535 | 11 |
Registration and filing fees | 1,777 | 2,178 | 478 |
Transfer agency fees (See Note 2.F.) | 394 | 2,070 | 268 |
Other | 53 | 311 | 31 |
Total expenses | 72,255 | 264,672 | 46,112 |
Less fees waived | (1,937 ) | (7,394 ) | (1,362 ) |
Less expense reimbursements | (4 ) | (19 ) | (3 ) |
Net expenses | 70,314 | 257,259 | 44,747 |
Net investment income (loss) | 1,085,122 | 6,071,281 | 856,309 |
REALIZED/UNREALIZED GAINS (LOSSES): | |||
Net realized gain (loss) on transactions from investments in non-affiliates | 11 | (16,237 ) | 27 |
Change in net assets resulting from operations | $1,085,133 | $6,055,044 | $856,336 |
109 | J.P. Morgan Money Market Funds | August 31, 2023 |
JPMorgan Federal Money Market Fund | JPMorgan 100% U.S. Treasury Securities Money Market Fund | JPMorgan Tax Free Money Market Fund | |
INVESTMENT INCOME: | |||
Interest income from non-affiliates | $164,985 | $3,154,544 | $174,010 |
Interest income from affiliates | 2,888 | 78,823 | 1 |
Total investment income | 167,873 | 3,233,367 | 174,011 |
EXPENSES: | |||
Investment advisory fees | 2,649 | 51,753 | 4,267 |
Administration fees | 1,352 | 26,441 | 2,191 |
Distribution fees (See Note 4) | 96 | 3,422 | 928 |
Service fees (See Note 4) | 5,292 | 64,567 | 7,298 |
Custodian and accounting fees | 51 | 908 | 154 |
Interest expense to affiliates | — | — | 4 |
Professional fees | 33 | 244 | 55 |
Trustees’ and Chief Compliance Officer’s fees | 26 | 252 | 34 |
Printing and mailing costs | 38 | 39 | 26 |
Registration and filing fees | 179 | 1,047 | 76 |
Transfer agency fees (See Note 2.F.) | 57 | 1,026 | 109 |
Other | 13 | 210 | 33 |
Total expenses | 9,786 | 149,909 | 15,175 |
Less fees waived | (553 ) | (5,045 ) | (894 ) |
Less expense reimbursements | (1 ) | (10 ) | (2 ) |
Net expenses | 9,232 | 144,854 | 14,279 |
Net investment income (loss) | 158,641 | 3,088,513 | 159,732 |
REALIZED/UNREALIZED GAINS (LOSSES): | |||
Net realized gain (loss) on transactions from investments in non-affiliates | 110 | 3,255 | 64 |
Change in net assets resulting from operations | $158,751 | $3,091,768 | $159,796 |
August 31, 2023 | J.P. Morgan Money Market Funds | 110 |
FOR THE SIX MONTHS ENDED August 31, 2023 (Unaudited) (continued)
(Amounts in thousands)
JPMorgan Municipal Money Market Fund | JPMorgan California Municipal Money Market Fund | JPMorgan New York Municipal Money Market Fund | |
INVESTMENT INCOME: | |||
Interest income from non-affiliates | $23,115 | $8,206 | $34,107 |
Interest income from affiliates | — | — (a) | — (a) |
Total investment income | 23,115 | 8,206 | 34,107 |
EXPENSES: | |||
Investment advisory fees | 558 | 228 | 848 |
Administration fees | 285 | 118 | 436 |
Distribution fees (See Note 4) | 45 | 21 | 32 |
Service fees (See Note 4) | 1,016 | 514 | 1,703 |
Custodian and accounting fees | 41 | 37 | 56 |
Interest expense to affiliates | — (a) | — | — |
Professional fees | 28 | 29 | 29 |
Trustees’ and Chief Compliance Officer’s fees | 16 | 16 | 16 |
Printing and mailing costs | 48 | 4 | 16 |
Registration and filing fees | 18 | 51 | 57 |
Transfer agency fees (See Note 2.F.) | 15 | 8 | 29 |
Other | 7 | 5 | 7 |
Total expenses | 2,077 | 1,031 | 3,229 |
Less fees waived | (204 ) | (140 ) | (246 ) |
Less expense reimbursements | (1 ) | (1 ) | (1 ) |
Net expenses | 1,872 | 890 | 2,982 |
Net investment income (loss) | 21,243 | 7,316 | 31,125 |
REALIZED/UNREALIZED GAINS (LOSSES): | |||
Net realized gain (loss) on transactions from investments in non-affiliates | 2 | 10 | 14 |
Change in net assets resulting from operations | $21,245 | $7,326 | $31,139 |
111 | J.P. Morgan Money Market Funds | August 31, 2023 |
FOR THE PERIODS INDICATED
(Amounts in thousands)
JPMorgan Prime Money Market Fund | JPMorgan Institutional Tax Free Money Market Fund | |||
Six Months Ended August 31, 2023 (Unaudited) | Year Ended February 28, 2023 | Six Months Ended August 31, 2023 (Unaudited) | Year Ended February 28, 2023 | |
CHANGE IN NET ASSETS RESULTING FROM OPERATIONS: | ||||
Net investment income (loss) | $1,899,802 | $1,469,471 | $20,924 | $23,905 |
Net realized gain (loss) | 21 | (2,088 ) | — | 72 |
Change in net unrealized appreciation/depreciation | (9,443 ) | 20,926 | 73 | 43 |
Change in net assets resulting from operations | 1,890,380 | 1,488,309 | 20,997 | 24,020 |
DISTRIBUTIONS TO SHAREHOLDERS: | ||||
Academy | (22,796 ) | (16,740 ) | — | — |
Agency | (73,183 ) | (48,443 ) | (1,613 ) | (1,052 ) |
Capital | (1,023,995 ) | (850,012 ) | (4,821 ) | (4,592 ) |
Class C (a) | — | (6 ) | — | — |
Empower | (9,214 ) | (8,487 ) | — | — |
IM | (252,584 ) | (197,073 ) | (8,318 ) | (11,616 ) |
Institutional Class | (392,344 ) | (286,085 ) | (6,172 ) | (6,745 ) |
Morgan | (60,104 ) | (28,514 ) | — | — |
Premier | (65,346 ) | (34,053 ) | — | — |
Reserve (a) | (76 ) | (58 ) | — | — |
Total distributions to shareholders | (1,899,642 ) | (1,469,471 ) | (20,924 ) | (24,005 ) |
CAPITAL TRANSACTIONS: | ||||
Change in net assets resulting from capital transactions | 7,583,308 | 252,044 | (326,677 ) | 229,695 |
NET ASSETS: | ||||
Change in net assets | 7,574,046 | 270,882 | (326,604 ) | 229,710 |
Beginning of period | 69,872,438 | 69,601,556 | 1,507,623 | 1,277,913 |
End of period | $77,446,484 | $69,872,438 | $1,181,019 | $1,507,623 |
August 31, 2023 | J.P. Morgan Money Market Funds | 112 |
FOR THE PERIODS INDICATED (continued)
(Amounts in thousands)
JPMorgan Securities Lending Money Market Fund | JPMorgan Liquid Assets Money Market Fund | |||
Six Months Ended August 31, 2023 (Unaudited) | Year Ended February 28, 2023 | Six Months Ended August 31, 2023 (Unaudited) | Year Ended February 28, 2023 | |
CHANGE IN NET ASSETS RESULTING FROM OPERATIONS: | ||||
Net investment income (loss) | $65,378 | $41,370 | $1,085,122 | $461,186 |
Net realized gain (loss) | (30 ) | (129 ) | 11 | 70 |
Change in net unrealized appreciation/depreciation | (432 ) | 1,568 | — | — |
Change in net assets resulting from operations | 64,916 | 42,809 | 1,085,133 | 461,256 |
DISTRIBUTIONS TO SHAREHOLDERS: | ||||
Agency | — | — | (87,407 ) | (42,431 ) |
Agency SL | (65,378 ) | (41,372 ) | — | — |
Capital | — | — | (278,289 ) | (123,194 ) |
Class C (a) | — | — | — | (381 ) |
Institutional Class | — | — | (235,548 ) | (131,253 ) |
Investor | — | — | (95 ) | (58 ) |
Morgan | — | — | (79,579 ) | (21,452 ) |
Premier | — | — | (403,535 ) | (142,247 ) |
Reserve (a) | — | — | (565 ) | (173 ) |
Total distributions to shareholders | (65,378 ) | (41,372 ) | (1,085,018 ) | (461,189 ) |
CAPITAL TRANSACTIONS: | ||||
Change in net assets resulting from capital transactions | 824,998 | 148,292 | 15,284,364 | 29,207,241 |
NET ASSETS: | ||||
Change in net assets | 824,536 | 149,729 | 15,284,479 | 29,207,308 |
Beginning of period | 2,071,723 | 1,921,994 | 35,478,781 | 6,271,473 |
End of period | $2,896,259 | $2,071,723 | $50,763,260 | $35,478,781 |
113 | J.P. Morgan Money Market Funds | August 31, 2023 |
JPMorgan U.S. Government Money Market Fund | JPMorgan U.S. Treasury Plus Money Market Fund | |||
Six Months Ended August 31, 2023 (Unaudited) | Year Ended February 28, 2023 | Six Months Ended August 31, 2023 (Unaudited) | Year Ended February 28, 2023 | |
CHANGE IN NET ASSETS RESULTING FROM OPERATIONS: | ||||
Net investment income (loss) | $6,071,281 | $4,678,181 | $856,309 | $484,081 |
Net realized gain (loss) | (16,237 ) | (56,799 ) | 27 | (3,269 ) |
Change in net assets resulting from operations | 6,055,044 | 4,621,382 | 856,336 | 480,812 |
DISTRIBUTIONS TO SHAREHOLDERS: | ||||
Academy | (206,473 ) | (153,967 ) | (3,843 ) | (3,465 ) |
Agency | (289,274 ) | (206,805 ) | (48,043 ) | (23,485 ) |
Capital | (3,800,502 ) | (3,001,431 ) | (406,400 ) | (237,685 ) |
Class C (a) | — | — | — | (4,471 ) |
E*Trade | (4,451 ) | (4,606 ) | — | — |
Empower | (233,469 ) | (127,065 ) | (10,861 ) | (5,266 ) |
IM | (241,849 ) | (213,575 ) | (127 ) | (1 ) |
Institutional Class | (864,806 ) | (666,967 ) | (228,770 ) | (148,361 ) |
Investor | (49,750 ) | (49,849 ) | (402 ) | (313 ) |
Morgan | (123,776 ) | (50,549 ) | (47,292 ) | (14,207 ) |
Premier | (210,067 ) | (132,661 ) | (89,952 ) | (44,801 ) |
Reserve (a) | (40,311 ) | (65,490 ) | (20,540 ) | (2,026 ) |
Service | (6,016 ) | (5,216 ) | — | — |
Total distributions to shareholders | (6,070,744 ) | (4,678,181 ) | (856,230 ) | (484,081 ) |
CAPITAL TRANSACTIONS: | ||||
Change in net assets resulting from capital transactions | 72,777,338 | (49,057,205 ) | 11,400,213 | 4,830,578 |
NET ASSETS: | ||||
Change in net assets | 72,761,638 | (49,114,004 ) | 11,400,319 | 4,827,309 |
Beginning of period | 195,632,298 | 244,746,302 | 27,707,938 | 22,880,629 |
End of period | $268,393,936 | $195,632,298 | $39,108,257 | $27,707,938 |
August 31, 2023 | J.P. Morgan Money Market Funds | 114 |
FOR THE PERIODS INDICATED (continued)
(Amounts in thousands)
JPMorgan Federal Money Market Fund | JPMorgan 100% U.S. Treasury Securities Money Market Fund | |||
Six Months Ended August 31, 2023 (Unaudited) | Year Ended February 28, 2023 | Six Months Ended August 31, 2023 (Unaudited) | Year Ended February 28, 2023 | |
CHANGE IN NET ASSETS RESULTING FROM OPERATIONS: | ||||
Net investment income (loss) | $158,641 | $50,503 | $3,088,513 | $1,726,741 |
Net realized gain (loss) | 110 | 4 | 3,255 | (9,194 ) |
Change in net assets resulting from operations | 158,751 | 50,507 | 3,091,768 | 1,717,547 |
DISTRIBUTIONS TO SHAREHOLDERS: | ||||
Academy | — | — | (4,007 ) | (3,344 ) |
Agency | (17,351 ) | (4,877 ) | (202,488 ) | (84,238 ) |
Capital | — | — | (1,651,423 ) | (996,077 ) |
Empower | — | — | (9,435 ) | (2,540 ) |
IM | — | — | (1,550 ) | (717 ) |
Institutional Class | (100,718 ) | (34,779 ) | (898,552 ) | (512,494 ) |
Morgan | (4,328 ) | (1,715 ) | (76,163 ) | (33,291 ) |
Premier | (36,229 ) | (9,139 ) | (215,272 ) | (64,230 ) |
Reserve | — | — | (29,326 ) | (30,054 ) |
Total distributions to shareholders | (158,626 ) | (50,510 ) | (3,088,216 ) | (1,726,985 ) |
CAPITAL TRANSACTIONS: | ||||
Change in net assets resulting from capital transactions | 2,465,140 | 2,907,851 | 53,901,530 | 192,410 |
NET ASSETS: | ||||
Change in net assets | 2,465,265 | 2,907,848 | 53,905,082 | 182,972 |
Beginning of period | 4,626,620 | 1,718,772 | 91,990,389 | 91,807,417 |
End of period | $7,091,885 | $4,626,620 | $145,895,471 | $91,990,389 |
115 | J.P. Morgan Money Market Funds | August 31, 2023 |
JPMorgan Tax Free Money Market Fund | JPMorgan Municipal Money Market Fund | |||
Six Months Ended August 31, 2023 (Unaudited) | Year Ended February 28, 2023 | Six Months Ended August 31, 2023 (Unaudited) | Year Ended February 28, 2023 | |
CHANGE IN NET ASSETS RESULTING FROM OPERATIONS: | ||||
Net investment income (loss) | $159,732 | $147,394 | $21,243 | $15,596 |
Net realized gain (loss) | 64 | 92 | 2 | — |
Change in net assets resulting from operations | 159,796 | 147,486 | 21,245 | 15,596 |
DISTRIBUTIONS TO SHAREHOLDERS: | ||||
Agency | (8,830 ) | (8,477 ) | (1,990 ) | (1,484 ) |
Institutional Class | (126,222 ) | (119,114 ) | (15,332 ) | (12,239 ) |
Morgan | (711 ) | (345 ) | (584 ) | (386 ) |
Premier | (14,643 ) | (9,053 ) | (3,248 ) | (1,392 ) |
Reserve | (9,326 ) | (10,489 ) | — | — |
Service | — | — | (89 ) | (98 ) |
Total distributions to shareholders | (159,732 ) | (147,478 ) | (21,243 ) | (15,599 ) |
CAPITAL TRANSACTIONS: | ||||
Change in net assets resulting from capital transactions | (121,892 ) | 2,869,568 | 381,325 | 192,960 |
NET ASSETS: | ||||
Change in net assets | (121,828 ) | 2,869,576 | 381,327 | 192,957 |
Beginning of period | 10,449,428 | 7,579,852 | 1,192,403 | 999,446 |
End of period | $10,327,600 | $10,449,428 | $1,573,730 | $1,192,403 |
August 31, 2023 | J.P. Morgan Money Market Funds | 116 |
FOR THE PERIODS INDICATED (continued)
(Amounts in thousands)
JPMorgan California Municipal Money Market Fund | JPMorgan New York Municipal Money Market Fund | |||
Six Months Ended August 31, 2023 (Unaudited) | Year Ended February 28, 2023 | Six Months Ended August 31, 2023 (Unaudited) | Year Ended February 28, 2023 | |
CHANGE IN NET ASSETS RESULTING FROM OPERATIONS: | ||||
Net investment income (loss) | $7,316 | $7,482 | $31,125 | $26,734 |
Net realized gain (loss) | 10 | 14 | 14 | 2 |
Change in net assets resulting from operations | 7,326 | 7,496 | 31,139 | 26,736 |
DISTRIBUTIONS TO SHAREHOLDERS: | ||||
Agency | (984 ) | (1,183 ) | (4,354 ) | (3,001 ) |
Institutional Class | (3,839 ) | (4,051 ) | (19,066 ) | (19,252 ) |
Morgan | (93 ) | (75 ) | (724 ) | (506 ) |
Premier | (2,347 ) | (2,124 ) | (6,956 ) | (3,945 ) |
Reserve | — | — | (10 ) | (19 ) |
Service | (53 ) | (50 ) | (15 ) | (16 ) |
Total distributions to shareholders | (7,316 ) | (7,483 ) | (31,125 ) | (26,739 ) |
CAPITAL TRANSACTIONS: | ||||
Change in net assets resulting from capital transactions | 89,823 | 229,765 | (464,607 ) | 1,968,005 |
NET ASSETS: | ||||
Change in net assets | 89,833 | 229,778 | (464,593 ) | 1,968,002 |
Beginning of period | 459,053 | 229,275 | 2,595,375 | 627,373 |
End of period | $548,886 | $459,053 | $2,130,782 | $2,595,375 |
117 | J.P. Morgan Money Market Funds | August 31, 2023 |
JPMorgan Prime Money Market Fund | JPMorgan Institutional Tax Free Money Market Fund | |||
Six Months Ended August 31, 2023 (Unaudited) | Year Ended February 28, 2023 | Six Months Ended August 31, 2023 (Unaudited) | Year Ended February 28, 2023 | |
CAPITAL TRANSACTIONS: | ||||
Academy | ||||
Proceeds from shares issued | $1,754,141 | $3,644,765 | $— | $— |
Distributions reinvested | 18,056 | 13,056 | — | — |
Cost of shares redeemed | (1,742,301 ) | (3,958,184 ) | — | — |
Change in net assets resulting from Academy capital transactions | 29,896 | (300,363 ) | — | — |
Agency | ||||
Proceeds from shares issued | 147,334,849 | 228,418,159 | 136,416 | 271,270 |
Distributions reinvested | 9,809 | 5,893 | — | — |
Cost of shares redeemed | (147,027,671 ) | (227,063,342 ) | (140,100 ) | (179,626 ) |
Change in net assets resulting from Agency capital transactions | 316,987 | 1,360,710 | (3,684 ) | 91,644 |
Capital | ||||
Proceeds from shares issued | 128,035,734 | 178,586,258 | 905,840 | 1,046,093 |
Distributions reinvested | 522,217 | 461,084 | 1,239 | 985 |
Cost of shares redeemed | (131,695,047 ) | (177,939,917 ) | (1,078,036 ) | (830,070 ) |
Change in net assets resulting from Capital capital transactions | (3,137,096 ) | 1,107,425 | (170,957 ) | 217,008 |
Class C (a) | ||||
Proceeds from shares issued | — | 185 | — | — |
Distributions reinvested | — | 5 | — | — |
Cost of shares redeemed | — | (587 ) | — | — |
Merger to Reserve Shares | — | (143 ) | — | — |
Change in net assets resulting from Class C capital transactions | — | (540 ) | — | — |
Empower | ||||
Proceeds from shares issued | 319,967 | 273,923 | — | — |
Distributions reinvested | 9,190 | 7,675 | — | — |
Cost of shares redeemed | (334,282 ) | (491,521 ) | — | — |
Change in net assets resulting from Empower capital transactions | (5,125 ) | (209,923 ) | — | — |
IM | ||||
Proceeds from shares issued | 36,699,606 | 62,949,114 | 3,207,666 | 8,470,093 |
Distributions reinvested | 5,556 | 5,241 | — | — |
Cost of shares redeemed | (30,208,911 ) | (66,427,768 ) | (3,383,754 ) | (8,591,558 ) |
Change in net assets resulting from IM capital transactions | 6,496,251 | (3,473,413 ) | (176,088 ) | (121,465 ) |
August 31, 2023 | J.P. Morgan Money Market Funds | 118 |
FOR THE PERIODS INDICATED (continued)
(Amounts in thousands)
JPMorgan Prime Money Market Fund | JPMorgan Institutional Tax Free Money Market Fund | |||
Six Months Ended August 31, 2023 (Unaudited) | Year Ended February 28, 2023 | Six Months Ended August 31, 2023 (Unaudited) | Year Ended February 28, 2023 | |
CAPITAL TRANSACTIONS: (continued) | ||||
Institutional Class | ||||
Proceeds from shares issued | $42,597,517 | $82,497,160 | $1,795,357 | $4,821,089 |
Distributions reinvested | 101,272 | 66,696 | 1,469 | 592 |
Cost of shares redeemed | (40,637,941 ) | (83,053,723 ) | (1,772,774 ) | (4,779,173 ) |
Change in net assets resulting from Institutional Class capital transactions | 2,060,848 | (489,867 ) | 24,052 | 42,508 |
Morgan | ||||
Proceeds from shares issued | 276,609,305 | 231,690,376 | — | — |
Distributions reinvested | 6,189 | 3,310 | — | — |
Cost of shares redeemed | (275,250,793 ) | (230,715,280 ) | — | — |
Change in net assets resulting from Morgan capital transactions | 1,364,701 | 978,406 | — | — |
Premier | ||||
Proceeds from shares issued | 29,039,974 | 50,171,247 | — | — |
Distributions reinvested | 5,935 | 2,167 | — | — |
Cost of shares redeemed | (28,589,014 ) | (48,894,247 ) | — | — |
Change in net assets resulting from Premier capital transactions | 456,895 | 1,279,167 | — | — |
Reserve (a) | ||||
Proceeds from shares issued | 61 | 652 | — | — |
Distributions reinvested | 28 | 19 | — | — |
Cost of shares redeemed | (138 ) | (372 ) | — | — |
Merger from Class C Shares | — | 143 | — | — |
Change in net assets resulting from Reserve capital transactions | (49 ) | 442 | — | — |
Total change in net assets resulting from capital transactions | $7,583,308 | $252,044 | $(326,677 ) | $229,695 |
SHARE TRANSACTIONS: | ||||
Academy | ||||
Issued | 1,753,597 | 3,643,563 | — | — |
Reinvested | 18,052 | 13,051 | — | — |
Redeemed | (1,741,944 ) | (3,956,825 ) | — | — |
Change in Academy Shares | 29,705 | (300,211 ) | — | — |
Agency | ||||
Issued | 147,237,493 | 228,273,306 | 136,390 | 271,168 |
Reinvested | 9,804 | 5,889 | — | — |
Redeemed | (146,929,230 ) | (226,917,915 ) | (140,070 ) | (179,552 ) |
Change in Agency Shares | 318,067 | 1,361,280 | (3,680 ) | 91,616 |
119 | J.P. Morgan Money Market Funds | August 31, 2023 |
JPMorgan Prime Money Market Fund | JPMorgan Institutional Tax Free Money Market Fund | |||
Six Months Ended August 31, 2023 (Unaudited) | Year Ended February 28, 2023 | Six Months Ended August 31, 2023 (Unaudited) | Year Ended February 28, 2023 | |
SHARE TRANSACTIONS: (continued) | ||||
Capital | ||||
Issued | 128,006,406 | 178,544,082 | 905,623 | 1,045,725 |
Reinvested | 522,096 | 460,909 | 1,239 | 985 |
Redeemed | (131,663,633 ) | (177,899,358 ) | (1,077,695 ) | (829,688 ) |
Change in Capital Shares | (3,135,131 ) | 1,105,633 | (170,833 ) | 217,022 |
Class C (a) | ||||
Issued | — | 186 | — | — |
Reinvested | — | 5 | — | — |
Redeemed | — | (587 ) | — | — |
Merger to Reserve Shares | — | (143 ) | — | — |
Change in Class C Shares | — | (539 ) | — | — |
Empower | ||||
Issued | 319,906 | 273,940 | — | — |
Reinvested | 9,187 | 7,671 | — | — |
Redeemed | (334,243 ) | (491,467 ) | — | — |
Change in Empower Shares | (5,150 ) | (209,856 ) | — | — |
IM | ||||
Issued | 36,690,350 | 62,931,818 | 3,207,238 | 8,467,097 |
Reinvested | 5,555 | 5,238 | — | — |
Redeemed | (30,201,444 ) | (66,408,089 ) | (3,383,238 ) | (8,588,529 ) |
Change in IM Shares | 6,494,461 | (3,471,033 ) | (176,000 ) | (121,432 ) |
Institutional Class | ||||
Issued | 42,586,509 | 82,473,939 | 1,795,044 | 4,819,358 |
Reinvested | 101,246 | 66,671 | 1,469 | 592 |
Redeemed | (40,627,473 ) | (83,030,901 ) | (1,772,427 ) | (4,777,377 ) |
Change in Institutional Class Shares | 2,060,282 | (490,291 ) | 24,086 | 42,573 |
Morgan | ||||
Issued | 276,406,245 | 231,504,539 | — | — |
Reinvested | 6,185 | 3,307 | — | — |
Redeemed | (275,046,338 ) | (230,528,750 ) | — | — |
Change in Morgan Shares | 1,366,092 | 979,096 | — | — |
Premier | ||||
Issued | 29,028,018 | 50,150,616 | — | — |
Reinvested | 5,932 | 2,166 | — | — |
Redeemed | (28,577,017 ) | (48,873,990 ) | — | — |
Change in Premier Shares | 456,933 | 1,278,792 | — | — |
August 31, 2023 | J.P. Morgan Money Market Funds | 120 |
FOR THE PERIODS INDICATED (continued)
(Amounts in thousands)
JPMorgan Prime Money Market Fund | JPMorgan Institutional Tax Free Money Market Fund | |||
Six Months Ended August 31, 2023 (Unaudited) | Year Ended February 28, 2023 | Six Months Ended August 31, 2023 (Unaudited) | Year Ended February 28, 2023 | |
SHARE TRANSACTIONS: (continued) | ||||
Reserve (a) | ||||
Issued | 62 | 652 | — | — |
Reinvested | 28 | 19 | — | — |
Redeemed | (139 ) | (372 ) | — | — |
Merger from Class C Shares | — | 143 | — | — |
Change in Reserve Shares | (49 ) | 442 | — | — |
121 | J.P. Morgan Money Market Funds | August 31, 2023 |
JPMorgan Securities Lending Money Market Fund | JPMorgan Liquid Assets Money Market Fund | |||
Six Months Ended August 31, 2023 (Unaudited) | Year Ended February 28, 2023 | Six Months Ended August 31, 2023 (Unaudited) | Year Ended February 28, 2023 | |
CAPITAL TRANSACTIONS: | ||||
Agency | ||||
Proceeds from shares issued | $— | $— | $4,305,372 | $5,069,403 |
Distributions reinvested | — | — | 11,060 | 5,448 |
Cost of shares redeemed | — | — | (3,673,397 ) | (2,720,609 ) |
Change in net assets resulting from Agency capital transactions | — | — | 643,035 | 2,354,242 |
Agency SL | ||||
Proceeds from shares issued | 16,063,610 | 16,211,894 | — | — |
Cost of shares redeemed | (15,238,612 ) | (16,063,602 ) | — | — |
Change in net assets resulting from Agency SL capital transactions | 824,998 | 148,292 | — | — |
Capital | ||||
Proceeds from shares issued | — | — | 11,785,834 | 13,943,986 |
Distributions reinvested | — | — | 154,022 | 54,875 |
Cost of shares redeemed | — | — | (9,250,899 ) | (6,169,090 ) |
Change in net assets resulting from Capital capital transactions | — | — | 2,688,957 | 7,829,771 |
Class C (a) | ||||
Proceeds from shares issued | — | — | — | 26,345 |
Distributions reinvested | — | — | — | 297 |
Cost of shares redeemed | — | — | — | (23,034 ) |
Merger to Reserve Shares | — | — | — | (25,172 ) |
Change in net assets resulting from Class C capital transactions | — | — | — | (21,564 ) |
Institutional Class | ||||
Proceeds from shares issued | — | — | 10,450,249 | 13,363,433 |
Distributions reinvested | — | — | 20,459 | 10,405 |
Cost of shares redeemed | — | — | (8,704,405 ) | (6,858,978 ) |
Change in net assets resulting from Institutional Class capital transactions | — | — | 1,766,303 | 6,514,860 |
Investor | ||||
Proceeds from shares issued | — | — | 3,395 | 2,071 |
Distributions reinvested | — | — | 95 | 58 |
Cost of shares redeemed | — | — | (1,629 ) | (920 ) |
Change in net assets resulting from Investor capital transactions | — | — | 1,861 | 1,209 |
August 31, 2023 | J.P. Morgan Money Market Funds | 122 |
FOR THE PERIODS INDICATED (continued)
(Amounts in thousands)
JPMorgan Securities Lending Money Market Fund | JPMorgan Liquid Assets Money Market Fund | |||
Six Months Ended August 31, 2023 (Unaudited) | Year Ended February 28, 2023 | Six Months Ended August 31, 2023 (Unaudited) | Year Ended February 28, 2023 | |
CAPITAL TRANSACTIONS: (continued) | ||||
Morgan | ||||
Proceeds from shares issued | $— | $— | $4,223,466 | $2,403,544 |
Distributions reinvested | — | — | 78,963 | 20,834 |
Cost of shares redeemed | — | — | (1,820,509 ) | (699,885 ) |
Change in net assets resulting from Morgan capital transactions | — | — | 2,481,920 | 1,724,493 |
Premier | ||||
Proceeds from shares issued | — | — | 18,276,903 | 17,176,796 |
Distributions reinvested | — | — | 270,177 | 78,642 |
Cost of shares redeemed | — | — | (10,839,329 ) | (6,475,677 ) |
Change in net assets resulting from Premier capital transactions | — | — | 7,707,751 | 10,779,761 |
Reserve (a) | ||||
Proceeds from shares issued | — | — | 1,389 | 1,378 |
Distributions reinvested | — | — | 563 | 172 |
Cost of shares redeemed | — | — | (7,415 ) | (2,253 ) |
Merger from Class C Shares | — | — | — | 25,172 |
Change in net assets resulting from Reserve capital transactions | — | — | (5,463 ) | 24,469 |
Total change in net assets resulting from capital transactions | $824,998 | $148,292 | $15,284,364 | $29,207,241 |
SHARE TRANSACTIONS: | ||||
Agency | ||||
Issued | — | — | 4,305,370 | 5,069,402 |
Reinvested | — | — | 11,060 | 5,448 |
Redeemed | — | — | (3,673,397 ) | (2,720,609 ) |
Change in Agency Shares | — | — | 643,033 | 2,354,241 |
Agency SL | ||||
Issued | 16,060,261 | 16,215,187 | — | — |
Redeemed | (15,235,450 ) | (16,067,147 ) | — | — |
Change in Agency SL Shares | 824,811 | 148,040 | — | — |
Capital | ||||
Issued | — | — | 11,785,835 | 13,943,986 |
Reinvested | — | — | 154,022 | 54,875 |
Redeemed | — | — | (9,250,898 ) | (6,169,073 ) |
Change in Capital Shares | — | — | 2,688,959 | 7,829,788 |
123 | J.P. Morgan Money Market Funds | August 31, 2023 |
JPMorgan Securities Lending Money Market Fund | JPMorgan Liquid Assets Money Market Fund | |||
Six Months Ended August 31, 2023 (Unaudited) | Year Ended February 28, 2023 | Six Months Ended August 31, 2023 (Unaudited) | Year Ended February 28, 2023 | |
SHARE TRANSACTIONS: (continued) | ||||
Class C (a) | ||||
Issued | — | — | — | 26,344 |
Reinvested | — | — | — | 297 |
Redeemed | — | — | — | (23,034 ) |
Merger to Reserve Shares | — | — | — | (25,173 ) |
Change in Class C Shares | — | — | — | (21,566 ) |
Institutional Class | ||||
Issued | — | — | 10,450,242 | 13,363,426 |
Reinvested | — | — | 20,459 | 10,405 |
Redeemed | — | — | (8,704,404 ) | (6,858,978 ) |
Change in Institutional Class Shares | — | — | 1,766,297 | 6,514,853 |
Investor | ||||
Issued | — | — | 3,394 | 2,071 |
Reinvested | — | — | 95 | 58 |
Redeemed | — | — | (1,629 ) | (920 ) |
Change in Investor Shares | — | — | 1,860 | 1,209 |
Morgan | ||||
Issued | — | — | 4,223,466 | 2,403,537 |
Reinvested | — | — | 78,963 | 20,834 |
Redeemed | — | — | (1,820,507 ) | (699,885 ) |
Change in Morgan Shares | — | — | 2,481,922 | 1,724,486 |
Premier | ||||
Issued | — | — | 18,276,903 | 17,176,794 |
Reinvested | — | — | 270,177 | 78,642 |
Redeemed | — | — | (10,839,324 ) | (6,475,676 ) |
Change in Premier Shares | — | — | 7,707,756 | 10,779,760 |
Reserve (a) | ||||
Issued | — | — | 1,389 | 1,377 |
Reinvested | — | — | 563 | 172 |
Redeemed | — | — | (7,415 ) | (2,253 ) |
Merger from Class C Shares | — | — | — | 25,173 |
Change in Reserve Shares | — | — | (5,463 ) | 24,469 |
August 31, 2023 | J.P. Morgan Money Market Funds | 124 |
FOR THE PERIODS INDICATED (continued)
(Amounts in thousands)
JPMorgan U.S. Government Money Market Fund | JPMorgan U.S. Treasury Plus Money Market Fund | |||
Six Months Ended August 31, 2023 (Unaudited) | Year Ended February 28, 2023 | Six Months Ended August 31, 2023 (Unaudited) | Year Ended February 28, 2023 | |
CAPITAL TRANSACTIONS: | ||||
Academy | ||||
Proceeds from shares issued | $27,790,804 | $95,150,543 | $29,318 | $311,239 |
Distributions reinvested | 114,940 | 108,642 | 3,823 | 3,424 |
Cost of shares redeemed | (20,621,789 ) | (101,724,029 ) | (29,311 ) | (161,251 ) |
Change in net assets resulting from Academy capital transactions | 7,283,955 | (6,464,844 ) | 3,830 | 153,412 |
Agency | ||||
Proceeds from shares issued | 811,790,059 | 1,677,492,219 | 69,751,211 | 102,091,551 |
Distributions reinvested | 40,042 | 15,553 | 7,304 | 2,319 |
Cost of shares redeemed | (809,086,785 ) | (1,675,892,058 ) | (69,435,280 ) | (101,263,308 ) |
Change in net assets resulting from Agency capital transactions | 2,743,316 | 1,615,714 | 323,235 | 830,562 |
Capital | ||||
Proceeds from shares issued | 786,691,162 | 1,876,389,058 | 90,653,201 | 139,063,231 |
Distributions reinvested | 1,792,728 | 1,415,580 | 145,741 | 82,147 |
Cost of shares redeemed | (743,663,383 ) | (1,924,443,092 ) | (85,193,035 ) | (137,761,889 ) |
Change in net assets resulting from Capital capital transactions | 44,820,507 | (46,638,454 ) | 5,605,907 | 1,383,489 |
Class C (a) | ||||
Proceeds from shares issued | — | — | — | 574,894 |
Distributions reinvested | — | — | — | 3,437 |
Cost of shares redeemed | — | — | — | (706,703 ) |
Merger to Reserve Shares | — | — | — | (332,678 ) |
Change in net assets resulting from Class C capital transactions | — | — | — | (461,050 ) |
E*Trade | ||||
Proceeds from shares issued | 56,865 | 193,092 | — | — |
Distributions reinvested | 4,451 | 4,605 | — | — |
Cost of shares redeemed | (204,063 ) | (300,518 ) | — | — |
Change in net assets resulting from E*Trade capital transactions | (142,747 ) | (102,821 ) | — | — |
Empower | ||||
Proceeds from shares issued | 15,463,029 | 12,713,279 | 129,459 | 1,200,414 |
Distributions reinvested | 113,809 | 79,191 | 4,647 | 2,716 |
Cost of shares redeemed | (9,418,316 ) | (11,558,268 ) | (1,124,427 ) | (108,294 ) |
Change in net assets resulting from Empower capital transactions | 6,158,522 | 1,234,202 | (990,321 ) | 1,094,836 |
125 | J.P. Morgan Money Market Funds | August 31, 2023 |
JPMorgan U.S. Government Money Market Fund | JPMorgan U.S. Treasury Plus Money Market Fund | |||
Six Months Ended August 31, 2023 (Unaudited) | Year Ended February 28, 2023 | Six Months Ended August 31, 2023 (Unaudited) | Year Ended February 28, 2023 | |
CAPITAL TRANSACTIONS: (continued) | ||||
IM | ||||
Proceeds from shares issued | $34,293,537 | $71,463,577 | $26,597 | $110 |
Distributions reinvested | 13,134 | 23,677 | 127 | 1 |
Cost of shares redeemed | (35,672,476 ) | (72,074,039 ) | (8,254 ) | — |
Change in net assets resulting from IM capital transactions | (1,365,805 ) | (586,785 ) | 18,470 | 111 |
Institutional Class | ||||
Proceeds from shares issued | 175,104,491 | 356,479,846 | 30,072,892 | 55,007,660 |
Distributions reinvested | 307,694 | 180,439 | 86,643 | 59,114 |
Cost of shares redeemed | (168,501,494 ) | (354,444,196 ) | (28,699,469 ) | (54,805,997 ) |
Change in net assets resulting from Institutional Class capital transactions | 6,910,691 | 2,216,089 | 1,460,066 | 260,777 |
Investor | ||||
Proceeds from shares issued | 1,619,287 | 2,741,105 | 16,939 | 89,228 |
Distributions reinvested | 49,750 | 49,849 | — | — |
Cost of shares redeemed | (1,811,388 ) | (2,242,091 ) | (19,908 ) | (89,915 ) |
Change in net assets resulting from Investor capital transactions | (142,351 ) | 548,863 | (2,969 ) | (687 ) |
Morgan | ||||
Proceeds from shares issued | 451,961,928 | 329,986,817 | 220,020,164 | 123,203,416 |
Distributions reinvested | 37,737 | 18,287 | 6,266 | 1,999 |
Cost of shares redeemed | (449,080,131 ) | (327,933,726 ) | (217,648,464 ) | (122,445,317 ) |
Change in net assets resulting from Morgan capital transactions | 2,919,534 | 2,071,378 | 2,377,966 | 760,098 |
Premier | ||||
Proceeds from shares issued | 99,388,832 | 201,112,688 | 32,481,342 | 55,492,592 |
Distributions reinvested | 56,929 | 17,686 | 46,954 | 18,396 |
Cost of shares redeemed | (95,401,313 ) | (199,915,259 ) | (30,807,264 ) | (54,883,517 ) |
Change in net assets resulting from Premier capital transactions | 4,044,448 | 1,215,115 | 1,721,032 | 627,471 |
Reserve (a) | ||||
Proceeds from shares issued | 5,971,296 | 33,714,846 | 2,532,858 | 3,827,257 |
Distributions reinvested | 40,311 | 65,486 | 20,540 | 2,026 |
Cost of shares redeemed | (6,414,736 ) | (37,837,664 ) | (1,670,401 ) | (3,980,402 ) |
Merger from Class C Shares | — | — | — | 332,678 |
Change in net assets resulting from Reserve capital transactions | (403,129 ) | (4,057,332 ) | 882,997 | 181,559 |
August 31, 2023 | J.P. Morgan Money Market Funds | 126 |
FOR THE PERIODS INDICATED (continued)
(Amounts in thousands)
JPMorgan U.S. Government Money Market Fund | JPMorgan U.S. Treasury Plus Money Market Fund | |||
Six Months Ended August 31, 2023 (Unaudited) | Year Ended February 28, 2023 | Six Months Ended August 31, 2023 (Unaudited) | Year Ended February 28, 2023 | |
CAPITAL TRANSACTIONS: (continued) | ||||
Service | ||||
Proceeds from shares issued | $18,426 | $66,974 | $— | $— |
Distributions reinvested | 6,016 | 5,216 | — | — |
Cost of shares redeemed | (74,045 ) | (180,520 ) | — | — |
Change in net assets resulting from Service capital transactions | (49,603 ) | (108,330 ) | — | — |
Total change in net assets resulting from capital transactions | $72,777,338 | $(49,057,205 ) | $11,400,213 | $4,830,578 |
SHARE TRANSACTIONS: | ||||
Academy | ||||
Issued | 27,787,686 | 95,149,665 | 29,301 | 311,200 |
Reinvested | 114,940 | 108,642 | 3,823 | 3,424 |
Redeemed | (20,617,081 ) | (101,723,955 ) | (29,300 ) | (161,200 ) |
Change in Academy Shares | 7,285,545 | (6,465,648 ) | 3,824 | 153,424 |
Agency | ||||
Issued | 811,786,928 | 1,677,492,216 | 69,750,909 | 102,091,118 |
Reinvested | 40,042 | 15,553 | 7,304 | 2,319 |
Redeemed | (809,083,669 ) | (1,675,891,597 ) | (69,434,975 ) | (101,262,827 ) |
Change in Agency Shares | 2,743,301 | 1,616,172 | 323,238 | 830,610 |
Capital | ||||
Issued | 786,678,109 | 1,876,385,241 | 90,652,142 | 139,061,772 |
Reinvested | 1,792,728 | 1,415,580 | 145,741 | 82,147 |
Redeemed | (743,651,240 ) | (1,924,442,472 ) | (85,191,973 ) | (137,760,561 ) |
Change in Capital Shares | 44,819,597 | (46,641,651 ) | 5,605,910 | 1,383,358 |
Class C (a) | ||||
Issued | — | — | — | 574,740 |
Reinvested | — | — | — | 3,437 |
Redeemed | — | — | — | (706,568 ) |
Merger to Reserve Shares | — | — | — | (332,734 ) |
Change in Class C Shares | — | — | — | (461,125 ) |
E*Trade | ||||
Issued | 56,777 | 193,090 | — | — |
Reinvested | 4,451 | 4,605 | — | — |
Redeemed | (204,047 ) | (300,510 ) | — | — |
Change in E*Trade Shares | (142,819 ) | (102,815 ) | — | — |
127 | J.P. Morgan Money Market Funds | August 31, 2023 |
JPMorgan U.S. Government Money Market Fund | JPMorgan U.S. Treasury Plus Money Market Fund | |||
Six Months Ended August 31, 2023 (Unaudited) | Year Ended February 28, 2023 | Six Months Ended August 31, 2023 (Unaudited) | Year Ended February 28, 2023 | |
SHARE TRANSACTIONS: (continued) | ||||
Empower | ||||
Issued | 15,460,833 | 12,713,279 | 129,273 | 1,200,371 |
Reinvested | 113,809 | 79,191 | 4,647 | 2,716 |
Redeemed | (9,415,095 ) | (11,557,452 ) | (1,124,407 ) | (108,093 ) |
Change in Empower Shares | 6,159,547 | 1,235,018 | (990,487 ) | 1,094,994 |
IM | ||||
Issued | 34,289,887 | 71,463,229 | 26,594 | 110 |
Reinvested | 13,134 | 23,677 | 127 | 2 |
Redeemed | (35,670,099 ) | (72,073,384 ) | (8,251 ) | — |
Change in IM Shares | (1,367,078 ) | (586,478 ) | 18,470 | 112 |
Institutional Class | ||||
Issued | 175,096,855 | 356,479,846 | 30,072,072 | 55,006,459 |
Reinvested | 307,694 | 180,439 | 86,643 | 59,114 |
Redeemed | (168,494,901 ) | (354,442,594 ) | (28,698,825 ) | (54,805,000 ) |
Change in Institutional Class Shares | 6,909,648 | 2,217,691 | 1,459,890 | 260,573 |
Investor | ||||
Issued | 1,618,613 | 2,741,080 | 16,936 | 89,215 |
Reinvested | 49,750 | 49,849 | — | — |
Redeemed | (1,811,010 ) | (2,241,947 ) | (19,906 ) | (89,903 ) |
Change in Investor Shares | (142,647 ) | 548,982 | (2,970 ) | (688 ) |
Morgan | ||||
Issued | 451,960,886 | 329,986,817 | 220,020,024 | 123,203,049 |
Reinvested | 37,737 | 18,287 | 6,266 | 1,999 |
Redeemed | (449,078,374 ) | (327,933,280 ) | (217,648,101 ) | (122,444,885 ) |
Change in Morgan Shares | 2,920,249 | 2,071,824 | 2,378,189 | 760,163 |
Premier | ||||
Issued | 99,385,008 | 201,111,925 | 32,481,079 | 55,491,861 |
Reinvested | 56,929 | 17,686 | 46,954 | 18,396 |
Redeemed | (95,396,772 ) | (199,914,160 ) | (30,806,953 ) | (54,882,713 ) |
Change in Premier Shares | 4,045,165 | 1,215,451 | 1,721,080 | 627,544 |
Reserve (a) | ||||
Issued | 5,969,642 | 33,714,687 | 2,532,743 | 3,826,808 |
Reinvested | 40,311 | 65,486 | 20,540 | 2,026 |
Redeemed | (6,413,469 ) | (37,837,601 ) | (1,670,214 ) | (3,979,957 ) |
Merger from Class C Shares | — | — | — | 332,734 |
Change in Reserve Shares | (403,516 ) | (4,057,428 ) | 883,069 | 181,611 |
August 31, 2023 | J.P. Morgan Money Market Funds | 128 |
FOR THE PERIODS INDICATED (continued)
(Amounts in thousands)
JPMorgan U.S. Government Money Market Fund | JPMorgan U.S. Treasury Plus Money Market Fund | |||
Six Months Ended August 31, 2023 (Unaudited) | Year Ended February 28, 2023 | Six Months Ended August 31, 2023 (Unaudited) | Year Ended February 28, 2023 | |
SHARE TRANSACTIONS: (continued) | ||||
Service | ||||
Issued | 18,355 | 66,971 | — | — |
Reinvested | 6,016 | 5,216 | — | — |
Redeemed | (74,024 ) | (180,514 ) | — | — |
Change in Service Shares | (49,653 ) | (108,327 ) | — | — |
129 | J.P. Morgan Money Market Funds | August 31, 2023 |
JPMorgan Federal Money Market Fund | JPMorgan 100% U.S. Treasury Securities Money Market Fund | |||
Six Months Ended August 31, 2023 (Unaudited) | Year Ended February 28, 2023 | Six Months Ended August 31, 2023 (Unaudited) | Year Ended February 28, 2023 | |
CAPITAL TRANSACTIONS: | ||||
Academy | ||||
Proceeds from shares issued | $— | $— | $1,279,848 | $1,035,587 |
Distributions reinvested | — | — | — (a) | 43 |
Cost of shares redeemed | — | — | (1,330,104 ) | (1,066,359 ) |
Change in net assets resulting from Academy capital transactions | — | — | (50,256 ) | (30,729 ) |
Agency | ||||
Proceeds from shares issued | 1,232,407 | 485,422 | 241,414,551 | 511,735,689 |
Distributions reinvested | 1,396 | 679 | 28,214 | 9,274 |
Cost of shares redeemed | (838,665 ) | (286,096 ) | (236,305,836 ) | (509,389,374 ) |
Change in net assets resulting from Agency capital transactions | 395,138 | 200,005 | 5,136,929 | 2,355,589 |
Capital | ||||
Proceeds from shares issued | — | — | 155,813,398 | 162,970,525 |
Distributions reinvested | — | — | 473,064 | 365,870 |
Cost of shares redeemed | — | — | (128,437,126 ) | (173,120,935 ) |
Change in net assets resulting from Capital capital transactions | — | — | 27,849,336 | (9,784,540 ) |
Empower | ||||
Proceeds from shares issued | — | — | 446,702 | 211,654 |
Distributions reinvested | — | — | 8,562 | 2,143 |
Cost of shares redeemed | — | — | (225,765 ) | (24,365 ) |
Change in net assets resulting from Empower capital transactions | — | — | 229,499 | 189,432 |
IM | ||||
Proceeds from shares issued | — | — | 255,435 | 275,798 |
Distributions reinvested | — | — | 1,427 | 652 |
Cost of shares redeemed | — | — | (252,748 ) | (238,409 ) |
Change in net assets resulting from IM capital transactions | — | — | 4,114 | 38,041 |
Institutional Class | ||||
Proceeds from shares issued | 8,595,587 | 9,342,483 | 80,714,517 | 113,665,336 |
Distributions reinvested | 35,976 | 11,561 | 112,916 | 52,449 |
Cost of shares redeemed | (7,462,739 ) | (7,605,278 ) | (67,854,792 ) | (107,826,010 ) |
Change in net assets resulting from Institutional Class capital transactions | 1,168,824 | 1,748,766 | 12,972,641 | 5,891,775 |
August 31, 2023 | J.P. Morgan Money Market Funds | 130 |
FOR THE PERIODS INDICATED (continued)
(Amounts in thousands)
JPMorgan Federal Money Market Fund | JPMorgan 100% U.S. Treasury Securities Money Market Fund | |||
Six Months Ended August 31, 2023 (Unaudited) | Year Ended February 28, 2023 | Six Months Ended August 31, 2023 (Unaudited) | Year Ended February 28, 2023 | |
CAPITAL TRANSACTIONS: (continued) | ||||
Morgan | ||||
Proceeds from shares issued | $198,694 | $157,340 | $194,374,149 | $81,693,613 |
Distributions reinvested | 4,303 | 1,690 | 35,849 | 23,628 |
Cost of shares redeemed | (101,401 ) | (79,010 ) | (192,398,386 ) | (81,593,909 ) |
Change in net assets resulting from Morgan capital transactions | 101,596 | 80,020 | 2,011,612 | 123,332 |
Premier | ||||
Proceeds from shares issued | 2,147,832 | 1,304,372 | 35,063,067 | 33,088,308 |
Distributions reinvested | 19,020 | 5,091 | 66,179 | 15,533 |
Cost of shares redeemed | (1,367,270 ) | (430,403 ) | (29,205,831 ) | (29,295,217 ) |
Change in net assets resulting from Premier capital transactions | 799,582 | 879,060 | 5,923,415 | 3,808,624 |
Reserve | ||||
Proceeds from shares issued | — | — | 4,488,337 | 14,423,157 |
Distributions reinvested | — | — | 892 | 471 |
Cost of shares redeemed | — | — | (4,664,989 ) | (16,822,742 ) |
Change in net assets resulting from Reserve capital transactions | — | — | (175,760 ) | (2,399,114 ) |
Total change in net assets resulting from capital transactions | $2,465,140 | $2,907,851 | $53,901,530 | $192,410 |
SHARE TRANSACTIONS: | ||||
Academy | ||||
Issued | — | — | 1,279,787 | 1,035,560 |
Reinvested | — | — | — (a) | 43 |
Redeemed | — | — | (1,330,049 ) | (1,066,340 ) |
Change in Academy Shares | — | — | (50,262 ) | (30,737 ) |
Agency | ||||
Issued | 1,232,392 | 485,404 | 241,414,444 | 511,735,656 |
Reinvested | 1,396 | 679 | 28,214 | 9,274 |
Redeemed | (838,642 ) | (286,081 ) | (236,305,560 ) | (509,389,228 ) |
Change in Agency Shares | 395,146 | 200,002 | 5,137,098 | 2,355,702 |
Capital | ||||
Issued | — | — | 155,812,833 | 162,969,668 |
Reinvested | — | — | 473,064 | 365,870 |
Redeemed | — | — | (128,436,778 ) | (173,120,819 ) |
Change in Capital Shares | — | — | 27,849,119 | (9,785,281 ) |
131 | J.P. Morgan Money Market Funds | August 31, 2023 |
JPMorgan Federal Money Market Fund | JPMorgan 100% U.S. Treasury Securities Money Market Fund | |||
Six Months Ended August 31, 2023 (Unaudited) | Year Ended February 28, 2023 | Six Months Ended August 31, 2023 (Unaudited) | Year Ended February 28, 2023 | |
SHARE TRANSACTIONS: (continued) | ||||
Empower | ||||
Issued | — | — | 446,691 | 211,651 |
Reinvested | — | — | 8,562 | 2,143 |
Redeemed | — | — | (225,747 ) | (24,335 ) |
Change in Empower Shares | — | — | 229,506 | 189,459 |
IM | ||||
Issued | — | — | 255,425 | 275,776 |
Reinvested | — | — | 1,427 | 652 |
Redeemed | — | — | (252,739 ) | (238,384 ) |
Change in IM Shares | — | — | 4,113 | 38,044 |
Institutional Class | ||||
Issued | 8,595,508 | 9,342,424 | 80,714,034 | 113,665,081 |
Reinvested | 35,976 | 11,561 | 112,916 | 52,449 |
Redeemed | (7,462,703 ) | (7,605,268 ) | (67,854,457 ) | (107,825,365 ) |
Change in Institutional Class Shares | 1,168,781 | 1,748,717 | 12,972,493 | 5,892,165 |
Morgan | ||||
Issued | 198,682 | 157,335 | 194,374,094 | 81,693,587 |
Reinvested | 4,303 | 1,690 | 35,849 | 23,628 |
Redeemed | (101,396 ) | (78,996 ) | (192,398,299 ) | (81,593,867 ) |
Change in Morgan Shares | 101,589 | 80,029 | 2,011,644 | 123,348 |
Premier | ||||
Issued | 2,147,809 | 1,304,372 | 35,062,991 | 33,088,308 |
Reinvested | 19,020 | 5,091 | 66,179 | 15,533 |
Redeemed | (1,367,205 ) | (430,359 ) | (29,205,511 ) | (29,294,888 ) |
Change in Premier Shares | 799,624 | 879,104 | 5,923,659 | 3,808,953 |
Reserve | ||||
Issued | — | — | 4,488,223 | 14,423,013 |
Reinvested | — | — | 892 | 471 |
Redeemed | — | — | (4,664,956 ) | (16,822,728 ) |
Change in Reserve Shares | — | — | (175,841 ) | (2,399,244 ) |
August 31, 2023 | J.P. Morgan Money Market Funds | 132 |
FOR THE PERIODS INDICATED (continued)
(Amounts in thousands)
JPMorgan Tax Free Money Market Fund | JPMorgan Municipal Money Market Fund | |||
Six Months Ended August 31, 2023 (Unaudited) | Year Ended February 28, 2023 | Six Months Ended August 31, 2023 (Unaudited) | Year Ended February 28, 2023 | |
CAPITAL TRANSACTIONS: | ||||
Agency | ||||
Proceeds from shares issued | $519,366 | $1,765,500 | $296,098 | $394,467 |
Distributions reinvested | 947 | 370 | 901 | 179 |
Cost of shares redeemed | (526,487 ) | (1,465,283 ) | (293,789 ) | (278,870 ) |
Change in net assets resulting from Agency capital transactions | (6,174 ) | 300,587 | 3,210 | 115,776 |
Institutional Class | ||||
Proceeds from shares issued | 13,263,409 | 34,459,802 | 5,640,885 | 8,061,664 |
Distributions reinvested | 9,488 | 8,850 | 9,416 | 7,899 |
Cost of shares redeemed | (13,488,033 ) | (31,413,891 ) | (5,405,505 ) | (8,112,805 ) |
Change in net assets resulting from Institutional Class capital transactions | (215,136 ) | 3,054,761 | 244,796 | (43,242 ) |
Morgan | ||||
Proceeds from shares issued | 43,751 | 54,370 | 30,406 | 38,290 |
Distributions reinvested | 706 | 344 | 583 | 386 |
Cost of shares redeemed | (28,592 ) | (28,184 ) | (17,439 ) | (26,293 ) |
Change in net assets resulting from Morgan capital transactions | 15,865 | 26,530 | 13,550 | 12,383 |
Premier | ||||
Proceeds from shares issued | 1,078,965 | 1,971,421 | 368,606 | 330,326 |
Distributions reinvested | 2,626 | 914 | 1,591 | 586 |
Cost of shares redeemed | (893,569 ) | (1,438,641 ) | (248,419 ) | (211,985 ) |
Change in net assets resulting from Premier capital transactions | 188,022 | 533,694 | 121,778 | 118,927 |
Reserve | ||||
Proceeds from shares issued | 3,157,274 | 8,415,437 | — | — |
Distributions reinvested | 369 | 307 | — | — |
Cost of shares redeemed | (3,262,112 ) | (9,461,748 ) | — | — |
Change in net assets resulting from Reserve capital transactions | (104,469 ) | (1,046,004 ) | — | — |
Service | ||||
Proceeds from shares issued | — | — | 1 | 533 |
Distributions reinvested | — | — | 88 | 98 |
Cost of shares redeemed | — | — | (2,098 ) | (11,515 ) |
Change in net assets resulting from Service capital transactions | — | — | (2,009 ) | (10,884 ) |
Total change in net assets resulting from capital transactions | $(121,892 ) | $2,869,568 | $381,325 | $192,960 |
133 | J.P. Morgan Money Market Funds | August 31, 2023 |
JPMorgan Tax Free Money Market Fund | JPMorgan Municipal Money Market Fund | |||
Six Months Ended August 31, 2023 (Unaudited) | Year Ended February 28, 2023 | Six Months Ended August 31, 2023 (Unaudited) | Year Ended February 28, 2023 | |
SHARE TRANSACTIONS: | ||||
Agency | ||||
Issued | 519,352 | 1,765,500 | 296,079 | 394,452 |
Reinvested | 947 | 370 | 901 | 179 |
Redeemed | (526,479 ) | (1,465,283 ) | (293,764 ) | (278,870 ) |
Change in Agency Shares | (6,180 ) | 300,587 | 3,216 | 115,761 |
Institutional Class | ||||
Issued | 13,263,373 | 34,459,802 | 5,640,854 | 8,061,657 |
Reinvested | 9,488 | 8,850 | 9,416 | 7,899 |
Redeemed | (13,487,996 ) | (31,413,891 ) | (5,405,476 ) | (8,112,776 ) |
Change in Institutional Class Shares | (215,135 ) | 3,054,761 | 244,794 | (43,220 ) |
Morgan | ||||
Issued | 43,748 | 54,370 | 30,405 | 38,287 |
Reinvested | 706 | 344 | 583 | 386 |
Redeemed | (28,591 ) | (28,184 ) | (17,437 ) | (26,290 ) |
Change in Morgan Shares | 15,863 | 26,530 | 13,551 | 12,383 |
Premier | ||||
Issued | 1,078,938 | 1,971,422 | 368,586 | 330,312 |
Reinvested | 2,626 | 914 | 1,591 | 587 |
Redeemed | (893,559 ) | (1,438,641 ) | (248,406 ) | (211,982 ) |
Change in Premier Shares | 188,005 | 533,695 | 121,771 | 118,917 |
Reserve | ||||
Issued | 3,157,245 | 8,415,438 | — | — |
Reinvested | 369 | 307 | — | — |
Redeemed | (3,262,060 ) | (9,461,748 ) | — | — |
Change in Reserve Shares | (104,446 ) | (1,046,003 ) | — | — |
Service | ||||
Issued | — | — | 1 | 534 |
Reinvested | — | — | 88 | 98 |
Redeemed | — | — | (2,097 ) | (11,512 ) |
Change in Service Shares | — | — | (2,008 ) | (10,880 ) |
August 31, 2023 | J.P. Morgan Money Market Funds | 134 |
FOR THE PERIODS INDICATED (continued)
(Amounts in thousands)
JPMorgan California Municipal Money Market Fund | JPMorgan New York Municipal Money Market Fund | |||
Six Months Ended August 31, 2023 (Unaudited) | Year Ended February 28, 2023 | Six Months Ended August 31, 2023 (Unaudited) | Year Ended February 28, 2023 | |
CAPITAL TRANSACTIONS: | ||||
Agency | ||||
Proceeds from shares issued | $92,574 | $286,546 | $342,296 | $863,243 |
Distributions reinvested | 138 | 91 | 98 | 68 |
Cost of shares redeemed | (109,115 ) | (210,910 ) | (315,894 ) | (645,166 ) |
Change in net assets resulting from Agency capital transactions | (16,403 ) | 75,727 | 26,500 | 218,145 |
Institutional Class | ||||
Proceeds from shares issued | 508,176 | 1,106,652 | 1,890,224 | 6,437,877 |
Distributions reinvested | 720 | 387 | 1,632 | 1,669 |
Cost of shares redeemed | (393,800 ) | (1,010,633 ) | (2,358,707 ) | (5,084,320 ) |
Change in net assets resulting from Institutional Class capital transactions | 115,096 | 96,406 | (466,851 ) | 1,355,226 |
Morgan | ||||
Proceeds from shares issued | 3,979 | 13,362 | 17,544 | 26,704 |
Distributions reinvested | 91 | 75 | 675 | 490 |
Cost of shares redeemed | (4,737 ) | (8,419 ) | (15,693 ) | (26,554 ) |
Change in net assets resulting from Morgan capital transactions | (667 ) | 5,018 | 2,526 | 640 |
Premier | ||||
Proceeds from shares issued | 202,350 | 581,981 | 681,608 | 1,300,818 |
Distributions reinvested | 542 | 314 | 306 | 165 |
Cost of shares redeemed | (209,832 ) | (526,577 ) | (706,147 ) | (906,118 ) |
Change in net assets resulting from Premier capital transactions | (6,940 ) | 55,718 | (24,233 ) | 394,865 |
Reserve | ||||
Proceeds from shares issued | — | — | 2,009 | 385 |
Distributions reinvested | — | — | 10 | 19 |
Cost of shares redeemed | — | — | (3,728 ) | (571 ) |
Change in net assets resulting from Reserve capital transactions | — | — | (1,709 ) | (167 ) |
Service | ||||
Proceeds from shares issued | — | 6,661 | — | — |
Distributions reinvested | 53 | 50 | 15 | 16 |
Cost of shares redeemed | (1,316 ) | (9,815 ) | (855 ) | (720 ) |
Change in net assets resulting from Service capital transactions | (1,263 ) | (3,104 ) | (840 ) | (704 ) |
Total change in net assets resulting from capital transactions | $89,823 | $229,765 | $(464,607 ) | $1,968,005 |
135 | J.P. Morgan Money Market Funds | August 31, 2023 |
JPMorgan California Municipal Money Market Fund | JPMorgan New York Municipal Money Market Fund | |||
Six Months Ended August 31, 2023 (Unaudited) | Year Ended February 28, 2023 | Six Months Ended August 31, 2023 (Unaudited) | Year Ended February 28, 2023 | |
SHARE TRANSACTIONS: | ||||
Agency | ||||
Issued | 92,568 | 286,535 | 342,294 | 863,243 |
Reinvested | 138 | 91 | 98 | 68 |
Redeemed | (109,107 ) | (210,910 ) | (315,891 ) | (645,166 ) |
Change in Agency Shares | (16,401 ) | 75,716 | 26,501 | 218,145 |
Institutional Class | ||||
Issued | 508,162 | 1,106,636 | 1,890,213 | 6,437,877 |
Reinvested | 720 | 387 | 1,632 | 1,669 |
Redeemed | (393,788 ) | (1,010,628 ) | (2,358,703 ) | (5,084,320 ) |
Change in Institutional Class Shares | 115,094 | 96,395 | (466,858 ) | 1,355,226 |
Morgan | ||||
Issued | 3,977 | 13,360 | 17,544 | 26,704 |
Reinvested | 91 | 75 | 675 | 490 |
Redeemed | (4,737 ) | (8,417 ) | (15,693 ) | (26,554 ) |
Change in Morgan Shares | (669 ) | 5,018 | 2,526 | 640 |
Premier | ||||
Issued | 202,338 | 581,981 | 681,606 | 1,300,818 |
Reinvested | 542 | 314 | 306 | 165 |
Redeemed | (209,819 ) | (526,558 ) | (706,140 ) | (906,118 ) |
Change in Premier Shares | (6,939 ) | 55,737 | (24,228 ) | 394,865 |
Reserve | ||||
Issued | — | — | 2,009 | 384 |
Reinvested | — | — | 10 | 20 |
Redeemed | — | — | (3,728 ) | (571 ) |
Change in Reserve Shares | — | — | (1,709 ) | (167 ) |
Service | ||||
Issued | — | 6,659 | — | — |
Reinvested | 53 | 50 | 15 | 16 |
Redeemed | (1,314 ) | (9,810 ) | (855 ) | (721 ) |
Change in Service Shares | (1,261 ) | (3,101 ) | (840 ) | (705 ) |
August 31, 2023 | J.P. Morgan Money Market Funds | 136 |
FOR THE PERIODS INDICATED
Per share operating performance | |||||||
Investment operations | Distributions | ||||||
Net asset value, beginning of period | Net investment income (loss) | Net realized and unrealized gains (losses) on investments | Total from investment operations | Net investment income | Net realized gain | Total distributions | |
JPMorgan Prime Money Market Fund | |||||||
Academy | |||||||
Six Months Ended August 31, 2023 (Unaudited) | $1.0006 | $0.0256 | $(0.0003 ) | $0.0253 | $(0.0256 ) | $— | $(0.0256 ) |
Year Ended February 28, 2023 | 1.0003 | 0.0240 | 0.0003 | 0.0243 | (0.0240 ) | — | (0.0240 ) |
Year Ended February 28, 2022 | 1.0006 | 0.0007 | (0.0003 ) | 0.0004 | (0.0007 ) | — | (0.0007 ) |
Year Ended February 28, 2021 | 1.0006 | 0.0036 | — (e) | 0.0036 | (0.0036 ) | — (e) | (0.0036 ) |
May 15, 2019 (f) through February 29, 2020 | 1.0003 | 0.0162 | 0.0003 | 0.0165 | (0.0162 ) | — | (0.0162 ) |
Agency | |||||||
Six Months Ended August 31, 2023 (Unaudited) | 1.0009 | 0.0252 | (0.0003 ) | 0.0249 | (0.0252 ) | — | (0.0252 ) |
Year Ended February 28, 2023 | 1.0005 | 0.0231 | 0.0004 | 0.0235 | (0.0231 ) | — | (0.0231 ) |
Year Ended February 28, 2022 | 1.0008 | 0.0001 | (0.0003 ) | (0.0002 ) | (0.0001 ) | — | (0.0001 ) |
Year Ended February 28, 2021 | 1.0007 | 0.0028 | 0.0001 | 0.0029 | (0.0028 ) | — (e) | (0.0028 ) |
Year Ended February 29, 2020 | 1.0003 | 0.0205 | 0.0004 | 0.0209 | (0.0205 ) | — (e) | (0.0205 ) |
Year Ended February 28, 2019 | 1.0001 | 0.0204 | 0.0002 | 0.0206 | (0.0204 ) | — (e) | (0.0204 ) |
Capital | |||||||
Six Months Ended August 31, 2023 (Unaudited) | 1.0005 | 0.0256 | (0.0002 ) | 0.0254 | (0.0256 ) | — | (0.0256 ) |
Year Ended February 28, 2023 | 1.0003 | 0.0240 | 0.0002 | 0.0242 | (0.0240 ) | — | (0.0240 ) |
Year Ended February 28, 2022 | 1.0005 | 0.0007 | (0.0002 ) | 0.0005 | (0.0007 ) | — | (0.0007 ) |
Year Ended February 28, 2021 | 1.0005 | 0.0036 | — (e) | 0.0036 | (0.0036 ) | — (e) | (0.0036 ) |
Year Ended February 29, 2020 | 1.0003 | 0.0213 | 0.0002 | 0.0215 | (0.0213 ) | — (e) | (0.0213 ) |
Year Ended February 28, 2019 | 1.0001 | 0.0212 | 0.0002 | 0.0214 | (0.0212 ) | — (e) | (0.0212 ) |
Empower | |||||||
Six Months Ended August 31, 2023 (Unaudited) | 1.0005 | 0.0256 | (0.0002 ) | 0.0254 | (0.0256 ) | — | (0.0256 ) |
Year Ended February 28, 2023 | 1.0002 | 0.0240 | 0.0003 | 0.0243 | (0.0240 ) | — | (0.0240 ) |
Year Ended February 28, 2022 | 1.0005 | 0.0007 | (0.0003 ) | 0.0004 | (0.0007 ) | — | (0.0007 ) |
February 23, 2021 (f) through February 28, 2021 | 1.0005 | — (e) | — (e) | — (e) | — (e) | — | — (e) |
IM | |||||||
Six Months Ended August 31, 2023 (Unaudited) | 1.0005 | 0.0259 | (0.0002 ) | 0.0257 | (0.0259 ) | — | (0.0259 ) |
Year Ended February 28, 2023 | 1.0003 | 0.0244 | 0.0002 | 0.0246 | (0.0244 ) | — | (0.0244 ) |
Year Ended February 28, 2022 | 1.0006 | 0.0007 | (0.0003 ) | 0.0004 | (0.0007 ) | — | (0.0007 ) |
Year Ended February 28, 2021 | 1.0006 | 0.0039 | — (e) | 0.0039 | (0.0039 ) | — (e) | (0.0039 ) |
Year Ended February 29, 2020 | 1.0003 | 0.0216 | 0.0003 | 0.0219 | (0.0216 ) | — (e) | (0.0216 ) |
Year Ended February 28, 2019 | 1.0001 | 0.0215 | 0.0002 | 0.0217 | (0.0215 ) | — (e) | (0.0215 ) |
Institutional Class | |||||||
Six Months Ended August 31, 2023 (Unaudited) | 1.0005 | 0.0255 | (0.0002 ) | 0.0253 | (0.0255 ) | — | (0.0255 ) |
Year Ended February 28, 2023 | 1.0003 | 0.0237 | 0.0002 | 0.0239 | (0.0237 ) | — | (0.0237 ) |
Year Ended February 28, 2022 | 1.0005 | 0.0005 | (0.0002 ) | 0.0003 | (0.0005 ) | — | (0.0005 ) |
Year Ended February 28, 2021 | 1.0005 | 0.0033 | — (e) | 0.0033 | (0.0033 ) | — (e) | (0.0033 ) |
Year Ended February 29, 2020 | 1.0003 | 0.0210 | 0.0002 | 0.0212 | (0.0210 ) | — (e) | (0.0210 ) |
Year Ended February 28, 2019 | 1.0001 | 0.0209 | 0.0002 | 0.0211 | (0.0209 ) | — (e) | (0.0209 ) |
Morgan | |||||||
Six Months Ended August 31, 2023 (Unaudited) | 1.0010 | 0.0241 | (0.0003 ) | 0.0238 | (0.0241 ) | — | (0.0241 ) |
Year Ended February 28, 2023 | 1.0007 | 0.0209 | 0.0003 | 0.0212 | (0.0209 ) | — | (0.0209 ) |
Year Ended February 28, 2022 | 1.0011 | 0.0001 | (0.0004 ) | (0.0003 ) | (0.0001 ) | — | (0.0001 ) |
Year Ended February 28, 2021 | 1.0008 | 0.0016 | 0.0003 | 0.0019 | (0.0016 ) | — (e) | (0.0016 ) |
Year Ended February 29, 2020 | 1.0003 | 0.0180 | 0.0005 | 0.0185 | (0.0180 ) | — (e) | (0.0180 ) |
Year Ended February 28, 2019 | 1.0001 | 0.0179 | 0.0002 | 0.0181 | (0.0179 ) | — (e) | (0.0179 ) |
137 | J.P. Morgan Money Market Funds | August 31, 2023 |
Ratios/Supplemental data | |||||
Ratios to average net assets(a) | |||||
Net asset value, end of period | Total return(b) | Net assets, end of period (000's) | Net expenses(c) | Net investment income (loss) | Expenses without waivers and reimbursements |
$1.0003 | 2.56 % | $647,802 | 0.17 % | 5.07 % | 0.18 % |
1.0006 | 2.46 | 618,235 | 0.17 (d) | 2.30 | 0.19 |
1.0003 | 0.04 | 918,415 | 0.10 (d) | 0.07 | 0.19 |
1.0006 | 0.36 | 1,011,973 | 0.17 (d) | 0.38 | 0.19 |
1.0006 | 1.66 | 150,519 | 0.18 | 1.69 | 0.26 |
1.0006 | 2.52 | 3,084,572 | 0.26 | 5.02 | 0.28 |
1.0009 | 2.38 | 2,766,889 | 0.26 (d) | 2.64 | 0.29 |
1.0005 | (0.02 ) | 1,403,993 | 0.16 (d) | 0.01 | 0.29 |
1.0008 | 0.29 | 1,492,906 | 0.24 (d) | 0.30 | 0.29 |
1.0007 | 2.11 | 2,517,667 | 0.26 | 2.05 | 0.30 |
1.0003 | 2.08 | 2,474,137 | 0.26 | 2.09 | 0.31 |
1.0003 | 2.57 | 38,476,887 | 0.17 | 5.10 | 0.18 |
1.0005 | 2.45 | 41,621,459 | 0.17 (d) | 2.43 | 0.19 |
1.0003 | 0.05 | 40,505,885 | 0.10 (d) | 0.07 | 0.18 |
1.0005 | 0.36 | 42,867,638 | 0.16 (d) | 0.31 | 0.19 |
1.0005 | 2.17 | 33,683,247 | 0.18 | 2.09 | 0.20 |
1.0003 | 2.16 | 26,725,832 | 0.18 | 2.13 | 0.21 |
1.0003 | 2.57 | 349,908 | 0.18 | 5.09 | 0.19 |
1.0005 | 2.46 | 355,132 | 0.16 (d) | 2.15 | 0.19 |
1.0002 | 0.04 | 564,948 | 0.10 (d) | 0.07 | 0.20 |
1.0005 | 0.00 (g) | 25 | 0.12 (d) | 0.10 | 0.19 |
1.0003 | 2.59 | 12,549,608 | 0.13 | 5.20 | 0.13 |
1.0005 | 2.48 | 6,054,242 | 0.13 (d) | 2.32 | 0.14 |
1.0003 | 0.04 | 9,524,945 | 0.10 (d) | 0.07 | 0.13 |
1.0006 | 0.39 | 7,515,957 | 0.13 (d) | 0.35 | 0.14 |
1.0006 | 2.21 | 5,541,728 | 0.15 | 2.12 | 0.15 |
1.0003 | 2.19 | 1,896,262 | 0.16 | 2.13 | 0.16 |
1.0003 | 2.55 | 16,365,788 | 0.21 | 5.07 | 0.23 |
1.0005 | 2.41 | 14,307,780 | 0.20 (d) | 2.38 | 0.24 |
1.0003 | 0.03 | 14,794,803 | 0.12 (d) | 0.05 | 0.23 |
1.0005 | 0.33 | 19,063,596 | 0.19 (d) | 0.30 | 0.24 |
1.0005 | 2.14 | 15,607,982 | 0.21 | 2.07 | 0.25 |
1.0003 | 2.13 | 11,691,618 | 0.21 | 2.12 | 0.26 |
1.0007 | 2.40 | 3,224,170 | 0.48 | 4.82 | 0.48 |
1.0010 | 2.14 | 1,857,527 | 0.48 (d) | 2.41 | 0.50 |
1.0007 | (0.03 ) | 877,230 | 0.17 (d) | 0.01 | 0.50 |
1.0011 | 0.19 | 1,353,316 | 0.38 (d) | 0.22 | 0.50 |
1.0008 | 1.87 | 2,880,586 | 0.51 | 1.78 | 0.51 |
1.0003 | 1.82 | 2,395,205 | 0.52 | 1.88 | 0.53 |
August 31, 2023 | J.P. Morgan Money Market Funds | 138 |
FOR THE PERIODS INDICATED (continued)
Per share operating performance | |||||||
Investment operations | Distributions | ||||||
Net asset value, beginning of period | Net investment income (loss) | Net realized and unrealized gains (losses) on investments | Total from investment operations | Net investment income | Net realized gain | Total distributions | |
JPMorgan Prime Money Market Fund (continued) | |||||||
Premier | |||||||
Six Months Ended August 31, 2023 (Unaudited) | $1.0007 | $0.0244 | $(0.0002 ) | $0.0242 | $(0.0244 ) | $— | $(0.0244 ) |
Year Ended February 28, 2023 | 1.0004 | 0.0214 | 0.0003 | 0.0217 | (0.0214 ) | — | (0.0214 ) |
Year Ended February 28, 2022 | 1.0007 | 0.0001 | (0.0003 ) | (0.0002 ) | (0.0001 ) | — | (0.0001 ) |
Year Ended February 28, 2021 | 1.0006 | 0.0019 | 0.0001 | 0.0020 | (0.0019 ) | — (e) | (0.0019 ) |
Year Ended February 29, 2020 | 1.0003 | 0.0186 | 0.0003 | 0.0189 | (0.0186 ) | — (e) | (0.0186 ) |
Year Ended February 28, 2019 | 1.0001 | 0.0185 | 0.0002 | 0.0187 | (0.0185 ) | — (e) | (0.0185 ) |
Reserve | |||||||
Six Months Ended August 31, 2023 (Unaudited) | 1.0008 | 0.0230 | (0.0002 ) | 0.0228 | (0.0230 ) | — | (0.0230 ) |
Year Ended February 28, 2023 | 1.0006 | 0.0192 | 0.0002 | 0.0194 | (0.0192 ) | — | (0.0192 ) |
Year Ended February 28, 2022 | 1.0009 | 0.0001 | (0.0003 ) | (0.0002 ) | (0.0001 ) | — | (0.0001 ) |
Year Ended February 28, 2021 | 1.0007 | 0.0010 | 0.0002 | 0.0012 | (0.0010 ) | — (e) | (0.0010 ) |
Year Ended February 29, 2020 | 1.0003 | 0.0161 | 0.0004 | 0.0165 | (0.0161 ) | — (e) | (0.0161 ) |
Year Ended February 28, 2019 | 1.0001 | 0.0160 | 0.0002 | 0.0162 | (0.0160 ) | — (e) | (0.0160 ) |
(a) | Annualized for periods less than one year, unless otherwise noted. |
(b) | Not annualized for periods less than one year. |
(c) | Includes interest expense, if applicable, each of which is less than 0.005% unless otherwise noted. |
(d) | |
Voluntary waivers were as follows: | August 31, 2023 | February 28, 2023 | February 28, 2022 | February 28, 2021 | February 29, 2020 | February 28, 2019 |
Academy | — | 0.01 % | 0.08 % | 0.01 % | — | — |
Agency | — | — (a) | 0.10 % | 0.02 % | — | — |
Capital | — | 0.01 % | 0.08 % | 0.02 % | — | — |
Empower | — | 0.02 % | 0.08 % | — (a) | — | — |
IM | — | — (a) | 0.04 % | 0.01 % | — | — |
Institutional Class | — | 0.01 % | 0.09 % | 0.02 % | — | — |
Morgan | — | 0.02 % | 0.34 % | 0.12 % | — | — |
Premier | — | 0.01 % | 0.27 % | 0.09 % | — | — |
Reserve | — | 0.05 % | 0.54 % | 0.16 % | — | — |
(a) Amount rounds to less than 0.005%. | ||||||
(e) | Amount rounds to less than $0.00005. |
(f) | Commencement of offering of class of shares. |
(g) | Amount rounds to less than 0.005%. |
139 | J.P. Morgan Money Market Funds | August 31, 2023 |
Ratios/Supplemental data | |||||
Ratios to average net assets(a) | |||||
Net asset value, end of period | Total return(b) | Net assets, end of period (000's) | Net expenses(c) | Net investment income (loss) | Expenses without waivers and reimbursements |
$1.0005 | 2.44 % | $2,744,504 | 0.43 % | 4.86 % | 0.43 % |
1.0007 | 2.19 | 2,287,879 | 0.43 (d) | 2.55 | 0.44 |
1.0004 | (0.02 ) | 1,007,946 | 0.16 (d) | 0.01 | 0.44 |
1.0007 | 0.20 | 1,337,044 | 0.35 (d) | 0.22 | 0.44 |
1.0006 | 1.91 | 2,646,576 | 0.45 | 1.83 | 0.45 |
1.0003 | 1.89 | 1,884,553 | 0.45 | 1.90 | 0.46 |
1.0006 | 2.30 | 3,245 | 0.70 | 4.57 | 1.51 |
1.0008 | 1.96 | 3,295 | 0.65 (d) | 1.97 | 1.14 |
1.0006 | (0.02 ) | 2,852 | 0.16 (d) | 0.01 | 2.42 |
1.0009 | 0.12 | 1,084 | 0.53 (d) | 0.33 | 2.00 |
1.0007 | 1.66 | 12,017 | 0.70 | 1.59 | 0.94 |
1.0003 | 1.64 | 13,024 | 0.70 | 1.57 | 0.85 |
August 31, 2023 | J.P. Morgan Money Market Funds | 140 |
FOR THE PERIODS INDICATED
Per share operating performance | |||||||
Investment operations | Distributions | ||||||
Net asset value, beginning of period | Net investment income (loss) | Net realized and unrealized gains (losses) on investments | Total from investment operations | Net investment income | Net realized gain | Total distributions | |
JPMorgan Institutional Tax Free Money Market Fund | |||||||
Agency | |||||||
Six Months Ended August 31, 2023 (Unaudited) | $1.0002 | $0.0151 | $(0.0001 ) | $0.0150 | $(0.0151 ) | $— | $(0.0151 ) |
Year Ended February 28, 2023 | 1.0003 | 0.0136 | — (d) | 0.0136 | (0.0136 ) | (0.0001 ) | (0.0137 ) |
Year Ended February 28, 2022 | 1.0005 | 0.0001 | (0.0002 ) | (0.0001 ) | (0.0001 ) | — (d) | (0.0001 ) |
Year Ended February 28, 2021 | 1.0001 | 0.0023 | 0.0004 | 0.0027 | (0.0023 ) | — (d) | (0.0023 ) |
Year Ended February 29, 2020 | 1.0000 | 0.0117 | 0.0001 (f) | 0.0118 | (0.0117 ) | — (d) | (0.0117 ) |
March 01, 2018 (g) through February 28, 2019 | 1.0000 | 0.0123 | — (d) | 0.0123 | (0.0123 ) | — (d) | (0.0123 ) |
Capital | |||||||
Six Months Ended August 31, 2023 (Unaudited) | 1.0002 | 0.0155 | — (d) | 0.0155 | (0.0155 ) | — | (0.0155 ) |
Year Ended February 28, 2023 | 1.0003 | 0.0144 | — (d) | 0.0144 | (0.0144 ) | (0.0001 ) | (0.0145 ) |
Year Ended February 28, 2022 | 1.0006 | 0.0002 | (0.0003 ) | (0.0001 ) | (0.0002 ) | — (d) | (0.0002 ) |
Year Ended February 28, 2021 | 1.0000 | 0.0028 | 0.0006 | 0.0034 | (0.0028 ) | — (d) | (0.0028 ) |
Year Ended February 29, 2020 | 1.0000 | 0.0125 | — (d) | 0.0125 | (0.0125 ) | — (d) | (0.0125 ) |
March 01, 2018 (g) through February 28, 2019 | 1.0000 | 0.0131 | — (d) | 0.0131 | (0.0131 ) | — (d) | (0.0131 ) |
IM | |||||||
Six Months Ended August 31, 2023 (Unaudited) | 1.0002 | 0.0156 | (0.0001 ) | 0.0155 | (0.0156 ) | — | (0.0156 ) |
Year Ended February 28, 2023 | 1.0003 | 0.0147 | — (d) | 0.0147 | (0.0147 ) | (0.0001 ) | (0.0148 ) |
Year Ended February 28, 2022 | 1.0005 | 0.0002 | (0.0002 ) | — (d) | (0.0002 ) | — (d) | (0.0002 ) |
Year Ended February 28, 2021 | 1.0000 | 0.0030 | 0.0005 | 0.0035 | (0.0030 ) | — (d) | (0.0030 ) |
Year Ended February 29, 2020 | 1.0000 | 0.0127 | — (d) | 0.0127 | (0.0127 ) | — (d) | (0.0127 ) |
March 01, 2018 (g) through February 28, 2019 | 1.0000 | 0.0133 | — (d) | 0.0133 | (0.0133 ) | — (d) | (0.0133 ) |
Institutional Class | |||||||
Six Months Ended August 31, 2023 (Unaudited) | 1.0002 | 0.0153 | (0.0001 ) | 0.0152 | (0.0153 ) | — | (0.0153 ) |
Year Ended February 28, 2023 | 1.0003 | 0.0141 | — (d) | 0.0141 | (0.0141 ) | (0.0001 ) | (0.0142 ) |
Year Ended February 28, 2022 | 1.0005 | 0.0001 | (0.0002 ) | (0.0001 ) | (0.0001 ) | — (d) | (0.0001 ) |
Year Ended February 28, 2021 | 1.0000 | 0.0026 | 0.0005 | 0.0031 | (0.0026 ) | — (d) | (0.0026 ) |
Year Ended February 29, 2020 | 1.0000 | 0.0122 | — (d) | 0.0122 | (0.0122 ) | — (d) | (0.0122 ) |
March 01, 2018 (g) through February 28, 2019 | 1.0000 | 0.0128 | — (d) | 0.0128 | (0.0128 ) | — (d) | (0.0128 ) |
(a) | Annualized for periods less than one year, unless otherwise noted. |
(b) | Not annualized for periods less than one year. |
(c) | Includes interest expense, if applicable, each of which is less than 0.005% unless otherwise noted. |
(d) | Amount rounds to less than $0.00005. |
(e) | |
Voluntary waivers were as follows: | August 31, 2023 | February 28, 2023 | February 28, 2022 | February 28, 2021 | February 29, 2020 | February 28, 2019 |
Agency | — | — (a) | 0.16 % | 0.02 % | — | — |
Capital | — | — (a) | 0.09 % | — (a) | — | — |
IM | — | — | 0.07 % | 0.01 % | — | — |
Institutional Class | — | — (a) | 0.12 % | 0.01 % | — | — |
(a) Amount rounds to less than 0.005%. | ||||||
(f) | Net realized and unrealized gains (losses) on investments may appear disproportionate in relation to the classes due to rounding. |
(g) | Commencement of operations. |
(h) | Certain non-recurring expenses incurred by the Fund were not annualized for the period indicated. |
(i) | Amount rounds to less than 0.005%. |
141 | J.P. Morgan Money Market Funds | August 31, 2023 |
Ratios/Supplemental data | |||||
Ratios to average net assets(a) | |||||
Net asset value, end of period | Total return(b) | Net assets, end of period (000's) | Net expenses(c) | Net investment income (loss) | Expenses without waivers and reimbursements |
$1.0001 | 1.51 % | $105,028 | 0.26 % | 2.97 % | 0.32 % |
1.0002 | 1.36 | 108,719 | 0.26 (e) | 1.81 | 0.35 |
1.0003 | (0.01 ) | 17,084 | 0.11 (e) | 0.01 | 0.44 |
1.0005 | 0.27 | 23,163 | 0.24 (e) | 0.25 | 0.36 |
1.0001 | 1.19 | 41,696 | 0.26 | 1.15 | 0.38 |
1.0000 | 1.24 | 17,148 | 0.26 (h) | 1.36 (h) | 2.96 (h) |
1.0002 | 1.56 | 228,669 | 0.18 | 2.98 | 0.21 |
1.0002 | 1.44 | 399,560 | 0.18 (e) | 1.78 | 0.21 |
1.0003 | (0.01 ) | 182,500 | 0.09 (e) | 0.02 | 0.22 |
1.0006 | 0.34 | 37,889 | 0.18 (e) | 0.41 | 0.22 |
1.0000 | 1.26 | 228,168 | 0.18 | 1.18 | 0.24 |
1.0000 | 1.32 | 72,933 | 0.18 (h) | 1.42 (h) | 0.40 (h) |
1.0001 | 1.56 | 425,709 | 0.15 | 3.03 | 0.15 |
1.0002 | 1.47 | 601,785 | 0.15 | 1.36 | 0.15 |
1.0003 | 0.00 (i) | 723,312 | 0.08 (e) | 0.02 | 0.15 |
1.0005 | 0.35 | 665,960 | 0.15 (e) | 0.18 | 0.16 |
1.0000 | 1.28 | 391,386 | 0.16 | 1.24 | 0.18 |
1.0000 | 1.34 | 475,368 | 0.16 (h) | 1.32 (h) | 0.23 (h) |
1.0001 | 1.53 | 421,613 | 0.21 | 3.01 | 0.25 |
1.0002 | 1.41 | 397,559 | 0.21 (e) | 1.48 | 0.26 |
1.0003 | (0.01 ) | 355,017 | 0.09 (e) | 0.01 | 0.26 |
1.0005 | 0.31 | 478,239 | 0.20 (e) | 0.23 | 0.26 |
1.0000 | 1.23 | 309,118 | 0.21 | 1.20 | 0.28 |
1.0000 | 1.29 | 377,900 | 0.21 (h) | 1.40 (h) | 0.37 (h) |
August 31, 2023 | J.P. Morgan Money Market Funds | 142 |
FOR THE PERIODS INDICATED
Per share operating performance | |||||||
Investment operations | Distributions | ||||||
Net asset value, beginning of period | Net investment income (loss) | Net realized and unrealized gains (losses) on investments | Total from investment operations | Net investment income | Net realized gain | Total distributions | |
JPMorgan Securities Lending Money Market Fund | |||||||
Agency SL | |||||||
Six Months Ended August 31, 2023 (Unaudited) | $1.0004 | $0.0262 | $(0.0002 ) | $0.0260 | $(0.0262 ) | $— | $(0.0262 ) |
Year Ended February 28, 2023 | 0.9996 | 0.0241 | 0.0008 | 0.0249 | (0.0241 ) | — | (0.0241 ) |
Year Ended February 28, 2022 | 1.0001 | 0.0010 | (0.0005 ) | 0.0005 | (0.0010 ) | — (d) | (0.0010 ) |
Year Ended February 28, 2021 | 1.0002 | 0.0045 | (0.0001 ) | 0.0044 | (0.0045 ) | — (d) | (0.0045 ) |
Year Ended February 29, 2020 | 1.0001 | 0.0222 | 0.0001 | 0.0223 | (0.0222 ) | — (d) | (0.0222 ) |
September 19, 2018 (e) through February 28, 2019 | 1.0000 | 0.0109 | 0.0001 | 0.0110 | (0.0109 ) | — | (0.0109 ) |
(a) | Annualized for periods less than one year, unless otherwise noted. |
(b) | Not annualized for periods less than one year. |
(c) | Includes interest expense, if applicable, each of which is less than 0.005% unless otherwise noted. |
(d) | Amount rounds to less than $0.00005. |
(e) | Commencement of operations. |
(f) | Certain non-recurring expenses incurred by the Fund were not annualized for the period indicated. |
143 | J.P. Morgan Money Market Funds | August 31, 2023 |
Ratios/Supplemental data | |||||
Ratios to average net assets(a) | |||||
Net asset value, end of period | Total return(b) | Net assets, end of period (000's) | Net expenses(c) | Net investment income (loss) | Expenses without waivers and reimbursements |
$1.0002 | 2.63 % | $2,896,259 | 0.06 % | 5.19 % | 0.14 % |
1.0004 | 2.52 | 2,071,723 | 0.06 | 2.35 | 0.15 |
0.9996 | 0.05 | 1,921,994 | 0.06 | 0.10 | 0.14 |
1.0001 | 0.44 | 2,168,587 | 0.06 | 0.48 | 0.15 |
1.0002 | 2.25 | 3,455,824 | 0.06 | 2.20 | 0.16 |
1.0001 | 1.10 | 2,865,539 | 0.06 (f) | 2.53 (f) | 0.23 (f) |
August 31, 2023 | J.P. Morgan Money Market Funds | 144 |
FOR THE PERIODS INDICATED
Per share operating performance | |||||||
Investment operations | Distributions | ||||||
Net asset value, beginning of period | Net investment income (loss)(b) | Net realized and unrealized gains (losses) on investments | Total from investment operations | Net investment income | Net realized gain | Total distributions | |
JPMorgan Liquid Assets Money Market Fund | |||||||
Agency | |||||||
Six Months Ended August 31, 2023 (Unaudited) | $1.00 | $0.03 | $— (e) | $0.03 | $(0.03 ) | $— | $(0.03 ) |
Year Ended February 28, 2023 | 1.00 | 0.02 | — (e) | 0.02 | (0.02 ) | — | (0.02 ) |
Year Ended February 28, 2022 | 1.00 | — (e) | — (e) | — (e) | — (e) | — | — (e) |
Year Ended February 28, 2021 | 1.00 | — (e) | — (e) | — (e) | — (e) | — (e) | — (e) |
Year Ended February 29, 2020 | 1.00 | 0.02 | — (e) | 0.02 | (0.02 ) | — (e) | (0.02 ) |
Year Ended February 28, 2019 | 1.00 | 0.02 | — (e) | 0.02 | (0.02 ) | — (e) | (0.02 ) |
Capital | |||||||
Six Months Ended August 31, 2023 (Unaudited) | 1.00 | 0.03 | — (e) | 0.03 | (0.03 ) | — | (0.03 ) |
Year Ended February 28, 2023 | 1.00 | 0.02 | — (e) | 0.02 | (0.02 ) | — | (0.02 ) |
Year Ended February 28, 2022 | 1.00 | — (e) | — (e) | — (e) | — (e) | — | — (e) |
Year Ended February 28, 2021 | 1.00 | — (e) | — (e) | — (e) | — (e) | — (e) | — (e) |
Year Ended February 29, 2020 | 1.00 | 0.02 | — (e) | 0.02 | (0.02 ) | — (e) | (0.02 ) |
Year Ended February 28, 2019 | 1.00 | 0.02 | — (e) | 0.02 | (0.02 ) | — (e) | (0.02 ) |
Institutional Class | |||||||
Six Months Ended August 31, 2023 (Unaudited) | 1.00 | 0.03 | — (e) | 0.03 | (0.03 ) | — | (0.03 ) |
Year Ended February 28, 2023 | 1.00 | 0.02 | — (e) | 0.02 | (0.02 ) | — | (0.02 ) |
Year Ended February 28, 2022 | 1.00 | — (e) | — (e) | — (e) | — (e) | — | — (e) |
Year Ended February 28, 2021 | 1.00 | — (e) | — (e) | — (e) | — (e) | — (e) | — (e) |
Year Ended February 29, 2020 | 1.00 | 0.02 | — (e) | 0.02 | (0.02 ) | — (e) | (0.02 ) |
Year Ended February 28, 2019 | 1.00 | 0.02 | — (e) | 0.02 | (0.02 ) | — (e) | (0.02 ) |
Investor | |||||||
Six Months Ended August 31, 2023 (Unaudited) | 1.00 | 0.02 | — (e) | 0.02 | (0.02 ) | — | (0.02 ) |
Year Ended February 28, 2023 | 1.00 | 0.02 | — (e) | 0.02 | (0.02 ) | — | (0.02 ) |
Year Ended February 28, 2022 | 1.00 | — (e) | — (e) | — (e) | — (e) | — | — (e) |
Year Ended February 28, 2021 | 1.00 | — (e) | — (e) | — (e) | — (e) | — (e) | — (e) |
Year Ended February 29, 2020 | 1.00 | 0.02 | — (e) | 0.02 | (0.02 ) | — (e) | (0.02 ) |
Year Ended February 28, 2019 | 1.00 | 0.02 | — (e) | 0.02 | (0.02 ) | — (e) | (0.02 ) |
Morgan | |||||||
Six Months Ended August 31, 2023 (Unaudited) | 1.00 | 0.02 | — (e) | 0.02 | (0.02 ) | — | (0.02 ) |
Year Ended February 28, 2023 | 1.00 | 0.02 | — (e) | 0.02 | (0.02 ) | — | (0.02 ) |
Year Ended February 28, 2022 | 1.00 | — (e) | — (e) | — (e) | — (e) | — | — (e) |
Year Ended February 28, 2021 | 1.00 | — (e) | — (e) | — (e) | — (e) | — (e) | — (e) |
Year Ended February 29, 2020 | 1.00 | 0.02 | — (e) | 0.02 | (0.02 ) | — (e) | (0.02 ) |
Year Ended February 28, 2019 | 1.00 | 0.02 | — (e) | 0.02 | (0.02 ) | — (e) | (0.02 ) |
Premier | |||||||
Six Months Ended August 31, 2023 (Unaudited) | 1.00 | 0.02 | — (e) | 0.02 | (0.02 ) | — | (0.02 ) |
Year Ended February 28, 2023 | 1.00 | 0.02 | — (e) | 0.02 | (0.02 ) | — | (0.02 ) |
Year Ended February 28, 2022 | 1.00 | — (e) | — (e) | — (e) | — (e) | — | — (e) |
Year Ended February 28, 2021 | 1.00 | — (e) | — (e) | — (e) | — (e) | — (e) | — (e) |
Year Ended February 29, 2020 | 1.00 | 0.02 | — (e) | 0.02 | (0.02 ) | — (e) | (0.02 ) |
Year Ended February 28, 2019 | 1.00 | 0.02 | — (e) | 0.02 | (0.02 ) | — (e) | (0.02 ) |
145 | J.P. Morgan Money Market Funds | August 31, 2023 |
Ratios/Supplemental data | |||||
Ratios to average net assets(a) | |||||
Net asset value, end of period | Total return(c) | Net assets, end of period (000's) | Net expenses(d) | Net investment income (loss) | Expenses without waivers and reimbursements |
$1.00 | 2.53 % | $3,688,300 | 0.26 % | 5.00 % | 0.28 % |
1.00 | 2.32 | 3,045,257 | 0.26 (f) | 3.07 | 0.29 |
1.00 | 0.01 | 691,008 | 0.17 (f) | 0.01 | 0.30 |
1.00 | 0.29 | 1,234,800 | 0.24 (f) | 0.27 | 0.29 |
1.00 | 2.07 | 1,452,745 | 0.26 | 1.94 | 0.31 |
1.00 | 2.06 | 542,003 | 0.26 | 2.13 | 0.33 |
1.00 | 2.57 | 12,322,971 | 0.18 | 5.08 | 0.18 |
1.00 | 2.40 | 9,633,984 | 0.18 (f) | 3.32 | 0.19 |
1.00 | 0.04 | 1,804,197 | 0.15 (f) | 0.04 | 0.19 |
1.00 | 0.35 | 4,806,805 | 0.18 (f) | 0.25 | 0.19 |
1.00 | 2.15 | 2,295,874 | 0.18 | 2.01 | 0.21 |
1.00 | 2.14 | 558,492 | 0.18 | 2.16 | 0.23 |
1.00 | 2.56 | 10,044,300 | 0.21 | 5.05 | 0.23 |
1.00 | 2.37 | 8,277,974 | 0.21 (f) | 3.19 | 0.24 |
1.00 | 0.02 | 1,763,092 | 0.16 (f) | 0.02 | 0.25 |
1.00 | 0.32 | 3,055,814 | 0.21 (f) | 0.30 | 0.24 |
1.00 | 2.12 | 3,412,753 | 0.21 | 2.07 | 0.26 |
1.00 | 2.11 | 2,717,544 | 0.21 | 2.17 | 0.28 |
1.00 | 2.42 | 4,873 | 0.49 | 4.80 | 0.49 |
1.00 | 2.10 | 3,013 | 0.48 (f) | 2.43 | 0.49 |
1.00 | 0.01 | 1,804 | 0.17 (f) | 0.01 | 0.50 |
1.00 | 0.17 | 6,189 | 0.34 (f) | 0.16 | 0.58 |
1.00 | 1.81 | 7,904 | 0.51 | 1.78 | 0.52 |
1.00 | 1.81 | 8,147 | 0.51 | 1.79 | 0.54 |
1.00 | 2.37 | 4,659,512 | 0.58 | 4.70 | 0.59 |
1.00 | 2.02 | 2,177,582 | 0.56 (f) | 2.79 | 0.60 |
1.00 | 0.01 | 453,086 | 0.17 (f) | 0.01 | 0.61 |
1.00 | 0.14 | 627,541 | 0.40 (f) | 0.14 | 0.60 |
1.00 | 1.73 | 543,317 | 0.59 | 1.69 | 0.63 |
1.00 | 1.73 | 307,584 | 0.59 | 1.76 | 0.68 |
1.00 | 2.44 | 20,020,067 | 0.43 | 4.84 | 0.43 |
1.00 | 2.15 | 12,312,271 | 0.43 (f) | 3.20 | 0.44 |
1.00 | 0.01 | 1,532,491 | 0.17 (f) | 0.01 | 0.45 |
1.00 | 0.19 | 2,373,258 | 0.35 (f) | 0.19 | 0.44 |
1.00 | 1.87 | 3,031,847 | 0.45 | 1.77 | 0.46 |
1.00 | 1.87 | 1,140,955 | 0.45 | 1.93 | 0.48 |
August 31, 2023 | J.P. Morgan Money Market Funds | 146 |
FOR THE PERIODS INDICATED (continued)
Per share operating performance | |||||||
Investment operations | Distributions | ||||||
Net asset value, beginning of period | Net investment income (loss)(b) | Net realized and unrealized gains (losses) on investments | Total from investment operations | Net investment income | Net realized gain | Total distributions | |
JPMorgan Liquid Assets Money Market Fund (continued) | |||||||
Reserve | |||||||
Six Months Ended August 31, 2023 (Unaudited) | $1.00 | $0.02 | $— (e) | $0.02 | $(0.02 ) | $— | $(0.02 ) |
Year Ended February 28, 2023 | 1.00 | 0.02 | — (e) | 0.02 | (0.02 ) | — | (0.02 ) |
Year Ended February 28, 2022 | 1.00 | — (e) | — (e) | — (e) | — (e) | — | — (e) |
Year Ended February 28, 2021 | 1.00 | — (e) | — (e) | — (e) | — (e) | — (e) | — (e) |
Year Ended February 29, 2020 | 1.00 | 0.02 | — (e) | 0.02 | (0.02 ) | — (e) | (0.02 ) |
Year Ended February 28, 2019 | 1.00 | 0.02 | — (e) | 0.02 | (0.02 ) | — (e) | (0.02 ) |
(a) | Annualized for periods less than one year, unless otherwise noted. |
(b) | Calculated based upon average shares outstanding. |
(c) | Not annualized for periods less than one year. |
(d) | Includes interest expense, if applicable, each of which is less than 0.005% unless otherwise noted. |
(e) | Amount rounds to less than $0.005. |
(f) | |
Voluntary waivers were as follows: | August 31, 2023 | February 28, 2023 | February 28, 2022 | February 28, 2021 | February 29, 2020 | February 28, 2019 |
Agency | — | — (a) | 0.09 % | 0.02 % | — | — |
Capital | — | — (a) | 0.03 % | — (a) | — | — |
Institutional Class | — | — (a) | 0.05 % | — (a) | — | — |
Investor | — | 0.02 % | 0.32 % | 0.16 % | — | — |
Morgan | — | 0.02 % | 0.42 % | 0.19 % | — | — |
Premier | — | — (a) | 0.28 % | 0.10 % | — | — |
Reserve | — | 0.04 % | 0.53 % | 0.29 % | — | — |
(a) Amount rounds to less than 0.005%. | ||||||
147 | J.P. Morgan Money Market Funds | August 31, 2023 |
Ratios/Supplemental data | |||||
Ratios to average net assets(a) | |||||
Net asset value, end of period | Total return(c) | Net assets, end of period (000's) | Net expenses(d) | Net investment income (loss) | Expenses without waivers and reimbursements |
$1.00 | 2.31 % | $23,237 | 0.68 % | 4.55 % | 0.68 % |
1.00 | 1.94 | 28,700 | 0.66 (f) | 2.58 | 0.69 |
1.00 | 0.01 | 4,231 | 0.17 (f) | 0.01 | 0.70 |
1.00 | 0.11 | 5,661 | 0.40 (f) | 0.11 | 0.88 |
1.00 | 1.62 | 3,797 | 0.70 | 1.62 | 0.84 |
1.00 | 1.61 | 4,548 | 0.70 | 1.59 | 0.74 |
August 31, 2023 | J.P. Morgan Money Market Funds | 148 |
FOR THE PERIODS INDICATED
Per share operating performance | ||||||
Investment operations | Distributions | |||||
Net asset value, beginning of period | Net investment income (loss)(b) | Net realized and unrealized gains (losses) on investments | Total from investment operations | Net investment income | Net asset value, end of period | |
JPMorgan U.S. Government Money Market Fund | ||||||
Academy | ||||||
Six Months Ended August 31, 2023 (Unaudited) | $1.00 | $0.02 | $— (e) | $0.02 | $(0.02 ) | $1.00 |
Year Ended February 28, 2023 | 1.00 | 0.02 | — (e) | 0.02 | (0.02 ) | 1.00 |
Year Ended February 28, 2022 | 1.00 | — (e) | — (e) | — (e) | — (e) | 1.00 |
Year Ended February 28, 2021 | 1.00 | — (e) | — (e) | — (e) | — (e) | 1.00 |
May 15, 2019 (g) through February 29, 2020 | 1.00 | 0.01 | — (e) | 0.01 | (0.01 ) | 1.00 |
Agency | ||||||
Six Months Ended August 31, 2023 (Unaudited) | 1.00 | 0.02 | — (e) | 0.02 | (0.02 ) | 1.00 |
Year Ended February 28, 2023 | 1.00 | 0.02 | — (e) | 0.02 | (0.02 ) | 1.00 |
Year Ended February 28, 2022 | 1.00 | — (e) | — (e) | — (e) | — (e) | 1.00 |
Year Ended February 28, 2021 | 1.00 | — (e) | — (e) | — (e) | — (e) | 1.00 |
Year Ended February 29, 2020 | 1.00 | 0.02 | — (e) | 0.02 | (0.02 ) | 1.00 |
Year Ended February 28, 2019 | 1.00 | 0.02 | — (e) | 0.02 | (0.02 ) | 1.00 |
Capital | ||||||
Six Months Ended August 31, 2023 (Unaudited) | 1.00 | 0.02 | — (e) | 0.02 | (0.02 ) | 1.00 |
Year Ended February 28, 2023 | 1.00 | 0.02 | — (e) | 0.02 | (0.02 ) | 1.00 |
Year Ended February 28, 2022 | 1.00 | — (e) | — (e) | — (e) | — (e) | 1.00 |
Year Ended February 28, 2021 | 1.00 | — (e) | — (e) | — (e) | — (e) | 1.00 |
Year Ended February 29, 2020 | 1.00 | 0.02 | — (e) | 0.02 | (0.02 ) | 1.00 |
Year Ended February 28, 2019 | 1.00 | 0.02 | — (e) | 0.02 | (0.02 ) | 1.00 |
E*Trade | ||||||
Six Months Ended August 31, 2023 (Unaudited) | 1.00 | 0.02 | — (e) | 0.02 | (0.02 ) | 1.00 |
Year Ended February 28, 2023 | 1.00 | 0.01 | — (e) | 0.01 | (0.01 ) | 1.00 |
Year Ended February 28, 2022 | 1.00 | — (e) | — (e) | — (e) | — (e) | 1.00 |
Year Ended February 28, 2021 | 1.00 | — (e) | — (e) | — (e) | — (e) | 1.00 |
Year Ended February 29, 2020 | 1.00 | 0.01 | — (e) | 0.01 | (0.01 ) | 1.00 |
Year Ended February 28, 2019 | 1.00 | 0.01 | — (e) | 0.01 | (0.01 ) | 1.00 |
Empower | ||||||
Six Months Ended August 31, 2023 (Unaudited) | 1.00 | 0.02 | — (e) | 0.02 | (0.02 ) | 1.00 |
Year Ended February 28, 2023 | 1.00 | 0.02 | — (e) | 0.02 | (0.02 ) | 1.00 |
Year Ended February 28, 2022 | 1.00 | — (e) | — (e) | — (e) | — (e) | 1.00 |
February 23, 2021 (g) through February 28, 2021 | 1.00 | — (e) | — (e) | — (e) | — (e) | 1.00 |
IM | ||||||
Six Months Ended August 31, 2023 (Unaudited) | 1.00 | 0.02 | — (e) | 0.02 | (0.02 ) | 1.00 |
Year Ended February 28, 2023 | 1.00 | 0.02 | — (e) | 0.02 | (0.02 ) | 1.00 |
Year Ended February 28, 2022 | 1.00 | — (e) | — (e) | — (e) | — (e) | 1.00 |
Year Ended February 28, 2021 | 1.00 | — (e) | — (e) | — (e) | — (e) | 1.00 |
Year Ended February 29, 2020 | 1.00 | 0.02 | — (e) | 0.02 | (0.02 ) | 1.00 |
Year Ended February 28, 2019 | 1.00 | 0.02 | — (e) | 0.02 | (0.02 ) | 1.00 |
Institutional Class | ||||||
Six Months Ended August 31, 2023 (Unaudited) | 1.00 | 0.02 | — (e) | 0.02 | (0.02 ) | 1.00 |
Year Ended February 28, 2023 | 1.00 | 0.02 | — (e) | 0.02 | (0.02 ) | 1.00 |
Year Ended February 28, 2022 | 1.00 | — (e) | — (e) | — (e) | — (e) | 1.00 |
Year Ended February 28, 2021 | 1.00 | — (e) | — (e) | — (e) | — (e) | 1.00 |
Year Ended February 29, 2020 | 1.00 | 0.02 | — (e) | 0.02 | (0.02 ) | 1.00 |
Year Ended February 28, 2019 | 1.00 | 0.02 | — (e) | 0.02 | (0.02 ) | 1.00 |
149 | J.P. Morgan Money Market Funds | August 31, 2023 |
Ratios/Supplemental data | ||||
Ratios to average net assets(a) | ||||
Total return(c) | Net assets, end of period (000's) | Net expenses(d) | Net investment income (loss) | Expenses without waivers and reimbursements |
2.50 % | $11,550,930 | 0.17 % | 4.99 % | 0.18 % |
2.20 | 4,267,302 | 0.15 (f) | 1.79 | 0.18 |
0.03 | 10,734,174 | 0.04 (f) | 0.03 | 0.18 |
0.14 | 3,689,489 | 0.14 (f) | 0.07 | 0.18 |
1.47 | 85,026 | 0.18 | 1.49 | 0.21 |
2.45 | 12,841,291 | 0.26 | 4.84 | 0.28 |
2.11 | 10,098,820 | 0.24 (f) | 2.11 | 0.28 |
0.01 | 8,485,249 | 0.06 (f) | 0.01 | 0.28 |
0.09 | 16,148,773 | 0.20 (f) | 0.08 | 0.28 |
1.87 | 14,132,125 | 0.26 | 1.84 | 0.30 |
1.82 | 11,112,454 | 0.26 | 1.79 | 0.31 |
2.50 | 164,622,049 | 0.17 | 4.93 | 0.18 |
2.20 | 119,811,381 | 0.15 (f) | 1.97 | 0.18 |
0.03 | 166,488,233 | 0.04 (f) | 0.03 | 0.18 |
0.14 | 143,184,525 | 0.15 (f) | 0.13 | 0.19 |
1.95 | 86,263,432 | 0.18 | 1.91 | 0.20 |
1.90 | 73,390,258 | 0.18 | 1.87 | 0.21 |
2.07 | 142,019 | 1.00 | 4.03 | 1.03 |
1.48 | 284,787 | 0.85 (f) | 1.36 | 1.03 |
0.01 | 387,687 | 0.06 (f) | 0.01 | 1.03 |
0.03 | 404,756 | 0.25 (f) | 0.02 | 1.03 |
1.12 | 298,348 | 1.00 | 1.10 | 1.05 |
1.07 | 274,993 | 1.00 | 1.04 | 1.06 |
2.50 | 11,552,029 | 0.17 | 4.96 | 0.18 |
2.20 | 5,393,885 | 0.15 (f) | 2.45 | 0.19 |
0.03 | 4,160,732 | 0.04 (f) | 0.03 | 0.18 |
0.00 (h) | 500,028 | 0.06 (f) | 0.04 | 0.19 |
2.52 | 8,090,920 | 0.13 | 4.93 | 0.13 |
2.23 | 9,457,598 | 0.12 (f) | 2.22 | 0.13 |
0.03 | 10,046,645 | 0.04 (f) | 0.03 | 0.13 |
0.17 | 7,317,310 | 0.12 (f) | 0.16 | 0.14 |
1.99 | 7,443,910 | 0.15 | 1.90 | 0.15 |
1.92 | 6,108,975 | 0.16 | 1.95 | 0.16 |
2.48 | 36,573,113 | 0.21 | 4.89 | 0.23 |
2.17 | 29,664,717 | 0.18 (f) | 2.15 | 0.24 |
0.01 | 27,455,761 | 0.06 (f) | 0.01 | 0.23 |
0.12 | 39,608,624 | 0.17 (f) | 0.11 | 0.23 |
1.92 | 43,246,064 | 0.21 | 1.89 | 0.25 |
1.87 | 41,868,607 | 0.21 | 1.88 | 0.26 |
August 31, 2023 | J.P. Morgan Money Market Funds | 150 |
FOR THE PERIODS INDICATED (continued)
Per share operating performance | ||||||
Investment operations | Distributions | |||||
Net asset value, beginning of period | Net investment income (loss)(b) | Net realized and unrealized gains (losses) on investments | Total from investment operations | Net investment income | Net asset value, end of period | |
JPMorgan U.S. Government Money Market Fund (continued) | ||||||
Investor | ||||||
Six Months Ended August 31, 2023 (Unaudited) | $1.00 | $0.02 | $— (e) | $0.02 | $(0.02 ) | $1.00 |
Year Ended February 28, 2023 | 1.00 | 0.02 | — (e) | 0.02 | (0.02 ) | 1.00 |
Year Ended February 28, 2022 | 1.00 | — (e) | — (e) | — (e) | — (e) | 1.00 |
Year Ended February 28, 2021 | 1.00 | — (e) | — (e) | — (e) | — (e) | 1.00 |
Year Ended February 29, 2020 | 1.00 | 0.02 | — (e) | 0.02 | (0.02 ) | 1.00 |
Year Ended February 28, 2019 | 1.00 | 0.02 | — (e) | 0.02 | (0.02 ) | 1.00 |
Morgan | ||||||
Six Months Ended August 31, 2023 (Unaudited) | 1.00 | 0.02 | — (e) | 0.02 | (0.02 ) | 1.00 |
Year Ended February 28, 2023 | 1.00 | 0.02 | — (e) | 0.02 | (0.02 ) | 1.00 |
Year Ended February 28, 2022 | 1.00 | — (e) | — (e) | — (e) | — (e) | 1.00 |
Year Ended February 28, 2021 | 1.00 | — (e) | — (e) | — (e) | — (e) | 1.00 |
Year Ended February 29, 2020 | 1.00 | 0.02 | — (e) | 0.02 | (0.02 ) | 1.00 |
Year Ended February 28, 2019 | 1.00 | 0.01 | — (e) | 0.01 | (0.01 ) | 1.00 |
Premier | ||||||
Six Months Ended August 31, 2023 (Unaudited) | 1.00 | 0.02 | — (e) | 0.02 | (0.02 ) | 1.00 |
Year Ended February 28, 2023 | 1.00 | 0.02 | — (e) | 0.02 | (0.02 ) | 1.00 |
Year Ended February 28, 2022 | 1.00 | — (e) | — (e) | — (e) | — (e) | 1.00 |
Year Ended February 28, 2021 | 1.00 | — (e) | — (e) | — (e) | — (e) | 1.00 |
Year Ended February 29, 2020 | 1.00 | 0.02 | — (e) | 0.02 | (0.02 ) | 1.00 |
Year Ended February 28, 2019 | 1.00 | 0.02 | — (e) | 0.02 | (0.02 ) | 1.00 |
Reserve | ||||||
Six Months Ended August 31, 2023 (Unaudited) | 1.00 | 0.02 | — (e) | 0.02 | (0.02 ) | 1.00 |
Year Ended February 28, 2023 | 1.00 | 0.02 | — (e) | 0.02 | (0.02 ) | 1.00 |
Year Ended February 28, 2022 | 1.00 | — (e) | — (e) | — (e) | — (e) | 1.00 |
Year Ended February 28, 2021 | 1.00 | — (e) | — (e) | — (e) | — (e) | 1.00 |
Year Ended February 29, 2020 | 1.00 | 0.01 | — (e) | 0.01 | (0.01 ) | 1.00 |
Year Ended February 28, 2019 | 1.00 | 0.01 | — (e) | 0.01 | (0.01 ) | 1.00 |
Service | ||||||
Six Months Ended August 31, 2023 (Unaudited) | 1.00 | 0.02 | — (e) | 0.02 | (0.02 ) | 1.00 |
Year Ended February 28, 2023 | 1.00 | 0.01 | — (e) | 0.01 | (0.01 ) | 1.00 |
Year Ended February 28, 2022 | 1.00 | — (e) | — (e) | — (e) | — (e) | 1.00 |
Year Ended February 28, 2021 | 1.00 | — (e) | — (e) | — (e) | — (e) | 1.00 |
Year Ended February 29, 2020 | 1.00 | 0.01 | — (e) | 0.01 | (0.01 ) | 1.00 |
Year Ended February 28, 2019 | 1.00 | 0.01 | — (e) | 0.01 | (0.01 ) | 1.00 |
(a) | Annualized for periods less than one year, unless otherwise noted. |
(b) | Calculated based upon average shares outstanding. |
(c) | Not annualized for periods less than one year. |
(d) | Includes interest expense, if applicable, each of which is less than 0.005% unless otherwise noted. |
(e) | Amount rounds to less than $0.005. |
(f) | |
Voluntary waivers were as follows: | August 31, 2023 | February 28, 2023 | February 28, 2022 | February 28, 2021 | February 29, 2020 | February 28, 2019 |
Academy | — | 0.03 % | 0.13 % | 0.04 % | — | — |
Agency | — | 0.02 % | 0.20 % | 0.06 % | — | — |
Capital | — | 0.03 % | 0.13 % | 0.03 % | — | — |
E*Trade | — | 0.15 % | 0.94 % | 0.75 % | — | — |
Empower | — | 0.03 % | 0.13 % | — (a) | — | — |
IM | — | 0.01 % | 0.09 % | 0.01 % | — | — |
Institutional Class | — | 0.03 % | 0.15 % | 0.04 % | — | — |
Investor | — | 0.03 % | 0.41 % | 0.25 % | — | — |
Morgan | — | 0.04 % | 0.51 % | 0.33 % | — | — |
Premier | — | 0.03 % | 0.37 % | 0.21 % | — | — |
Reserve | — | 0.11 % | 0.61 % | 0.47 % | — | — |
Service | — | 0.16 % | 0.96 % | 0.74 % | — | — |
(a) Amount rounds to less than 0.005%. | ||||||
(g) | Commencement of offering of class of shares. |
(h) | Amount rounds to less than 0.005%. |
151 | J.P. Morgan Money Market Funds | August 31, 2023 |
Ratios/Supplemental data | ||||
Ratios to average net assets(a) | ||||
Total return(c) | Net assets, end of period (000's) | Net expenses(d) | Net investment income (loss) | Expenses without waivers and reimbursements |
2.34 % | $2,264,193 | 0.48 % | 4.60 % | 0.48 % |
1.90 | 2,406,713 | 0.46 (f) | 1.98 | 0.48 |
0.00 (h) | 1,858,457 | 0.07 (f) | 0.00 (h) | 0.48 |
0.05 | 842,931 | 0.24 (f) | 0.04 | 0.48 |
1.63 | 684,791 | 0.50 | 1.68 | 0.50 |
1.57 | 1,127,675 | 0.50 | 1.60 | 0.50 |
2.29 | 6,946,528 | 0.58 | 4.54 | 0.58 |
1.81 | 4,027,309 | 0.54 (f) | 2.08 | 0.59 |
0.00 (h) | 1,956,424 | 0.07 (f) | 0.00 (h) | 0.59 |
0.05 | 1,870,723 | 0.25 (f) | 0.05 | 0.59 |
1.54 | 2,064,159 | 0.59 | 1.50 | 0.60 |
1.48 | 1,660,477 | 0.59 | 1.49 | 0.61 |
2.36 | 10,587,829 | 0.43 | 4.68 | 0.43 |
1.94 | 6,543,879 | 0.41 (f) | 1.97 | 0.44 |
0.01 | 5,330,175 | 0.06 (f) | 0.01 | 0.43 |
0.06 | 5,020,827 | 0.22 (f) | 0.05 | 0.43 |
1.68 | 4,095,749 | 0.45 | 1.64 | 0.45 |
1.62 | 2,945,521 | 0.45 | 1.59 | 0.46 |
2.24 | 2,947,650 | 0.68 | 4.43 | 0.68 |
1.73 | 3,350,896 | 0.58 (f) | 1.44 | 0.69 |
0.00 (h) | 7,409,330 | 0.07 (f) | 0.00 (h) | 0.68 |
0.04 | 27,414 | 0.22 (f) | 0.03 | 0.69 |
1.42 | 20,829 | 0.70 | 1.41 | 0.71 |
1.37 | 19,468 | 0.70 | 1.28 | 0.71 |
2.06 | 275,385 | 1.03 | 4.05 | 1.03 |
1.45 | 325,011 | 0.88 (f) | 1.33 | 1.03 |
0.00 (h) | 433,435 | 0.07 (f) | 0.00 (h) | 1.03 |
0.03 | 514,476 | 0.29 (f) | 0.03 | 1.03 |
1.07 | 867,659 | 1.05 | 1.19 | 1.05 |
1.02 | 2,993,274 | 1.05 | 1.08 | 1.05 |
August 31, 2023 | J.P. Morgan Money Market Funds | 152 |
FOR THE PERIODS INDICATED
Per share operating performance | ||||||
Investment operations | Distributions | |||||
Net asset value, beginning of period | Net investment income (loss)(b) | Net realized and unrealized gains (losses) on investments | Total from investment operations | Net investment income | Net asset value, end of period | |
JPMorgan U.S. Treasury Plus Money Market Fund | ||||||
Academy | ||||||
Six Months Ended August 31, 2023 (Unaudited) | $1.00 | $0.02 | $— (e) | $0.02 | $(0.02 ) | $1.00 |
Year Ended February 28, 2023 | 1.00 | 0.02 | — (e) | 0.02 | (0.02 ) | 1.00 |
Year Ended February 28, 2022 | 1.00 | — (e) | — (e) | — (e) | — (e) | 1.00 |
September 30, 2020 (g) through February 28, 2021 | 1.00 | — (e) | — (e) | — (e) | — (e) | 1.00 |
Agency | ||||||
Six Months Ended August 31, 2023 (Unaudited) | 1.00 | 0.02 | — (e) | 0.02 | (0.02 ) | 1.00 |
Year Ended February 28, 2023 | 1.00 | 0.02 | — (e) | 0.02 | (0.02 ) | 1.00 |
Year Ended February 28, 2022 | 1.00 | — (e) | — (e) | — (e) | — (e) | 1.00 |
Year Ended February 28, 2021 | 1.00 | — (e) | — (e) | — (e) | — (e) | 1.00 |
Year Ended February 29, 2020 | 1.00 | 0.02 | — (e) | 0.02 | (0.02 ) | 1.00 |
Year Ended February 28, 2019 | 1.00 | 0.02 | — (e) | 0.02 | (0.02 ) | 1.00 |
Capital | ||||||
Six Months Ended August 31, 2023 (Unaudited) | 1.00 | 0.02 | — (e) | 0.02 | (0.02 ) | 1.00 |
Year Ended February 28, 2023 | 1.00 | 0.02 | — (e) | 0.02 | (0.02 ) | 1.00 |
Year Ended February 28, 2022 | 1.00 | — (e) | — (e) | — (e) | — (e) | 1.00 |
Year Ended February 28, 2021 | 1.00 | — (e) | — (e) | — (e) | — (e) | 1.00 |
Year Ended February 29, 2020 | 1.00 | 0.02 | — (e) | 0.02 | (0.02 ) | 1.00 |
Year Ended February 28, 2019 | 1.00 | 0.02 | — (e) | 0.02 | (0.02 ) | 1.00 |
Empower | ||||||
Six Months Ended August 31, 2023 (Unaudited) | 1.00 | 0.02 | — (e) | 0.02 | (0.02 ) | 1.00 |
Year Ended February 28, 2023 | 1.00 | 0.02 | — (e) | 0.02 | (0.02 ) | 1.00 |
Year Ended February 28, 2022 | 1.00 | — (e) | — (e) | — (e) | — (e) | 1.00 |
February 23, 2021 (g) through February 28, 2021 | 1.00 | — (e) | — (e) | — (e) | — (e) | 1.00 |
IM | ||||||
Six Months Ended August 31, 2023 (Unaudited) | 1.00 | 0.02 | — (e) | 0.02 | (0.02 ) | 1.00 |
Year Ended February 28, 2023 | 1.00 | 0.02 | — (e) | 0.02 | (0.02 ) | 1.00 |
Year Ended February 28, 2022 | 1.00 | — (e) | — (e) | — (e) | — (e) | 1.00 |
Year Ended February 28, 2021 | 1.00 | — (e) | — (e) | — (e) | — (e) | 1.00 |
Year Ended February 29, 2020 | 1.00 | 0.02 | — (e) | 0.02 | (0.02 ) | 1.00 |
Year Ended February 28, 2019 | 1.00 | 0.02 | — (e) | 0.02 | (0.02 ) | 1.00 |
Institutional Class | ||||||
Six Months Ended August 31, 2023 (Unaudited) | 1.00 | 0.02 | — (e) | 0.02 | (0.02 ) | 1.00 |
Year Ended February 28, 2023 | 1.00 | 0.02 | — (e) | 0.02 | (0.02 ) | 1.00 |
Year Ended February 28, 2022 | 1.00 | — (e) | — (e) | — (e) | — (e) | 1.00 |
Year Ended February 28, 2021 | 1.00 | — (e) | — (e) | — (e) | — (e) | 1.00 |
Year Ended February 29, 2020 | 1.00 | 0.02 | — (e) | 0.02 | (0.02 ) | 1.00 |
Year Ended February 28, 2019 | 1.00 | 0.02 | — (e) | 0.02 | (0.02 ) | 1.00 |
Investor | ||||||
Six Months Ended August 31, 2023 (Unaudited) | 1.00 | 0.02 | — (e) | 0.02 | (0.02 ) | 1.00 |
Year Ended February 28, 2023 | 1.00 | 0.02 | — (e) | 0.02 | (0.02 ) | 1.00 |
Year Ended February 28, 2022 | 1.00 | — (e) | — (e) | — (e) | — (e) | 1.00 |
Year Ended February 28, 2021 | 1.00 | — (e) | — (e) | — (e) | — (e) | 1.00 |
Year Ended February 29, 2020 | 1.00 | 0.02 | — (e) | 0.02 | (0.02 ) | 1.00 |
Year Ended February 28, 2019 | 1.00 | 0.02 | — (e) | 0.02 | (0.02 ) | 1.00 |
153 | J.P. Morgan Money Market Funds | August 31, 2023 |
Ratios/Supplemental data | ||||
Ratios to average net assets(a) | ||||
Total return(c) | Net assets, end of period (000's) | Net expenses(d) | Net investment income (loss) | Expenses without waivers and reimbursements |
2.49 % | $157,332 | 0.17 % | 4.91 % | 0.18 % |
2.18 | 153,500 | 0.15 (f) | 2.60 | 0.19 |
0.01 | 100 | 0.04 (f) | 0.01 | 0.19 |
0.01 | 17,600 | 0.07 (f) | 0.03 | 0.23 |
2.45 | 2,068,506 | 0.26 | 4.82 | 0.28 |
2.09 | 1,745,265 | 0.24 (f) | 2.19 | 0.29 |
0.01 | 914,835 | 0.06 (f) | 0.01 | 0.28 |
0.09 | 1,865,281 | 0.20 (f) | 0.09 | 0.29 |
1.85 | 1,744,289 | 0.26 | 1.85 | 0.30 |
1.83 | 2,013,982 | 0.26 | 1.90 | 0.30 |
2.49 | 17,772,739 | 0.17 | 4.92 | 0.18 |
2.18 | 12,166,783 | 0.16 (f) | 2.12 | 0.19 |
0.01 | 10,784,903 | 0.06 (f) | 0.01 | 0.18 |
0.14 | 13,539,346 | 0.16 (f) | 0.13 | 0.19 |
1.94 | 9,945,933 | 0.18 | 1.89 | 0.20 |
1.91 | 6,425,187 | 0.18 | 1.92 | 0.20 |
2.49 | 216,513 | 0.18 | 4.71 | 0.18 |
2.18 | 1,206,832 | 0.17 (f) | 2.94 | 0.19 |
0.01 | 112,014 | 0.05 (f) | 0.01 | 0.18 |
0.00 (h) | 25 | 0.06 (f) | 0.02 | 0.18 |
2.51 | 18,610 | 0.13 | 5.26 | 0.13 |
2.17 | 142 | 0.15 (f) | 2.89 | 0.16 |
0.01 | 30 | 0.05 (f) | 0.02 | 0.14 |
0.17 | 24,276 | 0.12 (f) | 0.19 | 0.14 |
1.97 | 37,429 | 0.15 | 2.26 | 0.15 |
1.93 | 1,451,488 | 0.15 | 1.87 | 0.15 |
2.47 | 9,682,892 | 0.21 | 4.88 | 0.23 |
2.15 | 8,222,799 | 0.19 (f) | 2.05 | 0.24 |
0.01 | 7,963,115 | 0.06 (f) | 0.01 | 0.24 |
0.12 | 12,055,194 | 0.17 (f) | 0.13 | 0.24 |
1.90 | 16,887,054 | 0.21 | 1.88 | 0.25 |
1.88 | 17,766,429 | 0.21 | 1.89 | 0.25 |
2.33 | 13,007 | 0.48 | 4.59 | 0.48 |
1.88 | 15,976 | 0.45 (f) | 1.90 | 0.49 |
0.00 (h) | 16,665 | 0.07 (f) | 0.00 (h) | 0.48 |
0.04 | 16,604 | 0.27 (f) | 0.05 | 0.54 |
1.61 | 29,937 | 0.50 | 1.60 | 0.50 |
1.58 | 28,583 | 0.51 | 1.57 | 0.51 |
August 31, 2023 | J.P. Morgan Money Market Funds | 154 |
FOR THE PERIODS INDICATED (continued)
Per share operating performance | ||||||
Investment operations | Distributions | |||||
Net asset value, beginning of period | Net investment income (loss)(b) | Net realized and unrealized gains (losses) on investments | Total from investment operations | Net investment income | Net asset value, end of period | |
JPMorgan U.S. Treasury Plus Money Market Fund (continued) | ||||||
Morgan | ||||||
Six Months Ended August 31, 2023 (Unaudited) | $1.00 | $0.02 | $— (e) | $0.02 | $(0.02 ) | $1.00 |
Year Ended February 28, 2023 | 1.00 | 0.02 | — (e) | 0.02 | (0.02 ) | 1.00 |
Year Ended February 28, 2022 | 1.00 | — (e) | — (e) | — (e) | — (e) | 1.00 |
Year Ended February 28, 2021 | 1.00 | — (e) | — (e) | — (e) | — (e) | 1.00 |
Year Ended February 29, 2020 | 1.00 | 0.02 | — (e) | 0.02 | (0.02 ) | 1.00 |
Year Ended February 28, 2019 | 1.00 | 0.01 | — (e) | 0.01 | (0.01 ) | 1.00 |
Premier | ||||||
Six Months Ended August 31, 2023 (Unaudited) | 1.00 | 0.02 | — (e) | 0.02 | (0.02 ) | 1.00 |
Year Ended February 28, 2023 | 1.00 | 0.02 | — (e) | 0.02 | (0.02 ) | 1.00 |
Year Ended February 28, 2022 | 1.00 | — (e) | — (e) | — (e) | — (e) | 1.00 |
Year Ended February 28, 2021 | 1.00 | — (e) | — (e) | — (e) | — (e) | 1.00 |
Year Ended February 29, 2020 | 1.00 | 0.02 | — (e) | 0.02 | (0.02 ) | 1.00 |
Year Ended February 28, 2019 | 1.00 | 0.02 | — (e) | 0.02 | (0.02 ) | 1.00 |
Reserve | ||||||
Six Months Ended August 31, 2023 (Unaudited) | 1.00 | 0.02 | — (e) | 0.02 | (0.02 ) | 1.00 |
Year Ended February 28, 2023 | 1.00 | 0.02 | — (e) | 0.02 | (0.02 ) | 1.00 |
Year Ended February 28, 2022 | 1.00 | — (e) | — (e) | — (e) | — (e) | 1.00 |
Year Ended February 28, 2021 | 1.00 | — (e) | — (e) | — (e) | — (e) | 1.00 |
Year Ended February 29, 2020 | 1.00 | 0.01 | — (e) | 0.01 | (0.01 ) | 1.00 |
Year Ended February 28, 2019 | 1.00 | 0.01 | — (e) | 0.01 | (0.01 ) | 1.00 |
(a) | Annualized for periods less than one year, unless otherwise noted. |
(b) | Calculated based upon average shares outstanding. |
(c) | Not annualized for periods less than one year. |
(d) | Includes interest expense, if applicable, each of which is less than 0.005% unless otherwise noted. |
(e) | Amount rounds to less than $0.005. |
(f) | |
Voluntary waivers were as follows: | August 31, 2023 | February 28, 2023 | February 28, 2022 | February 28, 2021 | February 29, 2020 | February 28, 2019 |
Academy | — | 0.03 % | 0.14 % | 0.05 % | — | — |
Agency | — | 0.02 % | 0.20 % | 0.06 % | — | — |
Capital | — | 0.02 % | 0.12 % | 0.02 % | — | — |
Empower | — | 0.01 % | 0.13 % | — (a) | — | — |
IM | — | 0.01 % | 0.09 % | 0.01 % | — | — |
Institutional Class | — | 0.02 % | 0.15 % | 0.04 % | — | — |
Investor | — | 0.04 % | 0.42 % | 0.22 % | — | — |
Morgan | — | 0.04 % | 0.52 % | 0.31 % | — | — |
Premier | — | 0.03 % | 0.38 % | 0.19 % | — | — |
Reserve | — | 0.08 % | 0.61 % | 0.35 % | — | — |
(a) Amount rounds to less than 0.005%. | ||||||
(g) | Commencement of offering of class of shares. |
(h) | Amount rounds to less than 0.005%. |
155 | J.P. Morgan Money Market Funds | August 31, 2023 |
Ratios/Supplemental data | ||||
Ratios to average net assets(a) | ||||
Total return(c) | Net assets, end of period (000's) | Net expenses(d) | Net investment income (loss) | Expenses without waivers and reimbursements |
2.28 % | $3,488,718 | 0.58 % | 4.57 % | 0.58 % |
1.80 | 1,110,743 | 0.55 (f) | 2.21 | 0.59 |
0.00 (h) | 350,701 | 0.06 (f) | 0.00 (h) | 0.59 |
0.04 | 436,183 | 0.28 (f) | 0.05 | 0.59 |
1.52 | 734,856 | 0.59 | 1.49 | 0.60 |
1.49 | 634,508 | 0.59 | 1.55 | 0.61 |
2.36 | 4,381,035 | 0.43 | 4.68 | 0.43 |
1.92 | 2,659,992 | 0.41 (f) | 2.02 | 0.44 |
0.01 | 2,032,795 | 0.06 (f) | 0.01 | 0.44 |
0.05 | 1,694,724 | 0.25 (f) | 0.04 | 0.44 |
1.66 | 1,439,412 | 0.45 | 1.60 | 0.45 |
1.63 | 981,194 | 0.45 | 1.68 | 0.45 |
2.23 | 1,308,905 | 0.68 | 4.47 | 0.68 |
1.71 | 425,906 | 0.61 (f) | 2.34 | 0.69 |
0.00 (h) | 244,357 | 0.07 (f) | 0.00 (h) | 0.68 |
0.03 | 4,562 | 0.34 (f) | 0.03 | 0.74 |
1.41 | 5,966 | 0.70 | 1.41 | 0.73 |
1.38 | 6,986 | 0.70 | 1.34 | 0.71 |
August 31, 2023 | J.P. Morgan Money Market Funds | 156 |
FOR THE PERIODS INDICATED
Per share operating performance | |||||||
Investment operations | Distributions | ||||||
Net asset value, beginning of period | Net investment income (loss)(b) | Net realized and unrealized gains (losses) on investments | Total from investment operations | Net investment income | Net realized gain | Total distributions | |
JPMorgan Federal Money Market Fund | |||||||
Agency | |||||||
Six Months Ended August 31, 2023 (Unaudited) | $1.00 | $0.02 | $— (e) | $0.02 | $(0.02 ) | $— | $(0.02 ) |
Year Ended February 28, 2023 | 1.00 | 0.02 | — (e) | 0.02 | (0.02 ) | — | (0.02 ) |
Year Ended February 28, 2022 | 1.00 | — (e) | — (e) | — (e) | — (e) | — (e) | — (e) |
Year Ended February 28, 2021 | 1.00 | — (e) | — (e) | — (e) | — (e) | — (e) | — (e) |
Year Ended February 29, 2020 | 1.00 | 0.02 | — (e) | 0.02 | (0.02 ) | — (e) | (0.02 ) |
Year Ended February 28, 2019 | 1.00 | 0.02 | — (e) | 0.02 | (0.02 ) | — (e) | (0.02 ) |
Institutional Class | |||||||
Six Months Ended August 31, 2023 (Unaudited) | 1.00 | 0.02 | — (e) | 0.02 | (0.02 ) | — | (0.02 ) |
Year Ended February 28, 2023 | 1.00 | 0.02 | — (e) | 0.02 | (0.02 ) | — | (0.02 ) |
Year Ended February 28, 2022 | 1.00 | — (e) | — (e) | — (e) | — (e) | — (e) | — (e) |
Year Ended February 28, 2021 | 1.00 | — (e) | — (e) | — (e) | — (e) | — (e) | — (e) |
Year Ended February 29, 2020 | 1.00 | 0.02 | — (e) | 0.02 | (0.02 ) | — (e) | (0.02 ) |
Year Ended February 28, 2019 | 1.00 | 0.02 | — (e) | 0.02 | (0.02 ) | — (e) | (0.02 ) |
Morgan | |||||||
Six Months Ended August 31, 2023 (Unaudited) | 1.00 | 0.02 | — (e) | 0.02 | (0.02 ) | — | (0.02 ) |
Year Ended February 28, 2023 | 1.00 | 0.02 | — (e) | 0.02 | (0.02 ) | — | (0.02 ) |
Year Ended February 28, 2022 | 1.00 | — (e) | — (e) | — (e) | — (e) | — (e) | — (e) |
Year Ended February 28, 2021 | 1.00 | — (e) | — (e) | — (e) | — (e) | — (e) | — (e) |
Year Ended February 29, 2020 | 1.00 | 0.01 | 0.01 | 0.02 | (0.02 ) | — (e) | (0.02 ) |
Year Ended February 28, 2019 | 1.00 | 0.01 | — (e) | 0.01 | (0.01 ) | — (e) | (0.01 ) |
Premier | |||||||
Six Months Ended August 31, 2023 (Unaudited) | 1.00 | 0.02 | — (e) | 0.02 | (0.02 ) | — | (0.02 ) |
Year Ended February 28, 2023 | 1.00 | 0.02 | — (e) | 0.02 | (0.02 ) | — | (0.02 ) |
Year Ended February 28, 2022 | 1.00 | — (e) | — (e) | — (e) | — (e) | — (e) | — (e) |
Year Ended February 28, 2021 | 1.00 | — (e) | — (e) | — (e) | — (e) | — (e) | — (e) |
Year Ended February 29, 2020 | 1.00 | 0.02 | — (e) | 0.02 | (0.02 ) | — (e) | (0.02 ) |
Year Ended February 28, 2019 | 1.00 | 0.02 | — (e) | 0.02 | (0.02 ) | — (e) | (0.02 ) |
(a) | Annualized for periods less than one year, unless otherwise noted. |
(b) | Calculated based upon average shares outstanding. |
(c) | Not annualized for periods less than one year. |
(d) | Includes interest expense, if applicable, each of which is less than 0.005% unless otherwise noted. |
(e) | Amount rounds to less than $0.005. |
(f) | |
Voluntary waivers were as follows: | August 31, 2023 | February 28, 2023 | February 28, 2022 | February 28, 2021 | February 29, 2020 | February 28, 2019 |
Agency | — | 0.01 % | 0.20 % | 0.06 % | — | — |
Institutional Class | — | 0.01 % | 0.16 % | 0.04 % | — | — |
Morgan | — | 0.04 % | 0.53 % | 0.36 % | — | — |
Premier | — | 0.01 % | 0.39 % | 0.21 % | — | — |
(g) | Amount rounds to less than 0.005%. |
157 | J.P. Morgan Money Market Funds | August 31, 2023 |
Ratios/Supplemental data | |||||
Ratios to average net assets(a) | |||||
Net asset value, end of period | Total return(c) | Net assets, end of period (000's) | Net expenses(d) | Net investment income (loss) | Expenses without waivers and reimbursements |
$1.00 | 2.44 % | $813,097 | 0.26 % | 4.81 % | 0.28 % |
1.00 | 2.09 | 417,945 | 0.26 (f) | 2.40 | 0.31 |
1.00 | 0.01 | 217,942 | 0.06 (f) | 0.01 | 0.31 |
1.00 | 0.11 | 318,757 | 0.20 (f) | 0.10 | 0.30 |
1.00 | 1.85 | 242,716 | 0.26 | 1.79 | 0.30 |
1.00 | 1.80 | 148,122 | 0.26 | 1.82 | 0.31 |
1.00 | 2.46 | 4,239,875 | 0.21 | 4.84 | 0.23 |
1.00 | 2.14 | 3,070,971 | 0.21 (f) | 2.50 | 0.26 |
1.00 | 0.01 | 1,322,211 | 0.06 (f) | 0.01 | 0.25 |
1.00 | 0.13 | 2,344,288 | 0.17 (f) | 0.14 | 0.25 |
1.00 | 1.90 | 2,572,379 | 0.21 | 1.90 | 0.25 |
1.00 | 1.85 | 3,417,418 | 0.21 | 1.85 | 0.26 |
1.00 | 2.27 | 236,912 | 0.59 | 4.48 | 0.59 |
1.00 | 1.81 | 135,312 | 0.55 (f) | 2.16 | 0.63 |
1.00 | 0.00 (g) | 55,291 | 0.06 (f) | 0.00 (g) | 0.64 |
1.00 | 0.06 | 53,546 | 0.23 (f) | 0.05 | 0.63 |
1.00 | 1.51 | 34,728 | 0.59 | 1.48 | 0.67 |
1.00 | 1.46 | 29,289 | 0.59 | 1.45 | 0.70 |
1.00 | 2.35 | 1,802,001 | 0.43 | 4.63 | 0.43 |
1.00 | 1.93 | 1,002,392 | 0.44 (f) | 2.97 | 0.46 |
1.00 | 0.01 | 123,328 | 0.06 (f) | 0.01 | 0.46 |
1.00 | 0.08 | 198,516 | 0.24 (f) | 0.08 | 0.45 |
1.00 | 1.65 | 218,858 | 0.45 | 1.58 | 0.45 |
1.00 | 1.60 | 155,001 | 0.45 | 1.54 | 0.47 |
August 31, 2023 | J.P. Morgan Money Market Funds | 158 |
FOR THE PERIODS INDICATED
Per share operating performance | |||||||
Investment operations | Distributions | ||||||
Net asset value, beginning of period | Net investment income (loss)(b) | Net realized and unrealized gains (losses) on investments | Total from investment operations | Net investment income | Net realized gain | Total distributions | |
JPMorgan 100% U.S. Treasury Securities Money Market Fund | |||||||
Academy | |||||||
Six Months Ended August 31, 2023 (Unaudited) | $1.00 | $0.02 | $— (e) | $0.02 | $(0.02 ) | $— | $(0.02 ) |
Year Ended February 28, 2023 | 1.00 | 0.02 | — (e) | 0.02 | (0.02 ) | — (e) | (0.02 ) |
Year Ended February 28, 2022 | 1.00 | — (e) | — (e) | — (e) | — (e) | — (e) | — (e) |
September 30, 2020 (g) through February 28, 2021 | 1.00 | — (e) | — (e) | — (e) | — (e) | — | — (e) |
Agency | |||||||
Six Months Ended August 31, 2023 (Unaudited) | 1.00 | 0.02 | — (e) | 0.02 | (0.02 ) | — | (0.02 ) |
Year Ended February 28, 2023 | 1.00 | 0.02 | — (e) | 0.02 | (0.02 ) | — (e) | (0.02 ) |
Year Ended February 28, 2022 | 1.00 | — (e) | — (e) | — (e) | — (e) | — (e) | — (e) |
Year Ended February 28, 2021 | 1.00 | — (e) | — (e) | — (e) | — (e) | — | — (e) |
Year Ended February 29, 2020 | 1.00 | 0.02 | — (e) | 0.02 | (0.02 ) | — (e) | (0.02 ) |
Year Ended February 28, 2019 | 1.00 | 0.02 | — (e) | 0.02 | (0.02 ) | — (e) | (0.02 ) |
Capital | |||||||
Six Months Ended August 31, 2023 (Unaudited) | 1.00 | 0.02 | — (e) | 0.02 | (0.02 ) | — | (0.02 ) |
Year Ended February 28, 2023 | 1.00 | 0.02 | — (e) | 0.02 | (0.02 ) | — (e) | (0.02 ) |
Year Ended February 28, 2022 | 1.00 | — (e) | — (e) | — (e) | — (e) | — (e) | — (e) |
Year Ended February 28, 2021 | 1.00 | — (e) | — (e) | — (e) | — (e) | — | — (e) |
Year Ended February 29, 2020 | 1.00 | 0.02 | — (e) | 0.02 | (0.02 ) | — (e) | (0.02 ) |
Year Ended February 28, 2019 | 1.00 | 0.02 | — (e) | 0.02 | (0.02 ) | — (e) | (0.02 ) |
Empower | |||||||
Six Months Ended August 31, 2023 (Unaudited) | 1.00 | 0.02 | — (e) | 0.02 | (0.02 ) | — | (0.02 ) |
Year Ended February 28, 2023 | 1.00 | 0.02 | — (e) | 0.02 | (0.02 ) | — (e) | (0.02 ) |
Year Ended February 28, 2022 | 1.00 | — (e) | — (e) | — (e) | — (e) | — (e) | — (e) |
February 23, 2021 (g) through February 28, 2021 | 1.00 | — (e) | — (e) | — (e) | — (e) | — | — (e) |
IM | |||||||
Six Months Ended August 31, 2023 (Unaudited) | 1.00 | 0.02 | — (e) | 0.02 | (0.02 ) | — | (0.02 ) |
Year Ended February 28, 2023 | 1.00 | 0.02 | — (e) | 0.02 | (0.02 ) | — (e) | (0.02 ) |
Year Ended February 28, 2022 | 1.00 | — (e) | — (e) | — (e) | — (e) | — (e) | — (e) |
Year Ended February 28, 2021 | 1.00 | — (e) | — (e) | — (e) | — (e) | — | — (e) |
January 15, 2020 (g) through February 29, 2020 | 1.00 | — (e) | — (e) | — (e) | — (e) | — | — (e) |
Institutional Class | |||||||
Six Months Ended August 31, 2023 (Unaudited) | 1.00 | 0.02 | — (e) | 0.02 | (0.02 ) | — | (0.02 ) |
Year Ended February 28, 2023 | 1.00 | 0.02 | — (e) | 0.02 | (0.02 ) | — (e) | (0.02 ) |
Year Ended February 28, 2022 | 1.00 | — (e) | — (e) | — (e) | — (e) | — (e) | — (e) |
Year Ended February 28, 2021 | 1.00 | — (e) | — (e) | — (e) | — (e) | — | — (e) |
Year Ended February 29, 2020 | 1.00 | 0.02 | — (e) | 0.02 | (0.02 ) | — (e) | (0.02 ) |
Year Ended February 28, 2019 | 1.00 | 0.02 | — (e) | 0.02 | (0.02 ) | — (e) | (0.02 ) |
Morgan | |||||||
Six Months Ended August 31, 2023 (Unaudited) | 1.00 | 0.02 | — (e) | 0.02 | (0.02 ) | — | (0.02 ) |
Year Ended February 28, 2023 | 1.00 | 0.02 | — (e) | 0.02 | (0.02 ) | — (e) | (0.02 ) |
Year Ended February 28, 2022 | 1.00 | — (e) | — (e) | — (e) | — (e) | — (e) | — (e) |
Year Ended February 28, 2021 | 1.00 | — (e) | — (e) | — (e) | — (e) | — | — (e) |
Year Ended February 29, 2020 | 1.00 | 0.01 | — (e) | 0.01 | (0.01 ) | — (e) | (0.01 ) |
Year Ended February 28, 2019 | 1.00 | 0.01 | — (e) | 0.01 | (0.01 ) | — (e) | (0.01 ) |
159 | J.P. Morgan Money Market Funds | August 31, 2023 |
Ratios/Supplemental data | |||||
Ratios to average net assets(a) | |||||
Net asset value, end of period | Total return(c) | Net assets, end of period (000's) | Net expenses(d) | Net investment income (loss) | Expenses without waivers and reimbursements |
$1.00 | 2.44 % | $50,019 | 0.17 % | 4.93 % | 0.17 % |
1.00 | 2.10 | 100,272 | 0.18 (f) | 2.20 | 0.19 |
1.00 | 0.01 | 131,020 | 0.05 (f) | 0.01 | 0.18 |
1.00 | 0.00 (h) | 17,600 | 0.10 (f) | 0.01 | 0.21 |
1.00 | 2.40 | 10,665,521 | 0.26 | 4.77 | 0.28 |
1.00 | 2.02 | 5,528,371 | 0.26 (f) | 2.19 | 0.29 |
1.00 | 0.01 | 3,173,164 | 0.05 (f) | 0.01 | 0.28 |
1.00 | 0.10 | 4,187,912 | 0.20 (f) | 0.09 | 0.29 |
1.00 | 1.82 | 4,197,262 | 0.26 | 1.76 | 0.30 |
1.00 | 1.79 | 2,567,061 | 0.26 | 1.81 | 0.31 |
1.00 | 2.44 | 75,482,900 | 0.17 | 4.84 | 0.18 |
1.00 | 2.10 | 47,631,670 | 0.18 (f) | 2.01 | 0.18 |
1.00 | 0.01 | 57,422,062 | 0.05 (f) | 0.01 | 0.18 |
1.00 | 0.13 | 58,366,269 | 0.16 (f) | 0.11 | 0.19 |
1.00 | 1.90 | 32,963,549 | 0.18 | 1.85 | 0.20 |
1.00 | 1.88 | 23,528,259 | 0.18 | 1.88 | 0.21 |
1.00 | 2.44 | 448,463 | 0.17 | 4.85 | 0.18 |
1.00 | 2.10 | 218,952 | 0.18 (f) | 3.29 | 0.19 |
1.00 | 0.01 | 29,519 | 0.04 (f) | 0.01 | 0.18 |
1.00 | 0.00 (h) | 25 | 0.07 (f) | 0.01 | 0.20 |
1.00 | 2.47 | 42,380 | 0.12 | 4.95 | 0.12 |
1.00 | 2.14 | 38,265 | 0.13 (f) | 3.39 | 0.13 |
1.00 | 0.01 | 224 | 0.04 (f) | 0.01 | 0.18 |
1.00 | 0.16 | 227 | 0.13 (f) | 0.11 | 0.14 |
1.00 | 0.18 | 11,885 | 0.15 | 1.46 | 0.15 |
1.00 | 2.43 | 41,939,493 | 0.21 | 4.80 | 0.23 |
1.00 | 2.07 | 28,965,801 | 0.21 (f) | 2.15 | 0.24 |
1.00 | 0.01 | 23,076,533 | 0.05 (f) | 0.01 | 0.23 |
1.00 | 0.12 | 24,097,829 | 0.18 (f) | 0.11 | 0.24 |
1.00 | 1.87 | 22,282,460 | 0.21 | 1.83 | 0.25 |
1.00 | 1.84 | 17,858,556 | 0.21 | 1.87 | 0.26 |
1.00 | 2.24 | 4,340,853 | 0.58 | 4.45 | 0.58 |
1.00 | 1.73 | 2,329,156 | 0.53 (f) | 1.70 | 0.59 |
1.00 | 0.00 (h) | 2,206,039 | 0.06 (f) | 0.00 (h) | 0.58 |
1.00 | 0.05 | 2,251,619 | 0.24 (f) | 0.05 | 0.59 |
1.00 | 1.49 | 2,023,440 | 0.59 | 1.47 | 0.60 |
1.00 | 1.46 | 2,009,129 | 0.59 | 1.45 | 0.61 |
August 31, 2023 | J.P. Morgan Money Market Funds | 160 |
FOR THE PERIODS INDICATED (continued)
Per share operating performance | |||||||
Investment operations | Distributions | ||||||
Net asset value, beginning of period | Net investment income (loss)(b) | Net realized and unrealized gains (losses) on investments | Total from investment operations | Net investment income | Net realized gain | Total distributions | |
JPMorgan 100% U.S. Treasury Securities Money Market Fund (continued) | |||||||
Premier | |||||||
Six Months Ended August 31, 2023 (Unaudited) | $1.00 | $0.02 | $— (e) | $0.02 | $(0.02 ) | $— | $(0.02 ) |
Year Ended February 28, 2023 | 1.00 | 0.02 | — (e) | 0.02 | (0.02 ) | — (e) | (0.02 ) |
Year Ended February 28, 2022 | 1.00 | — (e) | — (e) | — (e) | — (e) | — (e) | — (e) |
Year Ended February 28, 2021 | 1.00 | — (e) | — (e) | — (e) | — (e) | — | — (e) |
Year Ended February 29, 2020 | 1.00 | 0.02 | — (e) | 0.02 | (0.02 ) | — (e) | (0.02 ) |
Year Ended February 28, 2019 | 1.00 | 0.02 | — (e) | 0.02 | (0.02 ) | — (e) | (0.02 ) |
Reserve | |||||||
Six Months Ended August 31, 2023 (Unaudited) | 1.00 | 0.02 | — (e) | 0.02 | (0.02 ) | — | (0.02 ) |
Year Ended February 28, 2023 | 1.00 | 0.02 | — (e) | 0.02 | (0.02 ) | — (e) | (0.02 ) |
Year Ended February 28, 2022 | 1.00 | — (e) | — (e) | — (e) | — (e) | — (e) | — (e) |
Year Ended February 28, 2021 | 1.00 | — (e) | — (e) | — (e) | — (e) | — | — (e) |
Year Ended February 29, 2020 | 1.00 | 0.01 | — (e) | 0.01 | (0.01 ) | — (e) | (0.01 ) |
Year Ended February 28, 2019 | 1.00 | 0.01 | — (e) | 0.01 | (0.01 ) | — (e) | (0.01 ) |
(a) | Annualized for periods less than one year, unless otherwise noted. |
(b) | Calculated based upon average shares outstanding. |
(c) | Not annualized for periods less than one year. |
(d) | Includes interest expense, if applicable, each of which is less than 0.005% unless otherwise noted. |
(e) | Amount rounds to less than $0.005. |
(f) | |
Voluntary waivers were as follows: | August 31, 2023 | February 28, 2023 | February 28, 2022 | February 28, 2021 | February 29, 2020 | February 28, 2019 |
Academy | — | — (a) | 0.12 % | 0.08 % | — | — |
Agency | — | — (a) | 0.21 % | 0.05 % | — | — |
Capital | — | — (a) | 0.12 % | 0.02 % | — | — |
Empower | — | — (a) | 0.13 % | 0.12 % | — | — |
IM | — | — (a) | 0.14 % | — (a) | — | — |
Institutional Class | — | — (a) | 0.16 % | 0.03 % | — | — |
Morgan | — | 0.05 % | 0.52 % | 0.34 % | — | — |
Premier | — | 0.02 % | 0.38 % | 0.19 % | — | — |
Reserve | — | 0.09 % | 0.62 % | 0.44 % | — | — |
(a) Amount rounds to less than 0.005%. | ||||||
(g) | Commencement of offering of class of shares. |
(h) | Amount rounds to less than 0.005%. |
161 | J.P. Morgan Money Market Funds | August 31, 2023 |
Ratios/Supplemental data | |||||
Ratios to average net assets(a) | |||||
Net asset value, end of period | Total return(c) | Net assets, end of period (000's) | Net expenses(d) | Net investment income (loss) | Expenses without waivers and reimbursements |
$1.00 | 2.31 % | $11,679,465 | 0.43 % | 4.60 % | 0.43 % |
1.00 | 1.86 | 5,755,805 | 0.42 (f) | 2.37 | 0.44 |
1.00 | 0.01 | 1,947,356 | 0.05 (f) | 0.01 | 0.43 |
1.00 | 0.06 | 1,999,999 | 0.25 (f) | 0.06 | 0.44 |
1.00 | 1.63 | 2,537,050 | 0.45 | 1.62 | 0.45 |
1.00 | 1.60 | 2,059,307 | 0.45 | 1.65 | 0.46 |
1.00 | 2.19 | 1,246,377 | 0.68 | 4.31 | 0.68 |
1.00 | 1.65 | 1,422,097 | 0.59 (f) | 1.33 | 0.68 |
1.00 | 0.00 (h) | 3,821,500 | 0.06 (f) | 0.00 (h) | 0.68 |
1.00 | 0.04 | 2,893,380 | 0.25 (f) | 0.03 | 0.69 |
1.00 | 1.38 | 2,102,023 | 0.70 | 1.34 | 0.70 |
1.00 | 1.35 | 1,561,835 | 0.70 | 1.42 | 0.71 |
August 31, 2023 | J.P. Morgan Money Market Funds | 162 |
FOR THE PERIODS INDICATED
Per share operating performance | |||||||
Investment operations | Distributions | ||||||
Net asset value, beginning of period | Net investment income (loss)(b) | Net realized and unrealized gains (losses) on investments | Total from investment operations | Net investment income | Net realized gain | Total distributions | |
JPMorgan Tax Free Money Market Fund | |||||||
Agency | |||||||
Six Months Ended August 31, 2023 (Unaudited) | $1.00 | $0.02 | $— (e) | $0.02 | $(0.02 ) | $— | $(0.02 ) |
Year Ended February 28, 2023 | 1.00 | 0.01 | — (e) | 0.01 | (0.01 ) | — (e) | (0.01 ) |
Year Ended February 28, 2022 | 1.00 | — (e) | — (e) | — (e) | — (e) | — (e) | — (e) |
Year Ended February 28, 2021 | 1.00 | — (e) | — (e) | — (e) | — (e) | — (e) | — (e) |
Year Ended February 29, 2020 | 1.00 | 0.01 | — (e) | 0.01 | (0.01 ) | — (e) | (0.01 ) |
Year Ended February 28, 2019 | 1.00 | 0.01 | — (e) | 0.01 | (0.01 ) | — (e) | (0.01 ) |
Institutional Class | |||||||
Six Months Ended August 31, 2023 (Unaudited) | 1.00 | 0.02 | — (e) | 0.02 | (0.02 ) | — | (0.02 ) |
Year Ended February 28, 2023 | 1.00 | 0.01 | — (e) | 0.01 | (0.01 ) | — (e) | (0.01 ) |
Year Ended February 28, 2022 | 1.00 | — (e) | — (e) | — (e) | — (e) | — (e) | — (e) |
Year Ended February 28, 2021 | 1.00 | — (e) | — (e) | — (e) | — (e) | — (e) | — (e) |
Year Ended February 29, 2020 | 1.00 | 0.01 | — (e) | 0.01 | (0.01 ) | — (e) | (0.01 ) |
Year Ended February 28, 2019 | 1.00 | 0.01 | — (e) | 0.01 | (0.01 ) | — (e) | (0.01 ) |
Morgan | |||||||
Six Months Ended August 31, 2023 (Unaudited) | 1.00 | 0.01 | — (e) | 0.01 | (0.01 ) | — | (0.01 ) |
Year Ended February 28, 2023 | 1.00 | 0.01 | — (e) | 0.01 | (0.01 ) | — (e) | (0.01 ) |
Year Ended February 28, 2022 | 1.00 | — (e) | — (e) | — (e) | — (e) | — (e) | — (e) |
Year Ended February 28, 2021 | 1.00 | — (e) | — (e) | — (e) | — (e) | — (e) | — (e) |
Year Ended February 29, 2020 | 1.00 | 0.01 | — (e) | 0.01 | (0.01 ) | — (e) | (0.01 ) |
Year Ended February 28, 2019 | 1.00 | 0.01 | — (e) | 0.01 | (0.01 ) | — (e) | (0.01 ) |
Premier | |||||||
Six Months Ended August 31, 2023 (Unaudited) | 1.00 | 0.01 | — (e) | 0.01 | (0.01 ) | — | (0.01 ) |
Year Ended February 28, 2023 | 1.00 | 0.01 | — (e) | 0.01 | (0.01 ) | — (e) | (0.01 ) |
Year Ended February 28, 2022 | 1.00 | — (e) | — (e) | — (e) | — (e) | — (e) | — (e) |
Year Ended February 28, 2021 | 1.00 | — (e) | — (e) | — (e) | — (e) | — (e) | — (e) |
Year Ended February 29, 2020 | 1.00 | 0.01 | — (e) | 0.01 | (0.01 ) | — (e) | (0.01 ) |
Year Ended February 28, 2019 | 1.00 | 0.01 | — (e) | 0.01 | (0.01 ) | — (e) | (0.01 ) |
Reserve | |||||||
Six Months Ended August 31, 2023 (Unaudited) | 1.00 | 0.01 | — (e) | 0.01 | (0.01 ) | — | (0.01 ) |
Year Ended February 28, 2023 | 1.00 | 0.01 | — (e) | 0.01 | (0.01 ) | — (e) | (0.01 ) |
Year Ended February 28, 2022 | 1.00 | — (e) | — (e) | — (e) | — (e) | — (e) | — (e) |
Year Ended February 28, 2021 | 1.00 | — (e) | — (e) | — (e) | — (e) | — (e) | — (e) |
Year Ended February 29, 2020 | 1.00 | 0.01 | — (e) | 0.01 | (0.01 ) | — (e) | (0.01 ) |
Year Ended February 28, 2019 | 1.00 | 0.01 | — (e) | 0.01 | (0.01 ) | — (e) | (0.01 ) |
(a) | Annualized for periods less than one year, unless otherwise noted. |
(b) | Calculated based upon average shares outstanding. |
(c) | Not annualized for periods less than one year. |
(d) | Includes interest expense, if applicable, each of which is less than 0.005% unless otherwise noted. |
(e) | Amount rounds to less than $0.005. |
(f) | |
Voluntary waivers were as follows: | August 31, 2023 | February 28, 2023 | February 28, 2022 | February 28, 2021 | February 29, 2020 | February 28, 2019 |
Agency | — | — (a) | 0.16 % | 0.03 % | — | — |
Institutional Class | — | — | 0.12 % | 0.01 % | — | — |
Morgan | — | 0.02 % | 0.49 % | 0.29 % | — | — |
Premier | — | — (a) | 0.33 % | 0.14 % | — | — |
Reserve | — | 0.07 % | 0.59 % | 0.39 % | — | — |
(a) Amount rounds to less than 0.005%. | ||||||
163 | J.P. Morgan Money Market Funds | August 31, 2023 |
Ratios/Supplemental data | |||||
Ratios to average net assets(a) | |||||
Net asset value, end of period | Total return(c) | Net assets, end of period (000's) | Net expenses(d) | Net investment income (loss) | Expenses without waivers and reimbursements |
$1.00 | 1.53 % | $575,491 | 0.26 % | 3.01 % | 0.28 % |
1.00 | 1.39 | 581,661 | 0.26 (f) | 1.52 | 0.29 |
1.00 | 0.01 | 281,075 | 0.10 (f) | 0.01 | 0.29 |
1.00 | 0.26 | 372,457 | 0.23 (f) | 0.33 | 0.29 |
1.00 | 1.17 | 782,269 | 0.26 | 1.17 | 0.30 |
1.00 | 1.24 | 1,063,941 | 0.26 | 1.23 | 0.31 |
1.00 | 1.55 | 7,975,417 | 0.21 | 3.06 | 0.23 |
1.00 | 1.44 | 8,190,503 | 0.21 | 1.54 | 0.24 |
1.00 | 0.02 | 5,135,738 | 0.09 (f) | 0.02 | 0.24 |
1.00 | 0.29 | 6,858,653 | 0.20 (f) | 0.33 | 0.24 |
1.00 | 1.22 | 9,173,460 | 0.21 | 1.23 | 0.25 |
1.00 | 1.29 | 12,402,297 | 0.21 | 1.27 | 0.26 |
1.00 | 1.36 | 59,535 | 0.59 | 2.70 | 0.59 |
1.00 | 1.09 | 43,671 | 0.56 (f) | 1.31 | 0.60 |
1.00 | 0.01 | 17,140 | 0.10 (f) | 0.01 | 0.62 |
1.00 | 0.19 | 22,830 | 0.30 (f) | 0.12 | 0.61 |
1.00 | 0.84 | 10,842 | 0.59 | 0.83 | 0.64 |
1.00 | 0.90 | 9,884 | 0.59 | 0.89 | 0.68 |
1.00 | 1.44 | 1,059,788 | 0.43 | 2.85 | 0.43 |
1.00 | 1.22 | 871,759 | 0.43 (f) | 1.49 | 0.44 |
1.00 | 0.01 | 338,064 | 0.10 (f) | 0.01 | 0.44 |
1.00 | 0.21 | 498,856 | 0.29 (f) | 0.26 | 0.44 |
1.00 | 0.98 | 847,483 | 0.45 | 0.99 | 0.45 |
1.00 | 1.04 | 1,062,712 | 0.45 | 1.03 | 0.46 |
1.00 | 1.31 | 657,369 | 0.68 | 2.59 | 0.68 |
1.00 | 1.01 | 761,834 | 0.62 (f) | 0.80 | 0.69 |
1.00 | 0.01 | 1,807,835 | 0.10 (f) | 0.01 | 0.69 |
1.00 | 0.18 | 1,574,145 | 0.29 (f) | 0.16 | 0.69 |
1.00 | 0.73 | 1,707,525 | 0.70 | 0.72 | 0.70 |
1.00 | 0.79 | 2,028,976 | 0.70 | 0.78 | 0.71 |
August 31, 2023 | J.P. Morgan Money Market Funds | 164 |
FOR THE PERIODS INDICATED
Per share operating performance | |||||||
Investment operations | Distributions | ||||||
Net asset value, beginning of period | Net investment income (loss)(b) | Net realized and unrealized gains (losses) on investments | Total from investment operations | Net investment income | Net realized gain | Total distributions | |
JPMorgan Municipal Money Market Fund | |||||||
Agency | |||||||
Six Months Ended August 31, 2023 (Unaudited) | $1.00 | $0.02 | $— (e) | $0.02 | $(0.02 ) | $— | $(0.02 ) |
Year Ended February 28, 2023 | 1.00 | 0.01 | — | 0.01 | (0.01 ) | — | (0.01 ) |
Year Ended February 28, 2022 | 1.00 | — (e) | — (e) | — (e) | — (e) | — (e) | — (e) |
Year Ended February 28, 2021 | 1.00 | — (e) | — (e) | — (e) | — (e) | — (e) | — (e) |
Year Ended February 29, 2020 | 1.00 | 0.01 | — (e) | 0.01 | (0.01 ) | — (e) | (0.01 ) |
Year Ended February 28, 2019 | 1.00 | 0.01 | — (e) | 0.01 | (0.01 ) | — (e) | (0.01 ) |
Institutional Class | |||||||
Six Months Ended August 31, 2023 (Unaudited) | 1.00 | 0.02 | — (e) | 0.02 | (0.02 ) | — | (0.02 ) |
Year Ended February 28, 2023 | 1.00 | 0.01 | — | 0.01 | (0.01 ) | — | (0.01 ) |
Year Ended February 28, 2022 | 1.00 | — (e) | — (e) | — (e) | — (e) | — (e) | — (e) |
Year Ended February 28, 2021 | 1.00 | — (e) | — (e) | — (e) | — (e) | — (e) | — (e) |
Year Ended February 29, 2020 | 1.00 | 0.01 | — (e) | 0.01 | (0.01 ) | — (e) | (0.01 ) |
Year Ended February 28, 2019 | 1.00 | 0.01 | — (e) | 0.01 | (0.01 ) | — (e) | (0.01 ) |
Morgan | |||||||
Six Months Ended August 31, 2023 (Unaudited) | 1.00 | 0.01 | — (e) | 0.01 | (0.01 ) | — | (0.01 ) |
Year Ended February 28, 2023 | 1.00 | 0.01 | — | 0.01 | (0.01 ) | — | (0.01 ) |
Year Ended February 28, 2022 | 1.00 | — (e) | — (e) | — (e) | — (e) | — (e) | — (e) |
Year Ended February 28, 2021 | 1.00 | — (e) | — (e) | — (e) | — (e) | — (e) | — (e) |
Year Ended February 29, 2020 | 1.00 | 0.01 | — (e) | 0.01 | (0.01 ) | — (e) | (0.01 ) |
Year Ended February 28, 2019 | 1.00 | 0.01 | — (e) | 0.01 | (0.01 ) | — (e) | (0.01 ) |
Premier | |||||||
Six Months Ended August 31, 2023 (Unaudited) | 1.00 | 0.01 | — (e) | 0.01 | (0.01 ) | — | (0.01 ) |
Year Ended February 28, 2023 | 1.00 | 0.01 | — | 0.01 | (0.01 ) | — | (0.01 ) |
Year Ended February 28, 2022 | 1.00 | — (e) | — (e) | — (e) | — (e) | — (e) | — (e) |
Year Ended February 28, 2021 | 1.00 | — (e) | — (e) | — (e) | — (e) | — (e) | — (e) |
Year Ended February 29, 2020 | 1.00 | 0.01 | — (e) | 0.01 | (0.01 ) | — (e) | (0.01 ) |
Year Ended February 28, 2019 | 1.00 | 0.01 | — (e) | 0.01 | (0.01 ) | — (e) | (0.01 ) |
Service | |||||||
Six Months Ended August 31, 2023 (Unaudited) | 1.00 | 0.01 | — (e) | 0.01 | (0.01 ) | — | (0.01 ) |
Year Ended February 28, 2023 | 1.00 | 0.01 | — | 0.01 | (0.01 ) | — | (0.01 ) |
Year Ended February 28, 2022 | 1.00 | — (e) | — (e) | — (e) | — (e) | — (e) | — (e) |
Year Ended February 28, 2021 | 1.00 | — (e) | — (e) | — (e) | — (e) | — (e) | — (e) |
Year Ended February 29, 2020 | 1.00 | — (e) | — (e) | — (e) | — (e) | — (e) | — (e) |
Year Ended February 28, 2019 | 1.00 | — (e) | — (e) | — (e) | — (e) | — (e) | — (e) |
(a) | Annualized for periods less than one year, unless otherwise noted. |
(b) | Calculated based upon average shares outstanding. |
(c) | Not annualized for periods less than one year. |
(d) | Includes interest expense, if applicable, each of which is less than 0.005% unless otherwise noted. |
(e) | Amount rounds to less than $0.005. |
(f) | |
Voluntary waivers were as follows: | August 31, 2023 | February 28, 2023 | February 28, 2022 | February 28, 2021 | February 29, 2020 | February 28, 2019 |
Agency | — | — (a) | 0.13 % | 0.01 % | — | — |
Institutional Class | — | — (a) | 0.09 % | 0.01 % | — | — |
Morgan | — | 0.02 % | 0.46 % | 0.24 % | — | — |
Premier | — | — (a) | 0.32 % | 0.10 % | — | — |
Service | — | 0.19 % | 0.92 % | 0.60 % | — (a) | — (a) |
(a) Amount rounds to less than 0.005%. | ||||||
165 | J.P. Morgan Money Market Funds | August 31, 2023 |
Ratios/Supplemental data | |||||
Ratios to average net assets(a) | |||||
Net asset value, end of period | Total return(c) | Net assets, end of period (000's) | Net expenses(d) | Net investment income (loss) | Expenses without waivers and reimbursements |
$1.00 | 1.55 % | $157,259 | 0.26 % | 3.06 % | 0.30 % |
1.00 | 1.38 | 154,048 | 0.26 (f) | 1.53 | 0.31 |
1.00 | 0.01 | 38,272 | 0.13 (f) | 0.01 | 0.32 |
1.00 | 0.31 | 60,879 | 0.25 (f) | 0.38 | 0.31 |
1.00 | 1.20 | 112,747 | 0.26 | 1.20 | 0.34 |
1.00 | 1.26 | 127,136 | 0.26 | 1.25 | 0.33 |
1.00 | 1.58 | 1,080,908 | 0.21 | 3.11 | 0.25 |
1.00 | 1.43 | 836,112 | 0.21 (f) | 1.37 | 0.26 |
1.00 | 0.02 | 879,357 | 0.12 (f) | 0.02 | 0.27 |
1.00 | 0.35 | 834,116 | 0.20 (f) | 0.38 | 0.26 |
1.00 | 1.25 | 1,688,150 | 0.21 | 1.24 | 0.29 |
1.00 | 1.31 | 2,003,502 | 0.21 | 1.30 | 0.28 |
1.00 | 1.38 | 50,169 | 0.59 | 2.74 | 0.61 |
1.00 | 1.07 | 36,619 | 0.57 (f) | 1.16 | 0.62 |
1.00 | 0.01 | 24,236 | 0.13 (f) | 0.01 | 0.63 |
1.00 | 0.22 | 43,853 | 0.35 (f) | 0.16 | 0.62 |
1.00 | 0.87 | 35,473 | 0.59 | 0.84 | 0.66 |
1.00 | 0.93 | 15,899 | 0.59 | 0.92 | 0.65 |
1.00 | 1.46 | 278,606 | 0.44 | 2.90 | 0.45 |
1.00 | 1.20 | 156,828 | 0.44 (f) | 1.51 | 0.46 |
1.00 | 0.01 | 37,902 | 0.13 (f) | 0.01 | 0.47 |
1.00 | 0.23 | 69,237 | 0.35 (f) | 0.28 | 0.47 |
1.00 | 1.01 | 135,261 | 0.45 | 1.00 | 0.50 |
1.00 | 1.07 | 129,260 | 0.45 | 1.06 | 0.48 |
1.00 | 1.15 | 6,788 | 1.05 | 2.27 | 1.05 |
1.00 | 0.75 | 8,796 | 0.86 (f) | 0.62 | 1.06 |
1.00 | 0.01 | 19,679 | 0.13 (f) | 0.01 | 1.06 |
1.00 | 0.16 | 28,684 | 0.44 (f) | 0.21 | 1.06 |
1.00 | 0.41 | 68,493 | 1.05 (f) | 0.48 | 1.09 |
1.00 | 0.47 | 256,953 | 1.05 (f) | 0.46 | 1.08 |
August 31, 2023 | J.P. Morgan Money Market Funds | 166 |
FOR THE PERIODS INDICATED
Per share operating performance | |||||||
Investment operations | Distributions | ||||||
Net asset value, beginning of period | Net investment income (loss)(b) | Net realized and unrealized gains (losses) on investments | Total from investment operations | Net investment income | Net realized gain | Total distributions | |
JPMorgan California Municipal Money Market Fund | |||||||
Agency | |||||||
Six Months Ended August 31, 2023 (Unaudited) | $1.00 | $0.01 | $— (e) | $0.01 | $(0.01 ) | $— | $(0.01 ) |
Year Ended February 28, 2023 | 1.00 | 0.01 | — (e) | 0.01 | (0.01 ) | — | (0.01 ) |
Year Ended February 28, 2022 | 1.00 | — (e) | — (e) | — (e) | — (e) | — (e) | — (e) |
Year Ended February 28, 2021 | 1.00 | — (e) | — (e) | — (e) | — (e) | — (e) | — (e) |
March 1, 2019 (g) through February 29, 2020 | 1.00 | 0.01 | — (e) | 0.01 | (0.01 ) | — (e) | (0.01 ) |
Institutional Class | |||||||
Six Months Ended August 31, 2023 (Unaudited) | 1.00 | 0.01 | — (e) | 0.01 | (0.01 ) | — | (0.01 ) |
Year Ended February 28, 2023 | 1.00 | 0.01 | — (e) | 0.01 | (0.01 ) | — | (0.01 ) |
Year Ended February 28, 2022 | 1.00 | — (e) | — (e) | — (e) | — (e) | — (e) | — (e) |
Year Ended February 28, 2021 | 1.00 | — (e) | — (e) | — (e) | — (e) | — (e) | — (e) |
March 1, 2019 (g) through February 29, 2020 | 1.00 | 0.01 | — (e) | 0.01 | (0.01 ) | — (e) | (0.01 ) |
Morgan | |||||||
Six Months Ended August 31, 2023 (Unaudited) | 1.00 | 0.01 | — (e) | 0.01 | (0.01 ) | — | (0.01 ) |
Year Ended February 28, 2023 | 1.00 | 0.01 | — (e) | 0.01 | (0.01 ) | — | (0.01 ) |
Year Ended February 28, 2022 | 1.00 | — (e) | — (e) | — (e) | — (e) | — (e) | — (e) |
Year Ended February 28, 2021 | 1.00 | — (e) | — (e) | — (e) | — (e) | — (e) | — (e) |
Year Ended February 29, 2020 | 1.00 | 0.01 | — (e) | 0.01 | (0.01 ) | — (e) | (0.01 ) |
Year Ended February 28, 2019 | 1.00 | 0.01 | — (e) | 0.01 | (0.01 ) | — (e) | (0.01 ) |
Premier | |||||||
Six Months Ended August 31, 2023 (Unaudited) | 1.00 | 0.01 | — (e) | 0.01 | (0.01 ) | — | (0.01 ) |
Year Ended February 28, 2023 | 1.00 | 0.01 | — (e) | 0.01 | (0.01 ) | — | (0.01 ) |
Year Ended February 28, 2022 | 1.00 | — (e) | — (e) | — (e) | — (e) | — (e) | — (e) |
Year Ended February 28, 2021 | 1.00 | — (e) | — (e) | — (e) | — (e) | — (e) | — (e) |
Year Ended February 29, 2020 | 1.00 | 0.01 | — (e) | 0.01 | (0.01 ) | — (e) | (0.01 ) |
Year Ended February 28, 2019 | 1.00 | 0.01 | — (e) | 0.01 | (0.01 ) | — (e) | (0.01 ) |
Service | |||||||
Six Months Ended August 31, 2023 (Unaudited) | 1.00 | 0.01 | — (e) | 0.01 | (0.01 ) | — | (0.01 ) |
Year Ended February 28, 2023 | 1.00 | 0.01 | — (e) | 0.01 | (0.01 ) | — | (0.01 ) |
Year Ended February 28, 2022 | 1.00 | — (e) | — (e) | — (e) | — (e) | — (e) | — (e) |
Year Ended February 28, 2021 | 1.00 | — (e) | — (e) | — (e) | — (e) | — (e) | — (e) |
Year Ended February 29, 2020 | 1.00 | — (e) | — (e) | — (e) | — (e) | — (e) | — (e) |
Year Ended February 28, 2019 | 1.00 | — (e) | — (e) | — (e) | — (e) | — (e) | — (e) |
(a) | Annualized for periods less than one year, unless otherwise noted. |
(b) | Calculated based upon average shares outstanding. |
(c) | Not annualized for periods less than one year. |
(d) | Includes interest expense, if applicable, each of which is less than 0.005% unless otherwise noted. |
(e) | Amount rounds to less than $0.005. |
(f) | |
Voluntary waivers were as follows: | August 31, 2023 | February 28, 2023 | February 28, 2022 | February 28, 2021 | February 29, 2020 | February 28, 2019 |
Agency | — | — (a) | 0.14 % | 0.04 % | — | — |
Institutional Class | — | — (a) | 0.12 % | 0.01 % | — | — |
Morgan | — | 0.02 % | 0.49 % | 0.31 % | — | — |
Premier | — | 0.01 % | 0.36 % | 0.18 % | — | — |
Service | — | 0.21 % | 0.95 % | 0.68 % | 0.01 % | 0.01 % |
(a) Amount rounds to less than 0.005%. | ||||||
(g) | Commencement of offering of class of shares. |
167 | J.P. Morgan Money Market Funds | August 31, 2023 |
Ratios/Supplemental data | |||||
Ratios to average net assets(a) | |||||
Net asset value, end of period | Total return(c) | Net assets, end of period (000's) | Net expenses(d) | Net investment income (loss) | Expenses without waivers and reimbursements |
$1.00 | 1.33 % | $61,854 | 0.26 % | 2.62 % | 0.32 % |
1.00 | 1.29 | 78,257 | 0.26 (f) | 1.78 | 0.32 |
1.00 | 0.02 | 2,527 | 0.12 (f) | 0.01 | 0.37 |
1.00 | 0.23 | 21,715 | 0.22 (f) | 0.24 | 0.33 |
1.00 | 1.11 | 24,892 | 0.26 | 0.87 | 0.35 |
1.00 | 1.36 | 298,772 | 0.21 | 2.68 | 0.27 |
1.00 | 1.34 | 183,670 | 0.21 (f) | 1.69 | 0.28 |
1.00 | 0.03 | 87,260 | 0.09 (f) | 0.02 | 0.32 |
1.00 | 0.25 | 156,740 | 0.20 (f) | 0.30 | 0.28 |
1.00 | 1.15 | 287,724 | 0.21 | 1.03 | 0.30 |
1.00 | 1.16 | 8,093 | 0.59 | 2.29 | 0.64 |
1.00 | 0.98 | 8,762 | 0.57 (f) | 1.26 | 0.68 |
1.00 | 0.02 | 3,744 | 0.10 (f) | 0.01 | 0.69 |
1.00 | 0.17 | 7,122 | 0.28 (f) | 0.12 | 0.63 |
1.00 | 0.77 | 2,447 | 0.59 | 0.70 | 0.69 |
1.00 | 0.86 | 1,591 | 0.59 | 0.85 | 0.72 |
1.00 | 1.23 | 174,910 | 0.45 | 2.43 | 0.47 |
1.00 | 1.10 | 181,845 | 0.44 (f) | 1.26 | 0.49 |
1.00 | 0.02 | 126,122 | 0.09 (f) | 0.01 | 0.52 |
1.00 | 0.19 | 101,991 | 0.27 (f) | 0.20 | 0.48 |
1.00 | 0.91 | 233,249 | 0.45 | 0.87 | 0.50 |
1.00 | 1.00 | 259,463 | 0.45 | 0.97 | 0.52 |
1.00 | 0.93 | 5,257 | 1.05 | 1.83 | 1.07 |
1.00 | 0.66 | 6,519 | 0.84 (f) | 0.59 | 1.09 |
1.00 | 0.02 | 9,622 | 0.10 (f) | 0.01 | 1.12 |
1.00 | 0.12 | 12,065 | 0.37 (f) | 0.16 | 1.08 |
1.00 | 0.32 | 28,405 | 1.05 (f) | 0.37 | 1.10 |
1.00 | 0.41 | 118,146 | 1.04 (f) | 0.37 | 1.12 |
August 31, 2023 | J.P. Morgan Money Market Funds | 168 |
FOR THE PERIODS INDICATED
Per share operating performance | |||||||
Investment operations | Distributions | ||||||
Net asset value, beginning of period | Net investment income (loss)(b) | Net realized and unrealized gains (losses) on investments | Total from investment operations | Net investment income | Net realized gain | Total distributions | |
JPMorgan New York Municipal Money Market Fund | |||||||
Agency | |||||||
Six Months Ended August 31, 2023 (Unaudited) | $1.00 | $0.02 | $— (e) | $0.02 | $(0.02 ) | $— | $(0.02 ) |
Year Ended February 28, 2023 | 1.00 | 0.01 | — (e) | 0.01 | (0.01 ) | — | (0.01 ) |
Year Ended February 28, 2022 | 1.00 | — (e) | — (e) | — (e) | — (e) | — (e) | — (e) |
Year Ended February 28, 2021 | 1.00 | — (e) | — (e) | — (e) | — (e) | — (e) | — (e) |
March 1, 2019 (g) through February 29, 2020 | 1.00 | 0.01 | — (e) | 0.01 | (0.01 ) | — (e) | (0.01 ) |
Institutional Class | |||||||
Six Months Ended August 31, 2023 (Unaudited) | 1.00 | 0.02 | — (e) | 0.02 | (0.02 ) | — | (0.02 ) |
Year Ended February 28, 2023 | 1.00 | 0.01 | — (e) | 0.01 | (0.01 ) | — | (0.01 ) |
Year Ended February 28, 2022 | 1.00 | — (e) | — (e) | — (e) | — (e) | — (e) | — (e) |
Year Ended February 28, 2021 | 1.00 | — (e) | — (e) | — (e) | — (e) | — (e) | — (e) |
March 1, 2019 (g) through February 29, 2020 | 1.00 | 0.01 | — (e) | 0.01 | (0.01 ) | — (e) | (0.01 ) |
Morgan | |||||||
Six Months Ended August 31, 2023 (Unaudited) | 1.00 | 0.01 | — (e) | 0.01 | (0.01 ) | — | (0.01 ) |
Year Ended February 28, 2023 | 1.00 | 0.01 | — (e) | 0.01 | (0.01 ) | — | (0.01 ) |
Year Ended February 28, 2022 | 1.00 | — (e) | — (e) | — (e) | — (e) | — (e) | — (e) |
Year Ended February 28, 2021 | 1.00 | — (e) | — (e) | — (e) | — (e) | — (e) | — (e) |
Year Ended February 29, 2020 | 1.00 | 0.01 | — (e) | 0.01 | (0.01 ) | — (e) | (0.01 ) |
Year Ended February 28, 2019 | 1.00 | 0.01 | — (e) | 0.01 | (0.01 ) | — (e) | (0.01 ) |
Premier | |||||||
Six Months Ended August 31, 2023 (Unaudited) | 1.00 | 0.01 | — (e) | 0.01 | (0.01 ) | — | (0.01 ) |
Year Ended February 28, 2023 | 1.00 | 0.01 | — (e) | 0.01 | (0.01 ) | — | (0.01 ) |
Year Ended February 28, 2022 | 1.00 | — (e) | — (e) | — (e) | — (e) | — (e) | — (e) |
Year Ended February 28, 2021 | 1.00 | — (e) | — (e) | — (e) | — (e) | — (e) | — (e) |
Year Ended February 29, 2020 | 1.00 | 0.01 | — (e) | 0.01 | (0.01 ) | — (e) | (0.01 ) |
Year Ended February 28, 2019 | 1.00 | 0.01 | — (e) | 0.01 | (0.01 ) | — (e) | (0.01 ) |
Reserve | |||||||
Six Months Ended August 31, 2023 (Unaudited) | 1.00 | 0.01 | — (e) | 0.01 | (0.01 ) | — | (0.01 ) |
Year Ended February 28, 2023 | 1.00 | 0.01 | — (e) | 0.01 | (0.01 ) | — | (0.01 ) |
Year Ended February 28, 2022 | 1.00 | — (e) | — (e) | — (e) | — (e) | — (e) | — (e) |
Year Ended February 28, 2021 | 1.00 | — (e) | — (e) | — (e) | — (e) | — (e) | — (e) |
Year Ended February 29, 2020 | 1.00 | 0.01 | — (e) | 0.01 | (0.01 ) | — (e) | (0.01 ) |
Year Ended February 28, 2019 | 1.00 | 0.01 | — (e) | 0.01 | (0.01 ) | — (e) | (0.01 ) |
Service | |||||||
Six Months Ended August 31, 2023 (Unaudited) | 1.00 | 0.01 | — (e) | 0.01 | (0.01 ) | — | (0.01 ) |
Year Ended February 28, 2023 | 1.00 | 0.01 | — (e) | 0.01 | (0.01 ) | — | (0.01 ) |
Year Ended February 28, 2022 | 1.00 | — (e) | — (e) | — (e) | — (e) | — (e) | — (e) |
Year Ended February 28, 2021 | 1.00 | — (e) | — (e) | — (e) | — (e) | — (e) | — (e) |
Year Ended February 29, 2020 | 1.00 | — (e) | — (e) | — (e) | — (e) | — (e) | — (e) |
Year Ended February 28, 2019 | 1.00 | — (e) | — (e) | — (e) | — (e) | — (e) | — (e) |
(a) | Annualized for periods less than one year, unless otherwise noted. |
(b) | Calculated based upon average shares outstanding. |
(c) | Not annualized for periods less than one year. |
(d) | Includes interest expense, if applicable, each of which is less than 0.005% unless otherwise noted. |
(e) | Amount rounds to less than $0.005. |
(f) | |
Voluntary waivers were as follows: | August 31, 2023 | February 28, 2023 | February 28, 2022 | February 28, 2021 | February 29, 2020 | February 28, 2019 |
Agency | — | — (a) | 0.14 % | 0.01 % | — | — |
Institutional Class | — | — | 0.09 % | — (a) | — | — |
Morgan | — | 0.04 % | 0.46 % | 0.27 % | — | — |
Premier | — | — (a) | 0.33 % | 0.11 % | — | — |
Reserve | — | 0.06 % | 0.58 % | 0.35 % | — | — |
Service | — | 0.20 % | 0.92 % | 0.63 % | 0.01 % | 0.01 % |
(a) Amount rounds to less than 0.005%. | ||||||
(g) | Commencement of offering of class of shares. |
169 | J.P. Morgan Money Market Funds | August 31, 2023 |
Ratios/Supplemental data | |||||
Ratios to average net assets(a) | |||||
Net asset value, end of period | Total return(c) | Net assets, end of period (000's) | Net expenses(d) | Net investment income (loss) | Expenses without waivers and reimbursements |
$1.00 | 1.51 % | $294,804 | 0.26 % | 2.98 % | 0.29 % |
1.00 | 1.40 | 268,303 | 0.26 (f) | 1.84 | 0.30 |
1.00 | 0.01 | 50,157 | 0.12 (f) | 0.01 | 0.32 |
1.00 | 0.30 | 72,812 | 0.25 (f) | 0.44 | 0.30 |
1.00 | 1.15 | 262,677 | 0.26 | 1.06 | 0.31 |
1.00 | 1.54 | 1,313,472 | 0.21 | 3.01 | 0.24 |
1.00 | 1.45 | 1,780,316 | 0.21 | 1.85 | 0.25 |
1.00 | 0.03 | 425,093 | 0.12 (f) | 0.02 | 0.27 |
1.00 | 0.34 | 532,580 | 0.21 (f) | 0.41 | 0.25 |
1.00 | 1.20 | 1,625,406 | 0.21 | 1.09 | 0.26 |
1.00 | 1.34 | 53,182 | 0.59 | 2.66 | 0.62 |
1.00 | 1.10 | 50,655 | 0.55 (f) | 1.08 | 0.63 |
1.00 | 0.01 | 50,015 | 0.13 (f) | 0.01 | 0.65 |
1.00 | 0.23 | 59,934 | 0.32 (f) | 0.20 | 0.64 |
1.00 | 0.82 | 62,178 | 0.59 | 0.84 | 0.63 |
1.00 | 0.89 | 132,127 | 0.59 | 0.88 | 0.66 |
1.00 | 1.42 | 468,051 | 0.44 | 2.79 | 0.44 |
1.00 | 1.22 | 492,280 | 0.44 (f) | 1.68 | 0.45 |
1.00 | 0.01 | 97,415 | 0.12 (f) | 0.01 | 0.47 |
1.00 | 0.25 | 91,945 | 0.34 (f) | 0.38 | 0.45 |
1.00 | 0.96 | 742,781 | 0.45 | 0.95 | 0.47 |
1.00 | 1.03 | 769,285 | 0.45 | 1.03 | 0.49 |
1.00 | 1.29 | 266 | 0.70 | 2.44 | 0.70 |
1.00 | 1.01 | 1,975 | 0.64 (f) | 1.01 | 0.71 |
1.00 | 0.01 | 2,142 | 0.12 (f) | 0.01 | 0.72 |
1.00 | 0.21 | 1,498 | 0.34 (f) | 0.20 | 0.70 |
1.00 | 0.70 | 1,122 | 0.70 | 0.71 | 0.72 |
1.00 | 0.78 | 1,569 | 0.70 | 0.75 | 0.74 |
1.00 | 1.12 | 1,007 | 1.04 | 2.17 | 1.04 |
1.00 | 0.78 | 1,846 | 0.85 (f) | 0.71 | 1.06 |
1.00 | 0.01 | 2,551 | 0.13 (f) | 0.01 | 1.07 |
1.00 | 0.18 | 3,729 | 0.41 (f) | 0.21 | 1.11 |
1.00 | 0.36 | 8,363 | 1.05 (f) | 0.45 | 1.08 |
1.00 | 0.43 | 36,537 | 1.04 (f) | 0.43 | 1.09 |
August 31, 2023 | J.P. Morgan Money Market Funds | 170 |
AS OF August 31, 2023 (Unaudited)
(Dollar values in thousands)
Classes Offered | Trust | Diversification Classification | |
JPMorgan Prime Money Market Fund | Academy, Agency, Capital, Empower, IM, Institutional Class, Morgan, Premier and Reserve | JPM I | Diversified |
JPMorgan Institutional Tax Free Money Market Fund | Agency, Capital, IM and Institutional Class | JPM IV | Diversified |
JPMorgan Securities Lending Money Market Fund | Agency SL | JPM IV | Diversified |
JPMorgan Liquid Assets Money Market Fund | Agency, Capital, E*Trade(1), Institutional Class, Investor, Morgan, Premier and Reserve | JPM II | Diversified |
JPMorgan U.S. Government Money Market Fund | Academy, Agency, Capital, E*Trade, Empower, IM, Institutional Class, Investor, Morgan, Premier, Reserve and Service | JPM II | Diversified |
JPMorgan U.S. Treasury Plus Money Market Fund | Academy, Agency, Capital, Empower, IM, Institutional Class, Investor, Morgan, Premier and Reserve | JPM II | Diversified |
JPMorgan Federal Money Market Fund | Agency, Institutional Class, Morgan and Premier | JPM I | Diversified |
JPMorgan 100% U.S. Treasury Securities Money Market Fund | Academy, Agency, Capital, Empower, IM, Institutional Class, Morgan, Premier and Reserve | JPM I | Diversified |
JPMorgan Tax Free Money Market Fund | Agency, Institutional Class, Morgan, Premier and Reserve | JPM I | Diversified |
JPMorgan Municipal Money Market Fund | Agency, E*Trade(2), Institutional Class, Morgan, Premier and Service | JPM II | Diversified |
JPMorgan California Municipal Money Market Fund | Agency, E*Trade(2), Institutional Class, Morgan, Premier and Service | JPM I | Diversified |
JPMorgan New York Municipal Money Market Fund | Agency, E*Trade(2), Institutional Class, Morgan, Premier, Reserve and Service | JPM I | Diversified |
(1) | E*Trade Shares had no assets from the close of business on October 19, 2016. |
(2) | E*Trade Shares had no assets from the close of business on September 21, 2016. |
171 | J.P. Morgan Money Market Funds | August 31, 2023 |
August 31, 2023 | J.P. Morgan Money Market Funds | 172 |
AS OF August 31, 2023 (Unaudited) (continued)
(Dollar values in thousands)
Prime Money Market Fund | ||||
Level 1 Quoted prices | Level 2 Other significant observable inputs | Level 3 Significant unobservable inputs | Total | |
Total Investments in Securities (a) | $— | $76,479,809 | $— | $76,479,809 |
(a) | Please refer to the SOI for specifics of portfolio holdings. |
Institutional Tax Free Money Market Fund | ||||
Level 1 Quoted prices | Level 2 Other significant observable inputs | Level 3 Significant unobservable inputs | Total | |
Total Investments in Securities (a) | $— | $1,185,077 | $— | $1,185,077 |
(a) | Please refer to the SOI for specifics of portfolio holdings. |
Securities Lending Money Market Fund | ||||
Level 1 Quoted prices | Level 2 Other significant observable inputs | Level 3 Significant unobservable inputs | Total | |
Total Investments in Securities (a) | $— | $2,900,855 | $— | $2,900,855 |
(a) | Please refer to the SOI for specifics of portfolio holdings. |
Liquid Assets Money Market Fund | ||||
Level 1 Quoted prices | Level 2 Other significant observable inputs | Level 3 Significant unobservable inputs | Total | |
Total Investments in Securities (a) | $— | $50,160,454 | $— | $50,160,454 |
(a) | Please refer to the SOI for specifics of portfolio holdings. |
173 | J.P. Morgan Money Market Funds | August 31, 2023 |
U.S. Government Money Market Fund | ||||
Level 1 Quoted prices | Level 2 Other significant observable inputs | Level 3 Significant unobservable inputs | Total | |
Total Investments in Securities (a) | $— | $263,383,427 | $— | $263,383,427 |
(a) | Please refer to the SOI for specifics of portfolio holdings. |
U.S. Treasury Plus Money Market Fund | ||||
Level 1 Quoted prices | Level 2 Other significant observable inputs | Level 3 Significant unobservable inputs | Total | |
Total Investments in Securities (a) | $— | $38,369,680 | $— | $38,369,680 |
(a) | Please refer to the SOI for specifics of portfolio holdings. |
Federal Money Market Fund | ||||
Level 1 Quoted prices | Level 2 Other significant observable inputs | Level 3 Significant unobservable inputs | Total | |
Total Investments in Securities (a) | $— | $7,296,218 | $— | $7,296,218 |
(a) | Please refer to the SOI for specifics of portfolio holdings. |
100% U.S. Treasury Securities Money Market Fund | ||||
Level 1 Quoted prices | Level 2 Other significant observable inputs | Level 3 Significant unobservable inputs | Total | |
Total Investments in Securities (a) | $— | $155,512,341 | $— | $155,512,341 |
(a) | Please refer to the SOI for specifics of portfolio holdings. |
Tax Free Money Market Fund | ||||
Level 1 Quoted prices | Level 2 Other significant observable inputs | Level 3 Significant unobservable inputs | Total | |
Total Investments in Securities (a) | $— | $10,060,931 | $— | $10,060,931 |
(a) | Please refer to the SOI for specifics of portfolio holdings. |
Municipal Money Market Fund | ||||
Level 1 Quoted prices | Level 2 Other significant observable inputs | Level 3 Significant unobservable inputs | Total | |
Total Investments in Securities (a) | $— | $1,577,196 | $— | $1,577,196 |
(a) | Please refer to the SOI for specifics of portfolio holdings. |
August 31, 2023 | J.P. Morgan Money Market Funds | 174 |
AS OF August 31, 2023 (Unaudited) (continued)
(Dollar values in thousands)
California Municipal Money Market Fund | ||||
Level 1 Quoted prices | Level 2 Other significant observable inputs | Level 3 Significant unobservable inputs | Total | |
Total Investments in Securities (a) | $— | $550,278 | $— | $550,278 |
(a) | Please refer to the SOI for specifics of portfolio holdings. |
New York Municipal Money Market Fund | ||||
Level 1 Quoted prices | Level 2 Other significant observable inputs | Level 3 Significant unobservable inputs | Total | |
Total Investments in Securities (a) | $— | $2,160,292 | $— | $2,160,292 |
(a) | Please refer to the SOI for specifics of portfolio holdings. |
175 | J.P. Morgan Money Market Funds | August 31, 2023 |
Prime Money Market Fund | Institutional Tax Free Money Market Fund | Securities Lending Money Market Fund | Liquid Assets Money Market Fund | U.S. Government Money Market Fund | U.S. Treasury Plus Money Market Fund | Federal Money Market Fund | 100% U.S. Treasury Securities Money Market Fund | Tax Free Money Market Fund | Municipal Money Market Fund | California Municipal Money Market Fund | New York Municipal Money Market Fund | |
Academy | $20 | n/a | n/a | n/a | $48 | $2 | n/a | $1 | n/a | n/a | n/a | n/a |
Agency | 44 | $12 | n/a | $30 | 102 | 9 | $5 | 60 | $6 | $1 | $1 | $3 |
Agency SL | n/a | n/a | $32 | n/a | n/a | n/a | n/a | n/a | n/a | n/a | n/a | n/a |
Capital | 423 | 20 | n/a | 86 | 1,242 | 120 | n/a | 520 | n/a | n/a | n/a | n/a |
E*Trade | n/a | n/a | n/a | n/a | 2 | n/a | n/a | n/a | n/a | n/a | n/a | n/a |
Empower | 17 | n/a | n/a | n/a | 79 | 3 | n/a | 3 | n/a | n/a | n/a | n/a |
IM | 107 | 15 | n/a | n/a | 89 | — (a) | n/a | — (a) | n/a | n/a | n/a | n/a |
Institutional Class | 169 | 19 | n/a | 89 | 315 | 78 | 29 | 310 | 81 | 9 | 4 | 13 |
Investor | n/a | n/a | n/a | — (a) | 22 | — (a) | n/a | n/a | n/a | n/a | n/a | n/a |
Morgan | 115 | n/a | n/a | 67 | 78 | 23 | 11 | 54 | 4 | 2 | — (a) | 8 |
Premier | 43 | n/a | n/a | 122 | 62 | 31 | 12 | 64 | 11 | 3 | 3 | 5 |
Reserve | 14 | n/a | n/a | — (a) | 28 | 2 | n/a | 14 | 7 | n/a | n/a | — (a) |
Service | n/a | n/a | n/a | n/a | 3 | n/a | n/a | n/a | n/a | — (a) | — (a) | — (a) |
Total | $952 | $66 | $32 | $394 | $2,070 | $268 | $57 | $1,026 | $109 | $15 | $8 | $29 |
(a) | Amount rounds to less than one thousand. |
August 31, 2023 | J.P. Morgan Money Market Funds | 176 |
AS OF August 31, 2023 (Unaudited) (continued)
(Dollar values in thousands)
E*Trade | Morgan | Reserve | Service | |
Prime Money Market Fund | n/a | n/a | 0.25 % | n/a |
Liquid Assets Money Market Fund | 0.60 % | 0.10 % | 0.25 | n/a |
U.S. Government Money Market Fund | 0.60 | 0.10 | 0.25 | 0.60 % |
U.S. Treasury Plus Money Market Fund | n/a | 0.10 | 0.25 | n/a |
Federal Money Market Fund | n/a | 0.10 | n/a | n/a |
100% U.S. Treasury Securities Money Market Fund | n/a | 0.10 | 0.25 | n/a |
Tax Free Money Market Fund | n/a | 0.10 | 0.25 | n/a |
Municipal Money Market Fund | 0.60 | 0.10 | n/a | 0.60 |
California Municipal Money Market Fund | 0.60 | 0.10 | n/a | 0.60 |
New York Municipal Money Market Fund | 0.60 | 0.10 | 0.25 | 0.60 |
177 | J.P. Morgan Money Market Funds | August 31, 2023 |
Academy | Agency | Capital | E*Trade | Empower | Institutional Class | |
Prime Money Market Fund | 0.05 % | 0.15 % | 0.05 % | n/a | 0.05 % | 0.10 % |
Institutional Tax Free Money Market Fund | n/a | 0.15 | 0.05 | n/a | n/a | 0.10 |
Securities Lending Money Market Fund | n/a | n/a | n/a | n/a | n/a | n/a |
Liquid Assets Money Market Fund | n/a | 0.15 | 0.05 | 0.30 % | n/a | 0.10 |
U.S. Government Money Market Fund | 0.05 | 0.15 | 0.05 | 0.30 | 0.05 | 0.10 |
U.S. Treasury Plus Money Market Fund | 0.05 | 0.15 | 0.05 | n/a | 0.05 | 0.10 |
Federal Money Market Fund | n/a | 0.15 | n/a | n/a | n/a | 0.10 |
100% U.S. Treasury Securities Money Market Fund | 0.05 | 0.15 | 0.05 | n/a | 0.05 | 0.10 |
Tax Free Money Market Fund | n/a | 0.15 | n/a | n/a | n/a | 0.10 |
Municipal Money Market Fund | n/a | 0.15 | n/a | 0.30 | n/a | 0.10 |
California Municipal Money Market Fund | n/a | 0.15 | n/a | 0.30 | n/a | 0.10 |
New York Municipal Money Market Fund | n/a | 0.15 | n/a | 0.30 | n/a | 0.10 |
Investor | Morgan | Premier | Reserve | Service | |
Prime Money Market Fund | n/a | 0.35 % | 0.30 % | 0.30 % | n/a |
Institutional Tax Free Money Market Fund | n/a | n/a | n/a | n/a | n/a |
Securities Lending Money Market Fund | n/a | n/a | n/a | n/a | n/a |
Liquid Assets Money Market Fund | 0.35 % | 0.35 | 0.30 | 0.30 | n/a |
U.S. Government Money Market Fund | 0.35 | 0.35 | 0.30 | 0.30 | 0.30 % |
U.S. Treasury Plus Money Market Fund | 0.35 | 0.35 | 0.30 | 0.30 | n/a |
Federal Money Market Fund | n/a | 0.35 | 0.30 | n/a | n/a |
100% U.S. Treasury Securities Money Market Fund | n/a | 0.35 | 0.30 | 0.30 | n/a |
Tax Free Money Market Fund | n/a | 0.35 | 0.30 | 0.30 | n/a |
Municipal Money Market Fund | n/a | 0.35 | 0.30 | n/a | 0.30 |
California Municipal Money Market Fund | n/a | 0.35 | 0.30 | n/a | 0.30 |
New York Municipal Money Market Fund | n/a | 0.35 | 0.30 | 0.30 | 0.30 |
August 31, 2023 | J.P. Morgan Money Market Funds | 178 |
AS OF August 31, 2023 (Unaudited) (continued)
(Dollar values in thousands)
Academy | Agency | Agency SL | Capital | E*Trade | Empower | |
Prime Money Market Fund | 0.18 % | 0.26 % | n/a | 0.18 % | n/a | 0.18 % |
Institutional Tax Free Money Market Fund | n/a | 0.26 | n/a | 0.18 | n/a | n/a |
Securities Lending Money Market Fund | n/a | n/a | 0.06 % | n/a | n/a | n/a |
Liquid Assets Money Market Fund | n/a | 0.26 | n/a | 0.18 | 1.00 % | n/a |
U.S. Government Money Market Fund | 0.18 | 0.26 | n/a | 0.18 | 1.00 | 0.18 |
U.S. Treasury Plus Money Market Fund | 0.18 | 0.26 | n/a | 0.18 | n/a | 0.18 |
Federal Money Market Fund | n/a | 0.26 | n/a | n/a | n/a | n/a |
100% U.S. Treasury Securities Money Market Fund | 0.18 | 0.26 | n/a | 0.18 | n/a | 0.18 |
Tax Free Money Market Fund | n/a | 0.26 | n/a | n/a | n/a | n/a |
Municipal Money Market Fund | n/a | 0.26 | n/a | n/a | 1.00 | n/a |
California Municipal Money Market Fund | n/a | 0.26 | n/a | n/a | 1.00 | n/a |
New York Municipal Money Market Fund | n/a | 0.26 | n/a | n/a | 1.00 | n/a |
IM | Institutional | Investor | Morgan | Premier | Reserve | Service | |
Prime Money Market Fund | n/a | 0.21 % | n/a | 0.52 % | 0.45 % | 0.70 % | n/a |
Institutional Tax Free Money Market Fund | 0.16 % | 0.21 | n/a | n/a | n/a | n/a | n/a |
Securities Lending Money Market Fund | n/a | n/a | n/a | n/a | n/a | n/a | n/a |
Liquid Assets Money Market Fund | n/a | 0.21 | 0.51 % | 0.59 | 0.45 | 0.70 | n/a |
U.S. Government Money Market Fund | n/a | 0.21 | 0.51 | 0.59 | 0.45 | 0.70 | 1.05 % |
U.S. Treasury Plus Money Market Fund | n/a | 0.21 | 0.51 | 0.59 | 0.45 | 0.70 | n/a |
Federal Money Market Fund | n/a | 0.21 | n/a | 0.59 | 0.45 | n/a | n/a |
100% U.S. Treasury Securities Money Market Fund | n/a | 0.21 | n/a | 0.59 | 0.45 | 0.70 | n/a |
Tax Free Money Market Fund | n/a | 0.21 | n/a | 0.59 | 0.45 | 0.70 | n/a |
Municipal Money Market Fund | n/a | 0.21 | n/a | 0.59 | 0.45 | n/a | 1.05 |
California Municipal Money Market Fund | n/a | 0.21 | n/a | 0.59 | 0.45 | n/a | 1.05 |
New York Municipal Money Market Fund | n/a | 0.21 | n/a | 0.59 | 0.45 | 0.70 | 1.05 |
179 | J.P. Morgan Money Market Funds | August 31, 2023 |
Contractual Waivers | |||||
Investment Advisory Fees | Administration Fees | Service Fees | Total | Contractual Reimbursements | |
Prime Money Market Fund | $11 | $— | $2,332 | $2,343 | $8 |
Institutional Tax Free Money Market Fund | 8 | 5 | 156 | 169 | — |
Securities Lending Money Market Fund | 594 | 396 | — | 990 | — |
Liquid Assets Money Market Fund | 5 | — | 1,932 | 1,937 | — |
U.S. Government Money Market Fund | 31 | — | 7,363 | 7,394 | — |
U.S. Treasury Plus Money Market Fund | 4 | — | 1,358 | 1,362 | — |
Federal Money Market Fund | — | — | 553 | 553 | — |
100% U.S. Treasury Securities Money Market Fund | 14 | — | 5,031 | 5,045 | — |
Tax Free Money Market Fund | — | — | 894 | 894 | — |
Municipal Money Market Fund | 14 | 9 | 181 | 204 | — |
California Municipal Money Market Fund | 36 | 24 | 80 | 140 | — |
New York Municipal Money Market Fund | 5 | 3 | 238 | 246 | — |
Federal Money Market Fund | $— (a) |
100% U.S. Treasury Securities Money Market Fund | — (a) |
(a) | Amount rounds to less than one thousand. |
Prime Money Market Fund | $7 |
Institutional Tax Free Money Market Fund | 1 |
Securities Lending Money Market Fund | 1 |
Liquid Assets Money Market Fund | 4 |
U.S. Government Money Market Fund | 19 |
U.S. Treasury Plus Money Market Fund | 3 |
Federal Money Market Fund | 1 |
100% U.S. Treasury Securities Money Market Fund | 10 |
Tax Free Money Market Fund | 2 |
Municipal Money Market Fund | 1 |
California Municipal Money Market Fund | 1 |
New York Municipal Money Market Fund | 1 |
August 31, 2023 | J.P. Morgan Money Market Funds | 180 |
AS OF August 31, 2023 (Unaudited) (continued)
(Dollar values in thousands)
Purchases | Sales | Realized Gain (Loss) | |
Institutional Tax Free Money Market Fund | $369,052 | $975,023 | $— |
Tax Free Money Market Fund | 1,095,766 | 457,702 | — |
Municipal Money Market Fund | 433,910 | 424,866 | — |
California Municipal Money Market Fund | 100,853 | 35,311 | — |
New York Municipal Money Market Fund | 507,220 | 613,900 | — |
Distribution | Service | |
Prime Money Market Fund | ||
Academy | $— | $225 |
Agency | — | 2,194 |
Capital | — | 10,068 |
Empower | — | 91 |
Institutional Class | — | 7,758 |
Morgan | — | 4,378 |
Premier | — | 4,047 |
Reserve | 4 | 5 |
$4 | $28,766 | |
Institutional Tax Free Money Market Fund | ||
Agency | $— | $81 |
Capital | — | 81 |
Institutional Class | — | 204 |
$— | $366 | |
Liquid Assets Money Market Fund | ||
Agency | $— | $2,629 |
Capital | — | 2,744 |
Institutional Class | — | 4,674 |
Investor | — | 7 |
Morgan | 1,697 | 5,938 |
Premier | — | 25,081 |
Reserve | 31 | 37 |
$1,728 | $41,110 |
181 | J.P. Morgan Money Market Funds | August 31, 2023 |
Distribution | Service | |
U.S. Government Money Market Fund | ||
Academy | $— | $2,073 |
Agency | — | 8,990 |
Capital | — | 38,637 |
E*Trade | 664 | 332 |
Empower | — | 2,359 |
Institutional Class | — | 17,738 |
Investor | — | 3,797 |
Morgan | 2,731 | 9,562 |
Premier | — | 13,496 |
Reserve | 2,281 | 2,738 |
Service | 894 | 447 |
$6,570 | $100,169 | |
U.S. Treasury Plus Money Market Fund | ||
Academy | $— | $39 |
Agency | — | 1,499 |
Capital | — | 4,138 |
Empower | — | 116 |
Institutional Class | — | 4,697 |
Investor | — | 31 |
Morgan | 1,038 | 3,634 |
Premier | — | 5,784 |
Reserve | 1,153 | 1,383 |
$2,191 | $21,321 | |
Federal Money Market Fund | ||
Agency | $— | $539 |
Institutional Class | — | 2,076 |
Morgan | 96 | 337 |
Premier | — | 2,340 |
$96 | $5,292 | |
100% U.S. Treasury Securities Money Market Fund | ||
Academy | $— | $41 |
Agency | — | 6,384 |
Capital | — | 17,124 |
Empower | — | 98 |
Institutional Class | — | 18,787 |
Morgan | 1,715 | 6,001 |
Premier | — | 14,083 |
Reserve | 1,707 | 2,049 |
$3,422 | $64,567 | |
Tax Free Money Market Fund | ||
Agency | $— | $441 |
Institutional Class | — | 4,137 |
Morgan | 26 | 92 |
Premier | — | 1,546 |
Reserve | 902 | 1,082 |
$928 | $7,298 |
August 31, 2023 | J.P. Morgan Money Market Funds | 182 |
AS OF August 31, 2023 (Unaudited) (continued)
(Dollar values in thousands)
Distribution | Service | |
Municipal Money Market Fund | ||
Agency | $— | $98 |
Institutional Class | — | 494 |
Morgan | 21 | 75 |
Premier | — | 337 |
Service | 24 | 12 |
$45 | $1,016 | |
California Municipal Money Market Fund | ||
Agency | $— | $56 |
Institutional Class | — | 144 |
Morgan | 4 | 14 |
Premier | — | 291 |
Service | 17 | 9 |
$21 | $514 | |
New York Municipal Money Market Fund | ||
Agency | $— | $220 |
Institutional Class | — | 635 |
Morgan | 27 | 96 |
Premier | — | 749 |
Reserve | 1 | 1 |
Service | 4 | 2 |
$32 | $1,703 |
Aggregate Cost | Gross Unrealized Appreciation | Gross Unrealized Depreciation | Net Unrealized Appreciation (Depreciation) | |
Prime Money Market Fund | $76,478,081 | $9,198 | $7,470 | $1,728 |
Institutional Tax Free Money Market Fund | 1,185,173 | — | 96 | (96 ) |
Securities Lending Money Market Fund | 2,900,599 | 453 | 197 | 256 |
Capital Loss Carryforward Character | ||
Short-Term | Long-Term | |
Prime Money Market Fund | $4,267 | $— |
Securities Lending Money Market Fund | 94 | — |
Liquid Assets Money Market Fund | 38 | — |
U.S. Government Money Market Fund | 55,548 | 1,159 |
U.S. Treasury Plus Money Market Fund | 3,447 | 120 |
Federal Money Market Fund | 73 | 1 |
100% U.S. Treasury Securities Money Market Fund | 9,462 | — |
183 | J.P. Morgan Money Market Funds | August 31, 2023 |
Net Capital Losses (Gains) | ||
Short-Term | Long-Term | |
Prime Money Market Fund | $1,935 | $— |
Securities Lending Money Market Fund | 36 | — |
U.S. Government Money Market Fund | 3,705 | 4 |
U.S. Treasury Plus Money Market Fund | — | 1 |
New York Municipal Money Market Fund | 1 | — |
Capital Loss Utilized | ||
Short-Term | Long-Term | |
Liquid Assets Money Market Fund | $37 | $— |
U.S. Government Money Market Fund | — | 155 |
U.S. Treasury Plus Money Market Fund | — | 48 |
Average Loans | Number of Days Outstanding | Interest Earned | |
Liquid Assets Money Market Fund | $29,586 | 72 | $208 |
August 31, 2023 | J.P. Morgan Money Market Funds | 184 |
AS OF August 31, 2023 (Unaudited) (continued)
(Dollar values in thousands)
Number of Individual Shareholder and/or Affiliated Omnibus Accounts | % of the Fund | Number of Individual Shareholder and/or Non-Affiliated Omnibus Accounts | % of the Fund | |
Prime Money Market Fund | 1 | 56.7 % | — | — % |
Institutional Tax Free Money Market Fund | 1 | 87.1 | — | — |
Securities Lending Money Market Fund | — | — | 1 | 100.0 |
Liquid Assets Money Market Fund | 2 | 58.2 | 2 | 38.2 |
U.S. Government Money Market Fund | 1 | 31.1 | — | — |
U.S. Treasury Plus Money Market Fund | 1 | 34.5 | 1 | 14.3 |
Federal Money Market Fund | 1 | 61.1 | 1 | 11.6 |
100% U.S. Treasury Securities Money Market Fund | 1 | 58.2 | — | — |
Tax Free Money Market Fund | 1 | 53.8 | 1 | 36.5 |
Municipal Money Market Fund | 2 | 82.2 | — | — |
California Municipal Money Market Fund | 1 | 67.6 | — | — |
New York Municipal Money Market Fund | 1 | 90.8 | — | — |
185 | J.P. Morgan Money Market Funds | August 31, 2023 |
Prime Money Market Fund | Liquid Assets Money Market Fund | |
France | 15.1 % | 13.0 % |
August 31, 2023 | J.P. Morgan Money Market Funds | 186 |
(Unaudited)
Hypothetical $1,000 Investment
Beginning Account Value March 1, 2023 | Ending Account Value August 31, 2023 | Expenses Paid During the Period* | Annualized Expense Ratio | |
JPMorgan Prime Money Market Fund | ||||
Academy | ||||
Actual | $1,000.00 | $1,025.60 | $0.87 | 0.17 % |
Hypothetical | 1,000.00 | 1,024.28 | 0.87 | 0.17 |
Agency | ||||
Actual | 1,000.00 | 1,025.20 | 1.32 | 0.26 |
Hypothetical | 1,000.00 | 1,023.83 | 1.32 | 0.26 |
Capital | ||||
Actual | 1,000.00 | 1,025.70 | 0.87 | 0.17 |
Hypothetical | 1,000.00 | 1,024.28 | 0.87 | 0.17 |
Empower | ||||
Actual | 1,000.00 | 1,025.70 | 0.92 | 0.18 |
Hypothetical | 1,000.00 | 1,024.23 | 0.92 | 0.18 |
IM | ||||
Actual | 1,000.00 | 1,025.90 | 0.66 | 0.13 |
Hypothetical | 1,000.00 | 1,024.48 | 0.66 | 0.13 |
Institutional Class | ||||
Actual | 1,000.00 | 1,025.50 | 1.07 | 0.21 |
Hypothetical | 1,000.00 | 1,024.08 | 1.07 | 0.21 |
Morgan | ||||
Actual | 1,000.00 | 1,024.00 | 2.44 | 0.48 |
Hypothetical | 1,000.00 | 1,022.72 | 2.44 | 0.48 |
Premier | ||||
Actual | 1,000.00 | 1,024.40 | 2.19 | 0.43 |
Hypothetical | 1,000.00 | 1,022.98 | 2.19 | 0.43 |
Reserve | ||||
Actual | 1,000.00 | 1,023.00 | 3.56 | 0.70 |
Hypothetical | 1,000.00 | 1,021.62 | 3.56 | 0.70 |
187 | J.P. Morgan Money Market Funds | August 31, 2023 |
Beginning Account Value March 1, 2023 | Ending Account Value August 31, 2023 | Expenses Paid During the Period* | Annualized Expense Ratio | |
JPMorgan Institutional Tax Free Money Market Fund | ||||
Agency | ||||
Actual | $1,000.00 | $1,015.10 | $1.32 | 0.26 % |
Hypothetical | 1,000.00 | 1,023.83 | 1.32 | 0.26 |
Capital | ||||
Actual | 1,000.00 | 1,015.60 | 0.91 | 0.18 |
Hypothetical | 1,000.00 | 1,024.23 | 0.92 | 0.18 |
IM | ||||
Actual | 1,000.00 | 1,015.60 | 0.76 | 0.15 |
Hypothetical | 1,000.00 | 1,024.38 | 0.76 | 0.15 |
Institutional Class | ||||
Actual | 1,000.00 | 1,015.30 | 1.06 | 0.21 |
Hypothetical | 1,000.00 | 1,024.08 | 1.07 | 0.21 |
JPMorgan Securities Lending Money Market Fund | ||||
Agency SL | ||||
Actual | 1,000.00 | 1,026.30 | 0.31 | 0.06 |
Hypothetical | 1,000.00 | 1,024.84 | 0.31 | 0.06 |
JPMorgan Liquid Assets Money Market Fund | ||||
Agency | ||||
Actual | 1,000.00 | 1,025.30 | 1.32 | 0.26 |
Hypothetical | 1,000.00 | 1,023.83 | 1.32 | 0.26 |
Capital | ||||
Actual | 1,000.00 | 1,025.70 | 0.92 | 0.18 |
Hypothetical | 1,000.00 | 1,024.23 | 0.92 | 0.18 |
Institutional Class | ||||
Actual | 1,000.00 | 1,025.60 | 1.07 | 0.21 |
Hypothetical | 1,000.00 | 1,024.08 | 1.07 | 0.21 |
Investor | ||||
Actual | 1,000.00 | 1,024.20 | 2.49 | 0.49 |
Hypothetical | 1,000.00 | 1,022.67 | 2.49 | 0.49 |
Morgan | ||||
Actual | 1,000.00 | 1,023.70 | 2.95 | 0.58 |
Hypothetical | 1,000.00 | 1,022.22 | 2.95 | 0.58 |
Premier | ||||
Actual | 1,000.00 | 1,024.40 | 2.19 | 0.43 |
Hypothetical | 1,000.00 | 1,022.98 | 2.19 | 0.43 |
Reserve | ||||
Actual | 1,000.00 | 1,023.10 | 3.46 | 0.68 |
Hypothetical | 1,000.00 | 1,021.72 | 3.46 | 0.68 |
JPMorgan U.S. Government Money Market Fund | ||||
Academy | ||||
Actual | 1,000.00 | 1,025.00 | 0.87 | 0.17 |
Hypothetical | 1,000.00 | 1,024.28 | 0.87 | 0.17 |
Agency | ||||
Actual | 1,000.00 | 1,024.50 | 1.32 | 0.26 |
Hypothetical | 1,000.00 | 1,023.83 | 1.32 | 0.26 |
Capital | ||||
Actual | 1,000.00 | 1,025.00 | 0.87 | 0.17 |
Hypothetical | 1,000.00 | 1,024.28 | 0.87 | 0.17 |
E*Trade | ||||
Actual | 1,000.00 | 1,020.70 | 5.08 | 1.00 |
Hypothetical | 1,000.00 | 1,020.11 | 5.08 | 1.00 |
August 31, 2023 | J.P. Morgan Money Market Funds | 188 |
(Unaudited) (continued)
Hypothetical $1,000 Investment
Beginning Account Value March 1, 2023 | Ending Account Value August 31, 2023 | Expenses Paid During the Period* | Annualized Expense Ratio | |
JPMorgan U.S. Government Money Market Fund (continued) | ||||
Empower | ||||
Actual | $1,000.00 | $1,025.00 | $0.87 | 0.17 % |
Hypothetical | 1,000.00 | 1,024.28 | 0.87 | 0.17 |
IM | ||||
Actual | 1,000.00 | 1,025.20 | 0.66 | 0.13 |
Hypothetical | 1,000.00 | 1,024.48 | 0.66 | 0.13 |
Institutional Class | ||||
Actual | 1,000.00 | 1,024.80 | 1.07 | 0.21 |
Hypothetical | 1,000.00 | 1,024.08 | 1.07 | 0.21 |
Investor | ||||
Actual | 1,000.00 | 1,023.40 | 2.44 | 0.48 |
Hypothetical | 1,000.00 | 1,022.72 | 2.44 | 0.48 |
Morgan | ||||
Actual | 1,000.00 | 1,022.90 | 2.95 | 0.58 |
Hypothetical | 1,000.00 | 1,022.22 | 2.95 | 0.58 |
Premier | ||||
Actual | 1,000.00 | 1,023.60 | 2.19 | 0.43 |
Hypothetical | 1,000.00 | 1,022.98 | 2.19 | 0.43 |
Reserve | ||||
Actual | 1,000.00 | 1,022.40 | 3.46 | 0.68 |
Hypothetical | 1,000.00 | 1,021.72 | 3.46 | 0.68 |
Service | ||||
Actual | 1,000.00 | 1,020.60 | 5.23 | 1.03 |
Hypothetical | 1,000.00 | 1,019.96 | 5.23 | 1.03 |
JPMorgan U.S. Treasury Plus Money Market Fund | ||||
Academy | ||||
Actual | 1,000.00 | 1,024.90 | 0.87 | 0.17 |
Hypothetical | 1,000.00 | 1,024.28 | 0.87 | 0.17 |
Agency | ||||
Actual | 1,000.00 | 1,024.50 | 1.32 | 0.26 |
Hypothetical | 1,000.00 | 1,023.83 | 1.32 | 0.26 |
Capital | ||||
Actual | 1,000.00 | 1,024.90 | 0.87 | 0.17 |
Hypothetical | 1,000.00 | 1,024.28 | 0.87 | 0.17 |
Empower | ||||
Actual | 1,000.00 | 1,024.90 | 0.92 | 0.18 |
Hypothetical | 1,000.00 | 1,024.23 | 0.92 | 0.18 |
IM | ||||
Actual | 1,000.00 | 1,025.10 | 0.66 | 0.13 |
Hypothetical | 1,000.00 | 1,024.48 | 0.66 | 0.13 |
Institutional Class | ||||
Actual | 1,000.00 | 1,024.70 | 1.07 | 0.21 |
Hypothetical | 1,000.00 | 1,024.08 | 1.07 | 0.21 |
Investor | ||||
Actual | 1,000.00 | 1,023.30 | 2.44 | 0.48 |
Hypothetical | 1,000.00 | 1,022.72 | 2.44 | 0.48 |
Morgan | ||||
Actual | 1,000.00 | 1,022.80 | 2.95 | 0.58 |
Hypothetical | 1,000.00 | 1,022.22 | 2.95 | 0.58 |
Premier | ||||
Actual | 1,000.00 | 1,023.60 | 2.19 | 0.43 |
Hypothetical | 1,000.00 | 1,022.98 | 2.19 | 0.43 |
189 | J.P. Morgan Money Market Funds | August 31, 2023 |
Beginning Account Value March 1, 2023 | Ending Account Value August 31, 2023 | Expenses Paid During the Period* | Annualized Expense Ratio | |
JPMorgan U.S. Treasury Plus Money Market Fund (continued) | ||||
Reserve | ||||
Actual | $1,000.00 | $1,022.30 | $3.46 | 0.68 % |
Hypothetical | 1,000.00 | 1,021.72 | 3.46 | 0.68 |
JPMorgan Federal Money Market Fund | ||||
Agency | ||||
Actual | 1,000.00 | 1,024.40 | 1.32 | 0.26 |
Hypothetical | 1,000.00 | 1,023.83 | 1.32 | 0.26 |
Institutional Class | ||||
Actual | 1,000.00 | 1,024.60 | 1.07 | 0.21 |
Hypothetical | 1,000.00 | 1,024.08 | 1.07 | 0.21 |
Morgan | ||||
Actual | 1,000.00 | 1,022.70 | 3.00 | 0.59 |
Hypothetical | 1,000.00 | 1,022.17 | 3.00 | 0.59 |
Premier | ||||
Actual | 1,000.00 | 1,023.50 | 2.19 | 0.43 |
Hypothetical | 1,000.00 | 1,022.98 | 2.19 | 0.43 |
JPMorgan 100% U.S. Treasury Securities Money Market Fund | ||||
Academy | ||||
Actual | 1,000.00 | 1,024.40 | 0.87 | 0.17 |
Hypothetical | 1,000.00 | 1,024.28 | 0.87 | 0.17 |
Agency | ||||
Actual | 1,000.00 | 1,024.00 | 1.32 | 0.26 |
Hypothetical | 1,000.00 | 1,023.83 | 1.32 | 0.26 |
Capital | ||||
Actual | 1,000.00 | 1,024.40 | 0.87 | 0.17 |
Hypothetical | 1,000.00 | 1,024.28 | 0.87 | 0.17 |
Empower | ||||
Actual | 1,000.00 | 1,024.40 | 0.87 | 0.17 |
Hypothetical | 1,000.00 | 1,024.28 | 0.87 | 0.17 |
IM | ||||
Actual | 1,000.00 | 1,024.70 | 0.61 | 0.12 |
Hypothetical | 1,000.00 | 1,024.53 | 0.61 | 0.12 |
Institutional Class | ||||
Actual | 1,000.00 | 1,024.30 | 1.07 | 0.21 |
Hypothetical | 1,000.00 | 1,024.08 | 1.07 | 0.21 |
Morgan | ||||
Actual | 1,000.00 | 1,022.40 | 2.95 | 0.58 |
Hypothetical | 1,000.00 | 1,022.22 | 2.95 | 0.58 |
Premier | ||||
Actual | 1,000.00 | 1,023.10 | 2.19 | 0.43 |
Hypothetical | 1,000.00 | 1,022.98 | 2.19 | 0.43 |
Reserve | ||||
Actual | 1,000.00 | 1,021.90 | 3.46 | 0.68 |
Hypothetical | 1,000.00 | 1,021.72 | 3.46 | 0.68 |
JPMorgan Tax Free Money Market Fund | ||||
Agency | ||||
Actual | 1,000.00 | 1,015.30 | 1.32 | 0.26 |
Hypothetical | 1,000.00 | 1,023.83 | 1.32 | 0.26 |
Institutional Class | ||||
Actual | 1,000.00 | 1,015.50 | 1.06 | 0.21 |
Hypothetical | 1,000.00 | 1,024.08 | 1.07 | 0.21 |
August 31, 2023 | J.P. Morgan Money Market Funds | 190 |
(Unaudited) (continued)
Hypothetical $1,000 Investment
Beginning Account Value March 1, 2023 | Ending Account Value August 31, 2023 | Expenses Paid During the Period* | Annualized Expense Ratio | |
JPMorgan Tax Free Money Market Fund (continued) | ||||
Morgan | ||||
Actual | $1,000.00 | $1,013.60 | $2.99 | 0.59 % |
Hypothetical | 1,000.00 | 1,022.17 | 3.00 | 0.59 |
Premier | ||||
Actual | 1,000.00 | 1,014.40 | 2.18 | 0.43 |
Hypothetical | 1,000.00 | 1,022.98 | 2.19 | 0.43 |
Reserve | ||||
Actual | 1,000.00 | 1,013.10 | 3.44 | 0.68 |
Hypothetical | 1,000.00 | 1,021.72 | 3.46 | 0.68 |
JPMorgan Municipal Money Market Fund | ||||
Agency | ||||
Actual | 1,000.00 | 1,015.50 | 1.32 | 0.26 |
Hypothetical | 1,000.00 | 1,023.83 | 1.32 | 0.26 |
Institutional Class | ||||
Actual | 1,000.00 | 1,015.80 | 1.06 | 0.21 |
Hypothetical | 1,000.00 | 1,024.08 | 1.07 | 0.21 |
Morgan | ||||
Actual | 1,000.00 | 1,013.80 | 2.99 | 0.59 |
Hypothetical | 1,000.00 | 1,022.17 | 3.00 | 0.59 |
Premier | ||||
Actual | 1,000.00 | 1,014.60 | 2.23 | 0.44 |
Hypothetical | 1,000.00 | 1,022.92 | 2.24 | 0.44 |
Service | ||||
Actual | 1,000.00 | 1,011.50 | 5.31 | 1.05 |
Hypothetical | 1,000.00 | 1,019.86 | 5.33 | 1.05 |
JPMorgan California Municipal Money Market Fund | ||||
Agency | ||||
Actual | 1,000.00 | 1,013.30 | 1.32 | 0.26 |
Hypothetical | 1,000.00 | 1,023.83 | 1.32 | 0.26 |
Institutional Class | ||||
Actual | 1,000.00 | 1,013.60 | 1.06 | 0.21 |
Hypothetical | 1,000.00 | 1,024.08 | 1.07 | 0.21 |
Morgan | ||||
Actual | 1,000.00 | 1,011.60 | 2.98 | 0.59 |
Hypothetical | 1,000.00 | 1,022.17 | 3.00 | 0.59 |
Premier | ||||
Actual | 1,000.00 | 1,012.30 | 2.28 | 0.45 |
Hypothetical | 1,000.00 | 1,022.87 | 2.29 | 0.45 |
Service | ||||
Actual | 1,000.00 | 1,009.30 | 5.30 | 1.05 |
Hypothetical | 1,000.00 | 1,019.86 | 5.33 | 1.05 |
JPMorgan New York Municipal Money Market Fund | ||||
Agency | ||||
Actual | 1,000.00 | 1,015.10 | 1.32 | 0.26 |
Hypothetical | 1,000.00 | 1,023.83 | 1.32 | 0.26 |
Institutional Class | ||||
Actual | 1,000.00 | 1,015.40 | 1.06 | 0.21 |
Hypothetical | 1,000.00 | 1,024.08 | 1.07 | 0.21 |
Morgan | ||||
Actual | 1,000.00 | 1,013.40 | 2.99 | 0.59 |
Hypothetical | 1,000.00 | 1,022.17 | 3.00 | 0.59 |
191 | J.P. Morgan Money Market Funds | August 31, 2023 |
Beginning Account Value March 1, 2023 | Ending Account Value August 31, 2023 | Expenses Paid During the Period* | Annualized Expense Ratio | |
JPMorgan New York Municipal Money Market Fund (continued) | ||||
Premier | ||||
Actual | $1,000.00 | $1,014.20 | $2.23 | 0.44 % |
Hypothetical | 1,000.00 | 1,022.92 | 2.24 | 0.44 |
Reserve | ||||
Actual | 1,000.00 | 1,012.90 | 3.54 | 0.70 |
Hypothetical | 1,000.00 | 1,021.62 | 3.56 | 0.70 |
Service | ||||
Actual | 1,000.00 | 1,011.20 | 5.26 | 1.04 |
Hypothetical | 1,000.00 | 1,019.91 | 5.28 | 1.04 |
* | Expenses are equal to each Class’ respective annualized net expense ratio, multiplied by the average account value over the period, multiplied by 184/366 (to reflect the one-half year period). |
August 31, 2023 | J.P. Morgan Money Market Funds | 192 |
(Unaudited)
193 | J.P. Morgan Money Market Funds | August 31, 2023 |
August 31, 2023 | J.P. Morgan Money Market Funds | 194 |
(Unaudited) (continued)
195 | J.P. Morgan Money Market Funds | August 31, 2023 |
August 31, 2023 | J.P. Morgan Money Market Funds | 196 |
(Unaudited) (continued)
197 | J.P. Morgan Money Market Funds | August 31, 2023 |
August 31, 2023 | J.P. Morgan Money Market Funds | 198 |


JPMorgan California Tax Free Bond Fund |
JPMorgan National Municipal Income Fund |
JPMorgan New York Tax Free Bond Fund |
JPMorgan Short-Intermediate Municipal Bond Fund |
JPMorgan Tax Free Bond Fund |
JPMorgan Ultra-Short Municipal Fund |

1 | |
2 | |
3 | |
5 | |
7 | |
9 | |
11 | |
13 | |
15 | |
119 | |
136 | |
148 | |
163 | |
165 | |
166 |
October 19, 2023 (Unaudited)
 | “A properly diversified portfolio together with a long-term approach may help investors weather economic and geopolitical uncertainties.” — Brian S. Shlissel |

President - J.P. Morgan Funds
J.P. Morgan Asset Management
1-800-480-4111 or www.jpmorganfunds.com for more information
August 31, 2023 | J.P. Morgan Municipal Bond Funds | 1 |
SIX MONTHS ENDED August 31, 2023 (Unaudited)
2 | J.P. Morgan Municipal Bond Funds | August 31, 2023 |
SIX MONTHS ENDED August 31, 2023 (Unaudited)
REPORTING PERIOD RETURN: | |
Fund (Class I Shares) * | 0.78% |
Bloomberg LB California 1–17 Year Muni Index | 1.00% |
Net Assets as of 8/31/2023 (In Thousands) | $292,765 |
Duration as of 8/31/2023 | 4.8 Years |
CREDIT QUALITY ALLOCATIONS AS OF AUGUST 31, 2023 | PERCENT OF TOTAL INVESTMENTS |
AAA | 21.3% |
AA | 62.3 |
A | 12.5 |
BBB | 1.9 |
NR | 2.0 |
August 31, 2023 | J.P. Morgan Municipal Bond Funds | 3 |
SIX MONTHS ENDED August 31, 2023 (Unaudited) (continued)
INCEPTION DATE OF CLASS | 6 MONTH* | 1 YEAR | 5 YEAR | 10 YEAR | |
CLASS A SHARES | September 10, 2001 | ||||
With Sales Charge ** | (3.11 )% | (2.20 )% | 0.06 % | 1.43 % | |
Without Sales Charge | 0.71 | 1.64 | 0.83 | 1.82 | |
CLASS C SHARES | February 19, 2005 | ||||
With CDSC *** | (0.54 ) | 0.15 | 0.33 | 1.42 | |
Without CDSC | 0.46 | 1.15 | 0.33 | 1.42 | |
CLASS I SHARES | December 23, 1996 | 0.78 | 1.69 | 0.92 | 1.92 |
CLASS R6 SHARES | October 1, 2018 | 0.83 | 1.79 | 1.02 | 1.97 |
* | Not annualized. |
** | Sales Charge for Class A Shares is 3.75%. |
*** | Assumes a 1% CDSC (contingent deferred sales charge) for the 6 month and one year periods and 0% CDSC thereafter. |
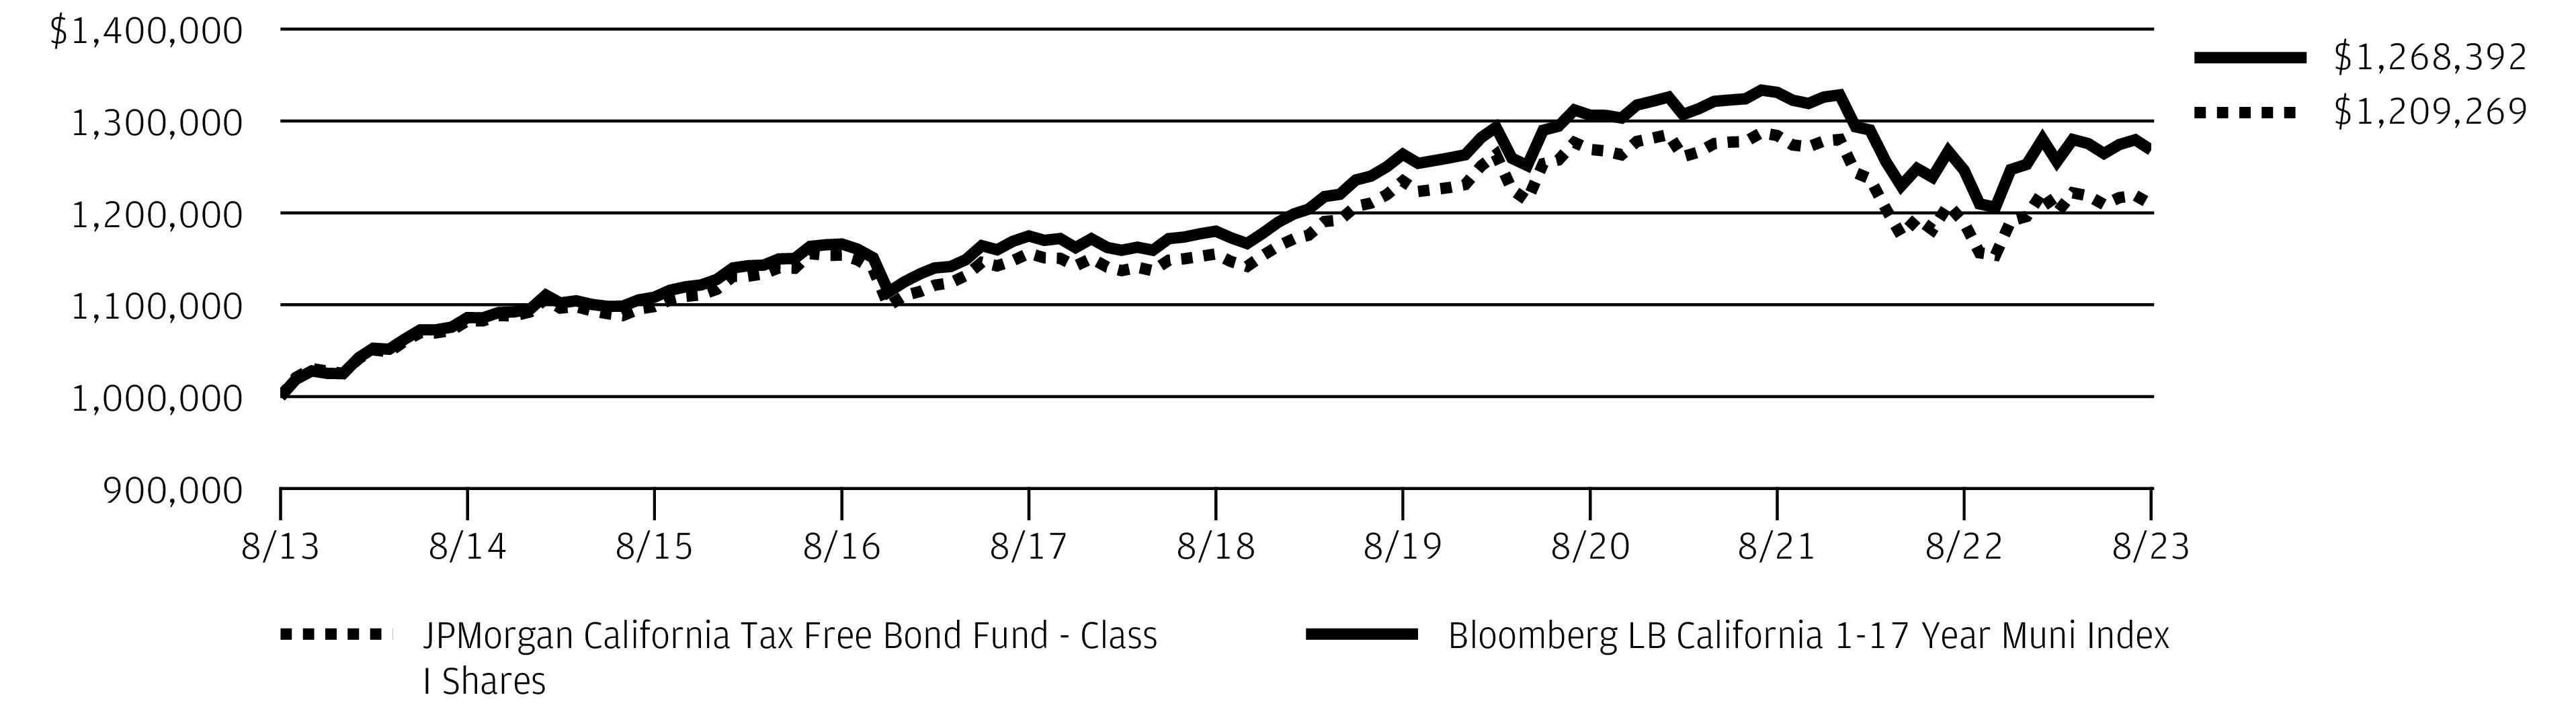
4 | J.P. Morgan Municipal Bond Funds | August 31, 2023 |
SIX MONTHS ENDED August 31, 2023 (Unaudited)
REPORTING PERIOD RETURN: | |
Fund (Class I Shares) * | 0.50% |
Bloomberg U.S. 1-15 Year Blend (1-17) Municipal Bond Index | 0.89% |
Net Assets as of 8/31/2023 (In Thousands) | $3,400,779 |
Duration as of 8/31/2023 | 5.8 Years |
CREDIT QUALITY ALLOCATIONS AS OF AUGUST 31, 2023 | PERCENT OF TOTAL INVESTMENTS |
AAA | 9.7% |
AA | 42.7 |
A | 31.6 |
BBB | 8.3 |
BB | 0.9 |
B | 0.2 |
CCC | 0.8 |
NR | 5.8 |
August 31, 2023 | J.P. Morgan Municipal Bond Funds | 5 |
SIX MONTHS ENDED August 31, 2023 (Unaudited) (continued)
INCEPTION DATE OF CLASS | 6 MONTH* | 1 YEAR | 5 YEAR | 10 YEAR | |
CLASS A SHARES | December 31, 2003 | ||||
With Sales Charge ** | (3.26 )% | (2.85 )% | 0.18 % | 1.26 % | |
Without Sales Charge | 0.46 | 0.95 | 0.95 | 1.65 | |
CLASS C SHARES | December 31, 2003 | ||||
With CDSC *** | (0.90 ) | (0.68 ) | 0.40 | 1.16 | |
Without CDSC | 0.10 | 0.32 | 0.40 | 1.16 | |
CLASS I SHARES | September 10, 2001 | 0.50 | 1.13 | 1.19 | 1.91 |
CLASS R6 SHARES | November 6, 2017 | 0.55 | 1.23 | 1.31 | 1.97 |
* | Not annualized. |
** | Sales Charge for Class A Shares is 3.75%. |
*** | Assumes a 1% CDSC (contingent deferred sales charge) for the 6 month and one year periods and 0% CDSC thereafter. |

6 | J.P. Morgan Municipal Bond Funds | August 31, 2023 |
SIX MONTHS ENDED August 31, 2023 (Unaudited)
REPORTING PERIOD RETURN: | |
Fund (Class A Shares, without a sales charge) * | 0.81% |
Bloomberg New York Intermediate (1–17 Year) Maturities Index | 0.96% |
Net Assets as of 8/31/2023 (In Thousands) | $376,988 |
Duration as of 8/31/2023 | 4.8 Years |
CREDIT QUALITY ALLOCATIONS AS OF AUGUST 31, 2023 | PERCENT OF TOTAL INVESTMENTS |
AAA | 19.5% |
AA | 64.0 |
A | 8.5 |
BBB | 6.9 |
NR | 1.1 |
August 31, 2023 | J.P. Morgan Municipal Bond Funds | 7 |
SIX MONTHS ENDED August 31, 2023 (Unaudited) (continued)
INCEPTION DATE OF CLASS | 6 MONTH* | 1 YEAR | 5 YEAR | 10 YEAR | |
CLASS A SHARES | February 16, 2001 | ||||
With Sales Charge ** | (2.99 )% | (2.15 )% | 0.26 % | 1.17 % | |
Without Sales Charge | 0.81 | 1.68 | 1.03 | 1.55 | |
CLASS C SHARES | January 31, 2003 | ||||
With CDSC *** | (0.44 ) | 0.16 | 0.52 | 1.09 | |
Without CDSC | 0.56 | 1.16 | 0.52 | 1.09 | |
CLASS I SHARES | September 10, 2001 | 0.86 | 1.64 | 1.25 | 1.79 |
CLASS R6 SHARES | October 1, 2018 | 0.91 | 1.90 | 1.35 | 1.84 |
* | Not annualized. |
** | Sales Charge for Class A Shares is 3.75%. |
*** | Assumes a 1% CDSC (contingent deferred sales charge) for the 6 month and one year periods and 0% CDSC thereafter. |
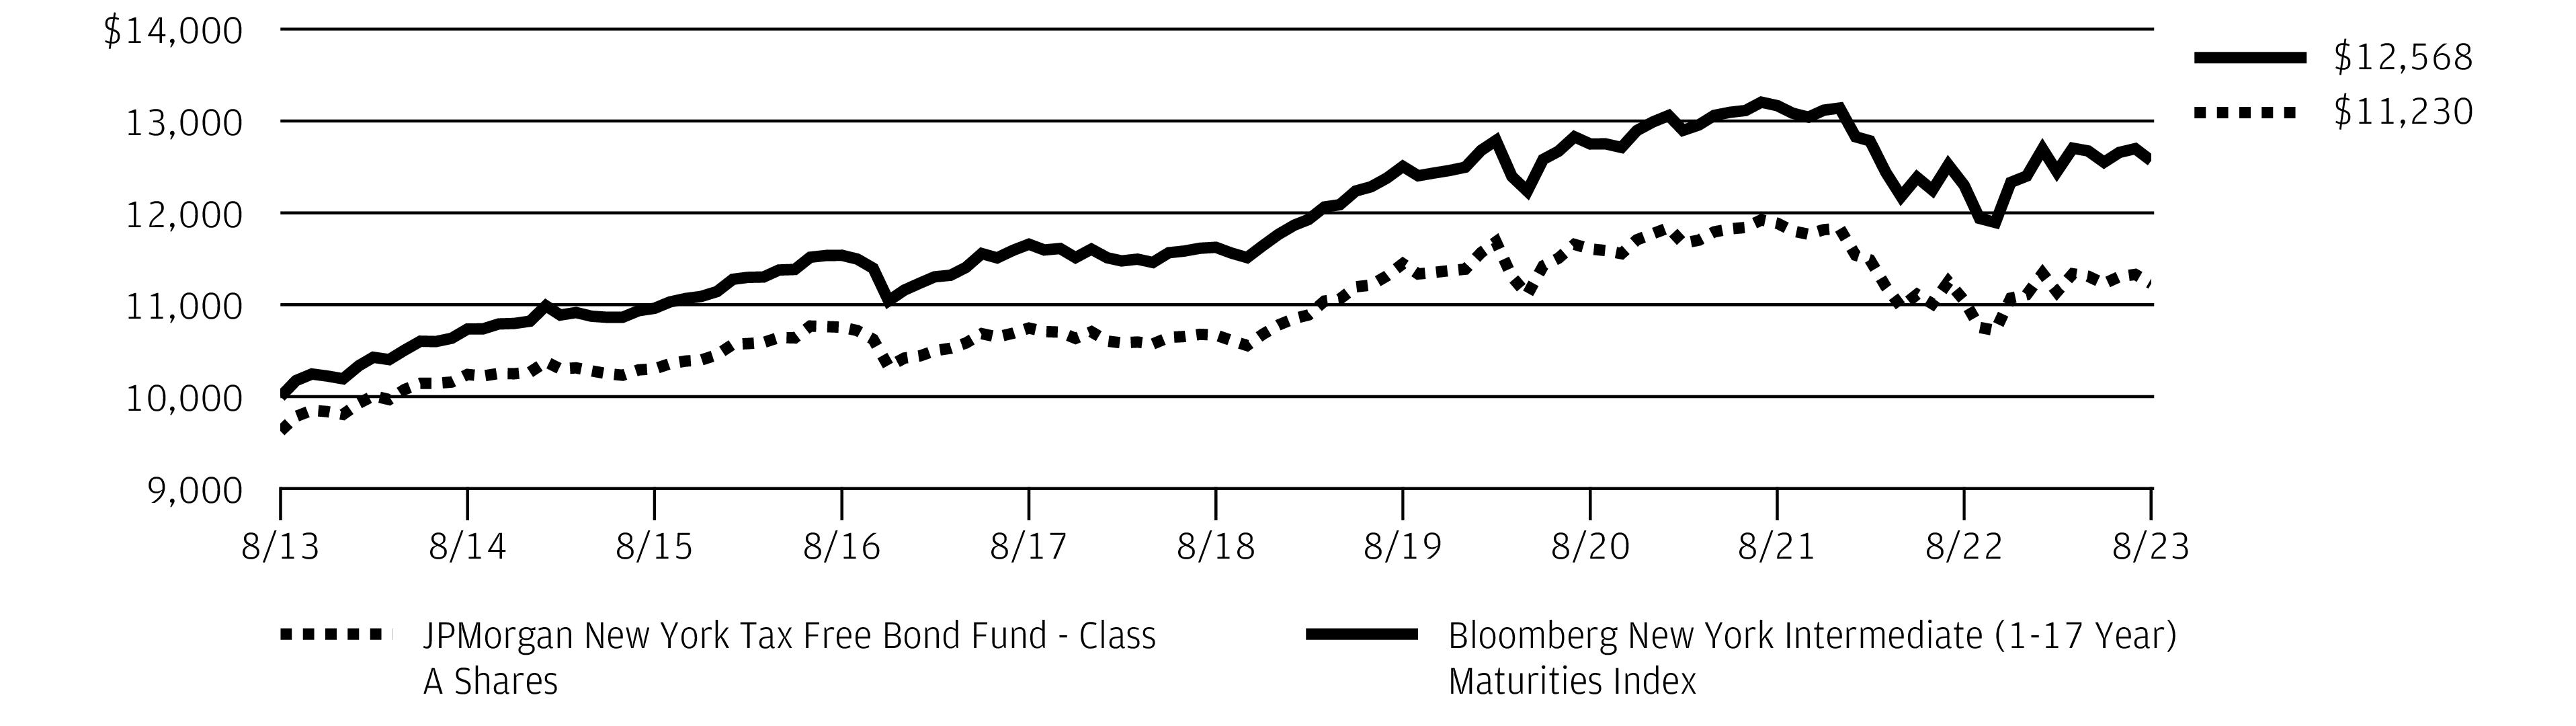
8 | J.P. Morgan Municipal Bond Funds | August 31, 2023 |
SIX MONTHS ENDED August 31, 2023 (Unaudited)
REPORTING PERIOD RETURN: | |
Fund (Class A Shares, without a sales charge) * | 0.80% |
Bloomberg U.S. 1-5 Year Blend (1-6) Municipal Bond Index | 1.05% |
Net Assets as of 8/31/2023 (In Thousands) | $975,658 |
Duration as of 8/31/2023 | 3.1 Years |
CREDIT QUALITY ALLOCATIONS AS OF AUGUST 31, 2023 | PERCENT OF TOTAL INVESTMENTS |
AAA | 7.8% |
AA | 54.1 |
A | 28.3 |
BBB | 7.1 |
BB | 0.4 |
NR | 2.3 |
August 31, 2023 | J.P. Morgan Municipal Bond Funds | 9 |
SIX MONTHS ENDED August 31, 2023 (Unaudited) (continued)
INCEPTION DATE OF CLASS | 6 MONTH* | 1 YEAR | 5 YEAR | 10 YEAR | |
CLASS A SHARES | May 4, 1998 | ||||
With Sales Charge ** | (1.47 )% | (1.30 )% | 0.13 % | 0.52 % | |
Without Sales Charge | 0.80 | 0.96 | 0.58 | 0.75 | |
CLASS C SHARES | November 1, 2001 | ||||
With CDSC *** | (0.46 ) | (0.46 ) | 0.08 | 0.36 | |
Without CDSC | 0.54 | 0.54 | 0.08 | 0.36 | |
CLASS I SHARES | June 19, 2009 | 1.02 | 1.50 | 1.05 | 1.22 |
CLASS R6 SHARES | October 1, 2018 | 0.94 | 1.45 | 1.08 | 1.23 |
* | Not annualized. |
** | Sales Charge for Class A Shares is 2.25%. |
*** | Assumes a 1% CDSC (contingent deferred sales charge) for the 6 month and one year periods and 0% CDSC thereafter. |
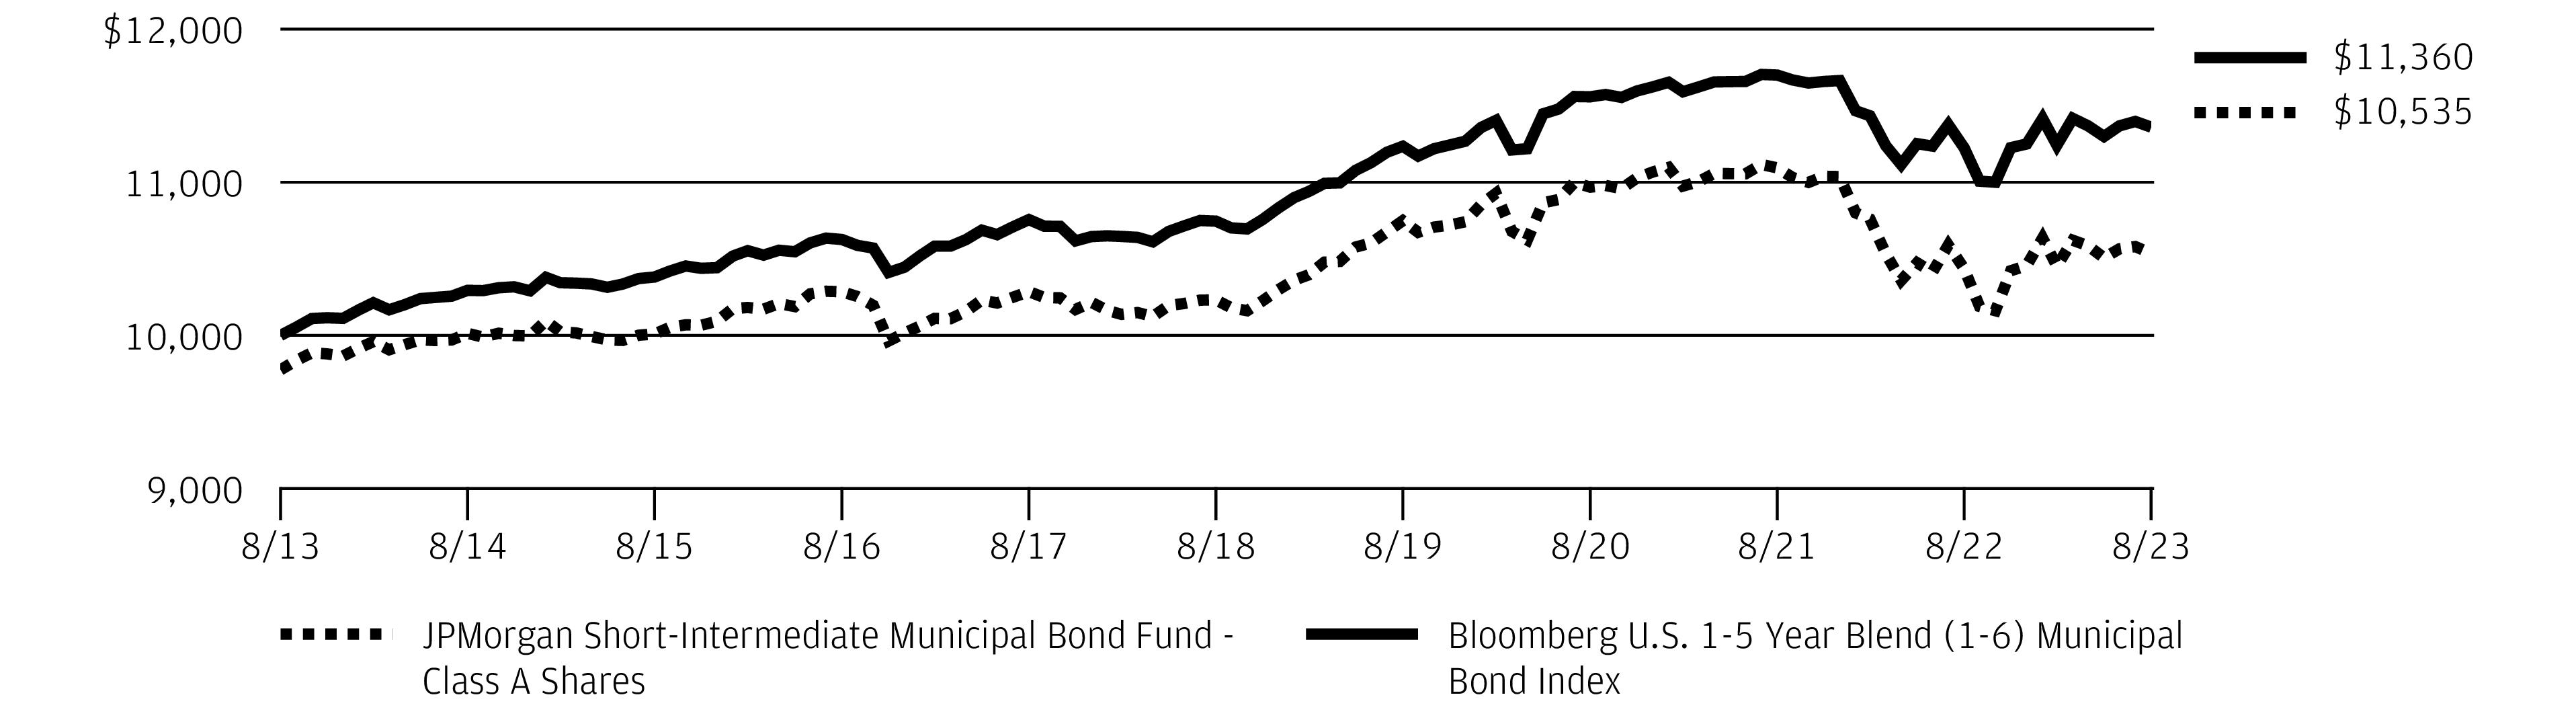
10 | J.P. Morgan Municipal Bond Funds | August 31, 2023 |
SIX MONTHS ENDED August 31, 2023 (Unaudited)
REPORTING PERIOD RETURN: | |
Fund (Class A Shares, without a sales charge) * | 0.82% |
Bloomberg U.S. Municipal Index | 1.04% |
Net Assets as of 8/31/2023 (In Thousands) | $758,979 |
Duration as of 8/31/2023 | 9.0 Years |
CREDIT QUALITY ALLOCATIONS AS OF AUGUST 31, 2023 | PERCENT OF TOTAL INVESTMENTS |
AAA | 20.9% |
AA | 37.6 |
A | 22.5 |
BBB | 11.5 |
BB | 1.6 |
CCC | 0.3 |
NR | 5.6 |
August 31, 2023 | J.P. Morgan Municipal Bond Funds | 11 |
SIX MONTHS ENDED August 31, 2023 (Unaudited) (continued)
INCEPTION DATE OF CLASS | 6 MONTH* | 1 YEAR | 5 YEAR | 10 YEAR | |
CLASS A SHARES | March 1, 1988 | ||||
With Sales Charge ** | (2.99 )% | (3.47 )% | (0.21 )% | 1.94 % | |
Without Sales Charge | 0.82 | 0.33 | 0.56 | 2.33 | |
CLASS C SHARES | July 1, 2008 | ||||
With CDSC *** | (0.46 ) | (1.24 ) | (0.02 ) | 1.82 | |
Without CDSC | 0.54 | (0.24 ) | (0.02 ) | 1.82 | |
CLASS I SHARES | February 1, 1995 | 0.94 | 0.65 | 0.78 | 2.53 |
CLASS R6 SHARES | October 1, 2018 | 0.96 | 0.61 | 0.82 | 2.55 |
* | Not annualized. |
** | Sales Charge for Class A Shares is 3.75%. |
*** | Assumes a 1% CDSC (contingent deferred sales charge) for the 6 month and one year periods and 0% CDSC thereafter. |

12 | J.P. Morgan Municipal Bond Funds | August 31, 2023 |
SIX MONTHS ENDED August 31, 2023 (Unaudited)
REPORTING PERIOD RETURN: | |
Fund (Class I Shares) * | 1.58% |
Bloomberg 1 Year Municipal Bond Index | 1.48% |
Net Assets as of 8/31/2023 (In Thousands) | $1,891,342 |
Duration as of 8/31/2023 | 0.7 Years |
CREDIT QUALITY ALLOCATIONS AS OF AUGUST 31, 2023 | PERCENT OF TOTAL INVESTMENTS |
AAA | 15.1% |
AA | 31.1 |
A | 28.1 |
BBB | 6.7 |
NR | 19.0 |
August 31, 2023 | J.P. Morgan Municipal Bond Funds | 13 |
SIX MONTHS ENDED August 31, 2023 (Unaudited) (continued)
INCEPTION DATE OF CLASS | 6 MONTH* | 1 YEAR | 5 YEAR | SINCE INCEPTION | |
CLASS A SHARES ** | May 31, 2016 | 1.43 % | 2.20 % | 0.74 % | 0.71 % |
CLASS I SHARES | May 31, 2016 | 1.58 | 2.44 | 0.92 | 0.92 |
* | Not annualized. |
** | Performance of Class A Shares reflects no initial sales charge. Prior to September 15, 2020, the maximum initial sales charge applicable to Class A Shares was 2.25%, which is not reflected in the performance shown in the table above. |
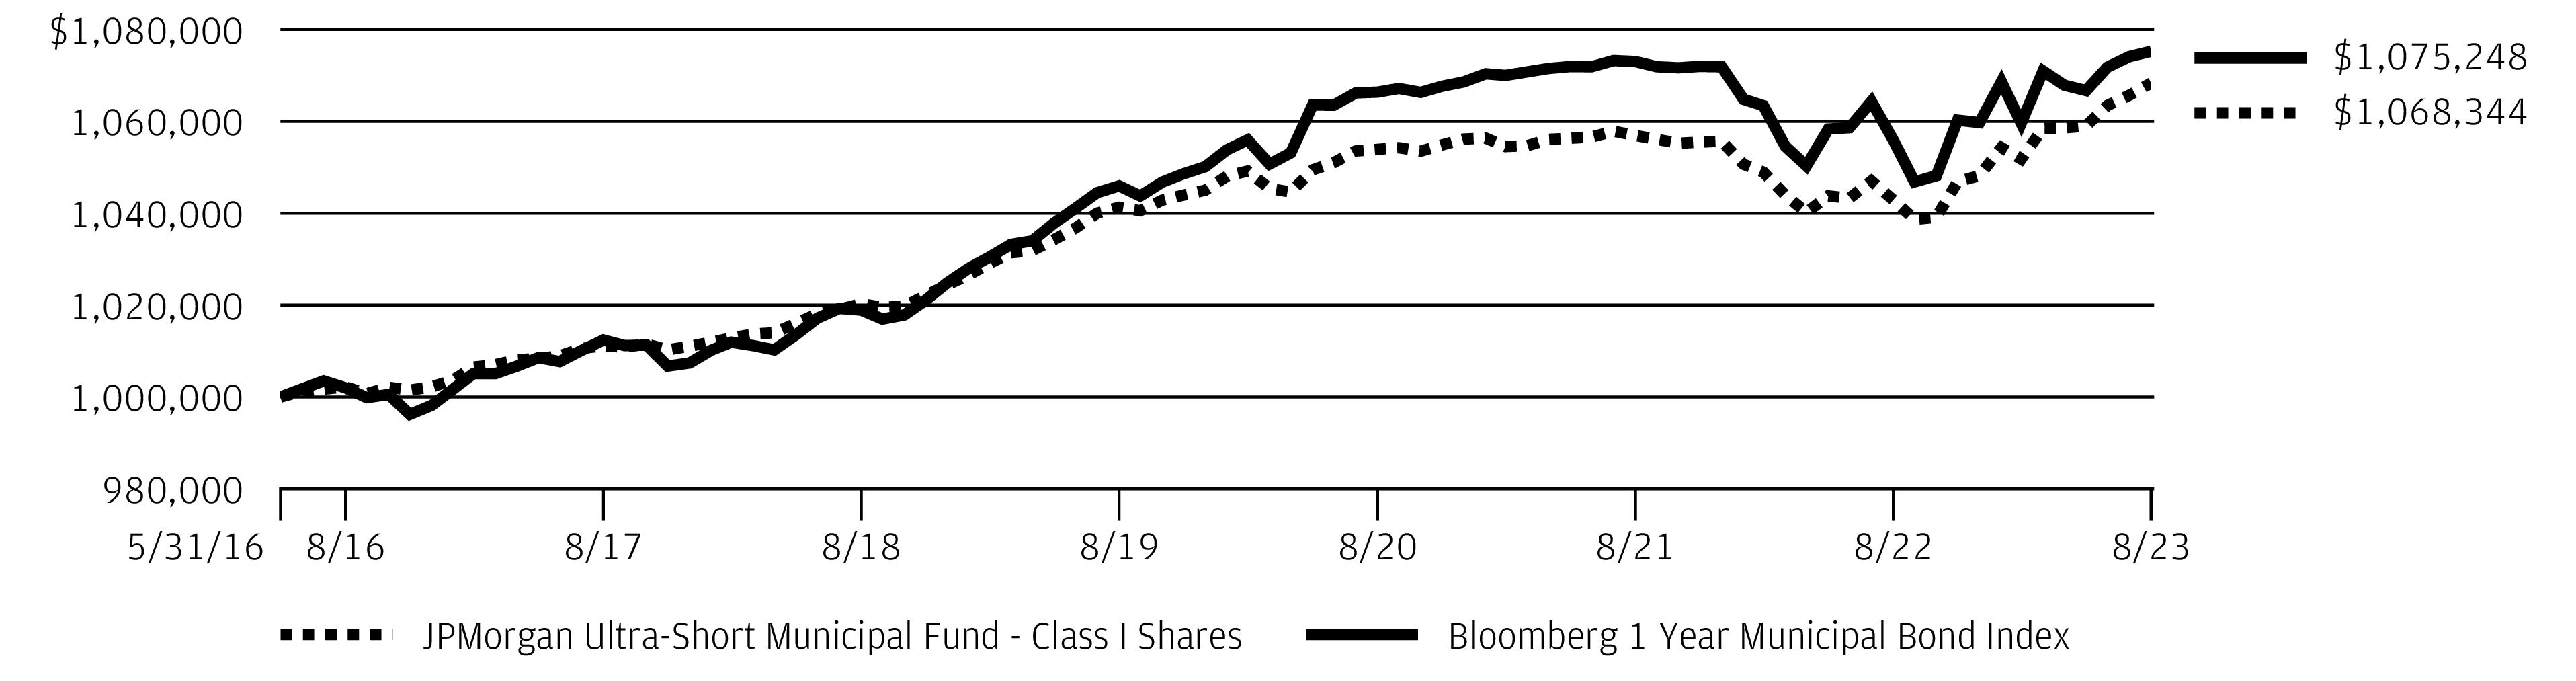
14 | J.P. Morgan Municipal Bond Funds | August 31, 2023 |
AS OF August 31, 2023 (Unaudited)
INVESTMENTS | Principal Amount ($000) | Value ($000) |
Municipal Bonds—95.9% (a) | ||
California—95.9% | ||
Education—7.7% | ||
California Educational Facilities Authority | ||
Series U-4, Rev., 5.00%, 6/1/2043 | 2,000 | 2,281 |
Series U-6, Rev., 5.00%, 5/1/2045 | 1,500 | 1,708 |
California Educational Facilities Authority, Art Centre College of Design | ||
Series 2022A, Rev., 5.00%, 12/1/2028 | 210 | 222 |
Series 2022A, Rev., 5.00%, 12/1/2031 | 450 | 485 |
Series 2022A, Rev., 5.00%, 12/1/2032 | 275 | 295 |
California Educational Facilities Authority, Stanford University | ||
Series U-2, Rev., 5.00%, 10/1/2032 | 1,500 | 1,782 |
Series T-1, Rev., 5.00%, 3/15/2039 | 1,535 | 1,765 |
California Enterprise Development Authority, Riverside County, Rocketship Public Schools-Obligated Group No. 2 | ||
Series 2022A, Rev., 4.00%, 6/1/2027 (b) | 315 | 300 |
Series 2022A, Rev., 4.00%, 6/1/2031 (b) | 1,250 | 1,129 |
California School Finance Authority, Green Dot Public Schools Project, Series 2022A, Rev., 5.00%, 8/1/2032 (b) | 350 | 360 |
California State University, Series 2023A, Rev., 5.00%, 11/1/2044 | 2,660 | 2,924 |
University of California | ||
Series 2014AM, Rev., 5.00%, 5/15/2028 | 1,500 | 1,520 |
Series 2020BE, Rev., 5.00%, 5/15/2034 | 1,065 | 1,209 |
Series 2016AR, Rev., 5.00%, 5/15/2035 | 1,500 | 1,577 |
Series 2023BN, Rev., 5.00%, 5/15/2042 | 3,000 | 3,357 |
University of California, Limited Project, Series 2018O, Rev., 5.00%, 5/15/2034 | 1,500 | 1,634 |
22,548 | ||
General Obligation—26.9% | ||
Allan Hancock Joint Community College District, GO, 5.00%, 8/1/2030 | 1,250 | 1,266 |
Chaffey Joint Union High School District | ||
Series F, GO, Zero Coupon, 2/1/2033 | 230 | 162 |
Series F, GO, Zero Coupon, 2/1/2034 | 545 | 367 |
City and County of San Francisco, California General Obligation, Earthquake Safety and Emergency Response, Series 2018C, GO, 4.00%, 6/15/2029 | 2,500 | 2,516 |
City of San Jose, Disaster Preparedness, Public Safety and Infrastructure | ||
Series 2019A-1, GO, 5.00%, 9/1/2036 | 1,500 | 1,645 |
Series 2019A-1, GO, 5.00%, 9/1/2038 | 2,710 | 2,937 |
INVESTMENTS | Principal Amount ($000) | Value ($000) |
General Obligation — continued | ||
Coast Community College District, Election of 2002, Series 2006B, GO, AGM, Zero Coupon, 8/1/2030 | 2,000 | 1,571 |
East Side Union High School District, GO, NATL - RE, 5.25%, 2/1/2026 | 2,000 | 2,064 |
Escondido Union High School District, Capital Appreciation, Election of 2008 | ||
Series A, GO, AGC, Zero Coupon, 8/1/2025 | 1,500 | 1,403 |
Series A, GO, AGC, Zero Coupon, 8/1/2029 | 1,000 | 814 |
Evergreen School District, Series 2009B, GO, AGC, Zero Coupon, 8/1/2024 | 1,915 | 1,859 |
Los Alamitos Unified School District, School Facilities Improvement District, Election of 2018, Series C, GO, 4.00%, 8/1/2045 | 1,235 | 1,211 |
Los Angeles Unified School District, Dedicated Unlimited Ad Valorem Property Tax, Series 2019A, GO, 5.00%, 7/1/2032 | 1,500 | 1,680 |
Menlo Park City School District, Capital Appreciation | ||
GO, Zero Coupon, 7/1/2031 | 500 | 373 |
GO, Zero Coupon, 7/1/2032 | 880 | 627 |
Murrieta Valley Unified School District, GO, AGM, Zero Coupon, 9/1/2024 | 1,000 | 967 |
Napa Valley Unified School District, Election of 2006, Series 2010A, GO, Zero Coupon, 8/1/2027 | 2,000 | 1,741 |
Palo Alto Unified School District, Election of 2008 | ||
Series 2008-2, GO, Zero Coupon, 8/1/2025 | 1,015 | 954 |
Series 2008-2, GO, Zero Coupon, 8/1/2026 | 1,790 | 1,631 |
San Diego Community College District, Election of 2002, GO, Zero Coupon, 8/1/2035 | 1,500 | 965 |
San Diego Unified School District, Election of 1998 | ||
Series C-2, GO, AGM, 5.50%, 7/1/2024 | 2,010 | 2,049 |
Series G-1, GO, AGM, 5.25%, 7/1/2028 | 2,115 | 2,351 |
San Diego Unified School District, Election of 1998, Series G-1, GO, AGM, 5.25%, 7/1/2028 (c) | 385 | 426 |
San Francisco Unified School District, GO, 5.00%, 6/15/2031 | 2,000 | 2,277 |
San Jose Evergreen Community College District | ||
Series C, GO, 4.00%, 9/1/2041 | 650 | 653 |
Series C, GO, 4.00%, 9/1/2043 | 1,500 | 1,493 |
San Jose Unified School District, Election of 2002, Series C, GO, NATL - RE, Zero Coupon, 6/1/2031 | 3,035 | 2,297 |
San Mateo County Community College District, Election of 2001, Series 2005B, GO, NATL - RE, Zero Coupon, 9/1/2027 | 1,130 | 994 |
San Mateo County Community College District, Election of 2005 | ||
Series A, GO, NATL - RE, Zero Coupon, 9/1/2026 | 1,100 | 998 |
August 31, 2023 | J.P. Morgan Municipal Bond Funds | 15 |
AS OF August 31, 2023 (Unaudited) (continued)
INVESTMENTS | Principal Amount ($000) | Value ($000) |
Municipal Bonds — continued | ||
General Obligation — continued | ||
Series A, GO, NATL - RE, Zero Coupon, 9/1/2029 | 2,000 | 1,642 |
Series 2006B, GO, NATL - RE, Zero Coupon, 9/1/2034 | 1,000 | 674 |
San Mateo County Community College District, Election of 2014, Series 2018B, GO, 5.00%, 9/1/2033 | 1,000 | 1,104 |
San Rafael City Elementary School District, Election of 2002, Series 2004B, GO, NATL - RE, Zero Coupon, 8/1/2029 | 2,000 | 1,613 |
Santa Monica Community College District, Election of 2004, Series 2009C, GO, Zero Coupon, 8/1/2027 | 1,000 | 874 |
South San Francisco Unified School District, Measure J, Dedicated Unlimited Ad Valorem Property Tax, Series 2016C, GO, Zero Coupon, 9/1/2028 | 1,800 | 1,511 |
State of California, School Facilities, GO, 4.00%, 9/1/2032 | 2,000 | 2,045 |
State of California, Various Purpose | ||
GO, 5.00%, 8/1/2027 | 2,000 | 2,154 |
GO, 5.00%, 12/1/2029 | 2,000 | 2,008 |
Series C, GO, 5.00%, 8/1/2030 | 2,000 | 2,145 |
GO, 5.00%, 8/1/2031 | 1,500 | 1,538 |
GO, 5.00%, 10/1/2032 | 3,000 | 3,057 |
GO, 5.00%, 8/1/2033 | 1,000 | 1,050 |
GO, 4.00%, 10/1/2035 | 2,520 | 2,634 |
GO, 4.00%, 3/1/2036 | 2,000 | 2,065 |
GO, 5.00%, 4/1/2036 | 1,000 | 1,097 |
GO, 5.00%, 11/1/2037 | 2,000 | 2,262 |
GO, 4.00%, 10/1/2041 | 6,000 | 6,024 |
GO, 5.00%, 10/1/2042 | 1,000 | 1,072 |
William S Hart Union High School District, Capital Appreciation Election 2001, Series 2005B, GO, AGM, Zero Coupon, 9/1/2029 | 2,500 | 2,010 |
78,870 | ||
Hospital—7.4% | ||
Abag Finance Authority for Nonprofit Corps., Sharp Healthcare, Series 2014A, Rev., 5.00%, 8/1/2031 | 1,000 | 1,000 |
California Health Facilities Financing Authority, Adventist Health System | ||
Series 2013A, Rev., 5.00%, 3/1/2026 | 1,400 | 1,400 |
Series 2016A, Rev., 4.00%, 3/1/2029 | 2,165 | 2,171 |
California Health Facilities Financing Authority, Cedars-Sinai Medical Center | ||
Rev., 5.00%, 11/15/2030 | 250 | 260 |
Rev., 5.00%, 11/15/2032 | 400 | 415 |
Series A, Rev., 5.00%, 8/15/2033 | 3,500 | 3,691 |
INVESTMENTS | Principal Amount ($000) | Value ($000) |
Hospital — continued | ||
Series B, Rev., 5.00%, 8/15/2035 | 1,500 | 1,574 |
California Health Facilities Financing Authority, Kaiser Permanente, Series A-1, Rev., 5.00%, 11/1/2027 | 1,995 | 2,168 |
California Health Facilities Financing Authority, Lucile Salter Packard Children's Hospital at Stanford | ||
Series 2014A, Rev., 5.00%, 8/15/2027 | 580 | 588 |
Series 2014A, Rev., 5.00%, 8/15/2028 | 850 | 862 |
Series 2014A, Rev., 5.00%, 8/15/2030 | 655 | 664 |
Series A, Rev., 5.00%, 8/15/2030 | 1,000 | 1,046 |
California Health Facilities Financing Authority, Stanford Health Clinic, Series 2017A, Rev., 5.00%, 11/15/2034 | 1,200 | 1,292 |
California Health Facilities Financing Authority, Sutter Health | ||
Series 2018A, Rev., 5.00%, 11/15/2025 | 500 | 518 |
Series 2017A, Rev., 5.00%, 11/15/2034 | 1,500 | 1,599 |
Regents of the University of California, Medical Center Pooled, Series 2022P, Rev., 5.00%, 5/15/2037 | 2,105 | 2,363 |
21,611 | ||
Industrial Development Revenue/Pollution Control Revenue—0.5% | ||
California Pollution Control Financing Authority, Solid Waste Disposal, Waste Management, Inc., Project, Series B-1, Rev., AMT, 3.00%, 11/1/2025 | 1,500 | 1,462 |
Other Revenue—7.4% | ||
California Community Choice Financing Authority | ||
Series 2022A-1, Rev., 4.00%, 8/1/2025 | 500 | 500 |
Series 2022A-1, Rev., 4.00%, 8/1/2026 | 1,000 | 998 |
California County Tobacco Securitization Agency, Los Angeles County Securitization Corp., Series 2020A, Rev., 5.00%, 6/1/2030 | 1,095 | 1,189 |
California State Public Works Board | ||
Series F, Rev., 5.00%, 5/1/2028 | 1,500 | 1,547 |
Series F, Rev., 5.00%, 5/1/2030 | 1,000 | 1,031 |
California Statewide Communities Development Authority, San Francisco Campus for Jewish Living Project, Rev., 4.00%, 11/1/2029 | 140 | 146 |
Contra Costa County Transportation Authority, Sales Tax, Series 2015A, Rev., 5.00%, 3/1/2032 | 2,000 | 2,059 |
CSCDA Community Improvement Authority, Essential Housing, Towne at Glendale Apartments, Series 2022B, Rev., 5.00%, 9/1/2037 (b) | 400 | 389 |
Golden State Tobacco Securitization Corp., Enhanced Tobacco Settlement, Series 2017A-1, Rev., 5.00%, 6/1/2024 (c) | 2,500 | 2,534 |
16 | J.P. Morgan Municipal Bond Funds | August 31, 2023 |
INVESTMENTS | Principal Amount ($000) | Value ($000) |
Municipal Bonds — continued | ||
Other Revenue — continued | ||
Los Angeles County Metropolitan Transportation Authority Sales Tax, Series 2021A, Rev., 5.00%, 7/1/2045 | 1,000 | 1,092 |
Los Angeles County Metropolitan Transportation Authority, Measure R Junior Subordinate Sales Tax, Series 2020A, Rev., 4.00%, 6/1/2035 | 1,500 | 1,574 |
Los Angeles County Metropolitan Transportation Authority, Proposition C Senior Sales Tax, Series 2019B, Rev., 5.00%, 7/1/2035 | 2,000 | 2,194 |
Los Angeles County Public Works Financing Authority, Series 2022G, Rev., 5.00%, 12/1/2037 | 1,500 | 1,689 |
Midpeninsula Regional Open Space District, Promissory Notes, 2004 Project Lease | ||
Series NTS2015, Rev., 5.00%, 9/1/2030 | 500 | 520 |
Series NTS2015, Rev., 5.00%, 9/1/2031 | 270 | 281 |
Pasadena Public Financing Authority, Rose Bowl Renovation Project, Series 2010A, Rev., Zero Coupon, 3/1/2030 | 1,000 | 782 |
Riverside Public Financing Authority, Main Library Project, Series 2019B, Rev., 5.00%, 11/1/2034 | 450 | 492 |
San Diego Regional Building Authority, County Operations Center, Series 2016A, Rev., 5.00%, 10/15/2033 | 2,370 | 2,479 |
Santa Ana Financing Authority, Police Administration and Holding Facility Lease, Series 1994A, Rev., NATL - RE, 6.25%, 7/1/2024 (c) | 170 | 174 |
Santa Ana Financing Authority, Police Administration and Holding Facility Lease, Series 1994A, Rev., NATL - RE, 6.25%, 7/1/2024 | 172 | 176 |
21,846 | ||
Prerefunded—5.7% | ||
California Health Facilities Financing Authority, Sutter Health, Series 2016A, Rev., 5.00%, 11/15/2025 (c) | 2,650 | 2,766 |
California Infrastructure and Economic Development Bank, Infrastructure State Revolving Fund, Series 2014A, Rev., 5.00%, 10/1/2023 (c) | 1,000 | 1,001 |
Campbell Union High School District, GO, 5.00%, 8/1/2024 (c) | 1,700 | 1,730 |
Campbell Union High School District, Election of 2016Series B, GO, 5.00%, 8/1/2026 (c) | 2,370 | 2,512 |
Los Angeles Community College District, Series 2015A, GO, 5.00%, 8/1/2024 (c) | 1,500 | 1,526 |
San Jose Unified School District, Election of 2012, Tax-ExemptSeries C, GO, 5.00%, 8/1/2024 (c) | 2,460 | 2,503 |
San Mateo Union High School District, Election of 2006, Series 2013A, GO, 5.00%, 9/1/2023 (c) | 1,005 | 1,005 |
INVESTMENTS | Principal Amount ($000) | Value ($000) |
Prerefunded — continued | ||
Silicon Valley Clean Water, Wastewater, Rev., 5.00%, 2/1/2024 (c) | 790 | 796 |
State of California Department of Water Resources, Central Valley Project, Water System, Series AW, Rev., 5.00%, 12/1/2026 (c) | 2,600 | 2,768 |
16,607 | ||
Transportation—15.3% | ||
California Infrastructure and Economic Development Bank, Academy Of Motion Picture | ||
Series 2023A, Rev., 5.00%, 11/1/2024 (d) | 275 | 281 |
Series 2023A, Rev., 5.00%, 11/1/2034 (d) | 1,000 | 1,160 |
California Municipal Finance Authority, Linxs Apartments Project, Senior Lien, Series 2018A, Rev., AMT, 5.00%, 12/31/2028 | 1,750 | 1,815 |
City of Long Beach Harbor | ||
Series 2014B, Rev., 5.00%, 5/15/2026 | 250 | 253 |
Series 2014B, Rev., 5.00%, 5/15/2027 | 225 | 227 |
Series C, Rev., AMT, 5.00%, 5/15/2030 | 2,000 | 2,050 |
Series A, Rev., AMT, 5.00%, 5/15/2033 | 500 | 526 |
Series 2019A, Rev., 5.00%, 5/15/2036 | 750 | 823 |
Series 2019A, Rev., 5.00%, 5/15/2039 | 1,425 | 1,531 |
City of Los Angeles Department of Airports | ||
Series 2022C, Rev., AMT, 5.00%, 5/15/2031 | 500 | 548 |
Series 2022C, Rev., AMT, 5.00%, 5/15/2032 | 500 | 553 |
Series 2020A, Rev., 5.00%, 5/15/2039 | 2,000 | 2,182 |
Series 2022B, Rev., 4.00%, 5/15/2041 | 1,755 | 1,751 |
City of Los Angeles Department of Airports, International Airport Senior | ||
Series 2018B, Rev., AMT, 5.00%, 5/15/2027 | 2,000 | 2,103 |
Series D, Rev., AMT, 5.00%, 5/15/2030 | 2,000 | 2,041 |
City of Los Angeles Department of Airports, International Airport Subordinate | ||
Series 2018A, Rev., AMT, 5.00%, 5/15/2030 | 1,475 | 1,561 |
Series C, Rev., 5.00%, 5/15/2031 | 1,250 | 1,296 |
Series 2018C, Rev., AMT, 5.00%, 5/15/2034 | 1,250 | 1,311 |
Foothill Eastern Transportation Corridor Agency, Capital Appreciation, Senior Lien, Series 1995A, Rev., Zero Coupon, 1/1/2026 (c) | 1,795 | 1,666 |
Norman Y Mineta San Jose International Airport SJC, Series 2021A, Rev., AMT, 5.00%, 3/1/2032 | 2,000 | 2,172 |
Port of Los Angeles, Harbor Department | ||
Series 2019B, Rev., 5.00%, 8/1/2026 | 3,420 | 3,622 |
Series 2014A, Rev., AMT, 5.00%, 8/1/2027 | 1,625 | 1,644 |
Series 2014A, Rev., AMT, 5.00%, 8/1/2031 | 1,500 | 1,517 |
August 31, 2023 | J.P. Morgan Municipal Bond Funds | 17 |
AS OF August 31, 2023 (Unaudited) (continued)
INVESTMENTS | Principal Amount ($000) | Value ($000) |
Municipal Bonds — continued | ||
Transportation — continued | ||
Riverside County Transportation Commission, Senior Lien, Series 2021B-1, Rev., 4.00%, 6/1/2037 | 1,250 | 1,231 |
San Diego County Regional Airport Authority, Subordinate Airport | ||
Series B, Rev., AMT, 5.00%, 7/1/2034 | 755 | 785 |
Series A, Rev., 5.00%, 7/1/2035 | 1,000 | 1,064 |
San Francisco City and County Airport Commission, San Francisco International Airport | ||
Series 2017D, Rev., AMT, 5.00%, 5/1/2025 | 2,000 | 2,043 |
Series 2019A, Rev., AMT, 5.00%, 5/1/2034 | 2,000 | 2,138 |
Series 2019A, Rev., AMT, 5.00%, 5/1/2035 | 1,000 | 1,063 |
Series 2019A, Rev., AMT, 5.00%, 5/1/2037 | 1,500 | 1,573 |
Series 2020A, Rev., AMT, 5.00%, 5/1/2037 | 545 | 576 |
San Francisco City and County Airport Commission, San Francisco International Airport, Special Facilities, SFO Fuel Company LLC, Series 2019A, Rev., AMT, 5.00%, 1/1/2025 | 1,790 | 1,811 |
44,917 | ||
Utility—5.7% | ||
Los Angeles Department of Water and Power, Power System | ||
Series 2014C, Rev., 5.00%, 7/1/2027 | 1,500 | 1,522 |
Series 2018D, Rev., 5.00%, 7/1/2031 | 1,100 | 1,210 |
Series 2019A, Rev., 5.00%, 7/1/2036 | 1,825 | 1,991 |
Series 2019C, Rev., 5.00%, 7/1/2036 | 2,715 | 2,983 |
Series 2022C, Rev., 5.00%, 7/1/2038 | 2,410 | 2,728 |
Series 2020B, Rev., 5.00%, 7/1/2039 | 2,000 | 2,207 |
Northern California Power Agency, Hydroelectric Project, Series 2022A, Rev., 5.00%, 7/1/2028 | 1,500 | 1,648 |
Sacramento Municipal Utility District, Series 2023K, Rev., 5.00%, 8/15/2041 | 1,200 | 1,344 |
Southern California Public Power Authority, Apex Power Project, Series 2014A, Rev., 5.00%, 7/1/2030 | 1,000 | 1,015 |
16,648 | ||
Water & Sewer—19.3% | ||
Alameda County Water District Financing Authority, California Water System, Rev., 5.00%, 6/1/2033 | 1,565 | 1,831 |
California Infrastructure and Economic Development Bank, Clean Water State Revolving Fund, Rev., 4.00%, 10/1/2040 | 3,000 | 3,024 |
California Pollution Control Financing Authority, Poseidon Resources Channelside LP Desalination Project, Rev., AMT, 5.00%, 7/1/2035 (b) | 2,105 | 2,196 |
INVESTMENTS | Principal Amount ($000) | Value ($000) |
Water & Sewer — continued | ||
City of Bakersfield, Wastewater, Series 2015A, Rev., 5.00%, 9/15/2031 | 2,000 | 2,080 |
City of Los Angeles, Wastewater System | ||
Series A, Rev., 5.00%, 6/1/2028 | 1,825 | 1,888 |
Series B, Rev., 5.00%, 6/1/2033 | 1,500 | 1,547 |
Series 2018A, Rev., 5.00%, 6/1/2034 | 1,000 | 1,097 |
Series 2018A, Rev., 5.00%, 6/1/2035 | 1,500 | 1,634 |
City of San Francisco, Public Utilities Commission Water | ||
Series D, Rev., 5.00%, 11/1/2034 | 2,710 | 2,934 |
Series 2020, Subseries C-10, Rev., 4.00%, 11/1/2040 | 2,650 | 2,675 |
Series 2023AB, Subseries A, Rev., 5.00%, 11/1/2041 | 1,850 | 2,089 |
City of Santa Rosa, Wastewater, Series 2002B, Rev., AGM-CR, AMBAC, Zero Coupon, 9/1/2023 | 1,500 | 1,500 |
East Bay Municipal Utility District, Water System | ||
Series 2022B-1, Rev., 5.00%, 6/1/2034 | 1,500 | 1,763 |
Series 2019A, Rev., 5.00%, 6/1/2038 | 1,595 | 1,739 |
Eastern Municipal Water District Financing Authority, Water and Wastewater System, Series 2016B, Rev., 5.00%, 7/1/2033 | 2,885 | 3,049 |
Metropolitan Water District of Southern California, Series 2020C, Rev., 5.00%, 7/1/2040 | 1,500 | 1,645 |
Metropolitan Water District of Southern California, Waterworks | ||
Series 2022A, Rev., 5.00%, 10/1/2029 | 1,250 | 1,407 |
Series 2019A, Rev., 5.00%, 7/1/2038 | 2,500 | 2,708 |
Series 2022B, Rev., 5.00%, 7/1/2039 | 1,250 | 1,404 |
San Diego Public Facilities Financing Authority, Series 2023A, Rev., 5.00%, 8/1/2042 | 1,180 | 1,315 |
San Francisco City and County Public Utilities Commission Wastewater | ||
Series 2018B, Rev., 5.00%, 10/1/2026 | 1,075 | 1,140 |
Series 2018B, Rev., 5.00%, 10/1/2036 | 1,675 | 1,810 |
Santa Clara Valley Water District, Series 2023A, Rev., 5.00%, 6/1/2042 | 1,665 | 1,850 |
Santa Clara Valley Water District, Water System, Series A, Rev., 5.00%, 6/1/2030 | 1,600 | 1,670 |
Southern California Water Replenishment District | ||
Rev., 5.00%, 8/1/2030 | 1,050 | 1,089 |
Rev., 5.00%, 8/1/2031 | 1,420 | 1,474 |
Rev., 5.00%, 8/1/2032 | 2,410 | 2,500 |
Rev., 5.00%, 8/1/2038 | 1,250 | 1,338 |
18 | J.P. Morgan Municipal Bond Funds | August 31, 2023 |
INVESTMENTS | Principal Amount ($000) | Value ($000) |
Municipal Bonds — continued | ||
Water & Sewer — continued | ||
State of California Department of Water Resources, Central Valley Project, Series BF, Rev., 5.00%, 12/1/2035 | 2,000 | 2,337 |
State of California Department of Water Resources, Central Valley Project, Water System, Series BA, Rev., 5.00%, 12/1/2033 | 1,500 | 1,682 |
56,415 | ||
Total California | 280,924 | |
Total Municipal Bonds (Cost $284,859) | 280,924 | |
Shares (000) | ||
Short-Term Investments—4.4% | ||
Investment Companies—4.4% | ||
JPMorgan Institutional Tax Free Money Market Fund Class IM Shares, 3.71% (e) (f)(Cost $12,759) | 12,759 | 12,760 |
Total Investments—100.3% (Cost $297,618) | 293,684 | |
Liabilities in Excess of Other Assets—(0.3)% | (919 ) | |
Net Assets—100.0% | 292,765 | |
Percentages indicated are based on net assets. |
Abbreviations | |
AGC | Insured by Assured Guaranty Corp. |
AGM | Insured by Assured Guaranty Municipal Corp. |
AMBAC | Insured by American Municipal Bond Assurance Corp. |
AMT | Alternative Minimum Tax |
BA | Canadian Bankers' Acceptance Rate |
CR | Custodial Receipts |
GO | General Obligation |
NATL | Insured by National Public Finance Guarantee Corp. |
RE | Reinsured |
Rev. | Revenue |
(a) | The date shown represents the earliest of the prerefunded date, next put date or final maturity date. |
(b) | Securities exempt from registration under Rule 144A or section 4(a)(2), of the Securities Act of 1933, as amended. |
(c) | Security is prerefunded or escrowed to maturity. |
(d) | All or a portion of the security is a when-issued security, delayed delivery security, or forward commitment. |
(e) | Investment in an affiliated fund, which is registered under the Investment Company Act of 1940, as amended, and is advised by J.P. Morgan Investment Management Inc. |
(f) | The rate shown is the current yield as of August 31, 2023. |
August 31, 2023 | J.P. Morgan Municipal Bond Funds | 19 |
AS OF August 31, 2023 (Unaudited)
INVESTMENTS | PRINCIPAL AMOUNT ($000) | VALUE ($000) |
Municipal Bonds — 97.2% (a) | ||
Alabama — 4.4% | ||
Alabama Community College System, Special Fee, Board of Trustees Rev., AGM, 4.00%, 9/1/2031 | 345 | 351 |
Alabama Federal Aid Highway Finance Authority Series B, Rev., 5.00%, 9/1/2023 (b) | 30 | 30 |
Birmingham Airport Authority | ||
Rev., 5.00%, 7/1/2031 | 175 | 194 |
Rev., 5.00%, 7/1/2032 | 150 | 166 |
Black Belt Energy Gas District, Gas Project | ||
Series 2022B-1, Rev., 4.00%, 10/1/2027 (c) | 8,455 | 8,219 |
Series 2022E, Rev., 5.00%, 6/1/2028 (c) | 13,050 | 13,386 |
Series 2022C-1, Rev., 5.25%, 6/1/2029 (c) | 5,000 | 5,184 |
Series 2022C-1, Rev., 5.25%, 6/1/2029 | 2,760 | 2,871 |
Black Belt Energy Gas District, Gas Project No. 8 Series 2022A, Rev., 4.00%, 12/1/2029 (c) | 18,140 | 17,414 |
City of Birmingham, Warrant | ||
Series 2018B, GO, 4.00%, 12/1/2032 | 570 | 584 |
Series 2018B, GO, 4.00%, 12/1/2033 | 375 | 382 |
Series 2018B, GO, 4.00%, 12/1/2034 | 510 | 519 |
Series 2018B, GO, 4.00%, 12/1/2035 | 500 | 505 |
City of Huntsville, Warrants Series 2018-A, GO, 5.00%, 5/1/2033 | 70 | 75 |
Infirmary Health System Special Care Facilities Financing Authority of Mobile, Infirmary Health System, Inc. Series 2016A, Rev., 5.00%, 2/1/2025 | 320 | 324 |
Lower Alabama Gas District (The), Gas Project Series 2016A, Rev., 5.00%, 9/1/2031 | 1,250 | 1,283 |
Montgomery County Public Building Authority, Facilities Project | ||
Rev., 5.00%, 3/1/2024 (b) | 3,910 | 3,940 |
Rev., 5.00%, 3/1/2026 | 1,735 | 1,747 |
Shelby County Board of Education, Special Tax 5.00%, 2/1/2025 | 50 | 51 |
Southeast Alabama Gas Supply District (The), Project No. 1 | ||
Series 2018A, Rev., 4.00%, 4/1/2024 (c) | 34,000 | 33,901 |
Series 2018A, Rev., 5.00%, 4/1/2024 | 20,845 | 20,932 |
Southeast Energy Authority A Cooperative District, Project No. 1 Series 2021A, Rev., 4.00%, 10/1/2028 (c) | 1,000 | 971 |
Southeast Energy Authority A Cooperative District, Project No. 2 Series 2021B, Rev., 4.00%, 12/1/2031 (c) | 22,135 | 21,092 |
INVESTMENTS | PRINCIPAL AMOUNT ($000) | VALUE ($000) |
Alabama — continued | ||
Southeast Energy Authority A Cooperative District, Project No. 4 Series 2022B-1, Rev., 5.00%, 8/1/2028 (c) | 14,065 | 14,346 |
UAB Medicine Finance Authority Series 2019B, Rev., 5.00%, 9/1/2035 | 55 | 59 |
Total Alabama | 148,526 | |
Alaska — 0.2% | ||
Alaska Housing Finance Corp., State Capital Project Series 2019B, Rev., 5.00%, 6/1/2026 | 20 | 21 |
Alaska Industrial Development and Export Authority, Tanana Chiefs Conference Project | ||
Series 2019A, Rev., 5.00%, 10/1/2026 | 2,185 | 2,259 |
Series 2019A, Rev., 5.00%, 10/1/2027 | 1,455 | 1,524 |
Series 2019A, Rev., 5.00%, 10/1/2028 | 1,530 | 1,621 |
Municipality of Anchorage Series 2018C, GO, 5.00%, 9/1/2028 | 1,675 | 1,829 |
Total Alaska | 7,254 | |
Arizona — 1.9% | ||
Arizona Department of Transportation State Highway Fund Rev., 5.00%, 7/1/2031 | 25 | 26 |
Arizona Industrial Development Authority, Aliante and Skye Canyon Campus Project | ||
Series 2021A, Rev., 3.00%, 12/15/2031 (d) | 265 | 227 |
Series 2021A, Rev., 4.00%, 12/15/2051 (d) | 250 | 180 |
Arizona Industrial Development Authority, Children's National Medical Center | ||
Series 2020A, Rev., 4.00%, 9/1/2035 | 200 | 200 |
Series 2020A, Rev., 4.00%, 9/1/2036 | 355 | 349 |
Series 2020A, Rev., 4.00%, 9/1/2037 | 820 | 784 |
Series 2020A, Rev., 4.00%, 9/1/2039 | 810 | 760 |
Series 2020A, Rev., 4.00%, 9/1/2046 | 2,750 | 2,428 |
Arizona Industrial Development Authority, Doral Academy of Northern Nevada Project | ||
Series 2021A, Rev., 4.00%, 7/15/2027 (d) | 120 | 116 |
Series 2021A, Rev., 4.00%, 7/15/2028 (d) | 200 | 192 |
Series 2021A, Rev., 4.00%, 7/15/2031 (d) | 215 | 201 |
Series 2021A, Rev., 4.00%, 7/15/2032 (d) | 225 | 208 |
Series 2021A, Rev., 4.00%, 7/15/2033 (d) | 180 | 165 |
Series 2021A, Rev., 4.00%, 7/15/2034 (d) | 200 | 181 |
Series 2021A, Rev., 4.00%, 7/15/2035 (d) | 250 | 222 |
Series 2021A, Rev., 4.00%, 7/15/2037 (d) | 270 | 229 |
Series 2021A, Rev., 4.00%, 7/15/2041 (d) | 135 | 108 |
20 | J.P. Morgan Municipal Bond Funds | August 31, 2023 |
INVESTMENTS | PRINCIPAL AMOUNT ($000) | VALUE ($000) |
Municipal Bonds — continued | ||
Arizona — continued | ||
Arizona Industrial Development Authority, Equitable School Revolving Fund LLC | ||
Series 2022A, Rev., 5.00%, 11/1/2033 | 1,435 | 1,550 |
Series 2022A, Rev., 5.00%, 11/1/2034 | 1,550 | 1,667 |
Series 2022A, Rev., 5.00%, 11/1/2035 | 1,875 | 1,995 |
Series 2022A, Rev., 5.00%, 11/1/2036 | 1,775 | 1,869 |
Arizona Industrial Development Authority, Great Lakes Senior Living Communities LLC Project | ||
Series 2019A, Rev., 5.00%, 1/1/2024 | 1,475 | 1,437 |
Series 2019A, Rev., 5.00%, 1/1/2025 | 1,800 | 1,683 |
Series 2019A, Rev., 5.00%, 1/1/2026 | 1,875 | 1,709 |
Series 2019A, Rev., 5.00%, 1/1/2027 | 1,850 | 1,622 |
Series 2019A, Rev., 5.00%, 1/1/2028 | 1,500 | 1,279 |
Series 2019A, Rev., 5.00%, 1/1/2029 | 660 | 546 |
Series 2019A, Rev., 5.00%, 1/1/2030 | 3,670 | 2,951 |
Series 2019A, Rev., 4.00%, 1/1/2031 | 4,100 | 3,014 |
Series 2019A, Rev., 4.00%, 1/1/2032 | 4,265 | 2,997 |
Series 2019A, Rev., 4.00%, 1/1/2033 | 4,440 | 3,060 |
Series 2019A, Rev., 5.00%, 1/1/2034 | 1,770 | 1,296 |
Series 2019A, Rev., 5.00%, 1/1/2035 | 2,285 | 1,645 |
Series 2019A, Rev., 5.00%, 1/1/2036 | 1,835 | 1,290 |
Series 2019A, Rev., 5.00%, 1/1/2037 | 500 | 343 |
Series 2019A, Rev., 5.00%, 1/1/2038 | 500 | 342 |
Series 2019A, Rev., 4.25%, 1/1/2039 | 545 | 336 |
Series 2019A, Rev., 4.25%, 1/1/2040 | 1,320 | 799 |
Series 2019A, Rev., 5.00%, 1/1/2043 | 1,750 | 1,135 |
Arizona Industrial Development Authority, Macombs Facility Project | ||
Series 2021A, Rev., 5.00%, 7/1/2033 | 320 | 336 |
Series 2021A, Rev., 4.00%, 7/1/2035 | 360 | 344 |
Series 2021A, Rev., 4.00%, 7/1/2036 | 155 | 146 |
Arizona Industrial Development Authority, Pebble Campus Project | ||
Series 2020A, Rev., 4.00%, 7/15/2030 (d) | 250 | 238 |
Series 2020A, Rev., 5.00%, 7/15/2040 (d) | 415 | 397 |
Arizona Industrial Development Authority, Pinecrest Academy of Northern Nevada Project Series 2022A, Rev., 4.50%, 7/15/2029 (d) | 1,100 | 1,059 |
Arizona State University | ||
Series 2017B, Rev., 5.00%, 7/1/2034 | 920 | 977 |
Series 2017B, Rev., 5.00%, 7/1/2035 | 1,000 | 1,058 |
Series 2016B, Rev., 5.00%, 7/1/2042 | 30 | 31 |
City of Mesa, Utility System | ||
Series 2019A, Rev., 5.00%, 7/1/2029 | 40 | 44 |
Rev., 4.00%, 7/1/2031 | 50 | 51 |
INVESTMENTS | PRINCIPAL AMOUNT ($000) | VALUE ($000) |
Arizona — continued | ||
Series 2019A, Rev., 5.00%, 7/1/2031 | 25 | 28 |
Series 2019A, Rev., 5.00%, 7/1/2033 | 25 | 28 |
City of Phoenix Civic Improvement Corp., Junior Lien, Airport System Series 2017D, Rev., 5.00%, 7/1/2029 | 190 | 202 |
City of Phoenix Civic Improvement Corp., Junior Lien, Water System Series 2020B, Rev., 5.00%, 7/1/2040 | 70 | 76 |
City of Phoenix Civic Improvement Corp., Senior Lien, Airport System Rev., AMT, 5.00%, 7/1/2037 | 1,000 | 1,037 |
City of Yuma, Arizona Utility System Rev., 4.00%, 7/1/2038 | 85 | 85 |
County of Pinal Rev., 4.00%, 8/1/2037 | 75 | 75 |
Industrial Development Authority of The City of Phoenix, Downtown Phoenix Student Housing LLC - Arizona State University Project | ||
Series 2018A, Rev., 5.00%, 7/1/2028 | 700 | 727 |
Series 2018A, Rev., 5.00%, 7/1/2029 | 1,300 | 1,354 |
Industrial Development Authority of the County of Pima (The), La Posada at Pusch Ridge Project Series 2022B-3, Rev., 5.13%, 11/15/2029 (d) | 4,000 | 3,930 |
Industrial Development Authority of the County of Yavapai (The), Regional Medical Center Series 2013A, Rev., 5.25%, 8/1/2033 | 1,000 | 1,000 |
Maricopa County Industrial Development Authority, Banner Health Series A, Rev., 4.00%, 1/1/2041 | 1,650 | 1,591 |
Maricopa County Industrial Development Authority, HonorHealth | ||
Series 2021A, Rev., 5.00%, 9/1/2024 | 90 | 91 |
Series 2019A, Rev., 5.00%, 9/1/2033 | 500 | 532 |
Series 2019A, Rev., 5.00%, 9/1/2034 | 1,000 | 1,063 |
Series 2019A, Rev., 5.00%, 9/1/2035 | 1,000 | 1,055 |
Maricopa County Industrial Development Authority, Ottawa University | ||
Rev., 5.00%, 10/1/2026 (d) | 125 | 124 |
Rev., 5.13%, 10/1/2030 (d) | 215 | 214 |
Maricopa County Industrial Development Authority, Valley Christian Schools Project | ||
Series 2023A, Rev., 5.25%, 7/1/2033 (d) | 165 | 163 |
Series 2023A, Rev., 6.00%, 7/1/2043 (d) | 940 | 928 |
Maricopa County Special Health Care District, Integrated Health Services | ||
Series 2018C, GO, 5.00%, 7/1/2031 | 25 | 27 |
Series 2018C, GO, 5.00%, 7/1/2033 | 25 | 27 |
August 31, 2023 | J.P. Morgan Municipal Bond Funds | 21 |
AS OF August 31, 2023 (Unaudited) (continued)
INVESTMENTS | PRINCIPAL AMOUNT ($000) | VALUE ($000) |
Municipal Bonds — continued | ||
Arizona — continued | ||
Maricopa County Unified School District No. 48 Scottsdale, School Improvement, Project of 2016 Series 2017B, GO, 5.00%, 7/1/2031 | 25 | 27 |
Maricopa County Unified School District No. 95, Queen Creek, School Improvement | ||
GO, 5.00%, 7/1/2028 | 225 | 236 |
GO, 5.00%, 7/1/2029 | 500 | 524 |
Maricopa County Union High School District No. 216 Agua Fria, School Improvement GO, 4.00%, 7/1/2034 | 50 | 52 |
Mohave County Unified School District No. 1 Lake Havasu, School Improvement, Project of 2016 Series 2017A, GO, 4.00%, 7/1/2030 | 30 | 31 |
Pima County Community College District | ||
Rev., 5.00%, 7/1/2030 | 60 | 65 |
Rev., 5.00%, 7/1/2034 | 50 | 54 |
Regional Public Transportation Authority, Transportation Excise Tax, Maricopa County Public Transportation Fund Rev., 5.25%, 7/1/2025 | 1,000 | 1,015 |
Scottsdale Municipal Property Corp., Excise Tax Rev., 5.00%, 7/1/2026 | 1,570 | 1,647 |
University of Arizona (The) Rev., 5.00%, 6/1/2026 | 10 | 10 |
University of Arizona (The), Stimulus Plan for Economic and Educational Development Series 2020A, Rev., 5.00%, 8/1/2036 | 85 | 93 |
Total Arizona | 63,933 | |
Arkansas — 0.0% ^ | ||
County of Pulaski Rev., 4.25%, 3/1/2048 | 250 | 237 |
State of Arkansas, Federal Highway GO, 5.00%, 10/1/2025 | 25 | 25 |
University of Arkansas, Various Facility Fayetteville Campus Series A, Rev., 4.50%, 11/1/2024 (b) | 45 | 46 |
Total Arkansas | 308 | |
California — 8.6% | ||
Alameda County Joint Powers Authority, Multiple Capital Projects | ||
Series 2013A, Rev., 5.25%, 12/1/2025 | 75 | 75 |
Series 2013A, Rev., 5.25%, 12/1/2027 | 50 | 50 |
Anaheim Public Financing Authority, Public Improvement Project Series 1997C, Rev., AGM, Zero Coupon, 3/1/2037 (b) | 30 | 18 |
Arcadia Unified School District GO, 4.00%, 8/1/2038 | 9,385 | 9,410 |
Bay Area Toll Authority, Toll Bridge Series 2019S-H, Rev., 5.00%, 4/1/2029 (b) | 50 | 56 |
INVESTMENTS | PRINCIPAL AMOUNT ($000) | VALUE ($000) |
California — continued | ||
Beverly Hills Unified School District, Election of 2008 GO, 5.00%, 8/1/2026 | 30 | 31 |
Brentwood Union School District, Election of 2016 GO, 5.00%, 8/1/2031 | 20 | 21 |
California Community Choice Financing Authority, Clean Energy Project Series 2021B-1, Rev., 4.00%, 8/1/2031 (c) | 39,435 | 38,577 |
California Community Choice Financing Authority, Green Bond Series 2022A-1, Rev., 4.00%, 8/1/2028 (c) | 2,935 | 2,895 |
California Community Housing Agency, Fountains at Emerald Park Series 2021A-2, Rev., 4.00%, 8/1/2046 (d) | 2,955 | 2,356 |
California County Tobacco Securitization Agency, Los Angeles County Securitization Corp. | ||
Series 2020A, Rev., 5.00%, 6/1/2024 | 350 | 354 |
Series 2020A, Rev., 5.00%, 6/1/2027 | 400 | 419 |
Series 2020A, Rev., 5.00%, 6/1/2033 | 300 | 326 |
California Educational Facilities Authority, Claremont McKenna College | ||
Series 2015A, Rev., 4.00%, 1/1/2026 (b) | 3,000 | 3,062 |
Series 2015A, Rev., 5.00%, 1/1/2026 (b) | 6,515 | 6,795 |
California Educational Facilities Authority, Santa Clara University Series 2017B, Rev., 5.00%, 4/1/2035 | 80 | 85 |
California Enterprise Development Authority, Riverside County, Rocketship Public Schools-Obligated Group No. 2 | ||
Series 2022A, Rev., 4.00%, 6/1/2031 (d) | 1,000 | 903 |
Series 2022A, Rev., 4.00%, 6/1/2042 (d) | 5,450 | 4,264 |
California Health Facilities Financing Authority, Children's Hospital Series 2019A, Rev., 5.00%, 11/1/2024 | 30 | 31 |
California Health Facilities Financing Authority, On Lok Senior Health Service | ||
Rev., 3.00%, 8/1/2028 | 130 | 125 |
Rev., 3.00%, 8/1/2029 | 150 | 142 |
Rev., 5.00%, 8/1/2040 | 600 | 611 |
California Health Facilities Financing Authority, Sutter Health | ||
Series 2016A, Rev., 3.25%, 11/15/2025 (b) | 1,725 | 1,736 |
Series 2017A, Rev., 5.00%, 11/15/2032 | 25 | 27 |
Series 2017A, Rev., 5.00%, 11/15/2033 | 50 | 53 |
Series 2018A, Rev., 5.00%, 11/15/2035 | 25 | 26 |
Series 2018A, Rev., 5.00%, 11/15/2036 | 35 | 37 |
22 | J.P. Morgan Municipal Bond Funds | August 31, 2023 |
INVESTMENTS | PRINCIPAL AMOUNT ($000) | VALUE ($000) |
Municipal Bonds — continued | ||
California — continued | ||
California Infrastructure and Economic Development Bank, Clean Water State Revolving Fund Rev., 5.00%, 10/1/2032 | 25 | 27 |
California Infrastructure and Economic Development Bank, Infrastructure State Revolving Fund Series 2015A, Rev., 5.00%, 10/1/2025 (b) | 40 | 42 |
California Municipal Finance Authority, California Lutheran University | ||
Rev., 5.00%, 10/1/2026 | 150 | 155 |
Rev., 5.00%, 10/1/2027 | 150 | 156 |
Rev., 5.00%, 10/1/2028 | 150 | 158 |
California Municipal Finance Authority, Community Medical Center | ||
Series 2017A, Rev., 5.00%, 2/1/2028 | 900 | 933 |
Series 2017A, Rev., 5.00%, 2/1/2029 | 1,250 | 1,297 |
California Municipal Finance Authority, Linxs Apartments Project, Senior Lien | ||
Series 2018A, Rev., AMT, AGM, 3.25%, 12/31/2032 | 6,680 | 6,147 |
Series 2018A, Rev., AMT, AGM, 3.50%, 12/31/2035 | 4,555 | 4,117 |
California Municipal Finance Authority, San Antonio Gardens Project Series 2022B1, Rev., 2.75%, 11/15/2027 | 160 | 151 |
California Pollution Control Financing Authority, Poseidon Resources Channelside LP Desalination Project | ||
Rev., AMT, 5.00%, 7/1/2036 (d) | 1,095 | 1,134 |
Rev., AMT, 5.00%, 7/1/2037 (d) | 1,100 | 1,136 |
Rev., AMT, 5.00%, 7/1/2038 (d) | 1,000 | 1,027 |
Rev., AMT, 5.00%, 11/21/2045 (d) | 1,000 | 1,003 |
California Public Finance Authority, Enso Village Project | ||
Series 2021B-3, Rev., 2.13%, 11/15/2027 (d) | 6,240 | 6,050 |
Series 2021B-1, Rev., 3.13%, 5/15/2029 (d) | 400 | 378 |
Series 2021A, Rev., 5.00%, 11/15/2036 (d) | 400 | 386 |
Series 2021A, Rev., 5.00%, 11/15/2046 (d) | 635 | 566 |
California Public Finance Authority, Henry Mayo Newhall Hospital | ||
Rev., 5.00%, 10/15/2029 | 700 | 722 |
Rev., 5.00%, 10/15/2030 | 500 | 515 |
Rev., 5.00%, 10/15/2031 | 535 | 551 |
California State Public Works Board Series C, Rev., 5.00%, 3/1/2032 | 3,025 | 3,231 |
INVESTMENTS | PRINCIPAL AMOUNT ($000) | VALUE ($000) |
California — continued | ||
California State Public Works Board, California State University, Various University Projects Series 2013H, Rev., 5.00%, 9/1/2023 (b) | 5,405 | 5,405 |
California State University, Systemwide | ||
Series 2017A, Rev., 5.00%, 11/1/2034 | 2,875 | 3,079 |
Series 2016A, Rev., 5.00%, 11/1/2045 | 30 | 31 |
Capistrano Unified School District Community Facilities District No. 90-2, Special Tax Rev., AGM, 4.00%, 9/1/2023 (b) | 35 | 35 |
Castaic Lake Water Agency, Capital Appreciation, Water System Improvement Project Series 1999A, COP, AMBAC, Zero Coupon, 8/1/2025 | 10,445 | 9,777 |
Central Unified School District GO, 5.00%, 8/1/2025 | 110 | 114 |
Cerritos Community College District Series A, GO, 5.00%, 8/1/2029 | 45 | 46 |
City of Alameda GO, 4.00%, 8/1/2033 | 10 | 10 |
City of Brea, Water Utility Rev., 5.00%, 7/1/2028 | 90 | 99 |
City of Livermore Series 2020B, COP, 4.00%, 10/1/2029 | 235 | 250 |
City of Los Angeles Department of Airports Series 2019C, Rev., 5.00%, 5/15/2033 | 20 | 22 |
City of Los Angeles, Wastewater System Series 2013A, Rev., 5.00%, 6/1/2026 | 12,500 | 12,511 |
City of Oceanside Series 2020A, Rev., 4.00%, 5/1/2040 | 375 | 374 |
City of Pasadena, Electric Series 2016A, Rev., 5.00%, 6/1/2031 | 25 | 26 |
City of San Francisco, Public Utilities Commission Water Series A, Rev., 5.00%, 11/1/2035 | 1,500 | 1,587 |
City of Santa Rosa, Wastewater Series 2002B, Rev., AGM-CR, AMBAC, Zero Coupon, 9/1/2023 | 5,000 | 5,000 |
City of Ukiah, Water System Rev., AGM, 5.00%, 9/1/2023 | 50 | 50 |
County of San Benito, Jail Facility Project COP, 5.00%, 10/1/2025 | 45 | 46 |
County of Santa Clara, Election of 2008 Series 2017C, GO, 5.00%, 8/1/2033 | 25 | 27 |
CSCDA Community Improvement Authority, Essential Housing, Altana-Glendale Series 2021A-1, Rev., 3.50%, 10/1/2046 (d) | 6,000 | 4,461 |
CSCDA Community Improvement Authority, Essential Housing, Orange Portfolio Series 2021A-1, Rev., 2.80%, 3/1/2047 (d) | 13,400 | 10,006 |
CSCDA Community Improvement Authority, Essential Housing, Pasadena Portfolio Series 2021A-1, Rev., 2.65%, 12/1/2046 (d) | 4,055 | 2,990 |
August 31, 2023 | J.P. Morgan Municipal Bond Funds | 23 |
AS OF August 31, 2023 (Unaudited) (continued)
INVESTMENTS | PRINCIPAL AMOUNT ($000) | VALUE ($000) |
Municipal Bonds — continued | ||
California — continued | ||
CSCDA Community Improvement Authority, Essential Housing, Senior Lien Series 2021A-1, Rev., 2.45%, 2/1/2047 (d) | 3,000 | 2,241 |
Desert Sands Unified School District, Election of 2014 GO, 4.00%, 8/1/2038 | 1,000 | 1,004 |
East Bay Municipal Utility District, Water System Series 2015B, Rev., 5.00%, 6/1/2024 | 45 | 46 |
East Side Union High School District Series 2016B, GO, 5.00%, 8/1/2027 | 50 | 53 |
Escondido Union School District, Election of 2014 Series A, GO, 5.00%, 8/1/2027 | 100 | 104 |
Etiwanda School District Community Facilities District No. 9, Special Tax Rev., 4.00%, 9/1/2028 | 305 | 308 |
Fremont Public Financing Authority Rev., 5.00%, 10/1/2028 | 325 | 358 |
Golden State Tobacco Securitization Corp., Enhanced Tobacco Settlement Series 2015A, Rev., 5.00%, 6/1/2025 (b) | 4,000 | 4,140 |
Grossmont-Cuyamaca Community College District, Election of 2002 Series 2008C, GO, AGC, Zero Coupon, 8/1/2026 | 19,585 | 17,648 |
Hollister Joint Powers Financing Authority Rev., AGM, 5.00%, 6/1/2031 | 65 | 69 |
La Canada Unified School District, Election of 2017 Series 2018A, GO, 5.00%, 8/1/2031 | 50 | 55 |
Lincoln Public Financing Authority Series A, Rev., 4.00%, 10/1/2023 | 25 | 25 |
Long Beach Community College District, Election of 2016 Series 2019C, GO, 4.00%, 8/1/2045 | 40 | 39 |
Los Angeles Department of Water and Power, Power System | ||
Series 2019B, Rev., 5.00%, 7/1/2024 | 275 | 279 |
Series 2014D, Rev., 5.00%, 7/1/2027 | 50 | 51 |
Series 2017B, Rev., 5.00%, 7/1/2029 | 10,000 | 10,686 |
Series 2018A, Rev., 5.00%, 7/1/2030 | 35 | 38 |
Series 2014B, Rev., 5.00%, 7/1/2031 | 3,400 | 3,419 |
Series 2014B, Rev., 5.00%, 7/1/2032 | 3,075 | 3,092 |
Series 2017A, Rev., 5.00%, 7/1/2032 | 2,550 | 2,728 |
Series 2014D, Rev., 5.00%, 7/1/2033 | 390 | 395 |
Series 2017A, Rev., 5.00%, 7/1/2033 | 5,000 | 5,347 |
Series 2014D, Rev., 5.00%, 7/1/2034 | 4,750 | 4,813 |
Series 2018D, Rev., 5.00%, 7/1/2034 | 30 | 33 |
Series 2014D, Rev., 5.00%, 7/1/2035 | 250 | 253 |
Series 2019A, Rev., 5.00%, 7/1/2039 | 35 | 38 |
Los Angeles Unified School District, Election of 2005 Series 2018M-1, GO, 5.00%, 7/1/2033 | 4,305 | 4,694 |
INVESTMENTS | PRINCIPAL AMOUNT ($000) | VALUE ($000) |
California — continued | ||
Madera Irrigation District Rev., AGM, 5.00%, 9/1/2025 | 150 | 155 |
Menlo Park City School District, Capital Appreciation | ||
GO, Zero Coupon, 7/1/2033 | 1,000 | 682 |
GO, Zero Coupon, 7/1/2035 | 725 | 451 |
GO, Zero Coupon, 7/1/2036 | 1,150 | 679 |
GO, Zero Coupon, 7/1/2037 | 1,950 | 1,097 |
GO, Zero Coupon, 7/1/2041 | 1,250 | 583 |
Metropolitan Water District of Southern California, Waterworks Series 2016A, Rev., 5.00%, 1/1/2026 (b) | 30 | 31 |
Modesto Elementary School District, Election of 2018 Series C, GO, 5.00%, 8/1/2052 | 2,500 | 2,657 |
Morgan Hill Financing Authority Series 2015A, Rev., 5.00%, 11/1/2024 | 55 | 56 |
Mountain View-Los Altos Union High School District, Election of 2010 Series C, GO, Zero Coupon, 8/1/2027 | 1,000 | 877 |
Murrieta Valley Unified School District, Election of 2014 Series 2015, GO, AGM, 4.00%, 3/1/2025 (b) | 25 | 25 |
Oakland Joint Powers Financing Authority Rev., 5.00%, 11/1/2025 | 100 | 104 |
Orange County Community Facilities District No. 2021-1, Rienda | ||
Series 2021-1, Rev., 5.00%, 8/15/2037 | 400 | 412 |
Rev., 5.00%, 8/15/2042 | 800 | 805 |
Orange County Sanitation District, Wastewater Series 2016A, Rev., 5.00%, 2/1/2027 | 45 | 47 |
Orange County Water District Series 2017A, Rev., 5.00%, 8/15/2034 | 350 | 376 |
Orange Redevelopment Agency, Orange Merged and Amended Redevelopment Project Series 2014A, Rev., AGM, 5.00%, 9/1/2023 | 110 | 110 |
Orange Unified School District, Election of 2016 GO, 5.00%, 8/1/2031 | 85 | 93 |
Plumas Unified School District, Election of 2016 Series B, GO, 5.00%, 8/1/2024 | 50 | 51 |
Pomona Unified School District GO, AGM, 5.00%, 8/1/2027 | 50 | 52 |
Regents of the University of California Medical Center Pooled Series 2016L, Rev., 5.00%, 5/15/2041 | 155 | 160 |
River Islands Public Financing Authority, Facilities District No. 2003 | ||
Series 2022A-1, Rev., AGM, 5.00%, 9/1/2033 | 400 | 452 |
24 | J.P. Morgan Municipal Bond Funds | August 31, 2023 |
INVESTMENTS | PRINCIPAL AMOUNT ($000) | VALUE ($000) |
Municipal Bonds — continued | ||
California — continued | ||
Series 2022A-1, Rev., AGM, 4.00%, 9/1/2037 | 250 | 252 |
Series 2022A-1, Rev., AGM, 5.00%, 9/1/2042 | 1,000 | 1,083 |
Riverside County Infrastructure Financing Authority Series 2016A, Rev., 4.00%, 11/1/2023 | 25 | 25 |
Riverside County Public Financing Authority, Capital Facilities Project Rev., 4.25%, 11/1/2025 (b) | 35 | 36 |
Riverside County Public Financing Authority, Desert Communities and Interstate 215 Corridor Projects Series 2017A, Rev., 5.00%, 10/1/2026 | 75 | 79 |
Riverside County Redevelopment Successor Agency, Desert Communities Redevelopment Project Series 2014D, Rev., AGM, 5.00%, 10/1/2026 | 115 | 117 |
Riverside Public Financing Authority Series 2012A, Rev., 5.00%, 11/1/2023 | 50 | 50 |
Riverside Unified School District, Election of 2016 Series B, GO, 4.00%, 8/1/2042 | 50 | 49 |
Sacramento Area Flood Control Agency, Consolidated Capital Assessment District No. 2 Series 2016A, 5.00%, 10/1/2023 | 125 | 125 |
Sacramento City Financing Authority, Master Lease Program Facilities Series 2015A, Rev., 5.00%, 12/1/2023 | 135 | 136 |
Sacramento County Sanitation Districts Financing Authority Series 2014A, Rev., 5.00%, 12/1/2027 | 60 | 61 |
San Bruno Park School District, Election of 2018 Series 2022C, GO, 4.00%, 8/1/2039 | 245 | 244 |
San Diego Community College District GO, 5.00%, 8/1/2025 | 25 | 26 |
San Diego County Regional Airport Authority Series 2021B, Rev., AMT, 5.00%, 7/1/2056 | 5,180 | 5,250 |
San Diego Public Facilities Financing Authority, Fire and Life Safety Facilities Series B, Rev., 4.00%, 4/15/2027 | 70 | 70 |
San Dieguito School Facilities Financing Authority, Special Tax Rev., 5.00%, 3/1/2025 | 125 | 128 |
San Francisco City and County Airport Commission, San Francisco International Airport Series 2021A, Rev., AMT, 5.00%, 5/1/2032 | 5,065 | 5,537 |
San Francisco Municipal Transportation Agency Series 2017, Rev., 5.00%, 3/1/2028 | 60 | 64 |
San Joaquin County Transportation Authority, Measure K Sales Tax | ||
Rev., 5.00%, 3/1/2032 | 2,000 | 2,140 |
Rev., 5.00%, 3/1/2033 | 750 | 802 |
San Jose Evergreen Community College District | ||
Series C, GO, 4.00%, 9/1/2042 | 2,000 | 1,997 |
Series C, GO, 4.00%, 9/1/2045 | 1,250 | 1,235 |
INVESTMENTS | PRINCIPAL AMOUNT ($000) | VALUE ($000) |
California — continued | ||
San Luis Coastal Unified School District, Election of 2014 Series C, GO, 4.00%, 8/1/2025 | 25 | 25 |
San Luis Obispo Public Financing Authority, Los Osos Valley Road Interchange Project Rev., 4.00%, 11/1/2023 | 75 | 75 |
San Marcos Unified School District | ||
GO, 5.00%, 8/1/2031 | 60 | 65 |
GO, 4.00%, 8/1/2033 | 25 | 26 |
San Marcos Unified School, District No. 4, Community Facilities, Special Tax Rev., 4.00%, 9/1/2025 | 55 | 56 |
San Mateo Joint Powers Financing Authority, Maple Street Correctional Center Series 2014A, Rev., 5.00%, 6/15/2027 | 75 | 76 |
San Mateo Joint Powers Financing Authority, Youth Services Campus Series 2016A, Rev., 5.00%, 7/15/2027 | 25 | 26 |
Santa Clara County Financing Authority, County Facilities | ||
Series 2019A, Rev., 5.00%, 5/1/2028 | 25 | 27 |
Series 2019A, Rev., 4.00%, 5/1/2034 | 55 | 57 |
Santa Clara County Financing Authority, Multiple Facilities Projects Series 2015P, Rev., 5.00%, 5/15/2029 | 8,400 | 8,687 |
Santa Clara Unified School District GO, 5.00%, 7/1/2025 | 25 | 26 |
Santa Clara Unified School District, Election of 2014 GO, 5.00%, 7/1/2027 | 25 | 26 |
Santa Clara Valley Water District, Water System Series 2017A, Rev., 5.00%, 6/1/2035 | 3,115 | 3,312 |
Santa Cruz County Redevelopment Successor Agency Series A, Rev., AGM, 5.00%, 9/1/2028 | 50 | 52 |
Santa Margarita-Dana Point Authority, Water District Improvement District No. 2, 3 | ||
Series 2017, Rev., 5.00%, 8/1/2031 | 950 | 1,027 |
Series 2017, Rev., 5.00%, 8/1/2032 | 1,030 | 1,113 |
Series 2017, Rev., 5.00%, 8/1/2033 | 1,455 | 1,561 |
Santa Monica Community College District, Election of 2016 Series 2018A, GO, 4.00%, 8/1/2035 | 25 | 26 |
Santa Monica Public Financing Authority, City Yards Projects Series 2021, Rev., 4.00%, 7/1/2034 | 100 | 105 |
Santa Monica-Malibu Unified School District Series 2016C, GO, 4.00%, 7/1/2024 | 30 | 30 |
Schools Infrastructure Financing Agency, Special Tax Rev., AGM, 4.00%, 9/1/2034 | 105 | 106 |
Sierra View Local Health Care District | ||
Rev., 5.00%, 7/1/2027 | 155 | 162 |
August 31, 2023 | J.P. Morgan Municipal Bond Funds | 25 |
AS OF August 31, 2023 (Unaudited) (continued)
INVESTMENTS | PRINCIPAL AMOUNT ($000) | VALUE ($000) |
Municipal Bonds — continued | ||
California — continued | ||
Rev., 5.00%, 7/1/2028 | 165 | 174 |
Rev., 5.00%, 7/1/2029 | 160 | 170 |
Rev., 5.00%, 7/1/2030 | 155 | 166 |
Sonoma Valley Unified School District, Election of 2016 GO, 4.00%, 8/1/2042 | 25 | 25 |
Southwestern Community College District, Election of 2016 Series A, GO, 4.00%, 8/1/2038 | 1,000 | 1,005 |
State of California Department of Water Resources, Central Valley Project, Water System Series BA, Rev., 5.00%, 12/1/2031 | 65 | 73 |
State of California, Various Purpose | ||
GO, AMBAC, 5.00%, 2/1/2027 | 565 | 603 |
Series 2018A, GO, 5.00%, 8/1/2030 | 20,000 | 20,499 |
Union Elementary School District Series C, GO, 5.00%, 9/1/2027 | 50 | 54 |
University of California | ||
Series 2017AY, Rev., 5.00%, 5/15/2028 | 55 | 59 |
Series 2018AZ, Rev., 5.00%, 5/15/2031 | 35 | 38 |
University of California, Limited Project Series 2017M, Rev., 5.00%, 5/15/2036 | 25 | 27 |
Ventura County Public Financing Authority Series 2016A, Rev., 5.00%, 11/1/2027 | 55 | 58 |
West Hills Community College District | ||
GO, AGM, 5.00%, 8/1/2029 | 65 | 72 |
GO, AGM, 5.00%, 8/1/2030 | 60 | 68 |
GO, AGM, 5.00%, 8/1/2031 | 25 | 29 |
GO, AGM, 5.00%, 8/1/2032 | 25 | 28 |
GO, AGM, 5.00%, 8/1/2033 | 50 | 57 |
GO, AGM, 4.00%, 8/1/2034 | 420 | 433 |
GO, AGM, 4.00%, 8/1/2037 | 1,650 | 1,640 |
West Hills Community College District, School Facilities Improvement District No. 2, 2008 Election Series 2012B, GO, AGM, 4.00%, 8/1/2038 | 25 | 25 |
West Valley-Mission Community College District, Election of 2012, Tax Exempt Series 2015B, GO, 5.00%, 8/1/2027 | 40 | 41 |
Total California | 291,740 | |
Colorado — 4.8% | ||
Adams 12 Five Star Schools, The City and County of Broomfield | ||
GO, 5.50%, 12/15/2030 | 1,400 | 1,573 |
GO, 5.50%, 12/15/2032 | 625 | 703 |
Adams County School District No. 1, Mapleton Public Schools GO, 4.00%, 12/1/2030 | 25 | 25 |
INVESTMENTS | PRINCIPAL AMOUNT ($000) | VALUE ($000) |
Colorado — continued | ||
Board of Governors of Colorado State University System Series 2019A, Rev., 4.00%, 3/1/2037 | 50 | 50 |
Boulder Valley School District No. Re-2 Boulder GO, 4.13%, 12/1/2046 | 3,660 | 3,494 |
Broadway Park North Metropolitan District No. 2, Limited Tax GO, 5.00%, 12/1/2040 (d) | 550 | 513 |
Canyon Pines Metropolitan District Special Improvement District No. 1 Series 2021A-2, 3.75%, 12/1/2040 | 1,325 | 1,016 |
City and County of Denver, Airport System | ||
Series 2017B, Rev., 5.00%, 11/15/2033 | 25 | 27 |
Series 2022A, Rev., AMT, 5.00%, 11/15/2034 | 4,565 | 4,985 |
Series 2022A, Rev., AMT, 5.50%, 11/15/2035 | 12,500 | 14,129 |
Series 2018A, Rev., AMT, 5.00%, 12/1/2035 | 18,390 | 19,205 |
Series 2018A, Rev., AMT, 5.00%, 12/1/2036 | 2,500 | 2,714 |
Series 2022A, Rev., AMT, 5.00%, 11/15/2037 | 8,750 | 9,297 |
Series 2022A, Rev., AMT, 5.50%, 11/15/2038 | 15,000 | 16,552 |
Series 2022B, Rev., 5.00%, 11/15/2040 | 1,000 | 1,090 |
Series 2022A, Rev., AMT, 5.50%, 11/15/2040 | 8,750 | 9,590 |
Series 2022B, Rev., 5.00%, 11/15/2041 | 1,220 | 1,325 |
Series 2022A, Rev., AMT, 5.50%, 11/15/2042 | 3,340 | 3,631 |
City of Aurora, First Lien Water Rev., 5.00%, 8/1/2024 | 15 | 15 |
City of Commerce City COP, AGM, 4.00%, 12/15/2037 | 150 | 149 |
City of Englewood GO, 5.00%, 12/1/2029 | 15 | 16 |
Clear Creek Transit Metropolitan District No. 2, Limited Tax | ||
Series 2021A, GO, 5.00%, 12/1/2041 | 575 | 518 |
Series 2021A, GO, 5.00%, 12/1/2050 | 500 | 424 |
Colorado Educational and Cultural Facilities Authority, Aspen View Academy Project | ||
Rev., 4.00%, 5/1/2029 | 35 | 34 |
Rev., 4.00%, 5/1/2031 | 30 | 29 |
Rev., 4.00%, 5/1/2041 | 85 | 72 |
Colorado Educational and Cultural Facilities Authority, Global Village Academy Northglenn Project | ||
Rev., 4.00%, 12/1/2030 (d) | 595 | 544 |
Rev., 5.00%, 12/1/2040 (d) | 555 | 496 |
Colorado Educational and Cultural Facilities Authority, University Denver Project Rev., NATL - RE, 5.00%, 3/1/2035 | 5,055 | 5,714 |
Colorado Health Facilities Authority | ||
Series 2019A, Rev., 4.00%, 1/1/2037 | 2,605 | 2,603 |
Series 2019A-2, Rev., 5.00%, 8/1/2039 | 1,225 | 1,259 |
26 | J.P. Morgan Municipal Bond Funds | August 31, 2023 |
INVESTMENTS | PRINCIPAL AMOUNT ($000) | VALUE ($000) |
Municipal Bonds — continued | ||
Colorado — continued | ||
Colorado Health Facilities Authority, Adventist Health System/Sunbelt Obligated Group Series B, Rev., 5.00%, 11/15/2028 | 30 | 31 |
Colorado Health Facilities Authority, Boulder Community Health Project | ||
Rev., 4.00%, 10/1/2035 | 725 | 720 |
Rev., 4.00%, 10/1/2037 | 400 | 379 |
Rev., 4.00%, 10/1/2038 | 300 | 280 |
Rev., 4.00%, 10/1/2039 | 270 | 249 |
Rev., 4.00%, 10/1/2040 | 300 | 275 |
Colorado Health Facilities Authority, CommonSpirit Health | ||
Series 2019A-2, Rev., 5.00%, 8/1/2030 | 2,055 | 2,193 |
Series 2019A-2, Rev., 5.00%, 8/1/2031 | 1,000 | 1,067 |
Series 2019A-2, Rev., 5.00%, 8/1/2032 | 2,000 | 2,127 |
Series 2019A-2, Rev., 5.00%, 8/1/2034 | 2,000 | 2,117 |
Series 2019A-1, Rev., 5.00%, 8/1/2035 | 2,500 | 2,627 |
Colorado Health Facilities Authority, Parkview Medical Center, Inc., Project | ||
Series A, Rev., 3.00%, 9/1/2024 | 235 | 232 |
Series 2020A, Rev., 4.00%, 9/1/2045 | 1,000 | 866 |
Colorado Health Facilities Authority, School Health System Series 2013A, Rev., 5.50%, 1/1/2024 (b) | 4,550 | 4,580 |
Colorado Health Facilities Authority, Tax Exempt Series 2021B-3, Rev., 2.13%, 5/15/2028 | 1,155 | 1,043 |
Colorado Mountain College Project COP, 5.00%, 8/1/2031 | 30 | 32 |
Colorado State Board for Community Colleges and Occupational Educational System Series 2019A, Rev., 5.00%, 11/1/2025 | 40 | 41 |
County of Adams | ||
COP, 5.00%, 12/1/2031 | 1,100 | 1,136 |
COP, 5.00%, 12/1/2034 | 500 | 515 |
County of Eagle COP, 5.00%, 12/1/2028 | 25 | 26 |
County of Gunnison COP, 4.00%, 12/1/2033 | 50 | 51 |
Denver Health and Hospital Authority | ||
Series 2019A, Rev., 5.00%, 12/1/2031 | 1,400 | 1,453 |
Series 2019A, Rev., 5.00%, 12/1/2032 | 3,500 | 3,634 |
Series 2019A, Rev., 4.00%, 12/1/2037 | 2,540 | 2,291 |
Dominion Water and Sanitation District | ||
Rev., 5.00%, 12/1/2027 | 1,095 | 1,084 |
Rev., 5.25%, 12/1/2032 | 1,905 | 1,877 |
Ebert Metropolitan District Series 2018A-2, GO, 5.00%, 12/1/2034 | 170 | 184 |
INVESTMENTS | PRINCIPAL AMOUNT ($000) | VALUE ($000) |
Colorado — continued | ||
El Paso County School District No. 49 Falcon Series 2017B, COP, 5.00%, 12/15/2028 | 25 | 26 |
Jefferson Center Metropolitan District No. 1 Series 2020A-2, Rev., 4.13%, 12/1/2040 | 290 | 240 |
Jefferson County School District R-1 COP, 5.00%, 12/15/2028 | 5 | 5 |
Larimer County School District No. R-1 Poudre GO, 5.00%, 12/15/2037 | 2,450 | 2,603 |
Montrose County School District RE-1J GO, 5.00%, 12/1/2036 | 200 | 208 |
Peak Metropolitan District No. 1 | ||
Series 2021A, GO, 4.00%, 12/1/2035 (d) | 500 | 422 |
Series 2021A, GO, 5.00%, 12/1/2041 (d) | 500 | 453 |
Series 2021A, GO, 5.00%, 12/1/2051 (d) | 550 | 468 |
Raindance Metropolitan District No. 1, Non-Potable Water System Rev., 5.00%, 12/1/2040 | 750 | 687 |
Regional Transportation District, Denver Transit Partners Series 2020A, Rev., 4.00%, 7/15/2035 | 2,000 | 2,008 |
Reunion Metropolitan District Series 2021A, Rev., 3.63%, 12/1/2044 | 491 | 355 |
Rocky Mountain Rail Park Metropolitan District, Limited Tax | ||
Series 2021A, GO, 5.00%, 12/1/2031 (d) | 750 | 642 |
Series 2021A, GO, 5.00%, 12/1/2041 (d) | 750 | 502 |
State of Colorado | ||
Series 2018A, COP, 4.00%, 12/15/2034 | 75 | 77 |
COP, 4.00%, 12/15/2039 | 3,100 | 3,067 |
State of Colorado Department of Transportation Headquarters Facilities, Headquarters Facilities Lease Purchase Agreement COP, 5.00%, 6/15/2041 | 1,500 | 1,536 |
State of Colorado, Building Excellent Schools Today Series 2018N, COP, 5.00%, 3/15/2028 | 75 | 81 |
Third Creek Metropolitan District No. 1, Limited Tax Series 2022A-1, GO, 4.75%, 12/1/2051 | 1,515 | 1,144 |
University of Colorado, Enterprise System Series A, Rev., 5.00%, 6/1/2024 (b) | 60 | 60 |
University of Northern Colorado, Institutional Enterprise Series 2018B, Rev., 4.00%, 6/1/2035 | 250 | 254 |
Verve Metropolitan District No. 1 | ||
GO, 5.75%, 12/1/2033 | 2,000 | 1,883 |
GO, 5.00%, 12/1/2036 | 500 | 416 |
GO, 5.00%, 12/1/2041 | 1,125 | 894 |
Waterview II Metropolitan District Series 2022A, GO, 5.00%, 12/1/2041 | 1,250 | 1,125 |
August 31, 2023 | J.P. Morgan Municipal Bond Funds | 27 |
AS OF August 31, 2023 (Unaudited) (continued)
INVESTMENTS | PRINCIPAL AMOUNT ($000) | VALUE ($000) |
Municipal Bonds — continued | ||
Colorado — continued | ||
Weld County School District No. RE-2 Eaton GO, 5.00%, 12/1/2035 | 40 | 44 |
Windler Public Improvement Authority, Limited Tax | ||
Series 2021 A-1, Rev., 4.00%, 12/1/2031 | 535 | 444 |
Series 2021A-1, Rev., 4.00%, 12/1/2036 | 7,500 | 5,620 |
Series 2021A-1, Rev., 4.00%, 12/1/2041 | 6,750 | 4,575 |
Total Colorado | 162,741 | |
Connecticut — 1.1% | ||
City of Stamford, Water Pollution Control System and Facility | ||
Series 2013A, Rev., 5.00%, 8/15/2024 | 100 | 100 |
Series 2013A, Rev., 5.00%, 8/15/2025 | 350 | 350 |
Series 2013A, Rev., 5.00%, 8/15/2026 | 150 | 150 |
Series 2013A, Rev., 5.00%, 8/15/2027 | 250 | 250 |
Series 2013A, Rev., 5.00%, 8/15/2029 | 300 | 300 |
Connecticut Municipal Electric Energy Cooperative Series 2021A, Rev., 5.00%, 1/1/2035 | 545 | 594 |
Connecticut State Health and Educational Facilities Authority, Connecticut State University System Series N, Rev., 5.00%, 11/1/2025 | 4,165 | 4,173 |
Connecticut State Health and Educational Facilities Authority, Nuvance Health Series 2019A, Rev., 5.00%, 7/1/2033 | 2,630 | 2,730 |
Connecticut State Health and Educational Facilities Authority, Sacred Heart University | ||
Series K, Rev., 5.00%, 7/1/2036 | 1,000 | 1,070 |
Series K, Rev., 5.00%, 7/1/2037 | 1,750 | 1,856 |
Connecticut State Health and Educational Facilities Authority, Trinity College Series R, Rev., 4.00%, 6/1/2045 | 2,250 | 2,026 |
Connecticut State Health and Educational Facilities Authority,Sacred Heart University Issues Series I 1, Rev., 5.00%, 7/1/2042 | 1,725 | 1,757 |
Stamford Housing Authority, The Dogwoods Project Rev., BAN, 11.00%, 12/1/2027 (d) | 7,150 | 7,538 |
State of Connecticut | ||
Series 2014A, GO, 4.00%, 3/1/2034 | 40 | 40 |
Series 2019A, GO, 5.00%, 4/15/2034 | 3,450 | 3,767 |
Series 2019A, GO, 5.00%, 4/15/2035 | 2,900 | 3,149 |
Series 2016A, GO, 4.00%, 3/15/2036 | 60 | 60 |
Series A, GO, 4.00%, 4/15/2037 | 460 | 458 |
Series 2019A, GO, 4.00%, 4/15/2038 | 3,625 | 3,626 |
State of Connecticut Clean Water Fund, State Revolving Fund Series 2015A, Rev., 5.00%, 3/1/2024 | 70 | 71 |
INVESTMENTS | PRINCIPAL AMOUNT ($000) | VALUE ($000) |
Connecticut — continued | ||
State of Connecticut, Special Tax Transportation Infrastructure Purposes | ||
Rev., 5.00%, 10/1/2029 | 25 | 25 |
Series A, Rev., 5.00%, 9/1/2030 | 2,000 | 2,026 |
Series A, Rev., 5.00%, 9/1/2031 | 25 | 26 |
Series A, Rev., 5.00%, 8/1/2032 | 15 | 16 |
Steel Point Infrastructure Improvement District, Steelpointe Harbor Project | ||
Rev., 4.00%, 4/1/2031 (d) | 300 | 283 |
Rev., 4.00%, 4/1/2036 (d) | 485 | 433 |
Rev., 4.00%, 4/1/2041 (d) | 550 | 469 |
Town of Trumbull Series 2017B, GO, 5.00%, 9/1/2025 | 50 | 52 |
Total Connecticut | 37,395 | |
Delaware — 0.1% | ||
Delaware State Economic Development Authority, Newark Charter School, Inc., Project | ||
Rev., 4.00%, 9/1/2025 | 385 | 382 |
Rev., 4.00%, 9/1/2030 | 530 | 520 |
Rev., 5.00%, 9/1/2040 | 1,550 | 1,566 |
Rev., 5.00%, 9/1/2050 | 600 | 588 |
Delaware Transportation Authority, Transportation System Rev., 5.00%, 7/1/2025 | 25 | 26 |
Total Delaware | 3,082 | |
District of Columbia — 0.9% | ||
District of Columbia | ||
Series 2016A, GO, 5.00%, 6/1/2029 | 25 | 26 |
Series D, GO, 5.00%, 6/1/2031 | 250 | 264 |
Series 2015A, GO, 5.00%, 6/1/2035 | 7,175 | 7,331 |
Series 2015A, GO, 5.00%, 6/1/2036 | 4,200 | 4,289 |
District of Columbia, Income Tax | ||
Series 2019C, Rev., 5.00%, 10/1/2031 | 35 | 39 |
Series 2020A, Rev., 5.00%, 3/1/2038 | 70 | 76 |
Series 2020A, Rev., 5.00%, 3/1/2040 | 65 | 70 |
District of Columbia, Kipp DC Project | ||
Series 2017A, Rev., 5.00%, 7/1/2025 | 100 | 101 |
Rev., 5.00%, 7/1/2027 | 115 | 118 |
Rev., 5.00%, 7/1/2028 | 275 | 285 |
Rev., 5.00%, 7/1/2029 | 255 | 266 |
District of Columbia, Water and Sewer Authority, Public Utility, Subordinate Lien Series B, Rev., 5.00%, 10/1/2037 | 100 | 103 |
28 | J.P. Morgan Municipal Bond Funds | August 31, 2023 |
INVESTMENTS | PRINCIPAL AMOUNT ($000) | VALUE ($000) |
Municipal Bonds — continued | ||
District of Columbia — continued | ||
Metropolitan Washington Airports Authority Aviation | ||
Series 2019B, Rev., 5.00%, 10/1/2027 | 75 | 80 |
Series 2017A, Rev., AMT, 5.00%, 10/1/2029 | 180 | 188 |
Series 2021A, Rev., AMT, 5.00%, 10/1/2032 | 650 | 708 |
Metropolitan Washington Airports Authority Dulles Toll Road, Metrorail and Capital Improvement Projects Series 2019B, Rev., AGM, 4.00%, 10/1/2053 | 500 | 456 |
Washington Convention and Sports Authority, Senior Lien Dedicated Tax | ||
Series 2018A, Rev., 5.00%, 10/1/2027 | 4,620 | 4,948 |
Series 2018A, Rev., 5.00%, 10/1/2028 | 4,035 | 4,316 |
Series 2018A, Rev., 5.00%, 10/1/2029 | 2,690 | 2,870 |
Washington Metropolitan Area Transit Authority | ||
Series 2017B, Rev., 5.00%, 7/1/2030 | 50 | 53 |
Series A-1, Rev., 5.00%, 7/1/2030 | 5,185 | 5,498 |
Rev., 5.00%, 7/1/2034 | 5 | 5 |
Series 2017B, Rev., 5.00%, 7/1/2034 | 75 | 79 |
Total District of Columbia | 32,169 | |
Florida — 3.7% | ||
Alachua County Health Facilities Authority, Shands Teaching Hospital and Clinic Series B-1, Rev., 5.00%, 12/1/2035 | 1,000 | 1,040 |
Brevard County Health Facilities Authority, Health First, Inc., Project Rev., 5.00%, 4/1/2024 | 1,400 | 1,408 |
Capital Projects Finance Authority, Capital Projects Loan Program - Florida Universities | ||
Series 2020A-1, Rev., 5.00%, 10/1/2024 | 550 | 553 |
Series 2020A-1, Rev., 5.00%, 10/1/2025 | 1,000 | 1,011 |
Series 2020A-1, Rev., 5.00%, 10/1/2026 | 1,000 | 1,020 |
Series 2020A-1, Rev., 5.00%, 10/1/2027 | 1,000 | 1,026 |
Series 2020A-1, Rev., 5.00%, 10/1/2028 | 1,000 | 1,032 |
Capital Trust Agency, Inc., Legends Academy Project Series 2021A, Rev., 5.00%, 12/1/2045 (d) | 1,445 | 1,152 |
Capital Trust Agency, Inc., Sustainability Bonds -The Marie Rev., 4.00%, 6/15/2031 (d) | 250 | 226 |
Charlotte County Industrial Development Authority, Town and Country Utilities Project Series 2021A, Rev., AMT, 4.00%, 10/1/2041 (d) | 500 | 419 |
City of Gainesville, Utilities System Series 2017A, Rev., 5.00%, 10/1/2037 | 120 | 126 |
City of Jacksonville Series A, Rev., 5.00%, 10/1/2027 | 100 | 105 |
INVESTMENTS | PRINCIPAL AMOUNT ($000) | VALUE ($000) |
Florida — continued | ||
City of Jacksonville, Health Care Facilities, Brooks Rehabilitation Project | ||
Rev., 4.00%, 11/1/2036 | 500 | 472 |
Rev., 4.00%, 11/1/2045 | 6,500 | 5,548 |
City of Lakeland, Department of Electric Utilities Rev., 5.00%, 10/1/2032 | 250 | 286 |
City of Pompano Beach, John Knox Village Project | ||
Rev., 3.50%, 9/1/2030 | 1,900 | 1,722 |
Series 2020, Rev., 3.50%, 9/1/2035 | 2,250 | 1,887 |
Series 2021A, Rev., 4.00%, 9/1/2036 | 550 | 483 |
Series 2021A, Rev., 4.00%, 9/1/2041 | 385 | 314 |
City of Tampa, H. Lee Moffitt Cancer Center Project | ||
Series 2020B, Rev., 5.00%, 7/1/2029 | 225 | 239 |
Series 2020B, Rev., 5.00%, 7/1/2030 | 250 | 268 |
Series 2020B, Rev., 5.00%, 7/1/2031 | 325 | 347 |
Series 2020B, Rev., 5.00%, 7/1/2032 | 275 | 293 |
Series 2020B, Rev., 5.00%, 7/1/2033 | 250 | 267 |
Series 2020B, Rev., 5.00%, 7/1/2034 | 375 | 399 |
Series 2020B, Rev., 5.00%, 7/1/2035 | 335 | 354 |
Series 2020B, Rev., 4.00%, 7/1/2038 | 185 | 174 |
Series 2020B, Rev., 4.00%, 7/1/2039 | 1,600 | 1,477 |
Series 2020B, Rev., 5.00%, 7/1/2040 | 2,390 | 2,455 |
Series 2020B, Rev., 4.00%, 7/1/2045 | 7,400 | 6,503 |
City of West Palm Beach, Special Obligation Series C, Rev., 5.00%, 10/1/2028 | 25 | 26 |
County of Broward Airport System Series 2019A, Rev., AMT, 5.00%, 10/1/2028 | 1,500 | 1,586 |
County of Broward, Airport System Series 2019A, Rev., AMT, 5.00%, 10/1/2027 | 350 | 366 |
County of Broward, Professional Sports Facilities, Civic Arena Project Rev., 5.00%, 9/1/2024 | 40 | 40 |
County of Escambia, Sales Tax Rev., 5.00%, 10/1/2025 | 15 | 15 |
County of Lee, Airport Series 2021A, Rev., AMT, 5.00%, 10/1/2031 | 11,550 | 12,494 |
County of Lee, Transportation Facilities Rev., AGM, 5.00%, 10/1/2035 | 190 | 192 |
County of Manatee, Public Utilities Rev., 5.00%, 10/1/2031 | 815 | 881 |
County of Miami-Dade Aviation Rev., Zero Coupon, 10/1/2040 | 5,000 | 2,237 |
County of Miami-Dade, Aviation System Rev., AMT, 5.00%, 10/1/2028 | 1,500 | 1,513 |
County of Miami-Dade, Building Better Communities Program | ||
Series 2016A, GO, 5.00%, 7/1/2033 | 2,835 | 2,956 |
August 31, 2023 | J.P. Morgan Municipal Bond Funds | 29 |
AS OF August 31, 2023 (Unaudited) (continued)
INVESTMENTS | PRINCIPAL AMOUNT ($000) | VALUE ($000) |
Municipal Bonds — continued | ||
Florida — continued | ||
Series 2016A, GO, 5.00%, 7/1/2034 | 5,355 | 5,576 |
County of Miami-Dade, Capital Asset Acquisition Series 2019B, Rev., 5.00%, 4/1/2040 | 45 | 48 |
County of Miami-Dade, Subordinate Special Obligation | ||
Rev., 5.00%, 10/1/2025 | 100 | 103 |
Rev., 5.00%, 10/1/2028 | 120 | 125 |
County of Miami-Dade, Transit System, Sales Surtax Rev., 4.00%, 7/1/2034 | 35 | 36 |
County of Miami-Dade, Water and Sewer System | ||
Rev., 5.00%, 10/1/2033 | 25 | 27 |
Series 2017A, Rev., 4.00%, 10/1/2037 | 40 | 40 |
Series 2017A, Rev., 4.00%, 10/1/2039 | 50 | 50 |
Series 2019B, Rev., 5.00%, 10/1/2044 | 40 | 41 |
County of Palm Beach, Airport System Rev., AMT, 5.00%, 10/1/2036 | 500 | 511 |
County of Palm Beach, Public Improvement Rev., 5.00%, 5/1/2038 | 1,545 | 1,594 |
County of Sarasota, Guaranteed Entitlement Rev., 4.50%, 10/1/2023 (b) | 25 | 25 |
County of Sarasota, Utility System Series 2019A, Rev., 5.00%, 10/1/2038 | 35 | 37 |
Escambia County Health Facilities Authority, Baptist Health Care Corp. Obligated Group Series 2020A, Rev., 5.00%, 8/15/2040 | 3,600 | 3,626 |
Florida Atlantic University Finance Corp., Student Housing Project | ||
Series 2019A, Rev., 5.00%, 7/1/2025 | 205 | 210 |
Series 2019A, Rev., 5.00%, 7/1/2027 | 785 | 831 |
Series 2019B, Rev., 5.00%, 7/1/2032 | 1,715 | 1,862 |
Series 2019B, Rev., 5.00%, 7/1/2033 | 1,475 | 1,599 |
Florida Department of Environmental Protection Series 2017A, Rev., 5.00%, 7/1/2028 | 40 | 44 |
Florida Department of Management Services Series 2018A, COP, 5.00%, 11/1/2026 | 20 | 21 |
Florida Development Finance Corp., Central Charter School Project | ||
Series 2022, Rev., 5.00%, 8/15/2032 (d) | 230 | 225 |
Series 2022, Rev., 5.25%, 8/15/2037 (d) | 350 | 329 |
Florida Development Finance Corp., Cornerstone Charter Academy Project Series 2022, Rev., 5.00%, 10/1/2032 (d) | 465 | 473 |
Florida Development Finance Corp., Educational Facilities, River City Science Academy Projects | ||
Series 2022A-1, Rev., 4.00%, 7/1/2031 | 170 | 164 |
Series 2022A-1, Rev., 5.00%, 7/1/2042 | 220 | 212 |
INVESTMENTS | PRINCIPAL AMOUNT ($000) | VALUE ($000) |
Florida — continued | ||
Series 2022B, Rev., 5.00%, 7/1/2042 | 230 | 222 |
Florida Development Finance Corp., IDEA Florida, Inc., Jacksonville IV Project Rev., 5.25%, 6/15/2029 (d) | 1,000 | 981 |
Florida Development Finance Corp., Imagine School at Broward Project | ||
Series 2019A, Rev., 4.00%, 12/15/2029 (d) | 265 | 253 |
Series 2019A, Rev., 5.00%, 12/15/2039 (d) | 305 | 290 |
Florida Development Finance Corp., Mater Academy Project | ||
Series 2022A, Rev., 5.00%, 6/15/2025 | 110 | 111 |
Series 2022A, Rev., 5.00%, 6/15/2026 | 135 | 137 |
Series 2020A, Rev., 5.00%, 6/15/2027 | 390 | 401 |
Series 2022A, Rev., 5.00%, 6/15/2027 | 145 | 149 |
Series 2020A, Rev., 5.00%, 6/15/2028 | 410 | 422 |
Series 2020A, Rev., 5.00%, 6/15/2029 | 400 | 411 |
Series 2022A, Rev., 5.00%, 6/15/2029 | 235 | 242 |
Series 2020A, Rev., 5.00%, 6/15/2030 | 375 | 385 |
Series 2022A, Rev., 5.00%, 6/15/2030 | 245 | 252 |
Series 2022A, Rev., 5.00%, 6/15/2032 | 275 | 282 |
Series 2022A, Rev., 5.00%, 6/15/2033 | 380 | 389 |
Series 2022A, Rev., 5.00%, 6/15/2034 | 400 | 409 |
Series 2022A, Rev., 5.00%, 6/15/2035 | 1,260 | 1,283 |
Series 2020A, Rev., 5.00%, 6/15/2040 | 1,250 | 1,250 |
Florida Development Finance Corp., Mayflower Retirement Community Project Series 2021B-1, Rev., 2.38%, 6/1/2027 (d) | 390 | 374 |
Florida Gulf Coast University Financing Corp., Housing Project Series 2019A, Rev., 5.00%, 2/1/2026 | 125 | 128 |
Florida Higher Educational Facilities Financial Authority, Florida Institute of Technology Rev., 5.00%, 10/1/2023 | 125 | 125 |
Greater Orlando Aviation Authority, Airport Facilities Series 2019A, Rev., AMT, 5.00%, 10/1/2038 | 1,810 | 1,885 |
Hillsborough County, Aviation Authority, Tampa International Airport Series 2018F, Rev., 5.00%, 10/1/2043 | 150 | 156 |
Key West Utility Board, Electric System Rev., 5.00%, 10/1/2027 | 45 | 48 |
Lee County School Board (The) | ||
Series 2016A, COP, 5.00%, 8/1/2035 | 25 | 26 |
COP, 5.00%, 8/1/2042 | 6,725 | 7,151 |
Manatee County School District, Sales Tax Rev., AGM, 5.00%, 10/1/2023 | 50 | 50 |
30 | J.P. Morgan Municipal Bond Funds | August 31, 2023 |
INVESTMENTS | PRINCIPAL AMOUNT ($000) | VALUE ($000) |
Municipal Bonds — continued | ||
Florida — continued | ||
Miami-Dade County Health Facilities Authority, Niklaus Children's Hospital Series 2021A, Rev., 4.00%, 8/1/2046 | 2,140 | 1,917 |
Middleton Community Development District A, City of Wildwood, Florida Special Assessment | ||
5.45%, 5/1/2032 | 250 | 259 |
5.85%, 5/1/2037 | 750 | 777 |
Orange County Health Facilities Authority, Orlando Health Obligated Group Series 2023A, Rev., 5.00%, 10/1/2037 | 930 | 999 |
Orange County School Board Series 2016C, COP, 5.00%, 8/1/2033 | 40 | 42 |
Orlando Utilities Commission, Utility System Series 2012A, Rev., 5.00%, 10/1/2023 | 25 | 25 |
Palm Beach County Health Facilities Authority, Acts Retirement Life Communities, Inc., Obligated Group | ||
Series 2020B, Rev., 4.00%, 11/15/2041 | 250 | 207 |
Series 2020B, Rev., 5.00%, 11/15/2042 | 500 | 474 |
Palm Beach County Health Facilities Authority, Jupiter Medical Center | ||
Series 2022, Rev., 5.00%, 11/1/2031 | 100 | 105 |
Series 2022, Rev., 5.00%, 11/1/2032 | 100 | 106 |
Palm Beach County Health Facilities Authority, Toby and Leon Cooperman Sinai Residences of Boca Raton Expansion | ||
Rev., 4.00%, 6/1/2026 | 300 | 292 |
Rev., 4.00%, 6/1/2031 | 1,250 | 1,149 |
Rev., 4.00%, 6/1/2041 | 1,600 | 1,246 |
Palm Beach County School District Series C, COP, 5.00%, 8/1/2029 | 16,000 | 17,319 |
Pinellas County Educational Facilities Authority, Discovery Academy of Science Project Series 2022A, Rev., 4.00%, 6/1/2036 (d) | 1,660 | 1,397 |
School Board of Miami-Dade County (The) Series 2015A, COP, 5.00%, 5/1/2030 | 70 | 71 |
School District of Broward County Series 2019A, COP, 5.00%, 7/1/2029 | 35 | 39 |
Seminole County Industrial Development Authority, Galileo Schools for Gifted Learning | ||
Series 2021A, Rev., 4.00%, 6/15/2036 (d) | 155 | 134 |
Series 2021A, Rev., 4.00%, 6/15/2041 (d) | 215 | 173 |
South Florida Water Management District COP, 5.00%, 10/1/2036 | 125 | 129 |
St. Johns County Industrial Development Authority, Vicar's Landing Project | ||
Series 2021A, Rev., 4.00%, 12/15/2030 | 200 | 184 |
INVESTMENTS | PRINCIPAL AMOUNT ($000) | VALUE ($000) |
Florida — continued | ||
Series 2021A, Rev., 4.00%, 12/15/2031 | 205 | 187 |
Series 2021A, Rev., 4.00%, 12/15/2036 | 500 | 424 |
Series 2021A, Rev., 4.00%, 12/15/2041 | 375 | 293 |
State of Florida Board of Education, Public Education Capital Outlay Series 2015F, GO, 5.00%, 6/1/2026 | 25 | 26 |
State of Florida Department of Transportation Series 2023, Rev., 5.00%, 7/1/2039 | 4,735 | 5,193 |
Tohopekaliga Water Authority, Utility System Rev., 4.00%, 10/1/2034 | 40 | 40 |
Village Community Development District No. 15 4.85%, 5/1/2038 (d) | 1,000 | 1,002 |
Volusia County Educational Facility Authority, Embry-Riddle Aeronautical University, Inc., Project | ||
Series 2020A, Rev., 4.00%, 10/15/2035 | 300 | 299 |
Series 2020A, Rev., 4.00%, 10/15/2036 | 500 | 491 |
Total Florida | 125,532 | |
Georgia — 2.9% | ||
Albany-Dougherty Inner City Authority, State University Projects Rev., 5.00%, 7/1/2030 | 1,155 | 1,275 |
Bartow County Development Authority Series 2009-1, Rev., 3.95%, 3/8/2028 (c) | 2,000 | 1,970 |
Brookhaven Urban Redevelopment Agency Series 2023A, Rev., 5.00%, 7/1/2039 | 1,415 | 1,590 |
Cherokee County Board of Education, School System | ||
GO, 5.00%, 8/1/2031 | 475 | 497 |
GO, 5.00%, 8/1/2033 | 690 | 721 |
Cherokee County Water and Sewer Authority | ||
Series 2023, Rev., 5.00%, 8/1/2038 | 140 | 157 |
Series 2023, Rev., 5.00%, 8/1/2039 | 375 | 417 |
Series 2023, Rev., 5.00%, 8/1/2041 | 800 | 882 |
Series 2023, Rev., 5.00%, 8/1/2042 | 730 | 800 |
City of Atlanta, Water and Wastewater | ||
Rev., 5.00%, 11/1/2029 | 2,110 | 2,171 |
Rev., 5.00%, 11/1/2030 | 4,250 | 4,374 |
City of Columbus, Water and Sewerage | ||
Series 2014A, Rev., 5.00%, 5/1/2027 | 445 | 450 |
Series 2014A, Rev., 5.00%, 5/1/2028 | 595 | 602 |
Cobb County, Kennestone Hospital Authority, Wellstar Health System, Inc., Project | ||
Series 2020A, Rev., 4.00%, 4/1/2034 | 350 | 353 |
Series 2020A, Rev., 4.00%, 4/1/2036 | 505 | 503 |
Series 2020A, Rev., 3.00%, 4/1/2037 | 700 | 581 |
August 31, 2023 | J.P. Morgan Municipal Bond Funds | 31 |
AS OF August 31, 2023 (Unaudited) (continued)
INVESTMENTS | PRINCIPAL AMOUNT ($000) | VALUE ($000) |
Municipal Bonds — continued | ||
Georgia — continued | ||
Series 2020A, Rev., 4.00%, 4/1/2039 | 475 | 456 |
Series 2020A, Rev., 3.00%, 4/1/2045 | 1,785 | 1,292 |
County of DeKalb, Water and Sewerage | ||
Series 2006B, Rev., 5.25%, 10/1/2023 | 8,660 | 8,672 |
Series 2006B, Rev., 5.25%, 10/1/2026 | 5,500 | 5,853 |
DeKalb Private Hospital Authority, Children's Healthcare of Atlanta, Inc. Series 2019B, Rev., 5.00%, 7/1/2032 | 50 | 55 |
Gainesville and Hall County Hospital Authority, Northeast Georgia Health System, Inc., Project Series 2017A, Rev., 5.00%, 2/15/2028 | 115 | 120 |
George L Smith II Congress Center Authority, Convention Center Hotel First | ||
Series 2021A, Rev., 2.38%, 1/1/2031 | 500 | 431 |
Series 2021A, Rev., 4.00%, 1/1/2036 | 500 | 470 |
George L Smith II Congress Center Authority, Convention Center Hotel Second | ||
Series 2021B, Rev., 3.63%, 1/1/2031 (d) | 1,170 | 1,018 |
Series 2021B, Rev., 5.00%, 1/1/2036 (d) | 1,000 | 927 |
Georgia Higher Education Facilities Authority, USG Real Estate Foundation II LLC Projects | ||
Rev., 5.00%, 6/15/2026 | 500 | 520 |
Rev., 5.00%, 6/15/2027 | 500 | 529 |
Rev., 5.00%, 6/15/2028 | 500 | 538 |
Rev., 5.00%, 6/15/2029 | 500 | 545 |
Rev., 5.00%, 6/15/2030 | 500 | 545 |
Rev., 5.00%, 6/15/2031 | 800 | 870 |
Rev., 3.00%, 6/15/2032 | 1,175 | 1,113 |
Rev., 5.00%, 6/15/2033 | 1,660 | 1,798 |
Rev., 5.00%, 6/15/2034 | 1,125 | 1,213 |
Rev., 5.00%, 6/15/2035 | 1,250 | 1,341 |
Rev., 4.00%, 6/15/2036 | 1,000 | 996 |
Rev., 4.00%, 6/15/2037 | 1,500 | 1,475 |
Rev., 4.00%, 6/15/2039 | 1,785 | 1,728 |
Georgia Ports Authority | ||
Series 2022, Rev., 4.00%, 7/1/2040 | 4,000 | 3,957 |
Rev., 4.00%, 7/1/2052 | 4,030 | 3,833 |
Georgia State Road and Tollway Authority, Managed Lane System Series 2021A, Rev., GTD, 4.00%, 7/15/2039 | 2,000 | 2,000 |
Glynn-Brunswick Memorial Hospital Authority, Southeast Georgia Health System Project | ||
Rev., 4.00%, 8/1/2035 | 500 | 466 |
Rev., 4.00%, 8/1/2036 | 375 | 348 |
Rev., 4.00%, 8/1/2037 | 495 | 449 |
INVESTMENTS | PRINCIPAL AMOUNT ($000) | VALUE ($000) |
Georgia — continued | ||
Henry County, Water and Sewerage Authority | ||
Rev., AGM-CR, BHAC - CR , NATL - RE, 5.25%, 2/1/2028 | 5,000 | 5,460 |
Rev., AGM-CR, BHAC - CR , NATL - RE, 5.25%, 2/1/2029 | 25 | 28 |
Main Street Natural Gas, Inc., Gas Supply | ||
Series 2021A, Rev., 4.00%, 9/1/2027 (c) | 9,430 | 9,349 |
Series 2021C, Rev., 4.00%, 12/1/2028 (c) | 2,500 | 2,434 |
Series 2022B, Rev., 5.00%, 6/1/2029 (c) | 16,615 | 16,990 |
Milledgeville and Baldwin County Development Authority, Georgia College and State University Projects Rev., 5.00%, 6/15/2032 | 670 | 745 |
Private Colleges and Universities Authority, Emory University | ||
Series 2019A, Rev., 5.00%, 9/1/2028 | 40 | 44 |
Series 2013A, Rev., 5.00%, 10/1/2043 | 2,005 | 1,961 |
State of Georgia Series 2016E, GO, 5.00%, 12/1/2023 | 20 | 20 |
Total Georgia | 97,932 | |
Hawaii — 0.0% ^ | ||
City and County of Honolulu Series D, GO, 5.00%, 9/1/2023 | 20 | 20 |
Idaho — 0.2% | ||
Idaho Housing and Finance Association, Federal Highway Trust | ||
Series 2015A, Rev., 5.00%, 7/15/2025 | 2,550 | 2,623 |
Series 2015A, Rev., 5.00%, 7/15/2026 | 4,800 | 5,021 |
Total Idaho | 7,644 | |
Illinois — 7.8% | ||
Champaign County Community Unit School District No. 4 Champaign, School Building GO, 5.00%, 1/1/2031 | 305 | 315 |
City of Chicago, Waterworks, Second Lien | ||
Rev., 5.00%, 11/1/2027 | 1,000 | 1,013 |
Rev., 5.00%, 11/1/2030 | 500 | 505 |
Series 2023B, Rev., AGM, 5.00%, 11/1/2036 | 1,500 | 1,635 |
Series 2023B, Rev., AGM, 5.00%, 11/1/2037 | 800 | 867 |
City of Decatur GO, AGM, 5.00%, 3/1/2028 | 15 | 15 |
City of Rockford, Sales Tax | ||
GO, 4.00%, 12/15/2029 | 515 | 534 |
GO, 4.00%, 12/15/2030 | 360 | 372 |
City of Springfield, Electric System, Senior Lien | ||
Rev., 5.00%, 3/1/2027 | 4,500 | 4,559 |
Rev., 5.00%, 3/1/2028 | 4,000 | 4,055 |
32 | J.P. Morgan Municipal Bond Funds | August 31, 2023 |
INVESTMENTS | PRINCIPAL AMOUNT ($000) | VALUE ($000) |
Municipal Bonds — continued | ||
Illinois — continued | ||
Rev., AGM, 3.50%, 3/1/2030 | 3,500 | 3,501 |
Cook County Community Consolidated School District No. 15 Palatine | ||
GO, 5.00%, 12/1/2037 | 500 | 551 |
GO, 5.00%, 12/1/2039 | 650 | 698 |
GO, 5.00%, 12/1/2040 | 690 | 737 |
GO, 4.00%, 12/1/2041 | 750 | 734 |
Cook County School District No. 111 Burbank GO, AGM, 4.00%, 12/1/2035 | 50 | 50 |
Cook County Township High School District No. 225, Glenbrook Series 2016A, GO, 5.00%, 12/1/2024 | 15 | 15 |
County of Cook, Sales Tax Rev., 5.00%, 11/15/2031 | 3,600 | 3,812 |
County of Du Page, Courthouse Project | ||
GO, 5.00%, 1/1/2028 | 255 | 264 |
GO, 5.00%, 1/1/2029 | 830 | 860 |
County of Will GO, 4.00%, 11/15/2036 | 60 | 60 |
DuPage & Cook Counties Community Unit School District No. 205 Elmhurst Series 2022, GO, 4.00%, 9/15/2042 | 1,060 | 1,010 |
DuPage and Cook Counties Community Consolidated School District No. 181 Hinsdale | ||
Rev., 5.00%, 12/1/2025 | 25 | 26 |
Series 2018A, GO, 4.00%, 1/15/2032 | 25 | 25 |
DuPage County Community Unit School District No. 200 Wheaton-Warrenville GO, 5.00%, 10/1/2025 | 30 | 31 |
DuPage County High School District No. 87 Glenbard GO, 5.00%, 1/1/2028 | 25 | 26 |
Illinois Finance Authority, Advocate Health and Hospital Corp. Obligated Group Rev., 4.13%, 5/1/2045 | 30 | 28 |
Illinois Finance Authority, Clark-Lindsey Village | ||
Series 2022A, Rev., 4.60%, 6/1/2027 | 170 | 165 |
Series 2022A, Rev., 5.13%, 6/1/2032 | 190 | 183 |
Series 2022A, Rev., 5.25%, 6/1/2037 | 175 | 164 |
Illinois Finance Authority, Clean Water Initiative Revolving Fund Rev., 5.00%, 7/1/2039 | 80 | 85 |
Illinois Finance Authority, Depaul College Prep Project Series 2023A, Rev., 5.25%, 8/1/2038 (d) | 650 | 653 |
Illinois Finance Authority, DePaul College Prep Project Series 2023A, Rev., 5.50%, 8/1/2043 (d) | 1,360 | 1,369 |
Illinois Finance Authority, Memorial Health System Series 2019, Rev., 5.00%, 4/1/2032 | 380 | 401 |
INVESTMENTS | PRINCIPAL AMOUNT ($000) | VALUE ($000) |
Illinois — continued | ||
Illinois Finance Authority, Mercy Health System Rev., 5.00%, 12/1/2025 | 20 | 21 |
Illinois Finance Authority, Plymouth Place, Inc. | ||
Series 2022B-3, Rev., 4.75%, 11/15/2027 | 1,000 | 992 |
Series 2022B-2, Rev., 5.25%, 11/15/2027 | 1,000 | 994 |
Series 2022B-1, Rev., 6.00%, 11/15/2027 | 500 | 500 |
Series 2021A, Rev., 5.00%, 5/15/2032 | 140 | 131 |
Series 2021A, Rev., 5.00%, 5/15/2033 | 145 | 135 |
Series 2021A, Rev., 5.00%, 5/15/2034 | 300 | 275 |
Series 2021A, Rev., 5.00%, 5/15/2035 | 315 | 284 |
Series 2021A, Rev., 5.00%, 5/15/2036 | 325 | 291 |
Illinois Finance Authority, Riverside Health System Rev., 4.00%, 11/15/2030 | 45 | 46 |
Illinois Finance Authority, Smith Crossing | ||
Rev., 4.00%, 10/15/2026 | 465 | 448 |
Rev., 4.00%, 10/15/2027 | 485 | 460 |
Rev., 4.00%, 10/15/2028 | 320 | 299 |
Rev., 4.00%, 10/15/2029 | 900 | 827 |
Rev., 4.00%, 10/15/2030 | 625 | 565 |
Rev., 4.00%, 10/15/2031 | 1,000 | 891 |
Illinois Finance Authority, Social Bonds-Learn Chapter School Project | ||
Rev., 4.00%, 11/1/2028 | 120 | 118 |
Rev., 4.00%, 11/1/2029 | 120 | 118 |
Rev., 4.00%, 11/1/2030 | 130 | 127 |
Rev., 4.00%, 11/1/2031 | 130 | 127 |
Rev., 4.00%, 11/1/2041 | 375 | 325 |
Illinois Finance Authority, Southern Illinois Healthcare Enterprises, Inc. Series 2017C, Rev., 5.00%, 3/1/2025 | 400 | 407 |
Illinois Finance Authority, Township High School District Rev., 4.00%, 12/1/2035 | 40 | 40 |
Illinois Sports Facilities Authority (The), State Tax Rev., 5.00%, 6/15/2030 | 4,030 | 4,188 |
Illinois State Toll Highway Authority | ||
Series 2019C, Rev., 5.00%, 1/1/2028 | 25 | 27 |
Series 2015B, Rev., 5.00%, 1/1/2029 | 35 | 36 |
Series 2016B, Rev., 5.00%, 1/1/2030 | 30 | 31 |
Series 2016A, Rev., 5.00%, 12/1/2031 | 30 | 31 |
Series 2021A, Rev., 4.00%, 1/1/2040 | 160 | 157 |
Kane Cook and DuPage Counties School District No. U-46 Elgin | ||
Series D, GO, 5.00%, 1/1/2024 (b) | 195 | 196 |
Series D, GO, 5.00%, 1/1/2034 | 1,505 | 1,508 |
August 31, 2023 | J.P. Morgan Municipal Bond Funds | 33 |
AS OF August 31, 2023 (Unaudited) (continued)
INVESTMENTS | PRINCIPAL AMOUNT ($000) | VALUE ($000) |
Municipal Bonds — continued | ||
Illinois — continued | ||
Kane County Community Unit School District No. 304 Geneva GO, 5.00%, 1/1/2029 | 20 | 21 |
Kane County School District No. 131 Aurora East Side | ||
Series 2020A, GO, AGM, 4.00%, 12/1/2029 | 65 | 67 |
Series 2020A, GO, AGM, 4.00%, 12/1/2030 | 75 | 78 |
Series 2020A, GO, AGM, 4.00%, 12/1/2031 | 100 | 103 |
Series 2020A, GO, AGM, 4.00%, 12/1/2032 | 115 | 118 |
Series 2020A, GO, AGM, 4.00%, 12/1/2033 | 130 | 134 |
Series 2020A, GO, AGM, 4.00%, 12/1/2034 | 430 | 438 |
Series 2020A, GO, AGM, 4.00%, 12/1/2035 | 280 | 282 |
Series 2020A, GO, AGM, 4.00%, 12/1/2036 | 250 | 249 |
Lake County Community Consolidated School District No. 3 Beach Park | ||
GO, AGM, 4.00%, 2/1/2030 | 730 | 756 |
GO, AGM, 4.00%, 2/1/2031 | 830 | 859 |
GO, AGM, 4.00%, 2/1/2032 | 535 | 554 |
GO, AGM, 4.00%, 2/1/2033 | 500 | 514 |
Northern Illinois University, Auxiliary Facilities System | ||
Series 2020B, Rev., 5.00%, 4/1/2025 | 425 | 432 |
Rev., 5.00%, 10/1/2027 | 350 | 365 |
Rev., 5.00%, 10/1/2028 | 325 | 343 |
Series 2020B, Rev., 5.00%, 4/1/2029 | 425 | 448 |
Series 2020B, Rev., 5.00%, 4/1/2032 | 400 | 419 |
Series 2020B, Rev., 5.00%, 4/1/2033 | 675 | 704 |
Series 2020B, Rev., 5.00%, 4/1/2034 | 115 | 120 |
Park Ridge Park District Series 2023B, GO, 4.00%, 12/1/2042 | 1,030 | 977 |
Peoria County Community Unit School District No. 323 GO, 4.00%, 4/1/2027 | 100 | 102 |
Regional Transportation Authority Series 2002A, Rev., NATL - RE, 6.00%, 7/1/2029 | 55 | 63 |
Sales Tax Securitization Corp. | ||
Series 2017A, Rev., 5.00%, 1/1/2027 | 60 | 63 |
Series 2018C, Rev., 5.50%, 1/1/2030 | 18,250 | 19,972 |
Series 2018C, Rev., 5.50%, 1/1/2031 | 3,540 | 3,875 |
Series 2018C, Rev., 5.50%, 1/1/2032 | 22,820 | 24,984 |
Series 2018C, Rev., 5.25%, 1/1/2034 | 13,520 | 14,561 |
Series 2018C, Rev., 5.25%, 1/1/2035 | 9,000 | 9,663 |
State of Illinois | ||
Series 2018A, GO, 4.00%, 5/1/2024 | 50 | 50 |
Series 2017D, GO, 5.00%, 11/1/2024 | 15,715 | 15,935 |
GO, 5.00%, 1/1/2025 | 700 | 711 |
GO, 5.00%, 11/1/2025 | 1,750 | 1,796 |
INVESTMENTS | PRINCIPAL AMOUNT ($000) | VALUE ($000) |
Illinois — continued | ||
Series 2017D, GO, 5.00%, 11/1/2025 | 5,000 | 5,131 |
GO, 5.00%, 2/1/2026 | 4,900 | 5,044 |
Series 2017D, GO, 5.00%, 11/1/2026 | 5,175 | 5,378 |
GO, 5.00%, 6/1/2027 | 25 | 26 |
GO, 5.00%, 1/1/2028 | 150 | 154 |
GO, 4.50%, 2/1/2029 | 450 | 451 |
Series 2018A, GO, 5.00%, 5/1/2030 | 35 | 37 |
GO, 4.13%, 11/1/2031 | 40 | 40 |
Series 2022B, GO, 5.00%, 3/1/2032 | 10,000 | 11,000 |
GO, 4.00%, 6/1/2032 | 100 | 99 |
Series 2020B, GO, 4.00%, 10/1/2032 | 2,300 | 2,327 |
Series 2022B, GO, 5.00%, 10/1/2032 | 18,000 | 19,845 |
Series 2022B, GO, 5.00%, 3/1/2033 | 12,500 | 13,673 |
Series 2022A, GO, 5.00%, 3/1/2034 | 10,765 | 11,690 |
Series 2022A, GO, 5.00%, 3/1/2035 | 12,000 | 12,925 |
Series 2021A, GO, 5.00%, 3/1/2036 | 5,940 | 6,304 |
Series B, GO, 4.00%, 12/1/2037 | 5,000 | 4,820 |
Series 2021A, GO, 4.00%, 3/1/2038 | 1,705 | 1,639 |
GO, 5.00%, 2/1/2039 | 2,275 | 2,275 |
Series 2021A, GO, 4.00%, 3/1/2039 | 2,975 | 2,826 |
Series 2021A, GO, 4.00%, 3/1/2040 | 1,300 | 1,224 |
Series 2019C, GO, 4.00%, 11/1/2042 | 5,880 | 5,429 |
Series 2023B, GO, 5.50%, 5/1/2047 | 1,125 | 1,207 |
State of Illinois, Sales Tax | ||
Series 2016D, Rev., 5.00%, 6/15/2024 | 40 | 40 |
Series 2021A, Rev., 4.00%, 6/15/2029 | 150 | 152 |
Series 2018A, Rev., 4.00%, 6/15/2035 | 975 | 969 |
Village of Bolingbrook Series 2014A, GO, AGM, 5.00%, 1/1/2032 | 150 | 153 |
Village of Bolingbrook, Will and Dupage Counties, Special Service Areas Numbers 2001-1, 2001-2, 2001-3, and 2002-1 | ||
Rev., AGM, 4.00%, 3/1/2026 | 620 | 629 |
Rev., AGM, 4.00%, 3/1/2027 | 370 | 377 |
Rev., AGM, 4.00%, 3/1/2028 | 995 | 1,013 |
Village of Westmont GO, 4.00%, 1/1/2027 | 45 | 46 |
Will County Community Unit School District No. 365-U Valley View | ||
GO, 4.00%, 1/1/2030 | 975 | 990 |
GO, 4.00%, 1/1/2033 | 1,000 | 1,015 |
GO, 3.00%, 7/1/2036 | 1,700 | 1,512 |
Will County Forest Preservation District, Limited Tax | ||
GO, 5.00%, 12/15/2032 | 500 | 564 |
GO, 5.00%, 12/15/2033 | 710 | 799 |
34 | J.P. Morgan Municipal Bond Funds | August 31, 2023 |
INVESTMENTS | PRINCIPAL AMOUNT ($000) | VALUE ($000) |
Municipal Bonds — continued | ||
Illinois — continued | ||
GO, 5.00%, 12/15/2034 | 915 | 1,026 |
Will Grundy Etc Counties Community College District No. 525, Joliet Junior College GO, 5.00%, 1/1/2026 | 40 | 42 |
Total Illinois | 266,540 | |
Indiana — 1.5% | ||
Brownsburg 1999 School Building Corp., Ad Valorem Property Tax First Mortgage Rev., 5.00%, 1/15/2028 | 10 | 11 |
City of Franklin, Otterbeit Homes | ||
Series 2019B, Rev., 5.00%, 7/1/2030 | 670 | 699 |
Series 2019B, Rev., 5.00%, 7/1/2032 | 735 | 767 |
Series 2019B, Rev., 4.00%, 7/1/2034 | 705 | 694 |
Series 2019B, Rev., 4.00%, 7/1/2035 | 685 | 665 |
City of Goshen, Multi-Family, Green Oaks of Goshen Project Series 2021A, Rev., 5.00%, 8/1/2041 (d) | 750 | 592 |
City of Jeffersonville, Vivera Senior Living of Jeffersonville Project Series 2020A, Rev., 5.25%, 11/1/2040 (d) | 4,560 | 3,553 |
City of Rockport, Indiana Michigan Power Co. Project Series 2009A, Rev., 3.05%, 6/1/2025 | 11,600 | 11,390 |
City of Valparaiso Rev., 5.38%, 12/1/2041 (d) | 1,550 | 1,180 |
East Allen Multi School Building Corp., Indiana Ad Valorem Property Tax, First Mortgage Rev., 5.00%, 1/15/2038 | 25 | 26 |
Fort Wayne Redevelopment Authority Lease Rental, Harrison Square Project | ||
Rev., 5.00%, 8/1/2024 | 1,095 | 1,102 |
Rev., 5.00%, 2/1/2025 | 500 | 503 |
Greenfield Middle School Building Corp., Ad Valorem Property Tax First Mortgage | ||
Rev., 4.00%, 7/15/2033 | 460 | 471 |
Rev., 4.00%, 1/15/2035 | 550 | 561 |
Hobart Building Corp., Ad Valorem Property Tax First Mortgage Rev., 5.00%, 1/15/2029 | 130 | 136 |
Huntington Countywide School Building Corp., Ad Valorem Property Tax First Mortgage Rev., 5.00%, 1/15/2035 | 35 | 38 |
Indiana Bond Bank, Hamilton County Projects | ||
Series 2019B, Rev., Zero Coupon, 1/15/2028 | 350 | 299 |
Series 2019B, Rev., Zero Coupon, 7/15/2028 | 50 | 42 |
Series 2019B, Rev., Zero Coupon, 1/15/2029 | 560 | 461 |
Series 2019B, Rev., Zero Coupon, 7/15/2029 | 735 | 593 |
Series 2019B, Rev., Zero Coupon, 1/15/2030 | 750 | 594 |
Series 2019B, Rev., Zero Coupon, 7/15/2030 | 740 | 575 |
INVESTMENTS | PRINCIPAL AMOUNT ($000) | VALUE ($000) |
Indiana — continued | ||
Indiana Finance Authority | ||
Series 2023A, Rev., 5.00%, 6/1/2038 | 400 | 409 |
Series 2023A, Rev., 5.00%, 6/1/2053 | 210 | 210 |
Indiana Finance Authority, DePauw University | ||
Series 2022A, Rev., 5.00%, 7/1/2026 | 365 | 372 |
Series 2022A, Rev., 5.00%, 7/1/2027 | 520 | 535 |
Series 2022A, Rev., 5.00%, 7/1/2028 | 760 | 789 |
Series 2022A, Rev., 5.00%, 7/1/2029 | 1,395 | 1,455 |
Series 2022A, Rev., 5.00%, 7/1/2030 | 1,400 | 1,467 |
Series 2022A, Rev., 5.00%, 7/1/2031 | 1,530 | 1,609 |
Series 2022A, Rev., 5.00%, 7/1/2032 | 1,625 | 1,713 |
Indiana Finance Authority, Educational Facilities, Kipp Indianapolis, Inc., Project Series 2020A, Rev., 4.00%, 7/1/2030 | 110 | 103 |
Indiana Finance Authority, First Lien Wastewater, CWA Authority Project Series 2016A, Rev., 5.00%, 10/1/2036 | 70 | 73 |
Indiana Finance Authority, Franciscan Alliance, Inc., Obligated Group | ||
Series 2016B, Rev., 5.00%, 11/1/2026 | 10 | 10 |
Series 2017B, Rev., 5.00%, 11/1/2032 | 25 | 26 |
Indiana Finance Authority, Goshen Health | ||
Series 2019A, Rev., 5.00%, 11/1/2030 | 500 | 526 |
Series 2019A, Rev., 5.00%, 11/1/2031 | 1,020 | 1,074 |
Series 2019A, Rev., 5.00%, 11/1/2032 | 530 | 558 |
Series 2019A, Rev., 5.00%, 11/1/2033 | 1,110 | 1,167 |
Series 2019A, Rev., 5.00%, 11/1/2034 | 760 | 800 |
Series 2019A, Rev., 5.00%, 11/1/2035 | 665 | 693 |
Series 2019A, Rev., 4.00%, 11/1/2036 | 230 | 217 |
Series 2019A, Rev., 4.00%, 11/1/2037 | 335 | 313 |
Series 2019A, Rev., 4.00%, 11/1/2038 | 340 | 314 |
Series 2019A, Rev., 4.00%, 11/1/2039 | 355 | 321 |
Indiana Finance Authority, State Revolving Fund Program | ||
Series 2017B, Rev., 5.00%, 2/1/2026 | 20 | 21 |
Series 2018A, Rev., 5.00%, 2/1/2035 | 100 | 107 |
Indiana Housing and Community Development Authority, Vita of Marion Project | ||
Series 2021B, Rev., 4.00%, 4/1/2024 | 500 | 492 |
Series 2021A, Rev., 5.00%, 4/1/2031 (d) | 665 | 576 |
Series 2021A, Rev., 5.25%, 4/1/2041 (d) | 1,875 | 1,462 |
Indiana Housing and Community Development Authority, Vita of New Whiteland Project Rev., 6.75%, 1/1/2043 | 5,000 | 4,842 |
August 31, 2023 | J.P. Morgan Municipal Bond Funds | 35 |
AS OF August 31, 2023 (Unaudited) (continued)
INVESTMENTS | PRINCIPAL AMOUNT ($000) | VALUE ($000) |
Municipal Bonds — continued | ||
Indiana — continued | ||
Indianapolis Local Public Improvement Bond Bank, Courthouse and Jail Project Series 2019A, Rev., 5.00%, 2/1/2032 | 225 | 247 |
Indianapolis Local Public Improvement Bond Bank, Pilot Infrastructure Project Series 2017C, Rev., 5.00%, 1/1/2035 | 195 | 207 |
Indianapolis Local Public Improvement Bond Bank, Stormwater Project Series 2013D, Rev., 5.00%, 1/1/2024 | 1,250 | 1,251 |
Metropolitan School District of Warren Township Vision 2005 School Building Corp., First Mortgage, Ad Valorem Property Tax Rev., 4.00%, 7/10/2032 | 25 | 26 |
North Adams Community Schools Renovation Building Corp., First Mortgage, Ad Valorem Property Tax Rev., 5.00%, 7/15/2032 | 25 | 27 |
Northern Wells Multi-School Building Corp., Ad Valorem Property Tax, First Mortgage Rev., 4.00%, 7/15/2035 | 50 | 51 |
Plainfield High School Building Corp., Ad Valorem Property Tax, First Mortgage Series 2019A, Rev., 5.00%, 7/15/2028 | 30 | 33 |
Whitley County Multi School Building Corp., Ad Valorem Property Tax Rev., 5.00%, 7/15/2038 | 3,200 | 3,372 |
Yorktown Redevelopment Authority, Ad Valorem Property Tax Lease Rev., 4.00%, 1/15/2026 | 35 | 35 |
Total Indiana | 52,455 | |
Iowa — 0.1% | ||
City of Cedar Rapids, Sewer Series 2019C, Rev., 4.00%, 6/1/2031 | 25 | 26 |
County of Linn | ||
COP, 4.00%, 6/1/2030 | 490 | 501 |
COP, 4.00%, 6/1/2034 | 600 | 610 |
COP, 4.00%, 6/1/2035 | 470 | 476 |
Series 2023A, GO, 4.00%, 6/1/2040 | 270 | 265 |
Series 2023A, GO, 4.00%, 6/1/2041 | 275 | 268 |
Iowa Finance Authority, Senior Living Facility, Sunrise Retirement Community Project | ||
Rev., 4.00%, 9/1/2025 | 115 | 110 |
Rev., 5.00%, 9/1/2026 | 85 | 82 |
Rev., 5.00%, 9/1/2028 | 200 | 188 |
Rev., 5.00%, 9/1/2030 | 110 | 100 |
Rev., 5.00%, 9/1/2031 | 100 | 90 |
INVESTMENTS | PRINCIPAL AMOUNT ($000) | VALUE ($000) |
Iowa — continued | ||
Rev., 5.00%, 9/1/2036 | 440 | 374 |
Iowa Finance Authority, State Revolving Fund Series 2019A, Rev., 5.00%, 8/1/2031 | 30 | 33 |
Total Iowa | 3,123 | |
Kansas — 0.3% | ||
Butler County, Unified School District No. 385 Andover, School Building GO, 5.00%, 9/1/2027 (b) | 790 | 850 |
City of Manhattan, Meadowlark Hills Series 2021A, Rev., 4.00%, 6/1/2046 | 500 | 356 |
City of Topeka, Kansas Health Care Facilities | ||
Series 2022B, Rev., 5.13%, 12/1/2026 | 250 | 247 |
Series 2022A, Rev., 5.75%, 12/1/2033 | 500 | 493 |
City of Wichita, Airport Bonds Series 2015A, GO, 4.00%, 12/1/2040 | 25 | 23 |
Johnson and Miami Counties Unified School District No. 230 Spring Hills Series 2018A, GO, 4.00%, 9/1/2033 | 2,965 | 3,019 |
Riley County Unified School District No. 383, Manhattan-Ogden Series 2018A, GO, 5.00%, 9/1/2027 (b) | 40 | 43 |
State of Kansas Department of Transportation Series 2015B, Rev., 5.00%, 9/1/2035 | 4,375 | 4,492 |
Wyandotte County Unified School District No. 203 Piper | ||
Series 2018A, GO, 5.00%, 9/1/2041 | 1,000 | 1,050 |
Series 2018A, GO, 5.00%, 9/1/2042 | 30 | 32 |
Total Kansas | 10,605 | |
Kentucky — 1.4% | ||
City of Henderson, Pratt Paper LLC Project Series 2022B, Rev., AMT, 4.45%, 1/1/2042 (d) | 500 | 474 |
County of Boone, Duke Energy Kentucky, Inc. Series 2008A, Rev., 3.70%, 8/1/2027 | 5,220 | 5,088 |
County of Carroll, Kentucky Environmental Facilities | ||
Series 2008A, Rev., AMT, 2.00%, 2/1/2032 | 11,025 | 8,679 |
Series 2006B, Rev., AMT, 2.13%, 10/1/2034 | 7,440 | 5,649 |
Kentucky Economic Development Finance Authority, Baptist Healthcare System Obligated Group Series 2017B, Rev., 5.00%, 8/15/2028 | 2,885 | 3,032 |
Kentucky Economic Development Finance Authority, Commonspirit Health | ||
Series 2019A-1, Rev., 5.00%, 8/1/2031 | 1,250 | 1,333 |
Series 2019A-1, Rev., 5.00%, 8/1/2032 | 1,000 | 1,064 |
Series 2019A-1, Rev., 5.00%, 8/1/2035 | 500 | 525 |
36 | J.P. Morgan Municipal Bond Funds | August 31, 2023 |
INVESTMENTS | PRINCIPAL AMOUNT ($000) | VALUE ($000) |
Municipal Bonds — continued | ||
Kentucky — continued | ||
Kentucky Economic Development Finance Authority, Owensboro Health, Inc. | ||
Series 2017A, Rev., AGM, 4.00%, 6/1/2037 | 1,750 | 1,692 |
Series 2017A, Rev., 5.00%, 6/1/2037 | 2,795 | 2,783 |
Kentucky Municipal Power Agency, Prairie State Project Series 2015A, Rev., NATL - RE, 5.00%, 9/1/2024 | 50 | 51 |
Kentucky Public Energy Authority, Gas Supply | ||
Series 2019C, Rev., 4.00%, 2/1/2028 (c) | 10,300 | 10,221 |
Series 2022A-1, Rev., 4.00%, 8/1/2030 (c) | 6,110 | 6,002 |
Louisville and Jefferson County Metropolitan Government, Norton Healthcare, Inc. Series 2016A, Rev., 5.00%, 10/1/2024 | 40 | 41 |
Warren County School District Finance Corp. Rev., 5.00%, 6/1/2025 | 100 | 103 |
Total Kentucky | 46,737 | |
Louisiana — 0.3% | ||
City of Shreveport, Water and Sewer Series 2016B, Rev., 5.00%, 12/1/2031 | 75 | 78 |
City of Shreveport, Water and Sewer, Junior Lien | ||
Series 2018C, Rev., 5.00%, 12/1/2026 | 500 | 523 |
Series 2018C, Rev., 5.00%, 12/1/2028 | 400 | 423 |
Series 2018C, Rev., 5.00%, 12/1/2029 | 1,500 | 1,583 |
Series 2019B, Rev., AGM, 5.00%, 12/1/2029 | 300 | 324 |
Series 2019B, Rev., AGM, 5.00%, 12/1/2031 | 1,470 | 1,590 |
Series 2019B, Rev., AGM, 4.00%, 12/1/2033 | 325 | 322 |
Louisiana Public Facilities Authority, Lincoln Preparatory School Project | ||
Series 2021A, Rev., 5.00%, 6/1/2031 (d) | 450 | 427 |
Series 2021A, Rev., 5.00%, 6/1/2041 (d) | 525 | 439 |
Louisiana Public Facilities Authority, Materra Campus Project | ||
Series 2021C, Rev., 4.00%, 6/1/2031 (d) | 245 | 223 |
Series 2021A, Rev., 4.00%, 6/1/2041 (d) | 1,330 | 1,038 |
Series 2021C, Rev., 4.00%, 6/1/2041 (d) | 440 | 343 |
Louisiana Public Facilities Authority, Mentorship Steam Academy Project | ||
Series 2021A, Rev., 5.00%, 6/1/2036 (d) | 385 | 335 |
Series 2021A, Rev., 5.00%, 6/1/2042 (d) | 440 | 361 |
Series 2021A, Rev., 5.00%, 6/1/2051 (d) | 705 | 545 |
INVESTMENTS | PRINCIPAL AMOUNT ($000) | VALUE ($000) |
Louisiana — continued | ||
Louisiana Public Facilities Authority, Tulane University Project Series 2016A, Rev., 5.00%, 12/15/2027 | 160 | 168 |
Louisiana State University and Agricultural and Mechanical College, Auxiliary Facilities System Rev., 3.75%, 7/1/2024 (b) | 75 | 75 |
Total Louisiana | 8,797 | |
Maine — 0.1% | ||
City of Portland GO, 5.00%, 4/1/2024 | 25 | 25 |
Maine Health and Higher Educational Facilities Authority, John F Murphy Homes, Inc. Series 2019B, Rev., 4.00%, 7/1/2036 | 25 | 25 |
Maine Health and Higher Educational Facilities Authority, Mainehealth Series 2020A, Rev., 4.00%, 7/1/2036 | 950 | 952 |
Maine Municipal Bond Bank Series C, Rev., 5.00%, 11/1/2034 | 660 | 711 |
Total Maine | 1,713 | |
Maryland — 2.0% | ||
City of Baltimore, Consolidated Public Improvement Series 2017B, GO, 5.00%, 10/15/2027 | 2,000 | 2,152 |
City of Baltimore, Wastewater Projects Series 2017A, Rev., 5.00%, 7/1/2041 | 13,845 | 14,285 |
County of Anne Arundel, Consolidated General Improvements | ||
GO, 5.00%, 10/1/2034 | 3,360 | 3,531 |
GO, 5.00%, 10/1/2035 | 2,395 | 2,507 |
GO, 5.00%, 10/1/2037 | 3,400 | 3,531 |
County of Anne Arundel, Consolidated Water and Sewer | ||
GO, 5.00%, 10/1/2034 | 1,875 | 1,970 |
GO, 5.00%, 10/1/2035 | 1,925 | 2,015 |
County of Baltimore, Metropolitan District, 2019 Crossover GO, 5.00%, 11/1/2024 | 25 | 26 |
County of Prince George's, Consolidated Public Improvement Series 2018A, GO, 5.00%, 7/15/2029 | 10 | 11 |
Maryland Health and Higher Educational Facilities Authority, Frederick Health System Issue | ||
Rev., 3.25%, 7/1/2039 | 175 | 137 |
Rev., 4.00%, 7/1/2040 | 215 | 204 |
Rev., 4.00%, 7/1/2045 | 800 | 727 |
Rev., 4.00%, 7/1/2050 | 1,295 | 1,143 |
Maryland Health and Higher Educational Facilities Authority, Lifebridge Health Issue | ||
Rev., 4.00%, 7/1/2035 | 1,000 | 1,001 |
August 31, 2023 | J.P. Morgan Municipal Bond Funds | 37 |
AS OF August 31, 2023 (Unaudited) (continued)
INVESTMENTS | PRINCIPAL AMOUNT ($000) | VALUE ($000) |
Municipal Bonds — continued | ||
Maryland — continued | ||
Rev., 4.00%, 7/1/2036 | 1,000 | 996 |
Maryland Health and Higher Educational Facilities Authority, Medstar Health Issue Series 2017A, Rev., 5.00%, 5/15/2045 | 1,205 | 1,224 |
Maryland Health and Higher Educational Facilities Authority, Stevenson University Project | ||
Series 2021A, Rev., 5.00%, 6/1/2029 | 150 | 159 |
Series 2021A, Rev., 5.00%, 6/1/2031 | 175 | 189 |
Series 2021A, Rev., 5.00%, 6/1/2033 | 200 | 214 |
Series 2021A, Rev., 4.00%, 6/1/2034 | 350 | 349 |
Series 2021A, Rev., 4.00%, 6/1/2035 | 475 | 468 |
Series 2021A, Rev., 4.00%, 6/1/2037 | 445 | 425 |
Series 2021A, Rev., 4.00%, 6/1/2039 | 465 | 433 |
Series 2021A, Rev., 4.00%, 6/1/2040 | 250 | 231 |
State of Maryland, State and Local Facilities Loan of 2017 | ||
Series 2017, GO, 5.00%, 3/15/2024 | 40 | 40 |
Series 2017, GO, 4.00%, 3/15/2030 | 7,260 | 7,480 |
Washington Suburban Sanitary Commission | ||
Rev., GTD, 4.00%, 6/1/2045 | 13,035 | 12,783 |
Rev., GTD, 4.00%, 6/1/2048 | 10,870 | 10,537 |
Washington Suburban Sanitary Commission, Consolidated Public Improvement Rev., GTD, 5.00%, 6/1/2030 | 25 | 28 |
Total Maryland | 68,796 | |
Massachusetts — 2.6% | ||
City of Lawrence, State Qualified Municipal Purpose Loan of 2022 Bonds GO, 4.00%, 6/1/2036 | 1,215 | 1,261 |
Commonwealth of Massachusetts Series A, GO, 5.00%, 7/1/2036 | 3,535 | 3,626 |
Commonwealth of Massachusetts, Consolidated Loan Series E, GO, AMBAC, 5.00%, 11/1/2025 | 5,000 | 5,197 |
Commonwealth of Massachusetts, Consolidated Loan of 2015 Series 2015D, GO, 4.00%, 9/1/2029 | 9,460 | 9,560 |
Commonwealth of Massachusetts, Consolidated Loan of 2016 Series 2016J, GO, 4.00%, 12/1/2039 | 13,125 | 13,062 |
Commonwealth of Massachusetts, Consolidated Loan of 2017 | ||
Series A, GO, 5.00%, 4/1/2032 | 9,145 | 9,756 |
Series A, GO, 5.00%, 4/1/2033 | 10,000 | 10,663 |
Series 2017D, GO, 5.00%, 2/1/2036 | 40 | 42 |
Commonwealth of Massachusetts, Consolidated Loan of 2018 Series 2018A, GO, 5.00%, 1/1/2040 | 35 | 37 |
INVESTMENTS | PRINCIPAL AMOUNT ($000) | VALUE ($000) |
Massachusetts — continued | ||
Essex North Shore Agricultural and Technical School District, State Qualified School Bonds GO, 4.00%, 6/1/2043 | 35 | 34 |
Massachusetts Bay Transportation Authority Assessment Series 2006A, Rev., 5.25%, 7/1/2025 | 2,250 | 2,331 |
Massachusetts Bay Transportation Authority, Sales Tax | ||
Series 2017A-2, Rev., 5.00%, 7/1/2027 | 25 | 27 |
Series 2006A, Rev., 5.25%, 7/1/2029 | 5,000 | 5,670 |
Series A-1, Rev., 5.25%, 7/1/2033 | 5,000 | 6,008 |
Massachusetts Development Finance Agency, Boston Medical Center Issue Series 2023G, Rev., 4.38%, 7/1/2052 | 1,200 | 1,095 |
Massachusetts Development Finance Agency, Mass General Brigham Issue Series 2020A-2, Rev., 5.00%, 7/1/2029 | 75 | 83 |
Massachusetts Development Finance Agency, Milford Regional Medical Center | ||
Series 2020G, Rev., 5.00%, 7/15/2024 (d) | 130 | 131 |
Series 2020G, Rev., 5.00%, 7/15/2025 (d) | 120 | 119 |
Series 2020G, Rev., 5.00%, 7/15/2027 (d) | 320 | 318 |
Series 2020G, Rev., 5.00%, 7/15/2029 (d) | 600 | 590 |
Series 2020G, Rev., 5.00%, 7/15/2031 (d) | 675 | 653 |
Series 2020G, Rev., 5.00%, 7/15/2032 (d) | 400 | 386 |
Massachusetts Development Finance Agency, Salem Community Corp. Rev., 5.13%, 1/1/2040 | 410 | 370 |
Massachusetts Development Finance Agency, Suffolk University Issue | ||
Rev., 5.00%, 7/1/2029 | 440 | 462 |
Rev., 5.00%, 7/1/2030 | 720 | 755 |
Rev., 5.00%, 7/1/2031 | 620 | 650 |
Rev., 5.00%, 7/1/2032 | 770 | 805 |
Rev., 5.00%, 7/1/2033 | 800 | 835 |
Rev., 5.00%, 7/1/2034 | 550 | 572 |
Massachusetts Development Finance Agency, Wellforce Issue | ||
Series 2020C, Rev., AGM, 5.00%, 10/1/2033 | 1,290 | 1,386 |
Series 2020C, Rev., AGM, 5.00%, 10/1/2034 | 1,175 | 1,260 |
Series 2020C, Rev., AGM, 3.00%, 10/1/2045 | 1,770 | 1,306 |
Massachusetts Health and Educational Facilities Authority, Massachusetts Institute of Technology Series M, Rev., 5.25%, 7/1/2025 | 4,070 | 4,223 |
Massachusetts Transportation Trust Fund Metropolitan Highway System, Commonwealth Contract Assistance Secured, Subordinated Series 2019C, Rev., 5.00%, 1/1/2035 | 40 | 44 |
38 | J.P. Morgan Municipal Bond Funds | August 31, 2023 |
INVESTMENTS | PRINCIPAL AMOUNT ($000) | VALUE ($000) |
Municipal Bonds — continued | ||
Massachusetts — continued | ||
Massachusetts Water Resources Authority | ||
Series B, Rev., AGM, 5.25%, 8/1/2024 | 3,110 | 3,167 |
Series C, Rev., 5.00%, 8/1/2030 | 55 | 59 |
Series B, Rev., AGM, 5.25%, 8/1/2036 | 20 | 24 |
Town of Stoughton, Municipal Purpose Loan GO, 4.00%, 10/15/2038 | 50 | 50 |
University of Massachusetts Building Authority Series 2019-1, Rev., 5.00%, 5/1/2035 | 105 | 115 |
Total Massachusetts | 86,732 | |
Michigan — 1.2% | ||
Bendle Public School District, Unlimited Tax GO, Q-SBLF, 4.00%, 5/1/2035 | 40 | 40 |
Cadillac Area Public Schools, Unlimited Tax GO, Q-SBLF, 5.00%, 5/1/2041 | 45 | 48 |
Caledonia Community Schools, Unlimited Tax GO, Q-SBLF, 4.00%, 5/1/2044 | 70 | 67 |
City of Detroit, Unlimited Tax | ||
Series 2021A, GO, 5.00%, 4/1/2035 | 555 | 572 |
Series 2021A, GO, 5.00%, 4/1/2037 | 475 | 484 |
City of Grand Rapids, Sanitary Sewer System | ||
Rev., 5.00%, 1/1/2029 | 350 | 362 |
Rev., 5.00%, 1/1/2033 | 1,400 | 1,446 |
Rev., 5.00%, 1/1/2036 | 160 | 176 |
Rev., 5.00%, 1/1/2038 | 35 | 37 |
County of Genesee, Water Supply System GO, 5.00%, 2/1/2024 | 90 | 91 |
Dansville Schools, Unlimited Tax GO, Q-SBLF, 4.00%, 5/1/2039 | 25 | 25 |
Grand Rapids Charter Township Economic Development Corp., Porter Hills Presbyterian Village Project | ||
Rev., 4.00%, 5/15/2027 | 2,365 | 2,281 |
Rev., 5.00%, 5/15/2037 | 4,575 | 4,306 |
Grand Rapids Public Schools, Unlimited Tax | ||
GO, AGM, 5.00%, 11/1/2032 | 1,500 | 1,635 |
GO, AGM, 5.00%, 11/1/2034 | 1,045 | 1,129 |
GO, AGM, 5.00%, 11/1/2037 | 1,750 | 1,853 |
Grosse Pointe Public School System GO, 5.00%, 5/1/2035 | 45 | 49 |
Hartford Public Schools, School Building and Site, Unlimited Tax GO, Q-SBLF, 4.00%, 5/1/2037 | 35 | 35 |
Holland School District GO, AGM, 4.00%, 5/1/2035 | 25 | 25 |
Holt Public Schools, Unlimited Tax GO, Q-SBLF, 5.00%, 5/1/2028 | 45 | 49 |
INVESTMENTS | PRINCIPAL AMOUNT ($000) | VALUE ($000) |
Michigan — continued | ||
Hudsonville Public Schools, Unlimited Tax Series 2020-I, GO, Q-SBLF, 5.00%, 5/1/2031 | 25 | 28 |
Huron School District, Unlimited Tax GO, Q-SBLF, 5.00%, 5/1/2044 | 35 | 37 |
Kalamazoo Economic Development Corp., Heritage Community of Kalamazoo Project Series 2020B-1, Rev., 2.88%, 5/15/2026 | 170 | 161 |
Lansing Community College, Building and Site, Limited Tax | ||
GO, 5.00%, 5/1/2030 | 600 | 646 |
GO, 5.00%, 5/1/2032 | 635 | 684 |
Lawrence Public Schools, Unlimited Tax GO, Q-SBLF, 4.00%, 5/1/2026 | 30 | 30 |
Macomb Interceptor Drain Drainage District, Limited Tax GTD, 5.00%, 5/1/2028 | 85 | 92 |
Michigan Finance Authority, Aqunias College Project Rev., 4.00%, 5/1/2031 | 540 | 476 |
Michigan Finance Authority, Clean Water Revolving Fund Series 2016B, Rev., 5.00%, 10/1/2024 | 15 | 15 |
Michigan Finance Authority, Henry Ford Health System Rev., 4.00%, 11/15/2036 | 1,900 | 1,838 |
Michigan Finance Authority, Kettering University Project Rev., 4.00%, 9/1/2045 | 500 | 436 |
Michigan Finance Authority, Lawrence Technological University Obligated Group | ||
Rev., 4.00%, 2/1/2027 | 50 | 48 |
Rev., 4.00%, 2/1/2032 | 95 | 88 |
Michigan Finance Authority, Local Government Loan Program, Detroit Water and Sewerage Department Water Supply System Local Project Series D-4, Rev., 5.00%, 7/1/2034 | 50 | 51 |
Michigan Finance Authority, Trinity Health Credit Group | ||
Series 2019MI-1, Rev., 5.00%, 12/1/2024 | 30 | 31 |
Series 2017MI, Rev., 5.00%, 12/1/2027 | 50 | 53 |
Series 2017A-MI, Rev., 5.00%, 12/1/2029 | 125 | 133 |
Series 2016MI, Rev., 5.00%, 12/1/2035 | 4,600 | 4,751 |
Series 2017A-MI, Rev., 5.00%, 12/1/2035 | 130 | 136 |
Series 2013MI-4, Rev., 4.00%, 12/1/2038 | 1,000 | 978 |
Michigan State Hospital Finance Authority, Ascension Health Credit Group Series 1999B-4, Rev., 5.00%, 11/15/2027 | 50 | 51 |
Michigan Strategic Fund, Graphic Packaging International, LLC Coated Recycled Board Machine Project Rev., AMT, 4.00%, 10/1/2026 (c) | 1,125 | 1,114 |
August 31, 2023 | J.P. Morgan Municipal Bond Funds | 39 |
AS OF August 31, 2023 (Unaudited) (continued)
INVESTMENTS | PRINCIPAL AMOUNT ($000) | VALUE ($000) |
Municipal Bonds — continued | ||
Michigan — continued | ||
Michigan Strategic Fund, Holland Home Obligated Group Rev., 5.00%, 11/15/2029 | 1,700 | 1,681 |
Michigan Strategic Fund, United Methodist Retirement Communities Obligated Group, Porter Hills Presbyterian Village Project Rev., 5.00%, 5/15/2037 | 2,360 | 2,221 |
Plymouth-Canton Community School District Series 2015B, GO, AGM, 4.00%, 5/1/2035 | 50 | 50 |
Roseville Community Schools, School Building and Site, Unlimited Tax GO, Q-SBLF, 5.00%, 5/1/2028 | 25 | 27 |
South Lyon Community Schools, School Building and Site GO, 4.00%, 5/1/2038 | 25 | 25 |
State of Michigan Trunk Line Series 2020B, Rev., 4.00%, 11/15/2039 | 5,280 | 5,282 |
State of Michigan, Environmental Program Series 2014A, GO, 5.00%, 12/1/2028 | 4,300 | 4,374 |
University of Michigan | ||
Series 2019A, Rev., 5.00%, 4/1/2029 | 25 | 28 |
Rev., 5.00%, 4/1/2031 | 15 | 16 |
Utica Community Schools, School Building and Site, Unlimited Tax GO, Q-SBLF, 5.00%, 5/1/2028 | 25 | 27 |
Warren Consolidated Schools, School Building and Site, Unlimited Tax GO, Q-SBLF, 5.00%, 5/1/2034 | 25 | 26 |
Waterford School District GO, Q-SBLF, 4.00%, 5/1/2032 | 40 | 41 |
West Ottawa Public Schools, Unlimited Tax | ||
GO, AGM, 4.00%, 11/1/2039 | 1,055 | 1,042 |
GO, AGM, 4.00%, 11/1/2040 | 700 | 690 |
Total Michigan | 42,117 | |
Minnesota — 0.6% | ||
Chisholm Independent School District No. 695 | ||
Series 2023A, GO, Zero Coupon, 2/1/2035 | 950 | 604 |
Series 2023A, GO, Zero Coupon, 2/1/2036 | 845 | 504 |
Series 2023A, GO, Zero Coupon, 2/1/2037 | 615 | 345 |
Series 2023A, GO, Zero Coupon, 2/1/2038 | 825 | 432 |
City of Brainerd Series 2016A, GO, 5.00%, 10/1/2024 | 10 | 10 |
City of Minneapolis, Health Care System, Fairview Health Services | ||
Series 2018A, Rev., 4.00%, 11/15/2037 | 6,230 | 5,879 |
Series 2018A, Rev., 4.00%, 11/15/2038 | 750 | 702 |
Series 2018A, Rev., 4.00%, 11/15/2048 | 2,000 | 1,667 |
Series 2018A, Rev., 5.00%, 11/15/2049 | 1,000 | 1,004 |
INVESTMENTS | PRINCIPAL AMOUNT ($000) | VALUE ($000) |
Minnesota — continued | ||
City of Savage Series 2019A, GO, 4.00%, 2/1/2029 | 25 | 26 |
City of Woodbury, Charter School Lease | ||
Series 2020A, Rev., 3.00%, 12/1/2030 | 230 | 204 |
Series 2020A, Rev., 4.00%, 12/1/2040 | 200 | 168 |
City of Woodbury, Charter School Lease, Woodbury Leadership Academy Project | ||
Series 2021A, Rev., 4.00%, 7/1/2031 | 355 | 322 |
Series 2021A, Rev., 4.00%, 7/1/2041 | 445 | 348 |
Duluth Economic Development Authority, Benedictine Health System | ||
Series 2021A, Rev., 4.00%, 7/1/2031 | 800 | 730 |
Series 2021A, Rev., 4.00%, 7/1/2036 | 1,500 | 1,252 |
Series 2021A, Rev., 4.00%, 7/1/2041 | 430 | 335 |
Duluth Independent School District No. 709 | ||
Series 2019B, COP, 5.00%, 2/1/2024 | 215 | 216 |
Series 2019B, COP, 5.00%, 2/1/2025 | 190 | 194 |
Series 2019B, COP, 5.00%, 2/1/2026 | 200 | 207 |
Series 2019B, COP, 5.00%, 2/1/2027 | 185 | 194 |
Series 2019B, COP, 5.00%, 2/1/2028 | 175 | 187 |
Itasca County Independent School District No. 318, School Building, Minnesota School District Credit Enhancement Program Series 2018A, GO, 5.00%, 2/1/2030 | 1,400 | 1,498 |
Lakeville Independent School District No. 194 Series 2020B, COP, 4.00%, 4/1/2026 | 140 | 142 |
Minneapolis-St. Paul Metropolitan Airports Commission | ||
Series 2019C, Rev., 5.00%, 1/1/2026 | 100 | 104 |
Series A, Rev., 5.00%, 1/1/2026 | 25 | 26 |
Series A, Rev., 5.00%, 1/1/2027 | 85 | 90 |
Series A, Rev., 5.00%, 1/1/2032 | 35 | 37 |
Series 2019A, Rev., 5.00%, 1/1/2034 | 50 | 54 |
Minnesota Municipal Gas Agency | ||
Subseries, 2022A, Rev., LIQ : Royal Bank of Canada, 4.00%, 12/1/2026 | 1,000 | 997 |
Subseries, 2022A, Rev., LIQ : Royal Bank of Canada, 4.00%, 6/1/2027 | 535 | 532 |
Round Lake-Brewster Independent School District No. 2907 | ||
Series 2023A, GO, 5.00%, 2/1/2035 | 765 | 866 |
Series 2023A, GO, 5.00%, 2/1/2036 | 575 | 642 |
Series 2023A, GO, 5.00%, 2/1/2037 | 725 | 798 |
Series 2023A, GO, 5.00%, 2/1/2038 | 440 | 478 |
Total Minnesota | 21,794 | |
40 | J.P. Morgan Municipal Bond Funds | August 31, 2023 |
INVESTMENTS | PRINCIPAL AMOUNT ($000) | VALUE ($000) |
Municipal Bonds — continued | ||
Mississippi — 1.2% | ||
City of Tupelo GO, 4.00%, 12/1/2030 | 45 | 46 |
Mississippi Development Bank, Department of Corrections Walnut Grove Correctional Facility Refunding Bonds Project Series A, Rev., 5.00%, 8/1/2025 | 35 | 36 |
Mississippi Development Bank, Department of Transportation, Industrial Development Authority Series A, Rev., 5.00%, 1/1/2026 | 35 | 36 |
Mississippi Development Bank, Public Improvement Rev., 4.00%, 3/1/2025 | 100 | 100 |
State of Mississippi | ||
Series 2018A, GO, 4.00%, 11/1/2026 (b) | 5,030 | 5,166 |
Series 2018A, GO, 5.00%, 11/1/2026 (b) | 11,595 | 12,254 |
Series 2019B, GO, 5.00%, 10/1/2033 | 30 | 33 |
Series 2018A, GO, 4.00%, 11/1/2038 | 21,155 | 20,952 |
State of Mississippi, Gaming Tax Series 2019A, Rev., 5.00%, 10/15/2025 | 2,250 | 2,305 |
Total Mississippi | 40,928 | |
Missouri — 0.8% | ||
City of Bridgeton Series 2021A, Rev., 4.00%, 12/1/2031 | 115 | 118 |
City of Gladstone Series A, COP, 3.00%, 12/1/2025 | 5 | 5 |
City of Kansas Series 2023A, Rev., 4.00%, 12/1/2047 | 1,750 | 1,660 |
County of Jackson, Special Obligation Rev., 4.00%, 12/1/2023 | 25 | 25 |
Health and Educational Facilities Authority of the State of Missouri Rev., 5.00%, 9/1/2028 | 1,355 | 1,376 |
Health and Educational Facilities Authority of the State of Missouri, City Art Institute Rev., 5.00%, 9/1/2030 | 210 | 224 |
Health and Educational Facilities Authority of the State of Missouri, Coxhealth and Obligated Group Series 2019A, Rev., 5.00%, 11/15/2032 | 135 | 143 |
Health and Educational Facilities Authority of the State of Missouri, Lutheran Senior Services Projects | ||
Series 2019A, Rev., 5.00%, 2/1/2029 | 550 | 553 |
Series 2019C, Rev., 4.00%, 2/1/2030 | 1,500 | 1,426 |
Series 2016B, Rev., 5.00%, 2/1/2035 | 1,000 | 997 |
Series 2019A, Rev., 5.00%, 2/1/2042 | 1,000 | 953 |
Health and Educational Facilities Authority of the State of Missouri, Mercy Health Series 2018A, Rev., 5.00%, 6/1/2027 | 100 | 105 |
INVESTMENTS | PRINCIPAL AMOUNT ($000) | VALUE ($000) |
Missouri — continued | ||
Health and Educational Facilities Authority of the State of Missouri, Wright Memorial Hospital | ||
Rev., 5.00%, 9/1/2024 | 300 | 301 |
Rev., 5.00%, 9/1/2025 | 315 | 317 |
Rev., 5.00%, 9/1/2026 | 620 | 627 |
Rev., 5.00%, 9/1/2031 | 100 | 101 |
Industrial Development Authority of the City of St Louis Missouri (The), Innovation District Rev., 5.00%, 5/15/2041 | 2,815 | 2,747 |
Jefferson City School District, Missouri Direct Deposit Program GO, 5.00%, 3/1/2025 | 35 | 36 |
Kansas City Industrial Development Authority, City International Airport Terminal Modernization Project | ||
Series 2019B, Rev., AMT, 5.00%, 3/1/2032 | 1,250 | 1,325 |
Series 2019B, Rev., AMT, 5.00%, 3/1/2033 | 2,250 | 2,387 |
Series 2019B, Rev., AMT, 5.00%, 3/1/2034 | 1,800 | 1,910 |
Metropolitan St. Louis Sewer District, Wastewater System Improvement | ||
Series 2015B, Rev., 5.00%, 5/1/2031 | 530 | 542 |
Series 2015B, Rev., 5.00%, 5/1/2032 | 1,900 | 1,945 |
Series 2015B, Rev., 5.00%, 5/1/2033 | 3,185 | 3,260 |
Series 2015B, Rev., 5.00%, 5/1/2034 | 1,670 | 1,709 |
Series 2015B, Rev., 5.00%, 5/1/2035 | 2,125 | 2,175 |
Pattonville-Bridgeton Terrace Fire Protection District GO, 4.00%, 11/1/2025 | 25 | 25 |
Total Missouri | 26,992 | |
Montana — 0.5% | ||
City of Missoula, Water System | ||
Series 2019A, Rev., 5.00%, 7/1/2026 | 300 | 314 |
Series 2019A, Rev., 5.00%, 7/1/2029 | 1,000 | 1,082 |
Series 2019A, Rev., 5.00%, 7/1/2030 | 690 | 746 |
Series 2019A, Rev., 5.00%, 7/1/2031 | 870 | 939 |
Series 2019A, Rev., 5.00%, 7/1/2032 | 720 | 777 |
Series 2019A, Rev., 5.00%, 7/1/2033 | 565 | 609 |
Series 2019A, Rev., 5.00%, 7/1/2034 | 545 | 587 |
Series 2019A, Rev., 5.00%, 7/1/2035 | 550 | 590 |
Series 2019A, Rev., 5.00%, 7/1/2036 | 800 | 853 |
Series 2019A, Rev., 5.00%, 7/1/2038 | 850 | 897 |
Series 2019A, Rev., 5.00%, 7/1/2039 | 840 | 884 |
Series 2019A, Rev., 4.00%, 7/1/2044 | 3,500 | 3,235 |
County of Gallatin, Bozeman Fiber Project Series 2021A, Rev., 4.00%, 10/15/2032 (d) | 2,000 | 1,804 |
August 31, 2023 | J.P. Morgan Municipal Bond Funds | 41 |
AS OF August 31, 2023 (Unaudited) (continued)
INVESTMENTS | PRINCIPAL AMOUNT ($000) | VALUE ($000) |
Municipal Bonds — continued | ||
Montana — continued | ||
Gallatin County School District No. 44 Belgrade, School Building | ||
GO, 4.00%, 6/1/2029 | 290 | 301 |
GO, 4.00%, 6/1/2030 | 230 | 238 |
GO, 4.00%, 6/1/2031 | 220 | 228 |
GO, 4.00%, 6/1/2032 | 255 | 263 |
GO, 4.00%, 6/1/2033 | 155 | 160 |
GO, 4.00%, 6/1/2034 | 175 | 180 |
GO, 4.00%, 6/1/2035 | 270 | 277 |
GO, 4.00%, 6/1/2037 | 410 | 412 |
GO, 4.00%, 6/1/2038 | 375 | 367 |
GO, 4.00%, 6/1/2039 | 385 | 374 |
Montana Facility Finance Authority, School Health System Series 2019A, Rev., 4.00%, 1/1/2038 | 465 | 458 |
Montana State Board of Regents, Montana State University Series 2019B, Rev., 5.00%, 11/15/2028 | 55 | 60 |
Total Montana | 16,635 | |
Nebraska — 1.5% | ||
Central Plains Energy Project Series 2022-1, Rev., 5.00%, 10/1/2029 (c) | 2,500 | 2,548 |
Central Plains Energy Project, Gas Project No. 3 Series 2017A, Rev., 5.00%, 9/1/2042 | 1,500 | 1,526 |
Central Plains Energy Project, Gas Project No. 4 Series 2018A, Rev., 5.00%, 1/1/2024 (c) | 9,000 | 9,023 |
City of Columbus, Combined Utilities System Rev., 5.00%, 6/15/2027 | 145 | 154 |
City of Lincoln, Electric System | ||
Series 2020A, Rev., 5.00%, 9/1/2025 | 40 | 41 |
Series 2020A, Rev., 5.00%, 9/1/2033 | 30 | 33 |
City of Lincoln, Water Rev., 5.00%, 8/15/2028 | 105 | 115 |
City of Omaha, Sanitary Sewerage System Rev., 5.00%, 11/15/2031 | 1,825 | 1,856 |
City of Omaha, Various Purpose GO, 4.00%, 4/15/2034 | 75 | 77 |
County of Cherry, Limited Tax GO, 3.00%, 12/15/2023 | 15 | 15 |
Douglas County Hospital Authority No. 2, Children's Hospital Obligated Group | ||
Series 2020A, Rev., 5.00%, 11/15/2026 | 400 | 417 |
Series 2020A, Rev., 5.00%, 11/15/2029 | 285 | 309 |
Series 2020A, Rev., 5.00%, 11/15/2030 | 225 | 247 |
Series 2020A, Rev., 5.00%, 11/15/2031 | 275 | 300 |
Series 2020A, Rev., 5.00%, 11/15/2033 | 625 | 679 |
Series 2020A, Rev., 5.00%, 11/15/2034 | 600 | 650 |
INVESTMENTS | PRINCIPAL AMOUNT ($000) | VALUE ($000) |
Nebraska — continued | ||
Series 2020A, Rev., 4.00%, 11/15/2035 | 550 | 548 |
Series 2020A, Rev., 4.00%, 11/15/2036 | 425 | 419 |
Series 2020A, Rev., 4.00%, 11/15/2037 | 525 | 508 |
Series 2020A, Rev., 4.00%, 11/15/2038 | 600 | 566 |
Series 2020A, Rev., 4.00%, 11/15/2039 | 600 | 561 |
Douglas County Hospital Authority No. 2, Health Facilities, Nebraska Medicine Rev., 5.00%, 5/15/2031 | 25 | 26 |
Douglas County School District No. 001, Omaha Public | ||
GO, 4.00%, 12/15/2041 | 10,000 | 9,689 |
GO, 4.00%, 12/15/2042 | 10,000 | 9,612 |
Douglas County School District No. 010, Elkhorn Public Schools | ||
GO, 5.00%, 12/15/2027 | 175 | 189 |
GO, 5.00%, 12/15/2028 | 180 | 198 |
GO, 5.00%, 12/15/2029 | 250 | 279 |
GO, 5.00%, 12/15/2030 | 450 | 503 |
GO, 5.00%, 12/15/2031 | 325 | 364 |
GO, 4.00%, 12/15/2032 | 165 | 169 |
GO, 4.00%, 12/15/2033 | 185 | 190 |
GO, 4.00%, 12/15/2034 | 350 | 359 |
GO, 4.00%, 12/15/2035 | 350 | 356 |
Municipal Energy Agency of Nebraska, Power Supply System Series 2022A, Rev., 5.00%, 4/1/2030 | 180 | 199 |
Nebraska Educational Health Cultural and Social Services Finance Authority, Immanuel Retirement Communities Obligated Group | ||
Series 2019A, Rev., 4.00%, 1/1/2033 | 150 | 152 |
Series 2019A, Rev., 4.00%, 1/1/2034 | 1,000 | 1,012 |
Series 2019A, Rev., 4.00%, 1/1/2036 | 1,250 | 1,246 |
Series 2019A, Rev., 4.00%, 1/1/2037 | 1,000 | 975 |
Omaha Public Power District, Electric System | ||
Series 2019A, Rev., 5.00%, 2/1/2031 | 35 | 38 |
Series 2017A, Rev., 5.00%, 2/1/2035 | 1,250 | 1,338 |
Series 2017A, Rev., 5.00%, 2/1/2036 | 1,750 | 1,862 |
Series 2017A, Rev., 5.00%, 2/1/2037 | 2,000 | 2,117 |
Public Power Generation Agency, Whelan Energy Center Unit 2 Series 2016A, Rev., 5.00%, 1/1/2034 | 500 | 518 |
Total Nebraska | 51,983 | |
Nevada — 1.0% | ||
Clark County School District Series 2020A, GO, AGM, 4.00%, 6/15/2039 | 1,215 | 1,187 |
42 | J.P. Morgan Municipal Bond Funds | August 31, 2023 |
INVESTMENTS | PRINCIPAL AMOUNT ($000) | VALUE ($000) |
Municipal Bonds — continued | ||
Nevada — continued | ||
Clark County School District, Limited Tax Series 2017A, GO, 5.00%, 6/15/2026 | 2,080 | 2,172 |
Clark County Water Reclamation District | ||
Series 2023, GO, 5.00%, 7/1/2040 | 11,105 | 12,181 |
Series 2023, GO, 5.00%, 7/1/2041 | 5,000 | 5,420 |
Series 2023, GO, 5.00%, 7/1/2053 | 10,000 | 10,629 |
County of Clark, Department of Aviation, Nevada Airport System, Subordinate Lien, McCarran International Airport Series 2019A, Rev., 5.00%, 7/1/2026 | 110 | 115 |
County of Clark, Las Vegas Convention and Visitors Authority, Limited Tax Series 2015A, GO, 4.00%, 7/1/2033 | 75 | 76 |
County of Clark, Passenger Facility Charge, Las Vegas-McCarran International Airport Passenger Facility | ||
Series 2017B, Rev., AMT, 5.00%, 7/1/2024 | 200 | 202 |
Series 2015C, Rev., 5.00%, 7/1/2027 | 195 | 208 |
County of Clark, Stadium Improvement, Limited Tax Series 2018A, GO, 5.00%, 6/1/2028 | 1,165 | 1,266 |
County of Washoe, Fuel Tax | ||
Rev., 5.00%, 2/1/2036 | 80 | 86 |
Rev., 5.00%, 2/1/2042 | 150 | 157 |
Las Vegas Valley Water District, Limited Tax Series 2019A, GO, 5.00%, 6/1/2030 | 40 | 44 |
State of Nevada Highway Improvement, Motor Vehicle Fuel Tax Rev., 5.00%, 12/1/2031 | 25 | 26 |
Washoe County School District, Limited Tax, School Improvement Series 2020A, GO, 4.00%, 10/1/2035 | 45 | 46 |
Total Nevada | 33,815 | |
New Hampshire — 0.1% | ||
New Hampshire Business Finance Authority, University of Nevada Reno Project Series 2023A, Rev., 5.25%, 6/1/2051 | 4,000 | 4,197 |
New Jersey — 4.2% | ||
Bergen County Improvement Authority (The), Guaranteed Governmental Loan Rev., GTD, 5.00%, 8/15/2034 | 50 | 55 |
Freehold Township Board of Education GO, 4.00%, 7/15/2025 | 85 | 86 |
New Jersey Economic Development Authority, Motor Vehicle Surcharges Series 2017A, Rev., 4.00%, 7/1/2034 | 325 | 326 |
INVESTMENTS | PRINCIPAL AMOUNT ($000) | VALUE ($000) |
New Jersey — continued | ||
New Jersey Economic Development Authority, School Facilities Construction | ||
Series 2019LLL, Rev., 5.00%, 6/15/2029 | 1,970 | 2,139 |
Series 2021QQQ, Rev., 4.00%, 6/15/2034 | 500 | 512 |
Series 2019LLL, Rev., 5.00%, 6/15/2034 | 1,000 | 1,081 |
Series 2021QQQ, Rev., 4.00%, 6/15/2035 | 400 | 407 |
Series 2021QQQ, Rev., 4.00%, 6/15/2036 | 575 | 582 |
Series 2018EEE, Rev., 5.00%, 6/15/2043 | 1,255 | 1,292 |
New Jersey Economic Development Authority, Transit Transportation Project | ||
Series 2020A, Rev., 4.00%, 11/1/2037 | 1,500 | 1,501 |
Series 2020A, Rev., 4.00%, 11/1/2038 | 3,250 | 3,224 |
New Jersey Transportation Trust Fund Authority, Federal Highway Reimbursement | ||
Series A, Rev., 5.00%, 6/15/2024 | 10,880 | 10,999 |
Series 2018A, Rev., 5.00%, 6/15/2030 | 9,585 | 9,973 |
Series A, Rev., 5.00%, 6/15/2031 | 11,500 | 11,953 |
New Jersey Transportation Trust Fund Authority, Transportation Program | ||
Series 2019BB, Rev., 5.00%, 6/15/2032 | 2,000 | 2,140 |
Series 2020AA, Rev., 4.00%, 6/15/2035 | 870 | 884 |
Series 2020AA, Rev., 4.00%, 6/15/2036 | 2,750 | 2,772 |
Series 2020AA, Rev., 4.00%, 6/15/2038 | 1,000 | 990 |
Series 2022A, Rev., 4.00%, 6/15/2041 | 2,000 | 1,932 |
Series 2022A, Rev., 4.00%, 6/15/2042 | 3,000 | 2,875 |
Rutgers The State University of New Jersey Series 2016M, Rev., 5.00%, 5/1/2030 | 100 | 104 |
State of New Jersey, COVID-19 Emergency Bonds | ||
Series 2020A, GO, 4.00%, 6/1/2031 | 28,340 | 29,672 |
Series 2020A, GO, 4.00%, 6/1/2032 | 28,260 | 29,582 |
Tobacco Settlement Financing Corp. | ||
Series 2018A, Rev., 5.00%, 6/1/2024 | 7,645 | 7,715 |
Series 2018A, Rev., 5.00%, 6/1/2026 | 6,300 | 6,534 |
Series 2018A, Rev., 5.00%, 6/1/2028 | 3,000 | 3,207 |
Series 2018A, Rev., 5.00%, 6/1/2029 | 4,500 | 4,814 |
Series 2018A, Rev., 4.00%, 6/1/2037 | 1,000 | 1,004 |
Township of Montclair, General Improvement Series 2017A, GO, 4.00%, 3/1/2024 | 35 | 35 |
Township of North Brunswick, General Improvement GO, 4.00%, 7/1/2039 | 1,540 | 1,522 |
Washington Borough Board of Education Series 2021, GO, AGM, 4.00%, 7/15/2031 | 25 | 27 |
August 31, 2023 | J.P. Morgan Municipal Bond Funds | 43 |
AS OF August 31, 2023 (Unaudited) (continued)
INVESTMENTS | PRINCIPAL AMOUNT ($000) | VALUE ($000) |
Municipal Bonds — continued | ||
New Jersey — continued | ||
Watchung School District | ||
GO, 4.00%, 3/1/2039 | 420 | 415 |
GO, 4.00%, 3/1/2041 | 960 | 938 |
Total New Jersey | 141,292 | |
New Mexico — 0.2% | ||
Albuquerque Municipal School District No. 12, School Building | ||
GO, 5.00%, 8/1/2030 | 800 | 870 |
GO, 5.00%, 8/1/2031 | 850 | 923 |
GO, 5.00%, 8/1/2032 | 1,050 | 1,139 |
GO, 5.00%, 8/1/2033 | 1,385 | 1,501 |
GO, 5.00%, 8/1/2035 | 1,980 | 2,130 |
City of Santa Fe, Water Utility System Rev., 4.00%, 6/1/2031 | 50 | 51 |
County of Bernalillo Series 1996B, Rev., NATL - RE - IBC, 5.70%, 4/1/2027 | 670 | 704 |
New Mexico Finance Authority, Subordinate Lien Public Project Revolving Fund, Tax-Exempt Series 2019C-1, Rev., 4.00%, 6/15/2035 | 25 | 26 |
State of New Mexico, Severance Tax Permanent Fund Series 2017A, Rev., 5.00%, 7/1/2024 | 180 | 182 |
Total New Mexico | 7,526 | |
New York — 14.3% | ||
Broome County Local Development Corp., Good Shepherd Village at Endwell, Inc. | ||
Rev., 4.00%, 7/1/2031 | 685 | 627 |
Rev., 4.00%, 7/1/2036 | 1,440 | 1,225 |
Buffalo and Erie County Industrial Land Development Corp., D'youville College Project | ||
Series 2020A, Rev., 4.00%, 11/1/2035 | 515 | 495 |
Series 2020A, Rev., 4.00%, 11/1/2040 | 1,035 | 930 |
Build NYC Resource Corp., Global Community Charter School | ||
Series 2022A, Rev., 4.00%, 6/15/2032 | 135 | 128 |
Series 2022A, Rev., 5.00%, 6/15/2042 | 365 | 347 |
Build NYC Resource Corp., Grand Concourse Academy Charter School | ||
Series 2022A, Rev., 5.00%, 7/1/2032 | 100 | 104 |
Series 2022A, Rev., 5.00%, 7/1/2042 | 300 | 296 |
Series 2022A, Rev., 5.00%, 7/1/2052 | 350 | 333 |
Build NYC Resource Corp., New World Preparatory Charter School Project | ||
Series 2021A, Rev., 4.00%, 6/15/2041 (d) | 240 | 191 |
Series 2021A, Rev., 4.00%, 6/15/2051 (d) | 320 | 230 |
INVESTMENTS | PRINCIPAL AMOUNT ($000) | VALUE ($000) |
New York — continued | ||
City of Buffalo Series 2021A, GO, 5.00%, 4/1/2026 | 50 | 52 |
City of New York | ||
Series 2023E, GO, 4.00%, 4/1/2042 | 18,840 | 18,215 |
Series 2023E, SubseriesE-1, GO, 4.00%, 4/1/2045 | 17,240 | 16,504 |
City of New York, Fiscal Year 2014 Series G, GO, 5.00%, 8/1/2025 | 9,520 | 9,589 |
City of New York, Fiscal Year 2018 Series 2018B-1, GO, 4.00%, 10/1/2041 | 6,450 | 6,273 |
City of New York, Fiscal Year 2020 | ||
Series 2020B-1, GO, 5.00%, 10/1/2033 | 25 | 27 |
Series 2020B-1, GO, 5.00%, 10/1/2039 | 90 | 95 |
City of New York, Fiscal Year 2024 Series 2024A, GO, 4.13%, 8/1/2053 | 2,000 | 1,890 |
City of Yonkers Series 2022C, GO, AGM, 5.00%, 3/15/2038 | 35 | 38 |
County of Suffolk | ||
Series 2015B, GO, AGM, 5.00%, 10/1/2023 | 30 | 30 |
Series 2017D, GO, 5.00%, 10/15/2026 | 105 | 111 |
County of Suffolk, Public Improvement Series 2021A, GO, 4.00%, 6/15/2031 | 880 | 904 |
Erie County Fiscal Stability Authority, Sales Tax and State Aid Secured Series 2017D, Rev., 5.00%, 9/1/2038 | 25 | 26 |
Hudson Yards Infrastructure Corp., Second Indenture | ||
Series 2017A, Rev., 5.00%, 2/15/2030 | 20 | 21 |
Series 2017A, Rev., 5.00%, 2/15/2037 | 50 | 52 |
Hyde Park Central School District GO, 4.00%, 6/15/2034 | 125 | 128 |
Long Island Power Authority, Electric System | ||
Series 2018, Rev., 5.00%, 9/1/2034 | 5,000 | 5,426 |
Series 2018, Rev., 5.00%, 9/1/2035 | 3,000 | 3,236 |
Metropolitan Transportation Authority | ||
Series C-1, Rev., 5.25%, 11/15/2029 | 6,000 | 6,166 |
Series 2017C-1, Rev., 5.00%, 11/15/2030 | 4,885 | 5,156 |
Series C-1, Rev., 5.00%, 11/15/2035 | 3,000 | 3,045 |
Metropolitan Transportation Authority, Dedicated Tax Fund | ||
Series 2016A, Rev., 5.00%, 11/15/2025 | 45 | 47 |
Series B-1, Rev., 5.00%, 11/15/2025 | 150 | 156 |
Monroe County Industrial Development Corp., Academy of Health Sciences Charter School Project | ||
Series 2022A, Rev., 5.00%, 7/1/2032 (d) | 250 | 241 |
44 | J.P. Morgan Municipal Bond Funds | August 31, 2023 |
INVESTMENTS | PRINCIPAL AMOUNT ($000) | VALUE ($000) |
Municipal Bonds — continued | ||
New York — continued | ||
Series 2022A, Rev., 5.63%, 7/1/2042 (d) | 1,385 | 1,320 |
Monroe County Industrial Development Corp., Rochester Schools Modernization Project Rev., 5.00%, 5/1/2033 | 810 | 863 |
Monroe County Industrial Development Corp., True North Rochester Preparatory Charter School Project Series 2020A, Rev., 5.00%, 6/1/2040 (d) | 630 | 620 |
New York City Municipal Water Finance Authority Fiscal Year 2022 Series 2022BB-1, Rev., 4.00%, 6/15/2045 | 17,765 | 17,018 |
New York City Municipal Water Finance Authority, Water and Sewer System Series 2020CC-2, Rev., 4.00%, 6/15/2042 | 5,000 | 4,873 |
New York City Transitional Finance Authority, Building Aid, Fiscal Year 2015 | ||
Series 2015S-1, Rev., 5.00%, 7/15/2040 | 45 | 46 |
Series 2015S-2, Rev., 5.00%, 7/15/2040 | 50 | 51 |
New York City Transitional Finance Authority, Building Aid, Fiscal Year 2016 | ||
Series 2016S-1, Rev., 5.00%, 7/15/2029 | 30 | 31 |
Series 2016 S-1, Rev., 5.00%, 7/15/2033 | 70 | 73 |
Series 2016S-1, Rev., 4.00%, 7/15/2036 | 45 | 45 |
Series 2016S-1, Rev., 5.00%, 7/15/2043 | 45 | 46 |
New York City Transitional Finance Authority, Building Aid, Fiscal Year 2018 | ||
Series S-2, Rev., 5.00%, 7/15/2030 | 25 | 27 |
Series S-2, Rev., 5.00%, 7/15/2031 | 45 | 48 |
Series 2018S-4, Rev., 5.00%, 7/15/2032 | 25 | 27 |
New York City Transitional Finance Authority, Building Aid, Fiscal Year 2019 | ||
Series 2019, Subseries S-3A, Rev., 5.00%, 7/15/2029 | 25 | 27 |
Series S-2A, Rev., 4.00%, 7/15/2037 | 5,000 | 4,974 |
Series 2019, Subseries S-3A, Rev., 5.00%, 7/15/2037 | 180 | 191 |
New York City Transitional Finance Authority, Future Tax Secured | ||
Series 2021-A, Rev., 4.00%, 11/1/2038 | 10,575 | 10,542 |
Series 2022B, Subseries B-1, Rev., 4.00%, 8/1/2045 | 3,700 | 3,552 |
Series 2022C-1, Rev., 4.00%, 2/1/2047 | 7,750 | 7,372 |
New York City Transitional Finance Authority, Future Tax Secured, Fiscal Year 2014 Series 2014B-1, Rev., 5.00%, 11/1/2026 | 40 | 40 |
INVESTMENTS | PRINCIPAL AMOUNT ($000) | VALUE ($000) |
New York — continued | ||
New York City Transitional Finance Authority, Future Tax Secured, Fiscal Year 2015 | ||
Series 2015B-1, Rev., 5.00%, 8/1/2029 | 55 | 56 |
Series 2015A-1, Rev., 5.00%, 8/1/2037 | 100 | 101 |
New York City Transitional Finance Authority, Future Tax Secured, Fiscal Year 2016 | ||
Series 2016E-1, Rev., 5.00%, 2/1/2031 | 30 | 31 |
Series 2016E-1, Rev., 5.00%, 2/1/2035 | 7,295 | 7,528 |
New York City Transitional Finance Authority, Future Tax Secured, Fiscal Year 2017 | ||
Series C, Rev., 5.00%, 11/1/2030 | 5,685 | 6,018 |
Series 2017E1-1, Rev., 5.00%, 2/1/2031 | 1,410 | 1,486 |
Series 2017E1-1, Rev., 5.00%, 2/1/2032 | 7,000 | 7,371 |
Series 2017F-1, Rev., 5.00%, 5/1/2032 | 25 | 26 |
Series 2017E-1, Rev., 5.00%, 2/1/2033 | 10,000 | 10,515 |
Series 2017A-1, Rev., 4.00%, 5/1/2036 | 40 | 40 |
Series 2017E1-1, Rev., 5.00%, 2/1/2039 | 2,525 | 2,609 |
New York City Transitional Finance Authority, Future Tax Secured, Fiscal Year 2018 Series 2018 -1, Rev., 5.00%, 11/1/2028 | 20 | 21 |
New York City Transitional Finance Authority, Future Tax Secured, Fiscal Year 2019 | ||
Series 2019C-1, Rev., 5.00%, 11/1/2034 | 45 | 49 |
Series 2019C-1, Rev., 5.00%, 11/1/2035 | 65 | 70 |
Series 2019A-1, Rev., 5.00%, 8/1/2038 | 30 | 32 |
New York City Transitional Finance Authority, Future Tax Secured, Tax-Exempt, Fiscal Year 2018 | ||
Series 2018-A-2, Rev., 5.00%, 8/1/2033 | 30 | 32 |
Series 2018-A-2, Rev., 5.00%, 8/1/2038 | 25 | 26 |
Series C-3, Rev., 5.00%, 5/1/2039 | 70 | 74 |
Series C-3, Rev., 5.00%, 5/1/2041 | 2,100 | 2,198 |
New York City Transitional Finance Authority, Future Tax Secured, Tax-Exempt, Fiscal Year 2020 | ||
Series A, Subseries A-2, Rev., 5.00%, 5/1/2035 | 125 | 135 |
Series 2020B-1, Rev., 5.00%, 11/1/2035 | 35 | 38 |
New York City Water and Sewer System, Second General Resolution, Fiscal Year 2015 | ||
Series 2015FF, Rev., 5.00%, 6/15/2031 | 5,000 | 5,143 |
Series 2015AA, Rev., 4.00%, 6/15/2044 | 25 | 24 |
New York City Water and Sewer System, Second General Resolution, Fiscal Year 2017 Series 2017EE, Rev., 5.00%, 6/15/2036 | 5,000 | 5,258 |
New York City Water and Sewer System, Second General Resolution, Fiscal Year 2018 | ||
Series 2018EE, Rev., 5.00%, 6/15/2035 | 35 | 36 |
Series 2018FF, Rev., 5.00%, 6/15/2040 | 50 | 53 |
August 31, 2023 | J.P. Morgan Municipal Bond Funds | 45 |
AS OF August 31, 2023 (Unaudited) (continued)
INVESTMENTS | PRINCIPAL AMOUNT ($000) | VALUE ($000) |
Municipal Bonds — continued | ||
New York — continued | ||
New York City Water and Sewer System, Second General Resolution, Fiscal Year 2019 Series 2019EE-2, Rev., 5.00%, 6/15/2040 | 35 | 37 |
New York City Water and Sewer System, Second General Resolution, Fiscal Year 2020 | ||
Series 2020CC-1, Rev., 4.00%, 6/15/2038 | 14,705 | 14,756 |
Series 2020AA, Rev., 5.00%, 6/15/2040 | 25 | 27 |
Series 2020, Subseries 202DD-3, Rev., 5.00%, 6/15/2041 | 140 | 149 |
Subseries 202DD-3, Rev., 4.00%, 6/15/2042 | 1,880 | 1,832 |
New York Convention Center Development Corp., Subordinate Lien, Hotel Unit Fee Secured | ||
Series B, Rev., Zero Coupon, 11/15/2025 | 805 | 736 |
Series B, Rev., Zero Coupon, 11/15/2026 | 1,250 | 1,099 |
Series B, Rev., Zero Coupon, 11/15/2027 | 1,500 | 1,267 |
Series B, Rev., Zero Coupon, 11/15/2028 | 1,960 | 1,589 |
Series B, Rev., Zero Coupon, 11/15/2030 | 3,400 | 2,519 |
Series B, Rev., Zero Coupon, 11/15/2032 | 2,000 | 1,352 |
Series B, Rev., Zero Coupon, 11/15/2033 | 2,150 | 1,392 |
Series B, Rev., AGM-CR, Zero Coupon, 11/15/2052 | 10,625 | 2,349 |
New York Liberty Development Corp., Secured by Port Authority | ||
Series 1WTC-2021, Rev., AGM-CR, 3.00%, 2/15/2042 | 3,345 | 2,581 |
Series 1WTC-2021, Rev., 2.75%, 2/15/2044 | 2,000 | 1,432 |
New York Liberty Development Corp., World Trade Centre Series 1WTC-2021, Rev., 2.25%, 2/15/2041 | 4,500 | 3,137 |
New York State Dormitory Authority Series 2019D, Rev., 4.00%, 2/15/2047 | 1,500 | 1,418 |
New York State Dormitory Authority, Barnard College Series 2020A, Rev., 4.00%, 7/1/2045 | 725 | 650 |
New York State Dormitory Authority, Cornell University Series 2019A, Rev., 5.00%, 7/1/2025 | 65 | 67 |
New York State Dormitory Authority, Municipal Health Facilities Improvement Program Series 2018 1, Rev., 5.00%, 1/15/2031 | 3,445 | 3,714 |
New York State Dormitory Authority, New York University | ||
Series 2016A, Rev., 5.00%, 7/1/2024 | 50 | 51 |
Series 2017A, Rev., 4.00%, 7/1/2035 | 25 | 25 |
Series 2017A, Rev., 4.00%, 7/1/2036 | 75 | 76 |
Series 2019A, Rev., 5.00%, 7/1/2036 | 45 | 49 |
Series 2017A, Rev., 4.00%, 7/1/2037 | 45 | 45 |
INVESTMENTS | PRINCIPAL AMOUNT ($000) | VALUE ($000) |
New York — continued | ||
Series 2016A, Rev., 5.00%, 7/1/2039 | 140 | 145 |
Series 2019A, Rev., 5.00%, 7/1/2039 | 25 | 27 |
Series 2016A, Rev., 4.00%, 7/1/2043 | 3,500 | 3,369 |
Series 2019A, Rev., 4.00%, 7/1/2045 | 13,000 | 12,433 |
New York State Dormitory Authority, Rockefeller University Series 2020A, Rev., 5.00%, 7/1/2053 | 2,500 | 2,646 |
New York State Dormitory Authority, School Districts Financing Program | ||
Series 2019A, Rev., 5.00%, 4/1/2028 | 80 | 86 |
Series 2018A, Rev., 5.00%, 10/1/2030 | 25 | 26 |
Series 2018A, Rev., 5.00%, 10/1/2031 | 75 | 79 |
New York State Dormitory Authority, State Personal Income Tax, General Purpose | ||
Series 2014A, Rev., 5.00%, 2/15/2024 (b) | 20,015 | 20,166 |
Series 2014A, Rev., 5.00%, 2/15/2028 | 10,000 | 10,063 |
Series 2015E, Rev., 5.00%, 3/15/2030 | 30 | 31 |
Series 2014C, Rev., 5.00%, 3/15/2033 | 20,000 | 20,145 |
Series 2019A, Rev., 5.00%, 3/15/2033 | 95 | 104 |
Series 2017B, Rev., 5.00%, 2/15/2042 | 30 | 31 |
Series 2019A, Rev., 5.00%, 3/15/2042 | 25 | 26 |
Series 2019A, Rev., 5.00%, 3/15/2043 | 95 | 100 |
New York State Dormitory Authority, State Sales Tax | ||
Series A, Rev., 5.00%, 3/15/2028 | 25 | 25 |
Series 2015B, Rev., 5.00%, 3/15/2029 | 45 | 46 |
Series 2018C, Rev., 5.00%, 3/15/2029 | 40 | 43 |
Series 2016A, Rev., 5.00%, 3/15/2032 | 35 | 37 |
Series 2016A, Rev., 5.00%, 3/15/2033 | 70 | 73 |
Series 2018C, Rev., 5.00%, 3/15/2036 | 8,020 | 8,508 |
Series 2015B, Rev., 5.00%, 3/15/2038 | 80 | 82 |
Series 2018E, Rev., 5.00%, 3/15/2038 | 2,000 | 2,110 |
Series 2015B, Rev., 5.00%, 3/15/2039 | 2,505 | 2,558 |
Series 2018E, Rev., 5.00%, 3/15/2041 | 225 | 236 |
Series 2018A, Rev., 5.00%, 3/15/2044 | 30 | 31 |
New York State Dormitory Authority, State University Dormitory Facilities | ||
Series 2018A, Rev., 5.00%, 7/1/2029 | 1,000 | 1,085 |
Series 2017A, Rev., 5.00%, 7/1/2030 | 750 | 799 |
Series 2018A, Rev., 5.00%, 7/1/2030 | 2,190 | 2,376 |
Series 2018A, Rev., 5.00%, 7/1/2031 | 4,430 | 4,807 |
Series 2018A, Rev., 5.00%, 7/1/2032 | 3,130 | 3,393 |
Series 2017A, Rev., 5.00%, 7/1/2037 | 230 | 241 |
New York State Dormitory Authority, State University of New York Dormitory Facilities | ||
Series 2017A, Rev., 5.00%, 7/1/2027 (b) | 5 | 5 |
46 | J.P. Morgan Municipal Bond Funds | August 31, 2023 |
INVESTMENTS | PRINCIPAL AMOUNT ($000) | VALUE ($000) |
Municipal Bonds — continued | ||
New York — continued | ||
Series 2017A, Rev., 5.00%, 7/1/2042 | 20 | 21 |
New York State Environmental Facilities Corp., State Clean Water and Drinking Water Revolving Funds, Municipal Water Finance Authority Projects - Second Resolution | ||
Series 2017E, Rev., 4.00%, 6/15/2037 | 40 | 40 |
Series 2018B, Rev., 5.00%, 6/15/2043 | 50 | 53 |
New York State Environmental Facilities Corp., State Revolving Fund Series 2021A, Rev., 4.00%, 6/15/2038 | 7,515 | 7,556 |
New York State Environmental Facilities Corp., State Revolving Funds Series 2014B, Rev., 5.00%, 5/15/2027 | 3,130 | 3,162 |
New York State Thruway Authority | ||
Series L, Rev., 5.00%, 1/1/2027 | 1,250 | 1,327 |
Series 2019B, Rev., 4.00%, 1/1/2039 | 5,000 | 4,849 |
Series 2019B, Rev., 4.00%, 1/1/2045 | 3,900 | 3,632 |
New York State Thruway Authority, Personal Income Tax Series 2022A, Rev., 5.00%, 3/15/2041 | 12,000 | 12,941 |
New York State Urban Development Corp., State Personal Income Tax, General Purpose | ||
Series 2016A, Rev., 5.00%, 3/15/2024 | 10 | 10 |
Series 2013C, Rev., 5.00%, 3/15/2032 | 30 | 30 |
Series 2015A, Rev., 5.00%, 3/15/2033 | 60 | 62 |
Series 2019A, Rev., 5.00%, 3/15/2035 | 25 | 27 |
Series 2019A, Rev., 5.00%, 3/15/2037 | 35 | 37 |
Series 2019A, Rev., 5.00%, 3/15/2038 | 45 | 48 |
Series 2019A, Rev., 5.00%, 3/15/2041 | 70 | 74 |
New York State Urban Development Corp., State Sales Tax | ||
Series 2019A, Rev., 5.00%, 3/15/2039 | 13,555 | 14,424 |
Series 2021A, Rev., 4.00%, 3/15/2046 | 2,000 | 1,911 |
New York Transportation Development Corp., Delta Air Lines, Inc., LaGuardia Airport Terminals C&D Redevelopment Project | ||
Series 2018, Rev., AMT, 5.00%, 1/1/2025 | 5,000 | 5,042 |
Rev., AMT, 5.00%, 1/1/2029 | 1,400 | 1,438 |
Series 2018, Rev., AMT, 5.00%, 1/1/2031 | 3,500 | 3,602 |
Rev., AMT, 5.00%, 1/1/2034 | 9,885 | 10,153 |
Rev., AMT, 5.00%, 10/1/2035 | 3,920 | 4,041 |
Rev., AMT, 5.00%, 10/1/2040 | 5,350 | 5,398 |
Rev., AMT, 4.38%, 10/1/2045 | 1,690 | 1,587 |
Port Authority of New York and New Jersey, Consolidated | ||
Series 207, Rev., AMT, 5.00%, 9/15/2033 | 800 | 836 |
Series 209, Rev., 5.00%, 7/15/2035 | 125 | 134 |
INVESTMENTS | PRINCIPAL AMOUNT ($000) | VALUE ($000) |
New York — continued | ||
Series 224, Rev., 4.00%, 7/15/2041 | 220 | 217 |
Series 214, Rev., AMT, 4.00%, 9/1/2043 | 3,000 | 2,817 |
Series 93, Rev., 6.13%, 6/1/2094 | 12,000 | 12,143 |
Port Washington Union Free School District GO, 3.00%, 8/1/2027 | 70 | 70 |
Sales Tax Asset Receivable Corp., Fiscal Year 2015 Series 2015A, Rev., 5.00%, 10/15/2024 (b) | 80 | 81 |
Triborough Bridge and Tunnel Authority Series 2018D, Rev., 4.00%, 11/15/2038 | 4,000 | 3,969 |
Triborough Bridge and Tunnel Authority Sales Tax, TBTA Capital Lockbox Series 2023A, Rev., 4.00%, 5/15/2048 | 7,910 | 7,524 |
Triborough Bridge and Tunnel Authority, MTA Bridges and Tunnels | ||
Series 2016A, Rev., 5.00%, 11/15/2023 | 20 | 20 |
Series 2017C-1, Rev., 5.00%, 11/15/2025 | 150 | 156 |
Series 2012B, Rev., Zero Coupon, 11/15/2032 | 8,860 | 6,193 |
Triborough Bridge and Tunnel Authority, Payroll Mobility Tax Senior Lien Series 2023B, Rev., 5.00%, 11/15/2030 | 7,500 | 8,447 |
Utility Debt Securitization Authority | ||
Rev., 5.00%, 12/15/2037 | 5,250 | 5,406 |
Series 2013TE, Rev., 5.00%, 12/15/2041 | 4,250 | 4,259 |
Utility Debt Securitization Authority, Federally Tax-Exempt Series 2013TE, Rev., 5.00%, 12/15/2032 | 3,500 | 3,512 |
Westchester County Local Development Corp., Kendal on Hudson Project | ||
Series 2022B, Rev., 5.00%, 1/1/2037 | 260 | 258 |
Series 2022B, Rev., 5.00%, 1/1/2041 | 250 | 242 |
Westchester County Local Development Corp., Purchase Senior Learning Community, Inc. Project | ||
Series 2021D, Rev., 2.88%, 7/1/2026 (d) | 3,765 | 3,586 |
Series 2021C-EFRB, Rev., 3.20%, 7/1/2028 (d) | 13,350 | 12,446 |
Westchester County Local Development Corp., Purchase Senior Learning Community, Inc., Project Series 2021A, Rev., 5.00%, 7/1/2041 (d) | 10,450 | 8,838 |
Westchester County Local Development Corp., The Bethel Methodist Home D/B/A, The Knolls Project Series 2020A, Rev., 5.00%, 7/1/2040 | 1,000 | 817 |
Total New York | 484,807 | |
North Carolina — 0.8% | ||
City of Charlotte Series 2016A, GO, 5.00%, 7/1/2029 | 1,050 | 1,105 |
August 31, 2023 | J.P. Morgan Municipal Bond Funds | 47 |
AS OF August 31, 2023 (Unaudited) (continued)
INVESTMENTS | PRINCIPAL AMOUNT ($000) | VALUE ($000) |
Municipal Bonds — continued | ||
North Carolina — continued | ||
City of Charlotte, Airport Special Facilities, Charlotte Douglas International Airport | ||
Series 2019A, Rev., 5.00%, 7/1/2031 | 25 | 27 |
Series A, Rev., 5.00%, 7/1/2034 | 25 | 27 |
City of High Point, Combined Water and Sewer System Rev., 5.00%, 11/1/2028 | 25 | 27 |
City of Wilmington Series 2014A, Rev., 5.00%, 6/1/2028 | 400 | 405 |
County of Buncombe, Limited Obligation Series 2020A, Rev., 5.00%, 6/1/2033 | 25 | 28 |
County of Onslow, Public Facilities Company Ltd., Limited Obligation Rev., 5.00%, 10/1/2026 | 25 | 26 |
County of Wake Series 2023B, Rev., 5.00%, 4/1/2038 | 1,865 | 2,082 |
North Carolina Capital Facilities Finance Agency, High Point University Rev., 4.00%, 5/1/2033 | 2,210 | 2,234 |
North Carolina Medical Care Commission, Retirement Facilities, Friends Homes, Inc. Series 2020B-1, Rev., 2.55%, 9/1/2026 | 1,575 | 1,458 |
North Carolina Medical Care Commission, Retirement Facilities, Pennybyrn at Maryfield Project Series 2020A, Rev., 5.00%, 10/1/2040 | 695 | 629 |
North Carolina Medical Care Commission, The Forest at Duke Project Rev., 4.00%, 9/1/2041 | 415 | 348 |
North Carolina Medical Care Commission, The Presbyterian Homes Obligated Group Series 2020A, Rev., 4.00%, 10/1/2040 | 600 | 518 |
Raleigh Durham Airport Authority | ||
Series 2020B, Rev., 5.00%, 5/1/2026 | 30 | 31 |
Series 2020B, Rev., 5.00%, 5/1/2029 | 25 | 28 |
Series 2020B, Rev., 5.00%, 5/1/2031 | 75 | 84 |
State of North Carolina Rev., 5.00%, 3/1/2033 | 15,345 | 16,818 |
University of North Carolina at Charlotte (The) Rev., 5.00%, 10/1/2029 | 45 | 48 |
University of North Carolina, School of the Arts | ||
Rev., 5.00%, 2/1/2034 | 1,240 | 1,354 |
Rev., 4.00%, 2/1/2040 | 500 | 466 |
Total North Carolina | 27,743 | |
North Dakota — 0.0% ^ | ||
City of Fargo Series 2014E, GO, 5.00%, 5/1/2025 | 290 | 293 |
Ohio — 1.6% | ||
Akron Bath Copley Joint Township Hospital District, Summa Health Obligated Group | ||
Rev., 5.00%, 11/15/2028 | 130 | 136 |
Rev., 5.00%, 11/15/2029 | 275 | 290 |
INVESTMENTS | PRINCIPAL AMOUNT ($000) | VALUE ($000) |
Ohio — continued | ||
Rev., 5.00%, 11/15/2030 | 350 | 372 |
Rev., 5.00%, 11/15/2031 | 300 | 319 |
Rev., 5.00%, 11/15/2032 | 350 | 372 |
American Municipal Power, Inc., Solar Electricity Prepayment Project | ||
Series 2019A, Rev., 5.00%, 2/15/2024 | 225 | 226 |
Series 2019A, Rev., 5.00%, 2/15/2025 | 160 | 163 |
Series 2019A, Rev., 5.00%, 2/15/2026 | 200 | 207 |
Series 2019A, Rev., 5.00%, 2/15/2027 | 250 | 263 |
Series 2019A, Rev., 5.00%, 2/15/2028 | 125 | 133 |
Buckeye Tobacco Settlement Financing Authority Series 2020A-2, Rev., 4.00%, 6/1/2038 | 4,000 | 3,910 |
City of Cincinnati, Water System Series B, Rev., 5.00%, 12/1/2023 | 30 | 30 |
City of Huber Heights, Limited Tax, Various Purpose GO, 5.00%, 12/1/2032 | 25 | 26 |
City of Middleburg Heights, Southwest General Health Center Project, Tax-Exempt | ||
Series 2020A, Rev., 5.00%, 8/1/2034 | 355 | 380 |
Series 2020A, Rev., 4.00%, 8/1/2041 | 905 | 799 |
Cleveland-Cuyahoga County Port Authority, The Cleveland Museum of Natural History Project | ||
Rev., 5.00%, 7/1/2031 | 200 | 222 |
Rev., 5.00%, 7/1/2032 | 225 | 250 |
Rev., 5.00%, 7/1/2033 | 250 | 277 |
Rev., 5.00%, 7/1/2034 | 200 | 221 |
Rev., 5.00%, 7/1/2035 | 200 | 219 |
Rev., 5.00%, 7/1/2036 | 300 | 325 |
Rev., 4.00%, 7/1/2037 | 200 | 197 |
Rev., 4.00%, 7/1/2038 | 250 | 242 |
Rev., 4.00%, 7/1/2039 | 280 | 265 |
Rev., 4.00%, 7/1/2040 | 200 | 186 |
Rev., 4.00%, 7/1/2046 | 750 | 642 |
Columbus City School District, Ohio School Facilities Construction and Improvement, Unlimited Tax Series 2016-A, GO, 5.00%, 12/1/2031 | 3,000 | 3,128 |
County of Cuyahoga, Eliza Jennings Senior Care Network Series 2022A, Rev., 5.00%, 5/15/2032 | 1,105 | 1,053 |
County of Franklin, Health Care Facilities, Ohio Living Communities | ||
Series 2020B, Rev., 4.00%, 7/1/2028 | 225 | 215 |
Series 2020B, Rev., 4.00%, 7/1/2029 | 265 | 251 |
Series 2020B, Rev., 4.00%, 7/1/2030 | 875 | 823 |
Series 2020B, Rev., 4.00%, 7/1/2031 | 925 | 864 |
48 | J.P. Morgan Municipal Bond Funds | August 31, 2023 |
INVESTMENTS | PRINCIPAL AMOUNT ($000) | VALUE ($000) |
Municipal Bonds — continued | ||
Ohio — continued | ||
Series 2020B, Rev., 4.00%, 7/1/2032 | 1,440 | 1,333 |
Series 2020B, Rev., 4.00%, 7/1/2033 | 385 | 354 |
Series 2020B, Rev., 4.00%, 7/1/2034 | 475 | 432 |
Series 2020B, Rev., 4.00%, 7/1/2035 | 365 | 326 |
Series 2020B, Rev., 5.00%, 7/1/2040 | 5,290 | 4,977 |
County of Hamilton, Sales Tax Series 2016A, Rev., 5.00%, 12/1/2025 | 50 | 52 |
County of Hardin, Economic Development Facilities Improvement, Ohio Northern University | ||
Rev., 4.00%, 5/1/2026 | 175 | 167 |
Rev., 5.00%, 5/1/2030 | 500 | 472 |
County of Montgomery, Dayton Children's Hospital Rev., 4.00%, 8/1/2046 | 950 | 849 |
County of Warren, Healthcare Facilities, Otterbein Homes Obligated Group | ||
Series 2019A, Rev., 5.00%, 7/1/2031 | 250 | 261 |
Series 2019A, Rev., 4.00%, 7/1/2033 | 920 | 908 |
Ohio Air Quality Development Authority, American Electric Power Co. Project Series 2014A, Rev., 2.40%, 10/1/2029 (c) | 1,820 | 1,565 |
Ohio Higher Educational Facility Commission, Capital University 2022 Project | ||
Rev., 5.00%, 9/1/2027 | 325 | 329 |
Rev., 5.00%, 9/1/2028 | 340 | 346 |
Rev., 5.00%, 9/1/2029 | 360 | 367 |
Rev., 5.00%, 9/1/2031 | 395 | 404 |
Rev., 5.00%, 9/1/2032 | 420 | 428 |
Rev., 5.75%, 9/1/2037 | 1,400 | 1,446 |
Ohio Higher Educational Facility Commission, Cleveland Institute of Music 2 | ||
Rev., 5.00%, 12/1/2027 | 500 | 506 |
Rev., 5.00%, 12/1/2032 | 395 | 407 |
Ohio Higher Educational Facility Commission, Tiffin University 2019 Project | ||
Rev., 3.00%, 11/1/2024 | 100 | 97 |
Rev., 3.00%, 11/1/2025 | 605 | 573 |
Rev., 3.00%, 11/1/2026 | 585 | 543 |
Rev., 3.00%, 11/1/2027 | 645 | 588 |
Rev., 3.00%, 11/1/2028 | 655 | 586 |
Rev., 5.00%, 11/1/2034 | 1,520 | 1,475 |
Ohio Higher Educational Facility Commission, University of Dayton 2018 Project Series 2018B, Rev., 5.00%, 12/1/2029 | 1,105 | 1,175 |
Ohio Higher Educational Facility Commission, University of Findlay 2019 Project | ||
Rev., 5.00%, 3/1/2029 | 720 | 729 |
INVESTMENTS | PRINCIPAL AMOUNT ($000) | VALUE ($000) |
Ohio — continued | ||
Rev., 5.00%, 3/1/2034 | 3,000 | 3,013 |
Ohio Higher Educational Facility Commission, Xavier University 2020 Project Rev., 4.00%, 5/1/2037 | 595 | 561 |
Ohio State University (The), General Receipts Series 2010D, Rev., 5.00%, 12/1/2028 | 20 | 22 |
Ohio Turnpike and Infrastructure Commission, Junior Lien Series 2018A, Rev., 5.00%, 2/15/2030 | 50 | 54 |
Ohio Water Development Authority, Fresh Water Series 2016A, Rev., 5.00%, 12/1/2030 | 55 | 58 |
Ohio Water Development Authority, Water Pollution Control Loan Fund | ||
Series 2017A, Rev., 5.00%, 12/1/2029 | 25 | 27 |
Series 2019B, Rev., 5.00%, 12/1/2035 | 55 | 61 |
Port of Greater Cincinnati Development Authority, FC Cincinnati Public Improvements Project Rev., 3.75%, 12/1/2031 (d) | 245 | 224 |
State of Ohio Series 2021E, Rev., 4.00%, 1/15/2038 | 1,700 | 1,629 |
State of Ohio, Capital Facilities Lease Appropriation Administrative Building Fund Projects Series 2017A, Rev., 5.00%, 4/1/2027 (b) | 760 | 811 |
State of Ohio, Capital Facilities Lease Appropriation Park and Recreation Improvement Fund Projects Series 2017A, Rev., 5.00%, 12/1/2032 | 35 | 37 |
State of Ohio, Cleveland Clinic Health System Obligated Group Series 2017A, Rev., 5.00%, 1/1/2032 | 170 | 182 |
State of Ohio, Higher Education Series 2018A, GO, 5.00%, 2/1/2024 | 25 | 25 |
State of Ohio, Major New Infrastructure Project Series 2018-1, Rev., 5.00%, 12/15/2029 | 7,000 | 7,338 |
Total Ohio | 52,743 | |
Oklahoma — 0.1% | ||
Grand River Dam Authority Series 2016A, Rev., 5.00%, 6/1/2031 | 60 | 63 |
Oklahoma Capitol Improvement Authority Series 2014C, Rev., 5.00%, 7/1/2024 | 25 | 25 |
Oklahoma County Finance Authority, Educational Facilities, Lease Midwest City-Del City Public Schools Project | ||
Rev., 5.00%, 10/1/2025 | 510 | 524 |
Rev., 5.00%, 10/1/2026 | 500 | 522 |
Oklahoma Development Finance Authority Health System, OU Medicine Project Series 2018B, Rev., 5.00%, 8/15/2025 | 800 | 795 |
August 31, 2023 | J.P. Morgan Municipal Bond Funds | 49 |
AS OF August 31, 2023 (Unaudited) (continued)
INVESTMENTS | PRINCIPAL AMOUNT ($000) | VALUE ($000) |
Municipal Bonds — continued | ||
Oklahoma — continued | ||
Oklahoma Turnpike Authority, Second Senior Series 2017C, Rev., 5.00%, 1/1/2036 | 25 | 26 |
Oklahoma Turnpike Authority, Turnpike System, Second Senior Series 2017A, Rev., 5.00%, 1/1/2038 | 2,000 | 2,047 |
Oklahoma Water Resources Board, Master Trust, Drinking Water Program Rev., 4.00%, 4/1/2032 | 30 | 30 |
University of Oklahoma (The), Tax Exempt Series 2014C, Rev., 5.00%, 7/1/2031 | 50 | 50 |
Total Oklahoma | 4,082 | |
Oregon — 0.9% | ||
City of Portland, 4th and Montgomery and Streetcar Projects Series 2019A, GO, 5.00%, 2/1/2035 | 650 | 713 |
City of Portland, Sewer System, Second Lien | ||
Series 2019A, Rev., 5.00%, 3/1/2031 | 85 | 95 |
Series 2023A, Rev., 5.00%, 12/1/2043 | 1,040 | 1,132 |
City of Portland, Water System, Second Lien Series 2020A, Rev., 5.00%, 5/1/2031 | 45 | 50 |
City of Tualatin GO, 5.00%, 6/15/2028 | 60 | 65 |
Oregon State Facilities Authority, Samaritan Health Services Project, Tax-Exempt | ||
Series 2020A, Rev., 5.00%, 10/1/2024 | 200 | 202 |
Series 2020A, Rev., 5.00%, 10/1/2026 | 125 | 128 |
Series 2020A, Rev., 5.00%, 10/1/2027 | 150 | 155 |
Series 2020A, Rev., 5.00%, 10/1/2028 | 175 | 182 |
Series 2020A, Rev., 5.00%, 10/1/2029 | 300 | 315 |
Series 2020A, Rev., 5.00%, 10/1/2030 | 300 | 317 |
Series 2020A, Rev., 5.00%, 10/1/2035 | 140 | 147 |
Series 2020A, Rev., 5.00%, 10/1/2040 | 1,165 | 1,188 |
Oregon State Lottery | ||
Series C, Rev., 5.00%, 4/1/2024 | 25 | 25 |
Series 2015C, Rev., 5.00%, 4/1/2026 | 200 | 205 |
Series A, Rev., 5.00%, 4/1/2027 | 100 | 101 |
Series A, Rev., 5.00%, 4/1/2031 | 1,900 | 2,020 |
Series A, Rev., 5.00%, 4/1/2032 | 1,750 | 1,859 |
Series A, Rev., 5.00%, 4/1/2033 | 3,500 | 3,715 |
Series A, Rev., 5.00%, 4/1/2035 | 2,470 | 2,609 |
Port of Portland, International Airport Series 27A, Rev., AMT, 4.00%, 7/1/2039 | 2,500 | 2,381 |
Salem Hospital Facility Authority, Capital Manor Project Rev., 4.00%, 5/15/2040 | 375 | 308 |
State of Oregon, Article XI-G State Projects | ||
Series L, GO, 5.00%, 8/1/2035 | 1,930 | 2,050 |
Series L, GO, 5.00%, 8/1/2036 | 1,975 | 2,086 |
INVESTMENTS | PRINCIPAL AMOUNT ($000) | VALUE ($000) |
Oregon — continued | ||
State of Oregon, Article XI-Q State Projects Series F, GO, 5.00%, 5/1/2032 | 2,885 | 3,016 |
State of Oregon, Department of Transportation Highway User Subordinate Lien, Tax-Exempt Series 2019A, Rev., 5.00%, 11/15/2038 | 40 | 43 |
Tualatin Valley Water District Series 2023, Rev., 5.00%, 6/1/2045 | 3,265 | 3,549 |
Union County Hospital Facility Authority, Grande Ronde Hospital, Inc. Series 2022, Rev., 5.00%, 7/1/2047 | 1,000 | 951 |
Washington and Multnomah Counties School District No. 48J Beaverton Series B, GO, 5.00%, 6/15/2024 (b) | 105 | 106 |
Yamhill County Hospital Authority, Friendsview, Tax Exempt | ||
Series 2021A, Rev., 5.00%, 11/15/2036 | 305 | 270 |
Series 2021A, Rev., 5.00%, 11/15/2046 | 770 | 603 |
Series 2021A, Rev., 5.00%, 11/15/2051 | 550 | 417 |
Yamhill County School District No. 40 McMinnville | ||
GO, 4.00%, 6/15/2029 | 5 | 5 |
GO, 4.00%, 6/15/2035 | 75 | 76 |
Total Oregon | 31,084 | |
Pennsylvania — 3.8% | ||
Abington School District, Limited Tax Series 2017A, GO, 4.00%, 10/1/2037 | 40 | 40 |
Allegheny County Higher Education Building Authority, Chatham University | ||
Rev., 5.00%, 9/1/2026 | 130 | 131 |
Rev., 5.00%, 9/1/2027 | 250 | 253 |
Series 2022, Rev., 5.00%, 9/1/2028 | 655 | 664 |
Rev., 5.00%, 9/1/2029 | 740 | 748 |
Rev., 5.00%, 9/1/2030 | 770 | 777 |
Rev., 5.00%, 9/1/2031 | 360 | 362 |
Rev., 5.00%, 9/1/2032 | 380 | 379 |
Allegheny County Hospital Development Authority, Allegheny Health Network Obligated Group | ||
Series 2018A, Rev., 5.00%, 4/1/2028 | 7,000 | 7,385 |
Series 2018A, Rev., 5.00%, 4/1/2029 | 8,785 | 9,223 |
Series 2018A, Rev., 5.00%, 4/1/2030 | 5,000 | 5,234 |
Series 2018A, Rev., 5.00%, 4/1/2031 | 3,800 | 3,974 |
Allegheny County Sanitary Authority, Sewer Rev., AGM, 4.00%, 12/1/2035 | 5 | 5 |
Allentown City School District, Limited Tax | ||
Series 2019B, GO, 5.00%, 2/1/2029 | 3,110 | 3,345 |
Series 2019B, GO, 5.00%, 2/1/2030 | 4,300 | 4,608 |
50 | J.P. Morgan Municipal Bond Funds | August 31, 2023 |
INVESTMENTS | PRINCIPAL AMOUNT ($000) | VALUE ($000) |
Municipal Bonds — continued | ||
Pennsylvania — continued | ||
Bucks County Industrial Development Authority, Grand View Hospital Project | ||
Rev., 5.00%, 7/1/2026 | 450 | 445 |
Rev., 5.00%, 7/1/2027 | 475 | 470 |
Rev., 5.00%, 7/1/2028 | 500 | 496 |
Rev., 5.00%, 7/1/2029 | 500 | 495 |
Rev., 5.00%, 7/1/2030 | 675 | 668 |
Rev., 5.00%, 7/1/2031 | 1,150 | 1,139 |
Rev., 5.00%, 7/1/2032 | 500 | 494 |
Rev., 5.00%, 7/1/2033 | 1,170 | 1,154 |
Rev., 5.00%, 7/1/2034 | 1,300 | 1,277 |
Rev., 5.00%, 7/1/2035 | 1,055 | 1,024 |
Cambria County General Financing Authority, Mount Aloysius Project Series 2021TT-4, Rev., 4.00%, 11/1/2036 | 535 | 483 |
Chester County Industrial Development Authority, Longwood Gardens Project | ||
Rev., 5.00%, 12/1/2034 | 400 | 443 |
Rev., 5.00%, 12/1/2035 | 175 | 193 |
Rev., 5.00%, 12/1/2036 | 305 | 334 |
Rev., 5.00%, 12/1/2037 | 450 | 489 |
City of Erie, Higher Education Building Authority, Gannon University Project - AICUP Financing Program Series 2021TT-1, Rev., 4.00%, 5/1/2036 | 100 | 90 |
City of Philadelphia, Airport System Series 2017B, Rev., AMT, 5.00%, 7/1/2032 | 250 | 260 |
Commonwealth Financing Authority, Tobacco Master Settlement Payment | ||
Rev., 5.00%, 6/1/2024 | 1,275 | 1,287 |
Rev., 5.00%, 6/1/2025 | 1,875 | 1,918 |
Rev., 5.00%, 6/1/2026 | 1,120 | 1,159 |
Rev., 5.00%, 6/1/2027 | 1,500 | 1,574 |
Rev., 5.00%, 6/1/2028 | 2,620 | 2,788 |
Rev., 5.00%, 6/1/2029 | 1,120 | 1,192 |
Commonwealth of Pennsylvania | ||
Series 1, GO, 5.00%, 6/15/2024 (b) | 50 | 51 |
Series 2018A, COP, 5.00%, 7/1/2028 | 400 | 431 |
Series 2018A, COP, 5.00%, 7/1/2029 | 300 | 323 |
Series 2018A, COP, 5.00%, 7/1/2030 | 375 | 405 |
Series 2018A, COP, 5.00%, 7/1/2031 | 425 | 457 |
Series 1, GO, 4.00%, 4/1/2033 | 5,000 | 5,002 |
Series 2018A, COP, 5.00%, 7/1/2034 | 450 | 482 |
County of Allegheny Series C-77, GO, 5.00%, 11/1/2043 | 50 | 52 |
INVESTMENTS | PRINCIPAL AMOUNT ($000) | VALUE ($000) |
Pennsylvania — continued | ||
County of Berks GO, 5.00%, 11/15/2023 | 20 | 20 |
County of Cambria | ||
Series 2020B, GO, AGM, 4.00%, 8/1/2032 | 500 | 510 |
Series 2020B, GO, AGM, 4.00%, 8/1/2033 | 500 | 510 |
Series 2020B, GO, AGM, 4.00%, 8/1/2034 | 700 | 712 |
County of Chester GO, 4.00%, 7/15/2036 | 20 | 20 |
Delaware County Authority, Haverford College | ||
Series 2017A, Rev., 5.00%, 10/1/2026 | 30 | 32 |
Series 2017A, Rev., 5.00%, 10/1/2042 | 70 | 72 |
Delaware Valley Regional Finance Authority, Local Government Series 2022D, Rev., 4.00%, 3/1/2029 | 2,000 | 2,066 |
DuBois Hospital Authority, Penn Highlands Healthcare | ||
Rev., 5.00%, 7/15/2029 | 1,700 | 1,773 |
Rev., 5.00%, 7/15/2030 | 2,000 | 2,083 |
Rev., 5.00%, 7/15/2031 | 1,450 | 1,509 |
Rev., 5.00%, 7/15/2032 | 1,525 | 1,586 |
Rev., 5.00%, 7/15/2034 | 1,675 | 1,741 |
Rev., 4.00%, 7/15/2043 | 5,670 | 5,098 |
Easton Area School District Series 2020B, GO, 5.00%, 2/1/2031 | 50 | 54 |
Erie City Water Authority | ||
Series 2019B, Rev., AGM, 5.00%, 12/1/2032 | 1,235 | 1,360 |
Series 2019B, Rev., AGM, 5.00%, 12/1/2033 | 800 | 879 |
Series 2018D, Rev., 4.00%, 12/1/2036 | 35 | 35 |
Lancaster County Hospital Authority, Health Center, Masonic Villages Project Series 2015, Rev., 5.00%, 11/1/2028 | 1,215 | 1,232 |
Lehigh County Industrial Development Authority, Seven Generation Charter School | ||
Series 2021A, Rev., 4.00%, 5/1/2031 | 340 | 316 |
Series 2021A, Rev., 4.00%, 5/1/2041 | 890 | 708 |
Montgomery County Higher Education and Health Authority, Arcadia University | ||
Rev., 5.00%, 4/1/2027 | 815 | 821 |
Rev., 5.00%, 4/1/2029 | 815 | 826 |
Rev., 5.00%, 4/1/2030 | 760 | 771 |
Rev., 5.00%, 4/1/2031 | 705 | 715 |
Rev., 5.00%, 4/1/2032 | 945 | 956 |
Rev., 5.00%, 4/1/2033 | 920 | 929 |
Montgomery County Higher Education and Health Authority, Thomas Jefferson University | ||
Series 2018A, Rev., 5.00%, 9/1/2030 | 3,125 | 3,290 |
Series 2018A, Rev., 4.00%, 9/1/2038 | 2,950 | 2,829 |
August 31, 2023 | J.P. Morgan Municipal Bond Funds | 51 |
AS OF August 31, 2023 (Unaudited) (continued)
INVESTMENTS | PRINCIPAL AMOUNT ($000) | VALUE ($000) |
Municipal Bonds — continued | ||
Pennsylvania — continued | ||
Montgomery County Industrial Development Authority, Acts Retirement-Life Communities, Inc., Obligated Group Series 2020C, Rev., 4.00%, 11/15/2043 | 300 | 244 |
Montgomery County Industrial Development Authority, Waverly Heights Ltd., Project | ||
Rev., 4.00%, 12/1/2025 | 150 | 149 |
Rev., 4.00%, 12/1/2026 | 150 | 149 |
Rev., 4.00%, 12/1/2027 | 200 | 199 |
Rev., 4.00%, 12/1/2028 | 205 | 204 |
Rev., 4.00%, 12/1/2029 | 250 | 249 |
Rev., 4.00%, 12/1/2030 | 300 | 298 |
Rev., 4.00%, 12/1/2031 | 300 | 298 |
Rev., 4.00%, 12/1/2032 | 435 | 432 |
Rev., 4.00%, 12/1/2033 | 400 | 395 |
Rev., 4.00%, 12/1/2034 | 165 | 162 |
Rev., 4.00%, 12/1/2035 | 175 | 170 |
Rev., 4.00%, 12/1/2036 | 175 | 167 |
Rev., 4.00%, 12/1/2037 | 100 | 94 |
Rev., 4.00%, 12/1/2038 | 100 | 93 |
Nazareth Area School District | ||
Series 2017D, GO, 5.00%, 11/15/2025 (b) | 1,800 | 1,868 |
Series 2017E, GO, 5.00%, 11/15/2025 (b) | 810 | 840 |
North Allegheny School District, Limited Tax GO, 4.00%, 5/1/2038 | 40 | 40 |
Pennsylvania Economic Development Financing Authority, The Penndot Major Bridges Rev., AMT, AGM, 5.00%, 12/31/2057 | 5,645 | 5,702 |
Pennsylvania Higher Educational Facilities Authority, Trustees of the University Series A, Rev., 5.00%, 10/1/2023 | 30 | 30 |
Pennsylvania Higher Educational Facilities Authority, University of Pennsylvania Health System | ||
Rev., 5.00%, 8/15/2031 | 50 | 55 |
Rev., 5.00%, 8/15/2040 | 100 | 101 |
Pennsylvania Turnpike Commission | ||
Series 2023, Rev., 5.00%, 12/1/2038 | 330 | 357 |
Series 2021B, Rev., 4.00%, 12/1/2039 | 2,250 | 2,202 |
Series 2023, Rev., 5.00%, 12/1/2039 | 320 | 345 |
Series 2023, Rev., 5.00%, 12/1/2040 | 1,000 | 1,065 |
Pennsylvania Turnpike Commission, Subordinate Series 2021B, Rev., 4.00%, 12/1/2038 | 1,500 | 1,485 |
Philadelphia Authority for Industrial Development, Holy Family University Project | ||
Series 2023, Rev., 5.00%, 9/1/2030 | 835 | 881 |
INVESTMENTS | PRINCIPAL AMOUNT ($000) | VALUE ($000) |
Pennsylvania — continued | ||
Series 2023, Rev., 5.50%, 9/1/2037 | 2,135 | 2,302 |
Philadelphia Authority for Industrial Development, MAST Community Charter School II Project Series 2020A, Rev., 5.00%, 8/1/2030 | 260 | 265 |
Philadelphia Authority for Industrial Development, Philadelphia Electrical and Technology Charter School Project | ||
Series 2021A, Rev., 4.00%, 6/1/2041 | 375 | 305 |
Series 2021A, Rev., 4.00%, 6/1/2051 | 400 | 294 |
Pittsburgh Water and Sewer Authority Series 2019B, Rev., AGM, 5.00%, 9/1/2033 | 1,000 | 1,151 |
School District of the City of Erie (The) | ||
Series 2019C, GO, AGM, 5.00%, 4/1/2027 | 1,275 | 1,339 |
Series 2019C, GO, AGM, 5.00%, 4/1/2029 | 1,000 | 1,079 |
Series 2019C, GO, AGM, 5.00%, 4/1/2030 | 500 | 540 |
School District of the City of Erie (The), Limited Tax | ||
Series 2019A, GO, AGM, 5.00%, 4/1/2027 | 525 | 551 |
Series 2019A, GO, AGM, 5.00%, 4/1/2028 | 550 | 587 |
Series 2019A, GO, AGM, 5.00%, 4/1/2029 | 310 | 334 |
Series 2019A, GO, AGM, 5.00%, 4/1/2030 | 425 | 459 |
Series 2019A, GO, AGM, 5.00%, 4/1/2031 | 525 | 567 |
Series 2019A, GO, AGM, 4.00%, 4/1/2033 | 1,150 | 1,177 |
Series 2019A, GO, AGM, 5.00%, 4/1/2034 | 825 | 892 |
St. Mary Hospital Authority, Trinity Health Credit Group Series 2019PA, Rev., 5.00%, 12/1/2031 | 25 | 27 |
Swarthmore Borough Authority, Swarthmore College Series 2016B, Rev., 4.00%, 9/15/2041 | 50 | 49 |
Township of Hampton GO, 4.00%, 1/1/2039 | 45 | 45 |
Township of Spring GO, 5.00%, 11/15/2028 | 25 | 28 |
Upper Merion Area School District GO, 5.00%, 1/15/2026 (b) | 675 | 703 |
West Chester Area School District GO, 4.00%, 5/15/2039 | 40 | 40 |
Wilkes-Barre Area School District | ||
GO, 3.50%, 4/15/2038 | 370 | 334 |
GO, 3.50%, 4/15/2039 | 235 | 212 |
GO, 3.75%, 4/15/2044 | 1,500 | 1,317 |
Total Pennsylvania | 130,527 | |
Puerto Rico — 0.3% | ||
Puerto Rico Public Finance Corp. Series 2001E, Rev., AGC-ICC, AGM-CR, 6.00%, 8/1/2026 (b) | 10,000 | 10,695 |
52 | J.P. Morgan Municipal Bond Funds | August 31, 2023 |
INVESTMENTS | PRINCIPAL AMOUNT ($000) | VALUE ($000) |
Municipal Bonds — continued | ||
Rhode Island — 0.0% ^ | ||
Rhode Island Infrastructure Bank, Municipal Road and Bridge Series 2018A, Rev., 5.00%, 10/1/2024 | 25 | 25 |
Rhode Island Turnpike and Bridge Authority, Motor Fuel Tax Series 2019A, Rev., 4.00%, 10/1/2044 | 480 | 445 |
Total Rhode Island | 470 | |
South Carolina — 0.2% | ||
Berkeley County School District Rev., 5.00%, 12/1/2023 | 1,505 | 1,510 |
Charleston County Airport District Rev., 5.00%, 7/1/2026 (b) | 100 | 105 |
City of Columbia | ||
Rev., 5.00%, 2/1/2035 | 125 | 144 |
Rev., 5.00%, 2/1/2036 | 100 | 114 |
Rev., 5.00%, 2/1/2038 | 160 | 178 |
City of Spartanburg, Water System Series 2017B, Rev., 5.00%, 6/1/2031 | 480 | 512 |
Lexington County Health Services District, Inc., LexMed Obligated Group | ||
Rev., 5.00%, 11/1/2025 | 140 | 144 |
Rev., 5.00%, 11/1/2029 | 575 | 605 |
Rev., 4.00%, 11/1/2030 | 750 | 756 |
Rev., 4.00%, 11/1/2031 | 500 | 503 |
Rev., 4.00%, 11/1/2032 | 535 | 537 |
Rev., 4.00%, 11/1/2033 | 200 | 201 |
Total South Carolina | 5,309 | |
South Dakota — 0.0% ^ | ||
Brookings School District No. 005-1 GO, 4.00%, 7/1/2026 | 25 | 25 |
Tennessee — 6.5% | ||
Chattanooga Health Educational and Housing Facility Board, Commonspirit Health | ||
Series 2019A-1, Rev., 5.00%, 8/1/2032 | 1,000 | 1,064 |
Series 2019A-1, Rev., 5.00%, 8/1/2034 | 750 | 794 |
Series 2019A-1, Rev., 5.00%, 8/1/2035 | 510 | 536 |
City of Johnson City Series 2019B, GO, 5.00%, 6/1/2028 | 45 | 49 |
City of Kingsport Series B, GO, 5.00%, 3/1/2025 | 110 | 113 |
County of Sullivan GO, 4.00%, 5/1/2045 | 40 | 39 |
Franklin Special School District, School Improvement, Limited Tax GO, 5.00%, 6/1/2028 | 100 | 109 |
INVESTMENTS | PRINCIPAL AMOUNT ($000) | VALUE ($000) |
Tennessee — continued | ||
Knox County Health Educational and Housing Facility Board, East Tennessee Children's Hospital | ||
Rev., 5.00%, 11/15/2025 | 855 | 879 |
Rev., 5.00%, 11/15/2027 | 800 | 842 |
Rev., 4.00%, 11/15/2043 | 6,145 | 5,548 |
Memphis-Shelby County Airport Authority Series 2021A, Rev., AMT, 5.00%, 7/1/2030 | 545 | 583 |
Metropolitan Government Nashville and Davidson County, Health and Educational Facilities Board, Belmont University | ||
Series 2023, Rev., 5.00%, 5/1/2036 | 500 | 545 |
Series 2023, Rev., 5.00%, 5/1/2037 | 250 | 270 |
Series 2023, Rev., 5.00%, 5/1/2039 | 500 | 532 |
Series 2023, Rev., 5.00%, 5/1/2040 | 725 | 768 |
Series 2023, Rev., 5.00%, 5/1/2041 | 500 | 528 |
Metropolitan Government Nashville and Davidson County, Health and Educational Facilities Board, Trevecca Nazarene University Project Series 2021B, Rev., 4.00%, 10/1/2041 | 2,590 | 2,194 |
Metropolitan Government of Nashville and Davidson County | ||
GO, 5.00%, 7/1/2024 | 15 | 15 |
Series 2015C, GO, 5.00%, 7/1/2025 (b) | 5,500 | 5,672 |
GO, 5.00%, 7/1/2029 | 27,295 | 29,760 |
GO, 5.00%, 1/1/2031 | 15 | 16 |
GO, 4.00%, 7/1/2031 | 17,400 | 17,793 |
GO, 5.00%, 7/1/2031 | 10,000 | 10,838 |
GO, 4.00%, 7/1/2036 | 24,290 | 24,475 |
GO, 4.00%, 7/1/2037 | 16,205 | 16,216 |
Metropolitan Nashville Airport Authority (The) | ||
Series 2022B, Rev., AMT, 5.50%, 7/1/2036 | 600 | 671 |
Series 2022B, Rev., AMT, 5.50%, 7/1/2037 | 1,500 | 1,662 |
Series 2022B, Rev., AMT, 5.50%, 7/1/2039 | 2,300 | 2,527 |
Series 2022B, Rev., AMT, 5.50%, 7/1/2040 | 2,000 | 2,189 |
Series 2022B, Rev., AMT, 5.50%, 7/1/2041 | 1,875 | 2,045 |
Series 2022B, Rev., AMT, 5.50%, 7/1/2042 | 2,000 | 2,171 |
Series 2022B, Rev., AMT, 5.25%, 7/1/2047 | 9,470 | 9,907 |
Metropolitan Nashville Airport Authority (The), Subordinate Airport | ||
Series 2019A, Rev., 5.00%, 7/1/2034 | 275 | 303 |
Series 2019A, Rev., 5.00%, 7/1/2035 | 545 | 595 |
Series 2019B, Rev., AMT, 5.00%, 7/1/2035 | 300 | 319 |
Series 2019A, Rev., 5.00%, 7/1/2039 | 1,000 | 1,062 |
Series 2019B, Rev., AMT, 5.00%, 7/1/2039 | 625 | 647 |
Series 2019A, Rev., 5.00%, 7/1/2044 | 1,440 | 1,505 |
August 31, 2023 | J.P. Morgan Municipal Bond Funds | 53 |
AS OF August 31, 2023 (Unaudited) (continued)
INVESTMENTS | PRINCIPAL AMOUNT ($000) | VALUE ($000) |
Municipal Bonds — continued | ||
Tennessee — continued | ||
Series 2019A, Rev., 5.00%, 7/1/2049 | 180 | 187 |
Series 2019B, Rev., AMT, 4.00%, 7/1/2054 | 1,550 | 1,342 |
Series 2019B, Rev., AMT, 5.00%, 7/1/2054 | 5,000 | 5,054 |
Shelby County Health Educational and Housing Facilities Board, The Farms at Bailey Station Project | ||
Series 2019A, Rev., 5.75%, 10/1/2049 | 2,420 | 1,829 |
Series 2019A, Rev., 5.75%, 10/1/2054 | 4,280 | 3,145 |
Series 2019A, Rev., 5.75%, 10/1/2059 | 1,240 | 894 |
Tennessee Energy Acquisition Corp., Commodity Project Series 2021A, Rev., 5.00%, 11/1/2031 (c) | 1,090 | 1,127 |
Tennessee Energy Acquisition Corp., Gas Project | ||
Series 2018, Rev., 4.00%, 11/1/2025 (c) | 57,150 | 56,489 |
Series 2006B, Rev., 5.63%, 9/1/2026 | 5,000 | 5,096 |
Tennessee State School Bond Authority, Higher Educational Facilities Second Program Series B, Rev., 5.00%, 11/1/2031 | 75 | 80 |
Total Tennessee | 221,024 | |
Texas — 4.6% | ||
Arlington Higher Education Finance Corp. | ||
Series 2021A, Rev., 5.00%, 8/15/2024 | 195 | 194 |
Series 2021A, Rev., 5.00%, 8/15/2025 | 205 | 204 |
Series 2021A, Rev., 5.00%, 8/15/2026 | 190 | 189 |
Series 2021A, Rev., 5.00%, 8/15/2027 | 105 | 105 |
Series 2021A, Rev., 5.00%, 8/15/2028 | 35 | 35 |
Series 2021A, Rev., 4.00%, 8/15/2029 | 40 | 38 |
Series 2021A, Rev., 4.00%, 8/15/2030 | 45 | 42 |
Series 2021A, Rev., 4.00%, 8/15/2031 | 45 | 42 |
Series 2021A, Rev., 4.00%, 8/15/2036 | 170 | 146 |
Arlington Higher Education Finance Corp., Trinity Basin Preparatory, Inc. | ||
Rev., PSF-GTD, 5.00%, 8/15/2033 | 125 | 141 |
Rev., PSF-GTD, 5.00%, 8/15/2034 | 150 | 168 |
Rev., PSF-GTD, 5.00%, 8/15/2035 | 200 | 223 |
Arlington Independent School District, Unlimited Tax GO, PSF-GTD, 5.00%, 2/15/2031 | 40 | 44 |
Austin Independent School District, Unlimited Tax Series 2023, GO, 5.00%, 8/1/2040 | 3,000 | 3,278 |
Barbers Hill Independent School District, Unimited Tax Series 2022, GO, PSF-GTD, 5.00%, 2/15/2042 | 4,525 | 4,868 |
Baytown Municipal Development District, Baytown Convention Center Hotel, First Lien | ||
Series 2021A, Rev., 2.50%, 10/1/2031 | 270 | 232 |
INVESTMENTS | PRINCIPAL AMOUNT ($000) | VALUE ($000) |
Texas — continued | ||
Series 2021A, Rev., 4.00%, 10/1/2050 | 895 | 724 |
Belton Independent School District, Unlimited Tax GO, PSF-GTD, 4.00%, 2/15/2032 | 25 | 25 |
Bexar County Hospital District, Limited Tax GO, 4.00%, 2/15/2036 | 25 | 25 |
Carrollton-Farmers Branch Independent School District, Unlimited Tax Series 2023, GO, PSF-GTD, 5.00%, 2/15/2035 | 2,660 | 3,038 |
Central Texas Regional Mobility Authority, Senior Lien | ||
Series 2021B, Rev., 4.00%, 1/1/2040 | 1,000 | 948 |
Series 2021B, Rev., 4.00%, 1/1/2041 | 1,000 | 940 |
City of Austin, Airport System | ||
Rev., AMT, 5.00%, 11/15/2033 | 500 | 503 |
Series 2019B, Rev., AMT, 5.00%, 11/15/2036 | 1,000 | 1,046 |
Series 2017B, Rev., AMT, 5.00%, 11/15/2046 | 5,000 | 5,034 |
City of Carrollton GO, 5.00%, 8/15/2024 | 10 | 10 |
City of College Station GO, 5.00%, 2/15/2024 | 25 | 25 |
City of Copperas Cove, Combination Tax GO, 5.00%, 8/15/2027 | 20 | 21 |
City of Dallas GO, 5.00%, 2/15/2029 | 2,505 | 2,557 |
City of Dallas Housing Finance Corp., Rosemont At Ash Creek Apartments Series 2023, Rev., FHA, 5.00%, 12/1/2025 (c) | 1,375 | 1,403 |
City of Denton GO, 5.00%, 2/15/2025 | 25 | 26 |
City of El Paso GO, 4.00%, 8/15/2031 | 75 | 76 |
City of Fort Worth, General Purpose, Tarrant Denton Parker Johnson, General Purpose GO, 5.00%, 3/1/2028 | 30 | 32 |
City of Houston, Airport System, Subordinate Lien | ||
Series 2018C, Rev., AMT, 5.00%, 7/1/2027 | 200 | 208 |
Series 2018B, Rev., 5.00%, 7/1/2030 | 85 | 91 |
Series 2018A, Rev., AMT, 5.00%, 7/1/2031 | 250 | 262 |
Series 2021A, Rev., AMT, 5.00%, 7/1/2033 | 750 | 808 |
Series 2018D, Rev., 5.00%, 7/1/2038 | 65 | 68 |
City of Houston, Airport System, United Airlines, Inc., Terminal Improvements Projects Series 2021B-1, Rev., AMT, 4.00%, 7/15/2041 | 3,150 | 2,777 |
City of Houston, Combined Utility System, First Lien | ||
Series 2016B, Rev., 4.00%, 11/15/2031 | 25 | 25 |
Series 2016B, Rev., 4.00%, 11/15/2037 | 40 | 39 |
City of Houston, Combined Utility System, Junior Lien Series 2002A, Rev., AGM, 5.75%, 12/1/2032 (b) | 2,000 | 2,453 |
City of Houston, Public Improvement Series 2014A, GO, 5.00%, 3/1/2024 (b) | 2,600 | 2,619 |
54 | J.P. Morgan Municipal Bond Funds | August 31, 2023 |
INVESTMENTS | PRINCIPAL AMOUNT ($000) | VALUE ($000) |
Municipal Bonds — continued | ||
Texas — continued | ||
City of Irving, Hotel Occupancy, Occupancy Tax GO, 5.00%, 8/15/2028 | 40 | 43 |
City of Irving, Waterworks and Sewer System, New Lien Rev., 5.00%, 8/15/2029 | 20 | 22 |
City of Killeen GO, 4.00%, 8/1/2033 | 50 | 51 |
City of Laredo, Waterworks and Sewer System | ||
Rev., 4.00%, 3/1/2035 | 30 | 30 |
Rev., 4.00%, 3/1/2040 | 100 | 97 |
City of McAllen GO, 5.00%, 2/15/2029 | 355 | 383 |
City of Mesquite, Combination tax GO, 4.13%, 2/15/2040 | 1,665 | 1,632 |
City of Midland, Certificates of Obligation GO, 5.00%, 3/1/2024 | 55 | 55 |
City of Pflugerville, Limited Tax GO, 5.00%, 8/1/2026 | 25 | 26 |
City of Plano GO, 5.00%, 9/1/2029 | 1,855 | 1,973 |
City of Richardson Series 2016A, GO, 5.00%, 2/15/2025 | 65 | 67 |
City of San Antonio, Electric and Gas Systems | ||
Rev., 5.00%, 2/1/2029 | 100 | 106 |
Series 2020, Rev., 5.00%, 2/1/2036 | 30 | 33 |
City of San Antonio, General Improvement GO, 5.00%, 8/1/2027 | 20 | 21 |
City of Victoria, Utility System Rev., 5.00%, 12/1/2023 (b) | 1,740 | 1,747 |
City of Waco, Combination Tax, Certificates of Obligation GO, 5.00%, 2/1/2028 | 35 | 38 |
Cleveland Independent School District, Unlimited Tax School Building Series 2018A, GO, PSF-GTD, 5.00%, 2/15/2031 | 80 | 87 |
Clifton Higher Education Finance Corp., Idea Public Schools Series 2019, Rev., PSF-GTD, 4.00%, 8/15/2037 | 1,860 | 1,844 |
Clifton Higher Education Finance Corp., Yes Prep Public Schools, Inc. Series 2023, Rev., PSF-GTD, 4.25%, 4/1/2048 | 1,520 | 1,438 |
Coastal Water Authority, City of Houston Projects Rev., 5.00%, 12/15/2025 | 5,115 | 5,120 |
Conroe Local Government Corp., Conroe Convention Center Hotel Series 2021A, Rev., 2.50%, 10/1/2031 | 125 | 104 |
County of Denton, Permanent Improvement GO, 5.00%, 7/15/2027 | 50 | 52 |
County of Harris | ||
Series 2023A, GO, 4.25%, 9/15/2048 | 2,000 | 1,928 |
Series 2023A, GO, 5.00%, 9/15/2048 | 1,950 | 2,090 |
INVESTMENTS | PRINCIPAL AMOUNT ($000) | VALUE ($000) |
Texas — continued | ||
County of Harris, Toll Road, Senior Lien | ||
Series 2016A, Rev., 5.00%, 8/15/2028 | 4,500 | 4,698 |
Series 2016A, Rev., 5.00%, 8/15/2036 | 60 | 62 |
County of Hays, Unlimited Tax GO, 5.00%, 2/15/2031 | 45 | 48 |
County of Hidalgo Series 2018B, GO, 5.00%, 8/15/2028 | 25 | 27 |
Cypress-Fairbanks Independent School District, Unlimited Tax Series 2019A, GO, PSF-GTD, 5.00%, 2/15/2031 | 25 | 28 |
Dallas Area Rapid Transit, Sales Tax, Senior Lien | ||
Series 2016A, Rev., 5.00%, 12/1/2025 (b) | 9,905 | 10,273 |
Series 2020A, Rev., 5.00%, 12/1/2030 | 45 | 50 |
Rev., 5.00%, 12/1/2031 | 45 | 50 |
Dallas Fort Worth International Airport Series 2013F, Rev., 5.00%, 11/1/2023 | 5,000 | 5,012 |
Denison Independent School District, Unlimited Tax Series 2023, GO, PSF-GTD, 4.00%, 8/1/2045 | 2,865 | 2,747 |
Fort Bend County Municipal Utility District No. 25, Unlimited Tax GO, 4.00%, 10/1/2024 | 25 | 25 |
Garland Independent School District, Unlimited Tax, School Building Series A, GO, PSF-GTD, 5.00%, 2/15/2026 | 10 | 10 |
Georgetown Independent School District, Unlimited Tax Series 2019-D, GO, 4.00%, 8/15/2033 | 30 | 31 |
Grand Parkway Transportation Corp., System Toll Series 2018A, Rev., 5.00%, 10/1/2034 | 45 | 48 |
Harris County Cultural Education Facilities Finance Corp., Memorial Hermann Health System | ||
Series 2014A, Rev., 5.00%, 12/1/2024 | 30 | 31 |
Series 2014A, Rev., 5.00%, 12/1/2028 | 185 | 188 |
Harris County-Houston Sports Authority Series A, Rev., AGM, 5.00%, 11/15/2024 | 30 | 31 |
Haskell Consolidated Independent School District, Unlimited Tax GO, PSF-GTD, 5.00%, 2/15/2029 | 10 | 10 |
Houston Community College System, Combined Fee Rev., 4.00%, 4/15/2031 | 25 | 25 |
Houston Higher Education Finance Corp., Houston Baptist University Rev., 3.38%, 10/1/2037 | 250 | 207 |
Houston Independent School District, Maintenance Tax Notes GO, 5.00%, 7/15/2031 | 9,700 | 10,565 |
Johnson City Independent School District, Unlimited Tax Series 2023, GO, PSF-GTD, 5.00%, 2/15/2038 | 1,745 | 1,927 |
Kermit Independent School District, Unlimited Tax Series 2023, GO, PSF-GTD, 5.00%, 2/15/2048 | 3,500 | 3,733 |
August 31, 2023 | J.P. Morgan Municipal Bond Funds | 55 |
AS OF August 31, 2023 (Unaudited) (continued)
INVESTMENTS | PRINCIPAL AMOUNT ($000) | VALUE ($000) |
Municipal Bonds — continued | ||
Texas — continued | ||
Killeen Independent School District, Unlimited Tax GO, PSF-GTD, 5.00%, 2/15/2035 | 25 | 27 |
La Porte Independent School District, Unlimited Tax GO, 4.00%, 2/15/2030 | 20 | 20 |
Lewisville Independent School District, Unlimited Tax Series 2016A, GO, PSF-GTD, 4.00%, 8/15/2026 | 505 | 509 |
Longview Independent School District, Unlimited Tax GO, PSF-GTD, 5.00%, 2/15/2025 | 80 | 82 |
Lower Colorado River Authority, LCRA Transmission Services Corp. Project Series 2023A, Rev., AGM, 5.00%, 5/15/2039 | 750 | 811 |
Matagorda County Navigation District No.1, Pollution Control, Central Power and Light Co. Project Series 2001A, Rev., 2.60%, 11/1/2029 | 4,625 | 4,120 |
Metropolitan Transit Authority of Harris County, Sales and Use Tax, Contractual Obligations Rev., 5.00%, 11/1/2023 | 25 | 25 |
New Hope Cultural Education Facilities Finance Corp, Outlook at Windhaven Forefront Living Series 2022B-3, Rev., 4.25%, 10/1/2026 | 2,225 | 2,181 |
New Hope Cultural Education Facilities Finance Corp., Morningside Ministries Project | ||
Rev., 4.00%, 1/1/2032 | 420 | 356 |
Rev., 4.00%, 1/1/2037 | 525 | 408 |
New Hope Cultural Education Facilities Finance Corp., Westminster Project Rev., 4.00%, 11/1/2055 | 600 | 448 |
North Texas Municipal Water District Water System Rev., 5.00%, 9/1/2035 | 20 | 21 |
North Texas Municipal Water District, Upper East Fork Wastewater Interceptor System Rev., 5.00%, 6/1/2027 | 15 | 16 |
North Texas Municipal Water District, Wastewater System Rev., 5.00%, 6/1/2027 | 15 | 16 |
North Texas Tollway Authority, First Tier Series 2020A, Rev., 4.00%, 1/2/2038 | 5,000 | 4,890 |
North Texas Tollway Authority, Second Tier | ||
Series B, Rev., 5.00%, 1/1/2026 | 25 | 25 |
Series B, Rev., 5.00%, 1/1/2030 | 1,100 | 1,139 |
Pearland Independent School District, Unlimited Tax GO, PSF-GTD, 5.00%, 2/15/2024 | 25 | 25 |
Permanent University Fund - Texas A&M University System Series 2009A, Rev., 5.25%, 7/1/2028 | 2,015 | 2,084 |
Plano Independent School District, Unlimited Tax GO, 5.00%, 2/15/2041 | 3,900 | 4,221 |
INVESTMENTS | PRINCIPAL AMOUNT ($000) | VALUE ($000) |
Texas — continued | ||
San Antonio Education Facilities Corp., Hallmark University Project | ||
Series 2021A, Rev., 5.00%, 10/1/2031 | 260 | 246 |
Series 2021A, Rev., 5.00%, 10/1/2041 | 200 | 166 |
San Antonio Water System, Junior Lien Series 2016C, Rev., 5.00%, 5/15/2031 | 1,125 | 1,182 |
San Jacinto Community College District, Limited Tax Series A, GO, 5.00%, 2/15/2024 | 75 | 76 |
Southwest Houston Redevelopment Authority, Tax Increment | ||
Rev., AGM, 4.00%, 9/1/2031 | 225 | 233 |
Rev., AGM, 4.00%, 9/1/2032 | 250 | 258 |
Rev., AGM, 4.00%, 9/1/2033 | 225 | 229 |
Rev., AGM, 4.00%, 9/1/2034 | 225 | 229 |
Rev., AGM, 4.00%, 9/1/2035 | 225 | 226 |
Rev., AGM, 4.00%, 9/1/2036 | 350 | 350 |
Rev., AGM, 4.00%, 9/1/2037 | 390 | 387 |
Tarrant County Cultural Education Facilities Finance Corp., Christus Health | ||
Series 2018A, Rev., 5.00%, 7/1/2025 | 150 | 154 |
Series 2018A, Rev., 5.00%, 7/1/2028 | 40 | 43 |
Series 2018B, Rev., 5.00%, 7/1/2033 | 100 | 107 |
Tarrant County Cultural Education Facilities Finance Corp., Health Resources System Series 2016A, Rev., 5.00%, 2/15/2026 | 50 | 52 |
Tarrant County Cultural Education Facilities Finance Corp., Hospital, Cook Children's Medical Center | ||
Rev., 5.00%, 12/1/2027 | 50 | 54 |
Rev., 5.00%, 12/1/2029 | 25 | 28 |
Tarrant County Cultural Education Facilities Finance Corp., Retirement Facility, MRC Stevenson Oaks Project | ||
Series 2020A, Rev., 6.25%, 11/15/2031 | 500 | 479 |
Series 2020A, Rev., 6.63%, 11/15/2041 | 2,545 | 2,356 |
Tarrant County Cultural Education Facilities Finance Corp., Retirement Facility, MRC Stevenson Oaks Project, Tax Exempt | ||
Series 2020B-2, Rev., 3.00%, 11/15/2026 | 160 | 153 |
Series 2020B-1, Rev., 4.00%, 11/15/2027 | 18,900 | 17,809 |
Tarrant Regional, Water Control and Improvement District, Water System Rev., 4.00%, 3/1/2031 | 25 | 25 |
Texas Municipal Gas Acquisition and Supply Corp., I Gas Supply Senior Lien Series 2008D, Rev., 6.25%, 12/15/2026 | 2,890 | 2,992 |
Texas Water Development Board, State Revolving Fund Rev., 5.00%, 8/1/2038 | 45 | 48 |
56 | J.P. Morgan Municipal Bond Funds | August 31, 2023 |
INVESTMENTS | PRINCIPAL AMOUNT ($000) | VALUE ($000) |
Municipal Bonds — continued | ||
Texas — continued | ||
Texas Water Development Board, Water Implementation, Master Trust Series 2018B, Rev., 5.00%, 4/15/2031 | 7,000 | 7,621 |
Trinity River Authority of Texas, Livingston Regional Water Supply System Project Series 2023, Rev., 5.00%, 8/1/2038 | 1,220 | 1,310 |
Trinity River Authority, Tarrant County Water Project | ||
Series 2023, Rev., 5.00%, 2/1/2036 | 700 | 784 |
Series 2023, Rev., 5.00%, 2/1/2037 | 625 | 693 |
Series 2023, Rev., 5.00%, 2/1/2038 | 330 | 361 |
University of Houston Series 2017A, Rev., 5.00%, 2/15/2037 | 30 | 31 |
University of North Texas System, Financing System Series 2015A, Rev., 5.00%, 4/15/2040 | 50 | 51 |
Waxahachie Independent School District, Unlimited Tax GO, PSF-GTD, 4.00%, 8/15/2041 | 25 | 23 |
Weslaco Independent School District, Limited Maintenance Tax Notes GO, AGM, 5.00%, 2/15/2028 | 25 | 27 |
Total Texas | 154,752 | |
Utah — 0.5% | ||
City of Salt Lake City, Airport System | ||
Series 2018B, Rev., 5.00%, 7/1/2048 | 45 | 46 |
Series 2023A, Rev., AMT, 5.25%, 7/1/2048 | 1,750 | 1,840 |
County of Davis, Sales Tax Series 2019B, Rev., 5.00%, 4/1/2026 | 30 | 31 |
County of Utah, IHC Health Services, Inc. Series 2018A, Rev., 5.00%, 5/15/2034 | 70 | 75 |
Mida Golf and Equestrian Center Public Infrastructure District, Limited Tax GO, 4.25%, 6/1/2041 (d) | 1,105 | 836 |
Mida Mountain Village Public Infrastructure District, Mountain Village Assessment Area #2 | ||
Rev., 4.00%, 8/1/2024 (d) | 1,120 | 1,110 |
Rev., 4.00%, 8/1/2026 (d) | 1,290 | 1,247 |
Rev., 4.00%, 8/1/2028 (d) | 1,230 | 1,164 |
Rev., 4.00%, 8/1/2031 (d) | 1,000 | 910 |
Military Installation Development Authority, Tax Allocation Series 2021A-2, Rev., 4.00%, 6/1/2036 | 1,150 | 960 |
Military Installation Development Authority, Tax Allocation and Hotel Tax Series 2021A-1, Rev., 4.00%, 6/1/2036 | 650 | 545 |
University of Utah (The) Series 2017A, Rev., 5.00%, 8/1/2032 | 40 | 42 |
INVESTMENTS | PRINCIPAL AMOUNT ($000) | VALUE ($000) |
Utah — continued | ||
Utah Charter School Finance Authority, Beehive Science and Technology Academy Project Series 2021A, Rev., 4.00%, 10/15/2031 (d) | 1,250 | 1,118 |
Utah Infrastructure Agency Rev., 4.00%, 10/15/2038 | 1,560 | 1,537 |
Utah Infrastructure Agency, Clearfield City Project Rev., 4.00%, 10/15/2040 | 915 | 834 |
Utah Infrastructure Agency, Tax-Exempt Telecommunications | ||
Series 2018A, Rev., 5.00%, 10/15/2023 | 620 | 620 |
Series 2018A, Rev., 5.00%, 10/15/2025 | 1,450 | 1,454 |
Rev., 5.00%, 10/15/2027 | 160 | 162 |
Series 2018A, Rev., 5.00%, 10/15/2028 | 1,000 | 1,014 |
Rev., 5.00%, 10/15/2032 | 515 | 528 |
Series 2018A, Rev., 5.25%, 10/15/2033 | 965 | 986 |
Utah Transit Authority, Subordinate Sales Tax Rev., 4.00%, 12/15/2031 | 40 | 40 |
Utah Water Finance Agency, Loan Financing Program Series 2017C, Rev., 5.00%, 3/1/2034 | 350 | 369 |
West Valley City Municipal Building Authority Rev., AGM, 5.00%, 2/1/2039 | 30 | 31 |
Total Utah | 17,499 | |
Vermont — 0.0% ^ | ||
City of Burlington, Public Improvement Series 2019A, GO, 4.00%, 11/1/2034 | 125 | 130 |
University of Vermont and State Agricultural College | ||
Rev., 5.00%, 10/1/2024 | 25 | 25 |
Series 2019A, Rev., 5.00%, 10/1/2039 | 15 | 16 |
Vermont Educational and Health Buildings Financing Agency, University of Vermont Medical Center Series 2016A, Rev., 5.00%, 12/1/2025 | 30 | 31 |
Vermont Municipal Bond Bank Series 4, Rev., 5.00%, 12/1/2028 | 400 | 433 |
Total Vermont | 635 | |
Virginia — 1.7% | ||
City of Newport News, Water Revenue Rev., 5.00%, 7/15/2024 | 10 | 10 |
County of Fairfax, Sewer Series 2016A, Rev., 4.00%, 7/15/2038 | 50 | 50 |
Fairfax County Water Authority Series 2005B, Rev., 5.25%, 4/1/2025 | 3,500 | 3,609 |
Hampton Roads Transportation Accountability Commission, Transportation Fund, Senior Lien Series 2018A, Rev., 5.00%, 7/1/2027 | 45 | 48 |
August 31, 2023 | J.P. Morgan Municipal Bond Funds | 57 |
AS OF August 31, 2023 (Unaudited) (continued)
INVESTMENTS | PRINCIPAL AMOUNT ($000) | VALUE ($000) |
Municipal Bonds — continued | ||
Virginia — continued | ||
Lynchburg Economic Development Authority, Centra Health Obligated Group Rev., 4.00%, 1/1/2037 | 1,590 | 1,554 |
Northern Virginia Transportation Authority, Special Tax | ||
Rev., 5.00%, 6/1/2033 | 2,035 | 2,054 |
Rev., 5.00%, 6/1/2034 | 2,285 | 2,305 |
Powhatan County Economic Development Authority Rev., 5.00%, 10/15/2025 | 25 | 26 |
Virginia College Building Authority, Educational Facilities, Washington & Lee University Project | ||
Rev., NATL - RE, 5.25%, 1/1/2026 | 3,175 | 3,233 |
Rev., NATL - RE, 5.25%, 1/1/2031 | 30 | 33 |
Virginia Commonwealth Transportation Board, Capital Projects Series 2017A, Rev., 5.00%, 5/15/2032 | 35 | 37 |
Virginia Commonwealth Transportation Board, Federal Transportation | ||
Rev., GAN, 5.00%, 9/15/2025 | 45 | 46 |
Series 2017, Rev., GAN, 5.00%, 9/15/2025 | 20 | 21 |
Virginia Commonwealth Transportation Board, I-81 Regional Fuels Tax | ||
Series 2021, Rev., 4.00%, 5/15/2037 | 640 | 646 |
Series 2021, Rev., 4.00%, 5/15/2038 | 800 | 797 |
Virginia Public School Authority | ||
Series 2023, Rev., 5.00%, 8/1/2041 | 4,880 | 5,433 |
Series 2023, Rev., 5.00%, 8/1/2042 | 6,450 | 7,146 |
Series 2023, Rev., 5.00%, 8/1/2043 | 2,795 | 3,090 |
Virginia Public School Authority, School Financing 1997 Resolution Series 2015A, Rev., 5.00%, 8/1/2028 | 30 | 31 |
Virginia Resources Authority, Infrastructure Moral Obligation, Pooled Financing Program Series 2019C, Rev., 5.00%, 11/1/2029 | 25 | 28 |
Virginia Small Business Financing Authority, National Senior Communities, Inc. Series 2020A, Rev., 5.00%, 1/1/2034 | 1,000 | 1,050 |
Virginia Small Business Financing Authority, Senior Lien | ||
Rev., AMT, 4.00%, 1/1/2029 | 775 | 765 |
Rev., AMT, 4.00%, 7/1/2029 | 3,875 | 3,824 |
Rev., AMT, 4.00%, 1/1/2031 | 5,250 | 5,170 |
Rev., AMT, 4.00%, 1/1/2032 | 5,000 | 4,917 |
Virginia Small Business Financing Authority, Senior Lien, Elizabeth River Crossing Opco, LLC Project Rev., AMT, 4.00%, 1/1/2036 | 5,000 | 4,782 |
INVESTMENTS | PRINCIPAL AMOUNT ($000) | VALUE ($000) |
Virginia — continued | ||
Virginia Small Business Financing Authority, The Obligated Group of National Senior Campuses, Inc. | ||
Series 2020A, Rev., 5.00%, 1/1/2028 | 2,635 | 2,725 |
Series 2020A, Rev., 5.00%, 1/1/2030 | 400 | 419 |
Series 2020A, Rev., 5.00%, 1/1/2031 | 2,750 | 2,889 |
Series 2020A, Rev., 5.00%, 1/1/2032 | 500 | 526 |
Total Virginia | 57,264 | |
Washington — 3.7% | ||
Benton County School District No. 17 Kennewick, Unlimited Tax GO, 5.00%, 12/1/2027 | 50 | 51 |
Central Puget Sound Regional Transit Authority, Sales and Motor Vehicle Excise Tax | ||
Series 2016 S-1, Rev., 5.00%, 11/1/2027 | 25 | 26 |
Series 2016 S-1, Rev., 5.00%, 11/1/2028 | 40 | 42 |
Chelan County Public Utility District No. 1 Series 2020A, Rev., 4.00%, 7/1/2038 | 1,670 | 1,653 |
Chelan County School District No. 228 Cascade, Unlimited Tax GO, 5.00%, 12/1/2027 | 90 | 94 |
City of Everett, Limited Tax GO, 5.00%, 12/1/2026 | 60 | 64 |
City of Seattle, Municipal Light and Power Improvement Series 2018A, Rev., 4.00%, 1/1/2048 | 2,000 | 1,885 |
City of Tacoma, Electric System Rev., 5.00%, 1/1/2028 | 35 | 37 |
City of Tacoma, Sewer System Rev., 5.00%, 12/1/2031 | 40 | 44 |
City of Wenatchee, Limited Tax GO, 4.00%, 12/1/2034 | 70 | 72 |
Clark County, Vancouver School District No. 37, Unlimited Tax GO, 5.00%, 12/1/2027 | 25 | 27 |
Clark Regional Wastewater District | ||
Rev., 5.00%, 12/1/2032 | 125 | 139 |
Rev., 5.00%, 12/1/2034 | 180 | 199 |
Rev., 5.00%, 12/1/2035 | 160 | 176 |
Rev., 5.00%, 12/1/2037 | 310 | 336 |
County of King, Sewer Rev., 5.00%, 7/1/2031 | 30 | 32 |
County of Kitsap, Sewer Rev., 4.00%, 12/1/2032 | 25 | 26 |
County of Snohomish, Limited Tax GO, 4.00%, 12/1/2039 | 1,470 | 1,441 |
County of Spokane, Limited Tax Series 2019A, GO, 5.00%, 12/1/2040 | 25 | 27 |
Energy Northwest, Columbia Generating Station | ||
Series 2015-A, Rev., 5.00%, 7/1/2031 | 30 | 31 |
Series 2018C, Rev., 5.00%, 7/1/2031 | 35 | 38 |
58 | J.P. Morgan Municipal Bond Funds | August 31, 2023 |
INVESTMENTS | PRINCIPAL AMOUNT ($000) | VALUE ($000) |
Municipal Bonds — continued | ||
Washington — continued | ||
Series 2017-A, Rev., 5.00%, 7/1/2034 | 5,025 | 5,356 |
Series 2018A, Rev., 5.00%, 7/1/2034 | 25 | 27 |
Series 2019A, Rev., 5.00%, 7/1/2036 | 40 | 43 |
FYI Properties, State of Washington District Project | ||
Rev., 5.00%, 6/1/2030 | 50 | 54 |
Rev., 5.00%, 6/1/2031 | 5,650 | 6,063 |
Rev., 5.00%, 6/1/2032 | 235 | 252 |
Rev., 5.00%, 6/1/2033 | 5,345 | 5,706 |
Rev., 5.00%, 6/1/2034 | 5,990 | 6,374 |
Rev., 5.00%, 6/1/2035 | 7,200 | 7,655 |
Rev., 5.00%, 6/1/2036 | 4,915 | 5,216 |
King County Fire Protection District No. 2, Unlimited Tax GO, 4.00%, 12/1/2025 | 125 | 127 |
King County School District No. 403 Renton, Unlimited Tax GO, 4.00%, 12/1/2036 | 35 | 35 |
King County School District No. 405 Bellevue, Unlimited Tax GO, 5.00%, 12/1/2023 | 25 | 25 |
King County School District No. 411 Issaquah, Unlimited Tax GO, 5.00%, 12/1/2027 | 30 | 32 |
King County School District No. 415 Kent, Unlimited Tax GO, 4.00%, 12/1/2037 | 40 | 40 |
Kitsap County School District No. 401 Central Kitsap, Unlimited Tax GO, 4.00%, 12/1/2031 | 45 | 46 |
Pierce County Fire Protection District No. 5 Series 2022, GO, 4.00%, 12/1/2041 | 3,275 | 3,150 |
Port of Seattle, Intermediate Lien | ||
Series B, Rev., 5.00%, 3/1/2032 | 4,000 | 4,045 |
Series B, Rev., 5.00%, 3/1/2034 | 1,000 | 1,011 |
Port of Tacoma, Limited Tax Series 2016A, GO, 5.00%, 12/1/2030 | 15 | 16 |
Shoreline Fire Department, Limited Tax GO, 5.00%, 12/1/2027 | 25 | 27 |
State of Washington, Motor Vehicle Fuel Tax Series R-2016C, GO, 5.00%, 7/1/2030 | 75 | 78 |
State of Washington, State and Local Agency Real and Personal Property | ||
Series 2017A, COP, 5.00%, 7/1/2029 | 35 | 37 |
Series 2018C, COP, 5.00%, 7/1/2034 | 1,050 | 1,125 |
Series 2019A, COP, 5.00%, 1/1/2035 | 45 | 49 |
Series 2015C, COP, 4.00%, 1/1/2038 | 50 | 49 |
State of Washington, Various Purpose | ||
Series R-2015A, GO, 4.00%, 7/1/2026 | 4,465 | 4,481 |
Series 2016C, GO, 5.00%, 2/1/2028 | 30 | 31 |
Series 2018C, GO, 5.00%, 2/1/2037 | 14,430 | 15,320 |
Series 2015B, GO, 5.00%, 2/1/2039 | 1,575 | 1,595 |
INVESTMENTS | PRINCIPAL AMOUNT ($000) | VALUE ($000) |
Washington — continued | ||
Series 2015B, GO, 5.00%, 2/1/2040 | 19,390 | 19,624 |
Series 2017D, GO, 5.00%, 2/1/2040 | 40 | 42 |
Series 2018A, GO, 5.00%, 8/1/2040 | 10,000 | 10,431 |
Series 2020C, GO, 5.00%, 2/1/2041 | 75 | 80 |
Series 2023C, GO, 5.00%, 6/1/2041 | 2,330 | 2,554 |
Tacoma Metropolitan Park District, Unlimited Tax | ||
GO, 5.00%, 12/1/2036 | 600 | 611 |
GO, 5.00%, 12/1/2037 | 1,750 | 1,774 |
University of Washington | ||
Series 2015C, Rev., 5.00%, 12/1/2023 | 25 | 25 |
Rev., 5.00%, 4/1/2029 | 1,860 | 1,981 |
Washington Health Care Facilities Authority, Commonspirit Health | ||
Series 2019A-1, Rev., 5.00%, 8/1/2031 | 780 | 832 |
Series 2019A-1, Rev., 5.00%, 8/1/2032 | 1,000 | 1,064 |
Series 2019A-2, Rev., 5.00%, 8/1/2032 | 1,000 | 1,064 |
Series 2019A-1, Rev., 5.00%, 8/1/2034 | 1,250 | 1,323 |
Series 2019A-2, Rev., 5.00%, 8/1/2034 | 1,000 | 1,059 |
Series 2019A-1, Rev., 5.00%, 8/1/2035 | 750 | 788 |
Series 2019A-2, Rev., 5.00%, 8/1/2035 | 1,000 | 1,051 |
Washington Health Care Facilities Authority, Multi-care Health System Series 2017B, Rev., 5.00%, 8/15/2034 | 35 | 36 |
Washington Health Care Facilities Authority, Seattle Cancer Care Alliance | ||
Rev., 5.00%, 12/1/2031 (d) | 200 | 216 |
Rev., 5.00%, 9/1/2039 | 100 | 104 |
Washington Higher Education Facilities Authority, Seattle University Project | ||
Rev., 3.63%, 5/1/2040 | 985 | 853 |
Rev., 4.00%, 5/1/2045 | 500 | 447 |
Washington State Housing Finance Commission, Rockwood Retirement Communities Project | ||
Series 2020B-1, Rev., 3.38%, 7/1/2028 (d) | 2,665 | 2,334 |
Series 2020A, Rev., 5.00%, 1/1/2032 (d) | 1,920 | 1,730 |
Series 2020A, Rev., 5.00%, 1/1/2041 (d) | 2,000 | 1,580 |
Washington State University Rev., 5.00%, 4/1/2030 | 40 | 41 |
Whitman County Reorganized School District No. 300, Colfax Unlimited Tax GO, 5.00%, 12/1/2032 | 40 | 44 |
Yakima County School District No. 208 West Valley GO, 4.00%, 12/1/2034 | 30 | 31 |
August 31, 2023 | J.P. Morgan Municipal Bond Funds | 59 |
AS OF August 31, 2023 (Unaudited) (continued)
INVESTMENTS | PRINCIPAL AMOUNT ($000) | VALUE ($000) |
Municipal Bonds — continued | ||
Washington — continued | ||
Yelm Community School Thurston and Pierce Counties Community Schools, Unlimited Tax | ||
GO, 5.00%, 12/1/2027 | 30 | 32 |
GO, 4.00%, 12/1/2034 | 55 | 57 |
Total Washington | 126,313 | |
West Virginia — 0.0% ^ | ||
State of West Virginia Series 2018A, GO, 5.00%, 6/1/2028 | 25 | 27 |
Wisconsin — 1.4% | ||
City of Mequon, Water System Series 2017A, Rev., 4.00%, 5/1/2027 | 25 | 25 |
County of Milwaukee, Airport Series 2019A, Rev., 5.00%, 12/1/2026 | 175 | 185 |
DeForest Area School District GO, 4.00%, 4/1/2031 | 25 | 26 |
Public Finance Authority | ||
Series 2022, Rev., 4.00%, 4/1/2032 (d) | 265 | 249 |
Series 2022, Rev., 4.00%, 4/1/2032 (b) (d) | 95 | 98 |
Series 2022, Rev., 4.00%, 4/1/2042 (d) | 1,400 | 1,135 |
Series 2022A, Rev., 5.00%, 10/1/2052 | 6,530 | 6,650 |
Public Finance Authority, Acts Retirement Life Communities, Inc., Obligated Group | ||
Series 2020A, Rev., 4.00%, 11/15/2037 | 300 | 262 |
Series 2020A, Rev., 5.00%, 11/15/2041 | 1,445 | 1,378 |
Public Finance Authority, Appalachian Regional Healthcare System Obligated Group | ||
Series 2021A, Rev., 5.00%, 7/1/2035 | 300 | 309 |
Series 2021A, Rev., 5.00%, 7/1/2036 | 350 | 356 |
Series 2021A, Rev., 5.00%, 7/1/2037 | 300 | 302 |
Series 2021A, Rev., 5.00%, 7/1/2038 | 375 | 376 |
Series 2021A, Rev., 5.00%, 7/1/2039 | 350 | 347 |
Public Finance Authority, Ascend Leadership Academy Project Series 2021A, Rev., 5.00%, 6/15/2041 (d) | 1,035 | 856 |
Public Finance Authority, Blue Ridge Healthcare Facilities | ||
Series 2020A, Rev., 5.00%, 1/1/2033 | 500 | 530 |
Series 2020A, Rev., 5.00%, 1/1/2034 | 500 | 529 |
Series 2020A, Rev., 5.00%, 1/1/2035 | 500 | 527 |
Series 2020A, Rev., 5.00%, 1/1/2036 | 500 | 523 |
Series 2020A, Rev., 5.00%, 1/1/2037 | 600 | 623 |
Public Finance Authority, Carson Valley Medical Center | ||
Series 2021A, Rev., 3.00%, 12/1/2026 | 250 | 236 |
Series 2021A, Rev., 4.00%, 12/1/2031 | 350 | 330 |
INVESTMENTS | PRINCIPAL AMOUNT ($000) | VALUE ($000) |
Wisconsin — continued | ||
Series 2021A, Rev., 4.00%, 12/1/2041 | 750 | 620 |
Public Finance Authority, ENO River Academy Project | ||
Series 2020A, Rev., 4.00%, 6/15/2030 (d) | 235 | 223 |
Series 2020A, Rev., 5.00%, 6/15/2040 (d) | 405 | 382 |
Public Finance Authority, Entrance Fee Principal Redemption, Searstone CCRC Project Series 2021B2, Rev., 2.25%, 6/1/2027 (d) | 1,755 | 1,626 |
Public Finance Authority, Lenoir-Rhyne University | ||
Series 2022, Rev., 5.00%, 4/1/2032 | 670 | 683 |
Series 2022, Rev., 5.00%, 4/1/2033 | 1,405 | 1,430 |
Public Finance Authority, Piedmont Community Charter School | ||
Rev., 5.00%, 6/15/2024 | 205 | 205 |
Rev., 5.00%, 6/15/2026 | 225 | 227 |
Rev., 5.00%, 6/15/2034 | 215 | 219 |
Rev., 5.00%, 6/15/2039 | 390 | 381 |
Public Finance Authority, The Carmelite System, Inc., Obligated Group Rev., 3.25%, 1/1/2028 | 1,190 | 1,114 |
Public Finance Authority, The Franklin School of Innovation Rev., 5.00%, 1/1/2042 (d) | 500 | 443 |
Public Finance Authority, Triad Educational Services, Inc. | ||
Series 2021A, Rev., 4.00%, 6/15/2027 | 385 | 373 |
Series 2021A, Rev., 4.00%, 6/15/2029 | 415 | 397 |
Series 2021A, Rev., 4.00%, 6/15/2031 | 450 | 425 |
Series 2021A, Rev., 4.00%, 6/15/2041 | 1,000 | 814 |
Public Finance Authority, Viticus Group Project | ||
Series 2022A, Rev., 4.00%, 12/1/2031 (d) | 540 | 486 |
Series 2022A, Rev., 4.00%, 12/1/2041 (d) | 2,320 | 1,851 |
Public Finance Authority, Wakemed Hospital Series 2019A, Rev., 5.00%, 10/1/2044 | 12,500 | 12,690 |
State of Wisconsin | ||
Series 2017-1, GO, 5.00%, 11/1/2023 | 30 | 30 |
Series 2017-3, GO, 5.00%, 11/1/2030 | 4,190 | 4,484 |
State of Wisconsin, Annual Appropriation Federally Tax-Exempt Series 2017B, Rev., 5.00%, 5/1/2026 (b) | 25 | 26 |
Wisconsin Department of Transportation Series 2017-2, Rev., 5.00%, 7/1/2030 | 30 | 32 |
Wisconsin Health and Educational Facilities Authority, Agnesian Healthcare, Inc. Rev., 5.00%, 7/1/2027 | 95 | 100 |
Wisconsin Health and Educational Facilities Authority, Aspirus, Inc., Obligated Group | ||
Rev., 5.00%, 8/15/2025 | 35 | 36 |
60 | J.P. Morgan Municipal Bond Funds | August 31, 2023 |
INVESTMENTS | PRINCIPAL AMOUNT ($000) | VALUE ($000) |
Municipal Bonds — continued | ||
Wisconsin — continued | ||
Rev., 5.00%, 8/15/2027 | 25 | 25 |
Wisconsin Health and Educational Facilities Authority, Hope Christian Schools Rev., 3.00%, 12/1/2031 | 560 | 467 |
Wisconsin Health and Educational Facilities Authority, Oakwood Lutheran Senior Ministries | ||
Rev., 4.00%, 1/1/2026 | 175 | 170 |
Rev., 4.00%, 1/1/2027 | 180 | 172 |
Rev., 4.00%, 1/1/2028 | 375 | 352 |
Rev., 4.00%, 1/1/2029 | 385 | 356 |
Rev., 4.00%, 1/1/2030 | 405 | 369 |
Rev., 4.00%, 1/1/2037 | 1,125 | 911 |
Wisconsin Health and Educational Facilities Authority, Three Pillars Senior Living Communities Series 2021A, Rev., 4.00%, 8/15/2041 | 825 | 674 |
Total Wisconsin | 48,645 | |
Wyoming — 0.6% | ||
Casper Community College District Rev., 4.00%, 4/15/2035 | 440 | 449 |
County of Campbell, Solid Waste Facilities, Basin Electric Power Co-operative, Dry Fork Station Facilities Series 2019A, Rev., 3.63%, 7/15/2039 | 23,570 | 20,333 |
Total Wyoming | 20,782 | |
Total Municipal Bonds (Cost $3,408,071) | 3,305,772 | |
SHARES (000) | ||
Short-Term Investments — 1.6% | ||
Investment Companies — 1.6% | ||
JPMorgan Institutional Tax Free Money Market Fund Class IM Shares, 3.71% (e) (f) (Cost $52,959) | 52,960 | 52,966 |
Total Investments — 98.8% (Cost $3,461,030) | 3,358,738 | |
Other Assets Less Liabilities — 1.2% | 42,041 | |
NET ASSETS — 100.0% | 3,400,779 | |
Percentages indicated are based on net assets. |
Abbreviations | |
AGC | Insured by Assured Guaranty Corp. |
AGM | Insured by Assured Guaranty Municipal Corp. |
AMBAC | Insured by American Municipal Bond Assurance Corp. |
AMT | Alternative Minimum Tax |
BAN | Bond Anticipation Note |
BHAC | Insured by Berkshire Hathaway Assurance Corp. |
CCRC | Congregate Care Retirement Center |
COP | Certificate of Participation |
CR | Custodial Receipts |
FHA | Federal Housing Administration |
GAN | Grant Anticipation Notes |
GO | General Obligation |
GTD | Guaranteed |
IBC | Insured Bond Certificates |
ICC | Insured Custody Certificates |
LIQ | Liquidity Agreement |
MTA | Metropolitan Transportation Authority |
NATL | Insured by National Public Finance Guarantee Corp. |
PSF-GTD | Permanent School Fund Guaranteed |
Q-SBLF | Qualified School Bond Loan Fund |
RE | Reinsured |
Rev. | Revenue |
^ | Amount rounds to less than 0.1% of net assets. | |
(a) | The date shown represents the earliest of the prerefunded date, next put date or final maturity date. | |
(b) | Security is prerefunded or escrowed to maturity. | |
(c) | Variable or floating rate security, the interest rate of which adjusts periodically based on changes in current interest rates and prepayments on the underlying pool of assets. The interest rate shown is the current rate as of August 31, 2023. | |
(d) | Securities exempt from registration under Rule 144A or section 4(a)(2), of the Securities Act of 1933, as amended. | |
(e) | Investment in an affiliated fund, which is registered under the Investment Company Act of 1940, as amended, and is advised by J.P. Morgan Investment Management Inc. | |
(f) | The rate shown is the current yield as of August 31, 2023. | |
August 31, 2023 | J.P. Morgan Municipal Bond Funds | 61 |
AS OF August 31, 2023 (Unaudited) (continued)
DESCRIPTION | NUMBER OF CONTRACTS | EXPIRATION DATE | TRADING CURRENCY | NOTIONAL AMOUNT ($) | VALUE AND UNREALIZED APPRECIATION (DEPRECIATION) ($) |
Long Contracts | |||||
U.S. Treasury 2 Year Note | 393 | 12/29/2023 | USD | 80,114 | 161 |
U.S. Treasury 5 Year Note | 388 | 12/29/2023 | USD | 41,498 | 225 |
386 |
Abbreviations | |
USD | United States Dollar |
REFERENCE OBLIGATION/INDEX | FINANCING RATE PAID BY THE FUND (%) | PAYMENT FREQUENCY | MATURITY DATE | IMPLIED CREDIT SPREAD (%)(a) | NOTIONAL AMOUNT(b) | UPFRONT PAYMENTS (RECEIPTS) ($)(c) | UNREALIZED APPRECIATION (DEPRECIATION) ($) | VALUE ($) |
CDX.NA.HY.40-V1 | 5.00 | Quarterly | 6/20/2028 | 4.26 | USD151,300 | (3,584 ) | (2,224 ) | (5,808 ) |
(*) | The Fund, as a buyer of credit protection, is generally obligated to make periodic payments and may also pay or receive an upfront premium to or from the protection seller, in exchange for the right to receive a contingent payment, upon occurrence of a credit event with respect to an underlying reference obligation, as defined under the terms of individual swap contracts. | ||||||||
(a) | Implied credit spreads are an indication of the seller's performance risk, related to the likelihood of a credit event occurring that would require a seller to make payment to a buyer. Implied credit spreads are used to determine the value of swap contracts and reflect the cost of buying/selling protection, which may include upfront payments made to enter into the contract. Therefore, higher spreads would indicate a greater likelihood that a seller will be obligated to perform (i.e. make payment) under the swap contract. Increasing values, in absolute terms and relative to notional amounts, are also indicative of greater performance risk. Implied credit spreads for credit default swaps on credit indices are linked to the weighted average spread across the underlying reference obligations included in a particular index. | ||||||||
(b) | The notional amount is the maximum amount that a seller of credit protection would be obligated to pay and a buyer of credit protection would receive, upon occurrence of a credit event. | ||||||||
(c) | Upfront payments and receipts generally represent premiums paid or received at the initiation of the agreement to compensate the differences between the stated terms of the swap agreement and current market conditions (credit spreads, interest rates and other relevant factors). | ||||||||
Abbreviations | |
CDX | Credit Default Swap Index |
USD | United States Dollar |
62 | J.P. Morgan Municipal Bond Funds | August 31, 2023 |
AS OF August 31, 2023 (Unaudited)
INVESTMENTS | Principal Amount ($000) | Value ($000) |
Municipal Bonds—94.7% (a) | ||
New York—94.7% | ||
Education—3.4% | ||
Build NYC Resource Corp., Global Community Charter School, Series 2022A, Rev., 4.00%, 6/15/2032 | 130 | 123 |
New York State Dormitory Authority, Court Facilities Lease, Series 2005A, Rev., AMBAC, 5.50%, 5/15/2026 | 5,000 | 5,278 |
New York State Dormitory Authority, New York University | ||
Series 2001-1, Rev., AMBAC, 5.50%, 7/1/2024 | 1,570 | 1,599 |
Series 2001-1, Rev., AMBAC, 5.50%, 7/1/2025 | 2,280 | 2,375 |
New York State Dormitory Authority, Non Stop Supported Debt, New School University | ||
Series 2022A, Rev., 5.00%, 7/1/2031 | 250 | 277 |
Series 2022A, Rev., 5.00%, 7/1/2033 | 250 | 278 |
New York State Dormitory Authority, Rochester Institute of Technology, Series 2019A, Rev., 5.00%, 7/1/2036 | 900 | 966 |
New York State Dormitory Authority, School Districts Financing Program | ||
Series 2009A, Rev., AGC, 5.00%, 10/1/2024 | 20 | 20 |
Series 2018A, Rev., 5.00%, 10/1/2027 | 2,000 | 2,102 |
13,018 | ||
General Obligation—17.6% | ||
City of New York | ||
Series 2018E-1, GO, 5.25%, 3/1/2035 | 1,300 | 1,405 |
Series 2023A-1, GO, 5.00%, 9/1/2037 | 1,400 | 1,537 |
Series 2022D-1, GO, 5.25%, 5/1/2039 | 1,500 | 1,653 |
Series 2022A-1, GO, 4.00%, 8/1/2041 | 2,065 | 2,009 |
Series 2023E, GO, 4.00%, 4/1/2042 | 1,000 | 967 |
Series 2023E, SubseriesE-1, GO, 4.00%, 4/1/2045 | 1,700 | 1,627 |
City of New York, Fiscal Year 2018, Series 2018F-1, GO, 5.00%, 4/1/2034 | 2,500 | 2,678 |
City of New York, Fiscal Year 2020, Series 2020C-1, GO, 5.00%, 8/1/2033 | 2,000 | 2,222 |
City of New York, Fiscal Year 2024 | ||
Series 2024A, GO, 5.00%, 8/1/2043 | 1,250 | 1,343 |
Series 2024A, GO, 5.00%, 8/1/2044 | 2,600 | 2,786 |
City of Rochester, Series 2022-II, GO, 5.00%, 8/1/2029 | 2,000 | 2,224 |
City of Syracuse, Public Improvement, Series 2019A, GO, 4.00%, 5/15/2024 | 1,000 | 1,005 |
City of White Plains, Public Improvement | ||
GO, 4.00%, 9/15/2028 | 705 | 727 |
GO, 4.00%, 9/15/2029 | 1,100 | 1,134 |
INVESTMENTS | Principal Amount ($000) | Value ($000) |
General Obligation — continued | ||
County of Albany, Series 2022A, GO, 4.00%, 6/1/2036 | 1,080 | 1,111 |
County of Monroe | ||
GO, 5.00%, 6/1/2025 | 1,330 | 1,374 |
GO, 4.00%, 6/1/2040 | 2,115 | 2,122 |
County of Nassau | ||
Series 2021A, GO, AGM, 4.00%, 4/1/2036 | 2,000 | 2,053 |
Series 2023A, GO, AGM, 4.00%, 4/1/2042 | 1,500 | 1,465 |
County of Nassau, General Improvement | ||
Series 2016A, GO, 5.00%, 1/1/2025 | 1,000 | 1,022 |
Series 2022A, GO, 5.00%, 4/1/2037 | 1,000 | 1,110 |
County of Onondaga | ||
Series 2018, GO, 4.00%, 4/15/2029 | 2,760 | 2,801 |
Series 2022, GO, 4.00%, 6/15/2037 | 2,000 | 2,061 |
County of Suffolk, Series 2017D, GO, 4.00%, 10/15/2028 | 3,375 | 3,452 |
County of Westchester | ||
Series 2018A, GO, 5.00%, 12/1/2025 | 1,500 | 1,560 |
Series 2018-A, GO, 4.00%, 12/1/2028 | 1,000 | 1,036 |
Series 2022B, GO, 4.00%, 12/15/2035 | 2,600 | 2,752 |
Greece Central School District, Series B, GO, 5.00%, 12/15/2023 | 500 | 501 |
Mamaroneck Union Free School District, Series 2022, GO, 4.00%, 8/15/2031 | 2,120 | 2,254 |
Orchard Park Central School District, GO, 4.00%, 4/1/2029 | 1,685 | 1,728 |
Port Washington Union Free School District, GO, 4.00%, 8/1/2037 | 2,765 | 2,830 |
Town of Babylon, Series 2022, GO, 4.00%, 12/15/2041 | 1,295 | 1,300 |
Town of Brookhaven, Series 2015, GO, 5.00%, 5/1/2027 | 2,000 | 2,056 |
Town of Huntington, Public Improvement, Series 2022A, GO, 4.00%, 6/15/2037 | 1,385 | 1,431 |
Town of Islip, Public Improvement, Series 2022A, GO, 5.00%, 7/15/2027 | 430 | 465 |
Town of Oyster Bay, Public Improvement | ||
GO, AGM, 5.00%, 8/1/2029 | 500 | 556 |
GO, AGM, 5.00%, 8/1/2031 | 650 | 745 |
Uniondale Union Free School District | ||
GO, 4.00%, 1/15/2038 | 2,000 | 1,976 |
August 31, 2023 | J.P. Morgan Municipal Bond Funds | 63 |
AS OF August 31, 2023 (Unaudited) (continued)
INVESTMENTS | Principal Amount ($000) | Value ($000) |
Municipal Bonds — continued | ||
General Obligation — continued | ||
GO, 4.00%, 1/15/2041 | 2,000 | 1,925 |
Village of Mamaroneck, Public Improvement, Series 2019, GO, 3.00%, 8/15/2030 | 1,540 | 1,529 |
66,532 | ||
Hospital—1.4% | ||
New York City Health and Hospitals Corp., Series 2020A, Rev., 4.00%, 2/15/2028 | 1,700 | 1,769 |
New York State Dormitory Authority, Hospitals Center, Langone Hospitals Obligated Group, Rev., 5.00%, 7/1/2026 | 3,360 | 3,400 |
5,169 | ||
Other Revenue—23.7% | ||
Hudson Yards Infrastructure Corp., Second Indenture | ||
Series 2017A, Rev., 5.00%, 2/15/2029 | 3,500 | 3,721 |
Series 2017A, Rev., 5.00%, 2/15/2030 | 1,600 | 1,698 |
Series 2017A, Rev., 5.00%, 2/15/2034 | 1,115 | 1,179 |
Series 2017A, Rev., 5.00%, 2/15/2035 | 4,000 | 4,217 |
Series 2017A, Rev., 5.00%, 2/15/2036 | 3,500 | 3,673 |
Series 2022A, Rev., 4.00%, 2/15/2040 | 1,730 | 1,671 |
New York City Industrial Development Agency, Queens Baseball Stadium Project, Series 2021A, Rev., AGM, 5.00%, 1/1/2031 | 1,250 | 1,378 |
New York City Transitional Finance Authority Future Tax Secured | ||
Series 2023D, Subseries D-1, Rev., 5.25%, 11/1/2037 | 1,500 | 1,688 |
Series 2023F, Rev., 5.00%, 2/1/2042 | 2,000 | 2,157 |
New York City Transitional Finance Authority, Building Aid, Fiscal Year 2015 | ||
Series 2015S-1, Rev., 5.00%, 7/15/2028 | 3,000 | 3,067 |
Series 2015S-1, Rev., 5.00%, 7/15/2030 | 2,000 | 2,044 |
New York City Transitional Finance Authority, Building Aid, Fiscal Year 2018, Series 2018S-4A, Rev., 5.25%, 7/15/2035 | 4,000 | 4,348 |
New York City Transitional Finance Authority, Building Aid, Fiscal Year 2019 | ||
Series 2019S-2A, Rev., 5.00%, 7/15/2034 | 2,000 | 2,155 |
Series 2019S-3A, Rev., 5.00%, 7/15/2034 | 4,000 | 4,311 |
New York City Transitional Finance Authority, Future Tax Secured | ||
Series 2022F-1, Rev., 4.00%, 2/1/2038 | 2,000 | 1,995 |
Series 2022B-1, Rev., 4.00%, 8/1/2039 | 4,475 | 4,431 |
Series 2024B, Rev., 5.00%, 5/1/2042 | 1,000 | 1,084 |
INVESTMENTS | Principal Amount ($000) | Value ($000) |
Other Revenue — continued | ||
New York City Transitional Finance Authority, Future Tax Secured, Fiscal Year 2017, Series 2017E1-1, Rev., 5.00%, 2/1/2032 | 2,000 | 2,106 |
New York City Transitional Finance Authority, Future Tax Secured, Fiscal Year 2019 | ||
Series 2019A-1, Rev., 5.00%, 8/1/2034 | 1,500 | 1,617 |
Series 2019A-1, Rev., 5.00%, 8/1/2035 | 1,000 | 1,073 |
New York City Transitional Finance Authority, Future Tax Secured, Tax-Exempt, Fiscal Year 2017, Series 2017E-1, Rev., 5.00%, 2/1/2034 | 2,260 | 2,367 |
New York Convention Center Development Corp., Hotel Unit Fee Secured, Rev., 5.00%, 11/15/2030 | 2,000 | 2,047 |
New York Convention Center Development Corp., Subordinate Lien, Hotel Unit Fee Secured, Series B, Rev., Zero Coupon, 11/15/2033 | 4,090 | 2,649 |
New York State Dormitory Authority, Personal Income Tax, Series 2019A, Rev., 5.00%, 3/15/2024 (b) | 2,350 | 2,371 |
New York State Dormitory Authority, State Sales Tax | ||
Series A, Rev., 5.00%, 3/15/2029 | 2,500 | 2,519 |
Series 2016A, Rev., 5.00%, 3/15/2031 | 2,000 | 2,091 |
Series A, Rev., 5.00%, 3/15/2031 | 3,100 | 3,123 |
Series 2015B, Rev., 5.00%, 3/15/2032 | 2,500 | 2,576 |
Series A, Rev., 5.00%, 3/15/2032 | 2,000 | 2,015 |
Series 2015B, Rev., 5.00%, 3/15/2033 | 2,500 | 2,575 |
Series 2018E-2, Rev., 5.00%, 3/15/2033 | 2,000 | 2,165 |
Series 2017A, Rev., 5.00%, 3/15/2034 | 2,000 | 2,111 |
New York State Urban Development Corp., Personal Income Tax, Series 2020E, Rev., 4.00%, 3/15/2045 | 1,500 | 1,437 |
New York State Urban Development Corp., State Sales Tax, Series 2021A, Rev., 4.00%, 3/15/2043 | 5,000 | 4,833 |
State of New York Mortgage Agency, Homeowner Mortgage, Series 197, Rev., 3.50%, 10/1/2044 | 250 | 247 |
Trust for Cultural Resources of City of New York (The), Carnegie Hall, Rev., 5.00%, 12/1/2031 | 275 | 305 |
Westchester County Local Development Corp., Kendal on Hudson Project | ||
Series 2022B, Rev., 5.00%, 1/1/2027 | 135 | 137 |
Series 2022B, Rev., 5.00%, 1/1/2032 | 240 | 242 |
Westchester Tobacco Asset Securitization Corp., Tobacco Settlement | ||
Series B, Rev., 5.00%, 6/1/2033 | 1,775 | 1,833 |
Series B, Rev., 5.00%, 6/1/2034 | 2,000 | 2,061 |
89,317 | ||
64 | J.P. Morgan Municipal Bond Funds | August 31, 2023 |
INVESTMENTS | Principal Amount ($000) | Value ($000) |
Municipal Bonds — continued | ||
Prerefunded—2.4% | ||
New York State Urban Development Corp., State Personal Income Tax, General Purpose, Series 2014A, Rev., 5.00%, 3/15/2024 (b) | 1,500 | 1,514 |
Sales Tax Asset Receivable Corp., Fiscal Year 2015Series 2015A, Rev., 5.00%, 10/15/2024 (b) | 7,500 | 7,638 |
9,152 | ||
Special Tax—9.2% | ||
New York State Dormitory Authority, State Personal Income Tax, General Purpose | ||
Series 2019A, Rev., 5.00%, 3/15/2033 | 1,500 | 1,642 |
Series 2019A, Rev., 5.00%, 3/15/2035 | 1,500 | 1,629 |
Series 2019A, Rev., 5.00%, 3/15/2036 | 1,825 | 1,968 |
Series 2021A, Rev., 5.00%, 3/15/2036 | 1,800 | 1,978 |
New York State Thruway Authority, Personal Income Tax | ||
Series 2022A, Rev., 5.00%, 3/15/2036 | 2,000 | 2,250 |
Series 2022A, Rev., 5.00%, 3/15/2037 | 1,500 | 1,666 |
Series 2021A-1, Rev., 4.00%, 3/15/2038 | 1,500 | 1,480 |
Series 2022A, Rev., 5.00%, 3/15/2039 | 4,650 | 5,066 |
Series 2021A-1, Rev., 4.00%, 3/15/2042 | 2,500 | 2,386 |
New York State Urban Development Corp., State Personal Income Tax, General Purpose | ||
Series 2014A, Rev., 5.00%, 3/15/2031 | 3,000 | 3,022 |
Series 2015A, Rev., 5.00%, 3/15/2032 | 2,500 | 2,576 |
Series 2019A, Rev., 5.00%, 3/15/2033 | 2,575 | 2,808 |
Series 2020C, Rev., 4.00%, 3/15/2037 | 1,000 | 1,009 |
New York State Urban Development Corp., State Personal Income Tax, State Facilities and Equipment, Series A-2, Rev., NATL - RE, 5.50%, 3/15/2025 | 5,000 | 5,168 |
34,648 | ||
Transportation—20.5% | ||
Metropolitan Transportation Authority | ||
Series C-1, Rev., 5.25%, 11/15/2030 | 1,500 | 1,540 |
Series 2015B, Rev., 5.00%, 11/15/2031 | 2,000 | 2,030 |
Series 2016A-1, Rev., 5.00%, 11/15/2031 | 2,500 | 2,560 |
Series D-1, Rev., 5.00%, 11/15/2031 | 2,000 | 2,041 |
Series A-1, Rev., 5.00%, 11/15/2032 | 2,000 | 2,046 |
Series A-1, Rev., 4.00%, 11/15/2033 | 2,000 | 1,998 |
Metropolitan Transportation Authority, Dedicated Tax Fund | ||
Series 2012A, Rev., Zero Coupon, 11/15/2030 | 4,000 | 3,059 |
Series B-2, Rev., 5.25%, 11/15/2033 | 1,000 | 1,083 |
Series 2016A, Rev., 5.25%, 11/15/2034 | 1,020 | 1,078 |
INVESTMENTS | Principal Amount ($000) | Value ($000) |
Transportation — continued | ||
New York State Thruway Authority | ||
Series K, Rev., 5.00%, 1/1/2028 | 1,000 | 1,019 |
Series K, Rev., 5.00%, 1/1/2030 | 2,500 | 2,547 |
Series L, Rev., 5.00%, 1/1/2032 | 2,250 | 2,415 |
Series N, Rev., 4.00%, 1/1/2041 | 2,500 | 2,413 |
New York State Thruway Authority, Junior Lien, Series 2016A, Rev., 5.00%, 1/1/2035 | 1,000 | 1,032 |
New York Transportation Development Corp., Delta Air Lines, Inc., LaGuardia Airport Terminals C&D Redevelopment Project | ||
Series 2018, Rev., AMT, 5.00%, 1/1/2025 | 2,075 | 2,093 |
Series 2018, Rev., AMT, 5.00%, 1/1/2026 | 2,000 | 2,029 |
Series 2018, Rev., AMT, 5.00%, 1/1/2027 | 2,000 | 2,043 |
Series 2018, Rev., AMT, 5.00%, 1/1/2031 | 2,155 | 2,218 |
Series 2018, Rev., AMT, 4.00%, 1/1/2036 | 2,000 | 1,912 |
Port Authority of New York and New Jersey, Series 221, Rev., AMT, 4.00%, 7/15/2039 | 1,355 | 1,305 |
Port Authority of New York and New Jersey, Consolidated | ||
Series 186, Rev., AMT, 5.00%, 10/15/2027 | 2,000 | 2,017 |
Series 185, Rev., AMT, 5.00%, 9/1/2028 | 1,000 | 1,008 |
Series 184, Rev., 5.00%, 9/1/2030 | 2,020 | 2,049 |
Series 185, Rev., AMT, 5.00%, 9/1/2030 | 2,000 | 2,014 |
Series 207, Rev., AMT, 5.00%, 9/15/2031 | 2,335 | 2,446 |
Series 185, Rev., AMT, 5.00%, 9/1/2032 | 1,750 | 1,762 |
Series 207, Rev., AMT, 5.00%, 9/15/2032 | 3,000 | 3,138 |
Series 205, Rev., 5.00%, 11/15/2032 | 1,000 | 1,074 |
Series 214, Rev., AMT, 5.00%, 9/1/2036 | 2,950 | 3,093 |
Triborough Bridge and Tunnel Authority, MTA Bridges and Tunnels | ||
Series 2018B, Rev., 5.00%, 11/15/2029 | 1,600 | 1,779 |
Series B, Rev., 5.00%, 11/15/2029 | 2,500 | 2,648 |
Series 2018B, Rev., 5.00%, 11/15/2030 | 3,355 | 3,785 |
Series B, Rev., 5.00%, 11/15/2030 | 2,000 | 2,117 |
Series B, Rev., 5.00%, 11/15/2031 | 1,100 | 1,164 |
Series 2013A, Rev., Zero Coupon, 11/15/2032 | 3,000 | 2,069 |
Series B, Rev., 5.00%, 11/15/2033 | 1,500 | 1,585 |
Series 2022A, Rev., 4.00%, 5/15/2041 | 2,040 | 2,011 |
Series 2019C, Rev., 4.00%, 11/15/2042 | 1,375 | 1,333 |
Triborough Bridge and Tunnel Authority, Payroll Mobility Tax Senior Lien, Series 2023A, Rev., 4.00%, 11/15/2037 | 1,600 | 1,609 |
77,162 | ||
August 31, 2023 | J.P. Morgan Municipal Bond Funds | 65 |
AS OF August 31, 2023 (Unaudited) (continued)
INVESTMENTS | Principal Amount ($000) | Value ($000) |
Municipal Bonds — continued | ||
Utility—7.4% | ||
Long Island Power Authority, Electric System | ||
Series 2018, Rev., 5.00%, 9/1/2034 | 1,500 | 1,628 |
Series 2018, Rev., 5.00%, 9/1/2035 | 2,000 | 2,158 |
Series 2018, Rev., 5.00%, 9/1/2036 | 1,225 | 1,312 |
Long Island Power Authority, Electrical System, Series 2021A, Rev., 4.00%, 9/1/2041 | 2,030 | 1,967 |
New York Power Authority, Green Transmission Project | ||
Series 2022A, Rev., AGM, 5.00%, 11/15/2028 | 1,300 | 1,439 |
Series 2022A, Rev., AGM, 5.00%, 11/15/2035 | 840 | 961 |
Series 2022A, Rev., AGM, 4.00%, 11/15/2038 | 2,000 | 1,989 |
Utility Debt Securitization Authority | ||
Series 2016A, Rev., 5.00%, 6/15/2026 | 1,250 | 1,266 |
Rev., 5.00%, 12/15/2032 | 2,500 | 2,596 |
Series 2016A, Rev., 5.00%, 12/15/2033 | 3,000 | 3,145 |
Series 2016A, Rev., 5.00%, 12/15/2034 | 4,595 | 4,808 |
Series 2016B, Rev., 5.00%, 12/15/2034 | 2,450 | 2,563 |
Series 2022TE-1, Rev., 5.00%, 12/15/2035 | 800 | 923 |
Utility Debt Securitization Authority, Federally Tax-Exempt, Series 2013TE, Rev., 5.00%, 12/15/2030 | 1,000 | 1,004 |
27,759 | ||
Water & Sewer—9.1% | ||
New York City Municipal Water Finance Authority Fiscal Year 2022, Series 2022BB-1, Rev., 4.00%, 6/15/2045 | 1,500 | 1,437 |
New York City Municipal Water Finance Authority, Second General Resolution | ||
Subseries DD-2, Rev., 5.00%, 6/15/2027 | 1,285 | 1,335 |
Series 2020-EE, Rev., 5.00%, 6/15/2030 | 1,155 | 1,309 |
Series 2018CC-1, Rev., 4.00%, 6/15/2037 | 1,150 | 1,160 |
New York City Municipal Water Finance Authority, Water and Sewer System Second General Resolution, Series 2020CC-1, Rev., 4.00%, 6/15/2041 | 2,000 | 1,966 |
New York City Municipal Water Finance Authority, Water and Sewer System, Second General Resolution, Fiscal Year 2021, Series 2021B-2, Rev., 4.00%, 6/15/2042 | 1,075 | 1,048 |
New York City Municipal Water Finance Authority, Water and Sewer System, Second General Resolution, Fiscal Year 2023, Series 2023DD, Rev., 5.25%, 6/15/2046 | 2,000 | 2,187 |
New York City Water and Sewer System, Second General Resolution, Fiscal Year 2015 | ||
Series 2015EE, Rev., 5.00%, 6/15/2028 | 2,000 | 2,024 |
Series 2015DD, Rev., 5.00%, 6/15/2029 | 2,000 | 2,024 |
INVESTMENTS | Principal Amount ($000) | Value ($000) |
Water & Sewer — continued | ||
New York City Water and Sewer System, Second General Resolution, Fiscal Year 2020, Subseries 202DD-3, Rev., 4.00%, 6/15/2042 | 2,500 | 2,436 |
New York State Environmental Facilities Corp., State Clean Water and Drinking Water Revolving Funds, Municipal Water Finance Authority Projects - Second Resolution | ||
Series 2014A, Rev., 5.00%, 6/15/2027 | 1,500 | 1,517 |
Series 2021A, Rev., 5.00%, 6/15/2030 | 1,070 | 1,217 |
Series 2016A, Rev., 5.00%, 6/15/2031 | 2,150 | 2,254 |
Series 2016A, Rev., 5.00%, 6/15/2032 | 2,000 | 2,096 |
Series 2015A, Rev., 5.00%, 6/15/2033 | 2,000 | 2,060 |
Series 2017E, Rev., 5.00%, 6/15/2038 | 1,240 | 1,307 |
New York State Environmental Facilities Corp., State Clean Water and Drinking Water Revolving Funds, Pooled Financing Program, Series 2005B, Rev., 5.50%, 10/15/2025 (b) | 4,175 | 4,337 |
New York State Environmental Facilities Corp., State Revolving Fund | ||
Series 2019B, Rev., 5.00%, 6/15/2035 | 1,000 | 1,102 |
Series 2021-B, Rev., 4.00%, 8/15/2039 | 1,380 | 1,382 |
34,198 | ||
Total New York | 356,955 | |
Total Municipal Bonds (Cost $361,727) | 356,955 | |
Shares (000) | ||
Short-Term Investments—5.4% | ||
Investment Companies—5.4% | ||
JPMorgan Institutional Tax Free Money Market Fund Class IM Shares, 3.71% (c) (d)(Cost $20,530) | 20,530 | 20,532 |
Total Investments—100.1% (Cost $382,257) | 377,487 | |
Liabilities in Excess of Other Assets—(0.1)% | (499 ) | |
Net Assets—100.0% | 376,988 | |
Percentages indicated are based on net assets. |
Abbreviations | |
AGC | Insured by Assured Guaranty Corp. |
AGM | Insured by Assured Guaranty Municipal Corp. |
AMBAC | Insured by American Municipal Bond Assurance Corp. |
AMT | Alternative Minimum Tax |
66 | J.P. Morgan Municipal Bond Funds | August 31, 2023 |
GO | General Obligation |
MTA | Metropolitan Transportation Authority |
NATL | Insured by National Public Finance Guarantee Corp. |
RE | Reinsured |
Rev. | Revenue |
(a) | The date shown represents the earliest of the prerefunded date, next put date or final maturity date. |
(b) | Security is prerefunded or escrowed to maturity. |
(c) | Investment in an affiliated fund, which is registered under the Investment Company Act of 1940, as amended, and is advised by J.P. Morgan Investment Management Inc. |
(d) | The rate shown is the current yield as of August 31, 2023. |
August 31, 2023 | J.P. Morgan Municipal Bond Funds | 67 |
AS OF August 31, 2023 (Unaudited)
INVESTMENTS | PRINCIPAL AMOUNT ($000) | VALUE ($000) |
Municipal Bonds — 97.8% (a) | ||
Alabama — 3.0% | ||
Birmingham Airport Authority | ||
Rev., 5.00%, 7/1/2027 | 250 | 267 |
Rev., 5.00%, 7/1/2028 | 350 | 380 |
Rev., 5.00%, 7/1/2029 | 375 | 411 |
Rev., 5.00%, 7/1/2030 | 250 | 278 |
Rev., 5.00%, 7/1/2031 | 175 | 194 |
Rev., 5.00%, 7/1/2032 | 150 | 166 |
Rev., 5.00%, 7/1/2033 | 325 | 359 |
Rev., 5.00%, 7/1/2034 | 375 | 413 |
Black Belt Energy Gas District Series 2021C-1, Rev., 4.00%, 12/1/2026 (b) | 7,515 | 7,346 |
Black Belt Energy Gas District, Gas Prepay Series 2018B-2, Rev., (SIFMA Municipal Swap Index Yield + 0.62%), 4.68%, 9/7/2023 (c) | 7,500 | 7,495 |
Black Belt Energy Gas District, Gas Project | ||
Series 2022C-1, Rev., 5.25%, 6/1/2027 | 1,300 | 1,349 |
Series 2022B-1, Rev., 4.00%, 10/1/2027 (b) | 2,500 | 2,430 |
Series 2022C-1, Rev., 5.25%, 12/1/2027 | 1,165 | 1,216 |
City of Huntsville, Warrants Series 2017D, GO, 5.00%, 11/1/2024 | 125 | 127 |
City of Montgomery, Warrants Series 2020, GO, 4.00%, 2/1/2025 | 100 | 101 |
Selma Industrial Development Board, International Paper Co. Project Series 2019A, Rev., 2.00%, 10/1/2024 (b) | 3,625 | 3,546 |
Southeast Energy Authority A Cooperative District Project No.06 Series 2023B, Rev., LIQ : Royal Bank of Canada, 5.00%, 6/1/2030 (b) | 3,320 | 3,442 |
Total Alabama | 29,520 | |
Alaska — 0.5% | ||
Alaska Municipal Bond Bank Authority | ||
Series 1, Rev., 5.00%, 12/1/2028 | 1,230 | 1,327 |
Series 1, Rev., 5.00%, 12/1/2029 | 1,275 | 1,393 |
Series 1, Rev., 5.00%, 12/1/2030 | 875 | 969 |
Borough of Matanuska-Susitna Series 2007A, GO, NATL - RE, 5.00%, 4/1/2025 | 100 | 102 |
City of Anchorage, Electric Utilities, Senior Lien Series 2014A, Rev., 5.00%, 12/1/2023 (d) | 500 | 502 |
State of Alaska Series 2023A, GO, 5.00%, 8/1/2024 | 145 | 147 |
Total Alaska | 4,440 | |
Arizona — 3.5% | ||
Arizona Health Facilities Authority Series 2014A, Rev., 5.00%, 1/1/2024 (d) | 235 | 236 |
Arizona Health Facilities Authority, Scottsdale Lincoln Hospitals Series 2014A, Rev., 5.00%, 12/1/2025 | 3,540 | 3,597 |
INVESTMENTS | PRINCIPAL AMOUNT ($000) | VALUE ($000) |
Arizona — continued | ||
Arizona Industrial Development Authority, Phoenix Children's Hospital Series 2020A, Rev., 5.00%, 2/1/2027 | 125 | 131 |
Arizona State University Series 2021, Rev., 5.00%, 8/1/2024 | 125 | 127 |
City of Mesa Series 2016, GO, 3.00%, 7/1/2025 | 500 | 496 |
City of Phoenix Civic Improvement Corp., Junior Lien, Water System Series 2014B, Rev., 5.00%, 7/1/2024 | 350 | 355 |
City of Phoenix Civic Improvement Corp., Senior Lien, Airport System | ||
Series 2023, Rev., AMT, 5.00%, 7/1/2024 | 375 | 378 |
Series 2023, Rev., AMT, 5.00%, 7/1/2025 | 500 | 510 |
Series 2023, Rev., AMT, 5.00%, 7/1/2026 | 1,505 | 1,555 |
Maricopa County Elementary School District No. 6 Washington, School Improvement, Project of 2016 Series 2019B, GO, 5.00%, 7/1/2029 | 3,950 | 4,285 |
Maricopa County Industrial Development Authority, Banner Health | ||
Series C, Rev., 5.00%, 10/18/2024 (b) | 5,000 | 5,077 |
Series 2023A-1, Rev., 5.00%, 5/15/2026 (b) | 1,235 | 1,280 |
Maricopa County Pollution Control Corp., Palo Verde Project | ||
Series 2010A, Rev., 0.88%, 10/1/2026 (b) | 4,500 | 3,972 |
Series 2010B, Rev., 0.88%, 10/1/2026 (b) | 2,150 | 1,898 |
Maricopa County Unified School District No. 11-Peoria Series 2015, GO, AGM, 5.00%, 7/1/2024 | 250 | 254 |
Maricopa County Unified School District No. 41 Gilbert, Project of 2019 Series 2023C, GO, 5.00%, 7/1/2024 | 775 | 785 |
Salt River Project Agricultural Improvement and Power District Series 2022A, Rev., 5.00%, 1/1/2031 | 5,000 | 5,673 |
Tempe Industrial Development Authority, Friendship Village of Tempe Project | ||
Series 2021C-2, Rev., 1.13%, 12/1/2026 | 1,470 | 1,369 |
Series 2021C-1, Rev., 1.50%, 12/1/2027 | 1,965 | 1,791 |
Total Arizona | 33,769 | |
Arkansas — 1.0% | ||
Arkansas Development Finance Authority Public Safety Charges, Division of Emergency Management Project | ||
Rev., 4.00%, 6/1/2028 | 1,000 | 1,022 |
Rev., 4.00%, 6/1/2030 | 1,195 | 1,211 |
68 | J.P. Morgan Municipal Bond Funds | August 31, 2023 |
INVESTMENTS | PRINCIPAL AMOUNT ($000) | VALUE ($000) |
Municipal Bonds — continued | ||
Arkansas — continued | ||
Arkansas Development Finance Authority, Department of Community Correction Project Rev., 5.00%, 11/1/2026 | 325 | 342 |
City of Rogers, Sales Tax Series 2018B, Rev., 5.00%, 11/1/2027 | 3,855 | 4,034 |
County of Sharp, Sales and Use Tax | ||
Rev., 5.00%, 3/1/2024 | 595 | 598 |
Rev., 5.00%, 3/1/2026 | 685 | 705 |
University of Arkansas, Various Facility Fayetteville Campus Series 2012A, Rev., 5.00%, 5/1/2024 (d) | 125 | 126 |
University of Arkansas, Various Facility UAMS Campus | ||
Rev., 5.00%, 3/1/2025 | 500 | 512 |
Rev., 5.00%, 3/1/2026 | 1,000 | 1,022 |
University of Central Arkansas, Student Housing System | ||
Series 2019C, Rev., AGM, 4.00%, 11/1/2025 | 110 | 111 |
Series 2019C, Rev., AGM, 4.00%, 11/1/2026 | 240 | 243 |
Series 2019C, Rev., AGM, 4.00%, 11/1/2027 | 180 | 182 |
Total Arkansas | 10,108 | |
California — 12.2% | ||
Bay Area Toll Authority, Toll Bridge Series 2017S-7, Rev., 4.00%, 4/1/2029 | 20,000 | 20,703 |
California Community Choice Financing Authority, Clean Energy Project | ||
Series 2023B-1, Rev., 5.00%, 8/1/2029 (b) | 2,500 | 2,598 |
Series 2023E-1, Rev., 5.00%, 3/1/2031 (b) | 2,500 | 2,618 |
California Health Facilities Financing Authority, Adventist Health System Series 2011A, Rev., 3.00%, 3/1/2024 (b) | 7,690 | 7,655 |
California Health Facilities Financing Authority, Cedars-Sinai Medical Center Rev., 5.00%, 11/15/2025 | 1,850 | 1,918 |
California Municipal Finance Authority, California Lutheran University | ||
Rev., 5.00%, 10/1/2025 | 275 | 280 |
Rev., 5.00%, 10/1/2026 | 150 | 155 |
Rev., 5.00%, 10/1/2027 | 150 | 156 |
California Municipal Finance Authority, North Bay Healthcare Group | ||
Series 2017A, Rev., 5.00%, 11/1/2023 | 500 | 501 |
Series 2017A, Rev., 5.00%, 11/1/2024 | 800 | 807 |
California Public Finance Authority, Enso Village Project Series 2021B-3, Rev., 2.13%, 11/15/2027 (e) | 2,945 | 2,855 |
INVESTMENTS | PRINCIPAL AMOUNT ($000) | VALUE ($000) |
California — continued | ||
California School Finance Authority Series A, Rev., 6.38%, 7/1/2025 (d) (e) | 1,000 | 1,058 |
California Statewide Communities Development Authority, Marin General Hospital Project Series 2018A, Rev., 5.00%, 8/1/2028 | 250 | 260 |
City of Chula Vista, Police Facility Project COP, 5.00%, 10/1/2023 | 1,000 | 1,001 |
City of Los Angeles Department of Airports Series D, Rev., AMT, 5.00%, 5/15/2028 | 1,950 | 1,990 |
City of Los Angeles Department of Airports, International Airport Senior | ||
Series B, Rev., 4.00%, 5/15/2024 | 365 | 367 |
Series D, Rev., AMT, 5.00%, 5/15/2027 | 2,700 | 2,752 |
Series D, Rev., AMT, 5.00%, 5/15/2029 | 2,550 | 2,602 |
Grossmont Healthcare District | ||
Series C, GO, 5.00%, 7/15/2026 | 1,000 | 1,033 |
Series D, GO, 5.00%, 7/15/2026 | 1,225 | 1,266 |
Los Angeles Community College District Series 2015C, GO, 5.00%, 6/1/2026 | 5,000 | 5,273 |
Los Angeles Community College District, Election of 2016 Series C-1, GO, 5.00%, 8/1/2026 | 250 | 265 |
Los Angeles Department of Water and Power, Water System Series 2018A, Rev., 5.00%, 7/1/2025 | 100 | 103 |
Novato Unified School District | ||
Series 2014A, GO, 5.00%, 8/1/2025 | 1,500 | 1,524 |
Series 2014A, GO, 5.00%, 8/1/2026 | 1,800 | 1,830 |
Placentia-Yorba Linda Unified School District GO, 5.00%, 8/1/2025 | 1,770 | 1,831 |
Port of Oakland, Intermediate Lien Series 2021H, Rev., AMT, 5.00%, 5/1/2024 (d) | 210 | 212 |
Sacramento Municipal Utility District, Electric Series 2017E, Rev., 5.00%, 8/15/2027 | 105 | 114 |
San Diego Public Facilities Financing Authority Series 2020A, Rev., 5.00%, 8/1/2027 | 250 | 270 |
San Francisco Bay Area Rapid Transit District, Election of 2004 Series 2015D, GO, 5.00%, 8/1/2028 | 1,685 | 1,747 |
Santa Barbara Unified School District Series 2017B, GO, 5.00%, 8/1/2026 | 50 | 53 |
Sequoia Union High School District Series 2014, GO, 4.00%, 7/1/2024 (d) | 1,095 | 1,103 |
Sonoma County Transportation Authority, Limited Tax Rev., 5.00%, 12/1/2024 | 1,000 | 1,020 |
State of California, Various Purpose | ||
Series B, GO, 5.00%, 9/1/2023 | 2,810 | 2,810 |
GO, 5.00%, 3/1/2026 | 13,210 | 13,565 |
GO, 5.00%, 9/1/2026 | 1,000 | 1,058 |
August 31, 2023 | J.P. Morgan Municipal Bond Funds | 69 |
AS OF August 31, 2023 (Unaudited) (continued)
INVESTMENTS | PRINCIPAL AMOUNT ($000) | VALUE ($000) |
Municipal Bonds — continued | ||
California — continued | ||
GO, 4.00%, 8/1/2028 | 4,000 | 4,095 |
GO, 4.00%, 8/1/2029 | 4,180 | 4,274 |
GO, 5.00%, 8/1/2029 | 7,830 | 8,259 |
GO, 4.00%, 8/1/2030 | 10,000 | 10,223 |
Stockton Public Financing Authority | ||
Rev., 5.00%, 3/1/2027 | 630 | 638 |
Rev., 5.00%, 3/1/2029 | 465 | 476 |
University of California Series 2023BN, Rev., 5.00%, 5/15/2033 | 5,000 | 5,958 |
Total California | 119,276 | |
Colorado — 1.3% | ||
Board of Governors of Colorado State University System Series E-2, Rev., 5.00%, 3/1/2024 | 110 | 111 |
City of Longmont Series A, COP, 5.00%, 12/1/2023 (d) | 100 | 100 |
Colorado Health Facilities Authority, School Health System Series 2013A, Rev., 5.50%, 1/1/2024 (d) | 125 | 126 |
Colorado Housing and Finance Authority, Single Family Mortgage Series 2023L, Rev., GNMA COLL, 5.75%, 11/1/2053 (f) | 3,500 | 3,716 |
Colorado School of Mines Series 2022D, Rev., (SIFMA Municipal Swap Index Yield + 0.87%), 4.93%, 9/7/2023 (c) | 1,500 | 1,500 |
Counties of Gunnison, Watershed School District No. 1J Series A, GO, 5.00%, 12/1/2024 (d) | 500 | 510 |
Regional Transportation District, Denver Transit Partners | ||
Series 2020A, Rev., 5.00%, 1/15/2027 | 500 | 521 |
Series 2020A, Rev., 5.00%, 7/15/2027 | 500 | 524 |
Series 2020A, Rev., 5.00%, 1/15/2028 | 250 | 264 |
Series 2020A, Rev., 5.00%, 7/15/2028 | 175 | 186 |
Series 2020A, Rev., 5.00%, 1/15/2029 | 300 | 320 |
Series 2020A, Rev., 5.00%, 7/15/2029 | 135 | 145 |
Series 2020A, Rev., 5.00%, 1/15/2030 | 165 | 178 |
Series 2020A, Rev., 5.00%, 7/15/2030 | 115 | 124 |
State of Colorado | ||
Series 2013I, COP, 5.00%, 3/15/2024 (d) | 1,405 | 1,416 |
COP, 4.00%, 12/15/2039 | 3,075 | 3,042 |
Total Colorado | 12,783 | |
Connecticut — 2.0% | ||
City of New Haven | ||
Series 2021A, GO, 5.00%, 8/1/2024 | 400 | 404 |
Series 2021A, GO, 5.00%, 8/1/2025 | 425 | 434 |
INVESTMENTS | PRINCIPAL AMOUNT ($000) | VALUE ($000) |
Connecticut — continued | ||
Connecticut State Health and Educational Facilities Authority, Hartford Healthcare Series 2020B-2, Rev., 5.00%, 1/1/2027 (b) | 7,750 | 8,043 |
State of Connecticut | ||
Series 2022G, GO, 5.00%, 11/15/2031 | 5,000 | 5,715 |
Series 2020C, GO, 4.00%, 6/1/2032 | 1,000 | 1,051 |
State of Connecticut, Special Tax Transportation Infrastructure Purposes | ||
Series 2021D, Rev., 5.00%, 11/1/2029 | 1,230 | 1,367 |
Series 2021D, Rev., 5.00%, 11/1/2030 | 1,825 | 2,059 |
Total Connecticut | 19,073 | |
Delaware — 0.0% ^ | ||
Delaware Transportation Authority Series 2022, Rev., 5.00%, 7/1/2024 | 175 | 178 |
District of Columbia — 0.2% | ||
Metropolitan Washington Airports Authority Aviation Series 2023A, Rev., AMT, 5.00%, 10/1/2025 | 875 | 894 |
Washington Metropolitan Area Transit Authority | ||
Series A-1, Rev., 5.00%, 7/1/2024 | 250 | 253 |
Series 2017B, Rev., 5.00%, 7/1/2029 | 1,120 | 1,189 |
Total District of Columbia | 2,336 | |
Florida — 1.0% | ||
City of Tallahassee, Energy System Rev., 5.00%, 10/1/2025 | 300 | 310 |
Collier County Educational Facilities Authority | ||
Series 2023, Rev., 5.00%, 6/1/2028 | 1,000 | 1,022 |
Series 2023, Rev., 5.00%, 6/1/2029 | 500 | 513 |
County of Pasco Series A, Rev., 5.00%, 10/1/2024 | 250 | 254 |
Florida Higher Educational Facilities Financial Authority, Florida Institute of Technology Rev., 5.00%, 10/1/2023 | 125 | 125 |
Fort Pierce Utilities Authority | ||
Series 2022A, Rev., AGM, 5.00%, 10/1/2028 | 350 | 379 |
Series 2022A, Rev., AGM, 5.00%, 10/1/2029 | 350 | 383 |
Hillsborough County Industrial Development Authority, Tampa General Hospital Project Series 2012A, Rev., 4.00%, 10/1/2023 (d) | 1,000 | 1,000 |
JEA Water and Sewer System Series 2017A, Rev., 5.00%, 10/1/2025 | 250 | 259 |
Orange County Health Facilities Authority, Orlando Health Obligated Group Series 2023A, Rev., 5.00%, 10/1/2032 | 1,500 | 1,693 |
70 | J.P. Morgan Municipal Bond Funds | August 31, 2023 |
INVESTMENTS | PRINCIPAL AMOUNT ($000) | VALUE ($000) |
Municipal Bonds — continued | ||
Florida — continued | ||
State of Florida Series 2022C, GO, 5.00%, 6/1/2024 | 1,850 | 1,873 |
Volusia County School Board Series 2021A, COP, 5.00%, 8/1/2027 | 1,965 | 2,102 |
Total Florida | 9,913 | |
Georgia — 2.4% | ||
Atlanta Development Authority (The), New Downtown Atlanta Stadium Project, Senior Lien | ||
Series A-1, Rev., 5.00%, 7/1/2027 | 1,000 | 1,029 |
Series A-1, Rev., 5.00%, 7/1/2028 | 1,000 | 1,028 |
City of Atlanta Airport Passenger Facility Charge, Subordinate Lien Series 2023E, Rev., AMT, 5.00%, 7/1/2024 | 1,750 | 1,764 |
City of Columbus Series 2022, GO, 5.00%, 1/1/2025 | 100 | 102 |
Dahlonega Downtown Development Authority, North Georgia MAC, LLC Project | ||
Rev., 5.00%, 7/1/2025 | 250 | 255 |
Rev., 5.00%, 7/1/2026 | 275 | 285 |
Rev., 5.00%, 7/1/2028 | 375 | 393 |
Rev., 4.00%, 7/1/2032 | 1,000 | 1,001 |
Main Street Natural Gas, Inc., Gas Supply Series 2021A, Rev., 4.00%, 9/1/2027 (b) | 3,250 | 3,222 |
Private Colleges and Universities Authority, Emory University Series 2020B, Rev., 5.00%, 9/1/2030 | 10,755 | 12,140 |
State of Georgia | ||
Series 2019A, GO, 5.00%, 7/1/2024 | 245 | 248 |
Series 2016F, GO, 5.00%, 7/1/2028 | 2,000 | 2,129 |
Total Georgia | 23,596 | |
Guam — 0.3% | ||
Territory of Guam (Guam) | ||
Series 2021F, Rev., 5.00%, 1/1/2028 | 250 | 258 |
Series 2021F, Rev., 5.00%, 1/1/2029 | 750 | 776 |
Series 2021F, Rev., 5.00%, 1/1/2030 | 750 | 776 |
Series 2021F, Rev., 5.00%, 1/1/2031 | 750 | 776 |
Total Guam | 2,586 | |
Hawaii — 0.1% | ||
City and County of Honolulu Series A, GO, 5.00%, 10/1/2029 | 675 | 698 |
Illinois — 8.4% | ||
Carol Stream Park District Series 2020C, GO, 4.00%, 11/1/2027 | 200 | 207 |
Carol Stream Park District, Limited Tax Series 2020A, GO, 4.00%, 11/1/2028 | 145 | 150 |
INVESTMENTS | PRINCIPAL AMOUNT ($000) | VALUE ($000) |
Illinois — continued | ||
Champaign County Community Unit School District No. 4 Champaign | ||
GO, 4.00%, 6/1/2028 | 1,255 | 1,292 |
GO, 4.00%, 6/1/2029 | 1,000 | 1,033 |
GO, 4.00%, 6/1/2030 | 1,285 | 1,326 |
Champaign County Community Unit School District No. 4 Champaign, Capital Appreciation | ||
Series 2020A, GO, Zero Coupon, 1/1/2027 | 385 | 339 |
Series 2020A, GO, Zero Coupon, 1/1/2028 | 570 | 484 |
Chicago Transit Authority Capital Grant Receipts Rev., 5.00%, 6/1/2029 | 1,875 | 2,009 |
City of Chicago, Waterworks, Second Lien Series 2023B, Rev., 5.00%, 11/1/2023 | 1,500 | 1,503 |
City of Springfield Series 2015, Rev., 5.00%, 3/1/2024 | 225 | 227 |
City of Waukegan | ||
Series 2018B, GO, AGM, 5.00%, 12/30/2025 | 1,075 | 1,115 |
Series 2018B, GO, AGM, 5.00%, 12/30/2026 | 1,125 | 1,186 |
Series 2018B, GO, AGM, 5.00%, 12/30/2027 | 1,185 | 1,248 |
City of Waukegan, First Lien, Water and Sewer System | ||
Series 2018C, Rev., AGM, 5.00%, 12/30/2023 | 535 | 538 |
Series 2018C, Rev., AGM, 5.00%, 12/30/2026 | 680 | 717 |
Series 2018C, Rev., AGM, 5.00%, 12/30/2027 | 710 | 748 |
Cook County Community Consolidated School District No. 65, Evanston, Limited Tax GO, 4.00%, 12/1/2030 | 1,225 | 1,265 |
Cook County Community School District No. 97, Oak Park | ||
GO, 4.00%, 1/1/2028 | 500 | 511 |
GO, 4.00%, 1/1/2029 | 375 | 386 |
GO, 4.00%, 1/1/2030 | 285 | 293 |
Cook County School District No. 69, Skokie, Limited Tax | ||
GO, 4.00%, 12/1/2026 | 470 | 479 |
GO, 4.00%, 12/1/2027 | 490 | 503 |
GO, 4.00%, 12/1/2028 | 545 | 564 |
GO, 4.00%, 12/1/2029 | 515 | 532 |
GO, 4.00%, 12/1/2030 | 200 | 207 |
GO, 4.00%, 12/1/2031 | 820 | 845 |
Cook County School District No. 99 Cicero, Limited Tax | ||
Series 2019B, GO, 5.00%, 12/1/2024 | 505 | 513 |
Series 2019B, GO, 5.00%, 12/1/2025 | 515 | 532 |
Cook County Township High School District No. 225, Glenbrook Series 2016A, GO, 5.00%, 12/1/2023 | 5 | 5 |
August 31, 2023 | J.P. Morgan Municipal Bond Funds | 71 |
AS OF August 31, 2023 (Unaudited) (continued)
INVESTMENTS | PRINCIPAL AMOUNT ($000) | VALUE ($000) |
Municipal Bonds — continued | ||
Illinois — continued | ||
Cook County, Proviso Township High School District No. 209, Limited Tax GO, 5.00%, 12/1/2023 | 2,350 | 2,358 |
County of Cook Series 2021B, GO, 4.00%, 11/15/2027 | 125 | 128 |
County of Du Page, Courthouse Project GO, 5.00%, 1/1/2024 | 335 | 337 |
DeKalb County Community Unit School District No. 428 DeKalb | ||
GO, 4.00%, 1/1/2028 | 1,265 | 1,307 |
GO, 4.00%, 1/1/2029 | 650 | 673 |
GO, 4.00%, 1/1/2030 | 600 | 620 |
GO, 4.00%, 1/1/2031 | 1,000 | 1,032 |
Effingham Community Unit School District No. 40 Series 2019A, GO, 4.00%, 12/1/2028 | 565 | 585 |
Glenview Park District | ||
GO, 5.00%, 12/1/2026 | 300 | 318 |
GO, 5.00%, 12/1/2029 | 350 | 369 |
Grundy and Kendall Counties Consolidated Grade School District No. 60-C GO, 4.00%, 2/1/2030 | 1,145 | 1,191 |
Illinois Finance Authority, DePaul University | ||
Rev., 5.00%, 10/1/2023 | 200 | 200 |
Rev., 5.00%, 10/1/2025 | 300 | 308 |
Rev., 5.00%, 10/1/2028 | 250 | 261 |
Illinois Finance Authority, Lake Zurich Community Unit School District No. 95 Project | ||
Rev., 4.00%, 1/15/2030 | 1,960 | 2,014 |
Rev., 4.00%, 1/15/2032 | 2,120 | 2,176 |
Illinois Finance Authority, The University of Chicago Medical Center Series 2011B, Rev., VRDO, LOC : Sumitomo Mitsui Banking Corp., 4.05%, 9/8/2023 (b) | 1,000 | 1,000 |
Illinois Finance Authority, University of Chicago Series 2015A, Rev., 5.00%, 10/1/2025 (d) | 6,500 | 6,708 |
Kane and DeKalb Counties Community Unit School District No 301 Burlington GO, 5.00%, 1/1/2027 | 355 | 374 |
Kane County School District No. 131 Aurora East Side | ||
Series 2020A, GO, AGM, 5.00%, 12/1/2026 | 115 | 120 |
Series 2020B, GO, AGM, 5.00%, 12/1/2026 | 210 | 220 |
Series 2020A, GO, AGM, 4.00%, 12/1/2027 | 105 | 108 |
Series 2020A, GO, AGM, 4.00%, 12/1/2028 | 65 | 67 |
Series 2020B, GO, AGM, 4.00%, 12/1/2028 | 135 | 140 |
Series 2020A, GO, AGM, 4.00%, 12/1/2029 | 65 | 67 |
Series 2020B, GO, AGM, 4.00%, 12/1/2029 | 40 | 41 |
Series 2020A, GO, AGM, 4.00%, 12/1/2030 | 80 | 83 |
INVESTMENTS | PRINCIPAL AMOUNT ($000) | VALUE ($000) |
Illinois — continued | ||
Madison-Macoupin Etc. Counties Community College District No. 536, Lewis and Clark Community | ||
GO, AGM, 4.00%, 5/1/2025 | 400 | 402 |
GO, AGM, 4.00%, 5/1/2026 | 200 | 203 |
GO, AGM, 4.00%, 5/1/2028 | 350 | 359 |
GO, AGM, 4.00%, 5/1/2029 | 2,000 | 2,049 |
Maine Township High School District No. 207 of Cook Country | ||
Series 2019A, GO, 5.00%, 12/1/2027 | 1,915 | 2,067 |
Series 2019A, GO, 5.00%, 12/1/2028 | 1,930 | 2,120 |
Series 2019A, GO, 4.00%, 12/1/2029 | 1,945 | 2,022 |
Peoria County Community Unit School District No. 309 Brimfield | ||
GO, AGM, 4.00%, 4/1/2026 | 750 | 761 |
GO, AGM, 4.00%, 4/1/2027 | 780 | 798 |
GO, AGM, 4.00%, 4/1/2028 | 410 | 423 |
GO, AGM, 4.00%, 4/1/2029 | 240 | 250 |
GO, AGM, 4.00%, 4/1/2030 | 375 | 390 |
Peoria Public Building Commission | ||
Series 2019A, Rev., AGM, 4.00%, 12/1/2025 | 700 | 705 |
Series 2019A, Rev., AGM, 4.00%, 12/1/2026 | 1,000 | 1,012 |
Series 2019A, Rev., AGM, 4.00%, 12/1/2027 | 1,270 | 1,292 |
Series 2019A, Rev., AGM, 5.00%, 12/1/2028 | 1,200 | 1,286 |
Series 2019A, Rev., AGM, 5.00%, 12/1/2029 | 2,400 | 2,564 |
Sales Tax Securitization Corp. | ||
Series 2018C, Rev., 5.00%, 1/1/2024 | 3,000 | 3,013 |
Series 2018C, Rev., 5.00%, 1/1/2025 | 4,250 | 4,326 |
Southwestern Illinois Development Authority, Hospital Sisters Services, Inc., Obligated Group Series 2017A, Rev., 5.00%, 2/15/2027 | 2,000 | 2,071 |
State of Illinois | ||
Series 2017D, GO, 5.00%, 11/1/2023 | 5,000 | 5,009 |
Series 2022A, GO, 5.00%, 3/1/2024 | 500 | 503 |
Series 2023D, GO, 5.00%, 7/1/2024 | 1,000 | 1,010 |
Series 2023B, GO, 5.00%, 5/1/2028 | 1,000 | 1,059 |
Village of Skokie GO, 5.00%, 12/1/2028 | 1,550 | 1,693 |
Will County Forest Preservation District, Limited Tax GO, 5.00%, 12/15/2027 | 805 | 873 |
Will County Township High School District No. 204 Joliet, Limited Tax GO, 4.00%, 1/1/2029 | 250 | 257 |
Total Illinois | 82,079 | |
Indiana — 2.3% | ||
City of Evansville, Sewage Works Rev., 4.00%, 7/1/2027 | 985 | 1,012 |
72 | J.P. Morgan Municipal Bond Funds | August 31, 2023 |
INVESTMENTS | PRINCIPAL AMOUNT ($000) | VALUE ($000) |
Municipal Bonds — continued | ||
Indiana — continued | ||
City of Rockport, Indiana Michigan Power Co. Project Series 2009B, Rev., 3.05%, 6/1/2025 | 5,000 | 4,910 |
Indiana Finance Authority, Indiana University Health Obligated Group Series 2019B, Rev., 2.25%, 7/1/2025 (b) | 5,000 | 4,850 |
Indiana Finance Authority, Indianapolis Power and Light Co. Project | ||
Series 2020B, Rev., AMT, 0.95%, 4/1/2026 (b) | 4,525 | 4,041 |
Series 2021A, Rev., 1.40%, 8/1/2029 (b) | 7,000 | 5,976 |
Purdue University, Student Fee | ||
Series DD, Rev., 5.00%, 7/1/2025 | 870 | 898 |
Series DD, Rev., 5.00%, 7/1/2027 | 10 | 11 |
South Bend Community School Corp. Series 2022B, GO, 4.00%, 1/15/2024 | 720 | 721 |
Total Indiana | 22,419 | |
Iowa — 1.1% | ||
Iowa Finance Authority, Health System Series 2018A, Rev., (SIFMA Municipal Swap Index Yield + 0.50%), 4.64%, 9/7/2023 (c) (e) | 10,835 | 10,828 |
Kansas — 1.3% | ||
City of Wichita, Sales Tax, River District Stadium Star Bond Project | ||
Rev., 5.00%, 9/1/2025 | 300 | 308 |
Rev., 5.00%, 9/1/2026 | 465 | 487 |
City of Wichita, Water and Sewer System Series 2016B, Rev., 5.00%, 10/1/2024 | 200 | 203 |
Kansas Development Finance Authority, State of Kansas Project | ||
Series 2019F, Rev., 5.00%, 11/1/2024 | 170 | 173 |
Series 2019F, Rev., 4.00%, 11/1/2029 | 6,820 | 6,988 |
Seward County Unified School District No. 480 Liberal Series 2017-B, GO, 5.00%, 9/1/2025 | 1,750 | 1,806 |
University of Kansas Hospital Authority, Health System | ||
Series 2017A, Rev., 5.00%, 3/1/2024 (d) | 70 | 71 |
Series 2017A, Rev., 5.00%, 3/1/2024 | 205 | 207 |
Wyandotte County Unified School District No. 202 Turner | ||
Series 2019A, GO, AGM, 5.00%, 9/1/2025 | 400 | 411 |
Series 2019A, GO, AGM, 5.00%, 9/1/2026 | 220 | 230 |
Series 2019A, GO, AGM, 5.00%, 9/1/2027 | 325 | 346 |
Series 2019A, GO, AGM, 5.00%, 9/1/2028 | 400 | 432 |
INVESTMENTS | PRINCIPAL AMOUNT ($000) | VALUE ($000) |
Kansas — continued | ||
Series 2019A, GO, AGM, 5.00%, 9/1/2029 | 375 | 405 |
Wyandotte County-Kansas City Unified Government Series 2021A, GO, AGM, 4.00%, 8/1/2024 | 1,000 | 1,006 |
Total Kansas | 13,073 | |
Kentucky — 3.2% | ||
Kentucky Municipal Power Agency, Prairie State Project Series 2015A, Rev., NATL - RE, 5.00%, 9/1/2023 | 240 | 240 |
Kentucky Public Energy Authority, Gas Supply | ||
Series 2018A, Rev., 4.00%, 4/1/2024 (b) | 2,500 | 2,501 |
Series 2018C-1, Rev., 4.00%, 6/1/2025 (b) | 10,160 | 10,165 |
Series 2019C, Rev., 4.00%, 2/1/2028 (b) | 6,500 | 6,450 |
Louisville and Jefferson County Metropolitan Government, Norton Healthcare, Inc. Series 2020D, Rev., 5.00%, 10/1/2029 (b) | 10,500 | 11,060 |
Northern Kentucky University Series 2014A, Rev., 5.00%, 9/1/2024 | 1,310 | 1,319 |
Total Kentucky | 31,735 | |
Louisiana — 1.5% | ||
City of Shreveport, Water and Sewer, Junior Lien | ||
Series 2018C, Rev., 5.00%, 12/1/2023 | 365 | 366 |
Series 2019B, Rev., AGM, 4.00%, 12/1/2025 | 400 | 405 |
Series 2018C, Rev., 5.00%, 12/1/2025 | 915 | 943 |
Series 2018C, Rev., 5.00%, 12/1/2026 | 500 | 523 |
Series 2019B, Rev., AGM, 5.00%, 12/1/2026 | 360 | 375 |
Series 2019B, Rev., AGM, 5.00%, 12/1/2027 | 600 | 634 |
Series 2019B, Rev., AGM, 5.00%, 12/1/2028 | 500 | 540 |
Series 2019B, Rev., AGM, 5.00%, 12/1/2029 | 300 | 324 |
Jefferson Sales Tax District Series 2019B, Rev., AGM, 4.00%, 12/1/2032 | 5,815 | 5,960 |
Louisiana Public Facilities Authority, Tulane University of Louisiana Project | ||
Series 2023A, Rev., 5.00%, 10/15/2028 | 175 | 190 |
Series 2023A, Rev., 5.00%, 10/15/2029 | 175 | 193 |
Series 2023A, Rev., 5.00%, 10/15/2030 | 175 | 196 |
Series 2023A, Rev., 5.00%, 10/15/2031 | 175 | 198 |
Series 2023A, Rev., 5.00%, 10/15/2032 | 225 | 257 |
Louisiana Public Facilities Authority, Tulane University Project | ||
Series 2017A, Rev., 5.00%, 12/15/2025 | 250 | 259 |
Series 2020A, Rev., 5.00%, 4/1/2027 | 150 | 159 |
Series 2020A, Rev., 5.00%, 4/1/2028 | 165 | 178 |
Series 2020A, Rev., 5.00%, 4/1/2029 | 220 | 241 |
Series 2020A, Rev., 5.00%, 4/1/2030 | 130 | 144 |
August 31, 2023 | J.P. Morgan Municipal Bond Funds | 73 |
AS OF August 31, 2023 (Unaudited) (continued)
INVESTMENTS | PRINCIPAL AMOUNT ($000) | VALUE ($000) |
Municipal Bonds — continued | ||
Louisiana — continued | ||
Series 2020A, Rev., 5.00%, 4/1/2031 | 150 | 165 |
State of Louisiana Series 2014C, GO, 5.00%, 8/1/2024 | 150 | 152 |
State of Louisiana Gasoline and Fuels Tax Series A, Rev., 4.50%, 5/1/2025 (d) | 2,000 | 2,034 |
Total Louisiana | 14,436 | |
Maryland — 0.1% | ||
County of Prince George's Series 2020A, GO, 5.00%, 7/15/2032 | 1,000 | 1,088 |
Massachusetts — 2.5% | ||
Commonwealth of Massachusetts, Consolidated Loan of 2015 Series 2015D, GO, 4.00%, 9/1/2030 | 8,290 | 8,365 |
Massachusetts Bay Transportation Authority Sales Tax Series 2022A, Rev., VRDO, LIQ : TD Bank NA, 4.20%, 9/12/2023 (b) | 14,000 | 14,000 |
Massachusetts Development Finance Agency, Suffolk University Issue | ||
Rev., 5.00%, 7/1/2025 | 525 | 531 |
Rev., 5.00%, 7/1/2026 | 435 | 446 |
Rev., 5.00%, 7/1/2027 | 420 | 435 |
Rev., 5.00%, 7/1/2028 | 525 | 548 |
Total Massachusetts | 24,325 | |
Michigan — 1.2% | ||
Avondale School District, Unlimited Tax Series 2020A, GO, Q-SBLF, 5.00%, 5/1/2029 | 1,835 | 2,023 |
City of Royal Oak, Limited Tax, Capital Improvement | ||
GO, 5.00%, 4/1/2027 | 625 | 663 |
GO, 5.00%, 4/1/2028 | 245 | 264 |
Gerald R Ford International Airport Authority, Limited Tax Rev., GTD, 5.00%, 1/1/2024 | 1,400 | 1,408 |
Grosse Pointe Public School System GO, 4.00%, 5/1/2027 | 765 | 785 |
Jackson Public Schools, Unlimited Tax | ||
GO, Q-SBLF, 4.00%, 5/1/2025 | 570 | 576 |
GO, Q-SBLF, 4.00%, 5/1/2026 | 885 | 902 |
GO, Q-SBLF, 4.00%, 5/1/2027 | 1,090 | 1,123 |
Michigan State Hospital Finance Authority, Ascension Health Credit Group Series 1999B-4, Rev., 5.00%, 11/15/2027 | 2,250 | 2,306 |
Northville Public Schools, School Building and Site | ||
Series 2019-II, GO, 5.00%, 5/1/2027 | 375 | 399 |
Series 2019-II, GO, 5.00%, 5/1/2028 | 600 | 650 |
Series 2019-II, GO, 5.00%, 5/1/2029 | 250 | 275 |
Total Michigan | 11,374 | |
INVESTMENTS | PRINCIPAL AMOUNT ($000) | VALUE ($000) |
Minnesota — 0.5% | ||
City of Minneapolis Series 2021, GO, 4.00%, 12/1/2024 | 355 | 358 |
Duluth Independent School District No. 709 | ||
Series 2019B, COP, 5.00%, 2/1/2024 | 210 | 211 |
Series 2019C, COP, 5.00%, 2/1/2024 | 295 | 297 |
Series 2019B, COP, 5.00%, 2/1/2025 | 185 | 189 |
Series 2019C, COP, 5.00%, 2/1/2025 | 310 | 316 |
Series 2019B, COP, 5.00%, 2/1/2026 | 195 | 202 |
Series 2019C, COP, 5.00%, 2/1/2026 | 320 | 331 |
Series 2019B, COP, 5.00%, 2/1/2027 | 185 | 194 |
Series 2019B, COP, 5.00%, 2/1/2028 | 175 | 187 |
Series 2019C, COP, 5.00%, 2/1/2028 | 350 | 373 |
Minnesota Higher Education Facilities Authority, College of St. Scholastica, Inc. | ||
Rev., 4.00%, 12/1/2024 | 100 | 99 |
Rev., 4.00%, 12/1/2025 | 185 | 183 |
Rev., 4.00%, 12/1/2026 | 185 | 183 |
Rev., 4.00%, 12/1/2027 | 195 | 192 |
Rev., 4.00%, 12/1/2028 | 240 | 236 |
State of Minnesota Series 2013E, GO, 5.00%, 11/7/2023 | 115 | 115 |
University of Minnesota Series 2016A, Rev., 5.00%, 4/1/2024 | 300 | 303 |
Western Minnesota Municipal Power Agency, Power Supply Series 2014A, Rev., 5.00%, 1/1/2024 | 1,000 | 1,005 |
Total Minnesota | 4,974 | |
Mississippi — 1.0% | ||
County of Harrison, Tax-Exempt | ||
Series 2019A, GO, 5.00%, 10/1/2027 | 800 | 855 |
Series 2019A, GO, 5.00%, 10/1/2028 | 345 | 374 |
Medical Center Educational Building Corp., Capital Improvements and Refinancing Project Rev., 5.00%, 6/1/2031 | 3,105 | 3,410 |
Mississippi Business Finance Corp., Pollution Control, Power Co., Project Rev., 3.20%, 9/1/2028 | 4,000 | 3,890 |
State of Mississippi, Gaming Tax Series 2019A, Rev., 5.00%, 10/15/2028 | 1,400 | 1,491 |
Total Mississippi | 10,020 | |
Missouri — 0.5% | ||
City of Kansas City | ||
Series 2022C, Rev., 5.00%, 9/1/2024 | 100 | 101 |
Series 2019A, Rev., 5.00%, 12/1/2024 | 140 | 143 |
City of St. Peters | ||
COP, 4.00%, 5/1/2026 | 705 | 716 |
74 | J.P. Morgan Municipal Bond Funds | August 31, 2023 |
INVESTMENTS | PRINCIPAL AMOUNT ($000) | VALUE ($000) |
Municipal Bonds — continued | ||
Missouri — continued | ||
COP, 4.00%, 5/1/2027 | 730 | 748 |
COP, 4.00%, 5/1/2028 | 760 | 786 |
COP, 4.00%, 5/1/2029 | 760 | 789 |
COP, 4.00%, 5/1/2030 | 545 | 570 |
County of Greene, Missouri Capital project Series 2018, COP, 4.00%, 9/1/2024 | 250 | 251 |
County of Greene, Special Obligation | ||
Rev., 4.00%, 12/1/2028 | 300 | 311 |
Rev., 4.00%, 12/1/2029 | 200 | 208 |
Total Missouri | 4,623 | |
Montana — 0.1% | ||
Gallatin County High School District No. 7 Bozeman Series 2017A, GO, 5.00%, 12/1/2023 | 515 | 517 |
Nebraska — 1.5% | ||
Central Plains Energy Project Series 2022-1, Rev., 5.00%, 10/1/2029 (b) | 10,000 | 10,193 |
Central Plains Energy Project, Gas Project No. 4 Series 2018A, Rev., 5.00%, 1/1/2024 (b) | 3,000 | 3,008 |
Southeast Community College Area, Tax Supported | ||
COP, 5.00%, 12/15/2026 | 275 | 292 |
COP, 5.00%, 12/15/2027 | 495 | 534 |
COP, 5.00%, 12/15/2028 | 540 | 589 |
University of Nebraska, Lincoln Student Fees and Facilities Series 2015A, Rev., 5.00%, 7/1/2025 (d) | 250 | 257 |
Total Nebraska | 14,873 | |
Nevada — 0.3% | ||
County of Clark Series 2016, Rev., 5.00%, 7/1/2024 | 125 | 127 |
Nevada Housing Division, Woodcreek Apartments Rev., FHA, 5.00%, 12/1/2024 (b) | 2,775 | 2,802 |
Total Nevada | 2,929 | |
New Hampshire — 0.5% | ||
New Hampshire Municipal Bond Bank Series 2020A, Rev., 5.00%, 2/15/2029 | 1,870 | 2,066 |
State of New Hampshire Series 2014A, GO, 5.00%, 3/1/2026 | 2,880 | 2,951 |
Total New Hampshire | 5,017 | |
New Jersey — 6.3% | ||
Burlington County Bridge Commission,Government Leasing Program Rev., 4.50%, 8/7/2024 | 2,340 | 2,360 |
City of Newark | ||
Series 2020A, GO, AGM, 5.00%, 10/1/2027 | 1,000 | 1,053 |
Series 2020A, GO, AGM, 5.00%, 10/1/2028 | 750 | 801 |
INVESTMENTS | PRINCIPAL AMOUNT ($000) | VALUE ($000) |
New Jersey — continued | ||
New Jersey Economic Development Authority | ||
Series 2023RRR, Rev., 5.00%, 3/1/2025 | 3,250 | 3,315 |
Series 2024SSS, Rev., 5.00%, 6/15/2026 (f) | 2,320 | 2,369 |
New Jersey Economic Development Authority, School Facilities Construction | ||
Series 2017DDD, Rev., 5.00%, 6/15/2025 | 1,500 | 1,536 |
Series 2017DDD, Rev., 5.00%, 6/15/2026 | 1,840 | 1,914 |
Series 2021QQQ, Rev., 5.00%, 6/15/2027 | 435 | 460 |
Series 2021QQQ, Rev., 5.00%, 6/15/2028 | 400 | 429 |
Series 2021QQQ, Rev., 5.00%, 6/15/2029 | 500 | 543 |
Series 2021QQQ, Rev., 5.00%, 6/15/2030 | 275 | 301 |
Series 2021QQQ, Rev., 5.00%, 6/15/2031 | 500 | 550 |
New Jersey Institute of Technology, Tax-Exempt | ||
Series 2020A, Rev., 5.00%, 7/1/2027 | 175 | 186 |
Series 2020A, Rev., 5.00%, 7/1/2028 | 200 | 216 |
Series 2020A, Rev., 5.00%, 7/1/2029 | 270 | 295 |
Series 2020A, Rev., 5.00%, 7/1/2030 | 415 | 454 |
Series 2020A, Rev., 5.00%, 7/1/2032 | 725 | 790 |
New Jersey Transportation Trust Fund Authority, Federal Highway Reimbursement | ||
Series A, Rev., 5.00%, 6/15/2028 | 3,000 | 3,124 |
Series A, Rev., 5.00%, 6/15/2029 | 5,350 | 5,574 |
Series A, Rev., 5.00%, 6/15/2031 | 4,750 | 4,937 |
Passaic Valley Sewerage Commission, Sewer System | ||
Series J, Rev., AGM, 3.00%, 12/1/2027 | 6,370 | 6,219 |
Series J, Rev., AGM, 3.00%, 12/1/2028 | 6,465 | 6,254 |
Series J, Rev., AGM, 3.00%, 12/1/2030 | 6,665 | 6,324 |
State of New Jersey Series 2020A, GO, 5.00%, 6/1/2026 | 7,455 | 7,800 |
State of New Jersey, Various Purpose GO, 4.00%, 6/1/2026 | 3,870 | 3,872 |
Township of Stafford Series 2016, GO, 4.00%, 8/1/2024 | 250 | 251 |
Total New Jersey | 61,927 | |
New Mexico — 0.7% | ||
Albuquerque Municipal School District No. 12 Series 2023B, GO, 5.00%, 8/1/2024 | 590 | 598 |
City of Farmington, San Juan Project Series 2010A, Rev., 0.88%, 10/1/2026 (b) | 4,000 | 3,535 |
County of Sandoval | ||
GO, 5.00%, 8/1/2024 | 1,100 | 1,116 |
GO, 5.00%, 8/1/2025 | 500 | 516 |
GO, 5.00%, 8/1/2026 | 650 | 682 |
Total New Mexico | 6,447 | |
August 31, 2023 | J.P. Morgan Municipal Bond Funds | 75 |
AS OF August 31, 2023 (Unaudited) (continued)
INVESTMENTS | PRINCIPAL AMOUNT ($000) | VALUE ($000) |
Municipal Bonds — continued | ||
New York — 8.2% | ||
City of Jamestown, Public Improvement GO, 5.00%, 6/1/2025 | 540 | 554 |
Floral Park-Bellerose Union Free School District GO, 4.00%, 12/1/2029 | 670 | 702 |
Long Island Power Authority, Electric System | ||
Rev., 5.00%, 9/1/2025 | 500 | 518 |
Rev., 5.00%, 9/1/2027 | 500 | 539 |
Rev., 5.00%, 9/1/2028 | 750 | 802 |
Longwood Central School District, Suffolk County GO, 5.00%, 6/15/2026 | 365 | 384 |
Metropolitan Transportation Authority Series 2014C, Rev., 5.00%, 11/15/2024 | 3,000 | 3,045 |
Metropolitan Transportation Authority, Dedicated Tax Fund Series B-2, Rev., 4.00%, 11/15/2032 | 4,000 | 4,121 |
New York City Industrial Development Agency, Queens Baseball Stadium Project Series 2021A, Rev., AGM, 4.00%, 1/1/2032 | 1,000 | 1,025 |
New York City Industrial Development Agency, Yankee Stadium LLC Project Series 2020A, Rev., AGM, 5.00%, 3/1/2030 | 1,600 | 1,746 |
New York City Industrial Development Agency, Yankee Stadium Project | ||
Series 2020A, Rev., AGM, 4.00%, 3/1/2031 | 2,500 | 2,578 |
Series 2020A, Rev., AGM, 4.00%, 3/1/2032 | 1,500 | 1,546 |
New York City Municipal Water Finance Authority, Water and Sewer System, Second General Resolution, Fiscal Year 2021 Series 2021, Subseries CC-2, Rev., 5.00%, 6/15/2028 | 3,410 | 3,602 |
New York Convention Center Development Corp., Hotel Unit Fee Secured Rev., 5.00%, 11/15/2026 | 5,000 | 5,127 |
New York State Dormitory Authority, Memorial Sloan-Kettering Cancer Center | ||
Series 2017-1, Rev., 5.00%, 7/1/2026 | 1,000 | 1,048 |
Series 2019 SERIES 1, Rev., 4.00%, 7/1/2031 | 4,255 | 4,389 |
New York State Dormitory Authority, Montefiore Obligated Group Series 2018A, Rev., 5.00%, 8/1/2027 | 3,225 | 3,210 |
New York State Dormitory Authority, Non Stop Supported Debt, New School University Series 2015A, Rev., 5.00%, 7/1/2024 (d) | 75 | 76 |
New York State Dormitory Authority, Personal Income Tax Series 2017B-2, Rev., 5.00%, 2/15/2030 | 1,750 | 1,867 |
New York State Dormitory Authority, School Districts Bond Financing Series 2020A, Rev., AGM, 5.00%, 10/1/2031 | 5,065 | 5,507 |
INVESTMENTS | PRINCIPAL AMOUNT ($000) | VALUE ($000) |
New York — continued | ||
New York State Dormitory Authority, St. John's University | ||
Series 2021A, Rev., 4.00%, 7/1/2029 | 975 | 1,009 |
Series 2021A, Rev., 4.00%, 7/1/2030 | 1,500 | 1,559 |
New York State Dormitory Authority, State Personal Income Tax, General Purpose Series 2021A, Rev., 5.00%, 3/15/2034 | 5,965 | 6,664 |
New York State Thruway Authority Series J, Rev., 5.00%, 1/1/2028 | 1,000 | 1,005 |
New York State Urban Development Corp., Personal Income Tax | ||
Series 2017A, Rev., 5.00%, 3/15/2030 | 1,450 | 1,534 |
Series 2022A, Rev., 5.00%, 9/15/2032 | 5,000 | 5,746 |
New York State Urban Development Corp., State Personal Income Tax, General Purpose Series 2014A, Rev., 5.00%, 3/15/2024 (d) | 1,210 | 1,221 |
New York Transportation Development Corp., Terminal 4 John F. Kennedy International Airport Project, Tax-Exempt | ||
Series 2020C, Rev., 5.00%, 12/1/2027 | 800 | 845 |
Series 2020C, Rev., 5.00%, 12/1/2028 | 500 | 534 |
Niagara Frontier Transportation Authority, Buffalo Niagara International Airport | ||
Series 2019A, Rev., AMT, 5.00%, 4/1/2028 | 265 | 277 |
Series 2019A, Rev., AMT, 5.00%, 4/1/2029 | 265 | 280 |
Schenectady County Capital Resource Corp., Union College Project Rev., 5.00%, 1/1/2025 | 400 | 408 |
Town of Oyster Bay, Public Improvement | ||
GO, 4.00%, 11/1/2026 | 800 | 822 |
GO, 4.00%, 11/1/2027 | 675 | 702 |
Triborough Bridge and Tunnel Authority, MTA Bridges and Tunnels Series 2021A-2, Rev., 2.00%, 5/15/2028 (b) | 10,000 | 9,062 |
Trust for Cultural Resources of The City of New York (The), Lincoln Center for the Performing Arts, Inc. Series 2020A, Rev., 5.00%, 12/1/2032 | 1,000 | 1,116 |
Trust for Cultural Resources of The City of New York, The Museum of Modern Art Series 2020A, Rev., 5.00%, 12/1/2031 | 2,800 | 3,130 |
White Plains City School District GO, 5.00%, 5/15/2024 | 1,550 | 1,568 |
Total New York | 79,868 | |
North Carolina — 1.7% | ||
City of Charlotte Series 2014A, Rev., 5.00%, 7/1/2024 | 100 | 101 |
76 | J.P. Morgan Municipal Bond Funds | August 31, 2023 |
INVESTMENTS | PRINCIPAL AMOUNT ($000) | VALUE ($000) |
Municipal Bonds — continued | ||
North Carolina — continued | ||
City of Winston-Salem, Water and Sewer System Series A, Rev., 5.00%, 6/1/2024 | 1,300 | 1,316 |
County of Alamance GO, 5.00%, 2/1/2024 | 200 | 201 |
County of Mecklenburg Series 2015A, Rev., 5.00%, 10/1/2024 | 250 | 255 |
North Carolina Medical Care Commission, Wake Forest Baptist Obligated Group Series 2019C, Rev., 2.55%, 6/1/2026 (b) | 13,805 | 13,388 |
State of North Carolina Rev., 5.00%, 3/1/2024 | 600 | 604 |
Winston-Salem State University Foundation LLC, The Board of Governors of The University of North Carolina Rev., AGM, 5.00%, 10/1/2023 | 445 | 446 |
Total North Carolina | 16,311 | |
Ohio — 1.1% | ||
City of Cleveland, Income Tax, Subordinate Lien, Public Facilities Improvements | ||
Series 2018A, Rev., 5.00%, 10/1/2025 | 150 | 155 |
Series 2018A, Rev., 5.00%, 10/1/2027 | 250 | 268 |
Series 2018A, Rev., 5.00%, 10/1/2028 | 250 | 271 |
Series 2017B-1, Rev., 5.00%, 10/1/2030 | 2,510 | 2,709 |
City of Dublin, Various Purpose GO, 4.00%, 12/1/2028 | 200 | 203 |
Cuyahoga Community College District, Facilities Construction Improvement, Unlimited Tax GO, 5.00%, 12/1/2028 | 2,300 | 2,408 |
Franklin County Convention Facilities Authority, Greater Columbus Convention Center Hotel Expansion Project | ||
Rev., 5.00%, 12/1/2025 | 250 | 250 |
Rev., 5.00%, 12/1/2026 | 625 | 626 |
Rev., 5.00%, 12/1/2029 | 800 | 804 |
Ohio Water Development Authority Water Pollution Control Loan Fund Series 2023A, Rev., 5.00%, 12/1/2024 | 3,000 | 3,060 |
Total Ohio | 10,754 | |
Oklahoma — 3.1% | ||
Bryan County School Finance Authority, Durant Public Schools Project | ||
Rev., 4.00%, 12/1/2028 | 385 | 398 |
Rev., 4.00%, 12/1/2029 | 415 | 430 |
Rev., 4.00%, 12/1/2030 | 435 | 450 |
Carter County Public Facilities Authority, Educational Facilities Lease, Ardmore City Schools Project | ||
Rev., 5.00%, 9/1/2025 | 365 | 371 |
Rev., 5.00%, 9/1/2026 | 820 | 842 |
INVESTMENTS | PRINCIPAL AMOUNT ($000) | VALUE ($000) |
Oklahoma — continued | ||
Rev., 5.00%, 9/1/2027 | 1,250 | 1,294 |
Cleveland County Educational Facilities Authority | ||
Series 2021, Rev., 4.00%, 6/1/2026 | 7,015 | 7,122 |
Series 2021, Rev., 4.00%, 6/1/2028 | 2,200 | 2,272 |
Cleveland County Educational Facilities Authority, Norman Public Schools Project Rev., 5.00%, 6/1/2025 | 3,050 | 3,129 |
Custer County Economic Development Authority, Thomas Fay Public Schools Rev., 4.00%, 12/1/2025 | 700 | 706 |
Grady County School Finance Authority, Educational Facilities Lease, Minco Public Schools Project | ||
Rev., 5.00%, 9/1/2028 | 375 | 399 |
Rev., 5.00%, 9/1/2029 | 1,175 | 1,246 |
Grady County School Finance Authority, Educational Facilities Lease, Tuttle Public Schools Project Rev., 4.00%, 9/1/2029 | 300 | 308 |
Muskogee Industrial Trust, Muskogee Public Schools Project | ||
Rev., 5.00%, 9/1/2024 | 890 | 900 |
Rev., 5.00%, 9/1/2025 | 850 | 864 |
Rev., 5.00%, 9/1/2026 | 1,800 | 1,841 |
Rev., 5.00%, 9/1/2027 | 480 | 496 |
Muskogee Industrial Trust, Public School Project Series 2019, Rev., 4.00%, 9/1/2029 | 3,010 | 2,939 |
Oklahoma County Finance Authority, Educational Facilities, Lease Midwest City-Del City Public Schools Project | ||
Rev., 5.00%, 10/1/2023 | 355 | 355 |
Rev., 5.00%, 10/1/2025 | 1,000 | 1,027 |
Oklahoma State University, Agricultural Mechanical Colleges Series 2021A, Rev., 5.00%, 9/1/2024 | 255 | 259 |
Pittsburg County Educational Facilities Authority, McAlester Public Schools Project | ||
Rev., 4.00%, 12/1/2027 | 125 | 128 |
Rev., 4.00%, 12/1/2028 | 175 | 179 |
University of Oklahoma (The), Tax Exempt | ||
Series 2020B, Rev., 5.00%, 7/1/2028 | 455 | 490 |
Series 2020B, Rev., 5.00%, 7/1/2029 | 480 | 522 |
Wagoner County School Development Authority, Wagoner Public Schools Project | ||
Rev., 4.00%, 9/1/2025 | 625 | 630 |
Rev., 4.00%, 9/1/2027 | 725 | 736 |
Rev., 4.00%, 9/1/2028 | 300 | 306 |
Total Oklahoma | 30,639 | |
August 31, 2023 | J.P. Morgan Municipal Bond Funds | 77 |
AS OF August 31, 2023 (Unaudited) (continued)
INVESTMENTS | PRINCIPAL AMOUNT ($000) | VALUE ($000) |
Municipal Bonds — continued | ||
Oregon — 0.2% | ||
City of Portland, Sewer System, First Lien Series 2014A, Rev., 5.00%, 10/1/2023 | 40 | 40 |
Multnomah County School District No. 1 Portland Series 2023, GO, 5.00%, 6/15/2024 | 400 | 405 |
Port of Portland, International Airport Series 23, Rev., 5.00%, 7/1/2024 | 1,595 | 1,616 |
Total Oregon | 2,061 | |
Pennsylvania — 7.3% | ||
Charleroi Borough Authority Water System | ||
Rev., AGM, 4.00%, 12/1/2024 | 175 | 176 |
Rev., AGM, 4.00%, 12/1/2025 | 150 | 152 |
Rev., AGM, 4.00%, 12/1/2026 | 100 | 102 |
Rev., AGM, 4.00%, 12/1/2027 | 125 | 129 |
Chester County Health and Education Facilities Authority, Main Line Health System | ||
Series 2020A, Rev., 5.00%, 9/1/2026 | 250 | 261 |
Series 2020A, Rev., 5.00%, 9/1/2027 | 200 | 213 |
Series 2020A, Rev., 5.00%, 9/1/2028 | 175 | 189 |
Series 2020A, Rev., 5.00%, 9/1/2029 | 175 | 192 |
Commonwealth of Pennsylvania Series 2016-2, GO, 5.00%, 1/15/2025 | 630 | 644 |
County of Lackawanna | ||
Series 2020B, GO, 4.00%, 9/1/2027 | 1,480 | 1,513 |
Series 2020B, GO, 4.00%, 9/1/2028 | 1,495 | 1,527 |
Series 2020B, GO, 4.00%, 9/1/2029 | 1,525 | 1,554 |
County of Northampton | ||
Series 2019A, GO, 4.00%, 10/1/2026 | 750 | 762 |
Series 2019A, GO, 4.00%, 10/1/2027 | 1,565 | 1,600 |
Series 2019A, GO, 4.00%, 10/1/2028 | 920 | 943 |
County of Westmoreland Series 2019A, GO, 5.00%, 8/15/2028 | 3,000 | 3,249 |
General Authority of Southcentral Pennsylvania, Hanover Hospital, Inc. Rev., 5.00%, 12/1/2026 | 1,400 | 1,438 |
General Authority of Southcentral Pennsylvania, Wellspan Health Obligation Series 2014A, Rev., 5.00%, 6/1/2024 | 380 | 384 |
Montgomery County Higher Education and Health Authority, Thomas Jefferson University Series 2018A, Rev., 5.00%, 9/1/2024 | 1,000 | 1,010 |
Montgomery County Industrial Development Authority, Constellation Energy Generation LLC Series 2023B, Rev., 4.10%, 6/1/2029 | 5,200 | 5,253 |
Panther Valley School District | ||
GO, 2.00%, 10/15/2026 | 750 | 695 |
GO, 2.00%, 10/15/2027 | 680 | 618 |
INVESTMENTS | PRINCIPAL AMOUNT ($000) | VALUE ($000) |
Pennsylvania — continued | ||
GO, 2.00%, 10/15/2028 | 300 | 268 |
GO, 2.00%, 10/15/2029 | 300 | 262 |
Penn Hills School District | ||
GO, 5.00%, 10/1/2027 | 3,585 | 3,781 |
GO, 5.00%, 10/1/2028 | 3,585 | 3,836 |
GO, 5.00%, 10/1/2029 | 3,815 | 4,132 |
Pennsylvania Turnpike Commission Series 2018A-1, Rev., (SIFMA Municipal Swap Index Yield + 0.60%), 4.66%, 9/7/2023 (c) | 13,000 | 13,003 |
Pennsylvania Turnpike Commission, Motor License Fund, Enhanced, Subordinate Series 2017-3, Rev., 5.00%, 12/1/2028 | 1,000 | 1,069 |
Pittsburgh Water and Sewer Authority, First Lien Series 2019A, Rev., 5.00%, 9/1/2023 | 270 | 270 |
Quaker Valley School District | ||
GO, 5.00%, 10/1/2028 | 350 | 384 |
GO, 5.00%, 10/1/2029 | 425 | 474 |
GO, 5.00%, 10/1/2030 | 250 | 282 |
School District of Philadelphia (The) Series 2021A, GO, 5.00%, 9/1/2024 | 1,265 | 1,281 |
Southeastern Pennsylvania Transportation Authority | ||
Rev., 5.00%, 6/1/2027 | 635 | 673 |
Rev., 5.00%, 6/1/2029 | 3,115 | 3,413 |
Southeastern Pennsylvania Transportation Authority, Asset Improvement Program Rev., 5.00%, 6/1/2032 | 100 | 114 |
Sports and Exhibition Authority of Pittsburgh and Allegheny County, Sales Tax | ||
Rev., AGM, 5.00%, 2/1/2029 | 2,750 | 2,998 |
Rev., AGM, 5.00%, 2/1/2030 | 2,925 | 3,205 |
Rev., AGM, 5.00%, 2/1/2031 | 4,750 | 5,211 |
State Public School Building Authority, Community College of Philadelphia Project Rev., 5.00%, 6/15/2024 | 2,625 | 2,656 |
Upper St. Clair Township School District | ||
Series 2019B, GO, 4.00%, 10/1/2028 | 575 | 589 |
Series 2019B, GO, 4.00%, 10/1/2029 | 420 | 430 |
Total Pennsylvania | 70,935 | |
Tennessee — 2.3% | ||
City of Chattanooga Series A, Rev., 5.00%, 9/1/2024 | 125 | 127 |
City of Jackson Series 2019, GO, 5.00%, 6/1/2024 | 115 | 117 |
County of Rutherford Series 2015A, GO, 5.00%, 4/1/2026 | 1,165 | 1,194 |
78 | J.P. Morgan Municipal Bond Funds | August 31, 2023 |
INVESTMENTS | PRINCIPAL AMOUNT ($000) | VALUE ($000) |
Municipal Bonds — continued | ||
Tennessee — continued | ||
Johnson City Health and Educational Facilities Board, Ballad Health | ||
Series 2023A, Rev., 5.00%, 7/1/2024 | 625 | 631 |
Series 2023A, Rev., 5.00%, 7/1/2025 | 760 | 776 |
Metropolitan Government Nashville and Davidson County Health and Educational Facilities Board, Chippington Towers Project Rev., 0.45%, 10/1/2024 (b) | 10,000 | 9,601 |
Tennessee Energy Acquisition Corp., Gas Project Series 2023A-1, Rev., 5.00%, 5/1/2028 (b) | 10,000 | 10,190 |
Total Tennessee | 22,636 | |
Texas — 6.1% | ||
Abilene Independent School District, Unlimited Tax School Building GO, PSF-GTD, 4.00%, 2/15/2029 | 2,000 | 2,057 |
Alief Independent School District, Unlimited Tax Series 2021, GO, PSF-GTD, 5.00%, 2/15/2024 | 125 | 126 |
Arlington Higher Education Finance Corp., Uplift Education Series 2017A, Rev., PSF-GTD, 4.00%, 12/1/2029 | 1,000 | 1,014 |
Austin Community College District Public Facility Corp., Lease, Highland Campus Parking Garage Project | ||
Series 2018C, Rev., 5.00%, 8/1/2026 | 250 | 262 |
Series 2018C, Rev., 5.00%, 8/1/2027 | 200 | 214 |
Series 2018C, Rev., 5.00%, 8/1/2029 | 325 | 347 |
Bridge City Independent School District, Unlimited Tax GO, PSF-GTD, 5.00%, 2/15/2033 | 520 | 586 |
City of Austin, Airport System | ||
Series 2017B, Rev., AMT, 5.00%, 11/15/2026 | 1,095 | 1,132 |
Series 2017B, Rev., AMT, 5.00%, 11/15/2027 | 585 | 606 |
Series 2017B, Rev., AMT, 5.00%, 11/15/2028 | 630 | 652 |
City of Corpus Christi Rev., 5.00%, 7/15/2024 | 110 | 111 |
City of Denton GO, 5.00%, 2/15/2025 | 270 | 276 |
City of El Paso | ||
Series 2023, GO, 5.00%, 8/15/2024 | 1,030 | 1,045 |
Series 2023, GO, 5.00%, 8/15/2025 | 1,080 | 1,112 |
City of Galveston GO, 4.00%, 5/1/2024 | 635 | 637 |
City of Garland Series 2023, GO, 5.00%, 2/15/2024 | 1,155 | 1,163 |
City of Garland, Water and Sewer System Series 2018A, Rev., 5.00%, 3/1/2026 | 1,030 | 1,071 |
City of Houston, Public Improvement Series 2017A, GO, 5.00%, 3/1/2025 | 1,195 | 1,224 |
City of Laredo GO, 5.00%, 2/15/2024 | 410 | 413 |
City of Lubbock, Electric Light and Power System Series 2022, Rev., AGM, 5.00%, 4/15/2024 | 770 | 776 |
City of Pearland Series 2017, GO, 5.00%, 3/1/2025 | 125 | 128 |
INVESTMENTS | PRINCIPAL AMOUNT ($000) | VALUE ($000) |
Texas — continued | ||
City of San Antonio, Electric and Gas Systems Rev., 5.25%, 2/1/2024 | 200 | 201 |
Colorado River Municipal Water District Series 2021, Rev., 5.00%, 1/1/2024 | 100 | 100 |
Conroe Independent School District Series 2017, GO, PSF-GTD, 5.00%, 2/15/2025 | 500 | 512 |
County of Bexar Series 2015, Rev., AGM, 4.00%, 8/15/2024 (d) | 215 | 216 |
County of Fort Bend Series B, GO, 5.00%, 3/1/2024 | 225 | 227 |
Cypress-Fairbanks Independent School District, Unlimited Tax GO, PSF-GTD, 5.00%, 2/15/2033 | 2,040 | 2,337 |
Eagle Mountain and Saginaw Independent School District Series 2015, GO, PSF-GTD, 5.00%, 8/15/2024 | 100 | 102 |
Elgin Independent School District, Unlimited Tax Series 2022, GO, PSF-GTD, 5.00%, 8/1/2032 | 1,025 | 1,180 |
Forney Independent School District, Unlimited Tax GO, PSF-GTD, 5.00%, 8/15/2024 | 1,310 | 1,330 |
Grand Parkway Transportation Corp. Series 2023, Rev., 5.00%, 4/1/2028 (b) | 1,000 | 1,066 |
Harris County Cultural Education Facilities Finance Corp., Memorial Hermann Health System Series 2014A, Rev., 5.00%, 12/1/2026 | 1,910 | 1,941 |
Harris County Fresh Water Supply District No. 61, Unlimited Tax GO, AGM, 3.00%, 9/1/2025 | 530 | 520 |
Hereford Independent School District, School Building, Unlimited Tax | ||
GO, PSF-GTD, 4.00%, 2/15/2028 | 1,420 | 1,450 |
GO, PSF-GTD, 4.00%, 2/15/2029 | 1,480 | 1,511 |
Humble Independent School District, Unlimited Tax School Building GO, PSF-GTD, 5.00%, 2/15/2033 | 1,655 | 1,896 |
Huntsville Independent School District, Unlimited Tax GO, PSF-GTD, 5.00%, 2/15/2034 | 1,340 | 1,518 |
Irving Hospital Authority, Baylor Scott and White Medical Center | ||
Series 2017A, Rev., 5.00%, 10/15/2028 | 250 | 258 |
Series 2017A, Rev., 5.00%, 10/15/2029 | 500 | 515 |
Klein Independent School District, Unlimited Tax Series B, GO, 5.00%, 8/1/2029 | 525 | 539 |
North Texas Tollway Authority, First Tier Series A, Rev., 4.00%, 1/1/2033 | 2,500 | 2,526 |
Odessa Junior College District, Consolidated Fund | ||
Rev., AGM, 4.00%, 7/1/2026 | 300 | 305 |
Rev., AGM, 4.00%, 7/1/2027 | 430 | 441 |
Pasadena Independent School District, School Building, Unlimited Tax Series 2015A, GO, PSF-GTD, 5.00%, 2/15/2028 | 1,000 | 1,007 |
August 31, 2023 | J.P. Morgan Municipal Bond Funds | 79 |
AS OF August 31, 2023 (Unaudited) (continued)
INVESTMENTS | PRINCIPAL AMOUNT ($000) | VALUE ($000) |
Municipal Bonds — continued | ||
Texas — continued | ||
Richardson Independent School District, Unlimited Tax GO, PSF-GTD, 5.00%, 2/15/2029 | 3,165 | 3,432 |
S&S Consolidated Independent School District GO, PSF-GTD, 4.00%, 2/15/2028 | 580 | 595 |
Southwest Higher Education Authority, Inc., Southern Methodist University Project Rev., 5.00%, 10/1/2023 | 400 | 400 |
Spring Branch Independent School District Series 2022, GO, PSF-GTD, 5.00%, 2/1/2024 | 510 | 513 |
State of Texas Series 2014, GO, 5.00%, 4/1/2024 (d) | 11,720 | 11,828 |
State of Texas, College Student Loan Series 2023A, GO, AMT, 5.25%, 8/1/2029 | 2,470 | 2,702 |
Texas Municipal Gas Acquisition and Supply Corp., I Gas Supply Senior Lien Series 2008D, Rev., 6.25%, 12/15/2026 | 1,100 | 1,139 |
Tyler Independent School District Series 2015, GO, PSF-GTD, 5.00%, 2/15/2024 | 150 | 151 |
West Travis County Public Utility Agency Rev., 5.00%, 8/15/2027 | 350 | 372 |
Wichita Falls Independent School District, Unlimited Tax | ||
GO, PSF-GTD, 4.00%, 2/1/2030 | 800 | 836 |
GO, PSF-GTD, 4.00%, 2/1/2031 | 1,000 | 1,043 |
Ysleta Independent School District Series 2020, GO, PSF-GTD, 5.00%, 8/15/2024 | 150 | 152 |
Total Texas | 59,813 | |
Utah — 1.0% | ||
Utah Infrastructure Agency, Tax-Exempt Telecommunications Series 2017A, Rev., 5.00%, 10/15/2025 | 6,880 | 6,909 |
West Valley City Municipal Building Authority | ||
Rev., AGM, 4.00%, 2/1/2024 | 500 | 501 |
Rev., AGM, 5.00%, 2/1/2025 | 250 | 255 |
Rev., AGM, 5.00%, 2/1/2027 | 720 | 757 |
Rev., AGM, 5.00%, 2/1/2029 | 1,070 | 1,127 |
Total Utah | 9,549 | |
Virginia — 1.4% | ||
Chesapeake Bay Bridge and Tunnel District General Resolution Series 2019, Rev., BAN, 5.00%, 11/1/2023 | 8,355 | 8,369 |
Norfolk Economic Development Authority, Sentara Healthcare Series 2018A, Rev., 5.00%, 11/1/2028 (b) | 3,000 | 3,230 |
INVESTMENTS | PRINCIPAL AMOUNT ($000) | VALUE ($000) |
Virginia — continued | ||
Virginia College Building Authority Series 2018A, Rev., 5.00%, 2/1/2024 | 450 | 453 |
Virginia Resources Authority, Infrastructure Pooled Financing Program Series 2016C, Rev., 5.00%, 11/1/2027 | 1,235 | 1,308 |
Total Virginia | 13,360 | |
Washington — 2.7% | ||
Energy Northwest Series 2018C, Rev., 5.00%, 7/1/2024 | 125 | 127 |
Energy Northwest, Columbia Generating Series 2017A, Rev., 5.00%, 7/1/2024 | 185 | 187 |
Snohomish County Public Utility District No. 1, Electric System Rev., 5.00%, 12/1/2025 | 500 | 519 |
State of Washington, Various Purpose | ||
Series 2014D, GO, 5.00%, 2/1/2024 | 150 | 151 |
Series 2017D, GO, 5.00%, 2/1/2024 | 100 | 101 |
University of Washington Series 2022C, Rev., 4.00%, 8/1/2027 (b) | 7,900 | 8,050 |
Washington Health Care Facilities Authority, Commonspirit Health Series 2019B-3, Rev., 5.00%, 8/1/2026 (b) | 17,000 | 17,406 |
Total Washington | 26,541 | |
Wisconsin — 2.1% | ||
Pewaukee School District Series 2019B, GO, 5.00%, 9/1/2027 | 200 | 215 |
State of Wisconsin Series 2016A, GO, 5.00%, 5/1/2026 | 5,050 | 5,198 |
Sun Prairie Area School District GO, 4.00%, 3/1/2028 | 2,500 | 2,558 |
Wauwatosa School District, School Building and Improvement Series 2019A, GO, 5.00%, 3/1/2029 | 6,025 | 6,425 |
Wisconsin Department of Transportation Series 2017-1, Rev., 5.00%, 7/1/2025 | 1,790 | 1,845 |
Wisconsin Health and Educational Facilities Authority, Advocate Aurora Health Credit Group Series 2018B-2, Rev., 5.00%, 6/24/2026 (b) | 3,500 | 3,630 |
Wisconsin Health and Educational Facilities Authority, Aspirus, Inc., Obligated Group Rev., 5.00%, 8/15/2025 | 325 | 334 |
Total Wisconsin | 20,205 | |
80 | J.P. Morgan Municipal Bond Funds | August 31, 2023 |
INVESTMENTS | PRINCIPAL AMOUNT ($000) | VALUE ($000) |
Municipal Bonds — continued | ||
Wyoming — 0.1% | ||
Wyoming Municipal Power Agency, Inc. Series 2017A, Rev., 5.00%, 1/1/2027 (d) | 1,000 | 1,059 |
Total Municipal Bonds (Cost $990,316) | 954,691 | |
Collateralized Mortgage Obligations — 0.0% ^ | ||
FNMA, REMIC Series 2002-36, Class FS, 5.90%, 6/25/2032 (b)(Cost $21) | 21 | 21 |
SHARES (000) | ||
Short-Term Investments — 1.4% | ||
Investment Companies — 1.4% | ||
JPMorgan Institutional Tax Free Money Market Fund Class IM Shares, 3.71% (g) (h) (Cost $13,449) | 13,449 | 13,450 |
Total Investments — 99.2% (Cost $1,003,786) | 968,162 | |
Other Assets Less Liabilities — 0.8% | 7,496 | |
NET ASSETS — 100.0% | 975,658 | |
Percentages indicated are based on net assets. |
Abbreviations | |
AGM | Insured by Assured Guaranty Municipal Corp. |
AMT | Alternative Minimum Tax |
BAN | Bond Anticipation Note |
COLL | Collateral |
COP | Certificate of Participation |
FHA | Federal Housing Administration |
FNMA | Federal National Mortgage Association |
GNMA | Government National Mortgage Association |
GO | General Obligation |
GTD | Guaranteed |
LIQ | Liquidity Agreement |
LOC | Letter of Credit |
MTA | Metropolitan Transportation Authority |
NATL | Insured by National Public Finance Guarantee Corp. |
PSF-GTD | Permanent School Fund Guaranteed |
Q-SBLF | Qualified School Bond Loan Fund |
RE | Reinsured |
REMIC | Real Estate Mortgage Investment Conduit |
Rev. | Revenue |
SIFMA | The Securities Industry and Financial Markets Association |
VRDO | Variable Rate Demand Obligation |
^ | Amount rounds to less than 0.1% of net assets. | |
(a) | The date shown represents the earliest of the prerefunded date, next put date or final maturity date. | |
(b) | Variable or floating rate security, the interest rate of which adjusts periodically based on changes in current interest rates and prepayments on the underlying pool of assets. The interest rate shown is the current rate as of August 31, 2023. | |
(c) | Variable or floating rate security, linked to the referenced benchmark. The interest rate shown is the current rate as of August 31, 2023. | |
(d) | Security is prerefunded or escrowed to maturity. | |
(e) | Securities exempt from registration under Rule 144A or section 4(a)(2), of the Securities Act of 1933, as amended. | |
(f) | All or a portion of the security is a when-issued security, delayed delivery security, or forward commitment. | |
(g) | Investment in an affiliated fund, which is registered under the Investment Company Act of 1940, as amended, and is advised by J.P. Morgan Investment Management Inc. | |
(h) | The rate shown is the current yield as of August 31, 2023. |
August 31, 2023 | J.P. Morgan Municipal Bond Funds | 81 |
AS OF August 31, 2023 (Unaudited)
INVESTMENTS | PRINCIPAL AMOUNT ($000) | VALUE ($000) |
Municipal Bonds — 92.8% (a) | ||
Alabama — 2.0% | ||
Black Belt Energy Gas District, Gas Project | ||
Series 2023D-1, Rev., 5.50%, 2/1/2029 (b) (c) | 2,665 | 2,780 |
Series 2023B-2, Rev., LIQ : Royal Bank of Canada, 5.25%, 12/1/2030 (b) | 2,000 | 2,108 |
Black Belt Energy Gas District, Gas Project No. 8 Series 2022A, Rev., 4.00%, 12/1/2029 (b) | 1,300 | 1,248 |
Montgomery County Public Building Authority, Facilities Project Rev., 5.00%, 3/1/2024 (d) | 1,000 | 1,008 |
Southeast Alabama Gas Supply District (The), Project No. 1 Series 2018A, Rev., 4.00%, 4/1/2024 (b) | 300 | 299 |
Southeast Energy Authority A Cooperative District Project No.06 Series 2023B, Rev., LIQ : Royal Bank of Canada, 5.00%, 6/1/2030 (b) | 5,530 | 5,734 |
Southeast Energy Authority A Cooperative District, Project No. 2 Series 2021B, Rev., 4.00%, 12/1/2031 (b) | 2,000 | 1,906 |
UAB Medicine Finance Authority Series 2017B-2, Rev., 3.50%, 9/1/2035 | 160 | 149 |
Total Alabama | 15,232 | |
Alaska — 0.2% | ||
Alaska Industrial Development and Export Authority, Tanana Chiefs Conference Project Series 2019A, Rev., 4.00%, 10/1/2044 | 1,500 | 1,352 |
Arizona — 1.5% | ||
Arizona Industrial Development Authority, Aliante and Skye Canyon Campus Project Series 2021A, Rev., 4.00%, 12/15/2051 (e) | 350 | 252 |
Arizona Industrial Development Authority, Doral Academy of Northern Nevada Project Series 2021A, Rev., 4.00%, 7/15/2051 (e) | 250 | 180 |
Arizona Industrial Development Authority, Equitable School Revolving Fund LLC | ||
Series 2021A, Rev., 4.00%, 11/1/2051 | 1,300 | 1,099 |
Series 2022A, Rev., 4.25%, 11/1/2052 | 800 | 703 |
Arizona Industrial Development Authority, Great Lakes Senior Living Communities LLC Project Series 2019A, Rev., 4.50%, 1/1/2049 | 4,000 | 2,236 |
Arizona Industrial Development Authority, Pinecrest Academy, Canyon Campus Project Series 2020A1, Rev., 5.00%, 7/15/2040 (e) | 2,515 | 2,336 |
City of Phoenix Civic Improvement Corp., Civic Plaza Expansion Series 2005B, Rev., BHAC - CR, FGIC, 5.50%, 7/1/2036 | 125 | 150 |
City of Phoenix Civic Improvement Corp., Junior Lien, Airport System Series 2019A, Rev., 4.00%, 7/1/2049 | 50 | 47 |
INVESTMENTS | PRINCIPAL AMOUNT ($000) | VALUE ($000) |
Arizona — continued | ||
City of Phoenix Civic Improvement Corp., Junior Lien, Water System Series 2021A, Rev., 4.00%, 7/1/2040 | 3,375 | 3,311 |
Industrial Development Authority of The City of Phoenix, Downtown Phoenix Student Housing LLC - Arizona State University Project | ||
Series 2018A, Rev., 5.00%, 7/1/2032 | 350 | 363 |
Series 2018A, Rev., 5.00%, 7/1/2033 | 150 | 155 |
Series 2018A, Rev., 5.00%, 7/1/2037 | 200 | 203 |
Maricopa County Special Health Care District, Integrated Health Services Series 2018C, GO, 5.00%, 7/1/2033 | 10 | 11 |
Salt River Project Agricultural Improvement and Power District, Electric System Series 2017A, Rev., 5.00%, 1/1/2028 | 35 | 38 |
University of Arizona (The) Rev., 5.00%, 6/1/2033 | 40 | 41 |
Total Arizona | 11,125 | |
Arkansas — 0.1% | ||
County of Pulaski Rev., 4.25%, 3/1/2048 | 250 | 237 |
University of Arkansas, Various Facility Fayetteville Campus Series 2016A, Rev., 5.00%, 11/1/2037 | 185 | 191 |
University of Arkansas, Various Facility Monticello Campus Series 2017A, Rev., 5.00%, 12/1/2027 | 100 | 106 |
Total Arkansas | 534 | |
California — 5.7% | ||
Alta Loma School District, Election of 2016 Series 2017A, GO, 5.00%, 8/1/2032 | 60 | 65 |
Bay Area Toll Authority, Toll Bridge Series 2017S-7, Rev., 4.00%, 4/1/2032 | 35 | 36 |
Calexico Unified School District Series 2022, GO, 4.00%, 8/1/2043 | 2,065 | 1,998 |
California Community Choice Financing Authority, Clean Energy Project Series 2023E-1, Rev., 5.00%, 3/1/2031 (b) | 2,565 | 2,687 |
California County Tobacco Securitization Agency, Los Angeles County Securitization Corp. | ||
Series 2020A, Rev., 5.00%, 6/1/2029 | 110 | 118 |
Series 2020A, Rev., 4.00%, 6/1/2034 | 510 | 521 |
California Educational Facilities Authority, Claremont McKenna College Series 2015A, Rev., 4.00%, 1/1/2026 (d) | 500 | 510 |
California Health Facilities Financing Authority, On Lok Senior Health Service Rev., 5.00%, 8/1/2050 | 1,000 | 998 |
California Health Facilities Financing Authority, Sutter Health Series 2016A, Rev., 5.00%, 11/15/2025 (d) | 250 | 261 |
82 | J.P. Morgan Municipal Bond Funds | August 31, 2023 |
INVESTMENTS | PRINCIPAL AMOUNT ($000) | VALUE ($000) |
Municipal Bonds — continued | ||
California — continued | ||
California Infrastructure and Economic Development Bank, Academy of Motion Picture Series 2020A-3, Rev., AMT, 8.00%, 9/14/2023 (b) (c) (e) | 2,000 | 2,000 |
California Municipal Finance Authority, Community Health System Series 2021A, Rev., 4.00%, 2/1/2051 | 365 | 319 |
California Public Finance Authority, Enso Village Project | ||
Series 2021A, Rev., 5.00%, 11/15/2046 (e) | 600 | 535 |
Series 2021A, Rev., 5.00%, 11/15/2051 (e) | 500 | 435 |
California Public Finance Authority, Henry Mayo Newhall Hospital | ||
Rev., 5.00%, 10/15/2037 | 500 | 504 |
Rev., 5.00%, 10/15/2047 | 1,000 | 968 |
California School Finance Authority, Green Dot Public School Projects | ||
Series 2018A, Rev., 5.00%, 8/1/2024 (e) | 160 | 161 |
Series 2018A, Rev., 5.00%, 8/1/2025 (e) | 150 | 151 |
Series 2018A, Rev., 5.00%, 8/1/2026 (e) | 150 | 152 |
Series 2018A, Rev., 5.00%, 8/1/2027 (e) | 150 | 153 |
Series 2018A, Rev., 5.00%, 8/1/2028 (e) | 190 | 195 |
California State University, Systemwide | ||
Series 2017A, Rev., 5.00%, 11/1/2042 | 30 | 31 |
Series 2016A, Rev., 5.00%, 11/1/2045 | 25 | 26 |
California Statewide Communities Development Authority, Marin General Hospital Project Series 2018A, Rev., 4.00%, 8/1/2045 | 2,130 | 1,799 |
Campbell Union High School District GO, 3.00%, 8/1/2031 | 30 | 29 |
City of Irvine, Reassessment District No. 19-01, Limited Obligation Improvement 5.00%, 9/2/2027 | 15 | 16 |
City of Los Angeles Department of Airports, International Airport Subordinate Series 2019E, Rev., AMT, 5.00%, 5/15/2039 | 155 | 167 |
Clovis Unified School District COP, 4.00%, 6/1/2028 | 150 | 157 |
CSCDA Community Improvement Authority, Essential Housing, Oceanaire-Long Beach Series 2021A-2, Rev., 4.00%, 9/1/2056 (e) | 2,115 | 1,522 |
CSCDA Community Improvement Authority, Essential Housing, Parallel-Anaheim Series 2021A, Rev., 4.00%, 8/1/2056 (e) | 1,500 | 1,102 |
CSCDA Community Improvement Authority, Essential Housing, Pasadena Portfolio Series 2021A-1, Rev., 2.65%, 12/1/2046 (e) | 365 | 269 |
Dixon Unified School District COP, 5.00%, 9/1/2027 | 10 | 11 |
INVESTMENTS | PRINCIPAL AMOUNT ($000) | VALUE ($000) |
California — continued | ||
East Bay Municipal Utility District, Wastewater System Series A-1, Rev., 5.00%, 6/1/2036 | 1,850 | 1,903 |
East Bay Municipal Utility District, Water System Series 2015B, Rev., 5.00%, 6/1/2033 | 515 | 532 |
Fontana Redevelopment Agency, Successor Agency, Tax Allocation Series 2017A, Rev., 5.00%, 10/1/2025 | 50 | 52 |
Fresno Joint Powers Financing Authority, Master Lease Project Series 2017A, Rev., AGM, 5.00%, 4/1/2026 | 100 | 105 |
Hartnell Community College District, Election of 2016 Series B, GO, 4.00%, 8/1/2036 | 430 | 436 |
Long Beach Unified School District, Election of 2008 Series G, GO, 4.00%, 8/1/2045 | 4,165 | 4,056 |
Los Angeles Unified School District, Election of 2008 Series 2018B-1, GO, 5.00%, 7/1/2037 | 30 | 32 |
Modesto Elementary School District, Election of 2018 Series C, GO, 5.00%, 8/1/2052 | 2,500 | 2,657 |
Modesto High School District Series A, GO, 4.00%, 8/1/2048 | 5,200 | 5,003 |
Moulton-Niguel Water District Public Facilities Corp. Rev., 5.00%, 9/1/2038 | 35 | 38 |
Mount San Antonio Community College District, Election of 2008 Series 2013A, GO, Zero Coupon, 8/1/2043 | 7,150 | 6,484 |
Mountain View Shoreline Regional Park Community Series 2018A, Rev., AGM, 5.00%, 8/1/2034 | 25 | 27 |
Ontario Public Financing Authority, Civic Center Improvements Series 2022A, Rev., AGM, 5.00%, 11/1/2037 | 200 | 224 |
Rim of the World Unified School District Series 2010B, GO, AGM, Zero Coupon, 8/1/2039 | 25 | 12 |
Riverside Public Financing Authority, Riverside Pavement Rehabilitation Project COP, AGM, 5.00%, 10/24/2023 | 1,500 | 1,503 |
San Francisco City and County Airport Commission, San Francisco International Airport Series 2019A, Rev., AMT, 4.00%, 5/1/2049 | 1,325 | 1,186 |
Santa Clara Valley Transportation Authority, Sales Tax Series 2018A, Rev., 5.00%, 6/1/2024 | 30 | 31 |
State of California, Various Purpose GO, 5.00%, 11/1/2029 | 1,020 | 1,102 |
Total California | 43,279 | |
Colorado — 3.5% | ||
Boulder Valley School District No. Re-2 Boulder GO, 4.13%, 12/1/2046 | 5,000 | 4,773 |
August 31, 2023 | J.P. Morgan Municipal Bond Funds | 83 |
AS OF August 31, 2023 (Unaudited) (continued)
INVESTMENTS | PRINCIPAL AMOUNT ($000) | VALUE ($000) |
Municipal Bonds — continued | ||
Colorado — continued | ||
Brighton Crossing Metropolitan District No. 6, Limited Tax Series 2020A-3, GO, 5.00%, 12/1/2050 | 670 | 566 |
Broadway Park North Metropolitan District No. 2, Limited Tax GO, 5.00%, 12/1/2049 (e) | 650 | 585 |
City and County of Denver, Airport System Series 2022A, Rev., AMT, 5.50%, 11/15/2053 | 3,465 | 3,688 |
City of Colorado Springs, Utilities System Improvement Series 2020A, Rev., 4.00%, 11/15/2050 | 1,715 | 1,613 |
Colorado Educational and Cultural Facilities Authority, Aspen View Academy Project Rev., 4.00%, 5/1/2051 | 175 | 135 |
Colorado Educational and Cultural Facilities Authority, Global Village Academy Northglenn Project Rev., 5.00%, 12/1/2050 (e) | 740 | 619 |
Colorado Educational and Cultural Facilities Authority, James Irwin Educational Foundation | ||
Series 2022, Rev., 5.00%, 9/1/2052 | 750 | 702 |
Series 2022, Rev., 5.00%, 9/1/2057 | 1,750 | 1,619 |
Colorado Health Facilities Authority, Children's Hospital Colorado Project Series C, Rev., 5.00%, 12/1/2027 | 160 | 166 |
Colorado Health Facilities Authority, CommonSpirit Health Series 2019A-1, Rev., 4.00%, 8/1/2044 | 2,565 | 2,281 |
Colorado Health Facilities Authority, Vail Valley Medical Centre Project Rev., 4.00%, 1/15/2045 | 1,095 | 956 |
County of Adams COP, 4.00%, 12/1/2040 | 2,815 | 2,726 |
County of El Paso, The Colorado College Project Series 2020A, Rev., 5.00%, 6/1/2031 | 100 | 111 |
Denver Health and Hospital Authority Series A, Rev., 5.25%, 12/1/2045 | 1,000 | 1,001 |
Raindance Metropolitan District No. 1, Non-Potable Water System Rev., 5.25%, 12/1/2050 | 1,000 | 884 |
Sky Ranch Community Authority Board, Metropolitan District No. 3 Series 2022A, Rev., 5.75%, 12/1/2052 | 500 | 460 |
State of Colorado | ||
Series 2018A, COP, 5.00%, 9/1/2031 | 20 | 22 |
Series 2020-A, COP, 4.00%, 12/15/2034 | 30 | 31 |
State of Colorado Department of Transportation Headquarters Facilities, Headquarters Facilities Lease Purchase Agreement COP, 5.00%, 6/15/2041 | 1,000 | 1,024 |
INVESTMENTS | PRINCIPAL AMOUNT ($000) | VALUE ($000) |
Colorado — continued | ||
Transport Metropolitan District No. 3, Limited Tax Series 2021A-1, GO, 5.00%, 12/1/2041 | 1,700 | 1,499 |
Verve Metropolitan District No. 1 GO, 6.75%, 12/1/2052 | 1,500 | 1,369 |
Total Colorado | 26,830 | |
Connecticut — 0.8% | ||
City of Norwalk Series 2023, GO, 4.25%, 8/15/2053 | 1,000 | 977 |
Connecticut Housing Finance Authority, Housing Mortgage Finance Program | ||
Series A-1, Rev., 4.00%, 11/15/2045 | 25 | 25 |
Series A-1, Rev., 4.00%, 11/15/2047 | 145 | 144 |
Connecticut State Health and Educational Facilities Authority, Covenant Home, Inc. | ||
Series 2018B, Rev., 5.00%, 12/1/2025 | 1,000 | 1,002 |
Series 2020A, Rev., 5.00%, 7/1/2028 | 50 | 53 |
Connecticut State Health and Educational Facilities Authority, Sacred Heart University Series K, Rev., 4.00%, 7/1/2045 | 2,475 | 2,220 |
Stamford Housing Authority, The Dogwoods Project Rev., BAN, 11.00%, 12/1/2027 (e) | 1,000 | 1,054 |
State of Connecticut | ||
Series 2016D, GO, 5.00%, 8/15/2026 | 25 | 26 |
Series A, GO, 5.00%, 4/15/2029 | 150 | 160 |
State of Connecticut, Special Tax Transportation Infrastructure Purposes | ||
Series A, Rev., 5.00%, 9/1/2027 | 25 | 27 |
Series 2018B, Rev., 5.00%, 10/1/2033 | 55 | 60 |
Town of Stratford GO, 5.00%, 5/15/2028 | 245 | 263 |
University of Connecticut Series 2015A, Rev., 5.00%, 2/15/2028 | 15 | 15 |
Total Connecticut | 6,026 | |
Delaware — 0.7% | ||
Delaware State Economic Development Authority, Acts Retirement-Life Communities, Inc., Obligated Group Series 2018B, Rev., 5.00%, 11/15/2048 | 1,000 | 931 |
Delaware State Economic Development Authority, Newark Charter School, Inc., Project | ||
Series A, Rev., 5.00%, 9/1/2036 | 500 | 508 |
Series A, Rev., 5.00%, 9/1/2046 | 500 | 496 |
Rev., 5.00%, 9/1/2050 | 1,500 | 1,471 |
84 | J.P. Morgan Municipal Bond Funds | August 31, 2023 |
INVESTMENTS | PRINCIPAL AMOUNT ($000) | VALUE ($000) |
Municipal Bonds — continued | ||
Delaware — continued | ||
Delaware State Health Facilities Authority, Bayhealth Medical Center Project Series 2017A, Rev., 4.00%, 7/1/2043 | 1,275 | 1,182 |
University of Delaware Series 2019A, Rev., 5.00%, 11/1/2045 | 500 | 554 |
Total Delaware | 5,142 | |
District of Columbia — 1.5% | ||
District of Columbia, Georgetown University Issue Rev., 5.00%, 4/1/2030 | 15 | 16 |
District of Columbia, Kipp DC Project | ||
Series 2017B, Rev., 5.00%, 7/1/2027 | 30 | 31 |
Series 2017B, Rev., 5.00%, 7/1/2037 | 25 | 25 |
Rev., 4.00%, 7/1/2039 | 1,925 | 1,737 |
District of Columbia, National Public Radio, Inc. Rev., 5.00%, 4/1/2024 (d) | 25 | 25 |
District of Columbia, Rocketship Obligated Group Series 2021A, Rev., 5.00%, 6/1/2041 (e) | 1,130 | 1,026 |
Metropolitan Washington Airports Authority Aviation | ||
Series A, Rev., AMT, 5.00%, 10/1/2030 | 80 | 83 |
Series 2021A, Rev., AMT, 4.00%, 10/1/2040 | 3,250 | 3,130 |
Washington Metropolitan Area Transit Authority Series 2017B, Rev., 5.00%, 7/1/2042 | 5,010 | 5,166 |
Total District of Columbia | 11,239 | |
Florida — 4.5% | ||
City of Kissimmee, Sales Tax Series 2022A, Rev., 4.00%, 10/1/2051 | 8,110 | 7,520 |
City of Lakeland, Capital Improvement | ||
Series 2021A, Rev., 5.00%, 10/1/2039 | 275 | 305 |
Series 2021A, Rev., 5.00%, 10/1/2040 | 290 | 320 |
Series 2021A, Rev., 5.00%, 10/1/2041 | 200 | 220 |
City of Leesburg, Electric System Rev., 5.00%, 10/1/2031 | 15 | 16 |
City of Pompano Beach Series 2021A, Rev., 4.00%, 9/1/2051 | 3,400 | 2,509 |
City of Port St. Lucie, Utility System Rev., 5.00%, 9/1/2028 | 25 | 27 |
City of Tampa, The University of Tampa Project Series 2020A, Rev., 4.00%, 4/1/2050 | 2,000 | 1,728 |
County of Hillsborough, Parks and Recreation Program GO, NATL - RE, 5.25%, 7/1/2025 | 1,200 | 1,232 |
County of Miami-Dade Aviation Series 2020A, Rev., 4.00%, 7/1/2047 | 4,275 | 4,034 |
County of Miami-Dade, Subordinate Special Obligation Rev., 4.00%, 10/1/2040 | 105 | 97 |
INVESTMENTS | PRINCIPAL AMOUNT ($000) | VALUE ($000) |
Florida — continued | ||
County of Sarasota, Utility System Series 2016A, Rev., 4.00%, 10/1/2043 | 65 | 62 |
Florida Department of Management Services Series 2021A, COP, 5.00%, 11/1/2033 | 1,250 | 1,424 |
Florida Development Finance Corp., Educational Facilities, River City Science Academy Projects Series 2022A-1, Rev., 5.00%, 7/1/2051 | 195 | 181 |
Florida Development Finance Corp., Mater Academy Project Series 2022A, Rev., 4.00%, 6/15/2042 | 1,500 | 1,284 |
Florida Development Finance Corp., Mayflower Retirement Community Project | ||
Series 2021A, Rev., 4.00%, 6/1/2041 (e) | 1,320 | 945 |
Series 2021A, Rev., 4.00%, 6/1/2046 (e) | 1,005 | 669 |
Florida Gulf Coast University Financing Corp., Housing Project Series 2020A, Rev., 4.00%, 2/1/2037 | 225 | 220 |
Florida Municipal Power Agency, All-Requirements Power Supply Project Series 2016A, Rev., 5.00%, 10/1/2026 | 25 | 26 |
Florida State Board of Governors, Florida International University Dormitory Series 2021A, Rev., 4.00%, 7/1/2032 | 65 | 67 |
Lee County School Board (The) | ||
Series 2023A, COP, 4.00%, 8/1/2046 | 3,735 | 3,505 |
Series 2023A, COP, 4.00%, 8/1/2048 | 2,500 | 2,329 |
Miami-Dade County Health Facilities Authority, Niklaus Children's Hospital Series 2021A, Rev., 4.00%, 8/1/2046 | 860 | 770 |
Middleton Community Development District A, City of Wildwood, Florida Special Assessment Series 2022, 6.10%, 5/1/2042 | 1,000 | 1,034 |
Monroe County School District | ||
Series 2018A, COP, 5.00%, 6/1/2030 | 150 | 161 |
Series 2018A, COP, 5.00%, 6/1/2034 | 40 | 43 |
Orange County Convention Center, Tourist Development Tax Series 2016A, Rev., 4.00%, 10/1/2036 | 40 | 40 |
Palm Beach County Health Facilities Authority, Acts Retirement Life Communities, Inc., Obligated Group Series 2020B, Rev., 4.00%, 11/15/2041 | 400 | 332 |
State of Florida Department of Transportation Turnpike System Series 2018A, Rev., 5.00%, 7/1/2033 | 90 | 98 |
Village Community Development District No. 15 5.00%, 5/1/2043 (e) | 750 | 751 |
Volusia County Educational Facility Authority, Embry Riddle Aeronautical University, Inc., Project | ||
Series 2020A, Rev., 4.00%, 10/15/2037 | 725 | 701 |
August 31, 2023 | J.P. Morgan Municipal Bond Funds | 85 |
AS OF August 31, 2023 (Unaudited) (continued)
INVESTMENTS | PRINCIPAL AMOUNT ($000) | VALUE ($000) |
Municipal Bonds — continued | ||
Florida — continued | ||
Series 2020A, Rev., 4.00%, 10/15/2038 | 880 | 835 |
Series 2020A, Rev., 4.00%, 10/15/2039 | 1,020 | 956 |
Total Florida | 34,441 | |
Georgia — 1.9% | ||
Carroll City-County Hospital Authority Rev., GTD, 4.00%, 7/1/2045 | 1,250 | 1,156 |
Dalton Whitfield County Joint Development Authority, Hamilton Health Care System Rev., 4.00%, 8/15/2041 | 1,000 | 968 |
Downtown Development Authority of The City of Dalton, Hamilton Health Care System Rev., NATL - RE, 5.50%, 8/15/2026 | 1,210 | 1,244 |
George L Smith II Congress Center Authority, Convention Center Hotel First Series 2021A, Rev., 4.00%, 1/1/2054 | 1,000 | 822 |
George L Smith II Congress Center Authority, Convention Center Hotel Second Series 2021B, Rev., 5.00%, 1/1/2054 (e) | 1,145 | 931 |
Georgia Higher Education Facilities Authority, USG Real Estate Foundation II LLC Projects Rev., 4.00%, 6/15/2038 | 2,000 | 1,949 |
Georgia Housing and Finance Authority, Single Family Mortgage Series 2014A-1, Rev., AMT, 4.00%, 6/1/2044 | 15 | 15 |
Georgia Ports Authority Rev., 4.00%, 7/1/2052 | 2,805 | 2,668 |
Municipal Electric Authority of Georgia Series 2019B, Rev., 5.00%, 1/1/2059 | 5,000 | 4,991 |
Total Georgia | 14,744 | |
Hawaii — 0.3% | ||
City and County of Honolulu Series A, GO, 5.00%, 10/1/2037 | 1,970 | 2,014 |
Idaho — 0.2% | ||
Boise State University General Project Series 2023A, Rev., 5.00%, 4/1/2048 (c) | 1,595 | 1,677 |
Illinois — 4.5% | ||
Chicago O'Hare International Airport, General Airport, Senior Lien | ||
Series C, Rev., 5.00%, 1/1/2025 | 105 | 107 |
Series 2018B, Rev., 5.00%, 1/1/2053 | 3,000 | 3,079 |
City of Chicago, Waterworks, Second Lien | ||
Series 2023B, Rev., AGM, 4.00%, 11/1/2040 | 1,000 | 974 |
Series 2023A, Rev., AGM, 5.25%, 11/1/2053 | 635 | 676 |
City of Evanston, Corporate Purpose Series 2018B, GO, 5.00%, 12/1/2024 | 25 | 25 |
City of Fairview Park GO, 4.00%, 12/1/2024 | 25 | 25 |
INVESTMENTS | PRINCIPAL AMOUNT ($000) | VALUE ($000) |
Illinois — continued | ||
City of St. Charles Series 2020B, GO, 4.00%, 12/1/2030 | 440 | 450 |
City of Sterling Series 2021B, GO, 4.00%, 11/1/2037 | 570 | 555 |
Cook County School District No. 99 Cicero, Limited Tax Series 2019B, GO, 5.00%, 12/1/2024 | 185 | 188 |
County of Cook | ||
Series 2021A, GO, 5.00%, 11/15/2028 | 35 | 38 |
GO, 5.00%, 11/15/2034 | 700 | 722 |
Hoffman Estates Park District Series 2014A, GO, 4.00%, 12/1/2044 | 25 | 24 |
Illinois Finance Authority, Clean Water Initiative Revolving Fund | ||
Rev., 5.00%, 1/1/2025 | 100 | 102 |
Rev., 5.00%, 7/1/2040 | 105 | 112 |
Illinois Finance Authority, Memorial Health System Series 2019, Rev., 5.00%, 4/1/2035 | 380 | 398 |
Illinois Finance Authority, Mercy Health System Rev., 5.00%, 12/1/2046 | 305 | 305 |
Illinois Finance Authority, Northwest community Hospital Series 2016A, Rev., 5.00%, 7/1/2025 (d) | 250 | 258 |
Illinois Finance Authority, Presbyterian Homes Obligated Group Series 2016A, Rev., 5.00%, 11/1/2031 | 10 | 10 |
Illinois Finance Authority, Social Bonds-Learn Chapter School Project Rev., 4.00%, 11/1/2051 | 500 | 399 |
Illinois Finance Authority, Southern Illinois Healthcare Enterprises, Inc. | ||
Series 2017C, Rev., 5.00%, 3/1/2033 | 305 | 315 |
Series 2017C, Rev., 5.00%, 3/1/2034 | 205 | 211 |
Illinois State Toll Highway Authority Series 2019A, Rev., 4.00%, 1/1/2044 | 1,000 | 951 |
Kendall and Kane Counties Community Unit School District No. 115 Series 2021, GO, 4.00%, 1/1/2026 | 65 | 66 |
Lake County Community Consolidated School District No. 3 Beach Park GO, AGM, 4.00%, 2/1/2034 | 130 | 133 |
Metropolitan Pier and Exposition Authority, McCormick Place Expansion Project Series 2002A, Rev., AGM-CR, NATL - RE, Zero Coupon, 12/15/2040 | 5,000 | 2,291 |
Northern Illinois University, Board of Trustees, Auxiliary Facilities System Rev., 4.00%, 10/1/2043 | 275 | 248 |
Park Ridge Park District Series 2023B, GO, 4.00%, 12/1/2045 | 1,095 | 1,036 |
86 | J.P. Morgan Municipal Bond Funds | August 31, 2023 |
INVESTMENTS | PRINCIPAL AMOUNT ($000) | VALUE ($000) |
Municipal Bonds — continued | ||
Illinois — continued | ||
Sales Tax Securitization Corp. | ||
Series 2018C, Rev., 5.00%, 1/1/2026 | 3,500 | 3,602 |
Series 2018C, Rev., 5.25%, 1/1/2043 | 1,500 | 1,559 |
State of Illinois | ||
GO, 5.00%, 5/1/2024 | 205 | 207 |
Series 2017D, GO, 5.00%, 11/1/2024 | 325 | 330 |
GO, 5.00%, 5/1/2027 | 175 | 176 |
GO, 5.00%, 6/1/2027 | 25 | 26 |
GO, 5.00%, 11/1/2028 | 20 | 21 |
GO, 5.50%, 1/1/2030 | 20 | 22 |
GO, 5.50%, 5/1/2030 | 2,020 | 2,221 |
GO, 4.13%, 11/1/2031 | 20 | 20 |
Series 2022B, GO, 5.00%, 3/1/2033 | 6,000 | 6,563 |
GO, 4.00%, 6/1/2033 | 15 | 15 |
Series 2021A, GO, 5.00%, 3/1/2036 | 3,250 | 3,449 |
GO, 4.00%, 6/1/2036 | 25 | 25 |
GO, 4.00%, 6/1/2037 | 45 | 44 |
Series 2023B, GO, 4.50%, 5/1/2048 | 615 | 589 |
State of Illinois, Sales Tax | ||
Series 2016D, Rev., 5.00%, 6/15/2027 | 15 | 15 |
Series 2021C, Rev., 5.00%, 6/15/2032 | 65 | 69 |
Village of Arlington Heights GO, 4.00%, 12/1/2034 | 130 | 131 |
Village of Bolingbrook Series 2018A, GO, AGM, 5.00%, 1/1/2033 | 1,000 | 1,071 |
Will County Forest Preserve District GO, 5.00%, 12/15/2024 | 35 | 36 |
Will County School District No. 86 Joliet, Limited Tax Series 2015A, GO, 4.00%, 3/1/2024 | 220 | 220 |
Winnebago and Boone Counties School District No. 205 Rockford Series 2015B, GO, 3.75%, 2/1/2033 | 35 | 35 |
Total Illinois | 34,144 | |
Indiana — 0.5% | ||
City of Goshen, Multi-Family, Green Oaks of Goshen Project Series 2021A, Rev., 5.00%, 8/1/2041 (e) | 500 | 395 |
City of Lafayette, Local Income Tax Rev., 4.00%, 6/30/2028 | 180 | 184 |
Greencastle Community School Building Corp., Ad Valorem Property Tax First Mortgage Rev., 4.00%, 7/15/2031 | 25 | 26 |
Greenfield Middle School Building Corp., Ad Valorem Property Tax First Mortgage Rev., 4.00%, 7/15/2032 | 350 | 358 |
Indiana Finance Authority Series 2023A, Rev., 5.00%, 6/1/2053 | 900 | 901 |
INVESTMENTS | PRINCIPAL AMOUNT ($000) | VALUE ($000) |
Indiana — continued | ||
Indiana Finance Authority, Butler University Project Rev., 4.00%, 2/1/2040 | 25 | 23 |
Indiana Finance Authority, Educational Facilities, Kipp Indianapolis, Inc., Project | ||
Series 2020A, Rev., 5.00%, 7/1/2040 | 170 | 160 |
Series 2020A, Rev., 5.00%, 7/1/2055 | 460 | 407 |
Indiana Finance Authority, Marian University Project Series 2019A, Rev., 5.00%, 9/15/2034 | 1,100 | 1,127 |
Indiana Finance Authority, Parkview Health System, Inc. Series 2018A, Rev., 4.00%, 11/1/2048 | 50 | 45 |
Indiana Health and Educational Facilities Financing Authority, Ascension Senior Credit Group Series 2006B-1, Rev., 4.00%, 11/15/2046 | 15 | 14 |
Indiana Municipal Power Agency Series 2016A, Rev., 5.00%, 1/1/2042 | 30 | 31 |
Indiana State University, Housing and Dining System Rev., 5.00%, 4/1/2029 | 30 | 32 |
Indianapolis Local Public Improvement Bond Bank Series 2022B, Rev., 5.00%, 2/1/2031 | 160 | 180 |
Merrillville Building Corp. Rev., 4.00%, 7/15/2034 | 35 | 36 |
Total Indiana | 3,919 | |
Iowa — 0.0% ^ | ||
Waukee Community School District Infrastructure Sales Services & Use Tax Series 2021A, Rev., 5.00%, 6/1/2028 | 60 | 65 |
Kansas — 0.0% ^ | ||
Kansas Power Pool, Electric Utility Series 2021A, Rev., 5.00%, 12/1/2029 | 15 | 16 |
Kentucky — 0.6% | ||
City of Henderson, Pratt Paper LLC Project Series 2022A, Rev., AMT, 4.45%, 1/1/2042 (e) | 560 | 530 |
Commonwealth of Kentucky, State Office Building Project COP, 4.00%, 6/15/2032 | 30 | 30 |
Kentucky Public Energy Authority, Gas Supply Series 2022A-1, Rev., 4.00%, 8/1/2030 (b) | 4,000 | 3,930 |
Pike County School District Finance Corp., School Building Rev., 4.00%, 2/1/2028 | 20 | 20 |
Total Kentucky | 4,510 | |
Louisiana — 0.8% | ||
Lafourche Parish School Board, Parish Wide GO, 4.00%, 3/1/2033 | 125 | 130 |
Louisiana Public Facilities Authority, Lincoln Preparatory School Project Series 2021A, Rev., 5.25%, 6/1/2051 (e) | 1,140 | 924 |
August 31, 2023 | J.P. Morgan Municipal Bond Funds | 87 |
AS OF August 31, 2023 (Unaudited) (continued)
INVESTMENTS | PRINCIPAL AMOUNT ($000) | VALUE ($000) |
Municipal Bonds — continued | ||
Louisiana — continued | ||
Louisiana Public Facilities Authority, Louisiana Children's Medical Center Project Series 2015A1, Rev., 5.00%, 6/1/2039 | 25 | 25 |
Louisiana Public Facilities Authority, Mentorship Steam Academy Project Series 2021A, Rev., 5.00%, 6/1/2056 (e) | 740 | 557 |
Louisiana Public Facilities Authority, Ochsner Clinic Foundation Project Series 2015, Rev., 5.00%, 5/15/2047 | 1,055 | 1,057 |
State of Louisiana Series 2019A, GO, 5.00%, 3/1/2035 | 2,000 | 2,190 |
Tobacco Settlement Financing Corp. Series 2013A, Rev., 5.25%, 5/15/2035 | 815 | 821 |
Total Louisiana | 5,704 | |
Maine — 0.4% | ||
Maine Health and Higher Educational Facilities Authority Series 2021A, Rev., AGM, 4.00%, 7/1/2038 | 350 | 344 |
Maine Health and Higher Educational Facilities Authority, MaineHealth Series 2020A, Rev., 4.00%, 7/1/2045 | 2,355 | 2,161 |
Maine Municipal Bond Bank Series 2018A, Rev., GAN, 5.00%, 9/1/2026 | 80 | 84 |
Maine State Housing Authority, Mortgage Purchase Series 2016A, Rev., 4.00%, 11/15/2045 | 95 | 95 |
Total Maine | 2,684 | |
Maryland — 0.9% | ||
City of Baltimore, Water Projects Series 2019B, Rev., 4.00%, 7/1/2033 | 270 | 278 |
Maryland Health and Higher Educational Facilities Authority, Medstar Health Issue Series 2017A, Rev., 5.00%, 5/15/2042 | 5,000 | 5,097 |
Maryland Health and Higher Educational Facilities Authority, Stevenson University Project Series 2021A, Rev., 4.00%, 6/1/2051 | 2,000 | 1,703 |
Montgomery County Housing Opportunities Commission, Single Family Mortgage Series 2013A, Rev., 4.00%, 1/1/2031 | 45 | 45 |
Total Maryland | 7,123 | |
Massachusetts — 1.3% | ||
City of Methuen GO, 5.00%, 9/1/2030 | 685 | 782 |
Commonwealth of Massachusetts Transportation Fund, Rail Enhancement and Accelerated Bridge Programs Series 2016B, Rev., 4.00%, 6/1/2046 | 2,480 | 2,396 |
Commonwealth of Massachusetts, Consolidated Loan of 2016 Series 2016J, GO, 4.00%, 12/1/2039 | 3,690 | 3,672 |
INVESTMENTS | PRINCIPAL AMOUNT ($000) | VALUE ($000) |
Massachusetts — continued | ||
Massachusetts Development Finance Agency, Berklee College Music Rev., 5.00%, 10/1/2026 | 15 | 16 |
Massachusetts Development Finance Agency, Boston College Issue Series 2017T, Rev., 4.00%, 7/1/2042 | 35 | 34 |
Massachusetts Development Finance Agency, Emerson College | ||
Rev., 5.00%, 1/1/2036 | 825 | 837 |
Rev., 5.00%, 1/1/2037 | 315 | 318 |
Massachusetts Development Finance Agency, Wellforce Issue Series 2020C, Rev., AGM, 3.00%, 10/1/2045 | 1,000 | 738 |
Massachusetts Housing Finance Agency, Single Family Housing Series 177, Rev., AMT, 4.00%, 6/1/2039 | 105 | 104 |
Town of Bellingham, Municipal Purpose Loan GO, 4.00%, 6/15/2032 | 10 | 10 |
Town of Westwood, Unlimited Tax GO, 5.00%, 8/15/2037 | 1,040 | 1,163 |
Total Massachusetts | 10,070 | |
Michigan — 2.0% | ||
Berkley School District, Michigan 2015 School Building and Site Bonds, Unlimited Tax GO, Q-SBLF, 4.00%, 5/1/2040 | 30 | 29 |
City of Detroit, Unlimited Tax | ||
Series 2021A, GO, 4.00%, 4/1/2041 | 300 | 261 |
Series 2021A, GO, 4.00%, 4/1/2042 | 350 | 300 |
Dundee Community Schools, Limited Tax GO, AGM, 5.00%, 5/1/2026 | 70 | 73 |
Grand Rapids Charter Township Economic Development Corp., Porter Hills Presbyterian Village Project Rev., 5.00%, 5/15/2044 | 2,000 | 1,760 |
Grand Rapids Public Schools, Unlimited Tax GO, AGM, 5.00%, 11/1/2043 | 1,000 | 1,040 |
Grand Traverse County Hospital Finance Authority, Munson Healthcare Obligated Group Rev., 5.00%, 7/1/2034 | 25 | 27 |
Hanover Horton School District, Unlimited tax GO, AGM, 4.00%, 5/1/2028 | 45 | 46 |
Kentwood Economic Development Corp., Holland Home Obligated Group Series 2022, Rev., 4.00%, 11/15/2043 | 375 | 284 |
Michigan Finance Authority, Henry Ford Health System | ||
Rev., 4.00%, 11/15/2046 | 480 | 439 |
Series 2019A, Rev., 4.00%, 11/15/2050 | 4,890 | 4,371 |
88 | J.P. Morgan Municipal Bond Funds | August 31, 2023 |
INVESTMENTS | PRINCIPAL AMOUNT ($000) | VALUE ($000) |
Municipal Bonds — continued | ||
Michigan — continued | ||
Michigan Finance Authority, Lawrence Technological University Obligated Group Rev., 4.00%, 2/1/2042 | 375 | 299 |
Michigan State Building Authority, Facilities Program | ||
Series 2016 I, Rev., 4.00%, 10/15/2036 | 50 | 50 |
Series 2015I, Rev., 4.00%, 4/15/2040 | 120 | 120 |
Series 2023-II, Rev., 4.00%, 10/15/2047 | 675 | 637 |
Michigan State Housing Development Authority, Single Family Mortgage Series 2015A, Rev., AMT, 4.00%, 6/1/2046 | 25 | 25 |
Michigan Strategic Fund, Holland Home Obligated Group Rev., 5.00%, 11/15/2043 | 750 | 663 |
Michigan Strategic Fund, United Methodist Retirement Communities Obligated Group, Porter Hills Presbyterian Village Project Rev., 5.00%, 5/15/2044 | 1,000 | 880 |
Niles Community Schools, Unlimited Tax GO, Q-SBLF, 4.00%, 5/1/2041 | 25 | 25 |
State of Michigan Trunk Line Series 2021A, Rev., 4.00%, 11/15/2044 | 4,295 | 4,152 |
West Ottawa Public Schools, School Building and Site, Unlimited Tax Series 2014-1, GO, 4.00%, 5/1/2024 (d) | 25 | 25 |
Whitehall District Schools, Unlimited Tax GO, AGM, 5.00%, 5/1/2033 | 25 | 27 |
Total Michigan | 15,533 | |
Minnesota — 1.4% | ||
Aurora Independent School District No. 2711, School Building, Capital Appreciation | ||
Series 2017B, GO, Zero Coupon, 2/1/2026 | 150 | 137 |
Series 2017B, GO, Zero Coupon, 2/1/2027 | 400 | 350 |
Series 2017B, GO, Zero Coupon, 2/1/2028 | 225 | 189 |
Series 2017B, GO, Zero Coupon, 2/1/2030 | 880 | 673 |
City of Minneapolis, Health Care System, Fairview Health Services Series 2018A, Rev., 4.00%, 11/15/2048 | 3,000 | 2,501 |
City of Woodbury, Charter School Lease Series 2020A, Rev., 4.00%, 12/1/2050 | 250 | 193 |
Greenway Independent School District No. 316, Capital Appreciation | ||
Series 2019F, GO, Zero Coupon, 2/1/2030 | 700 | 550 |
Series 2019F, GO, Zero Coupon, 2/1/2031 | 545 | 411 |
Metropolitan Council Series 2023C, GO, 4.00%, 3/1/2041 | 3,000 | 2,951 |
Minneapolis Special School District No. 1 Series 2020A, COP, 4.00%, 4/1/2032 | 125 | 130 |
INVESTMENTS | PRINCIPAL AMOUNT ($000) | VALUE ($000) |
Minnesota — continued | ||
Minneapolis-St. Paul Housing Finance Board, Single Family Mortgage, City Living Home Programs Series 2007A-2, Rev., GNMA / FNMA / FHLMC, 5.52%, 3/1/2041 | 25 | 25 |
Minnesota Higher Education Facilities Authority, Carleton College | ||
Rev., 4.00%, 3/1/2032 | 1,000 | 1,021 |
Rev., 4.00%, 3/1/2033 | 500 | 509 |
Minnesota Housing Finance Agency, Residential Housing Finance | ||
Series 2014A, Rev., AMT, 4.00%, 7/1/2038 | 40 | 40 |
Series C, Rev., AMT, GNMA / FNMA / FHLMC, 4.00%, 1/1/2045 | 195 | 193 |
Series 2017B, Rev., AMT, GNMA / FNMA / FHLMC COLL, 4.00%, 7/1/2047 | 120 | 119 |
Nashwauk Keewatin Independent School District No. 319 Series 2022A, GO, 4.00%, 2/1/2035 | 500 | 520 |
Total Minnesota | 10,512 | |
Mississippi — 0.1% | ||
Mississippi Development Bank, Special Obligation, Water and Sewer System Project Rev., AGM, 6.88%, 12/1/2040 | 1,000 | 1,006 |
Missouri — 0.4% | ||
City of Excelsior Springs Series 2020B, COP, 4.00%, 3/1/2028 | 100 | 103 |
City of Sedalia COP, 4.00%, 7/15/2035 | 205 | 207 |
County of Pulaski COP, 4.00%, 12/1/2030 | 50 | 50 |
Health and Educational Facilities Authority of the State of Missouri, Lutheran Senior Services Projects | ||
Series 2019A, Rev., 5.00%, 2/1/2034 | 1,000 | 1,001 |
Series 2019A, Rev., 5.00%, 2/1/2042 | 1,000 | 953 |
Series 2019C, Rev., 4.00%, 2/1/2048 | 265 | 207 |
Health and Educational Facilities Authority of the State of Missouri, St. Luke's Episcopal-Presbyterian Hospitals Rev., 5.00%, 12/1/2030 | 260 | 275 |
Missouri Housing Development Commission, Single Family Mortgage, First Place Homeownership Loan Program Series B2, Rev., GNMA / FNMA / FHLMC, 4.00%, 11/1/2045 | 120 | 119 |
Total Missouri | 2,915 | |
August 31, 2023 | J.P. Morgan Municipal Bond Funds | 89 |
AS OF August 31, 2023 (Unaudited) (continued)
INVESTMENTS | PRINCIPAL AMOUNT ($000) | VALUE ($000) |
Municipal Bonds — continued | ||
Montana — 0.0% ^ | ||
Gallatin County School District No. 72 Ophir, Big Sky GO, 4.00%, 7/1/2027 | 100 | 103 |
Montana Board of Housing, Single Family Homeownership Series A-2, Rev., AMT, 4.00%, 12/1/2038 | 10 | 10 |
Total Montana | 113 | |
Nebraska — 2.0% | ||
Central Plains Energy Project | ||
Series 2022-1, Rev., 5.00%, 10/1/2029 (b) | 4,960 | 5,056 |
Series A, Rev., 5.00%, 9/1/2035 | 1,500 | 1,565 |
Central Plains Energy Project, Gas Project No. 3 | ||
Series 2017A, Rev., 5.00%, 9/1/2034 | 600 | 634 |
Series 2017A, Rev., 5.00%, 9/1/2042 | 750 | 763 |
Douglas County Hospital Authority No. 2, Children's Hospital Obligated Group | ||
Series 2020A, Rev., 4.00%, 11/15/2040 | 575 | 534 |
Series 2020A, Rev., 4.00%, 11/15/2041 | 300 | 278 |
Omaha Public Power District Series 2021B, Rev., 4.00%, 2/1/2046 | 6,635 | 6,280 |
Public Power Generation Agency, Whelan Energy Center Unit 2 | ||
Series 2015A, Rev., 5.00%, 1/1/2026 | 100 | 102 |
Series 2016A, Rev., 5.00%, 1/1/2034 | 185 | 191 |
Series 2016A, Rev., 5.00%, 1/1/2035 | 25 | 26 |
Total Nebraska | 15,429 | |
Nevada — 1.0% | ||
City of Reno, Sales Tax, Senior Lien, ReTrac-Reno Transportation Rail Access Corridor Project Series 2018B, Rev., AGM, 4.00%, 6/1/2048 | 375 | 330 |
County of Clark, Southern California Edison Co. Series 2010, Rev., 2.10%, 6/1/2031 | 5,000 | 4,040 |
Las Vegas Convention and Visitors Authority, Convention Center Expansion Series 2018B, Rev., 4.00%, 7/1/2049 | 2,500 | 2,295 |
Las Vegas Valley Water District, Limited Tax Series 2022A, GO, 4.00%, 6/1/2046 | 1,000 | 957 |
Truckee Meadows Water Authority Rev., 5.00%, 7/1/2031 | 15 | 16 |
Total Nevada | 7,638 | |
INVESTMENTS | PRINCIPAL AMOUNT ($000) | VALUE ($000) |
New Hampshire — 0.2% | ||
New Hampshire Business Finance Authority, Springpoint Senior Living Project Rev., 4.00%, 1/1/2041 | 1,000 | 818 |
New Hampshire Business Finance Authority, University of Nevada Reno Project Series 2023A, Rev., 4.50%, 6/1/2053 | 1,075 | 1,004 |
Total New Hampshire | 1,822 | |
New Jersey — 3.7% | ||
Borough of Dumont, County of Bergen GO, 4.00%, 5/1/2040 | 515 | 505 |
Monmouth County Improvement Authority (The), Governmental Pooled Loan Series 2019B, Rev., GTD, 4.00%, 12/1/2035 | 25 | 26 |
New Jersey Economic Development Authority Series 2023RRR, Rev., 5.00%, 3/1/2028 | 1,700 | 1,816 |
New Jersey Economic Development Authority, Biomedical Research Facilities Series 2016A, Rev., 5.00%, 7/15/2027 | 240 | 250 |
New Jersey Economic Development Authority, State House Project Series 2017B, Rev., 4.13%, 6/15/2039 | 2,800 | 2,808 |
New Jersey Educational Facilities Authority, Capital Improvement Series 2016B, Rev., 5.00%, 9/1/2036 | 105 | 108 |
New Jersey Housing and Mortgage Finance Agency, Single Family Housing Series 2018A, Rev., 4.50%, 10/1/2048 | 460 | 459 |
New Jersey Transportation Trust Fund Authority, Federal Highway Reimbursement | ||
Series A-1, Rev., 5.00%, 6/15/2027 | 2,670 | 2,778 |
Series A, Rev., 5.00%, 6/15/2031 | 3,000 | 3,118 |
New Jersey Transportation Trust Fund Authority, Transportation Program | ||
Series 2019BB, Rev., 4.00%, 6/15/2038 | 1,500 | 1,485 |
Series 2020AA, Rev., 4.00%, 6/15/2045 | 1,400 | 1,326 |
New Jersey Transportation Trust Fund Authority, Transportation System Series 2008A, Rev., Zero Coupon, 12/15/2036 | 10,355 | 5,788 |
New Jersey Turnpike Authority Series 2017G, Rev., 4.00%, 1/1/2043 | 1,000 | 965 |
State of New Jersey, COVID-19 Emergency Bonds Series 2020A, GO, 4.00%, 6/1/2031 | 3,000 | 3,141 |
Tobacco Settlement Financing Corp. | ||
Series 2018A, Rev., 4.00%, 6/1/2037 | 1,000 | 1,004 |
90 | J.P. Morgan Municipal Bond Funds | August 31, 2023 |
INVESTMENTS | PRINCIPAL AMOUNT ($000) | VALUE ($000) |
Municipal Bonds — continued | ||
New Jersey — continued | ||
Series 2018A, Rev., 5.00%, 6/1/2046 | 1,000 | 1,018 |
Series 2018A, Rev., 5.25%, 6/1/2046 | 1,500 | 1,549 |
Total New Jersey | 28,144 | |
New Mexico — 0.0% ^ | ||
New Mexico Mortgage Finance Authority, Single Family Mortgage Program Series B-1, Class I, Rev., AMT, GNMA / FNMA / FHLMC, 3.75%, 3/1/2048 | 250 | 246 |
New York — 13.3% | ||
Buffalo and Erie County Industrial Land Development Corp., D'youville College Project Series 2020A, Rev., 4.00%, 11/1/2045 | 2,300 | 1,970 |
Build NYC Resource Corp., Global Community Charter School Series 2022A, Rev., 5.00%, 6/15/2052 | 635 | 576 |
Build NYC Resource Corp., Grand Concourse Academy Charter School Series 2022A, Rev., 5.00%, 7/1/2052 | 350 | 333 |
City of New York | ||
Series 2023E, Subseries E-1, GO, 5.25%, 4/1/2047 | 6,500 | 7,067 |
Series 2023E, Subseries E-1, GO, 4.00%, 4/1/2050 | 6,450 | 6,075 |
City of New York, Fiscal Year 2020 Series 2020D-1, GO, 4.00%, 3/1/2050 | 650 | 612 |
City of New York, Fiscal Year 2024 Series 2024A, GO, 4.13%, 8/1/2053 | 1,300 | 1,228 |
County of Suffolk, Public Improvement Series 2021A, GO, 4.00%, 6/15/2031 | 1,000 | 1,027 |
Dutchess County Local Development Corp., Millbrook School Series 2021, Rev., 4.00%, 9/1/2051 | 1,030 | 901 |
Metropolitan Transportation Authority | ||
Series A-1, Rev., 5.00%, 11/15/2023 | 20 | 20 |
Series 2016D, Rev., 5.00%, 11/15/2031 | 400 | 412 |
Metropolitan Transportation Authority, Dedicated Tax Fund | ||
Subseries B-3B, Rev., 5.00%, 11/15/2028 | 25 | 26 |
Series B-1, Rev., 5.00%, 11/15/2029 | 25 | 26 |
Series B-1, Rev., 5.00%, 11/15/2035 | 95 | 101 |
Monroe County Industrial Development Corp., True North Rochester Preparatory Charter School Project Series 2020A, Rev., 5.00%, 6/1/2059 (e) | 540 | 498 |
Monroe County Industrial Development Corp., University of Rochester Project | ||
Series 2017C, Rev., 4.00%, 7/1/2032 | 90 | 91 |
Series 2017C, Rev., 4.00%, 7/1/2033 | 60 | 61 |
INVESTMENTS | PRINCIPAL AMOUNT ($000) | VALUE ($000) |
New York — continued | ||
New York City Municipal Water Finance Authority Fiscal Year 2022 Series 2022BB-1, Rev., 4.00%, 6/15/2045 | 2,180 | 2,088 |
New York City Transitional Finance Authority Building Aid, Subordinate Series 2016S-1, Rev., 4.00%, 7/15/2040 | 410 | 397 |
New York City Transitional Finance Authority Future Tax Secured Series 2022F, Subseries F-1, Rev., 5.00%, 2/1/2051 | 5,000 | 5,261 |
New York City Transitional Finance Authority, Building Aid, Fiscal Year 2019 Series S-3, Subseries S-3A, Rev., 5.00%, 7/15/2032 | 235 | 254 |
New York City Transitional Finance Authority, Future Tax Secured | ||
Series 2022B, Subseries B-1, Rev., 4.00%, 8/1/2038 | 470 | 469 |
Series 2022B, Subseries B-1, Rev., 4.00%, 8/1/2045 | 2,450 | 2,352 |
Series 2023F, Subseries F-1, Rev., 4.00%, 2/1/2051 | 1,250 | 1,173 |
New York City Transitional Finance Authority, Future Tax Secured, Fiscal Year 2017 Series 2017F-1, Rev., 4.00%, 5/1/2044 | 375 | 362 |
New York City Transitional Finance Authority, Future Tax Secured, Fiscal Year 2019 Series 2019C-1, Rev., 5.00%, 11/1/2034 | 100 | 109 |
New York City Transitional Finance Authority, Future Tax Secured, Tax-Exempt, Fiscal Year 2018 Series C-3, Rev., 5.00%, 5/1/2041 | 5,000 | 5,234 |
New York City Transitional Finance Authority, Future Tax Secured, Tax-Exempt, Fiscal Year 2020 Series A, Subseries A-2, Rev., 5.00%, 5/1/2035 | 50 | 54 |
New York City Water and Sewer System, Second General Resolution, Fiscal Year 2019 Series 2019, Subseries 2019FF-2, Rev., 5.00%, 6/15/2038 | 30 | 32 |
New York City Water and Sewer System, Second General Resolution, Fiscal Year 2020 | ||
Series 2020AA, Rev., 5.00%, 6/15/2040 | 55 | 59 |
Series 2022FF, Rev., 4.00%, 6/15/2041 | 2,500 | 2,457 |
New York Liberty Development Corp., Secured by Port Authority Series 1WTC-2021, Rev., 2.75%, 2/15/2044 | 1,900 | 1,361 |
New York State Dormitory Authority | ||
Series 2019D, Rev., 4.00%, 2/15/2047 | 3,500 | 3,309 |
Series 2020A, Rev., 4.00%, 7/1/2053 | 2,500 | 2,225 |
New York State Dormitory Authority, Barnard College Series 2020A, Rev., 4.00%, 7/1/2045 | 1,000 | 897 |
August 31, 2023 | J.P. Morgan Municipal Bond Funds | 91 |
AS OF August 31, 2023 (Unaudited) (continued)
INVESTMENTS | PRINCIPAL AMOUNT ($000) | VALUE ($000) |
Municipal Bonds — continued | ||
New York — continued | ||
New York State Dormitory Authority, New York University Series 2019A, Rev., 4.00%, 7/1/2045 | 2,000 | 1,913 |
New York State Dormitory Authority, Northwell Health Obligated Group Series 2022A, Rev., 5.00%, 5/1/2052 | 3,970 | 4,081 |
New York State Dormitory Authority, Rockefeller University Series 2020A, Rev., 5.00%, 7/1/2053 | 2,500 | 2,646 |
New York State Dormitory Authority, School Districts Financing Program | ||
Series 2018A, Rev., 5.00%, 10/1/2031 | 50 | 52 |
Series A, Rev., 5.00%, 10/1/2032 | 55 | 57 |
New York State Dormitory Authority, St. John's University Series 2021A, Rev., 4.00%, 7/1/2035 | 125 | 127 |
New York State Dormitory Authority, State Personal Income Tax, General Purpose | ||
Series 2021A, Rev., 5.00%, 3/15/2030 | 1,000 | 1,119 |
Series 2020A, Rev., 4.00%, 3/15/2044 | 2,000 | 1,920 |
New York State Dormitory Authority, State Sales Tax | ||
Series 2017A, Rev., 5.00%, 3/15/2036 | 100 | 105 |
Series 2018A, Rev., 5.00%, 3/15/2037 | 40 | 42 |
New York State Environmental Facilities Corp., State Clean Water and Drinking Water Revolving Funds, Municipal Water Finance Authority Projects - Second Resolution Series 2017A, Rev., 5.00%, 6/15/2037 | 1,750 | 1,850 |
New York State Urban Development Corp., Personal Income Tax Series 2020C, Rev., 4.00%, 3/15/2041 | 110 | 108 |
New York State Urban Development Corp., State Personal Income Tax, General Purpose Series 2019A, Rev., 5.00%, 3/15/2039 | 25 | 27 |
New York State Urban Development Corp., State Sales Tax Series 2021A, Rev., 4.00%, 3/15/2046 | 2,000 | 1,911 |
New York Transportation Development Corp., Delta Air Lines, Inc., LaGuardia Airport Terminals C&D Redevelopment Project | ||
Rev., AMT, 4.00%, 10/1/2030 | 4,255 | 4,191 |
Series 2018, Rev., AMT, 5.00%, 1/1/2031 | 2,000 | 2,058 |
Rev., AMT, 5.00%, 1/1/2034 | 1,125 | 1,156 |
Series 2018, Rev., AMT, 4.00%, 1/1/2036 | 1,500 | 1,434 |
Rev., AMT, 4.38%, 10/1/2045 | 1,200 | 1,127 |
Onondaga Civic Development Corp., Le Moyne College Project Rev., 5.00%, 1/1/2028 | 25 | 26 |
Port Authority of New York and New Jersey, Consolidated | ||
Series 183, Rev., 4.00%, 6/15/2044 | 50 | 48 |
Series 93, Rev., 6.13%, 6/1/2094 | 7,320 | 7,407 |
INVESTMENTS | PRINCIPAL AMOUNT ($000) | VALUE ($000) |
New York — continued | ||
Suffolk County Economic Development Corp., St. Johnland Assisted Living Inc., Project | ||
Rev., 5.13%, 11/1/2041 (e) | 850 | 693 |
Series 2021, Rev., 5.38%, 11/1/2054 (e) | 750 | 594 |
Tompkins County Development Corp., Tax Exempt Ithaca College Project Rev., 5.00%, 7/1/2032 | 80 | 84 |
Town of Clarence GO, 4.00%, 7/15/2037 | 600 | 605 |
Town of Harrison, Public Improvement | ||
GO, 4.00%, 7/1/2037 | 715 | 740 |
GO, 4.00%, 7/1/2038 | 320 | 327 |
Town of Orangetown, Rockland County, Sparkill- Palisades Fire District | ||
GO, AGM, 4.00%, 11/15/2040 | 220 | 217 |
GO, AGM, 4.00%, 11/15/2041 | 205 | 201 |
GO, AGM, 4.00%, 11/15/2042 | 315 | 308 |
GO, AGM, 4.00%, 11/15/2043 | 325 | 316 |
Triborough Bridge and Tunnel Authority Sales Tax, TBTA Capital Lockbox Series 2023A, Rev., 4.13%, 5/15/2053 | 2,250 | 2,153 |
Triborough Bridge and Tunnel Authority, MTA Bridges and Tunnels | ||
Series 2018B, Rev., 5.00%, 11/15/2031 | 75 | 86 |
Series 2018C, Rev., 5.00%, 11/15/2038 | 35 | 37 |
Series 2022A, Rev., 4.00%, 5/15/2041 | 2,150 | 2,119 |
Series 2018A, Rev., 5.00%, 11/15/2045 | 140 | 146 |
Series 2022A, Rev., 4.00%, 5/15/2051 | 2,000 | 1,887 |
Triborough Bridge and Tunnel Authority, Payroll Mobility Tax Senior Lien Series 2021A-1, Rev., 4.00%, 5/15/2046 | 1,000 | 958 |
United Nations Development Corp. Series 2019A, Rev., 5.00%, 7/1/2025 | 200 | 206 |
Utility Debt Securitization Authority Series 2013TE, Rev., 5.00%, 12/15/2041 | 4,250 | 4,259 |
Village of Tuxedo Park, Public Improvement GO, 4.00%, 8/1/2031 | 45 | 46 |
Westchester County Local Development Corp., Purchase Senior Learning Community, Inc. Project Series 2021C-EFRB, Rev., 3.20%, 7/1/2028 (e) | 1,375 | 1,282 |
Westchester County Local Development Corp., The Bethel Methodist Home D/B/A, The Knolls Project Series 2020A, Rev., 5.13%, 7/1/2055 | 1,100 | 829 |
Westchester Tobacco Asset Securitization Corp., Tobacco Settlement Series B, Rev., 5.00%, 6/1/2025 | 130 | 133 |
Total New York | 100,748 | |
92 | J.P. Morgan Municipal Bond Funds | August 31, 2023 |
INVESTMENTS | PRINCIPAL AMOUNT ($000) | VALUE ($000) |
Municipal Bonds — continued | ||
North Carolina — 1.4% | ||
County of Burke, Limited Obligation Rev., 5.00%, 4/1/2031 | 25 | 27 |
North Carolina Capital Facilities Finance Agency, Meredith College | ||
Rev., 5.00%, 6/1/2027 | 105 | 108 |
Rev., 5.00%, 6/1/2028 | 805 | 832 |
Rev., 5.00%, 6/1/2030 | 400 | 413 |
North Carolina Housing Finance Agency, Homeownership Series 37-A, Rev., AMT, 3.50%, 7/1/2039 | 75 | 74 |
Raleigh Durham Airport Authority Series 2020A, Rev., AMT, 5.00%, 5/1/2033 | 1,645 | 1,767 |
State of North Carolina | ||
Series 2019, Rev., 5.00%, 3/1/2032 | 3,000 | 3,290 |
Rev., 5.00%, 3/1/2034 | 4,000 | 4,379 |
Total North Carolina | 10,890 | |
Ohio — 3.7% | ||
Athens City School District, School Facilities Construction and Improvement Series 2019A, GO, 4.00%, 12/1/2040 | 240 | 236 |
Buckeye Tobacco Settlement Financing Authority | ||
Series 2020A-2, Rev., 4.00%, 6/1/2048 | 3,210 | 2,840 |
Series 2020B-2, Rev., 5.00%, 6/1/2055 | 8,900 | 8,135 |
Butler County Port Authority, Community First Solutions Series 2021A, Rev., 4.00%, 5/15/2046 | 250 | 222 |
Cleveland-Cuyahoga County Port Authority, The Cleveland Museum of Natural History Project Rev., 4.00%, 7/1/2051 | 1,000 | 839 |
County of Allen, Hospital Facilities, Bon Secours Mercy Health, Inc. Series 2015A, Rev., 4.25%, 11/1/2045 | 2,000 | 1,938 |
County of Franklin, Health Care Facilities, Ohio Living Communities Series 2020B, Rev., 5.00%, 7/1/2045 | 5,565 | 5,021 |
County of Hardin, Economic Development Facilities Improvement, Ohio Northern University Rev., 5.25%, 5/1/2040 | 1,425 | 1,244 |
County of Union, Memorial Hospital GO, 4.00%, 12/1/2041 | 1,825 | 1,789 |
County of Warren, Healthcare Facilities, Otterbein Homes Obligated Group Series 2016A, Rev., 5.00%, 7/1/2031 | 115 | 118 |
Delaware City School District, School Facilities Construction and Improvement, Unlimited Tax GO, 4.00%, 12/1/2039 | 160 | 157 |
Hillsdale Local School District, Ohio School Facilities Project COP, 4.00%, 12/1/2023 | 260 | 260 |
INVESTMENTS | PRINCIPAL AMOUNT ($000) | VALUE ($000) |
Ohio — continued | ||
Licking Heights Local School District, School Facilities Construction and Improvement, Unlimited Tax Series 2017A, GO, 4.00%, 10/1/2034 | 10 | 10 |
Miami University, General Receipts Rev., 5.00%, 9/1/2029 | 25 | 26 |
Northeast Ohio Medical University | ||
Series 2021A, Rev., 3.00%, 12/1/2040 | 250 | 186 |
Series 2021A, Rev., 4.00%, 12/1/2045 | 115 | 96 |
Ohio Higher Educational Facility Commission, University of Dayton 2018 Project | ||
Series 2018A, Rev., 5.00%, 12/1/2024 | 10 | 10 |
Series 2018B, Rev., 5.00%, 12/1/2031 | 75 | 80 |
Ohio Water Development Authority, Drinking Water Assistance Fund | ||
Series 2022A, Rev., 5.00%, 12/1/2037 | 600 | 674 |
Series 2022A, Rev., 5.00%, 12/1/2039 | 560 | 621 |
Series 2022A, Rev., 5.00%, 12/1/2040 | 1,250 | 1,380 |
Series 2022A, Rev., 5.00%, 12/1/2042 | 1,000 | 1,096 |
Olmsted Falls City School District Series 2017A, GO, 4.00%, 12/1/2051 | 1,000 | 898 |
Total Ohio | 27,876 | |
Oklahoma — 0.3% | ||
Oklahoma Development Finance Authority, Health System, OU Medicine Project Series 2018B, Rev., AGM, 4.00%, 8/15/2048 | 700 | 631 |
Oklahoma Turnpike Authority, Second Senior Series 2017A, Rev., 5.00%, 1/1/2037 | 1,665 | 1,708 |
Total Oklahoma | 2,339 | |
Oregon — 2.3% | ||
City of Eugene, Electric Utility System Series 2016A, Rev., 4.00%, 8/1/2031 | 355 | 363 |
City of Portland, Sewer System, Second Lien Series 2023A, Rev., 5.00%, 12/1/2043 | 6,000 | 6,533 |
County of Benton GO, 4.13%, 6/1/2053 | 1,000 | 938 |
Deschutes County Hospital Facilities Authority, St. Charles Health System Series 2020A, Rev., 4.00%, 1/1/2037 | 210 | 199 |
Lane Community College Series 2020A, GO, 4.00%, 6/15/2038 | 200 | 198 |
Salem Hospital Facility Authority, Capital Manor Project Rev., 4.00%, 5/15/2047 | 500 | 379 |
August 31, 2023 | J.P. Morgan Municipal Bond Funds | 93 |
AS OF August 31, 2023 (Unaudited) (continued)
INVESTMENTS | PRINCIPAL AMOUNT ($000) | VALUE ($000) |
Municipal Bonds — continued | ||
Oregon — continued | ||
State of Oregon Series 2023A, GO, 5.25%, 5/1/2044 | 7,950 | 8,818 |
State of Oregon, Department of Transportation Highway User Subordinate Lien, Tax-Exempt Series 2019A, Rev., 5.00%, 11/15/2042 | 135 | 144 |
Total Oregon | 17,572 | |
Pennsylvania — 6.7% | ||
Abington School District, Limited Tax Series 2017A, GO, 4.00%, 10/1/2037 | 15 | 15 |
Allegheny County Hospital Development Authority, Allegheny Health Network Obligated Group Series 2018A, Rev., 4.00%, 4/1/2044 | 2,000 | 1,729 |
Bucks County Industrial Development Authority, Grand View Hospital Project Rev., 4.00%, 7/1/2046 | 1,110 | 830 |
Chester County Health and Education Facilities Authority, Main Line Health System Series 2017A, Rev., 4.00%, 10/1/2036 | 25 | 25 |
Chester County Industrial Development Authority Series 2021, Rev., 4.00%, 12/1/2046 | 1,250 | 1,181 |
Chester County Industrial Development Authority, Longwood Gardens Project Rev., 4.00%, 12/1/2049 | 2,000 | 1,848 |
City of Pittsburgh GO, 4.00%, 9/1/2031 | 1,155 | 1,186 |
Commonwealth Financing Authority, Tobacco Master Settlement Payment | ||
Rev., 5.00%, 6/1/2029 | 110 | 117 |
Rev., AGM, 4.00%, 6/1/2039 | 9,975 | 9,492 |
Commonwealth of Pennsylvania Series 2018A, COP, 4.00%, 7/1/2046 | 1,200 | 1,091 |
County of Cambria Series 2020B, GO, AGM, 4.00%, 8/1/2035 | 700 | 708 |
DuBois Hospital Authority, Penn Highlands Healthcare Rev., 4.00%, 7/15/2048 | 1,200 | 1,045 |
Erie City Water Authority Series 2018A, Rev., AGM, 5.00%, 12/1/2043 | 1,500 | 1,570 |
Lancaster County Hospital Authority, Health Center, Masonic Villages Project | ||
Rev., 5.00%, 11/1/2034 | 35 | 36 |
Rev., 5.00%, 11/1/2036 | 510 | 518 |
Rev., 5.00%, 11/1/2037 | 250 | 253 |
Lancaster Industrial Development Authority, Landis Homes Retirement Community Project | ||
Rev., 4.00%, 7/1/2037 | 175 | 148 |
Rev., 4.00%, 7/1/2046 | 675 | 509 |
INVESTMENTS | PRINCIPAL AMOUNT ($000) | VALUE ($000) |
Pennsylvania — continued | ||
Montgomery County Higher Education and Health Authority, Thomas Jefferson University | ||
Series 2018A, Rev., 4.00%, 9/1/2038 | 3,725 | 3,572 |
Series 2018A, Rev., 4.00%, 9/1/2043 | 3,740 | 3,465 |
Montgomery County Industrial Development Authority, Acts Retirement-Life Communities, Inc., Obligated Group Series 2020C, Rev., 5.00%, 11/15/2045 | 375 | 351 |
Montgomery County Industrial Development Authority, Waverly Heights Ltd. Project | ||
Rev., 5.00%, 12/1/2044 | 350 | 351 |
Rev., 5.00%, 12/1/2049 | 500 | 496 |
Northampton County General Purpose Authority, Moravian College Project | ||
Rev., 5.00%, 10/1/2027 | 135 | 137 |
Rev., 5.00%, 10/1/2036 | 100 | 100 |
Pennsylvania Economic Development Financing Authority, The Penndot Major Bridges Rev., AMT, AGM, 5.00%, 12/31/2057 | 2,825 | 2,854 |
Pennsylvania Housing Finance Agency, Single Family Mortgage | ||
Series A, Rev., AMT, 3.50%, 4/1/2040 | 65 | 65 |
Series 2017-122, Rev., AMT, 4.00%, 10/1/2046 | 160 | 159 |
Pennsylvania Turnpike Commission Series 2016-A, Rev., AGM-CR, 4.00%, 12/1/2034 | 10 | 10 |
Pennsylvania Turnpike Commission Oil Franchise Tax Series 2021B, Rev., 4.00%, 12/1/2051 | 10,000 | 9,088 |
Pennsylvania Turnpike Commission, Subordinate Series 2021B, Rev., 4.00%, 12/1/2038 | 2,000 | 1,980 |
Philadelphia Authority for Industrial Development, MAST Community Charter School II Project Series 2020A, Rev., 5.00%, 8/1/2040 | 315 | 306 |
Pittsburgh Water and Sewer Authority Series 2019B, Rev., AGM, 5.00%, 9/1/2032 | 1,000 | 1,143 |
School District of Philadelphia (The) Series 2018B, GO, AGM, 4.00%, 9/1/2043 | 1,250 | 1,194 |
Swarthmore Borough Authority, Swarthmore College Series 2016B, Rev., 4.00%, 9/15/2041 | 15 | 15 |
Upper Merion Area School District GO, 5.00%, 1/15/2026 (d) | 250 | 260 |
West Cornwall Township Municipal Authority, Pleasant View Retirement Community Project | ||
Rev., 3.00%, 12/15/2023 | 115 | 114 |
Rev., 4.00%, 12/15/2028 | 1,000 | 930 |
94 | J.P. Morgan Municipal Bond Funds | August 31, 2023 |
INVESTMENTS | PRINCIPAL AMOUNT ($000) | VALUE ($000) |
Municipal Bonds — continued | ||
Pennsylvania — continued | ||
Rev., 5.00%, 12/15/2038 | 750 | 690 |
West Mifflin School District, Limited Tax GO, 3.00%, 4/1/2038 | 1,400 | 1,166 |
Total Pennsylvania | 50,747 | |
Rhode Island — 0.0% ^ | ||
Rhode Island Health and Educational Building Corp., Public School Financing Program Series 2019A, Rev., AGM, 5.00%, 5/15/2032 | 25 | 27 |
South Carolina — 0.1% | ||
South Carolina Ports Authority Rev., AMT, 4.00%, 7/1/2040 | 1,095 | 992 |
South Carolina State Housing Finance and Development Authority Series 2017A, Rev., 4.00%, 1/1/2047 | 90 | 90 |
Total South Carolina | 1,082 | |
South Dakota — 0.1% | ||
South Dakota Board of Regents Housing and Auxiliary Facilities System | ||
Rev., 4.00%, 4/1/2030 | 215 | 224 |
Series 2019A, Rev., 4.00%, 4/1/2036 | 65 | 65 |
South Dakota Housing Development Authority, Homeownership Mortgage Series 2015D, Rev., 4.00%, 11/1/2045 | 130 | 129 |
Total South Dakota | 418 | |
Tennessee — 3.6% | ||
City of Cleveland | ||
Series 2018B, GO, 5.00%, 6/1/2027 | 245 | 262 |
Series 2018B, GO, 5.00%, 6/1/2028 | 260 | 283 |
Series 2018B, GO, 5.00%, 6/1/2030 | 285 | 309 |
Series 2018B, GO, 4.00%, 6/1/2031 | 300 | 309 |
Series 2018B, GO, 4.00%, 6/1/2032 | 310 | 318 |
Series 2018B, GO, 4.00%, 6/1/2038 | 395 | 393 |
Series 2018B, GO, 4.00%, 6/1/2039 | 410 | 406 |
City of Oak Ridge | ||
GO, 4.00%, 6/1/2037 | 695 | 690 |
GO, 4.00%, 6/1/2038 | 720 | 713 |
GO, 4.00%, 6/1/2039 | 750 | 742 |
County of Hamilton Series 2018A, GO, 5.00%, 4/1/2028 | 25 | 27 |
County of Wilson Series 2017A, GO, 4.00%, 4/1/2039 | 25 | 25 |
Greeneville Health and Educational Facilities Board, Ballad Health Obligated Group Series 2018A, Rev., 4.00%, 7/1/2040 | 4,000 | 3,667 |
INVESTMENTS | PRINCIPAL AMOUNT ($000) | VALUE ($000) |
Tennessee — continued | ||
Metropolitan Government Nashville and Davidson County Health and Educational Facilities Board, Blakeford at Green Hills Series 2020A, Rev., 4.00%, 11/1/2038 | 1,305 | 1,099 |
Metropolitan Government Nashville and Davidson County, Health and Educational Facilities Board, Belmont University | ||
Rev., 5.00%, 5/1/2026 | 500 | 519 |
Series 2023, Rev., 5.25%, 5/1/2048 | 1,250 | 1,321 |
Metropolitan Government Nashville and Davidson County, Health and Educational Facilities Board, Trevecca Nazarene University Project Series 2021B, Rev., 4.00%, 10/1/2041 | 2,265 | 1,919 |
Metropolitan Nashville Airport Authority (The) | ||
Series 2015A, Rev., 5.00%, 7/1/2035 | 20 | 21 |
Series 2022B, Rev., AMT, 5.00%, 7/1/2052 | 1,975 | 2,019 |
Series 2022B, Rev., AMT, 5.50%, 7/1/2052 | 4,165 | 4,419 |
Metropolitan Nashville Airport Authority (The), Subordinate Airport | ||
Series 2019A, Rev., 5.00%, 7/1/2044 | 3,690 | 3,856 |
Series 2019A, Rev., 5.00%, 7/1/2049 | 2,000 | 2,077 |
Shelby County Health Educational and Housing Facilities Board, The Farms at Bailey Station Project | ||
Series 2019A, Rev., 5.75%, 10/1/2054 | 1,000 | 735 |
Series 2019A, Rev., 5.75%, 10/1/2059 | 1,500 | 1,082 |
Tennessee State School Bond Authority, Higher Educational Facilities Second Program Series 2015B, Rev., 5.00%, 11/1/2025 (d) | 55 | 57 |
Total Tennessee | 27,268 | |
Texas — 11.1% | ||
Aledo Independent School District, Unlimited Tax | ||
Series 2023, GO, PSF-GTD, 5.00%, 2/15/2048 | 2,000 | 2,115 |
Series 2023, GO, PSF-GTD, 5.00%, 2/15/2053 | 4,400 | 4,647 |
Birdville Independent School District, Unlimited Tax Series 2023A, GO, PSF-GTD, 5.00%, 2/15/2045 | 2,785 | 2,987 |
Central Texas Regional Mobility Authority, Senior Lien Series 2021D, Rev., 5.00%, 1/1/2030 | 10 | 11 |
City of Bryan, Electric System Rev., AGM, 4.00%, 7/1/2031 | 50 | 51 |
City of Conroe Series 2018A, GO, 5.00%, 3/1/2032 | 10 | 11 |
City of Dallas Series 2019A, GO, 4.00%, 2/15/2034 | 15 | 15 |
City of Denton GO, 4.00%, 2/15/2053 | 4,985 | 4,563 |
City of EI Paso, Combination Tax GO, 4.00%, 8/15/2040 | 475 | 456 |
City of El Paso GO, 4.00%, 8/15/2042 | 145 | 136 |
August 31, 2023 | J.P. Morgan Municipal Bond Funds | 95 |
AS OF August 31, 2023 (Unaudited) (continued)
INVESTMENTS | PRINCIPAL AMOUNT ($000) | VALUE ($000) |
Municipal Bonds — continued | ||
Texas — continued | ||
City of Fort Worth Series 2023, Rev., 4.25%, 2/15/2053 | 3,600 | 3,429 |
City of Frisco Series 2023, GO, 4.00%, 2/15/2042 | 2,500 | 2,417 |
City of Houston, Airport System, Subordinate Lien Series 2021A, Rev., AMT, 4.00%, 7/1/2046 | 1,000 | 901 |
City of Houston, Airport System, United Airlines, Inc., Terminal E Project Rev., AMT, 5.00%, 7/1/2029 | 2,500 | 2,495 |
City of Houston, Combined Utility System, Junior Lien Series 2002A, Rev., AGM, 5.75%, 12/1/2032 (d) | 2,500 | 3,066 |
City of Laredo GO, 5.00%, 2/15/2032 | 40 | 42 |
City of Mission, Combination Tax, Certificates of Obligation GO, AGM, 5.00%, 2/15/2031 | 575 | 611 |
City of Pearland, Certificates of Obligation GO, 4.00%, 3/1/2032 | 35 | 36 |
City of Plano Series 2017A, GO, 4.00%, 9/1/2028 | 45 | 46 |
City of San Antonio, Electric and Gas Systems | ||
Rev., 5.00%, 2/1/2031 | 230 | 241 |
Rev., 5.00%, 2/1/2032 | 35 | 36 |
City of San Marcos | ||
GO, 5.00%, 8/15/2031 | 25 | 27 |
GO, 4.00%, 8/15/2037 | 400 | 400 |
Clifton Higher Education Finance Corp., Idea Public Schools | ||
Series 2016B, Rev., 5.00%, 8/15/2024 | 345 | 348 |
Series 2016B, Rev., 5.00%, 8/15/2025 | 460 | 467 |
Rev., 6.00%, 8/15/2033 | 1,250 | 1,252 |
Clifton Higher Education Finance Corp., Yes Prep Public Schools, Inc. Series 2023, Rev., PSF-GTD, 4.25%, 4/1/2048 | 1,000 | 946 |
Conroe Local Government Corp., Conroe Convention Center Hotel Series 2021A, Rev., 4.00%, 10/1/2050 | 550 | 421 |
County of Galveston, Unlimited Tax GO, 4.00%, 2/1/2039 | 10 | 10 |
County of Harris | ||
Series 2023A, GO, 4.25%, 9/15/2048 | 2,000 | 1,928 |
Series 2023A, GO, 5.00%, 9/15/2048 | 2,000 | 2,143 |
County of Hidalgo | ||
GO, 4.00%, 8/15/2035 | 85 | 86 |
Series B, GO, 4.00%, 8/15/2038 | 40 | 38 |
Crandall Independent School District, Unlimited Tax | ||
Series 2023, GO, PSF-GTD, 5.00%, 8/15/2048 | 315 | 336 |
Series 2023, GO, PSF-GTD, 5.00%, 8/15/2053 | 1,000 | 1,057 |
Crowley Independent School District, Unlimited Tax | ||
Series 2023, GO, PSF-GTD, 5.00%, 2/1/2048 | 1,000 | 1,071 |
Series 2023, GO, PSF-GTD, 4.25%, 2/1/2053 | 500 | 487 |
INVESTMENTS | PRINCIPAL AMOUNT ($000) | VALUE ($000) |
Texas — continued | ||
Series 2023, GO, PSF-GTD, 5.25%, 2/1/2053 | 1,000 | 1,084 |
Harris County Cultural Education Facilities Finance Corp., Baylor Medical Project Rev., 5.00%, 11/15/2023 | 25 | 25 |
Harris County Municipal Utility District No. 433 Series 2019A, GO, 4.00%, 9/1/2025 | 75 | 76 |
Johnson City Independent School District, Unlimited Tax | ||
Series 2023, GO, PSF-GTD, 5.00%, 2/15/2047 | 1,915 | 2,052 |
Series 2023, GO, PSF-GTD, 4.13%, 2/15/2051 | 3,270 | 3,159 |
Series 2023, GO, PSF-GTD, 4.13%, 2/15/2052 | 3,405 | 3,280 |
Series 2023, GO, PSF-GTD, 4.13%, 2/15/2053 | 3,550 | 3,410 |
Kermit Independent School District, Unlimited Tax Series 2023, GO, PSF-GTD, 5.00%, 2/15/2053 | 4,000 | 4,228 |
Lewisville Independent School District, Unlimited Tax Series 2015, GO, 5.00%, 8/15/2024 | 150 | 152 |
Marshall Independent School District, Unlimited Tax Series 2023, GO, PSF-GTD, 4.00%, 2/15/2045 | 2,525 | 2,422 |
Mount Vernon Independent School District, Unlimited Tax Series 2023, GO, PSF-GTD, 5.00%, 8/15/2048 (c) | 3,500 | 3,721 |
New Hope Cultural Education Facilities Finance Corp., Westminster Project Rev., 4.00%, 11/1/2055 | 850 | 635 |
Newark Higher Education Finance Corp., The Hughen Center, Inc. | ||
Series 2022A, Rev., PSF-GTD, 5.00%, 8/15/2047 | 250 | 266 |
Series 2022A, Rev., PSF-GTD, 5.00%, 8/15/2052 | 250 | 264 |
Series 2022A, Rev., PSF-GTD, 5.00%, 8/15/2057 | 600 | 630 |
North Texas Municipal Water District, Upper East Fork Wastewater Interceptor System Rev., 5.00%, 6/1/2031 | 10 | 11 |
North Texas Tollway Authority, Second Tier Rev., 4.00%, 1/1/2038 | 200 | 193 |
Northwest Independent School District, Unlimited Tax Series 2023, GO, PSF-GTD, 5.00%, 2/15/2039 | 2,000 | 2,182 |
Permanent University Fund - University of Texas System Series 2016A, Rev., 5.00%, 7/1/2031 | 210 | 215 |
San Antonio Education Facilities Corp., Hallmark University Project Series 2021A, Rev., 5.00%, 10/1/2051 | 500 | 384 |
San Antonio Education Facilities Corp., University of The Incarnate Word Series 2021A, Rev., 4.00%, 4/1/2051 | 1,750 | 1,387 |
San Antonio Water System, Junior Lien Series 2017A, Rev., 4.00%, 5/15/2034 | 60 | 61 |
State of Texas, College Student Loan Series 2023A, GO, AMT, 5.25%, 8/1/2030 | 4,090 | 4,536 |
96 | J.P. Morgan Municipal Bond Funds | August 31, 2023 |
INVESTMENTS | PRINCIPAL AMOUNT ($000) | VALUE ($000) |
Municipal Bonds — continued | ||
Texas — continued | ||
Tarrant County Cultural Education Facilities Finance Corp., CHRISTUS Health Series 2022A, Rev., 4.00%, 7/1/2053 | 1,750 | 1,560 |
Tarrant County Cultural Education Facilities Finance Corp., Hendrick Medical Center Rev., 5.50%, 9/1/2023 (d) | 2,300 | 2,300 |
Tarrant County Cultural Education Facilities Finance Corp., Retirement Facility, MRC Stevenson Oaks Project Series 2020A, Rev., 6.75%, 11/15/2051 | 3,000 | 2,680 |
Texas Water Development Board, Water Implementation Fund Series 2019A, Rev., 4.00%, 10/15/2044 | 2,100 | 2,006 |
Texas Woman's University, Financing System Rev., 4.00%, 7/1/2030 | 10 | 10 |
Trinity River Authority, Tarrant County Water Project Series 2023, Rev., 5.00%, 2/1/2043 | 825 | 880 |
West Harris County Regional Water Authority Rev., 4.00%, 12/15/2045 | 1,000 | 904 |
Total Texas | 84,042 | |
Utah — 0.6% | ||
City of Lehi, Sales Tax Rev., 4.00%, 6/1/2039 | 480 | 466 |
City of Provo GO, 5.00%, 1/1/2032 | 25 | 27 |
City of Salt Lake City, Airport System | ||
Series 2023A, Rev., AMT, 5.25%, 7/1/2040 | 1,065 | 1,145 |
Series 2017B, Rev., 5.00%, 7/1/2042 | 235 | 240 |
Series 2023A, Rev., AMT, 5.25%, 7/1/2048 | 1,750 | 1,840 |
City of St George Rev., 4.00%, 6/1/2028 | 35 | 36 |
Tooele County Municipal Building Authority, Cross-Over Lease Rev., 4.00%, 12/15/2042 | 25 | 24 |
Utah Infrastructure Agency, Tax-Exempt Telecommunications Rev., 4.00%, 10/15/2041 | 350 | 286 |
Utah Infrastructure Agency, Telecommunications and Franchise Rev., 4.00%, 10/15/2030 | 360 | 366 |
Utah Transit Authority, Sales Tax Rev., 4.00%, 12/15/2030 | 150 | 152 |
Total Utah | 4,582 | |
Vermont — 0.2% | ||
Vermont Housing Finance Agency, Multiple Purpose Series A, Rev., AMT, 4.00%, 11/1/2046 | 85 | 84 |
Vermont Student Assistance Corp., Education Loan | ||
Series 2018A, Rev., AMT, 3.63%, 6/15/2029 | 350 | 346 |
Series 2018A, Rev., AMT, 3.75%, 6/15/2030 | 485 | 480 |
Series 2018A, Rev., AMT, 4.00%, 6/15/2031 | 170 | 169 |
Series 2018A, Rev., AMT, 4.00%, 6/15/2032 | 65 | 64 |
INVESTMENTS | PRINCIPAL AMOUNT ($000) | VALUE ($000) |
Vermont — continued | ||
Series 2018A, Rev., AMT, 4.00%, 6/15/2033 | 85 | 84 |
Series 2018A, Rev., AMT, 4.00%, 6/15/2034 | 70 | 69 |
Total Vermont | 1,296 | |
Virginia — 0.6% | ||
Capital Region Airport Commission, Richmond International Airport | ||
Series 2016A, Rev., 4.00%, 7/1/2035 | 350 | 352 |
Series 2016A, Rev., 4.00%, 7/1/2036 | 320 | 321 |
City of Norfolk | ||
Series 2023A, GO, 5.00%, 9/1/2039 | 800 | 887 |
Series 2023A, GO, 5.00%, 9/1/2042 | 1,210 | 1,326 |
City of Richmond, Public Improvement Series 2018A, GO, 5.00%, 3/1/2029 | 5 | 5 |
Virginia Commonwealth Transportation Board Series 2022, Rev., 4.00%, 5/15/2037 | 500 | 507 |
Virginia Small Business Financing Authority, Senior Lien Rev., AMT, 3.00%, 1/1/2041 | 2,000 | 1,515 |
Total Virginia | 4,913 | |
Washington — 2.8% | ||
County of King, Sewer Series 2018B, Rev., 5.00%, 7/1/2031 | 10 | 11 |
Port of Seattle, Intermediate Lien Series 2022B, Rev., AMT, 4.00%, 8/1/2047 | 1,200 | 1,074 |
State of Washington, Various Purpose Series 2023A, GO, 5.00%, 8/1/2043 | 13,945 | 15,096 |
Washington Health Care Facilities Authority, Commonspirit Health Series 2019A-2, Rev., 5.00%, 8/1/2028 | 115 | 122 |
Washington Health Care Facilities Authority, Seattle Cancer Care Alliance | ||
Series 2021, Rev., 5.00%, 12/1/2028 (e) | 125 | 132 |
Rev., 5.00%, 12/1/2029 (e) | 250 | 267 |
Rev., 4.00%, 12/1/2040 (e) | 860 | 802 |
Rev., 4.00%, 12/1/2045 (e) | 880 | 787 |
Rev., 4.00%, 12/1/2048 (e) | 1,190 | 1,053 |
Washington State Housing Finance Commission, Rockwood Retirement Communities Project Series 2020A, Rev., 5.00%, 1/1/2041 (e) | 2,000 | 1,580 |
Washington State Housing Finance Commission, Single Family Program Series 2016 2A-R, Rev., AMT, 3.50%, 12/1/2046 | 65 | 64 |
Total Washington | 20,988 | |
August 31, 2023 | J.P. Morgan Municipal Bond Funds | 97 |
AS OF August 31, 2023 (Unaudited) (continued)
INVESTMENTS | PRINCIPAL AMOUNT ($000) | VALUE ($000) |
Municipal Bonds — continued | ||
West Virginia — 0.4% | ||
West Virginia Hospital Finance Authority, United Health System Series 2018A, Rev., 4.00%, 6/1/2051 | 1,000 | 874 |
West Virginia Hospital Finance Authority, West Virginia University Health System Obligation Series 2023A, Rev., 4.25%, 6/1/2047 | 2,000 | 1,866 |
Total West Virginia | 2,740 | |
Wisconsin — 2.8% | ||
Public Finance Authority Series 2022, Rev., 4.00%, 4/1/2042 (e) | 100 | 81 |
Public Finance Authority, Acts Retirement Life Communities, Inc., Obligated Group Series 2020A, Rev., 5.00%, 11/15/2041 | 1,395 | 1,331 |
Public Finance Authority, Coral Academy of Science Series 2021A, Rev., 4.00%, 7/1/2051 | 1,000 | 767 |
Public Finance Authority, ENO River Academy Project Series 2020A, Rev., 5.00%, 6/15/2054 (e) | 690 | 605 |
Public Finance Authority, KU Campus Development Corp. - Central District Development Project Rev., 5.00%, 3/1/2027 | 280 | 290 |
Public Finance Authority, Presbyterian Villages of Michigan Obligated Group Series 2020A, Rev., 4.75%, 11/15/2053 (e) | 2,740 | 1,946 |
Public Finance Authority, Renown Regional Medical Center Project | ||
Series 2020A, Rev., 5.00%, 6/1/2032 | 230 | 243 |
Series 2016A, Rev., 4.00%, 6/1/2035 | 105 | 101 |
Public Finance Authority, The Carmelite System, Inc., Obligated Group Rev., 5.00%, 1/1/2040 | 3,250 | 3,124 |
Public Finance Authority, The Franklin School of Innovation Rev., 5.00%, 1/1/2057 (e) | 1,500 | 1,231 |
Public Finance Authority, Triad Educational Services, Inc. | ||
Rev., 5.00%, 6/15/2042 | 380 | 353 |
Series 2021A, Rev., 4.00%, 6/15/2051 | 2,285 | 1,682 |
Rev., 5.25%, 6/15/2052 | 1,610 | 1,489 |
Rev., 5.38%, 6/15/2057 | 775 | 723 |
Wisconsin Health and Educational Facilities Authority, Beloit Health System, Inc. Rev., 4.00%, 7/1/2046 | 15 | 13 |
Wisconsin Health and Educational Facilities Authority, Children's Hospital of Wisconsin, Inc. Rev., 4.00%, 8/15/2047 | 4,800 | 4,348 |
Wisconsin Health and Educational Facilities Authority, Oakwood Lutheran Senior Ministries Rev., 4.00%, 1/1/2047 | 2,000 | 1,424 |
INVESTMENTS | PRINCIPAL AMOUNT ($000) | VALUE ($000) |
Wisconsin — continued | ||
Wisconsin Health and Educational Facilities Authority, Three Pillars Senior Living Communities Series 2021A, Rev., 4.00%, 8/15/2046 | 1,350 | 1,044 |
Wisconsin Housing and Economic Development Authority, Home Ownership Series B, Rev., 4.00%, 3/1/2048 | 350 | 347 |
Total Wisconsin | 21,142 | |
Wyoming — 0.1% | ||
University of Wyoming Series 2021C, Rev., AGM, 4.00%, 6/1/2041 | 600 | 580 |
Total Municipal Bonds (Cost $735,017) | 704,478 | |
SHARES (000) | ||
Short-Term Investments — 8.0% | ||
Investment Companies — 8.0% | ||
JPMorgan Institutional Tax Free Money Market Fund Class IM Shares, 3.71% (f) (g) (Cost $60,914) | 60,911 | 60,917 |
Total Investments — 100.8% (Cost $795,931) | 765,395 | |
Liabilities in Excess of Other Assets — (0.8)% | (6,416 ) | |
NET ASSETS — 100.0% | 758,979 | |
Percentages indicated are based on net assets. |
Abbreviations | |
AGM | Insured by Assured Guaranty Municipal Corp. |
AMT | Alternative Minimum Tax |
BAN | Bond Anticipation Note |
BHAC | Insured by Berkshire Hathaway Assurance Corp. |
COLL | Collateral |
COP | Certificate of Participation |
CR | Custodial Receipts |
FGIC | Insured by Financial Guaranty Insurance Co. |
FHLMC | Federal Home Loan Mortgage Corp. |
FNMA | Federal National Mortgage Association |
GAN | Grant Anticipation Notes |
GNMA | Government National Mortgage Association |
GO | General Obligation |
GTD | Guaranteed |
LIQ | Liquidity Agreement |
MTA | Metropolitan Transportation Authority |
NATL | Insured by National Public Finance Guarantee Corp. |
PSF-GTD | Permanent School Fund Guaranteed |
Q-SBLF | Qualified School Bond Loan Fund |
98 | J.P. Morgan Municipal Bond Funds | August 31, 2023 |
RE | Reinsured |
Rev. | Revenue |
^ | Amount rounds to less than 0.1% of net assets. | |
(a) | The date shown represents the earliest of the prerefunded date, next put date or final maturity date. | |
(b) | Variable or floating rate security, the interest rate of which adjusts periodically based on changes in current interest rates and prepayments on the underlying pool of assets. The interest rate shown is the current rate as of August 31, 2023. | |
(c) | All or a portion of the security is a when-issued security, delayed delivery security, or forward commitment. | |
(d) | Security is prerefunded or escrowed to maturity. | |
(e) | Securities exempt from registration under Rule 144A or section 4(a)(2), of the Securities Act of 1933, as amended. | |
(f) | Investment in an affiliated fund, which is registered under the Investment Company Act of 1940, as amended, and is advised by J.P. Morgan Investment Management Inc. | |
(g) | The rate shown is the current yield as of August 31, 2023. |
REFERENCE OBLIGATION/INDEX | FINANCING RATE PAID BY THE FUND (%) | PAYMENT FREQUENCY | MATURITY DATE | IMPLIED CREDIT SPREAD (%)(a) | NOTIONAL AMOUNT(b) | UPFRONT PAYMENTS (RECEIPTS) ($)(c) | UNREALIZED APPRECIATION (DEPRECIATION) ($) | VALUE ($) |
CDX.NA.HY.40-V1 | 5.00 | Quarterly | 6/20/2028 | 4.26 | USD21,400 | (507 ) | (315 ) | (822 ) |
(*) | The Fund, as a buyer of credit protection, is generally obligated to make periodic payments and may also pay or receive an upfront premium to or from the protection seller, in exchange for the right to receive a contingent payment, upon occurrence of a credit event with respect to an underlying reference obligation, as defined under the terms of individual swap contracts. | ||||||||
(a) | Implied credit spreads are an indication of the seller's performance risk, related to the likelihood of a credit event occurring that would require a seller to make payment to a buyer. Implied credit spreads are used to determine the value of swap contracts and reflect the cost of buying/selling protection, which may include upfront payments made to enter into the contract. Therefore, higher spreads would indicate a greater likelihood that a seller will be obligated to perform (i.e. make payment) under the swap contract. Increasing values, in absolute terms and relative to notional amounts, are also indicative of greater performance risk. Implied credit spreads for credit default swaps on credit indices are linked to the weighted average spread across the underlying reference obligations included in a particular index. | ||||||||
(b) | The notional amount is the maximum amount that a seller of credit protection would be obligated to pay and a buyer of credit protection would receive, upon occurrence of a credit event. | ||||||||
(c) | Upfront payments and receipts generally represent premiums paid or received at the initiation of the agreement to compensate the differences between the stated terms of the swap agreement and current market conditions (credit spreads, interest rates and other relevant factors). | ||||||||
Abbreviations | |
CDX | Credit Default Swap Index |
USD | United States Dollar |
August 31, 2023 | J.P. Morgan Municipal Bond Funds | 99 |
AS OF August 31, 2023 (Unaudited)
INVESTMENTS | PRINCIPAL AMOUNT ($000) | VALUE ($000) |
Municipal Bonds — 96.2% (a) | ||
Alabama — 7.0% | ||
Alabama Special Care Facilities Financing Authority-Birmingham Rev., 5.00%, 6/1/2025 | 90 | 92 |
Birmingham Airport Authority | ||
Rev., 5.00%, 7/1/2024 | 150 | 152 |
Rev., 5.00%, 7/1/2026 | 225 | 236 |
Black Belt Energy Gas District, Gas Prepay | ||
Series 2018B-2, Rev., (SIFMA Municipal Swap Index Yield + 0.62%), 4.68%, 9/7/2023 (b) | 30,000 | 29,980 |
Series 2018A, Rev., 4.00%, 12/1/2023 (c) | 19,865 | 19,845 |
Black Belt Energy Gas District, Gas Project No. 7 Series 2021C-2, Rev., (SIFMA Municipal Swap Index Yield + 0.35%), 4.41%, 9/7/2023 (b) | 27,000 | 26,270 |
Black Belt Energy Gas District, Gas Supply Series 2022D-2, Rev., LIQ : Royal Bank of Canada, (SOFR + 1.40%), 4.96%, 9/6/2023 (b) | 25,450 | 25,202 |
City of Centre, Warrant GO, 4.00%, 9/1/2023 | 215 | 215 |
Industrial Development Board of The City of Mobile, Alabama Power Control, Barry Plant Project Series 2007A, Rev., 1.00%, 6/26/2025 (c) | 4,750 | 4,506 |
Prattville Industrial Development Board, International Paper Co. Project | ||
Series 2019B, Rev., 2.00%, 10/1/2024 (c) | 450 | 440 |
Series 2019C, Rev., 2.00%, 10/1/2024 (c) | 430 | 421 |
Selma Industrial Development Board, International Paper Co. Project Series 2020A, Rev., 1.38%, 6/16/2025 (c) | 2,670 | 2,547 |
Southeast Alabama Gas Supply District (The), Project No. 2 Series 2018A, Rev., 4.00%, 6/1/2024 (c) | 10,515 | 10,469 |
Southeast Energy Authority A Cooperative District, Project No. 4 Series 2022B-2, Rev., (SOFR + 1.79%), 5.34%, 9/6/2023 (b) | 10,000 | 9,970 |
UAB Medicine Finance Authority Series 2016B, Rev., 5.00%, 9/1/2023 | 1,500 | 1,500 |
University of West Alabama, General Fee | ||
Rev., AGM, 4.00%, 1/1/2024 | 125 | 125 |
Rev., AGM, 4.00%, 1/1/2025 | 150 | 150 |
Total Alabama | 132,120 | |
Alaska — 2.0% | ||
Alaska Municipal Bond Bank Authority Rev., 5.00%, 12/1/2026 | 25 | 26 |
Borough of Matanuska-Susitna Rev., 5.25%, 9/1/2027 | 1,400 | 1,442 |
Borough of Matanuska-Susitna, Goose Creek Correctional Center Project Rev., 5.00%, 9/1/2024 | 100 | 101 |
INVESTMENTS | PRINCIPAL AMOUNT ($000) | VALUE ($000) |
Alaska — continued | ||
City of Valdez, Phillips Trans Alaska Project | ||
Series 1994A, Rev., VRDO, 4.05%, 9/12/2023 (c) | 23,100 | 23,100 |
Series 2002, Rev., VRDO, 4.05%, 9/12/2023 (c) | 12,200 | 12,200 |
University of Alaska Series V-1, Rev., 5.00%, 10/1/2024 | 800 | 809 |
Total Alaska | 37,678 | |
Arizona — 1.7% | ||
Arizona Industrial Development Authority, Equitable School Rvolving Series 2020A, Rev., 4.00%, 11/1/2023 | 800 | 800 |
Arizona Industrial Development Authority, Phoenix Children's Hospital Series 2020A, Rev., 5.00%, 2/1/2026 | 130 | 135 |
Arizona State University Energy Management LLC Rev., 4.50%, 7/1/2024 | 500 | 500 |
City of Tucson Series 2018A, GO, 5.00%, 7/1/2026 | 325 | 342 |
Industrial Development Authority of The City of Phoenix, Downtown Phoenix Student Housing LLC - Arizona State University Project Series 2018A, Rev., 5.00%, 7/1/2024 | 200 | 201 |
Maricopa County Industrial Development Authority, Banner Health | ||
Series 2016A, Rev., 5.00%, 1/1/2024 | 50 | 50 |
Series 2023A-1, Rev., 5.00%, 5/15/2026 (c) | 7,530 | 7,803 |
Maricopa County Industrial Development Authority, HonorHealth Series 2021A, Rev., 5.00%, 9/1/2024 | 175 | 177 |
Maricopa County Unified School District No. 95, Queen Creek, School Improvement GO, 3.00%, 7/1/2024 | 525 | 523 |
Salt River Project Agricultural Improvement and Power District Series 2015A, Rev., 5.00%, 12/1/2045 | 21,000 | 21,520 |
Total Arizona | 32,051 | |
Arkansas — 0.0% ^ | ||
City of Heber Springs, Water and Sewer Rev., 3.00%, 11/1/2023 | 100 | 100 |
University of Central Arkansas, Student Fee | ||
Series 2020A, Rev., 5.00%, 11/1/2023 | 205 | 205 |
Series 2020A, Rev., 5.00%, 11/1/2026 | 220 | 229 |
100 | J.P. Morgan Municipal Bond Funds | August 31, 2023 |
INVESTMENTS | PRINCIPAL AMOUNT ($000) | VALUE ($000) |
Municipal Bonds — continued | ||
Arkansas — continued | ||
Series 2020A, Rev., 5.00%, 11/1/2027 | 200 | 212 |
University of Central Arkansas, Student Housing System Series 2019C, Rev., AGM, 3.00%, 11/1/2023 | 135 | 135 |
Total Arkansas | 881 | |
California — 4.8% | ||
California Community Choice Financing Authority, Green Bond Series 2022A-2, Rev., (SOFR + 1.70%), 5.25%, 9/6/2023 (b) | 5,000 | 5,004 |
California Enterprise Development Authority, Riverside County, Library Facility Project Rev., 4.00%, 11/1/2023 | 200 | 200 |
California Health Facilities Financing Authority, Adventist Health System | ||
Series 2011A, Rev., 3.00%, 3/1/2024 (c) | 1,540 | 1,533 |
Series 2013A, Rev., 5.00%, 3/1/2024 | 55 | 55 |
California Health Facilities Financing Authority, Health System | ||
Series 2018A, Rev., 5.00%, 11/15/2023 | 100 | 100 |
Series 2013A, Rev., 5.00%, 7/1/2024 | 20 | 20 |
California Health Facilities Financing Authority, Stanford Health Clinic Series 2021A, Rev., 3.00%, 8/15/2025 (c) | 18,000 | 17,878 |
California Infrastructure and Economic Development Bank, The Broad Sustainability Bonds Series 2018C, Rev., (SIFMA Municipal Swap Index Yield + 0.35%), 4.41%, 9/7/2023 (b) | 19,250 | 19,067 |
California Municipal Finance Authority, San Antonio Gardens Project Rev., 4.00%, 11/15/2023 | 290 | 289 |
California Municipal Finance Authority, UCR North District, Phase 1 Student Housing Project | ||
Rev., 5.00%, 5/15/2024 | 300 | 302 |
Rev., 5.00%, 5/15/2025 | 425 | 433 |
California Pollution Control Financing Authority, American Water Capital Corp. Project Rev., VRDO, 0.60%, 9/1/2023 (c) | 1,850 | 1,850 |
California State Public Works Board, Various Capital Project Series 2019C, Rev., 5.00%, 11/1/2023 | 30 | 30 |
City of Los Angeles, Wastewater System Series 2013-A, Rev., 5.00%, 6/1/2025 | 75 | 75 |
City of Vernon, Electric System | ||
Series 2021A, Rev., 5.00%, 10/1/2023 | 1,250 | 1,251 |
Series 2021A, Rev., 5.00%, 4/1/2024 | 1,220 | 1,226 |
Ontario Public Financing Authority, Civic Center Improvements Series 2022A, Rev., AGM, 5.00%, 11/1/2023 | 20 | 20 |
INVESTMENTS | PRINCIPAL AMOUNT ($000) | VALUE ($000) |
California — continued | ||
Silicon Valley Clean Water, WIFIA Rescue Project Series 2021A, Rev., 0.25%, 3/1/2024 | 40,000 | 38,890 |
State of California, Various Purpose GO, 5.00%, 12/1/2027 | 2,205 | 2,391 |
Stockton Public Financing Authority Rev., 5.00%, 3/1/2025 | 570 | 571 |
University of California, Limited Project Series 2015I, Rev., 5.00%, 5/15/2029 | 40 | 41 |
Total California | 91,226 | |
Colorado — 1.1% | ||
City and County of Denver, Airport System | ||
Series 2016A, Rev., 5.00%, 11/15/2023 | 90 | 90 |
Series 2020A-2, Rev., 5.00%, 11/15/2023 | 50 | 50 |
Series 2022C, Rev., 5.00%, 11/15/2023 | 30 | 30 |
Series B, Rev., 5.00%, 11/15/2023 | 500 | 502 |
Series B, Rev., 5.00%, 11/15/2025 | 65 | 65 |
City of Colorado Springs COP, 5.00%, 12/1/2023 | 100 | 100 |
Colorado Health Facilities Authority, Advent Health Obligated Group Series 2016C, Rev., 5.00%, 11/15/2023 (c) | 160 | 161 |
Colorado Health Facilities Authority, Adventist Health System/Sunbelt Obligated Group Series 2018B, Rev., 5.00%, 11/20/2025 (c) | 765 | 788 |
Colorado Health Facilities Authority, CommonSpirit Health Obligated Group Series 2022A, Rev., 5.00%, 11/1/2024 | 45 | 46 |
Denver Urban Renewal Authority Series 2010B-1, Rev., 5.00%, 12/1/2025 | 40 | 41 |
E-470 Public Highway Authority Series 2021B, Rev., (SOFR + 0.35%), 3.91%, 9/6/2023 (b) | 5,000 | 4,988 |
Regional Transportation District | ||
COP, 5.00%, 6/1/2024 | 10,000 | 10,015 |
Series 2013A, COP, 5.00%, 6/1/2025 | 2,480 | 2,484 |
Regional Transportation District, Denver Transit Partners | ||
Series 2020A, Rev., 5.00%, 1/15/2024 | 200 | 201 |
Series 2020A, Rev., 5.00%, 7/15/2024 | 150 | 151 |
Series 2020A, Rev., 5.00%, 1/15/2025 | 165 | 166 |
Series 2020A, Rev., 3.00%, 1/15/2026 | 110 | 108 |
Series 2020A, Rev., 5.00%, 7/15/2026 | 225 | 233 |
Total Colorado | 20,219 | |
Connecticut — 0.1% | ||
City of New Britain GO, 5.00%, 9/1/2023 (d) | 110 | 110 |
August 31, 2023 | J.P. Morgan Municipal Bond Funds | 101 |
AS OF August 31, 2023 (Unaudited) (continued)
INVESTMENTS | PRINCIPAL AMOUNT ($000) | VALUE ($000) |
Municipal Bonds — continued | ||
Connecticut — continued | ||
Connecticut State Health and Educational Facilities Authority, Stamford Hospital | ||
Series L-1, Rev., 4.00%, 7/1/2024 | 300 | 299 |
Series L-1, Rev., 4.00%, 7/1/2026 | 350 | 350 |
Series L-1, Rev., 4.00%, 7/1/2027 | 350 | 350 |
State of Connecticut Series 2020C, GO, 3.00%, 6/1/2024 | 1,065 | 1,062 |
Total Connecticut | 2,171 | |
Delaware — 0.3% | ||
Delaware Municipal Electric Corp. (The), Middletown and Seaford Project Series 2019A, Rev., 5.00%, 10/1/2023 | 220 | 220 |
Delaware River and Bay Authority Series C, Rev., 5.00%, 1/1/2025 | 150 | 151 |
Delaware State Economic Development Authority, Delmarva Power and Light Co. Project Series 2020A, Rev., 1.05%, 7/1/2025 (c) | 6,000 | 5,660 |
Total Delaware | 6,031 | |
District of Columbia — 0.2% | ||
District of Columbia, Childern's Hospital Obligated Group Series 2015, Rev., 5.00%, 7/15/2025 | 25 | 25 |
District of Columbia, Gallaudet University Project Series 2021A, Rev., 5.00%, 4/1/2026 | 100 | 103 |
Metropolitan Washington Airports Authority Aviation Series 2021A, Rev., AMT, 5.00%, 10/1/2023 | 3,500 | 3,503 |
Total District of Columbia | 3,631 | |
Florida — 2.4% | ||
Brevard County School District Series 2014, COP, 5.00%, 7/1/2027 | 140 | 142 |
Central Florida Expressway Authority Series 2019B, Rev., 5.00%, 7/1/2026 | 40 | 42 |
City of Fort Myers, Subordinate Utility System Series 2020B, Rev., AGM, 5.00%, 10/1/2023 | 2,125 | 2,127 |
City of Jacksonville Series 2018, Rev., 5.00%, 10/1/2023 | 100 | 100 |
City of South Miami Health Facilities Authority, Inc., Baptist Health South Florida Obligated Group Rev., 5.00%, 8/15/2028 | 45 | 48 |
County of Broward, Airport System | ||
Series Q-1, Rev., 5.00%, 10/1/2023 | 100 | 100 |
Series 2013C, Rev., 5.25%, 10/1/2026 | 50 | 50 |
County of Escambia, International Paper Co. Project, Environmental Improvement Series 2019B, Rev., 2.00%, 10/1/2024 (c) | 775 | 758 |
INVESTMENTS | PRINCIPAL AMOUNT ($000) | VALUE ($000) |
Florida — continued | ||
County of Hillsborough, Community Investment Tax Rev., 5.00%, 11/1/2023 | 45 | 45 |
County of Miami-Dade, Aviation System | ||
Series 2020A, Rev., 5.00%, 10/1/2023 | 2,500 | 2,502 |
Series 2020A, Rev., 5.00%, 10/1/2024 | 200 | 203 |
Rev., 5.00%, 7/1/2026 | 220 | 225 |
Series B, Rev., 5.00%, 10/1/2028 | 150 | 152 |
County of Okeechobee, Solid Waste Disposal, Waste Management, Inc., Okeechobee Landfill Project Series 2004A, Rev., 0.55%, 7/1/2024 (c) | 2,250 | 2,184 |
Duval County Public Schools COP, AGM, 5.00%, 7/1/2027 | 25 | 27 |
Florida Higher Educational Facilities Financial Authority, Ringling College Project Rev., 5.00%, 3/1/2024 | 110 | 110 |
Florida Housing Finance Corp. | ||
Series 2023E, Rev., 5.00%, 5/1/2025 (c) | 2,260 | 2,296 |
Series 2023C, Rev., 5.00%, 12/1/2025 (c) | 3,450 | 3,518 |
Florida Municipal Power Agency, All-Requirements Power Supply Project | ||
Series 2016A, Rev., 5.00%, 10/1/2023 | 250 | 250 |
Series 2016A, Rev., 5.00%, 10/1/2028 | 45 | 47 |
Hillsborough County Industrial Development Authority, Baycare Health System Series 2020D, Rev., VRDO, LOC : TD Bank NA, 3.50%, 9/1/2023 (c) | 8,030 | 8,030 |
Hillsborough County Industrial Development Authority, Tampa General Hospital Project Series 2012A, Rev., 4.00%, 10/1/2023 (d) | 830 | 830 |
Lee County School Board (The) COP, 5.00%, 8/1/2024 | 25 | 25 |
Lee Memorial Health System Series A-1, Rev., 5.00%, 4/1/2024 | 575 | 579 |
Miami Beach Redevelopment Agency Series A, Rev., 5.00%, 2/1/2028 | 300 | 301 |
Miami-Dade County Housing Finance Authority | ||
Series 2023, Rev., 5.00%, 9/1/2025 (c) | 2,250 | 2,283 |
Series 2023, Rev., 5.00%, 10/1/2025 (c) | 4,625 | 4,720 |
Miami-Dade County Industrial Development Authority, Solid Waste Disposal, Waste Management, Inc. of Florida Project Series 2018B, Rev., AMT, (SIFMA Municipal Swap Index Yield + 0.38%), 4.44%, 9/7/2023 (b) | 10,500 | 10,330 |
Palm Beach County Health Facilities Authority, Baptist Health South Florida Obligated Group Rev., 5.00%, 8/15/2024 | 40 | 41 |
102 | J.P. Morgan Municipal Bond Funds | August 31, 2023 |
INVESTMENTS | PRINCIPAL AMOUNT ($000) | VALUE ($000) |
Municipal Bonds — continued | ||
Florida — continued | ||
Palm Beach County School District COP, 5.00%, 8/1/2027 | 375 | 401 |
Pasco County School Board | ||
Series 2013A, COP, 5.00%, 8/1/2024 | 1,000 | 1,001 |
COP, 5.00%, 8/1/2025 | 40 | 41 |
COP, 5.00%, 8/1/2027 | 35 | 37 |
School Board of Miami-Dade County (The) | ||
Series 2014D, COP, 5.00%, 11/1/2023 | 115 | 115 |
COP, 5.00%, 5/1/2025 | 290 | 298 |
Series 2014D, COP, 5.00%, 11/1/2025 | 235 | 239 |
COP, 5.00%, 2/1/2026 | 125 | 129 |
COP, 5.00%, 5/1/2026 | 110 | 112 |
Series 2015D, COP, 5.00%, 2/1/2027 | 25 | 26 |
COP, 5.00%, 5/1/2027 | 20 | 20 |
Series 2015A, COP, AGM, 5.00%, 5/1/2027 | 215 | 220 |
COP, 5.00%, 11/1/2028 | 20 | 20 |
School District of Broward County (The) COP, 5.00%, 7/1/2025 | 60 | 62 |
South Broward Hospital District, Memorial Healthcare System Rev., 4.00%, 5/1/2026 | 110 | 112 |
State of Florida Department of Education Series 2018A, Rev., 5.00%, 7/1/2027 | 50 | 53 |
State of Florida Department of Transportation Series 2021A, Rev., 5.00%, 7/1/2025 | 25 | 26 |
Sunshine State Governmental Financing Commission, Miami Dade Country Program Series 2010B-1, Rev., 5.00%, 9/1/2023 (d) | 1,015 | 1,015 |
Village Community Development District No. 13 Special Assessment Series 2019, Rev., 2.63%, 5/1/2024 | 130 | 129 |
Total Florida | 46,121 | |
Georgia — 1.1% | ||
Bartow County Development Authority, Georgia Power Co. Plant Series 2013FIRST, Rev., 2.88%, 8/19/2025 (c) | 13,500 | 13,073 |
Main Street Natural Gas, Inc., Gas Supply | ||
Series 2018A, Rev., VRDO, LIQ : Royal Bank of Canada, 4.00%, 9/1/2023 (c) | 500 | 500 |
Series 2021C, Rev., 4.00%, 12/1/2023 | 750 | 750 |
Series 2021C, Rev., 4.00%, 12/1/2024 | 750 | 746 |
INVESTMENTS | PRINCIPAL AMOUNT ($000) | VALUE ($000) |
Georgia — continued | ||
Municipal Electric Authority of Georgia, Project One Series 2008-B, Rev., VRDO, LOC : PNC Bank NA, 4.20%, 9/12/2023 (c) | 4,255 | 4,255 |
Savannah Economic Development Authority, International Paper Co. Project Series 2019A, Rev., 2.00%, 10/1/2024 (c) | 1,675 | 1,639 |
Total Georgia | 20,963 | |
Idaho — 0.0% ^ | ||
University of Idaho Series 2020A, Rev., 5.00%, 4/1/2024 | 315 | 318 |
Illinois — 4.4% | ||
Carol Stream Park District Series 2020C, GO, 4.00%, 11/1/2026 | 535 | 547 |
Champaign County Community Unit School District No. 4 Champaign, Capital Appreciation Series 2020A, GO, Zero Coupon, 1/1/2024 | 385 | 380 |
Chicago Midway International Airport | ||
Series 2014B, Rev., 5.00%, 1/1/2024 | 200 | 201 |
Series 2014B, Rev., 5.00%, 1/1/2028 | 80 | 80 |
Chicago O'Hare International Airport, General Airport, Senior Lien | ||
Series B, Rev., 5.00%, 1/1/2024 | 175 | 176 |
Series C, Rev., 5.00%, 1/1/2024 | 100 | 100 |
Series D, Rev., 5.00%, 1/1/2024 | 110 | 111 |
Series E, Rev., 5.00%, 1/1/2024 | 1,730 | 1,738 |
Series 2020B, Rev., 5.00%, 1/1/2025 | 25 | 26 |
Series B, Rev., 5.00%, 1/1/2025 | 25 | 26 |
Series B, Rev., 5.00%, 1/1/2026 | 175 | 178 |
Series B, Rev., 5.00%, 1/1/2028 | 280 | 284 |
City of Aurora Series 2019A, GO, 4.00%, 12/30/2024 | 1,655 | 1,665 |
City of Chicago, Waterworks, Second Lien | ||
Series 2014, Rev., 5.00%, 11/1/2023 | 40 | 40 |
Series 2014, Rev., 5.00%, 1/1/2024 | 325 | 326 |
City of Danville GO, 4.00%, 12/1/2023 | 145 | 145 |
City of Elgin Series 2020A, GO, 3.00%, 12/15/2023 | 1,025 | 1,023 |
City of Rockford, Sales Tax Alternative Revenue Source Series 2019A, GO, AGM, 4.00%, 12/15/2023 | 140 | 140 |
City of Waukegan Series 2018A, GO, AGM, 4.00%, 12/30/2023 | 525 | 526 |
Clay Wayne and Marion Counties Community Unit School District No. 35 GO, AGM, 5.00%, 12/1/2023 | 175 | 176 |
August 31, 2023 | J.P. Morgan Municipal Bond Funds | 103 |
AS OF August 31, 2023 (Unaudited) (continued)
INVESTMENTS | PRINCIPAL AMOUNT ($000) | VALUE ($000) |
Municipal Bonds — continued | ||
Illinois — continued | ||
Cook County Community College District No. 508, Unlimited Tax, City Collage of Chicago Series 2013, GO, 5.25%, 12/1/2029 | 250 | 251 |
Cook County Community Consolidated School District No. 34, Glenview, Limited Tax GO, 4.00%, 12/1/2023 | 150 | 150 |
Cook County Community School District No. 97, Oak Park GO, 4.00%, 1/1/2024 | 275 | 275 |
Cook County School District No. 100, South Berwyn | ||
Series 2019A, GO, 5.00%, 12/1/2023 | 345 | 346 |
Series 2019C, GO, 5.00%, 12/1/2023 | 660 | 662 |
Cook County School District No. 102, La Grange, Limited Tax | ||
GO, AGM, 4.00%, 12/15/2023 | 825 | 826 |
GO, AGM, 4.00%, 12/15/2024 | 930 | 935 |
Cook County School District No. 109, Indian Springs, Limited Tax Series 2020A, GO, 4.00%, 12/1/2023 | 125 | 125 |
Cook County School District No. 145, Arbor Park Series 2019D, GO, 4.00%, 12/1/2023 | 110 | 110 |
Cook County School District No. 160, Country Club Hills | ||
Series 2020A, GO, 4.00%, 12/1/2023 | 285 | 285 |
Series 2020A, GO, 4.00%, 12/1/2024 | 255 | 256 |
Cook County School District No. 160, Country Club Hills, Limited Tax Series 2020B, GO, 4.00%, 12/1/2023 | 100 | 100 |
Cook County School District No. 89, Maywood, Maywood-Melrose Park-Broadview, Limited Tax | ||
Series 2020, GO, AGM, 4.00%, 12/15/2023 | 555 | 556 |
Series 2020, GO, AGM, 4.00%, 12/15/2024 | 580 | 583 |
Cook County School District No. 99 Cicero, Limited Tax Series 2019B, GO, 5.00%, 12/1/2023 | 575 | 577 |
County of Cook | ||
Series 2021B, GO, 4.00%, 11/15/2023 | 1,185 | 1,186 |
Series 2016A, GO, 5.00%, 11/15/2023 | 195 | 196 |
County of Cook, Sales Tax Series 2022A, Rev., 5.00%, 11/15/2023 | 90 | 90 |
County of Will GO, 5.00%, 11/15/2023 | 525 | 527 |
DuPage County Community High School District No. 94 West Chicago GO, 4.00%, 1/1/2033 | 10 | 10 |
Flagg-Rochelle Community Park District Series 2019A, GO, AGM, 4.00%, 1/1/2024 | 225 | 225 |
Hoffman Estates Park District Series 2019B, GO, 4.00%, 12/1/2023 | 245 | 245 |
Illinois Finance Authority, Northwestern University Series 2015, Rev., 5.00%, 12/1/2025 | 25 | 26 |
INVESTMENTS | PRINCIPAL AMOUNT ($000) | VALUE ($000) |
Illinois — continued | ||
Illinois Finance Authority, Presbyterian Homes Obligated Group Series 2021B, Rev., (SIFMA Municipal Swap Index Yield + 0.70%), 4.76%, 9/7/2023 (b) | 1,125 | 1,099 |
Illinois Finance Authority, Rush University Medical Center Obligated Group Series 2015A, Rev., 5.00%, 11/15/2025 | 105 | 107 |
Illinois Finance Authority, Swedish Covenant Hospital Series 2016A, Rev., 5.00%, 8/15/2026 (d) | 900 | 942 |
Illinois Finance Authority, The Carle Foundation Series 2021A, Rev., 5.00%, 8/15/2028 | 80 | 86 |
Illinois Finance Authority, The University Medical Center Series 2015A, Rev., 5.00%, 11/15/2023 | 185 | 185 |
Illinois Finance Authority, University of Chicago Series 2015A, Rev., 5.00%, 10/1/2025 (d) | 23,000 | 23,736 |
Illinois Finance Authority, Water Facilities, American Water Capital Corp. Project Rev., VRDO, 0.70%, 9/1/2023 (c) | 2,800 | 2,800 |
Illinois Housing Development Authority Rev., FHA, 4.00%, 6/1/2025 (c) | 1,150 | 1,147 |
Illinois State Toll Highway Authority Series 2019B, Rev., 5.00%, 1/1/2027 | 75 | 79 |
Illinois State Toll Highway Authority, Toll Highway Senior Series 2019C, Rev., 5.00%, 1/1/2027 | 25 | 26 |
Kane County School District No. 131 Aurora East Side | ||
Series 2020A, GO, AGM, 5.00%, 12/1/2023 | 145 | 145 |
Series 2020B, GO, AGM, 5.00%, 12/1/2023 | 235 | 236 |
Sangamon Menard Etc Counties Community School District No. 8 Pleasant Plains Series 2019C, GO, 4.00%, 1/1/2024 | 370 | 370 |
State of Illinois | ||
Series 2017D, GO, 5.00%, 11/1/2023 | 3,185 | 3,191 |
GO, 5.00%, 2/1/2024 | 3,370 | 3,386 |
Series 2017D, GO, 5.00%, 11/1/2024 | 280 | 284 |
Series 2021A, GO, 5.00%, 12/1/2024 | 20 | 20 |
Series 2022B, GO, 5.00%, 3/1/2025 | 165 | 168 |
GO, 5.50%, 5/1/2025 | 2,500 | 2,570 |
Series 2023D, GO, 5.00%, 7/1/2025 | 6,855 | 7,006 |
Series 2020D, GO, 5.00%, 10/1/2025 | 20 | 21 |
Series 2017D, GO, 5.00%, 11/1/2025 | 250 | 257 |
Series 2017A, GO, 5.00%, 12/1/2025 | 250 | 257 |
GO, 5.50%, 5/1/2026 | 5,000 | 5,226 |
Series 2023D, GO, 5.00%, 7/1/2026 | 8,000 | 8,283 |
Series 2017D, GO, 5.00%, 11/1/2026 | 650 | 676 |
104 | J.P. Morgan Municipal Bond Funds | August 31, 2023 |
INVESTMENTS | PRINCIPAL AMOUNT ($000) | VALUE ($000) |
Municipal Bonds — continued | ||
Illinois — continued | ||
Series FEBRUARY 2014, GO, AGM-CR, 5.00%, 2/1/2027 | 940 | 944 |
Series 2017D, GO, 5.00%, 11/1/2027 | 35 | 37 |
Series 2017D, GO, 5.00%, 11/1/2028 | 2,895 | 3,042 |
Village of Midlothian Series 2019A, GO, 4.00%, 1/1/2024 | 120 | 120 |
Village of Villa Park Series 2019B, GO, 4.00%, 12/15/2023 | 205 | 205 |
Village of Villa Park, Sales Tax Series 2019A, GO, 4.00%, 12/15/2023 | 125 | 125 |
Total Illinois | 83,206 | |
Indiana — 0.8% | ||
City of Indianapolis, Department of Public Utilities Water System Series 2018A, Rev., 5.00%, 10/1/2026 | 20 | 21 |
City of Rockport, Indiana Michigan Power Co. Project Series 2009B, Rev., 3.05%, 6/1/2025 | 6,500 | 6,382 |
Gary Community School Building Corp., Ad Valorem Property Tax First Mortgage | ||
Series 2020B, Rev., 4.00%, 1/15/2026 | 220 | 222 |
Series 2020B, Rev., 4.00%, 7/15/2026 | 235 | 238 |
Indiana Finance Authority, Franciscan Alliance, Inc., Obligated Group Series 2017B, Rev., 5.00%, 11/1/2023 | 40 | 40 |
Indiana Finance Authority, Goshen Health Series 2019B, Rev., 2.10%, 11/1/2026 (c) | 2,700 | 2,525 |
Indiana Finance Authority, Indianapolis Power and Light Co. Project Series 2021B, Rev., 0.65%, 8/1/2025 | 4,500 | 4,121 |
Indiana Finance Authority, Marian University Project | ||
Series 2019A, Rev., 5.00%, 9/15/2023 | 75 | 75 |
Series 2019A, Rev., 5.00%, 9/15/2024 | 155 | 156 |
Indiana Finance Authority, Parkview Health System, Inc. Series 2017A, Rev., 5.00%, 11/1/2023 | 165 | 165 |
Indiana Municipal Power Agency | ||
Series 2014A, Rev., 5.00%, 1/1/2024 | 75 | 76 |
Series 2017A, Rev., 5.00%, 1/1/2024 | 60 | 60 |
Series 2014A, Rev., 5.00%, 1/1/2027 | 20 | 20 |
Town of Schererville, Sewage Works Rev., 4.00%, 3/1/2024 | 110 | 110 |
Total Indiana | 14,211 | |
Iowa — 2.4% | ||
Iowa Finance Authority, Health System Series 2018A, Rev., (SIFMA Municipal Swap Index Yield + 0.50%), 4.64%, 9/7/2023 (b) (e) | 16,125 | 16,115 |
INVESTMENTS | PRINCIPAL AMOUNT ($000) | VALUE ($000) |
Iowa — continued | ||
Iowa Finance Authority, Single Family Mortgage-Backed Securities Program Series 2020E, Rev., VRDO, GNMA / FNMA / FHLMC, LIQ : TD Bank NA, 4.04%, 9/8/2023 (c) | 8,500 | 8,500 |
State of Iowa Board of Regents, University of Iowa, Hospitals and Clinics Series 2016, Rev., 5.00%, 9/1/2023 | 225 | 225 |
University of Iowa (The), Parking System Bond Anticipation Project Series 2023, Rev., BAN, 3.50%, 7/1/2026 | 21,595 | 21,216 |
Total Iowa | 46,056 | |
Kansas — 0.2% | ||
Johnson County Park and Recreation District | ||
Series 2019B, COP, 3.00%, 9/1/2023 | 200 | 200 |
Series 2019A, COP, 5.00%, 9/1/2023 | 125 | 125 |
Sedgwick County Unified School District No. 265 Goddard | ||
Series 2020A, GO, 3.00%, 10/1/2023 | 350 | 350 |
Series 2020A, GO, 3.00%, 10/1/2024 | 1,050 | 1,042 |
Sedgwick County Unified School District No. 267 Renwick Series 2019A, GO, 3.00%, 11/1/2023 | 100 | 100 |
Wyandotte County Unified School District No. 202 Turner | ||
Series 2019A, GO, AGM, 3.00%, 9/1/2023 | 400 | 400 |
Series 2019A, GO, AGM, 3.00%, 9/1/2024 | 400 | 396 |
Wyandotte County-Kansas City Unified Government Utility System Series 2014A, Rev., 5.00%, 9/1/2023 | 770 | 770 |
Total Kansas | 3,383 | |
Kentucky — 1.1% | ||
City of Ashland, Ashland Hospital Corp. DBA King's Daughters Medical Center Rev., 5.00%, 2/1/2024 | 575 | 577 |
City of Hazard, Appalachian Regional Healthcare Project Rev., 5.00%, 7/1/2027 | 600 | 623 |
County of Owen, Water Facilities, Kentucky- American Water Co. Project Rev., VRDO, 0.70%, 9/1/2023 (c) | 2,500 | 2,500 |
Kentucky Asset Liability Commission Series 2021A, Rev., 5.00%, 11/1/2023 | 2,550 | 2,555 |
Kentucky Asset Liability Commission, Federal Highway Trust Fund | ||
Series A, Rev., 5.00%, 9/1/2023 | 445 | 445 |
Series 2013A, Rev., 5.25%, 9/1/2023 | 245 | 245 |
Rev., 5.00%, 9/1/2024 | 105 | 107 |
August 31, 2023 | J.P. Morgan Municipal Bond Funds | 105 |
AS OF August 31, 2023 (Unaudited) (continued)
INVESTMENTS | PRINCIPAL AMOUNT ($000) | VALUE ($000) |
Municipal Bonds — continued | ||
Kentucky — continued | ||
Kentucky Municipal Power Agency, Prairie State Project Series 2015A, Rev., NATL - RE, 5.00%, 9/1/2023 | 100 | 100 |
Kentucky Public Energy Authority, Gas Supply Series 2018A, Rev., 4.00%, 4/1/2024 (c) | 3,170 | 3,171 |
Kentucky State Property and Building Commission, Project No. 110 Rev., 5.00%, 8/1/2024 | 85 | 86 |
Kentucky State Property and Building Commission, Project No. 112 | ||
Series B, Rev., 5.00%, 11/1/2023 | 2,210 | 2,215 |
Series B, Rev., 5.00%, 11/1/2028 | 80 | 84 |
Kentucky State Property and Building Commission, Project No. 122 Series A, Rev., 5.00%, 11/1/2027 | 125 | 133 |
Kentucky Turnpike Authority, Revitalization Projects Series B, Rev., 5.00%, 7/1/2027 | 25 | 26 |
Louisville and Jefferson County Metropolitan Government, Louisville Gas and Electric Co. Project Series 2001A, Rev., 0.90%, 9/1/2026 | 5,000 | 4,518 |
Louisville and Jefferson County Metropolitan Government, Norton Healthcare, Inc. | ||
Series 2013A, Rev., 5.25%, 10/1/2023 | 500 | 501 |
Series 2016A, Rev., 5.00%, 10/1/2027 | 20 | 21 |
Paducah Electric Plant Board Rev., 5.00%, 10/1/2023 | 2,000 | 2,002 |
Total Kentucky | 19,909 | |
Louisiana — 3.1% | ||
Calcasieu Parish School District No. 23, Public School Improvement | ||
GO, 5.00%, 9/1/2023 | 180 | 180 |
GO, 5.00%, 9/1/2024 | 250 | 254 |
City of Shreveport, Water and Sewer, Junior Lien Series 2019B, Rev., AGM, 4.00%, 12/1/2023 | 310 | 310 |
Lake Charles Harbor and Terminal District, Big Lake Full LLC Projects Rev., AMT, 1.00%, 12/1/2024 (c) | 5,000 | 4,753 |
Louisiana Housing Corp., England Apartment Projects Rev., 1.25%, 2/1/2024 (c) | 7,890 | 7,790 |
Louisiana Office Facilities Corp., State Capitol Complex Program Series 2012, Rev., 5.00%, 11/1/2023 | 30 | 30 |
Louisiana Public Facilities Authority, Tulane University Project | ||
Series 2020A, Rev., 5.00%, 4/1/2025 (d) | 60 | 62 |
Series 2020A, Rev., 5.00%, 4/1/2026 (d) | 20 | 21 |
Series 2020A, Rev., 5.00%, 4/1/2026 | 80 | 83 |
INVESTMENTS | PRINCIPAL AMOUNT ($000) | VALUE ($000) |
Louisiana — continued | ||
Parish of St. John the Baptist, Marathon Oil Corp., Project | ||
Series 2017B-1, Rev., 2.13%, 7/1/2024 (c) | 18,000 | 17,682 |
Series 2017B-2, Rev., 2.38%, 7/1/2026 (c) | 12,800 | 12,109 |
State of Louisiana Series 2014A, GO, 4.00%, 2/1/2033 | 600 | 602 |
State of Louisiana Gasoline and Fuels Tax Series A, Rev., 4.50%, 5/1/2025 (d) | 14,005 | 14,245 |
Total Louisiana | 58,121 | |
Maine — 0.1% | ||
Maine Health and Higher Educational Facilities Authority, Mainehealth Series 2020A, Rev., 5.00%, 7/1/2026 | 250 | 259 |
Maine Municipal Bond Bank Series 2010C, Rev., 5.00%, 11/1/2023 | 370 | 371 |
Maine State Housing Authority, Mortgage Purchase Series C-1, Rev., AMT, 3.00%, 11/15/2023 | 1,000 | 997 |
Total Maine | 1,627 | |
Maryland — 0.1% | ||
Maryland Health and Higher Educational Facilities Authority, Medstar Health Issue | ||
Series 2013A, Rev., 4.00%, 8/15/2024 | 85 | 85 |
Rev., 5.00%, 8/15/2024 | 340 | 344 |
Series 2013A, Rev., 5.00%, 8/15/2024 | 415 | 415 |
State of Maryland Department of Transportation, Second Issue Rev., 5.00%, 6/1/2025 | 250 | 250 |
Total Maryland | 1,094 | |
Massachusetts — 0.9% | ||
Massachusetts Development Finance Agency, Northeastern University Issue Series 2020A, Rev., 5.00%, 10/1/2023 | 2,900 | 2,903 |
Massachusetts Development Finance Agency, Partners Healthcare System Issue Series 2017S-2, Rev., 5.00%, 1/30/2025 (c) | 70 | 71 |
Massachusetts Development Finance Agency, Suffolk University Issue Rev., 5.00%, 7/1/2024 | 350 | 353 |
Massachusetts Development Finance Agency, Wellforce Issue | ||
Series 2020C, Rev., AGM, 5.00%, 10/1/2023 | 100 | 100 |
Series 2020C, Rev., AGM, 5.00%, 10/1/2026 | 175 | 182 |
Montachusett Regional Transit Authority Rev., RAN, GTD, 4.50%, 7/26/2024 | 8,000 | 8,041 |
Town of Hatfield GO, BAN, 4.50%, 5/16/2024 | 2,060 | 2,073 |
Town of Randolph GO, BAN, 4.75%, 6/27/2024 | 1,690 | 1,702 |
106 | J.P. Morgan Municipal Bond Funds | August 31, 2023 |
INVESTMENTS | PRINCIPAL AMOUNT ($000) | VALUE ($000) |
Municipal Bonds — continued | ||
Massachusetts — continued | ||
Town of Wareham GO, 5.00%, 11/1/2023 | 50 | 50 |
Town of West Springfield GO, BAN, 4.75%, 6/20/2024 | 1,070 | 1,077 |
Total Massachusetts | 16,552 | |
Michigan — 3.3% | ||
Charter Township of Green Oak GO, 5.00%, 11/1/2023 | 210 | 211 |
City of Charlevoix, Building Authority, Limited Tax Rev., 4.00%, 10/1/2023 | 110 | 110 |
City of Gladstone, Capital Improvement, Limited Tax | ||
GO, AGM, 3.00%, 3/1/2024 | 265 | 264 |
GO, AGM, 3.00%, 3/1/2025 | 275 | 272 |
Fulton School District, Unlimited Tax | ||
GO, AGM, 4.00%, 5/1/2025 | 215 | 216 |
GO, AGM, 4.00%, 5/1/2026 | 220 | 224 |
GO, AGM, 4.00%, 5/1/2027 | 210 | 215 |
Grand Valley State University Series 2014B, Rev., 5.00%, 12/1/2028 | 1,840 | 1,869 |
Huron Valley School District, Unlimited Tax GO, Q-SBLF, 2.00%, 5/1/2024 | 5,825 | 5,745 |
Jackson Public Schools, Unlimited Tax GO, Q-SBLF, 4.00%, 5/1/2024 | 690 | 692 |
Kent Hospital Finance Authority, Spectrum Health System Series 2008B-3, Rev., VRDO, LIQ : Wells Fargo Bank NA, 4.25%, 9/12/2023 (c) | 15,000 | 15,000 |
Michigan Finance Authority, Henry Ford Health System | ||
Rev., 5.00%, 11/15/2023 | 150 | 150 |
Rev., 5.00%, 11/15/2027 | 150 | 155 |
Michigan Finance Authority, Hospital Trinity Health Credit Group Series 2015MI, Rev., 5.50%, 12/1/2027 | 1,000 | 1,033 |
Michigan Finance Authority, Local Government Loan Program, Detroit Water and Sewerage Department, Sewage Disposal | ||
Series 2014C-3, Rev., AGM, 5.00%, 7/1/2027 | 200 | 202 |
Series 2014C-3, Rev., AGM, 5.00%, 7/1/2028 | 50 | 51 |
Michigan Finance Authority, Trinity Health Credit Group Series 2017A-MI, Rev., 5.00%, 12/1/2026 | 30 | 31 |
Michigan State Hospital Finance Authority, Ascension Health Credit Group Series 2010F-3, Rev., 4.00%, 7/1/2024 (c) | 150 | 150 |
Michigan Strategic Fund, Holland Home Obligated Group Rev., 4.00%, 11/15/2023 | 190 | 190 |
INVESTMENTS | PRINCIPAL AMOUNT ($000) | VALUE ($000) |
Michigan — continued | ||
Michigan Strategic Fund, Waste Management, Inc. Project Rev., 0.58%, 8/1/2024 (c) | 3,000 | 2,904 |
RIB Floater Trust Various States Series 46, Rev., VRDO, LOC : Barclays Bank plc, 4.07%, 9/1/2023 (c) (e) | 31,410 | 31,410 |
Van Buren Public Schools Series 2019, GO, Q-SBLF, 4.00%, 11/1/2023 | 1,300 | 1,301 |
Walled Lake Consolidated School District, School Building and Site Series 2014, GO, Q-SBLF, 5.00%, 11/1/2023 (d) | 865 | 867 |
Total Michigan | 63,262 | |
Minnesota — 0.1% | ||
City of Minneapolis Series 2017A, Rev., 5.00%, 11/15/2023 | 135 | 135 |
City of Minneapolis & St. Paul Housing and Redevelopment Authority, Health Care, Allina Health System Series 2019, Rev., 5.00%, 11/15/2023 | 340 | 341 |
City of Wayzata, Folkestone Senior Living Community Rev., 3.00%, 8/1/2024 | 100 | 99 |
Duluth Economic Development Authority, Benedictine Health System | ||
Series 2021A, Rev., 3.00%, 7/1/2024 | 100 | 98 |
Series 2021A, Rev., 3.00%, 7/1/2025 | 100 | 96 |
Series 2021A, Rev., 3.00%, 7/1/2026 | 180 | 170 |
Duluth Housing and Redevelopment Authority, Duluth Public Schools Academy Project Series 2018A, Rev., 3.88%, 11/1/2023 | 325 | 325 |
Duluth Independent School District No. 709 Series 2019B, COP, 5.00%, 2/1/2028 | 300 | 320 |
Minneapolis-St. Paul Metropolitan Airports Commission Series A, Rev., 5.00%, 1/1/2027 | 25 | 26 |
Minnesota Higher Education Facilities Authority, College of St. Scholastica, Inc. Rev., 3.00%, 12/1/2023 | 100 | 100 |
State of Minnesota, State Trunk Highway Series 2013B, GO, 4.00%, 11/7/2023 | 1,000 | 1,001 |
Total Minnesota | 2,711 | |
Mississippi — 0.9% | ||
City of Tupelo GO, 4.00%, 12/1/2023 | 315 | 315 |
County of Warren, Gulf Opportunity Zone, International Paper Co. Project | ||
Series 2020A, Rev., 1.38%, 6/16/2025 (c) | 1,750 | 1,669 |
Series 2020C, Rev., 1.38%, 6/16/2025 (c) | 1,500 | 1,431 |
August 31, 2023 | J.P. Morgan Municipal Bond Funds | 107 |
AS OF August 31, 2023 (Unaudited) (continued)
INVESTMENTS | PRINCIPAL AMOUNT ($000) | VALUE ($000) |
Municipal Bonds — continued | ||
Mississippi — continued | ||
Mississippi Business Finance Corp., Gulf Opportunity Zone Industrial Development, Chevron USA, Inc., Project Series 2010G, Rev., VRDO, 3.50%, 9/1/2023 (c) | 12,000 | 12,000 |
Mississippi Hospital Equipment and Facilities Authority, Forrest County General Hospital Refunding Project Series 2019B, Rev., 5.00%, 1/1/2024 | 770 | 773 |
Total Mississippi | 16,188 | |
Missouri — 2.0% | ||
City of St. Peters COP, 4.00%, 5/1/2025 | 425 | 428 |
Health and Educational Facilities Authority of the State of Missouri, Mercy Health Series 2018A, Rev., 5.00%, 6/1/2028 | 20 | 22 |
Health and Educational Facilities Authority of the State of Missouri, SSM Health Care Corp. Series 2018F, Rev., VRDO, 3.95%, 9/1/2023 (c) | 30,000 | 30,000 |
Missouri Joint Municipal Electric Utility Commission, IATAN 2 Project | ||
Series 2014A, Rev., 5.00%, 1/1/2024 | 50 | 50 |
Series 2014A, Rev., 5.00%, 1/1/2026 | 30 | 30 |
Series 2014A, Rev., 5.00%, 1/1/2027 | 100 | 100 |
Missouri Joint Municipal Electric Utility Commission, Plum Point Project | ||
Series 2014A, Rev., 5.00%, 1/1/2024 | 135 | 136 |
Series 2014A, Rev., 5.00%, 1/1/2027 | 195 | 198 |
St. Louis County Special School District COP, 4.00%, 4/1/2024 | 605 | 607 |
Tender Option Bond Trust Receipts/Certificates Series 2018-XG0176, Rev., VRDO, LIQ : Royal Bank of Canada, 4.19%, 9/12/2023 (c) (e) | 5,440 | 5,440 |
Total Missouri | 37,011 | |
Nebraska — 0.4% | ||
County of Saunders | ||
GO, 3.00%, 11/1/2023 | 325 | 325 |
GO, 3.00%, 11/1/2024 | 415 | 412 |
County of Washington, Wastewater and Solid Waste Disposal Facilities, Cargill Incorporated Projects Rev., AMT, 0.90%, 9/1/2025 (c) | 6,800 | 6,426 |
Douglas County Hospital Authority No. 2 Rev., 5.00%, 5/15/2025 | 50 | 51 |
Nebraska Public Power District | ||
Series 2021C, Rev., 5.00%, 1/1/2024 | 190 | 191 |
Series B, Rev., 5.00%, 1/1/2024 | 40 | 40 |
INVESTMENTS | PRINCIPAL AMOUNT ($000) | VALUE ($000) |
Nebraska — continued | ||
Omaha Public Power District Series 2014AA, Rev., 5.00%, 2/1/2026 | 30 | 30 |
Public Power Generation Agency Series 2015A, Rev., 5.00%, 1/1/2025 | 20 | 20 |
Total Nebraska | 7,495 | |
Nevada — 0.1% | ||
Carson City Nevada Hospital Rev., 5.00%, 9/1/2027 | 610 | 634 |
Clark County School District | ||
Series 2015C, GO, 5.00%, 6/15/2025 | 25 | 26 |
Series 2016A, GO, 5.00%, 6/15/2025 | 25 | 26 |
Series 2018A, GO, 5.00%, 6/15/2025 | 50 | 51 |
Series 2021C, GO, 5.00%, 6/15/2026 | 75 | 78 |
Series 2017A, GO, 5.00%, 6/15/2027 | 35 | 37 |
Series 2017A, GO, 5.00%, 6/15/2028 | 25 | 26 |
Clark County School District, Limited Tax Series 2018A, GO, 5.00%, 6/15/2027 | 95 | 101 |
Total Nevada | 979 | |
New Hampshire — 1.3% | ||
New Hampshire Business Finance Authority, Waste Management, Inc., Project Series 2018A, Rev., AMT, (SIFMA Municipal Swap Index Yield + 0.38%), 4.44%, 9/7/2023 (b) | 24,500 | 24,104 |
New Jersey — 7.0% | ||
Atlantic County Improvement Authority (The), Atlantic City Campus Phase II Project | ||
Series 2021A, Rev., AGM, 5.00%, 7/1/2024 | 75 | 76 |
Series 2021A, Rev., AGM, 5.00%, 7/1/2026 | 100 | 103 |
Bergen County Improvement Authority (The) Series 2023, Rev., GTD, 4.50%, 5/31/2024 | 3,000 | 3,027 |
Borough of Carlstadt GO, BAN, 4.50%, 5/3/2024 | 15,941 | 16,009 |
Borough of Carteret Series 2023, GO, BAN, 4.75%, 5/31/2024 | 13,800 | 13,925 |
Borough of Glen Ridge GO, BAN, 4.50%, 7/11/2024 | 1,600 | 1,608 |
Borough of High Bridge GO, BAN, 5.00%, 6/13/2024 | 945 | 953 |
Borough of Montvale GO, BAN, 4.50%, 4/11/2024 | 3,700 | 3,714 |
Borough of Mountainside GO, BAN, 5.00%, 7/19/2024 | 2,600 | 2,622 |
Borough of North Caldwell GO, BAN, 4.50%, 7/12/2024 | 2,050 | 2,066 |
Borough of Point Pleasant, General Capital Water and Sewer Utility GO, BAN, 4.50%, 8/30/2024 | 1,354 | 1,364 |
108 | J.P. Morgan Municipal Bond Funds | August 31, 2023 |
INVESTMENTS | PRINCIPAL AMOUNT ($000) | VALUE ($000) |
Municipal Bonds — continued | ||
New Jersey — continued | ||
Borough of Union Beach GO, BAN, 4.50%, 4/23/2024 | 2,900 | 2,906 |
City of Newark | ||
Series 2020A, GO, AGM, 5.00%, 10/1/2023 | 1,000 | 1,001 |
Series 2020B, GO, AGM, 5.00%, 10/1/2023 | 525 | 525 |
City of Ventnor City GO, BAN, 4.50%, 7/10/2024 | 5,300 | 5,329 |
Jersey City Municipal Utilities Authority, Sewer Project Notes Series 2023A, Rev., 4.00%, 5/3/2024 | 7,500 | 7,517 |
Jersey City Municipal Utilities Authority, Water Project Notes Series 2023B, Rev., 4.00%, 5/3/2024 | 7,500 | 7,517 |
New Brunswick Parking Authority, Tax-Exempt | ||
Series 2020B, Rev., GTD, 5.00%, 9/1/2023 | 335 | 335 |
Series 2020B, Rev., GTD, 5.00%, 9/1/2024 | 425 | 432 |
New Jersey Economic Development Authority | ||
Series 2024SSS, Rev., 5.00%, 6/15/2026 (f) | 2,450 | 2,502 |
Series 2024SSS, Rev., 5.00%, 6/15/2027 (f) | 1,400 | 1,446 |
New Jersey Economic Development Authority, School Facilities Construction | ||
Series 2021QQQ, Rev., 5.00%, 6/15/2024 | 300 | 303 |
Series 2019GGG, Rev., 5.25%, 9/1/2024 (e) | 7,000 | 7,108 |
New Jersey Economic Development Authority, Transit Corporation Projects Series B, Rev., 5.00%, 11/1/2023 | 405 | 406 |
New Jersey Health Care Facilities Financing Authority, Virtual Health, Inc. Rev., 5.00%, 7/1/2025 | 35 | 35 |
New Jersey Transportation Trust Fund Authority, Capital Appreciation Series 2010A, Rev., Zero Coupon, 12/15/2028 | 2,485 | 2,043 |
New Jersey Transportation Trust Fund Authority, Transportation Program Series 2023AA, Rev., 5.00%, 6/15/2026 | 1,850 | 1,925 |
New Jersey Transportation Trust Fund Authority, Transportation System Series 2010D, Rev., 5.25%, 12/15/2023 | 625 | 628 |
New Jersey Turnpike Authority | ||
Series 2014A, Rev., 5.00%, 1/1/2027 | 125 | 126 |
Series 2014A, Rev., 5.00%, 1/1/2028 | 20 | 20 |
Series 2020D, Rev., 5.00%, 1/1/2028 | 7,000 | 7,282 |
Passaic County Improvement Authority (The), City of Paterson Project Rev., GTD, 5.00%, 8/15/2026 | 350 | 369 |
Passaic Valley Sewerage Commission, Sewer System Series J, Rev., AGM, 3.00%, 12/1/2025 | 1,825 | 1,801 |
INVESTMENTS | PRINCIPAL AMOUNT ($000) | VALUE ($000) |
New Jersey — continued | ||
Penns Grove-Carneys Point Regional School District GO, GAN, 4.50%, 7/3/2024 | 2,765 | 2,777 |
State of New Jersey Series 2020A, GO, 5.00%, 6/1/2026 | 2,000 | 2,093 |
State of New Jersey, Various Purpose | ||
GO, 5.00%, 6/1/2024 | 500 | 506 |
GO, 4.00%, 6/1/2026 | 25 | 25 |
Township of Eastampton GO, BAN, 4.50%, 7/24/2024 | 2,350 | 2,362 |
Township of Lawrence GO, BAN, 5.00%, 6/7/2024 | 2,015 | 2,029 |
Township of Middle, General Improvement Sewer Utility GO, BAN, 4.50%, 9/5/2024 (f) | 4,590 | 4,621 |
Township of Rochelle Park GO, BAN, 4.50%, 8/9/2024 | 2,200 | 2,211 |
Township of Saddle Brook GO, BAN, 4.50%, 5/10/2024 | 9,096 | 9,140 |
Township of Tewksbury Series 2023A, GO, 4.50%, 5/14/2024 | 2,337 | 2,351 |
Union County Improvement Authority, City of Linden Omnibus Revenue Refunding Project Series 2016, Rev., AGM, GTD, 4.00%, 11/1/2023 | 20 | 20 |
Village of Ridgefield Park GO, BAN, 4.50%, 4/5/2024 | 7,640 | 7,645 |
Total New Jersey | 132,803 | |
New York — 18.6% | ||
Canton Central School District GO, BAN, 4.50%, 7/5/2024 | 11,150 | 11,216 |
Chenango Forks Central School District GO, BAN, 4.50%, 6/28/2024 | 10,480 | 10,530 |
City of Geneva Series 2023, GO, BAN, 4.50%, 5/2/2024 | 16,050 | 16,127 |
City of New York, Fiscal Year 2018 Series B, Subseries B-5, GO, VRDO, LIQ : Barclays Bank plc, 3.95%, 9/1/2023 (c) | 10,000 | 10,000 |
City of Troy GO, BAN, 4.50%, 7/26/2024 | 4,300 | 4,322 |
Clarence Central School District GO, BAN, 4.50%, 6/20/2024 | 10,675 | 10,739 |
Deposit Central School District GO, BAN, 4.75%, 6/28/2024 (f) | 1,825 | 1,835 |
East Islip Union Free School District GO, BAN, 4.50%, 6/26/2024 | 16,055 | 16,154 |
Erie County Industrial Development Agency (The), City School District of the City of Buffalo Project Series 2013A, Rev., 5.00%, 5/1/2026 | 85 | 85 |
Evans-Brant Central School District GO, BAN, 4.50%, 6/20/2024 | 17,735 | 17,832 |
August 31, 2023 | J.P. Morgan Municipal Bond Funds | 109 |
AS OF August 31, 2023 (Unaudited) (continued)
INVESTMENTS | PRINCIPAL AMOUNT ($000) | VALUE ($000) |
Municipal Bonds — continued | ||
New York — continued | ||
Floral Park-Bellerose Union Free School District GO, 5.00%, 12/1/2023 | 495 | 497 |
Fonda-Fultonville Central School District GO, BAN, 4.50%, 7/12/2024 | 2,750 | 2,768 |
Frewsburg Central School District GO, BAN, 4.50%, 7/9/2024 | 2,600 | 2,613 |
Greenwich Central School District GO, BAN, 4.50%, 6/25/2024 | 1,400 | 1,407 |
Guilderland Central School District GO, BAN, 4.50%, 7/26/2024 | 10,750 | 10,819 |
Hempstead Town Local Development Corp., Adelphi University Project Rev., 4.00%, 2/1/2024 | 200 | 200 |
Hempstead Union Free School District GO, RAN, 5.00%, 6/28/2024 | 7,600 | 7,669 |
Lafayette Central School District | ||
GO, RAN, 5.00%, 6/14/2024 | 1,670 | 1,684 |
GO, BAN, 4.50%, 6/28/2024 | 3,225 | 3,239 |
Le Roy Central School District GO, BAN, 4.75%, 6/28/2024 | 4,725 | 4,760 |
Letchworth Central School District of Gainesville GO, BAN, 4.75%, 6/21/2024 | 6,625 | 6,673 |
Long Island Power Authority, Electric System Rev., 1.00%, 9/1/2025 | 25,000 | 23,290 |
Lyncourt Union Free School District GO, BAN, 4.50%, 6/27/2024 | 2,075 | 2,084 |
Malone Central School District GO, BAN, 4.50%, 6/27/2024 | 7,600 | 7,635 |
Massena Central School District GO, BAN, 4.50%, 6/28/2024 | 10,565 | 10,627 |
Metropolitan Transportation Authority | ||
Subseries G-4, Rev., VRDO, LOC : Bank of Montreal, 4.00%, 9/1/2023 (c) | 18,745 | 18,745 |
Series 2002G-1F, Rev., (SOFR + 0.43%), 3.99%, 9/6/2023 (b) | 1,330 | 1,318 |
Series 2008B-3, Rev., 5.00%, 11/15/2023 | 200 | 201 |
Series 2013B, Rev., 5.00%, 11/15/2023 | 700 | 700 |
Series 2013C, Rev., 5.00%, 11/15/2023 | 55 | 55 |
Series 2013E, Rev., 5.00%, 11/15/2023 (d) | 450 | 451 |
Series 2014C, Rev., 5.00%, 11/15/2023 | 385 | 386 |
Series 2016B, Rev., 5.00%, 11/15/2023 | 240 | 241 |
Series 2017B, Rev., 5.00%, 11/15/2023 | 4,050 | 4,061 |
Series 2017C-1, Rev., 5.00%, 11/15/2023 | 105 | 105 |
Series 2018B, Rev., 5.00%, 11/15/2023 | 100 | 100 |
Series A-1, Rev., 5.00%, 11/15/2023 | 200 | 201 |
Series A-2, Rev., 5.00%, 11/15/2023 | 3,125 | 3,133 |
INVESTMENTS | PRINCIPAL AMOUNT ($000) | VALUE ($000) |
New York — continued | ||
Series 2005B, Rev., AMBAC, 5.25%, 11/15/2023 | 110 | 110 |
Series 2014B, Rev., 5.00%, 11/15/2024 | 115 | 116 |
Series 2015F, Rev., 5.00%, 11/15/2024 | 25 | 25 |
Series 2017B, Rev., 5.00%, 11/15/2024 | 30 | 30 |
Series A-1, Rev., 5.00%, 11/15/2024 | 20 | 20 |
Series 2016B, Rev., 4.00%, 11/15/2025 | 40 | 40 |
Mount Vernon City School District GO, 5.00%, 9/15/2023 | 95 | 95 |
New York City Municipal Water Finance Authority, Second General Resolution, Fiscal Year 2008 Series 2008BB-5, Rev., VRDO, LIQ : Bank of America NA, 3.85%, 9/1/2023 (c) | 2,800 | 2,800 |
New York City Municipal Water Finance Authority, Second General Resolution, Fiscal year 2023 Series 2023B-1, Rev., VRDO, LIQ : Mizuho Bank Ltd., 3.70%, 9/1/2023 (c) | 10,000 | 10,000 |
New York City Transitional Finance Authority Future Tax Secured Series 2021A, Rev., 5.00%, 11/1/2023 | 50 | 50 |
New York State Dormitory Authority, Hospitals Center, Langone Hospitals Obligated Group Series 2016A, Rev., 5.00%, 7/1/2024 | 30 | 30 |
New York State Dormitory Authority, State Sales Tax Series 2018C, Rev., 5.00%, 3/15/2025 (d) | 400 | 411 |
New York State Thruway Authority | ||
Series J, Rev., 5.00%, 1/1/2024 | 25 | 25 |
Series K, Rev., 5.00%, 1/1/2024 | 25 | 25 |
New York Transportation Development Corp., Terminal 4 John F. Kennedy International Airport Project, Tax-Exempt Series 2020C, Rev., 5.00%, 12/1/2023 | 800 | 803 |
Newark Valley Central School District GO, BAN, 4.75%, 8/30/2024 | 1,174 | 1,182 |
Onondaga Central School District GO, BAN, 4.50%, 6/28/2024 | 8,310 | 8,342 |
Oriskany Central School District GO, BAN, 4.50%, 7/5/2024 | 3,630 | 3,646 |
Otego-Unadilla Central School District, New York General Obligation Anticipation GO, BAN, 4.50%, 7/18/2024 | 5,400 | 5,428 |
Owego Apalachin Central School District GO, BAN, 4.50%, 7/5/2024 | 4,235 | 4,261 |
Saranac Lake Central School District GO, BAN, 4.50%, 6/21/2024 | 2,145 | 2,155 |
Schenectady City School District GO, BAN, 4.50%, 7/19/2024 | 8,100 | 8,155 |
110 | J.P. Morgan Municipal Bond Funds | August 31, 2023 |
INVESTMENTS | PRINCIPAL AMOUNT ($000) | VALUE ($000) |
Municipal Bonds — continued | ||
New York — continued | ||
Shenendehowa Central School District GO, BAN, 4.50%, 6/28/2024 | 7,300 | 7,342 |
Spencer Van Etten Central School GO, BAN, 4.50%, 6/28/2024 | 6,520 | 6,548 |
Town of Goshen Series 2023, GO, BAN, 4.50%, 4/25/2024 | 1,856 | 1,863 |
Town of Haverstraw Series 2023, GO, BAN, 4.50%, 5/10/2024 | 4,210 | 4,229 |
Town of Lancaster GO, BAN, 4.50%, 7/19/2024 | 4,600 | 4,625 |
Town of Orchard Park GO, BAN, 4.50%, 8/16/2024 | 2,680 | 2,701 |
Town of Oyster Bay, Public Improvement GO, 4.00%, 11/1/2023 | 1,000 | 1,001 |
Town of Stillwater Series 2023, GO, BAN, 4.50%, 5/31/2024 | 2,215 | 2,231 |
Town of Wawarsing GO, BAN, 4.50%, 7/25/2024 | 3,000 | 3,015 |
Triborough Bridge and Tunnel Authority, MTA Bridges and Tunnels | ||
Series 2013A, Rev., 5.00%, 11/15/2023 | 105 | 105 |
Series 2021A-2, Rev., 2.00%, 5/15/2026 (c) | 16,000 | 15,063 |
Tully Central School District GO, BAN, 4.50%, 6/27/2024 | 1,140 | 1,146 |
Village of Freeport Series 2023C, GO, BAN, 4.50%, 4/26/2024 | 9,455 | 9,490 |
Village of Ilion Series 2023, GO, BAN, 4.50%, 5/10/2024 | 9,000 | 9,006 |
Village of Kenmore Series 2023, GO, BAN, 4.50%, 5/17/2024 | 7,901 | 7,954 |
Village of Skaneateles GO, BAN, 5.00%, 6/14/2024 | 1,150 | 1,160 |
Warwick Valley Central School District GO, BAN, 4.75%, 6/28/2024 | 3,765 | 3,795 |
Wayne Central School District GO, BAN, 4.50%, 7/26/2024 | 2,100 | 2,109 |
Westfield Central School District GO, BAN, 5.00%, 6/13/2024 | 1,670 | 1,684 |
Windsor Central School District GO, BAN, 4.50%, 7/26/2024 | 4,750 | 4,773 |
Total New York | 352,091 | |
North Carolina — 1.6% | ||
Charlotte-Mecklenburg Hospital Authority (The) Series 2016A, Rev., 5.00%, 1/15/2024 | 250 | 251 |
City of Raleigh, Downtown Improvement Projects Series 2005-B-1, COP, VRDO, LIQ : PNC Bank NA, 4.20%, 9/8/2023 (c) | 19,500 | 19,500 |
City of Raleigh, Limited Obligation Series 2016A, Rev., VRDO, LIQ : PNC Bank NA, 4.20%, 9/12/2023 (c) | 6,515 | 6,515 |
INVESTMENTS | PRINCIPAL AMOUNT ($000) | VALUE ($000) |
North Carolina — continued | ||
Columbus County Industrial Facilities and Pollution Control Financing Authority, International Paper Co. Project | ||
Series 2019A, Rev., 2.00%, 10/1/2024 (c) | 825 | 807 |
Series 2019B, Rev., 2.00%, 10/1/2024 (c) | 825 | 807 |
Series 2020A, Rev., 1.38%, 6/16/2025 (c) | 1,780 | 1,698 |
County of Orange, Limited Obligation Series 2021A, Rev., 5.00%, 11/15/2023 | 630 | 632 |
North Carolina Municipal Power Agency No. 1, Catawba Electric Series A, Rev., 5.00%, 1/1/2024 | 285 | 286 |
North Carolina Turnpike Authority, Triangle Expressway System, Senior Lien Rev., AGM, 5.00%, 1/1/2024 | 60 | 60 |
State of North Carolina Rev., 5.00%, 3/1/2024 | 75 | 76 |
Total North Carolina | 30,632 | |
Ohio — 2.8% | ||
American Municipal Power, Inc., Electric System Improvement, City of Wapakoneta Project Rev., BAN, 4.50%, 6/21/2024 | 1,500 | 1,508 |
American Municipal Power, Inc., Prairie State Energy Campus Project Series 2015A, Rev., 5.00%, 2/15/2026 | 2,470 | 2,484 |
City of Akron, Various Purpose Series 2020, GO, 2.00%, 12/1/2023 | 485 | 483 |
City of Lorain, Limited Tax Series 2020A, GO, 4.00%, 12/1/2023 | 300 | 300 |
City of Strongsville Series 2023, GO, BAN, 4.50%, 6/7/2024 | 2,060 | 2,075 |
Cleveland-Cuyahoga County Port Authority, The Cleveland Museum of Natural History Project Rev., 5.00%, 7/1/2026 | 125 | 130 |
County of Hamilton, Hospital Facility Cincinnati Children Hospital Series 2014S, Rev., 5.00%, 5/15/2027 | 1,500 | 1,513 |
County of Lorain Series 2023, GO, BAN, 4.13%, 5/2/2024 | 4,455 | 4,459 |
County of Montgomery, Catholic Health Initiatives Series 2009B, Rev., 5.25%, 11/13/2023 (d) | 1,380 | 1,384 |
County of Montgomery, Dayton Childern's Hospital Series 2021, Rev., 5.00%, 8/1/2026 | 270 | 281 |
County of Ross, Adena Health System Obligated Group Project Rev., 5.00%, 12/1/2023 | 490 | 491 |
Dayton City School District Series 2014, GO, 5.00%, 11/1/2023 | 60 | 60 |
Euclid City School District COP, 4.00%, 12/1/2023 | 70 | 70 |
August 31, 2023 | J.P. Morgan Municipal Bond Funds | 111 |
AS OF August 31, 2023 (Unaudited) (continued)
INVESTMENTS | PRINCIPAL AMOUNT ($000) | VALUE ($000) |
Municipal Bonds — continued | ||
Ohio — continued | ||
Lucas-Plaza Housing Development Corp. Series B, Rev., FHA, Zero Coupon, 6/1/2024 (d) | 150 | 146 |
State of Ohio, Cleveland Clinic Health System Series 2019F, Rev., VRDO, LIQ : US Bank NA, 3.65%, 9/1/2023 (c) | 15,000 | 15,000 |
State of Ohio, University Hospitals Health System, Inc. Series 2015A, Rev., VRDO, 4.44%, 9/12/2023 (c) | 23,250 | 23,250 |
University of Akron (The), General Receipt Series 2019A, Rev., 5.00%, 1/1/2024 | 175 | 176 |
Total Ohio | 53,810 | |
Oklahoma — 0.3% | ||
Bryan County School Finance Authority, Durant Public Schools Project Rev., 4.00%, 12/1/2023 | 155 | 155 |
Canadian County Educational Facilities Authority, Mustang Public Schools Project Rev., 3.00%, 9/1/2023 | 1,000 | 1,000 |
Cleveland County Educational Facilities Authority, Lexington Public Schools Project Rev., 4.00%, 9/1/2023 | 270 | 270 |
Custer County Economic Development Authority, Thomas Fay Public Schools Rev., 4.00%, 12/1/2023 | 450 | 450 |
Garvin County Educational Facilities Authority, Pernell Public Schools Project | ||
Rev., 4.00%, 9/1/2023 | 110 | 110 |
Rev., 4.00%, 9/1/2024 | 160 | 161 |
Grady County School Finance Authority, Educational Facilities Lease, Tuttle Public Schools Project | ||
Rev., 4.00%, 9/1/2023 | 300 | 300 |
Rev., 4.00%, 9/1/2024 | 245 | 246 |
Grand River Dam Authority | ||
Series 2014A, Rev., 5.00%, 6/1/2025 | 40 | 40 |
Series 2016A, Rev., 5.00%, 6/1/2026 | 25 | 26 |
Kingfisher County Educational Facilities Authority, Lomega Public Schools Project Rev., 3.00%, 3/1/2024 | 270 | 269 |
Muskogee Industrial Trust, Muskogee Public Schools Project Rev., 5.00%, 9/1/2023 | 900 | 900 |
Oklahoma Municipal Power Authority, Power Supply System Series 2021A, Rev., AGM, 5.00%, 1/1/2027 | 65 | 68 |
Pittsburg County Educational Facilities Authority, McAlester Public Schools Project Rev., 4.00%, 12/1/2026 | 250 | 254 |
INVESTMENTS | PRINCIPAL AMOUNT ($000) | VALUE ($000) |
Oklahoma — continued | ||
Tulsa County Industrial Authority Educational Facilities Lease, Jenks Public Schools Project Rev., 5.00%, 9/1/2023 | 450 | 450 |
Tulsa County Industrial Authority, Sand Springs Public Schools Project | ||
Rev., 4.00%, 9/1/2023 | 175 | 175 |
Rev., 4.00%, 9/1/2024 | 435 | 437 |
Wagoner County School Development Authority, Wagoner Public Schools Project Rev., 4.00%, 9/1/2023 | 525 | 525 |
Total Oklahoma | 5,836 | |
Oregon — 0.8% | ||
County of Yamhill, Linfield University Project | ||
Series 2020A, Rev., 4.00%, 10/1/2023 | 410 | 410 |
Series 2020A, Rev., 4.00%, 10/1/2024 | 425 | 422 |
Port of Portland, International Airport Series 28, Rev., AMT, 5.00%, 7/1/2026 | 5,240 | 5,412 |
State of Oregon, Housing and Community Services Department Series 2021BB, Rev., 0.47%, 12/1/2023 (c) | 8,500 | 8,398 |
Yamhill County Hospital Authority, Friendsview, Tax Exempt Series 2021B-2, Rev., 2.13%, 11/15/2027 | 500 | 451 |
Total Oregon | 15,093 | |
Pennsylvania — 8.0% | ||
Allegheny County Higher Education Building Authority, University Refunding Duquesne University Series 2016, Rev., 5.00%, 3/1/2027 | 40 | 41 |
Allegheny County Hospital Development Authority Series 1997B, Rev., NATL - RE, 6.00%, 7/1/2027 | 25 | 27 |
Allegheny County Sanitary Authority, Sewer | ||
Series 2020A, Rev., 4.00%, 6/1/2024 | 300 | 301 |
Series 2020A, Rev., 4.00%, 6/1/2025 | 150 | 152 |
Series 2020B, Rev., 4.00%, 6/1/2025 | 210 | 212 |
Series 2020A, Rev., 5.00%, 6/1/2026 | 425 | 446 |
Ambridge Borough Water Authority Rev., 4.00%, 11/15/2023 | 175 | 175 |
Apollo-Ridge School District | ||
Series 2019A, GO, 4.00%, 9/1/2023 | 385 | 385 |
Series 2019A, GO, 4.00%, 9/1/2024 | 450 | 452 |
Carmichaels Area School District, Limited Tax GO, 4.00%, 9/1/2023 | 150 | 150 |
Charleroi Borough Authority Water System Rev., AGM, 4.00%, 12/1/2023 | 225 | 225 |
112 | J.P. Morgan Municipal Bond Funds | August 31, 2023 |
INVESTMENTS | PRINCIPAL AMOUNT ($000) | VALUE ($000) |
Municipal Bonds — continued | ||
Pennsylvania — continued | ||
Chester County Health and Education Facilities Authority, Main Line Health System | ||
Series 2020A, Rev., 3.00%, 9/1/2023 | 230 | 230 |
Series 2020A, Rev., 3.00%, 9/1/2024 | 215 | 214 |
City of Altoona, Guaranteed Sewer GO, AGM, 5.00%, 12/1/2023 | 300 | 301 |
City of Lebanon Authority Rev., 4.00%, 12/15/2023 | 360 | 361 |
City of Philadelphia | ||
Series 2019A, GO, 5.00%, 8/1/2024 | 45 | 46 |
Series 2019B, GO, 5.00%, 2/1/2028 | 40 | 43 |
City of Philadelphia, Water and Wastewater Series 2019B, Rev., 5.00%, 11/1/2023 | 380 | 381 |
City of Pittsburgh Series 2020A, GO, 5.00%, 9/1/2026 | 300 | 316 |
Commonwealth Financing Authority | ||
Series 2019B, Rev., 5.00%, 6/1/2027 | 20 | 21 |
Series 2020A, Rev., 5.00%, 6/1/2027 | 20 | 21 |
Commonwealth Financing Authority, Tobacco Master Settlement Payment | ||
Rev., 5.00%, 6/1/2024 | 150 | 151 |
Rev., 5.00%, 6/1/2025 | 45 | 46 |
Rev., 5.00%, 6/1/2027 | 25 | 26 |
Rev., 5.00%, 6/1/2028 | 25 | 27 |
Commonwealth of Pennsylvania Series 2018A, COP, 5.00%, 7/1/2027 | 405 | 434 |
County of Armstrong | ||
GO, AGM, 4.00%, 6/1/2024 | 230 | 231 |
GO, AGM, 4.00%, 6/1/2025 | 240 | 243 |
County of Indiana | ||
GO, 2.00%, 12/15/2023 | 260 | 258 |
GO, 3.00%, 12/15/2024 | 430 | 427 |
GO, 3.00%, 12/15/2025 | 250 | 247 |
GO, 3.00%, 12/15/2026 | 435 | 428 |
County of Lackawanna | ||
Series 2020B, GO, 4.00%, 9/1/2023 | 305 | 305 |
Series 2020A, GO, 4.00%, 3/15/2024 | 300 | 301 |
Series 2020A, GO, 4.00%, 3/15/2025 | 300 | 302 |
County of Somerset | ||
GO, 2.00%, 10/1/2023 | 335 | 334 |
GO, 2.00%, 10/1/2024 | 300 | 293 |
Dallas School District GO, AGM, 5.00%, 10/15/2023 | 175 | 175 |
Delaware River Port Authority Series 2018B, Rev., 5.00%, 1/1/2024 | 150 | 151 |
INVESTMENTS | PRINCIPAL AMOUNT ($000) | VALUE ($000) |
Pennsylvania — continued | ||
Delaware Valley Regional Finance Authority | ||
Series 1997B, Rev., AMBAC, 5.70%, 7/1/2027 | 50 | 54 |
Series 1998A, Rev., AMBAC, 5.50%, 8/1/2028 | 240 | 264 |
General Authority of Southcentral Pennsylvania, WellSpan Health Obligated Group Series D, Rev., VRDO, LIQ : Bank of America NA, 4.05%, 9/1/2023 (c) | 6,215 | 6,215 |
General Authority of Southcentral Pennsylvania, Wellspan Health Obligation Series C, Rev., VRDO, LIQ : Bank of America NA, 3.55%, 9/1/2023 (c) | 15,700 | 15,700 |
Iroquois School District GO, 4.00%, 10/1/2023 | 200 | 200 |
Lancaster County Hospital Authority, University of Pennsylvania Health System Series 2016A, Rev., 5.00%, 8/15/2026 | 20 | 21 |
Lycoming County Water and Sewer Authority Rev., AGM, 4.00%, 11/15/2023 | 150 | 150 |
Mars Area School District Series 2019B, GO, AGM, 5.00%, 9/1/2023 | 115 | 115 |
Middletown Township Sewer Authority Series 2019, Rev., GTD, 4.00%, 10/1/2023 | 210 | 210 |
Montgomery County Higher Education and Health Authority, Arcadia University | ||
Rev., 5.00%, 4/1/2024 | 300 | 301 |
Rev., 5.00%, 4/1/2025 | 250 | 252 |
Rev., 5.00%, 4/1/2026 | 165 | 166 |
Montour School District GO, 3.00%, 10/1/2023 | 200 | 200 |
Municipality of Penn Hills Series 2019A, GO, 3.00%, 12/1/2023 | 305 | 305 |
Neshannock Township School District Series 2019AA, GO, 4.00%, 9/1/2023 | 200 | 200 |
New Castle Area School District GO, 4.00%, 3/1/2024 | 240 | 241 |
Northampton County General Purpose Authority, Lafayette College Rev., 5.00%, 11/1/2023 | 85 | 85 |
Penn Hills School District GO, 4.00%, 10/1/2023 | 1,790 | 1,790 |
Pennsylvania Economic Development Financing Authority, Waste Management, Inc., Project Series 2017A, Rev., AMT, 0.58%, 8/1/2024 (c) | 5,500 | 5,266 |
Pennsylvania Higher Educational Facilities Authority, State System of Higher Education | ||
Series AT-1, Rev., 5.00%, 6/15/2025 | 40 | 41 |
Series 2017AU-2, Rev., 5.00%, 6/15/2027 | 50 | 53 |
Pennsylvania Turnpike Commission | ||
Rev., VRDO, LOC : TD Bank NA, 4.01%, 9/8/2023 (c) | 20,000 | 20,000 |
Series 2020B, Rev., 5.00%, 12/1/2023 | 425 | 427 |
Series A-2, Rev., 5.00%, 12/1/2024 | 425 | 434 |
August 31, 2023 | J.P. Morgan Municipal Bond Funds | 113 |
AS OF August 31, 2023 (Unaudited) (continued)
INVESTMENTS | PRINCIPAL AMOUNT ($000) | VALUE ($000) |
Municipal Bonds — continued | ||
Pennsylvania — continued | ||
Series 2020B, Rev., 5.00%, 12/1/2026 | 400 | 422 |
Series 2019A, Rev., 4.00%, 12/1/2027 | 25 | 26 |
Series 2016A-1, Rev., 5.00%, 12/1/2027 | 100 | 105 |
Series 2016A-3, Rev., 5.00%, 12/1/2027 | 200 | 210 |
Series 2017-2, Rev., 5.00%, 12/1/2028 | 1,065 | 1,139 |
Series 2014, Rev., 5.00%, 12/1/2031 | 2,600 | 2,639 |
Series 2014C, Rev., 5.00%, 12/1/2039 | 4,250 | 4,310 |
Perkiomen Valley School District Series 2020, GO, 5.00%, 11/15/2023 | 280 | 281 |
Philadelphia Gas Works Co., 1998 General Ordinance Series A-2, Rev., VRDO, LOC : TD Bank NA, 4.01%, 9/8/2023 (c) | 20,300 | 20,300 |
Pittsburgh School District GO, 5.00%, 9/1/2023 | 1,810 | 1,810 |
Punxsutawney Area School District Series 2020A, GO, AGM, 5.00%, 10/15/2023 | 250 | 250 |
School District of Philadelphia (The) | ||
Series 2019A, GO, 5.00%, 9/1/2023 | 1,050 | 1,050 |
Series F, GO, 5.00%, 9/1/2024 | 250 | 253 |
Selinsgrove Area School District Series 2019A, GO, 2.00%, 9/1/2023 | 585 | 585 |
Spring-Benner-Walker Joint Authority Series 2020, Rev., 4.00%, 9/1/2024 | 440 | 442 |
Steel Valley School District, Allegheny County, Pennsylvania Unlimited Tax Series 2019B, GO, 4.00%, 11/1/2023 | 250 | 250 |
Steelton-Highspire School District, Limited Tax GO, 4.00%, 11/15/2023 | 85 | 85 |
Township of Butler GO, 5.00%, 10/1/2023 | 260 | 260 |
Township of East Coventry | ||
GO, 3.00%, 12/1/2025 | 345 | 340 |
GO, 3.00%, 12/1/2026 | 275 | 270 |
Township of Radnor GO, 3.00%, 6/15/2024 | 145 | 144 |
Uniontown Area School District | ||
GO, 2.00%, 10/1/2023 | 530 | 529 |
GO, 3.00%, 10/1/2024 | 900 | 893 |
University of Pittsburgh of the Commonwealth System of Higher Education Series 2019, Rev., (SIFMA Municipal Swap Index Yield + 0.36%), 4.42%, 9/7/2023 (b) | 52,000 | 52,001 |
Upper Allegheny Joint Sanitary Authority Series 2019A, Rev., AGM, 4.00%, 9/1/2023 | 215 | 215 |
Waynesboro Area School District, Franklin County GO, 5.00%, 10/1/2023 | 320 | 320 |
INVESTMENTS | PRINCIPAL AMOUNT ($000) | VALUE ($000) |
Pennsylvania — continued | ||
Wyalusing Area School District | ||
GO, 3.00%, 4/1/2024 | 185 | 184 |
GO, 3.00%, 4/1/2026 | 300 | 294 |
Total Pennsylvania | 151,176 | |
Rhode Island — 0.0% ^ | ||
Rhode Island Health and Educational Building Corp. Series 2013A, Rev., 6.00%, 9/1/2023 (d) | 500 | 500 |
Rhode Island Turnpike and Bridge Authority, Motor Fuel Tax Series 2019A, Rev., 5.00%, 10/1/2023 | 125 | 125 |
Total Rhode Island | 625 | |
South Carolina — 0.1% | ||
Piedmont Municipal Power Agency | ||
Series 2017A, Rev., 5.00%, 1/1/2024 | 25 | 25 |
Series 2017B, Rev., 5.00%, 1/1/2024 | 235 | 236 |
Series 2015A, Rev., 5.00%, 1/1/2026 | 1,300 | 1,319 |
SCAGO Educational Facilities Corp. for Pickens School District Rev., 5.00%, 12/1/2027 | 60 | 61 |
South Carolina Jobs-Economic Development Authority, Lowcountry Leadership Charter School Project Series 2019A, Rev., 2.38%, 12/1/2024 (e) | 405 | 391 |
South Carolina Jobs-Economic Development Authority, Woodlands at Furman Project Series 2020A, Rev., 4.00%, 11/15/2023 | 130 | 130 |
Total South Carolina | 2,162 | |
Tennessee — 1.1% | ||
Knox County Health Educational and Housing Facility Board, University Health System, Inc. Rev., 5.00%, 4/1/2025 | 1,000 | 1,012 |
Knoxville's Community Development Corp., Austin Homes 1B Apartments Project Rev., 0.22%, 10/1/2023 (c) | 4,500 | 4,484 |
Metropolitan Government Nashville and Davidson County Health and Educational Facilities Board, Trevecca Nazarene University Project Rev., 3.00%, 10/1/2024 | 220 | 215 |
Metropolitan Government Nashville and Davidson County Industrial Development Board, Waste Management, Inc. of Tennessee Project Rev., 0.58%, 8/1/2024 (c) | 1,150 | 1,113 |
Metropolitan Government Nashville and Davidson County, Health and Educational Facilities Board, Shelby House Apartments Project Series 2021B, Rev., 1.25%, 12/1/2024 (c) | 5,655 | 5,444 |
114 | J.P. Morgan Municipal Bond Funds | August 31, 2023 |
INVESTMENTS | PRINCIPAL AMOUNT ($000) | VALUE ($000) |
Municipal Bonds — continued | ||
Tennessee — continued | ||
Shelby County Health Educational and Housing Facilities Board, The Farms at Bailey Station Project Series 2019B-1, Rev., 4.00%, 12/1/2026 | 8,825 | 8,206 |
Tennessee Energy Acquisition Corp., Commodity Project | ||
Series 2021A, Rev., 5.00%, 11/1/2023 | 250 | 250 |
Series 2021A, Rev., 5.00%, 11/1/2026 | 350 | 358 |
Tennessee State School Bond Authority, Higher Educational Facilities Second Program Series 2014B, Rev., 5.00%, 11/1/2023 | 250 | 251 |
Total Tennessee | 21,333 | |
Texas — 7.8% | ||
Arlington Housing Finance Corp. Series 2023, Rev., 4.50%, 4/1/2027 (c) | 1,220 | 1,234 |
Austin Community College District Public Facility Corp., Lease, Highland Campus Parking Garage Project | ||
Series 2018C, Rev., 5.00%, 8/1/2024 | 200 | 203 |
Series 2018C, Rev., 5.00%, 8/1/2025 | 200 | 206 |
Austin Independent School District Series A, GO, PSF-GTD, 4.00%, 8/1/2025 (d) | 1,000 | 1,011 |
Capital Area Housing Finance Corp., Multi-Family Housing, Grand Avenue Flats Ltd. Rev., 0.29%, 8/1/2024 (c) | 11,100 | 10,666 |
Capital Area Housing Finance Corp., Variable Lockhart Farms Apartments Rev., 0.70%, 6/1/2024 (c) | 3,000 | 2,909 |
Central Texas Turnpike System | ||
Series C, Rev., 5.00%, 8/15/2025 | 100 | 101 |
Series C, Rev., 5.00%, 8/15/2026 | 30 | 30 |
City of Austin Series 2012A, Rev., 5.00%, 11/15/2023 | 65 | 65 |
City of Austin Water and Wastewater System Series 2017, Rev., 5.00%, 11/15/2028 | 30 | 32 |
City of Dallas Series 2014, GO, 5.00%, 2/15/2027 | 100 | 101 |
City of El Paso Series 2020A, GO, 5.00%, 8/15/2024 | 275 | 279 |
City of Houston, Convention and Entertainment Facilities Series 2015, Rev., 5.00%, 9/1/2023 | 50 | 50 |
City of Houston, Public Improvement Series 2019A, GO, 5.00%, 3/1/2027 | 30 | 32 |
City of Houston, Utility System Series 2016B, Rev., 5.00%, 11/15/2027 | 1,010 | 1,065 |
City of Plano Series 2022, GO, 4.00%, 9/1/2024 | 1,000 | 1,006 |
INVESTMENTS | PRINCIPAL AMOUNT ($000) | VALUE ($000) |
Texas — continued | ||
City of Port Arthur, Combination Tax, Certificates of Obligation | ||
Series 2020A, GO, AGM, 5.00%, 2/15/2024 | 380 | 382 |
Series 2020A, GO, AGM, 5.00%, 2/15/2025 | 400 | 408 |
City of San Antonio, Electric and Gas Systems Series 2018, Rev., 5.00%, 2/1/2027 | 160 | 169 |
County of Harris Toll Road Series 2022A, Rev., 5.00%, 8/15/2027 | 20 | 21 |
County of Kaufman, Limited Tax | ||
Series 2020A, GO, 5.00%, 2/15/2024 | 125 | 126 |
Series 2020A, GO, 5.00%, 2/15/2025 | 130 | 133 |
County of Kaufman, Unlimited Tax | ||
GO, 5.00%, 2/15/2024 | 210 | 211 |
GO, 5.00%, 2/15/2025 | 255 | 261 |
Cypress Hill Municipal Utility District No. 1, Unlimited Tax GO, 3.00%, 9/1/2023 | 270 | 270 |
Dallas Fort Worth International Airport | ||
Series 2013F, Rev., 5.00%, 11/1/2023 | 330 | 331 |
Series 2013G, Rev., 5.00%, 11/1/2023 | 495 | 496 |
Series 2014C, Rev., 5.00%, 11/1/2023 | 400 | 401 |
Series 2020A, Rev., 5.00%, 11/1/2023 | 35 | 35 |
Series 2022B, Rev., 5.00%, 11/1/2023 | 25 | 25 |
Series 2013F, Rev., 5.13%, 11/1/2023 | 235 | 236 |
Series 2013D, Rev., 5.25%, 11/1/2023 | 85 | 85 |
Series 2023B, Rev., 5.00%, 11/1/2025 (f) | 4,000 | 4,128 |
Series 2021B, Rev., 5.00%, 11/1/2026 | 35 | 37 |
Series 2023B, Rev., 5.00%, 11/1/2027 (f) | 1,000 | 1,069 |
Series 2023B, Rev., 5.00%, 11/1/2028 (f) | 1,250 | 1,358 |
Florence Independent School District, Unlimited Tax | ||
GO, PSF-GTD, 3.00%, 8/15/2026 | 230 | 225 |
GO, PSF-GTD, 3.00%, 8/15/2027 | 115 | 112 |
Fort Bend County Levee Improvement District No. 11, Unlimited Tax GO, AGM, 3.00%, 9/1/2023 | 400 | 400 |
Fort Bend County Municipal Utility District No. 116, Unlimited Tax GO, 3.00%, 9/1/2023 | 450 | 450 |
Galveston Public Facility Corp., The Oleanders at Broadway Rev., 0.47%, 8/1/2024 (c) | 11,255 | 10,853 |
Grand Parkway Transportation Corp., System Toll Series 2013B, Rev., 5.00%, 10/1/2023 (d) | 21,060 | 21,081 |
Greenhawe Water Control and Improvement District No. 2, Unlimited Tax GO, AGM, 3.00%, 9/1/2023 | 200 | 200 |
Harris County Cultural Education Facilities Finance Corp., Memorial Hermann Health System | ||
Series 2019C-2, Rev., (SIFMA Municipal Swap Index Yield + 0.57%), 4.63%, 9/7/2023 (b) | 9,000 | 9,003 |
August 31, 2023 | J.P. Morgan Municipal Bond Funds | 115 |
AS OF August 31, 2023 (Unaudited) (continued)
INVESTMENTS | PRINCIPAL AMOUNT ($000) | VALUE ($000) |
Municipal Bonds — continued | ||
Texas — continued | ||
Series 2014A, Rev., 5.00%, 12/1/2025 | 100 | 102 |
Series 2022B, Rev., 5.00%, 12/1/2028 (c) | 1,000 | 1,067 |
Harris County Fresh Water Supply District No. 61, Unlimited Tax | ||
GO, AGM, 4.00%, 9/1/2023 | 445 | 445 |
GO, AGM, 3.00%, 9/1/2024 | 695 | 687 |
Harris County Municipal Utility District No. 096, Unlimited Tax GO, 2.00%, 9/1/2023 | 195 | 195 |
Harris County Municipal Utility District No. 276, Unlimited Tax GO, 3.00%, 9/1/2023 | 745 | 745 |
Harris County Municipal Utility District No. 281, Unlimited Tax GO, 2.00%, 9/1/2023 | 305 | 305 |
Harris County Municipal Utility District No. 374, Unlimited Tax GO, 3.00%, 9/1/2023 | 115 | 115 |
Harris County Municipal Utility District No. 391, Unlimited Tax GO, 3.00%, 9/1/2023 | 400 | 400 |
Harris County Municipal Utility District No. 419, Unlimited Tax GO, 3.00%, 9/1/2023 | 455 | 455 |
Harris County Water Control and Improvement District No. 119, Unlimited Tax GO, AGM, 3.00%, 10/1/2023 | 375 | 375 |
Harris County-Houston Sports Authority Series 2004A-3, Rev., NATL - RE, Zero Coupon, 11/15/2024 (d) | 3,410 | 1,429 |
Lewisville Independent School District, Unlimited Tax Series 2023, GO, PSF-GTD, 5.00%, 8/15/2026 | 825 | 868 |
Lower Colorado River Authority, LCRA Transmission Services Corp. Project Rev., 5.00%, 5/15/2025 | 50 | 51 |
Lytle Independent School District, Unlimited Tax GO, PSF-GTD, 4.00%, 2/15/2028 | 255 | 264 |
Matagorda County Navigation District No.1, Pollution Control, Central Power and Light Co. Project Rev., AMT, VRDO, 0.90%, 9/1/2023 (c) | 3,750 | 3,750 |
Metropolitan Transit Authority of Harris County, Sales and Use Tax, Contractual Obligations Series 2015B, Rev., 5.00%, 11/1/2023 | 25 | 25 |
Mission Economic Development Corp., Waste Management, Inc., Project Rev., AMT, (SIFMA Municipal Swap Index Yield + 0.38%), 4.44%, 9/7/2023 (b) | 10,000 | 9,838 |
Montgomery County Municipal Utility District No. 94, Unlimited Tax GO, 2.00%, 10/1/2023 | 185 | 185 |
New Hope Cultural Education Facilities Finance Corp., Morningside Ministries Project | ||
Series 2020A, Rev., 2.20%, 1/1/2024 | 180 | 178 |
Series 2020A, Rev., 2.25%, 1/1/2025 | 315 | 301 |
INVESTMENTS | PRINCIPAL AMOUNT ($000) | VALUE ($000) |
Texas — continued | ||
North Harris County Regional Water Authority Rev., 4.00%, 12/15/2024 | 100 | 101 |
North Texas Tollway Authority, First Tier | ||
Series 2016A, Rev., 5.00%, 1/1/2025 | 185 | 186 |
Series A, Rev., 5.00%, 1/1/2025 | 530 | 531 |
Series 2016A, Rev., 5.00%, 1/1/2027 | 455 | 457 |
North Texas Tollway Authority, Second Tier Series 2021B, Rev., 5.00%, 1/1/2025 | 250 | 255 |
Northwest Harris County Municipal Utility District No. 19, Unlimited Tax GO, AGM, 2.00%, 10/1/2023 | 105 | 105 |
Pecan Grove Municipal Utility District, Unlimited Tax | ||
GO, AGM, 3.00%, 9/1/2023 | 345 | 345 |
GO, 4.00%, 9/1/2023 | 740 | 740 |
GO, AGM, 3.00%, 9/1/2024 | 600 | 595 |
Plano Public Facility Corp., K Avenue Lofts Rev., VRDO, 0.65%, 12/1/2024 (c) | 9,500 | 9,500 |
Robstown Independent School District, Unlimited Tax GO, PSF-GTD, 3.00%, 2/15/2024 | 360 | 359 |
State of Texas, Veterans | ||
Series 2011A, GO, VRDO, LIQ : State Street Bank & Trust Co., 4.15%, 9/8/2023 (c) | 10,280 | 10,280 |
GO, VRDO, LIQ : Sumitomo Mitsui Banking Corp., 4.25%, 9/12/2023 (c) | 13,485 | 13,485 |
State of Texas, Veterans Housing Assistance Program Series 2008B, GO, VRDO, LIQ : State Street Bank & Trust Co., 4.15%, 9/8/2023 (c) | 5,060 | 5,060 |
Tarrant County Cultural Education Facilities Finance Corp., Cook Children's Medical Center Series 2014, Rev., 5.00%, 12/1/2026 | 20 | 20 |
Texas Department of Housing & Community Affairs, Fishpond at Corpus Christi Apartments Series 2020, Rev., 4.00%, 12/1/2023 (c) | 850 | 850 |
Travis County Housing Finance Corp., Multi-Family Housing, Enclave on Ross Apartments Rev., 0.23%, 2/1/2024 (c) | 10,000 | 9,825 |
Travis County Municipal Utility District No. 4, Unlimited Contract Tax Series 2019A, GO, AGM, 3.00%, 9/1/2023 | 650 | 650 |
Travis County Water Control and Improvement District No. 17, Texas Steiner Ranch Defined Area Unlimited Tax | ||
GO, 3.00%, 5/1/2024 | 400 | 397 |
GO, 4.00%, 5/1/2025 | 300 | 302 |
116 | J.P. Morgan Municipal Bond Funds | August 31, 2023 |
INVESTMENTS | PRINCIPAL AMOUNT ($000) | VALUE ($000) |
Municipal Bonds — continued | ||
Texas — continued | ||
GO, 4.00%, 5/1/2026 | 280 | 285 |
University of Houston Series 2016A, Rev., 4.00%, 2/15/2027 | 25 | 25 |
Total Texas | 147,629 | |
Utah — 0.0% ^ | ||
Utah Infrastructure Agency, Tax-Exempt Telecommunications | ||
Rev., 3.00%, 10/15/2023 | 60 | 60 |
Rev., 3.00%, 10/15/2025 | 125 | 120 |
Total Utah | 180 | |
Virginia — 3.9% | ||
Chesapeake Bay Bridge and Tunnel District General Resolution Series 2019, Rev., BAN, 5.00%, 11/1/2023 | 19,255 | 19,287 |
County of Fairfax, Public Improvement Series 2021A, GO, 4.00%, 10/1/2023 | 2,740 | 2,741 |
Fairfax County Industrial Development Authority, Virginia Health Care, Inova Health System Project Series 2018C, Rev., VRDO, 4.05%, 9/12/2023 (c) | 30,000 | 30,000 |
Rockingham County Economic Development Authority, Sunnyside Presbyterian Home Series 2020A, Rev., 4.00%, 12/1/2023 | 100 | 100 |
Virginia Resources Authority, Infrastructure Pooled Financing Program Series 2013A, Rev., 5.00%, 11/1/2023 (d) | 25 | 25 |
Wise County Industrial Development Authority, Electric and Power Co. Project Series 2009A, Rev., 0.75%, 9/2/2025 (c) | 22,765 | 20,913 |
Total Virginia | 73,066 | |
Washington — 0.7% | ||
King County Housing Authority, Highland Village Project Rev., 5.00%, 1/1/2024 | 120 | 120 |
Port of Seattle, Intermediate Lien Series A, Rev., 5.00%, 5/1/2027 | 25 | 27 |
State of Washington, Senior 520 Corridor Program, Federal Highway Series 2014C, Rev., 5.00%, 9/1/2024 | 100 | 100 |
State of Washington, Various Purpose Series 2014C, Rev., 5.00%, 9/1/2023 | 75 | 75 |
Washington Health Care Facilities Authority, Catholic Health Initiatives Series B-2, Rev., (SIFMA Municipal Swap Index Yield + 1.40%), 5.46%, 9/7/2023 (b) | 10,000 | 10,003 |
INVESTMENTS | PRINCIPAL AMOUNT ($000) | VALUE ($000) |
Washington — continued | ||
Washington Health Care Facilities Authority, Seattle Cancer Care Alliance Rev., 5.00%, 3/1/2026 | 150 | 152 |
Washington State Housing Finance Commission, Rockwood Retirement Communities Project Series A, Rev., 7.38%, 1/1/2024 (d) (e) | 3,000 | 3,034 |
Total Washington | 13,511 | |
West Virginia — 0.3% | ||
Berkeley County Board of Education GO, 5.00%, 5/1/2025 | 360 | 369 |
West Virginia Commissioner of Highways, Surface Transportation Improvements | ||
Rev., 5.00%, 9/1/2023 | 80 | 80 |
Rev., 5.00%, 9/1/2028 | 215 | 229 |
West Virginia Economic Development Authority, Solid Waste Disposal Facilities, Appalachian Power Co. Amos Project Series 2011A, Rev., AMT, 1.00%, 9/1/2025 (c) | 5,650 | 5,249 |
West Virginia Lottery Excess Lottery Series 2015A, Rev., 5.00%, 7/1/2024 | 50 | 51 |
Total West Virginia | 5,978 | |
Wisconsin — 1.3% | ||
City of Milwaukee, Promissory Notes | ||
Series N2, GO, 4.00%, 3/15/2024 | 1,955 | 1,952 |
Series N4, GO, 5.00%, 4/1/2024 | 3,045 | 3,062 |
Series N2, GO, 4.00%, 3/15/2025 | 100 | 100 |
City of Racine Series 2019B, GO, 5.00%, 12/1/2023 | 125 | 125 |
City of Watertown, Promissory Notes GO, 3.00%, 6/1/2024 | 425 | 423 |
City of Waukesha Series 2019C, GO, 3.00%, 10/1/2023 | 350 | 350 |
County of Manitowoc GO, AGM, 3.00%, 11/1/2023 | 150 | 150 |
County of Manitowoc, Promissory Notes GO, AGM, 4.00%, 4/1/2024 | 680 | 682 |
County of Rusk, Promissory Notes GO, 3.00%, 3/1/2024 | 270 | 269 |
Lakeshore Technical College District Series 2019A, GO, 3.00%, 3/1/2024 | 405 | 404 |
Pewaukee School District Series 2019A, GO, 5.00%, 3/1/2024 | 375 | 378 |
Wisconsin Health and Educational Facilities Authority, Ascension Health Alliance Senior Credit Group Series 2013B-2, Rev., 4.00%, 11/15/2023 | 35 | 35 |
August 31, 2023 | J.P. Morgan Municipal Bond Funds | 117 |
AS OF August 31, 2023 (Unaudited) (continued)
INVESTMENTS | PRINCIPAL AMOUNT ($000) | VALUE ($000) |
Municipal Bonds — continued | ||
Wisconsin — continued | ||
Wisconsin Health and Educational Facilities Authority, Ascension Senior Credit Group Series 2019A, Rev., 5.00%, 11/15/2024 | 25 | 26 |
Wisconsin Health and Educational Facilities Authority, Hmong American Peace Academy | ||
Rev., 4.00%, 3/15/2024 | 120 | 119 |
Rev., 4.00%, 3/15/2025 | 125 | 123 |
Wisconsin Health and Educational Facilities Authority, Hospital Sisters Services, Inc., Obligated Group Series 2014A, Rev., 5.00%, 11/15/2023 | 525 | 526 |
Wisconsin Health and Educational Facilities Authority, St. John's Community, Inc. Projects Series 2018A, Rev., 5.00%, 9/15/2023 (d) | 1,000 | 1,000 |
Wisconsin Housing and Economic Development Authority, Home Ownership Series 2021B, Rev., VRDO, LIQ : FHLB, 4.05%, 9/8/2023 (c) | 15,000 | 15,000 |
Total Wisconsin | 24,724 | |
Total Municipal Bonds (Cost $1,842,059) | 1,819,968 | |
SHARES (000) | ||
Short-Term Investments — 3.6% | ||
Investment Companies — 3.6% | ||
JPMorgan Institutional Tax Free Money Market Fund Class IM Shares, 3.71% (g) (h) (Cost $67,986) | 67,983 | 67,990 |
Total Investments — 99.8% (Cost $1,910,045) | 1,887,958 | |
Other Assets Less Liabilities — 0.2% | 3,384 | |
NET ASSETS — 100.0% | 1,891,342 | |
Percentages indicated are based on net assets. |
Abbreviations | |
AGM | Insured by Assured Guaranty Municipal Corp. |
AMBAC | Insured by American Municipal Bond Assurance Corp. |
AMT | Alternative Minimum Tax |
BAN | Bond Anticipation Note |
COP | Certificate of Participation |
CR | Custodial Receipts |
FHA | Federal Housing Administration |
FHLB | Federal Home Loan Bank |
FHLMC | Federal Home Loan Mortgage Corp. |
FNMA | Federal National Mortgage Association |
GAN | Grant Anticipation Notes |
GNMA | Government National Mortgage Association |
GO | General Obligation |
GTD | Guaranteed |
LIQ | Liquidity Agreement |
LOC | Letter of Credit |
MTA | Metropolitan Transportation Authority |
NATL | Insured by National Public Finance Guarantee Corp. |
PSF-GTD | Permanent School Fund Guaranteed |
Q-SBLF | Qualified School Bond Loan Fund |
RAN | Revenue Anticipation Note |
RE | Reinsured |
Rev. | Revenue |
SIFMA | The Securities Industry and Financial Markets Association |
SOFR | Secured Overnight Financing Rate |
VRDO | Variable Rate Demand Obligation |
^ | Amount rounds to less than 0.1% of net assets. | |
(a) | The date shown represents the earliest of the prerefunded date, next put date or final maturity date. | |
(b) | Variable or floating rate security, linked to the referenced benchmark. The interest rate shown is the current rate as of August 31, 2023. | |
(c) | Variable or floating rate security, the interest rate of which adjusts periodically based on changes in current interest rates and prepayments on the underlying pool of assets. The interest rate shown is the current rate as of August 31, 2023. | |
(d) | Security is prerefunded or escrowed to maturity. | |
(e) | Securities exempt from registration under Rule 144A or section 4(a)(2), of the Securities Act of 1933, as amended. | |
(f) | All or a portion of the security is a when-issued security, delayed delivery security, or forward commitment. | |
(g) | Investment in an affiliated fund, which is registered under the Investment Company Act of 1940, as amended, and is advised by J.P. Morgan Investment Management Inc. | |
(h) | The rate shown is the current yield as of August 31, 2023. | |
118 | J.P. Morgan Municipal Bond Funds | August 31, 2023 |
AS OF August 31, 2023 (Unaudited)
(Amounts in thousands, except per share amounts)
JPMorgan California Tax Free Bond Fund | JPMorgan National Municipal Income Fund | JPMorgan New York Tax Free Bond Fund | |
ASSETS: | |||
Investments in non-affiliates, at value | $280,924 | $3,305,772 | $356,955 |
Investments in affiliates, at value | 12,760 | 52,966 | 20,532 |
Cash | — | 173 | — |
Deposits at broker for futures contracts | — | 1,054 | — |
Deposits at broker for centrally cleared swaps | — | 8,206 | — |
Receivables: | |||
Investment securities sold — delayed delivery securities | — | 695 | 65 |
Fund shares sold | 366 | 4,794 | 104 |
Interest from non-affiliates | 2,839 | 37,784 | 4,574 |
Dividends from affiliates | 37 | 111 | 17 |
Variation margin on futures contracts | — | 98 | — |
Variation margin on centrally cleared swaps | — | 75 | — |
Total Assets | 296,926 | 3,411,728 | 382,247 |
LIABILITIES: | |||
Payables: | |||
Investment securities purchased | 2,516 | — | 4,846 |
Investment securities purchased — delayed delivery securities | 1,436 | — | — |
Fund shares redeemed | 85 | 9,792 | 259 |
Accrued liabilities: | |||
Investment advisory fees | 51 | 698 | 67 |
Administration fees | 7 | 106 | 11 |
Distribution fees | 32 | 82 | 37 |
Service fees | 4 | 81 | 8 |
Custodian and accounting fees | 13 | 101 | 8 |
Trustees’ and Chief Compliance Officer’s fees | 1 | 2 | 1 |
Other | 16 | 87 | 22 |
Total Liabilities | 4,161 | 10,949 | 5,259 |
Net Assets | $292,765 | $3,400,779 | $376,988 |
August 31, 2023 | J.P. Morgan Municipal Bond Funds | 119 |
AS OF August 31, 2023 (Unaudited) (continued)
(Amounts in thousands, except per share amounts)
JPMorgan California Tax Free Bond Fund | JPMorgan National Municipal Income Fund | JPMorgan New York Tax Free Bond Fund | |
NET ASSETS: | |||
Paid-in-Capital | $312,867 | $3,612,585 | $390,256 |
Total distributable earnings (loss) | (20,102 ) | (211,806 ) | (13,268 ) |
Total Net Assets | $292,765 | $3,400,779 | $376,988 |
Net Assets: | |||
Class A | $102,110 | $358,245 | $119,086 |
Class C | 15,223 | 8,629 | 17,442 |
Class I | 49,273 | 576,089 | 92,382 |
Class R6 | 126,159 | 2,457,816 | 148,078 |
Total | $292,765 | $3,400,779 | $376,988 |
Outstanding units of beneficial interest (shares) ($0.0001 par value; unlimited number of shares authorized): | |||
Class A | 10,112 | 35,709 | 18,795 |
Class C | 1,521 | 884 | 2,753 |
Class I | 5,001 | 58,642 | 14,504 |
Class R6 | 12,805 | 250,187 | 23,257 |
Net Asset Value (a): | |||
Class A — Redemption price per share | $10.10 | $10.03 | $6.34 |
Class C — Offering price per share (b) | 10.01 | 9.75 | 6.34 |
Class I — Offering and redemption price per share | 9.85 | 9.82 | 6.37 |
Class R6 — Offering and redemption price per share | 9.85 | 9.82 | 6.37 |
Class A maximum sales charge | 3.75 % | 3.75 % | 3.75 % |
Class A maximum public offering price per share [net asset value per share/(100% – maximum sales charge)] | $10.49 | $10.42 | $6.59 |
Cost of investments in non-affiliates | $284,859 | $3,408,071 | $361,727 |
Cost of investments in affiliates | 12,759 | 52,959 | 20,530 |
Net upfront receipts on centrally cleared swaps | — | (3,584 ) | — |
120 | J.P. Morgan Municipal Bond Funds | August 31, 2023 |
JPMorgan Short- Intermediate Municipal Bond Fund | JPMorgan Tax Free Bond Fund | JPMorgan Ultra-Short Municipal Fund | |
ASSETS: | |||
Investments in non-affiliates, at value | $954,712 | $704,478 | $1,819,968 |
Investments in affiliates, at value | 13,450 | 60,917 | 67,990 |
Cash | — | 69 | — |
Deposits at broker for centrally cleared swaps | — | 1,272 | — |
Receivables: | |||
Investment securities sold | 1,507 | — | — |
Investment securities sold — delayed delivery securities | — | 95 | — |
Fund shares sold | 2,572 | 264 | 11,546 |
Interest from non-affiliates | 10,717 | 7,498 | 13,472 |
Dividends from affiliates | 90 | 143 | 268 |
Variation margin on centrally cleared swaps | — | 10 | — |
Due from adviser | — | — | 9 |
Total Assets | 983,048 | 774,746 | 1,913,253 |
LIABILITIES: | |||
Payables: | |||
Investment securities purchased | — | 4,565 | 1,516 |
Investment securities purchased — delayed delivery securities | 6,115 | 10,147 | 16,975 |
Fund shares redeemed | 979 | 696 | 2,308 |
Accrued liabilities: | |||
Investment advisory fees | 128 | 168 | — |
Administration fees | 9 | 40 | — |
Distribution fees | 21 | 59 | 23 |
Service fees | 39 | 13 | 366 |
Custodian and accounting fees | 21 | 33 | 42 |
Trustees’ and Chief Compliance Officer’s fees | — (a) | 1 | — (a) |
Other | 78 | 45 | 681 |
Total Liabilities | 7,390 | 15,767 | 21,911 |
Net Assets | $975,658 | $758,979 | $1,891,342 |
August 31, 2023 | J.P. Morgan Municipal Bond Funds | 121 |
AS OF August 31, 2023 (Unaudited) (continued)
(Amounts in thousands, except per share amounts)
JPMorgan Short- Intermediate Municipal Bond Fund | JPMorgan Tax Free Bond Fund | JPMorgan Ultra-Short Municipal Fund | |
NET ASSETS: | |||
Paid-in-Capital | $1,048,571 | $836,464 | $1,945,956 |
Total distributable earnings (loss) | (72,913 ) | (77,485 ) | (54,614 ) |
Total Net Assets | $975,658 | $758,979 | $1,891,342 |
Net Assets: | |||
Class A | $91,504 | $246,681 | $129,555 |
Class C | 2,653 | 9,250 | — |
Class I | 441,202 | 217,505 | 1,761,787 |
Class R6 | 440,299 | 285,543 | — |
Total | $975,658 | $758,979 | $1,891,342 |
Outstanding units of beneficial interest (shares) ($0.0001 par value; unlimited number of shares authorized): | |||
Class A | 9,143 | 23,256 | 13,047 |
Class C | 263 | 881 | — |
Class I | 43,827 | 20,604 | 177,603 |
Class R6 | 43,750 | 27,059 | — |
Net Asset Value (a): | |||
Class A — Redemption price per share | $10.01 | $10.61 | $9.93 |
Class C — Offering price per share (b) | 10.11 | 10.51 | — |
Class I — Offering and redemption price per share | 10.07 | 10.56 | 9.92 |
Class R6 — Offering and redemption price per share | 10.06 | 10.55 | — |
Class A maximum sales charge | 2.25 % | 3.75 % | — % |
Class A maximum public offering price per share [net asset value per share/(100% – maximum sales charge)] | $10.24 | $11.02 | $— |
Cost of investments in non-affiliates | $990,337 | $735,017 | $1,842,059 |
Cost of investments in affiliates | 13,449 | 60,914 | 67,986 |
Net upfront receipts on centrally cleared swaps | — | (507 ) | — |
122 | J.P. Morgan Municipal Bond Funds | August 31, 2023 |
FOR THE SIX MONTHS ENDED August 31, 2023 (Unaudited)
(Amounts in thousands)
JPMorgan California Tax Free Bond Fund | JPMorgan National Municipal Income Fund | JPMorgan New York Tax Free Bond Fund | |
INVESTMENT INCOME: | |||
Interest income from non-affiliates | $4,020 | $62,065 | $5,554 |
Interest income from affiliates | — | — (a) | — |
Dividend income from affiliates | 114 | 833 | 132 |
Total investment income | 4,134 | 62,898 | 5,686 |
EXPENSES: | |||
Investment advisory fees | 425 | 5,309 | 553 |
Administration fees | 106 | 1,327 | 139 |
Distribution fees: | |||
Class A | 130 | 449 | 156 |
Class C | 61 | 36 | 70 |
Service fees: | |||
Class A | 130 | 449 | 156 |
Class C | 21 | 12 | 24 |
Class I | 58 | 825 | 118 |
Custodian and accounting fees | 32 | 264 | 29 |
Interest expense to affiliates | — | — (a) | — |
Professional fees | 28 | 37 | 30 |
Trustees’ and Chief Compliance Officer’s fees | 14 | 21 | 14 |
Printing and mailing costs | 16 | 57 | 18 |
Registration and filing fees | 30 | 80 | 29 |
Transfer agency fees (See Note 2.H.) | 3 | 19 | 6 |
Other | 5 | 35 | 5 |
Total expenses | 1,059 | 8,920 | 1,347 |
Less fees waived | (350 ) | (2,640 ) | (429 ) |
Less expense reimbursements | (33 ) | (1 ) | (40 ) |
Net expenses | 676 | 6,279 | 878 |
Net investment income (loss) | 3,458 | 56,619 | 4,808 |
August 31, 2023 | J.P. Morgan Municipal Bond Funds | 123 |
FOR THE SIX MONTHS ENDED August 31, 2023 (Unaudited) (continued)
(Amounts in thousands)
JPMorgan California Tax Free Bond Fund | JPMorgan National Municipal Income Fund | JPMorgan New York Tax Free Bond Fund | |
REALIZED/UNREALIZED GAINS (LOSSES): | |||
Net realized gain (loss) on transactions from: | |||
Investments in non-affiliates | $(1,271 ) | $(27,480 ) | $(809 ) |
Investments in affiliates | — (a) | 11 | (1 ) |
Futures contracts | — | (3,710 ) | — |
Swaps | — | (12,039 ) | — |
Net realized gain (loss) | (1,271 ) | (43,218 ) | (810 ) |
Change in net unrealized appreciation/depreciation on: | |||
Investments in non-affiliates | (8 ) | 1,482 | (801 ) |
Investments in affiliates | 1 | (10 ) | 2 |
Futures contracts | — | 367 | — |
Swaps | — | 7,198 | — |
Change in net unrealized appreciation/depreciation | (7 ) | 9,037 | (799 ) |
Net realized/unrealized gains (losses) | (1,278 ) | (34,181 ) | (1,609 ) |
Change in net assets resulting from operations | $2,180 | $22,438 | $3,199 |
124 | J.P. Morgan Municipal Bond Funds | August 31, 2023 |
JPMorgan Short- Intermediate Municipal Bond Fund | JPMorgan Tax Free Bond Fund | JPMorgan Ultra-Short Municipal Fund | |
INVESTMENT INCOME: | |||
Interest income from non-affiliates | $12,079 | $12,442 | $25,516 |
Interest income from affiliates | 1 | — | 1 |
Dividend income from affiliates | 690 | 575 | 2,232 |
Total investment income | 12,770 | 13,017 | 27,749 |
EXPENSES: | |||
Investment advisory fees | 1,311 | 962 | 1,545 |
Administration fees | 393 | 241 | 772 |
Distribution fees: | |||
Class A | 120 | 321 | 201 |
Class C | 10 | 35 | — |
Service fees: | |||
Class A | 120 | 321 | 201 |
Class C | 3 | 12 | — |
Class I | 576 | 233 | 2,374 |
Custodian and accounting fees | 71 | 82 | 111 |
Interest expense to affiliates | — (a) | — (a) | 4 |
Professional fees | 31 | 37 | 32 |
Trustees’ and Chief Compliance Officer’s fees | 15 | 15 | 17 |
Printing and mailing costs | 23 | 20 | 17 |
Registration and filing fees | 55 | 46 | 27 |
Transfer agency fees (See Note 2.H.) | 6 | 6 | 9 |
Other | 9 | 7 | 18 |
Total expenses | 2,743 | 2,338 | 5,328 |
Less fees waived | (1,356 ) | (639 ) | (2,680 ) |
Less expense reimbursements | (1 ) | (1 ) | (1 ) |
Net expenses | 1,386 | 1,698 | 2,647 |
Net investment income (loss) | 11,384 | 11,319 | 25,102 |
August 31, 2023 | J.P. Morgan Municipal Bond Funds | 125 |
FOR THE SIX MONTHS ENDED August 31, 2023 (Unaudited) (continued)
(Amounts in thousands)
JPMorgan Short- Intermediate Municipal Bond Fund | JPMorgan Tax Free Bond Fund | JPMorgan Ultra-Short Municipal Fund | |
REALIZED/UNREALIZED GAINS (LOSSES): | |||
Net realized gain (loss) on transactions from: | |||
Investments in non-affiliates | $(15,861 ) | $(9,624 ) | $(14,028 ) |
Investments in affiliates | 2 | (2 ) | 13 |
Futures contracts | — | 12 | (2,604 ) |
Swaps | — | (1,700 ) | — |
Net realized gain (loss) | (15,859 ) | (11,314 ) | (16,619 ) |
Change in net unrealized appreciation/depreciation on: | |||
Investments in non-affiliates | 14,853 | 3,223 | 23,392 |
Investments in affiliates | (1 ) | — (a) | (8 ) |
Futures contracts | — | (5 ) | — |
Swaps | — | 1,016 | — |
Change in net unrealized appreciation/depreciation | 14,852 | 4,234 | 23,384 |
Net realized/unrealized gains (losses) | (1,007 ) | (7,080 ) | 6,765 |
Change in net assets resulting from operations | $10,377 | $4,239 | $31,867 |
126 | J.P. Morgan Municipal Bond Funds | August 31, 2023 |
FOR THE PERIODS INDICATED
(Amounts in thousands)
JPMorgan California Tax Free Bond Fund | JPMorgan National Municipal Income Fund | |||
Six Months Ended August 31, 2023 (Unaudited) | Year Ended February 28, 2023 | Six Months Ended August 31, 2023 (Unaudited) | Year Ended February 28, 2023 | |
CHANGE IN NET ASSETS RESULTING FROM OPERATIONS: | ||||
Net investment income (loss) | $3,458 | $6,652 | $56,619 | $112,177 |
Net realized gain (loss) | (1,271 ) | (11,089 ) | (43,218 ) | (66,187 ) |
Distributions of capital gains received from investment company affiliates | — | — (a) | — | 2 |
Change in net unrealized appreciation/depreciation | (7 ) | (8,133 ) | 9,037 | (257,214 ) |
Change in net assets resulting from operations | 2,180 | (12,570 ) | 22,438 | (211,222 ) |
DISTRIBUTIONS TO SHAREHOLDERS: | ||||
Class A | (1,241 ) | (2,292 ) | (5,175 ) | (8,588 ) |
Class C | (154 ) | (284 ) | (114 ) | (263 ) |
Class I | (594 ) | (1,370 ) | (10,359 ) | (19,414 ) |
Class R6 | (1,533 ) | (2,704 ) | (41,324 ) | (86,669 ) |
Total distributions to shareholders | (3,522 ) | (6,650 ) | (56,972 ) | (114,934 ) |
CAPITAL TRANSACTIONS: | ||||
Change in net assets resulting from capital transactions | 14,011 | (87,038 ) | (120,916 ) | (632,503 ) |
NET ASSETS: | ||||
Change in net assets | 12,669 | (106,258 ) | (155,450 ) | (958,659 ) |
Beginning of period | 280,096 | 386,354 | 3,556,229 | 4,514,888 |
End of period | $292,765 | $280,096 | $3,400,779 | $3,556,229 |
August 31, 2023 | J.P. Morgan Municipal Bond Funds | 127 |
FOR THE PERIODS INDICATED (continued)
(Amounts in thousands)
JPMorgan New York Tax Free Bond Fund | JPMorgan Short-Intermediate Municipal Bond Fund | |||
Six Months Ended August 31, 2023 (Unaudited) | Year Ended February 28, 2023 | Six Months Ended August 31, 2023 (Unaudited) | Year Ended February 28, 2023 | |
CHANGE IN NET ASSETS RESULTING FROM OPERATIONS: | ||||
Net investment income (loss) | $4,808 | $7,694 | $11,384 | $22,068 |
Net realized gain (loss) | (810 ) | (4,967 ) | (15,859 ) | (10,763 ) |
Distributions of capital gains received from investment company affiliates | — | 1 | — | 6 |
Change in net unrealized appreciation/depreciation | (799 ) | (14,005 ) | 14,852 | (53,464 ) |
Change in net assets resulting from operations | 3,199 | (11,277 ) | 10,377 | (42,153 ) |
DISTRIBUTIONS TO SHAREHOLDERS: | ||||
Class A | (1,577 ) | (2,647 ) | (843 ) | (1,279 ) |
Class C | (191 ) | (338 ) | (17 ) | (24 ) |
Class I | (1,239 ) | (1,858 ) | (5,040 ) | (10,185 ) |
Class R6 | (1,819 ) | (2,837 ) | (5,468 ) | (10,521 ) |
Total distributions to shareholders | (4,826 ) | (7,680 ) | (11,368 ) | (22,009 ) |
CAPITAL TRANSACTIONS: | ||||
Change in net assets resulting from capital transactions | 17,165 | 6,925 | (102,099 ) | (410,934 ) |
NET ASSETS: | ||||
Change in net assets | 15,538 | (12,032 ) | (103,090 ) | (475,096 ) |
Beginning of period | 361,450 | 373,482 | 1,078,748 | 1,553,844 |
End of period | $376,988 | $361,450 | $975,658 | $1,078,748 |
128 | J.P. Morgan Municipal Bond Funds | August 31, 2023 |
JPMorgan Tax Free Bond Fund | JPMorgan Ultra-Short Municipal Fund | |||
Six Months Ended August 31, 2023 (Unaudited) | Year Ended February 28, 2023 | Six Months Ended August 31, 2023 (Unaudited) | Year Ended February 28, 2023 | |
CHANGE IN NET ASSETS RESULTING FROM OPERATIONS: | ||||
Net investment income (loss) | $11,319 | $17,586 | $25,102 | $32,226 |
Net realized gain (loss) | (11,314 ) | (25,108 ) | (16,619 ) | (7,883 ) |
Distributions of capital gains received from investment company affiliates | — | 1 | — | 8 |
Change in net unrealized appreciation/depreciation | 4,234 | (53,658 ) | 23,384 | (24,980 ) |
Change in net assets resulting from operations | 4,239 | (61,179 ) | 31,867 | (629 ) |
DISTRIBUTIONS TO SHAREHOLDERS: | ||||
Class A | (4,235 ) | (7,865 ) | (1,563 ) | (2,278 ) |
Class C | (129 ) | (230 ) | — | — |
Class I | (3,387 ) | (4,747 ) | (23,280 ) | (29,968 ) |
Class R6 | (3,491 ) | (4,630 ) | — | — |
Total distributions to shareholders | (11,242 ) | (17,472 ) | (24,843 ) | (32,246 ) |
CAPITAL TRANSACTIONS: | ||||
Change in net assets resulting from capital transactions | 217,575 | (42,894 ) | (452,443 ) | (1,687,065 ) |
NET ASSETS: | ||||
Change in net assets | 210,572 | (121,545 ) | (445,419 ) | (1,719,940 ) |
Beginning of period | 548,407 | 669,952 | 2,336,761 | 4,056,701 |
End of period | $758,979 | $548,407 | $1,891,342 | $2,336,761 |
August 31, 2023 | J.P. Morgan Municipal Bond Funds | 129 |
FOR THE PERIODS INDICATED (continued)
(Amounts in thousands)
JPMorgan California Tax Free Bond Fund | JPMorgan National Municipal Income Fund | |||
Six Months Ended August 31, 2023 (Unaudited) | Year Ended February 28, 2023 | Six Months Ended August 31, 2023 (Unaudited) | Year Ended February 28, 2023 | |
CAPITAL TRANSACTIONS: | ||||
Class A | ||||
Proceeds from shares issued | $9,248 | $21,303 | $47,643 | $171,717 |
Distributions reinvested | 1,217 | 2,252 | 5,133 | 8,492 |
Cost of shares redeemed | (11,947 ) | (49,568 ) | (41,240 ) | (146,657 ) |
Change in net assets resulting from Class A capital transactions | (1,482 ) | (26,013 ) | 11,536 | 33,552 |
Class C | ||||
Proceeds from shares issued | 561 | 2,507 | 821 | 6,916 |
Distributions reinvested | 154 | 281 | 114 | 261 |
Cost of shares redeemed | (2,451 ) | (9,030 ) | (2,548 ) | (10,262 ) |
Change in net assets resulting from Class C capital transactions | (1,736 ) | (6,242 ) | (1,613 ) | (3,085 ) |
Class I | ||||
Proceeds from shares issued | 9,535 | 38,656 | 135,661 | 737,481 |
Distributions reinvested | 590 | 1,364 | 10,074 | 18,738 |
Cost of shares redeemed | (8,393 ) | (68,766 ) | (242,361 ) | (682,129 ) |
Change in net assets resulting from Class I capital transactions | 1,732 | (28,746 ) | (96,626 ) | 74,090 |
Class R6 | ||||
Proceeds from shares issued | 32,879 | 68,051 | 208,957 | 632,437 |
Distributions reinvested | 1,528 | 2,700 | 41,167 | 85,904 |
Cost of shares redeemed | (18,910 ) | (96,788 ) | (284,337 ) | (1,455,401 ) |
Change in net assets resulting from Class R6 capital transactions | 15,497 | (26,037 ) | (34,213 ) | (737,060 ) |
Total change in net assets resulting from capital transactions | $14,011 | $(87,038 ) | $(120,916 ) | $(632,503 ) |
SHARE TRANSACTIONS: | ||||
Class A | ||||
Issued | 905 | 2,091 | 4,676 | 16,759 |
Reinvested | 120 | 222 | 505 | 834 |
Redeemed | (1,171 ) | (4,874 ) | (4,044 ) | (14,310 ) |
Change in Class A Shares | (146 ) | (2,561 ) | 1,137 | 3,283 |
Class C | ||||
Issued | 56 | 249 | 83 | 698 |
Reinvested | 15 | 28 | 12 | 26 |
Redeemed | (242 ) | (893 ) | (258 ) | (1,035 ) |
Change in Class C Shares | (171 ) | (616 ) | (163 ) | (311 ) |
130 | J.P. Morgan Municipal Bond Funds | August 31, 2023 |
JPMorgan California Tax Free Bond Fund | JPMorgan National Municipal Income Fund | |||
Six Months Ended August 31, 2023 (Unaudited) | Year Ended February 28, 2023 | Six Months Ended August 31, 2023 (Unaudited) | Year Ended February 28, 2023 | |
SHARE TRANSACTIONS: (continued) | ||||
Class I | ||||
Issued | 962 | 3,892 | 13,597 | 73,343 |
Reinvested | 59 | 138 | 1,012 | 1,876 |
Redeemed | (836 ) | (6,937 ) | (24,359 ) | (68,094 ) |
Change in Class I Shares | 185 | (2,907 ) | (9,750 ) | 7,125 |
Class R6 | ||||
Issued | 3,304 | 6,864 | 20,989 | 62,866 |
Reinvested | 154 | 273 | 4,139 | 8,601 |
Redeemed | (1,895 ) | (9,739 ) | (28,486 ) | (145,612 ) |
Change in Class R6 Shares | 1,563 | (2,602 ) | (3,358 ) | (74,145 ) |
August 31, 2023 | J.P. Morgan Municipal Bond Funds | 131 |
FOR THE PERIODS INDICATED (continued)
(Amounts in thousands)
JPMorgan New York Tax Free Bond Fund | JPMorgan Short-Intermediate Municipal Bond Fund | |||
Six Months Ended August 31, 2023 (Unaudited) | Year Ended February 28, 2023 | Six Months Ended August 31, 2023 (Unaudited) | Year Ended February 28, 2023 | |
CAPITAL TRANSACTIONS: | ||||
Class A | ||||
Proceeds from shares issued | $5,814 | $22,952 | $13,049 | $58,420 |
Distributions reinvested | 1,546 | 2,592 | 836 | 1,267 |
Cost of shares redeemed | (10,996 ) | (39,012 ) | (17,915 ) | (54,204 ) |
Change in net assets resulting from Class A capital transactions | (3,636 ) | (13,468 ) | (4,030 ) | 5,483 |
Class C | ||||
Proceeds from shares issued | 598 | 1,605 | 146 | 736 |
Distributions reinvested | 190 | 335 | 17 | 23 |
Cost of shares redeemed | (2,647 ) | (6,102 ) | (96 ) | (1,510 ) |
Change in net assets resulting from Class C capital transactions | (1,859 ) | (4,162 ) | 67 | (751 ) |
Class I | ||||
Proceeds from shares issued | 14,889 | 68,065 | 90,382 | 393,609 |
Distributions reinvested | 1,225 | 1,831 | 5,018 | 10,130 |
Cost of shares redeemed | (13,083 ) | (53,136 ) | (125,893 ) | (721,531 ) |
Change in net assets resulting from Class I capital transactions | 3,031 | 16,760 | (30,493 ) | (317,792 ) |
Class R6 | ||||
Proceeds from shares issued | 34,118 | 52,101 | 38,840 | 376,224 |
Distributions reinvested | 1,817 | 2,834 | 5,386 | 10,335 |
Cost of shares redeemed | (16,306 ) | (47,140 ) | (111,869 ) | (484,433 ) |
Change in net assets resulting from Class R6 capital transactions | 19,629 | 7,795 | (67,643 ) | (97,874 ) |
Total change in net assets resulting from capital transactions | $17,165 | $6,925 | $(102,099 ) | $(410,934 ) |
SHARE TRANSACTIONS: | ||||
Class A | ||||
Issued | 906 | 3,613 | 1,293 | 5,811 |
Reinvested | 241 | 406 | 83 | 126 |
Redeemed | (1,715 ) | (6,102 ) | (1,777 ) | (5,378 ) |
Change in Class A Shares | (568 ) | (2,083 ) | (401 ) | 559 |
Class C | ||||
Issued | 93 | 252 | 14 | 73 |
Reinvested | 30 | 52 | 2 | 2 |
Redeemed | (412 ) | (953 ) | (9 ) | (148 ) |
Change in Class C Shares | (289 ) | (649 ) | 7 | (73 ) |
Class I | ||||
Issued | 2,306 | 10,637 | 8,904 | 38,844 |
Reinvested | 190 | 286 | 495 | 1,003 |
Redeemed | (2,032 ) | (8,267 ) | (12,406 ) | (71,310 ) |
Change in Class I Shares | 464 | 2,656 | (3,007 ) | (31,463 ) |
132 | J.P. Morgan Municipal Bond Funds | August 31, 2023 |
JPMorgan New York Tax Free Bond Fund | JPMorgan Short-Intermediate Municipal Bond Fund | |||
Six Months Ended August 31, 2023 (Unaudited) | Year Ended February 28, 2023 | Six Months Ended August 31, 2023 (Unaudited) | Year Ended February 28, 2023 | |
SHARE TRANSACTIONS: (continued) | ||||
Class R6 | ||||
Issued | 5,332 | 8,102 | 3,823 | 37,238 |
Reinvested | 283 | 442 | 532 | 1,023 |
Redeemed | (2,528 ) | (7,347 ) | (11,057 ) | (47,984 ) |
Change in Class R6 Shares | 3,087 | 1,197 | (6,702 ) | (9,723 ) |
August 31, 2023 | J.P. Morgan Municipal Bond Funds | 133 |
FOR THE PERIODS INDICATED (continued)
(Amounts in thousands)
JPMorgan Tax Free Bond Fund | JPMorgan Ultra-Short Municipal Fund | |||
Six Months Ended August 31, 2023 (Unaudited) | Year Ended February 28, 2023 | Six Months Ended August 31, 2023 (Unaudited) | Year Ended February 28, 2023 | |
CAPITAL TRANSACTIONS: | ||||
Class A | ||||
Proceeds from shares issued | $35,367 | $74,500 | $89,811 | $254,635 |
Distributions reinvested | 4,171 | 7,735 | 1,563 | 2,278 |
Cost of shares redeemed | (45,283 ) | (120,540 ) | (225,934 ) | (64,685 ) |
Change in net assets resulting from Class A capital transactions | (5,745 ) | (38,305 ) | (134,560 ) | 192,228 |
Class C | ||||
Proceeds from shares issued | 2,643 | 1,482 | — | — |
Distributions reinvested | 128 | 228 | — | — |
Cost of shares redeemed | (1,978 ) | (4,258 ) | — | — |
Change in net assets resulting from Class C capital transactions | 793 | (2,548 ) | — | — |
Class I | ||||
Proceeds from shares issued | 112,340 | 87,677 | 196,484 | 1,054,856 |
Distributions reinvested | 3,087 | 4,069 | 23,231 | 29,905 |
Cost of shares redeemed | (23,047 ) | (114,867 ) | (537,598 ) | (2,964,054 ) |
Change in net assets resulting from Class I capital transactions | 92,380 | (23,121 ) | (317,883 ) | (1,879,293 ) |
Class R6 | ||||
Proceeds from shares issued | 143,145 | 70,910 | — | — |
Distributions reinvested | 3,490 | 4,626 | — | — |
Cost of shares redeemed | (16,488 ) | (54,456 ) | — | — |
Change in net assets resulting from Class R6 capital transactions | 130,147 | 21,080 | — | — |
Total change in net assets resulting from capital transactions | $217,575 | $(42,894 ) | $(452,443 ) | $(1,687,065 ) |
SHARE TRANSACTIONS: | ||||
Class A | ||||
Issued | 3,264 | 6,784 | 9,044 | 25,616 |
Reinvested | 386 | 712 | 157 | 230 |
Redeemed | (4,186 ) | (10,919 ) | (22,737 ) | (6,525 ) |
Change in Class A Shares | (536 ) | (3,423 ) | (13,536 ) | 19,321 |
Class C | ||||
Issued | 248 | 137 | — | — |
Reinvested | 12 | 21 | — | — |
Redeemed | (185 ) | (393 ) | — | — |
Change in Class C Shares | 75 | (235 ) | — | — |
Class I | ||||
Issued | 10,427 | 8,020 | 19,789 | 106,500 |
Reinvested | 288 | 376 | 2,343 | 3,025 |
Redeemed | (2,152 ) | (10,661 ) | (54,150 ) | (299,231 ) |
Change in Class I Shares | 8,563 | (2,265 ) | (32,018 ) | (189,706 ) |
134 | J.P. Morgan Municipal Bond Funds | August 31, 2023 |
JPMorgan Tax Free Bond Fund | JPMorgan Ultra-Short Municipal Fund | |||
Six Months Ended August 31, 2023 (Unaudited) | Year Ended February 28, 2023 | Six Months Ended August 31, 2023 (Unaudited) | Year Ended February 28, 2023 | |
SHARE TRANSACTIONS: (continued) | ||||
Class R6 | ||||
Issued | 13,495 | 6,619 | — | — |
Reinvested | 326 | 429 | — | — |
Redeemed | (1,532 ) | (4,995 ) | — | — |
Change in Class R6 Shares | 12,289 | 2,053 | — | — |
August 31, 2023 | J.P. Morgan Municipal Bond Funds | 135 |
FOR THE PERIODS INDICATED
Per share operating performance | ||||||
Investment operations | Distributions | |||||
Net asset value, beginning of period | Net investment income (loss)(b) | Net realized and unrealized gains (losses) on investments | Total from investment operations | Net investment income | Net asset value, end of period | |
JPMorgan California Tax Free Bond Fund | ||||||
Class A | ||||||
Six Months Ended August 31, 2023 (Unaudited) | $10.15 | $0.12 | $(0.05 ) | $0.07 | $(0.12 ) | $10.10 |
Year Ended February 28, 2023 | 10.68 | 0.20 | (0.53 ) | (0.33 ) | (0.20 ) | 10.15 |
Year Ended February 28, 2022 | 11.06 | 0.16 | (0.38 ) | (0.22 ) | (0.16 ) | 10.68 |
Year Ended February 28, 2021 | 11.25 | 0.17 | (0.19 ) | (0.02 ) | (0.17 ) | 11.06 |
Year Ended February 29, 2020 | 10.71 | 0.23 | 0.54 | 0.77 | (0.23 ) | 11.25 |
Year Ended February 28, 2019 | 10.64 | 0.28 | 0.07 | 0.35 | (0.28 ) | 10.71 |
Class C | ||||||
Six Months Ended August 31, 2023 (Unaudited) | 10.06 | 0.10 | (0.05 ) | 0.05 | (0.10 ) | 10.01 |
Year Ended February 28, 2023 | 10.59 | 0.15 | (0.53 ) | (0.38 ) | (0.15 ) | 10.06 |
Year Ended February 28, 2022 | 10.96 | 0.10 | (0.37 ) | (0.27 ) | (0.10 ) | 10.59 |
Year Ended February 28, 2021 | 11.15 | 0.12 | (0.20 ) | (0.08 ) | (0.11 ) | 10.96 |
Year Ended February 29, 2020 | 10.62 | 0.18 | 0.53 | 0.71 | (0.18 ) | 11.15 |
Year Ended February 28, 2019 | 10.55 | 0.22 | 0.07 | 0.29 | (0.22 ) | 10.62 |
Class I | ||||||
Six Months Ended August 31, 2023 (Unaudited) | 9.90 | 0.12 | (0.04 ) | 0.08 | (0.13 ) | 9.85 |
Year Ended February 28, 2023 | 10.43 | 0.21 | (0.53 ) | (0.32 ) | (0.21 ) | 9.90 |
Year Ended February 28, 2022 | 10.80 | 0.17 | (0.37 ) | (0.20 ) | (0.17 ) | 10.43 |
Year Ended February 28, 2021 | 10.99 | 0.18 | (0.19 ) | (0.01 ) | (0.18 ) | 10.80 |
Year Ended February 29, 2020 | 10.47 | 0.24 | 0.52 | 0.76 | (0.24 ) | 10.99 |
Year Ended February 28, 2019 | 10.41 | 0.28 | 0.07 | 0.35 | (0.29 ) | 10.47 |
Class R6 | ||||||
Six Months Ended August 31, 2023 (Unaudited) | 9.90 | 0.13 | (0.05 ) | 0.08 | (0.13 ) | 9.85 |
Year Ended February 28, 2023 | 10.43 | 0.22 | (0.53 ) | (0.31 ) | (0.22 ) | 9.90 |
Year Ended February 28, 2022 | 10.80 | 0.18 | (0.37 ) | (0.19 ) | (0.18 ) | 10.43 |
Year Ended February 28, 2021 | 10.99 | 0.19 | (0.19 ) | — (f) | (0.19 ) | 10.80 |
Year Ended February 29, 2020 | 10.47 | 0.25 | 0.52 | 0.77 | (0.25 ) | 10.99 |
October 1, 2018 (g) through February 28, 2019 | 10.33 | 0.13 | 0.13 | 0.26 | (0.12 ) | 10.47 |
(a) | Annualized for periods less than one year, unless otherwise noted. |
(b) | Calculated based upon average shares outstanding. |
(c) | Not annualized for periods less than one year. |
(d) | Includes adjustments in accordance with accounting principles generally accepted in the United States of America and as such, the net asset values for financial reporting purposes and the returns based upon those net asset values may differ from the net asset values and returns for shareholder transactions. |
(e) | Includes interest expense, if applicable, each of which is less than 0.005% unless otherwise noted. |
(f) | Amount rounds to less than $0.005. |
(g) | Commencement of offering of class of shares. |
136 | J.P. Morgan Municipal Bond Funds | August 31, 2023 |
Ratios/Supplemental data | |||||
Ratios to average net assets(a) | |||||
Total return (excludes sales charge)(c)(d) | Net assets, end of period (000's) | Net expenses(e) | Net investment income (loss) | Expenses without waivers and reimbursements | Portfolio turnover rate(c) |
0.71 % | $102,110 | 0.55 % | 2.38 % | 0.97 % | 10 % |
(3.04 ) | 104,073 | 0.58 | 2.00 | 0.96 | 25 |
(2.05 ) | 136,939 | 0.60 | 1.43 | 0.94 | 11 |
(0.19 ) | 154,108 | 0.59 | 1.54 | 0.93 | 6 |
7.29 | 126,253 | 0.60 | 2.13 | 0.96 | 8 |
3.31 | 67,275 | 0.60 | 2.63 | 0.97 | 17 |
0.46 | 15,223 | 1.05 | 1.88 | 1.47 | 10 |
(3.56 ) | 17,015 | 1.08 | 1.49 | 1.46 | 25 |
(2.47 ) | 24,442 | 1.10 | 0.93 | 1.43 | 11 |
(0.70 ) | 33,234 | 1.09 | 1.07 | 1.43 | 6 |
6.72 | 52,168 | 1.10 | 1.66 | 1.47 | 8 |
2.82 | 46,950 | 1.10 | 2.13 | 1.48 | 17 |
0.78 | 49,273 | 0.45 | 2.48 | 0.72 | 10 |
(3.01 ) | 47,695 | 0.49 | 2.06 | 0.70 | 25 |
(1.90 ) | 80,566 | 0.50 | 1.53 | 0.68 | 11 |
(0.09 ) | 100,163 | 0.49 | 1.62 | 0.68 | 6 |
7.37 | 60,122 | 0.50 | 2.26 | 0.71 | 8 |
3.39 | 62,069 | 0.50 | 2.72 | 0.72 | 17 |
0.83 | 126,159 | 0.35 | 2.58 | 0.47 | 10 |
(2.92 ) | 111,313 | 0.38 | 2.19 | 0.45 | 25 |
(1.80 ) | 144,407 | 0.40 | 1.63 | 0.43 | 11 |
0.01 | 137,357 | 0.39 | 1.74 | 0.43 | 6 |
7.48 | 127,070 | 0.40 | 2.35 | 0.46 | 8 |
2.58 | 80,424 | 0.35 | 2.95 | 0.48 | 17 |
August 31, 2023 | J.P. Morgan Municipal Bond Funds | 137 |
FOR THE PERIODS INDICATED
Per share operating performance | |||||||
Investment operations | Distributions | ||||||
Net asset value, beginning of period | Net investment income (loss)(b) | Net realized and unrealized gains (losses) on investments | Total from investment operations | Net investment income | Net realized gain | Total distributions | |
JPMorgan National Municipal Income Fund | |||||||
Class A | |||||||
Six Months Ended August 31, 2023 (Unaudited) | $10.13 | $0.15 | $(0.10 ) | $0.05 | $(0.15 ) | $— | $(0.15 ) |
Year Ended February 28, 2023 | 10.91 | 0.27 | (0.78 ) | (0.51 ) | (0.26 ) | (0.01 ) | (0.27 ) |
Year Ended February 28, 2022 | 11.37 | 0.23 | (0.37 ) | (0.14 ) | (0.23 ) | (0.09 ) | (0.32 ) |
Year Ended February 28, 2021 | 11.52 | 0.22 | (0.16 ) | 0.06 | (0.21 ) | — | (0.21 ) |
Year Ended February 29, 2020 | 10.91 | 0.24 | 0.61 | 0.85 | (0.24 ) | — | (0.24 ) |
Year Ended February 28, 2019 | 10.80 | 0.25 | 0.11 | 0.36 | (0.25 ) | — | (0.25 ) |
Class C | |||||||
Six Months Ended August 31, 2023 (Unaudited) | 9.86 | 0.12 | (0.11 ) | 0.01 | (0.12 ) | — | (0.12 ) |
Year Ended February 28, 2023 | 10.62 | 0.20 | (0.75 ) | (0.55 ) | (0.20 ) | (0.01 ) | (0.21 ) |
Year Ended February 28, 2022 | 11.07 | 0.17 | (0.36 ) | (0.19 ) | (0.17 ) | (0.09 ) | (0.26 ) |
Year Ended February 28, 2021 | 11.23 | 0.15 | (0.16 ) | (0.01 ) | (0.15 ) | — | (0.15 ) |
Year Ended February 29, 2020 | 10.63 | 0.18 | 0.60 | 0.78 | (0.18 ) | — | (0.18 ) |
Year Ended February 28, 2019 | 10.53 | 0.18 | 0.11 | 0.29 | (0.19 ) | — | (0.19 ) |
Class I | |||||||
Six Months Ended August 31, 2023 (Unaudited) | 9.93 | 0.16 | (0.11 ) | 0.05 | (0.16 ) | — | (0.16 ) |
Year Ended February 28, 2023 | 10.69 | 0.29 | (0.75 ) | (0.46 ) | (0.29 ) | (0.01 ) | (0.30 ) |
Year Ended February 28, 2022 | 11.15 | 0.26 | (0.37 ) | (0.11 ) | (0.26 ) | (0.09 ) | (0.35 ) |
Year Ended February 28, 2021 | 11.31 | 0.24 | (0.16 ) | 0.08 | (0.24 ) | — | (0.24 ) |
Year Ended February 29, 2020 | 10.71 | 0.27 | 0.60 | 0.87 | (0.27 ) | — | (0.27 ) |
Year Ended February 28, 2019 | 10.61 | 0.27 | 0.10 | 0.37 | (0.27 ) | — | (0.27 ) |
Class R6 | |||||||
Six Months Ended August 31, 2023 (Unaudited) | 9.93 | 0.16 | (0.10 ) | 0.06 | (0.17 ) | — | (0.17 ) |
Year Ended February 28, 2023 | 10.69 | 0.29 | (0.74 ) | (0.45 ) | (0.30 ) | (0.01 ) | (0.31 ) |
Year Ended February 28, 2022 | 11.15 | 0.27 | (0.37 ) | (0.10 ) | (0.27 ) | (0.09 ) | (0.36 ) |
Year Ended February 28, 2021 | 11.31 | 0.25 | (0.16 ) | 0.09 | (0.25 ) | — | (0.25 ) |
Year Ended February 29, 2020 | 10.71 | 0.28 | 0.60 | 0.88 | (0.28 ) | — | (0.28 ) |
Year Ended February 28, 2019 | 10.60 | 0.28 | 0.11 | 0.39 | (0.28 ) | — | (0.28 ) |
(a) | Annualized for periods less than one year, unless otherwise noted. |
(b) | Calculated based upon average shares outstanding. |
(c) | Not annualized for periods less than one year. |
(d) | Includes adjustments in accordance with accounting principles generally accepted in the United States of America and as such, the net asset values for financial reporting purposes and the returns based upon those net asset values may differ from the net asset values and returns for shareholder transactions. |
(e) | Includes interest expense, if applicable, each of which is less than 0.005% unless otherwise noted. |
138 | J.P. Morgan Municipal Bond Funds | August 31, 2023 |
Ratios/Supplemental data | ||||||
Ratios to average net assets(a) | ||||||
Net asset value, end of period | Total return (excludes sales charge)(c)(d) | Net assets, end of period (000's) | Net expenses(e) | Net investment income (loss) | Expenses without waivers and reimbursements | Portfolio turnover rate(c) |
$10.03 | 0.46 % | $358,245 | 0.65 % | 2.91 % | 0.91 % | 9 % |
10.13 | (4.66 ) | 350,327 | 0.65 | 2.60 | 0.91 | 36 |
10.91 | (1.29 ) | 341,321 | 0.65 | 2.06 | 0.90 | 12 |
11.37 | 0.57 | 308,709 | 0.64 | 1.93 | 0.90 | 34 |
11.52 | 7.86 | 250,087 | 0.65 | 2.17 | 0.90 | 20 |
10.91 | 3.34 | 222,295 | 0.64 | 2.32 | 0.90 | 48 |
9.75 | 0.10 | 8,629 | 1.20 | 2.36 | 1.41 | 9 |
9.86 | (5.12 ) | 10,327 | 1.20 | 2.03 | 1.41 | 36 |
10.62 | (1.77 ) | 14,423 | 1.20 | 1.51 | 1.40 | 12 |
11.07 | (0.07 ) | 19,061 | 1.19 | 1.38 | 1.40 | 34 |
11.23 | 7.38 | 29,173 | 1.20 | 1.63 | 1.40 | 20 |
10.63 | 2.76 | 37,603 | 1.19 | 1.76 | 1.40 | 48 |
9.82 | 0.50 | 576,089 | 0.40 | 3.17 | 0.66 | 9 |
9.93 | (4.32 ) | 678,857 | 0.40 | 2.84 | 0.66 | 36 |
10.69 | (1.06 ) | 655,190 | 0.40 | 2.31 | 0.65 | 12 |
11.15 | 0.75 | 622,009 | 0.39 | 2.17 | 0.65 | 34 |
11.31 | 8.19 | 660,041 | 0.40 | 2.42 | 0.64 | 20 |
10.71 | 3.57 | 523,544 | 0.39 | 2.57 | 0.65 | 48 |
9.82 | 0.55 | 2,457,816 | 0.30 | 3.26 | 0.40 | 9 |
9.93 | (4.23 ) | 2,516,718 | 0.30 | 2.92 | 0.41 | 36 |
10.69 | (0.96 ) | 3,503,954 | 0.30 | 2.41 | 0.40 | 12 |
11.15 | 0.85 | 3,681,554 | 0.29 | 2.27 | 0.40 | 34 |
11.31 | 8.30 | 4,329,545 | 0.30 | 2.52 | 0.39 | 20 |
10.71 | 3.77 | 3,911,573 | 0.29 | 2.66 | 0.40 | 48 |
August 31, 2023 | J.P. Morgan Municipal Bond Funds | 139 |
FOR THE PERIODS INDICATED
Per share operating performance | ||||||
Investment operations | Distributions | |||||
Net asset value, beginning of period | Net investment income (loss)(b) | Net realized and unrealized gains (losses) on investments | Total from investment operations | Net investment income | Net asset value, end of period | |
JPMorgan New York Tax Free Bond Fund | ||||||
Class A | ||||||
Six Months Ended August 31, 2023 (Unaudited) | $6.37 | $0.08 | $(0.03 ) | $0.05 | $(0.08 ) | $6.34 |
Year Ended February 28, 2023 | 6.71 | 0.13 | (0.34 ) | (0.21 ) | (0.13 ) | 6.37 |
Year Ended February 28, 2022 | 6.93 | 0.11 | (0.21 ) | (0.10 ) | (0.12 ) | 6.71 |
Year Ended February 28, 2021 | 7.06 | 0.12 | (0.13 ) | (0.01 ) | (0.12 ) | 6.93 |
Year Ended February 29, 2020 | 6.71 | 0.14 | 0.35 | 0.49 | (0.14 ) | 7.06 |
Year Ended February 28, 2019 | 6.70 | 0.18 | 0.01 | 0.19 | (0.18 ) | 6.71 |
Class C | ||||||
Six Months Ended August 31, 2023 (Unaudited) | 6.37 | 0.07 | (0.03 ) | 0.04 | (0.07 ) | 6.34 |
Year Ended February 28, 2023 | 6.71 | 0.10 | (0.34 ) | (0.24 ) | (0.10 ) | 6.37 |
Year Ended February 28, 2022 | 6.93 | 0.08 | (0.22 ) | (0.14 ) | (0.08 ) | 6.71 |
Year Ended February 28, 2021 | 7.05 | 0.09 | (0.13 ) | (0.04 ) | (0.08 ) | 6.93 |
Year Ended February 29, 2020 | 6.71 | 0.10 | 0.34 | 0.44 | (0.10 ) | 7.05 |
Year Ended February 28, 2019 | 6.69 | 0.14 | 0.02 | 0.16 | (0.14 ) | 6.71 |
Class I | ||||||
Six Months Ended August 31, 2023 (Unaudited) | 6.40 | 0.09 | (0.03 ) | 0.06 | (0.09 ) | 6.37 |
Year Ended February 28, 2023 | 6.75 | 0.15 | (0.35 ) | (0.20 ) | (0.15 ) | 6.40 |
Year Ended February 28, 2022 | 6.96 | 0.13 | (0.21 ) | (0.08 ) | (0.13 ) | 6.75 |
Year Ended February 28, 2021 | 7.09 | 0.14 | (0.13 ) | 0.01 | (0.14 ) | 6.96 |
Year Ended February 29, 2020 | 6.75 | 0.15 | 0.34 | 0.49 | (0.15 ) | 7.09 |
Year Ended February 28, 2019 | 6.73 | 0.20 | 0.01 | 0.21 | (0.19 ) | 6.75 |
Class R6 | ||||||
Six Months Ended August 31, 2023 (Unaudited) | 6.40 | 0.09 | (0.03 ) | 0.06 | (0.09 ) | 6.37 |
Year Ended February 28, 2023 | 6.74 | 0.16 | (0.35 ) | (0.19 ) | (0.15 ) | 6.40 |
Year Ended February 28, 2022 | 6.96 | 0.14 | (0.22 ) | (0.08 ) | (0.14 ) | 6.74 |
Year Ended February 28, 2021 | 7.09 | 0.15 | (0.14 ) | 0.01 | (0.14 ) | 6.96 |
Year Ended February 29, 2020 | 6.75 | 0.16 | 0.34 | 0.50 | (0.16 ) | 7.09 |
October 1, 2018 (f) through February 28, 2019 | 6.64 | 0.08 | 0.11 | 0.19 | (0.08 ) | 6.75 |
(a) | Annualized for periods less than one year, unless otherwise noted. |
(b) | Calculated based upon average shares outstanding. |
(c) | Not annualized for periods less than one year. |
(d) | Includes adjustments in accordance with accounting principles generally accepted in the United States of America and as such, the net asset values for financial reporting purposes and the returns based upon those net asset values may differ from the net asset values and returns for shareholder transactions. |
(e) | Includes interest expense, if applicable, each of which is less than 0.005% unless otherwise noted. |
(f) | Commencement of offering of class of shares. |
140 | J.P. Morgan Municipal Bond Funds | August 31, 2023 |
Ratios/Supplemental data | |||||
Ratios to average net assets(a) | |||||
Total return(c)(d) | Net assets, end of period (000's) | Net expenses(e) | Net investment income (loss) | Expenses without waivers and reimbursements | Portfolio turnover rate(c) |
0.81 % | $119,086 | 0.55 % | 2.54 % | 0.95 % | 6 % |
(3.04 ) | 123,246 | 0.68 | 2.10 | 0.95 | 30 |
(1.55 ) | 143,940 | 0.75 | 1.60 | 0.94 | 10 |
(0.13 ) | 166,435 | 0.74 | 1.77 | 0.93 | 5 |
7.31 | 164,358 | 0.75 | 1.96 | 0.95 | 13 |
2.86 | 120,371 | 0.75 | 2.66 | 0.96 | 21 |
0.56 | 17,442 | 1.05 | 2.04 | 1.45 | 6 |
(3.53 ) | 19,364 | 1.19 | 1.59 | 1.45 | 30 |
(2.05 ) | 24,776 | 1.25 | 1.10 | 1.44 | 10 |
(0.51 ) | 31,173 | 1.24 | 1.26 | 1.43 | 5 |
6.62 | 57,781 | 1.25 | 1.49 | 1.45 | 13 |
2.50 | 67,242 | 1.25 | 2.16 | 1.45 | 21 |
0.86 | 92,382 | 0.45 | 2.65 | 0.70 | 6 |
(2.97 ) | 89,832 | 0.48 | 2.33 | 0.70 | 30 |
(1.16 ) | 76,802 | 0.50 | 1.85 | 0.69 | 10 |
0.12 | 87,928 | 0.49 | 2.02 | 0.68 | 5 |
7.38 | 105,497 | 0.50 | 2.22 | 0.70 | 13 |
3.26 | 87,158 | 0.50 | 2.92 | 0.70 | 21 |
0.91 | 148,078 | 0.35 | 2.74 | 0.45 | 6 |
(2.73 ) | 129,008 | 0.38 | 2.41 | 0.44 | 30 |
(1.20 ) | 127,964 | 0.40 | 1.95 | 0.43 | 10 |
0.22 | 122,625 | 0.39 | 2.11 | 0.43 | 5 |
7.49 | 119,722 | 0.40 | 2.32 | 0.44 | 13 |
2.89 | 91,813 | 0.40 | 2.93 | 0.45 | 21 |
August 31, 2023 | J.P. Morgan Municipal Bond Funds | 141 |
FOR THE PERIODS INDICATED
Per share operating performance | ||||||
Investment operations | Distributions | |||||
Net asset value, beginning of period | Net investment income (loss)(b) | Net realized and unrealized gains (losses) on investments | Total from investment operations | Net investment income | Net asset value, end of period | |
JPMorgan Short-Intermediate Municipal Bond Fund | ||||||
Class A | ||||||
Six Months Ended August 31, 2023 (Unaudited) | $10.02 | $0.09 | $(0.01 ) | $0.08 | $(0.09 ) | $10.01 |
Year Ended February 28, 2023 | 10.46 | 0.14 | (0.44 ) | (0.30 ) | (0.14 ) | 10.02 |
Year Ended February 28, 2022 | 10.78 | 0.11 | (0.32 ) | (0.21 ) | (0.11 ) | 10.46 |
Year Ended February 28, 2021 | 10.86 | 0.13 | (0.08 ) | 0.05 | (0.13 ) | 10.78 |
Year Ended February 29, 2020 | 10.49 | 0.16 | 0.37 | 0.53 | (0.16 ) | 10.86 |
Year Ended February 28, 2019 | 10.39 | 0.16 | 0.10 | 0.26 | (0.16 ) | 10.49 |
Class C | ||||||
Six Months Ended August 31, 2023 (Unaudited) | 10.12 | 0.06 | (0.01 ) | 0.05 | (0.06 ) | 10.11 |
Year Ended February 28, 2023 | 10.56 | 0.09 | (0.44 ) | (0.35 ) | (0.09 ) | 10.12 |
Year Ended February 28, 2022 | 10.88 | 0.06 | (0.32 ) | (0.26 ) | (0.06 ) | 10.56 |
Year Ended February 28, 2021 | 10.96 | 0.08 | (0.09 ) | (0.01 ) | (0.07 ) | 10.88 |
Year Ended February 29, 2020 | 10.59 | 0.11 | 0.37 | 0.48 | (0.11 ) | 10.96 |
Year Ended February 28, 2019 | 10.48 | 0.11 | 0.11 | 0.22 | (0.11 ) | 10.59 |
Class I | ||||||
Six Months Ended August 31, 2023 (Unaudited) | 10.08 | 0.11 | (0.01 ) | 0.10 | (0.11 ) | 10.07 |
Year Ended February 28, 2023 | 10.52 | 0.18 | (0.43 ) | (0.25 ) | (0.19 ) | 10.08 |
Year Ended February 28, 2022 | 10.84 | 0.16 | (0.32 ) | (0.16 ) | (0.16 ) | 10.52 |
Year Ended February 28, 2021 | 10.92 | 0.18 | (0.09 ) | 0.09 | (0.17 ) | 10.84 |
Year Ended February 29, 2020 | 10.55 | 0.21 | 0.37 | 0.58 | (0.21 ) | 10.92 |
Year Ended February 28, 2019 | 10.44 | 0.21 | 0.11 | 0.32 | (0.21 ) | 10.55 |
Class R6 | ||||||
Six Months Ended August 31, 2023 (Unaudited) | 10.08 | 0.11 | (0.01 ) | 0.10 | (0.12 ) | 10.06 |
Year Ended February 28, 2023 | 10.52 | 0.19 | (0.44 ) | (0.25 ) | (0.19 ) | 10.08 |
Year Ended February 28, 2022 | 10.83 | 0.16 | (0.31 ) | (0.15 ) | (0.16 ) | 10.52 |
Year Ended February 28, 2021 | 10.91 | 0.19 | (0.09 ) | 0.10 | (0.18 ) | 10.83 |
Year Ended February 29, 2020 | 10.54 | 0.21 | 0.38 | 0.59 | (0.22 ) | 10.91 |
October 1, 2018 (f) through February 28, 2019 | 10.39 | 0.09 | 0.15 | 0.24 | (0.09 ) | 10.54 |
(a) | Annualized for periods less than one year, unless otherwise noted. |
(b) | Calculated based upon average shares outstanding. |
(c) | Not annualized for periods less than one year. |
(d) | Includes adjustments in accordance with accounting principles generally accepted in the United States of America and as such, the net asset values for financial reporting purposes and the returns based upon those net asset values may differ from the net asset values and returns for shareholder transactions. |
(e) | Includes interest expense, if applicable, each of which is less than 0.005% unless otherwise noted. |
(f) | Commencement of offering of class of shares. |
142 | J.P. Morgan Municipal Bond Funds | August 31, 2023 |
Ratios/Supplemental data | |||||
Ratios to average net assets(a) | |||||
Total return (excludes sales charge)(c)(d) | Net assets, end of period (000's) | Net expenses(e) | Net investment income (loss) | Expenses without waivers and reimbursements | Portfolio turnover rate(c) |
0.80 % | $91,504 | 0.70 % | 1.75 % | 0.87 % | 17 % |
(2.86 ) | 95,647 | 0.70 | 1.36 | 0.87 | 8 |
(1.96 ) | 93,976 | 0.70 | 1.02 | 0.85 | 21 |
0.43 | 80,956 | 0.69 | 1.20 | 0.86 | 21 |
5.12 | 53,408 | 0.70 | 1.48 | 0.86 | 24 |
2.55 | 33,554 | 0.70 | 1.54 | 0.86 | 42 |
0.54 | 2,653 | 1.20 | 1.25 | 1.38 | 17 |
(3.34 ) | 2,590 | 1.20 | 0.85 | 1.37 | 8 |
(2.45 ) | 3,473 | 1.20 | 0.52 | 1.36 | 21 |
(0.09 ) | 4,626 | 1.19 | 0.72 | 1.36 | 21 |
4.52 | 4,303 | 1.20 | 0.99 | 1.36 | 24 |
2.10 | 4,590 | 1.20 | 1.03 | 1.38 | 42 |
1.02 | 441,202 | 0.24 | 2.20 | 0.62 | 17 |
(2.41 ) | 472,108 | 0.25 | 1.79 | 0.61 | 8 |
(1.51 ) | 823,600 | 0.25 | 1.47 | 0.60 | 21 |
0.87 | 829,847 | 0.24 | 1.66 | 0.60 | 21 |
5.56 | 641,836 | 0.24 | 1.94 | 0.61 | 24 |
3.09 | 573,350 | 0.25 | 1.97 | 0.61 | 42 |
0.94 | 440,299 | 0.19 | 2.24 | 0.37 | 17 |
(2.36 ) | 508,403 | 0.20 | 1.85 | 0.37 | 8 |
(1.37 ) | 632,795 | 0.20 | 1.52 | 0.35 | 21 |
0.92 | 688,820 | 0.19 | 1.72 | 0.35 | 21 |
5.61 | 961,820 | 0.19 | 1.99 | 0.36 | 24 |
2.31 | 866,630 | 0.19 | 2.19 | 0.37 | 42 |
August 31, 2023 | J.P. Morgan Municipal Bond Funds | 143 |
FOR THE PERIODS INDICATED
Per share operating performance | ||||||
Investment operations | Distributions | |||||
Net asset value, beginning of period | Net investment income (loss)(b) | Net realized and unrealized gains (losses) on investments | Total from investment operations | Net investment income | Net asset value, end of period | |
JPMorgan Tax Free Bond Fund | ||||||
Class A | ||||||
Six Months Ended August 31, 2023 (Unaudited) | $10.70 | $0.19 | $(0.10 ) | $0.09 | $(0.18 ) | $10.61 |
Year Ended February 28, 2023 | 12.15 | 0.33 | (1.45 ) | (1.12 ) | (0.33 ) | 10.70 |
Year Ended February 28, 2022 | 12.46 | 0.27 | (0.31 ) | (0.04 ) | (0.27 ) | 12.15 |
Year Ended February 28, 2021 | 12.66 | 0.28 | (0.20 ) | 0.08 | (0.28 ) | 12.46 |
Year Ended February 29, 2020 | 11.77 | 0.32 | 0.89 | 1.21 | (0.32 ) | 12.66 |
Year Ended February 28, 2019 | 11.82 | 0.40 | (0.05 ) | 0.35 | (0.40 ) | 11.77 |
Class C | ||||||
Six Months Ended August 31, 2023 (Unaudited) | 10.60 | 0.15 | (0.09 ) | 0.06 | (0.15 ) | 10.51 |
Year Ended February 28, 2023 | 12.04 | 0.26 | (1.44 ) | (1.18 ) | (0.26 ) | 10.60 |
Year Ended February 28, 2022 | 12.35 | 0.19 | (0.31 ) | (0.12 ) | (0.19 ) | 12.04 |
Year Ended February 28, 2021 | 12.55 | 0.21 | (0.21 ) | — (f) | (0.20 ) | 12.35 |
Year Ended February 29, 2020 | 11.67 | 0.25 | 0.87 | 1.12 | (0.24 ) | 12.55 |
Year Ended February 28, 2019 | 11.72 | 0.33 | (0.05 ) | 0.28 | (0.33 ) | 11.67 |
Class I | ||||||
Six Months Ended August 31, 2023 (Unaudited) | 10.65 | 0.20 | (0.10 ) | 0.10 | (0.19 ) | 10.56 |
Year Ended February 28, 2023 | 12.09 | 0.35 | (1.44 ) | (1.09 ) | (0.35 ) | 10.65 |
Year Ended February 28, 2022 | 12.41 | 0.29 | (0.32 ) | (0.03 ) | (0.29 ) | 12.09 |
Year Ended February 28, 2021 | 12.61 | 0.31 | (0.21 ) | 0.10 | (0.30 ) | 12.41 |
Year Ended February 29, 2020 | 11.72 | 0.34 | 0.89 | 1.23 | (0.34 ) | 12.61 |
Year Ended February 28, 2019 | 11.77 | 0.42 | (0.05 ) | 0.37 | (0.42 ) | 11.72 |
Class R6 | ||||||
Six Months Ended August 31, 2023 (Unaudited) | 10.64 | 0.20 | (0.10 ) | 0.10 | (0.19 ) | 10.55 |
Year Ended February 28, 2023 | 12.09 | 0.36 | (1.45 ) | (1.09 ) | (0.36 ) | 10.64 |
Year Ended February 28, 2022 | 12.41 | 0.30 | (0.32 ) | (0.02 ) | (0.30 ) | 12.09 |
Year Ended February 28, 2021 | 12.60 | 0.31 | (0.19 ) | 0.12 | (0.31 ) | 12.41 |
Year Ended February 29, 2020 | 11.72 | 0.35 | 0.88 | 1.23 | (0.35 ) | 12.60 |
October 1, 2018 (g) through February 28, 2019 | 11.61 | 0.17 | 0.11 | 0.28 | (0.17 ) | 11.72 |
(a) | Annualized for periods less than one year, unless otherwise noted. |
(b) | Calculated based upon average shares outstanding. |
(c) | Not annualized for periods less than one year. |
(d) | Includes adjustments in accordance with accounting principles generally accepted in the United States of America and as such, the net asset values for financial reporting purposes and the returns based upon those net asset values may differ from the net asset values and returns for shareholder transactions. |
(e) | Includes interest expense, if applicable, each of which is less than 0.005% unless otherwise noted. |
(f) | Amount rounds to less than $0.005. |
(g) | Commencement of offering of class of shares. |
144 | J.P. Morgan Municipal Bond Funds | August 31, 2023 |
Ratios/Supplemental data | |||||
Ratios to average net assets(a) | |||||
Total return (excludes sales charge)(c)(d) | Net assets, end of period (000's) | Net expenses(e) | Net investment income (loss) | Expenses without waivers and reimbursements | Portfolio turnover rate(c) |
0.82 % | $246,681 | 0.67 % | 3.41 % | 0.95 % | 11 % |
(9.24 ) | 254,468 | 0.67 | 2.99 | 0.95 | 42 |
(0.40 ) | 330,640 | 0.67 | 2.12 | 0.94 | 16 |
0.66 | 302,134 | 0.66 | 2.28 | 0.95 | 23 |
10.37 | 231,815 | 0.67 | 2.58 | 0.97 | 31 |
3.00 | 132,813 | 0.67 | 3.40 | 1.00 | 53 |
0.54 | 9,250 | 1.25 | 2.83 | 1.45 | 11 |
(9.78 ) | 8,546 | 1.25 | 2.39 | 1.45 | 42 |
(0.99 ) | 12,535 | 1.25 | 1.54 | 1.44 | 16 |
0.07 | 16,524 | 1.24 | 1.70 | 1.45 | 23 |
9.73 | 26,965 | 1.25 | 2.05 | 1.48 | 31 |
2.43 | 27,701 | 1.25 | 2.81 | 1.49 | 53 |
0.94 | 217,505 | 0.45 | 3.63 | 0.69 | 11 |
(9.00 ) | 128,202 | 0.45 | 3.20 | 0.70 | 42 |
(0.27 ) | 173,023 | 0.45 | 2.34 | 0.69 | 16 |
0.88 | 176,073 | 0.45 | 2.50 | 0.70 | 23 |
10.66 | 177,584 | 0.45 | 2.82 | 0.72 | 31 |
3.24 | 135,295 | 0.45 | 3.61 | 0.74 | 53 |
0.96 | 285,543 | 0.40 | 3.67 | 0.44 | 11 |
(9.04 ) | 157,191 | 0.40 | 3.29 | 0.45 | 42 |
(0.22 ) | 153,754 | 0.40 | 2.39 | 0.44 | 16 |
1.01 | 134,449 | 0.40 | 2.55 | 0.45 | 23 |
10.63 | 115,414 | 0.40 | 2.87 | 0.47 | 31 |
2.44 | 86,790 | 0.40 | 3.61 | 0.51 | 53 |
August 31, 2023 | J.P. Morgan Municipal Bond Funds | 145 |
FOR THE PERIODS INDICATED
Per share operating performance | ||||||
Investment operations | Distributions | |||||
Net asset value, beginning of period | Net investment income (loss)(b) | Net realized and unrealized gains (losses) on investments | Total from investment operations | Net investment income | Net asset value, end of period | |
JPMorgan Ultra-Short Municipal Fund | ||||||
Class A | ||||||
Six Months Ended August 31, 2023 (Unaudited) | $9.90 | $0.11 | $0.03 | $0.14 | $(0.11 ) | $9.93 |
Year Ended February 28, 2023 | 9.98 | 0.13 | (0.11 ) | 0.02 | (0.10 ) | 9.90 |
Year Ended February 28, 2022 | 10.07 | 0.01 | (0.09 ) | (0.08 ) | (0.01 ) | 9.98 |
Year Ended February 28, 2021 | 10.08 | 0.03 | — (f) | 0.03 | (0.04 ) | 10.07 |
Year Ended February 29, 2020 | 10.03 | 0.12 | 0.06 | 0.18 | (0.13 ) | 10.08 |
Year Ended February 28, 2019 | 10.01 | 0.13 | — (f) | 0.13 | (0.11 ) | 10.03 |
Class I | ||||||
Six Months Ended August 31, 2023 (Unaudited) | 9.89 | 0.12 | 0.04 | 0.16 | (0.13 ) | 9.92 |
Year Ended February 28, 2023 | 9.98 | 0.10 | (0.07 ) | 0.03 | (0.12 ) | 9.89 |
Year Ended February 28, 2022 | 10.06 | 0.03 | (0.08 ) | (0.05 ) | (0.03 ) | 9.98 |
Year Ended February 28, 2021 | 10.07 | 0.05 | — (f) | 0.05 | (0.06 ) | 10.06 |
Year Ended February 29, 2020 | 10.02 | 0.14 | 0.05 | 0.19 | (0.14 ) | 10.07 |
Year Ended February 28, 2019 | 10.00 | 0.14 | 0.02 | 0.16 | (0.14 ) | 10.02 |
(a) | Annualized for periods less than one year, unless otherwise noted. |
(b) | Calculated based upon average shares outstanding. |
(c) | Not annualized for periods less than one year. |
(d) | Includes adjustments in accordance with accounting principles generally accepted in the United States of America and as such, the net asset values for financial reporting purposes and the returns based upon those net asset values may differ from the net asset values and returns for shareholder transactions. |
(e) | Includes interest expense, if applicable, each of which is less than 0.005% unless otherwise noted. |
(f) | Amount rounds to less than $0.005. |
146 | J.P. Morgan Municipal Bond Funds | August 31, 2023 |
Ratios/Supplemental data | |||||
Ratios to average net assets(a) | |||||
Total return (excludes sales charge)(c)(d) | Net assets, end of period (000's) | Net expenses(e) | Net investment income (loss) | Expenses without waivers and reimbursements | Portfolio turnover rate(c) |
1.43 % | $129,555 | 0.44 % | 2.17 % | 0.75 % | 50 % |
0.18 | 263,135 | 0.44 | 1.27 | 0.76 | 16 |
(0.83 ) | 72,506 | 0.45 | 0.06 | 0.75 | 33 |
0.30 | 143,944 | 0.44 | 0.35 | 0.75 | 71 |
1.76 | 106,625 | 0.45 | 1.23 | 0.76 | 48 |
1.33 | 67,256 | 0.44 | 1.32 | 0.77 | 50 |
1.58 | 1,761,787 | 0.24 | 2.47 | 0.50 | 50 |
0.27 | 2,073,626 | 0.24 | 1.04 | 0.51 | 16 |
(0.53 ) | 3,984,195 | 0.25 | 0.26 | 0.50 | 33 |
0.51 | 6,666,678 | 0.24 | 0.53 | 0.50 | 71 |
1.96 | 4,050,886 | 0.25 | 1.43 | 0.50 | 48 |
1.60 | 3,021,190 | 0.24 | 1.42 | 0.52 | 50 |
August 31, 2023 | J.P. Morgan Municipal Bond Funds | 147 |
AS OF August 31, 2023 (Unaudited)
(Dollar values in thousands)
Classes Offered | Trust | Diversification Classification | |
JPMorgan California Tax Free Bond Fund | Class A, Class C, Class I and Class R6 | JPM I | Diversified |
JPMorgan National Municipal Income Fund | Class A, Class C, Class I and Class R6 | JPM I | Diversified |
JPMorgan New York Tax Free Bond Fund | Class A, Class C, Class I and Class R6 | JPM I | Diversified |
JPMorgan Short-Intermediate Municipal Bond Fund | Class A, Class C, Class I and Class R6 | JPM II | Diversified |
JPMorgan Tax Free Bond Fund | Class A, Class C, Class I and Class R6 | JPM II | Diversified |
JPMorgan Ultra-Short Municipal Fund | Class A and Class I | JPM IV | Diversified |
148 | J.P. Morgan Municipal Bond Funds | August 31, 2023 |
California Tax Free Bond Fund | ||||
Level 1 Quoted prices | Level 2 Other significant observable inputs | Level 3 Significant unobservable inputs | Total | |
Investments in Securities | ||||
Municipal Bonds | $— | $280,924 | $— | $280,924 |
Short-Term Investments | ||||
Investment Companies | 12,760 | — | — | 12,760 |
Total Investments in Securities | $12,760 | $280,924 | $— | $293,684 |
National Municipal Income Fund | ||||
Level 1 Quoted prices | Level 2 Other significant observable inputs | Level 3 Significant unobservable inputs | Total | |
Investments in Securities | ||||
Municipal Bonds | $— | $3,305,772 | $— | $3,305,772 |
Short-Term Investments | ||||
Investment Companies | 52,966 | — | — | 52,966 |
Total Investments in Securities | $52,966 | $3,305,772 | $— | $3,358,738 |
Appreciation in Other Financial Instruments | ||||
Futures Contracts | $386 | $— | $— | $386 |
August 31, 2023 | J.P. Morgan Municipal Bond Funds | 149 |
AS OF August 31, 2023 (Unaudited) (continued)
(Dollar values in thousands)
National Municipal Income Fund (continued) | ||||
Level 1 Quoted prices | Level 2 Other significant observable inputs | Level 3 Significant unobservable inputs | Total | |
Depreciation in Other Financial Instruments | ||||
Swaps | $— | $(2,224 ) | $— | $(2,224 ) |
Total Net Appreciation/ Depreciation in Other Financial Instruments | $386 | $(2,224 ) | $— | $(1,838 ) |
New York Tax Free Bond Fund | ||||
Level 1 Quoted prices | Level 2 Other significant observable inputs | Level 3 Significant unobservable inputs | Total | |
Investments in Securities | ||||
Municipal Bonds | $— | $356,955 | $— | $356,955 |
Short-Term Investments | ||||
Investment Companies | 20,532 | — | — | 20,532 |
Total Investments in Securities | $20,532 | $356,955 | $— | $377,487 |
Short-Intermediate Municipal Bond Fund | ||||
Level 1 Quoted prices | Level 2 Other significant observable inputs | Level 3 Significant unobservable inputs | Total | |
Investments in Securities | ||||
Collateralized Mortgage Obligations | $— | $21 | $— | $21 |
Municipal Bonds | — | 954,691 | — | 954,691 |
Short-Term Investments | ||||
Investment Companies | 13,450 | — | — | 13,450 |
Total Investments in Securities | $13,450 | $954,712 | $— | $968,162 |
Tax Free Bond Fund | ||||
Level 1 Quoted prices | Level 2 Other significant observable inputs | Level 3 Significant unobservable inputs | Total | |
Investments in Securities | ||||
Municipal Bonds | $— | $704,478 | $— | $704,478 |
Short-Term Investments | ||||
Investment Companies | 60,917 | — | — | 60,917 |
Total Investments in Securities | $60,917 | $704,478 | $— | $765,395 |
Depreciation in Other Financial Instruments | ||||
Swaps | $— | $(315 ) | $— | $(315 ) |
Ultra-Short Municipal Fund | ||||
Level 1 Quoted prices | Level 2 Other significant observable inputs | Level 3 Significant unobservable inputs | Total | |
Investments in Securities | ||||
Municipal Bonds | $— | $1,819,968 | $— | $1,819,968 |
Short-Term Investments | ||||
Investment Companies | 67,990 | — | — | 67,990 |
Total Investments in Securities | $67,990 | $1,819,968 | $— | $1,887,958 |
150 | J.P. Morgan Municipal Bond Funds | August 31, 2023 |
August 31, 2023 | J.P. Morgan Municipal Bond Funds | 151 |
AS OF August 31, 2023 (Unaudited) (continued)
(Dollar values in thousands)
California Tax Free Bond Fund | |||||||||
For the six months ended August 31, 2023 | |||||||||
Security Description | Value at February 28, 2023 | Purchases at Cost | Proceeds from Sales | Net Realized Gain (Loss) | Change in Unrealized Appreciation/ (Depreciation) | Value at August 31, 2023 | Shares at August 31, 2023 | Dividend Income | Capital Gain Distributions |
JPMorgan Institutional Tax Free Money Market Fund Class IM Shares, 3.71% (a) (b) | $6,651 | $50,632 | $44,524 | $— (c) | $1 | $12,760 | 12,759 | $114 | $— |
(a) | Investment in an affiliated fund, which is registered under the Investment Company Act of 1940, as amended, and is advised by J.P. Morgan Investment Management Inc. |
(b) | The rate shown is the current yield as of August 31, 2023. |
(c) | Amount rounds to less than one thousand. |
National Municipal Income Fund | |||||||||
For the six months ended August 31, 2023 | |||||||||
Security Description | Value at February 28, 2023 | Purchases at Cost | Proceeds from Sales | Net Realized Gain (Loss) | Change in Unrealized Appreciation/ (Depreciation) | Value at August 31, 2023 | Shares at August 31, 2023 | Dividend Income | Capital Gain Distributions |
JPMorgan Institutional Tax Free Money Market Fund Class IM Shares, 3.71% (a) (b) | $134,839 | $346,962 | $428,836 | $11 | $(10 ) | $52,966 | 52,960 | $833 | $— |
(a) | Investment in an affiliated fund, which is registered under the Investment Company Act of 1940, as amended, and is advised by J.P. Morgan Investment Management Inc. |
(b) | The rate shown is the current yield as of August 31, 2023. |
New York Tax Free Bond Fund | |||||||||
For the six months ended August 31, 2023 | |||||||||
Security Description | Value at February 28, 2023 | Purchases at Cost | Proceeds from Sales | Net Realized Gain (Loss) | Change in Unrealized Appreciation/ (Depreciation) | Value at August 31, 2023 | Shares at August 31, 2023 | Dividend Income | Capital Gain Distributions |
JPMorgan Institutional Tax Free Money Market Fund Class IM Shares, 3.71% (a) (b) | $11,948 | $46,681 | $38,098 | $(1 ) | $2 | $20,532 | 20,530 | $132 | $— |
(a) | Investment in an affiliated fund, which is registered under the Investment Company Act of 1940, as amended, and is advised by J.P. Morgan Investment Management Inc. |
(b) | The rate shown is the current yield as of August 31, 2023. |
152 | J.P. Morgan Municipal Bond Funds | August 31, 2023 |
Short-Intermediate Municipal Bond Fund | |||||||||
For the six months ended August 31, 2023 | |||||||||
Security Description | Value at February 28, 2023 | Purchases at Cost | Proceeds from Sales | Net Realized Gain (Loss) | Change in Unrealized Appreciation/ (Depreciation) | Value at August 31, 2023 | Shares at August 31, 2023 | Dividend Income | Capital Gain Distributions |
JPMorgan Institutional Tax Free Money Market Fund Class IM Shares, 3.71% (a) (b) | $70,373 | $161,042 | $217,966 | $2 | $(1 ) | $13,450 | 13,449 | $690 | $— |
(a) | Investment in an affiliated fund, which is registered under the Investment Company Act of 1940, as amended, and is advised by J.P. Morgan Investment Management Inc. |
(b) | The rate shown is the current yield as of August 31, 2023. |
Tax Free Bond Fund | |||||||||
For the six months ended August 31, 2023 | |||||||||
Security Description | Value at February 28, 2023 | Purchases at Cost | Proceeds from Sales | Net Realized Gain (Loss) | Change in Unrealized Appreciation/ (Depreciation) | Value at August 31, 2023 | Shares at August 31, 2023 | Dividend Income | Capital Gain Distributions |
JPMorgan Institutional Tax Free Money Market Fund Class IM Shares, 3.71% (a) (b) | $13,912 | $264,068 | $217,061 | $(2 ) | $— (c) | $60,917 | 60,911 | $575 | $— |
(a) | Investment in an affiliated fund, which is registered under the Investment Company Act of 1940, as amended, and is advised by J.P. Morgan Investment Management Inc. |
(b) | The rate shown is the current yield as of August 31, 2023. |
(c) | Amount rounds to less than one thousand. |
Ultra-Short Municipal Fund | |||||||||
For the six months ended August 31, 2023 | |||||||||
Security Description | Value at February 28, 2023 | Purchases at Cost | Proceeds from Sales | Net Realized Gain (Loss) | Change in Unrealized Appreciation/ (Depreciation) | Value at August 31, 2023 | Shares at August 31, 2023 | Dividend Income | Capital Gain Distributions |
JPMorgan Institutional Tax Free Money Market Fund Class IM Shares, 3.71% (a) (b) | $154,102 | $1,318,629 | $1,404,746 | $13 | $(8 ) | $67,990 | 67,983 | $2,232 | $— |
(a) | Investment in an affiliated fund, which is registered under the Investment Company Act of 1940, as amended, and is advised by J.P. Morgan Investment Management Inc. |
(b) | The rate shown is the current yield as of August 31, 2023. |
August 31, 2023 | J.P. Morgan Municipal Bond Funds | 153 |
AS OF August 31, 2023 (Unaudited) (continued)
(Dollar values in thousands)
154 | J.P. Morgan Municipal Bond Funds | August 31, 2023 |
National Municipal Income Fund | Tax Free Bond Fund | |
Interest Rate Risk Exposure: | ||
Unrealized Appreciation on Futures Contracts * | $386 | $— |
Credit Risk Exposure: | ||
Swaps at Value (Liabilities) ** | (5,808 ) | (822 ) |
Net Fair Value of Derivative Contracts: | ||
Unrealized Appreciation (Depreciation) on Futures Contracts * | 386 | — |
Swaps at Value ** | (5,808 ) | (822 ) |
* | Includes cumulative appreciation/(depreciation) on futures contracts, if any, as reported on the SOIs. Only current day’s variation margin is reported within the Statements of Assets and Liabilities. |
** | Includes the fair value of centrally cleared swap contracts as reported on the SOIs. Only current day’s variation margin is reported within the Statements of Assets and Liabilities. |
National Municipal Income Fund | Tax Free Bond Fund | Ultra-Short Municipal Fund | |
Realized Gain (Loss) on Derivatives Recognized as a Result From Operations: | |||
Interest Rate Risk Exposure: | |||
Futures Contracts | $(3,710 ) | $12 | $(2,604 ) |
Credit Exposure Risk: | |||
Swap Contracts | (12,039 ) | (1,700 ) | — |
Net Change in Unrealized Appreciation (Depreciation) on Derivatives Recognized as a Result of Operations: | |||
Interest Rate Risk Exposure: | |||
Futures Contracts | 367 | (5 ) | — |
Credit Exposure Risk: | |||
Swap Contracts | 7,198 | 1,016 | — |
August 31, 2023 | J.P. Morgan Municipal Bond Funds | 155 |
AS OF August 31, 2023 (Unaudited) (continued)
(Dollar values in thousands)
National Municipal Income Fund | Tax Free Bond Fund | Ultra-Short Municipal Fund | |
Futures Contracts: | |||
Average Notional Balance Long | $82,398 | $5,338 | $77,189 |
Average Notional Balance Short | (20,536 ) | (9,265 ) | — |
Ending Notional Balance Long | 121,612 | — | — |
Credit Default Swaps: | |||
Average Notional Balance - Buy Protection | 151,300 | 21,400 | — |
Ending Notional Balance - Buy Protection | 151,300 | 21,400 | — |
Class A | Class C | Class I | Class R6 | Total | |
California Tax Free Bond Fund | |||||
Transfer agency fees | $2 | $— (a) | $— (a) | $1 | $3 |
National Municipal Income Fund | |||||
Transfer agency fees | 4 | — (a) | 4 | 11 | 19 |
New York Tax Free Bond Fund | |||||
Transfer agency fees | 4 | — (a) | 1 | 1 | 6 |
Short-Intermediate Municipal Bond Fund | |||||
Transfer agency fees | 1 | — (a) | 2 | 3 | 6 |
Tax Free Bond Fund | |||||
Transfer agency fees | 4 | — (a) | 1 | 1 | 6 |
Ultra-Short Municipal Fund | |||||
Transfer agency fees | 2 | n/a | 7 | n/a | 9 |
(a) | Amount rounds to less than one thousand. |
156 | J.P. Morgan Municipal Bond Funds | August 31, 2023 |
California Tax Free Bond Fund | 0.30 % |
National Municipal Income Fund | 0.30 |
New York Tax Free Bond Fund | 0.30 |
Short-Intermediate Municipal Bond Fund | 0.25 |
Tax Free Bond Fund | 0.30 |
Ultra-Short Municipal Fund | 0.15 |
Class A | Class C | |
0.25 % | 0.75 % |
Front-End Sales Charge | CDSC | |
California Tax Free Bond Fund | $— (a) | $— |
National Municipal Income Fund | 10 | — |
New York Tax Free Bond Fund | 2 | — (a) |
August 31, 2023 | J.P. Morgan Municipal Bond Funds | 157 |
AS OF August 31, 2023 (Unaudited) (continued)
(Dollar values in thousands)
Front-End Sales Charge | CDSC | |
Short-Intermediate Municipal Bond Fund | $2 | $— |
Tax Free Bond Fund | 6 | — |
(a) | Amount rounds to less than one thousand. |
Class A | Class C | Class I | |
California Tax Free Bond Fund | 0.25 % | 0.25 % | 0.25 % |
National Municipal Income Fund | 0.25 | 0.25 | 0.25 |
New York Tax Free Bond Fund | 0.25 | 0.25 | 0.25 |
Short-Intermediate Municipal Bond Fund | 0.25 | 0.25 | 0.25 |
Tax Free Bond Fund | 0.25 | 0.25 | 0.25 |
Ultra-Short Municipal Fund | 0.25 | n/a | 0.25 |
Class A | Class C | Class I | Class R6 | |
California Tax Free Bond Fund | 0.55 % | 1.05 % | 0.45 % | 0.35 % |
National Municipal Income Fund | 0.65 | 1.20 | 0.40 | 0.30 |
New York Tax Free Bond Fund | 0.55 | 1.05 | 0.45 | 0.35 |
Short-Intermediate Municipal Bond Fund | 0.70 | 1.20 | 0.25 | 0.20 |
Tax Free Bond Fund | 0.67 | 1.25 | 0.45 | 0.40 |
Ultra-Short Municipal Fund | 0.45 | n/a | 0.25 | n/a |
158 | J.P. Morgan Municipal Bond Funds | August 31, 2023 |
Contractual Waivers | |||||
Investment Advisory Fees | Administration Fees | Service Fees | Total | Contractual Reimbursements | |
California Tax Free Bond Fund | $96 | $64 | $186 | $346 | $32 |
National Municipal Income Fund | 1,097 | 732 | 773 | 2,602 | — |
New York Tax Free Bond Fund | 103 | 69 | 251 | 423 | 39 |
Short-Intermediate Municipal Bond Fund | 518 | 345 | 461 | 1,324 | — |
Tax Free Bond Fund | 77 | 51 | 493 | 621 | — |
Ultra-Short Municipal Fund | 1,545 | 773 | 270 | 2,588 | — |
California Tax Free Bond Fund | $4 |
National Municipal Income Fund | 38 |
New York Tax Free Bond Fund | 6 |
Short-Intermediate Municipal Bond Fund | 32 |
Tax Free Bond Fund | 18 |
Ultra-Short Municipal Fund | 92 |
California Tax Free Bond Fund | $1 |
National Municipal Income Fund | 1 |
New York Tax Free Bond Fund | 1 |
Short-Intermediate Municipal Bond Fund | 1 |
Tax Free Bond Fund | 1 |
Ultra-Short Municipal Fund | 1 |
August 31, 2023 | J.P. Morgan Municipal Bond Funds | 159 |
AS OF August 31, 2023 (Unaudited) (continued)
(Dollar values in thousands)
Purchases (excluding U.S. Government) | Sales (excluding U.S. Government) | |
California Tax Free Bond Fund | $38,452 | $28,073 |
National Municipal Income Fund | 290,404 | 332,052 |
New York Tax Free Bond Fund | 35,413 | 22,093 |
Short-Intermediate Municipal Bond Fund | 166,995 | 210,890 |
Tax Free Bond Fund | 250,406 | 65,191 |
Ultra-Short Municipal Fund | 933,407 | 1,322,074 |
Aggregate Cost | Gross Unrealized Appreciation | Gross Unrealized Depreciation | Net Unrealized Appreciation (Depreciation) | |
California Tax Free Bond Fund | $297,618 | $1,456 | $5,390 | $(3,934 ) |
National Municipal Income Fund | 3,457,446 | 21,510 | 125,640 | (104,130 ) |
New York Tax Free Bond Fund | 382,257 | 1,052 | 5,822 | (4,770 ) |
Short-Intermediate Municipal Bond Fund | 1,003,786 | 370 | 35,994 | (35,624 ) |
Tax Free Bond Fund | 795,424 | 5,948 | 36,799 | (30,851 ) |
Ultra-Short Municipal Fund | 1,910,045 | 506 | 22,593 | (22,087 ) |
Capital Loss Carryforward Character | ||
Short-Term | Long-Term | |
California Tax Free Bond Fund | $3,488 | $6,643 |
National Municipal Income Fund | 20,219 | 19,782 |
New York Tax Free Bond Fund | 3,595 | 2,035 |
Short-Intermediate Municipal Bond Fund | 14,524 | 5,943 |
Tax Free Bond Fund | 15,480 | 10,869 |
Ultra-Short Municipal Fund | 7,988 | 7,118 |
Net Capital Losses (Gains) | ||
Short-Term | Long-Term | |
California Tax Free Bond Fund | $380 | $4,301 |
National Municipal Income Fund | 8,961 | 12,273 |
New York Tax Free Bond Fund | 79 | 1,932 |
Short-Intermediate Municipal Bond Fund | 10 | 1,174 |
Tax Free Bond Fund | 1,735 | 7,442 |
Ultra-Short Municipal Fund | 2 | 1,081 |
160 | J.P. Morgan Municipal Bond Funds | August 31, 2023 |
Number of Individual Shareholder and/or Affiliated Omnibus Accounts | % of the Fund | Number of Individual Shareholder and/or Non-Affiliated Omnibus Accounts | % of the Fund | |
California Tax Free Bond Fund | 1 | 65.2 % | 1 | 12.8 % |
National Municipal Income Fund | 1 | 78.0 | — | — |
New York Tax Free Bond Fund | 1 | 73.1 | — | — |
Short-Intermediate Municipal Bond Fund | 1 | 73.7 | — | — |
Tax Free Bond Fund | 1 | 53.9 | 2 | 30.2 |
Ultra-Short Municipal Fund | 1 | 78.4 | — | — |
August 31, 2023 | J.P. Morgan Municipal Bond Funds | 161 |
AS OF August 31, 2023 (Unaudited) (continued)
(Dollar values in thousands)
162 | J.P. Morgan Municipal Bond Funds | August 31, 2023 |
(Unaudited)
Hypothetical $1,000 Investment
Beginning Account Value March 1, 2023 | Ending Account Value August 31, 2023 | Expenses Paid During the Period* | Annualized Expense Ratio | |
JPMorgan California Tax Free Bond Fund | ||||
Class A | ||||
Actual | $1,000.00 | $1,007.10 | $2.77 | 0.55 % |
Hypothetical | 1,000.00 | 1,022.37 | 2.80 | 0.55 |
Class C | ||||
Actual | 1,000.00 | 1,004.60 | 5.29 | 1.05 |
Hypothetical | 1,000.00 | 1,019.86 | 5.33 | 1.05 |
Class I | ||||
Actual | 1,000.00 | 1,007.80 | 2.27 | 0.45 |
Hypothetical | 1,000.00 | 1,022.87 | 2.29 | 0.45 |
Class R6 | ||||
Actual | 1,000.00 | 1,008.30 | 1.77 | 0.35 |
Hypothetical | 1,000.00 | 1,023.38 | 1.78 | 0.35 |
JPMorgan National Municipal Income Fund | ||||
Class A | ||||
Actual | 1,000.00 | 1,004.60 | 3.28 | 0.65 |
Hypothetical | 1,000.00 | 1,021.87 | 3.30 | 0.65 |
Class C | ||||
Actual | 1,000.00 | 1,001.00 | 6.04 | 1.20 |
Hypothetical | 1,000.00 | 1,019.10 | 6.09 | 1.20 |
Class I | ||||
Actual | 1,000.00 | 1,005.00 | 2.02 | 0.40 |
Hypothetical | 1,000.00 | 1,023.13 | 2.03 | 0.40 |
Class R6 | ||||
Actual | 1,000.00 | 1,005.50 | 1.51 | 0.30 |
Hypothetical | 1,000.00 | 1,023.63 | 1.53 | 0.30 |
August 31, 2023 | J.P. Morgan Municipal Bond Funds | 163 |
(Unaudited) (continued)
Hypothetical $1,000 Investment
Beginning Account Value March 1, 2023 | Ending Account Value August 31, 2023 | Expenses Paid During the Period* | Annualized Expense Ratio | |
JPMorgan New York Tax Free Bond Fund | ||||
Class A | ||||
Actual | $1,000.00 | $1,008.10 | $2.78 | 0.55 % |
Hypothetical | 1,000.00 | 1,022.37 | 2.80 | 0.55 |
Class C | ||||
Actual | 1,000.00 | 1,005.60 | 5.29 | 1.05 |
Hypothetical | 1,000.00 | 1,019.86 | 5.33 | 1.05 |
Class I | ||||
Actual | 1,000.00 | 1,008.60 | 2.27 | 0.45 |
Hypothetical | 1,000.00 | 1,022.87 | 2.29 | 0.45 |
Class R6 | ||||
Actual | 1,000.00 | 1,009.10 | 1.77 | 0.35 |
Hypothetical | 1,000.00 | 1,023.38 | 1.78 | 0.35 |
JPMorgan Short-Intermediate Municipal Bond Fund | ||||
Class A | ||||
Actual | 1,000.00 | 1,008.00 | 3.53 | 0.70 |
Hypothetical | 1,000.00 | 1,021.62 | 3.56 | 0.70 |
Class C | ||||
Actual | 1,000.00 | 1,005.40 | 6.05 | 1.20 |
Hypothetical | 1,000.00 | 1,019.10 | 6.09 | 1.20 |
Class I | ||||
Actual | 1,000.00 | 1,010.20 | 1.21 | 0.24 |
Hypothetical | 1,000.00 | 1,023.93 | 1.22 | 0.24 |
Class R6 | ||||
Actual | 1,000.00 | 1,009.40 | 0.96 | 0.19 |
Hypothetical | 1,000.00 | 1,024.18 | 0.97 | 0.19 |
JPMorgan Tax Free Bond Fund | ||||
Class A | ||||
Actual | 1,000.00 | 1,008.20 | 3.38 | 0.67 |
Hypothetical | 1,000.00 | 1,021.77 | 3.40 | 0.67 |
Class C | ||||
Actual | 1,000.00 | 1,005.40 | 6.30 | 1.25 |
Hypothetical | 1,000.00 | 1,018.85 | 6.34 | 1.25 |
Class I | ||||
Actual | 1,000.00 | 1,009.40 | 2.27 | 0.45 |
Hypothetical | 1,000.00 | 1,022.87 | 2.29 | 0.45 |
Class R6 | ||||
Actual | 1,000.00 | 1,009.60 | 2.02 | 0.40 |
Hypothetical | 1,000.00 | 1,023.13 | 2.03 | 0.40 |
JPMorgan Ultra-Short Municipal Fund | ||||
Class A | ||||
Actual | 1,000.00 | 1,014.30 | 2.23 | 0.44 |
Hypothetical | 1,000.00 | 1,022.92 | 2.24 | 0.44 |
Class I | ||||
Actual | 1,000.00 | 1,015.80 | 1.22 | 0.24 |
Hypothetical | 1,000.00 | 1,023.93 | 1.22 | 0.24 |
* | Expenses are equal to each Class’ respective annualized net expense ratio, multiplied by the average account value over the period, multiplied by 184/366 (to reflect the one-half year period). |
164 | J.P. Morgan Municipal Bond Funds | August 31, 2023 |
(Unaudited)
August 31, 2023 | J.P. Morgan Municipal Bond Funds | 165 |
(Unaudited)
166 | J.P. Morgan Municipal Bond Funds | August 31, 2023 |
August 31, 2023 | J.P. Morgan Municipal Bond Funds | 167 |
(Unaudited) (continued)
168 | J.P. Morgan Municipal Bond Funds | August 31, 2023 |
August 31, 2023 | J.P. Morgan Municipal Bond Funds | 169 |
(Unaudited) (continued)
170 | J.P. Morgan Municipal Bond Funds | August 31, 2023 |


ITEM 2. CODE OF ETHICS.
Not applicable to a semi-annual report.
ITEM 3. AUDIT COMMITTEE FINANCIAL EXPERT.
Not applicable to a semi-annual report.
ITEM 4. PRINCIPAL ACCOUNTANT FEES AND SERVICES.
Not applicable to a semi-annual report.
ITEM 5. AUDIT COMMITTEE OF LISTED REGISTRANTS.
Not applicable to a semi-annual report.
ITEM 6. INVESTMENTS.
File Schedule I – Investments in securities of unaffiliated issuers as of the close of the reporting period as set forth in Section 210.12-12 of Regulation S-X, unless the schedule is included as part of the report to shareholders filed under Item 1 of this Form.
Included in Item 1.
ITEM 7. DISCLOSURE OF PROXY VOTING POLICIES AND PROCEDURES FOR CLOSED-END MANAGEMENT INVESTMENT COMPANIES.
Not applicable.
ITEM 8. PORTFOLIO MANAGERS OF CLOSED-END MANAGEMENT INVESTMENT COMPANIES.
Not applicable.
ITEM 9. PURCHASE OF EQUITY SECURITIES BY CLOSED-END MANAGEMENT INVESTMENT COMPANY AND AFFILIATED PURCHASERS.
Not applicable.
ITEM 10. SUBMISSION OF MATTERS TO A VOTE OF SECURITY HOLDERS.
Describe any material changes to the procedures by which shareholders may recommend nominees to the registrant’s board of directors, where those changes were implemented after the registrant last provided disclosure in response to the requirements of Item 7(d)(2)(ii)(G) of Schedule 14A (17 CFR 240.14a-101), or this Item.
No material changes to report.
ITEM 11. CONTROLS AND PROCEDURES.
(a) Disclose the conclusions of the registrant’s principal executive and principal financial officers, or persons performing similar functions, regarding the effectiveness of the registrant’s disclosure controls and procedures (as defined in Rule 30a-3(c) under the Act (17 CFR 270.30a-3(c))) as of a date within 90 days of the filing date of the report that includes the disclosure required by this paragraph, based on the evaluation of these controls and procedures required by Rule 30a-3(b) under the Act (17 CFR 270.30a-3(b)) and Rules 13a-15(b) or 15d-15(b) under the Exchange Act (17 CFR 240.13a-15(b) or 240.15d-15(b)).
The Registrant’s principal executive and principal financial officers have concluded, based on their evaluation of the Registrant’s disclosure controls and procedures as of a date within 90 days of the filing date of this report, that the Registrant’s disclosure controls and procedures are reasonably designed to ensure that information required to be disclosed by the Registrant on Form N-CSR is recorded, processed, summarized and reported within the required time periods and that information required to be disclosed by the Registrant in the reports that it files or submits on Form N-CSR is accumulated and communicated to the Registrant’s management, including its principal executive and principal financial officers, as appropriate to allow timely decisions regarding required disclosure.
(b) Disclose any change in the registrant’s internal control over financial reporting (as defined in Rule 30a-3(d) under the Act (17 CFR 270.30a-3(d)) that occurred during the period covered by this report that has materially affected, or is reasonably likely to materially affect, the registrant’s internal control over financial reporting.
There were no changes in the Registrant’s internal control over financial reporting that occurred during period covered by this report that have materially affected, or are reasonably likely to materially affect, the Registrant’s internal control over financial reporting.
ITEM 12. DISCLOSURE OF SECURITIES LENDING ACTIVITIES FOR CLOSED-END MANAGEMENT INVESTMENT COMPANIES.
Not applicable.
ITEM 13. EXHIBITS.
| (a) | File the exhibits listed below as part of this Form. Letter or number the exhibits in the sequence indicated. |
(1) Any code of ethics, or amendment thereto, that is the subject of the disclosure required by Item 2, to the extent that the registrant intends to satisfy the Item 2 requirements through filing of an exhibit.
Not applicable.
(2) A separate certification for each principal executive officer and principal financial officer of the registrant as required by Rule 30a-2(a) under the Act (17 CFR 270.30a-2), exactly as set forth below:
(1) Any written solicitation to purchase securities under Rule 23c-1 under the Act (17 CFR 270.23c-1) sent or given during the period covered by the report by or on behalf of the registrant to 10 or more persons.
Not applicable.
(2) Change in the registrant’s independent public accountant. Provide the information called for by Item 4 of Form 8-K under the Exchange Act (17 CFR 249.308). Unless otherwise specified by Item 4, or related to and necessary for a complete understanding of information not previously disclosed, the information should relate to events occurring during the reporting period.
Not applicable.
| (b) | A separate or combined certification for each principal executive officer and principal officer of the registrant as required by Rule 30a-2(b) under the Act of 1940. |
SIGNATURES
Pursuant to the requirements of the Securities Exchange Act of 1934 and the Investment Company Act of 1940, the registrant has duly caused this report to be signed on its behalf by the undersigned, thereunto duly authorized.
| JPMorgan Trust IV | ||
| By: | /s/ Brian S. Shlissel | |
| Brian S. Shlissel | ||
| President and Principal Executive Officer | ||
| November 2, 2023 | ||
Pursuant to the requirements of the Securities Exchange Act of 1934 and the Investment Company Act of 1940, this report has been signed below by the following persons on behalf of the registrant and in the capacities and on the dates indicated.
| By: | /s/ Brian S. Shlissel | |
| Brian S. Shlissel | ||
| President and Principal Executive Officer | ||
| November 2, 2023 | ||
| By: | /s/ Timothy J. Clemens | |
| Timothy J. Clemens | ||
| Treasurer and Principal Financial Officer | ||
| November 2, 2023 | ||