UNITED STATES
SECURITIES AND EXCHANGE COMMISSION
Washington, D.C. 20549
FORM N-CSR
CERTIFIED SHAREHOLDER REPORT OF REGISTERED
MANAGEMENT INVESTMENT COMPANIES
Investment Company Act file number (811-23127)
The Goodhaven Funds Trust
(Exact name of registrant as specified in charter)
4940 SW 83rd Street
Miami, Florida 33143_
(Address of principal executive offices) (Zip code)
Larry Pitkowsky
4940 SW 83rd Street
Miami, Florida 33143
(Name and address of agent for service)
(305) 677-7650
Registrant's telephone number, including area code
Date of fiscal year end: November 30
Date of reporting period: November 30, 2016
Item 1. Report to Stockholders.
Annual Report
November 30, 2016
GoodHaven Fund
Ticker: GOODX
GoodHaven Capital Management, LLC
GoodHaven Fund
Table of Contents
| Shareholder Letter | | | 1 |
| Portfolio Management Discussion and Analysis | | | 12 |
| Sector Allocation | | | 17 |
| Historical Performance | | | 18 |
| Schedule of Investments | | | 19 |
| Schedule of Options Written | | | 21 |
| Statement of Assets and Liabilities | | | 22 |
| Statement of Operations | | | 23 |
| Statements of Changes in Net Assets | | | 24 |
| Financial Highlights | | | 25 |
| Notes to Financial Statements | | | 26 |
| Report of Independent Registered Public Accounting Firm | | | 36 |
| Expense Example | | | 37 |
| Trustees and Executive Officers | | | 39 |
| Additional Information | | | 41 |
| Privacy Notice | | | 42 |
GoodHaven Fund
| | | 1 Year | | Since | Since |
| | Calendar | Ended | 5 Years | Incept.1 | Incept.1 |
| | Year 2016 | 11/30/16 | Annualized | Cumulative | Annualized |
| GOODX | 20.13% | 13.89% | 4.75% | 29.41% | 4.67% |
S&P 500 Index2 | 11.96% | 8.06% | 14.45% | 86.91% | 11.71% |
| Wilshire 5000 Total Market Index | 10.67% | 6.15% | 11.89% | 62.85% | 9.01% |
HFRI Fundamental Growth Index3 | 4.07% | 2.78% | 3.55% | 3.47% | 0.60% |
HFRI Fundamental Value Index3 | 7.34% | 4.25% | 7.09% | 28.34% | 4.50% |
CS Hedge Fund Index3 | 1.25% | -0.57% | 4.09% | 16.84% | 2.78% |
1 | The Fund commenced operations on April 8, 2011. |
2 | with dividends reinvested |
3 | Hedge Fund Index performance figures are supplied on a month end basis and are provided for illustrative purposes as a broad equity alternative asset class only. Accordingly, “since inception” hedge fund index performance figures reflect a start date of 3/31/11. Source: Bloomberg Terminal |
Performance data quoted represents past performance; past performance does not guarantee future results. The investment return and principal value of an investment will fluctuate so that an investor’s shares, when redeemed, may be worth more or less than their original cost. Current performance of the Fund may be lower or higher than the performance quoted. Performance data current to the most recent month-end may be obtained by calling (855) OK-GOODX or (855) 654-6639. The Fund imposes a 2.00% redemption fee on shares redeemed within 60 days of purchase. Performance data for an individual shareholder will be reduced by redemption fees that apply, if any. Redemption fees are paid directly into the Fund and do not reduce overall performance of the Fund. The annualized gross expense ratio of the GoodHaven Fund is 1.10%.
January 4, 2017
To Our Fellow Shareholders of the GoodHaven Fund (the “Fund”):
Measured by either a calendar year or fiscal year basis, 2016 was a good year for the Fund. For the calendar year ended December 31, 2016, the Fund gained 20.13% compared to a gain of 11.96% for the S&P 500 Index. For the fiscal year ended November 30, 2016 (and after a rough first month of December), the Fund gained 13.89% compared to 8.06% for the S&P 500 Index.1
As discussed in prior letters, outlier declines in oil, gas, and metals in 2015 overshadowed some positives and led to unusual portfolio weakness throughout 2015
__________
1 | As a reminder, we use the S&P 500 as a point of comparison as it is a widely quoted index and somewhat representative of large company equity performance. Nevertheless, we provide a wide range of alternatives for comparison purposes in the performance table shown above as the Fund may invest in securities beyond equities, is not required to be fully invested at all times, and is not limited to large capitalization common shares. |
GoodHaven Fund
and early 2016, which affected our historical and relative results. This weakness appeared to end in February of 2016 and has been followed by a sharp recovery in some key investments. Most of the factors that resulted in the weak results of 2015 appear to have been attenuated or reversed.2 Throughout this unusual volatility, we did our best to behave consistently, did not overreact, and bought under pressure when our research told us that values were intact.
We continue to own a portfolio that we believe is materially less expensive than the S&P 500 as measured by some common historical valuation markers and remain disciplined when looking at potential new investments. The Fund also continues to hold cash, reflective of generally high valuations, which allows us to behave opportunistically. We try to invest to the extent that we find sensible things to do and remind our fellow shareholders that our personal stakes in the Fund are material. We are not willing to do something for you that we are unwilling to do for ourselves.
Perhaps more importantly, we are increasingly confident that some of our headwinds are turning into tailwinds as we enter 2017. The overall environment seems to be friendlier to our approach despite stretched index valuations. While we do not pretend to have a crystal ball that predicts future economic conditions or commodity prices, most market trends regress toward the mean over time. In other words, very expensive securities tend to become less expensive given time, while bargain securities tend to become less of a bargain, barring some permanent change in demand.3
In addition, many industries tend to have cycles. However, it usually pays to hang on to a good business through cyclical moves unless that business becomes materially overvalued. Here’s why: a good business run by smart people has the opportunity to significantly outperform its direct competition over an extended time period. In other words, you don’t want to overweight cyclical influences, especially when good capital allocators are running an enterprise.
In that vein, we note that several of our investee companies improved costs and operations in significant ways or re-allocated capital in a shareholder friendly manner. For example, Alphabet (formerly Google) adopted new financial discipline in pursuing its non-advertising “moonshot” venture investments (which currently cost shareholders about $3 billion annually, or a penalty of nearly $5 per share
__________
2 | Clearly, the timing of the Fund’s initial investments in Barrick Gold and WPX Energy was poor, and in 2015, commodity performance overshadowed material business progress in these companies. Our timing in adding to positions was better and aided 2016 performance. |
3 | As the advent of the automobile did a century ago, the Internet has disrupted many businesses, causing permanent shifts in demand while opening new opportunities. Ad salesmen at newspaper companies have been fighting an increasingly desperate battle – and losing. Sometimes, as with saddles, buggy whips, or advertising, change in demand is permanent and long-term trends are important. For example, we know that demand for energy grows with increases in population and living standards. However, the source of that energy is changing at the margin. Oil will be around for many years, but the alternatives are growing, and that trend bears scrutiny. |
GoodHaven Fund
pre-tax). Barrick Gold has reduced its “all-in-sustaining-costs” per ounce of gold from over $1,000 four years ago to just above $750 today while also reducing debt by over $4 billion in the last two years. WPX Energy reduced the cost to drill a well in the Bakken formation from $11 million a few years ago to about $5.5 million today and made a major acquisition in the Permian basin in 2015 that now appears to have been a huge bargain. White Mountains Insurance sold some subsidiaries and used a portion of the proceeds to repurchase shares at or near tangible book value. And Birchcliff Energy, already a low-cost operator, recently upgraded its asset base through a major acquisition of overlapping properties, which should improve efficiencies and reduce risk going forward.
These types of changes, when sensibly implemented, make these companies more valuable, irrespective of cyclical influences. Improving cost structures, reducing leverage, and making sensible capital allocation decisions all add to value. While volatility may result from changing economic conditions or commodity prices, we think the medium-term demand for products and services offered by these businesses will remain robust and that intrinsic values will grow. Generally speaking, these businesses have tremendous optionality.
In past letters we have cautioned that while we could not predict when, the likelihood of interest rates rising from at or below zero was a virtual certainty. Although a recent increase in the federal funds rate was indeed small, subsequent bond market losses exceeded a trillion dollars.4 While we cannot predict the timing, further increases seem likely over time, particularly if inflation starts to heat up. In addition to the recovery in energy and metals this year, higher interest rates should help some of our other investments going forward, like Leucadia National, Federated Investors, White Mountains Insurance, and Berkshire Hathaway.5
Over time, we prefer to invest in companies that not only appear to offer business value well in excess of recent market values, but which also have strong balance sheets and shareholder friendly management. We are continually looking to upgrade what we own – but only if we can buy at an advantageous price. We have identified a number of companies meeting these criteria that await prices offering potential returns higher than what exists today.
Currently our largest holdings are WPX Energy, Barrick Gold, Alphabet, Birchcliff Energy, White Mountains, and Leucadia. Somewhat smaller positions include Hewlett Packard Enterprise, Spectrum Brands, Federated Investors, Staples,
__________
4 | The federal funds rate is the interbank borrowing rate that is typically targeted by the Federal Reserve as its main lever to change short-term interest rates in the United States. It also uses other tools, such as interest on reserves. |
5 | Gold prices retreated materially late in the year. The bad news is that the price change hurt performance late this year as Barrick Gold declined about 30% from its summer highs. The good news is that the potential for future gain has materially increased. |
GoodHaven Fund
and Verizon. While we feel good about all of these companies we must continue to ensure that we are sizing the investments commensurate with their risks.
WPX had a good year, and began to reap the benefits of its extensive reorganization, its purchase of very valuable RKI in the Permian Basin, and a material recovery in the prices of oil and natural gas. While the investment community seems split as to whether prices will rise further or decline, our expectation is for limited downside and reasonable upside due to: a deep and pervasive decline in capital spending across the oil and gas industry over the last two years; the lowest rate of new oil discoveries in seventy years (according to consultant Wood McKenzie); producer nations whose economies are deeply stressed at lower price levels; a recent OPEC agreement to limit production; and domestic inventories that, while still high, appear to have peaked.
WPX weathered the staggeringly large decline in oil prices (from over $100 per barrel in mid-2014 to less than $30 per barrel in early-2016) with some dings, but emerging as a much better business. In early 2014, natural gas dominated the business and it had holdings in the eastern and western United States and Argentina, which included a bloated overhead structure, large and fixed natural gas transportation agreements, and other onerous expenses. After consummating a number of tough dispositions at reasonable prices during a difficult period, the company acquired a sizeable position in the Permian basin in mid-2015 – a deal our research suggests has added billions of dollars of value to the company.6
As a result, WPX has streamlined its holdings into three main areas – the Permian, the Bakken, and the San Juan – focused primarily on oil rather than gas. All of these properties are among the most productive and lowest cost within these basins. Under the leadership of Rick Muncrief, the company has cleverly reallocated capital and sharply reduced its overhead and drilling costs. With oil prices now above $50 per barrel and a decent hedge book for 2017 and part of 2018, the company is well positioned to take advantage of the opportunities it has created in recent years. According to a recent corporate presentation, WPX is projecting that its oil output will almost double in the next two years.
The Fund’s second largest investment, Barrick Gold, was similar in a number of ways to our previously successful investment in pre-split Hewlett-Packard (HP) where a low-cost producer and asset rich company generating significant cash flows became over-leveraged after overpaying for a large acquisition and borrowing to
__________
6 | The Permian basin shale formation was recently cited by the U.S. Department of Energy as the largest onshore discovery ever in the United States. Based on recent comparable transactions, the WPX purchase of Permian assets in 2015 was a great bargain. Despite significant capex, reserves of major oil companies have been declining. We suspect these large businesses will soon be forced to try to acquire reserves by purchasing independent producers with core holdings in the most prolific shale basins (i.e., companies like WPX). |
GoodHaven Fund
finance the deal. HP overpaid for a software company and Barrick for a copper miner. In both cases, the fall-out from bad deal-making resulted in major governance changes, with new management teams and significant board turnover.
In the case of Barrick, we became aggressive buyers due to several factors: new management and governance was focused on rapidly improving the balance sheet and per share free cash flow as primary objectives; the company’s low cost operations appear to have opportunities to drive costs even lower; there were non-core assets that could be used to reduce and restructure borrowings; per share cash flows could easily justify a much higher price; gold prices were far off the highs of just a few years earlier; and central bank reserves had exploded since 2008, suggesting that depreciation of fiat currencies was more likely down the road.
Since John Thornton took over as Chairman of the Board, the company has eliminated roughly $4.5 billion in debt, built significant liquidity, eliminated near-term debt repayments, and reduced “all-in-sustaining costs.” Just as impactful, it has also announced several important capital allocation decisions designed to rationalize its holdings and improve growth prospects – all of which were accomplished without touching the core mines owned by the company that are among the lowest cost operations in the world.7
As a commodity company that produces gold, silver, and copper, Barrick’s short-term results are clearly dependent on metals prices. On that subject, we are somewhat agnostic, believing that gold represents an alternate currency that is relatively rare and hard to depreciate through increased supply. Its main paper alternatives – dollars, yen, euro, renminbi – have seen supply multiply sharply since 2008. In 2011, the price of gold peaked at just over $1,900 per ounce, followed by a decline to below $1,100 per ounce in early 2016. During 2016, the price rose during the year to about $1,400 per ounce and then declined to a bit below $1,150 per ounce in recent days.8 We sold some shares near August highs to manage concentration risk that we recently began to repurchase.
In the last few weeks, headlines as well as Barrick’s stock price appear to be reflecting fears that an incipient chain of interest rate increases will crush gold prices. These fears appear overdone and are only espoused by those whose study of markets does not go back to the 1970s, when interest rates and metals prices both
__________
7 | “All-in sustaining costs” is a term used in the mining industry as a proxy for the per-ounce costs of operating a mining business at “steady-state.” Generally stated, the definition includes all normal operating costs as well as corporate G&A, reclamation, sustaining exploration and sustaining capital expenditures. Excluded are growth costs, income taxes, working capital changes, financing charges, business combination expenses, and impairments. |
8 | Recent weakness in gold prices may relate to the decision in India to replace “high value” bank notes – an act that has apparently caused tremendous economic dislocation in a country that is traditionally a large importer of gold. We also note that the performance of gold in currencies other than the U.S. Dollar can look very different. |
GoodHaven Fund
rose sharply in response to rising inflation. Although deflationary forces have abounded in recent years, we suspect, though we are not betting the farm, that the greater possibility today is that governments around the world continue to try to devalue their currencies in response to debt levels that are simply too high. If gold behaves as it has historically – as a hedge against currency depreciation – a significant price increase could occur. Alternatively, more monetary ease may reappear at the first sign of real economic weakness. Either way, with a talented management team, a better balance sheet, and a much lower cost structure, Barrick appears poised to prosper over time.
While hardly unknown, Alphabet continues to grow at a rapid rate for such a large company. Alphabet’s scale is staggering, with at least five applications used regularly by more than a billion people and the largest digital ad platform in the world. It also owns YouTube, which as a standalone business would be larger than most television networks, and Android, the most widely used operating system on smartphones and increasingly on other devices.
On an annual basis, the company is expected to generate close to $40 per share in earnings, despite still losing about $4 per share after-tax in its corporate venture capital investments. The stock is no longer cheap, but neither is it overpriced given its valuation, prospects for growth, and generation of free cash flow. Recently, for the first time, the company approved a significant share repurchase. With nearly $120 per share in cash and almost no debt, the company is in a unique position to be able to spend heavily to improve its business and benefit its shareholders at the same time. Its biggest threat would appear to be regulation rather than direct competition.
Among other holdings, Leucadia National appears to have seen its fortunes turn up after a tough period of softness at its largest subsidiaries. Both Jefferies and National Beef have seen large and positive swings in earnings in recent quarters and the company just announced the sale of a long-held subsidiary at a very attractive price (we added to our investment well below tangible book value during 2016). Federated Investors is currently somewhat out of favor as investors reacted negatively to recently implemented changes in regulatory rules governing its core money-market fund business, though we do not believe such changes are a major threat. Nevertheless, in a rising rate environment, we would expect assets to migrate back into money funds, increasing earnings power.
Staples was forced to call off its merger with rival Office Depot due to anti-trust issues, but still retains a significant scale advantage in its core business. The company has struggled in recent years in response to changes in technology and retail trends, but appears to be approaching an inflection point where growth may begin to resume – something we are watching carefully. Hewlett Packard Enterprise successfully completed one divestiture and announced two others – all have helped to move shares higher in 2016. During the year, we bought shares of Verizon when its stock price
GoodHaven Fund
weakened in response to a forecast of flat growth for a year or two. Over time, we expect the wireless business will remain incredibly stable, wireless spectrum will be a valuable asset, and the company will have significant embedded pricing power.
While the personal computer business at HP Inc. has improved, the company continues to struggle with the effects of a higher dollar and soft printer supplies revenue, though the overall business still generates large cash flows while trading at a low valuation. Spectrum Brands continues to offer price conscious consumers and retailers a value proposition that seems to resonate in today’s business climate. We admire the management and board of Spectrum in their ability to continue to identify and successfully integrate several acquisitions in recent years (as a reminder, we first bought Spectrum nearly five years ago at roughly one-fifth its current price).
Nevertheless, as in most sports, even good investment managers cannot avoid unforced errors. While renewing efforts to minimize process mistakes, we do own a few securities where the underlying businesses or management teams were unable to prove out our thesis in the last year. Some decisions on these must be made soon. Among these investments are Walter Investment Management, Dundee Corp., and Sears Holdings, which total less than 5% of the overall portfolio as we write.9 There is sometimes a small upside to mistakes – during the year and despite a significant overall economic gain, we were able to realize sufficient tax loss to avoid taxable distributions in 2016. While tax does not drive our investment decisions, we are aware that it does impact many of our shareholders. We try to manage these liabilities to benefit shareholders when such actions are not disruptive to the portfolio.
In today’s world, it’s worth reflecting a few thoughts on money flows in mutual funds (both specific to the GoodHaven Fund and to the industry generally). Most investors are emotional and a good number of the decisions they make turn out to be counterproductive. For example, in our first two to three years, our performance was solid and money poured into the Fund. In hindsight, it seems that many of these new shareholders represented “hot money” chasing recent performance. These investors did not think much (if at all) about business values or how we try to select businesses that have the potential to offer a competitive return on our capital going forward.
Following that period, we went through a roughly eighteen month performance lag, after which a cascade of money exited the Fund (the former hot money shareholders, mostly) with the crescendo of outflows occurring in late 2015 and early 2016 – just in time to miss a double digit performance rebound that handily exceeded the performance of many broad equity and debt indexes notwithstanding a healthy cash position that moderated risk.
__________
9 | Since our initial purchases of Sears, the company has distributed roughly $35 in value of additional securities that we have monetized or retained – value not reflected in the current price. |
GoodHaven Fund
Through these periods, we believe we have behaved consistently and overall turnover in the portfolio has been fairly low (our shareholders were trading us more than we were trading the portfolio). In effect, we went through a tough period where we were out of sync with markets – something that happens to all value investors from time to time – yet many decided that the short-term result was somehow a fatal flaw.
So why the large influx and outflow of shareholder money – which of course makes it more difficult to manage a portfolio? The answer is relatively simple – it’s human nature. Most people are not wired to behave in a way that really benefits from the volatility of markets. As Ben Graham once said, markets exist to serve you, not to educate you. It seems to us that a longer-term view and a tolerance for some volatility is becoming an increasingly valuable competitive advantage in the world of investing. Accordingly, we want to thank our like-minded shareholders for sticking with us and benefitting from our rebound this past year. Onwards!
Lastly on this subject of seemingly ill-timed cash flows, we want to draw your attention to the cascade of money that has poured out of actively managed funds and into passive vehicles, such as index funds. While the trend from active to passive has been in place for a while, the recent acceleration has been astonishing, with nearly half a trillion dollars moving in the last two years. In September 2016, the Illinois State Pension Board fired all active managers and switched roughly two-thirds of its total assets to passive equity index funds. In October 2016, the Wall Street Journal ran an article entitled “The Dying Business of Picking Stocks,” essentially arguing that passive investing had become institutionalized, a preferred strategy of institutional investors, and that active investing was going the way of the dodo.10
Our views on indexation are probably not controversial, but they are pointed. Indexation may make sense for a good number of investors when markets are moderately valued or cheap and when people have no time or inclination to seek out sensible managers or research for undervalued securities. We believe however, when broad indexes sell at or near record high valuation levels, you do not want your portfolio to closely resemble the index (ours does not!)
As writer Samuel Clemens (also known as Mark Twain) once was reputed to have said, “History does not repeat, but it does rhyme.” The decade following the end of the technology bubble that ended in March 2000 was a fruitful and productive period for value investors who had refused to buy overpriced merchandise from late 1998 through early 2000. Yet these same investors had to have been willing to suffer relative weakness during the last eighteen months of the bubble even as the speculative trading profits from money-losing businesses seemed endless.
__________
10 | The dodo, a flightless bird last living on the island of Mauritius, near Madagascar, was determined to have been made extinct in 1681. After presumably thousands of years of remaining undisturbed by natural predation, it was wiped out after Portuguese explorers began to hunt them for food and introduced unnatural predators into their environment. Within one hundred years of human interaction, it was rare; in less than two hundred, it was gone. |
GoodHaven Fund
In the near-term, we suspect that money-flows from active to passive have been driving recent index returns and that such flows may be topping out. Historically, owning indexes at current valuation levels is correlated to poor forward ten-year returns. We suspect today is little different. As one of our shareholders recently wrote to us, why in the world would anyone want to own a piece of every business in the S&P 500 when most of these businesses seem fully valued or worse? Put simply, we don’t. A good investor should be willing to trade the comfort of the index crowd for the prospect of better returns, so long as they can tolerate the volatility of sometimes standing alone.
Today, there are still plenty of reasons for caution. Worldwide debt levels are materially higher than when the 2008 financial crisis began. Recovery has been tepid. Bond yields may have bottomed but remain at very low levels even as stock indexes hit all-time highs. As one commentator joked, the definition of a looming economic black hole is when the stock market is near record highs, bond yields are near record lows, and nobody is happy.
But amid all the noise and while not easy, investing boils down to trying to do a few simple things well. First, we want to own securities priced to offer reasonable prospects for returns relative to their market prices, not when they are priced to perfection. Second, we need to constantly test our assumptions and adjust holdings when new developments are hostile to our thesis or valuation, based on in-depth fundamental research. Third, we want to have the courage of our convictions and not be easily swayed by external events, market volatility, political developments, or investment fads. Lastly, we believe it is important that we invest personally in the fund and have significant “skin in the game.”
Thank you for your patience – we are confident this past year represents a return to better days.
Sincerely,
 |  |
| | |
| Larry Pitkowsky | Keith Trauner |
Mutual fund investing involves risk. Principal loss is possible. The Fund is non-diversified, meaning it may concentrate its assets in fewer individual holdings than a diversified fund. Therefore, the Fund is more exposed to individual stock volatility than a diversified fund. The Fund invests in midcap and smaller capitalization companies, which involve additional risks such as limited liquidity and greater volatility. The Fund may invest in foreign securities which involve political, economic and currency risks, greater volatility and differences in accounting methods. These risks are enhanced in emerging markets. The Fund may invest in REITs, which are subject to additional
GoodHaven Fund
risks associated with direct ownership of real property including decline in value, economic conditions, operating expenses, and property taxes. Investments in debt securities typically decrease in value when interest rates rise. This risk is usually greater for longer-term debt securities. Investments in lower-rated, non-rated and distressed securities present a greater risk of loss to principal and interest than higher-rated securities.
The opinions expressed are those of Larry Pitkowsky and/or Keith Trauner through the end of the period for this report, are subject to change, and are not intended to be a forecast of future events, a guarantee of future results, nor investment advice. This material may include statements that constitute “forward-looking statements” under the U.S. securities laws. Forward-looking statements include, among other things, projections, estimates, and information about possible or future results related to the Fund, market or regulatory developments. The views expressed herein are not guarantees of future performance or economic results and involve certain risks, uncertainties and assumptions that could cause actual outcomes and results to differ materially from the views expressed herein. The views expressed herein are subject to change at any time based upon economic, market, or other conditions and GoodHaven undertakes no obligation to update the views expressed herein. While we have gathered this information from sources believed to be reliable, GoodHaven cannot guarantee the accuracy of the information provided. Any discussions of specific securities or sectors should not be considered a recommendation to buy or sell those securities. The views expressed herein (including any forward-looking statement) may not be relied upon as investment advice or as an indication of the Fund’s trading intent. Information included herein is not an indication of the Fund’s future portfolio composition.
Must be preceded or accompanied by a prospectus. It is not possible to invest directly in an index.
Cash flow is generally defined as the cash a company generates from its business operations, before capital or securities investments.
Free cash flow is generally defined as cash revenues less all normal operating expenses (including interest expense) and less an estimate of the capital spending necessary to maintain the business in its current state.
Book Value represents the accounting value remaining after a corporation’s liabilities are subtracted from its assets.
Tangible Book Value represents the accounting value remaining after a corporation’s liabilities are subtracted from its assets (but excluding the value of any intangible assets, such as goodwill).
The S&P 500 Index is a capitalization weighted index of 500 large capitalization stocks which is designed to measure broad domestic securities markets.
The Wilshire 5000 Total Market Index (full-cap) measures the performance of all U.S. equity securities with readily available price data. Over 5,000 capitalization weighted security returns are used to adjust the index.
HFRI Fundamental Growth strategies employ analytical techniques in which the investment thesis is predicated on assessment of the valuation characteristics on the underlying companies which are expected to have prospects for earnings growth and capital appreciation exceeding those of the broader equity market. Investment theses are focused on characteristics of the firm’s financial statements in both an absolute sense and relative to other similar securities and more broadly, market indicators. Strategies employ investment processes designed to identify attractive opportunities in securities of companies which are experiencing or expected to experience abnormally high levels of growth compared with relevant benchmarks growth in earnings, profitability, sales or market share.
HFRI Fundamental Value Index strategies employ investment processes designed to identify attractive opportunities in securities of companies which trade a valuation metrics by which the manager determines them to be inexpensive and undervalued when compared with relevant benchmarks. Investment theses are focused on characteristics of the firm’s financial statements in both an absolute sense and relative to other similar securities and more broadly, market indicators. Relative to Fundamental Growth strategies, in
GoodHaven Fund
which earnings growth and capital appreciation is expected as a function of expanding market share & revenue increases, Fundamental Value strategies typically focus on equities which currently generate high cash flow, but trade at discounted valuation multiples, possibly as a result of limited anticipated growth prospects or generally out of favor conditions, which may be specific to sector or specific holding.
CS Hedge Fund Index is an asset-weighted hedge fund index derived from the TASS database of more than 5000 funds. The index consists of funds with a minimum of US $10 million under management and a current audited financial statement. Funds are separated into primary subcategories based on investment style. The index in all cases represents at least 85% of the assets under management in the universe. The index is rebalanced monthly, and funds are reselected on a quarterly basis. Index NAVs are updated on the 15th of each month.
GoodHaven Fund
PORTFOLIO MANAGEMENT DISCUSSION AND ANALYSIS (Unaudited) |
The Net Asset Value (“NAV”) of the GoodHaven Fund was $23.37 at November 30, 2016 based on 11,623,100 shares outstanding. This compares to the Fund’s NAV of $20.52 at November 30, 2015, an NAV of $21.63 at May 31, 2016, and an NAV of $20.00 at inception on April 8, 2011. Although the Fund did not pay a taxable distribution of capital gains or income in 2016, shareholders should be aware that the Fund has paid capital gains and income distributions in prior years that reduced NAV by the amount of a distribution on the ex-dividend date. Please note that except where otherwise indicated, discussions in this MD&A relate to the period ended November 30, 2016. The Fund’s performance for the period December 1, 2015 to November 30, 2016 was a gain of 13.89% compared to a gain of 8.06% for the S&P 500 Index. Since inception on April 8, 2011 and through November 30, 2016, the Fund’s annualized performance is a gain of 4.67% compared to an increase of 11.71% for the S&P 500 Index. The Fund gained 4.75% annualized for the five year period ending November 30, 2016 compared to 14.45% for the S&P 500 Index. Please see the portfolio manager’s letter to shareholders for additional information regarding performance and comparisons to other indexes. All comparisons assume reinvested dividends.
The performance data quoted above represents past performance. Past performance does not guarantee future results. The investment return and principal value of an investment will fluctuate so that an investor’s shares, when redeemed, may be worth more or less than their original cost. Current performance of the Fund may be lower or higher than the performance quoted. Performance data current to the most recent month-end may be obtained by calling (855) OK-GOODX or (855) 654-6639.
2016 was a good year for Fund performance as a number of important holdings rebounded from lows set early in the year. Still, it was a difficult year for many fund managers and the last two years have seen enormous industry reallocations away from actively managed mutual funds and into passively managed index funds (including ETFs). We believe the industry may be approaching an inflection point (at least in the intermediate term) where that trend will slow or perhaps reverse. As with almost all trends on Wall Street, we suspect the intense desire for index products is rearward looking, has gone too far, and may lead to significant investor losses in coming years.
The portfolio managers believe that short-term performance figures are less meaningful than a comparison of longer periods and that a long-term investment strategy should be properly judged over a period of years rather than weeks or months. Furthermore, the S&P 500 Index is an unmanaged index incurring no fees, expenses, or taxes and is shown solely for the purpose of comparing the Fund’s portfolio to an unmanaged and diversified index of large companies.
GoodHaven Fund
PORTFOLIO MANAGEMENT DISCUSSION AND ANALYSIS (Unaudited) (Continued) |
Below is a table of the Fund’s top ten holdings and categories as of November 30, 2016.1
Top 10 Holdings* | % | | Top Categories** | % |
| WPX Energy, Inc.*** | 14.8% | | Cash and Equivalents | 22.2% |
| Barrick Gold Corp. | 10.0% | | Oil & Gas Exploration | |
| Alphabet, Inc.*** | 5.8% | | & Production | 19.1% |
| Birchcliff Energy Ltd. | 4.3% | | Metals & Mining | 10.0% |
| White Mountains | | | Computers & | |
| Insurance Group | 4.1% | | Peripheral Equipment | 7.7% |
| Leucadia National Corp. | 3.9% | | Diversified Holding Companies | 7.2% |
| Hewlett Packard Enterprise Co. | 3.8% | | Property/Casualty Insurance | 5.9% |
| Walter Investment | | | Computer & Internet Software | 5.8% |
| Management Corp. | 3.4% | | Retailing | 4.3% |
| Spectrum Brands Holdings, Inc. | 3.3% | | Loan Servicing | 3.4% |
| Staples, Inc. | 3.3% | | Consumer Products | 3.3% |
| Total | 56.7% | | | 88.9% |
| * | | Top ten holdings excludes cash, money market funds and Government and Agency Obligations |
| ** | | Where applicable, includes money market funds and short-term Government and Agency Obligations |
| *** | | Issuer totals |
1 | | Fund holdings and/or sector allocations are subject to change at any time and are not recommendations to buy or sell any security. |
While the Fund experienced significant net withdrawals late in 2015 and early 2016 that reduced assets, a combination of positive performance and modest inflows in recent weeks left assets roughly the same at fiscal year-end 2016 compared to 2015. Should relative performance continue to improve, we would expect the Fund to begin to draw new net inflows. Nevertheless, since inception of the Fund, there have been periods where there were large new shareholder subscriptions and periods with significant net withdrawals. We believe this is primarily caused by shareholders who are attracted by the potential for better performance in a concentrated value fund but which are negatively and emotionally affected by volatility in results – resulting in short-term behavior that tends to reduce returns among mutual fund investors. It may be interesting to note that neither of the portfolio managers of the Fund, whose shareholdings total in the millions of dollars, has ever sold shares of the Fund.
Material swings in shareholder subscriptions and redemptions can make management of the portfolio more difficult. During the most recent fiscal year, the portfolio managers were able to undertake actions to avoid creating taxable gains during 2016 without materially affecting portfolio values. The Fund’s investments are stated as of November 30, 2016, and the amounts and rankings of the Fund’s holdings today may vary significantly from the data disclosed above and the managers may have taken actions that would result in material changes to the portfolio.
GoodHaven Fund
PORTFOLIO MANAGEMENT DISCUSSION AND ANALYSIS (Unaudited) (Continued) |
The Fund’s investments having the most positive impact on portfolio performance for the annual period ended November 30, 2016 were WPX Energy, Barrick Gold, Birchcliff Energy, Hewlett Packard Enterprise, Spectrum Brands, HP Inc., and Leucadia National. WPX rose as oil prices rebounded and the company continued to make progress on its strategic and operational initiatives; Barrick rose in response to higher prices for both gold and copper, as well as further debt reduction and lowered operating costs; Hewlett Packard Enterprise increased in response to a number of capital transactions effecting spin-out mergers while also repurchasing shares; Spectrum rose as it continued its record of growth while offering value to consumers and retailers; HP Inc. increased as personal computer revenues stabilized even as printer sales and supplies were weak; and Leucadia rose in response to a turn-around at its two largest business units as well as a rate increase late in the year.
The Fund’s investments having the most negative impact on the portfolio for the annual period ended November 30, 2016 were Walter Investment Management, Sears Holdings, Staples, Inc., and miscellaneous securities not previously disclosed. During the year, Walter fell as it continued to struggle with high operating and regulatory costs, despite replacing key management and adding shareholders to the Board; Sears Holdings fell as it continued to experience dismal retail results despite additional capital transactions to increase liquidity; Staples fell after its transaction to acquire Office Depot was ruled a violation of anti-trust law; and the Fund also saw realized losses from a number of modestly sized hedge transactions intended to reduce overall market risk during the year.
During the period, the Fund disposed of its investments in Colfax Corporation within a few months of purchase as it rose sharply almost immediately after purchase early in 2016 and reached our estimate of fair value.
The managers of the Fund do not believe that a decline in a security price necessarily means that the security is a less attractive investment. The opposite may be the case in that price declines may represent significant investment opportunities. During fiscal 2016, the largest single factors affecting performance was a significant recovery in oil and metals prices, as well as fundamental developments related to specific holdings in these areas. These gains occurred despite a fairly rapid rise of the U.S. dollar during the year, which tends to depress commodity prices as well as the revenues of companies that generate significant sales in non-U.S. jurisdictions as well as translation losses from securities that are denominated in currencies other than the U.S. dollar. The portfolio managers generally do not try to predict macroeconomic or market swings and prefer instead to try to react to what happens.
The Fund’s turnover rate, a measure of how frequently assets within a fund are bought and sold by the managers, remains at reasonably low levels and is consistent with the strategies, generally long-term in nature, of GoodHaven Capital Management, the Fund’s investment advisor. Turnover rates in fiscal 2016 were
GoodHaven Fund
PORTFOLIO MANAGEMENT DISCUSSION AND ANALYSIS (Unaudited) (Continued) |
modestly influenced by the need to meet shareholder redemptions rather than a change in the portfolio strategy of the Fund. Compared to most funds, turnover remains low. Importantly, there may be times when turnover rates rise, however, we do not anticipate rapid turnover of the portfolio under normal circumstances.
The portfolio managers believe that a significant liquidity position is an important part of portfolio management. Since inception, the Fund has continued to have significant liquidity available both in cash holdings as well as short-term fixed income investments. As a result of shareholder redemptions, liquidity has been somewhat reduced from the high points of the last couple of years. In order to ensure that we have sufficient resources to behave opportunistically, the Fund has sold or reduced certain investments and may hold some modest hedges from time to time. There is no guarantee that such hedges will protect against loss and the Fund may lose money should volatility be reduced in future months. In the last year, the Fund experienced modest losses as a result of hedge transactions. Over time, we expect the Fund’s level of cash to vary significantly and could be higher or lower than shown on the most recent Schedule of Investments.
As of the end of the fiscal year, the Fund is operating with a significant position in cash and equivalent investments. This position reflects high average equity valuations, the opportunity set we see, and other factors. Additionally, the continued rise in general stock prices has made bargains more difficult to find and slowed reinvestment, with some measures of valuation bumping up against historic highs. We believe that having a cash cushion at a time of generally elevated prices and investor ebullience is a strategic and tactical advantage. Although not obvious in results, cash has allowed us to meet redemptions in an efficient manner while mostly avoiding forced liquidation of investments.
It is our intention to invest a significant portion of current liquidity in an opportunistic manner when bargains meeting our investment criteria appear. However, it is possible that the Fund may have a significant cash position for an extended period of time if, in the opinion of the portfolio managers, market conditions are unfavorable. At times when liquidity is high, the Fund may underperform a strongly rising stock market. We note that although the Fund had significant liquidity during the period from Inception in April 2011 through May of 2014 (including a sizeable amount related to a large cash influx due to new Fund share subscriptions), performance was still reasonable by relative and absolute standards over that time frame. In the last year, the Fund significantly outperformed most equity indexes, despite having significant liquidity during a period when indexes significantly appreciated. The portfolio managers’ letter to shareholders contains additional discussion about performance.
Generally, we do not expect significant realized capital gain or loss from any particular short-term, non-U.S. investments when viewed over an extended period. However, during fiscal 2016, the dollar strengthened and we own or have acquired a
GoodHaven Fund
PORTFOLIO MANAGEMENT DISCUSSION AND ANALYSIS (Unaudited) (Continued) |
number of equity investments domiciled outside of the U.S. or with significant non-U.S. revenues. A strong dollar typically results in currency translation losses and may serve to reduce reported earnings of companies with significant non-U.S. revenues when reported in dollar terms. Such reduced earnings could negatively affect those companies’ market prices, although we would expect such negative effects to be primarily a short-term phenomenon.
To reiterate our view on liquidity, the portfolio managers believe that a certain amount of liquidity may benefit shareholders in several ways – by preventing liquidation of securities to meet modest levels of redemptions, by providing ammunition to purchase existing or new holdings in declining markets without being forced to sell existing holdings, and by lessening the chance that shareholders will blindly seek liquidations during periods of market stress that could adversely impact the Fund. That said, if bargains meeting our criteria seem plentiful, we are likely to have significantly less liquidity under such conditions than has been the case since inception.
The Fund is subject to certain risks as disclosed in the Prospectus and Statement of Additional Information, both of which may be obtained from the Fund’s website at www.goodhavenfunds.com or by calling 1-855-654-6639. Some of these risks include, but are not limited to, adverse market conditions that negatively affect the price of securities owned by the Fund, a high level of cash, which may result in underperformance during periods of robust price appreciation, adverse movements in foreign currency relationships as a number of the Fund’s holdings have earnings resulting from operations outside the United States, and the fact that the Fund is non-diversified, meaning that its holdings are more concentrated than a diversified Fund and that adverse price movements in a particular security may affect the Fund’s Net Asset Value more negatively than would occur in a more diversified fund.
As of November 30, 2016, the members, officers, and employees of GoodHaven Capital Management, LLC, the investment advisor to the GoodHaven Fund, owned approximately 249,878 shares of the Fund. The portfolio managers added to personal holdings during the fiscal year. It is management’s intention to disclose such holdings (in the aggregate) in this section of the Fund’s Annual and Semi-Annual reports on an ongoing basis.
GoodHaven Fund
SECTOR ALLOCATION at November 30, 2016 (Unaudited) |
| | Sector | | % of Net Assets |
| | | | | |
| | Cash & Equivalents1 | | | 22.2 | % |
| | Oil & Gas Exploration & Production2 | | | 19.1 | % |
| | Metals & Mining | | | 10.0 | % |
| | Computers & Peripheral Equipment | | | 7.7 | % |
| | Diversified Holdings Companies | | | 7.2 | % |
| | Property/Casualty Insurance | | | 5.9 | % |
| | Computer & Internet Software | | | 5.8 | % |
| | Retailing | | | 4.3 | % |
| | Loan Servicing | | | 3.4 | % |
| | Consumer Products | | | 3.3 | % |
| | Financial Services | | | 2.9 | % |
| | Telecommunications | | | 2.8 | % |
| | Guernsey Investment Fund | | | 2.4 | % |
| | Marine Services & Equipment | | | 1.7 | % |
| | Real Estate Investment Trusts | | | 1.2 | % |
| | Miscellaneous | | | 0.1 | % |
| | Total | | | 100.0 | % |
1 | Represents cash and other assets in excess of liabilities. |
2 | Including Call Options Written, sector weighting is 19.0%. |
GoodHaven Fund
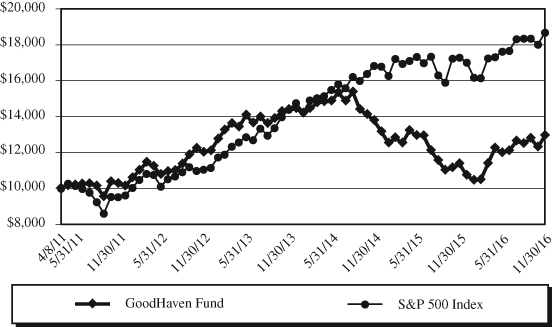
HISTORICAL PERFORMANCE (Unaudited) |
Value of $10,000 vs. S&P 500 Index
Average Annual Total Returns
Periods Ended November 30, 2016
| | | | | Annualized | Value of |
| | One | Three | Five | Since Inception | $10,000 |
| | Year | Year | Year | (4/8/2011) | (11/30/2016) |
| GoodHaven Fund | 13.89% | -3.46% | 4.75% | 4.67% | $12,940 |
| S&P 500 Index | 8.06% | 9.07% | 14.45% | 11.71% | $18,692 |
This chart illustrates the performance of a hypothetical $10,000 investment made on April 8, 2011 (the Fund’s inception) and is not intended to imply any future performance. The returns shown do not reflect the deduction of taxes that a shareholder would pay on Fund distributions or the redemption of Fund shares. The chart assumes reinvestment of capital gains and dividends, but does not reflect redemption fees of 2.00% on shares held less than 60 days.
GoodHaven Fund
SCHEDULE OF INVESTMENTS at November 30, 2016 |
| Shares | | Common Stocks – 73.7% | | Value | |
| | | | | | |
| | | Computer & Internet Software – 5.8% | | | |
| | 9,000 | | Alphabet, Inc. – Class A1 | | $ | 6,982,920 | |
| | 11,500 | | Alphabet, Inc. – Class C1 | | | 8,717,460 | |
| | | | | | | 15,700,380 | |
| | | | | | | | |
| | | | Computers & Peripheral Equipment – 7.7% | | | | |
| | 433,400 | | Hewlett Packard Enterprise Co. | | | 10,314,920 | |
| | 498,400 | | HP Inc. | | | 7,675,360 | |
| | 343,742 | | Systemax, Inc.2 | | | 2,969,931 | |
| | | | | | | 20,960,211 | |
| | | | | | | | |
| | | | Consumer Products – 3.3% | | | | |
| | 75,000 | | Spectrum Brands Holdings, Inc. | | | 8,991,750 | |
| | | | | | | | |
| | | | Diversified Holding Companies – 7.2% | | | | |
| | 29,200 | | Berkshire Hathaway, Inc. – Class B1 | | | 4,597,248 | |
| | 1,035,320 | | Dundee Corp.1,2 | | | 4,454,813 | |
| | 477,512 | | Leucadia National Corp. | | | 10,514,814 | |
| | | | | | | 19,566,875 | |
| | | | | | | | |
| | | | Financial Services – 2.9% | | | | |
| | 290,300 | | Federated Investors, Inc. – Class B | | | 7,980,347 | |
| | | | | | | | |
| | | | Loan Servicing – 3.4% | | | | |
| | 1,613,429 | | Walter Investment Management Corp.1,3 | | | 9,196,545 | |
| | | | | | | | |
| | | | Marine Services & Equipment – 1.7% | | | | |
| | 376,694 | | Stolt-Nielsen Ltd.2 | | | 4,490,931 | |
| | | | | | | | |
| | | | Metals & Mining – 10.0% | | | | |
| | 1,802,150 | | Barrick Gold Corp. | | | 27,068,293 | |
| | | | | | | | |
| | | | Oil & Gas Exploration & Production – 18.7% | | | | |
| | 1,718,100 | | Birchcliff Energy Ltd.1 | | | 11,613,450 | |
| | 2,530,055 | | WPX Energy, Inc.1 | | | 39,317,055 | |
| | | | | | | 50,930,505 | |
| | | | | | | | |
| | | | Property/Casualty Insurance – 5.9% | | | | |
| | 8,482 | | Alleghany Corp.1 | | | 4,817,352 | |
| | 13,411 | | White Mountains Insurance Group | | | 11,224,605 | |
| | | | | | | 16,041,957 | |
| | | | | | | | |
| | | | Retailing – 4.3% | | | | |
| | 218,000 | | Sears Holdings Corp.1 | | | 2,807,840 | |
The accompanying notes are an integral part of these financial statements.
GoodHaven Fund
SCHEDULE OF INVESTMENTS at November 30, 2016 (Continued) |
| Shares | | COMMON STOCKS – 73.7% (Continued) | | Value | |
| | | | | | |
| | | Retailing – 4.3% (Continued) | | | |
| | 921,900 | | Staples, Inc. | | $ | 8,914,773 | |
| | | | | | | 11,722,613 | |
| | | | | | | | |
| | | | Telecommunications – 2.8% | | | | |
| | 150,000 | | Verizon Communications, Inc. | | | 7,485,000 | |
| | | | TOTAL COMMON STOCKS | | | | |
| | | | (Cost $189,055,214) | | | 200,135,407 | |
| | | | | | | | |
| | | | GUERNSEY INVESTMENT FUND – 2.4% | | | | |
| | 1,036,487 | | JZ Capital Partners Limited2 | | | 6,575,065 | |
| | | | TOTAL GUERNSEY INVESTMENT FUND | | | | |
| | | | (Cost $5,910,842) | | | 6,575,065 | |
| | | | | | | | |
| | | | REAL ESTATE INVESTMENT TRUSTS – 1.2% | | | | |
| | 68,058 | | Seritage Growth Properties | | | 3,242,283 | |
| | | | TOTAL REAL ESTATE INVESTMENT TRUSTS | | | | |
| | | | (Cost $2,635,891) | | | 3,242,283 | |
| | | | | | | | |
| Principal | | | | | | |
| Amount | | CORPORATE BONDS – 0.4% | | | | |
| | | | | | | | |
| | | | Oil & Gas Exploration & Production – 0.4% | | | | |
| $ | 1,000,000 | | WPX Energy, Inc. 5.250% due 1/15/2017 | | | 1,001,875 | |
| | | | TOTAL CORPORATE BONDS | | | | |
| | | | (Cost $990,052) | | | 1,001,875 | |
| | | | | | | | |
| | | | MISCELLANEOUS SECURITIES – 0.1%1,4 | | | | |
| | | | TOTAL MISCELLANEOUS SECURITIES | | | | |
| | | | (Cost $754,410) | | | 331,500 | |
| | | | Total Investments | | | | |
| | | | (Cost $199,346,409) – 77.8% | | | 211,286,130 | |
| | | | Cash and Other Assets in | | | | |
| | | | Excess of Liabilities – 22.2% | | | 60,353,532 | |
| | | | TOTAL NET ASSETS – 100.0% | | $ | 271,639,662 | |
1 | Non-income producing security. |
2 | A portion of this security is considered illiquid. As of November 30, 2016, the total market value of illiquid securities was $14,462,195 or 5.3% of net assets. |
3 | Affiliated company as defined by the Investment Company Act of 1940. |
4 | Represents previously undisclosed securities which the Fund has held for less than one year. |
The accompanying notes are an integral part of these financial statements.
GoodHaven Fund
SCHEDULE OF OPTIONS WRITTEN at November 30, 2016 |
| Contracts | | | | | |
| (100 shares | | | | | |
| per contract) | | CALL OPTIONS WRITTEN | | Value | |
| | | | | | |
| | | Oil & Gas Exploration & Production – 0.1% | | | |
| | 1,000 | | WPX Energy, Inc. Expiration: January 2017, | | | |
| | | | Exercise Price: $15.001 | | $ | 155,000 | |
| | | | TOTAL CALL OPTIONS WRITTEN | | | | |
| | | | (Proceeds $114,199) | | $ | 155,000 | |
Percentage based on net assets.
1 | Non-income producing security. |
The accompanying notes are an integral part of these financial statements.
GoodHaven Fund
STATEMENT OF ASSETS AND LIABILITIES at November 30, 2016 |
| ASSETS | | | |
| Investments in unaffiliated securities, at value | | | |
| (Cost $165,260,901) | | $ | 202,089,585 | |
| Investments in securities of affiliated issuers, at value | | | | |
| (Cost $34,085,508) | | | 9,196,545 | |
| Total investments, at value (Cost $199,346,409) (Note 2) | | | 211,286,130 | |
| | | | | |
| Cash | | | 60,167,006 | |
| Receivables: | | | | |
| Fund shares sold | | | 455,402 | |
| Dividends and interest | | | 239,065 | |
| Total assets | | | 272,147,603 | |
| | | | | |
| LIABILITIES | | | | |
| Options written, at value (Proceeds received $114,199) | | | 155,000 | |
| Payables: | | | | |
| Fund shares redeemed | | | 116,504 | |
| Management fees | | | 193,448 | |
| Support services fees | | | 42,989 | |
| Total liabilities | | | 507,941 | |
| | | | | |
| NET ASSETS | | $ | 271,639,662 | |
| | | | | |
| COMPONENTS OF NET ASSETS | | | | |
| Paid-in capital | | $ | 262,761,153 | |
| Accumulated net investment loss | | | (1,137,293 | ) |
| Accumulated net realized loss on investments | | | (1,883,118 | ) |
| Net unrealized appreciation (depreciation) on: | | | | |
| Investments | | | 11,939,721 | |
| Options written | | | (40,801 | ) |
| Net assets | | $ | 271,639,662 | |
| | | | | |
| Net Asset Value (unlimited shares authorized): | | | | |
| Net assets | | $ | 271,639,662 | |
| Shares of beneficial interest issued and outstanding | | | 11,623,100 | |
| Net asset value, offering and redemption price per share | | $ | 23.37 | |
The accompanying notes are an integral part of these financial statements.
GoodHaven Fund
STATEMENT OF OPERATIONS For the Year Ended November 30, 2016 |
| INVESTMENT INCOME | | | |
| Dividends from unaffiliated securities | | | |
| (net of $22,196 in foreign withholding taxes) | | $ | 2,865,931 | |
| Interest | | | 164,765 | |
| Total investment income | | | 3,030,696 | |
| | | | | |
| EXPENSES | | | | |
| Management fees | | | 2,329,230 | |
| Support services fees | | | 517,607 | |
| Total expenses | | | 2,846,837 | |
| Net investment income | | | 183,859 | |
| | | | | |
| REALIZED AND UNREALIZED GAIN (LOSS) ON INVESTMENTS, | | | | |
| OPTIONS WRITTEN & FOREIGN CURRENCY | | | | |
| Net realized gain (loss) on transactions from: | | | | |
| Unaffiliated investments & foreign currency | | | 1,298,167 | |
| Affiliated investments | | | (2,113,819 | ) |
| Options written | | | 198,079 | |
| Net realized loss | | | (617,573 | ) |
| Net change in unrealized appreciation/depreciation on: | | | | |
| Investments | | | 35,228,114 | |
| Options written | | | (40,801 | ) |
| Net unrealized appreciation | | | 35,187,313 | |
| Net realized and unrealized gain | | | 34,569,740 | |
| Net increase in net assets resulting from operations | | $ | 34,753,599 | |
The accompanying notes are an integral part of these financial statements.
GoodHaven Fund
| STATEMENTS OF CHANGES IN NET ASSETS |
| | | Year Ended | | | Year Ended | |
| | | November 30, 2016 | | | November 30, 2015 | |
| INCREASE (DECREASE) IN NET ASSETS FROM: | | | | | | |
| | | | | | | |
| OPERATIONS | | | | | | |
| Net investment income | | $ | 183,859 | | | $ | 184,796 | |
| Net realized gain (loss) on unaffiliated | | | | | | | | |
| investments, affiliated investments, | | | | | | | | |
| options written & foreign currency | | | (617,573 | ) | | | 2,160,801 | |
| Change in unrealized appreciation/ | | | | | | | | |
| depreciation on investments, options | | | | | | | | |
| written & foreign currency | | | 35,187,313 | | | | (63,929,472 | ) |
| Net increase (decrease) in net assets | | | | | | | | |
| resulting from operations | | | 34,753,599 | | | | (61,583,875 | ) |
| | | | | | | | | |
| DISTRIBUTIONS TO SHAREHOLDERS | | | | | | | | |
| From net realized gain | | | — | | | | (25,958,120 | ) |
| Total distributions to shareholders | | | — | | | | (25,958,120 | ) |
| | | | | | | | | |
| CAPITAL SHARE TRANSACTIONS | | | | | | | | |
| Net decrease in net assets derived from | | | | | | | | |
net change in outstanding shares1 | | | (30,963,999 | ) | | | (88,302,552 | ) |
| Total increase (decrease) in net assets | | | 3,789,600 | | | | (175,844,547 | ) |
| | | | | | | | | |
| NET ASSETS | | | | | | | | |
| Beginning of year | | | 267,850,062 | | | | 443,694,609 | |
| End of year | | $ | 271,639,662 | | | $ | 267,850,062 | |
| Accumulated net investment loss | | $ | (1,137,293 | ) | | $ | (2,537,749 | ) |
1 | Summary of capital share transactions is as follows: |
| | | | Year Ended | | | Year Ended | |
| | | | November 30, 2016 | | | November 30, 2015 | |
| | | | Shares | | | Value | | | Shares | | | Value | |
| | Shares sold | | | 2,248,759 | | | $ | 44,719,478 | | | | 5,005,468 | | | $ | 111,749,266 | |
| | Shares issued in | | | | | | | | | | | | | | | | |
| | reinvestment | | | | | | | | | | | | | | | | |
| | of distributions | | | — | | | | — | | | | 1,018,626 | | | | 24,956,339 | |
| | Shares redeemed2 | | | (3,678,675 | ) | | | (75,683,477 | ) | | | (9,544,663 | ) | | | (225,008,157 | ) |
| | Net decrease | | | (1,429,916 | ) | | $ | (30,963,999 | ) | | | (3,520,569 | ) | | $ | (88,302,552 | ) |
2 | Net of redemption fees of $8,723 and $87,839, respectively. |
The accompanying notes are an integral part of these financial statements.
GoodHaven Fund
FINANCIAL HIGHLIGHTS For a capital share outstanding throughout each year |
| | | Year Ended November 30, | |
| | | 2016 | | | 2015 | | | 2014 | | | 2013 | | | 2012 | |
| Net asset value at | | | | | | | | | | | | | | | |
| beginning of year | | $ | 20.52 | | | $ | 26.77 | | | $ | 28.26 | | | $ | 24.00 | | | $ | 20.52 | |
| | | | | | | | | | | | | | | | | | | | | |
| INCOME FROM INVESTMENT OPERATIONS | | | | | | | | | | | | | | | | | | | | |
| Net investment | | | | | | | | | | | | | | | | | | | | |
income (loss)1 | | | 0.02 | | | | 0.01 | | | | (0.03 | ) | | | 0.02 | | | | 0.21 | |
| Net realized and unrealized | | | | | | | | | | | | | | | | | | | | |
| gain (loss) on investments | | | 2.83 | | | | (4.40 | ) | | | (1.16 | ) | | | 4.65 | | | | 3.29 | |
| Total from | | | | | | | | | | | | | | | | | | | | |
| investment operations | | | 2.85 | | | | (4.39 | ) | | | (1.19 | ) | | | 4.67 | | | | 3.50 | |
| | | | | | | | | | | | | | | | | | | | | |
| LESS DISTRIBUTIONS | | | | | | | | | | | | | | | | | | | | |
| From net investment income | | | — | | | | — | | | | — | | | | (0.32 | ) | | | (0.01 | ) |
| From net realized gain | | | — | | | | (1.87 | ) | | | (0.30 | ) | | | (0.09 | ) | | | (0.01 | ) |
| Total distributions | | | — | | | | (1.87 | ) | | | (0.30 | ) | | | (0.41 | ) | | | (0.02 | ) |
| Paid-in capital from | | | | | | | | | | | | | | | | | | | | |
| redemption fees | | | 0.00 | 2 | | | 0.01 | | | | 0.00 | 2 | | | 0.00 | 2 | | | 0.00 | 2 |
| | | | | | | | | | | | | | | | | | | | | |
| Net asset value, | | | | | | | | | | | | | | | | | | | | |
| end of year | | $ | 23.37 | | | $ | 20.52 | | | $ | 26.77 | | | $ | 28.26 | | | $ | 24.00 | |
| | | | | | | | | | | | | | | | | | | | | |
| Total return | | | 13.89 | % | | | (17.49 | )% | | | (4.26 | )% | | | 19.74 | % | | | 17.08 | % |
| | | | | | | | | | | | | | | | | | | | | |
| SUPPLEMENTAL DATA/RATIOS | | | | | | | | | | | | | | | | | | | | |
| Net assets at end | | | | | | | | | | | | | | | | | | | | |
| of year (millions) | | $ | 271.6 | | | $ | 267.9 | | | $ | 443.7 | | | $ | 553.5 | | | $ | 223.7 | |
| Portfolio turnover rate | | | 8 | % | | | 18 | % | | | 37 | % | | | 12 | % | | | 11 | % |
| | | | | | | | | | | | | | | | | | | | | |
| Ratio of expenses to | | | | | | | | | | | | | | | | | | | | |
| average net assets | | | 1.10 | % | | | 1.10 | % | | | 1.10 | % | | | 1.10 | % | | | 1.10 | % |
| Ratio of net investment | | | | | | | | | | | | | | | | | | | | |
| income (loss) | | | | | | | | | | | | | | | | | | | | |
| to average net assets | | | 0.07 | % | | | 0.06 | % | | | (0.11 | )% | | | 0.08 | % | | | 0.92 | % |
1 | Calculated using the average shares outstanding method. |
2 | Amount does not round to $0.01 per share. |
The accompanying notes are an integral part of these financial statements.
GoodHaven Fund
NOTES TO FINANCIAL STATEMENTS November 30, 2016 |
The GoodHaven Funds Trust (the “Trust”) was organized as a Delaware Statutory trust on December 18, 2015, and is registered under the Investment Company Act of 1940, as amended (the “1940 Act”) as a non-diversified, open-end management investment company. The GoodHaven Fund (the “Fund”), previously part of another investment company, Professionally Managed Portfolios, reorganized effective as of the close of business on March 30, 2016. See Note 2 for a discussion of the results of the special meeting of shareholders in which the reorganization was approved. The Fund is an investment company and accordingly follows the investment company accounting and reporting guidance of the Financial Accounting Standards Board (“FASB”) Accounting Standard Codification Topic 946 “Financial Services – Investment Companies.” The Fund commenced operations on April 8, 2011.
The Fund’s investment objective is to seek long-term growth of capital.
| NOTE 2 – SIGNIFICANT ACCOUNTING POLICIES |
The following is a summary of significant accounting policies consistently followed by the Fund. These policies are in conformity with accounting principles generally accepted in the United States of America (“U.S. GAAP”).
| | A. | Security Valuation. All equity securities that are traded on U.S. national or foreign securities exchanges, are valued at either the last reported sale price on the exchange on which the security is principally traded or the exchange’s official closing price, if applicable. If, on a particular day, an exchange-traded security does not trade, then the mean between the most recent quoted bid and asked prices will be used. All equity securities that are not traded on a listed exchange are valued at the last sale price in the over-the-counter market. If a non-exchange traded security does not trade on a particular day, then the mean between the last quoted closing bid and asked price will be used. |
| | | |
| | | Debt securities are valued by using the mean between the closing bid and asked prices provided by an independent pricing service. If the closing bid and asked prices are not readily available, the independent pricing service may provide a price determined by a matrix pricing method. These techniques generally consider such factors as yields or prices of bonds of comparable quality, type of issue, coupon, maturity, ratings and general market conditions. In the absence of a price from a pricing service, securities are valued at their respective fair values in accordance with policies approved by the Valuation Committee of the Trust. |
| | | |
| | | Exchange traded options are valued at the composite price, using the National Best Bid and Offer quotes (“NBBO”). NBBO consists of the |
GoodHaven Fund
NOTES TO FINANCIAL STATEMENTS November 30, 2016 (Continued) |
| | | highest bid price and lowest ask price across any of the exchanges on which an option is quoted, thus providing a view across the entire U.S. options marketplace. Composite option pricing calculates the mean of the highest bid price and lowest ask price across the exchanges where the option is traded. |
| | | |
| | | Securities for which quotations are not readily available are valued at their respective fair values as determined in accordance with policies approved by the Valuation Committee of the Trust. When a security is “fair valued,” consideration is given to the facts and circumstances relevant to the particular situation, including a review of various factors set forth in the pricing procedures adopted by the Board of Trustees. Fair value pricing is an inherently subjective process, and no single standard exists for determining fair value. Different funds could reasonably arrive at different values for the same security. The use of fair value pricing by a fund may cause the net asset value of its shares to differ significantly from the net asset value that would be calculated without regard to such considerations. |
| | | |
| | | As described above, the Fund utilizes various methods to measure the fair value of its investments on a recurring basis. U.S. GAAP establishes a hierarchy that prioritizes inputs to valuation methods. The three levels of inputs are: |
| | | Level 1 – | Unadjusted quoted prices in active markets for identical assets or liabilities that the Fund has the ability to access. |
| | | | |
| | | Level 2 – | Observable inputs other than quoted prices included in Level 1 that are observable for the asset or liability, either directly or indirectly. These inputs may include quoted prices for the identical instrument on an inactive market, prices for similar instruments, interest rates, prepayment speeds, credit risk, yield curves, default rates and similar data. |
| | | | |
| | | Level 3 – | Unobservable inputs for the asset or liability, to the extent relevant observable inputs are not available, representing the Fund’s own assumptions about the assumptions a market participant would use in valuing the asset or liability, and would be based on the best information available. |
| | | The availability of observable inputs can vary from security to security and is affected by a wide variety of factors, including, for example, the type of security, whether the security is new and not yet established in the marketplace, the liquidity of markets, and other characteristics particular to the security. To the extent that valuation is based on models or inputs that are less observable or unobservable in the market, the determination of fair value requires more judgment. Accordingly, the degree of judgment exercised in determining fair value is greatest for instruments categorized in Level 3. |
GoodHaven Fund
NOTES TO FINANCIAL STATEMENTS November 30, 2016 (Continued) |
| | | The inputs used to measure fair value may fall into different levels of the fair value hierarchy. In such cases, for disclosure purposes, the level in the fair value hierarchy within which the fair value measurement falls in its entirety, is determined based on the lowest level input that is significant to the fair value measurement in its entirety. |
| | | |
| | | The following is a summary of the inputs used to value the Fund’s investments as of November 30, 2016. See the Schedule of Investments for the industry breakouts. |
| | | | | Level 1 | | | Level 2 | | | Level 3 | | | Total | |
| | | Common Stocks | | $ | 200,135,407 | | | $ | — | | | $ | — | | | $ | 200,135,407 | |
| | | Guernsey | | | | | | | | | | | | | | | | |
| | | Investment Fund | | | 6,575,065 | | | | — | | | | — | | | | 6,575,065 | |
| | | Real Estate | | | | | | | | | | | | | | | | |
| | | Investment Trusts | | | 3,242,283 | | | | — | | | | — | | | | 3,242,283 | |
| | | Corporate Bonds | | | — | | | | 1,001,875 | | | | — | | | | 1,001,875 | |
| | | Miscellaneous | | | | | | | | | | | | | | | | |
| | | Securities | | | — | | | | 331,500 | | | | — | | | | 331,500 | |
| | | Total Investments | | $ | 209,952,755 | | | $ | 1,333,375 | | | $ | — | | | $ | 211,286,130 | |
| | | Liabilities | | | | | | | | | | | | | | | | |
| | | Call Options Written | | $ | — | | | $ | 155,000 | | | $ | — | | | $ | 155,000 | |
| | | It is the Fund’s policy to recognize transfers between levels at the end of the Fund’s reporting period. |
| | | |
| | | There were no transfers into or out of Level 1 or 2 during the year ended November 30, 2016. |
| | | |
| | | The Fund has adopted financial reporting rules and regulations that require enhanced disclosure regarding derivatives and hedging activity intending to improve financial reporting of derivative instruments by enabling investors to understand how and why an entity uses derivatives, how derivatives are accounted for, and how derivative instruments affect an entity’s results of operations and financial position. |
| | | |
| | | The Fund may invest, at the time of purchase, up to 10% of the Fund’s net assets in options, which are a type of derivative and employ specialized trading techniques such as options trading to increase the Fund’s exposure to certain selected securities. The Fund may employ these techniques as hedging tools as well as speculatively to enhance returns. Other than when used for hedging, these techniques may be riskier than many investment strategies and may result in greater volatility for the Fund, particularly in periods of market declines. As a hedging tool, options may help cushion the impact of market declines, but may reduce the Fund’s participation in a market advance. |
GoodHaven Fund
NOTES TO FINANCIAL STATEMENTS November 30, 2016 (Continued) |
| | | Balance Sheet |
| | | |
| | | Fair values of derivative instruments as of November 30, 2016: |
| | | | Asset Derivatives as of | | Liability Derivatives as of | |
| | | | November 30, 2016 | | November 30, 2016 | |
| | | Derivative | Balance Sheet | | Fair | | Balance Sheet | | Fair | |
| | | Instruments | Location | | Value | | Location | | Value | |
| | | Equity Contracts: | | | | | | | | |
| | | Call Options | | | | | Written Options, | | | |
| | | Written | None | | $ | — | | at value | | $ | 155,000 | |
| | | Put Options | Investments in | | | | | | | | | |
| | | Purchased | securities, at value | | | 331,500 | | None | | | — | |
| | | Total | | | $ | 331,500 | | | | $ | 155,000 | |
| | | Statement of Operations |
| | | |
| | | The effect of derivative instruments on the Statement of Operations for the year ended November 30, 2016: |
| | | | | | | Change in | |
| | Location of | | Realized | | | Unrealized | |
| | Gain (Loss) | | Gain (Loss) | | | Appreciation/ | |
| | on Derivatives | | on Derivatives | | | Depreciation | |
| Derivative | Recognized | | Recognized | | | on Derivatives | |
Instruments | in Income | | in Income | | | in Income | |
| Equity Contracts: | | | | | | | |
| Call Options | Realized and | | | | | | |
| Written | Unrealized | | | | | | |
| | Gain (Loss) | | | | | | |
| | on Investments, | | | | | | |
| | Options Written & | | | | | | |
| | Foreign Currency | | $ | 198,079 | | | $ | (40,801 | ) |
| | | | | | | | | | |
| Put Options | Realized and | | | | | | | | |
| Purchased | Unrealized | | | | | | | | |
| | Gain (Loss) on | | | | | | | | |
| | Investments, | | | | | | | | |
| | Options Purchased & | | | | | | | | |
| | Foreign Currency | | $ | (3,589,856 | ) | | $ | 256,070 | |
| | B. | Foreign Currency. Foreign currency amounts, other than the cost of investments, are translated into U.S. dollar values based upon the spot exchange rate prior to the close of regular trading. The cost of investments is translated at the rates of exchange prevailing on the dates the portfolio securities were acquired. The Fund includes foreign exchange gains and losses from dividends receivable and other foreign currency denominated |
GoodHaven Fund
NOTES TO FINANCIAL STATEMENTS November 30, 2016 (Continued) |
| | | payables and receivables in realized and unrealized gain (loss) on investments and foreign currency. The Fund does not isolate that portion of realized gain (loss) or unrealized gain (loss) on investments resulting from changes in foreign exchange rates on investments from fluctuations arising from changes in the market price of securities for financial reporting purposes. Fluctuations in foreign exchange rates on investments are thus included with net realized gain (loss) on investments and foreign currency and with net unrealized gain (loss) on investments and foreign currency. |
| | | |
| | C. | Federal Income Taxes. The Fund has elected to be taxed as a “regulated investment company” and intends to distribute substantially all taxable income to its shareholders and otherwise comply with the provisions of the Internal Revenue Code applicable to regulated investment companies. Therefore, no provision for federal income taxes or excise taxes has been made. |
| | | |
| | | In order to avoid imposition of the excise tax applicable to regulated investment companies, the Fund intends to declare each year as dividends in each calendar year at least 98.0% of its net investment income (earned during the calendar year) and at least 98.2% of its net realized capital gains (earned during the twelve months ended November 30) plus undistributed amounts, if any, from prior years. |
| | | |
| | | Net capital losses incurred after November 30, and within the taxable year are deemed to arise on the first business day of the Fund’s next taxable year. As of November 30, 2016, the Fund had $(473,070) in late year losses. For the year ended November 30, 2016, the Fund had short-term capital loss carryovers of $(1,006,355), with unlimited expiration. |
| | | |
| | | As of November 30, 2016, the Fund did not have any tax positions that did not meet the “more likely-than-not” threshold of being sustained by the applicable tax authority. Generally, tax authorities can examine all the tax returns filed for the last three years. The Fund identifies their major tax jurisdictions as U.S. Federal, State of Delaware and the Commonwealth of Massachusetts (as a series of Professionally Managed Portfolios). As of November 30, 2016, the Fund was not aware of any tax positions for which it is reasonably possible that the total amounts of unrecognized tax benefits will change materially. |
| | | |
| | D. | Security Transactions and Investment Income. Investment securities transactions are accounted for on the trade date. Gains and losses realized on sales of securities are determined on a specific identification basis. Discounts/premiums on debt securities purchased are accreted/amortized over the life of the respective securities using the effective interest method. Dividend income is recorded on the ex-dividend date. Dividends from REIT’s generally are comprised of income, capital gains and may include return of |
GoodHaven Fund
NOTES TO FINANCIAL STATEMENTS November 30, 2016 (Continued) |
| | | capital. Interest income is recorded on an accrual basis. Withholding taxes on foreign dividends have been provided for in accordance with the Trust’s understanding of the applicable country’s tax rules and rates. |
| | | |
| | E. | Distributions to Shareholders. Distributions to shareholders from net investment income and net realized gains for the Fund normally are declared and paid on an annual basis. Distributions are recorded on the ex-dividend date. |
| | | |
| | F. | Use of Estimates. The preparation of financial statements in conformity with U.S. GAAP requires management to make estimates and assumptions that affect the reported amounts of assets and liabilities at the date of the financial statements, as well as the reported amounts of revenues and expenses during the period. Actual results could differ from those estimates. |
| | | |
| | G. | Share Valuation. The net asset value (“NAV”) per share of the Fund is calculated by dividing the sum of the value of the securities held by the Fund, plus cash and other assets, minus all liabilities by the total number of shares outstanding for the Fund, rounded to the nearest cent. The Fund’s shares will not be priced on the days on which the New York Stock Exchange is closed for trading. The offering and redemption price per share for the Fund is equal to the Fund’s net asset value per share. The Fund charges a 2.00% redemption fee on shares held less than 60 days. This fee is deducted from the redemption proceeds otherwise payable to the shareholder. The Fund will retain the fee charged as paid-in capital and such fees become part of that Fund’s daily NAV calculation. |
| | | |
| | H. | Guarantees and Indemnifications. In the normal course of business, the Fund enters into contracts with service providers that contain general indemnification clauses. The Fund’s maximum exposure under these arrangements is unknown as this would involve future claims that may be made against the Fund that have not yet occurred. However, based on experience, the Fund expects the risk of loss to be remote. |
| | | |
| | I. | Options Contracts. When the Fund purchases an option, an amount equal to the premium paid by the Fund is recorded as an investment and is subsequently adjusted to the current value of the option purchased. If an option expires on the stipulated expiration date or if the Fund enters into a closing sale transaction, a gain or loss is realized. If a call option is exercised, the cost of the security acquired is increased by the premium paid for the call. If a put option is exercised, a gain or loss is realized from the sale of the underlying security, and the proceeds from such sale are decreased by the premium originally paid. Written and purchased options are non-income producing securities. |
| | | |
| | | When the Fund writes an option, an amount equal to the premium received by the Fund is recorded as a liability and is subsequently adjusted to the |
GoodHaven Fund
NOTES TO FINANCIAL STATEMENTS November 30, 2016 (Continued) |
| | | current fair value of the option written. Premiums received from writing options that expire unexercised are treated by the Fund on the expiration date as realized gains from investments. The difference between the premium and the amount paid on effecting a closing purchase transaction, including brokerage commissions, is also treated as a realized gain, or, if the premium is less that the amount paid for the closing purchase transaction, as a realized loss. If a call option is exercised, the premium is added to the proceeds from the sale of the underlying security or currency in determining whether the Fund has realized a gain or loss. If a put option is exercised, the premium reduces the cost basis of the securities purchased by the Fund. The Fund as writer of an option bears the market risk of an unfavorable change in the price of the security underlying the written option. |
| | | |
| | | The following table indicates the average volume for the year ended November 30, 2016: |
Average market value of:
| | Options written | | $ | (27,612 | ) |
| | Options purchased | | $ | 374,961 | |
| | | The activity in options written during the year ended November 30, 2016, for the Fund is as follows: |
| | | | | Amount of | | | Number of | |
| | | | | Premiums | | | Contracts | |
| | | Outstanding at 11/30/15 | | $ | — | | | | — | |
| | | Options written | | | 317,076 | | | | 2,000 | |
| | | Options exercised | | | (202,877 | ) | | | (1,000 | ) |
| | | Options expired | | | — | | | | — | |
| | | Outstanding at 11/30/16 | | $ | 114,199 | | | | 1,000 | |
| | J. | Reclassification of Capital Accounts. U.S. GAAP requires that certain components of net assets relating to permanent differences be reclassified between financial and tax reporting. These reclassifications have no effect on net assets or net asset value per share. These differences are primarily due to net operating loss. For the fiscal year ended November 30, 2016, the following adjustments were made: |
| | Undistributed Net | Accumulated Net | Paid-In | |
| | Investment Income/(Loss) | Realized Gain/(Loss) | Capital | |
| | $1,216,597 | $6,303 | ($1,222,900) | |
| | K. | Recent Accounting Pronouncement. In May 2015, the FASB issued ASU No. 2015-07 “Disclosure for Investments in Certain Entities that Calculate Net Asset Value per Share (or Its Equivalent).” The amendments in ASU No. 2015-07 remove the requirement to categorize within the fair value |
GoodHaven Fund
NOTES TO FINANCIAL STATEMENTS November 30, 2016 (Continued) |
| | | hierarchy investments measured using the NAV practical expedient. The ASU also removes certain disclosure requirements for investments that qualify, but do not utilize, the NAV practical expedient. The amendments in the ASU are effective for fiscal years beginning after December 15, 2015, and interim periods within those fiscal years. Management is currently evaluating the impact these changes will have on the Fund’s financial statements and related disclosures. |
| | | |
| | L. | Shareholder Meeting (Unaudited). At a special meeting of the shareholders held on March 28, 2016, the Fund’s shareholders voted on one proposal: |
| | | |
| | | 1) To approve the Agreement and Plan of Reorganization on behalf of the Fund. |
| | For % | Against % | Abstain % | |
| | 99.14% | 0.44% | 0.43% | |
| | | At a special meeting of the shareholders held on May 10, 2016, the Fund’s shareholders voted on one proposal: |
| | | |
| | | 1) To approve the election of the Trustees of the New Trust. |
| | | Name | For % | Withhold % |
| | | Richard A. Conn, Jr. | 99.34% | 0.66% |
| | | Bruce A. Eatroff | 99.22% | 0.78% |
| | | Steven H. Tishman | 99.23% | 0.77% |
| | | Larry Pitkowsky | 99.38% | 0.62% |
| | | Keith Trauner | 99.40% | 0.60% |
| | M. | Subsequent Events. In preparing these financial statements, the Fund has evaluated events and transactions for potential recognition or disclosure through the date the financial statements were issued. The Fund has determined that there were no subsequent events that would need to be disclosed in the Fund’s financial statements. |
| NOTE 3 – COMMITMENTS AND OTHER RELATED PARTY TRANSACTIONS |
GoodHaven Capital Management, LLC (the “Advisor”) provides the Fund with investment management services under an Investment Advisory Agreement (the “Advisory Agreement”). Under the Agreement, the Advisor provides all investment advice, office space and certain administrative services, and most of the personnel needed by the Fund. Under the Advisory Agreement, the Advisor is entitled to receive a monthly management fee calculated daily and payable monthly equal to 0.90% of the Fund’s average daily net assets. The amount of Management fees incurred by the Fund for the year ended November 30, 2016, is disclosed in the Statement of Operations.
The Fund has also entered into a Support Services Agreement (the “Support Agreement”) with the Advisor. Under this agreement, the Advisor is responsible for
GoodHaven Fund
NOTES TO FINANCIAL STATEMENTS November 30, 2016 (Continued) |
paying all of the Fund’s other normal day-to-day operational expenses, such as administrative, custody, transfer agency, fund accounting, legal and audit. The support services fee does not cover the following other expenses: (a) any charges associated with the execution of portfolio transactions, such as brokerage commissions, transaction charges or other transaction-related expenses (such as stamp taxes), (b) taxes, acquired fund fees and expenses, if any, imposed on the Fund, (c) interest, if any, on any Fund borrowings, or (d) extraordinary Fund legal expenses incurred outside of the normal operation of the Fund, such as legal fees, arbitration fees, or related expenses in connection with any actual or threatened arbitration, mediation, or litigation. Under the Support Agreement, the Advisor is entitled to receive a monthly fee calculated daily and payable monthly equal to 0.20% of the Fund’s average daily net assets. The amount of support services fees incurred by the Fund for the year ended November 30, 2016, is disclosed in the Statement of Operations.
U.S. Bancorp Fund Services, LLC (“USBFS”), an indirect wholly-owned subsidiary of U.S. Bancorp, serves as the Fund’s administrator, fund accountant and transfer agent. In those capacities USBFS maintains the Fund’s books and records, calculates the Fund’s NAV, prepares various federal and state regulatory filings, coordinates payment of fund expenses, prepares expense accruals and prepares materials supplied to the Board of Trustees.
Quasar Distributors, LLC (the “Distributor”) acts as the Fund’s principal underwriter in a continuous public offering of the Fund’s shares. U.S. Bank NA (the “Custodian”) serves as custodian to the Fund.
| NOTE 4 – PURCHASES AND SALES OF SECURITIES |
Investment transactions (excluding short-term investments) for the year ended November 30, 2016 were as follows:
| | Purchases | Sales or Maturity | |
| | at Cost | Proceeds | |
| | $16,089,796 | $32,491,976 | |
There were no purchases or sales of long-term U.S. Government securities for the year ended November 30, 2016.
| NOTE 5 – DISTRIBUTIONS TO SHAREHOLDERS |
The tax character of distributions paid during the year ended November 30, 2016 and year ended November 30, 2015 was as follows:
| | | November 30, 2016 | | | November 30, 2015 | |
| Distributions paid from: | | | | | | |
| Ordinary income | | $ | — | | | $ | — | |
| Long-term capital gain | | | — | | | | 25,958,120 | |
GoodHaven Fund
NOTES TO FINANCIAL STATEMENTS November 30, 2016 (Continued) |
Distribution classifications may differ from the statements of changes in net assets as a result of the treatment of short-term capital gains as ordinary income for tax purposes.
As of November 30, 2016, the components of distributable earnings on a tax basis were as follows:
| | | Cost of investments | | $ | 200,384,010 | |
| | | Gross tax unrealized appreciation | | | 64,619,169 | |
| | | Gross tax unrealized depreciation | | | (53,717,049 | ) |
| | | Net tax unrealized appreciation | | | 10,902,120 | |
| | | Unrealized currency appreciation | | | | |
| | | Undistributed ordinary income | | | | |
| | | Undistributed long-term capital gain | | | | |
| | | Total distributable earnings | | | | |
| | | Other accumulated loss | | | (2,023,611 | ) |
| | | Total accumulated earnings | | $ | 8,878,509 | |
The difference between book basis and tax basis unrealized appreciation was primarily attributable to wash sale adjustments and Passive Foreign Investment Companies. The difference between components of distributable earnings on a tax basis and the amounts reflected in the Statements of Assets and Liabilities are primarily due to the tax treatment of Passive Foreign Investment Companies held by the Fund.
| NOTE 6 – INVESTMENTS IN AFFILIATES |
Affiliated companies, as defined in Section 2(a)(3) of the 1940 Act, are companies 5% or more of whose outstanding voting shares are held by the Fund and the Advisor. For the year ended November 30, 2016, the Fund had the following transactions with affiliated companies:
As of November 30, 2016, the value of all securities of affiliated companies held in the Fund is $9,196,545, representing 3.4% of net assets.
| | | Share | | | | | | | | | Share | | | | | | | | | | | | | |
| | | Balance | | | | | | | | | Balance | | | Realized | | | | | | Value | | | | |
| | | Nov. 30, | | | | | | | | | Nov. 30, | | | Gain | | | Dividend | | | Nov. 30, | | | Acquisition | |
Issuer | | 2015 | | | Purchases | | | Sales | | | 2016 | | | (Loss) | | | Income | | | 2016 | | | Cost | |
| Walter | | | | | | | | | | | | | | | | | | | | | | | | |
| Investment | | | | | | | | | | | | | | | | | | | | | | | | |
| Management | | | | | | | | | | | | | | | | | | | | | | | | |
| Corp. | | | 1,633,106 | | | | 95,523 | | | | 115,200 | | | | 1,613,429 | | | | (2,113,819 | ) | | $ | — | | | $ | 9,196,545 | | | $ | 34,085,508 | |
| Total | | | | | | | | | | | | | | | | | | | | | | | | | | $ | 9,196,545 | | | $ | 34,085,508 | |
GoodHaven Fund
| REPORT OF INDEPENDENT REGISTERED PUBLIC ACCOUNTING FIRM |
To the Shareholders of
GoodHaven Fund and
The Board of Trustees of
GoodHaven Funds Trust
We have audited the accompanying statement of assets and liabilities, including the schedule of investments, of GoodHaven Fund, a series of GoodHaven Funds Trust, as of November 30, 2016 and the related statement of operations for the year then ended, the statement of changes in net assets for each of the two years in the period then ended, and the financial highlights for each of the five years in the period then ended. These financial statements and financial highlights are the responsibility of the Fund’s management. Our responsibility is to express an opinion on these financial statements and financial highlights based on our audits.
We conducted our audits in accordance with the standards of the Public Company Accounting Oversight Board (United States). Those standards require that we plan and perform the audit to obtain reasonable assurance about whether the financial statements and financial highlights are free of material misstatement. The Fund is not required to have, nor were we engaged to perform, an audit of its internal control over financial reporting. Our audit included consideration of internal control over financial reporting as a basis for designing audit procedures that are appropriate in the circumstances, but not for the purpose of expressing an opinion on the effectiveness of the Fund’s internal control over financial reporting. Accordingly, we express no such opinion. An audit includes examining, on a test basis, evidence supporting the amounts and disclosures in the financial statements. Our procedures included confirmation of securities owned as of November 30, 2016, by correspondence with the custodian and broker. An audit also includes assessing the accounting principles used and significant estimates made by management, as well as evaluating the overall financial statement presentation. We believe that our audits provide a reasonable basis for our opinion.
In our opinion, the financial statements and financial highlights referred to above present fairly, in all material respects, the financial position of GoodHaven Fund as of November 30, 2016, the results of its operations for the year then ended, the statement of changes in net assets for each of the two years in the period then ended, and the financial highlights for each of the five years in the period then ended, in conformity with accounting principles generally accepted in the United States of America.
Philadelphia, Pennsylvania
January 25, 2017
GoodHaven Fund
EXPENSE EXAMPLE For the Six Months Ended November 30, 2016 (Unaudited) |
As a shareholder of the Fund you incur two types of costs: (1) transaction costs, including redemption fees and exchange fees and (2) ongoing costs, including management fees and support service fees. This example is intended to help you understand your ongoing costs (in dollars) of investing in the Fund and to compare these costs with the ongoing costs of investing in other mutual funds. The example is based on an investment of $1,000 invested at the beginning of the period and held for the entire period (June 1, 2016 – November 30, 2016).
Actual Expenses
The first line of the table provides information about actual account values based on actual returns and actual expenses. Although the Fund charges no sales load or other transaction fees, you will be assessed fees for outgoing wire transfers, returned checks and stop payment orders at prevailing rates charged by U.S. Bancorp Fund Services, LLC, the Fund’s transfer agent. If you request that a redemption be made by wire transfer, currently, the Fund’s transfer agent charges a $15.00 fee. You will be charged a redemption fee equal to 2.00% of the net amount of the redemption if you redeem shares that have been held for less than 60 days. Individual Retirement Accounts will be charged a $15.00 annual maintenance fee. To the extent the Fund invests in shares of other investment companies as part of its investment strategy, you will indirectly bear your proportionate share of any fees and expenses charged by the underlying funds in which the Fund invests in addition to the expenses of the Fund. Actual expenses of the underlying funds may vary. These expenses are not included in the example. The example includes, but is not limited to, management fees and support services. However, the example does not include portfolio trading commissions and related expenses. You may use the information in this line, together with the amount you invested, to estimate the expenses that you paid over the period. Simply divide your account value by $1,000 (for example, an $8,600 account value divided by $1,000 = 8.6). Then, multiply the result by the number in the first line under the heading entitled “Expenses Paid During the Period” to estimate the expenses you paid on your account during this period.
Hypothetical Example for Comparison Purposes
The second line of the table provides information about hypothetical account values based on a hypothetical return and hypothetical expenses based on the Fund’s actual expense ratio and an assumed rate of return of 5% per year before expenses, which is not the Fund’s actual return. The hypothetical account values and expenses may not be used to estimate the actual ending account balance or expenses you paid for the period. You may use this information to compare the ongoing costs of investing in the Fund and other funds. To do so, compare this 5% hypothetical example with the 5% hypothetical examples that appear in the shareholder reports of the other funds. Please note that the expenses shown in the table are meant to highlight your ongoing costs only and do not reflect any
GoodHaven Fund
EXPENSE EXAMPLE For the Six Months Ended November 30, 2016 (Unaudited) (Continued) |
transactional costs, such as sales charges, redemption fees or exchange fees. Therefore, the second line of the table is useful in comparing ongoing costs only and will not help you determine the relative total costs of owning different funds. If these transactional costs were included, your costs would have been higher.
| | | | Expenses Paid |
| | Beginning | Ending | During the Period |
| | Account Value | Account Value | June 1, 2016 – |
| | June 1, 2016 | November 30, 2016 | November 30, 20161 |
| Actual | $1,000.00 | $1,080.40 | $5.72 |
| Hypothetical | | | |
| (5% annual return | | | |
| before expenses) | $1,000.00 | $1,019.50 | $5.55 |
| | 1 | The calculations are based on expenses incurred during the most recent six-month period. The annualized six-month expense ratio for the Fund during that period was 1.10%. The dollar amounts shown as expenses paid during the period are equal to the annualized six-month expense ratio multiplied by the average account value during the period, multiplied by 183/366 (to reflect the on half-year period). |
GoodHaven Fund
| TRUSTEES AND EXECUTIVE OFFICERS |
The Board is responsible for the overall management of the Trust, including general supervision and review of the investment activities of the Fund. The Board, in turn, elects the officers of the Trust, who are responsible for the day-to-day operations of the Trust and its separate series. The current Trustees and executive officers of the Trust, their birth dates, positions with the Trust, terms of office with the Trust and length of time served, their principal occupations during the past five years and other directorships are set forth in the table below.
| | | Term of | | Number of | |
| | | Office | | Portfolios | Other |
| | Position | and | | in New Fund | Directorships |
| | with | Length | | Complex | Held During |
| Name, Address | the New | of Time | Principal Occupation | Overseen by | the Past |
and Age | Trust | Served | During Past Five Years | Trustees | 5 Years |
| | | | | | |
| Independent Trustees of the Trust | | | |
| | | | | | |
| Richard A. Conn, Jr. | Trustee | Indefinite | Managing Partner, | 1 | None |
| c/o GoodHaven Capital | | term; | Innovate Partners LLC | | |
| Management LLC | | Since | (private investment | | |
| 4940 SW 83rd Street | | January | company) (2009 to present) | | |
| Miami, FL 33143 | | 2016 | | | |
| Age: 59 | | | | | |
| | | | | | |
| Bruce A. Eatroff | Trustee | Indefinite | Founding Partner, Halyard | 1 | None |
| c/o GoodHaven Capital | | term; | Capital (private equity firm) | | |
| Management LLC | | Since | (2006 to present) | | |
| 4940 SW 83rd Street | | January | | | |
| Miami, FL 33143 | | 2016 | | | |
| Age: 53 | | | | | |
| | | | | | |
| Steven H. Tishman | Trustee | Indefinite | Managing Director and | 1 | Director, |
| c/o GoodHaven Capital | | term; | Global Head of Mergers | | Acushnet |
| Management LLC | | Since | and Acquisitions Group, | | Holdings |
| 4940 SW 83rd Street | | January | Houlihan Lokey (global | | |
| Miami, FL 33143 | | 2016 | investment bank) | | |
| Age: 60 | | | (2012 to present) | | |
| | | | | | |
| Interested Trustees and Officers of the Trust |
| | | | | | |
| Larry Pitkowsky | Trustee, | Indefinite | Co-Managing Partner, | 1 | None |
| c/o GoodHaven Capital | President | Term; | GoodHaven Capital | | |
| Management LLC | and | Since | Management, LLC | | |
| 4940 SW 83rd Street | Treasurer | January | (Advisor); Co-Portfolio | | |
| Miami, FL 33143 | | 2016 | Manager of GoodHaven | | |
| Age: 52 | | | Fund (2010 to present) | | |
| | | | | | |
| Keith Trauner | Trustee | Indefinite | Co-Managing Partner, | 1 | None |
| c/o GoodHaven Capital | and | Term; | GoodHaven Capital | | |
| Management LLC | Chairman | Since | Management, LLC | | |
| 4940 SW 83rd Street | | January | (Advisor); Co-Portfolio | | |
| Miami, FL 33143 | | 2016 | Manager of GoodHaven | | |
| Age 59 | | | Fund (2010 to present) | | |
GoodHaven Fund
TRUSTEES AND EXECUTIVE OFFICERS (Continued) |
| | | Term of | | Number of | |
| | | Office | | Portfolios | Other |
| | Position | and | | in New Fund | Directorships |
| | with | Length | | Complex | Held During |
| Name, Address | the New | of Time | Principal Occupation | Overseen by | the Past |
And Age | Trust | Served | During Past Five Years | Trustees | 5 Years |
| | | | | | |
| Sarah Gillespie | Chief | Indefinite | Chief Compliance Officer | N/A | None |
| c/o GoodHaven Capital | Compli- | Term; | and Director of Operations, | | |
| Management LLC | ance | Since | GoodHaven Capital | | |
| 4940 SW 83rd Street | Officer; | January | Management LLC | | |
| Miami, FL 33143 | Secretary | 2016 | (Advisor) | | |
| Age 36 | | | | | |
GoodHaven Fund
ADDITIONAL INFORMATION (Unaudited) |
| INFORMATION ABOUT PROXY VOTING |
A description of the policies and procedures that the Fund uses to determine how to vote proxies relating to portfolio securities is available without charge, upon request, by calling toll-free at (855) 654-6639 and on the Fund’s website at www.goodhavenfunds.com. Furthermore, you can obtain the description on the SEC’s website at www.sec.gov.
Information regarding how the Fund voted proxies relating to portfolio securities during the most recent 12-month period ended June 30 is available without charge, upon request, by calling (855) 654-6639 or through the SEC’s website at www.sec.gov.
| INFORMATION ABOUT THE PORTFOLIO HOLDINGS |
The Fund files its complete schedule of portfolio holdings for the first and third quarters with the SEC on Form N-Q. The Fund’s Form N-Q may be reviewed and copied at the SEC’s Public Reference Room in Washington D.C. Information on the operation of the Public Reference Room may be obtained by calling (800) SEC-0330. The Fund’s Form N-Q is available without charge, upon request, by calling (855) 654-6639. Furthermore, you can obtain the Form N-Q on the SEC’s website at www.sec.gov.
In an effort to decrease costs, the Fund will reduce the number of duplicate Prospectuses and annual and semi-annual reports that you receive by sending only one copy of each to those addresses shown by two or more accounts. Please call the transfer agent toll free at (855) 654-6639 to request individual copies of these documents. The Fund will begin sending individual copies thirty days after receiving your request. This policy does not apply to account statements.
| INFORMATION ABOUT THE FUND’S TRUSTEES |
The Statement of Additional Information (“SAI”) includes additional information about the Fund’s Trustees and is available without charge, upon request, by calling (855) 654-6639. Furthermore, you can obtain the SAI on the SEC’s website at www.sec.gov or the Fund’s website at www.goodhavenfunds.com.
GoodHaven Fund
PRIVACY NOTICE (Unaudited) |
| FACTS | WHAT DOES GOODHAVEN CAPITAL MANAGEMENT, LLC & GOODHAVEN FUND DO WITH YOUR PERSONAL INFORMATION? |
| | |
| Why? | Financial companies choose how they share your personal information. Federal law gives consumers the right to limit some but not all sharing. Federal law also requires us to tell you how we collect, share, and protect your personal information. Please read this notice carefully to understand what we do. |
| | |
| What? | The types of personal information we collect and share depend on the product or service you have with us. This information can include: |
| | |
| | • Social Security number and Income |
| | • Account Balances and Employment Information |
| | • Assets and Investment Experience |
| | |
| | When you are no longer our customer, we continue to share your information as described in this notice. |
| | |
| How? | All financial companies need to share customer’s personal information to run their everyday business. In the section below, we list the reasons financial companies can share their customer’s personal information; the reasons GoodHaven chooses to share; and whether you can limit this sharing. |
| Reasons we can share your | Does GoodHaven | Can you limit |
| personal information | share? | this sharing? |
| For our everyday business purposes— | | |
| such as to process your transactions, maintain | | |
| your account(s), respond to court orders and | Yes | No |
| legal investigations, or report to credit bureaus | | |
| For our marketing purposes— | | |
| to offer our products and services to you | Yes | No |
| For joint marketing with | | |
| other financial companies | No | We don’t share |
| For our affiliates’ everyday | | |
| business purposes— | | |
| information about your | Yes | Yes |
| transactions and experiences | | |
| For our affiliates’ everyday | | |
| business purposes— | | |
| information about your creditworthiness | Yes | Yes |
| For nonaffiliates to market to you | No | We don’t share |
| Questions? | Call (305) 677-7650 or email info@goodhavenllc.com |
GoodHaven Fund
PRIVACY NOTICE (Unaudited) (Continued) |
| Who we are | |
| Who is providing | GoodHaven Capital Management, LLC |
| this notice? | GoodHaven Fund (collectively “GoodHaven”) |
| What we do | |
| How does | To protect your personal information from unauthorized |
| GoodHaven | access and use, we use security measures that comply |
| protect | with federal law. These measures include computer safeguards |
| my personal | and secured files and buildings. |
| information? | Our service providers must represent to us that they will protect any personal information through similar safeguards and security. |
| How does | We collect your personal information, for example, when you |
| GoodHaven | • open an account or give us your income |
| collect my | • give us contact information or seek advice about your |
| personal | investments |
| information? | • tell us about your investments or retirement portfolio |
| Why can’t I | Federal law gives you the right to limit only |
| limit all sharing? | • sharing for affiliates’ everyday business purposes—information about your creditworthiness |
| | • affiliates from using your information to market to you |
| | • sharing for nonaffiliates to market you |
| | State laws and individual companies may give you additional rights to limit sharing. |
| Definitions | |
| Affiliates | Companies related by common ownership or control. They can be financial and nonfinancial companies. |
| | • Our affiliates include: a series of a registered investment company called the GoodHaven Fund (a no-load mutual fund). |
| Nonaffiliates | Companies not related by common ownership or control. They can be financial and nonfinancial companies. |
| | • We do not share with nonaffiliates so they can market to you. |
| Joint marketing | A formal agreement between nonaffiliated financial companies that together market financial products or services to you. |
| | • We do not jointly market with nonaffiliated financial companies. |
| Other important information |
| |
| |
| |
| |
| |
(This Page Intentionally Left Blank.)
GoodHaven Fund
Advisor
GOODHAVEN CAPITAL MANAGEMENT, LLC
4940 SW 83rd Street
Miami, Florida 33143
Distributor
QUASAR DISTRIBUTORS, LLC
615 East Michigan Street
Milwaukee, Wisconsin 53202
Custodian
U.S. BANK N.A. Custody Operations
1555 N. RiverCenter Drive, Suite 302
Milwaukee, Wisconsin 53212
Transfer Agent, Fund Accountant & Fund Administrator
U.S. BANCORP FUND SERVICES, LLC
615 East Michigan Street
Milwaukee, Wisconsin 53202
1-800-536-3230
Independent Registered Public Accounting Firm
TAIT, WELLER & BAKER LLP
1818 Market Street, Suite 2400
Philadelphia, Pennsylvania 19103
Legal Counsel
BLANK ROME LLP
405 Lexington Ave
New York, New York 10174
GoodHaven Fund
855-OK-GOODX (855-654-6639)
www.goodhavenfunds.com
Symbol – GOODX
CUSIP – 38217G103
Item 2. Code of Ethics.
The registrant has adopted a code of ethics that applies to the registrant’s principal executive officer and principal financial officer. The registrant has not made any amendments to its code of ethics during the period covered by this report. The registrant has not granted any waivers from any provisions of the code of ethics during the period covered by this report.
A copy of the registrant’s Code of Ethics is filed herewith.
Item 3. Audit Committee Financial Expert.
The registrant’s Board of Trustees of the Trust has determined that there is at least one audit committee financial expert serving on its audit committee. Mr. Steven Tishman is an “audit committee financial expert” and is considered to be “independent” as each term is defined in Item 3 of Form N-CSR.
Item 4. Principal Accountant Fees and Services.
The registrant has engaged its principal accountant to perform audit services, audit-related services, tax services and other services during the past two fiscal years. “Audit services” refer to performing an audit of the registrant's annual financial statements or services that are normally provided by the accountant in connection with statutory and regulatory filings or engagements for those fiscal years. “Audit-related services” refer to the assurance and related services by the principal accountant that are reasonably related to the performance of the audit. “Tax services” refer to professional services rendered by the principal accountant for tax compliance, tax advice, and tax planning. There were no “Other services” provided by the principal accountant. The following table details the aggregate fees billed or expected to be billed for each of the last two fiscal years for audit fees, audit-related fees, tax fees and other fees by the principal accountant.
GoodHaven Fund
| | FYE 11/30/2016 | FYE 11/30/2015 |
| Audit Fees | $19,000 | $19,000 |
| Audit-Related Fees | N/A | N/A |
| Tax Fees | $2,600 | $2,600 |
| All Other Fees | N/A | N/A |
The audit committee has adopted pre-approval policies and procedures that require the audit committee to pre‑approve all audit and non‑audit services of the registrant, including services provided to any entity affiliated with the registrant.
All of the principal accountant’s hours spent on auditing the registrant’s financial statements were attributed to work performed by full‑time permanent employees of the principal accountant.
The following table indicates the non-audit fees billed or expected to be billed by the registrant’s accountant for services to the registrant and to the registrant’s investment advisor (and any other controlling entity, etc.—not sub-advisor) for the last two years. The audit committee of the board of trustees/directors has considered whether the provision of non-audit services that were rendered to the registrant's investment advisor is compatible with maintaining the principal accountant's independence and has concluded that the provision of such non-audit services by the accountant has not compromised the accountant’s independence.
GoodHaven Fund
| Non-Audit Related Fees | FYE 11/30/2016 | FYE 11/30/2015 |
| Registrant | N/A | N/A |
| Registrant’s Investment Advisor | N/A | N/A |
Item 5. Audit Committee of Listed Registrants.
Not applicable to open-end investment companies.
Item 6. Schedule of Investments.
Schedule of Investments is included as part of the report to shareholders filed under Item 1 of this Form.
Item 7. Disclosure of Proxy Voting Policies and Procedures for Closed-End Management Investment Companies.
Not applicable to open-end investment companies.
Item 8. Portfolio Managers of Closed-End Management Investment Companies
Not applicable to open-end investment companies.
Item 9. Purchases of Equity Securities by Closed‑End Management Investment Company and Affiliated Purchasers.
Not applicable to open-end investment companies.
Item 10. Submission of Matters to a Vote of Security Holders.
There have been no material changes to the procedures by which shareholders may recommend nominees to the registrant’s board of trustees.
Item 11. Controls and Procedures.
| (a) | The Registrant’s President and Treasurer have reviewed the Registrant's disclosure controls and procedures (as defined in Rule 30a-3(c) under the Investment Company Act of 1940 (the “Act”)) as of a date within 90 days of the filing of this report, as required by Rule 30a-3(b) under the Act and Rules 13a-15(b) or 15d‑15(b) under the Securities Exchange Act of 1934. Based on their review, such officers have concluded that the disclosure controls and procedures are effective in ensuring that information required to be disclosed in this report is appropriately recorded, processed, summarized and reported and made known to them by others within the Registrant and by the Registrant’s service provider. |
| (b) | There were no significant changes in the Registrant's internal control over financial reporting (as defined in Rule 30a-3(d) under the Act) that occurred during the second fiscal quarter of the period covered by this report that has materially affected, or is reasonably likely to materially affect, the Registrant's internal control over financial reporting. |
Item 12. Exhibits.
| (a) | (1) Any code of ethics or amendment thereto, that is subject of the disclosure required by Item 2, to the extent that the registrant intends to satisfy Item 2 requirements through filing an exhibit. Filed herewith. |
(2) Certifications pursuant to Section 302 of the Sarbanes-Oxley Act of 2002. Filed herewith.
(3) Any written solicitation to purchase securities under Rule 23c‑1 under the Act sent or given during the period covered by the report by or on behalf of the registrant to 10 or more persons. Not applicable to open-end investment companies.
| (b) | Certification pursuant to Section 906 of the Sarbanes‑Oxley Act of 2002. Furnished herewith. |
SIGNATURES
Pursuant to the requirements of the Securities Exchange Act of 1934 and the Investment Company Act of 1940, the registrant has duly caused this report to be signed on its behalf by the undersigned, thereunto duly authorized.
(Registrant) GoodHaven Funds Trust
By (Signature and Title) /s/Larry Pitkowsky
Larry Pitkowsky, Principal Executive Officer and Principal Financial and Accounting Officer
Date January 31, 2017
Pursuant to the requirements of the Securities Exchange Act of 1934 and the Investment Company Act of 1940, this report has been signed below by the following persons on behalf of the registrant and in the capacities and on the dates indicated.
By (Signature and Title)* /s/Larry Pitkowsky
Larry Pitkowsky, Principal Executive Officer and Principal Financial and Accounting Officer
Date January 31, 2017
* Print the name and title of each signing officer under his or her signature.