UNITED STATES
SECURITIES AND EXCHANGE COMMISSION
Washington, D.C. 20549
FORM N-CSR
CERTIFIED SHAREHOLDER REPORT OF REGISTERED
MANAGEMENT INVESTMENT COMPANIES
Investment Company Act file number (811-23127)
The Goodhaven Funds Trust
(Exact name of registrant as specified in charter)
4940 SW 83rd Street
Miami, Florida 33143_
(Address of principal executive offices) (Zip code)
Larry Pitkowsky
4940 SW 83rd Street
Miami, Florida 33143
(Name and address of agent for service)
(305) 677-7650
Registrant's telephone number, including area code
Date of fiscal year end: November 30
Date of reporting period: November 30, 2017
Item 1. Report to Stockholders.
Annual Report
November 30, 2017
GoodHaven Fund
Ticker: GOODX
GoodHaven Capital Management, LLC
Table of Contents
| Shareholder Letter | 1 |
| Portfolio Management Discussion and Analysis | 15 |
| Sector Allocation | 21 |
| Historical Performance | 22 |
| Schedule of Investments | 23 |
| Statement of Assets and Liabilities | 25 |
| Statement of Operations | 26 |
| Statements of Changes in Net Assets | 27 |
| Financial Highlights | 28 |
| Notes to Financial Statements | 29 |
| Report of Independent Registered Public Accounting Firm | 38 |
| Expense Example | 39 |
| Trustees and Executive Officers | 41 |
| Additional Information | 43 |
| Privacy Notice | 44 |
PERFORMANCE as of November 30, 2017 |
| | | 1 Year | | Since | Since |
| | Calendar | Ended | 5 Years | Incept.1 | Incept.1 |
| | Year 2017 | 11/30/17 | Annualized | Cumulative | Annualized |
| GOODX | 3.95% | 0.90% | 1.68% | 30.57% | 4.09% |
S&P 500 Index2 | 21.83% | 22.87% | 15.73% | 129.55% | 13.31% |
| Wilshire 5000 Total Market Index | 18.65% | 19.58% | 13.11% | 94.74% | 10.54% |
HFRI Fundamental Growth Index3 | 19.23% | 17.54% | 6.17% | 21.65% | 2.98% |
HFRI Fundamental Value Index3 | 13.56% | 13.22% | 8.01% | 45.59% | 5.76% |
CS Hedge Fund Index3 | 7.12% | 7.17% | 4.35% | 25.22% | 3.43% |
1 | The Fund commenced operations on April 8, 2011. |
2 | with dividends reinvested |
3 | Hedge Fund Index performance figures are supplied on a month end basis and are provided for illustrative purposes as a broad equity alternative asset class only. Accordingly, “since inception” hedge fund index performance figures reflect a start date of 3/31/11 and an end date of 11/30/17. Source: Bloomberg Terminal |
Performance data quoted represents past performance; past performance does not guarantee future results. The investment return and principal value of an investment will fluctuate so that an investor’s shares, when redeemed, may be worth more or less than their original cost. Current performance of the Fund may be lower or higher than the performance quoted. Performance data current to the most recent month-end may be obtained by calling (855) OK-GOODX or (855) 654-6639. The Fund imposes a 2.00% redemption fee on shares redeemed within 60 days of purchase. Performance data for an individual shareholder will be reduced by redemption fees that apply, if any. Redemption fees are paid directly into the Fund and do not reduce overall performance of the Fund. The annualized gross expense ratio of the GoodHaven Fund is 1.10%.
December 18, 2017
To Our Fellow Shareholders:
2017’s modest gains masked overall strong business results across our distinctively positioned portfolio, leaving us feeling well positioned going forward – especially compared to world where it appears that overvaluation reigns in almost all asset classes. To put the last two years’ returns into perspective, for the 24 calendar months ended December 31, 2017, the Fund gained approximately 25% compared to a gain of about 36% for the S&P 500 Index1, with most of the difference over that period attributable to our sizeable cash position compared to a zero cash position for
__________
1 | Actual returns for the 24 calendar months ended December 31, 2017: GoodHaven Fund: 24.88%; S&P 500 Index: 36.38%; Wilshire 5000 Index: 31.30%; HFRI Value: 21.80%; HFRI Growth: 24.19%; Credit Suisse Hedge Fund Index: 8.45%, U.S. T-Bill Index (adjusted for interest): 1.23%. |
the index. Notably, for this period, results were well above low risk, U.S. Treasury bills2 and typical hedge fund returns over the same period as measured by the HFRI Value and Growth indexes.
Similar to what we said at the beginning of that two-year period (in early 2016), we feel that this past year’s frustratingly modest gains are tomorrow’s opportunity. This year and despite positive business results, declines in our largest holdings overshadowed other upside performance in our concentrated portfolio, while a sizeable cash position, some modest hedges, and a collapse in volatility also helped to limit relative returns. These factors leave us both dissatisfied and optimistic, feeling frustrated about recent results yet positive about the Fund’s positions, especially compared to the stretched valuations of broader equity indexes. If the S&P 500 or NASDAQ 100 indexes were a single security, we would not own either today. By contrast, the Fund’s portfolio has many securities selling at a sizeable discount to our estimates of intrinsic value as well as typical index valuations. Moreover, we have cash while the indexes have none.
Imagine that a genie had appeared from a magic lamp a year ago and told us that by year end oil would rise to nearly $60 per barrel, OECD and U.S. oil inventories would decline meaningfully during the year, that WPX Energy Inc. (currently our largest investment) would grow oil production by almost 50% in 2017, monetize non-core assets, improve its balance sheet, forecast another 40% increase in 2018 oil production, and be less than one year from generating material free cash flow.
With that knowledge, we would have expected the stock price of WPX to be much higher than where the year began rather than its recent quote of a double digit decline for the fiscal year.3 Instead, our energy holdings were our worst performers creating the backdrop for what we believe is an opportunity to capitalize on the inefficiency of markets. The two energy companies we own have talented managers with proven capital allocation records. While not depending on material commodity price increases, we expect a material catch-up in WPX’s stock price, which should follow business value over time. Adding to our confidence, oil supplies are down and prices are up. To paraphrase Ben Graham, in the short-run the market is a voting machine; in the long run, a weighing machine.
In 2017 gold rose about 14% and copper about 32%, yet our second largest investment, Barrick Gold also saw its stock price decline this year. Despite solid operating results, another year of significantly improved balance sheet strength, and
__________
2 | U.S. T-Bill Index (adjusted for interest) returns: one year ending 11/30/2017: 0.75%; five year annualized as of 11/30/2017 0.32%; inception to date ending 11/30/2017 1.95% cumulative and 0.29% annualized. |
3 | As of 11/30/2017, WPX stock was trading well above our average holdings’ cost. Since fiscal year end on 11/30/2017 and through 12/31/2017, the stock price of WPX increased by about 11%. |
excellent cost control, the company had to deal with two unexpected developments: a temporary halt at its Veladero mine (which was promptly resolved, followed by the mid-year sale of a one-half interest in Veladero to a leading gold producer in China); and a partial interruption in production by 63% owned Acacia Gold, a relatively high-cost African gold-miner, which appears to be on a path to resolution, though there are no guarantees.4
Despite the issues noted above, we note that Barrick’s financial strength is the best in years and the company generates significant free cash flow at current commodity prices. Moreover, Barrick has large and low-cost reserves, it has roughly $2 billion in liquidity and nearly $4 billion in borrowing capacity, corporate insiders have purchased shares at both significantly higher prices earlier this year and again just recently, and we believe the company is now positioned to play offense rather than defense.
In a concentrated portfolio, results in any brief period can be heavily influenced by the short-term stock market performance of our largest holdings – as they have been in the past. As discussed in past letters, we urge our shareholders to avoid overweighting short-term results. Both of us have decades of investing experience, we are rational and disciplined, we have some non-consensus thoughts, and we remain optimistic about what we own today. We are among the largest individual investors in the Fund and added to holdings during the year. In addition, our minority partner Markel made a material new investment into the Fund mid-year.
A reduction in the corporate income tax rate to 21% will likely benefit a number of our companies although those with tax-loss carryforwards will see negative but non-cash balance sheet adjustments. On average, S&P 500 corporations have been paying a little less than a 25% effective rate, well below the old 35% statutory rate. Large international tech companies tend to have lower than average tax rates, so Alphabet Inc., for example, should not see much benefit and may actually see a modest drag. However, companies like Verizon Communications, Berkshire Hathaway, Builders FirstSource and others with mostly domestic revenue will likely see tangible benefits in terms of after-tax cash flow.
While positive, the overall impact to the S&P 500 is likely to be somewhat muted given the lower effective rate prior to the change, and indications that companies will increase capex and raise wages rather than simply pass through the entire benefit to earnings. We believe the indexes have already priced in at least some of benefit to expected overall corporate results.
__________
4 | Acacia is 63% owned by Barrick and carried on Barrick’s books as an equity investment. After insisting on higher royalties and taxes in 2017, the government of Tanzania halted some shipments of gold that, had Acacia been consolidated for accounting purposes, would have amounted to about 6% of Barrick’s annualized revenue. However, Acacia’s gold mines are high-cost compared to Barrick’s low-cost core mines (all of which are in stable political jurisdictions) and therefore its operations are less profitable. |
We own two energy companies comprising about 14% of our portfolio – WPX Energy and Birchcliff Energy – that have demonstrated exceptional management, solid assets, and the ability to grow production at low cost. Both of these companies should have low-cost growth ahead. We believe both are materially undervalued by the current market and both are negligible percentages of index funds.
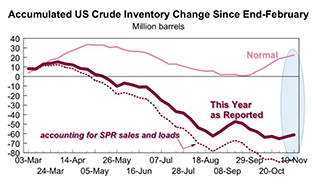
The fundamental industry backdrop continues to improve. As a percentage of the S&P 500, energy continues to bounce along forty-year lows, despite its necessity in everyday life. Yet since the oil price decline of 2014 and 2015, overall industry capital spending collapsed by at least $1 trillion and has not recovered. This is likely to constrain overall industry supply growth for years notwithstanding steady but still modest gains in hydrocarbon alternatives. Since February, both OECD and U.S. inventories have fallen sharply while the S&P energy sector underperformed the overall S&P 500 by a wide margin as shown below. In the short-run, this may simply reflect ETF cash flows, which now seem to be the tail wagging the fundamental dog.
Source: Cornerstone Analytics; November 2017
“SPR” represents the U.S. Strategic Petroleum Reserve which has sold oil into the market this year.
S&P Energy Sector shows performance of the S&P Energy Sector relative to the S&P 500 Index (left scale)
Any further improvement in industry fundamentals should result in renewed demand for the securities of a limited number of high quality and low cost energy businesses. Alternatively, we expect corporate acquirers to start to find better value in the market than at the end of a drill bit.5
Our other commodity related holding is Barrick Gold, as discussed above. During the year, both gold and copper – the two principal commodities produced by Barrick – rose modestly in price while remaining well below the highs of five years ago. As we noted six-months ago, gold supplies have barely increased compared to a massive expansion of central bank liquidity in recent years.
Over the last two years, Chairman John Thornton has focused on restoring balance sheet strength, rebuilding the production pipeline, increasing the company’s depth of talent in management, digitizing and finding other ways to make operations more efficient, and making sure that capital is allocated efficiently and on behalf of shareholders. We strongly suggest you read his last few letters to shareholders in quarterly and annual reports – we believe he is on the way to creating an exceptional company, not just an exceptional gold miner.6
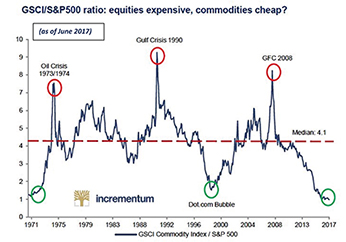
As a footnote to our investments in well-run businesses with commodity exposure, we note that commodities generally remain terribly depressed when compared to most financial assets. As the chart below suggests, the relative value spread between equities and the Goldman Sachs Commodity Index has rarely been as wide as it is now:
Source: Dr. Torsten Dennin, Incrementum AG
__________
5 | Interestingly, the Wall Street Journal just published an article suggesting that Saudi Aramco – the Saudi-Arabian national oil company, was looking to acquire assets in the United States, specifically mentioning the Permian Basin. |
6 | Annual and quarterly reports are available at: http://www.barrick.com/investors/default.aspx |
Our investments in commodity producers or distributors are not premised on commodity price jumps and there is no guarantee that commodities will behave as an offset to equity weakness. Nevertheless, many commodities are poorly correlated to large-cap equities historically; that is, they tend to zig when equities zag, particularly when inflation appears.
Among our other large holdings, most of which are well above our cost, we have further reasons to be optimistic. Alphabet is the only large software stock we own currently and, while no longer cheap, the company is growing fast and is more rationally priced than many of the companies with which it is often lumped together. Alphabet continues to hold and produce a prodigious amount of cash (its balance sheet shows roughly $140 per share in cash with little debt), has invested heavily in rapidly growing software for artificial intelligence, and retains huge optionality in its technology and medical venture portfolio. During the year, we scaled back our position modestly below current prices. Alphabet also approved a stock repurchase program which has yet to be implemented in a material way.
Despite large gains from our cost, HP Inc., which kept the computer and printer business after old Hewlett-Packard split into two businesses, continues to sell at about a 40% discount to the S&P 500 price-to-earnings multiple despite a rise in the stock price last year (price per share divided by earnings per share). Although cyclical and mature, the personal computer business appears to have entered an update cycle and HP is expanding into new printer markets, including the nascent, but potentially huge 3D printing business. While maintaining a sound balance sheet, the company has gained market share, and generated large free cash flows, which have been used to return billions of dollars to shareholders through buybacks and increasing dividends. At inception of our investment, we thought that if the company were stabilized, we would make good money and if it could grow (even modestly) we would earn more. Although our view was almost universally scorned then, it provided an opportunity that still continues. In this case, following the cash has proven rewarding.
Other material holdings include Spectrum Brands, Federated Investors, Verizon Communications, and Berkshire Hathaway. Shortly before this letter was written, Spectrum Brands became the subject of a merger proposal with HRG Group Inc., which owns a majority interest in Spectrum. This combination makes perfect sense at an appropriate price and conversion ratio. A merger will give Spectrum access to HRG’s material tax loss carryforwards. Spectrum is a leading consumer products company that expects to generate close to a 10% free cash flow yield in 2018.
Federated is an established money-management firm managing bond and equity funds, along with a large money-market fund business – a division that has struggled in past years due to ultra-low interest rates. As short-term rates have risen, the company has recouped money-fund fee waivers (increasing earnings) and it may start to see asset inflows if rates continue to rise – further bolstering earnings. Over time, Federated has been an excellent steward of capital, rewarding shareholders with sensible dividends and share repurchases. The company should be a beneficiary of higher interest rates.
Verizon is a company operating in a competitive oligopoly. We were attracted to Verizon by the essential nature of its services, its large customer base, a limited number of competitors, the “undisputed leader” for overall network coverage and reliability (as measured by RootMetrics), and a valuation far below that of the market as a whole. While there has been much promotional activity in the last year or two from clever marketer T-Mobile and weaker competitor Sprint, industry headwinds may be lessening as providers gear up to provide faster speeds through 5G technology. Speed is important to both cell and internet customers and 5G will give Verizon an opportunity to challenge some cable operators in providing basic Internet service as well as cell service.7
After a year or two of stagnation (which created the opportunity), we think Verizon will begin to grow again as it offers new services and is able to slowly increase prices. As a bonus, changes to net neutrality rules and a lower corporate tax rate should add materially to earnings while net worth will increase due to a large one-time benefit from a reduction of deferred tax liability. Although Verizon’s debt load is material, the company generates large cash flows, easily covers interest expense and recent capital spending, and pays a material dividend. Verizon’s shares trade at a large discount to the earnings multiple of the S&P 500.
Berkshire Hathaway has appreciated significantly since our purchase some years ago. The company today has over $90 billion in cash and investments despite having made some major purchases along the way. While Berkshire is getting closer to our estimate of fair value, we believe the company to be a very-well run business with clever capital allocators. Although Warren Buffett is now 87 years young, he has recruited a large stable of demonstrated talent both on the investment side as well as within the operating businesses. Using its strong cash flow and existing cash hoard to make sensible deals, Berkshire should continue to outperform many other large companies over a multi-year period.
During the year, we also added some new names. Unfortunately, two of them ran up fairly quickly and we erred by not moving faster to make larger investments. Earlier in the year, we bought Builders FirstSource, a supplier to the housing construction markets that has been consolidating the wholesale supplier market. The company’s earnings have been better than expected, acquisition debt has been paid down faster than expected, and the stock price has moved up. Housing markets remain relatively tight, as inventories are lean, mortgage rates still relatively low, and single family construction remains well below pre-crisis averages.
__________
7 | Notably and shortly before calendar year-end, both Comcast and Dish Networks announced plans to increase prices for their services. |
Late in the year, we added a position in Macy’s amid widespread general fear about retailers and a collapse in that company’s stock price. Although recent earnings have been pressured and we recognize the industry is changing, the company generates significant free cash flow, has a smaller and rapidly growing cosmetics division, has growing on-line sales, and is focused on expanding on-line talent. Moreover, the company owns extensive real estate assets that are not mall-based and which are worth a large portion of the company’s public market value based on recent comparable transactions.8
Unfortunately, the stock spiked up after reported Q3 results and we own only a modest position. However, with earnings expected to approach $3 per share, a significant dividend yield, some signs of stabilization, and efforts to monetize un-mortgaged property, we believe a share price in the high teens represented opportunity. In any industry where competitive dynamics are changing, there is both danger and opportunity. Accordingly, we expect to react faster and be quick to change our mind if the facts on the ground change.
We also recently made an initial purchase of Oaktree Capital, a money manager with a wonderful long-term record that specializes in distressed investing. We believe Oaktree is worth more than its current market price and could be worth a lot more, particularly as its business would seem inversely correlated to elevated equity indexes.9 Managed by founders Howard Marks, Bruce Karsh and CEO Jay Wintrob, Oaktree has created tremendous value for its owners and clients over time, has a history of paying out cash earnings, and has a franchise that should be able to grow.
During the year, we sold or eliminated some smaller positions and scaled back some others. These included, but were not limited to, our disposition of Staples Inc., which was taken private at a price that yielded us just a modest profit; the buyer got a bargain. Despite having eliminated our remaining position in Walter Investment Management earlier in the year, it still was a drag on performance for the period. At mid-year, we disclosed a position in New York REIT, a real estate investment trust that had approved a plan of liquidation. We bought after its stock price fell sharply in response to a lower estimate of realizable value by new management. Based on a property by property analysis, we expected that the liquidation proceeds would offer reasonable return to the newly lowered stock price with little or no correlation to broader indexes. However, after the company sold two properties for somewhat less than our original estimates, we sold the entire position at a modest loss amounting to
__________
8 | Macy’s largest parcel is its Herald Square property, a square block in Manhattan near a transportation hub that would appear to be conservatively worth close to $3 billion by itself. At the time we were buying shares, the company’s stock market value was only about $6 billion despite annual profits of roughly $1 billion in the last twelve months. |
9 | Oaktree could be a great example of what author Nassim Taleb calls “antifragile,” which he defined as the quality whereby something benefits from disorder. |
less than 1/10 of 1% of the portfolio. In this case, we believe that capable CEO Wendy Silverstein did all she could to cleverly maximize property value, however, it appears that the commercial market in New York has weakened perceptibly since the liquidation was announced.
Notably, we also sold some of our Systemax after the stock more than tripled in price during the year. It is important to understand that the intrinsic value of the company did not triple this year – but a set of circumstances caused the market to recognize value that was previously obscured for years. Despite our inability to predict the timing, it was a willingness to patiently wait that led to this quite profitable multi-year investment. Systemax is a small cap company with concentrated ownership by its managers and a very strong and liquid balance sheet with almost no debt, yet its stock had languished with limited liquidity when we were buyers.10 Frankly, we should have ignored the liquidity issues and owned more. Having a long-term view is a real competitive advantage, and our investment in this company is a good illustration of why.
A long view is a key factor that differentiates good fundamental investors from quants and large traders, who have very important edges over short time periods, as well as index funds. A study led by Martijn Cremers of the business school at the University of Notre Dame in 2014 suggested that:
“… among high Active Share portfolios – whose holdings differ substantially from the holdings of their benchmark – only those with patient investment strategies (i.e., with long stock holding durations of at least 2 years) outperform their benchmarks on average. Funds trading frequently generally underperform, regardless of Active Share.”
However, when you look different from the crowd and aren’t trying to constantly jump on the most popular bandwagon, you risk looking foolish, or worse, incompetent. It is far better for portfolio manager job security to hug indexes and not vary too far from consensus results. But when valuations are elevated as in the last couple of years – and particularly today – looking different makes sense if you care not just about potential profit, but also about preserving capital. Our investments are important to us and we assume that the capital of our fellow shareholders is just as important to them.
Trying to keep up with the Dow Joneses (or any similar but arbitrary index) can be a truly unsound strategy. The NASDAQ 100 index is one of the leading equity indexes, along with the S&P 500. Few investors really understand how these indexes are constructed or how valuation statistics are presented. For example, investment manager Horizon Kinetics pointed out in August 2017 that there is an enormous difference in the
__________
10 | As we were finalizing this letter, Systemax declared a $1.50 per share special dividend representing about 5% of the company’s stock market value. Investing tends to be more pleasant with conservative managers who are large equity owners and behave in a shareholder friendly manner. |
price-earnings (“P/E”) ratio of the $60 billion QQQ ETF, which mirrors the NASDAQ 100 Index, depending on just how you calculate the ratio. At that time, the QQQ “fact sheet” showed a P/E ratio of about 22 calculated using a “weighted harmonic mean.”
However, such a method effectively eliminated companies with a P/E of over 100 or those with large losses, meaning that Amazon, with a trailing P/E of 188 at the time, would not have been a factor, nor would Tesla, whose losses have been sizeable. Had the ratio been calculated by a method of taking a simple average of the 91 profitable companies, the P/E would have been 41 instead of 22. This appears to be a form of statistics jujitsu.11 Moreover, while one would think that an index of 100 companies would have some modicum of diversification, it is actually highly concentrated. Roughly 42% of its assets are in the top five holdings, all of which are technology companies – a level of industry concentration many would consider imprudent. Similar inconsistencies and misunderstandings are common in the index and ETF world.
To us, it appears that much of the nearly $2 trillion shift from active managers to passive index vehicles and ETFs is performance and diversification chasing rather than any sort of real analysis. Such massive flows and zero cash balances have helped to push index performance upwards, particularly relative to concentrated value investors.
Source: BofAML Global Investment Strategy, EPFR Global
While passive or index investment can make sense when markets as a whole are undervalued or reasonably priced, they are a potential disaster at high valuations. Do you know any business investor that would hand over a large chunk of their net worth to a money manager who never, ever, looked at the value of what he was buying on the client’s behalf? Yet that’s exactly how index funds behave; they buy when money flows in, sell when it flows out, and literally never attempt to understand the value of anything they buy or sell. They are not money-managers or capital allocators in a traditional sense.
__________
11 | The actual publication by Horizon Kinetics may be found online here: https://tinyurl.com/ychruajk |
Almost every bad idea in financial markets starts as something sensible, but is taken to excess. Investors have been told repeatedly that even modest diversification tends to reduce single stock risk. However, few index fund owners understand that if you have a widely diversified pool of securities that are materially overvalued by historic standards (on average), diversification does not diminish the risk.
From late 1998 through early 2000, clients and shareholders fled value investors as indexes filled with overpriced technology shares soared and cheap securities were ignored. After the overvalued tech bubble burst in March of 2000, the S&P returned nearly zero to investors over the ensuing ten years. Looking like a broad index today appears far riskier to us, and potentially less profitable, than the alternative of owning a handful of businesses generating significant cash in relation to their market prices, or those with valuable assets selling well below historic averages, particularly if they are not heavily weighted in popular ETFs, and some cash reserves.
There are some sound reasons to be cautious here. Central banks are belatedly starting to taper their extraordinary liquidity programs that began in 2008, reducing market liquidity even as they have balance sheets stuffed with some securities of uncertain value.12 Also, sentiment indicators remain at or near historical extremes. Among these are a record low level of assets in bearish equity funds, very high bullishness on the part of institutional and retail investors, and low historical holdings of cash by investors who are typically contra-indicators. Notably, the American Association of Individual Investors recorded its lowest cash allocation in two decades as did a long-held survey of clients of a large broker-dealer, both strong contrary indicators.
Low-yielding cash is a drag on performance in an up market but most valuable when others have little or none, as it allows an investor to behave opportunistically and avoid forced selling. The ability to behave opportunistically is common among great capital allocators. Seth Klarman, a great investor who is well-known for carefully evaluating risks before considering profits, wrote clients in September that his cash position was above 40%. Corporations such as Berkshire Hathaway, Leucadia National, White Mountains, and others (each of these aforementioned companies is in our portfolio currently) have a history of buying under stress when others are fearful or cash poor. It is not that they always hold above average levels of cash – it just seems like it. But historically they build up cash as securities get expensive and then deploy it when markets are volatile, depressed, or fearful. Notably, Berkshire Hathaway holds a record amount of liquidity today.
__________
12 | Central banks have traditionally owned only the highest quality monetary or fixed income instruments. Yet the Swiss National Bank owns $90 billion of equities today, including more Apple Inc. than Franklin Resources or Charles Schwab; the Bank of Japan owns most of the ETF market in Japan; and the European Central Bank owns $150 billion of corporate debt, including a tranche of suddenly defaulted Steinhoff International Holdings. |
We humbly suggest that investors today may not want a manager today who has an outstanding recent record compared to popular equity indexes, dominated by a handful of large cap companies, some with questionable earnings power, where investors have piled in at some of the most expensive valuation metrics in a century. Volatility is scarce and the S&P 500 Index is approaching the longest period ever without a five percent correction in prices (source: BofA Merrill Lynch). We believe that periodic underperformance by concentrated value investors – generally – is a feature, not a flaw of such an approach, and that such periods can be followed by a material snapback, particularly in relative performance.13
Warren Buffett has suggested that investors should be greedy when most are fearful and fearful when most are greedy. There are plenty of signs of frothy speculative activity, from cash hemorrhaging large-cap companies with jumping stock prices to astounding gains in cryptocurrencies.14 However, human psychology has not been repealed. Fear and greed will always oscillate in markets – despite times like the present when fear seems to have been largely banished from the stage.
Remaining disciplined is not easy when index valuations break records and speculation is high. However, in hindsight we have also failed to take advantage of certain opportunities due to misplaced concerns about the macro backdrop of specific industries – and this led to significant opportunity cost. We are working very hard today to make sure that the big picture backdrop of a fully priced market does not keep us from feverishly searching for pockets of opportunity – for that is our job and we are not constrained by a huge asset base or a limited list of investments. We are simply trying to find a few securities we can buy in scale for materially less than what they are worth to a rational and well-informed party in an arms-length transaction for both our shareholders and ourselves. We expect that we will. And we like our current positioning. Our goal has never been to always and forever outperform any particular equity index. We look at the returns of many types of investments, as well as risk-free rates when weighing risks against prospective return. While motivated to make money for all shareholders, we are unwilling to take large known risks for a nominally higher potential return. To paraphrase Buffett, investing is often like being a batter in a baseball game, except there are no called strikes. An investor just has to wait for one or two pitches he or she know they can hit hard and ignore the rest.
__________
13 | The article titled Are Short-Term Performance and Value Investing Mutually Exclusive? The Hare and the Tortoise Revisited (author: V. Eugene Shahan) should be read by every allocator of capital. One investor mentioned in the article outperformed the S&P 500 over a 19-year period, yet had a stretch where his returns underperformed the S&P 500 Index six years in a row! However, we make no representation that such results are repeatable, simply that they have occurred. |
14 | We have no price view on crypto, but recognize that distributed ledgers may well change how certain business is conducted. The ultimate success of related cryptocurrencies may be tied to the utility of the underlying software. To date, the best explanation we have found regarding cryptocurrencies and distributed ledgers may be found at the following link: https://blog.chain.com/a-letter-to-jamie-dimon-de89d417cb80 |
Thank you for your continued confidence.
Sincerely,
 |  |
| Larry | Keith |
Mutual fund investing involves risk. Principal loss is possible. The Fund is non-diversified, meaning it may concentrate its assets in fewer individual holdings than a diversified fund. Therefore, the Fund is more exposed to individual stock volatility than a diversified fund. The Fund invests in midcap and smaller capitalization companies, which involve additional risks such as limited liquidity and greater volatility. The Fund may invest in foreign securities which involve political, economic and currency risks, greater volatility and differences in accounting methods. These risks are enhanced in emerging markets. The Fund may invest in REITs, which are subject to additional risks associated with direct ownership of real property including decline in value, economic conditions, operating expenses, and property taxes. Investments in debt securities typically decrease in value when interest rates rise. This risk is usually greater for longer-term debt securities. Investments in lower-rated, non-rated and distressed securities present a greater risk of loss to principal and interest than higher-rated securities.
The opinions expressed are those of Larry Pitkowsky and/or Keith Trauner through the end of the period for this report, are subject to change, and are not intended to be a forecast of future events, a guarantee of future results, nor investment advice. This material may include statements that constitute “forward-looking statements” under the U.S. securities laws. Forward-looking statements include, among other things, projections, estimates, and information about possible or future results related to the Fund, market or regulatory developments. The views expressed herein are not guarantees of future performance or economic results and involve certain risks, uncertainties and assumptions that could cause actual outcomes and results to differ materially from the views expressed herein. The views expressed herein are subject to change at any time based upon economic, market, or other conditions and GoodHaven undertakes no obligation to update the views expressed herein. While we have gathered this information from sources believed to be reliable, GoodHaven cannot guarantee the accuracy of the information provided. Any discussions of specific securities or sectors should not be considered a recommendation to buy or sell those securities. The views expressed herein (including any forward-looking statement) may not be relied upon as investment advice or as an indication of the Fund’s trading intent. Information included herein is not an indication of the Fund’s future portfolio composition.
References to other mutual funds should not be interpreted as an offer of these securities.
Must be preceded or accompanied by a prospectus. It is not possible to invest directly in an index.
Passive investing involves the purchase of securities or funds that attempt to mirror the performance of a specific index. Active investing involves the purchase of individual securities or funds whose managers attempt to select securities based on fundamental research, quantitative analysis, or other factors and who actively change the underlying portfolios in response to corporate or macro developments.
Typically, passive funds have lower costs and fees compared to actively managed funds. Both actively and passively managed funds involves risk, and principal loss is possible. Both actively and passively managed funds generally have daily liquidity. There are no guarantees regarding the performance of actively and passively managed funds. Actively managed mutual funds may have higher portfolio turnover than passively managed funds. Excessive turnover can limit returns and can incur capital gains. Exchange-
Traded Funds (ETFs) are securities that track an index, a commodity or basket of assets like an index fund, but trade like a stock on an exchange. ETFs experience price changes throughout the day as they are bought and sold. Mutual Funds are structured and maintained to match their investment objectives and generally are priced and traded only once a day at the market close.
Cash flow is generally defined as the cash a company generates from its business operations, before capital or securities investments.
Free cash flow is generally defined as cash revenues less all normal operating expenses (including interest expense) and less an estimate of the capital spending necessary to maintain the business in its current state.
Book Value represents the accounting value remaining after a corporation’s liabilities are subtracted from its assets.
Tangible Book Value represents the accounting value remaining after a corporation’s liabilities are subtracted from its assets (but excluding the value of any intangible assets, such as goodwill).
A Treasury bill, or T-Bill, is short-term debt issued and backed by the full faith and credit of the United States government.
The S&P 500 Index is a capitalization weighted index of 500 large capitalization stocks which is designed to measure broad domestic securities markets.
The Wilshire 5000 Total Market Index (full-cap) measures the performance of all U.S. equity securities with readily available price data. Over 5,000 capitalization weighted security returns are used to adjust the index.
HFRI Fundamental Growth strategies employ analytical techniques in which the investment thesis is predicated on assessment of the valuation characteristics on the underlying companies which are expected to have prospects for earnings growth and capital appreciation exceeding those of the broader equity market. Investment theses are focused on characteristics of the firm’s financial statements in both an absolute sense and relative to other similar securities and more broadly, market indicators. Strategies employ investment processes designed to identify attractive opportunities in securities of companies which are experiencing or expected to experience abnormally high levels of growth compared with relevant benchmarks growth in earnings, profitability, sales or market share.
HFRI Fundamental Value Index strategies employ investment processes designed to identify attractive opportunities in securities of companies which trade a valuation metrics by which the manager determines them to be inexpensive and undervalued when compared with relevant benchmarks. Investment theses are focused on characteristics of the firm’s financial statements in both an absolute sense and relative to other similar securities and more broadly, market indicators. Relative to Fundamental Growth strategies, in which earnings growth and capital appreciation is expected as a function of expanding market share & revenue increases, Fundamental Value strategies typically focus on equities which currently generate high cash flow, but trade at discounted valuation multiples, possibly as a result of limited anticipated growth prospects or generally out of favor conditions, which may be specific to sector or specific holding.
CS Hedge Fund Index is an asset-weighted hedge fund index derived from the TASS database of more than 5000 funds. The index consists of funds with a minimum of US $10 million under management and a current audited financial statement. Funds are separated into primary subcategories based on investment style. The index in all cases represents at least 85% of the assets under management in the universe. The index is rebalanced monthly, and funds are reselected on a quarterly basis. Index NAVs are updated on the 15th of each month.
The NASDAQ-100 is a stock market index made up of 104 equity securities issued by 100 of the largest non-financial companies listed on the NASDAQ. It is a modified capitalization-weighted index.
PORTFOLIO MANAGEMENT DISCUSSION AND ANALYSIS (Unaudited) |
The Net Asset Value (“NAV”) of the GoodHaven Fund was $23.58 at November 30, 2017 based on 8,830,636 shares outstanding. This compares to the Fund’s NAV of $23.37 at November 30, 2016, an NAV of $22.55 at May 31, 2017, and an NAV of $20.00 at inception on April 8, 2011. Although the Fund did not pay a taxable distribution of capital gains or income in 2017, shareholders should be aware that the Fund has paid capital gains and income distributions in prior years that reduced NAV by the amount of a distribution on the ex-dividend date. Please note that except where otherwise indicated, discussions in this MD&A relate to the period ended November 30, 2017. The Fund’s performance for the period December 1, 2016 to November 30, 2017 was a gain of 0.90% compared to a total return of 22.87% for the S&P 500 Index. We note that certain holdings rebounded in the month of December, after the date of the attached financial statements. Since inception on April 8, 2011 and through November 30, 2017, the Fund’s annualized performance is a gain of 4.09% compared to an increase of 13.31% for the S&P 500 Index. Please see the portfolio manager’s letter to shareholders for additional information regarding performance and comparisons to other indexes. All comparisons assume reinvested dividends.
The performance data quoted above represents past performance. Past performance does not guarantee future results. The investment return and principal value of an investment will fluctuate so that an investor’s shares, when redeemed, may be worth more or less than their original cost. Current performance of the Fund may be lower or higher than the performance quoted. Performance data current to the most recent month-end may be obtained by calling (855) OK-GOODX or (855) 654-6639.
2017 was a frustrating year for Fund performance that followed a strong 2016 on both a relative and absolute basis. Money continued to pour into passive funds and ETFs at high valuations, reinforcing those indexes despite near historic valuation levels. Moreover, two of the Fund’s largest holdings declined for the year on a price basis, despite solid business performance of the underlying companies. 2017 continued to be a difficult year for investors who use fundamental value strategies generally, as their approach (and ours) has been deeply out of favor compared to growth and passive strategies. We note that multiple investment managers, some with outstanding long-term records, but who have struggled in the last couple of years, recently retired or decided to wind-up their funds.1 Moreover, signs of extraordinary speculation emerged during the year, including a rapid rise in the price of a number of large tech companies that are losing money on a cash basis, as well as a huge jump in the price of cryptocurrencies such as Bitcoin.
__________
1 | Among the most notable were John Burbank’s Passport Capital, famed for its profitable bets against subprime housing ahead of the financial crisis, which will shutter its flagship fund after persistent losses. John Griffin, one of famed investor Julian Robertson’s “tiger cubs” is closing his Blue Ridge Capital after three decades and recent stumbles. |
PORTFOLIO MANAGEMENT DISCUSSION AND ANALYSIS (Unaudited) (Continued) |
While the Fund’s record since inception is still colored by a material divergence between mid-2014 and the end of 2015, we continue to believe that the investment manager’s strategy is sound and risk averse. The portfolio managers continue to be among the largest individual owners of Fund shares and continue to have significant personal assets at risk, aligning the interests of shareholders. Moreover, while their past activities cannot determine future outcomes, the portfolio managers are highly experienced and have been associated with a number of successful investment businesses. Although we cannot predict when investors will once more exhibit risk aversion and abandon highly speculative or risky strategies (especially where we believe some of the risks of more popular strategies are poorly understood), we continue to believe that regression to the mean is a core characteristic of financial markets and that value investing and some measure of risk aversion will regain favor, probably sooner rather than later.
The portfolio managers believe that short-term performance figures are less meaningful than a comparison of longer periods and that a long-term investment strategy should be properly judged over a period of years rather than weeks or months. Furthermore, the S&P 500 Index is an unmanaged index incurring no fees, expenses, or taxes and is shown solely for the purpose of comparing the Fund’s portfolio to an unmanaged and diversified index of large companies. There are other indexes whose performance may diverge materially from that of the S&P 500. Below is a table of the Fund’s top ten holdings and categories as of November 30, 2017.
Top 10 Holdings*(1) | % | | Top Categories** | % |
| WPX Energy, Inc. | 12.5% | | Cash and Equivalents | 24.9% |
| Barrick Gold Corp. | 9.5% | | Oil & Gas Exploration | |
| Alphabet Inc. – Class A | | | & Production | 16.0% |
| and Class C | 6.7% | | Metals & Mining | 9.5% |
| HP Inc. | 4.9% | | Diversified Holding | |
| Federated Investors, Inc. – | | | Companies | 8.5% |
| Class B | 4.7% | | Computer & Internet Software | 6.7% |
| Leucadia National Corp. | 4.3% | | Computers & Peripheral | |
| Verizon Communications Inc. | 3.6% | | Equipment | 4.9% |
| Berkshire Hathaway Inc. – | | | Financial Services | 4.7% |
| Class B | 3.6% | | Telecommunications | 3.6% |
| Birchcliff Energy Ltd. | 3.5% | | Industrial Supplies | 3.4% |
| Systemax Inc. | 3.4% | | Consumer Products | 3.3% |
| Total | 56.7% | | | 85.5% |
| * | | Top ten holdings excludes cash, money market funds and Government and Agency Obligations |
| ** | | Where applicable, includes money market funds and short-term Government and Agency Obligations |
(1) | | Fund holdings and/or sector allocations are subject to change at any time and are not recommendations to buy or sell any security. |
PORTFOLIO MANAGEMENT DISCUSSION AND ANALYSIS (Unaudited) (Continued) |
Despite very good 2016 performance, the Fund continued to experience net outflows in 2017, although such outflows have diminished in recent months and assets appear reasonably stable. Since inception of the Fund, there have been periods where there were large new shareholder subscriptions and periods with significant net withdrawals. We believe this is primarily caused by shareholders who are attracted by the potential for better performance in a concentrated value fund but which are negatively and emotionally affected by volatility in results – resulting in short-term behavior that tends to reduce returns among mutual fund investors. It may be interesting to note that, as of the date of this report, neither of the portfolio managers of the Fund, whose shareholdings total in the millions of dollars, has ever sold shares of the Fund.
Material swings in shareholder subscriptions and redemptions can make management of the portfolio more difficult. During the most recent fiscal year, the portfolio managers were able to undertake actions to avoid creating taxable gains during 2017 without materially affecting portfolio values. The Fund’s investments are stated as of November 30, 2017, and the amounts and rankings of the Fund’s holdings today may vary significantly from the data disclosed above and the managers may have taken actions that would result in material changes to the portfolio.
The Fund’s investments having the most positive impact on portfolio performance for the annual period ended November 30, 2017 were: Systemax Inc., Alphabet Inc. (Classes A and C), HP Inc., Leucadia National Corporation, and Federated Investors, Inc. Systemax rose sharply after it sold a money-losing division, leaving a growing and profitable industrial supplies business; Alphabet rose as its revenues and earnings increased materially year over year with few signs of diminished growth; HP Inc. rose as it began to grow modestly during the year and showed positive results in both personal computers and printing divisions; Leucadia rose as it reported strong earnings from its investment banking and beef subsidiaries; and Federated Investors rose as earnings increased due to a reduction in money-market fund fee waivers and successful marketing efforts.
The Fund’s investments having the most negative impact on the portfolio for the annual period ended November 30, 2017 were: WPX Energy, Inc., Walter Investment Management Corporation, Birchcliff Energy Ltd., Barrick Gold Corporation, and Dundee Corporation. WPX and Birchcliff, our two significant energy investments, accounted for the largest part of the decline, in part due to weaker oil prices during the year and lower natural gas prices in both the U.S. and Canada. However, in both cases, we believe intrinsic value actually grew during the period. The Fund disposed of its entire Walter Investment stake, selling most in the early part of the year, but not before a price decline from the end of the 2016 fiscal year. Barrick declined as it had two production interruptions during the year at Veladero and Acacia, however it also generated significant positive free cash flow and paid down additional debt. Dundee declined in response to a decline in overall net asset value, though holding company cash increased and the company’s cash outflows were sharply reduced during the year.
PORTFOLIO MANAGEMENT DISCUSSION AND ANALYSIS (Unaudited) (Continued) |
During the period, the Fund disposed of its investments in: Alleghany Corporation, Hewlett Packard Enterprise Co., New York REIT Inc., Sears Holdings Corporation, Seritage Growth Properties, Staples Inc., and Walter Investment Management Corporation. In addition, two fixed income investments were redeemed by the issuers at a price above our cost basis, including bonds of HomeFed Corporation and WPX Energy.
The managers of the Fund do not believe that a decline in a security price necessarily means that the security is a less attractive investment. The opposite may be the case in that price declines may represent significant investment opportunities. During fiscal 2017, the largest single factor affecting performance was a decline in energy-related holdings despite oil ending the year higher than at the beginning of the year. The portfolio managers generally do not try to predict macroeconomic or market swings and prefer instead to try to react to what happens.
The Fund’s turnover rate, a measure of how frequently assets within a fund are bought and sold by the managers, remains at reasonably low levels and is consistent with the strategies, generally long-term in nature, of GoodHaven Capital Management LLC, the Fund’s investment advisor. Turnover rates in fiscal 2017 were modestly influenced by the need to meet shareholder redemptions rather than a change in the portfolio strategy of the Fund. The Fund’s turnover remains low. Importantly, there may be times when turnover rates rise, however, we do not anticipate rapid turnover of the portfolio under normal circumstances.
The portfolio managers believe that a significant liquidity position is an important part of portfolio management. Since inception, the Fund has continued to have significant liquidity available both in cash holdings as well as short-term fixed income investments. Currently, reflecting high prevailing valuations in most sectors of the equity markets, cash and equivalents are a material percentage of the overall portfolio. We recently began investing in some short-dated paper to take advantage of an increase in money-market rates but these holdings are generally highly rated. In order to ensure that we have sufficient resources to behave opportunistically, the Fund has sold or reduced certain investments and may hold some modest hedges from time to time. There is no guarantee that such hedges will protect against loss and the Fund may lose money should volatility be reduced in future months. In the last year, the Fund experienced modest losses as a result of hedge transactions. Over time, we expect the Fund’s level of cash to vary significantly and could be higher or lower than shown on the most recent Schedule of Investments.
We continue to believe that having a cash cushion at a time of generally elevated prices and investor ebullience is a strategic advantage. Had our cash been invested in index funds, our performance would have been materially higher, however management of the fund concurs with the portfolio manager that giving up relative performance is not the same as losing money. In an equity downturn, we would
PORTFOLIO MANAGEMENT DISCUSSION AND ANALYSIS (Unaudited) (Continued) |
expect our liquidity to act as a cushion until redeployed advantageously. Further, our liquidity has allowed us to meet redemptions in an efficient manner while mostly avoiding forced liquidation of investments.
It is our intention to invest a significant portion of current liquidity in an opportunistic manner when bargains meeting our investment criteria appear. However, it is possible that the Fund may have a significant cash or cash equivalent position for an extended period of time if, in the opinion of the portfolio managers, market conditions are unfavorable. At times when liquidity is high, the Fund may underperform a strongly rising stock market. We note that although the Fund had significant liquidity during the period from Inception in April 2011 through May of 2014 (including a sizeable amount related to a large cash influx due to new Fund share subscriptions),we believe performance was still reasonable by relative and absolute standards over that time frame. In the prior fiscal year, ended November 30, 2016, the Fund significantly outperformed most equity indexes, despite having significant liquidity during a period when indexes significantly appreciated. The portfolio managers’ letter to shareholders contains additional discussion about performance.
Generally, we do not expect significant realized capital gain or loss from any particular short-term, non-U.S. investments when viewed over an extended period. During fiscal 2017, we saw commodity prices such as oil and gold rise, yet the Fund’s holdings lagged, perhaps reflecting the current and short-term activity of ETF flows, which often trade opposite to short-term trends. Further, late in the year a tax-reform package was signed that lowered corporate income tax rates and which should help the earnings of a number of companies held by the Fund. Large multi-nationals are less affected and their earnings also remain subject to currency swings.
To reiterate our view on liquidity, the portfolio managers believe that a certain amount of liquidity may benefit shareholders in several ways – by preventing liquidation of securities to meet modest levels of redemptions, by providing ammunition to purchase existing or new holdings in declining markets without being forced to sell existing holdings, and by lessening the chance that shareholders will blindly seek liquidations during periods of market stress that could adversely impact the Fund. That said, if bargains meeting our criteria seem plentiful, we are likely to have significantly less liquidity under such conditions than has been the case since inception.
The Fund is subject to certain risks as disclosed in the Prospectus and Statement of Additional Information, both of which may be obtained from the Fund’s website at www.goodhavenfunds.com or by calling 1-855-654-6639. Some of these risks include, but are not limited to, adverse market conditions that negatively affect the price of securities owned by the Fund, a high level of cash, which may result in underperformance during periods of robust price appreciation, adverse movements in foreign currency relationships as a number of the Fund’s holdings have earnings resulting from operations outside the United States, and the fact that the Fund is non-
PORTFOLIO MANAGEMENT DISCUSSION AND ANALYSIS (Unaudited) (Continued) |
diversified, meaning that its holdings are more concentrated than a diversified Fund and that adverse price movements in a particular security may affect the Fund’s Net Asset Value more negatively than would occur in a more diversified fund.
As of November 30, 2017, the members, officers, and employees of GoodHaven Capital Management, LLC, the investment advisor to the GoodHaven Fund, owned approximately 259,941 shares of the Fund. The portfolio managers added to personal holdings during the fiscal year. It is management’s intention to disclose such holdings (in the aggregate) in this section of the Fund’s Annual and Semi-Annual reports on an ongoing basis.
SECTOR ALLOCATION at November 30, 2017 (Unaudited) |
| Sector | | % of Net Assets |
| | | | | |
Cash & Equivalents1 | | | 24.9 | % | |
| Oil & Gas Exploration & Production | | | 16.0 | % | |
| Metals & Mining | | | 9.5 | % | |
| Diversified Holding Companies | | | 8.5 | % | |
| Computer & Internet Software | | | 6.7 | % | |
| Computers & Peripheral Equipment | | | 4.9 | % | |
| Financial Services | | | 4.7 | % | |
| Telecommunications | | | 3.6 | % | |
| Industrial Supplies | | | 3.4 | % | |
| Consumer Products | | | 3.3 | % | |
| Air Transportation | | | 2.9 | % | |
| Property/Casualty Insurance | | | 2.8 | % | |
| Marine Services & Equipment | | | 2.1 | % | |
| General Building Materials | | | 2.0 | % | |
| Miscellaneous | | | 1.9 | % | |
| Retail | | | 1.3 | % | |
| Property Management | | | 1.1 | % | |
| Guernsey Investment Fund | | | 0.4 | % | |
| Total | | | 100.0 | % | |
1 | Represents cash and other assets in excess of liabilities. |
HISTORICAL PERFORMANCE (Unaudited) |
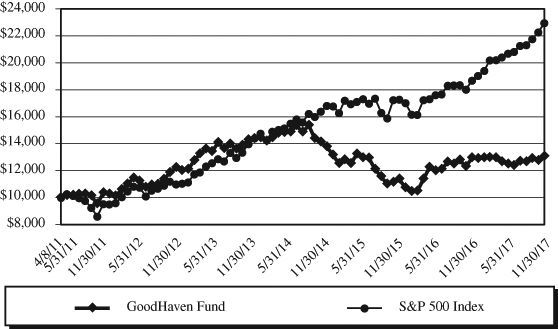
Value of $10,000 vs. S&P 500 Index
Average Annual Total Returns
Periods Ended November 30, 2017
| | | | | Annualized | Value of |
| | One | Three | Five | Since Inception | $10,000 |
| | Year | Year | Year | (4/8/2011) | (11/30/2017) |
| GoodHaven Fund | 0.90% | -1.76% | 1.68% | 4.09% | $13,056 |
| S&P 500 Index | 22.87% | 10.91% | 15.74% | 13.33% | $22,967 |
This chart illustrates the performance of a hypothetical $10,000 investment made on April 8, 2011 (the Fund’s inception) and is not intended to imply any future performance. The returns shown do not reflect the deduction of taxes that a shareholder would pay on Fund distributions or the redemption of Fund shares. The chart assumes reinvestment of capital gains and dividends, but does not reflect redemption fees of 2.00% on shares held less than 60 days.
SCHEDULE OF INVESTMENTS at November 30, 2017 |
| Shares | | COMMON STOCKS – 71.7% | | Value | |
| | | Air Transportation – 2.9% | | | |
| | 120,000 | | American Airlines Group Inc. | | $ | 6,058,800 | |
| | | | | | | | |
| | | | Computer & Internet Software – 6.7% | | | | |
| | 2,100 | | Alphabet Inc. – Class A1 | | | 2,175,957 | |
| | 11,500 | | Alphabet Inc. – Class C1 | | | 11,746,215 | |
| | | | | | | 13,922,172 | |
| | | | Computers & Peripheral Equipment – 4.9% | | | | |
| | 473,400 | | HP, Inc. | | | 10,154,430 | |
| | | | | | | | |
| | | | Consumer Products – 3.3% | | | | |
| | 60,000 | | Spectrum Brands Holdings, Inc. | | | 6,892,800 | |
| | | | | | | | |
| | | | Diversified Holding Companies – 8.5% | | | | |
| | 39,200 | | Berkshire Hathaway Inc. – Class B1 | | | 7,565,992 | |
| | 631,220 | | Dundee Corp.1,2 | | | 1,321,004 | |
| | 337,512 | | Leucadia National Corp. | | | 8,879,941 | |
| | | | | | | 17,766,937 | |
| | | | Financial Services – 4.7% | | | | |
| | 290,300 | | Federated Investors, Inc. – Class B | | | 9,742,468 | |
| | | | | | | | |
| | | | General Building Materials – 2.0% | | | | |
| | 200,000 | | Builders FirstSource, Inc.1 | | | 4,080,000 | |
| | | | | | | | |
| | | | Industrial Supplies – 3.4% | | | | |
| | 234,516 | | Systemax Inc. | | | 7,152,738 | |
| | | | | | | | |
| | | | Marine Services & Equipment – 2.1% | | | | |
| | 351,694 | | Stolt-Nielsen Ltd.2 | | | 4,417,603 | |
| | | | | | | | |
| | | | Metals & Mining – 9.5% | | | | |
| | 1,437,150 | | Barrick Gold Corp. | | | 19,803,927 | |
| | | | | | | | |
| | | | Oil & Gas Exploration & Production – 16.0% | | | | |
| | 1,868,100 | | Birchcliff Energy Ltd. | | | 7,225,375 | |
| | 2,053,055 | | WPX Energy, Inc.1 | | | 26,012,207 | |
| | | | | | | 33,237,582 | |
| | | | Property/Casualty Insurance – 2.8% | | | | |
| | 6,532 | | White Mountains Insurance Group, Ltd. | | | 5,819,947 | |
The accompanying notes are an integral part of these financial statements.
SCHEDULE OF INVESTMENTS at November 30, 2017 (Continued) |
| Shares | | COMMON STOCKS – 71.7% (Continued) | | Value | |
| | | Retail – 1.3% | | | |
| | 110,000 | | Macy’s Inc. | | $ | 2,618,000 | |
| | | | | | | | |
| | | | Telecommunications – 3.6% | | | | |
| | 149,000 | | Verizon Communications Inc. | | | 7,582,610 | |
| | | | TOTAL COMMON STOCKS | | | | |
| | | | (Cost $110,107,539) | | | 149,250,014 | |
| | | | | | | | |
| | | | GUERNSEY INVESTMENT FUND – 0.4% | | | | |
| | 132,601 | | JZ Capital Partners Limited1,2 | | | 911,886 | |
| | | | TOTAL GUERNSEY INVESTMENT FUND | | | | |
| | | | (Cost $688,013) | | | 911,886 | |
| | | | | | | | |
| Principal | | | | | | |
| Amount | | CORPORATE BONDS – 1.1% | | | | |
| | | | Property Management – 1.1% | | | | |
| $ | 2,200,000 | | HomeFed Corp. 6.500% due 10/1/2019 | | | 2,211,000 | |
| | | | TOTAL CORPORATE BONDS | | | | |
| | | | (Cost $2,200,000) | | | 2,211,000 | |
| | | | | | | | |
| | | | MISCELLANEOUS SECURITIES – 1.9%1,3,4 | | | | |
| | | | TOTAL MISCELLANEOUS SECURITIES | | | | |
| | | | (Cost $4,512,081) | | | 3,945,350 | |
| | | | Total Investments | | | | |
| | | | (Cost $117,507,634) – 75.1% | | | 156,318,250 | |
| | | | Cash and Other Assets in | | | | |
| | | | Excess of Liabilities – 24.9% | | | 51,921,105 | |
| | | | TOTAL NET ASSETS – 100.0% | | $ | 208,239,355 | |
1 | Non-income producing security. |
2 | A portion of this security is considered illiquid. As of November 30, 2017, the total value of illiquid securities was $3,131,368 or 1.5% of net assets. |
3 | Represents previously undisclosed securities which the Fund has held for less than one year. |
4 | Notional value of derivative instruments is $39,751,500. |
The accompanying notes are an integral part of these financial statements.
STATEMENT OF ASSETS AND LIABILITIES at November 30, 2017 |
| ASSETS | | | |
| Investments in securities, at value | | | |
| (Cost $117,507,634) (Note 2) | | $ | 156,318,250 | |
| Cash | | | 50,974,730 | |
| Receivables: | | | | |
| Fund shares sold | | | 74,220 | |
| Investment securities sold | | | 1,066,083 | |
| Dividends and interest | | | 174,796 | |
| Total assets | | | 208,608,079 | |
| | | | | |
| LIABILITIES | | | | |
| Payables: | | | | |
| Fund shares redeemed | | | 182,740 | |
| Management fees | | | 152,169 | |
| Support services fees | | | 33,815 | |
| Total liabilities | | | 368,724 | |
| | | | | |
| NET ASSETS | | $ | 208,239,355 | |
| | | | | |
| COMPONENTS OF NET ASSETS | | | | |
| Paid-in capital | | $ | 198,432,128 | |
| Accumulated net investment loss | | | (223,873 | ) |
| Accumulated net realized loss on investments | | | (28,779,516 | ) |
| Net unrealized appreciation on investments | | | 38,810,616 | |
| Net assets | | $ | 208,239,355 | |
| Net Asset Value (unlimited shares authorized): | | | | |
| Net assets | | $ | 208,239,355 | |
| Shares of beneficial interest issued and outstanding | | | 8,830,636 | |
| Net asset value, offering and redemption price per share | | $ | 23.58 | |
The accompanying notes are an integral part of these financial statements.
STATEMENT OF OPERATIONS For the Year Ended November 30, 2017 |
| INVESTMENT INCOME | | | |
| Dividends from unaffiliated securities | | | |
| (net of $15,095 in foreign withholding taxes) | | $ | 2,197,932 | |
| Interest | | | 49,963 | |
| Total investment income | | | 2,247,895 | |
| | | | | |
| EXPENSES | | | | |
| Management fees | | | 2,141,653 | |
| Support services fees | | | 475,923 | |
| Total expenses | | | 2,617,576 | |
| Net investment loss | | | (369,681 | ) |
| | | | | |
| REALIZED AND UNREALIZED GAIN (LOSS) ON INVESTMENTS, | | | | |
| OPTIONS WRITTEN & FOREIGN CURRENCY | | | | |
| Net realized gain (loss) on transactions from: | | | | |
| Unaffiliated investments & foreign currency | | | 4,831,002 | |
| Affiliated investments | | | (30,979,242 | ) |
| Options written | | | 114,199 | |
| Net realized loss | | | (26,034,041 | ) |
| Net change in unrealized appreciation/depreciation on: | | | | |
| Unaffiliated investments & foreign currency | | | 1,981,932 | |
| Affiliated investments | | | 24,888,963 | |
| Options written | | | 40,801 | |
| Net unrealized appreciation/depreciation | | | 26,911,696 | |
| Net realized and unrealized gain | | | 877,655 | |
| Net increase in net assets resulting from operations | | $ | 507,974 | |
The accompanying notes are an integral part of these financial statements.
| STATEMENTS OF CHANGES IN NET ASSETS |
| | | Year Ended | | | Year Ended | |
| | | November 30, 2017 | | | November 30, 2016 | |
| INCREASE (DECREASE) IN NET ASSETS FROM: | | | | | | |
| | | | | | | |
| OPERATIONS | | | | | | |
| Net investment income (loss) | | $ | (369,681 | ) | | $ | 183,859 | |
| Net realized loss on unaffiliated | | | | | | | | |
| investments, affiliated investments, | | | | | | | | |
| options written & foreign currency | | | (26,034,041 | ) | | | (617,573 | ) |
| Change in unrealized appreciation/ | | | | | | | | |
| depreciation on investments, options | | | | | | | | |
| written & foreign currency | | | 26,911,696 | | | | 35,187,313 | |
| Net increase in net assets | | | | | | | | |
| resulting from operations | | | 507,974 | | | | 34,753,599 | |
| | | | | | | | | |
| CAPITAL SHARE TRANSACTIONS | | | | | | | | |
| Net decrease in net assets derived from | | | | | | | | |
net change in outstanding shares1 | | | (63,908,281 | ) | | | (30,963,999 | ) |
| Total increase (decrease) in net assets | | | (63,400,307 | ) | | | 3,789,600 | |
| | | | | | | | | |
| NET ASSETS | | | | | | | | |
| Beginning of year | | | 271,639,662 | | | | 267,850,062 | |
| End of year | | $ | 208,239,355 | | | $ | 271,639,662 | |
| Accumulated net investment loss | | $ | (223,873 | ) | | $ | (1,137,293 | ) |
1 Summary of capital share transactions is as follows:
| | | Year Ended | | | Year Ended | |
| | | November 30, 2017 | | | November 30, 2016 | |
| | | Shares | | | Value | | | Shares | | | Value | |
| Shares sold | | | 1,842,063 | | | $ | 42,337,097 | | | | 2,248,759 | | | $ | 44,719,478 | |
Shares redeemed2 | | | (4,634,527 | ) | | | (106,245,378 | ) | | | (3,678,675 | ) | | | (75,683,477 | ) |
| Net decrease | | | (2,792,464 | ) | | $ | (63,908,281 | ) | | | (1,429,916 | ) | | $ | (30,963,999 | ) |
2 Net of redemption fees of $5,394 and $8,723, respectively.
The accompanying notes are an integral part of these financial statements.
FINANCIAL HIGHLIGHTS For a capital share outstanding throughout each year |
| | | Year Ended November 30, | |
| | | 2017 | | | 2016 | | | 2015 | | | 2014 | | | 2013 | |
| Net asset value at | | | | | | | | | | | | | | | |
| beginning of year | | $ | 23.37 | | | $ | 20.52 | | | $ | 26.77 | | | $ | 28.26 | | | $ | 24.00 | |
| | | | | | | | | | | | | | | | | | | | | |
| INCOME (LOSS) FROM INVESTMENT OPERATIONS | | | | | | | | | | | | | | | | | | | | |
| Net investment | | | | | | | | | | | | | | | | | | | | |
income (loss)1 | | | (0.04 | ) | | | 0.02 | | | | 0.01 | | | | (0.03 | ) | | | 0.02 | |
| Net realized and unrealized | | | | | | | | | | | | | | | | | | | | |
| gain (loss) on investments | | | 0.25 | | | | 2.83 | | | | (4.40 | ) | | | (1.16 | ) | | | 4.65 | |
| Total from | | | | | | | | | | | | | | | | | | | | |
| investment operations | | | 0.21 | | | | 2.85 | | | | (4.39 | ) | | | (1.19 | ) | | | 4.67 | |
| | | | | | | | | | | | | | | | | | | | | |
| LESS DISTRIBUTIONS | | | | | | | | | | | | | | | | | | | | |
| From net investment income | | | — | | | | — | | | | — | | | | — | | | | (0.32 | ) |
| From net realized gain | | | — | | | | — | | | | (1.87 | ) | | | (0.30 | ) | | | (0.09 | ) |
| Total distributions | | | — | | | | — | | | | (1.87 | ) | | | (0.30 | ) | | | (0.41 | ) |
| Paid-in capital from | | | | | | | | | | | | | | | | | | | | |
| redemption fees | | | 0.00 | 2 | | | 0.00 | 2 | | | 0.01 | | | | 0.00 | 2 | | | 0.00 | 2 |
| | | | | | | | | | | | | | | | | | | | | |
| Net asset value | | | | | | | | | | | | | | | | | | | | |
| at end of year | | $ | 23.58 | | | $ | 23.37 | | | $ | 20.52 | | | $ | 26.77 | | | $ | 28.26 | |
| | | | | | | | | | | | | | | | | | | | | |
| Total return | | | 0.90 | % | | | 13.89 | % | | | (17.49 | )% | | | (4.26 | )% | | | 19.74 | % |
| | | | | | | | | | | | | | | | | | | | | |
| SUPPLEMENTAL DATA/RATIOS | | | | | | | | | | | | | | | | | | | | |
| Net assets at end | | | | | | | | | | | | | | | | | | | | |
| of year (millions) | | $ | 208.2 | | | $ | 271.6 | | | $ | 267.9 | | | $ | 443.7 | | | $ | 553.5 | |
| Portfolio turnover rate | | | 14 | % | | | 8 | % | | | 18 | % | | | 37 | % | | | 12 | % |
| | | | | | | | | | | | | | | | | | | | | |
| Ratio of expenses to | | | | | | | | | | | | | | | | | | | | |
| average net assets | | | 1.10 | % | | | 1.10 | % | | | 1.10 | % | | | 1.10 | % | | | 1.10 | % |
| Ratio of net investment | | | | | | | | | | | | | | | | | | | | |
| income (loss) to | | | | | | | | | | | | | | | | | | | | |
| average net assets | | | (0.16 | )% | | | 0.07 | % | | | 0.06 | % | | | (0.11 | )% | | | 0.08 | % |
1 | Calculated using the average shares outstanding method. |
2 | Amount does not round to $0.01 per share. |
The accompanying notes are an integral part of these financial statements.
NOTES TO FINANCIAL STATEMENTS November 30, 2017 |
The GoodHaven Funds Trust (the “Trust”) is registered under the Investment Company Act of 1940, as amended (the “1940 Act”) as a non-diversified, open-end management investment company. The Fund is an investment company and accordingly follows the investment company accounting and reporting guidance of the Financial Accounting Standards Board (“FASB”) Accounting Standard Codification Topic 946 “Financial Services – Investment Companies.” The Fund commenced operations on April 8, 2011.
The Fund’s investment objective is to seek long-term growth of capital.
| NOTE 2 – SIGNIFICANT ACCOUNTING POLICIES |
The following is a summary of significant accounting policies consistently followed by the Fund. These policies are in conformity with accounting principles generally accepted in the United States of America (“U.S. GAAP”).
| | A. | Security Valuation. All equity securities, which may include Real Estate Investment Trusts (“REITs”), Business Development Companies (“BDCs”) and Master Limited Partnerships (“MLPs”), that are traded on U.S. national or foreign securities exchanges are valued at the last reported sale price on the exchange on which the security is principally traded or the exchange’s official closing price, if applicable. If, on a particular day, an exchange-traded security does not trade, then the mean between the most recent quoted bid and asked prices will be used. All equity securities, which may include REITs, BDCs and MLPs, that are not traded on a listed exchange are valued at the last sale price in the over-the-counter market. If a non-exchange traded security does not trade on a particular day, then the mean between the last quoted closing bid and asked price will be used. |
| | | Debt securities are valued by using the evaluated mean price supplied by an approved independent pricing service. The independent pricing service may use various valuation methodologies, including matrix pricing and other analytical pricing models as well as market transactions and dealer quotations. These models generally consider such factors as yields or prices of bonds of comparable quality, type of issue, coupon, maturity, ratings and general market conditions. In the absence of a price from a pricing service, securities are valued at their respective fair values in accordance with policies approved by the Valuation Committee of the Trust. |
| | | Exchange traded options are valued at the composite price, using the National Best Bid and Offer quotes (“NBBO”). NBBO consists of the highest bid price and lowest ask price across any of the exchanges on which an option is quoted, thus providing a view across the entire U.S. options |
NOTES TO FINANCIAL STATEMENTS November 30, 2017 (Continued) |
| | | marketplace. Composite option pricing calculates the mean of the highest bid price and lowest ask price across the exchanges where the option is traded. |
| | | Securities for which quotations are not readily available are valued at their respective fair values as determined in accordance with policies approved by the Valuation Committee of the Trust. When a security is “fair valued,” consideration is given to the facts and circumstances relevant to the particular situation, including a review of various factors set forth in the pricing procedures adopted by the Board of Trustees. Fair value pricing is an inherently subjective process, and no single standard exists for determining fair value. Different funds could reasonably arrive at different values for the same security. The use of fair value pricing by a fund may cause the net asset value of its shares to differ significantly from the net asset value that would be calculated without regard to such considerations. |
| | | As described above, the Fund utilizes various methods to measure the fair value of its investments on a recurring basis. U.S. GAAP establishes a hierarchy that prioritizes inputs to valuation methods. The three levels of inputs are: |
| | Level 1 – | Unadjusted quoted prices in active markets for identical assets or liabilities that the Fund has the ability to access. |
| | Level 2 – | Observable inputs other than quoted prices included in Level 1 that are observable for the asset or liability, either directly or indirectly. These inputs may include quoted prices for the identical instrument on an inactive market, prices for similar instruments, interest rates, prepayment speeds, credit risk, yield curves, default rates and similar data. |
| | Level 3 – | Unobservable inputs for the asset or liability, to the extent relevant observable inputs are not available, representing the Fund’s own assumptions about the assumptions a market participant would use in valuing the asset or liability, and would be based on the best information available. |
| | | The availability of observable inputs can vary from security to security and is affected by a wide variety of factors, including, for example, the type of security, whether the security is new and not yet established in the marketplace, the liquidity of markets, and other characteristics particular to the security. To the extent that valuation is based on models or inputs that are less observable or unobservable in the market, the determination of fair value requires more judgment. Accordingly, the degree of judgment exercised in determining fair value is greatest for instruments categorized in Level 3. |
NOTES TO FINANCIAL STATEMENTS November 30, 2017 (Continued) |
| | | The inputs used to measure fair value may fall into different levels of the fair value hierarchy. In such cases, for disclosure purposes, the level in the fair value hierarchy within which the fair value measurement falls in its entirety, is determined based on the lowest level input that is significant to the fair value measurement in its entirety. |
| | | The following is a summary of the inputs used to value the Fund’s investments as of November 30, 2017. See the Schedule of Investments for the industry breakouts. |
| | | | Level 1 | | | Level 2 | | | Level 3 | | | Total | |
| | Common Stocks | | $ | 149,250,014 | | | $ | — | | | $ | — | | | $ | 149,250,014 | |
| | Guernsey | | | | | | | | | | | | | | | | |
| | Investment Fund | | | 911,886 | | | | — | | | | — | | | | 911,886 | |
| | Corporate Bonds | | | — | | | | 2,211,000 | | | | — | | | | 2,211,000 | |
| | Miscellaneous | | | | | | | | | | | | | | | | |
| | Securities | | | 3,859,250 | | | | 86,100 | | | | — | | | | 3,945,350 | |
| | Total Investments | | $ | 154,021,150 | | | $ | 2,297,100 | | | $ | — | | | $ | 156,318,250 | |
| | | It is the Fund’s policy to recognize transfers between levels at the end of the Fund’s reporting period. |
| | | There were no transfers into or out of Level 1 or 2 during the period ended November 30, 2017. |
| | | The Fund has adopted financial reporting rules and regulations that require enhanced disclosure regarding derivatives and hedging activity intending to improve financial reporting of derivative instruments by enabling investors to understand how and why an entity uses derivatives, how derivatives are accounted for, and how derivative instruments affect an entity’s results of operations and financial position. |
| | | The Fund may invest, at the time of purchase, up to 10% of the Fund’s net assets in options, which are a type of derivative and employ specialized trading techniques such as options trading to increase the Fund’s exposure to certain selected securities. The Fund may employ these techniques as hedging tools as well as speculatively to enhance returns. Other than when used for hedging, these techniques may be riskier than many investment strategies and may result in greater volatility for the Fund, particularly in periods of market declines. As a hedging tool, options may help cushion the impact of market declines, but may reduce the Fund’s participation in a market advance. |
NOTES TO FINANCIAL STATEMENTS November 30, 2017 (Continued) |
| | | Balance Sheet |
| | | Fair values of derivative instruments as of November 30, 2017: |
| | | | Asset Derivatives as of | | Liability Derivatives as of | |
| | | | November 30, 2017 | | November 30, 2017 | |
| | Derivative | | Balance Sheet | | Fair | | Balance Sheet | | Fair | |
| | Instruments | | Location | | Value | | Location | | Value | |
| | Equity Contracts: | | | | | | | | | |
| | Put Options | | Investments in | | | | | | | |
| | Purchased | | securities,at value | | $ | 86,100 | | None | | $ | — | |
| | Total | | | | $ | 86,100 | | | | $ | — | |
| | | Statement of Operations |
| | | The effect of derivative instruments on the Statement of Operations for the year ended November 30, 2017: |
| | | | | Change in |
| | | Location of | Realized | Unrealized |
| | | Gain (Loss) | Gain (Loss) | Appreciation/ |
| | | on Derivatives | on Derivatives | Depreciation |
| | Derivative | Recognized | Recognized | on Derivatives |
| | Instruments | in Income | in Income | in Income |
| | Equity Contracts: | | | |
| | Options Written | Realized and Unrealized | | |
| | | Gain (Loss) on Investments, | | |
| | | Options Written & | | |
| | | Foreign Currency | $ 114,199 | $ 40,801 |
| | | | | |
| | Put Options | Realized and Unrealized | | |
| | Purchased | Gain (Loss) on Investments, | | |
| | | Options Written & | | |
| | | Foreign Currency | $(1,917,201) | $(69,194) |
| | B. | Foreign Currency. Foreign currency amounts, other than the cost of investments, are translated into U.S. dollar values based upon the spot exchange rate prior to the close of regular trading. The cost of investments is translated at the rates of exchange prevailing on the dates the portfolio securities were acquired. The Fund includes foreign exchange gains and losses from dividends receivable and other foreign currency denominated payables and receivables in realized and unrealized gain (loss) on investments and foreign currency. The Fund does not isolate that portion of realized gain (loss) or unrealized gain (loss) on investments resulting from changes in foreign exchange rates on investments from fluctuations arising from changes in the market price of securities for financial reporting purposes. Fluctuations in foreign exchange rates on investments are thus included with net realized gain (loss) on investments and foreign currency and with net unrealized gain (loss) on investments and foreign currency. |
NOTES TO FINANCIAL STATEMENTS November 30, 2017 (Continued) |
| | C. | Federal Income Taxes. The Fund has elected to be taxed as a “regulated investment company” and intends to distribute substantially all taxable income to its shareholders and otherwise comply with the provisions of the Internal Revenue Code applicable to regulated investment companies. Therefore, no provision for federal income taxes or excise taxes has been made. |
| | | In order to avoid imposition of the excise tax applicable to regulated investment companies, the Fund intends to declare each year as dividends in each calendar year at least 98.0% of its net investment income (earned during the calendar year) and at least 98.2% of its net realized capital gains (earned during the twelve months ended November 30) plus undistributed amounts, if any, from prior years. |
| | | Net investment losses incurred after December 31, and within the taxable year may be deferred and are deemed to arise on the first business day of the Fund’s next taxable year. As of November 30, 2017, the Fund did not defer any late year losses. For the year ended November 30, 2017, the Fund had short-term capital loss carryovers of $(3,514,607) and long-term capital loss carryovers of $(25,264,909), with unlimited expiration. |
| | | As of November 30, 2017, the Fund did not have any tax positions that did not meet the “more likely-than-not” threshold of being sustained by the applicable tax authority. Generally, tax authorities can examine all the tax returns filed for the last three years. The Fund identifies their major tax jurisdictions as U.S. Federal and the State of Delaware. As of November 30, 2017, the Fund was not aware of any tax positions for which it is reasonably possible that the total amounts of unrecognized tax benefits will change materially. |
| | D. | Security Transactions and Investment Income. Investment securities transactions are accounted for on the trade date. Gains and losses realized on sales of securities are determined on a specific identification basis. Discounts/premiums on debt securities purchased are accreted/amortized over the life of the respective securities using the effective interest method. Dividend income is recorded on the ex-dividend date. Dividends from REIT’s generally are comprised of income, capital gains and may include return of capital. Interest income is recorded on an accrual basis. Withholding taxes on foreign dividends have been provided for in accordance with the Trust’s understanding of the applicable country’s tax rules and rates. |
| | E. | Distributions to Shareholders. Distributions to shareholders from net investment income and net realized gains for the Fund normally are declared and paid on an annual basis. Distributions are recorded on the ex-dividend date. |
NOTES TO FINANCIAL STATEMENTS November 30, 2017 (Continued) |
| | F. | Use of Estimates. The preparation of financial statements in conformity with U.S. GAAP requires management to make estimates and assumptions that affect the reported amounts of assets and liabilities at the date of the financial statements, as well as the reported amounts of revenues and expenses during the period. Actual results could differ from those estimates. |
| | G. | Share Valuation. The net asset value (“NAV”) per share of the Fund is calculated by dividing the sum of the value of the securities held by the Fund, plus cash and other assets, minus all liabilities by the total number of shares outstanding for the Fund, rounded to the nearest cent. The Fund’s shares will not be priced on the days on which the New York Stock Exchange is closed for trading. The offering and redemption price per share for the Fund is equal to the Fund’s net asset value per share. The Fund charges a 2.00% redemption fee on shares held less than 60 days. This fee is deducted from the redemption proceeds otherwise payable to the shareholder. The Fund will retain the fee charged as paid-in capital and such fees become part of that Fund’s daily NAV calculation. |
| | H. | Guarantees and Indemnifications. In the normal course of business, the Fund enters into contracts with service providers that contain general indemnification clauses. The Fund’s maximum exposure under these arrangements is unknown as this would involve future claims that may be made against the Fund that have not yet occurred. However, based on experience, the Fund expects the risk of loss to be remote. |
| | I. | Options Contracts. When the Fund purchases an option, an amount equal to the premium paid by the Fund is recorded as an investment and is subsequently adjusted to the current value of the option purchased. If an option expires on the stipulated expiration date or if the Fund enters into a closing sale transaction, a gain or loss is realized. If a call option is exercised, the cost of the security acquired is increased by the premium paid for the call. If a put option is exercised, a gain or loss is realized from the sale of the underlying security, and the proceeds from such sale are decreased by the premium originally paid. Written and purchased options are non-income producing securities. |
| | | When the Fund writes an option, an amount equal to the premium received by the Fund is recorded as a liability and is subsequently adjusted to the current fair value of the option written. Premiums received from writing options that expire unexercised are treated by the Fund on the expiration date as realized gains from investments. The difference between the premium and the amount paid on effecting a closing purchase transaction, including brokerage commissions, is also treated as a realized gain, or, if the premium is less that the amount paid for the closing purchase transaction, as a realized loss. If a call option is exercised, the premium is added to the |
NOTES TO FINANCIAL STATEMENTS November 30, 2017 (Continued) |
| | | proceeds from the sale of the underlying security or currency in determining whether the Fund has realized a gain or loss. If a put option is exercised, the premium reduces the cost basis of the securities purchased by the Fund. The Fund as writer of an option bears the market risk of an unfavorable change in the price of the security underlying the written option. |
| | | The following table indicates the average volume for the year ended November 30, 2017: |
| | Average notional value of: | |
| | Options written | | $ | (121,417 | ) |
| | Options purchased | | $ | 51,466,192 | |
| | J. | Reclassification of Capital Accounts. U.S. GAAP requires that certain components of net assets relating to permanent differences be reclassified between financial and tax reporting. These reclassifications have no effect on net assets or net asset value per share. These differences are primarily due to net operating loss. For the fiscal year ended November 30, 2017, the following adjustments were made: |
| Undistributed Net | Accumulated Net | Paid-In |
Investment Income/(Loss) | Realized Gain/(Loss) | Capital |
| $1,283,101 | $(862,357) | $(420,744) |
| | K. | Subsequent Events. In preparing these financial statements, the Fund has evaluated events and transactions for potential recognition or disclosure through the date the financial statements were issued. The Fund has determined that there were no subsequent events that would need to be disclosed in the Fund’s financial statements. |
| NOTE 3 – COMMITMENTS AND OTHER RELATED PARTY TRANSACTIONS |
GoodHaven Capital Management, LLC (the “Advisor”) provides the Fund with investment management services under an Investment Advisory Agreement (the “Advisory Agreement”). Under the Agreement, the Advisor provides all investment advice, office space and certain administrative services, and most of the personnel needed by the Fund. Under the Advisory Agreement, the Advisor is entitled to receive a monthly management fee calculated daily and payable monthly equal to 0.90% of the Fund’s average daily net assets. The amount of Management fees incurred by the Fund for the year ended November 30, 2017, is disclosed in the Statement of Operations.
The Fund has also entered into a Support Services Agreement (the “Support Agreement”) with the Advisor. Under this agreement, the Advisor is responsible for paying all of the Fund’s other normal day-to-day operational expenses, such as administrative, custody, transfer agency, fund accounting, legal and audit. The support
NOTES TO FINANCIAL STATEMENTS November 30, 2017 (Continued) |
services fee does not cover the following other expenses: (a) any charges associated with the execution of portfolio transactions, such as brokerage commissions, transaction charges or other transaction-related expenses (such as stamp taxes), (b) taxes, acquired fund fees and expenses, if any, imposed on the Fund, (c) interest, if any, on any Fund borrowings, or (d) extraordinary Fund legal expenses incurred outside of the normal operation of the Fund, such as legal fees, arbitration fees, or related expenses in connection with any actual or threatened arbitration, mediation, or litigation. Under the Support Agreement, the Advisor is entitled to receive a monthly fee calculated daily and payable monthly equal to 0.20% of the Fund’s average daily net assets. The amount of support services fees incurred by the Fund for the year ended November 30, 2017, is disclosed in the Statement of Operations.
U.S. Bancorp Fund Services, LLC (“USBFS”), an indirect wholly-owned subsidiary of U.S. Bancorp, serves as the Fund’s administrator, fund accountant and transfer agent. In those capacities USBFS maintains the Fund’s books and records, calculates the Fund’s NAV, prepares various federal and state regulatory filings, coordinates payment of fund expenses, prepares expense accruals and prepares materials supplied to the Board of Trustees.
Quasar Distributors, LLC (the “Distributor”) acts as the Fund’s principal underwriter in a continuous public offering of the Fund’s shares. U.S. Bank N.A. (the “Custodian”) serves as custodian to the Fund.
| NOTE 4 – PURCHASES AND SALES OF SECURITIES |
Investment transactions (excluding short-term investments) for the year ended November 30, 2017 were as follows:
| | Purchases | Sales or Maturity | |
| | at Cost | Proceeds | |
| | $24,100,273 | $81,136,425 | |
There were no purchases or sales of long-term U.S. Government securities for the year ended November 30, 2017.
| NOTE 5 – DISTRIBUTIONS TO SHAREHOLDERS |
There were no distributions paid during the year ended November 30, 2017, or the year ended November 30, 2016.
NOTES TO FINANCIAL STATEMENTS November 30, 2017 (Continued) |
As of November 30, 2017, the components of distributable earnings on a tax basis were as follows:
| Cost of investments | | $ | 117,731,507 | |
| Gross tax unrealized appreciation | | | 58,303,617 | |
| Gross tax unrealized depreciation | | | (19,716,874 | ) |
| Net tax unrealized appreciation | | | 38,586,743 | |
| Unrealized currency appreciation | | | — | |
| Undistributed ordinary income | | | — | |
| Undistributed long-term capital gain | | | — | |
| Total distributable earnings | | | — | |
| Other accumulated loss | | | (28,779,516 | ) |
| Total accumulated earnings | | $ | 9,807,227 | |
The difference between book basis and tax basis unrealized appreciation was primarily attributable to wash sale adjustments and Passive Foreign Investment Companies. The difference between components of distributable earnings on a tax basis and the amounts reflected in the Statements of Assets and Liabilities are primarily due to the tax treatment of Passive Foreign Investment Companies held by the Fund.
| NOTE 6 – INVESTMENTS IN AFFILIATES |
Affiliated companies, as defined in Section 2(a)(3) of the 1940 Act, are companies 5% or more of whose outstanding voting shares are held by the Fund and the Advisor. As of November 30, 2017, the Fund did not hold securities of affiliated companies. For the year ended November 30, 2017, the Fund had the following transactions with affiliated companies:
| | | Share | | | | | | | | | | | | | | | Change in | | | | | | Dividend | |
| | | Balance | | | Value | | | | | | | | | Realized | | | Unrealized | | | Value | | | and | |
| | | Nov. 30, | | | Nov. 30, | | | Acquisi- | | | Disposi- | | | Gain | | | Appreciation/ | | | Nov. 30, | | | Interest | |
| | | 2017 | | | 2016 | | | tions | | | tions | | | (Loss) | | | Depreciation | | | 2017 | | | Income | |
| Walter | | | | | | | | | | | | | | | | | | | | | | | | | | |
| Investment | | | | | | | | | | | | | | | | | | | | | | | | | | |
| Management | | | | | | | | | | | | | | | | | | | | | | | | | | |
| Corp. | | — | | | $ | 9,196,545 | | | $ | — | | | $ | 3,106,266 | | | $ | (30,979,242 | ) | | $ | 24,888,963 | | | $ | — | | | $ | — | |
| Total | | | | | | | | | | | | | | | | | $ | (30,979,242 | ) | | $ | 24,888,963 | | | $ | — | | | $ | — | |
As of November 30, 2017, the Fund did not hold securities of affiliated companies.
| REPORT OF INDEPENDENT REGISTERED PUBLIC ACCOUNTING FIRM |
To the Shareholders of
GoodHaven Fund and
The Board of Trustees of
GoodHaven Funds Trust
We have audited the accompanying statement of assets and liabilities, including the schedule of investments, of GoodHaven Fund, a series of GoodHaven Funds Trust, as of November 30, 2017 and the related statement of operations for the year then ended, the statement of changes in net assets for each of the two years in the period then ended, and the financial highlights for each of the five years in the period then ended. These financial statements and financial highlights are the responsibility of the Fund’s management. Our responsibility is to express an opinion on these financial statements and financial highlights based on our audits.
We conducted our audits in accordance with the standards of the Public Company Accounting Oversight Board (United States). Those standards require that we plan and perform the audit to obtain reasonable assurance about whether the financial statements and financial highlights are free of material misstatement. The Fund is not required to have, nor were we engaged to perform, an audit of its internal control over financial reporting. Our audit included consideration of internal control over financial reporting as a basis for designing audit procedures that are appropriate in the circumstances, but not for the purpose of expressing an opinion on the effectiveness of the Fund’s internal control over financial reporting. Accordingly, we express no such opinion. An audit includes examining, on a test basis, evidence supporting the amounts and disclosures in the financial statements. Our procedures included confirmation of securities owned as of November 30, 2017, by correspondence with the custodian. An audit also includes assessing the accounting principles used and significant estimates made by management, as well as evaluating the overall financial statement presentation. We believe that our audits provide a reasonable basis for our opinion.
In our opinion, the financial statements and financial highlights referred to above present fairly, in all material respects, the financial position of GoodHaven Fund as of November 30, 2017, the results of its operations for the year then ended, the statement of changes in net assets for each of the two years in the period then ended, and the financial highlights for each of the five years in the period then ended, in conformity with accounting principles generally accepted in the United States of America.
Philadelphia, Pennsylvania
January 25, 2018
EXPENSE EXAMPLE For the Six Months Ended November 30, 2017 (Unaudited) |
As a shareholder of the Fund you incur two types of costs: (1) transaction costs, including redemption fees and (2) ongoing costs, including management fees and support service fees. This example is intended to help you understand your ongoing costs (in dollars) of investing in the Fund and to compare these costs with the ongoing costs of investing in other mutual funds. The example is based on an investment of $1,000 invested at the beginning of the period and held for the entire period (June 1, 2017 – November 30, 2017).
Actual Expenses
The first line of the following table provides information about actual account values based on actual returns and actual expenses. Although the Fund charges no sales load or other transaction fees, you will be assessed fees for outgoing wire transfers, returned checks and stop payment orders at prevailing rates charged by U.S. Bancorp Fund Services, LLC, the Fund’s transfer agent. If you request that a redemption be made by wire transfer, currently, the Fund’s transfer agent charges a $15.00 fee. You will be charged a redemption fee equal to 2.00% of the net amount of the redemption if you redeem shares that have been held for less than 60 days. Individual Retirement Accounts will be charged a $15.00 annual maintenance fee. To the extent the Fund invests in shares of other investment companies as part of its investment strategy, you will indirectly bear your proportionate share of any fees and expenses charged by the underlying funds in which the Fund invests in addition to the expenses of the Fund. Actual expenses of the underlying funds may vary. These expenses are not included in the example. The example includes, but is not limited to, management fees and support services. However, the example does not include portfolio trading commissions and related expenses. You may use the information in this line, together with the amount you invested, to estimate the expenses that you paid over the period. Simply divide your account value by $1,000 (for example, an $8,600 account value divided by $1,000 = 8.6). Then, multiply the result by the number in the first line under the heading entitled “Expenses Paid During the Period” to estimate the expenses you paid on your account during this period.
Hypothetical Example for Comparison Purposes
The second line of the table provides information about hypothetical account values based on a hypothetical return and hypothetical expenses based on the Fund’s actual expense ratio and an assumed rate of return of 5% per year before expenses, which is not the Fund’s actual return. The hypothetical account values and expenses may not be used to estimate the actual ending account balance or expenses you paid for the period. You may use this information to compare the ongoing costs of investing in the Fund and other funds. To do so, compare this 5% hypothetical example with the 5% hypothetical examples that appear in the shareholder reports of the other funds. Please note that the expenses shown in the table are meant to highlight your ongoing costs only and do not reflect any
EXPENSE EXAMPLE For the Six Months Ended November 30, 2017 (Unaudited) (Continued) |
transactional costs, such as redemption fees. Therefore, the second line of the table is useful in comparing ongoing costs only and will not help you determine the relative total costs of owning different funds. If these transactional costs were included, your costs would have been higher.
| | | | Expenses Paid |
| | Beginning | Ending | During the Period |
| | Account Value | Account Value | June 1, 2017 – |
| | June 1, 2017 | November 30, 2017 | November 30, 20171 |
| Actual | $1,000.00 | $1,045.70 | $5.64 |
| Hypothetical | | | |
| (5% annual return | | | |
| before expenses) | $1,000.00 | $1,019.55 | $5.57 |
1 | The calculations are based on expenses incurred during the most recent six-month period. The annualized six month expense ratio for the Fund during that period was 1.10%. The dollar amounts shown as expenses paid during the period are equal to the annualized six-month expense ratio multiplied by the average account value during the period, multiplied by 183/365 (to reflect the half-year period). |
| TRUSTEES AND EXECUTIVE OFFICERS |
The Board is responsible for the overall management of the Trust, including general supervision and review of the investment activities of the Fund. The Board, in turn, elects the officers of the Trust, who are responsible for the day-to-day operations of the Trust and its separate series. The current Trustees and executive officers of the Trust, their birth dates, positions with the Trust, terms of office with the Trust and length of time served, their principal occupations during the past five years and other directorships are set forth in the table below.
| | | Term of | | Number of | |
| | | Office | | Portfolios | Other |
| | Position | and | | in New Fund | Directorships |
| | with | Length | | Complex | Held During |
| Name, Address | the New | of Time | Principal Occupation | Overseen by | the Past |
and Age | Trust | Served | During Past Five Years | Trustees | 5 Years |
| Independent Trustees of the Trust | | | |
| | | | | | |
| Richard A. Conn, Jr. | Trustee | Indefinite | Managing Partner, | 1 | None |
| c/o GoodHaven Capital | | term; | Innovate Partners LLC | | |
| Management LLC | | Since | (private investment | | |
| 4940 SW 83rd Street | | January | company) (2009 to present) | | |
| Miami, FL 33143 | | 2016 | | | |
| Age: 60 | | | | | |
| | | | | | |
| Bruce A. Eatroff | Trustee | Indefinite | Founding Partner, Halyard | 1 | None |
| c/o GoodHaven Capital | | term; | Capital (private equity firm) | | |
| Management LLC | | Since | (2006 to present) | | |
| 4940 SW 83rd Street | | January | | | |
| Miami, FL 33143 | | 2016 | | | |
| Age: 54 | | | | | |
| | | | | | |
| Steven H. Tishman | Trustee | Indefinite | Managing Director and | 1 | Director, |
| c/o GoodHaven Capital | | term; | Global Head of Mergers | | Acushnet |
| Management LLC | | Since | and Acquisitions Group, | | Holdings |
| 4940 SW 83rd Street | | January | Houlihan Lokey (global | | |
| Miami, FL 33143 | | 2016 | investment bank) | | |
| Age: 61 | | | | | |
| | | | | | |
| Interested Trustees and Officers of the Trust | | | | |
| | | | | | |
| Larry Pitkowsky | Trustee, | Indefinite | Co-Managing Partner, | 1 | None |
| c/o GoodHaven Capital | President | term; | GoodHaven Capital | | |
| Management LLC | and | Since | Management, LLC | | |
| 4940 SW 83rd Street | Treasurer | January | (Advisor); Co-Portfolio | | |
| Miami, FL 33143 | | 2016 | Manager of GoodHaven | | |
| Age: 53 | | | Fund (2010 to present) | | |
| | | | | | |
| Keith Trauner | Trustee | Indefinite | Co-Managing Partner, | 1 | None |
| c/o GoodHaven Capital | and | term; | GoodHaven Capital | | |
| Management LLC | Chairman | Since | Management, LLC | | |
| 4940 SW 83rd Street | | January | (Advisor); Co-Portfolio | | |
| Miami, FL 33143 | | 2016 | Manager of GoodHaven | | |
| Age 60 | | | Fund (2010 to present) | | |
TRUSTEES AND EXECUTIVE OFFICERS (Continued) |
| | | Term of | | Number of | |
| | | Office | | Portfolios | Other |
| | Position | and | | in New Fund | Directorships |
| | with | Length | | Complex | Held During |
| Name, Address | the New | of Time | Principal Occupation | Overseen by | the Past |
And Age | Trust | Served | During Past Five Years | Trustees | 5 Years |
| Sarah Gillespie | Chief | Indefinite | Chief Compliance Officer | N/A | None |
| c/o GoodHaven Capital | Compli- | term; | and Director of Operations, | | |
| Management LLC | ance | Since | GoodHaven Capital | | |
| 4940 SW 83rd Street | Officer; | January | Management LLC | | |
| Miami, FL 33143 | Secretary | 2016 | (Advisor) | | |
| Age 37 | | | | | |
ADDITIONAL INFORMATION (Unaudited) |
| INFORMATION ABOUT PROXY VOTING |
A description of the policies and procedures that the Fund uses to determine how to vote proxies relating to portfolio securities is available without charge, upon request, by calling toll-free at (855) 654-6639 and on the Fund’s website at www.goodhavenfunds.com. Furthermore, you can obtain the description on the SEC’s website at www.sec.gov.
Information regarding how the Fund voted proxies relating to portfolio securities during the most recent 12-month period ended June 30 is available without charge, upon request, by calling (855) 654-6639 or through the SEC’s website at www.sec.gov.
| INFORMATION ABOUT THE PORTFOLIO HOLDINGS |
The Fund files its complete schedule of portfolio holdings for the first and third quarters with the SEC on Form N-Q. The Fund’s Form N-Q may be reviewed and copied at the SEC’s Public Reference Room in Washington D.C. Information on the operation of the Public Reference Room may be obtained by calling (800) SEC-0330. The Fund’s Form N-Q is available without charge, upon request, by calling (855) 654-6639. Furthermore, you can obtain the Form N-Q on the SEC’s website at www.sec.gov.
In an effort to decrease costs, the Fund will reduce the number of duplicate Prospectuses and annual and semi-annual reports that you receive by sending only one copy of each to those addresses shown by two or more accounts. Please call the transfer agent toll free at (855) 654-6639 to request individual copies of these documents. The Fund will begin sending individual copies thirty days after receiving your request. This policy does not apply to account statements.
| INFORMATION ABOUT THE FUND’S TRUSTEES |
The Statement of Additional Information (“SAI”) includes additional information about the Fund’s Trustees and is available without charge, upon request, by calling (855) 654-6639. Furthermore, you can obtain the SAI on the SEC’s website at www.sec.gov or the Fund’s website at www.goodhavenfunds.com.
PRIVACY NOTICE (Unaudited) |
| | FACTS | | WHAT DOES GOODHAVEN CAPITAL MANAGEMENT, LLC & | |
| | | GOODHAVEN FUND DO WITH YOUR PERSONAL INFORMATION? | |
| | | | | |
| | Why? | | Financial companies choose how they share your personal information. Federal law gives consumers the right to limit some but not all sharing. Federal law also requires us to tell you how we collect, share, and protect your personal information. Please read this notice carefully to understand what we do. | |
| | | | | |
| | What? | | The types of personal information we collect and share depend on the product or service you have with us. This information can include: | |
| | | | • Social Security number and Income | |
| | | | • Account Balances and Employment Information | |
| | | | • Assets and Investment Experience | |
| | | | When you are no longer our customer, we continue to share your information as described in this notice. | |
| | | | | |
| | How? | | All financial companies need to share customer’s personal information to run their everyday business. In the section below, we list the reasons financial companies can share their customer’s personal information; the reasons GoodHaven chooses to share; and whether you can limit this sharing. | |
| | | | |
| | Reasons we can share your | Does GoodHaven | Can you limit |
| | personal information | share? | this sharing? |
| | For our everyday business purposes— | | |
| | such as to process your transactions, maintain | | |
| | your account(s), respond to court orders and | Yes | No |
| | legal investigations, or report to credit bureaus | | |
| | For our marketing purposes— | | |
| | to offer our products and services to you | Yes | No |
| | For joint marketing with | | |
| | other financial companies | No | We don’t share |
| | For our affiliates’ everyday | | |
| | business purposes— | | |
| | information about your | Yes | Yes |
| | transactions and experiences | | |
| | For our affiliates’ everyday | | |
| | business purposes— | | |
| | information about your creditworthiness | Yes | Yes |
| | For nonaffiliates to market to you | No | We don’t share |
| | Questions? | | Call (305) 677-7650 or email info@goodhavenllc.com |
PRIVACY NOTICE (Unaudited) (Continued) |
| | Who we are | | | |
| | Who is providing | | GoodHaven Capital Management, LLC | |
| | this notice? | | GoodHaven Fund (collectively “GoodHaven”) | |
| | What we do | | | |
| | How does GoodHaven protect my personal information? | | To protect your personal information from unauthorized access and use, we use security measures that comply with federal law. These measures include computer safeguards and secured files and buildings. | |
| | | | |
| | | Our service providers must represent to us that they will protect any personal information through similar safeguards and security. | |
| | | | |
| | How does | | We collect your personal information, for example, when you | |
| | GoodHaven | | • open an account or give us your income | |
| | collect my | | • give us contact information or seek advice about your investments | |
| | personal | | • tell us about your investments or retirement portfolio | |
| | information? | | | |
| | Why can’t I | | Federal law gives you the right to limit only | |
| | limit all sharing? | | • sharing for affiliates’ everyday business purposes—information about your creditworthiness | |
| | | | • affiliates from using your information to market to you | |
| | | | • sharing for nonaffiliates to market you | |
| | | | State laws and individual companies may give you additional rights to limit sharing. | |
| | Definitions | | | |
| | Affiliates | | Companies related by common ownership or control. They can be financial and nonfinancial companies. | |
| | | | • Our affiliates include: a series of a registered investment company called the GoodHaven Fund (a no-load mutual fund). | |
| | Nonaffiliates | | Companies not related by common ownership or control. They can be financial and nonfinancial companies. | |
| | | | • We do not share with nonaffiliates so they can market to you. | |
| | Joint marketing | | A formal agreement between nonaffiliated financial companies that together market financial products or services to you. | |
| | | | • We do not jointly market with nonaffiliated financial companies. | |
| | Other important information | |
| | | |
| | | |
| | | |
Advisor
GOODHAVEN CAPITAL MANAGEMENT, LLC
4940 SW 83rd Street
Miami, Florida 33143
Distributor
QUASAR DISTRIBUTORS, LLC
777 East Wisconsin Avenue, 6th Floor
Milwaukee, Wisconsin 53202
Custodian
U.S. BANK N.A.
Custody Operations
1555 N. RiverCenter Drive, Suite 302
Milwaukee, Wisconsin 53212
Transfer Agent, Fund Accountant & Fund Administrator
U.S. BANCORP FUND SERVICES, LLC
615 East Michigan Street
Milwaukee, Wisconsin 53202
1-800-536-3230
Independent Registered Public Accounting Firm
TAIT, WELLER & BAKER LLP
1818 Market Street, Suite 2400
Philadelphia, Pennsylvania 19103
Legal Counsel
BLANK ROME LLP
405 Lexington Ave
New York, New York 10174
GoodHaven Fund
855-OK-GOODX (855-654-6639)
www.goodhavenfunds.com
Symbol – GOODX
CUSIP – 38217G103
Item 2. Code of Ethics.
The registrant has adopted a code of ethics that applies to the registrant’s principal executive officer and principal financial officer. The registrant has not made any amendments to its code of ethics during the period covered by this report. The registrant has not granted any waivers from any provisions of the code of ethics during the period covered by this report.
A copy of the registrant’s Code of Ethics is filed herewith.
Item 3. Audit Committee Financial Expert.
The registrant’s Board of Trustees of the Trust has determined that there is at least one audit committee financial expert serving on its audit committee. Mr. Steven Tishman is an “audit committee financial expert” and is considered to be “independent” as each term is defined in Item 3 of Form N-CSR.
Item 4. Principal Accountant Fees and Services.
The registrant has engaged its principal accountant to perform audit services, audit-related services, tax services and other services during the past two fiscal years. “Audit services” refer to performing an audit of the registrant's annual financial statements or services that are normally provided by the accountant in connection with statutory and regulatory filings or engagements for those fiscal years. “Audit-related services” refer to the assurance and related services by the principal accountant that are reasonably related to the performance of the audit. “Tax services” refer to professional services rendered by the principal accountant for tax compliance, tax advice, and tax planning. There were no “Other services” provided by the principal accountant. The following table details the aggregate fees billed or expected to be billed for each of the last two fiscal years for audit fees, audit-related fees, tax fees and other fees by the principal accountant.
GoodHaven Fund
| | FYE 11/30/2017 | FYE 11/30/2016 |
| Audit Fees | $19,000 | $19,000 |
| Audit-Related Fees | N/A | N/A |
| Tax Fees | $2,600 | $2,600 |
| All Other Fees | N/A | N/A |
The audit committee has adopted pre-approval policies and procedures that require the audit committee to pre‑approve all audit and non‑audit services of the registrant, including services provided to any entity affiliated with the registrant.
All of the principal accountant’s hours spent on auditing the registrant’s financial statements were attributed to work performed by full‑time permanent employees of the principal accountant.
The following table indicates the non-audit fees billed or expected to be billed by the registrant’s accountant for services to the registrant and to the registrant’s investment advisor (and any other controlling entity, etc.—not sub-advisor) for the last two years. The audit committee of the board of trustees/directors has considered whether the provision of non-audit services that were rendered to the registrant's investment advisor is compatible with maintaining the principal accountant's independence and has concluded that the provision of such non-audit services by the accountant has not compromised the accountant’s independence.
GoodHaven Fund
| Non-Audit Related Fees | FYE 11/30/2017 | FYE 11/30/2016 |
| Registrant | N/A | N/A |
| Registrant’s Investment Advisor | N/A | N/A |
Item 5. Audit Committee of Listed Registrants.
Not applicable to open-end investment companies.
Item 6. Schedule of Investments.
Schedule of Investments is included as part of the report to shareholders filed under Item 1 of this Form.
Item 7. Disclosure of Proxy Voting Policies and Procedures for Closed-End Management Investment Companies.
Not applicable to open-end investment companies.
Item 8. Portfolio Managers of Closed-End Management Investment Companies
Not applicable to open-end investment companies.
Item 9. Purchases of Equity Securities by Closed‑End Management Investment Company and Affiliated Purchasers.
Not applicable to open-end investment companies.
Item 10. Submission of Matters to a Vote of Security Holders.
There have been no material changes to the procedures by which shareholders may recommend nominees to the registrant’s board of trustees.
Item 11. Controls and Procedures.
| (a) | The Registrant’s President and Treasurer have reviewed the Registrant's disclosure controls and procedures (as defined in Rule 30a-3(c) under the Investment Company Act of 1940 (the “Act”)) as of a date within 90 days of the filing of this report, as required by Rule 30a-3(b) under the Act and Rules 13a-15(b) or 15d‑15(b) under the Securities Exchange Act of 1934. Based on their review, such officers have concluded that the disclosure controls and procedures are effective in ensuring that information required to be disclosed in this report is appropriately recorded, processed, summarized and reported and made known to them by others within the Registrant and by the Registrant’s service provider. |
| (b) | There were no significant changes in the Registrant's internal control over financial reporting (as defined in Rule 30a-3(d) under the Act) that occurred during the second fiscal quarter of the period covered by this report that has materially affected, or is reasonably likely to materially affect, the Registrant's internal control over financial reporting. |
Item 12. Disclosure of Securities Lending Activities for Closed-End Management Investment Companies.
(a) If the registrant is a closed-end management investment company, provide the following dollar amounts of income and fees/compensation related to the securities lending activities of the registrant during its most recent fiscal year:
(1) Gross income from securities lending activities;
(2) All fees and/or compensation for each of the following securities lending activities and related services: any share of revenue generated by the securities lending program paid to the securities lending agent(s) (“revenue split”); fees paid for cash collateral management services (including fees deducted from a pooled cash collateral reinvestment vehicle) that are not included in the revenue split; administrative fees that are not included in the revenue split; fees for indemnification that are not included in the revenue split; rebates paid to borrowers; and any other fees relating to the securities lending program that are not included in the revenue split, including a description of those other fees;
(3) The aggregate fees/compensation disclosed pursuant to paragraph (2); and
(4) Net income from securities lending activities (i.e., the dollar amount in paragraph (1) minus the dollar amount in paragraph (3)).
(b) If the registrant is a closed-end management investment company, describe the services provided to the registrant by the securities lending agent in the registrant’s most recent fiscal year.
Not applicable to open-end investment companies.
Item 13. Exhibits.
| (a) | (1) Any code of ethics or amendment thereto, that is subject of the disclosure required by Item 2, to the extent that the registrant intends to satisfy Item 2 requirements through filing an exhibit. Filed herewith. |
(2) Certifications pursuant to Section 302 of the Sarbanes-Oxley Act of 2002. Filed herewith.
(3) Any written solicitation to purchase securities under Rule 23c‑1 under the Act sent or given during the period covered by the report by or on behalf of the registrant to 10 or more persons. Not applicable to open-end investment companies.
(4) Change in the registrant’s independent public accountant. There was no change in the registrant’s independent public accountant for the period covered by this report.
| (b) | Certification pursuant to Section 906 of the Sarbanes‑Oxley Act of 2002. Furnished herewith. |
SIGNATURES
Pursuant to the requirements of the Securities Exchange Act of 1934 and the Investment Company Act of 1940, the registrant has duly caused this report to be signed on its behalf by the undersigned, thereunto duly authorized.
(Registrant) GoodHaven Funds Trust
By (Signature and Title) /s/Larry Pitkowsky
Larry Pitkowsky, Principal Executive Officer and Principal
Financial and Accounting Officer
Date January 29, 2018
Pursuant to the requirements of the Securities Exchange Act of 1934 and the Investment Company Act of 1940, this report has been signed below by the following persons on behalf of the registrant and in the capacities and on the dates indicated.
By (Signature and Title)* /s/Larry Pitkowsky
Larry Pitkowsky, Principal Executive Officer and Principal
Financial and Accounting Officer
Date January 29, 2018
* Print the name and title of each signing officer under his or her signature.