
2 Q E a r n i n g s P r e s e n t a t i o n 2 9 J U L Y 2 0 2 2 This presentation has been authorized and approved by the Sezzle Board

DISCLAIMER This presentation (the “Presentation”) contains summary information about the activities of Sezzle as at the date of this Presentation. The information in this Presentation is of a general nature and does not purport to be complete and the information in the Presentation remains subject to change without notice. Also, the information in the Presentation should not be relied upon as advice to potential investors or current shareholders. This Presentation has been prepared without taking into account the objectives, financial situation or needs of any particular prospective investor or current shareholder. Before making an investment decision, prospective investors and current shareholders should consider the appropriateness of the information having regard to their own objectives, financial situation and needs and seek appropriate advice, including financial, legal and taxation advice appropriate to their jurisdiction. The Presentation also includes information regarding our market and industry that is derived from publicly available third-party sources that have not been independently verified by Sezzle. This Presentation is not a disclosure document under Australian law. Accordingly, this Presentation should not be relied upon as advice to prospective investors or current shareholders and does not take into account the investment objectives, financial situation or needs of any particular shareholder or investor. This Presentation contains certain “forward-looking statements” within the meaning of the US federal securities laws including, but not limited to, statements regarding our anticipated new products, our ability to gain future market share, our timeline and intentions relating to operations in international markets, our strategy, our future operations, our financial position, our estimated revenues and losses, our projected costs, our prospects, and the plans and objectives of management. These forward-looking statements are generally identified by the words “could,” “believe,” “anticipate,” “intend,” “estimate,” “expect,” “project” or similar expressions. These forward-looking statements are subject to a number of risks and uncertainties, including those set out in this Presentation, but not limited to: (i) the potential impact of the termination of our merger agreement with Zip Co Limited, including any impact on our stock price, business, financial condition and results of operations, and the potential negative impact to our business and employee relationships(ii) impact of the “buy-now, pay-later” (“BNPL”) industry becoming subject to increased regulatory scrutiny; (iii) impact of operating in a highly competitive industry; (iv) impact of macro-economic conditions on consumer spending; (v) our ability to increase our merchant network, our base of consumers and Underlying Merchant Sales (“UMS”); (vi) our ability to effectively manage growth, sustain our growth rate and maintain our market share; (vii) our ability to meet additional capital requirements; (vii) impact of exposure to consumer bad debts and insolvency of merchants; (ix) impact of the integration, support and prominent presentation of our platform by our merchants; (x) impact of any data security breaches, cyberattacks, employee or other internal misconduct, malware, phishing or ransomware, physical security breaches, natural disasters, or similar disruptions; (xi) impact of key vendors or merchants failing to comply with legal or regulatory requirements or to provide various services that are important to our operations; (xii) impact of the loss of key partners and merchant relationships; (xiii) impact of exchange rate fluctuations in the international markets in which we operate; (xiv) our ability to protect our intellectual property rights; (xv) our ability to retain employees and recruit additional employees; (xvi) impact of the costs of complying with various laws and regulations applicable to the BNPL industry in the United States and the international markets in which we operate; (xvii) our ability to achieve our public benefit purpose and maintain our B Corporation certification; and (xviii) the other factors identified in the “Risk Factors” section of our Annual Report on Form 10-K filed with the Securities and Exchange Commission (the “SEC”) on March 30, 2022 and subsequent quarterly reports on Form 10-Q. These forward- looking statements are based on our current expectations and assumptions about future events and are based on currently available information as to the outcome and timing of future events. Nevertheless, and despite the fact that management’s expectations and estimates are based on assumptions management believes to be reasonable and data management believes to be reliable, our actual results, performance or achievements are subject to future risks and uncertainties, any of which could materially affect our actual performance. Except as otherwise required by applicable law, we disclaim any duty to update any forward-looking statements to reflect events or circumstances after the date of this Presentation. This Presentation has been prepared in good faith, but no representation or warranty, express or implied, is made as to the fairness, accuracy, completeness, correctness, reliability or adequacy of any statements, estimates, opinions or other information, or the reasonableness of any assumption or other statement, contained in the Presentation (any of which may change without notice). All financial figures are expressed in U.S. dollars unless otherwise stated. In addition to financial measures presented in accordance with U.S. generally accepted accounting principles (“U.S. GAAP”), this Presentation includes certain financial information, including Underlying Merchant Sales (“UMS”), Active Consumers and Active Merchants, which has been provided as supplemental measures of operating performance that are key metrics used by management to assess Sezzle’s growth and operating performance. In particular, UMS is a key operating metric in assessing the volume of transactions that take place on the Sezzle Platform, which is an indicator of the success of Sezzle’s merchants and the strength of the Sezzle Platform. Sezzle also use these operating metrics in order to evaluate the effectiveness of our business strategies, to make budgeting decisions, and to compare our performance against that of other peer companies using similar measures. UMS, Active Consumers and Active Merchants do not represent revenue earned by Sezzle, are not components of Sezzle’s income or included within Sezzle’s financial results prepared in accordance with GAAP. The UMS, Active Consumers and Active Merchants financial measures used by Sezzle may differ from the non-U.S. GAAP financial measures used by other companies. SEZZLE INC 2Q22 PRESENTATION | 2

Sezzle Overview OVERVIEW SEZZLE INC 2Q22 PRESENTATION | 3

Financial Scorecard U NDERLY I NG MERCH ANT S ALES 1 (U MS ) (U S $ in MI LL I ONS ) TOTAL I NCOME ($ in MI LL I ONS ) +111.1% YoY TOTAL I NCOME LES S TRANS ACTION RELATED COS TS 2 AS A PERCENTAGE OF U MS +95.3% YoY +1.9% YoY +6.8% YoY 1 UMS is defined as the total value of sales made by merchants based on the purchase price of each confirmed sale where a consumer has selected the Sezzle Platform as the applicable payment option. UMS does not represent revenue earned by Sezzle, is not a component of Sezzle’s income, nor is it included within Sezzle’s financial results prepared in accordance with U.S. GAAP. For more information on Sezzle’s use of UMS, please refer to the disclaimer on slide 1. 2 Total Income less Transaction Related Costs is a non-GAAP financial measure equal to Total Income less the sum of Transaction Expense, Provision for Uncollectible Accounts, and Net Interest Expense. U NDERLY I NG MERCH ANT S ALES 1 (U MS ) (U S $ in MI LL I ONS ) TOTAL I NCOME ($ in MI LL I ONS ) 2021 2Q22 $244.1 $856.4 $1,807.8 2019 2020 2021 $188.0 $411.1 $419.1 2Q20 2Q21 2Q22 TOTAL I NCOME LES S TRANS ACTION RELATED COS TS 2 AS A PERCENTAGE OF U MS $12.6 $27.4 $29.3 2Q20 2Q21 2Q22 $15.8 $58.8 $114.8 2019 2020 2021 2.2% 0.8% 2.3% 2Q20 2Q21 2Q22 +150 Bps0.2% 1.4% 0.7% 2019 2020 2021 -70 Bps SEZZLE INC 2Q22 PRESENTATION | 4
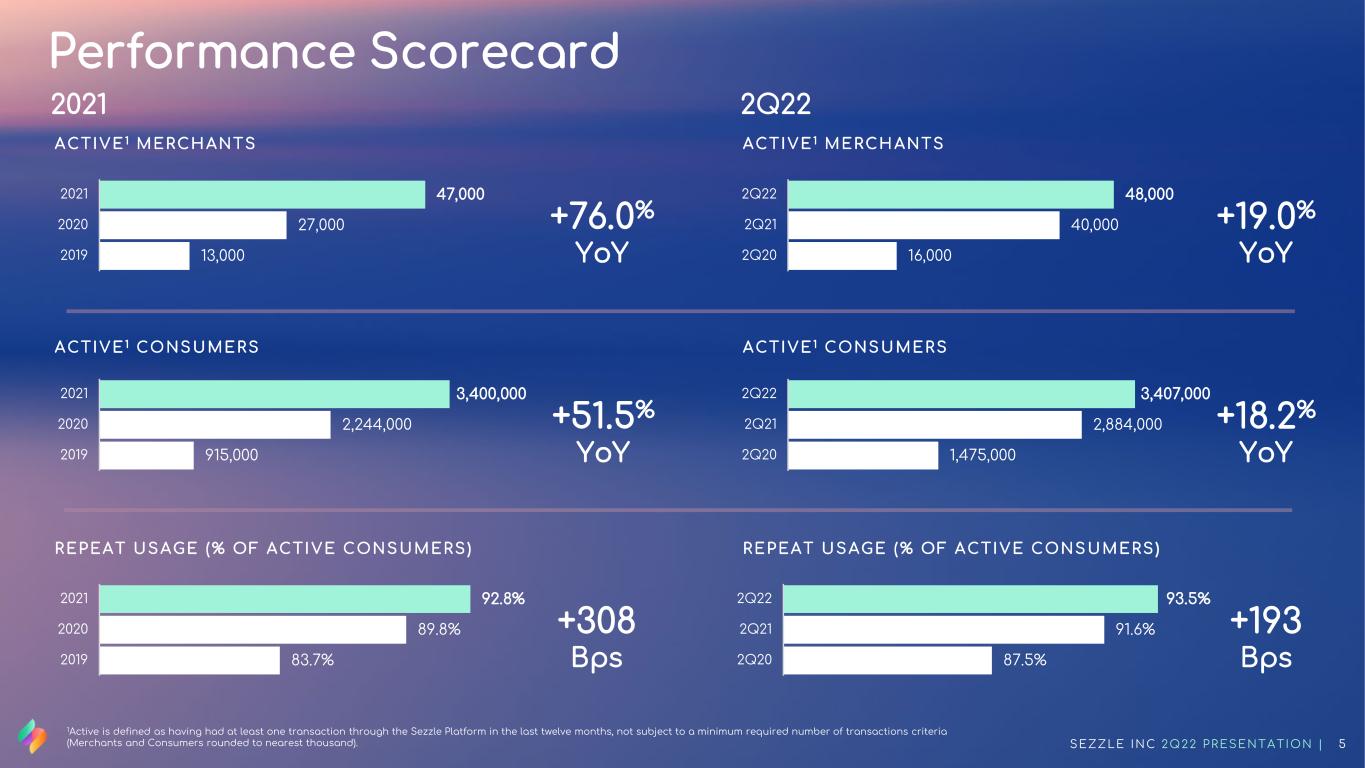
REPEAT U S AGE (% OF ACTI V E CONS U MERS ) ACTI V E 1 MERCH ANTS ACTI V E 1 CONS U MERS +19.0% YoY +193 Bps +18.2% YoY 1Active is defined as having had at least one transaction through the Sezzle Platform in the last twelve months, not subject to a minimum required number of transactions criteria (Merchants and Consumers rounded to nearest thousand). 2021 Performance Scorecard +76.0% YoY +308 Bps +51.5% YoY REPEAT U S AGE (% OF ACTI V E CONS U MERS ) ACTI V E 1 MERCH ANTS ACTI V E 1 CONS U MERS 2Q22 915,000 2,244,000 3,400,000 2019 2020 2021 1,475,000 2,884,000 3,407,000 2Q20 2Q21 2Q22 13,000 27,000 47,000 2019 2020 2021 16,000 40,000 48,000 2Q20 2Q21 2Q22 87.5% 91.6% 93.5% 2Q20 2Q21 2Q22 83.7% 89.8% 92.8% 2019 2020 2021 SEZZLE INC 2Q22 PRESENTATION | 5

Vision – Always Evolving SEZZLE INC 2Q22 PRESENTATION | 6 C O N S U M E R- F O C U S E DM E R C H A N T- F O C U S E D • Initially launched with a consumer-friendly focus for merchants - providing consumers a flexible alternative to traditional credit: increasing consumer basket sizes and purchase frequency • Merchant offerings have expanded beyond just Pay-in- Four to include items such as long-term financing and working capital loans (i.e., Sezzle Capital) • Sezzle is committed to continuing the expansion of its product offering to millions of consumers • In 2Q22, Sezzle launched Premium Subscription and Loyalty, and early results are promising • Additional product launches under consideration include: o Pay Now & Pay-in-2, o Physical Card (Flex) Upcoming launches Current products FU L L -S C A L E ME R C H A NT & C ONS U ME R FOC U S E D
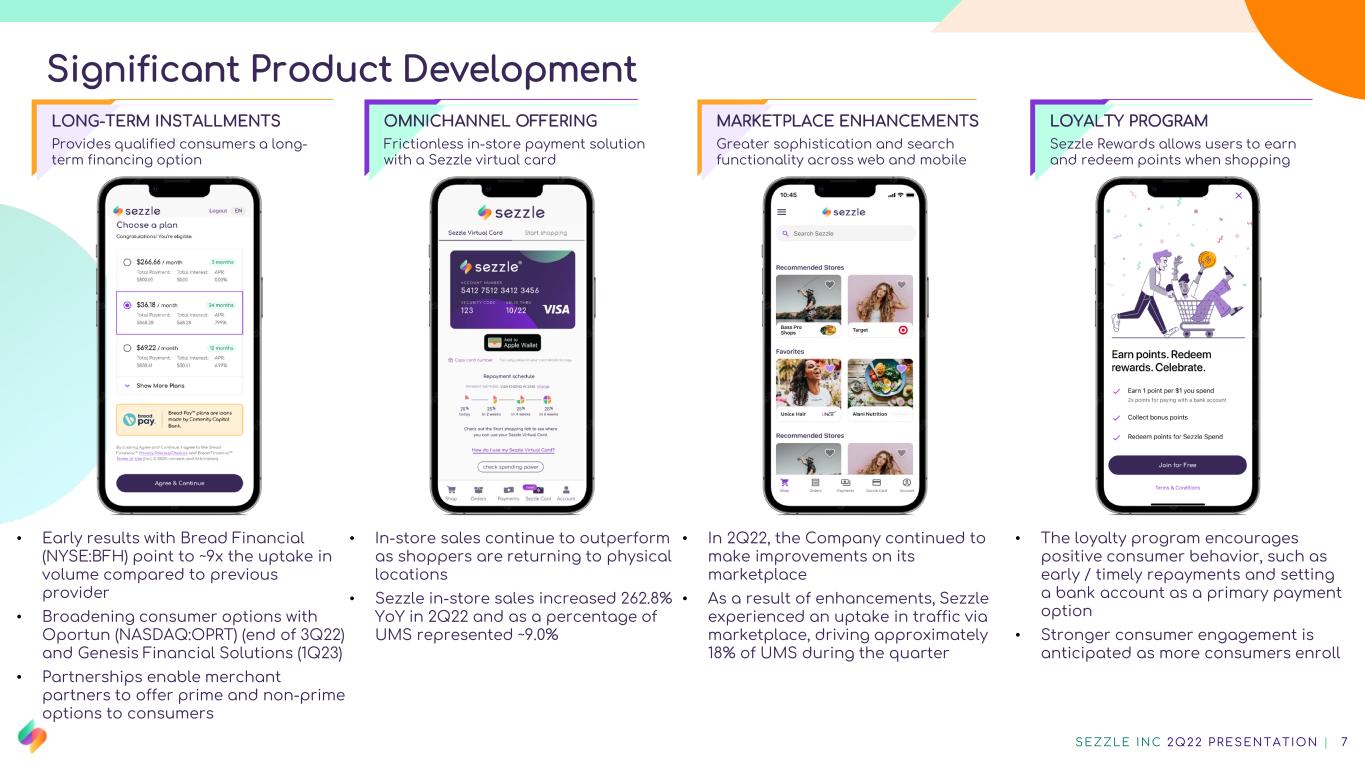
Significant Product Development LONG-TERM INSTALLMENTS Provides qualified consumers a long- term financing option OMNICHANNEL OFFERING Frictionless in-store payment solution with a Sezzle virtual card MARKETPLACE ENHANCEMENTS Greater sophistication and search functionality across web and mobile • In 2Q22, the Company continued to make improvements on its marketplace • As a result of enhancements, Sezzle experienced an uptake in traffic via marketplace, driving approximately 18% of UMS during the quarter • In-store sales continue to outperform as shoppers are returning to physical locations • Sezzle in-store sales increased 262.8% YoY in 2Q22 and as a percentage of UMS represented ~9.0% • Early results with Bread Financial (NYSE:BFH) point to ~9x the uptake in volume compared to previous provider • Broadening consumer options with Oportun (NASDAQ:OPRT) (end of 3Q22) and Genesis Financial Solutions (1Q23) • Partnerships enable merchant partners to offer prime and non-prime options to consumers SEZZLE INC 2Q22 PRESENTATION | 7 LOYALTY PROGRAM Sezzle Rewards allows users to earn and redeem points when shopping • The loyalty program encourages positive consumer behavior, such as early / timely repayments and setting a bank account as a primary payment option • Stronger consumer engagement is anticipated as more consumers enroll

SEZZLE INC CONFIDENTIAL AND PROPRIETARY | 8 Elevated Experience Through Sezzle Premium Note: performance data as of 27 July 2022. Sezzle Premium was launched on June 1, 2022 Priority Consumer Support Extra Free Payment Reschedule per Order Active Subscriptions % of UMS since launch 47, 000+ 10+% Exclusive Deals & Discounts 2x Points for Sezzle Rewards Access to Shop at 200+ Premium Brands
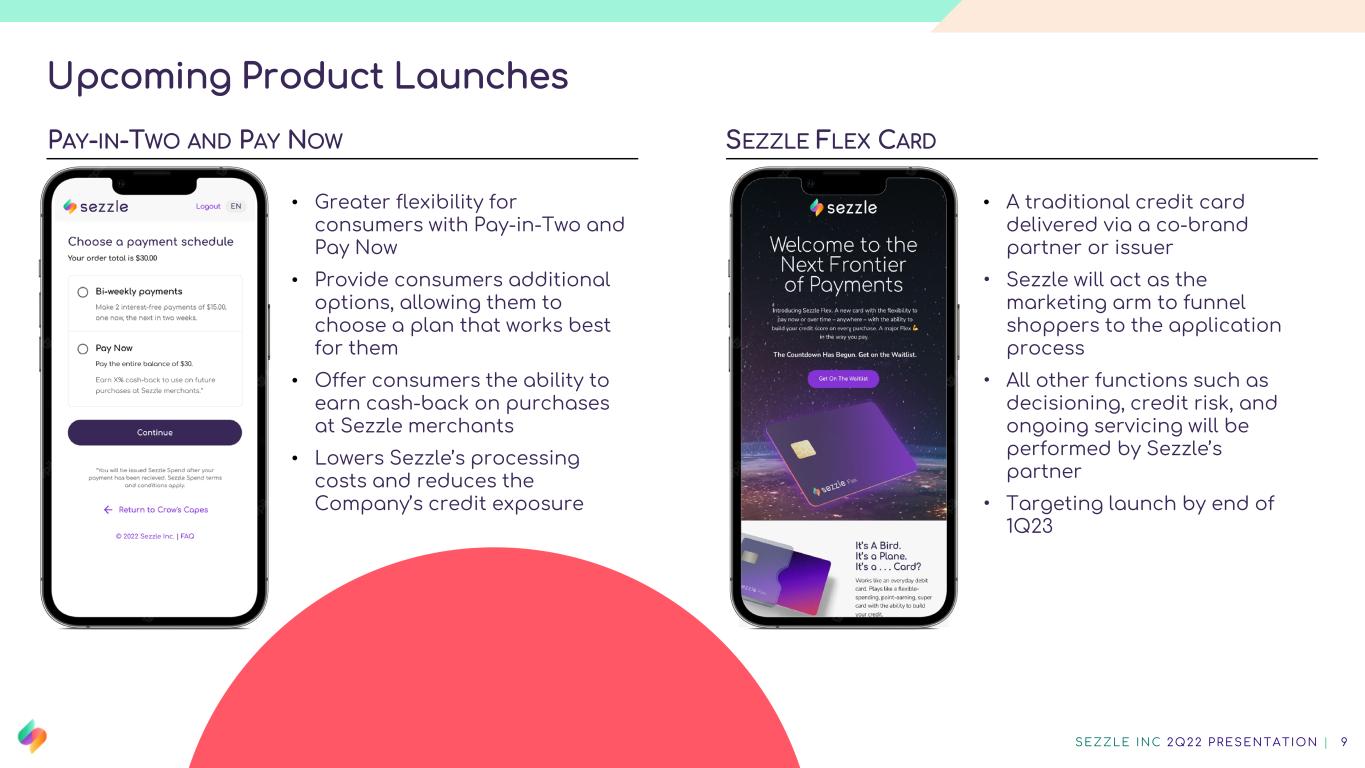
Upcoming Product Launches SEZZLE INC 2Q22 PRESENTATION | 9 PAY-IN-TWO AND PAY NOW SEZZLE FLEX CARD • Greater flexibility for consumers with Pay-in-Two and Pay Now • Provide consumers additional options, allowing them to choose a plan that works best for them • Offer consumers the ability to earn cash-back on purchases at Sezzle merchants • Lowers Sezzle’s processing costs and reduces the Company’s credit exposure • A traditional credit card delivered via a co-brand partner or issuer • Sezzle will act as the marketing arm to funnel shoppers to the application process • All other functions such as decisioning, credit risk, and ongoing servicing will be performed by Sezzle’s partner • Targeting launch by end of 1Q23

Initiatives to Reach Profitability INITIATIVES SEZZLE INC 2Q22 PRESENTATION | 10
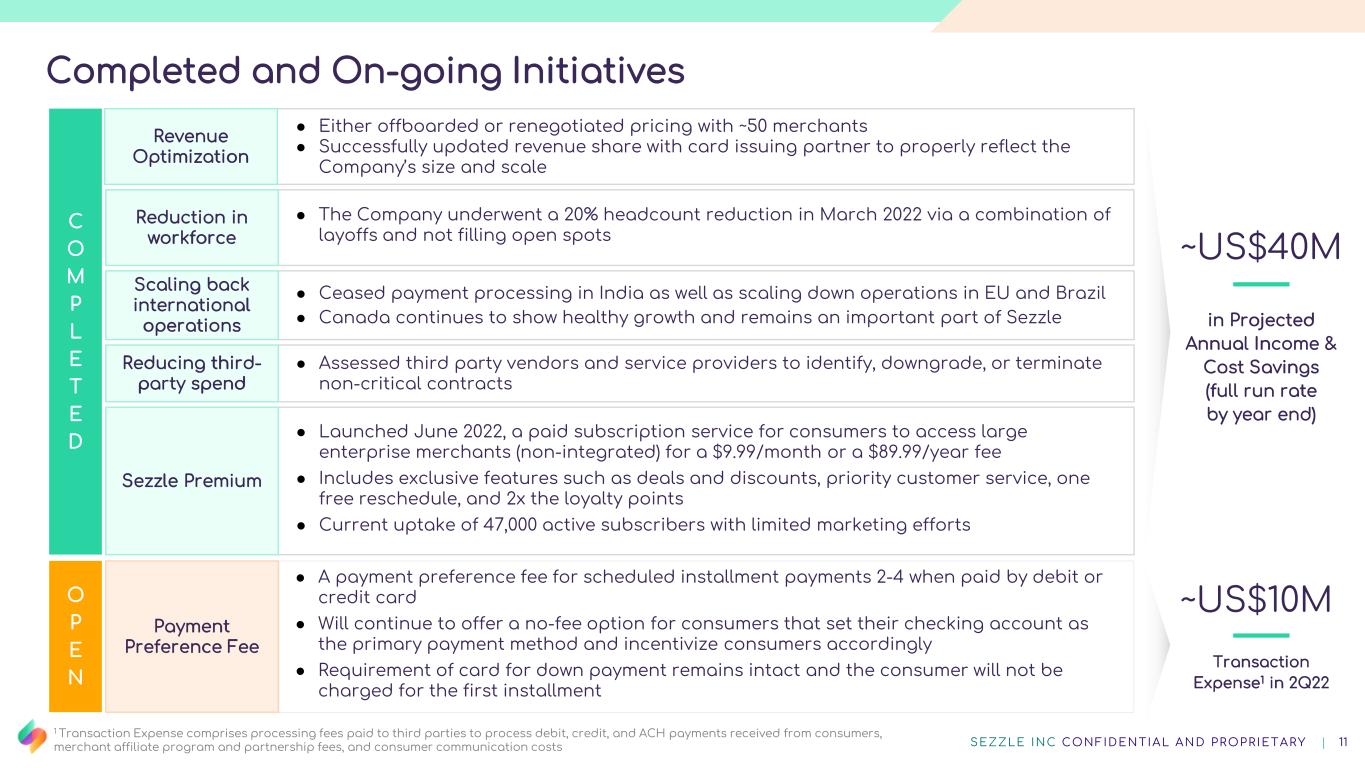
SEZZLE INC CONFIDENTIAL AND PROPRIETARY | 11 in Projected Annual Income & Cost Savings (full run rate by year end) ~US$40M Completed and On-going Initiatives ● Either offboarded or renegotiated pricing with ~50 merchants ● Successfully updated revenue share with card issuing partner to properly reflect the Company’s size and scale Revenue Optimization ● The Company underwent a 20% headcount reduction in March 2022 via a combination of layoffs and not filling open spots Reduction in workforce ● Ceased payment processing in India as well as scaling down operations in EU and Brazil ● Canada continues to show healthy growth and remains an important part of Sezzle Scaling back international operations ● Assessed third party vendors and service providers to identify, downgrade, or terminate non-critical contracts Reducing third- party spend ● Launched June 2022, a paid subscription service for consumers to access large enterprise merchants (non-integrated) for a $9.99/month or a $89.99/year fee ● Includes exclusive features such as deals and discounts, priority customer service, one free reschedule, and 2x the loyalty points ● Current uptake of 47,000 active subscribers with limited marketing efforts Sezzle Premium C O M P L E T E D ● A payment preference fee for scheduled installment payments 2-4 when paid by debit or credit card ● Will continue to offer a no-fee option for consumers that set their checking account as the primary payment method and incentivize consumers accordingly ● Requirement of card for down payment remains intact and the consumer will not be charged for the first installment O P E N ~US$10M Transaction Expense1 in 2Q22 1 Transaction Expense comprises processing fees paid to third parties to process debit, credit, and ACH payments received from consumers, merchant affiliate program and partnership fees, and consumer communication costs Payment Preference Fee

Financials FINANCIALS SEZZLE INC 2Q22 PRESENTATION | 12

Underlying Merchant Sales & Total Income SEZZLE INC 2Q22 PRESENTATION | 13 $27.4 $28.5 $32.9 $27.6 $29.3 6.7% 6.2% 5.9% 6.1% 7.0% 0 . 0 % 1 . 0 % 2 . 0 % 3 . 0 % 4 . 0 % 5 . 0 % 6 . 0 % 7 . 0 % 8 . 0 % $ 0 $ 1 0 $ 2 0 $ 3 0 $ 4 0 $ 5 0 $ 6 0 $ 7 0 $ 8 0 2Q21 3Q21 4Q21 1Q22 2Q22 TOTAL INCOME Total Income ($US in millions) Total Income-to-UMS Commentary • UMS reached US$419.1 million during the quarter, up 1.9% YoY, with instore up 262.8% YoY • For comparison, U.S. e-commerce retail sales declined in the low-single digits YoY for the months of April and May before rising 1.1% YoY in June1 • Total income grew 6.8% YoY to US$29.3 million for 2Q22, representing 7.0% of UMS compared to 6.1% in 2Q21 and 5.9% in the quarter prior • The increase in Total Income as a percentage of UMS is due to the Company’s recent initiatives on driving toward profitability such as renegotiations with, or offboarding of, unprofitable merchants $411.1 $460.7 $561.0 $450.5 $419.1 2 Q 2 1 3 Q 2 1 4 Q 2 1 1 Q 2 2 2 Q 2 2 U N D E R L Y I N G M E R C H A N T S A L E S ( U M S ) UMS ($US in million) 1 According to Mastercard SpendingPulse.
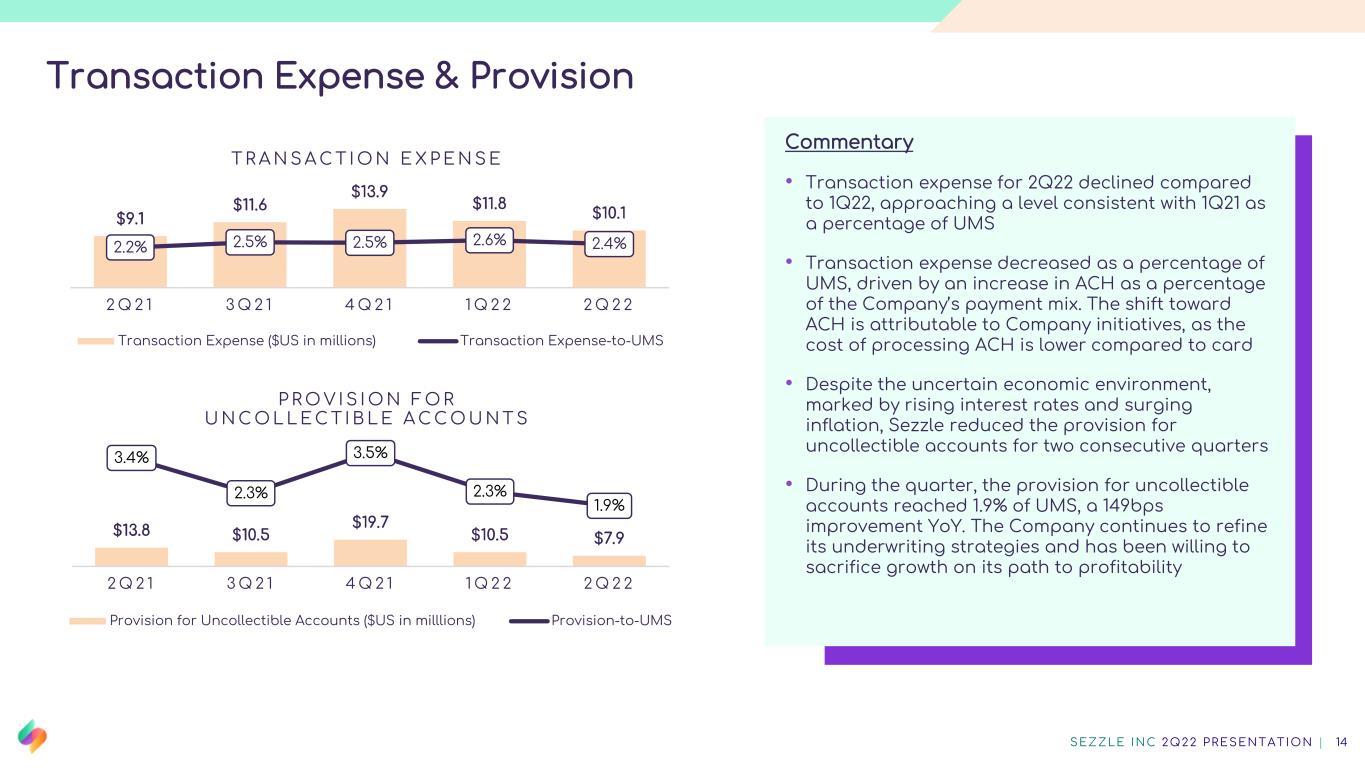
Transaction Expense & Provision SEZZLE INC 2Q22 PRESENTATION | 14 Commentary • Transaction expense for 2Q22 declined compared to 1Q22, approaching a level consistent with 1Q21 as a percentage of UMS • Transaction expense decreased as a percentage of UMS, driven by an increase in ACH as a percentage of the Company’s payment mix. The shift toward ACH is attributable to Company initiatives, as the cost of processing ACH is lower compared to card • Despite the uncertain economic environment, marked by rising interest rates and surging inflation, Sezzle reduced the provision for uncollectible accounts for two consecutive quarters • During the quarter, the provision for uncollectible accounts reached 1.9% of UMS, a 149bps improvement YoY. The Company continues to refine its underwriting strategies and has been willing to sacrifice growth on its path to profitability $9.1 $11.6 $13.9 $11.8 $10.1 2.2% 2.5% 2.5% 2.6% 2.4% 0.0% 1.0% 2.0% 3.0% 4.0% 5.0% $0.0 $2.0 $4.0 $6.0 $8.0 $10.0 $12.0 $14.0 $16.0 2 Q 2 1 3 Q 2 1 4 Q 2 1 1 Q 2 2 2 Q 2 2 T R A N S A C T I O N E X P E N S E Transaction Expense ($US in millions) Transaction Expense-to-UMS $13.8 $10.5 $19.7 $10.5 $7.9 3.4% 2.3% 3.5% 2.3% 1.9% 0.0% 0.5% 1.0% 1.5% 2.0% 2.5% 3.0% 3.5% 4.0% $0.0 $10.0 $20.0 $30.0 $40.0 $50.0 $60.0 $70.0 $80.0 $90.0 2 Q 2 1 3 Q 2 1 4 Q 2 1 1 Q 2 2 2 Q 2 2 P R O V I S I O N F O R U N C O L L E C T I B L E A C C O U N T S Provision for Uncollectible Accounts ($US in milllions) Provision-to-UMS
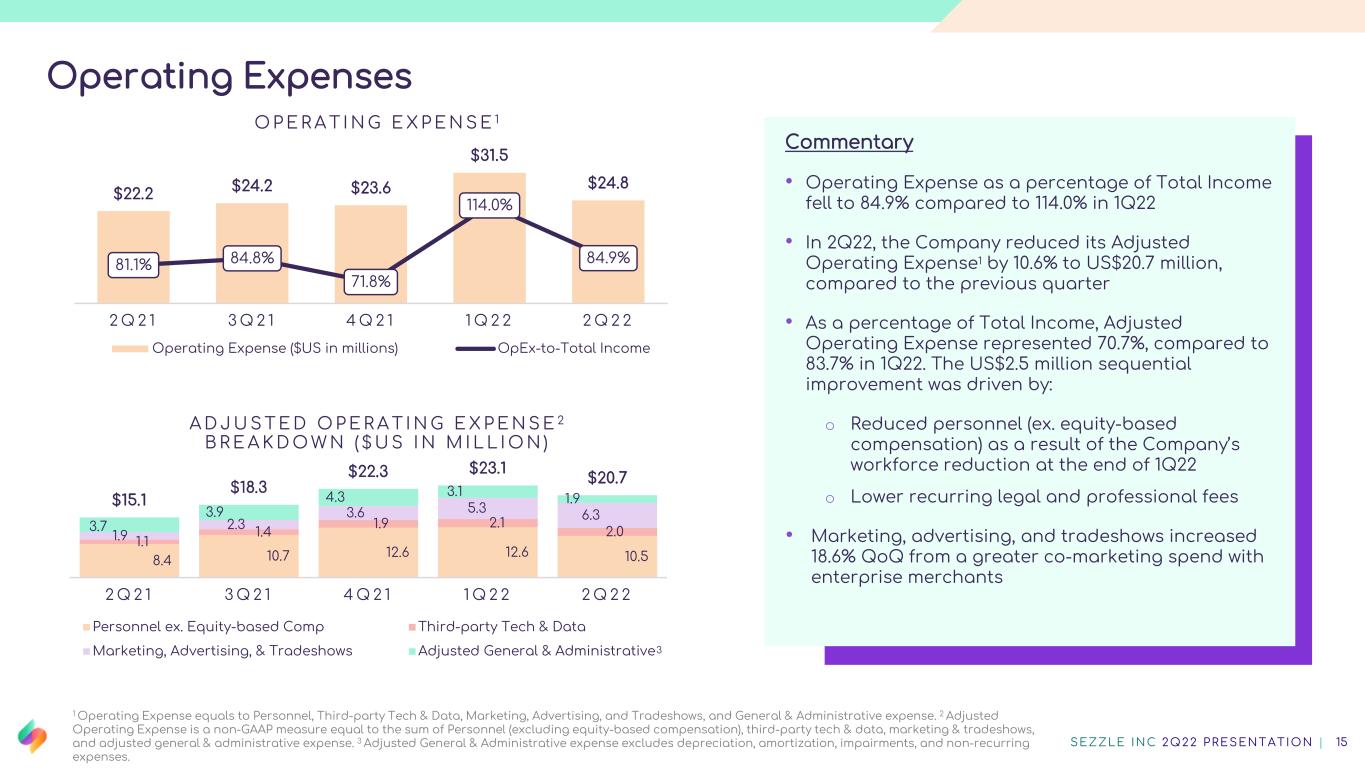
Operating Expenses SEZZLE INC 2Q22 PRESENTATION | 15 Commentary • Operating Expense as a percentage of Total Income fell to 84.9% compared to 114.0% in 1Q22 • In 2Q22, the Company reduced its Adjusted Operating Expense1 by 10.6% to US$20.7 million, compared to the previous quarter • As a percentage of Total Income, Adjusted Operating Expense represented 70.7%, compared to 83.7% in 1Q22. The US$2.5 million sequential improvement was driven by: o Reduced personnel (ex. equity-based compensation) as a result of the Company’s workforce reduction at the end of 1Q22 o Lower recurring legal and professional fees • Marketing, advertising, and tradeshows increased 18.6% QoQ from a greater co-marketing spend with enterprise merchants 8.4 10.7 12.6 12.6 10.5 1.1 1.4 1.9 2.1 2.01.9 2.3 3.6 5.3 6.3 3.7 3.9 4.3 3.1 1.9$15.1 $18.3 $22.3 $23.1 $20.7 2 Q 2 1 3 Q 2 1 4 Q 2 1 1 Q 2 2 2 Q 2 2 A D J U S T E D O P E R A T I N G E X P E N S E 2 B R E A K D O W N ( $ U S I N M I L L I O N ) Personnel ex. Equity-based Comp Third-party Tech & Data Marketing, Advertising, & Tradeshows Adjusted General & Administrative $22.2 $24.2 $23.6 $31.5 $24.8 81.1% 84.8% 71.8% 114.0% 84.9% 60.0% 70.0% 80.0% 90.0% 100.0% 110.0% 120.0% 130.0% 140.0% $0.0 $5.0 $10.0 $15.0 $20.0 $25.0 $30.0 $35.0 2 Q 2 1 3 Q 2 1 4 Q 2 1 1 Q 2 2 2 Q 2 2 O P E R A T I N G E X P E N S E 1 Operating Expense ($US in millions) OpEx-to-Total Income 1 Operating Expense equals to Personnel, Third-party Tech & Data, Marketing, Advertising, and Tradeshows, and General & Administrative expense. 2 Adjusted Operating Expense is a non-GAAP measure equal to the sum of Personnel (excluding equity-based compensation), third-party tech & data, marketing & tradeshows, and adjusted general & administrative expense. 3 Adjusted General & Administrative expense excludes depreciation, amortization, impairments, and non-recurring expenses. 3

Closing the Gap SEZZLE INC 2Q22 PRESENTATION | 16 Commentary • In 2Q22, Sezzle delivered a record quarter for Total Income less Transaction Related Costs of US$9.6 million • The deviation between Total Income less Transaction Related Costs and Adjusted Operating Expense decreased by 54.6% and 42.7%, compared to 4Q21 and 1Q22, respectively • The Company anticipates the gap to improve in 3Q22 as initiatives develop and mature, including: o Full quarter recognition of contract re- negotiations (occurred in the middle of 2Q22) o ACH rising as a % of repayment method, and o Testing of the Payment Preference Fee initiative • Sezzle anticipates fulling closing the gap between the two metrics on a monthly basis by year end as the Company’s actions take hold 1Total Income less Transaction Related Costs is a non-GAAP financial measure equal to Total Income less the sum of Transaction Expense, Provision for Uncollectible Accounts, and Net Interest Expense. 2Adjusted Operating Expense is defined in the previous slide. $13.0 $24.5 $19.4 $11.1 $5.3 ($2.2) $3.8 $9.6 $18.3 $22.3 $23.1 $20.7 3 Q 2 1 4 Q 2 1 1 Q 2 2 2 Q 2 2 Adjusted Operating Expense2 ($US in millions) Total Income less Transaction Related Costs1 ($US in millions)
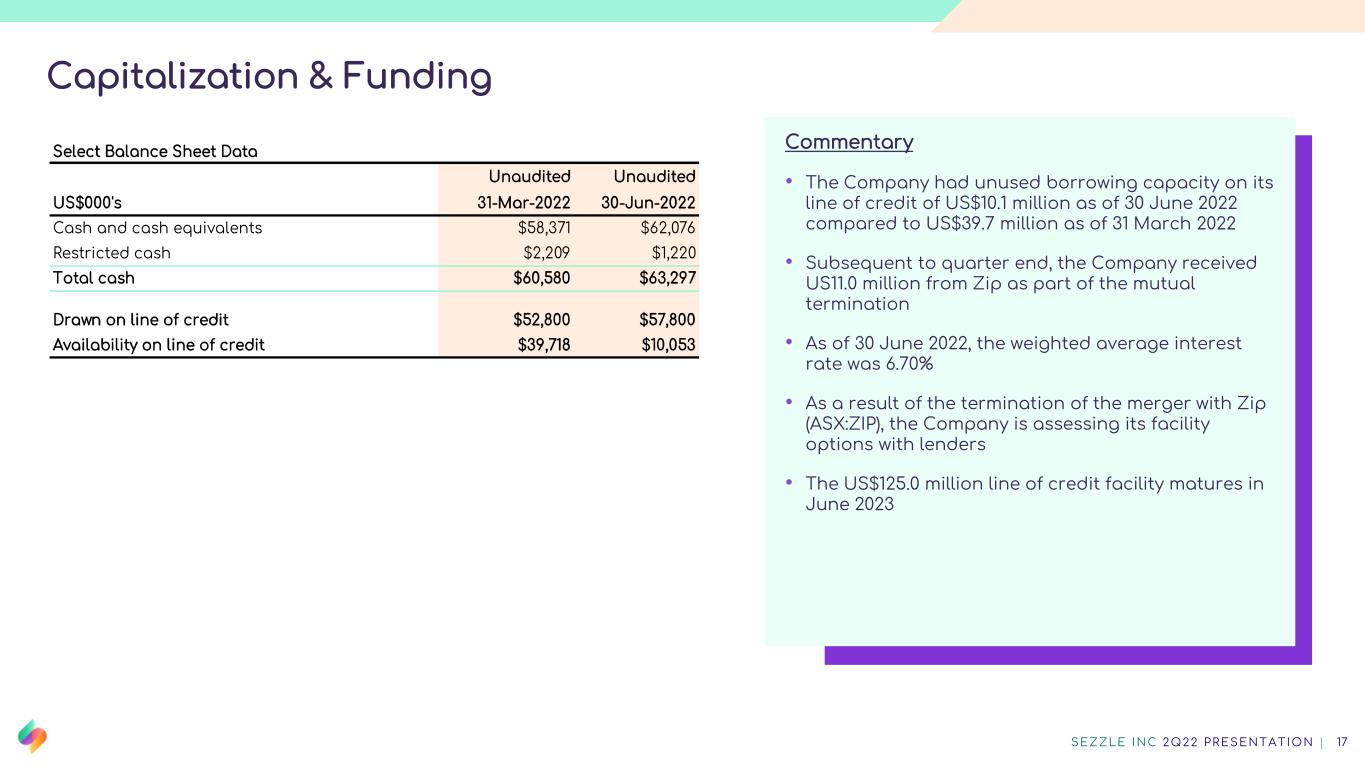
Capitalization & Funding SEZZLE INC 2Q22 PRESENTATION | 17 Commentary • The Company had unused borrowing capacity on its line of credit of US$10.1 million as of 30 June 2022 compared to US$39.7 million as of 31 March 2022 • Subsequent to quarter end, the Company received US11.0 million from Zip as part of the mutual termination • As of 30 June 2022, the weighted average interest rate was 6.70% • As a result of the termination of the merger with Zip (ASX:ZIP), the Company is assessing its facility options with lenders • The US$125.0 million line of credit facility matures in June 2023 Select Balance Sheet Data Unaudited Unaudited US$000's 31-Mar-2022 30-Jun-2022 Cash and cash equivalents $58,371 $62,076 Restricted cash $2,209 $1,220 Total cash $60,580 $63,297 Drawn on line of credit $52,800 $57,800 Availability on line of credit $39,718 $10,053

Termination of the Proposed Merger with Zip SEZZLE INC 2Q22 PRESENTATION | 18 • On 28 February 2022, Zip Co. (ASX: ZIP) and Sezzle entered into a definitive agreement to merge in an all- stock deal • On 12 July 2022, both companies mutually agreed to terminate the proposed merger • As part of the mutual termination, Sezzle received US$11.0 million from Zip to cover Sezzle’s legal, accounting, and other costs associated with the transaction MERGER TERMINATION “While we were excited by the potential of this transaction, our Board and management team are focused on our strategy and execution. We remain dedicated to driving toward profitability and free cash flow and believe this is the best outcome for our shareholders” Charlie Youakim, Co-Founder, Executive Chairman, and CEO

Thank you


