Wells Fargo Commercial Mortgage Trust 2016-C32
Filed: 26 Jan 16, 12:00am
| FREE WRITING PROSPECTUS | ||
| FILED PURSUANT TO RULE 433 | ||
| REGISTRATION FILE NO.: 333-206677-02 | ||

Free Writing Prospectus
Structural and Collateral Term Sheet
$959,979,761
(Approximate Initial Pool Balance)
$849,582,000
(Approximate Aggregate Certificate Balance of Offered Certificates)
Wells Fargo Commercial Mortgage Trust 2016-C32
as Issuing Entity
Wells Fargo Commercial Mortgage Securities, Inc.
as Depositor
Wells Fargo Bank, National Association
Rialto Mortgage Finance, LLC
National Cooperative Bank, N.A.
C-III Commercial Mortgage LLC
Basis Real Estate Capital II, LLC
as Sponsors and Mortgage Loan Sellers
Commercial Mortgage Pass-Through Certificates
Series 2016-C32
January 26, 2016
| WELLS FARGO SECURITIES | ||
| Lead Manager and Sole Bookrunner | ||
Barclays Co-Manager | Deutsche Bank Securities Co-Manager | |
STATEMENT REGARDING THIS FREE WRITING PROSPECTUS
The depositor has filed a registration statement (including a prospectus) with the Securities and Exchange Commission (‘‘SEC’’) (SEC File No. 333-206677) for the offering to which this communication relates. Before you invest, you should read the prospectus in the registration statement and other documents the depositor has filed with the SEC for more complete information about the depositor, the issuing entity and this offering. You may get these documents for free by visiting EDGAR on the SEC Web site at www.sec.gov. Alternatively, the depositor, any underwriter, or any dealer participating in the offering will arrange to send you the prospectus after filing if you request it by calling toll free 1-800-745-2063 (8 a.m. – 5 p.m. EST) or by emailing wfs.cmbs@wellsfargo.com.
Nothing in this document constitutes an offer of securities for sale in any jurisdiction where the offer or sale is not permitted. The information contained herein is preliminary as of the date hereof, supersedes any such information previously delivered to you and will be superseded by any such information subsequently delivered and ultimately by the final prospectus relating to the securities. These materials are subject to change, completion, supplement or amendment from time to time.
This free writing prospectus has been prepared by the underwriters for information purposes only and does not constitute, in whole or in part, a prospectus for the purposes of Directive 2003/71/EC (as amended) and/or Part VI of the Financial Services and Markets Act 2000, as amended, or other offering document.
STATEMENT REGARDING ASSUMPTIONS AS TO SECURITIES, PRICING ESTIMATES AND OTHER INFORMATION
The attached information contains certain tables and other statistical analyses (the “Computational Materials”) which have been prepared in reliance upon information furnished by the Mortgage Loan Sellers. Numerous assumptions were used in preparing the Computational Materials, which may or may not be reflected herein. As such, no assurance can be given as to the Computational Materials’ accuracy, appropriateness or completeness in any particular context; or as to whether the Computational Materials and/or the assumptions upon which they are based reflect present market conditions or future market performance. The Computational Materials should not be construed as either projections or predictions or as legal, tax, financial or accounting advice. You should consult your own counsel, accountant and other advisors as to the legal, tax, business, financial and related aspects of a purchase of these securities. Any weighted average lives, yields and principal payment periods shown in the Computational Materials are based on prepayment and/or loss assumptions, and changes in such prepayment and/or loss assumptions may dramatically affect such weighted average lives, yields and principal payment periods. In addition, it is possible that prepayments or losses on the underlying assets will occur at rates higher or lower than the rates shown in the attached Computational Materials. The specific characteristics of the securities may differ from those shown in the Computational Materials due to differences between the final underlying assets and the preliminary underlying assets used in preparing the Computational Materials. The principal amount and designation of any security described in the Computational Materials are subject to change prior to issuance. None of Wells Fargo Securities, LLC, Barclays Capital Inc., Deutsche Bank Securities Inc., or any of their respective affiliates, make any representation or warranty as to the actual rate or timing of payments or losses on any of the underlying assets or the payments or yield on the securities. The information in this presentation is based upon management forecasts and reflects prevailing conditions and management’s views as of this date, all of which are subject to change. In preparing this presentation, we have relied upon and assumed, without independent verification, the accuracy and completeness of all information available from public sources or which was provided to us by or on behalf of the Mortgage Loan Sellers or which was otherwise reviewed by us.
This free writing prospectus contains certain forward-looking statements. If and when included in this free writing prospectus, the words “expects”, “intends”, “anticipates”, “estimates” and analogous expressions and all statements that are not historical facts, including statements about our beliefs or expectations, are intended to identify forward-looking statements. Any forward-looking statements are made subject to risks and uncertainties which could cause actual results to differ materially from those stated. Those risks and uncertainties include, among other things, declines in general economic and business conditions, increased competition, changes in demographics, changes in political and social conditions, regulatory initiatives and changes in customer preferences, many of which are beyond our control and the control of any other person or entity related to this offering. The forward-looking statements made in this free writing prospectus are made as of the date stated on the cover. We have no obligation to update or revise any forward-looking statement.
Wells Fargo Securities is the trade name for the capital markets and investment banking services of Wells Fargo & Company and its subsidiaries, including but not limited to Wells Fargo Securities, LLC, a member of NYSE, FINRA, NFA and SIPC, Wells Fargo Prime Services, LLC, a member of FINRA, NFA and SIPC, and Wells Fargo Bank, N.A. Wells Fargo Securities, LLC and Wells Fargo Prime Services, LLC are distinct entities from affiliated banks and thrifts.
IMPORTANT NOTICE REGARDING THE OFFERED CERTIFICATES
The information herein is preliminary and may be supplemented or amended prior to the time of sale. Prospective investors should understand that, when considering the purchase of the Offered Certificates, a contract of sale will come into being no sooner than the date on which the relevant class of certificates has been priced and the investor has otherwise taken all actions the investor must take to become committed to purchase the Offered Certificates, and the investor has therefore entered into a contract of sale. Any “indications of interest” expressed by any prospective investor, and any “soft circles” generated by the underwriters, prior to the time of sale, will not create binding contractual obligations for such prospective investors, on the one hand, or the underwriters, the depositor or any of their respective agents or affiliates, on the other hand.
In addition, the Offered Certificates referred to in these materials and the asset pool backing them are subject to modification or revision (including the possibility that one or more classes of certificates may be split, combined or eliminated at any time prior to issuance or availability of a final prospectus) and are offered on a “when, as and if issued” basis. As a result of the foregoing, a prospective investor may commit to purchase certificates that have characteristics that may change, and each prospective investor is advised that all or a portion of the certificates referred to in these materials may be issued without all or certain of the characteristics described in these materials. The underwriters’ obligation to sell certificates to any prospective investor is conditioned on the certificates and the transaction having the characteristics described in these materials. If the underwriters determine that a condition is not satisfied in any material respect, such prospective investor will be notified, and neither the depositor nor the underwriters will have any obligation to such prospective investor to deliver any portion of the Offered Certificates which such prospective investor has committed to purchase, and there will be no liability between the underwriters, the depositor or any of their respective agents or affiliates, on the one hand, and such prospective investor, on the other hand, as a consequence of the non-delivery.
The underwriters described in these materials may from time to time perform investment banking services for, or solicit investment banking business from, any company named in these materials. The underwriters and/or their affiliates or respective employees may from time to time have a long or short position in any security or contract discussed in these materials.
The information contained herein supersedes any previous such information delivered to any prospective investor and will be superseded by information delivered to such prospective investor prior to the time of sale.
IMPORTANT NOTICE RELATING TO AUTOMATICALLY-GENERATED EMAIL DISCLAIMERS
Any legends, disclaimers or other notices that may appear at the bottom of any email communication to which this free writing prospectus is attached relating to (1) these materials not constituting an offer (or a solicitation of an offer), (2) no representation that these materials are accurate or complete and may not be updated or (3) these materials possibly being confidential, are not applicable to these materials and should be disregarded. Such legends, disclaimers or other notices have been automatically generated as a result of these materials having been sent via Bloomberg or another system.
THE INFORMATION IN THIS STRUCTURAL AND COLLATERAL TERM SHEET IS NOT COMPLETE AND MAY BE AMENDED PRIOR TO THE TIME OF SALE. THIS TERM SHEET IS NOT AN OFFER TO SELL THESE SECURITIES AND IT IS NOT A SOLICITATION OF AN OFFER TO BUY THESE SECURITIES IN ANY JURISDICTION WHERE THE OFFER OR SALE IS NOT PERMITTED.
| 2 |
| Wells Fargo Commercial Mortgage Trust 2016-C32 | Certificate Structure |
I. Certificate Structure
| Class | Expected Ratings (DBRS/KBRA/Moody’s)(1) | Approximate Initial Certificate Balance or Notional Amount(2) | Approx. | Pass-Through Rate Description | Weighted Average Life (Years)(4) | Expected Principal Window(4) | Certificate Principal to Value Ratio(5) | Certificate Principal U/W NOI Debt Yield(6) | ||
| Offered Certificates | ||||||||||
| A-1 | AAA(sf)/AAA(sf)/Aaa(sf) | $40,045,000 | 30.000% | (7) | 2.68 | 3/16 – 10/20 | 41.1% | 21.9% | ||
| A-2 | AAA(sf)/AAA(sf)/Aaa(sf) | $45,913,000 | 30.000% | (7) | 4.80 | 10/20 – 1/21 | 41.1% | 21.9% | ||
| A-3 | AAA(sf)/AAA(sf)/Aaa(sf) | $200,000,000 | 30.000% | (7) | 9.69 | 6/25 – 11/25 | 41.1% | 21.9% | ||
| A-4 | AAA(sf)/AAA(sf)/Aaa(sf) | $319,738,000 | 30.000% | (7) | 9.81 | 11/25 – 12/25 | 41.1% | 21.9% | ||
| A-SB | AAA(sf)/AAA(sf)/Aaa(sf) | $66,289,000 | 30.000% | (7) | 7.27 | 1/21 – 6/25 | 41.1% | 21.9% | ||
| A-S | AAA(sf)/AAA(sf)/Aa2(sf) | $77,999,000 | 21.875% | (7) | 9.88 | 12/25 – 1/26 | 45.8% | 19.6% | ||
| X-A | AAA(sf)/AAA(sf)/NR | $749,984,000(8) | N/A | Variable(9) | N/A | N/A | N/A | N/A | ||
| X-B | AAA(sf)/AAA(sf)/NR | $64,798,000(10) | N/A | Variable(11) | N/A | N/A | N/A | N/A | ||
| B | AA(low)(sf)/AA-(sf)/NR | $64,798,000 | 15.125% | (7) | 9.91 | 1/26 – 1/26 | 49.8% | 18.1% | ||
| C | A(low)(sf)/A-(sf)/NR | $34,800,000 | 11.500% | (7) | 9.91 | 1/26 – 1/26 | 51.9% | 17.3% | ||
| Non-Offered Certificates | ||||||||||
| X-D | BBB(low)(sf)/BBB-(sf)/NR | $38,399,000(12) | N/A | Variable(13) | N/A | N/A | N/A | N/A | ||
| X-E | AAA(sf)/BB-(sf)/NR | $23,999,000(14) | N/A | Variable(15) | N/A | N/A | N/A | N/A | ||
| X-F | AAA(sf)/B-(sf)/NR | $12,000,000(16) | N/A | Variable(17) | N/A | N/A | N/A | N/A | ||
| X-G | NR/NR/NR | $35,999,761(18) | N/A | Variable(19) | N/A | N/A | N/A | N/A | ||
| D | BBB(low)(sf)/BBB-(sf)/NR | $38,399,000 | 7.500% | (7) | 9.91 | 1/26 – 1/26 | 54.3% | 16.6% | ||
| E | BB(low)(sf)/BB-(sf)/NR | $23,999,000 | 5.000% | (7) | 9.91 | 1/26 – 1/26 | 55.7% | 16.1% | ||
| F | B(low)(sf)/B-(sf)/NR | $12,000,000 | 3.750% | (7) | 9.91 | 1/26 – 1/26 | 56.5% | 15.9% | ||
| G | NR/NR/NR | $35,999,761 | 0.000% | (7) | 9.91 | 1/26 – 1/26 | 58.7% | 15.3% | ||
| Notes: |
| (1) | The expected ratings presented are those of DBRS, Inc. (“DBRS”), Kroll Bond Rating Agency, Inc. (“KBRA”) and Moody’s Investors Service, Inc. (“Moody’s”) which the depositor hired to rate the offered certificates. One or more other nationally recognized statistical rating organizations that were not hired by the depositor may use information they receive pursuant to Rule 17g-5 under the Securities Exchange Act of 1934, as amended (the “Exchange Act”) or otherwise, to rate or provide market reports and/or published commentary related to the offered certificates. We cannot assure you as to what ratings a non-hired nationally recognized statistical rating organization would assign or that its reports will not express differing, possibly negative, views of the mortgage loans and/or the offered certificates. The ratings of each class of offered certificates address the likelihood of the timely distribution of interest and, except in the case of the Class X-A and X-B certificates, the ultimate distribution of principal due on those classes on or before the Rated Final Distribution Date. See “Risk Factors—Other Risks Relating to the Certificates—Nationally Recognized Statistical Rating Organizations May Assign Different Ratings to the Certificates; Ratings of the Certificates Reflect Only the Views of the Applicable Rating Agencies as of the Dates Such Ratings Were Issued; Ratings May Affect ERISA Eligibility; Ratings May Be Downgraded” and “Ratings” in the Preliminary Prospectus, expected to be dated January 26, 2016 (the “Preliminary Prospectus”). DBRS, KBRA and Moody’s have informed us that the “sf” designation in their ratings represents an identifier for structured finance product ratings. |
| (2) | The certificate balances and notional amounts set forth in the table are approximate. The actual initial certificate balances and notional amounts may be larger or smaller depending on the initial pool balance of the mortgage loans definitively included in the pool of mortgage loans, which aggregate cut-off date balance may be as much as 5% larger or smaller than the amount presented in the Preliminary Prospectus. |
| (3) | The approximate initial credit support with respect to the Class A-1, A-2, A-3, A-4 and A-SB Certificates represents the approximate credit enhancement for the Class A-1, A-2, A-3, A-4 and A-SB Certificates in the aggregate. |
| (4) | Weighted Average Lives and Expected Principal Windows are calculated based on an assumed prepayment rate of 0% CPR and the “Structuring Assumptions” described under “Yield and Maturity Considerations—Weighted Average Life” in the Preliminary Prospectus. |
| (5) | The Certificate Principal to Value Ratio for each Class of Certificates (other than the Class A-1, A-2, A-3, A-4 and A-SB Certificates) is calculated as the product of (a) the weighted average Cut-off Date LTV Ratio for the mortgage loans and (b) a fraction, the numerator of which is the total initial Certificate Balance of such Class of Certificates and all Classes of Principal Balance Certificates senior to such Class of Certificates and the denominator of which is the total initial Certificate Balance of all of the Principal Balance Certificates. The Certificate Principal to Value Ratio for each of the Class A-1, A-2, A-3, A-4 and A-SB Certificates is calculated in the aggregate for those Classes as if they were a single Class and is calculated as the product of (a) the weighted average Cut-off Date LTV Ratio for the mortgage loans and (b) a fraction, the numerator of which is the total initial aggregate Certificate Balances of such Classes of Certificates and the denominator of which is the total initial Certificate Balance of all of the Principal Balance Certificates. In any event, however, excess mortgaged property value associated with a mortgage loan will not be available to offset losses on any other mortgage loan. |
| (6) | The Certificate Principal U/W NOI Debt Yield for each Class of Certificates (other than the Class A-1, A-2, A-3, A-4 and A-SB Certificates) is calculated as the product of (a) the weighted average U/W NOI Debt Yield for the mortgage loans and (b) a fraction, the numerator of which is the total initial Certificate Balance of all of the Classes of Principal Balance Certificates and the denominator of which is the total initial Certificate Balance for such Class of Certificates and all Classes of Principal Balance Certificates senior to such Class of Certificates. The Certificate Principal U/W NOI Debt Yield for each of the Class A-1, A-2, A-3, A-4 and A-SB Certificates is calculated in the aggregate for those Classes as if they were a single Class and is calculated as the product of (a) the weighted average U/W NOI Debt Yield for the mortgage loans and (b) a fraction, the numerator of which is the total initial Certificate Balance of all of the Classes of Principal Balance Certificates and the denominator of which is the total aggregate initial Certificate Balances for the Class A-1, A-2, A-3, A-4 and A-SB Certificates. In any event, however, cash flow from each mortgaged property supports only the related mortgage loan and will not be available to support any other mortgage loan. |
| (7) | The pass-through rates for the Class A-1, A-2, A-3, A-4, A-SB, A-S, B, C, D, E, F and G Certificates in each case will be one of the following: (i) a fixed rateper annum, (ii) a variable rate per annum equal to the weighted average of the net mortgage interest rates on the mortgage loans for the related distribution date, (iii) a variable rateper annum equal to the lesser of (a) a fixed rate and (b) the weighted average of the net mortgage interest rates on the mortgage loans for the related distribution date or (iv) a variable rateper annum equal to the weighted average of the net mortgage interest rates on the mortgage loans for the related distribution date minus a specified percentage. For purposes of the calculation of the weighted average of the net mortgage interest rates on the mortgage loans for each distribution date, the mortgage interest rates will be adjusted as necessary to a 30/360 basis. |
| (8) | The Class X-A Certificates are notional amount certificates. The Notional Amount of the Class X-A Certificates will be equal to the aggregate Certificate Balance of the Class A-1, A-2, A-3, A-4, A-SB and A-S Certificates outstanding from time to time. The Class X-A Certificates will not be entitled to distributions of principal. |
THE INFORMATION IN THIS STRUCTURAL AND COLLATERAL TERM SHEET IS NOT COMPLETE AND MAY BE AMENDED PRIOR TO THE TIME OF SALE. THIS TERM SHEET IS NOT AN OFFER TO SELL THESE SECURITIES AND IT IS NOT A SOLICITATION OF AN OFFER TO BUY THESE SECURITIES IN ANY JURISDICTION WHERE THE OFFER OR SALE IS NOT PERMITTED.
| 3 |
| Wells Fargo Commercial Mortgage Trust 2016-C32 | Certificate Structure |
| (9) | The pass-through rate for the Class X-A Certificates for any distribution date will be aper annum rate equal to the excess, if any, of (a) the weighted average of the net mortgage interest rates on the mortgage loans for the related distribution date, over (b) the weighted average of the pass-through rates on the Class A-1, A-2, A-3, A-4, A-SB and A-S Certificates for the related distribution date, weighted on the basis of their respective Certificate Balances outstanding immediately prior to that distribution date. For purposes of the calculation of the weighted average of the net mortgage interest rates on the mortgage loans for each distribution date, the mortgage interest rates will be adjusted as necessary to a 30/360 basis. |
| (10) | The Class X-B Certificates are notional amount certificates. The Notional Amount of the Class X-B Certificates will be equal to the Certificate Balance of the Class B Certificates outstanding from time to time. The Class X-B Certificates will not be entitled to distributions of principal. |
| (11) | The pass-through rate for the Class X-B Certificates for any distribution date will be aper annum rate equal to the excess, if any, of (a) the weighted average of the net mortgage interest rates on the mortgage loans for the related distribution date, over (b) the pass-through rate on the Class B Certificates for the related distribution date. For purposes of the calculation of the weighted average of the net mortgage interest rates on the mortgage loans for each distribution date, the mortgage interest rates will be adjusted as necessary to a 30/360 basis. |
| (12) | The Class X-D Certificates are notional amount certificates. The Notional Amount of the Class X-D Certificates will be equal to the Certificate Balance of the Class D Certificates outstanding from time to time. The Class X-D Certificates will not be entitled to distributions of principal. |
| (13) | The pass-through rate for the Class X-D Certificates for any distribution date will be aper annum rate equal to the excess, if any, of (a) the weighted average of the net mortgage interest rates on the mortgage loans for the related distribution date, over (b) the pass-through rate on the Class D Certificates for the related distribution date. For purposes of the calculation of the weighted average of the net mortgage interest rates on the mortgage loans for each distribution date, the mortgage interest rates will be adjusted as necessary to a 30/360 basis. |
| (14) | The Class X-E Certificates are notional amount certificates. The Notional Amount of the Class X-E Certificates will be equal to the Certificate Balance of the Class E Certificates outstanding from time to time. The Class X-E Certificates will not be entitled to distributions of principal. |
| (15) | The pass-through rate for the Class X-E Certificates for any distribution date will be aper annumrate equal to the excess, if any, of (a) the weighted average of the net mortgage interest rates on the mortgage loans for the related distribution date, over (b) the pass-through rate on the Class E Certificates for the related distribution date. For purposes of the calculation of the weighted average of the net mortgage interest rates on the mortgage loans for each distribution date, the mortgage interest rates will be adjusted as necessary to a 30/360 basis. |
| (16) | The Class X-F Certificates are notional amount certificates. The Notional Amount of the Class X-F Certificates will be equal to the Certificate Balance of the Class F Certificates outstanding from time to time. The Class X-F Certificates will not be entitled to distributions of principal. |
| (17) | The pass-through rate for the Class X-F Certificates for any distribution date will be aper annumrate equal to the excess, if any, of (a) the weighted average of the net mortgage interest rates on the mortgage loans for the related distribution date, over (b) the pass-through rate on the Class F Certificates for the related distribution date. For purposes of the calculation of the weighted average of the net mortgage interest rates on the mortgage loans for each distribution date, the mortgage interest rates will be adjusted as necessary to a 30/360 basis. |
| (18) | The Class X-G Certificates are notional amount certificates. The Notional Amount of the Class X-G Certificates will be equal to the Certificate Balance of the Class G Certificates outstanding from time to time. The Class X-G Certificates will not be entitled to distributions of principal. |
| (19) | The pass-through rate for the Class X-G Certificates for any distribution date will be aper annum rate equal to the excess, if any, of (a) the weighted average of the net mortgage interest rates on the mortgage loans for the related distribution date, over (b) the pass-through rate on the Class G Certificates for the related distribution date. For purposes of the calculation of the weighted average of the net mortgage interest rates on the mortgage loans for each distribution date, the mortgage interest rates will be adjusted as necessary to a 30/360 basis. |
THE INFORMATION IN THIS STRUCTURAL AND COLLATERAL TERM SHEET IS NOT COMPLETE AND MAY BE AMENDED PRIOR TO THE TIME OF SALE. THIS TERM SHEET IS NOT AN OFFER TO SELL THESE SECURITIES AND IT IS NOT A SOLICITATION OF AN OFFER TO BUY THESE SECURITIES IN ANY JURISDICTION WHERE THE OFFER OR SALE IS NOT PERMITTED.
| 4 |
| Wells Fargo Commercial Mortgage Trust 2016-C32 | Issue Characteristics |
| II. | Transaction Highlights |
Mortgage Loan Sellers:
| Mortgage Loan Seller | Number of Mortgage Loans | Number of Mortgaged Properties | Aggregate Cut-off Date Balance | % of Initial Pool Balance | |||||
| Wells Fargo Bank, National Association | 28 | 52 | $421,611,490 | 43.9 | % | ||||
| Rialto Mortgage Finance, LLC | 25 | 33 | 227,693,458 | 23.7 | |||||
| National Cooperative Bank, N.A.(1) | 37 | 37 | 142,936,309 | 14.9 | |||||
| C-III Commercial Mortgage LLC | 14 | 22 | 96,264,903 | 10.0 | |||||
| Basis Real Estate Capital II, LLC | 8 | 8 | 71,473,602 | 7.4 | |||||
| Total | 112 | 152 | $959,979,761 | 100.0 | % | ||||
| (1) | Twenty-four (24) of the thirty-seven (37) mortgage loans for which National Cooperative Bank, N.A. is the mortgage loan seller were originated by its parent company, National Consumer Cooperative Bank, and transferred to National Cooperative Bank, N.A. Each such mortgage loan originated by National Consumer Cooperative Bank was underwritten pursuant to National Cooperative Bank, N.A.’s underwriting guidelines. |
Loan Pool:
| Initial Pool Balance: | $959,979,761 |
| Number of Mortgage Loans: | 112 |
| Average Cut-off Date Balance per Mortgage Loan: | $8,571,248 |
| Number of Mortgaged Properties: | 152 |
| Average Cut-off Date Balance per Mortgaged Property(1): | $6,315,656 |
| Weighted Average Mortgage Interest Rate: | 4.750% |
| Ten Largest Mortgage Loans as % of Initial Pool Balance: | 41.3% |
| Weighted Average Original Term to Maturity or ARD (months): | 117 |
| Weighted Average Remaining Term to Maturity or ARD (months): | 115 |
| Weighted Average Original Amortization Term (months)(2): | 350 |
| Weighted Average Remaining Amortization Term (months)(2): | 349 |
| Weighted Average Seasoning (months): | 2 |
| (1) | Information regarding mortgage loans secured by multiple properties is based on an allocation according to relative appraised values or the allocated loan amounts or property-specific release prices set forth in the related loan documents or such other allocation as the related mortgage loan seller deemed appropriate. |
| (2) | Excludes any mortgage loan that does not amortize. |
Credit Statistics:
| Weighted Average U/W Net Cash Flow DSCR(1): | 2.46x |
| Weighted Average U/W Net Operating Income Debt Yield(1): | 15.3% |
| Weighted Average Cut-off Date Loan-to-Value Ratio(1): | 58.7% |
| Weighted Average Balloon or ARD Loan-to-Value Ratio(1): | 51.8% |
| % of Mortgage Loans with Additional Subordinate Debt(2): | 19.6% |
| % of Mortgage Loans with Single Tenants(3): | 9.2% |
| (1) | With respect to the 10 South LaSalle Street mortgage loan, which is part of a whole loan, loan-to-value ratio, debt service coverage ratio and debt yield calculations include the relatedpari passu companion loan (unless otherwise stated). For mortgaged properties securing residential cooperative mortgage loans, the debt service coverage ratio or debt yield for each such mortgaged property is calculated using underwritten net cash flow for the related residential cooperative property which is the projected net cash flow reflected in the most recent appraisal obtained by or otherwise in the possession of the related mortgage loan seller as of the cut-off date, and the loan-to-value ratio, excluding the Gill Park Cooperative mortgage loan, is calculated based upon the appraised value of the residential cooperative property determined as if such residential cooperative property is operated as a residential cooperative. . The loan-to-value ratio for the Gill Park Cooperative mortgage loan is calculated based on the appraised value of the residential cooperative property determined as if such residential cooperative property is operated as a market rate multifamily rental property. The debt service coverage ratio, debt yield and loan-to-value ratio information do not take into account any subordinate debt (whether or not secured by the related mortgaged property), that currently exists or is allowed under the terms of any mortgage loan. See “Description of the Mortgage Pool—Mortgage Pool Characteristics” in the Preliminary Prospectus and Annex A-1 to the Preliminary Prospectus. |
| (2) | Twenty-two (22) of the mortgage loans, each of which is secured by a residential cooperative property, currently have in place subordinate secured lines of credit to the related mortgage borrowers that permit future advances (such loans, collectively, the “Subordinate Coop LOCs”). The percentage figure expressed as “% of Mortgage Loans with Additional Subordinate Debt” is determined as a percentage of the initial pool balance and does not take into account any future subordinate debt (whether or not secured by the mortgaged property), that may be permitted under the terms of any mortgage loan or the pooling and servicing agreement. See “Description of the Mortgage Pool—Additional Indebtedness—Other Unsecured Indebtedness” and “Description of the Mortgage Pool—Additional Debt Financing for Mortgage Loans Secured by Residential Cooperatives”. |
| (3) | Includes mortgage loans secured by multiple single tenant properties where each property is occupied by the same tenant or tenants that are affiliates of one another. |
THE INFORMATION IN THIS STRUCTURAL AND COLLATERAL TERM SHEET IS NOT COMPLETE AND MAY BE AMENDED PRIOR TO THE TIME OF SALE. THIS TERM SHEET IS NOT AN OFFER TO SELL THESE SECURITIES AND IT IS NOT A SOLICITATION OF AN OFFER TO BUY THESE SECURITIES IN ANY JURISDICTION WHERE THE OFFER OR SALE IS NOT PERMITTED.
| 5 |
| Wells Fargo Commercial Mortgage Trust 2016-C32 | Issue Characteristics |
Loan Structural Features:
Amortization:Based on the Initial Pool Balance, 84.4% of the mortgage pool (108 mortgage loans) has scheduled amortization, as follows:
45.9% (37 mortgage loans) provides for an interest-only period followed by an amortization period;
36.6% (70 mortgage loans) requires amortization during the entire loan term; and
1.9% (one mortgage loan) provides for an amortization period, then an interest-only period, followed by a subsequent amortization period.
Interest-Only:Based on the Initial Pool Balance, 15.6% of the mortgage pool (four mortgage loans) provides for interest-only payments during the entire loan term. The Weighted Average Cut-off Date Loan-to-Value Ratio and Weighted Average U/W Net Cash Flow DSCR for those mortgage loans are 62.0% and 1.98x, respectively.
Hard Lockboxes: Based on the Initial Pool Balance, 37.1% of the mortgage pool (17 mortgage loans) have hard lockboxes in place.
Reserves:The mortgage loans require amounts to be escrowed monthly as follows (excluding any mortgage loans with springing provisions):
| Real Estate Taxes: | 80.0% of the pool |
| Insurance: | 44.5% of the pool |
| Capital Replacements: | 68.9% of the pool |
| TI/LC: | 58.6% of the pool(1) |
| (1) | The percentage of Initial Pool Balance for mortgage loans with TI/LC reserves is based on the aggregate principal balance allocable to loans that include retail, office, industrial and mixed use properties. |
Call Protection/Defeasance: Based on the Initial Pool Balance, the mortgage pool has the following call protection and defeasance features:
62.8% of the mortgage pool (66 mortgage loans) features a lockout period, then defeasance only until an open period;
24.5% of the mortgage pool (15 mortgage loans) features a lockout period, then the greater of a prepayment premium or yield maintenance until an open period;
12.7% of the mortgage pool (31 mortgage loans) features no lockout period, but requires the greater of a prepayment premium or yield maintenance, then a prepayment premium until an open period;
Please refer to Annex A-1 to the Preliminary Prospectus for further information regarding individual loan call protection.
THE INFORMATION IN THIS STRUCTURAL AND COLLATERAL TERM SHEET IS NOT COMPLETE AND MAY BE AMENDED PRIOR TO THE TIME OF SALE. THIS TERM SHEET IS NOT AN OFFER TO SELL THESE SECURITIES AND IT IS NOT A SOLICITATION OF AN OFFER TO BUY THESE SECURITIES IN ANY JURISDICTION WHERE THE OFFER OR SALE IS NOT PERMITTED.
| 6 |
| Wells Fargo Commercial Mortgage Trust 2016-C32 | Issue Characteristics |
| III. | Issue Characteristics |
| Securities Offered: | $849,582,000 approximate monthly pay, multi-class, commercial mortgage REMIC pass-through certificates consisting of ten classes (Classes A-1, A-2, A-3, A-4, A-SB, A-S, B, C, X-A and X-B), which are offered pursuant to a registration statement filed with the SEC (such classes of certificates, the “Offered Certificates”). |
| Mortgage Loan Sellers: | Wells Fargo Bank, National Association (“WFB”), Rialto Mortgage Finance, LLC (“RMF”), National Cooperative Bank, N.A. (“NCB”), C-III Commercial Mortgage LLC (“CIIICM”) and Basis Real Estate Capital II, LLC (“Basis”). |
| Sole Lead Bookrunning Manager: | Wells Fargo Securities, LLC |
| Co-Managers: | Barclays Capital Inc. and Deutsche Bank Securities Inc. |
| Rating Agencies: | DBRS, Inc., Kroll Bond Rating Agency, Inc. and Moody’s Investors Service, Inc. |
| Master Servicers: | Wells Fargo Bank, National Association and National Cooperative Bank, N.A. |
| Special Servicers: | Rialto Capital Advisors, LLC and National Cooperative Bank, N.A. |
| Certificate Administrator: | Wells Fargo Bank, National Association |
| Trustee: | Wilmington Trust, National Association |
| Operating Advisor: | Pentalpha Surveillance LLC |
| Asset Representations Reviewer: | Pentalpha Surveillance LLC |
| Initial Majority Controlling Class Certificateholder: | Rialto CMBS VIII, LLC or another affiliate of Rialto Capital Advisors, LLC. |
| Cut-off Date: | The Cut-off Date with respect to each mortgage loan is the due date for the monthly debt service payment that is due in February 2016 (or, in the case of any mortgage loan that has its first due date in March 2016, the date that would have been its due date in February 2016 under the terms of that mortgage loan if a monthly debt service payment were scheduled to be due in that month). |
| Expected Closing Date: | On or about February 18, 2016. |
| Determination Dates: | The 11th day of each month (or if that day is not a business day, the next succeeding business day), commencing in March 2016. |
| Distribution Dates: | The fourth business day following the Determination Date in each month, commencing in March 2016. |
| Rated Final Distribution Date: | The Distribution Date in January 2059. |
| Interest Accrual Period: | With respect to any Distribution Date, the calendar month immediately preceding the month in which such Distribution Date occurs. |
| Day Count: | The Offered Certificates will accrue interest on a 30/360 basis. |
| Minimum Denominations: | $10,000 for each Class of Offered Certificates (other than the Class X-A and X-B Certificates) and $1,000,000 for the Class X-A and X-B Certificates. Investments may also be made in any whole dollar denomination in excess of the applicable minimum denomination. |
| Clean-up Call: | 1% |
| Delivery: | DTC, Euroclear and Clearstream Banking |
| ERISA/SMMEA Status: | Each Class of Offered Certificates is expected to be eligible for exemptive relief under ERISA. No Class of Offered Certificates will be SMMEA eligible. |
| Risk Factors: | THE CERTIFICATES INVOLVE CERTAIN RISKS AND MAY NOT BE SUITABLE FOR ALL INVESTORS. SEE THE “RISK FACTORS” SECTION OF THE PRELIMINARY PROSPECTUS. |
| Bond Analytics Information: | The Certificate Administrator will be authorized to make distribution date statements, CREFC® reports and certain supplemental reports (other than confidential information) available to certain financial modeling and data provision services, including Bloomberg, L.P., Trepp, LLC, Intex Solutions, Inc., Markit Group Limited, Interactive Data Corp., BlackRock Financial Management, Inc., CMBS.com, Inc. and Thomson Reuters Corporation. |
THE INFORMATION IN THIS STRUCTURAL AND COLLATERAL TERM SHEET IS NOT COMPLETE AND MAY BE AMENDED PRIOR TO THE TIME OF SALE. THIS TERM SHEET IS NOT AN OFFER TO SELL THESE SECURITIES AND IT IS NOT A SOLICITATION OF AN OFFER TO BUY THESE SECURITIES IN ANY JURISDICTION WHERE THE OFFER OR SALE IS NOT PERMITTED.
| 7 |
| Wells Fargo Commercial Mortgage Trust 2016-C32 | Characteristics of the Mortgage Pool |
| IV. | Characteristics of the Mortgage Pool(1) |
| A. | Ten Largest Mortgage Loans |
| Mortgage LoanSeller | Mortgage Loan Name | City | State | Number of Mortgage Loans / Mortgaged Properties | Mortgage Loan Cut-off Date Balance ($) | % of Initial Pool Balance (%) | Property Type | Number of SF/Rooms | Cut-off Date Balance Per SF/Room | Cut-off Date LTV Ratio (%) | Balloon or ARD LTV Ratio (%) | U/W NCFDSCR (x) | U/W NOI Debt Yield (%) | ||
| WFB | North Dallas Retail Portfolio | Various | TX | 1 / 8 | $81,325,000 | 8.5% | Retail | 673,382 | $121 | 63.2% | 63.2% | 1.77x | 9.1% | ||
| RMF | Marriott Melville Long Island | Melville | NY | 1 / 1 | 59,000,000 | 6.1 | Hospitality | 369 | 159,892 | 58.4 | 52.3 | 1.37 | 13.0 | ||
| WFB | Technology Station | Redwood City | CA | 1 / 1 | 50,000,000 | 5.2 | Office | 94,737 | 528 | 50.8 | 46.1 | 1.96 | 12.1 | ||
| WFB | Chicago Industrial Portfolio I | Various | Various | 1 / 18 | 44,200,000 | 4.6 | Industrial | 1,052,310 | 42 | 72.9 | 63.4 | 1.25 | 9.0 | ||
| WFB | Preferred Freezer - Newark | Newark | NJ | 1 / 1 | 36,200,000 | 3.8 | Industrial | 197,336 | 183 | 60.4 | 60.4 | 1.99 | 10.1 | ||
| WFB | 10 South LaSalle Street | Chicago | IL | 1 / 1 | 30,000,000 | 3.1 | Office | 781,426 | 134 | 63.1 | 63.1 | 2.27 | 12.2 | ||
| RMF | Hilton Wilmington/Christiana | Newark | DE | 1 / 1 | 29,000,000 | 3.0 | Hospitality | 266 | 109,023 | 56.5 | 49.5 | 1.89 | 13.5 | ||
| CIIICM | TownePlace Suites Redwood City | Redwood City | CA | 1 / 1 | 24,975,986 | 2.6 | Hospitality | 95 | 262,905 | 67.7 | 62.9 | 1.50 | 11.0 | ||
| WFB | Cottonwood Shopping Center | Albuquerque | NM | 1 / 1 | 21,075,000 | 2.2 | Retail | 188,887 | 112 | 72.2 | 63.7 | 1.35 | 9.5 | ||
| WFB | PRA Health Sciences | Lenexa | KS | 1 / 1 | 21,000,000 | 2.2 | Office | 142,679 | 147 | 67.4 | 59.2 | 1.32 | 8.9 | ||
| Top Three Total/Weighted Average | 3 / 10 | $190,325,000 | 19.8% | 58.5% | 55.3% | 1.70x | 11.1% | ||||||||
| Top Five Total/Weighted Average | 5 / 29 | $270,725,000 | 28.2% | 61.1% | 57.3% | 1.66x | 10.6% | ||||||||
| Top Ten Total/Weighted Average | 10 / 34 | $396,775,986 | 41.3% | 62.2% | 58.0% | 1.68x | 10.8% | ||||||||
| Non-Top Ten Total/Weighted Average | 102 / 118 | $563,203,775 | 58.7% | 56.2% | 47.4% | 3.01x | 18.5% | ||||||||
| (1) | With respect to the 10 South LaSalle Street mortgage loan, which is part of a whole loan, Cut-off Date Balance Per SF/Room, loan-to-value ratio, debt service coverage ratio and debt yield calculations include the relatedpari passu companion loan (unless otherwise stated). With respect to each mortgage loan, debt service coverage ratio, debt yield and loan-to-value ratio information do not take into account of subordinate debt (whether or not secured by the related mortgaged property), if any, that currently exists or is allowed under the terms of such mortgage loan. |
THE INFORMATION IN THIS STRUCTURAL AND COLLATERAL TERM SHEET IS NOT COMPLETE AND MAY BE AMENDED PRIOR TO THE TIME OF SALE. THIS TERM SHEET IS NOT AN OFFER TO SELL THESE SECURITIES AND IT IS NOT A SOLICITATION OF AN OFFER TO BUY THESE SECURITIES IN ANY JURISDICTION WHERE THE OFFER OR SALE IS NOT PERMITTED.
| 8 |
| Wells Fargo Commercial Mortgage Trust 2016-C32 | Characteristics of the Mortgage Pool |
| B. | Summary of thePari PassuWhole Loan |
| Property Name | Mortgage Loan Seller | Related Notes in Loan Group (Original Balance) | Holder of Note | Lead Servicer for the Entire Whole loan | Current Master Servicer Under Related Securitization Servicing Agreement | Current Special Servicer Under Related Securitization Servicing Agreement |
| 10 South LaSalle Street | WFB | $30,000,000 | WFCM 2016-C32 | Yes | Wells Fargo Bank, National Association | Rialto Capital Advisors, LLC |
| WFB | $75,000,000 | (1) | No | TBD | TBD |
| (1) | The relatedpari passu companion loan Note A-2 is currently held by an affiliate of WFB and is expected to be contributed to a future securitization. No assurance can be provided that Note A-2 will not be split further. |
| C. | Mortgage Loans with Additional Secured and Mezzanine Financing(1) |
| Loan No. | Mortgage Loan Seller | Mortgage Loan Name | Mortgage Loan Cut-off Date Balance ($) | % of Initial Pool Balance (%) | Subordinate Debt Cut-off Date Balance ($) | Mezzanine Debt Cut-off Date Balance ($) | Total Debt Interest Rate (%)(2) | Mortgage Loan U/W NCF DSCR (x) | Total Debt U/W NCF DSCR (x) | Mortgage Loan Cut-off Date U/W NOI Debt Yield (%) | Total Debt Cut-off Date U/W NOI Debt Yield (%) | Mortgage Loan Cut-off Date LTV Ratio (%) | Total Debt Cut-off Date LTV Ratio (%) |
| 2 | RMF | Marriott Melville Long Island | $59,000,000 | 6.1% | $0 | $9,707,097 | 5.690% | 1.37x | 1.27x | 13.0% | 11.2% | 58.4% | 68.0% |
| 4 | WFB | Chicago Industrial Portfolio I | 44,200,000 | 4.6 | 0 | 4,500,000 | 5.745 | 1.25 | 1.06 | 9.0 | 8.1 | 72.9 | 80.4 |
| Total/Weighted Average | $103,200,000 | 10.8% | $0 | $14,207,097 | 5.714% | 1.32x | 1.18x | 11.3% | 9.9% | 64.6% | 73.3% | ||
| (1) | In addition, twenty-two (22) of the mortgage loans, each of which is secured by a residential cooperative property, currently have in place Subordinate Coop LOCs that permit future advances. See “Description of the Mortgage Pool—Additional Indebtedness—Other Unsecured Indebtedness” and “Description of the Mortgage Pool—Additional Debt Financing for Mortgage Loans Secured by Residential Cooperatives” in the Preliminary Prospectus. |
| (2) | Total Debt Interest Rate for any specified mortgage loan reflects the weighted average of the interest rates on the respective components of the total debt. |
THE INFORMATION IN THIS STRUCTURAL AND COLLATERAL TERM SHEET IS NOT COMPLETE AND MAY BE AMENDED PRIOR TO THE TIME OF SALE. THIS TERM SHEET IS NOT AN OFFER TO SELL THESE SECURITIES AND IT IS NOT A SOLICITATION OF AN OFFER TO BUY THESE SECURITIES IN ANY JURISDICTION WHERE THE OFFER OR SALE IS NOT PERMITTED.
| 9 |
| Wells Fargo Commercial Mortgage Trust 2016-C32 | Characteristics of the Mortgage Pool |
| D. | Previous Securitization History(1) |
| Loan No. | Mortgage Loan Seller | Mortgage Loan or Mortgaged Property Name | City | State | Property Type | Mortgage Loan or Mortgaged Property Cut-off Date Balance ($) | % of Initial Pool Balance (%) | Previous Securitization |
| 1 | WFB | North Dallas Retail Portfolio | Various | TX | Retail | $81,325,000 | 8.5% | BACM 2007-3 |
| 2 | RMF | Marriott Melville Long Island | Melville | NY | Hospitality | $59,000,000 | 6.1 | WBCMT 2006-C24 |
| 5 | WFB | Preferred Freezer - Newark | Newark | NJ | Industrial | 36,200,000 | 3.8 | JPMCC 2006-CB15 |
| 7 | RMF | Hilton Wilmington/Christiana | Newark | DE | Hospitality | 29,000,000 | 3.0 | MSC 2005-HQ7 |
| 8 | CIIICM | TownePlace Suites Redwood City | Redwood City | CA | Hospitality | 24,975,986 | 2.6 | WBCMT 2006-C23 |
| 9 | WFB | Cottonwood Shopping Center | Albuquerque | NM | Retail | 21,075,000 | 2.2 | WBCMT 2005-C22 |
| 18 | RMF | Waterford Landing Apartments | McDonough | GA | Multifamily | 15,500,000 | 1.6 | FREMF 2013-K713 |
| 23.01 | RMF | Compass Self Storage | Florida | FL | Self Storage | 6,851,266 | 0.7 | JPMCC 2007-LD11 |
| 29 | Basis | Hampton Inn - Cincinnati Airport North | Hebron | KY | Hospitality | 8,490,967 | 0.9 | WFRBS 2011-C2 |
| 30.01 | RMF | Walgreens - Claremore | Claremore | OK | Retail | 4,745,568 | 0.5 | WBCMT 2006-C23 |
| 32 | NCB | 2 & 6 Terri Lane | Burlington | NJ | Office | 7,638,503 | 0.8 | JPMCC 2005-CB11 |
| 33 | WFB | Hampton Inn Carmel, IN | Carmel | IN | Hospitality | 7,475,269 | 0.8 | CSMC 2006-C2 |
| 36 | NCB | 440 East 79th Street Owners Corp. | New York | NY | Multifamily | 6,481,745 | 0.7 | JPMCC 2003-CB7 |
| 43 | WFB | Hy-Vee Waterloo | Waterloo | IA | Retail | 5,288,632 | 0.6 | BSCMS 2006-PW12 |
| 44 | NCB | 505 Central Avenue Corp. | White Plains | NY | Multifamily | 5,185,759 | 0.5 | MSC 2006-IQ11 |
| 48 | RMF | Wingate by Wyndham Round Rock | Round Rock | TX | Hospitality | 4,789,968 | 0.5 | WBCMT 2006-C23 |
| 54 | NCB | 24535 Owners Corp. | New York | NY | Multifamily | 4,443,943 | 0.5 | MSC 2006-IQ11 |
| 60 | Basis | Belle Promenade Shoppes | Marrero | LA | Retail | 3,996,091 | 0.4 | GSMS 2006-GG6 |
| 61 | RMF | Tops Plaza | Rochester | NY | Retail | 3,995,947 | 0.4 | LBUBS 2006-C1 |
| 62 | NCB | 333 Bronx River Tenants Corp. | Yonkers | NY | Multifamily | 3,985,229 | 0.4 | MSC 2006-IQ11 |
| 63 | NCB | Linden Hill No. 2 Cooperative Corp. | Flushing | NY | Multifamily | 3,983,705 | 0.4 | CSMC 2006-C1 |
| 70 | RMF | Summit Marketplace | Lafayette | CO | Retail | 3,600,000 | 0.4 | MLCFC 2006-1 |
| 72 | WFB | Arlington Square-MI | Ann Arbor | MI | Mixed Use | 3,591,819 | 0.4 | CSMC 2006-C2 |
| 73 | NCB | Southridge Cooperative, Section 3, Inc. a/k/a Southridge Cooperative Section 3, Inc. | Jackson Heights | NY | Multifamily | 3,494,695 | 0.4 | MSDWC 2002-IQ3 |
| 75 | CIIICM | The Oaks Plaza | Bradenton | FL | Retail | 3,484,263 | 0.4 | MLMT 2005-LC1 |
| 76 | NCB | Lakefront 17 LLC | Columbia | MD | Office | 3,400,000 | 0.4 | JPMCC 2006-CB14 |
| 77 | NCB | Tara Close Apartments Corp. | Mount Kisco | NY | Multifamily | 3,372,051 | 0.4 | CD 2006-CD2 |
| 78 | CIIICM | CVS Algonac | Algonac | MI | Retail | 3,196,796 | 0.3 | WBCMT 2006-C23 |
| 87 | RMF | Walgreens - Houston | Houston | TX | Retail | 2,242,513 | 0.2 | WBCMT 2006-C23 |
| 93 | WFB | 3123 Fire Road | Egg Harbor Township | NJ | Retail | 1,943,816 | 0.2 | MSC 2006-HQ9 |
| 96 | NCB | 6535 Broadway Owners Corp. | Bronx | NY | Multifamily | 1,800,000 | 0.2 | CSFB 2003-C3 |
| 97 | NCB | 16 Canterbury Corp. | Great Neck | NY | Multifamily | 1,797,596 | 0.2 | CSMC 2006-C1 |
| 102 | NCB | Fairfax House Owners, Inc. | Brooklyn | NY | Multifamily | 1,595,692 | 0.2 | MSC 2006-IQ11 |
| 108 | NCB | Starbucks Plaza | Corpus Christi | TX | Retail | 1,293,540 | 0.1 | MSC 2005-IQ10 |
| 112 | NCB | Gramatan Court Apartments, Inc. | Bronxville | NY | Multifamily | 994,295 | 0.1 | MSC 2007-IQ13 |
| Total | $380,235,654 | 39.6% |
| (1) | The table above represents the most recent securitization with respect to the mortgaged property securing the related mortgage loan, based on information provided by the related borrower or obtained through searches of a third-party database. While loans secured by the above mortgaged properties may have been securitized multiple times in prior transactions, mortgage loans in this securitization are only listed in the above chart if the mortgage loan paid off a loan in another securitization. The information has not otherwise been confirmed by the mortgage loan sellers. |
THE INFORMATION IN THIS STRUCTURAL AND COLLATERAL TERM SHEET IS NOT COMPLETE AND MAY BE AMENDED PRIOR TO THE TIME OF SALE. THIS TERM SHEET IS NOT AN OFFER TO SELL THESE SECURITIES AND IT IS NOT A SOLICITATION OF AN OFFER TO BUY THESE SECURITIES IN ANY JURISDICTION WHERE THE OFFER OR SALE IS NOT PERMITTED.
| 10 |
| Wells Fargo Commercial Mortgage Trust 2016-C32 | Characteristics of the Mortgage Pool |
| E. | Mortgage Loans with Scheduled Balloon Payments and Related Classes |
| Class A-2(1) | |||||||||||||||||
| Loan No. | Mortgage Loan Seller | Mortgage Loan Name | State | Property Type | Mortgage Loan Cut-off Date Balance ($) | % of Initial Pool Balance (%) | Balloon Balance ($) | % of Class A-2 Certificate Balance (%)(2) | SF/ Rooms | Loan per SF/ Room ($) | U/W NCF DSCR (x) | U/W NOI Debt Yield (%) | Cut-off Date LTV Ratio (%) | Balloon or ARD LTV Ratio (%) | Rem. IO Period (mos.) | Rem. Term to Maturity or ARD (mos.) | |
| 8 | CIIICM | TownePlace Suites Redwood City | CA | Hospitality | $24,975,986 | 2.6% | $23,202,299 | 50.5% | 95 | $262,905 | 1.50x | 11.0% | 67.7% | 62.9% | 0 | 59 | |
| 12 | WFB | Northline Industrial Center | MI | Industrial | 20,000,000 | 2.1 | 18,684,944 | 40.7 | 1,089,312 | 18 | 1.81 | 13.7 | 73.3 | 68.4 | 8 | 56 | |
| Total/Weighted Average | $44,975,986 | 4.7% | $41,887,243 | 91.2% | 1.64x | 12.2% | 70.2% | 65.3% | 4 | 58 | |||||||
| (1) | The table above presents the mortgage loan(s) whose balloon payments would be applied to pay down the principal balance of the Class A-2 Certificates, assuming a 0% CPR and applying the “Structuring Assumptions” described in the Preliminary Prospectus, including the assumptions that (i) none of the mortgage loans in the pool experience prepayments prior to maturity (or, in the case of an ARD loan, its anticipated repayment date), defaults or losses; (ii) there are no extensions of maturity dates of any mortgage loans in the pool; and (iii) each mortgage loan in the pool is paid in full on its stated maturity date (or, in the case of an ARD loan, its anticipated repayment date). Each Class of Certificates evidences undivided ownership interests in the entire pool of mortgage loans. Debt service coverage ratio, debt yield and loan-to-value ratio information do not take into account subordinate debt (whether or not secured by the related mortgaged property), if any, that currently exists or is allowed under the terms of any mortgage loan. See Annex A-1 to the Preliminary Prospectus. | |
| (2) | Reflects the percentage equal to the Balloon Balance divided by the initial Class A-2 Certificate Balance. |
THE INFORMATION IN THIS STRUCTURAL AND COLLATERAL TERM SHEET IS NOT COMPLETE AND MAY BE AMENDED PRIOR TO THE TIME OF SALE. THIS TERM SHEET IS NOT AN OFFER TO SELL THESE SECURITIES AND IT IS NOT A SOLICITATION OF AN OFFER TO BUY THESE SECURITIES IN ANY JURISDICTION WHERE THE OFFER OR SALE IS NOT PERMITTED.
| 11 |
| Wells Fargo Commercial Mortgage Trust 2016-C32 | Characteristics of the Mortgage Pool |
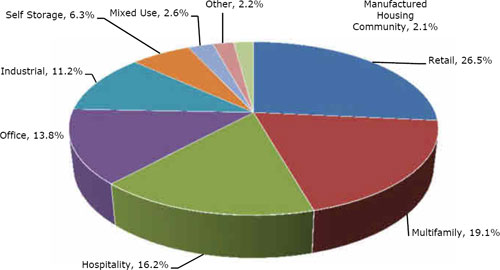
| F. | Property Type Distribution(1) |
| Property Type | Number of Mortgaged Properties | Aggregate Cut-off Date Balance ($) | % of Initial Pool Balance (%) | Weighted Average Cut-off Date LTV Ratio (%) | Weighted Average Balloon or ARD LTV Ratio (%) | Weighted Average U/W NCF DSCR (x) | Weighted Average U/W NOI Debt Yield (%) | Weighted Average U/W NCF Debt Yield (%) | Weighted Average Mortgage Rate (%) |
| Retail | 45 | $254,299,688 | 26.5% | 66.7% | 60.0% | 1.49x | 9.3% | 8.6% | 4.878% |
| Anchored | 18 | 172,888,243 | 18.0 | 66.6 | 61.3 | 1.54 | 9.3 | 8.5 | 4.815 |
| Unanchored | 16 | 51,291,824 | 5.3 | 65.5 | 56.9 | 1.44 | 10.1 | 9.3 | 4.961 |
| Single Tenant | 9 | 22,523,529 | 2.3 | 69.0 | 57.0 | 1.26 | 8.4 | 8.2 | 5.070 |
| Shadow Anchored | 2 | 7,596,091 | 0.8 | 71.1 | 60.9 | 1.30 | 9.4 | 8.5 | 5.156 |
| Multifamily | 37 | 183,441,688 | 19.1 | 33.3 | 27.3 | 6.18 | 35.5 | 35.3 | 4.322 |
| Cooperative | 31 | 121,642,986 | 12.7 | 17.3 | 12.1 | 8.61 | 48.6 | 48.6 | 3.981 |
| Garden | 6 | 61,798,702 | 6.4 | 65.0 | 57.1 | 1.40 | 9.7 | 9.2 | 4.994 |
| Hospitality | 9 | 155,519,788 | 16.2 | 60.7 | 52.8 | 1.63 | 13.0 | 11.4 | 5.010 |
| Full Service | 2 | 88,000,000 | 9.2 | 57.8 | 51.4 | 1.54 | 13.2 | 11.3 | 4.932 |
| Limited Service | 6 | 42,543,803 | 4.4 | 62.6 | 49.8 | 1.88 | 13.9 | 12.5 | 4.931 |
| Extended Stay | 1 | 24,975,986 | 2.6 | 67.7 | 62.9 | 1.50 | 11.0 | 10.1 | 5.420 |
| Office | 10 | 132,585,968 | 13.8 | 60.5 | 55.0 | 1.80 | 11.1 | 10.0 | 4.449 |
| Suburban | 6 | 93,688,503 | 9.8 | 59.6 | 52.8 | 1.67 | 10.8 | 10.0 | 4.407 |
| CBD | 1 | 30,000,000 | 3.1 | 63.1 | 63.1 | 2.27 | 12.2 | 10.2 | 4.430 |
| Medical | 3 | 8,897,464 | 0.9 | 61.3 | 50.6 | 1.59 | 10.9 | 10.2 | 4.953 |
| Industrial | 22 | 107,793,035 | 11.2 | 68.3 | 63.0 | 1.61 | 10.3 | 9.2 | 4.914 |
| Warehouse | 8 | 39,866,112 | 4.2 | 73.1 | 65.9 | 1.53 | 11.4 | 9.6 | 4.879 |
| Cold Storage Facility | 1 | 36,200,000 | 3.8 | 60.4 | 60.4 | 1.99 | 10.1 | 9.6 | 4.720 |
| Flex | 13 | 31,726,923 | 3.3 | 71.3 | 62.4 | 1.27 | 9.2 | 8.3 | 5.181 |
| Self Storage | 15 | 60,269,000 | 6.3 | 70.1 | 61.2 | 1.42 | 9.1 | 9.0 | 4.826 |
| Self Storage | 15 | 60,269,000 | 6.3 | 70.1 | 61.2 | 1.42 | 9.1 | 9.0 | 4.826 |
| Mixed Use | 6 | 25,137,938 | 2.6 | 67.2 | 55.6 | 1.52 | 10.7 | 9.7 | 4.969 |
| Office/Retail | 3 | 14,947,719 | 1.6 | 64.9 | 53.2 | 1.53 | 10.9 | 9.7 | 4.845 |
| Industrial/Office | 1 | 5,987,578 | 0.6 | 73.0 | 60.4 | 1.42 | 9.8 | 9.3 | 5.120 |
| Retail/Self Storage | 1 | 2,382,641 | 0.2 | 63.5 | 52.8 | 1.52 | 11.2 | 10.1 | 5.300 |
| Self Storage/Retail | 1 | 1,820,000 | 0.2 | 72.2 | 62.6 | 1.74 | 11.7 | 11.3 | 5.050 |
| Other | 1 | 20,978,206 | 2.2 | 62.8 | 51.9 | 1.37 | 9.0 | 8.9 | 5.100 |
| Parking Garage | 1 | 20,978,206 | 2.2 | 62.8 | 51.9 | 1.37 | 9.0 | 8.9 | 5.100 |
| Manufactured Housing Community | 7 | 19,954,451 | 2.1 | 60.3 | 49.2 | 1.53 | 10.9 | 10.5 | 5.255 |
| Manufactured Housing Community | 7 | 19,954,451 | 2.1 | 60.3 | 49.2 | 1.53 | 10.9 | 10.5 | 5.255 |
| Total/Weighted Average: | 152 | $959,979,761 | 100.0% | 58.7% | 51.8% | 2.46x | 15.3% | 14.5% | 4.750% |
| (1) | Because this table presents information relating to the mortgaged properties and not the mortgage loans, the information for mortgage loans secured by more than one mortgaged property is based on allocated amounts (allocating the mortgage loan balance to each of those properties according to the relative appraised values of the mortgaged properties or the allocated loan amounts or property-specific release prices set forth in the related mortgage loan documents or such other allocation as the related mortgage loan seller deemed appropriate). For mortgaged properties securing residential cooperative mortgage loans, the debt service coverage ratio or debt yield for each such mortgaged property is calculated using underwritten net cash flow for the related residential cooperative property which is the projected net cash flow reflected in the most recent appraisal obtained by or otherwise in the possession of the related mortgage loan seller as of the cut-off date and the loan-to-value ratio, excluding the Gill Park Cooperative mortgage loan, is calculated based upon the appraised value of the residential cooperative property determined as if such residential cooperative property is operated as a residential cooperative. The loan-to-value ratio for the Gill Park Cooperative mortgage loan is calculated based on the appraised value of the residential cooperative property determined as if such residential cooperative property is operated as a market rate multifamily rental property. With respect to the 10 South LaSalle Street mortgage loan, which is part of a whole loan, the loan-to-value ratio, debt service coverage ratio and debt yield calculations include the relatedpari passu companion loan (unless otherwise stated). With respect to each mortgage loan, debt service coverage ratio, debt yield and loan-to-value ratio information do not take into account of any subordinate debt (whether or not secured by the related mortgaged property) that currently exists or is allowed under the terms of such mortgage loan. See Annex A-1 to the Preliminary Prospectus. |
THE INFORMATION IN THIS STRUCTURAL AND COLLATERAL TERM SHEET IS NOT COMPLETE AND MAY BE AMENDED PRIOR TO THE TIME OF SALE. THIS TERM SHEET IS NOT AN OFFER TO SELL THESE SECURITIES AND IT IS NOT A SOLICITATION OF AN OFFER TO BUY THESE SECURITIES IN ANY JURISDICTION WHERE THE OFFER OR SALE IS NOT PERMITTED.
| 12 |
| Wells Fargo Commercial Mortgage Trust 2016-C32 | Characteristics of the Mortgage Pool |
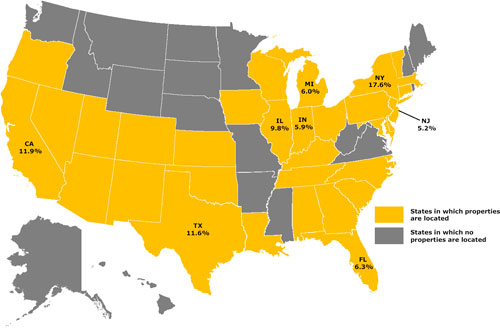
| G. | Geographic Distribution(1)(2) |
| Location | Number of Mortgaged Properties | Aggregate Cut-off Date Balance ($) | % of Initial Pool Balance (%) | Weighted Average Cut-off Date LTV Ratio (%) | Weighted Average Balloon or ARD LTV Ratio (%) | Weighted Average U/W NCF DSCR (x) | Weighted Average U/W NOI Debt Yield (%) | Weighted Average U/W NCF Debt Yield (%) | Weighted Average Mortgage Rate (%) |
| New York | 33 | $168,493,899 | 17.6% | 30.6% | 26.5% | 6.59x | 38.6% | 37.9% | 4.368% |
| California | 7 | 114,505,836 | 11.9 | 60.8 | 54.5 | 1.69 | 11.2 | 10.4 | 4.682 |
| Northern(3) | 4 | 90,193,563 | 9.4 | 59.4 | 53.6 | 1.73 | 11.3 | 10.5 | 4.609 |
| Southern(3) | 3 | 24,312,273 | 2.5 | 65.7 | 57.9 | 1.55 | 10.9 | 9.9 | 4.955 |
| Texas | 17 | 111,719,655 | 11.6 | 63.4 | 60.7 | 1.73 | 9.7 | 8.9 | 4.721 |
| Illinois | 20 | 93,835,007 | 9.8 | 64.5 | 55.9 | 1.62 | 10.8 | 9.8 | 4.804 |
| Florida | 8 | 60,259,032 | 6.3 | 68.9 | 58.6 | 1.35 | 8.9 | 8.7 | 4.962 |
| Michigan | 7 | 57,188,154 | 6.0 | 67.5 | 59.6 | 1.58 | 11.4 | 9.9 | 4.781 |
| Indiana | 14 | 56,983,462 | 5.9 | 65.8 | 56.1 | 1.51 | 10.9 | 10.0 | 5.036 |
| New Jersey | 4 | 49,756,053 | 5.2 | 63.3 | 60.1 | 1.82 | 10.0 | 9.4 | 4.773 |
| Other(4) | 42 | 247,238,664 | 25.8 | 65.4 | 56.1 | 1.47 | 10.2 | 9.4 | 4.904 |
| Total/Weighted Average | 152 | $959,979,761 | 100.0% | 58.7% | 51.8% | 2.46x | 15.3% | 14.5% | 4.750% |
| (1) | The mortgaged properties are located in 32 states and District of Columbia. |
| (2) | Because this table presents information relating to the mortgaged properties and not the mortgage loans, the information for mortgage loans secured by more than one mortgaged property is based on allocated amounts (allocating the mortgage loan balance to each of those properties according to the relative appraised values of the mortgaged properties or the allocated loan amounts or property-specific release prices set forth in the related mortgage loan documents or such other allocation as the related mortgage loan seller deemed appropriate). For mortgaged properties securing residential cooperative mortgage loans, the debt service coverage ratio or debt yield for each such mortgaged property is calculated using underwritten net cash flow for the related residential cooperative property which is the projected net cash flow reflected in the most recent appraisal obtained by or otherwise in the possession of the related mortgage loan seller as of the cut-off date and the loan-to-value ratio, excluding the Gill Park Cooperative mortgage loan, is calculated based upon the appraised value of the residential cooperative property determined as if such residential cooperative property is operated as a residential cooperative. The loan-to-value ratio for the Gill Park Cooperative mortgage loan is calculated based on the appraised value of the residential cooperative property determined as if such residential cooperative property is operated as a market rate multifamily rental property. With respect to the 10 South LaSalle Street mortgage loan, which is part of a whole loan, the loan-to-value ratio, debt service coverage ratio and debt yield calculations include the relatedpari passu companion loan (unless otherwise stated). With respect to each mortgage loan, debt service coverage ratio, debt yield and loan-to-value ratio information do not take into account of any subordinate debt (whether or not secured by the related mortgaged property) that currently exists or is allowed under the terms of such mortgage loan. See Annex A-1 to the Preliminary Prospectus. |
| (3) | For purposes of determining whether a mortgaged property is in Northern California or Southern California, Northern California includes areas with zip codes above 93600 and Southern California includes areas with zip codes of 93600 and below. |
| (4) | Includes 24 other states and District of Columbia. |
THE INFORMATION IN THIS STRUCTURAL AND COLLATERAL TERM SHEET IS NOT COMPLETE AND MAY BE AMENDED PRIOR TO THE TIME OF SALE. THIS TERM SHEET IS NOT AN OFFER TO SELL THESE SECURITIES AND IT IS NOT A SOLICITATION OF AN OFFER TO BUY THESE SECURITIES IN ANY JURISDICTION WHERE THE OFFER OR SALE IS NOT PERMITTED.
| 13 |
| Wells Fargo Commercial Mortgage Trust 2016-C32 | Characteristics of the Mortgage Pool |
H. Characteristics of the Mortgage Pool(1)
| CUT-OFF DATE BALANCE | |||||
| Range of Cut-off Date Balances ($) | Number of Mortgage Loans | Aggregate Cut- off Date Balance | % of Initial Pool Balance | ||
| 994,295 - 1,000,000 | 1 | $994,295 | 0.1 | % | |
| 1,000,001 - 2,000,000 | 23 | 37,754,901 | 3.9 | ||
| 2,000,001 - 3,000,000 | 8 | 20,618,419 | 2.1 | ||
| 3,000,001 - 4,000,000 | 21 | 76,296,502 | 7.9 | ||
| 4,000,001 - 5,000,000 | 14 | 63,515,550 | 6.6 | ||
| 5,000,001 - 6,000,000 | 8 | 44,202,060 | 4.6 | ||
| 6,000,001 - 7,000,000 | 3 | 19,590,181 | 2.0 | ||
| 7,000,001 - 8,000,000 | 3 | 22,553,773 | 2.3 | ||
| 8,000,001 - 9,000,000 | 5 | 42,534,151 | 4.4 | ||
| 9,000,001 - 10,000,000 | 3 | 28,226,000 | 2.9 | ||
| 10,000,001 - 15,000,000 | 4 | 47,941,165 | 5.0 | ||
| 15,000,001 - 20,000,000 | 8 | 137,998,575 | 14.4 | ||
| 20,000,001 - 30,000,000 | 6 | 147,029,191 | 15.3 | ||
| 30,000,001 - 50,000,000 | 3 | 130,400,000 | 13.6 | ||
| 50,000,001 - 80,000,000 | 1 | 59,000,000 | 6.1 | ||
| 80,000,001 - 81,325,000 | 1 | 81,325,000 | 8.5 | ||
| Total: | 112 | $959,979,761 | 100.0 | % | |
| Weighted Average: | $8,571,248 | ||||
| UNDERWRITTEN NOI DEBT SERVICE COVERAGE RATIO | |||||
| Range of U/W NOI DSCRs (x) | Number of Mortgage Loans | Aggregate Cut- off Date Balance | % of Initial Pool Balance | ||
| 1.23 - 1.30 | 6 | $28,608,941 | 3.0 | % | |
| 1.31 - 1.40 | 15 | 190,645,564 | 19.9 | ||
| 1.41 - 1.50 | 14 | 121,823,507 | 12.7 | ||
| 1.51 - 1.60 | 13 | 113,939,539 | 11.9 | ||
| 1.61 - 1.70 | 13 | 86,836,357 | 9.0 | ||
| 1.71 - 1.80 | 4 | 13,380,180 | 1.4 | ||
| 1.81 - 1.90 | 2 | 4,913,035 | 0.5 | ||
| 1.91 - 2.00 | 4 | 103,681,781 | 10.8 | ||
| 2.01 - 2.50 | 10 | 162,472,905 | 16.9 | ||
| 2.51 - 3.00 | 1 | 30,000,000 | 3.1 | ||
| 3.01 - 3.50 | 1 | 6,971,139 | 0.7 | ||
| 3.51 - 4.00 | 1 | 3,372,051 | 0.4 | ||
| 4.01 - 31.99 | 28 | 93,334,762 | 9.7 | ||
| Total: | 112 | $959,979,761 | 100.0 | % | |
| Weighted Average: | 2.59x | ||||
| UNDERWRITTEN NCF DEBT SERVICE COVERAGE RATIO | |||||
| Range of U/W NCF DSCRs (x) | Number of Mortgage Loans | Aggregate Cut- off Date Balance | % of Initial Pool Balance | ||
| 1.18 - 1.20 | 1 | $1,997,914 | 0.2 | % | |
| 1.21 - 1.30 | 16 | 161,795,713 | 16.9 | ||
| 1.31 - 1.40 | 20 | 231,519,345 | 24.1 | ||
| 1.41 - 1.50 | 15 | 92,037,526 | 9.6 | ||
| 1.51 - 1.60 | 7 | 47,556,419 | 5.0 | ||
| 1.61 - 1.70 | 6 | 21,970,207 | 2.3 | ||
| 1.71 - 1.80 | 5 | 100,759,092 | 10.5 | ||
| 1.81 - 1.90 | 4 | 58,784,508 | 6.1 | ||
| 1.91 - 2.00 | 3 | 91,134,693 | 9.5 | ||
| 2.01 - 2.50 | 5 | 48,746,393 | 5.1 | ||
| 3.01 - 3.50 | 1 | 6,971,139 | 0.7 | ||
| 3.51 - 4.00 | 1 | 3,372,051 | 0.4 | ||
| 4.01 - 31.99 | 28 | 93,334,762 | 9.7 | ||
| Total: | 112 | $959,979,761 | 100.0 | % | |
| Weighted Average: | 2.46x | ||||
| LOAN PURPOSE | ||||
| Loan Purpose | Number of Mortgage Loans | Aggregate Cut- off Date Balance | % of Initial Pool Balance | |
| Refinance | 86 | $660,659,856 | 68.8 | % |
| Acquisition | 26 | 299,319,905 | 31.2 | |
| Total: | 112 | $959,979,761 | 100.0 | % |
| MORTGAGE RATE | ||||
| Range of Mortgage Rates(%) | Number of Mortgage Loans | Aggregate Cut- off Date Balance | % of Initial Pool Balance | |
| 3.640 - 3.750 | 2 | $10,464,070 | 1.1 | % |
| 3.751 - 4.000 | 23 | 83,488,753 | 8.7 | |
| 4.001 - 4.250 | 6 | 59,725,130 | 6.2 | |
| 4.251 - 4.500 | 2 | 47,965,034 | 5.0 | |
| 4.501 - 4.750 | 18 | 268,455,192 | 28.0 | |
| 4.751 - 5.000 | 27 | 179,545,428 | 18.7 | |
| 5.001 - 5.250 | 23 | 228,509,346 | 23.8 | |
| 5.251 - 5.750 | 10 | 79,880,750 | 8.3 | |
| 5.751 – 5.920 | 1 | 1,946,060 | 0.2 | |
| Total: | 112 | $959,979,761 | 100.0 | % |
| Weighted Average: | 4.750% | |||
| UNDERWRITTEN NOI DEBT YIELD | ||||
| Range of U/W NOI Debt Yields (%) | Number of Mortgage Loans | Aggregate Cut- off Date Balance | % of Initial Pool Balance | |
| 7.7 - 8.0 | 1 | $8,500,000 | 0.9 | % |
| 8.1 - 9.0 | 20 | 222,813,039 | 23.2 | |
| 9.1 - 10.0 | 21 | 205,167,647 | 21.4 | |
| 10.1 - 11.0 | 15 | 122,947,128 | 12.8 | |
| 11.1 - 12.0 | 8 | 34,696,558 | 3.6 | |
| 12.1 - 13.0 | 9 | 188,202,811 | 19.6 | |
| 13.1 - 14.0 | 3 | 50,293,540 | 5.2 | |
| 14.1 - 15.0 | 2 | 7,924,273 | 0.8 | |
| 15.1 - 16.0 | 1 | 4,789,968 | 0.5 | |
| 16.1 - 17.0 | 1 | 7,475,269 | 0.8 | |
| 17.1 - 18.0 | 1 | 3,491,576 | 0.4 | |
| 18.1 – 20.0 | 1 | 6,971,139 | 0.7 | |
| 20.1 - 174.9 | 29 | 96,706,813 | 10.1 | |
| Total: | 112 | $959,979,761 | 100.0 | % |
| Weighted Average: | 15.3% | |||
| UNDERWRITTEN NCF DEBT YIELD | ||||
| Range of U/W NCF Debt Yields (%) | Number of Mortgage Loans | Aggregate Cut- off Date Balance | % of Initial Pool Balance | |
| 7.6 - 8.0 | 4 | $19,986,546 | 2.1 | % |
| 8.1 - 9.0 | 32 | 397,542,767 | 41.4 | |
| 9.1 - 10.0 | 18 | 106,025,147 | 11.0 | |
| 10.1 - 11.0 | 10 | 115,909,033 | 12.1 | |
| 11.1 - 12.0 | 10 | 171,952,595 | 17.9 | |
| 12.1 - 13.0 | 3 | 21,204,634 | 2.2 | |
| 13.1 - 14.0 | 3 | 12,714,240 | 1.3 | |
| 15.1 - 16.0 | 1 | 7,475,269 | 0.8 | |
| 17.1 - 18.0 | 1 | 3,491,576 | 0.4 | |
| 18.1 - 20.0 | 1 | 6,971,139 | 0.7 | |
| 20.1 - 174.9 | 29 | 96,706,813 | 10.1 | |
| Total: | 112 | $959,979,761 | 100.0 | % |
| Weighted Average: | 14.5% | |||
| (1) | For mortgaged properties securing residential cooperative mortgage loans, the debt service coverage ratio or debt yield for each such mortgaged property is calculated using underwritten net cash flow for the related residential cooperative property which is the projected net cash flow reflected in the most recent appraisal obtained by or otherwise in the possession of the related mortgage loan seller as of the cut-off date and the loan-to-value ratio, excluding the Gill Park Cooperative mortgage loan, is calculated based upon the appraised value of the residential cooperative property determined as if such residential cooperative property is operated as a residential cooperative. The loan-to-value ratio for the Gill Park Cooperative mortgage loan is calculated based on the appraised value of the residential cooperative property determined as if such residential cooperative property is operated as a market rate multifamily rental property. With respect to the 10 South LaSalle Street mortgage loan, which is part of apari passu whole loan, loan-to-value ratio, debt service coverage ratio and debt yield calculations include the relatedpari passu companion loan (unless otherwise stated). With respect to each mortgage loan, debt service coverage ratio, debt yield and loan-to-value ratio information do not take into account any subordinate debt (whether or not secured by the related mortgaged property), that currently exists or is allowed under the terms of such mortgage loan. See Annex A-1 to the Preliminary Prospectus. Prepayment provisions for each mortgage loan reflects the entire life of the loan (from origination to maturity or ARD). |
THE INFORMATION IN THIS STRUCTURAL AND COLLATERAL TERM SHEET IS NOT COMPLETE AND MAY BE AMENDED PRIOR TO THE TIME OF SALE. THIS TERM SHEET IS NOT AN OFFER TO SELL THESE SECURITIES AND IT IS NOT A SOLICITATION OF AN OFFER TO BUY THESE SECURITIES IN ANY JURISDICTION WHERE THE OFFER OR SALE IS NOT PERMITTED.
| 14 |
| Wells Fargo Commercial Mortgage Trust 2016-C32 | Characteristics of the Mortgage Pool |
| ORIGINAL TERM TO MATURITY OR ARD |
| Original Terms to Maturity or ARD (months) | Number of Mortgage Loans | Aggregate Cut- off Date Balance | % of Initial Pool Balance | ||
| 60 | 2 | $44,975,986 | 4.7 | % | |
| 120 | 110 | 915,003,775 | 95.3 | ||
| Total: | 112 | $959,979,761 | 100.0 | % | |
| Weighted Average: | 117 months | ||||
| REMAINING TERM TO MATURITY OR ARD |
| Range of Remaining Terms to Maturity or ARD (months) | Number of Mortgage Loans | Aggregate Cut- off Date Balance | % of Initial Pool Balance | ||
| 56 - 60 | 2 | $44,975,986 | 4.7 | % | |
| 85 - 119 | 110 | 915,003,775 | 95.3 | ||
| Total: | 112 | $959,979,761 | 100.0 | % | |
| Weighted Average: | 115 months | ||||
| ORIGINAL AMORTIZATION TERM(2) |
| Original Amortization Terms (months) | Number of Mortgage Loans | Aggregate Cut- off Date Balance | % of Initial Pool Balance | ||
| Non-Amortizing | 4 | $149,325,000 | 15.6 | % | |
| 180 | 1 | 17,965,034 | 1.9 | ||
| 240 | 3 | 8,809,688 | 0.9 | ||
| 300 | 10 | 89,935,011 | 9.4 | ||
| 360 | 89 | 678,771,496 | 70.7 | ||
| 480 | 5 | 15,173,533 | 1.6 | ||
| Total: | 112 | $959,979,761 | 100.0 | % | |
| Weighted Average(3): | 350 months | ||||
(2)The original amortization term shown for any mortgage loan that is interest-only for part of its term does not include the number of months in its interest-only period and reflects only the number of months as of the commencement of amortization remaining from the end of such interest-only period. (3)Excludes the non-amortizing mortgage loans. |
| REMAINING AMORTIZATION TERM(4) |
| Range of Remaining Amortization Terms (months) | Number of Mortgage Loans | Aggregate Cut- off Date Balance | % of Initial Pool Balance | ||
| Non-Amortizing | 4 | $149,325,000 | 15.6 | % | |
| 180 | 1 | 17,965,034 | 1.9 | ||
| 181 - 240 | 3 | 8,809,688 | 0.9 | ||
| 241 - 300 | 10 | 89,935,011 | 9.4 | ||
| 301 - 360 | 89 | 678,771,496 | 70.7 | ||
| 421 - 479 | 5 | 15,173,533 | 1.6 | ||
| Total: | 112 | $959,979,761 | 100.0 | % | |
| Weighted Average(5): | 349 months | ||||
(4)The remaining amortization term shown for any mortgage loan that is interest-only for part of its term does not include the number of months in its interest-only period and reflects only the number of months as of the commencement of amortization remaining from the end of such interest-only period. (5)Excludes the non-amortizing mortgage loans. | ||||
| LOCKBOXES |
| Type of Lockbox | Number of Mortgage Loans | Aggregate Cut- off Date Balance | % of Initial Pool Balance | ||
| Springing | 51 | $416,017,729 | 43.3 | % | |
| None | 44 | 188,181,388 | 19.6 | ||
| Hard/Springing Cash Management | 11 | 186,181,610 | 19.4 | ||
| Hard/Upfront Cash Management | 6 | 169,599,034 | 17.7 | ||
| Total: | 112 | $959,979,761 | 100.0 | % | |
| PREPAYMENT PROVISION SUMMARY |
| Prepayment Provision | Number of Mortgage Loans | Aggregate Cut- off Date Balance | % of Initial Pool Balance | ||
| Lockout /Def / Open | 66 | $602,898,433 | 62.8 | % | |
| Lockout / GRTR 1% or YM / Open | 15 | 235,438,342 | 24.5 | ||
| GRTR 1% or YM / 1% / Open | 31 | 121,642,986 | 12.7 | ||
| Total: | 112 | $959,979,761 | 100.0 | % | |
| CUT-OFF DATE LOAN-TO-VALUE RATIO | |||||
| Range of Cut-off Date LTV Ratios (%) | Number of Mortgage Loans | Aggregate Cut- off Date Balance | % of Initial Pool Balance | ||
| 1.6 - 20.0 | 25 | $83,114,773 | 8.7 | % | |
| 20.1 - 25.0 | 4 | 19,268,614 | 2.0 | ||
| 25.1 - 30.0 | 1 | 1,294,565 | 0.1 | ||
| 30.1 - 45.0 | 1 | 3,491,576 | 0.4 | ||
| 45.1 - 50.0 | 2 | 19,258,574 | 2.0 | ||
| 50.1 - 55.0 | 7 | 75,173,525 | 7.8 | ||
| 55.1 - 60.0 | 7 | 104,479,820 | 10.9 | ||
| 60.1 - 65.0 | 16 | 260,337,449 | 27.1 | ||
| 65.1 - 70.0 | 23 | 163,258,231 | 17.0 | ||
| 70.1 - 75.0 | 26 | 230,302,634 | 24.0 | ||
| Total: | 112 | $959,979,761 | 100.0 | % | |
| Weighted Average: | 58.7% | ||||
| BALLOON OR ARD LOAN-TO-VALUE RATIO |
| Range of Balloon or ARD LTV Ratios (%) | Number of Mortgage Loans | Aggregate Cut- off Date Balance | % of Initial Pool Balance | ||
| 1.3 - 20.0 | 30 | $105,874,964 | 11.0 | % | |
| 20.1 - 25.0 | 1 | 1,294,565 | 0.1 | ||
| 25.1 - 30.0 | 1 | 17,965,034 | 1.9 | ||
| 35.1 - 40.0 | 5 | 16,742,405 | 1.7 | ||
| 40.1 - 45.0 | 2 | 9,724,660 | 1.0 | ||
| 45.1 - 50.0 | 6 | 90,779,820 | 9.5 | ||
| 50.1 - 55.0 | 10 | 122,965,347 | 12.8 | ||
| 55.1 - 60.0 | 31 | 221,398,905 | 23.1 | ||
| 60.1 - 65.0 | 21 | 317,934,062 | 33.1 | ||
| 65.1 - 68.4 | 5 | 55,300,000 | 5.8 | ||
| Total: | 112 | $959,979,761 | 100.0 | % | |
| WeightedAverage: | 51.8% | ||||
| AMORTIZATION TYPE |
| Type of Amortization | Number of Mortgage Loans | Aggregate Cut- off Date Balance | % of Initial Pool Balance | ||
| Interest-only, Amortizing Balloon | 38 | $459,559,282 | 47.9 | % | |
| Amortizing Balloon | 69 | 345,806,847 | 36.0 | ||
| Interest-only, Balloon | 4 | 149,325,000 | 15.6 | ||
| Amortizing Balloon, ARD | 1 | 5,288,632 | 0.6 | ||
| Total: | 112 | $959,979,761 | 100.0 | % | |
ORIGINAL TERM OF INTEREST-ONLY PERIOD FOR PARTIAL IO LOANS |
| IO Term (months) | Number of Mortgage Loans | Aggregate Cut- off Date Balance | % of Initial Pool Balance | ||
| 12 | 4 | $27,408,000 | 2.9 | % | |
| 24 | 10 | 95,805,034 | 10.0 | ||
| 36 | 16 | 174,906,248 | 18.2 | ||
| 48 | 1 | 4,700,000 | 0.5 | ||
| 60 | 4 | 86,000,000 | 9.0 | ||
| 82 | 1 | 59,000,000 | 6.1 | ||
| 84 | 2 | 11,740,000 | 1.2 | ||
| Total: | 38 | $459,559,282 | 47.9 | % | |
| Weighted Average: | 44 months | ||||
SEASONING |
| Seasoning (months) | Number of Mortgage Loans | Aggregate Cut- off Date Balance | % of Initial Pool Balance | ||
| 1 | 36 | $336,087,682 | 35.0 | % | |
| 2 | 36 | 331,293,049 | 34.5 | ||
| 3 | 32 | 229,143,513 | 23.9 | ||
| 4 | 4 | 25,971,918 | 2.7 | ||
| 5 | 1 | 21,000,000 | 2.2 | ||
| 7 | 1 | 7,638,503 | 0.8 | ||
| 8 | 2 | 8,845,095 | 0.9 | ||
| Total: | 112 | $959,979,761 | 100.0 | % | |
| Weighted Average: | 2 months | ||||
THE INFORMATION IN THIS STRUCTURAL AND COLLATERAL TERM SHEET IS NOT COMPLETE AND MAY BE AMENDED PRIOR TO THE TIME OF SALE. THIS TERM SHEET IS NOT AN OFFER TO SELL THESE SECURITIES AND IT IS NOT A SOLICITATION OF AN OFFER TO BUY THESE SECURITIES IN ANY JURISDICTION WHERE THE OFFER OR SALE IS NOT PERMITTED.
| 15 |
| Wells Fargo Commercial Mortgage Trust 2016-C32 | Certain Terms and Conditions |
| V. Certain Terms and Conditions | |||
| Interest Entitlements: | The interest entitlement of each Class of Offered Certificates on each Distribution Date generally will be the interest accrued during the related Interest Accrual Period on the related Certificate Balance or Notional Amount at the related pass-through rate, net of any prepayment interest shortfalls allocated to that Class for such Distribution Date as described below. If prepayment interest shortfalls arise from voluntary prepayments (without applicable Master Servicer consent) on particular non-specially serviced loans during any collection period, the applicable Master Servicer is required to make a compensating interest payment to offset those shortfalls, generally up to an amount equal to the portion of its master servicing fees that accrue at 0.25 basis pointsper annum. The remaining amount of prepayment interest shortfalls will be allocated to reduce the interest entitlement on all Classes of Certificates,pro rata, based on their respective amounts of accrued interest for the related Distribution Date. If a Class receives less than the entirety of its interest entitlement on any Distribution Date, then the shortfall, excluding any shortfall due to prepayment interest shortfalls, will be added to its interest entitlement for the next succeeding Distribution Date. | ||
| Principal Distribution Amount: | The Principal Distribution Amount for each Distribution Date generally will be the aggregate amount of principal received or advanced in respect of the mortgage loans, net of any non-recoverable advances and interest thereon and workout-delayed reimbursement amounts that are reimbursed to the applicable Master Servicer, the applicable Special Servicer or the Trustee during the related collection period. Non-recoverable advances and interest thereon are reimbursable from principal collections and advances before reimbursement from other amounts. Workout-delayed reimbursement amounts are reimbursable from principal collections. | ||
| Distributions: | On each Distribution Date, funds available for distribution from the mortgage loans, net of specified trust fees, expenses and reimbursements will generally be distributed in the following amounts and order of priority (in each case to the extent of remaining available funds): | ||
| 1. | Class A-1, A-2, A-3, A-4, A-SB, X-A, X-B, X-E, X-F and X-G Certificates: To interest on the Class A-1, A-2, A-3, A-4, A-SB, X-A, X-B, X-E, X-F and X-G Certificates,pro rata, according to their respective interest entitlements. | ||
| 2. | Class A-1, A-2, A-3, A-4 and A-SB Certificates: To principal on the Class A-1, A-2, A-3, A-4 and A-SB Certificates in the following amounts and order of priority: (i) first, to principal on the Class A-SB Certificates, in an amount up to the Principal Distribution Amount for such Distribution Date until their Certificate Balance is reduced to the Class A-SB Planned Principal Balance for such Distribution Date; (ii) second, to principal on the Class A-1 Certificates until their Certificate Balance is reduced to zero, up to the remainder of the Principal Distribution Amount for such Distribution Date; (iii) third, to principal on the Class A-2 Certificates until their Certificate Balance is reduced to zero, up to the remainder of the Principal Distribution Amount for such Distribution Date; (iv) fourth, to principal on the Class A-3 Certificates until their Certificate Balance is reduced to zero, up to the remainder of the Principal Distribution Amount for such Distribution Date; (v) fifth, to principal on the Class A-4 Certificates until their Certificate Balance is reduced to zero, up to the remainder of the Principal Distribution Amount for such Distribution Date; and (vi) sixth, to principal on the Class A-SB Certificates until their Certificate Balance is reduced to zero, up to the remainder of the Principal Distribution Amount for such Distribution Date. However, if the Certificate Balance of each and every Class of Principal Balance Certificates, other than the Class A-1, A-2, A-3, A-4 and A-SB Certificates, has been reduced to zero as a result of the allocation of Mortgage Loan losses and expenses and any of the Class A-1, A-2, A-3, A-4 and A-SB Certificates remains outstanding, then the Principal Distribution Amount will be distributed to the Class A-1, A-2, A-3, A-4 and A-SB Certificates,pro rata, based on their respective outstanding Certificate Balances, until their Certificate Balances have been reduced to zero. | ||
| 3. | Class A-1, A-2, A-3, A-4 and A-SB Certificates: To reimburse the holders of the Class A-1, A-2, A-3, A-4 and A-SB Certificates,pro rata, on the basis of previously allocated unreimbursed losses, for any previously unreimbursed losses (plus interest thereon) on the mortgage loans that were previously allocated in reduction of the Certificate Balances of such Classes. | ||
| 4. | Class A-S Certificates: To make distributions on the Class A-S Certificates as follows: (a) first, to interest on the Class A-S Certificates in the amount of the interest entitlement for that Class; (b) next, to the extent of the portion of the Principal Distribution Amount remaining after distributions in respect of principal to each Class with a higher distribution priority (in this case, the Class A-1, A-2, A-3, A-4 and A-SB Certificates), to principal on the Class A-S Certificates until their Certificate Balance is reduced to zero; and (c) next, to reimburse the holders of the Class A-S Certificates for any previously unreimbursed losses (plus interest thereon) on the mortgage loans that were previously allocated to that Class in reduction of their Certificate Balance. | ||
THE INFORMATION IN THIS STRUCTURAL AND COLLATERAL TERM SHEET IS NOT COMPLETE AND MAY BE AMENDED PRIOR TO THE TIME OF SALE. THIS TERM SHEET IS NOT AN OFFER TO SELL THESE SECURITIES AND IT IS NOT A SOLICITATION OF AN OFFER TO BUY THESE SECURITIES IN ANY JURISDICTION WHERE THE OFFER OR SALE IS NOT PERMITTED.
| 16 |
| Wells Fargo Commercial Mortgage Trust 2016-C32 | Certain Terms and Conditions |
| 5. | Class B Certificates: To make distributions on the Class B Certificates as follows: (a) first, to interest on the Class B Certificates in the amount of the interest entitlement for that Class; (b) next, to the extent of the portion of the Principal Distribution Amount remaining after distributions in respect of principal to each Class with a higher distribution priority (in this case, the Class A-1, A-2, A-3, A-4, A-SB and A-S Certificates), to principal on the Class B Certificates until their Certificate Balance is reduced to zero; and (c) next, to reimburse the holders of the Class B Certificates for any previously unreimbursed losses (plus interest thereon) on the mortgage loans that were previously allocated to that Class in reduction of their Certificate Balance. | ||
| 6. | Class C Certificates: To make distributions on the Class C Certificates as follows: (a) first, to interest on the Class C Certificates in the amount of the interest entitlement for that Class; (b) next, to the extent of the portion of the Principal Distribution Amount remaining after distributions in respect of principal to each Class with a higher distribution priority (in this case, the Class A-1, A-2, A-3, A-4, A-SB, A-S and B Certificates), to principal on the Class C Certificates until their Certificate Balance is reduced to zero; and (c) next, to reimburse the holders of the Class C Certificates for any previously unreimbursed losses (plus interest thereon) on the mortgage loans that were previously allocated to that Class in reduction of their Certificate Balance. | ||
| 7. | Class D and X-D Certificates: To make distributions on the Class D and X-D Certificates as follows: (a) first, to interest on the Class D and X-D Certificates,pro rata, according to their respective interest entitlements; (b) next, to the extent of the portion of the Principal Distribution Amount remaining after distributions in respect of principal to each Class with a higher distribution priority (in this case, the Class A-1, A-2, A-3, A-4, A-SB, A-S, B and C Certificates, to principal on the Class D Certificates until their Certificate Balance is reduced to zero; and (c) next, to reimburse the holders of the Class D Certificates for any previously unreimbursed losses (plus interest thereon) on the mortgage loans that were previously allocated to that Class in reduction of their Certificate Balance. | ||
| 8. | Class E Certificates: To make distributions on the Class E Certificates as follows: (a) first, to interest on the Class E Certificates, in the amount of the interest entitlement for that Class; (b) next, to the extent of the portion of the Principal Distribution Amount remaining after distributions in respect of principal to each Class with a higher distribution priority (in this case, the Class A-1, A-2, A-3, A-4, A-SB, A-S, B, C and D Certificates), to principal on the Class E Certificates until their Certificate Balance is reduced to zero; and (c) next, to reimburse the holders of the Class E Certificates for any previously unreimbursed losses (plus interest thereon) on the mortgage loans that were previously allocated to that Class in reduction of their Certificate Balance. | ||
| 9. | After the Class A-1, A-2, A-3, A-4, A-SB, A-S, B, C, D and E Certificates are paid all amounts to which they are entitled, the remaining funds available for distribution will be used to pay interest, principal and loss reimbursement amounts on the Class F and G Certificates sequentially in that order in a manner analogous to the Class E Certificates. | ||
| Allocation of Yield Maintenance and Prepayment Premiums: | If any yield maintenance charge or prepayment premium is collected during any particular collection period with respect to any mortgage loan, then on the Distribution Date corresponding to that collection period, the certificate administrator will pay that yield maintenance charge or prepayment premium (net of liquidation fees payable therefrom) in the following manner: (1) to each of the Class A-1, A-2, A-3, A-4, A-SB, A-S, B, C and D Certificates, the product of (a) such yield maintenance charge or prepayment premium, (b) the related Base Interest Fraction (as defined in the Preliminary Prospectus) for such Class, and (c) a fraction, the numerator of which is equal to the amount of principal distributed to such Class for that Distribution Date, and the denominator of which is the total amount of principal distributed to all Principal Balance Certificates for that Distribution Date, and (2) to the Class X-A Certificates, the excess, if any, of (a) the product of (i) such yield maintenance charge or prepayment premium and (ii) a fraction, the numerator of which is equal to the amount of principal distributed to the Class A-1, A-2, A-3, A-4, A-SB and A-S Certificates for that Distribution Date, and the denominator of which is the total amount of principal distributed to all Principal Balance Certificates for that Distribution Date, over (b) the amount of such yield maintenance charge or prepayment premium distributed to the Class A-1, A-2, A-3, A-4, A-SB and A-S Certificates as described above, and (3) to the Class X-B Certificates, any remaining yield maintenance charge or prepayment premium not distributed as described above. No prepayment premiums or yield maintenance charges will be distributed to the holders of the Class X-D, X-E, X-F, X-G, E, F, G, V or R Certificates. For a description of when prepayment premiums and yield maintenance charges are generally required on the mortgage loans, see Annex A-1 to the Preliminary Prospectus. See also “Risk Factors—Risks Relating to the Mortgage Loans—Risks Relating to Enforceability of Yield Maintenance Charges, Prepayment Premiums or Defeasance Provisions” and “Risk Factors—Other Risks Relating to the | ||
THE INFORMATION IN THIS STRUCTURAL AND COLLATERAL TERM SHEET IS NOT COMPLETE AND MAY BE AMENDED PRIOR TO THE TIME OF SALE. THIS TERM SHEET IS NOT AN OFFER TO SELL THESE SECURITIES AND IT IS NOT A SOLICITATION OF AN OFFER TO BUY THESE SECURITIES IN ANY JURISDICTION WHERE THE OFFER OR SALE IS NOT PERMITTED.
| 17 |
| Wells Fargo Commercial Mortgage Trust 2016-C32 | Certain Terms and Conditions |
| Certificates—Your Yield May Be Affected by Defaults, Prepayments and Other Factors” in the Preliminary Prospectus. Prepayment premiums and yieldmaintenance charges will be distributed on each Distribution Date only to the extent they are actually received on the mortgage loans as of the related Determination Date. | ||
| Realized Losses: | The Certificate Balances of the Class A-1, A-2, A-3, A-4, A-SB, A-S, B, C, D, E, F and G Certificates, will be reduced without distribution on any Distribution Date as a write-off to the extent of any losses realized on the mortgage loans allocated to such Class on such Distribution Date. Such losses will be applied in the following order, in each case until the related Certificate Balance is reduced to zero: first, to the Class G Certificates; second, to the Class F Certificates; third, to the Class E Certificates; fourth, to the Class D Certificates; fifth, to the Class C Certificates; sixth, to the Class B Certificates; seventh, to the Class A-S Certificates; and, finally,pro rata, to the Class A-1, A-2, A-3, A-4 and A-SB Certificates based on their outstanding Certificate Balances. The notional amount of the Class X-A Certificates will be reduced by the amount of all losses that are allocated to the Class A-1, A-2, A-3, A-4, A-SB or A-S Certificates as write-offs in reduction of their Certificate Balances. | |
| The notional amount of the Class X-B Certificates will be reduced by the amount of all losses that are allocated to the Class B Certificates as write-offs in reduction of their Certificate Balance. The notional amount of the Class X-D Certificates will be reduced by the amount of all losses that are allocated to the Class D Certificates as write-offs in reduction of their Certificate Balance. The notional amount of the Class X-E Certificates will be reduced by the amount of all losses that are allocated to the Class E Certificates as write-offs in reduction of their Certificate Balance. The notional amount of the Class X-F Certificates will be reduced by the amount of all losses that are allocated to the Class F Certificates as write-offs in reduction of their Certificate Balance. The notional amount of the Class X-G Certificates will be reduced by the amount of all losses that are allocated to the Class G Certificates as write-offs in reduction of their Certificate Balance. | ||
| P&I Advances: | The related Master Servicer or, if such Master Servicer fails to do so, the Trustee, will be obligated to advance delinquent debt service payments with respect to the mortgage loans it services (other than balloon payments, excess interest and default interest) and assumed debt service payments on mortgage loans with delinquent balloon payments (excluding any related companion loan), except to the extent any such advance is deemed non-recoverable from collections on the related mortgage loan. In addition, if an Appraisal Reduction Amount exists for a given mortgage loan, the interest portion of any P&I advance for such mortgage loan will be reduced, which will have the effect of reducing the amount of interest available for distribution to the Certificates in reverse alphabetical order of their Class designations (except (a) that interest payments on the Class A-1, A-2, A-3, A-4, A-SB, X-A, X-B, X-E, X-F and X-G Certificates would be affected on apari passu basis and (b) interest payments on the Class D and Class X-D Certificates would be affected on apari passu basis and according to the alphabetical designation of the Class D Certificates). | |
| Servicing Advances: | The related Master Servicer or, if such Master Servicer fails to do so, the Trustee, will be obligated to make servicing advances with respect to each mortgage loan it services, including the payment of delinquent property taxes, insurance premiums and ground rent, except to the extent that those advances are deemed non-recoverable from collections on the related mortgage loan. The Special Servicers will have no obligation to make servicing advances but may do so in an emergency situation. | |
| Appraisal Reduction Amounts: | An Appraisal Reduction Amount generally will be created in the amount, if any, by which the principal balance of a required appraisal loan (which is a mortgage loan with respect to which certain defaults, modifications or insolvency events have occurred as further described in the Preliminary Prospectus) plus other amounts overdue or advanced in connection with such mortgage loan exceeds 90% of the appraised value of the related mortgaged property plus certain escrows and reserves (including letters of credit) held with respect to the mortgage loan. | |
| A mortgage loan will cease to be a required appraisal loan when the same has ceased to be a specially serviced loan (if applicable), has been brought current for at least three consecutive months and no other circumstances exist that would cause such mortgage loan to be a required appraisal loan. | ||
| Appraisal Reduction Amounts will affect the amount of debt service advances in respect of the related mortgage loan. Appraisal Reduction Amounts will also be taken into account in the determination of the identity of the Class whose majority constitutes the “majority controlling class certificateholder” and is entitled to appoint the directing certificateholder. |
THE INFORMATION IN THIS STRUCTURAL AND COLLATERAL TERM SHEET IS NOT COMPLETE AND MAY BE AMENDED PRIOR TO THE TIME OF SALE. THIS TERM SHEET IS NOT AN OFFER TO SELL THESE SECURITIES AND IT IS NOT A SOLICITATION OF AN OFFER TO BUY THESE SECURITIES IN ANY JURISDICTION WHERE THE OFFER OR SALE IS NOT PERMITTED.
| 18 |
| Wells Fargo Commercial Mortgage Trust 2016-C32 | Certain Terms and Conditions |
| Clean-Up Call and Exchange Termination: | On each Distribution Date occurring after the aggregate unpaid principal balance of the mortgage loans is reduced below 1% of the initial aggregate principal balance of the mortgage loans as of the Cut-off Date, certain specified persons will have the option to purchase all of the remaining mortgage loans (and the trust’s interest in all property acquired through exercise of remedies in respect of any mortgage loan) at the price specified in the Preliminary Prospectus. Exercise of the option will terminate the trust and retire the then-outstanding certificates. | |
| If the aggregate Certificate Balances of each of the Class A-1, A-2, A-3, A-4, A-SB, A-S, B, C, D and E Certificates have been reduced to zero, the trust may also be terminated in connection with an exchange of all the then-outstanding certificates (other than the Class V and R Certificates) for the mortgage loans and REO properties then remaining in the issuing entity, but all of the holders of those Classes of outstanding certificates would have to voluntarily participate in the exchange. | ||
| Liquidation Loan Waterfall: | Following the liquidation of any loan or property, the net liquidation proceeds generally will be applied (after reimbursement of advances and certain trust fund expenses), first, as a recovery of accrued interest, other than delinquent interest that was not advanced as a result of Appraisal Reduction Amounts, second, as a recovery of principal until all principal has been recovered, and then as a recovery of delinquent interest that was not advanced as a result of Appraisal Reduction Amounts. Please see “Description of the Certificates—Distributions—Application Priority of Mortgage Loan Collections or Whole Loan Collections” in the Preliminary Prospectus. | |
| Majority Controlling Class Certificateholder and Directing Certificateholder: | A directing certificateholder may be appointed by the “majority controlling class certificate-holder”, which will be the holder(s) of a majority of the “controlling class”, which means the most subordinate class among the Class F and G Certificates that has a Certificate Balance, as notionally reduced by any Appraisal Reduction Amounts allocable to that class, that is at least equal to 25% of its total initial Certificate Balance; provided that if at any time the Certificate Balances of the Principal Balance Certificates (other than the Class F and G Certificates) have been reduced to zero as a result of principal payments on the mortgage loans, then the ”controlling class” will be the most subordinate class of Class F and G Certificates that has a Certificate Balance greater than zero without regard to any Appraisal Reduction Amounts. The majority controlling class certificateholder will have a continuing right to appoint, remove or replace the directing certificateholder in its sole discretion. This right may be exercised at any time and from time to time. See “Pooling and Servicing Agreement—The Directing Certificateholder” in the Preliminary Prospectus. | |
| Control and Consultation: | The rights of various parties to replace each Special Servicer and approve or consult with respect to major actions of each Special Servicer will vary according to defined periods. | |
| A “Control Termination Event” occurs if the Class F Certificates have a Certificate Balance, net of any Appraisal Reduction Amounts allocable to that Class, that is less than 25% of the initial Certificate Balance of that Class or, while the Class F Certificates are the controlling class, the majority (by Certificate Balance) of the holders of the Class F Certificates irrevocably waived its right, in writing, to exercise any of the rights of the majority controlling class certificateholder and such rights have not been reinstated to a successor majority controlling class certificateholder. | ||
| A “Consultation Termination Event” occurs if the Class F Certificates have a Certificate Balance, without regard to any Appraisal Reduction Amounts allocable to that Class, that is less than 25% of the initial Certificate Balance of that Class or, while the Class F Certificates are the controlling class, the majority (by Certificate Balance) of the holders of the Class F Certificates irrevocably waived its right, in writing, to exercise any of the rights of the majority controlling class certificateholder and such rights have not been reinstated to a successor majority controlling class certificateholder. | ||
| If no Control Termination Event has occurred and is continuing, except with respect to the Excluded Loans (as defined below), (i) the directing certificateholder will be entitled to grant or withhold approval of asset status reports prepared, and material servicing actions proposed, by each Special Servicer, and (ii) the directing certificateholder will be entitled to terminate and replace each Special Servicer with or without cause, and appoint itself or another person as the successor special servicer. It will be a condition to such appointment that DBRS, KBRA and Moody’s confirm that the appointment would not result in a qualification, downgrade or withdrawal of any of their then-current ratings of certificates. | ||
| If a Control Termination Event has occurred and is continuing but no Consultation Termination Event has occurred and is continuing, each Special Servicer will be required to consult with the directing certificateholder (other than with respect to Excluded Loans) and the Operating Advisor in connection with asset status reports and material special servicing actions. | ||
| If a Consultation Termination Event has occurred and is continuing, each Special Servicer must seek to consult with the Operating Advisor in connection with asset status reports and material special servicing actions, and, in general, no directing certificateholder will be recognized or have any right to terminate the Special Servicers or approve, direct or consult with respect to servicing matters. |
THE INFORMATION IN THIS STRUCTURAL AND COLLATERAL TERM SHEET IS NOT COMPLETE AND MAY BE AMENDED PRIOR TO THE TIME OF SALE. THIS TERM SHEET IS NOT AN OFFER TO SELL THESE SECURITIES AND IT IS NOT A SOLICITATION OF AN OFFER TO BUY THESE SECURITIES IN ANY JURISDICTION WHERE THE OFFER OR SALE IS NOT PERMITTED.
| 19 |
| Wells Fargo Commercial Mortgage Trust 2016-C32 | Certain Terms and Conditions |
| With respect to the 10 South LaSalle Street mortgage loan, the rights of the directing certificateholder described above will be subject to the consultation rights of the holder of the relatedpari passu companion loan as described below. | ||
| Notwithstanding any contrary description set forth above, with respect to the 10 South LaSalle Street mortgage loan, the holder of thepari passu companion loan in the related whole loan (or its representative, including any directing certificateholder under any securitization of suchpari passu companion loan) will have consultation rights with respect to asset status reports and material special servicing actions involving the related whole loan, as provided for in the related intercreditor agreement and as described in the Preliminary Prospectus, and those rights will be in addition to the rights of the directing certificateholder in this transaction described above. | ||
| Notwithstanding any contrary description set forth above, in the event that, with respect to any mortgage loan, the majority controlling class certificateholder or the directing certificateholder is (i) a borrower, a mortgagor or a manager of a mortgaged property or any affiliate thereof, (ii) any person that owns, directly or indirectly, 25% or more of a borrower, mortgagor or manager of a mortgaged property, (iii) any person that owns, directly or indirectly, 25% or more of the beneficial interests in any mezzanine lender of any mezzanine loan related to a mortgage loan that has accelerated such mezzanine loan or commenced foreclosure proceedings as set forth in clause (iv) or (iv) a mezzanine lender (or any affiliate thereof) of any mezzanine loan related to a mortgage loan that has accelerated such mezzanine loan (unless (a) acceleration was automatic under such mezzanine loan, (b) the event directly giving rise to the automatic acceleration under such mezzanine loan was not initiated by such mezzanine lender or an affiliate of such mezzanine lender and (c) such mezzanine lender is stayed from exercising and has not commenced the exercise of remedies associated with foreclosure of the equity collateral under such mezzanine loan) or commenced foreclosure proceedings with respect to such mezzanine loan against the equity interests in the borrower(s) of such mortgage loan (each, a “borrower party”), the majority controlling class certificateholder and the directing certificateholder will have no right to receive asset status reports or such other information as may be specified in the pooling and servicing agreement, to grant or withhold approval of, or consult with respect to, asset status reports prepared, and material servicing actions proposed, by applicable Special Servicer, with respect to such mortgage loan, and such mortgage loan will be referred to as an “Excluded Loan”. | ||
| In addition, notwithstanding any contrary description set forth above, in the event that, with respect to any mortgage loan, a controlling class certificateholder is a borrower party, such controlling class certificateholder will have no right to receive asset status reports or such other information as may be specified in the pooling and servicing agreement with respect to such mortgage loan, and such controlling class certificateholder will be referred to as an “excluded controlling class holder”. | ||
| Replacement of Special Servicers by General Vote of Certificateholders: | If a Control Termination Event has occurred and is continuing, each Special Servicer may be removed and replaced without cause upon the affirmative direction of certificate owners holding not less than 66-2/3% of a certificateholder quorum, following a proposal from certificate owners holding not less than 25% of the appraisal-reduced voting rights of all Certificates. The certificateholders who initiate a vote on a termination and replacement of a Special Servicer without cause must cause DBRS, KBRA and Moody’s to confirm the then-current ratings of the certificates (or decline to review the matter) and cause the payment of the fees and expenses incurred in the replacement. If no Control Termination Event has occurred and is continuing, either Special Servicer may be replaced by the directing certificateholder, subject to DBRS, KBRA and Moody’s confirming the then-current ratings of the Certificates (or declining to review the matter). | |
| Excluded Special Servicer: | In the event that, with respect to any mortgage loan, a Special Servicer is a borrower party, such Special Servicer will be required to resign as special servicer of such mortgage loan (referred to as an “excluded special servicer loan”). If no Control Termination Event has occurred and is continuing, the directing certificateholder will be entitled to appoint (and may replace with or without cause) a separate special servicer that is not a borrower party (referred to as an “excluded special servicer”) with respect to such excluded special servicer loan unless such excluded special servicer loan is also an excluded loan. Otherwise, upon resignation of a Special Servicer with respect to an excluded special servicer loan, such resigning Special Servicer will be required to appoint the excluded special servicer. | |
| Appraisal Remedy: | If the Class of certificates comprising the controlling class loses its status as controlling class because of the application of an Appraisal Reduction Amount, the holders of a majority of the Voting Rights of such Class may require the applicable Special Servicer to order a second appraisal for any mortgage loan in respect of which an Appraisal Reduction Amount has been applied. The applicable Special Servicer must thereafter determine whether, based on its assessment of such second appraisal, any recalculation of the Appraisal Reduction Amount is warranted. Such Class will not be able to exercise any direction, control, consent and/or similar rights of the controlling class unless and until reinstated as the controlling class through such |
THE INFORMATION IN THIS STRUCTURAL AND COLLATERAL TERM SHEET IS NOT COMPLETE AND MAY BE AMENDED PRIOR TO THE TIME OF SALE. THIS TERM SHEET IS NOT AN OFFER TO SELL THESE SECURITIES AND IT IS NOT A SOLICITATION OF AN OFFER TO BUY THESE SECURITIES IN ANY JURISDICTION WHERE THE OFFER OR SALE IS NOT PERMITTED.
| 20 |
| Wells Fargo Commercial Mortgage Trust 2016-C32 | Certain Terms and Conditions |
| determination; and pending such determination, the rights of the controlling class will be exercised by the most senior control eligible certificates (which may only be any one of Class F or Class G), if any. | ||
| Sale of Defaulted Assets: | There will be no “fair value” purchase option. Instead, the pooling and servicing agreement will authorize each Special Servicer to sell defaulted mortgage loans serviced by such Special Servicer to the highest bidder in a manner generally similar to sales of REO properties. | |
| The sale of a defaulted loan for less than par plus accrued interest and certain other fees and expenses owed on the loan will be subject to consent or consultation rights of the directing certificateholder and/or Operating Advisor and, in the case of the 10 South LaSalle Street mortgage loan, consultation rights of the holders of the relatedpari passu companion loan, as described in the Preliminary Prospectus. | ||
| In the case of the 10 South LaSalle Street whole loan, pursuant to the related intercreditor agreement and the pooling and servicing agreement, if the applicable Special Servicer offers to sell to any person (or offers to purchase) for cash such mortgage loan during such time as the related whole loan constitutes a defaulted mortgage loan, then in connection with any such sale, such Special Servicer is required to sell both the mortgage loan and the relatedpari passu companion loan as a single whole loan. | ||
| “As-Is” Appraisals: | Appraisals must be conducted on an “as-is” basis, and must be no more than 9 months old, for purposes of determining Appraisal Reduction Amounts, market value in connection with REO sales, etc. Required appraisals may consist of updates of prior appraisals. Internal valuations by the applicable Special Servicer are permitted if the principal balance of a mortgage loan is less than $2,000,000. | |
| Operating Advisor: | The Operating Advisor will perform certain review duties if a Control Termination Event has occurred and is continuing, which will generally include a limited annual review of, and the delivery of a report regarding, certain actions of each Special Servicer with respect to the resolution and/or liquidation of specially serviced loans to the Certificate Administrator. The review and report generally will be based on any asset status reports and additional information delivered to the Operating Advisor by each Special Servicer. In addition, if a Control Termination Event has occurred and is continuing, each Special Servicer must seek to consult with the Operating Advisor (in addition to the directing certificateholder if no Consultation Termination Event has occurred and is continuing) in connection with material special servicing actions with respect to specially serviced loans serviced by such Special Servicer. Furthermore, under certain circumstances, but only if a Consultation Termination Event has occurred and is continuing, the Operating Advisor may recommend the replacement of a Special Servicer, in which case the Certificate Administrator will deliver notice of such recommendation to the certificateholders, and certificateholders with specified percentages of the voting rights may direct the replacement of such Special Servicer at their expense. | |
| If a Consultation Termination Event has occurred and is continuing, the Operating Advisor may be removed and replaced without cause upon the affirmative direction of certificate owners holding not less than 75% of the appraisal-reduced voting rights of all Principal Balance Certificates, following a proposal from certificate owners holding not less than 25% of the appraisal-reduced voting rights of all certificates. The certificateholders who initiate a vote on a termination and replacement of the Operating Advisor without cause must cause DBRS, KBRA and Moody’s to confirm the then-current ratings of the certificates (or decline to review the matter) and cause the payment of the fees and expenses incurred in the replacement. The Operating Advisor generally may be discharged from its duties if and when the Class A-1, A-2, A-3, A-4, A-SB, A-S, B, C, D and E Certificates are retired. | ||
| Asset Representations Reviewer: | The Asset Representations Reviewer will be required to review certain delinquent mortgage loans after a specified delinquency threshold has been exceeded (an “Asset Review Trigger”) and the required percentage of certificateholders vote to direct a review of such delinquent loans. An Asset Review Trigger will occur when either (1) mortgage loans with an aggregate outstanding principal balance of 25.0% or more of the aggregate outstanding principal balance of all of the mortgage loans (including any REO loans (or a portion of any REO loan in the case of a whole loan) held by the issuing entity as of the end of the applicable collection period are delinquent loans or (2) at least 15 mortgage loans are delinquent loans as of the end of the applicable collection period and the outstanding principal balance of such delinquent loans in the aggregate constitutes at least 20.0% of the aggregate outstanding principal balance of all of the mortgage loans (including any REO loans (or a portion of any REO loan in the case of a whole loan)) held by the issuing entity as of the end of the applicable collection period. See ”Pooling and Servicing Agreement—The Asset Representations Reviewer—Asset Review” in the Preliminary Prospectus. | |
| The Asset Representations Reviewer may be terminated and replaced without cause. Upon (i) the written direction of certificateholders evidencing not less than 25% of the voting rights requesting a vote to terminate and replace the Asset Representations Reviewer with a proposed successor Asset Representations Reviewer that is an eligible asset reviewer, and (ii) payment |
THE INFORMATION IN THIS STRUCTURAL AND COLLATERAL TERM SHEET IS NOT COMPLETE AND MAY BE AMENDED PRIOR TO THE TIME OF SALE. THIS TERM SHEET IS NOT AN OFFER TO SELL THESE SECURITIES AND IT IS NOT A SOLICITATION OF AN OFFER TO BUY THESE SECURITIES IN ANY JURISDICTION WHERE THE OFFER OR SALE IS NOT PERMITTED.
| 21 |
| Wells Fargo Commercial Mortgage Trust 2016-C32 | Certain Terms and Conditions |
| by such holders to the certificate administrator of the reasonable fees and expenses to be incurred by the certificate administrator in connection with administering such vote, the certificate administrator will promptly provide notice to all certificateholders and the Asset Representations Reviewer of such request by posting such notice on its internet website, and by mailing such notice to all certificateholders and the Asset Representations Reviewer. Upon the written direction of certificateholders evidencing at least 75% of a certificateholder quorum, the trustee will terminate all of the rights and obligations of the Asset Representations Reviewer under the pooling and servicing agreement by written notice to the Asset Representations Reviewer, and the proposed successor Asset Representations Reviewer will be appointed. See “Pooling and Servicing Agreement—The Asset Representations Reviewer” in the Preliminary Prospectus. | ||
| Dispute Resolution Provisions: | The mortgage loan sellers will be subject to the dispute resolution provisions set forth in the pooling and servicing agreement to the extent those provisions are triggered with respect to any mortgage loan sold to the depositor by a mortgage loan seller and such mortgage loan seller will be obligated under the related mortgage loan purchase agreement to comply with all applicable provisions and to take part in any mediation or arbitration proceedings that may result. | |
| Generally, in the event that a Repurchase Request (as defined in the Preliminary Prospectus) is not “Resolved” (as defined below) within 180 days after the related mortgage loan seller receives such Repurchase Request, then the enforcing servicer will be required to send a notice to the “Initial Requesting Certificateholder” (if any) indicating the enforcing servicer’s intended course of action with respect to the Repurchase Request. If (a) the enforcing servicer’s intended course of action with respect to the Repurchase Request does not involve pursuing further action to exercise rights against the related mortgage loan seller with respect to the Repurchase Request and the Initial Requesting Certificateholder, if any, or any other certificateholder or certificate owner wishes to exercise its right to refer the matter to mediation (including nonbinding arbitration) or arbitration, or (b) the enforcing servicer’s intended course of action is to pursue further action to exercise rights against the related mortgage loan seller with respect to the Repurchase Request but the Initial Requesting Certificateholder, if any, or any other certificateholder or certificate owner does not agree with the dispute resolution method selected by the enforcing servicer, then the Initial Requesting Certificateholder, if any, or such other certificateholder or certificate owner may deliver a written notice to the applicable Special Servicer indicating its intent to exercise its right to refer the matter to either mediation or arbitration. | ||
| “Resolved” means, with respect to a Repurchase Request, (i) that any Material Defect has been cured, (ii) the related mortgage loan has been repurchased in accordance with the related mortgage loan purchase agreement, (iii) a mortgage loan has been substituted for the related mortgage loan in accordance with the related mortgage loan purchase agreement, (iv) the applicable mortgage loan seller makes a Loss of Value Payment, (v) a contractually binding agreement is entered into between the enforcing servicer, on behalf of the issuing entity, and the related mortgage loan seller that settles the related mortgage loan seller’s obligations under the related mortgage loan purchase agreement, or (vi) the related mortgage loan is no longer property of the issuing entity as a result of a sale or other disposition in accordance with the pooling and servicing agreement. See “Pooling and Servicing Agreement—Dispute Resolution Provisions” in the Preliminary Prospectus. | ||
| Investor Communications: | The certificate administrator is required to include on any Form 10–D any request received from a certificateholder to communicate with other certificateholders related to certificateholders exercising their rights under the terms of the pooling and servicing agreement. Any certificateholder wishing to communicate with other certificateholders regarding the exercise of its rights under the terms of the Pooling and Servicing Agreement will be able to deliver a written request signed by an authorized representative of the requesting investor to the certificate administrator. | |
| Certain Fee Offsets: | If a workout fee is earned by a Special Servicer following a loan default with respect to any mortgage loan that it services, then certain limitations will apply based on modification fees paid by the borrower. The modification fee generally must not exceed 1% of the principal balance of the loan as modified in any 12-month period. In addition, if the loan re-defaults, any subsequent workout fee on that loan must be reduced by a portion of the modification fees paid by the borrower in the previous 12-months. Likewise, liquidation fees collected in connection with a liquidation or partial liquidation of a mortgage loan must be reduced by a portion of the modification fees paid by the borrower in the previous 12 months. | |
| Deal Website: | The Certificate Administrator will be required to maintain a deal website which will include, among other items: (a) summaries of asset status reports prepared by each Special Servicer, (b) inspection reports, (c) appraisals, (d) various “special notices” described in the Preliminary Prospectus, (e) the “Investor Q&A Forum” and (f) a voluntary “Investor Registry”. Investors may access the deal website following execution of a certification and confidentiality agreement. |
THE INFORMATION IN THIS STRUCTURAL AND COLLATERAL TERM SHEET IS NOT COMPLETE AND MAY BE AMENDED PRIOR TO THE TIME OF SALE. THIS TERM SHEET IS NOT AN OFFER TO SELL THESE SECURITIES AND IT IS NOT A SOLICITATION OF AN OFFER TO BUY THESE SECURITIES IN ANY JURISDICTION WHERE THE OFFER OR SALE IS NOT PERMITTED.
| 22 |
| Wells Fargo Commercial Mortgage Trust 2016-C32 | Certain Terms and Conditions |
| Initial Majority Controlling Class Certificateholder: | It is expected that Rialto CMBS VIII, LLC or another affiliate of Rialto Capital Advisors, LLC will be the initial majority controlling class certificateholder. | |
| Whole Loan: | The mortgaged property identified on Annex A-1 to the Preliminary Prospectus as 10 South LaSalle Street secures both a mortgage loan to be included in the trust fund and one other mortgage loan that will not be included in the trust fund, which will bepari passu in right of payment with the mortgage loan included in the trust fund. We refer to such group of mortgage loans as a “whole loan”. The 10 South LaSalle Street whole loan will be principally serviced under the pooling and servicing agreement for this WFCM 2016-C32 securitization. | |
| As of the closing date, the companion loan in such whole loan will be held by the party identified above under “IV. Characteristics of the Mortgage Pool—B. Summary of thePari Passu Whole Loan”. |
THE INFORMATION IN THIS STRUCTURAL AND COLLATERAL TERM SHEET IS NOT COMPLETE AND MAY BE AMENDED PRIOR TO THE TIME OF SALE. THIS TERM SHEET IS NOT AN OFFER TO SELL THESE SECURITIES AND IT IS NOT A SOLICITATION OF AN OFFER TO BUY THESE SECURITIES IN ANY JURISDICTION WHERE THE OFFER OR SALE IS NOT PERMITTED.
| 23 |
NORTH DALLAS RETAIL PORTFOLIO
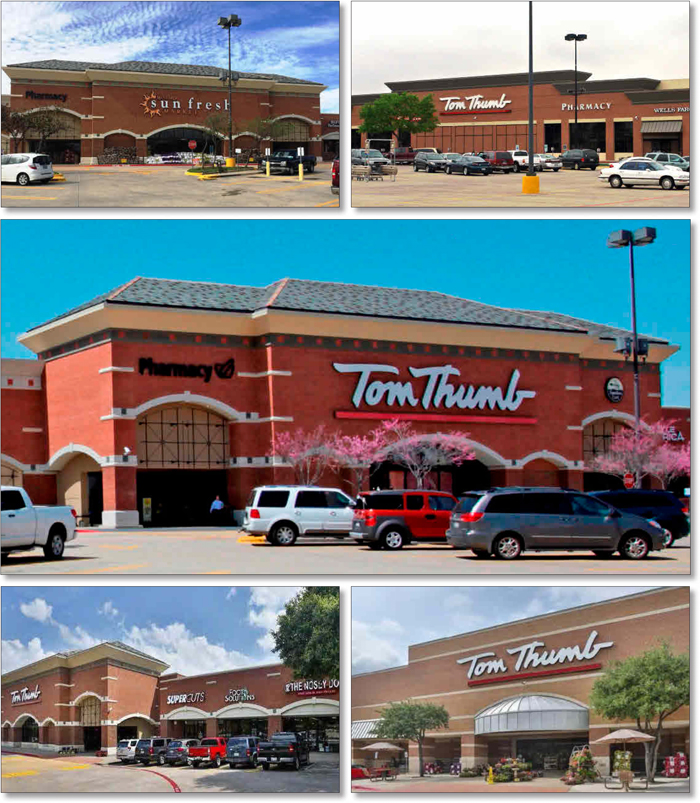
THE INFORMATION IN THIS STRUCTURAL AND COLLATERAL TERM SHEET IS NOT COMPLETE AND MAY BE AMENDED PRIOR TO THE TIME OF SALE. THIS TERM SHEET IS NOT AN OFFER TO SELL THESE SECURITIES AND IT IS NOT A SOLICITATION OF AN OFFER TO BUY THESE SECURITIES IN ANY JURISDICTION WHERE THE OFFER OR SALE IS NOT PERMITTED.
| 24 |
NORTH DALLAS RETAIL PORTFOLIO

THE INFORMATION IN THIS STRUCTURAL AND COLLATERAL TERM SHEET IS NOT COMPLETE AND MAY BE AMENDED PRIOR TO THE TIME OF SALE. THIS TERM SHEET IS NOT AN OFFER TO SELL THESE SECURITIES AND IT IS NOT A SOLICITATION OF AN OFFER TO BUY THESE SECURITIES IN ANY JURISDICTION WHERE THE OFFER OR SALE IS NOT PERMITTED.
| 25 |
| No. 1 – North Dallas Retail Portfolio | ||||||||
| Loan Information | Property Information | |||||||
| Mortgage Loan Seller: | Wells Fargo Bank, National Association | Single Asset/Portfolio: | Portfolio | |||||
| Credit Assessment (DBRS/KBRA/Moody’s): | NR/NR/NR | Property Type: | Retail | |||||
| Original Principal Balance: | $81,325,000 | Specific Property Type: | Anchored | |||||
| Cut-off Date Principal Balance: | $81,325,000 | Location: | Various – See Table | |||||
| % of Initial Pool Balance: | 8.5% | Size: | 673,382 SF | |||||
| Loan Purpose: | Acquisition | Cut-off Date Principal Balance Per SF: | $120.77 | |||||
| Borrower Names(1): | Various | Year Built/Renovated: | Various – See Table | |||||
| Sponsor: | Annaly Commercial Real Estate Group, Inc. | Title Vesting: | Fee | |||||
| Mortgage Rate: | 4.610% | Property Manager: | Pine Tree Commercial Realty, LLC | |||||
| Note Date: | November 25, 2015 | 4th Most Recent Occupancy (As of): | 92.8% (12/31/2011) | |||||
| Anticipated Repayment Date: | NAP | 3rd Most Recent Occupancy (As of): | 96.8% (12/31/2012) | |||||
| Maturity Date: | December 11, 2025 | 2nd Most Recent Occupancy(As of): | 97.1% (12/31/2013) | |||||
| IO Period: | 120 months | Most Recent Occupancy (As of): | 98.1% (12/31/2014) | |||||
| Loan Term (Original): | 120 months | Current Occupancy (As of): | 97.0% (11/25/2015) | |||||
| Seasoning: | 2 months | |||||||
| Amortization Term (Original): | NAP | Underwriting and Financial Information: | ||||||
| Loan Amortization Type: | Interest-only, Balloon | |||||||
| Interest Accrual Method: | Actual/360 | 4th Most Recent NOI (As of): | $7,047,664 (12/31/2012) | |||||
| Call Protection: | L(26),D(90),O(4) | 3rd Most Recent NOI (As of): | $7,464,604 (12/31/2013) | |||||
| Lockbox Type: | Hard/Springing Cash Management | 2nd Most Recent NOI (As of): | $7,893,273 (12/31/2014) | |||||
| Additional Debt: | None | Most Recent NOI (As of): | $7,918,175 (TTM 7/31/2015) | |||||
| Additional Debt Type: | NAP | |||||||
| U/W Revenues: | $10,995,451 | |||||||
| Escrows and Reserves(2): | U/W Expenses: | $3,607,237 | ||||||
| U/W NOI: | $7,388,304 | |||||||
| Type: | Initial | Monthly | Cap (If Any) | U/W NCF: | $6,729,454 | |||
| Taxes | $154,383 | $154,383 | NAP | U/W NOI DSCR: | 1.94x | |||
| Insurance | $0 | Springing | NAP | U/W NCF DSCR: | 1.77x | |||
| Replacement Reserves | $966,100 | $15,712 | NAP | U/W NOI Debt Yield: | 9.1% | |||
| TI/LC Reserve | $0 | Springing | NAP | U/W NCF Debt Yield: | 8.3% | |||
| Deferred Maintenance | $97,250 | $0 | NAP | As-Is Appraised Value: | $128,640,000 | |||
| Environmental Reserve | $148,330 | $0 | NAP | As-Is Appraisal Valuation Date: | October 22, 2015 | |||
| Outstanding TI/LC Reserve | $88,000 | $0 | NAP | Cut-off Date LTV Ratio: | 63.2% | |||
| Cantina Laredo Reserve | $271,703 | $0 | NAP | LTV Ratio at Maturity or ARD: | 63.2% | |||
| (1) | See “The Borrowers” section. |
| (2) | See “Escrows” section. |
The Mortgage Loan. The mortgage loan (the “North Dallas Retail Portfolio Mortgage Loan”) is evidenced by a single promissory note that is secured by a first mortgage encumbering eight anchored retail properties located in Texas (the “North Dallas Retail Portfolio Properties”). The North Dallas Retail Portfolio Mortgage Loan was originated on November 25, 2015 by Wells Fargo Bank, National Association. The North Dallas Retail Portfolio Mortgage Loan had an original principal balance of $81,325,000, has an outstanding principal balance as of the Cut-off Date of $81,325,000 and accrues interest at an interest rate of 4.610%per annum. The North Dallas Retail Portfolio Mortgage Loan had an initial term of 120 months, has a remaining term of 118 months as of the Cut-off Date and requires interest-only payments through the term of the North Dallas Retail Portfolio Mortgage Loan. The North Dallas Retail Portfolio Mortgage Loan matures on December 11, 2025.
Following the lockout period, the borrower has the right to defease the North Dallas Retail Portfolio Mortgage Loan in whole, or in part (see “Partial Release” section), on any day before September 11, 2025. In addition, the North Dallas Retail Portfolio Mortgage Loan is prepayable without penalty on or after September 11, 2025.
THE INFORMATION IN THIS STRUCTURAL AND COLLATERAL TERM SHEET IS NOT COMPLETE AND MAY BE AMENDED PRIOR TO THE TIME OF SALE. THIS TERM SHEET IS NOT AN OFFER TO SELL THESE SECURITIES AND IT IS NOT A SOLICITATION OF AN OFFER TO BUY THESE SECURITIES IN ANY JURISDICTION WHERE THE OFFER OR SALE IS NOT PERMITTED.
| 26 |
NORTH DALLAS RETAIL PORTFOLIO
Sources and Uses(1)
| Sources | Uses | |||||||
| Original loan amount | $81,325,000 | 66.4% | Purchase price | $119,950,000 | 98.0% | |||
| Sponsor’s new cash contribution | 41,127,875 | 33.6% | Reserves | 1,725,766 | 1.4% | |||
| Closing costs | 777,109 | 0.6 | ||||||
| Total Sources | $122,452,875 | 100.0% | Total Uses | $122,452,875 | 100.0% |
| (1) | The North Dallas Retail Portfolio Properties were previously securitized in the BACM 2007-3 transaction. |
The Properties.The North Dallas Retail Portfolio Properties are comprised of the fee interests in eight grocer-anchored retail properties totaling 673,382 rentable square feet. Seven of the North Dallas Retail Portfolio Properties are anchored by Tom Thumb and one is anchored by Minyard Sun Market (“Minyards”). Built between 1992 and 1999, the North Dallas Retail Portfolio Properties are all located north of the Dallas central business district in the Dallas-Fort Worth-Arlington metropolitan statistical area. The grocer anchors, on an average basis, comprise approximately 73.4% of the net rentable area of each North Dallas Retail Portfolio Property, and no tenant comprises more than 1.0% of the net rentable area (except for the grocers) of the North Dallas Retail Portfolio Properties. Approximately 47 of the North Dallas Retail Portfolio Properties’ current tenants (comprising 74.8% of the annual underwritten base rent) have been in occupancy for at least 15 years, and the North Dallas Portfolio Properties have exhibited an average occupancy rate of 96.5% over the last eight years and the anchors have been in occupancy for an average of 19.7 years. The North Dallas Retail Portfolio Properties were 97.0% occupied by 84 tenants as of November 25, 2015.
Tom Thumb was founded in 1948 in Texas and operates 61 stores in the state. Tom Thumb is owned by Safeway, Inc. which completed its merger with Albertsons in January 2015. The merger created a diversified network that includes 2,230 stores, 27 distribution facilities and 19 manufacturing plants with over 250,000 employees located in 34 states. The merged company now includes well-known grocery brands such as Safeway, Vons, Randall’s, Tom Thumb, Albertsons, ACME and Jewel-Osco among others. With the merger, it makes Albertsons/Safeway the largest traditional grocer in the Dallas area by market share and store count, ahead of Kroger. In order to secure approval of the merger, Albertsons/Safeway was required to divest 168 stores to four separate buyers. One of these stores, Minyards is located at the Heritage Heights property. Minyards purchased eight Albertsons and four Tom Thumb area stores as part of the divestiture.
The following table presents certain information relating to the North Dallas Retail Portfolio Properties:
| Property Name – Location | Allocated Cut-off Date Principal Balance | % of Portfolio Cut-off Date Principal Balance | Occupancy | Year Built/ Renovated | Net Rentable Area (SF) | Appraised Value | Allocated LTV |
| Heritage Heights – Grapevine, TX | $13,250,000 | 16.3% | 98.2% | 1999/2006 | 85,613 | $20,770,000 | 63.8% |
| The Highlands – Flower Mound, TX | $12,875,000 | 15.8% | 96.4% | 1998/NAP | 90,547 | $20,330,000 | 63.3% |
| Josey Oaks Crossing – Carrollton, TX | $12,100,000 | 14.9% | 97.9% | 1995/NAP | 82,320 | $19,300,000 | 62.7% |
| Hunter’s Glen Crossing – Plano, TX | $11,500,000 | 14.1% | 97.0% | 1994/NAP | 93,547 | $17,960,000 | 64.0% |
| Flower Mound Crossing – Flower Mound, TX | $9,200,000 | 11.3% | 100.0% | 1995/2006 | 81,582 | $14,660,000 | 62.8% |
| Park West Plaza – Grapevine, TX | $9,000,000 | 11.1% | 98.5% | 1993/2005 | 82,977 | $13,920,000 | 64.7% |
| Cross Timbers Court – Flower Mound, TX | $7,700,000 | 9.5% | 94.4% | 1992/2007 | 77,367 | $12,290,000 | 62.7% |
| 14th Street Market – Plano, TX | $5,700,000 | 7.0% | 93.6% | 1995/NAP | 79,429 | $9,410,000 | 60.6% |
| Total/Weighted Average | $81,325,000 | 100.0% | 97.0% | 673,382 | $128,640,000 | 63.2% |
THE INFORMATION IN THIS STRUCTURAL AND COLLATERAL TERM SHEET IS NOT COMPLETE AND MAY BE AMENDED PRIOR TO THE TIME OF SALE. THIS TERM SHEET IS NOT AN OFFER TO SELL THESE SECURITIES AND IT IS NOT A SOLICITATION OF AN OFFER TO BUY THESE SECURITIES IN ANY JURISDICTION WHERE THE OFFER OR SALE IS NOT PERMITTED.
| 27 |
NORTH DALLAS RETAIL PORTFOLIO
The following table presents certain information relating to the tenancies at the North Dallas Retail Portfolio Properties:
Major Tenants
| Tenant Name | Credit Rating Moody’s/ | Tenant NRSF | % of NRSF | Annual U/W Base Rent PSF | Annual U/W Base Rent | % of Total Annual U/W Base Rent | Sales PSF(2) | Occupancy Cost(2) | Lease Expiration Date |
| Major Tenants | |||||||||
| Tom Thumb | NR/B1/NR | 431,834 | 64.1% | $7.65 | $3,304,626 | 40.9% | $319(3) | 3.5%(3) | Various(4) |
| Minyard Sun Market | NR/NR/NR | 62,139 | 9.2% | $11.45 | $711,492 | 8.8% | $355 | 4.4% | 4/30/2024 |
| Bank of America | A/Baa1/BBB+ | 2(5) | 0.0% | NAP | $243,150 | 3.0% | NAP | NAP | Various(6) |
| Starbucks | A/A2/A- | 7,039 | 1.0% | $27.04 | $190,348 | 2.4% | $568 | 5.7% | Various(7) |
| Wendy’s | NR/B2/B | 3(8) | 0.0% | NAP | $175,588 | 2.2% | (9) | 6.7%(9) | Various(10) |
| Total Major Tenants | 501,017 | 74.4% | $8.40(11) | $4,625,203 | 57.3% | ||||
| Non-Major Tenants | 152,322 | 22.6% | $21.07(12) | $3,449,431 | 42.7% | ||||
| Occupied Collateral Total | 653,339 | 97.0% | $11.35(13) | $8,074,634 | 100.0% | ||||
| Vacant Space | 20,043 | 3.0% | |||||||
| Collateral Total | 673,382 | 100.0% | |||||||
| (1) | Certain ratings are those of the parent company whether or not the parent guarantees the lease. |
| (2) | Sales PSF and Occupancy Cost are based on the trailing 12-month period ending December 2014. |
| (3) | Sales PSF and Occupancy Cost are based on the trailing 12-month periods ending December 2014, March 2015 and July 2015. See “Historical Tom Thumb/Minyard Sun Market Tenant Sales (PSF) and Occupancy Costs” section. |
| (4) | See “Anchor Tenants” table. |
| (5) | Bank of America leases two outparcels which are on ground leases where the tenant owns its own improvements. One square foot was assigned to each parcel. |
| (6) | $139,150 of Annual U/W Base Rent (1.7% of Annual U/W Base Rent) at the Josey Oaks Crossing property has a lease expiration date of May 31, 2024 and $104,000 of Annual U/W Base Rent (1.3% of Annual U/W Base Rent) at the Cross Timbers Court property has a lease expiration date of December 11, 2016. |
| (7) | Starbucks leases four parcels: 2,584 square feet (0.4% of net rentable area) on a lease that expires June 30, 2017; 1,600 square feet (0.2% of net rentable area) on a lease that expires on March 31, 2019; 1,518 square feet (0.2% of net rentable area) on a lease that expires September 30, 2018; and 1,337 square feet (0.2% of net rentable area) on a lease that expires January 31, 2019. |
| (8) | Wendy’s leases three outparcels which are on ground leases where the tenant owns its own improvements. One square foot was assigned to each parcel. |
| (9) | Sales PSF are not applicable. Average gross sales are $1.1 million for the two locations required to report sales (the Flower Mound Crossing and Heritage Heights properties). |
| (10) | $64,125 of Annual U/W Base Rent (0.8% of Annual U/W Base Rent) at the Flower Mound Crossing property has a lease expiration date of February 11, 2019; $60,499 of Annual U/W Base Rent (0.7% of Annual U/W Base Rent) at the Heritage Heights property has a lease expiration date of December 31, 2018; and $50,964 of the Annual U/W Base Rent (0.6% of Annual U/W Base Rent) at the Josey Oaks Crossing property has a lease expiration date of May 31, 2017. |
| (11) | Total Major Tenants Annual U/W Base Rent PSF excludes the Annual U/W Base Rent from ground leased outparcels for Bank of America and Wendy’s. |
| (12) | Non-Major Tenants Annual U/W Base Rent PSF excludes the Annual U/W Base Rent from ground leased outparcels. |
| (13) | Occupied Collateral Total Annual U/W Base Rent PSF excludes the Annual U/W Base Rent from ground leased outparcels. |
The following table presents certain information relating to the anchor tenancies at the North Dallas Retail Portfolio Properties:
Anchor Tenants(1)
| Property Name – Tenant Name | Tenant NRSF | % of Portfolio NRSF | Annual U/W Base Rent PSF | Annual U/W Base Rent | % of Total Annual U/W Base Rent | Lease Expiration Date |
| Heritage Heights – Minyard Sun Market | 62,139 | 9.2% | $11.45 | $711,492 | 8.8% | 4/30/2024 |
| The Highlands – Tom Thumb | 62,139 | 9.2% | $10.50 | $652,460 | 8.1% | 4/30/2024 |
| Hunter’s Glen Crossing – Tom Thumb | 72,090 | 10.7% | $7.50 | $540,675 | 6.7% | 11/2/2019 |
| Park West Plaza – Tom Thumb | 59,480 | 8.8% | $8.00 | $475,840 | 5.9% | 2/1/2020 |
| Flower Mound Crossing – Tom Thumb | 58,960 | 8.8% | $8.00 | $471,680 | 5.8% | 9/13/2016 |
| Cross Timbers Court – Tom Thumb | 62,132 | 9.2% | $7.00 | $434,924 | 5.4% | 2/29/2020 |
| Josey Oaks Crossing – Tom Thumb | 57,553 | 8.5% | $7.50 | $431,648 | 5.3% | 8/1/2020 |
| 14th Street Market – Tom Thumb | 59,480 | 8.8% | $5.00 | $297,400 | 3.7% | 2/28/2018 |
| Total/Weighted Average | 493,973 | 73.4% | $8.13 | $4,016,118 | 49.7% |
(1) See “Major Tenants” and “Historical Tom Thumb/Minyard Sun Market Tenant Sales (PSF) and Occupancy Cost” tables.
THE INFORMATION IN THIS STRUCTURAL AND COLLATERAL TERM SHEET IS NOT COMPLETE AND MAY BE AMENDED PRIOR TO THE TIME OF SALE. THIS TERM SHEET IS NOT AN OFFER TO SELL THESE SECURITIES AND IT IS NOT A SOLICITATION OF AN OFFER TO BUY THESE SECURITIES IN ANY JURISDICTION WHERE THE OFFER OR SALE IS NOT PERMITTED.
| 28 |
NORTH DALLAS RETAIL PORTFOLIO
Historical Tom Thumb/Minyard Sun Market Tenant Sales (PSF) and Occupancy Costs(1)
| Property Name | % of Portfolio Cut-off Date Principal Balance | 2012 | 2013 | 2014 | 3/31/2015 TTM | Current Occupancy Cost |
| Heritage Heights | 16.3% | $337 | $348 | $354 | $355 | 4.4% |
| The Highlands | 15.8% | $355 | $434 | $434 | $408 | 3.6% |
| Josey Oaks Crossing | 14.9% | $433 | $409 | $432(2) | $432(2) | 2.7% |
| Hunter’s Glen Crossing | 14.1% | $316 | $332 | $309 | $310(3) | 3.6% |
| Flower Mound Crossing | 11.3% | $323 | $270 | $239 | $239(4) | 5.1% |
| Park West Plaza | 11.1% | $359 | $375 | $375 | $377 | 2.9% |
| Cross Timbers Court | 9.5% | $281 | $267 | $250 | $243 | 3.9% |
| 14th Street Market | 7.0% | $271 | $246 | $235 | $229(5) | 3.6% |
| Total/Weighted Average | $333 | $335 | $328 | $324 | 3.7% |
| (1) | Historical Sales (PSF) and Occupancy Costs were provided by the borrower. |
| (2) | 2014 and TTM sales are based on the trailing 12-month period ending July 31, 2014 for the Josey Oaks Crossing property. |
| (3) | TTM sales are based on the trailing-12 month period ending May 31, 2015 for the Hunter’s Glen Crossing property. |
| (4) | TTM sales are based on the year-end 2014 period for the Flower Mound Crossing property. |
| (5) | TTM sales are based on the trailing 12-month period ending July 31, 2015 for the 14thStreet Market property. |
The following table presents certain information relating to the lease rollover schedule at the North Dallas Retail Portfolio Properties:
Lease Expiration Schedule(1)(2)
Year Ending December 31, | No. of Leases Expiring | Expiring NRSF | % of Total NRSF | Cumulative Expiring NRSF | Cumulative % of Total NRSF | Annual U/W Base Rent | % of Total Annual U/W Base Rent | Annual U/W Base Rent PSF(3) |
| MTM | 1 | 1,470 | 0.2% | 1,470 | 0.2% | $27,195 | 0.3% | $18.50 |
| 2016 | 12 | 76,652 | 11.4% | 78,122 | 11.6% | $905,989 | 11.2% | $10.46 |
| 2017 | 11 | 21,994 | 3.3% | 100,116 | 14.9% | $589,574 | 7.3% | $24.49 |
| 2018 | 10 | 70,303 | 10.4% | 170,419 | 25.3% | $662,623 | 8.2% | $7.52 |
| 2019 | 18 | 106,268 | 15.8% | 276,687 | 41.1% | $1,460,204 | 18.1% | $12.50 |
| 2020 | 20 | 208,346 | 30.9% | 485,033 | 72.0% | $1,956,377 | 24.2% | $9.39 |
| 2021 | 4 | 13,921 | 2.1% | 498,954 | 74.1% | $328,733 | 4.1% | $23.61 |
| 2022 | 1 | 4,530 | 0.7% | 503,484 | 74.8% | $81,540 | 1.0% | $18.00 |
| 2023 | 5 | 16,302 | 2.4% | 519,786 | 77.2% | $304,301 | 3.8% | $18.67 |
| 2024 | 6 | 129,857 | 19.3% | 649,643 | 96.5% | $1,640,284 | 20.3% | $11.22 |
| 2025 | 2 | 3,696 | 0.5% | 653,339 | 97.0% | $117,815 | 1.5% | $17.00 |
| 2026 | 0 | 0 | 0.0% | 653,339 | 97.0% | $0 | 0.0% | $0.00 |
| Thereafter | 0 | 0 | 0.0% | 653,339 | 97.0% | $0 | 0.0% | $0.00 |
| Vacant | 0 | 20,043 | 3.0% | 673,382 | 100.0% | $0 | 0.0% | $0.00 |
| Total/Weighted Average | 90 | 673,382 | 100.0% | $8,074,634 | 100.0% | $11.35 |
| (1) | Information obtained from the underwritten rent roll. |
| (2) | Certain tenants may have lease termination options that are exercisable prior to the originally stated expiration date of the subject lease and that are not considered in the Lease Expiration Table. |
| (3) | Weighted Average Annual U/W Base Rent PSF excludes vacant space and excludes rent attributed to nine tenants which are on ground leases and own their own improvements. They were each assigned one square foot. |
The following table presents historical occupancy percentages at the North Dallas Retail Portfolio Properties:
Historical Occupancy
12/31/2011(1) | 12/31/2012(1) | 12/31/2013(1) | 12/31/2014(1) | 11/25/2015(2) |
| 92.8% | 96.8% | 97.1% | 98.1% | 97.0% |
| (1) | Information obtained from the borrower. |
| (2) | Information obtained from the underwritten rent roll. |
THE INFORMATION IN THIS STRUCTURAL AND COLLATERAL TERM SHEET IS NOT COMPLETE AND MAY BE AMENDED PRIOR TO THE TIME OF SALE. THIS TERM SHEET IS NOT AN OFFER TO SELL THESE SECURITIES AND IT IS NOT A SOLICITATION OF AN OFFER TO BUY THESE SECURITIES IN ANY JURISDICTION WHERE THE OFFER OR SALE IS NOT PERMITTED.
| 29 |
NORTH DALLAS RETAIL PORTFOLIO
Operating History and Underwritten Net Cash Flow. The following table presents certain information relating to the historical operating performance and underwritten net cash flow at the North Dallas Retail Portfolio Properties:
Cash Flow Analysis
| 2012 | 2013 | 2014 | TTM 7/31/2015 | U/W | % of U/W Effective Gross Income | U/W $ per SF | |
| Base Rent | $7,773,029 | $8,163,046 | $8,350,452 | $8,431,700 | $8,074,634 | 73.4% | $11.99 |
| Grossed Up Vacant Space | 0 | 0 | 0 | 0 | 406,766 | 3.7 | 0.60 |
| Total Reimbursables | 2,626,407 | 2,724,087 | 2,759,794 | 2,752,132 | 2,939,219 | 26.7 | 4.36 |
| Other Income | 23,302 | 11,535 | 56,371 | 25,224 | 0 | 0.0 | 0.00 |
| Less Vacancy & Credit Loss | (14,861) | (1,610) | 0 | 0 | (425,078)(1) | (3.9) | (0.63) |
| Effective Gross Income | $10,407,877 | $10,897,058 | $11,166,617 | $11,209,056 | $10,995,541 | 100.0% | $16.33 |
| Total Operating Expenses | $3,360,213 | $3,432,454 | $3,273,344 | $3,290,881 | $3,607,237 | 32.8% | $5.36 |
|
|
|
|
|
|
| |
| Net Operating Income | $7,047,664 | $7,464,604 | $7,893,273 | $7,918,175 | $7,388,304 | 67.2% | $10.97 |
| TI/LC | 0 | 0 | 0 | 0 | 470,303 | 4.3 | 0.70 |
| Capital Expenditures | 0 | 0 | 0 | 0 | 188,547 | 1.7 | 0.28 |
| Net Cash Flow | $7,047,664 | $7,464,604 | $7,893,273 | $7,918,175 | $6,729,454 | 61.2% | $9.99 |
| NOI DSCR | 1.85x | 1.96x | 2.07x | 2.08x | 1.94x | ||
| NCF DSCR | 1.85x | 1.96x | 2.07x | 2.08x | 1.77x | ||
| NOI DY | 8.7% | 9.2% | 9.7% | 9.7% | 9.1% | ||
| NCF DY | 8.7% | 9.2% | 9.7% | 9.7% | 8.3% |
| (1) | The underwritten economic vacancy is 5.0%. The North Dallas Retail Portfolio Properties were 97.0% physically occupied as of November 25, 2015. |
Appraisals. As of the appraisal valuation date of October 22, 2015, the North Dallas Retail Portfolio Properties had an aggregate “as-is” appraised value of $128,640,000.
Environmental Matters. According to the Phase I environmental site assessments dated October 8, 2015, there were no recognized environmental conditions at the North Dallas Retail Portfolio Properties. There was one controlled recognized environmental condition (“CREC”) at the Hunter’s Glen Crossing property from a prior on-site dry cleaner (from 1994 to 2006); groundwater monitoring wells identified volatile organic compounds. Regulatory closure was issued in May 2009 and no further action was recommended. However, due to this CREC and due to the presence of onsite dry cleaners at the North Dallas Retail Portfolio Properties, an environmental insurance policy was obtained at closing with an aggregate limit of $9.0 million and a thirteen year term. See “Description of the Mortgage Pool—Mortgage Pool Characteristics—Environmental Considerations” in the Preliminary Prospectus.
Market Overview and Competition.The North Dallas Retail Portfolio Properties are located in Flower Mound, Grapevine, Plano and Carrollton, Texas. The North Dallas Retail Portfolio Properties are all located north of the Dallas central business district in the Dallas-Fort Worth-Arlington metropolitan statistical area. The Dallas-Fort Worth (“DFW”) retail market is reporting its strongest occupancy rate in fifteen years according to a third party market research report. According to a government agency, employment in DFW grew by nearly 21,100 jobs during third quarter 2015, and unemployment decreased by 10 basis points to 3.9%. DFW residents are a substantial consumer force, with a per capita income estimated at $50,076. According to third party market research firm, per capita income has grown by 6.6% over the last 12 months, and is expected to grow another 6.1% by third quarter 2016. With an estimated population of 6.9 million, the DFW metropolitan area is the fourth-largest metropolitan statistical area in the United States. The area’s population has grown by 8.2% since 2010, and growth of 7.1% is projected for 2015 to 2020, according to a third party market research firm. DFW’s population has an average age of 35 years and with most of the population (51.0%) between the ages of 20 and 54. DFW residents earn more than the national average, supporting an estimated median household income of $58,034 annually compared to $53,229 per year in the United States. Overall, the DFW retail market occupancy rate increased 50 basis points from third quarter 2014 to 92.9%. As of third quarter 2015, absorption totaled over 1.4 million square feet, with year-to-date net absorption totaling nearly five million square feet, reaching a seven-year high in the market. Dallas retail market rents ended the third quarter 2015 at $14.36 per square foot, triple-net. That compares to $14.19 per square foot, triple-net in the second quarter 2015, and $14.09 per square foot, triple-net as of third quarter 2014. This represents a 1.9% increase from a year ago.
Flower Mound
The Highlands, Flower Mound Crossing and Cross Timbers Court properties (36.6% of allocated loan amount combined) are all located in Flower Mound, Texas. Flower Mound is located in the West Dallas retail submarket, approximately 12 miles northwest of Dallas Fort Worth International Airport and 31 miles northwest of the Dallas central business district. According to the appraisals, the 2015 populations range from 72,278 to 115,461 people within a three-mile radius and 180,026 to 193,557 people within a five-mile radius. The population within a three-mile radius is expected to grow 1.3% by 2020 on average. The 2015 average household incomes range from $97,868 to $119,325 within a three-mile radius and $102,124 to $114,550 within a five-mile radius. According to a third party market research report, the Flower Mound properties are located in the West Dallas retail submarket of the Dallas retail market. As of the third quarter 2015, the West Dallas submarket reported total inventory of 1,785 retail properties totaling approximately 15.0 million square feet with a 3.0% vacancy rate and average asking rent of $15.29, per square foot, triple-net.
THE INFORMATION IN THIS STRUCTURAL AND COLLATERAL TERM SHEET IS NOT COMPLETE AND MAY BE AMENDED PRIOR TO THE TIME OF SALE. THIS TERM SHEET IS NOT AN OFFER TO SELL THESE SECURITIES AND IT IS NOT A SOLICITATION OF AN OFFER TO BUY THESE SECURITIES IN ANY JURISDICTION WHERE THE OFFER OR SALE IS NOT PERMITTED.
| 30 |
NORTH DALLAS RETAIL PORTFOLIO
Grapevine
The Heritage Heights and Park West Plaza properties (27.4% of allocated loan amount combined) are both located in Grapevine, Texas. Grapevine is located in the Mid-Cities retail submarket, approximately 7 miles northwest of Dallas Fort Worth International Airport and 22 miles northwest of the Dallas central business district. According to the appraisals, the 2015 populations range from 46,659 to 72,055 within a three-mile radius and 103,699 to 182,758 people within a five-mile radius. The population within a three-mile radius is expected to grow 1.3% by 2020 on average. The 2015 average household incomes range from $110,364 to $113,451 within a three-mile radius and $102,209 to $133,272 within a five-mile radius. According to a third party market research report, the Grapevine properties are located in the Mid-Cities retail submarket of the Dallas retail market. As of the third quarter 2015, the Mid-Cities submarket reported total inventory of 2,891 retail properties totaling approximately 27.2 million square feet with a 2.9% vacancy rate and average asking rent of $14.14, per square foot, triple-net.
Plano
The Hunter’s Glen Crossing and 14th Street Market properties (21.1% of allocated loan amount combined) are both located in Plano, Texas. Plano is located in the Far North Dallas retail submarket, approximately 30 miles northeast of Dallas Fort Worth International Airport and 20 miles northeast of the Dallas central business district. According to the appraisals, the 2015 populations range from 83,202 to 133,214 within the three-mile radius and 251,496 to 297,672 people within a five-mile radius. The population within a three-mile radius is expected to grow 1.2% by 2020 on average. The 2015 average household incomes range from $90,937 to $126,025 and $95,075 to $119,908 within a five-mile radius. According to a third party market research report, the Plano properties are located in the Far North Dallas retail submarket of the Dallas retail market. As of the third quarter 2015, the Far North Dallas submarket reported total inventory of 2,593 retail properties totaling approximately 26.0 million square feet with a 3.5% vacancy rate and average asking rent of $16.84, per square foot, triple-net.
Carrollton
The Josey Oaks Crossing property (14.9% of allocated loan amount combined) is located in Carrollton, Texas. The Josey Oaks Crossing property is located in the North Central Dallas retail submarket, approximately 16.6 miles north of Dallas Fort Worth International Airport and 18.5 miles north of the Dallas central business district. According to the appraisal, the 2015 population and average household income within a three and five-mile radii is 120,227 and 255,983, and $91,366 and $95,320, respectively. The population within a three-mile radius is expected to grow 1.6% by 2020. According to a third party market research report, the Josey Oaks Crossing property is located in the North Central Dallas retail submarket of the Dallas retail market. As of the third quarter 2015, the North Central Dallas submarket reported total inventory of 1,125 retail properties totaling approximately 15.1 million square feet with a 3.3% vacancy rate and average asking rent of $17.13, per square foot, triple-net.
The Borrowers. The borrowers are eight separate Delaware limited liability companies and single purpose entities each with two independent directors. Legal counsel to the borrower delivered a non-consolidation opinion in connection with the origination of the North Dallas Retail Portfolio Mortgage Loan. ACREG Investment Holdings LLC, is the guarantor of certain nonrecourse carveouts under the North Dallas Retail Portfolio Mortgage Loan.
The Sponsor. The sponsor is Annaly Commercial Real Estate Group Inc., a wholly-owned subsidiary of Annaly Capital Management, Inc. (“Annaly”). Founded in 1997 as a real estate investment trust (“REIT”), Annaly is a leading mortgage REIT listed on the New York Stock Exchange. Annaly’s principal business objective is to generate net income for distribution to shareholders through the selection and management of its investments. As of September 30, 2015, Annaly owned $2.9 billion of real estate debt and equity positions and had a market capitalization of $8.5 billion as of January 15, 2016.
Escrows. The loan documents provide for an upfront reserve in the amount of $154,383 for real estate taxes, $966,100 for replacement reserves, $97,250 for deferred maintenance, $148,330 for environmental insurance premiums, $88,000 for outstanding tenant improvements and leasing commissions (“TI/LCs”) for Texas Health Resources at the 14th Street Market property and $271,703 for gap rent and outstanding TI/LCs for Cantina Laredo at the Heritage Heights property. The loan documents provide for ongoing monthly reserves in the amount of $154,383 for real estate taxes and $15,712 for replacement reserves. Ongoing monthly reserves for insurance are not required as long as (i) no event of default has occurred and is continuing; (ii) the North Dallas Retail Portfolio Properties are covered by an acceptable blanket insurance policy; and (iii) the borrower provides the lender with evidence of renewal of the policy and timely proof of payment of the insurance premiums. Upon the occurrence of a Cash Trap Event Period, ongoing monthly reserves for TI/LCs are required. Deposits to the TI/LC reserve shall be suspended at any time that such reserve has a balance equal to or greater than $3.00 per square foot provided no event of default has occurred and is continuing and the North Dallas Retail Portfolio Mortgage Loan maintains a minimum net cash flow debt yield of 5.25% for two consecutive calendar quarters.
Lockbox and Cash Management.The North Dallas Retail Portfolio Mortgage Loan requires a lender-controlled lockbox account, which is already in place, and that the borrower direct the tenants to pay its rent directly into such lockbox account. The loan documents also require that all rents received by the borrower or property manager be deposited into the lockbox account within three business days of receipt. Prior to the occurrence of a Cash Trap Event Period, all funds are required to be distributed to the borrower. During a Cash Trap Event Period, all funds are required to be swept to a lender-controlled cash management account.
A “Cash Trap Event Period” will commence upon (i) the occurrence and continuance of an event of default; or (ii) the net cash flow debt yield being less than 6.5% for two consecutive calendar quarters. A Cash Trap Event Period will expire, with regard to clause (i), upon the cure of such event of default; and with regard to clause (ii), upon the net cash flow debt yield being equal to or greater than 8.4% for two consecutive calendar quarters.
THE INFORMATION IN THIS STRUCTURAL AND COLLATERAL TERM SHEET IS NOT COMPLETE AND MAY BE AMENDED PRIOR TO THE TIME OF SALE. THIS TERM SHEET IS NOT AN OFFER TO SELL THESE SECURITIES AND IT IS NOT A SOLICITATION OF AN OFFER TO BUY THESE SECURITIES IN ANY JURISDICTION WHERE THE OFFER OR SALE IS NOT PERMITTED.
| 31 |
NORTH DALLAS RETAIL PORTFOLIO
Property Management.The North Dallas Retail Portfolio Properties are managed by Pine Tree Commercial Realty, LLC.
Assumption. The borrower has the two-time right to transfer the North Dallas Retail Portfolio Properties, provided that no event of default has occurred and is continuing and certain other conditions are satisfied, including (i) the lender’s reasonable determination that the proposed transferee and guarantor satisfy the lender’s credit review and underwriting standards, taking into consideration transferee experience, financial strength and general business standing; (ii) execution of a recourse guaranty and an environmental indemnity by an affiliate of the transferee; and (iii) if requested by the lender, rating agency confirmation from DBRS, KBRA and Moody’s that the transfer will not result in a downgrade, withdrawal or qualification of the respective ratings assigned to the Series 2016-C32 Certificates.
Partial Release.Following the lockout period, the borrower is permitted to partially release any of the North Dallas Retail Portfolio Properties in connection with a partial defeasance (and a bona-fide arms’-length sale), subject to certain conditions including (i) the principal balance of the North Dallas Retail Portfolio Mortgage Loan is reduced by (a) 110% of the allocated loan amount for the Cross Timbers Court, Heritage Heights, 14th Street Market and Hunter’s Glen Crossing properties (if any such property is the released property) and (b) 120% of the allocated loan balance for The Highlands, Josey Oaks Crossing, Park West Plaza and the Flower Mound Crossing properties (if any such property is the released property); (ii) the loan-to-value ratio with respect to the remaining properties will be no greater than 63.2%; (iii) the debt service coverage ratio with respect to the remaining properties will be no less than the greater of 1.80x and the debt service coverage ratio immediately prior to the release; (iv) the net cash flow debt yield with respect to the remaining properties will be no less than the greater of 8.3% and the net cash flow debt yield immediately prior to the release; (v) the lender receives rating agency confirmation from DBRS, KBRA and Moody’s that the release will not result in a downgrade, withdrawal or qualification of the respective ratings assigned to the Series 2016-C32 Certificates; and (vi) the lender receives a legal opinion that the release satisfies REMIC requirements.
Free Release. The partial release of a certain unimproved parcel on the Heritage Heights property is permitted, subject to certain conditions, including (i) if required by lender, rating agency confirmation from DBRS, KBRA and Moody’s that the release will not result in a downgrade, withdrawal or qualification of the respective ratings assigned to the Series 2016-C32 Certificates; and (ii) an opinion of counsel that the REMIC trust will not fail to maintain its REMIC status due to the unimproved property free release, among other things. No value or income was attributed to this vacant unimproved parcel.
Real Estate Substitution.Not permitted.
Subordinate and Mezzanine Indebtedness.None.
Additional Indebtedness.The loan documents permit the pledge of a direct or indirect interest in an upper tier entity (PTCR TT Portfolio, LLC or its affiliated owners) and non-controlling interests in the borrower if the pledgor owns a direct or indirect interest in real property other than the North Dallas Retail Portfolio Properties, subject to certain additional conditions, including no change of control to the parties other than PTCR TT Portfolio, LLC, or its affiliates and so long as the repayment of the debt secured by the pledge is not specifically tied to the cash flow from the North Dallas Retail Portfolio Properties unless the cash flow pledge includes properties in addition to the North Dallas Retail Portfolio Properties.
Ground Lease. None.
Terrorism Insurance.The loan documents require that the “all risk” insurance policy required to be maintained by the borrower provide coverage for terrorism in an amount equal to the full replacement cost of the North Dallas Retail Portfolio Properties. The loan documents also require business interruption insurance covering no less than the 18-month period following the occurrence of a casualty event, together with a six-month extended period of indemnity.
THE INFORMATION IN THIS STRUCTURAL AND COLLATERAL TERM SHEET IS NOT COMPLETE AND MAY BE AMENDED PRIOR TO THE TIME OF SALE. THIS TERM SHEET IS NOT AN OFFER TO SELL THESE SECURITIES AND IT IS NOT A SOLICITATION OF AN OFFER TO BUY THESE SECURITIES IN ANY JURISDICTION WHERE THE OFFER OR SALE IS NOT PERMITTED.
| 32 |
(THIS PAGE INTENTIONALLY LEFT BLANK)
THE INFORMATION IN THIS STRUCTURAL AND COLLATERAL TERM SHEET IS NOT COMPLETE AND MAY BE AMENDED PRIOR TO THE TIME OF SALE. THIS TERM SHEET IS NOT AN OFFER TO SELL THESE SECURITIES AND IT IS NOT A SOLICITATION OF AN OFFER TO BUY THESE SECURITIES IN ANY JURISDICTION WHERE THE OFFER OR SALE IS NOT PERMITTED.
| 33 |
MARRIOTT MELVILLE LONG ISLAND

THE INFORMATION IN THIS STRUCTURAL AND COLLATERAL TERM SHEET IS NOT COMPLETE AND MAY BE AMENDED PRIOR TO THE TIME OF SALE. THIS TERM SHEET IS NOT AN OFFER TO SELL THESE SECURITIES AND IT IS NOT A SOLICITATION OF AN OFFER TO BUY THESE SECURITIES IN ANY JURISDICTION WHERE THE OFFER OR SALE IS NOT PERMITTED.
| 34 |
MARRIOTT MELVILLE LONG ISLAND
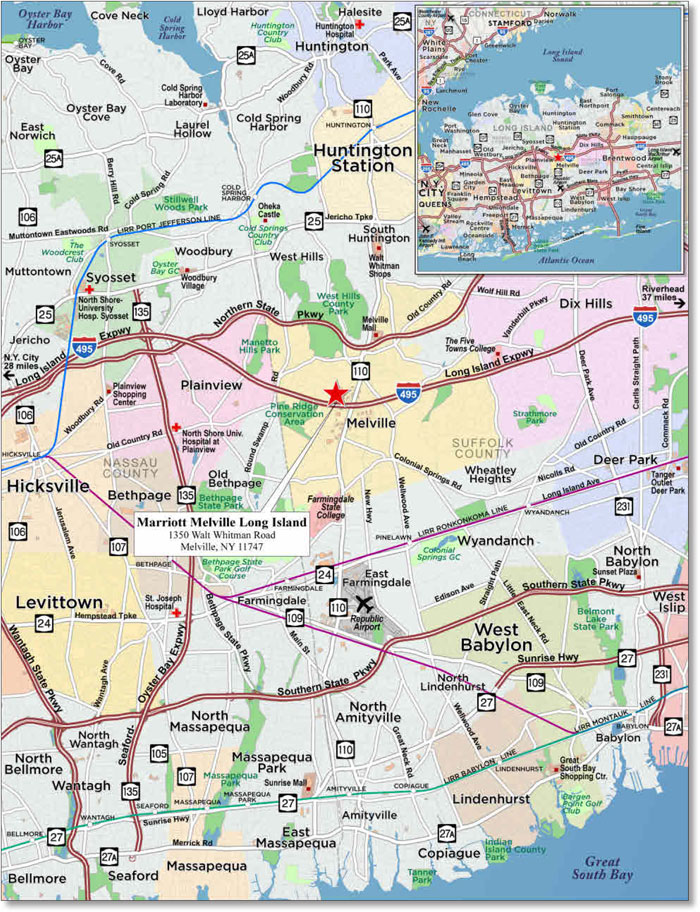
THE INFORMATION IN THIS STRUCTURAL AND COLLATERAL TERM SHEET IS NOT COMPLETE AND MAY BE AMENDED PRIOR TO THE TIME OF SALE. THIS TERM SHEET IS NOT AN OFFER TO SELL THESE SECURITIES AND IT IS NOT A SOLICITATION OF AN OFFER TO BUY THESE SECURITIES IN ANY JURISDICTION WHERE THE OFFER OR SALE IS NOT PERMITTED.
| 35 |
| No. 2 – Marriott Melville Long Island | ||||||||
| Loan Information | Property Information | |||||||
| Mortgage Loan Seller: | Rialto Mortgage Finance, LLC | Single Asset/Portfolio: | Single Asset | |||||
| Credit Assessment (DBRS/KBRA/Moody’s): | NR/NR/NR | Property Type: | Hospitality | |||||
| Original Principal Balance: | $59,000,000 | Specific Property Type: | Full Service | |||||
| Cut-off Date Principal Balance: | $59,000,000 | Location: | Melville, NY | |||||
| % of Initial Pool Balance: | 6.1% | Size: | 369 Rooms | |||||
| Loan Purpose: | Refinance | Cut-off Date Principal Balance Per Room(2): | $159,892 | |||||
| Borrower Name: | Columbia Properties Melville, LLC | Year Built/Renovated: | 1988/2015 | |||||
| Sponsors: | Columbia Sussex Corporation; CSC Holdings, LLC | Title Vesting: | Fee | |||||
| Mortgage Rate: | 5.120% | Property Manager: | Self-managed | |||||
| Note Date: | November 10, 2015 | 4th Most Recent Occupancy (As of): | 66.0% (12/31/2011) | |||||
| Anticipated Repayment Date: | NAP | 3rd Most Recent Occupancy (As of): | 67.9% (12/31/2012) | |||||
| Maturity Date: | November 6, 2025 | 2nd Most Recent Occupancy (As of): | 69.4% (12/31/2013) | |||||
| IO Period: | 82 months | Most Recent Occupancy (As of): | 63.6% (12/31/2014) | |||||
| Loan Term (Original): | 120 months | Current Occupancy (As of): | 62.8% (11/30/2015) | |||||
| Seasoning: | 3 months | |||||||
| Amortization Term (Original)(1): | Fixed | Underwriting and Financial Information: | ||||||
| Loan Amortization Type: | Interest-only, Amortizing Balloon | |||||||
| Interest Accrual Method: | Actual/360 | 4thMost Recent NOI (As of)(4): | $7,585,513 (12/31/2012) | |||||
| Call Protection: | L(27),D(89),O(4) | 3rdMost Recent NOI (As of)(4): | $8,475,581 (12/31/2013) | |||||
| Lockbox Type: | Hard/Upfront Cash Management | 2ndMost Recent NOI (As of)(4): | $7,771,913 (12/31/2014) | |||||
| Additional Debt(2): | Yes | Most Recent NOI (As of): | $7,449,678 (TTM 11/30/2015) | |||||
| Additional Debt Type(2): | Mezzanine | |||||||
| U/W Revenues: | $21,309,102 | |||||||
| U/W Expenses: | $13,643,381 | |||||||
| U/W NOI: | $7,665,721 | |||||||
| U/W NCF: | $6,600,266 | |||||||
| Escrows and Reserves(3): | U/W NOI DSCR(2): | 1.59x | ||||||
| U/W NCF DSCR(2): | 1.37x | |||||||
| Type: | Initial | Monthly | Cap (If Any) | U/W NOI Debt Yield(2): | 13.0% | |||
| Taxes | $112,214 | $106,870 | NAP | U/W NCF Debt Yield(2): | 11.2% | |||
| Insurance | $67,254 | $9,150 | NAP | As-Is Appraised Value(5): | $101,000,000 | |||
| FF&E | $0 | $87,324 | NAP | As-Is Appraisal Valuation Date(5): | September 11, 2015 | |||
| PIP Reserve | $3,500,000 | $41,667 | NAP | Cut-off Date LTV Ratio(2)(5): | 58.4% | |||
| Deferred Maintenance | $240,250 | $0 | NAP | LTV Ratio at Maturity or ARD(2)(5): | 52.3% | |||
| (1) | The Marriott Melville Long Island Mortgage Loan is interest-only for the first 82 months of the loan term and receives principal payments thereafter based on a fixed amortization schedule as shown on Annex F to the Preliminary Prospectus. The fixed principal payments result in an approximately 224 month amortization schedule. |
| (2) | See “Subordinate and Mezzanine Indebtedness” section. The equity interest in the borrower has been pledged to secure mezzanine indebtedness with an original principal balance of $10,000,000. All statistical information related to the balance per room, loan-to-value ratios, debt service coverage ratios and debt yields are based solely on the Marriott Melville Long Island Mortgage Loan. As of the Cut-off Date, the combined U/W NCF DSCR, Cut-off Date LTV Ratio and U/W NCF Debt Yield were 1.27x, 68.0% and 9.6%, respectively. |
| (3) | See “Escrows” section. |
| (4) | See “Cash Flow Analysis” section. |
| (5) | The appraiser also concluded to an “as-stabilized” appraised value of $119,000,000 with a valuation date of January 1, 2018 (which assumes completion of the PIP described under “The Property” below) which results in an “as-stabilized” Cut-off Date LTV Ratio of 49.6% and an LTV Ratio at Maturity or ARD of 44.4%. |
The Mortgage Loan. The mortgage loan (the “Marriott Melville Long Island Mortgage Loan”) is evidenced by a single promissory note that is secured by a first mortgage encumbering the fee interest in a full service hotel property located in Melville, New York (the “Marriott Melville Long Island Property”). The Marriott Melville Long Island Mortgage Loan was originated on November 10, 2015 by Rialto Mortgage Finance, LLC. The Marriott Melville Long Island Mortgage Loan had an original principal balance of $59,000,000, has an outstanding principal balance as of the Cut-off Date of $59,000,000 and accrues interest at an interest rate of 5.120%per annum. The Marriott Melville Long Island Mortgage Loan had an initial term of 120 months, has a remaining term of 117 months as of the Cut-off Date and requires interest-only payments for the first 82 months following origination and, thereafter, requires payments of principal and interest based on a fixed amortization schedule (see Annex F to the Preliminary Prospectus). The Marriott Melville Long Island Mortgage Loan matures on November 6, 2025.
Following the lockout period, the borrower has the right to defease the Marriott Melville Long Island Mortgage Loan in whole, but not in part, on any date before August 6, 2025. In addition, the Marriott Melville Long Island Mortgage Loan is prepayable without penalty on or after August 6, 2025.
THE INFORMATION IN THIS STRUCTURAL AND COLLATERAL TERM SHEET IS NOT COMPLETE AND MAY BE AMENDED PRIOR TO THE TIME OF SALE. THIS TERM SHEET IS NOT AN OFFER TO SELL THESE SECURITIES AND IT IS NOT A SOLICITATION OF AN OFFER TO BUY THESE SECURITIES IN ANY JURISDICTION WHERE THE OFFER OR SALE IS NOT PERMITTED.
| 36 |
MARRIOTT MELVILLE LONG ISLAND
Sources and Uses
| Sources | Uses | |||||||
| Original loan amount | $59,000,000 | 80.6% | Loan payoff(1) | $68,117,438 | 93.1% | |||
| Mezzanine loan | 10,000,000 | 13.7 | Reserves | 3,919,718 | 5.4 | |||
| Sponsor equity contribution | 4,199,293 | 5.7 | Closing costs | 1,162,136 | 1.6 | |||
| Total Sources | $73,199,293 | 100.0% | Total Uses | $73,199,293 | 100.0% |
| (1) | The Marriott Melville Long Island Property was previously securitized in the WBCMT 2006-C24 transaction. |
The Property.The Marriott Melville Long Island Property is a 369-room, 4-story, full-service hotel located on Long Island in Melville, New York, approximately 32.4 miles east of Manhattan. The Marriott Melville Long Island Property was developed from 1988 to 1990 and is situated on an 11.5-acre site. The Marriott Melville Long Island Property’s main entrance is accessed via a driveway with an attached porte-cochere along Walt Whitman Road. The Marriott Melville Long Island Property has 587 open air parking spaces resulting in a parking ratio of 1.6 spaces per room.
Amenities at the Marriott Melville Long Island Property include a business center, a fitness center, a gift shop, a heated indoor atrium swimming pool, a restaurant and a lounge. The Bistro 49 Restaurant and the Great Room Lounge are located on the main level of the Marriott Melville Long Island Property with an aggregate seating capacity of approximately 100 people. The Bistro 49 Restaurant serves breakfast, lunch, and dinner along with room service and includes two private dining rooms that contribute to catering demand. The Marriott Melville Long Island Property also includes the M Club Lounge, an exclusive lounge for members of Marriott’s rewards program. This newly renovated club is located just east of the Bistro 49 Restaurant and features numerous flat screen televisions, certain free beverages, free afternoon appetizers and the ability to order off the restaurant menu. The Marriott Melville Long Island Property contains more than 21,000 square feet of flexible meeting space. The ballroom is divisible into 12 separate salons, and there are seven smaller breakout rooms and two larger meeting rooms. The 5,000 square foot atrium serves as additional banquet space.
The guestroom mix includes 242 king guestrooms, 115 double/double guestrooms, and 12 suites. Suites contain additional furnishings including a living/sitting area with a sofa, coffee tables, wet bar and mini-refrigerator. Guestrooms and suites are equipped with high-speed internet, a 37-inch flat-screen television, an oversized chair, desk and ergonomic chair, iron and ironing board and coffee maker/tea service. Guestrooms located on the concierge level include access to the concierge lounge where complimentary continental breakfast, mid-day snack, hors d’oeuvres, desserts, and non-alcoholic beverages are served. In addition, cocktails are available for a fee along with complimentary business services.
In December 2014, the borrower executed a renewal of the franchise agreement with Marriott International, Inc., which required a Property Improvement Plan (“PIP”) for the Marriott Melville Long Island Property. The PIP is expected to be completed in three phases by December 2018. Phase I, at a total cost of $3.0 million, was completed in 2015 and included improvements to the building exterior, elevator lobby, food and beverage amenities and public areas. Phase II of the PIP is required to be completed by December 2016, and includes renovations of the function and meeting space at an estimated cost of $500,000. Phase III is required to be completed by December 2018, and will include renovations of the guest rooms, corridors and elevator banks at an estimated cost of $6.1 million. A $3.5 million PIP reserve was required at origination in addition to ongoing reserves of $500,000 annually until the PIP is completed and paid in full. The borrower plans to complete half of the guest room renovations between November 2016 and March 2017 and complete the other half between November 2017 and March 2018, which is not expected to impact room availability as occupancy is typically lower in these months. The guarantors provided a completion guarantee for the PIP. The franchise agreement with Marriott International, Inc. expires July 22, 2034.
THE INFORMATION IN THIS STRUCTURAL AND COLLATERAL TERM SHEET IS NOT COMPLETE AND MAY BE AMENDED PRIOR TO THE TIME OF SALE. THIS TERM SHEET IS NOT AN OFFER TO SELL THESE SECURITIES AND IT IS NOT A SOLICITATION OF AN OFFER TO BUY THESE SECURITIES IN ANY JURISDICTION WHERE THE OFFER OR SALE IS NOT PERMITTED.
| 37 |
MARRIOTT MELVILLE LONG ISLAND
Operating History and Underwritten Net Cash Flow.The following table presents certain information relating to the historical operating performance and underwritten net cash flow at the Marriott Melville Long Island Property:
Cash Flow Analysis
| 2012(1) | 2013(1) | 2014(1) | TTM 11/30/2015 | U/W | % of U/W Total Revenue | U/W $ per Room | ||||||||
| Occupancy | 67.9% | 69.4% | 63.6% | 62.8% | 62.8% | |||||||||
| ADR | $164.84 | $167.69 | $178.38 | $178.19 | $178.19 | |||||||||
| RevPAR | $111.84 | $116.34 | $113.42 | $111.84 | $111.84 | |||||||||
| Rooms Revenue | $15,105,101 | $15,669,402 | $15,275,371 | $15,063,453 | $15,063,453 | 70.7% | $40,822 | |||||||
| F&B Revenue | 6,012,594 | 6,360,739 | 6,103,742 | 6,118,064 | 6,118,064 | 28.7 | 16,580 | |||||||
| Other Revenue | 123,650 | 105,296 | 123,643 | 127,585 | 127,585 | 0.6 | 346 | |||||||
| Total Revenue | $21,241,345 | $22,135,437 | $21,502,756 | $21,309,102 | $21,309,102 | 100.0% | $57,748 | |||||||
| Total Department Expenses | $6,148,079 | 6,417,503 | 6,105,996 | 6,168,781 | 6,168,781 | 28.9 | 16,718 | |||||||
| Gross Operating Profit | $15,093,266 | $15,717,934 | $15,396,760 | $15,140,322 | $15,140,322 | 71.1% | $41,031 | |||||||
| Total Undistributed Expenses | $5,722,845 | 6,024,685 | 6,059,129 | 6,067,735 | 5,886,883 | 27.6 | 15,954 | |||||||
| Profit Before Fixed Charges | $9,370,421 | $9,693,249 | $9,337,631 | $9,072,586 | $9,253,438 | 43.4% | $25,077 | |||||||
| Total Fixed Charges | $1,784,908 | 1,217,668 | 1,565,718 | 1,622,908 | 1,587,717 | 7.5 | 4,303 | |||||||
| Net Operating Income | $7,585,513 | $8,475,581 | $7,771,913 | $7,449,678 | $7,665,721 | 36.0% | $20,774 | |||||||
| FF&E | $849,697 | 885,433 | 860,117 | 684,683 | 1,065,455 | 5.0 | 2,887 | |||||||
| Net Cash Flow | $6,735,816 | $7,590,148 | ��$6,911,796 | $6,764,995 | $6,600,266 | 31.0% | $17,887 | |||||||
| NOI DSCR | 1.57x | 1.75x | 1.61x | 1.54x | 1.59x | |||||||||
| NCF DSCR | 1.39x | 1.57x | 1.43x | 1.40x | 1.37x | |||||||||
| NOI DY | 12.9% | 14.4% | 13.2% | 12.6% | 13.0% | |||||||||
| NCF DY | 11.4% | 12.9% | 11.7% | 11.5% | 11.2% | |||||||||
| (1) | The Marriott Melville Long Island Property benefitted from increased demand related to Hurricane Sandy in late 2012 and the first half of 2013. Net Operating income decreased from 2013 to 2014 as the hurricane-related demand waned. Additionally, in 2013, the borrower received a one-time property tax refund in the amount of $333,648. |
Appraisal.As of the appraisal valuation date of September 11, 2015, the Marriott Melville Long Island Property had an “as-is” appraised value of $101,000,000. The appraiser also concluded to an “as-stabilized” appraised value of $119,000,000 as of January 1, 2018 which assumes the completion of the PIP.
Environmental Matters.According to a Phase I environmental assessment dated September 8, 2015, there was no evidence of any recognized environmental conditions at the Marriott Melville Long Island Property.
Market Overview and Competition.The Marriott Melville Long Island Property is located in Melville, Suffolk County, New York, approximately 32.4 miles east of Manhattan. Suffolk County occupies the eastern two-thirds of Long Island and is bounded on the north by the Long Island Sound, on the west by Nassau County, and on the south by the Atlantic Ocean. The 2015 estimated population for Suffolk and Nassau counties on Long Island is estimated to be 2.9 million with average household incomes of $118,500. According to a government agency, the unemployment rate for Suffolk County as of June 2015 was 4.6%. Comparatively, the unemployment rate for the state of New York was 5.3% and the national unemployment rate was 5.3% for the same period. Land use within the Marriott Melville Long Island Property’s neighborhood consists of a mixture of commercial and residential development. A variety of residential tract home communities have recently been developed throughout the Melville area, offering a mixture of condominiums, townhouses, and single family homes. Most of the neighborhood’s commercial development is located along Route 110 (Walt Whitman Road), which is a primary six-lane north-south corridor that is developed with class A and class B office space and numerous retail developments. The corridor’s economic focus has shifted over the past several decades to a center for business, professional and technology-intensive services. The corridor is now home to nearly 20% of Suffolk County’s workforce. Throughout the neighborhood, Walt Whitman Road is lined with a variety of industrial buildings, office space, hotels, educational institutions, and research facilities. The roadway transitions into the area’s primary technology office park corridor with a mixture of several commercial office buildings and office parks and local retailers, restaurants, furniture outlets, and neighborhood and community shopping centers located further to the north. The Marriott Melville Long Island Property is approximately three miles south of the Walt Whitman Mall and one mile south of the Melville Mall. The Walt Whitman Mall is a regional mall that includes anchors such as Lord & Taylor, Bloomingdale’s, Macy’s, and Saks Fifth Avenue. Restaurants at the Walt Witman Mall include Legal Sea Foods, P.F. Chang’s, and The Cheesecake Factory.
THE INFORMATION IN THIS STRUCTURAL AND COLLATERAL TERM SHEET IS NOT COMPLETE AND MAY BE AMENDED PRIOR TO THE TIME OF SALE. THIS TERM SHEET IS NOT AN OFFER TO SELL THESE SECURITIES AND IT IS NOT A SOLICITATION OF AN OFFER TO BUY THESE SECURITIES IN ANY JURISDICTION WHERE THE OFFER OR SALE IS NOT PERMITTED.
| 38 |
MARRIOTT MELVILLE LONG ISLAND
The following tables present certain information relating to the Marriott Melville Long Island Property’s competitive set:
Subject and Market Historical Occupancy, ADR and RevPAR(1)
Competitive Set | Marriott Melville Long Island | Penetration Factor | |||||||||||||||||
Year | Occupancy | ADR | RevPAR | Occupancy | ADR | RevPAR | Occupancy | ADR | RevPAR | ||||||||||
| 11/30/2015 TTM | 69.8% | $147.23 | $102.81 | 62.8% | $178.08 | $111.78 | 89.9% | 121.0% | 108.7% | ||||||||||
| 11/30/2014 TTM | 68.5% | $146.35 | $100.26 | 64.3% | $178.07 | $114.46 | 93.8% | 121.7% | 114.2% | ||||||||||
| 11/30/2013 TTM | 76.8% | $141.34 | $108.60 | 70.1% | $168.66 | $118.31 | 91.3% | 119.3% | 108.9% | ||||||||||
| (1) | Information obtained from a third party hospitality research report dated December 17, 2015. The competitive set includes the following hotels: Holiday Inn Plainview Long Island, UPSKY Long Island Hotel, Hilton Long Island Huntington, Courtyard Republic Airport Long Island Farmingdale and Hilton Garden Inn Melville. |
Competitive Property Summary(1)
Demand Segmentation | 2014 Performance | ||||||||||||||||||
Property | No. of | Year Built/ Renovated | Distance from | Commercial | Meeting & Group | Leisure | Occupancy | ADR | RevPAR | ||||||||||
Marriott Melville Long Island (Subject) Melville, NY | 369 | 1988/2015 | -- | 50% | 25% | 25% | 63.6% | $177.22 | $112.71 | ||||||||||
Hilton Long Island Melville, NY | 304 | 1988/NAV | 2.3 miles | 50% | 25% | 25% | 72.1% | $154.62 | $111.48 | ||||||||||
Hilton Garden Inn Melville Plainview, NY | 178 | 2008/NAP | 1.5 miles | 50% | 10% | 40% | 76.4% | $160.80 | $122.85 | ||||||||||
Marriott Islandia Long Island Islandia, NY | 278 | 1988/NAV | 15.0 miles | 55% | 25% | 20% | 64.9% | $136.92 | $88.86 | ||||||||||
Hyatt Regency Wind Watch Hauppauge, NY | 358 | 1989/NAV | 17.2 miles | 40% | 30% | 30% | 68.8% | $120.63 | $82.99 | ||||||||||
Courtyard Republic Airport Long Island Farmingdale, NY | 131 | 2007/NAV | 4.2 miles | 50% | 10% | 40% | 71.0% | $165.00 | $117.15 | ||||||||||
| (1) | Information obtained from the appraisal. |
The Borrower.The borrower is Columbia Properties Melville, LLC, a Delaware limited liability company and a single purpose entity with two independent directors. Legal counsel to the borrower delivered a non-consolidation opinion in connection with the origination of the Marriott Melville Long Island Mortgage Loan. Columbia Sussex Corporation and CSC Holdings, LLC are the guarantors of certain nonrecourse carveouts under the Marriott Melville Long Island Mortgage Loan on a joint and several basis.
The Sponsors.The sponsors are Columbia Sussex Corporation (“Columbia Sussex”) and CSC Holdings, LLC, a Kentucky corporation and an Ohio limited liability company, respectively. Founded in 1972, Columbia Sussex has owned and operated hospitality properties for more than 40 years. As of July 2015, Columbia Sussex owned and managed a total of 39 hospitality assets with over 12,700 rooms, including 30 hotels with over 9,700 rooms operated under Marriott-affiliated brands. Columbia Sussex currently operates properties under the JW Marriott, Marriott, Courtyard by Marriott, Renaissance, Hilton, DoubleTree by Hilton, Curio and Westin flags. Columbia Sussex has prior defaults, foreclosures and deeds in lieu of foreclosure. For additional information regarding the sponsors, see “Description of the Mortgage Pool—Litigation Considerations” and “Description of the Mortgage Pool—Loan Purpose, Default History, Bankruptcy Issues and Other Proceedings” in the Preliminary Prospectus.
Escrows.The loan documents provided for upfront escrows in the amount of $112,214 for real estate taxes, $67,254 for insurance premiums, $240,250 for deferred maintenance and $3,500,000 for the PIP Reserve.The loan documents also provide for monthly escrows in the amount of $106,870 for real estate taxes, $9,150 for insurance premiums, $41,667 for PIP reserves until the completion of PIP work and $87,324 for 2015 FF&E reserves. After 2015, the monthly FF&E reserves will be an amount equal to the greater of (a) one twelfth of 5.0% of gross income and (b) the aggregate amount, if any, required to be reserved under the management agreement and the franchise agreement. Upon the occurrence of a Renovation Reserve Trigger Event (as defined below), all excess cash flow will be deposited into the renovation reserve subaccount to fund any future PIP required under a Replacement Franchise Agreement (as defined below).
Lockbox and Cash Management.The Marriott Melville Long Island Mortgage Loan requires the borrower to establish a lender-controlled lockbox account, which is already in place, and to direct all tenants to pay their rents and all credit card companies under merchant agreements to pay receipts directly into such lockbox account. All checks and cash (to the extent such cash amounts exceed $50,000) received from hotel patrons by the borrower or the property manager are required to be deposited into the lockbox account within two business days of receipt. Available funds are then swept into a lender controlled cash management account and
THE INFORMATION IN THIS STRUCTURAL AND COLLATERAL TERM SHEET IS NOT COMPLETE AND MAY BE AMENDED PRIOR TO THE TIME OF SALE. THIS TERM SHEET IS NOT AN OFFER TO SELL THESE SECURITIES AND IT IS NOT A SOLICITATION OF AN OFFER TO BUY THESE SECURITIES IN ANY JURISDICTION WHERE THE OFFER OR SALE IS NOT PERMITTED.
| 39 |
MARRIOTT MELVILLE LONG ISLAND
distributed in accordance with the loan documents. All excess cash flow will be applied as follows (i) to the renovation reserve account after the occurrence and continuance of a Renovation Reserve Trigger Event (as defined below); (ii) to the excess cash flow subaccount following the occurrence and continuance of a Cash Sweep Event (as defined below); and (iii) to the borrower account, if no Cash Sweep Event period or Renovation Reserve Trigger Event is continuing.
A “Cash Sweep Event” will commence upon the occurrence of (i) an event of default; (ii) any bankruptcy action of borrower, guarantor or property manager; (iii) a Cash Sweep DSCR Trigger Event (as defined below); (iv) a Renovation Reserve Trigger Event; or (v) a mezzanine loan event of default. A Cash Sweep Event will end, with respect to clause (i) when such event of default has been cured or waived; with respect to clause (ii), when such bankruptcy petition has been discharged, stayed, or dismissed within 30 days of such filing among other conditions for the borrower or guarantor and within 120 days for the property manager or when the borrower has replaced the property manager with a qualified property manager acceptable to the lender; with respect to clause (iii), when the trailing 12-month amortizing debt service coverage ratio (based on the current amortization schedule) is greater than 1.15x for two consecutive calendar quarters, among other conditions; with respect to clause (iv), upon satisfaction of the following conditions: (a) the franchise agreement has been renewed or replaced with a Replacement Franchise Agreement (as defined below) and (b) the combined balance of the FF&E reserve, renovation reserve and PIP reserve is greater than an amount equal to 125.0% of the cost to fully satisfy, complete and pay for the PIP under the Replacement Franchise Agreement (as defined below), in accordance with an approved PIP budget among other conditions; and with respect to clause (v), upon a cure of the mezzanine loan event of default. A cure of any Cash Sweep Event may occur no more than two times during the term of the Marriott Melville Long Island Mortgage Loan.
A “Cash Sweep DSCR Trigger Event” occurs upon any date the amortizing debt service coverage ratio based on the trailing 12-month period immediately preceding the date of such determination, is less than 1.10x.
A “Renovation Reserve Trigger Event” means (i) any date upon which the lender or the borrower is notified of the election by a franchisor to terminate its respective franchise agreement effective as of a date prior to the scheduled expiration date of such franchise agreement or (ii) the occurrence of a default under the franchise agreement that gives the franchisor the right to terminate the franchise agreement.
A “Replacement Franchise Agreement” collectively means (a) a franchise, trademark and license agreement with a Qualified Franchisor (as defined below) substantially in the same form and substance as the franchise agreement currently in effect, (b) a renewal franchise agreement with the current franchisor in its then current form, or (c) a franchise trademark and license agreement with a Qualified Franchisor, which franchise, trademark and license agreement shall be in form and substance reasonably acceptable to the lender in each case, among other provisions as further outlined in the loan documents.
A “Qualified Franchisor” means (i) Marriott International, Inc. or (ii) a reputable and experienced franchisor (which may be an affiliate of the borrower), in the reasonable judgment of the lender as further outlined in the loan documents.
Property Management.The Marriott Melville Long Island Property is managed by an affiliate of the borrower.
Assumption.The borrower has the right to transfer the Marriott Melville Long Island Property after December 6, 2016, provided that no event of default has occurred and is continuing and certain other conditions are satisfied including, but not limited to, (i) the lender’s reasonable determination that the proposed transferee and guarantor satisfy the lender’s credit review and underwriting standards, taking into consideration transferee experience, financial strength and general business standing; (ii) execution of a recourse guaranty and an environmental indemnity by an affiliate of the transferee; and (iii) if requested by the lender, rating agency confirmation from DBRS, KBRA and Moody’s that the transfer will not result in a downgrade, withdrawal or qualification of the respective ratings assigned to the Series 2016-C32 Certificates.
Partial Release.Not permitted.
Real Estate Substitution.Not permitted.
Subordinate and Mezzanine Indebtedness.As of November 10, 2015, TH Commercial Mortgage LLC is the holder of a mezzanine loan in the original amount of $10,000,000 (the “Marriott Melville Long Island Mezzanine Loan”) from CP Melville Mezz, LLC, a Delaware limited liability company that directly owns 100.0% of the Marriott Melville Long Island Mortgage Loan borrower. The Marriott Melville Long Island Mezzanine Loan accrues interest at a variable interest rate generating not less than a 13% internal rate of return and requires payments of principal and interest based on a fixed amortization schedule and fully-amortizes in 83 months. The Marriott Melville Long Island Mezzanine Loan matures on November 6, 2025. The rights to the Marriott Melville Long Island Mezzanine Loan lender are further described under “Description of the Mortgage Pool—Additional Indebtedness—Mezzanine Indebtedness” in the Preliminary Prospectus.
Ground Lease. None.
Terrorism Insurance.The loan documents require that the “all risk” insurance policy required to be maintained by the borrower provide coverage for terrorism equal to the full replacement cost of the Marriott Melville Long Island Property, as well as business interruption insurance covering no less than the 18-month period following the occurrence of a casualty event, together with a 12-month extended period of indemnity.
THE INFORMATION IN THIS STRUCTURAL AND COLLATERAL TERM SHEET IS NOT COMPLETE AND MAY BE AMENDED PRIOR TO THE TIME OF SALE. THIS TERM SHEET IS NOT AN OFFER TO SELL THESE SECURITIES AND IT IS NOT A SOLICITATION OF AN OFFER TO BUY THESE SECURITIES IN ANY JURISDICTION WHERE THE OFFER OR SALE IS NOT PERMITTED.
| 40 |
(THIS PAGE INTENTIONALLY LEFT BLANK)
THE INFORMATION IN THIS STRUCTURAL AND COLLATERAL TERM SHEET IS NOT COMPLETE AND MAY BE AMENDED PRIOR TO THE TIME OF SALE. THIS TERM SHEET IS NOT AN OFFER TO SELL THESE SECURITIES AND IT IS NOT A SOLICITATION OF AN OFFER TO BUY THESE SECURITIES IN ANY JURISDICTION WHERE THE OFFER OR SALE IS NOT PERMITTED.
| 41 |
(THIS PAGE INTENTIONALLY LEFT BLANK)
THE INFORMATION IN THIS STRUCTURAL AND COLLATERAL TERM SHEET IS NOT COMPLETE AND MAY BE AMENDED PRIOR TO THE TIME OF SALE. THIS TERM SHEET IS NOT AN OFFER TO SELL THESE SECURITIES AND IT IS NOT A SOLICITATION OF AN OFFER TO BUY THESE SECURITIES IN ANY JURISDICTION WHERE THE OFFER OR SALE IS NOT PERMITTED.
| 42 |
| TECHNOLOGY STATION |
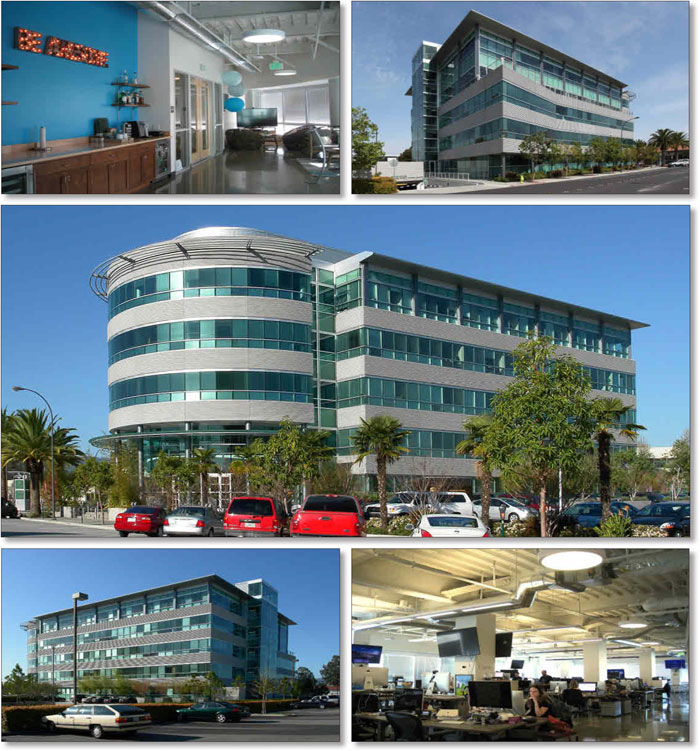
THE INFORMATION IN THIS STRUCTURAL AND COLLATERAL TERM SHEET IS NOT COMPLETE AND MAY BE AMENDED PRIOR TO THE TIME OF SALE. THIS TERM SHEET IS NOT AN OFFER TO SELL THESE SECURITIES AND IT IS NOT A SOLICITATION OF AN OFFER TO BUY THESE SECURITIES IN ANY JURISDICTION WHERE THE OFFER OR SALE IS NOT PERMITTED.
| 43 |
| TECHNOLOGY STATION |
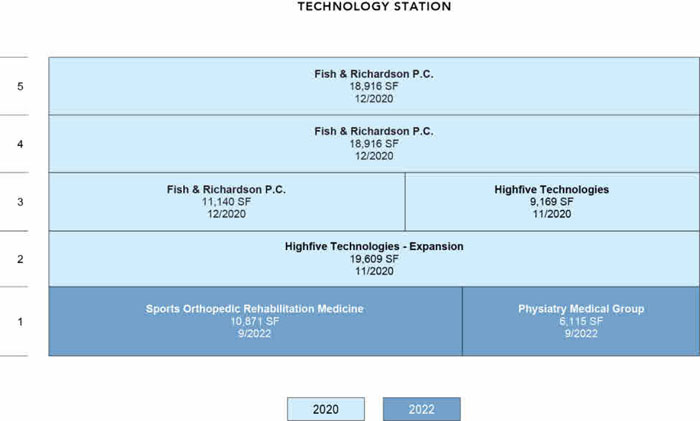
THE INFORMATION IN THIS STRUCTURAL AND COLLATERAL TERM SHEET IS NOT COMPLETE AND MAY BE AMENDED PRIOR TO THE TIME OF SALE. THIS TERM SHEET IS NOT AN OFFER TO SELL THESE SECURITIES AND IT IS NOT A SOLICITATION OF AN OFFER TO BUY THESE SECURITIES IN ANY JURISDICTION WHERE THE OFFER OR SALE IS NOT PERMITTED.
| 44 |
| TECHNOLOGY STATION |
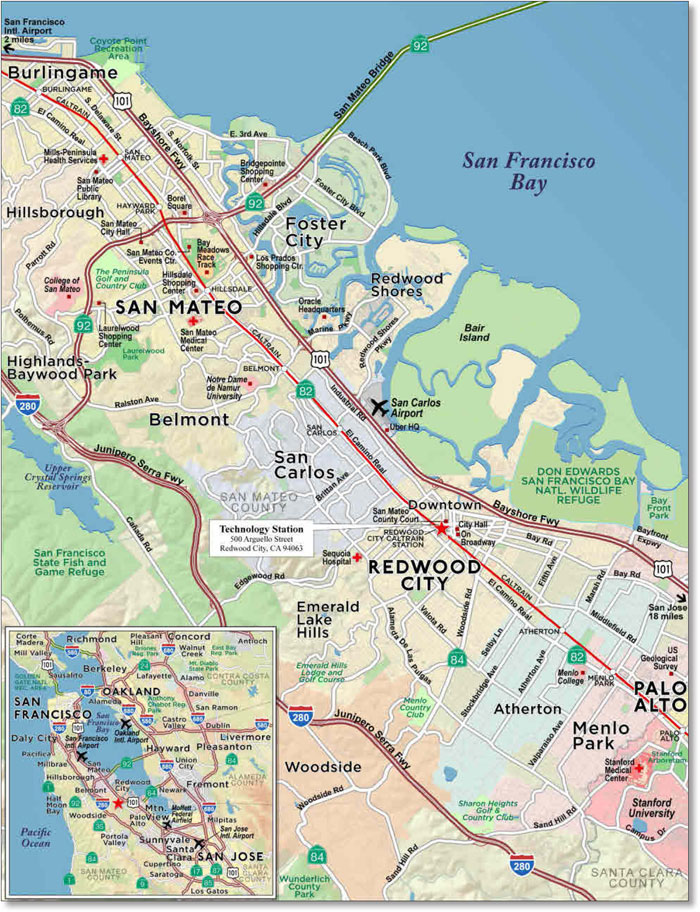
THE INFORMATION IN THIS STRUCTURAL AND COLLATERAL TERM SHEET IS NOT COMPLETE AND MAY BE AMENDED PRIOR TO THE TIME OF SALE. THIS TERM SHEET IS NOT AN OFFER TO SELL THESE SECURITIES AND IT IS NOT A SOLICITATION OF AN OFFER TO BUY THESE SECURITIES IN ANY JURISDICTION WHERE THE OFFER OR SALE IS NOT PERMITTED.
| 45 |
| No. 3 – Technology Station | ||||||||
| Loan Information | Property Information | |||||||
| Mortgage Loan Seller: | Wells Fargo Bank, National Association | Single Asset/Portfolio: | Single Asset | |||||
Credit Assessment (DBRS/KBRA/Moody’s): | NR/NR/NR | Property Type: | Office | |||||
| Original Principal Balance: | $50,000,000 | Specific Property Type: | Suburban | |||||
| Cut-off Date Principal Balance: | $50,000,000 | Location: | Redwood City, CA | |||||
| % of Initial Pool Balance: | 5.2% | Size: | 94,737 SF | |||||
| Loan Purpose: | Refinance | Cut-off Date Principal Balance Per SF: | $527.78 | |||||
| Borrower Name: | 500 Arguello, LLC | Year Built/Renovated: | 2001/NAP | |||||
| Sponsors(1): | Various | Title Vesting: | Fee | |||||
| Mortgage Rate: | 4.070% | Property Manager: | Self-managed | |||||
| Note Date: | November 19, 2015 | 4th Most Recent Occupancy (As of): | 100.0% (12/31/2011) | |||||
| Anticipated Repayment Date: | NAP | 3rd Most Recent Occupancy (As of): | 100.0% (12/31/2012) | |||||
| Maturity Date: | December 11, 2025 | 2nd Most Recent Occupancy (As of): | 100.0% (12/31/2013) | |||||
| IO Period: | 60 months | Most Recent Occupancy (As of): | 97.7% (12/31/2014) | |||||
| Loan Term (Original): | 120 months | Current Occupancy (As of)(3): | 100.0% (12/1/2015) | |||||
| Seasoning: | 2 months | |||||||
| Amortization Term (Original): | 360 months | Underwriting and Financial Information: | ||||||
| Loan Amortization Type: | Interest-only, Amortizing Balloon | |||||||
| Interest Accrual Method: | Actual/360 | 4th Most Recent NOI (As of): | $5,712,672 (12/31/2012) | |||||
| Call Protection: | L(26),GRTR 1% or YM(87),O(7) | 3rd Most Recent NOI (As of): | $5,296,536 (12/31/2013) | |||||
| Lockbox Type: | Springing | 2nd Most Recent NOI (As of): | $5,435,208 (12/31/2014) | |||||
| Additional Debt: | None | Most Recent NOI (As of): | $5,867,679 (TTM 10/31/2015) | |||||
| Additional Debt Type: | NAP | |||||||
| U/W Revenues: | $7,786,467 | |||||||
| U/W Expenses: | $1,760,742 | |||||||
| U/W NOI: | $6,025,725 | |||||||
| U/W NCF: | $5,666,670 | |||||||
| U/W NOI DSCR: | 2.09x | |||||||
| Escrows and Reserves(2): | U/W NCF DSCR: | 1.96x | ||||||
| U/W NOI Debt Yield: | 12.1% | |||||||
| Type: | Initial | Monthly | Cap (If Any) | U/W NCF Debt Yield: | 11.3% | |||
| Taxes | $84,726 | $28,242 | NAP | As-Is Appraised Value: | $98,500,000 | |||
| Insurance | $0 | Springing | NAP | As-Is Appraisal Valuation Date: | October 8, 2015 | |||
| Replacement Reserves | $0 | Springing | NAP | Cut-off Date LTV Ratio: | 50.8% | |||
| TI/LC Reserve | $0 | Springing | NAP | LTV Ratio at Maturity or ARD: | 46.1% | |||
| (1) | See “The Sponsors” section. |
| (2) | See “Escrows” section. |
| (3) | See “The Property” section. |
The Mortgage Loan.The mortgage loan (the “Technology Station Mortgage Loan”) is evidenced by a single promissory note that is secured by a first mortgage encumbering the fee interest in an office building located in Redwood City, California (the “Technology Station Property”). The Technology Station Mortgage Loan was originated on November 19, 2015 by Wells Fargo Bank, National Association. The Technology Station Mortgage Loan had an original principal balance of $50,000,000, has an outstanding principal balance as of the Cut-off Date of $50,000,000 and accrues interest at an interest rate of 4.070%per annum. The Technology Station Mortgage Loan had an initial term of 120 months, has a remaining term of 118 months as of the Cut-off Date and requires interest-only payments for the first 60 payments following origination and, thereafter, requires payments of principal and interest based on a 30-year amortization schedule. The Technology Station Mortgage Loan matures on December 11, 2025.
Following the lockout period, the borrower has the right to prepay the Technology Station Mortgage Loan in whole, but not in part, on any date before June 11, 2025, provided that the borrower pay the greater of a yield maintenance premium or a prepayment premium equal to 1.0% of the principal amount being prepaid. In addition, the Technology Station Mortgage Loan is prepayable without penalty on or after June 11, 2025.
THE INFORMATION IN THIS STRUCTURAL AND COLLATERAL TERM SHEET IS NOT COMPLETE AND MAY BE AMENDED PRIOR TO THE TIME OF SALE. THIS TERM SHEET IS NOT AN OFFER TO SELL THESE SECURITIES AND IT IS NOT A SOLICITATION OF AN OFFER TO BUY THESE SECURITIES IN ANY JURISDICTION WHERE THE OFFER OR SALE IS NOT PERMITTED.
| 46 |
| TECHNOLOGY STATION |
Sources and Uses
| Sources | Uses | |||||||||
| Original loan amount | $50,000,000 | 100.0% | Loan payoff | $24,339,759 | 48.7 | % | ||||
| Reserves | 84,726 | 0.2 | ||||||||
| Closing costs | 773,171 | 1.5 | ||||||||
| Return of equity | 24,802,343 | 49.6 | ||||||||
| Total Sources | $50,000,000 | 100.0% | Total Uses | $50,000,000 | 100.0 | % |
The Property.The Technology Station Property is a five-story, class A office building totaling 94,737 square feet and located in Redwood City, California, approximately 5.4 miles northwest of Stanford University, 6.2 miles northwest of Palo Alto and 26.3 miles southeast of San Francisco. Built in 2001 by the sponsor, the Technology Station Property is situated on a 1.6-acre parcel. The two largest tenants, Fish & Richardson P.C. (“F&R”) and Highfive Technologies (“Highfive”), make up approximately 82.1% of the net rentable area. F&R (48,973 square feet; 51.7% of net rentable area) was founded in 1878, is an intellectual property and litigation law firm, and was recently named the number one patent litigation firm in the United States for the 12th consecutive year by a national law publication. F&R has eleven offices in the United States and one in Munich, Germany. F&R has been in occupancy since the Technology Station Property was built in 2001, and this location serves as F&R’s only Northern California office.
In June 2010, F&R renewed its lease three years prior to its initial lease expiration and extended its lease through December 2020. The second largest tenant, Highfive, occupies three suites totaling 28,778 square feet or 30.4% of net rentable area. Highfive, is a fast growing technology company specializing in cost effective video conferencing hardware and cloud software. Highfive’s flagship product is an all-in-one video hardware device, which delivers easy-to-use, high quality enterprise video conferencing to any size conference room at 1/20th the cost of traditional products. Highfive has raised approximately $45.4 million in funding. In its latest round of Series B funding, Highfive raised $32.0 million from investors including Lightspeed Venture Partners, Salesforce’s Marc Benioff, and Google Ventures among others. Highfive quickly outgrew its original space in Palo Alto and relocated its headquarters to the Technology Station Property in May 2014, originally occupying 9,169 square feet. As a fast-growing company, Highfive wanted to secure expansion space at a competitive rental rate with the plan to sublease a portion of its space on a short term basis until the space is needed. Highfive took occupancy of a 3,081 square foot space in October 2015 and leased an additional 16,528 square foot space in December 2015, which it is currently building out and expects to occupy by March 2016. These two expansion spaces comprise the entire second floor. In anticipation of this new space, Highfive will sublease its 9,169 square foot third floor space to GoFundMe from April 1, 2016 through August 31, 2017 at a rental rate of $81.00 per square foot triple-net; which is a substantial profit on its current rental rate of $52.53 per square foot triple-net. By the end of the sublease term Highfive expects to expand into its third floor space as it continues to grow. Annual U/W Base Rent for this sublease space was underwritten to Highfive’s primary lease rate of $52.53 per square foot triple-net. The Technology Station Property contains 63 surface parking spaces and two floors of subterranean parking, which contain 262 parking spaces. The 325 total parking spaces result in a parking ratio of 3.4 spaces per 1,000 square feet of rentable area. As of December 1, 2015 the Technology Station Property was 100.0% leased by four tenants.
The following table presents certain information relating to the tenancy at the Technology Station Property:
Major Tenants
| Tenant Name | Credit Rating (Fitch/ Moody’s/ S&P) | Tenant NRSF | % of NRSF | Annual U/W Base Rent PSF | Annual U/W Base Rent | % of Total Annual U/W Base Rent | Lease Expiration Date |
| Major Tenants | |||||||
| Fish & Richardson P.C. | NR/NR/NR | 48,973 | 51.7% | $76.56 | $3,749,373 | 57.4% | 12/31/2020(1) |
| Highfive Technologies(2) | NR/NR/NR | 28,778(3)(4) | 30.4% | $63.75 | $1,834,669 | 28.1% | 11/30/2020(5) |
| Sports Orthopedic Rehabilitation Medicine | NR/NR/NR | 10,871 | 11.5% | $55.80 | $606,602 | 9.3% | 9/30/2022(6) |
| Physiatry Medical Group | NR/NR/NR | 6,115 | 6.5% | $55.80 | $341,217 | 5.2% | 9/30/2022(7) |
| Occupied Collateral Total | 94,737 | 100.0% | $68.95 | $6,531,860 | 100.0% | ||
| Vacant Space | 0 | 0.0% | |||||
| Collateral Total | 94,737 | 100.0% | |||||
| (1) | F&R has one, 5-year lease renewal option. |
| (2) | Highfive was granted abated rent totaling approximately $320,540 in lieu of a tenant improvement allowance for the expansion space, which runs through April 2016. |
| (3) | Highfive recently executed a lease for the entire second floor (19,609 square feet; 20.7% of net rentable area), is currently in occupancy of 3,081 square feet (3.3% of net rentable area) and is in the process of building out the remaining 16,528 square feet (17.4% of net rentable area) on the second floor. Highfive is expected to take occupancy by March 1, 2016. |
| (4) | Highfive will sublease its third floor space (9,169 square feet; 9.7% of net rentable area) to GoFundMe for $81.00 per square foot on a triple-net basis. GoFundMe’s sublease term is expected to commence on April 1, 2016 and expire on August 31, 2017. Annual U/W Base Rent for this space was underwritten to Highfive’s primary lease of $52.53 per square foot on a triple-net basis. |
| (5) | Highfive has one, 5-year lease renewal option. |
| (6) | Sports Orthopedic Rehabilitation Medicine has one, 5-year lease renewal option. |
| (7) | Physiatry Medical Group has one, 5-year lease renewal option. |
THE INFORMATION IN THIS STRUCTURAL AND COLLATERAL TERM SHEET IS NOT COMPLETE AND MAY BE AMENDED PRIOR TO THE TIME OF SALE. THIS TERM SHEET IS NOT AN OFFER TO SELL THESE SECURITIES AND IT IS NOT A SOLICITATION OF AN OFFER TO BUY THESE SECURITIES IN ANY JURISDICTION WHERE THE OFFER OR SALE IS NOT PERMITTED.
| 47 |
| TECHNOLOGY STATION |
The following table presents certain information relating to the lease rollover schedule at the Technology Station Property:
Lease Expiration Schedule(1)
| Year Ending December 31, | No. of Leases Expiring | Expiring NRSF | % of Total NRSF | Cumulative Expiring NRSF | Cumulative % of Total NRSF | Annual U/W Base Rent | % of Total Annual U/W Base Rent | Annual U/W Base Rent PSF |
| MTM | 0 | 0 | 0.0% | 0 | 0.0% | $0 | 0.0% | $0.00 |
| 2016 | 0 | 0 | 0.0% | 0 | 0.0% | $0 | 0.0% | $0.00 |
| 2017 | 0 | 0 | 0.0% | 0 | 0.0% | $0 | 0.0% | $0.00 |
| 2018 | 0 | 0 | 0.0% | 0 | 0.0% | $0 | 0.0% | $0.00 |
| 2019 | 0 | 0 | 0.0% | 0 | 0.0% | $0 | 0.0% | $0.00 |
| 2020 | 2 | 77,751 | 82.1% | 77,751 | 82.1% | $5,584,041 | 85.5% | $71.82 |
| 2021 | 0 | 0 | 0.0% | 77,751 | 82.1% | $0 | 0.0% | $0.00 |
| 2022 | 2 | 16,986 | 17.9% | 94,737 | 100.0% | $947,819 | 14.5% | $55.80 |
| 2023 | 0 | 0 | 0.0% | 94,737 | 100.0% | $0 | 0.0% | $0.00 |
| 2024 | 0 | 0 | 0.0% | 94,737 | 100.0% | $0 | 0.0% | $0.00 |
| 2025 | 0 | 0 | 0.0% | 94,737 | 100.0% | $0 | 0.0% | $0.00 |
| 2026 | 0 | 0 | 0.0% | 94,737 | 100.0% | $0 | 0.0% | $0.00 |
| Thereafter | 0 | 0 | 0.0% | 94,737 | 100.0% | $0 | 0.0% | $0.00 |
| Vacant | 0 | 0 | 0.0% | 94,737 | 100.0% | $0 | 0.0% | $0.00 |
| Total/Weighted Average | 4 | 94,737 | 100.0% | $6,531,860 | 100.0% | $68.95 |
| (1) | Information obtained from the underwritten rent roll. |
The following table presents historical occupancy percentages at the Technology Station Property:
Historical Occupancy
12/31/2011(1) | 12/31/2012(1) | 12/31/2013(1) | 12/31/2014(1) | 12/1/2015(2) |
| 100.0% | 100.0% | 100.0% | 97.7% | 100.0% |
| (1) | Information obtained from the borrower. |
| (2) | Information obtained from the underwritten rent roll. |
Operating History and Underwritten Net Cash Flow. The following table presents certain information relating to the historical operating performance and the underwritten net cash flow at the Technology Station Property:
Cash Flow Analysis
| 2012 | 2013 | 2014 | TTM 10/31/2015(1) | U/W(1) | % of U/W Effective Gross Income | U/W $ per SF | |
| Base Rent | $5,892,488 | $5,366,979 | $5,516,409 | $5,819,115 | $6,531,860 | 83.9% | $68.95 |
| Grossed Up Vacant Space | 0 | 0 | 0 | 0 | 0 | 0.0 | 0.00 |
| Total Reimbursables | 1,162,220 | 1,365,359 | 1,365,131 | 1,470,925 | 1,581,200 | 20.3 | 16.69 |
| Other Income | 123 | 0 | 2,021 | 3,000 | 0 | 0.0 | 0.00 |
| Less Vacancy & Credit Loss | 0 | 0 | 0 | 0 | (326,593)(2) | (4.2) | (3.45) |
| Effective Gross Income | $7,054,831 | $6,732,338 | $6,883,561 | $7,293,040 | $7,786,467 | 100.0% | $82.19 |
| Total Operating Expenses | $1,342,159 | $1,435,802 | $1,448,353 | $1,425,361 | $1,760,742 | 22.6% | $18.59 |
|
|
|
|
|
|
| |
| Net Operating Income | $5,712,672 | $5,296,536 | $5,435,208 | $5,867,679 | $6,025,725 | 77.4% | $63.60 |
| TI/LC | 0 | 0 | 0 | 0 | 334,423 | 4.3 | 3.53 |
| Capital Expenditures | 0 | 0 | 0 | 0 | 24,632 | 0.3 | 0.26 |
| Net Cash Flow | $5,712,672 | $5,296,536 | $5,435,208 | $5,867,679 | $5,666,670 | 72.8% | $59.81 |
| NOI DSCR | 1.98x | 1.83x | 1.88x | 2.03x | 2.09x | ||
| NCF DSCR | 1.98x | 1.83x | 1.88x | 2.03x | 1.96x | ||
| NOI DY | 11.4% | 10.6% | 10.9% | 11.7% | 12.1% | ||
| NCF DY | 11.4% | 10.6% | 10.9% | 11.7% | 11.3% |
| (1) | The increase in Net Operating Income from trailing twelve month October 31, 2015 to U/W is primarily due to Highfive commencing rent payment for its expansion space on December 1, 2015, and a contractual rent increase for F&R that occurred on January 1, 2016. |
| (2) | The underwritten economic vacancy is 5.0%. The Technology Station Property is 100.0% leased as of December 1, 2015. |
Appraisal. As of the appraisal valuation date of October 8, 2015, the Technology Station Property had an “as-is” appraised value of $98,500,000.
THE INFORMATION IN THIS STRUCTURAL AND COLLATERAL TERM SHEET IS NOT COMPLETE AND MAY BE AMENDED PRIOR TO THE TIME OF SALE. THIS TERM SHEET IS NOT AN OFFER TO SELL THESE SECURITIES AND IT IS NOT A SOLICITATION OF AN OFFER TO BUY THESE SECURITIES IN ANY JURISDICTION WHERE THE OFFER OR SALE IS NOT PERMITTED.
| 48 |
| TECHNOLOGY STATION |
Environmental Matters. According to a Phase I environmental site assessment dated October 20, 2015, there was no evidence of any recognized environmental conditions at the Technology Station Property.
Market Overview and Competition.The Technology Station Property is located in Redwood City, California, approximately 5.4 miles northwest of Stanford University, 6.2 miles northwest of Palo Alto and 26.3 miles southeast of San Francisco. The San Francisco–San Mateo–Redwood City market has been named one of the top three best performing markets in the country over the past three years by a third party research firm. The market’s wage growth is one of the highest in the country and is being driven by the quality of technology-related jobs. Of the three markets, Redwood City has the highest concentration of technology firms, which account for approximately 77.1% of its office space. Companies that do not want to pay the high rental rates for Class A office in areas like Palo Alto and Mountain View, which average approximately $107.04 per square foot and $95.16 per square foot full service gross, respectively, according to the appraisal, have found Redwood City to be a more affordable alternative, while still offering similar amenities and entertainment options.
The Technology Station Property benefits from its location near major freeways and public transportation. The Technology Station Property is located 0.8 miles west of Highway 101, a north-south route providing access between Santa Clara County to the south and Marin County to the north; 4.1 miles east of Interstate 280, a north-south route providing access between San Jose to the south and San Francisco to the north; and approximately two blocks north of the CalTrain Redwood City Station. The CalTrain commuter rail line serves the San Francisco Bay Area (including Silicon Valley), running as far north as San Francisco and as far south as Gilroy, the southernmost city in Santa Clara County, with 32 stations along the way and had approximately 18.6 million passengers in 2015. At the Millbrae station stop, which is approximately 13.0 miles north of the Technology Station Property, passengers can transfer from the CalTrain to the Bay Area Rapid Transit system (“BART”), which connects to downtown San Francisco, the San Francisco International Airport and the Oakland International Airport. Additionally, BART is currently constructing an extension that will travel south from Fremont to Santa Clara County. Proximity to transit is an increasingly important attribute for tenants, employees, and investors. According to the borrower, in addition to the centralized location and more affordable rental rates of Redwood City compared to Palo Alto, one of the major draws for Highfive to move to the Technology Station Property was due to its proximity to the CalTrain station as it wanted to provide its employees with an easy commute to and from work. Commuting via the CalTrain is more efficient than driving as it only takes passengers departing from the Technology Station Property approximately thirty minutes to travel north to downtown San Francisco or south to San Jose, compared to upwards of an hour to reach these destinations via car due to traffic.
The Technology Station Property also benefits from surrounding retail uses and housing developments. Broadway Street, which is located approximately one block from the Technology Station Property, is a destination in downtown Redwood City for shopping, restaurants, and entertainment. The “On Broadway” retail-cinema development at Broadway and Middlefield Road, four blocks from the Technology Station Property, consists of a 20-screen cinema, retail shops and an underground parking garage, and approximately 1,810 apartment units. According to the appraisal, the estimated 2015 population within a three- and five-mile radius of the Technology Station Property is 129,750 and 265,209, respectively, and the average household income within the same three- and five-mile radii was $133,722 and $147,909, respectively.
According to a third-party market research report, the Technology Station Property is located in the Redwood City submarket of San Mateo South County. San Mateo South County has only experienced one quarter of negative absorption in the past 15 quarters, which speaks to the high demand for quality office space in the area. Redwood City saw the largest growth in absorption because of the completion of the 330,000 square foot Crossing 900 development, which was 100% pre-leased to Box Inc., a cloud-storage technology company that is expected to draw other technology firms to the area. According to a third party research firm, the Redwood City Class A office submarket reported an inventory of 26 office properties totaling approximately 2.6 million square feet with a 4.4% vacancy rate. The appraiser concluded to a market rent for the Technology Station Property of $68.16 per square foot, triple-net.
THE INFORMATION IN THIS STRUCTURAL AND COLLATERAL TERM SHEET IS NOT COMPLETE AND MAY BE AMENDED PRIOR TO THE TIME OF SALE. THIS TERM SHEET IS NOT AN OFFER TO SELL THESE SECURITIES AND IT IS NOT A SOLICITATION OF AN OFFER TO BUY THESE SECURITIES IN ANY JURISDICTION WHERE THE OFFER OR SALE IS NOT PERMITTED.
| 49 |
| TECHNOLOGY STATION |
The following table presents certain information relating to comparable office leases for the Technology Station Property:
Comparable Leases(1)
| Property Name/Location | Year Built/ Renovated | Stories | Total GLA (SF) | Total Occupancy | Distance from Subject | Tenant Name | Lease Date / Term | Lease Area (SF) | Annual Base Rent PSF | Lease Type |
Technology Station (Subject) Redwood City, CA | 2001/NAP | 5 | 94,737 | 100% | -- | Highfive | December 2015 / 5 Yrs | 28,778 | $63.75 | NNN |
Crossing 900 Redwood City, CA | 2015/NAP | 7 | 330,000 | 100% | 0.3 miles | Pebble Technology, Corp. | September 2015 / 3 Yrs | 54,066 | $61.80 | NNN |
Marshall Square Redwood City, CA | 1998/NAP | 3 | 65,488 | 100% | 0.5 miles | Turn Inc. | November 2015 / 5 Yrs | 31,270 | $63.00 | NNN |
401 Warren Street Redwood City, CA | 1981/NAP | 3 | 13,931 | 100% | 0.2 miles | EVA Automation Inc. | February 2015 / 5 Yrs | 5,775 | $60.24 | NNN |
650 Castro Street Mountain View, CA | 1989/NAP | 5 | 111,726 | 99% | 13.6 miles | Pure Storage | April 2015 / 3 Yrs | 10,992 | $78.00 | NNN |
Atherton Square Atherton, CA | 2009/NAP | 2 | 49,646 | 90% | 2.8 miles | Stanford Hospital & Clinic | November 2012 / 10 Yrs | 12,000 | $67.20 | NNN |
| (1) | Information obtained from the appraisal. |
The Borrower.The borrower is 500 Arguello, LLC, a Delaware limited liability company and single purpose entity with one independent director. Legal counsel to the borrower delivered a non-consolidation opinion in connection with the origination of the Technology Station Mortgage Loan. Edward D. Storm, individually and as trustee of the Edward D. Storm 2001 Revocable Trust; Derek J. Hunter, Jr., individually and as trustee of the Hunter 1988 Revocable Trust are the guarantors of certain nonrecourse carveouts under the Technology Station Mortgage Loan.
The Sponsors. The sponsors are Edward D. Storm, individually and as trustee of the Edward D. Storm 2001 Revocable Trust; and Derek J. Hunter, Jr., individually and as trustee of the Hunter 1988 Revocable Trust. Mr. Storm and Mr. Hunter, the Chairman and President, respectively, of Hunter Properties, Inc., each have 30 years of real estate experience, with a focus in Silicon Valley and the greater San Francisco Bay Area including office, retail, and self-storage properties. Mr. Storm has actively participated in approximately 110 development projects with a total capitalization in excess of $1.0 billion. Mr. Hunter has been involved in the development of over 25 office projects totaling more than 2.0 million square feet with an estimated capitalization of over $1.0 billion.
Escrows.The loan documents provide for upfront reserves in the amount of $84,726 for real estate taxes. The loan documents require monthly deposits of $28,242 for real estate taxes. The loan documents do not require monthly escrows for insurance provided (i) no event of default has occurred and is continuing; (ii) the Technology Station Property is insured under an acceptable blanket insurance policy; (iii) the amortizing debt service coverage ratio for the trailing 12-month period is at least 1.25x; and (iv) the borrower provides the lender with evidence of renewal of the policies and timely proof of payment of the insurance premiums. The loan documents require monthly escrows for replacement reserves of $1,579; however, those escrows are waived provided (i) no event of default has occurred and is continuing; (ii) the amortizing debt service coverage ratio for the trailing 12-month period is at least 1.25x; and (iii) the Technology Station Property is being adequately maintained as confirmed by annual inspections. The loan documents do not require monthly escrows for TI/LCs of $27,329 provided (i) no event of default has occurred and is continuing and (ii) the amortizing debt service coverage ratio is at least 1.25x.
The borrower assigned to lender letters of credit (“LOCs”) issued to the landlord on behalf of the following tenants to evidence existing security deposits in the following amounts under their respective lease: (i) $319,781 for F&R and (ii) $1,120,209 for Highfive. Lender may draw upon a LOC in the event the applicable tenant is in default pursuant to the terms of such tenant’s lease.
Lockbox and Cash Management. Upon the occurrence of a Cash Trap Event Period (as defined below), the borrower will be required to establish a lender-controlled lockbox account and direct all tenants to deposit all rents directly into such lockbox account. During a Cash Trap Event Period, all excess funds on deposit in the lockbox account are swept to a lender-controlled subaccount on a monthly basis.
A “Cash Trap Event Period” will commence upon the earlier of (i) the occurrence of an event of default; (ii) the amortizing debt service coverage ratio for the trailing 12-month period falling below 1.15x; and (iii) the occurrence of a Major Tenant Trigger Period (as defined below). A Cash Trap Event Period will end, with regard to clause (i), upon the cure of such event of default; with regard to clause (ii), upon the amortizing debt service coverage ratio being equal to or greater than 1.15x for two consecutive calendar quarters; and with regard to clause (iii), upon the occurrence of a Major Tenant Event Cure (as defined below).
A “Major Tenant Trigger Period” will commence upon on the earlier of F&R (i) filing for bankruptcy or a similar insolvency proceeding; (ii) going dark, vacating or otherwise failing to be open for business; (iii) failing to renew or extend its lease on terms and conditions acceptable to the lender; or (iv) terminating or canceling its lease (or the lease otherwise failing to be in full force and effect) or giving notice of its intent to do so.
THE INFORMATION IN THIS STRUCTURAL AND COLLATERAL TERM SHEET IS NOT COMPLETE AND MAY BE AMENDED PRIOR TO THE TIME OF SALE. THIS TERM SHEET IS NOT AN OFFER TO SELL THESE SECURITIES AND IT IS NOT A SOLICITATION OF AN OFFER TO BUY THESE SECURITIES IN ANY JURISDICTION WHERE THE OFFER OR SALE IS NOT PERMITTED.
| 50 |
| TECHNOLOGY STATION |
A “Major Tenant Event Cure” will commence with respect to clause (i), upon the bankruptcy or insolvency proceeding being terminated and F&R’s lease being affirmed; with respect to clause (ii), upon F&R (or a satisfactory replacement tenant acceptable to the lender) resuming normal business operations at the Technology Station Property and being open during customary hours for a period of no less than 45 consecutive days; with respect to clause (iii), upon the lender receiving satisfactory evidence that F&R has extended the term of its lease; and with respect to clause (iv), upon F&R curing all defaults (including, but not limited to the payment of any fees or other sums due in connection with such default) to the reasonable satisfaction of the lender.
Property Management. The Technology Station Property is managed by an affiliate of the borrower.
Assumption. The borrower has a two-time right to transfer the Technology Station Property provided that certain conditions are satisfied, including (i) no event of default has occurred and is continuing; (ii) the lender has reasonably determined that the proposed transferee and guarantor satisfy the lender’s credit review and underwriting standards, taking into consideration transferee experience, financial strength and general business standing; and (iii) if requested by lender, rating agency confirmation from DBRS, KBRA and Moody’s that such assumption will not result in a downgrade, withdrawal or qualification of the respective ratings assigned to the Series 2016-C32 Certificates.
Partial Release. Not permitted.
Real Estate Substitution.Not permitted.
Subordinate and Mezzanine Indebtedness.None.
Ground Lease. None.
Terrorism Insurance.The loan documents require that the “all risk” insurance policy required to be maintained by the borrower provide coverage for terrorism in an amount equal to the full replacement cost of the Technology Station Property, as well as business interruption insurance covering no less than the 18-month period following the occurrence of a casualty event, together with a six-month extended period of indemnity.
Earthquake Insurance. The loan documents do not require earthquake insurance. The seismic report indicated a probable maximum loss of 12%.
THE INFORMATION IN THIS STRUCTURAL AND COLLATERAL TERM SHEET IS NOT COMPLETE AND MAY BE AMENDED PRIOR TO THE TIME OF SALE. THIS TERM SHEET IS NOT AN OFFER TO SELL THESE SECURITIES AND IT IS NOT A SOLICITATION OF AN OFFER TO BUY THESE SECURITIES IN ANY JURISDICTION WHERE THE OFFER OR SALE IS NOT PERMITTED.
| 51 |
| CHICAGO INDUSTRIAL PORTFOLIO I |
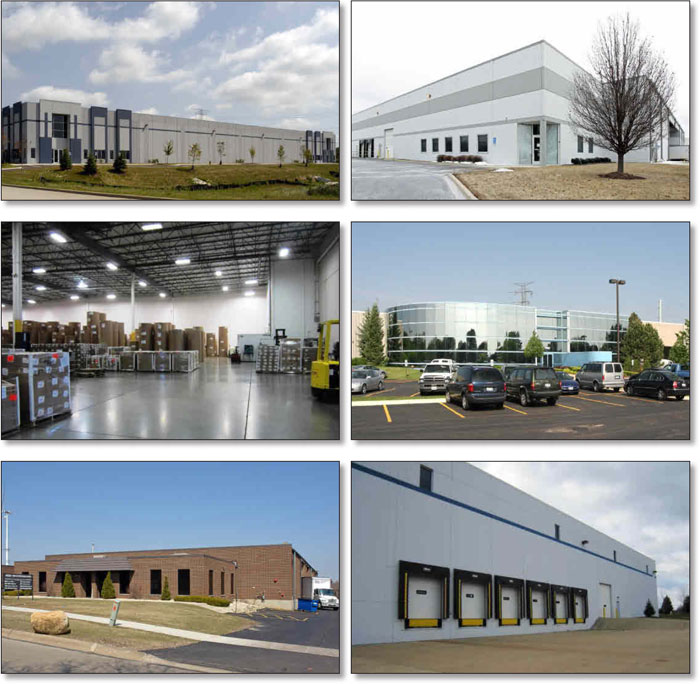
THE INFORMATION IN THIS STRUCTURAL AND COLLATERAL TERM SHEET IS NOT COMPLETE AND MAY BE AMENDED PRIOR TO THE TIME OF SALE. THIS TERM SHEET IS NOT AN OFFER TO SELL THESE SECURITIES AND IT IS NOT A SOLICITATION OF AN OFFER TO BUY THESE SECURITIES IN ANY JURISDICTION WHERE THE OFFER OR SALE IS NOT PERMITTED.
| 52 |
| CHICAGO INDUSTRIAL PORTFOLIO I |
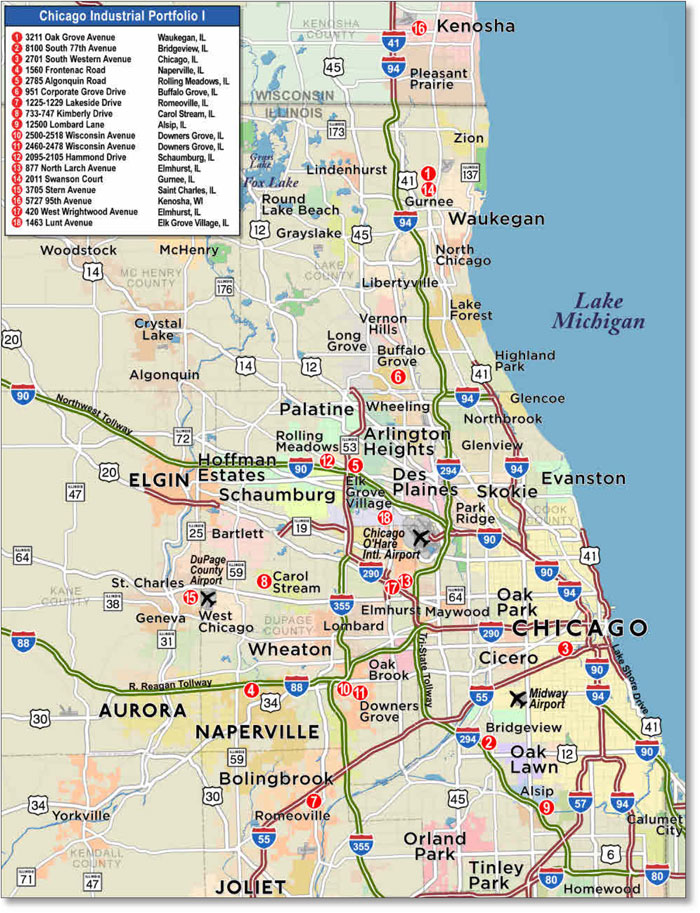
THE INFORMATION IN THIS STRUCTURAL AND COLLATERAL TERM SHEET IS NOT COMPLETE AND MAY BE AMENDED PRIOR TO THE TIME OF SALE. THIS TERM SHEET IS NOT AN OFFER TO SELL THESE SECURITIES AND IT IS NOT A SOLICITATION OF AN OFFER TO BUY THESE SECURITIES IN ANY JURISDICTION WHERE THE OFFER OR SALE IS NOT PERMITTED.
| 53 |
| No. 4 – Chicago Industrial Portfolio I | |||||||
| Loan Information | Property Information | ||||||
| Mortgage Loan Seller: | Wells Fargo Bank, National Association | Single Asset/Portfolio: | Portfolio | ||||
| Credit Assessment (DBRS/KBRA/Moody’s): | NR/NR/NR | Property Type: | Industrial | ||||
| Original Principal Balance(1): | $44,200,000 | Specific Property Type: | Various – See Table | ||||
| Cut-off Date Principal Balance(1): | $44,200,000 | Location: | Various – See Table | ||||
| % of Initial Pool Balance: | 4.6% | Size: | 1,052,310 SF | ||||
| Loan Purpose(2): | Acquisition | Cut-off Date Principal Balance Per SF: | $42.00 | ||||
| Borrower Names(3): | Various | Year Built/Renovated: | Various – See Table | ||||
| Sponsors: | George J. Cibula, Jr.; Matthew Lewandowski | Title Vesting: | Fee | ||||
| Mortgage Rate: | 5.210% | Property Manager: | Self-managed | ||||
| Note Date: | December 23, 2015 | 4th Most Recent Occupancy(5): | NAV | ||||
| Anticipated Repayment Date: | NAP | 3rd Most Recent Occupancy(5): | NAV | ||||
| Maturity Date: | January 11, 2026 | 2nd Most Recent Occupancy(As of)(5): | 85.5% (12/31/2013) | ||||
| IO Period: | 24 months | Most Recent Occupancy(As of)(5): | 85.7% (12/31/2014) | ||||
| Loan Term (Original): | 120 months | Current Occupancy (As of)(5): | 89.1% (Various) | ||||
| Seasoning: | 1 month | ||||||
| Amortization Term (Original): | 360 months | Underwriting and Financial Information: | |||||
| Loan Amortization Type: | Interest-only, Amortizing Balloon | ||||||
| Interest Accrual Method: | Actual/360 | 4th Most Recent NOI(6): | NAV | ||||
| Call Protection: | L(13),GRTR 1% or YM(103),O(4) | 3rd Most Recent NOI(6): | NAV | ||||
| Lockbox Type: | Hard/Upfront Cash Management | 2nd Most Recent NOI (As of)(6): | $2,666,370 (12/31/2014) | ||||
| Additional Debt(1): | Yes | Most Recent NOI (As of)(6): | $3,845,045 (Various) | ||||
| Additional Debt Type(1): | Mezzanine | ||||||
| U/W Revenues: | $6,416,686 | ||||||
| U/W Expenses: | $2,459,074 | ||||||
| U/W NOI: | $3,957,612 | ||||||
| Escrows and Reserves(4): | U/W NCF: | $3,640,675 | |||||
| U/W NOI DSCR(1): | 1.36x | ||||||
| Type: | Initial | Monthly | Cap (If Any) | U/W NCF DSCR(1): | 1.25x | ||
| Taxes | $756,506 | $139,208 | NAP | U/W NOI Debt Yield(1): | 9.0% | ||
| Insurance | $0 | Springing | NAP | U/W NCF Debt Yield(1): | 8.2% | ||
| Replacement Reserves | $0 | $14,557 | NAP | As-Is Appraised Value: | $60,595,000 | ||
| TI/LC Reserve | $750,000 | $30,692 | $1,600,000 | As-Is Appraisal Valuation Date: | Various | ||
| Deferred Maintenance | $235,845 | NAP | NAP | Cut-off Date LTV Ratio(1): | 72.9% | ||
| Environmental Reserve | $50,000 | NAP | NAP | LTV Ratio at Maturity or ARD(1): | 63.4% | ||
| (1) | See “Subordinate and Mezzanine Indebtedness” section. The equity interest in the borrower has been pledged to secure mezzanine indebtedness with an original principal balance of $4,500,000. All statistical information related to the balance per square foot, loan-to-value ratios, debt service coverage ratios and debt yields are based solely on the Chicago Industrial Portfolio I Mortgage Loan. As of the Cut-off Date, the combined U/W NCF DSCR, U/W NCF Debt Yield, Cut-off Date LTV Ratio and LTV Ratio at Maturity or ARD were 1.06x, 7.5%, 80.4% and 70.9%, respectively. |
| (2) | See “Sources and Uses” section. |
| (3) | See “The Borrowers” section. |
| (4) | See “Escrows” section. |
| (5) | See “Historical Occupancy” section. |
| (6) | See “Cash Flow Analysis” section. Historical cash flow information was not available for all of the Chicago Industrial Portfolio I Properties. |
The Mortgage Loan. The mortgage loan (the “Chicago Industrial Portfolio I Mortgage Loan”) is evidenced by a single promissory note that is secured by a first mortgage encumbering 18 industrial properties located in Illinois and Wisconsin (the “Chicago Industrial Portfolio I Properties”). The Chicago Industrial Portfolio I Mortgage Loan was originated on December 23, 2015 by Wells Fargo Bank, National Association. The Chicago Industrial Portfolio I Mortgage Loan had an original principal balance of $44,200,000, has an outstanding principal balance as of the Cut-off Date of $44,200,000 and accrues interest at an interest rate of 5.210%per annum. The Chicago Industrial Portfolio I Mortgage Loan had an initial term of 120 months, has a remaining term of 119 months as of the Cut-off Date and requires interest-only payments for the first 24 payments of the Chicago Industrial Portfolio I Mortgage Loan. The Chicago Industrial Portfolio I Mortgage Loan matures on January 11, 2026.
Following the lockout period, the borrowers have the right to prepay the Chicago Industrial Portfolio I Mortgage Loan in whole, or in part (see “Partial Release” section), on any date before October 11, 2025, provided that the borrower pay the greater of a yield maintenance premium or a prepayment premium equal to 1.0% of the principal amount being prepaid. In addition, the Chicago Industrial Portfolio I Mortgage Loan is prepayable without penalty on or after October 11, 2025.
THE INFORMATION IN THIS STRUCTURAL AND COLLATERAL TERM SHEET IS NOT COMPLETE AND MAY BE AMENDED PRIOR TO THE TIME OF SALE. THIS TERM SHEET IS NOT AN OFFER TO SELL THESE SECURITIES AND IT IS NOT A SOLICITATION OF AN OFFER TO BUY THESE SECURITIES IN ANY JURISDICTION WHERE THE OFFER OR SALE IS NOT PERMITTED.
| 54 |
| CHICAGO INDUSTRIAL PORTFOLIO I |
Sources and Uses
| Sources | Uses | |||||||||
| Original loan amount | $44,200,000 | 78.6 | % | Purchase price | $44,000,000 | 78.3 | % | |||
| Mezzanine loan | 4,500,000 | 8.0 | Loan payoff(1) | 9,489,756 | 16.9 | |||||
| Sponsor’s new cash contribution | 7,509,379 | 13.4 | Reserves | 1,792,351 | 3.2 | |||||
| Closing costs | 927,272 | 1.6 | ||||||||
| Total Sources | $56,209,379 | 100.0 | % | Total Uses | $56,209,379 | 100.0 | % |
| (1) | Four of the Chicago Industrial Portfolio I Properties (27.3% of the Cut-off Date Balance) are being refinanced, and the remaining 14 Chicago Industrial Portfolio I Properties (72.7% of the Cut-off Date Balance) are being acquired. |
The Properties. The Chicago Industrial Portfolio I Properties comprise 18 industrial properties totaling 1,052,310 square feet and are located throughout the Chicago, Illinois metropolitan statistical area. Built between 1966 and 2007, the Chicago Industrial Portfolio I Properties range in size from 15,185 square feet to 123,386 square feet, feature clear heights ranging from 16 feet to 30 feet, with an average of 21 feet, and have office space ranging from 4.5% to 29.0% of the net rentable area, with an average of 12.4%. Eight of the Chicago Industrial Portfolio I Properties (34.6% of NRA) are 100% occupied by single tenants; while the ten remaining Chicago Industrial Portfolio I Properties (65.4% of NRA) are multi-tenanted and feature two to eight tenant spaces. The Chicago Industrial Portfolio I Properties contain tenants from a variety of businesses and services including moving & storage, transportation, multimedia and industrial process engineering. As of dates ranging from April 1, 2015 to February 1, 2016, the Chicago Industrial Portfolio I Properties are 89.1% occupied by 40 tenants.
The following table presents certain information relating to the Chicago Industrial Portfolio I Properties:
Property Name – Location | Specific Property Type | Allocated Cut-off Date Principal Balance | % of Portfolio Cut-off Date Principal Balance | Occupancy | Year Built/ Renovated | Net Rentable Area (SF) | Appraised Value | Allocated LTV |
| 3211 Oak Grove Avenue - Waukegan, IL | Warehouse | $4,668,372 | 10.6% | 49.5% | 2007/NAP | 112,810 | $6,400,000 | 72.9% |
| 8100 South 77th Avenue - Bridgeview, IL | Warehouse | $4,194,241 | 9.5% | 100.0% | 1966/2014 | 115,000 | $5,750,000 | 72.9% |
| 2701 South Western Avenue - Chicago, IL | Flex | $4,121,297 | 9.3% | 100.0% | 1968/NAP | 123,386 | $5,650,000 | 72.9% |
| 1560 Frontenac Road - Naperville, IL | Warehouse | $3,647,166 | 8.3% | 100.0% | 1988/NAP | 85,608 | $5,000,000 | 72.9% |
2785 Algonquin Road - Rolling Meadows, IL | Flex | $3,406,453 | 7.7% | 100.0% | 1967/NAP | 41,000 | $4,670,000 | 72.9% |
| 951 Corporate Grove Drive - Buffalo Grove, IL | Flex | $3,245,977 | 7.3% | 50.0% | 1986/NAP | 72,600 | $4,450,000 | 72.9% |
| 1225-1229 Lakeside Drive - Romeoville, IL | Flex | $2,844,789 | 6.4% | 100.0% | 2001/NAP | 62,305 | $3,900,000 | 72.9% |
733-747 Kimberly Drive - Carol Stream, IL | Warehouse | $2,523,839 | 5.7% | 88.9% | 1991/NAP | 74,408 | $3,460,000 | 72.9% |
12500 Lombard Lane - Alsip, IL | Warehouse | $2,334,186 | 5.3% | 100.0% | 1979/NAP | 86,200 | $3,200,000 | 72.9% |
| 2500-2518 Wisconsin Avenue - Downers Grove, IL | Flex | $2,261,243 | 5.1% | 92.0% | 1976/NAP | 46,000 | $3,100,000 | 72.9% |
| 2460-2478 Wisconsin Avenue - Downers Grove, IL | Flex | $2,188,299 | 5.0% | 80.4% | 1976/NAP | 46,000 | $3,000,000 | 72.9% |
| 2095-2105 Hammond Drive - Schaumburg, IL | Flex | $1,954,881 | 4.4% | 100.0% | 1978/NAP | 31,931 | $2,680,000 | 72.9% |
| 877 North Larch Avenue - Elmhurst, IL | Flex | $1,838,171 | 4.2% | 100.0% | 1987/NAP | 37,540 | $2,520,000 | 72.9% |
2011 Swanson Court - Gurnee, IL | Warehouse | $1,568,281 | 3.5% | 100.0% | 1979/1998 | 44,104 | $2,150,000 | 72.9% |
3705 Stern Avenue - Saint Charles, IL | Flex | $970,146 | 2.2% | 100.0% | 1989/NAP | 20,792 | $1,330,000 | 72.9% |
5727 95th Avenue - Kenosha, WI | Warehouse | $930,027 | 2.1% | 100.0% | 1999/NAP | 20,000 | $1,275,000 | 72.9% |
| 420 West Wrightwood Avenue - Elmhurst, IL | Flex | $882,614 | 2.0% | 100.0% | 1969/NAP | 17,441 | $1,210,000 | 72.9% |
1463 Lunt Avenue - Elk Grove Village, IL | Flex | $620,018 | 1.4% | 100.0% | 1976/NAP | 15,185 | $850,000 | 72.9% |
| Total/Weighted Average | $44,200,000 | 100.0% | 89.1% | 1,052,310 | $60,595,000 | 72.9% |
THE INFORMATION IN THIS STRUCTURAL AND COLLATERAL TERM SHEET IS NOT COMPLETE AND MAY BE AMENDED PRIOR TO THE TIME OF SALE. THIS TERM SHEET IS NOT AN OFFER TO SELL THESE SECURITIES AND IT IS NOT A SOLICITATION OF AN OFFER TO BUY THESE SECURITIES IN ANY JURISDICTION WHERE THE OFFER OR SALE IS NOT PERMITTED.
| 55 |
| CHICAGO INDUSTRIAL PORTFOLIO I |
The following table presents certain information relating to the tenancy at the Chicago Industrial Portfolio I Properties:
Major Tenants
| Tenant Name | Property Name – Location | Credit Rating (Fitch/ Moody’s/ S&P) | Tenant NRSF | % of NRSF | Annual U/W Base Rent PSF(1) | Annual U/W Base Rent(1) | % of Total Annual U/W Base Rent | Lease Expiration Date |
| Major Tenants | ||||||||
| Pactiv, LLC | 8100 South 77th Avenue - Bridgeview, IL | NR/NR/NR | 115,000 | 10.9% | $4.65 | $534,766 | 10.5% | 4/30/2024(2) |
| Service King Paint & Body, LLC | 2785 Algonquin Road - Rolling Meadows, IL | NR/NR/NR | 41,000 | 3.9% | $9.96 | $408,155 | 8.0% | 7/31/2018 |
| PPS Business Corporation | 1560 Frontenac Road - Naperville, IL | NR/NR/NR | 85,608 | 8.1% | $3.96 | $338,879 | 6.7% | 11/30/2017 |
| Fischer Paper Products, Inc. | 3211 Oak Grove Avenue - Waukegan, IL | NR/NR/NR | 55,838 | 5.3% | $4.12 | $230,053 | 4.5% | 6/30/2017 |
| Anderson Brothers | 2701 South Western Avenue - Chicago, IL | NR/NR/NR | 50,474 | 4.8% | $4.24 | $214,101 | 4.2% | 4/18/2023 |
| GC Dies, LLC | 877 North Larch Avenue - Elmhurst, IL | NR/NR/NR | 37,540 | 3.6% | $5.44 | $204,368 | 4.0% | 11/30/2020 |
| Nandorf | 12500 Lombard Lane - Alsip, IL | NR/NR/NR | 40,867 | 3.9% | $4.84 | $197,796 | 3.9% | 1/31/2019(3) |
| RAM Racing, Inc. | 951 Corporate Grove Drive - Buffalo Grove, IL | NR/NR/NR | 36,300 | 3.4% | $5.27 | $191,302 | 3.8% | 11/30/2019 |
| MV Public Transportation | 12500 Lombard Lane - Alsip, IL | NR/NR/NR | 45,333 | 4.3% | $3.76 | $170,452 | 3.4% | 8/31/2019 |
| Moody Bible Institute | 2701 South Western Avenue - Chicago, IL | NR/NR/NR | 36,956 | 3.5% | $3.88 | $143,420 | 2.8% | 10/31/2023 |
| Total Major Tenants | 544,916 | 51.8% | $4.83 | $2,633,292 | 51.9% | |||
| Non-Major Tenants | 393,194 | 37.4% | $6.21 | $2,441,956 | 48.1% | |||
| Occupied Collateral Total | 938,110 | 89.1% | $5.41 | $5,075,249 | 100.0% | |||
| Vacant Space | 114,200 | 10.9% | ||||||
| Collateral Total | 1,052,310 | 100.0% | ||||||
| (1) | Annual U/W Base Rent PSF and Annual U/W Base Rent include contractual rent steps through December 2016 totaling $36,709. |
| (2) | Pactiv, LLC has two, 5-year lease renewal options. |
| (3) | Nandorf has a one-time right to terminate its lease on January 31, 2017 with 12 month’ notice and payment of a termination fee of $58,000. |
The following table presents certain information relating to the lease rollover schedule at the Chicago Industrial Portfolio I Properties:
Lease Expiration Schedule(1)(2)
| Year Ending December 31, | No. of Leases Expiring | Expiring NRSF | % of Total NRSF | Cumulative Expiring NRSF | Cumulative % of Total NRSF | Annual U/W Base Rent | % of Total Annual U/W Base Rent | Annual U/W Base Rent PSF(3) |
| MTM | 2 | 25,200 | 2.4% | 25,200 | 2.4% | $190,158 | 3.7% | $7.55 |
| 2016 | 7 | 57,641 | 5.5% | 82,841 | 7.9% | $386,156 | 7.6% | $6.70 |
| 2017 | 7 | 219,116 | 20.8% | 301,957 | 28.7% | $1,094,391 | 21.6% | $4.99 |
| 2018 | 6 | 93,310 | 8.9% | 395,267 | 37.6% | $756,253 | 14.9% | $8.10 |
| 2019 | 6 | 159,079 | 15.1% | 554,346 | 52.7% | $810,823 | 16.0% | $5.10 |
| 2020 | 6 | 121,922 | 11.6% | 676,268 | 64.3% | $670,175 | 13.2% | $5.50 |
| 2021 | 1 | 15,308 | 1.5% | 691,576 | 65.7% | $78,071 | 1.5% | $5.10 |
| 2022 | 2 | 44,104 | 4.2% | 735,680 | 69.9% | $196,935 | 3.9% | $4.47 |
| 2023 | 2 | 87,430 | 8.3% | 823,110 | 78.2% | $357,521 | 7.0% | $4.09 |
| 2024 | 1 | 115,000 | 10.9% | 938,110 | 89.1% | $534,766 | 10.5% | $4.65 |
| 2025 | 0 | 0 | 0.0% | 938,110 | 89.1% | $0 | 0.0% | $0.00 |
| 2026 | 0 | 0 | 0.0% | 938,110 | 89.1% | $0 | 0.0% | $0.00 |
| Thereafter | 0 | 0 | 0.0% | 938,110 | 89.1% | $0 | 0.0% | $0.00 |
| Vacant | 0 | 114,200 | 10.9% | 1,052,310 | 100.0% | $0 | 0.0% | $0.00 |
| Total/Weighted Average | 40 | 1,052,310 | 100.0% | $5,075,249 | 100.0% | $5.41 |
| (1) | Information obtained from the underwritten rent roll. |
| (2) | Certain tenants may have lease termination options that are exercisable prior to the originally stated expiration date of the subject lease and that are not considered in the Lease Expiration Table. |
| (3) | Weighted Average Annual U/W Base Rent PSF excludes vacant space. |
THE INFORMATION IN THIS STRUCTURAL AND COLLATERAL TERM SHEET IS NOT COMPLETE AND MAY BE AMENDED PRIOR TO THE TIME OF SALE. THIS TERM SHEET IS NOT AN OFFER TO SELL THESE SECURITIES AND IT IS NOT A SOLICITATION OF AN OFFER TO BUY THESE SECURITIES IN ANY JURISDICTION WHERE THE OFFER OR SALE IS NOT PERMITTED.
| 56 |
| CHICAGO INDUSTRIAL PORTFOLIO I |
The following table presents historical occupancy percentages at the Chicago Industrial Portfolio I Properties:
Historical Occupancy
12/31/2011(1) | 12/31/2012(1) | 12/31/2013(1) | 12/31/2014(1) | Various(2) |
| NAV | NAV | 85.5% | 85.7% | 89.1% |
| (1) | Information obtained from the borrower. |
| (2) | Information obtained from the underwritten rent roll. Occupancy shown is as of dates ranging from April 1, 2015 to February 1, 2016. |
Operating History and Underwritten Net Cash Flow. The following table presents certain information relating to the historical operating performance and the underwritten net cash flow at the Chicago Industrial Portfolio I Properties:
Cash Flow Analysis(1)
| 2014(2) | Various(2)(3) | U/W(2) | % of U/W Effective Gross Income | U/W $ per SF | |
| Base Rent | $4,371,981 | $4,886,241 | $5,075,249(4) | 79.1% | $4.82 |
| Grossed Up Vacant Space | 0 | 0 | 598,395 | 9.3 | 0.57 |
| Total Reimbursables | 960,536 | 1,344,354 | 1,386,245 | 21.6 | 1.32 |
| Other Income | 44,714 | 376,551 | 0 | 0.0 | 0.00 |
| Less Vacancy & Free Rent | (116,745) | (90,072) | (643,202)(5) | (10.0) | (0.61) |
| Effective Gross Income | $5,260,486 | $6,517,074 | $6,416,686 | 100.0% | $6.10 |
| Total Operating Expenses | $2,594,116 | $2,672,029 | $2,459,074 | 38.3% | $2.34 |
|
|
|
|
| |
| Net Operating Income | $2,666,370 | $3,845,045 | $3,957,612 | 61.7% | $3.76 |
| TI/LC | 0 | 0 | 154,179 | 2.4 | 0.15 |
| Capital Expenditures | 0 | 0 | 162,758 | 2.5 | 0.15 |
| Net Cash Flow | $2,666,370 | $3,845,045 | $3,640,675 | 56.7% | $3.46 |
| NOI DSCR | 0.91x | 1.32x | 1.36x | ||
| NCF DSCR | 0.91x | 1.32x | 1.25x | ||
| NOI DY | 6.0% | 8.7% | 9.0% | ||
| NCF DY | 6.0% | 8.7% | 8.2% |
| (1) | Historical cash flows prior to 2014 were not provided for all of the Chicago Industrial Portfolio I Properties. |
| (2) | The increase in Net Operating Income from 2014 to U/W was due to new leasing activity and contractual rent increases at the Chicago Industrial Portfolio I Properties. |
| (3) | The most recent financials represent the trailing 12-month period ending October 31, 2015 for four of the Chicago Industrial Portfolio I Properties and the annualized ten-month year-to-date period through October 31, 2015 for 14 of the Chicago Industrial Portfolio I Properties. |
| (4) | U/W Base Rent includes contractual rent steps through December 2016 totaling $36,709. |
| (5) | The underwritten economic vacancy is 11.3%. The Chicago Industrial Portfolio I Properties are 89.1% occupied as of dates ranging from April 1, 2015 to February 1, 2016. |
Appraisal. As of the appraisal valuation dates ranging from November 12, 2015 to November 18, 2015, the Chicago Industrial Portfolio I Properties had an “as-is” appraised value of $60,595,000.
Environmental Matters. According to Phase I environmental site assessments dated from November 10, 2015 to November 19, 2015, there was no evidence of any recognized environmental conditions (“RECs”) at any of the Chicago Industrial Portfolio I Properties. However, there were potentially sensitive historical activities identified at 12500 Lombard Lane and 2785 Algonquin Road. At the 12500 Lombard Lane property the Phase I environmental consultant identified four former underground storage tanks that were installed in 1979 and removed in 1989. The removal log reported no visual evidence of a release; however, no sampling activities were performed. The Phase I environmental consultant also identified potentially sensitive activities in connection with two triple oil/water separator units at the 2785 Algonquin Road property.
Although these potentially sensitive activities are not classified as RECs and Phase II environmental site assessments were not recommended, the lender obtained a $4.0 million environmental insurance policy with a $2.0 million sublimit per claim from Steadfast Insurance Company, a member company of Zurich North American, with a 10 year term, 3 year policy tail and a $50,000 deductible, for which the lender reserved upfront. See “Description of the Mortgage Pool — Environmental Considerations” in the Preliminary Prospectus.
Market Overview and Competition. The Chicago Industrial Portfolio I Properties are located within the Chicago Industrial market, which has experienced a steady decline in vacancy from 10.0% in 2009 to 4.6% as of the third quarter of 2015. Additionally, the Chicago Industrial market has experienced positive absorption over the same time period. The Chicago Industrial market is divided into 19 submarkets, and the Chicago Industrial Portfolio I Properties are located within 11 of these submarkets. According to the appraisal, the submarket vacancy rates ranged from 1.6% to 13.9%, with an average of 4.8%. The 13.9% submarket vacancy rate is an outlier as 7.9% is the next highest vacancy rate. Further, the appraiser concluded to market rents ranging from $3.25 per square foot to $10.00 per square foot, with an average of $5.31 per square foot.
THE INFORMATION IN THIS STRUCTURAL AND COLLATERAL TERM SHEET IS NOT COMPLETE AND MAY BE AMENDED PRIOR TO THE TIME OF SALE. THIS TERM SHEET IS NOT AN OFFER TO SELL THESE SECURITIES AND IT IS NOT A SOLICITATION OF AN OFFER TO BUY THESE SECURITIES IN ANY JURISDICTION WHERE THE OFFER OR SALE IS NOT PERMITTED.
| 57 |
| CHICAGO INDUSTRIAL PORTFOLIO I |
The Borrowers.The borrower structure is comprised of one independent director and 18 single purpose entities, each a Delaware limited liability company. Legal counsel to the borrowers delivered a non-consolidation opinion in connection with the origination of the Chicago Industrial Portfolio I Mortgage Loan. George J. Cibula, Jr. and Matthew Lewandowski are the guarantors of certain nonrecourse carveouts under the Chicago Industrial Portfolio I Mortgage Loan.
The Sponsors.The sponsors are George J. Cibula, Jr. and Matthew Lewandowski. Mr. Cibula has been involved in the industrial real estate market for over 40 years as a broker, investor, and developer. Mr. Cibula is a managing partner in over 60 industrial properties in Illinois, Indiana, and Wisconsin, comprising approximately 4.5 million square feet with over 200 tenants. In 1975 Mr. Cibula founded Darwin Realty & Development Corporation (“Darwin Realty”), a privately-held real estate brokerage, asset management, investment and development firm based in suburban Chicago, Illinois. Darwin Realty has a focus on industrial properties in the Midwest, with a specific focus on Chicago. Mr. Lewandowski is a Vice President of Darwin Realty. During his career, Mr. Lewandowski has participated in over $500 million of real estate transactions.
Escrows. The loan documents provide for upfront reserves in the amount of $756,506 for real estate taxes; $750,000 for tenant improvements and leasing commissions (“TI/LC”); $235,845 for deferred maintenance; and $50,000 for the environmental insurance deductible. Additionally, the loan documents provide for ongoing monthly escrows in the amount of $139,208 for real estate taxes, $14,557 for replacement reserves, and $30,692 for TI/LC (subject to a cap of $1,600,000).
The loan documents do not require monthly escrows for real estate taxes with respect to the 877 North Larch Avenue property provided the following conditions are met: (i) no event of default has occurred and is continuing; (ii) the real estate taxes are paid current; and (iii) the borrower has provided the lender with timely proof of payment. The loan documents do not require monthly escrows for insurance provided (i) no event of default has occurred and is continuing; (ii) the Chicago Industrial Portfolio I Properties is insured under an acceptable blanket insurance policy and (iii) the borrower provides the lender with evidence of renewal of the policies and timely proof of payment of the insurance premiums.
Lockbox and Cash Management. The Chicago Industrial Portfolio I Mortgage Loan requires a lender-controlled lockbox account, which is already in place, and that the borrower and property manager direct all tenants to pay rent payments directly into such lockbox account. The loan documents also require that all rents received by the borrower or property manager be deposited into the lockbox account within one business day of receipt. Prior to the occurrence of a Cash Trap Event Period (as defined below), all excess funds on deposit in the lockbox account are disbursed to the borrower. During a Cash Trap Event Period, all excess funds are swept to a lender-controlled cash management account.
A “Cash Trap Event Period” will commence upon the earlier of (i) the occurrence of an event of default or (ii) the amortizing debt service coverage ratio for the trailing 12-month period being less than 1.10x at the end of any calendar month. A Cash Trap Event Period will expire, with regard to clause (i), upon the cure of such event of default and with regard to clause (ii), upon the amortizing debt service coverage ratio being equal to or greater than 1.20x for two consecutive calendar quarters.
Property Management. The Chicago Industrial Portfolio I Properties are managed by an affiliate of the borrower.
Assumption. The borrower has a two-time right to transfer the Chicago Industrial Portfolio I Properties, provided that certain conditions are satisfied, including (i) no event of default has occurred and is continuing; (ii) the lender has reasonably determined that the proposed transferee and guarantor satisfy the lender’s credit review and underwriting standards, taking into consideration transferee experience, financial strength and general business standing; (iii) execution of a recourse guaranty and an environmental indemnity by an affiliate of the transferee; and (iv) the lender has received confirmation from DBRS, KBRA and Moody’s that such assumption will not result in a downgrade, withdrawal or qualification of the respective ratings assigned to the Series 2016-C32 Certificates.
Partial Release.Following the lockout period, the borrower is permitted to partially release any of the Chicago Industrial Portfolio I Properties, subject to certain conditions including (i) no event of default has occurred and is continuing; (ii) the principal balance is reduced by the greater of (a) 115% of the released property’s allocated loan amount or (b) 100% of the net proceeds of the sale of the released property, but no more than 125% of the released property’s allocated loan amount; (iii) the principal balance is reduced by an amount that would result in the net cash flow debt yield of the remaining Chicago Industrial Portfolio I Properties following the release being no less than the greater of (a) 8.0% and (b) the net cash flow debt yield of the Chicago Industrial Portfolio I Properties immediately prior to the release; (iv) the principal balance is reduced by an amount that would result in the amortizing debt service coverage ratio of the remaining Chicago Industrial Portfolio I Properties following the release being no less than the greater of (a) 1.25x and (b) the amortizing debt service coverage ratio of the Chicago Industrial Portfolio I Properties immediately prior to the release; (v) the principal balance is reduced by an amount that would result in a loan-to-value ratio of the remaining Chicago Industrial Portfolio I Properties following the release being no more than the lesser (a) 70.0% and (b) the loan-to-value ratio of the Chicago Industrial Portfolio I Properties immediately prior to the release; (vi) rating agency confirmation from DBRS, KBRA and Moody’s that the transfer will not result in a downgrade, withdrawal or qualification of the respective ratings assigned to the Series 2016-C32 Certificates; and (vii) the lender receives a legal opinion that the release satisfies REMIC requirements.
Free Release.The borrower is permitted to obtain the release of an unimproved parcel at the 8100 South 77th Avenue property (the “Bridgeview Release Parcel”), subject to the satisfaction of certain conditions contained in the loan agreement, including but not limited to (i) no event of default has occurred and is continuing; (ii) release will not impact the value of the remaining property; (iii) release conforms to REMIC requirements (iv) evidence that the remaining 8100 South 77th Avenue property will be in compliance with all applicable legal and zoning requirements; and (v) the loan to value ratio for the remaining 8100 South 77th Avenue property is in compliance with all REMIC requirements. As of the appraisal valuation date of November 17, 2015, the excess land parcel had an “as-is” appraised value of $1,200,000; however, this was excluded from the “as-is” appraised values of the 8100 South 77th Avenue property and the Chicago Industrial Portfolio I Properties.
THE INFORMATION IN THIS STRUCTURAL AND COLLATERAL TERM SHEET IS NOT COMPLETE AND MAY BE AMENDED PRIOR TO THE TIME OF SALE. THIS TERM SHEET IS NOT AN OFFER TO SELL THESE SECURITIES AND IT IS NOT A SOLICITATION OF AN OFFER TO BUY THESE SECURITIES IN ANY JURISDICTION WHERE THE OFFER OR SALE IS NOT PERMITTED.
| 58 |
| CHICAGO INDUSTRIAL PORTFOLIO I |
Real Estate Substitution.Not permitted.
Subordinate and Mezzanine Indebtedness.MSC–DRP HoldCo, LLC, a Delaware limited liability company (the “Chicago Industrial Portfolio I Mezzanine Lender”) has originated a $4,500,000 mezzanine loan (the “Chicago Industrial Portfolio I Mezzanine Loan”) to Welbic Mezz Manager IV LLC, a Delaware limited liability company (the “Chicago Industrial Portfolio I Mezzanine Borrower”). MSC-DRP HoldCo, LLC is owned by Morrison Street Debt Opportunities Fund, L.P., which is managed by Morrison Street Capital, LLC. The Chicago Industrial Portfolio I Mezzanine Loan is subject to an intercreditor agreement between lender and the Chicago Industrial Portfolio I Mezzanine Lender. The Chicago Industrial Portfolio I Mezzanine Loan had an initial term of 120 months and has a remaining term as of the Cut-off Date of 119 months. The Chicago Industrial Portfolio I Mezzanine Loan accrues interest at an interest rate of 11.000% per annum and requires interest-only payments through the term of the Chicago Industrial Portfolio I Mezzanine Loan.
Ground Lease. None.
Terrorism Insurance.The loan documents require that the “all risk” insurance policy required to be maintained by the borrower provide coverage for terrorism in an amount equal to the full replacement cost of the Chicago Industrial Portfolio I Properties. The loan documents also require business interruption insurance covering no less than the 18-month period following the occurrence of a casualty event, together with a six-month period of indemnity.
THE INFORMATION IN THIS STRUCTURAL AND COLLATERAL TERM SHEET IS NOT COMPLETE AND MAY BE AMENDED PRIOR TO THE TIME OF SALE. THIS TERM SHEET IS NOT AN OFFER TO SELL THESE SECURITIES AND IT IS NOT A SOLICITATION OF AN OFFER TO BUY THESE SECURITIES IN ANY JURISDICTION WHERE THE OFFER OR SALE IS NOT PERMITTED.
| 59 |
| PREFERRED FREEZER - NEWARK |

THE INFORMATION IN THIS STRUCTURAL AND COLLATERAL TERM SHEET IS NOT COMPLETE AND MAY BE AMENDED PRIOR TO THE TIME OF SALE. THIS TERM SHEET IS NOT AN OFFER TO SELL THESE SECURITIES AND IT IS NOT A SOLICITATION OF AN OFFER TO BUY THESE SECURITIES IN ANY JURISDICTION WHERE THE OFFER OR SALE IS NOT PERMITTED.
| 60 |
| PREFERRED FREEZER - NEWARK |
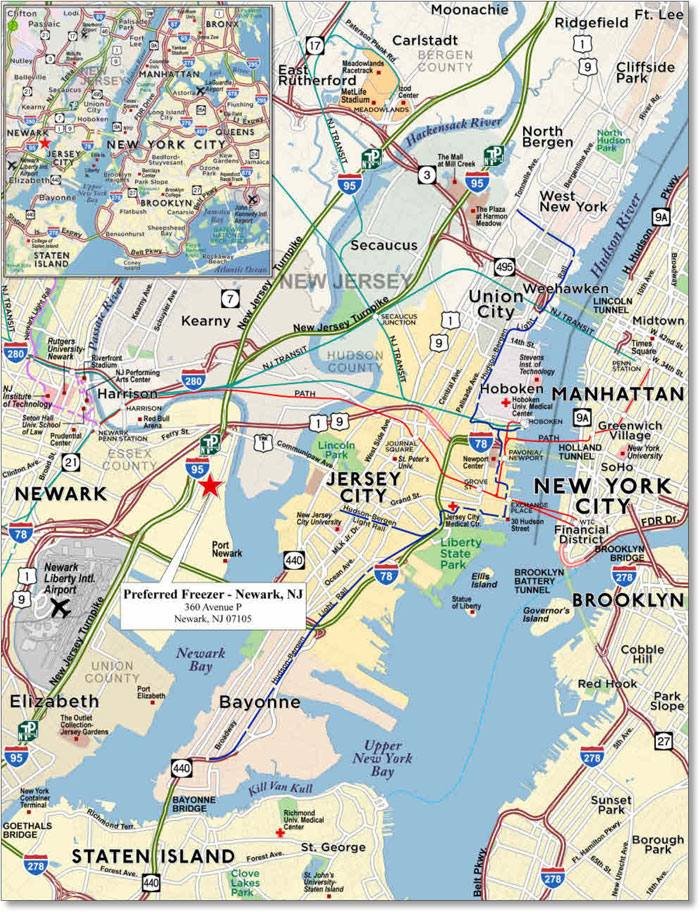
THE INFORMATION IN THIS STRUCTURAL AND COLLATERAL TERM SHEET IS NOT COMPLETE AND MAY BE AMENDED PRIOR TO THE TIME OF SALE. THIS TERM SHEET IS NOT AN OFFER TO SELL THESE SECURITIES AND IT IS NOT A SOLICITATION OF AN OFFER TO BUY THESE SECURITIES IN ANY JURISDICTION WHERE THE OFFER OR SALE IS NOT PERMITTED.
| 61 |
| No. 5 – Preferred Freezer – Newark | ||||||||
| Loan Information | Property Information | |||||||
| Mortgage Loan Seller: | Wells Fargo Bank, National Association | Single Asset/Portfolio: | Single Asset | |||||
| Credit Assessment (DBRS/KBRA/Moody’s): | NR/NR/NR | Property Type: | Industrial | |||||
| Original Principal Balance: | $36,200,000 | Specific Property Type: | Cold Storage Facility | |||||
| Cut-off Date Principal Balance: | $36,200,000 | Location: | Newark, NJ | |||||
| % of Initial Pool Balance: | 3.8% | Size: | 197,336 SF | |||||
| Loan Purpose: | Refinance | Cut-off Date Principal Balance Per SF: | $183.44 | |||||
| Borrower Names(1): | Various | Year Built/Renovated: | 2006/NAP | |||||
| Sponsor: | Sherwin Jarol | Title Vesting: | Fee | |||||
| Mortgage Rate: | 4.720% | Property Manager: | Self-managed | |||||
| Note Date: | December 1, 2015 | 4th Most Recent Occupancy (As of): | 100.0% (12/31/2012) | |||||
| Anticipated Repayment Date: | NAP | 3rd Most Recent Occupancy (As of): | 100.0% (12/31/2013) | |||||
| Maturity Date: | December 11, 2025 | 2nd Most Recent Occupancy (As of): | 100.0% (12/31/2014) | |||||
| IO Period: | 120 months | Most Recent Occupancy (As of): | 100.0% (12/31/2015) | |||||
| Loan Term (Original): | 120 months | Current Occupancy (As of): | 100.0% (2/1/2016) | |||||
| Seasoning: | 2 months | |||||||
| Amortization Term (Original): | NAP | Underwriting and Financial Information: | ||||||
| Loan Amortization Type: | Interest-only, Balloon | |||||||
| Interest Accrual Method: | Actual/360 | 4th Most Recent NOI (As of): | $3,564,000 (12/31/2011) | |||||
| Call Protection: | L(26),D(90),O(4) | 3rd Most Recent NOI (As of): | $3,564,000 (12/31/2012) | |||||
| Lockbox Type: | Hard/Upfront Cash Management | 2nd Most Recent NOI (As of): | $3,564,000 (12/31/2013) | |||||
| Additional Debt: | None | Most Recent NOI (As of): | $3,564,000 (12/31/2014) | |||||
| Additional Debt Type: | NAP | |||||||
| U/W Revenues: | $5,019,645 | |||||||
| U/W Expenses: | $1,345,883 | |||||||
| U/W NOI: | $3,673,762 | |||||||
| U/W NCF: | $3,462,057 | |||||||
| U/W NOI DSCR: | 2.11x | |||||||
| Escrows and Reserves(2): | U/W NCF DSCR: | 1.99x | ||||||
| U/W NOI Debt Yield: | 10.1% | |||||||
| Type: | Initial | Monthly | Cap (If Any) | U/W NCF Debt Yield: | 9.6% | |||
| Taxes | $0 | Springing | NAP | As-Is Appraised Value: | $59,900,000 | |||
| Insurance | $0 | Springing | NAP | As-Is Appraisal Valuation Date: | October 1, 2015 | |||
| Replacement Reserves | $0 | Springing | NAP | Cut-off Date LTV Ratio: | 60.4% | |||
| TI/LC Reserve | $0 | $0 | NAP | LTV Ratio at Maturity or ARD: | 60.4% | |||
| (1) | See “The Borrowers” section. |
| (2) | See “Escrows” section. |
The Mortgage Loan.The mortgage loan (the “Preferred Freezer – Newark Mortgage Loan”) is evidenced by a single promissory note that is secured by a first mortgage encumbering a cold storage facility located in Newark, New Jersey (the “Preferred Freezer – Newark Property”). The Preferred Freezer – Newark Mortgage Loan was originated on December 1, 2015 by Wells Fargo Bank, National Association. The Preferred Freezer – Newark Mortgage Loan had an original principal balance of $36,200,000, has an outstanding principal balance as of the Cut-off Date of $36,200,000 and accrues interest at an interest rate of 4.720%per annum. The Preferred Freezer – Newark Mortgage Loan had an initial term of 120 months, has a remaining term of 118 months as of the Cut-off Date and requires interest-only payments for the term of the Preferred Freezer – Newark Mortgage Loan. The Preferred Freezer – Newark Mortgage Loan matures on December 11, 2025.
Following the lockout period, the borrower has the right to defease the Preferred Freezer – Newark Mortgage Loan in whole, but not in part, on any date before September 11, 2025. In addition, the Preferred Freezer – Newark Mortgage Loan is prepayable without penalty on or after September 11, 2025.
THE INFORMATION IN THIS STRUCTURAL AND COLLATERAL TERM SHEET IS NOT COMPLETE AND MAY BE AMENDED PRIOR TO THE TIME OF SALE. THIS TERM SHEET IS NOT AN OFFER TO SELL THESE SECURITIES AND IT IS NOT A SOLICITATION OF AN OFFER TO BUY THESE SECURITIES IN ANY JURISDICTION WHERE THE OFFER OR SALE IS NOT PERMITTED.
| 62 |
| PREFERRED FREEZER - NEWARK |
Sources and Uses
| Sources | Uses | |||||||
| Original loan amount | $36,200,000 | 100.0% | Loan payoff(1) | $34,892,546 | 96.4% | |||
| Closing costs | 460,435 | 1.3 | ||||||
| Return of equity | 847,019 | 2.3 | ||||||
| Total Sources | $36,200,000 | 100.0% | Total Uses | $36,200,000 | 100.0% |
| (1) | The Preferred Freezer –Newark Property was previously securitized in the JPMCC 2006-CB15 transaction. |
The Property.The Preferred Freezer - Newark Property is a one-story, refrigerated/freezer warehouse comprising 197,336 square feet located in Newark, New Jersey that is 100.0% occupied by Preferred Freezer Services (“Preferred Freezer”). Built in 2006, the Preferred Freezer – Newark Property is comprised of approximately 142,889 square feet of freezer space, 32,235 square feet of refrigerated dock area, 17,712 square feet of office space and 4,500 square feet of mechanical area. The Preferred Freezer – Newark Property features 33 feet of clear height in the dock area, 59 feet of clear height in the freezer area and 24-dock-high loading doors. The Preferred Freezer – Newark Property has been 100.0% occupied by Preferred Freezer since 2006. Founded in 1989, Preferred Freezer operates 35 full service refrigerated warehouse facilities located across the United States totaling in excess of 200.0 million cubic feet, ranking the fourth largest of North American Refrigerated Warehouse Companies in the United States as of April 2015, according to an industry organization. Preferred Freezer’s headquarters in located in Chatham, New Jersey and has more than 1,300 employees with approximately $200.0 million in sales and has expanded internationally with facilities in China and Vietnam. The Preferred Freezer – Newark Property features 115 surface parking spaces, resulting in a parking ratio of 0.6 spaces per 1,000 square feet of rentable area. As of February 1, 2016, the Preferred Freezer – Newark Property is 100.0% occupied.
The following table presents certain information relating to the tenancy at the Preferred Freezer - Newark Property:
Major Tenant
| Tenant Name | Credit Rating (Fitch/ Moody’s/ S&P) | Tenant NRSF | % of NRSF | Annual U/W Base Rent PSF | Annual U/W Base Rent | % of Total Annual U/W Base Rent | Lease Expiration Date |
| Major Tenant | |||||||
| Preferred Freezer | NR/NR/NR | 197,336 | 100.0% | $19.51(1) | $3,849,120(1) | 100.0% | 2/28/2031(2) |
| Occupied Collateral Total | 197,336 | 100.0% | $19.51 | $3,849,120 | 100.0% | ||
| Vacant Space | 0 | 0.0% | |||||
| Collateral Total | 197,336 | 100.0% | |||||
| (1) | Annual U/W Base Rent PSF and Annual U/W Base Rent represents Preferred Freezer’s contractual rent step that will occur in March 2016; Preferred Freezer’s current rent is $3,564,000 ($18.06 per square foot). |
| (2) | Preferred Freezer has four, five-year lease renewal options. |
THE INFORMATION IN THIS STRUCTURAL AND COLLATERAL TERM SHEET IS NOT COMPLETE AND MAY BE AMENDED PRIOR TO THE TIME OF SALE. THIS TERM SHEET IS NOT AN OFFER TO SELL THESE SECURITIES AND IT IS NOT A SOLICITATION OF AN OFFER TO BUY THESE SECURITIES IN ANY JURISDICTION WHERE THE OFFER OR SALE IS NOT PERMITTED.
| 63 |
| PREFERRED FREEZER - NEWARK |
The following table presents certain information relating to the lease rollover schedule at the Preferred Freezer - Newark Property:
Lease Expiration Schedule(1)
| Year Ending December 31, | No. of Leases Expiring | Expiring NRSF | % of Total NRSF | Cumulative Expiring NRSF | Cumulative % of Total NRSF | Annual U/W Base Rent | % of Total Annual U/W Base Rent | Annual U/W Base Rent PSF |
| MTM | 0 | 0 | 0.0% | 0 | 0.0% | $0 | 0.0% | $0.00 |
| 2016 | 0 | 0 | 0.0% | 0 | 0.0% | $0 | 0.0% | $0.00 |
| 2017 | 0 | 0 | 0.0% | 0 | 0.0% | $0 | 0.0% | $0.00 |
| 2018 | 0 | 0 | 0.0% | 0 | 0.0% | $0 | 0.0% | $0.00 |
| 2019 | 0 | 0 | 0.0% | 0 | 0.0% | $0 | 0.0% | $0.00 |
| 2020 | 0 | 0 | 0.0% | 0 | 0.0% | $0 | 0.0% | $0.00 |
| 2021 | 0 | 0 | 0.0% | 0 | 0.0% | $0 | 0.0% | $0.00 |
| 2022 | 0 | 0 | 0.0% | 0 | 0.0% | $0 | 0.0% | $0.00 |
| 2023 | 0 | 0 | 0.0% | 0 | 0.0% | $0 | 0.0% | $0.00 |
| 2024 | 0 | 0 | 0.0% | 0 | 0.0% | $0 | 0.0% | $0.00 |
| 2025 | 0 | 0 | 0.0% | 0 | 0.0% | $0 | 0.0% | $0.00 |
| 2026 | 0 | 0 | 0.0% | 0 | 0.0% | $0 | 0.0% | $0.00 |
| Thereafter | 1 | 197,336 | 100.0% | 197,336 | 100.0% | $3,849,120 | 100.0% | $19.51 |
| Vacant | 0 | 0 | 0.0% | 197,336 | 100.0% | $0 | 0.0% | $0.00 |
| Total/Weighted Average | 1 | 197,336 | 100.0% | $3,849,120 | 100.0% | $19.51 |
| (1) | Information obtained from the underwritten rent roll. |
The following table presents historical occupancy percentages at the Preferred Freezer - Newark Property:
Historical Occupancy
12/31/2012(1) | 12/31/2013(1) | 12/31/2014(1) | 12/31/2015(1) | 2/1/2016(2) |
| 100.0% | 100.0% | 100.0% | 100.0% | 100.0% |
| (1) | Information obtained from the Preferred Freezer lease. |
| (2) | Information obtained from the underwritten rent roll. |
Operating History and Underwritten Net Cash Flow. The following table presents certain information relating to the historical operating performance and the underwritten net cash flow at the Preferred Freezer - Newark Property:
Cash Flow Analysis
| 2011 | 2012 | 2013 | 2014 | U/W | % of U/W Effective Gross Income | U/W $ per SF | |
| Base Rent | $3,564,000 | $3,564,000 | $3,564,000 | $3,564,000 | $3,849,120 | 76.7% | $19.51 |
| Grossed Up Vacant Space | 0 | 0 | 0 | 0 | 0 | 0.0 | 0.00 |
| Total Reimbursables | 0 | 0 | 0 | 0 | 1,362,981 | 27.2 | 6.91 |
| Other Income | 0 | 0 | 0 | 0 | 0 | 0.0 | 0.00 |
| Less Vacancy & Credit Loss | 0 | 0 | 0 | 0 | (192,456)(1) | (3.8) | (0.98) |
| Effective Gross Income | $3,564,000 | $3,564,000 | $3,564,000 | $3,564,000 | $5,019,645 | 100.0% | $25.44 |
| Total Operating Expenses | $0 | $0 | $0 | $0 | $1,345,883 | 26.8% | $6.82 |
| Net Operating Income | $3,564,000 | $3,564,000 | $3,564,000 | $3,564,000 | $3,673,762 | 73.2% | $18.62 |
| TI/LC | 0 | 0 | 0 | 0 | 122,903 | 2.4 | 0.62 |
| Capital Expenditures | 0 | 0 | 0 | 0 | 88,801 | 1.8 | 0.45 |
| Net Cash Flow | $3,564,000 | $3,564,000 | $3,564,000 | $3,564,000 | $3,462,057 | 69.0% | $17.54 |
| NOI DSCR | 2.05x | 2.05x | 2.05x | 2.05x | 2.11x | ||
| NCF DSCR | 2.05x | 2.05x | 2.05x | 2.05x | 1.99x | ||
| NOI DY | 9.8% | 9.8% | 9.8% | 9.8% | 10.1% | ||
| NCF DY | 9.8% | 9.8% | 9.8% | 9.8% | 9.6% |
| (1) | The underwritten economic vacancy is 5.0%. The Preferred Freezer - Newark Property is 100.0% physically occupied as of February 1, 2016. |
Appraisal. As of the appraisal valuation date of October 1, 2015, the Preferred Freezer - Newark Property had an “as-is” appraised value of $59,900,000.
Environmental Matters. According to a Phase I environmental site assessment dated October 6, 2015, the historical activities prior to construction of the Preferred Freezer - Newark Property represent a controlled recognized environmental condition. From 1930 to 1990, the Preferred Freezer – Newark Property and adjacent properties were historically developed with a gas and drum
THE INFORMATION IN THIS STRUCTURAL AND COLLATERAL TERM SHEET IS NOT COMPLETE AND MAY BE AMENDED PRIOR TO THE TIME OF SALE. THIS TERM SHEET IS NOT AN OFFER TO SELL THESE SECURITIES AND IT IS NOT A SOLICITATION OF AN OFFER TO BUY THESE SECURITIES IN ANY JURISDICTION WHERE THE OFFER OR SALE IS NOT PERMITTED.
| 64 |
| PREFERRED FREEZER - NEWARK |
manufacturing factory that was primarily operated by Linde Gases which impacted the soil. The site was subsequently used as a storage lot until redeveloped in 2005 with the existing Preferred Freezer – Newark Property. The Preferred Freezer – Newark Property obtained a Deed Notice with Engineering Controls Soil Permit in August 2014 which requires no further action other than continued compliance and maintenance. See “Description of the Mortgage Pool – Environmental Considerations” in the Preliminary Prospectus.
Market Overview and Competition.The Preferred Freezer - Newark Property is located in Newark, New Jersey, approximately 3.2 miles southeast of downtown Newark. The Preferred Freezer - Newark Property benefits from its location within a heavily industrialized area east of the New Jersey Turnpike between Interchanges 15E and 14 and immediately north of the Port of Newark. The Preferred Freezer – Newark Property has immediate access from Interchange 15E of the New Jersey Turnpike as well as U.S. Routes 1 and 9, and is located approximately 5.7 miles northeast of Newark Liberty International Airport. The estimated 2015 population within a three- and five-mile radius of the Preferred Freezer – Newark Property is 199,054 and 685,770, respectively, while the estimated 2015 median household income within the same radii is $44,508 and $44,688, respectively.
According to the appraisal, the Port of Newark, located approximately 3.5 miles southwest of the Preferred Freezer – Newark Property, is preparing for a $650.0 million upgrade in its infrastructure in preparation for the increased traffic generated by the expansion of the Panama Canal in 2015. Upgrades will include new straddle carriers and the addition of 80 acres to the Port’s existing container yard. In total, the project is expected to double the number of containers moving through the terminal and the Port Authority of New York/New Jersey will reportedly invest up to $150.0 million of additional improvements. The Port of Newark currently supports more than 200,000 jobs and the expansion is expected to generate approximately 6,900 additional jobs.
According to a third-party market research report, the Preferred Freezer - Newark Property is located within the East Newark industrial submarket of the Northern New Jersey industrial market. As of the third quarter of 2015, the submarket reported an inventory of 643 industrial properties totaling approximately 25.0 million square feet with a 3.9% vacancy rate and average asking rent of $6.88 per square foot on a modified gross basis. According to the appraisal, the local cold storage market consists of 25 properties in the Northern New Jersey area with eight directly comparable properties ranging in size from approximately 100,000 to 243,400 square feet; the eight comparable cold storage facilities were all 100.0% occupied.
The following table presents certain information relating to comparable cold storage leases for the Preferred Freezer - Newark Property:
Comparable Leases(1)
| Property Name/Location | Year Built/ Renovated | Property Sub-Type | Total SF | Occupancy | Distance to Subject | Clear Height (ft) | Dock Doors | Rent PSF | Lease Type |
Preferred Freezer - Newark (Subject) Newark, NJ | 2006/NAP | Cold Storage | 197,336 | 100% | -- | 59 | 24 | $19.51 | NNN |
Seafrigo Cold Storage Elizabeth, NJ | 2013/NAP | Cold Storage | 175,000 | 100% | 8.3 miles | 40 | 25 | $13.56 | NNN |
Preferred Freezer – 1 Elizabeth, NJ | 1998/NAP | Cold Storage | 198,848 | 100% | 11.2 miles | 57 | 24 | $17.58 | NNN |
Preferred Freezer – 2 Elizabeth, NJ | 2011/NAP | Cold Storage | 144,566 | 100% | 11.3 miles | 64 | 16 | $16.41 | NNN |
Albert’s Organics Swedesboro, NJ | 2013/NAP | Cold Storage | 70,000 | 100% | 104.0 miles | 28 | 10 | $11.04 | NNN |
| Preferred Freezer – 3 Woodbridge, NJ | 2015/NAP | Cold Storage | 192,400 | 100% | 15.7 miles | 32 | 24 | $12.15 | NNN |
| (1) | Information obtained from the appraisal and the underwritten rent roll. |
The Borrowers.The borrower structure is comprised of five tenants-in-common: Avenue P Venture, LLC; Brody Newark, LLC; Bradley Ind Holding, LLC; Houston Venture Holding, LLC and Kinross Venture Holding, LLC, each a Delaware limited liability company and single purpose entity with one independent director. Legal counsel to the borrowers delivered a non-consolidation opinion in connection with the origination of the Preferred Freezer – Newark Mortgage Loan. Sherwin Jarol is the guarantor of certain nonrecourse carveouts under the Preferred Freezer - Newark Mortgage Loan. See “Description of the Mortgage Pool – Mortgage Pool Characteristics – Tenancies-in-Common” in the Preliminary Prospectus.
The Sponsor.The sponsor is Sherwin Jarol, the chief executive officer of Bradley Associates, LP (“Bradley Associates”). Bradley Associates is a leading investment company that, since its inception over 30 years ago, has acquired over 100 properties representing more than 15.0 million square feet of industrial, office and retail space with market values exceeding approximately $1.5 billion.
Escrows.The loan documents do not require monthly escrows for real estate taxes provided that the following conditions are met: (i) no event of default has occurred and is continuing; (ii) the real estate taxes are paid current; and (iii) the borrower has provided the lender with timely proof of payment. The loan documents do not require monthly escrows for insurance provided that (i) no event of default has occurred and is continuing; (ii) the Preferred Freezer - Newark Property is insured under an acceptable blanket insurance policy and (iii) the borrower provides the lender with evidence of renewal of such policy and timely proof of payment of the insurance premiums. The loan documents require monthly escrows in an amount of $7,400 for replacement reserves upon the occurrence of an event of default or the lender determining that the borrower is not adequately maintaining the Preferred Freezer – Newark Property.
THE INFORMATION IN THIS STRUCTURAL AND COLLATERAL TERM SHEET IS NOT COMPLETE AND MAY BE AMENDED PRIOR TO THE TIME OF SALE. THIS TERM SHEET IS NOT AN OFFER TO SELL THESE SECURITIES AND IT IS NOT A SOLICITATION OF AN OFFER TO BUY THESE SECURITIES IN ANY JURISDICTION WHERE THE OFFER OR SALE IS NOT PERMITTED.
| 65 |
| PREFERRED FREEZER - NEWARK |
Lockbox and Cash Management.The Preferred Freezer - Newark Mortgage Loan requires a lender-controlled lockbox account, which is already in place, and that the borrower direct the tenant to pay its rents directly into such lockbox account. The loan documents also require that all rents received by the borrower or property manager be deposited into the lockbox account within one business day of receipt. Prior to the occurrence of a Cash Trap Event Period (as defined below), all excess cash flow on deposit in the lockbox account will be disbursed to the borrower. During a Cash Trap Event Period, all excess cash flow is required to be swept to a lender-controlled cash management account.
A “Cash Trap Event Period” will commence upon the earlier of (i) the occurrence of an event of default; (ii) the debt service coverage ratio based on a 30-year amortization schedule being less than 1.30x at the end of any calendar month; and (iii) the occurrence of a Tenant Trigger Event (as defined below). A Cash Trap Event Period will end, with regard to clause (i), upon the cure of such event of default; with regard to clause (ii), upon the debt service coverage ratio based on a 30-year amortization schedule being equal to or greater than 1.50x for two consecutive calendar quarters; and with regard to clause (iii), upon the cure of a Tenant Trigger Event.
A “Tenant Trigger Event” will occur upon the earlier of (a) 15 days following Preferred Freezer defaulting under its lease beyond available notice and cure periods, entering into any material lease modification with the borrower, exercising any right to terminate its lease, or ceasing to operate or go dark for more than ten business days in 100.0% of the Preferred Freezer – Newark Property; or (b) Preferred Freezer or its parent company filing bankruptcy or similar insolvency proceeding (or other similar actions, including but not limited to appointment of a receiver or trustee or filing a petition under bankruptcy laws).
A Tenant Trigger Event may be cured, with regard to clause (a), upon (i) 60 days following the lender receiving acceptable evidence that Preferred Freezer has resumed operations in at least 50.0% of the Preferred Freezer – Newark Property in accordance with its lease, or (ii) the date the lender receives an acceptable estoppel from one or more replacement tenants certifying that the replacement tenant is not in default under its lease, is in occupancy and paying full unabated rent and all tenant improvements have been completed per the lease; with regard to clause (b), upon a plan of reorganization being provided and Preferred Freezer’s lease being affirmed, Preferred Freezer commencing rent payments and an order by the bankruptcy court approving the affirmation of the lease; and, with regard to both clause (a) and (b), upon a new lease on terms acceptable to the lender with an acceptable replacement tenant being delivered.
Property Management. The Preferred Freezer - Newark Property is managed by an affiliate of the borrower.
Assumption. The borrower has a two-time right to transfer the Preferred Freezer - Newark Property provided that certain conditions are satisfied, including (i) no event of default has occurred and is continuing; (ii) the transferee satisfies certain specified criteria including value of real estate owned or under management and experience, or the lender has reasonably determined that the proposed transferee and guarantor satisfy the lender’s credit review and underwriting standards, taking into consideration transferee experience, financial strength and general business standing; and (iii) the lender has received confirmation from DBRS, KBRA and Moody’s that such assumption will not result in a downgrade, withdrawal or qualification of the respective ratings assigned to the Series 2016-C32 Certificates.
Right of First Offer.Preferred Freezer has a right of first offer (“ROFO”) to purchase the Preferred Freezer – Newark Property. The ROFO is not extinguished by a foreclosure of the Preferred Freezer – Newark Property; however the ROFO does not apply to a foreclosure or deed-in-lieu thereof.
Partial Release. Not permitted.
Real Estate Substitution.Not permitted.
Subordinate and Mezzanine Indebtedness.Not permitted.
Ground Lease. None.
Terrorism Insurance.The loan documents require that the “all risk” insurance policy required to be maintained by the borrower provide coverage for terrorism in an amount equal to the full replacement cost of the Preferred Freezer - Newark Property. The loan documents also require business interruption insurance covering no less than the 12-month period following the occurrence of a casualty event, together with a six-month period of indemnity.
Windstorm Insurance. The loan documents require windstorm insurance covering the full replacement cost of the Preferred Freezer – Newark Property during the loan term. At origination, the Preferred Freezer – Newark Property had windstorm insurance coverage.
THE INFORMATION IN THIS STRUCTURAL AND COLLATERAL TERM SHEET IS NOT COMPLETE AND MAY BE AMENDED PRIOR TO THE TIME OF SALE. THIS TERM SHEET IS NOT AN OFFER TO SELL THESE SECURITIES AND IT IS NOT A SOLICITATION OF AN OFFER TO BUY THESE SECURITIES IN ANY JURISDICTION WHERE THE OFFER OR SALE IS NOT PERMITTED.
| 66 |
(THIS PAGE INTENTIONALLY LEFT BLANK)
THE INFORMATION IN THIS STRUCTURAL AND COLLATERAL TERM SHEET IS NOT COMPLETE AND MAY BE AMENDED PRIOR TO THE TIME OF SALE. THIS TERM SHEET IS NOT AN OFFER TO SELL THESE SECURITIES AND IT IS NOT A SOLICITATION OF AN OFFER TO BUY THESE SECURITIES IN ANY JURISDICTION WHERE THE OFFER OR SALE IS NOT PERMITTED.
| 67 |
(THIS PAGE INTENTIONALLY LEFT BLANK)
THE INFORMATION IN THIS STRUCTURAL AND COLLATERAL TERM SHEET IS NOT COMPLETE AND MAY BE AMENDED PRIOR TO THE TIME OF SALE. THIS TERM SHEET IS NOT AN OFFER TO SELL THESE SECURITIES AND IT IS NOT A SOLICITATION OF AN OFFER TO BUY THESE SECURITIES IN ANY JURISDICTION WHERE THE OFFER OR SALE IS NOT PERMITTED.
| 68 |
10 SOUTH LASALLE STREET
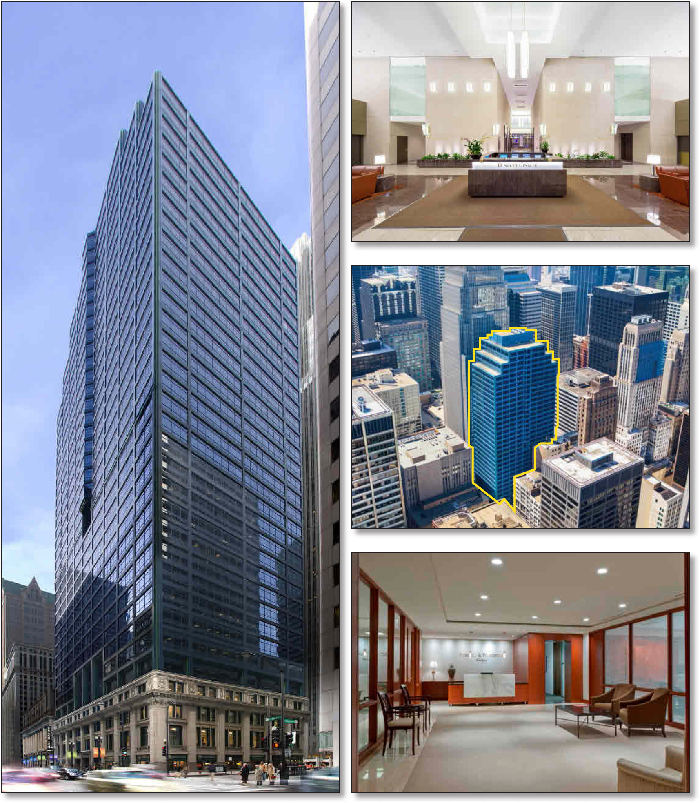
THE INFORMATION IN THIS STRUCTURAL AND COLLATERAL TERM SHEET IS NOT COMPLETE AND MAY BE AMENDED PRIOR TO THE TIME OF SALE. THIS TERM SHEET IS NOT AN OFFER TO SELL THESE SECURITIES AND IT IS NOT A SOLICITATION OF AN OFFER TO BUY THESE SECURITIES IN ANY JURISDICTION WHERE THE OFFER OR SALE IS NOT PERMITTED.
| 69 |
10 SOUTH LASALLE STREET
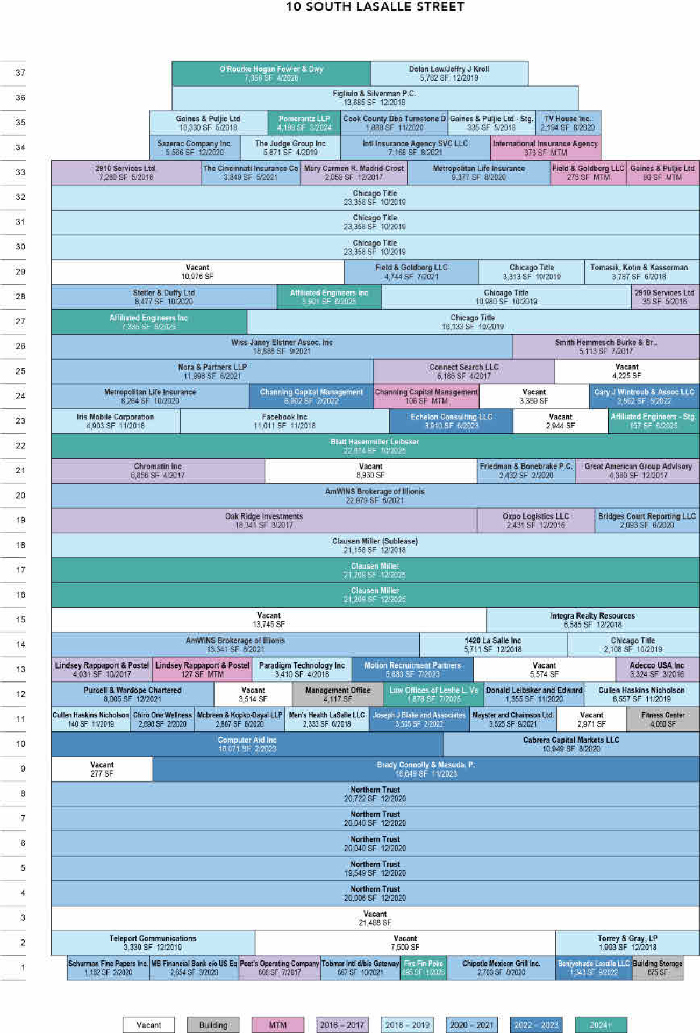
THE INFORMATION IN THIS STRUCTURAL AND COLLATERAL TERM SHEET IS NOT COMPLETE AND MAY BE AMENDED PRIOR TO THE TIME OF SALE. THIS TERM SHEET IS NOT AN OFFER TO SELL THESE SECURITIES AND IT IS NOT A SOLICITATION OF AN OFFER TO BUY THESE SECURITIES IN ANY JURISDICTION WHERE THE OFFER OR SALE IS NOT PERMITTED.
| 70 |
10 SOUTH LASALLE STREET
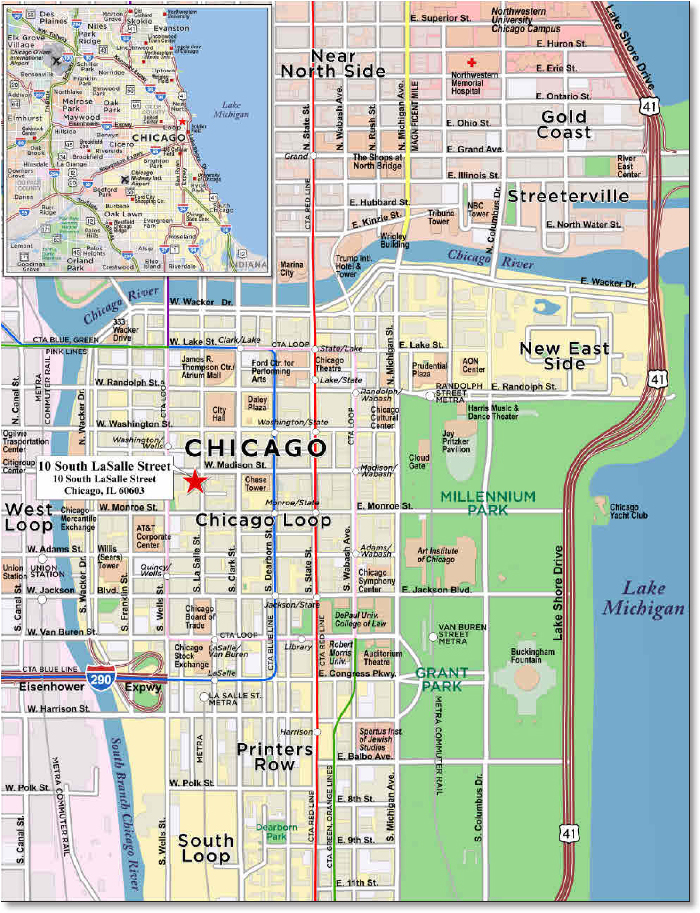
THE INFORMATION IN THIS STRUCTURAL AND COLLATERAL TERM SHEET IS NOT COMPLETE AND MAY BE AMENDED PRIOR TO THE TIME OF SALE. THIS TERM SHEET IS NOT AN OFFER TO SELL THESE SECURITIES AND IT IS NOT A SOLICITATION OF AN OFFER TO BUY THESE SECURITIES IN ANY JURISDICTION WHERE THE OFFER OR SALE IS NOT PERMITTED.
| 71 |
| No. 6 – 10 South LaSalle Street | |||||||
| Loan Information | Property Information | ||||||
| Mortgage Loan Seller: | Wells Fargo Bank, National Association | Single Asset/Portfolio: | Single Asset | ||||
Credit Assessment (DBRS/KBRA/Moody’s): | NR/NR/NR | Property Type: | Office | ||||
| Original Principal Balance(1): | $30,000,000 | Specific Property Type: | CBD | ||||
| Cut-off Date Principal Balance(1): | $30,000,000 | Location: | Chicago, IL | ||||
| % of Initial Pool Balance: | 3.1% | Size: | 781,426 SF | ||||
| Loan Purpose: | Refinance | Cut-off Date Principal Balance Per Unit/SF(1): | $134.37 | ||||
| Borrower Name: | 10 South LaSalle Owner LLC | Year Built/Renovated: | 1987/2013 | ||||
| Sponsor: | Jeffrey Feil | Title Vesting: | Fee | ||||
| Mortgage Rate: | 4.430% | Property Manager: | Self-managed | ||||
| Note Date: | December 31, 2015 | 4th Most Recent Occupancy (As of)(3): | 75.8% (12/31/2011) | ||||
| Anticipated Repayment Date: | NAP | 3rd Most Recent Occupancy (As of)(3): | 82.6% (12/31/2012) | ||||
| Maturity Date: | January 11, 2026 | 2nd Most Recent Occupancy (As of): | 85.9% (12/31/2013) | ||||
| IO Period: | 120 months | Most Recent Occupancy (As of): | 88.5% (12/31/2014) | ||||
| Loan Term (Original): | 120 months | Current Occupancy (As of): | 88.9% (11/20/2015) | ||||
| Seasoning: | 1 month | ||||||
| Amortization Term (Original): | NAP | Underwriting and Financial Information: | |||||
| Loan Amortization Type: | Interest-only, Balloon | ||||||
| Interest Accrual Method: | Actual/360 | 4th Most Recent NOI (As of)(4): | $7,211,200 (12/31/2012) | ||||
| Call Protection: | L(25),D(91),O(4) | 3rd Most Recent NOI (As of)(4): | $10,720,027 (12/31/2013) | ||||
| Lockbox Type: | Hard/Springing Cash Management | 2nd Most Recent NOI (As of): | $11,336,324 (12/31/2014) | ||||
| Additional Debt(1): | Yes | Most Recent NOI (As of)(4): | $11,857,421 (TTM 9/30/2015) | ||||
| Additional Debt Type(1): | Pari Passu | ||||||
| U/W Revenues: | $25,604,042 | ||||||
| U/W Expenses: | $12,785,427 | ||||||
| U/W NOI(4): | $12,818,615 | ||||||
| Escrows and Reserves(2): | U/W NCF: | $10,729,321 | |||||
| U/W NOI DSCR(1): | 2.71x | ||||||
| Type: | Initial | Monthly | Cap (If Any) | U/W NCF DSCR(1): | 2.27x | ||
| Taxes | $2,803,392 | $467,233 | NAP | U/W NOI Debt Yield(1): | 12.2% | ||
| Insurance | $0 | Springing | NAP | U/W NCF Debt Yield(1): | 10.2% | ||
| Replacement Reserves | $0 | $16,280 | NAP | As-Is Appraised Value: | $166,500,000 | ||
| TI/LC | $0 | $130,238 | $1,000,000 | As-Is Appraisal Valuation Date: | December 2, 2015 | ||
| Tenant Specific TI/LC Reserve | $2,248,889 | $0 | NAP | Cut-off Date LTV Ratio(1): | 63.1% | ||
| Rent Concession Reserve | $630,218 | $0 | NAP | LTV Ratio at Maturity or ARD(1): | 63.1% | ||
| (1) | The 10 South LaSalle Street Whole Loan, totaling $105,000,000, is comprised of twopari passu notes (Notes A-1 and A-2). Note A-1 had an original balance of $30,000,000, has an outstanding principal balance as of the Cut-off Date of $30,000,000 and will be contributed to the WFCM 2016-C32 Trust. Note A-2 had an original balance of $75,000,000 and is expected to be contributed to a future trust. All presented statistical information related to balances per square foot, loan-to-value ratios, debt service coverage ratios and debt yields are based on the 10 South LaSalle Street Whole Loan. |
| (2) | See “Escrows” section. |
| (3) | See “Historical Occupancy” section. |
| (4) | See “Cash Flow Analysis” section. |
The Mortgage Loan. The mortgage loan (the “10 South LaSalle Street Mortgage Loan”) is part of a whole loan (the “10 South LaSalle Street Whole Loan”) evidenced by twopari passupromissory notes (Note A-1 and Note A-2) secured by a first mortgage encumbering a 37-story office buildings located in the central business district of Chicago, Illinois (the “10 South LaSalle Street Property”). The 10 South LaSalle Street Whole Loan was originated on December 31, 2015 by Wells Fargo Bank, National Association. The 10 South LaSalle Street Whole Loan had an original balance of $105,000,000, has an outstanding principal balance as of the Cut-off Date of $105,000,000 and accrues interest at an interest rate of 4.430%per annum. The 10 South LaSalle Street Whole Loan had an initial term of 120 months, has a remaining term of 119 months as of the Cut-off Date and requires interest-only payments for the term of the 10 South LaSalle Street Whole Loan. The 10 South LaSalle Street Whole Loan matures on January 11, 2026. See “Description of the Mortgage Pool – Whole Loans – The 10 South LaSalle Street Whole Loan” in the Preliminary Prospectus.
The Note A-1, which will be contributed to the WFCM 2016-C32 Trust and represents the controlling interest, had an original principal balance of $30,000,000 and has an outstanding principal balance as of the Cut-off Date of $30,000,000. The non-controlling Note A-2 (the “10 South LaSalle Street Companion Loan”) had an original principal balance of $75,000,000 and is expected to be securitized in a future trust.
THE INFORMATION IN THIS STRUCTURAL AND COLLATERAL TERM SHEET IS NOT COMPLETE AND MAY BE AMENDED PRIOR TO THE TIME OF SALE. THIS TERM SHEET IS NOT AN OFFER TO SELL THESE SECURITIES AND IT IS NOT A SOLICITATION OF AN OFFER TO BUY THESE SECURITIES IN ANY JURISDICTION WHERE THE OFFER OR SALE IS NOT PERMITTED.
| 72 |
| 10 SOUTH LASALLE STREET |
Following the lockout period, the borrower has the right to defease the 10 South LaSalle Street Whole Loan in whole, but not in part, on any date before October 11, 2025. In addition, the 10 South LaSalle Street Whole Loan is prepayable without penalty on or after October 11, 2025.
Sources and Uses
| Sources | Uses | |||||||||
| Original whole loan amount | $105,000,000 | 68.5 | % | Loan payoff(1) | $144,858,926 | 94.5 | % | |||
| Sponsor’s new equity contribution | 48,257,703 | 31.5 | Reserves | 5,682,499 | 3.7 | |||||
| Closing costs | 2,716,278 | 1.8 | ||||||||
| Total Sources | $153,257,703 | 100.0 | % | Total Uses | $153,257,703 | 100.0 | % | |||
| (1) | Includes the sponsor’s buyout of additional ownership interest. |
The Property. The 10 South LaSalle Street Property is a 37-story, class B+ office tower totaling approximately 781,426 square feet located in the central business district of Chicago, Illinois. Built in 1987 and renovated between 2004 and 2013, the 10 South LaSalle Street Property’s amenities include a state-of-the-art fitness center with locker rooms, a sundry shop, a lobby ATM, a full-service MB Financial branch and various quick service restaurants. Renovated in 2011, the lobby is finished in polished granite floors and flame finished granite walls, as well as anodized aluminum and glass storefronts. Over the past five years, the sponsor has invested approximately $17.8 million in capital improvements at the 10 South LaSalle Street Property. The 10 South LaSalle Street Property features a diverse tenant roster with the two largest tenants, Chicago Title Insurance Co (“Chicago Title”) and Northern Trust Company (“Northern Trust”), which are both investment grade rated (see Major Tenants table below), representing only 26.0% of the combined net rentable area and no other tenant representing more than 8.1% of the net rentable area. Many small law and real estate firms prefer to be located near Chicago Title, a member of the Fidelity National Financial family of companies and one of the largest title insurers in the industry. The 10 South LaSalle Street Property is physically connected to Northern Trust’s historic headquarters via two pedestrian bridges, which create a campus-like setting for Northern Trust allowing access to parking options, restaurants, hotels and public transportation. As of November 20, 2015, the 10 South LaSalle Street Property was 88.9% leased to 91 tenants.
The following table presents certain information relating to the tenancies at the 10 South LaSalle Street Property:
Major Tenants
| Tenant Name | Credit Rating (Fitch/Moody’s/ S&P)(1) | Tenant NRSF | % of NRSF | Annual U/W Base Rent PSF(2) | Annual U/W Base Rent(2) | % of Total Annual U/W Base Rent | Lease Expiration Date | |||||
| Major Tenants | ||||||||||||
| Chicago Title | A-/A3/A | 102,608 | 13.1% | $31.13(3) | $3,194,367(3) | 19.0% | 10/31/2019(4)(5) | |||||
| Northern Trust | AA-/A2/A+ | 100,357(6) | 12.8% | $22.25(6) | $2,232,943(6) | 13.3% | 12/31/2020(7)(8) | |||||
| Clausen Miller | NR/NR/NR | 63,576 | 8.1% | $26.00(9)(10) | $1,652,976(9)(10) | 9.9% | Various(10) | |||||
| AmWINS Brokerage of Illinois | NR/NR/NR | 36,320 | 4.6% | $19.89 | $722,253 | 4.3% | 6/30/2021 | |||||
| Oak Ridge Investments | NR/NR/NR | 18,341 | 2.3% | $33.75(11) | $619,009(11) | 3.7% | 3/31/2017 | |||||
| Total Major Tenants | 321,202 | 41.1% | $26.22 | $8,421,548 | 50.2% | |||||||
| Non-Major Tenants(12) | 373,402 | 47.8% | $22.38 | $8,356,176 | 49.8% | |||||||
| Occupied Collateral Total | 694,604 | 88.9% | $24.15 | $16,777,724 | 100.0% | |||||||
| Vacant Space | 86,822 | 11.1% | ||||||||||
| Collateral Total | 781,426 | 100.0% | ||||||||||
| (1) | Certain ratings are those of the parent company whether or not the parent guarantees the lease. |
| (2) | Annual U/W Base Rent PSF and Annual U/W Base Rent include contractual rent steps through February 1, 2017 totaling $409,303. |
| (3) | Chicago Title operates on a modified gross lease while the other tenants at the 10 South LaSalle Street Property primarily operate on triple-net leases. |
| (4) | Chicago Title may terminate its lease on October 31, 2017 upon providing 12 months’ notice and payment of a termination fee of $532,219. |
| (5) | Chicago Title has two, 5-year renewal options. |
| (6) | Northern Trust’s Annual U/W Base Rent PSF and Annual U/W Base Rent represent the tenant’s average rent through the remainder of the lease term. Northern Trust has a current annual base rent of $2,132,586 ($21.25 per square foot). |
| (7) | Northern Trust may contract its seventh floor space (20,040 square feet; 2.6% of net rentable area) on December 31, 2017 upon providing 12 months and payment of a fee of $901,800. |
| (8) | Northern Trust has two, 5-year renewal options. |
| (9) | Clausen Miller has abated rent from September 1, 2015 through February 29, 2016 and January 1, 2017 through February 28, 2017 with respect to 21,158 square feet (2.7% of net rentable area) of its space; the associated abated rent was reserved upfront. |
| (10) | Clausen Miller leases two spaces with one space totaling 42,418 square feet (5.4% of the net rentable area) on a lease expiring December 31, 2025 and another space totaling 21,158 square feet (2.7% of the net rentable area) on a lease expiring December 31, 2018. The 21,158 square foot space is subleased to Ruberry, Stalmack & Garvey, LLC at a current rental rate of $23.00 per square foot. The entire Clausen Miller space was underwritten to the January 2017 contractual rent step of $26.00 per square foot. |
| (11) | Oak Ridge Investments operates on a modified gross lease while the other tenants at the 10 South LaSalle Street Property primarily operate on triple-net leases. |
| (12) | Non-Major Tenants includes 16,312 square feet (2.1% of the net rentable area) of gym, management and leased storage space which has no attributed rent. Annual U/W Base Rent PSF excluding the gym, management and storage space is $23.40. |
THE INFORMATION IN THIS STRUCTURAL AND COLLATERAL TERM SHEET IS NOT COMPLETE AND MAY BE AMENDED PRIOR TO THE TIME OF SALE. THIS TERM SHEET IS NOT AN OFFER TO SELL THESE SECURITIES AND IT IS NOT A SOLICITATION OF AN OFFER TO BUY THESE SECURITIES IN ANY JURISDICTION WHERE THE OFFER OR SALE IS NOT PERMITTED.
| 73 |
| 10 SOUTH LASALLE STREET |
The following table presents certain information relating to the lease rollover schedule at the 10 South LaSalle Street Property:
Lease Expiration Schedule(1)(2)
| Year Ending December 31, | No. of Leases Expiring | Expiring NRSF | % of Total NRSF | Cumulative Expiring NRSF | Cumulative % of Total NRSF | Annual U/W Base Rent | % of Total Annual U/W Base Rent | Annual U/W Base Rent PSF(4) | |||||||
| MTM(3) | 26 | 16,312 | 2.1% | 16,312 | 2.1% | $0 | 0.0% | $0.00 | |||||||
| 2016 | 3 | 13,035 | 1.7% | 29,347 | 3.8% | $359,754 | 2.1% | $27.60 | |||||||
| 2017 | 8 | 47,632 | 6.1% | 76,979 | 9.9% | $1,244,616 | 7.4% | $26.13 | |||||||
| 2018(5) | 10 | 84,496 | 10.8% | 161,475 | 20.7% | $2,192,184 | 13.1% | $25.94 | |||||||
| 2019 | 5 | 124,157 | 15.9% | 285,632 | 36.6% | $3,702,010 | 22.1% | $29.82 | |||||||
| 2020 | 17 | 165,328 | 21.2% | 450,960 | 57.7% | $3,946,255 | 23.5% | $23.87 | |||||||
| 2021 | 10 | 95,164 | 12.2% | 546,124 | 69.9% | $2,157,126 | 12.9% | $22.67 | |||||||
| 2022 | 4 | 15,312 | 2.0% | 561,436 | 71.8% | $320,934 | 1.9% | $20.96 | |||||||
| 2023 | 4 | 42,313 | 5.4% | 603,749 | 77.3% | $761,989 | 4.5% | $18.01 | |||||||
| 2024 | 1 | 4,198 | 0.5% | 607,947 | 77.8% | $89,208 | 0.5% | $21.25 | |||||||
| 2025 | 4 | 78,406 | 10.0% | 686,353 | 87.8% | $1,770,796 | 10.6% | $22.58 | |||||||
| 2026 | 2 | 8,251 | 1.1% | 694,604 | 88.9% | $232,852 | 1.4% | $28.22 | |||||||
| Thereafter | 0 | 0 | 0.0% | 694,604 | 88.9% | $0 | 0.0% | $0.00 | |||||||
| Vacant | 0 | 86,822 | 11.1% | 781,426 | 100.0% | $0 | 0.0% | $0.00 | |||||||
| Total/Weighted Average | 91 | 781,426 | 100.0% | $16,777,724 | 100.0% | $24.15 | |||||||||
| (1) | Information obtained from the underwritten rent roll. |
| (2) | Certain tenants may have lease termination options that are exercisable prior to the stated expiration date of the subject lease and that are not considered in the Lease Expiration Schedule. |
| (3) | Includes 16,312 square feet of gym, management and leased storage space which has no attributed rent. |
| (4) | Weighted Average Annual U/W Base Rent PSF excludes vacant space. |
| (5) | Includes a portion of Clausen Miller’s space totaling 21,158 square feet (2.7% of the net rentable area) which is on a lease expiring December 31, 2018. |
The following table presents historical occupancy percentages at the 10 South LaSalle Street Property:
Historical Occupancy
12/31/2011(1)(2) | 12/31/2012(1)(2) | 12/31/2013(1) | 12/31/2014(1) | 11/20/2015(3) | ||||
| 75.8% | 82.6% | 85.9% | 88.5% | 88.9% |
| (1) | Information obtained from the borrower. |
| (2) | Occupancy increased from 2011 to 2012 due to seven tenants totaling 60,955 square feet (7.8% of the net rentable area) taking occupancy in 2012. |
| (3) | Information obtained from the underwritten rent roll. |
Operating History and Underwritten Net Cash Flow.The following table presents certain information relating to the historical operating performance and the underwritten net cash flow at the 10 South LaSalle Street Property:
Cash Flow Analysis
| 2012(1) | 2013(1) | 2014 | TTM 9/30/2015 | U/W | % of U/W Effective Gross Income | U/W $ per SF | ||||||||
| Base Rent | $11,207,285 | $14,086,825 | $14,951,160 | $15,524,948(2) | $16,777,724(2) | 65.5% | $21.47 | |||||||
| Grossed Up Vacant Space | 0 | 0 | 0 | 0 | 1,597,045 | 6.2 | 2.04 | |||||||
| Total Reimbursables | 5,518,241 | 6,537,162 | 6,845,961 | 7,441,021 | 8,623,889 | 33.7 | 11.04 | |||||||
| Other Income | 168,929 | 224,384 | 206,812 | 257,520 | 202,430 | 0.8 | 0.26 | |||||||
| Less Vacancy & Credit Loss | 0 | 0 | 0 | 0 | (1,597,045)(3) | (6.2) | (2.04) | |||||||
| Effective Gross Income | $16,894,455 | $20,848,371 | $22,003,933 | $23,223,489 | $25,604,042 | 100.0 | $32.77 | |||||||
| Total Operating Expenses | $9,683,255 | $10,128,344 | $10,667,609 | $11,366,068 | $12,785,427 | 49.9% | $16.36 | |||||||
|
|
|
|
|
|
| ||||||||
| Net Operating Income | $7,211,200 | $10,720,027 | $11,336,324 | $11,857,421 | $12,818,615 | 50.1% | $16.40 | |||||||
| TI/LC | 0 | 0 | 0 | 0 | 1,893,938 | 7.4 | 2.42 | |||||||
| Capital Expenditures | 0 | 0 | 0 | 0 | 195,357 | 0.8 | 0.25 | |||||||
| Net Cash Flow | $7,211,200 | $10,720,027 | $11,336,324 | $11,857,421 | $10,729,321 | 41.9% | $13.73 | |||||||
| NOI DSCR(4) | 1.52x | 2.27x | 2.40x | 2.51x | 2.71x | |||||||||
| NCF DSCR(4) | 1.52x | 2.27x | 2.40x | 2.51x | 2.27x | |||||||||
| NOI DY(4) | 6.9% | 10.2% | 10.8% | 11.3% | 12.2% | |||||||||
| NCF DY(4) | 6.9% | 10.2% | 10.8% | 11.3% | 10.2% | |||||||||
| (1) | The increase in Net Operating Income from 2012 to 2013 is primarily due to Chicago Title taking occupancy and commencing rent payments in November 2012. The tenant’s first full year of rent is reflected in 2013. |
| (2) | The increase in U/W Base Rent from TTM 9/30/2015 is primarily attributable to six new leases commencing since August 2015 contributing approximately $676,123 to the U/W Base Rent, contractual rent steps through February 2017 totaling $409,303 and Northern Trust’s average rent with an increase of $150,535 being underwritten. |
| (3) | The underwritten economic vacancy is 8.7%. The 10 South LaSalle Street Property was 88.9% physically occupied as of November 20, 2015. |
| (4) | The debt service coverage ratios and debt yields are based on the 10 South LaSalle Street Whole Loan. |
THE INFORMATION IN THIS STRUCTURAL AND COLLATERAL TERM SHEET IS NOT COMPLETE AND MAY BE AMENDED PRIOR TO THE TIME OF SALE. THIS TERM SHEET IS NOT AN OFFER TO SELL THESE SECURITIES AND IT IS NOT A SOLICITATION OF AN OFFER TO BUY THESE SECURITIES IN ANY JURISDICTION WHERE THE OFFER OR SALE IS NOT PERMITTED.
| 74 |
| 10 SOUTH LASALLE STREET |
Appraisal.As of the appraisal valuation date of December 2, 2015, the 10 South LaSalle Street Property had an “as-is” appraised value of $166,500,000.
Environmental Matters.According to the Phase I environmental site assessment dated December 3, 2015, there was no evidence of any recognized environmental conditions at the 10 South LaSalle Street Property.
Market Overview and Competition. The 10 South LaSalle Street Property is located at the southwest corner of LaSalle Street and Madison Street in the Chicago, Illinois central business district (“CBD”). Downtown Chicago benefits by being the center of the metropolitan area’s transportation network. A total of five interstate highways lead directly to downtown Chicago, as do eight suburban railroad commuter lines, plus numerous public routes and six transit train lines. The 10 South LaSalle Street Property is located adjacent to the Chicago Transit Authority’s elevated “L” transportation and within half of a mile of both Ogilvie Transportation Center, which has approximately 110,000 daily rail commuters, and Union Station, which saw approximately 3.3 million rail commuters in 2015.
The 10 South LaSalle Street Property is located within the Central Loop submarket, which is known as the epicenter of the central business district featuring an urban mixed-use community supporting office, government, entertainment, shopping, residential and hotel accommodations. According to the appraisal, the area has undergone a resurgence over the past decade with the addition of residential and high-end retail, leading to renewed office tenant interest in the area which is illustrated by one the lowest office vacancy rates downtown. Immediately south of the 10 South LaSalle Street Property is the Financial District which is located primarily along LaSalle Street and is home to a large concentration of financial institutions including the Chicago offices for JP Morgan Chase, Harris Bank, Bank of America and the Federal Reserve. Further, at the southern end of the Financial District, approximately 5 blocks south of the 10 South LaSalle Street Property, are the Chicago Board of Trade, the Chicago Board Options Exchange and Chicago Stock Exchange. The 10 South LaSalle Street Property is also proximate to the Daley Center, City Hall, the Thompson Center (State of Illinois Building) and the State of Illinois Courthouse, which is imperative for many of the legal tenants at the 10 South LaSalle Street Property. The estimated 2015 population within a half-, one- and three-mile radius of the 10 South LaSalle Street Property was 10,119, 64,195 and 323,109, respectively, and the estimated 2015 average household income within the same radii was $116,485, $127,408 and $109,289, respectively.
According to a third party market research report, as of the third quarter of 2015, the Central Loop office submarket contained 104 buildings totaling approximately 47.9 million square feet of office space, a vacancy rate of 10.5% and average asking rent of $31.04 per square foot, full service gross. As of the third quarter of 2015, the Central Loop submarket contained 48 buildings totaling approximately 22.1 million square feet of class B space. The Central Loop office submarket class B vacancy was approximately 10.3% and the rental rate for class B space within the submarket was approximately $30.06 per square foot, full service gross.
The following table presents certain information relating to comparable office leases for the 10 South LaSalle Street Property:
Comparable Leases(1)
| Property Name/Location | Year Built/ Renovated | Stories | Total GLA (SF) | Total Occupancy | Distance from Subject | Tenant Name | Lease Date/Term | Lease Area (SF) | Annual Base Rent PSF | Lease Type |
10 S LaSalle St (Subject) Chicago, IL | 1987/2013 | 37 | 781,426 | 89% | -- | Metropolitan Life Insurance | August 2015/ 4.8 Yrs | 8,264 | $19.57 | NNN |
190 S LaSalle St Chicago, IL | 1985/NAP | 40 | 798,439 | 88% | 0.1 miles | Deutsche Leasing | October 2016/ 7.0 Yrs | 7,135 | $25.00 | NNN |
125 S Wacker Dr Chicago, IL | 1974/2005 | 31 | 518,276 | 77% | 0.4 miles | Addison Group | March 2016 / 9.3 Yrs | 4,427 | $19.00 | NNN |
200 W Madison St Chicago, IL | 1983/2006 | 45 | 928,040 | 94% | 0.1 miles | Knowledgepoint 360 Group, Inc. | December 2015/ 11.0 Yrs | 4,822 | $21.50 | NNN |
1 S Wacker Dr Chicago, IL | 1982/2000 | 40 | 1,195,170 | 86% | 0.3 miles | US Fire Insurance Company | October 2015 / 10.0 Yrs | 10,403 | $24.00 | NNN |
225 W Washington St Chicago, IL | 1987/NAP | 28 | 484,916 | 88% | 0.3 miles | WKFC Underwriting Managers | September 2015/ 5.5 Yrs | 2,233 | $19.00 | NNN |
440 S LaSalle St Chicago, IL | 1984/NAP | 40 | 1,000,000 | 74% | 0.5 miles | Spot Trading, LLC | May 2015 / 5.0 Yrs | 25,946 | $20.00 | NNN |
200 W Adams St Chicago, IL | 1985/NAP | 30 | 683,129 | 92% | 0.3 miles | Burns & McDonnell Engineering Co., Inc. | May 2015 / 5.5 Yrs | 24,276 | $16.50 | NNN |
540 W Madison St Chicago, IL | 2003/NAP | 31 | 1,107,819 | 93% | 0.5 miles | Variance Health | April 2015 / 12.0 Yrs | 125,005 | $26.00 | NNN |
(1) Information obtained from the appraisal, underwritten rent roll and a third party market report.
The Borrower.The borrower is 10 South LaSalle Owner LLC, a Delaware limited liability company and single purpose entity with two independent directors. Legal counsel to the borrower delivered a non-consolidation opinion in connection with the origination of the 10 South LaSalle Street Whole Loan. Jeffrey Feil is the guarantor of certain nonrecourse carveouts under the 10 South LaSalle Street Whole Loan.
THE INFORMATION IN THIS STRUCTURAL AND COLLATERAL TERM SHEET IS NOT COMPLETE AND MAY BE AMENDED PRIOR TO THE TIME OF SALE. THIS TERM SHEET IS NOT AN OFFER TO SELL THESE SECURITIES AND IT IS NOT A SOLICITATION OF AN OFFER TO BUY THESE SECURITIES IN ANY JURISDICTION WHERE THE OFFER OR SALE IS NOT PERMITTED.
| 75 |
| 10 SOUTH LASALLE STREET |
The Sponsor.The 10 South LaSalle Street Loan Sponsor is Jeffrey Feil. Mr. Feil is the CEO of The Feil Organization, a real estate investment, development and management firm based in New York City. Founded over 60 years ago, The Feil Organization owns, develops and manages over 26.0 million square feet of retail, commercial and industrial properties, over 5,000 residential rental units, as well as hundreds of net leased properties and thousands of acres of undeveloped land across the United States. Mr. Feil is involved in ongoing litigation with various family members and shareholders. See “Description of the Mortgage Pool – Litigation and Other Considerations” in the Preliminary Prospectus.
Escrows.The loan documents provide for an upfront escrow at closing in the amount of $2,803,392 for real estate taxes, $2,248,889 for outstanding tenant improvements and leasing commissions (“TI/LCs”) associated with 13 tenants, and $630,218 for rent concessions related to 15 tenants. The loan documents provide for ongoing monthly escrows of $467,233 for real estate taxes, $16,280 for replacement reserves. The loan documents do not require monthly deposits for insurance premiums as long as (i) no event of default has occurred or is continuing; (ii) the 10 South LaSalle Street Property is insured via an acceptable blanket insurance policy; and (iii) the borrower provides the lender with timely proof of payment of insurance premiums.
The loan documents also provide for ongoing monthly escrows of $130,238 for TI/LCs (capped at $1.0 million); however, upon the occurrence of the earlier of (i) the date that in 12 months prior to the expiration of the Chicago Title lease (including extension periods) or (ii) Chicago Title terminating its lease, the leasing reserve cap will be $3,000,000 and the monthly deposits will increase to an amount equal to one twelfth of the difference of the then-current balance of the TI/LC reserve and $3,000,000. Commencing upon (a) the lender receiving satisfactory evidence that the entire Chicago Title space is leased to an acceptable replacement tenant and such tenant is in occupancy, paying full unabated rent and all landlord obligations have been completed or paid in full; or (b) Chicago Title exercises its lease extension option with respect to the entire Chicago Title space, the leasing reserve will be required to maintain a balance of $750,000 and will be capped at $1,000,000.
Lockbox and Cash Management.The 10 South LaSalle Street Whole Loan requires a lender-controlled lockbox account, which is already in place, and that the borrower directs all tenants to pay their rents directly to such lockbox account. The loan documents also require that all rents received by the borrower or the property manager be deposited into the lockbox account. Prior to the occurrence of Cash Trap Event Period (as defined below), all funds are required to be distributed to the borrower. During a Cash Trap Event Period, all excess cash flow is required to be swept to a lender-controlled cash management account.
A “Cash Trap Event Period” will commence upon the earlier of (i) the occurrence and continuance of an event of default or (ii) the net cash flow debt yield being less than 7.5%. A Cash Trap Event Period will end, with respect to clause (i), upon the cure of such event of default; or, with respect to clause (ii), upon the net cash flow debt yield being at least 7.5% for two consecutive calendar quarters.
Property Management.The 10 South LaSalle Street Property is managed by an affiliate of the borrower.
Assumption.The borrower has a two-time right to transfer the 10 South LaSalle Street Property, provided that no event of default has occurred and is continuing and certain other conditions are satisfied, including, but not limited to: (i) the lender’s reasonable determination that the proposed transferee and guarantor satisfy the lender’s credit review and underwriting standards, taking into consideration transferee experience, financial strength and general business standing; (ii) execution of a recourse guaranty and an environmental indemnity by an affiliate of the transferee; and (iii) if requested by the lender, rating agency confirmation from DBRS, KBRA and Moody’s that the transfer will not result in a downgrade, withdrawal or qualification of the respective ratings assigned to the Series 2016-C32 Certificates, and similar confirmations with respect to the ratings of any securities backed by the 10 South LaSalle Street Companion Loan.
Partial Release.Not permitted.
Real Estate Substitution.Not permitted.
Subordinate and Mezzanine Indebtedness.Not permitted
Ground Lease.None.
Terrorism Insurance.The loan documents require that the “all risk” insurance policy required to be maintained by the borrower provide coverage for terrorism in an amount equal to the full replacement cost of the 10 South LaSalle Street Property (provided that the borrower is not required to pay terrorism insurance premiums in excess of two times the premium for all risk and business interruption coverage if the Terrorism Risk Insurance Program Reauthorization Act is no longer in effect), as well as business interruption insurance covering no less than the 18-month period following the occurrence of a casualty event, together with a 12-month extended period of indemnity.
THE INFORMATION IN THIS STRUCTURAL AND COLLATERAL TERM SHEET IS NOT COMPLETE AND MAY BE AMENDED PRIOR TO THE TIME OF SALE. THIS TERM SHEET IS NOT AN OFFER TO SELL THESE SECURITIES AND IT IS NOT A SOLICITATION OF AN OFFER TO BUY THESE SECURITIES IN ANY JURISDICTION WHERE THE OFFER OR SALE IS NOT PERMITTED.
| 76 |
(THIS PAGE INTENTIONALLY LEFT BLANK)
THE INFORMATION IN THIS STRUCTURAL AND COLLATERAL TERM SHEET IS NOT COMPLETE AND MAY BE AMENDED PRIOR TO THE TIME OF SALE. THIS TERM SHEET IS NOT AN OFFER TO SELL THESE SECURITIES AND IT IS NOT A SOLICITATION OF AN OFFER TO BUY THESE SECURITIES IN ANY JURISDICTION WHERE THE OFFER OR SALE IS NOT PERMITTED.
| 77 |
HILTON WILMINGTON/CHRISTIANA

THE INFORMATION IN THIS STRUCTURAL AND COLLATERAL TERM SHEET IS NOT COMPLETE AND MAY BE AMENDED PRIOR TO THE TIME OF SALE. THIS TERM SHEET IS NOT AN OFFER TO SELL THESE SECURITIES AND IT IS NOT A SOLICITATION OF AN OFFER TO BUY THESE SECURITIES IN ANY JURISDICTION WHERE THE OFFER OR SALE IS NOT PERMITTED.
| 78 |
HILTON WILMINGTON/CHRISTIANA
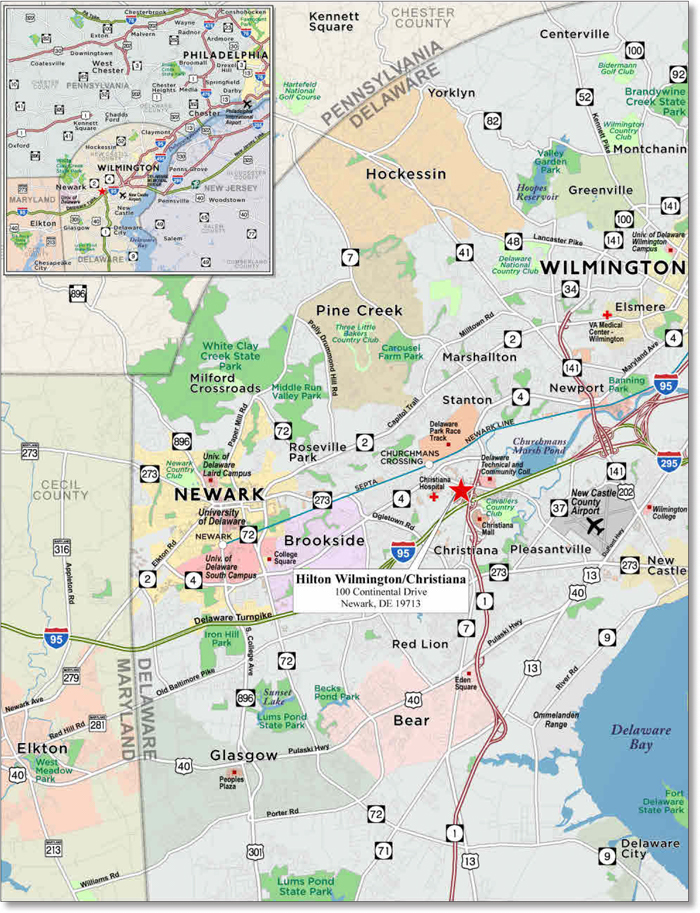
THE INFORMATION IN THIS STRUCTURAL AND COLLATERAL TERM SHEET IS NOT COMPLETE AND MAY BE AMENDED PRIOR TO THE TIME OF SALE. THIS TERM SHEET IS NOT AN OFFER TO SELL THESE SECURITIES AND IT IS NOT A SOLICITATION OF AN OFFER TO BUY THESE SECURITIES IN ANY JURISDICTION WHERE THE OFFER OR SALE IS NOT PERMITTED.
| 79 |
| No. 7 – Hilton Wilmington/Christiana | |||||||
| Loan Information | Property Information | ||||||
| Mortgage Loan Seller: | Rialto Mortgage Finance, LLC | Single Asset/Portfolio: | Single Asset | ||||
| Credit Assessment (DBRS/KBRA/Moody’s): | NR/NR/NR | Property Type: | Hospitality | ||||
| Original Principal Balance: | $29,000,000 | Specific Property Type: | Full Service | ||||
| Cut-off Date Principal Balance: | $29,000,000 | Location: | Newark, DE | ||||
| % of Initial Pool Balance: | 3.0% | Size: | 266 Rooms | ||||
| Loan Purpose: | Refinance | Cut-off Date Principal Balance Per Room: | $109,023 | ||||
| Borrower Name: | MJ Wilmington Hotel Associates, L.P. | Year Built/Renovated: | 1986/2015 | ||||
| Sponsors(1): | Various | Title Vesting: | Fee | ||||
| Mortgage Rate: | 4.550% | Property Manager: | Self-managed | ||||
| Note Date: | October 26, 2015 | 4th Most Recent Occupancy (As of): | 77.9% (12/31/2011) | ||||
| Anticipated Repayment Date: | NAP | 3rd Most Recent Occupancy (As of): | 79.6% (12/31/2012) | ||||
| Maturity Date: | November 6, 2025 | 2nd Most Recent Occupancy (As of): | 79.0% (12/31/2013) | ||||
| IO Period: | 36 months | Most Recent Occupancy (As of): | 77.0% (12/31/2014) | ||||
| Loan Term (Original): | 120 months | Current Occupancy (As of): | 78.1% (11/30/2015) | ||||
| Seasoning: | 3 months | ||||||
| Amortization Term (Original): | 360 months | Underwriting and Financial Information: | |||||
| Loan Amortization Type: | Interest-only, Amortizing Balloon | ||||||
| Interest Accrual Method: | Actual/360 | 4th Most Recent NOI (As of): | $4,135,376 (12/31/2012) | ||||
| Call Protection: | L(23),GRTR 1% or YM(90),O(7) | 3rd Most Recent NOI (As of): | $4,075,744 (12/31/2013) | ||||
| Lockbox Type: | Hard/Springing Cash Management | 2nd Most Recent NOI (As of): | $4,332,460 (12/31/2014) | ||||
| Additional Debt(2): | Yes | Most Recent NOI (As of): | $3,900,661 (TTM 11/30/2015) | ||||
| Additional Debt Type(2): | Future Mezzanine | ||||||
| U/W Revenues: | $14,278,089 | ||||||
| U/W Expenses: | $10,363,549 | ||||||
| U/W NOI: | $3,914,540 | ||||||
| U/W NCF: | $3,343,417 | ||||||
| U/W NOI DSCR: | 2.21x | ||||||
| Escrows and Reserves(3): | U/W NCF DSCR: | 1.89x | |||||
| U/W NOI Debt Yield: | 13.5% | ||||||
| Type: | Initial | Monthly | Cap (If Any) | U/W NCF Debt Yield: | 11.5% | ||
| Taxes | $76,409 | $25,470 | NAP | As-Is Appraised Value(4): | $45,500,000 | ||
| Insurance | $0 | Springing | NAP | As-Is Appraisal Valuation Date(4): | August 6, 2015 | ||
| FF&E | $0 | Springing | NAP | Cut-off Date LTV Ratio(4): | 56.5% | ||
| PIP Reserve | $4,784,251 | NAP | NAP | LTV Ratio at Maturity or ARD(4): | 49.5% | ||
| (1) | See “The Sponsors” section. |
| (2) | See “Subordinate and Mezzanine Indebtedness” section. |
| (3) | See “Escrows” section. |
| (4) | The appraiser concluded to an “as-complete” value of $51,300,000 as of November 1, 2016 which assumes the completion of a $4,100,000 property improvement plan. The Cut-off Date LTV Ratio and LTV Ratio at Maturity or ARD are calculated based on the “as-complete” appraised value. The Cut-off Date LTV Ratio and LTV Ratio at Maturity or ARD based on the “as-is” appraised value are 63.7% and 55.9%, respectively. |
The Mortgage Loan. The mortgage loan (the “Hilton Wilmington/Christiana Mortgage Loan”) is evidenced by a single promissory note that is secured by a first mortgage encumbering the fee interest in a full service hotel located in Newark, Delaware (the “Hilton Wilmington/Christiana Property”). The Hilton Wilmington/Christiana Mortgage Loan was originated on October 26, 2015 by Rialto Mortgage Finance, LLC. The Hilton Wilmington/Christiana Mortgage Loan had an original principal balance of $29,000,000, has an outstanding principal balance as of the Cut-off Date of $29,000,000 and accrues interest at an interest rate of 4.550%per annum. The Hilton Wilmington/Christiana Mortgage Loan had an initial term of 120 months, has a remaining term of 117 months as of the Cut-off Date and requires payments of interest only for the first 36 months following origination and, thereafter, requires payments of principal and interest based on a 30-year amortization schedule. The Hilton Wilmington/Christiana Mortgage Loan matures on November 6, 2025.
Following the lockout period, the borrower has the right to prepay the Hilton Wilmington/Christiana Mortgage Loan in whole, but not in part, on any date before May 6, 2025 provided that the borrower pays the greater of a yield maintenance premium or a prepayment premium equal to 1.0% of the principal amount being prepaid. In addition, the Hilton Wilmington/Christiana Mortgage Loan is prepayable without penalty on or after May 6, 2025.
THE INFORMATION IN THIS STRUCTURAL AND COLLATERAL TERM SHEET IS NOT COMPLETE AND MAY BE AMENDED PRIOR TO THE TIME OF SALE. THIS TERM SHEET IS NOT AN OFFER TO SELL THESE SECURITIES AND IT IS NOT A SOLICITATION OF AN OFFER TO BUY THESE SECURITIES IN ANY JURISDICTION WHERE THE OFFER OR SALE IS NOT PERMITTED.
| 80 |
HILTON WILMINGTON/CHRISTIANA
Sources and Uses
| Sources | Uses | ||||||||
| Original loan amount | $29,000,000 | 100.0% | Loan payoff(1) | $21,402,110 | 73.8 | % | |||
| Reserves | 4,860,660 | 16.8 | |||||||
| Closing costs | 350,138 | 1.2 | |||||||
| Return of equity | 2,387,091 | 8.2 | |||||||
| Total Sources | $29,000,000 | 100.0% | Total Uses | $29,000,000 | 100.0 | % |
| (1) | The Hilton Wilmington/Christiana Property was previously securitized in the MSC 2005-C24 transaction. |
The Property.The Hilton Wilmington/Christiana Property is a 266-room, four-story, full service hotel located in Newark, Delaware. The Hilton Wilmington/Christiana Property is situated on a 9.3-acre siteand was originally constructed in 1986, with the most recent renovations completed in 2015. The Hilton Wilmington/Christiana Property features 135 king guestrooms, 130 double/double guestrooms and one king suite. The guestrooms feature an entertainment armoire with a flat-panel television, a work desk with chair, an armchair, a dresser, a coffeemaker, a safe, and an iron and ironing board. In-room amenities also include wireless, high-speed internet access and a telephone with voicemail and data port. The king suite offers a larger living space including a kitchenette and rooms on the first floor offer direct access to the courtyard. The Hilton Wilmington/Christiana Property amenities include a fitness room, a business center, a gift shop, an outdoor pool and whirlpool, a guest laundry room, a courtyard and a full service restaurant and lounge. The Hilton Wilmington/Christiana Property also offers 7,741 square feet of meeting room space located on the main floor of the Hilton Wilmington/Christiana Property. The largest contiguous event space is the Christiana Ballroom, which can be divided into three separate rooms of 800 square feet each along with adjacent pre-function space.
According to the sponsor, the borrower has invested approximately $22.0 million in continual renovations to the Hilton Wilmington/Christiana Property during its 19-year ownership period. Since 2011, the borrower has invested approximately $2.0 million in capital improvements, which included upgrades and renovations related to the guestrooms, public areas, restaurants, pool, building exterior, mechanical/information technology, and building safety features. As of October 2015, the borrower has spent approximately $0.3 million in upgrades to the building exterior, information technology equipment, kitchen, and parking areas as part of a property improvement plan (“PIP”). The current PIP requires the borrower to perform renovations and upgrades to guestrooms, guest bathrooms, public areas, back of the house, building exterior, and site work with an estimated completion date of March 2017. The borrower’s schedule estimates that each guest room will take approximately six days to renovate and that no more than 30 rooms will be offline at any given time, and, therefore will have no adverse impact to room availability. The total estimated cost for the remaining PIP work is approximately $4.8 million ($17,986 per room) which was reserved in full upfront. The Hilton Wilmington/Christiana Mortgage Loan is recourse to the borrower and the guarantors for any losses arising from failure to complete and fund the PIP. The Hilton Wilmington/Christiana Mortgage Loan is also recourse to the borrower and the guarantors for losses arising from any expiration or termination of the franchise agreement during the term of the Hilton Wilmington/Christiana Mortgage Loan until such time as a replacement franchise agreement with a comparable franchisor has been executed and any related PIP work has been completed and paid for. The Hilton Wilmington/Christiana Property operates under a Hilton franchise agreement that expires on November 30, 2031.
Operating History and Underwritten Net Cash Flow.The following table presents certain information relating to the historical operating performance and underwritten net cash flow at the Hilton Wilmington/Christiana Property:
Cash Flow Analysis
| 2012 | 2013 | 2014 | TTM 11/30/2015 | U/W | % of U/W Total Revenue | U/W $ per Room | ||||||||||||||||||||||
| Occupancy | 79.6% | 79.0% | 77.0% | 78.1% | 78.1% | |||||||||||||||||||||||
| ADR | $129.76 | $130.96 | $137.03 | $134.48 | $134.48 | |||||||||||||||||||||||
| RevPAR | $103.32 | $103.52 | $105.57 | $105.04 | $105.04 | |||||||||||||||||||||||
| Rooms Revenue | $10,031,342 | $10,050,589 | $10,277,546 | $10,198,439 | $10,198,439 | 71.4% | $38,340 | |||||||||||||||||||||
| F&B Revenue | 3,973,650 | 4,178,629 | 4,151,427 | 3,863,262 | 3,863,262 | 27.1 | 14,524 | |||||||||||||||||||||
| Other Revenue | 208,244 | 208,655 | 233,210 | 216,388 | 216,388 | 1.5 | 813 | |||||||||||||||||||||
| Total Revenue | $14,213,236 | $14,437,873 | $14,662,183 | $14,278,089 | $14,278,089 | 100.0% | $53,677 | |||||||||||||||||||||
| Total Department Expenses | 4,907,804 | 5,009,619 | 5,035,774 | 5,108,264 | 5,108,264 | 35.8 | 19,204 | |||||||||||||||||||||
| Gross Operating Profit | $9,305,432 | $9,428,254 | $9,626,409 | $9,169,825 | $9,169,825 | 64.2% | $34,473 | |||||||||||||||||||||
| Total Undistributed Expenses | 4,616,380 | 4,739,183 | 4,782,177 | 4,760,263 | 4,748,444 | 33.3 | 17,851 | |||||||||||||||||||||
| Profit Before Fixed Charges | $4,689,052 | $4,689,071 | $4,844,232 | $4,409,562 | $4,421,381 | 31.0% | $16,622 | |||||||||||||||||||||
| Total Fixed Charges | 553,676 | 613,326 | 511,771 | 508,901 | 506,841 | 3.5 | 1,905 | |||||||||||||||||||||
| Net Operating Income | $4,135,376 | $4,075,744 | $4,332,460 | $3,900,661 | $3,914,540 | 27.4% | $14,716 | |||||||||||||||||||||
| FF&E | 426,397 | 433,136 | 439,865 | 428,343 | 571,124 | 4.0 | 2,147 | |||||||||||||||||||||
| Net Cash Flow | $3,708,979 | $3,642,608 | $3,892,595 | $3,472,318 | $3,343,417 | 23.4% | $12,569 | |||||||||||||||||||||
| NOI DSCR | 2.33x | 2.30x | 2.44x | 2.20x | 2.21x | |||||||||||||||||||||||
| NCF DSCR | 2.09x | 2.05x | 2.19x | 1.96x | 1.89x | |||||||||||||||||||||||
| NOI DY | 14.3% | 14.1% | 14.9% | 13.5% | 13.5% | |||||||||||||||||||||||
| NCF DY | 12.8% | 12.6% | 13.4% | 12.0% | 11.5% | |||||||||||||||||||||||
THE INFORMATION IN THIS STRUCTURAL AND COLLATERAL TERM SHEET IS NOT COMPLETE AND MAY BE AMENDED PRIOR TO THE TIME OF SALE. THIS TERM SHEET IS NOT AN OFFER TO SELL THESE SECURITIES AND IT IS NOT A SOLICITATION OF AN OFFER TO BUY THESE SECURITIES IN ANY JURISDICTION WHERE THE OFFER OR SALE IS NOT PERMITTED.
| 81 |
HILTON WILMINGTON/CHRISTIANA
Appraisal.As of the appraisal valuation date of August 6, 2015, the Hilton Wilmington/Christiana Property had an “as-is” appraised value of $45,500,000. The appraiser concluded an “as-complete” value as of November 1, 2016 of $51,300,000 which assumes the completion of the $4,100,000 PIP. The appraiser also concluded to an “as-stabilized” value of $52,400,000 with an “as-stabilized” valuation date of September 1, 2018.
Environmental Matters.According to a Phase I environmental assessment dated August 24, 2015, there was no evidence of any recognized environmental conditions at the Hilton Wilmington/Christiana Property.
Market Overview and Competition.The Hilton Wilmington/Christiana Property is located in Newark, New Castle County within the Philadelphia-Reading-Camden, PA-NJ-DE-MD metropolitan statistical area. The Hilton Wilmington/Christiana Property is located in an unincorporated community of Delaware known as Christiana. Christiana is located between Newark and Wilmington, and is approximately 10.0 miles southwest of the Wilmington central business district. According to the appraisal, the metropolitan statistical area had an estimated 2014 population of 6.1 million people. Primary regional access through the area is provided by Interstate 95 (“I-95”), a major north/south thoroughfare that extends to Philadelphia, Pennsylvania, and New York, New York to the northeast and Baltimore, Maryland and Washington, D.C. to the southwest. The Hilton Wilmington/Christiana Property has frontage along Continental Drive, approximately 0.1 miles north of I-95 and is situated at the southwest corner of Churchmans Road (State Route 58) and Stanton Christiana Road (State Route 7).
The Newark economy benefits from an economic base revolving around the presence of the University of Delaware, and financial, health care, pharmaceutical, technology, and manufacturing sectors. Financial institutions located in the area include JP Morgan Chase, Bank of America, HSBC Bank, and Sallie Mae. The University of Delaware, located adjacent to the Delaware Technology Park (approximately 5.5 miles west of the Hilton Wilmington/Christiana Property), is a scientific and research educational institution with a total enrollment of approximately 21,000 full and part-time undergraduate and graduate students. Leisure demand for the Hilton Wilmington/Christiana Property is supported by a variety of historic and entertainment venues both in the immediate area as well as in Philadelphia. Museums and garden attractions in the area include: Winterthur Museum & Gardens, Longwood Gardens, Delaware Art Museum, Brandywine River Museum, Delaware Museum of Natural History, Brandywine Valley and The Grand Opera House. The Hilton Wilmington/Christiana Property is located approximately 7.7 miles southwest of the Wilmington Riverfront featuring the Chase Center, Penn Cinema and IMAX complex. The Chase Center contains the largest event facility in the Wilmington region, with more than 87,000 square feet of available meeting and event space. Christiana Mall, located approximately 1.8 miles north of the Hilton Wilmington/Christiana Property, is a 1.2 million square foot regional mall anchored by Nordstrom, Cabela’s, Target, Macy’s, JCPenney and a 12-screen Cinemark Theater that was added in 2014. As Delaware’s largest mall, the Christiana Mall is a popular destination for out of state visitors seeking tax-free shopping in Delaware.
The following tables present certain information relating to the Hilton Wilmington/Christiana Property’s competitive set:
Subject and Market Historical Occupancy, ADR and RevPAR(1)
Competitive Set | Hilton Wilmington/Christiana | Penetration Factor | |||||||||||||||
Year | Occupancy | ADR | RevPAR | Occupancy | ADR | RevPAR | Occupancy | ADR | RevPAR | ||||||||
| 10/31/2015 TTM | 67.3% | $141.97 | $95.50 | 77.6% | $134.59 | $104.44 | 115.4% | 94.8% | 109.4% | ||||||||
| 10/31/2014 TTM | 71.6% | $137.21 | $98.29 | 77.9% | $136.58 | $106.36 | 108.7% | 99.5% | 108.2% | ||||||||
| 10/31/2013 TTM | 70.2% | $133.46 | $93.70 | 79.1% | $130.37 | $103.14 | 112.7% | 97.7% | 110.1% | ||||||||
| (1) | Information obtained from a third party hospitality research report dated November 17, 2015. The competitive set consists of the following hotels: Embassy Suites Newark Wilmington South, Sheraton Hotel Wilmington South, Doubletree Downtown Wilmington Legal District, Courtyard Wilmington Newark Christiana, Sheraton Hotel Suites Wilmington Downtown and Courtyard Newark University of Delaware. |
THE INFORMATION IN THIS STRUCTURAL AND COLLATERAL TERM SHEET IS NOT COMPLETE AND MAY BE AMENDED PRIOR TO THE TIME OF SALE. THIS TERM SHEET IS NOT AN OFFER TO SELL THESE SECURITIES AND IT IS NOT A SOLICITATION OF AN OFFER TO BUY THESE SECURITIES IN ANY JURISDICTION WHERE THE OFFER OR SALE IS NOT PERMITTED.
| 82 |
HILTON WILMINGTON/CHRISTIANA
Competitive Property Summary(1)
Demand Segmentation | 2014 Performance | ||||||||
Property | No. of | Year Built/ Renovated | Distance from | Commercial | Meeting & Group | Leisure | Occupancy | ADR | RevPAR |
Hilton Wilmington Christiana (Subject) Newark, DE | 266 | 1986/2015 | -- | 45% | 36% | 19% | 77.2% | $137.03 | $105.86 |
Embassy Suites Newark Wilmington South(2) Newark, DE | 154 | 1999/2014 | 7.3 miles | 60% | 30% | 10% | 80.0% | $144.00 | $115.20 |
Sheraton Wilmington South Hotel(2) New Castle, DE | 192 | 2011/2016 | 3.5 miles | 55% | 30% | 15% | 69.0% | $128.00 | $88.32 |
Courtyard by Marriott Wilmington Newark Christiana Mall(3) Newark, DE | 152 | 1991/NAV | 0.5 miles | 70% | 10% | 20% | 77.0% | $138.00 | $106.26 |
Hampton Inn & Suites Wilmington Christiana(3) Newark, DE | 136 | 2014/NAP | 0.2 miles | 60% | 10% | 30% | 66.0% | $133.00 | $87.78 |
DoubleTree by Hilton Downtown Wilmington Legal District(3) Wilmington, DE | 217 | 1979/NAV | 9.4 miles | 60% | 15% | 25% | 65.0% | $135.00 | $87.75 |
Sheraton Suites Wilmington(3) Wilmington, DE | 223 | 1989/NAV | 9.0 miles | 60% | 25% | 15% | 66.0% | $143.00 | $94.38 |
Courtyard by Marriott Newark University of Delaware(3) Newark, DE | 126 | 2004/NAV | 7.0 miles | 70% | 15% | 15% | 76.0% | $140.00 | $106.40 |
| (1) | Information obtained from the appraisal. |
| (2) | Appraisal: Primary Competitor. |
| (3) | Appraisal: Secondary Competitor. |
The Borrower.The borrower is MJ Wilmington Hotel Associates, L.P., a Delaware limited partnership and single purpose entity with one independent director. Legal counsel to the borrower delivered a non-consolidation opinion in connection with the origination of the Hilton Wilmington/Christiana Mortgage Loan. WAM Residential Investments, LLC, Richard G. Jabara, Theodore R. Jabara, Jr. and Gail Asarch, are the joint and several guarantors of certain nonrecourse carveouts under Hilton Wilmington/Christiana Loan Mortgage Loan.
The Sponsors.The sponsors are WAM Residential Investments, LLC, Richard G. Jabara, Theodore R. Jabara, Jr. and Gail Asarch. WAM Residential Investments, LLC is wholly owned by William Meyer. Mr. Meyer and Richard Jabara founded Meyer Jabara Hotels in 1977. Mr. Jabara serves as president and chief executive officer of Meyer Jabara Hotels and has 40 years of hospitality experience. Mr. Meyer is chairman of Meyer Jabara Hotels and prior to forming Meyer Jabara Hotels, Mr. Meyer served as president and chief executive officer for Servico, Inc., a large United States hotel company. Today, Meyer Jabara Hotels’ portfolio consists of 20 branded and boutique hotels comprised of more than 4,300 rooms. Mr. Meyer disclosed three foreclosures on CMBS loans between 2009 and 2012. See “Description of the Mortgage Pool—Litigation Considerations” and “Description of the Mortgage Pool—Loan Purpose, Default History, Bankruptcy Issues and Other Proceedings” in the Preliminary Prospectus.
Escrows.The loan documentsprovide for upfront escrows in the amount of $76,409 for real estate taxes and $4,784,251 for a PIP Reserve. The loan documents also provide for ongoing monthly reserves in the amount $25,470 for real estate taxes. The loan documents do not require monthly escrows for insurance premiums provided that (i) no event of default has occurred and is continuing, and (ii) the Hilton Wilmington/Christiana Property is insured via an acceptable blanket insurance policy and the borrower provides the lender with evidence of renewal of the insurance policies and timely proof of payment of the insurance premiums due. Monthly FF&E reserves are required beginning in October 2018 in an amount equal to the greater of (i) one-twelfth of 4.0% of gross income from operations during the immediately preceding calendar year in which the payment date occurs and (ii) the aggregate amount, if any, required to be reserved under the franchise agreement.
Lockbox and Cash Management.The Hilton Wilmington/Christiana Mortgage Loan requires a lender-controlled lockbox account, which is already in place, and that the borrower direct all credit card companies and tenants to pay directly into such lockbox account and the manager to deliver all amounts payable with respect to Hilton Wilmington/Christiana Property to be deposited into the lockbox account within one business day of receipt.
THE INFORMATION IN THIS STRUCTURAL AND COLLATERAL TERM SHEET IS NOT COMPLETE AND MAY BE AMENDED PRIOR TO THE TIME OF SALE. THIS TERM SHEET IS NOT AN OFFER TO SELL THESE SECURITIES AND IT IS NOT A SOLICITATION OF AN OFFER TO BUY THESE SECURITIES IN ANY JURISDICTION WHERE THE OFFER OR SALE IS NOT PERMITTED.
| 83 |
HILTON WILMINGTON/CHRISTIANA
Prior to a Cash Management Trigger Event (as defined below), all funds on deposit in the lockbox account are disbursed to the borrower. During the occurrence and continuance of a Cash Management Trigger Event, funds in the lockbox are transferred daily into the cash management account, where they are applied in accordance with the loan documents and, provided that no Cash Sweep Event (as defined below) has occurred, all excess funds on deposit in the cash management account are disbursed to the borrower.
A “Cash Management Trigger Event” will commence upon the occurrence of (i) an event of default; (ii) any bankruptcy action of the borrower; (iii) any bankruptcy action of a guarantor; provided, however, that such bankruptcy action of a guarantor will not constitute a Cash Management Trigger Event in the event that the remaining guarantors not subject to a bankruptcy action collectively are able to satisfy the net worth and liquidity covenants set forth in the guaranty; (iv) any bankruptcy action of the property manager; or (v) a Cash Management DSCR Trigger Event (as defined below). A Cash Management Trigger Event will end with respect to clause (i), when such event of default has been cured; with respect to clauses (ii), (iii) and (iv), if the related bankruptcy petition has been discharged, stayed, or dismissed within 90 days of filing for the borrower or guarantor and 120 days of filing for the property manager, among other conditions or, with respect to clause (iv) if the borrower replaces the property manager with a qualified property manager acceptable to the lender; and with respect to clause (v), once the amortizing debt service coverage ratio is greater than 1.25x for two consecutive quarters.
A “Cash Management DSCR Trigger Event” will occur upon any date at the end of each calendar quarter when the amortizing debt service coverage ratio based on the trailing 12-month period immediately preceding the date of determination is less than 1.25x.
A “Cash Sweep Event” will commence upon the occurrence of (i) an event of default; (ii) any bankruptcy action of the borrower; (iii) any bankruptcy action of a guarantor; provided, however, such bankruptcy action of a guarantor will not constitute a Cash Sweep Event in the event that the remaining guarantors not subject to a bankruptcy action collectively are able to satisfy the net worth and liquidity covenants set forth in the guaranty; (iv) any bankruptcy action of the property manager; or (v) a Cash Sweep DSCR Trigger Event (as defined below). A Cash Sweep Event will end (A) with respect to clause (i), when such event of default has been cured, and with respect to clauses (ii), (iii) and (iv), if the related bankruptcy petition has been discharged, stayed, or dismissed, within 90 days of filing for the borrower or guarantor and 120 days of filing for the property manager, among other conditions or, with respect to clause (iv) by the borrower replacing the property manager with a qualified property manager acceptable to the lender; and with respect toclause (v), once the amortizing debt service coverage ratio is greater than 1.15x for two consecutive quarters.
A “Cash Sweep DSCR Trigger Event” will occur upon any date at the end of each calendar quarter when the amortizing debt service coverage ratio based on the trailing 12-month period immediately preceding the date of determination is less than 1.15x.
Property Management.The Hilton Wilmington/Christiana Property is managed by an affiliate of the borrower.
Assumption.The borrower has the right to transfer the Hilton Wilmington/Christiana Property provided that no event of default has occurred and is continuing and certain other conditions are satisfied including, but not limited to, (i) the lender’s reasonable determination that the proposed transferee and guarantor satisfy the lender’s credit review and underwriting standards, taking into consideration transferee experience, financial strength and general business standing; (ii) execution of a recourse guaranty and an environmental indemnity by an affiliate of the transferee; and (iii) if requested by the lender, rating agency confirmation from DBRS, KBRA and Moody’s that the transfer will not result in a downgrade, withdrawal or qualification of the respective ratings assigned to the Series 2016-C32 Certificates.
Partial Release.Not permitted.
Real Estate Substitution.Not permitted.
Subordinate and Mezzanine Indebtedness.Provided that no event of default has occurred and is continuing, the borrower has the right to incur mezzanine financing subject to the satisfaction of certain conditions, including but not limited to (i) the execution of an intercreditor agreement in form and substance acceptable to the lender; (ii) the combined loan–to-value ratio will not be greater than 75.0%; (iii) the combined amortizing debt service coverage ratio will not be less than 1.40x (using a 30-year amortization schedule); (iv) the combined net operating income debt yield ratio will be greater than or equal to 9.0%; and (v) the lender receives rating agency confirmation from DBRS, KBRA and Moody’s that the mezzanine financing will not result in a downgrade, withdrawal or qualification of the respective ratings assigned to the Series 2016-C32 Certificates.
Ground Lease.None.
Terrorism Insurance.The loan documents require that the “all risk” insurance policy required to be maintained by the borrower provides coverage for terrorism in an amount equal to the full replacement cost of the Hilton Wilmington/Christiana Property, as well as business interruption insurance covering no less than the 12-month period following the occurrence of a casualty event, together with a six month period extended period of indemnity.
THE INFORMATION IN THIS STRUCTURAL AND COLLATERAL TERM SHEET IS NOT COMPLETE AND MAY BE AMENDED PRIOR TO THE TIME OF SALE. THIS TERM SHEET IS NOT AN OFFER TO SELL THESE SECURITIES AND IT IS NOT A SOLICITATION OF AN OFFER TO BUY THESE SECURITIES IN ANY JURISDICTION WHERE THE OFFER OR SALE IS NOT PERMITTED.
| 84 |
(THIS PAGE INTENTIONALLY LEFT BLANK)
THE INFORMATION IN THIS STRUCTURAL AND COLLATERAL TERM SHEET IS NOT COMPLETE AND MAY BE AMENDED PRIOR TO THE TIME OF SALE. THIS TERM SHEET IS NOT AN OFFER TO SELL THESE SECURITIES AND IT IS NOT A SOLICITATION OF AN OFFER TO BUY THESE SECURITIES IN ANY JURISDICTION WHERE THE OFFER OR SALE IS NOT PERMITTED.
| 85 |
| TOWNEPLACE SUITES REDWOOD CITY |
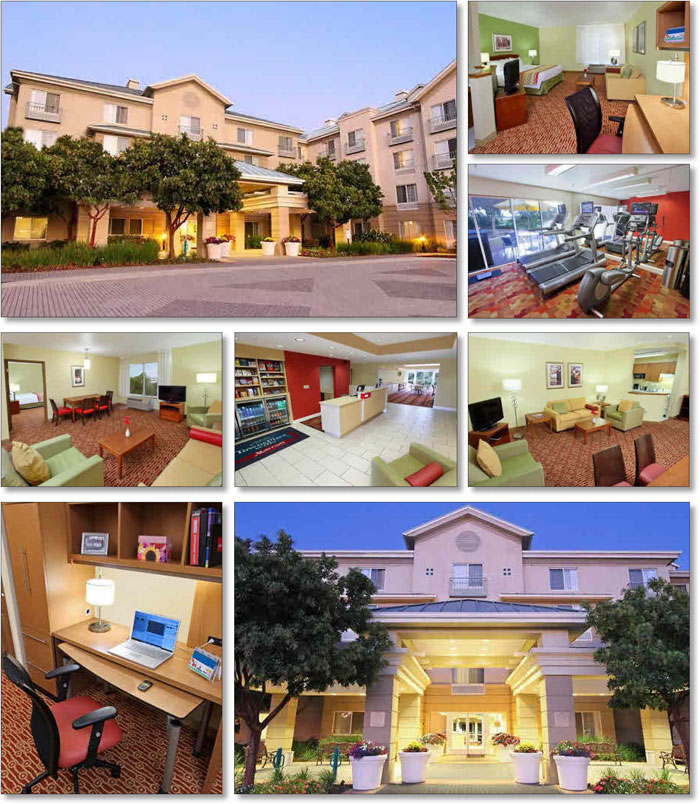
THE INFORMATION IN THIS STRUCTURAL AND COLLATERAL TERM SHEET IS NOT COMPLETE AND MAY BE AMENDED PRIOR TO THE TIME OF SALE. THIS TERM SHEET IS NOT AN OFFER TO SELL THESE SECURITIES AND IT IS NOT A SOLICITATION OF AN OFFER TO BUY THESE SECURITIES IN ANY JURISDICTION WHERE THE OFFER OR SALE IS NOT PERMITTED.
| 86 |
| TOWNEPLACE SUITES REDWOOD CITY |
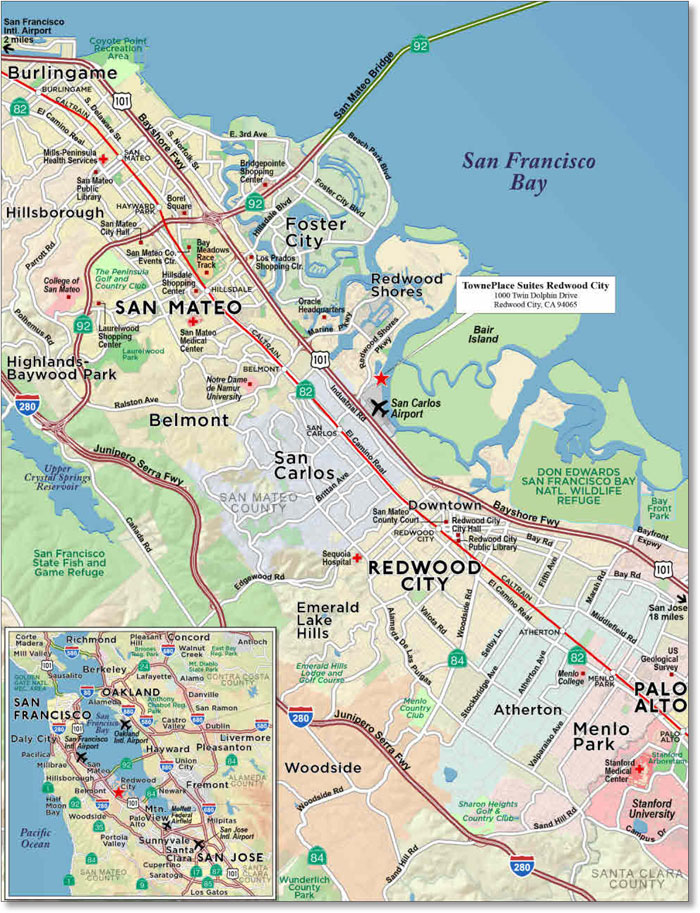
THE INFORMATION IN THIS STRUCTURAL AND COLLATERAL TERM SHEET IS NOT COMPLETE AND MAY BE AMENDED PRIOR TO THE TIME OF SALE. THIS TERM SHEET IS NOT AN OFFER TO SELL THESE SECURITIES AND IT IS NOT A SOLICITATION OF AN OFFER TO BUY THESE SECURITIES IN ANY JURISDICTION WHERE THE OFFER OR SALE IS NOT PERMITTED.
| 87 |
| No. 8 –TownePlace Suites Redwood City | ||||||||
| Loan Information | Property Information | |||||||
| Mortgage Loan Seller: | C-III Commercial Mortgage LLC | Single Asset/Portfolio: | Single Asset | |||||
Credit Assessment (DBRS/KBRA/Moody’s): | NR/NR/NR | Property Type: | Hospitality | |||||
| Original Principal Balance: | $25,000,000 | Specific Property Type: | Extended Stay | |||||
| Cut-off Date Principal Balance: | $24,975,986 | Location: | Redwood City, CA | |||||
| % of Initial Pool Balance: | 2.6% | Size: | 95 Rooms | |||||
| Loan Purpose: | Refinance | Cut-off Date Principal Balance Per Room: | $262,905 | |||||
| Borrower Name: | Redwood Suites, LLC | Year Built/Renovated: | 2002/2013 | |||||
| Sponsors(1): | Various | Title Vesting: | Fee | |||||
| Mortgage Rate: | 5.420% | Property Manager: | Self-managed | |||||
| Note Date: | December 11, 2015 | 4th Most Recent Occupancy (As of): | 90.2% (12/31/2011) | |||||
| Anticipated Repayment Date: | NAP | 3rd Most Recent Occupancy (As of): | 85.5% (12/31/2012) | |||||
| Maturity Date: | January 5, 2021 | 2nd Most Recent Occupancy (As of): | 86.9% (12/31/2013) | |||||
| IO Period: | None | Most Recent Occupancy (As of): | 89.8% (12/31/2014) | |||||
| Loan Term (Original): | 60 months | Current Occupancy (As of): | 87.5% (9/30/2015) | |||||
| Seasoning: | 1 month | |||||||
| Amortization Term (Original): | 360 months | Underwriting and Financial Information: | ||||||
| Loan Amortization Type: | Amortizing Balloon | |||||||
| Interest Accrual Method: | Actual/360 | 4th Most Recent NOI (As of): | $2,258,006 (12/31/2012) | |||||
| Call Protection: | L(25),D(32),O(3) | 3rd Most Recent NOI (As of)(3): | $2,449,134 (12/31/2013) | |||||
| Lockbox Type: | Springing | 2nd Most Recent NOI (As of)(3): | $2,862,279 (12/31/2014) | |||||
| Additional Debt: | None | Most Recent NOI (As of): | $3,172,232 (TTM 9/30/2015) | |||||
| Additional Debt Type: | NAP | |||||||
| U/W Revenues: | $5,536,724 | |||||||
| U/W Expenses: | $2,787,335 | |||||||
| U/W NOI: | $2,749,389 | |||||||
| U/W NCF: | $2,527,920 | |||||||
| U/W NOI DSCR: | 1.63x | |||||||
| Escrows and Reserves(2): | U/W NCF DSCR: | 1.50x | ||||||
| U/W NOI Debt Yield: | 11.0% | |||||||
| Type: | Initial | Monthly | Cap (If Any) | U/W NCF Debt Yield: | 10.1% | |||
| Taxes | $77,170 | $13,248 | NAP | As-Is Appraised Value: | $36,900,000 | |||
| Insurance | $9,465 | $3,155 | NAP | As-Is Appraisal Valuation Date: | September 25, 2015 | |||
| FF&E Reserve | $19,370 | $19,370 | NAP | Cut-off Date LTV Ratio: | 67.7% | |||
| PIP Reserve | $1,300,000 | $0 | NAP | LTV Ratio at Maturity or ARD: | 62.9% | |||
| (1) | See “The Sponsors” section. |
| (2) | See “Escrows” section. |
| (3) | See “Cash Flow Analysis” section. |
The Mortgage Loan. The mortgage loan (the “TownePlace Suites Redwood City Mortgage Loan”) is evidenced by a single promissory note that is secured by a first mortgage encumbering the fee interest in an extended stay hotel located in Redwood City, California (the “TownePlace Suites Redwood City Property”). The TownePlace Suites Redwood City Mortgage Loan was originated on December 11, 2015 by C-III Commercial Mortgage LLC. The TownePlace Suites Redwood City Mortgage Loan had an original principal balance of $25,000,000, has an outstanding principal balance as of the Cut-off Date of $24,975,986 and accrues interest at an interest rate of 5.420%per annum. The TownePlace Suites Redwood City Mortgage Loan had an initial term of 60 months, has a remaining term of 59 months as of the Cut-off Date and requires payments of principal and interest based on a 30-year amortization schedule. The TownePlace Suites Redwood City Mortgage Loan matures on January 5, 2021.
Following the lockout period, the borrower has the right to defease the TownePlace Suites Redwood City Mortgage Loan in whole, but not in part, on any date before November 5, 2020. In addition, the TownePlace Suites Redwood City Mortgage Loan is prepayable, without penalty, on or after November 5, 2020.
THE INFORMATION IN THIS STRUCTURAL AND COLLATERAL TERM SHEET IS NOT COMPLETE AND MAY BE AMENDED PRIOR TO THE TIME OF SALE. THIS TERM SHEET IS NOT AN OFFER TO SELL THESE SECURITIES AND IT IS NOT A SOLICITATION OF AN OFFER TO BUY THESE SECURITIES IN ANY JURISDICTION WHERE THE OFFER OR SALE IS NOT PERMITTED.
| 88 |
| TOWNEPLACE SUITES REDWOOD CITY |
Sources and Uses
| Sources | Uses | |||||||
| Original loan amount | $25,000,000 | 100.0% | Loan payoff(1) | $9,170,808 | 36.7% | |||
| Reserves | 1,406,005 | 5.6 | ||||||
| Closing costs | 319,526 | 1.3 | ||||||
| Return of equity | 14,103,660 | 56.4 | ||||||
| Total Sources | $25,000,000 | 100.0% | Total Uses | $25,000,000 | 100.0% |
| (1) | The TownePlace Suites Redwood City Property was previously securitized in the WBCMT 2006-C23 transaction. |
The Property. The TownePlace Suites Redwood City Property is a four-story, 95-room extended stay hotel located in northern Redwood City, California, east of the intersection of Twin Dolphin Drive and Redwood Shores Parkway. The TownePlace Suites Redwood City Property guestrooms configuration includes 46 HomeOffice suites (separate living and working areas), 29 studio suites, 8 executive studio suites, 9 one-bedroom suites and 3 two-bedroom suites. Amenities at the TownePlace Suites Redwood City Property include a breakfast dining area, fitness room, lobby workstation, market pantry and guest laundry room. All guestrooms feature separate living and sleeping areas, as well as a fully equipped kitchen. The guestrooms contain a table and chairs, work desk with chair, armchair and/or sleeper sofa, flat-panel television, and an iron and ironing board. The kitchens offer a full-sized refrigerator, conventional oven and stove top, toaster, microwave, dishwasher, cabinets, and dining and cooking utensils. In-room amenities include complimentary high-speed internet access and a phone with voice mail. The TownePlace Suites Redwood City Property includes fronts on the western edges of the San Francisco Bay, providing some of the rooms with water views. The TownePlace Suites Redwood City Property was built by the borrower in 2002 on a 2.1-acre site and opened for business in October 2002 and the existing franchise agreement with Marriott International, Inc. expires in September 2027. A property improvement plan (“PIP”) at the TownePlace Suites Redwood City Property was required by Marriott International, Inc. with a total estimated cost of $1,500,000 ($15,789 per room). The PIP will include renovations to the guestrooms, guestroom bathrooms, corridors and stairwells, lobby/vestibule and FF&E. The borrower reportedly already spent $200,000 on FF&E expenditures and an upfront PIP reserve in the amount of $1,300,000 was established at loan origination. The PIP is expected to be completed in March 2016. The PIP is not expected to reduce occupancy at the property.
Operating History and Underwritten Net Cash Flow.The following table presents certain information relating to the historical operating performance and the underwritten net cash flow at the TownePlace Suites Redwood City Property:
Cash Flow Analysis
| 2012 | 2013(1) | 2014(1) | TTM 9/30/2015 | U/W | % of U/W Total Revenue | U/W $ per Room | ||||||||
| Occupancy | 85.5% | 86.9% | 89.8% | 87.5% | 84.0% | |||||||||
| ADR | $143.12 | $152.35 | $167.46 | $187.87 | $187.87 | |||||||||
| RevPAR | $122.32 | $132.35 | $150.37 | $164.33 | $157.81 | |||||||||
| Room Revenue | $4,253,142 | $4,589,126 | $5,213,997 | $5,698,311 | $5,472,114 | 98.8% | $57,601 | |||||||
| F&B Revenue | 0 | 0 | 0 | 0 | 0 | 0.0 | 0 | |||||||
| Other Revenue | 57,699 | 81,407 | 56,678 | 64,610 | 64,610 | 1.2 | 680 | |||||||
| Total Revenue | $4,310,841 | $4,670,533 | $5,270,675 | $5,762,921 | $5,536,724 | 100.0% | $58,281 | |||||||
| Total Department Expenses | 798,965 | 897,363 | 979,865 | 1,043,196 | 1,138,476 | 20.6 | 11,984 | |||||||
| Gross Operating Profit | $3,511,876 | $3,773,170 | $4,290,810 | $4,719,725 | $4,398,249 | 79.4% | $46,297 | |||||||
| Total Undistributed Expenses | 1,087,076 | 1,155,907 | 1,253,138 | 1,362,823 | 1,316,328 | 23.8 | 13,856 | |||||||
| Profit Before Fixed Charges | $2,424,800 | $2,617,263 | $3,037,672 | $3,356,902 | $3,081,921 | 55.7% | $32,441 | |||||||
| Total Fixed Charges | 166,794 | 168,129 | 175,393 | 184,670 | 332,532 | 6.0 | 3,500 | |||||||
| Net Operating Income | $2,258,006 | $2,449,134 | $2,862,279 | $3,172,232 | $2,749,389 | 49.7% | $28,941 | |||||||
| FF&E | 0 | 0 | 0 | 0 | 221,469 | 4.0 | 2,331 | |||||||
| Net Cash Flow | $2,258,006 | $2,449,134 | $2,862,279 | $3,172,232 | $2,527,920 | 45.7% | $26,610 | |||||||
| NOI DSCR | 1.34x | 1.45x | 1.70x | 1.88x | 1.63x | |||||||||
| NCF DSCR | 1.34x | 1.45x | 1.70x | 1.88x | 1.50x | |||||||||
| NOI DY | 9.0% | 9.8% | 11.5% | 12.7% | 11.0% | |||||||||
| NCF DY | 9.0% | 9.8% | 11.5% | 12.7% | 10.1% | |||||||||
| (1) | With occupancy remaining stable over 85%, the sponsor increased room rates in 2014, resulting in RevPAR growth of 13.6% year over year from 2013. |
Appraisal.As of the appraisal valuation date of September 25, 2015, the TownePlace Suites Redwood City Property had an “as-is” appraised value of $36,900,000.
Environmental Matters.According to the Phase I environmental site assessment dated October 2, 2015, there was no evidence of any recognized environmental conditions at the TownePlace Suites Redwood City Property.
THE INFORMATION IN THIS STRUCTURAL AND COLLATERAL TERM SHEET IS NOT COMPLETE AND MAY BE AMENDED PRIOR TO THE TIME OF SALE. THIS TERM SHEET IS NOT AN OFFER TO SELL THESE SECURITIES AND IT IS NOT A SOLICITATION OF AN OFFER TO BUY THESE SECURITIES IN ANY JURISDICTION WHERE THE OFFER OR SALE IS NOT PERMITTED.
| 89 |
| TOWNEPLACE SUITES REDWOOD CITY |
Market Overview and Competition.The TownePlace Suites Redwood City Property is located in Redwood City just off Highway 101, approximately 10 miles south of the San Francisco International Airport and approximately 12 miles northeast of the heart of Silicon Valley. Redwood City and the greater Silicon Valley are home to a variety of companies and entities related to the technology, biotechnology, healthcare, and education sectors. These local employers and headquarter offices, as well as Stanford University and Stanford Hospital, represent the primary sources of demand for the San Francisco Bay Area hospitality market. Major national and international technology and manufacturing companies located in Redwood City and the greater Silicon Valley area include Oracle, Abbot Laboratories, Electronic Arts, Box Inc., and Nikkon Corporation. Box Inc. recently moved its new headquarters to Redwood City and leased 334,000 square feet of office space. Redwood City is located in the South San Mateo office submarket, which is the third-largest office submarket in the greater San Francisco market and has the third-highest average asking rents of all of the office submarkets. Several new office projects are under construction in the South San Mateo submarket which will bring over 1,000,000 square feet of office space to the submarket. According to a third party market research report, the average asking rental rate is anticipated to increase significantly over the next five years with the additional class A office space entering the market. Redwood City draws office demand, in part, due to a Caltrain location which makes it attractive for bringing in workforce from San Francisco to the north or any of the cities served by Caltrain to the south. Commercial demand is also generated by major employers in the healthcare sector, such as Sequoia Hospital and Kaiser Permanente. The Redwood City submarket also draws demand from business travelers coming to the Silicon Valley who are seeking more affordable rates, as the average rental rate in the submarket is relatively lower than other major submarkets in Silicon Valley. According to the appraisal, the outlook for commercial demand is positive as technology companies continue to hire and expand office space and as the area continues to attract new startups. Demand segmentation at the TownePlace Suites Redwood City Property is comprised of 70.0% commercial, 5.0% group and 25.0% leisure.
The following tables present certain information relating to the TownePlace Suites Redwood City Property’s competitive set:
Subject and Market Historical Occupancy, ADR and RevPAR(1)
Competitive Set | TownePlace Suites Redwood City | Penetration Factor | |||||||||||||||
Year | Occupancy | ADR | RevPAR | Occupancy | ADR | RevPAR | Occupancy | ADR | RevPAR | ||||||||
| 11/30/2015 TTM | 84.7% | $161.65 | $136.86 | 86.3% | $192.11 | $165.82 | 101.9% | 118.8% | 121.2% | ||||||||
| 11/30/2014 TTM | 86.0% | $150.98 | $129.87 | 88.9% | $166.65 | $148.15 | 103.3% | 110.4% | 114.1% | ||||||||
| 11/30/2013 TTM | 82.9% | $137.47 | $114.00 | 87.0% | $151.66 | $131.91 | 104.9% | 110.3% | 115.7% | ||||||||
| (1) | Information obtained from a third party hospitality report dated December 17, 2015. The competitive set includes the following hotels: Holiday Inn Express & Suites Belmont, Hyatt House Belmont Redwood Shores, Country Inn & Suites San Carlos and Extended Stay America San Francisco San Carlos. |
Competitive Property Summary(1)
Demand Segmentation | 2014 Performance | ||||||||||||||||
Property Name/Location | No. of Rooms | Year Built/ Renovated | Distance | Commercial | Meeting | Leisure | Occupancy | ADR | RevPAR | ||||||||
TownePlace Suites Redwood City (Subject) - Redwood City, CA | 95 | 2002/2013 | -- | 70% | 5% | 25% | 89.8% | $167.46 | $150.37 | ||||||||
| Extended StayAmerica San Francisco Belmont – Belmont, CA | 116 | 2003/NAP | 1.3 miles | 60% | 5% | 35% | 90% | $115.00 | $103.50 | ||||||||
| Fairfield Inn & Suites by Marriott San Francisco San Carlos – San Carlos, CA | 120 | 1997/2004 | 0.6 miles | 65% | 10% | 25% | 80% | $146.00 | $116.80 | ||||||||
| Holiday Inn Express & Suites Belmont – Belmont, CA | 82 | 1998/2015 | 2.1 miles | 60% | 10% | 30% | 78% | $145.00 | $113.10 | ||||||||
| Country Inn & Suites by Carlson San Carlos – San Carlos, CA | 51 | 1998/2012 | 1.4 miles | 60% | 5% | 35% | 83% | $159.00 | $131.97 | ||||||||
| Hyatt House Belmont Redwood Shores – Belmont, CA | 132 | 1995/NAP | 1.9 miles | 65% | 5% | 30% | 91% | $191.00 | $173.81 | ||||||||
| (1) | Information obtained from the appraisal. |
��
The Borrower.The borrower is Redwood Suites, LLC, a California limited liability company and a single purpose entity with one independent director. Legal counsel to the borrower delivered a non-consolidation opinion in connection with the origination of the TownePlace Suites Redwood City Mortgage Loan. Max A. Keech, William J. Hamrick, Hamrick Investments, LLC, and Green Valley Corporation are the guarantors of certain nonrecourse carveouts under the TownePlace Suites Redwood City Mortgage Loan.
THE INFORMATION IN THIS STRUCTURAL AND COLLATERAL TERM SHEET IS NOT COMPLETE AND MAY BE AMENDED PRIOR TO THE TIME OF SALE. THIS TERM SHEET IS NOT AN OFFER TO SELL THESE SECURITIES AND IT IS NOT A SOLICITATION OF AN OFFER TO BUY THESE SECURITIES IN ANY JURISDICTION WHERE THE OFFER OR SALE IS NOT PERMITTED.
| 90 |
| TOWNEPLACE SUITES REDWOOD CITY |
The Sponsors.The sponsors are Max A. Keech, William J. Hamrick, Hamrick Investments, LLC, and Green Valley Corporation. The sponsors have more than 45 years of combined real estate experience owning and operating hotels and have owned and operated the TownePlace Suites Redwood City Property since 2002. A subsidiary of Green Valley Corporation, Barry Swenson Builder (“Swenson”), and Mr. Hamrick’s company, THM Hotels (“THM”), developed the TownePlace Suites Redwood City Property which is part of a larger project known as The Preserve at Redwood Shores. TMH and Swenson currently own three additional extended stay hotels in San Jose, Santa Clara and Campbell, California all of which operate under the Marriott TownePlace Suites brand.
Escrows.The loan documents provide for upfront escrows in the amount of $77,170 for real estate taxes, $9,465 for insurance premiums, $19,370 for FF&E reserves and $1.3 million for the franchisor-required PIP. The loan documents also provide for ongoing monthly escrows of $13,248 for real estate taxes, $3,155 for insurance premiums, and $19,370 for FF&E reserves. The FF&E reserve, to be adjusted each January, is equal to one-twelfth of 4% of the actual annual gross income from the prior year.
Lockbox and Cash Management.The TownePlace Suites Redwood City Mortgage Loan is structured with springing cash management. Upon the occurrence of a Cash Management Period (as defined below), the borrower is required to establish a lender-controlled lockbox account and direct tenants to deposit all rents, and all credit card companies under merchant agreements to pay receipts, directly into such lockbox account. The loan documents also require that all rents received by the borrower or property manager will be deposited into such lockbox account within one business day of receipt. During a Cash Management Period, all excess cash flow will be held in a separate account under the exclusive control of the lender.
A “Cash Management Period” will commence upon (i) the occurrence and continuance of an event of default; or (ii) the debt service coverage ratio falling below 1.30x during the 12 calendar months immediately preceding the date of determination. A Cash Management Period will expire with respect to (i), upon the event of default being cured, provided that no other event of default has occurred and is continuing; and with respect to (ii), upon the debt service coverage ratio being at least 1.35x for two consecutive calendar quarters.
Property Management.The TownePlace Suites Redwood City Property is managed by an affiliate of the borrower.
Assumption.The borrower has the right to transfer the TownePlace Suites Redwood City Property provided that certain conditions are satisfied, including but not limited to (i) no event of default has occurred and is continuing; (ii) the lender reasonably determines that the proposed transferee complies with single purpose bankruptcy remote entity requirements and the transferee and guarantor satisfy the lender’s credit review and underwriting standards; and (iii) the lender has received confirmation from DBRS, KBRA and Moody’s that such assumption will not result in a downgrade, withdrawal or qualification of the respective ratings assigned to the Series 2016-C32 Certificates.
Partial Release.Not permitted.
Real Estate Substitution.Not permitted.
Subordinate and Mezzanine Indebtedness.Not permitted.
Ground Lease.None.
Terrorism Insurance.The loan documents require that the “all risk” insurance policy required to be maintained by the borrower provide coverage for terrorism in an amount equal to the full replacement cost of the TownePlace Suites Redwood City Property, as well as business interruption insurance covering no less than the 18-month period following the occurrence of a casualty event, together with a 12-month extended period of indemnity.
Earthquake Insurance. The loan documents do not require earthquake insurance. The seismic report indicated a probable maximum loss of 5.0%.
THE INFORMATION IN THIS STRUCTURAL AND COLLATERAL TERM SHEET IS NOT COMPLETE AND MAY BE AMENDED PRIOR TO THE TIME OF SALE. THIS TERM SHEET IS NOT AN OFFER TO SELL THESE SECURITIES AND IT IS NOT A SOLICITATION OF AN OFFER TO BUY THESE SECURITIES IN ANY JURISDICTION WHERE THE OFFER OR SALE IS NOT PERMITTED.
| 91 |
(THIS PAGE INTENTIONALLY LEFT BLANK)
THE INFORMATION IN THIS STRUCTURAL AND COLLATERAL TERM SHEET IS NOT COMPLETE AND MAY BE AMENDED PRIOR TO THE TIME OF SALE. THIS TERM SHEET IS NOT AN OFFER TO SELL THESE SECURITIES AND IT IS NOT A SOLICITATION OF AN OFFER TO BUY THESE SECURITIES IN ANY JURISDICTION WHERE THE OFFER OR SALE IS NOT PERMITTED.
| 92 |
| COTTONWOOD SHOPPING CENTER |
THE INFORMATION IN THIS STRUCTURAL AND COLLATERAL TERM SHEET IS NOT COMPLETE AND MAY BE AMENDED PRIOR TO THE TIME OF SALE. THIS TERM SHEET IS NOT AN OFFER TO SELL THESE SECURITIES AND IT IS NOT A SOLICITATION OF AN OFFER TO BUY THESE SECURITIES IN ANY JURISDICTION WHERE THE OFFER OR SALE IS NOT PERMITTED.
| 93 |
| COTTONWOOD SHOPPING CENTER |
THE INFORMATION IN THIS STRUCTURAL AND COLLATERAL TERM SHEET IS NOT COMPLETE AND MAY BE AMENDED PRIOR TO THE TIME OF SALE. THIS TERM SHEET IS NOT AN OFFER TO SELL THESE SECURITIES AND IT IS NOT A SOLICITATION OF AN OFFER TO BUY THESE SECURITIES IN ANY JURISDICTION WHERE THE OFFER OR SALE IS NOT PERMITTED.
| 94 |
| COTTONWOOD SHOPPING CENTER |

THE INFORMATION IN THIS STRUCTURAL AND COLLATERAL TERM SHEET IS NOT COMPLETE AND MAY BE AMENDED PRIOR TO THE TIME OF SALE. THIS TERM SHEET IS NOT AN OFFER TO SELL THESE SECURITIES AND IT IS NOT A SOLICITATION OF AN OFFER TO BUY THESE SECURITIES IN ANY JURISDICTION WHERE THE OFFER OR SALE IS NOT PERMITTED.
| 95 |
| No. 9 – Cottonwood Shopping Center | |||||||||
| Loan Information | Property Information | ||||||||
| Mortgage Loan Seller: | Wells Fargo Bank, National Association | Single Asset/Portfolio: | Single Asset | ||||||
Credit Assessment (DBRS/KBRA/Moody’s): | NR/NR/NR | Property Type: | Retail | ||||||
| Original Principal Balance: | $21,075,000 | Specific Property Type: | Anchored | ||||||
| Cut-off Date Principal Balance: | $21,075,000 | Location: | Albuquerque, NM | ||||||
| % of Initial Pool Balance: | 2.2% | Size: | 188,887 SF | ||||||
| Loan Purpose: | Refinance | Cut-off Date Principal Balance Per SF: | $111.57 | ||||||
| Borrower Names(1): | Various | Year Built/Renovated: | 1996/NAP | ||||||
| Sponsor(2): | Various | Title Vesting: | Fee | ||||||
| Mortgage Rate: | 4.890% | Property Manager: | Commercial Real Estate Management, LLC | ||||||
| Note Date: | November 12, 2015 | 4th Most Recent Occupancy (As of): | 98.0% (12/31/2011) | ||||||
| Anticipated Repayment Date: | NAP | 3rd Most Recent Occupancy (As of): | 99.0% (12/31/2012) | ||||||
| Maturity Date: | December 11, 2025 | 2nd Most Recent Occupancy (As of): | 98.0% (12/31/2013) | ||||||
| IO Period: | 36 months | Most Recent Occupancy (As of): | 99.0% (12/31/2014) | ||||||
| Loan Term (Original): | 120 months | Current Occupancy (As of): | 98.3% (9/30/2015) | ||||||
| Seasoning: | 2 months | ||||||||
| Amortization Term (Original): | 360 months | Underwriting and Financial Information: | |||||||
| Loan Amortization Type: | Interest-only, Amortizing Balloon | ||||||||
| Interest Accrual Method: | Actual/360 | 4thMost Recent NOI (As of): | $2,076,306 (12/31/2012) | ||||||
| Call Protection: | L(26),D(90),O(4) | 3rdMost Recent NOI (As of): | $1,932,590 (12/31/2013) | ||||||
| Lockbox Type: | Springing | 2ndMost Recent NOI (As of): | $2,017,612 (12/31/2014) | ||||||
| Additional Debt: | None | Most Recent NOI (As of): | $2,172,416 (TTM 8/31/2015) | ||||||
| Additional Debt Type: | NAP | ||||||||
| U/W Revenues: | $2,715,447 | ||||||||
| U/W Expenses: | $709,532 | ||||||||
| U/W NOI: | $2,005,915 | ||||||||
| Escrows and Reserves(3): | U/W NCF: | $1,816,187 | |||||||
| U/W NOI DSCR: | 1.50x | ||||||||
| Type: | Initial | Monthly | Cap (If Any) | U/W NCF DSCR: | 1.35x | ||||
| Taxes | $36,312 | $18,156 | NAP | U/W NOI Debt Yield: | 9.5% | ||||
| Insurance | $0 | Springing | NAP | U/W NCF Debt Yield: | 8.6% | ||||
| Replacement Reserve | $0 | $3,635 | $87,248 | As-Is Appraised Value: | $29,200,000 | ||||
| TI/LC Reserve | $0 | $9,638 | $462,600 | As-Is Appraisal Valuation Date: | September 28, 2015 | ||||
| Office Max Reserve | $0 | $29,375 | $352,500 | Cut-off Date LTV Ratio: | 72.2% | ||||
| Parking Lot Repair Reserve | $0 | Springing | NAP | LTV Ratio at Maturity or ARD: | 63.7% | ||||
| (1) | See “The Borrowers” section. |
| (2) | See “The Sponsors” section. |
| (3) | See “Escrows” section. |
The Mortgage Loan.The mortgage loan (the “Cottonwood Shopping Center Mortgage Loan”) is evidenced by a single promissory note that is secured by a first mortgage encumbering an anchored retail center located in Albuquerque, New Mexico (the “Cottonwood Shopping Center Property”). The Cottonwood Shopping Center Mortgage Loan was originated on November 12, 2015 by Wells Fargo Bank, National Association. The Cottonwood Shopping Center Mortgage Loan had an original principal balance of $21,075,000, has an outstanding principal balance as of the Cut-off Date of $21,075,000 and accrues interest at an interest rate of 4.890%per annum. The Cottonwood Shopping Center Mortgage Loan had an initial term of 120 months, has a remaining term of 118 months as of the Cut-off Date and requires interest-only payments for the first 36 payments following origination and, thereafter, requires payments of principal and interest based on a 30-year amortization schedule. The Cottonwood Shopping Center Mortgage Loan matures on December 11, 2025.
Following the lockout period, the borrower has the right to defease the Cottonwood Shopping Center Mortgage Loan in whole, but not in part, on any date before September 11, 2025. In addition, the Cottonwood Shopping Center Mortgage Loan is prepayable without penalty on or after September 11, 2025.
THE INFORMATION IN THIS STRUCTURAL AND COLLATERAL TERM SHEET IS NOT COMPLETE AND MAY BE AMENDED PRIOR TO THE TIME OF SALE. THIS TERM SHEET IS NOT AN OFFER TO SELL THESE SECURITIES AND IT IS NOT A SOLICITATION OF AN OFFER TO BUY THESE SECURITIES IN ANY JURISDICTION WHERE THE OFFER OR SALE IS NOT PERMITTED.
| 96 |
| COTTONWOOD SHOPPING CENTER |
Sources and Uses
| Sources | Uses | |||||||
| Original loan amount | $21,075,000 | 73.7% | Loan payoff(1) | $28,229,964 | 98.7% | |||
| Sponsor’s new cash contribution | 7,512,437 | 26.3 | Closing costs | 321,161 | 1.1 | |||
| Reserves | 36,312 | 0.1 | ||||||
| Total Sources | $28,587,437 | 100.0% | Total Uses | $28,587,437 | 100.0% |
| (1) | The Cottonwood Shopping Center Property was previously securitized in the WBCMT 2005-C22 transaction. |
The Property.The Cottonwood Shopping Center Property is an anchored retail center totaling approximately 188,887 square feet located in Albuquerque, New Mexico, approximately 14.4 miles northwest of downtown Albuquerque. Built in 1996, the Cottonwood Shopping Center Property is comprised of four buildings situated on an approximate 19.2-acre site. The Cottonwood Shopping Center Property is anchored by Best Buy with junior anchors including Barnes & Noble, Michaels, and Toys “R” Us, which is on a ground lease and owns its own improvements. Six tenants representing 55.1% of the net rentable area are original tenants at the Cottonwood Shopping Center Property and have been in occupancy since construction. Further, tenants representing 73.1% of the net rentable area have been in occupancy for over 10 years. The Cottonwood Shopping Center Property has benefited from strong historical performance, maintaining an average occupancy of 98.5% since 2002. Parking at the Cottonwood Shopping Center Property is provided via 1,077 surface parking spaces, resulting in a parking ratio of 5.7 spaces per 1,000 square feet of net rentable area. Shadow anchors immediately adjacent to the Cottonwood Shopping Center Property include Sam’s Club and Kohl’s. Additionally, the Cottonwood Shopping Center Property is part of a regional retail cluster with over 3.5 million square feet of retail space centered around the Cottonwood Mall, an approximately 1.0 million square foot super regional mall anchored by Dillard’s, Macy’s, Sears, JC Penney, and Conns. As of September 30, 2015, the Cottonwood Shopping Center Property was 98.3% occupied by 13 tenants.
The following table presents certain information relating to the tenancy at the Cottonwood Shopping Center Property:
Major Tenants
| Tenant Name | Credit Rating (Fitch/Moody’s/ S&P)(1) | Tenant NRSF | % of NRSF | Annual U/W Base Rent PSF(2) | Annual U/W Base Rent(2) | % of Total Annual U/W Base Rent | Sales PSF(3) | Occupancy Cost(3) | Lease Expiration Date |
| Anchor Tenants | |||||||||
| Best Buy | BBB-/Baa1/BB+ | 45,750 | 24.2% | $13.00 | $594,750 | 26.3% | NAV | NAV | 1/31/2021(4) |
| Total Anchor Tenants | 45,750 | 24.2% | $13.00 | $594,750 | 26.3% | ||||
| Major Tenants | |||||||||
| Barnes & Noble | NR/NR/NR | 25,050 | 13.3% | $13.97(5) | $350,000(5) | 15.5% | $194 | 7.2% | 1/31/2017(6) |
| Home Life Furniture | NR/NR/NR | 35,650 | 18.9% | $9.00 | $320,850 | 14.2% | $95 | 12.9% | 9/30/2019(7)(8) |
| Michaels | NR/Ba3/B+ | 34,000(9) | 18.0% | $7.70 | $261,800 | 11.6% | $135 | 7.3% | 5/31/2018(10) |
| Office Max | NR/B2/B- | 23,500 | 12.4% | $9.00 | $211,500 | 9.3% | NAV | NAV | 11/30/2016(11) |
| Total Major Tenants | 118,200 | 62.6% | $9.68 | $1,144,150 | 50.5% | ||||
| Non-Major Tenants(12) | 21,751 | 11.5% | $24.13 | $524,885 | 23.2% | ||||
| Occupied Collateral Total | 185,701 | 98.3% | $12.19 | $2,263,785 | 100.0% | ||||
| Vacant Space | 3,186 | 1.7% | |||||||
| Collateral Total | 188,887 | 100.0% | |||||||
| (1) | Certain ratings are those of the parent company, whether or not the parent guarantees the lease. |
| (2) | Annual U/W Base Rent PSF and Annual U/W Base Rent include contractual rent steps through February 2016 totaling $37,818. |
| (3) | Sales and occupancy costs are for the trailing 12-month period ending August 31, 2015. |
| (4) | Best Buy has two, 5-year lease renewal options. |
| (5) | Barnes & Noble operates on a gross lease, whereas all other tenants at the Cottonwood Shopping Center Property operate on triple-net leases. |
| (6) | Barnes & Noble has two, 5-year lease renewal options. |
| (7) | Home Life Furniture has a live, ongoing right to terminate its lease with 120 days’ prior written notice if the tenant’s annual gross sales do not exceed $5 million. The original lease commenced as of October 1, 2009. Since 2012, annual gross sales have not exceeded $5 million. Tenant’s reported annual gross sales for 2013, 2014, and the trailing 12-month period ending August 31, 2015 were $3,233,695, $3,160,365, and $3,369,365, respectively. |
| (8) | Home Life Furniture has two, 5-year lease renewal options. |
| (9) | Michaels is not utilizing approximately 7,963 square feet of its space. |
| (10) | Michaels has two, 5-year lease renewal options. |
| (11) | Office Max Store has four, 5-year renewal options. |
| (12) | Toys ‘R’ Us (29,233 square feet) is on a ground lease and owns its own improvements; therefore its square footage was excluded from the total square footage for the Cottonwood Shopping Center Property. Non-Major Tenants and Occupied Collateral Total Annual U/W Base Rent PSF excluding this income are $19.22 and $11.61, respectively. |
THE INFORMATION IN THIS STRUCTURAL AND COLLATERAL TERM SHEET IS NOT COMPLETE AND MAY BE AMENDED PRIOR TO THE TIME OF SALE. THIS TERM SHEET IS NOT AN OFFER TO SELL THESE SECURITIES AND IT IS NOT A SOLICITATION OF AN OFFER TO BUY THESE SECURITIES IN ANY JURISDICTION WHERE THE OFFER OR SALE IS NOT PERMITTED.
| 97 |
| COTTONWOOD SHOPPING CENTER |
The following table presents certain information relating to the lease rollover schedule at the Cottonwood Shopping Center Property:
Lease Expiration Schedule(1)(2)
| Year Ending December 31, | No. of Leases Expiring | Expiring NRSF | % of Total NRSF | Cumulative Expiring NRSF | Cumulative % of Total NRSF | Annual U/W Base Rent | % of Total Annual U/W Base Rent | Annual U/W Base Rent PSF(3) | |
| MTM | 0 | 0 | 0.0% | 0 | 0.0% | $0 | 0.0% | $0.00 | |
| 2016 | 1 | 23,500 | 12.4% | 23,500 | 12.4% | $211,500 | 9.3% | $9.00 | |
| 2017 | 4 | 36,189 | 19.2% | 59,689 | 31.6% | $568,509 | 25.1% | $15.71 | |
| 2018 | 4 | 38,812 | 20.5% | 98,501 | 52.1% | $354,172 | 15.6% | $9.13 | |
| 2019 | 2 | 39,650 | 21.0% | 138,151 | 73.1% | $392,850 | 17.4% | $9.91 | |
| 2020 | 0 | 0 | 0.0% | 138,151 | 73.1% | $0 | 0.0% | $0.00 | |
| 2021 | 1 | 45,750 | 24.2% | 183,901 | 97.4% | $594,750 | 26.3% | $13.00 | |
| 2022 | 1(4) | 0(4) | 0.0%(4) | 183,901 | 97.4% | $106,904 | 4.7% | $0.00(4) | |
| 2023 | 1 | 1,800 | 1.0% | 185,701 | 98.3% | $35,100 | 1.6% | $19.50 | |
| 2024 | 0 | 0 | 0.0% | 185,701 | 98.3% | $0 | 0.0% | $0.00 | |
| 2025 | 0 | 0 | 0.0% | 185,701 | 98.3% | $0 | 0.0% | $0.00 | |
| 2026 | 0 | 0 | 0.0% | 185,701 | 98.3% | $0 | 0.0% | $0.00 | |
| Thereafter | 0 | 0 | 0.0% | 185,701 | 98.3% | $0 | 0.0% | $0.00 | |
| Vacant | 0 | 3,186 | 1.7% | 188,887 | 100.0% | $0 | 0.0% | $0.00 | |
| Total/Weighted Average | 14(5) | 188,887 | 100.0% | $2,263,785 | 100.0% | $12.19(3) |
| (1) | Information obtained from the underwritten rent roll. |
| (2) | Certain tenants may have lease termination options that are exercisable prior to the originally stated expiration date of the subject lease and that are not considered in the Lease Expiration Schedule. |
| (3) | Annual U/W Base Rent PSF excludes vacant space and rent attributed to one tenant which is on a ground lease and owns its own improvements. |
| (4) | Toys ‘R’ Us (29,233 square feet) is on a ground lease and owns its own improvements; therefore its square footage was excluded from the net rentable square feet. |
| (5) | The Cottonwood Shopping Center Property is occupied by 13 tenants subject to 14 leases. |
The following table presents historical occupancy percentages at the Cottonwood Shopping Center Property:
Historical Occupancy
12/31/2011(1) | 12/31/2012(1) | 12/31/2013(1) | 12/31/2014(1) | 9/30/2015(2) |
| 98.0% | 99.0% | 98.0% | 99.0% | 98.3% |
| (1) | Information obtained from a third party report. |
| (2) | Information obtained from the underwritten rent roll. |
THE INFORMATION IN THIS STRUCTURAL AND COLLATERAL TERM SHEET IS NOT COMPLETE AND MAY BE AMENDED PRIOR TO THE TIME OF SALE. THIS TERM SHEET IS NOT AN OFFER TO SELL THESE SECURITIES AND IT IS NOT A SOLICITATION OF AN OFFER TO BUY THESE SECURITIES IN ANY JURISDICTION WHERE THE OFFER OR SALE IS NOT PERMITTED.
| 98 |
| COTTONWOOD SHOPPING CENTER |
Operating History and Underwritten Net Cash Flow. The following table presents certain information relating to the historical operating performance and underwritten net cash flow at the Cottonwood Shopping Center Property:
Cash Flow Analysis
| 2012 | 2013 | 2014 | TTM 8/31/2015 | U/W | % of U/W Effective Gross Income | U/W $ per SF | |
| Base Rent | $2,104,925 | $2,077,670 | $2,124,132 | $2,256,363 | $2,208,103(1) | 81.3% | $11.69 |
| Grossed Up Vacant Space | 0 | 0 | 0 | 0 | 116,216 | 4.3 | 0.62 |
| Percentage Rent | 29,306 | 32,413 | 30,812 | 30,812 | 0 | 0.0 | 0.00 |
| Total Reimbursables | 560,047 | 425,349 | 440,488 | 441,052 | 507,343 | 18.7 | 2.69 |
| Other Income | 0 | 0 | 1,561 | 1,865 | 0 | 0.0 | 0.00 |
| Less Vacancy and Credit Loss | 0 | 0 | 0 | 0 | (116,216)(2) | (4.3) | (0.62) |
| Effective Gross Income | $2,694,279 | $2,535,432 | $2,596,992 | $2,730,092 | $2,715,447 | 100.0% | $14.38 |
| Total Operating Expenses | $617,973 | $602,842 | $579,380 | $557,676 | $709,532 | 26.1% | $3.76 |
|
|
|
|
|
|
| |
| Net Operating Income | $2,076,306 | $1,932,590 | $2,017,612 | $2,172,416 | $2,005,915 | 73.9% | $10.62 |
| TI/LC | 0 | 0 | 0 | 0 | 146,104 | 5.4 | 0.77 |
| Capital Expenditures | 0 | 0 | 0 | 0 | 43,624 | 1.6 | 0.23 |
| Net Cash Flow | $2,076,306 | $1,932,590 | $2,017,612 | $2,172,416 | $1,816,187 | 66.9% | $9.62 |
| NOI DSCR | 1.55x | 1.44x | 1.50x | 1.62x | 1.50x | ||
| NCF DSCR | 1.55x | 1.44x | 1.50x | 1.62x | 1.35x | ||
| NOI DY | 9.9% | 9.2% | 9.6% | 10.3% | 9.5% | ||
| NCF DY | 9.9% | 9.2% | 9.6% | 10.3% | 8.6% |
| (1) | The underwritten base rent includes rent steps through February 2016 totaling $37,818. |
| (2) | The underwritten economic vacancy is 5.0%. The Cottonwood Shopping Center Property was 98.3% physically occupied as of September 30, 2015. |
Appraisal.As of the appraisal valuation date of September 28, 2015, the Cottonwood Shopping Center Property had an “as-is” appraised value of $29,200,000.
Environmental Matters.According to the Phase I environmental assessment dated September 30, 2015, there was no evidence of any recognized environmental conditions at the Cottonwood Shopping Center Property.
Market Overview and Competition.The Cottonwood Shopping Center Property is located along Coor Boulevard, one of the neighborhood’s primary commercial thoroughfares, in Albuquerque, New Mexico, approximately 14.4 miles northwest of the central business district of Albuquerque. The Cottonwood Shopping Center Property’s infill neighborhood is situated along the northern border of the city of Albuquerque, in one the metropolitan’s densest retail clusters. The primary economic driver for the neighborhood and the broader region is the Cottonwood Mall, a super-regional mall located at the neighborhood’s southern tip and anchored by retailers such as Dillard’s, Macy’s, and JC Penney. Additionally, big-box retailers such as The Home Depot and Walmart are located directly north and northwest of the Cottonwood Mall. There are 11 multifamily developments within approximately 2.0 miles of the Cottonwood Shopping Center and Lovelace Westside Hospital is located directly west of the neighborhood, in addition to elementary and high schools.
The estimated 2015 population within a one-, three- and five-mile radius of the Cottonwood Shopping Center Property was 7,369, 67,575 and 158,610, respectively, and the average household income within the same radii was $68,336, $82,079 and $81,862, respectively. According to a third party market report, the retail market remained one of the best performing sectors in the Albuquerque real estate market for the third quarter of 2015 with positive net absorption tallied for the fifth consecutive quarter. The Cottonwood Shopping Center Property is located in the Cottonwood retail submarket of the Albuquerque retail market. As of the third quarter of 2015, the Cottonwood retail submarket contained a total inventory of 168 buildings containing 5.1 million square feet of retail space with a vacancy rate of 4.9% and an average asking rent of $15.73 per square foot, gross. The average underwritten base rent of $12.31 per square foot is approximately 12.9% below the appraiser’s concluded blended market rent of $14.13 per square foot for the Cottonwood Shopping Center Property.
THE INFORMATION IN THIS STRUCTURAL AND COLLATERAL TERM SHEET IS NOT COMPLETE AND MAY BE AMENDED PRIOR TO THE TIME OF SALE. THIS TERM SHEET IS NOT AN OFFER TO SELL THESE SECURITIES AND IT IS NOT A SOLICITATION OF AN OFFER TO BUY THESE SECURITIES IN ANY JURISDICTION WHERE THE OFFER OR SALE IS NOT PERMITTED.
| 99 |
| COTTONWOOD SHOPPING CENTER |
The following table presents certain information relating to some comparable retail leases for the Cottonwood Shopping Center Property:
Comparable Leases(1)
| Property Name/ Location | Year Built/ Renovated | Anchor Tenants | Total GLA (SF) | Total Occupancy | Distance from Subject | Tenant Name(2) | Lease Date/ Term | Lease Area (SF) | Annual Base Rent PSF | Lease Type |
Cottonwood Shopping Center (Subject) Albuquerque, NM | 1996/NAP | Barnes & Noble, Best Buy, Home Life Furniture, Michaels, OfficeMax, Toys ‘R’ Us | 188,887 | 98% | -- | Best Buy | February 2016 / 5 Yrs | 45,750 | $13.00 | NNN |
North Town Plaza Albuquerque, NM | 1978/2003 | Whole Foods Market, HomeGoods | 101,460 | 100% | 9.4 miles | HomeGoods | February 2012 / 10 Yrs | 22,500 | $12.00 | NNN |
Cottonwood Commons Albuquerque, NM | 2007/2013 | Bed Bath & Beyond, Cost Plus, Dick’s Sporting Goods, Gordman’s, Petco | 191,597 | 95% | 0.3 miles | Dick’s Sporting Goods | March 2012 / 10 Yrs | 50,872 | $13.25 | NNN |
Cottonwood Corners Phase III Albuquerque, NM | 1996/NAP | Total Wine, CVS, (shadow Sam’s Club and Kohl’s) | 68,514 | 51% | 0.1 miles | Baillo’s Electronics | February 2012 / 10 Yrs | 33,749 | $12.00 | NNN |
Pavilions at San Mateo Albuquerque, NM | 1997/NAP | Walmart Neighborhood Market, The Shoe Department, Dollar Tree | 78,070 | 100% | 12.4 miles | Walmart Neighborhood Market | July 2013 / 10 Yrs | 32,000 | $5.25 | NNN |
Cottonwood Mall Albuquerque, NM | 1996/NAP | Dillard’s, Macy’s, Sears, JC Penney, Conns | 1,040,000 | 100% | 1.4 miles | Sports Authority | August 2015 / NAV | 38,000 | $13.50 | NNN |
| (1) | Information obtained from the appraisal, third party market research reports and underwritten rent roll. |
| (2) | Represents anchor tenant comparables only. |
The Borrowers.The borrower structure comprises seven tenants-in-common: Gibson-Cottonwood, LLC; Benson-Cottonwood, LLC; Middlemas-Cottonwood, LLC; Speno-Cottonwood, LLC; Lazzarini-Cottonwood, LLC; Hodnefield-Cottonwood, LLC; and Brockhoff-Cottonwood, LLC, each of which is a single purpose entity, and Delaware limited liability company. Legal counsel to the borrowers delivered a non-consolidation opinion in connection with the origination of the Cottonwood Shopping Center Mortgage Loan. The following parties serve as the guarantors of certain nonrecourse carveouts under the Cottonwood Shopping Center Mortgage Loan: G. Drew Gibson, Gibson Community Property Trust, David P. Middlemas, The Middlemas Trust, William T. Benson, Steven G. Speno, David P. Lazzarini, Phyllis A. Lazzarini, Sherri J. Hodnefield, Kimberly L. Faris, and Ron S. Brockhoff. See “Description of the Mortgage Pool — Mortgage Pool Characteristics — Tenancies-in-Common” in the Preliminary Prospectus.
The Sponsors.The majority sponsors, collectively representing 66.6% of the borrowing entities, are G. Drew Gibson and David P. Middlemas. Each have over 35 years of experience in real estate management, development, and investment and have previously served as executives of the Koll Company, a real estate construction, development, and property management company with operations predominantly on the West Coast. The sponsors have been involved in two deeds-in-lieu and one foreclosure between 2010 and 2011. See “Description of the Mortgage Pool — Loan Purpose; Default History; Bankruptcy Issues and Other Proceedings” in the Preliminary Prospectus.
Escrows.The loan documents provide for upfront reserves of $36,312 for real estate taxes. Ongoing monthly reserves are required in an amount equal to $18,156 for taxes; $3,635 for replacement reserves (capped at $87,248); $9,638 for TI/LCs (capped at $462,600) and $29,375 for Office Max (capped at $352,500, which includes any amounts held during a Reserve Tenant Event Period related to Office Max, as defined below) for TI/LCs until Office Max has extended its lease for a period of at least 5 years following the November 30, 2016 lease expiration date. A one-time springing reserve of $127,030 is required to be funded on March 11, 2016 to perform parking lot repairs and cleaning. The loan documents do not require monthly escrows for insurance provided (i) no event of default has occurred and is continuing; (ii) the Cottonwood Shopping Center Property is insured under an acceptable blanket insurance policy and (iii) the borrowers provide the lender with evidence of renewal of the policies and timely proof of payment of the insurance premiums.
Lockbox and Cash Management. Upon the occurrence of a Cash Trap Event Period (as defined below), the borrowers will be required to establish a lender-controlled lockbox account and direct all tenants to deposit all rents directly into such lockbox account. During a Cash Trap Event Period so long as no Major Tenant Event Period exists, all excess funds on deposit in the lockbox account are swept to a lender-controlled subaccount on a monthly basis.
THE INFORMATION IN THIS STRUCTURAL AND COLLATERAL TERM SHEET IS NOT COMPLETE AND MAY BE AMENDED PRIOR TO THE TIME OF SALE. THIS TERM SHEET IS NOT AN OFFER TO SELL THESE SECURITIES AND IT IS NOT A SOLICITATION OF AN OFFER TO BUY THESE SECURITIES IN ANY JURISDICTION WHERE THE OFFER OR SALE IS NOT PERMITTED.
| 100 |
| COTTONWOOD SHOPPING CENTER |
A “Cash Trap Event Period” will commence upon the earlier of (i) the occurrence and continuance of an event of default; (ii) the amortizing debt service coverage ratio being less than 1.20x for two consecutive quarters; or (iii) the occurrence of a Major Tenant Event Period and the borrower not depositing an amount equal to the applicable Major Tenant Reserve Funds Cap (as defined below) within ten days. A Cash Trap Event Period will expire, with regard to clause (i), upon the cure of such event of default; with regard to clause (ii), upon the amortizing debt service coverage ratio being equal to or greater than 1.25x for three consecutive calendar months; or with regard to clause (iii), upon the termination of a Major Tenant Event Period and provided that there is no occurrence and continuance of another Major Tenant Event Period.
A “Major Tenant” shall mean, individually or collectively, Office Max, Barnes & Noble and Toys ‘R’ Us, their respective successors and assigns, and any replacement tenant.
A “Major Tenant Event Period” will commence upon the earlier of (i) a Major Tenant failing to renew or extend its lease the earlier of twelve months prior to the lease expiration date or the renewal notice date for a term of at least five years and at a rental rate reasonably approved by the lender; (ii) a monetary or material non-monetary default by a Major Tenant (iii) the borrower’s granting of any rental rate reduction or material lease modification to any Major Tenant without lender approval; or (iv) a Major Tenant going dark, vacating or otherwise failing to occupy its space or giving notice of its intent to commence any of the foregoing, (v) a Major Tenant filing bankruptcy or similar insolvency proceeding or (vi) a Major Tenant terminates, or gives notice or intent or commences legal proceedings to terminate, its lease. A Major Tenant Event Period will expire, with regard to clause (i), (ii), (iii), (iv), (v), and (vi) upon (a) a Major Tenant Re-Tenanting Event (as defined below) occurring and (b) the reserve funds on deposit are greater than or equal to the applicable Major Tenant Reserve Funds, with regard to clause (i), the lender receiving evidence that the applicable Major Tenant has extended the term of its lease on terms and conditions acceptable to the lender; with regard to clause (ii), upon a cure of said default for two consecutive calendar quarters; with regard to clause (iii), upon receipt of evidence that the rate reduction or modification has been cancelled; with regard to clause (iv), the applicable Major Tenant has resumed operations in the entire space for two consecutive calendar quarters; with regard to (v), upon the bankruptcy or insolvency proceedings being terminated and the lease has been affirmed, and with respect to clause (vi), the applicable lease is in full force for two consecutive calendar quarters.
A “Major Tenant Reserve Funds Cap” is defined as (i) in connection with any Major Tenant Event Period related to Office Max, $352,500, (ii) in connection with any Major Tenant Event Period related to Barnes & Noble, $375,750, or (iii) in connection with any Major Tenant Reserve Period related to Toys ‘R’ Us, $165,000.
A “Major Tenant Re-Tenanting Event” will occur upon (i) the lender receiving reasonably satisfactory evidence that all of the applicable tenant space has been leased to one or more satisfactory replacement tenants, (ii) each replacement tenant has a lease term of at least five years and is open for business and paying full unabated rent, and (iii) all TI/LCs related to the replacement tenant have been paid.
Property Management. The Cottonwood Shopping Center Property is managed by Commercial Real Estate Management LLC, a third party management company.
Assumption.The borrower has a two-time right to transfer the Cottonwood Shopping Center Property, provided that no event of default has occurred and is continuing and certain other conditions are satisfied, including, but not limited to the following: (i) the lender’s reasonable determination that the proposed transferee and guarantor satisfy the lender’s credit review and underwriting standards, taking into consideration transferee’s experience, financial strength and general business standing; (ii) execution of a recourse guaranty and an environmental indemnity by an affiliate of the transferee; and (iii) if requested by the lender, rating agency confirmation from DBRS, KBRA and Moody’s that the transfer will not result in a downgrade, withdrawal or qualification of the respective ratings assigned to the Series 2016-C32 Certificates.
Partial Release. Not permitted.
Real Estate Substitution.Not permitted.
Subordinate and Mezzanine Indebtedness.None.
Ground Lease.None.
Terrorism Insurance.The loan documents require that the “all risk” insurance policy required to be maintained by the borrower provides coverage for terrorism in an amount equal to the full replacement cost of the Cottonwood Shopping Center Property, as well as business interruption insurance covering no less than the 12-month period following the occurrence of a casualty event, together with a six-month extended period of indemnity.
THE INFORMATION IN THIS STRUCTURAL AND COLLATERAL TERM SHEET IS NOT COMPLETE AND MAY BE AMENDED PRIOR TO THE TIME OF SALE. THIS TERM SHEET IS NOT AN OFFER TO SELL THESE SECURITIES AND IT IS NOT A SOLICITATION OF AN OFFER TO BUY THESE SECURITIES IN ANY JURISDICTION WHERE THE OFFER OR SALE IS NOT PERMITTED.
| 101 |
| PRA HEALTH SCIENCES |
THE INFORMATION IN THIS STRUCTURAL AND COLLATERAL TERM SHEET IS NOT COMPLETE AND MAY BE AMENDED PRIOR TO THE TIME OF SALE. THIS TERM SHEET IS NOT AN OFFER TO SELL THESE SECURITIES AND IT IS NOT A SOLICITATION OF AN OFFER TO BUY THESE SECURITIES IN ANY JURISDICTION WHERE THE OFFER OR SALE IS NOT PERMITTED.
| 102 |
| PRA HEALTH SCIENCES |

THE INFORMATION IN THIS STRUCTURAL AND COLLATERAL TERM SHEET IS NOT COMPLETE AND MAY BE AMENDED PRIOR TO THE TIME OF SALE. THIS TERM SHEET IS NOT AN OFFER TO SELL THESE SECURITIES AND IT IS NOT A SOLICITATION OF AN OFFER TO BUY THESE SECURITIES IN ANY JURISDICTION WHERE THE OFFER OR SALE IS NOT PERMITTED.
| 103 |
| No. 10 – PRA Health Sciences | |||||||
| Loan Information | Property Information | ||||||
| Mortgage Loan Seller: | Wells Fargo Bank, National Association | Single Asset/Portfolio: | Single Asset | ||||
| Credit Assessment (DBRS/KBRA/Moody’s): | NR/NR/NR | Property Type: | Office | ||||
| Original Principal Balance: | $21,000,000 | Specific Property Type: | Suburban | ||||
| Cut-off Date Principal Balance: | $21,000,000 | Location: | Lenexa, KS | ||||
| % of Initial Pool Balance: | 2.2% | Size: | 142,679 SF | ||||
| Loan Purpose: | Acquisition | Cut-off Date Principal Balance Per SF: | $147.18 | ||||
| Borrower Name: | AGNL Science, L.L.C | Year Built/Renovated: | 2005/NAP | ||||
| Sponsors: | AG Net Lease III Corp.; AG Net Lease III (SO) Corp. | Title Vesting: | Fee | ||||
| Mortgage Rate: | 4.670% | Property Manager: | Janko Asset Management LLC | ||||
| Note Date: | September 11, 2015 | 4th Most Recent Occupancy (As of): | 100.0% (12/31/2012) | ||||
| Anticipated Repayment Date: | NAP | 3rd Most Recent Occupancy (As of): | 100.0% (12/31/2013) | ||||
| Maturity Date: | September 11, 2025 | 2nd Most Recent Occupancy (As of): | 100.0% (12/31/2014) | ||||
| IO Period: | 36 months | Most Recent Occupancy (As of): | 100.0% (12/31/2015) | ||||
| Loan Term (Original): | 120 months | Current Occupancy (As of): | 100.0% (2/1/2016) | ||||
| Seasoning: | 5 months | ||||||
| Amortization Term (Original): | 360 months | Underwriting and Financial Information: | |||||
| Loan Amortization Type: | Interest-only, Amortizing Balloon | ||||||
| Interest Accrual Method: | Actual/360 | 4th Most Recent NOI(3): | NAV | ||||
| Call Protection: | L(29),GRTR 1% or YM(87),O(4) | 3rd Most Recent NOI(3): | NAV | ||||
| Lockbox Type: | Hard/Upfront Cash Management | 2nd Most Recent NOI(3): | NAV | ||||
| Additional Debt: | Yes(1) | Most Recent NOI(3): | NAV | ||||
| Additional Debt Type: | Future Mezzanine Debt(1) | ||||||
| U/W Revenues: | $3,311,268 | ||||||
| U/W Expenses: | $1,444,338 | ||||||
| U/W NOI: | $1,866,930 | ||||||
| U/W NCF: | $1,714,844 | ||||||
| U/W NOI DSCR: | 1.43x | ||||||
| Escrows and Reserves(2): | U/W NCF DSCR: | 1.32x | |||||
| U/W NOI Debt Yield: | 8.9% | ||||||
| Type: | Initial | Monthly | Cap (If Any) | U/W NCF Debt Yield: | 8.2% | ||
| Taxes | $0 | Springing | NAP | As-Is Appraised Value: | $31,150,000 | ||
| Insurance | $0 | Springing | NAP | As-Is Appraisal Valuation Date: | June 25, 2015 | ||
| Replacement Reserves | $0 | Springing | NAP | Cut-off Date LTV Ratio: | 67.4% | ||
| TI/LC Reserve | $0 | NAP | NAP | LTV Ratio at Maturity or ARD: | 59.2% | ||
| (1) | See “Subordinate and Mezzanine Indebtedness” section. |
| (2) | See “Escrows” section. |
| (3) | See “Cash Flow Analysis” section. |
The Mortgage Loan.The mortgage loan (the “PRA Health Sciences Mortgage Loan”) is evidenced by a singlepromissory note secured by a first mortgage encumbering a suburban office building located in Lenexa, Kansas (the “PRA Health Sciences Property”). The PRA Health Sciences Mortgage Loan was originated on September 11, 2015 by Wells Fargo Bank, National Association. The PRA Health Sciences Mortgage Loan had an original principal balance of $21,000,000, has an outstanding principal balance as of the Cut-off Date of $21,000,000 and accrues interest at an interest rate of 4.670%per annum. The PRA Health Sciences Mortgage Loan had an initial term of 120 months, has a remaining term of 115 months as of the Cut-off Date and requires interest-only payments for the first 36 payments following origination and, thereafter, requires payments of principal and interest based on a 30-year amortization schedule. The PRA Health Sciences Mortgage Loan matures on September 11, 2025.
Following the lockout period, the borrower has the right to prepay the PRA Health Sciences Mortgage Loan in whole, but not in part, on any date before June 11, 2025, provided that the borrower pays the greater of a yield maintenance premium or a prepayment premium equal to 1.0% of the principal amount being prepaid. In addition, the PRA Health Sciences Mortgage Loan is prepayable without penalty on or after June 11, 2025.
THE INFORMATION IN THIS STRUCTURAL AND COLLATERAL TERM SHEET IS NOT COMPLETE AND MAY BE AMENDED PRIOR TO THE TIME OF SALE. THIS TERM SHEET IS NOT AN OFFER TO SELL THESE SECURITIES AND IT IS NOT A SOLICITATION OF AN OFFER TO BUY THESE SECURITIES IN ANY JURISDICTION WHERE THE OFFER OR SALE IS NOT PERMITTED.
| 104 |
| PRA HEALTH SCIENCES |
Sources and Uses
| Sources | Uses | |||||||||
| Original loan amount | $21,000,000 | 66.8 | % | Purchase price | $31,140,000 | 99.1 | % | |||
| Sponsor’s new cash contribution | 10,436,068 | 33.2 | Closing costs | 296,068 | 0.9 | |||||
| Total Sources | $31,436,068 | 100.0 | % | Total Uses | $31,436,068 | 100.0 | % | |||
The Property.The PRA Health Sciences Property is a three-story, class A office building totaling 142,679 square feet and located in Lenexa, Kansas, approximately 18.3 miles south of the Kansas City central business district. Built in 2005, the PRA Health Sciences Property is situated on an 11.5-acre parcel. The PRA Health Sciences Property is 100.0% leased to PRA Health Sciences (“PRA”) and was constructed as a build to suit for the tenant. PRA is a contract research organization that specializes in product development for pharmaceutical and biotechnology companies. Founded in 1976 in Charlottesville, Virginia, PRA has more than 11,000 employees in over 80 countries. PRA (NASDAQ: PRAH) is rated B2 and B+ by Moody’s and S&P, respectively. As of the third quarter of 2015, PRA reported year-to-date revenues of $1.0 billion, an 8.0% increase over the year-to-date revenues as of the third quarter of 2014. The PRA Health Sciences Property houses one of PRA’s primary data and document management facilities, and operations and project management divisions. The PRA Health Sciences Property is also home to a 114-bed clinical research unit, which provides PRA’s clients with services including drug development, site services and clinical trial management. Additionally, the PRA Health Sciences Property is strategically located 2.0 miles northwest of PRA’s only bioanalytical laboratory in the United States. The PRA Health Sciences Property features 681 parking spaces resulting in a parking ratio of 4.8 spaces per 1,000 square feet of rentable area. As of February 1, 2016, the PRA Health Sciences Property is 100.0% leased by PRA.
The following table presents certain information relating to the tenancy at the PRA Health Sciences Property:
Major Tenant
| Tenant Name | Credit Rating (Fitch/ Moody’s/ S&P)(1) | Tenant NRSF | % of NRSF | Annual U/W Base Rent PSF(2) | Annual U/W Base Rent(2) | % of Total Annual U/W Base Rent | Lease Expiration Date |
| Major Tenant | |||||||
| PRA Health Sciences | NR/B2/B+ | 142,679 | 100.0% | $14.70 | $2,097,057 | 100.0% | 12/31/2030(3) |
| Occupied Collateral Total | 142,679 | 100.0% | $14.70 | $2,097,057 | 100.0% | ||
| Vacant Space | 0 | 0.0% | |||||
| Collateral Total | 142,679 | 100.0% | |||||
| (1) | Certain ratings are those of the parent company whether or not the parent guarantees the lease. |
| (2) | PRA’s in-place annual rent is $2,055,938 ($14.41 per square foot). Annual U/W Base Rent PSF and Annual U/W Base Rent are based on the contractual rent increase in January 2017. |
| (3) | PRA has two, five-year lease extension options. |
The following table presents certain information relating to the lease rollover schedule at the PRA Health Sciences Property:
Lease Expiration Schedule(1)
| Year Ending December 31, | No. of Leases Expiring | Expiring NRSF | % of Total NRSF | Cumulative Expiring NRSF | Cumulative % of Total NRSF | Annual U/W Base Rent | % of Total Annual U/W Base Rent | Annual U/W Base Rent PSF |
| MTM | 0 | 0 | 0.0% | 0 | 0.0% | $0 | 0.0% | $0.00 |
| 2016 | 0 | 0 | 0.0% | 0 | 0.0% | $0 | 0.0% | $0.00 |
| 2017 | 0 | 0 | 0.0% | 0 | 0.0% | $0 | 0.0% | $0.00 |
| 2018 | 0 | 0 | 0.0% | 0 | 0.0% | $0 | 0.0% | $0.00 |
| 2019 | 0 | 0 | 0.0% | 0 | 0.0% | $0 | 0.0% | $0.00 |
| 2020 | 0 | 0 | 0.0% | 0 | 0.0% | $0 | 0.0% | $0.00 |
| 2021 | 0 | 0 | 0.0% | 0 | 0.0% | $0 | 0.0% | $0.00 |
| 2022 | 0 | 0 | 0.0% | 0 | 0.0% | $0 | 0.0% | $0.00 |
| 2023 | 0 | 0 | 0.0% | 0 | 0.0% | $0 | 0.0% | $0.00 |
| 2024 | 0 | 0 | 0.0% | 0 | 0.0% | $0 | 0.0% | $0.00 |
| 2025 | 0 | 0 | 0.0% | 0 | 0.0% | $0 | 0.0% | $0.00 |
| 2026 | 0 | 0 | 0.0% | 0 | 0.0% | $0 | 0.0% | $0.00 |
| Thereafter | 1 | 142,679 | 100.0% | 142,679 | 100.0% | $2,097,057 | 100.0% | $14.70 |
| Vacant | 0 | 0 | 0.0% | 142,679 | 100.0% | $0 | 0.0% | $0.00 |
| Total/Weighted Average | 1 | 142,679 | 100.0% | $2,097,057 | 100.0% | $14.70 |
| (1) | Information obtained from the underwritten rent roll. |
THE INFORMATION IN THIS STRUCTURAL AND COLLATERAL TERM SHEET IS NOT COMPLETE AND MAY BE AMENDED PRIOR TO THE TIME OF SALE. THIS TERM SHEET IS NOT AN OFFER TO SELL THESE SECURITIES AND IT IS NOT A SOLICITATION OF AN OFFER TO BUY THESE SECURITIES IN ANY JURISDICTION WHERE THE OFFER OR SALE IS NOT PERMITTED.
| 105 |
| PRA HEALTH SCIENCES |
The following table presents historical occupancy percentages at the PRA Health Sciences Property:
Historical Occupancy
12/31/2012(1) | 12/31/2013(1) | 12/31/2014(1) | 12/31/2015(1) | 2/1/2016(2) | ||||
| 100.0% | 100.0% | 100.0% | 100.0% | 100.0% |
| (1) | Information based on the PRA lease. |
| (2) | Information obtained from the underwritten rent roll. |
Operating History and Underwritten Net Cash Flow. The following table presents certain information relating to the underwritten net cash flow at the PRA Health Sciences Property:
Cash Flow Analysis(1)
| U/W | % of U/W Effective Gross Income | U/W $ per SF | |||
| Base Rent | $2,097,057(2) | 63.3% | $14.70 | ||
| Grossed Up Vacant Space | 0 | 0.0 | 0.00 | ||
| Total Reimbursables | 1,350,520 | 40.8 | 9.47 | ||
| Less Vacancy & Credit Loss | (136,309)(3) | (4.1) | (0.96) | ||
| Effective Gross Income | $3,311,268 | 100.0% | $23.21 | ||
| Total Operating Expenses | $1,444,338 | 43.6% | $10.12 | ||
| Net Operating Income | $1,866,930 | 56.4% | $13.08 | ||
| TI/LC | 130,684 | 3.9 | 0.92 | ||
| Capital Expenditures | 21,402 | 0.6 | 0.15 | ||
| Net Cash Flow | $1,714,844 | 51.8% | $12.02 | ||
| NOI DSCR | 1.43x | ||||
| NCF DSCR | 1.32x | ||||
| NOI DY | 8.9% | ||||
| NCF DY | 8.2% |
| (1) | The PRA Health Sciences Property was acquired in June 2015, therefore no historical information is available. |
| (2) | The U/W Base Rent includes contractual rent increases through January 2017 totaling approximately $41,119. |
| (3) | The underwritten economic vacancy is 6.5%. The PRA Health Sciences Property was 100.0% physically occupied as of February 1, 2016. |
Appraisal. As of the appraisal valuation date of June 25, 2015, the PRA Health Sciences Property had an “as-is” appraised value of $31,150,000.
Environmental Matters. According to a Phase I environmental site assessment dated June 1, 2015, there was no evidence of any recognized environmental conditions at the PRA Health Sciences Property.
Market Overview and Competition.The PRA Health Sciences Property is located in located in Lenexa, Kansas, approximately 18.3 miles southwest of the Kansas City central business district and 6.9 miles southwest of Overland Park. Access to the area is provided by Interstate 435, Interstate 35 and Highway 10, which are available via 95th Street, approximately 0.3 miles north of the PRA Health Sciences Property. According to the appraisal, the area is highly influenced by these thoroughfares which provide the neighborhood with some of the best highway access in the Kansas City Metropolitan Statistical Area (“MSA”). Additionally, the Kansas City International Airport is located approximately 34.1 miles north of the PRA Health Sciences Property. The PRA Health Sciences Property benefits from its proximity to multiple neighborhood amenities including the 18-hole Canyon Farms Golf Club (approximately 2.3 miles northwest of the PRA Health Sciences Property), the nine-hole Falcon Valley Golf Course (approximately 2.3 miles west of the PRA Health Sciences Property) and Oak Park Mall, a 1.6 million square foot regional mall anchored by Nordstrom, Dillard’s, JCPenney and Macy’s (approximately 3.8 miles east of the PRA Health Sciences Property). According to the appraisal, there has been substantial retail, residential, and office development in the neighborhood over the past 10 years, continuing the long term growth trend, through the construction of projects including Renner Ridge Square, the Golf Club of Kansas, and City Center. The 2015 population within a three- and five-mile radius is 52,343 and 174,379, respectively, and the 2015 median household income within the same radii is $74,286 and $69,974, respectively.
According to the appraisal, over the past 10 years, the healthcare industry grew ahead of other sectors in the Kansas City MSA at an average rate of 3.6% annually. Further, there are currently over 240 life sciences companies in Kansas City with the industry employing over 22,000 people. The Kansas City region has a proud history in life sciences that traces its roots to the establishment of regional land grant universities in the 1800s. In 1865, the University of Kansas was established, joining Kansas State University and the University of Missouri as the region’s bastion for life sciences research. According to a third party market research report, PRA Health Sciences Property is located in the Kansas City office market which, as of fourth quarter of 2015, was comprised of 4,369 buildings totaling approximately 115.0 million square feet and reported a vacancy rate of 10.3% and average asking rent of $17.85 per square foot, gross. As of the fourth quarter of 2015, the Northwest Johnson County office submarket contained 246 buildings
THE INFORMATION IN THIS STRUCTURAL AND COLLATERAL TERM SHEET IS NOT COMPLETE AND MAY BE AMENDED PRIOR TO THE TIME OF SALE. THIS TERM SHEET IS NOT AN OFFER TO SELL THESE SECURITIES AND IT IS NOT A SOLICITATION OF AN OFFER TO BUY THESE SECURITIES IN ANY JURISDICTION WHERE THE OFFER OR SALE IS NOT PERMITTED.
| 106 |
| PRA HEALTH SCIENCES |
totaling approximately 4.2 million square feet of office space, a vacancy rate of 9.0% and average asking rent of $20.35 per square foot, gross. As of the fourth quarter of 2015, the Northwest Johnson County the rental rate for class A space within the submarket was approximately $24.32 per square foot, gross.
The following table presents certain information relating to comparable office leases for the PRA Health Sciences Property:
Comparable Leases(1)
| Property Name/Location | Year Built/ Renovated | Stories | Total GLA (SF) | Total Occupancy | Distance from Subject | Tenant Name | Lease Date/Term | Lease Area (SF) | Annual Base Rent PSF | Lease Type |
PRA Health Sciences (Subject) Lenexa, KS | 2005/NAP | 3 | 142,679 | 100% | -- | PRA Health Sciences | January 2014 / 17 Yrs | 142,679 | $14.70 | NNN |
Board of Trade Building Kansas City, KS | 1966/2015 | 6 | 165,714 | 61% | 15.8 miles | Populous | November 2015 / 10 Yrs | 65,000 | $13.75 | NNN |
| Southcreek XVIII Overland Park, KS | 2005/NAP | 4 | 70,054 | 100% | 10.4 miles | Travelers Indemnity | May 2015 / 7.3 Yrs | 70,054 | $11.67 | NNN |
Eco Works I | 2002/NAP | 2 | 80,393 | 100% | 2.7 miles | Grantham College | April 2014 / 10 Yrs | 65,000 | $10.50 | NNN |
| Teva Neuroscience Overland Park, KS | 2013/NAP | 5 | 147,463 | 100% | 8.5 miles | Teva Neuroscience | October 2013 / 15 Yrs | 154,270 | $25.76 | NNN |
Farmers Insurance Building Olathe, KS | 2007/NAP | 2 | 102,035 | 100% | 2.3 miles | Farmers Insurance | October 2013 / 10.5 Yrs | 102,035 | $14.25 | NNN |
| (1) | Information obtained from the appraisal, a third party market research report and underwritten rent roll. |
The Borrower.The borrower is AGNL Science, L.L.C., a Delaware limited liability company and single purpose entity with one independent director. Legal counsel to the borrower delivered a non-consolidation opinion in connection with the origination of the PRA Health Sciences Mortgage Loan. AG Net Lease III Corp. and AG Net Lease III (SO) Corp. are the guarantors of certain nonrecourse carveouts under the PRA Health Sciences Mortgage Loan.
The Sponsors.The sponsors are AG Net Lease III Corp. and AG Net Lease III (SO) Corp., which are each owned and controlled by Angelo, Gordon & Co. (“Angelo Gordon”). Founded in 1988, Angelo Gordon is a privately-held registered investment advisor. Angelo Gordon engages in all aspects of real estate investment and management, including acquisition, financing, disposition, leasing and construction management. The firm has real estate professionals in New York, Los Angeles, London, Hong Kong, Seoul, Tokyo and Shanghai and since 1993 has acquired properties valued at over $13.0 billion and has approximately $27.0 billion under management.
Escrows.The loan documents do not require monthly escrows for real estate taxes provided the following conditions are met: (i)noCash Trap Event Period (as defined below) exists; (ii) PRA makes all payments to the taxing authority in a timely manner; and (iii) PRA’s lease is in full force and effect and is not terminated due to default. The loan documents do not require monthly escrows for insurance provided (i) noCash Trap Event Period exists; (ii) the PRA Health Sciences Property is insured via an acceptable blanket insurance policy; (iii) the borrower provides the lender with evidence of renewal of insurance policies and timely proof of payment of insurance premiums; and (iv) PRA’s lease is in full force and effect and is not terminated due to default. The loan documents do not require monthly escrows in the amount of $1,783 for replacements provided (i) noCash Trap Event Period (as defined below) exists; (ii) PRA’s lease is in full force and effect; and (iii) noMaintenance Trigger Event (as defined below) has occurred and is continuing.
Lockbox and Cash Management.The PRA Health Sciences Mortgage Loan requires a lender-controlled lockbox account, which is already in place, and that the borrower direct the tenant to pay its rents directly into such lockbox account. The loan documents also require that all rents received by the borrower or property manager be deposited into the lockbox account within one business day of receipt. Prior to the occurrence of a Cash Trap Event Period, all excess funds on deposit are distributed to the borrower. During a Cash Trap Event Period, all excess funds are swept to a lender-controlled cash management account. During the occurrence of a Maintenance Trigger Event (as defined below), all excess funds are swept to a subaccount for the payment of any repair, replacement, or other maintenance obligation set forth in the property condition report (the “Replacement Reserve Subaccount”).
A “Cash Trap Event Period” will commence upon the earlier of (i) the occurrence of an event of default; (ii) the amortizing debt service coverage ratio being less than 1.15x on a trailing 12-month basis; or (iii) the occurrence of an PRA Trigger Event (as defined below). A Cash Trap Event Period will end, with regard to clause (i), upon the cure of such event of default; with regard to clause (ii), upon the debt service coverage ratio being equal to or greater than 1.25x for one calendar quarter; and with regard to clause (iii), upon the occurrence of an PRA Trigger Cure Event (as defined below).
A “Maintenance Trigger Event” will commence upon the earlier of the borrower and/or PRA failing to (i) timely complete any repair, replacement, or other maintenance obligation set forth in the property condition report (the “Specified Repairs”); and (ii) provide evidence reasonably acceptable to lender of completion of the Specified Repairs. A Maintenance Trigger Event Period will end, with regard to clause (i) and (ii), when the balance of the Replacement Reserve Subaccount equals the lesser of the amount necessary to complete the applicable Specified Repairs and $285,000.
THE INFORMATION IN THIS STRUCTURAL AND COLLATERAL TERM SHEET IS NOT COMPLETE AND MAY BE AMENDED PRIOR TO THE TIME OF SALE. THIS TERM SHEET IS NOT AN OFFER TO SELL THESE SECURITIES AND IT IS NOT A SOLICITATION OF AN OFFER TO BUY THESE SECURITIES IN ANY JURISDICTION WHERE THE OFFER OR SALE IS NOT PERMITTED.
| 107 |
| PRA HEALTH SCIENCES |
A “PRA Trigger Event” will occur upon the earlier of (i) PRA ceasing to operate, going dark or vacating any portion of the PRA Health Sciences Property; (ii) PRA (or its parent) becoming insolvent or a debtor in any action or proceeding under Creditors Rights Laws; or (iii) the PRA lease being terminated as a result of default.
A “PRA Trigger Cure Event” shall mean, with regard to clause (i) the borrower has delivered evidence reasonably satisfactory to lender that PRA has recommenced operations at the PRA Health Sciences Property; with regard to clause (ii), upon the bankruptcy or insolvency proceeding being terminated, PRA ceasing to be a debtor in any bankruptcy proceeding, and PRA’s lease being reaffirmed or assumed by any entity related to PRA, amongst other things; and with regard to clause (i), (ii) and (iii), upon, but not limited to, the borrower entering into at least one lease with a replacement tenant reasonably satisfactory to lender demising in aggregate the entire PRA space at a net effective rental rate of at least $14.41 per square foot and for a term of at least the term remaining under the PRA lease at the time the PRA replacement lease is entered into.
Property Management. The PRA Health Sciences Property is managed by Janko Asset Management LLC, a third-party management company.
Assumption. The borrower has a two-time right to transfer the PRA Health Sciences Property provided that certain conditions are satisfied, including (i) no event of default has occurred and is continuing; (ii) the lender has reasonably determined that the proposed transferee and guarantor satisfy the lender’s credit review and underwriting standards, taking into consideration transferee experience, financial strength and general business standing; and (iii) if required by lender, receipt confirmation from DBRS, KBRA and Moody’s that such assumption will not result in a downgrade, withdrawal or qualification of the respective ratings assigned to the Series 2016-C32 Certificates.
Right of First Offer.PRA has a right of first offer (“ROFO”) to purchase the PRA Health Sciences Property. The ROFO is not extinguished by a foreclosure of the PRA Health Sciences Property; however, the ROFO does not apply to a foreclosure or deed-in-lieu thereof.
Partial Release. Not permitted.
Real Estate Substitution.Not permitted.
Subordinate and Mezzanine Indebtedness. Provided no event of default has occurred or is continuing, a direct or indirect owner of the borrower is permitted to incur mezzanine financing subject to satisfaction of certain conditions, including but not limited to (i) the equity held by the managing member may not be pledged; (ii) the combined LTV of the PRA Health Sciences Mortgage Loan and the mezzanine loan cannot exceed 70.0%; (iii) the combined debt service coverage ratio and net cash flow debt yield of the PRA Health Sciences Mortgage Loan and the mezzanine loan must be at least 1.25x and 8.5%, respectively; (iv) the execution of an intercreditor agreement; (v) the lender receives rating agency confirmation from DBRS, KBRA, and Moody’s that the mezzanine financing will not result in a downgrade, withdrawal, or qualification of respective ratings assigned to the Series 2016-C32 Certificates and (vi) the mezzanine loan is subordinate to the PRA Health Sciences Mortgage Loan.
Ground Lease. None.
Terrorism Insurance.The loan documents require that the “all risk” insurance policy required to be maintained by the borrower provide coverage for terrorism in an amount equal to the full replacement cost of the PRA Health Sciences Property (provided that the borrower is not required to pay terrorism insurance premiums in excess of two times the premium for all risk and business interruption coverage if the Terrorism Risk Insurance Program Reauthorization Act is no longer in effect), as well as business interruption insurance covering no less than the 12-month period following the occurrence of a casualty event, together with a six-month period of indemnity.
THE INFORMATION IN THIS STRUCTURAL AND COLLATERAL TERM SHEET IS NOT COMPLETE AND MAY BE AMENDED PRIOR TO THE TIME OF SALE. THIS TERM SHEET IS NOT AN OFFER TO SELL THESE SECURITIES AND IT IS NOT A SOLICITATION OF AN OFFER TO BUY THESE SECURITIES IN ANY JURISDICTION WHERE THE OFFER OR SALE IS NOT PERMITTED.
| 108 |
(THIS PAGE INTENTIONALLY LEFT BLANK)
THE INFORMATION IN THIS STRUCTURAL AND COLLATERAL TERM SHEET IS NOT COMPLETE AND MAY BE AMENDED PRIOR TO THE TIME OF SALE. THIS TERM SHEET IS NOT AN OFFER TO SELL THESE SECURITIES AND IT IS NOT A SOLICITATION OF AN OFFER TO BUY THESE SECURITIES IN ANY JURISDICTION WHERE THE OFFER OR SALE IS NOT PERMITTED.
| 109 |
| No. 11 – Orlando Plaza Garage | ||||||||
| Loan Information | Property Information | |||||||
| Mortgage Loan Seller: | Rialto Mortgage Finance, LLC | Single Asset/Portfolio: | Single Asset | |||||
| Credit Assessment (DBRS/KBRA/Moody’s): | NR/NR/NR | Property Type: | Other | |||||
| Original Principal Balance: | $21,000,000 | Specific Property Type: | Parking Garage | |||||
| Cut-off Date Principal Balance: | $20,978,206 | Location: | Orlando, FL | |||||
| % of Initial Pool Balance: | 2.2% | Size: | 1,133 Spaces | |||||
| Loan Purpose(1): | Refinance | Cut-off Date Principal Balance Per Space: | $18,516 | |||||
| Borrower Name: | RP Plaza Property, LLC | Year Built/Renovated: | 2007/NAP | |||||
| Sponsors(2): | A. Stuart Rubin; L & R Investment Company | Title Vesting: | Fee | |||||
| Mortgage Rate: | 5.100% | Property Manager: | Self-managed | |||||
| Note Date: | December 30, 2015 | 4th Most Recent Occupancy(6): | NAV | |||||
| Anticipated Repayment Date: | NAP | 3rd Most Recent Occupancy(6): | NAV | |||||
| Maturity Date: | January 6, 2026 | 2nd Most Recent Occupancy(6): | NAV | |||||
| IO Period: | None | Most Recent Occupancy(6): | NAV | |||||
| Loan Term (Original): | 120 months | Current Occupancy(6): | NAV | |||||
| Seasoning: | 1 month | |||||||
| Amortization Term (Original): | 360 months | Underwriting and Financial Information: | ||||||
| Loan Amortization Type: | Amortizing Balloon | |||||||
| Interest Accrual Method: | Actual/360 | 4th Most Recent NOI (As of): | $1,685,753 (12/31/2012) | |||||
| Call Protection: | L(25),D(91),O(4) | 3rd Most Recent NOI (As of): | $1,600,617 (12/31/2013) | |||||
| Lockbox Type: | None | 2nd Most Recent NOI (As of)(7): | $1,604,478 (12/31/2014) | |||||
| Additional Debt(3): | None | Most Recent NOI (As of)(7): | $1,888,679 (TTM 11/30/2015) | |||||
| Additional Debt Type(3): | NAP | |||||||
| U/W Revenues: | $3,060,832 | |||||||
| U/W Expenses: | $1,177,332 | |||||||
| U/W NOI: | $1,883,500 | |||||||
| U/W NCF: | $1,870,890 | |||||||
| U/W NOI DSCR: | 1.38x | |||||||
| Escrows and Reserves: | U/W NCF DSCR: | 1.37x | ||||||
| U/W NOI Debt Yield: | 9.0% | |||||||
| Type: | Initial | Monthly | Cap (If Any) | U/W NCF Debt Yield: | 8.9% | |||
| Taxes | $0 | $21,166 | NAP | As-Is Appraised Value: | $33,400,000 | |||
| Insurance(4) | $0 | Springing | NAP | As-Is Appraisal Valuation Date: | November 10, 2015 | |||
| Replacement Reserves(5) | $0 | Springing | NAP | Cut-off Date LTV Ratio: | 62.8% | |||
| TI/LC Reserve | $0 | $0 | NAP | LTV Ratio at Maturity or ARD: | 51.9% | |||
| (1) | In connection with the prior loan secured by the Orlando Plaza Garage Property (which prior loan was purchased by the lender), the borrower transferred the property to an affiliate (LR Plaza Garage LLC), also a special purpose entity, and, in connection with the transfer, the borrower became the holder of a subordinate wrap-around note secured by a subordinate mortgage on the Orlando Plaza Garage Property. For additional information, see “Description of the Mortgage Pool–Certain Terms of the Mortgage Loans–Single Purpose Entity Covenants” in the Preliminary Prospectus. |
| (2) | Affiliates of A. Stuart Rubin were involved in five foreclosures and three loan modifications. See “Description of the Mortgage Pool – Default History, Bankruptcy Issues and Other Proceedings” in the Preliminary Prospectus. |
| (3) | The borrower is the holder of a $1,800,000 subordinate note secured by a subordinate mortgage. See “Description of the Mortgage Pool—Certain Terms of the Mortgage Loans—Single Purpose Entity Covenants” in the Preliminary Prospectus. |
| (4) | Ongoing monthly reserves for insurance are not required as long as the Orlando Plaza Garage Property is insured under an acceptable blanket policy. |
| (5) | Ongoing monthly replacement reserves will be required at any time the lender has obtained a property condition report indicating maintenance of the Orlando Plaza Property is necessary. |
| (6) | See “Historical Occupancy” section. |
| (7) | See “Cash Flow Analysis” section. |
The Orlando Plaza Garage mortgage loan is evidenced by a single promissory note that is secured by six levels of a nine-level parking garage structure containing 1,133 parking spaces located in the Orlando, Florida central business district (the “Orlando Plaza Garage Property”). Built in 2007, the Orlando Plaza Garage Property is situated on a 0.7-acre parcel and consists of parking and storage condominium units situated on floors 2-7 of a nine-level parking garage structure located within a mixed use project known as “The Plaza.” The Plaza consists of two retail condominium units (the “Retail Unit” and “Theater Unit”) collectively encompassing 101,330 square feet, Class A office condominiums totaling 400,000 square feet located on floors 8-16 of the North Tower and floors 8-21 of the South Tower, and the Solaire at the Plaza (East Tower), a 29-story residential condominium containing 306 units. The Retail Unit is located in the open courtyard area of the ground floor section of The Plaza and contains 44,330 square feet of retail space while the Theater Unit is located on the second floor and contains a 57,000 square foot 12-screen movie theater operated by Cobb Theatres.
THE INFORMATION IN THIS STRUCTURAL AND COLLATERAL TERM SHEET IS NOT COMPLETE AND MAY BE AMENDED PRIOR TO THE TIME OF SALE. THIS TERM SHEET IS NOT AN OFFER TO SELL THESE SECURITIES AND IT IS NOT A SOLICITATION OF AN OFFER TO BUY THESE SECURITIES IN ANY JURISDICTION WHERE THE OFFER OR SALE IS NOT PERMITTED.
| 110 |
ORLANDO PLAZA GARAGE
The Orlando Plaza Garage Property is subject to multiple easement agreements that currently reserve the use of 418 of the total parking spaces to third party easement owners (generally office condo tenants) between the hours of 6:00 a.m. to 6:00 p.m. during Monday through Friday each week. The easement spaces are available to the parking operator (an affiliate of the borrower) after 6:00 p.m. each weekday and every weekend. According to the easement agreements, the owner of each parking space easement is responsible for 50.0% of all operating expenses or charges attributable to the applicable parking space and is billed on a monthly basis by the borrower. Parking revenues for the Orlando Plaza Garage Property consist of monthly parking fees, daily transient parking fees and validation fee income. The monthly parking rates vary by customer and range from $53 per month for easement customers to the monthly posted rate of $390 per month for reserved spaces. Parking customers consist of retail and office tenant employees and employees and guests of the nearby Grand Bohemian Hotel, which maintains 125 unreserved spaces at a discounted rate of $83.90 per month. Transient parking and validation income is derived from hourly parking fees from office and retail visitors to The Plaza as well as adjacent office buildings and downtown visitors. In addition, the parking facilities at the Orlando Plaza Garage Property are used for special event parking for events held at nearby facilities, including the Doctor Phillips Center for the Performing Arts and Amway Center.
Sources and Uses
| Sources | Uses | |||||||
| Original loan amount | $21,000,000 | 100.0% | Loan payoff | $19,176,104 | 91.3% | |||
| Closing costs | 847,008 | 4.0 | ||||||
| Return of equity | 976,888 | 4.7 | ||||||
| Total Sources | $21,000,000 | 100.0% | Total Uses | $21,000,000 | 100.0% |
The following table presents historical occupancy percentages at the Orlando Plaza Garage Property:
Historical Occupancy
12/31/2011(1) | 12/31/2012(1) | 12/31/2013(1) | 12/31/2014(1) | 12/31/2015(1) |
| NAV | NAV | NAV | NAV | NAV |
| (1) | Due to the nature of the property, occupancy is not tracked at the Orlando Plaza Garage Property. |
Operating History and Underwritten Net Cash Flow. The following table presents certain information relating to the historical operating performance and underwritten net cash flow at the Orlando Plaza Garage Property:
Cash Flow Analysis
| 2012 | 2013 | 2014(1) | TTM 11/30/2015(1) | U/W | % of U/W Effective Gross Income | U/W $ per Space | |
| Base Rent | $2,636,747 | $2,755,572 | $2,728,142 | $3,029,884 | $3,029,884 | 99.0% | $2,674 |
| Grossed Up Vacant Space | 0 | 0 | 0 | 0 | 0 | 0.0 | 0 |
| Other Income(2) | 23,272 | 13,735 | 23,069 | 30,948 | 30,948 | 1.0 | 27 |
| Less Vacancy & Credit Loss | 0 | 0 | 0 | 0 | 0 | 0.0 | 0 |
| Effective Gross Income | $2,660,018 | $2,769,307 | $2,751,211 | $3,060,832 | $3,060,832 | 100.0% | $2,702 |
| Total Operating Expenses | $974,265 | $1,168,690 | $1,146,733 | $1,172,153 | $1,177,332 | 38.5% | $1,039 |
|
|
|
|
|
|
| |
| Net Operating Income | $1,685,753 | $1,600,617 | $1,604,478 | $1,888,679 | $1,883,500 | 61.5% | $1,662 |
| Capital Expenditures | 0 | 0 | 0 | 0 | 12,610 | 0.4 | 11 |
| Net Cash Flow | $1,685,753 | $1,600,617 | $1,604,478 | $1,888,679 | $1,870,890 | 61.1% | $1,651 |
| NOI DSCR | 1.23x | 1.17x | 1.17x | 1.38x | 1.38x | ||
| NCF DSCR | 1.23x | 1.17x | 1.17x | 1.38x | 1.37x | ||
| NOI DY | 8.0% | 7.6% | 7.6% | 9.0% | 9.0% | ||
| NCF DY | 8.0% | 7.6% | 7.6% | 9.0% | 8.9% |
| (1) | The sponsors have increased revenues at the Orlando Plaza Garage Property since assuming management responsibilities in July 2014. |
| (2) | Other income includes key card, storage unit rental and miscellaneous revenue. |
THE INFORMATION IN THIS STRUCTURAL AND COLLATERAL TERM SHEET IS NOT COMPLETE AND MAY BE AMENDED PRIOR TO THE TIME OF SALE. THIS TERM SHEET IS NOT AN OFFER TO SELL THESE SECURITIES AND IT IS NOT A SOLICITATION OF AN OFFER TO BUY THESE SECURITIES IN ANY JURISDICTION WHERE THE OFFER OR SALE IS NOT PERMITTED.
| 111 |
ORLANDO PLAZA GARAGE
The following table presents certain information relating to comparable parking garages for the Orlando Plaza Garage Property:
Competitive Set(1)
Monthly Rates | ||||||||
| Property Name/Location | Type | Parking Operator | Total Spaces | Incremental Rates | Monthly Rates | High | Low | Average |
The Orlando Plaza Garage (Subject) 189 S. Orange Avenue | Garage | The L&R Group | 1,133 | $8.00 early bird $2.00 0 - 20 min $6.00 21 - 60 min $9.00 61 min - 1 1/2 hours $10.00 1 1/2 - 2 hours $12.00 2 - 4 hours $15.00 4 - 12 hours $30.00 12 - 24 hours | $170.00 12 hour-Limited Unreserved ($330.00 Reserved) $200.00 24 hour-Unlimited Unreserved ($360.00 Reserved) | $200.00 | $170.00 | $185.00 |
Capital I & II 302 E. Pine Street | Garage | Standard Parking | 1,533 | $3.00 per hour $15.00 Daily Max $5.00 Event | $95.00 Unlimited | $95.00 | $95.00 | $95.00 |
SunTrust Center 25 W. South Street | Garage | Standard Parking | 1,292 | $4.00 1st hour $3.00 each additional $17.00 Daily Max $10.00 Special Event | $133.13 Unlimited (includes tax) | $133.13 | $133.13 | $133.13 |
CNL/City Commons 460 Boone Avenue | Garage | Lanier Parking | 1,667 | $1.00 per half hour $2.00 per hour $12.00 Daily Max $10.00 after 6pm | $85.00-$95.00 Unreserved Reserved | $133.00 | $85.00 | $109.00 |
| (1) | Information obtained from the appraisal. |
THE INFORMATION IN THIS STRUCTURAL AND COLLATERAL TERM SHEET IS NOT COMPLETE AND MAY BE AMENDED PRIOR TO THE TIME OF SALE. THIS TERM SHEET IS NOT AN OFFER TO SELL THESE SECURITIES AND IT IS NOT A SOLICITATION OF AN OFFER TO BUY THESE SECURITIES IN ANY JURISDICTION WHERE THE OFFER OR SALE IS NOT PERMITTED.
| 112 |
(THIS PAGE INTENTIONALLY LEFT BLANK)
THE INFORMATION IN THIS STRUCTURAL AND COLLATERAL TERM SHEET IS NOT COMPLETE AND MAY BE AMENDED PRIOR TO THE TIME OF SALE. THIS TERM SHEET IS NOT AN OFFER TO SELL THESE SECURITIES AND IT IS NOT A SOLICITATION OF AN OFFER TO BUY THESE SECURITIES IN ANY JURISDICTION WHERE THE OFFER OR SALE IS NOT PERMITTED.
| 113 |
| No. 12 – Northline Industrial Center | ||||||
| Loan Information | Property Information | |||||
| Mortgage Loan Seller: | Wells Fargo Bank, National Association | Single Asset/Portfolio: | Single Asset | |||
| Credit Assessment (DBRS/KBRA/Moody’s): | NR/NR/NR | Property Type: | Industrial | |||
| Original Principal Balance: | $20,000,000 | Specific Property Type: | Warehouse | |||
| Cut-off Date Principal Balance: | $20,000,000 | Location: | Romulus, MI | |||
| % of Initial Pool Balance: | 2.1% | Size: | 1,089,312 SF | |||
| Loan Purpose: | Acquisition | Cut-off Date Principal Balance Per SF: | $18.36 | |||
| Borrower Names: | Romulus Huron River Drive LLC; Holdings Romulus, LLC | Year Built/Renovated: | 1952/2000 | |||
| Sponsors: | Christopher Semarjian; Stuart Lichter | Title Vesting: | Fee | |||
| Mortgage Rate: | 4.550% | Property Manager: | Self-managed | |||
| Note Date: | September 16, 2015 | 4th Most Recent Occupancy(1): | NAV | |||
| Anticipated Repayment Date: | NAP | 3rd Most Recent Occupancy (As of): | 62.6% (12/31/2012) | |||
| Maturity Date: | October 11, 2020 | 2nd Most Recent Occupancy (As of): | 62.6% (12/31/2013) | |||
| IO Period: | 12 months | Most Recent Occupancy (As of)(1): | 94.5% (12/31/2014) | |||
| Loan Term (Original): | 60 months | Current Occupancy (As of): | 94.5% (10/9/2015) | |||
| Seasoning: | 4 months | |||||
| Amortization Term (Original): | 360 months | Underwriting and Financial Information: | ||||
| Loan Amortization Type: | Interest-only, Amortizing Balloon | |||||
| Interest Accrual Method: | Actual/360 | 4th Most Recent NOI: | NAV | |||
| Call Protection: | L(24),GRTR 1% or YM(32),O(4) | 3rd Most Recent NOI (As of)(2): | $1,345,730 (12/31/2012) | |||
| Lockbox Type: | Springing | 2nd Most Recent NOI (As of)(2): | $1,990,928 (12/31/2013) | |||
| Additional Debt: | None | Most Recent NOI (As of)(2): | $2,439,747 (12/31/2014) | |||
| Additional Debt Type: | NAP | |||||
| U/W Revenues: | $4,581,404 | |||||
| U/W Expenses: | $1,846,917 | |||||
| U/W NOI: | $2,734,487 | |||||
| U/W NCF: | $2,208,130 | |||||
| Escrows and Reserves: | U/W NOI DSCR: | 2.24x | ||||
| U/W NCF DSCR: | 1.81x | |||||
| Type: | Initial | Monthly | Cap (If Any) | U/W NOI Debt Yield: | 13.7% | |
| Taxes | $36,011 | $32,647 | NAP | U/W NCF Debt Yield: | 11.0% | |
| Insurance | $30,777 | $4,396 | NAP | As-Is Appraised Value: | $27,300,000 | |
| Replacement Reserves | $0 | $26,325 | $750,000 | As-Is Appraisal Valuation Date: | July 28, 2015 | |
| TI/LC Reserve | $0 | $20,833 | $750,000 | Cut-off Date LTV Ratio: | 73.3% | |
| Environmental Reserve | $8,000 | $0 | NAP | LTV Ratio at Maturity or ARD: | 68.4% | |
| (1) | See “Historical Occupancy” section. |
| (2) | See “Cash Flow Analysis” section. |
The Northline Industrial Center mortgage loan is evidenced by a single promissory note that is secured by a first mortgage encumbering the borrower’s fee interest in an industrial warehouse facility comprising 1,089,312 square feet located in Romulus, Michigan (the “Northline Industrial Center Property”), approximately 24.3 miles southwest of the Detroit central business district. The Northline Industrial Center Property is comprised of two, one-story buildings containing 12 dock-high doors, 27 drive-in doors and an indoor rail service from CSX Corporation and Norfolk Southern. WF Whelan, Home Depot, and Renaissance Global, which use the space primarily as warehouse and distribution centers, occupy the Northline Industrial Center Property. The Northline Industrial Center Property is located 1.3 miles southeast of Interstate 94 and 4.6 miles west of the Detroit Metropolitan Wayne County Airport. The 2014 population within a three- and five-mile radius of the Northline Industrial Center Property was 21,215 and 62,988, respectively, and the 2014 average household income within the same radii was $61,560 and $61,525, respectively. As of October 9, 2015, the Northline Industrial Center Property was 94.5% occupied by three tenants.
THE INFORMATION IN THIS STRUCTURAL AND COLLATERAL TERM SHEET IS NOT COMPLETE AND MAY BE AMENDED PRIOR TO THE TIME OF SALE. THIS TERM SHEET IS NOT AN OFFER TO SELL THESE SECURITIES AND IT IS NOT A SOLICITATION OF AN OFFER TO BUY THESE SECURITIES IN ANY JURISDICTION WHERE THE OFFER OR SALE IS NOT PERMITTED.
| 114 |
NORTHLINE INDUSTRIAL CENTER
Sources and Uses
| Sources | Uses | |||||||
| Original loan amount | $20,000,000 | 83.2% | Purchase price | $23,250,000 | 96.7% | |||
| Sponsor’s new cash contribution | 4,048,931 | 16.8 | Reserves | 74,788 | 0.3 | |||
| Closing costs | 724,143 | 3.0 | ||||||
| Total Sources | $24,048,931 | 100.0% | Total Uses | $24,048,931 | 100.0% |
The following table presents certain information relating to the tenant at the Northline Industrial Center Property:
Major Tenants
| Tenant Name | Credit Rating (Fitch/Moody’s/ S&P)(1) | Tenant NRSF | % of NRSF | Annual U/W Base Rent PSF | Annual U/W Base Rent | % of Total Annual U/W Base Rent | Lease Expiration Date |
| Major Tenants | |||||||
| WF Whelan | NR/NR/NR | 347,532 | 31.9% | $4.25 | $1,477,011 | 36.9% | 10/02/2019(2) |
| Home Depot | A/A2/A | 285,400 | 26.2% | $4.65 | $1,327,110 | 33.2% | 1/31/2025(3) |
| Renaissance Global | NR/NR/NR | 396,090 | 36.4% | $3.01 | $1,193,752 | 29.9% | Various(4) |
| Total Major Tenants | 1,029,022 | 94.5% | $3.89 | $3,997,873 | 100.0% | ||
| Occupied Collateral Total | 1,029,022 | 94.5% | $3.89 | $3,997,873 | 100.0% | ||
| Vacant Space | 60,290 | 5.5% | |||||
| Collateral Total | 1,089,312 | 100.0% | |||||
| (1) | Certain ratings are those of the parent company whether or not the parent company guarantees the lease. |
| (2) | WF Whelan has two, three-year lease renewal options. |
| (3) | Home Depot has one, five-year lease renewal option. |
| (4) | Renaissance Global has two leases at the Northline Industrial Center Property: one expiring on September 30, 2016 (89,120 square feet comprising 8.2% of net rentable area) and another January 31, 2017 (306,970 square feet comprising 28.2% of net rentable area). |
The following table presents certain information relating to the lease rollover schedule at the Northline Industrial Center Property:
Lease Expiration Schedule(1)
| Year Ending December 31, | No. of Leases Expiring | Expiring NRSF | % of Total NRSF | Cumulative Expiring NRSF | Cumulative % of Total NRSF | Annual U/W Base Rent | % of Total Annual U/W Base Rent | Annual U/W Base Rent PSF |
| MTM | 0 | 0 | 0.0% | 0 | 0.0% | $0 | 0.0% | $0.00 |
| 2016 | 1 | 89,120 | 8.2% | 89,120 | 8.2% | $269,142 | 6.7% | $3.02 |
| 2017 | 1 | 306,970 | 28.2% | 396,090 | 36.4% | $924,609 | 23.1% | $3.01 |
| 2018 | 0 | 0 | 0.0% | 396,090 | 36.4% | $0 | 0.0% | $0.00 |
| 2019 | 1 | 347,532 | 31.9% | 743,622 | 68.3% | $1,477,011 | 36.9% | $4.25 |
| 2020 | 0 | 0 | 0.0% | 743,622 | 68.3% | $0 | 0.0% | $0.00 |
| 2021 | 0 | 0 | 0.0% | 743,622 | 68.3% | $0 | 0.0% | $0.00 |
| 2022 | 0 | 0 | 0.0% | 743,622 | 68.3% | $0 | 0.0% | $0.00 |
| 2023 | 0 | 0 | 0.0% | 743,622 | 68.3% | $0 | 0.0% | $0.00 |
| 2024 | 0 | 0 | 0.0% | 743,622 | 68.3% | $0 | 0.0% | $0.00 |
| 2025 | 1 | 285,400 | 26.2% | 1,029,022 | 94.5% | $1,327,110 | 33.2% | $4.65 |
| 2026 | 0 | 0 | 0.0% | 1,029,022 | 94.5% | $0 | 0.0% | $0.00 |
| Thereafter | 0 | 0 | 0.0% | 1,029,022 | 94.5% | $0 | 0.0% | $0.00 |
| Vacant | 0 | 60,290 | 5.5% | 1,089,312 | 100.0% | $0 | 0.0% | $0.00 |
| Total/Weighted Average | 4 | 1,089,312 | 100.0% | $3,997,873 | 100.0% | $3.89 |
| (1) | Information obtained from the underwritten rent roll. |
| (2) | Weighted Average Annual U/W Base Rent PSF excludes vacant space. |
THE INFORMATION IN THIS STRUCTURAL AND COLLATERAL TERM SHEET IS NOT COMPLETE AND MAY BE AMENDED PRIOR TO THE TIME OF SALE. THIS TERM SHEET IS NOT AN OFFER TO SELL THESE SECURITIES AND IT IS NOT A SOLICITATION OF AN OFFER TO BUY THESE SECURITIES IN ANY JURISDICTION WHERE THE OFFER OR SALE IS NOT PERMITTED.
| 115 |
NORTHLINE INDUSTRIAL CENTER
The following table presents historical occupancy percentages at the Northline Industrial Center Property:
Historical Occupancy
12/31/2011(1) | 12/31/2012(2) | 12/31/2013(2) | 12/31/2014(2)(3) | 10/9/2015(4) |
| NAV | 62.6% | 62.6% | 94.5% | 94.5% |
| (1) | Historical occupancy information prior to 2012 is not available. |
| (2) | Information obtained from the borrower. |
| (3) | The increase in occupancy between 2013 and 2014 was due to WF Whelan taking occupancy on October 1, 2014. |
| (4) | Information obtained from the underwritten rent roll. |
Operating History and Underwritten Net Cash Flow. The following table presents certain information relating to the historical operating performance and the underwritten net cash flow at the Northline Industrial Center Property:
Cash Flow Analysis
| 2012 | 2013 | 2014 | U/W | % of U/W Effective Gross Income | U/W $ per SF | |
| Base Rent | $2,559,355 | $2,889,619 | $3,394,249 | $3,997,873 | 87.3% | $3.67 |
| Grossed Up Vacant Space | 0 | 0 | 0 | 241,160 | 5.3 | 0.22 |
| Total Reimbursables | 154,403 | 208,884 | 408,220 | 597,379 | 13.0 | 0.55 |
| Other Income | 161,651 | 125,488 | 22,550 | 34,550 | 0.8 | 0.03 |
| Parking Income | 98,648 | 111,140 | 129,586 | 75,000 | 1.6 | 0.07 |
| Less Vacancy & Credit Loss | 0 | 0 | 0 | (364,557)(1) | (8.0) | (0.33) |
| Effective Gross Income | $2,974,057 | $3,335,131 | $3,954,605 | $4,581,404 | 100% | $4.21 |
| Total Operating Expenses | $1,628,327 | $1,344,203 | $1,514,858 | $1,846,917 | 40.3% | $1.70 |
|
|
|
|
|
| |
| Net Operating Income | $1,345,730 | $1,990,928 | $2,439,747 | $2,734,487 | 59.7% | $2.51 |
| TI/LC | 0 | 0 | 0 | 210,457 | 4.6 | 0.19 |
| Capital Expenditures | 0 | 0 | 0 | 315,900 | 6.9 | 0.29 |
| Net Cash Flow | $1,345,730(2) | $1,990,928(2) | $2,439,747(3) | $2,208,130 | 48.2% | $2.03 |
| NOI DSCR | 1.10x | 1.63x | 1.99x | 2.24x | ||
| NCF DSCR | 1.10x | 1.63x | 1.99x | 1.81x | ||
| NOI DY | 6.7% | 10.0% | 12.2% | 13.7% | ||
| NCF DY | 6.7% | 10.0% | 12.2% | 11.0% |
| (1) | The underwritten economic vacancy is 8.6%. The Northline Industrial Center Property was 94.5% physically occupied as of October 9, 2015. |
| (2) | The increase in net cash flow between 2012 and 2013 was due to Renaissance Global taking occupancy and commencing rent payments on July 1, 2012. |
| (3) | The increase in net cash flow between 2013 and 2014 was due to WF Whelan taking occupancy and commencing rent payments on October 1, 2014. |
The following table presents certain information relating to some comparable industrial leases for the Northline Industrial Center Property:
Comparable Leases(1)
| Property Name/Location | Year Built/ Renovated | Property Sub-Type | Total SF | Occupancy | Distance to Subject | Clear Height (ft) | Dock Doors | Rent PSF | Lease Type |
Northline Industrial Center (Subject) Romulus, MI | 1952/2000 | Warehouse | 1,089,312 | 94.5% | -- | 40 | 12 | $3.89 | NNN |
Metro Commerce Center Wayne, MI | 1968/NAP | Warehouse | 530,544 | 98.1% | 7.4 miles | 28 | 44 | $4.35 | Modified Gross |
Van Buren Commerce Center I Van Buren Township, MI | 2001/NAP | Warehouse | 199,920 | 100.0% | 4.9 miles | 28 | 8 | $3.50 | NNN |
Romulus Business Center - 2 Romulus, MI | 1990/NAP | Warehouse | 422,604 | 90.6% | 5.5 miles | 30 | 35 | $2.75 | NNN |
Romulus Business Center - 1 Romulus, MI | 1979/2007 | Warehouse | 915,000 | 37.0% | 5.6 miles | 20 | 54 | $3.50 | NNN |
Industrial Warehouse Romulus, MI | 1998/NAP | Warehouse | 268,800 | 0% | 4.3 miles | 24 | 23 | $3.50 | NNN |
Industrial Warehouse Livonia, MI | 1997/NAP | Warehouse | 145,232 | 100% | 13.8 miles | 30 | 17 | $4.50 | NNN |
| (1) | Information obtained from the appraisal and underwritten rent roll. |
THE INFORMATION IN THIS STRUCTURAL AND COLLATERAL TERM SHEET IS NOT COMPLETE AND MAY BE AMENDED PRIOR TO THE TIME OF SALE. THIS TERM SHEET IS NOT AN OFFER TO SELL THESE SECURITIES AND IT IS NOT A SOLICITATION OF AN OFFER TO BUY THESE SECURITIES IN ANY JURISDICTION WHERE THE OFFER OR SALE IS NOT PERMITTED.
| 116 |
(THIS PAGE INTENTIONALLY LEFT BLANK)
THE INFORMATION IN THIS STRUCTURAL AND COLLATERAL TERM SHEET IS NOT COMPLETE AND MAY BE AMENDED PRIOR TO THE TIME OF SALE. THIS TERM SHEET IS NOT AN OFFER TO SELL THESE SECURITIES AND IT IS NOT A SOLICITATION OF AN OFFER TO BUY THESE SECURITIES IN ANY JURISDICTION WHERE THE OFFER OR SALE IS NOT PERMITTED.
| 117 |
| No. 13 Wilshire Plaza | |||||||
| Loan Information | Property Information | ||||||
| Mortgage Loan Seller: | Basis Real Estate Capital II, LLC | Single Asset/Portfolio: | Single Asset | ||||
Credit Assessment (DBRS/KBRA/Moody’s): | NR/NR/NR | Property Type: | Retail | ||||
| Original Principal Balance: | $19,300,000 | Specific Property Type: | Anchored | ||||
| Cut-off Date Principal Balance: | $19,280,207 | Location: | Metairie, LA | ||||
| % of Initial Pool Balance: | 2.0% | Size: | 121,709 SF | ||||
| Loan Purpose: | Refinance | Cut-off Date Principal Balance Per SF: | $158.41 | ||||
| Borrower Name: | Wilshire Plaza Investors, LLC | Year Built/Renovated: | 1968/2015 | ||||
| Sponsor: | Victory Real Estate Investments, LLC | Title Vesting: | Fee | ||||
| Mortgage Rate: | 5.150% | Property Manager: | Self-managed | ||||
| Note Date: | December 24, 2015 | 4thMost Recent Occupancy(4): | NAV | ||||
| Anticipated Repayment Date: | NAP | 3rdMost Recent Occupancy (As of): | 87.0% (12/31/2012) | ||||
| Maturity Date: | January 1, 2026 | 2ndMost Recent Occupancy (As of): | 94.3% (12/31/2013) | ||||
| IO Period: | None | Most Recent Occupancy (As of): | 80.6% (12/31/2014) | ||||
| Loan Term (Original): | 120 months | Current Occupancy (As of)(4): | 94.6% (11/18/2015) | ||||
| Seasoning: | 1 month | ||||||
| Amortization Term (Original): | 360 months | Underwriting and Financial Information: | |||||
| Loan Amortization Type: | Amortizing Balloon | ||||||
| Interest Accrual Method: | Actual/360 | 4thMost Recent NOI (As of): | $1,191,396 (12/31/2012) | ||||
| Call Protection: | L(25),GRTR 1% or YM(92),O(3) | 3rdMost Recent NOI (As of): | $1,337,501 (12/31/2013) | ||||
| Lockbox Type: | Springing | 2ndMost Recent NOI (As of): | $1,346,939 (12/31/2014) | ||||
| Additional Debt: | None | Most Recent NOI (As of)(5): | $1,370,639 (TTM 10/31/2015) | ||||
| Additional Debt Type: | NAP | ||||||
| U/W Revenues: | $2,179,840 | ||||||
| U/W Expenses: | $487,296 | ||||||
| Escrows and Reserves: | U/W NOI(5): | $1,692,545 | |||||
| U/W NCF: | $1,583,923 | ||||||
| Type: | Initial | Monthly | Cap (If Any) | U/W NOI DSCR | 1.34x | ||
| Taxes | $37,166 | $18,583 | NAP | U/W NCF DSCR: | 1.25x | ||
| Insurance | $15,720 | $7,860 | NAP | U/W NOI Debt Yield: | 8.8% | ||
| Replacement Reserve | $0 | $1,519 | NAP | U/W NCF Debt Yield: | 8.2% | ||
| TI/LC Reserve(1) | $0 | $7,520 | $200,000 | As-Is Appraised Value: | $26,900,000 | ||
| Deferred Maintenance | $3,000 | $0 | NAP | As-Is Appraisal Valuation Date: | October 20, 2015 | ||
| Tenant Specific TI/LC(2) | $404,118 | $0 | NAP | Cut-off Date LTV Ratio: | 71.7% | ||
| Anchor Tenant Rollover(3) | $0 | Springing | NAP | LTV Ratio at Maturity or ARD: | 59.3% | ||
| (1) | The TI/LC reserve is capped at $200,000 as long as (i) no event of default has occurred and is continuing and (ii) the debt service coverage ratio is equal to or greater than 1.15x. |
| (2) | The Tenant Specific TI/LC reserve of $404,118 represents three years of base rent and recoveries and estimated TI/LC costs related to three suites consisting of 6,600 square feet. A letter of intent to lease this 6,600 square foot space has been signed with Zoo Health Club. The loan guarantor has signed a five-year master lease for this space at a rental rate of $14.75 per square foot ($97,350 per year) ending on the earlier of (i) November 30, 2020, or (ii) the date Zoo Health Club has executed a lease for a term expiring no earlier than November 30, 2020, or (iii) the date the borrower has leased the premises to one or more bona fide third party replacement tenants acceptable to the lender on a lease expiring no earlier than November 30, 2020. |
| (3) | Anchor Tenant Rollover reserve springs upon an Anchor Tenant Trigger Event, which is defined as: Big Lots, Fresh Market, and/or Gordon’s of Metairie (a) files for bankruptcy, (b) provides notice of its intent to terminate its lease early or terminates the lease, (c) provides notice of its intent to go dark or actually goes dark, (d) defaults under the terms of its lease beyond applicable notice and cure periods, (e) fails to renew at least six months prior to the scheduled lease renewal date, or (f) defaults under its lease. |
| (4) | See “Historical Occupancy” section. |
| (5) | See “Cash Flow Analysis” section. |
The Wilshire Plaza mortgage loan is evidenced by a single promissory note that is secured by a first mortgage encumbering a 121,709 square foot, anchored retail center located in Metairie, Louisiana, (the “Wilshire Plaza Property”), which is located approximately 6.1 miles north of New Orleans, Louisiana. Constructed in 1968 and last renovated in 2015, the Wilshire Plaza Property is situated on a 7.4-acre site and is anchored by Big Lot’s, Gordon’s of Metairie and Fresh Market. The Wilshire Plaza Property features 548 surface parking spaces resulting in a parking ratio of 4.5 spaces per 1,000 square feet of rentable area. The estimated 2015 population within a one-, three- and five-mile radius of the Wilshire Plaza Property was 19,919, 113,237 and 298,615, respectively, while the 2015 estimated average household income within the same radii was $73,895, $71,986 and $63,680, respectively. As of November 18, 2015, the Wilshire Plaza Property was 94.6% occupied by 15 tenants. A letter of intent to lease the remaining 6,600 square feet has been executed by Zoo Health Club. If Zoo Health Club takes occupancy, the Wilshire Plaza Property will be 100.0% occupied.
According to the appraisal, the Wilshire Plaza Property is located in the Airport/Metairie/Kenner retail submarket of the New Orleans retail market which, as of the third quarter of 2015, was comprised of 1,522 buildings totaling 17,657,118 square feet. As of the
THE INFORMATION IN THIS STRUCTURAL AND COLLATERAL TERM SHEET IS NOT COMPLETE AND MAY BE AMENDED PRIOR TO THE TIME OF SALE. THIS TERM SHEET IS NOT AN OFFER TO SELL THESE SECURITIES AND IT IS NOT A SOLICITATION OF AN OFFER TO BUY THESE SECURITIES IN ANY JURISDICTION WHERE THE OFFER OR SALE IS NOT PERMITTED.
| 118 |
| WILSHIRE PLAZA |
third quarter of 2015, the submarket reported a vacancy rate of 4.8%, an average annual rental rate of$18.51 per square foot, triple-net and positive year to date net absorption of 40,505 square feet.
Sources and Uses
| Sources | Uses | ||||||||
| Original loan amount | $19,300,000 | 100.0% | Loan payoff | $17,413,707 | 90.2 | % | |||
| Reserves | 460,004 | 2.4 | |||||||
| Closing costs | 513,358 | 2.7 | |||||||
| Return of equity | 912,931 | 4.7 | |||||||
| Total Sources | $19,300,000 | 100.0% | Total Uses | $19,300,000 | 100.0 | % |
The following table presents certain information relating to the tenancy at the Wilshire Plaza Property:
Major Tenants
| Tenant Name | Credit Moody’s/ S&P)(1) | Tenant NRSF | % of NRSF | Annual U/W Base Rent PSF | Annual U/W Base | % of Total Annual U/W Base Rent | Sales PSF(2) | Occupancy Cost(2) | Lease Expiration Date | |
| Anchor Tenants | ||||||||||
| The Fresh Market | NR/NR/NR | 19,265 | 15.8% | $19.50 | $375,668 | 19.8% | NAV | NAV | 7/31/2025(3) | |
| Gordon’s of Metairie | NR/NR/NR | 20,250 | 16.6% | $17.50 | $354,373 | 18.7% | $149 | 11.8% | 10/31/2019 | |
| Big Lots | NR/NR/BBB | 24,072 | 19.8% | $7.50 | $180,540 | 9.5% | $183 | 4.1% | 1/31/2021(4) | |
| Total Anchor Tenants | 63,587 | 52.2% | $14.32 | $910,580 | 47.9% | |||||
| Major Tenants | ||||||||||
| Office Depot | NR/B2/B- | 15,555 | 12.8% | $11.00 | $171,108 | 9.0% | NAV | NAV | 11/30/2020 | |
| Rite Aid | NR/B2/B | 12,000 | 9.9% | $15.50 | $186,000 | 9.8% | $333 | 4.7% | 7/31/2025(5) | |
| Total Major Tenants | 27,555 | 22.6% | $12.96 | $357,108 | 18.8% | |||||
| Non-major Tenants(6) | 30,567 | 25.1% | $20.67 | $631,719 | 33.3% | |||||
| Occupied Collateral Total | 121,709 | 100.0% | $15.61 | $1,899,408 | 100.0% | |||||
| Vacant Space | 0 | 0.0% | ||||||||
| Collateral Total | 121,709 | 100.0% | ||||||||
| (1) | Certain Ratings are those of the parent company whether or not the parent guarantees the lease. |
| (2) | Sales PSF and Occupancy Cost are as of year-end 2014. Most tenants are not required to report sales. |
| (3) | The Fresh Market has six, 5-year lease renewal options. |
| (4) | Big Lots has one, 10-year lease renewal option remaining. |
| (5) | Rite Aid has three, 5-year lease renewal options remaining. |
| (6) | Includes 6,600 square feet of space (5.4% of net rentable area) that is under letter of intent with Zoo Health Club, but currently vacant. The guarantor has signed a 5-year master lease for this space. |
THE INFORMATION IN THIS STRUCTURAL AND COLLATERAL TERM SHEET IS NOT COMPLETE AND MAY BE AMENDED PRIOR TO THE TIME OF SALE. THIS TERM SHEET IS NOT AN OFFER TO SELL THESE SECURITIES AND IT IS NOT A SOLICITATION OF AN OFFER TO BUY THESE SECURITIES IN ANY JURISDICTION WHERE THE OFFER OR SALE IS NOT PERMITTED.
| 119 |
| WILSHIRE PLAZA |
The following table presents certain information relating to the lease rollover schedule at the Wilshire Plaza Property:
Lease Expiration Schedule(1)
Year Ending December 31 | No. of Leases | Expiring NRSF | % of Total NRSF | Cumulative NRSF | Cumulative % of Total NRSF | Annual U/W Base Rent | % of Total Annual U/W Base Rent | Annual UW Base |
| MTM | 0 | 0 | 0.0% | 0 | 0.0% | $0 | 0.0% | $0.00 |
| 2016 | 5 | 9,190 | 7.6% | 9,190 | 7.6% | $163,414 | 8.6% | $17.78 |
| 2017 | 0 | 0 | 0.0% | 9,190 | 7.6% | $0 | 0.0% | $0.00 |
| 2018 | 3 | 6,730 | 5.5% | 15,920 | 13.1% | $133,416 | 7.0% | $19.82 |
| 2019 | 2 | 22,970 | 18.9% | 38,890 | 32.0% | $397,512 | 20.9% | $17.31 |
| 2020 | 1 | 15,555 | 12.8% | 54,445 | 44.7% | $171,108 | 9.0% | $11.00 |
| 2021 | 1 | 24,072 | 19.8% | 78,517 | 64.5% | $180,540 | 9.5% | $7.50 |
| 2022 | 1 | 5,327 | 4.4% | 83,844 | 68.9% | $194,400 | 10.2% | $36.49 |
| 2023 | 0 | 0 | 0.0% | 83,844 | 68.9% | $0 | 0.0% | $0.00 |
| 2024 | 0 | 0 | 0.0% | 83,844 | 68.9% | $0 | 0.0% | $0.00 |
| 2025 | 3 | 37,865 | 31.1% | 121,709 | 100.0% | $659,018 | 34.7% | $17.40 |
| 2026 | 0 | 0 | 0.0% | 121,709 | 100.0% | $0 | 0.0% | $0.00 |
| Thereafter | 0 | 0 | 0.0% | 121,709 | 100.0% | $0 | 0.0% | $0.00 |
| Vacant | 0 | 0 | 0.0% | 121,709 | 100.0% | $0 | 0.0% | $0.00 |
| Total/Weighted Average | 16 | 121,709 | 100.0% | $1,899,408 | 100.0% | $15.61 |
| (1) | Information obtained from the underwritten rent roll. |
The following table presents historical occupancy percentages at the Wilshire Plaza Property:
Historical Occupancy
12/31/2011(1) | 12/31/2012(2) | 12/31/2013(2) | 12/31/2014(2) | 11/18/2015(3)(4) |
| NAV | 87.0% | 94.3% | 80.6% | 94.6% |
| (1) | Historical occupancy information prior to 2012 is not available. |
| (2) | Information obtained from the borrower. |
| (3) | Information obtained from the underwritten rent roll. The Wilshire Plaza Property is currently 94.6% occupied. A letter of intent to lease 6,600 square feet has been executed by Zoo Health Club for a 10 year term. Once the tenant takes occupancy it will bring the occupancy to 100%. |
| (4) | The increase in occupancy between December 31, 2014 and November 18, 2015 is driven by The Fresh Market taking occupancy of 19,264 square feet of previously vacant space. |
Operating History and Underwritten Net Cash Flow. The following table presents certain information relating to the historical operating performance and underwritten net cash flow at the Wilshire Plaza Property:
Cash Flow Analysis
| 2012 | 2013 | 2014 | TTM 10/31/2015 | U/W | % of U/W Effective Gross Income | U/W $ per SF | |||
| Base Rent | $1,317,638 | $1,463,480 | $1,429,472 | $1,479,127(1) | $1,899,407(1) | 87.1% | $15.61 | ||
| Grossed Up Vacant Space | 0 | 0 | 0 | 0 | 0 | 0.0 | 0.00 | ||
| Total Reimbursables | 280,976 | 300,402 | 298,072 | 324,405(2) | 409,746(2) | 18.8 | 3.37 | ||
| Less Vacancy & Credit Loss | 0 | 0 | 0 | 0 | (129,313) | (5.9) | (1.06) | ||
| Effective Gross Income | $1,598,614 | $1,763,883 | $1,727,544 | $1,803,532 | $2,179,840 | 100.0% | $17.91 | ||
| Total Operating Expenses | $407,218 | $426,382 | $380,605 | $432,893 | $487,296 | 22.4% | $4.00 | ||
|
|
|
|
|
|
| |||
| Net Operating Income | $1,191,396 | $1,337,501 | $1,346,939 | $1,370,639 | $1,692,544 | 77.6% | $13.91 | ||
| TI/LC | 0 | 0 | 0 | 0 | 90,365 | 4.1 | 0.74 | ||
| Capital Expenditures | 0 | 0 | 0 | 0 | 18,256 | 0.8 | 0.15 | ||
| Net Cash Flow | $1,191,396 | $1,337,501 | $1,346,939 | $1,370,639 | $1,583,923 | 72.7% | $13.01 | ||
| NOI DSCR | 0.94x | 1.06x | 1.07x | 1.08x | 1.34x | ||||
| NCF DSCR | 0.94x | 1.06x | 1.07x | 1.08x | 1.25x | ||||
| NOI DY | 6.2% | 6.9% | 7.0% | 7.1% | 8.8% | ||||
| NCF DY | 6.2% | 6.9% | 7.0% | 7.1% | 8.2% |
| (1) | U/W Base Rent is higher than trailing twelve month October 31, 2015 because it includes $375,668 in annual Base Rent from The Fresh Market, which began paying rent on November 1, 2015. U/W Base rent also includes $97,350 for space that is under letter of intent with Zoo Health Club, but currently vacant. An upfront escrow representing three years of base rent and recoveries was taken at closing related to Zoo Health Club and the guarantor has signed a 5-year master lease for this space. |
| (2) | U/W Total Reimbursables is higher than trailing twelve month October 31, 2015 because it includes $76,827 for The Fresh Market, which began paying rent on November 1, 2014 and $26,320 for vacant space currently under letter of intent with Zoo Health Club. |
| (3) | The underwritten economic vacancy is 5.6%. The Wilshire Plaza Property was 94.6% physically occupied as of November 18, 2015. |
THE INFORMATION IN THIS STRUCTURAL AND COLLATERAL TERM SHEET IS NOT COMPLETE AND MAY BE AMENDED PRIOR TO THE TIME OF SALE. THIS TERM SHEET IS NOT AN OFFER TO SELL THESE SECURITIES AND IT IS NOT A SOLICITATION OF AN OFFER TO BUY THESE SECURITIES IN ANY JURISDICTION WHERE THE OFFER OR SALE IS NOT PERMITTED.
| 120 |
| WILSHIRE PLAZA |
The following table presents certain information relating to the comparable retail leases for the Wilshire Plaza Property:
Comparable Leases(1)
| Property Name/ Location | Year Built/ Renovated | Anchor Tenants | Total GLA (SF) | Total Occupancy | Distance from Subject | Tenant Name(2) | Lease Date /Term | Lease Area (SF) | Annual Base Rent PSF | Lease Type |
Wilshire Plaza (Subject) Metairie, LA | 1968/2015 | Big Lots, Gordons of Metairie, The Fresh Market | 121,709 | 95% | -- | The Fresh Market | July 2015 / 10 Yrs | 19,265 | $19.50 | NNN |
Magnolia Shopping Center Metairie, LA | 1975/NAP | Big K-Mart, Katz, Rouse’s | 212,866 | 90% | 0.4 miles | Rouse’s | January 2013 / 5 Yrs | 38,000 | $4.94 | NNN |
Oakridge Place Shopping Center Metairie, LA | 1994/NAP | Langenstein’s, Pier 1 Imports, Rite Aid Drugs | 60,742 | 100% | 1.7 miles | Hallmark Cards | March 2002 / 10 Yrs | 1,000 | $23.00 | NNN |
Mid-City Market New Orleans, LA | 2013/NAP | Winn Dixie | 108,964 | 96% | 8.5 miles | Winn Dixie | July 2013 / 1.7 Yrs | 54,390 | $18.51 | NNN |
| Magnolia Marketplace New Orleans, LA | 2014/NAP | PetSmart, Michaels, TJ Maxx, Shoe Carnival | 97,289 | 100% | 11.4 miles | PetSmart | March 2015 / 10 Yrs | 12,507 | $19.50 | NNN |
Sena Mall Metairie, LA | 1964/1984 | Humana Marketpoint, Joann’s Fabrics, CVS | 27,337 | 71% | 8.4 miles | Humana Marketpoint | September 2012 / 5 Yrs | 4,492 | $17.00 | NNN |
| (1) | Information obtained from the appraisal, third party market research reports and underwritten rent roll. |
| (2) | Represents anchor tenant comparables only. |
THE INFORMATION IN THIS STRUCTURAL AND COLLATERAL TERM SHEET IS NOT COMPLETE AND MAY BE AMENDED PRIOR TO THE TIME OF SALE. THIS TERM SHEET IS NOT AN OFFER TO SELL THESE SECURITIES AND IT IS NOT A SOLICITATION OF AN OFFER TO BUY THESE SECURITIES IN ANY JURISDICTION WHERE THE OFFER OR SALE IS NOT PERMITTED.
| 121 |
| No. 14 Northview Harbor Apartments | |||||||
| Loan Information | Property Information | ||||||
| Mortgage Loan Seller: | Basis Real Estate Capital II, LLC | Single Asset/Portfolio: | Single Asset | ||||
| Credit Assessment (DBRS/KBRA/Moody’s): | NR/NR/NR | Property Type: | Multifamily | ||||
| Original Principal Balance: | $18,500,000 | Specific Property Type: | Garden | ||||
| Cut-off Date Principal Balance: | $18,480,248 | Location: | Grand Rapids, MI | ||||
| % of Initial Pool Balance: | 1.9% | Size: | 360 Units | ||||
| Loan Purpose: | Acquisition | Cut-off Date Principal Balance Per Unit: | $51,334 | ||||
| Borrower Name: | NVH-GR360, LLC | Year Built/Renovated: | 1978/2015 | ||||
| Sponsor(1): | Shawn Stafford | Title Vesting: | Fee | ||||
| Mortgage Rate: | 4.980% | Property Manager: | Self-managed | ||||
| Note Date: | December 7, 2015 | 4th Most Recent Occupancy(5): | NAV | ||||
| Anticipated Repayment Date: | NAP | 3rd Most Recent Occupancy (As of): | 88.6% (12/31/2012) | ||||
| Maturity Date: | January 1, 2026 | 2nd Most Recent Occupancy (As of): | 91.9% (12/31/2013) | ||||
| IO Period(2): | 36 months | Most Recent Occupancy (As of): | 96.0% (12/31/2014) | ||||
| Loan Term (Original): | 120 months | Current Occupancy (As of): | 97.8% (10/20/2015) | ||||
| Seasoning: | 1 month | ||||||
| Amortization Term (Original)(2): | 360 months | Underwriting and Financial Information: | |||||
| Loan Amortization Type(2): | Interest-only, Amortizing Balloon | ||||||
| Interest Accrual Method: | Actual/360 | 4th Most Recent NOI (As of): | $1,223,882 (12/31/2012) | ||||
| Call Protection: | L(25),D(92),O(3) | 3rd Most Recent NOI (As of): | $1,429,913 (12/31/2013) | ||||
| Lockbox Type: | Springing | 2nd Most Recent NOI (As of): | $1,429,387 (12/31/2014) | ||||
| Additional Debt: | None | Most Recent NOI (As of): | $1,592,514 (TTM 10/31/2015) | ||||
| Additional Debt Type: | NAP | ||||||
| U/W Revenues: | $3,064,872 | ||||||
| U/W Expenses: | $1,431,331 | ||||||
| U/W NOI: | $1,633,542 | ||||||
| Escrows and Reserves: | U/W NCF: | $1,543,542 | |||||
| U/W NOI DSCR: | 1.37x | ||||||
| Type: | Initial | Monthly | Cap (If Any) | U/W NCF DSCR: | 1.30x | ||
| Taxes | $0 | $20,909 | NAP | U/W NOI Debt Yield: | 8.8% | ||
| Insurance | $20,727 | $5,182 | NAP | U/W NCF Debt Yield: | 8.4% | ||
| Replacement Reserves | $0 | $7,500 | NAP | As-Stabilized Appraised Value(6): | $29,500,000 | ||
| TI/LC Reserve | $0 | $0 | NAP | As-Stabilized Appraisal Valuation Date(6): | February 1, 2017 | ||
| Renovation Reserve(3) | $2,071,000 | $0 | NAP | Cut-off Date LTV Ratio(6): | 62.6% | ||
| Debt Yield Reserve Fund(4) | $0 | Springing | NAP | LTV Ratio at Maturity or ARD(6): | 55.5% | ||
| (1) | Shawn Stafford was involved in four short sales, one deed-in-lieu, one discounted payoff and two tax foreclosures related to Detroit rental properties from 2006 to 2011. See “Description of the Mortgage Pool – Default History, Bankruptcy Issues and Other Proceedings” in the Preliminary Prospectus. |
| (2) | The 36-month, interest-only period will commence on February 1, 2021. As long as (i) the approximate $2.1 million renovation has been completed in accordance with the loan agreement; (ii) the Northview Harbor Apartments Property has achieved a minimum NOI debt yield ratio of 9.0% based on the trailing twelve-month period ending January 1, 2021 and (iii) no event of default has occurred and is continuing (collectively the “Debt Yield Reserve Conditions”); the borrower will only be required to make interest only debt service payments during the interest only period. However, if the Debt Yield Reserve Conditions are not met on January 1, 2021, then in addition to the interest only payments, the borrower will be required to deposit the principal portion of the full principal and interest payment into a debt yield reserve, which will be held as additional collateral. |
| (3) | The Renovation Reserve of $2,071,000 ($5,753 per unit) is required to be used by February 7, 2017 with one extension of up to 10 months allowed if significant work is already underway at the time of the extension request. The pre-approved renovation budget is comprised of approximately $1.5 million ($4,219 per unit) for interior upgrades, which include improvements to the flooring, fixtures, appliances, kitchens, bathrooms, HVAC and doors on selected units; $495,000 ($1,375 per unit) for exterior renovations, which include improvements to the roofs on selected buildings, siding work, landscaping, deck work and parking lot repairs; and $57,000 for miscellaneous costs. |
| (4) | The monthly principal portion of the total monthly payment of $99,086 is required upon (i) an event of default occurring and continuing; (ii) failure to complete all renovations as outlined in the loan agreement; and (iii) failure of the Northview Harbor Apartments Property to achieve a minimum U/W NOI debt yield ratio of 9.0% by January 1, 2021. |
| (5) | See “Historical Occupancy” section. |
| (6) | The Cut-off Date LTV Ratio and LTV Ratio at Maturity or ARD are based on the as-stabilized appraised value of $29,500,000 as of February 1, 2017. The as-stabilized value assumes the completion of the approximate $2.1 million renovation. The Cut-Off Date LTV Ratio and LTV Ratio at Maturity or ARD based on the as-is appraised value of $25,400,000 with a valuation date of October 15, 2015 are 72.8% and 64.5%, respectively. |
The Northview Harbor Apartments mortgage loan is evidenced by a single promissory note that is secured by a first mortgage encumbering a fee interest in a multifamily property containing 25 garden-style buildings located in Grand Rapids, Michigan (the “Northview Harbor Apartments Property”),approximately 14.5 miles north of the Gerald R. Ford International Airport and 9.1 miles northeast of the Grand Rapids central business district. Built in 1978 and last renovated in 2015, the Northview Harbor Apartments Property comprises 360 units totaling 252,126 square feet.The unit mix features 48 studio units, 115 one-bedroom/one-bathroom units, 60 one-bedroom/1.5 bathroom units, 107 two-bedroom/one-bathroom units and 30 two-bedroom/1.5-bathroom units. Amenities at the Northview Harbor Apartments Property include a swimming pool, carports, basketball, volleyball and tennis courts
THE INFORMATION IN THIS STRUCTURAL AND COLLATERAL TERM SHEET IS NOT COMPLETE AND MAY BE AMENDED PRIOR TO THE TIME OF SALE. THIS TERM SHEET IS NOT AN OFFER TO SELL THESE SECURITIES AND IT IS NOT A SOLICITATION OF AN OFFER TO BUY THESE SECURITIES IN ANY JURISDICTION WHERE THE OFFER OR SALE IS NOT PERMITTED.
| 122 |
| NORTHVIEW HARBOR APARTMENTS |
and an on-site management and leasing office. Unit amenities include private patios or balconies and central air-conditioning in all units and full size washer/dryer connections and fireplaces in select units.
The Northview Harbor Apartments Property’s immediate area is predominantly residential with supporting commercial uses along the major thoroughfares, primarily 5 Mile Road and Plainfield Avenue NE.Residential appeal is generated by its location near major employment centers, retail centers and restaurants. Large retail draws include North Kent Center outdoor lifestyle retail center, which is located 0.4 miles west of the Northview Harbor Apartments Property and is anchored by Lowe’s Home Improvement, Kmart, Dunham Sports, Dollar Tree and Family Farm and Home.Kuyper College is located approximately 2.7 miles southeast of the Northview Harbor Apartments Property and major area employers such as Spectrum Health and Meijer are located within 9.0 miles.The Northview Harbor Apartments Property features 361 surface parking spaces and 343 covered carports, for a total of 704 parking spaces, resulting in an overall parking ratio of approximately 2.0 spaces per unit. As of October 20, 2015, the Northview Harbor Apartments Property was 97.8% occupied. The borrower plans to invest approximately $2,071,000 in capital improvements within 14 months of origination, which will include $1,519,000 of interior renovations, $495,000 of exterior renovations and $57,000 allocated to miscellaneous costs.
Sources and Uses
| Sources | Uses | |||||||
| Original loan amount | $18,500,000 | 74.6% | Purchase price | $22,000,000 | 88.7% | |||
| Sponsor’s new cash contribution | 6,299,312 | 25.4 | Reserves | 2,091,727 | 8.4 | |||
| Closing costs | 707,585 | 2.9 | ||||||
| Total Sources | $24,799,312 | 100.0% | Total Uses | $24,799,312 | 100.0% |
The following table presents certain information relating to the unit mix of the Northview Harbor Apartments Property:
Unit Mix Summary(1)
| Unit Type | No. of Units | % of Total Units | Average Unit Size (SF) | Average U/W Monthly Rent per Unit |
| Studio | 48 | 13.3% | 430 | $643 |
| 1 Bedroom/1 Bathroom | 115 | 31.9% | 603 | $641 |
| 1 Bedroom/1.5 Bathrooms | 60 | 16.7% | 698 | $683 |
| 2 Bedroom/1 Bathroom | 107 | 29.7% | 858 | $740 |
| 2 Bedroom/1.5 Bathrooms | 30 | 8.3% | 947 | $856 |
| Total/Weighted Average | 360 | 100.0% | 700 | $696 |
| (1) | Information obtained from the appraisal. |
The following table presents historical occupancy percentages at the Northview Harbor Apartments Property:
Historical Occupancy
12/31/2011(1) | 12/31/2012(2) | 12/31/2013(2) | 12/31/2014(2) | 10/20/2015(3) |
| NAV | 88.6% | 91.9% | 96.0% | 97.8% |
| (1) | Historical occupancy information prior to 2012 is not available. |
| (2) | Information obtained from the borrower. |
| (3) | Information obtained from the underwritten rent roll. |
THE INFORMATION IN THIS STRUCTURAL AND COLLATERAL TERM SHEET IS NOT COMPLETE AND MAY BE AMENDED PRIOR TO THE TIME OF SALE. THIS TERM SHEET IS NOT AN OFFER TO SELL THESE SECURITIES AND IT IS NOT A SOLICITATION OF AN OFFER TO BUY THESE SECURITIES IN ANY JURISDICTION WHERE THE OFFER OR SALE IS NOT PERMITTED.
| 123 |
| NORTHVIEW HARBOR APARTMENTS |
Operating History and Underwritten Net Cash Flow.The following table presents certain information relating to the historical operating performance and underwritten net cash flow at the Northview Harbor Apartments Property:
Cash Flow Analysis
| 2012 | 2013 | 2014 | TTM 10/31/2015 | U/W | % of U/W Effective Gross Income | U/W $ per Unit | |
| Base Rent | $2,360,737 | $2,430,461 | $2,648,821 | $2,766,853 | $2,779,580 | 90.7% | $7,721 |
| Grossed Up Vacant Space | 293,000 | 209,456 | 110,150 | 89,291 | 164,248 | 5.4 | 456 |
| Concessions | (41,522) | (30,910) | (7,150) | (1,875) | (3,285) | (0.1) | (9) |
| Other Income(1) | 341,643 | 339,685 | 351,322 | 341,137 | 341,137 | 11.1 | 948 |
| Less Vacancy & Credit Loss(2) | (478,868) | (266,694) | (183,724) | (140,138) | (216,808) | (7.1) | (602) |
| Effective Gross Income | $2,474,990 | $2,681,998 | $2,919,419 | $3,055,268 | $3,064,872 | 100.0% | $8,514 |
| Total Operating Expenses | $1,251,108 | $1,252,085 | $1,490,032 | $1,462,754 | $1,431,331 | 46.7% | $3,976 |
|
|
|
|
|
|
| |
| Net Operating Income | $1,223,882 | $1,429,913 | $1,429,387 | $1,592,514 | $1,633,542 | 53.3% | $4,538 |
| Capital Expenditures | 121,551 | 0 | 0 | 0 | 90,000 | 2.9 | 250 |
| Net Cash Flow | $1,102,331 | $1,429,913 | $1,429,387 | $1,592,514 | $1,543,542 | 50.4% | $4,288 |
| NOI DSCR | 1.03x | 1.20x | 1.20x | 1.34x | 1.37x | ||
| NCF DSCR | 0.93x | 1.20x | 1.20x | 1.34x | 1.30x | ||
| NOI DY | 6.6% | 7.7% | 7.7% | 8.6% | 8.8% | ||
| NCF DY | 6.0% | 7.7% | 7.7% | 8.6% | 8.4% |
| (1) | Other Income consist of late fees, pet fees, damage fees, legal charges, Ratio Utility Billing System (RUBS), termination fees, application fees and laundry fees. |
| (2) | The underwritten economic vacancy is 5.0%. The Northview Harbor Apartments Property was 97.8% physically occupied as of October 20, 2015. |
The following table presents certain information relating to comparable multifamily properties for the Northview Harbor Apartments Property:
Competitive Set(1)
| Average Rent (per unit) | ||||||||||
| Location | Distance to Subject | Property Type | No. of Units | Studio | 1 BR | 2 BR | 3 BR | Overall Average PSF | Total Occupancy | |
Northview Harbor Apartments (Subject) | Grand Rapids | -- | Garden | 360 | $643 | $655 | $765 | NAP | $0.99 | 98% |
| Pine Ridge Apartments | Grand Rapids | 1.0 miles | Garden | 168 | NAP | $828 | $1,015 | NAP | $1.13 | 98% |
| The Valley | Grand Rapids | 1.1 miles | Garden | 176 | NAP | $854 | $1,299 | $1,399 | $0.75 | 100% |
| Autumn Ridge Apartments | Grand Rapids | 1.9 miles | Garden | 328 | $565 | $665 | $792 | NAP | $1.12 | 98% |
| Central Park Place | Grand Rapids | 3.3 miles | Garden | 216 | NAP | $1,031 | $1,100 | NAP | $1.24 | 90% |
| Lake Forest I Apartments | Grand Rapids | 2.5 miles | Garden | 199 | NAP | $789 | $934 | NAP | $0.87 | 100% |
| (1) | Information obtained from the appraisal and underwritten rent roll. |
THE INFORMATION IN THIS STRUCTURAL AND COLLATERAL TERM SHEET IS NOT COMPLETE AND MAY BE AMENDED PRIOR TO THE TIME OF SALE. THIS TERM SHEET IS NOT AN OFFER TO SELL THESE SECURITIES AND IT IS NOT A SOLICITATION OF AN OFFER TO BUY THESE SECURITIES IN ANY JURISDICTION WHERE THE OFFER OR SALE IS NOT PERMITTED.
| 124 |
(THIS PAGE INTENTIONALLY LEFT BLANK)
THE INFORMATION IN THIS STRUCTURAL AND COLLATERAL TERM SHEET IS NOT COMPLETE AND MAY BE AMENDED PRIOR TO THE TIME OF SALE. THIS TERM SHEET IS NOT AN OFFER TO SELL THESE SECURITIES AND IT IS NOT A SOLICITATION OF AN OFFER TO BUY THESE SECURITIES IN ANY JURISDICTION WHERE THE OFFER OR SALE IS NOT PERMITTED.
| 125 |
| No. 15 – Gill Park Cooperative | |||||||||
| Loan Information | Property Information | ||||||||
| Mortgage Loan Seller: | National Cooperative Bank, N.A. | Single Asset/Portfolio: | Single Asset | ||||||
Credit Assessment (DBRS/KBRA/Moody’s): | NR/NR/NR | Property Type: | Multifamily | ||||||
| Original Principal Balance: | $17,965,034 | Specific Property Type: | Cooperative | ||||||
| Cut-off Date Principal Balance: | $17,965,034 | Location: | Chicago, IL | ||||||
| % of Initial Pool Balance: | 1.9% | Size: | 260 units | ||||||
| Loan Purpose: | Refinance | Cut-off Date Principal Balance Per Unit: | $69,096 | ||||||
| Borrower Name: | Gill Park Cooperative | Year Built/Renovated: | 1968/1995 | ||||||
| Sponsor(1): | NAP | Title Vesting: | Fee | ||||||
| Mortgage Rate: | 4.470% | Property Manager: | Leasing and Management Company, Inc. | ||||||
| Note Date: | December 30, 2015 | 4th Most Recent Occupancy(6): | NAP | ||||||
| Anticipated Repayment Date: | NAP | 3rd Most Recent Occupancy(6): | NAP | ||||||
| Maturity Date: | January 1, 2026 | 2nd Most Recent Occupancy(6): | NAP | ||||||
| IO Period: | 24 months | Most Recent Occupancy(6): | NAP | ||||||
| Loan Term (Original): | 120 months | Current Occupancy (As of)(6): | 95.0% (3/4/2015) | ||||||
| Seasoning: | 1 month | ||||||||
| Amortization Term (Original): | 180 months | Underwriting and Financial Information: | |||||||
| Loan Amortization Type: | Interest-only, Amortizing Balloon | ||||||||
| Interest Accrual Method: | Actual/360 | 4th Most Recent NOI(7) | NAP | ||||||
| Call Protection: | GRTR 1% or YM(113),1%(3),O(4) | 3rd Most Recent NOI(7): | NAP | ||||||
| Lockbox Type: | None | 2nd Most Recent NOI(7): | NAP | ||||||
| Additional Debt: | None | Most Recent NOI(7): | NAP | ||||||
| Additional Debt Type: | NAP | ||||||||
| U/W Revenues(7): | $4,559,823 | ||||||||
| U/W Expenses(7): | $2,225,378 | ||||||||
| U/W NOI(7): | $2,334,445 | ||||||||
| U/W NCF(7): | $2,334,445 | ||||||||
| U/W NOI DSCR(7): | 1.42x | ||||||||
| U/W NCF DSCR(7): | 1.42x | ||||||||
| U/W NOI Debt Yield(7): | 13.0% | ||||||||
| Escrows and Reserves: | U/W NCF Debt Yield(7): | 13.0% | |||||||
| As-Is Appraised Value(8): | $38,910,000 | ||||||||
| Type: | Initial | Monthly | Cap (If Any) | As-Is Appraisal Valuation Date: | March 4, 2015 | ||||
| Taxes(2) | $0 | Springing | NAP | Cut-off Date LTV Ratio(8): | 46.2% | ||||
| Insurance(3) | $0 | Springing | NAP | LTV Ratio at Maturity or ARD(8): | 25.6% | ||||
| Capital Improvements(4) | $17,965,034 | $72,917 | NAP | Coop-Rental Value(9): | $38,910,000 | ||||
| Elevator Work(5) | $675,000 | $0 | NAP | Coop-LTV as Rental(9): | 46.2% | ||||
| (1) | The Gill Park Cooperative Property (as defined below) is owned by the borrower, which is a limited equity cooperative housing corporation. No individual or entity (other than the borrower) has recourse obligations with respect to such mortgage loan, including pursuant to any guaranty or environmental indemnity. |
| (2) | Ongoing monthly reserves for real estate taxes are not required as long as (i) no event of default has occurred and is continuing; and (ii) the borrower provides evidence of payment of real estate taxes. |
| (3) | Ongoing monthly reserves for insurance premiums are not required as long as (i) no event of default has occurred and is continuing; and (ii) the borrower maintains the insurance policies. |
| (4) | The borrower was required to deposit the entire amount of the loan proceeds into an escrow account for ongoing redevelopment, renovation and expansion. Additionally, monthly collections of $72,917 are required through the initial twenty-four payment dates. No monthly collections will be required thereafter. See “Description of the Mortgage Pool – Redevelopment, Renovation and Expansion” in the Preliminary Prospectus. |
| (5) | The borrower was required to deposit $675,000 into escrow for identified elevator work. |
| (6) | See “Historical Occupancy” section. Historical occupancy is not reported as all units are owned by tenant-shareholders or the borrower. Units owned by tenant-shareholders are considered occupied as the tenant-shareholders are responsible for paying the maintenance charges on the respective units. The 25 vacant borrower owned units are intentionally being held vacant to facilitate planned capital improvements and are intended to be sold after the completion of the capital improvements. The “Current Occupancy” reflects the vacancy assumption in the appraisal for purposes of determining the appraised value of the Gill Park Cooperative Property as a multifamily rental property (i.e., the Coop - Rental Value). Additionally, the Current Occupancy “As of” date reflects the appraisal valuation date for the Gill Park Cooperative Property. |
| (7) | See “Cash Flow Analysis” section. |
| (8) | The As-Is Appraised Value, Cut-off Date LTV Ratio and LTV Ratio at Maturity or ARD are based on the Coop-Rental Value which assumes the Gill Park Cooperative Property is operated as a multifamily market rate rental property. The Gill Park Cooperative Property was not valued as a cooperative as the subject has historically operated as a limited equity Section 8 multifamily cooperative. Therefore, there have been no market rate transfers within the building. |
| (9) | The Coop-Rental Value of the Gill Park Cooperative Property is the appraised value of the Gill Park Cooperative Property assuming the Gill Park Cooperative Property is operated as a market-rate multifamily rental property, and in general, is derived by applying an appropriate capitalization rate (as determined by the appraiser) to the U/W NCF for the Gill Park Cooperative Property. |
THE INFORMATION IN THIS STRUCTURAL AND COLLATERAL TERM SHEET IS NOT COMPLETE AND MAY BE AMENDED PRIOR TO THE TIME OF SALE. THIS TERM SHEET IS NOT AN OFFER TO SELL THESE SECURITIES AND IT IS NOT A SOLICITATION OF AN OFFER TO BUY THESE SECURITIES IN ANY JURISDICTION WHERE THE OFFER OR SALE IS NOT PERMITTED.
| 126 |
| GILL PARK COOPERATIVE |
The mortgage loan is evidenced by a single promissory note that is secured by a first mortgage encumbering a multifamily residential cooperative apartment building located in Chicago, Illinois (the “Gill Park Cooperative Property”). The Gill Park Cooperative Property is a 260-unit, 27-story, limited equity high-rise housing cooperative apartment building which was constructed in 1968 and converted to cooperative ownership in 1980. The Gill Park Cooperative Property receives project-based Section-8 subsidies under a contract for housing assistance payments between the borrower and The United States Department of Housing and Urban Development. The property has operated as a Section 8 project since inception and is subsidized through the Housing Assistance Program (“HAP”) contracts. The Gill Park Cooperative Property amenities include three elevators and a laundry room located on the ground floor. The Gill Park Cooperative Property features a three-story parking garage (with one open air deck and two covered levels) with 170 parking spaces resulting in a parking ratio of 0.7 spaces per unit. The Gill Park Cooperative Property is located approximately 0.5 miles northeast of Wrigley Field and 0.9 miles west of the Lake Michigan water front. The cooperative is 90.4% sold to tenant shareholders and the borrower owns 25 vacant units (9.6%) that it plans to hold during the capital improvement project. The appraiser applied a normalized 5% vacancy in its valuation. The planned capital improvements include but are not limited to: common building areas and commercial space upgrades, exterior improvements of curbing and walkways, plumbing system replacement, new heating, ventilation and air conditioning systems, corridor renovations, electrical upgrades, security system installation and interior unit renovation.
Sources and Uses
| Sources | Uses | |||||||
| Original loan amount | $17,965,034 | 80.9% | Loan payoff | $3,386,785 | 15.3% | |||
| Borrower’s new cash contribution | 4,237,472 | 19.1 | Reserves | 18,640,034 | 84.0 | |||
| Closing costs | 175,686 | 0.8 | ||||||
| Total Sources | $22,205,505 | 100.0% | Total Uses | $22,202,505 | 100.0% | |||
The following table presents certain information relating to the unit mix of the Gill Park Cooperative Property:
Unit Mix Summary(1)
| Unit Type | No. of Units | % of Total Units |
Average Unit | Total Net SF |
| 1 Bedroom | 78 | 30.0% | 624 | 48,672 |
| 2 Bedroom | 156 | 60.0% | 782 | 121,992 |
| 3 Bedroom | 26 | 10.0% | 1,014 | 26,364 |
| Total/Weighted Average | 260 | 100.0% | 758 | 197,028 |
| (1) | Information obtained from the appraisal. |
The following table presents historical occupancy percentages at the Gill Park Cooperative Property:
Historical Occupancy(1)
12/31/2011 | 12/31/2012 | 12/31/2013 | 12/31/2014 | 3/4/2015(2) |
| NAP | NAP | NAP | NAP | 95.0% |
| (1) | Historical occupancy is not reported as all units are owned by tenant-shareholders or the borrower. |
| (2) | Occupancy reported reflects the vacancy assumption in the related appraisal for purposes of determining the appraised value of the Gill Park Cooperative Property as a multifamily rental property as of the appraisal valuation date. The Gill Park Cooperative Property is currently 90.4% occupied, with 25 borrower-owned vacant units (9.6%). The borrower-owned vacant units are intentionally left vacant in anticipation of the capital improvement project. |
THE INFORMATION IN THIS STRUCTURAL AND COLLATERAL TERM SHEET IS NOT COMPLETE AND MAY BE AMENDED PRIOR TO THE TIME OF SALE. THIS TERM SHEET IS NOT AN OFFER TO SELL THESE SECURITIES AND IT IS NOT A SOLICITATION OF AN OFFER TO BUY THESE SECURITIES IN ANY JURISDICTION WHERE THE OFFER OR SALE IS NOT PERMITTED.
| 127 |
| GILL PARK COOPERATIVE |
Operating History and Underwritten Net Cash Flow. The following table presents certain information relating to the underwritten net cash flow at the Gill Park Cooperative Property:
Cash Flow Analysis(1)
| U/W | % of U/W Effective Gross Income | U/W $ per Unit | |
| Gross Potential Rent | $4,704,024 | 103.2% | $18,092 |
| Other Income | 26,000 | 0.6 | 100 |
| Parking Income | 65,000 | 1.4 | 250 |
| Less Vacancy & Credit Loss | (235,201)(2) | (5.2) | (905) |
| Effective Gross Income | $4,559,823 | 100.0% | $17,538 |
| Total Operating Expenses | $2,225,378 | 48.8% | $8,559 |
|
|
| |
| Net Operating Income | $2,334,445 | 51.2% | $8,979 |
| Capital Expenditures | 0 | 0.0 | 0 |
| Net Cash Flow | $2,334,445 | 51.2% | $8,979 |
| NOI DSCR | 1.42x | ||
| NCF DSCR | 1.42x | ||
| NOI DY | 13.0% | ||
| NCF DY | 13.0% |
| (1) | Residential cooperatives are not-for-profit entities that set maintenance fees to cover current expenses and plan for future capital needs. The U/W Net Cash Flow and the U/W Net Operating Income for a residential cooperative property is the projected net cash flow reflected in an appraisal and, in general, equals projected operating income at the property assuming such property is operated as a rental property with rents and other income set at the prevailing market rates, reduced by underwritten property operating expenses, a market-rate vacancy assumption and projected replacement reserves – in each case as determined by the appraiser. However, the projected net cash flow used in such determinations may differ materially from the scheduled monthly maintenance payments from the tenant-shareholders upon which residential cooperatives depend. |
| (2) | The underwritten economic vacancy of 5.0% reflects the vacancy assumption in the related appraisal for purposes of determining the appraised value of the Gill Park Cooperative Property as a multifamily rental property. The Gill Park Cooperative Property is currently 90.4% occupied, with 25 borrower-owned vacant units (9.6%). The borrower-owned vacant units are intentionally left vacant in anticipation of the capital improvement project. |
THE INFORMATION IN THIS STRUCTURAL AND COLLATERAL TERM SHEET IS NOT COMPLETE AND MAY BE AMENDED PRIOR TO THE TIME OF SALE. THIS TERM SHEET IS NOT AN OFFER TO SELL THESE SECURITIES AND IT IS NOT A SOLICITATION OF AN OFFER TO BUY THESE SECURITIES IN ANY JURISDICTION WHERE THE OFFER OR SALE IS NOT PERMITTED.
| 128 |
| Wells Fargo Commercial Mortgage Trust 2016-C32 | Transaction Contact Information |
VI. Transaction Contact Information
Questions regarding this Structural and Collateral Term Sheet may be directed to any of the following individuals:
| Wells Fargo Securities, LLC | |
| Brigid Mattingly | Tel. (312) 269-3062 |
| A.J. Sfarra | Tel. (212) 214-5613 |
| Alex Wong | Tel. (212) 214-5615 |
THE INFORMATION IN THIS STRUCTURAL AND COLLATERAL TERM SHEET IS NOT COMPLETE AND MAY BE AMENDED PRIOR TO THE TIME OF SALE. THIS TERM SHEET IS NOT AN OFFER TO SELL THESE SECURITIES AND IT IS NOT A SOLICITATION OF AN OFFER TO BUY THESE SECURITIES IN ANY JURISDICTION WHERE THE OFFER OR SALE IS NOT PERMITTED.
| 129 |