Exhibit (c)(iv) Confidential Treatment Requested. Certain portions of this exhibit have been redacted and separately filed with the Securities and Exchange Commission pursuant to a request for confidential treatment. Special Committee Update and Preliminary Valuation Discussion Project Orange August 19, 2022 PRELIMINARY AND CONFIDENTIAL DRAFT
Executive Summary *** • Management has prepared and the Board has approved financial forecasts –Morgan Stanley has prepared a preliminary valuation analysis based on the forecasts (1) • Share price was up 6% on the back of successful quarterly earnings results. Now trading at $20.80 Notes 1. Share price increase calculated based on spike post-earnings release on 8/4/2022. Current share price as of closing 8/16/2022. PROJECT ORANGE PRELIMINARY AND CONFIDENTIAL DRAFT 2
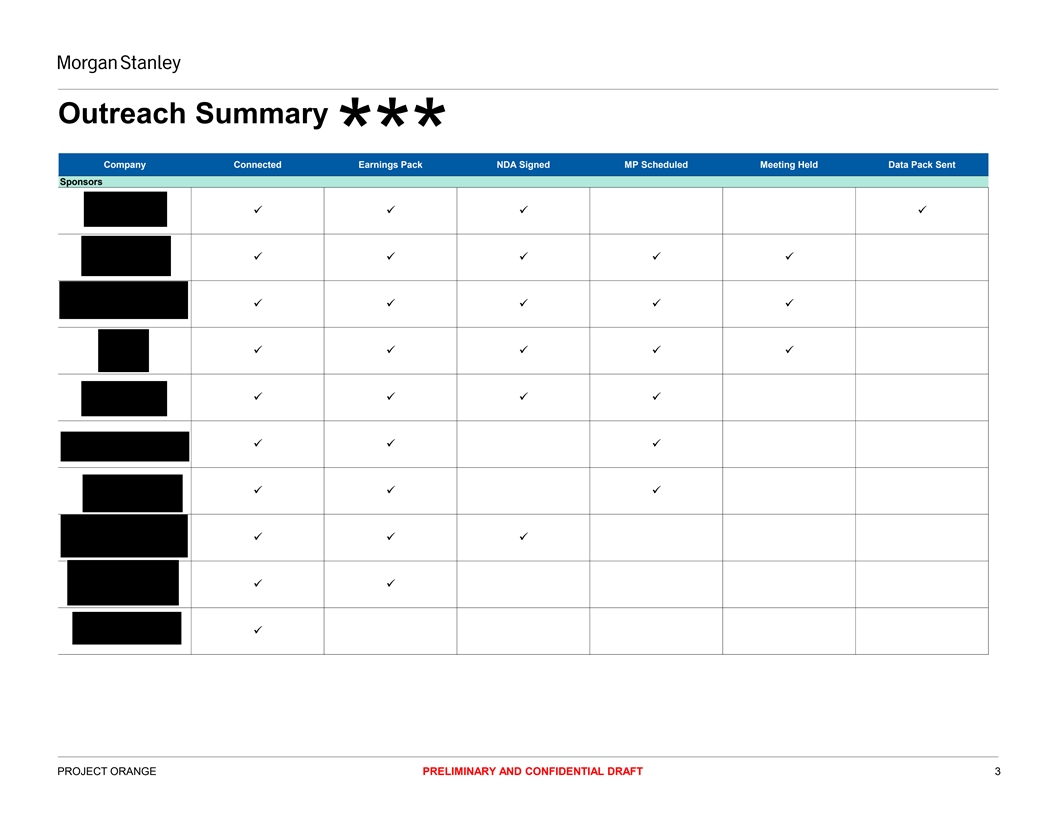
Outreach Summary Company Connected*** Earnings Pack NDA Signed MP Scheduled Meeting Held Data Pack Sent Sponsors ✓✓✓✓ ✓✓✓✓✓ ✓✓✓✓✓ ✓✓✓✓✓ ✓✓✓✓ ✓✓✓ ✓✓✓ ✓✓✓ ✓✓ ✓ PROJECT ORANGE PRELIMINARY AND CONFIDENTIAL DRAFT 3
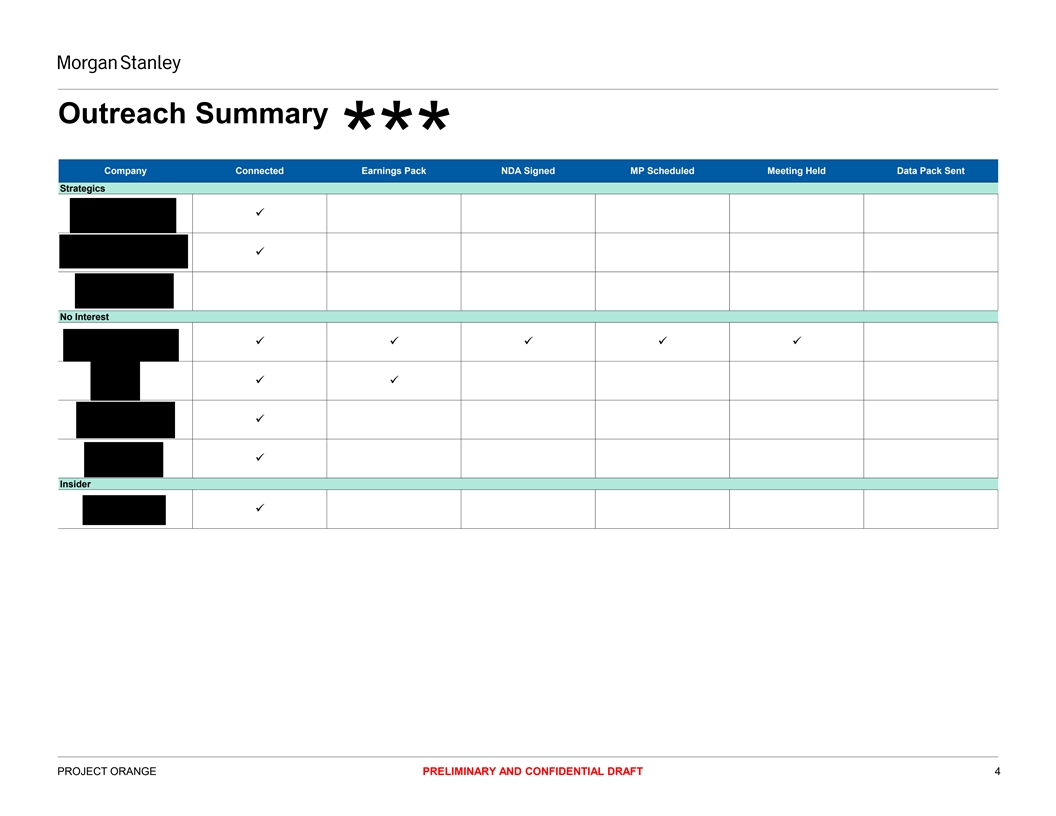
Outreach Summary *** Company Connected Earnings Pack NDA Signed MP Scheduled Meeting Held Data Pack Sent Strategics ✓ ✓ No Interest ✓✓✓✓✓ ✓✓ ✓ ✓ Insider ✓ PROJECT ORANGE PRELIMINARY AND CONFIDENTIAL DRAFT 4
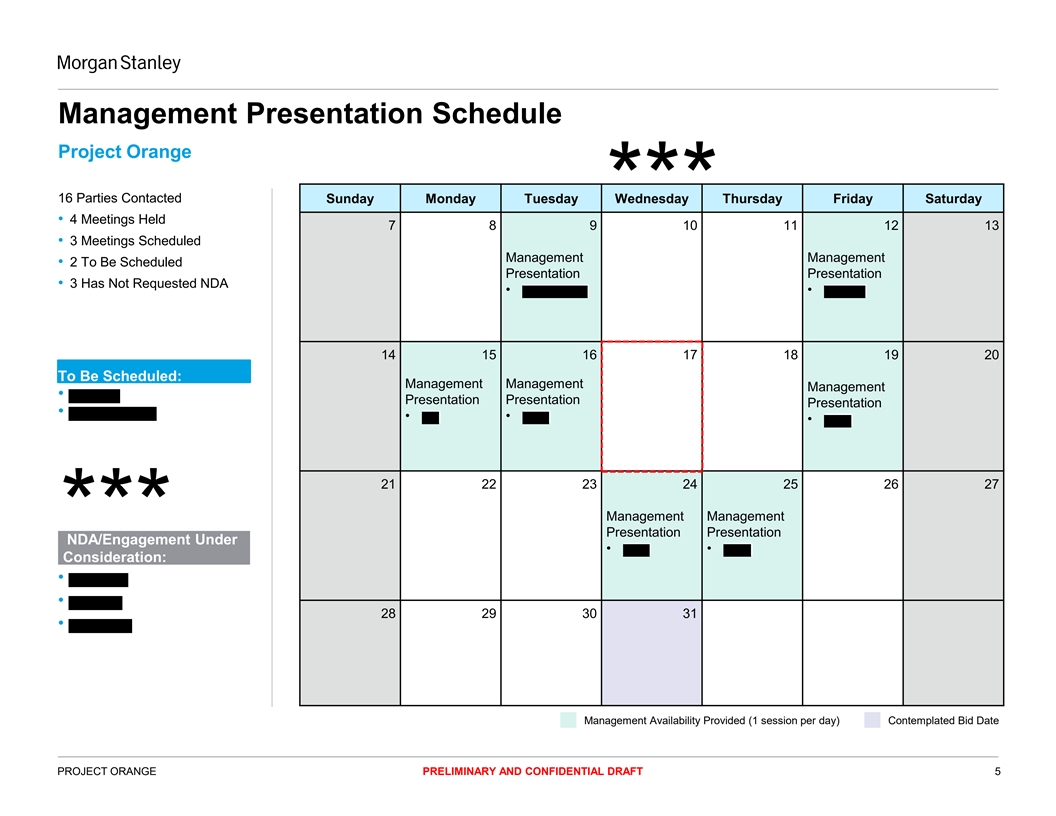
Management Presentation Schedule Project Orange 16 Parties Contacted Sunday Monday Tuesday Wednesday Thursday Friday Saturday *** • 4 Meetings Held 7 8 9 10 11 12 13 • 3 Meetings Scheduled Management Management • 2 To Be Scheduled Presentation Presentation • 3 Has Not Requested NDA • • 14 15 16 17 18 19 20 To Be Scheduled: Management Management Management • Presentation Presentation Presentation • • • • 21 22 23 24 25 26 27 Management Management Presentation Presentation *** NDA/Engagement Under • • Consideration: • • 28 29 30 31 • Management Availability Provided (1 session per day) Contemplated Bid Date PROJECT ORANGE PRELIMINARY AND CONFIDENTIAL DRAFT 5
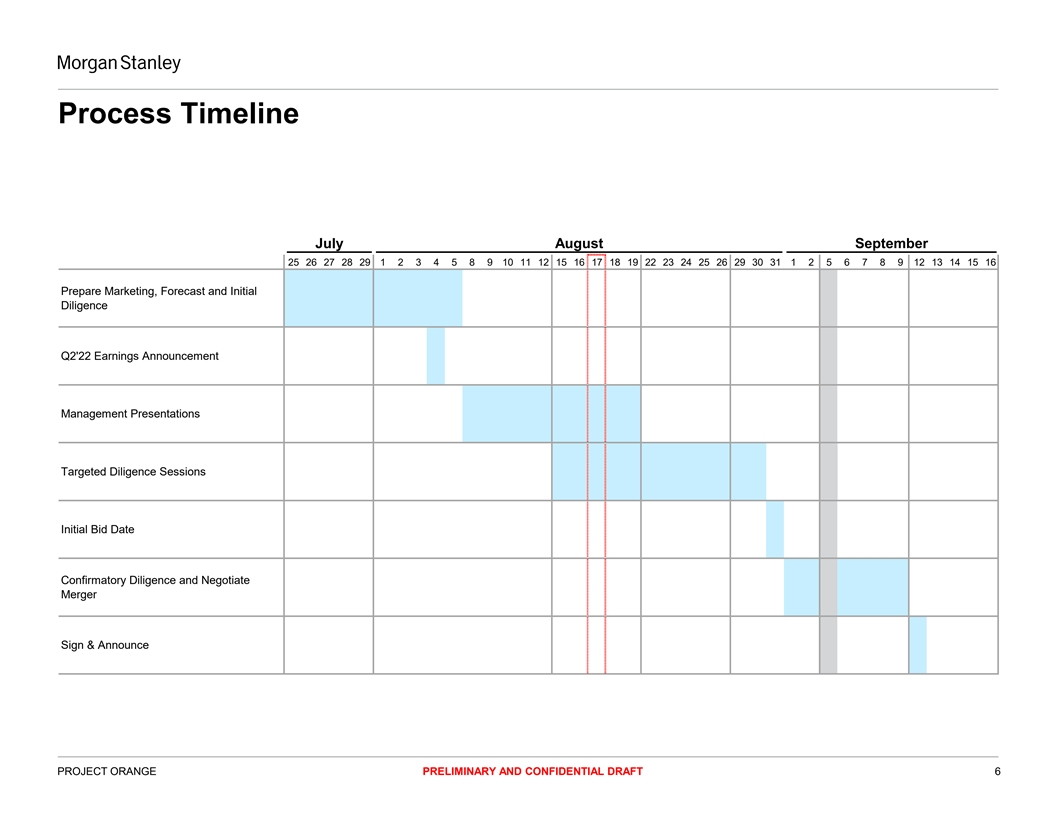
Process Timeline July August September 25 26 27 28 29 1 2 3 4 5 8 9 10 11 12 15 16 17 18 19 22 23 24 25 26 29 30 31 1 2 5 6 7 8 9 12 13 14 15 16 Prepare Marketing, Forecast and Initial Diligence Q2'22 Earnings Announcement Management Presentations Targeted Diligence Sessions Initial Bid Date Confirmatory Diligence and Negotiate Merger Sign & Announce PROJECT ORANGE PRELIMINARY AND CONFIDENTIAL DRAFT 6
SECTION 1 Standalone Forecasts Overview PRELIMINARY AND CONFIDENTIAL DRAFT 7
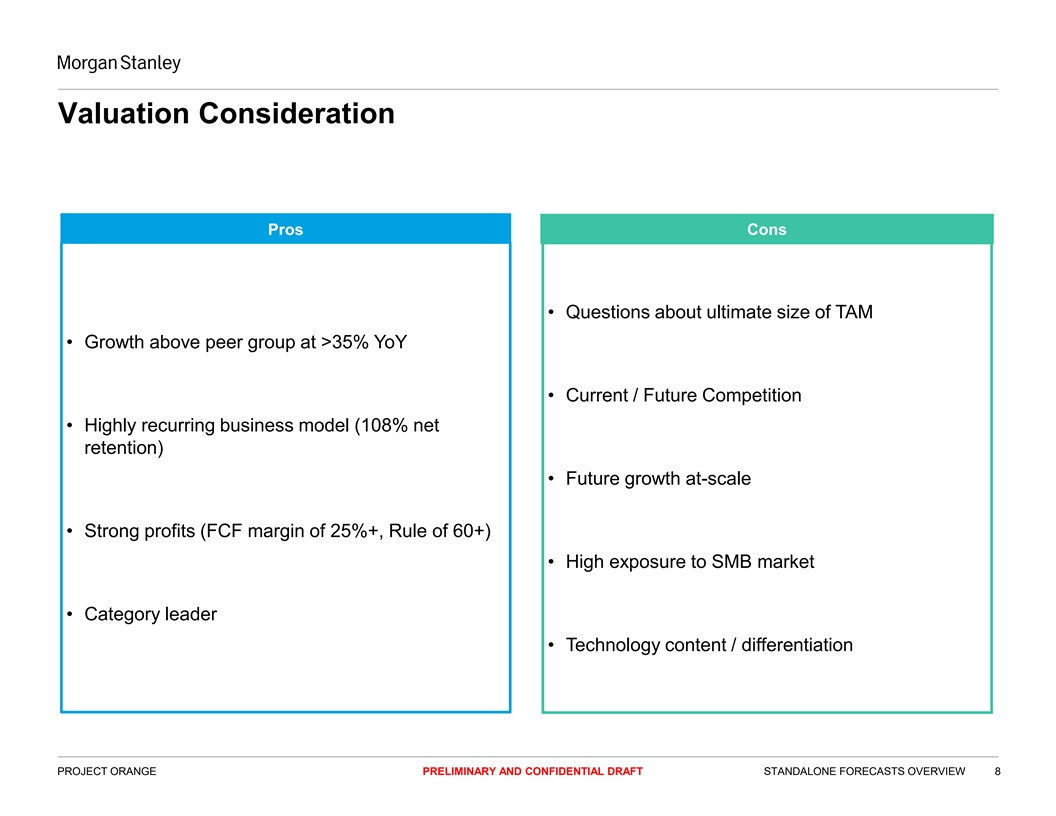
Valuation Consideration Pros Cons • Questions about ultimate size of TAM • Growth above peer group at >35% YoY • Current / Future Competition • Highly recurring business model (108% net retention) • Future growth at-scale • Strong profits (FCF margin of 25%+, Rule of 60+) • High exposure to SMB market • Category leader • Technology content / differentiation PROJECT ORANGE PRELIMINARY AND CONFIDENTIAL DRAFT STANDALONE FORECASTS OVERVIEW 8
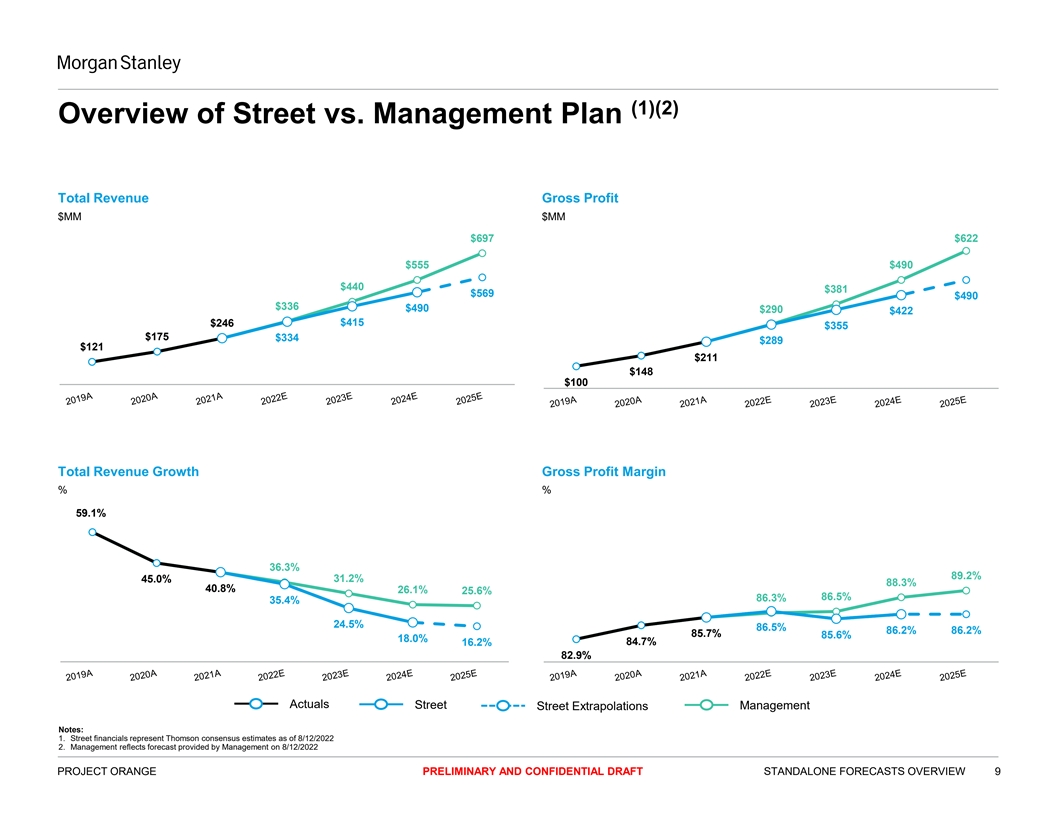
(1)(2) Overview of Street vs. Management Plan Total Revenue Gross Profit $MM $MM $697 $622 $555 $490 $440 $381 $569 $490 $336 $490 $290 $422 $246 $415 $355 $175 $334 $289 $121 $211 $148 $100 Total Revenue Growth Gross Profit Margin % % 59.1% 36.3% 89.2% 45.0% 31.2% 88.3% 40.8% 26.1% 25.6% 86.5% 86.3% 35.4% 24.5% 86.5% 86.2% 86.2% 85.7% 85.6% 18.0% 84.7% 16.2% 82.9% Actuals Street Management Street Extrapolations Notes: 1. Street financials represent Thomson consensus estimates as of 8/12/2022 2. Management reflects forecast provided by Management on 8/12/2022 PROJECT ORANGE PRELIMINARY AND CONFIDENTIAL DRAFT STANDALONE FORECASTS OVERVIEW 9
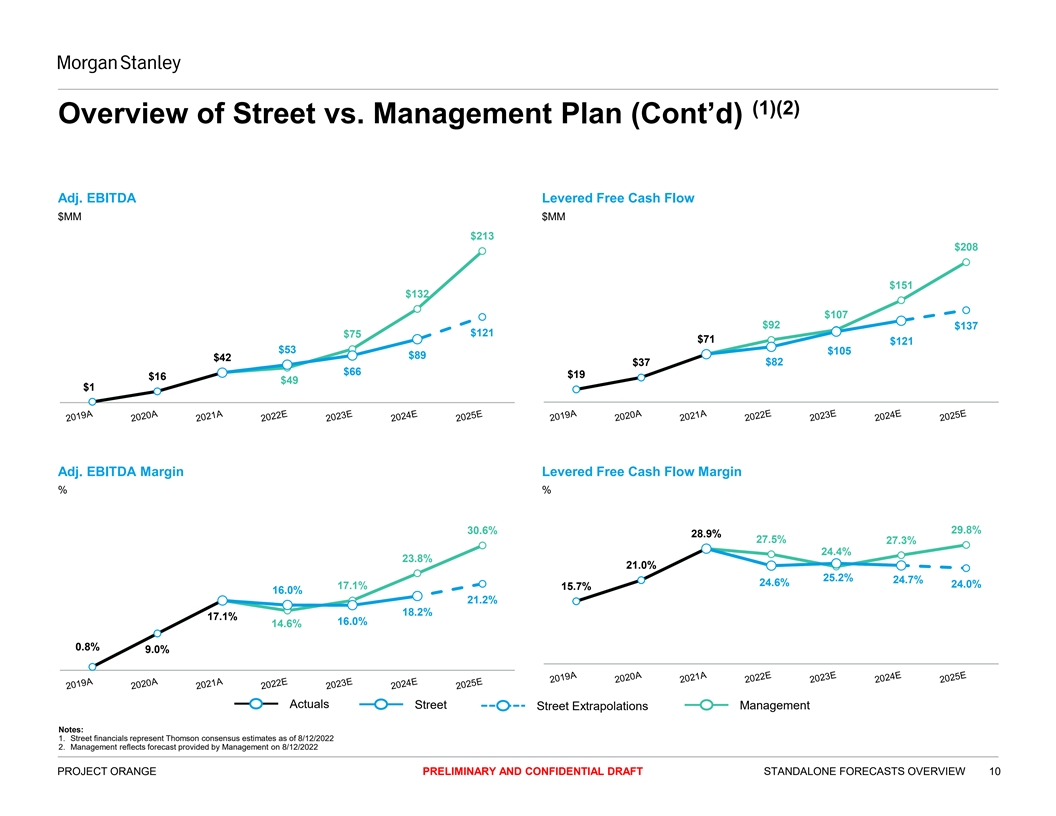
(1)(2) Overview of Street vs. Management Plan (Cont’d) Adj. EBITDA Levered Free Cash Flow $MM $MM $213 $208 $151 $132 $107 $92 $137 $75 $121 $71 $121 $53 $105 $89 $42 $82 $37 $66 $19 $16 $49 $1 Adj. EBITDA Margin Levered Free Cash Flow Margin % % 29.8% 30.6% 28.9% 27.5% 27.3% 24.4% 23.8% 21.0% 25.2% 24.7% 24.6% 24.0% 17.1% 15.7% 16.0% 21.2% 18.2% 17.1% 16.0% 14.6% 0.8% 9.0% Actuals Street Management Street Extrapolations Notes: 1. Street financials represent Thomson consensus estimates as of 8/12/2022 2. Management reflects forecast provided by Management on 8/12/2022 PROJECT ORANGE PRELIMINARY AND CONFIDENTIAL DRAFT STANDALONE FORECASTS OVERVIEW 10
SECTION 2 Preliminary Valuation Perspectives PRELIMINARY AND CONFIDENTIAL DRAFT 11
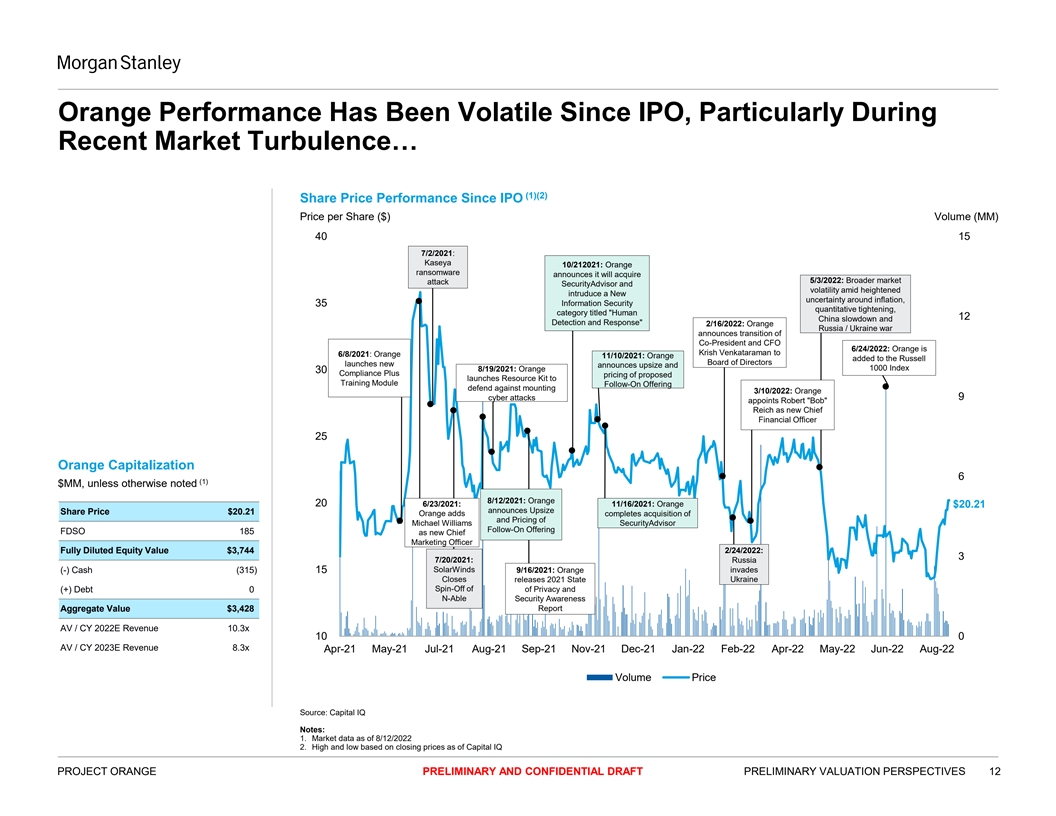
Orange Performance Has Been Volatile Since IPO, Particularly During Recent Market Turbulence… (1)(2) Share Price Performance Since IPO Price per Share ($) Volume (MM) 40 15 7/2/2021: Kaseya 10/212021: Orange ransomware announces it will acquire 5/3/2022: Broader market attack SecurityAdvisor and volatility amid heightened intruduce a New uncertainty around inflation, 35 Information Security quantitative tightening, category titled Human 12 China slowdown and Detection and Response 2/16/2022: Orange Russia / Ukraine war announces transition of Co-President and CFO 6/24/2022: Orange is Krish Venkataraman to 6/8/2021: Orange 11/10/2021: Orange added to the Russell Board of Directors launches new announces upsize and 1000 Index 8/19/2021: Orange 30 Compliance Plus pricing of proposed launches Resource Kit to Training Module Follow-On Offering defend against mounting 3/10/2022: Orange cyber attacks 9 appoints Robert Bob Reich as new Chief Financial Officer 25 Orange Capitalization 6 (1) $MM, unless otherwise noted 8/12/2021: Orange 20 6/23/2021: 11/16/2021: Orange $20.21 announces Upsize Share Price $20.21 Orange adds completes acquisition of and Pricing of Michael Williams SecurityAdvisor Follow-On Offering FDSO 185 as new Chief Marketing Officer Fully Diluted Equity Value $3,744 2/24/2022: 3 7/20/2021: Russia SolarWinds (-) Cash (315) 15 9/16/2021: Orange invades Closes releases 2021 State Ukraine Spin-Off of of Privacy and (+) Debt 0 N-Able Security Awareness Aggregate Value $3,428 Report AV / CY 2022E Revenue 10.3x 10 0 AV / CY 2023E Revenue 8.3x Apr-21 May-21 Jul-21 Aug-21 Sep-21 Nov-21 Dec-21 Jan-22 Feb-22 Apr-22 May-22 Jun-22 Aug-22 Volume Price Source: Capital IQ Notes: 1. Market data as of 8/12/2022 2. High and low based on closing prices as of Capital IQ PROJECT ORANGE PRELIMINARY AND CONFIDENTIAL DRAFT PRELIMINARY VALUATION PERSPECTIVES 12
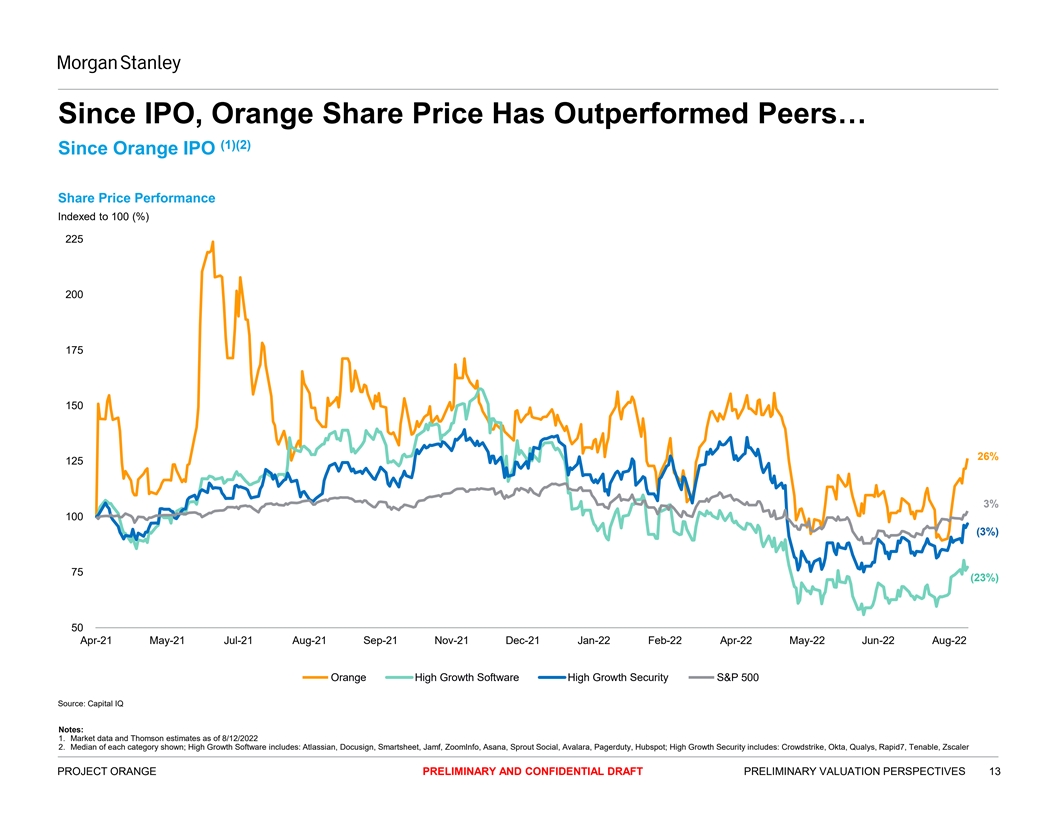
Since IPO, Orange Share Price Has Outperformed Peers… (1)(2) Since Orange IPO Share Price Performance Indexed to 100 (%) 225 200 175 150 26% 125 3% 100 (3%) 75 (23%) 50 Apr-21 May-21 Jul-21 Aug-21 Sep-21 Nov-21 Dec-21 Jan-22 Feb-22 Apr-22 May-22 Jun-22 Aug-22 Orange High Growth Software High Growth Security S&P 500 Source: Capital IQ Notes: 1. Market data and Thomson estimates as of 8/12/2022 2. Median of each category shown; High Growth Software includes: Atlassian, Docusign, Smartsheet, Jamf, ZoomInfo, Asana, Sprout Social, Avalara, Pagerduty, Hubspot; High Growth Security includes: Crowdstrike, Okta, Qualys, Rapid7, Tenable, Zscaler PROJECT ORANGE PRELIMINARY AND CONFIDENTIAL DRAFT PRELIMINARY VALUATION PERSPECTIVES 13
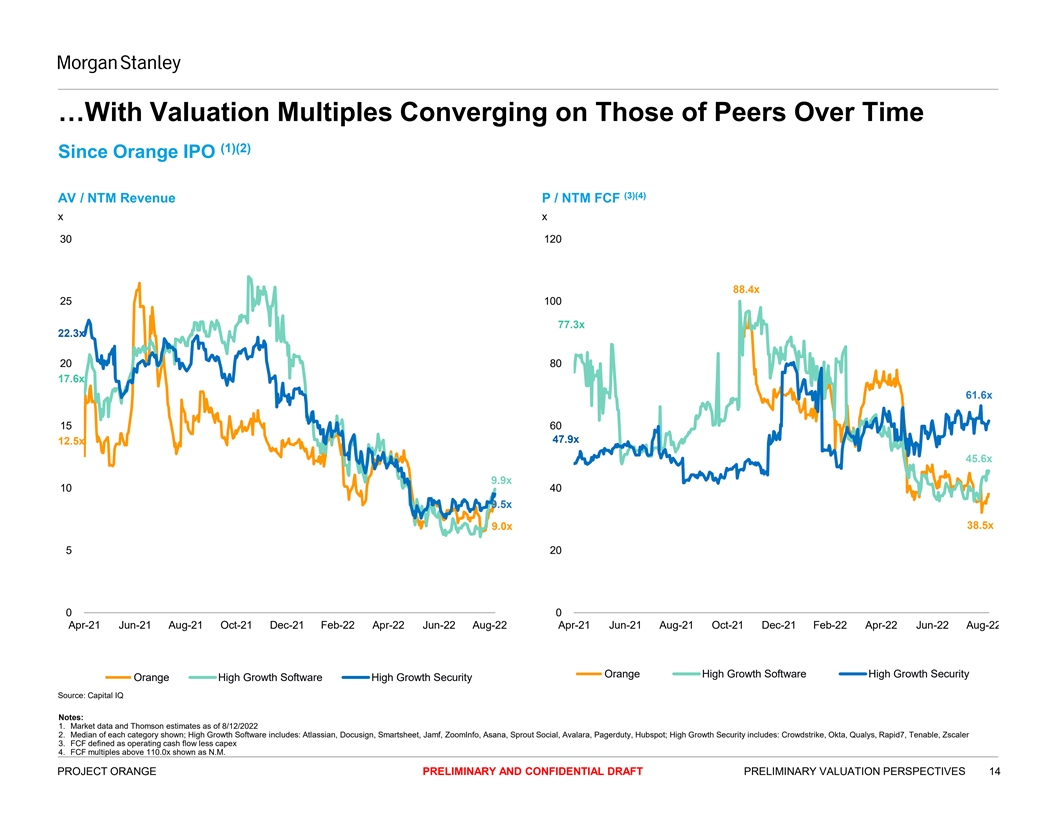
…With Valuation Multiples Converging on Those of Peers Over Time (1)(2) Since Orange IPO (3)(4) AV / NTM Revenue P / NTM FCF x x 30 120 88.4x 25 100 77.3x 22.3x 20 80 17.6x 61.6x 15 60 47.9x 12.5x 45.6x 9.9x 10 40 9.5x 38.5x 9.0x 5 20 0 0 Apr-21 Jun-21 Aug-21 Oct-21 Dec-21 Feb-22 Apr-22 Jun-22 Aug-22 Apr-21 Jun-21 Aug-21 Oct-21 Dec-21 Feb-22 Apr-22 Jun-22 Aug-22 Orange High Growth Software High Growth Security Orange High Growth Software High Growth Security Source: Capital IQ Notes: 1. Market data and Thomson estimates as of 8/12/2022 2. Median of each category shown; High Growth Software includes: Atlassian, Docusign, Smartsheet, Jamf, ZoomInfo, Asana, Sprout Social, Avalara, Pagerduty, Hubspot; High Growth Security includes: Crowdstrike, Okta, Qualys, Rapid7, Tenable, Zscaler 3. FCF defined as operating cash flow less capex 4. FCF multiples above 110.0x shown as N.M. PROJECT ORANGE PRELIMINARY AND CONFIDENTIAL DRAFT PRELIMINARY VALUATION PERSPECTIVES 14
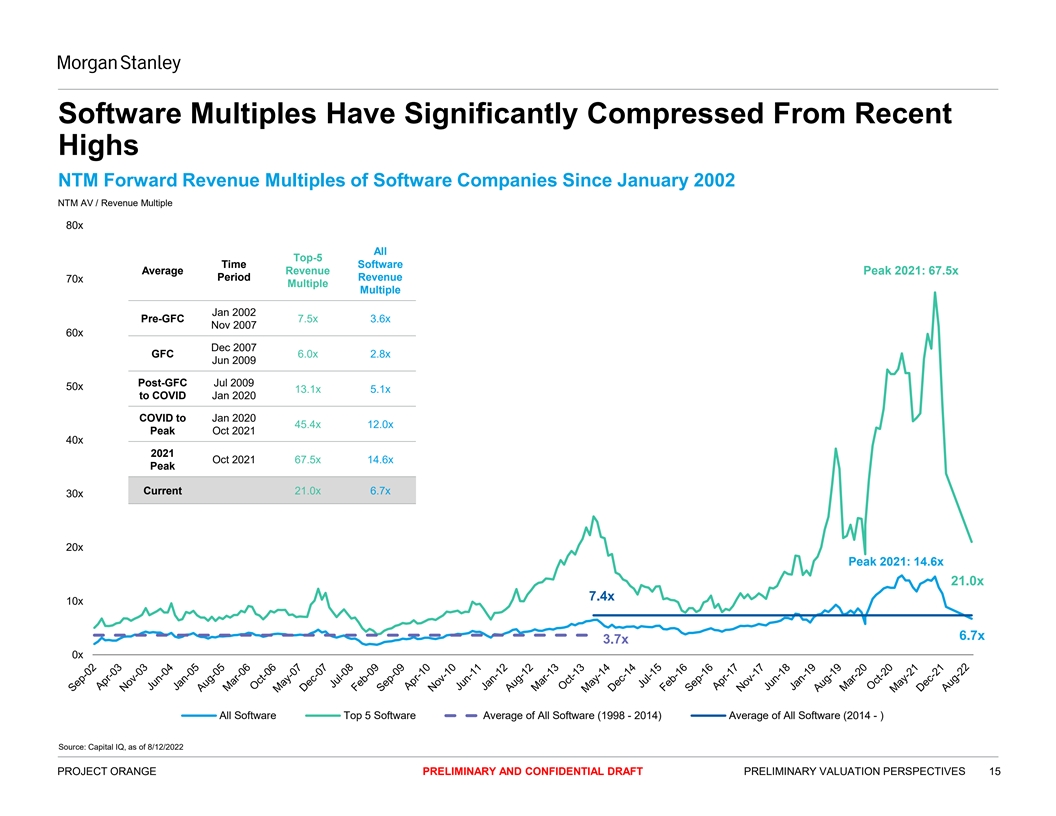
Software Multiples Have Significantly Compressed From Recent Highs NTM Forward Revenue Multiples of Software Companies Since January 2002 NTM AV / Revenue Multiple 80x All Top-5 Time Software Average Revenue Peak 2021: 67.5x Period Revenue 70x Multiple Multiple Jan 2002 Pre-GFC 7.5x 3.6x Nov 2007 60x Dec 2007 GFC 6.0x 2.8x Jun 2009 Post-GFC Jul 2009 50x 13.1x 5.1x to COVID Jan 2020 COVID to Jan 2020 45.4x 12.0x Peak Oct 2021 40x 2021 Oct 2021 67.5x 14.6x Peak Current 21.0x 6.7x 30x 20x Peak 2021: 14.6x 21.0x 7.4x 10x 6.7x 3.7x 0x All Software Top 5 Software Average of All Software (1998 - 2014) Average of All Software (2014 - ) Source: Capital IQ, as of 8/12/2022 PROJECT ORANGE PRELIMINARY AND CONFIDENTIAL DRAFT PRELIMINARY VALUATION PERSPECTIVES 15
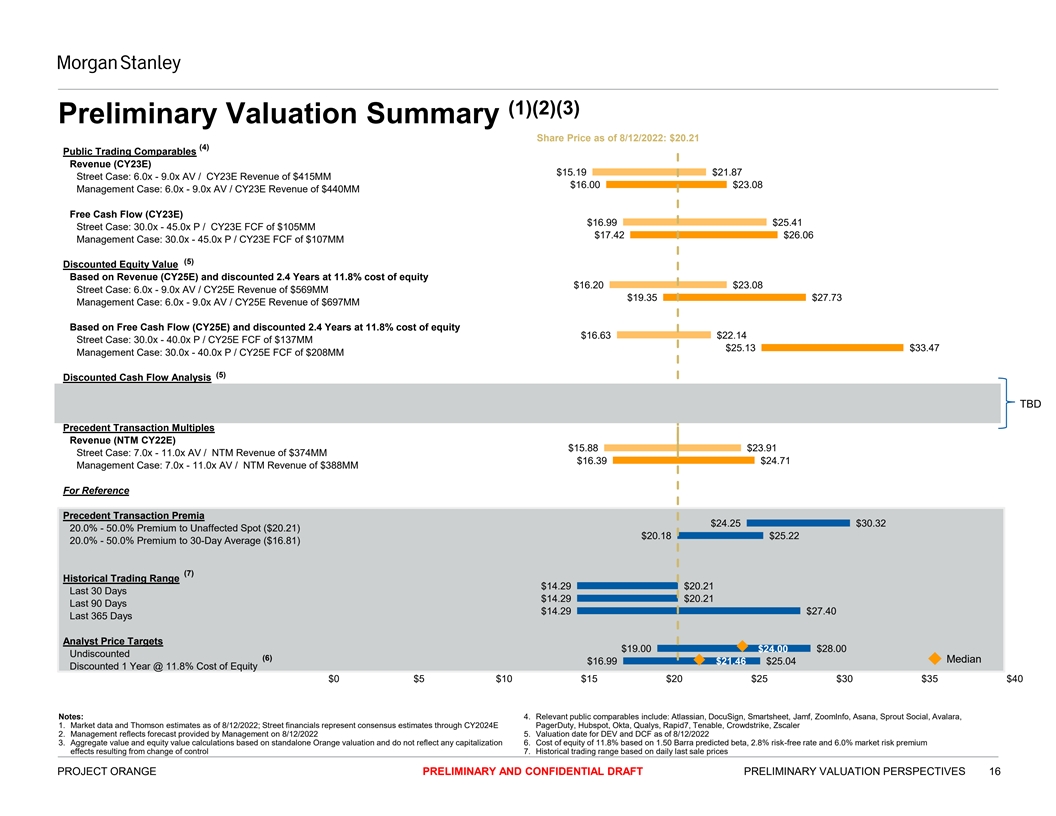
(1)(2)(3) Preliminary Valuation Summary Share Price as of 8/12/2022: $20.21 (4) Public Trading Comparables Revenue (CY23E) $15.19 $21.87 Street Case: 6.0x - 9.0x AV / CY23E Revenue of $415MM $16.00 $23.08 Management Case: 6.0x - 9.0x AV / CY23E Revenue of $440MM Free Cash Flow (CY23E) $16.99 $25.41 Street Case: 30.0x - 45.0x P / CY23E FCF of $105MM $17.42 $26.06 Management Case: 30.0x - 45.0x P / CY23E FCF of $107MM (5) Discounted Equity Value Based on Revenue (CY25E) and discounted 2.4 Years at 11.8% cost of equity $16.20 $23.08 Street Case: 6.0x - 9.0x AV / CY25E Revenue of $569MM $19.35 $27.73 Management Case: 6.0x - 9.0x AV / CY25E Revenue of $697MM Based on Free Cash Flow (CY25E) and discounted 2.4 Years at 11.8% cost of equity $16.63 $22.14 Street Case: 30.0x - 40.0x P / CY25E FCF of $137MM $25.13 $33.47 Management Case: 30.0x - 40.0x P / CY25E FCF of $208MM (5) Discounted Cash Flow Analysis Street Case: 10.8% - 12.8% WACC; 3.0% - 4.0% PGR Management Case: 10.8% - 12.8% WACC; 3.0% - 4.0% PGR TBD Precedent Transaction Multiples Revenue (NTM CY22E) $15.88 $23.91 Street Case: 7.0x - 11.0x AV / NTM Revenue of $374MM $16.39 $24.71 Management Case: 7.0x - 11.0x AV / NTM Revenue of $388MM For Reference Precedent Transaction Premia $24.25 $30.32 20.0% - 50.0% Premium to Unaffected Spot ($20.21) $20.18 $25.22 20.0% - 50.0% Premium to 30-Day Average ($16.81) (7) Historical Trading Range $14.29 $20.21 Last 30 Days $14.29 $20.21 Last 90 Days $14.29 $27.40 Last 365 Days Analyst Price Targets $19.00 $24.00 $28.00 Undiscounted (6) Median $16.99 $21.46 $25.04 Discounted 1 Year @ 11.8% Cost of Equity $0 $5 $10 $15 $20 $25 $30 $35 $40 Notes: 4. Relevant public comparables include: Atlassian, DocuSign, Smartsheet, Jamf, ZoomInfo, Asana, Sprout Social, Avalara, 1. Market data and Thomson estimates as of 8/12/2022; Street financials represent consensus estimates through CY2024E PagerDuty, Hubspot, Okta, Qualys, Rapid7, Tenable, Crowdstrike, Zscaler 2. Management reflects forecast provided by Management on 8/12/2022 5. Valuation date for DEV and DCF as of 8/12/2022 3. Aggregate value and equity value calculations based on standalone Orange valuation and do not reflect any capitalization 6. Cost of equity of 11.8% based on 1.50 Barra predicted beta, 2.8% risk-free rate and 6.0% market risk premium effects resulting from change of control 7. Historical trading range based on daily last sale prices PROJECT ORANGE PRELIMINARY AND CONFIDENTIAL DRAFT PRELIMINARY VALUATION PERSPECTIVES 16
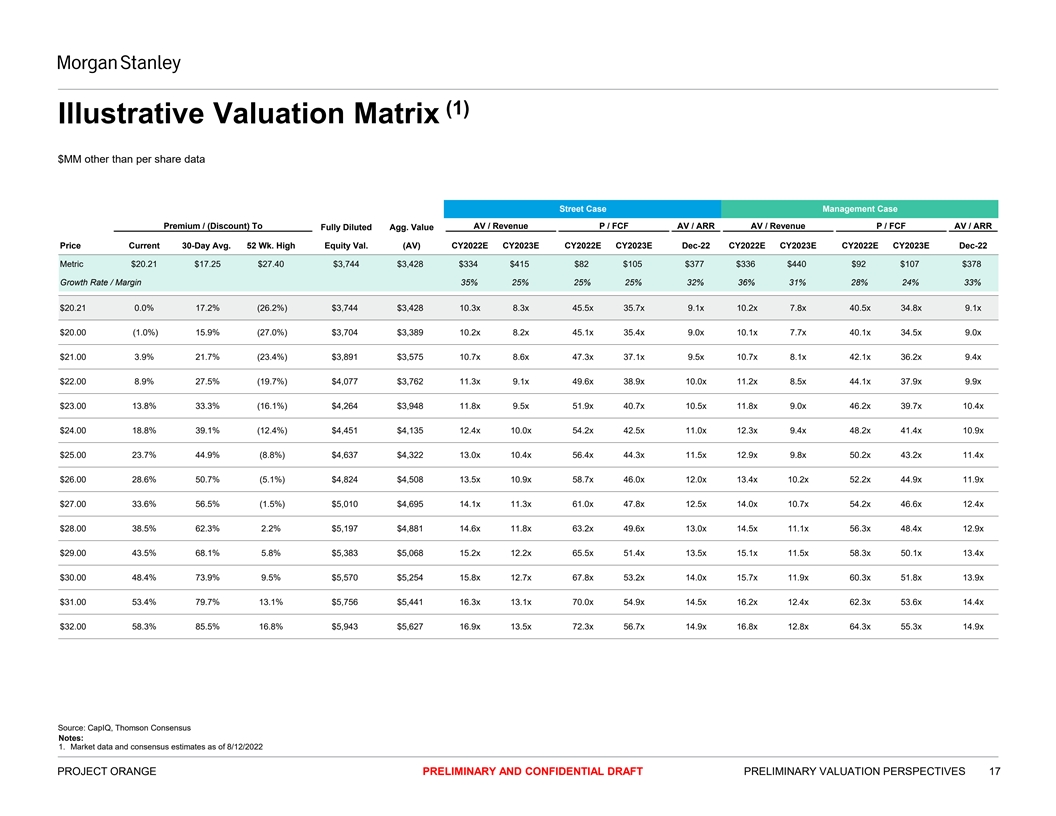
(1) Illustrative Valuation Matrix $MM other than per share data Street Case Management Case Premium / (Discount) To AV / Revenue P / FCF AV / ARR AV / Revenue P / FCF AV / ARR Fully Diluted Agg. Value Price Current 30-Day Avg. 52 Wk. High Equity Val. (AV) CY2022E CY2023E CY2022E CY2023E Dec-22 CY2022E CY2023E CY2022E CY2023E Dec-22 Metric $20.21 $17.25 $27.40 $3,744 $3,428 $334 $415 $82 $105 $377 $336 $440 $92 $107 $378 Growth Rate / Margin 35% 25% 25% 25% 32% 36% 31% 28% 24% 33% $20.21 0.0% 17.2% (26.2%) $3,744 $3,428 10.3x 8.3x 45.5x 35.7x 9.1x 10.2x 7.8x 40.5x 34.8x 9.1x $20.00 (1.0%) 15.9% (27.0%) $3,704 $3,389 10.2x 8.2x 45.1x 35.4x 9.0x 10.1x 7.7x 40.1x 34.5x 9.0x $21.00 3.9% 21.7% (23.4%) $3,891 $3,575 10.7x 8.6x 47.3x 37.1x 9.5x 10.7x 8.1x 42.1x 36.2x 9.4x $22.00 8.9% 27.5% (19.7%) $4,077 $3,762 11.3x 9.1x 49.6x 38.9x 10.0x 11.2x 8.5x 44.1x 37.9x 9.9x $23.00 13.8% 33.3% (16.1%) $4,264 $3,948 11.8x 9.5x 51.9x 40.7x 10.5x 11.8x 9.0x 46.2x 39.7x 10.4x $24.00 18.8% 39.1% (12.4%) $4,451 $4,135 12.4x 10.0x 54.2x 42.5x 11.0x 12.3x 9.4x 48.2x 41.4x 10.9x $25.00 23.7% 44.9% (8.8%) $4,637 $4,322 13.0x 10.4x 56.4x 44.3x 11.5x 12.9x 9.8x 50.2x 43.2x 11.4x $26.00 28.6% 50.7% (5.1%) $4,824 $4,508 13.5x 10.9x 58.7x 46.0x 12.0x 13.4x 10.2x 52.2x 44.9x 11.9x $27.00 33.6% 56.5% (1.5%) $5,010 $4,695 14.1x 11.3x 61.0x 47.8x 12.5x 14.0x 10.7x 54.2x 46.6x 12.4x $28.00 38.5% 62.3% 2.2% $5,197 $4,881 14.6x 11.8x 63.2x 49.6x 13.0x 14.5x 11.1x 56.3x 48.4x 12.9x (4) $29.00 43.5% 68.1% 5.8% $5,383 $5,068 15.2x 12.2x 65.5x 51.4x 13.5x 15.1x 11.5x 58.3x 50.1x 13.4x $30.00 48.4% 73.9% 9.5% $5,570 $5,254 15.8x 12.7x 67.8x 53.2x 14.0x 15.7x 11.9x 60.3x 51.8x 13.9x $31.00 53.4% 79.7% 13.1% $5,756 $5,441 16.3x 13.1x 70.0x 54.9x 14.5x 16.2x 12.4x 62.3x 53.6x 14.4x $32.00 58.3% 85.5% 16.8% $5,943 $5,627 16.9x 13.5x 72.3x 56.7x 14.9x 16.8x 12.8x 64.3x 55.3x 14.9x (4) Source: CapIQ, Thomson Consensus Notes: 1. Market data and consensus estimates as of 8/12/2022 PROJECT ORANGE PRELIMINARY AND CONFIDENTIAL DRAFT PRELIMINARY VALUATION PERSPECTIVES 17
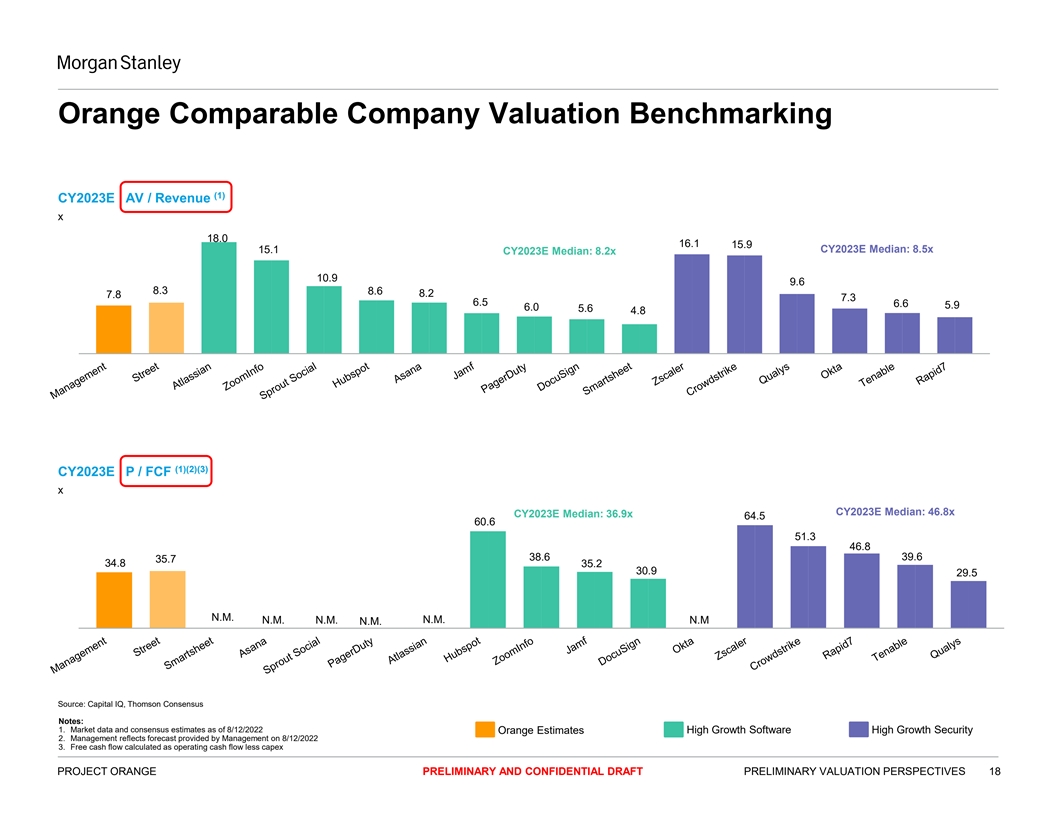
Orange Comparable Company Valuation Benchmarking (1) CY2023E AV / Revenue x 18.0 16.1 15.9 15.1 CY2023E Median: 8.5x CY2023E Median: 8.2x 10.9 9.6 8.3 8.6 8.2 7.8 7.3 6.5 6.6 5.9 6.0 5.6 4.8 (1)(2)(3) CY2023E P / FCF x CY2023E Median: 46.8x CY2023E Median: 36.9x 64.5 60.6 51.3 46.8 39.6 38.6 35.7 34.8 35.2 30.9 29.5 N.M. N.M. N.M. N.M. N.M N.M. Source: Capital IQ, Thomson Consensus Notes: 1. Market data and consensus estimates as of 8/12/2022 High Growth Software High Growth Security Orange Estimates 2. Management reflects forecast provided by Management on 8/12/2022 3. Free cash flow calculated as operating cash flow less capex PROJECT ORANGE PRELIMINARY AND CONFIDENTIAL DRAFT PRELIMINARY VALUATION PERSPECTIVES 18
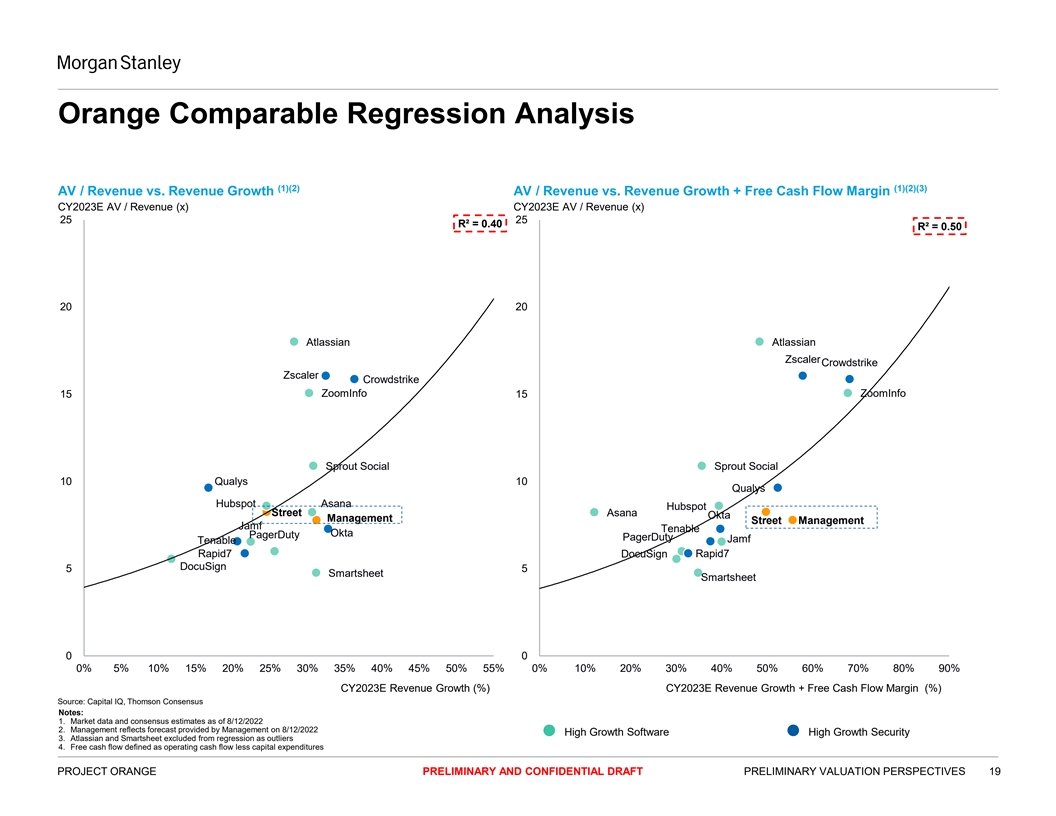
Orange Comparable Regression Analysis (1)(2) (1)(2)(3) AV / Revenue vs. Revenue Growth AV / Revenue vs. Revenue Growth + Free Cash Flow Margin CY2023E AV / Revenue (x) CY2023E AV / Revenue (x) 25 25 R² = 0.40 R² = 0.50 20 20 Atlassian Atlassian Zscaler Crowdstrike Zscaler Crowdstrike 15 ZoomInfo 15 ZoomInfo Sprout Social Sprout Social 10 Qualys 10 Qualys Hubspot Asana Hubspot Street Asana Okta Management Street Management Jamf Tenable Okta PagerDuty PagerDuty Jamf Tenable Rapid7 DocuSign Rapid7 DocuSign 5 5 Smartsheet Smartsheet 0 0 0% 5% 10% 15% 20% 25% 30% 35% 40% 45% 50% 55% 0% 10% 20% 30% 40% 50% 60% 70% 80% 90% CY2023E Revenue Growth (%) CY2023E Revenue Growth + Free Cash Flow Margin (%) Source: Capital IQ, Thomson Consensus Notes: 1. Market data and consensus estimates as of 8/12/2022 2. Management reflects forecast provided by Management on 8/12/2022 High Growth Software High Growth Security 3. Atlassian and Smartsheet excluded from regression as outliers 4. Free cash flow defined as operating cash flow less capital expenditures PROJECT ORANGE PRELIMINARY AND CONFIDENTIAL DRAFT PRELIMINARY VALUATION PERSPECTIVES 19
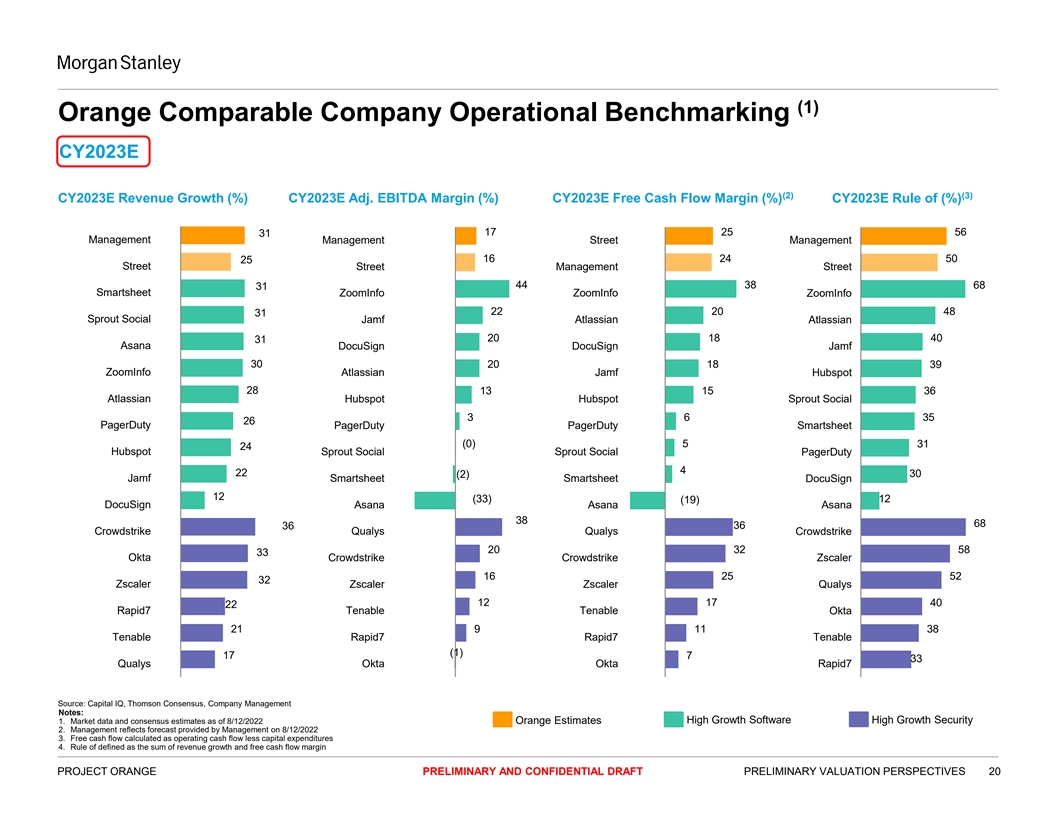
(1) Orange Comparable Company Operational Benchmarking CY2023E (2) (3) CY2023E Revenue Growth (%) CY2023E Adj. EBITDA Margin (%) CY2023E Free Cash Flow Margin (%) CY2023E Rule of (%) 17 25 56 31 Management Management Street Management 16 24 50 25 Street Street Management Street 44 38 68 31 Smartsheet ZoomInfo ZoomInfo ZoomInfo 22 20 48 31 Sprout Social Jamf Atlassian Atlassian 20 18 40 31 Asana DocuSign DocuSign Jamf 30 20 18 39 ZoomInfo Atlassian Jamf Hubspot 28 13 15 36 Atlassian Hubspot Hubspot Sprout Social 3 6 35 26 PagerDuty PagerDuty PagerDuty Smartsheet (0) 5 31 24 Hubspot Sprout Social Sprout Social PagerDuty 4 22 30 (2) Jamf Smartsheet Smartsheet DocuSign 12 (33) 12 (19) DocuSign Asana Asana Asana 38 68 36 36 Crowdstrike Qualys Qualys Crowdstrike 20 32 58 33 Okta Crowdstrike Crowdstrike Zscaler 16 25 52 32 Zscaler Zscaler Zscaler Qualys 12 17 40 22 Rapid7 Tenable Tenable Okta 21 9 11 38 Tenable Rapid7 Rapid7 Tenable (1) 17 7 33 Qualys Okta Okta Rapid7 Source: Capital IQ, Thomson Consensus, Company Management Notes: 1. Market data and consensus estimates as of 8/12/2022 Orange Estimates High Growth Software High Growth Security 2. Management reflects forecast provided by Management on 8/12/2022 3. Free cash flow calculated as operating cash flow less capital expenditures 4. Rule of defined as the sum of revenue growth and free cash flow margin PROJECT ORANGE PRELIMINARY AND CONFIDENTIAL DRAFT PRELIMINARY VALUATION PERSPECTIVES 20
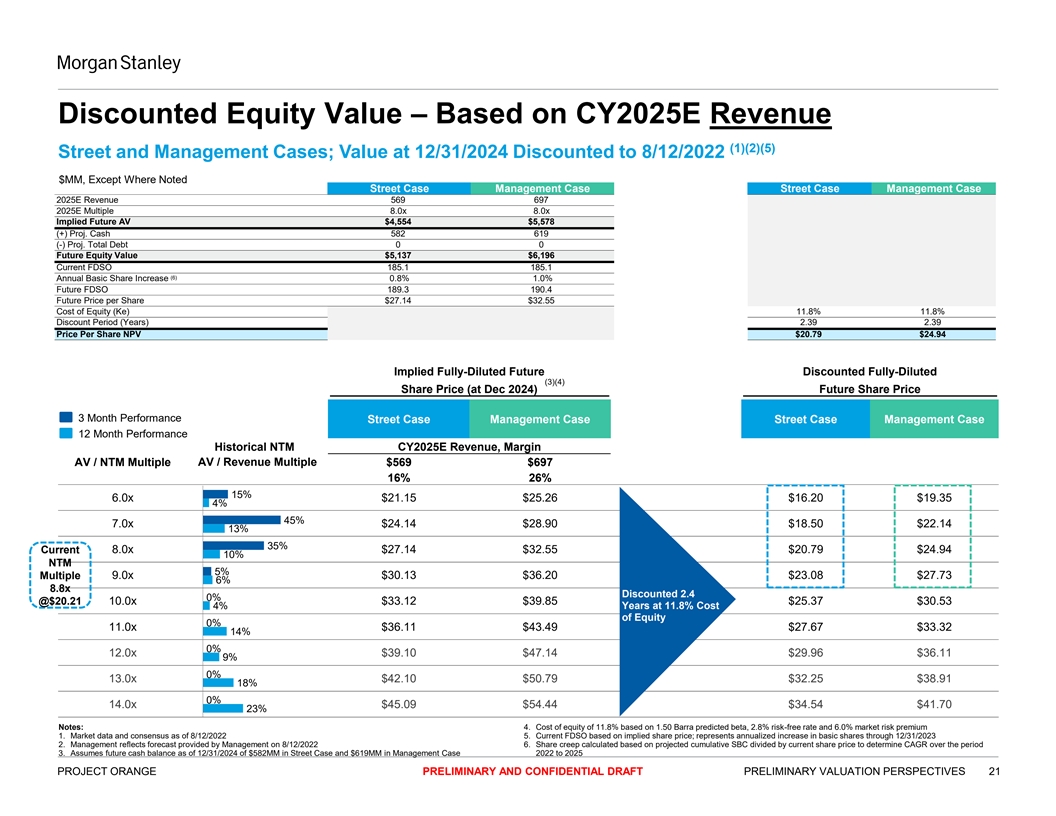
Discounted Equity Value – Based on CY2025E Revenue (1)(2)(5) Street and Management Cases; Value at 12/31/2024 Discounted to 8/12/2022 $MM, Except Where Noted Street Case Management Case Street Case Management Case 2025E Revenue 569 697 2025E Multiple 8.0x 8.0x Implied Future AV $4,554 $5,578 (+) Proj. Cash 582 619 (-) Proj. Total Debt 0 0 Future Equity Value $5,137 $6,196 Current FDSO 185.1 185.1 (6) Annual Basic Share Increase 0.8% 1.0% Future FDSO 189.3 190.4 Future Price per Share $27.14 $32.55 Cost of Equity (Ke) 11.8% 11.8% Discount Period (Years) 2.39 2.39 Price Per Share NPV $20.79 $24.94 Implied Fully-Diluted Future Discounted Fully-Diluted (3)(4) Share Price (at Dec 2024) Future Share Price 3 Month Performance Street Case Management Case Street Case Management Case 12 Month Performance Historical NTM CY2025E Revenue, Margin AV / NTM Multiple AV / Revenue Multiple $569 $697 16% 26% 15% 6.0x $21.15 $25.26 $16.20 $19.35 4% 45% 7.0x $24.14 $28.90 $18.50 $22.14 13% 35% Current 8.0x $27.14 $32.55 $20.79 $24.94 10% NTM 5% 9.0x $30.13 $36.20 $23.08 $27.73 Multiple 6% 8.8x Discounted 2.4 0% @$20.21 10.0x $33.12 $39.85 $25.37 $30.53 4% Years at 11.8% Cost of Equity 0% 11.0x $36.11 $43.49 $27.67 $33.32 14% 0% 12.0x $39.10 $47.14 $29.96 $36.11 9% 0% 13.0x $42.10 $50.79 $32.25 $38.91 18% 0% 14.0x $45.09 $54.44 $34.54 $41.70 23% Notes: 4. Cost of equity of 11.8% based on 1.50 Barra predicted beta, 2.8% risk-free rate and 6.0% market risk premium 1. Market data and consensus as of 8/12/2022 5. Current FDSO based on implied share price; represents annualized increase in basic shares through 12/31/2023 2. Management reflects forecast provided by Management on 8/12/2022 6. Share creep calculated based on projected cumulative SBC divided by current share price to determine CAGR over the period 3. Assumes future cash balance as of 12/31/2024 of $582MM in Street Case and $619MM in Management Case 2022 to 2025 PROJECT ORANGE PRELIMINARY AND CONFIDENTIAL DRAFT PRELIMINARY VALUATION PERSPECTIVES 21
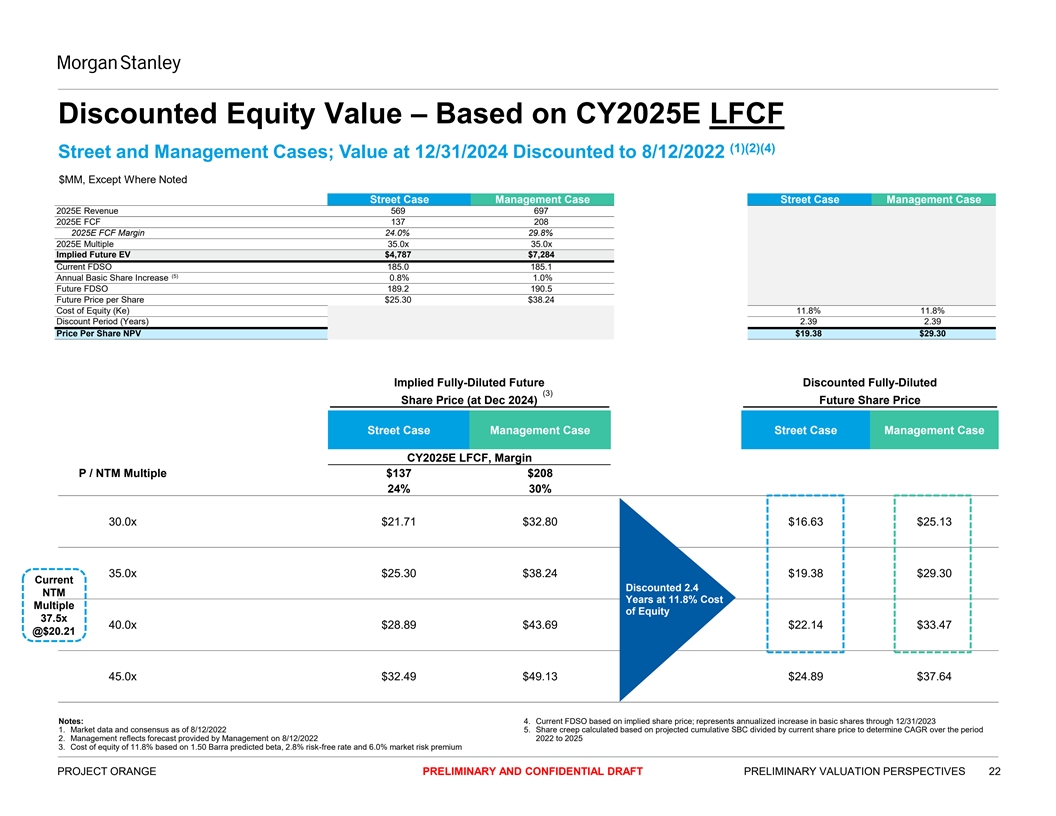
Discounted Equity Value – Based on CY2025E LFCF (1)(2)(4) Street and Management Cases; Value at 12/31/2024 Discounted to 8/12/2022 $MM, Except Where Noted Street Case Management Case Street Case Management Case 2025E Revenue 569 697 2025E FCF 137 208 2025E FCF Margin 24.0% 29.8% 2025E Multiple 35.0x 35.0x Implied Future EV $4,787 $7,284 Current FDSO 185.0 185.1 (5) Annual Basic Share Increase 0.8% 1.0% Future FDSO 189.2 190.5 Future Price per Share $25.30 $38.24 Cost of Equity (Ke) 11.8% 11.8% Discount Period (Years) 2.39 2.39 Price Per Share NPV $19.38 $29.30 Implied Fully-Diluted Future Discounted Fully-Diluted (3) Share Price (at Dec 2024) Future Share Price Street Case Management Case Street Case Management Case CY2025E LFCF, Margin P / NTM Multiple $137 $208 24% 30% 30.0x $21.71 $32.80 $16.63 $25.13 35.0x $25.30 $38.24 $19.38 $29.30 Current Discounted 2.4 NTM Years at 11.8% Cost Multiple of Equity 37.5x 40.0x $28.89 $43.69 $22.14 $33.47 @$20.21 45.0x $32.49 $49.13 $24.89 $37.64 Notes: 4. Current FDSO based on implied share price; represents annualized increase in basic shares through 12/31/2023 1. Market data and consensus as of 8/12/2022 5. Share creep calculated based on projected cumulative SBC divided by current share price to determine CAGR over the period 2. Management reflects forecast provided by Management on 8/12/2022 2022 to 2025 3. Cost of equity of 11.8% based on 1.50 Barra predicted beta, 2.8% risk-free rate and 6.0% market risk premium PROJECT ORANGE PRELIMINARY AND CONFIDENTIAL DRAFT PRELIMINARY VALUATION PERSPECTIVES 22
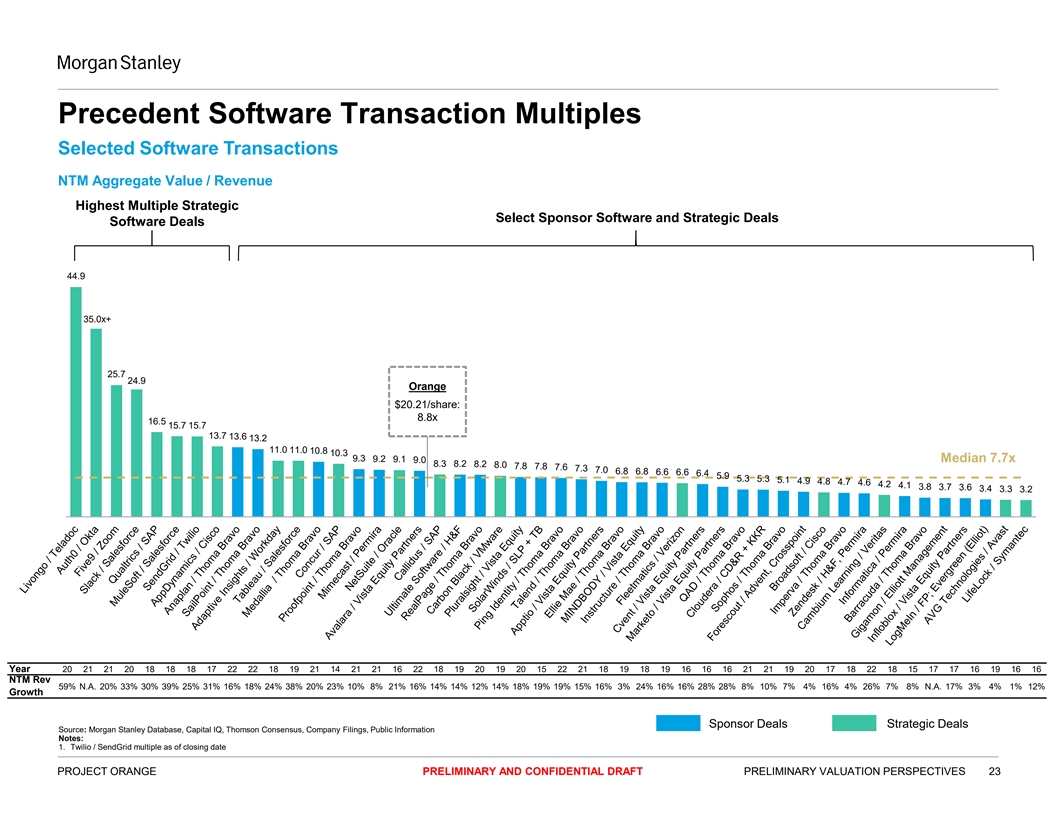
Precedent Software Transaction Multiples Selected Software Transactions NTM Aggregate Value / Revenue Highest Multiple Strategic Select Sponsor Software and Strategic Deals Software Deals 44.9 ~36.7 35.0x+ 25.7 24.9 Orange $20.21/share: 8.8x 16.5 15.7 15.7 13.7 13.6 13.2 11.0 11.0 10.8 10.3 9.3 9.2 9.1 9.0 Median 7.7x 8.3 8.2 8.2 8.0 7.8 7.8 7.6 7.3 7.0 6.8 6.8 6.6 6.6 6.4 5.9 5.3 5.3 5.1 4.9 4.8 4.7 4.6 4.2 4.1 3.8 3.7 3.6 3.4 3.3 3.2 Year 20 21 21 20 18 18 18 17 22 22 18 19 21 14 21 21 16 22 18 19 20 19 20 15 22 21 18 19 18 19 16 16 16 21 21 19 20 17 18 22 18 15 17 17 16 19 16 16 NTM Rev 59% N.A. 20% 33% 30% 39% 25% 31% 16% 18% 24% 38% 20% 23% 10% 8% 21% 16% 14% 14% 12% 14% 18% 19% 19% 15% 16% 3% 24% 16% 16% 28% 28% 8% 10% 7% 4% 16% 4% 26% 7% 8% N.A. 17% 3% 4% 1% 12% Growth Sponsor Deals Strategic Deals Source: Morgan Stanley Database, Capital IQ, Thomson Consensus, Company Filings, Public Information Notes: 1. Twilio / SendGrid multiple as of closing date PROJECT ORANGE PRELIMINARY AND CONFIDENTIAL DRAFT PRELIMINARY VALUATION PERSPECTIVES 23
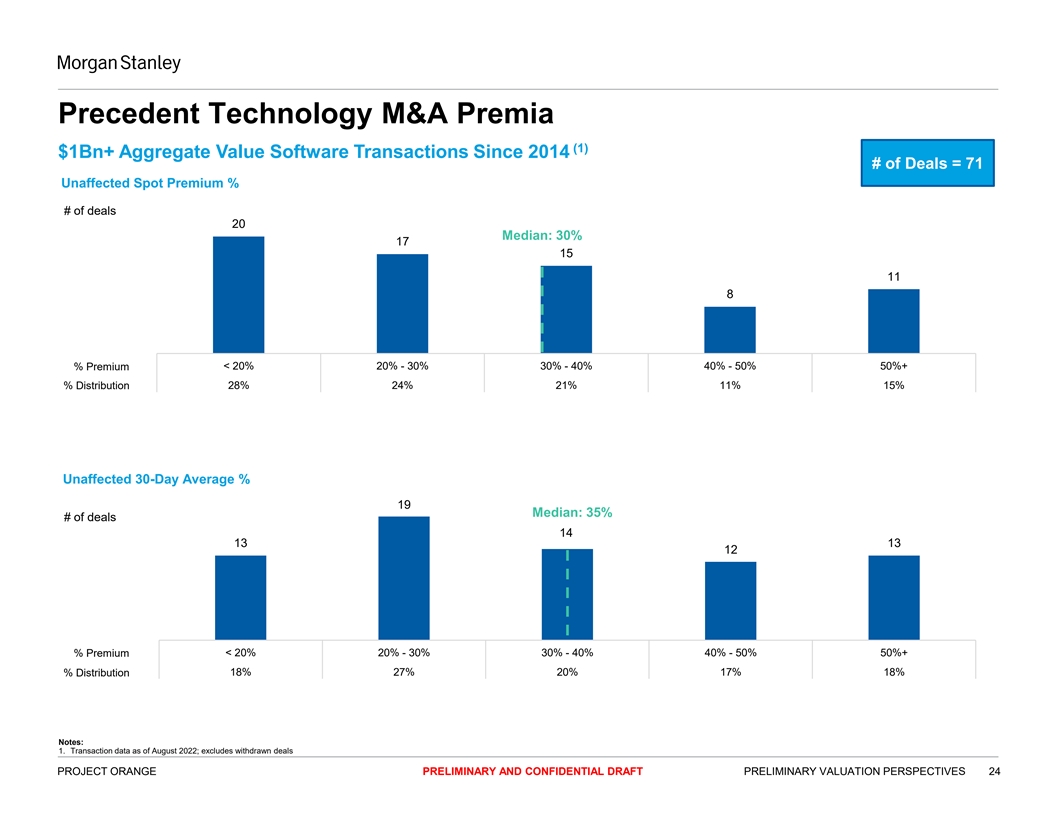
Precedent Technology M&A Premia (1) $1Bn+ Aggregate Value Software Transactions Since 2014 # of Deals = 71 Unaffected Spot Premium % # of deals 20 Median: 30% 17 15 11 8 < 20% 20% - 30% 30% - 40% 40% - 50% 50%+ % Premium % Distribution 28% 24% 21% 11% 15% Unaffected 30-Day Average % 19 Median: 35% # of deals 14 13 13 12 < 20% 20% - 30% 30% - 40% 40% - 50% 50%+ % Premium 18% 27% 20% 17% 18% % Distribution Notes: 1. Transaction data as of August 2022; excludes withdrawn deals PROJECT ORANGE PRELIMINARY AND CONFIDENTIAL DRAFT PRELIMINARY VALUATION PERSPECTIVES 24
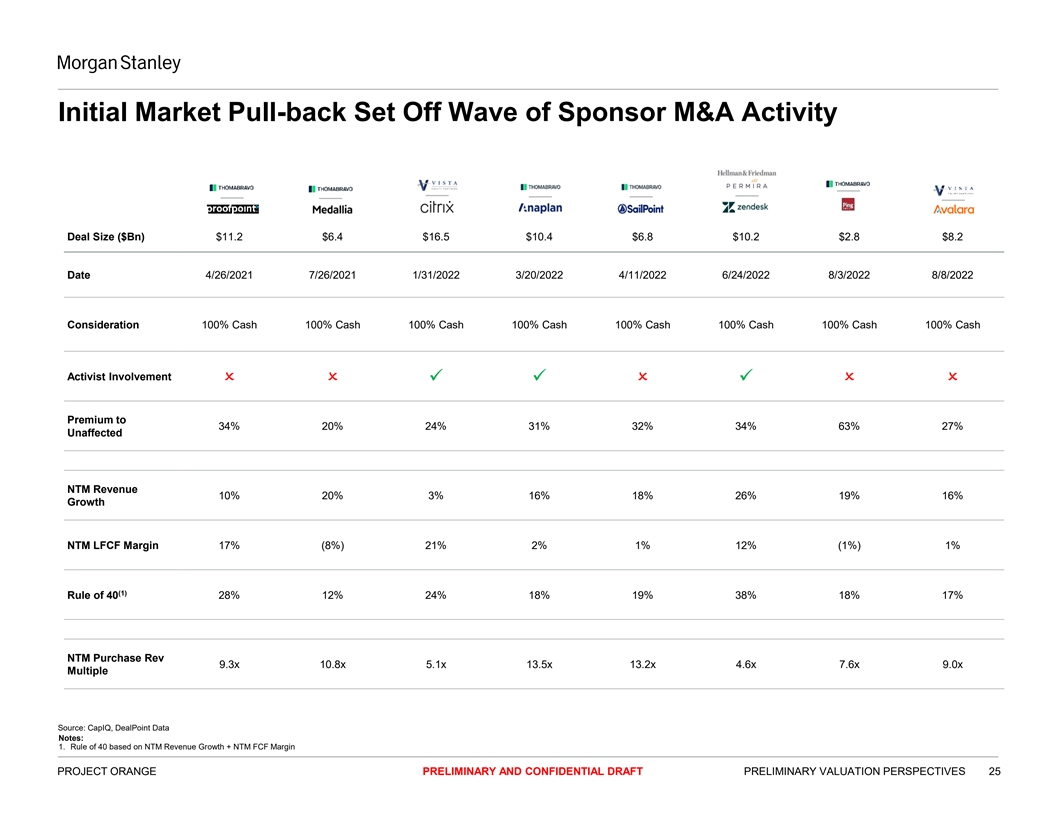
Initial Market Pull-back Set Off Wave of Sponsor M&A Activity Deal Size ($Bn) $11.2 $6.4 $16.5 $10.4 $6.8 $10.2 $2.8 $8.2 Date 4/26/2021 7/26/2021 1/31/2022 3/20/2022 4/11/2022 6/24/2022 8/3/2022 8/8/2022 Consideration 100% Cash 100% Cash 100% Cash 100% Cash 100% Cash 100% Cash 100% Cash 100% Cash Activist Involvement ����✓✓��✓���� Premium to 34% 20% 24% 31% 32% 34% 63% 27% Unaffected NTM Revenue 10% 20% 3% 16% 18% 26% 19% 16% Growth NTM LFCF Margin 17% (8%) 21% 2% 1% 12% (1%) 1% (1) Rule of 40 28% 12% 24% 18% 19% 38% 18% 17% NTM Purchase Rev 9.3x 10.8x 5.1x 13.5x 13.2x 4.6x 7.6x 9.0x Multiple Source: CapIQ, DealPoint Data Notes: 1. Rule of 40 based on NTM Revenue Growth + NTM FCF Margin PROJECT ORANGE PRELIMINARY AND CONFIDENTIAL DRAFT PRELIMINARY VALUATION PERSPECTIVES 25
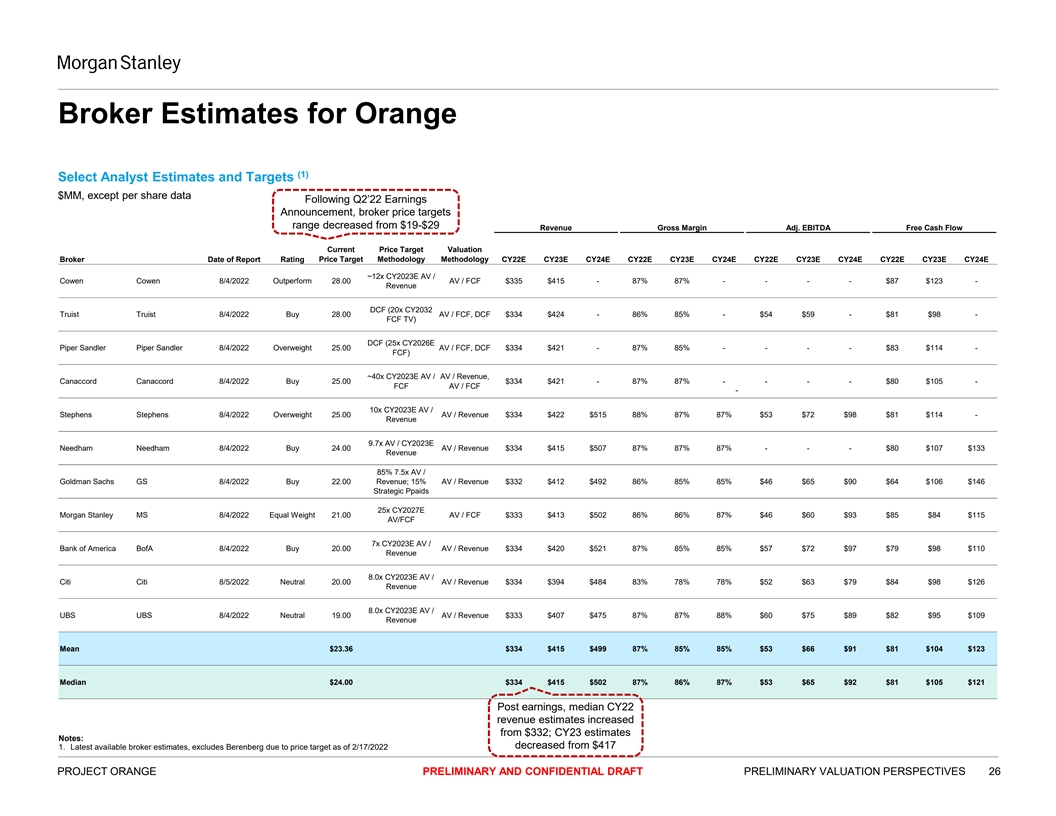
Broker Estimates for Orange (1) Select Analyst Estimates and Targets $MM, except per share data Following Q2’22 Earnings Announcement, broker price targets range decreased from $19-$29 Revenue Gross Margin Adj. EBITDA Free Cash Flow Current Price Target Valuation Broker Date of Report Rating Price Target Methodology Methodology CY22E CY23E CY24E CY22E CY23E CY24E CY22E CY23E CY24E CY22E CY23E CY24E ~12x CY2023E AV / Cowen Cowen 8/4/2022 Outperform 28.00 AV / FCF $335 $415 - 87% 87% - - - - $87 $123 - Revenue DCF (20x CY2032 Truist Truist 8/4/2022 Buy 28.00 AV / FCF, DCF $334 $424 - 86% 85% - $54 $59 - $81 $98 - FCF TV) DCF (25x CY2026E Piper Sandler Piper Sandler 8/4/2022 Overweight 25.00 AV / FCF, DCF $334 $421 - 87% 85% - - - - $83 $114 - FCF) ~40x CY2023E AV / AV / Revenue, Canaccord Canaccord 8/4/2022 Buy 25.00 $334 $421 - 87% 87% - - - - $80 $105 - FCF AV / FCF - 10x CY2023E AV / Stephens Stephens 8/4/2022 Overweight 25.00 AV / Revenue $334 $422 $515 88% 87% 87% $53 $72 $98 $81 $114 - Revenue 9.7x AV / CY2023E Needham Needham 8/4/2022 Buy 24.00 AV / Revenue $334 $415 $507 87% 87% 87% - - - $80 $107 $133 Revenue 85% 7.5x AV / Goldman Sachs GS 8/4/2022 Buy 22.00 Revenue; 15% AV / Revenue $332 $412 $492 86% 85% 85% $46 $65 $90 $64 $106 $146 Strategic Ppaids 25x CY2027E Morgan Stanley MS 8/4/2022 Equal Weight 21.00 AV / FCF $333 $413 $502 86% 86% 87% $46 $60 $93 $85 $84 $115 AV/FCF 7x CY2023E AV / Bank of America BofA 8/4/2022 Buy 20.00 AV / Revenue $334 $420 $521 87% 85% 85% $57 $72 $97 $79 $98 $110 Revenue 8.0x CY2023E AV / Citi Citi 8/5/2022 Neutral 20.00 AV / Revenue $334 $394 $484 83% 78% 78% $52 $63 $79 $84 $98 $126 Revenue 8.0x CY2023E AV / UBS UBS 8/4/2022 Neutral 19.00 AV / Revenue $333 $407 $475 87% 87% 88% $60 $75 $89 $82 $95 $109 Revenue Mean $23.36 $334 $415 $499 87% 85% 85% $53 $66 $91 $81 $104 $123 Median $24.00 $334 $415 $502 87% 86% 87% $53 $65 $92 $81 $105 $121 Post earnings, median CY22 revenue estimates increased from $332; CY23 estimates Notes: decreased from $417 1. Latest available broker estimates, excludes Berenberg due to price target as of 2/17/2022 PROJECT ORANGE PRELIMINARY AND CONFIDENTIAL DRAFT PRELIMINARY VALUATION PERSPECTIVES 26
APPENDIX Reference Materials PRELIMINARY AND CONFIDENTIAL DRAFT 27
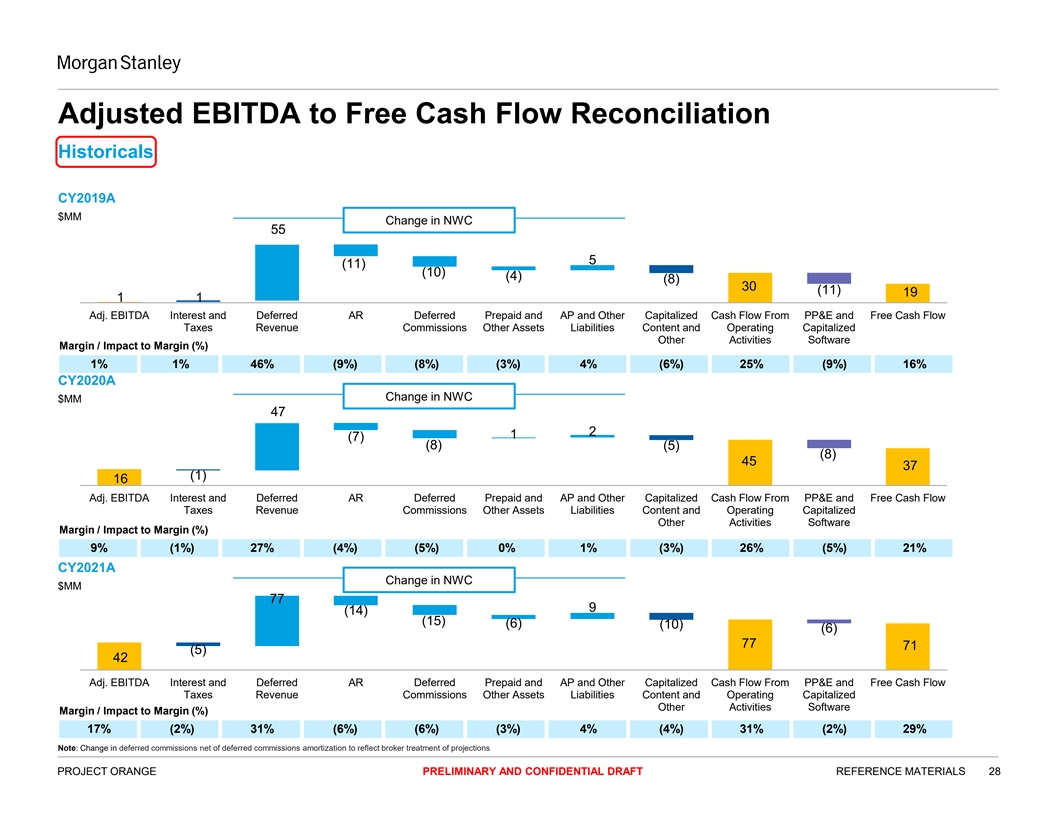
Adjusted EBITDA to Free Cash Flow Reconciliation Historicals CY2019A $MM Change in NWC 55 5 (11) (10) (4) (8) 30 (11) 19 1 1 Adj. EBITDA Interest and Deferred AR Deferred Prepaid and AP and Other Capitalized Cash Flow From PP&E and Free Cash Flow Taxes Revenue Commissions Other Assets Liabilities Content and Operating Capitalized Other Activities Software Margin / Impact to Margin (%) 1% 1% 46% (9%) (8%) (3%) 4% (6%) 25% (9%) 16% CY2020A Change in NWC $MM 47 2 1 (7) (8) (5) (8) 45 37 (1) 16 Adj. EBITDA Interest and Deferred AR Deferred Prepaid and AP and Other Capitalized Cash Flow From PP&E and Free Cash Flow Taxes Revenue Commissions Other Assets Liabilities Content and Operating Capitalized Other Activities Software Margin / Impact to Margin (%) 9% (1%) 27% (4%) (5%) 0% 1% (3%) 26% (5%) 21% CY2021A Change in NWC $MM 77 9 (14) (15) (6) (10) (6) 77 71 (5) 42 Adj. EBITDA Interest and Deferred AR Deferred Prepaid and AP and Other Capitalized Cash Flow From PP&E and Free Cash Flow Taxes Revenue Commissions Other Assets Liabilities Content and Operating Capitalized Other Activities Software Margin / Impact to Margin (%) 17% (2%) 31% (6%) (6%) (3%) 4% (4%) 31% (2%) 29% Note: Change in deferred commissions net of deferred commissions amortization to reflect broker treatment of projections PROJECT ORANGE PRELIMINARY AND CONFIDENTIAL DRAFT REFERENCE MATERIALS 28
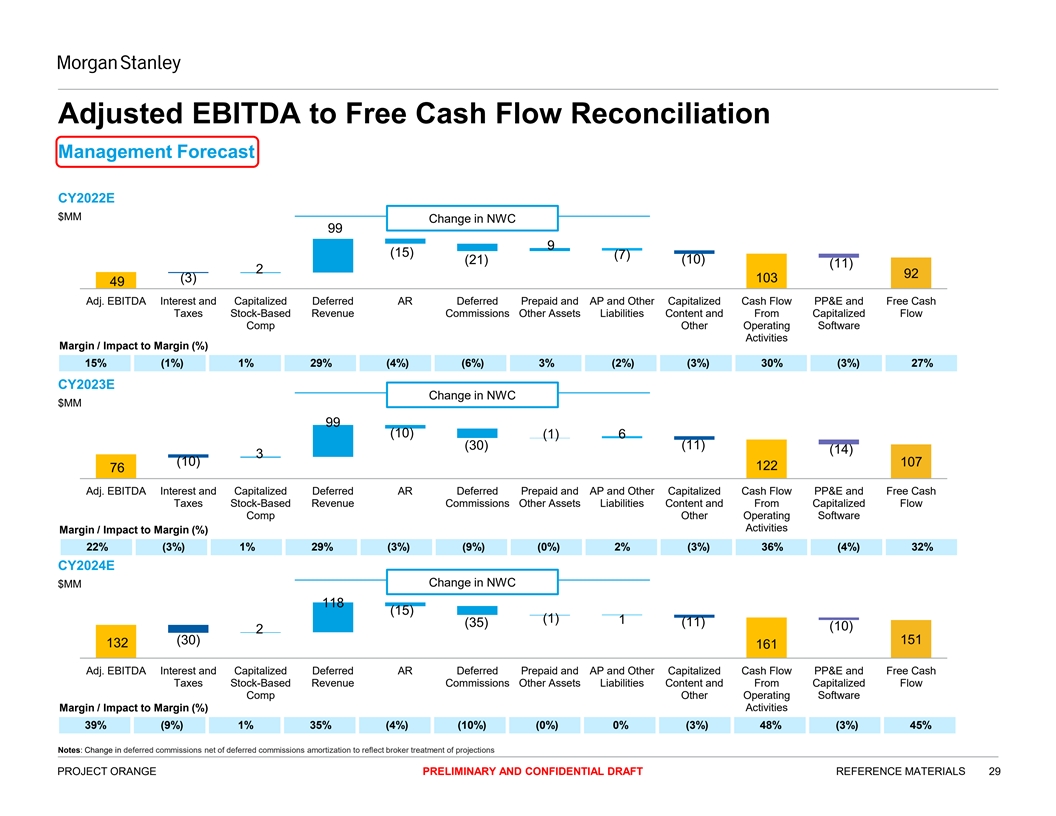
Adjusted EBITDA to Free Cash Flow Reconciliation Management Forecast CY2022E $MM Change in NWC 99 9 (15) (7) (21) (10) (11) 2 92 (3) 103 49 Adj. EBITDA Interest and Capitalized Deferred AR Deferred Prepaid and AP and Other Capitalized Cash Flow PP&E and Free Cash Taxes Stock-Based Revenue Commissions Other Assets Liabilities Content and From Capitalized Flow Comp Other Operating Software Activities Margin / Impact to Margin (%) 15% (1%) 1% 29% (4%) (6%) 3% (2%) (3%) 30% (3%) 27% CY2023E Change in NWC $MM 99 (10) (1) 6 (11) (30) (14) 3 (10) 107 122 76 Adj. EBITDA Interest and Capitalized Deferred AR Deferred Prepaid and AP and Other Capitalized Cash Flow PP&E and Free Cash Taxes Stock-Based Revenue Commissions Other Assets Liabilities Content and From Capitalized Flow Comp Other Operating Software Activities Margin / Impact to Margin (%) 22% (3%) 1% 29% (3%) (9%) (0%) 2% (3%) 36% (4%) 32% CY2024E Change in NWC $MM 118 (15) (1) 1 (35) (11) (10) 2 (30) 151 132 161 Adj. EBITDA Interest and Capitalized Deferred AR Deferred Prepaid and AP and Other Capitalized Cash Flow PP&E and Free Cash Taxes Stock-Based Revenue Commissions Other Assets Liabilities Content and From Capitalized Flow Comp Other Operating Software Margin / Impact to Margin (%) Activities 39% (9%) 1% 35% (4%) (10%) (0%) 0% (3%) 48% (3%) 45% Notes: Change in deferred commissions net of deferred commissions amortization to reflect broker treatment of projections PROJECT ORANGE PRELIMINARY AND CONFIDENTIAL DRAFT REFERENCE MATERIALS 29
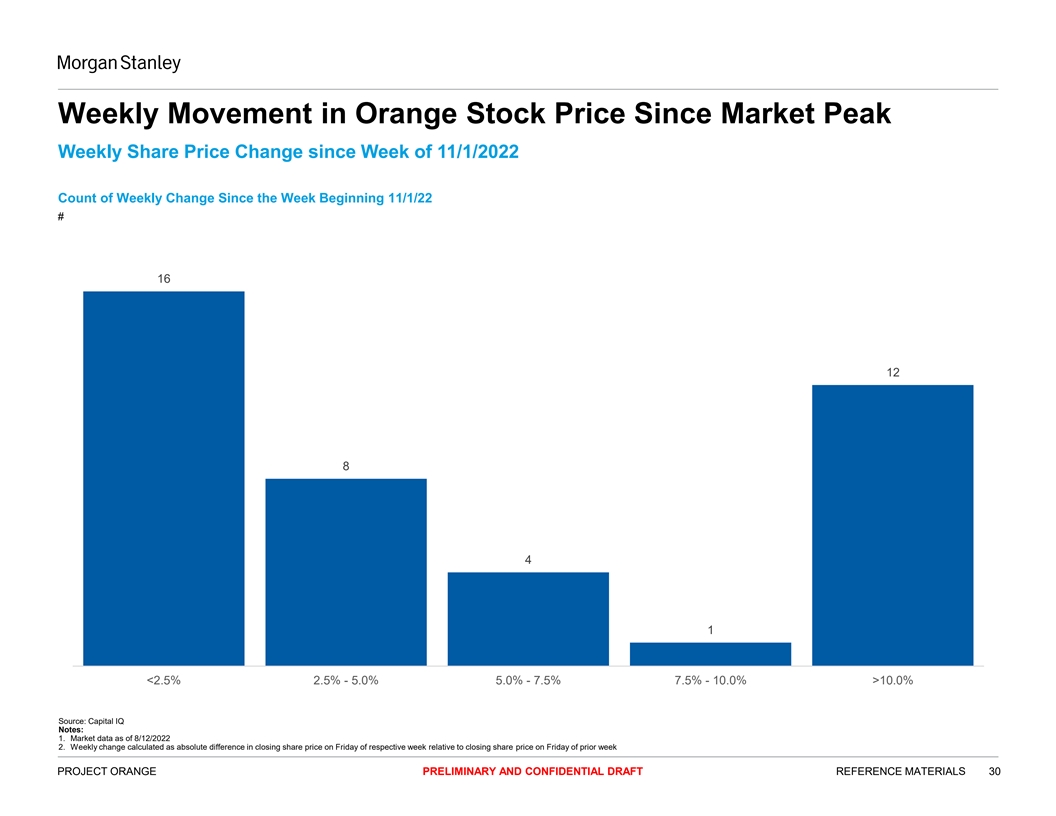
Weekly Movement in Orange Stock Price Since Market Peak Weekly Share Price Change since Week of 11/1/2022 Count of Weekly Change Since the Week Beginning 11/1/22 # 16 12 8 4 1 <2.5% 2.5% - 5.0% 5.0% - 7.5% 7.5% - 10.0% >10.0% Source: Capital IQ Notes: 1. Market data as of 8/12/2022 2. Weekly change calculated as absolute difference in closing share price on Friday of respective week relative to closing share price on Friday of prior week PROJECT ORANGE PRELIMINARY AND CONFIDENTIAL DRAFT REFERENCE MATERIALS 30
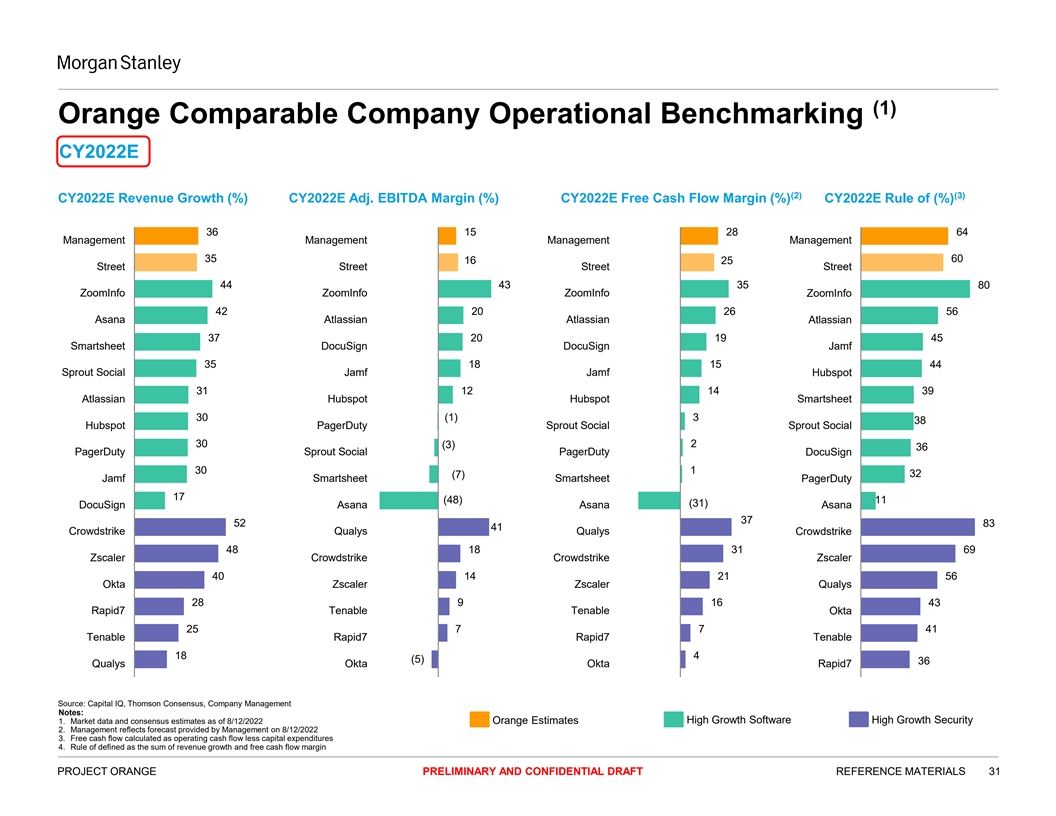
(1) Orange Comparable Company Operational Benchmarking CY2022E (2) (3) CY2022E Revenue Growth (%) CY2022E Adj. EBITDA Margin (%) CY2022E Free Cash Flow Margin (%) CY2022E Rule of (%) 36 15 28 64 Management Management Management Management 35 60 16 25 Street Street Street Street 44 43 35 80 ZoomInfo ZoomInfo ZoomInfo ZoomInfo 42 20 26 56 Asana Atlassian Atlassian Atlassian 37 20 19 45 Smartsheet DocuSign DocuSign Jamf 35 18 15 44 Sprout Social Jamf Jamf Hubspot 31 12 14 39 Atlassian Hubspot Hubspot Smartsheet 30 (1) 3 38 Hubspot PagerDuty Sprout Social Sprout Social 30 (3) 2 36 PagerDuty Sprout Social PagerDuty DocuSign 30 1 32 (7) Jamf Smartsheet Smartsheet PagerDuty 17 (48) 11 (31) DocuSign Asana Asana Asana 37 52 83 41 Crowdstrike Qualys Qualys Crowdstrike 48 18 31 69 Zscaler Crowdstrike Crowdstrike Zscaler 40 14 21 56 Okta Zscaler Zscaler Qualys 28 9 16 43 Rapid7 Tenable Tenable Okta 25 7 7 41 Tenable Rapid7 Rapid7 Tenable 18 4 (5) 36 Qualys Okta Okta Rapid7 Source: Capital IQ, Thomson Consensus, Company Management Notes: 1. Market data and consensus estimates as of 8/12/2022 Orange Estimates High Growth Software High Growth Security 2. Management reflects forecast provided by Management on 8/12/2022 3. Free cash flow calculated as operating cash flow less capital expenditures 4. Rule of defined as the sum of revenue growth and free cash flow margin PROJECT ORANGE PRELIMINARY AND CONFIDENTIAL DRAFT REFERENCE MATERIALS 31
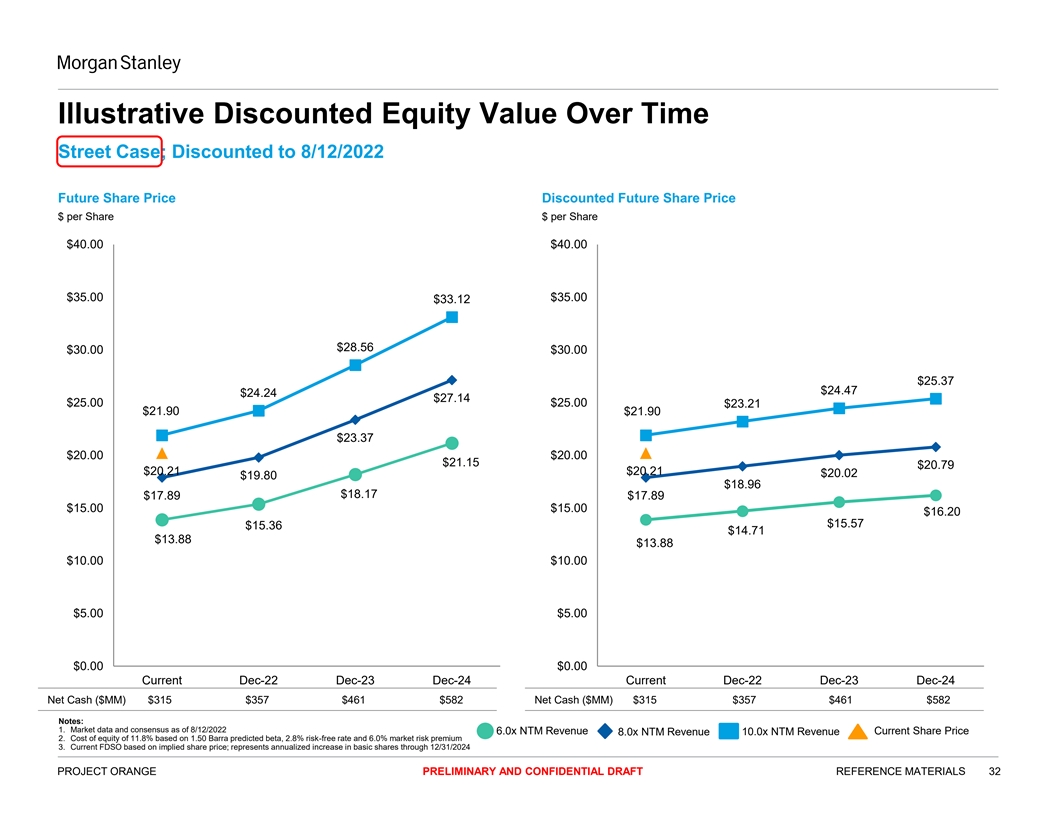
Illustrative Discounted Equity Value Over Time Street Case; Discounted to 8/12/2022 Future Share Price Discounted Future Share Price $ per Share $ per Share $40.00 $40.00 $35.00 $35.00 $33.12 $28.56 $30.00 $30.00 $25.37 $24.47 $24.24 $27.14 $25.00 $25.00 $23.21 $21.90 $21.90 $23.37 $20.00 $20.00 $21.15 $20.79 $20.21 $20.21 $20.02 $19.80 $18.96 $18.17 $17.89 $17.89 $15.00 $15.00 $16.20 $15.57 $15.36 $14.71 $13.88 $13.88 $10.00 $10.00 $5.00 $5.00 $0.00 $0.00 Current Dec-22 Dec-23 Dec-24 Current Dec-22 Dec-23 Dec-24 Net Cash ($MM) $315 $357 $461 $582 Net Cash ($MM) $315 $357 $461 $582 Notes: 1. Market data and consensus as of 8/12/2022 6.0x NTM Revenue Current Share Price 8.0x NTM Revenue 10.0x NTM Revenue 2. Cost of equity of 11.8% based on 1.50 Barra predicted beta, 2.8% risk-free rate and 6.0% market risk premium 3. Current FDSO based on implied share price; represents annualized increase in basic shares through 12/31/2024 PROJECT ORANGE PRELIMINARY AND CONFIDENTIAL DRAFT REFERENCE MATERIALS 32
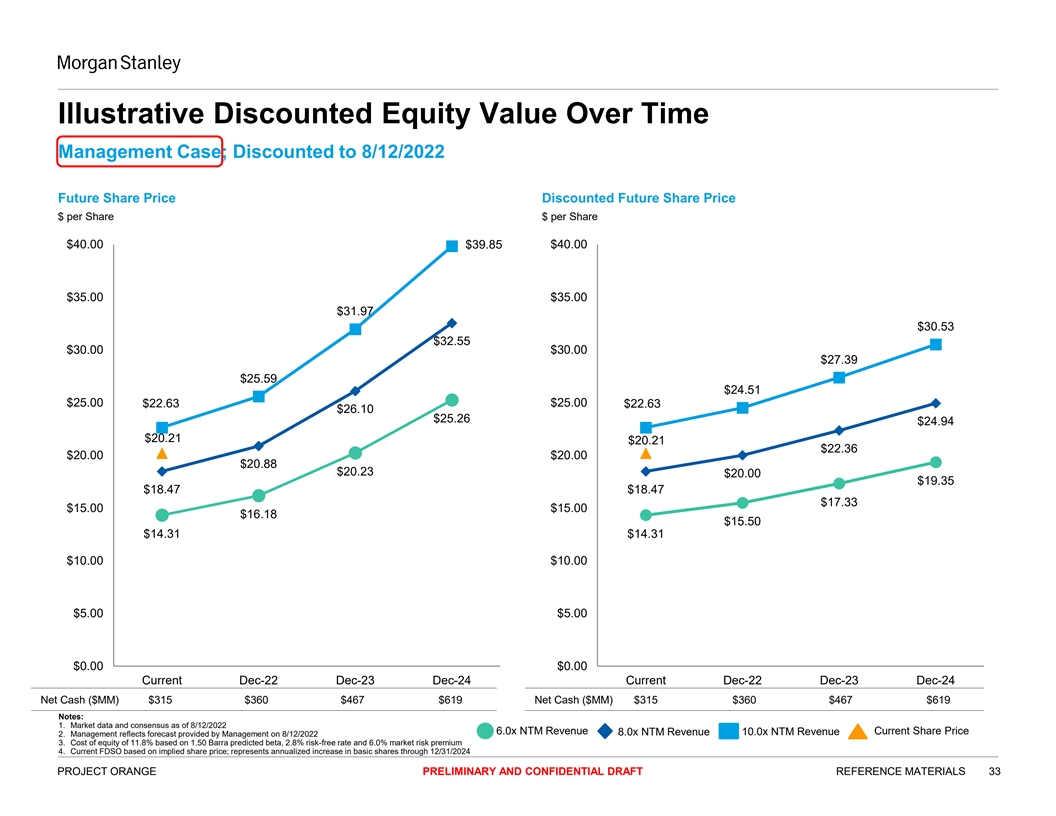
Illustrative Discounted Equity Value Over Time Management Case; Discounted to 8/12/2022 Future Share Price Discounted Future Share Price $ per Share $ per Share $40.00 $39.85 $40.00 $35.00 $35.00 $31.97 $30.53 $32.55 $30.00 $30.00 $27.39 $25.59 $24.51 $25.00 $25.00 $22.63 $22.63 $26.10 $25.26 $24.94 $20.21 $20.21 $22.36 $20.00 $20.00 $20.88 $20.23 $20.00 $19.35 $18.47 $18.47 $17.33 $15.00 $15.00 $16.18 $15.50 $14.31 $14.31 $10.00 $10.00 $5.00 $5.00 $0.00 $0.00 Current Dec-22 Dec-23 Dec-24 Current Dec-22 Dec-23 Dec-24 Net Cash ($MM) $315 $360 $467 $619 Net Cash ($MM) $315 $360 $467 $619 Notes: 1. Market data and consensus as of 8/12/2022 6.0x NTM Revenue Current Share Price 8.0x NTM Revenue 10.0x NTM Revenue 2. Management reflects forecast provided by Management on 8/12/2022 3. Cost of equity of 11.8% based on 1.50 Barra predicted beta, 2.8% risk-free rate and 6.0% market risk premium 4. Current FDSO based on implied share price; represents annualized increase in basic shares through 12/31/2024 PROJECT ORANGE PRELIMINARY AND CONFIDENTIAL DRAFT REFERENCE MATERIALS 33
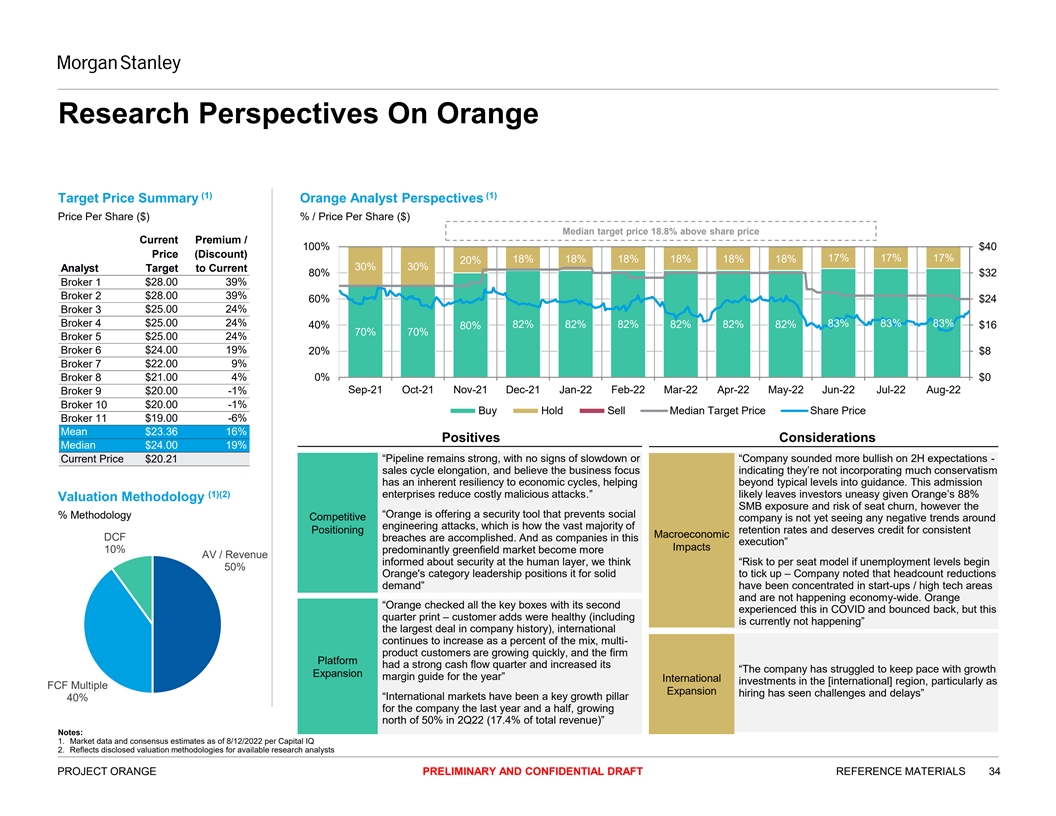
Research Perspectives On Orange (1) (1) Target Price Summary Orange Analyst Perspectives Price Per Share ($) % / Price Per Share ($) Median target price 18.8% above share price Current Premium / Aug-21 Sep-21 Oct-21 Nov-21 Dec-21 Jan-22 Feb-22 Mar-22 Apr-22 May-22 Jun-22 Jul-22 Aug-22 100% $40 Price (Discount) 17% 17% 17% 18% 18% 18% 18% 18% 18% 20% 30% 30% Analyst Target to Current 80% $32 $28.00 39% Broker 1 Broker 2 $28.00 39% 60% $24 Broker 3 $25.00 24% Broker 4 $25.00 24% 83% 83% 83% 82% 82% 82% 82% 82% 82% 40% 80% $16 70% 70% Broker 5 $25.00 24% $24.00 19% Broker 6 20% $8 Broker 7 $22.00 9% Broker 8 $21.00 4% 0% $0 Sep-21 Oct-21 Nov-21 Dec-21 Jan-22 Feb-22 Mar-22 Apr-22 May-22 Jun-22 Jul-22 Aug-22 Broker 9 $20.00 -1% Broker 10 $20.00 -1% Buy Hold Sell Median Target Price Share Price $19.00 -6% Broker 11 Mean $23.36 16% Positives Considerations Median $24.00 19% Current Price $20.21 • “Pipeline remains strong, with no signs of slowdown or • “Company sounded more bullish on 2H expectations - sales cycle elongation, and believe the business focus indicating they’re not incorporating much conservatism has an inherent resiliency to economic cycles, helping beyond typical levels into guidance. This admission (1)(2) enterprises reduce costly malicious attacks.” likely leaves investors uneasy given Orange’s 88% Valuation Methodology SMB exposure and risk of seat churn, however the • “Orange is offering a security tool that prevents social % Methodology Competitive company is not yet seeing any negative trends around engineering attacks, which is how the vast majority of Positioning retention rates and deserves credit for consistent Macroeconomic DCF breaches are accomplished. And as companies in this execution” Impacts 10% predominantly greenfield market become more AV / Revenue informed about security at the human layer, we think • “Risk to per seat model if unemployment levels begin 50% Orange's category leadership positions it for solid to tick up – Company noted that headcount reductions demand” have been concentrated in start-ups / high tech areas and are not happening economy-wide. Orange • “Orange checked all the key boxes with its second experienced this in COVID and bounced back, but this quarter print – customer adds were healthy (including is currently not happening” the largest deal in company history), international continues to increase as a percent of the mix, multi- product customers are growing quickly, and the firm Platform had a strong cash flow quarter and increased its • “The company has struggled to keep pace with growth Expansion margin guide for the year” International • investments in the [international] region, particularly as FCF Multiple Expansion • hiring has seen challenges and delays” • “International markets have been a key growth pillar 40% for the company the last year and a half, growing north of 50% in 2Q22 (17.4% of total revenue)” • d Notes: 1. Market data and consensus estimates as of 8/12/2022 per Capital IQ 2. Reflects disclosed valuation methodologies for available research analysts PROJECT ORANGE PRELIMINARY AND CONFIDENTIAL DRAFT REFERENCE MATERIALS 34
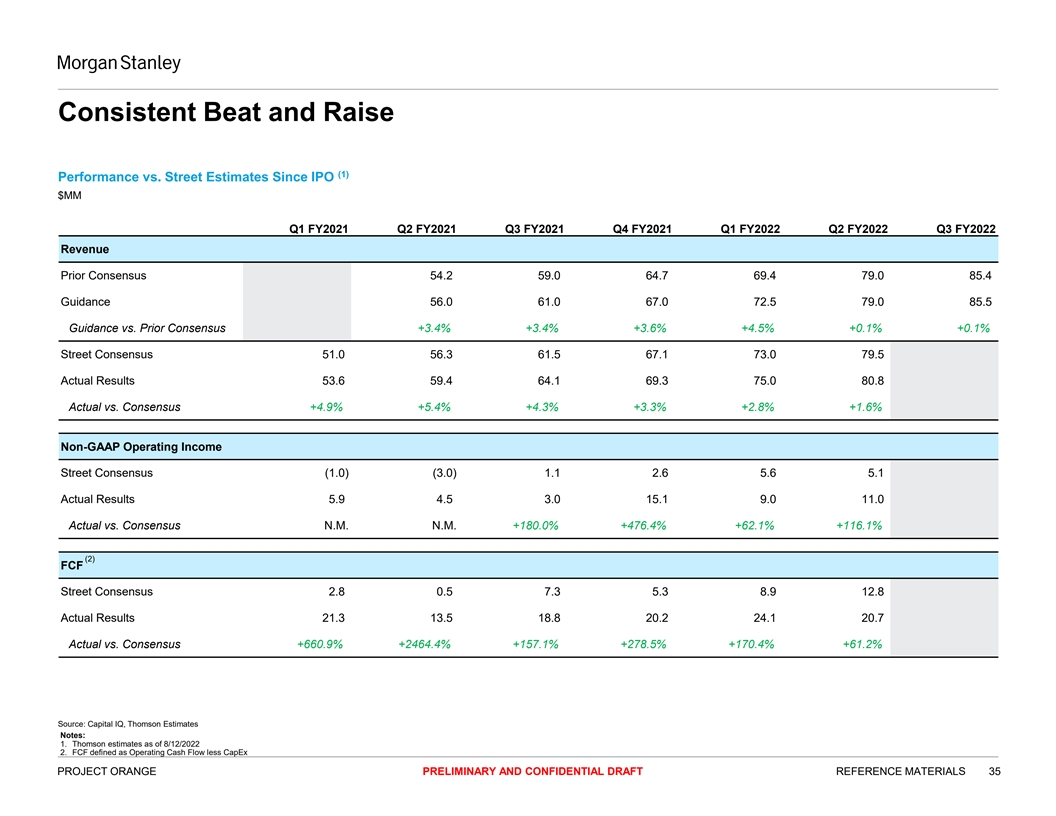
Consistent Beat and Raise (1) Performance vs. Street Estimates Since IPO $MM Q1 FY2021 Q2 FY2021 Q3 FY2021 Q4 FY2021 Q1 FY2022 Q2 FY2022 Q3 FY2022 Revenue Prior Consensus 54.2 59.0 64.7 69.4 79.0 85.4 Guidance 56.0 61.0 67.0 72.5 79.0 85.5 Guidance vs. Prior Consensus +3.4% +3.4% +3.6% +4.5% +0.1% +0.1% Street Consensus 51.0 56.3 61.5 67.1 73.0 79.5 Actual Results 53.6 59.4 64.1 69.3 75.0 80.8 Actual vs. Consensus +4.9% +5.4% +4.3% +3.3% +2.8% +1.6% Non-GAAP Operating Income Street Consensus (1.0) (3.0) 1.1 2.6 5.6 5.1 Actual Results 5.9 4.5 3.0 15.1 9.0 11.0 Actual vs. Consensus N.M. N.M. +180.0% +476.4% +62.1% +116.1% (2) FCF Street Consensus 2.8 0.5 7.3 5.3 8.9 12.8 Actual Results 21.3 13.5 18.8 20.2 24.1 20.7 Actual vs. Consensus +660.9% +2464.4% +157.1% +278.5% +170.4% +61.2% Source: Capital IQ, Thomson Estimates Notes: 1. Thomson estimates as of 8/12/2022 2. FCF defined as Operating Cash Flow less CapEx PROJECT ORANGE PRELIMINARY AND CONFIDENTIAL DRAFT REFERENCE MATERIALS 35
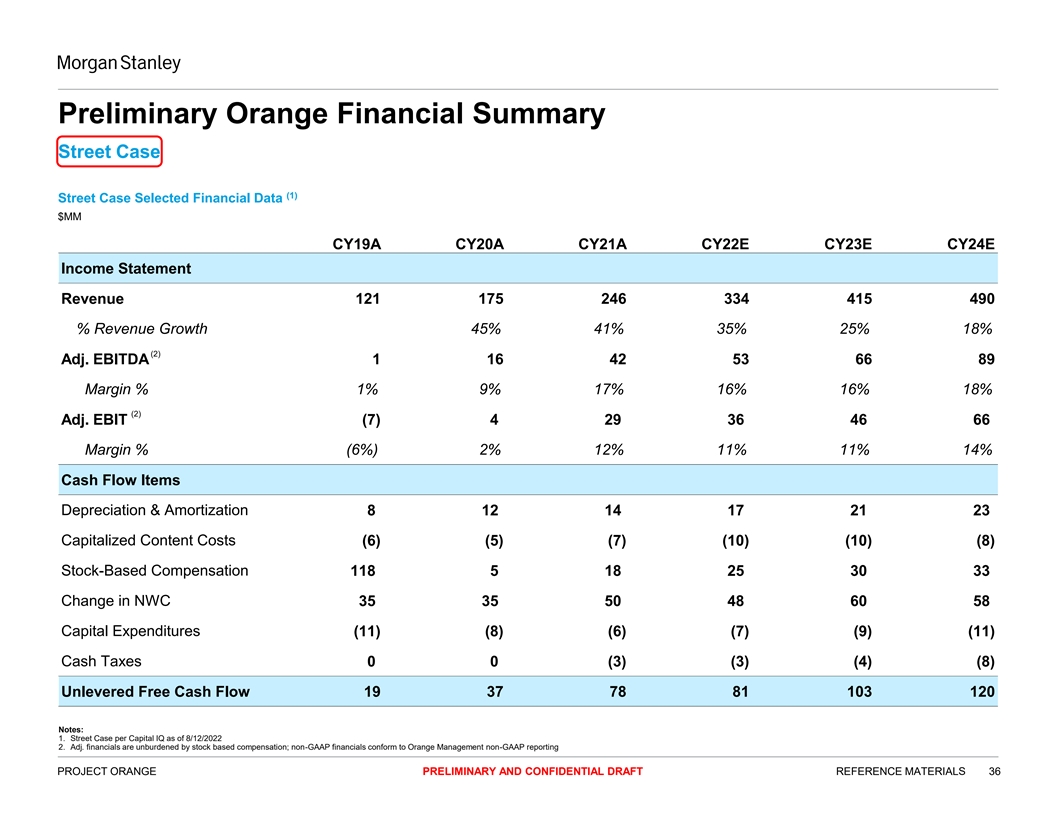
Preliminary Orange Financial Summary Street Case (1) Street Case Selected Financial Data $MM CY19A CY20A CY21A CY22E CY23E CY24E Income Statement Revenue 121 175 246 334 415 490 % Revenue Growth 45% 41% 35% 25% 18% (2) Adj. EBITDA 1 16 42 53 66 89 Margin % 1% 9% 17% 16% 16% 18% (2) Adj. EBIT (7) 4 29 36 46 66 Margin % (6%) 2% 12% 11% 11% 14% Cash Flow Items Depreciation & Amortization 8 12 14 17 21 23 Capitalized Content Costs (6) (5) (7) (10) (10) (8) Stock-Based Compensation 118 5 18 25 30 33 Change in NWC 35 35 50 48 60 58 Capital Expenditures (11) (8) (6) (7) (9) (11) Cash Taxes 0 0 (3) (3) (4) (8) Unlevered Free Cash Flow 19 37 78 81 103 120 Notes: 1. Street Case per Capital IQ as of 8/12/2022 2. Adj. financials are unburdened by stock based compensation; non-GAAP financials conform to Orange Management non-GAAP reporting PROJECT ORANGE PRELIMINARY AND CONFIDENTIAL DRAFT REFERENCE MATERIALS 36
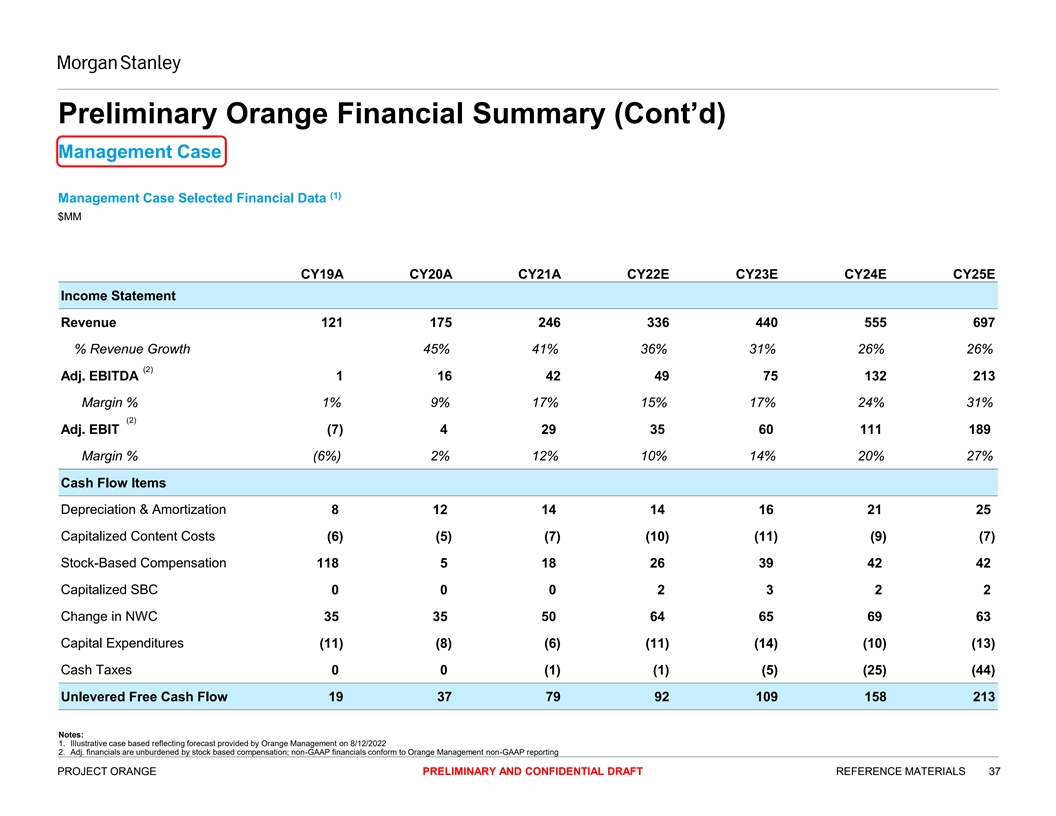
Preliminary Orange Financial Summary (Cont’d) Management Case (1) Management Case Selected Financial Data $MM CY19A CY20A CY21A CY22E CY23E CY24E CY25E Income Statement Revenue 121 175 246 336 440 555 697 % Revenue Growth 45% 41% 36% 31% 26% 26% (2) Adj. EBITDA 1 16 42 49 75 132 213 Margin % 1% 9% 17% 15% 17% 24% 31% (2) Adj. EBIT (7) 4 29 35 60 111 189 Margin % (6%) 2% 12% 10% 14% 20% 27% Cash Flow Items Depreciation & Amortization 8 12 14 14 16 21 25 Capitalized Content Costs (6) (5) (7) (10) (11) (9) (7) Stock-Based Compensation 118 5 18 26 39 42 42 Capitalized SBC 0 0 0 2 3 2 2 Change in NWC 35 35 50 64 65 69 63 Capital Expenditures (11) (8) (6) (11) (14) (10) (13) Cash Taxes 0 0 (1) (1) (5) (25) (44) Unlevered Free Cash Flow 19 37 79 92 109 158 213 Notes: 1. Illustrative case based reflecting forecast provided by Orange Management on 8/12/2022 2. Adj. financials are unburdened by stock based compensation; non-GAAP financials conform to Orange Management non-GAAP reporting PROJECT ORANGE PRELIMINARY AND CONFIDENTIAL DRAFT REFERENCE MATERIALS 37
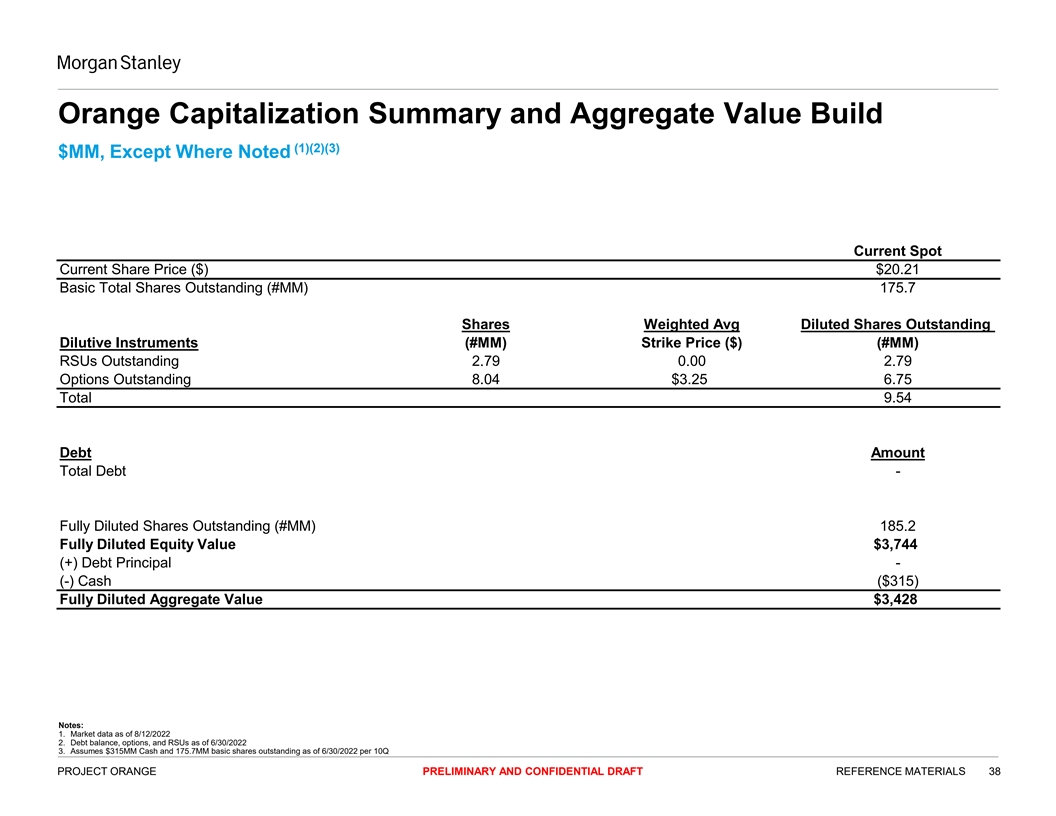
Orange Capitalization Summary and Aggregate Value Build (1)(2)(3) $MM, Except Where Noted Current Spot Current Share Price ($) $20.21 Basic Total Shares Outstanding (#MM) 175.7 Shares Weighted Avg Diluted Shares Outstanding Dilutive Instruments (#MM) Strike Price ($) (#MM) RSUs Outstanding 2.79 0.00 2.79 Options Outstanding 8.04 $3.25 6.75 Total 9.54 Debt Amount Total Debt - Fully Diluted Shares Outstanding (#MM) 185.2 Fully Diluted Equity Value $3,744 (+) Debt Principal - (-) Cash ($315) Fully Diluted Aggregate Value $3,428 Notes: 1. Market data as of 8/12/2022 2. Debt balance, options, and RSUs as of 6/30/2022 3. Assumes $315MM Cash and 175.7MM basic shares outstanding as of 6/30/2022 per 10Q PROJECT ORANGE PRELIMINARY AND CONFIDENTIAL DRAFT REFERENCE MATERIALS 38
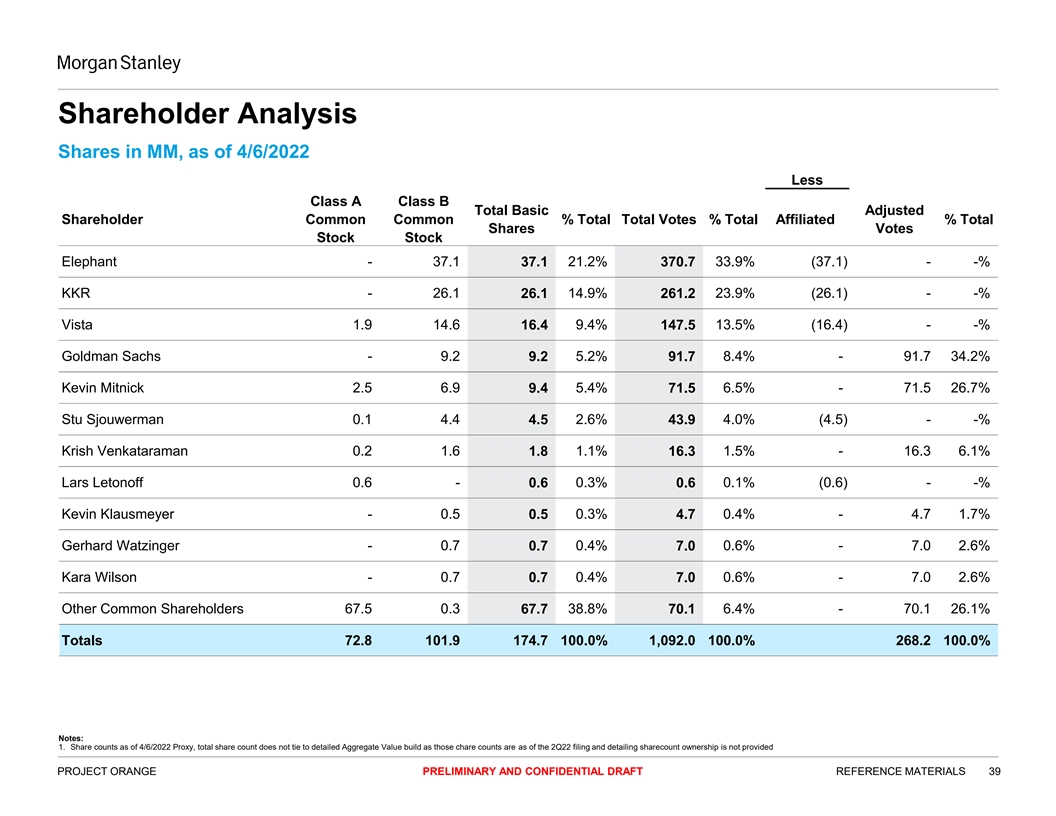
Shareholder Analysis Shares in MM, as of 4/6/2022 Less Class A Class B Total Basic Adjusted Shareholder Common Common % Total Total Votes % Total Affiliated % Total Shares Votes Stock Stock Elephant - 37.1 37.1 21.2% 370.7 33.9% (37.1) - -% KKR - 26.1 26.1 14.9% 261.2 23.9% (26.1) - -% Vista 1.9 14.6 16.4 9.4% 147.5 13.5% (16.4) - -% Goldman Sachs - 9.2 9.2 5.2% 91.7 8.4% - 91.7 34.2% Kevin Mitnick 2.5 6.9 9.4 5.4% 71.5 6.5% - 71.5 26.7% Stu Sjouwerman 0.1 4.4 4.5 2.6% 43.9 4.0% (4.5) - -% Krish Venkataraman 0.2 1.6 1.8 1.1% 16.3 1.5% - 16.3 6.1% Lars Letonoff 0.6 - 0.6 0.3% 0.6 0.1% (0.6) - -% Kevin Klausmeyer - 0.5 0.5 0.3% 4.7 0.4% - 4.7 1.7% Gerhard Watzinger - 0.7 0.7 0.4% 7.0 0.6% - 7.0 2.6% Kara Wilson - 0.7 0.7 0.4% 7.0 0.6% - 7.0 2.6% Other Common Shareholders 67.5 0.3 67.7 38.8% 70.1 6.4% - 70.1 26.1% Totals 72.8 101.9 174.7 100.0% 1,092.0 100.0% 268.2 100.0% Notes: 1. Share counts as of 4/6/2022 Proxy, total share count does not tie to detailed Aggregate Value build as those chare counts are as of the 2Q22 filing and detailing sharecount ownership is not provided PROJECT ORANGE PRELIMINARY AND CONFIDENTIAL DRAFT REFERENCE MATERIALS 39
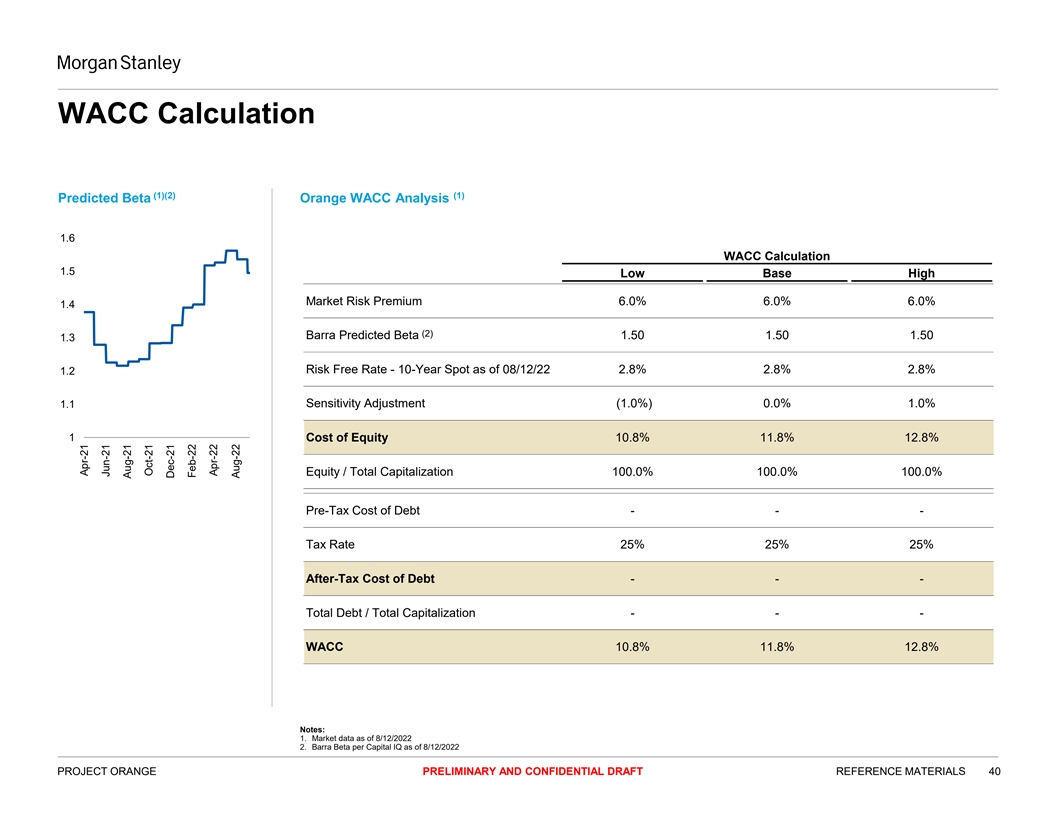
WACC Calculation (1)(2) (1) Predicted Beta Orange WACC Analysis 1.6 WACC Calculation 1.5 Low Base High Market Risk Premium 6.0% 6.0% 6.0% 1.4 (2) Barra Predicted Beta 1.50 1.50 1.50 1.3 Risk Free Rate - 10-Year Spot as of 08/12/22 2.8% 2.8% 2.8% 1.2 1.1 Sensitivity Adjustment (1.0%) 0.0% 1.0% 1 Cost of Equity 10.8% 11.8% 12.8% Equity / Total Capitalization 100.0% 100.0% 100.0% Pre-Tax Cost of Debt - - - Tax Rate 25% 25% 25% After-Tax Cost of Debt - - - Total Debt / Total Capitalization - - - WACC 10.8% 11.8% 12.8% Notes: 1. Market data as of 8/12/2022 2. Barra Beta per Capital IQ as of 8/12/2022 PROJECT ORANGE PRELIMINARY AND CONFIDENTIAL DRAFT REFERENCE MATERIALS 40 Apr-21 Jun-21 Aug-21 Oct-21 Dec-21 Feb-22 Apr-22 Jun-22 Aug-22
Legal Disclaimer We have prepared this document solely for informational purposes. You should not definitively rely upon it or use it to form the definitive basis for any decision, contract, commitment or action whatsoever, with respect to any proposed transaction or otherwise. You and your directors, officers, employees, agents and affiliates must hold this document and any oral information provided in connection with this document in strict confidence and may not communicate, reproduce, distribute or disclose it to any other person, or refer to it publicly, in whole or in part at any time except with our prior written consent. If you are not the intended recipient of this document, please delete and destroy all copies immediately. We have prepared this document and the analyses contained in it based, in part, on certain assumptions and information obtained by us from the recipient, its directors, officers, employees, agents, affiliates and/or from other sources. Our use of such assumptions and information does not imply that we have independently verified or necessarily agree with any of such assumptions or information, and we have assumed and relied upon the accuracy and completeness of such assumptions and information for purposes of this document. Neither we nor any of our affiliates, or our or their respective officers, employees or agents, make any representation or warranty, express or implied, in relation to the accuracy or completeness of the information contained in this document or any oral information provided in connection herewith, or any data it generates and accept no responsibility, obligation or liability (whether direct or indirect, in contract, tort or otherwise) in relation to any of such information. We and our affiliates and our and their respective officers, employees and agents expressly disclaim any and all liability which may be based on this document and any errors therein or omissions therefrom. Neither we nor any of our affiliates, or our or their respective officers, employees or agents, make any representation or warranty, express or implied, that any transaction has been or may be effected on the terms or in the manner stated in this document, or as to the achievement or reasonableness of future projections, management targets, estimates, prospects or returns, if any. Any views or terms contained herein are preliminary only, and are based on financial, economic, market and other conditions prevailing as of the date of this document and are therefore subject to change. We undertake no obligation or responsibility to update any of the information contained in this document. Past performance does not guarantee or predict future performance. We have (i) assumed that any forecasted financial information contained herein reflects the best available estimates of future financial performance, and (ii) not made any independent valuation or appraisal of the assets or liabilities of any company involved in any proposed transaction, nor have we been furnished with any such valuations or appraisals. The purpose of this document is to provide the recipient with a preliminary valuation for discussion purposes in connection with a potential transaction. This document and the information contained herein do not constitute an offer to sell or the solicitation of an offer to buy any security, commodity or instrument or related derivative, nor do they constitute an offer or commitment to lend, syndicate or arrange a financing, underwrite or purchase or act as an agent or advisor or in any other capacity with respect to any transaction, or commit capital, or to participate in any trading strategies, and do not constitute legal, regulatory, accounting or tax advice to the recipient. We recommend that the recipient seek independent third party legal, regulatory, accounting and tax advice regarding the contents of this document. This document does not constitute and should not be considered as any form of financial opinion or recommendation by us or any of our affiliates. This document is not a research report and was not prepared by the research department of Morgan Stanley or any of its affiliates. Notwithstanding anything herein to the contrary, each recipient hereof (and their employees, representatives, and other agents) may disclose to any and all persons, without limitation of any kind from the commencement of discussions, the U.S. federal and state income tax treatment and tax structure of the proposed transaction and all materials of any kind (including opinions or other tax analyses) that are provided relating to the tax treatment and tax structure. For this purpose, tax structure is limited to facts relevant to the U.S. federal and state income tax treatment of the proposed transaction and does not include information relating to the identity of the parties, their affiliates, agents or advisors. This document is provided by Morgan Stanley & Co. LLC and/or certain of its affiliates or other applicable entities, which may include Morgan Stanley Realty Incorporated, Morgan Stanley Senior Funding, Inc., Morgan Stanley Bank, N.A., Morgan Stanley & Co. International plc, Morgan Stanley Securities Limited, Morgan Stanley Bank AG, Morgan Stanley MUFG Securities Co., Ltd., Mitsubishi UFJ Morgan Stanley Securities Co., Ltd., Morgan Stanley Asia Limited, Morgan Stanley Australia Securities Limited, Morgan Stanley Australia Limited, Morgan Stanley Asia (Singapore) Pte., Morgan Stanley Services Limited, Morgan Stanley & Co. International plc Seoul Branch and/or Morgan Stanley Canada Limited Unless governing law permits otherwise, you must contact an authorized Morgan Stanley entity in your jurisdiction regarding this document or any of the information contained herein. © Morgan Stanley and/or certain of its affiliates. All rights reserved. PROJECT ORANGE PRELIMINARY AND CONFIDENTIAL DRAFT 41