UNITED STATES
SECURITIES AND EXCHANGE COMMISSION
WASHINGTON, D.C. 20549
FORM N-CSR
CERTIFIED SHAREHOLDER REPORT OF REGISTERED
MANAGEMENT INVESTMENT COMPANIES
Investment Company Act file number:811-23137
SIERRA TOTAL RETURN FUND
(exact name of registrant as specified in charter)
280 Park Ave, 6th Floor East
New York, NY 10017
(Address of principal executive offices) (Zip code)
Seth Taube
Chief Executive Officer
280 Park Ave, 6th Floor East
New York, NY 10017
(Name and address of agent for service)
Registrant’s telephone number, including area code:(212) 759-0777
Date of fiscal year end:June 30
Date of reporting period:July 1, 2018 – June 30, 2019
Item 1. Reports to Stockholders.
| ANNUAL REPORT |
| JUNE 30, 2019 |
| TABLE OF CONTENTS |
Beginning on January 1, 2021, as permitted by regulations adopted by the U.S. Securities and Exchange Commission, paper copies of the Funds’ annual and semi-annual shareholder reports will no longer be sent by mail, unless you specifically request paper copies of the reports from your financial intermediary (such as a broker-dealer or bank). Instead, the reports will be made available on the Funds’ website (www.sierratotalreturnfund.com), and you will be notified by mail each time a report is posted and provided with a website link to access the report.
If you already elected to receive shareholder reports electronically, you will not be affected by this change and you need not take any action. You may elect to receive shareholder reports and other communications from a Fund electronically anytime by contacting your financial intermediary.
You may elect to receive all future reports in paper free of charge. You can contact your financial intermediary to request that you continue to receive paper copies of your shareholder reports. Your election to receive reports in paper will apply to all funds held in your account with your financial intermediary.

| Sierra Total Return Fund | Shareholder Letter |
| June 30, 2019 (Unaudited) |
Dear Shareholders:
We are pleased to provide Sierra Total Return Fund’s (the “Fund”) annual report for the year ended June 30, 2019. The Fund seeks a total return for shareholders through a combination of current income and long-term capital appreciation.
The Fund intends to create a diversified portfolio of credit investments through a disciplined and balanced allocation among four distinct strategies. Our goal is create a granular portfolio of investments focused on secured floating rate investments in U.S. middle market companies. We believe this portfolio strategy has the ability to generate superior risk-adjusted returns over the long-term.
As of June 30, 2019, the following presents our portfolio by our core strategies and asset types, as a percentage of total investments:
| STRATEGY DIVERSIFICATION | ASSET TYPE DIVERSIFICATION |
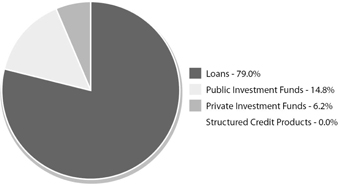 | 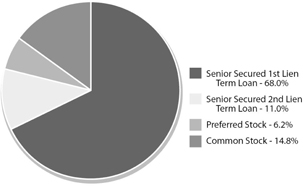 |
The U.S. and global economy remain strong throughout the first half of 2019. We expect this backdrop to remain in place in the near term. To the extent the strength continues, we expect it will be constructive for the Fund’s investments in fixed-income oriented positions.
We are excited about the future and look forward to your continued interest in Sierra Total Return Fund.
Sincerely,
Seth Taube
CEO and Chairman of the Board of Trustees
Sierra Total Return Fund
Past performance is not indicative of future results.Fund holdings and sector allocations are subject to change and are not a recommendation to buy or sell any security. Diversification does not assure a profit or protect against loss in a declining market. ALPS Distributors, Inc. is the distributor of Sierra Total Return Fund. Investing involves risk; Principal loss is possible. The Fund offers Class T shares. For more information on the differences in share classes, refer to the applicable prospectus, which can be found at: www.sierratotalreturnfund.com
FUND RISK DISCLOSURE
There currently is no secondary market for the Fund’s shares and the Fund expects that no secondary market will develop. To provide liquidity to shareholders, the Fund intends to make quarterly offers to repurchase its shares at net asset value. There can be no assurance, however, that the Fund will be able to provide this intended level of liquidity. Investments in lesser-known, small and medium capitalization companies may be more vulnerable than larger, more established organizations. The sales of securities to fund repurchases could reduce the market price of those securities, which in turn would reduce the Fund’s NAV.
Shares of the Fund will not be listed on any securities exchange, which makes them inherently illiquid. Regardless of how the Fund performs, an investor may not be able to sell or otherwise liquidate his or her shares whenever such investor would prefer and will be unable to reduce his or her exposure or any market downturn. The Fund may pay distributions in significant part from sources that may not be available in the future and that are unrelated to the Fund’s performance.
Investing in the Fund involves risks, including, but not limited to, the risk that you may receive little or no return on your investment or that you may lose part or all of your investment. The ability of the Fund to achieve its investment objective depends, in part, on the ability of its investment adviser to effectively allocate the assets of the Fund among the various securities and investments in which the Fund invests. There can be no assurance that the actual allocations will be effective in achieving the Fund’s investment objective or delivering positive returns. The Fund is newly organized and has a limited operating history.
| Annual Report | June 30, 2019 | 1 |
| Sierra Total Return Fund | Shareholder Letter |
| June 30, 2019 (Unaudited) |
Investors should be aware that traded and non-traded BDCs, senior loans, real estate investments and REITs, structured products and CLOs are all significantly different investments each with its own risks, rewards and limitations. Investors should understand these differences (which may include investment objectives, costs and expenses, liquidity, market risk, safety, fluctuation of principal or return, insurance, tax features, interest rate risk and consequences, etc.) before making an investment.
SC Distributors is the exclusive wholesale marketing agent for Sierra Total Return Fund. ALPS Distributors, Inc. is the distributor of Sierra Total Return Fund. SC Distributors and ALPS Distributors, Inc. are not affiliated. ALPS Distributor, Inc., 1290 Broadway, Suite 1100, Denver, CO 80203, member FINRA.
The Fund will concentrate its investments in debt and equity fixed income and its portfolio will be significantly impacted by the performance of the debt/credit markets. The value of companies engaged in the debt/credit industry is affected by: (i) changes in general economic and market conditions; (ii) changes in the value of debt investments; (iii) risks related to local economic conditions and increased competition and (iv) changes in interest rates and leverage.
| 2 | www.sierratotalreturnfund.com |
| Sierra Total Return Fund | Manager Commentary |
| June 30, 2019 (Unaudited) |
Performance(for the period ended June 30, 2019)
| 1 Month | Quarter | 6 Month | 1 Year | Since Inception | Inception | |||||||||||||||||
| Sierra Total Return Fund - Class T – Without Sales Load | 2.80 | % | 1.39 | % | 6.30 | % | 8.48 | % | 6.00 | % | 6/1/17 | |||||||||||
| Sierra Total Return Fund - Class T – With Sales Load | 0.74 | % | -0.66 | % | 4.17 | % | 6.31 | % | 4.97 | % | 6/1/17 | |||||||||||
| S&P 500® Total Return Index | 7.05 | % | 4.30 | % | 18.54 | % | 10.42 | % | 11.80 | % | 6/1/17 | |||||||||||
| ICE BofAML US High Yield Index | 2.45 | % | 2.57 | % | 10.16 | % | 7.58 | % | 4.82 | % | 6/1/17 | |||||||||||
Past performance is not predictive of future results. The investment return and principal value of an investment will fluctuate. An investor’s shares, when redeemed, may be worth more or less than the original cost. Total return is calculated assuming reinvestment of all dividends and distributions. Performance figures for periods less than one year are not annualized. Class T shares are subject to a maximum sales load of 2.00% of the amount invested in Class T shares. For performance information current to the most recent month-end, please call toll-free 1-888-292-3178.
The S&P 500® Total Return Index is an unmanaged index of 500 common stocks chosen for market size, liquidity and industry group representation. It is a market-value weighted index. The index is not actively managed and does not reflect any deduction for fees, expenses or taxes. An investor cannot invest directly into an index.
ICE BofAML US High Yield Index tracks the performance of US dollar denominated below investment grade corporate debt publicly issued in the US domestic market. Index constituents are market capitalization weighted. The index is not actively managed and does not reflect any deduction for fees, expenses or taxes. An investor cannot invest directly into an index.
Pursuant to the Expense Support Agreement, STRF Advisors LLC (the “Adviser”) has agreed to reimburse the Fund for expenses the Fund incurs for the purpose of limiting the Fund’s payment of certain operating expenses (exclusive of any taxes, interest, brokerage commissions, acquired fund fees and expenses, incentive fees, shareholder services expenses, annual dealer manager fees, distribution fees and extraordinary expenses, such as litigation or reorganization costs, but inclusive of organizational costs and offering costs) in any fiscal year to 2.66% per annum of the Fund’s average daily gross assets attributable to Class T shares (the “Operational Expense Limit”). The Fund’s Expense Support and Reimbursement Agreement with the Adviser will remain in effect at least until July 25, 2019. Following this term, the Adviser may elect, in its sole discretion, to offer to continue the Expense Support Agreement for successive quarterly periods. Any such continuance must be approved by a majority of the Fund’s board of trustees (the “Board”), including a majority of the trustees that are not “interested persons” of the Fund, as such term is defined under the Investment Company Act of 1940, as amended. The Board may terminate the Expense Support Agreement at any time, and there can be no assurance that the Adviser will renew the Expense Support Agreement after the period noted above. The Adviser will be eligible to recoup expense support payments it previously made, both during the term of the Expense Support Agreement and upon its termination by the Board, within the three years following the period in which the expenses occurred and the Adviser will recoup an amount from the Fund to the extent the amount recouped does not cause the Fund’s average daily gross assets with respect to Class T shares in the period of recoupment to exceed the lesser of the Operational Expense Limit in effect at the time the Expense Support Payment was made in that period or the Operational Expense Limit in effect at such time STRF Advisors seeks recoupment. Without the waiver the expenses would be 37.40% (based off of average net assets for 12 months ended 6/30/19 and annualized expenses before ESA) for Class T shares. Please review the Fund’s Prospectus for more details regarding the Fund’s fees and expenses. No assurances can be given that the Fund will pay a distribution in the future; or, if any such distribution is paid, the amount or rate of the distribution.
| Annual Report | June 30, 2019 | 3 |
| Sierra Total Return Fund | Manager Commentary |
| June 30, 2019 (Unaudited) |
Comparison of the Change in Value of a $10,000 Investment
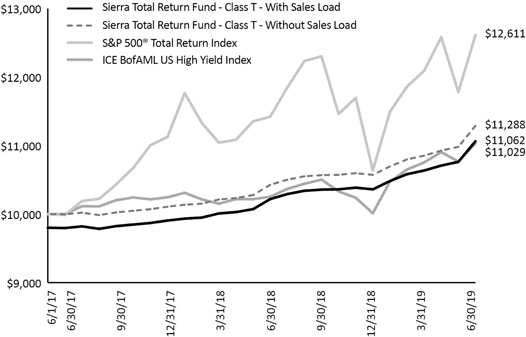
The graph shown above represents historical performance of a hypothetical investment of $10,000 in the Fund since inception. Past performance does not guarantee future results. All returns reflect reinvested dividends, but do not reflect the deduction of taxes that a shareholder would pay on Fund distributions or the redemption of Fund shares.
| Percent of | ||||
| Top Ten Holdings* | Net Assets | |||
| Avantor Inc | 5.22 | % | ||
| iQor US Inc. | 4.36 | % | ||
| Barry’s Bootcamp Holdings, LLC | 3.83 | % | ||
| The Imagine Group, LLC | 3.63 | % | ||
| New York Mortgage Trust, Inc. | 3.28 | % | ||
| RMS Holding Company, LLC | 2.73 | % | ||
| SFP Holding, Inc. | 2.69 | % | ||
| Ares Capital Corporation | 2.34 | % | ||
| Golub Capital BDC, Inc. | 2.33 | % | ||
| Callaway Golf Company | 2.27 | % | ||
| Top Ten Holdings | 32.68 | % | ||
| Percent of | ||||
| Asset Type Allocation | Net Assets | |||
| Senior Secured First Lien Term Loans | 63.63 | % | ||
| Common Stocks | 14.14 | % | ||
| Senior Secured Second Lien Term Loans | 10.50 | % | ||
| Preferred Stocks | 5.94 | % | ||
| Cash, Cash Equivalents, & Other Net Assets | 5.79 | % | ||
| Total Net Assets | 100.00 | % | ||
* Excludes money market investments.
| 4 | www.sierratotalreturnfund.com |
| Sierra Total Return Fund | Consolidated Schedule of Investments |
| June 30, 2019 |
| Description | Shares | Fair Value | ||||||
| COMMON STOCKS - 14.14% | ||||||||
| BANKING, FINANCE, INSURANCE & REAL ESTATE - 7.34% | ||||||||
| Ares Capital Corporation | 2,900 | $ | 52,026 | |||||
| Golub Capital BDC, Inc. | 2,900 | 51,620 | ||||||
| Hercules Capital, Inc. | 2,500 | 32,050 | ||||||
| New Mountain Finance Corp. | 1,000 | 13,970 | ||||||
| PennantPark Investment Corp. | 2,100 | 13,272 | ||||||
| ENVIRONMENTAL INDUSTRIES - 1.58% | ||||||||
| JFL-WCS Partners, LLC(a)(b) | 1,648 | 35,037 | ||||||
| WHOLESALE - 5.22% | ||||||||
| Avantor Inc(b) | 6,068 | 115,838 | ||||||
| TOTAL COMMON STOCKS(Cost $267,387) | $ | 313,813 | ||||||
| PREFERRED STOCKS - 5.94% | ||||||||
| BANKING, FINANCE, INSURANCE & REAL ESTATE - 4.04% | ||||||||
| New York Mortgage Trust, Inc., Series C, 7.875% | 689 | $ | 16,874 | |||||
| New York Mortgage Trust, Inc., Series D, 8.000% | 3,000 | 72,870 | ||||||
| ENVIRONMENTAL INDUSTRIES - 0.67% | ||||||||
| JFL-WCS Partners, LLC, 6.00% PIK%(a) | 14,832 | 14,832 | ||||||
| FOREST PRODUCTS & PAPER - 1.23% | ||||||||
| Caddo Investment Holdings 1, LLC, 10.25% PIK(c) | 25,000 | 27,362 | ||||||
| TOTAL PREFERRED STOCKS (Cost $131,296) | $ | 131,938 | ||||||
| Description | Interest Rate* | Maturity | Par Amount | Fair Value | ||||||||
| SENIOR SECURED FIRST LIEN TERM LOANS - 63.63% | ||||||||||||
| AUTOMOTIVE - 2.16% | ||||||||||||
| Safe Fleet Holdings, LLC(a)(d) | 1M-L+3.00%, 1.00%, Floor | 05/22/2025 | $ | 49,375 | $ | 48,022 | ||||||
| BANKING, FINANCE, INSURANCE & REAL ESTATE - 4.42% | ||||||||||||
| Shift4 Payments, LLC(a)(d) | 3M-L+4.50%, 1.00%, Floor | 11/29/2024 | 49,250 | 49,250 | ||||||||
| Tortoise Borrower, LLC(a)(d) | 1M-L+4.00%, 1.00%, Floor | 01/31/2025 | 49,375 | 48,783 | ||||||||
| CHEMICALS, PLASTICS & RUBBER - 2.21% | ||||||||||||
| Polymer Solutions Group Holdings, LLC(a)(d) | 1M-L+6.50%, 1.00%, Floor | 06/30/2021 | 49,288 | 49,150 | ||||||||
| CONSTRUCTION & BUILDING - 3.74% | ||||||||||||
| SFP Holding, Inc.(a)(d) | 3M-L+6.25%, 1.00%, Floor | 09/01/2022 | 83,843 | 83,004 | ||||||||
| CONSUMER GOODS: DURABLE - 4.12% | ||||||||||||
| BRG Sports, Inc.(a)(d) | 1M-L+6.50%, 1.00%, Floor | 06/15/2023 | 41,705 | 41,200 | ||||||||
| Callaway Golf Company(a)(d) | 1M-L+4.50%, 1.00% Floor | 01/05/2026 | 49,875 | 50,299 | ||||||||
| CONTAINERS, PACKAGING & GLASS - 4.05% | ||||||||||||
| Brook And Whittle Holding Corp.(a)(d) | 3M-L+5.75%, 1.00% Floor | 10/17/2024 | 48,347 | 47,777 | ||||||||
| Interflex Acquisition Company, LLC(a)(d) | 1M-L+8.00%, 1.00%, Floor | 08/18/2022 | 44,822 | 41,989 | ||||||||
| ENERGY: OIL & GAS - 4.42% | ||||||||||||
| Glass Mountain Pipeline Holdings, LLC(a)(d) | 3M-L+4.50%, 1.00%, Floor | 12/23/2024 | 49,375 | 48,264 | ||||||||
| Midcoast Energy, LLC(a)(d) | 1M-L+5.50%, 1.00%, Floor | 08/01/2025 | 49,874 | 49,874 | ||||||||
| HEALTHCARE & PHARMACEUTICALS - 9.20% | ||||||||||||
| Brightspring Health Services(a)(d) | 1M-L+4.50%, 1.00% Floor | 03/05/2026 | 50,000 | 49,745 | ||||||||
| Central States Dermatology Services, LLC(a)(d) | 1M-L+6.50%, 1.00%, Floor | 04/20/2022 | 49,115 | 48,668 | ||||||||
| Envision Healthcare Corporation(a)(d) | 1M-L+3.75%, 1.00%, Floor | 10/10/2025 | 49,750 | 43,531 | ||||||||
| Smile Doctors, LLC(a)(d)(e) | 3M-L+6.00%, 1.00%, Floor | 10/06/2022 | 64,462 | 62,215 | ||||||||
| HIGH TECH INDUSTRIES - 2.22% | ||||||||||||
| Alpine SG, LLC(a)(d) | 1M-L+5.50%, 1.00%, Floor | 11/16/2022 | 49,625 | 49,218 | ||||||||
| MEDIA: ADVERTISING, PRINTING & PUBLISHING - 5.81% | ||||||||||||
| New Media Holdings II, LLC(a)(d) | 1M-L+6.25%, 1.00%, Floor | 07/14/2022 | 48,878 | 48,447 | ||||||||
| The Imagine Group, LLC(a)(d) | 1M-L+4.75%, 1.00%, Floor | 06/21/2022 | 97,750 | 80,468 | ||||||||
| See Notes to Financial Statements. | |
| Annual Report | June 30, 2019 | 5 |
| Sierra Total Return Fund | Consolidated Schedule of Investments |
| June 30, 2019 |
| Description | Interest Rate* | Maturity | Par Amount | Fair Value | ||||||||
| MEDIA: DIVERSIFIED & PRODUCTION - 4.19% | ||||||||||||
| Recorded Books, Inc.(a)(d) | 3M-L+4.50%, 1.00% Floor | 08/29/2025 | $ | 49,625 | $ | 49,625 | ||||||
| The Octave Music Group, Inc.(a)(d) | 1M-L+4.75%, 1.00%, Floor | 05/28/2021 | 43,600 | 43,247 | ||||||||
| RETAIL - 2.16% | ||||||||||||
| Wok Holdings Inc.(a)(d) | 1M-L+6.50%, 1.00% Floor | 03/01/2026 | 49,750 | 47,959 | ||||||||
| SERVICES: BUSINESS - 7.09% | ||||||||||||
| iQor US Inc.(a)(d) | 1M-L+5.00%, 1.00% Floor | 04/01/2021 | 99,478 | 96,742 | ||||||||
| RMS Holding Company, LLC(a)(d) | 1M-L+6.00%, 1.00%, Floor | 11/16/2022 | 61,160 | 60,622 | ||||||||
| SERVICES: CONSUMER - 6.16% | ||||||||||||
| Barry’s Bootcamp Holdings, LLC(a)(d) | 3M-L+6.00%, 1.00%, Floor | 07/14/2022 | 100,000 | 99,170 | ||||||||
| Wrench Group, LLC(a)(d)(e) | 1M-L+4.25%, 1.00% Floor | 04/30/2026 | 37,500 | 37,500 | ||||||||
| WHOLESALE - 1.68% | ||||||||||||
| Isagenix International, LLC(a)(d) | 3M-L+5.75%, 1.00%, Floor | 06/16/2025 | 47,500 | 37,231 | ||||||||
| �� | ||||||||||||
| TOTAL SENIOR SECURED FIRST LIEN TERM LOANS(Cost $1,451,650) | $ | 1,412,000 | ||||||||||
| SENIOR SECURED SECOND LIEN TERM LOANS - 10.50% | ||||||||||||
| BANKING, FINANCE, INSURANCE & REAL ESTATE - 4.41% | ||||||||||||
| Resolute Investment Managers, Inc.(a)(d) | 3M-L+7.50%, 1.00%, Floor | 04/30/2023 | 50,000 | 49,680 | ||||||||
| Shift4 Payments, LLC(a)(d) | 3M-L+8.50%, 1.00%, Floor | 11/28/2025 | 50,000 | 48,265 | ||||||||
| HEALTHCARE & PHARMACEUTICALS - 2.20% | ||||||||||||
| Midwest Physician Administrative Services, LLC(a)(d) | 1M-L+7.00%, 0.75%, Floor | 08/15/2025 | 50,000 | 48,750 | ||||||||
| HIGH TECH INDUSTRIES - 2.19% | ||||||||||||
| Vertafore, Inc.(a)(d) | 1M-L+7.25%, 1.00% Floor | 07/02/2026 | 50,000 | 48,565 | ||||||||
| MEDIA: ADVERTISING, PRINTING & PUBLISHING - 1.70% | ||||||||||||
| The Imagine Group, LLC(a)(d) | 1M-L+8.75%, 1.00%, Floor | 06/21/2023 | 50,000 | 37,705 | ||||||||
| TOTAL SENIOR SECURED SECOND LIEN TERM LOANS(Cost $247,141) | $ | 232,965 | ||||||||||
| TOTAL INVESTMENTS - 94.21%(Cost $2,097,474) | 2,090,716 | |||||||||||
| US BANK MONEY MARKET CORP. TRUST - 13.72%(Cost $304,467) | 304,467 | 304,467 | ||||||||||
| LIABILITIES IN EXCESS OF OTHER ASSETS - (7.93)% | (176,007 | ) | ||||||||||
| NET ASSETS - 100.00% | $ | 2,219,176 | ||||||||||
| (a) | Fair Value estimated using Fair Valuation Policies and Procedures adopted by the board of trustees. The security is valued using significant unobservable inputs, which are categorized as Level 3 assets under the definition of ASC 820 fair value hierarchy. The aggregate fair value of these securities is $1,694,834 which represents 76.37% of Net Assets. |
| (b) | Non-income producing security. |
| (c) | As a practical expedient, the Fund uses NAV to determine the fair value of this investment. |
| (d) | Floating or variable rate security. The Reference Rate is described below. The Interest Rate in effect as of June 30, 2019 is based on the Reference Rate plus the displayed spread as of the security’s last reset date. |
| (e) | The investment has an unfunded commitment as of June 30, 2019. Fair value includes an analysis of the unfunded commitment. |
* Investment Abbreviations:
L - London Interbank Offered Rate (“LIBOR”)
Reference Rates:
1M-L - 1 Month LIBOR as of June 30, 2019 was 2.40%
3M-L - 3 Month LIBOR as of June 30, 2019 was 2.32%
All of the Fund’s investments are made in companies which are domiciled in the United States of America and are denominated in US Dollars
| See Notes to Financial Statements. | |
| 6 | www.sierratotalreturnfund.com |
| Sierra Total Return Fund | Consolidated Statement of Assets and Liabilities |
| June 30, 2019 |
| ASSETS: | ||||
| Investments, at fair value (Cost $2,097,474) | $ | 2,090,716 | ||
| Cash and cash equivalents | 309,924 | |||
| Receivable due from adviser | 111,653 | |||
| Receivable for investment securities sold | 50,399 | |||
| Prepaid expenses and other assets | 25,509 | |||
| Interest receivable | 7,627 | |||
| Dividend receivable | 3,488 | |||
| Total Assets | 2,599,316 | |||
| LIABILITIES: | ||||
| Other payables and accrued expenses | 120,837 | |||
| Accrued fund accounting and administration fees payable | 119,831 | |||
| Accrued legal and audit fees payable | 94,117 | |||
| Management fees payable | 10,237 | |||
| Accrued transfer agent fees payable | 10,154 | |||
| Accrued trustees’ fees payable | 9,750 | |||
| Accrued custodian fees payable | 8,202 | |||
| Deferred tax liability | 7,012 | |||
| Total Liabilities | 380,140 | |||
| Commitments (Note 8) | – | |||
| Net Assets | $ | 2,219,176 | ||
| COMPOSITION OF NET ASSETS: | ||||
| Paid-in capital | $ | 2,107,499 | ||
| Total distributable earnings | 111,677 | |||
| Net Assets | $ | 2,219,176 | ||
| PRICING OF SHARES: | ||||
| Class T Shares | ||||
| Net Assets | $ | 2,219,176 | ||
| Shares of beneficial interest outstanding (unlimited number of shares, no par value common share authorized) | 86,228 | |||
| Net Asset Value and redemption price per share | $ | 25.74 | ||
| Maximum Offering Price per Share (Including Maximum Sales Load of 2.00%) | $ | 26.26 | ||
| See Notes to Financial Statements. | |
| Annual Report | June 30, 2019 | 7 |
| Sierra Total Return Fund | Consolidated Statement of Operations |
| For the Year Ended June 30, 2019 |
| INVESTMENT INCOME: | ||||
| Interest | $ | 143,003 | ||
| Dividends | 33,198 | |||
| Fee income | 3,976 | |||
| Total Investment Income | 180,177 | |||
| EXPENSES: | ||||
| Fund accounting and administration fees | 467,674 | |||
| Legal and audit fees | 107,220 | |||
| Custodian fees | 61,229 | |||
| Insurance expenses | 54,113 | |||
| Transfer agent fees | 42,275 | |||
| Trustees’ fees and expenses | 37,500 | |||
| Management fees | 37,330 | |||
| Other expenses | 1,712 | |||
| Total expenses before expense support reimbursement (Note 3) | 809,053 | |||
| Expense support reimbursement (Note 3) | (743,367 | ) | ||
| Net expenses | 65,686 | |||
| Net Investment Income | 114,491 | |||
| REALIZED AND UNREALIZED GAIN/(LOSS) ON INVESTMENTS: | ||||
| Net realized gain on investments | 60,571 | |||
| Net change in unrealized appreciation on investments (net of ($7,012) change in deferred tax provision) | 1,474 | |||
| Net Realized and Unrealized Gain on Investments | 62,045 | |||
| Net Increase in Net Assets | $ | 176,536 | ||
| See Notes to Financial Statements. | |
| 8 | www.sierratotalreturnfund.com |
| Sierra Total Return Fund | Consolidated Statement of Changes in Net Assets |
| For the Year Ended | For the Year Ended | |||||||
| June 30, 2019 | June 30, 2018 | |||||||
| FROM OPERATIONS: | ||||||||
| Net investment income | $ | 114,491 | $ | 82,907 | ||||
| Net realized gain on investments | 60,571 | 22,308 | ||||||
| Net realized gain distributions from other investment companies | – | 76 | ||||||
| Net change in unrealized appreciation/(depreciation) on investments | 1,474 | (16,146 | ) | |||||
| Net Increase in Net Assets from Operations | 176,536 | 89,145 | ||||||
| DISTRIBUTIONS TO SHAREHOLDERS: | ||||||||
| From distributable earnings | (113,958 | ) | (83,492 | ) | ||||
| Net Decrease in Net Assets from Distributions to Shareholders | (113,958 | ) | (83,492 | ) | ||||
| CAPITAL SHARE TRANSACTIONS: | ||||||||
| Class T Shares | ||||||||
| Shares issued in reinvestment of distributions | – | 55,399 | ||||||
| Net Increase from Capital Share Transactions | – | 55,399 | ||||||
| Net Increase in Net Assets | 62,578 | 61,052 | ||||||
| NET ASSETS: | ||||||||
| Beginning of period | 2,156,598 | 2,095,546 | ||||||
| End of period | $ | 2,219,176 | $ | 2,156,598 | ||||
| OTHER INFORMATION: | ||||||||
| CAPITAL SHARE TRANSACTIONS: | ||||||||
| Class T Shares | ||||||||
| Beginning shares | 86,228 | 84,000 | ||||||
| Distributions reinvested | – | 2,228 | ||||||
| Net increase in capital shares | – | 2,228 | ||||||
| Ending shares | 86,228 | 86,228 | ||||||
| See Notes to Financial Statements. | |
| Annual Report | June 30, 2019 | 9 |
| Sierra Total Return Fund | Consolidated Statement of Cash Flows |
| For the Year Ended June 30, 2019 |
| CASH FLOWS FROM OPERATING ACTIVITIES: | ||||
| Net increase/(decrease) in net assets from operations | $ | 176,536 | ||
| Adjustments to reconcile net increase in net assets from operations to net cash provided by operating activities: | ||||
| Purchases of investments | (1,820,420 | ) | ||
| Proceeds from disposition of investments | 1,685,894 | |||
| Amortization of premium and accretion of discount on investments | (1,975 | ) | ||
| Net realized (gain)/loss on investments | (60,571 | ) | ||
| Net change in unrealized (appreciation)/depreciation on investments (net of $7,012 change in deferred tax provision) | (1,474 | ) | ||
| (Increase) decrease in assets: | ||||
| Receivable due from adviser | 181,781 | |||
| Prepaid expenses and other assets | (3,847 | ) | ||
| Interest receivable | (3,025 | ) | ||
| Dividend receivable | (251 | ) | ||
| Increase (decrease) in liabilities: | ||||
| Other payables and accrued expenses | (73,510 | ) | ||
| Accrued fund accounting and administration fees payable | (5,308 | ) | ||
| Accrued legal and audit fees payable | 18,767 | |||
| Accrued custodian fees payable | 8,202 | |||
| Management fees payable | 1,083 | |||
| Accrued transfer agent fees payable | 10,154 | |||
| Accrued trustees’ fees payable | 9,750 | |||
| Net cash provided by operating activities | 121,786 | |||
| CASH FLOWS FROM FINANCING ACTIVITIES: | ||||
| Cash distributions paid | (113,958 | ) | ||
| Net cash used in financing activities | (113,958 | ) | ||
| NET INCREASE IN CASH FOR THE PERIOD | 7,828 | |||
| CASH AND CASH EQUIVALENTS, BEGINNING OF YEAR | $ | 302,096 | ||
| CASH AND CASH EQUIVALENTS, END OF YEAR | $ | 309,924 | ||
| See Notes to Financial Statements. | |
| 10 | www.sierratotalreturnfund.com |
| Sierra Total Return Fund | Consolidated Financial Highlights |
| For a share outstanding throughout the periods presented |
| For the Period | ||||||||||||
| June 1, 2017 | ||||||||||||
| For the | For the | (Commencement of | ||||||||||
| Year Ended | Year Ended | Operations) to | ||||||||||
| June 30, 2019 | June 30, 2018 | June 30, 2017 | ||||||||||
| OPERATING PERFORMANCE: | ||||||||||||
| Net asset value - beginning of period | $ | 25.01 | $ | 24.95 | $ | 25.00 | ||||||
| INCOME/(LOSS) FROM INVESTMENT OPERATIONS: | ||||||||||||
| Net investment income/(loss)(a) | 1.33 | 0.98 | (0.07 | ) | ||||||||
| Net realized and unrealized gain on investments | 0.73 | 0.06 | 0.02 | |||||||||
| Total Income/(Loss) from Investment Operations | 2.06 | 1.04 | (0.05 | ) | ||||||||
| DISTRIBUTIONS TO SHAREHOLDERS: | ||||||||||||
| From net investment income | (1.07 | ) | (0.98 | ) | – | |||||||
| From net realized gains | (0.26 | ) | – | – | ||||||||
| Total Distributions to Shareholders | (1.33 | ) | (0.98 | ) | – | |||||||
| Net asset value - end of period | $ | 25.74 | $ | 25.01 | $ | 24.95 | ||||||
| Total Investment Return - Net Asset Value(b) | 8.48 | % | 4.26 | % | (0.20 | )%(c) | ||||||
| RATIOS AND SUPPLEMENTAL DATA: | ||||||||||||
| Net assets end of period | $ | 2,219,176 | $ | 2,156,598 | $ | 2,095,546 | ||||||
| Including interest expense: | ||||||||||||
| Ratio of expenses to average net assets excluding reimbursement(d) | 37.40 | % | 136.47 | % | 96.26 | % | ||||||
| Ratio of expenses to average net assets including reimbursement(d) | 3.04 | % | 3.71 | % | 5.98 | % | ||||||
| Excluding interest expense: | ||||||||||||
| Ratio of expenses to average net assets excluding reimbursement(d) | 37.40 | % | 136.45 | % | 96.26 | % | ||||||
| Ratio of expenses to average net assets including reimbursement(d) | 3.04 | % | 3.69 | % | 5.98 | % | ||||||
| Ratio of net investment income/(loss) to average net assets(d) | 5.29 | % | 3.92 | % | (3.39 | )% | ||||||
| Portfolio turnover rate | 82 | % | 144 | % | 0 | %(c) | ||||||
| (a) | Calculated using daily average shares outstanding. |
| (b) | Total returns are for the period indicated and have not been annualized. Total returns would have been lower had certain expenses not been reimbursed during the period. Returns shown do not reflect the deduction of taxes that a shareholder would pay on Fund distributions or the redemption of Fund shares. Returns shown exclude applicable sales charges. |
| (c) | Not Annualized. |
| (d) | Expenses and net investment income/(loss) amounts used to calculate the ratios above include amounts allocated to investors of Class T Shares. An individual investor’s results may vary based on a variety of factors including differing fee arrangements and the timing of capital transactions. These ratios to average net assets have been annualized except certain non-recurring expenses, such as organization/offering costs which have not been annualized. |
| See Notes to Financial Statements. | |
| Annual Report | June 30, 2019 | 11 |
| Sierra Total Return Fund | Notes to Consolidated Financial Statements |
| June 30, 2019 |
| 1. | ORGANIZATION |
Sierra Total Return Fund (the “Fund”) is a Delaware statutory trust registered under the Investment Act of 1940, as amended (“1940 Act”), as a continuously offered, non-diversified, closed-end management investment company that operates as an interval fund. In order to operate as an interval fund, the Fund has adopted a fundamental policy to make repurchase offers for no less than 5.00% and no more than 25% of its outstanding shares at the net asset value (“NAV”) during each calendar quarter of each year.
The Fund currently has Class T shares outstanding. Class T Shares are offered at NAV plus a maximum sales load of 2.00% of the amount invested in Class T shares. Class T shares are subject to (i) a monthly shareholder services fee that will accrue at an annual rate of up to 0.25% of the average daily net assets of the Fund attributable to Class T shares; (ii) a distribution fee that will accrue at an annual rate equal to 0.75% of the average daily net assets of the Fund attributable to Class T shares; and (iii) an early withdrawal charge equal to 1.00% of the original purchase price of Class T shares repurchased by the Fund, through a quarterly repurchase offer request, during the 365 days following such shareholder’s initial purchase. Class T shares are subject to a total sales charge cap, which consists of the upfront sales load, early withdrawal charges and the ongoing distribution fee of 6.25% under FINRA Rule 2341.
The Fund’s investment adviser is STRF Advisors LLC (the “Adviser”). The Adviser is registered with the U.S. Securities and Exchange Commission (“SEC”) as a registered investment adviser under the Investment Advisers Act of 1940, as amended. The Adviser’s registration became effective on May 12, 2016.
The Fund has formed and expects to continue to form certain taxable subsidiaries (the “Taxable Subsidiaries”), which are taxed as corporations for U.S. federal income tax purposes. Taxable Subsidiaries allow the Fund to hold equity securities of portfolio companies organized as pass-through entities while continuing to satisfy the requirements of a Registered Investment Company “RIC” under the Code.
The investment objective of the Fund is to seek a total return through a combination of current income and long-term capital appreciation by investing in a portfolio of debt securities and equities. The Fund expects to pursue its investment objectives by investing its assets in the debt and equities of fixed-income and fixed-income related securities, including real estate securities. The Fund may invest without limitation in fixed-income and fixed-income related securities of any industry, sector, or minimum market cap. In addition, the Fund may invest across domestic and foreign markets.
| 2. | SIGNIFICANT ACCOUNTING POLICIES |
Basis of Presentation
The Fund follows the accounting and reporting guidance in the Financial Accounting Standards Board Accounting Standards Codification (“ASC”) Topic 946 - Financial Services, Investment Companies (“ASC 946”). The accompanying consolidated financial statements have been prepared on the accrual basis of accounting in conformity with U.S. generally accepted accounting principles (“GAAP”) and includes the accounts of the Funds and its wholly-owned subsidiary, STRF Investment Holdings LLC, the Taxable Subsidiary. All intercompany balances and transactions have been eliminated in consolidation. All references made to the “Fund,” “we,” and “us” herein include Sierra Total Return Fund and its consolidated subsidiaries, except as stated otherwise.
Other Expenses
All costs incurred by the Fund in connection with its organization were expensed as incurred. The Adviser paid these organizational expenses on behalf of the Fund. Organization costs consist of costs incurred to establish the Fund and enable it legally to do business. Examples of these costs are incorporation fees, legal fees, and audit fees relating to the initial registration statement and the seed audit. Expenses that have been advanced by the Adviser are subject to recoupment under the Expense Support Agreement as described in Note 3.
Use of Estimates
The preparation of financial statements in conformity with GAAP requires management to make estimates and assumptions related to the reported amounts of assets and liabilities and disclosure of contingent assets and liabilities as of the date of the financial statements and the reported amounts of income and expenses during the period. Actual results could differ from those estimates.
Cash and Cash Equivalents
The Fund considers cash equivalents to be highly liquid investments or investments with original maturities of three months or less. Cash and cash equivalents include deposits in a money market demand deposit account. The Fund deposits its cash in a financial institution that, at times, may be in excess of the Federal Deposit Insurance Corporation insurance limits. There are no restrictions on cash. As of June 30, 2019, the Fund had a balance of $309,924 in cash and cash equivalents.
| 12 | www.sierratotalreturnfund.com |
| Sierra Total Return Fund | Notes to Consolidated Financial Statements |
| June 30, 2019 |
Loan Participations and Assignments
The Fund may invest in loan participations and assignments. The Fund considers loan participations and assignments to be investments in debt securities. Loan participations typically will result in the Fund having a contractual relationship only with the lender, not with the borrower. The Fund will have the right to receive payments of principal, interest and any fees to which it is entitled only from the lender selling the participation and only upon receipt by the lender of the payments from the borrower. Under a loan participation, the Fund generally will have no right to enforce compliance by the borrower with the terms of the loan agreement relating to the loan, nor any rights of set-off against the borrower, and the Fund may not benefit directly from any collateral supporting the loan in which it has purchased the participation. As a result, the Fund will assume the credit risk of both the borrower and the lender that is selling the participation. In the event of the insolvency of the lender selling a participation, the Fund may be treated as a general creditor of the lender and may not benefit from any set-off between the lender and the borrower. When the Fund purchases assignments of loans from lenders, the Fund will acquire direct rights against the borrower on the loan, except that under certain circumstances such rights may be more limited than those held by the assigning lender.
Recent Accounting Pronouncements
In August 2018, the Financial Accounting Standards Board (“FASB”) issued Accounting Standards Update (“ASU”) 2018-13, which changes the fair value measurement disclosure requirements of FASB Accounting Standards Codification Topic 820, Fair Value Measurement. The update to Topic 820 includes new, eliminated, and modified disclosure requirements. ASU 2018-13 is effective for fiscal years beginning after December 15, 2019, including interim periods. Early adoption is permitted for any eliminated or modified disclosures. The Fund early adopted effective with the financial statements prepared as of June 30, 2019, and they had no effect on the Fund’s net assets or results of operations.
Fair Value Measurements
The Fund applies fair value accounting to all of its financial instruments in accordance with the 1940 Act and ASC Topic 820 - Fair Value Measurements and Disclosures (“ASC 820”). ASC 820 defines fair value, establishes a framework used to measure fair value and requires disclosures for fair value measurements. In accordance with ASC 820, the Fund has categorized its financial instruments carried at fair value, based on the priority of the valuation technique, into a three-level fair value hierarchy. Fair value is a market-based measure considered from the perspective of the market participant who holds the financial instrument rather than an entity specific measure. Therefore, when market assumptions are not readily available, the Fund’s own assumptions are set to reflect those that management believes market participants would use in pricing the financial instrument at the measurement date.
Various inputs are used in determining the value of the Fund’s investments as of the reporting period end. These inputs are categorized in the following hierarchy under applicable financial accounting standards:
Level 1 — Valuations based on quoted prices in active markets for identical assets or liabilities at the measurement date.
Level 2 — Valuations based on inputs other than quoted prices in active markets included in Level 1, which are either directly or indirectly observable at the measurement date. This category includes quoted prices for similar assets or liabilities in active markets, quoted prices for identical or similar assets or liabilities in non-active markets including actionable bids from third parties for privately held assets or liabilities, and observable inputs other than quoted prices such as yield curves and forward currency rates that are entered directly into valuation models to determine the value of derivatives or other assets or liabilities.
Level 3 — Valuations based on inputs that are unobservable and where there is little, if any, market activity at the measurement date. The inputs for the determination of fair value may require significant management judgment or estimation and are based upon management’s assessment of the assumptions that market participants would use in pricing the assets or liabilities. These investments include debt and equity investments in private companies or assets valued using the Market or Income Approach and may involve pricing models whose inputs require significant judgment or estimation because of the absence of any meaningful current market data for identical or similar investments. The inputs in these valuations may include, but are not limited to, capitalization and discount rates, beta and Earnings Before Interest, Taxes, Depreciation and Amortization (“EBITDA”) multiples. The information may also include pricing information or broker quotes which include a disclaimer that the broker would not be held to such a price in an actual transaction. The non-binding nature of consensus pricing and/or quotes accompanied by disclaimer would result in classification as Level 3 information, assuming no additional corroborating evidence.
Investments for which market quotations are readily available are valued at such market quotations, which are generally obtained from an independent pricing service or multiple broker-dealers or market makers. The Fund weighs the use of third-party broker quotations, if any, in determining fair value based on management’s understanding of the level of actual transactions used by the broker to develop the quote and whether the quote was an indicative price or binding offer. However, debt investments with remaining maturities within 60 days that are not credit impaired are valued at cost plus accreted discount, or minus amortized premium, which approximates fair value. Investments for which market quotations are not readily available are valued at fair value as determined by the Fund’s board of trustees based upon input from management and third party valuation firms. Because these investments are illiquid and because there may not be any directly comparable companies whose financial instruments have observable market values, these loans are valued using a fundamental valuation methodology, consistent with traditional asset pricing standards, that is objective and consistently applied across all loans and through time.
| Annual Report | June 30, 2019 | 13 |
| Sierra Total Return Fund | Notes to Consolidated Financial Statements |
| June 30, 2019 |
Investments in investment companies are generally determined utilizing the NAV supplied by, or on behalf of, management of each investment company, which is net of management and incentive fees or allocations charged by the investment company and is in accordance with the “practical expedient”, as defined by ASC 820. NAVs received by, or on behalf of, management of each investment company are based on the fair value of the investment company’s underlying investments in accordance with policies established by management of each investment company, as described in each of their financial statements and offering memorandum.
The methodologies utilized by the Fund in estimating the fair value of its investments categorized as Level 3 generally fall into the following two categories:
| · | The “Market Approach” uses prices and other relevant information generated by market transactions involving identical or comparable assets, liabilities, or a group of assets and liabilities, such as a business. |
| · | The “Income Approach” converts future amounts (for example, cash flows or income and expenses) to a single current (that is, discounted) amount. When the Income Approach is used, the fair value measurement reflects current market expectations about those future amounts. |
The Fund uses third-party valuation firms to assist the board of trustees (the “Board”) in the valuation of its portfolio investments. The valuation reports generated by the third-party valuation firms consider the evaluation of financing and sale transactions with third parties, expected cash flows and market based information, including comparable transactions, performance multiples, and movement in yields of debt instruments, among other factors. Based on market data obtained from the third-party valuation firms, the Fund uses a combined market yield analysis and an enterprise model of valuation. In applying the market yield analysis, the value of the Fund’s loans is determined based upon inputs such as the coupon rate, current market yield, interest rate spreads of similar securities, the stated value of the loan, and the length to maturity. In applying the enterprise model, the Fund uses a waterfall analysis which takes into account the specific capital structure of the borrower and the related seniority of the instruments within the borrower’s capital structure into consideration. To estimate the enterprise value of the portfolio company, the Fund weighs some or all of the traditional market valuation methods and factors based on the individual circumstances of the portfolio company in order to estimate the enterprise value. The methodologies for performing investments may be based on, among other things: valuations of comparable public companies, recent sales of private and public comparable companies, discounting the forecasted cash flows of the portfolio company, third party valuations of the portfolio company, considering offers from third parties to buy the Fund, estimating the value to potential strategic buyers and considering the value of recent investments in the equity securities of the portfolio company. For non-performing investments, the Fund may estimate the liquidation or collateral value of the portfolio company’s assets and liabilities using an expected recovery model. The Fund may estimate the fair value of warrants based on a model such as the Black-Scholes model or simulation models or a combination thereof.
The methodologies and information that the Fund utilizes when applying the Market Approach for performing investments include, among other things:
| · | valuations of comparable public companies (“Guideline Comparable Approach”); |
| · | recent sales of private and public comparable companies (“Guideline Comparable Approach”); |
| · | recent acquisition prices of the Fund, debt securities or equity securities (“Acquisition Price Approach”); |
| · | external valuations of the portfolio company, offers from third parties to buy the Fund (“Estimated Sales Proceeds Approach”); |
| · | subsequent sales made by the Fund of its investments (“Expected Sales Proceeds Approach”); and |
| · | estimating the value to potential buyers. |
The methodologies and information that the Fund utilizes when applying the Income Approach for performing investments include:
| · | discounting the forecasted cash flows of the portfolio company or securities (“Discounted Cash Flow” or “DCF” Approach); and |
| · | Black-Scholes model or simulation models or a combination thereof (“Income Approach – Option Model”) with respect to the valuation of warrants. |
The Fund undertakes a multi-step valuation process when valuing investments for which market quotations are not readily available, as described below:
| · | the Fund’s valuation process begins with each portfolio investment being initially valued by the valuation professionals; |
| · | conclusions are then documented and discussed with senior management; and |
| · | an independent valuation firm engaged by the Fund’s board of trustees prepares an independent valuation report for approximately one-third of the portfolio investments on non-fiscal year-end quarters, such that each of the investments will be valued by an independent valuation firm at least twice per annum when combined with the fiscal year -end review of all the investments by independent valuation firms. |
| 14 | www.sierratotalreturnfund.com |
| Sierra Total Return Fund | Notes to Consolidated Financial Statements |
| June 30, 2019 |
In addition, all of the Fund’s investments are subject to the following valuation process:
| · | management reviews preliminary valuations and conducts its own independent assessment; |
| · | the audit committee of the Fund’s board of trustees reviews the preliminary valuations of senior management and independent valuation firms; and |
| · | the Fund’s board of trustees discusses valuations and determines the fair value of each investment in the Fund’s portfolio in good faith based on the input of the Adviser, the respective independent valuation firms and the audit committee. |
Due to the inherent uncertainty of determining the fair value of investments that do not have a readily available market value, the fair value of the Fund’s investments may differ significantly from the values that would have been used had a readily available market value existed for such investments, and the differences could be material.
The following is a summary of the inputs used in valuing the Fund’s investments as of June 30, 2019:
| Valuation Inputs | ||||||||||||||||
| Investments in Securities at Fair Value(a) | Level 1 | Level 2 | Level 3 | Total | ||||||||||||
| Common Stocks | $ | 278,776 | $ | – | $ | 35,037 | $ | 313,813 | ||||||||
| Preferred Stocks | 89,744 | – | 14,832 | 104,576 | ||||||||||||
| Senior Secured First Lien Term Loans | – | – | 1,412,000 | 1,412,000 | ||||||||||||
| Senior Secured Second Lien Term Loans | – | – | 232,965 | 232,965 | ||||||||||||
| Total | $ | 368,520 | $ | – | $ | 1,694,834 | $ | 2,063,354 | ||||||||
| Investments measured at net asset value | $ | 27,362 | ||||||||||||||
| Total Investments, at fair value | $ | 2,090,716 | ||||||||||||||
The following is a reconciliation of assets in which Level 3 inputs were used in determining value:
| Net change | ||||||||||||||||||||||||||||||||
| in unrealized | ||||||||||||||||||||||||||||||||
| appreciation/ | ||||||||||||||||||||||||||||||||
| (depreciation) | ||||||||||||||||||||||||||||||||
| included in | ||||||||||||||||||||||||||||||||
| the Statements | ||||||||||||||||||||||||||||||||
| Change in | of Operations | |||||||||||||||||||||||||||||||
| Accrued | Unrealized | attributable to Level 3 | ||||||||||||||||||||||||||||||
| Balance as of | Discount/ | Realized | Appreciation/ | Sales | Balance as of | investments held at | ||||||||||||||||||||||||||
| Asset Type | June 30, 2018 | premium | Gain/(Loss) | Depreciation | Purchases | Proceeds | June 30, 2019 | June 30, 2019 | ||||||||||||||||||||||||
| Common Stocks | $ | 1,648 | $ | – | $ | – | $ | 33,389 | $ | – | $ | – | $ | 35,037 | $ | 33,389 | ||||||||||||||||
| Preferred Stocks | 115,516 | – | 57,752 | 166 | 5,804 | (164,406 | ) | 14,832 | – | |||||||||||||||||||||||
| Senior Secured First Lien Term Loans | 1,117,416 | 1,704 | 398 | (32,810 | ) | 710,585 | (385,293 | ) | 1,412,000 | (32,939 | ) | |||||||||||||||||||||
| Senior Secured Second Lien Term Loans | 444,635 | 251 | 685 | (11,931 | ) | 98,625 | (299,300 | ) | 232,965 | (11,369 | ) | |||||||||||||||||||||
| Warrants | 2,150 | – | 913 | – | – | (3,063 | ) | – | – | |||||||||||||||||||||||
| Total | $ | 1,681,365 | $ | 1,955 | $ | 59,748 | $ | (11,186 | ) | $ | 815,014 | $ | (852,062 | ) | $ | 1,694,834 | $ | (10,919 | ) | |||||||||||||
| Annual Report | June 30, 2019 | 15 |
| Sierra Total Return Fund | Notes to Consolidated Financial Statements |
| June 30, 2019 |
Significant unobservable valuation inputs for material Level 3 investments as of June 30, 2019 are as follows:
| Range | ||||||||||
| Fair Value | Valuation Technique | Unobservable Input | (Weighted Average) | |||||||
| Senior Secured First Lien Term Loan | $ | 1,310,458 | Income Approach (DCF) | Market Yield | 5.36%-14.39% (8.35%) | |||||
| Senior Secured First Lien Term Loan | 101,542 | Recent Arms-Length Transaction | Recent Arms-Length Transaction | N/A | ||||||
| Senior Secured Second Lien Term Loan | 232,965 | Income Approach (DCF) | Market Yield | 9.33%-19.55% (11.31%) | ||||||
| Market Approach (Guideline | 5.50x-6.00x (6.00x)/ | |||||||||
| Common Stock | 35,037 | Comparable)/Income Approach (DCF) | EBITDA Multiple, Discount rate | 17.00%-19.00% (18.00%) | ||||||
| Market Approach (Guideline | 5.50x-6.00x (6.00x)/ | |||||||||
| Preferred Stock | 14,832 | Comparable)/Income Approach (DCF) | EBITDA Multiple, Discount rate | 17.00%-19.00% (18.00%) | ||||||
| Total | $ | 1,694,834 | ||||||||
The significant unobservable inputs used in the fair value measurement of the Fund’s debt and derivative investments are market yields. The significant unobservable inputs used in the fair value measurement of the Company’s equity/warrants investments are comparable company multiples of revenue or EBITDA for the latest twelve months (“LTM”), next twelve months (“NTM”) or a reasonable period a market participant would consider. Increases or decreases in any of the above significant unobservable inputs in isolation would result in a lower or higher fair value measurement for such assets.
Security Transactions and Investment Income
Investment security transactions are accounted for on a trade date basis. Cost is determined and gains and losses are based upon the specific identification method for both financial statement and federal income tax purposes. Dividend income is recorded on the ex-dividend date and interest income is recorded on the accrual basis. Purchase discounts and premiums on securities are accreted and amortized over the life of the respective securities.
The significant unobservable inputs used in the fair value measurement of the Fund’s debt investments are market yields and recent arms-length transactions. The significant unobservable inputs used in the fair value measurement of the Fund’s equity investments are market yields, discount rates, volatility, or comparable company multiples of revenue or EBITDA for the latest twelve months (“LTM”), next twelve months (“NTM”) or a reasonable period a market participant would consider. Increases or decreases in any of the above significant unobservable inputs in isolation would result in a lower or higher fair value measurement for such assets.
The Taxable Subsidiaries accrue income taxes payable based on the applicable corporate rates on the unrealized gains generated by the investments held by the Taxable Subsidiaries. As of June 30, 2019 the Company recorded a deferred tax liability of $7,012 on the Consolidated Statements of Assets and Liabilities. The change in deferred tax liabilities is included as a component of net realized and unrealized gain/(loss) on investments on the Consolidated Statements of Operations.
The Fund accounts for income taxes in conformity with ASC Topic 740 - Income Taxes (“ASC 740”). ASC 740 provides guidelines for how uncertain tax positions should be recognized, measured, presented and disclosed in financial statements. ASC 740 requires the evaluation of tax positions taken or expected to be taken in the course of preparing the Fund’s tax returns to determine whether the tax positions are “more-likely-than-not” to be sustained by the applicable tax authority. Tax positions deemed to meet the “more-likely-than-not” threshold would be recorded as a tax benefit or expense. For the year ended June 30, 2019, there were no interest or penalties due to uncertain income tax positions.
The Fund complies with the requirements under Subchapter M of the Internal Revenue Code of 1986, as amended, applicable to regulated investment companies and intend to distribute substantially all of their net taxable income and net capital gains, if any, each year so that the Fund will not be subject to excise tax on undistributed income and gains. The Fund is not subject to income taxes to the extent such distributions are made.
As of June 30, 2019, the Fund did not have a liability for any unrecognized tax benefits. The Fund files U.S. federal, state and local tax returns as required. The Fund’s tax returns are subject to examination by the relevant tax authorities until expiration of the applicable statute of limitations which is generally three years after the filing of the tax return for federal purposes and four years for most state returns. Tax returns for open years have incorporated no uncertain tax positions that require a provision for income taxes.
| 16 | www.sierratotalreturnfund.com |
| Sierra Total Return Fund | Notes to Consolidated Financial Statements |
| June 30, 2019 |
Distributions to Shareholders
Distributions from investment income, if any, are declared and paid quarterly. Distributions from net realized capital gains, if any, are declared and paid annually and are recorded on the ex-dividend date. The character of income and gains to be distributed is determined in accordance with income tax regulations, which may differ from GAAP.
We have adopted an “opt in” distribution reinvestment plan pursuant to which shareholders may elect to have the full amount of any cash distributions reinvested in additional shares of the fund. As a result, if we declare a cash distribution, shareholders that have “opted in” to our distribution reinvestment plan will have their distribution automatically reinvested in additional shares of the fund rather than receiving cash distributions. Shareholders who receive distributions in the form of shares will be subject to the same federal, state and local tax consequences as if they received cash distributions.
Fair Value of Other Financial Instruments
The carrying amounts of certain of the Fund’s financial instruments, including cash and cash equivalents and accounts payable and accrued expenses, approximate fair value due to their short-term nature.
| Indemnification |
The Fund expects to indemnify its officers and trustees for certain liabilities that may arise from the performance of their duties to the Fund in a manner consistent with the 1940 Act. Additionally, in the normal course of business, the Fund enters into contracts that contain a variety of representations and warranties which provide general indemnities. The Fund has had no material claims or payments pursuant to such agreements. The Fund’s maximum exposure under these arrangements is unknown, as this would involve future claims that may be made against the Fund that have not yet occurred. However, the Fund expects the risk of loss due to these warranties and indemnities to be remote.
| 3. | MANAGEMENT FEES AND OTHER RELATED PARTY TRANSACTIONS |
Management Fee
The Fund’s management fee is calculated and payable monthly in arrears at the annual rate of 1.50% of the Fund’s average daily total assets during such period. For the year ended June 30, 2019, the Fund incurred $37,330 of management fees.
Incentive Fee
The Fund’s incentive fee is calculated and payable quarterly in arrears in an amount equal to 15% of the Fund’s “pre-incentive fee net investment income” for the immediately preceding quarter, and is subject to a hurdle rate, expressed as a rate of return on the Fund’s “adjusted capital,” equal to 1.50% per quarter, subject to a “catch-up” feature, which allows the Adviser to recover foregone incentive fees that were previously limited by the hurdle rate. Any incentive fees will be accrued and tracked on a daily basis. For this purpose, “pre-incentive fee net investment income” means interest income, dividend income and any other income accrued during the calendar quarter, minus the Fund’s operating expenses for the quarter (including the management fee, expenses reimbursed to the Adviser and any interest expenses and distributions paid on any issued and outstanding preferred shares, but excluding the incentive fee). Pre-incentive fee net investment income includes, in the case of investments with a deferred interest feature (such as original issue discount, debt instruments with paid-in-kind interest and zero coupon securities), accrued income that the Fund has not yet received in cash. Pre-incentive fee net investment income does not include any realized capital gains, realized capital losses or unrealized capital appreciation or depreciation. “Adjusted capital” means the cumulative gross proceeds received by the Fund from the sale of shares (including pursuant to the Fund’s distribution reinvestment plan), reduced by amounts paid in connection with purchases of shares pursuant to the Fund’s fundamental policy to make repurchase offers. No incentive fees were paid during the year ended June 30, 2019.
Expense Support Agreement
The Fund entered into an Expense Support and Reimbursement Agreement, (the “Expense Support Agreement”), with the Adviser.
The Adviser has agreed to reimburse the Fund for expenses the Fund incurs for the purpose of limiting the Fund’s payment of certain operating expenses (exclusive of any taxes, interest, brokerage commissions, acquired fund fees and expenses, incentive fees, shareholder services expenses, annual dealer manager fees, distribution fees and extraordinary expenses, such as litigation or reorganization costs, but inclusive of organizational costs and offering costs) in any fiscal year to 2.66% per annum of the Fund’s average daily gross assets attributable to Class T (the “Operational Expense Limit”). The Adviser will be eligible to recoup expense support payments it previously made, both during the term of the Expense Support Agreement and upon its termination by the Board, within the three years following the period in which the expenses occurred, and the Adviser will recoup an amount from the Fund to the extent the amount recouped does not cause the Fund’s average daily gross assets with respect to Class T, Class I shares in the period of recoupment to exceed the lesser of the Operational Expense Limit in effect at the time the Expense Support Payment was made in that period or the Operational Expense Limit in effect at such time the Adviser seeks recoupment. The initial term of the Expense Support Agreement was for twelve months, beginning as of the effective date of the Fund’s registration statement, November 9, 2016. The Adviser
| Annual Report | June 30, 2019 | 17 |
| Sierra Total Return Fund | Notes to Consolidated Financial Statements |
| June 30, 2019 |
and the Fund have agreed to extend the term of the Expense Support Agreement through July 25, 2019. The Board of Trustees may terminate the Expense Support Agreement at any time, and there can be no assurance that the Adviser will renew the Expense Support Agreement after July 25, 2019. As of June 30, 2019, the Fund had a receivable due from Adviser of $111,653. Intercompany balances are typically settled within 12 months.
As of June 30, 2019, the following amounts were available for recoupment by the Adviser based upon their potential expiration dates:
| Amount of Expense | Amount Repaid | Eligible to be | ||||||||
| Period Ended | Payment Obligations | to STRF Advisors | Repaid Through | |||||||
| June 30, 2019 | $ | 743,367 | – | June 30, 2022 | ||||||
| June 30, 2018 | $ | 2,808,871 | – | June 30, 2021 | ||||||
| June 30, 2017 | $ | 556,460 | – | June 30, 2020 | ||||||
Administration
The Fund entered into an administration agreement (“Administration Agreement”) with Medley Capital LLC, (“Medley”), an affiliate of the Adviser, whereby Medley provides administrative services necessary to conduct the Fund’s day-to-day operations. Such services will include providing office facilities and equipment, clerical, bookkeeping, accounting and recordkeeping services, legal services, and all such other services as deemed necessary by the Fund. The Fund will reimburse Medley for any such costs and expenses which have been paid by Medley on behalf of the Fund on the terms and conditions set forth in the Administration Agreement. The Fund incurred $467,674 of administrative expenses from Medley for the year ended June 30, 2019 of which $106,376 was payable as of June 30, 2019 and included in fund accounting and administration fees on statement of operations.
Sub-Administration
Medley entered into a sub-administration agreement with ALPS Fund Services, Inc. (“ALPS”) to serve as sub-administrator and fund accounting agent for the Fund. ALPS will provide certain administrative and bookkeeping services to Medley for the benefit of the Fund.
Distributor and Transfer Agent
ALPS Distributor, Inc., (the “Distributor”) an affiliate of ALPS, serves as the Fund’s principal underwriter within the meaning of the 1940 Act, and acts as the distributor of the Fund’s shares on a best efforts basis, subject to various conditions. The Distributor acts as the Fund’s principal underwriter in a continuous public offering of the Fund’s shares. During the year ended June 30, 2019, no fees were retained by the Distributor.
The Board has adopted, on behalf of the Fund, a Shareholder Services Plan under which the Fund may compensate financial industry professionals for providing ongoing services in respect of clients with whom they have distributed shares of the Fund. Under the Shareholder Servicing Plan, the Fund’s Class T shares are subject to a shareholder services fee at an annual rate of 0.25% of the average daily net assets attributable to Class T shares. Class T shares are subject to distribution fee that accrues at an annual rate equal to 0.75% of the Fund’s average daily net assets attributable to Class T shares and is payable on a quarterly basis. The fund is currently not collecting shareholder service and distribution fees.
DST Systems, Inc. (“DST”), the parent company of ALPS, serves as the transfer agent to the Fund. Under the Transfer Agency Agreement, DST is responsible for maintaining all shareholder records of the Fund.
| Trustees |
Each trustee who is not an “interested person” of the Fund or the Adviser as defined in Section 2(a)(19) of the 1940 Act (the “Independent Trustees”) receives an annual fee of $2,500. Independent Trustees also receive $2,000 ($500 for each telephonic board or committee meeting) plus reimbursement of reasonable out-of-pocket expenses incurred in connection with attending each in-person board or committee meeting. None of the interested trustees receive compensation from the Fund. The Fund incurred $37,500 of trustees fees for the year ended June 30, 2019, of which, $9,750 was included on the consolidated statement of assets and liabilities as accrued trustees’ fees payable at June 30, 2019.
| 4. | INVESTMENT TRANSACTIONS |
The cost of purchases and proceeds from the sale of securities, other than short-term securities, for the year ended June 30, 2019 amounted to $1,814,076 and $1,736,311, respectively.
| 18 | www.sierratotalreturnfund.com |
| Sierra Total Return Fund | Notes to Consolidated Financial Statements |
| June 30, 2019 |
| 5. | TAX BASIS INFORMATION |
For the year ended June 30, 2019, the following reclassifications, which had no impact on results of operations or net assets, were recorded to reflect tax character. The fund reclassified for book purposes amounts arising from permanent book/tax differences related to reversal of subsidiary blocker level dividends, and non-deductible excise tax paid.
| Decrease | Increase in Distributable | |||||||
| Paid-in capital | Earnings | |||||||
| $ | (1,443 | ) | $ | 1,443 | ||||
As of June 30, 2019, the components of accumulated earnings/(deficit) on a tax basis were as follows:
| Accumulated net investment income | $ | 65,246 | ||
| Accumulated net realized gain | 56,961 | |||
| Net unrealized appreciation/(depreciation) | (10,530 | ) | ||
| Total | $ | 111,677 |
The following information is computed on a tax basis for each item as of June 30, 2019:
| Cost of investments for income tax purposes (excluding money market investments) | $ | 2,094,234 | ||
| Gross appreciation (excess of value over tax cost) | $ | 27,914 | ||
| Gross depreciation (excess of tax cost over value) | (31,432 | ) | ||
| Net unrealized depreciation | $ | (3,518 | ) |
The difference between book basis and tax basis distributable earnings and unrealized appreciation/(depreciation) is primarily attributable to the tax treatment of organizational costs and certain other investments.
The tax character of distributions paid by the Fund for the Fiscal Year Ended June 30, 2019 was as follows:
| 2019 | Sierra Total Return Fund | |||
| Distributions Paid From: | ||||
| Ordinary Income | $ | 112,535 | ||
| Long-Term Capital Gain | 1,423 | |||
| Total | $ | 113,958 | ||
The tax character of distributions paid by the Fund for the Fiscal Year Ended June 30, 2018 was as follows:
| 2018 | Sierra Total Return Fund | |||
| Distributions Paid From: | ||||
| Ordinary Income | $ | 83,198 | ||
| Long-Term Capital Gain | 294 | |||
| Total | $ | 83,492 | ||
| 6. | REPURCHASE OFFERS |
Once each quarter, pursuant to Rule 23c-3 under the 1940 Act, the Fund intends to offer to repurchase at NAV no less than 5% and no more than 25% of its outstanding shares as of the close of regular business hours on the New York Stock Exchange pursuant to a fundamental policy. There can be no assurance that the Fund will be able to repurchase all shares that each shareholder has tendered, even if all the shares in a shareholder’s account are tendered. If shareholders tender for repurchase more than the repurchase offer amount for a given repurchase offer, the Fund will repurchase the shares on a pro rata basis. However, the Fund may accept all shares tendered for repurchase by shareholders who own less than one hundred shares and who tender all of their shares, before prorating other amounts tendered. No shareholders tendered their Class T shares during the year ended June 30, 2019.
| Annual Report | June 30, 2019 | 19 |
| Sierra Total Return Fund | Notes to Consolidated Financial Statements |
| June 30, 2019 |
| 7. | BENEFICIAL OWNERSHIP |
The beneficial ownership, either directly or indirectly, of more than 25% of the voting securities of a fund creates a presumption of control of the fund, under Section 2(a)(9) of the 1940 Act. As of June 30, 2019, the Adviser is the beneficial owner of more than 25% of the voting securities and controls the Fund. Control Investments are defined by the 1940 Act as investments in companies in which the Company owns more than 25% of the voting securities or maintains greater than 50% of the board representation.
| 8. | COMMITMENTS |
As of June 30, 2019, the Company had $19,269 of unfunded commitments under loan and financing agreements. This amount is primarily composed of commitments for senior secured term loans and revolvers. The unrealized gain or loss associated with unfunded commitments is recorded in the financial statements and reflected as an adjustment to the valuation of the related investment in the Consolidated Schedule of Investments. The par amounts of the unfunded commitments are not recognized by the company until the commitment is funded.
| Smile Doctors, LLC | $ | 13,018 | ||
| Wrench Group, LLC | 12,500 | |||
| Total Commitments | $ | 25,519 |
| 9. | LINE OF CREDIT |
The Fund has a secured revolving bank line of credit through Interactive Brokers (the “Bank”) for purpose of investment purchases subject to the limitations of the 1940 Act for borrowings.
Borrowings under this arrangement bear interest at the Bank’s benchmark rate plus a spread. The Bank’s benchmark rate and spread were 2.4% and 1.5%, respectively, as of June 30, 2018. During the year ended June 30, 2019, the Fund incurred $203 of interest expense related to the fees from prior year. The Fund did not utilize any borrowings throughout the year ended June 30, 2019 and did not have any outstanding borrowings as of June 30, 2019.
| 10. | SUBSEQUENT EVENTS |
Management has evaluated subsequent events through the date of issuance of the consolidated financial statements included herein. There have been no subsequent events that occurred during such period that would require disclosure in this annual report or would be required to be recognized in the consolidated financial statements as of and for the year ended June 30, 2019.
| 20 | www.sierratotalreturnfund.com |
To the Shareholders and Board of Trustees of Sierra Total Return Fund
Opinion on the Financial Statements
We have audited the accompanying consolidated statement of assets and liabilities of Sierra Total Return Fund (the “Fund”), including the consolidated schedule of investments as of June 30, 2019, the related consolidated statements of operations and cash flows for the year then ended, the consolidated statement of changes in net assets for each of the two years in the period then ended, the consolidated financial highlights for each of the two years ended June 30, 2019 and the period from June 1, 2017 (commencement of operations) to June 30, 2017 and the related notes (collectively referred to as the “financial statements”). In our opinion, the consolidated financial statements present fairly, in all material respects, the consolidated financial position of the Fund at June 30, 2019, the consolidated results of its operations and cash flows for the year then ended, changes in its net assets for each of the two years in the period then ended, and financial highlights for each of the two years in the period ended June 30, 2019, and the period from June 1, 2017 (commencement of operations) to June 30, 2017, in conformity with U.S. generally accepted accounting principles.
Basis for Opinion
These financial statements are the responsibility of the Fund’s management. Our responsibility is to express an opinion on the Fund’s financial statements based on our audits. We are a public accounting firm registered with the Public Company Accounting Oversight Board (United States) (“PCAOB”) and are required to be independent with respect to the Fund in accordance with the U.S. federal securities laws and the applicable rules and regulations of the Securities and Exchange Commission and the PCAOB.
We conducted our audits in accordance with the standards of the PCAOB. Those standards require that we plan and perform the audit to obtain reasonable assurance about whether the financial statements are free of material misstatement, whether due to error or fraud. The Fund is not required to have, nor were we engaged to perform, an audit of the Fund’s internal control over financial reporting. As part of our audits we are required to obtain an understanding of internal control over financial reporting but not for the purpose of expressing an opinion on the effectiveness of the Fund’s internal control over financial reporting. Accordingly, we express no such opinion.
Our audits included performing procedures to assess the risks of material misstatement of the financial statements, whether due to error or fraud, and performing procedures that respond to those risks. Such procedures included examining, on a test basis, evidence regarding the amounts and disclosures in the financial statements. Our procedures included confirmation of investments owned as of June 30, 2019, by correspondence with the custodian, directly with counterparties and management of the portfolio companies, debt agents, and brokers or by other appropriate auditing procedures where replies were not received. Our audits also included evaluating the accounting principles used and significant estimates made by management, as well as evaluating the overall presentation of the financial statements. We believe that our audits provide a reasonable basis for our opinion.

We have served as the Fund’s auditor since 2016.
New York, New York
August 29, 2019
| Annual Report | June 30, 2019 | 21 |
| Sierra Total Return Fund | Additional Information |
| June 30, 2019 (Unaudited) |
| 1. | PROXY VOTING POLICIES AND VOTING RECORD |
The Board has adopted the Adviser’s Proxy Voting Policies and Procedures (“Policies”) on behalf of the Fund, which delegate the responsibility for voting proxies to the Adviser, subject to the Board’s continuing oversight. A description of, or a copy of, the Policies is available without charge, upon request, by calling the Fund toll-free at 1-888-292-3178, or on the SEC’s website at http://www.sec.gov. Information regarding how the Fund voted proxies relating to portfolio securities during the most recent 12-month period ended June 30, 2019 is available without charge upon request by calling toll-free 1-888-292-3178, or on the SEC’s website at http://www.sec.gov.
| 2. | QUARTERLY PORTFOLIO HOLDINGS |
The Fund files a complete listing of portfolio holdings for the Fund with the SEC as of the first and third quarters of each fiscal year on Form N-Q. The filings are available upon request by calling 1-888-292-3178. Furthermore, you may obtain a copy of the filing on the SEC’s website at http://www.sec.gov.
| 3. | TAX DESIGNATIONS |
The Fund designates the following as a percentage of taxable ordinary income distributions, or up to the maximum amount allowable, for the calendar year ended December 31, 2018:
| Dividends Received Deduction | Qualified Dividend Income | |||||||
| Sierra Total Return Fund | 4.42 | % | 4.42 | % | ||||
In early 2019, if applicable, shareholders of record received this information for the distributions paid to them by the Funds during the calendar year 2018 via Form 1099. The Funds will notify shareholders in early 2020 of amounts paid to them by the Funds, if any, during the calendar year 2019.
Pursuant to Section 852(b)(3) of the Internal Revenue Code, the Sierra Total Return Fund designates $1,423 as long-term capital gain distributions.
Please consult a tax advisor if you have questions about federal or state income tax laws, or how to prepare your tax returns.
| 22 | www.sierratotalreturnfund.com |
| Sierra Total Return Fund | Trustees & Officers |
| June 30, 2019 (Unaudited) |
INDEPENDENT TRUSTEES
| Number of | Other | |||||||
| Portfolios in | Directorships | |||||||
| Fund Complex | held by Trustee | |||||||
| Name, Address(1) | Position/Term | Principal Occupation | Overseen | During Last | ||||
| and Age | of Office(2) | During the Past Five Years | by Trustee | 5 Years | ||||
Jonathan Gregory Coules Age: 49 | Trustee since 2016 | Jonathan Gregory Coules has served on the Board of Trustees since its inception in 2016. Mr. Coules has also served as the President and Founder of JG Coules Advisors, a retained search firm which specializes in placements of senior level hedge fund, asset management and family office professionals, since its inception in March 2012. He also has experience as a retained strategic advisor, helping investment managers consider growth strategies, crisis management and related personnel decisions. Mr. Coules was previously a Managing Director at Hunter Advisors, a global retained search firm, where he focused on the Hedge Fund and Asset Management practice and led the Family Office practice, from 2008 to 2011, and a portfolio manager at Brencourt Advisors, a multi-billion dollar, multi-strategy hedge fund, from 2007 to 2008. Mr. Coules was also a portfolio manager at Metropolitan Capital Advisors, an event-driven hedge fund from 2004 to 2007. Mr. Coules is also a member of the Visiting Committee of the University of Chicago Law School, a founding Advisory Board member of The Family Office Association and a Senior Advisor to a major private family foundation focused on projects in the United States and Israel. Mr. Coules began his investment career as a research analyst at Morgan Stanley, where in 2002 he led the Broadcasting, Printing and Publishing team to a #1 ranking in Institutional Investor Magazine. Mr. Coules received a BA from the University of Chicago, an MBA from Harvard Business School and a JD from the University of Chicago Law School. | 1 | N/A | ||||
John Hathaway Dyett Age: 49 | Trustee since 2016 | John Hathaway Dyett has served on the Board of Trustees since its inception in 2016. Mr. Dyett has also served as the Co-CEO of Salem Partners Wealth Management, LLC since 2004 and the Co-CEO of Salem Partners, LLC, an investment banking firm, since 1997. Mr. Dyett also serves on the Board of Directors of Femasys, Inc. and as an advisor to Akashi Therapeutics. Mr. Dyett was previously a banker with Gerard Klauer Mattison & Co., Inc. and Needham and Co., Inc. Mr. Dyett also serves on the Board of Trustees of Middlesex School in Concord. Mr. Dyett received a BA from Harvard University. | 1 | 1 | ||||
Anthony E. Gellert Age: 49 | Trustee since 2016 | Anthony E. Gellert has served on the Board of Trustees since its inception in 2016. Mr. Gellert has also served as Managing Member of the General Partner and Chief Financial Officer of Livingston Capital Fund, a hedge fund and public securities firm, since February 2001 and Managing Member of Livingston Capital Ventures, an angel investing fund, since July 2015. He previously served as a junior investment banker at Lazard Frères and Wertheim Schroder & Co. Mr. Gellert also serves as the Treasurer of the Harvard Business School Alumni Angels of Greater New York, a non-profit angel organization affiliated with The Harvard Business School Club of New York. Mr. Gellert received a BA from Harvard University and an MBA from Harvard Business School. | 1 | N/A |
| Annual Report | June 30, 2019 | 23 |
| Sierra Total Return Fund | Trustees & Officers |
| June 30, 2019 (Unaudited) |
INTERESTED TRUSTEES AND OFFICERS
| Number of | Other | |||||||
| Portfolios in | Directorships | |||||||
| Fund Complex | held by Trustee | |||||||
| Name, Address(1) | Position/Term | Principal Occupation | Overseen | During Last | ||||
| and Year of Birth | Of Office(2) | During the Past Five Years | by Trustee | 5 Years | ||||
Seth Taube(3) Age: 48 | Trustee, Chairman of the Board and Chief Executive officer since 2016 | Seth Taube has served as Chief Executive Officer and Chairman of the Board of Trustees of the Fund since its inception in 2016. He also co-founded Medley in 2006 and has served as Medley’s Co-Chief Executive Officer since then and as Co-Chairman of the Board of Directors of Medley Management Inc. since its formation. He has also served as Chief Executive Officer and Chairman of the Board of Directors of Sierra Income Corporation since its inception in 2012 and on the Board of Directors of Medley Capital Corporation since its inception in 2011. Prior to forming Medley, Mr. Taube was a Partner with CN Opportunity Fund, T3 Group, a principal and advisory firm focused on distressed asset and credit investments, and Griphon Capital Management. Mr. Taube previously worked with Tiger Management and held positions with Morgan Stanley & Co. in the Investment Banking and Institutional Equity Divisions. Mr. Taube received a BA from Harvard University, an M. Litt. in Economics from St. Andrew’s University in Great Britain, where he was a Rotary Foundation Fellow, and an MBA from the Wharton School at the University of Pennsylvania. | 1 | 3 | ||||
Brook Taube(3) Age: 48 | Trustee since 2016 | Brook Taube has served on the Board of Trustees of the Fund since its inception in 2016. He also co-founded Medley in 2006 and has served as Medley’s Co-Chief Executive Officer since then and as Co-Chairman of the Board of Directors of Medley Management Inc. since its formation. He has also served as Chief Executive Officer and Chairman of the Board of Directors of Medley Capital Corporation since 2011 and has served on the Board of Directors of Sierra Income Corporation since its inception in 2012. Prior to forming Medley, Mr. Taube was a Partner with CN Opportunity Fund, T3 Group, a principal and advisory firm focused on distressed asset and credit investments, and Griphon Capital Management. Mr. Taube began his career at Bankers Trust in leveraged finance in 1992. Mr. Taube received a BA from Harvard University. | 1 | 3 | ||||
Jeffrey Tonkel Age: 48 | President since 2016 | Jeffrey Tonkel has served as President of the Fund since its inception in 2016. He joined Medley in 2011 and has served as President and as a member of the Board of Directors of Medley Management Inc. since its formation. He has also served as President of Sierra Income Corporation since July 2013 and as a member of the Board of Directors of Medley Capital Corporation since February 2014. Prior to joining Medley, Mr. Tonkel was a Managing Director with JPMorgan from January 2010 to November 2011, where he was Chief Financial Officer of a global financing and markets business. Prior to JPMorgan, Mr. Tonkel was a Managing Director, Principal Investments, with Friedman Billings Ramsey, where he focused on merchant banking and corporate development investments in diversified industrials, energy, real estate and specialty finance. Mr. Tonkel began his investment career with Summit Partners. Mr. Tonkel received a BA from Harvard University and an MBA from Harvard Business School. | N/A | 2 |
| 24 | www.sierratotalreturnfund.com |
| Sierra Total Return Fund | Trustees & Officers |
| June 30, 2019 (Unaudited) |
| Number of | Other | |||||||
| Portfolios in | Directorships | |||||||
| Fund Complex | held by Trustee | |||||||
| Name, Address(1) | Position/Term | Principal Occupation | Overseen | During Last | ||||
| and Year of Birth | Of Office(2) | During the Past Five Years | by Trustee | 5 Years | ||||
Richard T. Allorto, Jr. Age: 47 | Chief Financial Officer, Treasurer and Secretary since 2018 | Richard T. Allorto, Jr. has served as Chief Financial Officer, Treasurer, and Secretary of the Fund since August 2018. He has served as Medley’s Chief Financial Officer since July 2010. Mr. Allorto has also served as the Chief Financial Officer, Treasurer and Secretary of Sierra Income Corporation since July 2018. Mr. Allorto has also served as the Chief Financial Officer and Secretary of Medley Capital Corporation since January 2011. Prior to joining Medley, Mr. Allorto held various positions at GSC Group, Inc., a registered investment advisor, including, Chief Financial Officer of GSC Investment Corp., a business development company that was externally managed by GSC Group. Mr. Allorto is a licensed CPA and received a B.S. in Accounting from Seton Hall University. | N/A | N/A | ||||
John D. Fredericks Age: 54 | Chief Compliance Officer since 2016 | John D. Fredericks has served as Chief Compliance Officer of the Fund since its inception in 2016. He has served as Medley’s General Counsel since June 2013. Mr. Fredericks has also served as the Chief Compliance Officer of Medley Capital Corporation and Sierra Income Corporation since February 2014. Prior to joining Medley, Mr. Fredericks was a partner with Winston & Strawn, LLP from February 2003 to May 2013, where he was a member of the firm’s restructuring and insolvency and corporate lending groups. Before joining Winston & Strawn, LLP, from 2000 to 2003, Mr. Fredericks was a partner with Murphy Sheneman Julian & Rogers and, from 1993 to 2000, an associate at Murphy, Weir & Butler. Mr. Fredericks was admitted to the California State Bar in 1993. Mr. Fredericks received a B.A. from the University of California Santa Cruz and a JD from University of San Francisco. | N/A | N/A |
| (1) | The address of each Trustee and Officer is c/o Sierra Total Return Fund, 280 Park Ave, 6th Floor East, New York, NY 10017. |
| (2) | The term of office for each Trustee and Officer listed above will continue indefinitely. |
| (3) | Seth Taube and Brook Taube are brothers. |
Sierra Total Return Funds’ statement of additional information (SAI) contains further information about the directors. Please call 888.292.3178 or visit our website at www.sierratotalreturnfund.com for a free copy of the SAI.
| Annual Report | June 30, 2019 | 25 |

Must be accompanied or preceded by a Prospectus.
ALPS Distributors, Inc. is the Distributor for the Sierra Total Return Fund.
Item 2. Code of Ethics.
| (a) | As of the end of the period covered by this report, the registrant has adopted a code of ethics that applies to the registrant’s principal executive officer, principal financial officer, principal accounting officer or controller, or persons performing similar functions, regardless of whether these individuals are employed by the registrant or a third party. |
| (b) | Not applicable. |
| (c) | During the period covered by this report, there have not been any amendments to the provisions of the code of ethics referred to in Item 2(a) of this report. |
| (d) | During the period covered by this report, the registrant had not granted any waivers, including an implicit waiver, from the provisions of the code of ethics referred to in Item 2(a) of this report. |
| (e) | Not applicable. |
| (f) | Registrant’s Code of Business Conduct and Ethics was filed as Exhibit 13(a)(1) to the Registrants’s Certified Shareholder Report on Form N-CSR, File No. 811-23137, on August 29, 2018. |
Item 3. Audit Committee Financial Expert.
| (a)(1)(ii) | The Board of Trustees of the registrant has determined that the registrant has at least one audit committee financial expert serving on its audit committee. |
| (a)(2) | The Board of Trustees of the registrant has designated Mr. John Hathaway Dyett as the registrant’s audit committee financial expert. Mr. Dyett is “independent” as defined in paragraph (a)(2) of Item 3 to Form N-CSR. |
Item 4. Principal Accountant Fees and Services.
| (a) | Audit Fees: For the registrant’s fiscal years ended June 30, 2019 and June 30, 2018, the aggregate fees billed for professional services rendered by the principal accountant for the audit of the registrant’s annual financial statements or services that are normally provided by the accountant in connection with statutory and regulatory filings or engagements were $52,000 and $50,000, respectively. |
| (b) | Audit-Related Fees: For the registrant’s fiscal years ended June 30, 2019 and June 30, 2018, the aggregate fees billed for assurance and related services by the principal accountant that are reasonably related to the performance of the audit of the registrant’s financial statements and are not otherwise reported under paragraph (a) of this Item 4, were $0 and $0, respectively. |
| (c) | Tax Fees: For the registrant’s fiscal years ended June 30, 2019 and June 30, 2018, the aggregate fees billed for professional services rendered by the principal accountant for tax compliance, tax advice and tax planning, which were comprised of the preparation of Federal and state income tax returns, assistance with calculation of required income, capital gain and excise distributions and preparation of Federal excise tax returns, were $19,200 and $15,000, respectively. |
| (d) | All Other Fees: For the registrant’s fiscal years ended June 30, 2019 and June 30, 2018, the aggregate fees billed for products and services provided by the principal accountant, other than the services reported in paragraphs (a) through (c) of this Item 4, were $0 and $0, respectively. |
| (e)(1) | The registrant’s audit committee is required to pre-approve all audit services and, when appropriate, any non-audit services (including audit-related, tax and all other services) to the registrant. The registrant’s audit committee is also required to pre-approve, when appropriate, any non-audit services (including audit-related, tax and all other services) to its investment adviser, or any entity controlling, controlled by or under common control with the investment adviser that provides ongoing services to the registrant, to the extent that the services may be determined to have an impact on the operations or financial reporting of the registrant. Services are reviewed on an engagement by engagement basis by the Audit Committee. |
| (2) | No services described in paragraphs (b) through (d) of this Item 4 were approved by the registrant’s audit committee pursuant to paragraph (c)(7)(i)(C) of Rule 2-01 of Regulation S-X. |
| (f) | During the audit of registrant’s financial statements for the most recent fiscal year, less than 50 percent of the hours expended on the principal accountant’s engagement were attributed to work performed by persons other than the principal accountant’s full-time, permanent employees. |
| (g) | For the registrant’s fiscal years ended June 30, 2019 and June 30, 2018, the aggregate non-audit fees for services billed by the registrant’s accountant for services rendered to the registrant and rendered to the registrant’s investment adviser and any entity controlling, controlled by, or under common control with the investment adviser that provides ongoing services to the registrant were $0 and $0, respectively. |
| (h) | The registrant’s audit committee has considered whether the provision of non-audit services to the registrant’s investment adviser, and any entity controlling, controlled by, or under common control with the investment adviser that provides ongoing services to the registrant, that were not pre-approved pursuant to paragraph (c)(7)(ii) of Rule 2-01 of Regulation S-X, is compatible with maintaining the principal accountant’s independence. |
Item 5. Audit Committee of Listed Registrants.
Not applicable.
Item 6. Investments.
| (a) | The schedule of investments is included as part of the Reports to Shareholders filed under Item 1 of this report. |
| (b) | Not applicable. |
Item 7. Disclosure of Proxy Voting Policies and Procedures for Closed-End Management Investment Companies.
| I. | INTRODUCTION |
The following Proxy Voting Policy and its corresponding procedures have been adopted by the Advisers to comply with Rule 206(4)-6 under the Advisers Act and other fiduciary obligations (the “Proxy Rule”). The Policy applies to voting Securities held by the Advisory Clients and has been designed to ensure that the Advisers vote proxies in the best interest of their respective Advisory Clients. In accordance with their obligations under the Proxy Rule, the Advisers have designed and adopted the following procedures to ensure that proxies are considered, determined and voted, at all times, in the best interests of the Advisory Clients holding the corresponding Securities. Any questions or concerns regarding this Proxy Voting Policy, or whether a particular issue may present a material conflict of interest with respect to the Advisers voting of Advisory Client proxies, should be directed to the CCO.
This Proxy Voting Policy does not apply to the consideration of amendments and waivers to transaction documents entered into by the Advisers on behalf of Advisory Clients in connection with their direct lending activities and their purchase of or participation in syndicated loans. The procedures by which amendments and waivers are considered and voted upon are set forth in Section V of the Portfolio Management Review Policy.
| II. | POLICY |
The Policy applies to those Advisory Clients that own voting Securities for which the relevant Adviser has authority to vote proxies. The Policy will be reviewed and, as necessary, updated periodically to address new or revised proxy voting issues. When voting proxies, the Advisers’ primary objective is to make voting decisions in the best interest of those Advisory Clients. In fulfilling their obligations to Advisory Clients pursuant to this Policy, the Advisers will act in a manner deemed to be prudent and diligent and which is intended to enhance the economic value of the underlying investment(s) held by the Advisory Client.
| A. | Material Conflicts of Interest (Actual or Apparent) |
The Advisers will vote their Advisory Clients’ proxies in the best interest of such Advisory Clients. In acting upon these matters on behalf of their Advisory Clients, the Advisers will seek to avoid material conflicts of interest between the interests of the Advisers on the one hand and the interests of their respective Advisory Clients on the other. The Client Disclosure Documents for each of the Advisory Clients typically include provisions for the identification and mitigation of conflicts of interest. In certain cases, the Client Disclosure Documents for a particular Advisory Client may provide for an advisory committee comprised of one or more investors who are convened at the applicable Adviser’s request to address conflicts. In these cases, conflict resolution will be addressed with the advisory committee as contemplated in the Client Disclosure Documents.
| B. | Rule 206(4)-6, (b) and (c) – Proxy Voting Disclosure to Advisory Clients |
Proper records will be maintained in connection with this Proxy Policy. Investors in the Advisers 1940 Act Funds can obtain a copy of the Proxy Policy and Voting Procedures or information on how the Advisers have voted proxies pertinent to the Advisory Client in which they have invested by contacting the Advisers’ CCO.
| III. | GENERAL PROCEDURES |
| 1. | The Advisers will maintain a list of all Advisory Clients for which it votes proxies. The list will be maintained electronically and updated by the CCO or a Compliance Representative. |
| 2. | The Advisers will ensure that it is the designated party to receive voting materials from Portfolio Companies (or their respective intermediaries). Such entities will be instructed to direct all proxy voting materials to the CCO. |
| 3. | The CCO, or a Compliance Representative, will maintain records of the Advisers’ proxy voting function as specified in the Records Maintenance and Retention Policy. |
| 4. | The CCO or a Compliance Representative will refer all proxy solicitation information and materials to the Investment Committee for review and consideration |
| 5. | Each proxy will be reviewed and considered by the Investment Committee on a case-by-case basis taking into account relevant factors including (i) the impact of the proposal on the value of the Securities; (ii) anticipated costs and benefits of the proposal; (iii) effect on liquidity; and (iv) customary industry practices. |
| 6. | The following are certain of the Advisers general principles when voting proxies or determinations relative to requests in respect of Advisory Client portfolio holdings. |
| a) | In cases in which the Adviser holds “control” positions in their Portfolio Companies, the Adviser generally gives significant weight to the views of management it has supported. In all cases, the Adviser considers the effect of management positions on the value of the Advisory Client’s investment. |
| b) | The Advisers evaluate proposals related to corporate governance matters, such as changes in the state or form of organization, amendment of charter documents, mergers and other corporate restructurings, and anti-takeover provisions, in light of the purpose underlying the Advisory Client’s investment position, including the investment horizon and the current or planned ownership position and degree of management involvement by the Advisers on behalf of the 1940 Act Funds. |
| c) | The Advisers believe that compensation of Portfolio Company executives and other appropriate employees should provide proper incentives by aligning economic interests with those of shareholders. In considering proposals related to stock option plans and other management compensation issues, the Advisers consider the Portfolio Company’s need to recruit and retain highly qualified individuals in competitive labor markets and will consider proposals related to compensation matters in relation to relevant industry standards and practices. |
| d) | The Advisers consider proposals regarding changes in capital structure on a case-by-case basis in light of what the Advisers believe to be the purpose of the proposed change, the applicable Adviser’s estimation of the likely effect of the change on the Advisory Client’s investment in the Portfolio Company, and other relevant factors. |
| e) | The Advisers considers the merit of proposals related to social and corporate responsibility issues and will generally defer to company management on such issues. The Advisers are skeptical of proposals by outsiders with non-economic agendas. The Advisers will not support proposals that the Advisers believe may conflict with the company’s ability to maximize long-term profits or would have an adverse effect on the Advisory Client’s investment. |
| 7. | The Investment Committee or the investment professionals designated by it will be responsible for making voting decisions with respect to all Advisory Client proxies. Such decisions will then be forwarded to the CCO or a Compliance Representative, typically via e-mail, for consultation and review, who will then ensure that such proxy is voted appropriately and in a timely manner. |
| 8. | The Advisers are not required to vote every Advisory Client proxy and not voting a proxy should not be construed as a violation of the Advisers’ fiduciary obligations. The Advisers will at no time ignore or neglect their proxy voting responsibilities. However, there may be times when refraining from voting is in the Advisory Client’s best interest, such as when the applicable Adviser’s analysis of a particular proxy reveals that the cost of voting the proxy may exceed the expected benefit to the Advisory Client (i.e., casting a vote on a foreign security may require that the adviser engage a translator or travel to a foreign country to vote in person). |
| 9. | The CCO will report any attempts by any Employee to influence the voting of proxies in a manner that is inconsistent with this Policy. Such report will be made to Senior Management. |
| IV. | RECORDKEEPING |
The CCO or a Compliance Representative will maintain the appropriate proxy voting records as required under the Advisers Act. A list of the records required to be maintained is set forth in the Records Maintenance and Retention Policy.
| V. | CONFIDENTIALITY |
All reports and any other information filed with the applicable Adviser pursuant to this Proxy Policy will be treated as confidential, except that the same may be disclosed to Senior Management, any regulatory or self-regulatory authority or agency upon its request, or as required by law or court or administrative order.
Item 8. Portfolio Managers of Closed-End Management Investment Companies.
Howard Liao is the Portfolio Manager of the Fund and Senior Managing Director and Head of Corporate Credit for Medley Management Inc. (NYSE: MDLY). Mr. Liao has over 15 years of leveraged finance, direct lending and private equity experience originating, structuring and investing in a variety of credit-oriented alternative investments. Prior to joining Medley, Mr. Liao held several positions at Lehman Brothers. He was a member of Lehman’s Leveraged Finance Group, a founding principal of Lehman’s Mezzanine Fund and, most recently, a Managing Director in Lehman’s Private Equity Principal Investments Group managing private and syndicated debt and private equity investments for the Lehman estate. Mr. Liao has served on the board of directors, either as a representative or observer, of the following companies: Varel International, Castex Energy, DHS Drilling Company, Universal Pegasus, Invicta Financial, Greenbrier Minerals and Energy Maintenance Services. Mr. Liao received a BSBA from Georgetown University and an MBA from UCLA Anderson School of Management.
As of June 30, 2019, Mr. Liao did not beneficially own any Fund shares and did not manage any other accounts other than the Fund.
Mr. Liao receives compensation in the form of a fixed base salary, a performance-based cash bonus and related long-term equity interest incentives from the Adviser. Performance-based compensation is determined on both individual efforts and the overall performance of the Adviser. The Adviser reviews the compensation of all employees, including Mr. Liao, at least annually.
Item 9. Purchases of Equity Securities by Closed-End Management Investment Company and Affiliates Purchasers.
None.
Item 10. Submission of Matters to a Vote of Security Holders.
None.
Item 11. Controls and Procedures.
| (a) | Based on an evaluation of the registrant’s disclosure controls and procedures as of a date within 90 days of the filing date of this report (as required by Rule 30a-3(b) under the Investment Company Act of 1940, as amended (the “Act”) and Rules 13a-15(b) or 15d-15(b) under the Securities Exchange Act of 1934), the registrant’s principal executive officer and principal financial officer have concluded that the disclosure controls and procedures (as defined in Rule 30a-3(c) under the Act,) are reasonably designed to ensure that the information required in filings on Form N-CSR is recorded, processed, summarized and reported by the filing date, including that information required to be disclosed is accumulated and communicated to the registrant’s management, including the registrant’s principal executive officer and principal financial officer, as appropriate to allow timely decisions regarding required disclosure. |
| (b) | There were no significant changes in the registrant’s internal control over financial reporting (as defined in Rule 30a-3(c) under the Act,) that occurred during the registrant’s last fiscal quarter that have materially affected, or are reasonably likely to materially affect, the registrant’s internal control over financial reporting. |
Item 12. Disclosure of Securities Lending Activities for Closed-End Management Investment Companies.
None.
Item 13. Exhibits.
| (a)(1) | Registrant's Code of Business Conduct and Ethics, which is the subject of the disclosure required by Item 2 of Form N-CSR, was filed as Exhibit 13(a)(1) to the Registrant's Certified Shareholder Report on Form N-CSR, File No. 811-23137, on August 29, 2018. |
| (a)(2) | Certifications required by Item 13(a)(2) of Form N-CSR are filed herewith as Exhibit 99.CERT. |
SIGNATURES
Pursuant to the requirements of the Securities Exchange Act of 1934 and the Investment Company Act of 1940, the registrant has duly caused this report to be signed on its behalf by the undersigned, thereunto duly authorized.
| SIERRA TOTAL RETURN FUND | ||
| By: | /s/ Seth Taube | |
| Seth Taube | ||
| Chief Executive Officer (Principal Executive Officer) | ||
| Date: | August 29, 2019 | |
Pursuant to the requirements of the Securities Exchange Act of 1934 and the Investment Company Act of 1940, this report has been signed below by the following persons on behalf of the registrant and in the capacities and on the dates indicated.
| By: | /s/ Seth Taube | |
| Seth Taube | ||
| Chief Executive Officer (Principal Executive Officer) | ||
| Date: | August 29, 2019 | |
| By: | /s/ Richard T. Allorto, Jr. | |
| Richard T. Allorto, Jr. | ||
| Chief Financial Officer (Principal Financial Officer) | ||
| Date: | August 29, 2019 |