0001667919 us-gaap:StandardPoors500IndexMember 2021-12-17
UNITED STATES
SECURITIES AND EXCHANGE COMMISSION
Washington, D.C. 20549
FORM N-CSR
CERTIFIED SHAREHOLDER REPORT OF REGISTERED MANAGEMENT INVESTMENT COMPANIES
Investment Company Act file number
First Trust Exchange-Traded Fund VIII
(Exact name of registrant as specified in charter)
120 East Liberty Drive, Suite 400
Wheaton, IL 60187
(Address of principal executive offices) (Zip code)
W. Scott Jardine, Esq.
First Trust Portfolios L.P.
120 East Liberty Drive, Suite 400
Wheaton, IL 60187
(Name and address of agent for service)
Registrant's telephone number, including area code:
Date of reporting period:
Form N-CSR is to be used by management investment companies to file reports with the Commission not later than 10 days after the transmission to stockholders of any report that is required to be transmitted to stockholders under Rule 30e-1 under the Investment Company Act of 1940 (17 CFR 270.30e-1). The Commission may use the information provided on Form N-CSR in its regulatory, disclosure review, inspection, and policymaking roles.
A registrant is required to disclose the information specified by Form N-CSR, and the Commission will make this information public. A registrant is not required to respond to the collection of information contained in Form N-CSR unless the Form displays a currently valid Office of Management and Budget (“OMB”) control number. Please direct comments concerning the accuracy of the information collection burden estimate and any suggestions for reducing the burden to Secretary, Securities and Exchange Commission, 100 F Street, NE, Washington, DC 20549. The OMB has reviewed this collection of information under the clearance requirements of 44 U.S.C. § 3507.
Item 1. Reports to Shareholders.
(a) Following is a copy of the annual reports transmitted to shareholders pursuant to Rule 30e-1 under the Act.
First Trust Income Opportunities ETF
FCEF | NASDAQ, INC.
ANNUAL SHAREHOLDER REPORT | August 31, 2024
This annual shareholder report contains important information about the First Trust Income Opportunities ETF (the “Fund”) for the year of September 1, 2023 to August 31, 2024 (the “Period”). You can find additional information about the Fund at www.ftportfolios.com/fund-documents/etf/FCEF. You can also request this information by contacting us at 1-800-621-1675 or info@ftportfolios.com.
WHAT WERE THE FUND COSTS FOR THE LAST YEAR?
(Based on a hypothetical $10,000 investment)
| Fund | Costs of a $10,000 investment | Costs paid as a percentage
of a $10,000 investment |
| First Trust Income Opportunities ETF | $94(1) | 0.85%(1) |
(1) | Excludes any Acquired Fund Fees and Expenses of underlying investment companies in which the Fund invests. |
HOW DID THE FUND PERFORM LAST YEAR? WHAT AFFECTED THE FUND’S PERFORMANCE?
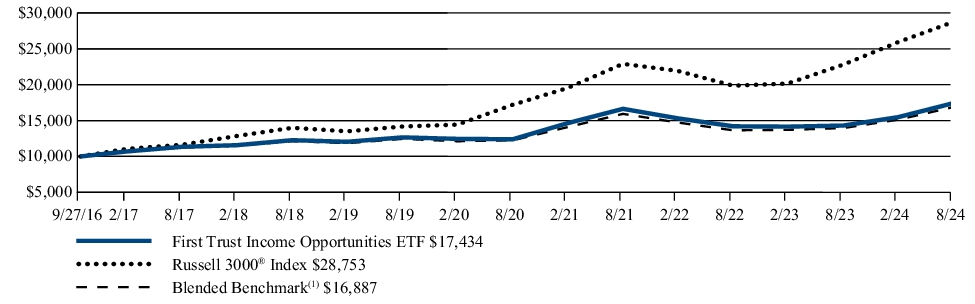
The Fund returned 21.94% for the 12 months ended August 31, 2024. The Fund outperformed its blended benchmark, which consists of the following two indexes: 60% of the First Trust Equity Closed-End Fund Total Return Index, and 40% of the First Trust Taxable Fixed Income Closed-End Fund Total Return Index. The blended benchmark returned 21.00% for the same Period.
This outperformance was a result of several factors including the security selection within the portfolio, sector selection as well as the Fund’s ability to actively manage positions on a continuous basis. Strength across the board in closed-end funds allowed the Fund to move out of previously established defensive positions and into funds which had the best potential for growth in the current market environment.
The Fund posted strong performance during the Period on anticipation that the Federal Reserve would begin to lower interest rates in an effort to encourage growth in a slowing economy. Strong general equity market performance also played a role in the Fund posting a double-digit total return for the Period.
In the closed-end fund space, wide discounts and the proactive move by many Fund sponsors to raise distribution levels encouraged retail investors to revisit the closed-end fund space as an investment option within their portfolios. As investor sentiment turned, we witnessed buyers return to the space. In the past, the Fund witnessed fund sponsors raising distributions in the equity-based funds to coincide with total returns funds were generating, however, the use of a total return-like distribution policy has not been common within the fixed income funds.
Driving fund sponsors to push distribution rates higher was an activist hedge fund. The hedge fund had been accumulating large share positions in a multitude of outstanding closed-end funds which it used to press sponsors to initiate policies which would work to reduce discounts. In some instances, this shareholder sought Board of Director seats, initiated proxy contests and worked to take over fund mandates. While these types of shareholders have existed in the closed-end fund space for a number of years, the engagement that we witnessed over the last year was unprecedented.
During the fiscal year, the Fund continued to make a conscious effort to continue to pay an attractive distribution to shareholders, one that consists predominately of income from the underlying funds.
The Fund will continue to utilize a total return approach to investing that has worked so well through the years. While big “yields” in the closed-end fund space can be enticing to investors, the ability of the Fund to deliver that yield through a portfolio that delivers a total return above and beyond the payout is where the Fund will focus.
FUND PERFORMANCE (September 27, 2016 to August 31, 2024)
The performance line graph below shows the performance of a hypothetical $10,000 initial investment in the Fund over a ten-year period (or for the life of the Fund, if shorter). The subsequent account value as of the end of the Period is listed next to the name of the Fund or index, as applicable. The performance table below shows the average annual total returns of the Fund for the past one-, five-, and ten-year periods, as applicable (or for the life of the Fund, if shorter), as of the end of the Period. Both the line graph and performance table compare the Fund’s performance to an appropriate broad-based index and may compare to additional indices reflecting the market segment(s) in which the Fund invests over the same periods.
Investment Performance of $10,000
| Average Annual Total Returns (as of August 31, 2024) | 1 Year | 5 Year | Since
Inception
(9/27/16) |
| First Trust Income Opportunities ETF | 21.94% | 6.62% | 7.27% |
| Russell 3000® Index | 26.14% | 15.19% | 14.25% |
| Blended Benchmark(1) | 21.00% | 6.28% | 6.83% |
| (1) | A blended benchmark (the “Blended Benchmark”) comprised 60% of the First Trust Equity Closed-End Fund Total Return Index, a cap-weighted index (based on NAV) designed to provide a broad representation of the equity based closed-end fund universe, and 40% of the First Trust Taxable Fixed Income Closed-End Fund Total Return Index, a cap-weighted index (based on NAV) designed to provide a broad representation of the taxable fixed income closed-end fund universe, has been selected as a secondary benchmark to provide a more direct correlation to the Fund's underlying portfolio. The Blended Benchmark returns are calculated by using the monthly return of the two indices during each period shown above. At the beginning of each month the two indices are rebalanced to a 60-40 ratio to account for divergence from that ratio that occurred during the course of each month. The monthly returns are then compounded for each period shown above, giving the performance for the Blended Benchmark for each period shown above. |
Visit www.ftportfolios.com/etf/FCEF for more recent performance information.
The Fund’s past performance is not a good predictor of the Fund’s future performance. The graph and table do not reflect the deduction of taxes that a shareholder would pay on Fund distributions or redemption of Fund shares.
KEY FUND STATISTICS (As of August 31, 2024)
| Fund net assets | $38,496,587 |
| Total number of portfolio holdings | 54 |
| Total advisory fee paid | $259,088 |
| Portfolio turnover rate | 14% |
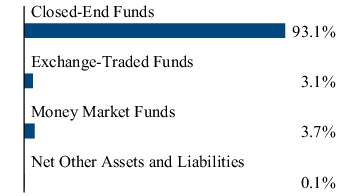
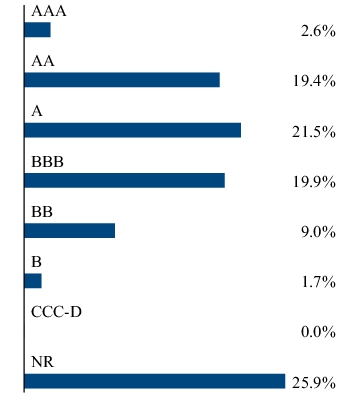
WHAT DID THE FUND INVEST IN? (As of August 31, 2024)
The tables below show the investment makeup of the Fund, representing the percentage of total investments and percentage of net assets, respectively, of the Fund.
| Eaton Vance Tax-Advantaged Global Dividend Income Fund | 4.0% |
| Morgan Stanley Institutional Liquidity Funds - Treasury Portfolio - Institutional Class | 3.7% |
| abrdn Healthcare Opportunities Fund | 3.5% |
| abrdn Healthcare Investors | 3.5% |
| abrdn Global Infrastructure Income Fund | 3.3% |
| Source Capital, Inc. | 3.3% |
| Eaton Vance Tax-Advantaged Dividend Income Fund | 3.3% |
| John Hancock Tax-Advantaged Dividend Income Fund | 3.3% |
| Invesco Variable Rate Investment Grade ETF | 3.2% |
| Eaton Vance Tax-Advantaged Global Dividend Opportunities Fund | 3.1% |
WHERE CAN I FIND ADDITIONAL INFORMATION ABOUT THE FUND?
Visit www.ftportfolios.com/fund-documents/etf/FCEF to view additional information about the Fund such as the prospectus, financial information, Fund holdings and proxy voting information. You may also request this information by contacting us at 1-800-621-1675 or info@ftportfolios.com.
First Trust Flexible Municipal
High Income ETF
MFLX | NASDAQ, INC.
ANNUAL SHAREHOLDER REPORT | August 31, 2024
This annual shareholder report contains important information about the First Trust Flexible Municipal High Income ETF (the “Fund”) for the year of September 1, 2023 to August 31, 2024 (the “Period”). You can find additional information about the Fund at www.ftportfolios.com/fund-documents/etf/MFLX. You can also request this information by contacting us at 1-800-621-1675 or info@ftportfolios.com.
WHAT WERE THE FUND COSTS FOR THE LAST YEAR?
(Based on a hypothetical $10,000 investment)
| Fund | Costs of a $10,000 investment | Costs paid as a percentage
of a $10,000 investment |
| First Trust Flexible Municipal High Income ETF | $79(1) | 0.75%(1) |
(1) | Excludes any Acquired Fund Fees and Expenses of underlying investment companies in which the Fund invests. |
HOW DID THE FUND PERFORM LAST YEAR? WHAT AFFECTED THE FUND’S PERFORMANCE?
The Fund returned 9.97% for the 12 months ended August 31, 2024. The Fund outperformed its benchmark, the Bloomberg Municipal Long Bond (22+) Index, which returned 8.34% for the same Period.
The following key Fund factors impacted Fund performance relative to the benchmark during the Period:
Credit Rating: The Fund’s selection and allocation of NR (“not-rated”) bonds was the primary contributor to Fund outperformance relative to the benchmark while the selection and allocation of BBB rated bonds was a secondary contributor. The Fund’s selection of A rated bonds was the primary detractor to Fund performance relative to the benchmark.
Yield Curve Positioning/Duration: Relative to the benchmark, the Fund’s selection of bonds in the 18+ years to maturity range and the allocation of levered closed-end funds were the primary contributors for Fund outperformance. The Fund’s allocation to bonds in the 16-18 years to maturity range was a secondary contributor. The Fund’s allocation to bonds in cash and the 10-12 years to maturity range were the primary detractors to Fund performance. Examining effective duration, the Fund’s selection of bonds with an effective duration of 7-10 years and the allocation and selection of the levered closed-end funds were the leading contributors to Fund performance while the Fund’s allocation and selection of bonds with an effective duration of 0-1 years and allocation in cash were the main detractors to Fund performance.
Interest Rate Hedge: The use of Treasury futures to hedge interest rate risk was a modest positive contributor to Fund performance.
Sector/Industry: The allocation of closed-end funds, as well as Health Care bonds and the selection of bonds in the Special Tax sectors were the leading contributors to Fund outperformance. Conversely, the Fund’s allocation to cash and selection to Utilities sectors were detractors to Fund performance.
U.S. Treasury Rate Trends: The 10-Year and 30-Year U.S. Treasury yields decreased by approximately 21 basis points (“bps”) and 1 bp, respectively, to 3.90% and 4.20%.
Industry Fund Flows: According to data collected by Investment Company Institute, fund outflows totaled approximately $4.76 billion; however, for the six months ended August 31, 2024, fund flows turned positive at $8.89 billion.
New Issue Supply: According to the Securities Industry and Financial Markets Assocation, primary market supply stood at $467.8 billion. New issue supply is up 34% year-to-date in 2024 as compared to the prior year.
Municipal Credit Yields: According to Municipal Market Data, AAA yield curve data, 10-Year and 30-Year municipal yields decreased 22 bps and 28 bps, respectively, to 2.71% and 3.60%.
Municipal Credit Spreads: Credit spreads for high yield, BBB, and A rated bonds all compressed.
During the Period, the Fund purchased odd lot positions which had a positive impact on performance of 0.058%.
FUND PERFORMANCE (September 27, 2016 to August 31, 2024)
The performance line graph below shows the performance of a hypothetical $10,000 initial investment in the Fund over a ten-year period (or for the life of the Fund, if shorter). The subsequent account value as of the end of the Period is listed next to the name of the Fund or index, as applicable. The performance table below shows the average annual total returns of the Fund for the past one-, five-, and ten-year periods, as applicable (or for the life of the Fund, if shorter), as of the end of the Period. Both the line graph and performance table compare the Fund’s performance to an appropriate broad-based index and may compare to additional indices reflecting the market segment(s) in which the Fund invests over the same periods.
Investment Performance of $10,000
| Average Annual Total Returns (as of August 31, 2024) | 1 Year | 5 Year | Since
Inception
(9/27/16) |
| First Trust Flexible Municipal High Income ETF | 9.97% | 1.26% | 1.85% |
| Bloomberg Municipal Long Bond (22+) Index | 8.34% | 0.53% | 1.98% |
| Blended Benchmark(1) | 9.20% | 1.96% | 3.00% |
| Bloomberg Municipal Bond Index | 6.09% | 1.02% | 1.94% |
| (1) | The Blended Benchmark returns are a 50/50 split between the Bloomberg Municipal High Yield Bond Index and the Bloomberg Municipal Bond Index. |
Visit www.ftportfolios.com/etf/MFLX for more recent performance information.
The Fund’s past performance is not a good predictor of the Fund’s future performance. The graph and table do not reflect the deduction of taxes that a shareholder would pay on Fund distributions or redemption of Fund shares.
Performance in municipal bond investment strategies can be impacted from the benefits of purchasing odd lot positions. The impact of these investments can be particularly meaningful when funds have limited assets under management and may not be a sustainable source of performance as a fund grows in size.
KEY FUND STATISTICS (As of August 31, 2024)
| Fund net assets | $15,634,548 |
| Total number of portfolio holdings | 71 |
| Total advisory fee paid | $112,116 |
| Portfolio turnover rate | 51% |
WHAT DID THE FUND INVEST IN? (As of August 31, 2024)
The tables below show the investment makeup of the Fund, representing the percentage of net assets and percentage of total investments, respectively, of the Fund.
| Municipal Bonds | 90.5% |
| Closed-End Funds | 8.1% |
| Net Other Assets and Liabilities | 1.4% |
| Total | 100.0% |
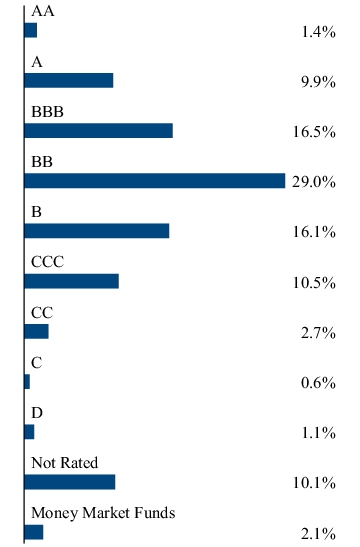
(1) This represents the municipal and closed-end fund holdings in the Fund. The ratings for the Municipal Bond portion of the Fund are by S&P Global Ratings, Moody’s Investors Service, Inc., Fitch Ratings, or a comparably rated NRSRO. For situations in which a security is rated by more than one NRSRO and the ratings are not equivalent, the highest ratings are used. The ratings for the CEF portion of the Fund are provided by Morningstar. A credit rating is an assessment provided by a nationally recognized statistical rating organization (NRSRO) of the creditworthiness of an issuer with respect to debt obligations except for those debt obligations that are only privately rated. Ratings are measured on a scale that generally ranges from AAA (highest) to D (lowest). Investment grade is defined as those issuers that have a long-term credit rating of BBB- or higher. “NR” indicates no rating. The credit ratings shown relate to the creditworthiness of the issuers of the underlying securities in the Fund, and not to the Fund or its shares. Credit ratings are subject to change.
Any amount shown as 0.0% represents less than 0.1%.
WHERE CAN I FIND ADDITIONAL INFORMATION ABOUT THE FUND?
Visit www.ftportfolios.com/fund-documents/etf/MFLX to view additional information about the Fund such as the prospectus, financial information, Fund holdings and proxy voting information. You may also request this information by contacting us at 1-800-621-1675 or info@ftportfolios.com.
First Trust Low Duration
Strategic Focus ETF
LDSF | NASDAQ, INC.
ANNUAL SHAREHOLDER REPORT | August 31, 2024
This annual shareholder report contains important information about the First Trust Low Duration Strategic Focus ETF (the “Fund”) for the year of September 1, 2023 to August 31, 2024 (the “Period”). You can find additional information about the Fund at www.ftportfolios.com/fund-documents/etf/LDSF. You can also request this information by contacting us at 1-800-621-1675 or info@ftportfolios.com.
WHAT WERE THE FUND COSTS FOR THE LAST YEAR?
(Based on a hypothetical $10,000 investment)
| Fund | Costs of a $10,000 investment | Costs paid as a percentage
of a $10,000 investment |
| First Trust Low Duration Strategic Focus ETF | $21(1) | 0.20%(1) |
(1) | Excludes any Acquired Fund Fees and Expenses of underlying investment companies in which the Fund invests. |
HOW DID THE FUND PERFORM LAST YEAR? WHAT AFFECTED THE FUND’S PERFORMANCE?
The Fund returned 7.46% for the 12 months ended August 31, 2024. The Fund outperformed its primary benchmark, the Bloomberg 1-5 Year Government/Credit Index, which returned 6.67% for the same Period. The Fund underperformed the secondary blended benchmark (80% Bloomberg 1-5 Year Government/Credit Index and 20% ICE BofA US High Yield Constrained Index), which returned 7.82% for the same Period.
The outperformance relative to the primary benchmark and the underperformance relative to the secondary benchmark were driven by the Fund’s allocation to credit spread sensitive assets through investments such as investment grade corporate bonds, mortgage-backed securities (“MBS”), high-yield bonds and senior loans, as these assets outperformed. The primary benchmark has no allocation to high-yield bonds, in contrast to 20% in the secondary benchmark. Neither benchmark had an allocation to MBS during the Period.
High yield corporate bond spreads narrowed from 387 to 318 basis points and the ICE BofA US High Yield Constrained Index returned 12.47%, as ‘risk’ assets benefitted from continued economic and corporate profit growth and market enthusiasm surrounding Artificial Intelligence-related growth companies provided a tailwind to returns. Meanwhile, the Federal Reserve (the “Fed”) made their last rate hike in July of 2023 and remained on hold throughout the Period before declining inflation and signs of labor market deterioration caused them to signal that rate cuts are expected in 2024, causing the market to price in lower yields and providing greater confidence the Fed would engineer a soft landing.
The Fund’s largest allocations were to MBS and short-duration investment-grade corporate bonds through the First Trust Low Duration Opportunities ETF and the First Trust Limited Duration Investment Grade Corporate ETF. These ETFs individually represented between 35% and 40% of the Fund and contributed positively to performance relative to the primary benchmark but were modest drags on returns relative to the blended benchmark given the blended benchmark’s exposure to high yield bonds, as both funds returned 7.66% on a market price basis, over the Period.
The best performing holding was the First Trust Tactical High Yield ETF which the Fund held at 10% over the entire Period and returned 11.20% on a market price basis, and which benefited from tightening credit spreads, declining interest rates and elevated levels of income. This allocation to high yield resulted in roughly a 10% overweight to the primary benchmark and a 10% underweight to the secondary blended benchmark.
The top detractor from relative performance was the First Trust Enhanced Short Maturity ETF which returned 5.68% on a market price basis, in line with a modest spread over the target range of the Federal Funds target rate, which was between 5.25% and 5.50% for the entire Period, however it underperformed both benchmarks. The declining rate environment, in which the 2-Year U.S. Treasury fell from 4.86% to 3.91% and the 10-Year U.S. Treasury declined from 4.11% to 3.90%, provided a greater benefit to total returns of fixed income securities with longer duration.
FUND PERFORMANCE (January 3, 2019 to August 31, 2024)
The performance line graph below shows the performance of a hypothetical $10,000 initial investment in the Fund over a ten-year period (or for the life of the Fund, if shorter). The subsequent account value as of the end of the Period is listed next to the name of the Fund or index, as applicable. The performance table below shows the average annual total returns of the Fund for the past one-, five-, and ten-year periods, as applicable (or for the life of the Fund, if shorter), as of the end of the Period. Both the line graph and performance table compare the Fund’s performance to an appropriate broad-based index and may compare to additional indices reflecting the market segment(s) in which the Fund invests over the same periods.
Investment Performance of $10,000
| Average Annual Total Returns (as of August 31, 2024) | 1 Year | 5 Year | Since
Inception
(1/3/19) |
| First Trust Low Duration Strategic Focus ETF | 7.46% | 1.57% | 2.19% |
| Bloomberg 1-5 Year Government/Credit Index | 6.67% | 1.32% | 1.93% |
| Blended Benchmark(1) | 7.82% | 1.96% | 2.72% |
| Bloomberg US Aggregate Bond Index | 7.30% | -0.04% | 1.39% |
| (1) | The Blended Benchmark consists of the following two indexes: 80% of the Bloomberg 1-5 Year Government/Credit Index which measures the performance of U.S. dollar-denominated U.S. Treasury bonds, government related bonds and investment grade U.S. corporate bonds that have a maturity between one and five years; and 20% of the ICE BofA US High Yield Constrained Index which tracks the performance of U.S. dollar denominated below investment grade corporate debt publicly issued in the U.S. domestic market but caps issuer exposure at 2%. |
Visit www.ftportfolios.com/etf/LDSF for more recent performance information.
The Fund’s past performance is not a good predictor of the Fund’s future performance. The graph and table do not reflect the deduction of taxes that a shareholder would pay on Fund distributions or redemption of Fund shares.
KEY FUND STATISTICS (As of August 31, 2024)
| Fund net assets | $153,152,294 |
| Total number of portfolio holdings | 8 |
| Total advisory fee paid | $257,182 |
| Portfolio turnover rate | 15% |
WHAT DID THE FUND INVEST IN? (As of August 31, 2024)
The table below shows the investment makeup of the Fund, representing the percentage of net assets of the Fund.
| Exchange-Traded Funds | 100.0% |
| Money Market Funds | 0.0% |
| Net Other Assets and Liabilities | 0.0% |
| Total | 100.0% |
Any amount shown as 0.0% represents less than 0.1%.
WHERE CAN I FIND ADDITIONAL INFORMATION ABOUT THE FUND?
Visit www.ftportfolios.com/fund-documents/etf/LDSF to view additional information about the Fund such as the prospectus, financial information, Fund holdings and proxy voting information. You may also request this information by contacting us at 1-800-621-1675 or info@ftportfolios.com.
First Trust Active Factor Large Cap ETF
AFLG | NYSE ARCA, INC.
ANNUAL SHAREHOLDER REPORT | August 31, 2024
This annual shareholder report contains important information about the First Trust Active Factor Large Cap ETF (the “Fund”) for the year of September 1, 2023 to August 31, 2024 (the “Period”). You can find additional information about the Fund at www.ftportfolios.com/fund-documents/etf/AFLG. You can also request this information by contacting us at 1-800-621-1675 or info@ftportfolios.com.
This report describes changes to the Fund that occurred during the Period.
WHAT WERE THE FUND COSTS FOR THE LAST YEAR?
(Based on a hypothetical $10,000 investment)
| Fund | Costs of a $10,000 investment | Costs paid as a percentage
of a $10,000 investment |
| First Trust Active Factor Large Cap ETF | $64 | 0.55% |
HOW DID THE FUND PERFORM LAST YEAR? WHAT AFFECTED THE FUND’S PERFORMANCE?
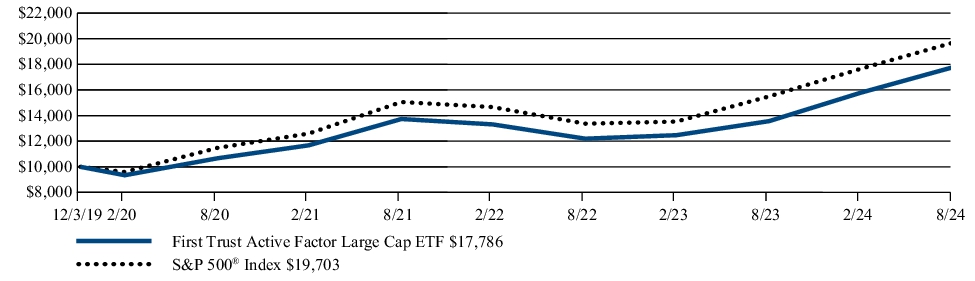
The Fund returned 31.10% for the 12 months ended August 31, 2024. The Fund outperformed its benchmark, the S&P 500® Index, which returned 27.14% for the same Period.
This outperformance was largely attributable to strong performance from the momentum and quality factors. Both quality and momentum were overweight the Technology sector, which was the best performing sector. In addition, both selection and industry effects added to performance. By contrast, the value and small size factors subtracted from the Fund’s returns as the largest stocks in the benchmark continued to outpace the broader market during the Period.
FUND PERFORMANCE (December 3, 2019 to August 31, 2024)
The performance line graph below shows the performance of a hypothetical $10,000 initial investment in the Fund over a ten-year period (or for the life of the Fund, if shorter). The subsequent account value as of the end of the Period is listed next to the name of the Fund or index, as applicable. The performance table below shows the average annual total returns of the Fund for the past one-, five-, and ten-year periods, as applicable (or for the life of the Fund, if shorter), as of the end of the Period. Both the line graph and performance table compare the Fund’s performance to an appropriate broad-based index and may compare to additional indices reflecting the market segment(s) in which the Fund invests over the same periods.
Investment Performance of $10,000
| Average Annual Total Returns (as of August 31, 2024) | 1 Year | Since
Inception
(12/3/19) |
| First Trust Active Factor Large Cap ETF | 31.10% | 12.90% |
| S&P 500® Index | 27.14% | 15.37% |
Visit www.ftportfolios.com/etf/AFLG for more recent performance information.
The Fund’s past performance is not a good predictor of the Fund’s future performance. The graph and table do not reflect the deduction of taxes that a shareholder would pay on Fund distributions or redemption of Fund shares.
KEY FUND STATISTICS (As of August 31, 2024)
| Fund net assets | $18,324,103 |
| Total number of portfolio holdings | 253 |
| Total advisory fee paid | $40,712 |
| Portfolio turnover rate | 48% |
WHAT DID THE FUND INVEST IN? (As of August 31, 2024)
The tables below show the investment makeup of the Fund, representing the percentage of total investments of the Fund.
| Apple, Inc. | 7.5% |
| Microsoft Corp. | 4.9% |
| NVIDIA Corp. | 4.7% |
| Alphabet, Inc., Class A | 2.0% |
| Berkshire Hathaway, Inc., Class B | 1.7% |
| Amazon.com, Inc. | 1.7% |
| Meta Platforms, Inc., Class A | 1.5% |
| Broadcom, Inc. | 1.3% |
| Hartford Financial Services Group (The), Inc. | 1.1% |
| Universal Health Services, Inc., Class B | 1.1% |
HOW HAS THE FUND MATERIALLY CHANGED?
This is a summary of certain changes to the Fund since September 1, 2023. For more complete information, you may review the Fund’s prospectus and any applicable supplements at www.ftportfolios.com/fund-documents/etf/AFLG or upon request at 1-800-621-1675 or info@ftportfolios.com.
The Fund may have significant investments in various jurisdictions or investment sectors from time to time, making the Fund subject to the risks of such jurisdictions or investment sectors.
WHERE CAN I FIND ADDITIONAL INFORMATION ABOUT THE FUND?
Visit www.ftportfolios.com/fund-documents/etf/AFLG to view additional information about the Fund such as the prospectus, financial information, Fund holdings and proxy voting information. You may also request this information by contacting us at 1-800-621-1675 or info@ftportfolios.com.
First Trust Active Factor Mid Cap ETF
AFMC | NYSE ARCA, INC.
ANNUAL SHAREHOLDER REPORT | August 31, 2024
This annual shareholder report contains important information about the First Trust Active Factor Mid Cap ETF (the “Fund”) for the year of September 1, 2023 to August 31, 2024 (the “Period”). You can find additional information about the Fund at www.ftportfolios.com/fund-documents/etf/AFMC. You can also request this information by contacting us at 1-800-621-1675 or info@ftportfolios.com.
This report describes changes to the Fund that occurred during the Period.
WHAT WERE THE FUND COSTS FOR THE LAST YEAR?
(Based on a hypothetical $10,000 investment)
| Fund | Costs of a $10,000 investment | Costs paid as a percentage
of a $10,000 investment |
| First Trust Active Factor Mid Cap ETF | $74 | 0.65% |
HOW DID THE FUND PERFORM LAST YEAR? WHAT AFFECTED THE FUND’S PERFORMANCE?
The Fund returned 26.81% for the 12 months ended August 31, 2024. The Fund outperformed its benchmark, the S&P MidCap 400® Index, which returned 18.75% for the same Period.
This outperformance was largely attributable to strong performance from the momentum and quality factors. The momentum factor benefited from the Artificial Intelligence trade. Additionally, quality stocks with better balance sheets and higher profitability outpaced peers as interest rates remained higher than expected. The strong performance was also aided by positive selection and industry effects. By contrast, the value factor subtracted from the Fund’s returns during the Period.
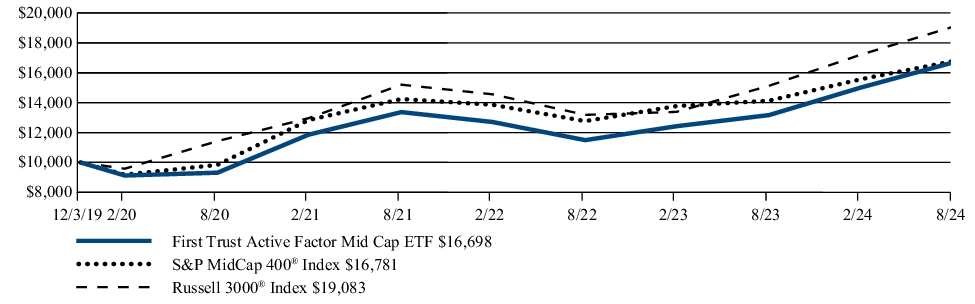
FUND PERFORMANCE (December 3, 2019 to August 31, 2024)
The performance line graph below shows the performance of a hypothetical $10,000 initial investment in the Fund over a ten-year period (or for the life of the Fund, if shorter). The subsequent account value as of the end of the Period is listed next to the name of the Fund or index, as applicable. The performance table below shows the average annual total returns of the Fund for the past one-, five-, and ten-year periods, as applicable (or for the life of the Fund, if shorter), as of the end of the Period. Both the line graph and performance table compare the Fund’s performance to an appropriate broad-based index and may compare to additional indices reflecting the market segment(s) in which the Fund invests over the same periods.
Investment Performance of $10,000
| Average Annual Total Returns (as of August 31, 2024) | 1 Year | Since
Inception
(12/3/19) |
| First Trust Active Factor Mid Cap ETF | 26.81% | 11.41% |
| S&P MidCap 400® Index | 18.75% | 11.53% |
| Russell 3000® Index | 26.14% | 14.60% |
Visit www.ftportfolios.com/etf/AFMC for more recent performance information.
The Fund’s past performance is not a good predictor of the Fund’s future performance. The graph and table do not reflect the deduction of taxes that a shareholder would pay on Fund distributions or redemption of Fund shares.
KEY FUND STATISTICS (As of August 31, 2024)
| Fund net assets | $14,228,486 |
| Total number of portfolio holdings | 247 |
| Total advisory fee paid | $62,842 |
| Portfolio turnover rate | 60% |
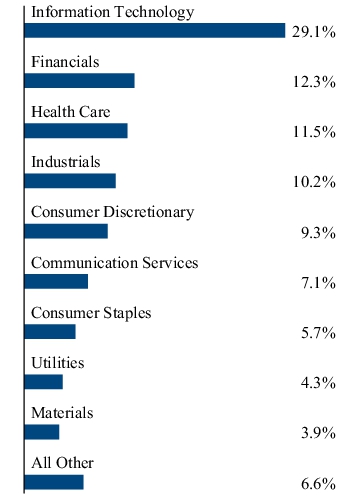
WHAT DID THE FUND INVEST IN? (As of August 31, 2024)
The tables below show the investment makeup of the Fund, representing the percentage of total investments of the Fund.
| United Therapeutics Corp. | 1.6% |
| Sprouts Farmers Market, Inc. | 1.5% |
| Toll Brothers, Inc. | 1.5% |
| Tenet Healthcare Corp. | 1.3% |
| KB Home | 1.2% |
| MGIC Investment Corp. | 1.2% |
| Old Republic International Corp. | 1.2% |
| GoDaddy, Inc., Class A | 1.1% |
| EMCOR Group, Inc. | 1.1% |
| Vistra Corp. | 1.0% |
HOW HAS THE FUND MATERIALLY CHANGED?
This is a summary of certain changes to the Fund since September 1, 2023. For more complete information, you may review the Fund’s prospectus and any applicable supplements at www.ftportfolios.com/fund-documents/etf/AFMC or upon request at 1-800-621-1675 or info@ftportfolios.com.
The Fund may have significant investments in various jurisdictions or investment sectors from time to time, making the Fund subject to the risks of such jurisdictions or investment sectors.
WHERE CAN I FIND ADDITIONAL INFORMATION ABOUT THE FUND?
Visit www.ftportfolios.com/fund-documents/etf/AFMC to view additional information about the Fund such as the prospectus, financial information, Fund holdings and proxy voting information. You may also request this information by contacting us at 1-800-621-1675 or info@ftportfolios.com.
First Trust Active Factor Small Cap ETF
AFSM | NYSE ARCA, INC.
ANNUAL SHAREHOLDER REPORT | August 31, 2024
This annual shareholder report contains important information about the First Trust Active Factor Small Cap ETF (the “Fund”) for the year of September 1, 2023 to August 31, 2024 (the “Period”). You can find additional information about the Fund at www.ftportfolios.com/fund-documents/etf/AFSM. You can also request this information by contacting us at 1-800-621-1675 or info@ftportfolios.com.
This report describes changes to the Fund that occurred during the Period.
WHAT WERE THE FUND COSTS FOR THE LAST YEAR?
(Based on a hypothetical $10,000 investment)
| Fund | Costs of a $10,000 investment | Costs paid as a percentage
of a $10,000 investment |
| First Trust Active Factor Small Cap ETF | $84 | 0.75% |
HOW DID THE FUND PERFORM LAST YEAR? WHAT AFFECTED THE FUND’S PERFORMANCE?
The Fund returned 22.72% for the 12 months ended August 31, 2024. The Fund outperformed its benchmark, the Russell 2000® Index, which returned 18.47% for the same Period.
This outperformance was largely attributable to strong performance from the momentum and quality factors. The momentum factor benefited from the Artificial Intelligence trade. Stocks with better balance sheets and higher profitability outpaced peers as interest rates remained higher than expected. In addition, selection effect added to performance. By contrast, the value factor and sector exposures, primarily from an underweight to the Technology and Financials sectors, subtracted from the Fund’s performance.
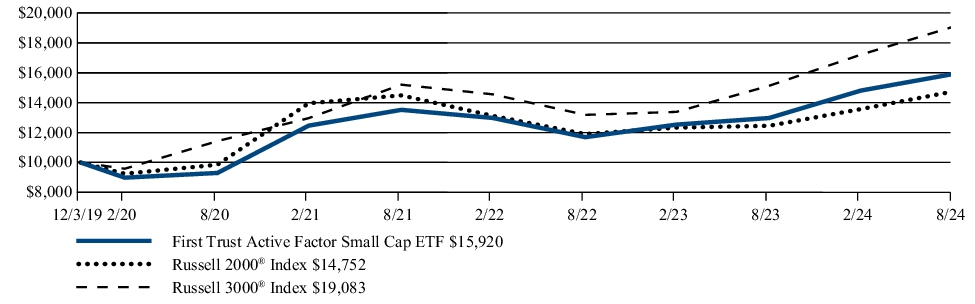
FUND PERFORMANCE (December 3, 2019 to August 31, 2024)
The performance line graph below shows the performance of a hypothetical $10,000 initial investment in the Fund over a ten-year period (or for the life of the Fund, if shorter). The subsequent account value as of the end of the Period is listed next to the name of the Fund or index, as applicable. The performance table below shows the average annual total returns of the Fund for the past one-, five-, and ten-year periods, as applicable (or for the life of the Fund, if shorter), as of the end of the Period. Both the line graph and performance table compare the Fund’s performance to an appropriate broad-based index and may compare to additional indices reflecting the market segment(s) in which the Fund invests over the same periods.
Investment Performance of $10,000
| Average Annual Total Returns (as of August 31, 2024) | 1 Year | Since
Inception
(12/3/19) |
| First Trust Active Factor Small Cap ETF | 22.72% | 10.29% |
| Russell 2000® Index | 18.47% | 8.54% |
| Russell 3000® Index | 26.14% | 14.60% |
Visit www.ftportfolios.com/etf/AFSM for more recent performance information.
The Fund’s past performance is not a good predictor of the Fund’s future performance. The graph and table do not reflect the deduction of taxes that a shareholder would pay on Fund distributions or redemption of Fund shares.
KEY FUND STATISTICS (As of August 31, 2024)
| Fund net assets | $15,282,901 |
| Total number of portfolio holdings | 307 |
| Total advisory fee paid | $53,780 |
| Portfolio turnover rate | 79% |
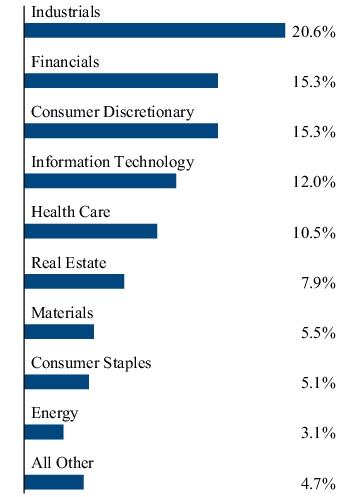
WHAT DID THE FUND INVEST IN? (As of August 31, 2024)
The tables below show the investment makeup of the Fund, representing the percentage of total investments of the Fund.
| National HealthCare Corp. | 1.3% |
| Mueller Industries, Inc. | 1.1% |
| Alkermes PLC | 1.0% |
| InterDigital, Inc. | 0.9% |
| Abercrombie & Fitch Co., Class A | 0.9% |
| SkyWest, Inc. | 0.9% |
| Daktronics, Inc. | 0.9% |
| Catalyst Pharmaceuticals, Inc. | 0.9% |
| M/I Homes, Inc. | 0.8% |
| Preferred Bank | 0.8% |
HOW HAS THE FUND MATERIALLY CHANGED?
This is a summary of certain changes to the Fund since September 1, 2023. For more complete information, you may review the Fund’s prospectus and any applicable supplements at www.ftportfolios.com/fund-documents/etf/AFSM or upon request at 1-800-621-1675 or info@ftportfolios.com.
The Fund may have significant investments in various jurisdictions or investment sectors from time to time, making the Fund subject to the risks of such jurisdictions or investment sectors.
WHERE CAN I FIND ADDITIONAL INFORMATION ABOUT THE FUND?
Visit www.ftportfolios.com/fund-documents/etf/AFSM to view additional information about the Fund such as the prospectus, financial information, Fund holdings and proxy voting information. You may also request this information by contacting us at 1-800-621-1675 or info@ftportfolios.com.
First Trust Innovation Leaders ETF
ILDR | NYSE ARCA, INC.
ANNUAL SHAREHOLDER REPORT | August 31, 2024
This annual shareholder report contains important information about the First Trust Innovation Leaders ETF (the “Fund”) for the year of September 1, 2023 to August 31, 2024 (the “Period”). You can find additional information about the Fund at www.ftportfolios.com/fund-documents/etf/ILDR. You can also request this information by contacting us at 1-800-621-1675 or info@ftportfolios.com.
WHAT WERE THE FUND COSTS FOR THE LAST YEAR?
(Based on a hypothetical $10,000 investment)
| Fund | Costs of a $10,000 investment | Costs paid as a percentage
of a $10,000 investment |
| First Trust Innovation Leaders ETF | $86 | 0.75% |
HOW DID THE FUND PERFORM LAST YEAR? WHAT AFFECTED THE FUND’S PERFORMANCE?
The Fund returned 29.64% for the 12 months ended August 31, 2024. The Fund underperformed its benchmark, the Russell 3000® Growth Index, which returned 30.10% for the same Period.
This underperformance was driven by negative selection effect and mostly offset by favorable allocation.
Key Drivers of Negative Selection Effect:
Health Care stocks were the largest detriment to the Fund’s performance for the Period as stock selection within the Health Care sector drove 367 basis points (bps) of underperformance.
The Fund did not have exposure to Eli Lilly and Company which had an average benchmark weight of 2.33% for the Period and returned 74.37% as its leading weight loss drugs gained approval from the Food and Drug Administration and went to market.
High contribution to negative selection effect for the Period arose from Coherus Biosciences, Inc., down 65.85%, Replimune Group, Inc., down 50.20%, Fulgent Genetics, Inc., down 37.85% and Inmode Ltd., down 37.54%.
NVIDIA Corp. contributed to negative performance despite the Fund having an average exposure of 6.03% to the stock for the Period. NVIDIA Corp. was up 141.93% on the strength of Artificial Intelligence-related demand for its Graphics Processing Units. However, the benchmark had an average weight of 7.04% to NVIDIA for the Period which generated relative underperformance for the Fund.
Key Drivers of Positive Allocation Effect:
Within the Consumer Discretionary sector holdings, the Fund held few stocks and, predominately, Amazon.com, Inc. This provided favorable allocation as the Fund’s average discretionary weight was only 5.68% for the Period compared with 14.71% in the benchmark. As consumers exhibited spending exhaustion driven by inflation ravaged incomes, the sector did not keep pace with the broader market for the Period.
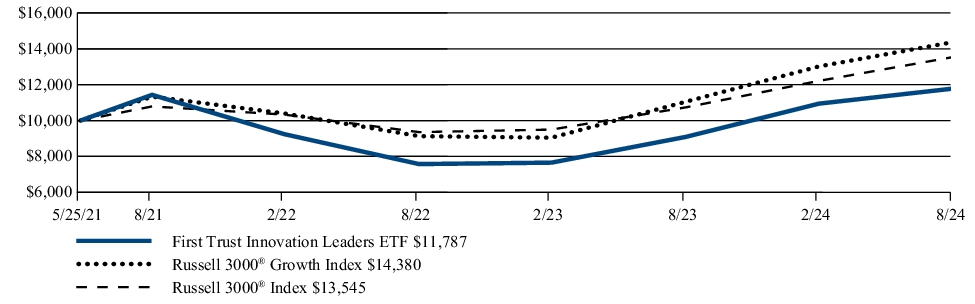
FUND PERFORMANCE (May 25, 2021 to August 31, 2024)
The performance line graph below shows the performance of a hypothetical $10,000 initial investment in the Fund over a ten-year period (or for the life of the Fund, if shorter). The subsequent account value as of the end of the Period is listed next to the name of the Fund or index, as applicable. The performance table below shows the average annual total returns of the Fund for the past one-, five-, and ten-year periods, as applicable (or for the life of the Fund, if shorter), as of the end of the Period. Both the line graph and performance table compare the Fund’s performance to an appropriate broad-based index and may compare to additional indices reflecting the market segment(s) in which the Fund invests over the same periods.
Investment Performance of $10,000
| Average Annual Total Returns (as of August 31, 2024) | 1 Year | Since
Inception
(5/25/21) |
| First Trust Innovation Leaders ETF | 29.64% | 5.16% |
| Russell 3000® Growth Index | 30.10% | 11.76% |
| Russell 3000® Index | 26.14% | 9.73% |
Visit www.ftportfolios.com/etf/ILDR for more recent performance information.
The Fund’s past performance is not a good predictor of the Fund’s future performance. The graph and table do not reflect the deduction of taxes that a shareholder would pay on Fund distributions or redemption of Fund shares.
KEY FUND STATISTICS (As of August 31, 2024)
| Fund net assets | $40,147,388 |
| Total number of portfolio holdings | 63 |
| Total advisory fee paid | $191,103 |
| Portfolio turnover rate | 43% |
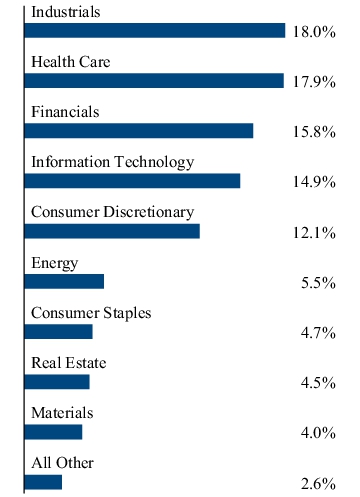
WHAT DID THE FUND INVEST IN? (As of August 31, 2024)
The tables below show the investment makeup of the Fund, representing the percentage of total investments of the Fund.
| NVIDIA Corp. | 7.7% |
| Oracle Corp. | 6.0% |
| Amazon.com, Inc. | 5.3% |
| Microsoft Corp. | 5.3% |
| Alphabet, Inc., Class C | 3.9% |
| ServiceNow, Inc. | 3.6% |
| Meta Platforms, Inc., Class A | 3.5% |
| Uber Technologies, Inc. | 3.3% |
| Broadcom, Inc. | 3.0% |
| Siemens AG | 2.3% |
WHERE CAN I FIND ADDITIONAL INFORMATION ABOUT THE FUND?
Visit www.ftportfolios.com/fund-documents/etf/ILDR to view additional information about the Fund such as the prospectus, financial information, Fund holdings and proxy voting information. You may also request this information by contacting us at 1-800-621-1675 or info@ftportfolios.com.
First Trust Expanded Technology ETF
XPND | NYSE ARCA, INC.
ANNUAL SHAREHOLDER REPORT | August 31, 2024
This annual shareholder report contains important information about the First Trust Expanded Technology ETF (the “Fund”) for the year of September 1, 2023 to August 31, 2024 (the “Period”). You can find additional information about the Fund at www.ftportfolios.com/fund-documents/etf/XPND. You can also request this information by contacting us at 1-800-621-1675 or info@ftportfolios.com.
This report describes changes to the Fund that occurred during the Period.
WHAT WERE THE FUND COSTS FOR THE LAST YEAR?
(Based on a hypothetical $10,000 investment)
| Fund | Costs of a $10,000 investment | Costs paid as a percentage
of a $10,000 investment |
| First Trust Expanded Technology ETF | $74 | 0.65% |
HOW DID THE FUND PERFORM LAST YEAR? WHAT AFFECTED THE FUND’S PERFORMANCE?
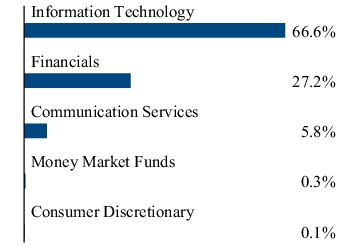
The Fund returned 29.18% for the 12 months ended August 31, 2024. The Fund underperformed its benchmark, the S&P 500® Information Technology Index, which returned 38.73% for the same Period.
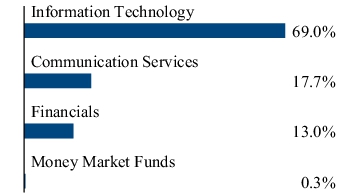
This underperformance was largely attributable to the Fund’s weighting methodology designed to minimize single stock risk and to the Fund’s exposure to industries outside of the benchmark. The Semiconductor stock NVIDIA Corp. (NVDA) represented over 15% of the benchmark and returned 141.93% over the Period, accounting for over 40% of the benchmark’s net contribution. The Fund caps the weight of individual names to a 4.50% max at the time of rebalance, which caused the Fund to be structurally underweight the technology market’s undisputed winner. The effect of the Fund’s underweight in NVDA accounted for a significant portion of the underperformance. The Financials sector and the Communication Services sector, which combined represented about 30% of the Fund, could not keep pace with the Information Technology sector. Of the five industries held by the Fund within these two sectors, only the Interactive Media & Services industry outperformed the benchmark.
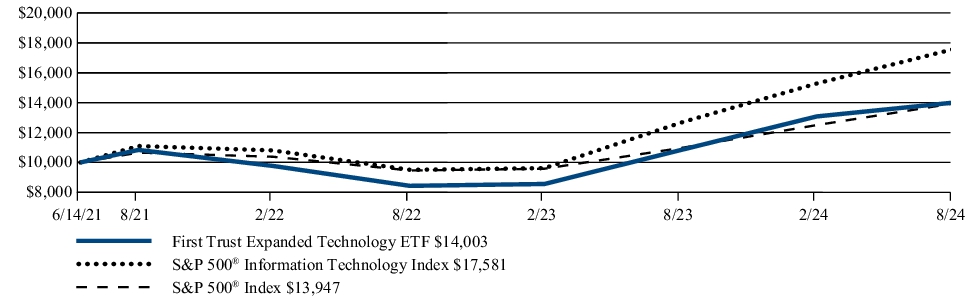
FUND PERFORMANCE (June 14, 2021 to August 31, 2024)
The performance line graph below shows the performance of a hypothetical $10,000 initial investment in the Fund over a ten-year period (or for the life of the Fund, if shorter). The subsequent account value as of the end of the Period is listed next to the name of the Fund or index, as applicable. The performance table below shows the average annual total returns of the Fund for the past one-, five-, and ten-year periods, as applicable (or for the life of the Fund, if shorter), as of the end of the Period. Both the line graph and performance table compare the Fund’s performance to an appropriate broad-based index and may compare to additional indices reflecting the market segment(s) in which the Fund invests over the same periods.
Investment Performance of $10,000
| Average Annual Total Returns (as of August 31, 2024) | 1 Year | Since
Inception
(6/14/21) |
| First Trust Expanded Technology ETF | 29.18% | 11.04% |
| S&P 500® Information Technology Index | 38.73% | 19.19% |
| S&P 500® Index | 27.14% | 10.91% |
Visit www.ftportfolios.com/etf/XPND for more recent performance information.
The Fund’s past performance is not a good predictor of the Fund’s future performance. The graph and table do not reflect the deduction of taxes that a shareholder would pay on Fund distributions or redemption of Fund shares.
KEY FUND STATISTICS (As of August 31, 2024)
| Fund net assets | $21,065,698 |
| Total number of portfolio holdings | 51 |
| Total advisory fee paid | $94,936 |
| Portfolio turnover rate | 61% |
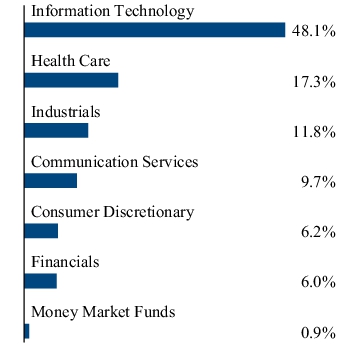
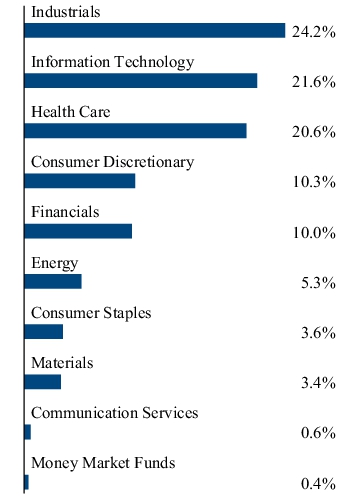
WHAT DID THE FUND INVEST IN? (As of August 31, 2024)
The tables below show the investment makeup of the Fund, representing the percentage of total investments of the Fund.
| Broadcom, Inc. | 5.1% |
| Oracle Corp. | 5.0% |
| Apple, Inc. | 5.0% |
| T-Mobile US, Inc. | 4.7% |
| Meta Platforms, Inc., Class A | 4.7% |
| NVIDIA Corp. | 4.6% |
| Mastercard, Inc., Class A | 4.5% |
| Visa, Inc., Class A | 4.2% |
| Microsoft Corp. | 4.2% |
| International Business Machines Corp. | 4.2% |
HOW HAS THE FUND MATERIALLY CHANGED?
This is a summary of certain changes to the Fund since September 1, 2023. For more complete information, you may review the Fund’s prospectus and any applicable supplements at www.ftportfolios.com/fund-documents/etf/XPND or upon request at 1-800-621-1675 or info@ftportfolios.com.
The Fund may have significant investments in various jurisdictions or investment sectors from time to time, making the Fund subject to the risks of such jurisdictions or investment sectors.
WHERE CAN I FIND ADDITIONAL INFORMATION ABOUT THE FUND?
Visit www.ftportfolios.com/fund-documents/etf/XPND to view additional information about the Fund such as the prospectus, financial information, Fund holdings and proxy voting information. You may also request this information by contacting us at 1-800-621-1675 or info@ftportfolios.com.
First Trust Multi-Strategy Alternative ETF
LALT | NYSE ARCA, INC.
ANNUAL SHAREHOLDER REPORT | August 31, 2024
This annual shareholder report contains important information about the First Trust Multi-Strategy Alternative ETF (the “Fund”) for the year of September 1, 2023 to August 31, 2024 (the “Period”). You can find additional information about the Fund at www.ftportfolios.com/fund-documents/etf/LALT. You can also request this information by contacting us at 1-800-621-1675 or info@ftportfolios.com.
This report describes changes to the Fund that occurred during the Period.
WHAT WERE THE FUND COSTS FOR THE LAST YEAR?
(Based on a hypothetical $10,000 investment)
| Fund | Costs of a $10,000 investment | Costs paid as a percentage
of a $10,000 investment |
| First Trust Multi-Strategy Alternative ETF | $21(1) | 0.20%(1) |
(1) | Excludes any Acquired Fund Fees and Expenses of underlying investment companies in which the Fund invests. |
HOW DID THE FUND PERFORM LAST YEAR? WHAT AFFECTED THE FUND’S PERFORMANCE?
The Fund returned 5.49% for the 12 months ended August 31, 2024. The Fund underperformed its benchmark, the Credit Suisse AllHedge Index, which returned 7.01% the same Period.
The overall economic backdrop over the Period was one of solid economic growth and declining inflation. Broad based economic indicators highlighting these trends were:
Average Quarterly Gross Domestic Product Growth in the prior four calendar quarters (Third Quarter 2023 – Second Quarter 2024) was 3.2%;
Year-over-year Consumer Price Index continued to decline, falling from 3.7% as of August 31, 2023 to 2.5% as of August 31, 2024;
Year-over-year increase in real wages, as measured by the U.S. Bureau of Labor Statistics, increased by 0.9%.
U.S. equities, as measured by the S&P 500® Index, dipped in September and October 2023 and then proceeded to rally strongly, ending the Period up 27.14%. A boost to equities during the Period was the market’s increasing confidence that the Federal Reserve (the “Fed”) would lower the Federal Funds target rate in the final four months of 2024 and then throughout 2025. Two-year Treasury rates, in anticipation of the lower Federal Funds target rate, declined by -0.98%, while the Ten-Year Treasury rate, which helps set 30-year mortgage rates, declined by -0.20%.
In response to the macro-economic environment, the Fund increased its holdings of equity long-short exchange-traded funds (“ETFs”). As of August 31, 2024, the Fund held 21.66% in the First Trust Long/Short Equity ETF (“FTLS”), up 11.71% from August 31, 2023. This was beneficial to the Fund as FTLS had the second highest total return of the ETFs held during the Period and contributed more than any other ETF to the Fund’s total return. The top performing ETF held by the Fund, and the second largest contributor to Fund’s total return, was the iShares Gold Trust ETF (“IAU”), which rallied strongly during the second half of the Period as market participants began anticipating that the Fed would likely lower short-term borrowing rates in the second half of 2024. IAU was up 29.08%, 23.51% in the second half of the Period. IAU’s weight within the Fund’s portfolio was increased during the Period, rising from 4.95% to 8.53% as of August 31, 2024. Also increasing in weight during the Period was the Fund’s allocation to the First Trust TCW Unconstrained Plus Bond ETF which returned 8.35% over the Period. The Fund’s weight was increased to 12.50% (up 2.50%) as of the end of the first quarter of the calendar year.
During the Period, the commodity allocation in the First Trust Global Tactical Commodity Strategy Fund (“FTGC”) and the merger arbitrage allocation in the First Trust Merger Arbitrage ETF (“MARB”) were reduced. FTGC’s allocation was reduced from 10.50% to 4.78% and MARB’s allocation was reduced from 11.96% to 5.10%. FTGC was the worst performing allocation during the Period, despite outperforming its benchmark by 1.82%. Commodities were down during the Period as declining inflation rates reduced the attractiveness of commodities to investors seeking inflation hedges. MARB’s total returns for the Period were positive but below the levels available from a risk-free cash allocation.
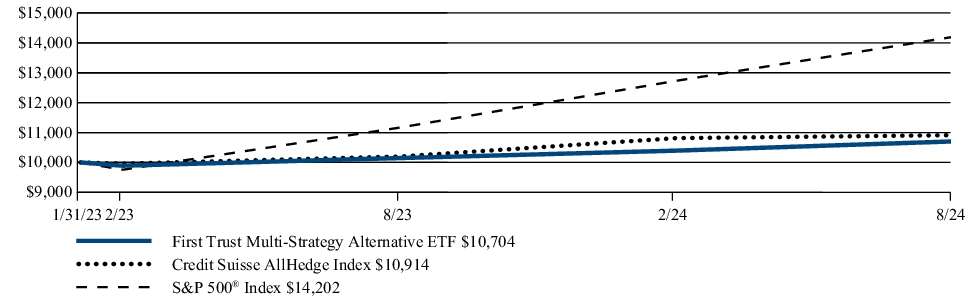
FUND PERFORMANCE (January 31, 2023 to August 31, 2024)
The performance line graph below shows the performance of a hypothetical $10,000 initial investment in the Fund over a ten-year period (or for the life of the Fund, if shorter). The subsequent account value as of the end of the Period is listed next to the name of the Fund or index, as applicable. The performance table below shows the average annual total returns of the Fund for the past one-, five-, and ten-year periods, as applicable (or for the life of the Fund, if shorter), as of the end of the Period. Both the line graph and performance table compare the Fund’s performance to an appropriate broad-based index and may compare to additional indices reflecting the market segment(s) in which the Fund invests over the same periods.
Investment Performance of $10,000
| Average Annual Total Returns (as of August 31, 2024) | 1 Year | Since
Inception
(1/31/23) |
| First Trust Multi-Strategy Alternative ETF | 5.49% | 4.40% |
| Credit Suisse AllHedge Index | 7.01% | 5.69% |
| S&P 500® Index | 27.14% | 24.85% |
Visit www.ftportfolios.com/etf/LALT for more recent performance information.
The Fund’s past performance is not a good predictor of the Fund’s future performance. The graph and table do not reflect the deduction of taxes that a shareholder would pay on Fund distributions or redemption of Fund shares.
KEY FUND STATISTICS (As of August 31, 2024)
| Fund net assets | $10,416,857 |
| Total number of portfolio holdings | 8 |
| Total advisory fee paid | $10,093 |
| Portfolio turnover rate | 21% |
WHAT DID THE FUND INVEST IN? (As of August 31, 2024)
The tables below show the investment makeup of the Fund, representing the percentage of net assets of the Fund.
| Exchange-Traded Funds | 99.9% |
| Net Other Assets and Liabilities | 0.1% |
| Total | 100.0% |
HOW HAS THE FUND MATERIALLY CHANGED?
This is a summary of certain changes to the Fund since September 1, 2023. For more complete information, you may review the Fund’s prospectus and any applicable supplements at www.ftportfolios.com/fund-documents/etf/LALT or upon request at 1-800-621-1675 or info@ftportfolios.com.
During the fiscal year ended August 31, 2024, the Fund’s principal investment strategies were revised to allow the Fund to invest in exchange-traded products with exposure to credit default swaps. The Fund’s principal investment strategies and principal risks were revised accordingly.
WHERE CAN I FIND ADDITIONAL INFORMATION ABOUT THE FUND?
Visit www.ftportfolios.com/fund-documents/etf/LALT to view additional information about the Fund such as the prospectus, financial information, Fund holdings and proxy voting information. You may also request this information by contacting us at 1-800-621-1675 or info@ftportfolios.com.
FT Vest U.S. Equity Buffer ETF - January
FJAN | CBOE BZX EXCHANGE, INC.
ANNUAL SHAREHOLDER REPORT | August 31, 2024
This annual shareholder report contains important information about the FT Vest U.S. Equity Buffer ETF - January (the “Fund”) for the year of September 1, 2023 to August 31, 2024 (the “Period”). You can find additional information about the Fund at www.ftportfolios.com/fund-documents/etf/FJAN. You can also request this information by contacting us at 1-800-621-1675 or info@ftportfolios.com.
This report describes changes to the Fund that occurred during the Period.
WHAT WERE THE FUND COSTS FOR THE LAST YEAR?
(Based on a hypothetical $10,000 investment)
| Fund | Costs of a $10,000 investment | Costs paid as a percentage
of a $10,000 investment |
| FT Vest U.S. Equity Buffer ETF - January | $93 | 0.85% |
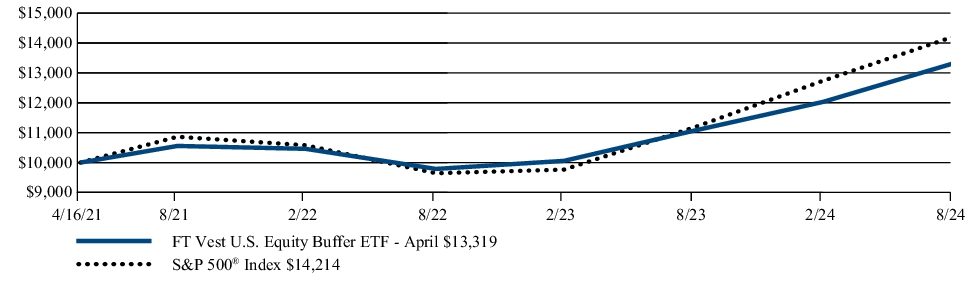
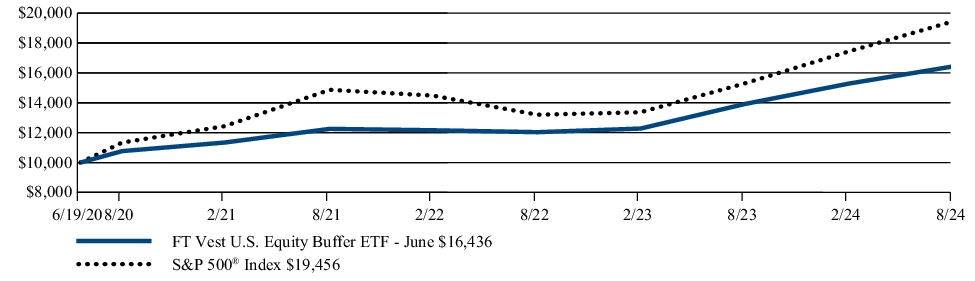
HOW DID THE FUND PERFORM LAST YEAR? WHAT AFFECTED THE FUND’S PERFORMANCE?
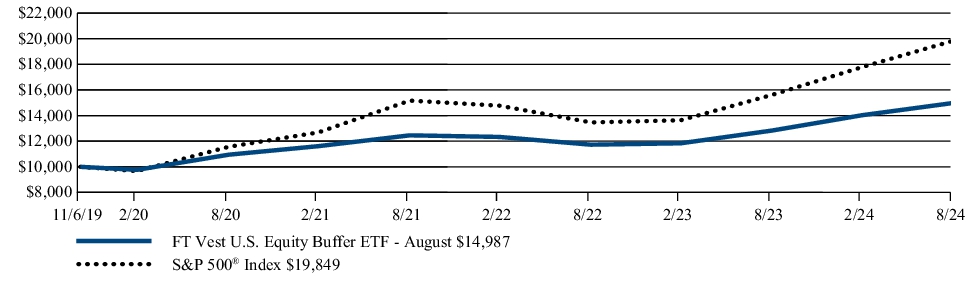
The Fund returned 17.84% for the twelve months ended August 31, 2024. The Fund underperformed its benchmark, the S&P 500® Index, which returned 27.14% for the same Period.
This underperformance was due to the following:
| Fund NAV Performance Attributed to*: | | |
| Changes in Reference Asset | 13.90 | % |
| Changes in other Variables | 4.79 | % |
| Fees and Expenses | -0.85 | % |
The Fund holds a combination of FLexible EXchange® Options (“FLEX Options”) designed to target the Fund’s objective.
* The Fund’s performance is impacted by changes in the values of the FLEX Options to which it is exposed. We attribute (allocate) the impact on the Fund’s performance into three components. The first of the three components is the impact on the Fund’s performance due to changes in the Fund’s Reference Asset. The second component is the aggregate impact on the Fund’s performance due to changes in other variables that impact FLEX Options prices - these include changes in a) the Reference Asset’s dividends, b) interest rates, c) implied volatility, and d) time to option expiration. The third component is from the Fund’s fees and expenses incurred during the Period.
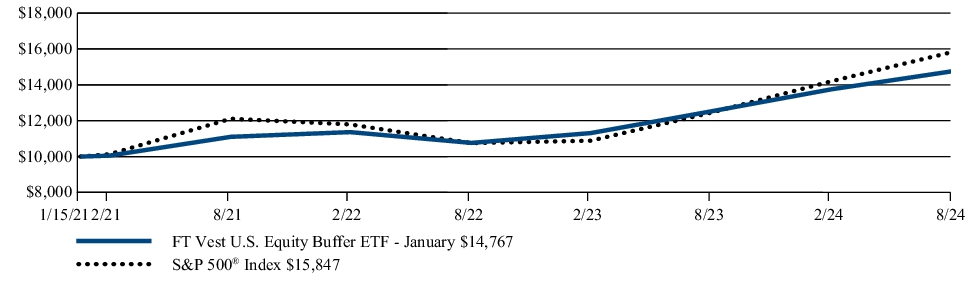
FUND PERFORMANCE (January 15, 2021 to August 31, 2024)
The performance line graph below shows the performance of a hypothetical $10,000 initial investment in the Fund over a ten-year period (or for the life of the Fund, if shorter). The subsequent account value as of the end of the Period is listed next to the name of the Fund or index, as applicable. The performance table below shows the average annual total returns of the Fund for the past one-, five-, and ten-year periods, as applicable (or for the life of the Fund, if shorter), as of the end of the Period. Both the line graph and performance table compare the Fund’s performance to an appropriate broad-based index and may compare to additional indices reflecting the market segment(s) in which the Fund invests over the same periods.
Investment Performance of $10,000
| Average Annual Total Returns (as of August 31, 2024) | 1 Year | Since
Inception
(1/15/21) |
| FT Vest U.S. Equity Buffer ETF - January | 17.84% | 11.35% |
| S&P 500® Index | 27.14% | 13.54% |
Visit www.ftportfolios.com/etf/FJAN for more recent performance information.
The Fund’s past performance is not a good predictor of the Fund’s future performance. The graph and table do not reflect the deduction of taxes that a shareholder would pay on Fund distributions or redemption of Fund shares.
KEY FUND STATISTICS (As of August 31, 2024)
| Fund net assets | $742,339,869 |
| Total number of portfolio holdings | 5 |
| Total advisory fee paid | $5,001,784 |
| Portfolio turnover rate | 0% |
WHAT DID THE FUND INVEST IN? (As of August 31, 2024)
The table below shows the investment makeup of the Fund, representing the percentage of net assets of the Fund.
| Money Market Funds | 0.6% |
| Purchased Options | 104.9% |
| Written Options | (5.4%) |
| Net Other Assets and Liabilities | (0.1%) |
| Total | 100.0% |
HOW HAS THE FUND MATERIALLY CHANGED?
This is a summary of certain changes to the Fund since September 1, 2023. For more complete information, you may review the Fund’s prospectus and any applicable supplements at www.ftportfolios.com/fund-documents/etf/FJAN or upon request at 1-800-621-1675 or info@ftportfolios.com.
During the fiscal year ended August 31, 2024, the Fund’s predetermined upside cap on Underlying ETF returns was reset based upon prevailing market conditions at the start of the new Target Outcome Period.
WHERE CAN I FIND ADDITIONAL INFORMATION ABOUT THE FUND?
Visit www.ftportfolios.com/fund-documents/etf/FJAN to view additional information about the Fund such as the prospectus, financial information, Fund holdings and proxy voting information. You may also request this information by contacting us at 1-800-621-1675 or info@ftportfolios.com.
OTHER INFORMATION
The Fund is not sponsored, endorsed, sold or promoted by SPDR® S&P 500® ETF Trust, PDR Services, LLC, or Standard & Poor’s® (together with their affiliates hereinafter referred to as the “Corporations”). The Corporations have not passed on the legality or suitability of, or the accuracy or adequacy of, descriptions and disclosures relating to the Fund or the FLEX Options. The Corporations make no representations or warranties, express or implied, regarding the advisability of investing in the Fund or the FLEX Options or results to be obtained by the Fund or the FLEX Options, shareholders or any other person or entity from use of the SPDR® S&P 500® ETF Trust. The Corporations have no liability in connection with the management, administration, marketing or trading of the Fund or the FLEX Options.
FT Vest U.S. Equity
Deep Buffer ETF - January
DJAN | CBOE BZX EXCHANGE, INC.
ANNUAL SHAREHOLDER REPORT | August 31, 2024
This annual shareholder report contains important information about the FT Vest U.S. Equity Deep Buffer ETF - January (the “Fund”) for the year of September 1, 2023 to August 31, 2024 (the “Period”). You can find additional information about the Fund at www.ftportfolios.com/fund-documents/etf/DJAN. You can also request this information by contacting us at 1-800-621-1675 or info@ftportfolios.com.
This report describes changes to the Fund that occurred during the Period.
WHAT WERE THE FUND COSTS FOR THE LAST YEAR?
(Based on a hypothetical $10,000 investment)
| Fund | Costs of a $10,000 investment | Costs paid as a percentage
of a $10,000 investment |
| FT Vest U.S. Equity Deep Buffer ETF - January | $91 | 0.85% |
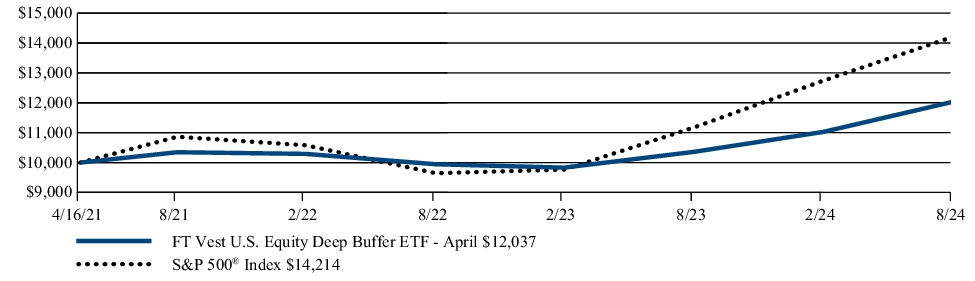
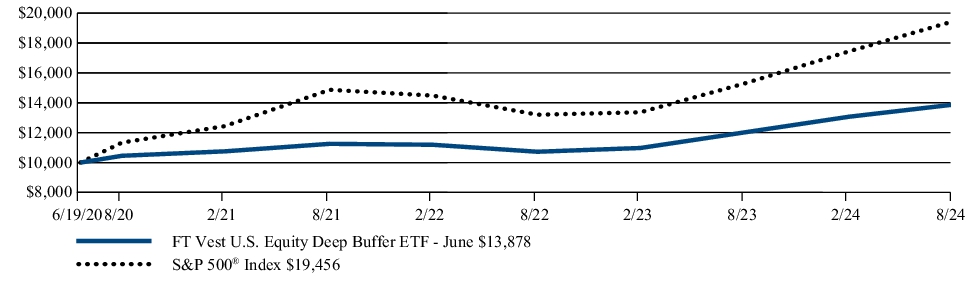
HOW DID THE FUND PERFORM LAST YEAR? WHAT AFFECTED THE FUND’S PERFORMANCE?
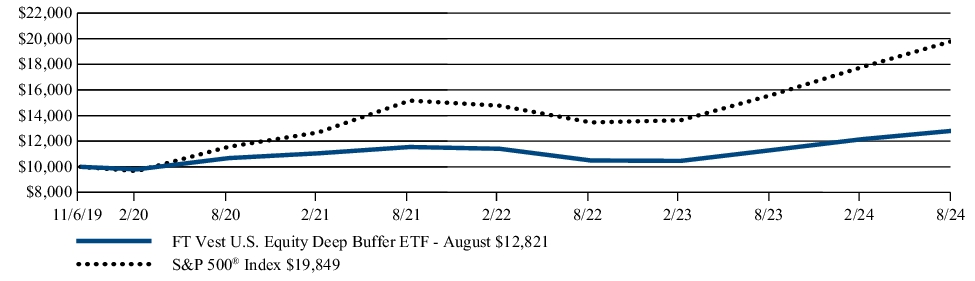
The Fund returned 14.16% for the twelve months ended August 31, 2024. The Fund underperformed its benchmark, the S&P 500® Index, which returned 27.14% for the same Period.
This underperformance was due to the following:
| Fund NAV Performance Attributed to*: | | |
| Changes in Reference Asset | 10.49 | % |
| Changes in other Variables | 4.52 | % |
| Fees and Expenses | -0.85 | % |
The Fund holds a combination of FLexible EXchange® Options (“FLEX Options”) designed to target the Fund’s objective.
* The Fund’s performance is impacted by changes in the values of the FLEX Options to which it is exposed. We attribute (allocate) the impact on the Fund’s performance into three components. The first of the three components is the impact on the Fund’s performance due to changes in the Fund’s Reference Asset. The second component is the aggregate impact on the Fund’s performance due to changes in other variables that impact FLEX Options prices - these include changes in a) the Reference Asset’s dividends, b) interest rates, c) implied volatility, and d) time to option expiration. The third component is from the Fund’s fees and expenses incurred during the Period.
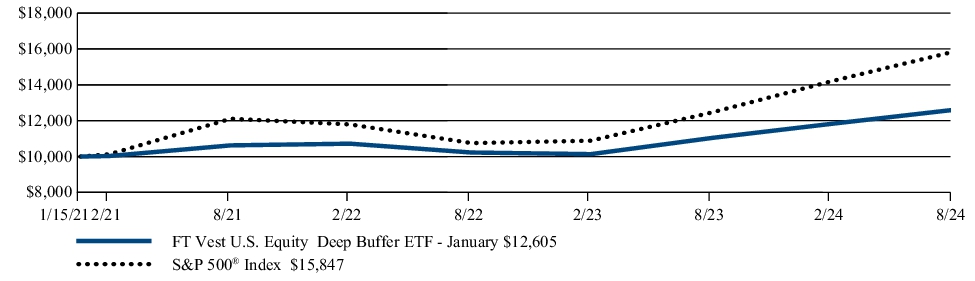
FUND PERFORMANCE (January 15, 2021 to August 31, 2024)
The performance line graph below shows the performance of a hypothetical $10,000 initial investment in the Fund over a ten-year period (or for the life of the Fund, if shorter). The subsequent account value as of the end of the Period is listed next to the name of the Fund or index, as applicable. The performance table below shows the average annual total returns of the Fund for the past one-, five-, and ten-year periods, as applicable (or for the life of the Fund, if shorter), as of the end of the Period. Both the line graph and performance table compare the Fund’s performance to an appropriate broad-based index and may compare to additional indices reflecting the market segment(s) in which the Fund invests over the same periods.
Investment Performance of $10,000
| Average Annual Total Returns (as of August 31, 2024) | 1 Year | Since
Inception
(1/15/21) |
| FT Vest U.S. Equity Deep Buffer ETF - January | 14.16% | 6.59% |
| S&P 500® Index | 27.14% | 13.54% |
Visit www.ftportfolios.com/etf/DJAN for more recent performance information.
The Fund’s past performance is not a good predictor of the Fund’s future performance. The graph and table do not reflect the deduction of taxes that a shareholder would pay on Fund distributions or redemption of Fund shares.
KEY FUND STATISTICS (As of August 31, 2024)
| Fund net assets | $245,331,379 |
| Total number of portfolio holdings | 5 |
| Total advisory fee paid | $1,991,100 |
| Portfolio turnover rate | 0% |
WHAT DID THE FUND INVEST IN? (As of August 31, 2024)
The table below shows the investment makeup of the Fund, representing the percentage of net assets of the Fund.
| Money Market Funds | 0.6% |
| Purchased Options | 106.0% |
| Written Options | (6.5%) |
| Net Other Assets and Liabilities | (0.1%) |
| Total | 100.0% |
HOW HAS THE FUND MATERIALLY CHANGED?
This is a summary of certain changes to the Fund since September 1, 2023. For more complete information, you may review the Fund’s prospectus and any applicable supplements at www.ftportfolios.com/fund-documents/etf/DJAN or upon request at 1-800-621-1675 or info@ftportfolios.com.
During the fiscal year ended August 31, 2024, the Fund’s predetermined upside cap on Underlying ETF returns was reset based upon prevailing market conditions at the start of the new Target Outcome Period.
WHERE CAN I FIND ADDITIONAL INFORMATION ABOUT THE FUND?
Visit www.ftportfolios.com/fund-documents/etf/DJAN to view additional information about the Fund such as the prospectus, financial information, Fund holdings and proxy voting information. You may also request this information by contacting us at 1-800-621-1675 or info@ftportfolios.com.
OTHER INFORMATION
The Fund is not sponsored, endorsed, sold or promoted by SPDR® S&P 500® ETF Trust, PDR Services, LLC, or Standard & Poor’s® (together with their affiliates hereinafter referred to as the “Corporations”). The Corporations have not passed on the legality or suitability of, or the accuracy or adequacy of, descriptions and disclosures relating to the Fund or the FLEX Options. The Corporations make no representations or warranties, express or implied, regarding the advisability of investing in the Fund or the FLEX Options or results to be obtained by the Fund or the FLEX Options, shareholders or any other person or entity from use of the SPDR® S&P 500® ETF Trust. The Corporations have no liability in connection with the management, administration, marketing or trading of the Fund or the FLEX Options.
FT Vest U.S. Equity Buffer ETF - February
FFEB | CBOE BZX EXCHANGE, INC.
ANNUAL SHAREHOLDER REPORT | August 31, 2024
This annual shareholder report contains important information about the FT Vest U.S. Equity Buffer ETF - February (the “Fund”) for the year of September 1, 2023 to August 31, 2024 (the “Period”). You can find additional information about the Fund at www.ftportfolios.com/fund-documents/etf/FFEB. You can also request this information by contacting us at 1-800-621-1675 or info@ftportfolios.com.
This report describes changes to the Fund that occurred during the Period.
WHAT WERE THE FUND COSTS FOR THE LAST YEAR?
(Based on a hypothetical $10,000 investment)
| Fund | Costs of a $10,000 investment | Costs paid as a percentage
of a $10,000 investment |
| FT Vest U.S. Equity Buffer ETF - February | $93 | 0.85% |
HOW DID THE FUND PERFORM LAST YEAR? WHAT AFFECTED THE FUND’S PERFORMANCE?
The Fund returned 19.11% for the twelve months ended August 31, 2024. The Fund underperformed its benchmark, the S&P 500® Index, which returned 27.14% for the same Period.
This underperformance was due to the following:
| Fund NAV Performance Attributed to*: | | |
| Changes in Reference Asset | 15.37 | % |
| Changes in other Variables | 4.59 | % |
| Fees and Expenses | -0.85 | % |
The Fund holds a combination of FLexible EXchange® Options (“FLEX Options”) designed to target the Fund’s objective.
* The Fund’s performance is impacted by changes in the values of the FLEX Options to which it is exposed. We attribute (allocate) the impact on the Fund’s performance into three components. The first of the three components is the impact on the Fund’s performance due to changes in the Fund’s Reference Asset. The second component is the aggregate impact on the Fund’s performance due to changes in other variables that impact FLEX Options prices - these include changes in a) the Reference Asset’s dividends, b) interest rates, c) implied volatility, and d) time to option expiration. The third component is from the Fund’s fees and expenses incurred during the Period.
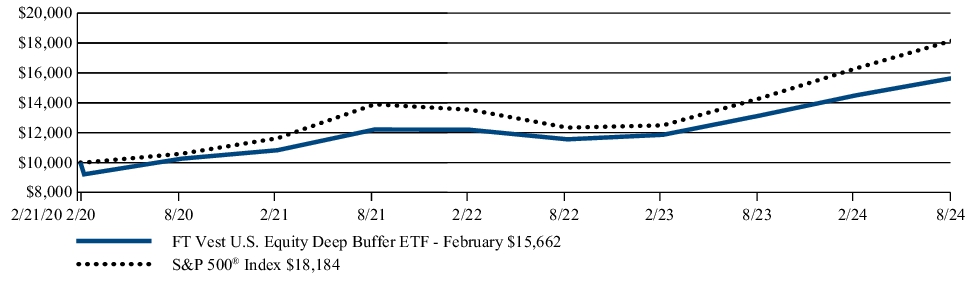
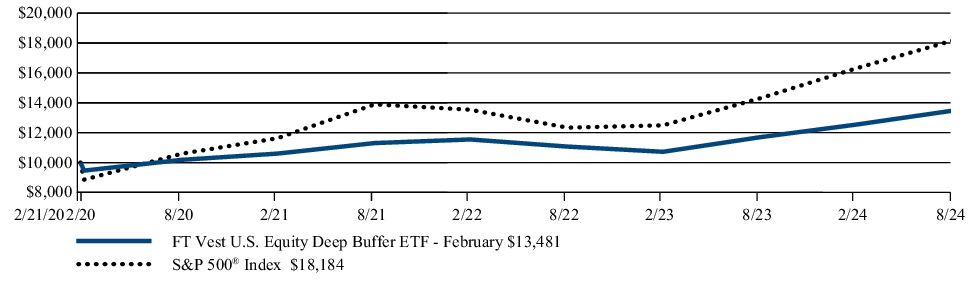
FUND PERFORMANCE (February 21, 2020 to August 31, 2024)
The performance line graph below shows the performance of a hypothetical $10,000 initial investment in the Fund over a ten-year period (or for the life of the Fund, if shorter). The subsequent account value as of the end of the Period is listed next to the name of the Fund or index, as applicable. The performance table below shows the average annual total returns of the Fund for the past one-, five-, and ten-year periods, as applicable (or for the life of the Fund, if shorter), as of the end of the Period. Both the line graph and performance table compare the Fund’s performance to an appropriate broad-based index and may compare to additional indices reflecting the market segment(s) in which the Fund invests over the same periods.
Investment Performance of $10,000
| Average Annual Total Returns (as of August 31, 2024) | 1 Year | Since
Inception
(2/21/20) |
| FT Vest U.S. Equity Buffer ETF - February | 19.11% | 10.42% |
| S&P 500® Index | 27.14% | 14.13% |
Visit www.ftportfolios.com/etf/FFEB for more recent performance information.
The Fund’s past performance is not a good predictor of the Fund’s future performance. The graph and table do not reflect the deduction of taxes that a shareholder would pay on Fund distributions or redemption of Fund shares.
KEY FUND STATISTICS (As of August 31, 2024)
| Fund net assets | $926,256,152 |
| Total number of portfolio holdings | 5 |
| Total advisory fee paid | $5,697,944 |
| Portfolio turnover rate | 0% |
WHAT DID THE FUND INVEST IN? (As of August 31, 2024)
The table below shows the investment makeup of the Fund, representing the percentage of net assets of the Fund.
| Money Market Funds | 0.7% |
| Purchased Options | 102.8% |
| Written Options | (3.4%) |
| Net Other Assets and Liabilities | (0.1%) |
| Total | 100.0% |
HOW HAS THE FUND MATERIALLY CHANGED?
This is a summary of certain changes to the Fund since September 1, 2023. For more complete information, you may review the Fund’s prospectus and any applicable supplements at www.ftportfolios.com/fund-documents/etf/FFEB or upon request at 1-800-621-1675 or info@ftportfolios.com.
During the fiscal year ended August 31, 2024, the Fund’s predetermined upside cap on Underlying ETF returns was reset based upon prevailing market conditions at the start of the new Target Outcome Period.
WHERE CAN I FIND ADDITIONAL INFORMATION ABOUT THE FUND?
Visit www.ftportfolios.com/fund-documents/etf/FFEB to view additional information about the Fund such as the prospectus, financial information, Fund holdings and proxy voting information. You may also request this information by contacting us at 1-800-621-1675 or info@ftportfolios.com.
OTHER INFORMATION
The Fund is not sponsored, endorsed, sold or promoted by SPDR® S&P 500® ETF Trust, PDR Services, LLC, or Standard & Poor’s® (together with their affiliates hereinafter referred to as the “Corporations”). The Corporations have not passed on the legality or suitability of, or the accuracy or adequacy of, descriptions and disclosures relating to the Fund or the FLEX Options. The Corporations make no representations or warranties, express or implied, regarding the advisability of investing in the Fund or the FLEX Options or results to be obtained by the Fund or the FLEX Options, shareholders or any other person or entity from use of the SPDR® S&P 500® ETF Trust. The Corporations have no liability in connection with the management, administration, marketing or trading of the Fund or the FLEX Options.
FT Vest U.S. Equity
Deep Buffer ETF - February
DFEB | CBOE BZX EXCHANGE, INC.
ANNUAL SHAREHOLDER REPORT | August 31, 2024
This annual shareholder report contains important information about the FT Vest U.S. Equity Deep Buffer ETF - February (the “Fund”) for the year of September 1, 2023 to August 31, 2024 (the “Period”). You can find additional information about the Fund at www.ftportfolios.com/fund-documents/etf/DFEB. You can also request this information by contacting us at 1-800-621-1675 or info@ftportfolios.com.
This report describes changes to the Fund that occurred during the Period.
WHAT WERE THE FUND COSTS FOR THE LAST YEAR?
(Based on a hypothetical $10,000 investment)
| Fund | Costs of a $10,000 investment | Costs paid as a percentage
of a $10,000 investment |
| FT Vest U.S. Equity Deep Buffer ETF - February | $91 | 0.85% |
HOW DID THE FUND PERFORM LAST YEAR? WHAT AFFECTED THE FUND’S PERFORMANCE?
The Fund returned 15.24% for the twelve months ended August 31, 2024. The Fund underperformed its benchmark, the S&P 500® Index, which returned 27.14% for the same Period.
This underperformance was due to the following:
| Fund NAV Performance Attributed to*: | | |
| Changes in Reference Asset | 12.01 | % |
| Changes in other Variables | 4.08 | % |
| Fees and Expenses | -0.85 | % |
The Fund holds a combination of FLexible EXchange® Options (“FLEX Options”) designed to target the Fund’s objective.
* The Fund’s performance is impacted by changes in the values of the FLEX Options to which it is exposed. We attribute (allocate) the impact on the Fund’s performance into three components. The first of the three components is the impact on the Fund’s performance due to changes in the Fund’s Reference Asset. The second component is the aggregate impact on the Fund’s performance due to changes in other variables that impact FLEX Options prices - these include changes in a) the Reference Asset’s dividends, b) interest rates, c) implied volatility, and d) time to option expiration. The third component is from the Fund’s fees and expenses incurred during the Period.
FUND PERFORMANCE (February 21, 2020 to August 31, 2024)
The performance line graph below shows the performance of a hypothetical $10,000 initial investment in the Fund over a ten-year period (or for the life of the Fund, if shorter). The subsequent account value as of the end of the Period is listed next to the name of the Fund or index, as applicable. The performance table below shows the average annual total returns of the Fund for the past one-, five-, and ten-year periods, as applicable (or for the life of the Fund, if shorter), as of the end of the Period. Both the line graph and performance table compare the Fund’s performance to an appropriate broad-based index and may compare to additional indices reflecting the market segment(s) in which the Fund invests over the same periods.
Investment Performance of $10,000
| Average Annual Total Returns (as of August 31, 2024) | 1 Year | Since
Inception
(2/21/20) |
| FT Vest U.S. Equity Deep Buffer ETF - February | 15.24% | 6.82% |
| S&P 500® Index | 27.14% | 14.13% |
Visit www.ftportfolios.com/etf/DFEB for more recent performance information.
The Fund’s past performance is not a good predictor of the Fund’s future performance. The graph and table do not reflect the deduction of taxes that a shareholder would pay on Fund distributions or redemption of Fund shares.
KEY FUND STATISTICS (As of August 31, 2024)
| Fund net assets | $262,627,031 |
| Total number of portfolio holdings | 5 |
| Total advisory fee paid | $2,080,212 |
| Portfolio turnover rate | 0% |
WHAT DID THE FUND INVEST IN? (As of August 31, 2024)
The table below shows the investment makeup of the Fund, representing the percentage of net assets of the Fund.
| Money Market Funds | 0.7% |
| Purchased Options | 103.4% |
| Written Options | (4.0%) |
| Net Other Assets and Liabilities | (0.1%) |
| Total | 100.0% |
HOW HAS THE FUND MATERIALLY CHANGED?
This is a summary of certain changes to the Fund since September 1, 2023. For more complete information, you may review the Fund’s prospectus and any applicable supplements at www.ftportfolios.com/fund-documents/etf/DFEB or upon request at 1-800-621-1675 or info@ftportfolios.com.
During the fiscal year ended August 31, 2024, the Fund’s predetermined upside cap on Underlying ETF returns was reset based upon prevailing market conditions at the start of the new Target Outcome Period.
WHERE CAN I FIND ADDITIONAL INFORMATION ABOUT THE FUND?
Visit www.ftportfolios.com/fund-documents/etf/DFEB to view additional information about the Fund such as the prospectus, financial information, Fund holdings and proxy voting information. You may also request this information by contacting us at 1-800-621-1675 or info@ftportfolios.com.
OTHER INFORMATION
The Fund is not sponsored, endorsed, sold or promoted by SPDR® S&P 500® ETF Trust, PDR Services, LLC, or Standard & Poor’s® (together with their affiliates hereinafter referred to as the “Corporations”). The Corporations have not passed on the legality or suitability of, or the accuracy or adequacy of, descriptions and disclosures relating to the Fund or the FLEX Options. The Corporations make no representations or warranties, express or implied, regarding the advisability of investing in the Fund or the FLEX Options or results to be obtained by the Fund or the FLEX Options, shareholders or any other person or entity from use of the SPDR® S&P 500® ETF Trust. The Corporations have no liability in connection with the management, administration, marketing or trading of the Fund or the FLEX Options.
FT Vest U.S. Equity Buffer ETF - March
FMAR | CBOE BZX EXCHANGE, INC.
ANNUAL SHAREHOLDER REPORT | August 31, 2024
This annual shareholder report contains important information about the FT Vest U.S. Equity Buffer ETF - March (the “Fund”) for the year of September 1, 2023 to August 31, 2024 (the “Period”). You can find additional information about the Fund at www.ftportfolios.com/fund-documents/etf/FMAR. You can also request this information by contacting us at 1-800-621-1675 or info@ftportfolios.com.
This report describes changes to the Fund that occurred during the Period.
WHAT WERE THE FUND COSTS FOR THE LAST YEAR?
(Based on a hypothetical $10,000 investment)
| Fund | Costs of a $10,000 investment | Costs paid as a percentage
of a $10,000 investment |
| FT Vest U.S. Equity Buffer ETF - March | $92 | 0.85% |
HOW DID THE FUND PERFORM LAST YEAR? WHAT AFFECTED THE FUND’S PERFORMANCE?
The Fund returned 15.67% for the twelve months ended August 31, 2024. The Fund underperformed its benchmark, the S&P 500® Index, which returned 27.14% for the same Period.
This underperformance was due to the following:
| Fund NAV Performance Attributed to*: | | |
| Changes in Reference Asset | 11.84 | % |
| Changes in other Variables | 4.68 | % |
| Fees and Expenses | -0.85 | % |
The Fund holds a combination of FLexible EXchange® Options (“FLEX Options”) designed to target the Fund’s objective.
* The Fund’s performance is impacted by changes in the values of the FLEX Options to which it is exposed. We attribute (allocate) the impact on the Fund’s performance into three components. The first of the three components is the impact on the Fund’s performance due to changes in the Fund’s Reference Asset. The second component is the aggregate impact on the Fund’s performance due to changes in other variables that impact FLEX Options prices - these include changes in a) the Reference Asset’s dividends, b) interest rates, c) implied volatility, and d) time to option expiration. The third component is from the Fund’s fees and expenses incurred during the Period.
FUND PERFORMANCE (March 19, 2021 to August 31, 2024)
The performance line graph below shows the performance of a hypothetical $10,000 initial investment in the Fund over a ten-year period (or for the life of the Fund, if shorter). The subsequent account value as of the end of the Period is listed next to the name of the Fund or index, as applicable. The performance table below shows the average annual total returns of the Fund for the past one-, five-, and ten-year periods, as applicable (or for the life of the Fund, if shorter), as of the end of the Period. Both the line graph and performance table compare the Fund’s performance to an appropriate broad-based index and may compare to additional indices reflecting the market segment(s) in which the Fund invests over the same periods.
Investment Performance of $10,000
| Average Annual Total Returns (as of August 31, 2024) | 1 Year | Since
Inception
(3/19/21) |
| FT Vest U.S. Equity Buffer ETF - March | 15.67% | 10.45% |
| S&P 500® Index | 27.14% | 12.93% |
Visit www.ftportfolios.com/etf/FMAR for more recent performance information.
The Fund’s past performance is not a good predictor of the Fund’s future performance. The graph and table do not reflect the deduction of taxes that a shareholder would pay on Fund distributions or redemption of Fund shares.
KEY FUND STATISTICS (As of August 31, 2024)
| Fund net assets | $860,250,150 |
| Total number of portfolio holdings | 5 |
| Total advisory fee paid | $4,672,327 |
| Portfolio turnover rate | 0% |
WHAT DID THE FUND INVEST IN? (As of August 31, 2024)
The table below shows the investment makeup of the Fund, representing the percentage of net assets of the Fund.
| Money Market Funds | 0.7% |
| Purchased Options | 102.2% |
| Written Options | (2.8%) |
| Net Other Assets and Liabilities | (0.1%) |
| Total | 100.0% |
HOW HAS THE FUND MATERIALLY CHANGED?
This is a summary of certain changes to the Fund since September 1, 2023. For more complete information, you may review the Fund’s prospectus and any applicable supplements at www.ftportfolios.com/fund-documents/etf/FMAR or upon request at 1-800-621-1675 or info@ftportfolios.com.
During the fiscal year ended August 31, 2024, the Fund’s predetermined upside cap on Underlying ETF returns was reset based upon prevailing market conditions at the start of the new Target Outcome Period.
WHERE CAN I FIND ADDITIONAL INFORMATION ABOUT THE FUND?
Visit www.ftportfolios.com/fund-documents/etf/FMAR to view additional information about the Fund such as the prospectus, financial information, Fund holdings and proxy voting information. You may also request this information by contacting us at 1-800-621-1675 or info@ftportfolios.com.
OTHER INFORMATION
The Fund is not sponsored, endorsed, sold or promoted by SPDR® S&P 500® ETF Trust, PDR Services, LLC, or Standard & Poor’s® (together with their affiliates hereinafter referred to as the “Corporations”). The Corporations have not passed on the legality or suitability of, or the accuracy or adequacy of, descriptions and disclosures relating to the Fund or the FLEX Options. The Corporations make no representations or warranties, express or implied, regarding the advisability of investing in the Fund or the FLEX Options or results to be obtained by the Fund or the FLEX Options, shareholders or any other person or entity from use of the SPDR® S&P 500® ETF Trust. The Corporations have no liability in connection with the management, administration, marketing or trading of the Fund or the FLEX Options.
FT Vest U.S. Equity
Deep Buffer ETF - March
DMAR | CBOE BZX EXCHANGE, INC.
ANNUAL SHAREHOLDER REPORT | August 31, 2024
This annual shareholder report contains important information about the FT Vest U.S. Equity Deep Buffer ETF - March (the “Fund”) for the year of September 1, 2023 to August 31, 2024 (the “Period”). You can find additional information about the Fund at www.ftportfolios.com/fund-documents/etf/DMAR. You can also request this information by contacting us at 1-800-621-1675 or info@ftportfolios.com.
This report describes changes to the Fund that occurred during the Period.
WHAT WERE THE FUND COSTS FOR THE LAST YEAR?
(Based on a hypothetical $10,000 investment)
| Fund | Costs of a $10,000 investment | Costs paid as a percentage
of a $10,000 investment |
| FT Vest U.S. Equity Deep Buffer ETF - March | $90 | 0.85% |
HOW DID THE FUND PERFORM LAST YEAR? WHAT AFFECTED THE FUND’S PERFORMANCE?
The Fund returned 12.93% for the twelve months ended August 31, 2024. The Fund underperformed its benchmark, the S&P 500® Index, which returned 27.14% for the same Period.
This underperformance was due to the following:
| Fund NAV Performance Attributed to*: | | |
| Changes in Reference Asset | 8.91 | % |
| Changes in other Variables | 4.87 | % |
| Fees and Expenses | -0.85 | % |
The Fund holds a combination of FLexible EXchange® Options (“FLEX Options”) designed to target the Fund’s objective.
* The Fund’s performance is impacted by changes in the values of the FLEX Options to which it is exposed. We attribute (allocate) the impact on the Fund’s performance into three components. The first of the three components is the impact on the Fund’s performance due to changes in the Fund’s Reference Asset. The second component is the aggregate impact on the Fund’s performance due to changes in other variables that impact FLEX Options prices - these include changes in a) the Reference Asset’s dividends, b) interest rates, c) implied volatility, and d) time to option expiration. The third component is from the Fund’s fees and expenses incurred during the Period.
FUND PERFORMANCE (March 19, 2021 to August 31, 2024)
The performance line graph below shows the performance of a hypothetical $10,000 initial investment in the Fund over a ten-year period (or for the life of the Fund, if shorter). The subsequent account value as of the end of the Period is listed next to the name of the Fund or index, as applicable. The performance table below shows the average annual total returns of the Fund for the past one-, five-, and ten-year periods, as applicable (or for the life of the Fund, if shorter), as of the end of the Period. Both the line graph and performance table compare the Fund’s performance to an appropriate broad-based index and may compare to additional indices reflecting the market segment(s) in which the Fund invests over the same periods.
Investment Performance of $10,000
| Average Annual Total Returns (as of August 31, 2024) | 1 Year | Since
Inception
(3/19/21) |
| FT Vest U.S. Equity Deep Buffer ETF - March | 12.93% | 6.63% |
| S&P 500® Index | 27.14% | 12.93% |
Visit www.ftportfolios.com/etf/DMAR for more recent performance information.
The Fund’s past performance is not a good predictor of the Fund’s future performance. The graph and table do not reflect the deduction of taxes that a shareholder would pay on Fund distributions or redemption of Fund shares.
KEY FUND STATISTICS (As of August 31, 2024)
| Fund net assets | $301,068,348 |
| Total number of portfolio holdings | 5 |
| Total advisory fee paid | $2,177,754 |
| Portfolio turnover rate | 0% |
WHAT DID THE FUND INVEST IN? (As of August 31, 2024)
The table below shows the investment makeup of the Fund, representing the percentage of net assets of the Fund.
| Money Market Funds | 0.8% |
| Purchased Options | 102.4% |
| Written Options | (3.1%) |
| Net Other Assets and Liabilities | (0.1%) |
| Total | 100.0% |
HOW HAS THE FUND MATERIALLY CHANGED?
This is a summary of certain changes to the Fund since September 1, 2023. For more complete information, you may review the Fund’s prospectus and any applicable supplements at www.ftportfolios.com/fund-documents/etf/DMAR or upon request at 1-800-621-1675 or info@ftportfolios.com.
During the fiscal year ended August 31, 2024, the Fund’s predetermined upside cap on Underlying ETF returns was reset based upon prevailing market conditions at the start of the new Target Outcome Period.
WHERE CAN I FIND ADDITIONAL INFORMATION ABOUT THE FUND?
Visit www.ftportfolios.com/fund-documents/etf/DMAR to view additional information about the Fund such as the prospectus, financial information, Fund holdings and proxy voting information. You may also request this information by contacting us at 1-800-621-1675 or info@ftportfolios.com.
OTHER INFORMATION
The Fund is not sponsored, endorsed, sold or promoted by SPDR® S&P 500® ETF Trust, PDR Services, LLC, or Standard & Poor’s® (together with their affiliates hereinafter referred to as the “Corporations”). The Corporations have not passed on the legality or suitability of, or the accuracy or adequacy of, descriptions and disclosures relating to the Fund or the FLEX Options. The Corporations make no representations or warranties, express or implied, regarding the advisability of investing in the Fund or the FLEX Options or results to be obtained by the Fund or the FLEX Options, shareholders or any other person or entity from use of the SPDR® S&P 500® ETF Trust. The Corporations have no liability in connection with the management, administration, marketing or trading of the Fund or the FLEX Options.
FT Vest U.S. Equity Buffer ETF - April
FAPR | CBOE BZX EXCHANGE, INC.
ANNUAL SHAREHOLDER REPORT | August 31, 2024
This annual shareholder report contains important information about the FT Vest U.S. Equity Buffer ETF - April (the “Fund”) for the year of September 1, 2023 to August 31, 2024 (the “Period”). You can find additional information about the Fund at www.ftportfolios.com/fund-documents/etf/FAPR. You can also request this information by contacting us at 1-800-621-1675 or info@ftportfolios.com.
This report describes changes to the Fund that occurred during the Period.
WHAT WERE THE FUND COSTS FOR THE LAST YEAR?
(Based on a hypothetical $10,000 investment)
| Fund | Costs of a $10,000 investment | Costs paid as a percentage
of a $10,000 investment |
| FT Vest U.S. Equity Buffer ETF - April | $94 | 0.85% |
HOW DID THE FUND PERFORM LAST YEAR? WHAT AFFECTED THE FUND’S PERFORMANCE?
The Fund returned 20.33% for the twelve months ended August 31, 2024. The Fund underperformed its benchmark, the S&P 500® Index, which returned 27.14% for the same Period.
This underperformance was due to the following:
| Fund NAV Performance Attributed to*: | | |
| Changes in Reference Asset | 12.40 | % |
| Changes in other Variables | 8.78 | % |
| Fees and Expenses | -0.85 | % |
The Fund holds a combination of FLexible EXchange® Options (“FLEX Options”) designed to target the Fund’s objective.
* The Fund’s performance is impacted by changes in the values of the FLEX Options to which it is exposed. We attribute (allocate) the impact on the Fund’s performance into three components. The first of the three components is the impact on the Fund’s performance due to changes in the Fund’s Reference Asset. The second component is the aggregate impact on the Fund’s performance due to changes in other variables that impact FLEX Options prices - these include changes in a) the Reference Asset’s dividends, b) interest rates, c) implied volatility, and d) time to option expiration. The third component is from the Fund’s fees and expenses incurred during the Period.
FUND PERFORMANCE (April 16, 2021 to August 31, 2024)
The performance line graph below shows the performance of a hypothetical $10,000 initial investment in the Fund over a ten-year period (or for the life of the Fund, if shorter). The subsequent account value as of the end of the Period is listed next to the name of the Fund or index, as applicable. The performance table below shows the average annual total returns of the Fund for the past one-, five-, and ten-year periods, as applicable (or for the life of the Fund, if shorter), as of the end of the Period. Both the line graph and performance table compare the Fund’s performance to an appropriate broad-based index and may compare to additional indices reflecting the market segment(s) in which the Fund invests over the same periods.
Investment Performance of $10,000
| Average Annual Total Returns (as of August 31, 2024) | 1 Year | Since
Inception
(4/16/21) |
| FT Vest U.S. Equity Buffer ETF - April | 20.33% | 8.86% |
| S&P 500® Index | 27.14% | 10.98% |
Visit www.ftportfolios.com/etf/FAPR for more recent performance information.
The Fund’s past performance is not a good predictor of the Fund’s future performance. The graph and table do not reflect the deduction of taxes that a shareholder would pay on Fund distributions or redemption of Fund shares.
KEY FUND STATISTICS (As of August 31, 2024)
| Fund net assets | $689,112,102 |
| Total number of portfolio holdings | 5 |
| Total advisory fee paid | $4,290,770 |
| Portfolio turnover rate | 0% |
WHAT DID THE FUND INVEST IN? (As of August 31, 2024)
The table below shows the investment makeup of the Fund, representing the percentage of net assets of the Fund.
| Money Market Funds | 0.8% |
| Purchased Options | 103.8% |
| Written Options | (4.6%) |
| Net Other Assets and Liabilities | (0.0%) |
| Total | 100.0% |
Any amount shown as 0.0% represents less than 0.1%.
HOW HAS THE FUND MATERIALLY CHANGED?
This is a summary of certain changes to the Fund since September 1, 2023. For more complete information, you may review the Fund’s prospectus and any applicable supplements at www.ftportfolios.com/fund-documents/etf/FAPR or upon request at 1-800-621-1675 or info@ftportfolios.com.
During the fiscal year ended August 31, 2024, the Fund’s predetermined upside cap on Underlying ETF returns was reset based upon prevailing market conditions at the start of the new Target Outcome Period.
WHERE CAN I FIND ADDITIONAL INFORMATION ABOUT THE FUND?
Visit www.ftportfolios.com/fund-documents/etf/FAPR to view additional information about the Fund such as the prospectus, financial information, Fund holdings and proxy voting information. You may also request this information by contacting us at 1-800-621-1675 or info@ftportfolios.com.
OTHER INFORMATION
The Fund is not sponsored, endorsed, sold or promoted by SPDR® S&P 500® ETF Trust, PDR Services, LLC, or Standard & Poor’s® (together with their affiliates hereinafter referred to as the “Corporations”). The Corporations have not passed on the legality or suitability of, or the accuracy or adequacy of, descriptions and disclosures relating to the Fund or the FLEX Options. The Corporations make no representations or warranties, express or implied, regarding the advisability of investing in the Fund or the FLEX Options or results to be obtained by the Fund or the FLEX Options, shareholders or any other person or entity from use of the SPDR® S&P 500® ETF Trust. The Corporations have no liability in connection with the management, administration, marketing or trading of the Fund or the FLEX Options.
FT Vest U.S. Equity Deep
Buffer ETF - April
DAPR | CBOE BZX EXCHANGE, INC.
ANNUAL SHAREHOLDER REPORT | August 31, 2024
This annual shareholder report contains important information about the FT Vest U.S. Equity Deep Buffer ETF - April (the “Fund”) for the year of September 1, 2023 to August 31, 2024 (the “Period”). You can find additional information about the Fund at www.ftportfolios.com/fund-documents/etf/DAPR. You can also request this information by contacting us at 1-800-621-1675 or info@ftportfolios.com.
This report describes changes to the Fund that occurred during the Period.
WHAT WERE THE FUND COSTS FOR THE LAST YEAR?
(Based on a hypothetical $10,000 investment)
| Fund | Costs of a $10,000 investment | Costs paid as a percentage
of a $10,000 investment |
| FT Vest U.S. Equity Deep Buffer ETF - April | $92 | 0.85% |
HOW DID THE FUND PERFORM LAST YEAR? WHAT AFFECTED THE FUND’S PERFORMANCE?
The Fund returned 16.20% for the twelve months ended August 31, 2024. The Fund underperformed its benchmark, the S&P 500® Index, which returned 27.14% for the same Period.
This underperformance was due to the following:
| Fund NAV Performance Attributed to*: | | |
| Changes in Reference Asset | 9.23 | % |
| Changes in other Variables | 7.82 | % |
| Fees and Expenses | -0.85 | % |
The Fund holds a combination of FLexible EXchange® Options (“FLEX Options”) designed to target the Fund’s objective.
* The Fund’s performance is impacted by changes in the values of the FLEX Options to which it is exposed. We attribute (allocate) the impact on the Fund’s performance into three components. The first of the three components is the impact on the Fund’s performance due to changes in the Fund’s Reference Asset. The second component is the aggregate impact on the Fund’s performance due to changes in other variables that impact FLEX Options prices - these include changes in a) the Reference Asset’s dividends, b) interest rates, c) implied volatility, and d) time to option expiration. The third component is from the Fund’s fees and expenses incurred during the Period.
FUND PERFORMANCE (April 16, 2021 to August 31, 2024)
The performance line graph below shows the performance of a hypothetical $10,000 initial investment in the Fund over a ten-year period (or for the life of the Fund, if shorter). The subsequent account value as of the end of the Period is listed next to the name of the Fund or index, as applicable. The performance table below shows the average annual total returns of the Fund for the past one-, five-, and ten-year periods, as applicable (or for the life of the Fund, if shorter), as of the end of the Period. Both the line graph and performance table compare the Fund’s performance to an appropriate broad-based index and may compare to additional indices reflecting the market segment(s) in which the Fund invests over the same periods.
Investment Performance of $10,000
| Average Annual Total Returns (as of August 31, 2024) | 1 Year | Since
Inception
(4/16/21) |
| FT Vest U.S. Equity Deep Buffer ETF - April | 16.20% | 5.65% |
| S&P 500® Index | 27.14% | 10.98% |
Visit www.ftportfolios.com/etf/DAPR for more recent performance information.
The Fund’s past performance is not a good predictor of the Fund’s future performance. The graph and table do not reflect the deduction of taxes that a shareholder would pay on Fund distributions or redemption of Fund shares.
KEY FUND STATISTICS (As of August 31, 2024)
| Fund net assets | $238,687,735 |
| Total number of portfolio holdings | 5 |
| Total advisory fee paid | $1,851,204 |
| Portfolio turnover rate | 0% |
WHAT DID THE FUND INVEST IN? (As of August 31, 2024)
The table below shows the investment makeup of the Fund, representing the percentage of net assets of the Fund.
| Money Market Funds | 0.8% |
| Purchased Options | 104.6% |
| Written Options | (5.3%) |
| Net Other Assets and Liabilities | (0.1%) |
| Total | 100.0% |
HOW HAS THE FUND MATERIALLY CHANGED?
This is a summary of certain changes to the Fund since September 1, 2023. For more complete information, you may review the Fund’s prospectus and any applicable supplements at www.ftportfolios.com/fund-documents/etf/DAPR or upon request at 1-800-621-1675 or info@ftportfolios.com.
During the fiscal year ended August 31, 2024, the Fund’s predetermined upside cap on Underlying ETF returns was reset based upon prevailing market conditions at the start of the new Target Outcome Period.
WHERE CAN I FIND ADDITIONAL INFORMATION ABOUT THE FUND?
Visit www.ftportfolios.com/fund-documents/etf/DAPR to view additional information about the Fund such as the prospectus, financial information, Fund holdings and proxy voting information. You may also request this information by contacting us at 1-800-621-1675 or info@ftportfolios.com.
OTHER INFORMATION
The Fund is not sponsored, endorsed, sold or promoted by SPDR® S&P 500® ETF Trust, PDR Services, LLC, or Standard & Poor’s® (together with their affiliates hereinafter referred to as the “Corporations”). The Corporations have not passed on the legality or suitability of, or the accuracy or adequacy of, descriptions and disclosures relating to the Fund or the FLEX Options. The Corporations make no representations or warranties, express or implied, regarding the advisability of investing in the Fund or the FLEX Options or results to be obtained by the Fund or the FLEX Options, shareholders or any other person or entity from use of the SPDR® S&P 500® ETF Trust. The Corporations have no liability in connection with the management, administration, marketing or trading of the Fund or the FLEX Options.
FT Vest U.S. Equity Buffer ETF - May
FMAY | CBOE BZX EXCHANGE, INC.
ANNUAL SHAREHOLDER REPORT | August 31, 2024
This annual shareholder report contains important information about the FT Vest U.S. Equity Buffer ETF - May (the “Fund”) for the year of September 1, 2023 to August 31, 2024 (the “Period”). You can find additional information about the Fund at www.ftportfolios.com/fund-documents/etf/FMAY. You can also request this information by contacting us at 1-800-621-1675 or info@ftportfolios.com.
This report describes changes to the Fund that occurred during the Period.
WHAT WERE THE FUND COSTS FOR THE LAST YEAR?
(Based on a hypothetical $10,000 investment)
| Fund | Costs of a $10,000 investment | Costs paid as a percentage
of a $10,000 investment |
| FT Vest U.S. Equity Buffer ETF - May | $92 | 0.85% |
HOW DID THE FUND PERFORM LAST YEAR? WHAT AFFECTED THE FUND’S PERFORMANCE?
The Fund returned 16.37% for the twelve months ended August 31, 2024. The Fund underperformed its benchmark, the S&P 500® Index, which returned 27.14% for the same Period.
This underperformance was due to the following:
| Fund NAV Performance Attributed to*: | | |
| Changes in Reference Asset | 12.31 | % |
| Changes in other Variables | 4.91 | % |
| Fees and Expenses | -0.85 | % |
The Fund holds a combination of FLexible EXchange® Options (“FLEX Options”) designed to target the Fund’s objective.
* The Fund’s performance is impacted by changes in the values of the FLEX Options to which it is exposed. We attribute (allocate) the impact on the Fund’s performance into three components. The first of the three components is the impact on the Fund’s performance due to changes in the Fund’s Reference Asset. The second component is the aggregate impact on the Fund’s performance due to changes in other variables that impact FLEX Options prices - these include changes in a) the Reference Asset’s dividends, b) interest rates, c) implied volatility, and d) time to option expiration. The third component is from the Fund’s fees and expenses incurred during the Period.
FUND PERFORMANCE (May 15, 2020 to August 31, 2024)
The performance line graph below shows the performance of a hypothetical $10,000 initial investment in the Fund over a ten-year period (or for the life of the Fund, if shorter). The subsequent account value as of the end of the Period is listed next to the name of the Fund or index, as applicable. The performance table below shows the average annual total returns of the Fund for the past one-, five-, and ten-year periods, as applicable (or for the life of the Fund, if shorter), as of the end of the Period. Both the line graph and performance table compare the Fund’s performance to an appropriate broad-based index and may compare to additional indices reflecting the market segment(s) in which the Fund invests over the same periods.
Investment Performance of $10,000
| Average Annual Total Returns (as of August 31, 2024) | 1 Year | Since
Inception
(5/15/20) |
| FT Vest U.S. Equity Buffer ETF - May | 16.37% | 10.09% |
| S&P 500® Index | 27.14% | 18.97% |
Visit www.ftportfolios.com/etf/FMAY for more recent performance information.
The Fund’s past performance is not a good predictor of the Fund’s future performance. The graph and table do not reflect the deduction of taxes that a shareholder would pay on Fund distributions or redemption of Fund shares.
KEY FUND STATISTICS (As of August 31, 2024)
| Fund net assets | $823,199,153 |
| Total number of portfolio holdings | 5 |
| Total advisory fee paid | $5,195,218 |
| Portfolio turnover rate | 0% |
WHAT DID THE FUND INVEST IN? (As of August 31, 2024)
The table below shows the investment makeup of the Fund, representing the percentage of net assets of the Fund.
| Money Market Funds | 0.9% |
| Purchased Options | 102.2% |
| Written Options | (3.0%) |
| Net Other Assets and Liabilities | (0.1%) |
| Total | 100.0% |
HOW HAS THE FUND MATERIALLY CHANGED?
This is a summary of certain changes to the Fund since September 1, 2023. For more complete information, you may review the Fund’s prospectus and any applicable supplements at www.ftportfolios.com/fund-documents/etf/FMAY or upon request at 1-800-621-1675 or info@ftportfolios.com.
During the fiscal year ended August 31, 2024, the Fund’s predetermined upside cap on Underlying ETF returns was reset based upon prevailing market conditions at the start of the new Target Outcome Period.
WHERE CAN I FIND ADDITIONAL INFORMATION ABOUT THE FUND?
Visit www.ftportfolios.com/fund-documents/etf/FMAY to view additional information about the Fund such as the prospectus, financial information, Fund holdings and proxy voting information. You may also request this information by contacting us at 1-800-621-1675 or info@ftportfolios.com.
OTHER INFORMATION
The Fund is not sponsored, endorsed, sold or promoted by SPDR® S&P 500® ETF Trust, PDR Services, LLC, or Standard & Poor’s® (together with their affiliates hereinafter referred to as the “Corporations”). The Corporations have not passed on the legality or suitability of, or the accuracy or adequacy of, descriptions and disclosures relating to the Fund or the FLEX Options. The Corporations make no representations or warranties, express or implied, regarding the advisability of investing in the Fund or the FLEX Options or results to be obtained by the Fund or the FLEX Options, shareholders or any other person or entity from use of the SPDR® S&P 500® ETF Trust. The Corporations have no liability in connection with the management, administration, marketing or trading of the Fund or the FLEX Options.
FT Vest U.S. Equity Deep Buffer ETF - May
DMAY | CBOE BZX EXCHANGE, INC.
ANNUAL SHAREHOLDER REPORT | August 31, 2024
This annual shareholder report contains important information about the FT Vest U.S. Equity Deep Buffer ETF - May (the “Fund”) for the year of September 1, 2023 to August 31, 2024 (the “Period”). You can find additional information about the Fund at www.ftportfolios.com/fund-documents/etf/DMAY. You can also request this information by contacting us at 1-800-621-1675 or info@ftportfolios.com.
This report describes changes to the Fund that occurred during the Period.
WHAT WERE THE FUND COSTS FOR THE LAST YEAR?
(Based on a hypothetical $10,000 investment)
| Fund | Costs of a $10,000 investment | Costs paid as a percentage
of a $10,000 investment |
| FT Vest U.S. Equity Deep Buffer ETF - May | $91 | 0.85% |
HOW DID THE FUND PERFORM LAST YEAR? WHAT AFFECTED THE FUND’S PERFORMANCE?
The Fund returned 13.67% for the twelve months ended August 31, 2024. The Fund underperformed its benchmark, the S&P 500® Index, which returned 27.14% for the same Period.
This underperformance was due to the following:
| Fund NAV Performance Attributed to*: | | |
| Changes in Reference Asset | 9.61 | % |
| Changes in other Variables | 4.91 | % |
| Fees and Expenses | -0.85 | % |
The Fund holds a combination of FLexible EXchange® Options (“FLEX Options”) designed to target the Fund’s objective.
* The Fund’s performance is impacted by changes in the values of the FLEX Options to which it is exposed. We attribute (allocate) the impact on the Fund’s performance into three components. The first of the three components is the impact on the Fund’s performance due to changes in the Fund’s Reference Asset. The second component is the aggregate impact on the Fund’s performance due to changes in other variables that impact FLEX Options prices - these include changes in a) the Reference Asset’s dividends, b) interest rates, c) implied volatility, and d) time to option expiration. The third component is from the Fund’s fees and expenses incurred during the Period.
FUND PERFORMANCE (May 15, 2020 to August 31, 2024)
The performance line graph below shows the performance of a hypothetical $10,000 initial investment in the Fund over a ten-year period (or for the life of the Fund, if shorter). The subsequent account value as of the end of the Period is listed next to the name of the Fund or index, as applicable. The performance table below shows the average annual total returns of the Fund for the past one-, five-, and ten-year periods, as applicable (or for the life of the Fund, if shorter), as of the end of the Period. Both the line graph and performance table compare the Fund’s performance to an appropriate broad-based index and may compare to additional indices reflecting the market segment(s) in which the Fund invests over the same periods.
Investment Performance of $10,000
| Average Annual Total Returns (as of August 31, 2024) | 1 Year | Since
Inception
(5/15/20) |
| FT Vest U.S. Equity Deep Buffer ETF - May | 13.67% | 6.32% |
| S&P 500® Index | 27.14% | 18.97% |
Visit www.ftportfolios.com/etf/DMAY for more recent performance information.
The Fund’s past performance is not a good predictor of the Fund’s future performance. The graph and table do not reflect the deduction of taxes that a shareholder would pay on Fund distributions or redemption of Fund shares.
KEY FUND STATISTICS (As of August 31, 2024)
| Fund net assets | $314,939,085 |
| Total number of portfolio holdings | 5 |
| Total advisory fee paid | $1,761,852 |
| Portfolio turnover rate | 0% |
WHAT DID THE FUND INVEST IN? (As of August 31, 2024)
The table below shows the investment makeup of the Fund, representing the percentage of net assets of the Fund.
| Money Market Funds | 0.9% |
| Purchased Options | 101.5% |
| Written Options | (2.3%) |
| Net Other Assets and Liabilities | (0.1%) |
| Total | 100.0% |
HOW HAS THE FUND MATERIALLY CHANGED?
This is a summary of certain changes to the Fund since September 1, 2023. For more complete information, you may review the Fund’s prospectus and any applicable supplements at www.ftportfolios.com/fund-documents/etf/DMAY or upon request at 1-800-621-1675 or info@ftportfolios.com.
During the fiscal year ended August 31, 2024, the Fund’s predetermined upside cap on Underlying ETF returns was reset based upon prevailing market conditions at the start of the new Target Outcome Period.
WHERE CAN I FIND ADDITIONAL INFORMATION ABOUT THE FUND?
Visit www.ftportfolios.com/fund-documents/etf/DMAY to view additional information about the Fund such as the prospectus, financial information, Fund holdings and proxy voting information. You may also request this information by contacting us at 1-800-621-1675 or info@ftportfolios.com.
OTHER INFORMATION
The Fund is not sponsored, endorsed, sold or promoted by SPDR® S&P 500® ETF Trust, PDR Services, LLC, or Standard & Poor’s® (together with their affiliates hereinafter referred to as the “Corporations”). The Corporations have not passed on the legality or suitability of, or the accuracy or adequacy of, descriptions and disclosures relating to the Fund or the FLEX Options. The Corporations make no representations or warranties, express or implied, regarding the advisability of investing in the Fund or the FLEX Options or results to be obtained by the Fund or the FLEX Options, shareholders or any other person or entity from use of the SPDR® S&P 500® ETF Trust. The Corporations have no liability in connection with the management, administration, marketing or trading of the Fund or the FLEX Options.
FT Vest U.S. Equity Buffer ETF - June
FJUN | CBOE BZX EXCHANGE, INC.
ANNUAL SHAREHOLDER REPORT | August 31, 2024
This annual shareholder report contains important information about the FT Vest U.S. Equity Buffer ETF - June (the “Fund”) for the year of September 1, 2023 to August 31, 2024 (the “Period”). You can find additional information about the Fund at www.ftportfolios.com/fund-documents/etf/FJUN. You can also request this information by contacting us at 1-800-621-1675 or info@ftportfolios.com.
This report describes changes to the Fund that occurred during the Period.
WHAT WERE THE FUND COSTS FOR THE LAST YEAR?
(Based on a hypothetical $10,000 investment)
| Fund | Costs of a $10,000 investment | Costs paid as a percentage
of a $10,000 investment |
| FT Vest U.S. Equity Buffer ETF - June | $93 | 0.85% |
HOW DID THE FUND PERFORM LAST YEAR? WHAT AFFECTED THE FUND’S PERFORMANCE?
The Fund returned 18.04% for the twelve months ended August 31, 2024. The Fund underperformed its benchmark, the S&P 500® Index, which returned 27.14% for the same Period.
This underperformance was due to the following:
| Fund NAV Performance Attributed to*: | | |
| Changes in Reference Asset | 14.90 | % |
| Changes in other Variables | 3.99 | % |
| Fees and Expenses | -0.85 | % |
The Fund holds a combination of FLexible EXchange® Options (“FLEX Options”) designed to target the Fund’s objective.
* The Fund’s performance is impacted by changes in the values of the FLEX Options to which it is exposed. We attribute (allocate) the impact on the Fund’s performance into three components. The first of the three components is the impact on the Fund’s performance due to changes in the Fund’s Reference Asset. The second component is the aggregate impact on the Fund’s performance due to changes in other variables that impact FLEX Options prices - these include changes in a) the Reference Asset’s dividends, b) interest rates, c) implied volatility, and d) time to option expiration. The third component is from the Fund’s fees and expenses incurred during the Period.
FUND PERFORMANCE (June 19, 2020 to August 31, 2024)
The performance line graph below shows the performance of a hypothetical $10,000 initial investment in the Fund over a ten-year period (or for the life of the Fund, if shorter). The subsequent account value as of the end of the Period is listed next to the name of the Fund or index, as applicable. The performance table below shows the average annual total returns of the Fund for the past one-, five-, and ten-year periods, as applicable (or for the life of the Fund, if shorter), as of the end of the Period. Both the line graph and performance table compare the Fund’s performance to an appropriate broad-based index and may compare to additional indices reflecting the market segment(s) in which the Fund invests over the same periods.
Investment Performance of $10,000
| Average Annual Total Returns (as of August 31, 2024) | 1 Year | Since
Inception
(6/19/20) |
| FT Vest U.S. Equity Buffer ETF - June | 18.04% | 12.56% |
| S&P 500® Index | 27.14% | 17.17% |
Visit www.ftportfolios.com/etf/FJUN for more recent performance information.
The Fund’s past performance is not a good predictor of the Fund’s future performance. The graph and table do not reflect the deduction of taxes that a shareholder would pay on Fund distributions or redemption of Fund shares.
KEY FUND STATISTICS (As of August 31, 2024)
| Fund net assets | $816,700,692 |
| Total number of portfolio holdings | 5 |
| Total advisory fee paid | $5,470,813 |
| Portfolio turnover rate | 0% |
WHAT DID THE FUND INVEST IN? (As of August 31, 2024)
The table below shows the investment makeup of the Fund, representing the percentage of net assets of the Fund.
| Money Market Funds | 1.0% |
| Purchased Options | 101.9% |
| Written Options | (2.8%) |
| Net Other Assets and Liabilities | (0.1%) |
| Total | 100.0% |
HOW HAS THE FUND MATERIALLY CHANGED?
This is a summary of certain changes to the Fund since September 1, 2023. For more complete information, you may review the Fund’s prospectus and any applicable supplements at www.ftportfolios.com/fund-documents/etf/FJUN or upon request at 1-800-621-1675 or info@ftportfolios.com.
During the fiscal year ended August 31, 2024, the Fund’s predetermined upside cap on Underlying ETF returns was reset based upon prevailing market conditions at the start of the new Target Outcome Period.
WHERE CAN I FIND ADDITIONAL INFORMATION ABOUT THE FUND?
Visit www.ftportfolios.com/fund-documents/etf/FJUN to view additional information about the Fund such as the prospectus, financial information, Fund holdings and proxy voting information. You may also request this information by contacting us at 1-800-621-1675 or info@ftportfolios.com.
OTHER INFORMATION
The Fund is not sponsored, endorsed, sold or promoted by SPDR® S&P 500® ETF Trust, PDR Services, LLC, or Standard & Poor’s® (together with their affiliates hereinafter referred to as the “Corporations”). The Corporations have not passed on the legality or suitability of, or the accuracy or adequacy of, descriptions and disclosures relating to the Fund or the FLEX Options. The Corporations make no representations or warranties, express or implied, regarding the advisability of investing in the Fund or the FLEX Options or results to be obtained by the Fund or the FLEX Options, shareholders or any other person or entity from use of the SPDR® S&P 500® ETF Trust. The Corporations have no liability in connection with the management, administration, marketing or trading of the Fund or the FLEX Options.
FT Vest U.S. Equity Deep Buffer ETF - June
DJUN | CBOE BZX EXCHANGE, INC.
ANNUAL SHAREHOLDER REPORT | August 31, 2024
This annual shareholder report contains important information about the FT Vest U.S. Equity Deep Buffer ETF - June (the “Fund”) for the year of September 1, 2023 to August 31, 2024 (the “Period”). You can find additional information about the Fund at www.ftportfolios.com/fund-documents/etf/DJUN. You can also request this information by contacting us at 1-800-621-1675 or info@ftportfolios.com.
This report describes changes to the Fund that occurred during the Period.
WHAT WERE THE FUND COSTS FOR THE LAST YEAR?
(Based on a hypothetical $10,000 investment)
| Fund | Costs of a $10,000 investment | Costs paid as a percentage
of a $10,000 investment |
| FT Vest U.S. Equity Deep Buffer ETF - June | $92 | 0.85% |
HOW DID THE FUND PERFORM LAST YEAR? WHAT AFFECTED THE FUND’S PERFORMANCE?
The Fund returned 15.39% for the twelve months ended August 31, 2024. The Fund underperformed its benchmark, the S&P 500® Index, which returned 27.14% for the same Period.
This underperformance was due to the following:
| Fund NAV Performance Attributed to*: | | |
| Changes in Reference Asset | 11.82 | % |
| Changes in other Variables | 4.42 | % |
| Fees and Expenses | -0.85 | % |
The Fund holds a combination of FLexible EXchange® Options (“FLEX Options”) designed to target the Fund’s objective.
* The Fund’s performance is impacted by changes in the values of the FLEX Options to which it is exposed. We attribute (allocate) the impact on the Fund’s performance into three components. The first of the three components is the impact on the Fund’s performance due to changes in the Fund’s Reference Asset. The second component is the aggregate impact on the Fund’s performance due to changes in other variables that impact FLEX Options prices - these include changes in a) the Reference Asset’s dividends, b) interest rates, c) implied volatility, and d) time to option expiration. The third component is from the Fund’s fees and expenses incurred during the Period.
FUND PERFORMANCE (June 19, 2020 to August 31, 2024)
The performance line graph below shows the performance of a hypothetical $10,000 initial investment in the Fund over a ten-year period (or for the life of the Fund, if shorter). The subsequent account value as of the end of the Period is listed next to the name of the Fund or index, as applicable. The performance table below shows the average annual total returns of the Fund for the past one-, five-, and ten-year periods, as applicable (or for the life of the Fund, if shorter), as of the end of the Period. Both the line graph and performance table compare the Fund’s performance to an appropriate broad-based index and may compare to additional indices reflecting the market segment(s) in which the Fund invests over the same periods.
Investment Performance of $10,000
| Average Annual Total Returns (as of August 31, 2024) | 1 Year | Since
Inception
(6/19/20) |
| FT Vest U.S. Equity Deep Buffer ETF - June | 15.39% | 8.11% |
| S&P 500® Index | 27.14% | 17.17% |
Visit www.ftportfolios.com/etf/DJUN for more recent performance information.
The Fund’s past performance is not a good predictor of the Fund’s future performance. The graph and table do not reflect the deduction of taxes that a shareholder would pay on Fund distributions or redemption of Fund shares.
KEY FUND STATISTICS (As of August 31, 2024)
| Fund net assets | $248,708,743 |
| Total number of portfolio holdings | 5 |
| Total advisory fee paid | $1,642,585 |
| Portfolio turnover rate | 0% |
WHAT DID THE FUND INVEST IN? (As of August 31, 2024)
The table below shows the investment makeup of the Fund, representing the percentage of net assets of the Fund.
| Money Market Funds | 1.0% |
| Purchased Options | 101.1% |
| Written Options | (2.0%) |
| Net Other Assets and Liabilities | (0.1%) |
| Total | 100.0% |
HOW HAS THE FUND MATERIALLY CHANGED?
This is a summary of certain changes to the Fund since September 1, 2023. For more complete information, you may review the Fund’s prospectus and any applicable supplements at www.ftportfolios.com/fund-documents/etf/DJUN or upon request at 1-800-621-1675 or info@ftportfolios.com.
During the fiscal year ended August 31, 2024, the Fund’s predetermined upside cap on Underlying ETF returns was reset based upon prevailing market conditions at the start of the new Target Outcome Period.
WHERE CAN I FIND ADDITIONAL INFORMATION ABOUT THE FUND?
Visit www.ftportfolios.com/fund-documents/etf/DJUN to view additional information about the Fund such as the prospectus, financial information, Fund holdings and proxy voting information. You may also request this information by contacting us at 1-800-621-1675 or info@ftportfolios.com.
OTHER INFORMATION
The Fund is not sponsored, endorsed, sold or promoted by SPDR® S&P 500® ETF Trust, PDR Services, LLC, or Standard & Poor’s® (together with their affiliates hereinafter referred to as the “Corporations”). The Corporations have not passed on the legality or suitability of, or the accuracy or adequacy of, descriptions and disclosures relating to the Fund or the FLEX Options. The Corporations make no representations or warranties, express or implied, regarding the advisability of investing in the Fund or the FLEX Options or results to be obtained by the Fund or the FLEX Options, shareholders or any other person or entity from use of the SPDR® S&P 500® ETF Trust. The Corporations have no liability in connection with the management, administration, marketing or trading of the Fund or the FLEX Options.
FT Vest U.S. Equity Buffer ETF - July
FJUL | CBOE BZX EXCHANGE, INC.
ANNUAL SHAREHOLDER REPORT | August 31, 2024
This annual shareholder report contains important information about the FT Vest U.S. Equity Buffer ETF - July (the “Fund”) for the year of September 1, 2023 to August 31, 2024 (the “Period”). You can find additional information about the Fund at www.ftportfolios.com/fund-documents/etf/FJUL. You can also request this information by contacting us at 1-800-621-1675 or info@ftportfolios.com.
This report describes changes to the Fund that occurred during the Period.
WHAT WERE THE FUND COSTS FOR THE LAST YEAR?
(Based on a hypothetical $10,000 investment)
| Fund | Costs of a $10,000 investment | Costs paid as a percentage
of a $10,000 investment |
| FT Vest U.S. Equity Buffer ETF - July | $93 | 0.85% |
HOW DID THE FUND PERFORM LAST YEAR? WHAT AFFECTED THE FUND’S PERFORMANCE?
The Fund returned 19.51% for the twelve months ended August 31, 2024. The Fund underperformed its benchmark, the S&P 500® Index, which returned 27.14% for the same Period.
This underperformance was due to the following:
| Fund NAV Performance Attributed to*: | | |
| Changes in Reference Asset | 14.94 | % |
| Changes in other Variables | 5.42 | % |
| Fees and Expenses | -0.85 | % |
The Fund holds a combination of FLexible EXchange® Options (“FLEX Options”) designed to target the Fund’s objective.
* The Fund’s performance is impacted by changes in the values of the FLEX Options to which it is exposed. We attribute (allocate) the impact on the Fund’s performance into three components. The first of the three components is the impact on the Fund’s performance due to changes in the Fund’s Reference Asset. The second component is the aggregate impact on the Fund’s performance due to changes in other variables that impact FLEX Options prices - these include changes in a) the Reference Asset’s dividends, b) interest rates, c) implied volatility, and d) time to option expiration. The third component is from the Fund’s fees and expenses incurred during the Period.
FUND PERFORMANCE (July 17, 2020 to August 31, 2024)
The performance line graph below shows the performance of a hypothetical $10,000 initial investment in the Fund over a ten-year period (or for the life of the Fund, if shorter). The subsequent account value as of the end of the Period is listed next to the name of the Fund or index, as applicable. The performance table below shows the average annual total returns of the Fund for the past one-, five-, and ten-year periods, as applicable (or for the life of the Fund, if shorter), as of the end of the Period. Both the line graph and performance table compare the Fund’s performance to an appropriate broad-based index and may compare to additional indices reflecting the market segment(s) in which the Fund invests over the same periods.
Investment Performance of $10,000
| Average Annual Total Returns (as of August 31, 2024) | 1 Year | Since
Inception
(7/17/20) |
| FT Vest U.S. Equity Buffer ETF - July | 19.51% | 11.49% |
| S&P 500® Index | 27.14% | 16.35% |
Visit www.ftportfolios.com/etf/FJUL for more recent performance information.
The Fund’s past performance is not a good predictor of the Fund’s future performance. The graph and table do not reflect the deduction of taxes that a shareholder would pay on Fund distributions or redemption of Fund shares.
KEY FUND STATISTICS (As of August 31, 2024)
| Fund net assets | $828,703,694 |
| Total number of portfolio holdings | 5 |
| Total advisory fee paid | $5,395,755 |
| Portfolio turnover rate | 0% |
WHAT DID THE FUND INVEST IN? (As of August 31, 2024)
The table below shows the investment makeup of the Fund, representing the percentage of net assets of the Fund.
| Money Market Funds | 1.1% |
| Purchased Options | 102.1% |
| Written Options | (3.1%) |
| Net Other Assets and Liabilities | (0.1%) |
| Total | 100.0% |
HOW HAS THE FUND MATERIALLY CHANGED?
This is a summary of certain changes to the Fund since September 1, 2023. For more complete information, you may review the Fund’s prospectus and any applicable supplements at www.ftportfolios.com/fund-documents/etf/FJUL or upon request at 1-800-621-1675 or info@ftportfolios.com.
During the fiscal year ended August 31, 2024, the Fund’s predetermined upside cap on Underlying ETF returns was reset based upon prevailing market conditions at the start of the new Target Outcome Period.
WHERE CAN I FIND ADDITIONAL INFORMATION ABOUT THE FUND?
Visit www.ftportfolios.com/fund-documents/etf/FJUL to view additional information about the Fund such as the prospectus, financial information, Fund holdings and proxy voting information. You may also request this information by contacting us at 1-800-621-1675 or info@ftportfolios.com.
OTHER INFORMATION
The Fund is not sponsored, endorsed, sold or promoted by SPDR® S&P 500® ETF Trust, PDR Services, LLC, or Standard & Poor’s® (together with their affiliates hereinafter referred to as the “Corporations”). The Corporations have not passed on the legality or suitability of, or the accuracy or adequacy of, descriptions and disclosures relating to the Fund or the FLEX Options. The Corporations make no representations or warranties, express or implied, regarding the advisability of investing in the Fund or the FLEX Options or results to be obtained by the Fund or the FLEX Options, shareholders or any other person or entity from use of the SPDR® S&P 500® ETF Trust. The Corporations have no liability in connection with the management, administration, marketing or trading of the Fund or the FLEX Options.
FT Vest U.S. Equity Deep Buffer ETF - July
DJUL | CBOE BZX EXCHANGE, INC.
ANNUAL SHAREHOLDER REPORT | August 31, 2024
This annual shareholder report contains important information about the FT Vest U.S. Equity Deep Buffer ETF - July (the “Fund”) for the year of September 1, 2023 to August 31, 2024 (the “Period”). You can find additional information about the Fund at www.ftportfolios.com/fund-documents/etf/DJUL. You can also request this information by contacting us at 1-800-621-1675 or info@ftportfolios.com.
This report describes changes to the Fund that occurred during the Period.
WHAT WERE THE FUND COSTS FOR THE LAST YEAR?
(Based on a hypothetical $10,000 investment)
| Fund | Costs of a $10,000 investment | Costs paid as a percentage
of a $10,000 investment |
| FT Vest U.S. Equity Deep Buffer ETF - July | $92 | 0.85% |
HOW DID THE FUND PERFORM LAST YEAR? WHAT AFFECTED THE FUND’S PERFORMANCE?
The Fund returned 16.68% for the twelve months ended August 31, 2024. The Fund underperformed its benchmark, the S&P 500® Index, which returned 27.14% for the same Period.
This underperformance was due to the following:
| Fund NAV Performance Attributed to*: | | |
| Changes in Reference Asset | 12.46 | % |
| Changes in other Variables | 5.07 | % |
| Fees and Expenses | -0.85 | % |
The Fund holds a combination of FLexible EXchange® Options (“FLEX Options”) designed to target the Fund’s objective.
* The Fund’s performance is impacted by changes in the values of the FLEX Options to which it is exposed. We attribute (allocate) the impact on the Fund’s performance into three components. The first of the three components is the impact on the Fund’s performance due to changes in the Fund’s Reference Asset. The second component is the aggregate impact on the Fund’s performance due to changes in other variables that impact FLEX Options prices - these include changes in a) the Reference Asset’s dividends, b) interest rates, c) implied volatility, and d) time to option expiration. The third component is from the Fund’s fees and expenses incurred during the Period.
FUND PERFORMANCE (July 17, 2020 to August 31, 2024)
The performance line graph below shows the performance of a hypothetical $10,000 initial investment in the Fund over a ten-year period (or for the life of the Fund, if shorter). The subsequent account value as of the end of the Period is listed next to the name of the Fund or index, as applicable. The performance table below shows the average annual total returns of the Fund for the past one-, five-, and ten-year periods, as applicable (or for the life of the Fund, if shorter), as of the end of the Period. Both the line graph and performance table compare the Fund’s performance to an appropriate broad-based index and may compare to additional indices reflecting the market segment(s) in which the Fund invests over the same periods.
Investment Performance of $10,000
| Average Annual Total Returns (as of August 31, 2024) | 1 Year | Since
Inception
(7/17/20) |
| FT Vest U.S. Equity Deep Buffer ETF - July | 16.68% | 7.53% |
| S&P 500® Index | 27.14% | 16.35% |
Visit www.ftportfolios.com/etf/DJUL for more recent performance information.
The Fund’s past performance is not a good predictor of the Fund’s future performance. The graph and table do not reflect the deduction of taxes that a shareholder would pay on Fund distributions or redemption of Fund shares.
KEY FUND STATISTICS (As of August 31, 2024)
| Fund net assets | $353,841,862 |
| Total number of portfolio holdings | 5 |
| Total advisory fee paid | $3,090,265 |
| Portfolio turnover rate | 0% |
WHAT DID THE FUND INVEST IN? (As of August 31, 2024)
The table below shows the investment makeup of the Fund, representing the percentage of net assets of the Fund.
| Money Market Funds | 1.0% |
| Purchased Options | 101.3% |
| Written Options | (2.2%) |
| Net Other Assets and Liabilities | (0.1%) |
| Total | 100.0% |
HOW HAS THE FUND MATERIALLY CHANGED?
This is a summary of certain changes to the Fund since September 1, 2023. For more complete information, you may review the Fund’s prospectus and any applicable supplements at www.ftportfolios.com/fund-documents/etf/DJUL or upon request at 1-800-621-1675 or info@ftportfolios.com.
During the fiscal year ended August 31, 2024, the Fund’s predetermined upside cap on Underlying ETF returns was reset based upon prevailing market conditions at the start of the new Target Outcome Period.
WHERE CAN I FIND ADDITIONAL INFORMATION ABOUT THE FUND?
Visit www.ftportfolios.com/fund-documents/etf/DJUL to view additional information about the Fund such as the prospectus, financial information, Fund holdings and proxy voting information. You may also request this information by contacting us at 1-800-621-1675 or info@ftportfolios.com.
OTHER INFORMATION
The Fund is not sponsored, endorsed, sold or promoted by SPDR® S&P 500® ETF Trust, PDR Services, LLC, or Standard & Poor’s® (together with their affiliates hereinafter referred to as the “Corporations”). The Corporations have not passed on the legality or suitability of, or the accuracy or adequacy of, descriptions and disclosures relating to the Fund or the FLEX Options. The Corporations make no representations or warranties, express or implied, regarding the advisability of investing in the Fund or the FLEX Options or results to be obtained by the Fund or the FLEX Options, shareholders or any other person or entity from use of the SPDR® S&P 500® ETF Trust. The Corporations have no liability in connection with the management, administration, marketing or trading of the Fund or the FLEX Options.
FT Vest U.S. Equity Buffer ETF - August
FAUG | CBOE BZX EXCHANGE, INC.
ANNUAL SHAREHOLDER REPORT | August 31, 2024
This annual shareholder report contains important information about the FT Vest U.S. Equity Buffer ETF - August (the “Fund”) for the year of September 1, 2023 to August 31, 2024 (the “Period”). You can find additional information about the Fund at www.ftportfolios.com/fund-documents/etf/FAUG. You can also request this information by contacting us at 1-800-621-1675 or info@ftportfolios.com.
This report describes changes to the Fund that occurred during the Period.
WHAT WERE THE FUND COSTS FOR THE LAST YEAR?
(Based on a hypothetical $10,000 investment)
| Fund | Costs of a $10,000 investment | Costs paid as a percentage
of a $10,000 investment |
| FT Vest U.S. Equity Buffer ETF - August | $92 | 0.85% |
HOW DID THE FUND PERFORM LAST YEAR? WHAT AFFECTED THE FUND’S PERFORMANCE?
The Fund returned 16.80% for the twelve months ended August 31, 2024. The Fund underperformed its benchmark, the S&P 500® Index, which returned 27.14% for the same Period.
This underperformance was due to the following:
| Fund NAV Performance Attributed to*: | | |
| Changes in Reference Asset | 12.41 | % |
| Changes in other Variables | 5.24 | % |
| Fees and Expenses | -0.85 | % |
The Fund holds a combination of FLexible EXchange® Options (“FLEX Options”) designed to target the Fund’s objective.
* The Fund’s performance is impacted by changes in the values of the FLEX Options to which it is exposed. We attribute (allocate) the impact on the Fund’s performance into three components. The first of the three components is the impact on the Fund’s performance due to changes in the Fund’s Reference Asset. The second component is the aggregate impact on the Fund’s performance due to changes in other variables that impact FLEX Options prices - these include changes in a) the Reference Asset’s dividends, b) interest rates, c) implied volatility, and d) time to option expiration. The third component is from the Fund’s fees and expenses incurred during the Period.
FUND PERFORMANCE (November 6, 2019 to August 31, 2024)
The performance line graph below shows the performance of a hypothetical $10,000 initial investment in the Fund over a ten-year period (or for the life of the Fund, if shorter). The subsequent account value as of the end of the Period is listed next to the name of the Fund or index, as applicable. The performance table below shows the average annual total returns of the Fund for the past one-, five-, and ten-year periods, as applicable (or for the life of the Fund, if shorter), as of the end of the Period. Both the line graph and performance table compare the Fund’s performance to an appropriate broad-based index and may compare to additional indices reflecting the market segment(s) in which the Fund invests over the same periods.
Investment Performance of $10,000
| Average Annual Total Returns (as of August 31, 2024) | 1 Year | Since
Inception
(11/6/19) |
| FT Vest U.S. Equity Buffer ETF - August | 16.80% | 8.76% |
| S&P 500® Index | 27.14% | 15.30% |
Visit www.ftportfolios.com/etf/FAUG for more recent performance information.
The Fund’s past performance is not a good predictor of the Fund’s future performance. The graph and table do not reflect the deduction of taxes that a shareholder would pay on Fund distributions or redemption of Fund shares.
KEY FUND STATISTICS (As of August 31, 2024)
| Fund net assets | $736,421,939 |
| Total number of portfolio holdings | 5 |
| Total advisory fee paid | $5,109,995 |
| Portfolio turnover rate | 0% |
WHAT DID THE FUND INVEST IN? (As of August 31, 2024)
The table below shows the investment makeup of the Fund, representing the percentage of net assets of the Fund.
| Money Market Funds | 1.1% |
| Purchased Options | 102.6% |
| Written Options | (3.6%) |
| Net Other Assets and Liabilities | (0.1%) |
| Total | 100.0% |
HOW HAS THE FUND MATERIALLY CHANGED?
This is a summary of certain changes to the Fund since September 1, 2023. For more complete information, you may review the Fund’s prospectus and any applicable supplements at www.ftportfolios.com/fund-documents/etf/FAUG or upon request at 1-800-621-1675 or info@ftportfolios.com.
During the fiscal year ended August 31, 2024, the Fund’s predetermined upside cap on Underlying ETF returns was reset based upon prevailing market conditions at the start of the new Target Outcome Period.
WHERE CAN I FIND ADDITIONAL INFORMATION ABOUT THE FUND?
Visit www.ftportfolios.com/fund-documents/etf/FAUG to view additional information about the Fund such as the prospectus, financial information, Fund holdings and proxy voting information. You may also request this information by contacting us at 1-800-621-1675 or info@ftportfolios.com.
OTHER INFORMATION
The Fund is not sponsored, endorsed, sold or promoted by SPDR® S&P 500® ETF Trust, PDR Services, LLC, or Standard & Poor’s® (together with their affiliates hereinafter referred to as the “Corporations”). The Corporations have not passed on the legality or suitability of, or the accuracy or adequacy of, descriptions and disclosures relating to the Fund or the FLEX Options. The Corporations make no representations or warranties, express or implied, regarding the advisability of investing in the Fund or the FLEX Options or results to be obtained by the Fund or the FLEX Options, shareholders or any other person or entity from use of the SPDR® S&P 500® ETF Trust. The Corporations have no liability in connection with the management, administration, marketing or trading of the Fund or the FLEX Options.
FT Vest U.S. Equity
Deep Buffer ETF - August
DAUG | CBOE BZX EXCHANGE, INC.
ANNUAL SHAREHOLDER REPORT | August 31, 2024
This annual shareholder report contains important information about the FT Vest U.S. Equity Deep Buffer ETF - August (the “Fund”) for the year of September 1, 2023 to August 31, 2024 (the “Period”). You can find additional information about the Fund at www.ftportfolios.com/fund-documents/etf/DAUG. You can also request this information by contacting us at 1-800-621-1675 or info@ftportfolios.com.
This report describes changes to the Fund that occurred during the Period.
WHAT WERE THE FUND COSTS FOR THE LAST YEAR?
(Based on a hypothetical $10,000 investment)
| Fund | Costs of a $10,000 investment | Costs paid as a percentage
of a $10,000 investment |
| FT Vest U.S. Equity Deep Buffer ETF - August | $91 | 0.85% |
HOW DID THE FUND PERFORM LAST YEAR? WHAT AFFECTED THE FUND’S PERFORMANCE?
The Fund returned 13.37% for the twelve months ended August 31, 2024. The Fund underperformed its benchmark, the S&P 500® Index, which returned 27.14% for the same Period.
This underperformance was due to the following:
| Fund NAV Performance Attributed to*: | | |
| Changes in Reference Asset | 9.57 | % |
| Changes in other Variables | 4.65 | % |
| Fees and Expenses | -0.85 | % |
The Fund holds a combination of FLexible EXchange® Options (“FLEX Options”) designed to target the Fund’s objective.
* The Fund’s performance is impacted by changes in the values of the FLEX Options to which it is exposed. We attribute (allocate) the impact on the Fund’s performance into three components. The first of the three components is the impact on the Fund’s performance due to changes in the Fund’s Reference Asset. The second component is the aggregate impact on the Fund’s performance due to changes in other variables that impact FLEX Options prices - these include changes in a) the Reference Asset’s dividends, b) interest rates, c) implied volatility, and d) time to option expiration. The third component is from the Fund’s fees and expenses incurred during the Period.
FUND PERFORMANCE (November 6, 2019 to August 31, 2024)
The performance line graph below shows the performance of a hypothetical $10,000 initial investment in the Fund over a ten-year period (or for the life of the Fund, if shorter). The subsequent account value as of the end of the Period is listed next to the name of the Fund or index, as applicable. The performance table below shows the average annual total returns of the Fund for the past one-, five-, and ten-year periods, as applicable (or for the life of the Fund, if shorter), as of the end of the Period. Both the line graph and performance table compare the Fund’s performance to an appropriate broad-based index and may compare to additional indices reflecting the market segment(s) in which the Fund invests over the same periods.
Investment Performance of $10,000
| Average Annual Total Returns (as of August 31, 2024) | 1 Year | Since
Inception
(11/6/19) |
| FT Vest U.S. Equity Deep Buffer ETF - August | 13.37% | 5.29% |
| S&P 500® Index | 27.14% | 15.30% |
Visit www.ftportfolios.com/etf/DAUG for more recent performance information.
The Fund’s past performance is not a good predictor of the Fund’s future performance. The graph and table do not reflect the deduction of taxes that a shareholder would pay on Fund distributions or redemption of Fund shares.
KEY FUND STATISTICS (As of August 31, 2024)
| Fund net assets | $273,983,182 |
| Total number of portfolio holdings | 5 |
| Total advisory fee paid | $2,659,618 |
| Portfolio turnover rate | 0% |
WHAT DID THE FUND INVEST IN? (As of August 31, 2024)
The table below shows the investment makeup of the Fund, representing the percentage of net assets of the Fund.
| Money Market Funds | 1.1% |
| Purchased Options | 101.7% |
| Written Options | (2.7%) |
| Net Other Assets and Liabilities | (0.1%) |
| Total | 100.0% |
HOW HAS THE FUND MATERIALLY CHANGED?
This is a summary of certain changes to the Fund since September 1, 2023. For more complete information, you may review the Fund’s prospectus and any applicable supplements at www.ftportfolios.com/fund-documents/etf/DAUG or upon request at 1-800-621-1675 or info@ftportfolios.com.
During the fiscal year ended August 31, 2024, the Fund’s predetermined upside cap on Underlying ETF returns was reset based upon prevailing market conditions at the start of the new Target Outcome Period.
WHERE CAN I FIND ADDITIONAL INFORMATION ABOUT THE FUND?
Visit www.ftportfolios.com/fund-documents/etf/DAUG to view additional information about the Fund such as the prospectus, financial information, Fund holdings and proxy voting information. You may also request this information by contacting us at 1-800-621-1675 or info@ftportfolios.com.
OTHER INFORMATION
The Fund is not sponsored, endorsed, sold or promoted by SPDR® S&P 500® ETF Trust, PDR Services, LLC, or Standard & Poor’s® (together with their affiliates hereinafter referred to as the “Corporations”). The Corporations have not passed on the legality or suitability of, or the accuracy or adequacy of, descriptions and disclosures relating to the Fund or the FLEX Options. The Corporations make no representations or warranties, express or implied, regarding the advisability of investing in the Fund or the FLEX Options or results to be obtained by the Fund or the FLEX Options, shareholders or any other person or entity from use of the SPDR® S&P 500® ETF Trust. The Corporations have no liability in connection with the management, administration, marketing or trading of the Fund or the FLEX Options.
FT Vest U.S. Equity Buffer ETF - September
FSEP | CBOE BZX EXCHANGE, INC.
ANNUAL SHAREHOLDER REPORT | August 31, 2024
This annual shareholder report contains important information about the FT Vest U.S. Equity Buffer ETF - September (the “Fund”) for the year of September 1, 2023 to August 31, 2024 (the “Period”). You can find additional information about the Fund at www.ftportfolios.com/fund-documents/etf/FSEP. You can also request this information by contacting us at 1-800-621-1675 or info@ftportfolios.com.
This report describes changes to the Fund that occurred during the Period.
WHAT WERE THE FUND COSTS FOR THE LAST YEAR?
(Based on a hypothetical $10,000 investment)
| Fund | Costs of a $10,000 investment | Costs paid as a percentage
of a $10,000 investment |
| FT Vest U.S. Equity Buffer ETF - September | $92 | 0.85% |
HOW DID THE FUND PERFORM LAST YEAR? WHAT AFFECTED THE FUND’S PERFORMANCE?
The Fund returned 15.56% for the twelve months ended August 31, 2024. The Fund underperformed its benchmark, the S&P 500® Index, which returned 27.14% for the same Period.
This underperformance was due to the following:
| Fund NAV Performance Attributed to*: | | |
| Changes in Reference Asset | 12.74 | % |
| Changes in other Variables | 3.67 | % |
| Fees and Expenses | -0.85 | % |
The Fund holds a combination of FLexible EXchange® Options (“FLEX Options”) designed to target the Fund’s objective.
* The Fund’s performance is impacted by changes in the values of the FLEX Options to which it is exposed. We attribute (allocate) the impact on the Fund’s performance into three components. The first of the three components is the impact on the Fund’s performance due to changes in the Fund’s Reference Asset. The second component is the aggregate impact on the Fund’s performance due to changes in other variables that impact FLEX Options prices - these include changes in a) the Reference Asset’s dividends, b) interest rates, c) implied volatility, and d) time to option expiration. The third component is from the Fund’s fees and expenses incurred during the Period.
FUND PERFORMANCE (September 18, 2020 to August 31, 2024)
The performance line graph below shows the performance of a hypothetical $10,000 initial investment in the Fund over a ten-year period (or for the life of the Fund, if shorter). The subsequent account value as of the end of the Period is listed next to the name of the Fund or index, as applicable. The performance table below shows the average annual total returns of the Fund for the past one-, five-, and ten-year periods, as applicable (or for the life of the Fund, if shorter), as of the end of the Period. Both the line graph and performance table compare the Fund’s performance to an appropriate broad-based index and may compare to additional indices reflecting the market segment(s) in which the Fund invests over the same periods.
Investment Performance of $10,000
| Average Annual Total Returns (as of August 31, 2024) | 1 Year | Since
Inception
(9/18/20) |
| FT Vest U.S. Equity Buffer ETF - September | 15.56% | 10.71% |
| S&P 500® Index | 27.14% | 16.18% |
Visit www.ftportfolios.com/etf/FSEP for more recent performance information.
The Fund’s past performance is not a good predictor of the Fund’s future performance. The graph and table do not reflect the deduction of taxes that a shareholder would pay on Fund distributions or redemption of Fund shares.
KEY FUND STATISTICS (As of August 31, 2024)
| Fund net assets | $598,276,499 |
| Total number of portfolio holdings | 5 |
| Total advisory fee paid | $4,059,771 |
| Portfolio turnover rate | 0% |
WHAT DID THE FUND INVEST IN? (As of August 31, 2024)
The table below shows the investment makeup of the Fund, representing the percentage of net assets of the Fund.
| Money Market Funds | 0.3% |
| Purchased Options | 107.5% |
| Written Options | (7.7%) |
| Net Other Assets and Liabilities | (0.1%) |
| Total | 100.0% |
HOW HAS THE FUND MATERIALLY CHANGED?
This is a summary of certain changes to the Fund since September 1, 2023. For more complete information, you may review the Fund’s prospectus and any applicable supplements at www.ftportfolios.com/fund-documents/etf/FSEP or upon request at 1-800-621-1675 or info@ftportfolios.com.
During the fiscal year ended August 31, 2024, the Fund’s predetermined upside cap on Underlying ETF returns was reset based upon prevailing market conditions at the start of the new Target Outcome Period.
WHERE CAN I FIND ADDITIONAL INFORMATION ABOUT THE FUND?
Visit www.ftportfolios.com/fund-documents/etf/FSEP to view additional information about the Fund such as the prospectus, financial information, Fund holdings and proxy voting information. You may also request this information by contacting us at 1-800-621-1675 or info@ftportfolios.com.
OTHER INFORMATION
The Fund is not sponsored, endorsed, sold or promoted by SPDR® S&P 500® ETF Trust, PDR Services, LLC, or Standard & Poor’s® (together with their affiliates hereinafter referred to as the “Corporations”). The Corporations have not passed on the legality or suitability of, or the accuracy or adequacy of, descriptions and disclosures relating to the Fund or the FLEX Options. The Corporations make no representations or warranties, express or implied, regarding the advisability of investing in the Fund or the FLEX Options or results to be obtained by the Fund or the FLEX Options, shareholders or any other person or entity from use of the SPDR® S&P 500® ETF Trust. The Corporations have no liability in connection with the management, administration, marketing or trading of the Fund or the FLEX Options.
FT Vest U.S. Equity
Deep Buffer ETF - September
DSEP | CBOE BZX EXCHANGE, INC.
ANNUAL SHAREHOLDER REPORT | August 31, 2024
This annual shareholder report contains important information about the FT Vest U.S. Equity Deep Buffer ETF - September (the “Fund”) for the year of September 1, 2023 to August 31, 2024 (the “Period”). You can find additional information about the Fund at www.ftportfolios.com/fund-documents/etf/DSEP. You can also request this information by contacting us at 1-800-621-1675 or info@ftportfolios.com.
This report describes changes to the Fund that occurred during the Period.
WHAT WERE THE FUND COSTS FOR THE LAST YEAR?
(Based on a hypothetical $10,000 investment)
| Fund | Costs of a $10,000 investment | Costs paid as a percentage
of a $10,000 investment |
| FT Vest U.S. Equity Deep Buffer ETF - September | $91 | 0.85% |
HOW DID THE FUND PERFORM LAST YEAR? WHAT AFFECTED THE FUND’S PERFORMANCE?
The Fund returned 13.57% for the twelve months ended August 31, 2024. The Fund underperformed its benchmark, the S&P 500® Index, which returned 27.14% for the same Period.
This underperformance was due to the following:
| Fund NAV Performance Attributed to*: | | |
| Changes in Reference Asset | 10.09 | % |
| Changes in other Variables | 4.33 | % |
| Fees and Expenses | -0.85 | % |
The Fund holds a combination of FLexible EXchange® Options (“FLEX Options”) designed to target the Fund’s objective.
* The Fund’s performance is impacted by changes in the values of the FLEX Options to which it is exposed. We attribute (allocate) the impact on the Fund’s performance into three components. The first of the three components is the impact on the Fund’s performance due to changes in the Fund’s Reference Asset. The second component is the aggregate impact on the Fund’s performance due to changes in other variables that impact FLEX Options prices - these include changes in a) the Reference Asset’s dividends, b) interest rates, c) implied volatility, and d) time to option expiration. The third component is from the Fund’s fees and expenses incurred during the Period.
FUND PERFORMANCE (September 18, 2020 to August 31, 2024)
The performance line graph below shows the performance of a hypothetical $10,000 initial investment in the Fund over a ten-year period (or for the life of the Fund, if shorter). The subsequent account value as of the end of the Period is listed next to the name of the Fund or index, as applicable. The performance table below shows the average annual total returns of the Fund for the past one-, five-, and ten-year periods, as applicable (or for the life of the Fund, if shorter), as of the end of the Period. Both the line graph and performance table compare the Fund’s performance to an appropriate broad-based index and may compare to additional indices reflecting the market segment(s) in which the Fund invests over the same periods.
Investment Performance of $10,000
| Average Annual Total Returns (as of August 31, 2024) | 1 Year | Since
Inception
(9/18/20) |
| FT Vest U.S. Equity Deep Buffer ETF - September | 13.57% | 7.55% |
| S&P 500® Index | 27.14% | 16.18% |
Visit www.ftportfolios.com/etf/DSEP for more recent performance information.
The Fund’s past performance is not a good predictor of the Fund’s future performance. The graph and table do not reflect the deduction of taxes that a shareholder would pay on Fund distributions or redemption of Fund shares.
KEY FUND STATISTICS (As of August 31, 2024)
| Fund net assets | $179,523,180 |
| Total number of portfolio holdings | 5 |
| Total advisory fee paid | $1,549,018 |
| Portfolio turnover rate | 0% |
WHAT DID THE FUND INVEST IN? (As of August 31, 2024)
The table below shows the investment makeup of the Fund, representing the percentage of net assets of the Fund.
| Money Market Funds | 0.3% |
| Purchased Options | 110.2% |
| Written Options | (10.4%) |
| Net Other Assets and Liabilities | (0.1%) |
| Total | 100.0% |
HOW HAS THE FUND MATERIALLY CHANGED?
This is a summary of certain changes to the Fund since September 1, 2023. For more complete information, you may review the Fund’s prospectus and any applicable supplements at www.ftportfolios.com/fund-documents/etf/DSEP or upon request at 1-800-621-1675 or info@ftportfolios.com.
During the fiscal year ended August 31, 2024, the Fund’s predetermined upside cap on Underlying ETF returns was reset based upon prevailing market conditions at the start of the new Target Outcome Period.
WHERE CAN I FIND ADDITIONAL INFORMATION ABOUT THE FUND?
Visit www.ftportfolios.com/fund-documents/etf/DSEP to view additional information about the Fund such as the prospectus, financial information, Fund holdings and proxy voting information. You may also request this information by contacting us at 1-800-621-1675 or info@ftportfolios.com.
OTHER INFORMATION
The Fund is not sponsored, endorsed, sold or promoted by SPDR® S&P 500® ETF Trust, PDR Services, LLC, or Standard & Poor’s® (together with their affiliates hereinafter referred to as the “Corporations”). The Corporations have not passed on the legality or suitability of, or the accuracy or adequacy of, descriptions and disclosures relating to the Fund or the FLEX Options. The Corporations make no representations or warranties, express or implied, regarding the advisability of investing in the Fund or the FLEX Options or results to be obtained by the Fund or the FLEX Options, shareholders or any other person or entity from use of the SPDR® S&P 500® ETF Trust. The Corporations have no liability in connection with the management, administration, marketing or trading of the Fund or the FLEX Options.
FT Vest U.S. Equity Buffer ETF - October
FOCT | CBOE BZX EXCHANGE, INC.
ANNUAL SHAREHOLDER REPORT | August 31, 2024
This annual shareholder report contains important information about the FT Vest U.S. Equity Buffer ETF - October (the “Fund”) for the year of September 1, 2023 to August 31, 2024 (the “Period”). You can find additional information about the Fund at www.ftportfolios.com/fund-documents/etf/FOCT. You can also request this information by contacting us at 1-800-621-1675 or info@ftportfolios.com.
This report describes changes to the Fund that occurred during the Period.
WHAT WERE THE FUND COSTS FOR THE LAST YEAR?
(Based on a hypothetical $10,000 investment)
| Fund | Costs of a $10,000 investment | Costs paid as a percentage
of a $10,000 investment |
| FT Vest U.S. Equity Buffer ETF - October | $89 | 0.85% |
HOW DID THE FUND PERFORM LAST YEAR? WHAT AFFECTED THE FUND’S PERFORMANCE?
The Fund returned 9.85% for the twelve months ended August 31, 2024. The Fund underperformed its benchmark, the S&P 500® Index, which returned 27.14% for the same Period.
This underperformance was due to the following:
| Fund NAV Performance Attributed to*: | | |
| Changes in Reference Asset | 10.94 | % |
| Changes in other Variables | -0.24 | % |
| Fees and Expenses | -0.85 | % |
The Fund holds a combination of FLexible EXchange® Options (“FLEX Options”) designed to target the Fund’s objective.
* The Fund’s performance is impacted by changes in the values of the FLEX Options to which it is exposed. We attribute (allocate) the impact on the Fund’s performance into three components. The first of the three components is the impact on the Fund’s performance due to changes in the Fund’s Reference Asset. The second component is the aggregate impact on the Fund’s performance due to changes in other variables that impact FLEX Options prices - these include changes in a) the Reference Asset’s dividends, b) interest rates, c) implied volatility, and d) time to option expiration. The third component is from the Fund’s fees and expenses incurred during the Period.
FUND PERFORMANCE (October 16, 2020 to August 31, 2024)
The performance line graph below shows the performance of a hypothetical $10,000 initial investment in the Fund over a ten-year period (or for the life of the Fund, if shorter). The subsequent account value as of the end of the Period is listed next to the name of the Fund or index, as applicable. The performance table below shows the average annual total returns of the Fund for the past one-, five-, and ten-year periods, as applicable (or for the life of the Fund, if shorter), as of the end of the Period. Both the line graph and performance table compare the Fund’s performance to an appropriate broad-based index and may compare to additional indices reflecting the market segment(s) in which the Fund invests over the same periods.
Investment Performance of $10,000
| Average Annual Total Returns (as of August 31, 2024) | 1 Year | Since
Inception
(10/16/20) |
| FT Vest U.S. Equity Buffer ETF - October | 9.85% | 9.23% |
| S&P 500® Index | 27.14% | 15.04% |
Visit www.ftportfolios.com/etf/FOCT for more recent performance information.
The Fund’s past performance is not a good predictor of the Fund’s future performance. The graph and table do not reflect the deduction of taxes that a shareholder would pay on Fund distributions or redemption of Fund shares.
KEY FUND STATISTICS (As of August 31, 2024)
| Fund net assets | $602,383,963 |
| Total number of portfolio holdings | 5 |
| Total advisory fee paid | $4,100,312 |
| Portfolio turnover rate | 0% |
WHAT DID THE FUND INVEST IN? (As of August 31, 2024)
The table below shows the investment makeup of the Fund, representing the percentage of net assets of the Fund.
| Money Market Funds | 0.4% |
| Purchased Options | 113.2% |
| Written Options | (13.5%) |
| Net Other Assets and Liabilities | (0.1%) |
| Total | 100.0% |
HOW HAS THE FUND MATERIALLY CHANGED?
This is a summary of certain changes to the Fund since September 1, 2023. For more complete information, you may review the Fund’s prospectus and any applicable supplements at www.ftportfolios.com/fund-documents/etf/FOCT or upon request at 1-800-621-1675 or info@ftportfolios.com.
During the fiscal year ended August 31, 2024, the Fund’s predetermined upside cap on Underlying ETF returns was reset based upon prevailing market conditions at the start of the new Target Outcome Period.
WHERE CAN I FIND ADDITIONAL INFORMATION ABOUT THE FUND?
Visit www.ftportfolios.com/fund-documents/etf/FOCT to view additional information about the Fund such as the prospectus, financial information, Fund holdings and proxy voting information. You may also request this information by contacting us at 1-800-621-1675 or info@ftportfolios.com.
OTHER INFORMATION
The Fund is not sponsored, endorsed, sold or promoted by SPDR® S&P 500® ETF Trust, PDR Services, LLC, or Standard & Poor’s® (together with their affiliates hereinafter referred to as the “Corporations”). The Corporations have not passed on the legality or suitability of, or the accuracy or adequacy of, descriptions and disclosures relating to the Fund or the FLEX Options. The Corporations make no representations or warranties, express or implied, regarding the advisability of investing in the Fund or the FLEX Options or results to be obtained by the Fund or the FLEX Options, shareholders or any other person or entity from use of the SPDR® S&P 500® ETF Trust. The Corporations have no liability in connection with the management, administration, marketing or trading of the Fund or the FLEX Options.
FT Vest U.S. Equity
Deep Buffer ETF - October
DOCT | CBOE BZX EXCHANGE, INC.
ANNUAL SHAREHOLDER REPORT | August 31, 2024
This annual shareholder report contains important information about the FT Vest U.S. Equity Deep Buffer ETF - October (the “Fund”) for the year of September 1, 2023 to August 31, 2024 (the “Period”). You can find additional information about the Fund at www.ftportfolios.com/fund-documents/etf/DOCT. You can also request this information by contacting us at 1-800-621-1675 or info@ftportfolios.com.
This report describes changes to the Fund that occurred during the Period.
WHAT WERE THE FUND COSTS FOR THE LAST YEAR?
(Based on a hypothetical $10,000 investment)
| Fund | Costs of a $10,000 investment | Costs paid as a percentage
of a $10,000 investment |
| FT Vest U.S. Equity Deep Buffer ETF - October | $89 | 0.85% |
HOW DID THE FUND PERFORM LAST YEAR? WHAT AFFECTED THE FUND’S PERFORMANCE?
The Fund returned 9.35% for the twelve months ended August 31, 2024. The Fund underperformed its benchmark, the S&P 500® Index, which returned 27.14% for the same Period.
This underperformance was due to the following:
| Fund NAV Performance Attributed to*: | | |
| Changes in Reference Asset | 8.15 | % |
| Changes in other Variables | 2.05 | % |
| Fees and Expenses | -0.85 | % |
The Fund holds a combination of FLexible EXchange® Options (“FLEX Options”) designed to target the Fund’s objective.
* The Fund’s performance is impacted by changes in the values of the FLEX Options to which it is exposed. We attribute (allocate) the impact on the Fund’s performance into three components. The first of the three components is the impact on the Fund’s performance due to changes in the Fund’s Reference Asset. The second component is the aggregate impact on the Fund’s performance due to changes in other variables that impact FLEX Options prices - these include changes in a) the Reference Asset’s dividends, b) interest rates, c) implied volatility, and d) time to option expiration. The third component is from the Fund’s fees and expenses incurred during the Period.
FUND PERFORMANCE (October 16, 2020 to August 31, 2024)
The performance line graph below shows the performance of a hypothetical $10,000 initial investment in the Fund over a ten-year period (or for the life of the Fund, if shorter). The subsequent account value as of the end of the Period is listed next to the name of the Fund or index, as applicable. The performance table below shows the average annual total returns of the Fund for the past one-, five-, and ten-year periods, as applicable (or for the life of the Fund, if shorter), as of the end of the Period. Both the line graph and performance table compare the Fund’s performance to an appropriate broad-based index and may compare to additional indices reflecting the market segment(s) in which the Fund invests over the same periods.
Investment Performance of $10,000
| Average Annual Total Returns (as of August 31, 2024) | 1 Year | Since
Inception
(10/16/20) |
| FT Vest U.S. Equity Deep Buffer ETF - October | 9.35% | 7.01% |
| S&P 500® Index | 27.14% | 15.04% |
Visit www.ftportfolios.com/etf/DOCT for more recent performance information.
The Fund’s past performance is not a good predictor of the Fund’s future performance. The graph and table do not reflect the deduction of taxes that a shareholder would pay on Fund distributions or redemption of Fund shares.
KEY FUND STATISTICS (As of August 31, 2024)
| Fund net assets | $192,207,705 |
| Total number of portfolio holdings | 5 |
| Total advisory fee paid | $1,540,175 |
| Portfolio turnover rate | 0% |
WHAT DID THE FUND INVEST IN? (As of August 31, 2024)
The table below shows the investment makeup of the Fund, representing the percentage of net assets of the Fund.
| Money Market Funds | 0.4% |
| Purchased Options | 116.6% |
| Written Options | (16.9%) |
| Net Other Assets and Liabilities | (0.1%) |
| Total | 100.0% |
HOW HAS THE FUND MATERIALLY CHANGED?
This is a summary of certain changes to the Fund since September 1, 2023. For more complete information, you may review the Fund’s prospectus and any applicable supplements at www.ftportfolios.com/fund-documents/etf/DOCT or upon request at 1-800-621-1675 or info@ftportfolios.com.
During the fiscal year ended August 31, 2024, the Fund’s predetermined upside cap on Underlying ETF returns was reset based upon prevailing market conditions at the start of the new Target Outcome Period.
WHERE CAN I FIND ADDITIONAL INFORMATION ABOUT THE FUND?
Visit www.ftportfolios.com/fund-documents/etf/DOCT to view additional information about the Fund such as the prospectus, financial information, Fund holdings and proxy voting information. You may also request this information by contacting us at 1-800-621-1675 or info@ftportfolios.com.
OTHER INFORMATION
The Fund is not sponsored, endorsed, sold or promoted by SPDR® S&P 500® ETF Trust, PDR Services, LLC, or Standard & Poor’s® (together with their affiliates hereinafter referred to as the “Corporations”). The Corporations have not passed on the legality or suitability of, or the accuracy or adequacy of, descriptions and disclosures relating to the Fund or the FLEX Options. The Corporations make no representations or warranties, express or implied, regarding the advisability of investing in the Fund or the FLEX Options or results to be obtained by the Fund or the FLEX Options, shareholders or any other person or entity from use of the SPDR® S&P 500® ETF Trust. The Corporations have no liability in connection with the management, administration, marketing or trading of the Fund or the FLEX Options.
FT Vest U.S. Equity Buffer ETF - November
FNOV | CBOE BZX EXCHANGE, INC.
ANNUAL SHAREHOLDER REPORT | August 31, 2024
This annual shareholder report contains important information about the FT Vest U.S. Equity Buffer ETF - November (the “Fund”) for the year of September 1, 2023 to August 31, 2024 (the “Period”). You can find additional information about the Fund at www.ftportfolios.com/fund-documents/etf/FNOV. You can also request this information by contacting us at 1-800-621-1675 or info@ftportfolios.com.
This report describes changes to the Fund that occurred during the Period.
WHAT WERE THE FUND COSTS FOR THE LAST YEAR?
(Based on a hypothetical $10,000 investment)
| Fund | Costs of a $10,000 investment | Costs paid as a percentage
of a $10,000 investment |
| FT Vest U.S. Equity Buffer ETF - November | $91 | 0.85% |
HOW DID THE FUND PERFORM LAST YEAR? WHAT AFFECTED THE FUND’S PERFORMANCE?
The Fund returned 14.61% for the twelve months ended August 31, 2024. The Fund underperformed its benchmark, the S&P 500® Index, which returned 27.14% for the same Period.
This underperformance was due to the following:
| Fund NAV Performance Attributed to*: | | |
| Changes in Reference Asset | 13.93 | % |
| Changes in other Variables | 1.53 | % |
| Fees and Expenses | -0.85 | % |
The Fund holds a combination of FLexible EXchange® Options (“FLEX Options”) designed to target the Fund’s objective.
* The Fund’s performance is impacted by changes in the values of the FLEX Options to which it is exposed. We attribute (allocate) the impact on the Fund’s performance into three components. The first of the three components is the impact on the Fund’s performance due to changes in the Fund’s Reference Asset. The second component is the aggregate impact on the Fund’s performance due to changes in other variables that impact FLEX Options prices - these include changes in a) the Reference Asset’s dividends, b) interest rates, c) implied volatility, and d) time to option expiration. The third component is from the Fund’s fees and expenses incurred during the Period.
FUND PERFORMANCE (November 15, 2019 to August 31, 2024)
The performance line graph below shows the performance of a hypothetical $10,000 initial investment in the Fund over a ten-year period (or for the life of the Fund, if shorter). The subsequent account value as of the end of the Period is listed next to the name of the Fund or index, as applicable. The performance table below shows the average annual total returns of the Fund for the past one-, five-, and ten-year periods, as applicable (or for the life of the Fund, if shorter), as of the end of the Period. Both the line graph and performance table compare the Fund’s performance to an appropriate broad-based index and may compare to additional indices reflecting the market segment(s) in which the Fund invests over the same periods.
Investment Performance of $10,000
| Average Annual Total Returns (as of August 31, 2024) | 1 Year | Since
Inception
(11/15/19) |
| FT Vest U.S. Equity Buffer ETF - November | 14.61% | 9.31% |
| S&P 500® Index | 27.14% | 15.01% |
Visit www.ftportfolios.com/etf/FNOV for more recent performance information.
The Fund’s past performance is not a good predictor of the Fund’s future performance. The graph and table do not reflect the deduction of taxes that a shareholder would pay on Fund distributions or redemption of Fund shares.
KEY FUND STATISTICS (As of August 31, 2024)
| Fund net assets | $701,158,434 |
| Total number of portfolio holdings | 5 |
| Total advisory fee paid | $4,876,908 |
| Portfolio turnover rate | 0% |
WHAT DID THE FUND INVEST IN? (As of August 31, 2024)
The table below shows the investment makeup of the Fund, representing the percentage of net assets of the Fund.
| Money Market Funds | 0.5% |
| Purchased Options | 108.2% |
| Written Options | (8.6%) |
| Net Other Assets and Liabilities | (0.1%) |
| Total | 100.0% |
HOW HAS THE FUND MATERIALLY CHANGED?
This is a summary of certain changes to the Fund since September 1, 2023. For more complete information, you may review the Fund’s prospectus and any applicable supplements at www.ftportfolios.com/fund-documents/etf/FNOV or upon request at 1-800-621-1675 or info@ftportfolios.com.
During the fiscal year ended August 31, 2024, the Fund’s predetermined upside cap on Underlying ETF returns was reset based upon prevailing market conditions at the start of the new Target Outcome Period.
WHERE CAN I FIND ADDITIONAL INFORMATION ABOUT THE FUND?
Visit www.ftportfolios.com/fund-documents/etf/FNOV to view additional information about the Fund such as the prospectus, financial information, Fund holdings and proxy voting information. You may also request this information by contacting us at 1-800-621-1675 or info@ftportfolios.com.
OTHER INFORMATION
The Fund is not sponsored, endorsed, sold or promoted by SPDR® S&P 500® ETF Trust, PDR Services, LLC, or Standard & Poor’s® (together with their affiliates hereinafter referred to as the “Corporations”). The Corporations have not passed on the legality or suitability of, or the accuracy or adequacy of, descriptions and disclosures relating to the Fund or the FLEX Options. The Corporations make no representations or warranties, express or implied, regarding the advisability of investing in the Fund or the FLEX Options or results to be obtained by the Fund or the FLEX Options, shareholders or any other person or entity from use of the SPDR® S&P 500® ETF Trust. The Corporations have no liability in connection with the management, administration, marketing or trading of the Fund or the FLEX Options.
FT Vest U.S. Equity
Deep Buffer ETF - November
DNOV | CBOE BZX EXCHANGE, INC.
ANNUAL SHAREHOLDER REPORT | August 31, 2024
This annual shareholder report contains important information about the FT Vest U.S. Equity Deep Buffer ETF - November (the “Fund”) for the year of September 1, 2023 to August 31, 2024 (the “Period”). You can find additional information about the Fund at www.ftportfolios.com/fund-documents/etf/DNOV. You can also request this information by contacting us at 1-800-621-1675 or info@ftportfolios.com.
This report describes changes to the Fund that occurred during the Period.
WHAT WERE THE FUND COSTS FOR THE LAST YEAR?
(Based on a hypothetical $10,000 investment)
| Fund | Costs of a $10,000 investment | Costs paid as a percentage
of a $10,000 investment |
| FT Vest U.S. Equity Deep Buffer ETF - November | $91 | 0.85% |
HOW DID THE FUND PERFORM LAST YEAR? WHAT AFFECTED THE FUND’S PERFORMANCE?
The Fund returned 13.86% for the twelve months ended August 31, 2024. The Fund underperformed its benchmark, the S&P 500® Index, which returned 27.14% for the same Period.
This underperformance was due to the following:
| Fund NAV Performance Attributed to*: | | |
| Changes in Reference Asset | 12.12 | % |
| Changes in other Variables | 2.59 | % |
| Fees and Expenses | -0.85 | % |
The Fund holds a combination of FLexible EXchange® Options (“FLEX Options”) designed to target the Fund’s objective.
* The Fund’s performance is impacted by changes in the values of the FLEX Options to which it is exposed. We attribute (allocate) the impact on the Fund’s performance into three components. The first of the three components is the impact on the Fund’s performance due to changes in the Fund’s Reference Asset. The second component is the aggregate impact on the Fund’s performance due to changes in other variables that impact FLEX Options prices - these include changes in a) the Reference Asset’s dividends, b) interest rates, c) implied volatility, and d) time to option expiration. The third component is from the Fund’s fees and expenses incurred during the Period.
FUND PERFORMANCE (November 15, 2019 to August 31, 2024)
The performance line graph below shows the performance of a hypothetical $10,000 initial investment in the Fund over a ten-year period (or for the life of the Fund, if shorter). The subsequent account value as of the end of the Period is listed next to the name of the Fund or index, as applicable. The performance table below shows the average annual total returns of the Fund for the past one-, five-, and ten-year periods, as applicable (or for the life of the Fund, if shorter), as of the end of the Period. Both the line graph and performance table compare the Fund’s performance to an appropriate broad-based index and may compare to additional indices reflecting the market segment(s) in which the Fund invests over the same periods.
Investment Performance of $10,000
| Average Annual Total Returns (as of August 31, 2024) | 1 Year | Since
Inception
(11/15/19) |
| FT Vest U.S. Equity Deep Buffer ETF - November | 13.86% | 6.90% |
| S&P 500® Index | 27.14% | 15.01% |
Visit www.ftportfolios.com/etf/DNOV for more recent performance information.
The Fund’s past performance is not a good predictor of the Fund’s future performance. The graph and table do not reflect the deduction of taxes that a shareholder would pay on Fund distributions or redemption of Fund shares.
KEY FUND STATISTICS (As of August 31, 2024)
| Fund net assets | $246,031,226 |
| Total number of portfolio holdings | 5 |
| Total advisory fee paid | $2,196,223 |
| Portfolio turnover rate | 0% |
WHAT DID THE FUND INVEST IN? (As of August 31, 2024)
The table below shows the investment makeup of the Fund, representing the percentage of net assets of the Fund.
| Money Market Funds | 0.4% |
| Purchased Options | 110.2% |
| Written Options | (10.5%) |
| Net Other Assets and Liabilities | (0.1%) |
| Total | 100.0% |
HOW HAS THE FUND MATERIALLY CHANGED?
This is a summary of certain changes to the Fund since September 1, 2023. For more complete information, you may review the Fund’s prospectus and any applicable supplements at www.ftportfolios.com/fund-documents/etf/DNOV or upon request at 1-800-621-1675 or info@ftportfolios.com.
During the fiscal year ended August 31, 2024, the Fund’s predetermined upside cap on Underlying ETF returns was reset based upon prevailing market conditions at the start of the new Target Outcome Period.
WHERE CAN I FIND ADDITIONAL INFORMATION ABOUT THE FUND?
Visit www.ftportfolios.com/fund-documents/etf/DNOV to view additional information about the Fund such as the prospectus, financial information, Fund holdings and proxy voting information. You may also request this information by contacting us at 1-800-621-1675 or info@ftportfolios.com.
OTHER INFORMATION
The Fund is not sponsored, endorsed, sold or promoted by SPDR® S&P 500® ETF Trust, PDR Services, LLC, or Standard & Poor’s® (together with their affiliates hereinafter referred to as the “Corporations”). The Corporations have not passed on the legality or suitability of, or the accuracy or adequacy of, descriptions and disclosures relating to the Fund or the FLEX Options. The Corporations make no representations or warranties, express or implied, regarding the advisability of investing in the Fund or the FLEX Options or results to be obtained by the Fund or the FLEX Options, shareholders or any other person or entity from use of the SPDR® S&P 500® ETF Trust. The Corporations have no liability in connection with the management, administration, marketing or trading of the Fund or the FLEX Options.
FT Vest U.S. Equity Buffer ETF - December
FDEC | CBOE BZX EXCHANGE, INC.
ANNUAL SHAREHOLDER REPORT | August 31, 2024
This annual shareholder report contains important information about the FT Vest U.S. Equity Buffer ETF - December (the “Fund”) for the year of September 1, 2023 to August 31, 2024 (the “Period”). You can find additional information about the Fund at www.ftportfolios.com/fund-documents/etf/FDEC. You can also request this information by contacting us at 1-800-621-1675 or info@ftportfolios.com.
This report describes changes to the Fund that occurred during the Period.
WHAT WERE THE FUND COSTS FOR THE LAST YEAR?
(Based on a hypothetical $10,000 investment)
| Fund | Costs of a $10,000 investment | Costs paid as a percentage
of a $10,000 investment |
| FT Vest U.S. Equity Buffer ETF - December | $93 | 0.85% |
HOW DID THE FUND PERFORM LAST YEAR? WHAT AFFECTED THE FUND’S PERFORMANCE?
The Fund returned 18.84% for the twelve months ended August 31, 2024. The Fund underperformed its benchmark, the S&P 500® Index, which returned 27.14% for the same Period.
This underperformance was due to the following:
| Fund NAV Performance Attributed to*: | | |
| Changes in Reference Asset | 15.30 | % |
| Changes in other Variables | 4.39 | % |
| Fees and Expenses | -0.85 | % |
The Fund holds a combination of FLexible EXchange® Options (“FLEX Options”) designed to target the Fund’s objective.
* The Fund’s performance is impacted by changes in the values of the FLEX Options to which it is exposed. We attribute (allocate) the impact on the Fund’s performance into three components. The first of the three components is the impact on the Fund’s performance due to changes in the Fund’s Reference Asset. The second component is the aggregate impact on the Fund’s performance due to changes in other variables that impact FLEX Options prices - these include changes in a) the Reference Asset’s dividends, b) interest rates, c) implied volatility, and d) time to option expiration. The third component is from the Fund’s fees and expenses incurred during the Period.
FUND PERFORMANCE (December 18, 2020 to August 31, 2024)
The performance line graph below shows the performance of a hypothetical $10,000 initial investment in the Fund over a ten-year period (or for the life of the Fund, if shorter). The subsequent account value as of the end of the Period is listed next to the name of the Fund or index, as applicable. The performance table below shows the average annual total returns of the Fund for the past one-, five-, and ten-year periods, as applicable (or for the life of the Fund, if shorter), as of the end of the Period. Both the line graph and performance table compare the Fund’s performance to an appropriate broad-based index and may compare to additional indices reflecting the market segment(s) in which the Fund invests over the same periods.
Investment Performance of $10,000
| Average Annual Total Returns (as of August 31, 2024) | 1 Year | Since
Inception
(12/18/20) |
| FT Vest U.S. Equity Buffer ETF - December | 18.84% | 10.26% |
| S&P 500® Index | 27.14% | 13.76% |
Visit www.ftportfolios.com/etf/FDEC for more recent performance information.
The Fund’s past performance is not a good predictor of the Fund’s future performance. The graph and table do not reflect the deduction of taxes that a shareholder would pay on Fund distributions or redemption of Fund shares.
KEY FUND STATISTICS (As of August 31, 2024)
| Fund net assets | $723,659,054 |
| Total number of portfolio holdings | 5 |
| Total advisory fee paid | $5,371,114 |
| Portfolio turnover rate | 0% |
WHAT DID THE FUND INVEST IN? (As of August 31, 2024)
The table below shows the investment makeup of the Fund, representing the percentage of net assets of the Fund.
| Money Market Funds | 0.5% |
| Purchased Options | 105.8% |
| Written Options | (6.2%) |
| Net Other Assets and Liabilities | (0.1%) |
| Total | 100.0% |
HOW HAS THE FUND MATERIALLY CHANGED?
This is a summary of certain changes to the Fund since September 1, 2023. For more complete information, you may review the Fund’s prospectus and any applicable supplements at www.ftportfolios.com/fund-documents/etf/FDEC or upon request at 1-800-621-1675 or info@ftportfolios.com.
During the fiscal year ended August 31, 2024, the Fund’s predetermined upside cap on Underlying ETF returns was reset based upon prevailing market conditions at the start of the new Target Outcome Period.
WHERE CAN I FIND ADDITIONAL INFORMATION ABOUT THE FUND?
Visit www.ftportfolios.com/fund-documents/etf/FDEC to view additional information about the Fund such as the prospectus, financial information, Fund holdings and proxy voting information. You may also request this information by contacting us at 1-800-621-1675 or info@ftportfolios.com.
OTHER INFORMATION
The Fund is not sponsored, endorsed, sold or promoted by SPDR® S&P 500® ETF Trust, PDR Services, LLC, or Standard & Poor’s® (together with their affiliates hereinafter referred to as the “Corporations”). The Corporations have not passed on the legality or suitability of, or the accuracy or adequacy of, descriptions and disclosures relating to the Fund or the FLEX Options. The Corporations make no representations or warranties, express or implied, regarding the advisability of investing in the Fund or the FLEX Options or results to be obtained by the Fund or the FLEX Options, shareholders or any other person or entity from use of the SPDR® S&P 500® ETF Trust. The Corporations have no liability in connection with the management, administration, marketing or trading of the Fund or the FLEX Options.
FT Vest U.S. Equity
Deep Buffer ETF - December
DDEC | CBOE BZX EXCHANGE, INC.
ANNUAL SHAREHOLDER REPORT | August 31, 2024
This annual shareholder report contains important information about the FT Vest U.S. Equity Deep Buffer ETF - December (the “Fund”) for the year of September 1, 2023 to August 31, 2024 (the “Period”). You can find additional information about the Fund at www.ftportfolios.com/fund-documents/etf/DDEC. You can also request this information by contacting us at 1-800-621-1675 or info@ftportfolios.com.
This report describes changes to the Fund that occurred during the Period.
WHAT WERE THE FUND COSTS FOR THE LAST YEAR?
(Based on a hypothetical $10,000 investment)
| Fund | Costs of a $10,000 investment | Costs paid as a percentage
of a $10,000 investment |
| FT Vest U.S. Equity Deep Buffer ETF - December | $91 | 0.85% |
HOW DID THE FUND PERFORM LAST YEAR? WHAT AFFECTED THE FUND’S PERFORMANCE?
The Fund returned 14.58% for the twelve months ended August 31, 2024. The Fund underperformed its benchmark, the S&P 500® Index, which returned 27.14% for the same Period.
This underperformance was due to the following:
| Fund NAV Performance Attributed to*: | | |
| Changes in Reference Asset | 10.83 | % |
| Changes in other Variables | 4.60 | % |
| Fees and Expenses | -0.85 | % |
The Fund holds a combination of FLexible EXchange® Options (“FLEX Options”) designed to target the Fund’s objective.
* The Fund’s performance is impacted by changes in the values of the FLEX Options to which it is exposed. We attribute (allocate) the impact on the Fund’s performance into three components. The first of the three components is the impact on the Fund’s performance due to changes in the Fund’s Reference Asset. The second component is the aggregate impact on the Fund’s performance due to changes in other variables that impact FLEX Options prices - these include changes in a) the Reference Asset’s dividends, b) interest rates, c) implied volatility, and d) time to option expiration. The third component is from the Fund’s fees and expenses incurred during the Period.
FUND PERFORMANCE (December 18, 2020 to August 31, 2024)
The performance line graph below shows the performance of a hypothetical $10,000 initial investment in the Fund over a ten-year period (or for the life of the Fund, if shorter). The subsequent account value as of the end of the Period is listed next to the name of the Fund or index, as applicable. The performance table below shows the average annual total returns of the Fund for the past one-, five-, and ten-year periods, as applicable (or for the life of the Fund, if shorter), as of the end of the Period. Both the line graph and performance table compare the Fund’s performance to an appropriate broad-based index and may compare to additional indices reflecting the market segment(s) in which the Fund invests over the same periods.
Investment Performance of $10,000
| Average Annual Total Returns (as of August 31, 2024) | 1 Year | Since
Inception
(12/18/20) |
| FT Vest U.S. Equity Deep Buffer ETF - December | 14.58% | 7.25% |
| S&P 500® Index | 27.14% | 13.76% |
Visit www.ftportfolios.com/etf/DDEC for more recent performance information.
The Fund’s past performance is not a good predictor of the Fund’s future performance. The graph and table do not reflect the deduction of taxes that a shareholder would pay on Fund distributions or redemption of Fund shares.
KEY FUND STATISTICS (As of August 31, 2024)
| Fund net assets | $322,617,352 |
| Total number of portfolio holdings | 5 |
| Total advisory fee paid | $2,656,770 |
| Portfolio turnover rate | 0% |
WHAT DID THE FUND INVEST IN? (As of August 31, 2024)
The table below shows the investment makeup of the Fund, representing the percentage of net assets of the Fund.
| Money Market Funds | 0.5% |
| Purchased Options | 107.5% |
| Written Options | (7.9%) |
| Net Other Assets and Liabilities | (0.1%) |
| Total | 100.0% |
HOW HAS THE FUND MATERIALLY CHANGED?
This is a summary of certain changes to the Fund since September 1, 2023. For more complete information, you may review the Fund’s prospectus and any applicable supplements at www.ftportfolios.com/fund-documents/etf/DDEC or upon request at 1-800-621-1675 or info@ftportfolios.com.
During the fiscal year ended August 31, 2024, the Fund’s predetermined upside cap on Underlying ETF returns was reset based upon prevailing market conditions at the start of the new Target Outcome Period.
WHERE CAN I FIND ADDITIONAL INFORMATION ABOUT THE FUND?
Visit www.ftportfolios.com/fund-documents/etf/DDEC to view additional information about the Fund such as the prospectus, financial information, Fund holdings and proxy voting information. You may also request this information by contacting us at 1-800-621-1675 or info@ftportfolios.com.
OTHER INFORMATION
The Fund is not sponsored, endorsed, sold or promoted by SPDR® S&P 500® ETF Trust, PDR Services, LLC, or Standard & Poor’s® (together with their affiliates hereinafter referred to as the “Corporations”). The Corporations have not passed on the legality or suitability of, or the accuracy or adequacy of, descriptions and disclosures relating to the Fund or the FLEX Options. The Corporations make no representations or warranties, express or implied, regarding the advisability of investing in the Fund or the FLEX Options or results to be obtained by the Fund or the FLEX Options, shareholders or any other person or entity from use of the SPDR® S&P 500® ETF Trust. The Corporations have no liability in connection with the management, administration, marketing or trading of the Fund or the FLEX Options.
FT Vest Buffered Allocation Defensive ETF
BUFT | CBOE BZX EXCHANGE, INC.
ANNUAL SHAREHOLDER REPORT | August 31, 2024
This annual shareholder report contains important information about the FT Vest Buffered Allocation Defensive ETF (the “Fund”) for the year of September 1, 2023 to August 31, 2024 (the “Period”). You can find additional information about the Fund at www.ftportfolios.com/fund-documents/etf/BUFT. You can also request this information by contacting us at 1-800-621-1675 or info@ftportfolios.com.
This report describes changes to the Fund that occurred during the Period.
WHAT WERE THE FUND COSTS FOR THE LAST YEAR?
(Based on a hypothetical $10,000 investment)
| Fund | Costs of a $10,000 investment | Costs paid as a percentage
of a $10,000 investment |
| FT Vest Buffered Allocation Defensive ETF | $21(1) | 0.20%(1) |
(1) | Excludes any Acquired Fund Fees and Expenses of underlying investment companies in which the Fund invests. |
HOW DID THE FUND PERFORM LAST YEAR? WHAT AFFECTED THE FUND’S PERFORMANCE?
The Fund returned 9.76% for the twelve months ended August 31, 2024. The Fund underperformed its benchmark, the S&P 500® Index, which returned 27.14% for the same Period.
This underperformance was due to the following:
| Fund NAV Performance Attributed to*: | | |
| Changes in Reference Asset | 9.36 | % |
| Changes in other Variables | 1.45 | % |
| Fees and Expenses** | -1.05 | % |
The Fund holds a portfolio that consists of a number of buffer funds, and thus is exposed to the combinations of FLexible EXchange® Options (“FLEX Options”) held by the funds in its portfolio.
* The Fund’s performance is impacted by changes in the values of the FLEX Options to which it is exposed. We attribute (allocate) the impact on the Fund’s performance into three components. The first of the three components is the impact on the Fund’s performance due to changes in the underlying buffer funds’ Reference Asset. The second component is the aggregate impact on the Fund’s performance due to changes in other variables that impact FLEX Options prices - these include changes in a) the Reference Asset’s dividends, b) interest rates, c) implied volatility, and d) time to option expiration. The third component is from the Fund’s fees and expenses incurred during the Period.
** Includes any Acquired Fund Fees and Expenses of underlying investment companies in which the Fund invests.
FUND PERFORMANCE (October 26, 2021 to August 31, 2024)
The performance line graph below shows the performance of a hypothetical $10,000 initial investment in the Fund over a ten-year period (or for the life of the Fund, if shorter). The subsequent account value as of the end of the Period is listed next to the name of the Fund or index, as applicable. The performance table below shows the average annual total returns of the Fund for the past one-, five-, and ten-year periods, as applicable (or for the life of the Fund, if shorter), as of the end of the Period. Both the line graph and performance table compare the Fund’s performance to an appropriate broad-based index and may compare to additional indices reflecting the market segment(s) in which the Fund invests over the same periods.
Investment Performance of $10,000
| Average Annual Total Returns (as of August 31, 2024) | 1 Year | Since
Inception
(10/26/21) |
| FT Vest Buffered Allocation Defensive ETF | 9.76% | 3.47% |
| S&P 500® Index | 27.14% | 9.40% |
Visit www.ftportfolios.com/etf/BUFT for more recent performance information.
The Fund’s past performance is not a good predictor of the Fund’s future performance. The graph and table do not reflect the deduction of taxes that a shareholder would pay on Fund distributions or redemption of Fund shares.
KEY FUND STATISTICS (As of August 31, 2024)
| Fund net assets | $113,549,903 |
| Total number of portfolio holdings | 8 |
| Total advisory fee paid | $211,158 |
| Portfolio turnover rate | 361% |
WHAT DID THE FUND INVEST IN? (As of August 31, 2024)
The table below shows the investment makeup of the Fund, representing the percentage of net assets of the Fund.
| Exchange-Traded Funds | 99.7% |
| Money Market Funds | 0.3% |
| Net Other Assets and Liabilities | (0.0%) |
| Total | 100.0% |
Any amount shown as 0.0% represents less than 0.1%
HOW HAS THE FUND MATERIALLY CHANGED?
This is a summary of certain changes to the Fund since September 1, 2023. For more complete information, you may review the Fund’s prospectus and any applicable supplements at www.ftportfolios.com/fund-documents/etf/BUFT or upon request at 1-800-621-1675 or info@ftportfolios.com.
Effective March 13, 2024, the Fund’s principal investment strategies were revised to permit the universe of Underlying ETFs to also include investments in the series of FT Vest U.S. Equity Moderate Buffer ETFs and for the Fund’s portfolio to be evaluated on a quarterly, instead of monthly, basis.
WHERE CAN I FIND ADDITIONAL INFORMATION ABOUT THE FUND?
Visit www.ftportfolios.com/fund-documents/etf/BUFT to view additional information about the Fund such as the prospectus, financial information, Fund holdings and proxy voting information. You may also request this information by contacting us at 1-800-621-1675 or info@ftportfolios.com.
OTHER INFORMATION
The Fund is not sponsored, endorsed, sold or promoted by SPDR® S&P 500® ETF Trust, PDR, or Standard & Poor’s (together with their affiliates hereinafter referred to as the “Corporations”). The Corporations have not passed on the legality or suitability of, or the accuracy or adequacy of, descriptions and disclosures relating to the Fund. The Corporations make no representations or warranties, express or implied, regarding the advisability of investing in the Fund or results to be obtained by the Fund, shareholders or any other person or entity from use of the SPDR® S&P 500® ETF Trust. The Corporations have no liability in connection with the management, administration, marketing or trading of the Fund.
FT Vest Buffered Allocation Growth ETF
BUFG | CBOE BZX EXCHANGE, INC.
ANNUAL SHAREHOLDER REPORT | August 31, 2024
This annual shareholder report contains important information about the FT Vest Buffered Allocation Growth ETF (the “Fund”) for the year of September 1, 2023 to August 31, 2024 (the “Period”). You can find additional information about the Fund at www.ftportfolios.com/fund-documents/etf/BUFG. You can also request this information by contacting us at 1-800-621-1675 or info@ftportfolios.com.
This report describes changes to the Fund that occurred during the Period.
WHAT WERE THE FUND COSTS FOR THE LAST YEAR?
(Based on a hypothetical $10,000 investment)
| Fund | Costs of a $10,000 investment | Costs paid as a percentage
of a $10,000 investment |
| FT Vest Buffered Allocation Growth ETF | $22(1) | 0.20%(1) |
(1) | Excludes any Acquired Fund Fees and Expenses of underlying investment companies in which the Fund invests. |
HOW DID THE FUND PERFORM LAST YEAR? WHAT AFFECTED THE FUND’S PERFORMANCE?
The Fund returned 16.72% for the twelve months ended August 31, 2024. The Fund underperformed its benchmark, the S&P 500® Index, which returned 27.14% for the same Period.
This underperformance was due to the following:
| Fund NAV Performance Attributed to*: | | |
| Changes in Reference Asset | 16.86 | % |
| Changes in other Variables | 0.91 | % |
| Fees and Expenses** | -1.05 | % |
The Fund holds a portfolio that consists of a number of buffer funds, and thus is exposed to the combinations of FLexible EXchange® Options (“FLEX Options”) held by the funds in its portfolio.
* The Fund’s performance is impacted by changes in the values of the FLEX Options to which it is exposed. We attribute (allocate) the impact on the Fund’s performance into three components. The first of the three components is the impact on the Fund’s performance due to changes in the underlying buffer funds’ Reference Asset. The second component is the aggregate impact on the Fund’s performance due to changes in other variables that impact FLEX Options prices - these include changes in a) the Reference Asset’s dividends, b) interest rates, c) implied volatility, and d) time to option expiration. The third component is from the Fund’s fees and expenses incurred during the Period.
** Includes any Acquired Fund Fees and Expenses of underlying investment companies in which the Fund invests.
FUND PERFORMANCE (October 26, 2021 to August 31, 2024)
The performance line graph below shows the performance of a hypothetical $10,000 initial investment in the Fund over a ten-year period (or for the life of the Fund, if shorter). The subsequent account value as of the end of the Period is listed next to the name of the Fund or index, as applicable. The performance table below shows the average annual total returns of the Fund for the past one-, five-, and ten-year periods, as applicable (or for the life of the Fund, if shorter), as of the end of the Period. Both the line graph and performance table compare the Fund’s performance to an appropriate broad-based index and may compare to additional indices reflecting the market segment(s) in which the Fund invests over the same periods.
Investment Performance of $10,000
| Average Annual Total Returns (as of August 31, 2024) | 1 Year | Since
Inception
(10/26/21) |
| FT Vest Buffered Allocation Growth ETF | 16.72% | 6.28% |
| S&P 500® Index | 27.14% | 9.40% |
Visit www.ftportfolios.com/etf/BUFG for more recent performance information.
The Fund’s past performance is not a good predictor of the Fund’s future performance. The graph and table do not reflect the deduction of taxes that a shareholder would pay on Fund distributions or redemption of Fund shares.
KEY FUND STATISTICS (As of August 31, 2024)
| Fund net assets | $237,980,706 |
| Total number of portfolio holdings | 8 |
| Total advisory fee paid | $394,572 |
| Portfolio turnover rate | 347% |
WHAT DID THE FUND INVEST IN? (As of August 31, 2024)
The table below shows the investment makeup of the Fund, representing the percentage of net assets of the Fund.
| Exchange-Traded Funds | 99.7% |
| Money Market Funds | 0.3% |
| Net Other Assets and Liabilities | (0.0%) |
| Total | 100.0% |
Any amount shown as 0.0% represents less than 0.1%
HOW HAS THE FUND MATERIALLY CHANGED?
This is a summary of certain changes to the Fund since September 1, 2023. For more complete information, you may review the Fund’s prospectus and any applicable supplements at www.ftportfolios.com/fund-documents/etf/BUFG or upon request at 1-800-621-1675 or info@ftportfolios.com.
Effective March 13, 2024, the Fund’s principal investment strategies were revised to permit the universe of Underlying ETFs to also include investments in the series of FT Vest U.S. Equity Moderate Buffer ETFs and for the Fund’s portfolio to be evaluated on a quarterly, instead of monthly, basis.
WHERE CAN I FIND ADDITIONAL INFORMATION ABOUT THE FUND?
Visit www.ftportfolios.com/fund-documents/etf/BUFG to view additional information about the Fund such as the prospectus, financial information, Fund holdings and proxy voting information. You may also request this information by contacting us at 1-800-621-1675 or info@ftportfolios.com.
OTHER INFORMATION
The Fund is not sponsored, endorsed, sold or promoted by SPDR® S&P 500® ETF Trust, PDR, or Standard & Poor’s (together with their affiliates hereinafter referred to as the “Corporations”). The Corporations have not passed on the legality or suitability of, or the accuracy or adequacy of, descriptions and disclosures relating to the Fund. The Corporations make no representations or warranties, express or implied, regarding the advisability of investing in the Fund or results to be obtained by the Fund, shareholders or any other person or entity from use of the SPDR® S&P 500® ETF Trust. The Corporations have no liability in connection with the management, administration, marketing or trading of the Fund.
FT Vest U.S. Equity
Enhance & Moderate Buffer ETF - January
XJAN | CBOE BZX EXCHANGE, INC.
ANNUAL SHAREHOLDER REPORT | August 31, 2024
This annual shareholder report contains important information about the FT Vest U.S. Equity Enhance & Moderate Buffer ETF - January (the “Fund”) for the period of January 19, 2024 (commencement of investment operations) to August 31, 2024 (the “Period”). You can find additional information about the Fund at www.ftportfolios.com/fund-documents/etf/XJAN. You can also request this information by contacting us at 1-800-621-1675 or info@ftportfolios.com.
WHAT WERE THE FUND COSTS FOR THE LAST YEAR?
(Based on a hypothetical $10,000 investment)
| Fund | Costs of a $10,000 investment | Costs paid as a percentage
of a $10,000 investment |
| FT Vest U.S. Equity Enhance & Moderate Buffer ETF - January | $54(1) | 0.85%(2) |
(1) | The Fund commenced investment operations on January 19, 2024. Had the Fund been in operation for a complete fiscal year, the cost of a $10,000 investment would have been higher. |
(2) | Annualized. |
HOW DID THE FUND PERFORM LAST YEAR? WHAT AFFECTED THE FUND’S PERFORMANCE?
The Fund returned 6.84% for the period from the Fund’s inception date on January 19, 2024 through August 31, 2024. The Fund underperformed its benchmark, the S&P 500® Index, which returned 17.72% for the same Period.
This underperformance was due to the following:
| Fund NAV Performance Attributed to*: | | |
| Changes in Reference Asset | 4.43 | % |
| Changes in other Variables | 2.93 | % |
| Fees and Expenses | -0.52 | % |
The Fund holds a combination of FLexible EXchange® Options (“FLEX Options”) designed to target the Fund’s objective.
* The Fund’s performance is impacted by changes in the values of the FLEX Options to which it is exposed. We attribute (allocate) the impact on the Fund’s performance into three components. The first of the three components is the impact on the Fund’s performance due to changes in the Fund’s Reference Asset. The second component is the aggregate impact on the Fund’s performance due to changes in other variables that impact FLEX Options prices - these include changes in a) the Reference Asset’s dividends, b) interest rates, c) implied volatility, and d) time to option expiration. The third component is from the Fund’s fees and expenses incurred during the Period.
FUND PERFORMANCE (January 19, 2024 to August 31, 2024)
The performance line graph below shows the performance of a hypothetical $10,000 initial investment in the Fund over a ten-year period (or for the life of the Fund, if shorter). The subsequent account value as of the end of the Period is listed next to the name of the Fund or index, as applicable. The performance table below shows the average annual total returns of the Fund for the past one-, five-, and ten-year periods, as applicable (or for the life of the Fund, if shorter), as of the end of the Period. Both the line graph and performance table compare the Fund’s performance to an appropriate broad-based index and may compare to additional indices reflecting the market segment(s) in which the Fund invests over the same periods.
Investment Performance of $10,000
| Average Annual Total Returns (as of August 31, 2024) | Since
Inception
(1/19/24) |
| FT Vest U.S. Equity Enhance & Moderate Buffer ETF - January | 6.84% |
| S&P 500® Index | 17.72% |
Visit www.ftportfolios.com/etf/XJAN for more recent performance information.
The Fund’s past performance is not a good predictor of the Fund’s future performance. The graph and table do not reflect the deduction of taxes that a shareholder would pay on Fund distributions or redemption of Fund shares.
KEY FUND STATISTICS (As of August 31, 2024)
| Fund net assets | $56,062,713 |
| Total number of portfolio holdings | 6 |
| Total advisory fee paid | $411,099 |
| Portfolio turnover rate | 0% |
WHAT DID THE FUND INVEST IN? (As of August 31, 2024)
The table below shows the investment makeup of the Fund, representing the percentage of net assets of the Fund.
| Money Market Funds | 0.6% |
| Purchased Options | 126.5% |
| Written Options | (27.0%) |
| Net Other Assets and Liabilities | (0.1%) |
| Total | 100.0% |
WHERE CAN I FIND ADDITIONAL INFORMATION ABOUT THE FUND?
Visit www.ftportfolios.com/fund-documents/etf/XJAN to view additional information about the Fund such as the prospectus, financial information, Fund holdings and proxy voting information. You may also request this information by contacting us at 1-800-621-1675 or info@ftportfolios.com.
OTHER INFORMATION
The Fund is not sponsored, endorsed, sold or promoted by SPDR® S&P 500® ETF Trust, PDR Services, LLC, or Standard & Poor’s® (together with their affiliates hereinafter referred to as the “Corporations”). The Corporations have not passed on the legality or suitability of, or the accuracy or adequacy of, descriptions and disclosures relating to the Fund or the FLEX Options. The Corporations make no representations or warranties, express or implied, regarding the advisability of investing in the Fund or the FLEX Options or results to be obtained by the Fund or the FLEX Options, shareholders or any other person or entity from use of the SPDR® S&P 500® ETF Trust. The Corporations have no liability in connection with the management, administration, marketing or trading of the Fund or the FLEX Options.
FT Vest U.S. Equity
Enhance & Moderate Buffer ETF - February
XFEB | CBOE BZX EXCHANGE, INC.
ANNUAL SHAREHOLDER REPORT | August 31, 2024
This annual shareholder report contains important information about the FT Vest U.S. Equity Enhance & Moderate Buffer ETF - February (the “Fund”) for the period of February 16, 2024 (commencement of investment operations) to August 31, 2024 (the “Period”). You can find additional information about the Fund at www.ftportfolios.com/fund-documents/etf/XFEB. You can also request this information by contacting us at 1-800-621-1675 or info@ftportfolios.com.
WHAT WERE THE FUND COSTS FOR THE LAST YEAR?
(Based on a hypothetical $10,000 investment)
| Fund | Costs of a $10,000 investment | Costs paid as a percentage
of a $10,000 investment |
| FT Vest U.S. Equity Enhance & Moderate Buffer ETF - February | $47(1) | 0.85%(2) |
(1) | The Fund commenced investment operations on February 16, 2024. Had the Fund been in operation for a complete fiscal year, the cost of a $10,000 investment would have been higher. |
(2) | Annualized. |
HOW DID THE FUND PERFORM LAST YEAR? WHAT AFFECTED THE FUND’S PERFORMANCE?
The Fund returned 6.37% for the period from the Fund’s inception date on February 16, 2024 through August 31, 2024. The Fund underperformed its benchmark, the S&P 500® Index, which returned 13.67% for the same Period.
This underperformance was due to the following:
| Fund NAV Performance Attributed to*: | | |
| Changes in Reference Asset | 4.08 | % |
| Changes in other Variables | 2.75 | % |
| Fees and Expenses | -0.46 | % |
The Fund holds a combination of FLexible EXchange® Options (“FLEX Options”) designed to target the Fund’s objective.
* The Fund’s performance is impacted by changes in the values of the FLEX Options to which it is exposed. We attribute (allocate) the impact on the Fund’s performance into three components. The first of the three components is the impact on the Fund’s performance due to changes in the Fund’s Reference Asset. The second component is the aggregate impact on the Fund’s performance due to changes in other variables that impact FLEX Options prices - these include changes in a) the Reference Asset’s dividends, b) interest rates, c) implied volatility, and d) time to option expiration. The third component is from the Fund’s fees and expenses incurred during the Period.
FUND PERFORMANCE (February 16, 2024 to August 31, 2024)
The performance line graph below shows the performance of a hypothetical $10,000 initial investment in the Fund over a ten-year period (or for the life of the Fund, if shorter). The subsequent account value as of the end of the Period is listed next to the name of the Fund or index, as applicable. The performance table below shows the average annual total returns of the Fund for the past one-, five-, and ten-year periods, as applicable (or for the life of the Fund, if shorter), as of the end of the Period. Both the line graph and performance table compare the Fund’s performance to an appropriate broad-based index and may compare to additional indices reflecting the market segment(s) in which the Fund invests over the same periods.
Investment Performance of $10,000
| Average Annual Total Returns (as of August 31, 2024) | Since
Inception
(2/16/24) |
| FT Vest U.S. Equity Enhance & Moderate Buffer ETF - February | 6.37% |
| S&P 500® Index | 13.67% |
Visit www.ftportfolios.com/etf/XFEB for more recent performance information.
The Fund’s past performance is not a good predictor of the Fund’s future performance. The graph and table do not reflect the deduction of taxes that a shareholder would pay on Fund distributions or redemption of Fund shares.
KEY FUND STATISTICS (As of August 31, 2024)
| Fund net assets | $25,501,057 |
| Total number of portfolio holdings | 6 |
| Total advisory fee paid | $133,526 |
| Portfolio turnover rate | 0% |
WHAT DID THE FUND INVEST IN? (As of August 31, 2024)
The table below shows the investment makeup of the Fund, representing the percentage of net assets of the Fund.
| Money Market Funds | 0.7% |
| Purchased Options | 120.9% |
| Written Options | (21.5%) |
| Net Other Assets and Liabilities | (0.1%) |
| Total | 100.0% |
WHERE CAN I FIND ADDITIONAL INFORMATION ABOUT THE FUND?
Visit www.ftportfolios.com/fund-documents/etf/XFEB to view additional information about the Fund such as the prospectus, financial information, Fund holdings and proxy voting information. You may also request this information by contacting us at 1-800-621-1675 or info@ftportfolios.com.
OTHER INFORMATION
The Fund is not sponsored, endorsed, sold or promoted by SPDR® S&P 500® ETF Trust, PDR Services, LLC, or Standard & Poor’s® (together with their affiliates hereinafter referred to as the “Corporations”). The Corporations have not passed on the legality or suitability of, or the accuracy or adequacy of, descriptions and disclosures relating to the Fund or the FLEX Options. The Corporations make no representations or warranties, express or implied, regarding the advisability of investing in the Fund or the FLEX Options or results to be obtained by the Fund or the FLEX Options, shareholders or any other person or entity from use of the SPDR® S&P 500® ETF Trust. The Corporations have no liability in connection with the management, administration, marketing or trading of the Fund or the FLEX Options.
FT Vest International Equity Moderate
Buffer ETF - March
YMAR | CBOE BZX EXCHANGE, INC.
ANNUAL SHAREHOLDER REPORT | August 31, 2024
This annual shareholder report contains important information about the FT Vest International Equity Moderate Buffer ETF - March (the “Fund”) for the year of September 1, 2023 to August 31, 2024 (the “Period”). You can find additional information about the Fund at www.ftportfolios.com/fund-documents/etf/YMAR. You can also request this information by contacting us at 1-800-621-1675 or info@ftportfolios.com.
This report describes changes to the Fund that occurred during the Period.
WHAT WERE THE FUND COSTS FOR THE LAST YEAR?
(Based on a hypothetical $10,000 investment)
| Fund | Costs of a $10,000 investment | Costs paid as a percentage
of a $10,000 investment |
| FT Vest International Equity Moderate Buffer ETF - March | $97 | 0.90% |
HOW DID THE FUND PERFORM LAST YEAR? WHAT AFFECTED THE FUND’S PERFORMANCE?
The Fund returned 14.98% for the twelve months ended August 31, 2024. The Fund underperformed its benchmark, the MSCI EAFE Index, which returned 19.40% for the same Period.
This underperformance was due to the following:
| Fund NAV Performance Attributed to*: | | |
| Changes in Reference Asset | 11.77 | % |
| Changes in other Variables | 4.11 | % |
| Fees and Expenses | -0.90 | % |
The Fund holds a combination of FLexible EXchange® Options (“FLEX Options”) designed to target the Fund’s objective.
* The Fund’s performance is impacted by changes in the values of the FLEX Options to which it is exposed. We attribute (allocate) the impact on the Fund’s performance into three components. The first of the three components is the impact on the Fund’s performance due to changes in the Fund’s Reference Asset. The second component is the aggregate impact on the Fund’s performance due to changes in other variables that impact FLEX Options prices - these include changes in a) the Reference Asset’s dividends, b) interest rates, c) implied volatility, and d) time to option expiration. The third component is from the Fund’s fees and expenses incurred during the Period.
FUND PERFORMANCE (March 19, 2021 to August 31, 2024)
The performance line graph below shows the performance of a hypothetical $10,000 initial investment in the Fund over a ten-year period (or for the life of the Fund, if shorter). The subsequent account value as of the end of the Period is listed next to the name of the Fund or index, as applicable. The performance table below shows the average annual total returns of the Fund for the past one-, five-, and ten-year periods, as applicable (or for the life of the Fund, if shorter), as of the end of the Period. Both the line graph and performance table compare the Fund’s performance to an appropriate broad-based index and may compare to additional indices reflecting the market segment(s) in which the Fund invests over the same periods.
Investment Performance of $10,000
| Average Annual Total Returns (as of August 31, 2024) | 1 Year | Since
Inception
(3/19/21) |
| FT Vest International Equity Moderate Buffer ETF - March | 14.98% | 5.42% |
| MSCI EAFE Index | 19.40% | 5.63% |
Visit www.ftportfolios.com/etf/YMAR for more recent performance information.
The Fund’s past performance is not a good predictor of the Fund’s future performance. The graph and table do not reflect the deduction of taxes that a shareholder would pay on Fund distributions or redemption of Fund shares.
KEY FUND STATISTICS (As of August 31, 2024)
| Fund net assets | $99,693,605 |
| Total number of portfolio holdings | 5 |
| Total advisory fee paid | $691,292 |
| Portfolio turnover rate | 0% |
WHAT DID THE FUND INVEST IN? (As of August 31, 2024)
The table below shows the investment makeup of the Fund, representing the percentage of net assets of the Fund.
| Money Market Funds | 0.8% |
| Purchased Options | 101.2% |
| Written Options | (1.9%) |
| Net Other Assets and Liabilities | (0.1%) |
| Total | 100.0% |
HOW HAS THE FUND MATERIALLY CHANGED?
This is a summary of certain changes to the Fund since September 1, 2023. For more complete information, you may review the Fund’s prospectus and any applicable supplements at www.ftportfolios.com/fund-documents/etf/YMAR or upon request at 1-800-621-1675 or info@ftportfolios.com.
Effective March 18, 2024, the name of the Fund changed from “FT Vest International Equity Buffer ETF - March” to “FT Vest International Equity Moderate Buffer ETF - March”, the Fund’s buffer against Underlying ETF losses increased from 10% to 15%, and the Fund’s predetermined upside cap on Underlying ETF returns was reset based upon prevailing market conditions at the start of the new Target Outcome Period.
WHERE CAN I FIND ADDITIONAL INFORMATION ABOUT THE FUND?
Visit www.ftportfolios.com/fund-documents/etf/YMAR to view additional information about the Fund such as the prospectus, financial information, Fund holdings and proxy voting information. You may also request this information by contacting us at 1-800-621-1675 or info@ftportfolios.com.
OTHER INFORMATION
The Fund is not sponsored, endorsed, sold or promoted by iShares MSCI EAFE ETF, BFA, or MSCI Inc. (together with their affiliates hereinafter referred to as the “Corporations”). The Corporations have not passed on the legality or suitability of, or the accuracy or adequacy of, descriptions and disclosures relating to the Fund or the FLEX Options. The Corporations make no representations or warranties, express or implied, regarding the advisability of investing in the Fund or the FLEX Options or results to be obtained by the Fund or the FLEX Options, shareholders or any other person or entity from use of the Underlying ETF. The Corporations have no liability in connection with the management, administration, marketing or trading of the Fund or the FLEX Options.
FT Vest Nasdaq-100® Buffer ETF - March
QMAR | CBOE BZX EXCHANGE, INC.
ANNUAL SHAREHOLDER REPORT | August 31, 2024
This annual shareholder report contains important information about the FT Vest Nasdaq-100® Buffer ETF - March (the “Fund”) for the year of September 1, 2023 to August 31, 2024 (the “Period”). You can find additional information about the Fund at www.ftportfolios.com/fund-documents/etf/QMAR. You can also request this information by contacting us at 1-800-621-1675 or info@ftportfolios.com.
This report describes changes to the Fund that occurred during the Period.
WHAT WERE THE FUND COSTS FOR THE LAST YEAR?
(Based on a hypothetical $10,000 investment)
| Fund | Costs of a $10,000 investment | Costs paid as a percentage
of a $10,000 investment |
| FT Vest Nasdaq-100® Buffer ETF - March | $97 | 0.90% |
HOW DID THE FUND PERFORM LAST YEAR? WHAT AFFECTED THE FUND’S PERFORMANCE?
The Fund returned 15.18% for the twelve months ended August 31, 2024. The Fund underperformed its benchmark, the Nasdaq-100 Index®, which returned 27.30% for the same Period.
This underperformance was due to the following:
| Fund NAV Performance Attributed to*: | | |
| Changes in Reference Asset | 9.37 | % |
| Changes in other Variables | 6.71 | % |
| Fees and Expenses | -0.90 | % |
The Fund holds a combination of FLexible EXchange® Options (“FLEX Options”) designed to target the Fund’s objective.
* The Fund’s performance is impacted by changes in the values of the FLEX Options to which it is exposed. We attribute (allocate) the impact on the Fund’s performance into three components. The first of the three components is the impact on the Fund’s performance due to changes in the Fund’s Reference Asset. The second component is the aggregate impact on the Fund’s performance due to changes in other variables that impact FLEX Options prices - these include changes in a) the Reference Asset’s dividends, b) interest rates, c) implied volatility, and d) time to option expiration. The third component is from the Fund’s fees and expenses incurred during the Period.
FUND PERFORMANCE (March 19, 2021 to August 31, 2024)
The performance line graph below shows the performance of a hypothetical $10,000 initial investment in the Fund over a ten-year period (or for the life of the Fund, if shorter). The subsequent account value as of the end of the Period is listed next to the name of the Fund or index, as applicable. The performance table below shows the average annual total returns of the Fund for the past one-, five-, and ten-year periods, as applicable (or for the life of the Fund, if shorter), as of the end of the Period. Both the line graph and performance table compare the Fund’s performance to an appropriate broad-based index and may compare to additional indices reflecting the market segment(s) in which the Fund invests over the same periods.
Investment Performance of $10,000
| Average Annual Total Returns (as of August 31, 2024) | 1 Year | Since
Inception
(3/19/21) |
| FT Vest Nasdaq-100® Buffer ETF - March | 15.18% | 10.34% |
| Nasdaq-100 Index® | 27.30% | 13.84% |
| S&P 500® Index | 27.14% | 12.93% |
Visit www.ftportfolios.com/etf/QMAR for more recent performance information.
The Fund’s past performance is not a good predictor of the Fund’s future performance. The graph and table do not reflect the deduction of taxes that a shareholder would pay on Fund distributions or redemption of Fund shares.
KEY FUND STATISTICS (As of August 31, 2024)
| Fund net assets | $416,610,335 |
| Total number of portfolio holdings | 5 |
| Total advisory fee paid | $2,712,496 |
| Portfolio turnover rate | 0% |
WHAT DID THE FUND INVEST IN? (As of August 31, 2024)
The table below shows the investment makeup of the Fund, representing the percentage of net assets of the Fund.
| Money Market Funds | 0.8% |
| Purchased Options | 102.9% |
| Written Options | (3.6%) |
| Net Other Assets and Liabilities | (0.1%) |
| Total | 100.0% |
HOW HAS THE FUND MATERIALLY CHANGED?
This is a summary of certain changes to the Fund since September 1, 2023. For more complete information, you may review the Fund’s prospectus and any applicable supplements at www.ftportfolios.com/fund-documents/etf/QMAR or upon request at 1-800-621-1675 or info@ftportfolios.com.
During the fiscal year ended August 31, 2024, the Fund’s predetermined upside cap on Underlying ETF returns was reset based upon prevailing market conditions at the start of the new Target Outcome Period.
WHERE CAN I FIND ADDITIONAL INFORMATION ABOUT THE FUND?
Visit www.ftportfolios.com/fund-documents/etf/QMAR to view additional information about the Fund such as the prospectus, financial information, Fund holdings and proxy voting information. You may also request this information by contacting us at 1-800-621-1675 or info@ftportfolios.com.
OTHER INFORMATION
The Fund is not sponsored, endorsed, sold or promoted by Invesco QQQ TrustSM, Series 1, Invesco, or Nasdaq, Inc. (together with their affiliates hereinafter referred to as the “Corporations”). The Corporations have not passed on the legality or suitability of, or the accuracy or adequacy of, descriptions and disclosures relating to the Fund or the FLEX Options. The Corporations make no representations or warranties, express or implied, regarding the advisability of investing in the Fund or the FLEX Options or results to be obtained by the Fund or the FLEX Options, shareholders or any other person or entity from use of the Invesco QQQ TrustSM, Series 1. The Corporations have no liability in connection with the management, administration, marketing or trading of the Fund or the FLEX Options.
FT Vest U.S. Equity
Enhance & Moderate Buffer ETF - March
XMAR | CBOE BZX EXCHANGE, INC.
ANNUAL SHAREHOLDER REPORT | August 31, 2024
This annual shareholder report contains important information about the FT Vest U.S. Equity Enhance & Moderate Buffer ETF - March (the “Fund”) for the year of September 1, 2023 to August 31, 2024 (the “Period”). You can find additional information about the Fund at www.ftportfolios.com/fund-documents/etf/XMAR. You can also request this information by contacting us at 1-800-621-1675 or info@ftportfolios.com.
This report describes changes to the Fund that occurred during the Period.
WHAT WERE THE FUND COSTS FOR THE LAST YEAR?
(Based on a hypothetical $10,000 investment)
| Fund | Costs of a $10,000 investment | Costs paid as a percentage
of a $10,000 investment |
| FT Vest U.S. Equity Enhance & Moderate Buffer ETF - March | $89 | 0.85% |
HOW DID THE FUND PERFORM LAST YEAR? WHAT AFFECTED THE FUND’S PERFORMANCE?
The Fund returned 10.46% for the twelve months ended August 31, 2024. The Fund underperformed its benchmark, the S&P 500® Index, which returned 27.14% for the same Period.
This underperformance was due to the following:
| Fund NAV Performance Attributed to*: | | |
| Changes in Reference Asset | 5.77 | % |
| Changes in other Variables | 5.54 | % |
| Fees and Expenses | -0.85 | % |
The Fund holds a combination of FLexible EXchange® Options (“FLEX Options”) designed to target the Fund’s objective.
* The Fund’s performance is impacted by changes in the values of the FLEX Options to which it is exposed. We attribute (allocate) the impact on the Fund’s performance into three components. The first of the three components is the impact on the Fund’s performance due to changes in the Fund’s Reference Asset. The second component is the aggregate impact on the Fund’s performance due to changes in other variables that impact FLEX Options prices - these include changes in a) the Reference Asset’s dividends, b) interest rates, c) implied volatility, and d) time to option expiration. The third component is from the Fund’s fees and expenses incurred during the Period.
FUND PERFORMANCE (March 17, 2023 to August 31, 2024)
The performance line graph below shows the performance of a hypothetical $10,000 initial investment in the Fund over a ten-year period (or for the life of the Fund, if shorter). The subsequent account value as of the end of the Period is listed next to the name of the Fund or index, as applicable. The performance table below shows the average annual total returns of the Fund for the past one-, five-, and ten-year periods, as applicable (or for the life of the Fund, if shorter), as of the end of the Period. Both the line graph and performance table compare the Fund’s performance to an appropriate broad-based index and may compare to additional indices reflecting the market segment(s) in which the Fund invests over the same periods.
Investment Performance of $10,000
| Average Annual Total Returns (as of August 31, 2024) | 1 Year | Since
Inception
(3/17/23) |
| FT Vest U.S. Equity Enhance & Moderate Buffer ETF - March | 10.46% | 12.65% |
| S&P 500® Index | 27.14% | 30.49% |
Visit www.ftportfolios.com/etf/XMAR for more recent performance information.
The Fund’s past performance is not a good predictor of the Fund’s future performance. The graph and table do not reflect the deduction of taxes that a shareholder would pay on Fund distributions or redemption of Fund shares.
KEY FUND STATISTICS (As of August 31, 2024)
| Fund net assets | $182,479,544 |
| Total number of portfolio holdings | 6 |
| Total advisory fee paid | $1,763,997 |
| Portfolio turnover rate | 0% |
WHAT DID THE FUND INVEST IN? (As of August 31, 2024)
The table below shows the investment makeup of the Fund, representing the percentage of net assets of the Fund.
| Money Market Funds | 0.7% |
| Purchased Options | 117.7% |
| Written Options | (18.3%) |
| Net Other Assets and Liabilities | (0.1%) |
| Total | 100.0% |
HOW HAS THE FUND MATERIALLY CHANGED?
This is a summary of certain changes to the Fund since September 1, 2023. For more complete information, you may review the Fund’s prospectus and any applicable supplements at www.ftportfolios.com/fund-documents/etf/XMAR or upon request at 1-800-621-1675 or info@ftportfolios.com.
During the fiscal year ended August 31, 2024, the Fund’s predetermined upside cap on Underlying ETF returns was reset based upon prevailing market conditions at the start of the new Target Outcome Period.
WHERE CAN I FIND ADDITIONAL INFORMATION ABOUT THE FUND?
Visit www.ftportfolios.com/fund-documents/etf/XMAR to view additional information about the Fund such as the prospectus, financial information, Fund holdings and proxy voting information. You may also request this information by contacting us at 1-800-621-1675 or info@ftportfolios.com.
OTHER INFORMATION
The Fund is not sponsored, endorsed, sold or promoted by SPDR® S&P 500® ETF Trust, PDR Services, LLC, or Standard & Poor’s® (together with their affiliates hereinafter referred to as the “Corporations”). The Corporations have not passed on the legality or suitability of, or the accuracy or adequacy of, descriptions and disclosures relating to the Fund or the FLEX Options. The Corporations make no representations or warranties, express or implied, regarding the advisability of investing in the Fund or the FLEX Options or results to be obtained by the Fund or the FLEX Options, shareholders or any other person or entity from use of the SPDR® S&P 500® ETF Trust. The Corporations have no liability in connection with the management, administration, marketing or trading of the Fund or the FLEX Options.
FT Vest Nasdaq-100® Conservative Buffer ETF - April
QCAP | CBOE BZX EXCHANGE, INC.
ANNUAL SHAREHOLDER REPORT | August 31, 2024
This annual shareholder report contains important information about the FT Vest Nasdaq-100® Conservative Buffer ETF - April (the “Fund”) for the period of April 19, 2024 (commencement of investment operations) to August 31, 2024 (the “Period”). You can find additional information about the Fund at www.ftportfolios.com/fund-documents/etf/QCAP. You can also request this information by contacting us at 1-800-621-1675 or info@ftportfolios.com.
WHAT WERE THE FUND COSTS FOR THE LAST YEAR?
(Based on a hypothetical $10,000 investment)
| Fund | Costs of a $10,000 investment | Costs paid as a percentage
of a $10,000 investment |
| FT Vest Nasdaq-100® Conservative Buffer ETF - April | $34(1) | 0.90%(2) |
(1) | The Fund commenced investment operations on April 19, 2024. Had the Fund been in operation for a complete fiscal year, the cost of a $10,000 investment would have been higher. |
(2) | Annualized. |
HOW DID THE FUND PERFORM LAST YEAR? WHAT AFFECTED THE FUND’S PERFORMANCE?
The Fund returned 7.39% for the period from the Fund’s inception date on April 19, 2024 through August 31, 2024. The Fund underperformed its benchmark, the Nasdaq-100 Index®, which returned 15.24% for the same Period.
This underperformance was due to the following:
| Fund NAV Performance Attributed to*: | | |
| Changes in Reference Asset | 4.41 | % |
| Changes in other Variables | 3.31 | % |
| Fees and Expenses | -0.33 | % |
The Fund holds a combination of FLexible EXchange® Options (“FLEX Options”) designed to target the Fund’s objective.
* The Fund’s performance is impacted by changes in the values of the FLEX Options to which it is exposed. We attribute (allocate) the impact on the Fund’s performance into three components. The first of the three components is the impact on the Fund’s performance due to changes in the Fund’s Reference Asset. The second component is the aggregate impact on the Fund’s performance due to changes in other variables that impact FLEX Options prices - these include changes in a) the Reference Asset’s dividends, b) interest rates, c) implied volatility, and d) time to option expiration. The third component is from the Fund’s fees and expenses incurred during the Period.
FUND PERFORMANCE (April 19, 2024 to August 31, 2024)
The performance line graph below shows the performance of a hypothetical $10,000 initial investment in the Fund over a ten-year period (or for the life of the Fund, if shorter). The subsequent account value as of the end of the Period is listed next to the name of the Fund or index, as applicable. The performance table below shows the average annual total returns of the Fund for the past one-, five-, and ten-year periods, as applicable (or for the life of the Fund, if shorter), as of the end of the Period. Both the line graph and performance table compare the Fund’s performance to an appropriate broad-based index and may compare to additional indices reflecting the market segment(s) in which the Fund invests over the same periods.
Investment Performance of $10,000
| Average Annual Total Returns (as of August 31, 2024) | Since
Inception
(4/19/24) |
| FT Vest Nasdaq-100® Conservative Buffer ETF - April | 7.39% |
| Nasdaq-100 Index® | 15.24% |
| S&P 500® Index | 14.29% |
Visit www.ftportfolios.com/etf/QCAP for more recent performance information.
The Fund’s past performance is not a good predictor of the Fund’s future performance. The graph and table do not reflect the deduction of taxes that a shareholder would pay on Fund distributions or redemption of Fund shares.
KEY FUND STATISTICS (As of August 31, 2024)
| Fund net assets | $30,981,260 |
| Total number of portfolio holdings | 4 |
| Total advisory fee paid | $87,983 |
| Portfolio turnover rate | 0% |
WHAT DID THE FUND INVEST IN? (As of August 31, 2024)
The table below shows the investment makeup of the Fund, representing the percentage of net assets of the Fund.
| Purchased Options | 107.8% |
| Written Options | (8.5%) |
| Net Other Assets and Liabilities | 0.7% |
| Total | 100.0% |
WHERE CAN I FIND ADDITIONAL INFORMATION ABOUT THE FUND?
Visit www.ftportfolios.com/fund-documents/etf/QCAP to view additional information about the Fund such as the prospectus, financial information, Fund holdings and proxy voting information. You may also request this information by contacting us at 1-800-621-1675 or info@ftportfolios.com.
OTHER INFORMATION
The Fund is not sponsored, endorsed, sold or promoted by Invesco QQQ TrustSM, Series 1, Invesco, or Nasdaq, Inc. (together with their affiliates hereinafter referred to as the “Corporations”). The Corporations have not passed on the legality or suitability of, or the accuracy or adequacy of, descriptions and disclosures relating to the Fund or the FLEX Options. The Corporations make no representations or warranties, express or implied, regarding the advisability of investing in the Fund or the FLEX Options or results to be obtained by the Fund or the FLEX Options, shareholders or any other person or entity from use of the Invesco QQQ TrustSM, Series 1. The Corporations have no liability in connection with the management, administration, marketing or trading of the Fund or the FLEX Options.
FT Vest U.S. Equity Enhance & Moderate Buffer ETF - April
XAPR | CBOE BZX EXCHANGE, INC.
ANNUAL SHAREHOLDER REPORT | August 31, 2024
This annual shareholder report contains important information about the FT Vest U.S. Equity Enhance & Moderate Buffer ETF - April (the “Fund”) for the period of April 19, 2024 (commencement of investment operations) to August 31, 2024 (the “Period”). You can find additional information about the Fund at www.ftportfolios.com/fund-documents/etf/XAPR. You can also request this information by contacting us at 1-800-621-1675 or info@ftportfolios.com.
WHAT WERE THE FUND COSTS FOR THE LAST YEAR?
(Based on a hypothetical $10,000 investment)
| Fund | Costs of a $10,000 investment | Costs paid as a percentage
of a $10,000 investment |
| FT Vest U.S. Equity Enhance & Moderate Buffer ETF - April | $32(1) | 0.85%(2) |
(1) | The Fund commenced investment operations on April 19, 2024. Had the Fund been in operation for a complete fiscal year, the cost of a $10,000 investment would have been higher. |
(2) | Annualized. |
HOW DID THE FUND PERFORM LAST YEAR? WHAT AFFECTED THE FUND’S PERFORMANCE?
The Fund returned 6.33% for the period from the Fund’s inception date on April 19, 2024 through August 31, 2024. The Fund underperformed its benchmark, the S&P 500® Index, which returned 14.29% for the same Period.
This underperformance was due to the following:
| Fund NAV Performance Attributed to*: | | |
| Changes in Reference Asset | 3.98 | % |
| Changes in other Variables | 2.66 | % |
| Fees and Expenses | -0.31 | % |
The Fund holds a combination of FLexible EXchange® Options (“FLEX Options”) designed to target the Fund’s objective.
* The Fund’s performance is impacted by changes in the values of the FLEX Options to which it is exposed. We attribute (allocate) the impact on the Fund’s performance into three components. The first of the three components is the impact on the Fund’s performance due to changes in the Fund’s Reference Asset. The second component is the aggregate impact on the Fund’s performance due to changes in other variables that impact FLEX Options prices - these include changes in a) the Reference Asset’s dividends, b) interest rates, c) implied volatility, and d) time to option expiration. The third component is from the Fund’s fees and expenses incurred during the Period.
FUND PERFORMANCE (April 19, 2024 to August 31, 2024)
The performance line graph below shows the performance of a hypothetical $10,000 initial investment in the Fund over a ten-year period (or for the life of the Fund, if shorter). The subsequent account value as of the end of the Period is listed next to the name of the Fund or index, as applicable. The performance table below shows the average annual total returns of the Fund for the past one-, five-, and ten-year periods, as applicable (or for the life of the Fund, if shorter), as of the end of the Period. Both the line graph and performance table compare the Fund’s performance to an appropriate broad-based index and may compare to additional indices reflecting the market segment(s) in which the Fund invests over the same periods.
Investment Performance of $10,000
| Average Annual Total Returns (as of August 31, 2024) | Since
Inception
(4/19/24) |
| FT Vest U.S. Equity Enhance & Moderate Buffer ETF - April | 6.33% |
| S&P 500® Index | 14.29% |
Visit www.ftportfolios.com/etf/XAPR for more recent performance information.
The Fund’s past performance is not a good predictor of the Fund’s future performance. The graph and table do not reflect the deduction of taxes that a shareholder would pay on Fund distributions or redemption of Fund shares.
KEY FUND STATISTICS (As of August 31, 2024)
| Fund net assets | $14,217,464 |
| Total number of portfolio holdings | 5 |
| Total advisory fee paid | $39,472 |
| Portfolio turnover rate | 0% |
WHAT DID THE FUND INVEST IN? (As of August 31, 2024)
The table below shows the investment makeup of the Fund, representing the percentage of net assets of the Fund.
| Purchased Options | 123.6% |
| Written Options | (24.3%) |
| Net Other Assets and Liabilities | 0.7% |
| Total | 100.0% |
WHERE CAN I FIND ADDITIONAL INFORMATION ABOUT THE FUND?
Visit www.ftportfolios.com/fund-documents/etf/XAPR to view additional information about the Fund such as the prospectus, financial information, Fund holdings and proxy voting information. You may also request this information by contacting us at 1-800-621-1675 or info@ftportfolios.com.
OTHER INFORMATION
The Fund is not sponsored, endorsed, sold or promoted by SPDR® S&P 500® ETF Trust, PDR Services, LLC, or Standard & Poor’s® (together with their affiliates hereinafter referred to as the “Corporations”). The Corporations have not passed on the legality or suitability of, or the accuracy or adequacy of, descriptions and disclosures relating to the Fund or the FLEX Options. The Corporations make no representations or warranties, express or implied, regarding the advisability of investing in the Fund or the FLEX Options or results to be obtained by the Fund or the FLEX Options, shareholders or any other person or entity from use of the SPDR® S&P 500® ETF Trust. The Corporations have no liability in connection with the management, administration, marketing or trading of the Fund or the FLEX Options.
FT Vest Nasdaq-100® Moderate Buffer ETF - May
QMMY | CBOE BZX EXCHANGE, INC.
ANNUAL SHAREHOLDER REPORT | August 31, 2024
This annual shareholder report contains important information about the FT Vest Nasdaq-100® Moderate Buffer ETF - May (the “Fund”) for the period of May 17, 2024 (commencement of investment operations) to August 31, 2024 (the “Period”). You can find additional information about the Fund at www.ftportfolios.com/fund-documents/etf/QMMY. You can also request this information by contacting us at 1-800-621-1675 or info@ftportfolios.com.
WHAT WERE THE FUND COSTS FOR THE LAST YEAR?
(Based on a hypothetical $10,000 investment)
| Fund | Costs of a $10,000 investment | Costs paid as a percentage
of a $10,000 investment |
| FT Vest Nasdaq-100® Moderate Buffer ETF - May | $27(1) | 0.90%(2) |
(1) | The Fund commenced investment operations on May 17, 2024. Had the Fund been in operation for a complete fiscal year, the cost of a $10,000 investment would have been higher. |
(2) | Annualized. |
HOW DID THE FUND PERFORM LAST YEAR? WHAT AFFECTED THE FUND’S PERFORMANCE?
The Fund returned 3.97% for the period from the Fund’s inception date on May 17, 2024 through August 31, 2024. The Fund underperformed its benchmark, the Nasdaq-100 Index®, which returned 5.78% for the same Period.
This underperformance was due to the following:
| Fund NAV Performance Attributed to*: | | |
| Changes in Reference Asset | 2.38 | % |
| Changes in other Variables | 1.85 | % |
| Fees and Expenses | -0.26 | % |
The Fund holds a combination of FLexible EXchange® Options (“FLEX Options”) designed to target the Fund’s objective.
* The Fund’s performance is impacted by changes in the values of the FLEX Options to which it is exposed. We attribute (allocate) the impact on the Fund’s performance into three components. The first of the three components is the impact on the Fund’s performance due to changes in the Fund’s Reference Asset. The second component is the aggregate impact on the Fund’s performance due to changes in other variables that impact FLEX Options prices - these include changes in a) the Reference Asset’s dividends, b) interest rates, c) implied volatility, and d) time to option expiration. The third component is from the Fund’s fees and expenses incurred during the Period.
FUND PERFORMANCE (May 17, 2024 to August 31, 2024)
The performance line graph below shows the performance of a hypothetical $10,000 initial investment in the Fund over a ten-year period (or for the life of the Fund, if shorter). The subsequent account value as of the end of the Period is listed next to the name of the Fund or index, as applicable. The performance table below shows the average annual total returns of the Fund for the past one-, five-, and ten-year periods, as applicable (or for the life of the Fund, if shorter), as of the end of the Period. Both the line graph and performance table compare the Fund’s performance to an appropriate broad-based index and may compare to additional indices reflecting the market segment(s) in which the Fund invests over the same periods.
Investment Performance of $10,000
| Average Annual Total Returns (as of August 31, 2024) | Since
Inception
(5/17/24) |
| FT Vest Nasdaq-100® Moderate Buffer ETF - May | 3.97% |
| Nasdaq-100 Index® | 5.78% |
| S&P 500® Index | 6.91% |
Visit www.ftportfolios.com/etf/QMMY for more recent performance information.
The Fund’s past performance is not a good predictor of the Fund’s future performance. The graph and table do not reflect the deduction of taxes that a shareholder would pay on Fund distributions or redemption of Fund shares.
KEY FUND STATISTICS (As of August 31, 2024)
| Fund net assets | $55,795,965 |
| Total number of portfolio holdings | 4 |
| Total advisory fee paid | $251,368 |
| Portfolio turnover rate | 0% |
WHAT DID THE FUND INVEST IN? (As of August 31, 2024)
The table below shows the investment makeup of the Fund, representing the percentage of net assets of the Fund.
| Purchased Options | 103.9% |
| Written Options | (4.7%) |
| Net Other Assets and Liabilities | 0.8% |
| Total | 100.0% |
WHERE CAN I FIND ADDITIONAL INFORMATION ABOUT THE FUND?
Visit www.ftportfolios.com/fund-documents/etf/QMMY to view additional information about the Fund such as the prospectus, financial information, Fund holdings and proxy voting information. You may also request this information by contacting us at 1-800-621-1675 or info@ftportfolios.com.
OTHER INFORMATION
The Fund is not sponsored, endorsed, sold or promoted by Invesco QQQ TrustSM, Series 1, Invesco, or Nasdaq, Inc. (together with their affiliates hereinafter referred to as the “Corporations”). The Corporations have not passed on the legality or suitability of, or the accuracy or adequacy of, descriptions and disclosures relating to the Fund or the FLEX Options. The Corporations make no representations or warranties, express or implied, regarding the advisability of investing in the Fund or the FLEX Options or results to be obtained by the Fund or the FLEX Options, shareholders or any other person or entity from use of the Invesco QQQ TrustSM, Series 1. The Corporations have no liability in connection with the management, administration, marketing or trading of the Fund or the FLEX Options.
FT Vest U.S. Equity Enhance & Moderate Buffer ETF - May
XMAY | CBOE BZX EXCHANGE, INC.
ANNUAL SHAREHOLDER REPORT | August 31, 2024
This annual shareholder report contains important information about the FT Vest U.S. Equity Enhance & Moderate Buffer ETF - May (the “Fund”) for the period of May 17, 2024 (commencement of investment operations) to August 31, 2024 (the “Period”). You can find additional information about the Fund at www.ftportfolios.com/fund-documents/etf/XMAY. You can also request this information by contacting us at 1-800-621-1675 or info@ftportfolios.com.
WHAT WERE THE FUND COSTS FOR THE LAST YEAR?
(Based on a hypothetical $10,000 investment)
| Fund | Costs of a $10,000 investment | Costs paid as a percentage
of a $10,000 investment |
| FT Vest U.S. Equity Enhance & Moderate Buffer ETF - May | $25(1) | 0.85%(2) |
(1) | The Fund commenced investment operations on May 17, 2024. Had the Fund been in operation for a complete fiscal year, the cost of a $10,000 investment would have been higher. |
(2) | Annualized. |
HOW DID THE FUND PERFORM LAST YEAR? WHAT AFFECTED THE FUND’S PERFORMANCE?
The Fund returned 3.84% for the period from the Fund’s inception date on May 17, 2024 through August 31, 2024. The Fund underperformed its benchmark, the S&P 500® Index, which returned 6.91% for the same Period.
This underperformance was due to the following:
| Fund NAV Performance Attributed to*: | | |
| Changes in Reference Asset | 2.35 | % |
| Changes in other Variables | 1.73 | % |
| Fees and Expenses | -0.24 | % |
The Fund holds a combination of FLexible EXchange® Options (“FLEX Options”) designed to target the Fund’s objective.
* The Fund’s performance is impacted by changes in the values of the FLEX Options to which it is exposed. We attribute (allocate) the impact on the Fund’s performance into three components. The first of the three components is the impact on the Fund’s performance due to changes in the Fund’s Reference Asset. The second component is the aggregate impact on the Fund’s performance due to changes in other variables that impact FLEX Options prices - these include changes in a) the Reference Asset’s dividends, b) interest rates, c) implied volatility, and d) time to option expiration. The third component is from the Fund’s fees and expenses incurred during the Period.
FUND PERFORMANCE (May 17, 2024 to August 31, 2024)
The performance line graph below shows the performance of a hypothetical $10,000 initial investment in the Fund over a ten-year period (or for the life of the Fund, if shorter). The subsequent account value as of the end of the Period is listed next to the name of the Fund or index, as applicable. The performance table below shows the average annual total returns of the Fund for the past one-, five-, and ten-year periods, as applicable (or for the life of the Fund, if shorter), as of the end of the Period. Both the line graph and performance table compare the Fund’s performance to an appropriate broad-based index and may compare to additional indices reflecting the market segment(s) in which the Fund invests over the same periods.
Investment Performance of $10,000
| Average Annual Total Returns (as of August 31, 2024) | Since
Inception
(5/17/24) |
| FT Vest U.S. Equity Enhance & Moderate Buffer ETF - May | 3.84% |
| S&P 500® Index | 6.91% |
Visit www.ftportfolios.com/etf/XMAY for more recent performance information.
The Fund’s past performance is not a good predictor of the Fund’s future performance. The graph and table do not reflect the deduction of taxes that a shareholder would pay on Fund distributions or redemption of Fund shares.
KEY FUND STATISTICS (As of August 31, 2024)
| Fund net assets | $21,552,952 |
| Total number of portfolio holdings | 6 |
| Total advisory fee paid | $68,562 |
| Portfolio turnover rate | 0% |
WHAT DID THE FUND INVEST IN? (As of August 31, 2024)
The table below shows the investment makeup of the Fund, representing the percentage of net assets of the Fund.
| Money Market Funds | 0.9% |
| Purchased Options | 114.6% |
| Written Options | (15.4%) |
| Net Other Assets and Liabilities | (0.1%) |
| Total | 100.0% |
WHERE CAN I FIND ADDITIONAL INFORMATION ABOUT THE FUND?
Visit www.ftportfolios.com/fund-documents/etf/XMAY to view additional information about the Fund such as the prospectus, financial information, Fund holdings and proxy voting information. You may also request this information by contacting us at 1-800-621-1675 or info@ftportfolios.com.
OTHER INFORMATION
The Fund is not sponsored, endorsed, sold or promoted by SPDR® S&P 500® ETF Trust, PDR Services, LLC, or Standard & Poor’s® (together with their affiliates hereinafter referred to as the “Corporations”). The Corporations have not passed on the legality or suitability of, or the accuracy or adequacy of, descriptions and disclosures relating to the Fund or the FLEX Options. The Corporations make no representations or warranties, express or implied, regarding the advisability of investing in the Fund or the FLEX Options or results to be obtained by the Fund or the FLEX Options, shareholders or any other person or entity from use of the SPDR® S&P 500® ETF Trust. The Corporations have no liability in connection with the management, administration, marketing or trading of the Fund or the FLEX Options.
FT Vest International Equity Moderate Buffer ETF - June
YJUN | CBOE BZX EXCHANGE, INC.
ANNUAL SHAREHOLDER REPORT | August 31, 2024
This annual shareholder report contains important information about the FT Vest International Equity Moderate Buffer ETF - June (the “Fund”) for the year of September 1, 2023 to August 31, 2024 (the “Period”). You can find additional information about the Fund at www.ftportfolios.com/fund-documents/etf/YJUN. You can also request this information by contacting us at 1-800-621-1675 or info@ftportfolios.com.
This report describes changes to the Fund that occurred during the Period.
WHAT WERE THE FUND COSTS FOR THE LAST YEAR?
(Based on a hypothetical $10,000 investment)
| Fund | Costs of a $10,000 investment | Costs paid as a percentage
of a $10,000 investment |
| FT Vest International Equity Moderate Buffer ETF - June | $95 | 0.90% |
HOW DID THE FUND PERFORM LAST YEAR? WHAT AFFECTED THE FUND’S PERFORMANCE?
The Fund returned 12.03% for the twelve months ended August 31, 2024. The Fund underperformed its benchmark, the MSCI EAFE Index, which returned 19.40% for the same Period.
This underperformance was due to the following:
| Fund NAV Performance Attributed to*: | | |
| Changes in Reference Asset | 11.37 | % |
| Changes in other Variables | 1.56 | % |
| Fees and Expenses | -0.90 | % |
The Fund holds a combination of FLexible EXchange® Options (“FLEX Options”) designed to target the Fund’s objective.
* The Fund’s performance is impacted by changes in the values of the FLEX Options to which it is exposed. We attribute (allocate) the impact on the Fund’s performance into three components. The first of the three components is the impact on the Fund’s performance due to changes in the Fund’s Reference Asset. The second component is the aggregate impact on the Fund’s performance due to changes in other variables that impact FLEX Options prices - these include changes in a) the Reference Asset’s dividends, b) interest rates, c) implied volatility, and d) time to option expiration. The third component is from the Fund’s fees and expenses incurred during the Period.
FUND PERFORMANCE (June 18, 2021 to August 31, 2024)
The performance line graph below shows the performance of a hypothetical $10,000 initial investment in the Fund over a ten-year period (or for the life of the Fund, if shorter). The subsequent account value as of the end of the Period is listed next to the name of the Fund or index, as applicable. The performance table below shows the average annual total returns of the Fund for the past one-, five-, and ten-year periods, as applicable (or for the life of the Fund, if shorter), as of the end of the Period. Both the line graph and performance table compare the Fund’s performance to an appropriate broad-based index and may compare to additional indices reflecting the market segment(s) in which the Fund invests over the same periods.
Investment Performance of $10,000
| Average Annual Total Returns (as of August 31, 2024) | 1 Year | Since
Inception
(6/18/21) |
| FT Vest International Equity Moderate Buffer ETF - June | 12.03% | 4.01% |
| MSCI EAFE Index | 19.40% | 4.65% |
Visit www.ftportfolios.com/etf/YJUN for more recent performance information.
The Fund’s past performance is not a good predictor of the Fund’s future performance. The graph and table do not reflect the deduction of taxes that a shareholder would pay on Fund distributions or redemption of Fund shares.
KEY FUND STATISTICS (As of August 31, 2024)
| Fund net assets | $174,275,037 |
| Total number of portfolio holdings | 5 |
| Total advisory fee paid | $1,372,586 |
| Portfolio turnover rate | 0% |
WHAT DID THE FUND INVEST IN? (As of August 31, 2024)
The table below shows the investment makeup of the Fund, representing the percentage of net assets of the Fund.
| Money Market Funds | 1.1% |
| Purchased Options | 102.5% |
| Written Options | (3.5%) |
| Net Other Assets and Liabilities | (0.1%) |
| Total | 100.0% |
HOW HAS THE FUND MATERIALLY CHANGED?
This is a summary of certain changes to the Fund since September 1, 2023. For more complete information, you may review the Fund’s prospectus and any applicable supplements at www.ftportfolios.com/fund-documents/etf/YJUN or upon request at 1-800-621-1675 or info@ftportfolios.com.
Effective June 24, 2024, the name of the Fund changed from “FT Vest International Equity Buffer ETF - June” to “FT Vest International Equity Moderate Buffer ETF - June”, the Fund’s buffer against Underlying ETF losses increased from 10% to 15%, and the Fund’s predetermined upside cap on Underlying ETF returns was reset based upon prevailing market conditions at the start of the new Target Outcome Period.
WHERE CAN I FIND ADDITIONAL INFORMATION ABOUT THE FUND?
Visit www.ftportfolios.com/fund-documents/etf/YJUN to view additional information about the Fund such as the prospectus, financial information, Fund holdings and proxy voting information. You may also request this information by contacting us at 1-800-621-1675 or info@ftportfolios.com.
OTHER INFORMATION
The Fund is not sponsored, endorsed, sold or promoted by iShares MSCI EAFE ETF, BFA, or MSCI Inc. (together with their affiliates hereinafter referred to as the “Corporations”). The Corporations have not passed on the legality or suitability of, or the accuracy or adequacy of, descriptions and disclosures relating to the Fund or the FLEX Options. The Corporations make no representations or warranties, express or implied, regarding the advisability of investing in the Fund or the FLEX Options or results to be obtained by the Fund or the FLEX Options, shareholders or any other person or entity from use of the Underlying ETF. The Corporations have no liability in connection with the management, administration, marketing or trading of the Fund or the FLEX Options.
FT Vest Nasdaq-100® Buffer ETF - June
QJUN | CBOE BZX EXCHANGE, INC.
ANNUAL SHAREHOLDER REPORT | August 31, 2024
This annual shareholder report contains important information about the FT Vest Nasdaq-100® Buffer ETF - June (the “Fund”) for the year of September 1, 2023 to August 31, 2024 (the “Period”). You can find additional information about the Fund at www.ftportfolios.com/fund-documents/etf/QJUN. You can also request this information by contacting us at 1-800-621-1675 or info@ftportfolios.com.
This report describes changes to the Fund that occurred during the Period.
WHAT WERE THE FUND COSTS FOR THE LAST YEAR?
(Based on a hypothetical $10,000 investment)
| Fund | Costs of a $10,000 investment | Costs paid as a percentage
of a $10,000 investment |
| FT Vest Nasdaq-100® Buffer ETF - June | $98 | 0.90% |
HOW DID THE FUND PERFORM LAST YEAR? WHAT AFFECTED THE FUND’S PERFORMANCE?
The Fund returned 17.51% for the twelve months ended August 31, 2024. The Fund underperformed its benchmark, the Nasdaq-100 Index®, which returned 27.30% for the same Period.
This underperformance was due to the following:
| Fund NAV Performance Attributed to*: | | |
| Changes in Reference Asset | 13.97 | % |
| Changes in other Variables | 4.44 | % |
| Fees and Expenses | -0.90 | % |
The Fund holds a combination of FLexible EXchange® Options (“FLEX Options”) designed to target the Fund’s objective.
* The Fund’s performance is impacted by changes in the values of the FLEX Options to which it is exposed. We attribute (allocate) the impact on the Fund’s performance into three components. The first of the three components is the impact on the Fund’s performance due to changes in the Fund’s Reference Asset. The second component is the aggregate impact on the Fund’s performance due to changes in other variables that impact FLEX Options prices - these include changes in a) the Reference Asset’s dividends, b) interest rates, c) implied volatility, and d) time to option expiration. The third component is from the Fund’s fees and expenses incurred during the Period.
FUND PERFORMANCE (June 18, 2021 to August 31, 2024)
The performance line graph below shows the performance of a hypothetical $10,000 initial investment in the Fund over a ten-year period (or for the life of the Fund, if shorter). The subsequent account value as of the end of the Period is listed next to the name of the Fund or index, as applicable. The performance table below shows the average annual total returns of the Fund for the past one-, five-, and ten-year periods, as applicable (or for the life of the Fund, if shorter), as of the end of the Period. Both the line graph and performance table compare the Fund’s performance to an appropriate broad-based index and may compare to additional indices reflecting the market segment(s) in which the Fund invests over the same periods.
Investment Performance of $10,000
| Average Annual Total Returns (as of August 31, 2024) | 1 Year | Since
Inception
(6/18/21) |
| FT Vest Nasdaq-100® Buffer ETF - June | 17.51% | 9.50% |
| Nasdaq-100 Index® | 27.30% | 11.82% |
| S&P 500® Index | 27.14% | 11.67% |
Visit www.ftportfolios.com/etf/QJUN for more recent performance information.
The Fund’s past performance is not a good predictor of the Fund’s future performance. The graph and table do not reflect the deduction of taxes that a shareholder would pay on Fund distributions or redemption of Fund shares.
KEY FUND STATISTICS (As of August 31, 2024)
| Fund net assets | $484,859,527 |
| Total number of portfolio holdings | 5 |
| Total advisory fee paid | $3,369,878 |
| Portfolio turnover rate | 0% |
WHAT DID THE FUND INVEST IN? (As of August 31, 2024)
The table below shows the investment makeup of the Fund, representing the percentage of net assets of the Fund.
| Money Market Funds | 1.0% |
| Purchased Options | 103.2% |
| Written Options | (4.1%) |
| Net Other Assets and Liabilities | (0.1%) |
| Total | 100.0% |
HOW HAS THE FUND MATERIALLY CHANGED?
This is a summary of certain changes to the Fund since September 1, 2023. For more complete information, you may review the Fund’s prospectus and any applicable supplements at www.ftportfolios.com/fund-documents/etf/QJUN or upon request at 1-800-621-1675 or info@ftportfolios.com.
During the fiscal year ended August 31, 2024, the Fund’s predetermined upside cap on Underlying ETF returns was reset based upon prevailing market conditions at the start of the new Target Outcome Period.
WHERE CAN I FIND ADDITIONAL INFORMATION ABOUT THE FUND?
Visit www.ftportfolios.com/fund-documents/etf/QJUN to view additional information about the Fund such as the prospectus, financial information, Fund holdings and proxy voting information. You may also request this information by contacting us at 1-800-621-1675 or info@ftportfolios.com.
OTHER INFORMATION
The Fund is not sponsored, endorsed, sold or promoted by Invesco QQQ TrustSM, Series 1, Invesco, or Nasdaq, Inc. (together with their affiliates hereinafter referred to as the “Corporations”). The Corporations have not passed on the legality or suitability of, or the accuracy or adequacy of, descriptions and disclosures relating to the Fund or the FLEX Options. The Corporations make no representations or warranties, express or implied, regarding the advisability of investing in the Fund or the FLEX Options or results to be obtained by the Fund or the FLEX Options, shareholders or any other person or entity from use of the Invesco QQQ TrustSM, Series 1. The Corporations have no liability in connection with the management, administration, marketing or trading of the Fund or the FLEX Options.
FT Vest U.S. Equity
Enhance & Moderate Buffer ETF - June
XJUN | CBOE BZX EXCHANGE, INC.
ANNUAL SHAREHOLDER REPORT | August 31, 2024
This annual shareholder report contains important information about the FT Vest U.S. Equity Enhance & Moderate Buffer ETF - June (the “Fund”) for the year of September 1, 2023 to August 31, 2024 (the “Period”). You can find additional information about the Fund at www.ftportfolios.com/fund-documents/etf/XJUN. You can also request this information by contacting us at 1-800-621-1675 or info@ftportfolios.com.
This report describes changes to the Fund that occurred during the Period.
WHAT WERE THE FUND COSTS FOR THE LAST YEAR?
(Based on a hypothetical $10,000 investment)
| Fund | Costs of a $10,000 investment | Costs paid as a percentage
of a $10,000 investment |
| FT Vest U.S. Equity Enhance & Moderate Buffer ETF - June | $90 | 0.85% |
HOW DID THE FUND PERFORM LAST YEAR? WHAT AFFECTED THE FUND’S PERFORMANCE?
The Fund returned 11.71% for the twelve months ended August 31, 2024. The Fund underperformed its benchmark, the S&P 500® Index, which returned 27.14% for the same Period.
This underperformance was due to the following:
| Fund NAV Performance Attributed to*: | | |
| Changes in Reference Asset | 7.63 | % |
| Changes in other Variables | 4.93 | % |
| Fees and Expenses | -0.85 | % |
The Fund holds a combination of FLexible EXchange® Options (“FLEX Options”) designed to target the Fund’s objective.
* The Fund’s performance is impacted by changes in the values of the FLEX Options to which it is exposed. We attribute (allocate) the impact on the Fund’s performance into three components. The first of the three components is the impact on the Fund’s performance due to changes in the Fund’s Reference Asset. The second component is the aggregate impact on the Fund’s performance due to changes in other variables that impact FLEX Options prices - these include changes in a) the Reference Asset’s dividends, b) interest rates, c) implied volatility, and d) time to option expiration. The third component is from the Fund’s fees and expenses incurred during the Period.
FUND PERFORMANCE (July 12, 2021 to August 31, 2024)
The performance line graph below shows the performance of a hypothetical $10,000 initial investment in the Fund over a ten-year period (or for the life of the Fund, if shorter). The subsequent account value as of the end of the Period is listed next to the name of the Fund or index, as applicable. The performance table below shows the average annual total returns of the Fund for the past one-, five-, and ten-year periods, as applicable (or for the life of the Fund, if shorter), as of the end of the Period. Both the line graph and performance table compare the Fund’s performance to an appropriate broad-based index and may compare to additional indices reflecting the market segment(s) in which the Fund invests over the same periods.
Investment Performance of $10,000
| Average Annual Total Returns (as of August 31, 2024) | 1 Year | Since
Inception
(7/12/21) |
| FT Vest U.S. Equity Enhance & Moderate Buffer ETF - June | 11.71% | 7.87% |
| S&P 500® Index | 27.14% | 10.10% |
Visit www.ftportfolios.com/etf/XJUN for more recent performance information.
The Fund’s past performance is not a good predictor of the Fund’s future performance. The graph and table do not reflect the deduction of taxes that a shareholder would pay on Fund distributions or redemption of Fund shares.
KEY FUND STATISTICS (As of August 31, 2024)
| Fund net assets | $186,547,120 |
| Total number of portfolio holdings | 6 |
| Total advisory fee paid | $2,038,257 |
| Portfolio turnover rate | 0% |
WHAT DID THE FUND INVEST IN? (As of August 31, 2024)
The table below shows the investment makeup of the Fund, representing the percentage of net assets of the Fund.
| Money Market Funds | 1.0% |
| Purchased Options | 111.7% |
| Written Options | (12.6%) |
| Net Other Assets and Liabilities | (0.1%) |
| Total | 100.0% |
HOW HAS THE FUND MATERIALLY CHANGED?
This is a summary of certain changes to the Fund since September 1, 2023. For more complete information, you may review the Fund’s prospectus and any applicable supplements at www.ftportfolios.com/fund-documents/etf/XJUN or upon request at 1-800-621-1675 or info@ftportfolios.com.
During the fiscal year ended August 31, 2024, the Fund’s predetermined upside cap on Underlying ETF returns was reset based upon prevailing market conditions at the start of the new Target Outcome Period.
WHERE CAN I FIND ADDITIONAL INFORMATION ABOUT THE FUND?
Visit www.ftportfolios.com/fund-documents/etf/XJUN to view additional information about the Fund such as the prospectus, financial information, Fund holdings and proxy voting information. You may also request this information by contacting us at 1-800-621-1675 or info@ftportfolios.com.
OTHER INFORMATION
The Fund is not sponsored, endorsed, sold or promoted by SPDR® S&P 500® ETF Trust, PDR Services, LLC, or Standard & Poor’s® (together with their affiliates hereinafter referred to as the “Corporations”). The Corporations have not passed on the legality or suitability of, or the accuracy or adequacy of, descriptions and disclosures relating to the Fund or the FLEX Options. The Corporations make no representations or warranties, express or implied, regarding the advisability of investing in the Fund or the FLEX Options or results to be obtained by the Fund or the FLEX Options, shareholders or any other person or entity from use of the SPDR® S&P 500® ETF Trust. The Corporations have no liability in connection with the management, administration, marketing or trading of the Fund or the FLEX Options.
FT Vest Nasdaq-100® Conservative Buffer ETF - July
QCJL | CBOE BZX EXCHANGE, INC.
ANNUAL SHAREHOLDER REPORT | August 31, 2024
This annual shareholder report contains important information about the FT Vest Nasdaq-100® Conservative Buffer ETF - July (the “Fund”) for the period of July 19, 2024 (commencement of investment operations) to August 31, 2024 (the “Period”). You can find additional information about the Fund at www.ftportfolios.com/fund-documents/etf/QCJL. You can also request this information by contacting us at 1-800-621-1675 or info@ftportfolios.com.
WHAT WERE THE FUND COSTS FOR THE LAST YEAR?
(Based on a hypothetical $10,000 investment)
| Fund | Costs of a $10,000 investment | Costs paid as a percentage
of a $10,000 investment |
| FT Vest Nasdaq-100® Conservative Buffer ETF - July | $11(1) | 0.90%(2) |
(1) | The Fund commenced investment operations on July 19, 2024. Had the Fund been in operation for a complete fiscal year, the cost of a $10,000 investment would have been higher. |
(2) | Annualized. |
HOW DID THE FUND PERFORM LAST YEAR? WHAT AFFECTED THE FUND’S PERFORMANCE?
The Fund returned 1.00% for the period from the Fund’s inception date on July 19, 2024 through August 31, 2024. The Fund outperformed its benchmark, the Nasdaq-100 Index®, which returned 0.36% for the same Period.
This outperformance was due to the following:
| Fund NAV Performance Attributed to*: | | |
| Changes in Reference Asset | 0.09 | % |
| Changes in other Variables | 1.01 | % |
| Fees and Expenses | -0.10 | % |
The Fund holds a combination of FLexible EXchange® Options (“FLEX Options”) designed to target the Fund’s objective.
* The Fund’s performance is impacted by changes in the values of the FLEX Options to which it is exposed. We attribute (allocate) the impact on the Fund’s performance into three components. The first of the three components is the impact on the Fund’s performance due to changes in the Fund’s Reference Asset. The second component is the aggregate impact on the Fund’s performance due to changes in other variables that impact FLEX Options prices - these include changes in a) the Reference Asset’s dividends, b) interest rates, c) implied volatility, and d) time to option expiration. The third component is from the Fund’s fees and expenses incurred during the Period.
FUND PERFORMANCE (July 19, 2024 to August 31, 2024)
The performance line graph below shows the performance of a hypothetical $10,000 initial investment in the Fund over a ten-year period (or for the life of the Fund, if shorter). The subsequent account value as of the end of the Period is listed next to the name of the Fund or index, as applicable. The performance table below shows the average annual total returns of the Fund for the past one-, five-, and ten-year periods, as applicable (or for the life of the Fund, if shorter), as of the end of the Period. Both the line graph and performance table compare the Fund’s performance to an appropriate broad-based index and may compare to additional indices reflecting the market segment(s) in which the Fund invests over the same periods.
Investment Performance of $10,000
| Average Annual Total Returns (as of August 31, 2024) | Since
Inception
(7/19/24) |
| FT Vest Nasdaq-100® Conservative Buffer ETF - July | 1.00% |
| Nasdaq-100 Index® | 0.36% |
| S&P 500® Index | 2.77% |
Visit www.ftportfolios.com/etf/QCJL for more recent performance information.
The Fund’s past performance is not a good predictor of the Fund’s future performance. The graph and table do not reflect the deduction of taxes that a shareholder would pay on Fund distributions or redemption of Fund shares.
KEY FUND STATISTICS (As of August 31, 2024)
| Fund net assets | $48,380,430 |
| Total number of portfolio holdings | 4 |
| Total advisory fee paid | $37,856 |
| Portfolio turnover rate | 0% |
WHAT DID THE FUND INVEST IN? (As of August 31, 2024)
The table below shows the investment makeup of the Fund, representing the percentage of net assets of the Fund.
| Purchased Options | 103.5% |
| Written Options | (4.5%) |
| Net Other Assets and Liabilities | 1.0% |
| Total | 100.0% |
WHERE CAN I FIND ADDITIONAL INFORMATION ABOUT THE FUND?
Visit www.ftportfolios.com/fund-documents/etf/QCJL to view additional information about the Fund such as the prospectus, financial information, Fund holdings and proxy voting information. You may also request this information by contacting us at 1-800-621-1675 or info@ftportfolios.com.
OTHER INFORMATION
The Fund is not sponsored, endorsed, sold or promoted by Invesco QQQ TrustSM, Series 1, Invesco, or Nasdaq, Inc. (together with their affiliates hereinafter referred to as the “Corporations”). The Corporations have not passed on the legality or suitability of, or the accuracy or adequacy of, descriptions and disclosures relating to the Fund or the FLEX Options. The Corporations make no representations or warranties, express or implied, regarding the advisability of investing in the Fund or the FLEX Options or results to be obtained by the Fund or the FLEX Options, shareholders or any other person or entity from use of the Invesco QQQ TrustSM, Series 1. The Corporations have no liability in connection with the management, administration, marketing or trading of the Fund or the FLEX Options.
FT Vest U.S. Equity
Enhance & Moderate Buffer ETF - July
XJUL | CBOE BZX EXCHANGE, INC.
ANNUAL SHAREHOLDER REPORT | August 31, 2024
This annual shareholder report contains important information about the FT Vest U.S. Equity Enhance & Moderate Buffer ETF - July (the “Fund”) for the year of September 1, 2023 to August 31, 2024 (the “Period”). You can find additional information about the Fund at www.ftportfolios.com/fund-documents/etf/XJUL. You can also request this information by contacting us at 1-800-621-1675 or info@ftportfolios.com.
This report describes changes to the Fund that occurred during the Period.
WHAT WERE THE FUND COSTS FOR THE LAST YEAR?
(Based on a hypothetical $10,000 investment)
| Fund | Costs of a $10,000 investment | Costs paid as a percentage
of a $10,000 investment |
| FT Vest U.S. Equity Enhance & Moderate Buffer ETF - July | $90 | 0.85% |
HOW DID THE FUND PERFORM LAST YEAR? WHAT AFFECTED THE FUND’S PERFORMANCE?
The Fund returned 12.14% for the twelve months ended August 31, 2024. The Fund underperformed its benchmark, the S&P 500® Index, which returned 27.14% for the same Period.
This underperformance was due to the following:
| Fund NAV Performance Attributed to*: | | |
| Changes in Reference Asset | 8.19 | % |
| Changes in other Variables | 4.80 | % |
| Fees and Expenses | -0.85 | % |
The Fund holds a combination of FLexible EXchange® Options (“FLEX Options”) designed to target the Fund’s objective.
* The Fund’s performance is impacted by changes in the values of the FLEX Options to which it is exposed. We attribute (allocate) the impact on the Fund’s performance into three components. The first of the three components is the impact on the Fund’s performance due to changes in the Fund’s Reference Asset. The second component is the aggregate impact on the Fund’s performance due to changes in other variables that impact FLEX Options prices - these include changes in a) the Reference Asset’s dividends, b) interest rates, c) implied volatility, and d) time to option expiration. The third component is from the Fund’s fees and expenses incurred during the Period.
FUND PERFORMANCE (July 21, 2023 to August 31, 2024)
The performance line graph below shows the performance of a hypothetical $10,000 initial investment in the Fund over a ten-year period (or for the life of the Fund, if shorter). The subsequent account value as of the end of the Period is listed next to the name of the Fund or index, as applicable. The performance table below shows the average annual total returns of the Fund for the past one-, five-, and ten-year periods, as applicable (or for the life of the Fund, if shorter), as of the end of the Period. Both the line graph and performance table compare the Fund’s performance to an appropriate broad-based index and may compare to additional indices reflecting the market segment(s) in which the Fund invests over the same periods.
Investment Performance of $10,000
| Average Annual Total Returns (as of August 31, 2024) | 1 Year | Since
Inception
(7/21/23) |
| FT Vest U.S. Equity Enhance & Moderate Buffer ETF - July | 12.14% | 11.25% |
| S&P 500® Index | 27.14% | 23.61% |
Visit www.ftportfolios.com/etf/XJUL for more recent performance information.
The Fund’s past performance is not a good predictor of the Fund’s future performance. The graph and table do not reflect the deduction of taxes that a shareholder would pay on Fund distributions or redemption of Fund shares.
KEY FUND STATISTICS (As of August 31, 2024)
| Fund net assets | $51,944,949 |
| Total number of portfolio holdings | 6 |
| Total advisory fee paid | $406,735 |
| Portfolio turnover rate | 0% |
WHAT DID THE FUND INVEST IN? (As of August 31, 2024)
The table below shows the investment makeup of the Fund, representing the percentage of net assets of the Fund.
| Money Market Funds | 1.0% |
| Purchased Options | 111.7% |
| Written Options | (12.6%) |
| Net Other Assets and Liabilities | (0.1%) |
| Total | 100.0% |
HOW HAS THE FUND MATERIALLY CHANGED?
This is a summary of certain changes to the Fund since September 1, 2023. For more complete information, you may review the Fund’s prospectus and any applicable supplements at www.ftportfolios.com/fund-documents/etf/XJUL or upon request at 1-800-621-1675 or info@ftportfolios.com.
During the fiscal year ended August 31, 2024, the Fund’s predetermined upside cap on Underlying ETF returns was reset based upon prevailing market conditions at the start of the new Target Outcome Period.
WHERE CAN I FIND ADDITIONAL INFORMATION ABOUT THE FUND?
Visit www.ftportfolios.com/fund-documents/etf/XJUL to view additional information about the Fund such as the prospectus, financial information, Fund holdings and proxy voting information. You may also request this information by contacting us at 1-800-621-1675 or info@ftportfolios.com.
OTHER INFORMATION
The Fund is not sponsored, endorsed, sold or promoted by SPDR® S&P 500® ETF Trust, PDR Services, LLC, or Standard & Poor’s® (together with their affiliates hereinafter referred to as the “Corporations”). The Corporations have not passed on the legality or suitability of, or the accuracy or adequacy of, descriptions and disclosures relating to the Fund or the FLEX Options. The Corporations make no representations or warranties, express or implied, regarding the advisability of investing in the Fund or the FLEX Options or results to be obtained by the Fund or the FLEX Options, shareholders or any other person or entity from use of the SPDR® S&P 500® ETF Trust. The Corporations have no liability in connection with the management, administration, marketing or trading of the Fund or the FLEX Options.
FT Vest Nasdaq-100® Moderate Buffer ETF - August
QMAG | CBOE BZX EXCHANGE, INC.
ANNUAL SHAREHOLDER REPORT | August 31, 2024
This annual shareholder report contains important information about the FT Vest Nasdaq-100® Moderate Buffer ETF - August (the “Fund”) for the period of August 16, 2024 (commencement of investment operations) to August 31, 2024 (the “Period”). You can find additional information about the Fund at www.ftportfolios.com/fund-documents/etf/QMAG. You can also request this information by contacting us at 1-800-621-1675 or info@ftportfolios.com.
WHAT WERE THE FUND COSTS FOR THE LAST YEAR?
(Based on a hypothetical $10,000 investment)
| Fund | Costs of a $10,000 investment | Costs paid as a percentage
of a $10,000 investment |
| FT Vest Nasdaq-100® Moderate Buffer ETF - August | $4(1) | 0.90%(2) |
(1) | The Fund commenced investment operations on August 16, 2024. Had the Fund been in operation for a complete fiscal year, the cost of a $10,000 investment would have been higher. |
(2) | Annualized. |
HOW DID THE FUND PERFORM LAST YEAR? WHAT AFFECTED THE FUND’S PERFORMANCE?
The Fund returned 0.40% for the period from the Fund’s inception date on August 16, 2024 through August 31, 2024. The Fund outperformed its benchmark, the Nasdaq-100 Index®, which returned 0.35% for the same Period.
This outperformance was due to the following:
| Fund NAV Performance Attributed to*: | | |
| Changes in Reference Asset | 0.12 | % |
| Changes in other Variables | 0.31 | % |
| Fees and Expenses | -0.03 | % |
The Fund holds a combination of FLexible EXchange® Options (“FLEX Options”) designed to target the Fund’s objective.
* The Fund’s performance is impacted by changes in the values of the FLEX Options to which it is exposed. We attribute (allocate) the impact on the Fund’s performance into three components. The first of the three components is the impact on the Fund’s performance due to changes in the Fund’s Reference Asset. The second component is the aggregate impact on the Fund’s performance due to changes in other variables that impact FLEX Options prices - these include changes in a) the Reference Asset’s dividends, b) interest rates, c) implied volatility, and d) time to option expiration. The third component is from the Fund’s fees and expenses incurred during the Period.
FUND PERFORMANCE (August 16, 2024 to August 31, 2024)
The performance line graph below shows the performance of a hypothetical $10,000 initial investment in the Fund over a ten-year period (or for the life of the Fund, if shorter). The subsequent account value as of the end of the Period is listed next to the name of the Fund or index, as applicable. The performance table below shows the average annual total returns of the Fund for the past one-, five-, and ten-year periods, as applicable (or for the life of the Fund, if shorter), as of the end of the Period. Both the line graph and performance table compare the Fund’s performance to an appropriate broad-based index and may compare to additional indices reflecting the market segment(s) in which the Fund invests over the same periods.
Investment Performance of $10,000
| Average Annual Total Returns (as of August 31, 2024) | Since
Inception
(8/16/24) |
| FT Vest Nasdaq-100® Moderate Buffer ETF - August | 0.40% |
| Nasdaq-100 Index® | 0.35% |
| S&P 500® Index | 1.75% |
Visit www.ftportfolios.com/etf/QMAG for more recent performance information.
The Fund’s past performance is not a good predictor of the Fund’s future performance. The graph and table do not reflect the deduction of taxes that a shareholder would pay on Fund distributions or redemption of Fund shares.
KEY FUND STATISTICS (As of August 31, 2024)
| Fund net assets | $72,090,340 |
| Total number of portfolio holdings | 4 |
| Total advisory fee paid | $10,200 |
| Portfolio turnover rate | 0% |
WHAT DID THE FUND INVEST IN? (As of August 31, 2024)
The table below shows the investment makeup of the Fund, representing the percentage of net assets of the Fund.
| Purchased Options | 104.4% |
| Written Options | (5.5%) |
| Net Other Assets and Liabilities | 1.1% |
| Total | 100.0% |
WHERE CAN I FIND ADDITIONAL INFORMATION ABOUT THE FUND?
Visit www.ftportfolios.com/fund-documents/etf/QMAG to view additional information about the Fund such as the prospectus, financial information, Fund holdings and proxy voting information. You may also request this information by contacting us at 1-800-621-1675 or info@ftportfolios.com.
OTHER INFORMATION
The Fund is not sponsored, endorsed, sold or promoted by Invesco QQQ TrustSM, Series 1, Invesco, or Nasdaq, Inc. (together with their affiliates hereinafter referred to as the “Corporations”). The Corporations have not passed on the legality or suitability of, or the accuracy or adequacy of, descriptions and disclosures relating to the Fund or the FLEX Options. The Corporations make no representations or warranties, express or implied, regarding the advisability of investing in the Fund or the FLEX Options or results to be obtained by the Fund or the FLEX Options, shareholders or any other person or entity from use of the Invesco QQQ TrustSM, Series 1. The Corporations have no liability in connection with the management, administration, marketing or trading of the Fund or the FLEX Options.
FT Vest U.S. Equity
Enhance & Moderate Buffer ETF - August
XAUG | CBOE BZX EXCHANGE, INC.
ANNUAL SHAREHOLDER REPORT | August 31, 2024
This annual shareholder report contains important information about the FT Vest U.S. Equity Enhance & Moderate Buffer ETF - August (the “Fund”) for the year of September 1, 2023 to August 31, 2024 (the “Period”). You can find additional information about the Fund at www.ftportfolios.com/fund-documents/etf/XAUG. You can also request this information by contacting us at 1-800-621-1675 or info@ftportfolios.com.
This report describes changes to the Fund that occurred during the Period.
WHAT WERE THE FUND COSTS FOR THE LAST YEAR?
(Based on a hypothetical $10,000 investment)
| Fund | Costs of a $10,000 investment | Costs paid as a percentage
of a $10,000 investment |
| FT Vest U.S. Equity Enhance & Moderate Buffer ETF - August | $90 | 0.85% |
HOW DID THE FUND PERFORM LAST YEAR? WHAT AFFECTED THE FUND’S PERFORMANCE?
The Fund returned 10.82% for the twelve months ended August 31, 2024. The Fund underperformed its benchmark, the S&P 500® Index, which returned 27.14% for the same Period.
This underperformance was due to the following:
| Fund NAV Performance Attributed to*: | | |
| Changes in Reference Asset | 6.40 | % |
| Changes in other Variables | 5.27 | % |
| Fees and Expenses | -0.85 | % |
The Fund holds a combination of FLexible EXchange® Options (“FLEX Options”) designed to target the Fund’s objective.
* The Fund’s performance is impacted by changes in the values of the FLEX Options to which it is exposed. We attribute (allocate) the impact on the Fund’s performance into three components. The first of the three components is the impact on the Fund’s performance due to changes in the Fund’s Reference Asset. The second component is the aggregate impact on the Fund’s performance due to changes in other variables that impact FLEX Options prices - these include changes in a) the Reference Asset’s dividends, b) interest rates, c) implied volatility, and d) time to option expiration. The third component is from the Fund’s fees and expenses incurred during the Period.
FUND PERFORMANCE (August 18, 2023 to August 31, 2024)
The performance line graph below shows the performance of a hypothetical $10,000 initial investment in the Fund over a ten-year period (or for the life of the Fund, if shorter). The subsequent account value as of the end of the Period is listed next to the name of the Fund or index, as applicable. The performance table below shows the average annual total returns of the Fund for the past one-, five-, and ten-year periods, as applicable (or for the life of the Fund, if shorter), as of the end of the Period. Both the line graph and performance table compare the Fund’s performance to an appropriate broad-based index and may compare to additional indices reflecting the market segment(s) in which the Fund invests over the same periods.
Investment Performance of $10,000
| Average Annual Total Returns (as of August 31, 2024) | 1 Year | Since
Inception
(8/18/23) |
| FT Vest U.S. Equity Enhance & Moderate Buffer ETF - August | 10.82% | 12.01% |
| S&P 500® Index | 27.14% | 30.01% |
Visit www.ftportfolios.com/etf/XAUG for more recent performance information.
The Fund’s past performance is not a good predictor of the Fund’s future performance. The graph and table do not reflect the deduction of taxes that a shareholder would pay on Fund distributions or redemption of Fund shares.
KEY FUND STATISTICS (As of August 31, 2024)
| Fund net assets | $27,550,932 |
| Total number of portfolio holdings | 6 |
| Total advisory fee paid | $215,388 |
| Portfolio turnover rate | 0% |
WHAT DID THE FUND INVEST IN? (As of August 31, 2024)
The table below shows the investment makeup of the Fund, representing the percentage of net assets of the Fund.
| Money Market Funds | 1.0% |
| Purchased Options | 112.0% |
| Written Options | (13.0%) |
| Net Other Assets and Liabilities | (0.0%) |
| Total | 100.0% |
Any amount shown as 0.0% represents less than 0.1%.
HOW HAS THE FUND MATERIALLY CHANGED?
This is a summary of certain changes to the Fund since September 1, 2023. For more complete information, you may review the Fund’s prospectus and any applicable supplements at www.ftportfolios.com/fund-documents/etf/XAUG or upon request at 1-800-621-1675 or info@ftportfolios.com.
During the fiscal year ended August 31, 2024, the Fund’s predetermined upside cap on Underlying ETF returns was reset based upon prevailing market conditions at the start of the new Target Outcome Period.
WHERE CAN I FIND ADDITIONAL INFORMATION ABOUT THE FUND?
Visit www.ftportfolios.com/fund-documents/etf/XAUG to view additional information about the Fund such as the prospectus, financial information, Fund holdings and proxy voting information. You may also request this information by contacting us at 1-800-621-1675 or info@ftportfolios.com.
OTHER INFORMATION
The Fund is not sponsored, endorsed, sold or promoted by SPDR® S&P 500® ETF Trust, PDR Services, LLC, or Standard & Poor’s® (together with their affiliates hereinafter referred to as the “Corporations”). The Corporations have not passed on the legality or suitability of, or the accuracy or adequacy of, descriptions and disclosures relating to the Fund or the FLEX Options. The Corporations make no representations or warranties, express or implied, regarding the advisability of investing in the Fund or the FLEX Options or results to be obtained by the Fund or the FLEX Options, shareholders or any other person or entity from use of the SPDR® S&P 500® ETF Trust. The Corporations have no liability in connection with the management, administration, marketing or trading of the Fund or the FLEX Options.
FT Vest International Equity Buffer ETF - September (now known as FT Vest International Equity Moderate Buffer ETF - September)
YSEP | CBOE BZX EXCHANGE, INC.
ANNUAL SHAREHOLDER REPORT | August 31, 2024
This annual shareholder report contains important information about the FT Vest International Equity Buffer ETF - September (the “Fund”) for the year of September 1, 2023 to August 31, 2024 (the “Period”). You can find additional information about the Fund at www.ftportfolios.com/fund-documents/etf/YSEP. You can also request this information by contacting us at 1-800-621-1675 or info@ftportfolios.com.
This report describes changes to the Fund that occurred during and after the reporting period.
WHAT WERE THE FUND COSTS FOR THE LAST YEAR?
(Based on a hypothetical $10,000 investment)
| Fund | Costs of a $10,000 investment | Costs paid as a percentage
of a $10,000 investment |
| FT Vest International Equity Buffer ETF - September | $97 | 0.90% |
HOW DID THE FUND PERFORM LAST YEAR? WHAT AFFECTED THE FUND’S PERFORMANCE?
The Fund returned 15.24% for the twelve months ended August 31, 2024. The Fund underperformed its benchmark, the MSCI EAFE Index, which returned 19.40% for the same Period.
This underperformance was due to the following:
| Fund NAV Performance Attributed to*: | | |
| Changes in Reference Asset | 11.98 | % |
| Changes in other Variables | 4.16 | % |
| Fees and Expenses | -0.90 | % |
The Fund holds a combination of FLexible EXchange® Options (“FLEX Options”) designed to target the Fund’s objective.
* The Fund’s performance is impacted by changes in the values of the FLEX Options to which it is exposed. We attribute (allocate) the impact on the Fund’s performance into three components. The first of the three components is the impact on the Fund’s performance due to changes in the Fund’s Reference Asset. The second component is the aggregate impact on the Fund’s performance due to changes in other variables that impact FLEX Options prices - these include changes in a) the Reference Asset’s dividends, b) interest rates, c) implied volatility, and d) time to option expiration. The third component is from the Fund’s fees and expenses incurred during the Period.
FUND PERFORMANCE (September 17, 2021 to August 31, 2024)
The performance line graph below shows the performance of a hypothetical $10,000 initial investment in the Fund over a ten-year period (or for the life of the Fund, if shorter). The subsequent account value as of the end of the Period is listed next to the name of the Fund or index, as applicable. The performance table below shows the average annual total returns of the Fund for the past one-, five-, and ten-year periods, as applicable (or for the life of the Fund, if shorter), as of the end of the Period. Both the line graph and performance table compare the Fund’s performance to an appropriate broad-based index and may compare to additional indices reflecting the market segment(s) in which the Fund invests over the same periods.
Investment Performance of $10,000
| Average Annual Total Returns (as of August 31, 2024) | 1 Year | Since
Inception
(9/17/21) |
| FT Vest International Equity Buffer ETF - September | 15.24% | 4.67% |
| MSCI EAFE Index | 19.40% | 4.28% |
Visit www.ftportfolios.com/etf/YSEP for more recent performance information.
The Fund’s past performance is not a good predictor of the Fund’s future performance. The graph and table do not reflect the deduction of taxes that a shareholder would pay on Fund distributions or redemption of Fund shares.
KEY FUND STATISTICS (As of August 31, 2024)
| Fund net assets | $34,253,525 |
| Total number of portfolio holdings | 5 |
| Total advisory fee paid | $296,994 |
| Portfolio turnover rate | 0% |
WHAT DID THE FUND INVEST IN? (As of August 31, 2024)
The table below shows the investment makeup of the Fund, representing the percentage of net assets of the Fund.
| Money Market Funds | 0.4% |
| Purchased Options | 99.8% |
| Written Options | (0.1%) |
| Net Other Assets and Liabilities | (0.1%) |
| Total | 100.0% |
HOW HAS THE FUND MATERIALLY CHANGED?
This is a summary of certain changes to the Fund since September 1, 2023. For more complete information, you may review the Fund’s prospectus and any applicable supplements at www.ftportfolios.com/fund-documents/etf/YSEP or upon request at 1-800-621-1675 or info@ftportfolios.com.
Effective September 23, 2024, the name of the Fund changed from “FT Vest International Equity Buffer ETF - September” to “FT Vest International Equity Moderate Buffer ETF - September”, the Fund’s buffer against Underlying ETF losses increased from 10% to 15%, and the Fund’s predetermined upside cap on Underlying ETF returns was reset based upon prevailing market conditions at the start of the new Target Outcome Period. Effective September 18, 2023, the Fund’s predetermined upside cap on Underlying ETF returns was reset based upon prevailing market conditions at the start of the new Target Outcome Period.
WHERE CAN I FIND ADDITIONAL INFORMATION ABOUT THE FUND?
Visit www.ftportfolios.com/fund-documents/etf/YSEP to view additional information about the Fund such as the prospectus, financial information, Fund holdings and proxy voting information. You may also request this information by contacting us at 1-800-621-1675 or info@ftportfolios.com.
OTHER INFORMATION
The Fund is not sponsored, endorsed, sold or promoted by iShares MSCI EAFE ETF, BFA, or MSCI Inc. (together with their affiliates hereinafter referred to as the “Corporations”). The Corporations have not passed on the legality or suitability of, or the accuracy or adequacy of, descriptions and disclosures relating to the Fund or the FLEX Options. The Corporations make no representations or warranties, express or implied, regarding the advisability of investing in the Fund or the FLEX Options or results to be obtained by the Fund or the FLEX Options, shareholders or any other person or entity from use of the Underlying ETF. The Corporations have no liability in connection with the management, administration, marketing or trading of the Fund or the FLEX Options.
FT Vest Nasdaq-100® Buffer ETF - September
QSPT | CBOE BZX EXCHANGE, INC.
ANNUAL SHAREHOLDER REPORT | August 31, 2024
This annual shareholder report contains important information about the FT Vest Nasdaq-100® Buffer ETF - September (the “Fund”) for the year of September 1, 2023 to August 31, 2024 (the “Period”). You can find additional information about the Fund at www.ftportfolios.com/fund-documents/etf/QSPT. You can also request this information by contacting us at 1-800-621-1675 or info@ftportfolios.com.
This report describes changes to the Fund that occurred during the Period.
WHAT WERE THE FUND COSTS FOR THE LAST YEAR?
(Based on a hypothetical $10,000 investment)
| Fund | Costs of a $10,000 investment | Costs paid as a percentage
of a $10,000 investment |
| FT Vest Nasdaq-100® Buffer ETF - September | $99 | 0.90% |
HOW DID THE FUND PERFORM LAST YEAR? WHAT AFFECTED THE FUND’S PERFORMANCE?
The Fund returned 20.25% for the twelve months ended August 31, 2024. The Fund underperformed its benchmark, the Nasdaq-100 Index®, which returned 27.30% for the same Period.
This underperformance was due to the following:
| Fund NAV Performance Attributed to*: | | |
| Changes in Reference Asset | 11.21 | % |
| Changes in other Variables | 9.94 | % |
| Fees and Expenses | -0.90 | % |
The Fund holds a combination of FLexible EXchange® Options (“FLEX Options”) designed to target the Fund’s objective.
* The Fund’s performance is impacted by changes in the values of the FLEX Options to which it is exposed. We attribute (allocate) the impact on the Fund’s performance into three components. The first of the three components is the impact on the Fund’s performance due to changes in the Fund’s Reference Asset. The second component is the aggregate impact on the Fund’s performance due to changes in other variables that impact FLEX Options prices - these include changes in a) the Reference Asset’s dividends, b) interest rates, c) implied volatility, and d) time to option expiration. The third component is from the Fund’s fees and expenses incurred during the Period.
FUND PERFORMANCE (September 17, 2021 to August 31, 2024)
The performance line graph below shows the performance of a hypothetical $10,000 initial investment in the Fund over a ten-year period (or for the life of the Fund, if shorter). The subsequent account value as of the end of the Period is listed next to the name of the Fund or index, as applicable. The performance table below shows the average annual total returns of the Fund for the past one-, five-, and ten-year periods, as applicable (or for the life of the Fund, if shorter), as of the end of the Period. Both the line graph and performance table compare the Fund’s performance to an appropriate broad-based index and may compare to additional indices reflecting the market segment(s) in which the Fund invests over the same periods.
Investment Performance of $10,000
| Average Annual Total Returns (as of August 31, 2024) | 1 Year | Since
Inception
(9/17/21) |
| FT Vest Nasdaq-100® Buffer ETF - September | 20.25% | 9.53% |
| Nasdaq-100 Index® | 27.30% | 9.52% |
| S&P 500® Index | 27.14% | 10.25% |
Visit www.ftportfolios.com/etf/QSPT for more recent performance information.
The Fund’s past performance is not a good predictor of the Fund’s future performance. The graph and table do not reflect the deduction of taxes that a shareholder would pay on Fund distributions or redemption of Fund shares.
KEY FUND STATISTICS (As of August 31, 2024)
| Fund net assets | $293,273,209 |
| Total number of portfolio holdings | 5 |
| Total advisory fee paid | $2,162,299 |
| Portfolio turnover rate | 0% |
WHAT DID THE FUND INVEST IN? (As of August 31, 2024)
The table below shows the investment makeup of the Fund, representing the percentage of net assets of the Fund.
| Money Market Funds | 0.3% |
| Purchased Options | 106.8% |
| Written Options | (7.0%) |
| Net Other Assets and Liabilities | (0.1%) |
| Total | 100.0% |
HOW HAS THE FUND MATERIALLY CHANGED?
This is a summary of certain changes to the Fund since September 1, 2023. For more complete information, you may review the Fund’s prospectus and any applicable supplements at www.ftportfolios.com/fund-documents/etf/QSPT or upon request at 1-800-621-1675 or info@ftportfolios.com.
During the fiscal year ended August 31, 2024, the Fund’s predetermined upside cap on Underlying ETF returns was reset based upon prevailing market conditions at the start of the new Target Outcome Period.
WHERE CAN I FIND ADDITIONAL INFORMATION ABOUT THE FUND?
Visit www.ftportfolios.com/fund-documents/etf/QSPT to view additional information about the Fund such as the prospectus, financial information, Fund holdings and proxy voting information. You may also request this information by contacting us at 1-800-621-1675 or info@ftportfolios.com.
OTHER INFORMATION
The Fund is not sponsored, endorsed, sold or promoted by Invesco QQQ TrustSM, Series 1, Invesco, or Nasdaq, Inc. (together with their affiliates hereinafter referred to as the “Corporations”). The Corporations have not passed on the legality or suitability of, or the accuracy or adequacy of, descriptions and disclosures relating to the Fund or the FLEX Options. The Corporations make no representations or warranties, express or implied, regarding the advisability of investing in the Fund or the FLEX Options or results to be obtained by the Fund or the FLEX Options, shareholders or any other person or entity from use of the Invesco QQQ TrustSM, Series 1. The Corporations have no liability in connection with the management, administration, marketing or trading of the Fund or the FLEX Options.
FT Vest U.S. Equity Enhance
& Moderate Buffer ETF - September
XSEP | CBOE BZX EXCHANGE, INC.
ANNUAL SHAREHOLDER REPORT | August 31, 2024
This annual shareholder report contains important information about the FT Vest U.S. Equity Enhance & Moderate Buffer ETF - September (the “Fund”) for the year of September 1, 2023 to August 31, 2024 (the “Period”). You can find additional information about the Fund at www.ftportfolios.com/fund-documents/etf/XSEP. You can also request this information by contacting us at 1-800-621-1675 or info@ftportfolios.com.
This report describes changes to the Fund that occurred during the Period.
WHAT WERE THE FUND COSTS FOR THE LAST YEAR?
(Based on a hypothetical $10,000 investment)
| Fund | Costs of a $10,000 investment | Costs paid as a percentage
of a $10,000 investment |
| FT Vest U.S. Equity Enhance & Moderate Buffer ETF - September | $90 | 0.85% |
HOW DID THE FUND PERFORM LAST YEAR? WHAT AFFECTED THE FUND’S PERFORMANCE?
The Fund returned 11.00% for the twelve months ended August 31, 2024. The Fund underperformed its benchmark, the S&P 500® Index, which returned 27.14% for the same Period.
This underperformance was due to the following:
| Fund NAV Performance Attributed to*: | | |
| Changes in Reference Asset | 6.10 | % |
| Changes in other Variables | 5.75 | % |
| Fees and Expenses | -0.85 | % |
The Fund holds a combination of FLexible EXchange® Options (“FLEX Options”) designed to target the Fund’s objective.
* The Fund’s performance is impacted by changes in the values of the FLEX Options to which it is exposed. We attribute (allocate) the impact on the Fund’s performance into three components. The first of the three components is the impact on the Fund’s performance due to changes in the Fund’s Reference Asset. The second component is the aggregate impact on the Fund’s performance due to changes in other variables that impact FLEX Options prices - these include changes in a) the Reference Asset’s dividends, b) interest rates, c) implied volatility, and d) time to option expiration. The third component is from the Fund’s fees and expenses incurred during the Period.
FUND PERFORMANCE (September 21, 2022 to August 31, 2024)
The performance line graph below shows the performance of a hypothetical $10,000 initial investment in the Fund over a ten-year period (or for the life of the Fund, if shorter). The subsequent account value as of the end of the Period is listed next to the name of the Fund or index, as applicable. The performance table below shows the average annual total returns of the Fund for the past one-, five-, and ten-year periods, as applicable (or for the life of the Fund, if shorter), as of the end of the Period. Both the line graph and performance table compare the Fund’s performance to an appropriate broad-based index and may compare to additional indices reflecting the market segment(s) in which the Fund invests over the same periods.
Investment Performance of $10,000
| Average Annual Total Returns (as of August 31, 2024) | 1 Year | Since
Inception
(9/21/22) |
| FT Vest U.S. Equity Enhance & Moderate Buffer ETF - September | 11.00% | 12.79% |
| S&P 500® Index | 27.14% | 24.75% |
Visit www.ftportfolios.com/etf/XSEP for more recent performance information.
The Fund’s past performance is not a good predictor of the Fund’s future performance. The graph and table do not reflect the deduction of taxes that a shareholder would pay on Fund distributions or redemption of Fund shares.
KEY FUND STATISTICS (As of August 31, 2024)
| Fund net assets | $149,680,732 |
| Total number of portfolio holdings | 6 |
| Total advisory fee paid | $1,123,821 |
| Portfolio turnover rate | 0% |
WHAT DID THE FUND INVEST IN? (As of August 31, 2024)
The table below shows the investment makeup of the Fund, representing the percentage of net assets of the Fund.
| Money Market Funds | 0.3% |
| Purchased Options | 138.2% |
| Written Options | (38.4%) |
| Net Other Assets and Liabilities | (0.1%) |
| Total | 100.0% |
HOW HAS THE FUND MATERIALLY CHANGED?
This is a summary of certain changes to the Fund since September 1, 2023. For more complete information, you may review the Fund’s prospectus and any applicable supplements at www.ftportfolios.com/fund-documents/etf/XSEP or upon request at 1-800-621-1675 or info@ftportfolios.com.
During the fiscal year ended August 31, 2024, the Fund’s predetermined upside cap on Underlying ETF returns was reset based upon prevailing market conditions at the start of the new Target Outcome Period.
WHERE CAN I FIND ADDITIONAL INFORMATION ABOUT THE FUND?
Visit www.ftportfolios.com/fund-documents/etf/XSEP to view additional information about the Fund such as the prospectus, financial information, Fund holdings and proxy voting information. You may also request this information by contacting us at 1-800-621-1675 or info@ftportfolios.com.
OTHER INFORMATION
The Fund is not sponsored, endorsed, sold or promoted by SPDR® S&P 500® ETF Trust, PDR Services, LLC, or Standard & Poor’s® (together with their affiliates hereinafter referred to as the “Corporations”). The Corporations have not passed on the legality or suitability of, or the accuracy or adequacy of, descriptions and disclosures relating to the Fund or the FLEX Options. The Corporations make no representations or warranties, express or implied, regarding the advisability of investing in the Fund or the FLEX Options or results to be obtained by the Fund or the FLEX Options, shareholders or any other person or entity from use of the SPDR® S&P 500® ETF Trust. The Corporations have no liability in connection with the management, administration, marketing or trading of the Fund or the FLEX Options.
FT Vest U.S. Equity
Enhance & Moderate Buffer ETF - October
XOCT | CBOE BZX EXCHANGE, INC.
ANNUAL SHAREHOLDER REPORT | August 31, 2024
This annual shareholder report contains important information about the FT Vest U.S. Equity Enhance & Moderate Buffer ETF - October (the “Fund”) for the period of October 20, 2023 (commencement of investment operations) to August 31, 2024 (the “Period”). You can find additional information about the Fund at www.ftportfolios.com/fund-documents/etf/XOCT. You can also request this information by contacting us at 1-800-621-1675 or info@ftportfolios.com.
WHAT WERE THE FUND COSTS FOR THE LAST YEAR?
(Based on a hypothetical $10,000 investment)
| Fund | Costs of a $10,000 investment | Costs paid as a percentage
of a $10,000 investment |
| FT Vest U.S. Equity Enhance & Moderate Buffer ETF - October | $78(1) | 0.85%(2) |
(1) | The Fund commenced investment operations on October 20, 2023. Had the Fund been in operation for a complete fiscal year, the cost of a $10,000 investment would have been higher. |
(2) | Annualized. |
HOW DID THE FUND PERFORM LAST YEAR? WHAT AFFECTED THE FUND’S PERFORMANCE?
The Fund returned 11.18% for the period from the Fund’s inception date on October 20, 2023 through August 31, 2024. The Fund underperformed its benchmark, the S&P 500® Index, which returned 35.42% for the same Period.
This underperformance was due to the following:
| Fund NAV Performance Attributed to*: | | |
| Changes in Reference Asset | 5.73 | % |
| Changes in other Variables | 6.18 | % |
| Fees and Expenses | -0.73 | % |
The Fund holds a combination of FLexible EXchange® Options (“FLEX Options”) designed to target the Fund’s objective.
* The Fund’s performance is impacted by changes in the values of the FLEX Options to which it is exposed. We attribute (allocate) the impact on the Fund’s performance into three components. The first of the three components is the impact on the Fund’s performance due to changes in the Fund’s Reference Asset. The second component is the aggregate impact on the Fund’s performance due to changes in other variables that impact FLEX Options prices - these include changes in a) the Reference Asset’s dividends, b) interest rates, c) implied volatility, and d) time to option expiration. The third component is from the Fund’s fees and expenses incurred during the Period.
FUND PERFORMANCE (October 20, 2023 to August 31, 2024)
The performance line graph below shows the performance of a hypothetical $10,000 initial investment in the Fund over a ten-year period (or for the life of the Fund, if shorter). The subsequent account value as of the end of the Period is listed next to the name of the Fund or index, as applicable. The performance table below shows the average annual total returns of the Fund for the past one-, five-, and ten-year periods, as applicable (or for the life of the Fund, if shorter), as of the end of the Period. Both the line graph and performance table compare the Fund’s performance to an appropriate broad-based index and may compare to additional indices reflecting the market segment(s) in which the Fund invests over the same periods.
Investment Performance of $10,000
| Average Annual Total Returns (as of August 31, 2024) | Since
Inception
(10/20/23) |
| FT Vest U.S. Equity Enhance & Moderate Buffer ETF - October | 11.18% |
| S&P 500® Index | 35.42% |
Visit www.ftportfolios.com/etf/XOCT for more recent performance information.
The Fund’s past performance is not a good predictor of the Fund’s future performance. The graph and table do not reflect the deduction of taxes that a shareholder would pay on Fund distributions or redemption of Fund shares.
KEY FUND STATISTICS (As of August 31, 2024)
| Fund net assets | $58,173,367 |
| Total number of portfolio holdings | 6 |
| Total advisory fee paid | $344,989 |
| Portfolio turnover rate | 0% |
WHAT DID THE FUND INVEST IN? (As of August 31, 2024)
The table below shows the investment makeup of the Fund, representing the percentage of net assets of the Fund.
| Money Market Funds | 0.4% |
| Purchased Options | 150.0% |
| Written Options | (50.3%) |
| Net Other Assets and Liabilities | (0.1%) |
| Total | 100.0% |
WHERE CAN I FIND ADDITIONAL INFORMATION ABOUT THE FUND?
Visit www.ftportfolios.com/fund-documents/etf/XOCT to view additional information about the Fund such as the prospectus, financial information, Fund holdings and proxy voting information. You may also request this information by contacting us at 1-800-621-1675 or info@ftportfolios.com.
OTHER INFORMATION
The Fund is not sponsored, endorsed, sold or promoted by SPDR® S&P 500® ETF Trust, PDR Services, LLC, or Standard & Poor’s® (together with their affiliates hereinafter referred to as the “Corporations”). The Corporations have not passed on the legality or suitability of, or the accuracy or adequacy of, descriptions and disclosures relating to the Fund or the FLEX Options. The Corporations make no representations or warranties, express or implied, regarding the advisability of investing in the Fund or the FLEX Options or results to be obtained by the Fund or the FLEX Options, shareholders or any other person or entity from use of the SPDR® S&P 500® ETF Trust. The Corporations have no liability in connection with the management, administration, marketing or trading of the Fund or the FLEX Options.
FT Vest U.S. Equity
Enhance & Moderate Buffer ETF - November
XNOV | CBOE BZX EXCHANGE, INC.
ANNUAL SHAREHOLDER REPORT | August 31, 2024
This annual shareholder report contains important information about the FT Vest U.S. Equity Enhance & Moderate Buffer ETF - November (the “Fund”) for the period of November 17, 2023 (commencement of investment operations) to August 31, 2024 (the “Period”). You can find additional information about the Fund at www.ftportfolios.com/fund-documents/etf/XNOV. You can also request this information by contacting us at 1-800-621-1675 or info@ftportfolios.com.
WHAT WERE THE FUND COSTS FOR THE LAST YEAR?
(Based on a hypothetical $10,000 investment)
| Fund | Costs of a $10,000 investment | Costs paid as a percentage
of a $10,000 investment |
| FT Vest U.S. Equity Enhance & Moderate Buffer ETF - November | $70(1) | 0.85%(2) |
(1) | The Fund commenced investment operations on November 17, 2023. Had the Fund been in operation for a complete fiscal year, the cost of a $10,000 investment would have been higher. |
(2) | Annualized. |
HOW DID THE FUND PERFORM LAST YEAR? WHAT AFFECTED THE FUND’S PERFORMANCE?
The Fund returned 9.14% for the period from the Fund’s inception date on November 17, 2023 through August 31, 2024. The Fund underperformed its benchmark, the S&P 500® Index, which returned 26.53% for the same Period.
This underperformance was due to the following:
| Fund NAV Performance Attributed to*: | | |
| Changes in Reference Asset | 5.39 | % |
| Changes in other Variables | 4.42 | % |
| Fees and Expenses | -0.67 | % |
The Fund holds a combination of FLexible EXchange® Options (“FLEX Options”) designed to target the Fund’s objective.
* The Fund’s performance is impacted by changes in the values of the FLEX Options to which it is exposed. We attribute (allocate) the impact on the Fund’s performance into three components. The first of the three components is the impact on the Fund’s performance due to changes in the Fund’s Reference Asset. The second component is the aggregate impact on the Fund’s performance due to changes in other variables that impact FLEX Options prices - these include changes in a) the Reference Asset’s dividends, b) interest rates, c) implied volatility, and d) time to option expiration. The third component is from the Fund’s fees and expenses incurred during the Period.
FUND PERFORMANCE (November 17, 2023 to August 31, 2024)
The performance line graph below shows the performance of a hypothetical $10,000 initial investment in the Fund over a ten-year period (or for the life of the Fund, if shorter). The subsequent account value as of the end of the Period is listed next to the name of the Fund or index, as applicable. The performance table below shows the average annual total returns of the Fund for the past one-, five-, and ten-year periods, as applicable (or for the life of the Fund, if shorter), as of the end of the Period. Both the line graph and performance table compare the Fund’s performance to an appropriate broad-based index and may compare to additional indices reflecting the market segment(s) in which the Fund invests over the same periods.
Investment Performance of $10,000
| Average Annual Total Returns (as of August 31, 2024) | Since
Inception
(11/17/23) |
| FT Vest U.S. Equity Enhance & Moderate Buffer ETF - November | 9.14% |
| S&P 500® Index | 26.53% |
Visit www.ftportfolios.com/etf/XNOV for more recent performance information.
The Fund’s past performance is not a good predictor of the Fund’s future performance. The graph and table do not reflect the deduction of taxes that a shareholder would pay on Fund distributions or redemption of Fund shares.
KEY FUND STATISTICS (As of August 31, 2024)
| Fund net assets | $35,962,841 |
| Total number of portfolio holdings | 6 |
| Total advisory fee paid | $169,319 |
| Portfolio turnover rate | 0% |
WHAT DID THE FUND INVEST IN? (As of August 31, 2024)
The table below shows the investment makeup of the Fund, representing the percentage of net assets of the Fund.
| Money Market Funds | 0.5% |
| Purchased Options | 137.6% |
| Written Options | (38.0%) |
| Net Other Assets and Liabilities | (0.1%) |
| Total | 100.0% |
WHERE CAN I FIND ADDITIONAL INFORMATION ABOUT THE FUND?
Visit www.ftportfolios.com/fund-documents/etf/XNOV to view additional information about the Fund such as the prospectus, financial information, Fund holdings and proxy voting information. You may also request this information by contacting us at 1-800-621-1675 or info@ftportfolios.com.
OTHER INFORMATION
The Fund is not sponsored, endorsed, sold or promoted by SPDR® S&P 500® ETF Trust, PDR Services, LLC, or Standard & Poor’s® (together with their affiliates hereinafter referred to as the “Corporations”). The Corporations have not passed on the legality or suitability of, or the accuracy or adequacy of, descriptions and disclosures relating to the Fund or the FLEX Options. The Corporations make no representations or warranties, express or implied, regarding the advisability of investing in the Fund or the FLEX Options or results to be obtained by the Fund or the FLEX Options, shareholders or any other person or entity from use of the SPDR® S&P 500® ETF Trust. The Corporations have no liability in connection with the management, administration, marketing or trading of the Fund or the FLEX Options.
FT Vest International Equity Moderate
Buffer ETF - December
YDEC | CBOE BZX EXCHANGE, INC.
ANNUAL SHAREHOLDER REPORT | August 31, 2024
This annual shareholder report contains important information about the FT Vest International Equity Moderate Buffer ETF - December (the “Fund”) for the year of September 1, 2023 to August 31, 2024 (the “Period”). You can find additional information about the Fund at www.ftportfolios.com/fund-documents/etf/YDEC. You can also request this information by contacting us at 1-800-621-1675 or info@ftportfolios.com.
This report describes changes to the Fund that occurred during the Period.
WHAT WERE THE FUND COSTS FOR THE LAST YEAR?
(Based on a hypothetical $10,000 investment)
| Fund | Costs of a $10,000 investment | Costs paid as a percentage
of a $10,000 investment |
| FT Vest International Equity Moderate Buffer ETF - December | $96 | 0.90% |
HOW DID THE FUND PERFORM LAST YEAR? WHAT AFFECTED THE FUND’S PERFORMANCE?
The Fund returned 13.37% for the twelve months ended August 31, 2024. The Fund underperformed its benchmark, the MSCI EAFE Index, which returned 19.40% for the same Period.
This underperformance was due to the following:
| Fund NAV Performance Attributed to*: | | |
| Changes in Reference Asset | 11.23 | % |
| Changes in other Variables | 3.04 | % |
| Fees and Expenses | -0.90 | % |
The Fund holds a combination of FLexible EXchange® Options (“FLEX Options”) designed to target the Fund’s objective.
* The Fund’s performance is impacted by changes in the values of the FLEX Options to which it is exposed. We attribute (allocate) the impact on the Fund’s performance into three components. The first of the three components is the impact on the Fund’s performance due to changes in the Fund’s Reference Asset. The second component is the aggregate impact on the Fund’s performance due to changes in other variables that impact FLEX Options prices - these include changes in a) the Reference Asset’s dividends, b) interest rates, c) implied volatility, and d) time to option expiration. The third component is from the Fund’s fees and expenses incurred during the Period.
FUND PERFORMANCE (December 18, 2020 to August 31, 2024)
The performance line graph below shows the performance of a hypothetical $10,000 initial investment in the Fund over a ten-year period (or for the life of the Fund, if shorter). The subsequent account value as of the end of the Period is listed next to the name of the Fund or index, as applicable. The performance table below shows the average annual total returns of the Fund for the past one-, five-, and ten-year periods, as applicable (or for the life of the Fund, if shorter), as of the end of the Period. Both the line graph and performance table compare the Fund’s performance to an appropriate broad-based index and may compare to additional indices reflecting the market segment(s) in which the Fund invests over the same periods.
Investment Performance of $10,000
| Average Annual Total Returns (as of August 31, 2024) | 1 Year | Since
Inception
(12/18/20) |
| FT Vest International Equity Moderate Buffer ETF - December | 13.37% | 5.75% |
| MSCI EAFE Index | 19.40% | 6.67% |
Visit www.ftportfolios.com/etf/YDEC for more recent performance information.
The Fund’s past performance is not a good predictor of the Fund’s future performance. The graph and table do not reflect the deduction of taxes that a shareholder would pay on Fund distributions or redemption of Fund shares.
KEY FUND STATISTICS (As of August 31, 2024)
| Fund net assets | $70,311,374 |
| Total number of portfolio holdings | 5 |
| Total advisory fee paid | $651,681 |
| Portfolio turnover rate | 0% |
WHAT DID THE FUND INVEST IN? (As of August 31, 2024)
The table below shows the investment makeup of the Fund, representing the percentage of net assets of the Fund.
| Money Market Funds | 0.6% |
| Purchased Options | 100.6% |
| Written Options | (1.1%) |
| Net Other Assets and Liabilities | (0.1%) |
| Total | 100.0% |
HOW HAS THE FUND MATERIALLY CHANGED?
This is a summary of certain changes to the Fund since September 1, 2023. For more complete information, you may review the Fund’s prospectus and any applicable supplements at www.ftportfolios.com/fund-documents/etf/YDEC or upon request at 1-800-621-1675 or info@ftportfolios.com.
Effective December 18, 2023, the name of the Fund changed from “FT Vest International Equity Buffer ETF - December” to “FT Vest International Equity Moderate Buffer ETF - December”, the Fund’s buffer against Underlying ETF losses increased from 10% to 15%, and the Fund’s predetermined upside cap on Underlying ETF returns was reset based upon prevailing market conditions at the start of the new Target Outcome Period.
WHERE CAN I FIND ADDITIONAL INFORMATION ABOUT THE FUND?
Visit www.ftportfolios.com/fund-documents/etf/YDEC to view additional information about the Fund such as the prospectus, financial information, Fund holdings and proxy voting information. You may also request this information by contacting us at 1-800-621-1675 or info@ftportfolios.com.
OTHER INFORMATION
The Fund is not sponsored, endorsed, sold or promoted by iShares MSCI EAFE ETF, BFA, or MSCI Inc. (together with their affiliates hereinafter referred to as the “Corporations”). The Corporations have not passed on the legality or suitability of, or the accuracy or adequacy of, descriptions and disclosures relating to the Fund or the FLEX Options. The Corporations make no representations or warranties, express or implied, regarding the advisability of investing in the Fund or the FLEX Options or results to be obtained by the Fund or the FLEX Options, shareholders or any other person or entity from use of the Underlying ETF. The Corporations have no liability in connection with the management, administration, marketing or trading of the Fund or the FLEX Options.
FT Vest Nasdaq-100® Buffer ETF - December
QDEC | CBOE BZX EXCHANGE, INC.
ANNUAL SHAREHOLDER REPORT | August 31, 2024
This annual shareholder report contains important information about the FT Vest Nasdaq-100® Buffer ETF - December (the “Fund”) for the year of September 1, 2023 to August 31, 2024 (the “Period”). You can find additional information about the Fund at www.ftportfolios.com/fund-documents/etf/QDEC. You can also request this information by contacting us at 1-800-621-1675 or info@ftportfolios.com.
This report describes changes to the Fund that occurred during the Period.
WHAT WERE THE FUND COSTS FOR THE LAST YEAR?
(Based on a hypothetical $10,000 investment)
| Fund | Costs of a $10,000 investment | Costs paid as a percentage
of a $10,000 investment |
| FT Vest Nasdaq-100® Buffer ETF - December | $97 | 0.90% |
HOW DID THE FUND PERFORM LAST YEAR? WHAT AFFECTED THE FUND’S PERFORMANCE?
The Fund returned 15.58% for the twelve months ended August 31, 2024. The Fund underperformed its benchmark, the Nasdaq-100 Index®, which returned 27.30% for the same Period.
This underperformance was due to the following:
| Fund NAV Performance Attributed to*: | | |
| Changes in Reference Asset | 10.00 | % |
| Changes in other Variables | 6.48 | % |
| Fees and Expenses | -0.90 | % |
The Fund holds a combination of FLexible EXchange® Options (“FLEX Options”) designed to target the Fund’s objective.
* The Fund’s performance is impacted by changes in the values of the FLEX Options to which it is exposed. We attribute (allocate) the impact on the Fund’s performance into three components. The first of the three components is the impact on the Fund’s performance due to changes in the Fund’s Reference Asset. The second component is the aggregate impact on the Fund’s performance due to changes in other variables that impact FLEX Options prices - these include changes in a) the Reference Asset’s dividends, b) interest rates, c) implied volatility, and d) time to option expiration. The third component is from the Fund’s fees and expenses incurred during the Period.
FUND PERFORMANCE (December 18, 2020 to August 31, 2024)
The performance line graph below shows the performance of a hypothetical $10,000 initial investment in the Fund over a ten-year period (or for the life of the Fund, if shorter). The subsequent account value as of the end of the Period is listed next to the name of the Fund or index, as applicable. The performance table below shows the average annual total returns of the Fund for the past one-, five-, and ten-year periods, as applicable (or for the life of the Fund, if shorter), as of the end of the Period. Both the line graph and performance table compare the Fund’s performance to an appropriate broad-based index and may compare to additional indices reflecting the market segment(s) in which the Fund invests over the same periods.
Investment Performance of $10,000
| Average Annual Total Returns (as of August 31, 2024) | 1 Year | Since
Inception
(12/18/20) |
| FT Vest Nasdaq-100® Buffer ETF - December | 15.58% | 7.95% |
| Nasdaq-100 Index® | 27.30% | 13.21% |
| S&P 500® Index | 27.14% | 13.76% |
Visit www.ftportfolios.com/etf/QDEC for more recent performance information.
The Fund’s past performance is not a good predictor of the Fund’s future performance. The graph and table do not reflect the deduction of taxes that a shareholder would pay on Fund distributions or redemption of Fund shares.
KEY FUND STATISTICS (As of August 31, 2024)
| Fund net assets | $355,470,601 |
| Total number of portfolio holdings | 5 |
| Total advisory fee paid | $2,809,339 |
| Portfolio turnover rate | 0% |
WHAT DID THE FUND INVEST IN? (As of August 31, 2024)
The table below shows the investment makeup of the Fund, representing the percentage of net assets of the Fund.
| Money Market Funds | 0.5% |
| Purchased Options | 104.5% |
| Written Options | (4.9%) |
| Net Other Assets and Liabilities | (0.1%) |
| Total | 100.0% |
HOW HAS THE FUND MATERIALLY CHANGED?
This is a summary of certain changes to the Fund since September 1, 2023. For more complete information, you may review the Fund’s prospectus and any applicable supplements at www.ftportfolios.com/fund-documents/etf/QDEC or upon request at 1-800-621-1675 or info@ftportfolios.com.
During the fiscal year ended August 31, 2024, the Fund’s predetermined upside cap on Underlying ETF returns was reset based upon prevailing market conditions at the start of the new Target Outcome Period.
WHERE CAN I FIND ADDITIONAL INFORMATION ABOUT THE FUND?
Visit www.ftportfolios.com/fund-documents/etf/QDEC to view additional information about the Fund such as the prospectus, financial information, Fund holdings and proxy voting information. You may also request this information by contacting us at 1-800-621-1675 or info@ftportfolios.com.
OTHER INFORMATION
The Fund is not sponsored, endorsed, sold or promoted by Invesco QQQ TrustSM, Series 1, Invesco, or Nasdaq, Inc. (together with their affiliates hereinafter referred to as the “Corporations”). The Corporations have not passed on the legality or suitability of, or the accuracy or adequacy of, descriptions and disclosures relating to the Fund or the FLEX Options. The Corporations make no representations or warranties, express or implied, regarding the advisability of investing in the Fund or the FLEX Options or results to be obtained by the Fund or the FLEX Options, shareholders or any other person or entity from use of the Invesco QQQ TrustSM, Series 1. The Corporations have no liability in connection with the management, administration, marketing or trading of the Fund or the FLEX Options.
FT Vest U.S. Equity
Enhance & Moderate Buffer ETF - December
XDEC | CBOE BZX EXCHANGE, INC.
ANNUAL SHAREHOLDER REPORT | August 31, 2024
This annual shareholder report contains important information about the FT Vest U.S. Equity Enhance & Moderate Buffer ETF - December (the “Fund”) for the year of September 1, 2023 to August 31, 2024 (the “Period”). You can find additional information about the Fund at www.ftportfolios.com/fund-documents/etf/XDEC. You can also request this information by contacting us at 1-800-621-1675 or info@ftportfolios.com.
This report describes changes to the Fund that occurred during the Period.
WHAT WERE THE FUND COSTS FOR THE LAST YEAR?
(Based on a hypothetical $10,000 investment)
| Fund | Costs of a $10,000 investment | Costs paid as a percentage
of a $10,000 investment |
| FT Vest U.S. Equity Enhance & Moderate Buffer ETF - December | $89 | 0.85% |
HOW DID THE FUND PERFORM LAST YEAR? WHAT AFFECTED THE FUND’S PERFORMANCE?
The Fund returned 10.25% for the twelve months ended August 31, 2024. The Fund underperformed its benchmark, the S&P 500® Index, which returned 27.14% for the same Period.
This underperformance was due to the following:
| Fund NAV Performance Attributed to*: | | |
| Changes in Reference Asset | 6.11 | % |
| Changes in other Variables | 4.99 | % |
| Fees and Expenses | -0.85 | % |
The Fund holds a combination of FLexible EXchange® Options (“FLEX Options”) designed to target the Fund’s objective.
* The Fund’s performance is impacted by changes in the values of the FLEX Options to which it is exposed. We attribute (allocate) the impact on the Fund’s performance into three components. The first of the three components is the impact on the Fund’s performance due to changes in the Fund’s Reference Asset. The second component is the aggregate impact on the Fund’s performance due to changes in other variables that impact FLEX Options prices - these include changes in a) the Reference Asset’s dividends, b) interest rates, c) implied volatility, and d) time to option expiration. The third component is from the Fund’s fees and expenses incurred during the Period.
FUND PERFORMANCE (December 17, 2021 to August 31, 2024)
The performance line graph below shows the performance of a hypothetical $10,000 initial investment in the Fund over a ten-year period (or for the life of the Fund, if shorter). The subsequent account value as of the end of the Period is listed next to the name of the Fund or index, as applicable. The performance table below shows the average annual total returns of the Fund for the past one-, five-, and ten-year periods, as applicable (or for the life of the Fund, if shorter), as of the end of the Period. Both the line graph and performance table compare the Fund’s performance to an appropriate broad-based index and may compare to additional indices reflecting the market segment(s) in which the Fund invests over the same periods.
Investment Performance of $10,000
| Average Annual Total Returns (as of August 31, 2024) | 1 Year | Since
Inception
(12/17/21) |
| FT Vest U.S. Equity Enhance & Moderate Buffer ETF - December | 10.25% | 7.13% |
| S&P 500® Index | 27.14% | 9.42% |
Visit www.ftportfolios.com/etf/XDEC for more recent performance information.
The Fund’s past performance is not a good predictor of the Fund’s future performance. The graph and table do not reflect the deduction of taxes that a shareholder would pay on Fund distributions or redemption of Fund shares.
KEY FUND STATISTICS (As of August 31, 2024)
| Fund net assets | $325,381,283 |
| Total number of portfolio holdings | 6 |
| Total advisory fee paid | $3,044,445 |
| Portfolio turnover rate | 0% |
WHAT DID THE FUND INVEST IN? (As of August 31, 2024)
The table below shows the investment makeup of the Fund, representing the percentage of net assets of the Fund.
| Money Market Funds | 0.5% |
| Purchased Options | 130.5% |
| Written Options | (30.9%) |
| Net Other Assets and Liabilities | (0.1%) |
| Total | 100.0% |
HOW HAS THE FUND MATERIALLY CHANGED?
This is a summary of certain changes to the Fund since September 1, 2023. For more complete information, you may review the Fund’s prospectus and any applicable supplements at www.ftportfolios.com/fund-documents/etf/XDEC or upon request at 1-800-621-1675 or info@ftportfolios.com.
During the fiscal year ended August 31, 2024, the Fund’s predetermined upside cap on Underlying ETF returns was reset based upon prevailing market conditions at the start of the new Target Outcome Period.
WHERE CAN I FIND ADDITIONAL INFORMATION ABOUT THE FUND?
Visit www.ftportfolios.com/fund-documents/etf/XDEC to view additional information about the Fund such as the prospectus, financial information, Fund holdings and proxy voting information. You may also request this information by contacting us at 1-800-621-1675 or info@ftportfolios.com.
OTHER INFORMATION
The Fund is not sponsored, endorsed, sold or promoted by SPDR® S&P 500® ETF Trust, PDR Services, LLC, or Standard & Poor’s® (together with their affiliates hereinafter referred to as the “Corporations”). The Corporations have not passed on the legality or suitability of, or the accuracy or adequacy of, descriptions and disclosures relating to the Fund or the FLEX Options. The Corporations make no representations or warranties, express or implied, regarding the advisability of investing in the Fund or the FLEX Options or results to be obtained by the Fund or the FLEX Options, shareholders or any other person or entity from use of the SPDR® S&P 500® ETF Trust. The Corporations have no liability in connection with the management, administration, marketing or trading of the Fund or the FLEX Options.
FT Vest Laddered Buffer ETF
BUFR | CBOE BZX EXCHANGE, INC.
ANNUAL SHAREHOLDER REPORT | August 31, 2024
This annual shareholder report contains important information about the FT Vest Laddered Buffer ETF (the “Fund”) for the year of September 1, 2023 to August 31, 2024 (the “Period”). You can find additional information about the Fund at www.ftportfolios.com/fund-documents/etf/BUFR. You can also request this information by contacting us at 1-800-621-1675 or info@ftportfolios.com.
This report describes changes to the Fund that occurred during the Period.
WHAT WERE THE FUND COSTS FOR THE LAST YEAR?
(Based on a hypothetical $10,000 investment)
| Fund | Costs of a $10,000 investment | Costs paid as a percentage
of a $10,000 investment |
| FT Vest Laddered Buffer ETF | $21(1) | 0.19%(1) |
(1) | Excludes any Acquired Fund Fees and Expenses of underlying investment companies in which the Fund invests. |
HOW DID THE FUND PERFORM LAST YEAR? WHAT AFFECTED THE FUND’S PERFORMANCE?
The Fund returned 16.73% for the twelve months ended August 31, 2024. The Fund underperformed its benchmark, the S&P 500® Index, which returned 27.14% for the same Period.
This underperformance was due to the following:
| Fund NAV Performance Attributed to*: | | |
| Changes in Reference Asset | 12.38 | % |
| Changes in other Variables | 5.40 | % |
| Fees and Expenses** | -1.05 | % |
The Fund holds a portfolio that consists of a number of buffer funds, and thus is exposed to the combinations of FLexible EXchange® Options (“FLEX Options”) held by the funds in its portfolio.
* The Fund’s performance is impacted by changes in the values of the FLEX Options to which it is exposed. We attribute (allocate) the impact on the Fund’s performance into three components. The first of the three components is the impact on the Fund’s performance due to changes in the underlying buffer funds’ Reference Asset. The second component is the aggregate impact on the Fund’s performance due to changes in other variables that impact FLEX Options prices - these include changes in a) the Reference Asset’s dividends, b) interest rates, c) implied volatility, and d) time to option expiration. The third component is from the Fund’s fees and expenses incurred during the Period.
** Includes any Acquired Fund Fees and Expenses of underlying investment companies in which the Fund invests.
FUND PERFORMANCE (August 10, 2020 to August 31, 2024)
The performance line graph below shows the performance of a hypothetical $10,000 initial investment in the Fund over a ten-year period (or for the life of the Fund, if shorter). The subsequent account value as of the end of the Period is listed next to the name of the Fund or index, as applicable. The performance table below shows the average annual total returns of the Fund for the past one-, five-, and ten-year periods, as applicable (or for the life of the Fund, if shorter), as of the end of the Period. Both the line graph and performance table compare the Fund’s performance to an appropriate broad-based index and may compare to additional indices reflecting the market segment(s) in which the Fund invests over the same periods.
Investment Performance of $10,000
| Average Annual Total Returns (as of August 31, 2024) | 1 Year | Since
Inception
(8/10/20) |
| FT Vest Laddered Buffer ETF | 16.73% | 10.06% |
| S&P 500® Index | 27.14% | 15.43% |
Visit www.ftportfolios.com/etf/BUFR for more recent performance information.
The Fund’s past performance is not a good predictor of the Fund’s future performance. The graph and table do not reflect the deduction of taxes that a shareholder would pay on Fund distributions or redemption of Fund shares.
KEY FUND STATISTICS (As of August 31, 2024)
| Fund net assets | $5,093,180,782 |
| Total number of portfolio holdings | 13 |
| Total advisory fee paid | $6,347,411 |
| Portfolio turnover rate | 1% |
WHAT DID THE FUND INVEST IN? (As of August 31, 2024)
The table below shows the investment makeup of the Fund, representing the percentage of net assets of the Fund.
| Exchange-Traded Funds | 100.0% |
| Money Market Funds | 0.0% |
| Net Other Assets and Liabilities | (0.0%) |
| Total | 100.0% |
Any amount shown as 0.0% represents less than 0.1%.
HOW HAS THE FUND MATERIALLY CHANGED?
This is a summary of certain changes to the Fund since September 1, 2023. For more complete information, you may review the Fund’s prospectus and any applicable supplements at www.ftportfolios.com/fund-documents/etf/BUFR or upon request at 1-800-621-1675 or info@ftportfolios.com.
Effective May 10, 2024, the name of the Fund changed from “FT Vest Fund of Buffer ETFs” to “FT Vest Laddered Buffer ETF.” During the fiscal year ended August 31, 2024, the Fund’s diversification status under the Investment Company Act of 1940 changed from non-diversified to diversified. The Fund’s principal investment strategies and principal risks were revised accordingly. Pursuant to a contractual agreement, effective August 1, 2024, the Fund’s investment advisor agreed to waive management fees of 0.10% of average daily net assets through December 31, 2025.
WHERE CAN I FIND ADDITIONAL INFORMATION ABOUT THE FUND?
Visit www.ftportfolios.com/fund-documents/etf/BUFR to view additional information about the Fund such as the prospectus, financial information, Fund holdings and proxy voting information. You may also request this information by contacting us at 1-800-621-1675 or info@ftportfolios.com.
OTHER INFORMATION
The Fund is not sponsored, endorsed, sold or promoted by SPDR® S&P 500® ETF Trust, PDR, or Standard & Poor’s (together with their affiliates hereinafter referred to as the “Corporations”). The Corporations have not passed on the legality or suitability of, or the accuracy or adequacy of, descriptions and disclosures relating to the Fund. The Corporations make no representations or warranties, express or implied, regarding the advisability of investing in the Fund or results to be obtained by the Fund, shareholders or any other person or entity from use of the SPDR® S&P 500® ETF Trust. The Corporations have no liability in connection with the management, administration, marketing or trading of the Fund.
FT Vest Laddered Deep Buffer ETF
BUFD | CBOE BZX EXCHANGE, INC.
ANNUAL SHAREHOLDER REPORT | August 31, 2024
This annual shareholder report contains important information about the FT Vest Laddered Deep Buffer ETF (the “Fund”) for the year of September 1, 2023 to August 31, 2024 (the “Period”). You can find additional information about the Fund at www.ftportfolios.com/fund-documents/etf/BUFD. You can also request this information by contacting us at 1-800-621-1675 or info@ftportfolios.com.
This report describes changes to the Fund that occurred during the Period.
WHAT WERE THE FUND COSTS FOR THE LAST YEAR?
(Based on a hypothetical $10,000 investment)
| Fund | Costs of a $10,000 investment | Costs paid as a percentage
of a $10,000 investment |
| FT Vest Laddered Deep Buffer ETF | $20(1) | 0.19%(1) |
(1) | Excludes any Acquired Fund Fees and Expenses of underlying investment companies in which the Fund invests. |
HOW DID THE FUND PERFORM LAST YEAR? WHAT AFFECTED THE FUND’S PERFORMANCE?
The Fund returned 13.97% for the twelve months ended August 31, 2024. The Fund underperformed its benchmark, the S&P 500® Index, which returned 27.14% for the same Period.
This underperformance was due to the following:
| Fund NAV Performance Attributed to*: | | |
| Changes in Reference Asset | 10.44 | % |
| Changes in other Variables | 4.58 | % |
| Fees and Expenses** | -1.05 | % |
The Fund holds a portfolio that consists of a number of buffer funds, and thus is exposed to the combinations of FLexible EXchange® Options (“FLEX Options”) held by the funds in its portfolio.
* The Fund’s performance is impacted by changes in the values of the FLEX Options to which it is exposed. We attribute (allocate) the impact on the Fund’s performance into three components. The first of the three components is the impact on the Fund’s performance due to changes in the underlying buffer funds’ Reference Asset. The second component is the aggregate impact on the Fund’s performance due to changes in other variables that impact FLEX Options prices - these include changes in a) the Reference Asset’s dividends, b) interest rates, c) implied volatility, and d) time to option expiration. The third component is from the Fund’s fees and expenses incurred during the Period.
** Includes any Acquired Fund Fees and Expenses of underlying investment companies in which the Fund invests.
FUND PERFORMANCE (January 20, 2021 to August 31, 2024)
The performance line graph below shows the performance of a hypothetical $10,000 initial investment in the Fund over a ten-year period (or for the life of the Fund, if shorter). The subsequent account value as of the end of the Period is listed next to the name of the Fund or index, as applicable. The performance table below shows the average annual total returns of the Fund for the past one-, five-, and ten-year periods, as applicable (or for the life of the Fund, if shorter), as of the end of the Period. Both the line graph and performance table compare the Fund’s performance to an appropriate broad-based index and may compare to additional indices reflecting the market segment(s) in which the Fund invests over the same periods.
Investment Performance of $10,000
| Average Annual Total Returns (as of August 31, 2024) | 1 Year | Since
Inception
(1/20/21) |
| FT Vest Laddered Deep Buffer ETF | 13.97% | 6.04% |
| S&P 500® Index | 27.14% | 12.91% |
Visit www.ftportfolios.com/etf/BUFD for more recent performance information.
The Fund’s past performance is not a good predictor of the Fund’s future performance. The graph and table do not reflect the deduction of taxes that a shareholder would pay on Fund distributions or redemption of Fund shares.
KEY FUND STATISTICS (As of August 31, 2024)
| Fund net assets | $978,328,172 |
| Total number of portfolio holdings | 13 |
| Total advisory fee paid | $1,509,179 |
| Portfolio turnover rate | 1% |
WHAT DID THE FUND INVEST IN? (As of August 31, 2024)
The table below shows the investment makeup of the Fund, representing the percentage of net assets of the Fund.
| Exchange-Traded Funds | 100.0% |
| Money Market Funds | 0.0% |
| Net Other Assets and Liabilities | (0.0%) |
| Total | 100.0% |
Any amount shown as 0.0% represents less than 0.1%.
HOW HAS THE FUND MATERIALLY CHANGED?
This is a summary of certain changes to the Fund since September 1, 2023. For more complete information, you may review the Fund’s prospectus and any applicable supplements at www.ftportfolios.com/fund-documents/etf/BUFD or upon request at 1-800-621-1675 or info@ftportfolios.com.
Effective May 10, 2024, the name of the Fund changed from “FT Vest Fund of Deep Buffer ETFs” to “FT Vest Laddered Deep Buffer ETF.” During the fiscal year ended August 31, 2024, the Fund’s diversification status under the Investment Company Act of 1940 changed from non-diversified to diversified. The Fund’s principal investment strategies and principal risks were revised accordingly. Pursuant to a contractual agreement, effective August 1, 2024, the Fund’s investment advisor agreed to waive management fees of 0.10% of average daily net assets through December 31, 2025.
WHERE CAN I FIND ADDITIONAL INFORMATION ABOUT THE FUND?
Visit www.ftportfolios.com/fund-documents/etf/BUFD to view additional information about the Fund such as the prospectus, financial information, Fund holdings and proxy voting information. You may also request this information by contacting us at 1-800-621-1675 or info@ftportfolios.com.
OTHER INFORMATION
The Fund is not sponsored, endorsed, sold or promoted by SPDR® S&P 500® ETF Trust, PDR, or Standard & Poor’s (together with their affiliates hereinafter referred to as the “Corporations”). The Corporations have not passed on the legality or suitability of, or the accuracy or adequacy of, descriptions and disclosures relating to the Fund. The Corporations make no representations or warranties, express or implied, regarding the advisability of investing in the Fund or results to be obtained by the Fund, shareholders or any other person or entity from use of the SPDR® S&P 500® ETF Trust. The Corporations have no liability in connection with the management, administration, marketing or trading of the Fund.
FT Vest Laddered Nasdaq Buffer ETF
BUFQ | CBOE BZX EXCHANGE, INC.
ANNUAL SHAREHOLDER REPORT | August 31, 2024
This annual shareholder report contains important information about the FT Vest Laddered Nasdaq Buffer ETF (the “Fund”) for the year of September 1, 2023 to August 31, 2024 (the “Period”). You can find additional information about the Fund at www.ftportfolios.com/fund-documents/etf/BUFQ. You can also request this information by contacting us at 1-800-621-1675 or info@ftportfolios.com.
This report describes changes to the Fund that occurred during the Period.
WHAT WERE THE FUND COSTS FOR THE LAST YEAR?
(Based on a hypothetical $10,000 investment)
| Fund | Costs of a $10,000 investment | Costs paid as a percentage
of a $10,000 investment |
| FT Vest Laddered Nasdaq Buffer ETF | $21(1) | 0.19%(1) |
(1) | Excludes any Acquired Fund Fees and Expenses of underlying investment companies in which the Fund invests. |
HOW DID THE FUND PERFORM LAST YEAR? WHAT AFFECTED THE FUND’S PERFORMANCE?
The Fund returned 16.97% for the twelve months ended August 31, 2024. The Fund underperformed its benchmark, the Nasdaq-100 Index®, which returned 27.30% for the same Period.
This underperformance was due to the following:
| Fund NAV Performance Attributed to*: | | |
| Changes in Reference Asset | 11.14 | % |
| Changes in other Variables | 6.93 | % |
| Fees and Expenses** | -1.10 | % |
The Fund holds a portfolio that consists of a number of buffer funds, and thus is exposed to the combinations of FLexible EXchange® Options (“FLEX Options”) held by the funds in its portfolio.
* The Fund’s performance is impacted by changes in the values of the FLEX Options to which it is exposed. We attribute (allocate) the impact on the Fund’s performance into three components. The first of the three components is the impact on the Fund’s performance due to changes in the underlying buffer funds’ Reference Asset. The second component is the aggregate impact on the Fund’s performance due to changes in other variables that impact FLEX Options prices - these include changes in a) the Reference Asset’s dividends, b) interest rates, c) implied volatility, and d) time to option expiration. The third component is from the Fund’s fees and expenses incurred during the Period.
** Includes any Acquired Fund Fees and Expenses of underlying investment companies in which the Fund invests.
FUND PERFORMANCE (June 15, 2022 to August 31, 2024)
The performance line graph below shows the performance of a hypothetical $10,000 initial investment in the Fund over a ten-year period (or for the life of the Fund, if shorter). The subsequent account value as of the end of the Period is listed next to the name of the Fund or index, as applicable. The performance table below shows the average annual total returns of the Fund for the past one-, five-, and ten-year periods, as applicable (or for the life of the Fund, if shorter), as of the end of the Period. Both the line graph and performance table compare the Fund’s performance to an appropriate broad-based index and may compare to additional indices reflecting the market segment(s) in which the Fund invests over the same periods.
Investment Performance of $10,000
| Average Annual Total Returns (as of August 31, 2024) | 1 Year | Since
Inception
(6/15/22) |
| FT Vest Laddered Nasdaq Buffer ETF | 16.97% | 18.60% |
| Nasdaq-100 Index® | 27.30% | 27.81% |
| S&P 500® Index | 27.14% | 21.69% |
Visit www.ftportfolios.com/etf/BUFQ for more recent performance information.
The Fund’s past performance is not a good predictor of the Fund’s future performance. The graph and table do not reflect the deduction of taxes that a shareholder would pay on Fund distributions or redemption of Fund shares.
KEY FUND STATISTICS (As of August 31, 2024)
| Fund net assets | $710,358,652 |
| Total number of portfolio holdings | 5 |
| Total advisory fee paid | $845,615 |
| Portfolio turnover rate | 1% |
WHAT DID THE FUND INVEST IN? (As of August 31, 2024)
The table below shows the investment makeup of the Fund, representing the percentage of net assets of the Fund.
| Exchange-Traded Funds | 100.0% |
| Money Market Funds | 0.0% |
| Net Other Assets and Liabilities | (0.0%) |
| Total | 100.0% |
Any amount shown as 0.0% represents less than 0.1%.
HOW HAS THE FUND MATERIALLY CHANGED?
This is a summary of certain changes to the Fund since September 1, 2023. For more complete information, you may review the Fund’s prospectus and any applicable supplements at www.ftportfolios.com/fund-documents/etf/BUFQ or upon request at 1-800-621-1675 or info@ftportfolios.com.
Effective May 10, 2024, the name of the Fund changed from “FT Vest Fund of Nasdaq-100® Buffer ETFs” to “FT Vest Laddered Nasdaq Buffer ETF.” Pursuant to a contractual agreement, effective August 1, 2024, the Fund’s investment advisor agreed to waive management fees of 0.10% of average daily net assets through December 31, 2025.
WHERE CAN I FIND ADDITIONAL INFORMATION ABOUT THE FUND?
Visit www.ftportfolios.com/fund-documents/etf/BUFQ to view additional information about the Fund such as the prospectus, financial information, Fund holdings and proxy voting information. You may also request this information by contacting us at 1-800-621-1675 or info@ftportfolios.com.
OTHER INFORMATION
The Fund is not sponsored, endorsed, sold or promoted by Invesco QQQ TrustSM, Series 1, Invesco, Nasdaq, Inc. or their affiliates. Invesco QQQ TrustSM, Series 1, Invesco, Nasdaq, Inc. or their affiliates have not passed on the legality or suitability of, or the accuracy or adequacy of, descriptions and disclosures relating to the Fund or the FLEX Options. Invesco QQQ TrustSM, Series 1, Invesco, Nasdaq, Inc. or their affiliates make no representations or warranties, express or implied, regarding the advisability of investing in the Fund or the FLEX Options or results to be obtained by the Fund or the FLEX Options, shareholders or any other person or entity from use of the QQQ. Invesco QQQ TrustSM, Series 1, Invesco, Nasdaq, Inc. or their affiliates have no liability in connection with the management, administration, marketing or trading of the Fund or the FLEX Options.
FT Vest U.S. Equity
Moderate Buffer ETF - January
GJAN | CBOE BZX EXCHANGE, INC.
ANNUAL SHAREHOLDER REPORT | August 31, 2024
This annual shareholder report contains important information about the FT Vest U.S. Equity Moderate Buffer ETF - January (the “Fund”) for the year of September 1, 2023 to August 31, 2024 (the “Period”). You can find additional information about the Fund at www.ftportfolios.com/fund-documents/etf/GJAN. You can also request this information by contacting us at 1-800-621-1675 or info@ftportfolios.com.
This report describes changes to the Fund that occurred during the Period.
WHAT WERE THE FUND COSTS FOR THE LAST YEAR?
(Based on a hypothetical $10,000 investment)
| Fund | Costs of a $10,000 investment | Costs paid as a percentage
of a $10,000 investment |
| FT Vest U.S. Equity Moderate Buffer ETF - January | $91 | 0.85% |
HOW DID THE FUND PERFORM LAST YEAR? WHAT AFFECTED THE FUND’S PERFORMANCE?
The Fund returned 13.95% for the twelve months ended August 31, 2024. The Fund underperformed its benchmark, the S&P 500® Index, which returned 27.14% for the same Period.
This underperformance was due to the following:
| Fund NAV Performance Attributed to*: | | |
| Changes in Reference Asset | 10.13 | % |
| Changes in other Variables | 4.67 | % |
| Fees and Expenses | -0.85 | % |
The Fund holds a combination of FLexible EXchange® Options (“FLEX Options”) designed to target the Fund’s objective.
* The Fund’s performance is impacted by changes in the values of the FLEX Options to which it is exposed. We attribute (allocate) the impact on the Fund’s performance into three components. The first of the three components is the impact on the Fund’s performance due to changes in the Fund’s Reference Asset. The second component is the aggregate impact on the Fund’s performance due to changes in other variables that impact FLEX Options prices - these include changes in a) the Reference Asset’s dividends, b) interest rates, c) implied volatility, and d) time to option expiration. The third component is from the Fund’s fees and expenses incurred during the Period.
FUND PERFORMANCE (January 20, 2023 to August 31, 2024)
The performance line graph below shows the performance of a hypothetical $10,000 initial investment in the Fund over a ten-year period (or for the life of the Fund, if shorter). The subsequent account value as of the end of the Period is listed next to the name of the Fund or index, as applicable. The performance table below shows the average annual total returns of the Fund for the past one-, five-, and ten-year periods, as applicable (or for the life of the Fund, if shorter), as of the end of the Period. Both the line graph and performance table compare the Fund’s performance to an appropriate broad-based index and may compare to additional indices reflecting the market segment(s) in which the Fund invests over the same periods.
Investment Performance of $10,000
| Average Annual Total Returns (as of August 31, 2024) | 1 Year | Since
Inception
(1/20/23) |
| FT Vest U.S. Equity Moderate Buffer ETF - January | 13.95% | 14.78% |
| S&P 500® Index | 27.14% | 26.36% |
Visit www.ftportfolios.com/etf/GJAN for more recent performance information.
The Fund’s past performance is not a good predictor of the Fund’s future performance. The graph and table do not reflect the deduction of taxes that a shareholder would pay on Fund distributions or redemption of Fund shares.
KEY FUND STATISTICS (As of August 31, 2024)
| Fund net assets | $253,631,076 |
| Total number of portfolio holdings | 5 |
| Total advisory fee paid | $1,808,424 |
| Portfolio turnover rate | 0% |
WHAT DID THE FUND INVEST IN? (As of August 31, 2024)
The table below shows the investment makeup of the Fund, representing the percentage of net assets of the Fund.
| Money Market Funds | 0.6% |
| Purchased Options | 106.9% |
| Written Options | (7.4%) |
| Net Other Assets and Liabilities | (0.1%) |
| Total | 100.0% |
HOW HAS THE FUND MATERIALLY CHANGED?
This is a summary of certain changes to the Fund since September 1, 2023. For more complete information, you may review the Fund’s prospectus and any applicable supplements at www.ftportfolios.com/fund-documents/etf/GJAN or upon request at 1-800-621-1675 or info@ftportfolios.com.
During the fiscal year ended August 31, 2024, the Fund’s predetermined upside cap on Underlying ETF returns was reset based upon prevailing market conditions at the start of the new Target Outcome Period.
WHERE CAN I FIND ADDITIONAL INFORMATION ABOUT THE FUND?
Visit www.ftportfolios.com/fund-documents/etf/GJAN to view additional information about the Fund such as the prospectus, financial information, Fund holdings and proxy voting information. You may also request this information by contacting us at 1-800-621-1675 or info@ftportfolios.com.
OTHER INFORMATION
The Fund is not sponsored, endorsed, sold or promoted by SPDR® S&P 500® ETF Trust, PDR Services, LLC, or Standard & Poor’s® (together with their affiliates hereinafter referred to as the “Corporations”). The Corporations have not passed on the legality or suitability of, or the accuracy or adequacy of, descriptions and disclosures relating to the Fund or the FLEX Options. The Corporations make no representations or warranties, express or implied, regarding the advisability of investing in the Fund or the FLEX Options or results to be obtained by the Fund or the FLEX Options, shareholders or any other person or entity from use of the SPDR® S&P 500® ETF Trust. The Corporations have no liability in connection with the management, administration, marketing or trading of the Fund or the FLEX Options.
FT Vest U.S. Equity
Moderate Buffer ETF - February
GFEB | CBOE BZX EXCHANGE, INC.
ANNUAL SHAREHOLDER REPORT | August 31, 2024
This annual shareholder report contains important information about the FT Vest U.S. Equity Moderate Buffer ETF - February (the “Fund”) for the year of September 1, 2023 to August 31, 2024 (the “Period”). You can find additional information about the Fund at www.ftportfolios.com/fund-documents/etf/GFEB. You can also request this information by contacting us at 1-800-621-1675 or info@ftportfolios.com.
This report describes changes to the Fund that occurred during the Period.
WHAT WERE THE FUND COSTS FOR THE LAST YEAR?
(Based on a hypothetical $10,000 investment)
| Fund | Costs of a $10,000 investment | Costs paid as a percentage
of a $10,000 investment |
| FT Vest U.S. Equity Moderate Buffer ETF - February | $91 | 0.85% |
HOW DID THE FUND PERFORM LAST YEAR? WHAT AFFECTED THE FUND’S PERFORMANCE?
The Fund returned 14.58% for the twelve months ended August 31, 2024. The Fund underperformed its benchmark, the S&P 500® Index, which returned 27.14% for the same Period.
This underperformance was due to the following:
| Fund NAV Performance Attributed to*: | | |
| Changes in Reference Asset | 11.17 | % |
| Changes in other Variables | 4.26 | % |
| Fees and Expenses | -0.85 | % |
The Fund holds a combination of FLexible EXchange® Options (“FLEX Options”) designed to target the Fund’s objective.
* The Fund’s performance is impacted by changes in the values of the FLEX Options to which it is exposed. We attribute (allocate) the impact on the Fund’s performance into three components. The first of the three components is the impact on the Fund’s performance due to changes in the Fund’s Reference Asset. The second component is the aggregate impact on the Fund’s performance due to changes in other variables that impact FLEX Options prices - these include changes in a) the Reference Asset’s dividends, b) interest rates, c) implied volatility, and d) time to option expiration. The third component is from the Fund’s fees and expenses incurred during the Period.
FUND PERFORMANCE (February 17, 2023 to August 31, 2024)
The performance line graph below shows the performance of a hypothetical $10,000 initial investment in the Fund over a ten-year period (or for the life of the Fund, if shorter). The subsequent account value as of the end of the Period is listed next to the name of the Fund or index, as applicable. The performance table below shows the average annual total returns of the Fund for the past one-, five-, and ten-year periods, as applicable (or for the life of the Fund, if shorter), as of the end of the Period. Both the line graph and performance table compare the Fund’s performance to an appropriate broad-based index and may compare to additional indices reflecting the market segment(s) in which the Fund invests over the same periods.
Investment Performance of $10,000
| Average Annual Total Returns (as of August 31, 2024) | 1 Year | Since
Inception
(2/17/23) |
| FT Vest U.S. Equity Moderate Buffer ETF - February | 14.58% | 14.79% |
| S&P 500® Index | 27.14% | 25.53% |
Visit www.ftportfolios.com/etf/GFEB for more recent performance information.
The Fund’s past performance is not a good predictor of the Fund’s future performance. The graph and table do not reflect the deduction of taxes that a shareholder would pay on Fund distributions or redemption of Fund shares.
KEY FUND STATISTICS (As of August 31, 2024)
| Fund net assets | $393,977,223 |
| Total number of portfolio holdings | 5 |
| Total advisory fee paid | $2,402,428 |
| Portfolio turnover rate | 0% |
WHAT DID THE FUND INVEST IN? (As of August 31, 2024)
The table below shows the investment makeup of the Fund, representing the percentage of net assets of the Fund.
| Money Market Funds | 0.7% |
| Purchased Options | 104.3% |
| Written Options | (4.9%) |
| Net Other Assets and Liabilities | (0.1%) |
| Total | 100.0% |
HOW HAS THE FUND MATERIALLY CHANGED?
This is a summary of certain changes to the Fund since September 1, 2023. For more complete information, you may review the Fund’s prospectus and any applicable supplements at www.ftportfolios.com/fund-documents/etf/GFEB or upon request at 1-800-621-1675 or info@ftportfolios.com.
During the fiscal year ended August 31, 2024, the Fund’s predetermined upside cap on Underlying ETF returns was reset based upon prevailing market conditions at the start of the new Target Outcome Period.
WHERE CAN I FIND ADDITIONAL INFORMATION ABOUT THE FUND?
Visit www.ftportfolios.com/fund-documents/etf/GFEB to view additional information about the Fund such as the prospectus, financial information, Fund holdings and proxy voting information. You may also request this information by contacting us at 1-800-621-1675 or info@ftportfolios.com.
OTHER INFORMATION
The Fund is not sponsored, endorsed, sold or promoted by SPDR® S&P 500® ETF Trust, PDR Services, LLC, or Standard & Poor’s® (together with their affiliates hereinafter referred to as the “Corporations”). The Corporations have not passed on the legality or suitability of, or the accuracy or adequacy of, descriptions and disclosures relating to the Fund or the FLEX Options. The Corporations make no representations or warranties, express or implied, regarding the advisability of investing in the Fund or the FLEX Options or results to be obtained by the Fund or the FLEX Options, shareholders or any other person or entity from use of the SPDR® S&P 500® ETF Trust. The Corporations have no liability in connection with the management, administration, marketing or trading of the Fund or the FLEX Options.
FT Vest U.S. Small Cap
Moderate Buffer ETF - February
SFEB | CBOE BZX EXCHANGE, INC.
ANNUAL SHAREHOLDER REPORT | August 31, 2024
This annual shareholder report contains important information about the FT Vest U.S. Small Cap Moderate Buffer ETF - February (the “Fund”) for the period of February 16, 2024 (commencement of investment operations) to August 31, 2024 (the “Period”). You can find additional information about the Fund at www.ftportfolios.com/fund-documents/etf/SFEB. You can also request this information by contacting us at 1-800-621-1675 or info@ftportfolios.com.
WHAT WERE THE FUND COSTS FOR THE LAST YEAR?
(Based on a hypothetical $10,000 investment)
| Fund | Costs of a $10,000 investment | Costs paid as a percentage
of a $10,000 investment |
| FT Vest U.S. Small Cap Moderate Buffer ETF - February | $50(1) | 0.90%(2) |
(1) | The Fund commenced investment operations on February 16, 2024. Had the Fund been in operation for a complete fiscal year, the cost of a $10,000 investment would have been higher. |
(2) | Annualized. |
HOW DID THE FUND PERFORM LAST YEAR? WHAT AFFECTED THE FUND’S PERFORMANCE?
The Fund returned 6.98% for the period from the Fund’s inception date on February 16, 2024 through August 31, 2024. The Fund underperformed its benchmark, the Russell 2000® Index, which returned 9.96% for the same Period.
This underperformance was due to the following:
| Fund NAV Performance Attributed to*: | | |
| Changes in Reference Asset | 4.75 | % |
| Changes in other Variables | 2.71 | % |
| Fees and Expenses | -0.48 | % |
The Fund holds a combination of FLexible EXchange® Options (“FLEX Options”) designed to target the Fund’s objective.
* The Fund’s performance is impacted by changes in the values of the FLEX Options to which it is exposed. We attribute (allocate) the impact on the Fund’s performance into three components. The first of the three components is the impact on the Fund’s performance due to changes in the Fund’s Reference Asset. The second component is the aggregate impact on the Fund’s performance due to changes in other variables that impact FLEX Options prices - these include changes in a) the Reference Asset’s dividends, b) interest rates, c) implied volatility, and d) time to option expiration. The third component is from the Fund’s fees and expenses incurred during the Period.
FUND PERFORMANCE (February 16, 2024 to August 31, 2024)
The performance line graph below shows the performance of a hypothetical $10,000 initial investment in the Fund over a ten-year period (or for the life of the Fund, if shorter). The subsequent account value as of the end of the Period is listed next to the name of the Fund or index, as applicable. The performance table below shows the average annual total returns of the Fund for the past one-, five-, and ten-year periods, as applicable (or for the life of the Fund, if shorter), as of the end of the Period. Both the line graph and performance table compare the Fund’s performance to an appropriate broad-based index and may compare to additional indices reflecting the market segment(s) in which the Fund invests over the same periods.
Investment Performance of $10,000
| Average Annual Total Returns (as of August 31, 2024) | Since
Inception
(2/16/24) |
| FT Vest U.S. Small Cap Moderate Buffer ETF - February | 6.98% |
| Russell 2000® Index | 9.96% |
| Russell 3000® Index | 12.85% |
Visit www.ftportfolios.com/etf/SFEB for more recent performance information.
The Fund’s past performance is not a good predictor of the Fund’s future performance. The graph and table do not reflect the deduction of taxes that a shareholder would pay on Fund distributions or redemption of Fund shares.
KEY FUND STATISTICS (As of August 31, 2024)
| Fund net assets | $66,584,615 |
| Total number of portfolio holdings | 5 |
| Total advisory fee paid | $271,851 |
| Portfolio turnover rate | 0% |
WHAT DID THE FUND INVEST IN? (As of August 31, 2024)
The table below shows the investment makeup of the Fund, representing the percentage of net assets of the Fund.
| Money Market Funds | 0.7% |
| Purchased Options | 102.7% |
| Written Options | (3.3%) |
| Net Other Assets and Liabilities | (0.1%) |
| Total | 100.0% |
WHERE CAN I FIND ADDITIONAL INFORMATION ABOUT THE FUND?
Visit www.ftportfolios.com/fund-documents/etf/SFEB to view additional information about the Fund such as the prospectus, financial information, Fund holdings and proxy voting information. You may also request this information by contacting us at 1-800-621-1675 or info@ftportfolios.com.
OTHER INFORMATION
The Fund is not sponsored, endorsed, sold or promoted by iShares Russell 2000 ETF, BFA, or Russell (together with their affiliates hereinafter referred to as the “Corporations”). The Corporations have not passed on the legality or suitability of, or the accuracy or adequacy of, descriptions and disclosures relating to the Fund or the FLEX Options. The Corporations make no representations or warranties, express or implied, regarding the advisability of investing in the Fund or the FLEX Options or results to be obtained by the Fund or the FLEX Options, shareholders or any other person or entity from use of the iShares Russell 2000 ETF. The Corporations have no liability in connection with the management, administration, marketing or trading of the Fund or the FLEX Options.
FT Vest U.S. Equity Buffer & Premium Income ETF - March
XIMR | CBOE BZX EXCHANGE, INC.
ANNUAL SHAREHOLDER REPORT | August 31, 2024
This annual shareholder report contains important information about the FT Vest U.S. Equity Buffer & Premium Income ETF - March (the “Fund”) for the period of March 18, 2024 (commencement of investment operations) to August 31, 2024 (the “Period”). You can find additional information about the Fund at www.ftportfolios.com/fund-documents/etf/XIMR. You can also request this information by contacting us at 1-800-621-1675 or info@ftportfolios.com.
WHAT WERE THE FUND COSTS FOR THE LAST YEAR?
(Based on a hypothetical $10,000 investment)
| Fund | Costs of a $10,000 investment | Costs paid as a percentage
of a $10,000 investment |
| FT Vest U.S. Equity Buffer & Premium Income ETF - March | $40(1) | 0.85%(2) |
(1) | The Fund commenced investment operations on March 18, 2024. Had the Fund been in operation for a complete fiscal year, the cost of a $10,000 investment would have been higher. |
(2) | Annualized. |
HOW DID THE FUND PERFORM LAST YEAR? WHAT AFFECTED THE FUND’S PERFORMANCE?
The Fund returned 3.72% for the period from the Fund’s inception date on March 18, 2024 through August 31, 2024. The Fund underperformed its benchmark, the S&P 500® Index, which returned 10.36% for the same Period.
This underperformance was due to the following:
| Fund NAV Performance Attributed to*: | | |
| Changes in Reference Asset | 1.29 | % |
| Changes in other Variables | 2.81 | % |
| Fees and Expenses | -0.38 | % |
The Fund holds a combination of FLexible EXchange® Options (“FLEX Options”) designed to target the Fund’s objective.
* The Fund’s performance is impacted by changes in the values of the FLEX Options to which it is exposed. We attribute (allocate) the impact on the Fund’s performance into three components. The first of the three components is the impact on the Fund’s performance due to changes in the Fund’s Reference Asset. The second component is the aggregate impact on the Fund’s performance due to changes in other variables that impact FLEX Options prices - these include changes in a) the Reference Asset’s dividends, b) interest rates, c) implied volatility, and d) time to option expiration. The third component is from the Fund’s fees and expenses incurred during the Period.
FUND PERFORMANCE (March 18, 2024 to August 31, 2024)
The performance line graph below shows the performance of a hypothetical $10,000 initial investment in the Fund over a ten-year period (or for the life of the Fund, if shorter). The subsequent account value as of the end of the Period is listed next to the name of the Fund or index, as applicable. The performance table below shows the average annual total returns of the Fund for the past one-, five-, and ten-year periods, as applicable (or for the life of the Fund, if shorter), as of the end of the Period. Both the line graph and performance table compare the Fund’s performance to an appropriate broad-based index and may compare to additional indices reflecting the market segment(s) in which the Fund invests over the same periods.
Investment Performance of $10,000
| Average Annual Total Returns (as of August 31, 2024) | Since
Inception
(3/18/24) |
| FT Vest U.S. Equity Buffer & Premium Income ETF - March | 3.72% |
| S&P 500® Index | 10.36% |
Visit www.ftportfolios.com/etf/XIMR for more recent performance information.
The Fund’s past performance is not a good predictor of the Fund’s future performance. The graph and table do not reflect the deduction of taxes that a shareholder would pay on Fund distributions or redemption of Fund shares.
The Fund has implemented a distribution policy pursuant to which the Fund intends to declare and pay monthly dividends to shareholders that is approximately 7.60% (before fees and expenses). The policy may reduce the Fund’s net asset value. The policy may be amended by the Trust’s Board of Trustees at any time, or the Fund may cease distributions entirely, at any time. Under the distribution policy, to the extent that sufficient investment income is not available on a monthly basis, the Fund’s distributions could consist of return of capital in order to maintain the distribution rate. During the Period, the Fund met its specified level of distributions. For the Period ended August 31, 2024, 100% of the Fund’s distributions were estimated as return of capital. The final determination of the source and tax status of all calendar year 2024 distributions will be made after the end of 2024 and will be provided on Form 1099-DIV. The foregoing is not to be construed as tax advice. Please consult your tax advisor for further information regarding tax matters.
KEY FUND STATISTICS (As of August 31, 2024)
| Fund net assets | $21,066,550 |
| Total number of portfolio holdings | 11 |
| Total advisory fee paid | $60,173 |
| Portfolio turnover rate | 0% |
WHAT DID THE FUND INVEST IN? (As of August 31, 2024)
The table below shows the investment makeup of the Fund, representing the percentage of net assets of the Fund.
| U.S. Treasury Bills | 3.8% |
| Money Market Funds | 1.2% |
| Purchased Options | 109.3% |
| Written Options | (14.2%) |
| Net Other Assets and Liabilities | (0.1%) |
| Total | 100.0% |
WHERE CAN I FIND ADDITIONAL INFORMATION ABOUT THE FUND?
Visit www.ftportfolios.com/fund-documents/etf/XIMR to view additional information about the Fund such as the prospectus, financial information, Fund holdings and proxy voting information. You may also request this information by contacting us at 1-800-621-1675 or info@ftportfolios.com.
OTHER INFORMATION
The Fund is not sponsored, endorsed, sold or promoted by SPDR® S&P 500® ETF Trust, PDR Services, LLC, or Standard & Poor’s® (together with their affiliates hereinafter referred to as the “Corporations”). The Corporations have not passed on the legality or suitability of, or the accuracy or adequacy of, descriptions and disclosures relating to the Fund or the FLEX Options. The Corporations make no representations or warranties, express or implied, regarding the advisability of investing in the Fund or the FLEX Options or results to be obtained by the Fund or the FLEX Options, shareholders or any other person or entity from use of the SPDR® S&P 500® ETF Trust. The Corporations have no liability in connection with the management, administration, marketing or trading of the Fund or the FLEX Options.
FT Vest U.S. Equity
Moderate Buffer ETF - March
GMAR | CBOE BZX EXCHANGE, INC.
ANNUAL SHAREHOLDER REPORT | August 31, 2024
This annual shareholder report contains important information about the FT Vest U.S. Equity Moderate Buffer ETF - March (the “Fund”) for the year of September 1, 2023 to August 31, 2024 (the “Period”). You can find additional information about the Fund at www.ftportfolios.com/fund-documents/etf/GMAR. You can also request this information by contacting us at 1-800-621-1675 or info@ftportfolios.com.
This report describes changes to the Fund that occurred during the Period.
WHAT WERE THE FUND COSTS FOR THE LAST YEAR?
(Based on a hypothetical $10,000 investment)
| Fund | Costs of a $10,000 investment | Costs paid as a percentage
of a $10,000 investment |
| FT Vest U.S. Equity Moderate Buffer ETF - March | $90 | 0.85% |
HOW DID THE FUND PERFORM LAST YEAR? WHAT AFFECTED THE FUND’S PERFORMANCE?
The Fund returned 12.69% for the twelve months ended August 31, 2024. The Fund underperformed its benchmark, the S&P 500® Index, which returned 27.14% for the same Period.
This underperformance was due to the following:
| Fund NAV Performance Attributed to*: | | |
| Changes in Reference Asset | 8.60 | % |
| Changes in other Variables | 4.94 | % |
| Fees and Expenses | -0.85 | % |
The Fund holds a combination of FLexible EXchange® Options (“FLEX Options”) designed to target the Fund’s objective.
* The Fund’s performance is impacted by changes in the values of the FLEX Options to which it is exposed. We attribute (allocate) the impact on the Fund’s performance into three components. The first of the three components is the impact on the Fund’s performance due to changes in the Fund’s Reference Asset. The second component is the aggregate impact on the Fund’s performance due to changes in other variables that impact FLEX Options prices - these include changes in a) the Reference Asset’s dividends, b) interest rates, c) implied volatility, and d) time to option expiration. The third component is from the Fund’s fees and expenses incurred during the Period.
FUND PERFORMANCE (March 17, 2023 to August 31, 2024)
The performance line graph below shows the performance of a hypothetical $10,000 initial investment in the Fund over a ten-year period (or for the life of the Fund, if shorter). The subsequent account value as of the end of the Period is listed next to the name of the Fund or index, as applicable. The performance table below shows the average annual total returns of the Fund for the past one-, five-, and ten-year periods, as applicable (or for the life of the Fund, if shorter), as of the end of the Period. Both the line graph and performance table compare the Fund’s performance to an appropriate broad-based index and may compare to additional indices reflecting the market segment(s) in which the Fund invests over the same periods.
Investment Performance of $10,000
| Average Annual Total Returns (as of August 31, 2024) | 1 Year | Since
Inception
(3/17/23) |
| FT Vest U.S. Equity Moderate Buffer ETF - March | 12.69% | 14.96% |
| S&P 500® Index | 27.14% | 30.49% |
Visit www.ftportfolios.com/etf/GMAR for more recent performance information.
The Fund’s past performance is not a good predictor of the Fund’s future performance. The graph and table do not reflect the deduction of taxes that a shareholder would pay on Fund distributions or redemption of Fund shares.
KEY FUND STATISTICS (As of August 31, 2024)
| Fund net assets | $361,427,722 |
| Total number of portfolio holdings | 5 |
| Total advisory fee paid | $1,733,988 |
| Portfolio turnover rate | 0% |
WHAT DID THE FUND INVEST IN? (As of August 31, 2024)
The table below shows the investment makeup of the Fund, representing the percentage of net assets of the Fund.
| Money Market Funds | 0.8% |
| Purchased Options | 103.2% |
| Written Options | (3.9%) |
| Net Other Assets and Liabilities | (0.1%) |
| Total | 100.0% |
HOW HAS THE FUND MATERIALLY CHANGED?
This is a summary of certain changes to the Fund since September 1, 2023. For more complete information, you may review the Fund’s prospectus and any applicable supplements at www.ftportfolios.com/fund-documents/etf/GMAR or upon request at 1-800-621-1675 or info@ftportfolios.com.
During the fiscal year ended August 31, 2024, the Fund’s predetermined upside cap on Underlying ETF returns was reset based upon prevailing market conditions at the start of the new Target Outcome Period.
WHERE CAN I FIND ADDITIONAL INFORMATION ABOUT THE FUND?
Visit www.ftportfolios.com/fund-documents/etf/GMAR to view additional information about the Fund such as the prospectus, financial information, Fund holdings and proxy voting information. You may also request this information by contacting us at 1-800-621-1675 or info@ftportfolios.com.
OTHER INFORMATION
The Fund is not sponsored, endorsed, sold or promoted by SPDR® S&P 500® ETF Trust, PDR Services, LLC, or Standard & Poor’s® (together with their affiliates hereinafter referred to as the “Corporations”). The Corporations have not passed on the legality or suitability of, or the accuracy or adequacy of, descriptions and disclosures relating to the Fund or the FLEX Options. The Corporations make no representations or warranties, express or implied, regarding the advisability of investing in the Fund or the FLEX Options or results to be obtained by the Fund or the FLEX Options, shareholders or any other person or entity from use of the SPDR® S&P 500® ETF Trust. The Corporations have no liability in connection with the management, administration, marketing or trading of the Fund or the FLEX Options.
FT Vest U.S. Equity
Moderate Buffer ETF - April
GAPR | CBOE BZX EXCHANGE, INC.
ANNUAL SHAREHOLDER REPORT | August 31, 2024
This annual shareholder report contains important information about the FT Vest U.S. Equity Moderate Buffer ETF - April (the “Fund”) for the year of September 1, 2023 to August 31, 2024 (the “Period”). You can find additional information about the Fund at www.ftportfolios.com/fund-documents/etf/GAPR. You can also request this information by contacting us at 1-800-621-1675 or info@ftportfolios.com.
This report describes changes to the Fund that occurred during the Period.
WHAT WERE THE FUND COSTS FOR THE LAST YEAR?
(Based on a hypothetical $10,000 investment)
| Fund | Costs of a $10,000 investment | Costs paid as a percentage
of a $10,000 investment |
| FT Vest U.S. Equity Moderate Buffer ETF - April | $92 | 0.85% |
HOW DID THE FUND PERFORM LAST YEAR? WHAT AFFECTED THE FUND’S PERFORMANCE?
The Fund returned 15.93% for the twelve months ended August 31, 2024. The Fund underperformed its benchmark, the S&P 500® Index, which returned 27.14% for the same Period.
This underperformance was due to the following:
| Fund NAV Performance Attributed to*: | | |
| Changes in Reference Asset | 9.00 | % |
| Changes in other Variables | 7.78 | % |
| Fees and Expenses | -0.85 | % |
The Fund holds a combination of FLexible EXchange® Options (“FLEX Options”) designed to target the Fund’s objective.
* The Fund’s performance is impacted by changes in the values of the FLEX Options to which it is exposed. We attribute (allocate) the impact on the Fund’s performance into three components. The first of the three components is the impact on the Fund’s performance due to changes in the Fund’s Reference Asset. The second component is the aggregate impact on the Fund’s performance due to changes in other variables that impact FLEX Options prices - these include changes in a) the Reference Asset’s dividends, b) interest rates, c) implied volatility, and d) time to option expiration. The third component is from the Fund’s fees and expenses incurred during the Period.
FUND PERFORMANCE (April 21, 2023 to August 31, 2024)
The performance line graph below shows the performance of a hypothetical $10,000 initial investment in the Fund over a ten-year period (or for the life of the Fund, if shorter). The subsequent account value as of the end of the Period is listed next to the name of the Fund or index, as applicable. The performance table below shows the average annual total returns of the Fund for the past one-, five-, and ten-year periods, as applicable (or for the life of the Fund, if shorter), as of the end of the Period. Both the line graph and performance table compare the Fund’s performance to an appropriate broad-based index and may compare to additional indices reflecting the market segment(s) in which the Fund invests over the same periods.
Investment Performance of $10,000
| Average Annual Total Returns (as of August 31, 2024) | 1 Year | Since
Inception
(4/21/23) |
| FT Vest U.S. Equity Moderate Buffer ETF - April | 15.93% | 16.28% |
| S&P 500® Index | 27.14% | 27.69% |
Visit www.ftportfolios.com/etf/GAPR for more recent performance information.
The Fund’s past performance is not a good predictor of the Fund’s future performance. The graph and table do not reflect the deduction of taxes that a shareholder would pay on Fund distributions or redemption of Fund shares.
KEY FUND STATISTICS (As of August 31, 2024)
| Fund net assets | $218,741,924 |
| Total number of portfolio holdings | 5 |
| Total advisory fee paid | $1,375,718 |
| Portfolio turnover rate | 0% |
WHAT DID THE FUND INVEST IN? (As of August 31, 2024)
The table below shows the investment makeup of the Fund, representing the percentage of net assets of the Fund.
| Money Market Funds | 0.8% |
| Purchased Options | 105.4% |
| Written Options | (6.1%) |
| Net Other Assets and Liabilities | (0.1%) |
| Total | 100.0% |
HOW HAS THE FUND MATERIALLY CHANGED?
This is a summary of certain changes to the Fund since September 1, 2023. For more complete information, you may review the Fund’s prospectus and any applicable supplements at www.ftportfolios.com/fund-documents/etf/GAPR or upon request at 1-800-621-1675 or info@ftportfolios.com.
During the fiscal year ended August 31, 2024, the Fund’s predetermined upside cap on Underlying ETF returns was reset based upon prevailing market conditions at the start of the new Target Outcome Period.
WHERE CAN I FIND ADDITIONAL INFORMATION ABOUT THE FUND?
Visit www.ftportfolios.com/fund-documents/etf/GAPR to view additional information about the Fund such as the prospectus, financial information, Fund holdings and proxy voting information. You may also request this information by contacting us at 1-800-621-1675 or info@ftportfolios.com.
OTHER INFORMATION
The Fund is not sponsored, endorsed, sold or promoted by SPDR® S&P 500® ETF Trust, PDR Services, LLC, or Standard & Poor’s® (together with their affiliates hereinafter referred to as the “Corporations”). The Corporations have not passed on the legality or suitability of, or the accuracy or adequacy of, descriptions and disclosures relating to the Fund or the FLEX Options. The Corporations make no representations or warranties, express or implied, regarding the advisability of investing in the Fund or the FLEX Options or results to be obtained by the Fund or the FLEX Options, shareholders or any other person or entity from use of the SPDR® S&P 500® ETF Trust. The Corporations have no liability in connection with the management, administration, marketing or trading of the Fund or the FLEX Options.
FT Vest U.S. Equity
Moderate Buffer ETF - May
GMAY | CBOE BZX EXCHANGE, INC.
ANNUAL SHAREHOLDER REPORT | August 31, 2024
This annual shareholder report contains important information about the FT Vest U.S. Equity Moderate Buffer ETF - May (the “Fund”) for the year of September 1, 2023 to August 31, 2024 (the “Period”). You can find additional information about the Fund at www.ftportfolios.com/fund-documents/etf/GMAY. You can also request this information by contacting us at 1-800-621-1675 or info@ftportfolios.com.
This report describes changes to the Fund that occurred during the Period.
WHAT WERE THE FUND COSTS FOR THE LAST YEAR?
(Based on a hypothetical $10,000 investment)
| Fund | Costs of a $10,000 investment | Costs paid as a percentage
of a $10,000 investment |
| FT Vest U.S. Equity Moderate Buffer ETF - May | $91 | 0.85% |
HOW DID THE FUND PERFORM LAST YEAR? WHAT AFFECTED THE FUND’S PERFORMANCE?
The Fund returned 13.37% for the twelve months ended August 31, 2024. The Fund underperformed its benchmark, the S&P 500® Index, which returned 27.14% for the same Period.
This underperformance was due to the following:
| Fund NAV Performance Attributed to*: | | |
| Changes in Reference Asset | 9.37 | % |
| Changes in other Variables | 4.85 | % |
| Fees and Expenses | -0.85 | % |
The Fund holds a combination of FLexible EXchange® Options (“FLEX Options”) designed to target the Fund’s objective.
* The Fund’s performance is impacted by changes in the values of the FLEX Options to which it is exposed. We attribute (allocate) the impact on the Fund’s performance into three components. The first of the three components is the impact on the Fund’s performance due to changes in the Fund’s Reference Asset. The second component is the aggregate impact on the Fund’s performance due to changes in other variables that impact FLEX Options prices - these include changes in a) the Reference Asset’s dividends, b) interest rates, c) implied volatility, and d) time to option expiration. The third component is from the Fund’s fees and expenses incurred during the Period.
FUND PERFORMANCE (May 19, 2023 to August 31, 2024)
The performance line graph below shows the performance of a hypothetical $10,000 initial investment in the Fund over a ten-year period (or for the life of the Fund, if shorter). The subsequent account value as of the end of the Period is listed next to the name of the Fund or index, as applicable. The performance table below shows the average annual total returns of the Fund for the past one-, five-, and ten-year periods, as applicable (or for the life of the Fund, if shorter), as of the end of the Period. Both the line graph and performance table compare the Fund’s performance to an appropriate broad-based index and may compare to additional indices reflecting the market segment(s) in which the Fund invests over the same periods.
Investment Performance of $10,000
| Average Annual Total Returns (as of August 31, 2024) | 1 Year | Since
Inception
(5/19/23) |
| FT Vest U.S. Equity Moderate Buffer ETF - May | 13.37% | 14.48% |
| S&P 500® Index | 27.14% | 28.01% |
Visit www.ftportfolios.com/etf/GMAY for more recent performance information.
The Fund’s past performance is not a good predictor of the Fund’s future performance. The graph and table do not reflect the deduction of taxes that a shareholder would pay on Fund distributions or redemption of Fund shares.
KEY FUND STATISTICS (As of August 31, 2024)
| Fund net assets | $275,190,760 |
| Total number of portfolio holdings | 5 |
| Total advisory fee paid | $1,264,254 |
| Portfolio turnover rate | 0% |
WHAT DID THE FUND INVEST IN? (As of August 31, 2024)
The table below shows the investment makeup of the Fund, representing the percentage of net assets of the Fund.
| Money Market Funds | 0.9% |
| Purchased Options | 102.7% |
| Written Options | (3.5%) |
| Net Other Assets and Liabilities | (0.1%) |
| Total | 100.0% |
HOW HAS THE FUND MATERIALLY CHANGED?
This is a summary of certain changes to the Fund since September 1, 2023. For more complete information, you may review the Fund’s prospectus and any applicable supplements at www.ftportfolios.com/fund-documents/etf/GMAY or upon request at 1-800-621-1675 or info@ftportfolios.com.
During the fiscal year ended August 31, 2024, the Fund’s predetermined upside cap on Underlying ETF returns was reset based upon prevailing market conditions at the start of the new Target Outcome Period.
WHERE CAN I FIND ADDITIONAL INFORMATION ABOUT THE FUND?
Visit www.ftportfolios.com/fund-documents/etf/GMAY to view additional information about the Fund such as the prospectus, financial information, Fund holdings and proxy voting information. You may also request this information by contacting us at 1-800-621-1675 or info@ftportfolios.com.
OTHER INFORMATION
The Fund is not sponsored, endorsed, sold or promoted by SPDR® S&P 500® ETF Trust, PDR Services, LLC, or Standard & Poor’s® (together with their affiliates hereinafter referred to as the “Corporations”). The Corporations have not passed on the legality or suitability of, or the accuracy or adequacy of, descriptions and disclosures relating to the Fund or the FLEX Options. The Corporations make no representations or warranties, express or implied, regarding the advisability of investing in the Fund or the FLEX Options or results to be obtained by the Fund or the FLEX Options, shareholders or any other person or entity from use of the SPDR® S&P 500® ETF Trust. The Corporations have no liability in connection with the management, administration, marketing or trading of the Fund or the FLEX Options.
FT Vest U.S. Small Cap
Moderate Buffer ETF - May
SMAY | CBOE BZX EXCHANGE, INC.
ANNUAL SHAREHOLDER REPORT | August 31, 2024
This annual shareholder report contains important information about the FT Vest U.S. Small Cap Moderate Buffer ETF - May (the “Fund”) for the year of September 1, 2023 to August 31, 2024 (the “Period”). You can find additional information about the Fund at www.ftportfolios.com/fund-documents/etf/SMAY. You can also request this information by contacting us at 1-800-621-1675 or info@ftportfolios.com.
This report describes changes to the Fund that occurred during the Period.
WHAT WERE THE FUND COSTS FOR THE LAST YEAR?
(Based on a hypothetical $10,000 investment)
| Fund | Costs of a $10,000 investment | Costs paid as a percentage
of a $10,000 investment |
| FT Vest U.S. Small Cap Moderate Buffer ETF - May | $97 | 0.90% |
HOW DID THE FUND PERFORM LAST YEAR? WHAT AFFECTED THE FUND’S PERFORMANCE?
The Fund returned 15.95% for the twelve months ended August 31, 2024. The Fund underperformed its benchmark, the Russell 2000® Index, which returned 18.47% for the same Period.
This underperformance was due to the following:
| Fund NAV Performance Attributed to*: | | |
| Changes in Reference Asset | 8.76 | % |
| Changes in other Variables | 8.09 | % |
| Fees and Expenses | -0.90 | % |
The Fund holds a combination of FLexible EXchange® Options (“FLEX Options”) designed to target the Fund’s objective.
* The Fund’s performance is impacted by changes in the values of the FLEX Options to which it is exposed. We attribute (allocate) the impact on the Fund’s performance into three components. The first of the three components is the impact on the Fund’s performance due to changes in the Fund’s Reference Asset. The second component is the aggregate impact on the Fund’s performance due to changes in other variables that impact FLEX Options prices - these include changes in a) the Reference Asset’s dividends, b) interest rates, c) implied volatility, and d) time to option expiration. The third component is from the Fund’s fees and expenses incurred during the Period.
FUND PERFORMANCE (May 19, 2023 to August 31, 2024)
The performance line graph below shows the performance of a hypothetical $10,000 initial investment in the Fund over a ten-year period (or for the life of the Fund, if shorter). The subsequent account value as of the end of the Period is listed next to the name of the Fund or index, as applicable. The performance table below shows the average annual total returns of the Fund for the past one-, five-, and ten-year periods, as applicable (or for the life of the Fund, if shorter), as of the end of the Period. Both the line graph and performance table compare the Fund’s performance to an appropriate broad-based index and may compare to additional indices reflecting the market segment(s) in which the Fund invests over the same periods.
Investment Performance of $10,000
| Average Annual Total Returns (as of August 31, 2024) | 1 Year | Since
Inception
(5/19/23) |
| FT Vest U.S. Small Cap Moderate Buffer ETF - May | 15.95% | 16.45% |
| Russell 2000® Index | 18.47% | 20.78% |
| Russell 3000® Index | 26.14% | 27.40% |
Visit www.ftportfolios.com/etf/SMAY for more recent performance information.
The Fund’s past performance is not a good predictor of the Fund’s future performance. The graph and table do not reflect the deduction of taxes that a shareholder would pay on Fund distributions or redemption of Fund shares.
KEY FUND STATISTICS (As of August 31, 2024)
| Fund net assets | $76,924,893 |
| Total number of portfolio holdings | 5 |
| Total advisory fee paid | $319,093 |
| Portfolio turnover rate | 0% |
WHAT DID THE FUND INVEST IN? (As of August 31, 2024)
The table below shows the investment makeup of the Fund, representing the percentage of net assets of the Fund.
| Money Market Funds | 1.0% |
| Purchased Options | 103.7% |
| Written Options | (4.6%) |
| Net Other Assets and Liabilities | (0.1%) |
| Total | 100.0% |
HOW HAS THE FUND MATERIALLY CHANGED?
This is a summary of certain changes to the Fund since September 1, 2023. For more complete information, you may review the Fund’s prospectus and any applicable supplements at www.ftportfolios.com/fund-documents/etf/SMAY or upon request at 1-800-621-1675 or info@ftportfolios.com.
During the fiscal year ended August 31, 2024, the Fund’s predetermined upside cap on Underlying ETF returns was reset based upon prevailing market conditions at the start of the new Target Outcome Period.
WHERE CAN I FIND ADDITIONAL INFORMATION ABOUT THE FUND?
Visit www.ftportfolios.com/fund-documents/etf/SMAY to view additional information about the Fund such as the prospectus, financial information, Fund holdings and proxy voting information. You may also request this information by contacting us at 1-800-621-1675 or info@ftportfolios.com.
OTHER INFORMATION
The Fund is not sponsored, endorsed, sold or promoted by iShares Russell 2000 ETF, BFA, or Russell (together with their affiliates hereinafter referred to as the “Corporations”). The Corporations have not passed on the legality or suitability of, or the accuracy or adequacy of, descriptions and disclosures relating to the Fund or the FLEX Options. The Corporations make no representations or warranties, express or implied, regarding the advisability of investing in the Fund or the FLEX Options or results to be obtained by the Fund or the FLEX Options, shareholders or any other person or entity from use of the iShares Russell 2000 ETF. The Corporations have no liability in connection with the management, administration, marketing or trading of the Fund or the FLEX Options.
FT Vest U.S. Equity Buffer & Premium Income ETF - June
XIJN | CBOE BZX EXCHANGE, INC.
ANNUAL SHAREHOLDER REPORT | August 31, 2024
This annual shareholder report contains important information about the FT Vest U.S. Equity Buffer & Premium Income ETF - June (the “Fund”) for the period of June 21, 2024 (commencement of investment operations) to August 31, 2024 (the “Period”). You can find additional information about the Fund at www.ftportfolios.com/fund-documents/etf/XIJN. You can also request this information by contacting us at 1-800-621-1675 or info@ftportfolios.com.
WHAT WERE THE FUND COSTS FOR THE LAST YEAR?
(Based on a hypothetical $10,000 investment)
| Fund | Costs of a $10,000 investment | Costs paid as a percentage
of a $10,000 investment |
| FT Vest U.S. Equity Buffer & Premium Income ETF - June | $17(1) | 0.85%(2) |
(1) | The Fund commenced investment operations on June 21, 2024. Had the Fund been in operation for a complete fiscal year, the cost of a $10,000 investment would have been higher. |
(2) | Annualized. |
HOW DID THE FUND PERFORM LAST YEAR? WHAT AFFECTED THE FUND’S PERFORMANCE?
The Fund returned 1.86% for the period from the Fund’s inception date on June 21, 2024 through August 31, 2024. The Fund underperformed its benchmark, the S&P 500® Index, which returned 3.61% for the same Period.
This underperformance was due to the following:
| Fund NAV Performance Attributed to*: | | |
| Changes in Reference Asset | 0.61 | % |
| Changes in other Variables | 1.41 | % |
| Fees and Expenses | -0.16 | % |
The Fund holds a combination of FLexible EXchange® Options (“FLEX Options”) designed to target the Fund’s objective.
* The Fund’s performance is impacted by changes in the values of the FLEX Options to which it is exposed. We attribute (allocate) the impact on the Fund’s performance into three components. The first of the three components is the impact on the Fund’s performance due to changes in the Fund’s Reference Asset. The second component is the aggregate impact on the Fund’s performance due to changes in other variables that impact FLEX Options prices - these include changes in a) the Reference Asset’s dividends, b) interest rates, c) implied volatility, and d) time to option expiration. The third component is from the Fund’s fees and expenses incurred during the Period.
FUND PERFORMANCE (June 21, 2024 to August 31, 2024)
The performance line graph below shows the performance of a hypothetical $10,000 initial investment in the Fund over a ten-year period (or for the life of the Fund, if shorter). The subsequent account value as of the end of the Period is listed next to the name of the Fund or index, as applicable. The performance table below shows the average annual total returns of the Fund for the past one-, five-, and ten-year periods, as applicable (or for the life of the Fund, if shorter), as of the end of the Period. Both the line graph and performance table compare the Fund’s performance to an appropriate broad-based index and may compare to additional indices reflecting the market segment(s) in which the Fund invests over the same periods.
Investment Performance of $10,000
| Average Annual Total Returns (as of August 31, 2024) | Since
Inception
(6/21/24) |
| FT Vest U.S. Equity Buffer & Premium Income ETF - June | 1.86% |
| S&P 500® Index | 3.61% |
Visit www.ftportfolios.com/etf/XIJN for more recent performance information.
The Fund’s past performance is not a good predictor of the Fund’s future performance. The graph and table do not reflect the deduction of taxes that a shareholder would pay on Fund distributions or redemption of Fund shares.
The Fund has implemented a distribution policy pursuant to which the Fund intends to declare and pay monthly dividends to shareholders that is approximately 7.36% (before fees and expenses). The policy may reduce the Fund’s net asset value. The policy may be amended by the Trust’s Board of Trustees at any time, or the Fund may cease distributions entirely, at any time. Under the distribution policy, to the extent that sufficient investment income is not available on a monthly basis, the Fund’s distributions could consist of return of capital in order to maintain the distribution rate. During the Period, the Fund met its specified level of distributions. For the Period ended August 31, 2024, 100% of the Fund’s distributions were estimated return of capital. The final determination of the source and tax status of all calendar year 2024 distributions will be made after the end of 2024 and will be provided on Form 1099-DIV. The foregoing is not to be construed as tax advice. Please consult your tax advisor for further information regarding tax matters.
KEY FUND STATISTICS (As of August 31, 2024)
| Fund net assets | $4,634,133 |
| Total number of portfolio holdings | 15 |
| Total advisory fee paid | $5,185 |
| Portfolio turnover rate | 0% |
WHAT DID THE FUND INVEST IN? (As of August 31, 2024)
The tables below show the investment makeup of the Fund, representing the percentage of net assets of the Fund.
| U.S. Treasury Bills | 5.7% |
| Purchased Options | 104.5% |
| Written Options | (11.0%) |
| Net Other Assets and Liabilities | 0.8% |
| Total | 100.0% |
WHERE CAN I FIND ADDITIONAL INFORMATION ABOUT THE FUND?
Visit www.ftportfolios.com/fund-documents/etf/XIJN to view additional information about the Fund such as the prospectus, financial information, Fund holdings and proxy voting information. You may also request this information by contacting us at 1-800-621-1675 or info@ftportfolios.com.
OTHER INFORMATION
The Fund is not sponsored, endorsed, sold or promoted by SPDR® S&P 500® ETF Trust, PDR Services, LLC, or Standard & Poor’s® (together with their affiliates hereinafter referred to as the “Corporations”). The Corporations have not passed on the legality or suitability of, or the accuracy or adequacy of, descriptions and disclosures relating to the Fund or the FLEX Options. The Corporations make no representations or warranties, express or implied, regarding the advisability of investing in the Fund or the FLEX Options or results to be obtained by the Fund or the FLEX Options, shareholders or any other person or entity from use of the SPDR® S&P 500® ETF Trust. The Corporations have no liability in connection with the management, administration, marketing or trading of the Fund or the FLEX Options.
FT Vest U.S. Equity
Moderate Buffer ETF - June
GJUN | CBOE BZX EXCHANGE, INC.
ANNUAL SHAREHOLDER REPORT | August 31, 2024
This annual shareholder report contains important information about the FT Vest U.S. Equity Moderate Buffer ETF - June (the “Fund”) for the year of September 1, 2023 to August 31, 2024 (the “Period”). You can find additional information about the Fund at www.ftportfolios.com/fund-documents/etf/GJUN. You can also request this information by contacting us at 1-800-621-1675 or info@ftportfolios.com.
This report describes changes to the Fund that occurred during the Period.
WHAT WERE THE FUND COSTS FOR THE LAST YEAR?
(Based on a hypothetical $10,000 investment)
| Fund | Costs of a $10,000 investment | Costs paid as a percentage
of a $10,000 investment |
| FT Vest U.S. Equity Moderate Buffer ETF - June | $91 | 0.85% |
HOW DID THE FUND PERFORM LAST YEAR? WHAT AFFECTED THE FUND’S PERFORMANCE?
The Fund returned 14.51% for the twelve months ended August 31, 2024. The Fund underperformed its benchmark, the S&P 500® Index, which returned 27.14% for the same Period.
This underperformance was due to the following:
| Fund NAV Performance Attributed to*: | | |
| Changes in Reference Asset | 11.13 | % |
| Changes in other Variables | 4.23 | % |
| Fees and Expenses | -0.85 | % |
The Fund holds a combination of FLexible EXchange® Options (“FLEX Options”) designed to target the Fund’s objective.
* The Fund’s performance is impacted by changes in the values of the FLEX Options to which it is exposed. We attribute (allocate) the impact on the Fund’s performance into three components. The first of the three components is the impact on the Fund’s performance due to changes in the Fund’s Reference Asset. The second component is the aggregate impact on the Fund’s performance due to changes in other variables that impact FLEX Options prices - these include changes in a) the Reference Asset’s dividends, b) interest rates, c) implied volatility, and d) time to option expiration. The third component is from the Fund’s fees and expenses incurred during the Period.
FUND PERFORMANCE (June 16, 2023 to August 31, 2024)
The performance line graph below shows the performance of a hypothetical $10,000 initial investment in the Fund over a ten-year period (or for the life of the Fund, if shorter). The subsequent account value as of the end of the Period is listed next to the name of the Fund or index, as applicable. The performance table below shows the average annual total returns of the Fund for the past one-, five-, and ten-year periods, as applicable (or for the life of the Fund, if shorter), as of the end of the Period. Both the line graph and performance table compare the Fund’s performance to an appropriate broad-based index and may compare to additional indices reflecting the market segment(s) in which the Fund invests over the same periods.
Investment Performance of $10,000
| Average Annual Total Returns (as of August 31, 2024) | 1 Year | Since
Inception
(6/16/23) |
| FT Vest U.S. Equity Moderate Buffer ETF - June | 14.51% | 13.88% |
| S&P 500® Index | 27.14% | 24.55% |
Visit www.ftportfolios.com/etf/GJUN for more recent performance information.
The Fund’s past performance is not a good predictor of the Fund’s future performance. The graph and table do not reflect the deduction of taxes that a shareholder would pay on Fund distributions or redemption of Fund shares.
KEY FUND STATISTICS (As of August 31, 2024)
| Fund net assets | $542,830,977 |
| Total number of portfolio holdings | 5 |
| Total advisory fee paid | $2,575,317 |
| Portfolio turnover rate | 0% |
WHAT DID THE FUND INVEST IN? (As of August 31, 2024)
The table below shows the investment makeup of the Fund, representing the percentage of net assets of the Fund.
| Money Market Funds | 1.0% |
| Purchased Options | 102.1% |
| Written Options | (3.0%) |
| Net Other Assets and Liabilities | (0.1%) |
| Total | 100.0% |
HOW HAS THE FUND MATERIALLY CHANGED?
This is a summary of certain changes to the Fund since September 1, 2023. For more complete information, you may review the Fund’s prospectus and any applicable supplements at www.ftportfolios.com/fund-documents/etf/GJUN or upon request at 1-800-621-1675 or info@ftportfolios.com.
During the fiscal year ended August 31, 2024, the Fund’s predetermined upside cap on Underlying ETF returns was reset based upon prevailing market conditions at the start of the new Target Outcome Period.
WHERE CAN I FIND ADDITIONAL INFORMATION ABOUT THE FUND?
Visit www.ftportfolios.com/fund-documents/etf/GJUN to view additional information about the Fund such as the prospectus, financial information, Fund holdings and proxy voting information. You may also request this information by contacting us at 1-800-621-1675 or info@ftportfolios.com.
OTHER INFORMATION
The Fund is not sponsored, endorsed, sold or promoted by SPDR® S&P 500® ETF Trust, PDR Services, LLC, or Standard & Poor’s® (together with their affiliates hereinafter referred to as the “Corporations”). The Corporations have not passed on the legality or suitability of, or the accuracy or adequacy of, descriptions and disclosures relating to the Fund or the FLEX Options. The Corporations make no representations or warranties, express or implied, regarding the advisability of investing in the Fund or the FLEX Options or results to be obtained by the Fund or the FLEX Options, shareholders or any other person or entity from use of the SPDR® S&P 500® ETF Trust. The Corporations have no liability in connection with the management, administration, marketing or trading of the Fund or the FLEX Options.
FT Vest U.S. Equity
Moderate Buffer ETF - July
GJUL | CBOE BZX EXCHANGE, INC.
ANNUAL SHAREHOLDER REPORT | August 31, 2024
This annual shareholder report contains important information about the FT Vest U.S. Equity Moderate Buffer ETF - July (the “Fund”) for the year of September 1, 2023 to August 31, 2024 (the “Period”). You can find additional information about the Fund at www.ftportfolios.com/fund-documents/etf/GJUL. You can also request this information by contacting us at 1-800-621-1675 or info@ftportfolios.com.
This report describes changes to the Fund that occurred during the Period.
WHAT WERE THE FUND COSTS FOR THE LAST YEAR?
(Based on a hypothetical $10,000 investment)
| Fund | Costs of a $10,000 investment | Costs paid as a percentage
of a $10,000 investment |
| FT Vest U.S. Equity Moderate Buffer ETF - July | $92 | 0.85% |
HOW DID THE FUND PERFORM LAST YEAR? WHAT AFFECTED THE FUND’S PERFORMANCE?
The Fund returned 15.50% for the twelve months ended August 31, 2024. The Fund underperformed its benchmark, the S&P 500® Index, which returned 27.14% for the same Period.
This underperformance was due to the following:
| Fund NAV Performance Attributed to*: | | |
| Changes in Reference Asset | 11.50 | % |
| Changes in other Variables | 4.85 | % |
| Fees and Expenses | -0.85 | % |
The Fund holds a combination of FLexible EXchange® Options (“FLEX Options”) designed to target the Fund’s objective.
* The Fund’s performance is impacted by changes in the values of the FLEX Options to which it is exposed. We attribute (allocate) the impact on the Fund’s performance into three components. The first of the three components is the impact on the Fund’s performance due to changes in the Fund’s Reference Asset. The second component is the aggregate impact on the Fund’s performance due to changes in other variables that impact FLEX Options prices - these include changes in a) the Reference Asset’s dividends, b) interest rates, c) implied volatility, and d) time to option expiration. The third component is from the Fund’s fees and expenses incurred during the Period.
FUND PERFORMANCE (July 21, 2023 to August 31, 2024)
The performance line graph below shows the performance of a hypothetical $10,000 initial investment in the Fund over a ten-year period (or for the life of the Fund, if shorter). The subsequent account value as of the end of the Period is listed next to the name of the Fund or index, as applicable. The performance table below shows the average annual total returns of the Fund for the past one-, five-, and ten-year periods, as applicable (or for the life of the Fund, if shorter), as of the end of the Period. Both the line graph and performance table compare the Fund’s performance to an appropriate broad-based index and may compare to additional indices reflecting the market segment(s) in which the Fund invests over the same periods.
Investment Performance of $10,000
| Average Annual Total Returns (as of August 31, 2024) | 1 Year | Since
Inception
(7/21/23) |
| FT Vest U.S. Equity Moderate Buffer ETF - July | 15.50% | 14.09% |
| S&P 500® Index | 27.14% | 23.61% |
Visit www.ftportfolios.com/etf/GJUL for more recent performance information.
The Fund’s past performance is not a good predictor of the Fund’s future performance. The graph and table do not reflect the deduction of taxes that a shareholder would pay on Fund distributions or redemption of Fund shares.
KEY FUND STATISTICS (As of August 31, 2024)
| Fund net assets | $368,714,580 |
| Total number of portfolio holdings | 5 |
| Total advisory fee paid | $2,347,994 |
| Portfolio turnover rate | 0% |
WHAT DID THE FUND INVEST IN? (As of August 31, 2024)
The table below shows the investment makeup of the Fund, representing the percentage of net assets of the Fund.
| Money Market Funds | 1.1% |
| Purchased Options | 102.3% |
| Written Options | (3.3%) |
| Net Other Assets and Liabilities | (0.1%) |
| Total | 100.0% |
HOW HAS THE FUND MATERIALLY CHANGED?
This is a summary of certain changes to the Fund since September 1, 2023. For more complete information, you may review the Fund’s prospectus and any applicable supplements at www.ftportfolios.com/fund-documents/etf/GJUL or upon request at 1-800-621-1675 or info@ftportfolios.com.
During the fiscal year ended August 31, 2024, the Fund’s predetermined upside cap on Underlying ETF returns was reset based upon prevailing market conditions at the start of the new Target Outcome Period.
WHERE CAN I FIND ADDITIONAL INFORMATION ABOUT THE FUND?
Visit www.ftportfolios.com/fund-documents/etf/GJUL to view additional information about the Fund such as the prospectus, financial information, Fund holdings and proxy voting information. You may also request this information by contacting us at 1-800-621-1675 or info@ftportfolios.com.
OTHER INFORMATION
The Fund is not sponsored, endorsed, sold or promoted by SPDR® S&P 500® ETF Trust, PDR Services, LLC, or Standard & Poor’s® (together with their affiliates hereinafter referred to as the “Corporations”). The Corporations have not passed on the legality or suitability of, or the accuracy or adequacy of, descriptions and disclosures relating to the Fund or the FLEX Options. The Corporations make no representations or warranties, express or implied, regarding the advisability of investing in the Fund or the FLEX Options or results to be obtained by the Fund or the FLEX Options, shareholders or any other person or entity from use of the SPDR® S&P 500® ETF Trust. The Corporations have no liability in connection with the management, administration, marketing or trading of the Fund or the FLEX Options.
FT Vest U.S. Equity
Moderate Buffer ETF - August
GAUG | CBOE BZX EXCHANGE, INC.
ANNUAL SHAREHOLDER REPORT | August 31, 2024
This annual shareholder report contains important information about the FT Vest U.S. Equity Moderate Buffer ETF - August (the “Fund”) for the year of September 1, 2023 to August 31, 2024 (the “Period”). You can find additional information about the Fund at www.ftportfolios.com/fund-documents/etf/GAUG. You can also request this information by contacting us at 1-800-621-1675 or info@ftportfolios.com.
This report describes changes to the Fund that occurred during the Period.
WHAT WERE THE FUND COSTS FOR THE LAST YEAR?
(Based on a hypothetical $10,000 investment)
| Fund | Costs of a $10,000 investment | Costs paid as a percentage
of a $10,000 investment |
| FT Vest U.S. Equity Moderate Buffer ETF - August | $91 | 0.85% |
HOW DID THE FUND PERFORM LAST YEAR? WHAT AFFECTED THE FUND’S PERFORMANCE?
The Fund returned 13.60% for the twelve months ended August 31, 2024. The Fund underperformed its benchmark, the S&P 500® Index, which returned 27.14% for the same Period.
This underperformance was due to the following:
| Fund NAV Performance Attributed to*: | | |
| Changes in Reference Asset | 9.29 | % |
| Changes in other Variables | 5.16 | % |
| Fees and Expenses | -0.85 | % |
The Fund holds a combination of FLexible EXchange® Options (“FLEX Options”) designed to target the Fund’s objective.
* The Fund’s performance is impacted by changes in the values of the FLEX Options to which it is exposed. We attribute (allocate) the impact on the Fund’s performance into three components. The first of the three components is the impact on the Fund’s performance due to changes in the Fund’s Reference Asset. The second component is the aggregate impact on the Fund’s performance due to changes in other variables that impact FLEX Options prices - these include changes in a) the Reference Asset’s dividends, b) interest rates, c) implied volatility, and d) time to option expiration. The third component is from the Fund’s fees and expenses incurred during the Period.
FUND PERFORMANCE (August 18, 2023 to August 31, 2024)
The performance line graph below shows the performance of a hypothetical $10,000 initial investment in the Fund over a ten-year period (or for the life of the Fund, if shorter). The subsequent account value as of the end of the Period is listed next to the name of the Fund or index, as applicable. The performance table below shows the average annual total returns of the Fund for the past one-, five-, and ten-year periods, as applicable (or for the life of the Fund, if shorter), as of the end of the Period. Both the line graph and performance table compare the Fund’s performance to an appropriate broad-based index and may compare to additional indices reflecting the market segment(s) in which the Fund invests over the same periods.
Investment Performance of $10,000
| Average Annual Total Returns (as of August 31, 2024) | 1 Year | Since
Inception
(8/18/23) |
| FT Vest U.S. Equity Moderate Buffer ETF - August | 13.60% | 15.06% |
| S&P 500® Index | 27.14% | 30.01% |
Visit www.ftportfolios.com/etf/GAUG for more recent performance information.
The Fund’s past performance is not a good predictor of the Fund’s future performance. The graph and table do not reflect the deduction of taxes that a shareholder would pay on Fund distributions or redemption of Fund shares.
KEY FUND STATISTICS (As of August 31, 2024)
| Fund net assets | $175,027,755 |
| Total number of portfolio holdings | 5 |
| Total advisory fee paid | $874,319 |
| Portfolio turnover rate | 0% |
WHAT DID THE FUND INVEST IN? (As of August 31, 2024)
The table below shows the investment makeup of the Fund, representing the percentage of net assets of the Fund.
| Money Market Funds | 1.1% |
| Purchased Options | 102.8% |
| Written Options | (3.9%) |
| Net Other Assets and Liabilities | (0.0%) |
| Total | 100.0% |
Any amount shown as 0.0% represents less than 0.1%.
HOW HAS THE FUND MATERIALLY CHANGED?
This is a summary of certain changes to the Fund since September 1, 2023. For more complete information, you may review the Fund’s prospectus and any applicable supplements at www.ftportfolios.com/fund-documents/etf/GAUG or upon request at 1-800-621-1675 or info@ftportfolios.com.
During the fiscal year ended August 31, 2024, the Fund’s predetermined upside cap on Underlying ETF returns was reset based upon prevailing market conditions at the start of the new Target Outcome Period.
WHERE CAN I FIND ADDITIONAL INFORMATION ABOUT THE FUND?
Visit www.ftportfolios.com/fund-documents/etf/GAUG to view additional information about the Fund such as the prospectus, financial information, Fund holdings and proxy voting information. You may also request this information by contacting us at 1-800-621-1675 or info@ftportfolios.com.
OTHER INFORMATION
The Fund is not sponsored, endorsed, sold or promoted by SPDR® S&P 500® ETF Trust, PDR Services, LLC, or Standard & Poor’s® (together with their affiliates hereinafter referred to as the “Corporations”). The Corporations have not passed on the legality or suitability of, or the accuracy or adequacy of, descriptions and disclosures relating to the Fund or the FLEX Options. The Corporations make no representations or warranties, express or implied, regarding the advisability of investing in the Fund or the FLEX Options or results to be obtained by the Fund or the FLEX Options, shareholders or any other person or entity from use of the SPDR® S&P 500® ETF Trust. The Corporations have no liability in connection with the management, administration, marketing or trading of the Fund or the FLEX Options.
FT Vest U.S. Small Cap
Moderate Buffer ETF - August
SAUG | CBOE BZX EXCHANGE, INC.
ANNUAL SHAREHOLDER REPORT | August 31, 2024
This annual shareholder report contains important information about the FT Vest U.S. Small Cap Moderate Buffer ETF - August (the “Fund”) for the year of September 1, 2023 to August 31, 2024 (the “Period”). You can find additional information about the Fund at www.ftportfolios.com/fund-documents/etf/SAUG. You can also request this information by contacting us at 1-800-621-1675 or info@ftportfolios.com.
This report describes changes to the Fund that occurred during the Period.
WHAT WERE THE FUND COSTS FOR THE LAST YEAR?
(Based on a hypothetical $10,000 investment)
| Fund | Costs of a $10,000 investment | Costs paid as a percentage
of a $10,000 investment |
| FT Vest U.S. Small Cap Moderate Buffer ETF - August | $97 | 0.90% |
HOW DID THE FUND PERFORM LAST YEAR? WHAT AFFECTED THE FUND’S PERFORMANCE?
The Fund returned 14.76% for the twelve months ended August 31, 2024. The Fund underperformed its benchmark, the Russell 2000® Index, which returned 18.47% for the same Period.
This underperformance was due to the following:
| Fund NAV Performance Attributed to*: | | |
| Changes in Reference Asset | 9.57 | % |
| Changes in other Variables | 6.09 | % |
| Fees and Expenses | -0.90 | % |
The Fund holds a combination of FLexible EXchange® Options (“FLEX Options”) designed to target the Fund’s objective.
* The Fund’s performance is impacted by changes in the values of the FLEX Options to which it is exposed. We attribute (allocate) the impact on the Fund’s performance into three components. The first of the three components is the impact on the Fund’s performance due to changes in the Fund’s Reference Asset. The second component is the aggregate impact on the Fund’s performance due to changes in other variables that impact FLEX Options prices - these include changes in a) the Reference Asset’s dividends, b) interest rates, c) implied volatility, and d) time to option expiration. The third component is from the Fund’s fees and expenses incurred during the Period.
FUND PERFORMANCE (August 18, 2023 to August 31, 2024)
The performance line graph below shows the performance of a hypothetical $10,000 initial investment in the Fund over a ten-year period (or for the life of the Fund, if shorter). The subsequent account value as of the end of the Period is listed next to the name of the Fund or index, as applicable. The performance table below shows the average annual total returns of the Fund for the past one-, five-, and ten-year periods, as applicable (or for the life of the Fund, if shorter), as of the end of the Period. Both the line graph and performance table compare the Fund’s performance to an appropriate broad-based index and may compare to additional indices reflecting the market segment(s) in which the Fund invests over the same periods.
Investment Performance of $10,000
| Average Annual Total Returns (as of August 31, 2024) | 1 Year | Since
Inception
(8/18/23) |
| FT Vest U.S. Small Cap Moderate Buffer ETF - August | 14.76% | 15.99% |
| Russell 2000® Index | 18.47% | 20.31% |
| Russell 3000® Index | 26.14% | 29.05% |
Visit www.ftportfolios.com/etf/SAUG for more recent performance information.
The Fund’s past performance is not a good predictor of the Fund’s future performance. The graph and table do not reflect the deduction of taxes that a shareholder would pay on Fund distributions or redemption of Fund shares.
KEY FUND STATISTICS (As of August 31, 2024)
| Fund net assets | $58,121,158 |
| Total number of portfolio holdings | 5 |
| Total advisory fee paid | $317,419 |
| Portfolio turnover rate | 0% |
WHAT DID THE FUND INVEST IN? (As of August 31, 2024)
The table below shows the investment makeup of the Fund, representing the percentage of net assets of the Fund.
| Money Market Funds | 1.1% |
| Purchased Options | 104.7% |
| Written Options | (5.8%) |
| Net Other Assets and Liabilities | 0.0% |
| Total | 100.0% |
Any amount shown as 0.0% represents less than 0.1%.
HOW HAS THE FUND MATERIALLY CHANGED?
This is a summary of certain changes to the Fund since September 1, 2023. For more complete information, you may review the Fund’s prospectus and any applicable supplements at www.ftportfolios.com/fund-documents/etf/SAUG or upon request at 1-800-621-1675 or info@ftportfolios.com.
During the fiscal year ended August 31, 2024, the Fund’s predetermined upside cap on Underlying ETF returns was reset based upon prevailing market conditions at the start of the new Target Outcome Period.
WHERE CAN I FIND ADDITIONAL INFORMATION ABOUT THE FUND?
Visit www.ftportfolios.com/fund-documents/etf/SAUG to view additional information about the Fund such as the prospectus, financial information, Fund holdings and proxy voting information. You may also request this information by contacting us at 1-800-621-1675 or info@ftportfolios.com.
OTHER INFORMATION
The Fund is not sponsored, endorsed, sold or promoted by iShares Russell 2000 ETF, BFA, or Russell (together with their affiliates hereinafter referred to as the “Corporations”). The Corporations have not passed on the legality or suitability of, or the accuracy or adequacy of, descriptions and disclosures relating to the Fund or the FLEX Options. The Corporations make no representations or warranties, express or implied, regarding the advisability of investing in the Fund or the FLEX Options or results to be obtained by the Fund or the FLEX Options, shareholders or any other person or entity from use of the iShares Russell 2000 ETF. The Corporations have no liability in connection with the management, administration, marketing or trading of the Fund or the FLEX Options.
FT Vest U.S. Equity
Buffer & Premium Income ETF - September
XISE | CBOE BZX EXCHANGE, INC.
ANNUAL SHAREHOLDER REPORT | August 31, 2024
This annual shareholder report contains important information about the FT Vest U.S. Equity Buffer & Premium Income ETF - September (the “Fund”) for the period of September 15, 2023 (commencement of investment operations) to August 31, 2024 (the “Period”). You can find additional information about the Fund at www.ftportfolios.com/fund-documents/etf/XISE. You can also request this information by contacting us at 1-800-621-1675 or info@ftportfolios.com.
WHAT WERE THE FUND COSTS FOR THE LAST YEAR?
(Based on a hypothetical $10,000 investment)
| Fund | Costs of a $10,000 investment | Costs paid as a percentage
of a $10,000 investment |
| FT Vest U.S. Equity Buffer & Premium Income ETF - September | $85(1) | 0.85%(2) |
(1) | The Fund commenced investment operations on September 15, 2023. Had the Fund been in operation for a complete fiscal year, the cost of a $10,000 investment would have been higher. |
(2) | Annualized. |
HOW DID THE FUND PERFORM LAST YEAR? WHAT AFFECTED THE FUND’S PERFORMANCE?
The Fund returned 7.31% for the period from the Fund’s inception date on September 15, 2023 through August 31, 2024. The Fund underperformed its benchmark, the S&P 500® Index, which returned 28.68% for the same Period.
This underperformance was due to the following:
| Fund NAV Performance Attributed to*: | | |
| Changes in Reference Asset | 9.78 | % |
| Changes in other Variables | -1.66 | % |
| Fees and Expenses | -0.81 | % |
The Fund holds a combination of FLexible EXchange® Options (“FLEX Options”) designed to target the Fund’s objective.
* The Fund’s performance is impacted by changes in the values of the FLEX Options to which it is exposed. We attribute (allocate) the impact on the Fund’s performance into three components. The first of the three components is the impact on the Fund’s performance due to changes in the Fund’s Reference Asset. The second component is the aggregate impact on the Fund’s performance due to changes in other variables that impact FLEX Options prices - these include changes in a) the Reference Asset’s dividends, b) interest rates, c) implied volatility, and d) time to option expiration. The third component is from the Fund’s fees and expenses incurred during the Period.
FUND PERFORMANCE (September 15, 2023 to August 31, 2024)
The performance line graph below shows the performance of a hypothetical $10,000 initial investment in the Fund over a ten-year period (or for the life of the Fund, if shorter). The subsequent account value as of the end of the Period is listed next to the name of the Fund or index, as applicable. The performance table below shows the average annual total returns of the Fund for the past one-, five-, and ten-year periods, as applicable (or for the life of the Fund, if shorter), as of the end of the Period. Both the line graph and performance table compare the Fund’s performance to an appropriate broad-based index and may compare to additional indices reflecting the market segment(s) in which the Fund invests over the same periods.
Investment Performance of $10,000
| Average Annual Total Returns (as of August 31, 2024) | Since
Inception
(9/15/23) |
| FT Vest U.S. Equity Buffer & Premium Income ETF - September | 7.31% |
| S&P 500® Index | 28.68% |
Visit www.ftportfolios.com/etf/XISE for more recent performance information.
The Fund’s past performance is not a good predictor of the Fund’s future performance. The graph and table do not reflect the deduction of taxes that a shareholder would pay on Fund distributions or redemption of Fund shares.
The Fund has implemented a distribution policy pursuant to which the Fund intends to declare and pay monthly dividends to shareholders that is approximately 6.67% (before fees and expenses). The policy may reduce the Fund’s net asset value. The policy may be amended by the Trust’s Board of Trustees at any time, or the Fund may cease distributions entirely, at any time. Under the distribution policy, to the extent that sufficient investment income is not available on a monthly basis, the Fund’s distributions could consist of return of capital in order to maintain the distribution rate. During the Period, the Fund met its specified level of distributions. For the Period ended August 31, 2024, 1.84% of the Fund’s distributions were estimated as ordinary income and 98.16% were estimated as return of capital. The final determination of the source and tax status of all calendar year 2024 distributions will be made after the end of 2024 and will be provided on Form 1099-DIV. The foregoing is not to be construed as tax advice. Please consult your tax advisor for further information regarding tax matters.
KEY FUND STATISTICS (As of August 31, 2024)
| Fund net assets | $78,442,428 |
| Total number of portfolio holdings | 6 |
| Total advisory fee paid | $398,593 |
| Portfolio turnover rate | 0% |
WHAT DID THE FUND INVEST IN? (As of August 31, 2024)
The table below shows the investment makeup of the Fund, representing the percentage of net assets of the Fund.
| U.S. Treasury Bills | 0.6% |
| Money Market Funds | 0.8% |
| Purchased Options | 125.5% |
| Written Options | (26.8%) |
| Net Other Assets and Liabilities | (0.1%) |
| Total | 100.0% |
WHERE CAN I FIND ADDITIONAL INFORMATION ABOUT THE FUND?
Visit www.ftportfolios.com/fund-documents/etf/XISE to view additional information about the Fund such as the prospectus, financial information, Fund holdings and proxy voting information. You may also request this information by contacting us at 1-800-621-1675 or info@ftportfolios.com.
OTHER INFORMATION
The Fund is not sponsored, endorsed, sold or promoted by SPDR® S&P 500® ETF Trust, PDR Services, LLC, or Standard & Poor’s® (together with their affiliates hereinafter referred to as the “Corporations”). The Corporations have not passed on the legality or suitability of, or the accuracy or adequacy of, descriptions and disclosures relating to the Fund or the FLEX Options. The Corporations make no representations or warranties, express or implied, regarding the advisability of investing in the Fund or the FLEX Options or results to be obtained by the Fund or the FLEX Options, shareholders or any other person or entity from use of the SPDR® S&P 500® ETF Trust. The Corporations have no liability in connection with the management, administration, marketing or trading of the Fund or the FLEX Options.
FT Vest U.S. Equity
Moderate Buffer ETF - September
GSEP | CBOE BZX EXCHANGE, INC.
ANNUAL SHAREHOLDER REPORT | August 31, 2024
This annual shareholder report contains important information about the FT Vest U.S. Equity Moderate Buffer ETF - September (the “Fund”) for the period of September 15, 2023 (commencement of investment operations) to August 31, 2024 (the “Period”). You can find additional information about the Fund at www.ftportfolios.com/fund-documents/etf/GSEP. You can also request this information by contacting us at 1-800-621-1675 or info@ftportfolios.com.
WHAT WERE THE FUND COSTS FOR THE LAST YEAR?
(Based on a hypothetical $10,000 investment)
| Fund | Costs of a $10,000 investment | Costs paid as a percentage
of a $10,000 investment |
| FT Vest U.S. Equity Moderate Buffer ETF - September | $88(1) | 0.85%(2) |
(1) | The Fund commenced investment operations on September 15, 2023. Had the Fund been in operation for a complete fiscal year, the cost of a $10,000 investment would have been higher. |
(2) | Annualized. |
HOW DID THE FUND PERFORM LAST YEAR? WHAT AFFECTED THE FUND’S PERFORMANCE?
The Fund returned 13.60% for the period from the Fund’s inception date on September 15, 2023 through August 31, 2024. The Fund underperformed its benchmark, the S&P 500® Index, which returned 28.68% for the same Period.
This underperformance was due to the following:
| Fund NAV Performance Attributed to*: | | |
| Changes in Reference Asset | 9.82 | % |
| Changes in other Variables | 4.59 | % |
| Fees and Expenses | -0.81 | % |
The Fund holds a combination of FLexible EXchange® Options (“FLEX Options”) designed to target the Fund’s objective.
* The Fund’s performance is impacted by changes in the values of the FLEX Options to which it is exposed. We attribute (allocate) the impact on the Fund’s performance into three components. The first of the three components is the impact on the Fund’s performance due to changes in the Fund’s Reference Asset. The second component is the aggregate impact on the Fund’s performance due to changes in other variables that impact FLEX Options prices - these include changes in a) the Reference Asset’s dividends, b) interest rates, c) implied volatility, and d) time to option expiration. The third component is from the Fund’s fees and expenses incurred during the Period.
FUND PERFORMANCE (September 15, 2023 to August 31, 2024)
The performance line graph below shows the performance of a hypothetical $10,000 initial investment in the Fund over a ten-year period (or for the life of the Fund, if shorter). The subsequent account value as of the end of the Period is listed next to the name of the Fund or index, as applicable. The performance table below shows the average annual total returns of the Fund for the past one-, five-, and ten-year periods, as applicable (or for the life of the Fund, if shorter), as of the end of the Period. Both the line graph and performance table compare the Fund’s performance to an appropriate broad-based index and may compare to additional indices reflecting the market segment(s) in which the Fund invests over the same periods.
Investment Performance of $10,000
| Average Annual Total Returns (as of August 31, 2024) | Since
Inception
(9/15/23) |
| FT Vest U.S. Equity Moderate Buffer ETF - September | 13.60% |
| S&P 500® Index | 28.68% |
Visit www.ftportfolios.com/etf/GSEP for more recent performance information.
The Fund’s past performance is not a good predictor of the Fund’s future performance. The graph and table do not reflect the deduction of taxes that a shareholder would pay on Fund distributions or redemption of Fund shares.
KEY FUND STATISTICS (As of August 31, 2024)
| Fund net assets | $128,444,282 |
| Total number of portfolio holdings | 5 |
| Total advisory fee paid | $980,170 |
| Portfolio turnover rate | 0% |
WHAT DID THE FUND INVEST IN? (As of August 31, 2024)
The table below shows the investment makeup of the Fund, representing the percentage of net assets of the Fund.
| Money Market Funds | 0.3% |
| Purchased Options | 110.8% |
| Written Options | (11.0%) |
| Net Other Assets and Liabilities | (0.1%) |
| Total | 100.0% |
WHERE CAN I FIND ADDITIONAL INFORMATION ABOUT THE FUND?
Visit www.ftportfolios.com/fund-documents/etf/GSEP to view additional information about the Fund such as the prospectus, financial information, Fund holdings and proxy voting information. You may also request this information by contacting us at 1-800-621-1675 or info@ftportfolios.com.
OTHER INFORMATION
The Fund is not sponsored, endorsed, sold or promoted by SPDR® S&P 500® ETF Trust, PDR Services, LLC, or Standard & Poor’s® (together with their affiliates hereinafter referred to as the “Corporations”). The Corporations have not passed on the legality or suitability of, or the accuracy or adequacy of, descriptions and disclosures relating to the Fund or the FLEX Options. The Corporations make no representations or warranties, express or implied, regarding the advisability of investing in the Fund or the FLEX Options or results to be obtained by the Fund or the FLEX Options, shareholders or any other person or entity from use of the SPDR® S&P 500® ETF Trust. The Corporations have no liability in connection with the management, administration, marketing or trading of the Fund or the FLEX Options.
FT Vest U.S. Equity
Moderate Buffer ETF - October
GOCT | CBOE BZX EXCHANGE, INC.
ANNUAL SHAREHOLDER REPORT | August 31, 2024
This annual shareholder report contains important information about the FT Vest U.S. Equity Moderate Buffer ETF - October (the “Fund”) for the period of October 20, 2023 (commencement of investment operations) to August 31, 2024 (the “Period”). You can find additional information about the Fund at www.ftportfolios.com/fund-documents/etf/GOCT. You can also request this information by contacting us at 1-800-621-1675 or info@ftportfolios.com.
WHAT WERE THE FUND COSTS FOR THE LAST YEAR?
(Based on a hypothetical $10,000 investment)
| Fund | Costs of a $10,000 investment | Costs paid as a percentage
of a $10,000 investment |
| FT Vest U.S. Equity Moderate Buffer ETF - October | $79(1) | 0.85%(2) |
(1) | The Fund commenced investment operations on October 20, 2023. Had the Fund been in operation for a complete fiscal year, the cost of a $10,000 investment would have been higher. |
(2) | Annualized. |
HOW DID THE FUND PERFORM LAST YEAR? WHAT AFFECTED THE FUND’S PERFORMANCE?
The Fund returned 13.78% for the period from the Fund’s inception date on October 20, 2023 through August 31, 2024. The Fund underperformed its benchmark, the S&P 500® Index, which returned 35.42% for the same Period.
This underperformance was due to the following:
| Fund NAV Performance Attributed to*: | | |
| Changes in Reference Asset | 8.37 | % |
| Changes in other Variables | 6.14 | % |
| Fees and Expenses | -0.73 | % |
The Fund holds a combination of FLexible EXchange® Options (“FLEX Options”) designed to target the Fund’s objective.
* The Fund’s performance is impacted by changes in the values of the FLEX Options to which it is exposed. We attribute (allocate) the impact on the Fund’s performance into three components. The first of the three components is the impact on the Fund’s performance due to changes in the Fund’s Reference Asset. The second component is the aggregate impact on the Fund’s performance due to changes in other variables that impact FLEX Options prices - these include changes in a) the Reference Asset’s dividends, b) interest rates, c) implied volatility, and d) time to option expiration. The third component is from the Fund’s fees and expenses incurred during the Period.
FUND PERFORMANCE (October 20, 2023 to August 31, 2024)
The performance line graph below shows the performance of a hypothetical $10,000 initial investment in the Fund over a ten-year period (or for the life of the Fund, if shorter). The subsequent account value as of the end of the Period is listed next to the name of the Fund or index, as applicable. The performance table below shows the average annual total returns of the Fund for the past one-, five-, and ten-year periods, as applicable (or for the life of the Fund, if shorter), as of the end of the Period. Both the line graph and performance table compare the Fund’s performance to an appropriate broad-based index and may compare to additional indices reflecting the market segment(s) in which the Fund invests over the same periods.
Investment Performance of $10,000
| Average Annual Total Returns (as of August 31, 2024) | Since
Inception
(10/20/23) |
| FT Vest U.S. Equity Moderate Buffer ETF - October | 13.78% |
| S&P 500® Index | 35.42% |
Visit www.ftportfolios.com/etf/GOCT for more recent performance information.
The Fund’s past performance is not a good predictor of the Fund’s future performance. The graph and table do not reflect the deduction of taxes that a shareholder would pay on Fund distributions or redemption of Fund shares.
KEY FUND STATISTICS (As of August 31, 2024)
| Fund net assets | $95,773,283 |
| Total number of portfolio holdings | 5 |
| Total advisory fee paid | $925,283 |
| Portfolio turnover rate | 0% |
WHAT DID THE FUND INVEST IN? (As of August 31, 2024)
The table below shows the investment makeup of the Fund, representing the percentage of net assets of the Fund.
| Money Market Funds | 0.4% |
| Purchased Options | 116.5% |
| Written Options | (16.8%) |
| Net Other Assets and Liabilities | (0.1%) |
| Total | 100.0% |
WHERE CAN I FIND ADDITIONAL INFORMATION ABOUT THE FUND?
Visit www.ftportfolios.com/fund-documents/etf/GOCT to view additional information about the Fund such as the prospectus, financial information, Fund holdings and proxy voting information. You may also request this information by contacting us at 1-800-621-1675 or info@ftportfolios.com.
OTHER INFORMATION
The Fund is not sponsored, endorsed, sold or promoted by SPDR® S&P 500® ETF Trust, PDR Services, LLC, or Standard & Poor’s® (together with their affiliates hereinafter referred to as the “Corporations”). The Corporations have not passed on the legality or suitability of, or the accuracy or adequacy of, descriptions and disclosures relating to the Fund or the FLEX Options. The Corporations make no representations or warranties, express or implied, regarding the advisability of investing in the Fund or the FLEX Options or results to be obtained by the Fund or the FLEX Options, shareholders or any other person or entity from use of the SPDR® S&P 500® ETF Trust. The Corporations have no liability in connection with the management, administration, marketing or trading of the Fund or the FLEX Options.
FT Vest U.S. Equity
Moderate Buffer ETF - November
GNOV | CBOE BZX EXCHANGE, INC.
ANNUAL SHAREHOLDER REPORT | August 31, 2024
This annual shareholder report contains important information about the FT Vest U.S. Equity Moderate Buffer ETF - November (the “Fund”) for the period of November 17, 2023 (commencement of investment operations) to August 31, 2024 (the “Period”). You can find additional information about the Fund at www.ftportfolios.com/fund-documents/etf/GNOV. You can also request this information by contacting us at 1-800-621-1675 or info@ftportfolios.com.
WHAT WERE THE FUND COSTS FOR THE LAST YEAR?
(Based on a hypothetical $10,000 investment)
| Fund | Costs of a $10,000 investment | Costs paid as a percentage
of a $10,000 investment |
| FT Vest U.S. Equity Moderate Buffer ETF - November | $71(1) | 0.85%(2) |
(1) | The Fund commenced investment operations on November 17, 2023. Had the Fund been in operation for a complete fiscal year, the cost of a $10,000 investment would have been higher. |
(2) | Annualized. |
HOW DID THE FUND PERFORM LAST YEAR? WHAT AFFECTED THE FUND’S PERFORMANCE?
The Fund returned 11.78% for the period from the Fund’s inception date on November 17, 2023 through August 31, 2024. The Fund underperformed its benchmark, the S&P 500® Index, which returned 26.53% for the same Period.
This underperformance was due to the following:
| Fund NAV Performance Attributed to*: | | |
| Changes in Reference Asset | 8.05 | % |
| Changes in other Variables | 4.39 | % |
| Fees and Expenses | -0.66 | % |
The Fund holds a combination of FLexible EXchange® Options (“FLEX Options”) designed to target the Fund’s objective.
* The Fund’s performance is impacted by changes in the values of the FLEX Options to which it is exposed. We attribute (allocate) the impact on the Fund’s performance into three components. The first of the three components is the impact on the Fund’s performance due to changes in the Fund’s Reference Asset. The second component is the aggregate impact on the Fund’s performance due to changes in other variables that impact FLEX Options prices - these include changes in a) the Reference Asset’s dividends, b) interest rates, c) implied volatility, and d) time to option expiration. The third component is from the Fund’s fees and expenses incurred during the Period.
FUND PERFORMANCE (November 17, 2023 to August 31, 2024)
The performance line graph below shows the performance of a hypothetical $10,000 initial investment in the Fund over a ten-year period (or for the life of the Fund, if shorter). The subsequent account value as of the end of the Period is listed next to the name of the Fund or index, as applicable. The performance table below shows the average annual total returns of the Fund for the past one-, five-, and ten-year periods, as applicable (or for the life of the Fund, if shorter), as of the end of the Period. Both the line graph and performance table compare the Fund’s performance to an appropriate broad-based index and may compare to additional indices reflecting the market segment(s) in which the Fund invests over the same periods.
Investment Performance of $10,000
| Average Annual Total Returns (as of August 31, 2024) | Since
Inception
(11/17/23) |
| FT Vest U.S. Equity Moderate Buffer ETF - November | 11.78% |
| S&P 500® Index | 26.53% |
Visit www.ftportfolios.com/etf/GNOV for more recent performance information.
The Fund’s past performance is not a good predictor of the Fund’s future performance. The graph and table do not reflect the deduction of taxes that a shareholder would pay on Fund distributions or redemption of Fund shares.
KEY FUND STATISTICS (As of August 31, 2024)
| Fund net assets | $158,473,141 |
| Total number of portfolio holdings | 5 |
| Total advisory fee paid | $1,059,751 |
| Portfolio turnover rate | 0% |
WHAT DID THE FUND INVEST IN? (As of August 31, 2024)
The table below shows the investment makeup of the Fund, representing the percentage of net assets of the Fund.
| Money Market Funds | 0.4% |
| Purchased Options | 111.0% |
| Written Options | (11.3%) |
| Net Other Assets and Liabilities | (0.1%) |
| Total | 100.0% |
WHERE CAN I FIND ADDITIONAL INFORMATION ABOUT THE FUND?
Visit www.ftportfolios.com/fund-documents/etf/GNOV to view additional information about the Fund such as the prospectus, financial information, Fund holdings and proxy voting information. You may also request this information by contacting us at 1-800-621-1675 or info@ftportfolios.com.
OTHER INFORMATION
The Fund is not sponsored, endorsed, sold or promoted by SPDR® S&P 500® ETF Trust, PDR Services, LLC, or Standard & Poor’s® (together with their affiliates hereinafter referred to as the “Corporations”). The Corporations have not passed on the legality or suitability of, or the accuracy or adequacy of, descriptions and disclosures relating to the Fund or the FLEX Options. The Corporations make no representations or warranties, express or implied, regarding the advisability of investing in the Fund or the FLEX Options or results to be obtained by the Fund or the FLEX Options, shareholders or any other person or entity from use of the SPDR® S&P 500® ETF Trust. The Corporations have no liability in connection with the management, administration, marketing or trading of the Fund or the FLEX Options.
FT Vest U.S. Small Cap
Moderate Buffer ETF - November
SNOV | CBOE BZX EXCHANGE, INC.
ANNUAL SHAREHOLDER REPORT | August 31, 2024
This annual shareholder report contains important information about the FT Vest U.S. Small Cap Moderate Buffer ETF - November (the “Fund”) for the period of November 17, 2023 (commencement of investment operations) to August 31, 2024 (the “Period”). You can find additional information about the Fund at www.ftportfolios.com/fund-documents/etf/SNOV. You can also request this information by contacting us at 1-800-621-1675 or info@ftportfolios.com.
WHAT WERE THE FUND COSTS FOR THE LAST YEAR?
(Based on a hypothetical $10,000 investment)
| Fund | Costs of a $10,000 investment | Costs paid as a percentage
of a $10,000 investment |
| FT Vest U.S. Small Cap Moderate Buffer ETF - November | $76(1) | 0.90%(2) |
(1) | The Fund commenced investment operations on November 17, 2023. Had the Fund been in operation for a complete fiscal year, the cost of a $10,000 investment would have been higher. |
(2) | Annualized. |
HOW DID THE FUND PERFORM LAST YEAR? WHAT AFFECTED THE FUND’S PERFORMANCE?
The Fund returned 13.82% for the period from the Fund’s inception date on November 17, 2023 through August 31, 2024. The Fund underperformed its benchmark, the Russell 2000® Index, which returned 24.76% for the same Period.
This underperformance was due to the following:
| Fund NAV Performance Attributed to*: | | |
| Changes in Reference Asset | 9.12 | % |
| Changes in other Variables | 5.40 | % |
| Fees and Expenses | -0.70 | % |
The Fund holds a combination of FLexible EXchange® Options (“FLEX Options”) designed to target the Fund’s objective.
* The Fund’s performance is impacted by changes in the values of the FLEX Options to which it is exposed. We attribute (allocate) the impact on the Fund’s performance into three components. The first of the three components is the impact on the Fund’s performance due to changes in the Fund’s Reference Asset. The second component is the aggregate impact on the Fund’s performance due to changes in other variables that impact FLEX Options prices - these include changes in a) the Reference Asset’s dividends, b) interest rates, c) implied volatility, and d) time to option expiration. The third component is from the Fund’s fees and expenses incurred during the Period.
FUND PERFORMANCE (November 17, 2023 to August 31, 2024)
The performance line graph below shows the performance of a hypothetical $10,000 initial investment in the Fund over a ten-year period (or for the life of the Fund, if shorter). The subsequent account value as of the end of the Period is listed next to the name of the Fund or index, as applicable. The performance table below shows the average annual total returns of the Fund for the past one-, five-, and ten-year periods, as applicable (or for the life of the Fund, if shorter), as of the end of the Period. Both the line graph and performance table compare the Fund’s performance to an appropriate broad-based index and may compare to additional indices reflecting the market segment(s) in which the Fund invests over the same periods.
Investment Performance of $10,000
| Average Annual Total Returns (as of August 31, 2024) | Since
Inception
(11/17/23) |
| FT Vest U.S. Small Cap Moderate Buffer ETF - November | 13.82% |
| Russell 2000® Index | 24.76% |
| Russell 3000® Index | 26.16% |
Visit www.ftportfolios.com/etf/SNOV for more recent performance information.
The Fund’s past performance is not a good predictor of the Fund’s future performance. The graph and table do not reflect the deduction of taxes that a shareholder would pay on Fund distributions or redemption of Fund shares.
KEY FUND STATISTICS (As of August 31, 2024)
| Fund net assets | $22,733,685 |
| Total number of portfolio holdings | 5 |
| Total advisory fee paid | $168,302 |
| Portfolio turnover rate | 0% |
WHAT DID THE FUND INVEST IN? (As of August 31, 2024)
The table below shows the investment makeup of the Fund, representing the percentage of net assets of the Fund.
| Money Market Funds | 0.5% |
| Purchased Options | 107.6% |
| Written Options | (8.0%) |
| Net Other Assets and Liabilities | (0.1%) |
| Total | 100.0% |
WHERE CAN I FIND ADDITIONAL INFORMATION ABOUT THE FUND?
Visit www.ftportfolios.com/fund-documents/etf/SNOV to view additional information about the Fund such as the prospectus, financial information, Fund holdings and proxy voting information. You may also request this information by contacting us at 1-800-621-1675 or info@ftportfolios.com.
OTHER INFORMATION
The Fund is not sponsored, endorsed, sold or promoted by iShares Russell 2000 ETF, BFA, or Russell (together with their affiliates hereinafter referred to as the “Corporations”). The Corporations have not passed on the legality or suitability of, or the accuracy or adequacy of, descriptions and disclosures relating to the Fund or the FLEX Options. The Corporations make no representations or warranties, express or implied, regarding the advisability of investing in the Fund or the FLEX Options or results to be obtained by the Fund or the FLEX Options, shareholders or any other person or entity from use of the iShares Russell 2000 ETF. The Corporations have no liability in connection with the management, administration, marketing or trading of the Fund or the FLEX Options.
FT Vest U.S. Equity
Buffer & Premium Income ETF - December
XIDE | CBOE BZX EXCHANGE, INC.
ANNUAL SHAREHOLDER REPORT | August 31, 2024
This annual shareholder report contains important information about the FT Vest U.S. Equity Buffer & Premium Income ETF - December (the “Fund”) for the period of December 15, 2023 (commencement of investment operations) to August 31, 2024 (the “Period”). You can find additional information about the Fund at www.ftportfolios.com/fund-documents/etf/XIDE. You can also request this information by contacting us at 1-800-621-1675 or info@ftportfolios.com.
WHAT WERE THE FUND COSTS FOR THE LAST YEAR?
(Based on a hypothetical $10,000 investment)
| Fund | Costs of a $10,000 investment | Costs paid as a percentage
of a $10,000 investment |
| FT Vest U.S. Equity Buffer & Premium Income ETF - December | $62(1) | 0.85%(2) |
(1) | The Fund commenced investment operations on December 15, 2023. Had the Fund been in operation for a complete fiscal year, the cost of a $10,000 investment would have been higher. |
(2) | Annualized. |
HOW DID THE FUND PERFORM LAST YEAR? WHAT AFFECTED THE FUND’S PERFORMANCE?
The Fund returned 5.22% for the period from the Fund’s inception date on December 15, 2023 through August 31, 2024. The Fund underperformed its benchmark, the S&P 500® Index, which returned 20.86% for the same Period.
This underperformance was due to the following:
| Fund NAV Performance Attributed to*: | | |
| Changes in Reference Asset | 1.72 | % |
| Changes in other Variables | 4.10 | % |
| Fees and Expenses | -0.60 | % |
The Fund holds a combination of FLexible EXchange® Options (“FLEX Options”) designed to target the Fund’s objective.
* The Fund’s performance is impacted by changes in the values of the FLEX Options to which it is exposed. We attribute (allocate) the impact on the Fund’s performance into three components. The first of the three components is the impact on the Fund’s performance due to changes in the Fund’s Reference Asset. The second component is the aggregate impact on the Fund’s performance due to changes in other variables that impact FLEX Options prices - these include changes in a) the Reference Asset’s dividends, b) interest rates, c) implied volatility, and d) time to option expiration. The third component is from the Fund’s fees and expenses incurred during the Period.
FUND PERFORMANCE (December 15, 2023 to August 31, 2024)
The performance line graph below shows the performance of a hypothetical $10,000 initial investment in the Fund over a ten-year period (or for the life of the Fund, if shorter). The subsequent account value as of the end of the Period is listed next to the name of the Fund or index, as applicable. The performance table below shows the average annual total returns of the Fund for the past one-, five-, and ten-year periods, as applicable (or for the life of the Fund, if shorter), as of the end of the Period. Both the line graph and performance table compare the Fund’s performance to an appropriate broad-based index and may compare to additional indices reflecting the market segment(s) in which the Fund invests over the same periods.
Investment Performance of $10,000
| Average Annual Total Returns (as of August 31, 2024) | Since
Inception
(12/15/23) |
| FT Vest U.S. Equity Buffer & Premium Income ETF - December | 5.22% |
| S&P 500® Index | 20.86% |
Visit www.ftportfolios.com/etf/XIDE for more recent performance information.
The Fund’s past performance is not a good predictor of the Fund’s future performance. The graph and table do not reflect the deduction of taxes that a shareholder would pay on Fund distributions or redemption of Fund shares.
The Fund has implemented a distribution policy pursuant to which the Fund intends to declare and pay monthly dividends to shareholders that is approximately 7.56% (before fees and expenses). The policy may reduce the Fund’s net asset value. The policy may be amended by the Trust’s Board of Trustees at any time, or the Fund may cease distributions entirely, at any time. Under the distribution policy, to the extent that sufficient investment income is not available on a monthly basis, the Fund’s distributions could consist of return of capital in order to maintain the distribution rate. During the Period, the Fund met its specified level of distributions. For the Period ended August 31, 2024, 6.38% of the Fund’s distributions were estimated as ordinary income and 93.62% were estimated as return of capital. The final determination of the source and tax status of all calendar year 2024 distributions will be made after the end of 2024 and will be provided on Form 1099-DIV. The foregoing is not to be construed as tax advice. Please consult your tax advisor for further information regarding tax matters.
KEY FUND STATISTICS (As of August 31, 2024)
| Fund net assets | $20,529,041 |
| Total number of portfolio holdings | 8 |
| Total advisory fee paid | $109,166 |
| Portfolio turnover rate | 0% |
WHAT DID THE FUND INVEST IN? (As of August 31, 2024)
The table below shows the investment makeup of the Fund, representing the percentage of net assets of the Fund.
| U.S. Treasury Bills | 2.2% |
| Money Market Funds | 1.0% |
| Purchased Options | 118.5% |
| Written Options | (21.6%) |
| Net Other Assets and Liabilities | (0.1%) |
| Total | 100.0% |
WHERE CAN I FIND ADDITIONAL INFORMATION ABOUT THE FUND?
Visit www.ftportfolios.com/fund-documents/etf/XIDE to view additional information about the Fund such as the prospectus, financial information, Fund holdings and proxy voting information. You may also request this information by contacting us at 1-800-621-1675 or info@ftportfolios.com.
OTHER INFORMATION
The Fund is not sponsored, endorsed, sold or promoted by SPDR® S&P 500® ETF Trust, PDR Services, LLC, or Standard & Poor’s® (together with their affiliates hereinafter referred to as the “Corporations”). The Corporations have not passed on the legality or suitability of, or the accuracy or adequacy of, descriptions and disclosures relating to the Fund or the FLEX Options. The Corporations make no representations or warranties, express or implied, regarding the advisability of investing in the Fund or the FLEX Options or results to be obtained by the Fund or the FLEX Options, shareholders or any other person or entity from use of the SPDR® S&P 500® ETF Trust. The Corporations have no liability in connection with the management, administration, marketing or trading of the Fund or the FLEX Options.
FT Vest U.S. Equity
Moderate Buffer ETF - December
GDEC | CBOE BZX EXCHANGE, INC.
ANNUAL SHAREHOLDER REPORT | August 31, 2024
This annual shareholder report contains important information about the FT Vest U.S. Equity Moderate Buffer ETF - December (the “Fund”) for the period of December 15, 2023 (commencement of investment operations) to August 31, 2024 (the “Period”). You can find additional information about the Fund at www.ftportfolios.com/fund-documents/etf/GDEC. You can also request this information by contacting us at 1-800-621-1675 or info@ftportfolios.com.
WHAT WERE THE FUND COSTS FOR THE LAST YEAR?
(Based on a hypothetical $10,000 investment)
| Fund | Costs of a $10,000 investment | Costs paid as a percentage
of a $10,000 investment |
| FT Vest U.S. Equity Moderate Buffer ETF - December | $64(1) | 0.85%(2) |
(1) | The Fund commenced investment operations on December 15, 2023. Had the Fund been in operation for a complete fiscal year, the cost of a $10,000 investment would have been higher. |
(2) | Annualized. |
HOW DID THE FUND PERFORM LAST YEAR? WHAT AFFECTED THE FUND’S PERFORMANCE?
The Fund returned 9.79% for the period from the Fund’s inception date on December 15, 2023 through August 31, 2024. The Fund underperformed its benchmark, the S&P 500® Index, which returned 20.86% for the same Period.
This underperformance was due to the following:
| Fund NAV Performance Attributed to*: | | |
| Changes in Reference Asset | 7.05 | % |
| Changes in other Variables | 3.34 | % |
| Fees and Expenses | -0.60 | % |
The Fund holds a combination of FLexible EXchange® Options (“FLEX Options”) designed to target the Fund’s objective.
* The Fund’s performance is impacted by changes in the values of the FLEX Options to which it is exposed. We attribute (allocate) the impact on the Fund’s performance into three components. The first of the three components is the impact on the Fund’s performance due to changes in the Fund’s Reference Asset. The second component is the aggregate impact on the Fund’s performance due to changes in other variables that impact FLEX Options prices - these include changes in a) the Reference Asset’s dividends, b) interest rates, c) implied volatility, and d) time to option expiration. The third component is from the Fund’s fees and expenses incurred during the Period.
FUND PERFORMANCE (December 15, 2023 to August 31, 2024)
The performance line graph below shows the performance of a hypothetical $10,000 initial investment in the Fund over a ten-year period (or for the life of the Fund, if shorter). The subsequent account value as of the end of the Period is listed next to the name of the Fund or index, as applicable. The performance table below shows the average annual total returns of the Fund for the past one-, five-, and ten-year periods, as applicable (or for the life of the Fund, if shorter), as of the end of the Period. Both the line graph and performance table compare the Fund’s performance to an appropriate broad-based index and may compare to additional indices reflecting the market segment(s) in which the Fund invests over the same periods.
Investment Performance of $10,000
| Average Annual Total Returns (as of August 31, 2024) | Since
Inception
(12/15/23) |
| FT Vest U.S. Equity Moderate Buffer ETF - December | 9.79% |
| S&P 500® Index | 20.86% |
Visit www.ftportfolios.com/etf/GDEC for more recent performance information.
The Fund’s past performance is not a good predictor of the Fund’s future performance. The graph and table do not reflect the deduction of taxes that a shareholder would pay on Fund distributions or redemption of Fund shares.
KEY FUND STATISTICS (As of August 31, 2024)
| Fund net assets | $126,965,952 |
| Total number of portfolio holdings | 5 |
| Total advisory fee paid | $985,390 |
| Portfolio turnover rate | 0% |
WHAT DID THE FUND INVEST IN? (As of August 31, 2024)
The table below shows the investment makeup of the Fund, representing the percentage of net assets of the Fund.
| Money Market Funds | 0.4% |
| Purchased Options | 108.5% |
| Written Options | (8.8%) |
| Net Other Assets and Liabilities | (0.1%) |
| Total | 100.0% |
WHERE CAN I FIND ADDITIONAL INFORMATION ABOUT THE FUND?
Visit www.ftportfolios.com/fund-documents/etf/GDEC to view additional information about the Fund such as the prospectus, financial information, Fund holdings and proxy voting information. You may also request this information by contacting us at 1-800-621-1675 or info@ftportfolios.com.
OTHER INFORMATION
The Fund is not sponsored, endorsed, sold or promoted by SPDR® S&P 500® ETF Trust, PDR Services, LLC, or Standard & Poor’s® (together with their affiliates hereinafter referred to as the “Corporations”). The Corporations have not passed on the legality or suitability of, or the accuracy or adequacy of, descriptions and disclosures relating to the Fund or the FLEX Options. The Corporations make no representations or warranties, express or implied, regarding the advisability of investing in the Fund or the FLEX Options or results to be obtained by the Fund or the FLEX Options, shareholders or any other person or entity from use of the SPDR® S&P 500® ETF Trust. The Corporations have no liability in connection with the management, administration, marketing or trading of the Fund or the FLEX Options.
FT Vest Laddered Moderate Buffer ETF
BUFZ | CBOE BZX EXCHANGE, INC.
ANNUAL SHAREHOLDER REPORT | August 31, 2024
This annual shareholder report contains important information about the FT Vest Laddered Moderate Buffer ETF (the “Fund”) for the period of October 25, 2023 (commencement of investment operations) to August 31, 2024 (the “Period”). You can find additional information about the Fund at www.ftportfolios.com/fund-documents/etf/BUFZ. You can also request this information by contacting us at 1-800-621-1675 or info@ftportfolios.com.
This report describes changes to the Fund that occurred during the Period.
WHAT WERE THE FUND COSTS FOR THE LAST YEAR?
(Based on a hypothetical $10,000 investment)
| Fund | Costs of a $10,000 investment | Costs paid as a percentage
of a $10,000 investment |
| FT Vest Laddered Moderate Buffer ETF | $16(1) (2) | 0.17%(1) (3) |
(1) | Excludes any Acquired Fund Fees and Expenses of underlying investment companies in which the Fund invests. |
(2) | The Fund commenced investment operations on October 25, 2023. Had the Fund been in operation for a complete fiscal year, the cost of a $10,000 investment would have been higher. |
(3) | Annualized. |
HOW DID THE FUND PERFORM LAST YEAR? WHAT AFFECTED THE FUND’S PERFORMANCE?
The Fund returned 17.47% for the period from the Fund’s inception date on October 25, 2023 through August 31, 2024. The Fund underperformed its benchmark, the S&P 500® Index, which returned 36.62% for the same Period.
This underperformance was due to the following:
| Fund NAV Performance Attributed to*: | | |
| Changes in Reference Asset | 13.03 | % |
| Changes in other Variables | 5.31 | % |
| Fees and Expenses** | -0.87 | % |
The Fund holds a portfolio that consists of a number of buffer funds, and thus is exposed to the combinations of FLexible EXchange® Options (“FLEX Options”) held by the funds in its portfolio.
* The Fund’s performance is impacted by changes in the values of the FLEX Options to which it is exposed. We attribute (allocate) the impact on the Fund’s performance into three components. The first of the three components is the impact on the Fund’s performance due to changes in the underlying buffer funds’ Reference Asset. The second component is the aggregate impact on the Fund’s performance due to changes in other variables that impact FLEX Options prices - these include changes in a) the Reference Asset’s dividends, b) interest rates, c) implied volatility, and d) time to option expiration. The third component is from the Fund’s fees and expenses incurred during the Period.
** Includes any Acquired Fund Fees and Expenses of underlying investment companies in which the Fund invests.
FUND PERFORMANCE (October 25, 2023 to August 31, 2024)
The performance line graph below shows the performance of a hypothetical $10,000 initial investment in the Fund over a ten-year period (or for the life of the Fund, if shorter). The subsequent account value as of the end of the Period is listed next to the name of the Fund or index, as applicable. The performance table below shows the average annual total returns of the Fund for the past one-, five-, and ten-year periods, as applicable (or for the life of the Fund, if shorter), as of the end of the Period. Both the line graph and performance table compare the Fund’s performance to an appropriate broad-based index and may compare to additional indices reflecting the market segment(s) in which the Fund invests over the same periods.
Investment Performance of $10,000
| Average Annual Total Returns (as of August 31, 2024) | Since
Inception
(10/25/23) |
| FT Vest Laddered Moderate Buffer ETF | 17.47% |
| S&P 500® Index | 36.62% |
Visit www.ftportfolios.com/etf/BUFZ for more recent performance information.
The Fund’s past performance is not a good predictor of the Fund’s future performance. The graph and table do not reflect the deduction of taxes that a shareholder would pay on Fund distributions or redemption of Fund shares.
KEY FUND STATISTICS (As of August 31, 2024)
| Fund net assets | $229,238,047 |
| Total number of portfolio holdings | 13 |
| Total advisory fee paid | $115,183 |
| Portfolio turnover rate | 1% |
WHAT DID THE FUND INVEST IN? (As of August 31, 2024)
The table below shows the investment makeup of the Fund, representing the percentage of net assets of the Fund.
| Exchange-Traded Funds | 100.0% |
| Money Market Funds | 0.0% |
| Net Other Assets and Liabilities | (0.0%) |
| Total | 100.0% |
Any amount shown as 0.0% represents less than 0.1%.
HOW HAS THE FUND MATERIALLY CHANGED?
This is a summary of certain changes to the Fund since September 1, 2023. For more complete information, you may review the Fund’s prospectus and any applicable supplements at www.ftportfolios.com/fund-documents/etf/BUFZ or upon request at 1-800-621-1675 or info@ftportfolios.com.
Pursuant to a contractual agreement, effective August 1, 2024, the Fund’s investment advisor agreed to waive management fees of 0.10% of average daily net assets through December 31, 2025.
WHERE CAN I FIND ADDITIONAL INFORMATION ABOUT THE FUND?
Visit www.ftportfolios.com/fund-documents/etf/BUFZ to view additional information about the Fund such as the prospectus, financial information, Fund holdings and proxy voting information. You may also request this information by contacting us at 1-800-621-1675 or info@ftportfolios.com.
OTHER INFORMATION
The Fund is not sponsored, endorsed, sold or promoted by SPDR® S&P 500® ETF Trust, PDR, or Standard & Poor’s (together with their affiliates hereinafter referred to as the “Corporations”). The Corporations have not passed on the legality or suitability of, or the accuracy or adequacy of, descriptions and disclosures relating to the Fund. The Corporations make no representations or warranties, express or implied, regarding the advisability of investing in the Fund or results to be obtained by the Fund, shareholders or any other person or entity from use of the SPDR® S&P 500® ETF Trust. The Corporations have no liability in connection with the management, administration, marketing or trading of the Fund.
FT Vest Laddered Small Cap Moderate Buffer ETF
BUFS | CBOE BZX EXCHANGE, INC.
ANNUAL SHAREHOLDER REPORT | August 31, 2024
This annual shareholder report contains important information about the FT Vest Laddered Small Cap Moderate Buffer ETF (the “Fund”) for the period of May 29, 2024 (commencement of investment operations) to August 31, 2024 (the “Period”). You can find additional information about the Fund at www.ftportfolios.com/fund-documents/etf/BUFS. You can also request this information by contacting us at 1-800-621-1675 or info@ftportfolios.com.
This report describes changes to the Fund that occurred during the Period.
WHAT WERE THE FUND COSTS FOR THE LAST YEAR?
(Based on a hypothetical $10,000 investment)
| Fund | Costs of a $10,000 investment | Costs paid as a percentage
of a $10,000 investment |
| FT Vest Laddered Small Cap Moderate Buffer ETF | $4(1) (2) | 0.15%(1) (3) |
(1) | Excludes any Acquired Fund Fees and Expenses of underlying investment companies in which the Fund invests. |
(2) | The Fund commenced investment operations on May 29, 2024. Had the Fund been in operation for a complete fiscal year, the cost of a $10,000 investment would have been higher. |
(3) | Annualized. |
HOW DID THE FUND PERFORM LAST YEAR? WHAT AFFECTED THE FUND’S PERFORMANCE?
The Fund returned 5.65% for the period from the Fund’s inception date on May 29, 2024 through August 31, 2024. The Fund underperformed its benchmark, the Russell 2000® Index, which returned 9.33% for the same Period.
This underperformance was due to the following:
| Fund NAV Performance Attributed to*: | | |
| Changes in Reference Asset | 4.46 | % |
| Changes in other Variables | 1.46 | % |
| Fees and Expenses** | -0.27 | % |
The Fund holds a combination of FLexible EXchange® Options (“FLEX Options”) designed to target the Fund’s objective.
* The Fund’s performance is impacted by changes in the values of the FLEX Options to which it is exposed. We attribute (allocate) the impact on the Fund’s performance into three components. The first of the three components is the impact on the Fund’s performance due to changes in the underlying buffer funds’ Reference Asset. The second component is the aggregate impact on the Fund’s performance due to changes in other variables that impact FLEX Options prices - these include changes in a) the Reference Asset’s dividends, b) interest rates, c) implied volatility, and d) time to option expiration. The third component is from the Fund’s fees and expenses incurred during the Period.
** Includes any Acquired Fund Fees and Expenses of underlying investment companies in which the Fund invests.
FUND PERFORMANCE (May 29, 2024 to August 31, 2024)
The performance line graph below shows the performance of a hypothetical $10,000 initial investment in the Fund over a ten-year period (or for the life of the Fund, if shorter). The subsequent account value as of the end of the Period is listed next to the name of the Fund or index, as applicable. The performance table below shows the average annual total returns of the Fund for the past one-, five-, and ten-year periods, as applicable (or for the life of the Fund, if shorter), as of the end of the Period. Both the line graph and performance table compare the Fund’s performance to an appropriate broad-based index and may compare to additional indices reflecting the market segment(s) in which the Fund invests over the same periods.
Investment Performance of $10,000
| Average Annual Total Returns (as of August 31, 2024) | Since
Inception
(5/29/24) |
| FT Vest Laddered Small Cap Moderate Buffer ETF | 5.65% |
| Russell 2000® Index | 9.33% |
| Russell 3000® Index | 7.64% |
Visit www.ftportfolios.com/etf/BUFS for more recent performance information.
The Fund’s past performance is not a good predictor of the Fund’s future performance. The graph and table do not reflect the deduction of taxes that a shareholder would pay on Fund distributions or redemption of Fund shares.
KEY FUND STATISTICS (As of August 31, 2024)
| Fund net assets | $10,480,703 |
| Total number of portfolio holdings | 5 |
| Total advisory fee paid | $2,386 |
| Portfolio turnover rate | 1% |
WHAT DID THE FUND INVEST IN? (As of August 31, 2024)
The table below shows the investment makeup of the Fund, representing the percentage of net assets of the Fund.
| Exchange-Traded Funds | 99.9% |
| Money Market Funds | 0.1% |
| Net Other Assets and Liabilities | (0.0%) |
| Total | 100.0% |
Any amount shown as 0.0% represents less than 0.1%.
HOW HAS THE FUND MATERIALLY CHANGED?
This is a summary of certain changes to the Fund since September 1, 2023. For more complete information, you may review the Fund’s prospectus and any applicable supplements at www.ftportfolios.com/fund-documents/etf/BUFS or upon request at 1-800-621-1675 or info@ftportfolios.com.
Pursuant to a contractual agreement, effective August 1, 2024, the Fund’s investment advisor agreed to waive management fees of 0.10% of average daily net assets through May 21, 2026.
WHERE CAN I FIND ADDITIONAL INFORMATION ABOUT THE FUND?
Visit www.ftportfolios.com/fund-documents/etf/BUFS to view additional information about the Fund such as the prospectus, financial information, Fund holdings and proxy voting information. You may also request this information by contacting us at 1-800-621-1675 or info@ftportfolios.com.
OTHER INFORMATION
The Fund is not sponsored, endorsed, sold or promoted by iShares Russell 2000 ETF, BFA, or Russell (together with their affiliates hereinafter referred to as the “Corporations”). The Corporations have not passed on the legality or suitability of, or the accuracy or adequacy of, descriptions and disclosures relating to the Fund or the FLEX Options. The Corporations make no representations or warranties, express or implied, regarding the advisability of investing in the Fund or the FLEX Options or results to be obtained by the Fund or the FLEX Options, shareholders or any other person or entity from use of the iShares Russell 2000 ETF. The Corporations have no liability in connection with the management, administration, marketing or trading of the Fund or the FLEX Options.
First Trust SkyBridge
Crypto Industry and Digital Economy ETF
CRPT | NYSE ARCA, INC.
ANNUAL SHAREHOLDER REPORT | August 31, 2024
This annual shareholder report contains important information about the First Trust SkyBridge Crypto Industry and Digital Economy ETF (the “Fund”) for the year of September 1, 2023 to August 31, 2024 (the “Period”). You can find additional information about the Fund at www.ftportfolios.com/fund-documents/etf/CRPT. You can also request this information by contacting us at 1-800-621-1675 or info@ftportfolios.com.
This report describes changes to the Fund that occurred during the Period.
WHAT WERE THE FUND COSTS FOR THE LAST YEAR?
(Based on a hypothetical $10,000 investment)
| Fund | Costs of a $10,000 investment | Costs paid as a percentage
of a $10,000 investment |
| First Trust SkyBridge Crypto Industry and Digital Economy ETF | $127 | 0.85% |
HOW DID THE FUND PERFORM LAST YEAR? WHAT AFFECTED THE FUND’S PERFORMANCE?
The Fund returned 98.79% for the 12 months ended August 31, 2024. The Fund outperformed its benchmark, the S&P 500® Index, which returned 27.14% for the same Period.
This outperformance was driven primarily by the Fund’s exposure to crypto industry equities that experienced a sharp increase in value driven by a crypto industry recovery and Bitcoin’s sharp increase in price over the Period, with several of the Fund’s top positions (for example, MicroStrategy, Inc. and Coinbase Global, Inc.) outperforming the return on spot Bitcoin over the Period.
FUND PERFORMANCE (September 20, 2021 to August 31, 2024)
The performance line graph below shows the performance of a hypothetical $10,000 initial investment in the Fund over a ten-year period (or for the life of the Fund, if shorter). The subsequent account value as of the end of the Period is listed next to the name of the Fund or index, as applicable. The performance table below shows the average annual total returns of the Fund for the past one-, five-, and ten-year periods, as applicable (or for the life of the Fund, if shorter), as of the end of the Period. Both the line graph and performance table compare the Fund’s performance to an appropriate broad-based index and may compare to additional indices reflecting the market segment(s) in which the Fund invests over the same periods.
Investment Performance of $10,000
| Average Annual Total Returns (as of August 31, 2024) | 1 Year | Since
Inception
(9/20/21) |
| First Trust SkyBridge Crypto Industry and Digital Economy ETF | 98.79% | -15.27% |
| S&P 500® Index | 27.14% | 10.92% |
Visit www.ftportfolios.com/etf/CRPT for more recent performance information.
The Fund’s past performance is not a good predictor of the Fund’s future performance. The graph and table do not reflect the deduction of taxes that a shareholder would pay on Fund distributions or redemption of Fund shares.
KEY FUND STATISTICS (As of August 31, 2024)
| Fund net assets | $51,050,606 |
| Total number of portfolio holdings | 31 |
| Total advisory fee paid | $346,621 |
| Portfolio turnover rate | 215% |
WHAT DID THE FUND INVEST IN? (As of August 31, 2024)
The tables below show the investment makeup of the Fund, representing the percentage of total investments of the Fund.
| MicroStrategy, Inc., Class A | 20.4% |
| Coinbase Global, Inc., Class A | 18.1% |
| Galaxy Digital Holdings Ltd. | 6.4% |
| Cleanspark, Inc. | 4.5% |
| Riot Platforms, Inc. | 4.5% |
| Marathon Digital Holdings, Inc. | 4.5% |
| Cipher Mining, Inc. | 4.5% |
| NVIDIA Corp. | 4.4% |
| Terawulf, Inc. | 4.3% |
| Iris Energy Ltd. | 4.2% |
HOW HAS THE FUND MATERIALLY CHANGED?
This is a summary of certain changes to the Fund since September 1, 2023. For more complete information, you may review the Fund’s prospectus and any applicable supplements at www.ftportfolios.com/fund-documents/etf/CRPT or upon request at 1-800-621-1675 or info@ftportfolios.com.
The Trust’s Board of Trustees approved a change to the Fund’s principal investment strategies to allow the Fund to invest in Bitcoin Exchange-Traded Products. These Bitcoin Exchange-Traded Products are expected to be held by the Fund indirectly via a wholly-owned subsidiary of the Fund organized under the laws of the Cayman Islands. The Fund generally intends to invest up to 25% of its net assets in Bitcoin Exchange-Traded Products; however, at certain times, the Fund may invest more than 25% of its net assets in Bitcoin Exchange-Traded Products. The Fund’s principal investment strategies and principal risks were revised accordingly.
WHERE CAN I FIND ADDITIONAL INFORMATION ABOUT THE FUND?
Visit www.ftportfolios.com/fund-documents/etf/CRPT to view additional information about the Fund such as the prospectus, financial information, Fund holdings and proxy voting information. You may also request this information by contacting us at 1-800-621-1675 or info@ftportfolios.com.
First Trust Multi-Manager
Large Growth ETF
MMLG | NYSE ARCA, INC.
ANNUAL SHAREHOLDER REPORT | August 31, 2024
This annual shareholder report contains important information about the First Trust Multi-Manager Large Growth ETF (the “Fund”) for the year of September 1, 2023 to August 31, 2024 (the “Period”). You can find additional information about the Fund at www.ftportfolios.com/fund-documents/etf/MMLG. You can also request this information by contacting us at 1-800-621-1675 or info@ftportfolios.com.
This report describes changes to the Fund that occurred during the Period.
WHAT WERE THE FUND COSTS FOR THE LAST YEAR?
(Based on a hypothetical $10,000 investment)
| Fund | Costs of a $10,000 investment | Costs paid as a percentage
of a $10,000 investment |
| First Trust Multi-Manager Large Growth ETF | $97 | 0.85% |
HOW DID THE FUND PERFORM LAST YEAR? WHAT AFFECTED THE FUND’S PERFORMANCE?
The Fund returned 27.91% for the 12 months ended August 31, 2024. The Fund underperformed its benchmark, the Russell 1000® Growth Index, which returned 30.75% for the same Period.
This underperformance was driven by the Fund’s positions in the Health Care sector where selection detracted from performance relative to the benchmark. An overweight to Dexcom, Inc., which works with devices for glucose monitoring for diabetes, returned -31.3% over the Period after reporting weak revenue and guidance. Additionally, the Fund was overweight to 10x Genomics, Inc., which was down 55.0% for the Period with an unfavorable ruling in a patent infringement case in Germany and a competitor gaining reach in the space. Selection in the Information Technology sector was also a detractor. An overweight to Snowflake, Inc., a software solutions company, detracted as the company traded down 27.2%. An overweight to Atlassian Corp. hurt performance as the name was down 18.9%. An overweight to Entegris, Inc. hurt Fund performance as the name was up but less than the benchmark. An off-benchmark position in ASML Holding N.V. returned -13.4% and also hurt Fund performance. Offsetting some losses was selection in the Consumer Discretionary sector which was up approximately 12.2% for the benchmark and the Fund outperformed. Additionally, the Fund’s selection within the Communication Services sector also aided returns as the Fund’s sector holdings outpaced the benchmark.
FUND PERFORMANCE (July 21, 2020 to August 31, 2024)
The performance line graph below shows the performance of a hypothetical $10,000 initial investment in the Fund over a ten-year period (or for the life of the Fund, if shorter). The subsequent account value as of the end of the Period is listed next to the name of the Fund or index, as applicable. The performance table below shows the average annual total returns of the Fund for the past one-, five-, and ten-year periods, as applicable (or for the life of the Fund, if shorter), as of the end of the Period. Both the line graph and performance table compare the Fund’s performance to an appropriate broad-based index and may compare to additional indices reflecting the market segment(s) in which the Fund invests over the same periods.
Investment Performance of $10,000
| Average Annual Total Returns (as of August 31, 2024) | 1 Year | Since
Inception
(7/21/20) |
| First Trust Multi-Manager Large Growth ETF | 27.91% | 8.63% |
| Russell 1000® Growth Index | 30.75% | 16.25% |
| Russell 1000® Index | 26.60% | 15.58% |
Visit www.ftportfolios.com/etf/MMLG for more recent performance information.
The Fund’s past performance is not a good predictor of the Fund’s future performance. The graph and table do not reflect the deduction of taxes that a shareholder would pay on Fund distributions or redemption of Fund shares.
KEY FUND STATISTICS (As of August 31, 2024)
| Fund net assets | $69,550,338 |
| Total number of portfolio holdings | 77 |
| Total advisory fee paid | $501,843 |
| Portfolio turnover rate | 41% |
WHAT DID THE FUND INVEST IN? (As of August 31, 2024)
The tables below show the investment makeup of the Fund, representing the percentage of total investments of the Fund.
| NVIDIA Corp. | 9.3% |
| Microsoft Corp. | 7.7% |
| Amazon.com, Inc. | 6.5% |
| Apple, Inc. | 4.7% |
| Meta Platforms, Inc., Class A | 4.6% |
| ServiceNow, Inc. | 4.1% |
| Alphabet, Inc., Class A | 2.9% |
| Netflix, Inc. | 2.4% |
| ASML Holding N.V. | 2.2% |
| Eli Lilly & Co. | 2.1% |
HOW HAS THE FUND MATERIALLY CHANGED?
This is a summary of certain changes to the Fund since September 1, 2023. For more complete information, you may review the Fund’s prospectus and any applicable supplements at www.ftportfolios.com/fund-documents/etf/MMLG or upon request at 1-800-621-1675 or info@ftportfolios.com.
During the fiscal year ended August 31, 2024, the Fund’s diversification status under the Investment Company Act of 1940 changed from non-diversified to diversified. The Fund’s principal investment strategies and principal risks were revised accordingly.
WHERE CAN I FIND ADDITIONAL INFORMATION ABOUT THE FUND?
Visit www.ftportfolios.com/fund-documents/etf/MMLG to view additional information about the Fund such as the prospectus, financial information, Fund holdings and proxy voting information. You may also request this information by contacting us at 1-800-621-1675 or info@ftportfolios.com.
First Trust Multi-Manager
Small Cap Opportunities ETF
MMSC | NYSE ARCA, INC.
ANNUAL SHAREHOLDER REPORT | August 31, 2024
This annual shareholder report contains important information about the First Trust Multi-Manager Small Cap Opportunities ETF (the “Fund”) for the year of September 1, 2023 to August 31, 2024 (the “Period”). You can find additional information about the Fund at www.ftportfolios.com/fund-documents/etf/MMSC. You can also request this information by contacting us at 1-800-621-1675 or info@ftportfolios.com.
This report describes changes to the Fund that occurred during the Period.
WHAT WERE THE FUND COSTS FOR THE LAST YEAR?
(Based on a hypothetical $10,000 investment)
| Fund | Costs of a $10,000 investment | Costs paid as a percentage
of a $10,000 investment |
| First Trust Multi-Manager Small Cap Opportunities ETF | $106 | 0.95% |
HOW DID THE FUND PERFORM LAST YEAR? WHAT AFFECTED THE FUND’S PERFORMANCE?
The Fund returned 23.06% for the 12 months ended August 31, 2024. The Fund outperformed its benchmark, the Russell 2000® Growth Index, which returned 17.67% for the same Period.
The outperformance was largely due to selection within the Industrials sector, followed by selection within the Consumer Discretionary and the Energy sectors. In the Industrials sector, an off-benchmark position in Axon Enterprise, Inc., up 71.4%, benefitted Fund performance as the company reported record sales, raised guidance, and saw excitement around its Artificial Intelligence product. An overweight to FTAI Aviation Ltd. was also beneficial as the stock was up 252.5% as the company continued to report strong numbers and see continued growth. In the Consumer Discretionary sector, an off-benchmark position in Wingstop, Inc. was additive with the restaurant up 141.0% in the Period. Selection in the Energy sector was also additive with the benchmark holdings in the sector down and the holdings in the Fund putting up positive performance. Detracting from relative performance was selection in the Information Technology sector as the Fund’s holdings underperformed the benchmark. An allocation to cash was a drag on returns versus the benchmark in an up market.
FUND PERFORMANCE (October 13, 2021 to August 31, 2024)
The performance line graph below shows the performance of a hypothetical $10,000 initial investment in the Fund over a ten-year period (or for the life of the Fund, if shorter). The subsequent account value as of the end of the Period is listed next to the name of the Fund or index, as applicable. The performance table below shows the average annual total returns of the Fund for the past one-, five-, and ten-year periods, as applicable (or for the life of the Fund, if shorter), as of the end of the Period. Both the line graph and performance table compare the Fund’s performance to an appropriate broad-based index and may compare to additional indices reflecting the market segment(s) in which the Fund invests over the same periods.
Investment Performance of $10,000
| Average Annual Total Returns (as of August 31, 2024) | 1 Year | Since
Inception
(10/13/21) |
| First Trust Multi-Manager Small Cap Opportunities ETF | 23.06% | -0.03% |
| Russell 2000® Growth Index | 17.67% | -1.20% |
| Russell 3000® Index | 26.14% | 9.36% |
Visit www.ftportfolios.com/etf/MMSC for more recent performance information.
The Fund’s past performance is not a good predictor of the Fund’s future performance. The graph and table do not reflect the deduction of taxes that a shareholder would pay on Fund distributions or redemption of Fund shares.
KEY FUND STATISTICS (As of August 31, 2024)
| Fund net assets | $21,177,786 |
| Total number of portfolio holdings | 199 |
| Total advisory fee paid | $108,422 |
| Portfolio turnover rate | 86% |
WHAT DID THE FUND INVEST IN? (As of August 31, 2024)
The tables below show the investment makeup of the Fund, representing the percentage of total investments of the Fund.
| Axon Enterprise, Inc. | 2.0% |
| CyberArk Software Ltd. | 1.8% |
| TransMedics Group, Inc. | 1.4% |
| Leonardo DRS, Inc. | 1.4% |
| BellRing Brands, Inc. | 1.3% |
| Crinetics Pharmaceuticals, Inc. | 1.3% |
| Varonis Systems, Inc. | 1.3% |
| Onto Innovation, Inc. | 1.2% |
| Palomar Holdings, Inc. | 1.2% |
| Wingstop, Inc. | 1.2% |
HOW HAS THE FUND MATERIALLY CHANGED?
This is a summary of certain changes to the Fund since September 1, 2023. For more complete information, you may review the Fund’s prospectus and any applicable supplements at www.ftportfolios.com/fund-documents/etf/MMSC or upon request at 1-800-621-1675 or info@ftportfolios.com.
The Fund may have significant investments in various jurisdictions or investment sectors from time to time, making the Fund subject to the risks of such jurisdictions or investment sectors.
WHERE CAN I FIND ADDITIONAL INFORMATION ABOUT THE FUND?
Visit www.ftportfolios.com/fund-documents/etf/MMSC to view additional information about the Fund such as the prospectus, financial information, Fund holdings and proxy voting information. You may also request this information by contacting us at 1-800-621-1675 or info@ftportfolios.com.
First Trust TCW Opportunistic
Fixed Income ETF
FIXD | NASDAQ, INC.
ANNUAL SHAREHOLDER REPORT | August 31, 2024
This annual shareholder report contains important information about the First Trust TCW Opportunistic Fixed Income ETF (the “Fund”) for the year of September 1, 2023 to August 31, 2024 (the “Period”). You can find additional information about the Fund at www.ftportfolios.com/fund-documents/etf/FIXD. You can also request this information by contacting us at 1-800-621-1675 or info@ftportfolios.com.
This report describes changes to the Fund that occurred during the Period.
WHAT WERE THE FUND COSTS FOR THE LAST YEAR?
(Based on a hypothetical $10,000 investment)
| Fund | Costs of a $10,000 investment | Costs paid as a percentage
of a $10,000 investment |
| First Trust TCW Opportunistic Fixed Income ETF | $66 | 0.64% |
HOW DID THE FUND PERFORM LAST YEAR? WHAT AFFECTED THE FUND’S PERFORMANCE?
The Fund returned 7.55% for the 12 months ended August 31, 2024. The Fund outperformed its benchmark, the Bloomberg U.S. Aggregate Bond Index, which returned 7.30% for the same Period.
This outperformance was driven in part by favorable issue selection in the Fund. Corporate issue selection contributed to relative performance, led largely by outperforming bank issues, including UBS (formerly Credit Suisse) as prices and spreads continued to stabilize from the early 2023 dislocation, while other large systemically important banks that had been a focus in the Fund’s holdings also rallied and compressed towards the rest of the investment grade corporate index. Consistent with disciplined value investing, the outsized compression of corporate yield spreads throughout the Period led to a trimming of the Fund’s corporate exposure, realizing gains, and affording the Fund liquidity to redeploy upon future pricing and spread dislocations. Away from corporates, issue selection within securitized products was also notable, led by non-agency mortgage-backed securities (“MBS”) holdings, where the large allocation to legacy collateral and floating rate structures helped mitigate the impacts of rate volatility during the period while providing attractive coupon income. Similarly, collateralized loan obligations contributed within the asset-backed securities allocation, with compressing spreads an added benefit to relative returns. Commercial mortgage-backed securities holdings emphasized single asset single borrower (“SASBs”) deal structures with strong collateral and/or sponsors, which outperformed over the period while avoiding some of the broader credit concerns that affected conduit structures and idiosyncratic struggles faced by SASBs with weaker property collateral. Finally, the overweight to agency MBS contributed for the Period given strong performance in recent months as yields have come down.
Also significant to relative performance was the Fund’s longer-than-Index duration position and yield curve positioning. While this duration position weighed on returns early in the Period as rates reached their cycle highs in October 2023, the precipitous decline in Treasury yields over the last two months as markets became increasingly confident in a September 2024 rate cut by the Federal Reserve more than offset the performance drag that had accumulated up to that point. In addition, yield curve positioning focused on front-end yields provided a further boost as the recent rally has been led by the policy sensitive 2-Year yield. Derivatives positioning in the Fund was largely focused on futures positions to manage duration, interest rate swaps for hedging, and a small allocation to currency forwards, all of which had little impact on the Fund’s performance for the Period.
FUND PERFORMANCE (February 14, 2017 to August 31, 2024)
The performance line graph below shows the performance of a hypothetical $10,000 initial investment in the Fund over a ten-year period (or for the life of the Fund, if shorter). The subsequent account value as of the end of the Period is listed next to the name of the Fund or index, as applicable. The performance table below shows the average annual total returns of the Fund for the past one-, five-, and ten-year periods, as applicable (or for the life of the Fund, if shorter), as of the end of the Period. Both the line graph and performance table compare the Fund’s performance to an appropriate broad-based index and may compare to additional indices reflecting the market segment(s) in which the Fund invests over the same periods.
Investment Performance of $10,000
| Average Annual Total Returns (as of August 31, 2024) | 1 Year | 5 Year | Since
Inception
(2/14/17) |
| First Trust TCW Opportunistic Fixed Income ETF | 7.55% | -0.12% | 1.59% |
| Bloomberg U.S. Aggregate Bond Index | 7.30% | -0.04% | 1.58% |
Visit www.ftportfolios.com/etf/FIXD for more recent performance information.
The Fund’s past performance is not a good predictor of the Fund’s future performance. The graph and table do not reflect the deduction of taxes that a shareholder would pay on Fund distributions or redemption of Fund shares.
Performance in securitized product investment strategies can be impacted from the benefits of purchasing odd lot positions. The impact of these investments can be particularly meaningful when funds have limited assets under management and may not be a sustainable source of performance as a fund grows in size.
KEY FUND STATISTICS (As of August 31, 2024)
| Fund net assets | $5,279,538,093 |
| Total number of portfolio holdings | 900 |
| Total advisory fee paid | $31,248,891 |
| Portfolio turnover rate | 511% |
WHAT DID THE FUND INVEST IN? (As of August 31, 2024)
The tables below show the investment makeup of the Fund, representing the percentage of total investments of the Fund.
| Dreyfus Government Cash Management Fund, Institutional Shares, Class I, 5.19% | 11.7% |
| U.S. Treasury Note, 4.00%, 07/31/29 | 6.9% |
| U.S. Treasury Note, 3.63%, 08/31/29 | 6.6% |
| U.S. Treasury Note, 3.88%, 08/15/34 | 4.2% |
| U.S. Treasury Bond, 4.25%, 08/15/54 | 3.8% |
| U.S. Treasury Bond, 4.13%, 08/15/44 | 2.9% |
| U.S. Treasury Note, 3.75%, 08/31/26 | 2.6% |
| Federal National Mortgage Association, Pool TBA, 3.50%, 09/15/54 | 2.0% |
| U.S. Treasury Note, 3.75%, 08/15/27 | 1.9% |
| U.S. Treasury Bond, 4.63%, 05/15/44 | 1.5% |
(1) The credit quality and ratings information presented above reflect the ratings assigned by one or more nationally recognized statistical rating organizations (NRSROs), including S&P Global Ratings, Moody’s Investors Service, Inc., Fitch Ratings, or a comparably rated NRSRO. For situations in which a security is rated by more than one NRSRO and the ratings are not equivalent, the lowest ratings are used. Sub-investment grade ratings are those rated BB+/Ba1 or lower. Investment grade ratings are those rated BBB-/Baa3 or higher. The credit ratings shown relate to the creditworthiness of the issuers of the underlying securities in the Fund, and not to the Fund or its shares. U.S. Treasury, U.S. Agency and U.S. Agency mortgage-backed securities appear under “Government/Agency.” Credit ratings are subject to change.
Any amount shown as 0.0% represents less than 0.1%.
HOW HAS THE FUND MATERIALLY CHANGED?
This is a summary of certain changes to the Fund since September 1, 2023. For more complete information, you may review the Fund’s prospectus and any applicable supplements at www.ftportfolios.com/fund-documents/etf/FIXD or upon request at 1-800-621-1675 or info@ftportfolios.com.
During the fiscal year ended August 31, 2024, the Fund’s principal investment strategies were revised to reflect that the Fund’s average portfolio duration varies within 1.5 years (previously 1 year) of the portfolio duration of the securities comprising the Bloomberg U.S. Aggregate Bond Index.
Effective December 31, 2024, Stephen M. Kane will retire from the Fund’s investment sub-advisor and will no longer serve as a portfolio manager of the Fund.
WHERE CAN I FIND ADDITIONAL INFORMATION ABOUT THE FUND?
Visit www.ftportfolios.com/fund-documents/etf/FIXD to view additional information about the Fund such as the prospectus, financial information, Fund holdings and proxy voting information. You may also request this information by contacting us at 1-800-621-1675 or info@ftportfolios.com.
First Trust TCW Unconstrained Plus
Bond ETF
UCON | NYSE ARCA, INC.
ANNUAL SHAREHOLDER REPORT | August 31, 2024
This annual shareholder report contains important information about the First Trust TCW Unconstrained Plus Bond ETF (the “Fund”) for the year of September 1, 2023 to August 31, 2024 (the “Period”). You can find additional information about the Fund at www.ftportfolios.com/fund-documents/etf/UCON. You can also request this information by contacting us at 1-800-621-1675 or info@ftportfolios.com.
This report describes changes to the Fund that occurred during the Period.
WHAT WERE THE FUND COSTS FOR THE LAST YEAR?
(Based on a hypothetical $10,000 investment)
| Fund | Costs of a $10,000 investment | Costs paid as a percentage
of a $10,000 investment |
| First Trust TCW Unconstrained Plus Bond ETF | $89 | 0.85% |
HOW DID THE FUND PERFORM LAST YEAR? WHAT AFFECTED THE FUND’S PERFORMANCE?
The Fund returned 8.35% for the 12 months ended August 31, 2024. The Fund outperformed its benchmark, the ICE BofA 3-Month US Treasury Bill Index, which returned 5.48% for the same Period.
This outperformance was largely driven by the positive duration (sensitivity to interest rate moves) position, which reached a cycle-long of approximately 3.6 years by the end of October 2023 but hovered near 3.0 years thereafter. While this positive duration position weighed on returns early in the Period as rates reached their cycle highs in October 2023, the precipitous decline in Treasury yields over the last two months as markets became increasingly confident in a September 2024 rate cut by the Federal Reserve more than offset the performance drag that had accumulated up to that point.
Also significant to outperformance was the allocation to fixed income spread sectors given a broad-based reduction in yield premiums across sectors, spurred by the late 2023 rally and attendant investor optimism regarding the future state of the economy. Though this optimism moderated somewhat in the first half of 2024, valuations remain rich across a large swath of the fixed income market, especially corporates where yield premiums remain near post-Great Financial Crisis lows. As such, exposure to corporates benefitted relative returns, with the strong market tone providing opportunity to crystalize gains and trim holdings where investment theses materialized. This was most prominent across the banking sector, where UBS (formerly Credit Suisse) contributed from an issue selection standpoint as it stabilized from its early 2023 dislocations, while other large systemically important banks that had been a focus in the Fund’s holdings also rallied and compressed towards the rest of the investment grade corporate index.
Away from corporates, securitized credit exposure was also additive. Non-agency holdings performed the best amid sustained demand and limited net issuance in the sector, with investor optimism helping drive a flattening of credit curves and outperformance among more subordinated tranches. Asset-backed securities were also additive, with collateralized loan obligations contributing as their floating rate nature mitigated the impact of rising rates while falling yield premiums helped propel the sector to strong returns. Among commercial mortgage-backed securities (“MBS”), positioning favored private label issues, focusing on single asset single borrower deals which benefitted from strong performing collateral. Finally, despite strong performance in recent months as yields have come down, agency MBS detracted for the Period given elevated levels of rate volatility throughout much of the Period. Derivatives positioning in the Fund was largely focused on futures positions to manage duration, interest rate swaps for hedging, and a small allocation to currency forwards, all of which had little impact on the Fund’s performance for the Period.
FUND PERFORMANCE (June 4, 2018 to August 31, 2024)
The performance line graph below shows the performance of a hypothetical $10,000 initial investment in the Fund over a ten-year period (or for the life of the Fund, if shorter). The subsequent account value as of the end of the Period is listed next to the name of the Fund or index, as applicable. The performance table below shows the average annual total returns of the Fund for the past one-, five-, and ten-year periods, as applicable (or for the life of the Fund, if shorter), as of the end of the Period. Both the line graph and performance table compare the Fund’s performance to an appropriate broad-based index and may compare to additional indices reflecting the market segment(s) in which the Fund invests over the same periods.
Investment Performance of $10,000
| Average Annual Total Returns (as of August 31, 2024) | 1 Year | 5 Year | Since
Inception
(6/4/18) |
| First Trust TCW Unconstrained Plus Bond ETF | 8.35% | 2.89% | 3.47% |
| ICE BofA 3-Month US Treasury Bill Index | 5.48% | 2.27% | 2.27% |
| ICE BofA US Dollar 3-Month Deposit Offered Rate Average Index(1) | 5.57% | 2.50% | 2.51% |
| Bloomberg U.S. Aggregate Bond Index | 7.30% | -0.04% | 1.71% |
| (1) | On May 31, 2023, the ICE BofA US Dollar 3-Month Deposit Offered Rate Average Index was replaced as a securities market index for the Fund with the ICE BofA 3‑Month US Treasury Bill Index in connection with the phase out of the London interbank offered rate. |
Visit www.ftportfolios.com/etf/UCON for more recent performance information.
The Fund’s past performance is not a good predictor of the Fund’s future performance. The graph and table do not reflect the deduction of taxes that a shareholder would pay on Fund distributions or redemption of Fund shares.
Performance in securitized product investment strategies can be impacted from the benefits of purchasing odd lot positions. The impact of these investments can be particularly meaningful when funds have limited assets under management and may not be a sustainable source of performance as a fund grows in size.
KEY FUND STATISTICS (As of August 31, 2024)
| Fund net assets | $2,906,455,874 |
| Total number of portfolio holdings | 1,052 |
| Total advisory fee paid | $17,623,436 |
| Portfolio turnover rate | 314% |
WHAT DID THE FUND INVEST IN? (As of August 31, 2024)
The tables below show the investment makeup of the Fund, representing the percentage of total investments of the Fund.
| Dreyfus Government Cash Management Fund, Institutional Shares, Class I, 5.19% | 6.3% |
| Federal Home Loan Bank Discount Notes, 0.00%, 01/27/25 | 4.0% |
| U.S. Treasury Bill, 0.00%, 10/17/24 | 2.4% |
| U.S. Treasury Bill, 0.00%, 11/12/24 | 2.4% |
| Federal Home Loan Bank Discount Notes, 0.00%, 01/14/25 | 2.3% |
| U.S. Treasury Bill, 0.00%, 11/14/24 | 2.0% |
| U.S. Treasury Note, 3.75%, 08/15/27 | 1.9% |
| U.S. Treasury Bill, 0.00%, 10/29/24 | 1.7% |
| U.S. Treasury Bill, 0.00%, 11/21/24 | 1.5% |
| Government National Mortgage Association, Pool TBA, 5.00%, 10/15/54 | 1.2% |
(1) The credit quality and ratings information presented above reflect the ratings assigned by one or more nationally recognized statistical rating organizations (NRSROs), including S&P Global Ratings, Moody’s Investors Service, Inc., Fitch Ratings, or a comparably rated NRSRO. For situations in which a security is rated by more than one NRSRO and the ratings are not equivalent, the lowest ratings are used. Sub-investment grade ratings are those rated BB+/Ba1 or lower. Investment grade ratings are those rated BBB-/Baa3 or higher. The credit ratings shown relate to the creditworthiness of the issuers of the underlying securities in the Fund, and not to the Fund or its shares. U.S. Treasury, U.S. Agency and U.S. Agency mortgage-backed securities appear under “Government/Agency.” Credit ratings are subject to change.
Any amount shown as 0.0% represents less than 0.1%.
HOW HAS THE FUND MATERIALLY CHANGED?
This is a summary of certain changes to the Fund since September 1, 2023. For more complete information, you may review the Fund’s prospectus and any applicable supplements at www.ftportfolios.com/fund-documents/etf/UCON or upon request at 1-800-621-1675 or info@ftportfolios.com.
Effective December 31, 2024, Stephen M. Kane will retire from the Fund’s investment sub-advisor and will no longer serve as a portfolio manager of the Fund.
WHERE CAN I FIND ADDITIONAL INFORMATION ABOUT THE FUND?
Visit www.ftportfolios.com/fund-documents/etf/UCON to view additional information about the Fund such as the prospectus, financial information, Fund holdings and proxy voting information. You may also request this information by contacting us at 1-800-621-1675 or info@ftportfolios.com.
First Trust TCW Securitized Plus ETF
DEED | NYSE ARCA, INC.
ANNUAL SHAREHOLDER REPORT | August 31, 2024
This annual shareholder report contains important information about the First Trust TCW Securitized Plus ETF (the “Fund”) for the year of September 1, 2023 to August 31, 2024 (the “Period”). You can find additional information about the Fund at www.ftportfolios.com/fund-documents/etf/DEED. You can also request this information by contacting us at 1-800-621-1675 or info@ftportfolios.com.
WHAT WERE THE FUND COSTS FOR THE LAST YEAR?
(Based on a hypothetical $10,000 investment)
| Fund | Costs of a $10,000 investment | Costs paid as a percentage
of a $10,000 investment |
| First Trust TCW Securitized Plus ETF | $78 | 0.75% |
HOW DID THE FUND PERFORM LAST YEAR? WHAT AFFECTED THE FUND’S PERFORMANCE?
The Fund returned 8.83% for the 12 months ended August 31, 2024. The Fund outperformed its benchmark, the Bloomberg U.S. Mortgage-Backed Securities Index, which returned 7.46% for the same Period.
This outperformance was driven by the Fund’s focus on structured credit given a continued tightening of yield spreads across collateral types and deal structures, with non-agency commercial mortgage-backed securities exposure providing the largest benefit. More specifically, the Fund’s emphasis on single asset single borrower deals with high-quality collateral and attractive yields provided a boost to relative returns, along with interest only commercial mortgage-backed securities bonds that benefitted from strong cash flows over the period. Issue selection in asset-backed securities was also notable, particularly collateralized loan obligations which benefitted from positive cash flows and strong market technicals as demand continued to outweigh supply. Finally, residential mortgage-backed securities exposure contributed, despite a drag from being underweight agency mortgage-backed securities in recent months as the sector has performed well amid declining rate volatility. Contributions came from non-agency holdings which benefitted from sustained demand and limited net issuance in the sector, with investor optimism helping drive a flattening of credit curves and outperformance among more subordinated tranches.
Also significant to relative performance was the Fund’s longer-than-Index duration position. While this duration position weighed on returns early in the Period as rates reached their cycle highs in October 2023, the precipitous decline in Treasury yields over the last two months as markets became increasingly confident in a September 2024 rate cut by the Federal Reserve more than offset the performance drag that had accumulated up to that point. Yield curve positioning focused on front-end yields provided a further boost as the recent rally has been led by the policy sensitive 2-Year yield. Derivative positioning in the Fund is largely focused on futures positions used to manage duration, with a small allocation to currency forwards which had little impact on the Fund’s performance for the Period.
FUND PERFORMANCE (April 29, 2020 to August 31, 2024)
The performance line graph below shows the performance of a hypothetical $10,000 initial investment in the Fund over a ten-year period (or for the life of the Fund, if shorter). The subsequent account value as of the end of the Period is listed next to the name of the Fund or index, as applicable. The performance table below shows the average annual total returns of the Fund for the past one-, five-, and ten-year periods, as applicable (or for the life of the Fund, if shorter), as of the end of the Period. Both the line graph and performance table compare the Fund’s performance to an appropriate broad-based index and may compare to additional indices reflecting the market segment(s) in which the Fund invests over the same periods.
Investment Performance of $10,000
| Average Annual Total Returns (as of August 31, 2024) | 1 Year | Since
Inception
(4/29/20) |
| First Trust TCW Securitized Plus ETF | 8.83% | -0.03% |
| Bloomberg U.S. Mortgage-Backed Securities Index | 7.46% | -1.14% |
| Bloomberg U.S. Aggregate Bond Index | 7.30% | -1.08% |
Visit www.ftportfolios.com/etf/DEED for more recent performance information.
The Fund’s past performance is not a good predictor of the Fund’s future performance. The graph and table do not reflect the deduction of taxes that a shareholder would pay on Fund distributions or redemption of Fund shares.
Performance in securitized product investment strategies can be impacted from the benefits of purchasing odd lot positions. The impact of these investments can be particularly meaningful when funds have limited assets under management and may not be a sustainable source of performance as a fund grows in size.
KEY FUND STATISTICS (As of August 31, 2024)
| Fund net assets | $72,819,140 |
| Total number of portfolio holdings | 271 |
| Total advisory fee paid | $506,297 |
| Portfolio turnover rate | 408% |
WHAT DID THE FUND INVEST IN? (As of August 31, 2024)
The tables below show the investment makeup of the Fund, representing the percentage of total investments of the Fund.
| Dreyfus Government Cash Management Fund, Institutional Shares, Class I, 5.19% | 7.0% |
| U.S. Treasury Note, 3.75%, 08/31/26 | 5.1% |
| Federal National Mortgage Association, Pool TBA, 2.50%, 09/15/54 | 2.0% |
| Government National Mortgage Association, Pool TBA, 5.00%, 10/15/54 | 2.0% |
| Federal National Mortgage Association, Pool TBA, 3.00%, 09/15/54 | 1.6% |
| Government National Mortgage Association, Pool TBA, 2.50%, 09/15/54 | 1.5% |
| Government National Mortgage Association, Pool TBA, 4.50%, 09/15/54 | 1.4% |
| Federal National Mortgage Association, Pool TBA, 5.50%, 09/15/54 | 1.3% |
| Federal National Mortgage Association, Pool TBA, 2.00%, 09/15/54 | 1.3% |
| Federal Home Loan Mortgage Corporation, Pool QD7088, 2.00%, 02/01/52 | 1.3% |
(1) The credit quality and ratings information presented above reflect the ratings assigned by one or more nationally recognized statistical rating organizations (NRSROs), including S&P Global Ratings, Moody’s Investors Service, Inc., Fitch Ratings, or a comparably rated NRSRO. For situations in which a security is rated by more than one NRSRO and the ratings are not equivalent, the lowest ratings are used. Sub-investment grade ratings are those rated BB+/Ba1 or lower. Investment grade ratings are those rated BBB-/Baa3 or higher. The credit ratings shown relate to the creditworthiness of the issuers of the underlying securities in the Fund, and not to the Fund or its shares. U.S.Treasury, U.S. Agency and U.S. Agency mortgage-backed securities appear under “Government/Agency.” Credit ratings are subject to change.
Any amount shown as 0.0% represents less than 0.1%.
WHERE CAN I FIND ADDITIONAL INFORMATION ABOUT THE FUND?
Visit www.ftportfolios.com/fund-documents/etf/DEED to view additional information about the Fund such as the prospectus, financial information, Fund holdings and proxy voting information. You may also request this information by contacting us at 1-800-621-1675 or info@ftportfolios.com.
First Trust TCW Emerging Markets Debt ETF
EFIX | NYSE ARCA, INC.
ANNUAL SHAREHOLDER REPORT | August 31, 2024
This annual shareholder report contains important information about the First Trust TCW Emerging Markets Debt ETF (the “Fund”) for the year of September 1, 2023 to August 31, 2024 (the “Period”). You can find additional information about the Fund at www.ftportfolios.com/fund-documents/etf/EFIX. You can also request this information by contacting us at 1-800-621-1675 or info@ftportfolios.com.
This report describes changes to the Fund that occurred during the Period.
WHAT WERE THE FUND COSTS FOR THE LAST YEAR?
(Based on a hypothetical $10,000 investment)
| Fund | Costs of a $10,000 investment | Costs paid as a percentage
of a $10,000 investment |
| First Trust TCW Emerging Markets Debt ETF | $102 | 0.95% |
HOW DID THE FUND PERFORM LAST YEAR? WHAT AFFECTED THE FUND’S PERFORMANCE?
The Fund returned 14.63% for the 12 months ended August 31, 2024. The Fund outperformed its benchmark, the JP Morgan Emerging Market Bond Index Global Diversified, which returned 13.42% for the same Period.
This outperformance was driven by security selection decisions and an overweight to high yield relative to investment grade (high yield sovereigns returned approximately 18.6% versus 8.5% for investment grade sovereigns.) From a sector perspective, an off-index allocation to corporates also benefited relative performance.
From a country perspective, the outperformance for the Period was driven by:
Overweight positioning and security selection in Egypt based on our view of support from international partners, market reforms and monetary policy tightening
Underweight positioning and security selection in China based on our view of valuations and growth outlook
Security selection in Brazil and Colombia
Overweight positioning in Pakistan, which benefited from International Monetary Fund support and reduced political uncertainty post elections
Security selection in Kazakhstan, particularly select oil & gas quasi-sovereign exposure
Overweight positioning and security selection in Chile, particularly select metals & mining quasi-sovereign exposure and other corporate exposure
On the other hand, the following hurt relative performance during the Period:
Overweight positioning and security selection in Venezuela given an unfavorable election outcome
Off-index exposure to oil & gas corporates in Israel due to elevated geopolitical tensions in the region
Security selection in the Dominican Republic
Overweight positioning in Ghana during the fourth quarter of 2023
Derivative positioning in the Fund is largely focused on a small allocation to currency forwards and intermittent use of credit default swaps for hedging index exposure, both of which had little impact on performance.
FUND PERFORMANCE (February 17, 2021 to August 31, 2024)
The performance line graph below shows the performance of a hypothetical $10,000 initial investment in the Fund over a ten-year period (or for the life of the Fund, if shorter). The subsequent account value as of the end of the Period is listed next to the name of the Fund or index, as applicable. The performance table below shows the average annual total returns of the Fund for the past one-, five-, and ten-year periods, as applicable (or for the life of the Fund, if shorter), as of the end of the Period. Both the line graph and performance table compare the Fund’s performance to an appropriate broad-based index and may compare to additional indices reflecting the market segment(s) in which the Fund invests over the same periods.
Investment Performance of $10,000
| Average Annual Total Returns (as of August 31, 2024) | 1 Year | Since
Inception
(2/17/21) |
| First Trust TCW Emerging Markets Debt ETF | 14.63% | -0.10% |
| JP Morgan Emerging Market Bond Index Global Diversified | 13.42% | -0.71% |
Visit www.ftportfolios.com/etf/EFIX for more recent performance information.
The Fund’s past performance is not a good predictor of the Fund’s future performance. The graph and table do not reflect the deduction of taxes that a shareholder would pay on Fund distributions or redemption of Fund shares.
KEY FUND STATISTICS (As of August 31, 2024)
| Fund net assets | $41,904,760 |
| Total number of portfolio holdings | 193 |
| Total advisory fee paid | $344,186 |
| Portfolio turnover rate | 98% |
WHAT DID THE FUND INVEST IN? (As of August 31, 2024)
The tables below show the investment makeup of the Fund, representing the percentage of total investments of the Fund.
| Dreyfus Government Cash Management Fund, Institutional Shares, Class I, 5.19% | 2.1% |
| Saudi Government International Bond, 5.75%, 01/16/54 | 1.7% |
| Oman Government International Bond, 6.25%, 01/25/31 | 1.5% |
| Bahrain Government International Bond, 6.75%, 09/20/29 | 1.5% |
| Peruvian Government International Bond, 2.78%, 01/23/31 | 1.3% |
| Colombia Government International Bond, 8.75%, 11/14/53 | 1.3% |
| Greensaif Pipelines Bidco Sarl, 6.13%, 02/23/38 | 1.2% |
| Egypt Government International Bond, 7.30%, 09/30/33 | 1.2% |
| Dominican Republic International Bond, 4.50%, 01/30/30 | 1.2% |
| Ukraine Government International Bond, 0.00%, 08/01/41 | 1.2% |
(1) The credit quality and ratings information presented above reflect the ratings assigned by one or more nationally recognized statistical rating organizations (NRSROs), including S&P Global Ratings, Moody’s Investors Service, Inc., Fitch Ratings, or a comparably rated NRSRO. For situations in which a security is rated by more than one NRSRO and the ratings are not equivalent, the lowest ratings are used. Sub-investment grade ratings are those rated BB+/Ba1 or lower. Investment grade ratings are those rated BBB-/Baa3 or higher. The credit ratings shown relate to the creditworthiness of the issuers of the underlying securities in the Fund, and not to the Fund or its shares. U.S.Treasury, U.S. Agency and U.S. Agency mortgage-backed securities appear under “Government/Agency.” Credit ratings are subject to change.
HOW HAS THE FUND MATERIALLY CHANGED?
This is a summary of certain changes to the Fund since September 1, 2023. For more complete information, you may review the Fund’s prospectus and any applicable supplements at www.ftportfolios.com/fund-documents/etf/EFIX or upon request at 1-800-621-1675 or info@ftportfolios.com.
During the fiscal year ended August 31, 2024, the Fund’s diversification status under the Investment Company Act of 1940 changed from non-diversified to diversified. The Fund’s principal investment strategies and principal risks were revised accordingly.
WHERE CAN I FIND ADDITIONAL INFORMATION ABOUT THE FUND?
Visit www.ftportfolios.com/fund-documents/etf/EFIX to view additional information about the Fund such as the prospectus, financial information, Fund holdings and proxy voting information. You may also request this information by contacting us at 1-800-621-1675 or info@ftportfolios.com.
| (b) | Not applicable to the Registrant. |
Item 2. Code of Ethics.
| (a) | The First Trust Exchange-Traded Fund VIII (“Registrant”), as of the end of the period covered by this report, has adopted a code of ethics that applies to the Registrant’s principal executive officer, principal financial officer, principal accounting officer or controller, or persons performing similar functions, regardless of whether these individuals are employed by the Registrant or a third party. |
| (c) | There have been no amendments, during the period covered by this report, to a provision of the code of ethics that applies to the Registrant's principal executive officer, principal financial officer, principal accounting officer or controller, or persons performing similar functions, regardless of whether these individuals are employed by the Registrant or a third party, and that relates to any element of the code of ethics description. |
| (d) | The Registrant, during the period covered by this report, has not granted any waivers, including an implicit waiver, from a provision of the code of ethics that applies to the Registrant’s principal executive officer, principal financial officer, principal accounting officer or controller, or persons performing similar functions, regardless of whether these individuals are employed by the Registrant or a third party, that relates to one or more of the items set forth in paragraph (b) of this item’s instructions. |
| (f) | A copy of the code of ethics that applies to the Registrant’s principal executive officer, principal financial officer, principal accounting officer or controller is filed as an exhibit pursuant to Item 13(a)(1). |
Item 3. Audit Committee Financial Expert.
As of the end of the period covered by the report, the Registrant’s Board of Trustees has determined that Thomas R. Kadlec and Robert F. Keith are qualified to serve as audit committee financial experts serving on its audit committee and that each of them is “independent,” as defined by Item 3 of Form N-CSR.
Item 4. Principal Accountant Fees and Services.
| (a) | Audit Fees (Registrant) -- The aggregate fees billed for professional services rendered by the principal accountant for the audit of the Registrant’s annual financial statements or services that are normally provided by the accountant in connection with statutory and regulatory filings or engagements were $1,277,125 for the fiscal year ended 2023 and $1,606,750 for the fiscal year ended 2024. |
| (b) | Audit-Related Fees (Registrant) -- The aggregate fees billed for assurance and related services by the principal accountant that are reasonably related to the performance of the audit of the Registrant’s financial statements and are not reported under paragraph (a) of this Item were $0 for the fiscal year ended 2023 and $0 for the fiscal year ended 2024. |
Audit-Related Fees (Investment Advisor) -- The aggregate fees billed for assurance and related services by the principal accountant that are reasonably related to the performance of the audit of the Registrant’s financial statements and are not reported under paragraph (a) of this Item were $0 for the fiscal year ended 2023 and $0 for the fiscal year ended 2024.
Audit-Related Fees (Distributor) -- The aggregate fees billed for assurance and related services by the principal accountant that are reasonably related to the performance of the audit of the Registrant’s financial statements and are not reported under paragraph (a) of this Item were $0 for the fiscal year ended 2023 and $0 for the fiscal year ended 2024.
| (c) | Tax Fees (Registrant) -- The aggregate fees billed for professional services rendered by the principal accountant for tax return review and debt instrument tax analysis and reporting were $763,793 for the fiscal year ended 2023 and $869,568 for the fiscal year ended 2024. |
Tax Fees (Investment Advisor) -- The aggregate fees billed for professional services rendered by the principal accountant for tax compliance, tax advice, and tax planning to the Registrant’s advisor and distributor were $0 for the fiscal year ended 2023 and $0 for the fiscal year ended 2024.
Tax Fees (Distributor) -- The aggregate fees billed for professional services rendered by the principal accountant for tax compliance, tax advice, and tax planning to the Registrant’s distributor were $0 for the fiscal year ended 2023 and $0 for the fiscal year ended 2024.
These fees were for tax consultation and/or tax return preparation and professional services rendered for PFIC (Passive Foreign Investment Company) Identification Services.
| (d) | All Other Fees (Registrant) -- The aggregate fees billed for products and services provided by the principal accountant to the Registrant, other than the services reported in paragraphs (a) through (c) of this Item were $0 for the fiscal year ended 2023 and $0 for the fiscal year ended 2024. |
All Other Fees (Investment Advisor) -- The aggregate fees billed for products and services provided by the principal accountant to the Registrant’s investment advisor, other than the services reported in paragraphs (a) through (c) of this Item were $0 for the fiscal year ended 2023 and $0 for the fiscal year ended 2024.
All Other Fees (Distributor) -- The aggregate fees billed for products and services provided by the principal accountant to the Registrant’s distributor, other than the services reported in paragraphs (a) through (c) of this Item were $0 for the fiscal year ended 2023 and $0 for the fiscal year ended 2024.
(e)(1) Disclose the audit committee’s pre-approval policies and procedures described in paragraph (c) (7) of Rule 2-01 of Regulation S-X.
Pursuant to its charter and its Audit and Non-Audit Services Pre-Approval Policy, the Audit Committee (the “Committee”) is responsible for the pre-approval of all audit services and permitted non-audit services (including the fees and terms thereof) to be performed for the Registrant by its independent auditors. The Chairman of the Committee is authorized to give such pre-approvals on behalf of the Committee up to $25,000 and report any such pre-approval to the full Committee.
The Committee is also responsible for the pre-approval of the independent auditor’s engagements for non-audit services with the Registrant’s advisor (not including a sub-advisor whose role is primarily portfolio management and is sub-contracted or overseen by another investment advisor) and any entity controlling, controlled by or under common control with the investment advisor that provides ongoing services to the Registrant, if the engagement relates directly to the operations and financial reporting of the Registrant, subject to the de minimis exceptions for non-audit services described in Rule 2-01 of Regulation S-X. If the independent auditor has provided non-audit services to the Registrant’s advisor (other than any sub-advisor whose role is primarily portfolio management and is sub-contracted with or overseen by another investment advisor) and any entity controlling, controlled by or under common control with the investment advisor that provides ongoing services to the Registrant that were not pre-approved pursuant to its policies, the Committee will consider whether the provision of such non-audit services is compatible with the auditor’s independence.
(e)(2) The percentage of services described in each of paragraphs (b) through (d) for the Registrant and the Registrant’s investment advisor and distributor of this Item that were approved by the audit committee pursuant to the pre-approval exceptions included in paragraph (c)(7)(i)(C) or paragraph(C)(7)(ii) of Rule 2-01 of Regulation S-X are as follows:
| Registrant: | | Advisor and Distributor: |
| (b) 0% | | (b) 0% |
| (c) 0% | | (c) 0% |
| (d) 0% | | (d) 0% |
| (f) | The percentage of hours expended on the principal accountant’s engagement to audit the Registrant’s financial statements for the most recent fiscal year that were attributed to work performed by persons other than the principal accountant’s full-time, permanent employees was less than fifty percent. |
| (g) | The aggregate non-audit fees billed by the Registrant’s accountant for services rendered to the Registrant, and rendered to the Registrant’s investment advisor (not including any sub-advisor whose role is primarily portfolio management and is subcontracted with or overseen by another investment advisor), and any entity controlling, controlled by, or under common control with the advisor that provides ongoing services to the Registrant for the fiscal year ended 2023 were $763,793 for the Registrant, $31,000 for the Registrant’s investment advisor and $45,500 for the Registrant’s distributor; and for the fiscal year ended 2024 were $869,568 for the Registrant, $28,600 for the Registrant’s investment advisor and $33,000 for the Registrant’s distributor. |
| (h) | The Registrant’s audit committee of its Board of Trustees has determined that the provision of non-audit services that were rendered to the Registrant’s investment advisor (not including any sub-advisor whose role is primarily portfolio management and is subcontracted with or overseen by another investment advisor), and any entity controlling, controlled by, or under common control with the investment advisor that provides ongoing services to the Registrant that were not pre-approved pursuant to paragraph (c)(7)(ii) of Rule 2-01 of Regulation S-X is compatible with maintaining the principal accountant’s independence. |
(i) Not applicable to the Registrant.
(j) Not applicable to the Registrant.
Item 5. Audit Committee of Listed Registrants.
| (a) | The Registrant has a separately designated standing audit committee established in accordance with Section 3(a)(58)(A) of the Securities Exchange Act of 1934 consisting of all the independent directors of the Registrant. The audit committee of the Registrant is comprised of: Richard E. Erickson, Thomas R. Kadlec, Denise M. Keefe, Robert F. Keith, Niel B. Nielson and Bronwyn Wright. |
| (b) | Not applicable to the Registrant. |
Item 6. Investments.
| (a) | The Schedule of Investments in securities of unaffiliated issuers as of the close of the reporting period is included in the Financial Statements and Other Information filed under Item 7(a) of this Form N-CSR. |
| (b) | Not applicable to the Registrant. |
Item 7. Financial Statements and Financial Highlights for Open-End Management Investment Companies.
(a) Following is a copy of the annual financial statements required, and for the periods specified, by Regulation S-X.
Annual Financial
Statements and
Other Information |
For the Year Ended
August 31, 2024 |
First Trust Exchange-Traded Fund VIII
First Trust Income Opportunities ETF (FCEF) |
First Trust Flexible Municipal High Income ETF (MFLX) |
First Trust Low Duration Strategic Focus ETF (LDSF) |
First Trust Active Factor Large Cap ETF (AFLG) |
First Trust Active Factor Mid Cap ETF (AFMC) |
First Trust Active Factor Small Cap ETF (AFSM) |
First Trust Exchange-Traded Fund VIII
Annual Financial Statements and Other Information
August 31, 2024
Performance and Risk Disclosure
There is no assurance that any series of First Trust Exchange-Traded Fund VIII (the “Trust”) described in this report (each such series is referred to as a “Fund” and collectively, as the “Funds”) will achieve its investment objective(s). Each Fund is subject to market risk, which is the possibility that the market values of securities owned by the Fund will decline and that the value of the Fund’s shares may therefore be less than what you paid for them. Accordingly, you can lose money by investing in a Fund.
Performance data quoted represents past performance, which is no guarantee of future results, and current performance may be lower or higher than the figures shown. For the most recent month-end performance figures, please visit www.ftportfolios.com or speak with your financial advisor. Investment returns, net asset value and share price will fluctuate and Fund shares, when sold, may be worth more or less than their original cost.
First Trust Advisors L.P., the Funds’ advisor, may also periodically provide additional information on Fund performance on each Fund’s webpage at www.ftportfolios.com.
This report contains information that may help you evaluate your investment. It includes details about each Fund and presents data that provides insight into each Fund’s performance and investment approach.
The material risks of investing in each Fund are spelled out in its prospectus, statement of additional information, and other Fund regulatory filings.
First Trust Income Opportunities ETF (FCEF)Portfolio of InvestmentsAugust 31, 2024
| | |
|
| | |
| abrdn Global Infrastructure Income Fund | |
| abrdn Healthcare Investors | |
| abrdn Healthcare Opportunities Fund | |
| abrdn Life Sciences Investors | |
| Adams Natural Resources Fund, Inc. | |
| Angel Oak Financial Strategies Income Term Trust | |
| Ares Dynamic Credit Allocation Fund, Inc. | |
| BlackRock Capital Allocation Term Trust | |
| BlackRock Enhanced Capital and Income Fund, Inc. | |
| BlackRock Health Sciences Trust | |
| BlackRock Multi-Sector Income Trust | |
| BlackRock Resources & Commodities Strategy Trust | |
| BlackRock Science & Technology Trust | |
| BlackRock Utilities Infrastructure & Power Opportunities Trust | |
| Blackstone Strategic Credit 2027 Term Fund | |
| Brookfield Real Assets Income Fund, Inc. | |
| | |
| Cohen & Steers Infrastructure Fund, Inc. | |
| Cohen & Steers REIT and Preferred and Income Fund, Inc. | |
| DoubleLine Yield Opportunities Fund | |
| Eaton Vance Short Duration Diversified Income Fund | |
| Eaton Vance Tax-Advantaged Dividend Income Fund | |
| Eaton Vance Tax-Advantaged Global Dividend Income Fund | |
| Eaton Vance Tax-Advantaged Global Dividend Opportunities Fund | |
| FS Credit Opportunities Corp. | |
| Gabelli Dividend & Income (The) Trust | |
| | |
|
| Capital Markets (Continued) | |
| General American Investors Co., Inc. | |
| John Hancock Tax-Advantaged Dividend Income Fund | |
| Kayne Anderson Energy Infrastructure Fund | |
| Nuveen Credit Strategies Income Fund | |
| Nuveen Floating Rate Income Fund | |
| Nuveen Mortgage and Income Fund | |
| Nuveen Multi-Asset Income Fund | |
| Nuveen NASDAQ 100 Dynamic Overwrite Fund | |
| Nuveen Preferred & Income Opportunities Fund | |
| Nuveen Real Asset Income and Growth Fund | |
| Nuveen Taxable Municipal Income Fund | |
| Nuveen Variable Rate Preferred & Income Fund | |
| NYLI CBRE Global Infrastructure Megatrends Term Fund | |
| PGIM Global High Yield Fund, Inc. | |
| | |
| PIMCO Dynamic Income Opportunities Fund | |
| PIMCO Dynamic Income Strategy Fund | |
| Reaves Utility Income Fund | |
| Royce Micro-Cap Trust, Inc. | |
| Royce Small-Cap Trust, Inc. | |
| | |
| Tortoise Power and Energy Infrastructure Fund, Inc. | |
| | |
| Virtus Artificial Intelligence & Technology Opportunities Fund | |
| Western Asset Diversified Income Fund | |
| Western Asset High Income Opportunity Fund, Inc. | |
| | |
| | |
See Notes to Financial Statements
First Trust Income Opportunities ETF (FCEF)Portfolio of Investments (Continued)August 31, 2024 | | |
EXCHANGE-TRADED FUNDS — 3.1% |
| | |
| Invesco Variable Rate Investment Grade ETF | |
| | |
MONEY MARKET FUNDS — 3.7% |
| Morgan Stanley Institutional Liquidity Funds - Treasury Portfolio - Institutional Class - 5.12% (a) | |
| | |
|
|
| Total Investments — 99.9% | |
| | |
| Net Other Assets and Liabilities — 0.1% | |
| | |
| Rate shown reflects yield as of August 31, 2024. |
Valuation InputsA summary of the inputs used to value the Fund’s investments as of August 31, 2024 is as follows (see Note 2A - Portfolio Valuation in the Notes to Financial Statements):
| | | Level 2
Significant
Observable
Inputs | Level 3
Significant
Unobservable
Inputs |
| | | | |
| | | | |
| | | | |
| | | | |
| See Portfolio of Investments for industry breakout. |
See Notes to Financial Statements
First Trust Flexible Municipal High Income ETF (MFLX)Portfolio of InvestmentsAugust 31, 2024
| | | | |
|
| | |
| Black Belt Energy Gas Dist AL Gas Proj Rev Bonds Proj No 7, Ser C-1 (Mandatory put 12/01/26) | | | |
| Jefferson Cnty AL Swr Rev Warrants Ref Warrants | | | |
| | |
| | |
| AZ St Indl Dev Auth Edu Rev Ref Doral Acdmy of Northern NV Proj, Ser A (a) | | | |
| AZ St Indl Dev Auth Edu Rev Somerset Acdmy of LV Aliante & Skye Canyon Cmps Proj, Ser A (a) | | | |
| | |
| | |
| AR Dev Fin Auth Envrnmntl Rev Sustainable Bond United St Steel Corp Proj, AMT | | | |
| | |
| Burbank Glendale Pasadena CA Arpt Auth Arpt Rev Sr, Ser B, AGM, AMT | | | |
| CA St Hlth Facs Fing Auth Rev Episcopal Cmntys & Svcs, Ser B | | | |
| CA St Muni Fin Auth Rev Ref HumanGood Oblig Grp, Ser A | | | |
| Elk Grove CA Fin Auth Spl Tax Rev Laguna Ridge CFD #2005-1 | | | |
| | |
| | |
| CO St Hlth Facs Auth Rev Ref Frasier Proj, Ser 2023A | | | |
| Denver City & Cnty CO Spl Facs Arpt Rev Ref United Airls Inc Proj, AMT | | | |
| | |
| | |
| Black Creek FL CDD Spl Assmnt Expansion Area Proj | | | |
| Capital Projs Fin Auth FL Eductnl Facs Rev Kissimmee Chrt Acdmy Proj (a) | | | |
| Charlotte Cnty FL Indl Dev Auth Util Sys Rev Town & Country Utils Proj, Ser A, AMT (a) | | | |
| Cypress Mill CDD FL Spl Assmnt 2023 Proj | | | |
| FL St Dev Fin Corp Ref Brightline FL Passenger Rail Proj, AGM, AMT | | | |
| N Sumter Cnty FL Util Dependent Dist Util Rev Sumter Wtr Conservation Auth Proj, AGM | | | |
| Ridge at Apopka CDD FL Spl Assmnt, Ser 22 | | | |
| Sawyers Landing CDD FL Spl Assmnt Rev | | | |
| | |
| | |
| Bartow Cnty GA Dev Auth Solidwaste Disp Fac Rev Var GA Pwr Co Plant Bowen Proj, AMT (b) | | | |
| Main Street Nat Gas Inc GA Gas Sply Rev, Ser A (Mandatory put 12/01/29) | | | |
| | |
| | |
| Guam Govt Busn Privilege Tax Rev Ref, Ser F | | | |
See Notes to Financial Statements
First Trust Flexible Municipal High Income ETF (MFLX)Portfolio of Investments (Continued)August 31, 2024 | | | | |
MUNICIPAL BONDS (Continued) |
| | |
| Chicago IL Brd of Edu Ref, Ser B | | | |
| | | | |
| | |
| | |
| IN St Fin Auth Hlth Fac Rev Margaret Mary Hlth Proj, Ser A | | | |
| Indianapolis IN Loc Pub Impt Bond Bank Sr Convention Ctr Hotel, Ser E | | | |
| | |
| | |
| Dallas Ctr IA Grimes Cmnty Sch Dist | | | |
| IA St Fin Auth Midwstrn Disaster Area Rev Ref IA Fertilizer Company Proj (Pre-refunded maturity 12/01/32) | | | |
| | |
| | |
| Wyandotte Cnty KS Kansas City Unif Govt Spl Oblg Rev Ref Vlg E Proj Areas 2B 3 5 (a) | | | |
| | |
| Saint Charles Cnty MO Pub Wtr Sply Dist #2 Pub Wtr Sply Dist No 2, COPS | | | |
| | |
| NH St Busn Fin Auth Wtr Fac Rev Pennichuck Wtr Wks Inc Proj, Ser A, AMT | | | |
| | |
| Dutchess Cnty NY Loc Dev Corp Mf Mtebs Sustainable Bonds Tomopkins Terrace Hsg LP Proj | | | |
| NY St Dorm Auth Revs Non St Supported Debt Ref Northwell Hlth Oblig Grp, Ser A | | | |
| NY St Thruway Auth Ref, Ser P | | | |
| Suffolk Regl Off Track Betting Corp NY Rev | | | |
| | |
| | |
| NC St Med Care Commn Hlth Care Facs Rev Lutheran Svcs For the Aging Ref, Ser A | | | |
| | |
| OH St Air Quality Dev Auth Exempt Facs Rev AMG Vanadium Proj, AMT (a) | | | |
| | |
| Clackamas Cnty OR Hosp Fac Auth Rev Ref Rose Villa Proj, Ser A | | | |
| Union Cnty OR Hosp Fac Auth Grande Ronde Hosp | | | |
| | |
| | |
| Allegheny Cnty PA Hosp Dev Auth Ref Univ Pittsburgh Med Ctr, Ser A | | | |
| | |
| Puerto Rico Cmwlth Restructured, Ser A1 | | | |
| Puerto Rico Sales Tax Fing Corp Sales Tax Rev Restructured, Converted, Ser A-2 | | | |
| | |
See Notes to Financial Statements
First Trust Flexible Municipal High Income ETF (MFLX)Portfolio of Investments (Continued)August 31, 2024 | | | | |
MUNICIPAL BONDS (Continued) |
| | |
| Patriots Energy Grp Fing Agy SC Gas Sply Rev Ref Var, Ser-B-1 (Mandatory put 03/01/31) | | | |
| SC St Jobs Econ Dev Auth Econ Dev Rev Ref The Woodlands at Furman | | | |
| SC St Jobs Econ Dev Auth Hlth Facs Rev Novant Hlth Oblig Grp, Ser A | | | |
| | |
| | |
| Austin TX Arpt Sys Rev, AMT | | | |
| Georgetown TX Util Sys Rev, BAM | | | |
| N Parkway Muni Mgmt Dist #1 TX Spl Assmnt Rev Major Impts Proj (a) | | | |
| TX St Muni Gas Acq & Sply Corp IV, Ser B (Mandatory put 01/01/34) | | | |
| | |
| | |
| VT St Econ Dev Auth Mtge Rev Ref Wake Robin Corp Proj, Ser A | | | |
| | |
| Skagit Cnty WA Pub Hosp Dist #1 | | | |
| WA St Hsg Fin Commn Nonprofit Rev Radford Court & Nordheim Court Portfolio | | | |
| | |
| | |
| Pub Fin Auth WI Chrt Sch Rev Founders of Acdmy Las Vegas Proj, Ser A (a) | | | |
| Pub Fin Auth WI Tax Incr Rev Miami Worldcenter Proj, Ser A (a) | | | |
| | |
| | |
| | |
| | |
|
| | |
| BlackRock MuniAssets Fund, Inc. | |
| BlackRock Municipal Income Fund, Inc. | |
| BlackRock Municipal Income Quality Trust | |
| BlackRock Municipal Income Trust | |
| BlackRock Municipal Income Trust II | |
| BlackRock MuniHoldings Fund, Inc. | |
| BlackRock MuniYield Quality Fund II, Inc. | |
| BlackRock MuniYield Quality Fund III, Inc. | |
| BlackRock MuniYield Quality Fund, Inc. | |
| Eaton Vance Municipal Income Trust | |
| Invesco Quality Municipal Income Trust | |
| Invesco Trust for Investment Grade Municipals | |
| Nuveen AMT-Free Municipal Credit Income Fund | |
| Nuveen AMT-Free Quality Municipal Income Fund | |
| Nuveen Municipal Credit Income Fund | |
See Notes to Financial Statements
First Trust Flexible Municipal High Income ETF (MFLX)Portfolio of Investments (Continued)August 31, 2024 | | |
CLOSED-END FUNDS (Continued) |
| Capital Markets (Continued) | |
| Nuveen Quality Municipal Income Fund | |
| Western Asset Managed Municipals Fund, Inc. | |
| | |
| | |
|
|
| Total Investments — 98.6% | |
| | |
| Net Other Assets and Liabilities — 1.4% | |
| | |
| This security, sold within the terms of a private placement memorandum, is exempt from registration upon resale under Rule 144A of the Securities Act of 1933, as amended, and may be resold in transactions exempt from registration, normally to qualified institutional buyers. Pursuant to procedures adopted by the Trust’s Board of Trustees, this security has been determined to be liquid by First Trust Advisors L.P., the Fund’s advisor. Although market instability can result in periods of increased overall market illiquidity, liquidity for each security is determined based on security specific factors and assumptions, which require subjective judgment. At August 31, 2024, securities noted as such amounted to $2,263,761 or 14.5% of net assets. |
| Variable rate demand bond. Interest rate is reset periodically by the agent based on current market conditions. |
Abbreviations throughout the Portfolio of Investments: |
| – Assured Guaranty Municipal Corp. |
| – Alternative Minimum Tax |
| |
| – Certificates of Participation |
Valuation InputsA summary of the inputs used to value the Fund’s investments as of August 31, 2024 is as follows (see Note 2A - Portfolio Valuation in the Notes to Financial Statements):
| | | Level 2
Significant
Observable
Inputs | Level 3
Significant
Unobservable
Inputs |
| | | | |
| | | | |
| | | | |
| See Portfolio of Investments for state and territory breakout. |
| See Portfolio of Investments for industry breakout. |
See Notes to Financial Statements
First Trust Low Duration Strategic Focus ETF (LDSF)Portfolio of InvestmentsAugust 31, 2024
| | |
EXCHANGE-TRADED FUNDS — 100.0% |
| | |
| First Trust Emerging Markets Local Currency Bond ETF (a) | |
| First Trust Enhanced Short Maturity ETF (a) | |
| First Trust Limited Duration Investment Grade Corporate ETF (a) | |
| First Trust Low Duration Opportunities ETF (a) | |
| First Trust Senior Loan Fund (a) | |
| First Trust Tactical High Yield ETF (a) | |
| iShares 3-7 Year Treasury Bond ETF | |
| Total Exchange-Traded Funds | |
| | |
MONEY MARKET FUNDS — 0.0% |
| Morgan Stanley Institutional Liquidity Funds - Treasury Portfolio - Institutional Class - 5.12% (b) | |
| | |
|
|
| Total Investments — 100.0% | |
| | |
| Net Other Assets and Liabilities — 0.0% | |
| | |
| Investment in an affiliated fund. |
| Rate shown reflects yield as of August 31, 2024. |
Valuation InputsA summary of the inputs used to value the Fund’s investments as of August 31, 2024 is as follows (see Note 2A - Portfolio Valuation in the Notes to Financial Statements):
| | | Level 2
Significant
Observable
Inputs | Level 3
Significant
Unobservable
Inputs |
| | | | |
| | | | |
| | | | |
| See Portfolio of Investments for industry breakout. |
See Notes to Financial Statements
First Trust Active Factor Large Cap ETF (AFLG)Portfolio of InvestmentsAugust 31, 2024
| | |
|
| Aerospace & Defense — 1.0% | |
| | |
| | |
| | |
| | |
| | |
| | |
| Air Freight & Logistics — | |
| | |
| | |
| | |
| | |
| Citizens Financial Group, Inc. | |
| | |
| | |
| | |
| | |
| | |
| | |
| | |
| Alnylam Pharmaceuticals, Inc. (a) | |
| | |
| | |
| United Therapeutics Corp. (a) | |
| | |
| | |
| | |
| | |
| | |
| | |
| | |
| | |
| | |
| Builders FirstSource, Inc. (a) | |
| | |
| Lennox International, Inc. | |
| | |
| | |
| | |
| | |
| | |
| Ameriprise Financial, Inc. | |
| Bank of New York Mellon (The) Corp. | |
| Cboe Global Markets, Inc. | |
| | |
| | |
|
| Capital Markets (Continued) | |
| | |
| Interactive Brokers Group, Inc., Class A | |
| Intercontinental Exchange, Inc. | |
| | |
| | |
| | |
| | |
| T. Rowe Price Group, Inc. | |
| | |
| | |
| CF Industries Holdings, Inc. | |
| | |
| LyondellBasell Industries N.V., Class A | |
| | |
| | |
| | |
| Sherwin-Williams (The) Co. | |
| | |
| | |
| | |
| | |
| | |
| | |
| Arista Networks, Inc. (a) | |
| | |
| | |
| | |
| | |
| Construction & Engineering | |
| | |
| | |
| | |
| | |
| | |
| Consumer Staples Distribution | |
| | |
| | |
| Walgreens Boots Alliance, Inc. | |
| | |
| | |
| | |
| | |
See Notes to Financial Statements
First Trust Active Factor Large Cap ETF (AFLG)Portfolio of Investments (Continued)August 31, 2024 | | |
COMMON STOCKS (Continued) |
| Containers & Packaging (Continued) | |
| | |
| Packaging Corp. of America | |
| | |
| | |
| | |
| | |
| | |
| Diversified Telecommunication | |
| | |
| Verizon Communications, Inc. | |
| | |
| Electric Utilities — 2.6% | |
| Constellation Energy Corp. | |
| | |
| | |
| | |
| | |
| | |
| | |
| | |
| Electrical Equipment — 0.6% | |
| | |
| Vertiv Holdings Co., Class A | |
| | |
| Electronic Equipment, Instruments & Components | |
| | |
| | |
| | |
| Keysight Technologies, Inc. (a) | |
| | |
| | |
| | |
| | |
| | |
| | |
| Financial Services — 3.1% | |
| Berkshire Hathaway, Inc., Class B (a) | |
| Corebridge Financial, Inc. | |
| | |
| Fidelity National Information Services, Inc. | |
| | |
| Mastercard, Inc., Class A | |
| | |
|
| Financial Services (Continued) | |
| | |
| | |
| | |
| | |
| Archer-Daniels-Midland Co. | |
| | |
| | |
| | |
| | |
| Boston Scientific Corp. (a) | |
| | |
| | |
| | |
| | |
| | |
| | |
| | |
| | |
| | |
| | |
| | |
| | |
| | |
| | |
| | |
| | |
| Molina Healthcare, Inc. (a) | |
| | |
| Universal Health Services, Inc., Class B | |
| | |
| | |
| | |
| | |
| | |
| Hotel & Resort REITs — 0.4% | |
| Host Hotels & Resorts, Inc. | |
| Hotels, Restaurants & Leisure | |
| | |
| Chipotle Mexican Grill, Inc. (a) | |
| | |
| DoorDash, Inc., Class A (a) | |
| | |
| Hilton Worldwide Holdings, Inc. | |
| | |
| Household Durables — 2.3% | |
| | |
See Notes to Financial Statements
First Trust Active Factor Large Cap ETF (AFLG)Portfolio of Investments (Continued)August 31, 2024 | | |
COMMON STOCKS (Continued) |
| Household Durables (Continued) | |
| | |
| | |
| | |
| | |
| | |
| | |
| Household Products — 1.7% | |
| | |
| | |
| Procter & Gamble (The) Co. | |
| | |
| Independent Power and Renewable Electricity | |
| | |
| Industrial Conglomerates — | |
| | |
| | |
| | |
| | |
| American International Group, Inc. | |
| Arch Capital Group Ltd. (a) | |
| | |
| | |
| | |
| Erie Indemnity Co., Class A | |
| | |
| | |
| Hartford Financial Services Group (The), Inc. | |
| | |
| | |
| Principal Financial Group, Inc. | |
| | |
| Prudential Financial, Inc. | |
| | |
| | |
| Interactive Media & Services | |
| | |
| | |
| Meta Platforms, Inc., Class A | |
| Pinterest, Inc., Class A (a) | |
| | |
| | |
| | |
| | |
|
| | |
| Cognizant Technology Solutions Corp., Class A | |
| | |
| | |
| | |
| GoDaddy, Inc., Class A (a) | |
| International Business Machines Corp. | |
| | |
| | |
| | |
| | |
| | |
| | |
| | |
| | |
| | |
| Westinghouse Air Brake Technologies Corp. | |
| | |
| | |
| | |
| | |
| Interpublic Group of (The) Cos., Inc. | |
| | |
| | |
| | |
| | |
| | |
| | |
| | |
| | |
| | |
| Consolidated Edison, Inc. | |
| Public Service Enterprise Group, Inc. | |
| | |
| Oil, Gas & Consumable Fuels | |
| | |
| | |
| | |
| | |
| | |
| | |
| | |
| | |
| | |
See Notes to Financial Statements
First Trust Active Factor Large Cap ETF (AFLG)Portfolio of Investments (Continued)August 31, 2024 | | |
COMMON STOCKS (Continued) |
| Oil, Gas & Consumable Fuels (Continued) | |
| | |
| | |
| | |
| | |
| | |
| | |
| | |
| | |
| | |
| | |
| | |
| Professional Services — 0.9% | |
| Booz Allen Hamilton Holding Corp. | |
| | |
| | |
| | |
| SS&C Technologies Holdings, Inc. | |
| | |
| | |
| AvalonBay Communities, Inc. | |
| | |
| | |
| Essex Property Trust, Inc. | |
| Mid-America Apartment Communities, Inc. | |
| | |
| | |
| | |
| Simon Property Group, Inc. | |
| Semiconductors & Semiconductor Equipment | |
| | |
| | |
| | |
| | |
| | |
| | |
| | |
| | |
| | |
| | |
| | |
| AppLovin Corp., Class A (a) | |
| Cadence Design Systems, Inc. (a) | |
| | |
|
| | |
| | |
| | |
| Manhattan Associates, Inc. (a) | |
| | |
| | |
| | |
| Zoom Video Communications, Inc., Class A (a) | |
| | |
| | |
| Gaming and Leisure Properties, Inc. | |
| | |
| | |
| | |
| | |
| | |
| | |
| | |
| | |
| Dick’s Sporting Goods, Inc. | |
| | |
| O’Reilly Automotive, Inc. (a) | |
| | |
| | |
| | |
| Victoria’s Secret & Co. (a) | |
| | |
| | |
| Technology Hardware, Storage | |
| | |
| Dell Technologies, Inc., Class C | |
| | |
| | |
| Pure Storage, Inc., Class A (a) | |
| | |
| Textiles, Apparel & Luxury | |
| Deckers Outdoor Corp. (a) | |
| | |
| | |
| | |
| | |
| | |
| Philip Morris International, Inc. | |
| | |
See Notes to Financial Statements
First Trust Active Factor Large Cap ETF (AFLG)Portfolio of Investments (Continued)August 31, 2024 | | |
COMMON STOCKS (Continued) |
| | |
| | |
| | |
| | |
| Wireless Telecommunication | |
| | |
| | |
| | |
MONEY MARKET FUNDS — 0.1% |
| Morgan Stanley Institutional Liquidity Funds - Treasury Portfolio - Institutional Class - 5.12% (b) | |
| | |
|
|
| Total Investments — 99.9% | |
| | |
| Net Other Assets and Liabilities — 0.1% | |
| | |
| Non-income producing security. |
| Rate shown reflects yield as of August 31, 2024. |
Abbreviations throughout the Portfolio of Investments: |
| – Real Estate Investment Trusts |
Valuation InputsA summary of the inputs used to value the Fund’s investments as of August 31, 2024 is as follows (see Note 2A - Portfolio Valuation in the Notes to Financial Statements):
| | | Level 2
Significant
Observable
Inputs | Level 3
Significant
Unobservable
Inputs |
| | | | |
| | | | |
| | | | |
| See Portfolio of Investments for industry breakout. |
See Notes to Financial Statements
First Trust Active Factor Mid Cap ETF (AFMC)Portfolio of InvestmentsAugust 31, 2024
| | |
|
| Aerospace & Defense — 1.0% | |
| | |
| | |
| | |
| Air Freight & Logistics — | |
| C.H. Robinson Worldwide, Inc. | |
| | |
| | |
| | |
| | |
| | |
| | |
| | |
| | |
| | |
| | |
| Columbia Banking System, Inc. | |
| Commerce Bancshares, Inc. | |
| | |
| | |
| | |
| International Bancshares Corp. | |
| | |
| | |
| | |
| | |
| | |
| Coca-Cola Consolidated, Inc. | |
| Molson Coors Beverage Co., Class B | |
| | |
| | |
| Blueprint Medicines Corp. (a) | |
| | |
| Halozyme Therapeutics, Inc. (a) | |
| | |
| Neurocrine Biosciences, Inc. (a) | |
| United Therapeutics Corp. (a) | |
| | |
| | |
| | |
| | |
| | |
| | |
| | |
| | |
| Armstrong World Industries, Inc. | |
| | |
|
| Building Products (Continued) | |
| Builders FirstSource, Inc. (a) | |
| | |
| | |
| Lennox International, Inc. | |
| | |
| | |
| | |
| | |
| | |
| Affiliated Managers Group, Inc. | |
| | |
| | |
| Janus Henderson Group PLC | |
| | |
| | |
| | |
| | |
| | |
| | |
| | |
| | |
| | |
| | |
| | |
| | |
| | |
| NetScout Systems, Inc. (a) | |
| | |
| Construction & Engineering | |
| Comfort Systems USA, Inc. | |
| | |
| | |
| | |
| | |
| | |
| | |
| Consumer Staples Distribution | |
| Casey’s General Stores, Inc. | |
| Sprouts Farmers Market, Inc. (a) | |
| | |
| | |
| | |
See Notes to Financial Statements
First Trust Active Factor Mid Cap ETF (AFMC)Portfolio of Investments (Continued)August 31, 2024 | | |
COMMON STOCKS (Continued) |
| Containers & Packaging (Continued) | |
| | |
| | |
| | |
| Diversified Consumer Services | |
| Graham Holdings Co., Class B | |
| Grand Canyon Education, Inc. (a) | |
| | |
| | |
| | |
| | |
| Electric Utilities — 0.9% | |
| | |
| Electrical Equipment — 2.1% | |
| | |
| | |
| | |
| | |
| | |
| Electronic Equipment, Instruments & Components | |
| Arrow Electronics, Inc. (a) | |
| | |
| | |
| | |
| | |
| Insight Enterprises, Inc. (a) | |
| | |
| | |
| | |
| | |
| Vishay Intertechnology, Inc. | |
| | |
| | |
| Energy Equipment & Services | |
| Weatherford International PLC | |
| Financial Services — 4.8% | |
| | |
| | |
| | |
| Jackson Financial, Inc., Class A | |
| | |
| | |
| | |
| | |
| | |
|
| | |
| | |
| | |
| Pilgrim’s Pride Corp. (a) | |
| | |
| | |
| | |
| | |
| | |
| | |
| Envista Holdings Corp. (a) | |
| Globus Medical, Inc., Class A (a) | |
| | |
| Integra LifeSciences Holdings Corp. (a) | |
| Lantheus Holdings, Inc. (a) | |
| Merit Medical Systems, Inc. (a) | |
| | |
| | |
| AMN Healthcare Services, Inc. (a) | |
| | |
| | |
| | |
| | |
| | |
| | |
| | |
| Molina Healthcare, Inc. (a) | |
| Option Care Health, Inc. (a) | |
| | |
| | |
| Tenet Healthcare Corp. (a) | |
| Universal Health Services, Inc., Class B | |
| | |
| | |
| | |
| Omega Healthcare Investors, Inc. | |
| Sabra Health Care REIT, Inc. | |
| | |
| | |
| Doximity, Inc., Class A (a) | |
| Hotel & Resort REITs — 0.9% | |
| Apple Hospitality REIT, Inc. | |
See Notes to Financial Statements
First Trust Active Factor Mid Cap ETF (AFMC)Portfolio of Investments (Continued)August 31, 2024 | | |
COMMON STOCKS (Continued) |
| Hotel & Resort REITs (Continued) | |
| Host Hotels & Resorts, Inc. | |
| Park Hotels & Resorts, Inc. | |
| | |
| Hotels, Restaurants & Leisure | |
| | |
| | |
| | |
| Household Durables — 5.2% | |
| Installed Building Products, Inc. | |
| | |
| | |
| | |
| Taylor Morrison Home Corp. (a) | |
| | |
| | |
| Tri Pointe Homes, Inc. (a) | |
| | |
| Independent Power and Renewable Electricity | |
| | |
| | |
| | |
| | |
| Erie Indemnity Co., Class A | |
| | |
| Old Republic International Corp. | |
| Oscar Health, Inc., Class A (a) | |
| | |
| | |
| | |
| Interactive Media & Services | |
| | |
| | |
| | |
| | |
| GoDaddy, Inc., Class A (a) | |
| | |
| Life Sciences Tools & Services | |
| Medpace Holdings, Inc. (a) | |
| | |
| | |
| Allison Transmission Holdings, Inc. | |
| | |
| | |
|
| | |
| | |
| | |
| | |
| | |
| | |
| Lincoln Electric Holdings, Inc. | |
| | |
| | |
| SPX Technologies, Inc. (a) | |
| | |
| | |
| | |
| New York Times (The) Co., Class A | |
| Nexstar Media Group, Inc. | |
| | |
| | |
| | |
| Alpha Metallurgical Resources, Inc. | |
| Carpenter Technology Corp. | |
| Cleveland-Cliffs, Inc. (a) | |
| | |
| | |
| | |
| | |
| | |
| | |
| | |
| | |
| Highwoods Properties, Inc. | |
| Hudson Pacific Properties, Inc. | |
| | |
| Oil, Gas & Consumable Fuels | |
| | |
| | |
| | |
| PBF Energy, Inc., Class A | |
| | |
| | |
| | |
| | |
| Paper & Forest Products — | |
| | |
| | |
| BellRing Brands, Inc. (a) | |
See Notes to Financial Statements
First Trust Active Factor Mid Cap ETF (AFMC)Portfolio of Investments (Continued)August 31, 2024 | | |
COMMON STOCKS (Continued) |
| Personal Care Products (Continued) | |
| | |
| Nu Skin Enterprises, Inc., Class A | |
| | |
| | |
| Jazz Pharmaceuticals PLC (a) | |
| | |
| | |
| Prestige Consumer Healthcare, Inc. (a) | |
| | |
| Professional Services — 2.8% | |
| CACI International, Inc., Class A (a) | |
| | |
| | |
| | |
| | |
| Science Applications International Corp. | |
| | |
| | |
| Jones Lang LaSalle, Inc. (a) | |
| | |
| | |
| | |
| | |
| Brixmor Property Group, Inc. | |
| | |
| | |
| Semiconductors & Semiconductor Equipment | |
| Axcelis Technologies, Inc. (a) | |
| | |
| | |
| Onto Innovation, Inc. (a) | |
| | |
| | |
| | |
| Appfolio, Inc., Class A (a) | |
| | |
| CommVault Systems, Inc. (a) | |
| Dropbox, Inc., Class A (a) | |
| | |
| | |
| | |
| | |
|
| | |
| Manhattan Associates, Inc. (a) | |
| Smartsheet, Inc., Class A (a) | |
| | |
| | |
| Varonis Systems, Inc. (a) | |
| Zeta Global Holdings Corp., Class A (a) | |
| | |
| | |
| | |
| | |
| Gaming and Leisure Properties, Inc. | |
| Lamar Advertising Co., Class A | |
| National Storage Affiliates Trust | |
| | |
| | |
| Abercrombie & Fitch Co., Class A (a) | |
| Academy Sports & Outdoors, Inc. | |
| American Eagle Outfitters, Inc. | |
| Asbury Automotive Group, Inc. (a) | |
| | |
| Dick’s Sporting Goods, Inc. | |
| | |
| | |
| | |
| | |
| | |
| Technology Hardware, Storage | |
| | |
| Pure Storage, Inc., Class A (a) | |
| | |
| Textiles, Apparel & Luxury | |
| | |
| | |
| Deckers Outdoor Corp. (a) | |
| Levi Strauss & Co., Class A | |
| | |
| | |
| Skechers U.S.A., Inc., Class A (a) | |
| | |
| | |
See Notes to Financial Statements
First Trust Active Factor Mid Cap ETF (AFMC)Portfolio of Investments (Continued)August 31, 2024 | | |
COMMON STOCKS (Continued) |
| | |
| Applied Industrial Technologies, Inc. | |
| | |
| Core & Main, Inc., Class A (a) | |
| MSC Industrial Direct Co., Inc., Class A | |
| | |
| WESCO International, Inc. | |
| | |
| | |
| | |
MONEY MARKET FUNDS — 0.2% |
| Morgan Stanley Institutional Liquidity Funds - Treasury Portfolio - Institutional Class - 5.12% (b) | |
| | |
|
|
| Total Investments — 100.0% | |
| | |
| Net Other Assets and Liabilities — 0.0% | |
| | |
| Non-income producing security. |
| Rate shown reflects yield as of August 31, 2024. |
Abbreviations throughout the Portfolio of Investments: |
| – Real Estate Investment Trusts |
Valuation InputsA summary of the inputs used to value the Fund’s investments as of August 31, 2024 is as follows (see Note 2A - Portfolio Valuation in the Notes to Financial Statements):
| | | Level 2
Significant
Observable
Inputs | Level 3
Significant
Unobservable
Inputs |
| | | | |
| | | | |
| | | | |
| See Portfolio of Investments for industry breakout. |
See Notes to Financial Statements
First Trust Active Factor Small Cap ETF (AFSM)Portfolio of InvestmentsAugust 31, 2024
| | |
|
| Aerospace & Defense — 0.3% | |
| | |
| Air Freight & Logistics — | |
| | |
| | |
| | |
| | |
| Standard Motor Products, Inc. | |
| | |
| | |
| Winnebago Industries, Inc. | |
| | |
| | |
| Bank of NT Butterfield & Son Ltd. (The) | |
| | |
| | |
| | |
| | |
| | |
| International Bancshares Corp. | |
| | |
| | |
| | |
| | |
| Provident Financial Services, Inc. | |
| | |
| | |
| | |
| | |
| | |
| Coca-Cola Consolidated, Inc. | |
| | |
| | |
| | |
| | |
| | |
| Blueprint Medicines Corp. (a) | |
| Catalyst Pharmaceuticals, Inc. (a) | |
| Corbus Pharmaceuticals Holdings, Inc. (a) | |
| Cullinan Therapeutics, Inc. (a) | |
| Halozyme Therapeutics, Inc. (a) | |
| Kiniksa Pharmaceuticals International PLC (a) | |
| Krystal Biotech, Inc. (a) | |
| | |
|
| Biotechnology (Continued) | |
| TG Therapeutics, Inc. (a) | |
| Twist Bioscience Corp. (a) | |
| Vanda Pharmaceuticals, Inc. (a) | |
| Y-mAbs Therapeutics, Inc. (a) | |
| | |
| | |
| | |
| | |
| | |
| | |
| | |
| | |
| American Woodmark Corp. (a) | |
| | |
| | |
| | |
| | |
| Janus International Group, Inc. (a) | |
| | |
| Quanex Building Products Corp. | |
| Resideo Technologies, Inc. (a) | |
| | |
| | |
| Artisan Partners Asset Management, Inc., Class A | |
| Donnelley Financial Solutions, Inc. (a) | |
| Main Street Capital Corp. | |
| | |
| Victory Capital Holdings, Inc., Class A | |
| Virtu Financial, Inc., Class A | |
| | |
| | |
| | |
| | |
| Perimeter Solutions S.A. (a) | |
| | |
| | |
| | |
| CECO Environmental Corp. (a) | |
| | |
| GEO Group (The), Inc. (a) | |
| | |
| | |
| | |
| | |
See Notes to Financial Statements
First Trust Active Factor Small Cap ETF (AFSM)Portfolio of Investments (Continued)August 31, 2024 | | |
COMMON STOCKS (Continued) |
| | |
| Extreme Networks, Inc. (a) | |
| NetScout Systems, Inc. (a) | |
| | |
| Construction & Engineering | |
| | |
| Comfort Systems USA, Inc. | |
| | |
| | |
| Sterling Infrastructure, Inc. (a) | |
| | |
| | |
| | |
| United States Lime & Minerals, Inc. | |
| | |
| | |
| | |
| | |
| | |
| Consumer Staples Distribution | |
| | |
| Ingles Markets, Inc., Class A | |
| Sprouts Farmers Market, Inc. (a) | |
| | |
| Diversified Consumer Services | |
| Adtalem Global Education, Inc. (a) | |
| | |
| Grand Canyon Education, Inc. (a) | |
| | |
| | |
| | |
| | |
| | |
| Broadstone Net Lease, Inc. | |
| Electric Utilities — 0.1% | |
| Hawaiian Electric Industries, Inc. (a) | |
| | |
| | |
| Electrical Equipment — 1.1% | |
| | |
| | |
| | |
|
| Electrical Equipment (Continued) | |
| | |
| | |
| | |
| Electronic Equipment, Instruments & Components | |
| | |
| | |
| | |
| Benchmark Electronics, Inc. | |
| | |
| | |
| | |
| Insight Enterprises, Inc. (a) | |
| | |
| Napco Security Technologies, Inc. | |
| | |
| | |
| | |
| Vishay Intertechnology, Inc. | |
| | |
| Energy Equipment & Services | |
| | |
| Helix Energy Solutions Group, Inc. (a) | |
| | |
| Weatherford International PLC | |
| | |
| | |
| Cinemark Holdings, Inc. (a) | |
| Financial Services — 4.5% | |
| | |
| | |
| Jackson Financial, Inc., Class A | |
| | |
| Mr. Cooper Group, Inc. (a) | |
| | |
| | |
| | |
| | |
| | |
| | |
| Fresh Del Monte Produce, Inc. | |
| | |
| | |
See Notes to Financial Statements
First Trust Active Factor Small Cap ETF (AFSM)Portfolio of Investments (Continued)August 31, 2024 | | |
COMMON STOCKS (Continued) |
| | |
| | |
| Southwest Gas Holdings, Inc. | |
| | |
| | |
| | |
| | |
| Envista Holdings Corp. (a) | |
| Globus Medical, Inc., Class A (a) | |
| | |
| | |
| Lantheus Holdings, Inc. (a) | |
| | |
| | |
| Tactile Systems Technology, Inc. (a) | |
| TransMedics Group, Inc. (a) | |
| UFP Technologies, Inc. (a) | |
| | |
| | |
| | |
| AMN Healthcare Services, Inc. (a) | |
| | |
| | |
| Cross Country Healthcare, Inc. (a) | |
| GeneDx Holdings Corp. (a) | |
| Hims & Hers Health, Inc. (a) | |
| National HealthCare Corp. | |
| | |
| Pediatrix Medical Group, Inc. (a) | |
| | |
| | |
| | |
| | |
| | |
| | |
| National Health Investors, Inc. | |
| Sabra Health Care REIT, Inc. | |
| | |
| | |
| | |
| Hotel & Resort REITs — 0.2% | |
| Park Hotels & Resorts, Inc. | |
| | |
|
| Hotels, Restaurants & Leisure | |
| Sweetgreen, Inc., Class A (a) | |
| Household Durables — 3.2% | |
| Ethan Allen Interiors, Inc. | |
| Green Brick Partners, Inc. (a) | |
| Hovnanian Enterprises, Inc., Class A (a) | |
| | |
| | |
| | |
| Taylor Morrison Home Corp. (a) | |
| Tri Pointe Homes, Inc. (a) | |
| | |
| | |
| Innovative Industrial Properties, Inc. | |
| | |
| | |
| | |
| | |
| Oscar Health, Inc., Class A (a) | |
| Universal Insurance Holdings, Inc. | |
| | |
| Interactive Media & Services | |
| EverQuote, Inc., Class A (a) | |
| | |
| MediaAlpha, Inc., Class A (a) | |
| | |
| | |
| | |
| | |
| | |
| | |
| | |
| Life Sciences Tools & Services | |
| BioLife Solutions, Inc. (a) | |
| Maravai LifeSciences Holdings, Inc., Class A (a) | |
| Medpace Holdings, Inc. (a) | |
| OmniAb, Inc. - 12.5 Earnout Shares (a) (b) (c) (d) (e) | |
| OmniAb, Inc. - 15 Earnout Shares (a) (b) (c) (d) (e) | |
| | |
| | |
| | |
| | |
See Notes to Financial Statements
First Trust Active Factor Small Cap ETF (AFSM)Portfolio of Investments (Continued)August 31, 2024 | | |
COMMON STOCKS (Continued) |
| | |
| | |
| | |
| | |
| SPX Technologies, Inc. (a) | |
| | |
| | |
| Titan International, Inc. (a) | |
| | |
| | |
| | |
| Genco Shipping & Trading Ltd. | |
| | |
| | |
| | |
| | |
| AMC Networks, Inc., Class A (a) | |
| John Wiley & Sons, Inc., Class A | |
| | |
| | |
| | |
| Alpha Metallurgical Resources, Inc. | |
| Carpenter Technology Corp. | |
| | |
| Ramaco Resources, Inc., Class A | |
| | |
| | |
| | |
| | |
| | |
| | |
| | |
| | |
| Highwoods Properties, Inc. | |
| | |
| Piedmont Office Realty Trust, Inc., Class A | |
| | |
| | |
| Oil, Gas & Consumable Fuels | |
| | |
| | |
| | |
| | |
| | |
| | |
|
| Oil, Gas & Consumable Fuels (Continued) | |
| International Seaways, Inc. | |
| PBF Energy, Inc., Class A | |
| | |
| | |
| | |
| Teekay Tankers Ltd., Class A | |
| | |
| Paper & Forest Products — | |
| Clearwater Paper Corp. (a) | |
| | |
| | |
| Passenger Airlines — 0.9% | |
| | |
| | |
| BellRing Brands, Inc. (a) | |
| | |
| Nu Skin Enterprises, Inc., Class A | |
| | |
| | |
| Amphastar Pharmaceuticals, Inc. (a) | |
| ANI Pharmaceuticals, Inc. (a) | |
| Axsome Therapeutics, Inc. (a) | |
| Collegium Pharmaceutical, Inc. (a) | |
| Corcept Therapeutics, Inc. (a) | |
| | |
| Harmony Biosciences Holdings, Inc. (a) | |
| | |
| | |
| Intra-Cellular Therapies, Inc. (a) | |
| Ligand Pharmaceuticals, Inc. (a) | |
| Pacira BioSciences, Inc. (a) | |
| | |
| Supernus Pharmaceuticals, Inc. (a) | |
| Tarsus Pharmaceuticals, Inc. (a) | |
| | |
| Professional Services — 1.7% | |
| Kelly Services Inc., Class A | |
| | |
| CSG Systems International, Inc. | |
| Heidrick & Struggles International, Inc. | |
See Notes to Financial Statements
First Trust Active Factor Small Cap ETF (AFSM)Portfolio of Investments (Continued)August 31, 2024 | | |
COMMON STOCKS (Continued) |
| Professional Services (Continued) | |
| Huron Consulting Group, Inc. (a) | |
| | |
| | |
| | |
| RMR Group (The), Inc., Class A | |
| | |
| | |
| Semiconductors & Semiconductor Equipment | |
| | |
| Axcelis Technologies, Inc. (a) | |
| Credo Technology Group Holding Ltd. (a) | |
| | |
| | |
| Onto Innovation, Inc. (a) | |
| | |
| Ultra Clean Holdings, Inc. (a) | |
| | |
| | |
| | |
| | |
| | |
| Alarm.com Holdings, Inc. (a) | |
| Alkami Technology, Inc. (a) | |
| Appfolio, Inc., Class A (a) | |
| | |
| Clear Secure, Inc., Class A | |
| CommVault Systems, Inc. (a) | |
| | |
| | |
| LiveRamp Holdings, Inc. (a) | |
| | |
| | |
| | |
| Sapiens International Corp. N.V. | |
| SEMrush Holdings, Inc., Class A (a) | |
| | |
| | |
| | |
| Varonis Systems, Inc. (a) | |
| | |
| | |
| Zeta Global Holdings Corp., Class A (a) | |
| | |
| | |
|
| | |
| Abercrombie & Fitch Co., Class A (a) | |
| Academy Sports & Outdoors, Inc. | |
| Asbury Automotive Group, Inc. (a) | |
| | |
| | |
| | |
| | |
| | |
| | |
| Sally Beauty Holdings, Inc. (a) | |
| | |
| | |
| | |
| Technology Hardware, Storage | |
| | |
| Textiles, Apparel & Luxury | |
| G-III Apparel Group Ltd. (a) | |
| | |
| | |
| | |
| | |
| Applied Industrial Technologies, Inc. | |
| BlueLinx Holdings, Inc. (a) | |
| | |
| | |
| | |
| Hudson Technologies, Inc. (a) | |
| | |
| | |
| Consolidated Water Co., Ltd. | |
| | |
| | |
MONEY MARKET FUNDS — 0.2% |
| Morgan Stanley Institutional Liquidity Funds - Treasury Portfolio - Institutional Class - 5.12% (f) | |
| | |
|
|
| Total Investments — 100.0% | |
| | |
| Net Other Assets and Liabilities — 0.0% | |
| | |
See Notes to Financial Statements
First Trust Active Factor Small Cap ETF (AFSM)Portfolio of Investments (Continued)August 31, 2024 | Non-income producing security. |
| Pursuant to procedures adopted by the Trust’s Board of Trustees, this security has been determined to be illiquid by First Trust Advisors L.P. (the “Advisor”). |
| Restricted security as to resale, excluding Rule 144A securities (see Note 2E - Restricted Securities in the Notes to Financial Statements). |
| This security is fair valued by the Advisor’s Pricing Committee in accordance with procedures approved by the Trust’s Board of Trustees, and in accordance with provisions of the Investment Company Act of 1940 and rules thereunder, as amended. At August 31, 2024, securities noted as such are valued at $0 or 0.0% of net assets. |
| This security’s value was determined using significant unobservable inputs (see Note 2A - Portfolio Valuation in the Notes to Financial Statements). |
| Rate shown reflects yield as of August 31, 2024. |
Abbreviations throughout the Portfolio of Investments: |
| – Real Estate Investment Trusts |
Valuation InputsA summary of the inputs used to value the Fund’s investments as of August 31, 2024 is as follows (see Note 2A - Portfolio Valuation in the Notes to Financial Statements):
| | | Level 2
Significant
Observable
Inputs | Level 3
Significant
Unobservable
Inputs |
| | | | |
Life Sciences Tools & Services | | | | |
Other Industry Categories* | | | | |
| | | | |
| | | | |
| See Portfolio of Investments for industry breakout. |
| Investments are valued at $0. |
Level 3 investments are fair valued by the Advisor’s Pricing Committee and are footnoted in the Portfolio of Investments. All Level 3 values are based on unobservable inputs.
See Notes to Financial Statements
First Trust Exchange-Traded Fund VIIIStatements of Assets and Liabilities
August 31, 2024
| First Trust Income Opportunities ETF
(FCEF) | First Trust Flexible Municipal High Income ETF
(MFLX) | First Trust Low Duration Strategic Focus ETF
(LDSF) |
| | | |
Investments, at value - Unaffiliated | | | |
Investments, at value - Affiliated | | | |
Total investments, at value | | | |
| | | |
| | | |
| | | |
Investment securities sold | | | |
| | | |
| | | |
| | | |
|
| | | |
| | | |
Investment securities purchased | | | |
| | | |
| | | |
| | | |
|
| | | |
| | | |
| | | |
Accumulated distributable earnings (loss) | | | |
| | | |
NET ASSET VALUE, per share | | | |
Number of shares outstanding (unlimited number of shares authorized, par value $0.01 per share) | | | |
Investments, at cost - Unaffiliated | | | |
Investments, at cost - Affiliated | | | |
Total investments, at cost | | | |
See Notes to Financial Statements
First Trust Active Factor Large Cap ETF
(AFLG) | First Trust Active Factor Mid Cap ETF
(AFMC) | First Trust Active Factor Small Cap ETF
(AFSM) |
| | |
| | |
| | |
| | |
| | |
| | |
| | |
| | |
| | |
| | |
| | |
|
| | |
| | |
| | |
| | |
| | |
| | |
|
| | |
| | |
| | |
| | |
| | |
| | |
| | |
| | |
| | |
| | |
See Notes to Financial Statements
First Trust Exchange-Traded Fund VIIIStatements of Operations
For the Year Ended August 31, 2024
| First Trust Income Opportunities ETF
(FCEF) | First Trust Flexible Municipal High Income ETF
(MFLX) | First Trust Low Duration Strategic Focus ETF
(LDSF) |
| | | |
| | | |
| | | |
| | | |
| | | |
| | | |
|
| | | |
| | | |
| | | |
NET INVESTMENT INCOME (LOSS) | | | |
|
NET REALIZED AND UNREALIZED GAIN (LOSS): | | | |
Net realized gain (loss) on: | | | |
Investments - Unaffiliated | | | |
| | | |
In-kind redemptions - Unaffiliated | | | |
In-kind redemptions - Affiliated | | | |
Distribution of capital gains from investment companies | | | |
| | | |
| | | |
Net change in unrealized appreciation (depreciation) on: | | | |
Investments - Unaffiliated | | | |
| | | |
| | | |
Net change in unrealized appreciation (depreciation) | | | |
NET REALIZED AND UNREALIZED GAIN (LOSS) | | | |
NET INCREASE (DECREASE) IN NET ASSETS RESULTING FROM OPERATIONS | | | |
See Notes to Financial Statements
First Trust Active Factor Large Cap ETF
(AFLG) | First Trust Active Factor Mid Cap ETF
(AFMC) | First Trust Active Factor Small Cap ETF
(AFSM) |
| | |
| | |
| | |
| | |
| | |
| | |
|
| | |
| | |
| | |
| | |
|
| | |
| | |
| | |
| | |
| | |
| | |
| | |
| | |
| | |
| | |
| | |
| | |
| | |
| | |
| | |
| | |
See Notes to Financial Statements
First Trust Exchange-Traded Fund VIIIStatements of Changes in Net Assets
| First Trust Income Opportunities ETF (FCEF) | First Trust Flexible Municipal High Income ETF (MFLX) |
| | | | |
| | | | |
Net investment income (loss) | | | | |
| | | | |
Net increase from payment by the advisor | | | | |
Net change in unrealized appreciation (depreciation) | | | | |
Net increase (decrease) in net assets resulting from operations | | | | |
|
DISTRIBUTIONS TO SHAREHOLDERS FROM: | | | | |
| | | | |
| | | | |
Total distributions to shareholders | | | | |
|
SHAREHOLDER TRANSACTIONS: | | | | |
Proceeds from shares sold | | | | |
| | | | |
Net increase (decrease) in net assets resulting from shareholder transactions | | | | |
Total increase (decrease) in net assets | | | | |
|
| | | | |
| | | | |
| | | | |
|
CHANGES IN SHARES OUTSTANDING: | | | | |
Shares outstanding, beginning of period | | | | |
| | | | |
| | | | |
Shares outstanding, end of period | | | | |
See Notes to Financial Statements
First Trust Low Duration Strategic Focus ETF (LDSF) | First Trust Active Factor Large Cap ETF (AFLG) |
| | | |
| | | |
| | | |
| | | |
| | | |
| | | |
| | | |
|
| | | |
| | | |
| | | |
| | | |
|
| | | |
| | | |
| | | |
| | | |
| | | |
|
| | | |
| | | |
| | | |
|
| | | |
| | | |
| | | |
| | | |
| | | |
See Notes to Financial Statements
First Trust Exchange-Traded Fund VIIIStatements of Changes in Net Assets (Continued)
| First Trust Active Factor Mid Cap ETF (AFMC) | First Trust Active Factor Small Cap ETF (AFSM) |
| | | | |
| | | | |
Net investment income (loss) | | | | |
| | | | |
Net increase from payment by the advisor | | | | |
Net change in unrealized appreciation (depreciation) | | | | |
Net increase (decrease) in net assets resulting from operations | | | | |
|
DISTRIBUTIONS TO SHAREHOLDERS FROM: | | | | |
| | | | |
| | | | |
Total distributions to shareholders | | | | |
|
SHAREHOLDER TRANSACTIONS: | | | | |
Proceeds from shares sold | | | | |
| | | | |
Net increase (decrease) in net assets resulting from shareholder transactions | | | | |
Total increase (decrease) in net assets | | | | |
|
| | | | |
| | | | |
| | | | |
|
CHANGES IN SHARES OUTSTANDING: | | | | |
Shares outstanding, beginning of period | | | | |
| | | | |
| | | | |
Shares outstanding, end of period | | | | |
See Notes to Financial Statements
First Trust Exchange-Traded Fund VIIIFinancial Highlights
For a share outstanding throughout each period First Trust Income Opportunities ETF (FCEF)
| |
| | | | | |
Net asset value, beginning of period | | | | | |
Income from investment operations: | | | | | |
Net investment income (loss) | | | | | |
Net realized and unrealized gain (loss) | | | | | |
Total from investment operations | | | | | |
Distributions paid to shareholders from: | | | | | |
| | | | | |
| | | | | |
| | | | | |
Net asset value, end of period | | | | | |
| | | | | |
|
Ratios to average net assets/supplemental data: | | | | | |
Net assets, end of period (in 000’s) | | | | | |
Ratio of total expenses to average net assets (d) | | | | | |
Ratio of net investment income (loss) to average net assets (d) | | | | | |
Portfolio turnover rate (e) | | | | | |
| Based on average shares outstanding. |
| The Fund received a payment from the advisor in the amount of $7, which represents less than $0.01 per share. Since the advisor reimbursed the Fund, there was no effect on the Fund’s total return. |
| Total return is calculated assuming an initial investment made at the net asset value at the beginning of the period, reinvestment of all distributions at net asset value during the period, and redemption at net asset value on the last day of the period. The returns presented do not reflect the deduction of taxes that a shareholder would pay on Fund distributions or the redemption or sale of Fund shares. Total return is calculated for the time period presented and is not annualized for periods of less than a year. |
| Ratio of total expenses to average net assets and ratio of net investment income (loss) to average net assets do not reflect the Fund’s proportionate share of expenses and income of underlying investment companies in which the Fund invests. |
| Portfolio turnover is calculated for the time period presented and is not annualized for periods of less than a year and does not include securities received or delivered from processing creations or redemptions and in-kind transactions. |
See Notes to Financial Statements
First Trust Exchange-Traded Fund VIIIFinancial Highlights (Continued)
For a share outstanding throughout each period First Trust Flexible Municipal High Income ETF (MFLX)
| |
| | | | | |
Net asset value, beginning of period | | | | | |
Income from investment operations: | | | | | |
Net investment income (loss) | | | | | |
Net realized and unrealized gain (loss) | | | | | |
Total from investment operations | | | | | |
Distributions paid to shareholders from: | | | | | |
| | | | | |
| | | | | |
| | | | | |
| | | | | |
Net asset value, end of period | | | | | |
| | | | | |
|
Ratios to average net assets/supplemental data: | | | | | |
Net assets, end of period (in 000’s) | | | | | |
Ratio of total expenses to average net assets (d) | | | | | |
Ratio of net expenses to average net assets (d) | | | | | |
Ratio of net investment income (loss) to average net assets (d) | | | | | |
Portfolio turnover rate (e) | | | | | |
| Based on average shares outstanding. |
| Amount represents less than $0.01. |
| Total return is calculated assuming an initial investment made at the net asset value at the beginning of the period, reinvestment of all distributions at net asset value during the period, and redemption at net asset value on the last day of the period. The returns presented do not reflect the deduction of taxes that a shareholder would pay on Fund distributions or the redemption or sale of Fund shares. Total return is calculated for the time period presented and is not annualized for periods of less than a year. The total returns would have been lower if certain fees had not been waived and expenses reimbursed by the investment advisor. |
| Ratios of expenses to average net assets and ratio of net investment income (loss) to average net assets do not reflect the Fund’s proportionate share of expenses and income of underlying investment companies in which the Fund invests. |
| Portfolio turnover is calculated for the time period presented and is not annualized for periods of less than a year and does not include securities received or delivered from processing creations or redemptions and in-kind transactions. |
| The variation in the portfolio turnover rate is due to the change in the Fund’s investment strategy effective April 14, 2022, which resulted in a rebalance of the Fund’s portfolio. |
See Notes to Financial Statements
First Trust Exchange-Traded Fund VIIIFinancial Highlights (Continued)
For a share outstanding throughout each period First Trust Low Duration Strategic Focus ETF (LDSF)
| |
| | | | | |
Net asset value, beginning of period | | | | | |
Income from investment operations: | | | | | |
Net investment income (loss) | | | | | |
Net realized and unrealized gain (loss) | | | | | |
Total from investment operations | | | | | |
Distributions paid to shareholders from: | | | | | |
| | | | | |
| | | | | |
| | | | | |
Net asset value, end of period | | | | | |
| | | | | |
|
Ratios to average net assets/supplemental data: | | | | | |
Net assets, end of period (in 000’s) | | | | | |
Ratio of total expenses to average net assets (c) | | | | | |
Ratio of net investment income (loss) to average net assets (c) | | | | | |
Portfolio turnover rate (d) | | | | | |
| Based on average shares outstanding. |
| Total return is calculated assuming an initial investment made at the net asset value at the beginning of the period, reinvestment of all distributions at net asset value during the period, and redemption at net asset value on the last day of the period. The returns presented do not reflect the deduction of taxes that a shareholder would pay on Fund distributions or the redemption or sale of Fund shares. Total return is calculated for the time period presented and is not annualized for periods of less than a year. |
| Ratio of total expenses to average net assets and ratio of net investment income (loss) to average net assets do not reflect the Fund’s proportionate share of expenses and income of underlying investment companies in which the Fund invests. |
| Portfolio turnover is calculated for the time period presented and is not annualized for periods of less than a year and does not include securities received or delivered from processing creations or redemptions and in-kind transactions. |
See Notes to Financial Statements
First Trust Exchange-Traded Fund VIIIFinancial Highlights (Continued)
For a share outstanding throughout each period First Trust Active Factor Large Cap ETF (AFLG)
| | Period
Ended
8/31/2020 (a) |
| | | | |
Net asset value, beginning of period | | | | | |
Income from investment operations: | | | | | |
Net investment income (loss) | | | | | |
Net realized and unrealized gain (loss) | | | | | |
Total from investment operations | | | | | |
Distributions paid to shareholders from: | | | | | |
| | | | | |
Net asset value, end of period | | | | | |
| | | | | |
|
Ratios to average net assets/supplemental data: | | | | | |
Net assets, end of period (in 000’s) | | | | | |
Ratio of total expenses to average net assets | | | | | |
Ratio of net investment income (loss) to average net assets | | | | | |
Portfolio turnover rate (e) | | | | | |
| Inception date is December 3, 2019, which is consistent with the commencement of investment operations and is the date the initial creation units were established. |
| Based on average shares outstanding. |
| Total return is calculated assuming an initial investment made at the net asset value at the beginning of the period, reinvestment of all distributions at net asset value during the period, and redemption at net asset value on the last day of the period. The returns presented do not reflect the deduction of taxes that a shareholder would pay on Fund distributions or the redemption or sale of Fund shares. Total return is calculated for the time period presented and is not annualized for periods of less than a year. |
| |
| Portfolio turnover is calculated for the time period presented and is not annualized for periods of less than a year and does not include securities received or delivered from processing creations or redemptions and in-kind transactions. |
See Notes to Financial Statements
First Trust Exchange-Traded Fund VIIIFinancial Highlights (Continued)
For a share outstanding throughout each period First Trust Active Factor Mid Cap ETF (AFMC)
| | Period
Ended
8/31/2020 (a) |
| | | | |
Net asset value, beginning of period | | | | | |
Income from investment operations: | | | | | |
Net investment income (loss) | | | | | |
Net realized and unrealized gain (loss) | | | | | |
Total from investment operations | | | | | |
Distributions paid to shareholders from: | | | | | |
| | | | | |
Net asset value, end of period | | | | | |
| | | | | |
|
Ratios to average net assets/supplemental data: | | | | | |
Net assets, end of period (in 000’s) | | | | | |
Ratio of total expenses to average net assets | | | | | |
Ratio of net investment income (loss) to average net assets | | | | | |
Portfolio turnover rate (e) | | | | | |
| Inception date is December 3, 2019, which is consistent with the commencement of investment operations and is the date the initial creation units were established. |
| Based on average shares outstanding. |
| Total return is calculated assuming an initial investment made at the net asset value at the beginning of the period, reinvestment of all distributions at net asset value during the period, and redemption at net asset value on the last day of the period. The returns presented do not reflect the deduction of taxes that a shareholder would pay on Fund distributions or the redemption or sale of Fund shares. Total return is calculated for the time period presented and is not annualized for periods of less than a year. |
| |
| Portfolio turnover is calculated for the time period presented and is not annualized for periods of less than a year and does not include securities received or delivered from processing creations or redemptions and in-kind transactions. |
See Notes to Financial Statements
First Trust Exchange-Traded Fund VIIIFinancial Highlights (Continued)
For a share outstanding throughout each period First Trust Active Factor Small Cap ETF (AFSM)
| | Period
Ended
8/31/2020 (a) |
| | | | |
Net asset value, beginning of period | | | | | |
Income from investment operations: | | | | | |
Net investment income (loss) | | | | | |
Net realized and unrealized gain (loss) | | | | | |
Total from investment operations | | | | | |
Distributions paid to shareholders from: | | | | | |
| | | | | |
Net asset value, end of period | | | | | |
| | | | | |
|
Ratios to average net assets/supplemental data: | | | | | |
Net assets, end of period (in 000’s) | | | | | |
Ratio of total expenses to average net assets | | | | | |
Ratio of net investment income (loss) to average net assets | | | | | |
Portfolio turnover rate (f) | | | | | |
| Inception date is December 3, 2019, which is consistent with the commencement of investment operations and is the date the initial creation units were established. |
| Based on average shares outstanding. |
| Total return is calculated assuming an initial investment made at the net asset value at the beginning of the period, reinvestment of all distributions at net asset value during the period, and redemption at net asset value on the last day of the period. The returns presented do not reflect the deduction of taxes that a shareholder would pay on Fund distributions or the redemption or sale of Fund shares. Total return is calculated for the time period presented and is not annualized for periods of less than a year. |
| Ratio of total expenses to average net assets and ratio of net investment income (loss) to average net assets do not reflect the Fund’s proportionate share of expenses and income of underlying investment companies in which the Fund invests. |
| |
| Portfolio turnover is calculated for the time period presented and is not annualized for periods of less than a year and does not include securities received or delivered from processing creations or redemptions and in-kind transactions. |
See Notes to Financial Statements
Notes to Financial Statements
First Trust Exchange-Traded Fund VIIIAugust 31, 2024 1. Organization
First Trust Exchange-Traded Fund VIII (the “Trust”) is an open-end management investment company organized as a Massachusetts business trust on February 22, 2016, and is registered with the Securities and Exchange Commission under the Investment Company Act of 1940, as amended (the “1940 Act”).
This report covers the six funds (each a “Fund” and collectively, the “Funds”), each a diversified series of the Trust, listed below:
First Trust Income Opportunities ETF – (Nasdaq, Inc. (“Nasdaq”) ticker “FCEF”) |
First Trust Flexible Municipal High Income ETF – (Nasdaq ticker “MFLX”) |
First Trust Low Duration Strategic Focus ETF – (Nasdaq ticker “LDSF”) |
First Trust Active Factor Large Cap ETF – (NYSE Arca, Inc. (“NYSE Arca”) ticker “AFLG”) |
First Trust Active Factor Mid Cap ETF – (NYSE Arca ticker “AFMC”) |
First Trust Active Factor Small Cap ETF – (NYSE Arca ticker “AFSM”) |
Each Fund represents a separate series of shares of beneficial interest in the Trust. Unlike conventional mutual funds, each Fund issues and redeems shares on a continuous basis, at net asset value (“NAV”), only in large blocks of shares known as “Creation Units.”
Each Fund is an actively managed exchange-traded fund. FCEF’s primary investment objective seeks to provide current income with a secondary emphasis on total return. MFLX’s investment objective seeks to provide current income. LDSF’s primary investment objective seeks to generate current income, with a secondary objective of preservation of capital. AFLG, AFMC and AFSM’s investment objective seeks to provide capital appreciation.
Under normal market conditions, FCEF will invest its net assets in a portfolio of closed-end investment companies (“Closed-End Funds”) and exchanged-traded funds (“ETFs”) that are listed and traded in the United States on registered exchanges.
Under normal market conditions, MFLX will invest at least 80% of its net assets (plus any investment borrowings) in municipal debt securities that pay interest that is exempt from regular federal income taxes.
Under normal market conditions, LDSF will invest at least 80% of its net assets (including investment borrowings) in a portfolio of U.S.-listed ETFs that principally invest in income-generating securities that provide the Fund with an effective portfolio duration of three years or less. A significant portion of the ETFs in which the Fund invests may be advised by First Trust Advisors L.P. (“First Trust” or the “Advisor”). The Fund may invest in ETFs that invest principally in corporate bonds, floating rate loans and fixed-to floating rate loans, senior loans, mortgage-backed securities, hybrid income securities (including convertible, contingent convertible and preferred securities), government debt and other fixed income securities. The securities to which the Fund may have exposure may be issued by both U.S. and non-U.S. issuers, including both corporate and governmental issuers located in countries considered to be emerging markets. The Fund may also invest up to 40% of its net assets in ETFs that have exposure to U.S. corporate high yield securities (also known as “junk bonds”) and senior loans. The Fund may invest up to 20% of its net assets in bonds issued by non-U.S. government and corporate issuers, including up to 10% of its net assets in ETFs holding debt of issuers located in countries considered to be emerging markets. The Fund may also invest up to 10% of its net assets in ETFs holding preferred securities and up to 10% of its net assets in ETFs holding convertible securities.
Under normal market conditions, AFLG will invest at least 80% of its net assets (including investment borrowings) in U.S.-listed equity securities issued by large capitalization companies.
Under normal market conditions, AFMC will invest at least 80% of its net assets (including investment borrowings) in U.S.-listed equity securities issued by mid capitalization companies.
Under normal market conditions, AFSM will invest at least 80% of its net assets (including investment borrowings) in U.S.-listed equity securities issued by small capitalization companies.
There can be no assurance that a Fund will achieve its investment objective(s). The Funds may not be appropriate for all investors.
2. Significant Accounting Policies
The Funds are each considered an investment company and follow accounting and reporting guidance under Financial Accounting Standards Board Accounting Standards Codification Topic 946, “Financial Services-Investment Companies.” The following is a summary of significant accounting policies consistently followed by the Funds in the preparation of the financial statements. The
Notes to Financial Statements (Continued)
First Trust Exchange-Traded Fund VIIIAugust 31, 2024 preparation of the financial statements in accordance with accounting principles generally accepted in the United States of America (“U.S. GAAP”) requires management to make estimates and assumptions that affect the reported amounts and disclosures in the financial statements. Actual results could differ from those estimates.
Each Fund’s NAV is determined daily as of the close of regular trading on the New York Stock Exchange (“NYSE”), normally 4:00 p.m. Eastern time, on each day the NYSE is open for trading. If the NYSE closes early on a valuation day, the NAV is determined as of that time. Each Fund’s NAV is calculated by dividing the value of all assets of each Fund (including accrued interest and dividends), less all liabilities (including accrued expenses and dividends declared but unpaid), by the total number of shares outstanding.
Each Fund’s investments are valued daily at market value or, in the absence of market value with respect to any portfolio securities, at fair value. Market value prices represent readily available market quotations such as last sale or official closing prices from a national or foreign exchange (i.e., a regulated market) and are primarily obtained from third-party pricing services. Fair value prices represent any prices not considered market value prices and are either obtained from a third-party pricing service or are determined by the Advisor’s Pricing Committee in accordance with valuation procedures approved by the Trust’s Board of Trustees, and in accordance with provisions of the 1940 Act and rules thereunder. Investments valued by the Advisor’s Pricing Committee, if any, are footnoted as such in the footnotes to the Portfolio of Investments. Each Fund’s investments are valued as follows:
Common stocks, Closed-End Funds, ETFs, and other equity securities listed on any national or foreign exchange (excluding Nasdaq and the London Stock Exchange Alternative Investment Market (“AIM”)) are valued at the last sale price on the exchange on which they are principally traded or, for Nasdaq and AIM securities, the official closing price. Securities traded on more than one securities exchange are valued at the last sale price or official closing price, as applicable, at the close of the securities exchange representing the primary exchange for such securities.
Equity securities traded in an over-the-counter market are valued at the close price or the last trade price.
Shares of open-end funds are valued based on NAV per share.
Exchange-traded futures contracts are valued at the end of the day settlement price.
Municipal securities and other debt securities are fair valued on the basis of fair valuations provided by a third-party pricing service approved by the Advisor’s Pricing Committee, which may use the following valuation inputs when available:
7)
reference data including market research publications.
Pricing services generally value fixed-income securities assuming orderly transactions of an institutional round lot size, but a Fund may hold or transact in such securities in smaller, odd lot sizes. Odd lots may trade at lower prices than institutional round lots.
Fixed income and other debt securities having a remaining maturity of sixty days or less when purchased are fair valued at cost adjusted for amortization of premiums and accretion of discounts (amortized cost), provided the Advisor’s Pricing Committee has determined that the use of amortized cost is an appropriate reflection of fair value given market and issuer-specific conditions existing at the time of the determination. Factors that may be considered in determining the appropriateness of the use of amortized cost include, but are not limited to, the following:
1)
the credit conditions in the relevant market and changes thereto;
2)
the liquidity conditions in the relevant market and changes thereto;
3)
the interest rate conditions in the relevant market and changes thereto (such as significant changes in interest rates);
4)
issuer-specific conditions (such as significant credit deterioration); and
Notes to Financial Statements (Continued)
First Trust Exchange-Traded Fund VIIIAugust 31, 2024 5)
any other market-based data the Advisor’s Pricing Committee considers relevant. In this regard, the Advisor’s Pricing Committee may use last-obtained market-based data to assist it when valuing portfolio securities using amortized cost.
Certain securities may not be able to be priced by pre-established pricing methods. Such securities may be valued by the Advisor’s Pricing Committee at fair value. These securities generally include, but are not limited to, restricted securities (securities which may not be publicly sold without registration under the Securities Act of 1933, as amended) for which a third-party pricing service is unable to provide a market price; securities whose trading has been formally suspended; a security whose market or fair value price is not available from a pre-established pricing source; a security with respect to which an event has occurred that is likely to materially affect the value of the security after the market has closed but before the calculation of a Fund’s NAV or make it difficult or impossible to obtain a reliable market quotation; and a security whose price, as provided by the third-party pricing service, does not reflect the security’s fair value. As a general principle, the current fair value of a security would appear to be the amount which the owner might reasonably expect to receive for the security upon its current sale. When fair value prices are used, generally they will differ from market quotations or official closing prices on the applicable exchanges. A variety of factors may be considered in determining the fair value of such securities.
Fair valuation of a debt security will be based on the consideration of all available information, including, but not limited to, the following:
1)
the most recent price provided by a pricing service;
2)
available market prices for the fixed-income security;
3)
the fundamental business data relating to the issuer;
4)
an evaluation of the forces which influence the market in which these securities are purchased and sold;
5)
the type, size and cost of the security;
6)
the financial statements of the issuer;
7)
the credit quality and cash flow of the issuer, based on the Advisor’s or external analysis;
8)
the information as to any transactions in or offers for the security;
9)
the price and extent of public trading in similar securities (or equity securities) of the issuer/borrower, or comparable companies;
11)
the quality, value and salability of collateral, if any, securing the security; and
12)
other relevant factors.
Fair valuation of an equity security will be based on the consideration of all available information, including, but not limited to, the following:
1)
the last sale price on the exchange on which they are principally traded or, for Nasdaq and AIM securities, the official closing price;
3)
the size of the holding;
4)
the initial cost of the security;
5)
transactions in comparable securities;
6)
price quotes from dealers and/or third-party pricing services;
7)
relationships among various securities;
8)
information obtained by contacting the issuer, analysts, or the appropriate stock exchange;
9)
an analysis of the issuer’s financial statements;
10)
the existence of merger proposals or tender offers that might affect the value of the security; and
11)
other relevant factors.
The Funds are subject to fair value accounting standards that define fair value, establish the framework for measuring fair value and provide a three-level hierarchy for fair valuation based upon the inputs to the valuation as of the measurement date. The three levels of the fair value hierarchy are as follows:
Notes to Financial Statements (Continued)
First Trust Exchange-Traded Fund VIIIAugust 31, 2024 • Level 1 – Level 1 inputs are quoted prices in active markets for identical investments. An active market is a market in which transactions for the investment occur with sufficient frequency and volume to provide pricing information on an ongoing basis.
• Level 2 – Level 2 inputs are observable inputs, either directly or indirectly, and include the following:
o Quoted prices for similar investments in active markets.
o Quoted prices for identical or similar investments in markets that are non-active. A non-active market is a market where there are few transactions for the investment, the prices are not current, or price quotations vary substantially either over time or among market makers, or in which little information is released publicly.
o Inputs other than quoted prices that are observable for the investment (for example, interest rates and yield curves observable at commonly quoted intervals, volatilities, prepayment speeds, loss severities, credit risks, and default rates).
o Inputs that are derived principally from or corroborated by observable market data by correlation or other means.
• Level 3 – Level 3 inputs are unobservable inputs. Unobservable inputs may reflect the reporting entity’s own assumptions about the assumptions that market participants would use in pricing the investment.
The inputs or methodologies used for valuing investments are not necessarily an indication of the risk associated with investing in those investments. A summary of the inputs used to value each Fund’s investments as of August 31, 2024, is included with each Fund’s Portfolio of Investments.
B. Securities Transactions and Investment Income
Securities transactions are recorded as of the trade date. Realized gains and losses from securities transactions are recorded on the identified cost basis. Dividend income is recorded on the ex-dividend date. Interest income, if any, is recorded on the accrual basis. Amortization of premiums and accretion of discounts are recorded using the effective interest method.
Withholding taxes and tax reclaims on foreign dividends have been provided for in accordance with each Fund’s understanding of the applicable country’s tax rules and rates.
Distributions received from a Fund’s investments in real estate investment trusts (“REITs”) may be comprised of return of capital, capital gains and income. The actual character of the amounts received during the year is not known until after the REITs’ fiscal year end. A Fund records the character of distributions received from the REITs during the year based on estimates available. The characterization of distributions received by a Fund may be subsequently revised based on information received from the REITs after their tax reporting periods conclude.
MFLX may invest in when-issued or delayed-delivery securities. Securities purchased or sold on a when-issued or delayed-delivery basis may have extended settlement periods. The value of the security so purchased is subject to market fluctuations during this period. MFLX maintains liquid assets with a current value at least equal to the amount of its when-issued or delayed-delivery securities. At August 31, 2024, MFLX held no when-issued or delayed-delivery securities.
MFLX may purchase or sell (i.e., is long or short) exchange-listed futures contracts to hedge against changes in interest rates (interest rate risk). Futures contracts are agreements between a Fund and a counterparty to buy or sell a specific quantity of an underlying instrument at a specified price and at a specified date. Depending on the terms of the contract, futures contracts are settled either through physical delivery of the underlying instrument on the settlement date or by payment of a cash settlement amount on the settlement date. Open futures contracts can also be closed out prior to settlement by entering into an offsetting transaction in a matching futures contract. If a Fund is not able to enter into an offsetting transaction, a Fund will continue to be required to maintain margin deposits on the futures contract. When the contract is closed or expires, a Fund records a realized gain or loss equal to the difference between the value of the contract at the time it was opened and the value at the time it was closed or expired. This gain or loss is included in “Net realized gain (loss) on futures contracts” on the Statements of Operations.
Upon entering into a futures contract, a Fund must deposit funds, called margin, with its custodian in the name of the clearing broker equal to a specified percentage of the current value of the contract. Open futures contracts are marked-to-market daily with the change in value recognized as a component of “Net change in unrealized appreciation (depreciation) on futures contracts” on the Statements of Operations. Pursuant to the contracts, a Fund agrees to receive from or pay to the broker an amount of cash equal to the daily fluctuation in value of the contract. Such receipts or payments are known as variation margin and are included in “Variation margin” payable or receivable on the Statements of Assets and Liabilities.
Notes to Financial Statements (Continued)
First Trust Exchange-Traded Fund VIIIAugust 31, 2024 If market conditions change unexpectedly, a Fund may not achieve the anticipated benefits of the futures contract and may realize a loss. The use of futures contracts involves the risk of imperfect correlation in movements in the price of the futures contracts, interest rates and the underlying instruments. MFLX did not hold any futures contracts at August 31, 2024.
D. Affiliated Transactions
LDSF invests in securities of affiliated funds. LDSF’s investment performance and risks are directly related to the investment performance and risks of the affiliated funds. The affiliated funds’ financial statements may be found at SEC.gov. Dividend income, if any, realized gains and losses, and change in appreciation (depreciation) from affiliated funds are presented on the Statements of Operations.
| | | | | Change in
Unrealized
Appreciation
(Depreciation) | | | |
First Trust Emerging Markets Local Currency Bond ETF | | | | | | | | |
First Trust Enhanced Short Maturity ETF | | | | | | | | |
First Trust Limited Duration Investment Grade Corporate ETF | | | | | | | | |
First Trust Low Duration Opportunities ETF | | | | | | | | |
First Trust Senior Loan Fund | | | | | | | | |
First Trust Tactical High Yield ETF | | | | | | | | |
First Trust TCW Unconstrained Plus Bond ETF | | | | | | | | |
| | | | | | | | |
As of August 31, 2024, AFSM held restricted securities as shown in the following table that the Advisor has deemed illiquid pursuant to procedures adopted by the Trust’s Board of Trustees.
| | | | | | |
OmniAb, Inc. - 12.5 Earnout Shares | | | | | | |
OmniAb, Inc. - 15 Earnout Shares | | | | | | |
| | | | | | |
F. Dividends and Distributions to Shareholders
Dividends from net investment income of each Fund, if any, are declared and paid quarterly, with the exception of FCEF, MFLX and LDSF which declare and pay monthly, or as the Board of Trustees may determine from time to time. Distributions of net realized capital gains earned by each Fund, if any, are distributed at least annually. Each Fund may also designate a portion of the amount paid to redeeming shareholders as a distribution for tax purposes.
Distributions from net investment income and realized capital gains are determined in accordance with federal income tax regulations, which may differ from U.S. GAAP. Certain capital accounts in the financial statements are periodically adjusted for permanent differences in order to reflect their tax character. These permanent differences are primarily due to the varying treatment of income and gain/loss on portfolio securities held by the Funds and have no impact on net assets or NAV per share. Temporary differences, which arise from recognizing certain items of income, expense and gain/loss in different periods for financial statement and tax purposes, will reverse at some time in the future.
Notes to Financial Statements (Continued)
First Trust Exchange-Traded Fund VIIIAugust 31, 2024 The tax character of distributions paid by each Fund during the fiscal year ended August 31, 2024 was as follows:
| Distributions
paid from
Ordinary
Income | Distributions
paid from
Capital
Gains | Distributions
paid from
Tax-Exempt
Income | Distributions
paid from
Return of
Capital |
First Trust Income Opportunities ETF | | | | |
First Trust Flexible Municipal High Income ETF | | | | |
First Trust Low Duration Strategic Focus ETF | | | | |
First Trust Active Factor Large Cap ETF | | | | |
First Trust Active Factor Mid Cap ETF | | | | |
First Trust Active Factor Small Cap ETF | | | | |
The tax character of distributions paid by each Fund during the fiscal year ended August 31, 2023 was as follows:
| Distributions
paid from
Ordinary
Income | Distributions
paid from
Capital
Gains | Distributions
paid from
Tax-Exempt
Income | Distributions
paid from
Return of
Capital |
First Trust Income Opportunities ETF | | | | |
First Trust Flexible Municipal High Income ETF | | | | |
First Trust Low Duration Strategic Focus ETF | | | | |
First Trust Active Factor Large Cap ETF | | | | |
First Trust Active Factor Mid Cap ETF | | | | |
First Trust Active Factor Small Cap ETF | | | | |
As of August 31, 2024, the components of distributable earnings on a tax basis for each Fund were as follows:
| Undistributed
Ordinary
Income | Accumulated
Capital and
Other
Gain (Loss) | Net
Unrealized
Appreciation
(Depreciation) |
First Trust Income Opportunities ETF | | | |
First Trust Flexible Municipal High Income ETF | | | |
First Trust Low Duration Strategic Focus ETF | | | |
First Trust Active Factor Large Cap ETF | | | |
First Trust Active Factor Mid Cap ETF | | | |
First Trust Active Factor Small Cap ETF | | | |
Each Fund intends to continue to qualify as a regulated investment company by complying with the requirements under Subchapter M of the Internal Revenue Code of 1986, as amended, which includes distributing substantially all of its net investment income and net realized gains to shareholders. Accordingly, no provision has been made for federal and state income taxes. However, due to the timing and amount of distributions, each Fund may be subject to an excise tax of 4% of the amount by which approximately 98% of each Fund’s taxable income exceeds the distributions from such taxable income for the calendar year.
In addition, MFLX intends to invest in such Municipal Closed-End Funds to allow it to qualify to pass through “exempt dividends” as defined in the Internal Revenue Code.
The Funds are subject to accounting standards that establish a minimum threshold for recognizing, and a system for measuring, the benefits of a tax position taken or expected to be taken in a tax return. The taxable years ended 2021, 2022, 2023, and 2024 remain open to federal and state audit. As of August 31, 2024, management has evaluated the application of these standards to the Funds and has determined that no provision for income tax is required in the Funds’ financial statements for uncertain tax positions.
Each Fund intends to utilize provisions of the federal income tax laws, which allow it to carry a realized capital loss forward indefinitely following the year of the loss and offset such loss against any future realized capital gains. Each Fund is subject to certain
Notes to Financial Statements (Continued)
First Trust Exchange-Traded Fund VIIIAugust 31, 2024 limitations under U.S. tax rules on the use of capital loss carryforwards and net unrealized built-in losses. These limitations apply when there has been a 50% change in ownership. At August 31, 2024, for federal income tax purposes, each applicable Fund had a capital loss carryforward available that is shown in the following table, to the extent provided by regulations, to offset future capital gains. To the extent that these loss carryforwards are used to offset future capital gains, it is probable that the capital gains so offset will not be distributed to each applicable Fund’s shareholders.
| Non-Expiring
Capital Loss
Carryforwards |
First Trust Income Opportunities ETF | |
First Trust Flexible Municipal High Income ETF | |
First Trust Low Duration Strategic Focus ETF | |
First Trust Active Factor Large Cap ETF | |
First Trust Active Factor Mid Cap ETF | |
First Trust Active Factor Small Cap ETF | |
During the taxable year ended August 31, 2024, the following Funds utilized capital loss carryforwards in the following amounts:
| |
First Trust Income Opportunities ETF | |
First Trust Active Factor Large Cap ETF | |
First Trust Active Factor Small Cap ETF | |
Certain losses realized during the current fiscal year may be deferred and treated as occurring on the first day of the following fiscal year for federal income tax purposes. For the fiscal year ended August 31, 2024, the Funds had no net late year ordinary or capital losses.
In order to present paid-in capital and accumulated distributable earnings (loss) (which consists of accumulated net investment income (loss), accumulated net realized gain (loss) on investments and net unrealized appreciation (depreciation) on investments) on the Statements of Assets and Liabilities that more closely represent their tax character, certain adjustments have been made to paid-in capital, accumulated net investment income (loss) and accumulated net realized gain (loss) on investments. These adjustments are primarily due to the difference between book and tax treatments of income and gains on various investment securities held by the Funds and in-kind transactions. The results of operations and net assets were not affected by these adjustments. For the fiscal year ended August 31, 2024, the adjustments for each Fund were as follows:
| Accumulated
Net Investment
Income (Loss) | Accumulated
Net Realized
Gain (Loss)
on Investments | |
First Trust Income Opportunities ETF | | | |
First Trust Flexible Municipal High Income ETF | | | |
First Trust Low Duration Strategic Focus ETF | | | |
First Trust Active Factor Large Cap ETF | | | |
First Trust Active Factor Mid Cap ETF | | | |
First Trust Active Factor Small Cap ETF | | | |
As of August 31, 2024, the aggregate cost, gross unrealized appreciation, gross unrealized depreciation, and net unrealized appreciation/(depreciation) on investments (including short positions and derivatives, if any) for federal income tax purposes were as follows:
| | Gross Unrealized
Appreciation | Gross Unrealized
(Depreciation) | Net Unrealized
Appreciation
(Depreciation) |
First Trust Income Opportunities ETF | | | | |
Notes to Financial Statements (Continued)
First Trust Exchange-Traded Fund VIIIAugust 31, 2024 | | Gross Unrealized Appreciation | Gross Unrealized (Depreciation) | Net Unrealized Appreciation (Depreciation) |
First Trust Flexible Municipal High Income ETF | | | | |
First Trust Low Duration Strategic Focus ETF | | | | |
First Trust Active Factor Large Cap ETF | | | | |
First Trust Active Factor Mid Cap ETF | | | | |
First Trust Active Factor Small Cap ETF | | | | |
Expenses, other than the investment advisory fee and other excluded expenses, are paid by the Advisor (see Note 3).
3. Investment Advisory Fee, Affiliated Transactions and Other Fee Arrangements
First Trust, the investment advisor to the Funds, is a limited partnership with one limited partner, Grace Partners of DuPage L.P., and one general partner, The Charger Corporation. The Charger Corporation is an Illinois corporation controlled by James A. Bowen, Chief Executive Officer of First Trust. First Trust is responsible for the selection and ongoing monitoring of the securities in each Fund’s portfolio, managing the Funds’ business affairs and providing certain administrative services necessary for the management of the Funds.
Pursuant to the Investment Management Agreement between the Trust and the Advisor, First Trust manages the investment of each Fund’s assets and is responsible for the expenses of each Fund, including the cost of transfer agency, custody, fund administration, legal, audit, license fees and other services, but excluding fee payments under the Investment Management Agreement, interest, taxes, pro rata share of fees and expenses attributable to investments in other investment companies (“acquired fund fees and expenses”), brokerage commissions and other expenses connected with the execution of portfolio transactions, distribution and service fees payable pursuant to a Rule 12b-1 plan, if any, and extraordinary expenses. The annual unitary management fee payable by each Fund to First Trust for these services will be reduced at certain levels of each Fund’s net assets (“breakpoints”) and calculated pursuant to the following schedule:
| | |
Fund net assets up to and including $2.5 billion | | |
Fund net assets greater than $2.5 billion up to and including $5 billion | | |
Fund net assets greater than $5 billion up to and including $7.5 billion | | |
Fund net assets greater than $7.5 billion up to and including $10 billion | | |
Fund net assets greater than $10 billion | | |
| | | | |
Fund net assets up to and including $2.5 billion | | | | |
Fund net assets greater than $2.5 billion up to and including $5 billion | | | | |
Fund net assets greater than $5 billion up to and including $7.5 billion | | | | |
Fund net assets greater than $7.5 billion up to and including $10 billion | | | | |
Fund net assets greater than $10 billion up to and including $15 billion | | | | |
Fund net assets greater than $15 billion | | | | |
In addition, FCEF, MFLX and LDSF incur acquired fund fees and expenses. The total of the unitary management fee and acquired fund fees and expenses represents each Fund’s total annual operating expenses.
For the fiscal year ended August 31, 2023, FCEF received a payment from the Advisor in the amount of $7 in connection with a trade error.
The Trust has multiple service agreements with The Bank of New York Mellon (“BNY”). Under the service agreements, BNY performs custodial, fund accounting, certain administrative services, and transfer agency services for each Fund. As custodian, BNY is responsible for custody of each Fund’s assets. As fund accountant and administrator, BNY is responsible for maintaining the books and records of each Fund’s securities and cash. As transfer agent, BNY is responsible for maintaining shareholder records for each Fund. BNY is a subsidiary of The Bank of New York Mellon Corporation, a financial holding company.
Notes to Financial Statements (Continued)
First Trust Exchange-Traded Fund VIIIAugust 31, 2024 Each Trustee who is not an officer or employee of First Trust, any sub-advisor or any of their affiliates (“Independent Trustees”) is paid a fixed annual retainer that is allocated equally among each fund in the First Trust Fund Complex. Each Independent Trustee is also paid an annual per fund fee that varies based on whether the fund is a closed-end or other actively managed fund, a target outcome fund or an index fund.
Additionally, the Chairs of the Audit Committee, Nominating and Governance Committee and Valuation Committee, the Vice Chair of the Audit Committee, the Lead Independent Trustee and the Vice Lead Independent Trustee are paid annual fees to serve in such capacities, with such compensation allocated pro rata among each fund in the First Trust Fund Complex based on net assets. Independent Trustees are reimbursed for travel and out-of-pocket expenses in connection with all meetings. The Committee Chairs, the Audit Committee Vice Chair, the Lead Independent Trustee and the Vice Lead Independent Trustee rotate periodically in serving in such capacities. The officers and “Interested” Trustee receive no compensation from the Trust for acting in such capacities.
4. Purchases and Sales of Securities
For the fiscal year ended August 31, 2024, the cost of purchases and proceeds from sales of investments for each Fund, excluding short-term investments and in-kind transactions, were as follows:
| | |
First Trust Income Opportunities ETF | | |
First Trust Flexible Municipal High Income ETF | | |
First Trust Low Duration Strategic Focus ETF | | |
First Trust Active Factor Large Cap ETF | | |
First Trust Active Factor Mid Cap ETF | | |
First Trust Active Factor Small Cap ETF | | |
For the fiscal year ended August 31, 2024, the cost of in-kind purchases and proceeds from in-kind sales for each Fund were as follows:
| | |
First Trust Income Opportunities ETF | | |
First Trust Flexible Municipal High Income ETF | | |
First Trust Low Duration Strategic Focus ETF | | |
First Trust Active Factor Large Cap ETF | | |
First Trust Active Factor Mid Cap ETF | | |
First Trust Active Factor Small Cap ETF | | |
5. Derivative Transactions
The following table presents the amount of net realized gain (loss) and change in net unrealized appreciation (depreciation) recognized for the fiscal year ended August 31, 2024, on MFLX’s derivative instruments, as well as the primary underlying risk exposure associated with the instruments.
|
Statements of Operations Location | |
Interest Rate Risk Exposure | |
Net realized gain (loss) on futures contracts | |
Net change in unrealized appreciation (depreciation) on futures contracts | |
The average notional value of futures contracts outstanding during the fiscal year ended August 31, 2024, which is indicative of the volume of this derivative type, was $46,444.
MFLX does not have the right to offset financial assets and financial liabilities related to futures contracts on the Statements of Assets and Liabilities.
Notes to Financial Statements (Continued)
First Trust Exchange-Traded Fund VIIIAugust 31, 2024 6. Creations, Redemptions and Transaction Fees
Each Fund generally issues and redeems its shares in primary market transactions through a creation and redemption mechanism and does not sell or redeem individual shares. Instead, financial entities known as “Authorized Participants” have contractual arrangements with a Fund or one of the Fund’s service providers to purchase and redeem Fund shares directly with the Fund in Creation Units. Prior to the start of trading on every business day, a Fund publishes through the National Securities Clearing Corporation the “basket” of securities, cash or other assets that it will accept in exchange for a Creation Unit of the Fund’s shares. An Authorized Participant that wishes to effectuate a creation of a Fund’s shares deposits with the Fund the “basket” of securities, cash or other assets identified by the Fund that day, and then receives the Creation Unit of the Fund’s shares in return for those assets. After purchasing a Creation Unit, the Authorized Participant may continue to hold the Fund’s shares or sell them in the secondary market. The redemption process is the reverse of the purchase process: the Authorized Participant redeems a Creation Unit of a Fund’s shares for a basket of securities, cash or other assets. The combination of the creation and redemption process with secondary market trading in a Fund’s shares and underlying securities provides arbitrage opportunities that are designed to help keep the market price of a Fund’s shares at or close to the NAV per share of the Fund.
Each Fund imposes fees in connection with the purchase of Creation Units. These fees may vary based upon various fact-based circumstances, including, but not limited to, the composition of the securities included in the Creation Unit or the countries in which the transactions are settled. The price for each Creation Unit will equal the daily NAV per share of a Fund times the number of shares in a Creation Unit, plus the fees described above and, if applicable, any operational processing and brokerage costs, transfer fees, stamp taxes and part or all of the spread between the expected bid and offer side of the market related to the securities comprising the creation basket.
Each Fund also imposes fees in connection with the redemption of Creation Units. These fees may vary based upon various fact-based circumstances, including, but not limited to, the composition of the securities included in the Creation Unit or the countries in which the transactions are settled. The price received for each Creation Unit will equal the daily NAV per share of a Fund times the number of shares in a Creation Unit, minus the fees described above and, if applicable, any operational processing and brokerage costs, transfer fees, stamp taxes and part or all of the spread between the expected bid and offer side of the market related to the securities comprising the redemption basket. Investors who use the services of a broker or other such intermediary in addition to an Authorized Participant to effect a redemption of a Creation Unit may also be assessed an amount to cover the cost of such services. The redemption fee charged by a Fund will comply with Rule 22c-2 of the 1940 Act which limits redemption fees to no more than 2% of the value of the shares redeemed.
The Board of Trustees adopted a Distribution and Service Plan pursuant to Rule 12b-1 under the 1940 Act. In accordance with the Rule 12b-1 plan, the Funds are authorized to pay an amount up to 0.25% of their average daily net assets each year to reimburse First Trust Portfolios L.P. (“FTP”), the distributor of the Funds, for amounts expended to finance activities primarily intended to result in the sale of Creation Units or the provision of investor services. FTP may also use this amount to compensate securities dealers or other persons that are Authorized Participants for providing distribution assistance, including broker-dealer and shareholder support and educational and promotional services.
No 12b-1 fees are currently paid by the Funds, and pursuant to a contractual arrangement, no 12b-1 fees will be paid any time before December 31, 2025.
The Trust, on behalf of the Funds, has a variety of indemnification obligations under contracts with its service providers. The Trust’s maximum exposure under these arrangements is unknown. However, the Trust has not had prior claims or losses pursuant to these contracts and expects the risk of loss to be remote.
Management has evaluated the impact of all subsequent events on the Funds through the date the financial statements were issued and has determined that there were no subsequent events requiring recognition or disclosure in the financial statements that have not already been disclosed.
Report of Independent Registered Public Accounting Firm
To the Shareholders and Board of Trustees of First Trust Exchange-Traded Fund VIII:
Opinion on the Financial Statements and Financial Highlights
We have audited the accompanying statements of assets and liabilities, including the portfolios of investments, of First Trust Income Opportunities ETF, First Trust Flexible Municipal High Income ETF, First Trust Low Duration Strategic Focus ETF, First Trust Active Factor Large Cap ETF, First Trust Active Factor Mid Cap ETF, and First Trust Active Factor Small Cap ETF (the “Funds”), each a series of the First Trust Exchange-Traded Fund VIII, as of August 31, 2024, the related statements of operations for the year then ended, the statements of changes in net assets for each of the two years in the period then ended, and the financial highlights for the periods indicated in the table below; and the related notes. In our opinion, the financial statements and financial highlights present fairly, in all material respects, the financial position of the Funds as of August 31, 2024, and the results of their operations for the year then ended, the changes in their net assets for each of the two years in the period then ended, and the financial highlights for the periods listed in the table below in conformity with accounting principles generally accepted in the United States of America.
Individual Funds Included in the Trust | |
First Trust Income Opportunities ETF
First Trust Flexible Municipal High Income ETF
First Trust Low Duration Strategic Focus ETF | For the years ended August 31, 2024, 2023, 2022, 2021, and 2020 |
First Trust Active Factor Large Cap ETF
First Trust Active Factor Mid Cap ETF
First Trust Active Factor Small Cap ETF | For the years ended August 31, 2024, 2023, 2022, and 2021, and for the period from December 3, 2019 (commencement of investment operations) through August 31, 2020 |
These financial statements and financial highlights are the responsibility of the Funds’ management. Our responsibility is to express an opinion on the Funds’ financial statements and financial highlights based on our audits. We are a public accounting firm registered with the Public Company Accounting Oversight Board (United States) (PCAOB) and are required to be independent with respect to the Funds in accordance with the U.S. federal securities laws and the applicable rules and regulations of the Securities and Exchange Commission and the PCAOB.
We conducted our audits in accordance with the standards of the PCAOB. Those standards require that we plan and perform the audit to obtain reasonable assurance about whether the financial statements and financial highlights are free of material misstatement, whether due to error or fraud. The Funds are not required to have, nor were we engaged to perform, an audit of their internal control over financial reporting. As part of our audits, we are required to obtain an understanding of internal control over financial reporting but not for the purpose of expressing an opinion on the effectiveness of the Funds’ internal control over financial reporting. Accordingly, we express no such opinion.
Our audits included performing procedures to assess the risks of material misstatement of the financial statements and financial highlights, whether due to error or fraud, and performing procedures that respond to those risks. Such procedures included examining, on a test basis, evidence regarding the amounts and disclosures in the financial statements and financial highlights. Our audits also included evaluating the accounting principles used and significant estimates made by management, as well as evaluating the overall presentation of the financial statements and financial highlights. Our procedures included confirmation of securities owned as of August 31, 2024, by correspondence with the custodian and brokers; when replies were not received from brokers, we performed other auditing procedures. We believe that our audits provide a reasonable basis for our opinion.
/s/ Deloitte & Touche, LLP
Chicago, Illinois
October 23, 2024
We have served as the auditor of one or more First Trust investment companies since 2001.
First Trust Exchange-Traded Fund VIIIAugust 31, 2024 (Unaudited) Changes in and Disagreements with Accountants (Item 8 of Form N-CSR)
There were no changes in or disagreements with the Funds’ accountants during the fiscal year ended August 31, 2024.
Proxy Disclosures (Item 9 of Form N-CSR)
There were no matters submitted for vote by shareholders of any Fund during the fiscal year ended August 31, 2024.
Remuneration Paid to Directors, Officers, and Others (Item 10 of Form N-CSR)
Independent Trustees and any member of any advisory board of each Fund are compensated through the unitary management fee paid by each Fund to the advisor and not directly by each Fund. The investment advisory fee paid is included in the Statements of Operations.
Statement Regarding the Basis for the Board’s Approval of Investment Advisory Contract (Item 11 of Form N-CSR)
The Board of Trustees of First Trust Exchange-Traded Fund VIII (the “Trust”), including the Independent Trustees, unanimously approved the continuation of the Investment Management Agreements (as applicable to a specific Fund, the “Agreement” and collectively, the “Agreements”) with First Trust Advisors L.P. (the “Advisor”) on behalf of the following series of the Trust (each a “Fund” and collectively, the “Funds”):
First Trust Income Opportunities ETF (FCEF)
First Trust Flexible Municipal High Income ETF (MFLX)
First Trust Low Duration Strategic Focus ETF (LDSF)
First Trust Active Factor Large Cap ETF (AFLG)
First Trust Active Factor Mid Cap ETF (AFMC)
First Trust Active Factor Small Cap ETF (AFSM)
The Board approved the continuation of the applicable Agreement for each Fund for a one-year period ending June 30, 2025 at a meeting held on June 2–3, 2024. The Board determined for each Fund that the continuation of the applicable Agreement is in the best interests of the Fund in light of the nature, extent and quality of the services provided and such other matters as the Board considered to be relevant in the exercise of its business judgment.
To reach this determination for each Fund, the Board considered its duties under the Investment Company Act of 1940, as amended (the “1940 Act”), as well as under the general principles of state law, in reviewing and approving advisory contracts; the requirements of the 1940 Act in such matters; the fiduciary duty of investment advisors with respect to advisory agreements and compensation; the standards used by courts in determining whether investment company boards have fulfilled their duties; and the factors to be considered by the Board in voting on such agreements. At meetings held on April 16, 2024, April 25, 2024 and June 2–3, 2024, the Board, including the Independent Trustees, reviewed materials provided by the Advisor responding to requests for information from counsel to the Independent Trustees, submitted on behalf of the Independent Trustees, that, among other things, outlined: the services provided by the Advisor to each Fund (including the relevant personnel responsible for these services and their experience); the unitary fee rate schedule payable by each Fund as compared to fees charged to a peer group of funds (the “Expense Group”) and a broad peer universe of funds (the “Expense Universe”), each assembled by Broadridge Financial Solutions, Inc. (“Broadridge”), an independent source, and as compared to fees charged to other clients of the Advisor, including other exchange-traded funds (“ETFs”) managed by the Advisor; the expense ratio of each Fund as compared to expense ratios of the funds in the Fund’s Expense Group and Expense Universe; performance information for each Fund, including comparisons of each Fund’s performance to that of one or more relevant benchmark indexes and to that of a performance group of funds and a broad performance universe of funds (the “Performance Universe”), each assembled by Broadridge; the nature of expenses incurred in providing services to each Fund and the potential for the Advisor to realize economies of scale, if any; profitability and other financial data for the Advisor; any indirect benefits to the Advisor and its affiliate, First Trust Portfolios L.P. (“FTP”); and information on the Advisor’s compliance program. The Board reviewed initial materials with the Advisor at the meeting held on April 25, 2024, prior to which the Independent Trustees and their counsel met separately to discuss the information provided by the Advisor. Following the April 25, 2024 meeting, counsel to the Independent Trustees, on behalf of the Independent Trustees, requested certain clarifications and supplements to the materials provided, and the information provided in response to those requests was considered at an executive session of the Independent Trustees and their counsel held prior to the June 2–3, 2024 meeting, as well as at the June meeting. The Board applied its business judgment to determine whether the arrangement between the Trust and the Advisor continues to be a reasonable business arrangement from each Fund’s perspective. The Board determined that, given the totality of the information provided with respect to the Agreements, the Board had
Other Information (Continued)
First Trust Exchange-Traded Fund VIIIAugust 31, 2024 (Unaudited) received sufficient information to renew the Agreements. The Board considered that shareholders chose to invest or remain invested in a Fund knowing that the Advisor manages the Fund and knowing the Fund’s unitary fee.
In reviewing the applicable Agreement for each Fund, the Board considered the nature, extent and quality of the services provided by the Advisor under the applicable Agreement. The Board considered that the Advisor is responsible for the overall management and administration of the Trust and each Fund and reviewed all of the services provided by the Advisor to the Funds, as well as the background and experience of the persons responsible for such services. The Board noted that each Fund is an actively-managed ETF. For AFLG, AFMC, AFSM and LDSF, the Board noted that the Advisor’s Investment Committee is responsible for the day-to-day management of each Fund’s investments. The Board considered the background and experience of the members of the Investment Committee. For FCEF and MFLX, the Board noted that the Advisor’s CEF Management Team is responsible for the day-to-day management of FCEF’s investments and the Advisor’s Municipal Securities Team is responsible for the day-to-day management of MFLX’s investments, with a sleeve managed by the CEF Management Team. The Board considered the background and experience of the members of the CEF Management Team and the Municipal Securities Team and noted the Board’s prior meetings with members of the CEF Management Team and the Municipal Securities Team. The Board considered the Advisor’s statement that it applies the same oversight model internally with its CEF Management Team and Municipal Securities Team as it uses for overseeing external sub-advisors, including portfolio risk monitoring and performance review. In reviewing the services provided, the Board noted the compliance program that had been developed by the Advisor and considered that it includes a robust program for monitoring the Advisor’s and each Fund’s compliance with the 1940 Act, as well as each Fund’s compliance with its investment objective(s), policies and restrictions. The Board also considered a report from the Advisor with respect to its risk management functions related to the operation of the Funds. Finally, as part of the Board’s consideration of the Advisor’s services, the Advisor, in its written materials and at the April 25, 2024 meeting, described to the Board the scope of its ongoing investment in additional personnel and infrastructure to maintain and improve the quality of services provided to the Funds and the other funds in the First Trust Fund Complex. In addition to the written materials provided by the Advisor, at the April 25, 2024 meeting, the Board also received a presentation from representatives of the Advisor’s Investment Committee, who discussed the services the Investment Committee provides to AFLG, AFMC, AFSM and LDSF, including the Investment Committee’s day-to-day management of the Funds’ investments. In light of the information presented and the considerations made, the Board concluded that the nature, extent and quality of the services provided to the Trust and each Fund by the Advisor under the Agreements have been and are expected to remain satisfactory and that the Advisor has managed each Fund consistent with its investment objective(s), policies and restrictions.
The Board considered the unitary fee rate schedule payable by each Fund under the applicable Agreement for the services provided. The Board considered that as part of the unitary fee the Advisor is responsible for each Fund’s expenses, including the cost of transfer agency, custody, fund administration, legal, audit and other services and license fees, if any, but excluding the fee payment under the applicable Agreement and interest, taxes, acquired fund fees and expenses, brokerage commissions and other expenses connected with the execution of portfolio transactions, distribution and service fees pursuant to a Rule 12b-1 plan, if any, and extraordinary expenses, if any. For MFLX, FCEF and LDSF, the Board noted that, because each Fund invests in underlying funds, including, for LDSF, ETFs in the First Trust Fund Complex, the Fund incurs acquired fund fees and expenses, which are not payable out of the unitary fee, and that such acquired fund fees and expenses will change over time as assets are reallocated among the underlying funds. The Board considered that, to the extent FCEF invests in underlying funds that are other funds in the First Trust Fund Complex, the Advisor has agreed to offset the unitary fee paid by FCEF related to FCEF’s assets invested in the affiliated underlying funds. The Board received and reviewed information showing the fee rates and expense ratios of the peer funds in the Expense Groups, as well as advisory and unitary fee rates charged by the Advisor to other fund (including ETFs) and non-fund clients, as applicable. Because each Fund pays a unitary fee, the Board determined that expense ratios were the most relevant comparative data point. Based on the information provided, the Board noted that the total (net) expense ratio for each of AFLG, AFMC and MFLX was above the median total (net) expense ratio of the peer funds in its respective Expense Group and that the total (net) expense ratio for AFSM was equal to the median total (net) expense ratio of the peer funds in its Expense Group. The Board noted that the total (net) expense ratio (excluding acquired fund fees and expenses) for FCEF was above the median total (net) expense ratio (excluding acquired fund fees and expenses) of the peer funds in its Expense Group. The Board also noted that the total (net) expense ratio (including acquired fund fees and expenses) for FCEF was above the median total (net) expense ratio (including acquired fund fees and expenses) of the peer funds in its Expense Group. The Board noted that the total (net) expense ratio (excluding acquired fund fees and expenses) for LDSF was below the median total (net) expense ratio (excluding acquired fund fees and expenses) of the peer funds in its Expense Group. The Board also noted that the total (net) expense ratio (including acquired fund fees and expenses) for LDSF was equal to the median total (net) expense ratio (including acquired fund fees and expenses) of the peer funds in its Expense Group. With respect to the Expense Groups, the Board discussed with Broadridge its methodology for assembling peer groups and discussed with the Advisor limitations in creating peer groups for actively-managed ETFs, including that the Expense Group for FCEF contained both actively-managed
Other Information (Continued)
First Trust Exchange-Traded Fund VIIIAugust 31, 2024 (Unaudited) ETFs and open-end mutual funds, and different business models that may affect the pricing of services among ETF sponsors. The Board took these limitations and differences into account in considering the peer data. With respect to fees charged to other non-ETF clients, the Board considered differences between the Funds and other non-ETF clients that limited their comparability. In considering the unitary fee rate schedules overall, the Board also considered the Advisor’s statement that it seeks to meet investor needs through innovative and value-added investment solutions and the Advisor’s demonstrated long-term commitment to each Fund and the other funds in the First Trust Fund Complex.
The Board considered performance information for each Fund. The Board noted the process it has established for monitoring each Fund’s performance and portfolio risk on an ongoing basis, which includes quarterly performance reporting from the Advisor for the Funds. The Board determined that this process continues to be effective for reviewing each Fund’s performance. The Board received and reviewed information comparing each Fund’s performance for periods ended December 31, 2023 to the performance of the funds in its Performance Universe and to that of a benchmark index. With respect to MFLX, the Board noted that on April 14, 2022, the Fund’s investment strategy changed from a fund-of-funds investment strategy primarily invested in municipal closed-end funds to an investment strategy primarily invested directly in municipal debt securities. With respect to FCEF, the Board noted that on April 8, 2022, the Fund’s investment strategy changed to allow the Fund to invest in ETFs in addition to closed-end funds. Based on the information provided, the Board noted that AFLG underperformed its Performance Universe median and benchmark index for the one-year period ended December 31, 2023 and outperformed its Performance Universe median and underperformed its benchmark index for the three-year period ended December 31, 2023. The Board noted that AFMC outperformed its Performance Universe median and benchmark index for the one- and three-year periods ended December 31, 2023. The Board noted that AFSM outperformed its Performance Universe median and benchmark index for the one- and three-year periods ended December 31, 2023. The Board noted that MFLX outperformed its Performance Universe median and underperformed its benchmark index for the one-year period ended December 31, 2023, underperformed its Performance Universe median and benchmark index for the three-year period ended December 31, 2023 and outperformed its Performance Universe median and benchmark index for the five-year period ended December 31, 2023. The Board noted that FCEF underperformed its Performance Universe median and benchmark index for the one- three- and five-year periods ended December 31, 2023. The Board noted that LDSF outperformed its Performance Universe median and benchmark index for the one-year period ended December 31, 2023 and underperformed its Performance Universe median and outperformed its benchmark index for the three-year period ended December 31, 2023. The Board noted the Advisor’s discussion of FCEF’s performance at the April 25, 2024 meeting. The Board also noted the Investment Committee’s discussion of AFLG’s, AFMC’s, AFSM’s, and LDSF’s performance at the April 25, 2024 meeting.
On the basis of all the information provided on the unitary fee and performance of each Fund and the ongoing oversight by the Board, the Board concluded that the unitary fee for each Fund continues to be reasonable and appropriate in light of the nature, extent and quality of the services provided by the Advisor to each Fund under the Agreements.
The Board considered information and discussed with the Advisor whether there were any economies of scale in connection with providing advisory services to the Funds at current asset levels and whether the Funds may benefit from any economies of scale. The Board noted that the unitary fee rate schedule for each Fund includes breakpoints pursuant to which the unitary fee rate will be reduced as assets of the Fund meet certain thresholds. The Board considered the Advisor’s statement that it believes that its expenses relating to providing advisory services to the Funds will increase during the next twelve months as the Advisor continues to build infrastructure and add new staff. The Board also noted that under the unitary fee structure, any reduction in expenses associated with the management and operations of the Funds would benefit the Advisor, but that the unitary fee structure provides a level of certainty in expenses for shareholders of the Funds. The Board concluded that the unitary fee rate schedule for each Fund reflects an appropriate level of sharing of any economies of scale that may be realized in the management of the Fund at current asset levels. The Board considered the revenues and allocated costs (including the allocation methodology) of the Advisor in serving as investment advisor to each Fund for the twelve months ended December 31, 2023 and the estimated profitability level for each Fund calculated by the Advisor based on such data, as well as complex-wide and product-line profitability data, for the same period. The Board noted the inherent limitations in the profitability analysis and concluded that, based on the information provided, the Advisor’s profitability level for each Fund was not unreasonable. In addition, the Board considered indirect benefits described by the Advisor that may be realized from its relationship with the Funds. The Board considered that the Advisor had identified as an indirect benefit to the Advisor and FTP their exposure to investors and brokers who, absent their exposure to the Funds, may have had no dealings with the Advisor or FTP, and noted that the Advisor does not utilize soft dollars in connection with the Funds. The Board concluded that the character and amount of potential indirect benefits to the Advisor were not unreasonable.
Other Information (Continued)
First Trust Exchange-Traded Fund VIIIAugust 31, 2024 (Unaudited) Based on all of the information considered and the conclusions reached, the Board, including the Independent Trustees, unanimously determined that the terms of the Agreements continue to be fair and reasonable and that the continuation of the Agreements is in the best interests of each Fund. No single factor was determinative in the Board’s analysis.
For the taxable year ended August 31, 2024, the following percentages of income dividends paid by the Funds qualify for the dividends received deduction available to corporations:
| Dividends Received
Deduction |
First Trust Income Opportunities ETF | |
First Trust Flexible Municipal High Income ETF | |
First Trust Low Duration Strategic Focus ETF | |
First Trust Active Factor Large Cap ETF | |
First Trust Active Factor Mid Cap ETF | |
First Trust Active Factor Small Cap ETF | |
| The actual percentage of income dividends that qualify for the dividends received deduction will be available to corporate shareholders shortly after the calendar year end. |
For the taxable year ended August 31, 2024, the following percentages of income dividends paid by the Funds are hereby designated as qualified dividend income:
| |
First Trust Income Opportunities ETF | |
First Trust Flexible Municipal High Income ETF | |
First Trust Low Duration Strategic Focus ETF | |
First Trust Active Factor Large Cap ETF | |
First Trust Active Factor Mid Cap ETF | |
First Trust Active Factor Small Cap ETF | |
| The actual qualified dividend income distributions will be reported to shareholders on Form 1099-DIV which will be sent to shareholders shortly after the calendar year end. |
A portion of each of the Funds’ 2024 ordinary dividends (including short-term capital gains) paid to its shareholders during the fiscal year ended August 31, 2024, may be eligible for the Qualified Business Income (QBI) Deduction under the Internal Revenue Code of 1986, as amended (the “Code”), Section 199A for the aggregate dividends each Fund received from the underlying Real Estate Investment Trusts (REITs) these Funds invest in.
Distributions paid to foreign shareholders for the taxable year ended August 31, 2024 that were properly designated by First Trust Income Opportunities ETF as “interest-related dividends” or “short-term capital gain dividends,” may not be subject to federal income tax provided that the income was earned directly by such foreign shareholders.
For the taxable year ended August 31, 2024, the following distribution information is being provided as required by the Code, or to meet a specific state’s requirement. The First Trust Flexible Municipal High Income ETF designates the following amounts or, if subsequently determined to be different, the maximum amount allowable for its fiscal year ended August 31, 2024:
Federal and State Income Tax | |
Tax-Exempt Interest Dividends | |
Alternative Minimum Tax (AMT) | |
For the fiscal year ended August 31, 2024, the amount of long-term capital gain distributions designated by First Trust Income Opportunities ETF was $69,814, which is taxable at the applicable capital gain tax rates for federal income tax purposes.
Annual Financial
Statements and
Other Information |
For the Year Ended
August 31, 2024 |
First Trust Exchange-Traded Fund VIII
First Trust Innovation Leaders ETF (ILDR) |
First Trust Expanded Technology ETF (XPND) |
First Trust Multi-Strategy Alternative ETF (LALT) |
First Trust Exchange-Traded Fund VIII
Annual Financial Statements and Other Information
August 31, 2024
Performance and Risk Disclosure
There is no assurance that any series of First Trust Exchange-Traded Fund VIII (the “Trust”) described in this report (each such series is referred to as a “Fund” and collectively, as the “Funds”) will achieve its investment objective. Each Fund is subject to market risk, which is the possibility that the market values of securities owned by the Fund will decline and that the value of the Fund’s shares may therefore be less than what you paid for them. Accordingly, you can lose money by investing in a Fund.
Performance data quoted represents past performance, which is no guarantee of future results, and current performance may be lower or higher than the figures shown. For the most recent month-end performance figures, please visit www.ftportfolios.com or speak with your financial advisor. Investment returns, net asset value and share price will fluctuate and Fund shares, when sold, may be worth more or less than their original cost.
First Trust Advisors L.P., the Funds’ advisor, may also periodically provide additional information on Fund performance on each Fund’s webpage at www.ftportfolios.com.
This report contains information that may help you evaluate your investment. It includes details about each Fund and presents data that provides insight into each Fund’s performance and investment approach.
The material risks of investing in each Fund are spelled out in its prospectus, statement of additional information, and other Fund regulatory filings.
First Trust Innovation Leaders ETF (ILDR)Portfolio of InvestmentsAugust 31, 2024
| | |
COMMON STOCKS (a) — 99.1% |
| Aerospace & Defense — 2.3% | |
| | |
| L3Harris Technologies, Inc. | |
| | |
| | |
| | |
| Amicus Therapeutics, Inc. (b) | |
| Arcus Biosciences, Inc. (b) | |
| BioMarin Pharmaceutical, Inc. (b) | |
| Halozyme Therapeutics, Inc. (b) | |
| Mirum Pharmaceuticals, Inc. (b) | |
| Neurocrine Biosciences, Inc. (b) | |
| Regeneron Pharmaceuticals, Inc. (b) | |
| Replimune Group, Inc. (b) | |
| SpringWorks Therapeutics, Inc. (b) | |
| Vertex Pharmaceuticals, Inc. (b) | |
| | |
| | |
| | |
| | |
| Tradeweb Markets, Inc., Class A | |
| | |
| Arista Networks, Inc. (b) | |
| Electrical Equipment — 1.0% | |
| Schneider Electric SE (EUR) | |
| Electronic Equipment, Instruments & Components | |
| | |
| | |
| | |
| Financial Services — 4.7% | |
| Adyen N.V. (EUR) (b) (c) (d) | |
| | |
| | |
| | |
| | |
| | |
| Grab Holdings Ltd., Class A (b) | |
| Uber Technologies, Inc. (b) | |
| | |
| | |
| Intuitive Surgical, Inc. (b) | |
| Hotels, Restaurants & Leisure | |
| Airbnb, Inc., Class A (b) | |
| Sweetgreen, Inc., Class A (b) | |
| | |
| | |
|
| Industrial Conglomerates — | |
| | |
| Interactive Media & Services | |
| | |
| Meta Platforms, Inc., Class A | |
| | |
| | |
| Akamai Technologies, Inc. (b) | |
| | |
| Shopify, Inc., Class A (b) | |
| | |
| Life Sciences Tools & Services | |
| | |
| Thermo Fisher Scientific, Inc. | |
| | |
| | |
| Chart Industries, Inc. (b) | |
| | |
| Trade Desk (The), Inc., Class A (b) | |
| | |
| Avadel Pharmaceuticals PLC (b) | |
| | |
| | |
| | |
| Professional Services — 1.2% | |
| Paylocity Holding Corp. (b) | |
| Semiconductors & Semiconductor Equipment | |
| | |
| | |
| | |
| | |
| | |
| | |
| | |
| | |
| | |
| | |
| CyberArk Software Ltd. (b) | |
| Datadog, Inc., Class A (b) | |
| | |
| Gitlab, Inc., Class A (b) | |
| | |
| | |
| Palantir Technologies, Inc., Class A (b) | |
| Palo Alto Networks, Inc. (b) | |
| | |
| Workday, Inc., Class A (b) | |
| | |
| | |
See Notes to Financial Statements
First Trust Innovation Leaders ETF (ILDR)Portfolio of Investments (Continued)August 31, 2024 | | |
COMMON STOCKS (a) (Continued) |
| Technology Hardware, Storage | |
| Pure Storage, Inc., Class A (b) | |
| | |
| | |
MONEY MARKET FUNDS — 0.9% |
| Morgan Stanley Institutional Liquidity Funds - Treasury Portfolio - Institutional Class - 5.12% (e) | |
| | |
|
|
| Total Investments — 100.0% | |
| | |
| Net Other Assets and Liabilities — (0.0)% | |
| | |
| Securities are issued in U.S. dollars unless otherwise indicated in the security description. |
| Non-income producing security. |
| This security is exempt from registration upon resale under Rule 144A of the Securities Act of 1933, as amended (the “1933 Act”) and may be resold in transactions exempt from registration, normally to qualified institutional buyers. This security is not restricted on the foreign exchange where it trades freely without any additional registration. |
| This security may be resold to qualified foreign investors and foreign institutional buyers under Regulation S of the 1933 Act. |
| Rate shown reflects yield as of August 31, 2024. |
Abbreviations throughout the Portfolio of Investments: |
| |
Valuation InputsA summary of the inputs used to value the Fund’s investments as of August 31, 2024 is as follows (see Note 2A - Portfolio Valuation in the Notes to Financial Statements):
| | | Level 2
Significant
Observable
Inputs | Level 3
Significant
Unobservable
Inputs |
| | | | |
| | | | |
| | | | |
| See Portfolio of Investments for industry breakout. |
See Notes to Financial Statements
First Trust Expanded Technology ETF (XPND)Portfolio of InvestmentsAugust 31, 2024
| | |
|
| | |
| Arista Networks, Inc. (a) | |
| | |
| | |
| Electronic Equipment, Instruments & Components | |
| | |
| | |
| | |
| Teledyne Technologies, Inc. (a) | |
| | |
| | |
| | |
| Warner Music Group Corp., Class A | |
| | |
| Financial Services — 13.0% | |
| | |
| | |
| Mastercard, Inc., Class A | |
| PayPal Holdings, Inc. (a) | |
| | |
| | |
| Interactive Media & Services | |
| | |
| Meta Platforms, Inc., Class A | |
| | |
| | |
| | |
| International Business Machines Corp. | |
| | |
| | |
| | |
| | |
| | |
| Semiconductors & Semiconductor Equipment | |
| | |
| | |
| | |
| | |
| | |
| | |
| | |
| Microchip Technology, Inc. | |
| | |
|
| Semiconductors & Semiconductor Equipment (Continued) | |
| Monolithic Power Systems, Inc. | |
| | |
| | |
| | |
| | |
| | |
| AppLovin Corp., Class A (a) | |
| Aspen Technology, Inc. (a) | |
| | |
| Bentley Systems, Inc., Class B | |
| Cadence Design Systems, Inc. (a) | |
| Crowdstrike Holdings, Inc., Class A (a) | |
| | |
| | |
| Manhattan Associates, Inc. (a) | |
| | |
| | |
| Palo Alto Networks, Inc. (a) | |
| | |
| | |
| Workday, Inc., Class A (a) | |
| | |
| Technology Hardware, Storage | |
| | |
| | |
| Pure Storage, Inc., Class A (a) | |
| | |
| Wireless Telecommunication | |
| | |
| | |
| | |
MONEY MARKET FUNDS — 0.3% |
| Morgan Stanley Institutional Liquidity Funds - Treasury Portfolio - Institutional Class - 5.12% (b) | |
| | |
|
|
| Total Investments — 100.0% | |
| | |
| Net Other Assets and Liabilities — 0.0% | |
| | |
See Notes to Financial Statements
First Trust Expanded Technology ETF (XPND)Portfolio of Investments (Continued)August 31, 2024 | Non-income producing security. |
| Rate shown reflects yield as of August 31, 2024. |
Valuation InputsA summary of the inputs used to value the Fund’s investments as of August 31, 2024 is as follows (see Note 2A - Portfolio Valuation in the Notes to Financial Statements):
| | | Level 2
Significant
Observable
Inputs | Level 3
Significant
Unobservable
Inputs |
| | | | |
| | | | |
| | | | |
| See Portfolio of Investments for industry breakout. |
See Notes to Financial Statements
First Trust Multi-Strategy Alternative ETF (LALT)Portfolio of InvestmentsAugust 31, 2024
| | |
EXCHANGE-TRADED FUNDS — 99.9% |
| | |
| First Trust Alternative Absolute Return Strategy ETF (a) | |
| First Trust Global Tactical Commodity Strategy Fund (a) | |
| First Trust Long/Short Equity ETF (a) | |
| First Trust Managed Futures Strategy Fund (a) | |
| First Trust Merger Arbitrage ETF (a) | |
| First Trust TCW Unconstrained Plus Bond ETF (a) | |
| iShares 7-10 Year Treasury Bond ETF | |
| | |
|
|
| Total Investments — 99.9% | |
| | |
| Net Other Assets and Liabilities — 0.1% | |
| | |
| Investment in an affiliated fund. |
| Non-income producing security. |
Valuation InputsA summary of the inputs used to value the Fund’s investments as of August 31, 2024 is as follows (see Note 2A - Portfolio Valuation in the Notes to Financial Statements):
| | | Level 2
Significant
Observable
Inputs | Level 3
Significant
Unobservable
Inputs |
| | | | |
| See Portfolio of Investments for industry breakout. |
See Notes to Financial Statements
First Trust Exchange-Traded Fund VIIIStatements of Assets and Liabilities
August 31, 2024
| First Trust Innovation Leaders ETF
(ILDR) | First Trust Expanded Technology ETF
(XPND) | First Trust Multi-Strategy Alternative ETF
(LALT) |
| | | |
Investments, at value - Unaffiliated | | | |
Investments, at value - Affiliated | | | |
Total investments, at value | | | |
| | | |
| | | |
| | | |
| | | |
| | | |
|
| | | |
Investment advisory fees payable | | | |
| | | |
| | | |
|
| | | |
| | | |
| | | |
Accumulated distributable earnings (loss) | | | |
| | | |
NET ASSET VALUE, per share | | | |
Number of shares outstanding (unlimited number of shares authorized, par value $0.01 per share) | | | |
Investments, at cost - Unaffiliated | | | |
Investments, at cost - Affiliated | | | |
Total investments, at cost | | | |
See Notes to Financial Statements
First Trust Exchange-Traded Fund VIIIStatements of Operations
For the Year Ended August 31, 2024
| First Trust Innovation Leaders ETF
(ILDR) | First Trust Expanded Technology ETF
(XPND) | First Trust Multi-Strategy Alternative ETF
(LALT) |
| | | |
| | | |
| | | |
| | | |
| | | |
|
| | | |
| | | |
| | | |
NET INVESTMENT INCOME (LOSS) | | | |
|
NET REALIZED AND UNREALIZED GAIN (LOSS): | | | |
Net realized gain (loss) on: | | | |
Investments - Unaffiliated | | | |
| | | |
In-kind redemptions - Unaffiliated | | | |
Foreign currency transactions | | | |
| | | |
Net change in unrealized appreciation (depreciation) on: | | | |
Investments - Unaffiliated | | | |
| | | |
Foreign currency translation | | | |
Net change in unrealized appreciation (depreciation) | | | |
NET REALIZED AND UNREALIZED GAIN (LOSS) | | | |
NET INCREASE (DECREASE) IN NET ASSETS RESULTING FROM OPERATIONS | | | |
See Notes to Financial Statements
First Trust Exchange-Traded Fund VIIIStatements of Changes in Net Assets
| First Trust Innovation Leaders ETF (ILDR) | First Trust Expanded Technology ETF (XPND) |
| | | | |
| | | | |
Net investment income (loss) | | | | |
| | | | |
Net change in unrealized appreciation (depreciation) | | | | |
Net increase (decrease) in net assets resulting from operations | | | | |
|
DISTRIBUTIONS TO SHAREHOLDERS FROM: | | | | |
| | | | |
|
SHAREHOLDER TRANSACTIONS: | | | | |
Proceeds from shares sold | | | | |
| | | | |
Net increase (decrease) in net assets resulting from shareholder transactions | | | | |
Total increase (decrease) in net assets | | | | |
|
| | | | |
| | | | |
| | | | |
|
CHANGES IN SHARES OUTSTANDING: | | | | |
Shares outstanding, beginning of period | | | | |
| | | | |
| | | | |
Shares outstanding, end of period | | | | |
| Inception date is January 31, 2023, which is consistent with the commencement of investment operations and is the date the initial creation units were established. |
See Notes to Financial Statements
First Trust Multi-Strategy Alternative ETF (LALT) |
| |
| |
| |
| |
| |
| |
|
| |
| |
|
| |
| |
| |
| |
| |
|
| |
| |
| |
|
| |
| |
| |
| |
| |
See Notes to Financial Statements
First Trust Exchange-Traded Fund VIIIFinancial Highlights
For a share outstanding throughout each period First Trust Innovation Leaders ETF (ILDR)
| | Period
Ended
8/31/2021 (a) |
| | | |
Net asset value, beginning of period | | | | |
Income from investment operations: | | | | |
Net investment income (loss) | | | | |
Net realized and unrealized gain (loss) | | | | |
Total from investment operations | | | | |
Distributions paid to shareholders from: | | | | |
| | | | |
| | | | |
| | | | |
Net asset value, end of period | | | | |
| | | | |
|
Ratios to average net assets/supplemental data: | | | | |
Net assets, end of period (in 000’s) | | | | |
Ratio of total expenses to average net assets | | | | |
Ratio of net investment income (loss) to average net assets | | | | |
Portfolio turnover rate (g) | | | | |
| Inception date is May 25, 2021, which is consistent with the commencement of investment operations and is the date the initial creation units were established. |
| Based on average shares outstanding. |
| Amount represents less than $0.01. |
| Total return is calculated assuming an initial investment made at the net asset value at the beginning of the period, reinvestment of all distributions at net asset value during the period, and redemption at net asset value on the last day of the period. The returns presented do not reflect the deduction of taxes that a shareholder would pay on Fund distributions or the redemption or sale of Fund shares. Total return is calculated for the time period presented and is not annualized for periods of less than a year. |
| Ratio of total expenses to average net assets and ratio of net investment income (loss) to average net assets do not reflect the Fund’s proportionate share of expenses and income of underlying investment companies in which the Fund invests. |
| |
| Portfolio turnover is calculated for the time period presented and is not annualized for periods of less than a year and does not include securities received or delivered from processing creations or redemptions and in-kind transactions. |
See Notes to Financial Statements
First Trust Exchange-Traded Fund VIIIFinancial Highlights (Continued)
For a share outstanding throughout each period First Trust Expanded Technology ETF (XPND)
| | Period
Ended
8/31/2021 (a) |
| | | |
Net asset value, beginning of period | | | | |
Income from investment operations: | | | | |
Net investment income (loss) | | | | |
Net realized and unrealized gain (loss) | | | | |
Total from investment operations | | | | |
Distributions paid to shareholders from: | | | | |
| | | | |
Net asset value, end of period | | | | |
| | | | |
|
Ratios to average net assets/supplemental data: | | | | |
Net assets, end of period (in 000’s) | | | | |
Ratio of total expenses to average net assets | | | | |
Ratio of net investment income (loss) to average net assets | | | | |
Portfolio turnover rate (f) | | | | |
| Inception date is June 14, 2021, which is consistent with the commencement of investment operations and is the date the initial creation units were established. |
| Based on average shares outstanding. |
| Amount represents less than $0.01. |
| Total return is calculated assuming an initial investment made at the net asset value at the beginning of the period, reinvestment of all distributions at net asset value during the period, and redemption at net asset value on the last day of the period. The returns presented do not reflect the deduction of taxes that a shareholder would pay on Fund distributions or the redemption or sale of Fund shares. Total return is calculated for the time period presented and is not annualized for periods of less than a year. |
| |
| Portfolio turnover is calculated for the time period presented and is not annualized for periods of less than a year and does not include securities received or delivered from processing creations or redemptions and in-kind transactions. |
See Notes to Financial Statements
First Trust Exchange-Traded Fund VIIIFinancial Highlights (Continued)
For a share outstanding throughout each period First Trust Multi-Strategy Alternative ETF (LALT)
| | |
|
Net asset value, beginning of period | | |
Income from investment operations: | | |
Net investment income (loss) (b) | | |
Net realized and unrealized gain (loss) | | |
Total from investment operations | | |
Distributions paid to shareholders from: | | |
| | |
Net asset value, end of period | | |
| | |
|
Ratios to average net assets/supplemental data: | | |
Net assets, end of period (in 000’s) | | |
Ratio of total expenses to average net assets (d) | | |
Ratio of net investment income (loss) to average net assets (d) | | |
Portfolio turnover rate (f) | | |
| Inception date is January 31, 2023, which is consistent with the commencement of investment operations and is the date the initial creation units were established. |
| Based on average shares outstanding. |
| Total return is calculated assuming an initial investment made at the net asset value at the beginning of the period, reinvestment of all distributions at net asset value during the period, and redemption at net asset value on the last day of the period. The returns presented do not reflect the deduction of taxes that a shareholder would pay on Fund distributions or the redemption or sale of Fund shares. Total return is calculated for the time period presented and is not annualized for periods of less than a year. |
| Ratio of total expenses to average net assets and ratio of net investment income (loss) to average net assets do not reflect the Fund’s proportionate share of expenses and income of underlying investment companies in which the Fund invests. |
| |
| Portfolio turnover is calculated for the time period presented and is not annualized for periods of less than a year and does not include securities received or delivered from processing creations or redemptions and in-kind transactions. |
See Notes to Financial Statements
Notes to Financial Statements
First Trust Exchange-Traded Fund VIIIAugust 31, 2024 1. Organization
First Trust Exchange-Traded Fund VIII (the “Trust”) is an open-end management investment company organized as a Massachusetts business trust on February 22, 2016, and is registered with the Securities and Exchange Commission under the Investment Company Act of 1940, as amended (the “1940 Act”).
This report covers the three funds (each a “Fund” and collectively, the “Funds”), each a non-diversified series of the Trust, listed below. The shares of each Fund are listed and traded on the NYSE Arca, Inc.
First Trust Innovation Leaders ETF – (ticker “ILDR”) |
First Trust Expanded Technology ETF – (ticker “XPND”) |
First Trust Multi-Strategy Alternative ETF – (ticker “LALT”) |
Each Fund represents a separate series of shares of beneficial interest in the Trust. Unlike conventional mutual funds, each Fund issues and redeems shares on a continuous basis, at net asset value (“NAV”), only in large blocks of shares known as “Creation Units.”
Each Fund is an actively managed exchange-traded fund. ILDR’s investment objective seeks to provide capital appreciation. XPND’s investment objective seeks to provide long-term capital appreciation. LALT’s investment objective is long-term total return.
Under normal market conditions, ILDR will invest at least 80% of its net assets (plus any borrowings for investment purposes) in common stock and depository receipts issued by U.S. and non-U.S. companies that may benefit from the development or application of scientific and technological innovation.
Under normal market conditions, XPND will invest at least 80% of its net assets (plus any borrowings for investment purposes) in the common stocks of companies identified by the Fund’s investment advisor as either information technology companies or financial companies and communication services companies whose operations are principally derived from and/or dependent upon technology.
Under normal market conditions, LALT allocates its assets amongst a variety of alternative asset categories and strategies in an effort to provide lower correlation and diversifying risk exposures compared to traditional equity and fixed income benchmarks (e.g., the S&P 500® Index or Bloomberg Aggregate Bond Index) over various market cycles.
There can be no assurance that a Fund will achieve its investment objective. The Funds may not be appropriate for all investors.
2. Significant Accounting Policies
The Funds are each considered an investment company and follow accounting and reporting guidance under Financial Accounting Standards Board Accounting Standards Codification Topic 946, “Financial Services-Investment Companies.” The following is a summary of significant accounting policies consistently followed by the Funds in the preparation of the financial statements. The preparation of the financial statements in accordance with accounting principles generally accepted in the United States of America (“U.S. GAAP”) requires management to make estimates and assumptions that affect the reported amounts and disclosures in the financial statements. Actual results could differ from those estimates.
Each Fund’s NAV is determined daily as of the close of regular trading on the New York Stock Exchange (“NYSE”), normally 4:00 p.m. Eastern time, on each day the NYSE is open for trading. If the NYSE closes early on a valuation day, the NAV is determined as of that time. Foreign securities are priced using data reflecting the earlier closing of the principal markets for those securities. Each Fund’s NAV is calculated by dividing the value of all assets of each Fund (including accrued interest and dividends), less all liabilities (including accrued expenses and dividends declared but unpaid), by the total number of shares outstanding.
Each Fund’s investments are valued daily at market value or, in the absence of market value with respect to any portfolio securities, at fair value. Market value prices represent readily available market quotations such as last sale or official closing prices from a national or foreign exchange (i.e., a regulated market) and are primarily obtained from third-party pricing services. Fair value prices represent any prices not considered market value prices and are either obtained from a third-party pricing service or are determined by the Pricing Committee of the Funds’ investment advisor, First Trust Advisors L.P. (“First Trust” or the “Advisor”), in accordance with valuation procedures approved by the Trust’s Board of Trustees, and in accordance with provisions of the 1940 Act and rules thereunder. Investments valued by the Advisor’s Pricing Committee, if any, are footnoted as such in the footnotes to the Portfolio of Investments. Each Fund’s investments are valued as follows:
Notes to Financial Statements (Continued)
First Trust Exchange-Traded Fund VIIIAugust 31, 2024 Common stocks, exchange-traded funds and other equity securities listed on any national or foreign exchange (excluding Nasdaq, Inc. (“Nasdaq”) and the London Stock Exchange Alternative Investment Market (“AIM”)) are valued at the last sale price on the exchange on which they are principally traded or, for Nasdaq and AIM securities, the official closing price. Securities traded on more than one securities exchange are valued at the last sale price or official closing price, as applicable, at the close of the securities exchange representing the primary exchange for such securities.
Securities trading on foreign exchanges or over-the-counter markets that close prior to the NYSE close may be valued using a systematic fair valuation model provided by a third-party pricing service. If these foreign securities meet certain criteria in relation to the valuation model, their valuation is systematically adjusted to reflect the impact of movement in the U.S. market after the close of the foreign markets.
Equity securities traded in an over-the-counter market are valued at the close price or the last trade price.
Shares of open-end funds are valued based on NAV per share.
Certain securities may not be able to be priced by pre-established pricing methods. Such securities may be valued by the Advisor’s Pricing Committee at fair value. These securities generally include, but are not limited to, restricted securities (securities which may not be publicly sold without registration under the Securities Act of 1933, as amended) for which a third-party pricing service is unable to provide a market price; securities whose trading has been formally suspended; a security whose market or fair value price is not available from a pre-established pricing source; a security with respect to which an event has occurred that is likely to materially affect the value of the security after the market has closed but before the calculation of a Fund’s NAV or make it difficult or impossible to obtain a reliable market quotation; and a security whose price, as provided by the third-party pricing service, does not reflect the security’s fair value. As a general principle, the current fair value of a security would appear to be the amount which the owner might reasonably expect to receive for the security upon its current sale. When fair value prices are used, generally they will differ from market quotations or official closing prices on the applicable exchanges. A variety of factors may be considered in determining the fair value of such securities, including, but not limited to, the following:
1)
the last sale price on the exchange on which they are principally traded or, for Nasdaq and AIM securities, the official closing price;
3)
the size of the holding;
4)
the initial cost of the security;
5)
transactions in comparable securities;
6)
price quotes from dealers and/or third-party pricing services;
7)
relationships among various securities;
8)
information obtained by contacting the issuer, analysts, or the appropriate stock exchange;
9)
an analysis of the issuer’s financial statements;
10)
the existence of merger proposals or tender offers that might affect the value of the security; and
11)
other relevant factors.
If the securities in question are foreign securities, the following additional information may be considered:
1)
the last sale price on the exchange on which they are principally traded;
2)
the value of similar foreign securities traded on other foreign markets;
3)
ADR trading of similar securities;
4)
closed-end fund or exchange-traded fund trading of similar securities;
5)
foreign currency exchange activity;
6)
the trading prices of financial products that are tied to baskets of foreign securities;
7)
factors relating to the event that precipitated the pricing problem;
8)
whether the event is likely to recur;
9)
whether the effects of the event are isolated or whether they affect entire markets, countries or regions; and
10)
other relevant factors.
Notes to Financial Statements (Continued)
First Trust Exchange-Traded Fund VIIIAugust 31, 2024 Because foreign markets may be open on different days than the days during which investors may transact in the shares of a Fund, the value of the Fund’s securities may change on the days when investors are not able to transact in the shares of the Fund. The value of the securities denominated in foreign currencies is converted into U.S. dollars using exchange rates determined daily as of the close of regular trading on the NYSE.
The Funds are subject to fair value accounting standards that define fair value, establish the framework for measuring fair value and provide a three-level hierarchy for fair valuation based upon the inputs to the valuation as of the measurement date. The three levels of the fair value hierarchy are as follows:
• Level 1 – Level 1 inputs are quoted prices in active markets for identical investments. An active market is a market in which transactions for the investment occur with sufficient frequency and volume to provide pricing information on an ongoing basis.
• Level 2 – Level 2 inputs are observable inputs, either directly or indirectly, and include the following:
o Quoted prices for similar investments in active markets.
o Quoted prices for identical or similar investments in markets that are non-active. A non-active market is a market where there are few transactions for the investment, the prices are not current, or price quotations vary substantially either over time or among market makers, or in which little information is released publicly.
o Inputs other than quoted prices that are observable for the investment (for example, interest rates and yield curves observable at commonly quoted intervals, volatilities, prepayment speeds, loss severities, credit risks, and default rates).
o Inputs that are derived principally from or corroborated by observable market data by correlation or other means.
• Level 3 – Level 3 inputs are unobservable inputs. Unobservable inputs may reflect the reporting entity’s own assumptions about the assumptions that market participants would use in pricing the investment.
The inputs or methodologies used for valuing investments are not necessarily an indication of the risk associated with investing in those investments. A summary of the inputs used to value each Fund’s investments as of August 31, 2024, is included with each Fund’s Portfolio of Investments.
B. Securities Transactions and Investment Income
Securities transactions are recorded as of the trade date. Realized gains and losses from securities transactions are recorded on the identified cost basis. Dividend income is recorded on the ex-dividend date. Interest income, if any, is recorded on the accrual basis.
Withholding taxes and tax reclaims on foreign dividends have been provided for in accordance with each Fund’s understanding of the applicable country’s tax rules and rates.
The books and records of the Funds are maintained in U.S. dollars. Foreign currencies, investments and other assets and liabilities are translated into U.S. dollars at the exchange rates prevailing at the end of the period. Purchases and sales of investments and items of income and expense are translated on the respective dates of such transactions. Unrealized gains and losses on assets and liabilities, other than investments in securities, which result from changes in foreign currency exchange rates have been included in “Net change in unrealized appreciation (depreciation) on foreign currency translation” on the Statements of Operations. Unrealized gains and losses on investments in securities which result from changes in foreign exchange rates are included with fluctuations arising from changes in market price and are shown in “Net change in unrealized appreciation (depreciation) on investments” on the Statements of Operations. Net realized foreign currency gains and losses include the effect of changes in exchange rates between trade date and settlement date on investment security transactions, foreign currency transactions and interest and dividends received and are included in “Net realized gain (loss) on foreign currency transactions” on the Statements of Operations. The portion of foreign currency gains and losses related to fluctuations in exchange rates between the initial purchase settlement date and subsequent sale trade date is included in “Net realized gain (loss) on investments” on the Statements of Operations.
D. Affiliated Transactions
LALT invests in securities of affiliated funds. Each Fund’s investment performance and risks are directly related to the investment performance and risks of the affiliated funds. The affiliated funds’ financial statements may be found at SEC.gov. Dividend income, if any, realized gains and losses, and change in appreciation (depreciation) from affiliated funds are presented on the Statements of Operations.
Notes to Financial Statements (Continued)
First Trust Exchange-Traded Fund VIIIAugust 31, 2024 Amounts relating to investments in affiliated funds at August 31, 2024, and for the fiscal year then ended are as follows:
| | | | | Change in
Unrealized
Appreciation
(Depreciation) | | | |
First Trust Alternative Absolute Return Strategy ETF | | | | | | | | |
First Trust Global Tactical Commodity Strategy Fund | | | | | | | | |
First Trust Long/Short Equity ETF | | | | | | | | |
First Trust Managed Futures Strategy Fund | | | | | | | | |
First Trust Merger Arbitrage ETF | | | | | | | | |
First Trust TCW Unconstrained Plus Bond ETF | | | | | | | | |
| | | | | | | | |
E. Dividends and Distributions to Shareholders
Dividends from net investment income of each Fund, if any, are declared and paid quarterly, or as the Board of Trustees may determine from time to time. Distributions of net realized capital gains earned by each Fund, if any, are distributed at least annually. Each Fund may also designate a portion of the amount paid to redeeming shareholders as a distribution for tax purposes.
Distributions from net investment income and realized capital gains are determined in accordance with federal income tax regulations, which may differ from U.S. GAAP. Certain capital accounts in the financial statements are periodically adjusted for permanent differences in order to reflect their tax character. These permanent differences are primarily due to the varying treatment of income and gain/loss on portfolio securities held by the Funds and have no impact on net assets or NAV per share. Temporary differences, which arise from recognizing certain items of income, expense and gain/loss in different periods for financial statement and tax purposes, will reverse at some time in the future.
The tax character of distributions paid by each Fund during the fiscal year ended August 31, 2024 was as follows:
| Distributions
paid from
Ordinary
Income | Distributions
paid from
Capital
Gains | Distributions
paid from
Return of
Capital |
First Trust Innovation Leaders ETF | | | |
First Trust Expanded Technology ETF | | | |
First Trust Multi-Strategy Alternative ETF | | | |
The tax character of distributions paid by each Fund during the fiscal period ended August 31, 2023 was as follows:
| Distributions
paid from
Ordinary
Income | Distributions
paid from
Capital
Gains | Distributions
paid from
Return of
Capital |
First Trust Innovation Leaders ETF | | | |
First Trust Expanded Technology ETF | | | |
First Trust Multi-Strategy Alternative ETF | | | |
Notes to Financial Statements (Continued)
First Trust Exchange-Traded Fund VIIIAugust 31, 2024 As of August 31, 2024, the components of distributable earnings on a tax basis for each Fund were as follows:
| Undistributed
Ordinary
Income | Accumulated
Capital and
Other
Gain (Loss) | Net
Unrealized
Appreciation
(Depreciation) |
First Trust Innovation Leaders ETF | | | |
First Trust Expanded Technology ETF | | | |
First Trust Multi-Strategy Alternative ETF | | | |
Each Fund intends to qualify or continue to qualify as a regulated investment company by complying with the requirements under Subchapter M of the Internal Revenue Code of 1986, as amended, which includes distributing substantially all of its net investment income and net realized gains to shareholders. Accordingly, no provision has been made for federal and state income taxes. However, due to the timing and amount of distributions, each Fund may be subject to an excise tax of 4% of the amount by which approximately 98% of each Fund’s taxable income exceeds the distributions from such taxable income for the calendar year.
The Funds are subject to accounting standards that establish a minimum threshold for recognizing, and a system for measuring, the benefits of a tax position taken or expected to be taken in a tax return. For ILDR and XPND, the taxable years ended 2021, 2022, 2023 and 2024 remain open to federal and state audit. For LALT, the taxable years ended 2023 and 2024 remain open to federal and state audit. As of August 31, 2024, management has evaluated the application of these standards to the Funds and has determined that no provision for income tax is required in the Funds’ financial statements for uncertain tax positions.
Each Fund intends to utilize provisions of the federal income tax laws, which allow it to carry a realized capital loss forward indefinitely following the year of the loss and offset such loss against any future realized capital gains. Each Fund is subject to certain limitations under U.S. tax rules on the use of capital loss carryforwards and net unrealized built-in losses. These limitations apply when there has been a 50% change in ownership. At August 31, 2024, for federal income tax purposes, each applicable Fund had a capital loss carryforward available that is shown in the following table, to the extent provided by regulations, to offset future capital gains. To the extent that these loss carryforwards are used to offset future capital gains, it is probable that the capital gains so offset will not be distributed to each applicable Fund’s shareholders.
| Non-Expiring
Capital Loss
Carryforwards |
First Trust Innovation Leaders ETF | |
First Trust Expanded Technology ETF | |
First Trust Multi-Strategy Alternative ETF | |
Certain losses realized during the current fiscal year may be deferred and treated as occurring on the first day of the following fiscal year for federal income tax purposes. For the fiscal year ended August 31, 2024, the following Fund incurred and elected to defer net late year ordinary or capital losses as follows:
| Qualified Late Year Losses |
| | |
First Trust Innovation Leaders ETF | | |
| | |
In order to present paid-in capital and accumulated distributable earnings (loss) (which consists of accumulated net investment income (loss), accumulated net realized gain (loss) on investments and net unrealized appreciation (depreciation) on investments) on the Statements of Assets and Liabilities that more closely represent their tax character, certain adjustments have been made to paid-in capital, accumulated net investment income (loss) and accumulated net realized gain (loss) on investments. These adjustments are primarily due to the difference between book and tax treatments of income and gains on various investment securities held by the Funds and in-kind transactions. The results of operations and net assets were not affected by these adjustments. For the fiscal year ended August 31, 2024, the adjustments for each Fund were as follows:
Notes to Financial Statements (Continued)
First Trust Exchange-Traded Fund VIIIAugust 31, 2024 | Accumulated
Net Investment
Income (Loss) | Accumulated
Net Realized
Gain (Loss)
on Investments | |
First Trust Innovation Leaders ETF | | | |
First Trust Expanded Technology ETF | | | |
First Trust Multi-Strategy Alternative ETF | | | |
As of August 31, 2024, the aggregate cost, gross unrealized appreciation, gross unrealized depreciation, and net unrealized appreciation/(depreciation) on investments (including short positions and derivatives, if any) for federal income tax purposes were as follows:
| | Gross Unrealized
Appreciation | Gross Unrealized
(Depreciation) | Net Unrealized
Appreciation
(Depreciation) |
First Trust Innovation Leaders ETF | | | | |
First Trust Expanded Technology ETF | | | | |
First Trust Multi-Strategy Alternative ETF | | | | |
Expenses, other than the investment advisory fee and other excluded expenses, are paid by the Advisor (see Note 3).
3. Investment Advisory Fee, Affiliated Transactions and Other Fee Arrangements
First Trust, the investment advisor to the Funds, is a limited partnership with one limited partner, Grace Partners of DuPage L.P., and one general partner, The Charger Corporation. The Charger Corporation is an Illinois corporation controlled by James A. Bowen, Chief Executive Officer of First Trust. First Trust is responsible for the selection and ongoing monitoring of the securities in each Fund’s portfolio, managing the Funds’ business affairs and providing certain administrative services necessary for the management of the Funds.
Pursuant to the Investment Management Agreement between the Trust and the Advisor, First Trust manages the investment of each Fund’s assets and is responsible for the expenses of each Fund, including the cost of transfer agency, custody, fund administration, legal, audit, license fees and other services, but excluding fee payments under the Investment Management Agreement, interest, taxes, pro rata share of fees and expenses attributable to investments in other investment companies (“acquired fund fees and expenses”), brokerage commissions and other expenses connected with the execution of portfolio transactions, distribution and service fees payable pursuant to a Rule 12b-1 plan, if any, and extraordinary expenses. The annual unitary management fee payable by each Fund to First Trust for these services will be reduced at certain levels of each Fund’s net assets (“breakpoints”) and calculated pursuant to the following schedules:
| |
Fund net assets up to and including $2.5 billion | |
Fund net assets greater than $2.5 billion up to and including $5 billion | |
Fund net assets greater than $5 billion up to and including $7.5 billion | |
Fund net assets greater than $7.5 billion up to and including $10 billion | |
Fund net assets greater than $10 billion | |
| | |
Fund net assets up to and including $2.5 billion | | |
Fund net assets greater than $2.5 billion up to and including $5 billion | | |
Fund net assets greater than $5 billion up to and including $7.5 billion | | |
Fund net assets greater than $7.5 billion up to and including $10 billion | | |
Fund net assets greater than $10 billion up to and including $15 billion | | |
Fund net assets greater than $15 billion | | |
The Trust has multiple service agreements with The Bank of New York Mellon (“BNY”). Under the service agreements, BNY performs custodial, fund accounting, certain administrative services, and transfer agency services for each Fund. As custodian, BNY is responsible for custody of each Fund’s assets. As fund accountant and administrator, BNY is responsible for maintaining the books
Notes to Financial Statements (Continued)
First Trust Exchange-Traded Fund VIIIAugust 31, 2024 and records of each Fund’s securities and cash. As transfer agent, BNY is responsible for maintaining shareholder records for each Fund. BNY is a subsidiary of The Bank of New York Mellon Corporation, a financial holding company.
Each Trustee who is not an officer or employee of First Trust, any sub-advisor or any of their affiliates (“Independent Trustees”) is paid a fixed annual retainer that is allocated equally among each fund in the First Trust Fund Complex. Each Independent Trustee is also paid an annual per fund fee that varies based on whether the fund is a closed-end or other actively managed fund, a target outcome fund or an index fund.
Additionally, the Chairs of the Audit Committee, Nominating and Governance Committee and Valuation Committee, the Vice Chair of the Audit Committee, the Lead Independent Trustee and the Vice Lead Independent Trustee are paid annual fees to serve in such capacities, with such compensation allocated pro rata among each fund in the First Trust Fund Complex based on net assets. Independent Trustees are reimbursed for travel and out-of-pocket expenses in connection with all meetings. The Committee Chairs, the Audit Committee Vice Chair, the Lead Independent Trustee and the Vice Lead Independent Trustee rotate periodically in serving in such capacities. The officers and “Interested” Trustee receive no compensation from the Trust for acting in such capacities.
4. Purchases and Sales of Securities
For the fiscal year ended August 31, 2024, the cost of purchases and proceeds from sales of investments for each Fund, excluding short-term investments and in-kind transactions, were as follows:
| | |
First Trust Innovation Leaders ETF | | |
First Trust Expanded Technology ETF | | |
First Trust Multi-Strategy Alternative ETF | | |
For the fiscal year ended August 31, 2024, the cost of in-kind purchases and proceeds from in-kind sales for each Fund were as follows:
| | |
First Trust Innovation Leaders ETF | | |
First Trust Expanded Technology ETF | | |
First Trust Multi-Strategy Alternative ETF | | |
5. Creations, Redemptions and Transaction Fees
Each Fund generally issues and redeems its shares in primary market transactions through a creation and redemption mechanism and does not sell or redeem individual shares. Instead, financial entities known as “Authorized Participants” have contractual arrangements with a Fund or one of the Fund’s service providers to purchase and redeem Fund shares directly with the Fund in Creation Units. Prior to the start of trading on every business day, a Fund publishes through the National Securities Clearing Corporation the “basket” of securities, cash or other assets that it will accept in exchange for a Creation Unit of the Fund’s shares. An Authorized Participant that wishes to effectuate a creation of a Fund’s shares deposits with the Fund the “basket” of securities, cash or other assets identified by the Fund that day, and then receives the Creation Unit of the Fund’s shares in return for those assets. After purchasing a Creation Unit, the Authorized Participant may continue to hold the Fund’s shares or sell them in the secondary market. The redemption process is the reverse of the purchase process: the Authorized Participant redeems a Creation Unit of a Fund’s shares for a basket of securities, cash or other assets. The combination of the creation and redemption process with secondary market trading in a Fund’s shares and underlying securities provides arbitrage opportunities that are designed to help keep the market price of a Fund’s shares at or close to the NAV per share of the Fund.
Each Fund imposes fees in connection with the purchase of Creation Units. These fees may vary based upon various fact-based circumstances, including, but not limited to, the composition of the securities included in the Creation Unit or the countries in which the transactions are settled. The price for each Creation Unit will equal the daily NAV per share of a Fund times the number of shares in a Creation Unit, plus the fees described above and, if applicable, any operational processing and brokerage costs, transfer fees, stamp taxes and part or all of the spread between the expected bid and offer side of the market related to the securities comprising the creation basket.
Each Fund also imposes fees in connection with the redemption of Creation Units. These fees may vary based upon various fact-based circumstances, including, but not limited to, the composition of the securities included in the Creation Unit or the countries in which
Notes to Financial Statements (Continued)
First Trust Exchange-Traded Fund VIIIAugust 31, 2024 the transactions are settled. The price received for each Creation Unit will equal the daily NAV per share of a Fund times the number of shares in a Creation Unit, minus the fees described above and, if applicable, any operational processing and brokerage costs, transfer fees, stamp taxes and part or all of the spread between the expected bid and offer side of the market related to the securities comprising the redemption basket. Investors who use the services of a broker or other such intermediary in addition to an Authorized Participant to effect a redemption of a Creation Unit may also be assessed an amount to cover the cost of such services. The redemption fee charged by a Fund will comply with Rule 22c-2 of the 1940 Act which limits redemption fees to no more than 2% of the value of the shares redeemed.
The Board of Trustees adopted a Distribution and Service Plan pursuant to Rule 12b-1 under the 1940 Act. In accordance with the Rule 12b-1 plan, the Funds are authorized to pay an amount up to 0.25% of their average daily net assets each year to reimburse First Trust Portfolios L.P. (“FTP”), the distributor of the Funds, for amounts expended to finance activities primarily intended to result in the sale of Creation Units or the provision of investor services. FTP may also use this amount to compensate securities dealers or other persons that are Authorized Participants for providing distribution assistance, including broker-dealer and shareholder support and educational and promotional services.
No 12b-1 fees are currently paid by the Funds, and pursuant to a contractual arrangement, no 12b-1 fees will be paid any time before December 31, 2025.
The Trust, on behalf of the Funds, has a variety of indemnification obligations under contracts with its service providers. The Trust’s maximum exposure under these arrangements is unknown. However, the Trust has not had prior claims or losses pursuant to these contracts and expects the risk of loss to be remote.
Management has evaluated the impact of all subsequent events on the Funds through the date the financial statements were issued and has determined that there were no subsequent events requiring recognition or disclosure in the financial statements that have not already been disclosed.
Report of Independent Registered Public Accounting Firm
To the Shareholders and Board of Trustees of First Trust Exchange-Traded Fund VIII:
Opinion on the Financial Statements and Financial Highlights
We have audited the accompanying statements of assets and liabilities, including the portfolios of investments, of First Trust Innovation Leaders ETF, First Trust Expanded Technology ETF, and First Trust Multi-Strategy Alternative ETF (the “Funds”), each a series of the First Trust Exchange-Traded Fund VIII, as of August 31, 2024, the related statements of operations, the statements of changes in net assets, and the financial highlights for the periods indicated in the table below; and the related notes. In our opinion, the financial statements and financial highlights present fairly, in all material respects, the financial position of the Funds as of August 31, 2024, and the results of their operations, the changes in their net assets, and the financial highlights for the periods listed in the table below in conformity with accounting principles generally accepted in the United States of America.
Individual Funds
Included in the Trust | | Statements of Changes
in Net Assets | |
First Trust Innovation Leaders ETF | For the year ended August 31, 2024 | For the years ended August 31, 2024 and 2023 | For the years ended August 31, 2024, 2023 and 2022, and for the period from May 25, 2021 (commencement of investment operations) through August 31, 2021 |
First Trust Expanded Technology ETF | For the year ended August 31, 2024 | For the years ended August 31, 2024 and 2023 | For the years ended August 31, 2024, 2023 and 2022, and for the period from June 14, 2021 (commencement of investment operations) through August 31, 2021 |
First Trust Multi-Strategy Alternative ETF | For the year ended August 31, 2024 | For the year ended August 31, 2024, and for the period from January 31, 2023 (commencement of investment operations) through August 31, 2023 |
These financial statements and financial highlights are the responsibility of the Funds’ management. Our responsibility is to express an opinion on the Funds’ financial statements and financial highlights based on our audits. We are a public accounting firm registered with the Public Company Accounting Oversight Board (United States) (PCAOB) and are required to be independent with respect to the Funds in accordance with the U.S. federal securities laws and the applicable rules and regulations of the Securities and Exchange Commission and the PCAOB.
We conducted our audits in accordance with the standards of the PCAOB. Those standards require that we plan and perform the audit to obtain reasonable assurance about whether the financial statements and financial highlights are free of material misstatement, whether due to error or fraud. The Funds are not required to have, nor were we engaged to perform, an audit of their internal control over financial reporting. As part of our audits, we are required to obtain an understanding of internal control over financial reporting but not for the purpose of expressing an opinion on the effectiveness of the Funds’ internal control over financial reporting. Accordingly, we express no such opinion.
Our audits included performing procedures to assess the risks of material misstatement of the financial statements and financial highlights, whether due to error or fraud, and performing procedures that respond to those risks. Such procedures included examining, on a test basis, evidence regarding the amounts and disclosures in the financial statements and financial highlights. Our audits also included evaluating the accounting principles used and significant estimates made by management, as well as evaluating the overall presentation of the financial statements and financial highlights. Our procedures included confirmation of securities owned as of August 31, 2024, by correspondence with the custodian and brokers; when replies were not received from brokers, we performed other auditing procedures. We believe that our audits provide a reasonable basis for our opinion.
/s/ Deloitte & Touche, LLP
Chicago, Illinois
October 23, 2024
We have served as the auditor of one or more First Trust investment companies since 2001.
First Trust Exchange-Traded Fund VIIIAugust 31, 2024 (Unaudited) Changes in and Disagreements with Accountants (Item 8 of Form N-CSR)
There were no changes in or disagreements with the Funds’ accountants during the fiscal year ended August 31, 2024.
Proxy Disclosures (Item 9 of Form N-CSR)
There were no matters submitted for vote by shareholders of any Fund during the fiscal year ended August 31, 2024.
Remuneration Paid to Directors, Officers, and Others (Item 10 of Form N-CSR)
Independent Trustees and any member of any advisory board of each Fund are compensated through the unitary management fee paid by each Fund to the advisor and not directly by each Fund. The investment advisory fee paid is included in the Statements of Operations.
Statement Regarding the Basis for the Board’s Approval of Investment Advisory Contract (Item 11 of Form N-CSR)
The Board of Trustees of First Trust Exchange-Traded Fund VIII (the “Trust”), including the Independent Trustees, unanimously approved the continuation of the Investment Management Agreements (as applicable to a specific Fund, the “Agreement” and collectively, the “Agreements”) with First Trust Advisors L.P. (the “Advisor”) on behalf of the following series of the Trust (each a “Fund” and collectively, the “Funds”):
First Trust Expanded Technology ETF (XPND)
First Trust Innovation Leaders ETF (ILDR)
First Trust Multi-Strategy Alternative ETF (LALT)
The Board approved the continuation of the Agreement for each Fund for a one-year period ending June 30, 2025 at a meeting held on June 2–3, 2024. The Board determined for each Fund that the continuation of the Agreement is in the best interests of the Fund in light of the nature, extent and quality of the services provided and such other matters as the Board considered to be relevant in the exercise of its business judgment.
To reach this determination for each Fund, the Board considered its duties under the Investment Company Act of 1940, as amended (the “1940 Act”), as well as under the general principles of state law, in reviewing and approving advisory contracts; the requirements of the 1940 Act in such matters; the fiduciary duty of investment advisors with respect to advisory agreements and compensation; the standards used by courts in determining whether investment company boards have fulfilled their duties; and the factors to be considered by the Board in voting on such agreements. At meetings held on April 16, 2024, April 25, 2024 and June 2–3, 2024, the Board, including the Independent Trustees, reviewed materials provided by the Advisor responding to requests for information from counsel to the Independent Trustees, submitted on behalf of the Independent Trustees, that, among other things, outlined: the services provided by the Advisor to each Fund (including the relevant personnel responsible for these services and their experience); the unitary fee rate schedule payable by each Fund as compared to fees charged to a peer group of funds (the “Expense Group”) and a broad peer universe of funds (the “Expense Universe”), each assembled by Broadridge Financial Solutions, Inc. (“Broadridge”), an independent source, and as compared to fees charged to other clients of the Advisor, including other exchange-traded funds (“ETFs”) managed by the Advisor; the expense ratio of each Fund as compared to expense ratios of the funds in the Fund’s Expense Group and Expense Universe; performance information for each Fund, including, as applicable, comparisons of each Fund’s performance to that of one or more relevant benchmark indexes and to that of a performance group of funds and a broad performance universe of funds (the “Performance Universe”), each assembled by Broadridge; the nature of expenses incurred in providing services to each Fund and the potential for the Advisor to realize economies of scale, if any; profitability and other financial data for the Advisor; any indirect benefits to the Advisor and its affiliate, First Trust Portfolios L.P. (“FTP”); and information on the Advisor’s compliance program. The Board reviewed initial materials with the Advisor at the meeting held on April 25, 2024, prior to which the Independent Trustees and their counsel met separately to discuss the information provided by the Advisor. Following the April 25, 2024 meeting, counsel to the Independent Trustees, on behalf of the Independent Trustees, requested certain clarifications and supplements to the materials provided, and the information provided in response to those requests was considered at an executive session of the Independent Trustees and their counsel held prior to the June 2–3, 2024 meeting, as well as at the June meeting. The Board applied its business judgment to determine whether the arrangement between the Trust and the Advisor continues to be a reasonable business arrangement from each Fund’s perspective. The Board determined that, given the totality of the information provided with respect to the Agreements, the Board had received sufficient information to renew the Agreements. The Board considered that shareholders chose to invest or remain invested in a Fund knowing that the Advisor manages the Fund and knowing the Fund’s unitary fee.
Other Information (Continued)
First Trust Exchange-Traded Fund VIIIAugust 31, 2024 (Unaudited) In reviewing the Agreement for each Fund, the Board considered the nature, extent and quality of the services provided by the Advisor under the Agreement. The Board considered that the Advisor is responsible for the overall management and administration of the Trust and each Fund and reviewed all of the services provided by the Advisor to the Funds, as well as the background and experience of the persons responsible for such services. The Board noted that each Fund is an actively-managed ETF. The Board noted that the Advisor’s Strategy Research Group is responsible for the day-to-day management of XPND’s and ILDR’s investments and that the Advisor’s Investment Committee is responsible for the day-to-day management of LALT’s investments. The Board considered the background and experience of the members of the Strategy Research Group and the Investment Committee. The Board considered the Advisor’s statement that it applies the same oversight model internally with its Strategy Research Group as it uses for overseeing external sub-advisors, including portfolio risk monitoring and performance review. In reviewing the services provided, the Board noted the compliance program that had been developed by the Advisor and considered that it includes a robust program for monitoring the Advisor’s and each Fund’s compliance with the 1940 Act, as well as each Fund’s compliance with its investment objective, policies and restrictions. The Board also considered a report from the Advisor with respect to its risk management functions related to the operation of the Funds. Finally, as part of the Board’s consideration of the Advisor’s services, the Advisor, in its written materials and at the April 25, 2024 meeting, described to the Board the scope of its ongoing investment in additional personnel and infrastructure to maintain and improve the quality of services provided to the Funds and the other funds in the First Trust Fund Complex. In addition to the written materials provided by the Advisor, at the April 25, 2024 meeting, the Board also received presentations from representatives of the Advisor’s Strategy Research Group and Investment Committee, who discussed the services that the Strategy Group provides to XPND and ILDR and the Investment Committee provides to LALT, including the day-to-day management of the Funds’ investments. In light of the information presented and the considerations made, the Board concluded that the nature, extent and quality of the services provided to the Trust and each Fund by the Advisor under the Agreements have been and are expected to remain satisfactory and that the Advisor has managed each Fund consistent with its investment objective, policies and restrictions.
The Board considered the unitary fee rate schedule payable by each Fund under the applicable Agreement for the services provided. The Board considered that as part of the unitary fee the Advisor is responsible for each Fund’s expenses, including the cost of transfer agency, custody, fund administration, legal, audit and other services and license fees, if any, but excluding the fee payment under the applicable Agreement and interest, taxes, acquired fund fees and expenses, if any, brokerage commissions and other expenses connected with the execution of portfolio transactions, distribution and service fees pursuant to a Rule 12b-1 plan, if any, and extraordinary expenses, if any. The Board noted that, because LALT invests in underlying funds, including ETFs in the First Trust Fund Complex, the Fund incurs acquired fund fees and expenses, which are not payable out of the unitary fee, and that such acquired fund fees and expenses will change over time as assets are reallocated among the underlying funds. The Board received and reviewed information showing the fee rates and expense ratios of the peer funds in the Expense Groups, as well as advisory and unitary fee rates charged by the Advisor to other fund (including ETFs) and non-fund clients, as applicable. Because each Fund pays a unitary fee, the Board determined that expense ratios were the most relevant comparative data point. Based on the information provided, the Board noted that the total (net) expense ratio for XPND was below the median total (net) expense ratio of the peer funds in its Expense Group and that the total (net) expense ratio for ILDR was equal to the median total (net) expense ratio of the peer funds in its Expense Group. The Board noted that the total (net) expense ratio (excluding acquired fund fees and expenses) for LALT was below the median total (net) expense ratio (excluding acquired fund fees and expenses) of the peer funds in its Expense Group. The Board also noted that the total (net) expense ratio (including acquired fund fees and expenses) for LALT was above the median total (net) expense ratio (including acquired fund fees and expenses) of the peer funds in its Expense Group. With respect to the Expense Groups, the Board discussed with Broadridge its methodology for assembling peer groups and discussed with the Advisor limitations in creating peer groups for actively-managed ETFs, and different business models that may affect the pricing of services among ETF sponsors. The Board took these limitations and differences into account in considering the peer data. With respect to fees charged to other non-ETF clients, the Board considered differences between the Funds and other non-ETF clients that limited their comparability. In considering the unitary fee rate schedules overall, the Board also considered the Advisor’s statement that it seeks to meet investor needs through innovative and value-added investment solutions and the Advisor’s demonstrated long-term commitment to each Fund and the other funds in the First Trust Fund Complex.
The Board considered performance information for each Fund. The Board noted the process it has established for monitoring each Fund’s performance and portfolio risk on an ongoing basis, which includes quarterly performance reporting from the Advisor for the Funds. The Board determined that this process continues to be effective for reviewing each Fund’s performance. For each Fund, the Board received and reviewed, as applicable, information comparing each Fund’s performance for the one-year period ended December 31, 2023 to the performance of the funds in its Performance Universe and to that of a benchmark index. Based on the information provided, the Board noted that each of XPND and ILDR underperformed its respective Performance Universe median and benchmark
Other Information (Continued)
First Trust Exchange-Traded Fund VIIIAugust 31, 2024 (Unaudited) index for the one-year period ended December 31, 2023. The Board noted the Strategy Research Group’s discussion of XPND’s and ILDR’s performance, and the Investment Committee’s discussion of LALT’s performance, at the April 25, 2024 meeting. Because LALT commended operations on January 31, 2023 and therefore has a limited performance history, comparative performance information for LALT was not reviewed.
On the basis of all the information provided on the unitary fee and performance, as applicable, of each Fund and the ongoing oversight by the Board, the Board concluded that the unitary fee for each Fund continues to be reasonable and appropriate in light of the nature, extent and quality of the services provided by the Advisor to each Fund under the Agreements.
The Board considered information and discussed with the Advisor whether there were any economies of scale in connection with providing advisory services to the Funds at current asset levels and whether the Funds may benefit from any economies of scale. The Board noted that the unitary fee rate schedule for each Fund includes breakpoints pursuant to which the unitary fee rate will be reduced as assets of the Fund meet certain thresholds. The Board considered the Advisor’s statement that it believes that its expenses relating to providing advisory services to the Funds will increase during the next twelve months as the Advisor continues to build infrastructure and add new staff. The Board also noted that under the unitary fee structure, any reduction in expenses associated with the management and operations of the Funds would benefit the Advisor, but that the unitary fee structure provides a level of certainty in expenses for shareholders of the Funds. The Board concluded that the unitary fee rate schedule for each Fund reflects an appropriate level of sharing of any economies of scale that may be realized in the management of the Fund at current asset levels. The Board considered the revenues and allocated costs (including the allocation methodology) of the Advisor in serving as investment advisor to each of XPND and ILDR for the twelve months ended December 31, 2023 and to LALT for the period from inception through December 31, 2023 and the estimated profitability level for each Fund calculated by the Advisor based on such data, as well as complex-wide and product-line profitability data, for the twelve months ended December 31, 2023. The Board noted the inherent limitations in the profitability analysis and concluded that, based on the information provided, the Advisor’s profitability level for each Fund was not unreasonable. In addition, the Board considered indirect benefits described by the Advisor that may be realized from its relationship with the Funds. The Board considered that the Advisor had identified as an indirect benefit to the Advisor and FTP their exposure to investors and brokers who, absent their exposure to the Funds, may have had no dealings with the Advisor or FTP, and noted that the Advisor does not utilize soft dollars in connection with the Funds. The Board concluded that the character and amount of potential indirect benefits to the Advisor were not unreasonable.
Based on all of the information considered and the conclusions reached, the Board, including the Independent Trustees, unanimously determined that the terms of the Agreements continue to be fair and reasonable and that the continuation of the Agreements is in the best interests of each Fund. No single factor was determinative in the Board’s analysis.
Remuneration Disclosure Under the Alternative Investment Fund Managers Directive
First Trust Advisors L.P. (“First Trust”) is authorised and regulated by the U.S. Securities and Exchange Commission and is entitled to market shares of certain First Trust Exchange-Traded Fund VIII funds it manages (the “Funds”) in certain member states in the European Economic Area in accordance with the cooperation arrangements in Article 42 of the Alternative Investment Fund Managers Directive (the “Directive”). First Trust is required under the Directive to make disclosures in respect of remuneration. The following disclosures are made in line with First Trust’s interpretation of currently available regulatory guidance on remuneration disclosures.
During the year ended December 31, 2023, the amount of remuneration paid (or to be paid) by First Trust Advisors L.P. in respect of the Funds is $10,046. This figure is comprised of $473 paid (or to be paid) in fixed compensation and $9,573 paid (or to be paid) in variable compensation. There were a total of 28 beneficiaries of the remuneration described above. Those amounts include $4,132 paid (or to be paid) to senior management of First Trust Advisors L.P. and $5,914 paid (or to be paid) to other employees whose professional activities have a material impact on the risk profiles of First Trust Advisors L.P. or the Funds (collectively, “Code Staff”).
Code Staff included in the aggregated figures disclosed above are rewarded in line with First Trust’s remuneration policy (the “Remuneration Policy”) which is determined and implemented by First Trust’s senior management. The Remuneration Policy reflects First Trust’s ethos of good governance and encapsulates the following principal objectives:
i.
to provide a clear link between remuneration and performance of First Trust and to avoid rewarding for failure;
ii.
to promote sound and effective risk management consistent with the risk profiles of the funds managed by First Trust; and
Other Information (Continued)
First Trust Exchange-Traded Fund VIIIAugust 31, 2024 (Unaudited) iii.
to remunerate staff in line with the business strategy, objectives, values and interests of First Trust and the funds managed by First Trust in a manner that avoids conflicts of interest.
First Trust assesses various risk factors which it is exposed to when considering and implementing remuneration for Code Staff and considers whether any potential award to such person(s) would give rise to a conflict of interest. First Trust does not reward failure, or consider the taking of risk or failure to take risk in its remuneration of Code Staff.
First Trust assesses performance for the purposes of determining payments in respect of performance-related remuneration of Code Staff by reference to a broad range of measures including (i) individual performance (using financial and non-financial criteria), and (ii) the overall performance of First Trust. Remuneration is not based upon the performance of the Funds.
The elements of remuneration are balanced between fixed and variable and the senior management sets fixed salaries at a level sufficient to ensure that variable remuneration incentivises and rewards strong individual performance but does not encourage excessive risk taking.
No individual is involved in setting his or her own remuneration.
For the taxable year ended August 31, 2024, the following percentages of income dividends paid by the Funds qualify for the dividends received deduction available to corporations:
| Dividends Received
Deduction |
First Trust Innovation Leaders ETF | |
First Trust Expanded Technology ETF | |
First Trust Multi-Strategy Alternative ETF | |
For the taxable year ended August 31, 2024, the following percentages of income dividends paid by the Funds are hereby designated as qualified dividend income:
| |
First Trust Innovation Leaders ETF | |
First Trust Expanded Technology ETF | |
First Trust Multi-Strategy Alternative ETF | |
A portion of each of the Funds’ 2024 ordinary dividends (including short-term capital gains) paid to its shareholders during the fiscal year ended August 31, 2024, may be eligible for the Qualified Business Income (QBI) Deduction under the Internal Revenue Code of 1986, as amended, Section 199A for the aggregate dividends each Fund received from the underlying Real Estate Investment Trusts (REITs) these Funds invest in.
Annual Financial
Statements and
Other Information |
For the Year Ended
August 31, 2024 |
First Trust Exchange-Traded Fund VIII
FT Vest U.S. Equity Buffer ETF - January (FJAN) |
FT Vest U.S. Equity Deep Buffer ETF - January (DJAN) |
FT Vest U.S. Equity Buffer ETF - February (FFEB) |
FT Vest U.S. Equity Deep Buffer ETF - February (DFEB) |
FT Vest U.S. Equity Buffer ETF - March (FMAR) |
FT Vest U.S. Equity Deep Buffer ETF - March (DMAR) |
FT Vest U.S. Equity Buffer ETF - April (FAPR) |
FT Vest U.S. Equity Deep Buffer ETF - April (DAPR) |
FT Vest U.S. Equity Buffer ETF - May (FMAY) |
FT Vest U.S. Equity Deep Buffer ETF - May (DMAY) |
FT Vest U.S. Equity Buffer ETF - June (FJUN) |
FT Vest U.S. Equity Deep Buffer ETF - June (DJUN) |
FT Vest U.S. Equity Buffer ETF - July (FJUL) |
FT Vest U.S. Equity Deep Buffer ETF - July (DJUL) |
FT Vest U.S. Equity Buffer ETF - August (FAUG) |
FT Vest U.S. Equity Deep Buffer ETF - August (DAUG) |
FT Vest U.S. Equity Buffer ETF - September (FSEP) |
FT Vest U.S. Equity Deep Buffer ETF - September (DSEP) |
FT Vest U.S. Equity Buffer ETF - October (FOCT) |
FT Vest U.S. Equity Deep Buffer ETF - October (DOCT) |
FT Vest U.S. Equity Buffer ETF - November (FNOV) |
FT Vest U.S. Equity Deep Buffer ETF - November (DNOV) |
FT Vest U.S. Equity Buffer ETF - December (FDEC) |
FT Vest U.S. Equity Deep Buffer ETF - December (DDEC) |
FT Vest Buffered Allocation Defensive ETF (BUFT) |
FT Vest Buffered Allocation Growth ETF (BUFG) |
First Trust Exchange-Traded Fund VIII
Annual Financial Statements and Other Information
August 31, 2024
Performance and Risk Disclosure
There is no assurance that any series of First Trust Exchange-Traded Fund VIII (the “Trust”) described in this report (each such series is referred to as a “Fund” and collectively, as the “Funds”) will achieve its investment objective. Each Fund is subject to market risk, which is the possibility that the market values of securities owned by the Fund will decline and that the value of the Fund’s shares may therefore be less than what you paid for them. Accordingly, you can lose money by investing in a Fund.
Performance data quoted represents past performance, which is no guarantee of future results, and current performance may be lower or higher than the figures shown. For the most recent month-end performance figures, please visit www.ftportfolios.com or speak with your financial advisor. Investment returns, net asset value and share price will fluctuate and Fund shares, when sold, may be worth more or less than their original cost.
First Trust Advisors L.P., the Funds’ advisor, may also periodically provide additional information on Fund performance on each Fund’s webpage at www.ftportfolios.com.
This report contains information that may help you evaluate your investment. It includes details about each Fund and presents data that provides insight into each Fund’s performance and investment approach.
The material risks of investing in each Fund are spelled out in its prospectus, statement of additional information, and other Fund regulatory filings.
FT Vest U.S. Equity Buffer ETF - January (FJAN)Portfolio of InvestmentsAugust 31, 2024
| | |
MONEY MARKET FUNDS — 0.6% |
| Dreyfus Government Cash Management Fund, Institutional Shares - 5.19% (a) | |
| | |
| | |
| | |
| | | | | |
PURCHASED OPTIONS — 104.9% |
| Call Options Purchased — 104.2% | |
| | | | | |
| | | | | |
| Put Options Purchased — 0.7% | |
| | | | | |
| | | | | |
| | |
| | |
|
| Call Options Written — (5.0)% | |
| | | | | |
| (Premiums received $7,976,600) | | | | |
| Put Options Written — (0.4)% | |
| | | | | |
| (Premiums received $14,546,559) | | | | |
| | |
| (Premiums received $22,523,159) | |
| Net Other Assets and Liabilities — (0.1)% | |
| | |
| Rate shown reflects yield as of August 31, 2024. |
| |
| |
| |
| |
Net Other Assets and Liabilities | |
| |
See Notes to Financial Statements
FT Vest U.S. Equity Buffer ETF - January (FJAN)Portfolio of Investments (Continued)August 31, 2024
Valuation InputsA summary of the inputs used to value the Fund’s investments as of August 31, 2024 is as follows (see Note 2A - Portfolio Valuation in the Notes to Financial Statements):
|
| | | Level 2
Significant
Observable
Inputs | Level 3
Significant
Unobservable
Inputs |
| | | | |
| | | | |
| | | | |
|
| | | Level 2
Significant
Observable
Inputs | Level 3
Significant
Unobservable
Inputs |
| | | | |
See Notes to Financial Statements
FT Vest U.S. Equity Deep Buffer ETF - January (DJAN)Portfolio of InvestmentsAugust 31, 2024
| | |
MONEY MARKET FUNDS — 0.6% |
| Dreyfus Government Cash Management Fund, Institutional Shares - 5.19% (a) | |
| | |
| | |
| | |
| | | | | |
PURCHASED OPTIONS — 106.0% |
| Call Options Purchased — 105.5% | |
| | | | | |
| | | | | |
| Put Options Purchased — 0.5% | |
| | | | | |
| | | | | |
| | |
| | |
|
| Call Options Written — (6.4)% | |
| | | | | |
| (Premiums received $2,742,016) | | | | |
| Put Options Written — (0.1)% | |
| | | | | |
| (Premiums received $1,365,337) | | | | |
| | |
| (Premiums received $4,107,353) | |
| Net Other Assets and Liabilities — (0.1)% | |
| | |
| Rate shown reflects yield as of August 31, 2024. |
| |
| |
| |
| |
Net Other Assets and Liabilities | |
| |
See Notes to Financial Statements
FT Vest U.S. Equity Deep Buffer ETF - January (DJAN)Portfolio of Investments (Continued)August 31, 2024
Valuation InputsA summary of the inputs used to value the Fund’s investments as of August 31, 2024 is as follows (see Note 2A - Portfolio Valuation in the Notes to Financial Statements):
|
| | | Level 2
Significant
Observable
Inputs | Level 3
Significant
Unobservable
Inputs |
| | | | |
| | | | |
| | | | |
|
| | | Level 2
Significant
Observable
Inputs | Level 3
Significant
Unobservable
Inputs |
| | | | |
See Notes to Financial Statements
FT Vest U.S. Equity Buffer ETF - February (FFEB)Portfolio of InvestmentsAugust 31, 2024
| | |
MONEY MARKET FUNDS — 0.7% |
| Dreyfus Government Cash Management Fund, Institutional Shares - 5.19% (a) | |
| | |
| | |
| | |
| | | | | |
PURCHASED OPTIONS — 102.8% |
| Call Options Purchased — 101.7% | |
| | | | | |
| | | | | |
| Put Options Purchased — 1.1% | |
| | | | | |
| | | | | |
| | |
| | |
|
| Call Options Written — (2.8)% | |
| | | | | |
| (Premiums received $9,736,060) | | | | |
| Put Options Written — (0.6)% | |
| | | | | |
| (Premiums received $17,682,215) | | | | |
| | |
| (Premiums received $27,418,275) | |
| Net Other Assets and Liabilities — (0.1)% | |
| | |
| Rate shown reflects yield as of August 31, 2024. |
| |
| |
| |
| |
Net Other Assets and Liabilities | |
| |
See Notes to Financial Statements
FT Vest U.S. Equity Buffer ETF - February (FFEB)Portfolio of Investments (Continued)August 31, 2024
Valuation InputsA summary of the inputs used to value the Fund’s investments as of August 31, 2024 is as follows (see Note 2A - Portfolio Valuation in the Notes to Financial Statements):
|
| | | Level 2
Significant
Observable
Inputs | Level 3
Significant
Unobservable
Inputs |
| | | | |
| | | | |
| | | | |
|
| | | Level 2
Significant
Observable
Inputs | Level 3
Significant
Unobservable
Inputs |
| | | | |
See Notes to Financial Statements
FT Vest U.S. Equity Deep Buffer ETF - February (DFEB)Portfolio of InvestmentsAugust 31, 2024
| | |
MONEY MARKET FUNDS — 0.7% |
| Dreyfus Government Cash Management Fund, Institutional Shares - 5.19% (a) | |
| | |
| | |
| | |
| | | | | |
PURCHASED OPTIONS — 103.4% |
| Call Options Purchased — 102.6% | |
| | | | | |
| | | | | |
| Put Options Purchased — 0.8% | |
| | | | | |
| | | | | |
| | |
| | |
|
| Call Options Written — (3.8)% | |
| | | | | |
| (Premiums received $3,683,065) | | | | |
| Put Options Written — (0.2)% | |
| | | | | |
| (Premiums received $1,498,239) | | | | |
| | |
| (Premiums received $5,181,304) | |
| Net Other Assets and Liabilities — (0.1)% | |
| | |
| Rate shown reflects yield as of August 31, 2024. |
| |
| |
| |
| |
Net Other Assets and Liabilities | |
| |
See Notes to Financial Statements
FT Vest U.S. Equity Deep Buffer ETF - February (DFEB)Portfolio of Investments (Continued)August 31, 2024
Valuation InputsA summary of the inputs used to value the Fund’s investments as of August 31, 2024 is as follows (see Note 2A - Portfolio Valuation in the Notes to Financial Statements):
|
| | | Level 2
Significant
Observable
Inputs | Level 3
Significant
Unobservable
Inputs |
| | | | |
| | | | |
| | | | |
|
| | | Level 2
Significant
Observable
Inputs | Level 3
Significant
Unobservable
Inputs |
| | | | |
See Notes to Financial Statements
FT Vest U.S. Equity Buffer ETF - March (FMAR)Portfolio of InvestmentsAugust 31, 2024
| | |
MONEY MARKET FUNDS — 0.7% |
| Dreyfus Government Cash Management Fund, Institutional Shares - 5.19% (a) | |
| | |
| | |
| | |
| | | | | |
PURCHASED OPTIONS — 102.2% |
| Call Options Purchased — 100.7% | |
| | | | | |
| | | | | |
| Put Options Purchased — 1.5% | |
| | | | | |
| | | | | |
| | |
| | |
|
| Call Options Written — (2.0)% | |
| | | | | |
| (Premiums received $10,467,144) | | | | |
| Put Options Written — (0.8)% | |
| | | | | |
| (Premiums received $18,123,033) | | | | |
| | |
| (Premiums received $28,590,177) | |
| Net Other Assets and Liabilities — (0.1)% | |
| | |
| Rate shown reflects yield as of August 31, 2024. |
| |
| |
| |
| |
Net Other Assets and Liabilities | |
| |
See Notes to Financial Statements
FT Vest U.S. Equity Buffer ETF - March (FMAR)Portfolio of Investments (Continued)August 31, 2024
Valuation InputsA summary of the inputs used to value the Fund’s investments as of August 31, 2024 is as follows (see Note 2A - Portfolio Valuation in the Notes to Financial Statements):
|
| | | Level 2
Significant
Observable
Inputs | Level 3
Significant
Unobservable
Inputs |
| | | | |
| | | | |
| | | | |
|
| | | Level 2
Significant
Observable
Inputs | Level 3
Significant
Unobservable
Inputs |
| | | | |
See Notes to Financial Statements
FT Vest U.S. Equity Deep Buffer ETF - March (DMAR)Portfolio of InvestmentsAugust 31, 2024
| | |
MONEY MARKET FUNDS — 0.8% |
| Dreyfus Government Cash Management Fund, Institutional Shares - 5.19% (a) | |
| | |
| | |
| | |
| | | | | |
PURCHASED OPTIONS — 102.4% |
| Call Options Purchased — 101.3% | |
| | | | | |
| | | | | |
| Put Options Purchased — 1.1% | |
| | | | | |
| | | | | |
| | |
| | |
|
| Call Options Written — (2.8)% | |
| | | | | |
| (Premiums received $3,857,171) | | | | |
| Put Options Written — (0.3)% | |
| | | | | |
| (Premiums received $1,905,003) | | | | |
| | |
| (Premiums received $5,762,174) | |
| Net Other Assets and Liabilities — (0.1)% | |
| | |
| Rate shown reflects yield as of August 31, 2024. |
| |
| |
| |
| |
Net Other Assets and Liabilities | |
| |
See Notes to Financial Statements
FT Vest U.S. Equity Deep Buffer ETF - March (DMAR)Portfolio of Investments (Continued)August 31, 2024
Valuation InputsA summary of the inputs used to value the Fund’s investments as of August 31, 2024 is as follows (see Note 2A - Portfolio Valuation in the Notes to Financial Statements):
|
| | | Level 2
Significant
Observable
Inputs | Level 3
Significant
Unobservable
Inputs |
| | | | |
| | | | |
| | | | |
|
| | | Level 2
Significant
Observable
Inputs | Level 3
Significant
Unobservable
Inputs |
| | | | |
See Notes to Financial Statements
FT Vest U.S. Equity Buffer ETF - April (FAPR)Portfolio of InvestmentsAugust 31, 2024
| | |
MONEY MARKET FUNDS — 0.8% |
| Dreyfus Government Cash Management Fund, Institutional Shares - 5.19% (a) | |
| | |
| | |
| | |
| | | | | |
PURCHASED OPTIONS — 103.8% |
| Call Options Purchased — 102.4% | |
| | | | | |
| | | | | |
| Put Options Purchased — 1.4% | |
| | | | | |
| | | | | |
| | |
| | |
|
| Call Options Written — (3.8)% | |
| | | | | |
| (Premiums received $11,015,842) | | | | |
| Put Options Written — (0.8)% | |
| | | | | |
| (Premiums received $14,736,865) | | | | |
| | |
| (Premiums received $25,752,707) | |
| Net Other Assets and Liabilities — (0.0)% | |
| | |
| Rate shown reflects yield as of August 31, 2024. |
| |
| |
| |
| |
Net Other Assets and Liabilities | |
| |
| Amount is less than 0.1%. |
See Notes to Financial Statements
FT Vest U.S. Equity Buffer ETF - April (FAPR)Portfolio of Investments (Continued)August 31, 2024
Valuation InputsA summary of the inputs used to value the Fund’s investments as of August 31, 2024 is as follows (see Note 2A - Portfolio Valuation in the Notes to Financial Statements):
|
| | | Level 2
Significant
Observable
Inputs | Level 3
Significant
Unobservable
Inputs |
| | | | |
| | | | |
| | | | |
|
| | | Level 2
Significant
Observable
Inputs | Level 3
Significant
Unobservable
Inputs |
| | | | |
See Notes to Financial Statements
FT Vest U.S. Equity Deep Buffer ETF - April (DAPR)Portfolio of InvestmentsAugust 31, 2024
| | |
MONEY MARKET FUNDS — 0.8% |
| Dreyfus Government Cash Management Fund, Institutional Shares - 5.19% (a) | |
| | |
| | |
| | |
| | | | | |
PURCHASED OPTIONS — 104.6% |
| Call Options Purchased — 103.6% | |
| | | | | |
| | | | | |
| Put Options Purchased — 1.0% | |
| | | | | |
| | | | | |
| | |
| | |
|
| Call Options Written — (5.0)% | |
| | | | | |
| (Premiums received $4,447,870) | | | | |
| Put Options Written — (0.3)% | |
| | | | | |
| (Premiums received $1,613,160) | | | | |
| | |
| (Premiums received $6,061,030) | |
| Net Other Assets and Liabilities — (0.1)% | |
| | |
| Rate shown reflects yield as of August 31, 2024. |
| |
| |
| |
| |
Net Other Assets and Liabilities | |
| |
See Notes to Financial Statements
FT Vest U.S. Equity Deep Buffer ETF - April (DAPR)Portfolio of Investments (Continued)August 31, 2024
Valuation InputsA summary of the inputs used to value the Fund’s investments as of August 31, 2024 is as follows (see Note 2A - Portfolio Valuation in the Notes to Financial Statements):
|
| | | Level 2
Significant
Observable
Inputs | Level 3
Significant
Unobservable
Inputs |
| | | | |
| | | | |
| | | | |
|
| | | Level 2
Significant
Observable
Inputs | Level 3
Significant
Unobservable
Inputs |
| | | | |
See Notes to Financial Statements
FT Vest U.S. Equity Buffer ETF - May (FMAY)Portfolio of InvestmentsAugust 31, 2024
| | |
MONEY MARKET FUNDS — 0.9% |
| Dreyfus Government Cash Management Fund, Institutional Shares - 5.19% (a) | |
| | |
| | |
| | |
| | | | | |
PURCHASED OPTIONS — 102.2% |
| Call Options Purchased — 99.8% | |
| | | | | |
| | | | | |
| Put Options Purchased — 2.4% | |
| | | | | |
| | | | | |
| | |
| | |
|
| Call Options Written — (1.8)% | |
| | | | | |
| (Premiums received $8,956,280) | | | | |
| Put Options Written — (1.2)% | |
| | | | | |
| (Premiums received $18,890,654) | | | | |
| | |
| (Premiums received $27,846,934) | |
| Net Other Assets and Liabilities — (0.1)% | |
| | |
| Rate shown reflects yield as of August 31, 2024. |
| |
| |
| |
| |
Net Other Assets and Liabilities | |
| |
See Notes to Financial Statements
FT Vest U.S. Equity Buffer ETF - May (FMAY)Portfolio of Investments (Continued)August 31, 2024
Valuation InputsA summary of the inputs used to value the Fund’s investments as of August 31, 2024 is as follows (see Note 2A - Portfolio Valuation in the Notes to Financial Statements):
|
| | | Level 2
Significant
Observable
Inputs | Level 3
Significant
Unobservable
Inputs |
| | | | |
| | | | |
| | | | |
|
| | | Level 2
Significant
Observable
Inputs | Level 3
Significant
Unobservable
Inputs |
| | | | |
See Notes to Financial Statements
FT Vest U.S. Equity Deep Buffer ETF - May (DMAY)Portfolio of InvestmentsAugust 31, 2024
| | |
MONEY MARKET FUNDS — 0.9% |
| Dreyfus Government Cash Management Fund, Institutional Shares - 5.19% (a) | |
| | |
| | |
| | |
| | | | | |
PURCHASED OPTIONS — 101.5% |
| Call Options Purchased — 99.8% | |
| | | | | |
| | | | | |
| Put Options Purchased — 1.7% | |
| | | | | |
| | | | | |
| | |
| | |
|
| Call Options Written — (1.9)% | |
| | | | | |
| (Premiums received $3,870,189) | | | | |
| Put Options Written — (0.4)% | |
| | | | | |
| (Premiums received $1,945,144) | | | | |
| | |
| (Premiums received $5,815,333) | |
| Net Other Assets and Liabilities — (0.1)% | |
| | |
| Rate shown reflects yield as of August 31, 2024. |
| |
| |
| |
| |
Net Other Assets and Liabilities | |
| |
See Notes to Financial Statements
FT Vest U.S. Equity Deep Buffer ETF - May (DMAY)Portfolio of Investments (Continued)August 31, 2024
Valuation InputsA summary of the inputs used to value the Fund’s investments as of August 31, 2024 is as follows (see Note 2A - Portfolio Valuation in the Notes to Financial Statements):
|
| | | Level 2
Significant
Observable
Inputs | Level 3
Significant
Unobservable
Inputs |
| | | | |
| | | | |
| | | | |
|
| | | Level 2
Significant
Observable
Inputs | Level 3
Significant
Unobservable
Inputs |
| | | | |
See Notes to Financial Statements
FT Vest U.S. Equity Buffer ETF - June (FJUN)Portfolio of InvestmentsAugust 31, 2024
| | |
MONEY MARKET FUNDS — 1.0% |
| Dreyfus Government Cash Management Fund, Institutional Shares - 5.19% (a) | |
| | |
| | |
| | |
| | | | | |
PURCHASED OPTIONS — 101.9% |
| Call Options Purchased — 98.7% | |
| | | | | |
| | | | | |
| Put Options Purchased — 3.2% | |
| | | | | |
| | | | | |
| | |
| | |
|
| Call Options Written — (1.2)% | |
| | | | | |
| (Premiums received $8,458,214) | | | | |
| Put Options Written — (1.6)% | |
| | | | | |
| (Premiums received $19,996,773) | | | | |
| | |
| (Premiums received $28,454,987) | |
| Net Other Assets and Liabilities — (0.1)% | |
| | |
| Rate shown reflects yield as of August 31, 2024. |
| |
| |
| |
| |
Net Other Assets and Liabilities | |
| |
See Notes to Financial Statements
FT Vest U.S. Equity Buffer ETF - June (FJUN)Portfolio of Investments (Continued)August 31, 2024
Valuation InputsA summary of the inputs used to value the Fund’s investments as of August 31, 2024 is as follows (see Note 2A - Portfolio Valuation in the Notes to Financial Statements):
|
| | | Level 2
Significant
Observable
Inputs | Level 3
Significant
Unobservable
Inputs |
| | | | |
| | | | |
| | | | |
|
| | | Level 2
Significant
Observable
Inputs | Level 3
Significant
Unobservable
Inputs |
| | | | |
See Notes to Financial Statements
FT Vest U.S. Equity Deep Buffer ETF - June (DJUN)Portfolio of InvestmentsAugust 31, 2024
| | |
MONEY MARKET FUNDS — 1.0% |
| Dreyfus Government Cash Management Fund, Institutional Shares - 5.19% (a) | |
| | |
| | |
| | |
| | | | | |
PURCHASED OPTIONS — 101.1% |
| Call Options Purchased — 98.9% | |
| | | | | |
| | | | | |
| Put Options Purchased — 2.2% | |
| | | | | |
| | | | | |
| | |
| | |
|
| Call Options Written — (1.5)% | |
| | | | | |
| (Premiums received $2,905,884) | | | | |
| Put Options Written — (0.5)% | |
| | | | | |
| (Premiums received $1,802,810) | | | | |
| | |
| (Premiums received $4,708,694) | |
| Net Other Assets and Liabilities — (0.1)% | |
| | |
| Rate shown reflects yield as of August 31, 2024. |
| |
| |
| |
| |
Net Other Assets and Liabilities | |
| |
See Notes to Financial Statements
FT Vest U.S. Equity Deep Buffer ETF - June (DJUN)Portfolio of Investments (Continued)August 31, 2024
Valuation InputsA summary of the inputs used to value the Fund’s investments as of August 31, 2024 is as follows (see Note 2A - Portfolio Valuation in the Notes to Financial Statements):
|
| | | Level 2
Significant
Observable
Inputs | Level 3
Significant
Unobservable
Inputs |
| | | | |
| | | | |
| | | | |
|
| | | Level 2
Significant
Observable
Inputs | Level 3
Significant
Unobservable
Inputs |
| | | | |
See Notes to Financial Statements
FT Vest U.S. Equity Buffer ETF - July (FJUL)Portfolio of InvestmentsAugust 31, 2024
| | |
MONEY MARKET FUNDS — 1.1% |
| Dreyfus Government Cash Management Fund, Institutional Shares - 5.19% (a) | |
| | |
| | |
| | |
| | | | | |
PURCHASED OPTIONS — 102.1% |
| Call Options Purchased — 98.6% | |
| | | | | |
| | | | | |
| Put Options Purchased — 3.5% | |
| | | | | |
| | | | | |
| | |
| | |
|
| Call Options Written — (1.3)% | |
| | | | | |
| (Premiums received $11,135,667) | | | | |
| Put Options Written — (1.8)% | |
| | | | | |
| (Premiums received $18,977,822) | | | | |
| | |
| (Premiums received $30,113,489) | |
| Net Other Assets and Liabilities — (0.1)% | |
| | |
| Rate shown reflects yield as of August 31, 2024. |
| |
| |
| |
| |
Net Other Assets and Liabilities | |
| |
See Notes to Financial Statements
FT Vest U.S. Equity Buffer ETF - July (FJUL)Portfolio of Investments (Continued)August 31, 2024
Valuation InputsA summary of the inputs used to value the Fund’s investments as of August 31, 2024 is as follows (see Note 2A - Portfolio Valuation in the Notes to Financial Statements):
|
| | | Level 2
Significant
Observable
Inputs | Level 3
Significant
Unobservable
Inputs |
| | | | |
| | | | |
| | | | |
|
| | | Level 2
Significant
Observable
Inputs | Level 3
Significant
Unobservable
Inputs |
| | | | |
See Notes to Financial Statements
FT Vest U.S. Equity Deep Buffer ETF - July (DJUL)Portfolio of InvestmentsAugust 31, 2024
| | |
MONEY MARKET FUNDS — 1.0% |
| Dreyfus Government Cash Management Fund, Institutional Shares - 5.19% (a) | |
| | |
| | |
| | |
| | | | | |
PURCHASED OPTIONS — 101.3% |
| Call Options Purchased — 98.7% | |
| | | | | |
| | | | | |
| Put Options Purchased — 2.6% | |
| | | | | |
| | | | | |
| | |
| | |
|
| Call Options Written — (1.7)% | |
| | | | | |
| (Premiums received $6,109,316) | | | | |
| Put Options Written — (0.5)% | |
| | | | | |
| (Premiums received $2,449,523) | | | | |
| | |
| (Premiums received $8,558,839) | |
| Net Other Assets and Liabilities — (0.1)% | |
| | |
| Rate shown reflects yield as of August 31, 2024. |
| |
| |
| |
| |
Net Other Assets and Liabilities | |
| |
See Notes to Financial Statements
FT Vest U.S. Equity Deep Buffer ETF - July (DJUL)Portfolio of Investments (Continued)August 31, 2024
Valuation InputsA summary of the inputs used to value the Fund’s investments as of August 31, 2024 is as follows (see Note 2A - Portfolio Valuation in the Notes to Financial Statements):
|
| | | Level 2
Significant
Observable
Inputs | Level 3
Significant
Unobservable
Inputs |
| | | | |
| | | | |
| | | | |
|
| | | Level 2
Significant
Observable
Inputs | Level 3
Significant
Unobservable
Inputs |
| | | | |
See Notes to Financial Statements
FT Vest U.S. Equity Buffer ETF - August (FAUG)Portfolio of InvestmentsAugust 31, 2024
| | |
MONEY MARKET FUNDS — 1.1% |
| Dreyfus Government Cash Management Fund, Institutional Shares - 5.19% (a) | |
| | |
| | |
| | |
| | | | | |
PURCHASED OPTIONS — 102.6% |
| Call Options Purchased — 98.7% | |
| | | | | |
| | | | | |
| Put Options Purchased — 3.9% | |
| | | | | |
| | | | | |
| | |
| | |
|
| Call Options Written — (1.6)% | |
| | | | | |
| (Premiums received $7,879,917) | | | | |
| Put Options Written — (2.0)% | |
| | | | | |
| (Premiums received $18,989,860) | | | | |
| | |
| (Premiums received $26,869,777) | |
| Net Other Assets and Liabilities — (0.1)% | |
| | |
| Rate shown reflects yield as of August 31, 2024. |
| |
| |
| |
| |
Net Other Assets and Liabilities | |
| |
See Notes to Financial Statements
FT Vest U.S. Equity Buffer ETF - August (FAUG)Portfolio of Investments (Continued)August 31, 2024
Valuation InputsA summary of the inputs used to value the Fund’s investments as of August 31, 2024 is as follows (see Note 2A - Portfolio Valuation in the Notes to Financial Statements):
|
| | | Level 2
Significant
Observable
Inputs | Level 3
Significant
Unobservable
Inputs |
| | | | |
| | | | |
| | | | |
|
| | | Level 2
Significant
Observable
Inputs | Level 3
Significant
Unobservable
Inputs |
| | | | |
See Notes to Financial Statements
FT Vest U.S. Equity Deep Buffer ETF - August (DAUG)Portfolio of InvestmentsAugust 31, 2024
| | |
MONEY MARKET FUNDS — 1.1% |
| Dreyfus Government Cash Management Fund, Institutional Shares - 5.19% (a) | |
| | |
| | |
| | |
| | | | | |
PURCHASED OPTIONS — 101.7% |
| Call Options Purchased — 98.8% | |
| | | | | |
| | | | | |
| Put Options Purchased — 2.9% | |
| | | | | |
| | | | | |
| | |
| | |
|
| Call Options Written — (2.1)% | |
| | | | | |
| (Premiums received $3,243,370) | | | | |
| Put Options Written — (0.6)% | |
| | | | | |
| (Premiums received $2,128,767) | | | | |
| | |
| (Premiums received $5,372,137) | |
| Net Other Assets and Liabilities — (0.1)% | |
| | |
| Rate shown reflects yield as of August 31, 2024. |
| |
| |
| |
| |
Net Other Assets and Liabilities | |
| |
See Notes to Financial Statements
FT Vest U.S. Equity Deep Buffer ETF - August (DAUG)Portfolio of Investments (Continued)August 31, 2024
Valuation InputsA summary of the inputs used to value the Fund’s investments as of August 31, 2024 is as follows (see Note 2A - Portfolio Valuation in the Notes to Financial Statements):
|
| | | Level 2
Significant
Observable
Inputs | Level 3
Significant
Unobservable
Inputs |
| | | | |
| | | | |
| | | | |
|
| | | Level 2
Significant
Observable
Inputs | Level 3
Significant
Unobservable
Inputs |
| | | | |
See Notes to Financial Statements
FT Vest U.S. Equity Buffer ETF - September (FSEP)Portfolio of InvestmentsAugust 31, 2024
| | |
MONEY MARKET FUNDS — 0.3% |
| Dreyfus Government Cash Management Fund, Institutional Shares - 5.19% (a) | |
| | |
| | |
| | |
| | | | | |
PURCHASED OPTIONS — 107.5% |
| Call Options Purchased — 107.5% | |
| | | | | |
| | | | | |
| Put Options Purchased — 0.0% | |
| | | | | |
| | | | | |
| | |
| | |
|
| Call Options Written — (7.7)% | |
| | | | | |
| (Premiums received $11,833,502) | | | | |
| Put Options Written — (0.0)% | |
| | | | | |
| (Premiums received $9,528,477) | | | | |
| | |
| (Premiums received $21,361,979) | |
| Net Other Assets and Liabilities — (0.1)% | |
| | |
| Rate shown reflects yield as of August 31, 2024. |
| |
| |
| |
| |
Net Other Assets and Liabilities | |
| |
See Notes to Financial Statements
FT Vest U.S. Equity Buffer ETF - September (FSEP)Portfolio of Investments (Continued)August 31, 2024
Valuation InputsA summary of the inputs used to value the Fund’s investments as of August 31, 2024 is as follows (see Note 2A - Portfolio Valuation in the Notes to Financial Statements):
|
| | | Level 2
Significant
Observable
Inputs | Level 3
Significant
Unobservable
Inputs |
| | | | |
| | | | |
| | | | |
|
| | | Level 2
Significant
Observable
Inputs | Level 3
Significant
Unobservable
Inputs |
| | | | |
See Notes to Financial Statements
FT Vest U.S. Equity Deep Buffer ETF - September (DSEP)Portfolio of InvestmentsAugust 31, 2024
| | |
MONEY MARKET FUNDS — 0.3% |
| Dreyfus Government Cash Management Fund, Institutional Shares - 5.19% (a) | |
| | |
| | |
| | |
| | | | | |
PURCHASED OPTIONS — 110.2% |
| Call Options Purchased — 110.2% | |
| | | | | |
| | | | | |
| Put Options Purchased — 0.0% | |
| | | | | |
| | | | | |
| | |
| | |
WRITTEN OPTIONS — (10.4)% |
| Call Options Written — (10.4)% | |
| | | | | |
| (Premiums received $1,997,915) | | | | |
| Put Options Written — (0.0)% | |
| | | | | |
| (Premiums received $1,142,993) | | | | |
| | |
| (Premiums received $3,140,908) | |
| Net Other Assets and Liabilities — (0.1)% | |
| | |
| Rate shown reflects yield as of August 31, 2024. |
| |
| |
| |
| |
Net Other Assets and Liabilities | |
| |
See Notes to Financial Statements
FT Vest U.S. Equity Deep Buffer ETF - September (DSEP)Portfolio of Investments (Continued)August 31, 2024
Valuation InputsA summary of the inputs used to value the Fund’s investments as of August 31, 2024 is as follows (see Note 2A - Portfolio Valuation in the Notes to Financial Statements):
|
| | | Level 2
Significant
Observable
Inputs | Level 3
Significant
Unobservable
Inputs |
| | | | |
| | | | |
| | | | |
|
| | | Level 2
Significant
Observable
Inputs | Level 3
Significant
Unobservable
Inputs |
| | | | |
See Notes to Financial Statements
FT Vest U.S. Equity Buffer ETF - October (FOCT)Portfolio of InvestmentsAugust 31, 2024
| | |
MONEY MARKET FUNDS — 0.4% |
| Dreyfus Government Cash Management Fund, Institutional Shares - 5.19% (a) | |
| | |
| | |
| | |
| | | | | |
PURCHASED OPTIONS — 113.2% |
| Call Options Purchased — 113.2% | |
| | | | | |
| | | | | |
| Put Options Purchased — 0.0% | |
| | | | | |
| | | | | |
| | |
| | |
WRITTEN OPTIONS — (13.5)% |
| Call Options Written — (13.5)% | |
| | | | | |
| (Premiums received $12,958,267) | | | | |
| Put Options Written — (0.0)% | |
| | | | | |
| (Premiums received $12,814,855) | | | | |
| | |
| (Premiums received $25,773,122) | |
| Net Other Assets and Liabilities — (0.1)% | |
| | |
| Rate shown reflects yield as of August 31, 2024. |
| |
| |
| |
| |
Net Other Assets and Liabilities | |
| |
See Notes to Financial Statements
FT Vest U.S. Equity Buffer ETF - October (FOCT)Portfolio of Investments (Continued)August 31, 2024
Valuation InputsA summary of the inputs used to value the Fund’s investments as of August 31, 2024 is as follows (see Note 2A - Portfolio Valuation in the Notes to Financial Statements):
|
| | | Level 2
Significant
Observable
Inputs | Level 3
Significant
Unobservable
Inputs |
| | | | |
| | | | |
| | | | |
|
| | | Level 2
Significant
Observable
Inputs | Level 3
Significant
Unobservable
Inputs |
| | | | |
See Notes to Financial Statements
FT Vest U.S. Equity Deep Buffer ETF - October (DOCT)Portfolio of InvestmentsAugust 31, 2024
| | |
MONEY MARKET FUNDS — 0.4% |
| Dreyfus Government Cash Management Fund, Institutional Shares - 5.19% (a) | |
| | |
| | |
| | |
| | | | | |
PURCHASED OPTIONS — 116.6% |
| Call Options Purchased — 116.5% | |
| | | | | |
| | | | | |
| Put Options Purchased — 0.1% | |
| | | | | |
| | | | | |
| | |
| | |
WRITTEN OPTIONS — (16.9)% |
| Call Options Written — (16.9)% | |
| | | | | |
| (Premiums received $3,817,664) | | | | |
| Put Options Written — (0.0)% | |
| | | | | |
| (Premiums received $1,293,530) | | | | |
| | |
| (Premiums received $5,111,194) | |
| Net Other Assets and Liabilities — (0.1)% | |
| | |
| Rate shown reflects yield as of August 31, 2024. |
| |
| |
| |
| |
Net Other Assets and Liabilities | |
| |
See Notes to Financial Statements
FT Vest U.S. Equity Deep Buffer ETF - October (DOCT)Portfolio of Investments (Continued)August 31, 2024
Valuation InputsA summary of the inputs used to value the Fund’s investments as of August 31, 2024 is as follows (see Note 2A - Portfolio Valuation in the Notes to Financial Statements):
|
| | | Level 2
Significant
Observable
Inputs | Level 3
Significant
Unobservable
Inputs |
| | | | |
| | | | |
| | | | |
|
| | | Level 2
Significant
Observable
Inputs | Level 3
Significant
Unobservable
Inputs |
| | | | |
See Notes to Financial Statements
FT Vest U.S. Equity Buffer ETF - November (FNOV)Portfolio of InvestmentsAugust 31, 2024
| | |
MONEY MARKET FUNDS — 0.5% |
| Dreyfus Government Cash Management Fund, Institutional Shares - 5.19% (a) | |
| | |
| | |
| | |
| | | | | |
PURCHASED OPTIONS — 108.2% |
| Call Options Purchased — 108.0% | |
| | | | | |
| | | | | |
| Put Options Purchased — 0.2% | |
| | | | | |
| | | | | |
| | |
| | |
|
| Call Options Written — (8.5)% | |
| | | | | |
| (Premiums received $10,309,087) | | | | |
| Put Options Written — (0.1)% | |
| | | | | |
| (Premiums received $17,064,493) | | | | |
| | |
| (Premiums received $27,373,580) | |
| Net Other Assets and Liabilities — (0.1)% | |
| | |
| Rate shown reflects yield as of August 31, 2024. |
| |
| |
| |
| |
Net Other Assets and Liabilities | |
| |
See Notes to Financial Statements
FT Vest U.S. Equity Buffer ETF - November (FNOV)Portfolio of Investments (Continued)August 31, 2024
Valuation InputsA summary of the inputs used to value the Fund’s investments as of August 31, 2024 is as follows (see Note 2A - Portfolio Valuation in the Notes to Financial Statements):
|
| | | Level 2
Significant
Observable
Inputs | Level 3
Significant
Unobservable
Inputs |
| | | | |
| | | | |
| | | | |
|
| | | Level 2
Significant
Observable
Inputs | Level 3
Significant
Unobservable
Inputs |
| | | | |
See Notes to Financial Statements
FT Vest U.S. Equity Deep Buffer ETF - November (DNOV)Portfolio of InvestmentsAugust 31, 2024
| | |
MONEY MARKET FUNDS — 0.4% |
| Dreyfus Government Cash Management Fund, Institutional Shares - 5.19% (a) | |
| | |
| | |
| | |
| | | | | |
PURCHASED OPTIONS — 110.2% |
| Call Options Purchased — 110.0% | |
| | | | | |
| | | | | |
| Put Options Purchased — 0.2% | |
| | | | | |
| | | | | |
| | |
| | |
WRITTEN OPTIONS — (10.5)% |
| Call Options Written — (10.5)% | |
| | | | | |
| (Premiums received $4,396,098) | | | | |
| Put Options Written — (0.0)% | |
| | | | | |
| (Premiums received $1,657,951) | | | | |
| | |
| (Premiums received $6,054,049) | |
| Net Other Assets and Liabilities — (0.1)% | |
| | |
| Rate shown reflects yield as of August 31, 2024. |
| |
| |
| |
| |
Net Other Assets and Liabilities | |
| |
See Notes to Financial Statements
FT Vest U.S. Equity Deep Buffer ETF - November (DNOV)Portfolio of Investments (Continued)August 31, 2024
Valuation InputsA summary of the inputs used to value the Fund’s investments as of August 31, 2024 is as follows (see Note 2A - Portfolio Valuation in the Notes to Financial Statements):
|
| | | Level 2
Significant
Observable
Inputs | Level 3
Significant
Unobservable
Inputs |
| | | | |
| | | | |
| | | | |
|
| | | Level 2
Significant
Observable
Inputs | Level 3
Significant
Unobservable
Inputs |
| | | | |
See Notes to Financial Statements
FT Vest U.S. Equity Buffer ETF - December (FDEC)Portfolio of InvestmentsAugust 31, 2024
| | |
MONEY MARKET FUNDS — 0.5% |
| Dreyfus Government Cash Management Fund, Institutional Shares - 5.19% (a) | |
| | |
| | |
| | |
| | | | | |
PURCHASED OPTIONS — 105.8% |
| Call Options Purchased — 105.3% | |
| | | | | |
| | | | | |
| Put Options Purchased — 0.5% | |
| | | | | |
| | | | | |
| | |
| | |
|
| Call Options Written — (6.0)% | |
| | | | | |
| (Premiums received $7,134,320) | | | | |
| Put Options Written — (0.2)% | |
| | | | | |
| (Premiums received $13,564,121) | | | | |
| | |
| (Premiums received $20,698,441) | |
| Net Other Assets and Liabilities — (0.1)% | |
| | |
| Rate shown reflects yield as of August 31, 2024. |
| |
| |
| |
| |
Net Other Assets and Liabilities | |
| |
See Notes to Financial Statements
FT Vest U.S. Equity Buffer ETF - December (FDEC)Portfolio of Investments (Continued)August 31, 2024
Valuation InputsA summary of the inputs used to value the Fund’s investments as of August 31, 2024 is as follows (see Note 2A - Portfolio Valuation in the Notes to Financial Statements):
|
| | | Level 2
Significant
Observable
Inputs | Level 3
Significant
Unobservable
Inputs |
| | | | |
| | | | |
| | | | |
|
| | | Level 2
Significant
Observable
Inputs | Level 3
Significant
Unobservable
Inputs |
| | | | |
See Notes to Financial Statements
FT Vest U.S. Equity Deep Buffer ETF - December (DDEC)Portfolio of InvestmentsAugust 31, 2024
| | |
MONEY MARKET FUNDS — 0.5% |
| Dreyfus Government Cash Management Fund, Institutional Shares - 5.19% (a) | |
| | |
| | |
| | |
| | | | | |
PURCHASED OPTIONS — 107.5% |
| Call Options Purchased — 107.1% | |
| | | | | |
| | | | | |
| Put Options Purchased — 0.4% | |
| | | | | |
| | | | | |
| | |
| | |
|
| Call Options Written — (7.8)% | |
| | | | | |
| (Premiums received $4,456,196) | | | | |
| Put Options Written — (0.1)% | |
| | | | | |
| (Premiums received $1,843,551) | | | | |
| | |
| (Premiums received $6,299,747) | |
| Net Other Assets and Liabilities — (0.1)% | |
| | |
| Rate shown reflects yield as of August 31, 2024. |
| |
| |
| |
| |
Net Other Assets and Liabilities | |
| |
See Notes to Financial Statements
FT Vest U.S. Equity Deep Buffer ETF - December (DDEC)Portfolio of Investments (Continued)August 31, 2024
Valuation InputsA summary of the inputs used to value the Fund’s investments as of August 31, 2024 is as follows (see Note 2A - Portfolio Valuation in the Notes to Financial Statements):
|
| | | Level 2
Significant
Observable
Inputs | Level 3
Significant
Unobservable
Inputs |
| | | | |
| | | | |
| | | | |
|
| | | Level 2
Significant
Observable
Inputs | Level 3
Significant
Unobservable
Inputs |
| | | | |
See Notes to Financial Statements
FT Vest Buffered Allocation Defensive ETF (BUFT)Portfolio of InvestmentsAugust 31, 2024
| | |
EXCHANGE-TRADED FUNDS — 99.7% |
| Capital Markets (a) — 99.7% | |
| FT Vest U.S. Equity Enhance & Moderate Buffer ETF - September (b) | |
| FT Vest U.S. Equity Moderate Buffer ETF - September (b) | |
| FT Vest U.S. Equity Buffer ETF - October (b) | |
| FT Vest U.S. Equity Deep Buffer ETF - October (b) | |
| FT Vest U.S. Equity Enhance & Moderate Buffer ETF - October (b) | |
| FT Vest U.S. Equity Moderate Buffer ETF - October (b) | |
| FT Vest U.S. Equity Enhance & Moderate Buffer ETF - November (b) | |
| Total Exchange-Traded Funds | |
| | |
MONEY MARKET FUNDS — 0.3% |
| Morgan Stanley Institutional Liquidity Funds - Treasury Portfolio - Institutional Class - 5.12% (c) | |
| | |
|
|
| Total Investments — 100.0% | |
| | |
| Net Other Assets and Liabilities — (0.0)% | |
| | |
| Represents investments in affiliated funds. |
| Non-income producing security. |
| Rate shown reflects yield as of August 31, 2024. |
| |
| |
| |
Net Other Assets and Liabilities | |
| |
| Amount is less than 0.1%. |
Valuation InputsA summary of the inputs used to value the Fund’s investments as of August 31, 2024 is as follows (see Note 2A - Portfolio Valuation in the Notes to Financial Statements):
| | | Level 2
Significant
Observable
Inputs | Level 3
Significant
Unobservable
Inputs |
| | | | |
| | | | |
| | | | |
| See Portfolio of Investments for industry breakout. |
See Notes to Financial Statements
FT Vest Buffered Allocation Growth ETF (BUFG)Portfolio of InvestmentsAugust 31, 2024
| | |
EXCHANGE-TRADED FUNDS — 99.7% |
| Capital Markets (a) — 99.7% | |
| FT Vest U.S. Equity Buffer ETF - February (b) | |
| FT Vest U.S. Equity Buffer ETF - March (b) | |
| FT Vest U.S. Equity Buffer ETF - April (b) | |
| FT Vest U.S. Equity Buffer ETF - May (b) | |
| FT Vest U.S. Equity Deep Buffer ETF - May (b) | |
| FT Vest U.S. Equity Buffer ETF - June (b) | |
| FT Vest U.S. Equity Moderate Buffer ETF - June (b) | |
| Total Exchange-Traded Funds | |
| | |
MONEY MARKET FUNDS — 0.3% |
| Morgan Stanley Institutional Liquidity Funds - Treasury Portfolio - Institutional Class - 5.12% (c) | |
| | |
|
|
| Total Investments — 100.0% | |
| | |
| Net Other Assets and Liabilities — (0.0)% | |
| | |
| Represents investments in affiliated funds. |
| Non-income producing security. |
| Rate shown reflects yield as of August 31, 2024. |
| |
| |
| |
Net Other Assets and Liabilities | |
| |
| Amount is less than 0.1%. |
Valuation InputsA summary of the inputs used to value the Fund’s investments as of August 31, 2024 is as follows (see Note 2A - Portfolio Valuation in the Notes to Financial Statements):
| | | Level 2
Significant
Observable
Inputs | Level 3
Significant
Unobservable
Inputs |
| | | | |
| | | | |
| | | | |
| See Portfolio of Investments for industry breakout. |
See Notes to Financial Statements
This page intentionally left blank.
First Trust Exchange-Traded Fund VIIIStatements of Assets and Liabilities
August 31, 2024
| FT Vest U.S. Equity Buffer ETF - January
(FJAN) | FT Vest U.S. Equity Deep Buffer ETF - January
(DJAN) | FT Vest U.S. Equity Buffer ETF - February
(FFEB) | FT Vest U.S. Equity Deep Buffer ETF - February
(DFEB) |
| | | | |
Investments, at value - Unaffiliated | | | | |
Investments, at value - Affiliated | | | | |
Total investments, at value | | | | |
Options contracts purchased, at value | | | | |
| | | | |
| | | | |
| | | | |
| | | | |
Investment securities sold | | | | |
| | | | |
| | | | |
|
| | | | |
Options contracts written, at value | | | | |
| | | | |
| | | | |
Investment securities purchased | | | | |
| | | | |
| | | | |
| | | | |
| | | | |
|
| | | | |
| | | | |
| | | | |
Accumulated distributable earnings (loss) | | | | |
| | | | |
NET ASSET VALUE, per share | | | | |
Number of shares outstanding (unlimited number of shares authorized, par value $0.01 per share) | | | | |
Investments, at cost - Unaffiliated | | | | |
Investments, at cost - Affiliated | | | | |
Total investments, at cost | | | | |
Premiums paid on options contracts purchased | | | | |
Premiums received on options contracts written | | | | |
See Notes to Financial Statements
FT Vest U.S. Equity Buffer ETF - March
(FMAR) | FT Vest U.S. Equity Deep Buffer ETF - March
(DMAR) | FT Vest U.S. Equity Buffer ETF - April
(FAPR) | FT Vest U.S. Equity Deep Buffer ETF - April
(DAPR) | FT Vest U.S. Equity Buffer ETF - May
(FMAY) | FT Vest U.S. Equity Deep Buffer ETF - May
(DMAY) |
| | | | | |
| | | | | |
| | | | | |
| | | | | |
| | | | | |
| | | | | |
| | | | | |
| | | | | |
| | | | | |
| | | | | |
| | | | | |
| | | | | |
|
| | | | | |
| | | | | |
| | | | | |
| | | | | |
| | | | | |
| | | | | |
| | | | | |
| | | | | |
| | | | | |
|
| | | | | |
| | | | | |
| | | | | |
| | | | | |
| | | | | |
| | | | | |
| | | | | |
| | | | | |
| | | | | |
| | | | | |
| | | | | |
| | | | | |
See Notes to Financial Statements
First Trust Exchange-Traded Fund VIIIStatements of Assets and Liabilities (Continued)
August 31, 2024
| FT Vest U.S. Equity Buffer ETF - June
(FJUN) | FT Vest U.S. Equity Deep Buffer ETF - June
(DJUN) | FT Vest U.S. Equity Buffer ETF - July
(FJUL) | FT Vest U.S. Equity Deep Buffer ETF - July
(DJUL) |
| | | | |
Investments, at value - Unaffiliated | | | | |
Investments, at value - Affiliated | | | | |
Total investments, at value | | | | |
Options contracts purchased, at value | | | | |
| | | | |
| | | | |
| | | | |
| | | | |
Investment securities sold | | | | |
| | | | |
| | | | |
|
| | | | |
Options contracts written, at value | | | | |
| | | | |
| | | | |
Investment securities purchased | | | | |
| | | | |
| | | | |
| | | | |
| | | | |
|
| | | | |
| | | | |
| | | | |
Accumulated distributable earnings (loss) | | | | |
| | | | |
NET ASSET VALUE, per share | | | | |
Number of shares outstanding (unlimited number of shares authorized, par value $0.01 per share) | | | | |
Investments, at cost - Unaffiliated | | | | |
Investments, at cost - Affiliated | | | | |
Total investments, at cost | | | | |
Premiums paid on options contracts purchased | | | | |
Premiums received on options contracts written | | | | |
See Notes to Financial Statements
FT Vest U.S. Equity Buffer ETF - August
(FAUG) | FT Vest U.S. Equity Deep Buffer ETF - August
(DAUG) | FT Vest U.S. Equity Buffer ETF - September
(FSEP) | FT Vest U.S. Equity Deep Buffer ETF - September
(DSEP) | FT Vest U.S. Equity Buffer ETF - October
(FOCT) | FT Vest U.S. Equity Deep Buffer ETF - October
(DOCT) |
| | | | | |
| | | | | |
| | | | | |
| | | | | |
| | | | | |
| | | | | |
| | | | | |
| | | | | |
| | | | | |
| | | | | |
| | | | | |
| | | | | |
|
| | | | | |
| | | | | |
| | | | | |
| | | | | |
| | | | | |
| | | | | |
| | | | | |
| | | | | |
| | | | | |
|
| | | | | |
| | | | | |
| | | | | |
| | | | | |
| | | | | |
| | | | | |
| | | | | |
| | | | | |
| | | | | |
| | | | | |
| | | | | |
| | | | | |
See Notes to Financial Statements
First Trust Exchange-Traded Fund VIIIStatements of Assets and Liabilities (Continued)
August 31, 2024
| FT Vest U.S. Equity Buffer ETF - November
(FNOV) | FT Vest U.S. Equity Deep Buffer ETF - November
(DNOV) | FT Vest U.S. Equity Buffer ETF - December
(FDEC) | FT Vest U.S. Equity Deep Buffer ETF - December
(DDEC) |
| | | | |
Investments, at value - Unaffiliated | | | | |
Investments, at value - Affiliated | | | | |
Total investments, at value | | | | |
Options contracts purchased, at value | | | | |
| | | | |
| | | | |
| | | | |
| | | | |
Investment securities sold | | | | |
| | | | |
| | | | |
|
| | | | |
Options contracts written, at value | | | | |
| | | | |
| | | | |
Investment securities purchased | | | | |
| | | | |
| | | | |
| | | | |
| | | | |
|
| | | | |
| | | | |
| | | | |
Accumulated distributable earnings (loss) | | | | |
| | | | |
NET ASSET VALUE, per share | | | | |
Number of shares outstanding (unlimited number of shares authorized, par value $0.01 per share) | | | | |
Investments, at cost - Unaffiliated | | | | |
Investments, at cost - Affiliated | | | | |
Total investments, at cost | | | | |
Premiums paid on options contracts purchased | | | | |
Premiums received on options contracts written | | | | |
See Notes to Financial Statements
FT Vest Buffered Allocation Defensive ETF
(BUFT) | FT Vest Buffered Allocation Growth ETF
(BUFG) |
| |
| |
| |
| |
| |
| |
| |
| |
| |
| |
| |
| |
|
| |
| |
| |
| |
| |
| |
| |
| |
| |
|
| |
| |
| |
| |
| |
| |
| |
| |
| |
| |
| |
| |
See Notes to Financial Statements
First Trust Exchange-Traded Fund VIIIStatements of Operations
For the Year Ended August 31, 2024
| FT Vest U.S. Equity Buffer ETF - January
(FJAN) | FT Vest U.S. Equity Deep Buffer ETF - January
(DJAN) | FT Vest U.S. Equity Buffer ETF - February
(FFEB) | FT Vest U.S. Equity Deep Buffer ETF - February
(DFEB) |
| | | | |
| | | | |
| | | | |
|
| | | | |
| | | | |
| | | | |
NET INVESTMENT INCOME (LOSS) | | | | |
|
NET REALIZED AND UNREALIZED GAIN (LOSS): | | | | |
Net realized gain (loss) on: | | | | |
| | | | |
In-kind redemptions - Affiliated | | | | |
Purchased options contracts | | | | |
Written options contracts | | | | |
In-kind redemptions - Purchased options contracts | | | | |
In-kind redemptions - Written options contracts | | | | |
| | | | |
Net change in unrealized appreciation (depreciation) on: | | | | |
| | | | |
Purchased options contracts | | | | |
Written options contracts | | | | |
Net change in unrealized appreciation (depreciation) | | | | |
NET REALIZED AND UNREALIZED GAIN (LOSS) | | | | |
NET INCREASE (DECREASE) IN NET ASSETS RESULTING FROM OPERATIONS | | | | |
See Notes to Financial Statements
FT Vest U.S. Equity Buffer ETF - March
(FMAR) | FT Vest U.S. Equity Deep Buffer ETF - March
(DMAR) | FT Vest U.S. Equity Buffer ETF - April
(FAPR) | FT Vest U.S. Equity Deep Buffer ETF - April
(DAPR) | FT Vest U.S. Equity Buffer ETF - May
(FMAY) | FT Vest U.S. Equity Deep Buffer ETF - May
(DMAY) |
| | | | | |
| | | | | |
| | | | | |
|
| | | | | |
| | | | | |
| | | | | |
| | | | | |
|
| | | | | |
| | | | | |
| | | | | |
| | | | | |
| | | | | |
| | | | | |
| | | | | |
| | | | | |
| | | | | |
| | | | | |
| | | | | |
| | | | | |
| | | | | |
| | | | | |
| | | | | |
| | | | | |
See Notes to Financial Statements
First Trust Exchange-Traded Fund VIIIStatements of Operations (Continued)
For the Year Ended August 31, 2024
| FT Vest U.S. Equity Buffer ETF - June
(FJUN) | FT Vest U.S. Equity Deep Buffer ETF - June
(DJUN) | FT Vest U.S. Equity Buffer ETF - July
(FJUL) | FT Vest U.S. Equity Deep Buffer ETF - July
(DJUL) |
| | | | |
| | | | |
| | | | |
|
| | | | |
| | | | |
| | | | |
NET INVESTMENT INCOME (LOSS) | | | | |
|
NET REALIZED AND UNREALIZED GAIN (LOSS): | | | | |
Net realized gain (loss) on: | | | | |
| | | | |
In-kind redemptions - Affiliated | | | | |
Purchased options contracts | | | | |
Written options contracts | | | | |
In-kind redemptions - Purchased options contracts | | | | |
In-kind redemptions - Written options contracts | | | | |
| | | | |
Net change in unrealized appreciation (depreciation) on: | | | | |
| | | | |
Purchased options contracts | | | | |
Written options contracts | | | | |
Net change in unrealized appreciation (depreciation) | | | | |
NET REALIZED AND UNREALIZED GAIN (LOSS) | | | | |
NET INCREASE (DECREASE) IN NET ASSETS RESULTING FROM OPERATIONS | | | | |
See Notes to Financial Statements
FT Vest U.S. Equity Buffer ETF - August
(FAUG) | FT Vest U.S. Equity Deep Buffer ETF - August
(DAUG) | FT Vest U.S. Equity Buffer ETF - September
(FSEP) | FT Vest U.S. Equity Deep Buffer ETF - September
(DSEP) | FT Vest U.S. Equity Buffer ETF - October
(FOCT) | FT Vest U.S. Equity Deep Buffer ETF - October
(DOCT) |
| | | | | |
| | | | | |
| | | | | |
|
| | | | | |
| | | | | |
| | | | | |
| | | | | |
|
| | | | | |
| | | | | |
| | | | | |
| | | | | |
| | | | | |
| | | | | |
| | | | | |
| | | | | |
| | | | | |
| | | | | |
| | | | | |
| | | | | |
| | | | | |
| | | | | |
| | | | | |
| | | | | |
See Notes to Financial Statements
First Trust Exchange-Traded Fund VIIIStatements of Operations (Continued)
For the Year Ended August 31, 2024
| FT Vest U.S. Equity Buffer ETF - November
(FNOV) | FT Vest U.S. Equity Deep Buffer ETF - November
(DNOV) | FT Vest U.S. Equity Buffer ETF - December
(FDEC) | FT Vest U.S. Equity Deep Buffer ETF - December
(DDEC) |
| | | | |
| | | | |
| | | | |
|
| | | | |
| | | | |
| | | | |
NET INVESTMENT INCOME (LOSS) | | | | |
|
NET REALIZED AND UNREALIZED GAIN (LOSS): | | | | |
Net realized gain (loss) on: | | | | |
| | | | |
In-kind redemptions - Affiliated | | | | |
Purchased options contracts | | | | |
Written options contracts | | | | |
In-kind redemptions - Purchased options contracts | | | | |
In-kind redemptions - Written options contracts | | | | |
| | | | |
Net change in unrealized appreciation (depreciation) on: | | | | |
| | | | |
Purchased options contracts | | | | |
Written options contracts | | | | |
Net change in unrealized appreciation (depreciation) | | | | |
NET REALIZED AND UNREALIZED GAIN (LOSS) | | | | |
NET INCREASE (DECREASE) IN NET ASSETS RESULTING FROM OPERATIONS | | | | |
See Notes to Financial Statements
FT Vest Buffered Allocation Defensive ETF
(BUFT) | FT Vest Buffered Allocation Growth ETF
(BUFG) |
| |
| |
| |
|
| |
| |
| |
| |
|
| |
| |
| |
| |
| |
| |
| |
| |
| |
| |
| |
| |
| |
| |
| |
| |
See Notes to Financial Statements
First Trust Exchange-Traded Fund VIIIStatements of Changes in Net Assets
| FT Vest U.S. Equity Buffer ETF - January (FJAN) | FT Vest U.S. Equity Deep Buffer ETF - January (DJAN) |
| | | | |
| | | | |
Net investment income (loss) | | | | |
| | | | |
Net change in unrealized appreciation (depreciation) | | | | |
Net increase (decrease) in net assets resulting from operations | | | | |
|
SHAREHOLDER TRANSACTIONS: | | | | |
Proceeds from shares sold | | | | |
| | | | |
Net increase (decrease) in net assets resulting from shareholder transactions | | | | |
Total increase (decrease) in net assets | | | | |
|
| | | | |
| | | | |
| | | | |
|
CHANGES IN SHARES OUTSTANDING: | | | | |
Shares outstanding, beginning of period | | | | |
| | | | |
| | | | |
Shares outstanding, end of period | | | | |
See Notes to Financial Statements
FT Vest U.S. Equity Buffer ETF - February (FFEB) | FT Vest U.S. Equity Deep Buffer ETF - February (DFEB) | FT Vest U.S. Equity Buffer ETF - March (FMAR) |
| | | | | |
| | | | | |
| | | | | |
| | | | | |
| | | | | |
| | | | | |
|
| | | | | |
| | | | | |
| | | | | |
| | | | | |
| | | | | |
|
| | | | | |
| | | | | |
| | | | | |
|
| | | | | |
| | | | | |
| | | | | |
| | | | | |
| | | | | |
See Notes to Financial Statements
First Trust Exchange-Traded Fund VIIIStatements of Changes in Net Assets (Continued)
| FT Vest U.S. Equity Deep Buffer ETF - March (DMAR) | FT Vest U.S. Equity Buffer ETF - April (FAPR) |
| | | | |
| | | | |
Net investment income (loss) | | | | |
| | | | |
Net change in unrealized appreciation (depreciation) | | | | |
Net increase (decrease) in net assets resulting from operations | | | | |
|
SHAREHOLDER TRANSACTIONS: | | | | |
Proceeds from shares sold | | | | |
| | | | |
Net increase (decrease) in net assets resulting from shareholder transactions | | | | |
Total increase (decrease) in net assets | | | | |
|
| | | | |
| | | | |
| | | | |
|
CHANGES IN SHARES OUTSTANDING: | | | | |
Shares outstanding, beginning of period | | | | |
| | | | |
| | | | |
Shares outstanding, end of period | | | | |
See Notes to Financial Statements
FT Vest U.S. Equity Deep Buffer ETF - April (DAPR) | FT Vest U.S. Equity Buffer ETF - May (FMAY) | FT Vest U.S. Equity Deep Buffer ETF - May (DMAY) |
| | | | | |
| | | | | |
| | | | | |
| | | | | |
| | | | | |
| | | | | |
|
| | | | | |
| | | | | |
| | | | | |
| | | | | |
| | | | | |
|
| | | | | |
| | | | | |
| | | | | |
|
| | | | | |
| | | | | |
| | | | | |
| | | | | |
| | | | | |
See Notes to Financial Statements
First Trust Exchange-Traded Fund VIIIStatements of Changes in Net Assets (Continued)
| FT Vest U.S. Equity Buffer ETF - June (FJUN) | FT Vest U.S. Equity Deep Buffer ETF - June (DJUN) |
| | | | |
| | | | |
Net investment income (loss) | | | | |
| | | | |
Net change in unrealized appreciation (depreciation) | | | | |
Net increase (decrease) in net assets resulting from operations | | | | |
|
SHAREHOLDER TRANSACTIONS: | | | | |
Proceeds from shares sold | | | | |
| | | | |
Net increase (decrease) in net assets resulting from shareholder transactions | | | | |
Total increase (decrease) in net assets | | | | |
|
| | | | |
| | | | |
| | | | |
|
CHANGES IN SHARES OUTSTANDING: | | | | |
Shares outstanding, beginning of period | | | | |
| | | | |
| | | | |
Shares outstanding, end of period | | | | |
See Notes to Financial Statements
FT Vest U.S. Equity Buffer ETF - July (FJUL) | FT Vest U.S. Equity Deep Buffer ETF - July (DJUL) | FT Vest U.S. Equity Buffer ETF - August (FAUG) |
| | | | | |
| | | | | |
| | | | | |
| | | | | |
| | | | | |
| | | | | |
|
| | | | | |
| | | | | |
| | | | | |
| | | | | |
| | | | | |
|
| | | | | |
| | | | | |
| | | | | |
|
| | | | | |
| | | | | |
| | | | | |
| | | | | |
| | | | | |
See Notes to Financial Statements
First Trust Exchange-Traded Fund VIIIStatements of Changes in Net Assets (Continued)
| FT Vest U.S. Equity Deep Buffer ETF - August (DAUG) | FT Vest U.S. Equity Buffer ETF - September (FSEP) |
| | | | |
| | | | |
Net investment income (loss) | | | | |
| | | | |
Net change in unrealized appreciation (depreciation) | | | | |
Net increase (decrease) in net assets resulting from operations | | | | |
|
SHAREHOLDER TRANSACTIONS: | | | | |
Proceeds from shares sold | | | | |
| | | | |
Net increase (decrease) in net assets resulting from shareholder transactions | | | | |
Total increase (decrease) in net assets | | | | |
|
| | | | |
| | | | |
| | | | |
|
CHANGES IN SHARES OUTSTANDING: | | | | |
Shares outstanding, beginning of period | | | | |
| | | | |
| | | | |
Shares outstanding, end of period | | | | |
See Notes to Financial Statements
FT Vest U.S. Equity Deep Buffer ETF - September (DSEP) | FT Vest U.S. Equity Buffer ETF - October (FOCT) | FT Vest U.S. Equity Deep Buffer ETF - October (DOCT) |
| | | | | |
| | | | | |
| | | | | |
| | | | | |
| | | | | |
| | | | | |
|
| | | | | |
| | | | | |
| | | | | |
| | | | | |
| | | | | |
|
| | | | | |
| | | | | |
| | | | | |
|
| | | | | |
| | | | | |
| | | | | |
| | | | | |
| | | | | |
See Notes to Financial Statements
First Trust Exchange-Traded Fund VIIIStatements of Changes in Net Assets (Continued)
| FT Vest U.S. Equity Buffer ETF - November (FNOV) | FT Vest U.S. Equity Deep Buffer ETF - November (DNOV) |
| | | | |
| | | | |
Net investment income (loss) | | | | |
| | | | |
Net change in unrealized appreciation (depreciation) | | | | |
Net increase (decrease) in net assets resulting from operations | | | | |
|
SHAREHOLDER TRANSACTIONS: | | | | |
Proceeds from shares sold | | | | |
| | | | |
Net increase (decrease) in net assets resulting from shareholder transactions | | | | |
Total increase (decrease) in net assets | | | | |
|
| | | | |
| | | | |
| | | | |
|
CHANGES IN SHARES OUTSTANDING: | | | | |
Shares outstanding, beginning of period | | | | |
| | | | |
| | | | |
Shares outstanding, end of period | | | | |
See Notes to Financial Statements
FT Vest U.S. Equity Buffer ETF - December (FDEC) | FT Vest U.S. Equity Deep Buffer ETF - December (DDEC) | FT Vest Buffered Allocation Defensive ETF (BUFT) |
| | | | | |
| | | | | |
| | | | | |
| | | | | |
| | | | | |
| | | | | |
|
| | | | | |
| | | | | |
| | | | | |
| | | | | |
| | | | | |
|
| | | | | |
| | | | | |
| | | | | |
|
| | | | | |
| | | | | |
| | | | | |
| | | | | |
| | | | | |
See Notes to Financial Statements
First Trust Exchange-Traded Fund VIIIStatements of Changes in Net Assets (Continued)
| FT Vest Buffered Allocation Growth ETF (BUFG) |
| | |
| | |
Net investment income (loss) | | |
| | |
Net change in unrealized appreciation (depreciation) | | |
Net increase (decrease) in net assets resulting from operations | | |
|
SHAREHOLDER TRANSACTIONS: | | |
Proceeds from shares sold | | |
| | |
Net increase (decrease) in net assets resulting from shareholder transactions | | |
Total increase (decrease) in net assets | | |
|
| | |
| | |
| | |
|
CHANGES IN SHARES OUTSTANDING: | | |
Shares outstanding, beginning of period | | |
| | |
| | |
Shares outstanding, end of period | | |
See Notes to Financial Statements
First Trust Exchange-Traded Fund VIIIFinancial Highlights
For a share outstanding throughout each period FT Vest U.S. Equity Buffer ETF - January (FJAN)
| | Period
Ended
8/31/2021 (a) |
| | | |
Net asset value, beginning of period | | | | |
Income from investment operations: | | | | |
Net investment income (loss) | | | | |
Net realized and unrealized gain (loss) | | | | |
Total from investment operations | | | | |
Net asset value, end of period | | | | |
| | | | |
|
Ratios to average net assets/supplemental data: | | | | |
Net assets, end of period (in 000’s) | | | | |
Ratio of total expenses to average net assets | | | | |
Ratio of net investment income (loss) to average net assets | | | | |
Portfolio turnover rate (e) | | | | |
| Inception date is January 15, 2021, which is consistent with the commencement of investment operations and is the date the initial creation units were established. |
| Based on average shares outstanding. |
| Total return is calculated assuming an initial investment made at the net asset value at the beginning of the period, reinvestment of all distributions at net asset value during the period, and redemption at net asset value on the last day of the period. The returns presented do not reflect the deduction of taxes that a shareholder would pay on Fund distributions or the redemption or sale of Fund shares. Total return is calculated for the time period presented and is not annualized for periods of less than a year. |
| |
| Portfolio turnover is calculated for the time period presented and is not annualized for periods of less than a year and does not include securities received or delivered from processing creations or redemptions, derivatives and in-kind transactions. |
See Notes to Financial Statements
First Trust Exchange-Traded Fund VIIIFinancial Highlights (Continued)
For a share outstanding throughout each period FT Vest U.S. Equity Deep Buffer ETF - January (DJAN)
| | Period
Ended
8/31/2021 (a) |
| | | |
Net asset value, beginning of period | | | | |
Income from investment operations: | | | | |
Net investment income (loss) | | | | |
Net realized and unrealized gain (loss) | | | | |
Total from investment operations | | | | |
Net asset value, end of period | | | | |
| | | | |
|
Ratios to average net assets/supplemental data: | | | | |
Net assets, end of period (in 000’s) | | | | |
Ratio of total expenses to average net assets | | | | |
Ratio of net investment income (loss) to average net assets | | | | |
Portfolio turnover rate (e) | | | | |
| Inception date is January 15, 2021, which is consistent with the commencement of investment operations and is the date the initial creation units were established. |
| Based on average shares outstanding. |
| Total return is calculated assuming an initial investment made at the net asset value at the beginning of the period, reinvestment of all distributions at net asset value during the period, and redemption at net asset value on the last day of the period. The returns presented do not reflect the deduction of taxes that a shareholder would pay on Fund distributions or the redemption or sale of Fund shares. Total return is calculated for the time period presented and is not annualized for periods of less than a year. |
| |
| Portfolio turnover is calculated for the time period presented and is not annualized for periods of less than a year and does not include securities received or delivered from processing creations or redemptions, derivatives and in-kind transactions. |
See Notes to Financial Statements
First Trust Exchange-Traded Fund VIIIFinancial Highlights (Continued)
For a share outstanding throughout each period FT Vest U.S. Equity Buffer ETF - February (FFEB)
| | Period
Ended
8/31/2020 (a) |
| | | | |
Net asset value, beginning of period | | | | | |
Income from investment operations: | | | | | |
Net investment income (loss) | | | | | |
Net realized and unrealized gain (loss) | | | | | |
Total from investment operations | | | | | |
Net asset value, end of period | | | | | |
| | | | | |
|
Ratios to average net assets/supplemental data: | | | | | |
Net assets, end of period (in 000’s) | | | | | |
Ratio of total expenses to average net assets | | | | | |
Ratio of net investment income (loss) to average net assets | | | | | |
Portfolio turnover rate (e) | | | | | |
| Inception date is February 21, 2020, which is consistent with the commencement of investment operations and is the date the initial creation units were established. |
| Based on average shares outstanding. |
| Total return is calculated assuming an initial investment made at the net asset value at the beginning of the period, reinvestment of all distributions at net asset value during the period, and redemption at net asset value on the last day of the period. The returns presented do not reflect the deduction of taxes that a shareholder would pay on Fund distributions or the redemption or sale of Fund shares. Total return is calculated for the time period presented and is not annualized for periods of less than a year. |
| |
| Portfolio turnover is calculated for the time period presented and is not annualized for periods of less than a year and does not include securities received or delivered from processing creations or redemptions, derivatives and in-kind transactions. |
See Notes to Financial Statements
First Trust Exchange-Traded Fund VIIIFinancial Highlights (Continued)
For a share outstanding throughout each period FT Vest U.S. Equity Deep Buffer ETF - February (DFEB)
| | Period
Ended
8/31/2020 (a) |
| | | | |
Net asset value, beginning of period | | | | | |
Income from investment operations: | | | | | |
Net investment income (loss) | | | | | |
Net realized and unrealized gain (loss) | | | | | |
Total from investment operations | | | | | |
Net asset value, end of period | | | | | |
| | | | | |
|
Ratios to average net assets/supplemental data: | | | | | |
Net assets, end of period (in 000’s) | | | | | |
Ratio of total expenses to average net assets | | | | | |
Ratio of net investment income (loss) to average net assets | | | | | |
Portfolio turnover rate (e) | | | | | |
| Inception date is February 21, 2020, which is consistent with the commencement of investment operations and is the date the initial creation units were established. |
| Based on average shares outstanding. |
| Total return is calculated assuming an initial investment made at the net asset value at the beginning of the period, reinvestment of all distributions at net asset value during the period, and redemption at net asset value on the last day of the period. The returns presented do not reflect the deduction of taxes that a shareholder would pay on Fund distributions or the redemption or sale of Fund shares. Total return is calculated for the time period presented and is not annualized for periods of less than a year. |
| |
| Portfolio turnover is calculated for the time period presented and is not annualized for periods of less than a year and does not include securities received or delivered from processing creations or redemptions, derivatives and in-kind transactions. |
See Notes to Financial Statements
First Trust Exchange-Traded Fund VIIIFinancial Highlights (Continued)
For a share outstanding throughout each period FT Vest U.S. Equity Buffer ETF - March (FMAR)
| | Period
Ended
8/31/2021 (a) |
| | | |
Net asset value, beginning of period | | | | |
Income from investment operations: | | | | |
Net investment income (loss) | | | | |
Net realized and unrealized gain (loss) | | | | |
Total from investment operations | | | | |
Net asset value, end of period | | | | |
| | | | |
|
Ratios to average net assets/supplemental data: | | | | |
Net assets, end of period (in 000’s) | | | | |
Ratio of total expenses to average net assets | | | | |
Ratio of net investment income (loss) to average net assets | | | | |
Portfolio turnover rate (e) | | | | |
| Inception date is March 19, 2021, which is consistent with the commencement of investment operations and is the date the initial creation units were established. |
| Based on average shares outstanding. |
| Total return is calculated assuming an initial investment made at the net asset value at the beginning of the period, reinvestment of all distributions at net asset value during the period, and redemption at net asset value on the last day of the period. The returns presented do not reflect the deduction of taxes that a shareholder would pay on Fund distributions or the redemption or sale of Fund shares. Total return is calculated for the time period presented and is not annualized for periods of less than a year. |
| |
| Portfolio turnover is calculated for the time period presented and is not annualized for periods of less than a year and does not include securities received or delivered from processing creations or redemptions, derivatives and in-kind transactions. |
See Notes to Financial Statements
First Trust Exchange-Traded Fund VIIIFinancial Highlights (Continued)
For a share outstanding throughout each period FT Vest U.S. Equity Deep Buffer ETF - March (DMAR)
| | Period
Ended
8/31/2021 (a) |
| | | |
Net asset value, beginning of period | | | | |
Income from investment operations: | | | | |
Net investment income (loss) | | | | |
Net realized and unrealized gain (loss) | | | | |
Total from investment operations | | | | |
Net asset value, end of period | | | | |
| | | | |
|
Ratios to average net assets/supplemental data: | | | | |
Net assets, end of period (in 000’s) | | | | |
Ratio of total expenses to average net assets | | | | |
Ratio of net investment income (loss) to average net assets | | | | |
Portfolio turnover rate (e) | | | | |
| Inception date is March 19, 2021, which is consistent with the commencement of investment operations and is the date the initial creation units were established. |
| Based on average shares outstanding. |
| Total return is calculated assuming an initial investment made at the net asset value at the beginning of the period, reinvestment of all distributions at net asset value during the period, and redemption at net asset value on the last day of the period. The returns presented do not reflect the deduction of taxes that a shareholder would pay on Fund distributions or the redemption or sale of Fund shares. Total return is calculated for the time period presented and is not annualized for periods of less than a year. |
| |
| Portfolio turnover is calculated for the time period presented and is not annualized for periods of less than a year and does not include securities received or delivered from processing creations or redemptions, derivatives and in-kind transactions. |
See Notes to Financial Statements
First Trust Exchange-Traded Fund VIIIFinancial Highlights (Continued)
For a share outstanding throughout each period FT Vest U.S. Equity Buffer ETF - April (FAPR)
| | Period
Ended
8/31/2021 (a) |
| | | |
Net asset value, beginning of period | | | | |
Income from investment operations: | | | | |
Net investment income (loss) | | | | |
Net realized and unrealized gain (loss) | | | | |
Total from investment operations | | | | |
Net asset value, end of period | | | | |
| | | | |
|
Ratios to average net assets/supplemental data: | | | | |
Net assets, end of period (in 000’s) | | | | |
Ratio of total expenses to average net assets | | | | |
Ratio of net investment income (loss) to average net assets | | | | |
Portfolio turnover rate (e) | | | | |
| Inception date is April 16, 2021, which is consistent with the commencement of investment operations and is the date the initial creation units were established. |
| Based on average shares outstanding. |
| Total return is calculated assuming an initial investment made at the net asset value at the beginning of the period, reinvestment of all distributions at net asset value during the period, and redemption at net asset value on the last day of the period. The returns presented do not reflect the deduction of taxes that a shareholder would pay on Fund distributions or the redemption or sale of Fund shares. Total return is calculated for the time period presented and is not annualized for periods of less than a year. |
| |
| Portfolio turnover is calculated for the time period presented and is not annualized for periods of less than a year and does not include securities received or delivered from processing creations or redemptions, derivatives and in-kind transactions. |
See Notes to Financial Statements
First Trust Exchange-Traded Fund VIIIFinancial Highlights (Continued)
For a share outstanding throughout each period FT Vest U.S. Equity Deep Buffer ETF - April (DAPR)
| | Period
Ended
8/31/2021 (a) |
| | | |
Net asset value, beginning of period | | | | |
Income from investment operations: | | | | |
Net investment income (loss) | | | | |
Net realized and unrealized gain (loss) | | | | |
Total from investment operations | | | | |
Net asset value, end of period | | | | |
| | | | |
|
Ratios to average net assets/supplemental data: | | | | |
Net assets, end of period (in 000’s) | | | | |
Ratio of total expenses to average net assets | | | | |
Ratio of net investment income (loss) to average net assets | | | | |
Portfolio turnover rate (e) | | | | |
| Inception date is April 16, 2021, which is consistent with the commencement of investment operations and is the date the initial creation units were established. |
| Based on average shares outstanding. |
| Total return is calculated assuming an initial investment made at the net asset value at the beginning of the period, reinvestment of all distributions at net asset value during the period, and redemption at net asset value on the last day of the period. The returns presented do not reflect the deduction of taxes that a shareholder would pay on Fund distributions or the redemption or sale of Fund shares. Total return is calculated for the time period presented and is not annualized for periods of less than a year. |
| |
| Portfolio turnover is calculated for the time period presented and is not annualized for periods of less than a year and does not include securities received or delivered from processing creations or redemptions, derivatives and in-kind transactions. |
See Notes to Financial Statements
First Trust Exchange-Traded Fund VIIIFinancial Highlights (Continued)
For a share outstanding throughout each period FT Vest U.S. Equity Buffer ETF - May (FMAY)
| | Period
Ended
8/31/2020 (a) |
| | | | |
Net asset value, beginning of period | | | | | |
Income from investment operations: | | | | | |
Net investment income (loss) | | | | | |
Net realized and unrealized gain (loss) | | | | | |
Total from investment operations | | | | | |
Net asset value, end of period | | | | | |
| | | | | |
|
Ratios to average net assets/supplemental data: | | | | | |
Net assets, end of period (in 000’s) | | | | | |
Ratio of total expenses to average net assets | | | | | |
Ratio of net investment income (loss) to average net assets | | | | | |
Portfolio turnover rate (e) | | | | | |
| Inception date is May 15, 2020, which is consistent with the commencement of investment operations and is the date the initial creation units were established. |
| Based on average shares outstanding. |
| Total return is calculated assuming an initial investment made at the net asset value at the beginning of the period, reinvestment of all distributions at net asset value during the period, and redemption at net asset value on the last day of the period. The returns presented do not reflect the deduction of taxes that a shareholder would pay on Fund distributions or the redemption or sale of Fund shares. Total return is calculated for the time period presented and is not annualized for periods of less than a year. |
| |
| Portfolio turnover is calculated for the time period presented and is not annualized for periods of less than a year and does not include securities received or delivered from processing creations or redemptions, derivatives and in-kind transactions. |
See Notes to Financial Statements
First Trust Exchange-Traded Fund VIIIFinancial Highlights (Continued)
For a share outstanding throughout each period FT Vest U.S. Equity Deep Buffer ETF - May (DMAY)
| | Period
Ended
8/31/2020 (a) |
| | | | |
Net asset value, beginning of period | | | | | |
Income from investment operations: | | | | | |
Net investment income (loss) | | | | | |
Net realized and unrealized gain (loss) | | | | | |
Total from investment operations | | | | | |
Net asset value, end of period | | | | | |
| | | | | |
|
Ratios to average net assets/supplemental data: | | | | | |
Net assets, end of period (in 000’s) | | | | | |
Ratio of total expenses to average net assets | | | | | |
Ratio of net investment income (loss) to average net assets | | | | | |
Portfolio turnover rate (e) | | | | | |
| Inception date is May 15, 2020, which is consistent with the commencement of investment operations and is the date the initial creation units were established. |
| Based on average shares outstanding. |
| Total return is calculated assuming an initial investment made at the net asset value at the beginning of the period, reinvestment of all distributions at net asset value during the period, and redemption at net asset value on the last day of the period. The returns presented do not reflect the deduction of taxes that a shareholder would pay on Fund distributions or the redemption or sale of Fund shares. Total return is calculated for the time period presented and is not annualized for periods of less than a year. |
| |
| Portfolio turnover is calculated for the time period presented and is not annualized for periods of less than a year and does not include securities received or delivered from processing creations or redemptions, derivatives and in-kind transactions. |
See Notes to Financial Statements
First Trust Exchange-Traded Fund VIIIFinancial Highlights (Continued)
For a share outstanding throughout each period FT Vest U.S. Equity Buffer ETF - June (FJUN)
| | Period
Ended
8/31/2020 (a) |
| | | | |
Net asset value, beginning of period | | | | | |
Income from investment operations: | | | | | |
Net investment income (loss) | | | | | |
Net realized and unrealized gain (loss) | | | | | |
Total from investment operations | | | | | |
Net asset value, end of period | | | | | |
| | | | | |
|
Ratios to average net assets/supplemental data: | | | | | |
Net assets, end of period (in 000’s) | | | | | |
Ratio of total expenses to average net assets | | | | | |
Ratio of net investment income (loss) to average net assets | | | | | |
Portfolio turnover rate (f) | | | | | |
| Inception date is June 19, 2020, which is consistent with the commencement of investment operations and is the date the initial creation units were established. |
| Based on average shares outstanding. |
| The per share amount does not correlate with the aggregate realized and unrealized gain (loss) due to the timing of the Fund share sales and repurchases in relation to market value fluctuation of the underlying investments. |
| Total return is calculated assuming an initial investment made at the net asset value at the beginning of the period, reinvestment of all distributions at net asset value during the period, and redemption at net asset value on the last day of the period. The returns presented do not reflect the deduction of taxes that a shareholder would pay on Fund distributions or the redemption or sale of Fund shares. Total return is calculated for the time period presented and is not annualized for periods of less than a year. |
| |
| Portfolio turnover is calculated for the time period presented and is not annualized for periods of less than a year and does not include securities received or delivered from processing creations or redemptions, derivatives and in-kind transactions. |
See Notes to Financial Statements
First Trust Exchange-Traded Fund VIIIFinancial Highlights (Continued)
For a share outstanding throughout each period FT Vest U.S. Equity Deep Buffer ETF - June (DJUN)
| | Period
Ended
8/31/2020 (a) |
| | | | |
Net asset value, beginning of period | | | | | |
Income from investment operations: | | | | | |
Net investment income (loss) | | | | | |
Net realized and unrealized gain (loss) | | | | | |
Total from investment operations | | | | | |
Net asset value, end of period | | | | | |
| | | | | |
|
Ratios to average net assets/supplemental data: | | | | | |
Net assets, end of period (in 000’s) | | | | | |
Ratio of total expenses to average net assets | | | | | |
Ratio of net investment income (loss) to average net assets | | | | | |
Portfolio turnover rate (e) | | | | | |
| Inception date is June 19, 2020, which is consistent with the commencement of investment operations and is the date the initial creation units were established. |
| Based on average shares outstanding. |
| Total return is calculated assuming an initial investment made at the net asset value at the beginning of the period, reinvestment of all distributions at net asset value during the period, and redemption at net asset value on the last day of the period. The returns presented do not reflect the deduction of taxes that a shareholder would pay on Fund distributions or the redemption or sale of Fund shares. Total return is calculated for the time period presented and is not annualized for periods of less than a year. |
| |
| Portfolio turnover is calculated for the time period presented and is not annualized for periods of less than a year and does not include securities received or delivered from processing creations or redemptions, derivatives and in-kind transactions. |
See Notes to Financial Statements
First Trust Exchange-Traded Fund VIIIFinancial Highlights (Continued)
For a share outstanding throughout each period FT Vest U.S. Equity Buffer ETF - July (FJUL)
| | Period
Ended
8/31/2020 (a) |
| | | | |
Net asset value, beginning of period | | | | | |
Income from investment operations: | | | | | |
Net investment income (loss) | | | | | |
Net realized and unrealized gain (loss) | | | | | |
Total from investment operations | | | | | |
Net asset value, end of period | | | | | |
| | | | | |
|
Ratios to average net assets/supplemental data: | | | | | |
Net assets, end of period (in 000’s) | | | | | |
Ratio of total expenses to average net assets | | | | | |
Ratio of net investment income (loss) to average net assets | | | | | |
Portfolio turnover rate (e) | | | | | |
| Inception date is July 17, 2020, which is consistent with the commencement of investment operations and is the date the initial creation units were established. |
| Based on average shares outstanding. |
| Total return is calculated assuming an initial investment made at the net asset value at the beginning of the period, reinvestment of all distributions at net asset value during the period, and redemption at net asset value on the last day of the period. The returns presented do not reflect the deduction of taxes that a shareholder would pay on Fund distributions or the redemption or sale of Fund shares. Total return is calculated for the time period presented and is not annualized for periods of less than a year. |
| |
| Portfolio turnover is calculated for the time period presented and is not annualized for periods of less than a year and does not include securities received or delivered from processing creations or redemptions, derivatives and in-kind transactions. |
See Notes to Financial Statements
First Trust Exchange-Traded Fund VIIIFinancial Highlights (Continued)
For a share outstanding throughout each period FT Vest U.S. Equity Deep Buffer ETF - July (DJUL)
| | Period
Ended
8/31/2020 (a) |
| | | | |
Net asset value, beginning of period | | | | | |
Income from investment operations: | | | | | |
Net investment income (loss) | | | | | |
Net realized and unrealized gain (loss) | | | | | |
Total from investment operations | | | | | |
Net asset value, end of period | | | | | |
| | | | | |
|
Ratios to average net assets/supplemental data: | | | | | |
Net assets, end of period (in 000’s) | | | | | |
Ratio of total expenses to average net assets | | | | | |
Ratio of net investment income (loss) to average net assets | | | | | |
Portfolio turnover rate (e) | | | | | |
| Inception date is July 17, 2020, which is consistent with the commencement of investment operations and is the date the initial creation units were established. |
| Based on average shares outstanding. |
| Total return is calculated assuming an initial investment made at the net asset value at the beginning of the period, reinvestment of all distributions at net asset value during the period, and redemption at net asset value on the last day of the period. The returns presented do not reflect the deduction of taxes that a shareholder would pay on Fund distributions or the redemption or sale of Fund shares. Total return is calculated for the time period presented and is not annualized for periods of less than a year. |
| |
| Portfolio turnover is calculated for the time period presented and is not annualized for periods of less than a year and does not include securities received or delivered from processing creations or redemptions, derivatives and in-kind transactions. |
See Notes to Financial Statements
First Trust Exchange-Traded Fund VIIIFinancial Highlights (Continued)
For a share outstanding throughout each period FT Vest U.S. Equity Buffer ETF - August (FAUG)
| | Period
Ended
8/31/2020 (a) |
| | | | |
Net asset value, beginning of period | | | | | |
Income from investment operations: | | | | | |
Net investment income (loss) | | | | | |
Net realized and unrealized gain (loss) | | | | | |
Total from investment operations | | | | | |
Net asset value, end of period | | | | | |
| | | | | |
|
Ratios to average net assets/supplemental data: | | | | | |
Net assets, end of period (in 000’s) | | | | | |
Ratio of total expenses to average net assets | | | | | |
Ratio of net investment income (loss) to average net assets | | | | | |
Portfolio turnover rate (e) | | | | | |
| Inception date is November 6, 2019, which is consistent with the commencement of investment operations and is the date the initial creation units were established. |
| Based on average shares outstanding. |
| Total return is calculated assuming an initial investment made at the net asset value at the beginning of the period, reinvestment of all distributions at net asset value during the period, and redemption at net asset value on the last day of the period. The returns presented do not reflect the deduction of taxes that a shareholder would pay on Fund distributions or the redemption or sale of Fund shares. Total return is calculated for the time period presented and is not annualized for periods of less than a year. |
| |
| Portfolio turnover is calculated for the time period presented and is not annualized for periods of less than a year and does not include securities received or delivered from processing creations or redemptions, derivatives and in-kind transactions. |
See Notes to Financial Statements
First Trust Exchange-Traded Fund VIIIFinancial Highlights (Continued)
For a share outstanding throughout each period FT Vest U.S. Equity Deep Buffer ETF - August (DAUG)
| | Period
Ended
8/31/2020 (a) |
| | | | |
Net asset value, beginning of period | | | | | |
Income from investment operations: | | | | | |
Net investment income (loss) | | | | | |
Net realized and unrealized gain (loss) | | | | | |
Total from investment operations | | | | | |
Net asset value, end of period | | | | | |
| | | | | |
|
Ratios to average net assets/supplemental data: | | | | | |
Net assets, end of period (in 000’s) | | | | | |
Ratio of total expenses to average net assets | | | | | |
Ratio of net investment income (loss) to average net assets | | | | | |
Portfolio turnover rate (e) | | | | | |
| Inception date is November 6, 2019, which is consistent with the commencement of investment operations and is the date the initial creation units were established. |
| Based on average shares outstanding. |
| Total return is calculated assuming an initial investment made at the net asset value at the beginning of the period, reinvestment of all distributions at net asset value during the period, and redemption at net asset value on the last day of the period. The returns presented do not reflect the deduction of taxes that a shareholder would pay on Fund distributions or the redemption or sale of Fund shares. Total return is calculated for the time period presented and is not annualized for periods of less than a year. |
| |
| Portfolio turnover is calculated for the time period presented and is not annualized for periods of less than a year and does not include securities received or delivered from processing creations or redemptions, derivatives and in-kind transactions. |
See Notes to Financial Statements
First Trust Exchange-Traded Fund VIIIFinancial Highlights (Continued)
For a share outstanding throughout each period FT Vest U.S. Equity Buffer ETF - September (FSEP)
| | Period
Ended
8/31/2021 (a) |
| | | |
Net asset value, beginning of period | | | | |
Income from investment operations: | | | | |
Net investment income (loss) | | | | |
Net realized and unrealized gain (loss) | | | | |
Total from investment operations | | | | |
Net asset value, end of period | | | | |
| | | | |
|
Ratios to average net assets/supplemental data: | | | | |
Net assets, end of period (in 000’s) | | | | |
Ratio of total expenses to average net assets | | | | |
Ratio of net investment income (loss) to average net assets | | | | |
Portfolio turnover rate (e) | | | | |
| Inception date is September 18, 2020, which is consistent with the commencement of investment operations and is the date the initial creation units were established. |
| Based on average shares outstanding. |
| Total return is calculated assuming an initial investment made at the net asset value at the beginning of the period, reinvestment of all distributions at net asset value during the period, and redemption at net asset value on the last day of the period. The returns presented do not reflect the deduction of taxes that a shareholder would pay on Fund distributions or the redemption or sale of Fund shares. Total return is calculated for the time period presented and is not annualized for periods of less than a year. |
| |
| Portfolio turnover is calculated for the time period presented and is not annualized for periods of less than a year and does not include securities received or delivered from processing creations or redemptions, derivatives and in-kind transactions. |
See Notes to Financial Statements
First Trust Exchange-Traded Fund VIIIFinancial Highlights (Continued)
For a share outstanding throughout each period FT Vest U.S. Equity Deep Buffer ETF - September (DSEP)
| | Period
Ended
8/31/2021 (a) |
| | | |
Net asset value, beginning of period | | | | |
Income from investment operations: | | | | |
Net investment income (loss) | | | | |
Net realized and unrealized gain (loss) | | | | |
Total from investment operations | | | | |
Net asset value, end of period | | | | |
| | | | |
|
Ratios to average net assets/supplemental data: | | | | |
Net assets, end of period (in 000’s) | | | | |
Ratio of total expenses to average net assets | | | | |
Ratio of net investment income (loss) to average net assets | | | | |
Portfolio turnover rate (e) | | | | |
| Inception date is September 18, 2020, which is consistent with the commencement of investment operations and is the date the initial creation units were established. |
| Based on average shares outstanding. |
| Total return is calculated assuming an initial investment made at the net asset value at the beginning of the period, reinvestment of all distributions at net asset value during the period, and redemption at net asset value on the last day of the period. The returns presented do not reflect the deduction of taxes that a shareholder would pay on Fund distributions or the redemption or sale of Fund shares. Total return is calculated for the time period presented and is not annualized for periods of less than a year. |
| |
| Portfolio turnover is calculated for the time period presented and is not annualized for periods of less than a year and does not include securities received or delivered from processing creations or redemptions, derivatives and in-kind transactions. |
See Notes to Financial Statements
First Trust Exchange-Traded Fund VIIIFinancial Highlights (Continued)
For a share outstanding throughout each period FT Vest U.S. Equity Buffer ETF - October (FOCT)
| | Period
Ended
8/31/2021 (a) |
| | | |
Net asset value, beginning of period | | | | |
Income from investment operations: | | | | |
Net investment income (loss) | | | | |
Net realized and unrealized gain (loss) | | | | |
Total from investment operations | | | | |
Net asset value, end of period | | | | |
| | | | |
|
Ratios to average net assets/supplemental data: | | | | |
Net assets, end of period (in 000’s) | | | | |
Ratio of total expenses to average net assets | | | | |
Ratio of net investment income (loss) to average net assets | | | | |
Portfolio turnover rate (e) | | | | |
| Inception date is October 16, 2020, which is consistent with the commencement of investment operations and is the date the initial creation units were established. |
| Based on average shares outstanding. |
| Total return is calculated assuming an initial investment made at the net asset value at the beginning of the period, reinvestment of all distributions at net asset value during the period, and redemption at net asset value on the last day of the period. The returns presented do not reflect the deduction of taxes that a shareholder would pay on Fund distributions or the redemption or sale of Fund shares. Total return is calculated for the time period presented and is not annualized for periods of less than a year. |
| |
| Portfolio turnover is calculated for the time period presented and is not annualized for periods of less than a year and does not include securities received or delivered from processing creations or redemptions, derivatives and in-kind transactions. |
See Notes to Financial Statements
First Trust Exchange-Traded Fund VIIIFinancial Highlights (Continued)
For a share outstanding throughout each period FT Vest U.S. Equity Deep Buffer ETF - October (DOCT)
| | Period
Ended
8/31/2021 (a) |
| | | |
Net asset value, beginning of period | | | | |
Income from investment operations: | | | | |
Net investment income (loss) | | | | |
Net realized and unrealized gain (loss) | | | | |
Total from investment operations | | | | |
Net asset value, end of period | | | | |
| | | | |
|
Ratios to average net assets/supplemental data: | | | | |
Net assets, end of period (in 000’s) | | | | |
Ratio of total expenses to average net assets | | | | |
Ratio of net investment income (loss) to average net assets | | | | |
Portfolio turnover rate (e) | | | | |
| Inception date is October 16, 2020, which is consistent with the commencement of investment operations and is the date the initial creation units were established. |
| Based on average shares outstanding. |
| Total return is calculated assuming an initial investment made at the net asset value at the beginning of the period, reinvestment of all distributions at net asset value during the period, and redemption at net asset value on the last day of the period. The returns presented do not reflect the deduction of taxes that a shareholder would pay on Fund distributions or the redemption or sale of Fund shares. Total return is calculated for the time period presented and is not annualized for periods of less than a year. |
| |
| Portfolio turnover is calculated for the time period presented and is not annualized for periods of less than a year and does not include securities received or delivered from processing creations or redemptions, derivatives and in-kind transactions. |
See Notes to Financial Statements
First Trust Exchange-Traded Fund VIIIFinancial Highlights (Continued)
For a share outstanding throughout each period FT Vest U.S. Equity Buffer ETF - November (FNOV)
| | Period
Ended
8/31/2020 (a) |
| | | | |
Net asset value, beginning of period | | | | | |
Income from investment operations: | | | | | |
Net investment income (loss) | | | | | |
Net realized and unrealized gain (loss) | | | | | |
Total from investment operations | | | | | |
Net asset value, end of period | | | | | |
| | | | | |
|
Ratios to average net assets/supplemental data: | | | | | |
Net assets, end of period (in 000’s) | | | | | |
Ratio of total expenses to average net assets | | | | | |
Ratio of net investment income (loss) to average net assets | | | | | |
Portfolio turnover rate (e) | | | | | |
| Inception date is November 15, 2019, which is consistent with the commencement of investment operations and is the date the initial creation units were established. |
| Based on average shares outstanding. |
| Total return is calculated assuming an initial investment made at the net asset value at the beginning of the period, reinvestment of all distributions at net asset value during the period, and redemption at net asset value on the last day of the period. The returns presented do not reflect the deduction of taxes that a shareholder would pay on Fund distributions or the redemption or sale of Fund shares. Total return is calculated for the time period presented and is not annualized for periods of less than a year. |
| |
| Portfolio turnover is calculated for the time period presented and is not annualized for periods of less than a year and does not include securities received or delivered from processing creations or redemptions, derivatives and in-kind transactions. |
See Notes to Financial Statements
First Trust Exchange-Traded Fund VIIIFinancial Highlights (Continued)
For a share outstanding throughout each period FT Vest U.S. Equity Deep Buffer ETF - November (DNOV)
| | Period
Ended
8/31/2020 (a) |
| | | | |
Net asset value, beginning of period | | | | | |
Income from investment operations: | | | | | |
Net investment income (loss) | | | | | |
Net realized and unrealized gain (loss) | | | | | |
Total from investment operations | | | | | |
Net asset value, end of period | | | | | |
| | | | | |
|
Ratios to average net assets/supplemental data: | | | | | |
Net assets, end of period (in 000’s) | | | | | |
Ratio of total expenses to average net assets | | | | | |
Ratio of net investment income (loss) to average net assets | | | | | |
Portfolio turnover rate (e) | | | | | |
| Inception date is November 15, 2019, which is consistent with the commencement of investment operations and is the date the initial creation units were established. |
| Based on average shares outstanding. |
| Total return is calculated assuming an initial investment made at the net asset value at the beginning of the period, reinvestment of all distributions at net asset value during the period, and redemption at net asset value on the last day of the period. The returns presented do not reflect the deduction of taxes that a shareholder would pay on Fund distributions or the redemption or sale of Fund shares. Total return is calculated for the time period presented and is not annualized for periods of less than a year. |
| |
| Portfolio turnover is calculated for the time period presented and is not annualized for periods of less than a year and does not include securities received or delivered from processing creations or redemptions, derivatives and in-kind transactions. |
See Notes to Financial Statements
First Trust Exchange-Traded Fund VIIIFinancial Highlights (Continued)
For a share outstanding throughout each period FT Vest U.S. Equity Buffer ETF - December (FDEC)
| | Period
Ended
8/31/2021 (a) |
| | | |
Net asset value, beginning of period | | | | |
Income from investment operations: | | | | |
Net investment income (loss) | | | | |
Net realized and unrealized gain (loss) | | | | |
Total from investment operations | | | | |
Net asset value, end of period | | | | |
| | | | |
|
Ratios to average net assets/supplemental data: | | | | |
Net assets, end of period (in 000’s) | | | | |
Ratio of total expenses to average net assets | | | | |
Ratio of net investment income (loss) to average net assets | | | | |
Portfolio turnover rate (e) | | | | |
| Inception date is December 18, 2020, which is consistent with the commencement of investment operations and is the date the initial creation units were established. |
| Based on average shares outstanding. |
| Total return is calculated assuming an initial investment made at the net asset value at the beginning of the period, reinvestment of all distributions at net asset value during the period, and redemption at net asset value on the last day of the period. The returns presented do not reflect the deduction of taxes that a shareholder would pay on Fund distributions or the redemption or sale of Fund shares. Total return is calculated for the time period presented and is not annualized for periods of less than a year. |
| |
| Portfolio turnover is calculated for the time period presented and is not annualized for periods of less than a year and does not include securities received or delivered from processing creations or redemptions, derivatives and in-kind transactions. |
See Notes to Financial Statements
First Trust Exchange-Traded Fund VIIIFinancial Highlights (Continued)
For a share outstanding throughout each period FT Vest U.S. Equity Deep Buffer ETF - December (DDEC)
| | Period
Ended
8/31/2021 (a) |
| | | |
Net asset value, beginning of period | | | | |
Income from investment operations: | | | | |
Net investment income (loss) | | | | |
Net realized and unrealized gain (loss) | | | | |
Total from investment operations | | | | |
Net asset value, end of period | | | | |
| | | | |
|
Ratios to average net assets/supplemental data: | | | | |
Net assets, end of period (in 000’s) | | | | |
Ratio of total expenses to average net assets | | | | |
Ratio of net investment income (loss) to average net assets | | | | |
Portfolio turnover rate (e) | | | | |
| Inception date is December 18, 2020, which is consistent with the commencement of investment operations and is the date the initial creation units were established. |
| Based on average shares outstanding. |
| Total return is calculated assuming an initial investment made at the net asset value at the beginning of the period, reinvestment of all distributions at net asset value during the period, and redemption at net asset value on the last day of the period. The returns presented do not reflect the deduction of taxes that a shareholder would pay on Fund distributions or the redemption or sale of Fund shares. Total return is calculated for the time period presented and is not annualized for periods of less than a year. |
| |
| Portfolio turnover is calculated for the time period presented and is not annualized for periods of less than a year and does not include securities received or delivered from processing creations or redemptions, derivatives and in-kind transactions. |
See Notes to Financial Statements
First Trust Exchange-Traded Fund VIIIFinancial Highlights (Continued)
For a share outstanding throughout each period FT Vest Buffered Allocation Defensive ETF (BUFT)
| | Period
Ended
8/31/2022 (a) |
| | |
Net asset value, beginning of period | | | |
Income from investment operations: | | | |
Net investment income (loss) | | | |
Net realized and unrealized gain (loss) | | | |
Total from investment operations | | | |
Net asset value, end of period | | | |
| | | |
|
Ratios to average net assets/supplemental data: | | | |
Net assets, end of period (in 000’s) | | | |
Ratio of total expenses to average net assets (d) | | | |
Ratio of net investment income (loss) to average net assets (d) | | | |
Portfolio turnover rate (f) | | | |
| Inception date is October 26, 2021, which is consistent with the commencement of investment operations and is the date the initial creation units were established. |
| Based on average shares outstanding. |
| Total return is calculated assuming an initial investment made at the net asset value at the beginning of the period, reinvestment of all distributions at net asset value during the period, and redemption at net asset value on the last day of the period. The returns presented do not reflect the deduction of taxes that a shareholder would pay on Fund distributions or the redemption or sale of Fund shares. Total return is calculated for the time period presented and is not annualized for periods of less than a year. |
| Ratio of total expenses to average net assets and ratio of net investment income (loss) to average net assets do not reflect the Fund’s proportionate share of expenses and income of underlying investment companies in which the Fund invests. |
| |
| Portfolio turnover is calculated for the time period presented and is not annualized for periods of less than a year and does not include securities received or delivered from processing creations or redemptions and in-kind transactions. |
See Notes to Financial Statements
First Trust Exchange-Traded Fund VIIIFinancial Highlights (Continued)
For a share outstanding throughout each period FT Vest Buffered Allocation Growth ETF (BUFG)
| | Period
Ended
8/31/2022 (a) |
| | |
Net asset value, beginning of period | | | |
Income from investment operations: | | | |
Net investment income (loss) | | | |
Net realized and unrealized gain (loss) | | | |
Total from investment operations | | | |
Net asset value, end of period | | | |
| | | |
|
Ratios to average net assets/supplemental data: | | | |
Net assets, end of period (in 000’s) | | | |
Ratio of total expenses to average net assets (d) | | | |
Ratio of net investment income (loss) to average net assets (d) | | | |
Portfolio turnover rate (f) | | | |
| Inception date is October 26, 2021, which is consistent with the commencement of investment operations and is the date the initial creation units were established. |
| Based on average shares outstanding. |
| Total return is calculated assuming an initial investment made at the net asset value at the beginning of the period, reinvestment of all distributions at net asset value during the period, and redemption at net asset value on the last day of the period. The return presented does not reflect the deduction of taxes that a shareholder would pay on Fund distributions or the redemption or sale of Fund shares. Total return is calculated for the time period presented and is not annualized for periods of less than a year. |
| Ratio of total expenses to average net assets and ratio of net investment income (loss) to average net assets do not reflect the Fund’s proportionate share of expenses and income of underlying investment companies in which the Fund invests. |
| |
| Portfolio turnover is calculated for the time period presented and is not annualized for periods of less than a year and does not include securities received or delivered from processing creations or redemptions and in-kind transactions. |
See Notes to Financial Statements
Notes to Financial Statements
First Trust Exchange-Traded Fund VIIIAugust 31, 2024 1. Organization
First Trust Exchange-Traded Fund VIII (the “Trust”) is an open-end management investment company organized as a Massachusetts business trust on February 22, 2016, and is registered with the Securities and Exchange Commission under the Investment Company Act of 1940, as amended (the “1940 Act”).
This report covers the twenty-six funds (each a “Fund” and collectively, the “Funds”), each a non-diversified series of the Trust, listed below. The shares of each Fund are listed and traded on the Cboe BZX Exchange, Inc.
FT Vest U.S. Equity Buffer ETF - January – (ticker “FJAN”) |
FT Vest U.S. Equity Deep Buffer ETF - January – (ticker “DJAN”) |
FT Vest U.S. Equity Buffer ETF - February – (ticker “FFEB”) |
FT Vest U.S. Equity Deep Buffer ETF - February – (ticker “DFEB”) |
FT Vest U.S. Equity Buffer ETF - March – (ticker “FMAR”) |
FT Vest U.S. Equity Deep Buffer ETF - March – (ticker “DMAR”) |
FT Vest U.S. Equity Buffer ETF - April – (ticker “FAPR”) |
FT Vest U.S. Equity Deep Buffer ETF - April – (ticker “DAPR”) |
FT Vest U.S. Equity Buffer ETF - May – (ticker “FMAY”) |
FT Vest U.S. Equity Deep Buffer ETF - May – (ticker “DMAY”) |
FT Vest U.S. Equity Buffer ETF - June – (ticker “FJUN”) |
FT Vest U.S. Equity Deep Buffer ETF - June – (ticker “DJUN”) |
FT Vest U.S. Equity Buffer ETF - July – (ticker “FJUL”) |
FT Vest U.S. Equity Deep Buffer ETF - July – (ticker “DJUL”) |
FT Vest U.S. Equity Buffer ETF - August – (ticker “FAUG”) |
FT Vest U.S. Equity Deep Buffer ETF - August – (ticker “DAUG”) |
FT Vest U.S. Equity Buffer ETF - September – (ticker “FSEP”) |
FT Vest U.S. Equity Deep Buffer ETF - September – (ticker “DSEP”) |
FT Vest U.S. Equity Buffer ETF - October – (ticker “FOCT”) |
FT Vest U.S. Equity Deep Buffer ETF - October – (ticker “DOCT”) |
FT Vest U.S. Equity Buffer ETF - November – (ticker “FNOV”) |
FT Vest U.S. Equity Deep Buffer ETF - November – (ticker “DNOV”) |
FT Vest U.S. Equity Buffer ETF - December – (ticker “FDEC”) |
FT Vest U.S. Equity Deep Buffer ETF - December – (ticker “DDEC”) |
FT Vest Buffered Allocation Defensive ETF – (ticker “BUFT”) |
FT Vest Buffered Allocation Growth ETF – (ticker “BUFG”) |
Each Fund represents a separate series of shares of beneficial interest in the Trust. Unlike conventional mutual funds, each Fund issues and redeems shares on a continuous basis, at net asset value (“NAV”), only in large blocks of shares known as “Creation Units.”
Each Fund is an actively managed exchange-traded fund (“ETF”).
The investment objective of FJAN is to seek to provide investors with returns (before fees and expenses) that match the price return of the SPDR® S&P 500® ETF Trust (the “Underlying ETF”), up to a predetermined upside cap of 15.70% while providing a buffer (before fees and expenses) against the first 10% of Underlying ETF losses, over the period (an “Outcome Period”) from January 22, 2024 through January 17, 2025. Prior to January 22, 2024, the Fund’s investment objective included an upside cap of 19.04% and an Outcome Period of January 23, 2023 through January 19, 2024.
The investment objective of DJAN is to seek to provide investors with returns (before fees and expenses) that match the price return of the Underlying ETF, up to a predetermined upside cap of 13.94% while providing a buffer (before fees and expenses) against Underlying ETF losses between -5% and -30% over the period from January 22, 2024 through January 17, 2025. Prior to January 22, 2024, the Fund’s investment objective included an upside cap of 14.70% and an Outcome Period of January 23, 2023 through January 19, 2024.
The investment objective of FFEB is to seek to provide investors with returns (before fees and expenses) that match the price return of the Underlying ETF, up to a predetermined upside cap of 16.82% while providing a buffer (before fees and expenses) against the first
Notes to Financial Statements (Continued)
First Trust Exchange-Traded Fund VIIIAugust 31, 2024 10% of Underlying ETF losses, over the period from February 20, 2024 through February 21, 2025. Prior to February 20, 2024, the Fund’s investment objective included an upside cap of 19.25% and an Outcome Period of February 21, 2023 through February 16, 2024.
The investment objective of DFEB is to seek to provide investors with returns (before fees and expenses) that match the price return of the Underlying ETF, up to a predetermined upside cap of 15.05% while providing a buffer (before fees and expenses) against Underlying ETF losses between -5% and -30% over the period from February 20, 2024 through February 21, 2025. Prior to February 20, 2024, the Fund’s investment objective included an upside cap of 14.97% and an Outcome Period of February 21, 2023 through February 16, 2024.
The investment objective of FMAR is to seek to provide investors with returns (before fees and expenses) that match the price return of the Underlying ETF, up to a predetermined upside cap of 17.13% while providing a buffer (before fees and expenses) against the first 10% of Underlying ETF losses, over the period from March 18, 2024 through March 21, 2025. Prior to March 18, 2024, the Fund’s investment objective included an upside cap of 19.35% and an Outcome Period of March 20, 2023 through March 15, 2024.
The investment objective of DMAR is to seek to provide investors with returns (before fees and expenses) that match the price return of the Underlying ETF, up to a predetermined upside cap of 15.41% while providing a buffer (before fees and expenses) against Underlying ETF losses between -5% and -30% over the period from March 18, 2024 through March 21, 2025. Prior to March 18, 2024, the Fund’s investment objective included an upside cap of 14.36% and an Outcome Period of March 20, 2023 through March 15, 2024.
The investment objective of FAPR is to seek to provide investors with returns (before fees and expenses) that match the price return of the Underlying ETF, up to a predetermined upside cap of 17.73% while providing a buffer (before fees and expenses) against the first 10% of Underlying ETF losses, over the period from April 22, 2024 through April 17, 2025. Prior to April 22, 2024, the Fund’s investment objective included an upside cap of 18.48% and an Outcome Period of April 24, 2023 through April 19, 2024.
The investment objective of DAPR is to seek to provide investors with returns (before fees and expenses) that match the price return of the Underlying ETF, up to a predetermined upside cap of 15.51% while providing a buffer (before fees and expenses) against Underlying ETF losses between -5% and -30% over the period from April 22, 2024 through April 17, 2025. Prior to April 22, 2024, the Fund’s investment objective included an upside cap of 14.05% and an Outcome Period of April 24, 2023 through April 19, 2024.
The investment objective of FMAY is to seek to provide investors with returns (before fees and expenses) that match the price return of the Underlying ETF, up to a predetermined upside cap of 15.92% while providing a buffer (before fees and expenses) against the first 10% of Underlying ETF losses, over the period from May 20, 2024 through May 16, 2025. Prior to May 20, 2024, the Fund’s investment objective included an upside cap of 17.65% and an Outcome Period of May 22, 2023 through May 17, 2024.
The investment objective of DMAY is to seek to provide investors with returns (before fees and expenses) that match the price return of the Underlying ETF, up to a predetermined upside cap of 15.42% while providing a buffer (before fees and expenses) against Underlying ETF losses between -5% and -30% over the period from May 20, 2024 through May 16, 2025. Prior to May 20, 2024, the Fund’s investment objective included an upside cap of 13.67% and an Outcome Period of May 22, 2023 through May 17, 2024.
The investment objective of FJUN is to seek to provide investors with returns (before fees and expenses) that match the price return of the Underlying ETF, up to a predetermined upside cap of 15.93% while providing a buffer (before fees and expenses) against the first 10% of Underlying ETF losses, over the period from June 24, 2024 through June 20, 2025. Prior to June 24, 2024, the Fund’s investment objective included an upside cap of 18.25% and an Outcome Period of June 20, 2023 through June 21, 2024.
The investment objective of DJUN is to seek to provide investors with returns (before fees and expenses) that match the price return of the Underlying ETF, up to a predetermined upside cap of 14.63% while providing a buffer (before fees and expenses) against Underlying ETF losses between -5% and -30% over the period from June 24, 2024 through June 20, 2025. Prior to June 24, 2024, the Fund’s investment objective included an upside cap of 14.70% and an Outcome Period of June 20, 2023 through June 21, 2024.
The investment objective of FJUL is to seek to provide investors with returns (before fees and expenses) that match the price return of the Underlying ETF, up to a predetermined upside cap of 15.69% while providing a buffer (before fees and expenses) against the first 10% of Underlying ETF losses, over the period from July 22, 2024 through July 18, 2025. Prior to July 22, 2024, the Fund’s investment objective included an upside cap of 17.46% and an Outcome Period of July 24, 2023 through July 19, 2024.
Notes to Financial Statements (Continued)
First Trust Exchange-Traded Fund VIIIAugust 31, 2024 The investment objective of DJUL is to seek to provide investors with returns (before fees and expenses) that match the price return of the Underlying ETF, up to a predetermined upside cap of 14.03% while providing a buffer (before fees and expenses) against Underlying ETF losses between -5% and -30% over the period from July 22, 2024 through July 18, 2025. Prior to July 22, 2024, the Fund’s investment objective included an upside cap of 14.79% and an Outcome Period of July 24, 2023 through July 19, 2024.
The investment objective of FAUG is to seek to provide investors with returns (before fees and expenses) that match the price return of the Underlying ETF, up to a predetermined upside cap of 14.55% while providing a buffer (before fees and expenses) against the first 10% of Underlying ETF losses, over the period from August 19, 2024 through August 15, 2025. Prior to August 19, 2024, the Fund’s investment objective included an upside cap of 18.70% and an Outcome Period of August 21, 2023 through August 16, 2024.
The investment objective of DAUG is to seek to provide investors with returns (before fees and expenses) that match the price return of the Underlying ETF, up to a predetermined upside cap of 12.70% while providing a buffer (before fees and expenses) against Underlying ETF losses between -5% and -30% over the period from August 19, 2024 through August 15, 2025. Prior to August 19, 2024, the Fund’s investment objective included an upside cap of 15.24% and an Outcome Period of August 21, 2023 through August 16, 2024.
The investment objective of FSEP is to seek to provide investors with returns (before fees and expenses) that match the price return of the Underlying ETF, up to a predetermined upside cap of 18.20% while providing a buffer (before fees and expenses) against the first 10% of Underlying ETF losses, over the period from September 18, 2023 through September 20, 2024. Prior to September 18, 2023, the Fund’s investment objective included an upside cap of 23.41% and an Outcome Period of September 19, 2022 through September 15, 2023.
The investment objective of DSEP is to seek to provide investors with returns (before fees and expenses) that match the price return of the Underlying ETF, up to a predetermined upside cap of 15.30% while providing a buffer (before fees and expenses) against Underlying ETF losses between -5% and -30% over the period from September 18, 2023 through September 20, 2024. Prior to September 18, 2023, the Fund’s investment objective included an upside cap of 16.98% and an Outcome Period of September 19, 2022 through September 15, 2023.
The investment objective of FOCT is to seek to provide investors with returns (before fees and expenses) that match the price return of the Underlying ETF, up to a predetermined upside cap of 18.85% while providing a buffer (before fees and expenses) against the first 10% of Underlying ETF losses, over the period from October 23, 2023 through October 18, 2024. Prior to October 23, 2023, the Fund’s investment objective included an upside cap of 27.12% and an Outcome Period of October 24, 2022 through October 20, 2023.
The investment objective of DOCT is to seek to provide investors with returns (before fees and expenses) that match the price return of the Underlying ETF, up to a predetermined upside cap of 15.38% while providing a buffer (before fees and expenses) against Underlying ETF losses between -5% and -30% over the period from October 23, 2023 through October 18, 2024. Prior to October 23, 2023, the Fund’s investment objective included an upside cap of 19.20% and an Outcome Period of October 24, 2022 through October 20, 2023.
The investment objective of FNOV is to seek to provide investors with returns (before fees and expenses) that match the price return of the Underlying ETF, up to a predetermined upside cap of 17.45% while providing a buffer (before fees and expenses) against the first 10% of Underlying ETF losses, over the period from November 20, 2023 through November 15, 2024. Prior to November 20, 2023, the Fund’s investment objective included an upside cap of 23.77% and an Outcome Period of November 21, 2022 through November 17, 2023.
The investment objective of DNOV is to seek to provide investors with returns (before fees and expenses) that match the price return of the Underlying ETF, up to a predetermined upside cap of 15.06% while providing a buffer (before fees and expenses) against Underlying ETF losses between -5% and -30% over the period from November 20, 2023 through November 15, 2024. Prior to November 20, 2023, the Fund’s investment objective included an upside cap of 17.19% and an Outcome Period of November 21, 2022 through November 17, 2023.
The investment objective of FDEC is to seek to provide investors with returns (before fees and expenses) that match the price return of the Underlying ETF, up to a predetermined upside cap of 16.65% while providing a buffer (before fees and expenses) against the first 10% of Underlying ETF losses, over the period from December 18, 2023 through December 20, 2024. Prior to December 18, 2023, the Fund’s investment objective included an upside cap of 23.10% and an Outcome Period of December 19, 2022 through December 15, 2023.
Notes to Financial Statements (Continued)
First Trust Exchange-Traded Fund VIIIAugust 31, 2024 The investment objective of DDEC is to seek to provide investors with returns (before fees and expenses) that match the price return of the Underlying ETF, up to a predetermined upside cap of 14.35% while providing a buffer (before fees and expenses) against Underlying ETF losses between -5% and -30% over the period from December 18, 2023 through December 20, 2024. Prior to December 18, 2023, the Fund’s investment objective included an upside cap of 16.68% and an Outcome Period of December 19, 2022 through December 15, 2023.
Under normal market conditions, each Fund, except BUFT and BUFG, will invest substantially all of its assets in FLexible EXchange® Options (“FLEX Options”) that reference the price performance of the Underlying ETF.
The investment objective of BUFT is to seek to provide investors with capital preservation. BUFT seeks to achieve its investment objective by investing in a portfolio of ETFs that seek to provide investors with returns (before fees and expenses) based on the price return of the SPDR® S&P 500® ETF Trust (“SPY”), up to a predetermined cap, while providing a defined buffer against losses of SPY over a defined one-year period (“SPY Underlying ETFs”). Under normal market conditions, BUFT will invest substantially all of its assets in SPY Underlying ETFs. Unlike the SPY Underlying ETFs, BUFT itself does not pursue a target outcome strategy. The buffer is only provided by the SPY Underlying ETFs and BUFT itself does not provide any stated buffer against losses. In order to understand BUFT’s strategy and risks, it is important to understand the strategies and risks of the SPY Underlying ETFs.
The investment objective of BUFG is to seek to provide investors with capital appreciation. BUFG seeks to achieve its investment objective by investing in a portfolio of ETFs that seek to provide investors with returns (before fees and expenses) based on the price return of the SPY, up to a predetermined cap, while providing a defined buffer against losses of SPY over a defined one-year period. Under normal market conditions, BUFG will invest substantially all of its assets in SPY Underlying ETFs. Unlike the SPY Underlying ETFs, BUFG itself does not pursue a target outcome strategy. The buffer is only provided by the SPY Underlying ETFs and BUFG itself does not provide any stated buffer against losses. In order to understand BUFG’s strategy and risks, it is important to understand the strategies and risks of the SPY Underlying ETFs.
2. Significant Accounting Policies
The Funds are each considered an investment company and follow accounting and reporting guidance under Financial Accounting Standards Board Accounting Standards Codification Topic 946, “Financial Services-Investment Companies.” The following is a summary of significant accounting policies consistently followed by the Funds in the preparation of the financial statements. The preparation of the financial statements in accordance with accounting principles generally accepted in the United States of America (“U.S. GAAP”) requires management to make estimates and assumptions that affect the reported amounts and disclosures in the financial statements. Actual results could differ from those estimates.
Each Fund’s NAV is determined daily as of the close of regular trading on the New York Stock Exchange (“NYSE”), normally 4:00 p.m. Eastern time, on each day the NYSE is open for trading. If the NYSE closes early on a valuation day, the NAV is determined as of that time. Each Fund’s NAV is calculated by dividing the value of all assets of each Fund (including accrued interest and dividends), less all liabilities (including accrued expenses and dividends declared but unpaid), by the total number of shares outstanding.
Each Fund’s investments are valued daily at market value or, in the absence of market value with respect to any portfolio securities, at fair value. Market value prices represent readily available market quotations such as last sale or official closing prices from a national or foreign exchange (i.e., a regulated market) and are primarily obtained from third-party pricing services. Fair value prices represent any prices not considered market value prices and are either obtained from a third-party pricing service or are determined by the Pricing Committee of the Funds’ investment advisor, First Trust Advisors L.P. (“First Trust” or the “Advisor”), in accordance with valuation procedures approved by the Trust’s Board of Trustees, and in accordance with provisions of the 1940 Act and rules thereunder. Investments valued by the Advisor’s Pricing Committee, if any, are footnoted as such in the footnotes to the Portfolio of Investments. Each Fund’s investments are valued as follows:
Exchange-traded options contracts (other than FLEX Option contracts) are valued at the closing price in the market where such contracts are principally traded. If no closing price is available, exchange-traded options contracts are valued at the mean of their most recent bid and ask price, if both are available. Over-the-counter options contracts are valued as follows, depending on the market in which the instrument trades: (1) the mean of their most recent bid and ask price, if available; or (2) a price based on the equivalent exchange-traded option. FLEX Option contracts are normally valued using a model-based price provided by a
Notes to Financial Statements (Continued)
First Trust Exchange-Traded Fund VIIIAugust 31, 2024 third-party pricing vendor. On days when a trade in a FLEX Option contract occurs, the trade price will be used to value such FLEX Option contracts in lieu of the model price.
ETFs listed on any national or foreign exchange (excluding Nasdaq, Inc. (“Nasdaq”) and the London Stock Exchange Alternative Investment Market (“AIM”)) are valued at the last sale price on the exchange on which they are principally traded or, for Nasdaq and AIM securities, the official closing price. Securities traded on more than one securities exchange are valued at the last sale price or official closing price, as applicable, at the close of the securities exchange representing the primary exchange for such securities.
Shares of open-end funds are valued based on NAV per share.
Certain securities may not be able to be priced by pre-established pricing methods. Such securities may be valued by the Advisor’s Pricing Committee at fair value. These securities generally include, but are not limited to, restricted securities (securities which may not be publicly sold without registration under the Securities Act of 1933, as amended) for which a third-party pricing service is unable to provide a market price; securities whose trading has been formally suspended; a security whose market or fair value price is not available from a pre-established pricing source; a security with respect to which an event has occurred that is likely to materially affect the value of the security after the market has closed but before the calculation of a Fund’s NAV or make it difficult or impossible to obtain a reliable market quotation; and a security whose price, as provided by the third-party pricing service, does not reflect the security’s fair value. As a general principle, the current fair value of a security would appear to be the amount which the owner might reasonably expect to receive for the security upon its current sale. When fair value prices are used, generally they will differ from market quotations or official closing prices on the applicable exchanges. A variety of factors may be considered in determining the fair value of such securities, including, but not limited to, the following:
1)
the last sale price on the exchange on which they are principally traded or, for Nasdaq and AIM securities, the official closing price;
3)
the size of the holding;
4)
the initial cost of the security;
5)
transactions in comparable securities;
6)
price quotes from dealers and/or third-party pricing services;
7)
relationships among various securities;
8)
information obtained by contacting the issuer, analysts, or the appropriate stock exchange;
9)
an analysis of the issuer’s financial statements;
10)
the existence of merger proposals or tender offers that might affect the value of the security; and
11)
other relevant factors.
The Funds are subject to fair value accounting standards that define fair value, establish the framework for measuring fair value and provide a three-level hierarchy for fair valuation based upon the inputs to the valuation as of the measurement date. The three levels of the fair value hierarchy are as follows:
• Level 1 – Level 1 inputs are quoted prices in active markets for identical investments. An active market is a market in which transactions for the investment occur with sufficient frequency and volume to provide pricing information on an ongoing basis.
• Level 2 – Level 2 inputs are observable inputs, either directly or indirectly, and include the following:
o Quoted prices for similar investments in active markets.
o Quoted prices for identical or similar investments in markets that are non-active. A non-active market is a market where there are few transactions for the investment, the prices are not current, or price quotations vary substantially either over time or among market makers, or in which little information is released publicly.
o Inputs other than quoted prices that are observable for the investment (for example, interest rates and yield curves observable at commonly quoted intervals, volatilities, prepayment speeds, loss severities, credit risks, and default rates).
o Inputs that are derived principally from or corroborated by observable market data by correlation or other means.
• Level 3 – Level 3 inputs are unobservable inputs. Unobservable inputs may reflect the reporting entity’s own assumptions about the assumptions that market participants would use in pricing the investment.
Notes to Financial Statements (Continued)
First Trust Exchange-Traded Fund VIIIAugust 31, 2024 The inputs or methodologies used for valuing investments are not necessarily an indication of the risk associated with investing in those investments. A summary of the inputs used to value each Fund’s investments as of August 31, 2024, is included with each Fund’s Portfolio of Investments.
B. Securities Transactions and Investment Income
Securities transactions are recorded as of the trade date. Realized gains and losses from securities transactions are recorded on the identified cost basis. Dividend income is recorded on the ex-dividend date. Negative dividend amount, if any, represents charges by broker on excess cash held in the account.
FLEX Options are customized equity or index option contracts that trade on an exchange, but provide investors with the ability to customize key contract terms like exercise prices, styles and expiration dates. FLEX Options are guaranteed for settlement by the Options Clearing Corporation.
Each Fund, with the exception of BUFT and BUFG, purchases and sells call and put FLEX Options based on the performance of the Underlying ETF. The FLEX Options that each Fund holds that reference the Underlying ETF will give each Fund the right to receive or deliver shares of the Underlying ETF on the option expiration date at a strike price, depending on whether the option is a put or call option and whether each Fund purchases or sells the option. The FLEX Options held by each Fund are European style options, which are exercisable at the strike price only on the FLEX Option expiration date. All options held by each Fund at August 31, 2024 are FLEX Options.
D. Affiliated Transactions
BUFT and BUFG invest in securities of affiliated funds. Each Fund’s investment performance and risks are directly related to the investment performance and risks of the affiliated funds. The affiliated funds’ financial statements may be found at SEC.gov. Dividend income, if any, realized gains and losses, and change in appreciation (depreciation) from affiliated funds are presented on the Statements of Operations.
Amounts relating to investments in affiliated funds in BUFT at August 31, 2024, and for the fiscal year then ended are as follows:
| | | | | Change in
Unrealized
Appreciation
(Depreciation) | | | |
FT Vest U.S. Equity Deep Buffer ETF - January | | | | | | | | |
FT Vest U.S. Equity Deep Buffer ETF - February | | | | | | | | |
FT Vest U.S. Equity Buffer ETF - March | | | | | | | | |
FT Vest U.S. Equity Deep Buffer ETF - March | | | | | | | | |
FT Vest U.S. Equity Deep Buffer ETF - April | | | | | | | | |
FT Vest U.S. Equity Deep Buffer ETF - May | | | | | | | | |
FT Vest U.S. Equity Deep Buffer ETF - June | | | | | | | | |
Notes to Financial Statements (Continued)
First Trust Exchange-Traded Fund VIIIAugust 31, 2024 | | | | | Change in Unrealized Appreciation (Depreciation) | | | |
FT Vest U.S. Equity Moderate Buffer ETF - June | | | | | | | | |
FT Vest U.S. Equity Deep Buffer ETF -July | | | | | | | | |
FT Vest U.S. Equity Deep Buffer ETF - August | | | | | | | | |
FT Vest U.S. Equity Moderate Buffer ETF - August | | | | | | | | |
FT Vest U.S. Equity Deep Buffer ETF - September | | | | | | | | |
FT Vest U.S. Equity Enhance & Moderate Buffer ETF - September | | | | | | | | |
FT Vest U.S. Equity Moderate Buffer ETF - September | | | | | | | | |
FT Vest U.S. Equity Buffer ETF - October | | | | | | | | |
FT Vest U.S. Equity Deep Buffer ETF - October | | | | | | | | |
FT Vest U.S. Equity Enhance & Moderate Buffer ETF - October | | | | | | | | |
FT Vest U.S. Equity Moderate Buffer ETF - October | | | | | | | | |
FT Vest U.S. Equity Enhance & Moderate Buffer ETF - November | | | | | | | | |
FT Vest U.S. Equity Deep Buffer ETF - December | | | | | | | | |
| | | | | | | | |
Amounts relating to investments in affiliated funds in BUFG at August 31, 2024, and for the fiscal year then ended are as follows:
| | | | | Change in
Unrealized
Appreciation
(Depreciation) | | | |
FT Vest U.S. Equity Buffer ETF - January | | | | | | | | |
FT Vest U.S. Equity Deep Buffer ETF - January | | | | | | | | |
Notes to Financial Statements (Continued)
First Trust Exchange-Traded Fund VIIIAugust 31, 2024 | | | | | Change in Unrealized Appreciation (Depreciation) | | | |
FT Vest U.S. Equity Buffer ETF - February | | | | | | | | |
FT Vest U.S. Equity Deep Buffer ETF - February | | | | | | | | |
FT Vest U.S. Equity Buffer ETF - March | | | | | | | | |
FT Vest U.S. Equity Deep Buffer ETF - March | | | | | | | | |
FT Vest U.S. Equity Buffer ETF - April | | | | | | | | |
FT Vest U.S. Equity Buffer ETF - May | | | | | | | | |
FT Vest U.S. Equity Deep Buffer ETF - May | | | | | | | | |
FT Vest U.S. Equity Buffer ETF - June | | | | | | | | |
FT Vest U.S. Equity Moderate Buffer ETF - June | | | | | | | | |
FT Vest U.S. Equity Buffer ETF - July | | | | | | | | |
FT Vest U.S. Equity Buffer ETF - August | | | | | | | | |
FT Vest U.S. Equity Buffer ETF - September | | | | | | | | |
FT Vest U.S. Equity Buffer ETF - October | | | | | | | | |
FT Vest U.S. Equity Buffer ETF - November | | | | | | | | |
FT Vest U.S. Equity Deep Buffer ETF - November | | | | | | | | |
FT Vest U.S. Equity Buffer ETF - December | | | | | | | | |
FT Vest U.S. Equity Deep Buffer ETF - December | | | | | | | | |
| | | | | | | | |
Notes to Financial Statements (Continued)
First Trust Exchange-Traded Fund VIIIAugust 31, 2024 E. Dividends and Distributions to Shareholders
Dividends from net investment income of each Fund, if any, are declared and paid annually, with the exception of BUFT and BUFG which are declared and paid quarterly, or as the Board of Trustees may determine from time to time. Distributions of net realized capital gains earned by each Fund, if any, are distributed at least annually. Each Fund may also designate a portion of the amount paid to redeeming shareholders as a distribution for tax purposes.
Distributions from net investment income and realized capital gains are determined in accordance with federal income tax regulations, which may differ from U.S. GAAP. Certain capital accounts in the financial statements are periodically adjusted for permanent differences in order to reflect their tax character. These permanent differences are primarily due to the varying treatment of income and gain/loss on significantly modified portfolio securities held by the Funds and have no impact on net assets or NAV per share. Temporary differences, which arise from recognizing certain items of income, expense and gain/loss in different periods for financial statement and tax purposes, will reverse at some time in the future. During their applicable taxable periods, none of the Funds paid a distribution in 2024 or 2023.
As of the applicable taxable year end, the components of distributable earnings on a tax basis for each Fund were as follows:
| | Undistributed
Ordinary
Income | Accumulated
Capital and
Other
Gain (Loss) | Net
Unrealized
Appreciation
(Depreciation) |
FT Vest U.S. Equity Buffer ETF - January | | | | |
FT Vest U.S. Equity Deep Buffer ETF - January | | | | |
FT Vest U.S. Equity Buffer ETF - February | | | | |
FT Vest U.S. Equity Deep Buffer ETF - February | | | | |
FT Vest U.S. Equity Buffer ETF - March | | | | |
FT Vest U.S. Equity Deep Buffer ETF - March | | | | |
FT Vest U.S. Equity Buffer ETF - April | | | | |
FT Vest U.S. Equity Deep Buffer ETF - April | | | | |
FT Vest U.S. Equity Buffer ETF - May | | | | |
FT Vest U.S. Equity Deep Buffer ETF - May | | | | |
FT Vest U.S. Equity Buffer ETF - June | | | | |
FT Vest U.S. Equity Deep Buffer ETF - June | | | | |
FT Vest U.S. Equity Buffer ETF - July | | | | |
FT Vest U.S. Equity Deep Buffer ETF - July | | | | |
FT Vest U.S. Equity Buffer ETF - August | | | | |
FT Vest U.S. Equity Deep Buffer ETF - August | | | | |
FT Vest U.S. Equity Buffer ETF - September | | | | |
FT Vest U.S. Equity Deep Buffer ETF - September | | | | |
FT Vest U.S. Equity Buffer ETF - October | | | | |
FT Vest U.S. Equity Deep Buffer ETF - October | | | | |
FT Vest U.S. Equity Buffer ETF - November | | | | |
FT Vest U.S. Equity Deep Buffer ETF - November | | | | |
FT Vest U.S. Equity Buffer ETF - December | | | | |
FT Vest U.S. Equity Deep Buffer ETF - December | | | | |
FT Vest Buffered Allocation Defensive ETF | | | | |
FT Vest Buffered Allocation Growth ETF | | | | |
Each Fund intends to continue to qualify as a regulated investment company by complying with the requirements under Subchapter M of the Internal Revenue Code of 1986, as amended, which includes distributing substantially all of its net investment income and net realized gains to shareholders. Accordingly, no provision has been made for federal and state income taxes. However, due to the timing and amount of distributions, each Fund may be subject to an excise tax of 4% of the amount by which approximately 98% of each Fund’s taxable income exceeds the distributions from such taxable income for the calendar year.
Notes to Financial Statements (Continued)
First Trust Exchange-Traded Fund VIIIAugust 31, 2024 The Funds are subject to accounting standards that establish a minimum threshold for recognizing, and a system for measuring, the benefits of a tax position taken or expected to be taken in a tax return. For FJAN, DJAN, FFEB, DFEB, FMAR, DMAR, FAPR, DAPR, FMAY, DMAY, FJUN, DJUN, FJUL, DJUL, FAUG, and DAUG, the taxable years ended 2021, 2022, 2023, and 2024 remain open to federal and state audit. For FSEP, DSEP, FOCT, DOCT, FNOV, DNOV, FDEC, and DDEC, the taxable years ended 2021, 2022, and 2023 remain open to federal and state audit. For BUFT and BUFG, the taxable years ended 2022, 2023, and 2024 remain open to federal and state audit. As of August 31, 2024, management has evaluated the application of these standards to the Funds and has determined that no provision for income tax is required in the Funds’ financial statements for uncertain tax positions.
Each Fund intends to utilize provisions of the federal income tax laws, which allow it to carry a realized capital loss forward indefinitely following the year of the loss and offset such loss against any future realized capital gains. Each Fund is subject to certain limitations under U.S. tax rules on the use of capital loss carryforwards and net unrealized built-in losses. These limitations apply when there has been a 50% change in ownership. At each Fund’s applicable taxable year end, each applicable Fund had a capital loss carryforward available that is shown in the following table, to the extent provided by regulations, to offset future capital gains. To the extent that these loss carryforwards are used to offset future capital gains, it is probable that the capital gains so offset will not be distributed to each applicable Fund’s shareholders.
| | Non-Expiring
Capital Loss
Carryforwards |
FT Vest U.S. Equity Buffer ETF - January | | |
FT Vest U.S. Equity Deep Buffer ETF - January | | |
FT Vest U.S. Equity Buffer ETF - February | | |
FT Vest U.S. Equity Deep Buffer ETF - February | | |
FT Vest U.S. Equity Buffer ETF - March | | |
FT Vest U.S. Equity Deep Buffer ETF - March | | |
FT Vest U.S. Equity Buffer ETF - April | | |
FT Vest U.S. Equity Deep Buffer ETF - April | | |
FT Vest U.S. Equity Buffer ETF - May | | |
FT Vest U.S. Equity Deep Buffer ETF - May | | |
FT Vest U.S. Equity Buffer ETF - June | | |
FT Vest U.S. Equity Deep Buffer ETF - June | | |
FT Vest U.S. Equity Buffer ETF - July | | |
FT Vest U.S. Equity Deep Buffer ETF - July | | |
FT Vest U.S. Equity Buffer ETF - August | | |
FT Vest U.S. Equity Deep Buffer ETF - August | | |
FT Vest U.S. Equity Buffer ETF - September | | |
FT Vest U.S. Equity Deep Buffer ETF - September | | |
FT Vest U.S. Equity Buffer ETF - October | | |
FT Vest U.S. Equity Deep Buffer ETF - October | | |
FT Vest U.S. Equity Buffer ETF - November | | |
FT Vest U.S. Equity Deep Buffer ETF - November | | |
FT Vest U.S. Equity Buffer ETF - December | | |
FT Vest U.S. Equity Deep Buffer ETF - December | | |
FT Vest Buffered Allocation Defensive ETF | | |
FT Vest Buffered Allocation Growth ETF | | |
During the applicable taxable year end, the Fund listed below utilized non-expiring capital loss carryforwards in the following amount:
| |
FT Vest U.S. Equity Deep Buffer ETF - January | |
FT Vest U.S. Equity Deep Buffer ETF - February | |
FT Vest U.S. Equity Deep Buffer ETF - March | |
Notes to Financial Statements (Continued)
First Trust Exchange-Traded Fund VIIIAugust 31, 2024 | |
FT Vest U.S. Equity Deep Buffer ETF - April | |
FT Vest U.S. Equity Buffer ETF - August | |
FT Vest U.S. Equity Deep Buffer ETF - August | |
FT Vest U.S. Equity Deep Buffer ETF - November | |
FT Vest Buffered Allocation Defensive ETF | |
FT Vest Buffered Allocation Growth ETF | |
Certain losses realized during the current taxable year may be deferred and treated as occurring on the first day of the following taxable year for federal income tax purposes. At each Fund’s applicable taxable year end, the following Funds incurred and elected to defer net late year ordinary or capital losses as follows:
| | Qualified Late Year Losses |
| | |
FT Vest U.S. Equity Buffer ETF - January | | | |
FT Vest U.S. Equity Deep Buffer ETF - January | | | |
FT Vest U.S. Equity Buffer ETF - February | | | |
FT Vest U.S. Equity Deep Buffer ETF - February | | | |
FT Vest U.S. Equity Buffer ETF - March | | | |
FT Vest U.S. Equity Deep Buffer ETF - March | | | |
FT Vest U.S. Equity Buffer ETF - April | | | |
FT Vest U.S. Equity Deep Buffer ETF - April | | | |
FT Vest U.S. Equity Buffer ETF - May | | | |
FT Vest U.S. Equity Deep Buffer ETF - May | | | |
FT Vest U.S. Equity Buffer ETF - June | | | |
FT Vest U.S. Equity Deep Buffer ETF - June | | | |
FT Vest U.S. Equity Buffer ETF - July | | | |
FT Vest U.S. Equity Deep Buffer ETF - July | | | |
FT Vest U.S. Equity Buffer ETF - August | | | |
FT Vest U.S. Equity Deep Buffer ETF - August | | | |
FT Vest U.S. Equity Buffer ETF - September | | | |
FT Vest U.S. Equity Deep Buffer ETF - September | | | |
FT Vest U.S. Equity Buffer ETF - October | | | |
FT Vest U.S. Equity Deep Buffer ETF - October | | | |
FT Vest U.S. Equity Buffer ETF - November | | | |
FT Vest U.S. Equity Deep Buffer ETF - November | | | |
FT Vest Buffered Allocation Defensive ETF | | | |
FT Vest Buffered Allocation Growth ETF | | | |
| | | |
In order to present paid-in capital and accumulated distributable earnings (loss) (which consists of accumulated net investment income (loss), accumulated net realized gain (loss) on investments and net unrealized appreciation (depreciation) on investments) on the Statements of Assets and Liabilities that more closely represent their tax character, certain adjustments have been made to paid-in capital, accumulated net investment income (loss) and accumulated net realized gain (loss) on investments. These adjustments are primarily due to the difference between book and tax treatments of income and gains on various investment securities held by the Funds and in-kind transactions. The results of operations and net assets were not affected by these adjustments. For each Fund’s applicable taxable period, the adjustments were as follows:
| | Accumulated
Net Investment
Income (Loss) | Accumulated
Net Realized
Gain (Loss)
on Investments | |
FT Vest U.S. Equity Buffer ETF - January | | | | |
Notes to Financial Statements (Continued)
First Trust Exchange-Traded Fund VIIIAugust 31, 2024 | | Accumulated Net Investment Income (Loss) | Accumulated Net Realized Gain (Loss) on Investments | |
FT Vest U.S. Equity Deep Buffer ETF - January | | | | |
FT Vest U.S. Equity Buffer ETF - February | | | | |
FT Vest U.S. Equity Deep Buffer ETF - February | | | | |
FT Vest U.S. Equity Buffer ETF - March | | | | |
FT Vest U.S. Equity Deep Buffer ETF - March | | | | |
FT Vest U.S. Equity Buffer ETF - April | | | | |
FT Vest U.S. Equity Deep Buffer ETF - April | | | | |
FT Vest U.S. Equity Buffer ETF - May | | | | |
FT Vest U.S. Equity Deep Buffer ETF - May | | | | |
FT Vest U.S. Equity Buffer ETF - June | | | | |
FT Vest U.S. Equity Deep Buffer ETF - June | | | | |
FT Vest U.S. Equity Buffer ETF - July | | | | |
FT Vest U.S. Equity Deep Buffer ETF - July | | | | |
FT Vest U.S. Equity Buffer ETF - August | | | | |
FT Vest U.S. Equity Deep Buffer ETF - August | | | | |
FT Vest U.S. Equity Buffer ETF - September | | | | |
FT Vest U.S. Equity Deep Buffer ETF - September | | | | |
FT Vest U.S. Equity Buffer ETF - October | | | | |
FT Vest U.S. Equity Deep Buffer ETF - October | | | | |
FT Vest U.S. Equity Buffer ETF - November | | | | |
FT Vest U.S. Equity Deep Buffer ETF - November | | | | |
FT Vest U.S. Equity Buffer ETF - December | | | | |
FT Vest U.S. Equity Deep Buffer ETF - December | | | | |
FT Vest Buffered Allocation Defensive ETF | | | | |
FT Vest Buffered Allocation Growth ETF | | | | |
As of August 31, 2024, the aggregate cost, gross unrealized appreciation, gross unrealized depreciation, and net unrealized appreciation/(depreciation) on investments (including short positions and derivatives, if any) for federal income tax purposes were as follows:
| | Gross Unrealized
Appreciation | Gross Unrealized
(Depreciation) | Net Unrealized
Appreciation
(Depreciation) |
FT Vest U.S. Equity Buffer ETF - January | | | | |
FT Vest U.S. Equity Deep Buffer ETF - January | | | | |
FT Vest U.S. Equity Buffer ETF - February | | | | |
FT Vest U.S. Equity Deep Buffer ETF - February | | | | |
FT Vest U.S. Equity Buffer ETF - March | | | | |
FT Vest U.S. Equity Deep Buffer ETF - March | | | | |
FT Vest U.S. Equity Buffer ETF - April | | | | |
FT Vest U.S. Equity Deep Buffer ETF - April | | | | |
FT Vest U.S. Equity Buffer ETF - May | | | | |
FT Vest U.S. Equity Deep Buffer ETF - May | | | | |
FT Vest U.S. Equity Buffer ETF - June | | | | |
FT Vest U.S. Equity Deep Buffer ETF - June | | | | |
FT Vest U.S. Equity Buffer ETF - July | | | | |
FT Vest U.S. Equity Deep Buffer ETF - July | | | | |
FT Vest U.S. Equity Buffer ETF - August | | | | |
FT Vest U.S. Equity Deep Buffer ETF - August | | | | |
FT Vest U.S. Equity Buffer ETF - September | | | | |
FT Vest U.S. Equity Deep Buffer ETF - September | | | | |
Notes to Financial Statements (Continued)
First Trust Exchange-Traded Fund VIIIAugust 31, 2024 | | Gross Unrealized Appreciation | Gross Unrealized (Depreciation) | Net Unrealized Appreciation (Depreciation) |
FT Vest U.S. Equity Buffer ETF - October | | | | |
FT Vest U.S. Equity Deep Buffer ETF - October | | | | |
FT Vest U.S. Equity Buffer ETF - November | | | | |
FT Vest U.S. Equity Deep Buffer ETF - November | | | | |
FT Vest U.S. Equity Buffer ETF - December | | | | |
FT Vest U.S. Equity Deep Buffer ETF - December | | | | |
FT Vest Buffered Allocation Defensive ETF | | | | |
FT Vest Buffered Allocation Growth ETF | | | | |
Expenses, other than the investment advisory fee and other excluded expenses, are paid by the Advisor (see Note 3).
3. Investment Advisory Fee, Affiliated Transactions and Other Fee Arrangements
First Trust, the investment advisor to the Funds, is a limited partnership with one limited partner, Grace Partners of DuPage L.P., and one general partner, The Charger Corporation. The Charger Corporation is an Illinois corporation controlled by James A. Bowen, Chief Executive Officer of First Trust. First Trust is responsible for the ongoing monitoring of the securities in each Fund’s portfolio, managing the Funds’ business affairs and providing certain administrative services necessary for the management of the Funds.
First Trust is paid an annual unitary management fee based on a percentage of each Fund’s average daily net assets. In addition, BUFT and BUFG incur pro rata share of fees and expenses attributable to investments in other investment companies (“acquired fund fees and expenses”). The total of the unitary management fee and acquired fund fees and expenses represents each Fund’s total annual operating expenses. The annual unitary management fee payable by each Fund, with the exception of BUFT and BUFG, to First Trust for these services will be reduced at certain levels of each Fund’s net assets (“breakpoints”) and calculated pursuant to the following schedule:
| |
Fund net assets up to and including $2.5 billion | |
Fund net assets greater than $2.5 billion up to and including $5 billion | |
Fund net assets greater than $5 billion up to and including $7.5 billion | |
Fund net assets greater than $7.5 billion up to and including $10 billion | |
Fund net assets greater than $10 billion | |
For BUFT and BUFG, the annual unitary management fee payable by each Fund will be calculated pursuant to the following schedule:
| |
Fund net assets up to and including $2.5 billion | |
Fund net assets greater than $2.5 billion up to and including $5 billion | |
Fund net assets greater than $5 billion up to and including $7.5 billion | |
Fund net assets greater than $7.5 billion up to and including $10 billion | |
Fund net assets greater than $10 billion up to and including $15 billion | |
Fund net assets greater than $15 billion | |
First Trust is responsible for each Fund’s expenses, including the cost of transfer agency, sub-advisory, custody, fund administration, legal, audit and other services, but excluding fee payments under the Investment Management Agreement, interest, taxes, acquired fund fees and expenses, if any, brokerage commissions and other expenses connected with the execution of portfolio transactions, distribution and service fees payable pursuant to a Rule 12b-1 plan, if any, and extraordinary expenses.
Vest Financial LLC (“Vest”), an affiliate of First Trust, serves as the Funds’ sub-advisor and manages each Fund’s portfolio subject to First Trust’s supervision. Pursuant to the Investment Management Agreement, between the Trust, on behalf of the Funds, and the Advisor, and the Investment Sub-Advisory Agreement among the Trust, on behalf of the Funds (other than BUFT and BUFG), the Advisor and Vest, First Trust will supervise Vest and its management of the investment of each Fund’s assets and will pay Vest for its services as the Funds’ sub-advisor a sub-advisory fee equal to 50% of any remaining monthly unitary management fee paid to the
Notes to Financial Statements (Continued)
First Trust Exchange-Traded Fund VIIIAugust 31, 2024 Advisor after the average Fund’s expenses accrued during the most recent twelve months are subtracted from the unitary management fee for that month. Pursuant to the Investment Management Agreement, between the Trust, on behalf of the Funds, and the Advisor, and the Investment Sub-Advisory Agreement among the Trust, on behalf of BUFT and BUFG, the Advisor and Vest, First Trust will supervise Vest and its management of the investment of each Fund’s assets and will pay Vest for its services as the Funds’ sub-advisor a sub-advisory fee equal to 50% of the monthly unitary management fee paid to the Advisor, less Vest’s 50% share of each of BUFT and BUFG’s expenses for that month. During any period in which the Advisor’s management fee is reduced in accordance with the breakpoints described above, the investment sub-advisory fee (which is based on the Advisor’s management fee) paid to Vest will be reduced to reflect the reduction in the Advisor’s management fee.
The Trust has multiple service agreements with The Bank of New York Mellon (“BNY”). Under the service agreements, BNY performs custodial, fund accounting, certain administrative services, and transfer agency services for each Fund. As custodian, BNY is responsible for custody of each Fund’s assets. As fund accountant and administrator, BNY is responsible for maintaining the books and records of each Fund’s securities and cash. As transfer agent, BNY is responsible for maintaining shareholder records for each Fund. BNY is a subsidiary of The Bank of New York Mellon Corporation, a financial holding company.
Each Trustee who is not an officer or employee of First Trust, any sub-advisor or any of their affiliates (“Independent Trustees”) is paid a fixed annual retainer that is allocated equally among each fund in the First Trust Fund Complex. Each Independent Trustee is also paid an annual per fund fee that varies based on whether the fund is a closed-end or other actively managed fund, a target outcome fund or an index fund.
Additionally, the Chairs of the Audit Committee, Nominating and Governance Committee and Valuation Committee, the Vice Chair of the Audit Committee, the Lead Independent Trustee and the Vice Lead Independent Trustee are paid annual fees to serve in such capacities, with such compensation allocated pro rata among each fund in the First Trust Fund Complex based on net assets. Independent Trustees are reimbursed for travel and out-of-pocket expenses in connection with all meetings. The Committee Chairs, the Audit Committee Vice Chair, the Lead Independent Trustee and the Vice Lead Independent Trustee rotate periodically in serving in such capacities. The officers and “Interested” Trustee receive no compensation from the Trust for acting in such capacities.
4. Purchases and Sales of Securities
For the fiscal year ended August 31, 2024, the Funds, except BUFT and BUFG, had no purchases or sales of investments, excluding short-term investments and in-kind transactions. Each Fund, except BUFT and BUFG, holds options for a target outcome period of approximately one year based on the expiration date of the options, which occurs on the third Friday of the month corresponding to the month in each Fund name. For securities transactions purposes, the options are considered short-term investments.
For the fiscal year ended August 31, 2024, the cost of purchases and proceeds from sales of investments for BUFT and BUFG, excluding short-term investments and in-kind transactions, were as follows:
| | |
FT Vest Buffered Allocation Defensive ETF | | |
FT Vest Buffered Allocation Growth ETF | | |
For the fiscal year ended August 31, 2024, the cost of in-kind purchases and proceeds from in-kind sales for each Fund were as follows:
| | |
FT Vest U.S. Equity Buffer ETF - January | | |
FT Vest U.S. Equity Deep Buffer ETF - January | | |
FT Vest U.S. Equity Buffer ETF - February | | |
FT Vest U.S. Equity Deep Buffer ETF - February | | |
FT Vest U.S. Equity Buffer ETF - March | | |
FT Vest U.S. Equity Deep Buffer ETF - March | | |
FT Vest U.S. Equity Buffer ETF - April | | |
FT Vest U.S. Equity Deep Buffer ETF - April | | |
FT Vest U.S. Equity Buffer ETF - May | | |
FT Vest U.S. Equity Deep Buffer ETF - May | | |
FT Vest U.S. Equity Buffer ETF - June | | |
Notes to Financial Statements (Continued)
First Trust Exchange-Traded Fund VIIIAugust 31, 2024 | | |
FT Vest U.S. Equity Deep Buffer ETF - June | | |
FT Vest U.S. Equity Buffer ETF - July | | |
FT Vest U.S. Equity Deep Buffer ETF - July | | |
FT Vest U.S. Equity Buffer ETF - August | | |
FT Vest U.S. Equity Deep Buffer ETF - August | | |
FT Vest U.S. Equity Buffer ETF - September | | |
FT Vest U.S. Equity Deep Buffer ETF - September | | |
FT Vest U.S. Equity Buffer ETF - October | | |
FT Vest U.S. Equity Deep Buffer ETF - October | | |
FT Vest U.S. Equity Buffer ETF - November | | |
FT Vest U.S. Equity Deep Buffer ETF - November | | |
FT Vest U.S. Equity Buffer ETF - December | | |
FT Vest U.S. Equity Deep Buffer ETF - December | | |
FT Vest Buffered Allocation Defensive ETF | | |
FT Vest Buffered Allocation Growth ETF | | |
5. Derivative Transactions
The following table presents the types of derivatives held by each Fund at August 31, 2024, the primary underlying risk exposure and the location of these instruments as presented on the Statements of Assets and Liabilities.
| | | |
| | Statements of Assets and
Liabilities Location | | Statements of Assets and
Liabilities Location | |
| | | | | |
| | Options contracts purchased, at value | | Options contracts written, at value | |
| | | | | |
| | Options contracts purchased, at value | | Options contracts written, at value | |
| | | | | |
| | Options contracts purchased, at value | | Options contracts written, at value | |
| | | | | |
| | Options contracts purchased, at value | | Options contracts written, at value | |
| | | | | |
| | Options contracts purchased, at value | | Options contracts written, at value | |
| | | | | |
| | Options contracts purchased, at value | | Options contracts written, at value | |
| | | | | |
| | Options contracts purchased, at value | | Options contracts written, at value | |
| | | | | |
| | Options contracts purchased, at value | | Options contracts written, at value | |
| | | | | |
| | Options contracts purchased, at value | | Options contracts written, at value | |
Notes to Financial Statements (Continued)
First Trust Exchange-Traded Fund VIIIAugust 31, 2024 | | | |
| | Statements of Assets and Liabilities Location | | Statements of Assets and Liabilities Location | |
| | | | | |
| | Options contracts purchased, at value | | Options contracts written, at value | |
| | | | | |
| | Options contracts purchased, at value | | Options contracts written, at value | |
| | | | | |
| | Options contracts purchased, at value | | Options contracts written, at value | |
| | | | | |
| | Options contracts purchased, at value | | Options contracts written, at value | |
| | | | | |
| | Options contracts purchased, at value | | Options contracts written, at value | |
| | | | | |
| | Options contracts purchased, at value | | Options contracts written, at value | |
| | | | | |
| | Options contracts purchased, at value | | Options contracts written, at value | |
| | | | | |
| | Options contracts purchased, at value | | Options contracts written, at value | |
| | | | | |
| | Options contracts purchased, at value | | Options contracts written, at value | |
| | | | | |
| | Options contracts purchased, at value | | Options contracts written, at value | |
| | | | | |
| | Options contracts purchased, at value | | Options contracts written, at value | |
| | | | | |
| | Options contracts purchased, at value | | Options contracts written, at value | |
| | | | | |
| | Options contracts purchased, at value | | Options contracts written, at value | |
| | | | | |
| | Options contracts purchased, at value | | Options contracts written, at value | |
| | | | | |
| | Options contracts purchased, at value | | Options contracts written, at value | |
Notes to Financial Statements (Continued)
First Trust Exchange-Traded Fund VIIIAugust 31, 2024 The following table presents the amount of net realized gain (loss) and change in net unrealized appreciation (depreciation) recognized for the fiscal year ended August 31, 2024, on each Fund’s derivative instruments, as well as the primary underlying risk exposure associated with the instruments.
|
Statements of Operations Location | | | | | | |
| | | | | | |
Net realized gain (loss) on: | | | | | | |
Purchased options contracts | | | | | | |
Written options contracts | | | | | | |
Net change in unrealized appreciation
(depreciation) on: | | | | | | |
Purchased options contracts | | | | | | |
Written options contracts | | | | | | |
|
Statements of Operations Location | | | | | | |
| | | | | | |
Net realized gain (loss) on: | | | | | | |
Purchased options contracts | | | | | | |
Written options contracts | | | | | | |
Notes to Financial Statements (Continued)
First Trust Exchange-Traded Fund VIIIAugust 31, 2024 |
Statements of Operations Location | | | | | | |
Net change in unrealized appreciation
(depreciation) on: | | | | | | |
Purchased options contracts | | | | | | |
Written options contracts | | | | | | |
The Funds do not have the right to offset financial assets and financial liabilities related to options contracts on the Statements of Assets and Liabilities.
The following table presents the premiums for purchased options contracts opened, premiums for purchased options contracts closed, exercised and expired, premiums for written options contracts opened, and premiums for written options contracts closed, exercised and expired, for the fiscal year ended August 31, 2024, on each Fund’s options contracts.
| Premiums for
purchased
options contracts
opened | Premiums for
purchased
options contracts
closed, exercised
and expired | Premiums for
written options
contracts opened | Premiums for
written options
contracts closed,
exercised and
expired |
| | | | |
| | | | |
| | | | |
| | | | |
| | | | |
| | | | |
| | | | |
| | | | |
| | | | |
| | | | |
| | | | |
| | | | |
| | | | |
| | | | |
| | | | |
| | | | |
| | | | |
| | | | |
| | | | |
| | | | |
| | | | |
| | | | |
| | | | |
| | | | |
6. Creations, Redemptions and Transaction Fees
Each Fund generally issues and redeems its shares in primary market transactions through a creation and redemption mechanism and does not sell or redeem individual shares. Instead, financial entities known as “Authorized Participants” have contractual arrangements with a Fund or one of the Fund’s service providers to purchase and redeem Fund shares directly with the Fund in Creation Units. Prior to the start of trading on every business day, a Fund publishes through the National Securities Clearing Corporation the “basket” of securities, cash or other assets that it will accept in exchange for a Creation Unit of the Fund’s shares. An Authorized Participant that wishes to effectuate a creation of a Fund’s shares deposits with the Fund the “basket” of securities, cash or other assets identified by the Fund that day, and then receives the Creation Unit of the Fund’s shares in return for those assets. After purchasing a Creation Unit,
Notes to Financial Statements (Continued)
First Trust Exchange-Traded Fund VIIIAugust 31, 2024 the Authorized Participant may continue to hold the Fund’s shares or sell them in the secondary market. The redemption process is the reverse of the purchase process: the Authorized Participant redeems a Creation Unit of a Fund’s shares for a basket of securities, cash or other assets. The combination of the creation and redemption process with secondary market trading in a Fund’s shares and underlying securities provides arbitrage opportunities that are designed to help keep the market price of a Fund’s shares at or close to the NAV per share of the Fund.
Each Fund imposes fees in connection with the purchase of Creation Units. These fees may vary based upon various fact-based circumstances, including, but not limited to, the composition of the securities included in the Creation Unit or the countries in which the transactions are settled. The price for each Creation Unit will equal the daily NAV per share of a Fund times the number of shares in a Creation Unit, plus the fees described above and, if applicable, any operational processing and brokerage costs, transfer fees, stamp taxes and part or all of the spread between the expected bid and offer side of the market related to the securities comprising the creation basket.
Each Fund also imposes fees in connection with the redemption of Creation Units. These fees may vary based upon various fact-based circumstances, including, but not limited to, the composition of the securities included in the Creation Unit or the countries in which the transactions are settled. The price received for each Creation Unit will equal the daily NAV per share of a Fund times the number of shares in a Creation Unit, minus the fees described above and, if applicable, any operational processing and brokerage costs, transfer fees, stamp taxes and part or all of the spread between the expected bid and offer side of the market related to the securities comprising the redemption basket. Investors who use the services of a broker or other such intermediary in addition to an Authorized Participant to effect a redemption of a Creation Unit may also be assessed an amount to cover the cost of such services. The redemption fee charged by a Fund will comply with Rule 22c-2 of the 1940 Act which limits redemption fees to no more than 2% of the value of the shares redeemed.
The Board of Trustees adopted a Distribution and Service Plan pursuant to Rule 12b-1 under the 1940 Act. In accordance with the Rule 12b-1 plan, the Funds are authorized to pay an amount up to 0.25% of their average daily net assets each year to reimburse First Trust Portfolios L.P. (“FTP”), the distributor of the Funds, for amounts expended to finance activities primarily intended to result in the sale of Creation Units or the provision of investor services. FTP may also use this amount to compensate securities dealers or other persons that are Authorized Participants for providing distribution assistance, including broker-dealer and shareholder support and educational and promotional services.
No 12b-1 fees are currently paid by the Funds, and pursuant to a contractual arrangement, no 12b-1 fees will be paid any time before December 31, 2025.
The Trust, on behalf of the Funds, has a variety of indemnification obligations under contracts with its service providers. The Trust’s maximum exposure under these arrangements is unknown. However, the Trust has not had prior claims or losses pursuant to these contracts and expects the risk of loss to be remote.
Management has evaluated the impact of all subsequent events on the Funds through the date the financial statements were issued and has determined that there were the following subsequent events:
As of September 23, 2024, the investment objective of the FT Vest U.S. Equity Buffer ETF - September changed to include an upside cap of 13.70% and an Outcome Period of September 23, 2024 through September 19, 2025.
As of September 23, 2024, the investment objective of the FT Vest U.S. Equity Deep Buffer ETF - September changed to include an upside cap of 11.48% and an Outcome Period of September 23, 2024 through September 19, 2025.
As of October 21, 2024, the investment objective of the FT Vest U.S. Equity Buffer ETF - October changed to include an upside cap of 14.09% and an Outcome Period of October 21, 2024 through October 17, 2025.
As of October 21, 2024, the investment objective of the FT Vest U.S. Equity Deep Buffer ETF - October changed to include an upside cap of 11.95% and an Outcome Period of October 21, 2024 through October 17, 2025.
Report of Independent Registered Public Accounting Firm
To the Shareholders and Board of Trustees of First Trust Exchange-Traded Fund VIII:
Opinion on the Financial Statements and Financial Highlights
We have audited the accompanying statements of assets and liabilities, including the portfolios of investments, of FT Vest U.S. Equity Buffer ETF - January, FT Vest U.S. Equity Deep Buffer ETF - January, FT Vest U.S. Equity Buffer ETF - February, FT Vest U.S. Equity Deep Buffer ETF - February, FT Vest U.S. Equity Buffer ETF - March, FT Vest U.S. Equity Deep Buffer ETF - March, FT Vest U.S. Equity Buffer ETF - April, FT Vest U.S. Equity Deep Buffer ETF - April, FT Vest U.S. Equity Buffer ETF - May, FT Vest U.S. Equity Deep Buffer ETF - May, FT Vest U.S. Equity Buffer ETF - June, FT Vest U.S. Equity Deep Buffer ETF - June, FT Vest U.S. Equity Buffer ETF - July, FT Vest U.S. Equity Deep Buffer ETF - July, FT Vest U.S. Equity Buffer ETF - August, FT Vest U.S. Equity Deep Buffer ETF - August, FT Vest U.S. Equity Buffer ETF - September, FT Vest U.S. Equity Deep Buffer ETF - September, FT Vest U.S. Equity Buffer ETF - October, FT Vest U.S. Equity Deep Buffer ETF - October, FT Vest U.S. Equity Buffer ETF - November, FT Vest U.S. Equity Deep Buffer ETF - November, FT Vest U.S. Equity Buffer ETF - December, FT Vest U.S. Equity Deep Buffer ETF - December, FT Vest Buffered Allocation Defensive ETF, and FT Vest Buffered Allocation Growth ETF (the “Funds”), each a series of the First Trust Exchange-Traded Fund VIII, as of August 31, 2024, the related statements of operations for the year then ended, the statements of changes in net assets for each of the two years in the period then ended, and the financial highlights for the periods indicated in the table below; and the related notes. In our opinion, the financial statements and financial highlights present fairly, in all material respects, the financial position of the Funds as of August 31, 2024, and the results of their operations for the year then ended, the changes in their net assets for each of the two years in the period then ended, and the financial highlights for the periods listed in the table below in conformity with accounting principles generally accepted in the United States of America.
Individual Funds
Included in the Trust | | Statements of
Changes in Net Assets | |
FT Vest U.S. Equity Buffer ETF - January | For the year ended August 31, 2024 | For the years ended August 31, 2024 and 2023 | For the years ended August 31, 2024, 2023, and 2022, and for the period from January 15, 2021 (commencement of investment operations) through August 31, 2021 |
FT Vest U.S. Equity Deep Buffer ETF - January |
FT Vest U.S. Equity Buffer ETF - February | For the year ended August 31, 2024 | For the years ended August 31, 2024 and 2023 | For the years ended August 31, 2024, 2023, 2022, and 2021, and for the period from February 21, 2020 (commencement of investment operations) through August 31, 2020 |
FT Vest U.S. Equity Deep Buffer ETF - February |
FT Vest U.S. Equity Buffer ETF - March | For the year ended August 31, 2024 | For the years ended August 31, 2024 and 2023 | For the years ended August 31, 2024, 2023, and 2022, and for the period from March 19, 2021 (commencement of investment operations) through August 31, 2021 |
FT Vest U.S. Equity Deep Buffer ETF - March |
FT Vest U.S. Equity Buffer ETF - April | For the year ended August 31, 2024 | For the years ended August 31, 2024 and 2023 | For the years ended August 31, 2024, 2023, and 2022, and for the period from April 16, 2021 (commencement of investment operations) through August 31, 2021 |
FT Vest U.S. Equity Deep Buffer ETF - April |
FT Vest U.S. Equity Buffer ETF - May | For the year ended August 31, 2024 | For the years ended August 31, 2024 and 2023 | For the years ended August 31, 2024, 2023, 2022, and 2021, and for the period from May 15, 2020 (commencement of investment operations) through August 31, 2020 |
FT Vest U.S. Equity Deep Buffer ETF - May |
Report of Independent Registered Public Accounting Firm (Continued)
Individual Funds Included in the Trust | | Statements of Changes in Net Assets | |
FT Vest U.S. Equity Buffer ETF - June | For the year ended August 31, 2024 | For the years ended August 31, 2024 and 2023 | For the years ended August 31, 2024, 2023, 2022, and 2021, and for the period from June 19, 2020 (commencement of investment operations) through August 31, 2020 |
FT Vest U.S. Equity Deep Buffer ETF - June |
FT Vest U.S. Equity Buffer ETF - July | For the year ended August 31, 2024 | For the years ended August 31, 2024 and 2023 | For the years ended August 31, 2024, 2023, 2022, and 2021, and for the period from July 17, 2020 (commencement of investment operations) through August 31, 2020 |
FT Vest U.S. Equity Deep Buffer ETF - July |
FT Vest U.S. Equity Buffer ETF - August | For the year ended August 31, 2024 | For the years ended August 31, 2024 and 2023 | For the years ended August 31, 2024, 2023, 2022, and 2021, and for the period from November 6, 2019 (commencement of investment operations) through August 31, 2020 |
FT Vest U.S. Equity Deep Buffer ETF - August |
FT Vest U.S. Equity Buffer ETF - September | For the year ended August 31, 2024 | For the years ended August 31, 2024 and 2023 | For the years ended August 31, 2024, 2023, and 2022, and for the period from September 18, 2020 (commencement of investment operations) through August 31, 2021 |
FT Vest U.S. Equity Deep Buffer ETF - September |
FT Vest U.S. Equity Buffer ETF - October | For the year ended August 31, 2024 | For the years ended August 31, 2024 and 2023 | For the years ended August 31, 2024, 2023, and 2022, and for the period from October 16, 2020 (commencement of investment operations) through August 31, 2021 |
FT Vest U.S. Equity Deep Buffer ETF - October |
FT Vest U.S. Equity Buffer ETF - November | For the year ended August 31, 2024 | For the years ended August 31, 2024 and 2023 | For the years ended August 31, 2024, 2023, 2022, and 2021, and for the period from November 15, 2019 (commencement of investment operations) through August 31, 2020 |
FT Vest U.S. Equity Deep Buffer ETF - November |
FT Vest U.S. Equity Buffer ETF - December | For the year ended August 31, 2024 | For the years ended August 31, 2024 and 2023 | For the years ended August 31, 2024, 2023, and 2022, and for the period from December 18, 2020 (commencement of investment operations) through August 31, 2021 |
FT Vest U.S. Equity Deep Buffer ETF - December |
FT Vest Buffered Allocation Defensive ETF | For the year ended August 31, 2024 | For the years ended August 31, 2024 and 2023 | For the year ended August 31, 2024, 2023, and for the period from October 26, 2021 (commencement of investment operations) through August 31, 2022 |
FT Vest Buffered Allocation Growth ETF |
These financial statements and financial highlights are the responsibility of the Funds’ management. Our responsibility is to express an opinion on the Funds’ financial statements and financial highlights based on our audits. We are a public accounting firm registered
Report of Independent Registered Public Accounting Firm (Continued)
with the Public Company Accounting Oversight Board (United States) (PCAOB) and are required to be independent with respect to the Funds in accordance with the U.S. federal securities laws and the applicable rules and regulations of the Securities and Exchange Commission and the PCAOB.
We conducted our audits in accordance with the standards of the PCAOB. Those standards require that we plan and perform the audit to obtain reasonable assurance about whether the financial statements and financial highlights are free of material misstatement, whether due to error or fraud. The Funds are not required to have, nor were we engaged to perform, an audit of their internal control over financial reporting. As part of our audits, we are required to obtain an understanding of internal control over financial reporting but not for the purpose of expressing an opinion on the effectiveness of the Funds’ internal control over financial reporting. Accordingly, we express no such opinion.
Our audits included performing procedures to assess the risks of material misstatement of the financial statements and financial highlights, whether due to error or fraud, and performing procedures that respond to those risks. Such procedures included examining, on a test basis, evidence regarding the amounts and disclosures in the financial statements and financial highlights. Our audits also included evaluating the accounting principles used and significant estimates made by management, as well as evaluating the overall presentation of the financial statements and financial highlights. Our procedures included confirmation of securities owned as of August 31, 2024, by correspondence with the custodian and brokers; when replies were not received from brokers, we performed other auditing procedures. We believe that our audits provide a reasonable basis for our opinion.
/s/ Deloitte & Touche, LLP
Chicago, Illinois
October 24, 2024
We have served as the auditor of one or more First Trust investment companies since 2001.
First Trust Exchange-Traded Fund VIIIAugust 31, 2024 (Unaudited) Changes in and Disagreements with Accountants (Item 8 of Form N-CSR)
There were no changes in or disagreements with the Funds’ accountants during the fiscal year ended August 31, 2024.
Proxy Disclosures (Item 9 of Form N-CSR)
There were no matters submitted for vote by shareholders of any Fund during the fiscal year ended August 31, 2024.
Remuneration Paid to Directors, Officers, and Others (Item 10 of Form N-CSR)
Independent Trustees and any member of any advisory board of each Fund are compensated through the unitary management fee paid by each Fund to the advisor and not directly by each Fund. The investment advisory fee paid is included in the Statements of Operations.
Statement Regarding the Basis for the Board’s Approval of Investment Advisory Contract (Item 11 of Form N-CSR)
The Board of Trustees of First Trust Exchange-Traded Fund VIII (the “Trust”), including the Independent Trustees, unanimously approved the continuation of the Investment Management Agreement (the “Advisory Agreement”) with First Trust Advisors L.P. (the “Advisor”) and the Investment Sub-Advisory Agreements (as applicable to a specific Fund, the “Sub-Advisory Agreement” and collectively, the “Sub-Advisory Agreements” and together with the Advisory Agreement, the “Agreements”) among the Trust, the Advisor and Vest Financial LLC (the “Sub-Advisor”) on behalf of the following series of the Trust (each a “Fund” and collectively, the “Funds”):
FT Vest U.S. Equity Buffer ETF - January (FJAN)
FT Vest U.S. Equity Deep Buffer ETF - January (DJAN)
FT Vest U.S. Equity Buffer ETF - February (FFEB)
FT Vest U.S. Equity Deep Buffer ETF - February (DFEB)
FT Vest U.S. Equity Buffer ETF - March (FMAR)
FT Vest U.S. Equity Deep Buffer ETF - March (DMAR)
FT Vest U.S. Equity Buffer ETF - April (FAPR)
FT Vest U.S. Equity Deep Buffer ETF - April (DAPR)
FT Vest U.S. Equity Buffer ETF - May (FMAY)
FT Vest U.S. Equity Deep Buffer ETF - May (DMAY)
FT Vest U.S. Equity Buffer ETF - June (FJUN)
FT Vest U.S. Equity Deep Buffer ETF - June (DJUN)
FT Vest U.S. Equity Buffer ETF - July (FJUL)
FT Vest U.S. Equity Deep Buffer ETF - July (DJUL)
FT Vest U.S. Equity Buffer ETF - August (FAUG)
FT Vest U.S. Equity Deep Buffer ETF - August (DAUG)
FT Vest U.S. Equity Buffer ETF - September (FSEP)
FT Vest U.S. Equity Deep Buffer ETF - September (DSEP)
FT Vest U.S. Equity Buffer ETF - October (FOCT)
FT Vest U.S. Equity Deep Buffer ETF - October (DOCT)
FT Vest U.S. Equity Buffer ETF - November (FNOV)
FT Vest U.S. Equity Deep Buffer ETF - November (DNOV)
FT Vest U.S. Equity Buffer ETF - December (FDEC)
FT Vest U.S. Equity Deep Buffer ETF - December (DDEC)
FT Vest Buffered Allocation Defensive ETF (BUFT)
FT Vest Buffered Allocation Growth ETF (BUFG)
The Board approved the continuation of the applicable Agreements for each Fund for a one-year period ending June 30, 2025 at a meeting held on June 2–3, 2024. The Board determined for each Fund that the continuation of the applicable Agreements is in the best interests of the Fund in light of the nature, extent and quality of the services provided and such other matters as the Board considered to be relevant in the exercise of its business judgment.
To reach this determination for each Fund, the Board considered its duties under the Investment Company Act of 1940, as amended (the “1940 Act”), as well as under the general principles of state law, in reviewing and approving advisory contracts; the requirements
Other Information (Continued)
First Trust Exchange-Traded Fund VIIIAugust 31, 2024 (Unaudited) of the 1940 Act in such matters; the fiduciary duty of investment advisors with respect to advisory agreements and compensation; the standards used by courts in determining whether investment company boards have fulfilled their duties; and the factors to be considered by the Board in voting on such agreements. At meetings held on April 16, 2024, April 25, 2024 and June 2–3, 2024, the Board, including the Independent Trustees, reviewed materials provided by the Advisor and the Sub-Advisor responding to requests for information from counsel to the Independent Trustees, submitted on behalf of the Independent Trustees, that, among other things, outlined: the services provided by the Advisor and the Sub-Advisor to each Fund (including the relevant personnel responsible for these services and their experience); the unitary fee rate schedule payable by each Fund as compared to fees charged to a peer group of funds (the “Expense Group”) and a broad peer universe of funds (the “Expense Universe”), each assembled by Broadridge Financial Solutions, Inc. (“Broadridge”), an independent source, and as compared to fees charged to other clients of the Advisor, including other exchange-traded funds (“ETFs”) managed by the Advisor; the sub-advisory fee as compared to fees charged to other clients of the Sub-Advisor; the expense ratio of each Fund as compared to expense ratios of the funds in the Fund’s Expense Group and Expense Universe; performance information for each Fund, including comparisons of each Fund’s performance to that of one or more relevant benchmark indexes and to that of a performance group of funds and a broad performance universe of funds (the “Performance Universe”), each assembled by Broadridge; the nature of expenses incurred in providing services to each Fund and the potential for the Advisor and the Sub-Advisor to realize economies of scale, if any; profitability and other financial data for the Advisor; financial data for the Sub-Advisor; any indirect benefits to the Advisor and its affiliates, First Trust Portfolios L.P. (“FTP”) and First Trust Capital Partners, LLC (“FTCP”), and the Sub-Advisor; and information on the Advisor’s and the Sub-Advisor’s compliance programs. The Board reviewed initial materials with the Advisor at the meeting held on April 25, 2024, prior to which the Independent Trustees and their counsel met separately to discuss the information provided by the Advisor and the Sub-Advisor. Following the April 25, 2024 meeting, counsel to the Independent Trustees, on behalf of the Independent Trustees, requested certain clarifications and supplements to the materials provided, and the information provided in response to those requests was considered at an executive session of the Independent Trustees and their counsel held prior to the June 2–3, 2024 meeting, as well as at the June meeting. The Board applied its business judgment to determine whether the arrangements between the Trust and the Advisor and among the Trust, the Advisor and the Sub-Advisor continue to be reasonable business arrangements from each Fund’s perspective. The Board determined that, given the totality of the information provided with respect to the Agreements, the Board had received sufficient information to renew the Agreements. The Board considered that shareholders chose to invest or remain invested in a Fund knowing that the Advisor and the Sub-Advisor manage the Fund and knowing the Fund’s unitary fee.
In reviewing the applicable Agreements for each Fund, the Board considered the nature, extent and quality of the services provided by the Advisor and the Sub-Advisor under the applicable Agreements. With respect to the Advisory Agreement, the Board considered that the Advisor is responsible for the overall management and administration of the Trust and each Fund and reviewed all of the services provided by the Advisor to the Funds, including the oversight of the Sub-Advisor, as well as the background and experience of the persons responsible for such services. The Board noted that the Advisor oversees the Sub-Advisor’s day-to-day management of each Fund’s investments, including portfolio risk monitoring and performance review. In reviewing the services provided, the Board noted the compliance program that had been developed by the Advisor and considered that it includes a robust program for monitoring the Advisor’s, the Sub-Advisor’s and each Fund’s compliance with the 1940 Act, as well as each Fund’s compliance with its investment objective, policies and restrictions. The Board also considered a report from the Advisor with respect to its risk management functions related to the operation of the Funds. Finally, as part of the Board’s consideration of the Advisor’s services, the Advisor, in its written materials and at the April 25, 2024 meeting, described to the Board the scope of its ongoing investment in additional personnel and infrastructure to maintain and improve the quality of services provided to the Funds and the other funds in the First Trust Fund Complex. With respect to the Sub-Advisory Agreements, the Board noted that each Fund is an actively-managed ETF and the Sub-Advisor actively manages the Fund’s investments. The Board reviewed the materials provided by the Sub-Advisor and considered the services that the Sub-Advisor provides to each Fund, including the Sub-Advisor’s day-to-day management of the Funds’ investments. In considering the Sub-Advisor’s management of the Funds, the Board noted the background and experience of the Sub-Advisor’s portfolio management team, including the Board’s prior meetings with members of the portfolio management team. In light of the information presented and the considerations made, the Board concluded that the nature, extent and quality of the services provided to the Trust and each Fund by the Advisor and the Sub-Advisor under the Agreements have been and are expected to remain satisfactory and that the Sub-Advisor, under the oversight of the Advisor, has managed each Fund consistent with its investment objective, policies and restrictions.
The Board considered the unitary fee rate schedule payable by each Fund under the Advisory Agreement for the services provided. The Board noted that the sub-advisory fee for each Fund is paid by the Advisor from the Fund’s unitary fee. The Board considered that as part of the unitary fee the Advisor is responsible for each Fund’s expenses, including the cost of sub-advisory, transfer agency, custody, fund administration, legal, audit and other services and license fees, if any, but excluding the fee payment under the Advisory
Other Information (Continued)
First Trust Exchange-Traded Fund VIIIAugust 31, 2024 (Unaudited) Agreement and interest, taxes, acquired fund fees and expenses, brokerage commissions and other expenses connected with the execution of portfolio transactions, distribution and service fees pursuant to a Rule 12b-1 plan, if any, and extraordinary expenses, if any. The Board noted that, because each of BUFT and BUFG invests in underlying ETFs in the First Trust Fund Complex, each such Fund incurs acquired fund fees and expenses, which are not payable out of the unitary fee. The Board received and reviewed information showing the fee rates and expense ratios of the peer funds in the Expense Groups, as well as advisory and unitary fee rates charged by the Advisor and the Sub-Advisor to other fund (including ETFs) and non-fund clients, as applicable. Because each Fund pays a unitary fee, the Board determined that expense ratios were the most relevant comparative data point. Based on the information provided, the Board noted that the total (net) expense ratio (excluding acquired fund fees and expenses) for each of BUFT and BUFG was below the median total (net) expense ratio (excluding acquired fund fees and expenses) of the peer funds in its respective Expense Group and that the total (net) expense ratio for each other Fund was above the median total (net) expense ratio of the peer funds in its respective Expense Group. The Board also noted that the total (net) expense ratio (including acquired fund fees and expenses) for each of BUFT and BUFG was above the median total (net) expense ratio (including acquired fund fees and expenses) of the peer funds in its respective Expense Group. With respect to the Expense Groups, the Board discussed with Broadridge its methodology for assembling peer groups and discussed with the Advisor limitations in creating peer groups for actively-managed ETFs, and different business models that may affect the pricing of services among ETF sponsors. The Board also noted that, for each Fund, not all peer funds employ an advisor/sub-advisor management structure. The Board took these limitations and differences into account in considering the peer data. With respect to fees charged to other non-ETF clients, the Board considered differences between the Funds and other non-ETF clients that limited their comparability. In considering the unitary fee rate schedules overall, the Board also considered the Advisor’s statement that it seeks to meet investor needs through innovative and value-added investment solutions and the Advisor’s demonstrated long-term commitment to each Fund and the other funds in the First Trust Fund Complex.
The Board considered performance information for each Fund. The Board noted the process it has established for monitoring each Fund’s performance and portfolio risk on an ongoing basis, which includes quarterly performance reporting from the Advisor and the Sub-Advisor for the Funds. The Board determined that this process continues to be effective for reviewing each Fund’s performance. The Board received and reviewed information comparing each Fund’s performance for one or more periods ended December 31, 2023 to the performance of the funds in its Performance Universe and to that of a benchmark index. The Board noted that all of the Funds, except for BUFT and BUFG, are target outcome ETFs that seek to provide investors with returns (before fees and expenses) over a defined period of time (typically one year) that match the price return of the SPDR S&P 500 ETF Trust (“SPY”), up to a predetermined cap, while providing a buffer against certain losses on the price return of SPY. The Board considered information provided by the Sub-Advisor on each Fund’s performance during its respective target outcome period that ended between April 1, 2023 and March 31, 2024 and noted that each Fund delivered on its target outcome objective. With respect to BUFT and BUFG, based on the information provided, the Board noted that BUFT underperformed its Performance Universe median and benchmark index for the one-year period ended December 31, 2023 and that BUFG outperformed its Performance Universe median and underperformed its benchmark index for the one-year period ended December 31, 2023. The Board also noted that each of BUFT and BUFG invests substantially all of its assets in multiple target outcome ETFs in the First Trust Fund Complex sub-advised by the Sub-Advisor that seek to provide investors with returns (before fees and expenses) over a defined period of time (typically one year) that match the price return of the SPDR S&P 500 ETF Trust (“SPY”), up to a predetermined cap, while providing a buffer against certain losses on the price return of SPY and considered that the investment strategy of the underlying ETFs limits the comparability of the performance of each of BUFT and BUFG to that of the funds in its respective Performance Universe and its benchmark index.
On the basis of all the information provided on the unitary fee and performance of each Fund and the ongoing oversight by the Board, the Board concluded that the unitary fee for each Fund (out of which the Sub-Advisor is compensated) continues to be reasonable and appropriate in light of the nature, extent and quality of the services provided by the Advisor and the Sub-Advisor to each Fund under the Agreements.
The Board considered information and discussed with the Advisor whether there were any economies of scale in connection with providing advisory services to the Funds at current asset levels and whether the Funds may benefit from any economies of scale. The Board noted that the unitary fee rate schedule for each Fund includes breakpoints pursuant to which the unitary fee rate will be reduced as assets of the Fund meet certain thresholds. The Board considered the Advisor’s statement that it believes that its expenses relating to providing advisory services to the Funds will increase during the next twelve months as the Advisor continues to build infrastructure and add new staff. The Board also noted that under the unitary fee structure, any reduction in expenses associated with the management and operations of the Funds would benefit the Advisor, but that the unitary fee structure provides a level of certainty in expenses for shareholders of the Funds. The Board concluded that the unitary fee rate schedule for each Fund reflects an appropriate level of sharing of any economies of scale that may be realized in the management of the Fund at current asset levels. The Board considered the revenues and allocated costs (including the allocation methodology) of the Advisor in serving as investment advisor to
Other Information (Continued)
First Trust Exchange-Traded Fund VIIIAugust 31, 2024 (Unaudited) each Fund for the twelve months ended December 31, 2023 and the estimated profitability level for each Fund calculated by the Advisor based on such data, as well as complex-wide and product-line profitability data, for the same period. The Board noted the inherent limitations in the profitability analysis and concluded that, based on the information provided, the Advisor’s profitability level for each Fund was not unreasonable. In addition, the Board considered indirect benefits described by the Advisor that may be realized from its relationship with the Funds. The Board considered that the Advisor had identified as an indirect benefit to the Advisor and FTP their exposure to investors and brokers who, absent their exposure to the Funds, may have had no dealings with the Advisor or FTP. The Board also noted that FTCP has a controlling ownership interest in the Sub-Advisor’s parent company and considered potential indirect benefits to the Advisor from such ownership interest. In addition, with respect to BUFT and BUFG, the Board considered that the Advisor, as the investment advisor to the underlying ETFs in which each Fund invests, will recognize additional revenue from the underlying ETFs if investment by the Funds causes the assets of the underlying ETFs to grow. The Board concluded that the character and amount of potential indirect benefits to the Advisor were not unreasonable.
The Board considered the Sub-Advisor’s statement that it believes that the sub-advisory fee for each Fund is appropriate. The Board noted the Sub-Advisor’s statements that it continues to invest in infrastructure, technology and personnel, and that it anticipates that its expenses relating to providing services to the Funds will remain approximately the same for the next twelve months. The Board noted that the Advisor pays the Sub-Advisor for each Fund from the unitary fee, that the sub-advisory fee will be reduced consistent with the breakpoints in the unitary fee rate schedule and its understanding that each Fund’s sub-advisory fee was the product of an arm’s length negotiation. The Board did not review the profitability of the Sub-Advisor with respect to each Fund. The Board concluded that the profitability analysis for the Advisor was more relevant. The Board considered the potential indirect benefits to the Sub-Advisor from being associated with the Advisor and the Funds, and noted the Sub-Advisor’s statements that it is the Sub-Advisor’s policy currently not to enter into soft-dollar arrangements for the procurement of research services in connection with client securities transactions and that, as a result, there are no foreseen indirect benefits from its relationship with the Funds. The Board also considered the potential indirect benefits to the Sub-Advisor from FTCP’s controlling ownership interest in the Sub-Advisor’s parent company. In addition, with respect to BUFT and BUFG, the Board considered that the Sub-Advisor, as the investment sub-advisor to the underlying ETFs in which each Fund invests, will recognize additional revenue from the underlying ETFs if investment by the Funds causes the assets of the underlying ETFs to grow. The Board concluded that the character and amount of potential indirect benefits to the Sub-Advisor were not unreasonable.
Based on all of the information considered and the conclusions reached, the Board, including the Independent Trustees, unanimously determined that the terms of the Agreements continue to be fair and reasonable and that the continuation of the Agreements is in the best interests of each Fund. No single factor was determinative in the Board’s analysis.
There were no distributions made by each Fund during their applicable taxable period; therefore, no analysis for the corporate dividends received deduction and qualified dividend income was completed.
The Funds are not sponsored, endorsed, sold or promoted by SPDR® S&P 500® ETF Trust, PDR Services, LLC, or Standard & Poor’s® (together with their affiliates hereinafter referred to as the “Corporations”). The Corporations have not passed on the legality or suitability of, or the accuracy or adequacy of, descriptions and disclosures relating to the Funds or the FLEX Options. The Corporations make no representations or warranties, express or implied, regarding the advisability of investing in the Funds or the FLEX Options or results to be obtained by the Funds or the FLEX Options, shareholders or any other person or entity from use of the SPDR® S&P 500® ETF Trust. The Corporations have no liability in connection with the management, administration, marketing or trading of the Funds or the FLEX Options.
Annual Financial
Statements and
Other Information |
For the Period Ended
August 31, 2024 |
First Trust Exchange-Traded Fund VIII
FT Vest U.S. Equity Enhance & Moderate Buffer ETF - January (XJAN) |
FT Vest U.S. Equity Enhance & Moderate Buffer ETF - February (XFEB) |
FT Vest International Equity Moderate Buffer ETF - March (YMAR) (formerly known as FT Vest International Equity Buffer ETF - March) |
FT Vest Nasdaq-100® Buffer ETF - March (QMAR) |
FT Vest U.S. Equity Enhance & Moderate Buffer ETF - March (XMAR) |
FT Vest Nasdaq-100® Conservative Buffer ETF - April (QCAP) |
FT Vest U.S. Equity Enhance & Moderate Buffer ETF - April (XAPR) |
FT Vest Nasdaq-100® Moderate Buffer ETF - May (QMMY) |
FT Vest U.S. Equity Enhance & Moderate Buffer ETF - May (XMAY) |
FT Vest International Equity Moderate Buffer ETF - June (YJUN) (formerly known as FT Vest International Equity Buffer ETF - June) |
FT Vest Nasdaq-100® Buffer ETF - June (QJUN) |
FT Vest U.S. Equity Enhance & Moderate Buffer ETF - June (XJUN) |
FT Vest Nasdaq-100® Conservative Buffer ETF - July (QCJL) |
FT Vest U.S. Equity Enhance & Moderate Buffer ETF - July (XJUL) |
FT Vest Nasdaq-100® Moderate Buffer ETF - August (QMAG) |
FT Vest U.S. Equity Enhance & Moderate Buffer ETF - August (XAUG) |
FT Vest International Equity Buffer ETF - September (YSEP) (now known as FT Vest International Equity Moderate Buffer ETF - September) |
FT Vest Nasdaq-100® Buffer ETF - September (QSPT) |
FT Vest U.S. Equity Enhance & Moderate Buffer ETF - September (XSEP) |
FT Vest U.S. Equity Enhance & Moderate Buffer ETF - October (XOCT) |
FT Vest U.S. Equity Enhance & Moderate Buffer ETF - November (XNOV) |
FT Vest International Equity Moderate Buffer ETF - December (YDEC) (formerly known as FT Vest International Equity Buffer ETF - December) |
FT Vest Nasdaq-100® Buffer ETF - December (QDEC) |
FT Vest U.S. Equity Enhance & Moderate Buffer ETF - December (XDEC) |
First Trust Exchange-Traded Fund VIII
Annual Financial Statements and Other Information
August 31, 2024
Performance and Risk Disclosure
There is no assurance that any series of First Trust Exchange-Traded Fund VIII (the “Trust”) described in this report (each such series is referred to as a “Fund” and collectively, as the “Funds”) will achieve its investment objective. Each Fund is subject to market risk, which is the possibility that the market values of securities owned by the Fund will decline and that the value of the Fund’s shares may therefore be less than what you paid for them. Accordingly, you can lose money by investing in a Fund.
Performance data quoted represents past performance, which is no guarantee of future results, and current performance may be lower or higher than the figures shown. For the most recent month-end performance figures, please visit www.ftportfolios.com or speak with your financial advisor. Investment returns, net asset value and share price will fluctuate and Fund shares, when sold, may be worth more or less than their original cost.
First Trust Advisors L.P., the Funds’ advisor, may also periodically provide additional information on Fund performance on each Fund’s webpage at www.ftportfolios.com.
This report contains information that may help you evaluate your investment. It includes details about each Fund and presents data that provides insight into each Fund’s performance and investment approach.
The material risks of investing in each Fund are spelled out in its prospectus, statement of additional information, and other Fund regulatory filings.
FT Vest U.S. Equity Enhance & Moderate Buffer ETF - January (XJAN)Portfolio of InvestmentsAugust 31, 2024
| | |
MONEY MARKET FUNDS — 0.6% |
| Dreyfus Government Cash Management Fund, Institutional Shares - 5.19% (a) | |
| | |
| | |
| | |
| | | | | |
PURCHASED OPTIONS — 126.5% |
| Call Options Purchased — 125.8% | |
| | | | | |
| | | | | |
| Total Call Options Purchased | |
| | |
| Put Options Purchased — 0.7% | |
| | | | | |
| | | | | |
| | |
| | |
WRITTEN OPTIONS — (27.0)% |
| Call Options Written — (26.7)% | |
| | | | | |
| (Premiums received $5,408,622) | | | | |
| Put Options Written — (0.3)% | |
| | | | | |
| (Premiums received $689,232) | | | | |
| | |
| (Premiums received $6,097,854) | |
| Net Other Assets and Liabilities — (0.1)% | |
| | |
| Rate shown reflects yield as of August 31, 2024. |
| |
| |
| |
| |
Net Other Assets and Liabilities | |
| |
See Notes to Financial Statements
FT Vest U.S. Equity Enhance & Moderate Buffer ETF - January (XJAN)Portfolio of Investments (Continued)August 31, 2024
Valuation InputsA summary of the inputs used to value the Fund’s investments as of August 31, 2024 is as follows (see Note 2A - Portfolio Valuation in the Notes to Financial Statements):
|
| | | Level 2
Significant
Observable
Inputs | Level 3
Significant
Unobservable
Inputs |
| | | | |
| | | | |
| | | | |
|
| | | Level 2
Significant
Observable
Inputs | Level 3
Significant
Unobservable
Inputs |
| | | | |
See Notes to Financial Statements
FT Vest U.S. Equity Enhance & Moderate Buffer ETF - February (XFEB)Portfolio of InvestmentsAugust 31, 2024
| | |
MONEY MARKET FUNDS — 0.7% |
| Dreyfus Government Cash Management Fund, Institutional Shares - 5.19% (a) | |
| | |
| | |
| | |
| | | | | |
PURCHASED OPTIONS — 120.9% |
| Call Options Purchased — 119.7% | |
| | | | | |
| | | | | |
| Total Call Options Purchased | |
| | |
| Put Options Purchased — 1.2% | |
| | | | | |
| | | | | |
| | |
| | |
WRITTEN OPTIONS — (21.5)% |
| Call Options Written — (21.0)% | |
| | | | | |
| (Premiums received $2,732,834) | | | | |
| Put Options Written — (0.5)% | |
| | | | | |
| (Premiums received $306,525) | | | | |
| | |
| (Premiums received $3,039,359) | |
| Net Other Assets and Liabilities — (0.1)% | |
| | |
| Rate shown reflects yield as of August 31, 2024. |
| |
| |
| |
| |
Net Other Assets and Liabilities | |
| |
See Notes to Financial Statements
FT Vest U.S. Equity Enhance & Moderate Buffer ETF - February (XFEB)Portfolio of Investments (Continued)August 31, 2024
Valuation InputsA summary of the inputs used to value the Fund’s investments as of August 31, 2024 is as follows (see Note 2A - Portfolio Valuation in the Notes to Financial Statements):
|
| | | Level 2
Significant
Observable
Inputs | Level 3
Significant
Unobservable
Inputs |
| | | | |
| | | | |
| | | | |
|
| | | Level 2
Significant
Observable
Inputs | Level 3
Significant
Unobservable
Inputs |
| | | | |
See Notes to Financial Statements
FT Vest International Equity Moderate Buffer ETF - March (YMAR)Portfolio of InvestmentsAugust 31, 2024
| | |
MONEY MARKET FUNDS — 0.8% |
| Dreyfus Government Cash Management Fund, Institutional Shares - 5.19% (a) | |
| | |
| | |
| | |
| | | | | |
PURCHASED OPTIONS — 101.2% |
| Call Options Purchased — 98.9% | |
| | | | | |
| | | | | |
| Put Options Purchased — 2.3% | |
| | | | | |
| | | | | |
| | |
| | |
|
| Call Options Written — (1.1)% | |
| | | | | |
| (Premiums received $1,024,496) | | | | |
| Put Options Written — (0.8)% | |
| | | | | |
| (Premiums received $1,094,476) | | | | |
| | |
| (Premiums received $2,118,972) | |
| Net Other Assets and Liabilities — (0.1)% | |
| | |
| Rate shown reflects yield as of August 31, 2024. |
| |
| |
| |
| |
Net Other Assets and Liabilities | |
| |
See Notes to Financial Statements
FT Vest International Equity Moderate Buffer ETF - March (YMAR)Portfolio of Investments (Continued)August 31, 2024
Valuation InputsA summary of the inputs used to value the Fund’s investments as of August 31, 2024 is as follows (see Note 2A - Portfolio Valuation in the Notes to Financial Statements):
|
| | | Level 2
Significant
Observable
Inputs | Level 3
Significant
Unobservable
Inputs |
| | | | |
| | | | |
| | | | |
|
| | | Level 2
Significant
Observable
Inputs | Level 3
Significant
Unobservable
Inputs |
| | | | |
See Notes to Financial Statements
FT Vest Nasdaq-100® Buffer ETF - March (QMAR)Portfolio of InvestmentsAugust 31, 2024
| | |
MONEY MARKET FUNDS — 0.8% |
| Dreyfus Government Cash Management Fund, Institutional Shares - 5.19% (a) | |
| | |
| | |
| | |
| | | | | |
PURCHASED OPTIONS — 102.9% |
| Call Options Purchased — 100.6% | |
| Invesco QQQ TrustSM, Series 1 | | | | |
| | | | | |
| Put Options Purchased — 2.3% | |
| Invesco QQQ TrustSM, Series 1 | | | | |
| | | | | |
| | |
| | |
|
| Call Options Written — (2.4)% | |
| Invesco QQQ TrustSM, Series 1 | | | | |
| (Premiums received $8,960,666) | | | | |
| Put Options Written — (1.2)% | |
| Invesco QQQ TrustSM, Series 1 | | | | |
| (Premiums received $11,809,723) | | | | |
| | |
| (Premiums received $20,770,389) | |
| Net Other Assets and Liabilities — (0.1)% | |
| | |
| Rate shown reflects yield as of August 31, 2024. |
| |
| |
| |
| |
Net Other Assets and Liabilities | |
| |
See Notes to Financial Statements
FT Vest Nasdaq-100® Buffer ETF - March (QMAR)Portfolio of Investments (Continued)August 31, 2024
Valuation InputsA summary of the inputs used to value the Fund’s investments as of August 31, 2024 is as follows (see Note 2A - Portfolio Valuation in the Notes to Financial Statements):
|
| | | Level 2
Significant
Observable
Inputs | Level 3
Significant
Unobservable
Inputs |
| | | | |
| | | | |
| | | | |
|
| | | Level 2
Significant
Observable
Inputs | Level 3
Significant
Unobservable
Inputs |
| | | | |
See Notes to Financial Statements
FT Vest U.S. Equity Enhance & Moderate Buffer ETF - March (XMAR)Portfolio of InvestmentsAugust 31, 2024
| | |
MONEY MARKET FUNDS — 0.7% |
| Dreyfus Government Cash Management Fund, Institutional Shares - 5.19% (a) | |
| | |
| | |
| | |
| | | | | |
PURCHASED OPTIONS — 117.7% |
| Call Options Purchased — 116.1% | |
| | | | | |
| | | | | |
| Total Call Options Purchased | |
| | |
| Put Options Purchased — 1.6% | |
| | | | | |
| | | | | |
| | |
| | |
WRITTEN OPTIONS — (18.3)% |
| Call Options Written — (17.7)% | |
| | | | | |
| (Premiums received $16,056,966) | | | | |
| Put Options Written — (0.6)% | |
| | | | | |
| (Premiums received $3,524,496) | | | | |
| | |
| (Premiums received $19,581,462) | |
| Net Other Assets and Liabilities — (0.1)% | |
| | |
| Rate shown reflects yield as of August 31, 2024. |
| |
| |
| |
| |
Net Other Assets and Liabilities | |
| |
See Notes to Financial Statements
FT Vest U.S. Equity Enhance & Moderate Buffer ETF - March (XMAR)Portfolio of Investments (Continued)August 31, 2024
Valuation InputsA summary of the inputs used to value the Fund’s investments as of August 31, 2024 is as follows (see Note 2A - Portfolio Valuation in the Notes to Financial Statements):
|
| | | Level 2
Significant
Observable
Inputs | Level 3
Significant
Unobservable
Inputs |
| | | | |
| | | | |
| | | | |
|
| | | Level 2
Significant
Observable
Inputs | Level 3
Significant
Unobservable
Inputs |
| | | | |
See Notes to Financial Statements
FT Vest Nasdaq-100® Conservative Buffer ETF - April (QCAP)Portfolio of InvestmentsAugust 31, 2024
| | | | | |
PURCHASED OPTIONS — 107.8% |
| Call Options Purchased — 105.8% | |
| Invesco QQQ TrustSM, Series 1 | | | | |
| | | | | |
| Put Options Purchased — 2.0% | |
| Invesco QQQ TrustSM, Series 1 | | | | |
| | | | | |
| | |
| | |
|
| Call Options Written — (7.9)% | |
| Invesco QQQ TrustSM, Series 1 | | | | |
| (Premiums received $1,711,422) | | | | |
| Put Options Written — (0.6)% | |
| Invesco QQQ TrustSM, Series 1 | | | | |
| (Premiums received $310,560) | | | | |
| | |
| (Premiums received $2,021,982) | |
| Net Other Assets and Liabilities — 0.7% | |
| | |
| |
| |
| |
Net Other Assets and Liabilities | |
| |
See Notes to Financial Statements
FT Vest Nasdaq-100® Conservative Buffer ETF - April (QCAP)Portfolio of Investments (Continued)August 31, 2024
Valuation InputsA summary of the inputs used to value the Fund’s investments as of August 31, 2024 is as follows (see Note 2A - Portfolio Valuation in the Notes to Financial Statements):
|
| | | Level 2
Significant
Observable
Inputs | Level 3
Significant
Unobservable
Inputs |
| | | | |
|
| | | Level 2
Significant
Observable
Inputs | Level 3
Significant
Unobservable
Inputs |
| | | | |
See Notes to Financial Statements
FT Vest U.S. Equity Enhance & Moderate Buffer ETF - April (XAPR)Portfolio of InvestmentsAugust 31, 2024
| | | | | |
PURCHASED OPTIONS — 123.6% |
| Call Options Purchased — 122.1% | |
| | | | | |
| | | | | |
| Total Call Options Purchased | |
| | |
| Put Options Purchased — 1.5% | |
| | | | | |
| | | | | |
| | |
| | |
WRITTEN OPTIONS — (24.3)% |
| Call Options Written — (23.7)% | |
| | | | | |
| (Premiums received $1,853,562) | | | | |
| Put Options Written — (0.6)% | |
| | | | | |
| (Premiums received $168,346) | | | | |
| | |
| (Premiums received $2,021,908) | |
| Net Other Assets and Liabilities — 0.7% | |
| | |
| |
| |
| |
Net Other Assets and Liabilities | |
| |
See Notes to Financial Statements
FT Vest U.S. Equity Enhance & Moderate Buffer ETF - April (XAPR)Portfolio of Investments (Continued)August 31, 2024
Valuation InputsA summary of the inputs used to value the Fund’s investments as of August 31, 2024 is as follows (see Note 2A - Portfolio Valuation in the Notes to Financial Statements):
|
| | | Level 2
Significant
Observable
Inputs | Level 3
Significant
Unobservable
Inputs |
| | | | |
|
| | | Level 2
Significant
Observable
Inputs | Level 3
Significant
Unobservable
Inputs |
| | | | |
See Notes to Financial Statements
FT Vest Nasdaq-100® Moderate Buffer ETF - May (QMMY)Portfolio of InvestmentsAugust 31, 2024
| | | | | |
PURCHASED OPTIONS — 103.9% |
| Call Options Purchased — 100.2% | |
| Invesco QQQ TrustSM, Series 1 | | | | |
| | | | | |
| Put Options Purchased — 3.7% | |
| Invesco QQQ TrustSM, Series 1 | | | | |
| | | | | |
| | |
| | |
|
| Call Options Written — (3.4)% | |
| Invesco QQQ TrustSM, Series 1 | | | | |
| (Premiums received $1,689,194) | | | | |
| Put Options Written — (1.3)% | |
| Invesco QQQ TrustSM, Series 1 | | | | |
| (Premiums received $885,186) | | | | |
| | |
| (Premiums received $2,574,380) | |
| Net Other Assets and Liabilities — 0.8% | |
| | |
| |
| |
| |
Net Other Assets and Liabilities | |
| |
See Notes to Financial Statements
FT Vest Nasdaq-100® Moderate Buffer ETF - May (QMMY)Portfolio of Investments (Continued)August 31, 2024
Valuation InputsA summary of the inputs used to value the Fund’s investments as of August 31, 2024 is as follows (see Note 2A - Portfolio Valuation in the Notes to Financial Statements):
|
| | | Level 2
Significant
Observable
Inputs | Level 3
Significant
Unobservable
Inputs |
| | | | |
|
| | | Level 2
Significant
Observable
Inputs | Level 3
Significant
Unobservable
Inputs |
| | | | |
See Notes to Financial Statements
FT Vest U.S. Equity Enhance & Moderate Buffer ETF - May (XMAY)Portfolio of InvestmentsAugust 31, 2024
| | |
MONEY MARKET FUNDS — 0.9% |
| Dreyfus Government Cash Management Fund, Institutional Shares - 5.19% (a) | |
| | |
| | |
| | |
| | | | | |
PURCHASED OPTIONS — 114.6% |
| Call Options Purchased — 112.2% | |
| | | | | |
| | | | | |
| Total Call Options Purchased | |
| | |
| Put Options Purchased — 2.4% | |
| | | | | |
| | | | | |
| | |
| | |
WRITTEN OPTIONS — (15.4)% |
| Call Options Written — (14.5)% | |
| | | | | |
| (Premiums received $2,136,679) | | | | |
| Put Options Written — (0.9)% | |
| | | | | |
| (Premiums received $238,269) | | | | |
| | |
| (Premiums received $2,374,948) | |
| Net Other Assets and Liabilities — (0.1)% | |
| | |
| Rate shown reflects yield as of August 31, 2024. |
| |
| |
| |
| |
Net Other Assets and Liabilities | |
| |
See Notes to Financial Statements
FT Vest U.S. Equity Enhance & Moderate Buffer ETF - May (XMAY)Portfolio of Investments (Continued)August 31, 2024
Valuation InputsA summary of the inputs used to value the Fund’s investments as of August 31, 2024 is as follows (see Note 2A - Portfolio Valuation in the Notes to Financial Statements):
|
| | | Level 2
Significant
Observable
Inputs | Level 3
Significant
Unobservable
Inputs |
| | | | |
| | | | |
| | | | |
|
| | | Level 2
Significant
Observable
Inputs | Level 3
Significant
Unobservable
Inputs |
| | | | |
See Notes to Financial Statements
FT Vest International Equity Moderate Buffer ETF - June (YJUN)Portfolio of InvestmentsAugust 31, 2024
| | |
MONEY MARKET FUNDS — 1.1% |
| Dreyfus Government Cash Management Fund, Institutional Shares - 5.19% (a) | |
| | |
| | |
| | |
| | | | | |
PURCHASED OPTIONS — 102.5% |
| Call Options Purchased — 99.5% | |
| | | | | |
| | | | | |
| Put Options Purchased — 3.0% | |
| | | | | |
| | | | | |
| | |
| | |
|
| Call Options Written — (2.0)% | |
| | | | | |
| (Premiums received $1,753,284) | | | | |
| Put Options Written — (1.5)% | |
| | | | | |
| (Premiums received $2,013,993) | | | | |
| | |
| (Premiums received $3,767,277) | |
| Net Other Assets and Liabilities — (0.1)% | |
| | |
| Rate shown reflects yield as of August 31, 2024. |
| |
| |
| |
| |
Net Other Assets and Liabilities | |
| |
See Notes to Financial Statements
FT Vest International Equity Moderate Buffer ETF - June (YJUN)Portfolio of Investments (Continued)August 31, 2024
Valuation InputsA summary of the inputs used to value the Fund’s investments as of August 31, 2024 is as follows (see Note 2A - Portfolio Valuation in the Notes to Financial Statements):
|
| | | Level 2
Significant
Observable
Inputs | Level 3
Significant
Unobservable
Inputs |
| | | | |
| | | | |
| | | | |
|
| | | Level 2
Significant
Observable
Inputs | Level 3
Significant
Unobservable
Inputs |
| | | | |
See Notes to Financial Statements
FT Vest Nasdaq-100® Buffer ETF - June (QJUN)Portfolio of InvestmentsAugust 31, 2024
| | |
MONEY MARKET FUNDS — 1.0% |
| Dreyfus Government Cash Management Fund, Institutional Shares - 5.19% (a) | |
| | |
| | |
| | |
| | | | | |
PURCHASED OPTIONS — 103.2% |
| Call Options Purchased — 97.5% | |
| Invesco QQQ TrustSM, Series 1 | | | | |
| | | | | |
| Put Options Purchased — 5.7% | |
| Invesco QQQ TrustSM, Series 1 | | | | |
| | | | | |
| | |
| | |
|
| Call Options Written — (1.2)% | |
| Invesco QQQ TrustSM, Series 1 | | | | |
| (Premiums received $9,899,775) | | | | |
| Put Options Written — (2.9)% | |
| Invesco QQQ TrustSM, Series 1 | | | | |
| (Premiums received $14,492,789) | | | | |
| | |
| (Premiums received $24,392,564) | |
| Net Other Assets and Liabilities — (0.1)% | |
| | |
| Rate shown reflects yield as of August 31, 2024. |
| |
| |
| |
| |
Net Other Assets and Liabilities | |
| |
See Notes to Financial Statements
FT Vest Nasdaq-100® Buffer ETF - June (QJUN)Portfolio of Investments (Continued)August 31, 2024
Valuation InputsA summary of the inputs used to value the Fund’s investments as of August 31, 2024 is as follows (see Note 2A - Portfolio Valuation in the Notes to Financial Statements):
|
| | | Level 2
Significant
Observable
Inputs | Level 3
Significant
Unobservable
Inputs |
| | | | |
| | | | |
| | | | |
|
| | | Level 2
Significant
Observable
Inputs | Level 3
Significant
Unobservable
Inputs |
| | | | |
See Notes to Financial Statements
FT Vest U.S. Equity Enhance & Moderate Buffer ETF - June (XJUN)Portfolio of InvestmentsAugust 31, 2024
| | |
MONEY MARKET FUNDS — 1.0% |
| Dreyfus Government Cash Management Fund, Institutional Shares - 5.19% (a) | |
| | |
| | |
| | |
| | | | | |
PURCHASED OPTIONS — 111.7% |
| Call Options Purchased — 108.5% | |
| | | | | |
| | | | | |
| Total Call Options Purchased | |
| | |
| Put Options Purchased — 3.2% | |
| | | | | |
| | | | | |
| | |
| | |
WRITTEN OPTIONS — (12.6)% |
| Call Options Written — (11.4)% | |
| | | | | |
| (Premiums received $18,156,676) | | | | |
| Put Options Written — (1.2)% | |
| | | | | |
| (Premiums received $2,733,812) | | | | |
| | |
| (Premiums received $20,890,488) | |
| Net Other Assets and Liabilities — (0.1)% | |
| | |
| Rate shown reflects yield as of August 31, 2024. |
| |
| |
| |
| |
Net Other Assets and Liabilities | |
| |
See Notes to Financial Statements
FT Vest U.S. Equity Enhance & Moderate Buffer ETF - June (XJUN)Portfolio of Investments (Continued)August 31, 2024
Valuation InputsA summary of the inputs used to value the Fund’s investments as of August 31, 2024 is as follows (see Note 2A - Portfolio Valuation in the Notes to Financial Statements):
|
| | | Level 2
Significant
Observable
Inputs | Level 3
Significant
Unobservable
Inputs |
| | | | |
| | | | |
| | | | |
|
| | | Level 2
Significant
Observable
Inputs | Level 3
Significant
Unobservable
Inputs |
| | | | |
See Notes to Financial Statements
FT Vest Nasdaq-100® Conservative Buffer ETF - July (QCJL)Portfolio of InvestmentsAugust 31, 2024
| | | | | |
PURCHASED OPTIONS — 103.5% |
| Call Options Purchased — 97.9% | |
| Invesco QQQ TrustSM, Series 1 | | | | |
| | | | | |
| Put Options Purchased — 5.6% | |
| Invesco QQQ TrustSM, Series 1 | | | | |
| | | | | |
| | |
| | |
|
| Call Options Written — (3.0)% | |
| Invesco QQQ TrustSM, Series 1 | | | | |
| (Premiums received $1,524,027) | | | | |
| Put Options Written — (1.5)% | |
| Invesco QQQ TrustSM, Series 1 | | | | |
| (Premiums received $950,701) | | | | |
| | |
| (Premiums received $2,474,728) | |
| Net Other Assets and Liabilities — 1.0% | |
| | |
| |
| |
| |
Net Other Assets and Liabilities | |
| |
See Notes to Financial Statements
FT Vest Nasdaq-100® Conservative Buffer ETF - July (QCJL)Portfolio of Investments (Continued)August 31, 2024
Valuation InputsA summary of the inputs used to value the Fund’s investments as of August 31, 2024 is as follows (see Note 2A - Portfolio Valuation in the Notes to Financial Statements):
|
| | | Level 2
Significant
Observable
Inputs | Level 3
Significant
Unobservable
Inputs |
| | | | |
|
| | | Level 2
Significant
Observable
Inputs | Level 3
Significant
Unobservable
Inputs |
| | | | |
See Notes to Financial Statements
FT Vest U.S. Equity Enhance & Moderate Buffer ETF - July (XJUL)Portfolio of InvestmentsAugust 31, 2024
| | |
MONEY MARKET FUNDS — 1.0% |
| Dreyfus Government Cash Management Fund, Institutional Shares - 5.19% (a) | |
| | |
| | |
| | |
| | | | | |
PURCHASED OPTIONS — 111.7% |
| Call Options Purchased — 108.2% | |
| | | | | |
| | | | | |
| Total Call Options Purchased | |
| | |
| Put Options Purchased — 3.5% | |
| | | | | |
| | | | | |
| | |
| | |
WRITTEN OPTIONS — (12.6)% |
| Call Options Written — (11.3)% | |
| | | | | |
| (Premiums received $5,008,718) | | | | |
| Put Options Written — (1.3)% | |
| | | | | |
| (Premiums received $902,565) | | | | |
| | |
| (Premiums received $5,911,283) | |
| Net Other Assets and Liabilities — (0.1)% | |
| | |
| Rate shown reflects yield as of August 31, 2024. |
| |
| |
| |
| |
Net Other Assets and Liabilities | |
| |
See Notes to Financial Statements
FT Vest U.S. Equity Enhance & Moderate Buffer ETF - July (XJUL)Portfolio of Investments (Continued)August 31, 2024
Valuation InputsA summary of the inputs used to value the Fund’s investments as of August 31, 2024 is as follows (see Note 2A - Portfolio Valuation in the Notes to Financial Statements):
|
| | | Level 2
Significant
Observable
Inputs | Level 3
Significant
Unobservable
Inputs |
| | | | |
| | | | |
| | | | |
|
| | | Level 2
Significant
Observable
Inputs | Level 3
Significant
Unobservable
Inputs |
| | | | |
See Notes to Financial Statements
FT Vest Nasdaq-100® Moderate Buffer ETF - August (QMAG)Portfolio of InvestmentsAugust 31, 2024
| | | | | |
PURCHASED OPTIONS — 104.4% |
| Call Options Purchased — 98.6% | |
| Invesco QQQ Trust Series 1 | | | | |
| | | | | |
| Put Options Purchased — 5.8% | |
| Invesco QQQ Trust Series 1 | | | | |
| | | | | |
| | |
| | |
|
| Call Options Written — (3.2)% | |
| Invesco QQQ Trust Series 1 | | | | |
| (Premiums received $2,463,287) | | | | |
| Put Options Written — (2.3)% | |
| Invesco QQQ Trust Series 1 | | | | |
| (Premiums received $1,737,022) | | | | |
| | |
| (Premiums received $4,200,309) | |
| Net Other Assets and Liabilities — 1.1% | |
| | |
| |
| |
| |
Net Other Assets and Liabilities | |
| |
See Notes to Financial Statements
FT Vest Nasdaq-100® Moderate Buffer ETF - August (QMAG)Portfolio of Investments (Continued)August 31, 2024
Valuation InputsA summary of the inputs used to value the Fund’s investments as of August 31, 2024 is as follows (see Note 2A - Portfolio Valuation in the Notes to Financial Statements):
|
| | | Level 2
Significant
Observable
Inputs | Level 3
Significant
Unobservable
Inputs |
| | | | |
|
| | | Level 2
Significant
Observable
Inputs | Level 3
Significant
Unobservable
Inputs |
| | | | |
See Notes to Financial Statements
FT Vest U.S. Equity Enhance & Moderate Buffer ETF - August (XAUG)Portfolio of InvestmentsAugust 31, 2024
| | |
MONEY MARKET FUNDS — 1.0% |
| Dreyfus Government Cash Management Fund, Institutional Shares - 5.19% (a) | |
| | |
| | |
| | |
| | | | | |
PURCHASED OPTIONS — 112.0% |
| Call Options Purchased — 108.0% | |
| | | | | |
| | | | | |
| Total Call Options Purchased | |
| | |
| Put Options Purchased — 4.0% | |
| | | | | |
| | | | | |
| | |
| | |
WRITTEN OPTIONS — (13.0)% |
| Call Options Written — (11.5)% | |
| | | | | |
| (Premiums received $2,833,076) | | | | |
| Put Options Written — (1.5)% | |
| | | | | |
| (Premiums received $394,468) | | | | |
| | |
| (Premiums received $3,227,544) | |
| Net Other Assets and Liabilities — (0.0)% | |
| | |
| Rate shown reflects yield as of August 31, 2024. |
| |
| |
| |
| |
Net Other Assets and Liabilities | |
| |
| Amount is less than 0.1%. |
See Notes to Financial Statements
FT Vest U.S. Equity Enhance & Moderate Buffer ETF - August (XAUG)Portfolio of Investments (Continued)August 31, 2024
Valuation InputsA summary of the inputs used to value the Fund’s investments as of August 31, 2024 is as follows (see Note 2A - Portfolio Valuation in the Notes to Financial Statements):
|
| | | Level 2
Significant
Observable
Inputs | Level 3
Significant
Unobservable
Inputs |
| | | | |
| | | | |
| | | | |
|
| | | Level 2
Significant
Observable
Inputs | Level 3
Significant
Unobservable
Inputs |
| | | | |
See Notes to Financial Statements
FT Vest International Equity Buffer ETF - September (YSEP)Portfolio of InvestmentsAugust 31, 2024
| | |
MONEY MARKET FUNDS — 0.4% |
| Dreyfus Government Cash Management Fund, Institutional Shares - 5.19% (a) | |
| | |
| | |
| | |
| | | | | |
PURCHASED OPTIONS — 99.8% |
| Call Options Purchased — 99.7% | |
| | | | | |
| | | | | |
| Put Options Purchased — 0.1% | |
| | | | | |
| | | | | |
| | |
| | |
|
| Call Options Written — (0.1)% | |
| | | | | |
| (Premiums received $95,520) | | | | |
| Put Options Written — (0.0)% | |
| | | | | |
| (Premiums received $735,339) | | | | |
| | |
| (Premiums received $830,859) | |
| Net Other Assets and Liabilities — (0.1)% | |
| | |
| Rate shown reflects yield as of August 31, 2024. |
| |
| |
| |
| |
Net Other Assets and Liabilities | |
| |
See Notes to Financial Statements
FT Vest International Equity Buffer ETF - September (YSEP)Portfolio of Investments (Continued)August 31, 2024
Valuation InputsA summary of the inputs used to value the Fund’s investments as of August 31, 2024 is as follows (see Note 2A - Portfolio Valuation in the Notes to Financial Statements):
|
| | | Level 2
Significant
Observable
Inputs | Level 3
Significant
Unobservable
Inputs |
| | | | |
| | | | |
| | | | |
|
| | | Level 2
Significant
Observable
Inputs | Level 3
Significant
Unobservable
Inputs |
| | | | |
See Notes to Financial Statements
FT Vest Nasdaq-100® Buffer ETF - September (QSPT)Portfolio of InvestmentsAugust 31, 2024
| | |
MONEY MARKET FUNDS — 0.3% |
| Dreyfus Government Cash Management Fund, Institutional Shares - 5.19% (a) | |
| | |
| | |
| | |
| | | | | |
PURCHASED OPTIONS — 106.8% |
| Call Options Purchased — 106.7% | |
| Invesco QQQ TrustSM, Series 1 | | | | |
| | | | | |
| Put Options Purchased — 0.1% | |
| Invesco QQQ TrustSM, Series 1 | | | | |
| | | | | |
| | |
| | |
|
| Call Options Written — (7.0)% | |
| Invesco QQQ TrustSM, Series 1 | | | | |
| (Premiums received $6,594,071) | | | | |
| Put Options Written — (0.0)% | |
| Invesco QQQ TrustSM, Series 1 | | | | |
| (Premiums received $6,697,166) | | | | |
| | |
| (Premiums received $13,291,237) | |
| Net Other Assets and Liabilities — (0.1)% | |
| | |
| Rate shown reflects yield as of August 31, 2024. |
| |
| |
| |
| |
Net Other Assets and Liabilities | |
| |
See Notes to Financial Statements
FT Vest Nasdaq-100® Buffer ETF - September (QSPT)Portfolio of Investments (Continued)August 31, 2024
Valuation InputsA summary of the inputs used to value the Fund’s investments as of August 31, 2024 is as follows (see Note 2A - Portfolio Valuation in the Notes to Financial Statements):
|
| | | Level 2
Significant
Observable
Inputs | Level 3
Significant
Unobservable
Inputs |
| | | | |
| | | | |
| | | | |
|
| | | Level 2
Significant
Observable
Inputs | Level 3
Significant
Unobservable
Inputs |
| | | | |
See Notes to Financial Statements
FT Vest U.S. Equity Enhance & Moderate Buffer ETF - September (XSEP)Portfolio of InvestmentsAugust 31, 2024
| | |
MONEY MARKET FUNDS — 0.3% |
| Dreyfus Government Cash Management Fund, Institutional Shares - 5.19% (a) | |
| | |
| | |
| | |
| | | | | |
PURCHASED OPTIONS — 138.2% |
| Call Options Purchased — 138.1% | |
| | | | | |
| | | | | |
| Total Call Options Purchased | |
| | |
| Put Options Purchased — 0.1% | |
| | | | | |
| | | | | |
| | |
| | |
WRITTEN OPTIONS — (38.4)% |
| Call Options Written — (38.4)% | |
| | | | | |
| (Premiums received $17,499,766) | | | | |
| Put Options Written — (0.0)% | |
| | | | | |
| (Premiums received $2,034,660) | | | | |
| | |
| (Premiums received $19,534,426) | |
| Net Other Assets and Liabilities — (0.1)% | |
| | |
| Rate shown reflects yield as of August 31, 2024. |
| |
| |
| |
| |
Net Other Assets and Liabilities | |
| |
See Notes to Financial Statements
FT Vest U.S. Equity Enhance & Moderate Buffer ETF - September (XSEP)Portfolio of Investments (Continued)August 31, 2024
Valuation InputsA summary of the inputs used to value the Fund’s investments as of August 31, 2024 is as follows (see Note 2A - Portfolio Valuation in the Notes to Financial Statements):
|
| | | Level 2
Significant
Observable
Inputs | Level 3
Significant
Unobservable
Inputs |
| | | | |
| | | | |
| | | | |
|
| | | Level 2
Significant
Observable
Inputs | Level 3
Significant
Unobservable
Inputs |
| | | | |
See Notes to Financial Statements
FT Vest U.S. Equity Enhance & Moderate Buffer ETF - October (XOCT)Portfolio of InvestmentsAugust 31, 2024
| | |
MONEY MARKET FUNDS — 0.4% |
| Dreyfus Government Cash Management Fund, Institutional Shares - 5.19% (a) | |
| | |
| | |
| | |
| | | | | |
PURCHASED OPTIONS — 150.0% |
| Call Options Purchased — 149.9% | |
| | | | | |
| | | | | |
| Total Call Options Purchased | |
| | |
| Put Options Purchased — 0.1% | |
| | | | | |
| | | | | |
| | |
| | |
WRITTEN OPTIONS — (50.3)% |
| Call Options Written — (50.3)% | |
| | | | | |
| (Premiums received $11,909,664) | | | | |
| Put Options Written — (0.0)% | |
| | | | | |
| (Premiums received $268,258) | | | | |
| | |
| (Premiums received $12,177,922) | |
| Net Other Assets and Liabilities — (0.1)% | |
| | |
| Rate shown reflects yield as of August 31, 2024. |
| |
| |
| |
| |
Net Other Assets and Liabilities | |
| |
See Notes to Financial Statements
FT Vest U.S. Equity Enhance & Moderate Buffer ETF - October (XOCT)Portfolio of Investments (Continued)August 31, 2024
Valuation InputsA summary of the inputs used to value the Fund’s investments as of August 31, 2024 is as follows (see Note 2A - Portfolio Valuation in the Notes to Financial Statements):
|
| | | Level 2
Significant
Observable
Inputs | Level 3
Significant
Unobservable
Inputs |
| | | | |
| | | | |
| | | | |
|
| | | Level 2
Significant
Observable
Inputs | Level 3
Significant
Unobservable
Inputs |
| | | | |
See Notes to Financial Statements
FT Vest U.S. Equity Enhance & Moderate Buffer ETF - November (XNOV)Portfolio of InvestmentsAugust 31, 2024
| | |
MONEY MARKET FUNDS — 0.5% |
| Dreyfus Government Cash Management Fund, Institutional Shares - 5.19% (a) | |
| | |
| | |
| | |
| | | | | |
PURCHASED OPTIONS — 137.6% |
| Call Options Purchased — 137.4% | |
| | | | | |
| | | | | |
| Total Call Options Purchased | |
| | |
| Put Options Purchased — 0.2% | |
| | | | | |
| | | | | |
| | |
| | |
WRITTEN OPTIONS — (38.0)% |
| Call Options Written — (37.9)% | |
| | | | | |
| (Premiums received $7,150,891) | | | | |
| Put Options Written — (0.1)% | |
| | | | | |
| (Premiums received $269,581) | | | | |
| | |
| (Premiums received $7,420,472) | |
| Net Other Assets and Liabilities — (0.1)% | |
| | |
| Rate shown reflects yield as of August 31, 2024. |
| |
| |
| |
| |
Net Other Assets and Liabilities | |
| |
See Notes to Financial Statements
FT Vest U.S. Equity Enhance & Moderate Buffer ETF - November (XNOV)Portfolio of Investments (Continued)August 31, 2024
Valuation InputsA summary of the inputs used to value the Fund’s investments as of August 31, 2024 is as follows (see Note 2A - Portfolio Valuation in the Notes to Financial Statements):
|
| | | Level 2
Significant
Observable
Inputs | Level 3
Significant
Unobservable
Inputs |
| | | | |
| | | | |
| | | | |
|
| | | Level 2
Significant
Observable
Inputs | Level 3
Significant
Unobservable
Inputs |
| | | | |
See Notes to Financial Statements
FT Vest International Equity Moderate Buffer ETF - December (YDEC)Portfolio of InvestmentsAugust 31, 2024
| | |
MONEY MARKET FUNDS — 0.6% |
| Dreyfus Government Cash Management Fund, Institutional Shares - 5.19% (a) | |
| | |
| | |
| | |
| | | | | |
PURCHASED OPTIONS — 100.6% |
| Call Options Purchased — 99.9% | |
| | | | | |
| | | | | |
| Put Options Purchased — 0.7% | |
| | | | | |
| | | | | |
| | |
| | |
|
| Call Options Written — (0.8)% | |
| | | | | |
| (Premiums received $350,322) | | | | |
| Put Options Written — (0.3)% | |
| | | | | |
| (Premiums received $865,645) | | | | |
| | |
| (Premiums received $1,215,967) | |
| Net Other Assets and Liabilities — (0.1)% | |
| | |
| Rate shown reflects yield as of August 31, 2024. |
| |
| |
| |
| |
Net Other Assets and Liabilities | |
| |
See Notes to Financial Statements
FT Vest International Equity Moderate Buffer ETF - December (YDEC)Portfolio of Investments (Continued)August 31, 2024
Valuation InputsA summary of the inputs used to value the Fund’s investments as of August 31, 2024 is as follows (see Note 2A - Portfolio Valuation in the Notes to Financial Statements):
|
| | | Level 2
Significant
Observable
Inputs | Level 3
Significant
Unobservable
Inputs |
| | | | |
| | | | |
| | | | |
|
| | | Level 2
Significant
Observable
Inputs | Level 3
Significant
Unobservable
Inputs |
| | | | |
See Notes to Financial Statements
FT Vest Nasdaq-100® Buffer ETF - December (QDEC)Portfolio of InvestmentsAugust 31, 2024
| | |
MONEY MARKET FUNDS — 0.5% |
| Dreyfus Government Cash Management Fund, Institutional Shares - 5.19% (a) | |
| | |
| | |
| | |
| | | | | |
PURCHASED OPTIONS — 104.5% |
| Call Options Purchased — 103.7% | |
| Invesco QQQ TrustSM, Series 1 | | | | |
| | | | | |
| Put Options Purchased — 0.8% | |
| Invesco QQQ TrustSM, Series 1 | | | | |
| | | | | |
| | |
| | |
|
| Call Options Written — (4.5)% | |
| Invesco QQQ TrustSM, Series 1 | | | | |
| (Premiums received $6,749,472) | | | | |
| Put Options Written — (0.4)% | |
| Invesco QQQ TrustSM, Series 1 | | | | |
| (Premiums received $8,763,788) | | | | |
| | |
| (Premiums received $15,513,260) | |
| Net Other Assets and Liabilities — (0.1)% | |
| | |
| Rate shown reflects yield as of August 31, 2024. |
| |
| |
| |
| |
Net Other Assets and Liabilities | |
| |
See Notes to Financial Statements
FT Vest Nasdaq-100® Buffer ETF - December (QDEC)Portfolio of Investments (Continued)August 31, 2024
Valuation InputsA summary of the inputs used to value the Fund’s investments as of August 31, 2024 is as follows (see Note 2A - Portfolio Valuation in the Notes to Financial Statements):
|
| | | Level 2
Significant
Observable
Inputs | Level 3
Significant
Unobservable
Inputs |
| | | | |
| | | | |
| | | | |
|
| | | Level 2
Significant
Observable
Inputs | Level 3
Significant
Unobservable
Inputs |
| | | | |
See Notes to Financial Statements
FT Vest U.S. Equity Enhance & Moderate Buffer ETF - December (XDEC)Portfolio of InvestmentsAugust 31, 2024
| | |
MONEY MARKET FUNDS — 0.5% |
| Dreyfus Government Cash Management Fund, Institutional Shares - 5.19% (a) | |
| | |
| | |
| | |
| | | | | |
PURCHASED OPTIONS — 130.5% |
| Call Options Purchased — 130.0% | |
| | | | | |
| | | | | |
| Total Call Options Purchased | |
| | |
| Put Options Purchased — 0.5% | |
| | | | | |
| | | | | |
| | |
| | |
WRITTEN OPTIONS — (30.9)% |
| Call Options Written — (30.7)% | |
| | | | | |
| (Premiums received $25,742,536) | | | | |
| Put Options Written — (0.2)% | |
| | | | | |
| (Premiums received $11,146,944) | | | | |
| | |
| (Premiums received $36,889,480) | |
| Net Other Assets and Liabilities — (0.1)% | |
| | |
| Rate shown reflects yield as of August 31, 2024. |
| |
| |
| |
| |
Net Other Assets and Liabilities | |
| |
See Notes to Financial Statements
FT Vest U.S. Equity Enhance & Moderate Buffer ETF - December (XDEC)Portfolio of Investments (Continued)August 31, 2024
Valuation InputsA summary of the inputs used to value the Fund’s investments as of August 31, 2024 is as follows (see Note 2A - Portfolio Valuation in the Notes to Financial Statements):
|
| | | Level 2
Significant
Observable
Inputs | Level 3
Significant
Unobservable
Inputs |
| | | | |
| | | | |
| | | | |
|
| | | Level 2
Significant
Observable
Inputs | Level 3
Significant
Unobservable
Inputs |
| | | | |
See Notes to Financial Statements
This page intentionally left blank.
First Trust Exchange-Traded Fund VIIIStatements of Assets and Liabilities
August 31, 2024
| FT Vest U.S. Equity Enhance & Moderate Buffer ETF - January
(XJAN) | FT Vest U.S. Equity Enhance & Moderate Buffer ETF - February
(XFEB) | FT Vest International Equity Moderate Buffer ETF - March
(YMAR) | FT Vest Nasdaq-100® Buffer ETF - March
(QMAR) |
| | | | |
| | | | |
Options contracts purchased, at value | | | | |
| | | | |
| | | | |
| | | | |
| | | | |
Investment securities sold | | | | |
| | | | |
| | | | |
|
| | | | |
Options contracts written, at value | | | | |
| | | | |
| | | | |
| | | | |
Investment securities purchased | | | | |
| | | | |
| | | | |
| | | | |
|
| | | | |
| | | | |
| | | | |
Accumulated distributable earnings (loss) | | | | |
| | | | |
NET ASSET VALUE, per share | | | | |
Number of shares outstanding (unlimited number of shares authorized, par value $0.01 per share) | | | | |
| | | | |
Premiums paid on options contracts purchased | | | | |
Premiums received on options contracts written | | | | |
See Notes to Financial Statements
FT Vest U.S. Equity Enhance & Moderate Buffer ETF - March
(XMAR) | FT Vest Nasdaq- 100® Conservative Buffer ETF - April
(QCAP) | FT Vest U.S. Equity Enhance & Moderate Buffer ETF - April
(XAPR) | FT Vest Nasdaq- 100® Moderate Buffer ETF - May
(QMMY) | FT Vest U.S. Equity Enhance & Moderate Buffer ETF - May
(XMAY) | FT Vest International Equity Moderate Buffer ETF - June
(YJUN) |
| | | | | |
| | | | | |
| | | | | |
| | | | | |
| | | | | |
| | | | | |
| | | | | |
| | | | | |
| | | | | |
| | | | | |
|
| | | | | |
| | | | | |
| | | | | |
| | | | | |
| | | | | |
| | | | | |
| | | | | |
| | | | | |
| | | | | |
|
| | | | | |
| | | | | |
| | | | | |
| | | | | |
| | | | | |
| | | | | |
| | | | | |
| | | | | |
| | | | | |
| | | | | |
See Notes to Financial Statements
First Trust Exchange-Traded Fund VIIIStatements of Assets and Liabilities (Continued)
August 31, 2024
| FT Vest Nasdaq-100® Buffer ETF - June
(QJUN) | FT Vest U.S. Equity Enhance & Moderate Buffer ETF - June
(XJUN) | FT Vest Nasdaq-100® Conservative Buffer ETF - July
(QCJL) | FT Vest U.S. Equity Enhance & Moderate Buffer ETF - July
(XJUL) |
| | | | |
| | | | |
Options contracts purchased, at value | | | | |
| | | | |
| | | | |
| | | | |
| | | | |
Investment securities sold | | | | |
| | | | |
| | | | |
|
| | | | |
Options contracts written, at value | | | | |
| | | | |
| | | | |
| | | | |
Investment securities purchased | | | | |
| | | | |
| | | | |
| | | | |
|
| | | | |
| | | | |
| | | | |
Accumulated distributable earnings (loss) | | | | |
| | | | |
NET ASSET VALUE, per share | | | | |
Number of shares outstanding (unlimited number of shares authorized, par value $0.01 per share) | | | | |
| | | | |
Premiums paid on options contracts purchased | | | | |
Premiums received on options contracts written | | | | |
See Notes to Financial Statements
FT Vest Nasdaq- 100® Moderate Buffer ETF - August
(QMAG) | FT Vest U.S. Equity Enhance & Moderate Buffer ETF - August
(XAUG) | FT Vest International Equity Buffer ETF - September
(YSEP) | FT Vest Nasdaq- 100® Buffer ETF - September
(QSPT) | FT Vest U.S. Equity Enhance & Moderate Buffer ETF - September
(XSEP) | FT Vest U.S. Equity Enhance & Moderate Buffer ETF - October
(XOCT) |
| | | | | |
| | | | | |
| | | | | |
| | | | | |
| | | | | |
| | | | | |
| | | | | |
| | | | | |
| | | | | |
| | | | | |
|
| | | | | |
| | | | | |
| | | | | |
| | | | | |
| | | | | |
| | | | | |
| | | | | |
| | | | | |
| | | | | |
|
| | | | | |
| | | | | |
| | | | | |
| | | | | |
| | | | | |
| | | | | |
| | | | | |
| | | | | |
| | | | | |
| | | | | |
See Notes to Financial Statements
First Trust Exchange-Traded Fund VIIIStatements of Assets and Liabilities (Continued)
August 31, 2024
| FT Vest U.S. Equity Enhance & Moderate Buffer ETF - November
(XNOV) | FT Vest International Equity Moderate Buffer ETF - December
(YDEC) | FT Vest Nasdaq-100® Buffer ETF - December
(QDEC) | FT Vest U.S. Equity Enhance & Moderate Buffer ETF - December
(XDEC) |
| | | | |
| | | | |
Options contracts purchased, at value | | | | |
| | | | |
| | | | |
| | | | |
| | | | |
Investment securities sold | | | | |
| | | | |
| | | | |
|
| | | | |
Options contracts written, at value | | | | |
| | | | |
| | | | |
| | | | |
Investment securities purchased | | | | |
| | | | |
| | | | |
| | | | |
|
| | | | |
| | | | |
| | | | |
Accumulated distributable earnings (loss) | | | | |
| | | | |
NET ASSET VALUE, per share | | | | |
Number of shares outstanding (unlimited number of shares authorized, par value $0.01 per share) | | | | |
| | | | |
Premiums paid on options contracts purchased | | | | |
Premiums received on options contracts written | | | | |
See Notes to Financial Statements
This page intentionally left blank.
First Trust Exchange-Traded Fund VIIIStatements of Operations
For the Period Ended August 31, 2024
| FT Vest U.S. Equity Enhance & Moderate Buffer ETF - January
(XJAN) (a) | FT Vest U.S. Equity Enhance & Moderate Buffer ETF - February
(XFEB) (b) | FT Vest International Equity Moderate Buffer ETF - March
(YMAR) | FT Vest Nasdaq-100® Buffer ETF - March
(QMAR) |
| | | | |
| | | | |
| | | | |
|
| | | | |
| | | | |
| | | | |
NET INVESTMENT INCOME (LOSS) | | | | |
|
NET REALIZED AND UNREALIZED GAIN (LOSS): | | | | |
Net realized gain (loss) on: | | | | |
Purchased options contracts | | | | |
Written options contracts | | | | |
In-kind redemptions - Purchased options contracts | | | | |
In-kind redemptions - Written options contracts | | | | |
| | | | |
Net change in unrealized appreciation (depreciation) on: | | | | |
Purchased options contracts | | | | |
Written options contracts | | | | |
Net change in unrealized appreciation (depreciation) | | | | |
NET REALIZED AND UNREALIZED GAIN (LOSS) | | | | |
NET INCREASE (DECREASE) IN NET ASSETS RESULTING FROM OPERATIONS | | | | |
| Inception date is January 19, 2024, which is consistent with the commencement of investment operations and is the date the initial creation units were established. |
| Inception date is February 16, 2024, which is consistent with the commencement of investment operations and is the date the initial creation units were established. |
| Inception date is April 19, 2024, which is consistent with the commencement of investment operations and is the date the initial creation units were established. |
| Inception date is May 17, 2024, which is consistent with the commencement of investment operations and is the date the initial creation units were established. |
See Notes to Financial Statements
FT Vest U.S. Equity Enhance & Moderate Buffer ETF - March
(XMAR) | FT Vest Nasdaq- 100® Conservative Buffer ETF - April
(QCAP) (c) | FT Vest U.S. Equity Enhance & Moderate Buffer ETF - April
(XAPR) (c) | FT Vest Nasdaq- 100® Moderate Buffer ETF - May
(QMMY) (d) | FT Vest U.S. Equity Enhance & Moderate Buffer ETF - May
(XMAY) (d) | FT Vest International Equity Moderate Buffer ETF - June
(YJUN) |
| | | | | |
| | | | | |
| | | | | |
|
| | | | | |
| | | | | |
| | | | | |
| | | | | |
|
| | | | | |
| | | | | |
| | | | | |
| | | | | |
| | | | | |
| | | | | |
| | | | | |
| | | | | |
| | | | | |
| | | | | |
| | | | | |
| | | | | |
| | | | | |
See Notes to Financial Statements
First Trust Exchange-Traded Fund VIIIStatements of Operations (Continued)
For the Period Ended August 31, 2024
| FT Vest Nasdaq-100® Buffer ETF - June
(QJUN) | FT Vest U.S. Equity Enhance & Moderate Buffer ETF - June
(XJUN) | FT Vest Nasdaq-100® Conservative Buffer ETF - July
(QCJL) (e) | FT Vest U.S. Equity Enhance & Moderate Buffer ETF - July
(XJUL) |
| | | | |
| | | | |
| | | | |
|
| | | | |
| | | | |
| | | | |
NET INVESTMENT INCOME (LOSS) | | | | |
|
NET REALIZED AND UNREALIZED GAIN (LOSS): | | | | |
Net realized gain (loss) on: | | | | |
Purchased options contracts | | | | |
Written options contracts | | | | |
In-kind redemptions - Purchased options contracts | | | | |
In-kind redemptions - Written options contracts | | | | |
| | | | |
Net change in unrealized appreciation (depreciation) on: | | | | |
Purchased options contracts | | | | |
Written options contracts | | | | |
Net change in unrealized appreciation (depreciation) | | | | |
NET REALIZED AND UNREALIZED GAIN (LOSS) | | | | |
NET INCREASE (DECREASE) IN NET ASSETS RESULTING FROM OPERATIONS | | | | |
| Inception date is July 19, 2024, which is consistent with the commencement of investment operations and is the date the initial creation units were established. |
| Inception date is August 16, 2024, which is consistent with the commencement of investment operations and is the date the initial creation units were established. |
| Inception date is October 20, 2023, which is consistent with the commencement of investment operations and is the date the initial creation units were established. |
See Notes to Financial Statements
FT Vest Nasdaq- 100® Moderate Buffer ETF - August
(QMAG) (f) | FT Vest U.S. Equity Enhance & Moderate Buffer ETF - August
(XAUG) | FT Vest International Equity Buffer ETF - September
(YSEP) | FT Vest Nasdaq- 100® Buffer ETF - September
(QSPT) | FT Vest U.S. Equity Enhance & Moderate Buffer ETF - September
(XSEP) | FT Vest U.S. Equity Enhance & Moderate Buffer ETF - October
(XOCT) (g) |
| | | | | |
| | | | | |
| | | | | |
|
| | | | | |
| | | | | |
| | | | | |
| | | | | |
|
| | | | | |
| | | | | |
| | | | | |
| | | | | |
| | | | | |
| | | | | |
| | | | | |
| | | | | |
| | | | | |
| | | | | |
| | | | | |
| | | | | |
| | | | | |
See Notes to Financial Statements
First Trust Exchange-Traded Fund VIIIStatements of Operations (Continued)
For the Period Ended August 31, 2024
| FT Vest U.S. Equity Enhance & Moderate Buffer ETF - November
(XNOV) (h) | FT Vest International Equity Moderate Buffer ETF - December
(YDEC) | FT Vest Nasdaq-100® Buffer ETF - December
(QDEC) | FT Vest U.S. Equity Enhance & Moderate Buffer ETF - December
(XDEC) |
| | | | |
| | | | |
| | | | |
|
| | | | |
| | | | |
| | | | |
NET INVESTMENT INCOME (LOSS) | | | | |
|
NET REALIZED AND UNREALIZED GAIN (LOSS): | | | | |
Net realized gain (loss) on: | | | | |
Purchased options contracts | | | | |
Written options contracts | | | | |
In-kind redemptions - Purchased options contracts | | | | |
In-kind redemptions - Written options contracts | | | | |
| | | | |
Net change in unrealized appreciation (depreciation) on: | | | | |
Purchased options contracts | | | | |
Written options contracts | | | | |
Net change in unrealized appreciation (depreciation) | | | | |
NET REALIZED AND UNREALIZED GAIN (LOSS) | | | | |
NET INCREASE (DECREASE) IN NET ASSETS RESULTING FROM OPERATIONS | | | | |
| Inception date is November 17, 2023, which is consistent with the commencement of investment operations and is the date the initial creation units were established. |
See Notes to Financial Statements
This page intentionally left blank.
First Trust Exchange-Traded Fund VIIIStatements of Changes in Net Assets
| FT Vest U.S. Equity Enhance & Moderate Buffer ETF - January (XJAN) | FT Vest U.S. Equity Enhance & Moderate Buffer ETF - February (XFEB) | FT Vest International Equity Moderate Buffer ETF - March (YMAR) |
| | | | |
| | | | |
Net investment income (loss) | | | | |
| | | | |
Net change in unrealized appreciation (depreciation) | | | | |
Net increase (decrease) in net assets resulting from operations | | | | |
|
SHAREHOLDER TRANSACTIONS: | | | | |
Proceeds from shares sold | | | | |
| | | | |
Net increase (decrease) in net assets resulting from shareholder transactions | | | | |
Total increase (decrease) in net assets | | | | |
|
| | | | |
| | | | |
| | | | |
|
CHANGES IN SHARES OUTSTANDING: | | | | |
Shares outstanding, beginning of period | | | | |
| | | | |
| | | | |
Shares outstanding, end of period | | | | |
| Inception date is January 19, 2024, which is consistent with the commencement of investment operations and is the date the initial creation units were established. |
| Inception date is February 16, 2024, which is consistent with the commencement of investment operations and is the date the initial creation units were established. |
| Inception date is March 17, 2023, which is consistent with the commencement of investment operations and is the date the initial creation units were established. |
| Inception date is April 19, 2024, which is consistent with the commencement of investment operations and is the date the initial creation units were established. |
See Notes to Financial Statements
FT Vest Nasdaq-100® Buffer ETF - March (QMAR) | FT Vest U.S. Equity Enhance & Moderate Buffer ETF - March (XMAR) | FT Vest Nasdaq-100® Conservative Buffer ETF - April (QCAP) |
| | | | |
| | | | |
| | | | |
| | | | |
| | | | |
| | | | |
|
| | | | |
| | | | |
| | | | |
| | | | |
| | | | |
|
| | | | |
| | | | |
| | | | |
|
| | | | |
| | | | |
| | | | |
| | | | |
| | | | |
See Notes to Financial Statements
First Trust Exchange-Traded Fund VIIIStatements of Changes in Net Assets (Continued)
| FT Vest U.S. Equity Enhance & Moderate Buffer ETF - April (XAPR) | FT Vest Nasdaq-100® Moderate Buffer ETF - May (QMMY) | FT Vest U.S. Equity Enhance & Moderate Buffer ETF - May (XMAY) |
| | | |
| | | |
Net investment income (loss) | | | |
| | | |
Net change in unrealized appreciation (depreciation) | | | |
Net increase (decrease) in net assets resulting from operations | | | |
|
SHAREHOLDER TRANSACTIONS: | | | |
Proceeds from shares sold | | | |
| | | |
Net increase (decrease) in net assets resulting from shareholder transactions | | | |
Total increase (decrease) in net assets | | | |
|
| | | |
| | | |
| | | |
|
CHANGES IN SHARES OUTSTANDING: | | | |
Shares outstanding, beginning of period | | | |
| | | |
| | | |
Shares outstanding, end of period | | | |
| Inception date is April 19, 2024, which is consistent with the commencement of investment operations and is the date the initial creation units were established. |
| Inception date is May 17, 2024, which is consistent with the commencement of investment operations and is the date the initial creation units were established. |
See Notes to Financial Statements
FT Vest International Equity Moderate Buffer ETF - June (YJUN) | FT Vest Nasdaq-100® Buffer ETF - June (QJUN) | FT Vest U.S. Equity Enhance & Moderate Buffer ETF - June (XJUN) |
| | | | | |
| | | | | |
| | | | | |
| | | | | |
| | | | | |
| | | | | |
|
| | | | | |
| | | | | |
| | | | | |
| | | | | |
| | | | | |
|
| | | | | |
| | | | | |
| | | | | |
|
| | | | | |
| | | | | |
| | | | | |
| | | | | |
| | | | | |
See Notes to Financial Statements
First Trust Exchange-Traded Fund VIIIStatements of Changes in Net Assets (Continued)
| FT Vest Nasdaq-100® Conservative Buffer ETF - July (QCJL) | FT Vest U.S. Equity Enhance & Moderate Buffer ETF - July (XJUL) | FT Vest Nasdaq-100® Moderate Buffer ETF - August (QMAG) |
| | | | |
| | | | |
Net investment income (loss) | | | | |
| | | | |
Net change in unrealized appreciation (depreciation) | | | | |
Net increase (decrease) in net assets resulting from operations | | | | |
|
SHAREHOLDER TRANSACTIONS: | | | | |
Proceeds from shares sold | | | | |
| | | | |
Net increase (decrease) in net assets resulting from shareholder transactions | | | | |
Total increase (decrease) in net assets | | | | |
|
| | | | |
| | | | |
| | | | |
|
CHANGES IN SHARES OUTSTANDING: | | | | |
Shares outstanding, beginning of period | | | | |
| | | | |
| | | | |
Shares outstanding, end of period | | | | |
| Inception date is July 19, 2024, which is consistent with the commencement of investment operations and is the date the initial creation units were established. |
| Inception date is July 21, 2023, which is consistent with the commencement of investment operations and is the date the initial creation units were established. |
| Inception date is August 16, 2024, which is consistent with the commencement of investment operations and is the date the initial creation units were established. |
| Inception date is August 18, 2023, which is consistent with the commencement of investment operations and is the date the initial creation units were established. |
See Notes to Financial Statements
FT Vest U.S. Equity Enhance & Moderate Buffer ETF - August (XAUG) | FT Vest International Equity Buffer ETF - September (YSEP) | FT Vest Nasdaq-100® Buffer ETF - September (QSPT) |
| | | | | |
| | | | | |
| | | | | |
| | | | | |
| | | | | |
| | | | | |
|
| | | | | |
| | | | | |
| | | | | |
| | | | | |
| | | | | |
|
| | | | | |
| | | | | |
| | | | | |
|
| | | | | |
| | | | | |
| | | | | |
| | | | | |
| | | | | |
See Notes to Financial Statements
First Trust Exchange-Traded Fund VIIIStatements of Changes in Net Assets (Continued)
| FT Vest U.S. Equity Enhance & Moderate Buffer ETF - September (XSEP) | FT Vest U.S. Equity Enhance & Moderate Buffer ETF - October (XOCT) | FT Vest U.S. Equity Enhance & Moderate Buffer ETF - November (XNOV) |
| | | | |
| | | | |
Net investment income (loss) | | | | |
| | | | |
Net change in unrealized appreciation (depreciation) | | | | |
Net increase (decrease) in net assets resulting from operations | | | | |
|
SHAREHOLDER TRANSACTIONS: | | | | |
Proceeds from shares sold | | | | |
| | | | |
Net increase (decrease) in net assets resulting from shareholder transactions | | | | |
Total increase (decrease) in net assets | | | | |
|
| | | | |
| | | | |
| | | | |
|
CHANGES IN SHARES OUTSTANDING: | | | | |
Shares outstanding, beginning of period | | | | |
| | | | |
| | | | |
Shares outstanding, end of period | | | | |
| Inception date is September 21, 2022, which is consistent with the commencement of investment operations and is the date the initial creation units were established. |
| Inception date is October 20, 2023, which is consistent with the commencement of investment operations and is the date the initial creation units were established. |
| Inception date is November 17, 2023, which is consistent with the commencement of investment operations and is the date the initial creation units were established. |
See Notes to Financial Statements
FT Vest International Equity Moderate Buffer ETF - December (YDEC) | FT Vest Nasdaq-100® Buffer ETF - December (QDEC) | FT Vest U.S. Equity Enhance & Moderate Buffer ETF - December (XDEC) |
| | | | | |
| | | | | |
| | | | | |
| | | | | |
| | | | | |
| | | | | |
|
| | | | | |
| | | | | |
| | | | | |
| | | | | |
| | | | | |
|
| | | | | |
| | | | | |
| | | | | |
|
| | | | | |
| | | | | |
| | | | | |
| | | | | |
| | | | | |
See Notes to Financial Statements
First Trust Exchange-Traded Fund VIIIFinancial Highlights
For a share outstanding throughout the period FT Vest U.S. Equity Enhance & Moderate Buffer ETF - January (XJAN)
| |
|
Net asset value, beginning of period | |
Income from investment operations: | |
Net investment income (loss) (b) | |
Net realized and unrealized gain (loss) | |
Total from investment operations | |
Net asset value, end of period | |
| |
|
Ratios to average net assets/supplemental data: | |
Net assets, end of period (in 000’s) | |
Ratio of total expenses to average net assets | |
Ratio of net investment income (loss) to average net assets | |
Portfolio turnover rate (e) | |
| Inception date is January 19, 2024, which is consistent with the commencement of investment operations and is the date the initial creation units were established. |
| Based on average shares outstanding. |
| Total return is calculated assuming an initial investment made at the net asset value at the beginning of the period, reinvestment of all distributions at net asset value during the period, and redemption at net asset value on the last day of the period. The return presented does not reflect the deduction of taxes that a shareholder would pay on Fund distributions or the redemption or sale of Fund shares. Total return is calculated for the time period presented and is not annualized for periods of less than a year. |
| |
| Portfolio turnover is calculated for the time period presented and is not annualized for periods of less than a year and does not include securities received or delivered from processing creations or redemptions, derivatives and in-kind transactions. |
See Notes to Financial Statements
First Trust Exchange-Traded Fund VIIIFinancial Highlights (Continued)
For a share outstanding throughout the period FT Vest U.S. Equity Enhance & Moderate Buffer ETF - February (XFEB)
| |
|
Net asset value, beginning of period | |
Income from investment operations: | |
Net investment income (loss) (b) | |
Net realized and unrealized gain (loss) | |
Total from investment operations | |
Net asset value, end of period | |
| |
|
Ratios to average net assets/supplemental data: | |
Net assets, end of period (in 000’s) | |
Ratio of total expenses to average net assets | |
Ratio of net investment income (loss) to average net assets | |
Portfolio turnover rate (e) | |
| Inception date is February 16, 2024, which is consistent with the commencement of investment operations and is the date the initial creation units were established. |
| Based on average shares outstanding. |
| Total return is calculated assuming an initial investment made at the net asset value at the beginning of the period, reinvestment of all distributions at net asset value during the period, and redemption at net asset value on the last day of the period. The return presented does not reflect the deduction of taxes that a shareholder would pay on Fund distributions or the redemption or sale of Fund shares. Total return is calculated for the time period presented and is not annualized for periods of less than a year. |
| |
| Portfolio turnover is calculated for the time period presented and is not annualized for periods of less than a year and does not include securities received or delivered from processing creations or redemptions, derivatives and in-kind transactions. |
See Notes to Financial Statements
First Trust Exchange-Traded Fund VIIIFinancial Highlights (Continued)
For a share outstanding throughout each period FT Vest International Equity Moderate Buffer ETF - March (YMAR)
| | Period
Ended
8/31/2021 (a) |
| | | |
Net asset value, beginning of period | | | | |
Income from investment operations: | | | | |
Net investment income (loss) | | | | |
Net realized and unrealized gain (loss) | | | | |
Total from investment operations | | | | |
Net asset value, end of period | | | | |
| | | | |
|
Ratios to average net assets/supplemental data: | | | | |
Net assets, end of period (in 000’s) | | | | |
Ratio of total expenses to average net assets | | | | |
Ratio of net investment income (loss) to average net assets | | | | |
Portfolio turnover rate (e) | | | | |
| Inception date is March 19, 2021, which is consistent with the commencement of investment operations and is the date the initial creation units were established. |
| Based on average shares outstanding. |
| Total return is calculated assuming an initial investment made at the net asset value at the beginning of the period, reinvestment of all distributions at net asset value during the period, and redemption at net asset value on the last day of the period. The returns presented do not reflect the deduction of taxes that a shareholder would pay on Fund distributions or the redemption or sale of Fund shares. Total return is calculated for the time period presented and is not annualized for periods of less than a year. |
| |
| Portfolio turnover is calculated for the time period presented and is not annualized for periods of less than a year and does not include securities received or delivered from processing creations or redemptions, derivatives and in-kind transactions. |
See Notes to Financial Statements
First Trust Exchange-Traded Fund VIIIFinancial Highlights (Continued)
For a share outstanding throughout each period FT Vest Nasdaq-100® Buffer ETF - March (QMAR)
| | Period
Ended
8/31/2021 (a) |
| | | |
Net asset value, beginning of period | | | | |
Income from investment operations: | | | | |
Net investment income (loss) | | | | |
Net realized and unrealized gain (loss) | | | | |
Total from investment operations | | | | |
Net asset value, end of period | | | | |
| | | | |
|
Ratios to average net assets/supplemental data: | | | | |
Net assets, end of period (in 000’s) | | | | |
Ratio of total expenses to average net assets | | | | |
Ratio of net investment income (loss) to average net assets | | | | |
Portfolio turnover rate (e) | | | | |
| Inception date is March 19, 2021, which is consistent with the commencement of investment operations and is the date the initial creation units were established. |
| Based on average shares outstanding. |
| Total return is calculated assuming an initial investment made at the net asset value at the beginning of the period, reinvestment of all distributions at net asset value during the period, and redemption at net asset value on the last day of the period. The returns presented do not reflect the deduction of taxes that a shareholder would pay on Fund distributions or the redemption or sale of Fund shares. Total return is calculated for the time period presented and is not annualized for periods of less than a year. |
| |
| Portfolio turnover is calculated for the time period presented and is not annualized for periods of less than a year and does not include securities received or delivered from processing creations or redemptions, derivatives and in-kind transactions. |
See Notes to Financial Statements
First Trust Exchange-Traded Fund VIIIFinancial Highlights (Continued)
For a share outstanding throughout each period FT Vest U.S. Equity Enhance & Moderate Buffer ETF - March (XMAR)
| | |
|
Net asset value, beginning of period | | |
Income from investment operations: | | |
Net investment income (loss) (b) | | |
Net realized and unrealized gain (loss) | | |
Total from investment operations | | |
Net asset value, end of period | | |
| | |
|
Ratios to average net assets/supplemental data: | | |
Net assets, end of period (in 000’s) | | |
Ratio of total expenses to average net assets | | |
Ratio of net investment income (loss) to average net assets | | |
Portfolio turnover rate (e) | | |
| Inception date is March 17, 2023, which is consistent with the commencement of investment operations and is the date the initial creation units were established. |
| Based on average shares outstanding. |
| Total return is calculated assuming an initial investment made at the net asset value at the beginning of the period, reinvestment of all distributions at net asset value during the period, and redemption at net asset value on the last day of the period. The returns presented do not reflect the deduction of taxes that a shareholder would pay on Fund distributions or the redemption or sale of Fund shares. Total return is calculated for the time period presented and is not annualized for periods of less than a year. |
| |
| Portfolio turnover is calculated for the time period presented and is not annualized for periods of less than a year and does not include securities received or delivered from processing creations or redemptions, derivatives and in-kind transactions. |
See Notes to Financial Statements
First Trust Exchange-Traded Fund VIIIFinancial Highlights (Continued)
For a share outstanding throughout the period FT Vest Nasdaq-100® Conservative Buffer ETF - April (QCAP)
| |
|
Net asset value, beginning of period | |
Income from investment operations: | |
Net investment income (loss) (b) | |
Net realized and unrealized gain (loss) | |
Total from investment operations | |
Net asset value, end of period | |
| |
|
Ratios to average net assets/supplemental data: | |
Net assets, end of period (in 000’s) | |
Ratio of total expenses to average net assets | |
Ratio of net investment income (loss) to average net assets | |
Portfolio turnover rate (e) | |
| Inception date is April 19, 2024, which is consistent with the commencement of investment operations and is the date the initial creation units were established. |
| Based on average shares outstanding. |
| Total return is calculated assuming an initial investment made at the net asset value at the beginning of the period, reinvestment of all distributions at net asset value during the period, and redemption at net asset value on the last day of the period. The return presented does not reflect the deduction of taxes that a shareholder would pay on Fund distributions or the redemption or sale of Fund shares. Total return is calculated for the time period presented and is not annualized for periods of less than a year. |
| |
| Portfolio turnover is calculated for the time period presented and is not annualized for periods of less than a year and does not include securities received or delivered from processing creations or redemptions, derivatives and in-kind transactions. |
See Notes to Financial Statements
First Trust Exchange-Traded Fund VIIIFinancial Highlights (Continued)
For a share outstanding throughout the period FT Vest U.S. Equity Enhance & Moderate Buffer ETF - April (XAPR)
| |
|
Net asset value, beginning of period | |
Income from investment operations: | |
Net investment income (loss) (b) | |
Net realized and unrealized gain (loss) | |
Total from investment operations | |
Net asset value, end of period | |
| |
|
Ratios to average net assets/supplemental data: | |
Net assets, end of period (in 000’s) | |
Ratio of total expenses to average net assets | |
Ratio of net investment income (loss) to average net assets | |
Portfolio turnover rate (e) | |
| Inception date is April 19, 2024, which is consistent with the commencement of investment operations and is the date the initial creation units were established. |
| Based on average shares outstanding. |
| Total return is calculated assuming an initial investment made at the net asset value at the beginning of the period, reinvestment of all distributions at net asset value during the period, and redemption at net asset value on the last day of the period. The return presented does not reflect the deduction of taxes that a shareholder would pay on Fund distributions or the redemption or sale of Fund shares. Total return is calculated for the time period presented and is not annualized for periods of less than a year. |
| |
| Portfolio turnover is calculated for the time period presented and is not annualized for periods of less than a year and does not include securities received or delivered from processing creations or redemptions, derivatives and in-kind transactions. |
See Notes to Financial Statements
First Trust Exchange-Traded Fund VIIIFinancial Highlights (Continued)
For a share outstanding throughout the period FT Vest Nasdaq-100® Moderate Buffer ETF - May (QMMY)
| |
|
Net asset value, beginning of period | |
Income from investment operations: | |
Net investment income (loss) (b) | |
Net realized and unrealized gain (loss) | |
Total from investment operations | |
Net asset value, end of period | |
| |
|
Ratios to average net assets/supplemental data: | |
Net assets, end of period (in 000’s) | |
Ratio of total expenses to average net assets | |
Ratio of net investment income (loss) to average net assets | |
Portfolio turnover rate (e) | |
| Inception date is May 17, 2024, which is consistent with the commencement of investment operations and is the date the initial creation units were established. |
| Based on average shares outstanding. |
| Total return is calculated assuming an initial investment made at the net asset value at the beginning of the period, reinvestment of all distributions at net asset value during the period, and redemption at net asset value on the last day of the period. The return presented does not reflect the deduction of taxes that a shareholder would pay on Fund distributions or the redemption or sale of Fund shares. Total return is calculated for the time period presented and is not annualized for periods of less than a year. |
| |
| Portfolio turnover is calculated for the time period presented and is not annualized for periods of less than a year and does not include securities received or delivered from processing creations or redemptions, derivatives and in-kind transactions. |
See Notes to Financial Statements
First Trust Exchange-Traded Fund VIIIFinancial Highlights (Continued)
For a share outstanding throughout the period FT Vest U.S. Equity Enhance & Moderate Buffer ETF - May (XMAY)
| |
|
Net asset value, beginning of period | |
Income from investment operations: | |
Net investment income (loss) (b) | |
Net realized and unrealized gain (loss) | |
Total from investment operations | |
Net asset value, end of period | |
| |
|
Ratios to average net assets/supplemental data: | |
Net assets, end of period (in 000’s) | |
Ratio of total expenses to average net assets | |
Ratio of net investment income (loss) to average net assets | |
Portfolio turnover rate (e) | |
| Inception date is May 17, 2024, which is consistent with the commencement of investment operations and is the date the initial creation units were established. |
| Based on average shares outstanding. |
| Total return is calculated assuming an initial investment made at the net asset value at the beginning of the period, reinvestment of all distributions at net asset value during the period, and redemption at net asset value on the last day of the period. The return presented does not reflect the deduction of taxes that a shareholder would pay on Fund distributions or the redemption or sale of Fund shares. Total return is calculated for the time period presented and is not annualized for periods of less than a year. |
| |
| Portfolio turnover is calculated for the time period presented and is not annualized for periods of less than a year and does not include securities received or delivered from processing creations or redemptions, derivatives and in-kind transactions. |
See Notes to Financial Statements
First Trust Exchange-Traded Fund VIIIFinancial Highlights (Continued)
For a share outstanding throughout each period FT Vest International Equity Moderate Buffer ETF - June (YJUN)
| | Period
Ended
8/31/2021 (a) |
| | | |
Net asset value, beginning of period | | | | |
Income from investment operations: | | | | |
Net investment income (loss) | | | | |
Net realized and unrealized gain (loss) | | | | |
Total from investment operations | | | | |
Net asset value, end of period | | | | |
| | | | |
|
Ratios to average net assets/supplemental data: | | | | |
Net assets, end of period (in 000’s) | | | | |
Ratio of total expenses to average net assets | | | | |
Ratio of net investment income (loss) to average net assets | | | | |
Portfolio turnover rate (e) | | | | |
| Inception date is June 18, 2021, which is consistent with the commencement of investment operations and is the date the initial creation units were established. |
| Based on average shares outstanding. |
| Total return is calculated assuming an initial investment made at the net asset value at the beginning of the period, reinvestment of all distributions at net asset value during the period, and redemption at net asset value on the last day of the period. The returns presented do not reflect the deduction of taxes that a shareholder would pay on Fund distributions or the redemption or sale of Fund shares. Total return is calculated for the time period presented and is not annualized for periods of less than a year. |
| |
| Portfolio turnover is calculated for the time period presented and is not annualized for periods of less than a year and does not include securities received or delivered from processing creations or redemptions, derivatives and in-kind transactions. |
See Notes to Financial Statements
First Trust Exchange-Traded Fund VIIIFinancial Highlights (Continued)
For a share outstanding throughout each period FT Vest Nasdaq-100® Buffer ETF - June (QJUN)
| | Period
Ended
8/31/2021 (a) |
| | | |
Net asset value, beginning of period | | | | |
Income from investment operations: | | | | |
Net investment income (loss) | | | | |
Net realized and unrealized gain (loss) | | | | |
Total from investment operations | | | | |
Net asset value, end of period | | | | |
| | | | |
|
Ratios to average net assets/supplemental data: | | | | |
Net assets, end of period (in 000’s) | | | | |
Ratio of total expenses to average net assets | | | | |
Ratio of net investment income (loss) to average net assets | | | | |
Portfolio turnover rate (e) | | | | |
| Inception date is June 18, 2021, which is consistent with the commencement of investment operations and is the date the initial creation units were established. |
| Based on average shares outstanding. |
| Total return is calculated assuming an initial investment made at the net asset value at the beginning of the period, reinvestment of all distributions at net asset value during the period, and redemption at net asset value on the last day of the period. The returns presented do not reflect the deduction of taxes that a shareholder would pay on Fund distributions or the redemption or sale of Fund shares. Total return is calculated for the time period presented and is not annualized for periods of less than a year. |
| |
| Portfolio turnover is calculated for the time period presented and is not annualized for periods of less than a year and does not include securities received or delivered from processing creations or redemptions, derivatives and in-kind transactions. |
See Notes to Financial Statements
First Trust Exchange-Traded Fund VIIIFinancial Highlights (Continued)
For a share outstanding throughout each period FT Vest U.S. Equity Enhance & Moderate Buffer ETF - June (XJUN)
| | Period
Ended
8/31/2021 (a) |
| | | |
Net asset value, beginning of period | | | | |
Income from investment operations: | | | | |
Net investment income (loss) | | | | |
Net realized and unrealized gain (loss) | | | | |
Total from investment operations | | | | |
Net asset value, end of period | | | | |
| | | | |
|
Ratios to average net assets/supplemental data: | | | | |
Net assets, end of period (in 000’s) | | | | |
Ratio of total expenses to average net assets | | | | |
Ratio of net investment income (loss) to average net assets | | | | |
Portfolio turnover rate (e) | | | | |
| Inception date is July 12, 2021, which is consistent with the commencement of investment operations and is the date the initial creation units were established. |
| Based on average shares outstanding. |
| Total return is calculated assuming an initial investment made at the net asset value at the beginning of the period, reinvestment of all distributions at net asset value during the period, and redemption at net asset value on the last day of the period. The returns presented do not reflect the deduction of taxes that a shareholder would pay on Fund distributions or the redemption or sale of Fund shares. Total return is calculated for the time period presented and is not annualized for periods of less than a year. |
| |
| Portfolio turnover is calculated for the time period presented and is not annualized for periods of less than a year and does not include securities received or delivered from processing creations or redemptions, derivatives and in-kind transactions. |
See Notes to Financial Statements
First Trust Exchange-Traded Fund VIIIFinancial Highlights (Continued)
For a share outstanding throughout the period FT Vest Nasdaq-100® Conservative Buffer ETF - July (QCJL)
| |
|
Net asset value, beginning of period | |
Income from investment operations: | |
Net investment income (loss) (b) | |
Net realized and unrealized gain (loss) | |
Total from investment operations | |
Net asset value, end of period | |
| |
|
Ratios to average net assets/supplemental data: | |
Net assets, end of period (in 000’s) | |
Ratio of total expenses to average net assets | |
Ratio of net investment income (loss) to average net assets | |
Portfolio turnover rate (e) | |
| Inception date is July 19, 2024, which is consistent with the commencement of investment operations and is the date the initial creation units were established. |
| Based on average shares outstanding. |
| Total return is calculated assuming an initial investment made at the net asset value at the beginning of the period, reinvestment of all distributions at net asset value during the period, and redemption at net asset value on the last day of the period. The return presented does not reflect the deduction of taxes that a shareholder would pay on Fund distributions or the redemption or sale of Fund shares. Total return is calculated for the time period presented and is not annualized for periods of less than a year. |
| |
| Portfolio turnover is calculated for the time period presented and is not annualized for periods of less than a year and does not include securities received or delivered from processing creations or redemptions, derivatives and in-kind transactions. |
See Notes to Financial Statements
First Trust Exchange-Traded Fund VIIIFinancial Highlights (Continued)
For a share outstanding throughout each period FT Vest U.S. Equity Enhance & Moderate Buffer ETF - July (XJUL)
| | |
|
Net asset value, beginning of period | | |
Income from investment operations: | | |
Net investment income (loss) (b) | | |
Net realized and unrealized gain (loss) | | |
Total from investment operations | | |
Net asset value, end of period | | |
| | |
|
Ratios to average net assets/supplemental data: | | |
Net assets, end of period (in 000’s) | | |
Ratio of total expenses to average net assets | | |
Ratio of net investment income (loss) to average net assets | | |
Portfolio turnover rate (e) | | |
| Inception date is July 21, 2023, which is consistent with the commencement of investment operations and is the date the initial creation units were established. |
| Based on average shares outstanding. |
| Total return is calculated assuming an initial investment made at the net asset value at the beginning of the period, reinvestment of all distributions at net asset value during the period, and redemption at net asset value on the last day of the period. The returns presented do not reflect the deduction of taxes that a shareholder would pay on Fund distributions or the redemption or sale of Fund shares. Total return is calculated for the time period presented and is not annualized for periods of less than a year. |
| |
| Portfolio turnover is calculated for the time period presented and is not annualized for periods of less than a year and does not include securities received or delivered from processing creations or redemptions, derivatives and in-kind transactions. |
See Notes to Financial Statements
First Trust Exchange-Traded Fund VIIIFinancial Highlights (Continued)
For a share outstanding throughout the period FT Vest Nasdaq-100® Moderate Buffer ETF - August (QMAG)
| |
|
Net asset value, beginning of period | |
Income from investment operations: | |
Net investment income (loss) (b) | |
Net realized and unrealized gain (loss) | |
Total from investment operations | |
Net asset value, end of period | |
| |
|
Ratios to average net assets/supplemental data: | |
Net assets, end of period (in 000’s) | |
Ratio of total expenses to average net assets | |
Ratio of net investment income (loss) to average net assets | |
Portfolio turnover rate (e) | |
| Inception date is August 16, 2024, which is consistent with the commencement of investment operations and is the date the initial creation units were established. |
| Based on average shares outstanding. |
| Total return is calculated assuming an initial investment made at the net asset value at the beginning of the period, reinvestment of all distributions at net asset value during the period, and redemption at net asset value on the last day of the period. The return presented does not reflect the deduction of taxes that a shareholder would pay on Fund distributions or the redemption or sale of Fund shares. Total return is calculated for the time period presented and is not annualized for periods of less than a year. |
| |
| Portfolio turnover is calculated for the time period presented and is not annualized for periods of less than a year and does not include securities received or delivered from processing creations or redemptions, derivatives and in-kind transactions. |
See Notes to Financial Statements
First Trust Exchange-Traded Fund VIIIFinancial Highlights (Continued)
For a share outstanding throughout each period FT Vest U.S. Equity Enhance & Moderate Buffer ETF - August (XAUG)
| | |
|
Net asset value, beginning of period | | |
Income from investment operations: | | |
Net investment income (loss) (b) | | |
Net realized and unrealized gain (loss) | | |
Total from investment operations | | |
Net asset value, end of period | | |
| | |
|
Ratios to average net assets/supplemental data: | | |
Net assets, end of period (in 000’s) | | |
Ratio of total expenses to average net assets | | |
Ratio of net investment income (loss) to average net assets | | |
Portfolio turnover rate (e) | | |
| Inception date is August 18, 2023, which is consistent with the commencement of investment operations and is the date the initial creation units were established. |
| Based on average shares outstanding. |
| Total return is calculated assuming an initial investment made at the net asset value at the beginning of the period, reinvestment of all distributions at net asset value during the period, and redemption at net asset value on the last day of the period. The returns presented do not reflect the deduction of taxes that a shareholder would pay on Fund distributions or the redemption or sale of Fund shares. Total return is calculated for the time period presented and is not annualized for periods of less than a year. |
| |
| Portfolio turnover is calculated for the time period presented and is not annualized for periods of less than a year and does not include securities received or delivered from processing creations or redemptions, derivatives and in-kind transactions. |
See Notes to Financial Statements
First Trust Exchange-Traded Fund VIIIFinancial Highlights (Continued)
For a share outstanding throughout each period FT Vest International Equity Buffer ETF - September (YSEP)
| | Period
Ended
8/31/2022 (a) |
| | |
Net asset value, beginning of period | | | |
Income from investment operations: | | | |
Net investment income (loss) | | | |
Net realized and unrealized gain (loss) | | | |
Total from investment operations | | | |
Net asset value, end of period | | | |
| | | |
|
Ratios to average net assets/supplemental data: | | | |
Net assets, end of period (in 000’s) | | | |
Ratio of total expenses to average net assets | | | |
Ratio of net investment income (loss) to average net assets | | | |
Portfolio turnover rate (e) | | | |
| Inception date is September 17, 2021, which is consistent with the commencement of investment operations and is the date the initial creation units were established. |
| Based on average shares outstanding. |
| Total return is calculated assuming an initial investment made at the net asset value at the beginning of the period, reinvestment of all distributions at net asset value during the period, and redemption at net asset value on the last day of the period. The returns presented do not reflect the deduction of taxes that a shareholder would pay on Fund distributions or the redemption or sale of Fund shares. Total return is calculated for the time period presented and is not annualized for periods of less than a year. |
| |
| Portfolio turnover is calculated for the time period presented and is not annualized for periods of less than a year and does not include securities received or delivered from processing creations or redemptions, derivatives and in-kind transactions. |
See Notes to Financial Statements
First Trust Exchange-Traded Fund VIIIFinancial Highlights (Continued)
For a share outstanding throughout each period FT Vest Nasdaq-100® Buffer ETF - September (QSPT)
| | Period
Ended
8/31/2022 (a) |
| | |
Net asset value, beginning of period | | | |
Income from investment operations: | | | |
Net investment income (loss) | | | |
Net realized and unrealized gain (loss) | | | |
Total from investment operations | | | |
Net asset value, end of period | | | |
| | | |
|
Ratios to average net assets/supplemental data: | | | |
Net assets, end of period (in 000’s) | | | |
Ratio of total expenses to average net assets | | | |
Ratio of net investment income (loss) to average net assets | | | |
Portfolio turnover rate (e) | | | |
| Inception date is September 17, 2021, which is consistent with the commencement of investment operations and is the date the initial creation units were established. |
| Based on average shares outstanding. |
| Total return is calculated assuming an initial investment made at the net asset value at the beginning of the period, reinvestment of all distributions at net asset value during the period, and redemption at net asset value on the last day of the period. The returns presented do not reflect the deduction of taxes that a shareholder would pay on Fund distributions or the redemption or sale of Fund shares. Total return is calculated for the time period presented and is not annualized for periods of less than a year. |
| |
| Portfolio turnover is calculated for the time period presented and is not annualized for periods of less than a year and does not include securities received or delivered from processing creations or redemptions, derivatives and in-kind transactions. |
See Notes to Financial Statements
First Trust Exchange-Traded Fund VIIIFinancial Highlights (Continued)
For a share outstanding throughout each period FT Vest U.S. Equity Enhance & Moderate Buffer ETF - September (XSEP)
| | |
|
Net asset value, beginning of period | | |
Income from investment operations: | | |
Net investment income (loss) (b) | | |
Net realized and unrealized gain (loss) | | |
Total from investment operations | | |
Net asset value, end of period | | |
| | |
|
Ratios to average net assets/supplemental data: | | |
Net assets, end of period (in 000’s) | | |
Ratio of total expenses to average net assets | | |
Ratio of net investment income (loss) to average net assets | | |
Portfolio turnover rate (e) | | |
| Inception date is September 21, 2022, which is consistent with the commencement of investment operations and is the date the initial creation units were established. |
| Based on average shares outstanding. |
| Total return is calculated assuming an initial investment made at the net asset value at the beginning of the period, reinvestment of all distributions at net asset value during the period, and redemption at net asset value on the last day of the period. The returns presented do not reflect the deduction of taxes that a shareholder would pay on Fund distributions or the redemption or sale of Fund shares. Total return is calculated for the time period presented and is not annualized for periods of less than a year. |
| |
| Portfolio turnover is calculated for the time period presented and is not annualized for periods of less than a year and does not include securities received or delivered from processing creations or redemptions, derivatives and in-kind transactions. |
See Notes to Financial Statements
First Trust Exchange-Traded Fund VIIIFinancial Highlights (Continued)
For a share outstanding throughout the period FT Vest U.S. Equity Enhance & Moderate Buffer ETF - October (XOCT)
| |
|
Net asset value, beginning of period | |
Income from investment operations: | |
Net investment income (loss) (b) | |
Net realized and unrealized gain (loss) | |
Total from investment operations | |
Net asset value, end of period | |
| |
|
Ratios to average net assets/supplemental data: | |
Net assets, end of period (in 000’s) | |
Ratio of total expenses to average net assets | |
Ratio of net investment income (loss) to average net assets | |
Portfolio turnover rate (e) | |
| Inception date is October 20, 2023, which is consistent with the commencement of investment operations and is the date the initial creation units were established. |
| Based on average shares outstanding. |
| Total return is calculated assuming an initial investment made at the net asset value at the beginning of the period, reinvestment of all distributions at net asset value during the period, and redemption at net asset value on the last day of the period. The return presented does not reflect the deduction of taxes that a shareholder would pay on Fund distributions or the redemption or sale of Fund shares. Total return is calculated for the time period presented and is not annualized for periods of less than a year. |
| |
| Portfolio turnover is calculated for the time period presented and is not annualized for periods of less than a year and does not include securities received or delivered from processing creations or redemptions, derivatives and in-kind transactions. |
See Notes to Financial Statements
First Trust Exchange-Traded Fund VIIIFinancial Highlights (Continued)
For a share outstanding throughout the period FT Vest U.S. Equity Enhance & Moderate Buffer ETF - November (XNOV)
| |
|
Net asset value, beginning of period | |
Income from investment operations: | |
Net investment income (loss) (b) | |
Net realized and unrealized gain (loss) | |
Total from investment operations | |
Net asset value, end of period | |
| |
|
Ratios to average net assets/supplemental data: | |
Net assets, end of period (in 000’s) | |
Ratio of total expenses to average net assets | |
Ratio of net investment income (loss) to average net assets | |
Portfolio turnover rate (e) | |
| Inception date is November 17, 2023, which is consistent with the commencement of investment operations and is the date the initial creation units were established. |
| Based on average shares outstanding. |
| Total return is calculated assuming an initial investment made at the net asset value at the beginning of the period, reinvestment of all distributions at net asset value during the period, and redemption at net asset value on the last day of the period. The return presented does not reflect the deduction of taxes that a shareholder would pay on Fund distributions or the redemption or sale of Fund shares. Total return is calculated for the time period presented and is not annualized for periods of less than a year. |
| |
| Portfolio turnover is calculated for the time period presented and is not annualized for periods of less than a year and does not include securities received or delivered from processing creations or redemptions, derivatives and in-kind transactions. |
See Notes to Financial Statements
First Trust Exchange-Traded Fund VIIIFinancial Highlights (Continued)
For a share outstanding throughout each period FT Vest International Equity Moderate Buffer ETF - December (YDEC)
| | Period
Ended
8/31/2021 (a) |
| | | |
Net asset value, beginning of period | | | | |
Income from investment operations: | | | | |
Net investment income (loss) | | | | |
Net realized and unrealized gain (loss) | | | | |
Total from investment operations | | | | |
Net asset value, end of period | | | | |
| | | | |
|
Ratios to average net assets/supplemental data: | | | | |
Net assets, end of period (in 000’s) | | | | |
Ratio of total expenses to average net assets | | | | |
Ratio of net investment income (loss) to average net assets | | | | |
Portfolio turnover rate (e) | | | | |
| Inception date is December 18, 2020, which is consistent with the commencement of investment operations and is the date the initial creation units were established. |
| Based on average shares outstanding. |
| Total return is calculated assuming an initial investment made at the net asset value at the beginning of the period, reinvestment of all distributions at net asset value during the period, and redemption at net asset value on the last day of the period. The returns presented do not reflect the deduction of taxes that a shareholder would pay on Fund distributions or the redemption or sale of Fund shares. Total return is calculated for the time period presented and is not annualized for periods of less than a year. |
| |
| Portfolio turnover is calculated for the time period presented and is not annualized for periods of less than a year and does not include securities received or delivered from processing creations or redemptions, derivatives and in-kind transactions. |
See Notes to Financial Statements
First Trust Exchange-Traded Fund VIIIFinancial Highlights (Continued)
For a share outstanding throughout each period FT Vest Nasdaq-100® Buffer ETF - December (QDEC)
| | Period
Ended
8/31/2021 (a) |
| | | |
Net asset value, beginning of period | | | | |
Income from investment operations: | | | | |
Net investment income (loss) | | | | |
Net realized and unrealized gain (loss) | | | | |
Total from investment operations | | | | |
Net asset value, end of period | | | | |
| | | | |
|
Ratios to average net assets/supplemental data: | | | | |
Net assets, end of period (in 000’s) | | | | |
Ratio of total expenses to average net assets | | | | |
Ratio of net investment income (loss) to average net assets | | | | |
Portfolio turnover rate (e) | | | | |
| Inception date is December 18, 2020, which is consistent with the commencement of investment operations and is the date the initial creation units were established. |
| Based on average shares outstanding. |
| Total return is calculated assuming an initial investment made at the net asset value at the beginning of the period, reinvestment of all distributions at net asset value during the period, and redemption at net asset value on the last day of the period. The returns presented do not reflect the deduction of taxes that a shareholder would pay on Fund distributions or the redemption or sale of Fund shares. Total return is calculated for the time period presented and is not annualized for periods of less than a year. |
| |
| Portfolio turnover is calculated for the time period presented and is not annualized for periods of less than a year and does not include securities received or delivered from processing creations or redemptions, derivatives and in-kind transactions. |
See Notes to Financial Statements
First Trust Exchange-Traded Fund VIIIFinancial Highlights (Continued)
For a share outstanding throughout each period FT Vest U.S. Equity Enhance & Moderate Buffer ETF - December (XDEC)
| | Period
Ended
8/31/2022 (a) |
| | |
Net asset value, beginning of period | | | |
Income from investment operations: | | | |
Net investment income (loss) | | | |
Net realized and unrealized gain (loss) | | | |
Total from investment operations | | | |
Net asset value, end of period | | | |
| | | |
|
Ratios to average net assets/supplemental data: | | | |
Net assets, end of period (in 000’s) | | | |
Ratio of total expenses to average net assets | | | |
Ratio of net investment income (loss) to average net assets | | | |
Portfolio turnover rate (e) | | | |
| Inception date is December 17, 2021, which is consistent with the commencement of investment operations and is the date the initial creation units were established. |
| Based on average shares outstanding. |
| Total return is calculated assuming an initial investment made at the net asset value at the beginning of the period, reinvestment of all distributions at net asset value during the period, and redemption at net asset value on the last day of the period. The returns presented do not reflect the deduction of taxes that a shareholder would pay on Fund distributions or the redemption or sale of Fund shares. Total return is calculated for the time period presented and is not annualized for periods of less than a year. |
| |
| Portfolio turnover is calculated for the time period presented and is not annualized for periods of less than a year and does not include securities received or delivered from processing creations or redemptions, derivatives and in-kind transactions. |
See Notes to Financial Statements
Notes to Financial Statements
First Trust Exchange-Traded Fund VIIIAugust 31, 2024 1. Organization
First Trust Exchange-Traded Fund VIII (the “Trust”) is an open-end management investment company organized as a Massachusetts business trust on February 22, 2016, and is registered with the Securities and Exchange Commission under the Investment Company Act of 1940, as amended (the “1940 Act”).
This report covers the twenty-four funds (each a “Fund” and collectively, the “Funds”), each a non-diversified series of the Trust, listed below. The shares of each Fund are listed and traded on the Cboe BZX Exchange, Inc.
FT Vest U.S. Equity Enhance & Moderate Buffer ETF - January – (ticker “XJAN”)(1) |
FT Vest U.S. Equity Enhance & Moderate Buffer ETF - February – (ticker “XFEB”)(2) |
FT Vest International Equity Moderate Buffer ETF - March – (ticker “YMAR”) |
FT Vest Nasdaq-100® Buffer ETF - March – (ticker “QMAR”) |
FT Vest U.S. Equity Enhance & Moderate Buffer ETF - March – (ticker “XMAR”) |
FT Vest Nasdaq-100® Conservative Buffer ETF - April – (ticker “QCAP”)(3) |
FT Vest U.S. Equity Enhance & Moderate Buffer ETF - April – (ticker “XAPR”)(3) |
FT Vest Nasdaq-100® Moderate Buffer ETF - May – (ticker “QMMY”)(4) |
FT Vest U.S. Equity Enhance & Moderate Buffer ETF - May – (ticker “XMAY”)(4) |
FT Vest International Equity Moderate Buffer ETF - June – (ticker “YJUN”) |
FT Vest Nasdaq-100® Buffer ETF - June – (ticker “QJUN”) |
FT Vest U.S. Equity Enhance & Moderate Buffer ETF - June – (ticker “XJUN”) |
FT Vest Nasdaq-100® Conservative Buffer ETF - July – (ticker “QCJL”)(5) |
FT Vest U.S. Equity Enhance & Moderate Buffer ETF - July – (ticker “XJUL”) |
FT Vest Nasdaq-100® Moderate Buffer ETF - August – (ticker “QMAG”)(6) |
FT Vest U.S. Equity Enhance & Moderate Buffer ETF - August – (ticker “XAUG”) |
FT Vest International Equity Buffer ETF - September – (ticker “YSEP”)
(now known as FT Vest International Equity Moderate Buffer ETF - September) |
FT Vest Nasdaq-100® Buffer ETF - September – (ticker “QSPT”) |
FT Vest U.S. Equity Enhance & Moderate Buffer ETF - September – (ticker “XSEP”) |
FT Vest U.S. Equity Enhance & Moderate Buffer ETF - October – (ticker “XOCT”)(7) |
FT Vest U.S. Equity Enhance & Moderate Buffer ETF - November – (ticker “XNOV”)(8) |
FT Vest International Equity Moderate Buffer ETF - December – (ticker “YDEC”) |
FT Vest Nasdaq-100® Buffer ETF - December – (ticker “QDEC”) |
FT Vest U.S. Equity Enhance & Moderate Buffer ETF - December – (ticker “XDEC”) |
| Commenced investment operations on January 19, 2024. |
| Commenced investment operations on February 16, 2024. |
| Commenced investment operations on April 19, 2024. |
| Commenced investment operations on May 17, 2024. |
| Commenced investment operations on July 19, 2024. |
| Commenced investment operations on August 16, 2024. |
| Commenced investment operations on October 20, 2023. |
| Commenced investment operations on November 17, 2023. |
Each Fund represents a separate series of shares of beneficial interest in the Trust. Unlike conventional mutual funds, each Fund issues and redeems shares on a continuous basis, at net asset value (“NAV”), only in large blocks of shares known as “Creation Units.”
Each Fund is an actively managed exchange-traded fund.
The investment objective of XJAN is to seek to provide investors with returns (before fees and expenses) of approximately twice any positive price return of the SPDR® S&P 500® ETF Trust (the “Underlying SPDR ETF”), up to a predetermined upside cap of 10.44% while providing a buffer (before fees and expenses) against the first 15% of Underlying SPDR ETF losses, over the period (an “Outcome Period”) from January 22, 2024 through January 17, 2025.
Notes to Financial Statements (Continued)
First Trust Exchange-Traded Fund VIIIAugust 31, 2024 The investment objective of XFEB is to seek to provide investors with returns (before fees and expenses) of approximately twice any positive price return of the Underlying SPDR ETF, up to a predetermined upside cap of 11.02% while providing a buffer (before fees and expenses) against the first 15% of Underlying SPDR ETF losses, over the period from February 20, 2024 through February 21, 2025.
The investment objective of YMAR is to seek to provide investors with returns (before fees and expenses) that match the price return of the iShares MSCI EAFE ETF (the “Underlying MSCI ETF”), up to a predetermined upside cap of 15.81% while providing a buffer (before fees and expenses) against the first 15% of Underlying MSCI ETF losses, over the period from March 18, 2024 through March 21, 2025. Prior to March 18, 2024, the Fund’s investment objective included an upside cap of 24.78% while providing a buffer (before fees and expenses) against the first 10% of Underlying MSCI ETF losses, over the period from March 20, 2023 through March 15, 2024.
The investment objective of QMAR is to seek to provide investors with returns (before fees and expenses) that match the price return of the Invesco QQQ TrustSM, Series 1 (the “Underlying Invesco ETF”), up to a predetermined upside cap of 20.90% while providing a buffer (before fees and expenses) against the first 10% of Underlying Invesco ETF losses, over the period from March 18, 2024 through March 21, 2025. Prior to March 18, 2024, the Fund’s investment objective included an upside cap of 22.15% and an Outcome Period of March 20, 2023 through March 15, 2024.
The investment objective of XMAR is to seek to provide investors with returns (before fees and expenses) of approximately twice any positive price return of the Underlying SPDR ETF, up to a predetermined upside cap of 11.56% while providing a buffer (before fees and expenses) against the first 15% of Underlying SPDR ETF losses, over the period from March 18, 2024 through March 21, 2025. Prior to March 18, 2024, the Fund’s investment objective included an upside cap of 13.01% and an Outcome Period of March 20, 2023 through March 15, 2024.
The investment objective of QCAP is to seek to provide investors with returns (before fees and expenses) that match the price return of the Underlying Invesco ETF, up to a predetermined upside cap of 15.21% while providing a buffer (before fees and expenses) against the first 20% of Underlying Invesco ETF losses, over the period from April 22, 2024 through April 17, 2025.
The investment objective of XAPR is to seek to provide investors with returns (before fees and expenses) of approximately twice any positive price return of the Underlying SPDR ETF, up to a predetermined upside cap of 12.02% while providing a buffer (before fees and expenses) against the first 15% of Underlying SPDR ETF losses, over the period from April 22, 2024 through April 17, 2025.
The investment objective of QMMY is to seek to provide investors with returns (before fees and expenses) that match the price return of the Underlying Invesco ETF, up to a predetermined upside cap of 15.93% while providing a buffer (before fees and expenses) against the first 15% of Underlying Invesco ETF losses, over the period from May 20, 2024 through May 16, 2025.
The investment objective of XMAY is to seek to provide investors with returns (before fees and expenses) of approximately twice any positive price return of the Underlying SPDR ETF, up to a predetermined upside cap of 10.78% while providing a buffer (before fees and expenses) against the first 15% of Underlying SPDR ETF losses, over the period from May 20, 2024 through May 16, 2025.
The investment objective of YJUN is to seek to provide investors with returns (before fees and expenses) that match the price return of the Underlying MSCI ETF, up to a predetermined upside cap of 16.41% while providing a buffer (before fees and expenses) against the first 15% of Underlying MSCI ETF losses, over the period from June 24, 2024 through June 20, 2025. Prior to June 24, 2024, the Fund’s investment objective included an upside cap of 18.94% while providing a buffer (before fees and expenses) against the first 10% of Underlying MSCI ETF losses, over the period from June 20, 2023 through June 21, 2024.
The investment objective of QJUN is to seek to provide investors with returns (before fees and expenses) that match the price return of the Underlying Invesco ETF, up to a predetermined upside cap of 19.30% while providing a buffer (before fees and expenses) against the first 10% of Underlying Invesco ETF losses, over the period from June 24, 2024 through June 20, 2025. Prior to June 24, 2024, the Fund’s investment objective included an upside cap of 20.53% and an Outcome Period of June 20, 2023 through June 21, 2024.
The investment objective of XJUN is to seek to provide investors with returns (before fees and expenses) of approximately twice any positive price return of the Underlying SPDR ETF, up to a predetermined upside cap of 10.70% while providing a buffer (before fees and expenses) against the first 15% of Underlying SPDR ETF losses, over the period from June 24, 2024 through June 20, 2025. Prior to June 24, 2024, the Fund’s investment objective included an upside cap of 11.60% and an Outcome Period of June 20, 2023 through June 21, 2024.
Notes to Financial Statements (Continued)
First Trust Exchange-Traded Fund VIIIAugust 31, 2024 The investment objective of QCJL is to seek to provide investors with returns (before fees and expenses) that match the price return of the Underlying Invesco ETF, up to a predetermined upside cap of 14.01% while providing a buffer (before fees and expenses) against the first 20% of Underlying Invesco ETF losses, over the period from July 22, 2024 through July 18, 2025.
The investment objective of XJUL is to seek to provide investors with returns (before fees and expenses) of approximately twice any positive price return of the Underlying SPDR ETF, up to a predetermined upside cap of 10.72% while providing a buffer (before fees and expenses) against the first 15% of Underlying SPDR ETF losses, over the period from July 22, 2024 through July 18, 2025. Prior to July 22, 2024, the Fund’s investment objective included an upside cap of 11.22% and an Outcome Period of July 24, 2023 through July 19, 2024.
The investment objective of QMAG is to seek to provide investors with returns (before fees and expenses) that match the price return of the Underlying Invesco ETF, up to a predetermined upside cap of 14.70% while providing a buffer (before fees and expenses) against the first 15% of Underlying Invesco ETF losses, over the period from August 19, 2024 through August 15, 2025.
The investment objective of XAUG is to seek to provide investors with returns (before fees and expenses) of approximately twice any positive price return of the Underlying SPDR ETF, up to a predetermined upside cap of 9.94% while providing a buffer (before fees and expenses) against the first 15% of Underlying SPDR ETF losses, over the period from August 19, 2024 through August 15, 2025. Prior to August 19, 2024, the Fund’s investment objective included an upside cap of 12.32% and an Outcome Period of August 21, 2023 through August 16, 2024.
The investment objective of YSEP is to seek to provide investors with returns (before fees and expenses) that match the price return of the Underlying MSCI ETF, up to a predetermined upside cap of 20.61% while providing a buffer (before fees and expenses) against the first 10% of Underlying MSCI ETF losses, over the period from September 18, 2023 through September 20, 2024. Prior to September 18, 2023, the Fund’s investment objective included an upside cap of 25.00% and an Outcome Period of September 19, 2022 through September 15, 2023.
The investment objective of QSPT is to seek to provide investors with returns (before fees and expenses) that match the price return of the Underlying Invesco ETF, up to a predetermined upside cap of 21.00% while providing a buffer (before fees and expenses) against the first 10% of Underlying Invesco ETF losses, over the period from September 18, 2023 through September 20, 2024. Prior to September 18, 2023, the Fund’s investment objective included an upside cap of 27.27% and an Outcome Period of September 19, 2022 through September 15, 2023.
The investment objective of XSEP is to seek to provide investors with returns (before fees and expenses) of approximately twice any positive price return of the Underlying SPDR ETF, up to a predetermined upside cap of 11.80% while providing a buffer (before fees and expenses) against the first 15% of Underlying SPDR ETF losses, over the period from September 18, 2023 through September 20, 2024. Prior to September 18, 2023, the Fund’s investment objective included an upside cap of 14.90% and an Outcome Period of September 22, 2022 through September 15, 2023.
The investment objective of XOCT is to seek to provide investors with returns (before fees and expenses) of approximately twice any positive price return of the Underlying SPDR ETF, up to a predetermined upside cap of 12.80% while providing a buffer (before fees and expenses) against the first 15% of Underlying SPDR ETF losses, over the period from October 23, 2023 through October 18, 2024.
The investment objective of XNOV is to seek to provide investors with returns (before fees and expenses) of approximately twice any positive price return of the Underlying SPDR ETF, up to a predetermined upside cap of 11.30% while providing a buffer (before fees and expenses) against the first 15% of Underlying SPDR ETF losses, over the period from November 20, 2023 through November 15, 2024.
The investment objective of YDEC is to seek to provide investors with returns (before fees and expenses) that match the price return of the Underlying MSCI ETF, up to a predetermined upside cap of 18.40% while providing a buffer (before fees and expenses) against the first 15% of Underlying MSCI ETF losses, over the period from December 18, 2023 through December 20, 2024. Prior to December 18, 2023, the Fund’s investment objective included an upside cap of 22.87% while providing a buffer (before fees and expenses) against the first 10% of Underlying MSCI ETF losses, over the period from December 19, 2022 through December 15, 2023.
Notes to Financial Statements (Continued)
First Trust Exchange-Traded Fund VIIIAugust 31, 2024 The investment objective of QDEC is to seek to provide investors with returns (before fees and expenses) that match the price return of the Underlying Invesco ETF, up to a predetermined upside cap of 18.98% while providing a buffer (before fees and expenses) against the first 10% of Underlying Invesco ETF losses, over the period from December 18, 2023 through December 20, 2024. Prior to December 18, 2023, the Fund’s investment objective included an upside cap of 27.03% and an Outcome Period of December 19, 2022 through December 15, 2023.
The investment objective of XDEC is to seek to provide investors with returns (before fees and expenses) of approximately twice any positive price return of the Underlying SPDR ETF, up to a predetermined upside cap of 10.76% while providing a buffer (before fees and expenses) against the first 15% of Underlying SPDR ETF losses, over the period from December 18, 2023 through December 20, 2024. Prior to December 18, 2023, the Fund’s investment objective included an upside cap of 15.31% and an Outcome Period of December 19, 2022 through December 15, 2023.
Under normal market conditions, each Fund will invest substantially all of its assets in FLexible EXchange® Options (“FLEX Options”) that reference the price performance of a specified reference ETF, either the SPDR® S&P 500® ETF Trust, the Invesco QQQ TrustSM, Series 1, or the iShares MSCI EAFE ETF (the “Underlying ETF”).
2. Significant Accounting Policies
The Funds are each considered an investment company and follow accounting and reporting guidance under Financial Accounting Standards Board Accounting Standards Codification Topic 946, “Financial Services-Investment Companies.” The following is a summary of significant accounting policies consistently followed by the Funds in the preparation of the financial statements. The preparation of the financial statements in accordance with accounting principles generally accepted in the United States of America (“U.S. GAAP”) requires management to make estimates and assumptions that affect the reported amounts and disclosures in the financial statements. Actual results could differ from those estimates.
Each Fund’s NAV is determined daily as of the close of regular trading on the New York Stock Exchange (“NYSE”), normally 4:00 p.m. Eastern time, on each day the NYSE is open for trading. If the NYSE closes early on a valuation day, the NAV is determined as of that time. Each Fund’s NAV is calculated by dividing the value of all assets of each Fund (including accrued interest and dividends), less all liabilities (including accrued expenses and dividends declared but unpaid), by the total number of shares outstanding.
Each Fund’s investments are valued daily at market value or, in the absence of market value with respect to any portfolio securities, at fair value. Market value prices represent readily available market quotations such as last sale or official closing prices from a national or foreign exchange (i.e., a regulated market) and are primarily obtained from third-party pricing services. Fair value prices represent any prices not considered market value prices and are either obtained from a third-party pricing service or are determined by the Pricing Committee of the Funds’ investment advisor, First Trust Advisors L.P. (“First Trust” or the “Advisor”), in accordance with valuation procedures approved by the Trust’s Board of Trustees, and in accordance with provisions of the 1940 Act and rules thereunder. Investments valued by the Advisor’s Pricing Committee, if any, are footnoted as such in the footnotes to the Portfolio of Investments. Each Fund’s investments are valued as follows:
Exchange-traded options contracts (other than FLEX Option contracts) are valued at the closing price in the market where such contracts are principally traded. If no closing price is available, exchange-traded options contracts are valued at the mean of their most recent bid and ask price, if both are available. Over-the-counter options contracts are valued as follows, depending on the market in which the instrument trades: (1) the mean of their most recent bid and ask price, if available; or (2) a price based on the equivalent exchange-traded option. FLEX Option contracts are normally valued using a model-based price provided by a third-party pricing vendor. On days when a trade in a FLEX Option contract occurs, the trade price will be used to value such FLEX Option contracts in lieu of the model price.
Common stocks and other equity securities listed on any national or foreign exchange (excluding Nasdaq, Inc. (“Nasdaq”) and the London Stock Exchange Alternative Investment Market (“AIM”)) are valued at the last sale price on the exchange on which they are principally traded or, for Nasdaq and AIM securities, the official closing price. Securities traded on more than one securities exchange are valued at the last sale price or official closing price, as applicable, at the close of the securities exchange representing the primary exchange for such securities.
Shares of open-end funds are valued based on NAV per share.
Notes to Financial Statements (Continued)
First Trust Exchange-Traded Fund VIIIAugust 31, 2024 Certain securities may not be able to be priced by pre-established pricing methods. Such securities may be valued by the Advisor’s Pricing Committee at fair value. These securities generally include, but are not limited to, restricted securities (securities which may not be publicly sold without registration under the Securities Act of 1933, as amended) for which a third-party pricing service is unable to provide a market price; securities whose trading has been formally suspended; a security whose market or fair value price is not available from a pre-established pricing source; a security with respect to which an event has occurred that is likely to materially affect the value of the security after the market has closed but before the calculation of a Fund’s NAV or make it difficult or impossible to obtain a reliable market quotation; and a security whose price, as provided by the third-party pricing service, does not reflect the security’s fair value. As a general principle, the current fair value of a security would appear to be the amount which the owner might reasonably expect to receive for the security upon its current sale. When fair value prices are used, generally they will differ from market quotations or official closing prices on the applicable exchanges. A variety of factors may be considered in determining the fair value of such securities, including, but not limited to, the following:
1)
the last sale price on the exchange on which they are principally traded or, for Nasdaq and AIM securities, the official closing price;
3)
the size of the holding;
4)
the initial cost of the security;
5)
transactions in comparable securities;
6)
price quotes from dealers and/or third-party pricing services;
7)
relationships among various securities;
8)
information obtained by contacting the issuer, analysts, or the appropriate stock exchange;
9)
an analysis of the issuer’s financial statements;
10)
the existence of merger proposals or tender offers that might affect the value of the security; and
11)
other relevant factors.
The Funds are subject to fair value accounting standards that define fair value, establish the framework for measuring fair value and provide a three-level hierarchy for fair valuation based upon the inputs to the valuation as of the measurement date. The three levels of the fair value hierarchy are as follows:
• Level 1 – Level 1 inputs are quoted prices in active markets for identical investments. An active market is a market in which transactions for the investment occur with sufficient frequency and volume to provide pricing information on an ongoing basis.
• Level 2 – Level 2 inputs are observable inputs, either directly or indirectly, and include the following:
o Quoted prices for similar investments in active markets.
o Quoted prices for identical or similar investments in markets that are non-active. A non-active market is a market where there are few transactions for the investment, the prices are not current, or price quotations vary substantially either over time or among market makers, or in which little information is released publicly.
o Inputs other than quoted prices that are observable for the investment (for example, interest rates and yield curves observable at commonly quoted intervals, volatilities, prepayment speeds, loss severities, credit risks, and default rates).
o Inputs that are derived principally from or corroborated by observable market data by correlation or other means.
• Level 3 – Level 3 inputs are unobservable inputs. Unobservable inputs may reflect the reporting entity’s own assumptions about the assumptions that market participants would use in pricing the investment.
The inputs or methodologies used for valuing investments are not necessarily an indication of the risk associated with investing in those investments. A summary of the inputs used to value each Fund’s investments as of August 31, 2024, is included with each Fund’s Portfolio of Investments.
B. Securities Transactions and Investment Income
Securities transactions are recorded as of the trade date. Realized gains and losses from securities transactions are recorded on the identified cost basis. Dividend income is recorded on the ex-dividend date.
Notes to Financial Statements (Continued)
First Trust Exchange-Traded Fund VIIIAugust 31, 2024 C. FLEX Options
FLEX Options are customized equity or index option contracts that trade on an exchange, but provide investors with the ability to customize key contract terms like exercise prices, styles and expiration dates. FLEX Options are guaranteed for settlement by the Options Clearing Corporation.
Each Fund purchases and sells call and put FLEX Options based on the performance of the Underlying ETF. The FLEX Options that each Fund holds that reference the Underlying ETF will give each Fund the right to receive or deliver shares of the Underlying ETF on the option expiration date at a strike price, depending on whether the option is a put or call option and whether each Fund purchases or sells the option. The FLEX Options held by each Fund are European style options, which are exercisable at the strike price only on the FLEX Option expiration date. All options held by each Fund at August 31, 2024 are FLEX Options.
D. Dividends and Distributions to Shareholders
Dividends from net investment income of each Fund, if any, are declared and paid annually, or as the Board of Trustees may determine from time to time. Distributions of net realized capital gains earned by each Fund, if any, are distributed at least annually. Each Fund may also designate a portion of the amount paid to redeeming shareholders as a distribution for tax purposes.
Distributions from net investment income and realized capital gains are determined in accordance with federal income tax regulations, which may differ from U.S. GAAP. Certain capital accounts in the financial statements are periodically adjusted for permanent differences in order to reflect their tax character. These permanent differences are primarily due to the varying treatment of income and gain/loss on significantly modified portfolio securities held by the Funds and have no impact on net assets or NAV per share. Temporary differences, which arise from recognizing certain items of income, expense and gain/loss in different periods for financial statement and tax purposes, will reverse at some time in the future. During their applicable taxable periods, none of the Funds paid a distribution in 2024 or 2023.
Notes to Financial Statements (Continued)
First Trust Exchange-Traded Fund VIIIAugust 31, 2024 As of the applicable taxable year end, the components of distributable earnings on a tax basis for each Fund were as follows:
| | Undistributed
Ordinary
Income | Accumulated
Capital and
Other
Gain (Loss) | Net
Unrealized
Appreciation
(Depreciation) |
FT Vest U.S. Equity Enhance & Moderate Buffer ETF - January | | | | |
FT Vest U.S. Equity Enhance & Moderate Buffer ETF - February | | | | |
FT Vest International Equity Moderate Buffer ETF - March | | | | |
FT Vest Nasdaq-100® Buffer ETF - March | | | | |
FT Vest U.S. Equity Enhance & Moderate Buffer ETF - March | | | | |
FT Vest Nasdaq-100® Conservative Buffer ETF - April | | | | |
FT Vest U.S. Equity Enhance & Moderate Buffer ETF - April | | | | |
FT Vest Nasdaq-100® Moderate Buffer ETF - May | | | | |
FT Vest U.S. Equity Enhance & Moderate Buffer ETF - May | | | | |
FT Vest International Equity Moderate Buffer ETF - June | | | | |
FT Vest Nasdaq-100® Buffer ETF - June | | | | |
FT Vest U.S. Equity Enhance & Moderate Buffer ETF - June | | | | |
FT Vest Nasdaq-100® Conservative Buffer ETF - July | | | | |
FT Vest U.S. Equity Enhance & Moderate Buffer ETF - July | | | | |
FT Vest Nasdaq-100® Moderate Buffer ETF - August | | | | |
FT Vest U.S. Equity Enhance & Moderate Buffer ETF - August | | | | |
FT Vest International Equity Buffer ETF - September | | | | |
FT Vest Nasdaq-100® Buffer ETF - September | | | | |
FT Vest U.S. Equity Enhance & Moderate Buffer ETF - September | | | | |
FT Vest U.S. Equity Enhance & Moderate Buffer ETF - October | | | | |
FT Vest U.S. Equity Enhance & Moderate Buffer ETF - November | | | | |
FT Vest International Equity Moderate Buffer ETF - December | | | | |
FT Vest Nasdaq-100® Buffer ETF - December | | | | |
FT Vest U.S. Equity Enhance & Moderate Buffer ETF - December | | | | |
Each Fund intends to qualify or continue to qualify as a regulated investment company by complying with the requirements under Subchapter M of the Internal Revenue Code of 1986, as amended, which includes distributing substantially all of its net investment income and net realized gains to shareholders. Accordingly, no provision has been made for federal and state income taxes. However, due to the timing and amount of distributions, each Fund may be subject to an excise tax of 4% of the amount by which approximately 98% of each Fund’s taxable income exceeds the distributions from such taxable income for the calendar year.
The Funds are subject to accounting standards that establish a minimum threshold for recognizing, and a system for measuring, the benefits of a tax position taken or expected to be taken in a tax return. For YMAR, QMAR, YJUN, QJUN, and XJUN, the taxable years ended 2021, 2022, 2023, and 2024 remain open to federal and state audit. For YSEP, QSPT, YDEC, QDEC, and XDEC, the taxable years ended 2021, 2022, and 2023 remain open to federal and state audit. For XMAR, XJUL, and XAUG, the taxable years
Notes to Financial Statements (Continued)
First Trust Exchange-Traded Fund VIIIAugust 31, 2024 ended 2023 and 2024 remain open to federal and state audit. For XSEP, XOCT, and XNOV, the taxable year ended 2023 remains open to federal and state audit. For XJAN, XFEB, QCAP, XAPR, QMMY, XMAY, QCJL, and QMAG, the taxable year ended 2024 remains open to federal and state audit. As of August 31, 2024, management has evaluated the application of these standards to the Funds and has determined that no provision for income tax is required in the Funds’ financial statements for uncertain tax positions.
Each Fund intends to utilize provisions of the federal income tax laws, which allow it to carry a realized capital loss forward indefinitely following the year of the loss and offset such loss against any future realized capital gains. Each Fund is subject to certain limitations under U.S. tax rules on the use of capital loss carryforwards and net unrealized built-in losses. These limitations apply when there has been a 50% change in ownership. At each Fund’s applicable taxable year end, each applicable Fund had a capital loss carryforward available that is shown in the following table, to the extent provided by regulations, to offset future capital gains. To the extent that these loss carryforwards are used to offset future capital gains, it is probable that the capital gains so offset will not be distributed to each applicable Fund’s shareholders.
| | Non-Expiring
Capital Loss
Carryforwards |
FT Vest U.S. Equity Enhance & Moderate Buffer ETF - January | | |
FT Vest U.S. Equity Enhance & Moderate Buffer ETF - February | | |
FT Vest International Equity Moderate Buffer ETF - March | | |
FT Vest Nasdaq-100® Buffer ETF - March | | |
FT Vest U.S. Equity Enhance & Moderate Buffer ETF - March | | |
FT Vest Nasdaq-100® Conservative Buffer ETF - April | | |
FT Vest U.S. Equity Enhance & Moderate Buffer ETF - April | | |
FT Vest Nasdaq-100® Moderate Buffer ETF - May | | |
FT Vest U.S. Equity Enhance & Moderate Buffer ETF - May | | |
FT Vest International Equity Moderate Buffer ETF - June | | |
FT Vest Nasdaq-100® Buffer ETF - June | | |
FT Vest U.S. Equity Enhance & Moderate Buffer ETF - June | | |
FT Vest Nasdaq-100® Conservative Buffer ETF - July | | |
FT Vest U.S. Equity Enhance & Moderate Buffer ETF - July | | |
FT Vest Nasdaq-100® Moderate Buffer ETF - August | | |
FT Vest U.S. Equity Enhance & Moderate Buffer ETF - August | | |
FT Vest International Equity Buffer ETF - September | | |
FT Vest Nasdaq-100® Buffer ETF - September | | |
FT Vest U.S. Equity Enhance & Moderate Buffer ETF - September | | |
FT Vest U.S. Equity Enhance & Moderate Buffer ETF - October | | |
FT Vest U.S. Equity Enhance & Moderate Buffer ETF - November | | |
FT Vest International Equity Moderate Buffer ETF - December | | |
FT Vest Nasdaq-100® Buffer ETF - December | | |
FT Vest U.S. Equity Enhance & Moderate Buffer ETF - December | | |
Notes to Financial Statements (Continued)
First Trust Exchange-Traded Fund VIIIAugust 31, 2024 Certain losses realized during the current taxable year may be deferred and treated as occurring on the first day of the following taxable year for federal income tax purposes. At each Fund’s applicable taxable year end, the following Funds incurred and elected to defer net late year ordinary or capital losses as follows:
| | Qualified Late Year Losses |
| | |
FT Vest International Equity Moderate Buffer ETF - March | | | |
FT Vest Nasdaq-100® Buffer ETF - March | | | |
FT Vest U.S. Equity Enhance & Moderate Buffer ETF - March | | | |
FT Vest International Equity Moderate Buffer ETF - June | | | |
FT Vest Nasdaq-100® Buffer ETF - June | | | |
FT Vest U.S. Equity Enhance & Moderate Buffer ETF - June | | | |
FT Vest U.S. Equity Enhance & Moderate Buffer ETF - July | | | |
FT Vest U.S. Equity Enhance & Moderate Buffer ETF - August | | | |
FT Vest International Equity Buffer ETF - September | | | |
FT Vest Nasdaq-100® Buffer ETF - September | | | |
FT Vest U.S. Equity Enhance & Moderate Buffer ETF - September | | | |
| | | |
In order to present paid-in capital and accumulated distributable earnings (loss) (which consists of accumulated net investment income (loss), accumulated net realized gain (loss) on investments and net unrealized appreciation (depreciation) on investments) on the Statements of Assets and Liabilities that more closely represent their tax character, certain adjustments have been made to paid-in capital, accumulated net investment income (loss) and accumulated net realized gain (loss) on investments. These adjustments are primarily due to the difference between book and tax treatments of income and gains on various investment securities held by the Funds and in-kind transactions. The results of operations and net assets were not affected by these adjustments. For each Fund’s applicable taxable period, the adjustments were as follows:
| | Accumulated
Net Investment
Income (Loss) | Accumulated
Net Realized
Gain (Loss)
on Investments | |
FT Vest U.S. Equity Enhance & Moderate Buffer ETF - January | | | | |
FT Vest U.S. Equity Enhance & Moderate Buffer ETF - February | | | | |
FT Vest International Equity Moderate Buffer ETF - March | | | | |
FT Vest Nasdaq-100® Buffer ETF - March | | | | |
FT Vest U.S. Equity Enhance & Moderate Buffer ETF - March | | | | |
FT Vest Nasdaq-100® Conservative Buffer ETF - April | | | | |
FT Vest U.S. Equity Enhance & Moderate Buffer ETF - April | | | | |
FT Vest Nasdaq-100® Moderate Buffer ETF - May | | | | |
FT Vest U.S. Equity Enhance & Moderate Buffer ETF - May | | | | |
FT Vest International Equity Moderate Buffer ETF - June | | | | |
FT Vest Nasdaq-100® Buffer ETF - June | | | | |
FT Vest U.S. Equity Enhance & Moderate Buffer ETF - June | | | | |
FT Vest Nasdaq-100® Conservative Buffer ETF - July | | | | |
FT Vest U.S. Equity Enhance & Moderate Buffer ETF - July | | | | |
FT Vest Nasdaq-100® Moderate Buffer ETF - August | | | | |
Notes to Financial Statements (Continued)
First Trust Exchange-Traded Fund VIIIAugust 31, 2024 | | Accumulated Net Investment Income (Loss) | Accumulated Net Realized Gain (Loss) on Investments | |
FT Vest U.S. Equity Enhance & Moderate Buffer ETF - August | | | | |
FT Vest International Equity Buffer ETF - September | | | | |
FT Vest Nasdaq-100® Buffer ETF - September | | | | |
FT Vest U.S. Equity Enhance & Moderate Buffer ETF - September | | | | |
FT Vest U.S. Equity Enhance & Moderate Buffer ETF - October | | | | |
FT Vest U.S. Equity Enhance & Moderate Buffer ETF - November | | | | |
FT Vest International Equity Moderate Buffer ETF - December | | | | |
FT Vest Nasdaq-100® Buffer ETF - December | | | | |
FT Vest U.S. Equity Enhance & Moderate Buffer ETF - December | | | | |
As of August 31, 2024, the aggregate cost, gross unrealized appreciation, gross unrealized depreciation, and net unrealized appreciation/(depreciation) on investments (including short positions and derivatives, if any) for federal income tax purposes were as follows:
| | Gross Unrealized
Appreciation | Gross Unrealized
(Depreciation) | Net Unrealized
Appreciation
(Depreciation) |
FT Vest U.S. Equity Enhance & Moderate Buffer ETF - January | | | | |
FT Vest U.S. Equity Enhance & Moderate Buffer ETF - February | | | | |
FT Vest International Equity Moderate Buffer ETF - March | | | | |
FT Vest Nasdaq-100® Buffer ETF - March | | | | |
FT Vest U.S. Equity Enhance & Moderate Buffer ETF - March | | | | |
FT Vest Nasdaq-100® Conservative Buffer ETF - April | | | | |
FT Vest U.S. Equity Enhance & Moderate Buffer ETF - April | | | | |
FT Vest Nasdaq-100® Moderate Buffer ETF - May | | | | |
FT Vest U.S. Equity Enhance & Moderate Buffer ETF - May | | | | |
FT Vest International Equity Moderate Buffer ETF - June | | | | |
FT Vest Nasdaq-100® Buffer ETF - June | | | | |
FT Vest U.S. Equity Enhance & Moderate Buffer ETF - June | | | | |
FT Vest Nasdaq-100® Conservative Buffer ETF - July | | | | |
FT Vest U.S. Equity Enhance & Moderate Buffer ETF - July | | | | |
FT Vest Nasdaq-100® Moderate Buffer ETF - August | | | | |
FT Vest U.S. Equity Enhance & Moderate Buffer ETF - August | | | | |
FT Vest International Equity Buffer ETF - September | | | | |
FT Vest Nasdaq-100® Buffer ETF - September | | | | |
FT Vest U.S. Equity Enhance & Moderate Buffer ETF - September | | | | |
Notes to Financial Statements (Continued)
First Trust Exchange-Traded Fund VIIIAugust 31, 2024 | | Gross Unrealized Appreciation | Gross Unrealized (Depreciation) | Net Unrealized Appreciation (Depreciation) |
FT Vest U.S. Equity Enhance & Moderate Buffer ETF - October | | | | |
FT Vest U.S. Equity Enhance & Moderate Buffer ETF - November | | | | |
FT Vest International Equity Moderate Buffer ETF - December | | | | |
FT Vest Nasdaq-100® Buffer ETF - December | | | | |
FT Vest U.S. Equity Enhance & Moderate Buffer ETF - December | | | | |
Expenses, other than the investment advisory fee and other excluded expenses, are paid by the Advisor (see Note 3).
3. Investment Advisory Fee, Affiliated Transactions and Other Fee Arrangements
First Trust, the investment advisor to the Funds, is a limited partnership with one limited partner, Grace Partners of DuPage L.P., and one general partner, The Charger Corporation. The Charger Corporation is an Illinois corporation controlled by James A. Bowen, Chief Executive Officer of First Trust. First Trust is responsible for the ongoing monitoring of the securities in each Fund’s portfolio, managing the Funds’ business affairs and providing certain administrative services necessary for the management of the Funds.
First Trust is paid an annual unitary management fee based on a percentage of each Fund’s average daily net assets. The annual unitary management fee payable by each Fund, with the exception of XJAN, XFEB, XMAR, XAPR, XMAY, XJUN, XJUL, XAUG, XSEP, XOCT, XNOV and XDEC, to First Trust for these services will be reduced at certain levels of each Fund’s net assets (“breakpoints”) and calculated pursuant to the following schedule:
| |
Fund net assets up to and including $2.5 billion | |
Fund net assets greater than $2.5 billion up to and including $5 billion | |
Fund net assets greater than $5 billion up to and including $7.5 billion | |
Fund net assets greater than $7.5 billion up to and including $10 billion | |
Fund net assets greater than $10 billion | |
For XJAN, XFEB, XMAR, XAPR, XMAY, XJUN, XJUL, XAUG, XSEP, XOCT, XNOV and XDEC, the annual unitary management fee payable by each Fund will be calculated pursuant to the following schedule:
| |
Fund net assets up to and including $2.5 billion | |
Fund net assets greater than $2.5 billion up to and including $5 billion | |
Fund net assets greater than $5 billion up to and including $7.5 billion | |
Fund net assets greater than $7.5 billion up to and including $10 billion | |
Fund net assets greater than $10 billion | |
First Trust and Vest Financial LLC (“Vest”), an affiliate of First Trust, are responsible for each Fund’s expenses, including the cost of transfer agency, sub-advisory, custody, fund administration, legal, audit and other services, but excluding fee payments under the Investment Management Agreement, interest, taxes, acquired fund fees and expenses, if any, brokerage commissions and other expenses connected with the execution of portfolio transactions, distribution and service fees payable pursuant to a Rule 12b-1 plan, if any, and extraordinary expenses.
Vest serves as the Funds’ sub-advisor and manages each Fund’s portfolio subject to First Trust’s supervision. Pursuant to the Investment Management Agreement, between the Trust, on behalf of the Funds, and the Advisor, and the Investment Sub-Advisory Agreement among the Trust, on behalf of the Funds, the Advisor and Vest, First Trust will supervise Vest and its management of the investment of each Fund’s assets and will pay Vest for its services as the Funds’ sub-advisor a sub-advisory fee equal to 50% of the monthly unitary management fee paid to the Advisor, less Vest’s 50% share of the expenses for that month. In the event the Sub-
Notes to Financial Statements (Continued)
First Trust Exchange-Traded Fund VIIIAugust 31, 2024 Advisor’s share of the expenses exceeds the amount of the sub-advisory fee in any month, the Sub-Advisor will pay the difference to the Advisor. During any period in which the Advisor’s management fee is reduced in accordance with the breakpoints described above, the investment sub-advisory fee (which is based on the Advisor’s management fee) paid to Vest will be reduced to reflect the reduction in the Advisor’s management fee.
The Trust has multiple service agreements with The Bank of New York Mellon (“BNY”). Under the service agreements, BNY performs custodial, fund accounting, certain administrative services, and transfer agency services for each Fund. As custodian, BNY is responsible for custody of each Fund’s assets. As fund accountant and administrator, BNY is responsible for maintaining the books and records of each Fund’s securities and cash. As transfer agent, BNY is responsible for maintaining shareholder records for each Fund. BNY is a subsidiary of The Bank of New York Mellon Corporation, a financial holding company.
Each Trustee who is not an officer or employee of First Trust, any sub-advisor or any of their affiliates (“Independent Trustees”) is paid a fixed annual retainer that is allocated equally among each fund in the First Trust Fund Complex. Each Independent Trustee is also paid an annual per fund fee that varies based on whether the fund is a closed-end or other actively managed fund, a target outcome fund or an index fund.
Additionally, the Chairs of the Audit Committee, Nominating and Governance Committee and Valuation Committee, the Vice Chair of the Audit Committee, the Lead Independent Trustee and the Vice Lead Independent Trustee are paid annual fees to serve in such capacities, with such compensation allocated pro rata among each fund in the First Trust Fund Complex based on net assets. Independent Trustees are reimbursed for travel and out-of-pocket expenses in connection with all meetings. The Committee Chairs, the Audit Committee Vice Chair, the Lead Independent Trustee and the Vice Lead Independent Trustee rotate periodically in serving in such capacities. The officers and “Interested” Trustee receive no compensation from the Trust for acting in such capacities.
4. Purchases and Sales of Securities
For the period ended August 31, 2024, the Funds had no purchases or sales of investments, excluding short-term investments and in-kind transactions. Each Fund holds options for a target outcome period of approximately one year based on the expiration date of the options, which occurs on the third Friday of the month corresponding to the month in each Fund name. For securities transactions purposes, the options are considered short-term investments.
For the period ended August 31, 2024, the cost of in-kind purchases and proceeds from in-kind sales for each Fund were as follows:
| | |
FT Vest U.S. Equity Enhance & Moderate Buffer ETF - January | | |
FT Vest U.S. Equity Enhance & Moderate Buffer ETF - February | | |
FT Vest International Equity Moderate Buffer ETF - March | | |
FT Vest Nasdaq-100® Buffer ETF - March | | |
FT Vest U.S. Equity Enhance & Moderate Buffer ETF - March | | |
FT Vest Nasdaq-100® Conservative Buffer ETF - April | | |
FT Vest U.S. Equity Enhance & Moderate Buffer ETF - April | | |
FT Vest Nasdaq-100® Moderate Buffer ETF - May | | |
FT Vest U.S. Equity Enhance & Moderate Buffer ETF - May | | |
FT Vest International Equity Moderate Buffer ETF - June | | |
FT Vest Nasdaq-100® Buffer ETF - June | | |
FT Vest U.S. Equity Enhance & Moderate Buffer ETF - June | | |
FT Vest Nasdaq-100® Conservative Buffer ETF - July | | |
FT Vest U.S. Equity Enhance & Moderate Buffer ETF - July | | |
FT Vest Nasdaq-100® Moderate Buffer ETF - August | | |
FT Vest U.S. Equity Enhance & Moderate Buffer ETF - August | | |
FT Vest International Equity Buffer ETF - September | | |
FT Vest Nasdaq-100® Buffer ETF - September | | |
FT Vest U.S. Equity Enhance & Moderate Buffer ETF - September | | |
FT Vest U.S. Equity Enhance & Moderate Buffer ETF - October | | |
FT Vest U.S. Equity Enhance & Moderate Buffer ETF - November | | |
FT Vest International Equity Moderate Buffer ETF - December | | |
FT Vest Nasdaq-100® Buffer ETF - December | | |
Notes to Financial Statements (Continued)
First Trust Exchange-Traded Fund VIIIAugust 31, 2024 | | |
FT Vest U.S. Equity Enhance & Moderate Buffer ETF - December | | |
5. Derivative Transactions
The following table presents the types of derivatives held by each Fund at August 31, 2024, the primary underlying risk exposure and the location of these instruments as presented on the Statements of Assets and Liabilities.
| | | |
| | Statements of Assets and
Liabilities Location | | Statements of Assets and
Liabilities Location | |
| | | | | |
| | Options contracts purchased, at value | | Options contracts written, at value | |
| | | | | |
| | Options contracts purchased, at value | | Options contracts written, at value | |
| | | | | |
| | Options contracts purchased, at value | | Options contracts written, at value | |
| | | | | |
| | Options contracts purchased, at value | | Options contracts written, at value | |
| | | | | |
| | Options contracts purchased, at value | | Options contracts written, at value | |
| | | | | |
| | Options contracts purchased, at value | | Options contracts written, at value | |
| | | | | |
| | Options contracts purchased, at value | | Options contracts written, at value | |
| | | | | |
| | Options contracts purchased, at value | | Options contracts written, at value | |
| | | | | |
| | Options contracts purchased, at value | | Options contracts written, at value | |
| | | | | |
| | Options contracts purchased, at value | | Options contracts written, at value | |
| | | | | |
| | Options contracts purchased, at value | | Options contracts written, at value | |
| | | | | |
| | Options contracts purchased, at value | | Options contracts written, at value | |
| | | | | |
| | Options contracts purchased, at value | | Options contracts written, at value | |
Notes to Financial Statements (Continued)
First Trust Exchange-Traded Fund VIIIAugust 31, 2024 | | | |
| | Statements of Assets and Liabilities Location | | Statements of Assets and Liabilities Location | |
| | | | | |
| | Options contracts purchased, at value | | Options contracts written, at value | |
| | | | | |
| | Options contracts purchased, at value | | Options contracts written, at value | |
| | | | | |
| | Options contracts purchased, at value | | Options contracts written, at value | |
| | | | | |
| | Options contracts purchased, at value | | Options contracts written, at value | |
| | | | | |
| | Options contracts purchased, at value | | Options contracts written, at value | |
| | | | | |
| | Options contracts purchased, at value | | Options contracts written, at value | |
| | | | | |
| | Options contracts purchased, at value | | Options contracts written, at value | |
| | | | | |
| | Options contracts purchased, at value | | Options contracts written, at value | |
| | | | | |
| | Options contracts purchased, at value | | Options contracts written, at value | |
| | | | | |
| | Options contracts purchased, at value | | Options contracts written, at value | |
| | | | | |
| | Options contracts purchased, at value | | Options contracts written, at value | |
The following table presents the amount of net realized gain (loss) and change in net unrealized appreciation (depreciation) recognized for the period ended August 31, 2024, on each Fund’s derivative instruments, as well as the primary underlying risk exposure associated with the instruments.
|
Statements of Operations Location | | | | | | |
| | | | | | |
Net realized gain (loss) on: | | | | | | |
Purchased options contracts | | | | | | |
Written options contracts | | | | | | |
Notes to Financial Statements (Continued)
First Trust Exchange-Traded Fund VIIIAugust 31, 2024 |
Statements of Operations Location | | | | | | |
Net change in unrealized appreciation
(depreciation) on: | | | | | | |
Purchased options contracts | | | | | | |
Written options contracts | | | | | | |
|
Statements of Operations Location | | | | | | |
| | | | | | |
Net realized gain (loss) on: | | | | | | |
Purchased options contracts | | | | | | |
Written options contracts | | | | | | |
Net change in unrealized appreciation
(depreciation) on: | | | | | | |
Purchased options contracts | | | | | | |
Written options contracts | | | | | | |
The Funds do not have the right to offset financial assets and financial liabilities related to options contracts on the Statements of Assets and Liabilities.
Notes to Financial Statements (Continued)
First Trust Exchange-Traded Fund VIIIAugust 31, 2024 The following table presents the premiums for purchased options contracts opened, premiums for purchased options contracts closed, exercised and expired, premiums for written options contracts opened, and premiums for written options contracts closed, exercised and expired, for the period ended August 31, 2024, on each Fund’s options contracts.
| Premiums for
purchased
options contracts
opened | Premiums for
purchased
options contracts
closed, exercised
and expired | Premiums for
written options
contracts opened | Premiums for
written options
contracts closed,
exercised and
expired |
| | | | |
| | | | |
| | | | |
| | | | |
| | | | |
| | | | |
| | | | |
| | | | |
| | | | |
| | | | |
| | | | |
| | | | |
| | | | |
| | | | |
| | | | |
| | | | |
| | | | |
| | | | |
| | | | |
| | | | |
| | | | |
| | | | |
| | | | |
| | | | |
6. Creations, Redemptions and Transaction Fees
Each Fund generally issues and redeems its shares in primary market transactions through a creation and redemption mechanism and does not sell or redeem individual shares. Instead, financial entities known as “Authorized Participants” have contractual arrangements with a Fund or one of the Fund’s service providers to purchase and redeem Fund shares directly with the Fund in Creation Units. Prior to the start of trading on every business day, a Fund publishes through the National Securities Clearing Corporation the “basket” of securities, cash or other assets that it will accept in exchange for a Creation Unit of the Fund’s shares. An Authorized Participant that wishes to effectuate a creation of a Fund’s shares deposits with the Fund the “basket” of securities, cash or other assets identified by the Fund that day, and then receives the Creation Unit of the Fund’s shares in return for those assets. After purchasing a Creation Unit, the Authorized Participant may continue to hold the Fund’s shares or sell them in the secondary market. The redemption process is the reverse of the purchase process: the Authorized Participant redeems a Creation Unit of a Fund’s shares for a basket of securities, cash or other assets. The combination of the creation and redemption process with secondary market trading in a Fund’s shares and underlying securities provides arbitrage opportunities that are designed to help keep the market price of a Fund’s shares at or close to the NAV per share of the Fund.
Each Fund imposes fees in connection with the purchase of Creation Units. These fees may vary based upon various fact-based circumstances, including, but not limited to, the composition of the securities included in the Creation Unit or the countries in which the transactions are settled. The price for each Creation Unit will equal the daily NAV per share of a Fund times the number of shares in a Creation Unit, plus the fees described above and, if applicable, any operational processing and brokerage costs, transfer fees, stamp taxes and part or all of the spread between the expected bid and offer side of the market related to the securities comprising the creation basket.
Notes to Financial Statements (Continued)
First Trust Exchange-Traded Fund VIIIAugust 31, 2024 Each Fund also imposes fees in connection with the redemption of Creation Units. These fees may vary based upon various fact-based circumstances, including, but not limited to, the composition of the securities included in the Creation Unit or the countries in which the transactions are settled. The price received for each Creation Unit will equal the daily NAV per share of a Fund times the number of shares in a Creation Unit, minus the fees described above and, if applicable, any operational processing and brokerage costs, transfer fees, stamp taxes and part or all of the spread between the expected bid and offer side of the market related to the securities comprising the redemption basket. Investors who use the services of a broker or other such intermediary in addition to an Authorized Participant to effect a redemption of a Creation Unit may also be assessed an amount to cover the cost of such services. The redemption fee charged by a Fund will comply with Rule 22c-2 of the 1940 Act which limits redemption fees to no more than 2% of the value of the shares redeemed.
The Board of Trustees adopted a Distribution and Service Plan pursuant to Rule 12b-1 under the 1940 Act. In accordance with the Rule 12b-1 plan, the Funds are authorized to pay an amount up to 0.25% of their average daily net assets each year to reimburse First Trust Portfolios L.P. (“FTP”), the distributor of the Funds, for amounts expended to finance activities primarily intended to result in the sale of Creation Units or the provision of investor services. FTP may also use this amount to compensate securities dealers or other persons that are Authorized Participants for providing distribution assistance, including broker-dealer and shareholder support and educational and promotional services.
No 12b-1 fees are currently paid by the Funds, and pursuant to a contractual arrangement, no 12b-1 fees will be paid any time before December 31, 2025 for XJAN, XFEB, YMAR, QMAR, XMAR, XAPR, XMAY, YJUN, QJUN, XJUN, XJUL, XAUG, YSEP, QSPT, XSEP, XOCT, YDEC, QDEC, XDEC and XNOV, April 8, 2026 for QCAP and QCJL, and May 6, 2026 for QMMY and QMAG.
The Trust, on behalf of the Funds, has a variety of indemnification obligations under contracts with its service providers. The Trust’s maximum exposure under these arrangements is unknown. However, the Trust has not had prior claims or losses pursuant to these contracts and expects the risk of loss to be remote.
Management has evaluated the impact of all subsequent events on the Funds through the date the financial statements were issued and has determined that there were the following subsequent events:
As of September 23, 2024, the investment objective of the FT Vest International Equity Buffer ETF - September changed to include an upside cap of 13.47% and an Outcome Period of September 23, 2024 through September 19, 2025. Also as of September 23, 2024, the Fund’s investment objective changed to seek a buffer (before fees and expenses) against the first 15% of Underlying ETF losses (prior to that date, the Fund sought to provide a 10% buffer) and its name was changed to FT Vest International Equity Moderate Buffer ETF - September.
As of September 23, 2024, the investment objective of the FT Vest Nasdaq-100® Buffer ETF - September changed to include an upside cap of 17.34% and an Outcome Period of September 23, 2024 through September 19, 2025.
As of September 23, 2024, the investment objective of the FT Vest U.S. Equity Enhance & Moderate Buffer ETF - September changed to include an upside cap of 9.42% and an Outcome Period of September 23, 2024 through September 19, 2025.
As of October 21, 2024, the investment objective of the FT Vest U.S. Equity Enhance & Moderate Buffer ETF - October changed to include an upside cap of 9.68% and an Outcome Period of October 21, 2024 through October 17, 2025.
Report of Independent Registered Public Accounting Firm
To the Shareholders and Board of Trustees of First Trust Exchange-Traded Fund VIII:
Opinion on the Financial Statements and Financial Highlights
We have audited the accompanying statements of assets and liabilities, including the portfolios of investments, of FT Vest U.S. Equity Enhance & Moderate Buffer ETF - January, FT Vest U.S. Equity Enhance & Moderate Buffer ETF - February, FT Vest International Equity Moderate Buffer ETF - March (formerly known as FT Vest International Equity Buffer ETF - March), FT Vest Nasdaq-100® Buffer ETF - March, FT Vest U.S. Equity Enhance & Moderate Buffer ETF - March, FT Vest Nasdaq-100® Conservative Buffer ETF - April, FT Vest U.S. Equity Enhance & Moderate Buffer ETF - April, FT Vest Nasdaq-100® Moderate Buffer ETF - May, FT Vest U.S. Equity Enhance & Moderate Buffer ETF - May, FT Vest International Equity Moderate Buffer ETF - June (formerly known as FT Vest International Equity Buffer ETF - June), FT Vest Nasdaq-100® Buffer ETF - June, FT Vest U.S. Equity Enhance & Moderate Buffer ETF - June, FT Vest Nasdaq-100® Conservative Buffer ETF - July, FT Vest U.S. Equity Enhance & Moderate Buffer ETF - July, FT Vest Nasdaq-100® Moderate Buffer ETF - August, FT Vest U.S. Equity Enhance & Moderate Buffer ETF - August, FT Vest International Equity Buffer ETF - September (now known as FT Vest International Equity Moderate Buffer ETF - September), FT Vest Nasdaq-100® Buffer ETF - September, FT Vest U.S. Equity Enhance & Moderate Buffer ETF - September, FT Vest U.S. Equity Enhance & Moderate Buffer ETF - October, FT Vest U.S. Equity Enhance & Moderate Buffer ETF - November, FT Vest International Equity Moderate Buffer ETF - December (formerly known as FT Vest International Equity Buffer ETF - December), FT Vest Nasdaq-100® Buffer ETF - December, and FT Vest U.S. Equity Enhance & Moderate Buffer ETF - December (the “Funds”), each a series of the First Trust Exchange-Traded Fund VIII, as of August 31, 2024, and the related statements of operations, the statements of changes in net assets, and the financial highlights for the periods indicated in the table below; and the related notes. In our opinion, the financial statements and financial highlights present fairly, in all material respects, the financial position of the Funds as of August 31, 2024, and the results of their operations, the changes in their net assets, and the financial highlights for the periods listed in the table below in conformity with accounting principles generally accepted in the United States of America.
Individual Funds
Included in the Trust | | Statements of
Changes in Net Assets | |
FT Vest U.S. Equity Enhance & Moderate Buffer ETF - January | For the period from January 19, 2024 (commencement of investment operations) through August 31, 2024 |
FT Vest U.S. Equity Enhance & Moderate Buffer ETF - February | For the period from February 16, 2024 (commencement of investment operations) through August 31, 2024 |
FT Vest International Equity Moderate Buffer ETF - March (formerly known as FT Vest International Equity Buffer ETF - March) | For the year ended August 31, 2024 | For the years ended August 31, 2024 and 2023 | For the years ended August 31, 2024, 2023, and 2022, and for the period from March 19, 2021 (commencement of investment operations) through August 31, 2021 |
FT Vest Nasdaq-100® Buffer ETF - March |
FT Vest U.S. Equity Enhance & Moderate Buffer ETF - March | For the year ended August 31, 2024 | For the year ended August 31, 2024, and for the period from March 17, 2023 (commencement of investment operations) through August 31, 2023 |
FT Vest Nasdaq-100® Conservative Buffer ETF - April | For the period from April 19, 2024 (commencement of investment operations) through August 31, 2024 |
FT Vest U.S. Equity Enhance & Moderate Buffer ETF - April |
FT Vest Nasdaq-100® Moderate Buffer ETF - May | For the period from May 17, 2024 (commencement of investment operations) through August 31, 2024 |
FT Vest U.S. Equity Enhance & Moderate Buffer ETF - May |
FT Vest International Equity Moderate Buffer ETF - June (formerly known as FT Vest International Equity Buffer ETF - June) | For the year ended August 31, 2024 | For the years ended August 31, 2024 and 2023 | For the years ended August 31, 2024, 2023, and 2022, and for the period from June 18, 2021 (commencement of investment operations) through August 31, 2021 |
FT Vest Nasdaq-100® Buffer ETF - June |
Report of Independent Registered Public Accounting Firm (Continued)
Individual Funds Included in the Trust | | Statements of Changes in Net Assets | |
FT Vest U.S. Equity Enhance & Moderate Buffer ETF - June | For the year ended August 31, 2024 | For the years ended August 31, 2024 and 2023 | For the years ended August 31, 2024, 2023, and 2022, and for the period from July 12, 2021 (commencement of investment operations) through August 31, 2021 |
FT Vest Nasdaq-100® Conservative Buffer ETF - July | For the period from July 19, 2024 (commencement of investment operations) through August 31, 2024 |
FT Vest U.S. Equity Enhance & Moderate Buffer ETF - July | For the year ended August 31, 2024 | For the year ended August 31, 2024, and for the period from July 21, 2023 (commencement of investment operations) through August 31, 2023 |
FT Vest Nasdaq-100® Moderate Buffer ETF - August | For the period from August 16, 2024 (commencement of investment operations) through August 31, 2024 |
FT Vest U.S. Equity Enhance & Moderate Buffer ETF - August | For the year ended August 31, 2024 | For the year ended August 31, 2024, and for the period from August 18, 2023 (commencement of investment operations) through August 31, 2023 |
FT Vest International Equity Buffer ETF - September (now known as FT Vest International Equity Moderate Buffer ETF - September) | For the year ended August 31, 2024 | For the years ended August 31, 2024 and 2023 | For the years ended August 31, 2024, and 2023, and for the period from September 17, 2021 (commencement of investment operations) through August 31, 2022 |
FT Vest Nasdaq-100® Buffer ETF - September |
FT Vest U.S. Equity Enhance & Moderate Buffer ETF - September | For the year ended August 31, 2024 | For the year ended August 31, 2024, and for the period from September 21, 2022 (commencement of investment operations) through August 31, 2023 |
FT Vest U.S. Equity Enhance & Moderate Buffer ETF - October | For the period from October 20, 2023 (commencement of investment operations) through August 31, 2024 |
FT Vest U.S. Equity Enhance & Moderate Buffer ETF - November | For the period from November 17, 2023 (commencement of investment operations) through August 31, 2024 |
FT Vest International Equity Moderate Buffer ETF - December (formerly known as FT Vest International Equity Buffer ETF - December) | For the year ended August 31, 2024 | For the years ended August 31, 2024 and 2023 | For the years ended August 31, 2024, 2023, and 2022, and for the period from December 18, 2020 (commencement of investment operations) through August 31, 2021 |
FT Vest Nasdaq-100® Buffer ETF - December |
FT Vest U.S. Equity Enhance & Moderate Buffer ETF - December | For the year ended August 31, 2024 | For the years ended August 31, 2024 and 2023 | For the years ended August 31, 2024, and 2023, and for the period from December 17, 2021 (commencement of investment operations) through August 31, 2022 |
These financial statements and financial highlights are the responsibility of the Funds’ management. Our responsibility is to express an opinion on the Funds’ financial statements and financial highlights based on our audits. We are a public accounting firm registered with the Public Company Accounting Oversight Board (United States) (PCAOB) and are required to be independent with respect to the Funds in accordance with the U.S. federal securities laws and the applicable rules and regulations of the Securities and Exchange Commission and the PCAOB.
We conducted our audits in accordance with the standards of the PCAOB. Those standards require that we plan and perform the audit to obtain reasonable assurance about whether the financial statements and financial highlights are free of material misstatement,
Report of Independent Registered Public Accounting Firm (Continued)
whether due to error or fraud. The Funds are not required to have, nor were we engaged to perform, an audit of their internal control over financial reporting. As part of our audits, we are required to obtain an understanding of internal control over financial reporting but not for the purpose of expressing an opinion on the effectiveness of the Funds’ internal control over financial reporting. Accordingly, we express no such opinion.
Our audits included performing procedures to assess the risks of material misstatement of the financial statements and financial highlights, whether due to error or fraud, and performing procedures that respond to those risks. Such procedures included examining, on a test basis, evidence regarding the amounts and disclosures in the financial statements and financial highlights. Our audits also included evaluating the accounting principles used and significant estimates made by management, as well as evaluating the overall presentation of the financial statements and financial highlights. Our procedures included confirmation of securities owned as of August 31, 2024, by correspondence with the custodian and brokers; when replies were not received from brokers, we performed other auditing procedures. We believe that our audits provide a reasonable basis for our opinion.
/s/ Deloitte & Touche, LLP
Chicago, Illinois
October 24, 2024
We have served as the auditor of one or more First Trust investment companies since 2001.
First Trust Exchange-Traded Fund VIIIAugust 31, 2024 (Unaudited) Changes in and Disagreements with Accountants (Item 8 of Form N-CSR)
There were no changes in or disagreements with the Funds’ accountants during the fiscal period ended August 31, 2024.
Proxy Disclosures (Item 9 of Form N-CSR)
There were no matters submitted for vote by shareholders of any Fund during the fiscal period ended August 31, 2024.
Remuneration Paid to Directors, Officers, and Others (Item 10 of Form N-CSR)
Independent Trustees and any member of any advisory board of each Fund are compensated through the unitary management fee paid by each Fund to the advisor and not directly by each Fund. The investment advisory fee paid is included in the Statements of Operations.
Statement Regarding the Basis for the Board’s Approval of Investment Advisory Contract (Item 11 of Form N-CSR)
The Board of Trustees of First Trust Exchange-Traded Fund VIII (the “Trust”), including the Independent Trustees, unanimously approved the continuation of the Investment Management Agreement (the “Advisory Agreement”) with First Trust Advisors L.P. (the “Advisor”) and the Investment Sub-Advisory Agreement (the “Sub-Advisory Agreement” and together with the Advisory Agreement, the “Agreements”) among the Trust, the Advisor and Vest Financial LLC (the “Sub-Advisor”) on behalf of the following series of the Trust (each a “Fund” and collectively, the “Funds”):
FT Vest International Equity Moderate Buffer ETF – March (YMAR) (formerly known as FT Vest International Equity Buffer ETF – March)
FT Vest International Equity Buffer ETF – June (YJUN) (now known as FT Vest International Equity Moderate Buffer ETF – June)
FT Vest International Equity Buffer ETF – September (YSEP)
FT Vest International Equity Moderate Buffer ETF – December (YDEC) (formerly known as FT Vest International Equity Buffer ETF – December)
FT Vest Nasdaq-100® Buffer ETF – March (QMAR)
FT Vest Nasdaq-100® Buffer ETF – June (QJUN)
FT Vest Nasdaq-100® Buffer ETF – September (QSPT)
FT Vest Nasdaq-100® Buffer ETF – December (QDEC)
FT Vest U.S. Equity Enhance & Moderate Buffer ETF – March (XMAR)
FT Vest U.S. Equity Enhance & Moderate Buffer ETF – June (XJUN)
FT Vest U.S. Equity Enhance & Moderate Buffer ETF – September (XSEP)
FT Vest U.S. Equity Enhance & Moderate Buffer ETF – December (XDEC)
The Board approved the continuation of the Agreements for each Fund for a one-year period ending June 30, 2025 at a meeting held on June 2–3, 2024. The Board determined for each Fund that the continuation of the Agreements is in the best interests of the Fund in light of the nature, extent and quality of the services provided and such other matters as the Board considered to be relevant in the exercise of its business judgment.
To reach this determination for each Fund, the Board considered its duties under the Investment Company Act of 1940, as amended (the “1940 Act”), as well as under the general principles of state law, in reviewing and approving advisory contracts; the requirements of the 1940 Act in such matters; the fiduciary duty of investment advisors with respect to advisory agreements and compensation; the standards used by courts in determining whether investment company boards have fulfilled their duties; and the factors to be considered by the Board in voting on such agreements. At meetings held on April 16, 2024, April 25, 2024 and June 2–3, 2024, the Board, including the Independent Trustees, reviewed materials provided by the Advisor and the Sub-Advisor responding to requests for information from counsel to the Independent Trustees, submitted on behalf of the Independent Trustees, that, among other things, outlined: the services provided by the Advisor and the Sub-Advisor to each Fund (including the relevant personnel responsible for these services and their experience); the unitary fee rate schedule payable by each Fund as compared to fees charged to a peer group of funds (the “Expense Group”) and a broad peer universe of funds (the “Expense Universe”), each assembled by Broadridge Financial Solutions, Inc. (“Broadridge”), an independent source, and as compared to fees charged to other clients of the Advisor, including other exchange-traded funds (“ETFs”) managed by the Advisor; the sub-advisory fee as compared to fees charged to other clients of the Sub-Advisor; the expense ratio of each Fund as compared to expense ratios of the funds in the Fund’s Expense Group and Expense Universe; performance information for each Fund, including, as applicable, comparisons of each Fund’s performance to that of one or
Other Information (Continued)
First Trust Exchange-Traded Fund VIIIAugust 31, 2024 (Unaudited) more relevant benchmark indexes and to that of a performance group of funds and a broad performance universe of funds (the “Performance Universe”), each assembled by Broadridge; the nature of expenses incurred in providing services to each Fund and the potential for the Advisor and the Sub-Advisor to realize economies of scale, if any; profitability and other financial data for the Advisor; financial data for the Sub-Advisor; any indirect benefits to the Advisor and its affiliates, First Trust Portfolios L.P. (“FTP”) and First Trust Capital Partners, LLC (“FTCP”), and the Sub-Advisor; and information on the Advisor’s and the Sub-Advisor’s compliance programs. The Board reviewed initial materials with the Advisor at the meeting held on April 25, 2024, prior to which the Independent Trustees and their counsel met separately to discuss the information provided by the Advisor and the Sub-Advisor. Following the April 25, 2024 meeting, counsel to the Independent Trustees, on behalf of the Independent Trustees, requested certain clarifications and supplements to the materials provided, and the information provided in response to those requests was considered at an executive session of the Independent Trustees and their counsel held prior to the June 2–3, 2024 meeting, as well as at the June meeting. The Board applied its business judgment to determine whether the arrangements between the Trust and the Advisor and among the Trust, the Advisor and the Sub-Advisor continue to be reasonable business arrangements from each Fund’s perspective. The Board determined that, given the totality of the information provided with respect to the Agreements, the Board had received sufficient information to renew the Agreements. The Board considered that shareholders chose to invest or remain invested in a Fund knowing that the Advisor and the Sub-Advisor manage the Fund and knowing the Fund’s unitary fee.
In reviewing the Agreements for each Fund, the Board considered the nature, extent and quality of the services provided by the Advisor and the Sub-Advisor under the Agreements. With respect to the Advisory Agreement, the Board considered that the Advisor is responsible for the overall management and administration of the Trust and each Fund and reviewed all of the services provided by the Advisor to the Funds, including the oversight of the Sub-Advisor, as well as the background and experience of the persons responsible for such services. The Board noted that the Advisor oversees the Sub-Advisor’s day-to-day management of each Fund’s investments, including portfolio risk monitoring and performance review. In reviewing the services provided, the Board noted the compliance program that had been developed by the Advisor and considered that it includes a robust program for monitoring the Advisor’s, the Sub-Advisor’s and each Fund’s compliance with the 1940 Act, as well as each Fund’s compliance with its investment objective, policies and restrictions. The Board also considered a report from the Advisor with respect to its risk management functions related to the operation of the Funds. Finally, as part of the Board’s consideration of the Advisor’s services, the Advisor, in its written materials and at the April 25, 2024 meeting, described to the Board the scope of its ongoing investment in additional personnel and infrastructure to maintain and improve the quality of services provided to the Funds and the other funds in the First Trust Fund Complex. With respect to the Sub-Advisory Agreement, the Board noted that each Fund is an actively-managed ETF and the Sub-Advisor actively manages the Fund’s investments. The Board reviewed the materials provided by the Sub-Advisor and considered the services that the Sub-Advisor provides to each Fund, including the Sub-Advisor’s day-to-day management of the Funds’ investments. In considering the Sub-Advisor’s management of the Funds, the Board noted the background and experience of the Sub-Advisor’s portfolio management team, including the Board’s prior meetings with members of the portfolio management team. In light of the information presented and the considerations made, the Board concluded that the nature, extent and quality of the services provided to the Trust and each Fund by the Advisor and the Sub-Advisor under the Agreements have been and are expected to remain satisfactory and that the Sub-Advisor, under the oversight of the Advisor, has managed each Fund consistent with its investment objective, policies and restrictions.
The Board considered the unitary fee rate schedule payable by each Fund under the Advisory Agreement for the services provided. The Board noted that the sub-advisory fee for each Fund is paid by the Advisor from the Fund’s unitary fee. The Board considered that as part of the unitary fee the Advisor is responsible for each Fund’s expenses, including the cost of sub-advisory, transfer agency, custody, fund administration, legal, audit and other services and license fees, if any, but excluding the fee payment under the Advisory Agreement and interest, taxes, brokerage commissions and other expenses connected with the execution of portfolio transactions, distribution and service fees pursuant to a Rule 12b-1 plan, if any, and extraordinary expenses, if any. The Board received and reviewed information showing the fee rates and expense ratios of the peer funds in the Expense Groups, as well as advisory and unitary fee rates charged by the Advisor and the Sub-Advisor to other fund (including ETFs) and non-fund clients, as applicable. Because each Fund pays a unitary fee, the Board determined that expense ratios were the most relevant comparative data point. Based on the information provided, the Board noted that the total (net) expense ratio for each Fund was above the median total (net) expense ratio of the peer funds in its respective Expense Group. With respect to the Expense Groups, the Board discussed with Broadridge its methodology for assembling peer groups and discussed with the Advisor limitations in creating peer groups for actively-managed ETFs, and different business models that may affect the pricing of services among ETF sponsors. The Board also noted that, for each Fund, not all peer funds employ an advisor/sub-advisor management structure. The Board took these limitations and differences into account in considering the peer data. With respect to fees charged to other non-ETF clients, the Board considered differences between the Funds and other non-ETF clients that limited their comparability. In considering the unitary fee rate schedules overall, the Board
Other Information (Continued)
First Trust Exchange-Traded Fund VIIIAugust 31, 2024 (Unaudited) also considered the Advisor’s statement that it seeks to meet investor needs through innovative and value-added investment solutions and the Advisor’s demonstrated long-term commitment to each Fund and the other funds in the First Trust Fund Complex.
The Board considered performance information for each Fund. The Board noted the process it has established for monitoring each Fund’s performance and portfolio risk on an ongoing basis, which includes quarterly performance reporting from the Advisor and the Sub-Advisor for the Funds. The Board determined that this process continues to be effective for reviewing each Fund’s performance. For each Fund, the Board received and reviewed, as applicable, information comparing each Fund’s performance for one or more periods ended December 31, 2023 to the performance of the funds in its Performance Universe and to that of a benchmark index. The Board noted that YMAR, YJUN, YSEP and YDEC are target outcome ETFs that seek to provide investors with returns (before fees and expenses) over a defined period of time (typically one year) that match the price return of the iShares MSCI EAFE ETF (“EFA”), up to a predetermined cap, while providing a buffer against certain losses on the price return of EFA. The Board noted that, during 2023, the Board approved changes to YMAR’s, YJUN’s, YSEP’s and YDEC’s respective investment strategies to increase the buffer provided against certain losses on the price return of the EFA, as well as changes to each Fund’s name, which took effect on March 18, 2024 for YMAR and on December 18, 2023 for YDEC and are expected to take effect later in 2024 for each of YJUN and YSEP. The Board noted that QMAR, QJUN, QSPT and QDEC are target outcome ETFs that seek to provide investors with returns (before fees and expenses) over a defined period of time (typically one year) that match the price return of the Invesco QQQ Trust, Series 1 (“QQQ”), up to a predetermined cap, while providing a buffer against certain losses on the price return of QQQ. The Board noted that XMAR, XJUN, XSEP and XDEC are target outcome ETFs that seek to provide investors with returns (before fees and expenses) over a defined period of time (typically one year) of approximately twice any positive price return of the SPDR S&P 500 ETF Trust (“SPY”), up to a predetermined cap, while providing a buffer against certain losses on the price return of SPY. For each Fund, the Board considered, as applicable, information provided by the Sub-Advisor on each Fund’s performance during its respective target outcome period that ended between April 1, 2023 and March 31, 2024 and noted that each applicable Fund delivered on its target outcome objective. Because XMAR commenced operations on March 17, 2023 and therefore has a limited performance history, comparative performance information for XMAR was not reviewed.
On the basis of all the information provided on the unitary fee and performance, as applicable, of each Fund and the ongoing oversight by the Board, the Board concluded that the unitary fee for each Fund (out of which the Sub-Advisor is compensated) continues to be reasonable and appropriate in light of the nature, extent and quality of the services provided by the Advisor and the Sub-Advisor to each Fund under the Agreements.
The Board considered information and discussed with the Advisor whether there were any economies of scale in connection with providing advisory services to the Funds at current asset levels and whether the Funds may benefit from any economies of scale. The Board noted that the unitary fee rate schedule for each Fund includes breakpoints pursuant to which the unitary fee rate will be reduced as assets of the Fund meet certain thresholds. The Board considered the Advisor’s statement that it believes that its expenses relating to providing advisory services to the Funds will increase during the next twelve months as the Advisor continues to build infrastructure and add new staff. The Board also noted that under the unitary fee structure, any reduction in expenses associated with the management and operations of the Funds would benefit the Advisor, but that the unitary fee structure provides a level of certainty in expenses for shareholders of the Funds. The Board concluded that the unitary fee rate schedule for each Fund reflects an appropriate level of sharing of any economies of scale that may be realized in the management of the Fund at current asset levels. The Board considered the revenues and allocated costs (including the allocation methodology) of the Advisor in serving as investment advisor to XMAR for the period from inception through December 31, 2023 and to each other Fund for the twelve months ended December 31, 2023 and the estimated profitability level for each Fund calculated by the Advisor based on such data, as well as complex-wide and product-line profitability data, for the twelve months ended December 31, 2023. The Board noted the inherent limitations in the profitability analysis and concluded that, based on the information provided, the Advisor’s profitability level for each Fund was not unreasonable. In addition, the Board considered indirect benefits described by the Advisor that may be realized from its relationship with the Funds. The Board considered that the Advisor had identified as an indirect benefit to the Advisor and FTP their exposure to investors and brokers who, absent their exposure to the Funds, may have had no dealings with the Advisor or FTP. The Board also noted that FTCP has a controlling ownership interest in the Sub-Advisor’s parent company and considered potential indirect benefits to the Advisor from such ownership interest. The Board concluded that the character and amount of potential indirect benefits to the Advisor were not unreasonable.
The Board considered the Sub-Advisor’s statement that it believes that the sub-advisory fee for each Fund is appropriate. The Board noted the Sub-Advisor’s statements that it continues to invest in infrastructure, technology and personnel, and that it anticipates that its expenses relating to providing services to the Funds will remain approximately the same for the next twelve months. The Board noted that the Advisor pays the Sub-Advisor for each Fund from the unitary fee, that the sub-advisory fee will be reduced consistent with the
Other Information (Continued)
First Trust Exchange-Traded Fund VIIIAugust 31, 2024 (Unaudited) breakpoints in the unitary fee rate schedule and its understanding that each Fund’s sub-advisory fee was the product of an arm’s length negotiation. The Board did not review the profitability of the Sub-Advisor with respect to each Fund. The Board concluded that the profitability analysis for the Advisor was more relevant. The Board considered the potential indirect benefits to the Sub-Advisor from being associated with the Advisor and the Funds, and noted the Sub-Advisor’s statements that it is the Sub-Advisor’s policy currently not to enter into soft-dollar arrangements for the procurement of research services in connection with client securities transactions and that, as a result, there are no foreseen indirect benefits from its relationship with the Funds. The Board also considered the potential indirect benefits to the Sub-Advisor from FTCP’s controlling ownership interest in the Sub-Advisor’s parent company. The Board concluded that the character and amount of potential indirect benefits to the Sub-Advisor were not unreasonable.
Based on all of the information considered and the conclusions reached, the Board, including the Independent Trustees, unanimously determined that the terms of the Agreements continue to be fair and reasonable and that the continuation of the Agreements is in the best interests of each Fund. No single factor was determinative in the Board’s analysis.
The Board of Trustees of First Trust Exchange-Traded Fund VIII (the “Trust”), including the Independent Trustees, approved the Investment Management Agreement (the “Advisory Agreement”) with First Trust Advisors L.P. (the “Advisor”) and the Investment Sub-Advisory Agreement (the “Sub-Advisory Agreement” and together with the Advisory Agreement, the “Agreements”) among the Trust, the Advisor and Vest Financial LLC (the “Sub-Advisor”) on behalf of the following series of the Trust (each a “Fund” and collectively, the “Funds”):
FT Vest U.S. Equity Enhance & Moderate Buffer ETF – April (XAPR)
FT Vest U.S. Equity Enhance & Moderate Buffer ETF – May (XMAY)
The Board approved the Agreements for each Fund for an initial two-year term at a meeting held on June 5, 2023. The Board determined for each Fund that the Agreements are in the best interests of the Fund in light of the nature, extent and quality of the services expected to be provided and such other matters as the Board considered to be relevant in the exercise of its business judgment.
To reach this determination for each Fund, the Board considered its duties under the Investment Company Act of 1940, as amended (the “1940 Act”), as well as under the general principles of state law, in reviewing and approving advisory contracts; the requirements of the 1940 Act in such matters; the fiduciary duty of investment advisors with respect to advisory agreements and compensation; the standards used by courts in determining whether investment company boards have fulfilled their duties; and the factors to be considered by the Board in voting on such agreements. To assist the Board in its evaluation of the Agreements for each Fund, the Independent Trustees received a separate report from each of the Advisor and the Sub-Advisor in advance of the Board meeting responding to requests for information from counsel to the Independent Trustees, submitted on behalf of the Independent Trustees, that, among other things, outlined: the services to be provided by the Advisor and the Sub-Advisor to each Fund (including the relevant personnel responsible for these services and their experience); the proposed unitary fee rate schedule payable by each Fund as compared to fees charged to a peer group of funds (the “Expense Group”) and a broad peer universe of funds (the “Expense Universe”), each assembled by Broadridge Financial Solutions, Inc. (“Broadridge”), an independent source, and as compared to fees charged to other exchange-traded funds (“ETFs”) managed by the Advisor; the proposed sub-advisory fee as compared to fees charged to other clients of the Sub-Advisor; the estimated expense ratio of each Fund as compared to expense ratios of the funds in the Fund’s Expense Group and Expense Universe; the nature of expenses to be incurred in providing services to each Fund and the potential for the Advisor and the Sub-Advisor to realize economies of scale, if any; profitability and other financial data for the Advisor; financial data for the Sub-Advisor; any indirect benefits to the Advisor and its affiliates, First Trust Portfolios L.P. (“FTP”) and First Trust Capital Partners, LLC (“FTCP”), and the Sub-Advisor; and information on the Advisor’s and the Sub-Advisor’s compliance programs. The Independent Trustees and their counsel also met separately to discuss the information provided by the Advisor and the Sub-Advisor. The Board applied its business judgment to determine whether the arrangements between the Trust and the Advisor and among the Trust, the Advisor and the Sub-Advisor are reasonable business arrangements from each Fund’s perspective.
In evaluating whether to approve the Agreements for each Fund, the Board considered the nature, extent and quality of the services to be provided by the Advisor and the Sub-Advisor under the Agreements. With respect to the Advisory Agreement, the Board considered that the Advisor will be responsible for the overall management and administration of each Fund and reviewed all of the services to be provided by the Advisor to the Funds, including the oversight of the Sub-Advisor, as well as the background and experience of the persons responsible for such services. The Board considered that each Fund will be an actively-managed ETF and will employ an advisor/sub-advisor management structure and considered that the Advisor manages other ETFs with a similar structure in the First Trust Fund Complex. The Board noted that the Advisor will oversee the Sub-Advisor’s day-to-day management
Other Information (Continued)
First Trust Exchange-Traded Fund VIIIAugust 31, 2024 (Unaudited) of the Fund’s investments, including portfolio risk monitoring and performance review. In reviewing the services to be provided, the Board noted the compliance program that had been developed by the Advisor and considered that it includes a robust program for monitoring the Advisor’s, the Sub-Advisor’s and each Fund’s compliance with the 1940 Act, as well as each Fund’s compliance with its investment objective, policies and restrictions. The Board noted that employees of the Advisor provide management services to other ETFs and to other funds in the First Trust Fund Complex with diligence and care. With respect to the Sub-Advisory Agreement, in addition to the written materials provided by the Sub-Advisor, at the June 5, 2023 meeting, the Board also received a presentation from representatives of the Sub-Advisor discussing the services that the Sub-Advisor will provide to the Funds, and the Trustees were able to ask questions about the proposed strategy for the Funds. The Board noted the background and experience of the Sub-Advisor’s portfolio management team and the Sub-Advisor’s investment style. The Board also noted that the Sub-Advisor manages a number of other defined-outcome ETFs with strategies similar to those of the Funds in the First Trust Fund Complex. Because the Funds had yet to commence investment operations, the Board could not consider the historical investment performance of the Funds. In light of the information presented and the considerations made, the Board concluded that the nature, extent and quality of the services to be provided to each Fund by the Advisor and the Sub-Advisor under the Agreements are expected to be satisfactory.
The Board considered the proposed unitary fee rate schedule payable by each Fund under the Advisory Agreement for the services to be provided. The Board noted that, under the unitary fee arrangement, each Fund would pay the Advisor a unitary fee starting at an annual rate of 0.85% of its average daily net assets, subject to a breakpoint schedule pursuant to which the unitary fee rate would be reduced as assets of the Fund meet certain thresholds. The Board considered that, from the unitary fee for each Fund, the Advisor would pay the Sub-Advisor a sub-advisory fee equal to 50% of the Fund’s unitary fee less one-half of the Fund’s expenses and that the sub-advisory fee would be reduced consistent with the breakpoints in the unitary fee rate schedule. The Board noted that the Advisor and the Sub-Advisor would be responsible for each Fund’s expenses, including the cost of sub-advisory, transfer agency, custody, fund administration, legal, audit and other services and license fees, if any, but excluding the fee payment under the Advisory Agreement and interest, taxes, acquired fund fees and expenses, if any, brokerage commissions and other expenses connected with the execution of portfolio transactions, distribution and service fees pursuant to a Rule 12b-1 plan, if any, and extraordinary expenses, if any. The Board received and reviewed information showing the fee rates and expense ratios of the peer funds in the Expense Group, as well as advisory and unitary fee rates charged by the Advisor and the Sub-Advisor to other fund (including ETF) and non-fund clients, as applicable. Because each Fund will pay a unitary fee, the Board determined that expense ratios were the most relevant comparative data point. Based on the information provided, the Board noted that the total (net) expense ratio for each Fund was above the median total (net) expense ratio of the peer funds in its Expense Group. With respect to the Expense Group, the Board discussed with representatives of the Advisor how the Expense Group was assembled and how each Fund compared and differed from the peer funds. The Board took this information into account in considering the peer data. With respect to fees charged to other clients, the Board considered the Advisor’s statement that the Funds will be most similar to the ETFs in the FT Vest U.S. Equity Buffer ETF and FT Vest U.S. Equity Deep Buffer ETF product lines in the First Trust Fund Complex that are managed by the Advisor and sub-advised by the Sub-Advisor, each of which has a unitary fee rate schedule starting at an annual rate of 0.85% of its average daily net assets. In light of the information considered and the nature, extent and quality of the services expected to be provided to each Fund under the Agreements, the Board determined that, for each Fund, the proposed unitary fee, including the sub-advisory fee to be paid by the Advisor to the Sub-Advisor from the unitary fee, was fair and reasonable.
The Board considered whether there are any potential economies of scale to be achieved in connection with the Advisor providing investment advisory services to the Funds and whether the Funds may benefit from any economies of scale. The Board noted that the proposed unitary fee rate schedule for each Fund includes breakpoints pursuant to which the unitary fee rate would be reduced as assets of the Fund meet certain thresholds. The Board considered that the Advisor has continued to build infrastructure and add new staff to improve the services to the funds in the First Trust Fund Complex. The Board also noted that under the unitary fee structure, any reduction in expenses associated with the management and operations of the Funds generally would benefit the Advisor and the Sub-Advisor, but that the unitary fee structure provides a level of certainty in expenses for shareholders of the Funds. The Board concluded that the proposed unitary fee rate schedule for each Fund reflects an appropriate level of sharing of any economies of scale that may be realized in the management of the Fund at reasonably foreseeable future asset levels. The Board considered that the Sub-Advisor would be paid by the Advisor from each Fund’s unitary fee, that the sub-advisory fee for each Fund would be reduced consistent with the breakpoints in the Fund’s unitary fee rate schedule and its understanding that the sub-advisory fee for each Fund was the product of an arm’s length negotiation. The Board took into consideration the types of costs to be borne by the Advisor in connection with its services to be performed for each Fund under the Advisory Agreement. The Board considered the Advisor’s estimate of the asset level for each Fund at which the Advisor expects the Advisory Agreement for the Fund to be profitable to the Advisor and the Advisor’s estimate of the profitability of the Advisory Agreement for each Fund if its assets reach $100 million. The Board noted the inherent limitations in the profitability analysis and concluded that, based on the information provided, the Advisor’s
Other Information (Continued)
First Trust Exchange-Traded Fund VIIIAugust 31, 2024 (Unaudited) estimated profitability level for each Fund was not unreasonable. The Board reviewed financial information provided by the Sub-Advisor, but did not review any potential profitability of the Sub-Advisory Agreement for each Fund to the Sub-Advisor. The Board concluded that the profitability analysis for the Advisor was more relevant. In addition, the Board considered indirect benefits described by the Advisor that may be realized from its relationship with the Funds. The Board noted that FTCP has a controlling ownership interest in the Sub-Advisor’s parent company and considered potential indirect benefits to the Advisor from such ownership interest. The Board also considered that the Advisor had identified as an indirect benefit to the Advisor and FTP their exposure to investors and brokers who, absent their exposure to the Funds, may have had no dealings with the Advisor or FTP. The Board also considered the potential indirect benefits to the Sub-Advisor from FTCP’s controlling ownership interest in the Sub-Advisor’s parent company. The Board noted the Sub-Advisor’s statements that it does not foresee any indirect benefits from its relationship with the Funds and that, as a policy, it does not enter into soft-dollar arrangements for the procurement of research services in connection with client securities transactions. The Board concluded that the character and amount of potential indirect benefits to the Advisor and the Sub-Advisor were not unreasonable.
Based on all of the information considered and the conclusions reached, the Board, including the Independent Trustees, determined that the terms of the Agreements are fair and reasonable and that the approval of the Agreements is in the best interests of each Fund. No single factor was determinative in the Board’s analysis.
The Board of Trustees of First Trust Exchange-Traded Fund VIII (the “Trust”), including the Independent Trustees, approved the Investment Management Agreement (the “Advisory Agreement”) with First Trust Advisors L.P. (the “Advisor”) and the Investment Sub-Advisory Agreement (the “Sub-Advisory Agreement” and together with the Advisory Agreement, the “Agreements”) among the Trust, the Advisor and Vest Financial LLC (the “Sub-Advisor”) on behalf of the following series of the Trust (each a “Fund” and collectively, the “Funds”):
FT Vest Nasdaq-100® Conservative Buffer ETF – April (QCAP)
FT Vest Nasdaq-100® Conservative Buffer ETF – July (QCJL)
The Board approved the Agreements for each Fund for an initial two-year term at a meeting held on March 11, 2024. The Board determined for each Fund that the Agreements are in the best interests of the Fund in light of the nature, extent and quality of the services expected to be provided and such other matters as the Board considered to be relevant in the exercise of its business judgment.
To reach this determination for each Fund, the Board considered its duties under the Investment Company Act of 1940, as amended (the “1940 Act”), as well as under the general principles of state law, in reviewing and approving advisory contracts; the requirements of the 1940 Act in such matters; the fiduciary duty of investment advisors with respect to advisory agreements and compensation; the standards used by courts in determining whether investment company boards have fulfilled their duties; and the factors to be considered by the Board in voting on such agreements. To assist the Board in its evaluation of the Agreements for each Fund, the Independent Trustees received a separate report from each of the Advisor and the Sub-Advisor in advance of the Board meeting responding to requests for information from counsel to the Independent Trustees, submitted on behalf of the Independent Trustees, that, among other things, outlined: the services to be provided by the Advisor and the Sub-Advisor to each Fund (including the relevant personnel responsible for these services and their experience); the proposed unitary fee rate schedule payable by each Fund as compared to fees charged to a peer group of funds (the “Expense Group”) and a broad peer universe of funds (the “Expense Universe”), each assembled by Broadridge Financial Solutions, Inc. (“Broadridge”), an independent source, and as compared to fees charged to other exchange-traded funds (“ETFs”) managed by the Advisor; the proposed sub-advisory fee as compared to fees charged to other clients of the Sub-Advisor; the estimated expense ratio of each Fund as compared to expense ratios of the funds in the Fund’s Expense Group and Expense Universe; the nature of expenses to be incurred in providing services to each Fund and the potential for the Advisor and the Sub-Advisor to realize economies of scale, if any; profitability and other financial data for the Advisor; financial data for the Sub-Advisor; any indirect benefits to the Advisor and its affiliates, First Trust Portfolios L.P. (“FTP”) and First Trust Capital Partners, LLC (“FTCP”), and the Sub-Advisor; and information on the Advisor’s and the Sub-Advisor’s compliance programs. The Independent Trustees and their counsel also met separately to discuss the information provided by the Advisor and the Sub-Advisor. The Board applied its business judgment to determine whether the arrangements between the Trust and the Advisor and among the Trust, the Advisor and the Sub-Advisor are reasonable business arrangements from each Fund’s perspective.
In evaluating whether to approve the Agreements for each Fund, the Board considered the nature, extent and quality of the services to be provided by the Advisor and the Sub-Advisor under the Agreements. With respect to the Advisory Agreement, the Board considered that the Advisor will be responsible for the overall management and administration of each Fund and reviewed all of the
Other Information (Continued)
First Trust Exchange-Traded Fund VIIIAugust 31, 2024 (Unaudited) services to be provided by the Advisor to the Funds, including the oversight of the Sub-Advisor, as well as the background and experience of the persons responsible for such services. The Board considered that each Fund will be an actively-managed ETF and will employ an advisor/sub-advisor management structure and considered that the Advisor manages other ETFs with a similar structure in the First Trust Fund Complex. The Board noted that the Advisor will oversee the Sub-Advisor’s day-to-day management of each Fund’s investments, including portfolio risk monitoring and performance review. In reviewing the services to be provided, the Board noted the compliance program that had been developed by the Advisor and considered that it includes a robust program for monitoring the Advisor’s, the Sub-Advisor’s and each Fund’s compliance with the 1940 Act, as well as each Fund’s compliance with its investment objective, policies and restrictions. The Board noted that employees of the Advisor provide management services to other ETFs and to other funds in the First Trust Fund Complex with diligence and care. With respect to the Sub-Advisory Agreement, in addition to the written materials provided by the Sub-Advisor, at the March 11, 2024 meeting, the Board also received a presentation from representatives of the Sub-Advisor, who discussed the services that the Sub-Advisor will provide to the Funds, and the Trustees were able to ask questions about the proposed investment strategy for the Funds. The Board noted the background and experience of the Sub-Advisor’s portfolio management team and the Sub-Advisor’s investment style. The Board also noted that the Sub-Advisor manages a number of other defined-outcome ETFs with strategies similar to those of the Funds in the First Trust Fund Complex. Because the Funds had yet to commence investment operations, the Board could not consider the historical investment performance of the Funds. In light of the information presented and the considerations made, the Board concluded that the nature, extent and quality of the services to be provided to each Fund by the Advisor and the Sub-Advisor under the Agreements are expected to be satisfactory.
The Board considered the proposed unitary fee rate schedule payable by each Fund under the Advisory Agreement for the services to be provided. The Board noted that, under the unitary fee arrangement, each Fund would pay the Advisor a unitary fee starting at an annual rate of 0.90% of its average daily net assets, subject to a breakpoint schedule pursuant to which the unitary fee rate would be reduced as assets of the Fund meet certain thresholds. The Board considered that, from the unitary fee for each Fund, the Advisor would pay the Sub-Advisor a sub-advisory fee equal to 50% of the Fund’s unitary fee less one-half of the Fund’s expenses and that the sub-advisory fee would be reduced consistent with the breakpoints in the unitary fee rate schedule. The Board noted that the Advisor and the Sub-Advisor would be responsible for each Fund’s expenses, including the cost of sub-advisory, transfer agency, custody, fund administration, legal, audit and other services and license fees, if any, but excluding the fee payment under the Advisory Agreement and interest, taxes, acquired fund fees and expenses, if any, brokerage commissions and other expenses connected with the execution of portfolio transactions, distribution and service fees pursuant to a Rule 12b-1 plan, if any, and extraordinary expenses, if any. The Board received and reviewed information showing the fee rates and expense ratios of the peer funds in the Expense Group, as well as advisory and unitary fee rates charged by the Advisor and the Sub-Advisor to other ETFs. Because each Fund will pay a unitary fee, the Board determined that expense ratios were the most relevant comparative data point. Based on the information provided, the Board noted that the total (net) expense ratio for each Fund was above the median total (net) expense ratio of the peer funds in the Expense Group. With respect to the Expense Group, the Board discussed with representatives of the Advisor how the Expense Group was assembled and how each Fund compared and differed from the peer funds. The Board took this information into account in considering the peer data. With respect to fees charged to other clients, the Board considered the Advisor’s statement that the Funds will be unique to the market and the First Trust Fund Complex, but will be most similar to the ETFs in the FT Vest Nasdaq-100® Buffer ETF product line in the First Trust Fund Complex that are managed by the Advisor and sub-advised by the Sub-Advisor, each of which has a unitary fee rate schedule starting at an annual rate of 0.90% of its average daily net assets. In light of the information considered and the nature, extent and quality of the services expected to be provided to each Fund under the Agreements, the Board determined that, for each Fund, the proposed unitary fee, including the sub-advisory fee to be paid by the Advisor to the Sub-Advisor from the unitary fee, was fair and reasonable.
The Board considered whether there are any potential economies of scale to be achieved in connection with the Advisor providing investment advisory services to the Funds and whether the Funds may benefit from any economies of scale. The Board noted that the proposed unitary fee rate schedule for each Fund includes breakpoints pursuant to which the unitary fee rate would be reduced as assets of the Fund meet certain thresholds. The Board considered that the Advisor has continued to build infrastructure and add new staff to improve the services to the funds in the First Trust Fund Complex. The Board also noted that under the unitary fee structure, any reduction in expenses associated with the management and operations of the Funds generally would benefit the Advisor and the Sub-Advisor, but that the unitary fee structure provides a level of certainty in expenses for shareholders of the Funds. The Board concluded that the proposed unitary fee rate schedule for each Fund reflects an appropriate level of sharing of any economies of scale that may be realized in the management of the Fund at reasonably foreseeable future asset levels. The Board considered that the Sub-Advisor would be paid by the Advisor from each Fund’s unitary fee, that the sub-advisory fee for each Fund would be reduced consistent with the breakpoints in the Fund’s unitary fee rate schedule and its understanding that the sub-advisory fee for each Fund
Other Information (Continued)
First Trust Exchange-Traded Fund VIIIAugust 31, 2024 (Unaudited) was the product of an arm’s length negotiation. The Board took into consideration the types of costs to be borne by the Advisor in connection with its services to be performed for each Fund under the Advisory Agreement. The Board considered the Advisor’s estimate of the asset level for each Fund at which the Advisor expects the Advisory Agreement for the Fund to be profitable to the Advisor and the Advisor’s estimate of the profitability of the Advisory Agreement for each Fund if its assets reach $100 million. The Board noted the inherent limitations in the profitability analysis and concluded that, based on the information provided, the Advisor’s estimated profitability level for each Fund was not unreasonable. The Board reviewed financial information provided by the Sub-Advisor, but did not review any potential profitability of the Sub-Advisory Agreement for each Fund to the Sub-Advisor. The Board concluded that the profitability analysis for the Advisor was more relevant. In addition, the Board considered indirect benefits described by the Advisor that may be realized from its relationship with the Funds. The Board noted that FTCP has a controlling ownership interest in the Sub-Advisor’s parent company and considered potential indirect benefits to the Advisor from such ownership interest. The Board also considered that the Advisor had identified as an indirect benefit to the Advisor and FTP their exposure to investors and brokers who, absent their exposure to the Funds, may have had no dealings with the Advisor or FTP. The Board also considered the potential indirect benefits to the Sub-Advisor from FTCP’s controlling ownership interest in the Sub-Advisor’s parent company. The Board noted the Sub-Advisor’s statements that it does not foresee any indirect benefits from its relationship with the Funds and that, as a policy, it does not enter into soft-dollar arrangements for the procurement of research services in connection with client securities transactions. The Board concluded that the character and amount of potential indirect benefits to the Advisor and the Sub-Advisor were not unreasonable.
Based on all of the information considered and the conclusions reached, the Board, including the Independent Trustees, determined that the terms of the Agreements are fair and reasonable and that the approval of the Agreements is in the best interests of each Fund. No single factor was determinative in the Board’s analysis.
The Board of Trustees of First Trust Exchange-Traded Fund VIII (the “Trust”), including the Independent Trustees, approved the Investment Management Agreement (the “Advisory Agreement”) with First Trust Advisors L.P. (the “Advisor”) and the Investment Sub-Advisory Agreement (the “Sub-Advisory Agreement” and together with the Advisory Agreement, the “Agreements”) among the Trust, the Advisor and Vest Financial LLC (the “Sub-Advisor”) on behalf of the following series of the Trust (each a “Fund” and collectively, the “Funds”):
FT Vest Nasdaq-100® Moderate Buffer ETF – May (QMMY)
FT Vest Nasdaq-100® Moderate Buffer ETF – August (QMAG)
The Board approved the Agreements for each Fund for an initial two-year term at a meeting held on March 11, 2024. The Board determined for each Fund that the Agreements are in the best interests of the Fund in light of the nature, extent and quality of the services expected to be provided and such other matters as the Board considered to be relevant in the exercise of its business judgment.
To reach this determination for each Fund, the Board considered its duties under the Investment Company Act of 1940, as amended (the “1940 Act”), as well as under the general principles of state law, in reviewing and approving advisory contracts; the requirements of the 1940 Act in such matters; the fiduciary duty of investment advisors with respect to advisory agreements and compensation; the standards used by courts in determining whether investment company boards have fulfilled their duties; and the factors to be considered by the Board in voting on such agreements. To assist the Board in its evaluation of the Agreements for each Fund, the Independent Trustees received a separate report from each of the Advisor and the Sub-Advisor in advance of the Board meeting responding to requests for information from counsel to the Independent Trustees, submitted on behalf of the Independent Trustees, that, among other things, outlined: the services to be provided by the Advisor and the Sub-Advisor to each Fund (including the relevant personnel responsible for these services and their experience); the proposed unitary fee rate schedule payable by each Fund as compared to fees charged to a peer group of funds (the “Expense Group”) and a broad peer universe of funds (the “Expense Universe”), each assembled by Broadridge Financial Solutions, Inc. (“Broadridge”), an independent source, and as compared to fees charged to other exchange-traded funds (“ETFs”) managed by the Advisor; the proposed sub-advisory fee as compared to fees charged to other clients of the Sub-Advisor; the estimated expense ratio of each Fund as compared to expense ratios of the funds in the Fund’s Expense Group and Expense Universe; the nature of expenses to be incurred in providing services to each Fund and the potential for the Advisor and the Sub-Advisor to realize economies of scale, if any; profitability and other financial data for the Advisor; financial data for the Sub-Advisor; any indirect benefits to the Advisor and its affiliates, First Trust Portfolios L.P. (“FTP”) and First Trust Capital Partners, LLC (“FTCP”), and the Sub-Advisor; and information on the Advisor’s and the Sub-Advisor’s compliance programs. The Independent Trustees and their counsel also met separately to discuss the information provided by the Advisor and the Sub-
Other Information (Continued)
First Trust Exchange-Traded Fund VIIIAugust 31, 2024 (Unaudited) Advisor. The Board applied its business judgment to determine whether the arrangements between the Trust and the Advisor and among the Trust, the Advisor and the Sub-Advisor are reasonable business arrangements from each Fund’s perspective.
In evaluating whether to approve the Agreements for each Fund, the Board considered the nature, extent and quality of the services to be provided by the Advisor and the Sub-Advisor under the Agreements. With respect to the Advisory Agreement, the Board considered that the Advisor will be responsible for the overall management and administration of each Fund and reviewed all of the services to be provided by the Advisor to the Funds, including the oversight of the Sub-Advisor, as well as the background and experience of the persons responsible for such services. The Board considered that each Fund will be an actively-managed ETF and will employ an advisor/sub-advisor management structure and considered that the Advisor manages other ETFs with a similar structure in the First Trust Fund Complex. The Board noted that the Advisor will oversee the Sub-Advisor’s day-to-day management of each Fund’s investments, including portfolio risk monitoring and performance review. In reviewing the services to be provided, the Board noted the compliance program that had been developed by the Advisor and considered that it includes a robust program for monitoring the Advisor’s, the Sub-Advisor’s and each Fund’s compliance with the 1940 Act, as well as each Fund’s compliance with its investment objective, policies and restrictions. The Board noted that employees of the Advisor provide management services to other ETFs and to other funds in the First Trust Fund Complex with diligence and care. With respect to the Sub-Advisory Agreement, in addition to the written materials provided by the Sub-Advisor, at the March 11, 2024 meeting, the Board also received a presentation from representatives of the Sub-Advisor, who discussed the services that the Sub-Advisor will provide to the Funds, and the Trustees were able to ask questions about the proposed investment strategy for the Funds. The Board noted the background and experience of the Sub-Advisor’s portfolio management team and the Sub-Advisor’s investment style. The Board also noted that the Sub-Advisor manages a number of other defined-outcome ETFs with strategies similar to those of the Funds in the First Trust Fund Complex. Because the Funds had yet to commence investment operations, the Board could not consider the historical investment performance of the Funds. In light of the information presented and the considerations made, the Board concluded that the nature, extent and quality of the services to be provided to each Fund by the Advisor and the Sub-Advisor under the Agreements are expected to be satisfactory.
The Board considered the proposed unitary fee rate schedule payable by each Fund under the Advisory Agreement for the services to be provided. The Board noted that, under the unitary fee arrangement, each Fund would pay the Advisor a unitary fee starting at an annual rate of 0.90% of its average daily net assets, subject to a breakpoint schedule pursuant to which the unitary fee rate would be reduced as assets of the Fund meet certain thresholds. The Board considered that, from the unitary fee for each Fund, the Advisor would pay the Sub-Advisor a sub-advisory fee equal to 50% of the Fund’s unitary fee less one-half of the Fund’s expenses and that the sub-advisory fee would be reduced consistent with the breakpoints in the unitary fee rate schedule. The Board noted that the Advisor and the Sub-Advisor would be responsible for each Fund’s expenses, including the cost of sub-advisory, transfer agency, custody, fund administration, legal, audit and other services and license fees, if any, but excluding the fee payment under the Advisory Agreement and interest, taxes, acquired fund fees and expenses, if any, brokerage commissions and other expenses connected with the execution of portfolio transactions, distribution and service fees pursuant to a Rule 12b-1 plan, if any, and extraordinary expenses, if any. The Board received and reviewed information showing the fee rates and expense ratios of the peer funds in the Expense Group, as well as advisory and unitary fee rates charged by the Advisor and the Sub-Advisor to other ETFs. Because each Fund will pay a unitary fee, the Board determined that expense ratios were the most relevant comparative data point. Based on the information provided, the Board noted that the total (net) expense ratio for each Fund was above the median total (net) expense ratio of the peer funds in the Expense Group. With respect to the Expense Group, the Board discussed with representatives of the Advisor how the Expense Group was assembled and how each Fund compared and differed from the peer funds. The Board took this information into account in considering the peer data. With respect to fees charged to other clients, the Board considered the Advisor’s statement that the Funds will be unique to the market and the First Trust Fund Complex, but will be most similar to the ETFs in the FT Vest Nasdaq-100® Buffer ETF and FT Vest U.S. Small Cap Moderate Buffer ETF product lines in the First Trust Fund Complex that are managed by the Advisor and sub-advised by the Sub-Advisor, each of which has a unitary fee rate schedule starting at an annual rate of 0.90% of its average daily net assets. In light of the information considered and the nature, extent and quality of the services expected to be provided to each Fund under the Agreements, the Board determined that, for each Fund, the proposed unitary fee, including the sub-advisory fee to be paid by the Advisor to the Sub-Advisor from the unitary fee, was fair and reasonable.
The Board considered whether there are any potential economies of scale to be achieved in connection with the Advisor providing investment advisory services to the Funds and whether the Funds may benefit from any economies of scale. The Board noted that the proposed unitary fee rate schedule for each Fund includes breakpoints pursuant to which the unitary fee rate would be reduced as assets of the Fund meet certain thresholds. The Board considered that the Advisor has continued to build infrastructure and add new staff to improve the services to the funds in the First Trust Fund Complex. The Board also noted that under the unitary fee structure, any reduction in expenses associated with the management and operations of the Funds generally would benefit the Advisor and the
Other Information (Continued)
First Trust Exchange-Traded Fund VIIIAugust 31, 2024 (Unaudited) Sub-Advisor, but that the unitary fee structure provides a level of certainty in expenses for shareholders of the Funds. The Board concluded that the proposed unitary fee rate schedule for each Fund reflects an appropriate level of sharing of any economies of scale that may be realized in the management of the Fund at reasonably foreseeable future asset levels. The Board considered that the Sub-Advisor would be paid by the Advisor from each Fund’s unitary fee, that the sub-advisory fee for each Fund would be reduced consistent with the breakpoints in the Fund’s unitary fee rate schedule and its understanding that the sub-advisory fee for each Fund was the product of an arm’s length negotiation. The Board took into consideration the types of costs to be borne by the Advisor in connection with its services to be performed for each Fund under the Advisory Agreement. The Board considered the Advisor’s estimate of the asset level for each Fund at which the Advisor expects the Advisory Agreement for the Fund to be profitable to the Advisor and the Advisor’s estimate of the profitability of the Advisory Agreement for each Fund if its assets reach $100 million. The Board noted the inherent limitations in the profitability analysis and concluded that, based on the information provided, the Advisor’s estimated profitability level for each Fund was not unreasonable. The Board reviewed financial information provided by the Sub-Advisor, but did not review any potential profitability of the Sub-Advisory Agreement for each Fund to the Sub-Advisor. The Board concluded that the profitability analysis for the Advisor was more relevant. In addition, the Board considered indirect benefits described by the Advisor that may be realized from its relationship with the Funds. The Board noted that FTCP has a controlling ownership interest in the Sub-Advisor’s parent company and considered potential indirect benefits to the Advisor from such ownership interest. The Board also considered that the Advisor had identified as an indirect benefit to the Advisor and FTP their exposure to investors and brokers who, absent their exposure to the Funds, may have had no dealings with the Advisor or FTP. The Board also considered the potential indirect benefits to the Sub-Advisor from FTCP’s controlling ownership interest in the Sub-Advisor’s parent company. The Board noted the Sub-Advisor’s statements that it does not foresee any indirect benefits from its relationship with the Funds and that, as a policy, it does not enter into soft-dollar arrangements for the procurement of research services in connection with client securities transactions. The Board concluded that the character and amount of potential indirect benefits to the Advisor and the Sub-Advisor were not unreasonable.
Based on all of the information considered and the conclusions reached, the Board, including the Independent Trustees, determined that the terms of the Agreements are fair and reasonable and that the approval of the Agreements is in the best interests of each Fund. No single factor was determinative in the Board’s analysis.
There were no distributions made by each Fund during their applicable taxable period; therefore, no analysis for the corporate dividends received deduction and qualified dividend income was completed.
The Funds are not sponsored, endorsed, sold or promoted by Invesco QQQ TrustSM, Series 1, Invesco, Nasdaq, Inc., or SPDR® S&P 500® ETF Trust, PDR Services, LLC, or Standard & Poor’s® (together with their affiliates hereinafter referred to as the “Corporations”). The Corporations have not passed on the legality or suitability of, or the accuracy or adequacy of, descriptions and disclosures relating to the Funds or the FLEX Options. The Corporations make no representations or warranties, express or implied, regarding the advisability of investing in the Funds or the FLEX Options or results to be obtained by the Funds or the FLEX Options, shareholders or any other person or entity from use of the Invesco QQQ TrustSM or SPDR® S&P 500® ETF Trust. The Corporations have no liability in connection with the management, administration, marketing or trading of the Funds or the FLEX Options.
The Funds are not sponsored, endorsed, sold or promoted by iShares MSCI EAFE ETF, BFA, MSCI Inc. or their affiliates. iShares MSCI EAFE ETF, BFA, MSCI Inc. or their affiliates have not passed on the legality or suitability of, or the accuracy or adequacy of, descriptions and disclosures relating to the Funds or the FLEX Options. iShares MSCI EAFE ETF, BFA, MSCI Inc. or their affiliates make no representations or warranties, express or implied, regarding the advisability of investing in the Fund or the FLEX Options or results to be obtained by the Funds or the FLEX Options, shareholders or any other person or entity from use of the Underlying ETF. iShares MSCI EAFE ETF, BFA, MSCI Inc. or their affiliates have no liability in connection with the management, administration, marketing or trading of the Funds or the FLEX Options.
Annual Financial
Statements and
Other Information |
For the Year Ended
August 31, 2024 |
First Trust Exchange-Traded Fund VIII
FT Vest Laddered Buffer ETF (BUFR) (formerly known as FT Vest Fund of Buffer ETFs) |
FT Vest Laddered Deep Buffer ETF (BUFD) (formerly known as FT Vest Fund of Deep Buffer ETFs) |
FT Vest Laddered Nasdaq Buffer ETF (BUFQ) (formerly known as FT Vest Fund of Nasdaq-100® Buffer ETFs) |
First Trust Exchange-Traded Fund VIII
Annual Financial Statements and Other Information
August 31, 2024
Performance and Risk Disclosure
There is no assurance that any series of First Trust Exchange-Traded Fund VIII (the “Trust”) described in this report (each such series is referred to as a “Fund” and collectively, as the “Funds”) will achieve its investment objective. Each Fund is subject to market risk, which is the possibility that the market values of securities owned by the Fund will decline and that the value of the Fund’s shares may therefore be less than what you paid for them. Accordingly, you can lose money by investing in a Fund.
Performance data quoted represents past performance, which is no guarantee of future results, and current performance may be lower or higher than the figures shown. For the most recent month-end performance figures, please visit www.ftportfolios.com or speak with your financial advisor. Investment returns, net asset value and share price will fluctuate and Fund shares, when sold, may be worth more or less than their original cost.
First Trust Advisors L.P., the Funds’ advisor, may also periodically provide additional information on Fund performance on each Fund’s webpage at www.ftportfolios.com.
This report contains information that may help you evaluate your investment. It includes details about each Fund and presents data that provides insight into each Fund’s performance and investment approach.
The material risks of investing in each Fund are spelled out in its prospectus, statement of additional information, and other Fund regulatory filings.
FT Vest Laddered Buffer ETF (BUFR)Portfolio of InvestmentsAugust 31, 2024
| | |
EXCHANGE-TRADED FUNDS — 100.0% |
| Capital Markets (a) — 100.0% | |
| FT Vest U.S. Equity Buffer ETF - January (b) | |
| FT Vest U.S. Equity Buffer ETF - February (b) | |
| FT Vest U.S. Equity Buffer ETF - March (b) | |
| FT Vest U.S. Equity Buffer ETF - April (b) | |
| FT Vest U.S. Equity Buffer ETF - May (b) | |
| FT Vest U.S. Equity Buffer ETF - June (b) | |
| FT Vest U.S. Equity Buffer ETF - July (b) | |
| FT Vest U.S. Equity Buffer ETF - August (b) | |
| FT Vest U.S. Equity Buffer ETF - September (b) | |
| FT Vest U.S. Equity Buffer ETF - October (b) | |
| FT Vest U.S. Equity Buffer ETF - November (b) | |
| FT Vest U.S. Equity Buffer ETF - December (b) | |
| Total Exchange-Traded Funds | |
| | |
MONEY MARKET FUNDS — 0.0% |
| Morgan Stanley Institutional Liquidity Funds - Treasury Portfolio - Institutional Class - 5.12% (c) | |
| | |
|
|
| Total Investments — 100.0% | |
| | |
| Net Other Assets and Liabilities — (0.0)% | |
| | |
| Represents investments in affiliated funds. |
| Non-income producing security. |
| Rate shown reflects yield as of August 31, 2024. |
| |
| |
| |
Net Other Assets and Liabilities | |
| |
| Amount is less than 0.1%. |
Valuation InputsA summary of the inputs used to value the Fund’s investments as of August 31, 2024 is as follows (see Note 2A - Portfolio Valuation in the Notes to Financial Statements):
| | | Level 2
Significant
Observable
Inputs | Level 3
Significant
Unobservable
Inputs |
| | | | |
| | | | |
| | | | |
| See Portfolio of Investments for industry breakout. |
See Notes to Financial Statements
FT Vest Laddered Deep Buffer ETF (BUFD)Portfolio of InvestmentsAugust 31, 2024
| | |
EXCHANGE-TRADED FUNDS — 100.0% |
| Capital Markets (a) — 100.0% | |
| FT Vest U.S. Equity Deep Buffer ETF - January (b) | |
| FT Vest U.S. Equity Deep Buffer ETF - February (b) | |
| FT Vest U.S. Equity Deep Buffer ETF - March (b) | |
| FT Vest U.S. Equity Deep Buffer ETF - April (b) | |
| FT Vest U.S. Equity Deep Buffer ETF - May (b) | |
| FT Vest U.S. Equity Deep Buffer ETF - June (b) | |
| FT Vest U.S. Equity Deep Buffer ETF - July (b) | |
| FT Vest U.S. Equity Deep Buffer ETF - August (b) | |
| FT Vest U.S. Equity Deep Buffer ETF - September (b) | |
| FT Vest U.S. Equity Deep Buffer ETF - October (b) | |
| FT Vest U.S. Equity Deep Buffer ETF - November (b) | |
| FT Vest U.S. Equity Deep Buffer ETF - December (b) | |
| Total Exchange-Traded Funds | |
| | |
MONEY MARKET FUNDS — 0.0% |
| Morgan Stanley Institutional Liquidity Funds - Treasury Portfolio - Institutional Class - 5.12% (c) | |
| | |
|
|
| Total Investments — 100.0% | |
| | |
| Net Other Assets and Liabilities — (0.0)% | |
| | |
| Represents investments in affiliated funds. |
| Non-income producing security. |
| Rate shown reflects yield as of August 31, 2024. |
| |
| |
| |
Net Other Assets and Liabilities | |
| |
| Amount is less than 0.1%. |
Valuation InputsA summary of the inputs used to value the Fund’s investments as of August 31, 2024 is as follows (see Note 2A - Portfolio Valuation in the Notes to Financial Statements):
| | | Level 2
Significant
Observable
Inputs | Level 3
Significant
Unobservable
Inputs |
| | | | |
| | | | |
| | | | |
| See Portfolio of Investments for industry breakout. |
See Notes to Financial Statements
FT Vest Laddered Nasdaq Buffer ETF (BUFQ)Portfolio of InvestmentsAugust 31, 2024
| | |
EXCHANGE-TRADED FUNDS — 100.0% |
| Capital Markets (a) — 100.0% | |
| FT Vest Nasdaq-100® Buffer ETF - March (b) | |
| FT Vest Nasdaq-100® Buffer ETF - June (b) | |
| FT Vest Nasdaq-100® Buffer ETF - September (b) | |
| FT Vest Nasdaq-100® Buffer ETF - December (b) | |
| Total Exchange-Traded Funds | |
| | |
MONEY MARKET FUNDS — 0.0% |
| Morgan Stanley Institutional Liquidity Funds - Treasury Portfolio - Institutional Class - 5.12% (c) | |
| | |
|
|
| Total Investments — 100.0% | |
| | |
| Net Other Assets and Liabilities — (0.0)% | |
| | |
| Represents investments in affiliated funds. |
| Non-income producing security. |
| Rate shown reflects yield as of August 31, 2024. |
| |
| |
| |
Net Other Assets and Liabilities | |
| |
| Amount is less than 0.1%. |
Valuation InputsA summary of the inputs used to value the Fund’s investments as of August 31, 2024 is as follows (see Note 2A - Portfolio Valuation in the Notes to Financial Statements):
| | | Level 2
Significant
Observable
Inputs | Level 3
Significant
Unobservable
Inputs |
| | | | |
| | | | |
| | | | |
| See Portfolio of Investments for industry breakout. |
See Notes to Financial Statements
First Trust Exchange-Traded Fund VIIIStatements of Assets and Liabilities
August 31, 2024
| FT Vest Laddered Buffer ETF
(BUFR) | FT Vest Laddered Deep Buffer ETF
(BUFD) | FT Vest Laddered Nasdaq Buffer ETF
(BUFQ) |
| | | |
Investments, at value - Affiliated | | | |
Investments, at value - Unaffiliated | | | |
Total investments, at value | | | |
| | | |
| | | |
| | | |
| | | |
|
| | | |
| | | |
Investment securities purchased | | | |
| | | |
| | | |
| | | |
|
| | | |
| | | |
| | | |
Accumulated distributable earnings (loss) | | | |
| | | |
NET ASSET VALUE, per share | | | |
Number of shares outstanding (unlimited number of shares authorized, par value $0.01 per share) | | | |
Investments, at cost - Affiliated | | | |
Investments, at cost - Unaffiliated | | | |
Total investments, at cost | | | |
See Notes to Financial Statements
First Trust Exchange-Traded Fund VIIIStatements of Operations
For the Year Ended August 31, 2024
| FT Vest Laddered Buffer ETF
(BUFR) | FT Vest Laddered Deep Buffer ETF
(BUFD) | FT Vest Laddered Nasdaq Buffer ETF
(BUFQ) |
| | | |
| | | |
| | | |
|
| | | |
| | | |
| | | |
Less fees waived by the investment advisor | | | |
| | | |
NET INVESTMENT INCOME (LOSS) | | | |
|
NET REALIZED AND UNREALIZED GAIN (LOSS): | | | |
Net realized gain (loss) on: | | | |
| | | |
In-kind redemptions - Affiliated | | | |
| | | |
Net change in unrealized appreciation (depreciation) on affiliated investments | | | |
NET REALIZED AND UNREALIZED GAIN (LOSS) | | | |
NET INCREASE (DECREASE) IN NET ASSETS RESULTING FROM OPERATIONS | | | |
See Notes to Financial Statements
First Trust Exchange-Traded Fund VIIIStatements of Changes in Net Assets
| FT Vest Laddered Buffer ETF (BUFR) | FT Vest Laddered Deep Buffer ETF (BUFD) |
| | | | |
| | | | |
Net investment income (loss) | | | | |
| | | | |
Net change in unrealized appreciation (depreciation) | | | | |
Net increase (decrease) in net assets resulting from operations | | | | |
|
SHAREHOLDER TRANSACTIONS: | | | | |
Proceeds from shares sold | | | | |
| | | | |
Net increase (decrease) in net assets resulting from shareholder transactions | | | | |
Total increase (decrease) in net assets | | | | |
|
| | | | |
| | | | |
| | | | |
|
CHANGES IN SHARES OUTSTANDING: | | | | |
Shares outstanding, beginning of period | | | | |
| | | | |
| | | | |
Shares outstanding, end of period | | | | |
See Notes to Financial Statements
FT Vest Laddered Nasdaq Buffer ETF (BUFQ) |
| |
| |
| |
| |
| |
| |
|
| |
| |
| |
| |
| |
|
| |
| |
| |
|
| |
| |
| |
| |
| |
See Notes to Financial Statements
First Trust Exchange-Traded Fund VIIIFinancial Highlights
For a share outstanding throughout each period FT Vest Laddered Buffer ETF (BUFR)
| | Period
Ended
8/31/2020 (a) |
| | | | |
Net asset value, beginning of period | | | | | |
Income from investment operations: | | | | | |
Net investment income (loss) | | | | | |
Net realized and unrealized gain (loss) | | | | | |
Total from investment operations | | | | | |
Net asset value, end of period | | | | | |
| | | | | |
|
Ratios to average net assets/supplemental data: | | | | | |
Net assets, end of period (in 000’s) | | | | | |
Ratio of total expenses to average net assets (d) | | | | | |
Ratio of net expenses to average net assets (d) | | | | | |
Ratio of net investment income (loss) to average net assets (d) | | | | | |
Portfolio turnover rate (f) | | | | | |
| Inception date is August 10, 2020, which is consistent with the commencement of investment operations and is the date the initial creation units were established. |
| Based on average shares outstanding. |
| Total return is calculated assuming an initial investment made at the net asset value at the beginning of the period, reinvestment of all distributions at net asset value during the period, and redemption at net asset value on the last day of the period. The returns presented do not reflect the deduction of taxes that a shareholder would pay on Fund distributions or the redemption or sale of Fund shares. Total return is calculated for the time period presented and is not annualized for periods of less than a year. The total returns would have been lower if certain fees had not been waived by the investment advisor. |
| Ratios of expenses to average net assets and ratio of net investment income (loss) to average net assets do not reflect the Fund’s proportionate share of expenses and income of underlying investment companies in which the Fund invests. |
| |
| Portfolio turnover is calculated for the time period presented and is not annualized for periods of less than a year and does not include securities received or delivered from processing creations or redemptions and in-kind transactions. |
See Notes to Financial Statements
First Trust Exchange-Traded Fund VIIIFinancial Highlights (Continued)
For a share outstanding throughout each period FT Vest Laddered Deep Buffer ETF (BUFD)
| | Period
Ended
8/31/2021 (a) |
| | | |
Net asset value, beginning of period | | | | |
Income from investment operations: | | | | |
Net investment income (loss) | | | | |
Net realized and unrealized gain (loss) | | | | |
Total from investment operations | | | | |
Net asset value, end of period | | | | |
| | | | |
|
Ratios to average net assets/supplemental data: | | | | |
Net assets, end of period (in 000’s) | | | | |
Ratio of total expenses to average net assets (d) | | | | |
Ratio of net expenses to average net assets (d) | | | | |
Ratio of net investment income (loss) to average net assets (d) | | | | |
Portfolio turnover rate (f) | | | | |
| Inception date is January 20, 2021, which is consistent with the commencement of investment operations and is the date the initial creation units were established. |
| Based on average shares outstanding. |
| Total return is calculated assuming an initial investment made at the net asset value at the beginning of the period, reinvestment of all distributions at net asset value during the period, and redemption at net asset value on the last day of the period. The returns presented do not reflect the deduction of taxes that a shareholder would pay on Fund distributions or the redemption or sale of Fund shares. Total return is calculated for the time period presented and is not annualized for periods of less than a year. The total returns would have been lower if certain fees had not been waived by the investment advisor. |
| Ratios of expenses to average net assets and ratio of net investment income (loss) to average net assets do not reflect the Fund’s proportionate share of expenses and income of underlying investment companies in which the Fund invests. |
| |
| Portfolio turnover is calculated for the time period presented and is not annualized for periods of less than a year and does not include securities received or delivered from processing creations or redemptions and in-kind transactions. |
See Notes to Financial Statements
First Trust Exchange-Traded Fund VIIIFinancial Highlights (Continued)
For a share outstanding throughout each period FT Vest Laddered Nasdaq Buffer ETF (BUFQ)
| | Period
Ended
8/31/2022 (a) |
| | |
Net asset value, beginning of period | | | |
Income from investment operations: | | | |
Net investment income (loss) | | | |
Net realized and unrealized gain (loss) | | | |
Total from investment operations | | | |
Net asset value, end of period | | | |
| | | |
|
Ratios to average net assets/supplemental data: | | | |
Net assets, end of period (in 000’s) | | | |
Ratio of total expenses to average net assets (f) | | | |
Ratio of net expenses to average net assets (f) | | | |
Ratio of net investment income (loss) to average net assets (f) | | | |
Portfolio turnover rate (h) | | | |
| Inception date is June 15, 2022, which is consistent with the commencement of investment operations and is the date the initial creation units were established. |
| Based on average shares outstanding. |
| Amount represents less than $0.01. |
| The per share amount does not correlate with the aggregate realized and unrealized gain (loss) due to the timing of the Fund share sales and repurchases in relation to market value fluctuation of the underlying investments. |
| Total return is calculated assuming an initial investment made at the net asset value at the beginning of the period, reinvestment of all distributions at net asset value during the period, and redemption at net asset value on the last day of the period. The returns presented do not reflect the deduction of taxes that a shareholder would pay on Fund distributions or the redemption or sale of Fund shares. Total return is calculated for the time period presented and is not annualized for periods of less than a year. The total returns would have been lower if certain fees had not been waived by the investment advisor. |
| Ratios of expenses to average net assets and ratio of net investment income (loss) to average net assets do not reflect the Fund’s proportionate share of expenses and income of underlying investment companies in which the Fund invests. |
| |
| Portfolio turnover is calculated for the time period presented and is not annualized for periods of less than a year and does not include securities received or delivered from processing creations or redemptions and in-kind transactions. |
See Notes to Financial Statements
Notes to Financial Statements
First Trust Exchange-Traded Fund VIIIAugust 31, 2024 1. Organization
First Trust Exchange-Traded Fund VIII (the “Trust”) is an open-end management investment company organized as a Massachusetts business trust on February 22, 2016, and is registered with the Securities and Exchange Commission under the Investment Company Act of 1940, as amended (the “1940 Act”).
This report covers the three funds (each a “Fund” and collectively, the “Funds”) listed below. The shares of each Fund are listed and traded on the Cboe BZX Exchange, Inc.
FT Vest Laddered Buffer ETF – (ticker “BUFR”) |
FT Vest Laddered Deep Buffer ETF – (ticker “BUFD”) |
FT Vest Laddered Nasdaq Buffer ETF – (ticker “BUFQ”) |
Both BUFR and BUFD are diversified series of the Trust. BUFQ is a non-diversified series of the Trust.
Each Fund represents a separate series of shares of beneficial interest in the Trust. Unlike conventional mutual funds, each Fund issues and redeems shares on a continuous basis, at net asset value (“NAV”), only in large blocks of shares known as “Creation Units.”
Each Fund is an actively managed exchange-traded fund.
The investment objective of BUFR is to seek to provide investors with capital appreciation. BUFR seeks to achieve its investment objective by providing investors with US large-cap equity market exposure while attempting to limit downside risk through a laddered portfolio of twelve FT Vest U.S. Equity Buffer ETFs (“FT ETFs”). Under normal market conditions, BUFR will invest substantially all of its assets in the FT ETFs, which seek to provide investors with returns (before fees and expenses) that match the return of the SPDR® S&P 500® ETF Trust (“SPY”), up to a predetermined upside cap, while providing a buffer (before fees and expenses) against the first 10% of SPY losses, over a defined one-year period. Unlike the FT ETFs, BUFR itself does not pursue a target outcome strategy. The buffer is only provided by the FT ETFs and BUFR itself does not provide any stated buffer against losses. In order to understand BUFR’s strategy and risks, it is important to understand the strategies and risks of the FT ETFs.
The investment objective of BUFD is to seek to provide investors with capital appreciation. BUFD seeks to achieve its investment objective by providing investors with US large-cap equity market exposure while attempting to limit downside risk through a laddered portfolio of twelve FT Vest U.S. Equity Deep Buffer ETFs (“FT DB ETFs”). Under normal market conditions, BUFD will invest substantially all of its assets in the FT DB ETFs, which seek to provide investors with returns (before fees and expenses) that match the return of the SPY, up to a predetermined upside cap, while providing a deep buffer (before fees and expenses) against losses between -5% and -30% of SPY, over a defined one-year period. Unlike the FT DB ETFs, BUFD itself does not pursue a target outcome strategy. The buffer is only provided by the FT DB ETFs and BUFD itself does not provide any stated buffer against losses. In order to understand BUFD’s strategy and risks, it is important to understand the strategies and risks of the FT DB ETFs.
The investment objective of BUFQ is to seek to provide investors with capital appreciation. BUFQ seeks to achieve its investment objective by providing investors with large-cap equity market exposure while attempting to limit downside risk through a laddered portfolio of four FT Vest Nasdaq-100® Buffer ETFs (“Nasdaq ETFs”). Under normal market conditions, the BUFQ will invest substantially all of its assets in the Nasdaq ETFs, which seek to provide investors with returns (before fees and expenses) that match the return of the Invesco QQQ TrustSM, Series 1 (“QQQ”), up to a predetermined upside cap, while providing a buffer (before fees and expenses) against the first 10% of QQQ losses, over a defined one-year period. Unlike the Nasdaq ETFs, BUFQ itself does not pursue a target outcome strategy. The buffer is only provided by the Nasdaq ETFs and the BUFQ itself does not provide any stated buffer against losses. In order to understand the BUFQ’s strategy and risks, it is important to understand the strategies and risks of the Nasdaq ETFs.
2. Significant Accounting Policies
The Funds are each considered an investment company and follow accounting and reporting guidance under Financial Accounting Standards Board Accounting Standards Codification Topic 946, “Financial Services-Investment Companies.” The following is a summary of significant accounting policies consistently followed by the Funds in the preparation of the financial statements. The preparation of the financial statements in accordance with accounting principles generally accepted in the United States of America (“U.S. GAAP”) requires management to make estimates and assumptions that affect the reported amounts and disclosures in the financial statements. Actual results could differ from those estimates.
Notes to Financial Statements (Continued)
First Trust Exchange-Traded Fund VIIIAugust 31, 2024 A. Portfolio Valuation
Each Fund’s NAV is determined daily as of the close of regular trading on the New York Stock Exchange (“NYSE”), normally 4:00 p.m. Eastern time, on each day the NYSE is open for trading. If the NYSE closes early on a valuation day, the NAV is determined as of that time. Each Fund’s NAV is calculated by dividing the value of all assets of each Fund (including accrued interest and dividends), less all liabilities (including accrued expenses and dividends declared but unpaid), by the total number of shares outstanding.
Each Fund’s investments are valued daily at market value or, in the absence of market value with respect to any portfolio securities, at fair value. Market value prices represent readily available market quotations such as last sale or official closing prices from a national or foreign exchange (i.e., a regulated market) and are primarily obtained from third-party pricing services. Fair value prices represent any prices not considered market value prices and are either obtained from a third-party pricing service or are determined by the Pricing Committee of the Funds’ investment advisor, First Trust Advisors L.P. (“First Trust” or the “Advisor”), in accordance with valuation procedures approved by the Trust’s Board of Trustees, and in accordance with provisions of the 1940 Act and rules thereunder. Investments valued by the Advisor’s Pricing Committee, if any, are footnoted as such in the footnotes to the Portfolio of Investments. Each Fund’s investments are valued as follows:
Exchange-traded funds and other equity securities listed on any national or foreign exchange (excluding Nasdaq, Inc. (“Nasdaq”) and the London Stock Exchange Alternative Investment Market (“AIM”)) are valued at the last sale price on the exchange on which they are principally traded or, for Nasdaq and AIM securities, the official closing price. Securities traded on more than one securities exchange are valued at the last sale price or official closing price, as applicable, at the close of the securities exchange representing the primary exchange for such securities.
Shares of open-end funds are valued based on NAV per share.
Certain securities may not be able to be priced by pre-established pricing methods. Such securities may be valued by the Advisor’s Pricing Committee at fair value. These securities generally include, but are not limited to, restricted securities (securities which may not be publicly sold without registration under the Securities Act of 1933, as amended) for which a third-party pricing service is unable to provide a market price; securities whose trading has been formally suspended; a security whose market or fair value price is not available from a pre-established pricing source; a security with respect to which an event has occurred that is likely to materially affect the value of the security after the market has closed but before the calculation of a Fund’s NAV or make it difficult or impossible to obtain a reliable market quotation; and a security whose price, as provided by the third-party pricing service, does not reflect the security’s fair value. As a general principle, the current fair value of a security would appear to be the amount which the owner might reasonably expect to receive for the security upon its current sale. When fair value prices are used, generally they will differ from market quotations or official closing prices on the applicable exchanges. A variety of factors may be considered in determining the fair value of such securities, including, but not limited to, the following:
1)
the last sale price on the exchange on which they are principally traded or, for Nasdaq and AIM securities, the official closing price;
3)
the size of the holding;
4)
the initial cost of the security;
5)
transactions in comparable securities;
6)
price quotes from dealers and/or third-party pricing services;
7)
relationships among various securities;
8)
information obtained by contacting the issuer, analysts, or the appropriate stock exchange;
9)
an analysis of the issuer’s financial statements;
10)
the existence of merger proposals or tender offers that might affect the value of the security; and
11)
other relevant factors.
The Funds are subject to fair value accounting standards that define fair value, establish the framework for measuring fair value and provide a three-level hierarchy for fair valuation based upon the inputs to the valuation as of the measurement date. The three levels of the fair value hierarchy are as follows:
Notes to Financial Statements (Continued)
First Trust Exchange-Traded Fund VIIIAugust 31, 2024 • Level 1 – Level 1 inputs are quoted prices in active markets for identical investments. An active market is a market in which transactions for the investment occur with sufficient frequency and volume to provide pricing information on an ongoing basis.
• Level 2 – Level 2 inputs are observable inputs, either directly or indirectly, and include the following:
o Quoted prices for similar investments in active markets.
o Quoted prices for identical or similar investments in markets that are non-active. A non-active market is a market where there are few transactions for the investment, the prices are not current, or price quotations vary substantially either over time or among market makers, or in which little information is released publicly.
o Inputs other than quoted prices that are observable for the investment (for example, interest rates and yield curves observable at commonly quoted intervals, volatilities, prepayment speeds, loss severities, credit risks, and default rates).
o Inputs that are derived principally from or corroborated by observable market data by correlation or other means.
• Level 3 – Level 3 inputs are unobservable inputs. Unobservable inputs may reflect the reporting entity’s own assumptions about the assumptions that market participants would use in pricing the investment.
The inputs or methodologies used for valuing investments are not necessarily an indication of the risk associated with investing in those investments. A summary of the inputs used to value each Fund’s investments as of August 31, 2024, is included with each Fund’s Portfolio of Investments.
B. Securities Transactions and Investment Income
Securities transactions are recorded as of the trade date. Realized gains and losses from securities transactions are recorded on the identified cost basis. Dividend income is recorded on the ex-dividend date.
C. Affiliated Transactions
Each of the Funds invests in securities of affiliated funds. Each Fund’s investment performance and risks are directly related to the investment performance and risks of the affiliated funds. The affiliated funds’ financial statements may be found at SEC.gov. Dividend income, if any, realized gains and losses, and change in appreciation (depreciation) from affiliated funds are presented on the Statements of Operations.
Amounts relating to investments in affiliated funds in BUFR at August 31, 2024, and for the fiscal year then ended are as follows:
| | | | | Change in
Unrealized
Appreciation
(Depreciation) | | | |
FT Vest U.S. Equity Buffer ETF - January | | | | | | | | |
FT Vest U.S. Equity Buffer ETF - February | | | | | | | | |
FT Vest U.S. Equity Buffer ETF - March | | | | | | | | |
FT Vest U.S. Equity Buffer ETF - April | | | | | | | | |
FT Vest U.S. Equity Buffer ETF - May | | | | | | | | |
Notes to Financial Statements (Continued)
First Trust Exchange-Traded Fund VIIIAugust 31, 2024 | | | | | Change in Unrealized Appreciation (Depreciation) | | | |
FT Vest U.S. Equity Buffer ETF - June | | | | | | | | |
FT Vest U.S. Equity Buffer ETF - July | | | | | | | | |
FT Vest U.S. Equity Buffer ETF - August | | | | | | | | |
FT Vest U.S. Equity Buffer ETF - September | | | | | | | | |
FT Vest U.S. Equity Buffer ETF - October | | | | | | | | |
FT Vest U.S. Equity Buffer ETF - November | | | | | | | | |
FT Vest U.S. Equity Buffer ETF - December | | | | | | | | |
| | | | | | | | |
Amounts relating to investments in affiliated funds in BUFD at August 31, 2024, and for the fiscal year then ended are as follows:
| | | | | Change in
Unrealized
Appreciation
(Depreciation) | | | |
FT Vest U.S. Equity Deep Buffer ETF - January | | | | | | | | |
FT Vest U.S. Equity Deep Buffer ETF - February | | | | | | | | |
FT Vest U.S. Equity Deep Buffer ETF - March | | | | | | | | |
FT Vest U.S. Equity Deep Buffer ETF - April | | | | | | | | |
FT Vest U.S. Equity Deep Buffer ETF - May | | | | | | | | |
Notes to Financial Statements (Continued)
First Trust Exchange-Traded Fund VIIIAugust 31, 2024 | | | | | Change in Unrealized Appreciation (Depreciation) | | | |
FT Vest U.S. Equity Deep Buffer ETF - June | | | | | | | | |
FT Vest U.S. Equity Deep Buffer ETF - July | | | | | | | | |
FT Vest U.S. Equity Deep Buffer ETF - August | | | | | | | | |
FT Vest U.S. Equity Deep Buffer ETF - September | | | | | | | | |
FT Vest U.S. Equity Deep Buffer ETF - October | | | | | | | | |
FT Vest U.S. Equity Deep Buffer ETF - November | | | | | | | | |
FT Vest U.S. Equity Deep Buffer ETF - December | | | | | | | | |
| | | | | | | | |
Amounts relating to investments in affiliated funds in BUFQ at August 31, 2024, and for the fiscal year then ended are as follows:
| | | | | Change in
Unrealized
Appreciation
(Depreciation) | | | |
FT Vest Nasdaq-100® Buffer ETF - March | | | | | | | | |
FT Vest Nasdaq-100® Buffer ETF - June | | | | | | | | |
FT Vest Nasdaq-100® Buffer ETF - September | | | | | | | | |
FT Vest Nasdaq-100® Buffer ETF - December | | | | | | | | |
| | | | | | | | |
D. Dividends and Distributions to Shareholders
Dividends from net investment income of each Fund, if any, are declared and paid quarterly, or as the Board of Trustees may determine from time to time. Distributions of net realized capital gains earned by each Fund, if any, are distributed at least annually. Each Fund may also designate a portion of the amount paid to redeeming shareholders as a distribution for tax purposes.
Distributions from net investment income and realized capital gains are determined in accordance with federal income tax regulations, which may differ from U.S. GAAP. Certain capital accounts in the financial statements are periodically adjusted for permanent differences in order to reflect their tax character. These permanent differences are primarily due to the varying treatment of income and gain/loss on significantly modified portfolio securities held by the Funds and have no impact on net assets or NAV per share. Temporary differences, which arise from recognizing certain items of income, expense and gain/loss in different periods for financial statement and tax purposes, will reverse at some time in the future.
Notes to Financial Statements (Continued)
First Trust Exchange-Traded Fund VIIIAugust 31, 2024 There were no distributions paid during the fiscal year ended August 31, 2024.
As of August 31, 2024, the components of distributable earnings on a tax basis for each Fund were as follows:
| Undistributed
Ordinary
Income | Accumulated
Capital and
Other
Gain (Loss) | Net
Unrealized
Appreciation
(Depreciation) |
FT Vest Laddered Buffer ETF | | | |
FT Vest Laddered Deep Buffer ETF | | | |
FT Vest Laddered Nasdaq Buffer ETF | | | |
Each Fund intends to continue to qualify as a regulated investment company by complying with the requirements under Subchapter M of the Internal Revenue Code of 1986, as amended, which includes distributing substantially all of its net investment income and net realized gains to shareholders. Accordingly, no provision has been made for federal and state income taxes. However, due to the timing and amount of distributions, each Fund may be subject to an excise tax of 4% of the amount by which approximately 98% of each Fund’s taxable income exceeds the distributions from such taxable income for the calendar year.
The Funds are subject to accounting standards that establish a minimum threshold for recognizing, and a system for measuring, the benefits of a tax position taken or expected to be taken in a tax return. For BUFR and BUFD, the taxable years ended 2021, 2022, 2023, and 2024 remain open to federal and state audit. For BUFQ, the taxable years ended 2022, 2023 and 2024 remain open to federal and state audit. As of August 31, 2024, management has evaluated the application of these standards to the Funds and has determined that no provision for income tax is required in the Funds’ financial statements for uncertain tax positions.
Each Fund intends to utilize provisions of the federal income tax laws, which allow it to carry a realized capital loss forward indefinitely following the year of the loss and offset such loss against any future realized capital gains. Each Fund is subject to certain limitations under U.S. tax rules on the use of capital loss carryforwards and net unrealized built-in losses. These limitations apply when there has been a 50% change in ownership. At August 31, 2024, for federal income tax purposes, the Funds had no non-expiring capital loss carryforwards for federal income tax purposes.
Certain losses realized during the current taxable year may be deferred and treated as occurring on the first day of the following taxable year for federal income tax purposes. At August 31, 2024, the following Funds incurred and elected to defer net late year ordinary or capital losses as follows:
| Qualified Late Year Losses |
| | |
FT Vest Laddered Buffer ETF | | |
FT Vest Laddered Deep Buffer ETF | | |
FT Vest Laddered Nasdaq Buffer ETF | | |
| | |
In order to present paid-in capital and accumulated distributable earnings (loss) (which consists of accumulated net investment income (loss), accumulated net realized gain (loss) on investments and net unrealized appreciation (depreciation) on investments) on the Statements of Assets and Liabilities that more closely represent their tax character, certain adjustments have been made to paid-in capital, accumulated net investment income (loss) and accumulated net realized gain (loss) on investments. These adjustments are primarily due to the difference between book and tax treatments of income and gains on various investment securities held by the Funds and in-kind transactions. The results of operations and net assets were not affected by these adjustments. For the fiscal year ended August 31, 2024, the adjustments for each Fund were as follows:
| Accumulated
Net Investment
Income (Loss) | Accumulated
Net Realized
Gain (Loss)
on Investments | |
FT Vest Laddered Buffer ETF | | | |
FT Vest Laddered Deep Buffer ETF | | | |
Notes to Financial Statements (Continued)
First Trust Exchange-Traded Fund VIIIAugust 31, 2024 | Accumulated Net Investment Income (Loss) | Accumulated Net Realized Gain (Loss) on Investments | |
FT Vest Laddered Nasdaq Buffer ETF | | | |
As of August 31, 2024, the aggregate cost, gross unrealized appreciation, gross unrealized depreciation, and net unrealized appreciation/(depreciation) on investments (including short positions and derivatives, if any) for federal income tax purposes were as follows:
| | Gross Unrealized
Appreciation | Gross Unrealized
(Depreciation) | Net Unrealized
Appreciation
(Depreciation) |
FT Vest Laddered Buffer ETF | | | | |
FT Vest Laddered Deep Buffer ETF | | | | |
FT Vest Laddered Nasdaq Buffer ETF | | | | |
Expenses, other than the investment advisory fee and other excluded expenses, are paid by the Advisor (see Note 3).
3. Investment Advisory Fee, Affiliated Transactions and Other Fee Arrangements
First Trust, the investment advisor to the Funds, is a limited partnership with one limited partner, Grace Partners of DuPage L.P., and one general partner, The Charger Corporation. The Charger Corporation is an Illinois corporation controlled by James A. Bowen, Chief Executive Officer of First Trust. First Trust is responsible for the ongoing monitoring of the securities in each Fund’s portfolio, managing the Funds’ business affairs and providing certain administrative services necessary for the management of the Funds.
First Trust is paid an annual unitary management fee based on a percentage of each Fund’s average daily net assets. In addition, each Fund incurs pro rata share of fees and expenses attributable to investments in other investment companies (“acquired fund fees and expenses”). The total of the unitary management fee and acquired fund fees and expenses represents each Fund’s total annual operating expenses. The annual unitary management fee payable by each Fund to First Trust for these services will be reduced at certain levels of each Fund’s net assets (“breakpoints”) and calculated pursuant to the following schedule:
| |
Fund net assets up to and including $2.5 billion | |
Fund net assets greater than $2.5 billion up to and including $5 billion | |
Fund net assets greater than $5 billion up to and including $7.5 billion | |
Fund net assets greater than $7.5 billion up to and including $10 billion | |
Fund net assets greater than $10 billion up to and including $15 billion | |
Fund net assets greater than $15 billion | |
Effective August 1, 2024 for each Fund, the Advisor has agreed to waive management fees of 0.10% of average daily net assets until December 31, 2025. During any period in which such waiver is in effect, each Fund will not be eligible for any breakpoint discounts. During the fiscal year ended August 31, 2024, the Advisor waived fees of $412,702, $80,860 and $57,950 for BUFR, BUFD and BUFQ, respectively.
First Trust is responsible for each Fund’s expenses, including the cost of transfer agency, sub-advisory, custody, fund administration, legal, audit and other services, but excluding fee payments under the Investment Management Agreement, interest, taxes, acquired fund fees and expenses, if any, brokerage commissions and other expenses connected with the execution of portfolio transactions, distribution and service fees payable pursuant to a Rule 12b-1 plan, if any, and extraordinary expenses.
Vest Financial LLC (“Vest”), an affiliate of First Trust, serves as the Funds’ sub-advisor and manages each Fund’s portfolio subject to First Trust’s supervision. Pursuant to the Investment Management Agreement, between the Trust, on behalf of the Funds, and the Advisor, and the Investment Sub-Advisory Agreement among the Trust, on behalf of the Funds, the Advisor and Vest, First Trust will supervise Vest and its management of the investment of each Fund’s assets and will pay Vest for its services as the Funds’ sub-advisor a sub-advisory fee equal to 50% of the monthly unitary management fee paid to the Advisor, less Vest’s 50% share of each Fund’s expenses for that month. In the event the Sub-Advisor’s share of the expenses exceeds the amount of the sub-advisory fee in any
Notes to Financial Statements (Continued)
First Trust Exchange-Traded Fund VIIIAugust 31, 2024 month, the Sub-Advisor will pay the difference to the Advisor. During any period in which the Advisor’s management fee is reduced in accordance with the breakpoints described above, the investment sub-advisory fee (which is based on the Advisor’s management fee) paid to Vest will be reduced to reflect the reduction in the Advisor’s management fee.
The Trust has multiple service agreements with The Bank of New York Mellon (“BNY”). Under the service agreements, BNY performs custodial, fund accounting, certain administrative services, and transfer agency services for each Fund. As custodian, BNY is responsible for custody of each Fund’s assets. As fund accountant and administrator, BNY is responsible for maintaining the books and records of each Fund’s securities and cash. As transfer agent, BNY is responsible for maintaining shareholder records for each Fund. BNY is a subsidiary of The Bank of New York Mellon Corporation, a financial holding company.
Each Trustee who is not an officer or employee of First Trust, any sub-advisor or any of their affiliates (“Independent Trustees”) is paid a fixed annual retainer that is allocated equally among each fund in the First Trust Fund Complex. Each Independent Trustee is also paid an annual per fund fee that varies based on whether the fund is a closed-end or other actively managed fund, a target outcome fund or an index fund.
Additionally, the Chairs of the Audit Committee, Nominating and Governance Committee and Valuation Committee, the Vice Chair of the Audit Committee, the Lead Independent Trustee and the Vice Lead Independent Trustee are paid annual fees to serve in such capacities, with such compensation allocated pro rata among each fund in the First Trust Fund Complex based on net assets. Independent Trustees are reimbursed for travel and out-of-pocket expenses in connection with all meetings. The Committee Chairs, the Audit Committee Vice Chair, the Lead Independent Trustee and the Vice Lead Independent Trustee rotate periodically in serving in such capacities. The officers and “Interested” Trustee receive no compensation from the Trust for acting in such capacities.
4. Purchases and Sales of Securities
For the fiscal year ended August 31, 2024, the cost of purchases and proceeds from sales of investments for each Fund, excluding short-term investments and in-kind transactions, were as follows:
| | |
FT Vest Laddered Buffer ETF | | |
FT Vest Laddered Deep Buffer ETF | | |
FT Vest Laddered Nasdaq Buffer ETF | | |
For the fiscal year ended August 31, 2024, the cost of in-kind purchases and proceeds from in-kind sales for each Fund were as follows:
| | |
FT Vest Laddered Buffer ETF | | |
FT Vest Laddered Deep Buffer ETF | | |
FT Vest Laddered Nasdaq Buffer ETF | | |
5. Creations, Redemptions and Transaction Fees
Each Fund generally issues and redeems its shares in primary market transactions through a creation and redemption mechanism and does not sell or redeem individual shares. Instead, financial entities known as “Authorized Participants” have contractual arrangements with a Fund or one of the Fund’s service providers to purchase and redeem Fund shares directly with the Fund in Creation Units. Prior to the start of trading on every business day, a Fund publishes through the National Securities Clearing Corporation the “basket” of securities, cash or other assets that it will accept in exchange for a Creation Unit of the Fund’s shares. An Authorized Participant that wishes to effectuate a creation of a Fund’s shares deposits with the Fund the “basket” of securities, cash or other assets identified by the Fund that day, and then receives the Creation Unit of the Fund’s shares in return for those assets. After purchasing a Creation Unit, the Authorized Participant may continue to hold the Fund’s shares or sell them in the secondary market. The redemption process is the reverse of the purchase process: the Authorized Participant redeems a Creation Unit of a Fund’s shares for a basket of securities, cash or other assets. The combination of the creation and redemption process with secondary market trading in a Fund’s shares and underlying securities provides arbitrage opportunities that are designed to help keep the market price of a Fund’s shares at or close to the NAV per share of the Fund.
Each Fund imposes fees in connection with the purchase of Creation Units. These fees may vary based upon various fact-based circumstances, including, but not limited to, the composition of the securities included in the Creation Unit or the countries in which
Notes to Financial Statements (Continued)
First Trust Exchange-Traded Fund VIIIAugust 31, 2024 the transactions are settled. The price for each Creation Unit will equal the daily NAV per share of a Fund times the number of shares in a Creation Unit, plus the fees described above and, if applicable, any operational processing and brokerage costs, transfer fees, stamp taxes and part or all of the spread between the expected bid and offer side of the market related to the securities comprising the creation basket.
Each Fund also imposes fees in connection with the redemption of Creation Units. These fees may vary based upon various fact-based circumstances, including, but not limited to, the composition of the securities included in the Creation Unit or the countries in which the transactions are settled. The price received for each Creation Unit will equal the daily NAV per share of a Fund times the number of shares in a Creation Unit, minus the fees described above and, if applicable, any operational processing and brokerage costs, transfer fees, stamp taxes and part or all of the spread between the expected bid and offer side of the market related to the securities comprising the redemption basket. Investors who use the services of a broker or other such intermediary in addition to an Authorized Participant to effect a redemption of a Creation Unit may also be assessed an amount to cover the cost of such services. The redemption fee charged by a Fund will comply with Rule 22c-2 of the 1940 Act which limits redemption fees to no more than 2% of the value of the shares redeemed.
The Board of Trustees adopted a Distribution and Service Plan pursuant to Rule 12b-1 under the 1940 Act. In accordance with the Rule 12b-1 plan, the Funds are authorized to pay an amount up to 0.25% of their average daily net assets each year to reimburse First Trust Portfolios L.P. (“FTP”), the distributor of the Funds, for amounts expended to finance activities primarily intended to result in the sale of Creation Units or the provision of investor services. FTP may also use this amount to compensate securities dealers or other persons that are Authorized Participants for providing distribution assistance, including broker-dealer and shareholder support and educational and promotional services.
No 12b-1 fees are currently paid by the Funds, and pursuant to a contractual arrangement, no 12b-1 fees will be paid any time before December 31, 2025.
The Trust, on behalf of the Funds, has a variety of indemnification obligations under contracts with its service providers. The Trust’s maximum exposure under these arrangements is unknown. However, the Trust has not had prior claims or losses pursuant to these contracts and expects the risk of loss to be remote.
Management has evaluated the impact of all subsequent events on the Funds through the date the financial statements were issued and has determined that there were no subsequent events requiring recognition or disclosure in the financial statements that have not already been disclosed.
Report of Independent Registered Public Accounting Firm
To the Shareholders and Board of Trustees of First Trust Exchange-Traded Fund VIII:
Opinion on the Financial Statements and Financial Highlights
We have audited the accompanying statements of assets and liabilities, including the portfolios of investments, of FT Vest Laddered Buffer ETF (formerly known as FT Vest Fund of Buffer ETFs), FT Vest Laddered Deep Buffer ETF (formerly known as FT Vest Fund of Deep Buffer ETFs), and FT Vest Laddered Nasdaq Buffer ETF (formerly known as FT Vest Fund of Nasdaq-100® Buffer ETFs) (the “Funds”), each a series of the First Trust Exchange-Traded Fund VIII, as of August 31, 2024, the related statements of operations, the statements of changes in net assets, and the financial highlights for the periods indicated in the table below; and the related notes. In our opinion, the financial statements and financial highlights present fairly, in all material respects, the financial position of the Funds as of August 31, 2024, and the results of their operations, the changes in their net assets, and the financial highlights for the periods listed in the table below in conformity with accounting principles generally accepted in the United States of America.
Individual Funds Included
in the Trust | | Statements of Changes
in Net Assets | |
FT Vest Laddered Buffer ETF (formerly known as FT Vest Fund of Buffer ETFs) | For the year ended August 31, 2024 | For the years ended August 31, 2024 and 2023 | For the years ended August 31, 2024, 2023, 2022, and 2021, and for the period from August 10, 2020 (commencement of investment operations) through August 31, 2020 |
FT Vest Laddered Deep Buffer ETF (formerly known as FT Vest Fund of Deep Buffer ETFs) | For the year ended August 31, 2024 | For the years ended August 31, 2024 and 2023 | For the years ended August 31, 2024, 2023, and 2022, and for the period from January 20, 2021 (commencement of investment operations) through August 31, 2021 |
FT Vest Laddered Nasdaq Buffer ETF (formerly known as FT Vest Fund of Nasdaq-100® Buffer ETFs) | For the year ended August 31, 2024 | For the years ended August 31, 2024 and 2023 | For the years ended August 31, 2024, and 2023, and for the period from June 15, 2022 (commencement of investment operations) through August 31, 2022 |
These financial statements and financial highlights are the responsibility of the Funds’ management. Our responsibility is to express an opinion on the Funds’ financial statements and financial highlights based on our audits. We are a public accounting firm registered with the Public Company Accounting Oversight Board (United States) (PCAOB) and are required to be independent with respect to the Funds in accordance with the U.S. federal securities laws and the applicable rules and regulations of the Securities and Exchange Commission and the PCAOB.
We conducted our audits in accordance with the standards of the PCAOB. Those standards require that we plan and perform the audit to obtain reasonable assurance about whether the financial statements and financial highlights are free of material misstatement, whether due to error or fraud. The Funds are not required to have, nor were we engaged to perform, an audit of their internal control over financial reporting. As part of our audits, we are required to obtain an understanding of internal control over financial reporting but not for the purpose of expressing an opinion on the effectiveness of the Funds’ internal control over financial reporting. Accordingly, we express no such opinion.
Our audits included performing procedures to assess the risks of material misstatement of the financial statements and financial highlights, whether due to error or fraud, and performing procedures that respond to those risks. Such procedures included examining, on a test basis, evidence regarding the amounts and disclosures in the financial statements and financial highlights. Our audits also included evaluating the accounting principles used and significant estimates made by management, as well as evaluating the overall presentation of the financial statements and financial highlights. Our procedures included confirmation of securities owned as of August 31, 2024, by correspondence with the custodian and brokers; when replies were not received from brokers, we performed other auditing procedures. We believe that our audits provide a reasonable basis for our opinion.
/s/ Deloitte & Touche, LLP
Chicago, Illinois
October 24, 2024
We have served as the auditor of one or more First Trust investment companies since 2001.
First Trust Exchange-Traded Fund VIIIAugust 31, 2024 (Unaudited) Changes in and Disagreements with Accountants (Item 8 of Form N-CSR)
There were no changes in or disagreements with the Funds’ accountants during the fiscal year ended August 31, 2024.
Proxy Disclosures (Item 9 of Form N-CSR)
There were no matters submitted for vote by shareholders of any Fund during the fiscal year ended August 31, 2024.
Remuneration Paid to Directors, Officers, and Others (Item 10 of Form N-CSR)
Independent Trustees and any member of any advisory board of each Fund are compensated through the unitary management fee paid by each Fund to the advisor and not directly by each Fund. The investment advisory fee paid is included in the Statements of Operations.
Statement Regarding the Basis for the Board’s Approval of Investment Advisory Contract (Item 11 of Form N-CSR)
The Board of Trustees of First Trust Exchange-Traded Fund VIII (the “Trust”), including the Independent Trustees, unanimously approved the continuation of the Investment Management Agreement (the “Advisory Agreement”) with First Trust Advisors L.P. (the “Advisor”) and the Investment Sub-Advisory Agreement (the “Sub-Advisory Agreement” and together with the Advisory Agreement, the “Agreements”) among the Trust, the Advisor and Vest Financial LLC (the “Sub-Advisor”) on behalf of the following series of the Trust (each a “Fund” and collectively, the “Funds”):
FT Vest Laddered Buffer ETF (BUFR) (formerly known as FT Vest Fund of Buffer ETFs)
FT Vest Laddered Deep Buffer ETF (BUFD) (formerly known as FT Vest Fund of Deep Buffer ETFs)
FT Vest Laddered Nasdaq Buffer ETF (BUFQ) (formerly known as FT Vest Fund of Nasdaq-100® Buffer ETFs)
The Board approved the continuation of the Agreements for each Fund for a one-year period ending June 30, 2025 at a meeting held on June 2–3, 2024. The Board determined for each Fund that the continuation of the Agreements is in the best interests of the Fund in light of the nature, extent and quality of the services provided and such other matters as the Board considered to be relevant in the exercise of its business judgment.
To reach this determination for each Fund, the Board considered its duties under the Investment Company Act of 1940, as amended (the “1940 Act”), as well as under the general principles of state law, in reviewing and approving advisory contracts; the requirements of the 1940 Act in such matters; the fiduciary duty of investment advisors with respect to advisory agreements and compensation; the standards used by courts in determining whether investment company boards have fulfilled their duties; and the factors to be considered by the Board in voting on such agreements. At meetings held on April 16, 2024, April 25, 2024 and June 2–3, 2024, the Board, including the Independent Trustees, reviewed materials provided by the Advisor and the Sub-Advisor responding to requests for information from counsel to the Independent Trustees, submitted on behalf of the Independent Trustees, that, among other things, outlined: the services provided by the Advisor and the Sub-Advisor to each Fund (including the relevant personnel responsible for these services and their experience); the unitary fee rate schedule payable by each Fund as compared to fees charged to a peer group of funds (the “Expense Group”) and a broad peer universe of funds (the “Expense Universe”), each assembled by Broadridge Financial Solutions, Inc. (“Broadridge”), an independent source, and as compared to fees charged to other clients of the Advisor, including other exchange-traded funds (“ETFs”) managed by the Advisor; the sub-advisory fee as compared to fees charged to other clients of the Sub-Advisor; the expense ratio of each Fund as compared to expense ratios of the funds in the Fund’s Expense Group and Expense Universe; performance information for each Fund, including comparisons of each Fund’s performance to that of one or more relevant benchmark indexes and to that of a performance group of funds and a broad performance universe of funds (the “Performance Universe”), each assembled by Broadridge; the nature of expenses incurred in providing services to each Fund and the potential for the Advisor and the Sub-Advisor to realize economies of scale, if any; profitability and other financial data for the Advisor; financial data for the Sub-Advisor; any indirect benefits to the Advisor and its affiliates, First Trust Portfolios L.P. (“FTP”) and First Trust Capital Partners, LLC (“FTCP”), and the Sub-Advisor; and information on the Advisor’s and the Sub-Advisor’s compliance programs. The Board reviewed initial materials with the Advisor at the meeting held on April 25, 2024, prior to which the Independent Trustees and their counsel met separately to discuss the information provided by the Advisor and the Sub-Advisor. Following the April 25, 2024 meeting, counsel to the Independent Trustees, on behalf of the Independent Trustees, requested certain clarifications and supplements to the materials provided, and the information provided in response to those requests was considered at an executive session of the Independent Trustees and their counsel held prior to the June 2–3, 2024 meeting, as well as at the June meeting. The Board applied its business judgment to determine whether the arrangements between the Trust and the Advisor and among the Trust, the Advisor and the Sub-Advisor continue to be reasonable business arrangements from each Fund’s perspective. The Board determined that, given the
Other Information (Continued)
First Trust Exchange-Traded Fund VIIIAugust 31, 2024 (Unaudited) totality of the information provided with respect to the Agreements, the Board had received sufficient information to renew the Agreements. The Board considered that shareholders chose to invest or remain invested in a Fund knowing that the Advisor and the Sub-Advisor manage the Fund and knowing the Fund’s unitary fee.
In reviewing the Agreements for each Fund, the Board considered the nature, extent and quality of the services provided by the Advisor and the Sub-Advisor under the Agreements. With respect to the Advisory Agreement, the Board considered that the Advisor is responsible for the overall management and administration of the Trust and each Fund and reviewed all of the services provided by the Advisor to the Funds, including the oversight of the Sub-Advisor, as well as the background and experience of the persons responsible for such services. The Board noted that the Advisor oversees the Sub-Advisor’s day-to-day management of each Fund’s investments, including portfolio risk monitoring and performance review. In reviewing the services provided, the Board noted the compliance program that had been developed by the Advisor and considered that it includes a robust program for monitoring the Advisor’s, the Sub-Advisor’s and each Fund’s compliance with the 1940 Act, as well as each Fund’s compliance with its investment objective, policies and restrictions. The Board also considered a report from the Advisor with respect to its risk management functions related to the operation of the Funds. Finally, as part of the Board’s consideration of the Advisor’s services, the Advisor, in its written materials and at the April 25, 2024 meeting, described to the Board the scope of its ongoing investment in additional personnel and infrastructure to maintain and improve the quality of services provided to the Funds and the other funds in the First Trust Fund Complex. With respect to the Sub-Advisory Agreement, the Board noted that each Fund is an actively-managed ETF and the Sub-Advisor actively manages the Fund’s investments. The Board reviewed the materials provided by the Sub-Advisor and considered the services that the Sub-Advisor provides to each Fund, including the Sub-Advisor’s day-to-day management of the Funds’ investments. In considering the Sub-Advisor’s management of the Funds, the Board noted the background and experience of the Sub-Advisor’s portfolio management team, including the Board’s prior meetings with members of the portfolio management team. In light of the information presented and the considerations made, the Board concluded that the nature, extent and quality of the services provided to the Trust and each Fund by the Advisor and the Sub-Advisor under the Agreements have been and are expected to remain satisfactory and that the Sub-Advisor, under the oversight of the Advisor, has managed each Fund consistent with its investment objective, policies and restrictions.
The Board considered the unitary fee rate schedule payable by each Fund under the Advisory Agreement for the services provided. The Board noted that the sub-advisory fee for each Fund is paid by the Advisor from the Fund’s unitary fee. The Board considered that as part of the unitary fee the Advisor is responsible for each Fund’s expenses, including the cost of sub-advisory, transfer agency, custody, fund administration, legal, audit and other services and license fees, if any, but excluding the fee payment under the Advisory Agreement and interest, taxes, acquired fund fees and expenses, brokerage commissions and other expenses connected with the execution of portfolio transactions, distribution and service fees pursuant to a Rule 12b-1 plan, if any, and extraordinary expenses, if any. The Board noted that, because each Fund invests in underlying ETFs in the First Trust Fund Complex, it incurs acquired fund fees and expenses, which are not payable out of the unitary fee. The Board received and reviewed information showing the fee rates and expense ratios of the peer funds in the Expense Groups, as well as advisory and unitary fee rates charged by the Advisor and the Sub-Advisor to other fund (including ETFs) and non-fund clients, as applicable. Because each Fund pays a unitary fee, the Board determined that expense ratios were the most relevant comparative data point. Based on the information provided, the Board noted that the total (net) expense ratio (excluding acquired fund fees and expenses) for each Fund was below the median total (net) expense ratio (excluding acquired fund fees and expenses) of the peer funds in its respective Expense Group. The Board also noted that the total (net) expense ratio (including acquired fund fees and expenses) for each Fund was above the median total (net) expense ratio (including acquired fund fees and expenses) of the peer funds in its respective Expense Group. With respect to the Expense Groups, the Board discussed with Broadridge its methodology for assembling peer groups and discussed with the Advisor limitations in creating peer groups for actively-managed ETFs, including the limited number of actively-managed ETFs following a fund-of-funds options arbitrage/options strategy, and different business models that may affect the pricing of services among ETF sponsors. The Board also noted that, for each Fund, not all peer funds employ an advisor/sub-advisor management structure. The Board took these limitations and differences into account in considering the peer data. With respect to fees charged to other non-ETF clients, the Board considered differences between the Funds and other non-ETF clients that limited their comparability. In considering the unitary fee rate schedules overall, the Board also considered the Advisor’s statement that it seeks to meet investor needs through innovative and value-added investment solutions and the Advisor’s demonstrated long-term commitment to each Fund and the other funds in the First Trust Fund Complex.
The Board considered performance information for each Fund. The Board noted the process it has established for monitoring each Fund’s performance and portfolio risk on an ongoing basis, which includes quarterly performance reporting from the Advisor and the Sub-Advisor for the Funds. The Board determined that this process continues to be effective for reviewing each Fund’s performance. The Board received and reviewed information comparing each Fund’s performance for one or more periods ended December 31, 2023
Other Information (Continued)
First Trust Exchange-Traded Fund VIIIAugust 31, 2024 (Unaudited) to the performance of the funds in its respective Performance Universe and to that of a benchmark index. Based on the information provided, the Board noted that BUFR outperformed its Performance Universe median and underperformed its benchmark index for the one- and three-year periods ended December 31, 2023; that BUFD underperformed its Performance Universe median and benchmark index for the one-year period ended December 31, 2023; and that BUFQ outperformed its Performance Universe median and underperformed its benchmark index for the one-year period ended December 31, 2023. The Board also noted that each Fund invests substantially all of its assets in multiple target outcome ETFs in the First Trust Fund Complex sub-advised by the Sub-Advisor that seek to provide investors with returns (before fees and expenses) over a defined period of time (typically one year) that, for each of BUFR and BUFD, match the price return of the SPDR S&P 500 ETF Trust (“SPY”) and, for BUFQ, match the price return of the Invesco QQQ Trust, Series 1 (“QQQ”), up to a predetermined cap, while providing a buffer against certain losses on the price return of SPY or QQQ, as applicable, and considered that the investment strategy of the underlying ETFs limits the comparability of the performance of each Fund to that of the funds in its respective Performance Universe and its benchmark index.
On the basis of all the information provided on the unitary fee and performance of each Fund and the ongoing oversight by the Board, the Board concluded that the unitary fee for each Fund (out of which the Sub-Advisor is compensated) continues to be reasonable and appropriate in light of the nature, extent and quality of the services provided by the Advisor and the Sub-Advisor to each Fund under the Agreements.
The Board considered information and discussed with the Advisor whether there were any economies of scale in connection with providing advisory services to the Funds at current asset levels and whether the Funds may benefit from any economies of scale. The Board noted that the unitary fee rate schedule for each Fund includes breakpoints pursuant to which the unitary fee rate will be reduced as assets of the Fund meet certain thresholds. The Board considered the Advisor’s statement that it believes that its expenses relating to providing advisory services to the Funds will increase during the next twelve months as the Advisor continues to build infrastructure and add new staff. The Board also noted that under the unitary fee structure, any reduction in expenses associated with the management and operations of the Funds would benefit the Advisor, but that the unitary fee structure provides a level of certainty in expenses for shareholders of the Funds. The Board concluded that the unitary fee rate schedule for each Fund reflects an appropriate level of sharing of any economies of scale that may be realized in the management of the Fund at current asset levels. The Board considered the revenues and allocated costs (including the allocation methodology) of the Advisor in serving as investment advisor to each Fund for the twelve months ended December 31, 2023 and the estimated profitability level for each Fund calculated by the Advisor based on such data, as well as complex-wide and product-line profitability data, for the same period. The Board noted the inherent limitations in the profitability analysis and concluded that, based on the information provided, the Advisor’s profitability level for each Fund was not unreasonable. In addition, the Board considered indirect benefits described by the Advisor that may be realized from its relationship with the Funds. The Board considered that the Advisor had identified as an indirect benefit to the Advisor and FTP their exposure to investors and brokers who, absent their exposure to the Funds, may have had no dealings with the Advisor or FTP. The Board also noted that FTCP has a controlling ownership interest in the Sub-Advisor’s parent company and considered potential indirect benefits to the Advisor from such ownership interest. In addition, the Board considered that the Advisor, as the investment advisor to the underlying ETFs in which each Fund invests, will recognize additional revenue from the underlying ETFs if investment by the Funds causes the assets of the underlying ETFs to grow. The Board concluded that the character and amount of potential indirect benefits to the Advisor were not unreasonable.
The Board considered the Sub-Advisor’s statement that it believes that the sub-advisory fee for each Fund is appropriate. The Board noted the Sub-Advisor’s statements that it continues to invest in infrastructure, technology and personnel, and that it anticipates that its expenses relating to providing services to the Funds will remain approximately the same for the next twelve months. The Board noted that the Advisor pays the Sub-Advisor for each Fund from the unitary fee, that the sub-advisory fee will be reduced consistent with the breakpoints in the unitary fee rate schedule and its understanding that each Fund’s sub-advisory fee was the product of an arm’s length negotiation. The Board did not review the profitability of the Sub-Advisor with respect to each Fund. The Board concluded that the profitability analysis for the Advisor was more relevant. The Board considered the potential indirect benefits to the Sub-Advisor from being associated with the Advisor and the Funds, and noted the Sub-Advisor’s statements that it is the Sub-Advisor’s policy currently not to enter into soft-dollar arrangements for the procurement of research services in connection with client securities transactions and that, as a result, there are no foreseen indirect benefits from its relationship with the Funds. The Board also considered the potential indirect benefits to the Sub-Advisor from FTCP’s controlling ownership interest in the Sub-Advisor’s parent company. In addition, the Board considered that the Sub-Advisor, as the investment sub-advisor to the underlying ETFs in which each Fund invests, will recognize additional revenue from the underlying ETFs if investment by the Funds causes the assets of the underlying ETFs to grow. The Board concluded that the character and amount of potential indirect benefits to the Sub-Advisor were not unreasonable.
Other Information (Continued)
First Trust Exchange-Traded Fund VIIIAugust 31, 2024 (Unaudited) Based on all of the information considered and the conclusions reached, the Board, including the Independent Trustees, unanimously determined that the terms of the Agreements continue to be fair and reasonable and that the continuation of the Agreements is in the best interests of each Fund. No single factor was determinative in the Board’s analysis.
Remuneration Disclosure Under the Alternative Investment Fund Managers Directive
First Trust Advisors L.P. (“First Trust”) is authorised and regulated by the U.S. Securities and Exchange Commission and is entitled to market shares of certain First Trust Exchange-Traded Fund VIII funds it manages (the “Funds”) in certain member states in the European Economic Area in accordance with the cooperation arrangements in Article 42 of the Alternative Investment Fund Managers Directive (the “Directive”). First Trust is required under the Directive to make disclosures in respect of remuneration. The following disclosures are made in line with First Trust’s interpretation of currently available regulatory guidance on remuneration disclosures.
During the year ended December 31, 2023, the amount of remuneration paid (or to be paid) by First Trust Advisors L.P. in respect of the Funds is $1,049,728. This figure is comprised of $46,179 paid (or to be paid) in fixed compensation and $1,003,549 paid (or to be paid) in variable compensation. There were a total of 26 beneficiaries of the remuneration described above. Those amounts include $524,388 paid (or to be paid) to senior management of First Trust Advisors L.P. and $525,340 paid (or to be paid) to other employees whose professional activities have a material impact on the risk profiles of First Trust Advisors L.P. or the Funds (collectively, “Code Staff”).
Code Staff included in the aggregated figures disclosed above are rewarded in line with First Trust’s remuneration policy (the “Remuneration Policy”) which is determined and implemented by First Trust’s senior management. The Remuneration Policy reflects First Trust’s ethos of good governance and encapsulates the following principal objectives:
i.
to provide a clear link between remuneration and performance of First Trust and to avoid rewarding for failure;
ii.
to promote sound and effective risk management consistent with the risk profiles of the funds managed by First Trust; and
iii.
to remunerate staff in line with the business strategy, objectives, values and interests of First Trust and the funds managed by First Trust in a manner that avoids conflicts of interest.
First Trust assesses various risk factors which it is exposed to when considering and implementing remuneration for Code Staff and considers whether any potential award to such person(s) would give rise to a conflict of interest. First Trust does not reward failure, or consider the taking of risk or failure to take risk in its remuneration of Code Staff.
First Trust assesses performance for the purposes of determining payments in respect of performance-related remuneration of Code Staff by reference to a broad range of measures including (i) individual performance (using financial and non-financial criteria), and (ii) the overall performance of First Trust. Remuneration is not based upon the performance of the Funds.
The elements of remuneration are balanced between fixed and variable and the senior management sets fixed salaries at a level sufficient to ensure that variable remuneration incentivises and rewards strong individual performance but does not encourage excessive risk taking.
No individual is involved in setting his or her own remuneration.
There were no distributions made by each Fund during the taxable year ended August 31, 2024; therefore, no analysis for the corporate dividends received deduction and qualified dividend income was completed.
Annual Financial
Statements and
Other Information |
For the Period Ended
August 31, 2024 |
First Trust Exchange-Traded Fund VIII
FT Vest U.S. Equity Moderate Buffer ETF - January (GJAN) |
FT Vest U.S. Equity Moderate Buffer ETF - February (GFEB) |
FT Vest U.S. Small Cap Moderate Buffer ETF - February (SFEB) |
FT Vest U.S. Equity Buffer & Premium Income ETF - March (XIMR) |
FT Vest U.S. Equity Moderate Buffer ETF - March (GMAR) |
FT Vest U.S. Equity Moderate Buffer ETF - April (GAPR) |
FT Vest U.S. Equity Moderate Buffer ETF - May (GMAY) |
FT Vest U.S. Small Cap Moderate Buffer ETF - May (SMAY) |
FT Vest U.S. Equity Buffer & Premium Income ETF - June (XIJN) |
FT Vest U.S. Equity Moderate Buffer ETF - June (GJUN) |
FT Vest U.S. Equity Moderate Buffer ETF - July (GJUL) |
FT Vest U.S. Equity Moderate Buffer ETF - August (GAUG) |
FT Vest U.S. Small Cap Moderate Buffer ETF - August (SAUG) |
FT Vest U.S. Equity Buffer & Premium Income ETF - September (XISE) |
FT Vest U.S. Equity Moderate Buffer ETF - September (GSEP) |
FT Vest U.S. Equity Moderate Buffer ETF - October (GOCT) |
FT Vest U.S. Equity Moderate Buffer ETF - November (GNOV) |
FT Vest U.S. Small Cap Moderate Buffer ETF - November (SNOV) |
FT Vest U.S. Equity Buffer & Premium Income ETF - December (XIDE) |
FT Vest U.S. Equity Moderate Buffer ETF - December (GDEC) |
FT Vest Laddered Moderate Buffer ETF (BUFZ) |
FT Vest Laddered Small Cap Moderate Buffer ETF (BUFS) |
First Trust Exchange-Traded Fund VIII
Annual Financial Statements and Other Information
August 31, 2024
Performance and Risk Disclosure
There is no assurance that any series of First Trust Exchange-Traded Fund VIII (the “Trust”) described in this report (each such series is referred to as a “Fund” and collectively, as the “Funds”) will achieve its investment objective. Each Fund is subject to market risk, which is the possibility that the market values of securities owned by the Fund will decline and that the value of the Fund’s shares may therefore be less than what you paid for them. Accordingly, you can lose money by investing in a Fund.
Performance data quoted represents past performance, which is no guarantee of future results, and current performance may be lower or higher than the figures shown. For the most recent month-end performance figures, please visit www.ftportfolios.com or speak with your financial advisor. Investment returns, net asset value and share price will fluctuate and Fund shares, when sold, may be worth more or less than their original cost.
First Trust Advisors L.P., the Funds’ advisor, may also periodically provide additional information on Fund performance on each Fund’s webpage at www.ftportfolios.com.
This report contains information that may help you evaluate your investment. It includes details about each Fund and presents data that provides insight into each Fund’s performance and investment approach.
The material risks of investing in each Fund are spelled out in its prospectus, statement of additional information, and other Fund regulatory filings.
FT Vest U.S. Equity Moderate Buffer ETF - January (GJAN)Portfolio of InvestmentsAugust 31, 2024
| | |
MONEY MARKET FUNDS — 0.6% |
| Dreyfus Government Cash Management Fund, Institutional Shares - 5.19% (a) | |
| | |
| | |
| | |
| | | | | |
PURCHASED OPTIONS — 106.9% |
| Call Options Purchased — 106.2% | |
| | | | | |
| | | | | |
| Put Options Purchased — 0.7% | |
| | | | | |
| | | | | |
| | |
| | |
|
| Call Options Written — (7.1)% | |
| | | | | |
| (Premiums received $3,568,720) | | | | |
| Put Options Written — (0.3)% | |
| | | | | |
| (Premiums received $3,944,133) | | | | |
| | |
| (Premiums received $7,512,853) | |
| Net Other Assets and Liabilities — (0.1)% | |
| | |
| Rate shown reflects yield as of August 31, 2024. |
| |
| |
| |
| |
Net Other Assets and Liabilities | |
| |
See Notes to Financial Statements
FT Vest U.S. Equity Moderate Buffer ETF - January (GJAN)Portfolio of Investments (Continued)August 31, 2024
Valuation InputsA summary of the inputs used to value the Fund’s investments as of August 31, 2024 is as follows (see Note 2A - Portfolio Valuation in the Notes to Financial Statements):
|
| | | Level 2
Significant
Observable
Inputs | Level 3
Significant
Unobservable
Inputs |
| | | | |
| | | | |
| | | | |
|
| | | Level 2
Significant
Observable
Inputs | Level 3
Significant
Unobservable
Inputs |
| | | | |
See Notes to Financial Statements
FT Vest U.S. Equity Moderate Buffer ETF - February (GFEB)Portfolio of InvestmentsAugust 31, 2024
| | |
MONEY MARKET FUNDS — 0.7% |
| Dreyfus Government Cash Management Fund, Institutional Shares - 5.19% (a) | |
| | |
| | |
| | |
| | | | | |
PURCHASED OPTIONS — 104.3% |
| Call Options Purchased — 103.2% | |
| | | | | |
| | | | | |
| Put Options Purchased — 1.1% | |
| | | | | |
| | | | | |
| | |
| | |
|
| Call Options Written — (4.5)% | |
| | | | | |
| (Premiums received $7,209,631) | | | | |
| Put Options Written — (0.4)% | |
| | | | | |
| (Premiums received $5,438,243) | | | | |
| | |
| (Premiums received $12,647,874) | |
| Net Other Assets and Liabilities — (0.1)% | |
| | |
| Rate shown reflects yield as of August 31, 2024. |
| |
| |
| |
| |
Net Other Assets and Liabilities | |
| |
See Notes to Financial Statements
FT Vest U.S. Equity Moderate Buffer ETF - February (GFEB)Portfolio of Investments (Continued)August 31, 2024
Valuation InputsA summary of the inputs used to value the Fund’s investments as of August 31, 2024 is as follows (see Note 2A - Portfolio Valuation in the Notes to Financial Statements):
|
| | | Level 2
Significant
Observable
Inputs | Level 3
Significant
Unobservable
Inputs |
| | | | |
| | | | |
| | | | |
|
| | | Level 2
Significant
Observable
Inputs | Level 3
Significant
Unobservable
Inputs |
| | | | |
See Notes to Financial Statements
FT Vest U.S. Small Cap Moderate Buffer ETF - February (SFEB)Portfolio of InvestmentsAugust 31, 2024
| | |
MONEY MARKET FUNDS — 0.7% |
| Dreyfus Government Cash Management Fund, Institutional Shares - 5.19% (a) | |
| | |
| | |
| | |
| | | | | |
PURCHASED OPTIONS — 102.7% |
| Call Options Purchased — 100.5% | |
| | | | | |
| | | | | |
| Put Options Purchased — 2.2% | |
| | | | | |
| | | | | |
| | |
| | |
|
| Call Options Written — (2.7)% | |
| | | | | |
| (Premiums received $1,635,045) | | | | |
| Put Options Written — (0.6)% | |
| | | | | |
| (Premiums received $1,235,747) | | | | |
| | |
| (Premiums received $2,870,792) | |
| Net Other Assets and Liabilities — (0.1)% | |
| | |
| Rate shown reflects yield as of August 31, 2024. |
| |
| |
| |
| |
Net Other Assets and Liabilities | |
| |
See Notes to Financial Statements
FT Vest U.S. Small Cap Moderate Buffer ETF - February (SFEB)Portfolio of Investments (Continued)August 31, 2024
Valuation InputsA summary of the inputs used to value the Fund’s investments as of August 31, 2024 is as follows (see Note 2A - Portfolio Valuation in the Notes to Financial Statements):
|
| | | Level 2
Significant
Observable
Inputs | Level 3
Significant
Unobservable
Inputs |
| | | | |
| | | | |
| | | | |
|
| | | Level 2
Significant
Observable
Inputs | Level 3
Significant
Unobservable
Inputs |
| | | | |
See Notes to Financial Statements
FT Vest U.S. Equity Buffer & Premium Income ETF - March (XIMR)Portfolio of InvestmentsAugust 31, 2024
| | | | |
U.S. TREASURY BILLS — 3.8% |
| | | | |
| | | | |
| | | | |
| | | | |
| | | | |
| | | | |
| Total U.S. Treasury Bills | |
| | |
| | |
MONEY MARKET FUNDS — 1.2% |
| Dreyfus Government Cash Management Fund, Institutional Shares - 5.19% (b) | |
| | |
| | |
| | |
| | | | | |
PURCHASED OPTIONS — 109.3% |
| Call Options Purchased — 107.6% | |
| | | | | |
| | | | | |
| Put Options Purchased — 1.7% | |
| | | | | |
| | | | | |
| | |
| | |
WRITTEN OPTIONS — (14.2)% |
| Call Options Written — (13.4)% | |
| | | | | |
| (Premiums received $1,829,637) | | | | |
| Put Options Written — (0.8)% | |
| | | | | |
| (Premiums received $429,108) | | | | |
| | |
| (Premiums received $2,258,745) | |
| Net Other Assets and Liabilities — (0.1)% | |
| | |
| |
| Rate shown reflects yield as of August 31, 2024. |
See Notes to Financial Statements
FT Vest U.S. Equity Buffer & Premium Income ETF - March (XIMR)Portfolio of Investments (Continued)August 31, 2024 | |
| |
| |
| |
| |
Net Other Assets and Liabilities | |
| |
Valuation InputsA summary of the inputs used to value the Fund’s investments as of August 31, 2024 is as follows (see Note 2A - Portfolio Valuation in the Notes to Financial Statements):
|
| | | Level 2
Significant
Observable
Inputs | Level 3
Significant
Unobservable
Inputs |
| | | | |
| | | | |
| | | | |
| | | | |
| | | | |
|
| | | Level 2
Significant
Observable
Inputs | Level 3
Significant
Unobservable
Inputs |
| | | | |
See Notes to Financial Statements
FT Vest U.S. Equity Moderate Buffer ETF - March (GMAR)Portfolio of InvestmentsAugust 31, 2024
| | |
MONEY MARKET FUNDS — 0.8% |
| Dreyfus Government Cash Management Fund, Institutional Shares - 5.19% (a) | |
| | |
| | |
| | |
| | | | | |
PURCHASED OPTIONS — 103.2% |
| Call Options Purchased — 101.7% | |
| | | | | |
| | | | | |
| Put Options Purchased — 1.5% | |
| | | | | |
| | | | | |
| | |
| | |
|
| Call Options Written — (3.3)% | |
| | | | | |
| (Premiums received $6,501,807) | | | | |
| Put Options Written — (0.6)% | |
| | | | | |
| (Premiums received $5,350,663) | | | | |
| | |
| (Premiums received $11,852,470) | |
| Net Other Assets and Liabilities — (0.1)% | |
| | |
| Rate shown reflects yield as of August 31, 2024. |
| |
| |
| |
| |
Net Other Assets and Liabilities | |
| |
See Notes to Financial Statements
FT Vest U.S. Equity Moderate Buffer ETF - March (GMAR)Portfolio of Investments (Continued)August 31, 2024
Valuation InputsA summary of the inputs used to value the Fund’s investments as of August 31, 2024 is as follows (see Note 2A - Portfolio Valuation in the Notes to Financial Statements):
|
| | | Level 2
Significant
Observable
Inputs | Level 3
Significant
Unobservable
Inputs |
| | | | |
| | | | |
| | | | |
|
| | | Level 2
Significant
Observable
Inputs | Level 3
Significant
Unobservable
Inputs |
| | | | |
See Notes to Financial Statements
FT Vest U.S. Equity Moderate Buffer ETF - April (GAPR)Portfolio of InvestmentsAugust 31, 2024
| | |
MONEY MARKET FUNDS — 0.8% |
| Dreyfus Government Cash Management Fund, Institutional Shares - 5.19% (a) | |
| | |
| | |
| | |
| | | | | |
PURCHASED OPTIONS — 105.4% |
| Call Options Purchased — 104.0% | |
| | | | | |
| | | | | |
| Put Options Purchased — 1.4% | |
| | | | | |
| | | | | |
| | |
| | |
|
| Call Options Written — (5.5)% | |
| | | | | |
| (Premiums received $4,573,035) | | | | |
| Put Options Written — (0.6)% | |
| | | | | |
| (Premiums received $3,387,794) | | | | |
| | |
| (Premiums received $7,960,829) | |
| Net Other Assets and Liabilities — (0.1)% | |
| | |
| Rate shown reflects yield as of August 31, 2024. |
| |
| |
| |
| |
Net Other Assets and Liabilities | |
| |
See Notes to Financial Statements
FT Vest U.S. Equity Moderate Buffer ETF - April (GAPR)Portfolio of Investments (Continued)August 31, 2024
Valuation InputsA summary of the inputs used to value the Fund’s investments as of August 31, 2024 is as follows (see Note 2A - Portfolio Valuation in the Notes to Financial Statements):
|
| | | Level 2
Significant
Observable
Inputs | Level 3
Significant
Unobservable
Inputs |
| | | | |
| | | | |
| | | | |
|
| | | Level 2
Significant
Observable
Inputs | Level 3
Significant
Unobservable
Inputs |
| | | | |
See Notes to Financial Statements
FT Vest U.S. Equity Moderate Buffer ETF - May (GMAY)Portfolio of InvestmentsAugust 31, 2024
| | |
MONEY MARKET FUNDS — 0.9% |
| Dreyfus Government Cash Management Fund, Institutional Shares - 5.19% (a) | |
| | |
| | |
| | |
| | | | | |
PURCHASED OPTIONS — 102.7% |
| Call Options Purchased — 100.4% | |
| | | | | |
| | | | | |
| Put Options Purchased — 2.3% | |
| | | | | |
| | | | | |
| | |
| | |
|
| Call Options Written — (2.6)% | |
| | | | | |
| (Premiums received $4,272,444) | | | | |
| Put Options Written — (0.9)% | |
| | | | | |
| (Premiums received $4,009,791) | | | | |
| | |
| (Premiums received $8,282,235) | |
| Net Other Assets and Liabilities — (0.1)% | |
| | |
| Rate shown reflects yield as of August 31, 2024. |
| |
| |
| |
| |
Net Other Assets and Liabilities | |
| |
See Notes to Financial Statements
FT Vest U.S. Equity Moderate Buffer ETF - May (GMAY)Portfolio of Investments (Continued)August 31, 2024
Valuation InputsA summary of the inputs used to value the Fund’s investments as of August 31, 2024 is as follows (see Note 2A - Portfolio Valuation in the Notes to Financial Statements):
|
| | | Level 2
Significant
Observable
Inputs | Level 3
Significant
Unobservable
Inputs |
| | | | |
| | | | |
| | | | |
|
| | | Level 2
Significant
Observable
Inputs | Level 3
Significant
Unobservable
Inputs |
| | | | |
See Notes to Financial Statements
FT Vest U.S. Small Cap Moderate Buffer ETF - May (SMAY)Portfolio of InvestmentsAugust 31, 2024
| | |
MONEY MARKET FUNDS — 1.0% |
| Dreyfus Government Cash Management Fund, Institutional Shares - 5.19% (a) | |
| | |
| | |
| | |
| | | | | |
PURCHASED OPTIONS — 103.7% |
| Call Options Purchased — 99.9% | |
| | | | | |
| | | | | |
| Put Options Purchased — 3.8% | |
| | | | | |
| | | | | |
| | |
| | |
|
| Call Options Written — (3.3)% | |
| | | | | |
| (Premiums received $1,658,448) | | | | |
| Put Options Written — (1.3)% | |
| | | | | |
| (Premiums received $1,715,918) | | | | |
| | |
| (Premiums received $3,374,366) | |
| Net Other Assets and Liabilities — (0.1)% | |
| | |
| Rate shown reflects yield as of August 31, 2024. |
| |
| |
| |
| |
Net Other Assets and Liabilities | |
| |
See Notes to Financial Statements
FT Vest U.S. Small Cap Moderate Buffer ETF - May (SMAY)Portfolio of Investments (Continued)August 31, 2024
Valuation InputsA summary of the inputs used to value the Fund’s investments as of August 31, 2024 is as follows (see Note 2A - Portfolio Valuation in the Notes to Financial Statements):
|
| | | Level 2
Significant
Observable
Inputs | Level 3
Significant
Unobservable
Inputs |
| | | | |
| | | | |
| | | | |
|
| | | Level 2
Significant
Observable
Inputs | Level 3
Significant
Unobservable
Inputs |
| | | | |
See Notes to Financial Statements
FT Vest U.S. Equity Buffer & Premium Income ETF - June (XIJN)Portfolio of InvestmentsAugust 31, 2024
| | | | |
U.S. TREASURY BILLS — 5.7% |
| | | | |
| | | | |
| | | | |
| | | | |
| | | | |
| | | | |
| | | | |
| | | | |
| | | | |
| | | | |
| | | | |
| Total U.S. Treasury Bills | |
| | |
| | |
| | |
| | | | | |
PURCHASED OPTIONS — 104.5% |
| Call Options Purchased — 101.3% | |
| | | | | |
| | | | | |
| Put Options Purchased — 3.2% | |
| | | | | |
| | | | | |
| | |
| | |
WRITTEN OPTIONS — (11.0)% |
| Call Options Written — (9.4)% | |
| | | | | |
| (Premiums received $362,432) | | | | |
| Put Options Written — (1.6)% | |
| | | | | |
| (Premiums received $106,085) | | | | |
| | |
| (Premiums received $468,517) | |
| Net Other Assets and Liabilities — 0.8% | |
| | |
| |
| |
| |
| |
Net Other Assets and Liabilities | |
| |
See Notes to Financial Statements
FT Vest U.S. Equity Buffer & Premium Income ETF - June (XIJN)Portfolio of Investments (Continued)August 31, 2024
Valuation InputsA summary of the inputs used to value the Fund’s investments as of August 31, 2024 is as follows (see Note 2A - Portfolio Valuation in the Notes to Financial Statements):
|
| | | Level 2
Significant
Observable
Inputs | Level 3
Significant
Unobservable
Inputs |
| | | | |
| | | | |
| | | | |
|
| | | Level 2
Significant
Observable
Inputs | Level 3
Significant
Unobservable
Inputs |
| | | | |
See Notes to Financial Statements
FT Vest U.S. Equity Moderate Buffer ETF - June (GJUN)Portfolio of InvestmentsAugust 31, 2024
| | |
MONEY MARKET FUNDS — 1.0% |
| Dreyfus Government Cash Management Fund, Institutional Shares - 5.19% (a) | |
| | |
| | |
| | |
| | | | | |
PURCHASED OPTIONS — 102.1% |
| Call Options Purchased — 99.0% | |
| | | | | |
| | | | | |
| Put Options Purchased — 3.1% | |
| | | | | |
| | | | | |
| | |
| | |
|
| Call Options Written — (1.8)% | |
| | | | | |
| (Premiums received $10,182,060) | | | | |
| Put Options Written — (1.2)% | |
| | | | | |
| (Premiums received $8,023,460) | | | | |
| | |
| (Premiums received $18,205,520) | |
| Net Other Assets and Liabilities — (0.1)% | |
| | |
| Rate shown reflects yield as of August 31, 2024. |
| |
| |
| |
| |
Net Other Assets and Liabilities | |
| |
See Notes to Financial Statements
FT Vest U.S. Equity Moderate Buffer ETF - June (GJUN)Portfolio of Investments (Continued)August 31, 2024
Valuation InputsA summary of the inputs used to value the Fund’s investments as of August 31, 2024 is as follows (see Note 2A - Portfolio Valuation in the Notes to Financial Statements):
|
| | | Level 2
Significant
Observable
Inputs | Level 3
Significant
Unobservable
Inputs |
| | | | |
| | | | |
| | | | |
|
| | | Level 2
Significant
Observable
Inputs | Level 3
Significant
Unobservable
Inputs |
| | | | |
See Notes to Financial Statements
FT Vest U.S. Equity Moderate Buffer ETF - July (GJUL)Portfolio of InvestmentsAugust 31, 2024
| | |
MONEY MARKET FUNDS — 1.1% |
| Dreyfus Government Cash Management Fund, Institutional Shares - 5.19% (a) | |
| | |
| | |
| | |
| | | | | |
PURCHASED OPTIONS — 102.3% |
| Call Options Purchased — 98.8% | |
| | | | | |
| | | | | |
| Put Options Purchased — 3.5% | |
| | | | | |
| | | | | |
| | |
| | |
|
| Call Options Written — (2.0)% | |
| | | | | |
| (Premiums received $7,021,670) | | | | |
| Put Options Written — (1.3)% | |
| | | | | |
| (Premiums received $6,251,987) | | | | |
| | |
| (Premiums received $13,273,657) | |
| Net Other Assets and Liabilities — (0.1)% | |
| | |
| Rate shown reflects yield as of August 31, 2024. |
| |
| |
| |
| |
Net Other Assets and Liabilities | |
| |
See Notes to Financial Statements
FT Vest U.S. Equity Moderate Buffer ETF - July (GJUL)Portfolio of Investments (Continued)August 31, 2024
Valuation InputsA summary of the inputs used to value the Fund’s investments as of August 31, 2024 is as follows (see Note 2A - Portfolio Valuation in the Notes to Financial Statements):
|
| | | Level 2
Significant
Observable
Inputs | Level 3
Significant
Unobservable
Inputs |
| | | | |
| | | | |
| | | | |
|
| | | Level 2
Significant
Observable
Inputs | Level 3
Significant
Unobservable
Inputs |
| | | | |
See Notes to Financial Statements
FT Vest U.S. Equity Moderate Buffer ETF - August (GAUG)Portfolio of InvestmentsAugust 31, 2024
| | |
MONEY MARKET FUNDS — 1.1% |
| Dreyfus Government Cash Management Fund, Institutional Shares - 5.19% (a) | |
| | |
| | |
| | |
| | | | | |
PURCHASED OPTIONS — 102.8% |
| Call Options Purchased — 98.9% | |
| | | | | |
| | | | | |
| Put Options Purchased — 3.9% | |
| | | | | |
| | | | | |
| | |
| | |
|
| Call Options Written — (2.4)% | |
| | | | | |
| (Premiums received $2,915,205) | | | | |
| Put Options Written — (1.5)% | |
| | | | | |
| (Premiums received $3,628,864) | | | | |
| | |
| (Premiums received $6,544,069) | |
| Net Other Assets and Liabilities — (0.0)% | |
| | |
| Rate shown reflects yield as of August 31, 2024. |
| |
| |
| |
| |
Net Other Assets and Liabilities | |
| |
| Amount is less than 0.1%. |
See Notes to Financial Statements
FT Vest U.S. Equity Moderate Buffer ETF - August (GAUG)Portfolio of Investments (Continued)August 31, 2024
Valuation InputsA summary of the inputs used to value the Fund’s investments as of August 31, 2024 is as follows (see Note 2A - Portfolio Valuation in the Notes to Financial Statements):
|
| | | Level 2
Significant
Observable
Inputs | Level 3
Significant
Unobservable
Inputs |
| | | | |
| | | | |
| | | | |
|
| | | Level 2
Significant
Observable
Inputs | Level 3
Significant
Unobservable
Inputs |
| | | | |
See Notes to Financial Statements
FT Vest U.S. Small Cap Moderate Buffer ETF - August (SAUG)Portfolio of InvestmentsAugust 31, 2024
| | |
MONEY MARKET FUNDS — 1.1% |
| Dreyfus Government Cash Management Fund, Institutional Shares - 5.19% (a) | |
| | |
| | |
| | |
| | | | | |
PURCHASED OPTIONS — 104.7% |
| Call Options Purchased — 99.4% | |
| | | | | |
| | | | | |
| Put Options Purchased — 5.3% | |
| | | | | |
| | | | | |
| | |
| | |
|
| Call Options Written — (3.9)% | |
| | | | | |
| (Premiums received $1,821,714) | | | | |
| Put Options Written — (1.9)% | |
| | | | | |
| (Premiums received $1,354,424) | | | | |
| | |
| (Premiums received $3,176,138) | |
| Net Other Assets and Liabilities — 0.0% | |
| | |
| Rate shown reflects yield as of August 31, 2024. |
| |
| |
| |
| |
Net Other Assets and Liabilities | |
| |
| Amount is less than 0.1%. |
See Notes to Financial Statements
FT Vest U.S. Small Cap Moderate Buffer ETF - August (SAUG)Portfolio of Investments (Continued)August 31, 2024
Valuation InputsA summary of the inputs used to value the Fund’s investments as of August 31, 2024 is as follows (see Note 2A - Portfolio Valuation in the Notes to Financial Statements):
|
| | | Level 2
Significant
Observable
Inputs | Level 3
Significant
Unobservable
Inputs |
| | | | |
| | | | |
| | | | |
|
| | | Level 2
Significant
Observable
Inputs | Level 3
Significant
Unobservable
Inputs |
| | | | |
See Notes to Financial Statements
FT Vest U.S. Equity Buffer & Premium Income ETF - September (XISE)Portfolio of InvestmentsAugust 31, 2024
| | | | |
U.S. TREASURY BILLS — 0.6% |
| | | | |
| | | | |
| | |
MONEY MARKET FUNDS — 0.8% |
| Dreyfus Government Cash Management Fund, Institutional Shares - 5.19% (b) | |
| | |
| | |
| | |
| | | | | |
PURCHASED OPTIONS — 125.5% |
| Call Options Purchased — 125.5% | |
| | | | | |
| | | | | |
| Put Options Purchased — 0.0% | |
| | | | | |
| | | | | |
| | |
| | |
WRITTEN OPTIONS — (26.8)% |
| Call Options Written — (26.8)% | |
| | | | | |
| (Premiums received $11,034,374) | | | | |
| Put Options Written — (0.0)% | |
| | | | | |
| (Premiums received $1,247,835) | | | | |
| | |
| (Premiums received $12,282,209) | |
| Net Other Assets and Liabilities — (0.1)% | |
| | |
| |
| Rate shown reflects yield as of August 31, 2024. |
| |
| |
| |
| |
| |
Net Other Assets and Liabilities | |
| |
See Notes to Financial Statements
FT Vest U.S. Equity Buffer & Premium Income ETF - September (XISE)Portfolio of Investments (Continued)August 31, 2024
Valuation InputsA summary of the inputs used to value the Fund’s investments as of August 31, 2024 is as follows (see Note 2A - Portfolio Valuation in the Notes to Financial Statements):
|
| | | Level 2
Significant
Observable
Inputs | Level 3
Significant
Unobservable
Inputs |
| | | | |
| | | | |
| | | | |
| | | | |
| | | | |
|
| | | Level 2
Significant
Observable
Inputs | Level 3
Significant
Unobservable
Inputs |
| | | | |
See Notes to Financial Statements
FT Vest U.S. Equity Moderate Buffer ETF - September (GSEP)Portfolio of InvestmentsAugust 31, 2024
| | |
MONEY MARKET FUNDS — 0.3% |
| Dreyfus Government Cash Management Fund, Institutional Shares - 5.19% (a) | |
| | |
| | |
| | |
| | | | | |
PURCHASED OPTIONS — 110.8% |
| Call Options Purchased — 110.7% | |
| | | | | |
| | | | | |
| Put Options Purchased — 0.1% | |
| | | | | |
| | | | | |
| | |
| | |
WRITTEN OPTIONS — (11.0)% |
| Call Options Written — (11.0)% | |
| | | | | |
| (Premiums received $1,662,458) | | | | |
| Put Options Written — (0.0)% | |
| | | | | |
| (Premiums received $1,917,024) | | | | |
| | |
| (Premiums received $3,579,482) | |
| Net Other Assets and Liabilities — (0.1)% | |
| | |
| Rate shown reflects yield as of August 31, 2024. |
| |
| |
| |
| |
Net Other Assets and Liabilities | |
| |
See Notes to Financial Statements
FT Vest U.S. Equity Moderate Buffer ETF - September (GSEP)Portfolio of Investments (Continued)August 31, 2024
Valuation InputsA summary of the inputs used to value the Fund’s investments as of August 31, 2024 is as follows (see Note 2A - Portfolio Valuation in the Notes to Financial Statements):
|
| | | Level 2
Significant
Observable
Inputs | Level 3
Significant
Unobservable
Inputs |
| | | | |
| | | | |
| | | | |
|
| | | Level 2
Significant
Observable
Inputs | Level 3
Significant
Unobservable
Inputs |
| | | | |
See Notes to Financial Statements
FT Vest U.S. Equity Moderate Buffer ETF - October (GOCT)Portfolio of InvestmentsAugust 31, 2024
| | |
MONEY MARKET FUNDS — 0.4% |
| Dreyfus Government Cash Management Fund, Institutional Shares - 5.19% (a) | |
| | |
| | |
| | |
| | | | | |
PURCHASED OPTIONS — 116.5% |
| Call Options Purchased — 116.4% | |
| | | | | |
| | | | | |
| Put Options Purchased — 0.1% | |
| | | | | |
| | | | | |
| | |
| | |
WRITTEN OPTIONS — (16.8)% |
| Call Options Written — (16.7)% | |
| | | | | |
| (Premiums received $2,975,615) | | | | |
| Put Options Written — (0.1)% | |
| | | | | |
| (Premiums received $846,479) | | | | |
| | |
| (Premiums received $3,822,094) | |
| Net Other Assets and Liabilities — (0.1)% | |
| | |
| Rate shown reflects yield as of August 31, 2024. |
| |
| |
| |
| |
Net Other Assets and Liabilities | |
| |
See Notes to Financial Statements
FT Vest U.S. Equity Moderate Buffer ETF - October (GOCT)Portfolio of Investments (Continued)August 31, 2024
Valuation InputsA summary of the inputs used to value the Fund’s investments as of August 31, 2024 is as follows (see Note 2A - Portfolio Valuation in the Notes to Financial Statements):
|
| | | Level 2
Significant
Observable
Inputs | Level 3
Significant
Unobservable
Inputs |
| | | | |
| | | | |
| | | | |
|
| | | Level 2
Significant
Observable
Inputs | Level 3
Significant
Unobservable
Inputs |
| | | | |
See Notes to Financial Statements
FT Vest U.S. Equity Moderate Buffer ETF - November (GNOV)Portfolio of InvestmentsAugust 31, 2024
| | |
MONEY MARKET FUNDS — 0.4% |
| Dreyfus Government Cash Management Fund, Institutional Shares - 5.19% (a) | |
| | |
| | |
| | |
| | | | | |
PURCHASED OPTIONS — 111.0% |
| Call Options Purchased — 110.8% | |
| | | | | |
| | | | | |
| Put Options Purchased — 0.2% | |
| | | | | |
| | | | | |
| | |
| | |
WRITTEN OPTIONS — (11.3)% |
| Call Options Written — (11.2)% | |
| | | | | |
| (Premiums received $2,675,388) | | | | |
| Put Options Written — (0.1)% | |
| | | | | |
| (Premiums received $2,080,036) | | | | |
| | |
| (Premiums received $4,755,424) | |
| Net Other Assets and Liabilities — (0.1)% | |
| | |
| Rate shown reflects yield as of August 31, 2024. |
| |
| |
| |
| |
Net Other Assets and Liabilities | |
| |
See Notes to Financial Statements
FT Vest U.S. Equity Moderate Buffer ETF - November (GNOV)Portfolio of Investments (Continued)August 31, 2024
Valuation InputsA summary of the inputs used to value the Fund’s investments as of August 31, 2024 is as follows (see Note 2A - Portfolio Valuation in the Notes to Financial Statements):
|
| | | Level 2
Significant
Observable
Inputs | Level 3
Significant
Unobservable
Inputs |
| | | | |
| | | | |
| | | | |
|
| | | Level 2
Significant
Observable
Inputs | Level 3
Significant
Unobservable
Inputs |
| | | | |
See Notes to Financial Statements
FT Vest U.S. Small Cap Moderate Buffer ETF - November (SNOV)Portfolio of InvestmentsAugust 31, 2024
| | |
MONEY MARKET FUNDS — 0.5% |
| Dreyfus Government Cash Management Fund, Institutional Shares - 5.19% (a) | |
| | |
| | |
| | |
| | | | | |
PURCHASED OPTIONS — 107.6% |
| Call Options Purchased — 107.2% | |
| | | | | |
| | | | | |
| Put Options Purchased — 0.4% | |
| | | | | |
| | | | | |
| | |
| | |
|
| Call Options Written — (7.8)% | |
| | | | | |
| (Premiums received $774,034) | | | | |
| Put Options Written — (0.2)% | |
| | | | | |
| (Premiums received $282,805) | | | | |
| | |
| (Premiums received $1,056,839) | |
| Net Other Assets and Liabilities — (0.1)% | |
| | |
| Rate shown reflects yield as of August 31, 2024. |
| |
| |
| |
| |
Net Other Assets and Liabilities | |
| |
See Notes to Financial Statements
FT Vest U.S. Small Cap Moderate Buffer ETF - November (SNOV)Portfolio of Investments (Continued)August 31, 2024
Valuation InputsA summary of the inputs used to value the Fund’s investments as of August 31, 2024 is as follows (see Note 2A - Portfolio Valuation in the Notes to Financial Statements):
|
| | | Level 2
Significant
Observable
Inputs | Level 3
Significant
Unobservable
Inputs |
| | | | |
| | | | |
| | | | |
|
| | | Level 2
Significant
Observable
Inputs | Level 3
Significant
Unobservable
Inputs |
| | | | |
See Notes to Financial Statements
FT Vest U.S. Equity Buffer & Premium Income ETF - December (XIDE)Portfolio of InvestmentsAugust 31, 2024
| | | | |
U.S. TREASURY BILLS — 2.2% |
| | | | |
| | | | |
| | | | |
| Total U.S. Treasury Bills | |
| | |
| | |
MONEY MARKET FUNDS — 1.0% |
| Dreyfus Government Cash Management Fund, Institutional Shares - 5.19% (b) | |
| | |
| | |
| | |
| | | | | |
PURCHASED OPTIONS — 118.5% |
| Call Options Purchased — 118.0% | |
| | | | | |
| | | | | |
| Put Options Purchased — 0.5% | |
| | | | | |
| | | | | |
| | |
| | |
WRITTEN OPTIONS — (21.6)% |
| Call Options Written — (21.3)% | |
| | | | | |
| (Premiums received $2,146,002) | | | | |
| Put Options Written — (0.3)% | |
| | | | | |
| (Premiums received $363,765) | | | | |
| | |
| (Premiums received $2,509,767) | |
| Net Other Assets and Liabilities — (0.1)% | |
| | |
| |
| Rate shown reflects yield as of August 31, 2024. |
| |
| |
| |
| |
| |
Net Other Assets and Liabilities | |
| |
See Notes to Financial Statements
FT Vest U.S. Equity Buffer & Premium Income ETF - December (XIDE)Portfolio of Investments (Continued)August 31, 2024
Valuation InputsA summary of the inputs used to value the Fund’s investments as of August 31, 2024 is as follows (see Note 2A - Portfolio Valuation in the Notes to Financial Statements):
|
| | | Level 2
Significant
Observable
Inputs | Level 3
Significant
Unobservable
Inputs |
| | | | |
| | | | |
| | | | |
| | | | |
| | | | |
|
| | | Level 2
Significant
Observable
Inputs | Level 3
Significant
Unobservable
Inputs |
| | | | |
See Notes to Financial Statements
FT Vest U.S. Equity Moderate Buffer ETF - December (GDEC)Portfolio of InvestmentsAugust 31, 2024
| | |
MONEY MARKET FUNDS — 0.4% |
| Dreyfus Government Cash Management Fund, Institutional Shares - 5.19% (a) | |
| | |
| | |
| | |
| | | | | |
PURCHASED OPTIONS — 108.5% |
| Call Options Purchased — 108.0% | |
| | | | | |
| | | | | |
| Put Options Purchased — 0.5% | |
| | | | | |
| | | | | |
| | |
| | |
|
| Call Options Written — (8.6)% | |
| | | | | |
| (Premiums received $2,256,556) | | | | |
| Put Options Written — (0.2)% | |
| | | | | |
| (Premiums received $1,606,152) | | | | |
| | |
| (Premiums received $3,862,708) | |
| Net Other Assets and Liabilities — (0.1)% | |
| | |
| Rate shown reflects yield as of August 31, 2024. |
| |
| |
| |
| |
Net Other Assets and Liabilities | |
| |
See Notes to Financial Statements
FT Vest U.S. Equity Moderate Buffer ETF - December (GDEC)Portfolio of Investments (Continued)August 31, 2024
Valuation InputsA summary of the inputs used to value the Fund’s investments as of August 31, 2024 is as follows (see Note 2A - Portfolio Valuation in the Notes to Financial Statements):
|
| | | Level 2
Significant
Observable
Inputs | Level 3
Significant
Unobservable
Inputs |
| | | | |
| | | | |
| | | | |
|
| | | Level 2
Significant
Observable
Inputs | Level 3
Significant
Unobservable
Inputs |
| | | | |
See Notes to Financial Statements
FT Vest Laddered Moderate Buffer ETF (BUFZ)Portfolio of InvestmentsAugust 31, 2024
| | |
EXCHANGE-TRADED FUNDS — 100.0% |
| Capital Markets (a) — 100.0% | |
| FT Vest U.S. Equity Moderate Buffer ETF - January (b) | |
| FT Vest U.S. Equity Moderate Buffer ETF - February (b) | |
| FT Vest U.S. Equity Moderate Buffer ETF - March (b) | |
| FT Vest U.S. Equity Moderate Buffer ETF - April (b) | |
| FT Vest U.S. Equity Moderate Buffer ETF - May (b) | |
| FT Vest U.S. Equity Moderate Buffer ETF - June (b) | |
| FT Vest U.S. Equity Moderate Buffer ETF - July (b) | |
| FT Vest U.S. Equity Moderate Buffer ETF - August (b) | |
| FT Vest U.S. Equity Moderate Buffer ETF - September (b) | |
| FT Vest U.S. Equity Moderate Buffer ETF - October (b) | |
| FT Vest U.S. Equity Moderate Buffer ETF - November (b) | |
| FT Vest U.S. Equity Moderate Buffer ETF - December (b) | |
| Total Exchange-Traded Funds | |
| | |
MONEY MARKET FUNDS — 0.0% |
| Dreyfus Government Cash Management Fund, Institutional Shares - 5.19% (c) | |
| | |
|
|
| Total Investments — 100.0% | |
| | |
| Net Other Assets and Liabilities — (0.0)% | |
| | |
| Represents investments in affiliated funds. |
| Non-income producing security. |
| Rate shown reflects yield as of August 31, 2024. |
| |
| |
| |
Net Other Assets and Liabilities | |
| |
| Amount is less than 0.1%. |
Valuation InputsA summary of the inputs used to value the Fund’s investments as of August 31, 2024 is as follows (see Note 2A - Portfolio Valuation in the Notes to Financial Statements):
| | | Level 2
Significant
Observable
Inputs | Level 3
Significant
Unobservable
Inputs |
| | | | |
| | | | |
| | | | |
| See Portfolio of Investments for industry breakout. |
See Notes to Financial Statements
FT Vest Laddered Small Cap Moderate Buffer ETF (BUFS)Portfolio of InvestmentsAugust 31, 2024
| | |
EXCHANGE-TRADED FUNDS — 99.9% |
| Capital Markets (a) — 99.9% | |
| FT Vest U.S. Small Cap Moderate Buffer ETF - February (b) | |
| FT Vest U.S. Small Cap Moderate Buffer ETF - May (b) | |
| FT Vest U.S. Small Cap Moderate Buffer ETF - August (b) | |
| FT Vest U.S. Small Cap Moderate Buffer ETF - November (b) | |
| Total Exchange-Traded Funds | |
| | |
MONEY MARKET FUNDS — 0.1% |
| Dreyfus Government Cash Management Fund, Institutional Shares - 5.19% (c) | |
| | |
|
|
| Total Investments — 100.0% | |
| | |
| Net Other Assets and Liabilities — (0.0)% | |
| | |
| Represents investments in affiliated funds. |
| Non-income producing security. |
| Rate shown reflects yield as of August 31, 2024. |
| |
| |
| |
Net Other Assets and Liabilities | |
| |
| Amount is less than 0.1%. |
Valuation InputsA summary of the inputs used to value the Fund’s investments as of August 31, 2024 is as follows (see Note 2A - Portfolio Valuation in the Notes to Financial Statements):
| | | Level 2
Significant
Observable
Inputs | Level 3
Significant
Unobservable
Inputs |
| | | | |
| | | | |
| | | | |
| See Portfolio of Investments for industry breakout. |
See Notes to Financial Statements
This page intentionally left blank.
First Trust Exchange-Traded Fund VIIIStatements of Assets and Liabilities
August 31, 2024
| FT Vest U.S. Equity Moderate Buffer ETF - January
(GJAN) | FT Vest U.S. Equity Moderate Buffer ETF - February
(GFEB) | FT Vest U.S. Small Cap Moderate Buffer ETF - February
(SFEB) | FT Vest U.S. Equity Buffer & Premium Income ETF - March
(XIMR) |
| | | | |
Investments, at value - Unaffiliated | | | | |
Investments, at value - Affiliated | | | | |
Total investments, at value | | | | |
Options contracts purchased, at value | | | | |
| | | | |
| | | | |
| | | | |
| | | | |
Investment securities sold | | | | |
| | | | |
| | | | |
|
| | | | |
Options contracts written, at value | | | | |
| | | | |
| | | | |
| | | | |
Investment securities purchased | | | | |
| | | | |
| | | | |
| | | | |
|
| | | | |
| | | | |
| | | | |
Accumulated distributable earnings (loss) | | | | |
| | | | |
NET ASSET VALUE, per share | | | | |
Number of shares outstanding (unlimited number of shares authorized, par value $0.01 per share) | | | | |
Investments, at cost - Unaffiliated | | | | |
Investments, at cost - Affiliated | | | | |
Total investments, at cost | | | | |
Premiums paid on options contracts purchased | | | | |
Premiums received on options contracts written | | | | |
See Notes to Financial Statements
FT Vest U.S. Equity Moderate Buffer ETF - March
(GMAR) | FT Vest U.S. Equity Moderate Buffer ETF - April
(GAPR) | FT Vest U.S. Equity Moderate Buffer ETF - May
(GMAY) | FT Vest U.S. Small Cap Moderate Buffer ETF - May
(SMAY) | FT Vest U.S. Equity Buffer & Premium Income ETF - June
(XIJN) | FT Vest U.S. Equity Moderate Buffer ETF - June
(GJUN) |
| | | | | |
| | | | | |
| | | | | |
| | | | | |
| | | | | |
| | | | | |
| | | | | |
| | | | | |
| | | | | |
| | | | | |
| | | | | |
| | | | | |
|
| | | | | |
| | | | | |
| | | | | |
| | | | | |
| | | | | |
| | | | | |
| | | | | |
| | | | | |
| | | | | |
|
| | | | | |
| | | | | |
| | | | | |
| | | | | |
| | | | | |
| | | | | |
| | | | | |
| | | | | |
| | | | | |
| | | | | |
| | | | | |
| | | | | |
See Notes to Financial Statements
First Trust Exchange-Traded Fund VIIIStatements of Assets and Liabilities (Continued)
August 31, 2024
| FT Vest U.S. Equity Moderate Buffer ETF - July
(GJUL) | FT Vest U.S. Equity Moderate Buffer ETF - August
(GAUG) | FT Vest U.S. Small Cap Moderate Buffer ETF - August
(SAUG) | FT Vest U.S. Equity Buffer & Premium Income ETF - September
(XISE) |
| | | | |
Investments, at value - Unaffiliated | | | | |
Investments, at value - Affiliated | | | | |
Total investments, at value | | | | |
Options contracts purchased, at value | | | | |
| | | | |
| | | | |
| | | | |
| | | | |
Investment securities sold | | | | |
| | | | |
| | | | |
|
| | | | |
Options contracts written, at value | | | | |
| | | | |
| | | | |
| | | | |
Investment securities purchased | | | | |
| | | | |
| | | | |
| | | | |
|
| | | | |
| | | | |
| | | | |
Accumulated distributable earnings (loss) | | | | |
| | | | |
NET ASSET VALUE, per share | | | | |
Number of shares outstanding (unlimited number of shares authorized, par value $0.01 per share) | | | | |
Investments, at cost - Unaffiliated | | | | |
Investments, at cost - Affiliated | | | | |
Total investments, at cost | | | | |
Premiums paid on options contracts purchased | | | | |
Premiums received on options contracts written | | | | |
See Notes to Financial Statements
FT Vest U.S. Equity Moderate Buffer ETF - September
(GSEP) | FT Vest U.S. Equity Moderate Buffer ETF - October
(GOCT) | FT Vest U.S. Equity Moderate Buffer ETF - November
(GNOV) | FT Vest U.S. Small Cap Moderate Buffer ETF - November
(SNOV) | FT Vest U.S. Equity Buffer & Premium Income ETF - December
(XIDE) | FT Vest U.S. Equity Moderate Buffer ETF - December
(GDEC) |
| | | | | |
| | | | | |
| | | | | |
| | | | | |
| | | | | |
| | | | | |
| | | | | |
| | | | | |
| | | | | |
| | | | | |
| | | | | |
| | | | | |
|
| | | | | |
| | | | | |
| | | | | |
| | | | | |
| | | | | |
| | | | | |
| | | | | |
| | | | | |
| | | | | |
|
| | | | | |
| | | | | |
| | | | | |
| | | | | |
| | | | | |
| | | | | |
| | | | | |
| | | | | |
| | | | | |
| | | | | |
| | | | | |
| | | | | |
See Notes to Financial Statements
First Trust Exchange-Traded Fund VIIIStatements of Assets and Liabilities (Continued)
August 31, 2024
| FT Vest Laddered Moderate Buffer ETF
(BUFZ) | FT Vest Laddered Small Cap Moderate Buffer ETF
(BUFS) |
| | |
Investments, at value - Unaffiliated | | |
Investments, at value - Affiliated | | |
Total investments, at value | | |
Options contracts purchased, at value | | |
| | |
| | |
| | |
| | |
Investment securities sold | | |
| | |
| | |
|
| | |
Options contracts written, at value | | |
| | |
| | |
| | |
Investment securities purchased | | |
| | |
| | |
| | |
|
| | |
| | |
| | |
Accumulated distributable earnings (loss) | | |
| | |
NET ASSET VALUE, per share | | |
Number of shares outstanding (unlimited number of shares authorized, par value $0.01 per share) | | |
Investments, at cost - Unaffiliated | | |
Investments, at cost - Affiliated | | |
Total investments, at cost | | |
Premiums paid on options contracts purchased | | |
Premiums received on options contracts written | | |
See Notes to Financial Statements
This page intentionally left blank.
First Trust Exchange-Traded Fund VIIIStatements of Operations
For the Period Ended August 31, 2024
| FT Vest U.S. Equity Moderate Buffer ETF - January
(GJAN) | FT Vest U.S. Equity Moderate Buffer ETF - February
(GFEB) | FT Vest U.S. Small Cap Moderate Buffer ETF - February
(SFEB) (a) | FT Vest U.S. Equity Buffer & Premium Income ETF - March
(XIMR) (b) |
| | | | |
| | | | |
| | | | |
| | | | |
|
| | | | |
| | | | |
| | | | |
Less fees waived by the investment advisor | | | | |
| | | | |
NET INVESTMENT INCOME (LOSS) | | | | |
|
NET REALIZED AND UNREALIZED GAIN (LOSS): | | | | |
Net realized gain (loss) on: | | | | |
Investments - Unaffiliated | | | | |
| | | | |
In-kind redemptions - Affiliated | | | | |
Purchased options contracts | | | | |
Written options contracts | | | | |
In-kind redemptions - Purchased options contracts | | | | |
In-kind redemptions - Written options contracts | | | | |
| | | | |
Net change in unrealized appreciation (depreciation) on: | | | | |
Investments - Unaffiliated | | | | |
| | | | |
Purchased options contracts | | | | |
Written options contracts | | | | |
Net change in unrealized appreciation (depreciation) | | | | |
NET REALIZED AND UNREALIZED GAIN (LOSS) | | | | |
NET INCREASE (DECREASE) IN NET ASSETS RESULTING FROM OPERATIONS | | | | |
| Inception date is February 16, 2024, which is consistent with the commencement of investment operations and is the date the initial creation units were established. |
| Inception date is March 18, 2024, which is consistent with the commencement of investment operations and is the date the initial creation units were established. |
| Inception date is June 21, 2024, which is consistent with the commencement of investment operations and is the date the initial creation units were established. |
See Notes to Financial Statements
FT Vest U.S. Equity Moderate Buffer ETF - March
(GMAR) | FT Vest U.S. Equity Moderate Buffer ETF - April
(GAPR) | FT Vest U.S. Equity Moderate Buffer ETF - May
(GMAY) | FT Vest U.S. Small Cap Moderate Buffer ETF - May
(SMAY) | FT Vest U.S. Equity Buffer & Premium Income ETF - June
(XIJN) (c) | FT Vest U.S. Equity Moderate Buffer ETF - June
(GJUN) |
| | | | | |
| | | | | |
| | | | | |
| | | | | |
|
| | | | | |
| | | | | |
| | | | | |
| | | | | |
| | | | | |
| | | | | |
|
| | | | | |
| | | | | |
| | | | | |
| | | | | |
| | | | | |
| | | | | |
| | | | | |
| | | | | |
| | | | | |
| | | | | |
| | | | | |
| | | | | |
| | | | | |
| | | | | |
| | | | | |
| | | | | |
| | | | | |
| | | | | |
See Notes to Financial Statements
First Trust Exchange-Traded Fund VIIIStatements of Operations (Continued)
For the Period Ended August 31, 2024
| FT Vest U.S. Equity Moderate Buffer ETF - July
(GJUL) | FT Vest U.S. Equity Moderate Buffer ETF - August
(GAUG) | FT Vest U.S. Small Cap Moderate Buffer ETF - August
(SAUG) | FT Vest U.S. Equity Buffer & Premium Income ETF - September
(XISE) (d) |
| | | | |
| | | | |
| | | | |
| | | | |
|
| | | | |
| | | | |
| | | | |
Less fees waived by the investment advisor | | | | |
| | | | |
NET INVESTMENT INCOME (LOSS) | | | | |
|
NET REALIZED AND UNREALIZED GAIN (LOSS): | | | | |
Net realized gain (loss) on: | | | | |
Investments - Unaffiliated | | | | |
| | | | |
In-kind redemptions - Affiliated | | | | |
Purchased options contracts | | | | |
Written options contracts | | | | |
In-kind redemptions - Purchased options contracts | | | | |
In-kind redemptions - Written options contracts | | | | |
| | | | |
Net change in unrealized appreciation (depreciation) on: | | | | |
Investments - Unaffiliated | | | | |
| | | | |
Purchased options contracts | | | | |
Written options contracts | | | | |
Net change in unrealized appreciation (depreciation) | | | | |
NET REALIZED AND UNREALIZED GAIN (LOSS) | | | | |
NET INCREASE (DECREASE) IN NET ASSETS RESULTING FROM OPERATIONS | | | | |
| Inception date is September 15, 2023, which is consistent with the commencement of investment operations and is the date the initial creation units were established. |
| Inception date is October 20, 2023, which is consistent with the commencement of investment operations and is the date the initial creation units were established. |
| Inception date is November 17, 2023, which is consistent with the commencement of investment operations and is the date the initial creation units were established. |
| Inception date is December 15, 2023, which is consistent with the commencement of investment operations and is the date the initial creation units were established. |
See Notes to Financial Statements
FT Vest U.S. Equity Moderate Buffer ETF - September
(GSEP) (d) | FT Vest U.S. Equity Moderate Buffer ETF - October
(GOCT) (e) | FT Vest U.S. Equity Moderate Buffer ETF - November
(GNOV) (f) | FT Vest U.S. Small Cap Moderate Buffer ETF - November
(SNOV) (f) | FT Vest U.S. Equity Buffer & Premium Income ETF - December
(XIDE) (g) | FT Vest U.S. Equity Moderate Buffer ETF - December
(GDEC) (g) |
| | | | | |
| | | | | |
| | | | | |
| | | | | |
|
| | | | | |
| | | | | |
| | | | | |
| | | | | |
| | | | | |
| | | | | |
|
| | | | | |
| | | | | |
| | | | | |
| | | | | |
| | | | | |
| | | | | |
| | | | | |
| | | | | |
| | | | | |
| | | | | |
| | | | | |
| | | | | |
| | | | | |
| | | | | |
| | | | | |
| | | | | |
| | | | | |
| | | | | |
See Notes to Financial Statements
First Trust Exchange-Traded Fund VIIIStatements of Operations (Continued)
For the Period Ended August 31, 2024
| FT Vest Laddered Moderate Buffer ETF
(BUFZ) (h) | FT Vest Laddered Small Cap Moderate Buffer ETF
(BUFS) (i) |
| | |
| | |
| | |
| | |
|
| | |
| | |
| | |
Less fees waived by the investment advisor | | |
| | |
NET INVESTMENT INCOME (LOSS) | | |
|
NET REALIZED AND UNREALIZED GAIN (LOSS): | | |
Net realized gain (loss) on: | | |
Investments - Unaffiliated | | |
| | |
In-kind redemptions - Affiliated | | |
Purchased options contracts | | |
Written options contracts | | |
In-kind redemptions - Purchased options contracts | | |
In-kind redemptions - Written options contracts | | |
| | |
Net change in unrealized appreciation (depreciation) on: | | |
Investments - Unaffiliated | | |
| | |
Purchased options contracts | | |
Written options contracts | | |
Net change in unrealized appreciation (depreciation) | | |
NET REALIZED AND UNREALIZED GAIN (LOSS) | | |
NET INCREASE (DECREASE) IN NET ASSETS RESULTING FROM OPERATIONS | | |
| Inception date is October 25, 2023, which is consistent with the commencement of investment operations and is the date the initial creation units were established. |
| Inception date is May 29, 2024, which is consistent with the commencement of investment operations and is the date the initial creation units were established. |
See Notes to Financial Statements
This page intentionally left blank.
First Trust Exchange-Traded Fund VIIIStatements of Changes in Net Assets
| FT Vest U.S. Equity Moderate Buffer ETF - January (GJAN) | FT Vest U.S. Equity Moderate Buffer ETF - February (GFEB) |
| | | | |
| | | | |
Net investment income (loss) | | | | |
| | | | |
Net change in unrealized appreciation (depreciation) | | | | |
Net increase (decrease) in net assets resulting from operations | | | | |
|
DISTRIBUTIONS TO SHAREHOLDERS FROM: | | | | |
| | | | |
|
SHAREHOLDER TRANSACTIONS: | | | | |
Proceeds from shares sold | | | | |
| | | | |
Net increase (decrease) in net assets resulting from shareholder transactions | | | | |
Total increase (decrease) in net assets | | | | |
|
| | | | |
| | | | |
| | | | |
|
CHANGES IN SHARES OUTSTANDING: | | | | |
Shares outstanding, beginning of period | | | | |
| | | | |
| | | | |
Shares outstanding, end of period | | | | |
| Inception date is January 20, 2023, which is consistent with the commencement of investment operations and is the date the initial creation units were established. |
| Inception date is February 17, 2023, which is consistent with the commencement of investment operations and is the date the initial creation units were established. |
| Inception date is February 16, 2024, which is consistent with the commencement of investment operations and is the date the initial creation units were established. |
| Inception date is March 18, 2024, which is consistent with the commencement of investment operations and is the date the initial creation units were established. |
| Inception date is March 17, 2023, which is consistent with the commencement of investment operations and is the date the initial creation units were established. |
| Inception date is April 21, 2023, which is consistent with the commencement of investment operations and is the date the initial creation units were established. |
See Notes to Financial Statements
FT Vest U.S. Small Cap Moderate Buffer ETF - February (SFEB) | FT Vest U.S. Equity Buffer & Premium Income ETF - March (XIMR) | FT Vest U.S. Equity Moderate Buffer ETF - March (GMAR) | FT Vest U.S. Equity Moderate Buffer ETF - April (GAPR) |
| | | | | |
| | | | | |
| | | | | |
| | | | | |
| | | | | |
| | | | | |
|
| | | | | |
| | | | | |
|
| | | | | |
| | | | | |
| | | | | |
| | | | | |
| | | | | |
|
| | | | | |
| | | | | |
| | | | | |
|
| | | | | |
| | | | | |
| | | | | |
| | | | | |
| | | | | |
See Notes to Financial Statements
First Trust Exchange-Traded Fund VIIIStatements of Changes in Net Assets (Continued)
| FT Vest U.S. Equity Moderate Buffer ETF - May (GMAY) | FT Vest U.S. Small Cap Moderate Buffer ETF - May (SMAY) |
| | | | |
| | | | |
Net investment income (loss) | | | | |
| | | | |
Net change in unrealized appreciation (depreciation) | | | | |
Net increase (decrease) in net assets resulting from operations | | | | |
|
DISTRIBUTIONS TO SHAREHOLDERS FROM: | | | | |
| | | | |
|
SHAREHOLDER TRANSACTIONS: | | | | |
Proceeds from shares sold | | | | |
| | | | |
Net increase (decrease) in net assets resulting from shareholder transactions | | | | |
Total increase (decrease) in net assets | | | | |
|
| | | | |
| | | | |
| | | | |
|
CHANGES IN SHARES OUTSTANDING: | | | | |
Shares outstanding, beginning of period | | | | |
| | | | |
| | | | |
Shares outstanding, end of period | | | | |
| Inception date is May 19, 2023, which is consistent with the commencement of investment operations and is the date the initial creation units were established. |
| Inception date is June 21, 2024, which is consistent with the commencement of investment operations and is the date the initial creation units were established. |
| Inception date is June 16, 2023, which is consistent with the commencement of investment operations and is the date the initial creation units were established. |
| Inception date is July 21, 2023, which is consistent with the commencement of investment operations and is the date the initial creation units were established. |
See Notes to Financial Statements
FT Vest U.S. Equity Buffer & Premium Income ETF - June (XIJN) | FT Vest U.S. Equity Moderate Buffer ETF - June (GJUN) | FT Vest U.S. Equity Moderate Buffer ETF - July (GJUL) |
| | | | |
| | | | |
| | | | |
| | | | |
| | | | |
| | | | |
|
| | | | |
| | | | |
|
| | | | |
| | | | |
| | | | |
| | | | |
| | | | |
|
| | | | |
| | | | |
| | | | |
|
| | | | |
| | | | |
| | | | |
| | | | |
| | | | |
See Notes to Financial Statements
First Trust Exchange-Traded Fund VIIIStatements of Changes in Net Assets (Continued)
| FT Vest U.S. Equity Moderate Buffer ETF - August (GAUG) | FT Vest U.S. Small Cap Moderate Buffer ETF - August (SAUG) |
| | | | |
| | | | |
Net investment income (loss) | | | | |
| | | | |
Net change in unrealized appreciation (depreciation) | | | | |
Net increase (decrease) in net assets resulting from operations | | | | |
|
DISTRIBUTIONS TO SHAREHOLDERS FROM: | | | | |
| | | | |
|
SHAREHOLDER TRANSACTIONS: | | | | |
Proceeds from shares sold | | | | |
| | | | |
Net increase (decrease) in net assets resulting from shareholder transactions | | | | |
Total increase (decrease) in net assets | | | | |
|
| | | | |
| | | | |
| | | | |
|
CHANGES IN SHARES OUTSTANDING: | | | | |
Shares outstanding, beginning of period | | | | |
| | | | |
| | | | |
Shares outstanding, end of period | | | | |
| Inception date is August 18, 2023, which is consistent with the commencement of investment operations and is the date the initial creation units were established. |
| Inception date is September 15, 2023, which is consistent with the commencement of investment operations and is the date the initial creation units were established. |
| Inception date is October 20, 2023, which is consistent with the commencement of investment operations and is the date the initial creation units were established. |
| Inception date is November 17, 2023, which is consistent with the commencement of investment operations and is the date the initial creation units were established. |
| Inception date is December 15, 2023, which is consistent with the commencement of investment operations and is the date the initial creation units were established. |
See Notes to Financial Statements
FT Vest U.S. Equity Buffer & Premium Income ETF - September (XISE) | FT Vest U.S. Equity Moderate Buffer ETF - September (GSEP) | FT Vest U.S. Equity Moderate Buffer ETF - October (GOCT) | FT Vest U.S. Equity Moderate Buffer ETF - November (GNOV) | FT Vest U.S. Small Cap Moderate Buffer ETF - November (SNOV) | FT Vest U.S. Equity Buffer & Premium Income ETF - December (XIDE) |
| | | | | |
| | | | | |
| | | | | |
| | | | | |
| | | | | |
| | | | | |
|
| | | | | |
| | | | | |
|
| | | | | |
| | | | | |
| | | | | |
| | | | | |
| | | | | |
|
| | | | | |
| | | | | |
| | | | | |
|
| | | | | |
| | | | | |
| | | | | |
| | | | | |
| | | | | |
See Notes to Financial Statements
First Trust Exchange-Traded Fund VIIIStatements of Changes in Net Assets (Continued)
| FT Vest U.S. Equity Moderate Buffer ETF - December (GDEC) | FT Vest Laddered Moderate Buffer ETF (BUFZ) | FT Vest Laddered Small Cap Moderate Buffer ETF (BUFS) |
| | | |
| | | |
Net investment income (loss) | | | |
| | | |
Net change in unrealized appreciation (depreciation) | | | |
Net increase (decrease) in net assets resulting from operations | | | |
|
DISTRIBUTIONS TO SHAREHOLDERS FROM: | | | |
| | | |
|
SHAREHOLDER TRANSACTIONS: | | | |
Proceeds from shares sold | | | |
| | | |
Net increase (decrease) in net assets resulting from shareholder transactions | | | |
Total increase (decrease) in net assets | | | |
|
| | | |
| | | |
| | | |
|
CHANGES IN SHARES OUTSTANDING: | | | |
Shares outstanding, beginning of period | | | |
| | | |
| | | |
Shares outstanding, end of period | | | |
| Inception date is December 15, 2023, which is consistent with the commencement of investment operations and is the date the initial creation units were established. |
| Inception date is October 25, 2023, which is consistent with the commencement of investment operations and is the date the initial creation units were established. |
| Inception date is May 29, 2024, which is consistent with the commencement of investment operations and is the date the initial creation units were established. |
See Notes to Financial Statements
First Trust Exchange-Traded Fund VIIIFinancial Highlights
For a share outstanding throughout each period FT Vest U.S. Equity Moderate Buffer ETF - January (GJAN)
| | |
|
Net asset value, beginning of period | | |
Income from investment operations: | | |
Net investment income (loss) (b) | | |
Net realized and unrealized gain (loss) | | |
Total from investment operations | | |
Net asset value, end of period | | |
| | |
|
Ratios to average net assets/supplemental data: | | |
Net assets, end of period (in 000’s) | | |
Ratio of total expenses to average net assets | | |
Ratio of net investment income (loss) to average net assets | | |
Portfolio turnover rate (e) | | |
| Inception date is January 20, 2023, which is consistent with the commencement of investment operations and is the date the initial creation units were established. |
| Based on average shares outstanding. |
| Total return is calculated assuming an initial investment made at the net asset value at the beginning of the period, reinvestment of all distributions at net asset value during the period, and redemption at net asset value on the last day of the period. The returns presented do not reflect the deduction of taxes that a shareholder would pay on Fund distributions or the redemption or sale of Fund shares. Total return is calculated for the time period presented and is not annualized for periods of less than a year. |
| |
| Portfolio turnover is calculated for the time period presented and is not annualized for periods of less than a year and does not include securities received or delivered from processing creations or redemptions, derivatives and in-kind transactions. |
See Notes to Financial Statements
First Trust Exchange-Traded Fund VIIIFinancial Highlights (Continued)
For a share outstanding throughout each period FT Vest U.S. Equity Moderate Buffer ETF - February (GFEB)
| | |
|
Net asset value, beginning of period | | |
Income from investment operations: | | |
Net investment income (loss) (b) | | |
Net realized and unrealized gain (loss) | | |
Total from investment operations | | |
Net asset value, end of period | | |
| | |
|
Ratios to average net assets/supplemental data: | | |
Net assets, end of period (in 000’s) | | |
Ratio of total expenses to average net assets | | |
Ratio of net investment income (loss) to average net assets | | |
Portfolio turnover rate (e) | | |
| Inception date is February 17, 2023, which is consistent with the commencement of investment operations and is the date the initial creation units were established. |
| Based on average shares outstanding. |
| Total return is calculated assuming an initial investment made at the net asset value at the beginning of the period, reinvestment of all distributions at net asset value during the period, and redemption at net asset value on the last day of the period. The returns presented do not reflect the deduction of taxes that a shareholder would pay on Fund distributions or the redemption or sale of Fund shares. Total return is calculated for the time period presented and is not annualized for periods of less than a year. |
| |
| Portfolio turnover is calculated for the time period presented and is not annualized for periods of less than a year and does not include securities received or delivered from processing creations or redemptions, derivatives and in-kind transactions. |
See Notes to Financial Statements
First Trust Exchange-Traded Fund VIIIFinancial Highlights (Continued)
For a share outstanding throughout the period FT Vest U.S. Small Cap Moderate Buffer ETF - February (SFEB)
| |
|
Net asset value, beginning of period | |
Income from investment operations: | |
Net investment income (loss) (b) | |
Net realized and unrealized gain (loss) | |
Total from investment operations | |
Net asset value, end of period | |
| |
|
Ratios to average net assets/supplemental data: | |
Net assets, end of period (in 000’s) | |
Ratio of total expenses to average net assets | |
Ratio of net investment income (loss) to average net assets | |
Portfolio turnover rate (e) | |
| Inception date is February 16, 2024, which is consistent with the commencement of investment operations and is the date the initial creation units were established. |
| Based on average shares outstanding. |
| Total return is calculated assuming an initial investment made at the net asset value at the beginning of the period, reinvestment of all distributions at net asset value during the period, and redemption at net asset value on the last day of the period. The return presented does not reflect the deduction of taxes that a shareholder would pay on Fund distributions or the redemption or sale of Fund shares. Total return is calculated for the time period presented and is not annualized for periods of less than a year. |
| |
| Portfolio turnover is calculated for the time period presented and is not annualized for periods of less than a year and does not include securities received or delivered from processing creations or redemptions, derivatives and in-kind transactions. |
See Notes to Financial Statements
First Trust Exchange-Traded Fund VIIIFinancial Highlights (Continued)
For a share outstanding throughout the period FT Vest U.S. Equity Buffer & Premium Income ETF - March (XIMR)
| |
|
Net asset value, beginning of period | |
Income from investment operations: | |
Net investment income (loss) (b) | |
Net realized and unrealized gain (loss) | |
Total from investment operations | |
Distributions paid to shareholders from: | |
| |
Net asset value, end of period | |
| |
|
Ratios to average net assets/supplemental data: | |
Net assets, end of period (in 000’s) | |
Ratio of total expenses to average net assets | |
Ratio of net investment income (loss) to average net assets | |
Portfolio turnover rate (e) | |
| Inception date is March 18, 2024, which is consistent with the commencement of investment operations and is the date the initial creation units were established. |
| Based on average shares outstanding. |
| Total return is calculated assuming an initial investment made at the net asset value at the beginning of the period, reinvestment of all distributions at net asset value during the period, and redemption at net asset value on the last day of the period. The return presented does not reflect the deduction of taxes that a shareholder would pay on Fund distributions or the redemption or sale of Fund shares. Total return is calculated for the time period presented and is not annualized for periods of less than a year. |
| |
| Portfolio turnover is calculated for the time period presented and is not annualized for periods of less than a year and does not include securities received or delivered from processing creations or redemptions, derivatives and in-kind transactions. |
See Notes to Financial Statements
First Trust Exchange-Traded Fund VIIIFinancial Highlights (Continued)
For a share outstanding throughout each period FT Vest U.S. Equity Moderate Buffer ETF - March (GMAR)
| | |
|
Net asset value, beginning of period | | |
Income from investment operations: | | |
Net investment income (loss) (b) | | |
Net realized and unrealized gain (loss) | | |
Total from investment operations | | |
Net asset value, end of period | | |
| | |
|
Ratios to average net assets/supplemental data: | | |
Net assets, end of period (in 000’s) | | |
Ratio of total expenses to average net assets | | |
Ratio of net investment income (loss) to average net assets | | |
Portfolio turnover rate (e) | | |
| Inception date is March 17, 2023, which is consistent with the commencement of investment operations and is the date the initial creation units were established. |
| Based on average shares outstanding. |
| Total return is calculated assuming an initial investment made at the net asset value at the beginning of the period, reinvestment of all distributions at net asset value during the period, and redemption at net asset value on the last day of the period. The returns presented do not reflect the deduction of taxes that a shareholder would pay on Fund distributions or the redemption or sale of Fund shares. Total return is calculated for the time period presented and is not annualized for periods of less than a year. |
| |
| Portfolio turnover is calculated for the time period presented and is not annualized for periods of less than a year and does not include securities received or delivered from processing creations or redemptions, derivatives and in-kind transactions. |
See Notes to Financial Statements
First Trust Exchange-Traded Fund VIIIFinancial Highlights (Continued)
For a share outstanding throughout each period FT Vest U.S. Equity Moderate Buffer ETF - April (GAPR)
| | |
|
Net asset value, beginning of period | | |
Income from investment operations: | | |
Net investment income (loss) (b) | | |
Net realized and unrealized gain (loss) | | |
Total from investment operations | | |
Net asset value, end of period | | |
| | |
|
Ratios to average net assets/supplemental data: | | |
Net assets, end of period (in 000’s) | | |
Ratio of total expenses to average net assets | | |
Ratio of net investment income (loss) to average net assets | | |
Portfolio turnover rate (e) | | |
| Inception date is April 21, 2023, which is consistent with the commencement of investment operations and is the date the initial creation units were established. |
| Based on average shares outstanding. |
| Total return is calculated assuming an initial investment made at the net asset value at the beginning of the period, reinvestment of all distributions at net asset value during the period, and redemption at net asset value on the last day of the period. The returns presented do not reflect the deduction of taxes that a shareholder would pay on Fund distributions or the redemption or sale of Fund shares. Total return is calculated for the time period presented and is not annualized for periods of less than a year. |
| |
| Portfolio turnover is calculated for the time period presented and is not annualized for periods of less than a year and does not include securities received or delivered from processing creations or redemptions, derivatives and in-kind transactions. |
See Notes to Financial Statements
First Trust Exchange-Traded Fund VIIIFinancial Highlights (Continued)
For a share outstanding throughout each period FT Vest U.S. Equity Moderate Buffer ETF - May (GMAY)
| | |
|
Net asset value, beginning of period | | |
Income from investment operations: | | |
Net investment income (loss) (b) | | |
Net realized and unrealized gain (loss) | | |
Total from investment operations | | |
Net asset value, end of period | | |
| | |
|
Ratios to average net assets/supplemental data: | | |
Net assets, end of period (in 000’s) | | |
Ratio of total expenses to average net assets | | |
Ratio of net investment income (loss) to average net assets | | |
Portfolio turnover rate (e) | | |
| Inception date is May 19, 2023, which is consistent with the commencement of investment operations and is the date the initial creation units were established. |
| Based on average shares outstanding. |
| Total return is calculated assuming an initial investment made at the net asset value at the beginning of the period, reinvestment of all distributions at net asset value during the period, and redemption at net asset value on the last day of the period. The returns presented do not reflect the deduction of taxes that a shareholder would pay on Fund distributions or the redemption or sale of Fund shares. Total return is calculated for the time period presented and is not annualized for periods of less than a year. |
| |
| Portfolio turnover is calculated for the time period presented and is not annualized for periods of less than a year and does not include securities received or delivered from processing creations or redemptions, derivatives and in-kind transactions. |
See Notes to Financial Statements
First Trust Exchange-Traded Fund VIIIFinancial Highlights (Continued)
For a share outstanding throughout each period FT Vest U.S. Small Cap Moderate Buffer ETF - May (SMAY)
| | |
|
Net asset value, beginning of period | | |
Income from investment operations: | | |
Net investment income (loss) (b) | | |
Net realized and unrealized gain (loss) | | |
Total from investment operations | | |
Net asset value, end of period | | |
| | |
|
Ratios to average net assets/supplemental data: | | |
Net assets, end of period (in 000’s) | | |
Ratio of total expenses to average net assets | | |
Ratio of net investment income (loss) to average net assets | | |
Portfolio turnover rate (e) | | |
| Inception date is May 19, 2023, which is consistent with the commencement of investment operations and is the date the initial creation units were established. |
| Based on average shares outstanding. |
| Total return is calculated assuming an initial investment made at the net asset value at the beginning of the period, reinvestment of all distributions at net asset value during the period, and redemption at net asset value on the last day of the period. The returns presented do not reflect the deduction of taxes that a shareholder would pay on Fund distributions or the redemption or sale of Fund shares. Total return is calculated for the time period presented and is not annualized for periods of less than a year. |
| |
| Portfolio turnover is calculated for the time period presented and is not annualized for periods of less than a year and does not include securities received or delivered from processing creations or redemptions, derivatives and in-kind transactions. |
See Notes to Financial Statements
First Trust Exchange-Traded Fund VIIIFinancial Highlights (Continued)
For a share outstanding throughout the period FT Vest U.S. Equity Buffer & Premium Income ETF - June (XIJN)
| |
|
Net asset value, beginning of period | |
Income from investment operations: | |
Net investment income (loss) (b) | |
Net realized and unrealized gain (loss) | |
Total from investment operations | |
Distributions paid to shareholders from: | |
| |
Net asset value, end of period | |
| |
|
Ratios to average net assets/supplemental data: | |
Net assets, end of period (in 000’s) | |
Ratio of total expenses to average net assets | |
Ratio of net investment income (loss) to average net assets | |
Portfolio turnover rate (e) | |
| Inception date is June 21, 2024, which is consistent with the commencement of investment operations and is the date the initial creation units were established. |
| Based on average shares outstanding. |
| Total return is calculated assuming an initial investment made at the net asset value at the beginning of the period, reinvestment of all distributions at net asset value during the period, and redemption at net asset value on the last day of the period. The return presented does not reflect the deduction of taxes that a shareholder would pay on Fund distributions or the redemption or sale of Fund shares. Total return is calculated for the time period presented and is not annualized for periods of less than a year. |
| |
| Portfolio turnover is calculated for the time period presented and is not annualized for periods of less than a year and does not include securities received or delivered from processing creations or redemptions, derivatives and in-kind transactions. |
See Notes to Financial Statements
First Trust Exchange-Traded Fund VIIIFinancial Highlights (Continued)
For a share outstanding throughout each period FT Vest U.S. Equity Moderate Buffer ETF - June (GJUN)
| | |
|
Net asset value, beginning of period | | |
Income from investment operations: | | |
Net investment income (loss) (b) | | |
Net realized and unrealized gain (loss) | | |
Total from investment operations | | |
Net asset value, end of period | | |
| | |
|
Ratios to average net assets/supplemental data: | | |
Net assets, end of period (in 000’s) | | |
Ratio of total expenses to average net assets | | |
Ratio of net investment income (loss) to average net assets | | |
Portfolio turnover rate (e) | | |
| Inception date is June 16, 2023, which is consistent with the commencement of investment operations and is the date the initial creation units were established. |
| Based on average shares outstanding. |
| Total return is calculated assuming an initial investment made at the net asset value at the beginning of the period, reinvestment of all distributions at net asset value during the period, and redemption at net asset value on the last day of the period. The returns presented do not reflect the deduction of taxes that a shareholder would pay on Fund distributions or the redemption or sale of Fund shares. Total return is calculated for the time period presented and is not annualized for periods of less than a year. |
| |
| Portfolio turnover is calculated for the time period presented and is not annualized for periods of less than a year and does not include securities received or delivered from processing creations or redemptions, derivatives and in-kind transactions. |
See Notes to Financial Statements
First Trust Exchange-Traded Fund VIIIFinancial Highlights (Continued)
For a share outstanding throughout each period FT Vest U.S. Equity Moderate Buffer ETF - July (GJUL)
| | |
|
Net asset value, beginning of period | | |
Income from investment operations: | | |
Net investment income (loss) (b) | | |
Net realized and unrealized gain (loss) | | |
Total from investment operations | | |
Net asset value, end of period | | |
| | |
|
Ratios to average net assets/supplemental data: | | |
Net assets, end of period (in 000’s) | | |
Ratio of total expenses to average net assets | | |
Ratio of net investment income (loss) to average net assets | | |
Portfolio turnover rate (e) | | |
| Inception date is July 21, 2023, which is consistent with the commencement of investment operations and is the date the initial creation units were established. |
| Based on average shares outstanding. |
| Total return is calculated assuming an initial investment made at the net asset value at the beginning of the period, reinvestment of all distributions at net asset value during the period, and redemption at net asset value on the last day of the period. The returns presented do not reflect the deduction of taxes that a shareholder would pay on Fund distributions or the redemption or sale of Fund shares. Total return is calculated for the time period presented and is not annualized for periods of less than a year. |
| |
| Portfolio turnover is calculated for the time period presented and is not annualized for periods of less than a year and does not include securities received or delivered from processing creations or redemptions, derivatives and in-kind transactions. |
See Notes to Financial Statements
First Trust Exchange-Traded Fund VIIIFinancial Highlights (Continued)
For a share outstanding throughout each period FT Vest U.S. Equity Moderate Buffer ETF - August (GAUG)
| | |
|
Net asset value, beginning of period | | |
Income from investment operations: | | |
Net investment income (loss) (b) | | |
Net realized and unrealized gain (loss) | | |
Total from investment operations | | |
Net asset value, end of period | | |
| | |
|
Ratios to average net assets/supplemental data: | | |
Net assets, end of period (in 000’s) | | |
Ratio of total expenses to average net assets | | |
Ratio of net investment income (loss) to average net assets | | |
Portfolio turnover rate (e) | | |
| Inception date is August 18, 2023, which is consistent with the commencement of investment operations and is the date the initial creation units were established. |
| Based on average shares outstanding. |
| Total return is calculated assuming an initial investment made at the net asset value at the beginning of the period, reinvestment of all distributions at net asset value during the period, and redemption at net asset value on the last day of the period. The returns presented do not reflect the deduction of taxes that a shareholder would pay on Fund distributions or the redemption or sale of Fund shares. Total return is calculated for the time period presented and is not annualized for periods of less than a year. |
| |
| Portfolio turnover is calculated for the time period presented and is not annualized for periods of less than a year and does not include securities received or delivered from processing creations or redemptions, derivatives and in-kind transactions. |
See Notes to Financial Statements
First Trust Exchange-Traded Fund VIIIFinancial Highlights (Continued)
For a share outstanding throughout each period FT Vest U.S. Small Cap Moderate Buffer ETF - August (SAUG)
| | |
|
Net asset value, beginning of period | | |
Income from investment operations: | | |
Net investment income (loss) (b) | | |
Net realized and unrealized gain (loss) | | |
Total from investment operations | | |
Net asset value, end of period | | |
| | |
|
Ratios to average net assets/supplemental data: | | |
Net assets, end of period (in 000’s) | | |
Ratio of total expenses to average net assets | | |
Ratio of net investment income (loss) to average net assets | | |
Portfolio turnover rate (f) | | |
| Inception date is August 18, 2023, which is consistent with the commencement of investment operations and is the date the initial creation units were established. |
| Based on average shares outstanding. |
| Amount represents less than $0.01. |
| Total return is calculated assuming an initial investment made at the net asset value at the beginning of the period, reinvestment of all distributions at net asset value during the period, and redemption at net asset value on the last day of the period. The returns presented do not reflect the deduction of taxes that a shareholder would pay on Fund distributions or the redemption or sale of Fund shares. Total return is calculated for the time period presented and is not annualized for periods of less than a year. |
| |
| Portfolio turnover is calculated for the time period presented and is not annualized for periods of less than a year and does not include securities received or delivered from processing creations or redemptions, derivatives and in-kind transactions. |
See Notes to Financial Statements
First Trust Exchange-Traded Fund VIIIFinancial Highlights (Continued)
For a share outstanding throughout the period FT Vest U.S. Equity Buffer & Premium Income ETF - September (XISE)
| |
|
Net asset value, beginning of period | |
Income from investment operations: | |
Net investment income (loss) (b) | |
Net realized and unrealized gain (loss) | |
Total from investment operations | |
Distributions paid to shareholders from: | |
| |
Net asset value, end of period | |
| |
|
Ratios to average net assets/supplemental data: | |
Net assets, end of period (in 000’s) | |
Ratio of total expenses to average net assets | |
Ratio of net investment income (loss) to average net assets | |
Portfolio turnover rate (e) | |
| Inception date is September 15, 2023, which is consistent with the commencement of investment operations and is the date the initial creation units were established. |
| Based on average shares outstanding. |
| Total return is calculated assuming an initial investment made at the net asset value at the beginning of the period, reinvestment of all distributions at net asset value during the period, and redemption at net asset value on the last day of the period. The return presented does not reflect the deduction of taxes that a shareholder would pay on Fund distributions or the redemption or sale of Fund shares. Total return is calculated for the time period presented and is not annualized for periods of less than a year. |
| |
| Portfolio turnover is calculated for the time period presented and is not annualized for periods of less than a year and does not include securities received or delivered from processing creations or redemptions, derivatives and in-kind transactions. |
See Notes to Financial Statements
First Trust Exchange-Traded Fund VIIIFinancial Highlights (Continued)
For a share outstanding throughout the period FT Vest U.S. Equity Moderate Buffer ETF - September (GSEP)
| |
|
Net asset value, beginning of period | |
Income from investment operations: | |
Net investment income (loss) (b) | |
Net realized and unrealized gain (loss) | |
Total from investment operations | |
Net asset value, end of period | |
| |
|
Ratios to average net assets/supplemental data: | |
Net assets, end of period (in 000’s) | |
Ratio of total expenses to average net assets | |
Ratio of net investment income (loss) to average net assets | |
Portfolio turnover rate (e) | |
| Inception date is September 15, 2023, which is consistent with the commencement of investment operations and is the date the initial creation units were established. |
| Based on average shares outstanding. |
| Total return is calculated assuming an initial investment made at the net asset value at the beginning of the period, reinvestment of all distributions at net asset value during the period, and redemption at net asset value on the last day of the period. The return presented does not reflect the deduction of taxes that a shareholder would pay on Fund distributions or the redemption or sale of Fund shares. Total return is calculated for the time period presented and is not annualized for periods of less than a year. |
| |
| Portfolio turnover is calculated for the time period presented and is not annualized for periods of less than a year and does not include securities received or delivered from processing creations or redemptions, derivatives and in-kind transactions. |
See Notes to Financial Statements
First Trust Exchange-Traded Fund VIIIFinancial Highlights (Continued)
For a share outstanding throughout the period FT Vest U.S. Equity Moderate Buffer ETF - October (GOCT)
| |
|
Net asset value, beginning of period | |
Income from investment operations: | |
Net investment income (loss) (b) | |
Net realized and unrealized gain (loss) | |
Total from investment operations | |
Net asset value, end of period | |
| |
|
Ratios to average net assets/supplemental data: | |
Net assets, end of period (in 000’s) | |
Ratio of total expenses to average net assets | |
Ratio of net investment income (loss) to average net assets | |
Portfolio turnover rate (e) | |
| Inception date is October 20, 2023, which is consistent with the commencement of investment operations and is the date the initial creation units were established. |
| Based on average shares outstanding. |
| Total return is calculated assuming an initial investment made at the net asset value at the beginning of the period, reinvestment of all distributions at net asset value during the period, and redemption at net asset value on the last day of the period. The return presented does not reflect the deduction of taxes that a shareholder would pay on Fund distributions or the redemption or sale of Fund shares. Total return is calculated for the time period presented and is not annualized for periods of less than a year. |
| |
| Portfolio turnover is calculated for the time period presented and is not annualized for periods of less than a year and does not include securities received or delivered from processing creations or redemptions, derivatives and in-kind transactions. |
See Notes to Financial Statements
First Trust Exchange-Traded Fund VIIIFinancial Highlights (Continued)
For a share outstanding throughout the period FT Vest U.S. Equity Moderate Buffer ETF - November (GNOV)
| |
|
Net asset value, beginning of period | |
Income from investment operations: | |
Net investment income (loss) (b) | |
Net realized and unrealized gain (loss) | |
Total from investment operations | |
Net asset value, end of period | |
| |
|
Ratios to average net assets/supplemental data: | |
Net assets, end of period (in 000’s) | |
Ratio of total expenses to average net assets | |
Ratio of net investment income (loss) to average net assets | |
Portfolio turnover rate (e) | |
| Inception date is November 17, 2023, which is consistent with the commencement of investment operations and is the date the initial creation units were established. |
| Based on average shares outstanding. |
| Total return is calculated assuming an initial investment made at the net asset value at the beginning of the period, reinvestment of all distributions at net asset value during the period, and redemption at net asset value on the last day of the period. The return presented does not reflect the deduction of taxes that a shareholder would pay on Fund distributions or the redemption or sale of Fund shares. Total return is calculated for the time period presented and is not annualized for periods of less than a year. |
| |
| Portfolio turnover is calculated for the time period presented and is not annualized for periods of less than a year and does not include securities received or delivered from processing creations or redemptions, derivatives and in-kind transactions. |
See Notes to Financial Statements
First Trust Exchange-Traded Fund VIIIFinancial Highlights (Continued)
For a share outstanding throughout the period FT Vest U.S. Small Cap Moderate Buffer ETF - November (SNOV)
| |
|
Net asset value, beginning of period | |
Income from investment operations: | |
Net investment income (loss) (b) | |
Net realized and unrealized gain (loss) | |
Total from investment operations | |
Net asset value, end of period | |
| |
|
Ratios to average net assets/supplemental data: | |
Net assets, end of period (in 000’s) | |
Ratio of total expenses to average net assets | |
Ratio of net investment income (loss) to average net assets | |
Portfolio turnover rate (e) | |
| Inception date is November 17, 2023, which is consistent with the commencement of investment operations and is the date the initial creation units were established. |
| Based on average shares outstanding. |
| Total return is calculated assuming an initial investment made at the net asset value at the beginning of the period, reinvestment of all distributions at net asset value during the period, and redemption at net asset value on the last day of the period. The return presented does not reflect the deduction of taxes that a shareholder would pay on Fund distributions or the redemption or sale of Fund shares. Total return is calculated for the time period presented and is not annualized for periods of less than a year. |
| |
| Portfolio turnover is calculated for the time period presented and is not annualized for periods of less than a year and does not include securities received or delivered from processing creations or redemptions, derivatives and in-kind transactions. |
See Notes to Financial Statements
First Trust Exchange-Traded Fund VIIIFinancial Highlights (Continued)
For a share outstanding throughout the period FT Vest U.S. Equity Buffer & Premium Income ETF - December (XIDE)
| |
|
Net asset value, beginning of period | |
Income from investment operations: | |
Net investment income (loss) (b) | |
Net realized and unrealized gain (loss) | |
Total from investment operations | |
Distributions paid to shareholders from: | |
| |
Net asset value, end of period | |
| |
|
Ratios to average net assets/supplemental data: | |
Net assets, end of period (in 000’s) | |
Ratio of total expenses to average net assets | |
Ratio of net investment income (loss) to average net assets | |
Portfolio turnover rate (e) | |
| Inception date is December 15, 2023, which is consistent with the commencement of investment operations and is the date the initial creation units were established. |
| Based on average shares outstanding. |
| Total return is calculated assuming an initial investment made at the net asset value at the beginning of the period, reinvestment of all distributions at net asset value during the period, and redemption at net asset value on the last day of the period. The return presented does not reflect the deduction of taxes that a shareholder would pay on Fund distributions or the redemption or sale of Fund shares. Total return is calculated for the time period presented and is not annualized for periods of less than a year. |
| |
| Portfolio turnover is calculated for the time period presented and is not annualized for periods of less than a year and does not include securities received or delivered from processing creations or redemptions, derivatives and in-kind transactions. |
See Notes to Financial Statements
First Trust Exchange-Traded Fund VIIIFinancial Highlights (Continued)
For a share outstanding throughout the period FT Vest U.S. Equity Moderate Buffer ETF - December (GDEC)
| |
|
Net asset value, beginning of period | |
Income from investment operations: | |
Net investment income (loss) (b) | |
Net realized and unrealized gain (loss) | |
Total from investment operations | |
Net asset value, end of period | |
| |
|
Ratios to average net assets/supplemental data: | |
Net assets, end of period (in 000’s) | |
Ratio of total expenses to average net assets | |
Ratio of net investment income (loss) to average net assets | |
Portfolio turnover rate (e) | |
| Inception date is December 15, 2023, which is consistent with the commencement of investment operations and is the date the initial creation units were established. |
| Based on average shares outstanding. |
| Total return is calculated assuming an initial investment made at the net asset value at the beginning of the period, reinvestment of all distributions at net asset value during the period, and redemption at net asset value on the last day of the period. The return presented does not reflect the deduction of taxes that a shareholder would pay on Fund distributions or the redemption or sale of Fund shares. Total return is calculated for the time period presented and is not annualized for periods of less than a year. |
| |
| Portfolio turnover is calculated for the time period presented and is not annualized for periods of less than a year and does not include securities received or delivered from processing creations or redemptions, derivatives and in-kind transactions. |
See Notes to Financial Statements
First Trust Exchange-Traded Fund VIIIFinancial Highlights (Continued)
For a share outstanding throughout the period FT Vest Laddered Moderate Buffer ETF (BUFZ)
| |
|
Net asset value, beginning of period | |
Income from investment operations: | |
Net investment income (loss) (b) | |
Net realized and unrealized gain (loss) | |
Total from investment operations | |
Net asset value, end of period | |
| |
|
Ratios to average net assets/supplemental data: | |
Net assets, end of period (in 000’s) | |
Ratio of total expenses to average net assets (d) | |
Ratio of net expenses to average net assets (d) | |
Ratio of net investment income (loss) to average net assets (d) | |
Portfolio turnover rate (f) | |
| Inception date is October 25, 2023, which is consistent with the commencement of investment operations and is the date the initial creation units were established. |
| Based on average shares outstanding. |
| Total return is calculated assuming an initial investment made at the net asset value at the beginning of the period, reinvestment of all distributions at net asset value during the period, and redemption at net asset value on the last day of the period. The return presented does not reflect the deduction of taxes that a shareholder would pay on Fund distributions or the redemption or sale of Fund shares. Total return is calculated for the time period presented and is not annualized for periods of less than a year. The total returns would have been lower if certain fees had not been waived by the investment advisor. |
| Ratios of expenses to average net assets and ratio of net investment income (loss) to average net assets do not reflect the Fund’s proportionate share of expenses and income of underlying investment companies in which the Fund invests. |
| |
| Portfolio turnover is calculated for the time period presented and is not annualized for periods of less than a year and does not include securities received or delivered from processing creations or redemptions and in-kind transactions. |
See Notes to Financial Statements
First Trust Exchange-Traded Fund VIIIFinancial Highlights (Continued)
For a share outstanding throughout the period FT Vest Laddered Small Cap Moderate Buffer ETF (BUFS)
| |
|
Net asset value, beginning of period | |
Income from investment operations: | |
Net investment income (loss) (b) | |
Net realized and unrealized gain (loss) | |
Total from investment operations | |
Net asset value, end of period | |
| |
|
Ratios to average net assets/supplemental data: | |
Net assets, end of period (in 000’s) | |
Ratio of total expenses to average net assets (d) | |
Ratio of net expenses to average net assets (d) | |
Ratio of net investment income (loss) to average net assets (d) | |
Portfolio turnover rate (f) | |
| Inception date is May 29, 2024, which is consistent with the commencement of investment operations and is the date the initial creation units were established. |
| Based on average shares outstanding. |
| Total return is calculated assuming an initial investment made at the net asset value at the beginning of the period, reinvestment of all distributions at net asset value during the period, and redemption at net asset value on the last day of the period. The return presented does not reflect the deduction of taxes that a shareholder would pay on Fund distributions or the redemption or sale of Fund shares. Total return is calculated for the time period presented and is not annualized for periods of less than a year. The total returns would have been lower if certain fees had not been waived by the investment advisor. |
| Ratios of expenses to average net assets and ratio of net investment income (loss) to average net assets do not reflect the Fund’s proportionate share of expenses and income of underlying investment companies in which the Fund invests. |
| |
| Portfolio turnover is calculated for the time period presented and is not annualized for periods of less than a year and does not include securities received or delivered from processing creations or redemptions and in-kind transactions. |
See Notes to Financial Statements
Notes to Financial Statements
First Trust Exchange-Traded Fund VIIIAugust 31, 2024 1. Organization
First Trust Exchange-Traded Fund VIII (the “Trust”) is an open-end management investment company organized as a Massachusetts business trust on February 22, 2016, and is registered with the Securities and Exchange Commission under the Investment Company Act of 1940, as amended (the “1940 Act”).
This report covers the twenty-two funds (each a “Fund” and collectively, the “Funds”), each a non-diversified series of the Trust, listed below. The shares of each Fund are listed and traded on the Cboe BZX Exchange, Inc.
FT Vest U.S. Equity Moderate Buffer ETF - January – (ticker “GJAN”) |
FT Vest U.S. Equity Moderate Buffer ETF - February – (ticker “GFEB”) |
FT Vest U.S. Small Cap Moderate Buffer ETF - February – (ticker “SFEB”)(1) |
FT Vest U.S. Equity Buffer & Premium Income ETF - March – (ticker “XIMR”)(2) |
FT Vest U.S. Equity Moderate Buffer ETF - March – (ticker “GMAR”) |
FT Vest U.S. Equity Moderate Buffer ETF - April – (ticker “GAPR”) |
FT Vest U.S. Equity Moderate Buffer ETF - May – (ticker “GMAY”) |
FT Vest U.S. Small Cap Moderate Buffer ETF - May – (ticker “SMAY”) |
FT Vest U.S. Equity Buffer & Premium Income ETF - June – (ticker “XIJN”)(3) |
FT Vest U.S. Equity Moderate Buffer ETF - June – (ticker “GJUN”) |
FT Vest U.S. Equity Moderate Buffer ETF - July – (ticker “GJUL”) |
FT Vest U.S. Equity Moderate Buffer ETF - August – (ticker “GAUG”) |
FT Vest U.S. Small Cap Moderate Buffer ETF - August – (ticker “SAUG”) |
FT Vest U.S. Equity Buffer & Premium Income ETF - September – (ticker “XISE”)(4) |
FT Vest U.S. Equity Moderate Buffer ETF - September – (ticker “GSEP”)(4) |
FT Vest U.S. Equity Moderate Buffer ETF - October – (ticker “GOCT”)(5) |
FT Vest U.S. Equity Moderate Buffer ETF - November – (ticker “GNOV”)(6) |
FT Vest U.S. Small Cap Moderate Buffer ETF - November – (ticker “SNOV”)(6) |
FT Vest U.S. Equity Buffer & Premium Income ETF - December – (ticker “XIDE”)(7) |
FT Vest U.S. Equity Moderate Buffer ETF - December – (ticker “GDEC”)(7) |
FT Vest Laddered Moderate Buffer ETF – (ticker “BUFZ”)(8) |
FT Vest Laddered Small Cap Moderate Buffer ETF – (ticker “BUFS”)(9) |
| Commenced investment operations on February 16, 2024. |
| Commenced investment operations on March 18, 2024. |
| Commenced investment operations on June 21, 2024. |
| Commenced investment operations on September 15, 2023. |
| Commenced investment operations on October 20, 2023. |
| Commenced investment operations on November 17, 2023. |
| Commenced investment operations on December 15, 2023. |
| Commenced investment operations on October 25, 2023. |
| Commenced investment operations on May 29, 2024. |
Each Fund represents a separate series of shares of beneficial interest in the Trust. Unlike conventional mutual funds, each Fund issues and redeems shares on a continuous basis, at net asset value (“NAV”), only in large blocks of shares known as “Creation Units.”
Each Fund is an actively managed exchange-traded fund (“ETF”).
The investment objective of GJAN is to seek to provide investors with returns (before fees and expenses) that match the price return of the SPDR® S&P 500® ETF Trust (the “Underlying SPDR ETF”), up to a predetermined upside cap of 12.95% while providing a buffer (before fees and expenses) against the first 15% of Underlying SPDR ETF losses, over the period (an “Outcome Period”) from January 22, 2024 through January 17, 2025. Prior to January 22, 2024, the Fund’s investment objective included an upside cap of 15.75% and an Outcome Period of January 23, 2023 through January 19, 2024.
The investment objective of GFEB is to seek to provide investors with returns (before fees and expenses) that match the price return of the Underlying SPDR ETF, up to a predetermined upside cap of 13.96% while providing a buffer (before fees and expenses) against
Notes to Financial Statements (Continued)
First Trust Exchange-Traded Fund VIIIAugust 31, 2024 the first 15% of Underlying SPDR ETF losses, over the period from February 20, 2024 through February 21, 2025. Prior to February 20, 2024, the Fund’s investment objective included an upside cap of 15.20% and an Outcome Period of February 21, 2023 through February 16, 2024.
The investment objective of SFEB is to seek to provide investors with returns (before fees and expenses) that match the price return of the iShares Russell 2000 ETF (the “Underlying Russell ETF”), up to a predetermined upside cap of 19.28% while providing a buffer (before fees and expenses) against the first 15% of Underlying Russell ETF losses, over the period from February 20, 2024 through February 21, 2025.
The investment objective of XIMR is to seek to provide investors with a consistent level of income that, when annualized, is approximately 7.60% (before fees and expenses) while providing a buffer against the first 10% of Underlying SPDR ETF losses, over the period from March 19, 2024 through March 21, 2025.
The investment objective of GMAR is to seek to provide investors with returns (before fees and expenses) that match the price return of the Underlying SPDR ETF, up to a predetermined upside cap of 14.37% while providing a buffer (before fees and expenses) against the first 15% of Underlying SPDR ETF losses, over the period from March 18, 2024 through March 21, 2025. Prior to March 18, 2024, the Fund’s investment objective included an upside cap of 15.31% and an Outcome Period of March 20, 2023 through March 15, 2024.
The investment objective of GAPR is to seek to provide investors with returns (before fees and expenses) that match the price return of the Underlying SPDR ETF, up to a predetermined upside cap of 14.83% while providing a buffer (before fees and expenses) against the first 15% of Underlying SPDR ETF losses, over the period from April 22, 2024 through April 17, 2025. Prior to April 22, 2024, the Fund’s investment objective included an upside cap of 14.67% and an Outcome Period of April 24, 2023 through April 19, 2024.
The investment objective of GMAY is to seek to provide investors with returns (before fees and expenses) that match the price return of the Underlying SPDR ETF, up to a predetermined upside cap of 13.59% while providing a buffer (before fees and expenses) against the first 15% of Underlying SPDR ETF losses, over the period from May 20, 2024 through May 16, 2025. Prior to May 20, 2024, the Fund’s investment objective included an upside cap of 14.60% and an Outcome Period of May 22, 2023 through May 17, 2024.
The investment objective of SMAY is to seek to provide investors with returns (before fees and expenses) that match the price return of the Underlying Russell ETF, up to a predetermined upside cap of 17.93% while providing a buffer (before fees and expenses) against the first 15% of Underlying Russell ETF losses, over the period from May 20, 2024 through May 16, 2025. Prior to May 20, 2024, the Fund’s investment objective included an upside cap of 17.76% and an Outcome Period of May 22, 2023 through May 17, 2024.
The investment objective of XIJN is to seek to provide investors with a consistent level of income that, when annualized, is approximately 7.36% (before fees and expenses) while providing a buffer against the first 10% of Underlying SPDR ETF losses, over the period from June 24, 2024 through June 20, 2025.
The investment objective of GJUN is to seek to provide investors with returns (before fees and expenses) that match the price return of the Underlying SPDR ETF, up to a predetermined upside cap of 13.50% while providing a buffer (before fees and expenses) against the first 15% of Underlying SPDR ETF losses, over the period from June 24, 2024 through June 20, 2025. Prior to June 24, 2024, the Fund’s investment objective included an upside cap of 14.65% and an Outcome Period of June 20, 2023 through June 21, 2024.
The investment objective of GJUL is to seek to provide investors with returns (before fees and expenses) that match the price return of the Underlying SPDR ETF, up to a predetermined upside cap of 13.17% while providing a buffer (before fees and expenses) against the first 15% of Underlying SPDR ETF losses, over the period from July 22, 2024 through July 18, 2025. Prior to July 22, 2024, the Fund’s investment objective included an upside cap of 14.30% and an Outcome Period of July 24, 2023 through July 19, 2024.
The investment objective of GAUG is to seek to provide investors with returns (before fees and expenses) that match the price return of the Underlying SPDR ETF, up to a predetermined upside cap of 12.07% while providing a buffer (before fees and expenses) against the first 15% of Underlying SPDR ETF losses, over the period from August 19, 2024 through August 15, 2025. Prior to August 19, 2024, the Fund’s investment objective included an upside cap of 15.26% and an Outcome Period of August 21, 2023 through August 16, 2024.
The investment objective of SAUG is to seek to provide investors with returns (before fees and expenses) that match the price return of the Underlying Russell ETF, up to a predetermined upside cap of 17.27% while providing a buffer (before fees and expenses)
Notes to Financial Statements (Continued)
First Trust Exchange-Traded Fund VIIIAugust 31, 2024 against the first 15% of Underlying Russell ETF losses, over the period from August 19, 2024 through August 15, 2025. Prior to August 19, 2024, the Fund’s investment objective included an upside cap of 19.07% and an Outcome Period of August 21, 2023 through August 16, 2024.
The investment objective of XISE is to seek to provide investors with a consistent level of income that, when annualized, is approximately 8.19% (before fees and expenses) while providing a buffer against the first 10% of Underlying SPDR ETF losses, over the period from September 18, 2023 through September 20, 2024.
The investment objective of GSEP is to seek to provide investors with returns (before fees and expenses) that match the price return of the Underlying SPDR ETF, up to a predetermined upside cap of 14.76% while providing a buffer (before fees and expenses) against the first 15% of Underlying SPDR ETF losses, over the period from September 18, 2023 through September 20, 2024.
The investment objective of GOCT is to seek to provide investors with returns (before fees and expenses) that match the price return of the Underlying SPDR ETF, up to a predetermined upside cap of 15.50% while providing a buffer (before fees and expenses) against the first 15% of Underlying SPDR ETF losses, over the period from October 23, 2023 through October 18, 2024.
The investment objective of GNOV is to seek to provide investors with returns (before fees and expenses) that match the price return of the Underlying SPDR ETF, up to a predetermined upside cap of 14.27% while providing a buffer (before fees and expenses) against the first 15% of Underlying SPDR ETF losses, over the period from November 20, 2023 through November 15, 2024.
The investment objective of SNOV is to seek to provide investors with returns (before fees and expenses) that match the price return of the Underlying Russell ETF, up to a predetermined upside cap of 17.92% while providing a buffer (before fees and expenses) against the first 15% of Underlying Russell ETF losses, over the period from November 20, 2023 through November 15, 2024.
The investment objective of XIDE is to seek to provide investors with a consistent level of income that, when annualized, is approximately 7.56% (before fees and expenses) while providing a buffer against the first 10% of Underlying SPDR ETF losses, over the period from December 18, 2023 through December 20, 2024.
The investment objective of GDEC is to seek to provide investors with returns (before fees and expenses) that match the price return of the Underlying SPDR ETF, up to a predetermined upside cap of 13.31% while providing a buffer (before fees and expenses) against the first 15% of Underlying SPDR ETF losses, over the period from December 18, 2023 through December 20, 2024.
Under normal market conditions, each Fund, with the exception of BUFZ and BUFS, will invest substantially all of its assets in FLexible EXchange® Options (“FLEX Options”) that reference the price performance of the SPDR® S&P 500® ETF Trust or the iShares Russell 2000 ETF (the “Underlying ETF”) and, for XIMR, XIJN, XISE and XIDE only, short-term (one year or less) U.S. Treasury securities.
The investment objective of BUFZ is to seek to provide investors with capital appreciation. BUFZ seeks to achieve its investment objective by providing investors with US large-cap equity market exposure while attempting to limit downside risk through a laddered portfolio of FT Vest U.S. Equity Moderate Buffer ETFs (“Underlying Laddered ETFs”). Under normal market conditions, BUFZ will invest substantially all of its assets in Underlying Laddered ETFs. Unlike the Underlying Laddered ETFs, BUFZ itself does not pursue a target outcome strategy. The buffer is only provided by the Underlying Laddered ETFs and BUFZ itself does not provide any stated buffer against losses. In order to understand BUFZ’s strategy and risks, it is important to understand the strategies and risks of the Underlying Laddered ETFs.
The investment objective of BUFS is to seek to provide investors with capital appreciation. BUFS seeks to achieve its investment objective by providing investors with small cap equity market exposure while attempting to limit downside risk through a laddered portfolio of FT Vest U.S. Small Cap Moderate Buffer ETFs (“Underlying Small Cap Laddered ETFs”). Under normal market conditions, BUFS will invest substantially all of its assets in Underlying Small Cap Laddered ETFs. Unlike the Underlying Small Cap Laddered ETFs, BUFS itself does not pursue a target outcome strategy. The buffer is only provided by the Underlying Small Cap Laddered ETFs and BUFS itself does not provide any stated buffer against losses. In order to understand BUFS’s strategy and risks, it is important to understand the strategies and risks of the Underlying Small Cap Laddered ETFs.
2. Significant Accounting Policies
The Funds are each considered an investment company and follow accounting and reporting guidance under Financial Accounting Standards Board Accounting Standards Codification Topic 946, “Financial Services-Investment Companies.” The following is a
Notes to Financial Statements (Continued)
First Trust Exchange-Traded Fund VIIIAugust 31, 2024 summary of significant accounting policies consistently followed by the Funds in the preparation of the financial statements. The preparation of the financial statements in accordance with accounting principles generally accepted in the United States of America (“U.S. GAAP”) requires management to make estimates and assumptions that affect the reported amounts and disclosures in the financial statements. Actual results could differ from those estimates.
Each Fund’s NAV is determined daily as of the close of regular trading on the New York Stock Exchange (“NYSE”), normally 4:00 p.m. Eastern time, on each day the NYSE is open for trading. If the NYSE closes early on a valuation day, the NAV is determined as of that time. Each Fund’s NAV is calculated by dividing the value of all assets of each Fund (including accrued interest and dividends), less all liabilities (including accrued expenses and dividends declared but unpaid), by the total number of shares outstanding.
Each Fund’s investments are valued daily at market value or, in the absence of market value with respect to any portfolio securities, at fair value. Market value prices represent readily available market quotations such as last sale or official closing prices from a national or foreign exchange (i.e., a regulated market) and are primarily obtained from third-party pricing services. Fair value prices represent any prices not considered market value prices and are either obtained from a third-party pricing service or are determined by the Pricing Committee of the Funds’ investment advisor, First Trust Advisors L.P. (“First Trust” or the “Advisor”), in accordance with valuation procedures approved by the Trust’s Board of Trustees, and in accordance with provisions of the 1940 Act and rules thereunder. Investments valued by the Advisor’s Pricing Committee, if any, are footnoted as such in the footnotes to the Portfolio of Investments. Each Fund’s investments are valued as follows:
Exchange-traded options contracts (other than FLEX Option contracts) are valued at the closing price in the market where such contracts are principally traded. If no closing price is available, exchange-traded options contracts are valued at the mean of their most recent bid and ask price, if both are available. Over-the-counter options contracts are valued as follows, depending on the market in which the instrument trades: (1) the mean of their most recent bid and ask price, if available; or (2) a price based on the equivalent exchange-traded option. FLEX Option contracts are normally valued using a model-based price provided by a third-party pricing vendor. On days when a trade in a FLEX Option contract occurs, the trade price will be used to value such FLEX Option contracts in lieu of the model price.
ETFs and other equity securities listed on any national or foreign exchange (excluding Nasdaq, Inc. (“Nasdaq”) and the London Stock Exchange Alternative Investment Market (“AIM”)) are valued at the last sale price on the exchange on which they are principally traded or, for Nasdaq and AIM securities, the official closing price. Securities traded on more than one securities exchange are valued at the last sale price or official closing price, as applicable, at the close of the securities exchange representing the primary exchange for such securities.
Shares of open-end funds are valued based on NAV per share.
U.S. Treasuries are valued on the basis of valuations provided by a third-party pricing service approved by the Trust’s Board of Trustees.
Certain securities may not be able to be priced by pre-established pricing methods. Such securities may be valued by the Advisor’s Pricing Committee at fair value. These securities generally include, but are not limited to, restricted securities (securities which may not be publicly sold without registration under the Securities Act of 1933, as amended) for which a third-party pricing service is unable to provide a market price; securities whose trading has been formally suspended; a security whose market or fair value price is not available from a pre-established pricing source; a security with respect to which an event has occurred that is likely to materially affect the value of the security after the market has closed but before the calculation of a Fund’s NAV or make it difficult or impossible to obtain a reliable market quotation; and a security whose price, as provided by the third-party pricing service, does not reflect the security’s fair value. As a general principle, the current fair value of a security would appear to be the amount which the owner might reasonably expect to receive for the security upon its current sale. When fair value prices are used, generally they will differ from market quotations or official closing prices on the applicable exchanges. A variety of factors may be considered in determining the fair value of such securities, including, but not limited to, the following:
1)
the last sale price on the exchange on which they are principally traded or, for Nasdaq and AIM securities, the official closing price;
Notes to Financial Statements (Continued)
First Trust Exchange-Traded Fund VIIIAugust 31, 2024 3)
the size of the holding;
4)
the initial cost of the security;
5)
transactions in comparable securities;
6)
price quotes from dealers and/or third-party pricing services;
7)
relationships among various securities;
8)
information obtained by contacting the issuer, analysts, or the appropriate stock exchange;
9)
an analysis of the issuer’s financial statements;
10)
the existence of merger proposals or tender offers that might affect the value of the security; and
11)
other relevant factors.
The Funds are subject to fair value accounting standards that define fair value, establish the framework for measuring fair value and provide a three-level hierarchy for fair valuation based upon the inputs to the valuation as of the measurement date. The three levels of the fair value hierarchy are as follows:
• Level 1 – Level 1 inputs are quoted prices in active markets for identical investments. An active market is a market in which transactions for the investment occur with sufficient frequency and volume to provide pricing information on an ongoing basis.
• Level 2 – Level 2 inputs are observable inputs, either directly or indirectly, and include the following:
o Quoted prices for similar investments in active markets.
o Quoted prices for identical or similar investments in markets that are non-active. A non-active market is a market where there are few transactions for the investment, the prices are not current, or price quotations vary substantially either over time or among market makers, or in which little information is released publicly.
o Inputs other than quoted prices that are observable for the investment (for example, interest rates and yield curves observable at commonly quoted intervals, volatilities, prepayment speeds, loss severities, credit risks, and default rates).
o Inputs that are derived principally from or corroborated by observable market data by correlation or other means.
• Level 3 – Level 3 inputs are unobservable inputs. Unobservable inputs may reflect the reporting entity’s own assumptions about the assumptions that market participants would use in pricing the investment.
The inputs or methodologies used for valuing investments are not necessarily an indication of the risk associated with investing in those investments. A summary of the inputs used to value each Fund’s investments as of August 31, 2024, is included with each Fund’s Portfolio of Investments.
B. Securities Transactions and Investment Income
Securities transactions are recorded as of the trade date. Realized gains and losses from securities transactions are recorded on the identified cost basis. Dividend income is recorded on the ex-dividend date. Interest income is recorded daily on the accrual basis. Amortization of premiums and accretion of discounts are recorded using the effective interest method.
FLEX Options are customized equity or index option contracts that trade on an exchange, but provide investors with the ability to customize key contract terms like exercise prices, styles and expiration dates. FLEX Options are guaranteed for settlement by the Options Clearing Corporation.
Each Fund, with the exception of BUFZ and BUFS, purchases and sells call and put FLEX Options based on the performance of the Underlying ETF. The FLEX Options that each Fund holds that reference the Underlying ETF will give each Fund the right to receive or deliver shares of the Underlying ETF on the option expiration date at a strike price, depending on whether the option is a put or call option and whether each Fund purchases or sells the option. The FLEX Options held by each Fund are European style options, which are exercisable at the strike price only on the FLEX Option expiration date. All options held by each Fund at August 31, 2024 are FLEX Options.
D. Affiliated Transactions
BUFZ and BUFS invest in securities of affiliated funds. Each Fund’s investment performance and risks are directly related to the investment performance and risks of the affiliated funds. The affiliated funds’ financial statements may be found at SEC.gov. Dividend income, if any, realized gains and losses, and change in appreciation (depreciation) from affiliated funds are presented on the Statements of Operations.
Notes to Financial Statements (Continued)
First Trust Exchange-Traded Fund VIIIAugust 31, 2024 Amounts relating to investments in affiliated funds in BUFZ at August 31, 2024, and for the fiscal period then ended are as follows:
| | | | | Change in
Unrealized
Appreciation
(Depreciation) | | | |
FT Vest U.S. Equity Moderate Buffer ETF - January | | | | | | | | |
FT Vest U.S. Equity Moderate Buffer ETF - February | | | | | | | | |
FT Vest U.S. Equity Moderate Buffer ETF - March | | | | | | | | |
FT Vest U.S. Equity Moderate Buffer ETF - April | | | | | | | | |
FT Vest U.S. Equity Moderate Buffer ETF - May | | | | | | | | |
FT Vest U.S. Equity Moderate Buffer ETF - June | | | | | | | | |
FT Vest U.S. Equity Moderate Buffer ETF - July | | | | | | | | |
FT Vest U.S. Equity Moderate Buffer ETF - August | | | | | | | | |
FT Vest U.S. Equity Moderate Buffer ETF - September | | | | | | | | |
FT Vest U.S. Equity Moderate Buffer ETF - October | | | | | | | | |
FT Vest U.S. Equity Moderate Buffer ETF - November | | | | | | | | |
FT Vest U.S. Equity Moderate Buffer ETF - December | | | | | | | | |
| | | | | | | | |
Amounts relating to investments in affiliated funds in BUFS at August 31, 2024, and for the fiscal period then ended are as follows:
| | | | | Change in
Unrealized
Appreciation
(Depreciation) | | | |
FT Vest U.S. Small Cap Moderate Buffer ETF - February | | | | | | | | |
FT Vest U.S. Small Cap Moderate Buffer ETF - May | | | | | | | | |
Notes to Financial Statements (Continued)
First Trust Exchange-Traded Fund VIIIAugust 31, 2024 | | | | | Change in Unrealized Appreciation (Depreciation) | | | |
FT Vest U.S. Small Cap Moderate Buffer ETF - August | | | | | | | | |
FT Vest U.S. Small Cap Moderate Buffer ETF - November | | | | | | | | |
| | | | | | | | |
E. Dividends and Distributions to Shareholders
Dividends from net investment income of each Fund, if any, are declared and paid annually, with the exception of XIMR, XIJN, XISE and XIDE which are declared and paid monthly and BUFZ and BUFS which are declared and paid quarterly, or as the Board of Trustees may determine from time to time. Distributions of net realized capital gains earned by each Fund, if any, are distributed at least annually. Each Fund may also designate a portion of the amount paid to redeeming shareholders as a distribution for tax purposes.
Distributions from net investment income and realized capital gains are determined in accordance with federal income tax regulations, which may differ from U.S. GAAP. Certain capital accounts in the financial statements are periodically adjusted for permanent differences in order to reflect their tax character. These permanent differences are primarily due to the varying treatment of income and gain/loss on significantly modified portfolio securities held by the Funds and have no impact on net assets or NAV per share. Temporary differences, which arise from recognizing certain items of income, expense and gain/loss in different periods for financial statement and tax purposes, will reverse at some time in the future. During their applicable taxable periods, none of the Funds paid a distribution in 2024 or 2023.
Notes to Financial Statements (Continued)
First Trust Exchange-Traded Fund VIIIAugust 31, 2024 As of the applicable taxable year end, the components of distributable earnings on a tax basis for each Fund were as follows:
| | Undistributed
Ordinary
Income | Accumulated
Capital and
Other
Gain (Loss) | Net
Unrealized
Appreciation
(Depreciation) |
FT Vest U.S. Equity Moderate Buffer ETF - January | | | | |
FT Vest U.S. Equity Moderate Buffer ETF - February | | | | |
FT Vest U.S. Small Cap Moderate Buffer ETF - February | | | | |
FT Vest U.S. Equity Buffer & Premium Income ETF - March | | | | |
FT Vest U.S. Equity Moderate Buffer ETF - March | | | | |
FT Vest U.S. Equity Moderate Buffer ETF - April | | | | |
FT Vest U.S. Equity Moderate Buffer ETF - May | | | | |
FT Vest U.S. Small Cap Moderate Buffer ETF - May | | | | |
FT Vest U.S. Equity Buffer & Premium Income ETF - June | | | | |
FT Vest U.S. Equity Moderate Buffer ETF - June | | | | |
FT Vest U.S. Equity Moderate Buffer ETF - July | | | | |
FT Vest U.S. Equity Moderate Buffer ETF - August | | | | |
FT Vest U.S. Small Cap Moderate Buffer ETF - August | | | | |
FT Vest U.S. Equity Buffer & Premium Income ETF - September | | | | |
FT Vest U.S. Equity Moderate Buffer ETF - September | | | | |
FT Vest U.S. Equity Moderate Buffer ETF - October | | | | |
FT Vest U.S. Equity Moderate Buffer ETF - November | | | | |
FT Vest U.S. Small Cap Moderate Buffer ETF - November | | | | |
FT Vest U.S. Equity Buffer & Premium Income ETF - December | | | | |
FT Vest U.S. Equity Moderate Buffer ETF - December | | | | |
FT Vest Laddered Moderate Buffer ETF | | | | |
FT Vest Laddered Small Cap Moderate Buffer ETF | | | | |
Each Fund intends to qualify or continue to qualify as a regulated investment company by complying with the requirements under Subchapter M of the Internal Revenue Code of 1986, as amended, which includes distributing substantially all of its net investment income and net realized gains to shareholders. Accordingly, no provision has been made for federal and state income taxes. However, due to the timing and amount of distributions, each Fund may be subject to an excise tax of 4% of the amount by which approximately 98% of each Fund’s taxable income exceeds the distributions from such taxable income for the calendar year.
The Funds are subject to accounting standards that establish a minimum threshold for recognizing, and a system for measuring, the benefits of a tax position taken or expected to be taken in a tax return. For GJAN, GFEB, GMAR, GAPR, GMAY, SMAY, GJUN, GJUL, GAUG and SAUG, the taxable years ended 2023 and 2024 remain open to federal and state audit. For XISE, GSEP, GOCT, GNOV, SNOV, XIDE, and GDEC, the taxable year ended 2023 remains open to federal and state audit. For SFEB, XIMR, XIJN, BUFZ, and BUFS, the taxable year ended 2024 remains open to federal and state audit. As of August 31, 2024, management has evaluated the application of these standards to the Funds and has determined that no provision for income tax is required in the Funds’ financial statements for uncertain tax positions.
Each Fund intends to utilize provisions of the federal income tax laws, which allow it to carry a realized capital loss forward indefinitely following the year of the loss and offset such loss against any future realized capital gains. Each Fund is subject to certain limitations under U.S. tax rules on the use of capital loss carryforwards and net unrealized built-in losses. These limitations apply when there has been a 50% change in ownership. At each Fund’s applicable taxable year end, each applicable Fund had a capital loss carryforward available that is shown in the following table, to the extent provided by regulations, to offset future capital gains. To the
Notes to Financial Statements (Continued)
First Trust Exchange-Traded Fund VIIIAugust 31, 2024 extent that these loss carryforwards are used to offset future capital gains, it is probable that the capital gains so offset will not be distributed to each applicable Fund’s shareholders.
| | Non-Expiring
Capital Loss
Carryforwards |
FT Vest U.S. Equity Moderate Buffer ETF - January | | |
FT Vest U.S. Equity Moderate Buffer ETF - February | | |
FT Vest U.S. Small Cap Moderate Buffer ETF - February | | |
FT Vest U.S. Equity Buffer & Premium Income ETF - March | | |
FT Vest U.S. Equity Moderate Buffer ETF - March | | |
FT Vest U.S. Equity Moderate Buffer ETF - April | | |
FT Vest U.S. Equity Moderate Buffer ETF - May | | |
FT Vest U.S. Small Cap Moderate Buffer ETF - May | | |
FT Vest U.S. Equity Buffer & Premium Income ETF - June | | |
FT Vest U.S. Equity Moderate Buffer ETF - June | | |
FT Vest U.S. Equity Moderate Buffer ETF - July | | |
FT Vest U.S. Equity Moderate Buffer ETF - August | | |
FT Vest U.S. Small Cap Moderate Buffer ETF - August | | |
FT Vest U.S. Equity Buffer & Premium Income ETF - September | | |
FT Vest U.S. Equity Moderate Buffer ETF - September | | |
FT Vest U.S. Equity Moderate Buffer ETF - October | | |
FT Vest U.S. Equity Moderate Buffer ETF - November | | |
FT Vest U.S. Small Cap Moderate Buffer ETF - November | | |
FT Vest U.S. Equity Buffer & Premium Income ETF - December | | |
FT Vest U.S. Equity Moderate Buffer ETF - December | | |
FT Vest Laddered Moderate Buffer ETF | | |
FT Vest Laddered Small Cap Moderate Buffer ETF | | |
Certain losses realized during the current taxable year may be deferred and treated as occurring on the first day of the following taxable year for federal income tax purposes. At each Fund’s applicable taxable year end, the following Funds incurred and elected to defer net late year ordinary or capital losses as follows:
| | Qualified Late Year Losses |
| | |
FT Vest U.S. Equity Moderate Buffer ETF - January | | | |
FT Vest U.S. Equity Moderate Buffer ETF - February | | | |
FT Vest U.S. Equity Moderate Buffer ETF - March | | | |
FT Vest U.S. Equity Moderate Buffer ETF - April | | | |
FT Vest U.S. Equity Moderate Buffer ETF - May | | | |
FT Vest U.S. Small Cap Moderate Buffer ETF - May | | | |
FT Vest U.S. Equity Moderate Buffer ETF - June | | | |
FT Vest U.S. Equity Moderate Buffer ETF - July | | | |
FT Vest U.S. Equity Moderate Buffer ETF - August | | | |
FT Vest U.S. Small Cap Moderate Buffer ETF - August | | | |
FT Vest Laddered Moderate Buffer ETF | | | |
| | | |
In order to present paid-in capital and accumulated distributable earnings (loss) (which consists of accumulated net investment income (loss), accumulated net realized gain (loss) on investments and net unrealized appreciation (depreciation) on investments) on the Statements of Assets and Liabilities that more closely represent their tax character, certain adjustments have been made to paid-in capital, accumulated net investment income (loss) and accumulated net realized gain (loss) on investments. These adjustments are primarily due to the difference between book and tax treatments of income and gains on various investment securities held by the Funds and in-kind transactions. The results of operations and net assets were not affected by these adjustments. For each Fund’s applicable taxable period, the adjustments were as follows:
Notes to Financial Statements (Continued)
First Trust Exchange-Traded Fund VIIIAugust 31, 2024
| | Accumulated
Net Investment
Income (Loss) | Accumulated
Net Realized
Gain (Loss)
on Investments | |
FT Vest U.S. Equity Moderate Buffer ETF - January | | | | |
FT Vest U.S. Equity Moderate Buffer ETF - February | | | | |
FT Vest U.S. Small Cap Moderate Buffer ETF - February | | | | |
FT Vest U.S. Equity Buffer & Premium Income ETF - March | | | | |
FT Vest U.S. Equity Moderate Buffer ETF - March | | | | |
FT Vest U.S. Equity Moderate Buffer ETF - April | | | | |
FT Vest U.S. Equity Moderate Buffer ETF - May | | | | |
FT Vest U.S. Small Cap Moderate Buffer ETF - May | | | | |
FT Vest U.S. Equity Buffer & Premium Income ETF - June | | | | |
FT Vest U.S. Equity Moderate Buffer ETF - June | | | | |
FT Vest U.S. Equity Moderate Buffer ETF - July | | | | |
FT Vest U.S. Equity Moderate Buffer ETF - August | | | | |
FT Vest U.S. Small Cap Moderate Buffer ETF - August | | | | |
FT Vest U.S. Equity Buffer & Premium Income ETF - September | | | | |
FT Vest U.S. Equity Moderate Buffer ETF - September | | | | |
FT Vest U.S. Equity Moderate Buffer ETF - October | | | | |
FT Vest U.S. Equity Moderate Buffer ETF - November | | | | |
FT Vest U.S. Small Cap Moderate Buffer ETF - November | | | | |
FT Vest U.S. Equity Buffer & Premium Income ETF - December | | | | |
FT Vest U.S. Equity Moderate Buffer ETF - December | | | | |
FT Vest Laddered Moderate Buffer ETF | | | | |
FT Vest Laddered Small Cap Moderate Buffer ETF | | | | |
As of August 31, 2024, the aggregate cost, gross unrealized appreciation, gross unrealized depreciation, and net unrealized appreciation/(depreciation) on investments (including short positions and derivatives, if any) for federal income tax purposes were as follows:
| | Gross Unrealized
Appreciation | Gross Unrealized
(Depreciation) | Net Unrealized
Appreciation
(Depreciation) |
FT Vest U.S. Equity Moderate Buffer ETF - January | | | | |
FT Vest U.S. Equity Moderate Buffer ETF - February | | | | |
FT Vest U.S. Small Cap Moderate Buffer ETF - February | | | | |
FT Vest U.S. Equity Buffer & Premium Income ETF - March | | | | |
FT Vest U.S. Equity Moderate Buffer ETF - March | | | | |
FT Vest U.S. Equity Moderate Buffer ETF - April | | | | |
FT Vest U.S. Equity Moderate Buffer ETF - May | | | | |
FT Vest U.S. Small Cap Moderate Buffer ETF - May | | | | |
FT Vest U.S. Equity Buffer & Premium Income ETF - June | | | | |
FT Vest U.S. Equity Moderate Buffer ETF - June | | | | |
FT Vest U.S. Equity Moderate Buffer ETF - July | | | | |
FT Vest U.S. Equity Moderate Buffer ETF - August | | | | |
FT Vest U.S. Small Cap Moderate Buffer ETF - August | | | | |
Notes to Financial Statements (Continued)
First Trust Exchange-Traded Fund VIIIAugust 31, 2024 | | Gross Unrealized Appreciation | Gross Unrealized (Depreciation) | Net Unrealized Appreciation (Depreciation) |
FT Vest U.S. Equity Buffer & Premium Income ETF - September | | | | |
FT Vest U.S. Equity Moderate Buffer ETF - September | | | | |
FT Vest U.S. Equity Moderate Buffer ETF - October | | | | |
FT Vest U.S. Equity Moderate Buffer ETF - November | | | | |
FT Vest U.S. Small Cap Moderate Buffer ETF - November | | | | |
FT Vest U.S. Equity Buffer & Premium Income ETF - December | | | | |
FT Vest U.S. Equity Moderate Buffer ETF - December | | | | |
FT Vest Laddered Moderate Buffer ETF | | | | |
FT Vest Laddered Small Cap Moderate Buffer ETF | | | | |
Expenses, other than the investment advisory fee and other excluded expenses, are paid by the Advisor (see Note 3).
3. Investment Advisory Fee, Affiliated Transactions and Other Fee Arrangements
First Trust, the investment advisor to the Funds, is a limited partnership with one limited partner, Grace Partners of DuPage L.P., and one general partner, The Charger Corporation. The Charger Corporation is an Illinois corporation controlled by James A. Bowen, Chief Executive Officer of First Trust. First Trust is responsible for the ongoing monitoring of the securities in each Fund’s portfolio, managing the Funds’ business affairs and providing certain administrative services necessary for the management of the Funds.
First Trust is paid an annual unitary management fee based on a percentage of each Fund’s average daily net assets. In addition, BUFZ and BUFS incur pro rata share of fees and expenses attributable to investments in other investment companies (“acquired fund fees and expenses”). The total of the unitary management fee and acquired fund fees and expenses represents each Fund’s total annual operating expenses. The annual unitary management fee payable by each Fund, with the exception of SFEB, SMAY, SAUG, SNOV, BUFZ and BUFS, to First Trust for these services will be reduced at certain levels of each Fund’s net assets (“breakpoints”) and calculated pursuant to the following schedule:
| |
Fund net assets up to and including $2.5 billion | |
Fund net assets greater than $2.5 billion up to and including $5 billion | |
Fund net assets greater than $5 billion up to and including $7.5 billion | |
Fund net assets greater than $7.5 billion up to and including $10 billion | |
Fund net assets greater than $10 billion | |
For SFEB, SMAY, SAUG and SNOV, the annual unitary management fee payable by each Fund will be calculated pursuant to the following schedule:
| |
Fund net assets up to and including $2.5 billion | |
Fund net assets greater than $2.5 billion up to and including $5 billion | |
Fund net assets greater than $5 billion up to and including $7.5 billion | |
Fund net assets greater than $7.5 billion up to and including $10 billion | |
Fund net assets greater than $10 billion | |
Notes to Financial Statements (Continued)
First Trust Exchange-Traded Fund VIIIAugust 31, 2024 For BUFZ and BUFS, the annual unitary management fee payable by each Fund will be calculated pursuant to the following schedule:
| |
Fund net assets up to and including $2.5 billion | |
Fund net assets greater than $2.5 billion up to and including $5 billion | |
Fund net assets greater than $5 billion up to and including $7.5 billion | |
Fund net assets greater than $7.5 billion up to and including $10 billion | |
Fund net assets greater than $10 billion up to and including $15 billion | |
Fund net assets greater than $15 billion | |
Effective August 1, 2024 for BUFZ and BUFS, the Advisor has agreed to waive management fees of 0.10% of average daily net assets until December 31, 2025. During any period in which such waiver is in effect, each Fund will not be eligible for any breakpoint discounts. During the fiscal period ended August 31, 2024, the Advisor waived fees of $16,987 and $785 for BUFZ and BUFS, respectively.
First Trust and Vest Financial LLC (“Vest”), an affiliate of First Trust, are responsible for each Fund’s expenses, including the cost of transfer agency, sub-advisory, custody, fund administration, legal, audit and other services, but excluding fee payments under the Investment Management Agreement, interest, taxes, acquired fund fees and expenses, if any, brokerage commissions and other expenses connected with the execution of portfolio transactions, distribution and service fees payable pursuant to a Rule 12b-1 plan, if any, and extraordinary expenses.
Vest serves as the Funds’ sub-advisor and manages each Fund’s portfolio subject to First Trust’s supervision. Pursuant to the Investment Management Agreement, between the Trust, on behalf of the Funds, and the Advisor, and the Investment Sub-Advisory Agreement among the Trust, on behalf of the Funds, the Advisor and Vest, First Trust will supervise Vest and its management of the investment of each Fund’s assets and will pay Vest for its services as the Funds’ sub-advisor a sub-advisory fee equal to 50% of the monthly unitary management fee paid to the Advisor, less Vest’s 50% share of the expenses for that month. In the event the Sub-Advisor’s share of the expenses exceeds the amount of the sub-advisory fee in any month, the Sub-Advisor will pay the difference to the Advisor. During any period in which the Advisor’s management fee is reduced in accordance with the breakpoints described above, the investment sub-advisory fee (which is based on the Advisor’s management fee) paid to Vest will be reduced to reflect the reduction in the Advisor’s management fee.
The Trust has multiple service agreements with The Bank of New York Mellon (“BNY”). Under the service agreements, BNY performs custodial, fund accounting, certain administrative services, and transfer agency services for each Fund. As custodian, BNY is responsible for custody of each Fund’s assets. As fund accountant and administrator, BNY is responsible for maintaining the books and records of each Fund’s securities and cash. As transfer agent, BNY is responsible for maintaining shareholder records for each Fund. BNY is a subsidiary of The Bank of New York Mellon Corporation, a financial holding company.
Each Trustee who is not an officer or employee of First Trust, any sub-advisor or any of their affiliates (“Independent Trustees”) is paid a fixed annual retainer that is allocated equally among each fund in the First Trust Fund Complex. Each Independent Trustee is also paid an annual per fund fee that varies based on whether the fund is a closed-end or other actively managed fund, a target outcome fund or an index fund.
Additionally, the Chairs of the Audit Committee, Nominating and Governance Committee and Valuation Committee, the Vice Chair of the Audit Committee, the Lead Independent Trustee and the Vice Lead Independent Trustee are paid annual fees to serve in such capacities, with such compensation allocated pro rata among each fund in the First Trust Fund Complex based on net assets. Independent Trustees are reimbursed for travel and out-of-pocket expenses in connection with all meetings. The Committee Chairs, the Audit Committee Vice Chair, the Lead Independent Trustee and the Vice Lead Independent Trustee rotate periodically in serving in such capacities. The officers and “Interested” Trustee receive no compensation from the Trust for acting in such capacities.
4. Purchases and Sales of Securities
For the fiscal period ended August 31, 2024, the Funds, except BUFZ and BUFS, had no purchases or sales of investments, excluding short-term investments and in-kind transactions. Each Fund, except BUFZ and BUFS, holds options for a target outcome period of approximately one year based on the expiration date of the options, which occurs on the third Friday of the month corresponding to the month in each Fund name. For securities transactions purposes, the options are considered short-term investments.
Notes to Financial Statements (Continued)
First Trust Exchange-Traded Fund VIIIAugust 31, 2024 For the fiscal period ended August 31, 2024, the cost of purchases and proceeds from sales of investments for BUFZ and BUFS, excluding short-term investments and in-kind transactions, were as follows:
| | |
FT Vest Laddered Moderate Buffer ETF | | |
FT Vest Laddered Small Cap Moderate Buffer ETF | | |
For the fiscal period ended August 31, 2024, the cost of in-kind purchases and proceeds from in-kind sales for each Fund were as follows:
| | |
FT Vest U.S. Equity Moderate Buffer ETF - January | | |
FT Vest U.S. Equity Moderate Buffer ETF - February | | |
FT Vest U.S. Small Cap Moderate Buffer ETF - February | | |
FT Vest U.S. Equity Buffer & Premium Income ETF - March | | |
FT Vest U.S. Equity Moderate Buffer ETF - March | | |
FT Vest U.S. Equity Moderate Buffer ETF - April | | |
FT Vest U.S. Equity Moderate Buffer ETF - May | | |
FT Vest U.S. Small Cap Moderate Buffer ETF - May | | |
FT Vest U.S. Equity Buffer & Premium Income ETF - June | | |
FT Vest U.S. Equity Moderate Buffer ETF - June | | |
FT Vest U.S. Equity Moderate Buffer ETF - July | | |
FT Vest U.S. Equity Moderate Buffer ETF - August | | |
FT Vest U.S. Small Cap Moderate Buffer ETF - August | | |
FT Vest U.S. Equity Buffer & Premium Income ETF - September | | |
FT Vest U.S. Equity Moderate Buffer ETF - September | | |
FT Vest U.S. Equity Moderate Buffer ETF - October | | |
FT Vest U.S. Equity Moderate Buffer ETF - November | | |
FT Vest U.S. Small Cap Moderate Buffer ETF - November | | |
FT Vest U.S. Equity Buffer & Premium Income ETF - December | | |
FT Vest U.S. Equity Moderate Buffer ETF - December | | |
FT Vest Laddered Moderate Buffer ETF | | |
FT Vest Laddered Small Cap Moderate Buffer ETF | | |
5. Derivative Transactions
The following table presents the types of derivatives held by each Fund at August 31, 2024, the primary underlying risk exposure and the location of these instruments as presented on the Statements of Assets and Liabilities.
| | | |
| | Statements of Assets and
Liabilities Location | | Statements of Assets and
Liabilities Location | |
| | | | | |
| | Options contracts purchased, at value | | Options contracts written, at value | |
| | | | | |
| | Options contracts purchased, at value | | Options contracts written, at value | |
| | | | | |
| | Options contracts purchased, at value | | Options contracts written, at value | |
| | | | | |
| | Options contracts purchased, at value | | Options contracts written, at value | |
Notes to Financial Statements (Continued)
First Trust Exchange-Traded Fund VIIIAugust 31, 2024 | | | |
| | Statements of Assets and Liabilities Location | | Statements of Assets and Liabilities Location | |
| | | | | |
| | Options contracts purchased, at value | | Options contracts written, at value | |
| | | | | |
| | Options contracts purchased, at value | | Options contracts written, at value | |
| | | | | |
| | Options contracts purchased, at value | | Options contracts written, at value | |
| | | | | |
| | Options contracts purchased, at value | | Options contracts written, at value | |
| | | | | |
| | Options contracts purchased, at value | | Options contracts written, at value | |
| | | | | |
| | Options contracts purchased, at value | | Options contracts written, at value | |
| | | | | |
| | Options contracts purchased, at value | | Options contracts written, at value | |
| | | | | |
| | Options contracts purchased, at value | | Options contracts written, at value | |
| | | | | |
| | Options contracts purchased, at value | | Options contracts written, at value | |
| | | | | |
| | Options contracts purchased, at value | | Options contracts written, at value | |
| | | | | |
| | Options contracts purchased, at value | | Options contracts written, at value | |
| | | | | |
| | Options contracts purchased, at value | | Options contracts written, at value | |
| | | | | |
| | Options contracts purchased, at value | | Options contracts written, at value | |
| | | | | |
| | Options contracts purchased, at value | | Options contracts written, at value | |
| | | | | |
| | Options contracts purchased, at value | | Options contracts written, at value | |
Notes to Financial Statements (Continued)
First Trust Exchange-Traded Fund VIIIAugust 31, 2024 | | | |
| | Statements of Assets and Liabilities Location | | Statements of Assets and Liabilities Location | |
| | | | | |
| | Options contracts purchased, at value | | Options contracts written, at value | |
The following table presents the amount of net realized gain (loss) and change in net unrealized appreciation (depreciation) recognized for the fiscal period ended August 31, 2024, on each Fund’s derivative instruments, as well as the primary underlying risk exposure associated with the instruments.
|
Statements of Operations Location | | | | | |
| | | | | |
Net realized gain (loss) on: | | | | | |
Purchased options contracts | | | | | |
Written options contracts | | | | | |
Net change in unrealized appreciation
(depreciation) on: | | | | | |
Purchased options contracts | | | | | |
Written options contracts | | | | | |
The Funds do not have the right to offset financial assets and financial liabilities related to options contracts on the Statements of Assets and Liabilities.
Notes to Financial Statements (Continued)
First Trust Exchange-Traded Fund VIIIAugust 31, 2024 The following table presents the premiums for purchased options contracts opened, premiums for purchased options contracts closed, exercised and expired, premiums for written options contracts opened, and premiums for written options contracts closed, exercised and expired, for the fiscal period ended August 31, 2024, on each Fund’s options contracts.
| Premiums for
purchased
options contracts
opened | Premiums for
purchased
options contracts
closed, exercised
and expired | Premiums for
written options
contracts opened | Premiums for
written options
contracts closed,
exercised and
expired |
| | | | |
| | | | |
| | | | |
| | | | |
| | | | |
| | | | |
| | | | |
| | | | |
| | | | |
| | | | |
| | | | |
| | | | |
| | | | |
| | | | |
| | | | |
| | | | |
| | | | |
| | | | |
| | | | |
| | | | |
6. Creations, Redemptions and Transaction Fees
Each Fund generally issues and redeems its shares in primary market transactions through a creation and redemption mechanism and does not sell or redeem individual shares. Instead, financial entities known as “Authorized Participants” have contractual arrangements with a Fund or one of the Fund’s service providers to purchase and redeem Fund shares directly with the Fund in Creation Units. Prior to the start of trading on every business day, a Fund publishes through the National Securities Clearing Corporation the “basket” of securities, cash or other assets that it will accept in exchange for a Creation Unit of the Fund’s shares. An Authorized Participant that wishes to effectuate a creation of a Fund’s shares deposits with the Fund the “basket” of securities, cash or other assets identified by the Fund that day, and then receives the Creation Unit of the Fund’s shares in return for those assets. After purchasing a Creation Unit, the Authorized Participant may continue to hold the Fund’s shares or sell them in the secondary market. The redemption process is the reverse of the purchase process: the Authorized Participant redeems a Creation Unit of a Fund’s shares for a basket of securities, cash or other assets. The combination of the creation and redemption process with secondary market trading in a Fund’s shares and underlying securities provides arbitrage opportunities that are designed to help keep the market price of a Fund’s shares at or close to the NAV per share of the Fund.
Each Fund imposes fees in connection with the purchase of Creation Units. These fees may vary based upon various fact-based circumstances, including, but not limited to, the composition of the securities included in the Creation Unit or the countries in which the transactions are settled. The price for each Creation Unit will equal the daily NAV per share of a Fund times the number of shares in a Creation Unit, plus the fees described above and, if applicable, any operational processing and brokerage costs, transfer fees, stamp taxes and part or all of the spread between the expected bid and offer side of the market related to the securities comprising the creation basket.
Each Fund also imposes fees in connection with the redemption of Creation Units. These fees may vary based upon various fact-based circumstances, including, but not limited to, the composition of the securities included in the Creation Unit or the countries in which the transactions are settled. The price received for each Creation Unit will equal the daily NAV per share of a Fund times the number of shares in a Creation Unit, minus the fees described above and, if applicable, any operational processing and brokerage costs,
Notes to Financial Statements (Continued)
First Trust Exchange-Traded Fund VIIIAugust 31, 2024 transfer fees, stamp taxes and part or all of the spread between the expected bid and offer side of the market related to the securities comprising the redemption basket. Investors who use the services of a broker or other such intermediary in addition to an Authorized Participant to effect a redemption of a Creation Unit may also be assessed an amount to cover the cost of such services. The redemption fee charged by a Fund will comply with Rule 22c-2 of the 1940 Act which limits redemption fees to no more than 2% of the value of the shares redeemed.
The Board of Trustees adopted a Distribution and Service Plan pursuant to Rule 12b-1 under the 1940 Act. In accordance with the Rule 12b-1 plan, the Funds are authorized to pay an amount up to 0.25% of their average daily net assets each year to reimburse First Trust Portfolios L.P. (“FTP”), the distributor of the Funds, for amounts expended to finance activities primarily intended to result in the sale of Creation Units or the provision of investor services. FTP may also use this amount to compensate securities dealers or other persons that are Authorized Participants for providing distribution assistance, including broker-dealer and shareholder support and educational and promotional services.
No 12b-1 fees are currently paid by the Funds, and pursuant to a contractual arrangement, no 12b-1 fees will be paid any time before December 31, 2025 for GJAN, GFEB, GMAR, GAPR, GMAY, SMAY, GJUN, GJUL, GAUG, SAUG, XISE, GSEP, GOCT, GNOV, SNOV, XIDE, GDEC and BUFZ, February 5, 2026 for SFEB, March 18, 2026 for XIMR, May 21, 2026 for BUFS, and June 10, 2026 for XIJN.
The Trust, on behalf of the Funds, has a variety of indemnification obligations under contracts with its service providers. The Trust’s maximum exposure under these arrangements is unknown. However, the Trust has not had prior claims or losses pursuant to these contracts and expects the risk of loss to be remote.
Management has evaluated the impact of all subsequent events on the Funds through the date the financial statements were issued and has determined that there were the following subsequent events:
As of September 23, 2024, the investment objective of XISE changed to include a consistent level of income of 6.67% and an Outcome Period of September 23, 2024 through September 19, 2025.
As of September 23, 2024, the investment objective of GSEP changed to include an upside cap of 11.30% and an Outcome Period of September 23, 2024 through September 19, 2025.
As of October 21, 2024, the investment objective of GOCT changed to include an upside cap of 11.66% and an Outcome Period of October 21, 2024 through October 17, 2025.
Report of Independent Registered Public Accounting Firm
To the Shareholders and Board of Trustees of First Trust Exchange-Traded Fund VIII:
Opinion on the Financial Statements and Financial Highlights
We have audited the accompanying statements of assets and liabilities, including the portfolios of investments, of FT Vest U.S. Equity Moderate Buffer ETF - January, FT Vest U.S. Equity Moderate Buffer ETF - February, FT Vest U.S. Small Cap Moderate Buffer ETF - February, FT Vest U.S. Equity Buffer & Premium Income ETF - March, FT Vest U.S. Equity Moderate Buffer ETF - March, FT Vest U.S. Equity Moderate Buffer ETF - April, FT Vest U.S. Equity Moderate Buffer ETF - May, FT Vest U.S. Small Cap Moderate Buffer ETF - May, FT Vest U.S. Equity Buffer & Premium Income ETF - June, FT Vest U.S. Equity Moderate Buffer ETF - June, FT Vest U.S. Equity Moderate Buffer ETF - July, FT Vest U.S. Equity Moderate Buffer ETF - August, FT Vest U.S. Small Cap Moderate Buffer ETF - August, FT Vest U.S. Equity Buffer & Premium Income ETF - September, FT Vest U.S. Equity Moderate Buffer ETF - September, FT Vest U.S. Equity Moderate Buffer ETF - October, FT Vest U.S. Equity Moderate Buffer ETF - November, FT Vest U.S. Small Cap Moderate Buffer ETF - November, FT Vest U.S. Equity Buffer & Premium Income ETF - December, FT Vest U.S. Equity Moderate Buffer ETF - December, FT Vest Laddered Moderate Buffer ETF, and FT Vest Laddered Small Cap Moderate Buffer ETF (the “Funds”), each a series of the First Trust Exchange-Traded Fund VIII, as of August 31, 2024, and the related statements of operations, the statements of changes in net assets, and the financial highlights for the periods indicated in the table below; and the related notes. In our opinion, the financial statements and financial highlights present fairly, in all material respects, the financial position of the Funds as of August 31, 2024, and the results of their operations, the changes in their net assets, and the financial highlights for the periods listed in the table below in conformity with accounting principles generally accepted in the United States of America.
Individual Funds
Included in the Trust | | Statements of
Changes in Net Assets | |
FT Vest U.S. Equity Moderate Buffer ETF - January | For the year ended August 31, 2024 | For the year ended August 31, 2024, and for the period from January 20, 2023 (commencement of investment operations) through August 31, 2023 |
FT Vest U.S. Equity Moderate Buffer ETF - February | For the year ended August 31, 2024 | For the year ended August 31, 2024, and for the period from February 17, 2023 (commencement of investment operations) through August 31, 2023 |
FT Vest U.S. Small Cap Moderate Buffer ETF - February | For the period from February 16, 2024 (commencement of investment operations) through August 31, 2024 |
FT Vest U.S. Equity Buffer & Premium Income ETF - March | For the period from March 18, 2024 (commencement of investment operations) through August 31, 2024 |
FT Vest U.S. Equity Moderate Buffer ETF - March | For the year ended August 31, 2024 | For the year ended August 31, 2024, and for the period from March 17, 2023 (commencement of investment operations) through August 31, 2023 |
FT Vest U.S. Equity Moderate Buffer ETF - April | For the year ended August 31, 2024 | For the year ended August 31, 2024, and for the period from April 21, 2023 (commencement of investment operations) through August 31, 2023 |
FT Vest U.S. Equity Moderate Buffer ETF - May | For the year ended August 31, 2024 | For the year ended August 31, 2024, and for the period from May 19, 2023 (commencement of investment operations) through August 31, 2023 |
FT Vest U.S. Small Cap Moderate Buffer ETF - May |
FT Vest U.S. Equity Buffer & Premium Income ETF - June | For the period from June 21, 2024 (commencement of investment operations) through August 31, 2024 |
FT Vest U.S. Equity Moderate Buffer ETF - June | For the year ended August 31, 2024 | For the year ended August 31, 2024, and for the period from June 16, 2023 (commencement of investment operations) through August 31, 2023 |
FT Vest U.S. Equity Moderate Buffer ETF - July | For the year ended August 31, 2024 | For the year ended August 31, 2024, and for the period from July 21, 2023 (commencement of investment operations) through August 31, 2023 |
FT Vest U.S. Equity Moderate Buffer ETF - August | For the year ended August 31, 2024 | For the year ended August 31, 2024, and for the period from August 18, 2023 (commencement of investment operations) through August 31, 2023 |
FT Vest U.S. Small Cap Moderate Buffer ETF - August |
Report of Independent Registered Public Accounting Firm (Continued)
Individual Funds Included in the Trust | | Statements of Changes in Net Assets | |
FT Vest U.S. Equity Buffer & Premium Income ETF - September | For the period from September 15, 2023 (commencement of investment operations) through August 31, 2023 |
FT Vest U.S. Equity Moderate Buffer ETF - September |
FT Vest U.S. Equity Moderate Buffer ETF - October | For the period from October 20, 2023 (commencement of investment operations) through August 31, 2024 |
FT Vest U.S. Equity Moderate Buffer ETF - November | For the period from November 17, 2023 (commencement of investment operations) through August 31, 2024 |
FT Vest U.S. Small Cap Moderate Buffer ETF - November |
FT Vest U.S. Equity Buffer & Premium Income ETF - December | For the period from December 15, 2023 (commencement of investment operations) through August 31, 2024 |
FT Vest U.S. Equity Moderate Buffer ETF - December |
FT Vest Laddered Moderate Buffer ETF | For the period from October 25, 2023 (commencement of investment operations) through August 31, 2024 |
FT Vest Laddered Small Cap Moderate Buffer ETF | For the period from May 29, 2024 (commencement of investment operations) through August 31, 2024 |
These financial statements and financial highlights are the responsibility of the Funds’ management. Our responsibility is to express an opinion on the Funds’ financial statements and financial highlights based on our audits. We are a public accounting firm registered with the Public Company Accounting Oversight Board (United States) (PCAOB) and are required to be independent with respect to the Funds in accordance with the U.S. federal securities laws and the applicable rules and regulations of the Securities and Exchange Commission and the PCAOB.
We conducted our audits in accordance with the standards of the PCAOB. Those standards require that we plan and perform the audit to obtain reasonable assurance about whether the financial statements and financial highlights are free of material misstatement, whether due to error or fraud. The Funds are not required to have, nor were we engaged to perform, an audit of their internal control over financial reporting. As part of our audits, we are required to obtain an understanding of internal control over financial reporting but not for the purpose of expressing an opinion on the effectiveness of the Funds’ internal control over financial reporting. Accordingly, we express no such opinion.
Our audits included performing procedures to assess the risks of material misstatement of the financial statements and financial highlights, whether due to error or fraud, and performing procedures that respond to those risks. Such procedures included examining, on a test basis, evidence regarding the amounts and disclosures in the financial statements and financial highlights. Our audits also included evaluating the accounting principles used and significant estimates made by management, as well as evaluating the overall presentation of the financial statements and financial highlights. Our procedures included confirmation of securities owned as of August 31, 2024, by correspondence with the custodian and brokers; when replies were not received from brokers, we performed other auditing procedures. We believe that our audits provide a reasonable basis for our opinion.
/s/ Deloitte & Touche, LLP
Chicago, Illinois
October 25, 2024
We have served as the auditor of one or more First Trust investment companies since 2001.
First Trust Exchange-Traded Fund VIIIAugust 31, 2024 (Unaudited) Changes in and Disagreements with Accountants (Item 8 of Form N-CSR)
There were no changes in or disagreements with the Funds’ accountants during the fiscal period ended August 31, 2024.
Proxy Disclosures (Item 9 of Form N-CSR)
There were no matters submitted for vote by shareholders of any Fund during the fiscal period ended August 31, 2024.
Remuneration Paid to Directors, Officers, and Others (Item 10 of Form N-CSR)
Independent Trustees and any member of any advisory board of each Fund are compensated through the unitary management fee paid by each Fund to the advisor and not directly by each Fund. The investment advisory fee paid is included in the Statements of Operations.
Statement Regarding the Basis for the Board’s Approval of Investment Advisory Contract (Item 11 of Form N-CSR)
The Board of Trustees of First Trust Exchange-Traded Fund VIII (the “Trust”), including the Independent Trustees, unanimously approved the continuation of the Investment Management Agreement (the “Advisory Agreement”) with First Trust Advisors L.P. (the “Advisor”) and the Investment Sub-Advisory Agreement (the “Sub-Advisory Agreement” and together with the Advisory Agreement, the “Agreements”) among the Trust, the Advisor and Vest Financial LLC (the “Sub-Advisor”) on behalf of the following series of the Trust (each a “Fund” and collectively, the “Funds”):
FT Vest U.S. Equity Moderate Buffer ETF - January (GJAN)
FT Vest U.S. Equity Moderate Buffer ETF - February (GFEB)
FT Vest U.S. Equity Moderate Buffer ETF - March (GMAR)
FT Vest U.S. Equity Moderate Buffer ETF - April (GAPR)
FT Vest U.S. Equity Moderate Buffer ETF - May (GMAY)
FT Vest U.S. Equity Moderate Buffer ETF - June (GJUN)
FT Vest U.S. Equity Moderate Buffer ETF - July (GJUL)
FT Vest U.S. Equity Moderate Buffer ETF - August (GAUG)
FT Vest U.S. Small Cap Moderate Buffer ETF - May (SMAY)
The Board approved the continuation of the Agreements for each Fund for a one-year period ending June 30, 2025 at a meeting held on June 2–3, 2024. The Board determined for each Fund that the continuation of the Agreements is in the best interests of the Fund in light of the nature, extent and quality of the services provided and such other matters as the Board considered to be relevant in the exercise of its business judgment.
To reach this determination for each Fund, the Board considered its duties under the Investment Company Act of 1940, as amended (the “1940 Act”), as well as under the general principles of state law, in reviewing and approving advisory contracts; the requirements of the 1940 Act in such matters; the fiduciary duty of investment advisors with respect to advisory agreements and compensation; the standards used by courts in determining whether investment company boards have fulfilled their duties; and the factors to be considered by the Board in voting on such agreements. At meetings held on April 16, 2024, April 25, 2024 and June 2–3, 2024, the Board, including the Independent Trustees, reviewed materials provided by the Advisor and the Sub-Advisor responding to requests for information from counsel to the Independent Trustees, submitted on behalf of the Independent Trustees, that, among other things, outlined: the services provided by the Advisor and the Sub-Advisor to each Fund (including the relevant personnel responsible for these services and their experience); the unitary fee rate schedule payable by each Fund as compared to fees charged to a peer group of funds (the “Expense Group”) and a broad peer universe of funds (the “Expense Universe”), each assembled by Broadridge Financial Solutions, Inc. (“Broadridge”), an independent source, and as compared to fees charged to other clients of the Advisor, including other exchange-traded funds (“ETFs”) managed by the Advisor; the sub-advisory fee as compared to fees charged to other clients of the Sub-Advisor; the expense ratio of each Fund as compared to expense ratios of the funds in the Fund’s Expense Group and Expense Universe; performance information for each Fund; the nature of expenses incurred in providing services to each Fund and the potential for the Advisor and the Sub-Advisor to realize economies of scale, if any; profitability and other financial data for the Advisor; financial data for the Sub-Advisor; any indirect benefits to the Advisor and its affiliates, First Trust Portfolios L.P. (“FTP”) and First Trust Capital Partners, LLC (“FTCP”), and the Sub-Advisor; and information on the Advisor’s and the Sub-Advisor’s compliance programs. The Board reviewed initial materials with the Advisor at the meeting held on April 25, 2024, prior to which the Independent Trustees and their counsel met separately to discuss the information provided by the Advisor and the Sub-Advisor. Following the April 25, 2024 meeting, counsel to the Independent Trustees, on behalf of the Independent Trustees, requested certain clarifications
Other Information (Continued)
First Trust Exchange-Traded Fund VIIIAugust 31, 2024 (Unaudited) and supplements to the materials provided, and the information provided in response to those requests was considered at an executive session of the Independent Trustees and their counsel held prior to the June 2–3, 2024 meeting, as well as at the June meeting. The Board applied its business judgment to determine whether the arrangements between the Trust and the Advisor and among the Trust, the Advisor and the Sub-Advisor continue to be reasonable business arrangements from each Fund’s perspective. The Board determined that, given the totality of the information provided with respect to the Agreements, the Board had received sufficient information to renew the Agreements. The Board considered that shareholders chose to invest or remain invested in a Fund knowing that the Advisor and the Sub-Advisor manage the Fund and knowing the Fund’s unitary fee.
In reviewing the Agreements for each Fund, the Board considered the nature, extent and quality of the services provided by the Advisor and the Sub-Advisor under the Agreements. With respect to the Advisory Agreement, the Board considered that the Advisor is responsible for the overall management and administration of the Trust and each Fund and reviewed all of the services provided by the Advisor to the Funds, including the oversight of the Sub-Advisor, as well as the background and experience of the persons responsible for such services. The Board noted that the Advisor oversees the Sub-Advisor’s day-to-day management of each Fund’s investments, including portfolio risk monitoring and performance review. In reviewing the services provided, the Board noted the compliance program that had been developed by the Advisor and considered that it includes a robust program for monitoring the Advisor’s, the Sub-Advisor’s and each Fund’s compliance with the 1940 Act, as well as each Fund’s compliance with its investment objective, policies and restrictions. The Board also considered a report from the Advisor with respect to its risk management functions related to the operation of the Funds. Finally, as part of the Board’s consideration of the Advisor’s services, the Advisor, in its written materials and at the April 25, 2024 meeting, described to the Board the scope of its ongoing investment in additional personnel and infrastructure to maintain and improve the quality of services provided to the Funds and the other funds in the First Trust Fund Complex. With respect to the Sub-Advisory Agreement, the Board noted that each Fund is an actively-managed ETF and the Sub-Advisor actively manages the Fund’s investments. The Board reviewed the materials provided by the Sub-Advisor and considered the services that the Sub-Advisor provides to each Fund, including the Sub-Advisor’s day-to-day management of the Funds’ investments. In considering the Sub-Advisor’s management of the Funds, the Board noted the background and experience of the Sub-Advisor’s portfolio management team, including the Board’s prior meetings with members of the portfolio management team. In light of the information presented and the considerations made, the Board concluded that the nature, extent and quality of the services provided to the Trust and each Fund by the Advisor and the Sub-Advisor under the Agreements have been and are expected to remain satisfactory and that the Sub-Advisor, under the oversight of the Advisor, has managed each Fund consistent with its investment objective, policies and restrictions.
The Board considered the unitary fee rate schedule payable by each Fund under the Advisory Agreement for the services provided. The Board noted that the sub-advisory fee for each Fund is paid by the Advisor from the Fund’s unitary fee. The Board considered that as part of the unitary fee the Advisor is responsible for each Fund’s expenses, including the cost of sub-advisory, transfer agency, custody, fund administration, legal, audit and other services and license fees, if any, but excluding the fee payment under the Advisory Agreement and interest, taxes, brokerage commissions and other expenses connected with the execution of portfolio transactions, distribution and service fees pursuant to a Rule 12b-1 plan, if any, and extraordinary expenses, if any. The Board received and reviewed information showing the fee rates and expense ratios of the peer funds in the Expense Groups, as well as advisory and unitary fee rates charged by the Advisor and the Sub-Advisor to other fund (including ETFs) and non-fund clients, as applicable. Because each Fund pays a unitary fee, the Board determined that expense ratios were the most relevant comparative data point. Based on the information provided, the Board noted that the total (net) expense ratio for each Fund was above the median total (net) expense ratio of the peer funds in its respective Expense Group. With respect to the Expense Groups, the Board discussed with Broadridge its methodology for assembling peer groups and discussed with the Advisor limitations in creating peer groups for actively-managed ETFs, and different business models that may affect the pricing of services among ETF sponsors. The Board also noted that, for each Fund, not all peer funds employ an advisor/sub-advisor management structure. The Board took these limitations and differences into account in considering the peer data. With respect to fees charged to other non-ETF clients, the Board considered differences between the Funds and other non-ETF clients that limited their comparability. In considering the unitary fee rate schedules overall, the Board also considered the Advisor’s statement that it seeks to meet investor needs through innovative and value-added investment solutions and the Advisor’s demonstrated long-term commitment to each Fund and the other funds in the First Trust Fund Complex.
The Board considered performance information for each Fund. The Board noted the process it has established for monitoring each Fund’s performance and portfolio risk on an ongoing basis, which includes quarterly performance reporting from the Advisor and the Sub-Advisor for the Funds. The Board determined that this process continues to be effective for reviewing each Fund’s performance. The Board noted that the Funds are target outcome ETFs that seek to provide investors with returns (before fees and expenses) over a defined period of time (typically one year) that, for each of GJAN, GFEB, GMAR, GAPR, GMAY, GJUN, GJUL and GAUG, match the price return of the SPDR S&P 500 ETF Trust (“SPY”) and, for SMAY, match the price return of the iShares Russell 2000 ETF
Other Information (Continued)
First Trust Exchange-Traded Fund VIIIAugust 31, 2024 (Unaudited) (“IWM”), up to a predetermined cap, while providing a buffer against certain losses on the price return of SPY or IWM, as applicable. For each Fund, the Board considered, as applicable, information provided by the Sub-Advisor on each Fund’s performance during its respective target outcome period that ended between April 1, 2023 and March 31, 2024 and noted that each applicable Fund delivered on its target outcome objective. Because each Fund commenced operations in 2023 and therefore has a limited performance history, comparative performance information for each Fund was not reviewed.
On the basis of all the information provided on the unitary fee and performance, as applicable, of each Fund and the ongoing oversight by the Board, the Board concluded that the unitary fee for each Fund (out of which the Sub-Advisor is compensated) continues to be reasonable and appropriate in light of the nature, extent and quality of the services provided by the Advisor and the Sub-Advisor to each Fund under the Agreements.
The Board considered information and discussed with the Advisor whether there were any economies of scale in connection with providing advisory services to the Funds at current asset levels and whether the Funds may benefit from any economies of scale. The Board noted that the unitary fee rate schedule for each Fund includes breakpoints pursuant to which the unitary fee rate will be reduced as assets of the Fund meet certain thresholds. The Board considered the Advisor’s statement that it believes that its expenses relating to providing advisory services to the Funds will increase during the next twelve months as the Advisor continues to build infrastructure and add new staff. The Board also noted that under the unitary fee structure, any reduction in expenses associated with the management and operations of the Funds would benefit the Advisor, but that the unitary fee structure provides a level of certainty in expenses for shareholders of the Funds. The Board concluded that the unitary fee rate schedule for each Fund reflects an appropriate level of sharing of any economies of scale that may be realized in the management of the Fund at current asset levels. The Board considered the revenues and allocated costs (including the allocation methodology) of the Advisor in serving as investment advisor to each Fund for the period from the Fund’s respective inception through December 31, 2023 and the estimated profitability level for each Fund calculated by the Advisor based on such data, as well as complex-wide and product-line profitability data, for the twelve months ended December 31, 2023. The Board noted the inherent limitations in the profitability analysis and concluded that, based on the information provided, the Advisor’s profitability level for each Fund was not unreasonable. In addition, the Board considered indirect benefits described by the Advisor that may be realized from its relationship with the Funds. The Board considered that the Advisor had identified as an indirect benefit to the Advisor and FTP their exposure to investors and brokers who, absent their exposure to the Funds, may have had no dealings with the Advisor or FTP. The Board also noted that FTCP has a controlling ownership interest in the Sub-Advisor’s parent company and considered potential indirect benefits to the Advisor from such ownership interest. The Board concluded that the character and amount of potential indirect benefits to the Advisor were not unreasonable.
The Board considered the Sub-Advisor’s statement that it believes that the sub-advisory fee for each Fund is appropriate. The Board noted the Sub-Advisor’s statements that it continues to invest in infrastructure, technology and personnel, and that it anticipates that its expenses relating to providing services to the Funds will remain approximately the same for the next twelve months. The Board noted that the Advisor pays the Sub-Advisor for each Fund from the unitary fee, that the sub-advisory fee will be reduced consistent with the breakpoints in the unitary fee rate schedule and its understanding that each Fund’s sub-advisory fee was the product of an arm’s length negotiation. The Board did not review the profitability of the Sub-Advisor with respect to each Fund. The Board concluded that the profitability analysis for the Advisor was more relevant. The Board considered the potential indirect benefits to the Sub-Advisor from being associated with the Advisor and the Funds, and noted the Sub-Advisor’s statements that it is the Sub-Advisor’s policy currently not to enter into soft-dollar arrangements for the procurement of research services in connection with client securities transactions and that, as a result, there are no foreseen indirect benefits from its relationship with the Funds. The Board also considered the potential indirect benefits to the Sub-Advisor from FTCP’s controlling ownership interest in the Sub-Advisor’s parent company. The Board concluded that the character and amount of potential indirect benefits to the Sub-Advisor were not unreasonable.
Based on all of the information considered and the conclusions reached, the Board, including the Independent Trustees, unanimously determined that the terms of the Agreements continue to be fair and reasonable and that the continuation of the Agreements is in the best interests of each Fund. No single factor was determinative in the Board’s analysis.
The Board of Trustees of First Trust Exchange-Traded Fund VIII (the “Trust”), including the Independent Trustees, approved the Investment Management Agreement (the “Advisory Agreement”) with First Trust Advisors L.P. (the “Advisor”) and the Investment
Other Information (Continued)
First Trust Exchange-Traded Fund VIIIAugust 31, 2024 (Unaudited) Sub-Advisory Agreement (the “Sub-Advisory Agreement” and together with the Advisory Agreement, the “Agreements”) among the Trust, the Advisor and Vest Financial LLC (the “Sub-Advisor”) on behalf of the following series of the Trust (each a “Fund” and collectively, the “Funds”):
FT Vest U.S. Equity Buffer & Premium Income ETF - March (XIMR)
FT Vest U.S. Equity Buffer & Premium Income ETF - June (XIJN)
The Board approved the Agreements for each Fund for an initial two-year term at a meeting held on September 11, 2023. The Board determined for each Fund that the Agreements are in the best interests of the Fund in light of the nature, extent and quality of the services expected to be provided and such other matters as the Board considered to be relevant in the exercise of its business judgment.
To reach this determination for each Fund, the Board considered its duties under the Investment Company Act of 1940, as amended (the “1940 Act”), as well as under the general principles of state law, in reviewing and approving advisory contracts; the requirements of the 1940 Act in such matters; the fiduciary duty of investment advisors with respect to advisory agreements and compensation; the standards used by courts in determining whether investment company boards have fulfilled their duties; and the factors to be considered by the Board in voting on such agreements. To assist the Board in its evaluation of the Agreements for each Fund, the Independent Trustees received a separate report from each of the Advisor and the Sub-Advisor in advance of the Board meeting responding to requests for information from counsel to the Independent Trustees, submitted on behalf of the Independent Trustees, that, among other things, outlined: the services to be provided by the Advisor and the Sub-Advisor to each Fund (including the relevant personnel responsible for these services and their experience); the proposed unitary fee rate schedule payable by each Fund as compared to fees charged to a peer group of funds (the “Expense Group”) and a broad peer universe of funds (the “Expense Universe”), each assembled by Broadridge Financial Solutions, Inc. (“Broadridge”), an independent source, and as compared to fees charged to other exchange-traded funds (“ETFs”) managed by the Advisor; the proposed sub-advisory fee as compared to fees charged to other clients of the Sub-Advisor; the estimated expense ratio of each Fund as compared to expense ratios of the funds in the Fund’s Expense Group and Expense Universe; the nature of expenses to be incurred in providing services to each Fund and the potential for the Advisor and the Sub-Advisor to realize economies of scale, if any; profitability and other financial data for the Advisor; financial data for the Sub-Advisor; any indirect benefits to the Advisor and its affiliates, First Trust Portfolios L.P. (“FTP”) and First Trust Capital Partners, LLC (“FTCP”), and the Sub-Advisor; and information on the Advisor’s and the Sub-Advisor’s compliance programs. The Independent Trustees and their counsel also met separately to discuss the information provided by the Advisor and the Sub-Advisor. The Board applied its business judgment to determine whether the arrangements between the Trust and the Advisor and among the Trust, the Advisor and the Sub-Advisor are reasonable business arrangements from each Fund’s perspective.
In evaluating whether to approve the Agreements for each Fund, the Board considered the nature, extent and quality of the services to be provided by the Advisor and the Sub-Advisor under the Agreements. With respect to the Advisory Agreement, the Board considered that the Advisor will be responsible for the overall management and administration of each Fund and reviewed all of the services to be provided by the Advisor to the Funds, including the oversight of the Sub-Advisor, as well as the background and experience of the persons responsible for such services. The Board considered that each Fund will be an actively-managed ETF and will employ an advisor/sub-advisor management structure and considered that the Advisor manages other ETFs with a similar structure in the First Trust Fund Complex. The Board noted that the Advisor will oversee the Sub-Advisor’s day-to-day management of each Fund’s investments, including portfolio risk monitoring and performance review. In reviewing the services to be provided, the Board noted the compliance program that had been developed by the Advisor and considered that it includes a robust program for monitoring the Advisor’s, the Sub-Advisor’s and each Fund’s compliance with the 1940 Act, as well as each Fund’s compliance with its investment objective, policies and restrictions. The Board noted that employees of the Advisor provide management services to other ETFs and to other funds in the First Trust Fund Complex with diligence and care. With respect to the Sub-Advisory Agreement, in addition to the written materials provided by the Sub-Advisor, at the September 11, 2023 meeting, the Board also received a presentation from representatives of the Sub-Advisor, who discussed the services that the Sub-Advisor will provide to the Funds, and the Trustees were able to ask questions about the proposed investment strategy for the Funds. The Board noted the background and experience of the Sub-Advisor’s portfolio management team and the Sub-Advisor’s investment style. The Board also noted that the Sub-Advisor manages a number of other defined-outcome ETFs with strategies similar to those of the Funds in the First Trust Fund Complex. Because the Funds had yet to commence investment operations, the Board could not consider the historical investment performance of the Funds. In light of the information presented and the considerations made, the Board concluded that the nature, extent and quality of the services to be provided to each Fund by the Advisor and the Sub-Advisor under the Agreements are expected to be satisfactory.
Other Information (Continued)
First Trust Exchange-Traded Fund VIIIAugust 31, 2024 (Unaudited) The Board considered the proposed unitary fee rate schedule payable by each Fund under the Advisory Agreement for the services to be provided. The Board noted that, under the unitary fee arrangement, each Fund would pay the Advisor a unitary fee starting at an annual rate of 0.85% of its average daily net assets, subject to a breakpoint schedule pursuant to which the unitary fee rate would be reduced as assets of the Fund meet certain thresholds. The Board considered that, from the unitary fee for each Fund, the Advisor would pay the Sub-Advisor a sub-advisory fee equal to 50% of the Fund’s unitary fee less one-half of the Fund’s expenses and that the sub-advisory fee would be reduced consistent with the breakpoints in the unitary fee rate schedule. The Board noted that the Advisor and the Sub-Advisor would be responsible for each Fund’s expenses, including the cost of sub-advisory, transfer agency, custody, fund administration, legal, audit and other services and license fees, if any, but excluding the fee payment under the Advisory Agreement and interest, taxes, acquired fund fees and expenses, if any, brokerage commissions and other expenses connected with the execution of portfolio transactions, distribution and service fees pursuant to a Rule 12b-1 plan, if any, and extraordinary expenses, if any. The Board received and reviewed information showing the fee rates and expense ratios of the peer funds in the Expense Group, as well as advisory and unitary fee rates charged by the Advisor and the Sub-Advisor to other fund (including ETF) and non-fund clients, as applicable. Because each Fund will pay a unitary fee, the Board determined that expense ratios were the most relevant comparative data point. Based on the information provided, the Board noted that the total (net) expense ratio for each Fund was above the median total (net) expense ratio of the peer funds in the Expense Group. With respect to the Expense Group, the Board discussed with representatives of the Advisor how the Expense Group was assembled and how each Fund compared and differed from the peer funds. The Board took this information into account in considering the peer data. With respect to fees charged to other clients, the Board considered the Advisor’s statement that the Funds will be unique to the market and the First Trust Fund Complex, but will be most similar to the ETFs in the FT Vest U.S. Equity Buffer ETF and FT Vest U.S. Equity Deep Buffer ETF product lines in the First Trust Fund Complex that are managed by the Advisor and sub-advised by the Sub-Advisor, each of which has a unitary fee rate schedule starting at an annual rate of 0.85% of its average daily net assets. In light of the information considered and the nature, extent and quality of the services expected to be provided to each Fund under the Agreements, the Board determined that, for each Fund, the proposed unitary fee, including the sub-advisory fee to be paid by the Advisor to the Sub-Advisor from the unitary fee, was fair and reasonable.
The Board considered whether there are any potential economies of scale to be achieved in connection with the Advisor providing investment advisory services to the Funds and whether the Funds may benefit from any economies of scale. The Board noted that the proposed unitary fee rate schedule for each Fund includes breakpoints pursuant to which the unitary fee rate would be reduced as assets of the Fund meet certain thresholds. The Board considered that the Advisor has continued to build infrastructure and add new staff to improve the services to the funds in the First Trust Fund Complex. The Board also noted that under the unitary fee structure, any reduction in expenses associated with the management and operations of the Funds generally would benefit the Advisor and the Sub-Advisor, but that the unitary fee structure provides a level of certainty in expenses for shareholders of the Funds. The Board concluded that the proposed unitary fee rate schedule for each Fund reflects an appropriate level of sharing of any economies of scale that may be realized in the management of the Fund at reasonably foreseeable future asset levels. The Board considered that the Sub-Advisor would be paid by the Advisor from each Fund’s unitary fee, that the sub-advisory fee for each Fund would be reduced consistent with the breakpoints in the Fund’s unitary fee rate schedule and its understanding that the sub-advisory fee for each Fund was the product of an arm’s length negotiation. The Board took into consideration the types of costs to be borne by the Advisor in connection with its services to be performed for each Fund under the Advisory Agreement. The Board considered the Advisor’s estimate of the asset level for each Fund at which the Advisor expects the Advisory Agreement for the Fund to be profitable to the Advisor and the Advisor’s estimate of the profitability of the Advisory Agreement for each Fund if its assets reach $100 million. The Board noted the inherent limitations in the profitability analysis and concluded that, based on the information provided, the Advisor’s estimated profitability level for each Fund was not unreasonable. The Board reviewed financial information provided by the Sub-Advisor, but did not review any potential profitability of the Sub-Advisory Agreement for each Fund to the Sub-Advisor. The Board concluded that the profitability analysis for the Advisor was more relevant. In addition, the Board considered indirect benefits described by the Advisor that may be realized from its relationship with the Funds. The Board noted that FTCP has a controlling ownership interest in the Sub-Advisor’s parent company and considered potential indirect benefits to the Advisor from such ownership interest. The Board also considered that the Advisor had identified as an indirect benefit to the Advisor and FTP their exposure to investors and brokers who, absent their exposure to the Funds, may have had no dealings with the Advisor or FTP. The Board also considered the potential indirect benefits to the Sub-Advisor from FTCP’s controlling ownership interest in the Sub-Advisor’s parent company. The Board noted the Sub-Advisor’s statements that it does not foresee any indirect benefits from its relationship with the Funds and that, as a policy, it does not enter into soft-dollar arrangements for the procurement of research services in connection with client securities transactions. The Board concluded that the character and amount of potential indirect benefits to the Advisor and the Sub-Advisor were not unreasonable.
Other Information (Continued)
First Trust Exchange-Traded Fund VIIIAugust 31, 2024 (Unaudited) Based on all of the information considered and the conclusions reached, the Board, including the Independent Trustees, determined that the terms of the Agreements are fair and reasonable and that the approval of the Agreements is in the best interests of each Fund. No single factor was determinative in the Board’s analysis.
The Board of Trustees of First Trust Exchange-Traded Fund VIII (the “Trust”), including the Independent Trustees, approved the Investment Management Agreement (the “Advisory Agreement”) with First Trust Advisors L.P. (the “Advisor”), on behalf of FT Vest Laddered Small Cap Moderate Buffer ETF (the “Fund”), and the Investment Sub-Advisory Agreement (the “Sub-Advisory Agreement” and together with the Advisory Agreement, the “Agreements”) among the Trust, on behalf of the Fund, the Advisor and Vest Financial LLC (the “Sub-Advisor”), for an initial two-year term at a meeting held on March 11, 2024. The Board determined that the Agreements are in the best interests of the Fund in light of the nature, extent and quality of the services expected to be provided and such other matters as the Board considered to be relevant in the exercise of its business judgment.
To reach this determination, the Board considered its duties under the Investment Company Act of 1940, as amended (the “1940 Act”), as well as under the general principles of state law, in reviewing and approving advisory contracts; the requirements of the 1940 Act in such matters; the fiduciary duty of investment advisors with respect to advisory agreements and compensation; the standards used by courts in determining whether investment company boards have fulfilled their duties; and the factors to be considered by the Board in voting on such agreements. To assist the Board in its evaluation of the Agreements for the Fund, the Independent Trustees received a separate report from each of the Advisor and the Sub-Advisor in advance of the Board meeting responding to requests for information from counsel to the Independent Trustees, submitted on behalf of the Independent Trustees, that, among other things, outlined: the services to be provided by the Advisor and the Sub-Advisor to the Fund (including the relevant personnel responsible for these services and their experience); the proposed unitary fee rate schedule payable by the Fund as compared to fees charged to a peer group of funds (the “Expense Group”) and a broad peer universe of funds (the “Expense Universe”), each assembled by Broadridge Financial Solutions, Inc. (“Broadridge”), an independent source, and as compared to fees charged to other exchange-traded funds (“ETFs”) managed by the Advisor; the proposed sub-advisory fee as compared to fees charged to other clients of the Sub-Advisor; the estimated expense ratio of the Fund as compared to expense ratios of the funds in the Fund’s Expense Group and Expense Universe; the nature of expenses to be incurred in providing services to the Fund and the potential for the Advisor and the Sub-Advisor to realize economies of scale, if any; profitability and other financial data for the Advisor; financial data for the Sub-Advisor; any indirect benefits to the Advisor and its affiliates, First Trust Portfolios L.P. (“FTP”) and First Trust Capital Partners, LLC (“FTCP”), and the Sub-Advisor; and information on the Advisor’s and the Sub-Advisor’s compliance programs. The Independent Trustees and their counsel also met separately to discuss the information provided by the Advisor and the Sub-Advisor. The Board applied its business judgment to determine whether the arrangements between the Trust and the Advisor and among the Trust, the Advisor and the Sub-Advisor are reasonable business arrangements from the Fund’s perspective.
In evaluating whether to approve the Agreements for the Fund, the Board considered the nature, extent and quality of the services to be provided by the Advisor and the Sub-Advisor under the Agreements. With respect to the Advisory Agreement, the Board considered that the Advisor will be responsible for the overall management and administration of the Fund and reviewed all of the services to be provided by the Advisor to the Fund, including the oversight of the Sub-Advisor, as well as the background and experience of the persons responsible for such services. The Board considered that the Fund will be an actively-managed ETF and will employ an advisor/sub-advisor management structure and considered that the Advisor manages other ETFs with a similar structure in the First Trust Fund Complex. The Board noted that the Advisor will oversee the Sub-Advisor’s day-to-day management of the Fund’s investments, including portfolio risk monitoring and performance review. In reviewing the services to be provided, the Board noted the compliance program that had been developed by the Advisor and considered that it includes a robust program for monitoring the Advisor’s, the Sub-Advisor’s and the Fund’s compliance with the 1940 Act, as well as the Fund’s compliance with its investment objective, policies and restrictions. The Board noted that employees of the Advisor provide management services to other ETFs and to other funds in the First Trust Fund Complex with diligence and care. With respect to the Sub-Advisory Agreement, in addition to the written materials provided by the Sub-Advisor, at the March 11, 2024 meeting, the Board also received a presentation from representatives of the Sub-Advisor, who discussed the services that the Sub-Advisor will provide to the Fund, and the Trustees were able to ask questions about the proposed investment strategy for the Fund. The Board noted the background and experience of the Sub-Advisor’s portfolio management team and the Sub-Advisor’s investment style. The Board also noted that the Fund would invest substantially all of its assets in multiple defined-outcome ETFs in the First Trust Fund Complex sub-advised by the Sub-Advisor. Because the Fund had yet to commence investment operations, the Board could not consider the historical investment performance of the Fund. In light of the information presented and the considerations made, the Board concluded that the nature, extent and quality of the services to be provided to the Fund by the Advisor and the Sub-Advisor under the Agreements are expected to be satisfactory.
Other Information (Continued)
First Trust Exchange-Traded Fund VIIIAugust 31, 2024 (Unaudited) The Board considered the proposed unitary fee rate schedule payable by the Fund under the Advisory Agreement for the services to be provided. The Board noted that, under the unitary fee arrangement, the Fund would pay the Advisor a unitary fee starting at an annual rate of 0.20% of its average daily net assets, subject to a breakpoint schedule pursuant to which the unitary fee rate would be reduced as assets of the Fund meet certain thresholds. The Board considered that, from the unitary fee for the Fund, the Advisor would pay the Sub-Advisor a sub-advisory fee equal to 50% of the Fund’s unitary fee less one-half of the Fund’s expenses and that the sub-advisory fee would be reduced consistent with the breakpoints in the unitary fee rate schedule. The Board noted that the Advisor and the Sub-Advisor would be responsible for the Fund’s expenses, including the cost of sub-advisory, transfer agency, custody, fund administration, legal, audit and other services and license fees, if any, but excluding the fee payment under the Advisory Agreement and interest, taxes, acquired fund fees and expenses, if any, brokerage commissions and other expenses connected with the execution of portfolio transactions, distribution and service fees pursuant to a Rule 12b-1 plan, if any, and extraordinary expenses, if any. The Board noted that, because the Fund will invest in underlying ETFs in the First Trust Fund Complex, it will incur acquired fund fees and expenses, which are not payable out of the unitary fee. The Board received and reviewed information showing the fee rates and expense ratios of the peer funds in the Expense Group, as well as advisory and unitary fee rates charged by the Advisor and the Sub-Advisor to other ETFs. Because the Fund will pay a unitary fee, the Board determined that expense ratios were the most relevant comparative data point. Based on the information provided, the Board noted that the total (net) expense ratio (excluding the estimated acquired fund fees and expenses) for the Fund was below the median total (net) expense ratio (excluding acquired fund fees and expenses) of the peer funds in the Expense Group. The Board also noted that the total (net) expense ratio (including the estimated acquired fund fees and expenses) for the Fund was above the median total (net) expense ratio (including acquired fund fees and expenses) of the peer funds in the Expense Group. With respect to the Expense Group, the Board discussed with representatives of the Advisor how the Expense Group was assembled and how the Fund compared and differed from the peer funds. The Board took this information into account in considering the peer data. With respect to fees charged to other clients, the Board considered the Advisor’s statement that the Fund will be most comparable to three other ETFs in the First Trust Fund Complex that invest in underlying ETFs, including ETFs in the First Trust Fund Complex, each of which has a unitary fee rate schedule starting at an annual rate of 0.20% of its average daily net assets, is managed by the Advisor and the Sub-Advisor, and also invests substantially all of its assets in multiple defined-outcome ETFs in the First Trust Fund Complex sub-advised by the Sub-Advisor. In light of the information considered and the nature, extent and quality of the services expected to be provided to the Fund under the Agreements, the Board determined that the proposed unitary fee, including the sub-advisory fee to be paid by the Advisor to the Sub-Advisor from the unitary fee, was fair and reasonable.
The Board considered whether there are any potential economies of scale to be achieved in connection with the Advisor providing investment advisory services to the Fund and whether the Fund may benefit from any economies of scale. The Board noted that the proposed unitary fee rate schedule for the Fund includes breakpoints pursuant to which the unitary fee rate would be reduced as assets of the Fund meet certain thresholds. The Board considered that the Advisor has continued to build infrastructure and add new staff to improve the services to the funds in the First Trust Fund Complex. The Board also noted that under the unitary fee structure, any reduction in expenses associated with the management and operations of the Fund generally would benefit the Advisor and the Sub-Advisor, but that the unitary fee structure provides a level of certainty in expenses for shareholders of the Fund. The Board concluded that the proposed unitary fee rate schedule for the Fund reflects an appropriate level of sharing of any economies of scale that may be realized in the management of the Fund at reasonably foreseeable future asset levels. The Board considered that the Sub-Advisor would be paid by the Advisor from the Fund’s unitary fee, that the sub-advisory fee would be reduced consistent with the breakpoints in the Fund’s unitary fee rate schedule and its understanding that the sub-advisory fee for the Fund was the product of an arm’s length negotiation. The Board took into consideration the types of costs to be borne by the Advisor in connection with its services to be performed for the Fund under the Advisory Agreement. The Board considered the Advisor’s estimate of the asset level for the Fund at which the Advisor expects the Advisory Agreement to be profitable to the Advisor and the Advisor’s estimate of the profitability of the Advisory Agreement if the Fund’s assets reach $100 million. The Board noted the inherent limitations in the profitability analysis and concluded that, based on the information provided, the Advisor’s estimated profitability level for the Fund was not unreasonable. The Board reviewed financial information provided by the Sub-Advisor, but did not review any potential profitability of the Sub-Advisory Agreement to the Sub-Advisor. The Board concluded that the profitability analysis for the Advisor was more relevant. In addition, the Board considered indirect benefits described by the Advisor that may be realized from its relationship with the Fund. The Board noted that FTCP has a controlling ownership interest in the Sub-Advisor’s parent company and considered potential indirect benefits to the Advisor from such ownership interest. The Board also considered that the Advisor had identified as an indirect benefit to the Advisor and FTP their exposure to investors and brokers who, absent their exposure to the Fund, may have had no dealings with the Advisor or FTP. The Board also noted that the Advisor will be responsible for trade execution for the Fund and will not utilize soft dollars in connection with the Fund. The Board also considered the potential indirect benefits to the Sub-Advisor from FTCP’s controlling ownership interest in the Sub-Advisor’s parent company. The Board noted the Sub-Advisor’s statement that it does not
Other Information (Continued)
First Trust Exchange-Traded Fund VIIIAugust 31, 2024 (Unaudited) foresee any indirect benefits from its relationship with the Fund. In addition, the Board considered that the Advisor and the Sub-Advisor, as the investment advisor and the investment sub-advisor, respectively, to the underlying ETFs in which the Fund would invest, will recognize additional revenue from such underlying ETFs if the Fund’s investment causes their assets to grow. The Board concluded that the character and amount of potential indirect benefits to the Advisor and the Sub-Advisor were not unreasonable.
Based on all of the information considered and the conclusions reached, the Board, including the Independent Trustees, determined that the terms of the Agreements are fair and reasonable and that the approval of the Agreements is in the best interests of the Fund. No single factor was determinative in the Board’s analysis.
There were no distributions made by each Fund during their applicable taxable period; therefore, no analysis for the corporate dividends received deduction and qualified dividend income was completed.
The Funds are not sponsored, endorsed, sold or promoted by iShares Russell 2000 ETF, BFA, Russell, SPDR® S&P 500® ETF Trust, PDR Services, LLC, or Standard & Poor’s® (together with their affiliates hereinafter referred to as the “Corporations”). The Corporations have not passed on the legality or suitability of, or the accuracy or adequacy of, descriptions and disclosures relating to the Funds or the FLEX Options. The Corporations make no representations or warranties, express or implied, regarding the advisability of investing in the Funds or the FLEX Options or results to be obtained by the Funds or the FLEX Options, shareholders or any other person or entity from use of the iShares Russell 2000 ETF or SPDR® S&P 500® ETF Trust. The Corporations have no liability in connection with the management, administration, marketing or trading of the Funds or the FLEX Options.
Annual Financial
Statements and
Other Information |
For the Year Ended
August 31, 2024 |
First Trust Exchange-Traded Fund VIII
First Trust SkyBridge Crypto Industry and Digital Economy ETF (CRPT) |
First Trust SkyBridge Crypto Industry and Digital Economy ETF (CRPT)
Annual Financial Statements and Other Information
August 31, 2024
Performance and Risk Disclosure
There is no assurance that First Trust SkyBridge Crypto Industry and Digital Economy ETF (the “Fund”) will achieve its investment objective. The Fund is subject to market risk, which is the possibility that the market values of securities owned by the Fund will decline and that the value of the Fund’s shares may therefore be less than what you paid for them. Accordingly, you can lose money by investing in the Fund.
Performance data quoted represents past performance, which is no guarantee of future results, and current performance may be lower or higher than the figures shown. For the most recent month-end performance figures, please visit www.ftportfolios.com or speak with your financial advisor. Investment returns, net asset value and share price will fluctuate and Fund shares, when sold, may be worth more or less than their original cost.
First Trust Advisors L.P., the Fund’s advisor, may also periodically provide additional information on Fund performance on the Fund’s webpage at www.ftportfolios.com.
This report contains information that may help you evaluate your investment in the Fund. It includes details about the Fund and presents data that provides insight into the Fund’s performance and investment approach.
The material risks of investing in the Fund are spelled out in its prospectus, statement of additional information, and other Fund regulatory filings.
First Trust SkyBridge Crypto Industry and Digital Economy ETF (CRPT)Portfolio of InvestmentsAugust 31, 2024
| | |
COMMON STOCKS (a) — 99.8% |
| | |
| | |
| | |
| | |
| Coinbase Global, Inc., Class A (b) | |
| Galaxy Digital Holdings Ltd. (CAD) (b) | |
| Interactive Brokers Group, Inc., Class A | |
| Robinhood Markets, Inc., Class A (b) | |
| | |
| Financial Services — 2.3% | |
| | |
| Mastercard, Inc., Class A | |
| PayPal Holdings, Inc. (b) | |
| | |
| | |
| Interactive Media & Services | |
| | |
| Meta Platforms, Inc., Class A | |
| | |
| | |
| Core Scientific, Inc. (b) | |
| Shopify, Inc., Class A (b) | |
| | |
| Semiconductors & Semiconductor Equipment | |
| Advanced Micro Devices, Inc. (b) | |
| Microchip Technology, Inc. | |
| | |
| Taiwan Semiconductor Manufacturing Co., Ltd., ADR | |
| | |
| | |
| | |
| Bitdeer Technologies Group, Class A (b) | |
| | |
| | |
| Hive Digital Technologies Ltd. (b) | |
| | |
| | |
| Marathon Digital Holdings, Inc. (b) | |
| | |
| | |
|
| | |
| MicroStrategy, Inc., Class A (b) | |
| | |
| | |
| | |
| | |
| | |
MONEY MARKET FUNDS — 0.2% |
| Morgan Stanley Institutional Liquidity Funds - Treasury Portfolio - Institutional Class - 5.12% (c) | |
| | |
|
|
| Total Investments — 100.0% | |
| | |
| Net Other Assets and Liabilities — (0.0)% | |
| | |
| Securities are issued in U.S. dollars unless otherwise indicated in the security description. |
| Non-income producing security. |
| Rate shown reflects yield as of August 31, 2024. |
Abbreviations throughout the Portfolio of Investments: |
| – American Depositary Receipt |
| |
Valuation InputsA summary of the inputs used to value the Fund’s investments as of August 31, 2024 is as follows (see Note 2A - Portfolio Valuation in the Notes to Financial Statements):
| | | Level 2
Significant
Observable
Inputs | Level 3
Significant
Unobservable
Inputs |
| | | | |
| | | | |
| | | | |
| See Portfolio of Investments for industry breakout. |
See Notes to Financial Statements
First Trust SkyBridge Crypto Industry and Digital Economy ETF (CRPT)Statement of Assets and Liabilities
August 31, 2024
| |
| |
| |
Investment securities sold | |
| |
| |
|
| |
| |
Investment securities purchased | |
| |
| |
| |
|
| |
| |
| |
Accumulated distributable earnings (loss) | |
| |
NET ASSET VALUE, per share | |
Number of shares outstanding (unlimited number of shares authorized, par value $0.01 per share) | |
| |
See Notes to Financial Statements
First Trust SkyBridge Crypto Industry and Digital Economy ETF (CRPT)Statement of Operations
For the Year Ended August 31, 2024
| |
| |
| |
| |
|
| |
| |
| |
NET INVESTMENT INCOME (LOSS) | |
|
NET REALIZED AND UNREALIZED GAIN (LOSS): | |
Net realized gain (loss) on: | |
| |
| |
Foreign currency transactions | |
| |
Net change in unrealized appreciation (depreciation) on: | |
| |
Foreign currency translation | |
Net change in unrealized appreciation (depreciation) | |
NET REALIZED AND UNREALIZED GAIN (LOSS) | |
NET INCREASE (DECREASE) IN NET ASSETS RESULTING FROM OPERATIONS | |
See Notes to Financial Statements
First Trust SkyBridge Crypto Industry and Digital Economy ETF (CRPT)Statements of Changes in Net Assets
| | |
| | |
Net investment income (loss) | | |
| | |
Net change in unrealized appreciation (depreciation) | | |
Net increase (decrease) in net assets resulting from operations | | |
|
DISTRIBUTIONS TO SHAREHOLDERS FROM: | | |
| | |
|
SHAREHOLDER TRANSACTIONS: | | |
Proceeds from shares sold | | |
| | |
Net increase (decrease) in net assets resulting from shareholder transactions | | |
Total increase (decrease) in net assets | | |
|
| | |
| | |
| | |
|
CHANGES IN SHARES OUTSTANDING: | | |
Shares outstanding, beginning of period | | |
| | |
| | |
Shares outstanding, end of period | | |
See Notes to Financial Statements
First Trust SkyBridge Crypto Industry and Digital Economy ETF (CRPT)Financial Highlights
For a share outstanding throughout each period
| | Period
Ended
8/31/2022 (a) |
| | |
Net asset value, beginning of period | | | |
Income from investment operations: | | | |
Net investment income (loss) (b) | | | |
Net realized and unrealized gain (loss) | | | |
Total from investment operations | | | |
Distributions paid to shareholders from: | | | |
| | | |
| | | |
| | | |
Net asset value, end of period | | | |
| | | |
|
Ratios to average net assets/supplemental data: | | | |
Net assets, end of period (in 000’s) | | | |
Ratio of total expenses to average net assets | | | |
Ratio of net investment income (loss) to average net assets | | | |
Portfolio turnover rate (f) | | | |
| Inception date is September 20, 2021, which is consistent with the commencement of investment operations and is the date the initial creation units were established. |
| Based on average shares outstanding. |
| Amount represents less than $0.01. |
| Total return is calculated assuming an initial investment made at the net asset value at the beginning of the period, reinvestment of all distributions at net asset value during the period, and redemption at net asset value on the last day of the period. The returns presented do not reflect the deduction of taxes that a shareholder would pay on Fund distributions or the redemption or sale of Fund shares. Total return is calculated for the time period presented and is not annualized for periods of less than a year. |
| |
| Portfolio turnover is calculated for the time period presented and is not annualized for periods of less than a year and does not include securities received or delivered from processing creations or redemptions and in-kind transactions. |
See Notes to Financial Statements
Notes to Financial Statements
First Trust SkyBridge Crypto Industry and Digital Economy ETF (CRPT)August 31, 2024 1. Organization
First Trust Exchange-Traded Fund VIII (the “Trust”) is an open-end management investment company organized as a Massachusetts business trust on February 22, 2016, and is registered with the Securities and Exchange Commission under the Investment Company Act of 1940, as amended (the “1940 Act”).
This report covers the First Trust SkyBridge Crypto Industry and Digital Economy ETF (the “Fund”), a non-diversified series of the Trust, which trades under the ticker “CRPT” on NYSE Arca, Inc. The Fund represents a separate series of shares of beneficial interest in the Trust. Unlike conventional mutual funds, the Fund issues and redeems shares on a continuous basis, at net asset value (“NAV”), only in large blocks of shares known as “Creation Units.”
The Fund is an actively managed exchange-traded fund. The Fund seeks to provide investors with capital appreciation. Under normal market conditions, the Fund invests at least 80% of its net assets (plus any investment borrowings) in the common stocks and American Depositary Receipts (“ADRs”) of Crypto Industry Companies and Digital Economy Companies. Under normal market conditions, the Fund will invest at least 50% of its net assets (plus any investment borrowings) in Crypto Industry Companies. The remainder of the Fund’s net assets used to satisfy the 80% test set forth above will be invested in Digital Economy Companies.
2. Significant Accounting Policies
The Fund is considered an investment company and follows accounting and reporting guidance under Financial Accounting Standards Board Accounting Standards Codification Topic 946, “Financial Services-Investment Companies.” The following is a summary of significant accounting policies consistently followed by the Fund in the preparation of the financial statements. The preparation of the financial statements in accordance with accounting principles generally accepted in the United States of America (“U.S. GAAP”) requires management to make estimates and assumptions that affect the reported amounts and disclosures in the financial statements. Actual results could differ from those estimates.
The Fund’s NAV is determined daily as of the close of regular trading on the New York Stock Exchange (“NYSE”), normally 4:00 p.m. Eastern time, on each day the NYSE is open for trading. If the NYSE closes early on a valuation day, the NAV is determined as of that time. The Fund’s NAV is calculated by dividing the value of all assets of the Fund (including accrued interest and dividends), less all liabilities (including accrued expenses and dividends declared but unpaid), by the total number of shares outstanding.
The Fund’s investments are valued daily at market value or, in the absence of market value with respect to any portfolio securities, at fair value. Market value prices represent readily available market quotations such as last sale or official closing prices from a national or foreign exchange (i.e., a regulated market) and are primarily obtained from third-party pricing services. Fair value prices represent any prices not considered market value prices and are either obtained from a third-party pricing service or are determined by the Pricing Committee of the Fund’s investment advisor, First Trust Advisors L.P. (“First Trust” or the “Advisor”), in accordance with valuation procedures approved by the Trust’s Board of Trustees, and in accordance with provisions of the 1940 Act and rules thereunder. Investments valued by the Advisor’s Pricing Committee, if any, are footnoted as such in the footnotes to the Portfolio of Investments. The Fund’s investments are valued as follows:
Common stocks and other equity securities listed on any national or foreign exchange (excluding Nasdaq, Inc. (“Nasdaq”) and the London Stock Exchange Alternative Investment Market (“AIM”)) are valued at the last sale price on the exchange on which they are principally traded or, for Nasdaq and AIM securities, the official closing price. Securities traded on more than one securities exchange are valued at the last sale price or official closing price, as applicable, at the close of the securities exchange representing the primary exchange for such securities.
Securities trading on foreign exchanges or over-the-counter markets that close prior to the NYSE close may be valued using a systematic fair valuation model provided by a third-party pricing service. If these foreign securities meet certain criteria in relation to the valuation model, their valuation is systematically adjusted to reflect the impact of movement in the U.S. market after the close of the foreign markets.
Shares of open-end funds are valued based on NAV per share.
Equity securities traded in an over-the-counter market are valued at the close price or the last trade price.
Notes to Financial Statements (Continued)
First Trust SkyBridge Crypto Industry and Digital Economy ETF (CRPT)August 31, 2024 Certain securities may not be able to be priced by pre-established pricing methods. Such securities may be valued by the Advisor’s Pricing Committee at fair value. These securities generally include, but are not limited to, restricted securities (securities which may not be publicly sold without registration under the Securities Act of 1933, as amended) for which a third-party pricing service is unable to provide a market price; securities whose trading has been formally suspended; a security whose market or fair value price is not available from a pre-established pricing source; a security with respect to which an event has occurred that is likely to materially affect the value of the security after the market has closed but before the calculation of the Fund’s NAV or make it difficult or impossible to obtain a reliable market quotation; and a security whose price, as provided by the third-party pricing service, does not reflect the security’s fair value. As a general principle, the current fair value of a security would appear to be the amount which the owner might reasonably expect to receive for the security upon its current sale. When fair value prices are used, generally they will differ from market quotations or official closing prices on the applicable exchanges. A variety of factors may be considered in determining the fair value of such securities, including, but not limited to, the following:
1)
the last sale price on the exchange on which they are principally traded or, for Nasdaq and AIM securities, the official closing price;
3)
the size of the holding;
4)
the initial cost of the security;
5)
transactions in comparable securities;
6)
price quotes from dealers and/or third-party pricing services;
7)
relationships among various securities;
8)
information obtained by contacting the issuer, analysts, or the appropriate stock exchange;
9)
an analysis of the issuer’s financial statements;
10)
the existence of merger proposals or tender offers that might affect the value of the security; and
11)
other relevant factors.
If the securities in question are foreign securities, the following additional information may be considered:
1)
the last sale price on the exchange on which they are principally traded;
2)
the value of similar foreign securities traded on other foreign markets;
3)
ADR trading of similar securities;
4)
closed-end fund or exchange-traded fund trading of similar securities;
5)
foreign currency exchange activity;
6)
the trading prices of financial products that are tied to baskets of foreign securities;
7)
factors relating to the event that precipitated the pricing problem;
8)
whether the event is likely to recur;
9)
whether the effects of the event are isolated or whether they affect entire markets, countries or regions; and
10)
other relevant factors.
Because foreign markets may be open on different days than the days during which investors may transact in the shares of the Fund, the value of the Fund’s securities may change on the days when investors are not able to transact in the shares of the Fund. The value of the securities denominated in foreign currencies is converted into U.S. dollars using exchange rates determined daily as of the close of regular trading on the NYSE.
The Fund is subject to fair value accounting standards that define fair value, establish the framework for measuring fair value and provide a three-level hierarchy for fair valuation based upon the inputs to the valuation as of the measurement date. The three levels of the fair value hierarchy are as follows:
• Level 1 – Level 1 inputs are quoted prices in active markets for identical investments. An active market is a market in which transactions for the investment occur with sufficient frequency and volume to provide pricing information on an ongoing basis.
• Level 2 – Level 2 inputs are observable inputs, either directly or indirectly, and include the following:
o Quoted prices for similar investments in active markets.
o Quoted prices for identical or similar investments in markets that are non-active. A non-active market is a market where there are few transactions for the investment, the prices are not current, or price quotations vary substantially either over time or among market makers, or in which little information is released publicly.
Notes to Financial Statements (Continued)
First Trust SkyBridge Crypto Industry and Digital Economy ETF (CRPT)August 31, 2024 o Inputs other than quoted prices that are observable for the investment (for example, interest rates and yield curves observable at commonly quoted intervals, volatilities, prepayment speeds, loss severities, credit risks, and default rates).
o Inputs that are derived principally from or corroborated by observable market data by correlation or other means.
• Level 3 – Level 3 inputs are unobservable inputs. Unobservable inputs may reflect the reporting entity’s own assumptions about the assumptions that market participants would use in pricing the investment.
The inputs or methodologies used for valuing investments are not necessarily an indication of the risk associated with investing in those investments. A summary of the inputs used to value the Fund’s investments as of August 31, 2024, is included with the Fund’s Portfolio of Investments.
B. Securities Transactions and Investment Income
Securities transactions are recorded as of the trade date. Realized gains and losses from securities transactions are recorded on the identified cost basis. Dividend income is recorded on the ex-dividend date.
The books and records of the Fund are maintained in U.S. dollars. Foreign currencies, investments and other assets and liabilities are translated into U.S. dollars at the exchange rates prevailing at the end of the period. Purchases and sales of investments and items of income and expense are translated on the respective dates of such transactions. Unrealized gains and losses on assets and liabilities, other than investments in securities, which result from changes in foreign currency exchange rates have been included in “Net change in unrealized appreciation (depreciation) on foreign currency translation” on the Statement of Operations. Unrealized gains and losses on investments in securities which result from changes in foreign exchange rates are included with fluctuations arising from changes in market price and are shown in “Net change in unrealized appreciation (depreciation) on investments” on the Statement of Operations. Net realized foreign currency gains and losses include the effect of changes in exchange rates between trade date and settlement date on investment security transactions, foreign currency transactions and interest and dividends received and are included in “Net realized gain (loss) on foreign currency transactions” on the Statement of Operations. The portion of foreign currency gains and losses related to fluctuations in exchange rates between the initial purchase settlement date and subsequent sale trade date is included in “Net realized gain (loss) on investments” on the Statement of Operations.
D. Dividends and Distributions to Shareholders
Dividends from net investment income of the Fund, if any, are declared and paid quarterly, or as the Board of Trustees may determine from time to time. Distributions of net realized capital gains earned by the Fund, if any, are distributed at least annually. The Fund may also designate a portion of the amount paid to redeeming shareholders as a distribution for tax purposes.
Distributions from net investment income and realized capital gains are determined in accordance with federal income tax regulations, which may differ from U.S. GAAP. Certain capital accounts in the financial statements are periodically adjusted for permanent differences in order to reflect their tax character. These permanent differences are primarily due to the varying treatment of income and gain/loss on portfolio securities held by the Fund and have no impact on net assets or NAV per share. Temporary differences, which arise from recognizing certain items of income, expense and gain/loss in different periods for financial statement and tax purposes, will reverse at some time in the future.
The tax character of distributions paid during the fiscal years ended August 31, 2024 and 2023 was as follows:
As of August 31, 2024, the components of distributable earnings on a tax basis for the Fund were as follows:
Undistributed ordinary income | |
Accumulated capital and other gain (loss) | |
Net unrealized appreciation (depreciation) | |
Notes to Financial Statements (Continued)
First Trust SkyBridge Crypto Industry and Digital Economy ETF (CRPT)August 31, 2024 E. Income Taxes
The Fund intends to continue to qualify as a regulated investment company by complying with the requirements under Subchapter M of the Internal Revenue Code of 1986, as amended, which includes distributing substantially all of its net investment income and net realized gains to shareholders. Accordingly, no provision has been made for federal and state income taxes. However, due to the timing and amount of distributions, the Fund may be subject to an excise tax of 4% of the amount by which approximately 98% of the Fund’s taxable income exceeds the distributions from such taxable income for the calendar year.
The Fund is subject to accounting standards that establish a minimum threshold for recognizing, and a system for measuring, the benefits of a tax position taken or expected to be taken in a tax return. The taxable period ended 2022 and taxable years ended 2023 and 2024 remain open to federal and state audit. As of August 31, 2024, management has evaluated the application of these standards to the Fund and has determined that no provision for income tax is required in the Fund’s financial statements for uncertain tax positions.
The Fund intends to utilize provisions of the federal income tax laws, which allow it to carry a realized capital loss forward indefinitely following the year of the loss and offset such loss against any future realized capital gains. The Fund is subject to certain limitations under U.S. tax rules on the use of capital loss carryforwards and net unrealized built-in losses. These limitations apply when there has been a 50% change in ownership. At August 31, 2024, for federal income tax purposes, the Fund had $32,280,929 of non-expiring capital loss carryforwards available, to the extent provided by regulations, to offset future capital gains. To the extent that these loss carryforwards are used to offset future capital gains, it is probable that the capital gains so offset will not be distributed to the Fund’s shareholders.
During the fiscal year ended August 31, 2024, the Fund utilized $5,596,709 of capital loss carryforwards.
Certain losses realized during the current fiscal year may be deferred and treated as occurring on the first day of the following fiscal year for federal income tax purposes. For the fiscal year ended August 31, 2024, the Fund had no net late year ordinary or capital losses.
In order to present paid-in capital and accumulated distributable earnings (loss) (which consists of accumulated net investment income (loss), accumulated net realized gain (loss) on investments and net unrealized appreciation (depreciation) on investments) on the Statement of Assets and Liabilities that more closely represent their tax character, certain adjustments have been made to paid-in capital, accumulated net investment income (loss) and accumulated net realized gain (loss) on investments. These adjustments are primarily due to the difference between book and tax treatments of income and gains on various investment securities held by the Fund and in-kind transactions. The results of operations and net assets were not affected by these adjustments. For the fiscal year ended August 31, 2024, the adjustments for the Fund were as follows:
Accumulated
Net Investment
Income (Loss) | Accumulated
Net Realized
Gain (Loss)
on Investments | |
| | |
As of August 31, 2024, the aggregate cost, gross unrealized appreciation, gross unrealized depreciation, and net unrealized appreciation/(depreciation) on investments (including short positions and derivatives, if any) for federal income tax purposes were as follows:
| Gross Unrealized
Appreciation | Gross Unrealized
(Depreciation) | Net Unrealized
Appreciation
(Depreciation) |
| | | |
Expenses, other than the investment advisory fee and other excluded expenses, are paid by the Advisor (see Note 3).
3. Investment Advisory Fee, Affiliated Transactions and Other Fee Arrangements
First Trust, the investment advisor to the Fund, is a limited partnership with one limited partner, Grace Partners of DuPage L.P., and one general partner, The Charger Corporation. The Charger Corporation is an Illinois corporation controlled by James A. Bowen,
Notes to Financial Statements (Continued)
First Trust SkyBridge Crypto Industry and Digital Economy ETF (CRPT)August 31, 2024 Chief Executive Officer of First Trust. First Trust is responsible for supervising the selection and ongoing monitoring of the securities in the Fund’s portfolio, managing the Fund’s business affairs and providing certain administrative services necessary for the management of the Fund.
SkyBridge Capital II, LLC (“SkyBridge” or the “Sub-Advisor”) serves as the Fund’s sub-advisor and manages the Fund’s portfolio subject to First Trust’s supervision. Pursuant to the Investment Management Agreement, between the Trust, on behalf of the Fund, and the Advisor, and the Investment Sub-Advisory Agreement among the Trust, on behalf of the Fund, the Advisor and SkyBridge, First Trust will supervise SkyBridge and its management of the investment of the Fund’s assets and will pay SkyBridge for its services as the Fund’s sub-advisor. SkyBridge receives a sub-advisory fee equal to 50% of any remaining monthly unitary management fee paid to the Advisor after the average Fund’s expenses accrued during the most recent twelve months are subtracted from the unitary management fee for that month. First Trust will also be responsible for the Fund’s expenses, including the cost of transfer agency, sub-advisory, custody, fund administration, legal, audit and other services, but excluding fee payments under the Investment Management Agreement, interest, taxes, acquired fund fees and expenses, if any, brokerage commissions and other expenses connected with the execution of portfolio transactions, distribution and service fees payable pursuant to a Rule 12b-1 plan, if any, and extraordinary expenses. The annual unitary management fee payable by the Fund to First Trust for these services will be reduced at certain levels of the Fund’s net assets (“breakpoints”) and calculated pursuant to the following schedule:
| |
Fund net assets up to and including $2.5 billion | |
Fund net assets greater than $2.5 billion up to and including $5 billion | |
Fund net assets greater than $5 billion up to and including $7.5 billion | |
Fund net assets greater than $7.5 billion up to and including $10 billion | |
Fund net assets greater than $10 billion | |
During any period in which the Advisor’s management fee is reduced in accordance with the breakpoints described above, the investment sub-advisory fee (which is based on the Advisor’s management fee) paid to SkyBridge will be reduced to reflect the reduction in the Advisor’s management fee.
The Trust has multiple service agreements with The Bank of New York Mellon (“BNY”). Under the service agreements, BNY performs custodial, fund accounting, certain administrative services, and transfer agency services for the Fund. As custodian, BNY is responsible for custody of the Fund’s assets. As fund accountant and administrator, BNY is responsible for maintaining the books and records of the Fund’s securities and cash. As transfer agent, BNY is responsible for maintaining shareholder records for the Fund. BNY is a subsidiary of The Bank of New York Mellon Corporation, a financial holding company.
Each Trustee who is not an officer or employee of First Trust, any sub-advisor or any of their affiliates (“Independent Trustees”) is paid a fixed annual retainer that is allocated equally among each fund in the First Trust Fund Complex. Each Independent Trustee is also paid an annual per fund fee that varies based on whether the fund is a closed-end or other actively managed fund, a target outcome fund or an index fund.
Additionally, the Chairs of the Audit Committee, Nominating and Governance Committee and Valuation Committee, the Vice Chair of the Audit Committee, the Lead Independent Trustee and the Vice Lead Independent Trustee are paid annual fees to serve in such capacities, with such compensation allocated pro rata among each fund in the First Trust Fund Complex based on net assets. Independent Trustees are reimbursed for travel and out-of-pocket expenses in connection with all meetings. The Committee Chairs, the Audit Committee Vice Chair, the Lead Independent Trustee and the Vice Lead Independent Trustee rotate periodically in serving in such capacities. The officers and “Interested” Trustee receive no compensation from the Trust for acting in such capacities.
4. Purchases and Sales of Securities
For the fiscal year ended August 31, 2024, the cost of purchases and proceeds from sales of investments, excluding short-term investments and in-kind transactions, were $85,926,673 and $86,384,737, respectively.
For the fiscal year ended August 31, 2024, the cost of in-kind purchases and proceeds from in-kind sales were $17,134,924 and $5,082,041, respectively.
Notes to Financial Statements (Continued)
First Trust SkyBridge Crypto Industry and Digital Economy ETF (CRPT)August 31, 2024 5. Creations, Redemptions and Transaction Fees
The Fund generally issues and redeems its shares in primary market transactions through a creation and redemption mechanism and does not sell or redeem individual shares. Instead, financial entities known as “Authorized Participants” have contractual arrangements with the Fund or one of the Fund’s service providers to purchase and redeem Fund shares directly with the Fund in Creation Units. Prior to the start of trading on every business day, the Fund publishes through the National Securities Clearing Corporation the “basket” of securities, cash or other assets that it will accept in exchange for a Creation Unit of the Fund’s shares. An Authorized Participant that wishes to effectuate a creation of the Fund’s shares deposits with the Fund the “basket” of securities, cash or other assets identified by the Fund that day, and then receives the Creation Unit of the Fund’s shares in return for those assets. After purchasing a Creation Unit, the Authorized Participant may continue to hold the Fund’s shares or sell them in the secondary market. The redemption process is the reverse of the purchase process: the Authorized Participant redeems a Creation Unit of the Fund’s shares for a basket of securities, cash or other assets. The combination of the creation and redemption process with secondary market trading in the Fund’s shares and underlying securities provides arbitrage opportunities that are designed to help keep the market price of the Fund’s shares at or close to the NAV per share of the Fund.
The Fund imposes fees in connection with the purchase of Creation Units. These fees may vary based upon various fact-based circumstances, including, but not limited to, the composition of the securities included in the Creation Unit or the countries in which the transactions are settled. The price for each Creation Unit will equal the daily NAV per share of the Fund times the number of shares in a Creation Unit, plus the fees described above and, if applicable, any operational processing and brokerage costs, transfer fees, stamp taxes and part or all of the spread between the expected bid and offer side of the market related to the securities comprising the creation basket.
The Fund also imposes fees in connection with the redemption of Creation Units. These fees may vary based upon various fact-based circumstances, including, but not limited to, the composition of the securities included in the Creation Unit or the countries in which the transactions are settled. The price received for each Creation Unit will equal the daily NAV per share of the Fund times the number of shares in a Creation Unit, minus the fees described above and, if applicable, any operational processing and brokerage costs, transfer fees, stamp taxes and part or all of the spread between the expected bid and offer side of the market related to the securities comprising the redemption basket. Investors who use the services of a broker or other such intermediary in addition to an Authorized Participant to effect a redemption of a Creation Unit may also be assessed an amount to cover the cost of such services. The redemption fee charged by the Fund will comply with Rule 22c-2 of the 1940 Act which limits redemption fees to no more than 2% of the value of the shares redeemed.
The Board of Trustees adopted a Distribution and Service Plan pursuant to Rule 12b-1 under the 1940 Act. In accordance with the Rule 12b-1 plan, the Fund is authorized to pay an amount up to 0.25% of its average daily net assets each year to reimburse First Trust Portfolios L.P. (“FTP”), the distributor of the Fund, for amounts expended to finance activities primarily intended to result in the sale of Creation Units or the provision of investor services. FTP may also use this amount to compensate securities dealers or other persons that are Authorized Participants for providing distribution assistance, including broker-dealer and shareholder support and educational and promotional services.
No 12b-1 fees are currently paid by the Fund, and pursuant to a contractual arrangement, no 12b-1 fees will be paid any time before December 31, 2025.
The Trust, on behalf of the Fund, has a variety of indemnification obligations under contracts with its service providers. The Trust’s maximum exposure under these arrangements is unknown. However, the Trust has not had prior claims or losses pursuant to these contracts and expects the risk of loss to be remote.
Notes to Financial Statements (Continued)
First Trust SkyBridge Crypto Industry and Digital Economy ETF (CRPT)August 31, 2024 8. Subsequent Events
Management has evaluated the impact of all subsequent events on the Fund through the date the financial statements were issued and has determined that there was the following subsequent event:
The Trust’s Board of Trustees approved a change to the Fund’s principal investment strategies to allow the Fund to invest in Bitcoin Exchange-Traded Products. These Bitcoin Exchange-Traded Products are expected to be held by the Fund indirectly via a wholly-owned subsidiary of the Fund organized under the laws of the Cayman Islands. The Fund generally intends to invest up to 25% of its net assets in Bitcoin Exchange-Traded Products; however, at certain times, the Fund may invest more than 25% of its net assets in Bitcoin Exchange-Traded Products. The Fund’s principal investment strategies and principal risks were revised accordingly.
Report of Independent Registered Public Accounting Firm
To the Shareholders and the Board of Trustees of First Trust Exchange-Traded Fund VIII:
Opinion on the Financial Statements and Financial Highlights
We have audited the accompanying statement of assets and liabilities, including the portfolio of investments, of First Trust SkyBridge Crypto Industry and Digital Economy ETF (the “Fund”), one of the funds constituting the First Trust Exchange-Traded Fund VIII, as of August 31, 2024, the related statement of operations for the year then ended, the statements of changes in net assets for each of the two years in the period then ended, and the financial highlights for the years ended August 31, 2024, and 2023 and for the period from September 20, 2021 (commencement of investment operations) through August 31, 2022, and the related notes. In our opinion, the financial statements and financial highlights present fairly, in all material respects, the financial position of the Fund as of August 31, 2024, and the results of its operations for the year then ended, the changes in its net assets for each of the two years in the period then ended, and the financial highlights for the years ended August 31, 2024, and 2023 and for the period from September 20, 2021 (commencement of investment operations) through August 31, 2022, in conformity with accounting principles generally accepted in the United States of America.
These financial statements and financial highlights are the responsibility of the Fund’s management. Our responsibility is to express an opinion on the Fund’s financial statements and financial highlights based on our audits. We are a public accounting firm registered with the Public Company Accounting Oversight Board (United States) (PCAOB) and are required to be independent with respect to the Fund in accordance with the U.S. federal securities laws and the applicable rules and regulations of the Securities and Exchange Commission and the PCAOB.
We conducted our audits in accordance with the standards of the PCAOB. Those standards require that we plan and perform the audit to obtain reasonable assurance about whether the financial statements and financial highlights are free of material misstatement, whether due to error or fraud. The Fund is not required to have, nor were we engaged to perform, an audit of its internal control over financial reporting. As part of our audits, we are required to obtain an understanding of internal control over financial reporting but not for the purpose of expressing an opinion on the effectiveness of the Fund’s internal control over financial reporting. Accordingly, we express no such opinion.
Our audits included performing procedures to assess the risks of material misstatement of the financial statements and financial highlights, whether due to error or fraud, and performing procedures that respond to those risks. Such procedures included examining, on a test basis, evidence regarding the amounts and disclosures in the financial statements and financial highlights. Our audits also included evaluating the accounting principles used and significant estimates made by management, as well as evaluating the overall presentation of the financial statements and financial highlights. Our procedures included confirmation of securities owned as of August 31, 2024, by correspondence with the custodian and brokers; when replies were not received from brokers, we performed other auditing procedures. We believe that our audits provide a reasonable basis for our opinion.
/s/ Deloitte & Touche, LLP
Chicago, Illinois
October 23, 2024
We have served as the auditor of one or more First Trust investment companies since 2001.
First Trust SkyBridge Crypto Industry and Digital Economy ETF (CRPT)August 31, 2024 (Unaudited) Changes in and Disagreements with Accountants (Item 8 of Form N-CSR)
There were no changes in or disagreements with the Fund’s accountants during the fiscal year ended August 31, 2024.
Proxy Disclosures (Item 9 of Form N-CSR)
There were no matters submitted for vote by shareholders of the Fund during the fiscal year ended August 31, 2024.
Remuneration Paid to Directors, Officers, and Others (Item 10 of Form N-CSR)
Independent Trustees and any member of any advisory board of the Fund are compensated through the unitary management fee paid by the Fund to the advisor and not directly by the Fund. The investment advisory fee paid is included in the Statement of Operations.
Statement Regarding the Basis for the Board’s Approval of Investment Advisory Contract (Item 11 of Form N-CSR)
The Board of Trustees of First Trust Exchange-Traded Fund VIII (the “Trust”), including the Independent Trustees, unanimously approved the continuation of the Investment Management Agreement (the “Fund Advisory Agreement”) with First Trust Advisors L.P. (the “Advisor”) on behalf of the First Trust SkyBridge Crypto Industry and Digital Economy ETF (the “Fund”) and the Investment Sub-Advisory Agreement (the “Fund Sub-Advisory Agreement” and together with the Fund Advisory Agreement, the “Fund Agreements”) among the Trust, on behalf of the Fund, the Advisor and SkyBridge Capital II, LLC (the “Sub-Advisor”). The Board approved the continuation of the Fund Agreements for a one-year period ending June 30, 2025 at a meeting held on June 2–3, 2024.
At a meeting held on April 25, 2024, the Board approved changes to the Fund’s investment strategy to allow the Fund to invest in U.S. exchange-traded products that invest directly in Bitcoin or Bitcoin derivatives (collectively, “Bitcoin ETPs”). At the June 2–3, 2024 meeting, because the Fund will invest in Bitcoin ETPs through a wholly-owned subsidiary of the Fund (the “Subsidiary”), the Board, including the Independent Trustees, also unanimously approved an Investment Management Agreement (the “Subsidiary Advisory Agreement”) with the Advisor on behalf of the Subsidiary and an Investment Sub-Advisory Agreement (the “Subsidiary Sub-Advisory Agreement” and together with the Subsidiary Advisory Agreement, the “Subsidiary Agreements”) among the Subsidiary, the Advisor and the Sub-Advisor. The Fund Agreements and the Subsidiary Agreements are referred to herein collectively as the “Agreements.”
The Board determined that the continuation of the Fund Agreements and the approval of the Subsidiary Agreements are in the best interests of the Fund in light of the nature, extent and quality of the services provided or expected to be provided and such other matters as the Board considered to be relevant in the exercise of its business judgment.
To reach this determination, the Board considered its duties under the Investment Company Act of 1940, as amended (the “1940 Act”), as well as under the general principles of state law, in reviewing and approving advisory contracts; the requirements of the 1940 Act in such matters; the fiduciary duty of investment advisors with respect to advisory agreements and compensation; the standards used by courts in determining whether investment company boards have fulfilled their duties; and the factors to be considered by the Board in voting on such agreements. At meetings held on April 16, 2024, April 25, 2024 and June 2–3, 2024, the Board, including the Independent Trustees, reviewed materials provided by the Advisor and the Sub-Advisor responding to requests for information from counsel to the Independent Trustees, submitted on behalf of the Independent Trustees, that, among other things, outlined: the services provided or to be provided by the Advisor and the Sub-Advisor to the Fund and the Subsidiary (including the relevant personnel responsible for these services and their experience); the unitary fee rate schedule payable by the Fund as compared to fees charged to a peer group of funds (the “Expense Group”) and a broad peer universe of funds (the “Expense Universe”), each assembled by Broadridge Financial Solutions, Inc. (“Broadridge”), an independent source, and as compared to fees charged to other clients of the Advisor, including other exchange-traded funds (“ETFs”) managed by the Advisor; the sub-advisory fee as compared to fees charged to other clients of the Sub-Advisor; the expense ratio of the Fund as compared to expense ratios of the funds in the Fund’s Expense Group and Expense Universe; performance information for the Fund, including comparisons of the Fund’s performance to that of one or more relevant benchmark indexes and to that of a performance group of funds and a broad performance universe of funds (the “Performance Universe”), each assembled by Broadridge; the nature of expenses incurred or to be incurred in providing services to the Fund and the Subsidiary and the potential for the Advisor and the Sub-Advisor to realize economies of scale, if any; profitability and other financial data for the Advisor; financial data for the Sub-Advisor; any indirect benefits to the Advisor and its affiliate, First Trust Portfolios L.P. (“FTP”), and the Sub-Advisor; and information on the Advisor’s and the Sub-Advisor’s compliance programs. The Board reviewed initial materials with the Advisor at the meeting held on April 25, 2024, prior to which the Independent Trustees and their counsel met separately to discuss the information provided by the Advisor and the Sub-Advisor. Following the April 25, 2024
Other Information (Continued)
First Trust SkyBridge Crypto Industry and Digital Economy ETF (CRPT)August 31, 2024 (Unaudited) meeting, counsel to the Independent Trustees, on behalf of the Independent Trustees, requested certain clarifications and supplements to the materials provided, and the information provided in response to those requests was considered at an executive session of the Independent Trustees and their counsel held prior to the June 2–3, 2024 meeting, as well as at the June meeting. The Board applied its business judgment to determine whether the arrangements between the Trust and the Advisor and among the Trust, the Advisor and the Sub-Advisor continue to be reasonable business arrangements from the Fund’s perspective and whether the arrangements between the Subsidiary and the Advisor and among the Subsidiary, the Advisor and the Sub-Advisor are reasonable business arrangements from the Fund’s and the Subsidiary’s perspectives. The Board determined that, given the totality of the information provided with respect to the Agreements, the Board had received sufficient information to renew or approve, as applicable, the Agreements. The Board considered that shareholders chose to invest or remain invested in the Fund knowing that the Advisor and the Sub-Advisor manage the Fund and knowing the Fund’s unitary fee.
In reviewing the Fund Agreements and evaluating whether to approve the Subsidiary Agreements, the Board considered the nature, extent and quality of the services provided or to be provided by the Advisor and the Sub-Advisor under the Agreements. With respect to the Fund Advisory Agreement and the Subsidiary Advisory Agreement, the Board considered that the Advisor is or will be, as applicable, responsible for the overall management and administration of the Trust, the Fund and the Subsidiary and reviewed all of the services provided or to be provided by the Advisor to the Fund and the Subsidiary, including the oversight of the Sub-Advisor, as well as the background and experience of the persons responsible for such services. The Board noted that the Advisor oversees or will oversee, as applicable, the Sub-Advisor’s day-to-day management of the Fund’s and the Subsidiary’s investments, including portfolio risk monitoring and performance review. In reviewing the services provided or to be provided, the Board noted the compliance program that had been developed by the Advisor and considered that it includes a robust program for monitoring the Advisor’s, the Sub-Advisor’s and the Fund’s compliance with the 1940 Act, as well as the Fund’s compliance with its investment objective, policies and restrictions. The Board also considered a report from the Advisor with respect to its risk management functions related to the operation of the Fund. Finally, as part of the Board’s consideration of the Advisor’s services, the Advisor, in its written materials and at the April 25, 2024 meeting, described to the Board the scope of its ongoing investment in additional personnel and infrastructure to maintain and improve the quality of services provided to the Fund and the other funds in the First Trust Fund Complex. With respect to the Fund Sub-Advisory Agreement and the Subsidiary Sub-Advisory Agreement, the Board noted that the Fund is an actively-managed ETF and the Sub-Advisor actively manages the Fund’s investments and will actively manage the Subsidiary’s investments. The Board reviewed the materials provided by the Sub-Advisor and considered the services that the Sub-Advisor provides or will provide, as applicable, to the Fund and the Subsidiary, including the Sub-Advisor’s day-to-day management of the Fund’s and the Subsidiary’s investments. In considering the Sub-Advisor’s management of the Fund and proposed management of the Subsidiary, the Board noted the background and experience of the Sub-Advisor’s portfolio management team, including the Board’s prior meetings with members of the portfolio management team. In light of the information presented and the considerations made, the Board concluded that the nature, extent and quality of the services provided or to be provided to the Trust, the Fund and the Subsidiary by the Advisor and the Sub-Advisor under the Agreements have been and are expected to remain or are expected to be, as applicable, satisfactory and that the Sub-Advisor, under the oversight of the Advisor, has managed the Fund consistent with its investment objective, policies and restrictions.
The Board considered the unitary fee rate schedule payable by the Fund under the Fund Advisory Agreement for the services provided. The Board noted that the sub-advisory fee is paid by the Advisor from the unitary fee. The Board considered that as part of the unitary fee the Advisor is responsible for the Fund’s expenses and would be responsible for the Subsidiary’s expenses, including the cost of sub-advisory, transfer agency, custody, fund administration, legal, audit and other services and license fees, if any, but excluding the fee payment under the Fund Advisory Agreement and interest, taxes, brokerage commissions and other expenses connected with the execution of portfolio transactions, distribution and service fees pursuant to a Rule 12b-1 plan, if any, and extraordinary expenses, if any. The Board noted that the Advisor would receive no compensation under the Subsidiary Advisory Agreement and no compensation would be paid to the Sub-Advisor under the Subsidiary Sub-Advisory Agreement. The Board received and reviewed information showing the fee rates and expense ratios of the peer funds in the Expense Group, as well as advisory and unitary fee rates charged by the Advisor and the Sub-Advisor to other fund (including ETFs) and non-fund clients, as applicable. Because the Fund pays a unitary fee, the Board determined that expense ratios were the most relevant comparative data point. Based on the information provided, the Board noted that the total (net) expense ratio for the Fund was above the median total (net) expense ratio of the peer funds in the Expense Group. With respect to the Expense Group, the Board discussed with Broadridge its methodology for assembling peer groups and discussed with the Advisor limitations in creating peer groups for actively-managed ETFs, and different business models that may affect the pricing of services among ETF sponsors. The Board also noted that not all peer funds employ an advisor/sub-advisor management structure. The Board took these limitations and differences into account in considering the peer data. With respect to fees charged to other non-ETF clients, the Board considered differences between the Fund
Other Information (Continued)
First Trust SkyBridge Crypto Industry and Digital Economy ETF (CRPT)August 31, 2024 (Unaudited) and other non-ETF clients that limited their comparability. In considering the unitary fee rate schedule overall, the Board also considered the Advisor’s statement that it seeks to meet investor needs through innovative and value-added investment solutions and the Advisor’s demonstrated long-term commitment to the Fund and the other funds in the First Trust Fund Complex.
The Board considered performance information for the Fund. The Board noted the process it has established for monitoring the Fund’s performance and portfolio risk on an ongoing basis, which includes quarterly performance reporting from the Advisor and the Sub-Advisor for the Fund. The Board determined that this process continues to be effective for reviewing the Fund’s performance. The Board received and reviewed information comparing the Fund’s performance for the one-year period ended December 31, 2023 to the performance of the funds in the Performance Universe and to that of a benchmark index. The Board noted that during 2024, it approved changes to the Fund’s investment strategy to allow the Fund to invest in Bitcoin ETPs through the Subsidiary. Based on the information provided, the Board noted that the Fund outperformed the Performance Universe median and the benchmark index for the one-year period ended December 31, 2023.
On the basis of all the information provided on the unitary fee and performance of the Fund and the ongoing oversight by the Board, the Board concluded that the unitary fee for the Fund (out of which the Sub-Advisor is compensated) continues to be reasonable and appropriate in light of the nature, extent and quality of the services provided by the Advisor and the Sub-Advisor under the Fund Agreements and expected to be provided by the Advisor and the Sub-Advisor under the Subsidiary Agreements.
The Board considered information and discussed with the Advisor whether there were any economies of scale in connection with providing advisory services to the Fund at current asset levels and whether the Fund may benefit from any economies of scale. The Board noted that the unitary fee rate schedule for the Fund includes breakpoints pursuant to which the unitary fee rate will be reduced as assets of the Fund meet certain thresholds. The Board considered the Advisor’s statement that it believes that its expenses relating to providing advisory services to the Fund will increase during the next twelve months as the Advisor continues to build infrastructure and add new staff. The Board also noted that under the unitary fee structure, any reduction in expenses associated with the management and operations of the Fund would benefit the Advisor, but that the unitary fee structure provides a level of certainty in expenses for shareholders of the Fund. The Board concluded that the unitary fee rate schedule for the Fund reflects an appropriate level of sharing of any economies of scale that may be realized in the management of the Fund at current asset levels. The Board considered the revenues and allocated costs (including the allocation methodology) of the Advisor in serving as investment advisor to the Fund for the twelve months ended December 31, 2023 and the estimated profitability level for the Fund calculated by the Advisor based on such data, as well as complex-wide and product-line profitability data, for the same period. The Board noted the inherent limitations in the profitability analysis and concluded that, based on the information provided, the Advisor’s profitability level for the Fund was not unreasonable. In addition, the Board considered indirect benefits described by the Advisor that may be realized from its relationship with the Fund. The Board considered that the Advisor had identified as an indirect benefit to the Advisor and FTP their exposure to investors and brokers who, absent their exposure to the Fund, may have had no dealings with the Advisor or FTP. The Board concluded that the character and amount of potential indirect benefits to the Advisor were not unreasonable.
The Board considered the Sub-Advisor’s statements that the nature of its sub-advisory services to the Fund does not produce economies of scale and that it anticipates that its expenses relating to providing services to the Fund will remain approximately the same for the next twelve months. The Board noted that the Advisor pays the Sub-Advisor from the unitary fee, that the sub-advisory fee will be reduced consistent with the breakpoints in the unitary fee rate schedule and its understanding that the Fund’s sub-advisory fee was the product of an arm’s length negotiation. The Board did not review the profitability of the Sub-Advisor with respect to the Fund. The Board concluded that the profitability analysis for the Advisor was more relevant. The Board considered the potential indirect benefits to the Sub-Advisor from being associated with the Advisor and the Fund, and noted the Sub-Advisor’s statements that there are no other benefits derived or that may be derived by the Sub-Advisor or its affiliates from the Sub-Advisor’s relationship with the Advisor and the Fund and that the Sub-Advisor does not use soft dollars. The Board concluded that the character and amount of potential indirect benefits to the Sub-Advisor were not unreasonable. Based on all of the information considered and the conclusions reached, the Board, including the Independent Trustees, unanimously determined that the terms of the Agreements continue to be or are, as applicable, fair and reasonable and that the continuation of the Fund Agreements and the approval of the Subsidiary Agreements are in the best interests of the Fund. No single factor was determinative in the Board’s analysis.
Remuneration Disclosure Under the Alternative Investment Fund Managers Directive
First Trust Advisors L.P. (“First Trust”) is authorised and regulated by the U.S. Securities and Exchange Commission and is entitled to market shares of certain funds it manages, including First Trust SkyBridge Crypto Industry and Digital Economy ETF (the “Fund”), in certain member states in the European Economic Area in accordance with the cooperation arrangements in Article 42 of the
Other Information (Continued)
First Trust SkyBridge Crypto Industry and Digital Economy ETF (CRPT)August 31, 2024 (Unaudited) Alternative Investment Fund Managers Directive (the “Directive”). First Trust is required under the Directive to make disclosures in respect of remuneration. The following disclosures are made in line with First Trust’s interpretation of currently available regulatory guidance on remuneration disclosures.
During the year ended December 31, 2023, the amount of remuneration paid (or to be paid) by First Trust Advisors L.P. in respect of the Fund is $9,276. This figure is comprised of $408 paid (or to be paid) in fixed compensation and $8,868 paid (or to be paid) in variable compensation. There were a total of 26 beneficiaries of the remuneration described above. Those amounts include $4,634 paid (or to be paid) to senior management of First Trust Advisors L.P. and $4,642 paid (or to be paid) to other employees whose professional activities have a material impact on the risk profiles of First Trust Advisors L.P. or the Fund (collectively, “Code Staff”).
Code Staff included in the aggregated figures disclosed above are rewarded in line with First Trust’s remuneration policy (the “Remuneration Policy”) which is determined and implemented by First Trust’s senior management. The Remuneration Policy reflects First Trust’s ethos of good governance and encapsulates the following principal objectives:
i.
to provide a clear link between remuneration and performance of First Trust and to avoid rewarding for failure;
ii.
to promote sound and effective risk management consistent with the risk profiles of the funds managed by First Trust; and
iii.
to remunerate staff in line with the business strategy, objectives, values and interests of First Trust and the funds managed by First Trust in a manner that avoids conflicts of interest.
First Trust assesses various risk factors which it is exposed to when considering and implementing remuneration for Code Staff and considers whether any potential award to such person(s) would give rise to a conflict of interest. First Trust does not reward failure, or consider the taking of risk or failure to take risk in its remuneration of Code Staff.
First Trust assesses performance for the purposes of determining payments in respect of performance-related remuneration of Code Staff by reference to a broad range of measures including (i) individual performance (using financial and non-financial criteria), and (ii) the overall performance of First Trust. Remuneration is not based upon the performance of the Fund.
The elements of remuneration are balanced between fixed and variable and the senior management sets fixed salaries at a level sufficient to ensure that variable remuneration incentivises and rewards strong individual performance but does not encourage excessive risk taking.
No individual is involved in setting his or her own remuneration.
There were no distributions made by CRPT during the Fund’s fiscal year ended August 31, 2024; therefore, no analysis for the corporate dividends received deduction and qualified dividend income was completed.
Annual Financial
Statements and
Other Information |
For the Year Ended
August 31, 2024 |
First Trust Exchange-Traded Fund VIII
First Trust Multi-Manager Large Growth ETF (MMLG) |
Wellington Management Company LLP
Sands Capital Management, LLC
First Trust Multi-Manager Large Growth ETF (MMLG)
Annual Financial Statements and Other Information
August 31, 2024
Performance and Risk Disclosure
There is no assurance that First Trust Multi-Manager Large Growth ETF (the “Fund”) will achieve its investment objective. The Fund is subject to market risk, which is the possibility that the market values of securities owned by the Fund will decline and that the value of the Fund’s shares may therefore be less than what you paid for them. Accordingly, you can lose money by investing in the Fund.
Performance data quoted represents past performance, which is no guarantee of future results, and current performance may be lower or higher than the figures shown. For the most recent month-end performance figures, please visit www.ftportfolios.com or speak with your financial advisor. Investment returns, net asset value and share price will fluctuate and Fund shares, when sold, may be worth more or less than their original cost.
First Trust Advisors L.P., the Fund’s advisor, may also periodically provide additional information on Fund performance on the Fund’s webpage at www.ftportfolios.com.
This report contains information that may help you evaluate your investment in the Fund. It includes details about the Fund and presents data that provides insight into the Fund’s performance and investment approach.
The material risks of investing in the Fund are spelled out in its prospectus, statement of additional information, and other Fund regulatory filings.
First Trust Multi-Manager Large Growth ETF (MMLG)Portfolio of InvestmentsAugust 31, 2024
| | |
|
| Aerospace & Defense — 0.4% | |
| | |
| | |
| | |
| | |
| NU Holdings Ltd., Class A (a) | |
| | |
| Brown-Forman Corp., Class B | |
| Constellation Brands, Inc., Class A | |
| Monster Beverage Corp. (a) | |
| | |
| | |
| Ultragenyx Pharmaceutical, Inc. (a) | |
| | |
| | |
| | |
| | |
| | |
| Sherwin-Williams (The) Co. | |
| | |
| | |
| | |
| | |
| | |
| | |
| Electronic Equipment, Instruments & Components | |
| | |
| | |
| | |
| | |
| Live Nation Entertainment, Inc. (a) | |
| | |
| | |
| Spotify Technology S.A. (a) | |
| | |
| Financial Services — 4.1% | |
| | |
| Mastercard, Inc., Class A | |
| | |
| | |
| | |
|
| | |
| Uber Technologies, Inc. (a) | |
| | |
| | |
| Align Technology, Inc. (a) | |
| Boston Scientific Corp. (a) | |
| | |
| Edwards Lifesciences Corp. (a) | |
| | |
| | |
| | |
| | |
| Veeva Systems, Inc., Class A (a) | |
| Hotels, Restaurants & Leisure | |
| Airbnb, Inc., Class A (a) | |
| Chipotle Mexican Grill, Inc. (a) | |
| DoorDash, Inc., Class A (a) | |
| | |
| Independent Power and Renewable Electricity | |
| | |
| | |
| | |
| | |
| Arch Capital Group Ltd. (a) | |
| | |
| | |
| Interactive Media & Services | |
| | |
| | |
| Meta Platforms, Inc., Class A | |
| | |
| | |
| | |
| Cloudflare, Inc., Class A (a) | |
| | |
| Shopify, Inc., Class A (a) | |
| Snowflake, Inc., Class A (a) | |
| | |
| Life Sciences Tools & Services | |
| Thermo Fisher Scientific, Inc. | |
See Notes to Financial Statements
First Trust Multi-Manager Large Growth ETF (MMLG)Portfolio of Investments (Continued)August 31, 2024 | | |
COMMON STOCKS (Continued) |
| | |
| | |
| | |
| | |
| Oil, Gas & Consumable Fuels | |
| | |
| | |
| Estee Lauder (The) Cos., Inc., Class A | |
| | |
| | |
| | |
| | |
| Semiconductors & Semiconductor Equipment | |
| | |
| | |
| | |
| | |
| | |
| | |
| | |
| | |
| | |
| | |
| Atlassian Corp., Class A (a) | |
| Cadence Design Systems, Inc. (a) | |
| Datadog, Inc., Class A (a) | |
| | |
| | |
| | |
| | |
| Samsara, Inc., Class A (a) | |
| | |
| Workday, Inc., Class A (a) | |
| | |
| | |
| | |
| | |
| Floor & Decor Holdings, Inc., Class A (a) | |
| O’Reilly Automotive, Inc. (a) | |
| | |
| | |
| | |
|
| Technology Hardware, Storage | |
| | |
| Textiles, Apparel & Luxury | |
| | |
| | |
| | |
MONEY MARKET FUNDS — 1.6% |
| Morgan Stanley Institutional Liquidity Funds - Treasury Portfolio - Institutional Class - 5.12% (b) | |
| | |
|
|
| Total Investments — 100.0% | |
| | |
| Net Other Assets and Liabilities — (0.0)% | |
| | |
| Non-income producing security. |
| Rate shown reflects yield as of August 31, 2024. |
Abbreviations throughout the Portfolio of Investments: |
| – American Depositary Receipt |
| – Real Estate Investment Trusts |
Valuation InputsA summary of the inputs used to value the Fund’s investments as of August 31, 2024 is as follows (see Note 2A - Portfolio Valuation in the Notes to Financial Statements):
| | | Level 2
Significant
Observable
Inputs | Level 3
Significant
Unobservable
Inputs |
| | | | |
| | | | |
| | | | |
| See Portfolio of Investments for industry breakout. |
See Notes to Financial Statements
First Trust Multi-Manager Large Growth ETF (MMLG)Statement of Assets and Liabilities
August 31, 2024
| |
| |
| |
| |
|
| |
Investment advisory fees payable | |
| |
| |
|
| |
| |
| |
Accumulated distributable earnings (loss) | |
| |
NET ASSET VALUE, per share | |
Number of shares outstanding (unlimited number of shares authorized, par value $0.01 per share) | |
| |
See Notes to Financial Statements
First Trust Multi-Manager Large Growth ETF (MMLG)Statement of Operations
For the Year Ended August 31, 2024
| |
| |
| |
| |
|
| |
| |
| |
NET INVESTMENT INCOME (LOSS) | |
|
NET REALIZED AND UNREALIZED GAIN (LOSS): | |
Net realized gain (loss) on: | |
| |
| |
| |
Net change in unrealized appreciation (depreciation) on investments | |
NET REALIZED AND UNREALIZED GAIN (LOSS) | |
NET INCREASE (DECREASE) IN NET ASSETS RESULTING FROM OPERATIONS | |
See Notes to Financial Statements
First Trust Multi-Manager Large Growth ETF (MMLG)Statements of Changes in Net Assets
| | |
| | |
Net investment income (loss) | | |
| | |
Net change in unrealized appreciation (depreciation) | | |
Net increase (decrease) in net assets resulting from operations | | |
|
SHAREHOLDER TRANSACTIONS: | | |
Proceeds from shares sold | | |
| | |
Net increase (decrease) in net assets resulting from shareholder transactions | | |
Total increase (decrease) in net assets | | |
|
| | |
| | |
| | |
|
CHANGES IN SHARES OUTSTANDING: | | |
Shares outstanding, beginning of period | | |
| | |
| | |
Shares outstanding, end of period | | |
See Notes to Financial Statements
First Trust Multi-Manager Large Growth ETF (MMLG)Financial Highlights
For a share outstanding throughout each period
| | Period
Ended
8/31/2020 (a) |
| | | | |
Net asset value, beginning of period | | | | | |
Income from investment operations: | | | | | |
Net investment income (loss) | | | | | |
Net realized and unrealized gain (loss) | | | | | |
Total from investment operations | | | | | |
Distributions paid to shareholders from: | | | | | |
| | | | | |
| | | | | |
| | | | | |
Net asset value, end of period | | | | | |
| | | | | |
|
Ratios to average net assets/supplemental data: | | | | | |
Net assets, end of period (in 000’s) | | | | | |
Ratio of total expenses to average net assets | | | | | |
Ratio of net investment income (loss) to average net assets | | | | | |
Portfolio turnover rate (f) | | | | | |
| Inception date is July 21, 2020, which is consistent with the commencement of investment operations and is the date the initial creation units were established. |
| Based on average shares outstanding. |
| Amount represents less than $0.01. |
| Total return is calculated assuming an initial investment made at the net asset value at the beginning of the period, reinvestment of all distributions at net asset value during the period, and redemption at net asset value on the last day of the period. The returns presented do not reflect the deduction of taxes that a shareholder would pay on Fund distributions or the redemption or sale of Fund shares. Total return is calculated for the time period presented and is not annualized for periods of less than a year. |
| |
| Portfolio turnover is calculated for the time period presented and is not annualized for periods of less than a year and does not include securities received or delivered from processing creations or redemptions and in-kind transactions. |
See Notes to Financial Statements
Notes to Financial Statements
First Trust Multi-Manager Large Growth ETF (MMLG)August 31, 2024 1. Organization
First Trust Exchange-Traded Fund VIII (the “Trust”) is an open-end management investment company organized as a Massachusetts business trust on February 22, 2016, and is registered with the Securities and Exchange Commission under the Investment Company Act of 1940, as amended (the “1940 Act”).
This report covers the First Trust Multi-Manager Large Growth ETF (the “Fund”), a diversified series of the Trust, which trades under the ticker “MMLG” on NYSE Arca, Inc. The Fund represents a separate series of shares of beneficial interest in the Trust. Unlike conventional mutual funds, the Fund issues and redeems shares on a continuous basis, at net asset value (“NAV”), only in large blocks of shares known as “Creation Units.”
The Fund is an actively managed exchange-traded fund. The Fund seeks to provide long-term capital appreciation. Under normal market conditions, the Fund invests at least 80% of its net assets (including investment borrowings) in equity securities issued by large capitalization companies. The Fund considers large capitalization companies to be those companies with market capitalizations within the market capitalization range of the companies comprising the Russell 1000® Growth Index (as of the index’s most recent reconstitution). The Fund’s portfolio is principally composed of common stocks issued by companies domiciled in the United States, common stocks issued by non-U.S. companies that are principally traded in the United States and American Depositary Receipts. The Fund utilizes a multi-manager approach to provide exposure to the large capitalization growth segment of the equity market through the blending of multiple portfolio management teams. There can be no assurance that the Fund will achieve its investment objective. The Fund may not be appropriate for all investors.
2. Significant Accounting Policies
The Fund is considered an investment company and follows accounting and reporting guidance under Financial Accounting Standards Board Accounting Standards Codification Topic 946, “Financial Services-Investment Companies.” The following is a summary of significant accounting policies consistently followed by the Fund in the preparation of the financial statements. The preparation of the financial statements in accordance with accounting principles generally accepted in the United States of America (“U.S. GAAP”) requires management to make estimates and assumptions that affect the reported amounts and disclosures in the financial statements. Actual results could differ from those estimates.
The Fund’s NAV is determined daily as of the close of regular trading on the New York Stock Exchange (“NYSE”), normally 4:00 p.m. Eastern time, on each day the NYSE is open for trading. If the NYSE closes early on a valuation day, the NAV is determined as of that time. The Fund’s NAV is calculated by dividing the value of all assets of the Fund (including accrued interest and dividends), less all liabilities (including accrued expenses and dividends declared but unpaid), by the total number of shares outstanding.
The Fund’s investments are valued daily at market value or, in the absence of market value with respect to any portfolio securities, at fair value. Market value prices represent readily available market quotations such as last sale or official closing prices from a national or foreign exchange (i.e., a regulated market) and are primarily obtained from third-party pricing services. Fair value prices represent any prices not considered market value prices and are either obtained from a third-party pricing service or are determined by the Pricing Committee of the Fund’s investment advisor, First Trust Advisors L.P. (“First Trust” or the “Advisor”), in accordance with valuation procedures approved by the Trust’s Board of Trustees, and in accordance with provisions of the 1940 Act and rules thereunder. Investments valued by the Advisor’s Pricing Committee, if any, are footnoted as such in the footnotes to the Portfolio of Investments. The Fund’s investments are valued as follows:
Common stocks and other equity securities listed on any national or foreign exchange (excluding Nasdaq, Inc. (“Nasdaq”) and the London Stock Exchange Alternative Investment Market (“AIM”)) are valued at the last sale price on the exchange on which they are principally traded or, for Nasdaq and AIM securities, the official closing price. Securities traded on more than one securities exchange are valued at the last sale price or official closing price, as applicable, at the close of the securities exchange representing the primary exchange for such securities.
Equity securities traded in an over-the-counter market are valued at the close price or the last trade price.
Shares of open-end funds are valued based on NAV per share.
Notes to Financial Statements (Continued)
First Trust Multi-Manager Large Growth ETF (MMLG)August 31, 2024 Certain securities may not be able to be priced by pre-established pricing methods. Such securities may be valued by the Advisor’s Pricing Committee at fair value. These securities generally include, but are not limited to, restricted securities (securities which may not be publicly sold without registration under the Securities Act of 1933, as amended) for which a third-party pricing service is unable to provide a market price; securities whose trading has been formally suspended; a security whose market or fair value price is not available from a pre-established pricing source; a security with respect to which an event has occurred that is likely to materially affect the value of the security after the market has closed but before the calculation of the Fund’s NAV or make it difficult or impossible to obtain a reliable market quotation; and a security whose price, as provided by the third-party pricing service, does not reflect the security’s fair value. As a general principle, the current fair value of a security would appear to be the amount which the owner might reasonably expect to receive for the security upon its current sale. When fair value prices are used, generally they will differ from market quotations or official closing prices on the applicable exchanges. A variety of factors may be considered in determining the fair value of such securities, including, but not limited to, the following:
1)
the last sale price on the exchange on which they are principally traded or, for Nasdaq and AIM securities, the official closing price;
3)
the size of the holding;
4)
the initial cost of the security;
5)
transactions in comparable securities;
6)
price quotes from dealers and/or third-party pricing services;
7)
relationships among various securities;
8)
information obtained by contacting the issuer, analysts, or the appropriate stock exchange;
9)
an analysis of the issuer’s financial statements;
10)
the existence of merger proposals or tender offers that might affect the value of the security; and
11)
other relevant factors.
The Fund is subject to fair value accounting standards that define fair value, establish the framework for measuring fair value and provide a three-level hierarchy for fair valuation based upon the inputs to the valuation as of the measurement date. The three levels of the fair value hierarchy are as follows:
• Level 1 – Level 1 inputs are quoted prices in active markets for identical investments. An active market is a market in which transactions for the investment occur with sufficient frequency and volume to provide pricing information on an ongoing basis.
• Level 2 – Level 2 inputs are observable inputs, either directly or indirectly, and include the following:
o Quoted prices for similar investments in active markets.
o Quoted prices for identical or similar investments in markets that are non-active. A non-active market is a market where there are few transactions for the investment, the prices are not current, or price quotations vary substantially either over time or among market makers, or in which little information is released publicly.
o Inputs other than quoted prices that are observable for the investment (for example, interest rates and yield curves observable at commonly quoted intervals, volatilities, prepayment speeds, loss severities, credit risks, and default rates).
o Inputs that are derived principally from or corroborated by observable market data by correlation or other means.
• Level 3 – Level 3 inputs are unobservable inputs. Unobservable inputs may reflect the reporting entity’s own assumptions about the assumptions that market participants would use in pricing the investment.
The inputs or methodologies used for valuing investments are not necessarily an indication of the risk associated with investing in those investments. A summary of the inputs used to value the Fund’s investments as of August 31, 2024, is included with the Fund’s Portfolio of Investments.
B. Securities Transactions and Investment Income
Securities transactions are recorded as of the trade date. Realized gains and losses from securities transactions are recorded on the identified cost basis. Dividend income is recorded on the ex-dividend date. Interest income, if any, is recorded on the accrual basis.
Notes to Financial Statements (Continued)
First Trust Multi-Manager Large Growth ETF (MMLG)August 31, 2024 C. Dividends and Distributions to Shareholders
Dividends from net investment income of the Fund, if any, are declared and paid quarterly, or as the Board of Trustees may determine from time to time. Distributions of net realized capital gains earned by the Fund, if any, are distributed at least annually. The Fund may also designate a portion of the amount paid to redeeming shareholders as a distribution for tax purposes.
Distributions from net investment income and realized capital gains are determined in accordance with federal income tax regulations, which may differ from U.S. GAAP. Certain capital accounts in the financial statements are periodically adjusted for permanent differences in order to reflect their tax character. These permanent differences are primarily due to the varying treatment of income and gain/loss on portfolio securities held by the Fund and have no impact on net assets or NAV per share. Temporary differences, which arise from recognizing certain items of income, expense and gain/loss in different periods for financial statement and tax purposes, will reverse at some time in the future.
There were no distributions paid during the fiscal years ended August 31, 2024 and August 31, 2023.
As of August 31, 2024, the components of distributable earnings on a tax basis for the Fund were as follows:
Undistributed ordinary income | |
Accumulated capital and other gain (loss) | |
Net unrealized appreciation (depreciation) | |
The Fund intends to continue to qualify as a regulated investment company by complying with the requirements under Subchapter M of the Internal Revenue Code of 1986, as amended, which includes distributing substantially all of its net investment income and net realized gains to shareholders. Accordingly, no provision has been made for federal and state income taxes. However, due to the timing and amount of distributions, the Fund may be subject to an excise tax of 4% of the amount by which approximately 98% of the Fund’s taxable income exceeds the distributions from such taxable income for the calendar year.
The Fund is subject to accounting standards that establish a minimum threshold for recognizing, and a system for measuring, the benefits of a tax position taken or expected to be taken in a tax return. The taxable years ended 2021, 2022, 2023, and 2024 remain open to federal and state audit. As of August 31, 2024, management has evaluated the application of these standards to the Fund and has determined that no provision for income tax is required in the Fund’s financial statements for uncertain tax positions.
The Fund intends to utilize provisions of the federal income tax laws, which allow it to carry a realized capital loss forward indefinitely following the year of the loss and offset such loss against any future realized capital gains. The Fund is subject to certain limitations under U.S. tax rules on the use of capital loss carryforwards and net unrealized built-in losses. These limitations apply when there has been a 50% change in ownership. At August 31, 2024, for federal income tax purposes, the Fund had $17,786,337 of non-expiring capital loss carryforwards available, to the extent provided by regulations, to offset future capital gains. To the extent that these loss carryforwards are used to offset future capital gains, it is probable that the capital gains so offset will not be distributed to the Fund’s shareholders.
Certain losses realized during the current fiscal year may be deferred and treated as occurring on the first day of the following fiscal year for federal income tax purposes. For the fiscal year ended August 31, 2024, the Fund incurred and elected to defer net late year ordinary or capital losses as follows:
Qualified Late Year Losses |
| |
| |
| |
In order to present paid-in capital and accumulated distributable earnings (loss) (which consists of accumulated net investment income (loss), accumulated net realized gain (loss) on investments and net unrealized appreciation (depreciation) on investments) on the Statement of Assets and Liabilities that more closely represent their tax character, certain adjustments have been made to paid-in capital, accumulated net investment income (loss) and accumulated net realized gain (loss) on investments. These adjustments are primarily due to the difference between book and tax treatments of income and gains on various investment securities held by the Fund and in-kind transactions. The results of operations and net assets were not affected by these adjustments. For the fiscal year ended August 31, 2024, the adjustments for the Fund were as follows:
Notes to Financial Statements (Continued)
First Trust Multi-Manager Large Growth ETF (MMLG)August 31, 2024
Accumulated
Net Investment
Income (Loss) | Accumulated
Net Realized
Gain (Loss)
on Investments | |
| | |
As of August 31, 2024, the aggregate cost, gross unrealized appreciation, gross unrealized depreciation, and net unrealized appreciation/(depreciation) on investments (including short positions and derivatives, if any) for federal income tax purposes were as follows:
| Gross Unrealized
Appreciation | Gross Unrealized
(Depreciation) | Net Unrealized
Appreciation
(Depreciation) |
| | | |
Expenses, other than the investment advisory fee and other excluded expenses, are paid by the Advisor (see Note 3).
3. Investment Advisory Fee, Affiliated Transactions and Other Fee Arrangements
First Trust, the investment advisor to the Fund, is a limited partnership with one limited partner, Grace Partners of DuPage L.P., and one general partner, The Charger Corporation. The Charger Corporation is an Illinois corporation controlled by James A. Bowen, Chief Executive Officer of First Trust. First Trust is responsible for the ongoing monitoring of the securities in the Fund’s portfolio, selecting and overseeing the investment sub-advisors, managing the Fund’s business affairs and providing certain administrative services necessary for the management of the Fund.
Pursuant to the Investment Management Agreement between the Trust and the Advisor, First Trust manages the Fund’s portfolio based on recommendations provided by the Sub-Advisors (defined below) and is responsible for the expenses of the Fund including the cost of transfer agency, sub-advisory, custody, fund administration, legal, audit and other services, but excluding fee payments under the Investment Management Agreement, interest, taxes, acquired fund fees and expenses, if any, brokerage commissions and other expenses connected with the execution of portfolio transactions, distribution and service fees payable pursuant to a Rule 12b-1 plan, if any, and extraordinary expenses, which are paid by the Fund. The annual unitary management fee payable by the Fund to First Trust for these services will be reduced at certain levels of the Fund’s net assets (“breakpoints”) and calculated pursuant to the following schedule:
| |
Fund net assets up to and including $2.5 billion | |
Fund net assets greater than $2.5 billion up to and including $5 billion | |
Fund net assets greater than $5 billion up to and including $7.5 billion | |
Fund net assets greater than $7.5 billion up to and including $10 billion | |
Fund net assets greater than $10 billion up to and including $15 billion | |
Fund net assets greater than $15 billion | |
The Fund utilizes a multi-manager structure. The Trust, on behalf of the Fund, and First Trust have retained Wellington Management Company LLP (“Wellington”) and Sands Capital Management, LLC (“Sands Capital”) (each, a “Sub-Advisor” and together, “Sub-Advisors”), to serve as non-discretionary investment sub-advisors to the Fund pursuant to sub-advisory agreements (the “Sub-Advisory Agreements”). In this capacity, Wellington and Sands Capital are each responsible for providing recommendations to First Trust regarding the selection and allocation of the securities in the portion of the Fund’s portfolio they have been allocated by First Trust. Pursuant to the Sub-Advisory Agreements, First Trust has agreed to pay for the services and facilities provided by the Sub-Advisors through sub-advisory fees equal in the aggregate to an annual rate of 0.30% of the average daily net assets of the Fund (i.e., for each sub-advisor, 0.30% of the average daily net assets of the portion of the Fund’s assets allocated to that sub-advisor). Each Sub-Advisor’s fees are paid by First Trust out of First Trust’s management fee.
The Trust has multiple service agreements with The Bank of New York Mellon (“BNY”). Under the service agreements, BNY performs custodial, fund accounting, certain administrative services, and transfer agency services for the Fund. As custodian, BNY is responsible for custody of the Fund’s assets. As fund accountant and administrator, BNY is responsible for maintaining the books and
Notes to Financial Statements (Continued)
First Trust Multi-Manager Large Growth ETF (MMLG)August 31, 2024 records of the Fund’s securities and cash. As transfer agent, BNY is responsible for maintaining shareholder records for the Fund. BNY is a subsidiary of The Bank of New York Mellon Corporation, a financial holding company.
Each Trustee who is not an officer or employee of First Trust, any sub-advisor or any of their affiliates (“Independent Trustees”) is paid a fixed annual retainer that is allocated equally among each fund in the First Trust Fund Complex. Each Independent Trustee is also paid an annual per fund fee that varies based on whether the fund is a closed-end or other actively managed fund, a target outcome fund or an index fund.
Additionally, the Chairs of the Audit Committee, Nominating and Governance Committee and Valuation Committee, the Vice Chair of the Audit Committee, the Lead Independent Trustee and the Vice Lead Independent Trustee are paid annual fees to serve in such capacities, with such compensation allocated pro rata among each fund in the First Trust Fund Complex based on net assets. Independent Trustees are reimbursed for travel and out-of-pocket expenses in connection with all meetings. The Committee Chairs, the Audit Committee Vice Chair, the Lead Independent Trustee and the Vice Lead Independent Trustee rotate periodically in serving in such capacities. The officers and “Interested” Trustee receive no compensation from the Trust for acting in such capacities.
4. Purchases and Sales of Securities
For the fiscal year ended August 31, 2024, the cost of purchases and proceeds from sales of investments, excluding short-term investments and in-kind transactions, were $23,533,176 and $24,045,385, respectively.
For the fiscal year ended August 31, 2024, the cost of in-kind purchases and proceeds from in-kind sales were $25,505,729 and $11,240,419, respectively.
5. Creations, Redemptions and Transaction Fees
The Fund generally issues and redeems its shares in primary market transactions through a creation and redemption mechanism and does not sell or redeem individual shares. Instead, financial entities known as “Authorized Participants” have contractual arrangements with the Fund or one of the Fund’s service providers to purchase and redeem Fund shares directly with the Fund in Creation Units. Prior to the start of trading on every business day, the Fund publishes through the National Securities Clearing Corporation the “basket” of securities, cash or other assets that it will accept in exchange for a Creation Unit of the Fund’s shares. An Authorized Participant that wishes to effectuate a creation of the Fund’s shares deposits with the Fund the “basket” of securities, cash or other assets identified by the Fund that day, and then receives the Creation Unit of the Fund’s shares in return for those assets. After purchasing a Creation Unit, the Authorized Participant may continue to hold the Fund’s shares or sell them in the secondary market. The redemption process is the reverse of the purchase process: the Authorized Participant redeems a Creation Unit of the Fund’s shares for a basket of securities, cash or other assets. The combination of the creation and redemption process with secondary market trading in the Fund’s shares and underlying securities provides arbitrage opportunities that are designed to help keep the market price of the Fund’s shares at or close to the NAV per share of the Fund.
The Fund imposes fees in connection with the purchase of Creation Units. These fees may vary based upon various fact-based circumstances, including, but not limited to, the composition of the securities included in the Creation Unit or the countries in which the transactions are settled. The price for each Creation Unit will equal the daily NAV per share of the Fund times the number of shares in a Creation Unit, plus the fees described above and, if applicable, any operational processing and brokerage costs, transfer fees, stamp taxes and part or all of the spread between the expected bid and offer side of the market related to the securities comprising the creation basket.
The Fund also imposes fees in connection with the redemption of Creation Units. These fees may vary based upon various fact-based circumstances, including, but not limited to, the composition of the securities included in the Creation Unit or the countries in which the transactions are settled. The price received for each Creation Unit will equal the daily NAV per share of the Fund times the number of shares in a Creation Unit, minus the fees described above and, if applicable, any operational processing and brokerage costs, transfer fees, stamp taxes and part or all of the spread between the expected bid and offer side of the market related to the securities comprising the redemption basket. Investors who use the services of a broker or other such intermediary in addition to an Authorized Participant to effect a redemption of a Creation Unit may also be assessed an amount to cover the cost of such services. The redemption fee charged by the Fund will comply with Rule 22c-2 of the 1940 Act which limits redemption fees to no more than 2% of the value of the shares redeemed.
Notes to Financial Statements (Continued)
First Trust Multi-Manager Large Growth ETF (MMLG)August 31, 2024 6. Distribution Plan
The Board of Trustees adopted a Distribution and Service Plan pursuant to Rule 12b-1 under the 1940 Act. In accordance with the Rule 12b-1 plan, the Fund is authorized to pay an amount up to 0.25% of its average daily net assets each year to reimburse First Trust Portfolios L.P. (“FTP”), the distributor of the Fund, for amounts expended to finance activities primarily intended to result in the sale of Creation Units or the provision of investor services. FTP may also use this amount to compensate securities dealers or other persons that are Authorized Participants for providing distribution assistance, including broker-dealer and shareholder support and educational and promotional services.
No 12b-1 fees are currently paid by the Fund, and pursuant to a contractual arrangement, no 12b-1 fees will be paid any time before December 31, 2025.
The Trust, on behalf of the Fund, has a variety of indemnification obligations under contracts with its service providers. The Trust’s maximum exposure under these arrangements is unknown. However, the Trust has not had prior claims or losses pursuant to these contracts and expects the risk of loss to be remote.
Management has evaluated the impact of all subsequent events on the Fund through the date the financial statements were issued and has determined that there were no subsequent events requiring recognition or disclosure in the financial statements that have not already been disclosed.
Report of Independent Registered Public Accounting Firm
To the Shareholders and the Board of Trustees of First Trust Exchange-Traded Fund VIII:
Opinion on the Financial Statements and Financial Highlights
We have audited the accompanying statement of assets and liabilities, including the portfolio of investments, of First Trust Multi-Manager Large Growth ETF (the “Fund”), one of the funds constituting the First Trust Exchange-Traded Fund VIII, as of August 31, 2024, the related statement of operations for the year then ended, the statements of changes in net assets for each of the two years in the period then ended, the financial highlights for the years ended August 31, 2024, 2023, 2022, and 2021, and for the period from July 21, 2020 (commencement of investment operations) through August 31, 2020, and the related notes. In our opinion, the financial statements and financial highlights present fairly, in all material respects, the financial position of the Fund as of August 31, 2024, and the results of its operations for the year then ended, the changes in its net assets for each of the two years in the period then ended, and the financial highlights for the years ended August 31, 2024, 2023, 2022, and 2021, and for the period from July 21, 2020 (commencement of investment operations) through August 31, 2020, in conformity with accounting principles generally accepted in the United States of America.
These financial statements and financial highlights are the responsibility of the Fund’s management. Our responsibility is to express an opinion on the Fund’s financial statements and financial highlights based on our audits. We are a public accounting firm registered with the Public Company Accounting Oversight Board (United States) (PCAOB) and are required to be independent with respect to the Fund in accordance with the U.S. federal securities laws and the applicable rules and regulations of the Securities and Exchange Commission and the PCAOB.
We conducted our audits in accordance with the standards of the PCAOB. Those standards require that we plan and perform the audit to obtain reasonable assurance about whether the financial statements and financial highlights are free of material misstatement, whether due to error or fraud. The Fund is not required to have, nor were we engaged to perform, an audit of its internal control over financial reporting. As part of our audits, we are required to obtain an understanding of internal control over financial reporting but not for the purpose of expressing an opinion on the effectiveness of the Fund’s internal control over financial reporting. Accordingly, we express no such opinion.
Our audits included performing procedures to assess the risks of material misstatement of the financial statements and financial highlights, whether due to error or fraud, and performing procedures that respond to those risks. Such procedures included examining, on a test basis, evidence regarding the amounts and disclosures in the financial statements and financial highlights. Our audits also included evaluating the accounting principles used and significant estimates made by management, as well as evaluating the overall presentation of the financial statements and financial highlights. Our procedures included confirmation of securities owned as of August 31, 2024, by correspondence with the custodian and brokers; when replies were not received from brokers, we performed other auditing procedures. We believe that our audits provide a reasonable basis for our opinion.
/s/ Deloitte & Touche, LLP
Chicago, Illinois
October 23, 2024
We have served as the auditor of one or more First Trust investment companies since 2001.
First Trust Multi-Manager Large Growth ETF (MMLG)August 31, 2024 (Unaudited) Changes in and Disagreements with Accountants (Item 8 of Form N-CSR)
There were no changes in or disagreements with the Fund’s accountants during the fiscal year ended August 31, 2024.
Proxy Disclosures (Item 9 of Form N-CSR)
There were no matters submitted for vote by shareholders of the Fund during the fiscal year ended August 31, 2024.
Remuneration Paid to Directors, Officers, and Others (Item 10 of Form N-CSR)
Independent Trustees and any member of any advisory board of the Fund are compensated through the unitary management fee paid by the Fund to the advisor and not directly by the Fund. The investment advisory fee paid is included in the Statement of Operations.
Statement Regarding the Basis for the Board’s Approval of Investment Advisory Contract (Item 11 of Form N-CSR)
The Board of Trustees of First Trust Exchange-Traded Fund VIII (the “Trust”), including the Independent Trustees, unanimously approved the continuation of the Investment Management Agreement (the “Advisory Agreement”) between the Trust, on behalf of First Trust Multi-Manager Large Growth ETF (the “Fund”), and First Trust Advisors L.P. (the “Advisor”); the Investment Sub-Advisory Agreement (the “Sands Sub-Advisory Agreement”) among the Trust, on behalf of the Fund, the Advisor and Sands Capital Management, LLC (“Sands”); and the Investment Sub-Advisory Agreement (the “Wellington Sub-Advisory Agreement”) among the Trust, on behalf of the Fund, the Advisor and Wellington Management Company LLP (“Wellington”). The Sands Sub-Advisory Agreement and the Wellington Sub-Advisory Agreement are collectively referred to as the “Sub-Advisory Agreements.” Sands and Wellington are each referred to as a “Sub-Advisor” and collectively as the “Sub-Advisors.” The Sub-Advisory Agreements together with the Advisory Agreement are referred to as the “Agreements.” The Board approved the continuation of the Agreements for a one-year period ending June 30, 2025 at a meeting held on June 2–3, 2024. The Board determined that the continuation of the Agreements is in the best interests of the Fund in light of the nature, extent and quality of the services provided and such other matters as the Board considered to be relevant in the exercise of its business judgment.
To reach this determination, the Board considered its duties under the Investment Company Act of 1940, as amended (the “1940 Act”), as well as under the general principles of state law, in reviewing and approving advisory contracts; the requirements of the 1940 Act in such matters; the fiduciary duty of investment advisors with respect to advisory agreements and compensation; the standards used by courts in determining whether investment company boards have fulfilled their duties; and the factors to be considered by the Board in voting on such agreements. At meetings held on April 16, 2024, April 25, 2024 and June 2–3, 2024, the Board, including the Independent Trustees, reviewed materials provided by the Advisor and each Sub-Advisor responding to requests for information from counsel to the Independent Trustees, submitted on behalf of the Independent Trustees, that, among other things, outlined: the services provided by the Advisor and each Sub-Advisor to the Fund (including the relevant personnel responsible for these services and their experience); the unitary fee rate schedule payable by the Fund as compared to fees charged to a peer group of funds (the “Expense Group”) and a broad peer universe of funds (the “Expense Universe”), each assembled by Broadridge Financial Solutions, Inc. (“Broadridge”), an independent source, and as compared to fees charged to other clients of the Advisor, including other exchange-traded funds (“ETFs”) managed by the Advisor; the sub-advisory fees as compared to fees charged to other clients of the Sub-Advisors; the expense ratio of the Fund as compared to expense ratios of the funds in the Fund’s Expense Group and Expense Universe; performance information for the Fund, including comparisons of the Fund’s performance to that of one or more relevant benchmark indexes and to that of a performance group of funds and a broad performance universe of funds (the “Performance Universe”), each assembled by Broadridge; the nature of expenses incurred in providing services to the Fund and the potential for the Advisor and each Sub-Advisor to realize economies of scale, if any; profitability and other financial data for the Advisor; financial data for each Sub-Advisor; any indirect benefits to the Advisor and its affiliate, First Trust Portfolios L.P. (“FTP”), and the Sub-Advisors; and information on the Advisor’s and each Sub-Advisor’s compliance programs. The Board reviewed initial materials with the Advisor at the meeting held on April 25, 2024, prior to which the Independent Trustees and their counsel met separately to discuss the information provided by the Advisor and the Sub-Advisors. Following the April 25, 2024 meeting, counsel to the Independent Trustees, on behalf of the Independent Trustees, requested certain clarifications and supplements to the materials provided, and the information provided in response to those requests was considered at an executive session of the Independent Trustees and their counsel held prior to the June 2–3, 2024 meeting, as well as at the June meeting. The Board applied its business judgment to determine whether the arrangements between the Trust and the Advisor and among the Trust, the Advisor and each Sub-Advisor continue to be reasonable business arrangements from the Fund’s perspective. The Board determined that, given the totality of the information provided with respect to the Agreements, the Board had received sufficient information to renew the Agreements. The Board
Other Information (Continued)
First Trust Multi-Manager Large Growth ETF (MMLG)August 31, 2024 (Unaudited) considered that shareholders chose to invest or remain invested in the Fund knowing that the Advisor and the Sub-Advisors manage the Fund and knowing the Fund’s unitary fee.
In reviewing the Agreements, the Board considered the nature, extent and quality of the services provided by the Advisor and the Sub-Advisors under the Agreements. The Board considered that the Fund is an actively-managed ETF and employs a multi-manager structure. With respect to the Advisory Agreement, the Board considered that the Advisor is responsible for the overall management and administration of the Trust and the Fund and reviewed all of the services provided by the Advisor to the Fund, including the oversight of the Sub-Advisors and the allocation of assets between the Sub-Advisors performed by members of the Advisor’s Investment Committee, as well as the background and experience of the persons responsible for such services. The Board considered that each Sub-Advisor acts as a non-discretionary manager providing model portfolio recommendations to the Advisor, and that the Advisor executes the Fund’s portfolio trades. The Board noted that the Advisor oversees the management of the Fund’s investments, including portfolio risk monitoring and performance review. In reviewing the services provided, the Board noted the compliance program that had been developed by the Advisor and considered that it includes a robust program for monitoring the Advisor’s, each Sub-Advisor’s and the Fund’s compliance with the 1940 Act, as well as the Fund’s compliance with its investment objective, policies and restrictions. The Board also considered a report from the Advisor with respect to its risk management functions related to the operation of the Fund. Finally, as part of the Board’s consideration of the Advisor’s services, the Advisor, in its written materials and at the April 25, 2024 meeting, described to the Board the scope of its ongoing investment in additional personnel and infrastructure to maintain and improve the quality of services provided to the Fund and the other funds in the First Trust Fund Complex. With respect to the Sub-Advisory Agreements, the Board noted that the Fund is an actively-managed ETF and the Sub-Advisors actively manage the Fund’s investments. The Board reviewed the materials provided by each Sub-Advisor and considered the services that each Sub-Advisor provides to the Fund, including each Sub-Advisor’s non-discretionary management of the portion of the Fund’s assets allocated to it. In considering each Sub-Advisor’s services to the Fund, the Board noted the background and experience of each Sub-Advisor’s portfolio management team, including the Board’s prior meetings with members of each portfolio management team. In light of the information presented and the considerations made, the Board concluded that the nature, extent and quality of the services provided to the Trust and the Fund by the Advisor and each Sub-Advisor under the Agreements have been and are expected to remain satisfactory and that the Advisor and the Sub-Advisors have managed the Fund consistent with its investment objective, policies and restrictions.
The Board considered the unitary fee rate schedule payable by the Fund under the Advisory Agreement for the services provided. The Board noted that the Advisor pays each Sub-Advisor a separate sub-advisory fee from the unitary fee. The Board considered that as part of the unitary fee the Advisor is responsible for the Fund’s expenses, including the cost of sub-advisory, transfer agency, custody, fund administration, legal, audit and other services and license fees, if any, but excluding the fee payment under the Advisory Agreement and interest, taxes, acquired fund fees and expenses, brokerage commissions and other expenses connected with the execution of portfolio transactions, distribution and service fees pursuant to a Rule 12b-1 plan, if any, and extraordinary expenses, if any. The Board received and reviewed information showing the fee rates and expense ratios of the peer funds in the Expense Group, as well as advisory and unitary fee rates charged by the Advisor and the Sub-Advisors to other fund (including ETFs) and non-fund clients, as applicable. Because the Fund pays a unitary fee, the Board determined that expense ratios were the most relevant comparative data point. Based on the information provided, the Board noted that the total (net) expense ratio for the Fund was above the median total (net) expense ratio of the peer funds in the Expense Group. With respect to the Expense Group, the Board discussed with Broadridge its methodology for assembling peer groups and discussed with the Advisor limitations in creating peer groups for actively-managed ETFs, and different business models that may affect the pricing of services among ETF sponsors. The Board also noted that not all peer funds employ an advisor/sub-advisor management structure. The Board took these limitations and differences into account in considering the peer data. With respect to fees charged to other non-ETF clients, the Board considered differences between the Fund and other non-ETF clients that limited their comparability. In considering the unitary fee rate schedule overall, the Board also considered the Advisor’s statement that it seeks to meet investor needs through innovative and value-added investment solutions and the Advisor’s demonstrated long-term commitment to the Fund and the other funds in the First Trust Fund Complex.
The Board considered performance information for the Fund. The Board noted the process it has established for monitoring the Fund’s performance and portfolio risk on an ongoing basis, which includes quarterly performance reporting from the Advisor and the Sub-Advisors for the Fund. The Board determined that this process continues to be effective for reviewing the Fund’s performance. The Board received and reviewed information comparing the Fund’s performance for periods ended December 31, 2023 to the performance of the funds in the Performance Universe and to that of a benchmark index. Based on the information provided, the Board noted that the Fund outperformed the Performance Universe median and the benchmark index for the one-year period ended December 31, 2023 and underperformed the Performance Universe median and the benchmark index for the three-year period ended December 31, 2023.
Other Information (Continued)
First Trust Multi-Manager Large Growth ETF (MMLG)August 31, 2024 (Unaudited) On the basis of all the information provided on the unitary fee and performance of the Fund and the ongoing oversight by the Board, the Board concluded that the unitary fee for the Fund (out of which the Sub-Advisors are compensated) continues to be reasonable and appropriate in light of the nature, extent and quality of the services provided by the Advisor and the Sub-Advisors to the Fund under the Agreements.
The Board considered information and discussed with the Advisor whether there were any economies of scale in connection with providing advisory services to the Fund at current asset levels and whether the Fund may benefit from any economies of scale. The Board noted that the unitary fee rate schedule for the Fund includes breakpoints pursuant to which the unitary fee rate will be reduced as assets of the Fund meet certain thresholds. The Board considered the Advisor’s statement that it believes that its expenses relating to providing advisory services to the Fund will increase during the next twelve months as the Advisor continues to build infrastructure and add new staff. The Board also noted that under the unitary fee structure, any reduction in expenses associated with the management and operations of the Fund would benefit the Advisor, but that the unitary fee structure provides a level of certainty in expenses for shareholders of the Fund. The Board concluded that the unitary fee rate schedule for the Fund reflects an appropriate level of sharing of any economies of scale that may be realized in the management of the Fund at current asset levels. The Board considered the revenues and allocated costs (including the allocation methodology) of the Advisor in serving as investment advisor to the Fund for the twelve months ended December 31, 2023 and the estimated profitability level for the Fund calculated by the Advisor based on such data, as well as complex-wide and product-line profitability data, for the same period. The Board noted the inherent limitations in the profitability analysis and concluded that, based on the information provided, the Advisor’s profitability level for the Fund was not unreasonable. In addition, the Board considered indirect benefits described by the Advisor that may be realized from its relationship with the Fund. The Board considered that the Advisor had identified as an indirect benefit to the Advisor and FTP their exposure to investors and brokers who, absent their exposure to the Fund, may have had no dealings with the Advisor or FTP, and noted that the Advisor does not utilize soft-dollars in connection with the Fund. The Board concluded that the character and amount of potential indirect benefits to the Advisor were not unreasonable.
With respect to the Sands Sub-Advisory Agreement, the Board considered Sands’ statements that it did not believe there are any specific economies of scale in connection with providing sub-advisory services to the Fund that will benefit the Fund’s shareholders and that Sands believes that the sub-advisory fee is appropriate given the services provided to the Fund. The Board noted that the Advisor pays Sands from the unitary fee and its understanding that the Fund’s sub-advisory fee was the product of an arm’s length negotiation. The Board did not review the profitability of Sands with respect to the Fund. The Board concluded that the profitability analysis for the Advisor was more relevant. The Board considered indirect benefits that may be realized by Sands from its relationship with the Fund, and noted Sands’ statement that, given that the Advisor is responsible for trade execution, no indirect benefits are expected to be derived from its relationship with the Fund. The Board noted that Sands acts as a non-discretionary manager providing model portfolio recommendations to the Advisor and does not provide trade execution services to the Fund. The Board concluded that the character and amount of potential indirect benefits to Sands were not unreasonable.
With respect to the Wellington Sub-Advisory Agreement, the Board considered Wellington’s statement that it believes the sub-advisory fee reflects the economies of scale inherent in providing investment advice to funds similar in size to the Fund, and that Wellington believes the fee schedule is competitive given the nature and quality of service provided by Wellington. The Board noted that the Advisor pays Wellington from the unitary fee and its understanding that the Fund’s sub-advisory fee was the product of an arm’s length negotiation. The Board did not review the profitability of Wellington with respect to the Fund. The Board concluded that the profitability analysis for the Advisor was more relevant. The Board considered indirect benefits that may be realized by Wellington from its relationship with the Fund, and noted Wellington’s statements that it derives no ancillary economic benefits of the type that may accrue to an adviser that also provides distribution and other services, and that although not quantifiable Wellington recognizes the reputational benefit that accrues from its relationship with the Fund and the Advisor. The Board noted that Wellington acts as a non-discretionary manager providing model portfolio recommendations to the Advisor and does not provide trade execution services to the Fund. The Board concluded that the character and amount of potential indirect benefits to Wellington were not unreasonable.
Based on all of the information considered and the conclusions reached, the Board, including the Independent Trustees, unanimously determined that the terms of the Agreements continue to be fair and reasonable and that the continuation of the Agreements is in the best interests of the Fund. No single factor was determinative in the Board’s analysis.
There were no distributions made by MMLG during the Fund’s fiscal year ended August 31, 2024; therefore, no analysis for the corporate dividends received deduction and qualified dividend income was completed.
Annual Financial
Statements and
Other Information |
For the Year Ended
August 31, 2024 |
First Trust Exchange-Traded Fund VIII
First Trust Multi-Manager Small Cap Opportunities ETF (MMSC) |
Driehaus Capital Management LLC
Stephens Investment Management Group, LLC
First Trust Multi-Manager Small Cap Opportunities ETF (MMSC)
Annual Financial Statements and Other Information
August 31, 2024
Performance and Risk Disclosure
There is no assurance that First Trust Multi-Manager Small Cap Opportunities ETF (the “Fund”) will achieve its investment objective. The Fund is subject to market risk, which is the possibility that the market values of securities owned by the Fund will decline and that the value of the Fund’s shares may therefore be less than what you paid for them. Accordingly, you can lose money by investing in the Fund.
Performance data quoted represents past performance, which is no guarantee of future results, and current performance may be lower or higher than the figures shown. For the most recent month-end performance figures, please visit www.ftportfolios.com or speak with your financial advisor. Investment returns, net asset value and share price will fluctuate and Fund shares, when sold, may be worth more or less than their original cost.
First Trust Advisors L.P., the Fund’s advisor, may also periodically provide additional information on Fund performance on the Fund’s webpage at www.ftportfolios.com.
This report contains information that may help you evaluate your investment in the Fund. It includes details about the Fund and presents data that provides insight into the Fund’s performance and investment approach.
The material risks of investing in the Fund are spelled out in its prospectus, statement of additional information, and other Fund regulatory filings.
First Trust Multi-Manager Small Cap Opportunities ETF (MMSC)Portfolio of InvestmentsAugust 31, 2024
| | |
|
| Aerospace & Defense — 7.8% | |
| | |
| Axon Enterprise, Inc. (a) | |
| | |
| | |
| | |
| Kratos Defense & Security Solutions, Inc. (a) | |
| | |
| | |
| | |
| | |
| Air Freight & Logistics — | |
| | |
| | |
| Modine Manufacturing Co. (a) | |
| | |
| Customers Bancorp, Inc. (a) | |
| | |
| | |
| | |
| Celsius Holdings, Inc. (a) | |
| | |
| Apogee Therapeutics, Inc. (a) | |
| Avidity Biosciences, Inc. (a) | |
| Blueprint Medicines Corp. (a) | |
| Crinetics Pharmaceuticals, Inc. (a) | |
| | |
| Halozyme Therapeutics, Inc. (a) | |
| | |
| Krystal Biotech, Inc. (a) | |
| Kymera Therapeutics, Inc. (a) | |
| | |
| | |
| Nuvalent, Inc., Class A (a) | |
| Rhythm Pharmaceuticals, Inc. (a) | |
| Ultragenyx Pharmaceutical, Inc. (a) | |
| | |
| Xenon Pharmaceuticals, Inc. (a) | |
| | |
| | |
| | |
| | |
| | |
| | |
| | |
|
| | |
| | |
| MarketAxess Holdings, Inc. | |
| | |
| Virtu Financial, Inc., Class A | |
| | |
| | |
| | |
| | |
| | |
| | |
| | |
| Montrose Environmental Group, Inc. (a) | |
| | |
| | |
| | |
| | |
| Construction & Engineering | |
| Ameresco, Inc., Class A (a) | |
| Comfort Systems USA, Inc. | |
| | |
| Sterling Infrastructure, Inc. (a) | |
| | |
| | |
| | |
| | |
| Encore Capital Group, Inc. (a) | |
| EZCORP, Inc., Class A (a) | |
| | |
| | |
| Consumer Staples Distribution | |
| Chefs’ Warehouse (The), Inc. (a) | |
| Sprouts Farmers Market, Inc. (a) | |
| | |
| Diversified Consumer Services | |
| Bright Horizons Family Solutions, Inc. (a) | |
| Grand Canyon Education, Inc. (a) | |
| | |
| | |
| Electrical Equipment — 1.2% | |
| | |
| Generac Holdings, Inc. (a) | |
See Notes to Financial Statements
First Trust Multi-Manager Small Cap Opportunities ETF (MMSC)Portfolio of Investments (Continued)August 31, 2024 | | |
COMMON STOCKS (Continued) |
| Electrical Equipment (Continued) | |
| | |
| Vertiv Holdings Co., Class A | |
| | |
| Electronic Equipment, Instruments & Components | |
| | |
| | |
| | |
| | |
| | |
| | |
| | |
| | |
| Energy Equipment & Services | |
| | |
| | |
| | |
| Weatherford International PLC | |
| | |
| Financial Services — 0.2% | |
| | |
| | |
| | |
| | |
| | |
| | |
| | |
| | |
| | |
| Globus Medical, Inc., Class A (a) | |
| | |
| Integer Holdings Corp. (a) | |
| iRhythm Technologies, Inc. (a) | |
| Lantheus Holdings, Inc. (a) | |
| | |
| | |
| Tandem Diabetes Care, Inc. (a) | |
| TransMedics Group, Inc. (a) | |
| | |
| | |
|
| | |
| Acadia Healthcare Co., Inc. (a) | |
| | |
| | |
| | |
| | |
| | |
| | |
| Hotels, Restaurants & Leisure | |
| | |
| Dutch Bros, Inc., Class A (a) | |
| First Watch Restaurant Group, Inc. (a) | |
| | |
| Life Time Group Holdings, Inc. (a) | |
| Papa John’s International, Inc. | |
| Sweetgreen, Inc., Class A (a) | |
| | |
| | |
| Household Durables — 1.1% | |
| | |
| Installed Building Products, Inc. | |
| | |
| | |
| Baldwin Insurance Group (The), Inc. (a) | |
| | |
| | |
| Kinsale Capital Group, Inc. | |
| Oscar Health, Inc., Class A (a) | |
| Palomar Holdings, Inc. (a) | |
| Ryan Specialty Holdings, Inc. | |
| Skyward Specialty Insurance Group, Inc. (a) | |
| | |
| Interactive Media & Services | |
| MediaAlpha, Inc., Class A (a) | |
| | |
| | |
| | |
| | |
| | |
| | |
| Life Sciences Tools & Services | |
| | |
See Notes to Financial Statements
First Trust Multi-Manager Small Cap Opportunities ETF (MMSC)Portfolio of Investments (Continued)August 31, 2024 | | |
COMMON STOCKS (Continued) |
| Life Sciences Tools & Services (Continued) | |
| BioLife Solutions, Inc. (a) | |
| | |
| | |
| Medpace Holdings, Inc. (a) | |
| OmniAb, Inc. - 12.5 Earnout Shares (a) (b) (c) (d) (e) | |
| OmniAb, Inc. - 15 Earnout Shares (a) (b) (c) (d) (e) | |
| | |
| | |
| | |
| Allison Transmission Holdings, Inc. | |
| | |
| | |
| | |
| | |
| | |
| SPX Technologies, Inc. (a) | |
| | |
| | |
| | |
| | |
| | |
| Carpenter Technology Corp. | |
| Pan American Silver Corp. | |
| | |
| Oil, Gas & Consumable Fuels | |
| | |
| Magnolia Oil & Gas Corp., Class A | |
| Southwestern Energy Co. (a) | |
| | |
| | |
| | |
| | |
| BellRing Brands, Inc. (a) | |
| | |
| | |
| | |
| Intra-Cellular Therapies, Inc. (a) | |
| Ligand Pharmaceuticals, Inc. (a) | |
| | |
|
| Pharmaceuticals (Continued) | |
| Structure Therapeutics, Inc., ADR (a) | |
| Supernus Pharmaceuticals, Inc. (a) | |
| | |
| Professional Services — 2.9% | |
| | |
| | |
| | |
| | |
| | |
| | |
| Semiconductors & Semiconductor Equipment | |
| | |
| | |
| | |
| Credo Technology Group Holding Ltd. (a) | |
| Lattice Semiconductor Corp. (a) | |
| MACOM Technology Solutions Holdings, Inc. (a) | |
| Onto Innovation, Inc. (a) | |
| | |
| | |
| | |
| Silicon Laboratories, Inc. (a) | |
| | |
| Veeco Instruments, Inc. (a) | |
| | |
| | |
| Alkami Technology, Inc. (a) | |
| Altair Engineering, Inc., Class A (a) | |
| Appfolio, Inc., Class A (a) | |
| Aspen Technology, Inc. (a) | |
| Clearwater Analytics Holdings, Inc., Class A (a) | |
| CommVault Systems, Inc. (a) | |
| CyberArk Software Ltd. (a) | |
| Descartes Systems Group (The), Inc. (a) | |
| | |
| | |
| Guidewire Software, Inc. (a) | |
| | |
| | |
| Manhattan Associates, Inc. (a) | |
| | |
| Nutanix, Inc., Class A (a) | |
See Notes to Financial Statements
First Trust Multi-Manager Small Cap Opportunities ETF (MMSC)Portfolio of Investments (Continued)August 31, 2024 | | |
COMMON STOCKS (Continued) |
| | |
| | |
| | |
| Rubrik, Inc., Class A (a) | |
| SentinelOne, Inc., Class A (a) | |
| | |
| Tenable Holdings, Inc. (a) | |
| Varonis Systems, Inc. (a) | |
| Vertex, Inc., Class A (a) | |
| | |
| | |
| Abercrombie & Fitch Co., Class A (a) | |
| Academy Sports & Outdoors, Inc. | |
| American Eagle Outfitters, Inc. | |
| Boot Barn Holdings, Inc. (a) | |
| | |
| | |
| | |
| | |
| | |
| Technology Hardware, Storage | |
| Pure Storage, Inc., Class A (a) | |
| | |
| Applied Industrial Technologies, Inc. | |
| Beacon Roofing Supply, Inc. (a) | |
| Core & Main, Inc., Class A (a) | |
| | |
| SiteOne Landscape Supply, Inc. (a) | |
| | |
| | |
| | |
MONEY MARKET FUNDS — 0.4% |
| Morgan Stanley Institutional Liquidity Funds - Treasury Portfolio - Institutional Class - 5.12% (f) | |
| | |
|
|
| Total Investments — 100.0% | |
| | |
| Net Other Assets and Liabilities — (0.0)% | |
| | |
| Non-income producing security. |
| Pursuant to procedures adopted by the Trust’s Board of Trustees, this security has been determined to be illiquid by First Trust Advisors L.P. (the “Advisor”). |
| Restricted security as to resale, excluding Rule 144A securities (see Note 2C - Restricted Securities in the Notes to Financial Statements). |
| This security is fair valued by the Advisor’s Pricing Committee in accordance with procedures approved by the Trust’s Board of Trustees, and in accordance with provisions of the Investment Company Act of 1940 and rules thereunder, as amended. At August 31, 2024, securities noted as such are valued at $0 or 0.0% of net assets. |
| This security’s value was determined using significant unobservable inputs (see Note 2A - Portfolio Valuation in the Notes to Financial Statements). |
| Rate shown reflects yield as of August 31, 2024. |
Abbreviations throughout the Portfolio of Investments: |
| – American Depositary Receipt |
Valuation InputsA summary of the inputs used to value the Fund’s investments as of August 31, 2024 is as follows (see Note 2A - Portfolio Valuation in the Notes to Financial Statements):
| | | Level 2
Significant
Observable
Inputs | Level 3
Significant
Unobservable
Inputs |
| | | | |
Life Sciences Tools & Services | | | | |
Other Industry Categories* | | | | |
| | | | |
| | | | |
| See Portfolio of Investments for industry breakout. |
| Investments are valued at $0. |
Level 3 investments are fair valued by the Advisor’s Pricing Committee and are footnoted in the Portfolio of Investments. All Level 3 values are based on unobservable inputs.
See Notes to Financial Statements
First Trust Multi-Manager Small Cap Opportunities ETF (MMSC)Statement of Assets and Liabilities
August 31, 2024
| |
| |
| |
| |
| |
|
| |
Investment advisory fees payable | |
| |
| |
|
| |
| |
| |
Accumulated distributable earnings (loss) | |
| |
NET ASSET VALUE, per share | |
Number of shares outstanding (unlimited number of shares authorized, par value $0.01 per share) | |
| |
See Notes to Financial Statements
First Trust Multi-Manager Small Cap Opportunities ETF (MMSC)Statement of Operations
For the Year Ended August 31, 2024
| |
| |
| |
| |
|
| |
| |
| |
NET INVESTMENT INCOME (LOSS) | |
|
NET REALIZED AND UNREALIZED GAIN (LOSS): | |
Net realized gain (loss) on: | |
| |
| |
| |
Net change in unrealized appreciation (depreciation) on investments | |
NET REALIZED AND UNREALIZED GAIN (LOSS) | |
NET INCREASE (DECREASE) IN NET ASSETS RESULTING FROM OPERATIONS | |
See Notes to Financial Statements
First Trust Multi-Manager Small Cap Opportunities ETF (MMSC)Statements of Changes in Net Assets
| | |
| | |
Net investment income (loss) | | |
| | |
Net change in unrealized appreciation (depreciation) | | |
Net increase (decrease) in net assets resulting from operations | | |
|
SHAREHOLDER TRANSACTIONS: | | |
Proceeds from shares sold | | |
| | |
Net increase (decrease) in net assets resulting from shareholder transactions | | |
Total increase (decrease) in net assets | | |
|
| | |
| | |
| | |
|
CHANGES IN SHARES OUTSTANDING: | | |
Shares outstanding, beginning of period | | |
| | |
| | |
Shares outstanding, end of period | | |
See Notes to Financial Statements
First Trust Multi-Manager Small Cap Opportunities ETF (MMSC)Financial Highlights
For a share outstanding throughout each period
| | Period
Ended
8/31/2022 (a) |
| | |
Net asset value, beginning of period | | | |
Income from investment operations: | | | |
Net investment income (loss) | | | |
Net realized and unrealized gain (loss) | | | |
Total from investment operations | | | |
Net asset value, end of period | | | |
| | | |
|
Ratios to average net assets/supplemental data: | | | |
Net assets, end of period (in 000’s) | | | |
Ratio of total expenses to average net assets | | | |
Ratio of net investment income (loss) to average net assets | | | |
Portfolio turnover rate (e) | | | |
| Inception date is October 13, 2021, which is consistent with the commencement of investment operations and is the date the initial creation units were established. |
| Based on average shares outstanding. |
| Total return is calculated assuming an initial investment made at the net asset value at the beginning of the period, reinvestment of all distributions at net asset value during the period, and redemption at net asset value on the last day of the period. The returns presented do not reflect the deduction of taxes that a shareholder would pay on Fund distributions or the redemption or sale of Fund shares. Total return is calculated for the time period presented and is not annualized for periods of less than a year. |
| |
| Portfolio turnover is calculated for the time period presented and is not annualized for periods of less than a year and does not include securities received or delivered from processing creations or redemptions and in-kind transactions. |
See Notes to Financial Statements
Notes to Financial Statements
First Trust Multi-Manager Small Cap Opportunities ETF (MMSC)August 31, 2024 1. Organization
First Trust Exchange-Traded Fund VIII (the “Trust”) is an open-end management investment company organized as a Massachusetts business trust on February 22, 2016, and is registered with the Securities and Exchange Commission under the Investment Company Act of 1940, as amended (the “1940 Act”).
This report covers the First Trust Multi-Manager Small Cap Opportunities ETF (the “Fund”), a non-diversified series of the Trust, which trades under the ticker “MMSC” on NYSE Arca, Inc. The Fund represents a separate series of shares of beneficial interest in the Trust. Unlike conventional mutual funds, the Fund issues and redeems shares on a continuous basis, at net asset value (“NAV”), only in large blocks of shares known as “Creation Units.”
The Fund is an actively managed exchange-traded fund. The Fund seeks to provide long-term capital appreciation. Under normal market conditions, the Fund invests at least 80% of its net assets (plus borrowing for investment purposes) in equity securities issued by small capitalization companies. The Fund considers small capitalization companies to be those companies with market capitalizations, at the time of investment, within the market capitalization range of the companies comprising the Russell 2000® Growth Index (as of the index’s most recent reconstitution). The Fund’s portfolio is principally composed of common stocks issued by companies domiciled in the United States and common stocks issued by non-U.S. companies that are principally traded in the United States. The Fund utilizes a multi-manager approach to provide exposure to the small capitalization growth segment of the equity market through the blending of multiple portfolio management teams. There can be no assurance that the Fund will achieve its investment objective. The Fund may not be appropriate for all investors.
2. Significant Accounting Policies
The Fund is considered an investment company and follows accounting and reporting guidance under Financial Accounting Standards Board Accounting Standards Codification Topic 946, “Financial Services-Investment Companies.” The following is a summary of significant accounting policies consistently followed by the Fund in the preparation of the financial statements. The preparation of the financial statements in accordance with accounting principles generally accepted in the United States of America (“U.S. GAAP”) requires management to make estimates and assumptions that affect the reported amounts and disclosures in the financial statements. Actual results could differ from those estimates.
The Fund’s NAV is determined daily as of the close of regular trading on the New York Stock Exchange (“NYSE”), normally 4:00 p.m. Eastern time, on each day the NYSE is open for trading. If the NYSE closes early on a valuation day, the NAV is determined as of that time. The Fund’s NAV is calculated by dividing the value of all assets of the Fund (including accrued interest and dividends), less all liabilities (including accrued expenses and dividends declared but unpaid), by the total number of shares outstanding.
The Fund’s investments are valued daily at market value or, in the absence of market value with respect to any portfolio securities, at fair value. Market value prices represent readily available market quotations such as last sale or official closing prices from a national or foreign exchange (i.e., a regulated market) and are primarily obtained from third-party pricing services. Fair value prices represent any prices not considered market value prices and are either obtained from a third-party pricing service or are determined by the Pricing Committee of the Fund’s investment advisor, First Trust Advisors L.P. (“First Trust” or the “Advisor”), in accordance with valuation procedures approved by the Trust’s Board of Trustees, and in accordance with provisions of the 1940 Act and rules thereunder. Investments valued by the Advisor’s Pricing Committee, if any, are footnoted as such in the footnotes to the Portfolio of Investments. The Fund’s investments are valued as follows:
Common stocks and other equity securities listed on any national or foreign exchange (excluding Nasdaq, Inc. (“Nasdaq”) and the London Stock Exchange Alternative Investment Market (“AIM”)) are valued at the last sale price on the exchange on which they are principally traded or, for Nasdaq and AIM securities, the official closing price. Securities traded on more than one securities exchange are valued at the last sale price or official closing price, as applicable, at the close of the securities exchange representing the primary exchange for such securities.
Equity securities traded in an over-the-counter market are valued at the close price or the last trade price.
Shares of open-end funds are valued based on NAV per share.
Notes to Financial Statements (Continued)
First Trust Multi-Manager Small Cap Opportunities ETF (MMSC)August 31, 2024 Certain securities may not be able to be priced by pre-established pricing methods. Such securities may be valued by the Advisor’s Pricing Committee at fair value. These securities generally include, but are not limited to, restricted securities (securities which may not be publicly sold without registration under the Securities Act of 1933, as amended) for which a third-party pricing service is unable to provide a market price; securities whose trading has been formally suspended; a security whose market or fair value price is not available from a pre-established pricing source; a security with respect to which an event has occurred that is likely to materially affect the value of the security after the market has closed but before the calculation of the Fund’s NAV or make it difficult or impossible to obtain a reliable market quotation; and a security whose price, as provided by the third-party pricing service, does not reflect the security’s fair value. As a general principle, the current fair value of a security would appear to be the amount which the owner might reasonably expect to receive for the security upon its current sale. When fair value prices are used, generally they will differ from market quotations or official closing prices on the applicable exchanges. A variety of factors may be considered in determining the fair value of such securities, including, but not limited to, the following:
1)
the last sale price on the exchange on which they are principally traded or, for Nasdaq and AIM securities, the official closing price;
3)
the size of the holding;
4)
the initial cost of the security;
5)
transactions in comparable securities;
6)
price quotes from dealers and/or third-party pricing services;
7)
relationships among various securities;
8)
information obtained by contacting the issuer, analysts, or the appropriate stock exchange;
9)
an analysis of the issuer’s financial statements;
10)
the existence of merger proposals or tender offers that might affect the value of the security; and
11)
other relevant factors.
The Fund is subject to fair value accounting standards that define fair value, establish the framework for measuring fair value and provide a three-level hierarchy for fair valuation based upon the inputs to the valuation as of the measurement date. The three levels of the fair value hierarchy are as follows:
• Level 1 – Level 1 inputs are quoted prices in active markets for identical investments. An active market is a market in which transactions for the investment occur with sufficient frequency and volume to provide pricing information on an ongoing basis.
• Level 2 – Level 2 inputs are observable inputs, either directly or indirectly, and include the following:
o Quoted prices for similar investments in active markets.
o Quoted prices for identical or similar investments in markets that are non-active. A non-active market is a market where there are few transactions for the investment, the prices are not current, or price quotations vary substantially either over time or among market makers, or in which little information is released publicly.
o Inputs other than quoted prices that are observable for the investment (for example, interest rates and yield curves observable at commonly quoted intervals, volatilities, prepayment speeds, loss severities, credit risks, and default rates).
o Inputs that are derived principally from or corroborated by observable market data by correlation or other means.
• Level 3 – Level 3 inputs are unobservable inputs. Unobservable inputs may reflect the reporting entity’s own assumptions about the assumptions that market participants would use in pricing the investment.
The inputs or methodologies used for valuing investments are not necessarily an indication of the risk associated with investing in those investments. A summary of the inputs used to value the Fund’s investments as of August 31, 2024, is included with the Fund’s Portfolio of Investments.
B. Securities Transactions and Investment Income
Securities transactions are recorded as of the trade date. Realized gains and losses from securities transactions are recorded on the identified cost basis. Dividend income is recorded on the ex-dividend date. Interest income, if any, is recorded on the accrual basis.
As of August 31, 2024, the Fund held restricted securities as shown in the following table that the Advisor has deemed illiquid pursuant to procedures adopted by the Trust’s Board of Trustees.
Notes to Financial Statements (Continued)
First Trust Multi-Manager Small Cap Opportunities ETF (MMSC)August 31, 2024
| | | | | | |
OmniAb, Inc. - 12.5 Earnout Shares | | | | | | |
OmniAb, Inc. - 15 Earnout Shares | | | | | | |
| | | | | | |
D. Dividends and Distributions to Shareholders
Dividends from net investment income of the Fund, if any, are declared and paid quarterly, or as the Board of Trustees may determine from time to time. Distributions of net realized capital gains earned by the Fund, if any, are distributed at least annually. The Fund may also designate a portion of the amount paid to redeeming shareholders as a distribution for tax purposes.
Distributions from net investment income and realized capital gains are determined in accordance with federal income tax regulations, which may differ from U.S. GAAP. Certain capital accounts in the financial statements are periodically adjusted for permanent differences in order to reflect their tax character. These permanent differences are primarily due to the varying treatment of income and gain/loss on portfolio securities held by the Fund and have no impact on net assets or NAV per share. Temporary differences, which arise from recognizing certain items of income, expense and gain/loss in different periods for financial statement and tax purposes, will reverse at some time in the future.
There were no distributions paid during the fiscal years ended August 31, 2024 and August 31, 2023.
As of August 31, 2024, the components of distributable earnings on a tax basis for the Fund were as follows:
Undistributed ordinary income | |
Accumulated capital and other gain (loss) | |
Net unrealized appreciation (depreciation) | |
The Fund intends to continue to qualify as a regulated investment company by complying with the requirements under Subchapter M of the Internal Revenue Code of 1986, as amended, which includes distributing substantially all of its net investment income and net realized gains to shareholders. Accordingly, no provision has been made for federal and state income taxes. However, due to the timing and amount of distributions, the Fund may be subject to an excise tax of 4% of the amount by which approximately 98% of the Fund’s taxable income exceeds the distributions from such taxable income for the calendar year.
The Fund is subject to accounting standards that establish a minimum threshold for recognizing, and a system for measuring, the benefits of a tax position taken or expected to be taken in a tax return. The taxable period ended 2022 and taxable years ended 2023 and 2024 remain open to federal and state audit. As of August 31, 2024, management has evaluated the application of these standards to the Fund and has determined that no provision for income tax is required in the Fund’s financial statements for uncertain tax positions.
The Fund intends to utilize provisions of the federal income tax laws, which allow it to carry a realized capital loss forward indefinitely following the year of the loss and offset such loss against any future realized capital gains. The Fund is subject to certain limitations under U.S. tax rules on the use of capital loss carryforwards and net unrealized built-in losses. These limitations apply when there has been a 50% change in ownership. At August 31, 2024, for federal income tax purposes, the Fund had $779,075 of non-expiring capital loss carryforwards available, to the extent provided by regulations, to offset future capital gains. To the extent that these loss carryforwards are used to offset future capital gains, it is probable that the capital gains so offset will not be distributed to the Fund’s shareholders.
Certain losses realized during the current fiscal year may be deferred and treated as occurring on the first day of the following fiscal year for federal income tax purposes. For the fiscal year ended August 31, 2024, the Fund had no net late year ordinary or capital losses.
In order to present paid-in capital and accumulated distributable earnings (loss) (which consists of accumulated net investment income (loss), accumulated net realized gain (loss) on investments and net unrealized appreciation (depreciation) on investments) on the Statement of Assets and Liabilities that more closely represent their tax character, certain adjustments have been made to paid-in capital, accumulated net investment income (loss) and accumulated net realized gain (loss) on investments. These adjustments are
Notes to Financial Statements (Continued)
First Trust Multi-Manager Small Cap Opportunities ETF (MMSC)August 31, 2024 primarily due to the difference between book and tax treatments of income and gains on various investment securities held by the Fund and in-kind transactions. The results of operations and net assets were not affected by these adjustments. For the fiscal year ended August 31, 2024, the adjustments for the Fund were as follows:
Accumulated
Net Investment
Income (Loss) | Accumulated
Net Realized
Gain (Loss)
on Investments | |
| | |
As of August 31, 2024, the aggregate cost, gross unrealized appreciation, gross unrealized depreciation, and net unrealized appreciation/(depreciation) on investments (including short positions and derivatives, if any) for federal income tax purposes were as follows:
| Gross Unrealized
Appreciation | Gross Unrealized
(Depreciation) | Net Unrealized
Appreciation
(Depreciation) |
| | | |
Expenses, other than the investment advisory fee and other excluded expenses, are paid by the Advisor (see Note 3).
3. Investment Advisory Fee, Affiliated Transactions and Other Fee Arrangements
First Trust, the investment advisor to the Fund, is a limited partnership with one limited partner, Grace Partners of DuPage L.P., and one general partner, The Charger Corporation. The Charger Corporation is an Illinois corporation controlled by James A. Bowen, Chief Executive Officer of First Trust. First Trust is responsible for the ongoing monitoring of the securities in the Fund’s portfolio, selecting and overseeing the investment sub-advisors, managing the Fund’s business affairs and providing certain administrative services necessary for the management of the Fund.
Pursuant to the Investment Management Agreement between the Trust and the Advisor, First Trust manages the Fund’s portfolio based on recommendations provided by the Sub-Advisors (defined below) and is responsible for the expenses of the Fund including the cost of transfer agency, sub-advisory, custody, fund administration, legal, audit and other services, but excluding fee payments under the Investment Management Agreement, interest, taxes, acquired fund fees and expenses, if any, brokerage commissions and other expenses connected with the execution of portfolio transactions, distribution and service fees payable pursuant to a Rule 12b-1 plan, if any, and extraordinary expenses, which are paid by the Fund. The annual unitary management fee payable by the Fund to First Trust for these services will be reduced at certain levels of the Fund’s net assets (“breakpoints”) and calculated pursuant to the following schedule:
| |
Fund net assets up to and including $2.5 billion | |
Fund net assets greater than $2.5 billion up to and including $5 billion | |
Fund net assets greater than $5 billion up to and including $7.5 billion | |
Fund net assets greater than $7.5 billion up to and including $10 billion | |
Fund net assets greater than $10 billion up to and including $15 billion | |
Fund net assets greater than $15 billion | |
The Fund utilizes a multi-manager structure. The Trust, on behalf of the Fund, and First Trust have retained Driehaus Capital Management LLC (“DCM”) and Stephens Investment Management Group, LLC (“SIMG”) (each, a “Sub-Advisor” and together, “Sub-Advisors”), to serve as non-discretionary investment sub-advisors to the Fund pursuant to sub-advisory agreements (the “Sub-Advisory Agreements”). In this capacity, DCM and SIMG are each responsible for providing recommendations to First Trust regarding the selection and allocation of the securities in the portion of the Fund’s portfolio they have been allocated by First Trust. Pursuant to the Sub-Advisory Agreements, First Trust has agreed to pay for the services and facilities provided by the Sub-Advisors through sub-advisory fees equal in the aggregate to an annual rate of 0.35% of the average daily net assets of the Fund (i.e., for each sub-advisor, 0.35% of the average daily net assets of the portion of the Fund’s assets allocated to that sub-advisor). Each Sub-Advisor’s fees are paid by First Trust out of First Trust’s management fee.
Notes to Financial Statements (Continued)
First Trust Multi-Manager Small Cap Opportunities ETF (MMSC)August 31, 2024 The Trust has multiple service agreements with The Bank of New York Mellon (“BNY”). Under the service agreements, BNY performs custodial, fund accounting, certain administrative services, and transfer agency services for the Fund. As custodian, BNY is responsible for custody of the Fund’s assets. As fund accountant and administrator, BNY is responsible for maintaining the books and records of the Fund’s securities and cash. As transfer agent, BNY is responsible for maintaining shareholder records for the Fund. BNY is a subsidiary of The Bank of New York Mellon Corporation, a financial holding company.
Each Trustee who is not an officer or employee of First Trust, any sub-advisor or any of their affiliates (“Independent Trustees”) is paid a fixed annual retainer that is allocated equally among each fund in the First Trust Fund Complex. Each Independent Trustee is also paid an annual per fund fee that varies based on whether the fund is a closed-end or other actively managed fund, a target outcome fund or an index fund.
Additionally, the Chairs of the Audit Committee, Nominating and Governance Committee and Valuation Committee, the Vice Chair of the Audit Committee, the Lead Independent Trustee and the Vice Lead Independent Trustee are paid annual fees to serve in such capacities, with such compensation allocated pro rata among each fund in the First Trust Fund Complex based on net assets. Independent Trustees are reimbursed for travel and out-of-pocket expenses in connection with all meetings. The Committee Chairs, the Audit Committee Vice Chair, the Lead Independent Trustee and the Vice Lead Independent Trustee rotate periodically in serving in such capacities. The officers and “Interested” Trustee receive no compensation from the Trust for acting in such capacities.
4. Purchases and Sales of Securities
For the fiscal year ended August 31, 2024, the cost of purchases and proceeds from sales of investments, excluding short-term investments and in-kind transactions, were $10,305,921 and $10,073,923, respectively.
For the fiscal year ended August 31, 2024, the cost of in-kind purchases and proceeds from in-kind sales were $13,174,516 and $1,801,042, respectively.
5. Creations, Redemptions and Transaction Fees
The Fund generally issues and redeems its shares in primary market transactions through a creation and redemption mechanism and does not sell or redeem individual shares. Instead, financial entities known as “Authorized Participants” have contractual arrangements with the Fund or one of the Fund’s service providers to purchase and redeem Fund shares directly with the Fund in Creation Units. Prior to the start of trading on every business day, the Fund publishes through the National Securities Clearing Corporation the “basket” of securities, cash or other assets that it will accept in exchange for a Creation Unit of the Fund’s shares. An Authorized Participant that wishes to effectuate a creation of the Fund’s shares deposits with the Fund the “basket” of securities, cash or other assets identified by the Fund that day, and then receives the Creation Unit of the Fund’s shares in return for those assets. After purchasing a Creation Unit, the Authorized Participant may continue to hold the Fund’s shares or sell them in the secondary market. The redemption process is the reverse of the purchase process: the Authorized Participant redeems a Creation Unit of the Fund’s shares for a basket of securities, cash or other assets. The combination of the creation and redemption process with secondary market trading in the Fund’s shares and underlying securities provides arbitrage opportunities that are designed to help keep the market price of the Fund’s shares at or close to the NAV per share of the Fund.
The Fund imposes fees in connection with the purchase of Creation Units. These fees may vary based upon various fact-based circumstances, including, but not limited to, the composition of the securities included in the Creation Unit or the countries in which the transactions are settled. The price for each Creation Unit will equal the daily NAV per share of the Fund times the number of shares in a Creation Unit, plus the fees described above and, if applicable, any operational processing and brokerage costs, transfer fees, stamp taxes and part or all of the spread between the expected bid and offer side of the market related to the securities comprising the creation basket.
The Fund also imposes fees in connection with the redemption of Creation Units. These fees may vary based upon various fact-based circumstances, including, but not limited to, the composition of the securities included in the Creation Unit or the countries in which the transactions are settled. The price received for each Creation Unit will equal the daily NAV per share of the Fund times the number of shares in a Creation Unit, minus the fees described above and, if applicable, any operational processing and brokerage costs, transfer fees, stamp taxes and part or all of the spread between the expected bid and offer side of the market related to the securities comprising the redemption basket. Investors who use the services of a broker or other such intermediary in addition to an Authorized Participant to effect a redemption of a Creation Unit may also be assessed an amount to cover the cost of such services. The redemption fee charged by the Fund will comply with Rule 22c-2 of the 1940 Act which limits redemption fees to no more than 2% of the value of the shares redeemed.
Notes to Financial Statements (Continued)
First Trust Multi-Manager Small Cap Opportunities ETF (MMSC)August 31, 2024 6. Distribution Plan
The Board of Trustees adopted a Distribution and Service Plan pursuant to Rule 12b-1 under the 1940 Act. In accordance with the Rule 12b-1 plan, the Fund is authorized to pay an amount up to 0.25% of its average daily net assets each year to reimburse First Trust Portfolios L.P. (“FTP”), the distributor of the Fund, for amounts expended to finance activities primarily intended to result in the sale of Creation Units or the provision of investor services. FTP may also use this amount to compensate securities dealers or other persons that are Authorized Participants for providing distribution assistance, including broker-dealer and shareholder support and educational and promotional services.
No 12b-1 fees are currently paid by the Fund, and pursuant to a contractual arrangement, no 12b-1 fees will be paid any time before December 31, 2025.
The Trust, on behalf of the Fund, has a variety of indemnification obligations under contracts with its service providers. The Trust’s maximum exposure under these arrangements is unknown. However, the Trust has not had prior claims or losses pursuant to these contracts and expects the risk of loss to be remote.
Management has evaluated the impact of all subsequent events on the Fund through the date the financial statements were issued and has determined that there were no subsequent events requiring recognition or disclosure in the financial statements that have not already been disclosed.
Report of Independent Registered Public Accounting Firm
To the Shareholders and the Board of Trustees of First Trust Exchange-Traded Fund VIII:
Opinion on the Financial Statements and Financial Highlights
We have audited the accompanying statement of assets and liabilities, including the portfolio of investments, of First Trust Multi-Manager Small Cap Opportunities ETF (the “Fund”), one of the funds constituting the First Trust Exchange-Traded Fund VIII, as of August 31, 2024, the related statement of operations for the year then ended, the statements of changes in net assets for each of the two years in the period then ended, and the financial highlights for the years ended August 31, 2024, and 2023, and for the period from October 13, 2021 (commencement of investment operations) through August 31, 2022, and the related notes. In our opinion, the financial statements and financial highlights present fairly, in all material respects, the financial position of the Fund as of August 31, 2024, and the results of its operations for the year then ended, the changes in its net assets for each of the two years in the period then ended, and the financial highlights for the years ended August 31, 2024, and 2023, and for the period from October 13, 2021 (commencement of investment operations) through August 31, 2022, in conformity with accounting principles generally accepted in the United States of America.
These financial statements and financial highlights are the responsibility of the Fund’s management. Our responsibility is to express an opinion on the Fund’s financial statements and financial highlights based on our audits. We are a public accounting firm registered with the Public Company Accounting Oversight Board (United States) (PCAOB) and are required to be independent with respect to the Fund in accordance with the U.S. federal securities laws and the applicable rules and regulations of the Securities and Exchange Commission and the PCAOB.
We conducted our audits in accordance with the standards of the PCAOB. Those standards require that we plan and perform the audit to obtain reasonable assurance about whether the financial statements and financial highlights are free of material misstatement, whether due to error or fraud. The Fund is not required to have, nor were we engaged to perform, an audit of its internal control over financial reporting. As part of our audits, we are required to obtain an understanding of internal control over financial reporting but not for the purpose of expressing an opinion on the effectiveness of the Fund’s internal control over financial reporting. Accordingly, we express no such opinion.
Our audits included performing procedures to assess the risks of material misstatement of the financial statements and financial highlights, whether due to error or fraud, and performing procedures that respond to those risks. Such procedures included examining, on a test basis, evidence regarding the amounts and disclosures in the financial statements and financial highlights. Our audits also included evaluating the accounting principles used and significant estimates made by management, as well as evaluating the overall presentation of the financial statements and financial highlights. Our procedures included confirmation of securities owned as of August 31, 2024, by correspondence with the custodian and brokers; when replies were not received from brokers, we performed other auditing procedures. We believe that our audits provide a reasonable basis for our opinion.
/s/ Deloitte & Touche, LLP
Chicago, Illinois
October 23, 2024
We have served as the auditor of one or more First Trust investment companies since 2001.
First Trust Multi-Manager Small Cap Opportunities ETF (MMSC)August 31, 2024 (Unaudited) Changes in and Disagreements with Accountants (Item 8 of Form N-CSR)
There were no changes in or disagreements with the Fund’s accountants during the fiscal year ended August 31, 2024.
Proxy Disclosures (Item 9 of Form N-CSR)
There were no matters submitted for vote by shareholders of the Fund during the fiscal year ended August 31, 2024.
Remuneration Paid to Directors, Officers, and Others (Item 10 of Form N-CSR)
Independent Trustees and any member of any advisory board of the Fund are compensated through the unitary management fee paid by the Fund to the advisor and not directly by the Fund. The investment advisory fee paid is included in the Statement of Operations.
Statement Regarding the Basis for the Board’s Approval of Investment Advisory Contract (Item 11 of Form N-CSR)
The Board of Trustees of First Trust Exchange-Traded Fund VIII (the “Trust”), including the Independent Trustees, unanimously approved the continuation of the Investment Management Agreement (the “Advisory Agreement”) between the Trust, on behalf of First Trust Multi-Manager Small Cap Opportunities ETF (the “Fund”), and First Trust Advisors L.P. (the “Advisor”); the Investment Sub-Advisory Agreement (the “Driehaus Sub-Advisory Agreement”) among the Trust, on behalf of the Fund, the Advisor and Driehaus Capital Management LLC (“Driehaus”); and the Investment Sub-Advisory Agreement (the “Stephens Sub-Advisory Agreement”) among the Trust, on behalf of the Fund, the Advisor and Stephens Investment Management Group, LLC (“Stephens”). The Driehaus Sub-Advisory Agreement and the Stephens Sub-Advisory Agreement are collectively referred to as the “Sub-Advisory Agreements.” Driehaus and Stephens are each referred to as a “Sub-Advisor” and collectively as the “Sub-Advisors.” The Sub-Advisory Agreements together with the Advisory Agreement are referred to as the “Agreements.” The Board approved the continuation of the Agreements for a one-year period ending June 30, 2025 at a meeting held on June 2–3, 2024. The Board determined that the continuation of the Agreements is in the best interests of the Fund in light of the nature, extent and quality of the services provided and such other matters as the Board considered to be relevant in the exercise of its business judgment.
To reach this determination, the Board considered its duties under the Investment Company Act of 1940, as amended (the “1940 Act”), as well as under the general principles of state law, in reviewing and approving advisory contracts; the requirements of the 1940 Act in such matters; the fiduciary duty of investment advisors with respect to advisory agreements and compensation; the standards used by courts in determining whether investment company boards have fulfilled their duties; and the factors to be considered by the Board in voting on such agreements. At meetings held on April 16, 2024, April 25, 2024 and June 2–3, 2024, the Board, including the Independent Trustees, reviewed materials provided by the Advisor and each Sub-Advisor responding to requests for information from counsel to the Independent Trustees, submitted on behalf of the Independent Trustees, that, among other things, outlined: the services provided by the Advisor and each Sub-Advisor to the Fund (including the relevant personnel responsible for these services and their experience); the unitary fee rate schedule payable by the Fund as compared to fees charged to a peer group of funds (the “Expense Group”) and a broad peer universe of funds (the “Expense Universe”), each assembled by Broadridge Financial Solutions, Inc. (“Broadridge”), an independent source, and as compared to fees charged to other clients of the Advisor, including other exchange-traded funds (“ETFs”) managed by the Advisor; the sub-advisory fees as compared to fees charged to other clients of the Sub-Advisors; the expense ratio of the Fund as compared to expense ratios of the funds in the Fund’s Expense Group and Expense Universe; performance information for the Fund, including comparisons of the Fund’s performance to that of one or more relevant benchmark indexes and to that of a performance group of funds and a broad performance universe of funds (the “Performance Universe”), each assembled by Broadridge; the nature of expenses incurred in providing services to the Fund and the potential for the Advisor and each Sub-Advisor to realize economies of scale, if any; profitability and other financial data for the Advisor; financial data for each Sub-Advisor; any indirect benefits to the Advisor and its affiliate, First Trust Portfolios L.P. (“FTP”), and the Sub-Advisors; and information on the Advisor’s and each Sub-Advisor’s compliance programs. The Board reviewed initial materials with the Advisor at the meeting held on April 25, 2024, prior to which the Independent Trustees and their counsel met separately to discuss the information provided by the Advisor and the Sub-Advisors. Following the April 25, 2024 meeting, counsel to the Independent Trustees, on behalf of the Independent Trustees, requested certain clarifications and supplements to the materials provided, and the information provided in response to those requests was considered at an executive session of the Independent Trustees and their counsel held prior to the June 2–3, 2024 meeting, as well as at the June meeting. The Board applied its business judgment to determine whether the arrangements between the Trust and the Advisor and among the Trust, the Advisor and each Sub-Advisor continue to be reasonable business arrangements from the Fund’s perspective. The Board determined that, given the totality of the information provided with respect to the Agreements, the Board had received sufficient information to renew the Agreements. The Board
Other Information (Continued)
First Trust Multi-Manager Small Cap Opportunities ETF (MMSC)August 31, 2024 (Unaudited) considered that shareholders chose to invest or remain invested in the Fund knowing that the Advisor and the Sub-Advisors manage the Fund and knowing the Fund’s unitary fee.
In reviewing the Agreements, the Board considered the nature, extent and quality of the services provided by the Advisor and the Sub-Advisors under the Agreements. The Board considered that the Fund is an actively-managed ETF and employs a multi-manager structure. With respect to the Advisory Agreement, the Board considered that the Advisor is responsible for the overall management and administration of the Trust and the Fund and reviewed all of the services provided by the Advisor to the Fund, including the oversight of the Sub-Advisors and the allocation of assets between the Sub-Advisors performed by members of the Advisor’s Investment Committee, as well as the background and experience of the persons responsible for such services. The Board considered that each Sub-Advisor acts as a non-discretionary manager providing model portfolio recommendations to the Advisor, and that the Advisor executes the Fund’s portfolio trades. The Board noted that the Advisor oversees the management of the Fund’s investments, including portfolio risk monitoring and performance review. In reviewing the services provided, the Board noted the compliance program that had been developed by the Advisor and considered that it includes a robust program for monitoring the Advisor’s, each Sub-Advisor’s and the Fund’s compliance with the 1940 Act, as well as the Fund’s compliance with its investment objective, policies and restrictions. The Board also considered a report from the Advisor with respect to its risk management functions related to the operation of the Fund. Finally, as part of the Board’s consideration of the Advisor’s services, the Advisor, in its written materials and at the April 25, 2024 meeting, described to the Board the scope of its ongoing investment in additional personnel and infrastructure to maintain and improve the quality of services provided to the Fund and the other funds in the First Trust Fund Complex. With respect to the Sub-Advisory Agreements, the Board noted that the Fund is an actively-managed ETF and the Sub-Advisors actively manage the Fund’s investments. The Board reviewed the materials provided by each Sub-Advisor and considered the services that each Sub-Advisor provides to the Fund, including each Sub-Advisor’s non-discretionary management of the portion of the Fund’s assets allocated to it. In considering each Sub-Advisor’s services to the Fund, the Board noted the background and experience of each Sub-Advisor’s portfolio management team, including the Board’s prior meetings with members of each portfolio management team. In light of the information presented and the considerations made, the Board concluded that the nature, extent and quality of the services provided to the Trust and the Fund by the Advisor and each Sub-Advisor under the Agreements have been and are expected to remain satisfactory and that the Advisor and the Sub-Advisors have managed the Fund consistent with its investment objective, policies and restrictions.
The Board considered the unitary fee rate schedule payable by the Fund under the Advisory Agreement for the services provided. The Board noted that the Advisor pays each Sub-Advisor a separate sub-advisory fee from the unitary fee. The Board considered that as part of the unitary fee the Advisor is responsible for the Fund’s expenses, including the cost of sub-advisory, transfer agency, custody, fund administration, legal, audit and other services and license fees, if any, but excluding the fee payment under the Advisory Agreement and interest, taxes, acquired fund fees and expenses, brokerage commissions and other expenses connected with the execution of portfolio transactions, distribution and service fees pursuant to a Rule 12b-1 plan, if any, and extraordinary expenses, if any. The Board received and reviewed information showing the fee rates and expense ratios of the peer funds in the Expense Group, as well as advisory and unitary fee rates charged by the Advisor and the Sub-Advisors to other fund (including ETFs) and non-fund clients, as applicable. Because the Fund pays a unitary fee, the Board determined that expense ratios were the most relevant comparative data point. Based on the information provided, the Board noted that the total (net) expense ratio for the Fund was above the median total (net) expense ratio of the peer funds in the Expense Group. With respect to the Expense Group, the Board discussed with Broadridge its methodology for assembling peer groups and discussed with the Advisor limitations in creating peer groups for actively-managed ETFs, and different business models that may affect the pricing of services among ETF sponsors. The Board also noted that not all peer funds employ an advisor/sub-advisor management structure. The Board took these limitations and differences into account in considering the peer data. With respect to fees charged to other non-ETF clients, the Board considered differences between the Fund and other non-ETF clients that limited their comparability. In considering the unitary fee rate schedule overall, the Board also considered the Advisor’s statement that it seeks to meet investor needs through innovative and value-added investment solutions and the Advisor’s demonstrated long-term commitment to the Fund and the other funds in the First Trust Fund Complex.
The Board considered performance information for the Fund. The Board noted the process it has established for monitoring the Fund’s performance and portfolio risk on an ongoing basis, which includes quarterly performance reporting from the Advisor and the Sub-Advisors for the Fund. The Board determined that this process continues to be effective for reviewing the Fund’s performance. The Board received and reviewed information comparing the Fund’s performance for the one-year period ended December 31, 2023 to the performance of the funds in the Performance Universe and to that of a benchmark index. Based on the information provided, the Board noted that the Fund outperformed the Performance Universe median and the benchmark index for the one-year period ended December 31, 2023.
Other Information (Continued)
First Trust Multi-Manager Small Cap Opportunities ETF (MMSC)August 31, 2024 (Unaudited) On the basis of all the information provided on the unitary fee and performance of the Fund and the ongoing oversight by the Board, the Board concluded that the unitary fee for the Fund (out of which the Sub-Advisors are compensated) continues to be reasonable and appropriate in light of the nature, extent and quality of the services provided by the Advisor and the Sub-Advisors to the Fund under the Agreements.
The Board considered information and discussed with the Advisor whether there were any economies of scale in connection with providing advisory services to the Fund at current asset levels and whether the Fund may benefit from any economies of scale. The Board noted that the unitary fee rate schedule for the Fund includes breakpoints pursuant to which the unitary fee rate will be reduced as assets of the Fund meet certain thresholds. The Board considered the Advisor’s statement that it believes that its expenses relating to providing advisory services to the Fund will increase during the next twelve months as the Advisor continues to build infrastructure and add new staff. The Board also noted that under the unitary fee structure, any reduction in expenses associated with the management and operations of the Fund would benefit the Advisor, but that the unitary fee structure provides a level of certainty in expenses for shareholders of the Fund. The Board concluded that the unitary fee rate schedule for the Fund reflects an appropriate level of sharing of any economies of scale that may be realized in the management of the Fund at current asset levels. The Board considered the revenues and allocated costs (including the allocation methodology) of the Advisor in serving as investment advisor to the Fund for the twelve months ended December 31, 2023 and the estimated profitability level for the Fund calculated by the Advisor based on such data, as well as complex-wide and product-line profitability data, for the same period. The Board noted the inherent limitations in the profitability analysis and concluded that, based on the information provided, the Advisor’s profitability level for the Fund was not unreasonable. In addition, the Board considered indirect benefits described by the Advisor that may be realized from its relationship with the Fund. The Board considered that the Advisor had identified as an indirect benefit to the Advisor and FTP their exposure to investors and brokers who, absent their exposure to the Fund, may have had no dealings with the Advisor or FTP, and noted that the Advisor does not utilize soft-dollars in connection with the Fund. The Board concluded that the character and amount of potential indirect benefits to the Advisor were not unreasonable.
With respect to the Driehaus Sub-Advisory Agreement, the Board considered Driehaus’ statements that it expects to earn a reasonable profit from its advisory relationship with the Fund after the allocation of overhead costs primarily due to having other client accounts that employ the same strategy as the Fund to scale fixed costs, but that Driehaus does not expect any sustained and meaningful economies of scale related to its relationship with the Fund in the near term, and that it believes the sub-advisory fee is appropriate. The Board noted that the Advisor pays Driehaus from the unitary fee and its understanding that the Fund’s sub-advisory fee was the product of an arm’s length negotiation. The Board did not review the profitability of Driehaus with respect to the Fund. The Board concluded that the profitability analysis for the Advisor was more relevant. The Board considered indirect benefits that may be realized by Driehaus from its relationship with the Fund, and noted Driehaus’ statement that it does not expect any other benefits to be derived from its relationship with the Advisor and the Fund. The Board noted that Driehaus acts as a non-discretionary manager providing model portfolio recommendations to the Advisor and does not provide trade execution services to the Fund. The Board concluded that the character and amount of potential indirect benefits to Driehaus were not unreasonable.
With respect to the Stephens Sub-Advisory Agreement, the Board considered Stephens’ statements that it believes the sub-advisory fee reflects economies of scale for the benefit of the Fund’s investors, that it does not anticipate additional economies of scale in the near future and that it believes the sub-advisory fee is appropriate in light of any economies of scale. The Board noted that the Advisor pays Stephens from the unitary fee and its understanding that the Fund’s sub-advisory fee was the product of an arm’s length negotiation. The Board did not review the profitability of Stephens with respect to the Fund. The Board concluded that the profitability analysis for the Advisor was more relevant. The Board considered indirect benefits that may be realized by Stephens from its relationship with the Fund, and noted Stephens’ description of marketing and related benefits it expects to receive from its relationship with the Advisor and the Fund. The Board noted that Stephens acts as a non-discretionary manager providing model portfolio recommendations to the Advisor and does not provide trade execution services to the Fund. The Board concluded that the character and amount of potential indirect benefits to Stephens were not unreasonable.
Based on all of the information considered and the conclusions reached, the Board, including the Independent Trustees, unanimously determined that the terms of the Agreements continue to be fair and reasonable and that the continuation of the Agreements is in the best interests of the Fund. No single factor was determinative in the Board’s analysis.
There were no distributions made by MMSC during the Fund’s fiscal year ended August 31, 2024; therefore, no analysis for the corporate dividends received deduction and qualified dividend income was completed.
Annual Financial
Statements and
Other Information |
For the Year Ended
August 31, 2024 |
First Trust Exchange-Traded Fund VIII
First Trust TCW Opportunistic Fixed Income ETF (FIXD) |
First Trust TCW Unconstrained Plus Bond ETF (UCON) |
First Trust TCW Securitized Plus ETF (DEED) |
First Trust TCW Emerging Markets Debt ETF (EFIX) |
First Trust Exchange-Traded Fund VIII
Annual Financial Statements and Other Information
August 31, 2024
Performance and Risk Disclosure
There is no assurance that any series of First Trust Exchange-Traded Fund VIII (the “Trust”) described in this report (each such series is referred to as a “Fund” and collectively, as the “Funds”) will achieve its investment objective. Each Fund is subject to market risk, which is the possibility that the market values of securities owned by the Fund will decline and that the value of the Fund’s shares may therefore be less than what you paid for them. Accordingly, you can lose money by investing in a Fund.
Performance data quoted represents past performance, which is no guarantee of future results, and current performance may be lower or higher than the figures shown. For the most recent month-end performance figures, please visit www.ftportfolios.com or speak with your financial advisor. Investment returns, net asset value and share price will fluctuate and Fund shares, when sold, may be worth more or less than their original cost.
First Trust Advisors L.P., the Funds’ advisor, may also periodically provide additional information on Fund performance on each Fund’s webpage at www.ftportfolios.com.
This report contains information that may help you evaluate your investment. It includes details about each Fund and presents data that provides insight into each Fund’s performance and investment approach.
The material risks of investing in each Fund are spelled out in its prospectus, statement of additional information, and other Fund regulatory filings.
First Trust TCW Opportunistic Fixed Income ETF (FIXD)Portfolio of InvestmentsAugust 31, 2024
| | | | |
U.S. GOVERNMENT BONDS AND NOTES — 40.5% |
| | | | |
| | | | |
| | | | |
| | | | |
| | | | |
| | | | |
| | | | |
| | | | |
| | | | |
| Total U.S. Government Bonds and Notes | |
| | |
U.S. GOVERNMENT AGENCY MORTGAGE-BACKED SECURITIES — 36.3% |
| Collateralized Mortgage Obligations — 0.3% | |
| Federal Home Loan Mortgage Corporation | | | |
| | | | |
| Federal National Mortgage Association | | | |
| | | | |
| | | | |
| | | | |
| | | | |
| | | | |
| | | | |
| | | | |
| | | | |
| | | | |
| Government National Mortgage Association | | | |
| Series 2018-115, Class DE | | | |
| Series 2018-124, Class NW | | | |
| | | | |
| | | | |
| | | | |
| Series 2019-119, Class JE | | | |
| Series 2024-30, Class CF, 30 Day Average SOFR + 1.25%, 6.50% Cap (a) | | | |
| | |
| Pass-Through Securities — 36.0% | |
| Federal Home Loan Mortgage Corporation |
| | | | |
| | | | |
| | | | |
| | | | |
| | | | |
| | | | |
| | | | |
| | | | |
| | | | |
| | | | |
| | | | |
| | | | |
| | | | |
See Notes to Financial Statements
First Trust TCW Opportunistic Fixed Income ETF (FIXD)Portfolio of Investments (Continued)August 31, 2024 | | | | |
U.S. GOVERNMENT AGENCY MORTGAGE-BACKED SECURITIES (Continued) |
| Pass-Through Securities (Continued) | |
| Federal Home Loan Mortgage Corporation (Continued) |
| | | | |
| | | | |
| | | | |
| | | | |
| | | | |
| | | | |
| | | | |
| | | | |
| | | | |
| | | | |
| | | | |
| | | | |
| | | | |
| | | | |
| | | | |
| | | | |
| | | | |
| | | | |
| | | | |
| | | | |
| | | | |
| | | | |
| | | | |
| | | | |
| | | | |
| | | | |
| | | | |
| | | | |
| | | | |
| | | | |
| | | | |
| | | | |
| | | | |
| | | | |
| | | | |
| | | | |
| | | | |
| | | | |
| | | | |
| | | | |
| | | | |
| | | | |
| | | | |
| | | | |
| | | | |
| | | | |
| | | | |
| | | | |
| | | | |
See Notes to Financial Statements
First Trust TCW Opportunistic Fixed Income ETF (FIXD)Portfolio of Investments (Continued)August 31, 2024 | | | | |
U.S. GOVERNMENT AGENCY MORTGAGE-BACKED SECURITIES (Continued) |
| Pass-Through Securities (Continued) | |
| Federal Home Loan Mortgage Corporation (Continued) |
| | | | |
| | | | |
| | | | |
| | | | |
| | | | |
| | | | |
| | | | |
| | | | |
| | | | |
| | | | |
| | | | |
| | | | |
| | | | |
| | | | |
| | | | |
| | | | |
| | | | |
| | | | |
| | | | |
| Federal National Mortgage Association |
| | | | |
| | | | |
| | | | |
| | | | |
| | | | |
| | | | |
| | | | |
| | | | |
| | | | |
| | | | |
| | | | |
| | | | |
| | | | |
| | | | |
| | | | |
| | | | |
| | | | |
| | | | |
| | | | |
| | | | |
| | | | |
| | | | |
| | | | |
| | | | |
| | | | |
| | | | |
| | | | |
| | | | |
| | | | |
See Notes to Financial Statements
First Trust TCW Opportunistic Fixed Income ETF (FIXD)Portfolio of Investments (Continued)August 31, 2024 | | | | |
U.S. GOVERNMENT AGENCY MORTGAGE-BACKED SECURITIES (Continued) |
| Pass-Through Securities (Continued) | |
| Federal National Mortgage Association (Continued) |
| | | | |
| | | | |
| | | | |
| | | | |
| | | | |
| | | | |
| | | | |
| | | | |
| | | | |
| | | | |
| | | | |
| | | | |
| | | | |
| | | | |
| | | | |
| | | | |
| | | | |
| | | | |
| | | | |
| | | | |
| | | | |
| | | | |
| | | | |
| | | | |
| | | | |
| | | | |
| | | | |
| | | | |
| | | | |
| | | | |
| | | | |
| | | | |
| | | | |
| | | | |
| | | | |
| | | | |
| | | | |
| | | | |
| | | | |
| | | | |
| | | | |
| | | | |
| | | | |
| | | | |
| | | | |
| | | | |
| | | | |
| | | | |
| | | | |
See Notes to Financial Statements
First Trust TCW Opportunistic Fixed Income ETF (FIXD)Portfolio of Investments (Continued)August 31, 2024 | | | | |
U.S. GOVERNMENT AGENCY MORTGAGE-BACKED SECURITIES (Continued) |
| Pass-Through Securities (Continued) | |
| Federal National Mortgage Association (Continued) |
| | | | |
| | | | |
| | | | |
| | | | |
| | | | |
| | | | |
| | | | |
| Government National Mortgage Association |
| | | | |
| | | | |
| | | | |
| | | | |
| | | | |
| | | | |
| | | | |
| | | | |
| | | | |
| | | | |
| | | | |
| | | | |
| | | | |
| | | | |
| | | | |
| | | | |
| | | | |
| | | | |
| | | | |
| | | | |
| | | | |
| | | | |
| | | | |
| | | | |
| | | | |
| | | | |
| | | | |
| | | | |
| | | | |
| | | | |
| | | | |
| | | | |
| | | | |
| | | | |
| | | | |
| | | | |
| | | | |
| | | | |
| | | | |
| | | | |
| | | | |
See Notes to Financial Statements
First Trust TCW Opportunistic Fixed Income ETF (FIXD)Portfolio of Investments (Continued)August 31, 2024 | | | | |
U.S. GOVERNMENT AGENCY MORTGAGE-BACKED SECURITIES (Continued) |
| Pass-Through Securities (Continued) | |
| Government National Mortgage Association (Continued) |
| | | | |
| | | | |
| | | | |
| | |
| Total U.S. Government Agency Mortgage-Backed Securities | |
| | |
CORPORATE BONDS AND NOTES (c) — 12.5% |
| | |
| BAE Systems Holdings, Inc. (d) | | | |
| | | | |
| | | | |
| | | | |
| | |
| | |
| | | | |
| | | | |
| | | | |
| | |
| | |
| American Airlines Pass-Through Trust, Series 2014-1, Class A | | | |
| American Airlines Pass-Through Trust, Series 2015-2, Class AA | | | |
| American Airlines Pass-Through Trust, Series 2016-1, Class AA | | | |
| Delta Air Lines Pass-Through Trust, Series 2020-1, Class AA | | | |
| JetBlue Pass-Through Trust, Series 2020-1, Class A | | | |
| | |
| | |
| Bank of America Corp. (e) | | | |
| Bank of America Corp. (e) | | | |
| Bank of America Corp. (e) | | | |
| Bank of America Corp. (e) | | | |
| Bank of America Corp. (e) | | | |
| Bank of America Corp. (e) | | | |
| Bank of America Corp., Series N (e) | | | |
| | | | |
| | | | |
| | | | |
| Goldman Sachs Group (The), Inc., SOFR + 0.49% (a) | | | |
| Goldman Sachs Group (The), Inc. (e) | | | |
| Goldman Sachs Group (The), Inc. (e) | | | |
| Goldman Sachs Group (The), Inc. (e) | | | |
| | | | |
| | | | |
| | | | |
| | | | |
| | | | |
| | | | |
| | | | |
| | | | |
See Notes to Financial Statements
First Trust TCW Opportunistic Fixed Income ETF (FIXD)Portfolio of Investments (Continued)August 31, 2024 | | | | |
CORPORATE BONDS AND NOTES (c) (Continued) |
| | |
| | | | |
| | | | |
| | | | |
| | | | |
| | | | |
| PNC Financial Services Group (The), Inc. (e) | | | |
| PNC Financial Services Group (The), Inc. (e) | | | |
| | | | |
| | | | |
| | | | |
| | | | |
| | | | |
| | | | |
| | | | |
| | | | |
| | | | |
| | | | |
| | | | |
| | |
| | |
| Regeneron Pharmaceuticals, Inc. | | | |
| | |
| International Flavors & Fragrances, Inc. (d) | | | |
| International Flavors & Fragrances, Inc. (d) | | | |
| International Flavors & Fragrances, Inc. (d) | | | |
| International Flavors & Fragrances, Inc. | | | |
| International Flavors & Fragrances, Inc. (d) | | | |
| | |
| Commercial Services — 0.0% | |
| Adtalem Global Education, Inc. (d) | | | |
| Diversified Financial Services — 0.2% | |
| | | | |
| | | | |
| | | | |
| | | | |
| Discover Financial Services | | | |
| | |
| | |
| Alliant Energy Finance LLC (d) | | | |
| | | | |
| | | | |
| Appalachian Power Co., Series Z | | | |
| Arizona Public Service Co. | | | |
| | | | |
| | | | |
| Dominion Energy, Inc., Series A | | | |
| Duke Energy Carolinas LLC | | | |
| | | | |
| | | | |
See Notes to Financial Statements
First Trust TCW Opportunistic Fixed Income ETF (FIXD)Portfolio of Investments (Continued)August 31, 2024 | | | | |
CORPORATE BONDS AND NOTES (c) (Continued) |
| | |
| | | | |
| | | | |
| | | | |
| FirstEnergy Pennsylvania Electric Co. (d) | | | |
| FirstEnergy Pennsylvania Electric Co. (d) | | | |
| FirstEnergy Transmission LLC (d) | | | |
| Interstate Power and Light Co. | | | |
| Interstate Power and Light Co. | | | |
| Jersey Central Power & Light Co. (d) | | | |
| | | | |
| Niagara Mohawk Power Corp. (d) | | | |
| Oncor Electric Delivery Co., LLC | | | |
| Public Service Co. of New Mexico | | | |
| Southwestern Electric Power Co. | | | |
| Southwestern Public Service Co., Series 9 | | | |
| Trans-Allegheny Interstate Line Co. (d) | | | |
| | | | |
| | |
| | |
| Honeywell International, Inc. (EUR) | | | |
| Honeywell International, Inc. (EUR) | | | |
| | |
| Engineering & Construction — 0.0% | |
| | | | |
| | |
| Warnermedia Holdings, Inc. | | | |
| Warnermedia Holdings, Inc. | | | |
| Warnermedia Holdings, Inc. | | | |
| | |
| | |
| | | | |
| | |
| East Ohio Gas (The), Co. (d) | | | |
| KeySpan Gas East Corp. (d) | | | |
| | | | |
| Piedmont Natural Gas Co., Inc. | | | |
| Piedmont Natural Gas Co., Inc. | | | |
| Piedmont Natural Gas Co., Inc. | | | |
| Southern Co. Gas Capital Corp. | | | |
| | |
| Healthcare-Products — 0.1% | |
| | | | |
| | | | |
| | | | |
| | |
| Healthcare-Services — 0.4% | |
| Bon Secours Mercy Health, Inc., Series 20-2 | | | |
| Catalent Pharma Solutions, Inc. (EUR) (f) | | | |
See Notes to Financial Statements
First Trust TCW Opportunistic Fixed Income ETF (FIXD)Portfolio of Investments (Continued)August 31, 2024 | | | | |
CORPORATE BONDS AND NOTES (c) (Continued) |
| Healthcare-Services (Continued) | |
| | | | |
| Fortrea Holdings, Inc. (d) | | | |
| | | | |
| | | | |
| ModivCare Escrow Issuer, Inc. (d) | | | |
| New York and Presbyterian (The) Hospital | | | |
| Universal Health Services, Inc. | | | |
| | |
| Household Products/Wares — 0.0% | |
| Spectrum Brands, Inc. (d) | | | |
| | |
| Athene Global Funding (d) | | | |
| Athene Global Funding (d) | | | |
| Athene Global Funding (d) | | | |
| Farmers Exchange Capital (d) | | | |
| Farmers Exchange Capital II (d) (e) | | | |
| Farmers Exchange Capital III (d) (e) | | | |
| Farmers Insurance Exchange (d) (e) | | | |
| Metropolitan Life Global Funding I (d) | | | |
| Metropolitan Life Global Funding I (d) | | | |
| Nationwide Mutual Insurance Co., 3 Mo. Synthetic USD LIBOR + 2.29% (a) (d) | | | |
| New York Life Insurance Co. (d) | | | |
| Teachers Insurance & Annuity Association of America (d) | | | |
| Teachers Insurance & Annuity Association of America (d) | | | |
| Teachers Insurance & Annuity Association of America (d) (e) | | | |
| | |
| Investment Companies — 0.1% | |
| Icahn Enterprises, L.P. / Icahn Enterprises Finance Corp. (d) | | | |
| Icahn Enterprises, L.P. / Icahn Enterprises Finance Corp. | | | |
| Icahn Enterprises, L.P. / Icahn Enterprises Finance Corp. (d) | | | |
| | |
| | |
| | | | |
| | |
| | | | |
| CCO Holdings LLC / CCO Holdings Capital Corp. (d) | | | |
| CCO Holdings LLC / CCO Holdings Capital Corp. (d) | | | |
| Charter Communications Operating LLC / Charter Communications Operating Capital | | | |
| Charter Communications Operating LLC / Charter Communications Operating Capital | | | |
| Charter Communications Operating LLC / Charter Communications Operating Capital | | | |
| Charter Communications Operating LLC / Charter Communications Operating Capital | | | |
| Charter Communications Operating LLC / Charter Communications Operating Capital | | | |
See Notes to Financial Statements
First Trust TCW Opportunistic Fixed Income ETF (FIXD)Portfolio of Investments (Continued)August 31, 2024 | | | | |
CORPORATE BONDS AND NOTES (c) (Continued) |
| | |
| Charter Communications Operating LLC / Charter Communications Operating Capital | | | |
| Cox Enterprises, Inc. (d) | | | |
| | | | |
| | | | |
| | | | |
| | | | |
| | | | |
| | |
| Oil & Gas Services — 0.0% | |
| Archrock Partners, L.P. / Archrock Partners Finance Corp. (d) | | | |
| Packaging & Containers — 0.3% | |
| | | | |
| Amcor Flexibles North America, Inc. | | | |
| | | | |
| | | | |
| | | | |
| | | | |
| Clearwater Paper Corp. (d) | | | |
| | |
| | |
| Bayer US Finance II LLC (d) | | | |
| Bayer US Finance II LLC (d) | | | |
| Bayer US Finance II LLC (d) | | | |
| Bayer US Finance II LLC (d) | | | |
| Bayer US Finance II LLC (d) | | | |
| | | | |
| | | | |
| | | | |
| | | | |
| | | | |
| | | | |
| | | | |
| | | | |
| | |
| | |
| | | | |
| Rockies Express Pipeline LLC (d) | | | |
| Venture Global LNG, Inc. (d) | | | |
| | |
| Real Estate Investment Trusts — 1.4% | |
| Alexandria Real Estate Equities, Inc. | | | |
| American Assets Trust, L.P. | | | |
| American Homes 4 Rent, L.P. | | | |
| American Homes 4 Rent, L.P. | | | |
| | | | |
| | | | |
| | | | |
| | | | |
See Notes to Financial Statements
First Trust TCW Opportunistic Fixed Income ETF (FIXD)Portfolio of Investments (Continued)August 31, 2024 | | | | |
CORPORATE BONDS AND NOTES (c) (Continued) |
| Real Estate Investment Trusts (Continued) | |
| | | | |
| | | | |
| Extra Space Storage, L.P. | | | |
| Extra Space Storage, L.P. | | | |
| Extra Space Storage, L.P. | | | |
| Extra Space Storage, L.P. | | | |
| Extra Space Storage, L.P. | | | |
| GLP Capital, L.P. / GLP Financing II, Inc. | | | |
| GLP Capital, L.P. / GLP Financing II, Inc. | | | |
| Healthcare Realty Holdings, L.P. | | | |
| Healthcare Realty Holdings, L.P. | | | |
| Healthcare Realty Holdings, L.P. | | | |
| Healthcare Realty Holdings, L.P. | | | |
| Hudson Pacific Properties, L.P. | | | |
| Hudson Pacific Properties, L.P. | | | |
| Hudson Pacific Properties, L.P. | | | |
| Hudson Pacific Properties, L.P. | | | |
| Invitation Homes Operating Partnership, L.P. | | | |
| Invitation Homes Operating Partnership, L.P. | | | |
| | | | |
| | | | |
| | | | |
| | | | |
| Piedmont Operating Partnership, L.P. | | | |
| Prologis Euro Finance LLC (EUR) | | | |
| Realty Income Corp. (EUR) | | | |
| Realty Income Corp. (EUR) | | | |
| Rexford Industrial Realty, L.P. | | | |
| | | | |
| | | | |
| | | | |
| VICI Properties, L.P. / VICI Note Co., Inc. (d) | | | |
| VICI Properties, L.P. / VICI Note Co., Inc. (d) | | | |
| VICI Properties, L.P. / VICI Note Co., Inc. (d) | | | |
| VICI Properties, L.P. / VICI Note Co., Inc. (d) | | | |
| | |
| | |
| Ferrellgas, L.P. / Ferrellgas Finance Corp. (d) | | | |
| Michaels (The) Cos., Inc. (d) | | | |
| | |
| | |
| | | | |
| Telecommunications — 0.4% | |
| Frontier Communications Holdings LLC (d) | | | |
| Frontier Communications Holdings LLC (d) | | | |
| Ses Global Americas Holdings, Inc. (d) | | | |
| Sprint Spectrum Co. LLC / Sprint Spectrum Co. II LLC / Sprint Spectrum Co. III LLC (d) | | | |
See Notes to Financial Statements
First Trust TCW Opportunistic Fixed Income ETF (FIXD)Portfolio of Investments (Continued)August 31, 2024 | | | | |
CORPORATE BONDS AND NOTES (c) (Continued) |
| Telecommunications (Continued) | |
| Sprint Spectrum Co. LLC / Sprint Spectrum Co. II LLC / Sprint Spectrum Co. III LLC (d) | | | |
| | | | |
| | |
| Total Corporate Bonds and Notes | |
| | |
ASSET-BACKED SECURITIES — 10.3% |
| ACE Securities Corp. Home Equity Loan Trust |
| Series 2007-HE1, Class A1, 1 Mo. CME Term SOFR + CSA + 0.30% (a) | | | |
| Series 2007-WM2, Class A1, 1 Mo. CME Term SOFR + CSA + 0.21% (a) | | | |
| |
| Series 2019-1A, Class BRR, 3 Mo. CME Term SOFR + 1.60% (a) (d) | | | |
| |
| Series 2021-SFR3, Class G (d) | | | |
| |
| Series 2005-W2, Class M1, 1 Mo. CME Term SOFR + CSA + 0.74% (a) | | | |
| Asset Backed Funding Certificates Trust |
| Series 2006-HE1, Class A2B, 1 Mo. CME Term SOFR + CSA + 0.11% (a) | | | |
| |
| Series 2019-2A, Class BR, 3 Mo. CME Term SOFR + CSA + 1.60% (a) (d) | | | |
| |
| Series 2018-4A, Class A1R, 3 Mo. CME Term SOFR + 1.15% (a) (d) | | | |
| Series 2019-2A, Class A2R, 3 Mo. CME Term SOFR + CSA + 1.70% (a) (d) | | | |
| |
| Series 2018-3A, Class BR, 3 Mo. CME Term SOFR + 1.85% (a) (d) | | | |
| Carrington Mortgage Loan Trust |
| Series 2006-NC4, Class A4, 1 Mo. CME Term SOFR + CSA + 0.24% (a) | | | |
| Series 2006-OPT1, Class M1, 1 Mo. CME Term SOFR + CSA + 0.53% (a) | | | |
| Carvana Auto Receivables Trust |
| Series 2022-P3, Class R (d) | | | |
| |
| Series 2021-7A, Class A1, 3 Mo. CME Term SOFR + CSA + 1.13% (a) (d) | | | |
| |
| Series 2021-NR3, Class A1, steps up to 6.57% on 04/01/25 (d) (h) | | | |
| Series 2021-NR4, Class A1, steps up to 5.82% on 10/01/24 (d) (h) | | | |
| Series 2023-NR1, Class A1, steps up to 9.00% on 01/01/26 (d) (h) | | | |
See Notes to Financial Statements
First Trust TCW Opportunistic Fixed Income ETF (FIXD)Portfolio of Investments (Continued)August 31, 2024 | | | | |
ASSET-BACKED SECURITIES (Continued) |
| |
| Series 2018-70A, Class B, 3 Mo. CME Term SOFR + CSA + 1.70% (a) (d) | | | |
| |
| Series 2013-26A, Class AR, 3 Mo. CME Term SOFR + CSA + 0.90% (a) (d) | | | |
| Series 2015-40A, Class AR2, 3 Mo. CME Term SOFR + 1.15% (a) (d) | | | |
| Series 2017-54A, Class BR, 3 Mo. CME Term SOFR + 1.50% (a) (d) | | | |
| ECMC Group Student Loan Trust |
| Series 2017-2A, Class A, 30 Day Average SOFR + 1.16% (a) (d) | | | |
| |
| Series 2020-3A, Class BRR, 3 Mo. CME Term SOFR + 1.70% (a) (d) | | | |
| Exeter Automobile Receivables Trust |
| Series 2021-4A, Class R (d) | | | |
| First Franklin Mortgage Loan Trust |
| Series 2006-FF13, Class A2C, 1 Mo. CME Term SOFR + CSA + 0.32% (a) | | | |
| Series 2007-FF2, Class A1, 1 Mo. CME Term SOFR + CSA + 0.28% (a) | | | |
| GE-WMC Mortgage Securities LLC |
| Series 2005-1, Class M1, 1 Mo. CME Term SOFR + CSA + 0.66% (a) | | | |
| GoldenTree Loan Management US CLO Ltd. |
| Series 2020-8A, Class AR, 3 Mo. CME Term SOFR + CSA + 1.15% (a) (d) | | | |
| |
| Series 2006-NC2, Class A2C, 1 Mo. CME Term SOFR + CSA + 0.30% (a) | | | |
| Series 2007-FM2, Class A1, 1 Mo. CME Term SOFR + CSA + 0.14% (a) | | | |
| |
| Series 2024-19A, Class B2, 3 Mo. CME Term SOFR + 2.25% (a) (d) | | | |
| JP Morgan Mortgage Acquisition Trust |
| Series 2006-WF1, Class A6 | | | |
| Series 2006-WMC2, Class A4, 1 Mo. CME Term SOFR + CSA + 0.30% (a) | | | |
| Series 2006-WMC2, Class A5, 1 Mo. CME Term SOFR + CSA + 0.50% (a) | | | |
| |
| Series 2006-9, Class A1C, 1 Mo. CME Term SOFR + CSA + 0.52% (a) | | | |
| Long Beach Mortgage Loan Trust |
| Series 2006-1, Class 1A, 1 Mo. CME Term SOFR + CSA + 0.44% (a) | | | |
| Madison Park Funding Ltd. |
| Series 2018-27A, Class A2, 3 Mo. CME Term SOFR + CSA + 1.35% (a) (d) | | | |
| Series 2018-29A, Class AR, 3 Mo. CME Term SOFR + 1.18% (a) (d) | | | |
See Notes to Financial Statements
First Trust TCW Opportunistic Fixed Income ETF (FIXD)Portfolio of Investments (Continued)August 31, 2024 | | | | |
ASSET-BACKED SECURITIES (Continued) |
| |
| Series 2015-12A, Class AR4, 3 Mo. CME Term SOFR + 1.15% (a) (d) | | | |
| Mastr Asset Backed Securities Trust |
| Series 2006-WMC3, Class A2, 1 Mo. CME Term SOFR + CSA + 0.10% (a) | | | |
| Merrill Lynch First Franklin Mortgage Loan Trust |
| Series 2007-3, Class A2B, 1 Mo. CME Term SOFR + CSA + 0.26% (a) | | | |
| |
| | | | |
| Morgan Stanley ABS Capital I, Inc. Trust |
| Series 2006-HE4, Class A3, 1 Mo. CME Term SOFR + CSA + 0.30% (a) | | | |
| Series 2006-HE8, Class A2B, 1 Mo. CME Term SOFR + CSA + 0.10% (a) | | | |
| Series 2006-NC1, Class M1, 1 Mo. CME Term SOFR + CSA + 0.57% (a) | | | |
| Series 2007-HE1, Class A2D, 1 Mo. CME Term SOFR + CSA + 0.23% (a) | | | |
| Series 2007-HE2, Class A2D, 1 Mo. CME Term SOFR + CSA + 0.21% (a) | | | |
| Series 2007-NC3, Class A2D, 1 Mo. CME Term SOFR + CSA + 0.26% (a) | | | |
| Navient Student Loan Trust |
| Series 2014-1, Class A3, 30 Day Average SOFR + CSA + 0.51% (a) | | | |
| Series 2017-3A, Class A3, 30 Day Average SOFR + 1.16% (a) (d) | | | |
| New Residential Mortgage Loan Trust |
| Series 2022-SFR2, Class B (d) | | | |
| Series 2022-SFR2, Class E1 (d) | | | |
| |
| Series 2014-6A, Class A1R2, 3 Mo. CME Term SOFR + 1.15% (a) (d) | | | |
| Series 2020-19A, Class AR, 3 Mo. CME Term SOFR + CSA + 1.15% (a) (d) | | | |
| Series 2021-21A, Class B, 3 Mo. CME Term SOFR + CSA + 1.70% (a) (d) | | | |
| Octagon Investment Partners 46 Ltd. |
| Series 2020-2A, Class AR, 3 Mo. CME Term SOFR + CSA + 1.16% (a) (d) | | | |
| OHA Credit Funding 4 Ltd. |
| Series 2019-4A, Class BR, 3 Mo. CME Term SOFR + CSA + 1.65% (a) (d) | | | |
| OHA Credit Partners XI Ltd. |
| Series 2015-11A, Class A2R2, 3 Mo. CME Term SOFR + 1.70% (a) (d) | | | |
| Progress Residential Trust |
| Series 2021-SFR2, Class G (d) | | | |
| Series 2021-SFR3, Class G (d) | | | |
| Series 2021-SFR8, Class F (d) | | | |
| Series 2021-SFR10, Class F (d) | | | |
See Notes to Financial Statements
First Trust TCW Opportunistic Fixed Income ETF (FIXD)Portfolio of Investments (Continued)August 31, 2024 | | | | |
ASSET-BACKED SECURITIES (Continued) |
| |
| Series 2021-7, Class A1, steps up to 5.87% on 08/25/25 (d) (h) | | | |
| Series 2021-10, Class A1, steps up to 5.49% on 10/25/24 (d) (h) | | | |
| Series 2022-4, Class A1, steps up to 9.00% on 08/25/2025 (d) (h) | | | |
| |
| Series 2021-14A, Class B, 3 Mo. CME Term SOFR + CSA + 1.65% (a) (d) | | | |
| |
| Series 2024-CES3, Class A1A (d) | | | |
| Residential Asset Securities Corp. |
| Series 2006-EMX3, Class A3, 1 Mo. CME Term SOFR + CSA + 0.28% (a) | | | |
| Series 2006-KS3, Class M1, 1 Mo. CME Term SOFR + CSA + 0.33% (a) | | | |
| |
| Series 2017-3A, Class A, 3 Mo. CME Term SOFR + CSA + 1.19% (a) (d) | | | |
| Series 2019-2A, Class AR, 3 Mo. CME Term SOFR + CSA + 1.10% (a) (d) | | | |
| Saxon Asset Securities Trust |
| Series 2007-2, Class A2C, 1 Mo. CME Term SOFR + CSA + 0.24% (a) | | | |
| Securitized Asset-Backed Receivables LLC Trust |
| Series 2006-WM4, Class A1, 1 Mo. CME Term SOFR + CSA + 0.38% (a) (d) | | | |
| Skyline Aircraft Finance LLC |
| Series 2020-1, Class A (i) (j) | | | |
| |
| Series 2008-1, Class A4A, 90 Day Average SOFR + CSA + 1.60% (a) | | | |
| |
| Series 2007-7, Class B, 90 Day Average SOFR + CSA + 0.75% (a) | | | |
| Series 2008-2, Class B, 90 Day Average SOFR + CSA + 1.20% (a) | | | |
| Series 2008-3, Class B, 90 Day Average SOFR + CSA + 1.20% (a) | | | |
| Series 2008-6, Class A4, 90 Day Average SOFR + 1.36% (a) | | | |
| Series 2008-7, Class B, 90 Day Average SOFR + 2.11% (a) | | | |
| Series 2012-2, Class A, 30 Day Average SOFR + 0.81% (a) | | | |
| Series 2012-6, Class A3, 30 Day Average SOFR + 0.86% (a) | | | |
| Series 2012-7, Class A3, 30 Day Average SOFR + 0.76% (a) | | | |
| Series 2012-7, Class B, 30 Day Average SOFR + CSA + 1.80% (a) | | | |
| Series 2013-2, Class A, 30 Day Average SOFR + 0.56% (a) | | | |
| Soundview Home Loan Trust |
| Series 2007-OPT4, Class 1A1, 1 Mo. CME Term SOFR + CSA + 1.00% (a) | | | |
| Structured Asset Investment Loan Trust |
| Series 2004-6, Class A3, 1 Mo. CME Term SOFR + CSA + 0.80% (a) | | | |
See Notes to Financial Statements
First Trust TCW Opportunistic Fixed Income ETF (FIXD)Portfolio of Investments (Continued)August 31, 2024 | | | | |
ASSET-BACKED SECURITIES (Continued) |
| Structured Asset Securities Corp. Mortgage Loan Trust |
| Series 2005-NC2, Class M5, 1 Mo. CME Term SOFR + CSA + 0.93% (a) | | | |
| |
| Series 2020-1A, Class A (d) | | | |
| |
| Series 2020-1A, Class A (d) | | | |
| |
| Series 2020-1A, Class AR, 3 Mo. CME Term SOFR + CSA + 1.15% (a) (d) | | | |
| Wachovia Student Loan Trust |
| Series 2006-1, Class A6, 90 Day Average SOFR + 0.43% (a) (d) | | | |
| WaMu Asset-Backed Certificates WaMu Trust |
| Series 2007-HE2, Class 2A1, 1 Mo. CME Term SOFR + CSA + 0.11% (a) | | | |
| Series 2007-HE2, Class 2A2, 1 Mo. CME Term SOFR + CSA + 0.19% (a) | | | |
| Series 2007-HE2, Class 2A3, 1 Mo. CME Term SOFR + CSA + 0.25% (a) | | | |
| Total Asset-Backed Securities | |
| | |
MORTGAGE-BACKED SECURITIES — 7.7% |
| Collateralized Mortgage Obligations — 4.6% | |
| |
| Series 2019-F, Class A1, steps up to 3.86% on 11/25/26 (d) (h) | | | |
| |
| Series 2005-16, Class A4, 1 Mo. CME Term SOFR + CSA + 0.48% (a) | | | |
| Series 2005-56, Class 1A1, 1 Mo. CME Term SOFR + CSA + 1.46% (a) | | | |
| Series 2005-67CB, Class A1 | | | |
| | | | |
| American Home Mortgage Assets Trust |
| Series 2007-1, Class A1, 12 Mo. Treasury Average + 0.70% (a) | | | |
| American Home Mortgage Investment Trust |
| Series 2005-4, Class 1A1, 1 Mo. CME Term SOFR + CSA + 0.58% (a) | | | |
| |
| Series 2024-1, Class A1, steps up to 6.21% on 01/01/28 (d) (h) | | | |
| Banc of America Funding Trust |
| Series 2014-R6, Class 2A13 (d) (k) | | | |
| Bear Stearns Mortgage Funding Trust |
| Series 2006-AR1, Class 1A1, 1 Mo. CME Term SOFR + CSA + 0.42% (a) | | | |
| Series 2006-AR3, Class 1A1, 1 Mo. CME Term SOFR + CSA + 0.36% (a) | | | |
| Series 2006-AR5, Class 2A1, 1 Mo. CME Term SOFR + CSA + 0.38% (a) | | | |
| Series 2007-AR5, Class 1A1G, 1 Mo. CME Term SOFR + CSA + 0.32% (a) | | | |
| |
| Series 2019-R1, Class A (d) | | | |
See Notes to Financial Statements
First Trust TCW Opportunistic Fixed Income ETF (FIXD)Portfolio of Investments (Continued)August 31, 2024 | | | | |
MORTGAGE-BACKED SECURITIES (Continued) |
| Collateralized Mortgage Obligations (Continued) | |
| |
| Series 2019-R4, Class A1 (d) | | | |
| Series 2020-R3, Class A1A (d) | | | |
| Series 2020-R3, Class A1B (d) | | | |
| Series 2020-R7, Class A1B (d) (l) | | | |
| Series 2021-R3, Class A1A (d) | | | |
| Series 2023-R1, Class A1A (d) | | | |
| Series 2023-R3, Class A1A (d) | | | |
| Connecticut Avenue Securities Trust |
| Series 2019-R04, Class 2B1, 30 Day Average SOFR + 5.36% (a) (d) | | | |
| Credit Suisse Mortgage Trust |
| | | | |
| Series 2007-3, Class 1A1A | | | |
| Series 2021-NQM7, Class A1 (d) | | | |
| Series 2021-RP11, Class A1 (d) | | | |
| Series 2021-RP11, Class PT (d) | | | |
| |
| | | | |
| GMACM Mortgage Loan Trust |
| Series 2006-AR1, Class 1A1 (k) | | | |
| | | | |
| GreenPoint Mortgage Funding Trust |
| Series 2006-AR1, Class A1A, 1 Mo. CME Term SOFR + CSA + 0.58% (a) | | | |
| |
| Series 2006-OA1, Class 2A2, 1 Mo. CME Term SOFR + CSA + 0.52% (a) | | | |
| HarborView Mortgage Loan Trust |
| Series 2005-10, Class 2A1A, 1 Mo. CME Term SOFR + CSA + 0.62% (a) | | | |
| Series 2007-7, Class 1A1, 1 Mo. CME Term SOFR + CSA + 2.00% (a) | | | |
| |
| Series 2004-2, Class A1, 1 Mo. CME Term SOFR + CSA + 0.74% (a) | | | |
| |
| Series 2005-2, Class 1A1, 1 Mo. CME Term SOFR + CSA + 0.52% (a) | | | |
| Series 2005-4, Class 1A1A, 1 Mo. CME Term SOFR + CSA + 0.27% (a) | | | |
| IndyMac INDX Mortgage Loan Trust |
| Series 2005-AR14, Class 2A1A, 1 Mo. CME Term SOFR + CSA + 0.60% (a) | | | |
| Series 2005-AR29, Class A1 (k) | | | |
| Series 2006-AR6, Class 2A1A, 1 Mo. CME Term SOFR + CSA + 0.40% (a) | | | |
| Series 2007-FLX4, Class 2A2, 1 Mo. CME Term SOFR + CSA + 0.50% (a) | | | |
| |
| Series 2006-A4, Class 1A1 (k) | | | |
See Notes to Financial Statements
First Trust TCW Opportunistic Fixed Income ETF (FIXD)Portfolio of Investments (Continued)August 31, 2024 | | | | |
MORTGAGE-BACKED SECURITIES (Continued) |
| Collateralized Mortgage Obligations (Continued) | |
| |
| Series 2006-16N, Class A4A, 1 Mo. CME Term SOFR + CSA + 0.38% (a) | | | |
| Series 2007-16N, Class 1A1, 1 Mo. CME Term SOFR + CSA + 0.94% (a) | | | |
| Series 2007-16N, Class 2A1, 1 Mo. CME Term SOFR + CSA + 0.80% (a) | | | |
| Merrill Lynch Alternative Note Asset Trust |
| Series 2007-OAR3, Class A1, 1 Mo. CME Term SOFR + CSA + 0.19% (a) | | | |
| Morgan Stanley Mortgage Loan Trust |
| Series 2005-2AR, Class A, 1 Mo. CME Term SOFR + CSA + 0.26% (a) | | | |
| |
| Series 2005-5, Class A1, 1 Mo. CME Term SOFR + CSA + 0.52% (a) | | | |
| Nomura Resecuritization Trust |
| Series 2015-5R, Class 1A1 (d) | | | |
| |
| Series 2021-NQM2, Class A1 (d) | | | |
| Series 2021-NQM3, Class A1 (d) | | | |
| Opteum Mortgage Acceptance Corp. |
| Series 2005-5, Class 1A1D, 1 Mo. CME Term SOFR + CSA + 0.76% (a) | | | |
| Series 2006-1, Class 1APT, 1 Mo. CME Term SOFR + CSA + 0.42% (a) | | | |
| |
| Series 2021-AFC2, Class A1 (d) | | | |
| |
| Series 2007-QS7, Class 1A1 | | | |
| Series 2007-QS9, Class A33 | | | |
| |
| Series 2007-S6, Class 1A4 | | | |
| Structured Adjustable Rate Mortgage Loan Trust |
| Series 2004-12, Class 3A1 (k) | | | |
| Series 2006-2, Class 4A1 (k) | | | |
| Structured Asset Mortgage Investments II Trust |
| Series 2006-AR1, Class 3A1, 1 Mo. CME Term SOFR + CSA + 0.46% (a) | | | |
| Series 2006-AR7, Class A1A, 1 Mo. CME Term SOFR + CSA + 0.42% (a) | | | |
| Series 2007-AR6, Class A1, 12 Mo. Treasury Average + 1.50% (a) | | | |
| WaMu Mortgage Pass-Through Certificates Trust |
| Series 2005-AR1, Class A2A1, 1 Mo. CME Term SOFR + CSA + 0.68% (a) | | | |
| Series 2005-AR15, Class A1A1, 1 Mo. CME Term SOFR + CSA + 0.52% (a) | | | |
See Notes to Financial Statements
First Trust TCW Opportunistic Fixed Income ETF (FIXD)Portfolio of Investments (Continued)August 31, 2024 | | | | |
MORTGAGE-BACKED SECURITIES (Continued) |
| Collateralized Mortgage Obligations (Continued) | |
| WaMu Mortgage Pass-Through Certificates Trust (Continued) |
| Series 2006-AR3, Class A1A, 12 Mo. Treasury Average + 1.00% (a) | | | |
| Series 2006-AR4, Class 1A1A, 12 Mo. Treasury Average + 0.94% (a) | | | |
| | |
| Commercial Mortgage-Backed Securities — 3.1% | |
| BAMLL Commercial Mortgage Securities Trust |
| Series 2015-200P, Class F (d) (k) | | | |
| BX Commercial Mortgage Trust |
| Series 2020-VIV2, Class C (d) (k) | | | |
| Series 2020-VIVA, Class D (d) (k) | | | |
| Series 2021-XL2, Class J, 1 Mo. CME Term SOFR + CSA + 3.89% (a) (d) | | | |
| |
| Series 2019-OC11, Class D (d) (k) | | | |
| |
| Series 2021-FILM, Class E, 1 Mo. CME Term SOFR + CSA + 2.00% (a) (d) | | | |
| |
| Series 2017-CC, Class B (d) (k) | | | |
| Series 2017-CC, Class D (d) (k) | | | |
| Series 2017-GM, Class D (d) (k) | | | |
| BXSC Commercial Mortgage Trust |
| Series 2022-WSS, Class D, 1 Mo. CME Term SOFR + 3.19% (a) (d) | | | |
| CAMB Commercial Mortgage Trust |
| Series 2019-LIFE, Class F, 1 Mo. CME Term SOFR + CSA + 2.55% (a) (d) | | | |
| |
| Series 2023-CITY, Class A, 1 Mo. CME Term SOFR + 2.62% (a) (d) | | | |
| |
| Series 2019-CPT, Class A (d) | | | |
| |
| Series 2023-BRND, Class B | | | |
| |
| Series 2019-MTC, Class A (d) | | | |
| |
| Series 2021-FILE, Class B, 1 Mo. CME Term SOFR + CSA + 1.70% (a) (d) | | | |
| |
| Series 2020-GRCE, Class D (d) (k) | | | |
| |
| Series 2016-HHV, Class F (d) (k) | | | |
| Hudson Yards Mortgage Trust |
| Series 2019-30HY, Class D (d) (k) | | | |
See Notes to Financial Statements
First Trust TCW Opportunistic Fixed Income ETF (FIXD)Portfolio of Investments (Continued)August 31, 2024 | | | | |
MORTGAGE-BACKED SECURITIES (Continued) |
| Commercial Mortgage-Backed Securities (Continued) | |
| |
| Series 2021-BMR, Class F, 1 Mo. CME Term SOFR + CSA + 2.35% (a) (d) | | | |
| Series 2021-BMR, Class G, 1 Mo. CME Term SOFR + CSA + 2.95% (a) (d) | | | |
| Manhattan West Mortgage Trust |
| Series 2020-1MW, Class A (d) | | | |
| |
| Series 2020-525M, Class D (d) (k) | | | |
| SFAVE Commercial Mortgage Securities Trust |
| Series 2015-5AVE, Class A2A (d) (k) | | | |
| |
| Series 2021-OVA, Class A (d) | | | |
| Series 2021-OVA, Class E (d) | | | |
| Series 2021-OVA, Class F (d) | | | |
| |
| Series 2021-PALM, Class E, 1 Mo. CME Term SOFR + CSA + 1.91% (a) (d) | | | |
| Series 2021-PALM, Class G, 1 Mo. CME Term SOFR + CSA + 3.62% (a) (d) | | | |
| |
| Series 2021-DGWD, Class E, 1 Mo. CME Term SOFR + CSA + 2.35% (a) (d) | | | |
| | |
| Total Mortgage-Backed Securities | |
| | |
FOREIGN CORPORATE BONDS AND NOTES (c) — 2.9% |
| | |
| Imperial Brands Finance PLC (d) | | | |
| | |
| Air Canada Pass-Through Trust, Series 2017-1, Class AA (d) | | | |
| | |
| | | | |
| | | | |
| | | | |
| | | | |
| Lloyds Banking Group PLC (e) | | | |
| Santander UK Group Holdings PLC (e) | | | |
| Santander UK Group Holdings PLC (e) | | | |
| Santander UK Group Holdings PLC (e) | | | |
| | |
| | |
| Anheuser-Busch InBev S.A. / N.V. (EUR) (f) | | | |
| | | | |
| | | | |
| | | | |
| | |
| Diversified Financial Services — 0.4% | |
| AerCap Ireland Capital DAC / AerCap Global Aviation Trust | | | |
See Notes to Financial Statements
First Trust TCW Opportunistic Fixed Income ETF (FIXD)Portfolio of Investments (Continued)August 31, 2024 | | | | |
FOREIGN CORPORATE BONDS AND NOTES (c) (Continued) |
| Diversified Financial Services (Continued) | |
| AerCap Ireland Capital DAC / AerCap Global Aviation Trust | | | |
| AerCap Ireland Capital DAC / AerCap Global Aviation Trust | | | |
| Avolon Holdings Funding Ltd. (d) | | | |
| Avolon Holdings Funding Ltd. (d) | | | |
| Avolon Holdings Funding Ltd. (d) | | | |
| | |
| | |
| | | | |
| | | | |
| Elia Group S.A. / N.V. (EUR) (f) | | | |
| Elia Transmission Belgium S.A. (EUR) (f) | | | |
| Mong Duong Finance Holdings B.V. (f) | | | |
| | | | |
| | | | |
| TenneT Holding B.V. (EUR) (f) | | | |
| TenneT Holding B.V. (EUR) (f) | | | |
| | |
| | |
| | | | |
| JBS USA Holding Lux S.A.R.L. / JBS USA Food Co. / JBS Lux Co., S.A.R.L. (d) | | | |
| JBS USA Holding Lux S.A.R.L. / JBS USA Food Co. / JBS Lux Co., S.A.R.L. | | | |
| JBS USA Holding Lux S.A.R.L. / JBS USA Food Co. / JBS Lux Co., S.A.R.L. | | | |
| JBS USA Holding Lux S.A.R.L. / JBS USA Food Co. / JBS Lux Co., S.A.R.L. (d) | | | |
| | |
| | |
| National Gas Transmission PLC (EUR) (f) | | | |
| Healthcare-Products — 0.0% | |
| Medtronic Global Holdings S.C.A. (EUR) | | | |
| Medtronic Global Holdings S.C.A. (EUR) | | | |
| | |
| Healthcare-Services — 0.1% | |
| | | | |
| Lonza Finance International N.V. (EUR) (f) | | | |
| | |
| | |
| VZ Secured Financing B.V. (d) | | | |
| | |
| Corp. Nacional del Cobre de Chile (f) | | | |
| Indonesia Asahan Aluminium PT / Mineral Industri Indonesia Persero PT (d) | | | |
| | |
| | |
| | | | |
| KazMunayGas National Co. JSC (f) | | | |
See Notes to Financial Statements
First Trust TCW Opportunistic Fixed Income ETF (FIXD)Portfolio of Investments (Continued)August 31, 2024 | | | | |
FOREIGN CORPORATE BONDS AND NOTES (c) (Continued) |
| | |
| KazMunayGas National Co. JSC (d) | | | |
| | | | |
| | | | |
| | | | |
| | |
| Packaging & Containers — 0.1% | |
| Ardagh Packaging Finance PLC / Ardagh Holdings USA, Inc. (d) | | | |
| Ardagh Packaging Finance PLC / Ardagh Holdings USA, Inc. (d) | | | |
| Ardagh Packaging Finance PLC / Ardagh Holdings USA, Inc. (d) | | | |
| | |
| | |
| | | | |
| | | | |
| | | | |
| MSD Netherlands Capital B.V. (EUR) | | | |
| | |
| | |
| Galaxy Pipeline Assets Bidco Ltd. (d) | | | |
| | | | |
| TransCanada PipeLines Ltd. | | | |
| | |
| | |
| Annington Funding PLC (GBP) (f) | | | |
| Annington Funding PLC (GBP) (f) | | | |
| Annington Funding PLC (GBP) (f) | | | |
| Annington Funding PLC (GBP) (f) | | | |
| Blackstone Property Partners Europe Holdings S.A.R.L. (EUR) (f) | | | |
| Blackstone Property Partners Europe Holdings S.A.R.L. (EUR) (f) | | | |
| Blackstone Property Partners Europe Holdings S.A.R.L. (EUR) (f) | | | |
| LEG Immobilien SE (EUR) (f) | | | |
| | | | |
| | | | |
| | | | |
| | |
| Real Estate Investment Trusts — 0.1% | |
| Digital Intrepid Holding B.V. (EUR) (f) | | | |
| | |
| Nationwide Building Society (d) (e) | | | |
| Telecommunications — 0.0% | |
| | | | |
| | | | |
| C&W Senior Finance Ltd. (d) | | | |
| Ooredoo International Finance Ltd. (f) | | | |
| | | | |
| | |
| Total Foreign Corporate Bonds and Notes | |
| | |
See Notes to Financial Statements
First Trust TCW Opportunistic Fixed Income ETF (FIXD)Portfolio of Investments (Continued)August 31, 2024 | | | | |
SENIOR FLOATING-RATE LOAN INTERESTS — 1.4% |
| | |
| TransDigm, Inc., Term Loan I, 3 Mo. CME Term SOFR + 2.75%, 0.00% Floor | | | |
| | |
| Invitation Homes Operating Partnership, L.P., Term Loan A, 1 Mo. CME Term SOFR + CSA + 1.00%, 0.00% Floor | | | |
| Brokerage/Asset Managers/Exchanges — 0.0% | |
| Deerfield Dakota Holding LLC, Term Loan B, 3 Mo. CME Term SOFR + 3.75%, 1.00% Floor | | | |
| Jane Street Group LLC, Term Loan B, 1 Mo. CME Term SOFR + CSA + 2.50%, 0.00% Floor | | | |
| | |
| | |
| CSC Holdings LLC, Term Loan B, 1 Mo. Synthetic LIBOR + 2.50%, 0.00% Floor | | | |
| Virgin Media Bristol LLC, Term Loan N, 1 Mo. CME Term SOFR + CSA + 2.50%, 0.00% Floor | | | |
| | |
| | |
| Chemours (The) Co., Term Loan B2, 1 Mo. CME Term SOFR + 3.50%, 0.50% Floor | | | |
| Consumer Cyclical Services — 0.1% | |
| 8 Avenue Food & Provisions, Inc., Term Loan B, 1 Mo. CME Term SOFR + CSA + 3.75%, 0.00% Floor | | | |
| Arches Buyer, Inc., Term Loan, 1 Mo. CME Term SOFR + CSA + 3.25%, 0.50% Floor | | | |
| Buzz Finco LLC, Term Loan B, 1 Mo. CME Term SOFR + CSA + 2.75%, 0.00% Floor | | | |
| Delivery Hero Finco LLC, Term Loan B, 3 Mo. CME Term SOFR + 5.00%, 0.50% Floor | | | |
| Match Group Holdings II LLC, Term Loan B, 3 Mo. CME Term SOFR + CSA + 1.75%, 0.00% Floor | | | |
| StubHub Holdco Sub LLC, Term Loan B, 1 Mo. CME Term SOFR + 4.75%, 0.00% Floor | | | |
| TruGreen, L.P., Term Loan B, 1 Mo. CME Term SOFR + CSA + 4.00%, 0.75% Floor | | | |
| | |
| | |
| AI Aqua Merger Sub, Inc., Term Loan B, 1 Mo. CME Term SOFR + 3.50%, 0.50% Floor | | | |
| Diversified Manufacturing — 0.0% | |
| Alliance Laundry Systems, Term Loan B, 1 Mo. CME Term SOFR + 3.50%, 0.00% Floor | | | |
| | |
| Edgewater Generation LLC, Term Loan B, 1 Mo. CME Term SOFR + 4.25%, 0.00% Floor | | | |
| Lackawanna Energy Center, Term Loan B2, 1 Mo. CME Term SOFR + 5.00%, 0.50% Floor | | | |
| Lackawanna Energy Center, Term Loan C, 1 Mo. CME Term SOFR + 5.00%, 0.50% Floor | | | |
See Notes to Financial Statements
First Trust TCW Opportunistic Fixed Income ETF (FIXD)Portfolio of Investments (Continued)August 31, 2024 | | | | |
SENIOR FLOATING-RATE LOAN INTERESTS (Continued) |
| | |
| South Field Energy LLC, Term Loan B, 1 Mo. CME Term SOFR + 3.75%, 0.00% Floor | | | |
| South Field Energy LLC, Term Loan C, 1 Mo. CME Term SOFR + 3.75%, 0.00% Floor | | | |
| Vistra Operations Co. LLC, Term Loan B, 1 Mo. CME Term SOFR + 2.00%, 0.00% Floor | | | |
| | |
| | |
| Clean Harbors, Inc., Term Loan B, 1 Mo. CME Term SOFR + CSA + 1.75%, 0.00% Floor | | | |
| Patriot Container Corp., Term Loan, 1 Mo. CME Term SOFR + CSA + 3.75%, 1.00% Floor | | | |
| | |
| | |
| Avolon TLB Borrower 1 (U.S.) LLC, Term Loan B, 1 Mo. CME Term SOFR + 2.00%, 0.50% Floor | | | |
| | |
| Trans Union LLC, Term Loan B7, 1 Mo. CME Term SOFR + 2.00%, 0.50% Floor | | | |
| Trans Union LLC, Term Loan B8, 1 Mo. CME Term SOFR + 1.75%, 0.00% Floor | | | |
| | |
| | |
| City Brewing Co. LLC, Term Loan, 1 Mo. CME Term SOFR + 6.25%, 0.75% Floor | | | |
| City Brewing Co. LLC, Term Loan, 3 Mo. CME Term SOFR + CSA + 3.50%, 0.75% Floor | | | |
| City Brewing Co. LLC, Term Loan, 3 Mo. CME Term SOFR + CSA + 5.00%, 0.75% Floor | | | |
| Naked Juice LLC, Term Loan, 3 Mo. CME Term SOFR + CSA + 3.25%, 0.50% Floor | | | |
| Naked Juice LLC, Term Loan, 3 Mo. CME Term SOFR + CSA + 6.00%, 0.50% Floor | | | |
| Triton Water Holdings, Inc., Term Loan B, 3 Mo. CME Term SOFR + 3.25%, 0.50% Floor | | | |
| United Natural Foods, Inc., Term Loan B, 1 Mo. CME Term SOFR + 4.75%, 0.00% Floor | | | |
| | |
| | |
| Caesars Entertainment, Inc., Term Loan B1, 3 Mo. CME Term SOFR + 2.75%, 0.50% Floor | | | |
| Churchill Downs, Inc., Term Loan B, 1 Mo. CME Term SOFR + CSA + 2.00%, 0.00% Floor | | | |
| | |
| | |
| Bausch & Lomb Corp., Term Loan, 1 Mo. CME Term SOFR + 4.00%, 0.00% Floor | | | |
| Catalent Pharma Solutions, Inc., Term Loan B3, 1 Mo. CME Term SOFR + CSA + 2.00%, 0.50% Floor | | | |
See Notes to Financial Statements
First Trust TCW Opportunistic Fixed Income ETF (FIXD)Portfolio of Investments (Continued)August 31, 2024 | | | | |
SENIOR FLOATING-RATE LOAN INTERESTS (Continued) |
| | |
| Gainwell Acquisition Corp., Term Loan B, 3 Mo. CME Term SOFR + CSA + 4.00%, 0.75% Floor | | | |
| Medline Borrower, L.P., Term Loan B, 1 Mo. CME Term SOFR + 2.75%, 0.50% Floor | | | |
| Modivcare, Inc., Term Loan B, 3 Mo. CME Term SOFR + CSA + 4.75%, 0.00% Floor | | | |
| NSM Top Holdings Corp., Term Loan, 1 Mo. CME Term SOFR + 5.25%, 0.00% Floor | | | |
| Star Parent, Inc., Term Loan B, 3 Mo. CME Term SOFR + 4.00%, 0.00% Floor | | | |
| | |
| | |
| Healthpeak Op LLC, Delayed Draw Term Loan, 1 Mo. CME Term SOFR + CSA + 0.85%, 0.00% Floor | | | |
| Healthpeak Op LLC, Delayed Draw Term Loan, 1 Mo. CME Term SOFR + CSA + 0.85%, 0.00% Floor | | | |
| | |
| | |
| Artera Services LLC, Term Loan, 1 Mo. CME Term SOFR + 4.50%, 0.00% Floor | | | |
| | |
| Acrisure LLC, Term Loan B1, 1 Mo. CME Term SOFR + 3.00%, 0.50% Floor | | | |
| AmWINS Group, Inc., Term Loan B, 1 Mo. CME Term SOFR + CSA + 2.25%, 0.75% Floor | | | |
| Asurion LLC (fka Asurion Corp.), Term Loan B, 1 Mo. CME Term SOFR + CSA + 3.25%, 0.00% Floor | | | |
| Asurion LLC (fka Asurion Corp.), Term Loan B4, 1 Mo. CME Term SOFR + CSA + 5.25%, 0.00% Floor | | | |
| Hub International Ltd., Term Loan B, 3 Mo. CME Term SOFR + 3.00%, 0.75% Floor | | | |
| Sedgwick CMS, Inc., Term Loan B, 1 Mo. CME Term SOFR + CSA + 3.00%, 0.00% Floor | | | |
| | |
| | |
| Showtime Acquisition LLC, Term Loan B, 1 Mo. CME Term SOFR + 4.75%, 0.00% Floor | | | |
| William Morris Endeavor Entertainment LLC, Term Loan B1, 1 Mo. CME Term SOFR + CSA + 2.75%, 0.00% Floor | | | |
| | |
| | |
| Hilton Domestic Operating Co., Inc., Term Loan B4, 1 Mo. CME Term SOFR + 1.75%, 0.00% Floor | | | |
| Media Entertainment — 0.0% | |
| Magnite, Inc., Term Loan B, 1 Mo. CME Term SOFR + 4.50%, 0.00% Floor | | | |
| MH Sub I LLC, Term Loan, 1 Mo. CME Term SOFR + 4.25%, 0.50% Floor | | | |
See Notes to Financial Statements
First Trust TCW Opportunistic Fixed Income ETF (FIXD)Portfolio of Investments (Continued)August 31, 2024 | | | | |
SENIOR FLOATING-RATE LOAN INTERESTS (Continued) |
| Media Entertainment (Continued) | |
| Research Now Group LLC and Dynata LLC, Term Loan, 3 Mo. CME Term SOFR + CSA + 5.00%, 0.00% Floor | | | |
| Research Now Group LLC and Dynata LLC, Term Loan, 3 Mo. CME Term SOFR + CSA + 5.50%, 1.00% Floor | | | |
| | |
| | |
| Berry Global, Inc., Term Loan, 1 Mo. CME Term SOFR + CSA + 1.75%, 0.00% Floor | | | |
| Plaze, Inc., Term Loan B, 1 Mo. CME Term SOFR + CSA + 3.75%, 0.75% Floor | | | |
| | |
| | |
| Mativ Holdings, Inc., Delayed Draw Term Loan, 1 Mo. CME Term SOFR + CSA + 2.50%, 0.00% Floor | | | |
| | |
| Elanco Animal Health, Inc., Term Loan B, 1 Mo. CME Term SOFR + CSA + 1.75%, 0.00% Floor | | | |
| Grifols Worldwide Operations Ltd., Term Loan B, 3 Mo. CME Term SOFR + CSA + 2.00%, 0.00% Floor | | | |
| Jazz Financing Lux S.A.R.L., Term Loan B, 1 Mo. CME Term SOFR + CSA + 2.25, 0.50% Floor | | | |
| Perrigo Investments LLC, Term Loan B, 1 Mo. CME Term SOFR + 2.50%, 0.50% Floor | | | |
| | |
| | |
| 1011778 BC ULC, Term Loan B5, 1 Mo. CME Term SOFR + 1.75%, 0.00% Floor | | | |
| | |
| Hanesbrands, Inc., Term Loan A, 1 Mo. CME Term SOFR + CSA + 2.00%, 0.00% Floor | | | |
| Peer Holding III B.V., Term Loan B5, 1 Mo. CME Term SOFR + 3.00%, 0.00% Floor | | | |
| | |
| | |
| Spin Holdco, Inc., Term Loan, 3 Mo. CME Term SOFR + CSA + 4.00%, 0.75% Floor | | | |
| | |
| Amentum Government Services Holdings LLC, Term Loan B, 1 Mo. CME Term SOFR + CSA + 4.00%, 0.00% Floor | | | |
| Boost Newco Borrower LLC, Term Loan B, 1 Mo. CME Term SOFR + 2.50%, 0.00% Floor | | | |
| Boxer Parent Co., Inc., Term Loan B, 1 Mo. CME Term SOFR + 3.75%, 0.00% Floor | | | |
| Central Parent, Inc., Term Loan B, 1 Mo. CME Term SOFR + 3.25%, 0.00% Floor | | | |
| Coherent Corp., Term Loan B, 1 Mo. CME Term SOFR + 2.50%, 0.50% Floor | | | |
| Commscope, Inc., Term Loan B2, 1 Mo. CME Term SOFR + CSA + 3.25%, 0.00% Floor | | | |
See Notes to Financial Statements
First Trust TCW Opportunistic Fixed Income ETF (FIXD)Portfolio of Investments (Continued)August 31, 2024 | | | | |
SENIOR FLOATING-RATE LOAN INTERESTS (Continued) |
| | |
| DTI Holdco, Inc., Term Loan B, 1 Mo. CME Term SOFR + 4.75%, 0.75% Floor | | | |
| EagleView Technology Corp., Term Loan B, 3 Mo. CME Term SOFR + CSA + 3.50%, 0.00% Floor | | | |
| Gen Digital, Inc., Term Loan A2, 1 Mo. CME Term SOFR + CSA + 1.50%, 0.00% Floor | | | |
| Indy US Holdco LLC, Term Loan B, 1 Mo. CME Term SOFR + 4.75%, 0.50% Floor | | | |
| Realpage, Inc., Term Loan B, 1 Mo. CME Term SOFR + CSA + 3.00%, 0.50% Floor | | | |
| Renaissance Holding Corp., Term Loan, 3 Mo. CME Term SOFR + 4.25%, 0.50% Floor | | | |
| Sabre GLBL, Inc., Term Loan B2, 1 Mo. CME Term SOFR + CSA + 5.00%, 0.50% Floor | | | |
| Xerox Corp., Term Loan, 1 Mo. CME Term SOFR + CSA + 4.00%, 0.50% Floor | | | |
| | |
| | |
| Altice France S.A., Term Loan B14, 3 Mo. CME Term SOFR + 5.50%, 0.00% Floor | | | |
| CCI Buyer, Inc., Term Loan B, 3 Mo. CME Term SOFR + 4.00%, 0.75% Floor | | | |
| SBA Senior Finance II LLC, Term Loan B, 1 Mo. CME Term SOFR + 2.00%, 0.00% Floor | | | |
| | |
| | |
| Zayo Group Holdings, Inc., Term Loan B, 1 Mo. CME Term SOFR + 3.00%, 0.00% Floor | | | |
| Zayo Group Holdings, Inc., Term Loan B, 1 Mo. CME Term SOFR + 4.25%, 0.50% Floor | | | |
| | |
| Total Senior Floating-Rate Loan Interests | |
| | |
| | | | |
FOREIGN SOVEREIGN BONDS AND NOTES (c) — 1.0% |
| | |
| Brazilian Government International Bond | | | |
| Brazilian Government International Bond | | | |
| Brazilian Government International Bond | | | |
| | |
| | |
| Colombia Government International Bond | | | |
| Colombia Government International Bond | | | |
| Colombia Government International Bond | | | |
| | |
| | |
| Costa Rica Government International Bond (f) | | | |
See Notes to Financial Statements
First Trust TCW Opportunistic Fixed Income ETF (FIXD)Portfolio of Investments (Continued)August 31, 2024 | | | | |
FOREIGN SOVEREIGN BONDS AND NOTES (c) (Continued) |
| Dominican Republic — 0.1% | |
| Dominican Republic International Bond (d) | | | |
| Dominican Republic International Bond (f) | | | |
| | |
| | |
| Guatemala Government Bond (f) | | | |
| Guatemala Government Bond (f) | | | |
| | |
| | |
| Hungary Government International Bond (d) | | | |
| | |
| Indonesia Government International Bond | | | |
| | |
| Mexico Government International Bond | | | |
| Mexico Government International Bond | | | |
| Mexico Government International Bond | | | |
| Mexico Government International Bond | | | |
| | |
| | |
| Oman Government International Bond (f) | | | |
| Oman Government International Bond (f) | | | |
| | |
| | |
| Panama Government International Bond | | | |
| Panama Government International Bond | | | |
| Panama Government International Bond | | | |
| Panama Government International Bond | | | |
| | |
| | |
| Paraguay Government International Bond (f) | | | |
| Paraguay Government International Bond (f) | | | |
| | |
| | |
| Philippine Government International Bond | | | |
| | |
| Romanian Government International Bond (d) | | | |
| Romanian Government International Bond (f) | | | |
| | |
| | |
| Republic of South Africa Government International Bond | | | |
| Republic of South Africa Government International Bond | | | |
| Republic of South Africa Government International Bond | | | |
| | |
| United Arab Emirates — 0.0% | |
| Finance Department Government of Sharjah (d) | | | |
| Total Foreign Sovereign Bonds and Notes | |
| | |
See Notes to Financial Statements
First Trust TCW Opportunistic Fixed Income ETF (FIXD)Portfolio of Investments (Continued)August 31, 2024 | | | | |
U.S. GOVERNMENT AGENCY SECURITIES — 0.9% |
| Federal Home Loan Bank Discount Notes | | | |
| Federal Home Loan Bank Discount Notes | | | |
| Total U.S. Government Agency Securities | |
| | |
|
| | |
| Regents of the Univ of CA Med Ctr Pooled Rev, Ser N | | | |
| | |
| Massachusetts Sch Bldg Auth Rev, Ser B | | | |
| | |
| NJ St Turnpike Auth Rev, Ser B | | | |
| NJ St Turnpike Auth Rev, Ser F | | | |
| | |
| | |
| City of New York NY, Ser F | | | |
| New York City NY Transitional Fin Auth Rev, Ser A3 | | | |
| New York City NY Transitional Fin Auth Rev, Ser B-3 | | | |
| New York City NY Transitional Fin Auth Rev Qualified Sch Constr, Ser BD G-3 | | | |
| NY St Urban Dev Corp., Rev, Ser B | | | |
| | |
| | |
| | |
CONVERTIBLE FOREIGN CORPORATE BONDS AND NOTES (c) — 0.0% |
| Commercial Services — 0.0% | |
| | | | |
| | | | |
| | |
|
| | |
| Dynata LLC and New Insight Holdings, Inc. | |
| Wireless Telecommunication Services — 0.0% | |
| Intelsat Jackson Emergence S.A. (i) (j) (o) (p) | |
| | |
| | |
| | | | |
U.S. TREASURY BILLS — 2.3% |
| | | | |
| | | | |
| | | | |
| Total U.S. Treasury Bills | |
| | |
See Notes to Financial Statements
First Trust TCW Opportunistic Fixed Income ETF (FIXD)Portfolio of Investments (Continued)August 31, 2024 | | |
MONEY MARKET FUNDS — 15.4% |
| Dreyfus Government Cash Management Fund, Institutional Shares - 5.19% (q) | |
| | |
|
|
| Total Investments — 131.6% | |
| | |
| Net Other Assets and Liabilities — (31.6)% | |
| | |
Forward Foreign Currency Contracts at August 31, 2024 (See Note 2D - Forward Foreign Currency Contracts in the Notes to Financial Statements):
| | | | Purchase Value
as of
8/31/2024 | | Unrealized
Appreciation
(Depreciation) |
| | | | | | | | |
| | | | | | | | |
| | | | | | | | |
| | | | | | | | |
| | | | | | | | |
| | | | | | | | |
| | | | | | | | |
| | | | | | | | |
| | | | | | | | |
| | | | | | | | |
| | | | | | | | |
| | | | | | | | |
| | | | | | | | |
| | | | | | | | |
| | | | | | | | |
| | | | | | | | |
| | | | | | | | |
| | | | | | | | |
| | | | | | | | |
| | | | | | | | |
| | | | | | | | |
| | | | | | | | |
Net Unrealized Appreciation (Depreciation) | |
Futures Contracts at August 31, 2024 (See Note 2C - Futures Contracts in the Notes to Financial Statements):
| | | | Unrealized
Appreciation
(Depreciation)/
Value |
U.S. 2-Year Treasury Notes | | | | |
| | | | |
| | | | |
| | | | |
Euro-Buxl 30 Year Bonds Futures | | | | |
| | | | |
| | | | |
U.S. 10-Year Treasury Notes | | | | |
| | | | |
| | | | |
See Notes to Financial Statements
First Trust TCW Opportunistic Fixed Income ETF (FIXD)Portfolio of Investments (Continued)August 31, 2024 Interest Rate Swap Agreements at August 31, 2024 (See Note 2E - Swap Agreements in the Notes to Financial Statements):
| | | | | Unrealized
Appreciation
(Depreciation)/
Value |
| | | | | |
| The Fund pays the fixed rate and receives the floating rate. At August 31, 2024, the floating rate accrued is 5.33%. |
| Floating or variable rate security. |
| All or a portion of this security is part of a mortgage dollar roll agreement (see Note 2J - Mortgage Dollar Rolls in the Notes to Financial Statements). |
| Principal Value is in U.S. dollars unless otherwise indicated in the security description. |
| This security, sold within the terms of a private placement memorandum, is exempt from registration upon resale under Rule 144A of the Securities Act of 1933, as amended (the “1933 Act”), and may be resold in transactions exempt from registration, normally to qualified institutional buyers. Pursuant to procedures adopted by the Trust’s Board of Trustees, this security has been determined to be liquid by First Trust Advisors L.P. (the “Advisor”). Although market instability can result in periods of increased overall market illiquidity, liquidity for each security is determined based on security specific factors and assumptions, which require subjective judgment. At August 31, 2024, securities noted as such amounted to $943,052,721 or 17.9% of net assets. |
| Fixed-to-floating or fixed-to-variable rate security. The interest rate shown reflects the fixed rate in effect at August 31, 2024. At a predetermined date, the fixed rate will change to a floating rate or a variable rate. |
| This security may be resold to qualified foreign investors and foreign institutional buyers under Regulation S of the 1933 Act. |
| |
| Step-up security. A security where the coupon increases or steps up at a predetermined date. |
| This security is fair valued by the Advisor’s Pricing Committee in accordance with procedures approved by the Trust’s Board of Trustees, and in accordance with provisions of the Investment Company Act of 1940 and rules thereunder, as amended. At August 31, 2024, securities noted as such are valued at $10,274,991 or 0.2% of net assets. |
| This security’s value was determined using significant unobservable inputs (see Note 2A - Portfolio Valuation in the Notes to Financial Statements). |
| Collateral Strip Rate security. Coupon is based on the weighted net interest rate of the investment’s underlying collateral. The interest rate resets periodically. |
| Weighted Average Coupon security. Coupon is based on the blended interest rate of the underlying holdings, which may have different coupons. The coupon may change in any period. |
| Senior Floating-Rate Loan Interests (“Senior Loans”) in which the Fund invests pay interest at rates which are periodically predetermined by reference to a base lending rate plus a premium. These base lending rates are generally (i) the SOFR obtained from the U.S. Department of the Treasury’s Office of Financial Research or another major financial institution, (ii) the lending rate offered by one or more major European banks, such as the synthetic LIBOR, (iii) the prime rate offered by one or more United States banks or (iv) the certificate of deposit rate. Certain Senior Loans are subject to a SOFR or synthetic LIBOR floor that establishes a minimum SOFR or synthetic LIBOR rate. When a range of rates is disclosed, the Fund holds more than one contract within the same tranche with identical SOFR or synthetic LIBOR period, spread and floor, but different SOFR or synthetic LIBOR reset dates. |
| Senior Loans generally are subject to mandatory and/or optional prepayment. As a result, the actual remaining maturity of Senior Loans may be substantially less than the stated maturities shown. |
| Pursuant to procedures adopted by the Trust’s Board of Trustees, this security has been determined to be illiquid by the Advisor. |
| Non-income producing security. |
| Rate shown reflects yield as of August 31, 2024. |
See Notes to Financial Statements
First Trust TCW Opportunistic Fixed Income ETF (FIXD)Portfolio of Investments (Continued)August 31, 2024 Abbreviations throughout the Portfolio of Investments: |
| |
| |
| – Chicago Mercantile Exchange |
| – Credit Spread Adjustment |
| |
| |
| – Goldman Sachs International, London |
| – London Interbank Offered Rate |
| – Real Estate Investment Trusts |
| – Secured Overnight Financing Rate |
| – To-Be-Announced Security |
| |
Valuation InputsA summary of the inputs used to value the Fund’s investments as of August 31, 2024 is as follows (see Note 2A - Portfolio Valuation in the Notes to Financial Statements):
|
| | | Level 2
Significant
Observable
Inputs | Level 3
Significant
Unobservable
Inputs |
U.S. Government Bonds and Notes | | | | |
U.S. Government Agency Mortgage-Backed Securities | | | | |
Corporate Bonds and Notes* | | | | |
| | | | |
Mortgage-Backed Securities | | | | |
Foreign Corporate Bonds and Notes* | | | | |
Senior Floating-Rate Loan Interests* | | | | |
Foreign Sovereign Bonds and Notes** | | | | |
U.S. Government Agency Securities | | | | |
| | | | |
Convertible Foreign Corporate Bonds and Notes | | | | |
| | | | |
| | | | |
Wireless Telecommunication Services | | | | |
| | | | |
| | | | |
| | | | |
Forward Foreign Currency Contracts | | | | |
| | | | |
| | | | |
See Notes to Financial Statements
First Trust TCW Opportunistic Fixed Income ETF (FIXD)Portfolio of Investments (Continued)August 31, 2024 |
| | | Level 2
Significant
Observable
Inputs | Level 3
Significant
Unobservable
Inputs |
Forward Foreign Currency Contracts | | | | |
| | | | |
Interest Rate Swap Agreements | | | | |
| | | | |
| See Portfolio of Investments for industry breakout. |
| See Portfolio of Investments for country breakout. |
| See Portfolio of Investments for state breakout. |
| Investment is valued at $0. |
| Includes cumulative appreciation/depreciation on futures contracts as reported in the Futures Contracts table. Only the current day’s variation margin is presented on the Statements of Assets and Liabilities. |
Level 3 investments are fair valued by the Advisor’s Pricing Committee and are footnoted in the Portfolio of Investments. All Level 3 values are based on unobservable inputs.
See Notes to Financial Statements
First Trust TCW Unconstrained Plus Bond ETF (UCON)Portfolio of InvestmentsAugust 31, 2024
| | | | |
U.S. GOVERNMENT AGENCY MORTGAGE-BACKED SECURITIES — 21.9% |
| Collateralized Mortgage Obligations — 0.0% | |
| Federal National Mortgage Association | | | |
| Series 2011-116, Class SA, IO, 30 Day Average SOFR ×-1+ 5.89% (a) | | | |
| Series 2012-128, Class UA | | | |
| Series 2013-18, Class MI, IO | | | |
| Government National Mortgage Association | | | |
| Series 2003-110, Class S, IO, 1 Mo. CME Term SOFR ×-1+ 6.49% (a) | | | |
| Series 2018-63, Class IO, IO | | | |
| | |
| Commercial Mortgage-Backed Securities — 0.2% | |
| Federal Home Loan Mortgage Corporation Multiclass Certificates | | | |
| Series 2021-P009, Class X, IO (b) | | | |
| Federal Home Loan Mortgage Corporation Multifamily PC REMIC Trust | | | |
| Series 2019-P002, Class X, IO (c) | | | |
| Federal Home Loan Mortgage Corporation Multifamily Structured Pass Through Certificates | | | |
| Series K039, Class X3, IO (b) | | | |
| Federal Home Loan Mortgage Corporation Multifamily Structured Pass-Through Certificates | | | |
| Series K037, Class X3, IO (b) | | | |
| Series K043, Class X1, IO (b) | | | |
| Series K044, Class X1, IO (b) | | | |
| Series K048, Class X3, IO (b) | | | |
| Series K051, Class X1, IO (b) | | | |
| Series K053, Class X3, IO (b) | | | |
| Series K056, Class X3, IO (b) | | | |
| Series K059, Class X3, IO (b) | | | |
| Series K060, Class X3, IO (b) | | | |
| Series K728, Class X3, IO (b) | | | |
| Series KC04, Class X1, IO (b) | | | |
| Series KC05, Class X1, IO (b) | | | |
| Series KLU1, Class X3, IO (b) | | | |
| Series KS06, Class X, IO (b) | | | |
| Series KS07, Class X, IO (b) | | | |
| Series Q017, Class X, IO (c) | | | |
| Federal National Mortgage Association | | | |
| Series 2016-M2, Class X3, IO (b) (d) | | | |
| Series 2016-M4, Class X2, IO (b) | | | |
| Series 2016-M11, Class X2, IO (b) | | | |
| Series 2019-M29, Class X4, IO | | | |
| | | | |
| Series 20K-1517, Class X2A, IO (e) | | | |
| Government National Mortgage Association | | | |
| | | | |
| Series 2013-125, Class IO, IO (c) | | | |
| Series 2014-52, Class D (c) | | | |
| Series 2014-125, Class IO, IO (c) | | | |
| | |
See Notes to Financial Statements
First Trust TCW Unconstrained Plus Bond ETF (UCON)Portfolio of Investments (Continued)August 31, 2024 | | | | |
U.S. GOVERNMENT AGENCY MORTGAGE-BACKED SECURITIES (Continued) |
| Pass-Through Securities — 21.7% | |
| Federal Home Loan Mortgage Corporation |
| | | | |
| | | | |
| | | | |
| | | | |
| | | | |
| | | | |
| | | | |
| | | | |
| | | | |
| | | | |
| | | | |
| | | | |
| | | | |
| | | | |
| | | | |
| | | | |
| Federal National Mortgage Association |
| | | | |
| | | | |
| | | | |
| | | | |
| | | | |
| | | | |
| | | | |
| | | | |
| | | | |
| | | | |
| | | | |
| | | | |
| | | | |
| | | | |
| | | | |
| | | | |
| | | | |
| | | | |
| | | | |
| | | | |
| | | | |
| | | | |
| | | | |
| | | | |
| | | | |
| | | | |
| | | | |
| | | | |
| | | | |
| Government National Mortgage Association |
| | | | |
| | | | |
See Notes to Financial Statements
First Trust TCW Unconstrained Plus Bond ETF (UCON)Portfolio of Investments (Continued)August 31, 2024 | | | | |
U.S. GOVERNMENT AGENCY MORTGAGE-BACKED SECURITIES (Continued) |
| Pass-Through Securities (Continued) | |
| Government National Mortgage Association (Continued) |
| | | | |
| | | | |
| | | | |
| | |
| Total U.S. Government Agency Mortgage-Backed Securities | |
| | |
MORTGAGE-BACKED SECURITIES — 19.8% |
| Collateralized Mortgage Obligations — 9.7% | |
| Adjustable Rate Mortgage Trust |
| Series 2005-8, Class 3A21 (b) | | | |
| |
| Series 2021-C, Class A, steps up to 5.12% on 09/25/24 (e) (g) | | | |
| Series 2021-D, Class A, steps up to 5.00% on 02/25/25 (e) (g) | | | |
| |
| Series 2005-16, Class A3, 1 Mo. CME Term SOFR + 0.61% (h) | | | |
| Series 2005-65CB, Class 2A4 | | | |
| Series 2005-76, Class 1A1, 12 Mo. Treasury Average + 1.48% (h) | | | |
| Series 2006-33CB, Class 2A1 | | | |
| Series 2007-15CB, Class A6 | | | |
| Series 2007-OA6, Class A1B, 1 Mo. CME Term SOFR + 0.51% (h) | | | |
| American Home Mortgage Assets Trust |
| Series 2006-1, Class 1A1, 1 Mo. CME Term SOFR + 0.32% (h) | | | |
| Series 2007-1, Class A1, 12 Mo. Treasury Average + 0.70% (h) | | | |
| Series 2007-2, Class A1, 1 Mo. CME Term SOFR + 0.24% (h) | | | |
| American Home Mortgage Investment Trust |
| Series 2005-4, Class 1A1, 1 Mo. CME Term SOFR + CSA + 0.58% (h) | | | |
| APS Resecuritization Trust |
| Series 2016-3, Class 3MZ (b) (e) | | | |
| Banc of America Funding Trust |
| Series 2007-1, Class TA3A, 1 Mo. CME Term SOFR + 0.43% (h) | | | |
| Series 2007-2, Class TA4, 1 Mo. CME Term SOFR + 0.91% (h) | | | |
| |
| Series 2007-AA3, Class 1A1A, 1 Mo. CME Term SOFR + 0.53% (h) | | | |
| Series 2012-RR8, Class 4A6 (b) (e) | | | |
| |
| Series 2004-8, Class M1, 1 Mo. CME Term SOFR + 1.03% (h) | | | |
| Series 2006-1, Class 21A2 (b) | | | |
| Bear Stearns Mortgage Funding Trust |
| Series 2006-AR1, Class 1A1, 1 Mo. CME Term SOFR + CSA + 0.42% (h) | | | |
| Series 2006-AR3, Class 1A1, 1 Mo. CME Term SOFR + CSA + 0.36% (h) | | | |
| Series 2007-AR1, Class 1A1, 1 Mo. CME Term SOFR + 0.27% (h) | | | |
See Notes to Financial Statements
First Trust TCW Unconstrained Plus Bond ETF (UCON)Portfolio of Investments (Continued)August 31, 2024 | | | | |
MORTGAGE-BACKED SECURITIES (Continued) |
| Collateralized Mortgage Obligations (Continued) | |
| Bear Stearns Mortgage Funding Trust (Continued) |
| Series 2007-AR3, Class 1A1, 1 Mo. CME Term SOFR + 0.25% (h) | | | |
| Series 2007-AR5, Class 2A2, 1 Mo. CME Term SOFR + 0.34% (h) | | | |
| |
| Series 2020-R6, Class A1 (e) | | | |
| Series 2020-R7, Class A1A (c) (e) | | | |
| Series 2021-INV1, Class A2 (e) | | | |
| Series 2021-R3, Class A1A (e) | | | |
| Series 2021-R5, Class A1A (e) | | | |
| Series 2023-R1, Class A1A (e) | | | |
| Series 2023-R3, Class A1A (e) | | | |
| Citigroup Mortgage Loan Trust |
| Series 2005-8, Class 2A4A | | | |
| Series 2009-10, Class 2A2 (e) | | | |
| |
| Series 2021-2, Class A1 (e) | | | |
| Connecticut Avenue Securities Trust |
| Series 2021-R03, Class 1B1, 30 Day Average SOFR + 2.75% (e) (h) | | | |
| Credit Suisse Mortgage Trust |
| Series 2014-2R, Class 28A1 (b) (e) | | | |
| Series 2014-8R, Class 3A2 (b) (e) | | | |
| Series 2014-11R, Class 17A2, 1 Mo. CME Term SOFR + 0.26% (e) (h) | | | |
| Series 2020-RPL3, Class A1 (b) (e) | | | |
| Series 2020-RPL6, Class A1 (b) (e) | | | |
| Series 2021-NQM6, Class A3 (e) | | | |
| Series 2021-RP11, Class A1 (e) | | | |
| Series 2021-RPL4, Class A1 (e) | | | |
| Series 2022-RPL1, Class A1 (e) | | | |
| Series 2022-RPL1, Class CERT (e) | | | |
| Series 2022-RPL1, Class PT (e) | | | |
| Deutsche Alt-A Securities Mortgage Loan Trust |
| Series 2006-AF1, Class A4, 1 Mo. CME Term SOFR + 0.71% (h) | | | |
| Series 2007-AR3, Class 2A5, 1 Mo. CME Term SOFR + 0.51% (h) | | | |
| |
| Series 2004-AR4, Class 2A1A, 1 Mo. CME Term SOFR + 0.83% (h) | | | |
| Series 2005-AR3, Class 1A, 1 Mo. CME Term SOFR + 0.63% (h) | | | |
| Federal Home Loan Mortgage Corporation STACR REMIC Trust |
| Series 2021-DNA6, Class M2, 30 Day Average SOFR + 1.50% (e) (h) | | | |
| Series 2021-HQA2, Class M2, 30 Day Average SOFR + 2.05% (e) (h) | | | |
See Notes to Financial Statements
First Trust TCW Unconstrained Plus Bond ETF (UCON)Portfolio of Investments (Continued)August 31, 2024 | | | | |
MORTGAGE-BACKED SECURITIES (Continued) |
| Collateralized Mortgage Obligations (Continued) | |
| Federal Home Loan Mortgage Corporation STACR REMIC Trust (Continued) |
| Series 2022-DNA1, Class M2, 30 Day Average SOFR + 2.50% (e) (h) | | | |
| Series 2022-DNA3, Class M1B, 30 Day Average SOFR + 2.90% (e) (h) | | | |
| First Horizon Alternative Mortgage Securities Trust |
| Series 2004-AA4, Class A1 (b) | | | |
| Series 2005-AA4, Class 2A1 (b) | | | |
| Series 2007-FA1, Class A4 | | | |
| |
| Series 2021-NQM6, Class A1 (e) | | | |
| GreenPoint Mortgage Funding Trust |
| Series 2006-AR1, Class A1A, 1 Mo. CME Term SOFR + CSA + 0.58% (h) | | | |
| Series 2006-AR6, Class A3A, 1 Mo. CME Term SOFR + 0.55% (h) | | | |
| Series 2007-AR1, Class 2A1A, 1 Mo. CME Term SOFR + 0.51% (h) | | | |
| Series 2007-AR2, Class 2A1, 1 Mo. CME Term SOFR + 0.51% (h) | | | |
| HarborView Mortgage Loan Trust |
| Series 2005-9, Class 2A1A, 1 Mo. CME Term SOFR + 0.79% (h) | | | |
| Series 2005-9, Class 2A1C, 1 Mo. CME Term SOFR + 1.01% (h) | | | |
| Series 2007-5, Class A1A, 1 Mo. CME Term SOFR + 0.49% (h) | | | |
| Series 2007-7, Class 1A1, 1 Mo. CME Term SOFR + CSA + 2.00% (h) | | | |
| Headlands Residential LLC |
| Series 2021-RPL1, Class NOTE (e) | | | |
| |
| Series 2005-3, Class M4, 1 Mo. CME Term SOFR + 1.12% (h) | | | |
| |
| Series 2005-1, Class 1A1, 1 Mo. CME Term SOFR + 0.63% (h) | | | |
| Series 2005-3, Class A1, 1 Mo. CME Term SOFR + 0.59% (h) | | | |
| Series 2005-5, Class A1, 1 Mo. CME Term SOFR + 0.43% (h) | | | |
| Series 2005-8, Class 1A, 1 Mo. CME Term SOFR + 0.63% (h) | | | |
| Impac Secured Assets Trust |
| Series 2007-1, Class A3, 1 Mo. CME Term SOFR + 0.59% (h) | | | |
| IndyMac INDX Mortgage Loan Trust |
| Series 2006-AR2, Class 1A1B, 1 Mo. CME Term SOFR + 0.53% (h) | | | |
| Series 2007-FLX2, Class A1C, 1 Mo. CME Term SOFR + 0.49% (h) | | | |
| JP Morgan Alternative Loan Trust |
| Series 2006-S1, Class 3A4 | | | |
| Series 2007-S1, Class A2, 1 Mo. CME Term SOFR + 0.79% (h) | | | |
| |
| Series 2021-5, Class A4 (e) | | | |
| JP Morgan Resecuritization Trust |
| Series 2014-6, Class 3A2, 1 Mo. CME Term SOFR + 0.32% (e) (h) | | | |
See Notes to Financial Statements
First Trust TCW Unconstrained Plus Bond ETF (UCON)Portfolio of Investments (Continued)August 31, 2024 | | | | |
MORTGAGE-BACKED SECURITIES (Continued) |
| Collateralized Mortgage Obligations (Continued) | |
| |
| | | | |
| |
| Series 2005-5N, Class 3A1A, 1 Mo. CME Term SOFR + 0.41% (h) | | | |
| Series 2006-2N, Class 2A1, 12 Mo. Treasury Average + 2.02% (h) | | | |
| Series 2006-4N, Class A1D1, 1 Mo. CME Term SOFR + 0.77% (h) | | | |
| Series 2007-12N, Class 1A3A, 1 Mo. CME Term SOFR + CSA + 0.40% (h) | | | |
| Series 2007-16N, Class 1A1, 1 Mo. CME Term SOFR + CSA + 0.94% (h) | | | |
| MASTR Adjustable Rate Mortgages Trust |
| Series 2006-OA2, Class 1A1, 12 Mo. Treasury Average + 0.80% (h) | | | |
| Series 2007-1, Class I1A, 1 Mo. CME Term SOFR + 0.50% (h) | | | |
| Series 2007-HF2, Class A2, 1 Mo. CME Term SOFR + CSA + 1.10% (h) | | | |
| Merrill Lynch Mortgage Investors Trust |
| Series 2003-D, Class A, 1 Mo. CME Term SOFR + 0.73% (h) | | | |
| New Residential Mortgage Loan Trust |
| Series 2019-RPL3, Class M1 (e) | | | |
| Nomura Resecuritization Trust |
| Series 2014-1R, Class 1A13, 1 Mo. CME Term SOFR + 0.27% (e) (h) | | | |
| |
| Series 2024-HYB1, Class A1 (b) (e) | | | |
| Opteum Mortgage Acceptance Corp Trust |
| Series 2006-1, Class 1AC1, 1 Mo. CME Term SOFR + 0.71% (h) | | | |
| PHH Alternative Mortgage Trust |
| Series 2007-2, Class 1A4, 1 Mo. CME Term SOFR + 0.71% (h) | | | |
| |
| Series 2005-QO1, Class A1, 1 Mo. CME Term SOFR + CSA + 0.30% (h) | | | |
| Series 2006-QO10, Class A1, 1 Mo. CME Term SOFR + 0.43% (h) | | | |
| Series 2006-QS6, Class 1A15 | | | |
| Series 2007-QA3, Class A1, 1 Mo. CME Term SOFR + 0.31% (h) | | | |
| Series 2007-QA3, Class A2, 1 Mo. CME Term SOFR + 0.45% (h) | | | |
| Series 2007-QH4, Class A1, 1 Mo. CME Term SOFR + CSA + 0.38% (h) | | | |
| Series 2007-QH9, Class A1 (b) | | | |
| Series 2007-QS9, Class A33 | | | |
| Structured Adjustable Rate Mortgage Loan Trust |
| Series 2005-12, Class 3A1 (b) | | | |
| Series 2007-4, Class 1A1, 1 Mo. CME Term SOFR + 0.59% (h) | | | |
| Series 2007-4, Class 1A2, 1 Mo. CME Term SOFR + 0.55% (h) | | | |
See Notes to Financial Statements
First Trust TCW Unconstrained Plus Bond ETF (UCON)Portfolio of Investments (Continued)August 31, 2024 | | | | |
MORTGAGE-BACKED SECURITIES (Continued) |
| Collateralized Mortgage Obligations (Continued) | |
| Structured Asset Mortgage Investments II Trust |
| Series 2003-AR3, Class A1, 1 Mo. CME Term SOFR + 0.79% (h) | | | |
| Series 2005-AR2, Class 2A1, 1 Mo. CME Term SOFR + 0.57% (h) | | | |
| Series 2006-AR1, Class 3A1, 1 Mo. CME Term SOFR + CSA + 0.46% (h) | | | |
| Series 2006-AR3, Class 12A1, 1 Mo. CME Term SOFR + 0.55% (h) | | | |
| Series 2006-AR4, Class 3A1, 1 Mo. CME Term SOFR + 0.49% (h) | | | |
| Series 2006-AR5, Class 1A1, 1 Mo. CME Term SOFR + 0.53% (h) | | | |
| Series 2006-AR6, Class 2A1, 1 Mo. CME Term SOFR + CSA + 0.38% (h) | | | |
| Series 2006-AR8, Class A1A, 1 Mo. CME Term SOFR + 0.51% (h) | | | |
| Series 2006-AR8, Class A2, 1 Mo. CME Term SOFR + 0.53% (h) | | | |
| Series 2007-AR1, Class 1A1, 1 Mo. CME Term SOFR + 0.43% (h) | | | |
| Series 2007-AR1, Class 2A1, 1 Mo. CME Term SOFR + CSA + 0.36% (h) | | | |
| Series 2007-AR6, Class A1, 12 Mo. Treasury Average + 1.50% (h) | | | |
| |
| Series 2023-1, Class B1 (e) | | | |
| WaMu Mortgage Pass-Through Certificates Trust |
| Series 2005-AR15, Class A1A2, 1 Mo. CME Term SOFR + 0.67% (h) | | | |
| Series 2006-AR3, Class A1A, 12 Mo. Treasury Average + 1.00% (h) | | | |
| Series 2006-AR11, Class 1A, 12 Mo. Treasury Average + 0.96% (h) | | | |
| Series 2007-OA4, Class 1A, 12 Mo. Treasury Average + 0.77% (h) | | | |
| Series 2007-OA5, Class 1A, 12 Mo. Treasury Average + 0.75% (h) | | | |
| Washington Mutual Mortgage Pass-Through Certificates WMALT Trust |
| Series 2006-AR6, Class 2A, 12 Mo. Treasury Average + 0.96% (h) | | | |
| Series 2007-OC1, Class A4, 1 Mo. CME Term SOFR + 0.75% (h) | | | |
| Wells Fargo Mortgage Backed Securities Trust |
| | | | |
| Series 2007-AR5, Class A1 (b) | | | |
| | |
| Commercial Mortgage-Backed Securities — 10.1% | |
| 1211 Avenue of the Americas Trust |
| Series 2015-1211, Class A1A2 (e) | | | |
| Series 2015-1211, Class C (b) (e) | | | |
See Notes to Financial Statements
First Trust TCW Unconstrained Plus Bond ETF (UCON)Portfolio of Investments (Continued)August 31, 2024 | | | | |
MORTGAGE-BACKED SECURITIES (Continued) |
| Commercial Mortgage-Backed Securities (Continued) | |
| |
| Series 2017-245P, Class A (e) | | | |
| 280 Park Avenue Mortgage Trust |
| Series 2017-280P, Class B, 1 Mo. CME Term SOFR + 1.38% (e) (h) | | | |
| BAMLL Commercial Mortgage Securities Trust |
| Series 2015-200P, Class D (b) (e) | | | |
| Series 2015-200P, Class F (b) (e) | | | |
| Series 2018-PARK, Class A (b) (e) | | | |
| Series 2020-BHP3, Class A, 1 Mo. CME Term SOFR + 2.01% (e) (h) | | | |
| Banc of America Commercial Mortgage Trust |
| Series 2015-UBS7, Class XA, IO (b) | | | |
| |
| Series 2020-BN27, Class XA, IO (b) | | | |
| Series 2024-BNK47, Class C (b) | | | |
| Bayview Commercial Asset Trust |
| Series 2005-4A, Class A1, 1 Mo. CME Term SOFR + 0.56% (e) (h) | | | |
| |
| Series 2020-BID, Class A, 1 Mo. CME Term SOFR + 2.25% (e) (h) | | | |
| Series 2020-BID, Class C, 1 Mo. CME Term SOFR + 3.75% (e) (h) | | | |
| |
| Series 2020-B18, Class AGNE (e) | | | |
| Series 2020-IG2, Class UBRD (b) (e) | | | |
| Series 2020-IG3, Class XA, IO (b) (e) | | | |
| |
| Series 2024-VICT, Class A, 1 Mo. CME Term SOFR + 1.89% (e) (h) | | | |
| |
| Series 2021-BLOX, Class D, 1 Mo. CME Term SOFR + 1.86% (e) (h) | | | |
| BX Commercial Mortgage Trust |
| Series 2020-VIV3, Class B (b) (e) | | | |
| Series 2020-VIV4, Class A (e) | | | |
| Series 2021-ACNT, Class C, 1 Mo. CME Term SOFR + CSA + 1.50% (e) (h) | | | |
| Series 2021-VOLT, Class E, 1 Mo. CME Term SOFR + 2.11% (e) (h) | | | |
| Series 2021-XL2, Class B, 1 Mo. CME Term SOFR + 1.11% (e) (h) | | | |
| Series 2021-XL2, Class J, 1 Mo. CME Term SOFR + CSA + 3.89% (e) (h) | | | |
| Series 2022-AHP, Class AS, 1 Mo. CME Term SOFR + 1.49% (e) (h) | | | |
| |
| Series 2019-OC11, Class A (e) | | | |
| Series 2021-LBA, Class CV, 1 Mo. CME Term SOFR + 1.46% (e) (h) | | | |
See Notes to Financial Statements
First Trust TCW Unconstrained Plus Bond ETF (UCON)Portfolio of Investments (Continued)August 31, 2024 | | | | |
MORTGAGE-BACKED SECURITIES (Continued) |
| Commercial Mortgage-Backed Securities (Continued) | |
| |
| Series 2021-LBA, Class DV, 1 Mo. CME Term SOFR + 1.71% (e) (h) | | | |
| Series 2021-RISE, Class D, 1 Mo. CME Term SOFR + 1.86% (e) (h) | | | |
| Series 2021-VIEW, Class A, 1 Mo. CME Term SOFR + 1.39% (e) (h) | | | |
| Series 2022-VAMF, Class E, 1 Mo. CME Term SOFR + 2.70% (e) (h) | | | |
| Series 2024-BIO, Class B, 1 Mo. CME Term SOFR + 1.94% (e) (h) | | | |
| Series 2024-BIO, Class D, 1 Mo. CME Term SOFR + 3.64% (e) (h) | | | |
| Series 2024-PAT, Class A, 1 Mo. CME Term SOFR + 2.09% (e) (h) | | | |
| |
| Series 2021-FILM, Class A, 1 Mo. CME Term SOFR + 0.76% (e) (h) | | | |
| Series 2021-FILM, Class B, 1 Mo. CME Term SOFR + 1.01% (e) (h) | | | |
| |
| Series 2020-FL3, Class A, 1 Mo. CME Term SOFR + 1.51% (e) (h) | | | |
| |
| Series 2017-GM, Class E (b) (e) | | | |
| Series 2017-GM, Class D (b) (e) | | | |
| CAMB Commercial Mortgage Trust |
| Series 2019-LIFE, Class D, 1 Mo. CME Term SOFR + 2.05% (e) (h) | | | |
| Series 2019-LIFE, Class F, 1 Mo. CME Term SOFR + CSA + 2.55% (e) (h) | | | |
| |
| Series 2020-MF2, Class A (e) | | | |
| Citigroup Commercial Mortgage Trust |
| Series 2017-C4, Class XA, IO (b) | | | |
| |
| Series 2012-CR4, Class XA, IO (b) | | | |
| Series 2020-CBM, Class XCP, IO (b) (e) | | | |
| Series 2020-CX, Class B (e) | | | |
| Series 2020-SBX, Class X, IO (b) (e) | | | |
| Series 2024-277P, Class B (b) (e) | | | |
| Csail Commercial Mortgage Trust |
| Series 2015-C2, Class C (b) | | | |
| |
| Series 2019-MTC, Class B (b) (e) | | | |
| |
| Series 2021-NYC, Class A (e) | | | |
| |
| Series 2021-FILE, Class B, 1 Mo. CME Term SOFR + CSA + 1.70% (e) (h) | | | |
See Notes to Financial Statements
First Trust TCW Unconstrained Plus Bond ETF (UCON)Portfolio of Investments (Continued)August 31, 2024 | | | | |
MORTGAGE-BACKED SECURITIES (Continued) |
| Commercial Mortgage-Backed Securities (Continued) | |
| Eleven Madison Trust Mortgage Trust |
| Series 2015-11MD, Class A (b) (e) | | | |
| Extended Stay America Trust |
| Series 2021-ESH, Class B, 1 Mo. CME Term SOFR + 1.49% (e) (h) | | | |
| Series 2021-ESH, Class C, 1 Mo. CME Term SOFR + 1.81% (e) (h) | | | |
| |
| Series 2019-KF64, Class B, 30 Day Average SOFR + 2.41% (e) (h) | | | |
| FS Commercial Mortgage Trust |
| Series 2023-4SZN, Class D (e) | | | |
| GS Mortgage Securities Corp Trust |
| Series 2020-UPTN, Class XA, IO (b) (e) | | | |
| Series 2023-FUN, Class B, 1 Mo. CME Term SOFR + 2.79% (e) (h) | | | |
| GS Mortgage Securities Trust |
| Series 2016-GS4, Class XA, IO (b) | | | |
| HILT Commercial Mortgage Trust |
| Series 2024-ORL, Class B, 1 Mo. CME Term SOFR + 1.94% (e) (h) | | | |
| |
| Series 2016-HHV, Class F (b) (e) | | | |
| Hudson Yards Mortgage Trust |
| Series 2019-30HY, Class D (b) (e) | | | |
| Series 2019-55HY, Class F (b) (e) | | | |
| JP Morgan Chase Commercial Mortgage Securities Trust |
| Series 2016-JP3, Class XA, IO (b) | | | |
| Series 2022-ACB, Class C, 30 Day Average SOFR + 2.20% (e) (h) | | | |
| Series 2022-NLP, Class G, 1 Mo. CME Term SOFR + 4.27% (e) (h) | | | |
| |
| Series 2021-BMR, Class G, 1 Mo. CME Term SOFR + CSA + 2.95% (e) (h) | | | |
| |
| Series 2020-FL4, Class A, 1 Mo. CME Term SOFR + 1.81% (e) (h) | | | |
| MHC Commercial Mortgage Trust |
| Series 2021-MHC, Class B, 1 Mo. CME Term SOFR + 1.22% (e) (h) | | | |
| |
| Series 2020-525M, Class A (e) | | | |
| Morgan Stanley Capital I Trust |
| Series 2018-H4, Class XA, IO (b) | | | |
| Series 2018-MP, Class A (b) (e) | | | |
| |
| Series 2024-PARK, Class A, 1 Mo. CME Term SOFR + 1.64% (e) (h) | | | |
| NYC Commercial Mortgage Trust |
| Series 2021-909, Class B (e) | | | |
See Notes to Financial Statements
First Trust TCW Unconstrained Plus Bond ETF (UCON)Portfolio of Investments (Continued)August 31, 2024 | | | | |
MORTGAGE-BACKED SECURITIES (Continued) |
| Commercial Mortgage-Backed Securities (Continued) | |
| |
| Series 2019-OBP, Class A (e) | | | |
| |
| Series 2020-1NYP, Class A, 1 Mo. CME Term SOFR + 1.06% (e) (h) | | | |
| Series 2020-1NYP, Class AJ, 1 Mo. CME Term SOFR + 1.36% (e) (h) | | | |
| |
| Series 2024-RSR2, Class A, 1 Mo. CME Term SOFR + 1.89% (e) (h) | | | |
| SDR Commercial Mortgage Trust |
| Series 2024-DSNY, Class B, 1 Mo. CME Term SOFR + 1.74% (e) (h) | | | |
| SFAVE Commercial Mortgage Securities Trust |
| Series 2015-5AVE, Class C (b) (e) | | | |
| SFO Commercial Mortgage Trust |
| Series 2021-555, Class A, 1 Mo. CME Term SOFR + 1.26% (e) (h) | | | |
| Shelter Growth CRE Issuer Ltd. |
| Series 2021-FL3, Class A, 1 Mo. CME Term SOFR + 1.19% (e) (h) | | | |
| |
| Series 2021-OVA, Class C (e) | | | |
| |
| Series 2022-MINI, Class F, 1 Mo. CME Term SOFR + 3.35% (e) (h) | | | |
| |
| Series 2021-MFP2, Class C, 1 Mo. CME Term SOFR + 1.49% (e) (h) | | | |
| Series 2021-MFP2, Class D, 1 Mo. CME Term SOFR + 1.68% (e) (h) | | | |
| |
| Series 2021-LIH, Class AS, 1 Mo. CME Term SOFR + 1.37% (e) (h) | | | |
| |
| Series 2021-FLWR, Class B, 1 Mo. CME Term SOFR + 1.04% (e) (h) | | | |
| Series 2021-FLWR, Class C, 1 Mo. CME Term SOFR + 1.14% (e) (h) | | | |
| Series 2021-FLWR, Class D, 1 Mo. CME Term SOFR + 1.49% (e) (h) | | | |
| UBS Commercial Mortgage Trust |
| Series 2017-C4, Class XA, IO (b) | | | |
| |
| Series 2021-FL4, Class B, 1 Mo. CME Term SOFR + 1.91% (e) (h) | | | |
| VNDO TRUST Mortgage-Backed Securities |
| Series 2016-350P, Class D (b) (e) | | | |
| Wells Fargo Commercial Mortgage Trust |
| Series 2016-C35, Class XA, IO (b) | | | |
See Notes to Financial Statements
First Trust TCW Unconstrained Plus Bond ETF (UCON)Portfolio of Investments (Continued)August 31, 2024 | | | | |
MORTGAGE-BACKED SECURITIES (Continued) |
| Commercial Mortgage-Backed Securities (Continued) | |
| Wells Fargo Commercial Mortgage Trust (Continued) |
| Series 2019-JWDR, Class E (b) (e) | | | |
| Series 2024-SVEN, Class C (b) (e) | | | |
| | |
| Total Mortgage-Backed Securities | |
| | |
ASSET-BACKED SECURITIES (i) — 17.8% |
| |
| Series 2007-NC1, Class A2, 1 Mo. CME Term SOFR + 0.41% (e) (h) | | | |
| Series 2007-WMC1, Class A1A, 1 Mo. CME Term SOFR + 1.36% (h) | | | |
| ACE Securities Corp. Home Equity Loan Trust |
| Series 2006-ASP6, Class A2C, 1 Mo. CME Term SOFR + 0.43% (h) | | | |
| Series 2006-HE3, Class A2C, 1 Mo. CME Term SOFR + 0.41% (h) | | | |
| Series 2007-HE1, Class A1, 1 Mo. CME Term SOFR + CSA + 0.30% (h) | | | |
| Series 2007-WM2, Class A1, 1 Mo. CME Term SOFR + CSA + 0.21% (h) | | | |
| |
| Series 2019-1A, Class A1 (e) | | | |
| |
| Series 2021-12A, Class A1, 3 Mo. CME Term SOFR + 1.42% (e) (h) | | | |
| |
| Series 2015-AA, Class BR2, 3 Mo. CME Term SOFR + 1.86% (e) (h) | | | |
| Series 2019-10A, Class BRR, 3 Mo. CME Term SOFR + 1.75% (e) (h) | | | |
| |
| Series 2017-2A, Class B, 3 Mo. CME Term SOFR + 1.76% (e) (h) | | | |
| |
| Series 2024-2A, Class B1, 3 Mo. CME Term SOFR + 1.90% (e) (h) | | | |
| |
| Series 2019-1A, Class BRR, 3 Mo. CME Term SOFR + 1.60% (e) (h) | | | |
| Ameriquest Mortgage Securities, Inc., Asset Backed Pass-Through Certificates |
| Series 2002-AR1, Class M1, 1 Mo. CME Term SOFR + 1.18% (h) | | | |
| |
| Series 2021-24A, Class B, 3 Mo. CME Term SOFR + 2.01% (e) (h) | | | |
| Series 2024-28A, Class A1A, 3 Mo. CME Term SOFR + 1.55% (e) (h) | | | |
| |
| Series 2020-SFR4, Class G2 (e) | | | |
| Series 2021-SFR2, Class F2 (e) | | | |
See Notes to Financial Statements
First Trust TCW Unconstrained Plus Bond ETF (UCON)Portfolio of Investments (Continued)August 31, 2024 | | | | |
ASSET-BACKED SECURITIES (i) (Continued) |
| |
| Series 2021-37A, Class B, 3 Mo. CME Term SOFR + 1.86% (e) (h) | | | |
| |
| Series 2021-62A, Class B, 3 Mo. CME Term SOFR + CSA + 1.65% (e) (h) | | | |
| |
| Series 2006-W2, Class A2B, 1 Mo. CME Term SOFR + 0.49% (h) | | | |
| Argent Securities, Inc., Asset-Backed Pass-Through Certificates |
| Series 2005-W3, Class M1, 1 Mo. CME Term SOFR + 0.77% (h) | | | |
| Series 2005-W3, Class M2, 1 Mo. CME Term SOFR + CSA + 0.69% (h) | | | |
| Avis Budget Rental Car Funding AESOP LLC |
| Series 2024-1A, Class A (e) | | | |
| |
| | | | |
| Bear Mountain Park CLO Ltd. |
| Series 2022-1A, Class BR, 3 Mo. CME Term SOFR + 1.75% (e) (h) | | | |
| |
| Series 2018-22A, Class A2, 3 Mo. CME Term SOFR + 1.66% (e) (h) | | | |
| Series 2021-31A, Class B, 3 Mo. CME Term SOFR + 1.96% (e) (h) | | | |
| BlueMountain Fuji U.S. CLO II Ltd. |
| Series 2017-2A, Class A2, 3 Mo. CME Term SOFR + 1.86% (e) (h) | | | |
| |
| Series 2006-2, Class A4, 1 Mo. CME Term SOFR + 0.43% (h) | | | |
| |
| Series 2020-1A, Class A (e) | | | |
| Carvana Auto Receivables Trust |
| Series 2020-P1, Class R (e) | | | |
| Series 2021-P4, Class R (e) | | | |
| Series 2022-N1, Class R (e) | | | |
| Series 2022-P2, Class R (e) | | | |
| Series 2023-N3, Class R (e) | | | |
| Series 2023-N3, Class XS, IO (e) | | | |
| Series 2023-P3, Class R (e) | | | |
| C-BASS Mortgage Loan Trust |
| Series 2007-CB3, Class A1 (g) | | | |
| Series 2007-CB3, Class A4, steps up to 6.47% after Redemption (g) | | | |
| Series 2007-CB3, Class A5 (g) | | | |
| |
| Series 2007-CB1, Class AF2, steps up to 6.22% after Redemption Date (g) | | | |
| Series 2007-CB1, Class AF3, steps up to 6.24% after Redemption Date (g) | | | |
| |
| Series 2022-AA, Class R1 (e) | | | |
See Notes to Financial Statements
First Trust TCW Unconstrained Plus Bond ETF (UCON)Portfolio of Investments (Continued)August 31, 2024 | | | | |
ASSET-BACKED SECURITIES (i) (Continued) |
| |
| Series 2021-NR1, Class A1, steps up to 5.00% on 02/25/25 (e) (g) | | | |
| Series 2023-NR1, Class A1, steps up to 9.00% on 01/01/26 (e) (g) | | | |
| |
| Series 2005-1, Class A4, 90 Day Average SOFR + 0.42% (h) | | | |
| Citigroup Mortgage Loan Trust |
| Series 2006-HE3, Class A2B, 1 Mo. CME Term SOFR + 0.31% (h) | | | |
| Citigroup Mortgage Loan Trust, Inc. |
| Series 2007-WFH3, Class M1, 1 Mo. CME Term SOFR + 0.50% (h) | | | |
| |
| Series 2020-1A, Class A (e) | | | |
| Series 2020-3A, Class A (e) | | | |
| |
| Series 2018-1A, Class B1RR, 3 Mo. CME Term SOFR + 1.95% (e) (h) | | | |
| Cologix Data Centers US Issuer LLC |
| Series 2021-1A, Class A2 (e) | | | |
| |
| | | | |
| CoreVest American Finance Trust |
| Series 2020-1, Class XA, IO (b) (e) | | | |
| Series 2020-4, Class B (e) | | | |
| Credit-Based Asset Servicing & Securitization LLC |
| Series 2006-MH1, Class B1 (e) (g) | | | |
| CWABS Asset-Backed Certificates Trust |
| Series 2005-17, Class MV2, 1 Mo. CME Term SOFR + 0.83% (h) | | | |
| CWABS Inc Asset-backed Certificates |
| Series 2007-12, Class 2A4, 1 Mo. CME Term SOFR + 1.46% (h) | | | |
| |
| Series 2021-1A, Class A2 (e) | | | |
| |
| Series 2019-72A, Class BR, 3 Mo. CME Term SOFR + CSA + 1.65% (e) (h) | | | |
| ECMC Group Student Loan Trust |
| Series 2021-1A, Class A1B, 30 Day Average SOFR + 0.68% (e) (h) | | | |
| |
| Series 2020-3A, Class BRR, 3 Mo. CME Term SOFR + 1.70% (e) (h) | | | |
| First Franklin Mortgage Loan Trust |
| Series 2006-FF7, Class 2A4, 1 Mo. CME Term SOFR + CSA + 0.48% (h) | | | |
| Series 2006-FF9, Class 2A4, 1 Mo. CME Term SOFR + 0.61% (h) | | | |
| |
| Series 2020-SFR1, Class B (e) | | | |
See Notes to Financial Statements
First Trust TCW Unconstrained Plus Bond ETF (UCON)Portfolio of Investments (Continued)August 31, 2024 | | | | |
ASSET-BACKED SECURITIES (i) (Continued) |
| FirstKey Homes Trust (Continued) |
| Series 2020-SFR1, Class F2 (e) | | | |
| Series 2020-SFR2, Class F1 (e) | | | |
| |
| Series 2021-1A, Class B, 3 Mo. CME Term SOFR + 1.86% (e) (h) | | | |
| |
| Series 2005-A, Class M4, 1 Mo. CME Term SOFR + 1.13% (h) | | | |
| Series 2005-D, Class 2A4, 1 Mo. CME Term SOFR + 0.79% (h) | | | |
| |
| Series 2021-1, Class A (e) | | | |
| GLS Auto Receivables Issuer Trust |
| Series 2024-2A, Class D (e) | | | |
| GLS Auto Select Receivables Trust |
| Series 2023-2A, Class D (e) | | | |
| GoldenTree Loan Management U.S. CLO Ltd. |
| Series 2024-20A, Class B, 3 Mo. CME Term SOFR + 1.80% (e) (h) | | | |
| Golub Capital Partners CLO 42M-R |
| Series 2019-42RA, Class A2R, 3 Mo. CME Term SOFR + 2.75% (e) (h) | | | |
| Golub Capital Partners CLO 66B Ltd. |
| Series 2023-66A, Class AJ, 3 Mo. CME Term SOFR + 2.20% (e) (h) | | | |
| GoodLeap Sustainable Home Solutions Trust |
| Series 2023-1GS, Class A (e) | | | |
| |
| Series 2005-4, Class M2, 1 Mo. CME Term SOFR + 1.16% (h) | | | |
| Series 2007-8, Class A3, 1 Mo. CME Term SOFR + 1.01% (h) | | | |
| |
| Series 2006-HE4, Class A2D, 1 Mo. CME Term SOFR + 0.63% (h) | | | |
| Series 2007-FM2, Class A1, 1 Mo. CME Term SOFR + CSA + 0.14% (h) | | | |
| Hertz Vehicle Financing III LLC |
| Series 2023-1A, Class C (e) | | | |
| Hertz Vehicle Financing III LP |
| Series 2021-2A, Class C (e) | | | |
| |
| Series 2024-1A, Class A2 (e) | | | |
| Series 2024-1A, Class C (e) | | | |
| |
| Series 2021-16A, Class B, 3 Mo. CME Term SOFR + 1.96% (e) (h) | | | |
| HSI Asset Securitization Corp Trust |
| Series 2007-OPT1, Class 1A, 1 Mo. CME Term SOFR + 0.25% (h) | | | |
| J.G. Wentworth XXXVIII LLC |
| Series 2017-1A, Class B (e) | | | |
| JP Morgan Mortgage Acquisition Trust |
| Series 2006-CH2, Class AF6, steps up to 6.04% after Redemption Date (g) | | | |
See Notes to Financial Statements
First Trust TCW Unconstrained Plus Bond ETF (UCON)Portfolio of Investments (Continued)August 31, 2024 | | | | |
ASSET-BACKED SECURITIES (i) (Continued) |
| JP Morgan Mortgage Acquisition Trust (Continued) |
| Series 2006-WF1, Class A5 (g) | | | |
| Series 2007-CH2, Class AF6, steps up to 6.05% after Redemption Date (g) | | | |
| LAD Auto Receivables Trust |
| Series 2023-1A, Class D (e) | | | |
| |
| Series 2006-15, Class A4, 1 Mo. CME Term SOFR + 0.45% (h) | | | |
| Series 2006-17, Class 1A3, 1 Mo. CME Term SOFR + 0.61% (h) | | | |
| Series 2006-19, Class A3, 1 Mo. CME Term SOFR + 0.61% (h) | | | |
| Series 2007-11, Class A3, 1 Mo. CME Term SOFR + 0.63% (h) | | | |
| Long Beach Mortgage Loan Trust |
| Series 2006-1, Class 2A3, 1 Mo. CME Term SOFR + 0.49% (h) | | | |
| Series 2006-8, Class 2A3, 1 Mo. CME Term SOFR + 0.43% (h) | | | |
| Series 2006-10, Class 2A3, 1 Mo. CME Term SOFR + 0.43% (h) | | | |
| Series 2006-10, Class 2A4, 1 Mo. CME Term SOFR + 0.55% (h) | | | |
| |
| Series 2019-21A, Class BR, 3 Mo. CME Term SOFR + 1.61% (e) (h) | | | |
| Mastr Asset Backed Securities Trust |
| Series 2005-NC2, Class A4, 1 Mo. CME Term SOFR + 0.81% (h) | | | |
| Series 2006-HE5, Class A3, 1 Mo. CME Term SOFR + 0.43% (h) | | | |
| Series 2006-NC2, Class A3, 1 Mo. CME Term SOFR + 0.33% (h) | | | |
| Merrill Lynch First Franklin Mortgage Loan Trust |
| Series 2007-1, Class A1, 1 Mo. CME Term SOFR + CSA + 0.28% (h) | | | |
| Series 2007-5, Class 1A, 1 Mo. CME Term SOFR + 0.96% (h) | | | |
| Series 2007-5, Class 2A2, 1 Mo. CME Term SOFR + 1.11% (h) | | | |
| Merrill Lynch Mortgage Investors Trust |
| Series 2006-HE6, Class A2C, 1 Mo. CME Term SOFR + 0.57% (h) | | | |
| Morgan Stanley ABS Capital I, Inc. Trust |
| Series 2006-HE8, Class A2B, 1 Mo. CME Term SOFR + CSA + 0.10% (h) | | | |
| Series 2006-HE8, Class A2C, 1 Mo. CME Term SOFR + 0.25% (h) | | | |
| Series 2007-HE2, Class A2B, 1 Mo. CME Term SOFR + 0.20% (h) | | | |
| Series 2007-HE4, Class A2B, 1 Mo. CME Term SOFR + 0.29% (h) | | | |
| Series 2007-NC3, Class A2D, 1 Mo. CME Term SOFR + CSA + 0.26% (h) | | | |
| |
| Series 2024-1A, Class C (e) | | | |
| Navient Student Loan Trust |
| Series 2014-1, Class A3, 30 Day Average SOFR + CSA + 0.51% (h) | | | |
See Notes to Financial Statements
First Trust TCW Unconstrained Plus Bond ETF (UCON)Portfolio of Investments (Continued)August 31, 2024 | | | | |
ASSET-BACKED SECURITIES (i) (Continued) |
| Navient Student Loan Trust (Continued) |
| Series 2016-2A, Class A3, 30 Day Average SOFR + 1.61% (e) (h) | | | |
| Series 2019-3A, Class B, 30 Day Average SOFR + CSA + 1.55% (e) (h) | | | |
| Nelnet Student Loan Trust |
| Series 2015-3A, Class B, 30 Day Average SOFR + 1.61% (e) (h) | | | |
| Neuberger Berman Loan Advisers CLO Ltd. |
| Series 2019-33A, Class BR, 3 Mo. CME Term SOFR + 1.86% (e) (h) | | | |
| NovaStar Mortgage Funding Trust |
| Series 2007-2, Class A1A, 1 Mo. CME Term SOFR + 0.31% (h) | | | |
| |
| Series 2021-21A, Class B, 3 Mo. CME Term SOFR + CSA + 1.70% (e) (h) | | | |
| Octagon Investment Partners 46 Ltd. |
| Series 2020-2A, Class AR, 3 Mo. CME Term SOFR + CSA + 1.16% (e) (h) | | | |
| Octagon Investment Partners XVI Ltd. |
| Series 2013-1A, Class A2R, 3 Mo. CME Term SOFR + 1.66% (e) (h) | | | |
| |
| Series 2019-3A, Class AR, 3 Mo. CME Term SOFR + 1.40% (e) (h) | | | |
| Series 2020-5A, Class B, 3 Mo. CME Term SOFR + 1.86% (e) (h) | | | |
| Park Place Securities Inc Asset-Backed Pass-Through Certificates |
| Series 2005-WHQ4, Class M3, 1 Mo. CME Term SOFR + 0.89% (h) | | | |
| |
| Series 2021-RN2, Class A1, steps up to 7.43% on 09/25/24 (e) (g) | | | |
| Series 2022-RN2, Class A1, steps up to 9.00% on 07/25/26 (e) (g) | | | |
| Progress Residential Trust |
| Series 2021-SFR2, Class E2 (e) | | | |
| Series 2021-SFR6, Class G (e) | | | |
| Series 2021-SFR8, Class E1 (e) | | | |
| Series 2021-SFR9, Class F (e) | | | |
| Series 2021-SFR10, Class F (e) | | | |
| Series 2021-SFR11, Class F (e) | | | |
| |
| Series 2021-6, Class A1, steps up to 5.93% on 07/25/25 (e) (g) | | | |
| Series 2021-9, Class A1, steps up to 5.36% on 10/25/24 (e) (g) | | | |
| Series 2021-10, Class A1, steps up to 5.49% on 10/25/24 (e) (g) | | | |
| |
| Series 2020-7A, Class B1R, 3 Mo. CME Term SOFR + 1.90% (e) (h) | | | |
| Series 2023-22A, Class D, 3 Mo. CME Term SOFR + 5.00% (e) (h) | | | |
See Notes to Financial Statements
First Trust TCW Unconstrained Plus Bond ETF (UCON)Portfolio of Investments (Continued)August 31, 2024 | | | | |
ASSET-BACKED SECURITIES (i) (Continued) |
| |
| Series 2024-CES6, Class A1A, steps up to 6.34% on 08/01/2028 (e) (g) (k) | | | |
| |
| Series 2018-1A, Class BR, 3 Mo. CME Term SOFR + 1.75% (e) (h) | | | |
| |
| Series 2019-1A, Class BR, 3 Mo. CME Term SOFR + 1.86% (e) (h) | | | |
| |
| Series 2021-2A, Class A, 3 Mo. CME Term SOFR + 1.42% (e) (h) | | | |
| Residential Asset Mortgage Products, Inc. |
| Series 2006-NC2, Class M1, 1 Mo. CME Term SOFR + 0.65% (h) | | | |
| Series 2006-RZ2, Class M1, 1 Mo. CME Term SOFR + 0.44% (h) | | | |
| Residential Asset Securities Corp. |
| Series 2005-KS11, Class M2, 1 Mo. CME Term SOFR + 0.74% (h) | | | |
| |
| Series 2019-2A, Class BR, 3 Mo. CME Term SOFR + 1.91% (e) (h) | | | |
| Sabey Data Center Issuer LLC |
| Series 2020-1, Class A2 (e) | | | |
| Saxon Asset Securities Trust |
| Series 2006-1, Class M1, 1 Mo. CME Term SOFR + 0.58% (h) | | | |
| Securitized Asset Backed Receivables LLC Trust |
| Series 2006-CB5, Class A3, 1 Mo. CME Term SOFR + 0.39% (h) | | | |
| Skyline Aircraft Finance LLC |
| Series 2020-1, Class A (k) (l) | | | |
| SLM Student Loan EDC Repackaging Trust |
| Series 2013-M1, Class M1R (e) | | | |
| |
| Series 2006-2, Class B, 90 Day Average SOFR + 0.48% (h) | | | |
| | | | |
| Series 2007-1, Class B, 90 Day Average SOFR + 0.48% (h) | | | |
| | | | |
| Series 2007-7, Class A4, 90 Day Average SOFR + 0.59% (h) | | | |
| Series 2007-7, Class B, 90 Day Average SOFR + CSA + 0.75% (h) | | | |
| Series 2008-2, Class B, 90 Day Average SOFR + CSA + 1.20% (h) | | | |
| Series 2008-3, Class B, 90 Day Average SOFR + CSA + 1.20% (h) | | | |
| Series 2008-4, Class A4, 90 Day Average SOFR + 1.91% (h) | | | |
| Series 2008-5, Class B, 90 Day Average SOFR + CSA + 1.85% (h) | | | |
| Series 2008-6, Class B, 90 Day Average SOFR + 2.11% (h) | | | |
| Series 2012-7, Class B, 30 Day Average SOFR + CSA + 1.80% (h) | | | |
See Notes to Financial Statements
First Trust TCW Unconstrained Plus Bond ETF (UCON)Portfolio of Investments (Continued)August 31, 2024 | | | | |
ASSET-BACKED SECURITIES (i) (Continued) |
| Soundview Home Loan Trust |
| Series 2007-OPT1, Class 2A3, 1 Mo. CME Term SOFR + 0.32% (h) | | | |
| Series 2007-OPT2, Class 2A4, 1 Mo. CME Term SOFR + 0.36% (h) | | | |
| Specialty Underwriting & Residential Finance Trust |
| Series 2006-AB3, Class A2C, 1 Mo. CME Term SOFR + CSA + 0.48% (h) | | | |
| Stack Infrastructure Issuer LLC |
| Series 2020-1A, Class A2 (e) | | | |
| Structured Asset Securities Corp Mortgage Loan Trust |
| Series 2005-2XS, Class M1, 1 Mo. CME Term SOFR + 0.82% (h) | | | |
| Series 2006-BC3, Class A3, 1 Mo. CME Term SOFR + 0.43% (h) | | | |
| Structured Receivables Finance LLC |
| Series 2010-B, Class A (e) | | | |
| |
| Series 2019-FL1, Class AS, 1 Mo. CME Term SOFR + 1.51% (e) (h) | | | |
| |
| Series 2024-2A, Class A2 (e) | | | |
| |
| Series 2018-19A, Class B, 3 Mo. CME Term SOFR + 1.61% (e) (h) | | | |
| |
| Series 2016-1A, Class A23 (e) | | | |
| |
| Series 2020-1A, Class A (e) | | | |
| Textainer Marine Containers Ltd. |
| Series 2021-3A, Class A (e) | | | |
| Textainer Marine Containers VII Ltd. |
| Series 2020-2A, Class A (e) | | | |
| |
| Series 2018-1A, Class A2R, 3 Mo. CME Term SOFR + 1.75% (e) (h) | | | |
| |
| Series 2021-SFR1, Class F (e) | | | |
| Series 2024-SFR3, Class D (e) | | | |
| Triton Container Finance VIII LLC |
| Series 2021-1A, Class A (e) | | | |
| |
| Series 2021-1, Class A (e) | | | |
| Vantage Data Centers Jersey Borrower Spv Ltd. |
| Series 2024-1A, Class A2 (GBP) (e) | | | |
| |
| Series 2020-1A, Class A2 (e) | | | |
| |
| Series 2024-1A, Class F (e) | | | |
| |
| Series 2022-1A, Class BR, 3 Mo. CME Term SOFR +1.75% (e) (h) (m) | | | |
See Notes to Financial Statements
First Trust TCW Unconstrained Plus Bond ETF (UCON)Portfolio of Investments (Continued)August 31, 2024 | | | | |
ASSET-BACKED SECURITIES (i) (Continued) |
| Wachovia Student Loan Trust |
| Series 2006-1, Class B, 90 Day Average SOFR + CSA + 0.24% (e) (h) | | | |
| WaMu Asset-Backed Certificates WaMu Trust |
| Series 2007-HE2, Class 2A3, 1 Mo. CME Term SOFR + CSA + 0.25% (h) | | | |
| Series 2007-HE3, Class 2A3, 1 Mo. CME Term SOFR + 0.35% (h) | | | |
| Series 2007-HE3, Class 2A4, 1 Mo. CME Term SOFR + 0.40% (h) | | | |
| Series 2007-HE3, Class 2A5, 1 Mo. CME Term SOFR + 0.36% (h) | | | |
| Washington Mutual Asset-Backed Certificates WMABS Trust |
| Series 2006-HE5, Class 1A, 1 Mo. CME Term SOFR + 0.42% (h) | | | |
| Wells Fargo Home Equity Asset-Backed Securities Trust |
| Series 2007-1, Class A3, 1 Mo. CME Term SOFR + 0.75% (h) | | | |
| Westlake Automobile Receivables Trust |
| Series 2023-1A, Class D (e) | | | |
| Total Asset-Backed Securities | |
| | |
CORPORATE BONDS AND NOTES (i) — 13.1% |
| | |
| | | | |
| | | | |
| | | | |
| | |
| | |
| | | | |
| | | | |
| | | | |
| | |
| | |
| American Airlines Pass-Through Trust, Series 2014-1, Class A | | | |
| JetBlue Pass-Through Trust, Series 2020-1, Class A | | | |
| United Airlines Pass-Through Trust, Series 2013-1, Class A | | | |
| US Airways Pass-Through Trust, Series 2012-1, Class A | | | |
| | |
| Auto Manufacturers — 0.0% | |
| Allison Transmission, Inc. (e) | | | |
| | |
| Bank of America Corp. (n) | | | |
| Bank of America Corp. (n) | | | |
| Bank of America Corp. (n) | | | |
| Bank of America Corp. (n) | | | |
| Bank of America Corp. (n) | | | |
| Bank of America Corp. (n) | | | |
| Bank of America Corp., Series RR (n) | | | |
| Citigroup, Inc., SOFR + 0.69% (h) | | | |
| | | | |
See Notes to Financial Statements
First Trust TCW Unconstrained Plus Bond ETF (UCON)Portfolio of Investments (Continued)August 31, 2024 | | | | |
CORPORATE BONDS AND NOTES (i) (Continued) |
| | |
| | | | |
| | | | |
| Goldman Sachs Group (The), Inc., SOFR + 0.49% (h) | | | |
| Goldman Sachs Group (The), Inc. (n) | | | |
| | | | |
| | | | |
| | | | |
| | | | |
| | | | |
| | | | |
| | | | |
| JPMorgan Chase & Co., Series KK (n) | | | |
| | | | |
| | | | |
| | | | |
| | | | |
| PNC Financial Services Group (The), Inc. (n) | | | |
| PNC Financial Services Group (The), Inc. (n) | | | |
| | | | |
| | | | |
| | | | |
| | | | |
| | | | |
| | | | |
| | | | |
| | | | |
| | | | |
| | | | |
| | | | |
| | | | |
| | |
| | |
| Triton Water Holdings, Inc. (e) | | | |
| | |
| | | | |
| | | | |
| | |
| | |
| International Flavors & Fragrances, Inc. (e) | | | |
| International Flavors & Fragrances, Inc. (e) | | | |
| International Flavors & Fragrances, Inc. (e) | | | |
| International Flavors & Fragrances, Inc. (e) | | | |
| International Flavors & Fragrances, Inc. | | | |
| International Flavors & Fragrances, Inc. | | | |
| International Flavors & Fragrances, Inc. (e) | | | |
| | |
| Commercial Services — 0.3% | |
| Adtalem Global Education, Inc. (e) | | | |
| | | | |
See Notes to Financial Statements
First Trust TCW Unconstrained Plus Bond ETF (UCON)Portfolio of Investments (Continued)August 31, 2024 | | | | |
CORPORATE BONDS AND NOTES (i) (Continued) |
| Commercial Services (Continued) | |
| Carriage Services, Inc. (e) | | | |
| Prime Security Services Borrower LLC / Prime Finance, Inc. (e) | | | |
| | | | |
| Service Corp. International | | | |
| | | | |
| | | | |
| | |
| | |
| | | | |
| | | | |
| | |
| Cosmetics/Personal Care — 0.1% | |
| Edgewell Personal Care Co. (e) | | | |
| Prestige Brands, Inc. (e) | | | |
| Prestige Brands, Inc. (e) | | | |
| | |
| Diversified Financial Services — 0.3% | |
| | | | |
| | | | |
| | | | |
| Capital One Financial Corp. (n) | | | |
| Charles Schwab (The) Corp., Series K (n) | | | |
| Jane Street Group / JSG Finance, Inc. (e) | | | |
| | |
| | |
| Alliant Energy Finance LLC (e) | | | |
| Alliant Energy Finance LLC (e) | | | |
| Appalachian Power Co., Series X | | | |
| Arizona Public Service Co. | | | |
| Arizona Public Service Co. | | | |
| Duke Energy Carolinas LLC | | | |
| | | | |
| | | | |
| | | | |
| | | | |
| FirstEnergy Pennsylvania Electric Co. (e) | | | |
| Jersey Central Power & Light Co. (e) | | | |
| | | | |
| New England Power Co. (e) | | | |
| Pennsylvania Electric Co. (e) | | | |
| | | | |
| Southwestern Electric Power Co., Series M | | | |
| | |
| Electrical Components & Equipments — 0.0% | |
| Energizer Holdings, Inc. (e) | | | |
See Notes to Financial Statements
First Trust TCW Unconstrained Plus Bond ETF (UCON)Portfolio of Investments (Continued)August 31, 2024 | | | | |
CORPORATE BONDS AND NOTES (i) (Continued) |
| | |
| Honeywell International, Inc. (EUR) | | | |
| Honeywell International, Inc. (EUR) | | | |
| | |
| Engineering & Construction — 0.0% | |
| | | | |
| | |
| Churchill Downs, Inc. (e) | | | |
| | | | |
| Live Nation Entertainment, Inc. (e) | | | |
| Penn Entertainment, Inc. (e) | | | |
| Warnermedia Holdings Inc. | | | |
| Warnermedia Holdings, Inc. | | | |
| Warnermedia Holdings, Inc. | | | |
| Warnermedia Holdings, Inc. | | | |
| | |
| Environmental Control — 0.1% | |
| | | | |
| | | | |
| | |
| | |
| | | | |
| H-Food Holdings LLC / Hearthside Finance Co., Inc. (e) | | | |
| | | | |
| | | | |
| | | | |
| | | | |
| | | | |
| Smithfield Foods, Inc. (e) | | | |
| | |
| | |
| Piedmont Natural Gas Co., Inc. | | | |
| Healthcare-Products — 0.1% | |
| | | | |
| | | | |
| | | | |
| | |
| Healthcare-Services — 0.5% | |
| Barnabas Health, Inc., Series 2012 | | | |
| Catalent Pharma Solutions, Inc. (EUR) (p) | | | |
| Catalent Pharma Solutions, Inc. (e) | | | |
| | | | |
| | | | |
| | | | |
| | | | |
| | | | |
| | | | |
| | | | |
| ModivCare Escrow Issuer, Inc. (e) | | | |
See Notes to Financial Statements
First Trust TCW Unconstrained Plus Bond ETF (UCON)Portfolio of Investments (Continued)August 31, 2024 | | | | |
CORPORATE BONDS AND NOTES (i) (Continued) |
| Healthcare-Services (Continued) | |
| Prime Healthcare Services, Inc. (e) | | | |
| Universal Health Services, Inc. | | | |
| | |
| Household Products/Wares — 0.0% | |
| | | | |
| Central Garden & Pet Co. (e) | | | |
| Spectrum Brands, Inc. (e) | | | |
| | |
| | |
| Acrisure LLC / Acrisure Finance, Inc. (e) | | | |
| Acrisure LLC / Acrisure Finance, Inc. (e) | | | |
| Athene Global Funding (e) | | | |
| Athene Global Funding (e) | | | |
| Athene Global Funding (e) | | | |
| Farmers Exchange Capital III (e) (n) | | | |
| Farmers Insurance Exchange (e) (n) | | | |
| MassMutual Global Funding II (e) | | | |
| Metropolitan Life Global Funding I (e) | | | |
| Nationwide Mutual Insurance Co., 3 Mo. Synthetic USD LIBOR + 2.29% (e) (h) | | | |
| Teachers Insurance & Annuity Association of America (e) | | | |
| Teachers Insurance & Annuity Association of America (e) | | | |
| Teachers Insurance & Annuity Association of America (e) (n) | | | |
| | |
| | |
| Cogent Communications Group, Inc. (e) | | | |
| | | | |
| | | | |
| | |
| Investment Companies — 0.1% | |
| Icahn Enterprises, L.P. / Icahn Enterprises Finance Corp. (e) | | | |
| Icahn Enterprises, L.P. / Icahn Enterprises Finance Corp. | | | |
| Icahn Enterprises, L.P. / Icahn Enterprises Finance Corp. (e) | | | |
| | |
| | |
| Hilton Domestic Operating Co., Inc. (e) | | | |
| Machinery-Diversified — 0.1% | |
| | | | |
| TK Elevator US Newco, Inc. (e) | | | |
| | |
| | |
| | | | |
| CCO Holdings LLC / CCO Holdings Capital Corp. (e) | | | |
| CCO Holdings LLC / CCO Holdings Capital Corp. (e) | | | |
| CCO Holdings LLC / CCO Holdings Capital Corp. (e) | | | |
| Charter Communications Operating LLC / Charter Communications Operating Capital | | | |
| Charter Communications Operating LLC / Charter Communications Operating Capital | | | |
See Notes to Financial Statements
First Trust TCW Unconstrained Plus Bond ETF (UCON)Portfolio of Investments (Continued)August 31, 2024 | | | | |
CORPORATE BONDS AND NOTES (i) (Continued) |
| | |
| Charter Communications Operating LLC / Charter Communications Operating Capital | | | |
| Charter Communications Operating LLC / Charter Communications Operating Capital | | | |
| Charter Communications Operating LLC / Charter Communications Operating Capital | | | |
| Charter Communications Operating LLC / Charter Communications Operating Capital | | | |
| Charter Communications Operating LLC / Charter Communications Operating Capital | | | |
| Charter Communications Operating LLC / Charter Communications Operating Capital | | | |
| Charter Communications Operating LLC / Charter Communications Operating Capital | | | |
| Cox Enterprises, Inc. (e) | | | |
| | | | |
| | | | |
| | | | |
| | | | |
| | | | |
| Directv Financing LLC / Directv Financing Co-Obligor, Inc. (e) | | | |
| | | | |
| Sirius XM Radio, Inc. (e) | | | |
| | | | |
| | | | |
| | | | |
| | |
| | |
| | | | |
| Sunoco, L.P. / Sunoco Finance Corp. | | | |
| | |
| Oil & Gas Services — 0.1% | |
| Archrock Partners, L.P. / Archrock Partners Finance Corp. (e) | | | |
| USA Compression Partners, L.P. / USA Compression Finance Corp. (e) | | | |
| | |
| Packaging & Containers — 0.2% | |
| | | | |
| | | | |
| | | | |
| Clearwater Paper Corp. (e) | | | |
| | | | |
| | |
| | |
| Bayer US Finance II LLC (e) | | | |
| Bayer US Finance II LLC (e) | | | |
| Bayer US Finance II LLC (e) | | | |
| Bayer US Finance II LLC (e) | | | |
| Bayer US Finance II LLC (e) | | | |
| | | | |
See Notes to Financial Statements
First Trust TCW Unconstrained Plus Bond ETF (UCON)Portfolio of Investments (Continued)August 31, 2024 | | | | |
CORPORATE BONDS AND NOTES (i) (Continued) |
| Pharmaceuticals (Continued) | |
| | | | |
| | | | |
| | | | |
| | | | |
| Option Care Health, Inc. (e) | | | |
| | |
| | |
| | | | |
| Energy Transfer, L.P., Series B (n) | | | |
| NGL Energy Operating LLC / NGL Energy Finance Corp. (e) | | | |
| NGL Energy Operating LLC / NGL Energy Finance Corp. (e) | | | |
| Rockies Express Pipeline LLC (e) | | | |
| TransMontaigne Partners, L.P. / TLP Finance Corp. | | | |
| Venture Global Calcasieu Pass LLC (e) | | | |
| Venture Global Calcasieu Pass LLC (e) | | | |
| Venture Global LNG, Inc. (e) | | | |
| | |
| | |
| Greystar Real Estate Partners LLC (e) | | | |
| Real Estate Investment Trusts — 1.3% | |
| Alexandria Real Estate Equities, Inc. | | | |
| American Assets Trust, L.P. | | | |
| American Homes 4 Rent, L.P. | | | |
| | | | |
| | | | |
| | | | |
| | | | |
| | | | |
| | | | |
| | | | |
| | | | |
| Extra Space Storage, L.P. | | | |
| Extra Space Storage, L.P. | | | |
| Extra Space Storage, L.P. | | | |
| GLP Capital, L.P. / GLP Financing II, Inc. | | | |
| GLP Capital, L.P. / GLP Financing II, Inc. | | | |
| GLP Capital, L.P. / GLP Financing II, Inc. | | | |
| GLP Capital, L.P. / GLP Financing II, Inc. | | | |
| GLP Capital, L.P. / GLP Financing II, Inc. | | | |
| Healthcare Realty Holdings, L.P. | | | |
| Healthcare Realty Holdings, L.P. | | | |
| Healthcare Realty Holdings, L.P. | | | |
| Healthcare Realty Holdings, L.P. | | | |
| Hudson Pacific Properties, L.P. | | | |
| Hudson Pacific Properties, L.P. | | | |
| Hudson Pacific Properties, L.P. | | | |
| Hudson Pacific Properties, L.P. | | | |
| Invitation Homes Operating Partnership, L.P. | | | |
| Invitation Homes Operating Partnership, L.P. | | | |
See Notes to Financial Statements
First Trust TCW Unconstrained Plus Bond ETF (UCON)Portfolio of Investments (Continued)August 31, 2024 | | | | |
CORPORATE BONDS AND NOTES (i) (Continued) |
| Real Estate Investment Trusts (Continued) | |
| Invitation Homes Operating Partnership, L.P. | | | |
| Invitation Homes Operating Partnership, L.P. | | | |
| | | | |
| | | | |
| | | | |
| | | | |
| Prologis Euro Finance LLC (EUR) | | | |
| Realty Income Corp. (EUR) | | | |
| Realty Income Corp. (EUR) | | | |
| Rexford Industrial Realty, L.P. | | | |
| | | | |
| | | | |
| | | | |
| VICI Properties, L.P. / VICI Note Co., Inc. (e) | | | |
| VICI Properties, L.P. / VICI Note Co., Inc. (e) | | | |
| | | | |
| | |
| | |
| Ferrellgas, L.P. / Ferrellgas Finance Corp. (e) | | | |
| Fertitta Entertainment LLC / Fertitta Entertainment Finance Co., Inc. (e) | | | |
| | | | |
| | | | |
| Michaels (The) Cos., Inc. (e) | | | |
| | |
| | |
| | | | |
| | | | |
| | |
| | |
| Central Parent, Inc. / CDK Global, Inc. (e) | | | |
| | | | |
| | | | |
| | |
| Telecommunications — 0.5% | |
| | | | |
| | | | |
| Frontier Communications Holdings LLC (e) | | | |
| Frontier Communications Holdings LLC (e) | | | |
| Frontier Communications Holdings LLC (e) | | | |
| Ses Global Americas Holdings, Inc. (e) | | | |
| Sprint Spectrum Co. LLC / Sprint Spectrum Co. II LLC / Sprint Spectrum Co. III LLC (e) | | | |
| Sprint Spectrum Co. LLC / Sprint Spectrum Co. II LLC / Sprint Spectrum Co. III LLC (e) | | | |
| | | | |
See Notes to Financial Statements
First Trust TCW Unconstrained Plus Bond ETF (UCON)Portfolio of Investments (Continued)August 31, 2024 | | | | |
CORPORATE BONDS AND NOTES (i) (Continued) |
| Telecommunications (Continued) | |
| | | | |
| Zayo Group Holdings, Inc. (e) | | | |
| | |
| Total Corporate Bonds and Notes | |
| | |
U.S. GOVERNMENT AGENCY SECURITIES — 8.9% |
| Federal Home Loan Bank Discount Notes | | | |
| Federal Home Loan Bank Discount Notes | | | |
| Federal Home Loan Bank Discount Notes | | | |
| Federal Home Loan Bank Discount Notes | | | |
| Total U.S. Government Agency Securities | |
| | |
FOREIGN CORPORATE BONDS AND NOTES (i) — 3.9% |
| | |
| Imperial Brands Finance PLC (e) | | | |
| | |
| | | | |
| | | | |
| | | | |
| Lloyds Banking Group PLC (n) | | | |
| Santander UK Group Holdings PLC (n) | | | |
| Santander UK Group Holdings PLC (n) | | | |
| | |
| | |
| Anheuser-Busch InBev S.A. / N.V. (EUR) (p) | | | |
| | | | |
| | | | |
| | | | |
| | | | |
| | |
| Building Materials — 0.0% | |
| Ingersoll-Rand Luxembourg Finance S.A. | | | |
| | |
| Axalta Coating Systems Dutch Holding B B.V. (e) | | | |
| Axalta Coating Systems LLC / Axalta Coating Systems Dutch Holding B B.V. (e) | | | |
| | |
| Diversified Financial Services — 0.4% | |
| AerCap Ireland Capital DAC / AerCap Global Aviation Trust | | | |
| AerCap Ireland Capital DAC / AerCap Global Aviation Trust | | | |
| AerCap Ireland Capital DAC / AerCap Global Aviation Trust | | | |
| AerCap Ireland Capital DAC / AerCap Global Aviation Trust | | | |
| Avolon Holdings Funding Ltd. (e) | | | |
| Avolon Holdings Funding Ltd. (e) | | | |
| | | | |
| | |
| | |
| | | | |
See Notes to Financial Statements
First Trust TCW Unconstrained Plus Bond ETF (UCON)Portfolio of Investments (Continued)August 31, 2024 | | | | |
FOREIGN CORPORATE BONDS AND NOTES (i) (Continued) |
| | |
| Comision Federal de Electricidad (p) | | | |
| Elia Group S.A. / N.V. (EUR) (p) | | | |
| Elia Transmission Belgium S.A. (EUR) (p) | | | |
| Mong Duong Finance Holdings B.V. (p) | | | |
| | | | |
| | | | |
| TenneT Holding B.V. (EUR) (p) | | | |
| TenneT Holding B.V. (EUR) (p) | | | |
| | |
| Engineering & Construction — 0.0% | |
| Heathrow Funding Ltd. (EUR) (p) | | | |
| | |
| Banijay Entertainment SASU (e) | | | |
| Environmental Control — 0.1% | |
| GFL Environmental, Inc. (e) | | | |
| GFL Environmental, Inc. (e) | | | |
| | |
| | |
| | | | |
| JBS USA Holding Lux S.A.R.L. / JBS USA Food Co. / JBS Lux Co., S.A.R.L. | | | |
| JBS USA Holding Lux S.A.R.L. / JBS USA Food Co. / JBS Lux Co., S.A.R.L. | | | |
| JBS USA Holding Lux S.A.R.L. / JBS USA Food Co. / JBS Lux Co., S.A.R.L. (e) | | | |
| | |
| | |
| National Gas Transmission PLC (EUR) (p) | | | |
| Healthcare-Products — 0.0% | |
| Medtronic Global Holdings S.C.A. (EUR) | | | |
| Medtronic Global Holdings S.C.A. (EUR) | | | |
| | |
| Healthcare-Services — 0.2% | |
| | | | |
| Lonza Finance International N.V. (EUR) (p) | | | |
| | |
| | |
| Tele Columbus AG, (10.00% PIK) (EUR) (e) (q) | | | |
| VZ Secured Financing B.V. (e) | | | |
| | | | |
| | |
| | |
| Corp. Nacional del Cobre de Chile (p) | | | |
| Corp. Nacional del Cobre de Chile (p) | | | |
| Indonesia Asahan Aluminium PT / Mineral Industri Indonesia Persero PT (p) | | | |
| | |
See Notes to Financial Statements
First Trust TCW Unconstrained Plus Bond ETF (UCON)Portfolio of Investments (Continued)August 31, 2024 | | | | |
FOREIGN CORPORATE BONDS AND NOTES (i) (Continued) |
| | |
| | | | |
| KazMunayGas National Co. JSC (p) | | | |
| KazMunayGas National Co. JSC (p) | | | |
| | | | |
| | | | |
| | |
| Packaging & Containers — 0.1% | |
| Ardagh Packaging Finance PLC / Ardagh Holdings USA, Inc. (e) | | | |
| Ardagh Packaging Finance PLC / Ardagh Holdings USA, Inc. (e) | | | |
| Ardagh Packaging Finance PLC / Ardagh Holdings USA, Inc. (e) | | | |
| | |
| | |
| | | | |
| | | | |
| | | | |
| | |
| | |
| Galaxy Pipeline Assets Bidco Ltd. (e) | | | |
| | | | |
| | | | |
| | |
| | |
| CBRE Global Investors Open-Ended Funds S.C.A. SICAV-SIF-Pan European Core Fund, Medium-Term Note (EUR) (p) | | | |
| | |
| Add Hero Holdings Ltd., Series IAI, (8.50% PIK) (q) | | | |
| Add Hero Holdings Ltd., Series IAI, (9.00% PIK) (q) | | | |
| Add Hero Holdings Ltd., Series IAI, (9.80% PIK) (q) | | | |
| Annington Funding PLC (GBP) (p) | | | |
| Annington Funding PLC (GBP) (p) | | | |
| Annington Funding PLC (GBP) (p) | | | |
| Annington Funding PLC (GBP) (p) | | | |
| Blackstone Property Partners Europe Holdings S.A.R.L. (EUR) (p) | | | |
| Blackstone Property Partners Europe Holdings S.A.R.L. (EUR) (p) | | | |
| Blackstone Property Partners Europe Holdings S.A.R.L. (EUR) (p) | | | |
| China Aoyuan Group Ltd., Series IAI, steps up to 1.00% on 09/30/31 (g) | | | |
| China Aoyuan Group Ltd., Series IAI, (6.75% PIK) (q) | | | |
| China SCE Group Holdings Ltd. (p) (r) | | | |
| LEG Immobilien SE (EUR) (p) | | | |
| Sunac China Holdings Ltd., (6.00% PIK) (e) (q) | | | |
| Sunac China Holdings Ltd., (6.25% PIK) (e) (q) | | | |
| Sunac China Holdings Ltd., (6.50% PIK) (e) (q) | | | |
| Sunac China Holdings Ltd., (6.75% PIK) (e) (q) | | | |
| Sunac China Holdings Ltd., (7.00% PIK) (e) (q) | | | |
| Sunac China Holdings Ltd., (7.25% PIK) (e) (q) | | | |
| Times China Holdings Ltd. (p) (r) | | | |
| | | | |
| | | | |
See Notes to Financial Statements
First Trust TCW Unconstrained Plus Bond ETF (UCON)Portfolio of Investments (Continued)August 31, 2024 | | | | |
FOREIGN CORPORATE BONDS AND NOTES (i) (Continued) |
| | |
| | | | |
| Zhenro Properties Group Ltd. (p) (r) | | | |
| | |
| Real Estate Investment Trusts — 0.1% | |
| Digital Intrepid Holding B.V. (EUR) (p) | | | |
| | |
| Nationwide Building Society (e) (n) | | | |
| | |
| | | | |
| Telecommunications — 0.2% | |
| | | | |
| | | | |
| C&W Senior Finance Ltd. (e) | | | |
| Global Switch Finance B.V. (EUR) (p) | | | |
| Intelsat Jackson Holdings S.A. (e) | | | |
| | | | |
| | |
| Total Foreign Corporate Bonds and Notes | |
| | |
FOREIGN SOVEREIGN BONDS AND NOTES — 2.4% |
| | |
| Brazilian Government International Bond | | | |
| Brazilian Government International Bond | | | |
| Brazilian Government International Bond | | | |
| | |
| | |
| Colombia Government International Bond | | | |
| Colombia Government International Bond | | | |
| Colombia Government International Bond | | | |
| | |
| | |
| Costa Rica Government International Bond (p) | | | |
| Dominican Republic — 0.2% | |
| Dominican Republic International Bond (e) | | | |
| Dominican Republic International Bond (p) | | | |
| Dominican Republic International Bond (p) | | | |
| | |
| | |
| Guatemala Government Bond (p) | | | |
| Guatemala Government Bond (p) | | | |
| Guatemala Government Bond (p) | | | |
| Guatemala Government Bond (p) | | | |
| | |
| | |
| Hungary Government International Bond (e) | | | |
| | |
| Indonesia Government International Bond | | | |
See Notes to Financial Statements
First Trust TCW Unconstrained Plus Bond ETF (UCON)Portfolio of Investments (Continued)August 31, 2024 | | | | |
FOREIGN SOVEREIGN BONDS AND NOTES (Continued) |
| | |
| Mexico Government International Bond | | | |
| Mexico Government International Bond | | | |
| Mexico Government International Bond | | | |
| Mexico Government International Bond | | | |
| Mexico Government International Bond | | | |
| | |
| | |
| Oman Government International Bond (p) | | | |
| | |
| Panama Government International Bond | | | |
| Panama Government International Bond | | | |
| Panama Government International Bond | | | |
| | |
| | |
| Paraguay Government International Bond (p) | | | |
| Paraguay Government International Bond (e) | | | |
| Paraguay Government International Bond (p) | | | |
| | |
| | |
| Romanian Government International Bond (e) | | | |
| Romanian Government International Bond (p) | | | |
| Romanian Government International Bond (p) | | | |
| | |
| | |
| Republic of South Africa Government International Bond | | | |
| Republic of South Africa Government International Bond | | | |
| Republic of South Africa Government International Bond | | | |
| Republic of South Africa Government International Bond | | | |
| | |
| United Arab Emirates — 0.0% | |
| Finance Department Government of Sharjah (e) | | | |
| Total Foreign Sovereign Bonds and Notes | |
| | |
| | | | |
SENIOR FLOATING-RATE LOAN INTERESTS — 2.4% |
| | |
| TransDigm, Inc., Term Loan I, 3 Mo. CME Term SOFR + 2.75%, 0.00% Floor | | | |
| | |
| Invitation Homes Operating Partnership, L.P., Term Loan A, 1 Mo. CME Term SOFR + CSA + 1.00%, 0.00% Floor | | | |
| | |
| First Brands Group LLC, Term Loan B, 3 Mo. CME Term SOFR + CSA + 5.00%, 1.00% Floor | | | |
See Notes to Financial Statements
First Trust TCW Unconstrained Plus Bond ETF (UCON)Portfolio of Investments (Continued)August 31, 2024 | | | | |
SENIOR FLOATING-RATE LOAN INTERESTS (Continued) |
| Brokerage/Asset Managers/Exchanges — 0.1% | |
| Deerfield Dakota Holding LLC, Term Loan B, 3 Mo. CME Term SOFR + 3.75%, 1.00% Floor | | | |
| Jane Street Group LLC, Term Loan B, 1 Mo. CME Term SOFR + CSA + 2.50%, 0.00% Floor | | | |
| | |
| | |
| Telenet Financing USD LLC, Term Loan AR, 1 Mo. CME Term SOFR + CSA + 2.00%, 0.00% Floor | | | |
| Virgin Media Bristol LLC, Term Loan N, 1 Mo. CME Term SOFR + CSA + 2.50%, 0.00% Floor | | | |
| | |
| Consumer Cyclical Services — 0.0% | |
| Delivery Hero Finco LLC, Term Loan B, 3 Mo. CME Term SOFR + 5.00%, 0.50% Floor | | | |
| Match Group Holdings II LLC, Term Loan B, 3 Mo. CME Term SOFR + CSA + 1.75%, 0.00% Floor | | | |
| StubHub Holdco Sub LLC, Term Loan B, 1 Mo. CME Term SOFR + 4.75%, 0.00% Floor | | | |
| | |
| | |
| AI Aqua Merger Sub, Inc., Term Loan B, 1 Mo. CME Term SOFR + 3.50%, 0.50% Floor | | | |
| Diversified Manufacturing — 0.0% | |
| Alliance Laundry Systems, Term Loan B, 1 Mo. CME Term SOFR + 3.50%, 0.00% Floor | | | |
| | |
| Calpine Corp., Term Loan B9, 1 Mo. CME Term SOFR + 2.00%, 0.00% Floor | | | |
| Edgewater Generation LLC, Term Loan B, 1 Mo. CME Term SOFR + 4.25%, 0.00% Floor | | | |
| Lackawanna Energy Center, Term Loan B2, 1 Mo. CME Term SOFR + 5.00%, 0.50% Floor | | | |
| Lackawanna Energy Center, Term Loan C, 1 Mo. CME Term SOFR + 5.00%, 0.50% Floor | | | |
| South Field Energy LLC, Term Loan B, 1 Mo. CME Term SOFR + 3.75%, 0.00% Floor | | | |
| South Field Energy LLC, Term Loan C, 1 Mo. CME Term SOFR + 3.75%, 0.00% Floor | | | |
| Vistra Operations Co. LLC, Term Loan B, 1 Mo. CME Term SOFR + 2.00%, 0.00% Floor | | | |
| Vistra Operations Co. LLC, Term Loan B, 1 Mo. CME Term SOFR + 2.75%, 0.00% Floor | | | |
| | |
| | |
| Clean Harbors, Inc., Term Loan B, 1 Mo. CME Term SOFR + CSA + 1.75%, 0.00% Floor | | | |
| Patriot Container Corp., Term Loan, 1 Mo. CME Term SOFR + CSA + 7.75%, 1.00% Floor | | | |
| | |
See Notes to Financial Statements
First Trust TCW Unconstrained Plus Bond ETF (UCON)Portfolio of Investments (Continued)August 31, 2024 | | | | |
SENIOR FLOATING-RATE LOAN INTERESTS (Continued) |
| | |
| Trans Union LLC, Term Loan B7, 1 Mo. CME Term SOFR + 2.00%, 0.50% Floor | | | |
| Trans Union LLC, Term Loan B8, 1 Mo. CME Term SOFR + 1.75%, 0.00% Floor | | | |
| | |
| | |
| City Brewing Co. LLC, Term Loan, 1 Mo. CME Term SOFR + 6.25%, 0.75% Floor | | | |
| City Brewing Co. LLC, Term Loan, 3 Mo. CME Term SOFR + CSA + 3.50%, 0.75% Floor | | | |
| City Brewing Co. LLC, Term Loan, 3 Mo. CME Term SOFR + CSA + 5.00%, 0.75% Floor | | | |
| Fiesta Purchaser, Inc., Term Loan B, 1 Mo. CME Term SOFR + 4.00%, 0.00% Floor | | | |
| Naked Juice LLC, Term Loan, 3 Mo. CME Term SOFR + CSA + 3.25%, 0.50% Floor | | | |
| Naked Juice LLC, Term Loan, 3 Mo. CME Term SOFR + CSA + 6.00%, 0.50% Floor | | | |
| Triton Water Holdings, Inc., Term Loan B, 3 Mo. CME Term SOFR + 3.25%, 0.50% Floor | | | |
| United Natural Foods, Inc., Term Loan B, 1 Mo. CME Term SOFR + 4.75%, 0.00% Floor | | | |
| | |
| | |
| Caesars Entertainment, Inc., Term Loan B1, 3 Mo. CME Term SOFR + 2.75%, 0.50% Floor | | | |
| Ontario Gaming GTA, L.P., Term Loan B, 3 Mo. CME Term SOFR + 4.25%, 0.50% Floor | | | |
| | |
| | |
| ADMI Corp., Term Loan B1, 1 Mo. CME Term SOFR + 5.75%, 0.00% Floor | | | |
| Bausch & Lomb Corp., Term Loan B, 1 Mo. CME Term SOFR + CSA + 3.25%, 0.50% Floor | | | |
| Catalent Pharma Solutions, Inc., Term Loan B3, 1 Mo. CME Term SOFR + CSA + 2.00%, 0.50% Floor | | | |
| Gainwell Acquisition Corp., Term Loan B, 3 Mo. CME Term SOFR + CSA + 4.00%, 0.75% Floor | | | |
| Medline Borrower, L.P., Term Loan, 1 Mo. CME Term SOFR + 2.25%, 0.50% Floor | | | |
| Modivcare, Inc., Term Loan B, 3 Mo. CME Term SOFR + CSA + 4.75%, 0.00% Floor | | | |
| NSM Top Holdings Corp., Term Loan, 1 Mo. CME Term SOFR + 5.25%, 0.00% Floor | | | |
| Star Parent, Inc., Term Loan B, 3 Mo. CME Term SOFR + 4.00%, 0.00% Floor | | | |
| | |
See Notes to Financial Statements
First Trust TCW Unconstrained Plus Bond ETF (UCON)Portfolio of Investments (Continued)August 31, 2024 | | | | |
SENIOR FLOATING-RATE LOAN INTERESTS (Continued) |
| | |
| Healthpeak Op LLC, Delayed Draw Term Loan, 1 Mo. CME Term SOFR + CSA + 0.85%, 0.00% Floor | | | |
| Healthpeak Op LLC, Delayed Draw Term Loan, 1 Mo. CME Term SOFR + CSA + 0.85%, 0.00% Floor | | | |
| | |
| | |
| Artera Services LLC, Term Loan, 1 Mo. CME Term SOFR + 4.50%, 0.00% Floor | | | |
| | |
| Acrisure LLC, Term Loan B1, 1 Mo. CME Term SOFR + 3.00%, 0.50% Floor | | | |
| Asurion LLC (fka Asurion Corp.), Term Loan B, 1 Mo. CME Term SOFR + CSA + 3.25%, 0.00% Floor | | | |
| Asurion LLC (fka Asurion Corp.), Term Loan B4, 1 Mo. CME Term SOFR + CSA + 5.25%, 0.00% Floor | | | |
| Hub International Ltd., Term Loan B, 3 Mo. CME Term SOFR + 3.00%, 0.75% Floor | | | |
| Sedgwick CMS, Inc., Term Loan B, 1 Mo. CME Term SOFR + CSA + 3.00%, 0.00% Floor | | | |
| | |
| | |
| Showtime Acquisition LLC, Term Loan B, 1 Mo. CME Term SOFR + 4.75%, 0.00% Floor | | | |
| | |
| Hilton Domestic Operating Co., Inc., Term Loan B4, 1 Mo. CME Term SOFR + 1.75%, 0.00% Floor | | | |
| Media Entertainment — 0.0% | |
| Magnite, Inc., Term Loan B, 1 Mo. CME Term SOFR + 4.50%, 0.00% Floor | | | |
| Research Now Group LLC and Dynata LLC, DIP Term Loan, 3 Mo. CME Term SOFR + CSA + 5.12%, 0.00% Floor | | | |
| Research Now Group LLC and Dynata LLC, Term Loan, 3 Mo. CME Term SOFR + CSA + 5.00%, 0.00% Floor | | | |
| Research Now Group LLC and Dynata LLC, Term Loan, 3 Mo. CME Term SOFR + CSA + 5.50%, 1.00% Floor | | | |
| | |
| | |
| Buckeye Partners, L.P., Term Loan B, 1 Mo. CME Term SOFR + 2.00%, 0.00% Floor | | | |
| | |
| Mativ Holdings, Inc., Delayed Draw Term Loan, 1 Mo. CME Term SOFR + CSA + 2.50%, 0.00% Floor | | | |
| | |
| Grifols Worldwide Operations Ltd., Term Loan B, 3 Mo. CME Term SOFR + CSA + 2.00%, 0.00% Floor | | | |
| Jazz Financing Lux S.A.R.L., Term Loan B, 1 Mo. CME Term SOFR + CSA + 2.25, 0.50% Floor | | | |
| | |
See Notes to Financial Statements
First Trust TCW Unconstrained Plus Bond ETF (UCON)Portfolio of Investments (Continued)August 31, 2024 | | | | |
SENIOR FLOATING-RATE LOAN INTERESTS (Continued) |
| | |
| 1011778 BC ULC, Term Loan B5, 1 Mo. CME Term SOFR + 1.75%, 0.00% Floor | | | |
| | |
| Peer Holding III B.V., Term Loan B5, 1 Mo. CME Term SOFR + 3.00%, 0.00% Floor | | | |
| | |
| Boost Newco Borrower LLC, Term Loan B, 1 Mo. CME Term SOFR + 2.50%, 0.00% Floor | | | |
| Boxer Parent Co., Inc., Term Loan, 1 Mo. CME Term SOFR + 5.75%, 0.00% Floor | | | |
| Boxer Parent Co., Inc., Term Loan B, 1 Mo. CME Term SOFR + 3.75%, 0.00% Floor | | | |
| Central Parent, Inc., Term Loan B, 1 Mo. CME Term SOFR + 3.25%, 0.00% Floor | | | |
| Coherent Corp., Term Loan B, 1 Mo. CME Term SOFR + 2.50%, 0.50% Floor | | | |
| EagleView Technology Corp., Term Loan B, 3 Mo. CME Term SOFR + CSA + 3.50%, 0.00% Floor | | | |
| Indy US Holdco LLC, Term Loan B, 1 Mo. CME Term SOFR + 4.75%, 0.50% Floor | | | |
| Iron Mountain Information Management LLC, 1 Mo. CME Term SOFR + 2.25%, 0.00% Floor | | | |
| Iron Mountain, Inc., Term Loan B, 1 Mo. CME Term SOFR + CSA + 2.00%, 0.00% Floor | | | |
| Peraton Corp., Term Loan B, 1 Mo. CME Term SOFR + CSA + 3.75%, 0.75% Floor | | | |
| Realpage, Inc., Term Loan B, 1 Mo. CME Term SOFR + CSA + 3.00%, 0.50% Floor | | | |
| Renaissance Holding Corp., Term Loan, 3 Mo. CME Term SOFR + 4.25%, 0.50% Floor | | | |
| Sabre GLBL, Inc., Term Loan B2, 1 Mo. CME Term SOFR + CSA + 5.00%, 0.50% Floor | | | |
| Xerox Corp., Term Loan, 1 Mo. CME Term SOFR + CSA + 4.00%, 0.50% Floor | | | |
| | |
| | |
| Altice France S.A., Term Loan B14, 3 Mo. CME Term SOFR + 5.50%, 0.00% Floor | | | |
| CCI Buyer, Inc., Term Loan B, 3 Mo. CME Term SOFR + 4.00%, 0.75% Floor | | | |
| SBA Senior Finance II LLC, Term Loan B, 1 Mo. CME Term SOFR + 2.00%, 0.00% Floor | | | |
| | |
| Total Senior Floating-Rate Loan Interests | |
| | |
| | | | |
U.S. GOVERNMENT BONDS AND NOTES — 2.1% |
| | | | |
| | | | |
See Notes to Financial Statements
First Trust TCW Unconstrained Plus Bond ETF (UCON)Portfolio of Investments (Continued)August 31, 2024 | | | | |
CONVERTIBLE FOREIGN CORPORATE BONDS AND NOTES (i) — 0.0% |
| Commercial Services — 0.0% | |
| | | | |
| | |
| China Aoyuan Group Ltd., Series IAI (d) | | | |
| Sunac China Holdings Ltd., (1.00% PIK) (e) (q) | | | |
| | |
| Total Convertible Foreign Corporate Bonds and Notes | |
| | |
|
| | |
| City & Cnty of Denver Cnty Arpt Sys Rev, Ser C | | | |
| | | | |
| | |
|
| | |
| Dynata LLC and New Insight Holdings, Inc. | |
| Real Estate Management & Development — 0.0% | |
| China Aoyuan Group Ltd. (HKD) (v) | |
| Wireless Telecommunication Services — 0.0% | |
| Intelsat Jackson Emergence S.A. (d) (k) (l) (v) | |
| | |
| | |
| | | | |
U.S. TREASURY BILLS — 11.5% |
| | | | |
| | | | |
| | | | |
| | | | |
| | | | |
| | | | |
| Total U.S. Treasury Bills | |
| | |
| | |
MONEY MARKET FUNDS — 7.0% |
| Dreyfus Government Cash Management Fund, Institutional Shares - 5.19% (w) | |
| | |
|
|
| Total Investments — 110.8% | |
| | |
| Net Other Assets and Liabilities — (10.8)% | |
| | |
See Notes to Financial Statements
First Trust TCW Unconstrained Plus Bond ETF (UCON)Portfolio of Investments (Continued)August 31, 2024 Forward Foreign Currency Contracts at August 31, 2024 (See Note 2D - Forward Foreign Currency Contracts in the Notes to Financial Statements):
| | | | Purchase Value
as of
8/31/2024 | | Unrealized
Appreciation
(Depreciation) |
| | | | | | | | |
| | | | | | | | |
| | | | | | | | |
| | | | | | | | |
| | | | | | | | |
| | | | | | | | |
| | | | | | | | |
| | | | | | | | |
| | | | | | | | |
| | | | | | | | |
| | | | | | | | |
| | | | | | | | |
| | | | | | | | |
| | | | | | | | |
| | | | | | | | |
| | | | | | | | |
| | | | | | | | |
| | | | | | | | |
| | | | | | | | |
| | | | | | | | |
| | | | | | | | |
| | | | | | | | |
Net Unrealized Appreciation (Depreciation) | |
Futures Contracts at August 31, 2024 (See Note 2C - Futures Contracts in the Notes to Financial Statements):
| | | | Unrealized
Appreciation
(Depreciation)/
Value |
U.S. 2-Year Treasury Notes | | | | |
U.S. 5-Year Treasury Notes | | | | |
| | | | |
| | | | |
| | | | |
| | | | |
| | | | |
Euro-Buxl 30 Year Bonds Futures | | | | |
| | | | |
| | | | |
Ultra 10-Year U.S. Treasury Notes | | | | |
Ultra U.S. Treasury Bond Futures | | | | |
| | | | |
| | | | |
See Notes to Financial Statements
First Trust TCW Unconstrained Plus Bond ETF (UCON)Portfolio of Investments (Continued)August 31, 2024 Interest Rate Swap Agreements at August 31, 2024 (See Note 2E - Swap Agreements in the Notes to Financial Statements):
| | | | | Unrealized
Appreciation
(Depreciation)/
Value |
| | | | | |
| The Fund pays the fixed rate and receives the floating rate. At August 31, 2024, the floating rate accrued is 5.33%. |
| Inverse floating rate security. |
| Collateral Strip Rate security. Coupon is based on the weighted net interest rate of the investment’s underlying collateral. The interest rate resets periodically. |
| Weighted Average Coupon security. Coupon is based on the blended interest rate of the underlying holdings, which may have different coupons. The coupon may change in any period. |
| Pursuant to procedures adopted by the Trust’s Board of Trustees, this security has been determined to be illiquid by First Trust Advisors L.P. (the “Advisor”). |
| This security, sold within the terms of a private placement memorandum, is exempt from registration upon resale under Rule 144A of the Securities Act of 1933, as amended (the “1933 Act”), and may be resold in transactions exempt from registration, normally to qualified institutional buyers. Pursuant to procedures adopted by the Trust’s Board of Trustees, this security has been determined to be liquid by the Advisor. Although market instability can result in periods of increased overall market illiquidity, liquidity for each security is determined based on security specific factors and assumptions, which require subjective judgment. At August 31, 2024, securities noted as such amounted to $1,003,422,414 or 34.5% of net assets. |
| All or a portion of this security is part of a mortgage dollar roll agreement (see Note 2J - Mortgage Dollar Rolls in the Notes to Financial Statements). |
| Step-up security. A security where the coupon increases or steps up at a predetermined date. The coupon rate is determined based on the underlying investments. The coupon rate resets periodically. |
| Floating or variable rate security. |
| Principal Value is in U.S. dollars unless otherwise indicated in the security description. |
| |
| This security is fair valued by the Advisor’s Pricing Committee in accordance with procedures approved by the Trust’s Board of Trustees, and in accordance with provisions of the Investment Company Act of 1940 and rules thereunder, as amended. At August 31, 2024, securities noted as such are valued at $12,963,507 or 0.4% of net assets. |
| This security’s value was determined using significant unobservable inputs (see Note 2A - Portfolio Valuation in the Notes to Financial Statements). |
| When-issued security. The interest rate shown reflects the rate in effect at August 31, 2024. Interest will begin accruing on the security’s first settlement date. |
| Fixed-to-floating or fixed-to-variable rate security. The interest rate shown reflects the fixed rate in effect at August 31, 2024. At a predetermined date, the fixed rate will change to a floating rate or a variable rate. |
| |
| This security may be resold to qualified foreign investors and foreign institutional buyers under Regulation S of the 1933 Act. |
| The issuer will pay interest in cash and/or in PIK interest. |
| This issuer is in default. |
| Senior Floating-Rate Loan Interests (“Senior Loans”) in which the Fund invests pay interest at rates which are periodically predetermined by reference to a base lending rate plus a premium. These base lending rates are generally (i) the SOFR obtained from the U.S. Department of the Treasury’s Office of Financial Research or another major financial institution, (ii) the lending rate offered by one or more major European banks, such as the synthetic LIBOR, (iii) the prime rate offered by one or more United States banks or (iv) the certificate of deposit rate. Certain Senior Loans are subject to a SOFR or synthetic LIBOR floor that establishes a minimum SOFR or synthetic LIBOR rate. When a range of rates is disclosed, the Fund holds more than one contract within the same tranche with identical SOFR or synthetic LIBOR period, spread and floor, but different SOFR or synthetic LIBOR reset dates. |
| Senior Loans generally are subject to mandatory and/or optional prepayment. As a result, the actual remaining maturity of Senior Loans may be substantially less than the stated maturities shown. |
| Securities are issued in U.S. dollars unless otherwise indicated in the security description. |
See Notes to Financial Statements
First Trust TCW Unconstrained Plus Bond ETF (UCON)Portfolio of Investments (Continued)August 31, 2024 | Non-income producing security. |
| Rate shown reflects yield as of August 31, 2024. |
Abbreviations throughout the Portfolio of Investments: |
| |
| |
| – Chicago Mercantile Exchange |
| – Credit Spread Adjustment |
| |
| |
| – Goldman Sachs International, London |
| |
| – Interest-Only Security - Principal amount shown represents par value on which interest payments are based |
| – London Interbank Offered Rate |
| |
| – Real Estate Investment Trusts |
| – Real Estate Mortgage Investment Conduit |
| – Swedish Depositary Receipt |
| – Secured Overnight Financing Rate |
| – Structured Agency Credit Risk |
| – To-Be-Announced Security |
| |
See Notes to Financial Statements
First Trust TCW Unconstrained Plus Bond ETF (UCON)Portfolio of Investments (Continued)August 31, 2024
Valuation InputsA summary of the inputs used to value the Fund’s investments as of August 31, 2024 is as follows (see Note 2A - Portfolio Valuation in the Notes to Financial Statements):
|
| | | Level 2
Significant
Observable
Inputs | Level 3
Significant
Unobservable
Inputs |
U.S. Government Agency Mortgage-Backed Securities | | | | |
Mortgage-Backed Securities | | | | |
| | | | |
Corporate Bonds and Notes* | | | | |
U.S. Government Agency Securities | | | | |
Foreign Corporate Bonds and Notes* | | | | |
Foreign Sovereign Bonds and Notes** | | | | |
Senior Floating-Rate Loan Interests* | | | | |
U.S. Government Bonds and Notes | | | | |
Convertible Foreign Corporate Bonds and Notes* | | | | |
| | | | |
| | | | |
| | | | |
Real Estate Management & Development | | | | |
Wireless Telecommunication Services | | | | |
| | | | |
| | | | |
| | | | |
Forward Foreign Currency Contracts | | | | |
| | | | |
| | | | |
|
| | | Level 2
Significant
Observable
Inputs | Level 3
Significant
Unobservable
Inputs |
Forward Foreign Currency Contracts | | | | |
| | | | |
Interest Rate Swap Agreements | | | | |
| | | | |
| See Portfolio of Investments for industry breakout. |
| See Portfolio of Investments for country breakout. |
| See Portfolio of Investments for state breakout. |
| Investment is valued at $0. |
| Includes cumulative appreciation/depreciation on futures contracts as reported in the Futures Contracts table. Only the current day’s variation margin is presented on the Statements of Assets and Liabilities. |
Level 3 investments are fair valued by the Advisor’s Pricing Committee and are footnoted in the Portfolio of Investments. All Level 3 values are based on unobservable inputs.
See Notes to Financial Statements
First Trust TCW Securitized Plus ETF (DEED)Portfolio of InvestmentsAugust 31, 2024
| | | | |
U.S. GOVERNMENT AGENCY MORTGAGE-BACKED SECURITIES — 68.4% |
| Collateralized Mortgage Obligations — 8.6% | |
| Federal Home Loan Mortgage Corporation | | | |
| Series 3071, Class TF, 30 Day Average SOFR + CSA + 0.30% (a) | | | |
| | | | |
| | | | |
| | | | |
| | | | |
| | | | |
| Series 4993, Class OP, PO | | | |
| | | | |
| Federal Home Loan Mortgage Corporation STACR REMIC Trust | | | |
| Series 2022-DNA1, Class M1B, 30 Day Average SOFR + 1.85% (a) (c) | | | |
| Federal National Mortgage Association | | | |
| Series 2006-56, Class FE, 30 Day Average SOFR + CSA + 0.43% (a) | | | |
| Series 2011-47, Class GF, 30 Day Average SOFR + CSA + 0.57% (a) | | | |
| | | | |
| | | | |
| | | | |
| | | | |
| Series 2019-67, Class FE, 30 Day Average SOFR + CSA + 0.45% (a) | | | |
| Series 2019-68, Class US, IO, (30 Day Average SOFR + CSA) × -1+ 6.00% (d) | | | |
| Government National Mortgage Association | | | |
| Series 2012-34, Class SA, IO, (1 Mo. CME Term SOFR + CSA) ×-1+ 6.05% (d) | | | |
| Series 2013-25, Class SA, IO, (1 Mo. CME Term SOFR + CSA) ×-1+ 6.20% (d) | | | |
| | | | |
| Series 2014-57, Class PS, IO, (1 Mo. CME Term SOFR + CSA) ×-1+ 6.20% (d) | | | |
| | | | |
| Series 2017-117, Class ZN | | | |
| | | | |
| Series 2021-125, Class EL | | | |
| | | | |
| Series 2023-113, Class FD, 30 Day Average SOFR + 1.35%, 6.50% Cap (a) | | | |
| Series 2023-116, Class FL, 30 Day Average SOFR + 1.15% (a) | | | |
| | |
| Commercial Mortgage-Backed Securities — 0.0% | |
| Federal Home Loan Mortgage Corporation Multifamily Structured Pass-Through Certificates | | | |
| Series K732, Class X3, IO (e) | | | |
| | | | |
| Series 2017-K726, Class X2B, IO (c) | | | |
| | |
See Notes to Financial Statements
First Trust TCW Securitized Plus ETF (DEED)Portfolio of Investments (Continued)August 31, 2024 | | | | |
U.S. GOVERNMENT AGENCY MORTGAGE-BACKED SECURITIES (Continued) |
| Pass-Through Securities — 59.8% | |
| Federal Home Loan Mortgage Corporation |
| | | | |
| | | | |
| | | | |
| | | | |
| | | | |
| | | | |
| | | | |
| | | | |
| | | | |
| | | | |
| | | | |
| | | | |
| | | | |
| | | | |
| | | | |
| | | | |
| | | | |
| | | | |
| | | | |
| | | | |
| | | | |
| | | | |
| | | | |
| | | | |
| | | | |
| | | | |
| Federal National Mortgage Association |
| | | | |
| | | | |
| | | | |
| | | | |
| | | | |
| | | | |
| | | | |
| | | | |
| | | | |
| | | | |
| | | | |
| | | | |
| | | | |
| | | | |
| | | | |
| | | | |
| | | | |
| | | | |
| | | | |
| | | | |
| | | | |
| | | | |
See Notes to Financial Statements
First Trust TCW Securitized Plus ETF (DEED)Portfolio of Investments (Continued)August 31, 2024 | | | | |
U.S. GOVERNMENT AGENCY MORTGAGE-BACKED SECURITIES (Continued) |
| Pass-Through Securities (Continued) | |
| Federal National Mortgage Association (Continued) |
| | | | |
| | | | |
| | | | |
| | | | |
| | | | |
| | | | |
| | | | |
| | | | |
| | | | |
| | | | |
| | | | |
| | | | |
| | | | |
| | | | |
| | | | |
| | | | |
| | | | |
| | | | |
| Government National Mortgage Association |
| | | | |
| | | | |
| | | | |
| | | | |
| | | | |
| | | | |
| | | | |
| | | | |
| | | | |
| | | | |
| | | | |
| | | | |
| | | | |
| | | | |
| | |
| Total U.S. Government Agency Mortgage-Backed Securities | |
| | |
MORTGAGE-BACKED SECURITIES (g) — 23.6% |
| Collateralized Mortgage Obligations — 11.2% | |
| |
| Series 2005-16, Class A4, 1 Mo. CME Term SOFR + CSA + 0.48% (a) | | | |
| Series 2007-5CB, Class 1A11 | | | |
| Series 2007-15CB, Class A5 | | | |
| Series 2007-HY8C, Class A1, 1 Mo. CME Term SOFR + CSA + 0.32% (a) | | | |
| American Home Mortgage Assets Trust |
| Series 2006-3, Class 1A1, 12 Mo. Treasury Average + 0.97% (a) | | | |
See Notes to Financial Statements
First Trust TCW Securitized Plus ETF (DEED)Portfolio of Investments (Continued)August 31, 2024 | | | | |
MORTGAGE-BACKED SECURITIES (g) (Continued) |
| Collateralized Mortgage Obligations (Continued) | |
| Banc of America Funding Trust |
| Series 2007-C, Class 7A1, 1 Mo. CME Term SOFR + CSA + 0.42% (a) | | | |
| |
| Series 2006-1, Class 21A2 (e) | | | |
| |
| Series 2005-1, Class 2A1 (e) | | | |
| CHL Mortgage Pass-Through Trust |
| Series 2004-25, Class 2A1, 1 Mo. CME Term SOFR + CSA + 0.68% (a) | | | |
| | | | |
| |
| Series 2021-R3, Class A1A (c) | | | |
| Series 2023-R3, Class A1B (c) | | | |
| Citigroup Mortgage Loan Trust |
| Series 2009-10, Class 2A2 (c) | | | |
| Credit Suisse Mortgage Trust |
| Series 2014-8R, Class 3A2 (c) (e) | | | |
| Series 2021-RP11, Class PT (c) | | | |
| Series 2021-RPL4, Class A1 (c) | | | |
| |
| | | | |
| Deutsche Alt-A Securities Mortgage Loan Trust |
| Series 2007-3, Class 2A1, 1 Mo. CME Term SOFR + CSA + 0.75% (a) | | | |
| GreenPoint Mortgage Funding Trust |
| Series 2005-AR4, Class G41B, 1 Mo. CME Term SOFR + CSA + 0.20% (a) | | | |
| |
| Series 2006-OA1, Class 2A2, 1 Mo. CME Term SOFR + CSA + 0.52% (a) | | | |
| IndyMac INDX Mortgage Loan Trust |
| Series 2005-AR29, Class A1 (e) | | | |
| Series 2006-AR3, Class 2A1A (e) | | | |
| Series 2006-AR13, Class A3 (e) | | | |
| Series 2006-AR19, Class 5A2 (e) | | | |
| Series 2006-AR31, Class A3 (e) | | | |
| |
| Series 2006-10N, Class 1A4A, 1 Mo. CME Term SOFR + CSA + 0.60% (a) | | | |
| Series 2007-12N, Class 1A3A, 1 Mo. CME Term SOFR + CSA + 0.40% (a) | | | |
| |
| Series 2021-RTL3, Class A1 (c) | | | |
| MASTR Adjustable Rate Mortgages Trust |
| Series 2006-OA2, Class 1A1, 12 Mo. Treasury Average + 0.80% (a) | | | |
| Series 2007-HF2, Class A2, 1 Mo. CME Term SOFR + CSA + 1.10% (a) | | | |
See Notes to Financial Statements
First Trust TCW Securitized Plus ETF (DEED)Portfolio of Investments (Continued)August 31, 2024 | | | | |
MORTGAGE-BACKED SECURITIES (g) (Continued) |
| Collateralized Mortgage Obligations (Continued) | |
| |
| Series 2005-QO1, Class A1, 1 Mo. CME Term SOFR + CSA + 0.30% (a) | | | |
| Series 2006-QS7, Class A2 | | | |
| Series 2007-QH4, Class A1, 1 Mo. CME Term SOFR + CSA + 0.38% (a) | | | |
| Series 2007-QS1, Class 1A4 | | | |
| Series 2007-QS2, Class A4 | | | |
| |
| Series 2006-S10, Class 1A1 | | | |
| Structured Asset Mortgage Investments II Trust |
| Series 2005-AR8, Class A2, 12 Mo. Treasury Average + 1.48% (a) | | | |
| Series 2006-AR6, Class 2A1, 1 Mo. CME Term SOFR + CSA + 0.38% (a) | | | |
| Series 2006-AR7, Class A1BG, 1 Mo. CME Term SOFR + CSA + 0.12% (a) | | | |
| Series 2007-AR1, Class 2A1, 1 Mo. CME Term SOFR + CSA + 0.36% (a) | | | |
| Series 2007-AR3, Class 2A1, 1 Mo. CME Term SOFR + CSA + 0.19% (a) | | | |
| WaMu Mortgage Pass-Through Certificates Trust |
| Series 2006-AR3, Class A1A, 12 Mo. Treasury Average + 1.00% (a) | | | |
| Washington Mutual Mortgage Pass-Through Certificates WMALT Trust |
| Series 2006-AR6, Class 2A, 12 Mo. Treasury Average + 0.96% (a) | | | |
| | |
| Commercial Mortgage-Backed Securities — 12.4% | |
| |
| Series 2024-BNK47, Class C (e) | | | |
| |
| Series 2020-BID, Class D, 1 Mo. CME Term SOFR + CSA + 4.63% (a) (c) | | | |
| Series 2024-5C25, Class AS | | | |
| Series 2024-5C27, Class AS | | | |
| Series 2024-C26, Class AS | | | |
| | | | |
| |
| Series 2020-B18, Class AGNF (c) | | | |
| Series 2024-V8, Class C (e) | | | |
| |
| Series 2013-1515, Class XA, IO (c) (e) | | | |
| BX Commercial Mortgage Trust |
| Series 2020-VIV2, Class C (c) (e) | | | |
| Series 2021-ACNT, Class C, 1 Mo. CME Term SOFR + CSA + 1.50% (a) (c) | | | |
| Series 2021-XL2, Class J, 1 Mo. CME Term SOFR + CSA + 3.89% (a) (c) | | | |
| Series 2024-KING, Class B, 1 Mo. CME Term SOFR + 1.74% (a) (c) | | | |
See Notes to Financial Statements
First Trust TCW Securitized Plus ETF (DEED)Portfolio of Investments (Continued)August 31, 2024 | | | | |
MORTGAGE-BACKED SECURITIES (g) (Continued) |
| Commercial Mortgage-Backed Securities (Continued) | |
| |
| Series 2021-VIEW, Class B, 1 Mo. CME Term SOFR + CSA + 1.80% (a) (c) | | | |
| |
| Series 2021-601L, Class A (c) | | | |
| Citigroup Commercial Mortgage Trust |
| Series 2016-P3, Class XA, IO (e) | | | |
| |
| Series 2012-CR4, Class XA, IO (e) | | | |
| Series 2014-UBS3, Class XA, IO (e) (h) | | | |
| Series 2014-UBS3, Class XB, IO (c) (e) | | | |
| Series 2015-LC21, Class XE, IO (c) (e) | | | |
| Series 2016-787S, Class A (c) | | | |
| Series 2020-CX, Class E (c) (e) | | | |
| Series 2024-277P, Class A (c) | | | |
| Credit Suisse Mortgage Trust |
| Series 2019-UVIL, Class B (c) (e) | | | |
| Series 2021-B33, Class B (c) (e) | | | |
| CSAIL Commercial Mortgage Trust |
| Series 2016-C5, Class XA, IO (e) | | | |
| |
| Series 2017-BRBK, Class A (c) | | | |
| |
| Series 2021-FILE, Class B, 1 Mo. CME Term SOFR + CSA + 1.70% (a) (c) | | | |
| |
| Series 2021-1A, Class GBB, SONIA + 1.65% (GBP) (a) (c) | | | |
| |
| Series 2020-GRCE, Class X, IO (c) (e) | | | |
| GS Mortgage Securities Trust |
| Series 2011-GC5, Class XA, IO (e) (i) | | | |
| Series 2015-GC28, Class XA, IO (e) | | | |
| |
| Series 2016-HHV, Class F (c) (e) | | | |
| JP Morgan Chase Commercial Mortgage Securities Trust |
| Series 2013-LC11, Class XA, IO (e) (h) | | | |
| Series 2014-C20, Class XA, IO (e) (h) (j) | | | |
| Series 2019-OSB, Class A (c) | | | |
| JPMBB Commercial Mortgage Securities Trust |
| Series 2015-C32, Class XA, IO (e) | | | |
| JPMCC Commercial Mortgage Securities Trust |
| Series 2017-JP5, Class XA, IO (e) | | | |
| JPMDB Commercial Mortgage Securities Trust |
| Series 2016-C2, Class XA, IO (e) | | | |
| Last Mile Logistics Pan Euro Finance DAC |
| Series 1A, Class E, 3 Mo. EURIBOR + 2.70% (EUR) (a) (c) | | | |
| Morgan Stanley Bank of America Merrill Lynch Trust |
| Series 2015-C20, Class XA, IO (e) | | | |
| Series 2015-C25, Class XA, IO (e) | | | |
See Notes to Financial Statements
First Trust TCW Securitized Plus ETF (DEED)Portfolio of Investments (Continued)August 31, 2024 | | | | |
MORTGAGE-BACKED SECURITIES (g) (Continued) |
| Commercial Mortgage-Backed Securities (Continued) | |
| SFAVE Commercial Mortgage Securities Trust |
| Series 2015-5AVE, Class A2A (c) (e) | | | |
| Series 2015-5AVE, Class A2B (c) (e) | | | |
| |
| Series 2021-OVA, Class D (c) | | | |
| Series 2021-OVA, Class G (c) | | | |
| |
| Series 2022-MINI, Class F, 1 Mo. CME Term SOFR + 3.35% (a) (c) | | | |
| Series 2022-MINI, Class XCP, IO (e) (i) | | | |
| VLS Commercial Mortgage Trust |
| Series 2020-LAB, Class B (c) | | | |
| Wells Fargo Commercial Mortgage Trust |
| Series 2015-C26, Class XA, IO (e) | | | |
| Series 2015-C27, Class XA, IO (e) | | | |
| Series 2015-C28, Class XA, IO (e) | | | |
| Series 2015-LC22, Class XA, IO (e) | | | |
| Series 2016-C33, Class XA, IO (e) | | | |
| Series 2016-C37, Class XEF, IO (c) (e) | | | |
| WFRBS Commercial Mortgage Trust |
| Series 2014-C22, Class XA, IO (e) (h) | | | |
| Series 2014-C24, Class XA, IO (e) (h) | | | |
| | |
| Total Mortgage-Backed Securities | |
| | |
ASSET-BACKED SECURITIES — 15.6% |
| |
| Series 2020-SFR1, Class F (c) | | | |
| Series 2020-SFR3, Class G (c) | | | |
| |
| Series 2021-62A, Class B, 3 Mo. CME Term SOFR + CSA + 1.65% (a) (c) | | | |
| Argent Securities, Inc., Asset-Backed Pass-Through Certificates |
| Series 2005-W3, Class M2, 1 Mo. CME Term SOFR + CSA + 0.69% (a) | | | |
| |
| Series 2023-1A, Class A, 3 Mo. CME Term SOFR + 2.30% (a) (c) | | | |
| |
| Series 2022-1A, Class M2, IO (c) | | | |
| Series 2022-1A, Class SUB (c) | | | |
| |
| Series 2022-2A, Class INCB (c) | | | |
| CoreVest American Finance Trust |
| Series 2021-2, Class XA, IO (c) (e) | | | |
| Credit-Based Asset Servicing and Securitization LLC |
| Series 2007-CB6, Class A1, 1 Mo. CME Term SOFR + CSA + 0.12% (a) (c) | | | |
See Notes to Financial Statements
First Trust TCW Securitized Plus ETF (DEED)Portfolio of Investments (Continued)August 31, 2024 | | | | |
ASSET-BACKED SECURITIES (Continued) |
| |
| Series 2019-72A, Class BR, 3 Mo. CME Term SOFR + CSA + 1.65% (a) (c) | | | |
| First Franklin Mortgage Loan Trust |
| Series 2006-FF7, Class 2A4, 1 Mo. CME Term SOFR + CSA + 0.48% (a) | | | |
| |
| Series 2021-1A, Class A2 (c) | | | |
| GoldenTree Loan Management U.S. CLO Ltd. |
| Series 2024-20A, Class B, 3 Mo. CME Term SOFR + 1.80% (a) (c) | | | |
| Golub Capital Partners CLO 42M-R |
| Series 2019-42RA, Class A2R, 3 Mo. CME Term SOFR + 2.75% (a) (c) | | | |
| HSI Asset Securitization Corp. Trust |
| Series 2006-WMC1, Class A4, 1 Mo. CME Term SOFR + CSA + 0.50% (a) | | | |
| Madison Park Funding XLV Ltd. |
| Series 2020-45A, Class BR, 3 Mo. CME Term SOFR + CSA + 1.70% (a) (c) | | | |
| Mastr Asset Backed Securities Trust |
| Series 2007-HE1, Class A4, 1 Mo. CME Term SOFR + CSA + 0.28% (a) | | | |
| Merrill Lynch First Franklin Mortgage Loan Trust |
| Series 2007-1, Class A1, 1 Mo. CME Term SOFR + CSA + 0.28% (a) | | | |
| Series 2007-3, Class A2B, 1 Mo. CME Term SOFR + CSA + 0.26% (a) | | | |
| Merrill Lynch Mortgage Investors Trust |
| Series 2006-HE6, Class A2B, 1 Mo. CME Term SOFR + CSA + 0.30% (a) | | | |
| Series 2006-OPT1, Class A2D, 1 Mo. CME Term SOFR + CSA + 0.48% (a) | | | |
| Morgan Stanley Capital I, Inc., Trust |
| Series 2006-NC2, Class A2D, 1 Mo. CME Term SOFR + CSA + 0.58% (a) | | | |
| Navient Student Loan Trust |
| Series 2015-3, Class B, 30 Day Average SOFR + CSA + 1.50% (a) | | | |
| Series 2019-3A, Class B, 30 Day Average SOFR + CSA + 1.55% (a) (c) | | | |
| Nelnet Student Loan Trust |
| Series 2005-4, Class B, 90 Day Average SOFR + CSA + 0.28% (a) | | | |
| Oakwood Mortgage Investors, Inc. |
| | | | |
| | | | |
| Ownit Mortgage Loan Trust |
| Series 2006-6, Class A2C, 1 Mo. CME Term SOFR + CSA + 0.32% (a) | | | |
| Park Avenue Institutional Advisers CLO Ltd. |
| Series 2018-1A, Class A2R, 3 Mo. CME Term SOFR + CSA + 1.60% (a) (c) | | | |
See Notes to Financial Statements
First Trust TCW Securitized Plus ETF (DEED)Portfolio of Investments (Continued)August 31, 2024 | | | | |
ASSET-BACKED SECURITIES (Continued) |
| |
| Series 2022-RN1, Class A1, steps up to 6.72% on 02/25/25 (c) (k) | | | |
| |
| Series 2021-SFR1, Class H (c) | | | |
| |
| Series 2021-11, Class A1, steps up to 5.49% on 11/25/24 (c) (k) | | | |
| Series 2021-3, Class A1, steps up to 5.87% on 04/25/25 (c) (k) | | | |
| Sabey Data Center Issuer LLC |
| Series 2020-1, Class A2 (c) | | | |
| Saxon Asset Securities Trust |
| Series 2005-1, Class M2, 1 Mo. CME Term SOFR + CSA + 0.72% (a) | | | |
| Securitized Asset Backed Receivables LLC Trust |
| Series 2006-NC2, Class A3, 1 Mo. CME Term SOFR + CSA + 0.48% (a) | | | |
| Series 2007-NC2, Class A2B, 1 Mo. CME Term SOFR + CSA + 0.28% (a) | | | |
| |
| Series 2008-4, Class B, 90 Day Average SOFR + CSA + 1.85% (a) | | | |
| Series 2008-5, Class B, 90 Day Average SOFR + CSA + 1.85% (a) | | | |
| Soundview Home Loan Trust |
| Series 2007-OPT3, Class 1A1, 1 Mo. CME Term SOFR + CSA + 0.17% (a) | | | |
| Specialty Underwriting & Residential Finance Trust |
| Series 2006-AB3, Class A2C, 1 Mo. CME Term SOFR + CSA + 0.48% (a) | | | |
| |
| Series 2021-3A, Class SUB (c) | | | |
| Structured Asset Securities Corp. Mortgage Loan Trust |
| Series 2006-OPT1, Class A1, 1 Mo. CME Term SOFR + CSA + 0.18% (a) | | | |
| Textainer Marine Containers VII Ltd. |
| Series 2020-3A, Class A (c) | | | |
| |
| Series 2018-1A, Class A2R, 3 Mo. CME Term SOFR + 1.75% (a) (c) | | | |
| |
| Series 2017-2A, Class A2AR, 3 Mo. CME Term SOFR + CSA + 1.65% (a) (c) | | | |
| Wachovia Student Loan Trust |
| Series 2006-1, Class B, 90 Day Average SOFR + CSA + 0.24% (a) (c) | | | |
| Total Asset-Backed Securities | |
| | |
U.S. GOVERNMENT BONDS AND NOTES — 10.3% |
| | | | |
| | | | |
| | | | |
| | | | |
See Notes to Financial Statements
First Trust TCW Securitized Plus ETF (DEED)Portfolio of Investments (Continued)August 31, 2024 | | | | |
U.S. GOVERNMENT BONDS AND NOTES (Continued) |
| | | | |
| | | | |
| Total U.S. Government Bonds and Notes | |
| | |
| | |
MONEY MARKET FUNDS — 8.9% |
| Dreyfus Government Cash Management Fund, Institutional Shares - 5.19% (l) | |
| | |
|
|
| Total Investments — 126.8% | |
| | |
| Net Other Assets and Liabilities — (26.8)% | |
| | |
Forward Foreign Currency Contracts at August 31, 2024 (See Note 2D - Forward Foreign Currency Contracts in the Notes to Financial Statements):
| | | | Purchase Value
as of
8/31/2024 | | Unrealized
Appreciation
(Depreciation) |
| | | | | | | | |
| | | | | | | | |
Net Unrealized Appreciation (Depreciation) | |
Futures Contracts at August 31, 2024 (See Note 2C - Futures Contracts in the Notes to Financial Statements):
| | | | Unrealized
Appreciation
(Depreciation)/
Value |
U.S. 2-Year Treasury Notes | | | | |
U.S. 5-Year Treasury Notes | | | | |
Ultra 10-Year U.S. Treasury Notes | | | | |
| | | | |
| | | | |
Ultra U.S. Treasury Bond Futures | | | | |
| | | | |
| Floating or variable rate security. |
| |
| This security, sold within the terms of a private placement memorandum, is exempt from registration upon resale under Rule 144A of the Securities Act of 1933, as amended (the “1933 Act”), and may be resold in transactions exempt from registration, normally to qualified institutional buyers. Pursuant to procedures adopted by the Trust’s Board of Trustees, this security has been determined to be liquid by First Trust Advisors L.P. (the “Advisor”). Although market instability can result in periods of increased overall market illiquidity, liquidity for each security is determined based on security specific factors and assumptions, which require subjective judgment. At August 31, 2024, securities noted as such amounted to $16,088,917 or 22.1% of net assets. |
| Inverse floating rate security. |
| Collateral Strip Rate security. Coupon is based on the weighted net interest rate of the investment’s underlying collateral. The interest rate resets periodically. |
See Notes to Financial Statements
First Trust TCW Securitized Plus ETF (DEED)Portfolio of Investments (Continued)August 31, 2024 | All or a portion of this security is part of a mortgage dollar roll agreement (see Note 2J - Mortgage Dollar Rolls in the Notes to Financial Statements). |
| Principal Value is in U.S. dollars unless otherwise indicated in the security description. |
| Pursuant to procedures adopted by the Trust’s Board of Trustees, this security has been determined to be illiquid by the Advisor. |
| This security, sold within the terms of a private placement memorandum, is exempt from registration upon resale under Rule 144A of the 1933 Act, and may be resold in transactions exempt from registration, normally to qualified institutional buyers (see Note 2K - Restricted Securities in the Notes to Financial Statements). |
| This security is fair valued by the Advisor’s Pricing Committee in accordance with procedures approved by the Trust’s Board of Trustees, and in accordance with provisions of the Investment Company Act of 1940 and rules thereunder, as amended. At August 31, 2024, securities noted as such are valued at $31 or 0.0% of net assets. |
| Step-up security. A security where the coupon increases or steps up at a predetermined date. |
| Rate shown reflects yield as of August 31, 2024. |
Abbreviations throughout the Portfolio of Investments: |
| |
| – Chicago Mercantile Exchange |
| – Credit Spread Adjustment |
| |
| – Euro Interbank Offered Rate |
| |
| – Goldman Sachs International, London |
| – Interest-Only Security - Principal amount shown represents par value on which interest payments are based |
| – Principal-Only Security |
| – Real Estate Mortgage Investment Conduit |
| – Secured Overnight Financing Rate |
| – Sterling Overnight Index Average |
| – Structured Agency Credit Risk |
| – To-Be-Announced Security |
| |
Valuation InputsA summary of the inputs used to value the Fund’s investments as of August 31, 2024 is as follows (see Note 2A - Portfolio Valuation in the Notes to Financial Statements):
|
| | | Level 2
Significant
Observable
Inputs | Level 3
Significant
Unobservable
Inputs |
U.S. Government Agency Mortgage-Backed Securities | | | | |
Mortgage-Backed Securities | | | | |
| | | | |
U.S. Government Bonds and Notes | | | | |
| | | | |
| | | | |
| | | | |
| | | | |
See Notes to Financial Statements
First Trust TCW Securitized Plus ETF (DEED)Portfolio of Investments (Continued)August 31, 2024 |
| | | Level 2
Significant
Observable
Inputs | Level 3
Significant
Unobservable
Inputs |
Forward Foreign Currency Contracts | | | | |
| | | | |
| | | | |
| Includes cumulative appreciation/depreciation on futures contracts as reported in the Futures Contracts table. Only the current day’s variation margin is presented on the Statements of Assets and Liabilities. |
See Notes to Financial Statements
First Trust TCW Emerging Markets Debt ETF (EFIX)Portfolio of InvestmentsAugust 31, 2024
| | | | |
FOREIGN SOVEREIGN BONDS AND NOTES (a) — 67.5% |
| | |
| Angolan Government International Bond (b) | | | |
| Angolan Government International Bond (c) | | | |
| Angolan Government International Bond (c) | | | |
| | |
| | |
| Argentine Republic Government International Bond, steps up to 1.75% on 07/09/27 (d) | | | |
| Argentine Republic Government International Bond, steps up to 4.75% on 07/09/27 (d) | | | |
| Argentine Republic Government International Bond | | | |
| Argentine Republic Government International Bond, steps up to 4.88% on 07/09/29 (d) | | | |
| | |
| | |
| Republic of Azerbaijan International Bond (c) | | | |
| | |
| Bahamas Government International Bond (c) | | | |
| Bahamas Government International Bond (c) | | | |
| | |
| | |
| Bahrain Government International Bond (c) | | | |
| Bahrain Government International Bond (b) | | | |
| | |
| | |
| Brazilian Government International Bond | | | |
| Brazilian Government International Bond | | | |
| Brazilian Government International Bond | | | |
| | |
| | |
| Chile Government International Bond | | | |
| | |
| Colombia Government International Bond | | | |
| Colombia Government International Bond | | | |
| Colombia Government International Bond | | | |
| Colombia Government International Bond | | | |
| | |
| | |
| Costa Rica Government International Bond (b) | | | |
| Dominican Republic — 2.9% | |
| Dominican Republic International Bond (b) | | | |
| Dominican Republic International Bond (b) | | | |
| Dominican Republic International Bond (c) | | | |
| Dominican Republic International Bond (c) | | | |
| | |
| | |
| Ecuador Government International Bond (c) | | | |
| Ecuador Government International Bond (c) | | | |
See Notes to Financial Statements
First Trust TCW Emerging Markets Debt ETF (EFIX)Portfolio of Investments (Continued)August 31, 2024 | | | | |
FOREIGN SOVEREIGN BONDS AND NOTES (a) (Continued) |
| | |
| Ecuador Government International Bond, steps up to 6.90% on 07/31/25 (b) (d) | | | |
| Ecuador Government International Bond, steps up to 6.90% on 07/31/25 (c) (d) | | | |
| Ecuador Government International Bond, steps up to 5.50% on 07/31/26 (c) (d) | | | |
| | |
| | |
| Egypt Government International Bond (c) | | | |
| Egypt Government International Bond (b) | | | |
| Egypt Government International Bond (c) | | | |
| Egypt Government International Bond (c) | | | |
| Egypt Government International Bond (c) | | | |
| | |
| | |
| El Salvador Government International Bond (c) | | | |
| El Salvador Government International Bond (c) | | | |
| El Salvador Government International Bond (c) | | | |
| El Salvador Government International Bond (c) | | | |
| El Salvador Government International Bond (c) | | | |
| El Salvador Government International Bond (c) | | | |
| | |
| | |
| Gabon Government International Bond (c) | | | |
| | |
| Ghana Government International Bond (c) (f) | | | |
| Ghana Government International Bond (c) (f) | | | |
| Ghana Government International Bond (c) (f) | | | |
| | |
| | |
| Guatemala Government Bond (c) | | | |
| Guatemala Government Bond (b) | | | |
| Guatemala Government Bond (c) | | | |
| Guatemala Government Bond (b) | | | |
| | |
| | |
| Hungary Government International Bond (b) | | | |
| Magyar Export-Import Bank Zrt (b) | | | |
| | |
| | |
| Indonesia Government International Bond | | | |
| Indonesia Government International Bond | | | |
| Indonesia Government International Bond | | | |
| Indonesia Government International Bond | | | |
| Perusahaan Penerbit SBSN Indonesia III (b) | | | |
| Perusahaan Penerbit SBSN Indonesia III (b) | | | |
| | |
See Notes to Financial Statements
First Trust TCW Emerging Markets Debt ETF (EFIX)Portfolio of Investments (Continued)August 31, 2024 | | | | |
FOREIGN SOVEREIGN BONDS AND NOTES (a) (Continued) |
| | |
| Israel Government International Bond | | | |
| Israel Government International Bond | | | |
| Israel Government International Bond | | | |
| | |
| Ivory Coast (Cote d’Ivoire) — 1.4% | |
| Ivory Coast Government International Bond (c) | | | |
| Ivory Coast Government International Bond (b) | | | |
| | |
| | |
| Jamaica Government International Bond | | | |
| Jamaica Government International Bond | | | |
| | |
| | |
| Jordan Government International Bond (c) | | | |
| | |
| Republic of Kenya Government International Bond (c) | | | |
| | |
| Mexico Government International Bond | | | |
| Mexico Government International Bond | | | |
| | |
| | |
| Morocco Government International Bond (b) | | | |
| | |
| Mozambique International Bond (c) | | | |
| | |
| Nigeria Government International Bond (b) | | | |
| Nigeria Government International Bond (c) | | | |
| Nigeria Government International Bond (c) | | | |
| | |
| | |
| Oman Government International Bond (c) | | | |
| Oman Government International Bond (c) | | | |
| Oman Government International Bond (c) | | | |
| | |
| | |
| Pakistan Government International Bond (c) | | | |
| Pakistan Government International Bond (c) | | | |
| | |
| | |
| Panama Government International Bond | | | |
| Panama Government International Bond | | | |
| Panama Government International Bond | | | |
| Panama Government International Bond | | | |
| Panama Government International Bond | | | |
| Panama Government International Bond | | | |
| | |
See Notes to Financial Statements
First Trust TCW Emerging Markets Debt ETF (EFIX)Portfolio of Investments (Continued)August 31, 2024 | | | | |
FOREIGN SOVEREIGN BONDS AND NOTES (a) (Continued) |
| | |
| Paraguay Government International Bond (c) | | | |
| Paraguay Government International Bond (b) | | | |
| | |
| | |
| Peruvian Government International Bond | | | |
| Peruvian Government International Bond | | | |
| Peruvian Government International Bond | | | |
| Peruvian Government International Bond | | | |
| | |
| | |
| Philippine Government International Bond | | | |
| Philippine Government International Bond | | | |
| | |
| | |
| Republic of Poland Government International Bond | | | |
| Republic of Poland Government International Bond | | | |
| Republic of Poland Government International Bond | | | |
| Republic of Poland Government International Bond | | | |
| | |
| | |
| Romanian Government International Bond (b) | | | |
| Romanian Government International Bond (b) | | | |
| Romanian Government International Bond (b) | | | |
| Romanian Government International Bond (b) | | | |
| Romanian Government International Bond (b) | | | |
| | |
| | |
| Saudi Government International Bond (c) | | | |
| Saudi Government International Bond (b) | | | |
| | |
| | |
| Republic of South Africa Government International Bond | | | |
| Republic of South Africa Government International Bond | | | |
| Republic of South Africa Government International Bond | | | |
| Republic of South Africa Government International Bond | | | |
| | |
| | |
| Hazine Mustesarligi Varlik Kiralama AS (b) | | | |
| Istanbul Metropolitan Municipality (b) | | | |
| Turkiye Government International Bond | | | |
| Turkiye Government International Bond | | | |
| | |
| | |
| Ukraine Government International Bond, steps up to 4.50% on 08/01/25 (b) (d) | | | |
| Ukraine Government International Bond, steps up to 3.00% on 02/01/27 (b) (d) | | | |
See Notes to Financial Statements
First Trust TCW Emerging Markets Debt ETF (EFIX)Portfolio of Investments (Continued)August 31, 2024 | | | | |
FOREIGN SOVEREIGN BONDS AND NOTES (a) (Continued) |
| | |
| Ukraine Government International Bond, steps up to 3.00% on 02/01/27 (b) (d) | | | |
| Ukraine Government International Bond, steps up to 4.50% on 08/01/25 (b) (d) | | | |
| Ukraine Government International Bond, steps up to 3.00% on 02/01/27 (b) (d) | | | |
| Ukraine Government International Bond, steps up to 4.50% on 08/01/25 (b) (d) | | | |
| Ukraine Government International Bond, steps up to 3.00% on 02/01/27 (b) (d) | | | |
| Ukraine Government International Bond, steps up to 4.50% on 08/01/25 (b) (d) | | | |
| Ukraine Government International Bond (c) (g) | | | |
| | |
| United Arab Emirates — 1.8% | |
| Finance Department Government of Sharjah (b) | | | |
| Finance Department Government of Sharjah (b) | | | |
| Finance Department Government of Sharjah (c) | | | |
| | |
| | |
| Uruguay Government International Bond | | | |
| Uruguay Government International Bond | | | |
| | |
| | |
| Republic of Uzbekistan International Bond (c) | | | |
| | |
| Venezuela Government International Bond (c) (f) | | | |
| Venezuela Government International Bond (c) (f) | | | |
| Venezuela Government International Bond (c) (f) | | | |
| Venezuela Government International Bond (f) | | | |
| Venezuela Government International Bond (c) (f) | | | |
| Venezuela Government International Bond (c) (f) | | | |
| | |
| Total Foreign Sovereign Bonds and Notes | |
| | |
FOREIGN CORPORATE BONDS AND NOTES (a) — 28.3% |
| | |
| Air Baltic Corp. AS (EUR) (b) | | | |
| | |
| | | | |
| Bank Gospodarstwa Krajowego (b) | | | |
| Bank Gospodarstwa Krajowego (b) | | | |
| BBVA Bancomer S.A. (c) (h) | | | |
| Turkiye Vakiflar Bankasi TAO (b) (h) | | | |
| Turkiye Vakiflar Bankasi TAO (b) (h) | | | |
| Yapi ve Kredi Bankasi AS (b) (h) | | | |
| Yapi ve Kredi Bankasi AS (b) (h) | | | |
| | |
See Notes to Financial Statements
First Trust TCW Emerging Markets Debt ETF (EFIX)Portfolio of Investments (Continued)August 31, 2024 | | | | |
FOREIGN CORPORATE BONDS AND NOTES (a) (Continued) |
| Building Materials — 0.5% | |
| | | | |
| | |
| | | | |
| | |
| | | | |
| | | | |
| Engie Energia Chile S.A. (b) | | | |
| Eskom Holdings SOC Ltd. (c) | | | |
| Mazoon Assets Co. SAOC (b) | | | |
| | | | |
| | |
| Engineering & Construction — 0.5% | |
| TAV Havalimanlari Holding AS (c) | | | |
| | |
| Minerva Luxembourg S.A. (b) | | | |
| | |
| China Oil & Gas Group Ltd. (c) | | | |
| | |
| | | | |
| Samarco Mineracao S.A., (9.00% PIK) (b) (j) | | | |
| | |
| | |
| Fortune Star BVI Ltd. (c) | | | |
| | |
| | | | |
| Corp. Nacional del Cobre de Chile (c) | | | |
| Corp. Nacional del Cobre de Chile (c) | | | |
| Corp. Nacional del Cobre de Chile (c) | | | |
| Corp. Nacional del Cobre de Chile (c) | | | |
| First Quantum Minerals Ltd. (b) | | | |
| First Quantum Minerals Ltd. (b) | | | |
| Freeport Indonesia PT (b) | | | |
| | |
| | |
| | | | |
| | | | |
| Empresa Nacional del Petroleo (b) | | | |
| KazMunayGas National Co. JSC (c) | | | |
| KazMunayGas National Co. JSC (c) | | | |
| KazMunayGas National Co. JSC (c) | | | |
| NAK Naftogaz Ukraine via Kondor Finance PLC (c) | | | |
| Petroleos de Venezuela S.A. (c) (f) | | | |
| Petroleos de Venezuela S.A. (c) (f) | | | |
| Petroleos de Venezuela S.A. (c) (f) | | | |
| | | | |
| | | | |
| | | | |
| | | | |
See Notes to Financial Statements
First Trust TCW Emerging Markets Debt ETF (EFIX)Portfolio of Investments (Continued)August 31, 2024 | | | | |
FOREIGN CORPORATE BONDS AND NOTES (a) (Continued) |
| | |
| | | | |
| | | | |
| | | | |
| | | | |
| | | | |
| Saudi Arabian Oil Co. (b) | | | |
| | |
| Oil & Gas Services — 0.3% | |
| Yinson Boronia Production B.V. (b) | | | |
| | |
| Acu Petroleo Luxembourg Sarl (b) | | | |
| Galaxy Pipeline Assets Bidco Ltd. (b) | | | |
| Galaxy Pipeline Assets Bidco Ltd. (b) | | | |
| Greensaif Pipelines Bidco Sarl (b) | | | |
| | |
| | |
| | | | |
| Total Foreign Corporate Bonds and Notes | |
| | |
CORPORATE BONDS AND NOTES — 0.9% |
| | |
| Stillwater Mining Co. (c) | | | |
| | |
| Gran Tierra Energy, Inc. (b) | | | |
| Total Corporate Bonds and Notes | |
| | |
| | |
MONEY MARKET FUNDS — 2.0% |
| Dreyfus Government Cash Management Fund, Institutional Shares - 5.19% (k) | |
| | |
|
|
| Total Investments — 98.7% | |
| | |
| Net Other Assets and Liabilities — 1.3% | |
| | |
Forward Foreign Currency Contracts at August 31, 2024 (See Note 2D - Forward Foreign Currency Contracts in the Notes to Financial Statements):
| | | | Purchase Value
as of
8/31/2024 | | Unrealized
Appreciation
(Depreciation) |
| | | | | | | | |
See Notes to Financial Statements
First Trust TCW Emerging Markets Debt ETF (EFIX)Portfolio of Investments (Continued)August 31, 2024 | Principal Value is in U.S. dollars unless otherwise indicated in the security description. |
| This security, sold within the terms of a private placement memorandum, is exempt from registration upon resale under Rule 144A of the Securities Act of 1933, as amended (the “1933 Act”), and may be resold in transactions exempt from registration, normally to qualified institutional buyers. Pursuant to procedures adopted by the Trust’s Board of Trustees, this security has been determined to be liquid by First Trust Advisors L.P. (the “Advisor”). Although market instability can result in periods of increased overall market illiquidity, liquidity for each security is determined based on security specific factors and assumptions, which require subjective judgment. At August 31, 2024, securities noted as such amounted to $14,076,953 or 33.6% of net assets. |
| This security may be resold to qualified foreign investors and foreign institutional buyers under Regulation S of the 1933 Act. |
| Step-up security. A security where the coupon increases or steps up at a predetermined date. |
| |
| This issuer is in default and interest is not being accrued by the Fund. |
| Floating or variable rate security. |
| Fixed-to-floating or fixed-to-variable rate security. The interest rate shown reflects the fixed rate in effect at August 31, 2024. At a predetermined date, the fixed rate will change to a floating rate or a variable rate. |
| |
| The issuer will pay interest in cash and/or in PIK interest. |
| Rate shown reflects yield as of August 31, 2024. |
Abbreviations throughout the Portfolio of Investments: |
| |
| – Morgan Stanley Capital Services LLC |
| |
| |
Valuation InputsA summary of the inputs used to value the Fund’s investments as of August 31, 2024 is as follows (see Note 2A - Portfolio Valuation in the Notes to Financial Statements):
|
| | | Level 2
Significant
Observable
Inputs | Level 3
Significant
Unobservable
Inputs |
Foreign Sovereign Bonds and Notes* | | | | |
Foreign Corporate Bonds and Notes** | | | | |
Corporate Bonds and Notes** | | | | |
| | | | |
| | | | |
|
| | | Level 2
Significant
Observable
Inputs | Level 3
Significant
Unobservable
Inputs |
Forward Foreign Currency Contracts | | | | |
| See Portfolio of Investments for country breakout. |
| See Portfolio of Investments for industry breakout. |
See Notes to Financial Statements
First Trust Exchange-Traded Fund VIIIStatements of Assets and Liabilities
August 31, 2024
| First Trust TCW Opportunistic Fixed Income ETF
(FIXD) | First Trust TCW Unconstrained Plus Bond ETF
(UCON) | First Trust TCW Securitized Plus ETF
(DEED) | First Trust TCW Emerging Markets Debt ETF
(EFIX) |
| | | | |
| | | | |
| | | | |
Cash segregated as collateral for open swap contracts | | | | |
Cash segregated as collateral for open futures contracts | | | | |
Unrealized appreciation on forward foreign currency contracts | | | | |
| | | | |
Investment securities sold | | | | |
| | | | |
| | | | |
| | | | |
| | | | |
| | | | |
|
| | | | |
| | | | |
| | | | |
Unrealized depreciation on forward foreign currency contracts | | | | |
| | | | |
Investment securities purchased | | | | |
| | | | |
| | | | |
| | | | |
| | | | |
| | | | |
|
| | | | |
| | | | |
| | | | |
Accumulated distributable earnings (loss) | | | | |
| | | | |
NET ASSET VALUE, per share | | | | |
Number of shares outstanding (unlimited number of shares authorized, par value $0.01 per share) | | | | |
| | | | |
See Notes to Financial Statements
First Trust Exchange-Traded Fund VIIIStatements of Operations
For the Year Ended August 31, 2024
| First Trust TCW Opportunistic Fixed Income ETF
(FIXD) | First Trust TCW Unconstrained Plus Bond ETF
(UCON) | First Trust TCW Securitized Plus ETF
(DEED) | First Trust TCW Emerging Markets Debt ETF
(EFIX) |
| | | | |
| | | | |
| | | | |
| | | | |
| | | | |
|
| | | | |
| | | | |
| | | | |
NET INVESTMENT INCOME (LOSS) | | | | |
|
NET REALIZED AND UNREALIZED GAIN (LOSS): | | | | |
Net realized gain (loss) on: | | | | |
| | | | |
| | | | |
Forward foreign currency contracts | | | | |
| | | | |
Foreign currency transactions | | | | |
| | | | |
Net change in unrealized appreciation (depreciation) on: | | | | |
| | | | |
| | | | |
Forward foreign currency contracts | | | | |
| | | | |
Foreign currency translation | | | | |
Net change in unrealized appreciation (depreciation) | | | | |
NET REALIZED AND UNREALIZED GAIN (LOSS) | | | | |
NET INCREASE (DECREASE) IN NET ASSETS RESULTING FROM OPERATIONS | | | | |
See Notes to Financial Statements
This page intentionally left blank.
First Trust Exchange-Traded Fund VIIIStatements of Changes in Net Assets
| First Trust TCW Opportunistic Fixed Income ETF (FIXD) | First Trust TCW Unconstrained Plus Bond ETF (UCON) |
| | | | |
| | | | |
Net investment income (loss) | | | | |
| | | | |
Net change in unrealized appreciation (depreciation) | | | | |
Net increase (decrease) in net assets resulting from operations | | | | |
|
DISTRIBUTIONS TO SHAREHOLDERS FROM: | | | | |
| | | | |
| | | | |
Total distributions to shareholders | | | | |
|
SHAREHOLDER TRANSACTIONS: | | | | |
Proceeds from shares sold | | | | |
| | | | |
Net increase (decrease) in net assets resulting from shareholder transactions | | | | |
Total increase (decrease) in net assets | | | | |
|
| | | | |
| | | | |
| | | | |
|
CHANGES IN SHARES OUTSTANDING: | | | | |
Shares outstanding, beginning of period | | | | |
| | | | |
| | | | |
Shares outstanding, end of period | | | | |
See Notes to Financial Statements
First Trust TCW Securitized Plus ETF (DEED) | First Trust TCW Emerging Markets Debt ETF (EFIX) |
| | | |
| | | |
| | | |
| | | |
| | | |
| | | |
|
| | | |
| | | |
| | | |
| | | |
|
| | | |
| | | |
| | | |
| | | |
| | | |
|
| | | |
| | | |
| | | |
|
| | | |
| | | |
| | | |
| | | |
| | | |
See Notes to Financial Statements
First Trust Exchange-Traded Fund VIIIFinancial Highlights
For a share outstanding throughout each period First Trust TCW Opportunistic Fixed Income ETF (FIXD)
| |
| | | | | |
Net asset value, beginning of period | | | | | |
Income from investment operations: | | | | | |
Net investment income (loss) | | | | | |
Net realized and unrealized gain (loss) | | | | | |
Total from investment operations | | | | | |
Distributions paid to shareholders from: | | | | | |
| | | | | |
| | | | | |
| | | | | |
| | | | | |
Net asset value, end of period | | | | | |
| | | | | |
|
Ratios to average net assets/supplemental data: | | | | | |
Net assets, end of period (in 000’s) | | | | | |
Ratio of total expenses to average net assets | | | | | |
Ratio of net expenses to average net assets | | | | | |
Ratio of net investment income (loss) to average net assets | | | | | |
Portfolio turnover rate (c) (d) | | | | | |
| Based on average shares outstanding. |
| Total return is calculated assuming an initial investment made at the net asset value at the beginning of the period, reinvestment of all distributions at net asset value during the period, and redemption at net asset value on the last day of the period. The returns presented do not reflect the deduction of taxes that a shareholder would pay on Fund distributions or the redemption or sale of Fund shares. Total return is calculated for the time period presented and is not annualized for periods of less than a year. The total returns would have been lower if certain fees had not been waived by the investment advisor. |
| Portfolio turnover is calculated for the time period presented and is not annualized for periods of less than a year and does not include securities received or delivered from processing creations or redemptions and in-kind transactions. |
| The portfolio turnover rate not including mortgage dollar rolls was 345%, 290%, 271%, 282% and 270% for the years ending August 31, 2024, August 31, 2023, August 31, 2022, August 31, 2021 and August 31, 2020 respectively. |
See Notes to Financial Statements
First Trust Exchange-Traded Fund VIIIFinancial Highlights (Continued)
For a share outstanding throughout each period First Trust TCW Unconstrained Plus Bond ETF (UCON)
| |
| | | | | |
Net asset value, beginning of period | | | | | |
Income from investment operations: | | | | | |
Net investment income (loss) | | | | | |
Net realized and unrealized gain (loss) | | | | | |
Total from investment operations | | | | | |
Distributions paid to shareholders from: | | | | | |
| | | | | |
| | | | | |
| | | | | |
Net asset value, end of period | | | | | |
| | | | | |
|
Ratios to average net assets/supplemental data: | | | | | |
Net assets, end of period (in 000’s) | | | | | |
Ratio of total expenses to average net assets | | | | | |
Ratio of net expenses to average net assets | | | | | |
Ratio of net investment income (loss) to average net assets | | | | | |
Portfolio turnover rate (c) (d) | | | | | |
| Based on average shares outstanding. |
| Total return is calculated assuming an initial investment made at the net asset value at the beginning of the period, reinvestment of all distributions at net asset value during the period, and redemption at net asset value on the last day of the period. The returns presented do not reflect the deduction of taxes that a shareholder would pay on Fund distributions or the redemption or sale of Fund shares. Total return is calculated for the time period presented and is not annualized for periods of less than a year. The total returns would have been lower if certain fees had not been waived by the investment advisor. |
| Portfolio turnover is calculated for the time period presented and is not annualized for periods of less than a year and does not include securities received or delivered from processing creations or redemptions and in-kind transactions. |
| The portfolio turnover rate not including mortgage dollar rolls was 138%, 33%, 43%, 40%, and 67% for the years ending August 31, 2024, August 31, 2023, August 31, 2022, August 31, 2021, and August 31, 2020 respectively. |
See Notes to Financial Statements
First Trust Exchange-Traded Fund VIIIFinancial Highlights (Continued)
For a share outstanding throughout each period First Trust TCW Securitized Plus ETF (DEED)
| | Period
Ended
8/31/2020 (a) |
| | | | |
Net asset value, beginning of period | | | | | |
Income from investment operations: | | | | | |
Net investment income (loss) | | | | | |
Net realized and unrealized gain (loss) | | | | | |
Total from investment operations | | | | | |
Distributions paid to shareholders from: | | | | | |
| | | | | |
| | | | | |
| | | | | |
| | | | | |
Net asset value, end of period | | | | | |
| | | | | |
|
Ratios to average net assets/supplemental data: | | | | | |
Net assets, end of period (in 000’s) | | | | | |
Ratio of total expenses to average net assets | | | | | |
Ratio of net expenses to average net assets | | | | | |
Ratio of net investment income (loss) to average net assets | | | | | |
Portfolio turnover rate (e) (f) | | | | | |
| Inception date is April 29, 2020, which is consistent with the commencement of investment operations and is the date the initial creation units were established. |
| Based on average shares outstanding. |
| Total return is calculated assuming an initial investment made at the net asset value at the beginning of the period, reinvestment of all distributions at net asset value during the period, and redemption at net asset value on the last day of the period. The returns presented do not reflect the deduction of taxes that a shareholder would pay on Fund distributions or the redemption or sale of Fund shares. Total return is calculated for the time period presented and is not annualized for periods of less than a year. The total returns would have been lower if certain fees had not been waived by the investment advisor. |
| |
| Portfolio turnover is calculated for the time period presented and is not annualized for periods of less than a year and does not include securities received or delivered from processing creations or redemptions and in-kind transactions. |
| The portfolio turnover rate not including mortgage dollar rolls was 130%, 93%, 272%, 299% and 21% for the periods ending August 31, 2024, August 31, 2023, August 31, 2022, August 31, 2021 and August 31, 2020, respectively. |
See Notes to Financial Statements
First Trust Exchange-Traded Fund VIIIFinancial Highlights (Continued)
For a share outstanding throughout each period First Trust TCW Emerging Markets Debt ETF (EFIX)
| | Period
Ended
8/31/2021 (a) |
| | | |
Net asset value, beginning of period | | | | |
Income from investment operations: | | | | |
Net investment income (loss) | | | | |
Net realized and unrealized gain (loss) | | | | |
Total from investment operations | | | | |
Distributions paid to shareholders from: | | | | |
| | | | |
| | | | |
| | | | |
Net asset value, end of period | | | | |
| | | | |
|
Ratios to average net assets/supplemental data: | | | | |
Net assets, end of period (in 000’s) | | | | |
Ratio of total expenses to average net assets | | | | |
Ratio of net expenses to average net assets | | | | |
Ratio of net investment income (loss) to average net assets | | | | |
Portfolio turnover rate (e) | | | | |
| Inception date is February 17, 2021, which is consistent with the commencement of investment operations and is the date the initial creation units were established. |
| Based on average shares outstanding. |
| Total return is calculated assuming an initial investment made at the net asset value at the beginning of the period, reinvestment of all distributions at net asset value during the period, and redemption at net asset value on the last day of the period. The returns presented do not reflect the deduction of taxes that a shareholder would pay on Fund distributions or the redemption or sale of Fund shares. Total return is calculated for the time period presented and is not annualized for periods of less than a year. The total returns would have been lower if certain fees had not been waived by the investment advisor. |
| |
| Portfolio turnover is calculated for the time period presented and is not annualized for periods of less than a year and does not include securities received or delivered from processing creations or redemptions and in-kind transactions. |
See Notes to Financial Statements
Notes to Financial Statements
First Trust Exchange-Traded Fund VIIIAugust 31, 2024 1. Organization
First Trust Exchange-Traded Fund VIII (the “Trust”) is an open-end management investment company organized as a Massachusetts business trust on February 22, 2016, and is registered with the Securities and Exchange Commission under the Investment Company Act of 1940, as amended (the “1940 Act”).
This report covers the four funds (each a “Fund” and collectively, the “Funds”), each a diversified series of the Trust, listed below:
First Trust TCW Opportunistic Fixed Income ETF – (Nasdaq, Inc. (“Nasdaq”) ticker “FIXD”) |
First Trust TCW Unconstrained Plus Bond ETF – (NYSE Arca, Inc. (“NYSE Arca”) ticker “UCON”) |
First Trust TCW Securitized Plus ETF – (NYSE Arca ticker “DEED”) |
First Trust TCW Emerging Markets Debt ETF – (NYSE Arca ticker “EFIX”) |
Each Fund represents a separate series of shares of beneficial interest in the Trust. Unlike conventional mutual funds, each Fund issues and redeems shares on a continuous basis, at net asset value (“NAV”), only in large blocks of shares known as “Creation Units.”
Each Fund is an actively managed exchange-traded fund. FIXD’s, UCON’s, and DEED’s investment objective is to seek to maximize long-term total return. EFIX’s investment objective is to seek to provide high total return from current income and capital appreciation. Each of FIXD and UCON seeks to achieve its investment objective by investing, under normal market conditions, at least 80% of its net assets (including investment borrowings) in fixed income securities. DEED seeks to achieve its investment objective by investing, under normal market conditions, at least 80% of its net assets (including investment borrowings) in securitized debt securities. EFIX seeks to achieve its investment objective by investing, under normal market conditions, at least 80% of its net assets (including investment borrowings) in debt securities issued or guaranteed by companies, financial institutions and government entities located in emerging market countries.
2. Significant Accounting Policies
The Funds are each considered an investment company and follow accounting and reporting guidance under Financial Accounting Standards Board Accounting Standards Codification Topic 946, “Financial Services-Investment Companies.” The following is a summary of significant accounting policies consistently followed by the Funds in the preparation of the financial statements. The preparation of the financial statements in accordance with accounting principles generally accepted in the United States of America (“U.S. GAAP”) requires management to make estimates and assumptions that affect the reported amounts and disclosures in the financial statements. Actual results could differ from those estimates.
Each Fund’s NAV is determined daily as of the close of regular trading on the New York Stock Exchange (“NYSE”), normally 4:00 p.m. Eastern time, on each day the NYSE is open for trading. If the NYSE closes early on a valuation day, the NAV is determined as of that time. Domestic debt securities and foreign securities are priced using data reflecting the earlier closing of the principal markets for those securities. Each Fund’s NAV is calculated by dividing the value of all assets of each Fund (including accrued interest and dividends), less all liabilities (including accrued expenses and dividends declared but unpaid), by the total number of shares outstanding.
Each Fund’s investments are valued daily at market value or, in the absence of market value with respect to any portfolio securities, at fair value. Market value prices represent readily available market quotations such as last sale or official closing prices from a national or foreign exchange (i.e., a regulated market) and are primarily obtained from third-party pricing services. Fair value prices represent any prices not considered market value prices and are either obtained from a third-party pricing service or are determined by the Pricing Committee of the Funds’ investment advisor, First Trust Advisors L.P. (“First Trust” or the “Advisor”), in accordance with valuation procedures approved by the Trust’s Board of Trustees, and in accordance with provisions of the 1940 Act and rules thereunder. Investments valued by the Advisor’s Pricing Committee, if any, are footnoted as such in the footnotes to the Portfolio of Investments. Each Fund’s investments are valued as follows:
Corporate bonds, corporate notes, U.S. government securities, mortgage-backed securities, asset-backed securities, municipal securities, capital preferred securities and other debt securities are fair valued on the basis of valuations provided by dealers who make markets in such securities or by a third-party pricing service approved by the Advisor’s Pricing Committee, which may use the following valuation inputs when available:
Notes to Financial Statements (Continued)
First Trust Exchange-Traded Fund VIIIAugust 31, 2024 7)
reference data including market research publications.
Pricing services generally value fixed-income securities assuming orderly transactions of an institutional round lot size, but a Fund may hold or transact in such securities in smaller, odd lot sizes. Odd lots may trade at lower prices than institutional round lots.
Common stocks and other equity securities listed on any national or foreign exchange (excluding Nasdaq and the London Stock Exchange Alternative Investment Market (“AIM”)) are valued at the last sale price on the exchange on which they are principally traded or, for Nasdaq and AIM securities, the official closing price. Securities traded on more than one securities exchange are valued at the last sale price or official closing price, as applicable, at the close of the securities exchange representing the primary exchange for such securities.
Equity securities traded in an over-the-counter market are valued at the close price or the last trade price.
Options on swaps (“swaptions”) are valued by a third-party pricing service using a mathematical model, which incorporates a number of market data factors, such as the trades and prices of the underlying instruments.
Shares of open-end funds are valued based on NAV per share.
Senior Floating-Rate Loan Interests (“Senior Loans”)(1) are not listed on any securities exchange or board of trade. Senior Loans are typically bought and sold by institutional investors in individually negotiated private transactions that function in many respects like an over-the-counter secondary market, although typically no formal market-makers exist. This market, while having grown substantially since its inception, generally has fewer trades and less liquidity than the secondary market for other types of securities. Some Senior Loans have few or no trades, or trade infrequently, and information regarding a specific Senior Loan may not be widely available or may be incomplete. Accordingly, determinations of the market value of Senior Loans may be based on infrequent and dated information. Because there is less reliable, objective data available, elements of judgment may play a greater role in valuation of Senior Loans than for other types of securities. Typically, Senior Loans are valued using information provided by a third-party pricing service. The third-party pricing service primarily uses over-the-counter pricing from dealer runs and broker quotes from indicative sheets to value the Senior Loans.
Forward foreign currency contracts are valued at the current day’s interpolated foreign exchange rate, as calculated using the current day’s spot rate, and the thirty, sixty, ninety, and one-hundred eighty day forward rates provided by a third-party pricing service.
Exchange-traded futures contracts are valued at the end of the day settlement price.
Exchange-traded options contracts are valued at the closing price in the market where such contracts are principally traded. If no closing price is available, exchange-traded options contracts are valued at the mean of their most recent bid and ask price, if both are available. Options contracts traded in the over-the-counter market may be valued as follows, depending on the market in which the investment trades: (1) the mean of the most recent bid and ask price, if available; or (2) a price based on the equivalent exchange-traded option.
Swaps are fair valued utilizing quotations provided by a third-party pricing service or, if the third-party pricing service does not provide a value, by quotes provided by the selling dealer or financial institution.
Fixed income and other debt securities having a remaining maturity of sixty days or less when purchased are fair valued at cost adjusted for amortization of premiums and accretion of discounts (amortized cost), provided the Advisor’s Pricing Committee has determined that the use of amortized cost is an appropriate reflection of fair value given market and issuer-specific conditions existing at the time of the determination. Factors that may be considered in determining the appropriateness of the use of amortized cost include, but are not limited to, the following:
(1)
The terms “security” and “securities” used throughout the Notes to Financial Statements include Senior Loans.
Notes to Financial Statements (Continued)
First Trust Exchange-Traded Fund VIIIAugust 31, 2024 1)
the credit conditions in the relevant market and changes thereto;
2)
the liquidity conditions in the relevant market and changes thereto;
3)
the interest rate conditions in the relevant market and changes thereto (such as significant changes in interest rates);
4)
issuer-specific conditions (such as significant credit deterioration); and
5)
any other market-based data the Advisor’s Pricing Committee considers relevant. In this regard, the Advisor’s Pricing Committee may use last-obtained market-based data to assist it when valuing portfolio securities using amortized cost.
Certain securities may not be able to be priced by pre-established pricing methods. Such securities may be valued by the Advisor’s Pricing Committee at fair value. These securities generally include, but are not limited to, restricted securities (securities which may not be publicly sold without registration under the Securities Act of 1933, as amended (the “1933 Act”)) for which a third-party pricing service is unable to provide a market price; securities whose trading has been formally suspended; a security whose market or fair value price is not available from a pre-established pricing source; a security with respect to which an event has occurred that is likely to materially affect the value of the security after the market has closed but before the calculation of a Fund’s NAV or make it difficult or impossible to obtain a reliable market quotation; and a security whose price, as provided by the third-party pricing service, does not reflect the security’s fair value. As a general principle, the current fair value of a security would appear to be the amount which the owner might reasonably expect to receive for the security upon its current sale. When fair value prices are used, generally they will differ from market quotations or official closing prices on the applicable exchanges. A variety of factors may be considered in determining the fair value of such securities, including, but not limited to, the following:
1)
the most recent price provided by a pricing service;
2)
available market prices for the fixed-income security;
3)
the fundamental business data relating to the borrower/issuer;
4)
an evaluation of the forces which influence the market in which these securities are purchased and sold;
5)
the type, size and cost of a security;
6)
the financial statements of the borrower/issuer or the financial condition of the country of issue;
7)
the credit quality and cash flow of the borrower/issuer, or country of issue, based on the Pricing Committee’s, TCW Investment Management Company LLC’s (“TCW” or the “Sub-Advisor”) or portfolio manager’s analysis, as applicable, or external analysis;
8)
the information as to any transactions in or offers for the security;
9)
the price and extent of public trading in similar securities of the borrower/issuer, or comparable companies;
11)
the quality, value and salability of collateral, if any, securing the security;
12)
the business prospects of the borrower/issuer, including any ability to obtain money or resources from a parent or affiliate and an assessment of the borrower’s/issuer’s management (for corporate debt only);
13)
the economic, political and social prospects/developments of the country of issue and the assessment of the country’s government leaders/officials (for sovereign debt only);
14)
the prospects for the borrower’s/issuer’s industry, and multiples (of earnings and/or cash flows) being paid for similar businesses in that industry (for corporate debt only);
15)
the borrower’s/issuer’s competitive position within the industry;
16)
the borrower’s/issuer’s ability to access additional liquidity through public and/or private markets; and
17)
other relevant factors.
Because foreign markets may be open on different days than the days during which investors may transact in the shares of a Fund, the value of the Fund’s securities may change on the days when investors are not able to transact in the shares of the Fund. The value of the securities denominated in foreign currencies is converted into U.S. dollars using exchange rates determined daily as of the close of regular trading on the NYSE.
The Funds are subject to fair value accounting standards that define fair value, establish the framework for measuring fair value and provide a three-level hierarchy for fair valuation based upon the inputs to the valuation as of the measurement date. The three levels of the fair value hierarchy are as follows:
Notes to Financial Statements (Continued)
First Trust Exchange-Traded Fund VIIIAugust 31, 2024 • Level 1 – Level 1 inputs are quoted prices in active markets for identical investments. An active market is a market in which transactions for the investment occur with sufficient frequency and volume to provide pricing information on an ongoing basis.
• Level 2 – Level 2 inputs are observable inputs, either directly or indirectly, and include the following:
o Quoted prices for similar investments in active markets.
o Quoted prices for identical or similar investments in markets that are non-active. A non-active market is a market where there are few transactions for the investment, the prices are not current, or price quotations vary substantially either over time or among market makers, or in which little information is released publicly.
o Inputs other than quoted prices that are observable for the investment (for example, interest rates and yield curves observable at commonly quoted intervals, volatilities, prepayment speeds, loss severities, credit risks, and default rates).
o Inputs that are derived principally from or corroborated by observable market data by correlation or other means.
• Level 3 – Level 3 inputs are unobservable inputs. Unobservable inputs may reflect the reporting entity’s own assumptions about the assumptions that market participants would use in pricing the investment.
The inputs or methodologies used for valuing investments are not necessarily an indication of the risk associated with investing in those investments. A summary of the inputs used to value each Fund’s investments as of August 31, 2024, is included with each Fund’s Portfolio of Investments.
B. Securities Transactions and Investment Income
Securities transactions are recorded as of the trade date. Realized gains and losses from securities transactions are recorded on the identified cost basis. Dividend income is recorded on the ex-dividend date. Interest income is recorded daily on the accrual basis. Amortization of premiums and accretion of discounts are recorded using the effective interest method.
The United Kingdom’s Financial Conduct Authority (the “FCA”), which regulates the London Interbank Offered Rates (“LIBOR”), ceased making LIBOR available as a reference rate over a phase-out period that began December 31, 2021. The overnight and 12-month USD LIBOR settings permanently ceased as of June 30, 2023. The FCA announced that the 1-, 3- and 6-month USD LIBOR settings will continue to be published using a synthetic methodology to serve as a fallback for non-U.S. contracts until September 2024. In response to the discontinuation of LIBOR, investors have added fallback provisions to existing contracts for investments whose value is tied to LIBOR, with most fallback provisions requiring the adoption of the Secured Overnight Financing Rate (“SOFR”) as a replacement rate. There is no assurance that any alternative reference rate, including SOFR, will be similar to or produce the same value or economic equivalence as LIBOR or that instruments using an alternative rate will have the same volume or liquidity. At this time, it is not possible to predict the full impact of the elimination of LIBOR and the establishment of an alternative reference rate on the Funds or their investments.
Withholding taxes and tax reclaims on foreign dividends have been provided for in accordance with each Fund’s understanding of the applicable country’s tax rules and rates.
Securities purchased or sold on a when-issued, delayed-delivery or forward purchase commitment basis may have extended settlement periods. The value of the security so purchased is subject to market fluctuations during this period. Each Fund maintains liquid assets with a current value at least equal to the amount of its when-issued, delayed-delivery or forward purchase commitments until payment is made. At August 31, 2024, UCON held $7,108,875 of when-issued or delayed-delivery securities. At August 31, 2024, FIXD, UCON, and DEED held $875,838,124, $293,366,865 and $14,721,312, respectively, of forward purchase commitments.
Each Fund may purchase or sell (i.e., is long or short) exchange-listed futures contracts to hedge against changes in interest rates (interest rate risk). Futures contracts are agreements between a Fund and a counterparty to buy or sell a specific quantity of an underlying instrument at a specified price and at a specified date. Depending on the terms of the contract, futures contracts are settled either through physical delivery of the underlying instrument on the settlement date or by payment of a cash settlement amount on the settlement date. Open futures contracts can also be closed out prior to settlement by entering into an offsetting transaction in a matching futures contract. If a Fund is not able to enter into an offsetting transaction, a Fund will continue to be required to maintain margin deposits on the futures contract. When the contract is closed or expires, a Fund record a realized gain or loss equal to the difference between the value of the contract at the time it was opened and the value at the time it was closed or expired. This gain or loss is included in “Net realized gain (loss) on futures contracts” on the Statements of Operations.
Notes to Financial Statements (Continued)
First Trust Exchange-Traded Fund VIIIAugust 31, 2024 Upon entering into a futures contract, a Fund must deposit funds, called margin, with its custodian in the name of the clearing broker equal to a specified percentage of the current value of the contract. Open futures contracts are marked-to-market daily with the change in value recognized as a component of “Net change in unrealized appreciation (depreciation) on futures contracts” on the Statements of Operations. Pursuant to the contracts, a Fund agrees to receive from or pay to the broker an amount of cash equal to the daily fluctuation in value of the contract. Such receipts or payments are known as variation margin and are included in “Variation margin” payable or receivable on the Statements of Assets and Liabilities.
If market conditions change unexpectedly, a Fund may not achieve the anticipated benefits of the futures contract and may realize a loss. The use of futures contracts involves the risk of imperfect correlation in movements in the price of the futures contracts, interest rates and the underlying instruments.
D. Forward Foreign Currency Contracts
Each Fund is subject to foreign currency risk in the normal course of pursuing its investment objective. Forward foreign currency contracts are agreements between two parties (“Counterparties”) to exchange one currency for another at a future date and at a specified price. Each Fund uses forward foreign currency contracts to facilitate transactions in foreign securities and to manage the Fund’s foreign currency exposure. These contracts are valued daily, and a Fund’s net equity therein, representing unrealized gain or loss on the contracts as measured by the difference between the forward foreign exchange rates at the dates of entry into the contracts and the forward rates at the reporting date, is included in “Unrealized appreciation on forward foreign currency contracts” and “Unrealized depreciation on forward foreign currency contracts” on the Statements of Assets and Liabilities. The change in unrealized appreciation/(depreciation) is included in “Net change in unrealized appreciation (depreciation) on forward foreign currency contracts” on the Statements of Operations. When the forward contract is closed, a Fund records a realized gain or loss equal to the difference between the proceeds from (or the cost of) the closing transaction and the Fund’s basis in the contract. This realized gain or loss is included in “Net realized gain (loss) on forward foreign currency contracts” on the Statements of Operations. Risks arise from the possible inability of Counterparties to meet the terms of their contracts and from movement in currency and securities values and interest rates. Due to the risks, a Fund could incur losses in excess of the net unrealized value shown on the Forward Foreign Currency Contracts table in the Fund’s Portfolio of Investments. In the event of default by the Counterparty, a Fund will provide notice to the Counterparty of the Fund’s intent to convert the currency held by the Fund into the currency that the Counterparty agreed to exchange with the Fund. If a Counterparty becomes bankrupt or otherwise fails to perform its obligations due to financial difficulties, a Fund may experience significant delays in obtaining any recovery in a bankruptcy or other reorganization proceeding. The Fund may obtain only limited recovery or may obtain no recovery in such circumstances.
Each Fund may enter into swap agreements. A swap is a financial instrument that typically involves the exchange of cash flows between two parties on specified dates (settlement dates), where the cash flows are based on agreed upon prices, rates, credit event, etc. Payment received or made by the Fund for swaps, if any, are recorded on the Statements of Operations as “Net realized gain (loss) on swap contracts.” When a swap is terminated, the Fund will record a realized gain or loss equal to the difference between the proceeds from (or cost of) the closing transaction and the Fund’s basis in the contract, if any. Generally, the basis of the contracts, if any, is the premium received or paid. Swap agreements are individually negotiated and involve the risk of the potential inability of the Counterparties to meet the terms of the agreement. In connection with these agreements, cash and securities may be identified as collateral in accordance with the terms of the respective swap agreements to provide assets of value and recourse in the event of default under the swap agreement or bankruptcy/insolvency of a party to the swap agreement. In the event of a default by a Counterparty, the Fund will seek withdrawal of the collateral and may incur certain costs exercising its rights with respect to the collateral. If a Counterparty becomes bankrupt or otherwise fails to perform its obligations due to financial difficulties, the Fund may experience significant delays in obtaining any recovery in a bankruptcy or other reorganization proceeding. The Fund may obtain only limited recovery or may obtain no recovery in such circumstances.
Swap agreements may increase or decrease the overall volatility of the investments of the Fund. The performance of swap agreements may be affected by changes in the specific interest rate, credit event, security, currency, or other factors that determine the amounts of payments due to and from the Fund. The notional amount represents the U.S. dollar value of the contract as of the day of the opening transaction or contract reset. When the Fund enters into a swap agreement, any premium paid is included in “Swap contracts, at value” on the Statements of Assets and Liabilities.
FIXD and UCON held interest rate swap agreements at August 31, 2024. An interest rate swap agreement involves the Fund’s agreement to exchange a stream of interest payments for another party’s stream of cash flows. Interest rate swaps do not involve the
Notes to Financial Statements (Continued)
First Trust Exchange-Traded Fund VIIIAugust 31, 2024 delivery of securities or other underlying assets or principal. Accordingly, the risk of loss with respect to interest rate swaps is limited to the net amount of interest payments that the Fund is contractually obligated to make. The Fund’s maximum interest rate risk to meet its future payments under swap agreements is equal to the total notional amount as shown on the Portfolio of Investments.
EFIX held credit default swap contracts (“CDS”) during the period, but had no open positions at August 31, 2024. A fund may enter into credit default swap contracts for investment purposes or to manage credit risk. A CDS is an agreement between two parties (“Counterparties”) to exchange the credit risk of an issuer. Swap agreements may be privately negotiated in the over-the-counter market as a bilateral contract or centrally cleared.
A CDS can mitigate risks in bond investing by transferring a given risk from one party to another without transferring the underlying bond or other credit asset. In a credit default swap agreement, one party “sells” risk and the counterparty “buys” that risk. The “seller” of credit risk, who also tends to own the underlying credit asset, pays a periodic fee to the risk “buyer.” In return, the risk “buyer” agrees to pay the “seller” a set amount if there is a default, or a credit event.
A CDS is marked to market daily based upon quotations from brokers, market makers or an independent pricing service and the change in value, if any, is recorded as unrealized appreciation (depreciation). For a CDS sold by the Fund, payment of the agreed upon amount made by the Fund in the event of default of the referenced debt obligation is recorded as the cost of the reference debt obligation purchased/received.
FIXD may invest in option contracts to adjust its exposure to interest rate risk. The primary risk associated with purchasing options is that the value of the underlying investments may move in such a way that the option is out-of-the-money (the exercise price of the option exceeds the value of the underlying investment), the position is worthless at expiration, and the Fund loses the premium paid. The primary risk associated with selling options is that the value of the underlying investments may move in such a way that the option is in-the money (the exercise price of the option exceeds the value of the underlying investment), the counterparty exercises the option, and the Fund loses an amount equal to the market value of the option written less the premium received.
FIXD and UCON may invest in options on swaps (swaptions), which are transacted over-the-counter (“OTC”) and not on an exchange. The purchaser and writer of a swaption is buying or granting the right to enter into a previously agreed upon interest rate or credit default swap agreement (interest rate risk and/or credit risk) at any time before the expiration of the option. Unlike exchange-traded options, which are standardized with respect to the underlying instrument, expiration date, contract size, and strike price, the terms of OTC options generally are established through negotiation with the other party to the option contract. Although this type of arrangement allows the purchaser or writer greater flexibility to tailor an option to its needs, OTC options have the risk of the potential inability of counterparties to meet the terms of their contracts. Each Fund’s maximum equity price risk for purchased options is limited to the premium initially paid.
FIXD may purchase or write (sell) put and call options on futures contracts and enter into closing transactions with respect to such options to terminate an existing position. A futures option gives the holder the right, in return for the premium paid, to assume a long position (call) or short position (put) in a futures contract at a specified exercise price prior to the expiration of the option. Upon exercise of a call option, the holder acquires a long position in the futures contract and the writer is assigned the opposite short position. In the case of a put option, the opposite is true. Prior to exercise or expiration, a futures contract may be closed out by an offsetting purchase or sale of a futures option of the same series. Options are marked-to-market daily and their value is affected by changes in the value of the underlying security, changes in interest rates, changes in the actual or perceived volatility of the securities markets and the underlying securities, and the remaining time to the option’s expiration. The value of options may also be adversely affected if the market for the options becomes less liquid or the trading volume diminishes.
When a Fund purchases a call or put option, the premium paid represents the cost of the call or put option, which is included in “Options contracts purchased, at value” on the Statements of Assets and Liabilities. When a Fund writes (sells) an option, an amount equal to the premium received by the Fund is included in “Options contracts written, at value” on the Statements of Assets and Liabilities. Options are marked-to-market daily and their value will be affected by changes in the value and dividend rates of the underlying equity securities, changes in interest rates, changes in the actual or perceived volatility of the securities markets and the underlying equity securities and the remaining time to the options’ expiration. The value of options may also be adversely affected if the market for the options becomes less liquid or trading volume diminishes.
Notes to Financial Statements (Continued)
First Trust Exchange-Traded Fund VIIIAugust 31, 2024 When a Fund purchases a call or put swaption, the premium paid represents the cost of the call or put swaption, which is included in “Swaptions contracts purchased, at value” on the Statements of Assets and Liabilities and is subsequently adjusted daily to the current market value of the option purchased. Fluctuations in the value of the swaptions are recorded in the Statements of Operations as unrealized appreciation (depreciation) until expired, closed, or exercised, at which time realized gains (losses) are recognized. If a Fund elects to allow a put swaption to expire, then the interest rate risk for purchased swaptions is limited to the premium initially paid. Any gain or loss on swaptions is included in “Purchased/Written swaptions contracts” on the Statements of Operations.
G. Offsetting on the Statements of Assets and Liabilities
Offsetting assets and liabilities requires entities to disclose both gross and net information about instruments and transactions eligible for offset on the Statements of Assets and Liabilities and disclose instruments and transactions subject to master netting or similar agreements. These disclosure requirements are intended to help investors and other financial statement users better assess the effect or potential effect of offsetting arrangements on a fund’s financial position. The transactions subject to offsetting disclosures are derivative instruments, repurchase agreements and reverse repurchase agreements, and securities borrowing and securities lending transactions.
For financial reporting purposes, the Funds do not offset financial assets and financial liabilities that are subject to master netting arrangements (“MNAs”) or similar agreements on the Statements of Assets and Liabilities. MNAs provide the right, in the event of default (including bankruptcy and insolvency), for the non-defaulting counterparty to liquidate the collateral and calculate the net exposure to the defaulting party or request additional collateral.
The Funds do not have the right to offset financial assets and financial liabilities related to options and swaptions contracts, forward foreign currency contracts, futures contracts or swap contracts on the Statements of Assets and Liabilities.
The books and records of the Funds are maintained in U.S. dollars. Foreign currencies, investments and other assets and liabilities are translated into U.S. dollars at the exchange rates prevailing at the end of the period. Purchases and sales of investments and items of income and expense are translated on the respective dates of such transactions. Unrealized gains and losses on assets and liabilities, other than investments in securities, which result from changes in foreign currency exchange rates have been included in “Net change in unrealized appreciation (depreciation) on foreign currency translation” on the Statements of Operations. Unrealized gains and losses on investments in securities which result from changes in foreign exchange rates are included with fluctuations arising from changes in market price and are shown in “Net change in unrealized appreciation (depreciation) on investments” on the Statements of Operations. Net realized foreign currency gains and losses include the effect of changes in exchange rates between trade date and settlement date on investment security transactions, foreign currency transactions and interest and dividends received and are included in “Net realized gain (loss) on foreign currency transactions” on the Statements of Operations. The portion of foreign currency gains and losses related to fluctuations in exchange rates between the initial purchase settlement date and subsequent sale trade date for fixed-income securities is included in “Net realized gain (loss) on investments” on the Statements of Operations.
I. Interest-Only Securities
An interest-only security (“IO Security”) is the interest-only portion of a mortgage-backed security that receives some or all of the interest portion of the underlying mortgage-backed security and little or no principal. A reference principal value called a notional value is used to calculate the amount of interest due to the IO Security. IO Securities are sold at a deep discount to their notional principal amount. Generally speaking, when interest rates are falling and prepayment rates are increasing, the value of an IO Security will fall. Conversely, when interest rates are rising and prepayment rates are decreasing, generally the value of an IO Security will rise. These securities, if any, are identified on each Fund’s Portfolio of Investments.
Each Fund may invest, without limitation, in mortgage dollar rolls. The Funds intend to enter into mortgage dollar rolls only with high quality securities dealers and banks, as determined by the Funds’ Sub-Advisor. In a mortgage dollar roll, a Fund will sell (or buy) mortgage-backed securities for delivery on a specified date and simultaneously contract to repurchase (or sell) substantially similar (same type, coupon and maturity) securities on a future date. Mortgage dollar rolls are recorded as separate purchases and sales in a Fund.
Notes to Financial Statements (Continued)
First Trust Exchange-Traded Fund VIIIAugust 31, 2024 K. Restricted Securities
DEED invests in restricted securities, which are securities that may not be offered for public sale without first being registered under the 1933 Act. Prior to registration, restricted securities may only be resold in transactions exempt from registration under Rule 144A under the 1933 Act, normally to qualified institutional buyers. As of August 31, 2024, DEED held restricted securities as shown in the following table that the Advisor has deemed illiquid pursuant to procedures adopted by the Trust’s Board of Trustees. Although market instability can result in periods of increased overall market illiquidity, liquidity for each security is determined based on security-specific factors and assumptions, which require subjective judgment. The Fund does not have the right to demand that such securities be registered. These securities are valued according to the valuation procedures as stated in the Portfolio Valuation note (Note 2A) and are not expressed as a discount to the carrying value of a comparable unrestricted security. There are no unrestricted securities with the same maturity dates and yields for these issuers.
| | | | | | |
| | | | | | |
GS Mortgage Securities Trust, Series 2011-GC5, Class XA, IO, 0.09%, 08/10/44 | | | | | | |
SMRT, Series 2022-MINI, Class XCP, IO, 0.00%, 01/15/39 | | | | | | |
| | | | | | |
| Amount is less than $0.01. |
| Amount is less than 0.01%. |
L. Dividends and Distributions to Shareholders
Dividends from net investment income of each Fund, if any, are declared and paid monthly, or as the Board of Trustees may determine from time to time. Distributions of net realized capital gains earned by each Fund, if any, are distributed at least annually. Each Fund may also designate a portion of the amount paid to redeeming shareholders as a distribution for tax purposes.
Distributions in cash may be reinvested automatically in additional whole shares only if the broker through whom the shares were purchased makes such option available. Such shares will generally be reinvested by the broker based upon the market price of those shares and investors may be subject to customary brokerage commissions charged by the broker.
Distributions from net investment income and realized capital gains are determined in accordance with federal income tax regulations, which may differ from U.S. GAAP. Certain capital accounts in the financial statements are periodically adjusted for permanent differences in order to reflect their tax character. These permanent differences are primarily due to the varying treatment of income and gain/loss on portfolio securities held by the Funds and have no impact on net assets or NAV per share. Temporary differences, which arise from recognizing certain items of income, expense and gain/loss in different periods for financial statement and tax purposes, will reverse at some time in the future.
The tax character of distributions paid by each Fund during the fiscal year ended August 31, 2024 was as follows:
| Distributions
paid from
Ordinary
Income | Distributions
paid from
Capital
Gains | Distributions
paid from
Return of
Capital |
First Trust TCW Opportunistic Fixed Income ETF | | | |
First Trust TCW Unconstrained Plus Bond ETF | | | |
First Trust TCW Securitized Plus ETF | | | |
First Trust TCW Emerging Markets Debt ETF | | | |
Notes to Financial Statements (Continued)
First Trust Exchange-Traded Fund VIIIAugust 31, 2024 The tax character of distributions paid by each Fund during the fiscal year ended August 31, 2023 was as follows:
| Distributions
paid from
Ordinary
Income | Distributions
paid from
Capital
Gains | Distributions
paid from
Return of
Capital |
First Trust TCW Opportunistic Fixed Income ETF | | | |
First Trust TCW Unconstrained Plus Bond ETF | | | |
First Trust TCW Securitized Plus ETF | | | |
First Trust TCW Emerging Markets Debt ETF | | | |
As of August 31, 2024, the components of distributable earnings on a tax basis for each Fund were as follows:
| Undistributed
Ordinary
Income | Accumulated
Capital and
Other
Gain (Loss) | Net
Unrealized
Appreciation
(Depreciation) |
First Trust TCW Opportunistic Fixed Income ETF | | | |
First Trust TCW Unconstrained Plus Bond ETF | | | |
First Trust TCW Securitized Plus ETF | | | |
First Trust TCW Emerging Markets Debt ETF | | | |
Each Fund intends to continue to qualify as a regulated investment company by complying with the requirements under Subchapter M of the Internal Revenue Code of 1986, as amended, which includes distributing substantially all of its net investment income and net realized gains to shareholders. Accordingly, no provision has been made for federal and state income taxes. However, due to the timing and amount of distributions, each Fund may be subject to an excise tax of 4% of the amount by which approximately 98% of each Fund’s taxable income exceeds the distributions from such taxable income for the calendar year.
The Funds are subject to accounting standards that establish a minimum threshold for recognizing, and a system for measuring, the benefits of a tax position taken or expected to be taken in a tax return. The taxable years ended 2021, 2022, 2023, and 2024 remain open to federal and state audit. As of August 31, 2024, management has evaluated the application of these standards to the Funds and has determined that no provision for income tax is required in the Funds’ financial statements for uncertain tax positions.
Each Fund intends to utilize provisions of the federal income tax laws, which allow it to carry a realized capital loss forward indefinitely following the year of the loss and offset such loss against any future realized capital gains. Each Fund is subject to certain limitations under U.S. tax rules on the use of capital loss carryforwards and net unrealized built-in losses. These limitations apply when there has been a 50% change in ownership. At August 31, 2024, for federal income tax purposes, each applicable Fund had a capital loss carryforward available that is shown in the following table, to the extent provided by regulations, to offset future capital gains. To the extent that these loss carryforwards are used to offset future capital gains, it is probable that the capital gains so offset will not be distributed to each applicable Fund’s shareholders.
| Non-Expiring
Capital Loss
Carryforwards |
First Trust TCW Opportunistic Fixed Income ETF | |
First Trust TCW Unconstrained Plus Bond ETF | |
First Trust TCW Securitized Plus ETF | |
First Trust TCW Emerging Markets Debt ETF | |
During the taxable year ended August 31, 2024, the following Funds utilized capital loss carryforwards in the following amounts:
| |
First Trust TCW Unconstrained Plus Bond ETF | |
Notes to Financial Statements (Continued)
First Trust Exchange-Traded Fund VIIIAugust 31, 2024 | |
First Trust TCW Emerging Markets Debt ETF | |
Certain losses realized during the current fiscal year may be deferred and treated as occurring on the first day of the following fiscal year for federal income tax purposes. For the fiscal year ended August 31, 2024, the following Funds incurred and elected to defer net late year ordinary or capital losses as follows:
| Qualified Late Year Losses |
| | |
First Trust TCW Opportunistic Fixed Income ETF | | |
First Trust TCW Unconstrained Plus Bond ETF | | |
First Trust TCW Emerging Markets Debt ETF | | |
| | |
In order to present paid-in capital and accumulated distributable earnings (loss) (which consists of accumulated net investment income (loss), accumulated net realized gain (loss) on investments and net unrealized appreciation (depreciation) on investments) on the Statements of Assets and Liabilities that more closely represent their tax character, certain adjustments have been made to paid-in capital, accumulated net investment income (loss) and accumulated net realized gain (loss) on investments. These adjustments are primarily due to the difference between book and tax treatments of income and gains on various investment securities held by the Funds. The results of operations and net assets were not affected by these adjustments. For the fiscal year ended August 31, 2024, the adjustments for each Fund were as follows:
| Accumulated
Net Investment
Income (Loss) | Accumulated
Net Realized
Gain (Loss)
on Investments | |
First Trust TCW Opportunistic Fixed Income ETF | | | |
First Trust TCW Unconstrained Plus Bond ETF | | | |
First Trust TCW Securitized Plus ETF | | | |
First Trust TCW Emerging Markets Debt ETF | | | |
As of August 31, 2024, the aggregate cost, gross unrealized appreciation, gross unrealized depreciation, and net unrealized appreciation/(depreciation) on investments (including short positions and derivatives, if any) for federal income tax purposes were as follows:
| | Gross Unrealized
Appreciation | Gross Unrealized
(Depreciation) | Net Unrealized
Appreciation
(Depreciation) |
First Trust TCW Opportunistic Fixed Income ETF | | | | |
First Trust TCW Unconstrained Plus Bond ETF | | | | |
First Trust TCW Securitized Plus ETF | | | | |
First Trust TCW Emerging Markets Debt ETF | | | | |
Expenses, other than the investment advisory fee and other excluded expenses, are paid by the Advisor (see Note 3).
3. Investment Advisory Fee, Affiliated Transactions and Other Fee Arrangements
First Trust, the investment advisor to the Funds, is a limited partnership with one limited partner, Grace Partners of DuPage L.P., and one general partner, The Charger Corporation. The Charger Corporation is an Illinois corporation controlled by James A. Bowen, Chief Executive Officer of First Trust. First Trust is responsible for the ongoing monitoring of the securities in each Fund’s portfolio, managing the Funds’ business affairs and providing certain administrative services necessary for the management of the Funds.
TCW serves as the Funds’ sub-advisor and manages each Fund’s portfolio subject to First Trust’s supervision. Pursuant to the Investment Management Agreement, between the Trust, on behalf of the Funds, and the Advisor, and the Investment Sub-Advisory
Notes to Financial Statements (Continued)
First Trust Exchange-Traded Fund VIIIAugust 31, 2024 Agreement among the Trust, on behalf of the Funds, the Advisor and TCW, First Trust will supervise TCW and its management of the investment of each Fund’s assets and will pay TCW for its services as the Funds’ sub-advisor. TCW receives a sub-advisory fee equal to 50% of any remaining monthly unitary management fee paid to the Advisor after the average Fund’s expenses accrued during the most recent twelve months are subtracted from the unitary management fee for that month. During any period in which the Advisor’s management fee is reduced in accordance with the breakpoints described below, the investment sub-advisory fee (which is based on the Advisor’s management fee) paid to TCW will be reduced to reflect the reduction in the Advisor’s management fee. First Trust will also be responsible for each Fund’s expenses, including the cost of transfer agency, sub-advisory, custody, fund administration, legal, audit and other services, but excluding fee payments under the Investment Management Agreement, interest, taxes, acquired fund fees and expenses, if any, brokerage commissions and other expenses connected with the execution of portfolio transactions, distribution and service fees payable pursuant to a Rule 12b-1 plan, if any, and extraordinary expenses. The unitary management fee payable by each Fund to First Trust for these services will be reduced at certain levels of each Fund’s net asset (“breakpoints”) and calculated pursuant to the following schedule:
| | | | |
Fund net assets up to and including $2.5 billion | | | | |
Fund net assets greater than $2.5 billion up to and including $5 billion | | | | |
Fund net assets greater than $5 billion up to and including $7.5 billion | | | | |
Fund net assets greater than $7.5 billion up to and including $10 billion | | | | |
Fund net assets greater than $10 billion | | | | |
The Trust has multiple service agreements with The Bank of New York Mellon (“BNY”). Under the service agreements, BNY performs custodial, fund accounting, certain administrative services, and transfer agency services for each Fund. As custodian, BNY is responsible for custody of each Fund’s assets. As fund accountant and administrator, BNY is responsible for maintaining the books and records of each Fund’s securities and cash. As transfer agent, BNY is responsible for maintaining shareholder records for each Fund. BNY is a subsidiary of The Bank of New York Mellon Corporation, a financial holding company.
Each Trustee who is not an officer or employee of First Trust, any sub-advisor or any of their affiliates (“Independent Trustees”) is paid a fixed annual retainer that is allocated equally among each fund in the First Trust Fund Complex. Each Independent Trustee is also paid an annual per fund fee that varies based on whether the fund is a closed-end or other actively managed fund, a target outcome fund or an index fund.
Additionally, the Chairs of the Audit Committee, Nominating and Governance Committee and Valuation Committee, the Vice Chair of the Audit Committee, the Lead Independent Trustee and the Vice Lead Independent Trustee are paid annual fees to serve in such capacities, with such compensation allocated pro rata among each fund in the First Trust Fund Complex based on net assets. Independent Trustees are reimbursed for travel and out-of-pocket expenses in connection with all meetings. The Committee Chairs, the Audit Committee Vice Chair, the Lead Independent Trustee and the Vice Lead Independent Trustee rotate periodically in serving in such capacities. The officers and “Interested” Trustee receive no compensation from the Trust for acting in such capacities.
4. Purchases and Sales of Securities
For the fiscal year ended August 31, 2024, the cost of purchases and proceeds from sales and paydowns of U.S. Government securities and non-U.S. Government securities for each Fund, excluding short-term investments and in-kind transactions, were as follows:
| | |
First Trust TCW Opportunistic Fixed Income ETF | | |
U.S. Government securities | | |
Non-U.S. Government securities | | |
First Trust TCW Unconstrained Plus Bond ETF | | |
U.S. Government securities | | |
Non-U.S. Government securities | | |
First Trust TCW Securitized Plus ETF | | |
U.S. Government securities | | |
Non-U.S. Government securities | | |
Notes to Financial Statements (Continued)
First Trust Exchange-Traded Fund VIIIAugust 31, 2024 | | |
First Trust TCW Emerging Markets Debt ETF | | |
U.S. Government securities | | |
Non-U.S. Government securities | | |
For the fiscal year ended August 31, 2024, the Funds had no in-kind transactions.
5. Derivative Transactions
The following table presents the types of derivatives held by each Fund at August 31, 2024, the primary underlying risk exposure and the location of these instruments as presented on the Statements of Assets and Liabilities.
| | | |
| | Statements of Assets and
Liabilities Location | | Statements of Assets and
Liabilities Location | |
| | | | | |
Forward foreign currency contracts | | Unrealized appreciation on forward foreign currency contracts | | Unrealized depreciation on forward foreign currency contracts | |
| | Unrealized appreciation on futures contracts* | | Unrealized depreciation on futures contracts* | |
| | | | | |
| | | | | |
Forward foreign currency contracts | | Unrealized appreciation on forward foreign currency contracts | | Unrealized depreciation on forward foreign currency contracts | |
| | Unrealized appreciation on futures contracts* | | Unrealized depreciation on futures contracts* | |
| | | | | |
| | | | | |
Forward foreign currency contracts | | Unrealized appreciation on forward foreign currency contracts | | Unrealized depreciation on forward foreign currency contracts | |
| | Unrealized appreciation on futures contracts* | | Unrealized depreciation on futures contracts* | |
| | | | | |
Forward foreign currency contracts | | Unrealized appreciation on forward foreign currency contracts | | Unrealized depreciation on forward foreign currency contracts | |
| Includes cumulative appreciation/depreciation on futures contracts as reported in each Fund’s Portfolio of Investments. Only the current day’s variation margin is presented on the Statements of Assets and Liabilities. |
The following table presents the amount of net realized gain (loss) and change in net unrealized appreciation (depreciation) recognized for the fiscal year ended August 31, 2024, on each Fund’s derivative instruments, as well as the primary underlying risk exposure associated with the instruments.
|
Statements of Operations Location | | | | |
| | | | |
Net realized gain (loss) on swap contracts | | | | |
Net change in unrealized appreciation (depreciation) on swap contracts | | | | |
Notes to Financial Statements (Continued)
First Trust Exchange-Traded Fund VIIIAugust 31, 2024 |
Statements of Operations Location | | | | |
| | | | |
Net realized gain (loss) on forward foreign currency contracts | | | | |
Net change in unrealized appreciation (depreciation) on forward foreign currency contracts | | | | |
Interest Rate Risk Exposure | | | | |
Net realized gain (loss) on: | | | | |
| | | | |
| | | | |
Net change in unrealized appreciation (depreciation) on: | | | | |
| | | | |
| | | | |
The average notional value of forward foreign currency contracts outstanding during the fiscal year ended August 31, 2024, which is indicative of the volume of this derivative type, was $66,428,426.
The average notional value of futures contracts during the fiscal year ended August 31, 2024, which is indicative of the volume of this derivative type, was $1,517,135,957.
The average notional value of interest rate swaps during the fiscal year ended August 31, 2024, which is indicative of the volume of this derivative type, was $27,661,000.
The average notional value of forward foreign currency contracts outstanding during the fiscal year ended August 31, 2024, which is indicative of the volume of this derivative type, was $32,010,832.
The average notional value of futures contracts during the fiscal year ended August 31, 2024, which is indicative of the volume of this derivative type, was $946,511,632.
The average notional value of interest rate swaps during the fiscal year ended August 31, 2024, which is indicative of the volume of this derivative type, was $3,279,000.
The average notional value of forward foreign currency contracts outstanding during the fiscal year ended August 31, 2024, which is indicative of the volume of this derivative type, was $2,021,383.
The average notional value of futures contracts during the fiscal year ended August 31, 2024, which is indicative of the volume of this derivative type, was $22,412,456.
The average notional value of forward foreign currency contracts outstanding during the fiscal year ended August 31, 2024, which is indicative of the volume of this derivative type, was $23,881.
The average notional value of credit default swaps during the fiscal year ended August 31, 2024, which is indicative of the volume of this derivative type, was $145,000.
6. Creations, Redemptions and Transaction Fees
Each Fund generally issues and redeems its shares in primary market transactions through a creation and redemption mechanism and does not sell or redeem individual shares. Instead, financial entities known as “Authorized Participants” have contractual arrangements with a Fund or one of the Fund’s service providers to purchase and redeem Fund shares directly with the Fund in Creation Units. Prior to the start of trading on every business day, a Fund publishes through the National Securities Clearing Corporation the “basket” of securities, cash or other assets that it will accept in exchange for a Creation Unit of the Fund’s shares. An Authorized Participant that wishes to effectuate a creation of a Fund’s shares deposits with the Fund the “basket” of securities, cash or other assets identified by the Fund that day, and then receives the Creation Unit of the Fund’s shares in return for those assets. After purchasing a Creation Unit,
Notes to Financial Statements (Continued)
First Trust Exchange-Traded Fund VIIIAugust 31, 2024 the Authorized Participant may continue to hold the Fund’s shares or sell them in the secondary market. The redemption process is the reverse of the purchase process: the Authorized Participant redeems a Creation Unit of a Fund’s shares for a basket of securities, cash or other assets. The combination of the creation and redemption process with secondary market trading in a Fund’s shares and underlying securities provides arbitrage opportunities that are designed to help keep the market price of a Fund’s shares at or close to the NAV per share of the Fund.
Each Fund imposes fees in connection with the purchase of Creation Units. These fees may vary based upon various fact-based circumstances, including, but not limited to, the composition of the securities included in the Creation Unit or the countries in which the transactions are settled. The price for each Creation Unit will equal the daily NAV per share of a Fund times the number of shares in a Creation Unit, plus the fees described above and, if applicable, any operational processing and brokerage costs, transfer fees, stamp taxes and part or all of the spread between the expected bid and offer side of the market related to the securities comprising the creation basket.
Each Fund also imposes fees in connection with the redemption of Creation Units. These fees may vary based upon various fact-based circumstances, including, but not limited to, the composition of the securities included in the Creation Unit or the countries in which the transactions are settled. The price received for each Creation Unit will equal the daily NAV per share of a Fund times the number of shares in a Creation Unit, minus the fees described above and, if applicable, any operational processing and brokerage costs, transfer fees, stamp taxes and part or all of the spread between the expected bid and offer side of the market related to the securities comprising the redemption basket. Investors who use the services of a broker or other such intermediary in addition to an Authorized Participant to effect a redemption of a Creation Unit may also be assessed an amount to cover the cost of such services. The redemption fee charged by a Fund will comply with Rule 22c-2 of the 1940 Act which limits redemption fees to no more than 2% of the value of the shares redeemed.
The Board of Trustees adopted a Distribution and Service Plan pursuant to Rule 12b-1 under the 1940 Act. In accordance with the Rule 12b-1 plan, the Funds are authorized to pay an amount up to 0.25% of their average daily net assets each year to reimburse First Trust Portfolios L.P. (“FTP”), the distributor of the Funds, for amounts expended to finance activities primarily intended to result in the sale of Creation Units or the provision of investor services. FTP may also use this amount to compensate securities dealers or other persons that are Authorized Participants for providing distribution assistance, including broker-dealer and shareholder support and educational and promotional services.
No 12b-1 fees are currently paid by the Funds, and pursuant to a contractual arrangement, no 12b-1 fees will be paid any time before December 31, 2025.
The Trust, on behalf of the Funds, has a variety of indemnification obligations under contracts with its service providers. The Trust’s maximum exposure under these arrangements is unknown. However, the Trust has not had prior claims or losses pursuant to these contracts and expects the risk of loss to be remote.
Management has evaluated the impact of all subsequent events on the Funds through the date the financial statements were issued and has determined that there were no subsequent events requiring recognition or disclosure in the financial statements that have not already been disclosed.
Report of Independent Registered Public Accounting Firm
To the Shareholders and Board of Trustees of First Trust Exchange-Traded Fund VIII:
Opinion on the Financial Statements and Financial Highlights
We have audited the accompanying statements of assets and liabilities, including the portfolios of investments, of First Trust TCW Opportunistic Fixed Income ETF, First Trust TCW Unconstrained Plus Bond ETF, First Trust TCW Securitized Plus ETF, and First Trust TCW Emerging Markets Debt ETF (the “Funds”), each a series of the First Trust Exchange-Traded Fund VIII, as of August 31, 2024, the related statements of operations for the year then ended, the statements of changes in net assets for each of the two years in the period then ended, the financial highlights for the periods indicated in the table below; and the related notes. In our opinion, the financial statements and financial highlights present fairly, in all material respects, the financial position of the Funds as of August 31, 2024, the results of their operations for the year then ended, the changes in their net assets for each of the two years in the period then ended, and the financial highlights for the periods listed in the table below in conformity with accounting principles generally accepted in the United States of America.
Individual Funds Included
in the Trust | |
First Trust TCW Opportunistic Fixed Income ETF | For the years ended August 31, 2024, 2023, 2022, 2021, and 2020 |
First Trust TCW Unconstrained Plus Bond ETF | For the years ended August 31, 2024, 2023, 2022, 2021, and 2020 |
First Trust TCW Securitized Plus ETF | For the years ended August 31, 2024, 2023, 2022, and 2021, and for the period from April 29, 2020 (commencement of investment operations) through August 31, 2020 |
First Trust TCW Emerging Markets Debt ETF | For the years ended August 31, 2024, 2023, and 2022, and for the period from February 17, 2021 (commencement of investment operations) through August 31, 2021 |
These financial statements and financial highlights are the responsibility of the Funds’ management. Our responsibility is to express an opinion on the Funds’ financial statements and financial highlights based on our audits. We are a public accounting firm registered with the Public Company Accounting Oversight Board (United States) (PCAOB) and are required to be independent with respect to the Funds in accordance with the U.S. federal securities laws and the applicable rules and regulations of the Securities and Exchange Commission and the PCAOB.
We conducted our audits in accordance with the standards of the PCAOB. Those standards require that we plan and perform the audit to obtain reasonable assurance about whether the financial statements and financial highlights are free of material misstatement, whether due to error or fraud. The Funds are not required to have, nor were we engaged to perform, an audit of their internal control over financial reporting. As part of our audits, we are required to obtain an understanding of internal control over financial reporting but not for the purpose of expressing an opinion on the effectiveness of the Funds’ internal control over financial reporting. Accordingly, we express no such opinion.
Our audits included performing procedures to assess the risks of material misstatement of the financial statements and financial highlights, whether due to error or fraud, and performing procedures that respond to those risks. Such procedures included examining, on a test basis, evidence regarding the amounts and disclosures in the financial statements and financial highlights. Our audits also included evaluating the accounting principles used and significant estimates made by management, as well as evaluating the overall presentation of the financial statements and financial highlights. Our procedures included confirmation of securities owned as of August 31, 2024, by correspondence with the custodian, agent banks, and brokers; when replies were not received from brokers or agent banks, we performed other auditing procedures. We believe that our audits provide a reasonable basis for our opinion.
/s/ Deloitte & Touche, LLP
Chicago, Illinois
October 25, 2024
We have served as the auditor of one or more First Trust investment companies since 2001.
First Trust Exchange-Traded Fund VIIIAugust 31, 2024 (Unaudited) Changes in and Disagreements with Accountants (Item 8 of Form N-CSR)
There were no changes in or disagreements with the Funds’ accountants during the fiscal year ended August 31, 2024.
Proxy Disclosures (Item 9 of Form N-CSR)
There were no matters submitted for vote by shareholders of any Fund during the fiscal year ended August 31, 2024.
Remuneration Paid to Directors, Officers, and Others (Item 10 of Form N-CSR)
Independent Trustees and any member of any advisory board of each Fund are compensated through the unitary management fee paid by each Fund to the advisor and not directly by each Fund. The investment advisory fee paid is included in the Statements of Operations.
Statement Regarding the Basis for the Board’s Approval of Investment Advisory Contract (Item 11 of Form N-CSR)
The Board of Trustees of First Trust Exchange-Traded Fund VIII (the “Trust”), including the Independent Trustees, unanimously approved the continuation of the Investment Management Agreements (as applicable to a specific Fund, the “Advisory Agreement” and collectively, the “Advisory Agreements”) with First Trust Advisors L.P. (the “Advisor”) and the Investment Sub-Advisory Agreements (as applicable to a specific Fund, the “Sub-Advisory Agreement” and collectively, the “Sub-Advisory Agreements” and together with the Advisory Agreements, the “Agreements”) among the Trust, the Advisor and TCW Investment Management Company LLC (the “Sub-Advisor”) on behalf of the following series of the Trust (each a “Fund” and collectively, the “Funds”):
First Trust TCW Emerging Markets Debt ETF (EFIX)
First Trust TCW Opportunistic Fixed Income ETF (FIXD)
First Trust TCW Securitized Plus ETF (DEED)
First Trust TCW Unconstrained Plus Bond ETF (UCON)
The Board approved the continuation of the applicable Agreements for each Fund for a one-year period ending June 30, 2025 at a meeting held on June 2–3, 2024. The Board determined for each Fund that the continuation of the applicable Agreements is in the best interests of the Fund in light of the nature, extent and quality of the services provided and such other matters as the Board considered to be relevant in the exercise of its business judgment.
To reach this determination for each Fund, the Board considered its duties under the Investment Company Act of 1940, as amended (the “1940 Act”), as well as under the general principles of state law, in reviewing and approving advisory contracts; the requirements of the 1940 Act in such matters; the fiduciary duty of investment advisors with respect to advisory agreements and compensation; the standards used by courts in determining whether investment company boards have fulfilled their duties; and the factors to be considered by the Board in voting on such agreements. At meetings held on April 16, 2024, April 25, 2024 and June 2–3, 2024, the Board, including the Independent Trustees, reviewed materials provided by the Advisor and the Sub-Advisor responding to requests for information from counsel to the Independent Trustees, submitted on behalf of the Independent Trustees, that, among other things, outlined: the services provided by the Advisor and the Sub-Advisor to each Fund (including the relevant personnel responsible for these services and their experience); the unitary fee rate schedule payable by each Fund as compared to fees charged to a peer group of funds (the “Expense Group”) and a broad peer universe of funds (the “Expense Universe”), each assembled by Broadridge Financial Solutions, Inc. (“Broadridge”), an independent source, and as compared to fees charged to other clients of the Advisor, including other exchange-traded funds (“ETFs”) managed by the Advisor; the sub-advisory fee as compared to fees charged to other clients of the Sub-Advisor; the expense ratio of each Fund as compared to expense ratios of the funds in the Fund’s Expense Group and Expense Universe; performance information for each Fund, including comparisons of each Fund’s performance to that of one or more relevant benchmark indexes and to that of a performance group of funds and a broad performance universe of funds (the “Performance Universe”), each assembled by Broadridge; the nature of expenses incurred in providing services to each Fund and the potential for the Advisor and the Sub-Advisor to realize economies of scale, if any; profitability and other financial data for the Advisor; financial data for the Sub-Advisor; any indirect benefits to the Advisor and its affiliate, First Trust Portfolios L.P. (“FTP”), and the Sub-Advisor; and information on the Advisor’s and the Sub-Advisor’s compliance programs. The Board reviewed initial materials with the Advisor at the meeting held on April 25, 2024, prior to which the Independent Trustees and their counsel met separately to discuss the information provided by the Advisor and the Sub-Advisor. Following the April 25, 2024 meeting, counsel to the Independent Trustees, on behalf of the Independent Trustees, requested certain clarifications and supplements to the materials provided, and the information provided in response to those requests was considered at an executive session of the Independent Trustees and their counsel held prior to the June 2–3, 2024 meeting, as well as at the June meeting. The Board applied its business judgment to determine
Other Information (Continued)
First Trust Exchange-Traded Fund VIIIAugust 31, 2024 (Unaudited) whether the arrangements between the Trust and the Advisor and among the Trust, the Advisor and the Sub-Advisor continue to be reasonable business arrangements from each Fund’s perspective. The Board determined that, given the totality of the information provided with respect to the Agreements, the Board had received sufficient information to renew the Agreements. The Board considered that shareholders chose to invest or remain invested in a Fund knowing that the Advisor and the Sub-Advisor manage the Fund and knowing the Fund’s unitary fee.
In reviewing the applicable Agreements for each Fund, the Board considered the nature, extent and quality of the services provided by the Advisor and the Sub-Advisor under the applicable Agreements. With respect to the Advisory Agreements, the Board considered that the Advisor is responsible for the overall management and administration of the Trust and each Fund and reviewed all of the services provided by the Advisor to the Funds, including the oversight of the Sub-Advisor, as well as the background and experience of the persons responsible for such services. The Board noted that the Advisor oversees the Sub-Advisor’s day-to-day management of each Fund’s investments, including portfolio risk monitoring and performance review. In reviewing the services provided, the Board noted the compliance program that had been developed by the Advisor and considered that it includes a robust program for monitoring the Advisor’s, the Sub-Advisor’s and each Fund’s compliance with the 1940 Act, as well as each Fund’s compliance with its investment objective, policies and restrictions. The Board also considered a report from the Advisor with respect to its risk management functions related to the operation of the Funds. Finally, as part of the Board’s consideration of the Advisor’s services, the Advisor, in its written materials and at the April 25, 2024 meeting, described to the Board the scope of its ongoing investment in additional personnel and infrastructure to maintain and improve the quality of services provided to the Funds and the other funds in the First Trust Fund Complex. With respect to the Sub-Advisory Agreements, the Board noted that each Fund is an actively-managed ETF and the Sub-Advisor actively manages the Fund’s investments. The Board reviewed the materials provided by the Sub-Advisor and considered the services that the Sub-Advisor provides to each Fund, including the Sub-Advisor’s day-to-day management of the Funds’ investments. In considering the Sub-Advisor’s management of the Funds, the Board noted the background and experience of the Sub-Advisor’s portfolio management teams, including the Board’s prior meetings with members of the portfolio management teams. In light of the information presented and the considerations made, the Board concluded that the nature, extent and quality of the services provided to the Trust and each Fund by the Advisor and the Sub-Advisor under the Agreements have been and are expected to remain satisfactory and that the Sub-Advisor, under the oversight of the Advisor, has managed each Fund consistent with its investment objective, policies and restrictions.
The Board considered the unitary fee rate schedule payable by each Fund under the applicable Advisory Agreement for the services provided. The Board noted that the sub-advisory fee for each Fund is paid by the Advisor from the Fund’s unitary fee. The Board considered that as part of the unitary fee the Advisor is responsible for each Fund’s expenses, including the cost of sub-advisory, transfer agency, custody, fund administration, legal, audit and other services and license fees, if any, but excluding the fee payment under the applicable Advisory Agreement and interest, taxes, brokerage commissions and other expenses connected with the execution of portfolio transactions, distribution and service fees pursuant to a Rule 12b-1 plan, if any, and extraordinary expenses, if any. The Board received and reviewed information showing the fee rates and expense ratios of the peer funds in the Expense Groups, as well as advisory and unitary fee rates charged by the Advisor and the Sub-Advisor to other fund (including ETFs) and non-fund clients, as applicable. Because each Fund pays a unitary fee, the Board determined that expense ratios were the most relevant comparative data point. Based on the information provided, the Board noted that the total (net) expense ratio for each Fund was above the median total (net) expense ratio of the peer funds in its respective Expense Group. With respect to the Expense Groups, the Board discussed with Broadridge its methodology for assembling peer groups and discussed with the Advisor limitations in creating peer groups for actively-managed ETFs, and different business models that may affect the pricing of services among ETF sponsors. The Board also noted that not all peer funds employ an advisor/sub-advisor management structure. The Board took these limitations and differences into account in considering the peer data. With respect to fees charged to other non-ETF clients, the Board considered differences between the Funds and other non-ETF clients that limited their comparability. In considering the unitary fee rate schedules overall, the Board also considered the Advisor’s statement that it seeks to meet investor needs through innovative and value-added investment solutions and the Advisor’s demonstrated long-term commitment to each Fund and the other funds in the First Trust Fund Complex.
The Board considered performance information for each Fund. The Board noted the process it has established for monitoring each Fund’s performance and portfolio risk on an ongoing basis, which includes quarterly performance reporting from the Advisor and the Sub-Advisor for the Funds. The Board determined that this process continues to be effective for reviewing each Fund’s performance. The Board received and reviewed information comparing each Fund’s performance for one or more periods ended December 31, 2023 to the performance of the funds in its Performance Universe and to that of a benchmark index. Based on the information provided, the Board noted that EFIX outperformed its Performance Universe median and benchmark index for the one-year period ended December 31, 2023; that FIXD underperformed its Performance Universe median for the one-, three- and five-year periods ended December 31, 2023, outperformed its benchmark index for the one-year period ended December 31, 2023 and underperformed its
Other Information (Continued)
First Trust Exchange-Traded Fund VIIIAugust 31, 2024 (Unaudited) benchmark index for the three- and five-year periods ended December 31, 2023; that DEED outperformed its Performance Universe median and benchmark index for the one-year period ended December 31, 2023 and underperformed its Performance Universe median and benchmark index for the three-year period ended December 31, 2023; and that UCON outperformed its Performance Universe median for the one-, three- and five-year periods ended December 31, 2023, outperformed its benchmark index for the one- and five-year periods ended December 31, 2023 and underperformed its benchmark index for the three-year period ended December 31, 2023. The Board noted the Advisor’s discussion of FIXD’s performance at the April 25, 2024 meeting.
On the basis of all the information provided on the unitary fee and performance of each Fund and the ongoing oversight by the Board, the Board concluded that the unitary fee for each Fund (out of which the Sub-Advisor is compensated) continues to be reasonable and appropriate in light of the nature, extent and quality of the services provided by the Advisor and the Sub-Advisor to each Fund under the Agreements.
The Board considered information and discussed with the Advisor whether there were any economies of scale in connection with providing advisory services to the Funds at current asset levels and whether the Funds may benefit from any economies of scale. The Board noted that the unitary fee rate schedule for each Fund includes breakpoints pursuant to which the unitary fee rate will be reduced as assets of the Fund meet certain thresholds. The Board considered the Advisor’s statement that it believes that its expenses relating to providing advisory services to the Funds will increase during the next twelve months as the Advisor continues to build infrastructure and add new staff. The Board also noted that under the unitary fee structure, any reduction in expenses associated with the management and operations of the Funds would benefit the Advisor, but that the unitary fee structure provides a level of certainty in expenses for shareholders of the Funds. The Board concluded that the unitary fee rate schedule for each Fund reflects an appropriate level of sharing of any economies of scale that may be realized in the management of the Fund at current asset levels. The Board considered the revenues and allocated costs (including the allocation methodology) of the Advisor in serving as investment advisor to each Fund for the twelve months ended December 31, 2023 and the estimated profitability level for each Fund calculated by the Advisor based on such data, as well as complex-wide and product-line profitability data, for the same period. The Board noted the inherent limitations in the profitability analysis and concluded that, based on the information provided, the Advisor’s profitability level for each Fund was not unreasonable. In addition, the Board considered indirect benefits described by the Advisor that may be realized from its relationship with the Funds. The Board considered that the Advisor had identified as an indirect benefit to the Advisor and FTP their exposure to investors and brokers who, absent their exposure to the Funds, may have had no dealings with the Advisor or FTP. The Board concluded that the character and amount of potential indirect benefits to the Advisor were not unreasonable.
The Board considered the Sub-Advisor’s statements that the Sub-Advisor believes economies of scale in managing fixed-income portfolios are limited, that the current sub-advisory fees appropriately reflect economies of scale, and that the Sub-Advisor continually assesses opportunities to improve service delivery by reinvesting profits back into the business. The Board noted that the Advisor pays the Sub-Advisor for each Fund from the unitary fee, that the sub-advisory fee will be reduced consistent with the breakpoints in the unitary fee rate schedule and its understanding that each Fund’s sub-advisory fee was the product of an arm’s length negotiation. The Board did not review the profitability of the Sub-Advisor with respect to each Fund. The Board concluded that the profitability analysis for the Advisor was more relevant. The Board considered the potential indirect benefits to the Sub-Advisor from being associated with the Advisor and the Funds, and noted the Sub-Advisor’s statements that the Sub-Advisor does not accrue any ancillary or indirect benefits due to its relationship with the Funds, and that the Sub-Advisor’s U.S./Developed Markets and Emerging Markets Fixed Income teams do not enter into soft dollar arrangements. The Board concluded that the character and amount of potential indirect benefits to the Sub-Advisor were not unreasonable.
Based on all of the information considered and the conclusions reached, the Board, including the Independent Trustees, unanimously determined that the terms of the Agreements continue to be fair and reasonable and that the continuation of the Agreements is in the best interests of each Fund. No single factor was determinative in the Board’s analysis.
Remuneration Disclosure Under the Alternative Investment Fund Managers Directive
First Trust Advisors L.P. (“First Trust”) is authorised and regulated by the U.S. Securities and Exchange Commission and is entitled to market shares of certain First Trust Exchange-Traded Fund VIII funds it manages (the “Funds”) in certain member states in the European Economic Area in accordance with the cooperation arrangements in Article 42 of the Alternative Investment Fund Managers Directive (the “Directive”). First Trust is required under the Directive to make disclosures in respect of remuneration. The following disclosures are made in line with First Trust’s interpretation of currently available regulatory guidance on remuneration disclosures.
During the year ended December 31, 2023, the amount of remuneration paid (or to be paid) by First Trust Advisors L.P. in respect of the Funds is $2,721,360. This figure is comprised of $119,716 paid (or to be paid) in fixed compensation and $2,601,644 paid (or to be
Other Information (Continued)
First Trust Exchange-Traded Fund VIIIAugust 31, 2024 (Unaudited) paid) in variable compensation. There were a total of 26 beneficiaries of the remuneration described above. Those amounts include $1,359,447 paid (or to be paid) to senior management of First Trust Advisors L.P. and $1,361,913 paid (or to be paid) to other employees whose professional activities have a material impact on the risk profiles of First Trust Advisors L.P. or the Funds (collectively, “Code Staff”).
Code Staff included in the aggregated figures disclosed above are rewarded in line with First Trust’s remuneration policy (the “Remuneration Policy”) which is determined and implemented by First Trust’s senior management. The Remuneration Policy reflects First Trust’s ethos of good governance and encapsulates the following principal objectives:
i.
to provide a clear link between remuneration and performance of First Trust and to avoid rewarding for failure;
ii.
to promote sound and effective risk management consistent with the risk profiles of the funds managed by First Trust; and
iii.
to remunerate staff in line with the business strategy, objectives, values and interests of First Trust and the funds managed by First Trust in a manner that avoids conflicts of interest.
First Trust assesses various risk factors which it is exposed to when considering and implementing remuneration for Code Staff and considers whether any potential award to such person(s) would give rise to a conflict of interest. First Trust does not reward failure, or consider the taking of risk or failure to take risk in its remuneration of Code Staff.
First Trust assesses performance for the purposes of determining payments in respect of performance-related remuneration of Code Staff by reference to a broad range of measures including (i) individual performance (using financial and non-financial criteria), and (ii) the overall performance of First Trust. Remuneration is not based upon the performance of the Funds.
The elements of remuneration are balanced between fixed and variable and the senior management sets fixed salaries at a level sufficient to ensure that variable remuneration incentivises and rewards strong individual performance but does not encourage excessive risk taking.
No individual is involved in setting his or her own remuneration.
Distributions paid to foreign shareholders for the taxable year ended August 31, 2024 that were properly designated by each Fund as “interest-related dividends” or “short-term capital gain dividends,” may not be subject to federal income tax provided that the income was earned directly by such foreign shareholders.
Of the ordinary income (including short-term capital gain) distribution made by each Fund during the fiscal year ended August 31, 2024, none qualify for the corporate dividends received deduction available to corporate shareholders or as qualified dividend income.
(b) The Financial Highlights is included in the Financial Statements and Other Information filed under Item 7(a) of this Form N-CSR.
Item 8. Changes in and Disagreements with Accountants for Open-End Management Investment Companies.
Not applicable to the Registrant.
Item 9. Proxy Disclosures for Open-End Management Investment Companies.
Not applicable to the Registrant.
Item 10. Remuneration Paid to Directors, Officers, and Others of Open-End Management Investment Companies
This information is included in the Financial Statements and Other Information filed under Item 7(a) of this Form N-CSR.
Item 11. Statement Regarding Basis for Approval of Investment Advisory Contract.
This statement is included in the Financial Statements and Other Information filed under Item 7(a) of this Form N-CSR.
Item 12. Disclosure of Proxy Voting Policies and Procedures for Closed-End Management Investment Companies.
Not applicable to the Registrant.
Item 13. Portfolio Managers of Closed-End Management Investment Companies.
Not applicable to the Registrant.
Item 14. Purchases of Equity Securities by Closed-End Management Investment Company and Affiliated Purchasers.
Not applicable to the Registrant.
Item 15. Submission of Matters to a Vote of Security Holders.
There have been no material changes to the procedures by which the shareholders may recommend nominees to the Registrant’s board of directors, where those changes were implemented after the Registrant last provided disclosure in response to the requirements of Item 407(c)(2)(iv) of Regulation S-K (17 CFR 229.407) (as required by Item 22(b)(15) of Schedule 14A (17 CFR 240.14a-101)), or this Item.
Item 16. Controls and Procedures.
| (a) | The Registrant’s principal executive and principal financial officers, or persons performing similar functions, have concluded that the Registrant’s disclosure controls and procedures (as defined in Rule 30a-3(c) under the Investment Company Act of 1940, as amended (the “1940 Act”) (17 CFR 270.30a-3(c))) are effective, as of a date within 90 days of the filing date of the report that includes the disclosure required by this paragraph, based on their evaluation of these controls and procedures required by Rule 30a-3(b) under the 1940 Act (17 CFR 270.30a-3(b)) and Rules 13a-15(b) or 15d-15(b) under the Securities Exchange Act of 1934, as amended (17 CFR 240.13a-15(b) or 240.15d-15(b)). |
| (b) | There were no changes in the Registrant’s internal control over financial reporting (as defined in Rule 30a-3(d) under the 1940 Act (17 CFR 270.30a-3(d)) that occurred during the period covered by this report that has materially affected, or is reasonably likely to materially affect, the Registrant’s internal control over financial reporting. |
Item 17. Disclosure of Securities Lending Activities for Closed-End Management Investment Companies.
| (a) | Not applicable to the Registrant. |
| (b) | Not applicable to the Registrant. |
Item 18. Recovery of Erroneously Awarded Compensation.
| (a) | Not applicable to the Registrant. |
| (b) | Not applicable to the Registrant. |
Item 19. Exhibits.
| (a)(2) | Not applicable to the Registrant. |
| (a)(4) | Not applicable to the Registrant. |
| (a)(5) | Not applicable to the Registrant. |
SIGNATURES
Pursuant to the requirements of the Securities Exchange Act of 1934 and the Investment Company Act of 1940, the registrant has duly caused this report to be signed on its behalf by the undersigned, thereunto duly authorized.
| (registrant) | | First Trust Exchange-Traded Fund VIII |
| By (Signature and Title)* | | /s/ James M. Dykas |
| | | James M. Dykas, President and Chief Executive Officer
(principal executive officer) |
Pursuant to the requirements of the Securities Exchange Act of 1934 and the Investment Company Act of 1940, this report has been signed below by the following persons on behalf of the registrant and in the capacities and on the dates indicated.
| By (Signature and Title)* | | /s/ James M. Dykas |
| | | James M. Dykas, President and Chief Executive Officer
(principal executive officer) |
| By (Signature and Title)* | | /s/ Derek D. Maltbie |
| | | Derek D. Maltbie, Treasurer, Chief Financial Officer
and Chief Accounting Officer
(principal financial officer) |
* Print the name and title of each signing officer under his or her signature.