Wells Fargo Commercial Mortgage Trust 2016-C33
Filed: 15 Mar 16, 12:00am
| FREE WRITING PROSPECTUS | ||
| FILED PURSUANT TO RULE 433 | ||
| REGISTRATION FILE NO.: 333-206677-04 | ||

Free Writing Prospectus
Structural and Collateral Term Sheet
$712,219,087
(Approximate Initial Pool Balance)
$622,301,000
(Approximate Aggregate Certificate Balance of Offered Certificates)
Wells Fargo Commercial Mortgage Trust 2016-C33
as Issuing Entity
Wells Fargo Commercial Mortgage Securities, Inc.
as Depositor
Wells Fargo Bank, National Association
Ladder Capital Finance LLC
Rialto Mortgage Finance, LLC
C-III Commercial Mortgage LLC
Natixis Real Estate Capital LLC
National Cooperative Bank, N.A.
as Sponsors and Mortgage Loan Sellers
Commercial Mortgage Pass-Through Certificates
Series 2016-C33
March 14, 2016
| WELLS FARGO SECURITIES | ||
| Lead Manager and Sole Bookrunner | ||
Academy Securities Co-Manager | Deutsche Bank Securities Co-Manager | Natixis Securities Americas LLC Co-Manager |
STATEMENT REGARDING THIS FREE WRITING PROSPECTUS
The depositor has filed a registration statement (including a prospectus) with the Securities and Exchange Commission (‘‘SEC’’) (SEC File No. 333-206677) for the offering to which this communication relates. Before you invest, you should read the prospectus in the registration statement and other documents the depositor has filed with the SEC for more complete information about the depositor, the issuing entity and this offering. You may get these documents for free by visiting EDGAR on the SEC Web site at www.sec.gov. Alternatively, the depositor, any underwriter, or any dealer participating in the offering will arrange to send you the prospectus after filing if you request it by calling toll free 1-800-745-2063 (8 a.m. – 5 p.m. EST) or by emailing wfs.cmbs@wellsfargo.com.
Nothing in this document constitutes an offer of securities for sale in any jurisdiction where the offer or sale is not permitted. The information contained herein is preliminary as of the date hereof, supersedes any such information previously delivered to you and will be superseded by any such information subsequently delivered and ultimately by the final prospectus relating to the securities. These materials are subject to change, completion, supplement or amendment from time to time.
This free writing prospectus has been prepared by the underwriters for information purposes only and does not constitute, in whole or in part, a prospectus for the purposes of Directive 2003/71/EC (as amended) and/or Part VI of the Financial Services and Markets Act 2000, as amended, or other offering document.
STATEMENT REGARDING ASSUMPTIONS AS TO SECURITIES, PRICING ESTIMATES AND OTHER INFORMATION
The attached information contains certain tables and other statistical analyses (the “Computational Materials”) which have been prepared in reliance upon information furnished by the Mortgage Loan Sellers. Numerous assumptions were used in preparing the Computational Materials, which may or may not be reflected herein. As such, no assurance can be given as to the Computational Materials’ accuracy, appropriateness or completeness in any particular context; or as to whether the Computational Materials and/or the assumptions upon which they are based reflect present market conditions or future market performance. The Computational Materials should not be construed as either projections or predictions or as legal, tax, financial or accounting advice. You should consult your own counsel, accountant and other advisors as to the legal, tax, business, financial and related aspects of a purchase of these securities. Any weighted average lives, yields and principal payment periods shown in the Computational Materials are based on prepayment and/or loss assumptions, and changes in such prepayment and/or loss assumptions may dramatically affect such weighted average lives, yields and principal payment periods. In addition, it is possible that prepayments or losses on the underlying assets will occur at rates higher or lower than the rates shown in the attached Computational Materials. The specific characteristics of the securities may differ from those shown in the Computational Materials due to differences between the final underlying assets and the preliminary underlying assets used in preparing the Computational Materials. The principal amount and designation of any security described in the Computational Materials are subject to change prior to issuance. None of Wells Fargo Securities, LLC, Academy Securities, Inc., Deutsche Bank Securities Inc., Natixis Securities Americas LLC or any of their respective affiliates, make any representation or warranty as to the actual rate or timing of payments or losses on any of the underlying assets or the payments or yield on the securities. The information in this presentation is based upon management forecasts and reflects prevailing conditions and management’s views as of this date, all of which are subject to change. In preparing this presentation, we have relied upon and assumed, without independent verification, the accuracy and completeness of all information available from public sources or which was provided to us by or on behalf of the Mortgage Loan Sellers or which was otherwise reviewed by us.
This free writing prospectus contains certain forward-looking statements. If and when included in this free writing prospectus, the words “expects”, “intends”, “anticipates”, “estimates” and analogous expressions and all statements that are not historical facts, including statements about our beliefs or expectations, are intended to identify forward-looking statements. Any forward-looking statements are made subject to risks and uncertainties which could cause actual results to differ materially from those stated. Those risks and uncertainties include, among other things, declines in general economic and business conditions, increased competition, changes in demographics, changes in political and social conditions, regulatory initiatives and changes in customer preferences, many of which are beyond our control and the control of any other person or entity related to this offering. The forward-looking statements made in this free writing prospectus are made as of the date stated on the cover. We have no obligation to update or revise any forward-looking statement.
Wells Fargo Securities is the trade name for the capital markets and investment banking services of Wells Fargo & Company and its subsidiaries, including but not limited to Wells Fargo Securities, LLC, a member of NYSE, FINRA, NFA and SIPC, Wells Fargo Prime Services, LLC, a member of FINRA, NFA and SIPC, and Wells Fargo Bank, N.A. Wells Fargo Securities, LLC and Wells Fargo Prime Services, LLC are distinct entities from affiliated banks and thrifts.
IMPORTANT NOTICE REGARDING THE OFFERED CERTIFICATES
The information herein is preliminary and may be supplemented or amended prior to the time of sale. Prospective investors should understand that, when considering the purchase of the Offered Certificates, a contract of sale will come into being no sooner than the date on which the relevant class of certificates has been priced and the investor has otherwise taken all actions the investor must take to become committed to purchase the Offered Certificates, and the investor has therefore entered into a contract of sale. Any “indications of interest” expressed by any prospective investor, and any “soft circles” generated by the underwriters, prior to the time of sale, will not create binding contractual obligations for such prospective investors, on the one hand, or the underwriters, the depositor or any of their respective agents or affiliates, on the other hand.
In addition, the Offered Certificates referred to in these materials and the asset pool backing them are subject to modification or revision (including the possibility that one or more classes of certificates may be split, combined or eliminated at any time prior to issuance or availability of a final prospectus) and are offered on a “when, as and if issued” basis. As a result of the foregoing, a prospective investor may commit to purchase certificates that have characteristics that may change, and each prospective investor is advised that all or a portion of the certificates referred to in these materials may be issued without all or certain of the characteristics described in these materials. The underwriters’ obligation to sell certificates to any prospective investor is conditioned on the certificates and the transaction having the characteristics described in these materials. If the underwriters determine that a condition is not satisfied in any material respect, such prospective investor will be notified, and neither the depositor nor the underwriters will have any obligation to such prospective investor to deliver any portion of the Offered Certificates which such prospective investor has committed to purchase, and there will be no liability between the underwriters, the depositor or any of their respective agents or affiliates, on the one hand, and such prospective investor, on the other hand, as a consequence of the non-delivery.
The underwriters described in these materials may from time to time perform investment banking services for, or solicit investment banking business from, any company named in these materials. The underwriters and/or their affiliates or respective employees may from time to time have a long or short position in any security or contract discussed in these materials.
The information contained herein supersedes any previous such information delivered to any prospective investor and will be superseded by information delivered to such prospective investor prior to the time of sale.
IMPORTANT NOTICE RELATING TO AUTOMATICALLY-GENERATED EMAIL DISCLAIMERS
Any legends, disclaimers or other notices that may appear at the bottom of any email communication to which this free writing prospectus is attached relating to (1) these materials not constituting an offer (or a solicitation of an offer), (2) no representation that these materials are accurate or complete and may not be updated or (3) these materials possibly being confidential, are not applicable to these materials and should be disregarded. Such legends, disclaimers or other notices have been automatically generated as a result of these materials having been sent via Bloomberg or another system.
THE INFORMATION IN THIS STRUCTURAL AND COLLATERAL TERM SHEET IS NOT COMPLETE AND MAY BE AMENDED PRIOR TO THE TIME OF SALE. THIS TERM SHEET IS NOT AN OFFER TO SELL THESE SECURITIES AND IT IS NOT A SOLICITATION OF AN OFFER TO BUY THESE SECURITIES IN ANY JURISDICTION WHERE THE OFFER OR SALE IS NOT PERMITTED.
| 2 |
| Wells Fargo Commercial Mortgage Trust 2016-C33 | Certificate Structure |
| I. | Certificate Structure |
| Class | Expected Ratings (DBRS/Fitch/Moody’s)(1) | Approximate Initial Certificate Balance or Notional Amount(2) | Approx. Initial Credit | Pass-Through Rate Description | Weighted Average Life (Years)(4) | Expected Principal Window(4) | Certificate Principal to Value Ratio(5) | Certificate Principal U/W NOI Debt Yield(6) | ||
| Offered Certificates | ||||||||||
| A-1 | AAA(sf)/AAAsf/Aaa(sf) | $30,449,000 | 30.000% | (7) | 2.67 | 4/16 – 1/21 | 41.3% | 19.9% | ||
| A-2 | AAA(sf)/AAAsf/Aaa(sf) | $84,502,000 | 30.000% | (7) | 4.81 | 1/21 – 3/21 | 41.3% | 19.9% | ||
| A-3 | AAA(sf)/AAAsf/Aaa(sf) | $150,000,000 | 30.000% | (7) | 9.71 | 8/25 – 1/26 | 41.3% | 19.9% | ||
| A-4 | AAA(sf)/AAAsf/Aaa(sf) | $191,116,000 | 30.000% | (7) | 9.87 | 1/26 – 2/26 | 41.3% | 19.9% | ||
| A-SB | AAA(sf)/AAAsf/Aaa(sf) | $42,486,000 | 30.000% | (7) | 7.25 | 3/21 – 8/25 | 41.3% | 19.9% | ||
| A-S | AAA(sf)/AAAsf/Aa2(sf) | $53,416,000 | 22.500% | (7) | 9.88 | 2/26 – 2/26 | 45.7% | 18.0% | ||
| X-A | AAA(sf)/AAAsf/NR | $551,969,000(8) | N/A | Variable(9) | N/A | N/A | N/A | N/A | ||
| X-B | AAA(sf)/A-sf/NR | $70,332,000(10) | N/A | Variable(11) | N/A | N/A | N/A | N/A | ||
| B | AA(low)(sf)/AA-sf/NR | $38,282,000 | 17.125% | (7) | 9.92 | 2/26 – 3/26 | 48.9% | 16.8% | ||
| C | A(low)(sf)/A-sf/NR | $32,050,000 | 12.625% | (7) | 9.96 | 3/26 – 3/26 | 51.6% | 16.0% | ||
| Non-Offered Certificates | ||||||||||
| X-D | BBB(low)(sf)/BBB-sf/NR | $35,611,000(12) | N/A | Variable(13) | N/A | N/A | N/A | N/A | ||
| X-E | AAA(sf)/BB-sf/NR | $16,915,000(14) | N/A | Variable(15) | N/A | N/A | N/A | N/A | ||
| X-F | AAA(sf)/B-sf/NR | $7,122,000(16) | N/A | Variable(17) | N/A | N/A | N/A | N/A | ||
| X-G | NR/NR/NR | $30,270,087(18) | N/A | Variable(19) | N/A | N/A | N/A | N/A | ||
| D | BBB(low)(sf)/BBB-sf/NR | $35,611,000 | 7.625% | (7) | 9.96 | 3/26 – 3/26 | 54.5% | 15.1% | ||
| E | BB(low)(sf)/BB-sf/NR | $16,915,000 | 5.250% | (7) | 9.96 | 3/26 – 3/26 | 55.9% | 14.7% | ||
| F | B(low)(sf)/B-sf/NR | $7,122,000 | 4.250% | (7) | 9.96 | 3/26 – 3/26 | 56.5% | 14.6% | ||
| G | NR/NR/NR | $30,270,087 | 0.000% | (7) | 9.98 | 3/26 – 4/26 | 59.0% | 14.0% | ||
| Notes: | |
| (1) | The expected ratings presented are those of DBRS, Inc. (“DBRS”), Fitch Ratings, Inc. (“Fitch”) and Moody’s Investors Service, Inc. (“Moody’s”) which the depositor hired to rate the offered certificates. One or more other nationally recognized statistical rating organizations that were not hired by the depositor may use information they receive pursuant to Rule 17g-5 under the Securities Exchange Act of 1934, as amended (the “Exchange Act”) or otherwise, to rate or provide market reports and/or published commentary related to the offered certificates. We cannot assure you as to what ratings a non-hired nationally recognized statistical rating organization would assign or that its reports will not express differing, possibly negative, views of the mortgage loans and/or the offered certificates. The ratings of each class of offered certificates address the likelihood of the timely distribution of interest and, except in the case of the Class X-A and X-B certificates, the ultimate distribution of principal due on those classes on or before the Rated Final Distribution Date. See “Risk Factors—Other Risks Relating to the Certificates—Nationally Recognized Statistical Rating Organizations May Assign Different Ratings to the Certificates; Ratings of the Certificates Reflect Only the Views of the Applicable Rating Agencies as of the Dates Such Ratings Were Issued; Ratings May Affect ERISA Eligibility; Ratings May Be Downgraded” and “Ratings” in the Preliminary Prospectus, expected to be dated March 14, 2016 (the “Preliminary Prospectus”). DBRS, Fitch and Moody’s have informed us that the “sf” designation in their ratings represents an identifier for structured finance product ratings. |
| (2) | The certificate balances and notional amounts set forth in the table are approximate. The actual initial certificate balances and notional amounts may be larger or smaller depending on the initial pool balance of the mortgage loans definitively included in the pool of mortgage loans, which aggregate cut-off date balance may be as much as 5% larger or smaller than the amount presented in the Preliminary Prospectus. |
| (3) | The approximate initial credit support with respect to the Class A-1, A-2, A-3, A-4 and A-SB Certificates represents the approximate credit enhancement for the Class A-1, A-2, A-3, A-4 and A-SB Certificates in the aggregate. |
| (4) | Weighted Average Lives and Expected Principal Windows are calculated based on an assumed prepayment rate of 0% CPR and the “Structuring Assumptions” described under “Yield and Maturity Considerations—Weighted Average Life” in the Preliminary Prospectus. |
| (5) | The Certificate Principal to Value Ratio for each Class of Certificates (other than the Class A-1, A-2, A-3, A-4 and A-SB Certificates) is calculated as the product of (a) the weighted average Cut-off Date LTV Ratio for the mortgage loans and (b) a fraction, the numerator of which is the total initial Certificate Balance of such Class of Certificates and all Classes of Principal Balance Certificates senior to such Class of Certificates and the denominator of which is the total initial Certificate Balance of all of the Principal Balance Certificates. The Certificate Principal to Value Ratio for each of the Class A-1, A-2, A-3, A-4 and A-SB Certificates is calculated in the aggregate for those Classes as if they were a single Class and is calculated as the product of (a) the weighted average Cut-off Date LTV Ratio for the mortgage loans and (b) a fraction, the numerator of which is the total initial aggregate Certificate Balances of such Classes of Certificates and the denominator of which is the total initial Certificate Balance of all of the Principal Balance Certificates. In any event, however, excess mortgaged property value associated with a mortgage loan will not be available to offset losses on any other mortgage loan. |
| (6) | The Certificate Principal U/W NOI Debt Yield for each Class of Certificates (other than the Class A-1, A-2, A-3, A-4 and A-SB Certificates) is calculated as the product of (a) the weighted average U/W NOI Debt Yield for the mortgage loans and (b) a fraction, the numerator of which is the total initial Certificate Balance of all of the Classes of Principal Balance Certificates and the denominator of which is the total initial Certificate Balance for such Class of Certificates and all Classes of Principal Balance Certificates senior to such Class of Certificates. The Certificate Principal U/W NOI Debt Yield for each of the Class A-1, A-2, A-3, A-4 and A-SB Certificates is calculated in the aggregate for those Classes as if they were a single Class and is calculated as the product of (a) the weighted average U/W NOI Debt Yield for the mortgage loans and (b) a fraction, the numerator of which is the total initial Certificate Balance of all of the Classes of Principal Balance Certificates and the denominator of which is the total aggregate initial Certificate Balances for the Class A-1, A-2, A-3, A-4 and A-SB Certificates. In any event, however, cash flow from each mortgaged property supports only the related mortgage loan and will not be available to support any other mortgage loan. |
| (7) | The pass-through rates for the Class A-1, A-2, A-3, A-4, A-SB, A-S, B, C, D, E, F and G Certificates in each case will be one of the following: (i) a fixed rateper annum, (ii) a variable rate per annum equal to the weighted average of the net mortgage interest rates on the mortgage loans for the related distribution date, (iii) a variable rateper annum equal to the lesser of (a) a fixed rate and (b) the weighted average of the net mortgage interest rates on the mortgage loans for the related distribution date or (iv) a variable rateper annum equal to the weighted average of the net mortgage interest rates on the mortgage loans for the related distribution date minus a specified percentage. For purposes of the calculation of the weighted average of the net mortgage interest rates on the mortgage loans for each distribution date, the mortgage interest rates will be adjusted as necessary to a 30/360 basis. |
| (8) | The Class X-A Certificates are notional amount certificates. The Notional Amount of the Class X-A Certificates will be equal to the aggregate Certificate Balance of the Class A-1, A-2, A-3, A-4, A-SB and A-S Certificates outstanding from time to time. The Class X-A Certificates will not be entitled to distributions of principal. |
THE INFORMATION IN THIS STRUCTURAL AND COLLATERAL TERM SHEET IS NOT COMPLETE AND MAY BE AMENDED PRIOR TO THE TIME OF SALE. THIS TERM SHEET IS NOT AN OFFER TO SELL THESE SECURITIES AND IT IS NOT A SOLICITATION OF AN OFFER TO BUY THESE SECURITIES IN ANY JURISDICTION WHERE THE OFFER OR SALE IS NOT PERMITTED.
| 3 |
| Wells Fargo Commercial Mortgage Trust 2016-C33 | Certificate Structure |
| (9) | The pass-through rate for the Class X-A Certificates for any distribution date will be aper annum rate equal to the excess, if any, of (a) the weighted average of the net mortgage interest rates on the mortgage loans for the related distribution date, over (b) the weighted average of the pass-through rates on the Class A-1, A-2, A-3, A-4, A-SB and A-S Certificates for the related distribution date, weighted on the basis of their respective Certificate Balances outstanding immediately prior to that distribution date. For purposes of the calculation of the weighted average of the net mortgage interest rates on the mortgage loans for each distribution date, the mortgage interest rates will be adjusted as necessary to a 30/360 basis. |
| (10) | The Class X-B Certificates are notional amount certificates. The Notional Amount of the Class X-B Certificates will be equal to the aggregate Certificate Balance of the Class B and C Certificates outstanding from time to time. The Class X-B Certificates will not be entitled to distributions of principal. |
| (11) | The pass-through rate for the Class X-B Certificates for any distribution date will be aper annum rate equal to the excess, if any, of (a) the weighted average of the net mortgage interest rates on the mortgage loans for the related distribution date, over (b) the weighted average of the pass-through rates on the Class B and C Certificates for the related distribution date, weighted on the basis of their respective Certificate Balances outstanding immediately prior to that distribution date. For purposes of the calculation of the weighted average of the net mortgage interest rates on the mortgage loans for each distribution date, the mortgage interest rates will be adjusted as necessary to a 30/360 basis. |
| (12) | The Class X-D Certificates are notional amount certificates. The Notional Amount of the Class X-D Certificates will be equal to the Certificate Balance of the Class D Certificates outstanding from time to time. The Class X-D Certificates will not be entitled to distributions of principal. |
| (13) | The pass-through rate for the Class X-D Certificates for any distribution date will be aper annum rate equal to the excess, if any, of (a) the weighted average of the net mortgage interest rates on the mortgage loans for the related distribution date, over (b) the pass-through rate on the Class D Certificates for the related distribution date. For purposes of the calculation of the weighted average of the net mortgage interest rates on the mortgage loans for each distribution date, the mortgage interest rates will be adjusted as necessary to a 30/360 basis. |
| (14) | The Class X-E Certificates are notional amount certificates. The Notional Amount of the Class X-E Certificates will be equal to the Certificate Balance of the Class E Certificates outstanding from time to time. The Class X-E Certificates will not be entitled to distributions of principal. |
| (15) | The pass-through rate for the Class X-E Certificates for any distribution date will be aper annumrate equal to the excess, if any, of (a) the weighted average of the net mortgage interest rates on the mortgage loans for the related distribution date, over (b) the pass-through rate on the Class E Certificates for the related distribution date. For purposes of the calculation of the weighted average of the net mortgage interest rates on the mortgage loans for each distribution date, the mortgage interest rates will be adjusted as necessary to a 30/360 basis. |
| (16) | The Class X-F Certificates are notional amount certificates. The Notional Amount of the Class X-F Certificates will be equal to the Certificate Balance of the Class F Certificates outstanding from time to time. The Class X-F Certificates will not be entitled to distributions of principal. |
| (17) | The pass-through rate for the Class X-F Certificates for any distribution date will be aper annumrate equal to the excess, if any, of (a) the weighted average of the net mortgage interest rates on the mortgage loans for the related distribution date, over (b) the pass-through rate on the Class F Certificates for the related distribution date. For purposes of the calculation of the weighted average of the net mortgage interest rates on the mortgage loans for each distribution date, the mortgage interest rates will be adjusted as necessary to a 30/360 basis. |
| (18) | The Class X-G Certificates are notional amount certificates. The Notional Amount of the Class X-G Certificates will be equal to the Certificate Balance of the Class G Certificates outstanding from time to time. The Class X-G Certificates will not be entitled to distributions of principal. |
| (19) | The pass-through rate for the Class X-G Certificates for any distribution date will be aper annum rate equal to the excess, if any, of (a) the weighted average of the net mortgage interest rates on the mortgage loans for the related distribution date, over (b) the pass-through rate on the Class G Certificates for the related distribution date. For purposes of the calculation of the weighted average of the net mortgage interest rates on the mortgage loans for each distribution date, the mortgage interest rates will be adjusted as necessary to a 30/360 basis. |
THE INFORMATION IN THIS STRUCTURAL AND COLLATERAL TERM SHEET IS NOT COMPLETE AND MAY BE AMENDED PRIOR TO THE TIME OF SALE. THIS TERM SHEET IS NOT AN OFFER TO SELL THESE SECURITIES AND IT IS NOT A SOLICITATION OF AN OFFER TO BUY THESE SECURITIES IN ANY JURISDICTION WHERE THE OFFER OR SALE IS NOT PERMITTED.
| 4 |
| Wells Fargo Commercial Mortgage Trust 2016-C33 | Issue Characteristics |
| II. | Transaction Highlights |
Mortgage Loan Sellers:
Mortgage Loan Seller | Number of | Number of | Aggregate Cut-off | % of Initial | |||||||
| Wells Fargo Bank, National Association(1)(2) | 15 | 28 | $198,654,757 | 27.9 | % | ||||||
| Ladder Capital Finance LLC | 16 | 20 | 188,399,257 | 26.5 | |||||||
| Rialto Mortgage Finance, LLC | 18 | 24 | 151,201,629 | 21.2 | |||||||
| C-III Commercial Mortgage LLC(3) | 13 | 15 | 77,084,644 | 10.8 | |||||||
| Natixis Real Estate Capital LLC | 3 | 3 | 57,750,000 | 8.1 | |||||||
| National Cooperative Bank, N.A.(4) | 14 | 14 | 39,128,800 | 5.5 | |||||||
Total | 79 | 104 | $712,219,087 | 100.0 | % | ||||||
| (1) | One (1) of the fifteen (15) mortgage loans for which Wells Fargo Bank, National Association is the mortgage loan seller was co-originated by Citigroup Global Markets Realty Corp., German American Capital Corporation and Wells Fargo Bank, National Association. |
| (2) | One (1) of the fifteen (15) mortgage loans for which Wells Fargo Bank, National Association is the mortgage loan seller was originated by FirstKey Lending, LLC and purchased by Wells Fargo Bank, National Association. |
| (3) | Two (2) of the thirteen (13) mortgage loans for which C-III Commercial Mortgage LLC is the mortgage loan seller were originated by UnionCapitalFunding LLC and transferred to C-III Commercial Mortgage LLC. Each such mortgage loan originated by UnionCapitalFunding LLC was re-underwritten by C-III Commercial Mortgage LLC in accordance with C-III Commercial Mortgage LLC’s underwriting guidelines. |
| (4) | Thirteen (13) of the fourteen (14) mortgage loans for which National Cooperative Bank, N.A. is the mortgage loan seller were originated by its parent company, National Consumer Cooperative Bank, and transferred to National Cooperative Bank, N.A. Each such mortgage loan originated by National Consumer Cooperative Bank was underwritten pursuant to National Cooperative Bank, N.A.’s underwriting guidelines. |
Loan Pool:
| Initial Pool Balance: | $712,219,087 |
| Number of Mortgage Loans: | 79 |
| Average Cut-off Date Balance per Mortgage Loan: | $9,015,431 |
| Number of Mortgaged Properties: | 104 |
| Average Cut-off Date Balance per Mortgaged Property(1): | $6,848,260 |
| Weighted Average Mortgage Interest Rate: | 5.023% |
| Ten Largest Mortgage Loans as % of Initial Pool Balance: | 45.5% |
| Weighted Average Original Term to Maturity or ARD (months): | 113 |
| Weighted Average Remaining Term to Maturity or ARD (months): | 112 |
| Weighted Average Original Amortization Term (months)(2): | 354 |
| Weighted Average Remaining Amortization Term (months)(2): | 353 |
| Weighted Average Seasoning (months): | 1 |
| (1) | Information regarding mortgage loans secured by multiple properties is based on an allocation according to relative appraised values or the allocated loan amounts or property-specific release prices set forth in the related loan documents or such other allocation as the related mortgage loan seller deemed appropriate. |
| (2) | Excludes any mortgage loan that does not amortize. |
Credit Statistics:
| Weighted Average U/W Net Cash Flow DSCR(1): | 2.18x |
| Weighted Average U/W Net Operating Income Debt Yield(1): | 14.0% |
| Weighted Average Cut-off Date Loan-to-Value Ratio(1): | 59.0% |
| Weighted Average Balloon or ARD Loan-to-Value Ratio(1): | 52.1% |
| % of Mortgage Loans with Additional Subordinate Debt(2): | 9.5% |
| % of Mortgage Loans with Single Tenants(3): | 12.2% |
| (1) | With respect to the Sanofi Office Complex mortgage loan and the 225 Liberty Street mortgage loan, each of which is part of a whole loan, loan-to-value ratio, debt service coverage ratio and debt yield calculations include the relatedpari passu companion loan(s) but exclude any related subordinate companion loan(s) (unless otherwise stated). For mortgaged properties securing residential cooperative mortgage loans, the debt service coverage ratio or debt yield for each such mortgaged property is calculated using underwritten net cash flow for the related residential cooperative property which is the projected net cash flow reflected in the most recent appraisal obtained by or otherwise in the possession of the related mortgage loan seller as of the cut-off date, and the loan-to-value ratio, excluding the Ansley South Cooperative, Inc. mortgage loan, is calculated based upon the appraised value of the residential cooperative property determined as if such residential cooperative property is operated as a residential cooperative. The loan-to-value ratio for the Ansley South Cooperative, Inc. mortgage loan is calculated based on the appraised value of the residential cooperative property determined as if such residential cooperative property is operated as a market rate multifamily rental property. The debt service coverage ratio, debt yield and loan-to-value ratio information do not take into account any subordinate debt (whether or not secured by the related mortgaged property), that currently exists or is allowed under the terms of any mortgage loan. See “Description of the Mortgage Pool—Mortgage Pool Characteristics” in the Preliminary Prospectus and Annex A-1 to the Preliminary Prospectus. |
| (2) | Eleven (11) of the mortgage loans, each of which is secured by a residential cooperative property, currently have in place subordinate secured lines of credit to the related mortgage borrowers that permit future advances (such loans, collectively, the “Subordinate Coop LOCs”). The percentage figure expressed as “% of Mortgage Loans with Additional Subordinate Debt” is determined as a percentage of the initial pool balance and does not take into account any future subordinate debt (whether or not secured by the mortgaged property), that may be permitted under the terms of any mortgage loan or the pooling and servicing agreement. See “Description of the Mortgage Pool—Additional Indebtedness—Other Unsecured Indebtedness” and “Description of the Mortgage Pool—Additional Debt Financing for Mortgage Loans Secured by Residential Cooperatives”. |
| (3) | Excludes mortgage loans that are secured by multiple single tenant properties. |
THE INFORMATION IN THIS STRUCTURAL AND COLLATERAL TERM SHEET IS NOT COMPLETE AND MAY BE AMENDED PRIOR TO THE TIME OF SALE. THIS TERM SHEET IS NOT AN OFFER TO SELL THESE SECURITIES AND IT IS NOT A SOLICITATION OF AN OFFER TO BUY THESE SECURITIES IN ANY JURISDICTION WHERE THE OFFER OR SALE IS NOT PERMITTED.
| 5 |
| Wells Fargo Commercial Mortgage Trust 2016-C33 | Issue Characteristics |
Loan Structural Features:
Amortization:Based on the Initial Pool Balance, 72.1% of the mortgage pool (66 mortgage loans) has scheduled amortization, as follows:
40.4% (42 mortgage loans) requires amortization during the entire loan term; and
31.8% (24 mortgage loans) provides for an interest-only period followed by an amortization period.
Interest-Only:Based on the Initial Pool Balance, 27.9% of the mortgage pool (13 mortgage loans) provides for interest-only payments during the entire loan term. The Weighted Average Cut-off Date Loan-to-Value Ratio and Weighted Average U/W Net Cash Flow DSCR for those mortgage loans are 46.5% and 2.71x, respectively.
Hard Lockboxes: Based on the Initial Pool Balance, 34.3% of the mortgage pool (16 mortgage loans) have hard lockboxes in place.
Reserves: The mortgage loans require amounts to be escrowed monthly as follows (excluding any mortgage loans with springing provisions):
| Real Estate Taxes: | 67.7% of the pool |
| Insurance: | 56.7% of the pool |
| Capital Replacements: | 65.0% of the pool |
| TI/LC: | 62.4% of the pool(1) |
| (1) The percentage of Initial Pool Balance for mortgage loans with TI/LC reserves is based on the aggregate principal balance allocable to loans that include retail, office and industrial properties. | |
Call Protection/Defeasance: Based on the Initial Pool Balance, the mortgage pool has the following call protection and defeasance features:
84.6% of the mortgage pool (53 mortgage loans) features a lockout period, then defeasance only until an open period;
8.3% of the mortgage pool (seven mortgage loans) features a lockout period, then the greater of a prepayment premium or yield maintenance until an open period;
5.5% of the mortgage pool (14 mortgage loans) features no lockout period, but requires the greater of a prepayment premium or yield maintenance, then a prepayment premium until an open period;
1.1% of the mortgage pool (two mortgage loans) features a lockout period, then the greater of a prepayment premium or yield maintenance or defeasance until an open period; and
0.4% of the mortgage pool (three mortgage loans) features no lockout period, but requires yield maintenance, then yield maintenance or defeasance until an open period.
Please refer to Annex A-1 to the Preliminary Prospectus for further information regarding individual loan call protection.
THE INFORMATION IN THIS STRUCTURAL AND COLLATERAL TERM SHEET IS NOT COMPLETE AND MAY BE AMENDED PRIOR TO THE TIME OF SALE. THIS TERM SHEET IS NOT AN OFFER TO SELL THESE SECURITIES AND IT IS NOT A SOLICITATION OF AN OFFER TO BUY THESE SECURITIES IN ANY JURISDICTION WHERE THE OFFER OR SALE IS NOT PERMITTED.
| 6 |
| Wells Fargo Commercial Mortgage Trust 2016-C33 | Issue Characteristics |
| III. | Issue Characteristics |
| Securities Offered: | $622,301,000 approximate monthly pay, multi-class, commercial mortgage REMIC pass-through certificates consisting of ten classes (Classes A-1, A-2, A-3, A-4, A-SB, A-S, B, C, X-A and X-B), which are offered pursuant to a registration statement filed with the SEC (such classes of certificates, the “Offered Certificates”). | |
| Mortgage Loan Sellers: | Wells Fargo Bank, National Association (“WFB”), Ladder Capital Finance LLC (“LCF”), Rialto Mortgage Finance, LLC (“RMF”), C-III Commercial Mortgage LLC (“CIIICM”), Natixis Real Estate Capital LLC (“Natixis”) and National Cooperative Bank, N.A. (“NCB”). | |
| Sole Lead Bookrunning Manager: | Wells Fargo Securities, LLC | |
| Co-Managers: | Academy Securities, Inc., Deutsche Bank Securities Inc. and Natixis Securities Americas LLC | |
| Rating Agencies: | DBRS, Inc., Fitch Ratings, Inc. and Moody’s Investors Service, Inc. | |
| Master Servicers: | Wells Fargo Bank, National Association and National Cooperative Bank, N.A. | |
| Special Servicers: | Rialto Capital Advisors, LLC and National Cooperative Bank, N.A. | |
| Certificate Administrator: | Wells Fargo Bank, National Association | |
| Trustee: | Wilmington Trust, National Association | |
| Operating Advisor: | Park Bridge Lender Services LLC | |
| Asset Representations Reviewer: | Park Bridge Lender Services LLC | |
| Initial Majority Controlling Class Certificateholder: | Rialto CMBS IX, LLC or another affiliate of Rialto Capital Advisors, LLC. | |
| Cut-off Date: | The Cut-off Date with respect to each mortgage loan is the due date for the monthly debt service payment that is due in March 2016 (or, in the case of any mortgage loan that has its first due date in April 2016, the date that would have been its due date in March 2016 under the terms of that mortgage loan if a monthly debt service payment were scheduled to be due in that month). | |
| Expected Closing Date: | On or about March 31, 2016. | |
| Determination Dates: | The 11th day of each month (or if that day is not a business day, the next succeeding business day), commencing in April 2016. | |
| Distribution Dates: | The fourth business day following the Determination Date in each month, commencing in April 2016. | |
| Rated Final Distribution Date: | The Distribution Date in March 2059. | |
| Interest Accrual Period: | With respect to any Distribution Date, the calendar month immediately preceding the month in which such Distribution Date occurs. | |
| Day Count: | The Offered Certificates will accrue interest on a 30/360 basis. | |
| Minimum Denominations: | $10,000 for each Class of Offered Certificates (other than the Class X-A and X-B Certificates) and $1,000,000 for the Class X-A and X-B Certificates. Investments may also be made in any whole dollar denomination in excess of the applicable minimum denomination. | |
| Clean-up Call: | 1% | |
| Delivery: | DTC, Euroclear and Clearstream Banking | |
| ERISA/SMMEA Status: | Each Class of Offered Certificates is expected to be eligible for exemptive relief under ERISA. No Class of Offered Certificates will be SMMEA eligible. | |
| Risk Factors: | THE CERTIFICATES INVOLVE CERTAIN RISKS AND MAY NOT BE SUITABLE FOR ALL INVESTORS. SEE THE “RISK FACTORS” SECTION OF THE PRELIMINARY PROSPECTUS. | |
| Bond Analytics Information: | The Certificate Administrator will be authorized to make distribution date statements, CREFC® reports and certain supplemental reports (other than confidential information) available to certain financial modeling and data provision services, including Bloomberg, L.P., Trepp, LLC, Intex Solutions, Inc., Markit Group Limited, Interactive Data Corp., BlackRock Financial Management, Inc., CMBS.com, Inc. and Thomson Reuters Corporation. |
THE INFORMATION IN THIS STRUCTURAL AND COLLATERAL TERM SHEET IS NOT COMPLETE AND MAY BE AMENDED PRIOR TO THE TIME OF SALE. THIS TERM SHEET IS NOT AN OFFER TO SELL THESE SECURITIES AND IT IS NOT A SOLICITATION OF AN OFFER TO BUY THESE SECURITIES IN ANY JURISDICTION WHERE THE OFFER OR SALE IS NOT PERMITTED.
| 7 |
| Wells Fargo Commercial Mortgage Trust 2016-C33 | Characteristics of the Mortgage Pool |
| IV. | Characteristics of the Mortgage Pool(1) |
| A. | Ten Largest Mortgage Loans |
| Mortgage Loan Seller | Mortgage Loan Name | City | State | Number of Mortgage Loans / Mortgaged Properties | Mortgage Loan Cut-off Date Balance ($) | % of Initial Pool Balance (%) | Property Type | Number of SF/Rooms | Cut-off Date Per SF/Room | Cut-off Date LTV Ratio (%) | Balloon or ARD LTV Ratio (%) | U/W NCF DSCR (x) | U/W NOI Debt Yield (%) | ||||||
| LCF | Sanofi Office Complex | Bridgewater | NJ | 1 / 1 | $65,000,000 | 9.1 | % | Office | 674,325 | $185 | 45.8 | % | 45.8 | % | 2.60 | x | 13.5 | % | |
| WFB | WPC Self Storage IX | Various | Various | 1 / 13 | 49,000,000 | 6.9 | Self Storage | 938,219 | 52 | 65.4 | 65.4 | 1.76 | 9.0 | ||||||
| WFB | 225 Liberty Street | New York | NY | 1 / 1 | 40,500,000 | 5.7 | Office | 2,427,515 | 189 | 32.8 | 32.8 | 3.13 | 16.0 | ||||||
| Natixis | Business & Research Center at Garden City | Garden City | NY | 1 / 1 | 37,000,000 | 5.2 | Office | 187,118 | 198 | 64.1 | 53.1 | 1.29 | 8.8 | ||||||
| CIIICM | Doubletree Seattle Airport Southcenter | Seattle | WA | 1 / 1 | 28,437,374 | 4.0 | Hospitality | 219 | 129,851 | 67.5 | 56.5 | 1.56 | 12.4 | ||||||
| LCF | Independence Marketplace | Allen Park | MI | 1 / 1 | 26,896,773 | 3.8 | Retail | 178,308 | 151 | 69.0 | 56.0 | 1.55 | 10.2 | ||||||
| WFB | Brier Creek Corporate Center I & II | Raleigh | NC | 1 / 1 | 22,919,344 | 3.2 | Office | 180,955 | 127 | 72.9 | 60.1 | 1.35 | 9.7 | ||||||
| RMF | Atlantic Mini Self Storage Portfolio | Various | Various | 1 / 4 | 20,980,000 | 2.9 | Self Storage | 292,460 | 72 | 69.3 | 61.3 | 1.47 | 9.7 | ||||||
| WFB | Parkview at Spring Street | Silver Spring | MD | 1 / 1 | 17,750,000 | 2.5 | Office | 100,895 | 176 | 65.0 | 56.1 | 1.26 | 9.3 | ||||||
| LCF | Omni Officentre | Southfield | MI | 1 / 1 | 15,500,000 | 2.2 | Office | 294,090 | 53 | 64.6 | 56.9 | 1.90 | 14.3 | ||||||
| Top Three Total/Weighted Average | 3 / 15 | $154,500,000 | 21.7 | % | 48.6 | % | 48.6 | % | 2.47 | x | 12.7 | % | |||||||
| Top Five Total/Weighted Average | 5 / 17 | $219,937,374 | 30.9 | % | 53.7 | % | 50.4 | % | 2.16 | x | 12.0 | % | |||||||
| Top Ten Total/Weighted Average | 10 / 25 | $323,983,491 | 45.5 | % | 58.5 | % | 52.9 | % | 1.94 | x | 11.5 | % | |||||||
| Non-Top Ten Total/Weighted Average | 69 / 79 | $388,235,596 | 54.5 | % | 59.5 | % | 51.5 | % | 2.37 | x | 16.0 | % | |||||||
| (1) | With respect to the Sanofi Office Complex mortgage loan and the 225 Liberty Street mortgage loan, each of which is part of a whole loan, Cut-off Date Balance Per SF/Room, loan-to-value ratio, debt service coverage ratio and debt yield calculations include the relatedpari passu companion loan(s) but exclude any related subordinate companion loan(s) (unless otherwise stated). With respect to each mortgage loan, debt service coverage ratio, debt yield and loan-to-value ratio information do not take into account of subordinate debt (whether or not secured by the related mortgaged property), if any, that currently exists or is allowed under the terms of such mortgage loan. |
THE INFORMATION IN THIS STRUCTURAL AND COLLATERAL TERM SHEET IS NOT COMPLETE AND MAY BE AMENDED PRIOR TO THE TIME OF SALE. THIS TERM SHEET IS NOT AN OFFER TO SELL THESE SECURITIES AND IT IS NOT A SOLICITATION OF AN OFFER TO BUY THESE SECURITIES IN ANY JURISDICTION WHERE THE OFFER OR SALE IS NOT PERMITTED.
| 8 |
| Wells Fargo Commercial Mortgage Trust 2016-C33 | Characteristics of the Mortgage Pool |
| B. | Summary of the Whole Loans |
| Property Name | Mortgage Loan Seller | Note(s) | Related Notes in Loan Group (Original Balance) | Holder of Note | Lead Servicer for Whole loan | Current Master Servicer Under Related Securitization Servicing Agreement | Current Special Servicer Under Related Securitization Servicing Agreement |
| Sanofi Office Complex | LCF | (1) | $65,000,000 | WFCM 2016-C33 | Yes | Wells Fargo Bank, National Association | Rialto Capital Advisors, LLC |
| LCF | (1) | $60,000,000 | (1) | No | TBD | TBD | |
| 225 Liberty Street(4) | CGMRC/GACC/WFB | (2) | $337,500,000 | LBTY 2016-225L | Yes | Wells Fargo Bank, National Association | Trimont Real Estate Advisors, LLC |
| WFB | A-1F | $40,500,000 | WFCM 2016-C33 | No | Wells Fargo Bank, National Association | Rialto Capital Advisors, LLC | |
| CGMRC | A-1D | $40,500,000 | (3) | No | TBD | TBD | |
| GACC | A-1E | $40,500,000 | (3) | No | TBD | TBD |
| (1) | Consists of eightpari passu notes. The controlling Note A-1-A and non-controlling Notes A-1-B, A-2-A, and A-2-B have an aggregate original balance of $65,000,000 and will be contributed to the WFCM 2016-C33 Trust. The non-controlling Notes A-3-A and A-4-A have an aggregate original principal balance of $40,000,000 and are currently held by LCF and the non-controlling Notes A-3-B and A-4-B have an aggregate original principal balance of $20,000,000 and are currently held by JPMorgan Chase Bank, National Association. Notes A-3-A, A-3-B, A-4-A and A-4-B are expected to be contributed to one or more future securitizations. No assurance can be provided that the Notes A-3-A, A-3-B, A-4-A and Note A-4-B will not be split further. |
| (2) | Consists of threepari passu notes and three subordinate notes. The controlling Note A-1A and non-controlling Notes A-1B, and A-1C have an aggregate original balance of $337,500,000 and the subordinate controlling Note A-2A and non-controlling Notes A-2B and A-2C have an aggregate original balance of $441,000,000 and were contributed to the LBTY 2016-225L Trust. |
| (3) | The relatedpari passucompanion loan Note A-1D is currently held by Citigroup Global Markets Realty Corp.(“CGMRC”) or an affiliate. The relatedpari passucompanion loan Note A-1E is currently held by German American Capital Corporation (“GACC”) or an affiliate. Note A-1D and Note A-1E are expected to be contributed to one or more future securitizations. No assurance can be provided that Note A-1D and Note A-1E will not be split further. |
| (4) | The 225 Liberty Street whole loan also includes three junior companion loans with an aggregate original principal balance of $441,000,000, which were contributed to the LBTY 2016-225L securitization. Such junior companion loans are not reflected in the “Related Notes in Loan Group” column. |
| C. | Mortgage Loans with Additional Secured and Mezzanine Financing(1) |
| Loan No. | Mortgage Loan Seller | Mortgage Loan Name | Mortgage Loan Cut-off Date Balance ($) | % of Initial Pool Balance (%) | Subordinate DebtCut-off Date Balance ($) | Mezzanine Debt Cut-off Date Balance ($) | Total Debt Interest Rate (%)(2) | Mortgage Loan U/W NCF DSCR (x)(3) | Total Debt U/W NCF DSCR (x) | Mortgage Loan Cut-off Date U/W NOI Debt Yield (%)(3) | Total Debt Cut-off Date U/W NOI Debt Yield (%) | Mortgage Loan Cut-off Date LTV Ratio (%)(3) | Total Debt Cut-off Date LTV Ratio (%) |
| 3 | WFB | 225 Liberty Street | $40,500,000 | 5.7% | $441,000,000 | NAP | 4.657% | 3.13x | 1.60x | 16.0% | 8.2% | 32.8% | 64.3% |
| Total/Weighted Average | $40,500,000 | 5.7% | $441,000,000 | NAP | 4.657% | 3.13x | 1.60x | 16.0% | 8.2% | 32.8% | 64.3% | ||
| (1) | In addition, eleven (11) of the mortgage loans, each of which is secured by a residential cooperative property, currently have in place Subordinate Coop LOCs that permit future advances. See “Description of the Mortgage Pool—Additional Indebtedness—Other Unsecured Indebtedness” and “Description of the Mortgage Pool—Additional Debt Financing for Mortgage Loans Secured by Residential Cooperatives” in the Preliminary Prospectus. |
| (2) | Total Debt Interest Rate for any specified mortgage loan reflects the weighted average of the interest rates on the respective components of the total debt. |
| (3) | With respect to the 225 Liberty Street mortgage loan, which is part of a whole loan, debt service coverage ratio, debt yield and loan-to-value ratio calculations include the relatedpari passucompanion loan(s) but exclude any related junior companion loan(s). |
THE INFORMATION IN THIS STRUCTURAL AND COLLATERAL TERM SHEET IS NOT COMPLETE AND MAY BE AMENDED PRIOR TO THE TIME OF SALE. THIS TERM SHEET IS NOT AN OFFER TO SELL THESE SECURITIES AND IT IS NOT A SOLICITATION OF AN OFFER TO BUY THESE SECURITIES IN ANY JURISDICTION WHERE THE OFFER OR SALE IS NOT PERMITTED.
| 9 |
| Wells Fargo Commercial Mortgage Trust 2016-C33 | Characteristics of the Mortgage Pool |
| D. | Previous Securitization History(1) |
| Loan No. | Mortgage Loan Seller | Mortgage Loan or Mortgaged Property Name | City | State | Property Type | Mortgage Loan or Mortgaged Property Cut-off Date Balance ($) | % of Initial Pool Balance (%) | Previous Securitization | ||
| 1 | LCF | Sanofi Office Complex | Bridgewater | NJ | Office | $65,000,000 | 9.1 | % | GCCFC 2006-GG7 | |
| 5 | CIIICM | Doubletree Seattle Airport Southcenter | Seattle | WA | Hospitality | 28,437,374 | 4.0 | CGCMT 2006-C4 | ||
| 6 | LCF | Independence Marketplace | Allen Park | MI | Retail | 26,896,773 | 3.8 | GSMS 2006-GG6 | ||
| 9 | WFB | Parkview at Spring Street | Silver Spring | MD | Office | 17,750,000 | 2.5 | LBUBS 2006-C4 | ||
| 13 | RMF | The Vineyard at Arlington | Arlington | TX | Multifamily | 13,750,000 | 1.9 | LMREC 2015-CRE1 | ||
| 16 | Natixis | McHenry East Center | McHenry | IL | Retail | 12,650,000 | 1.8 | BSCMS 2006-PW12 | ||
| 20 | RMF | Holiday Inn & Suites Parsippany Fairfield | Parsippany | NJ | Hospitality | 11,150,000 | 1.6 | JPMCC 2006-LDP8 | ||
| 24 | RMF | Wal-Mart Supercenter Dahlonega | Dahlonega | GA | Retail | 9,650,000 | 1.4 | CGCMT 2006-C4 | ||
| 29 | WFB | The Grupe Building | Stockton | CA | Office | 8,600,000 | 1.2 | BACM 2006-1 | ||
| 31 | LCF | Northwest Plaza | Midland | MI | Retail | 7,750,000 | 1.1 | WBCMT 2006-C23 | ||
| 32 | WFB | Cherry Hill Court | Canton | MI | Retail | 7,489,874 | 1.1 | JPMCC 2006-LDP6 | ||
| 33 | CIIICM | Ramp Creek MHC | Heath | OH | Manufactured Housing Community | 7,155,000 | 1.0 | CD 2007-CD4 | ||
| 35 | LCF | Hilton Garden Inn Chesapeake | Chesapeake | VA | Hospitality | 6,639,060 | 0.9 | JPMCC 2006-LDP6 | ||
| 46 | WFB | Security Public Storage - Glendora | Glendora | CA | Self Storage | 3,964,944 | 0.6 | BSCMS 2006-T22 | ||
| 47 | WFB | Security Public Storage - Sparks | Sparks | NV | Self Storage | 3,790,387 | 0.5 | BSCMS 2006-T22 | ||
| 50 | CIIICM | Summerville MHP | Summerville | SC | Manufactured Housing Community | 3,375,000 | 0.5 | GSMS 2012-GCJ9 | ||
| 57 | WFB | Shelby Township Center | Shelby Township | MI | Retail | 2,992,657 | 0.4 | WBCMT 2006-C24 | ||
| 59 | CIIICM | Picture Ranch MHP | Clifton | CO | Manufactured Housing Community | 2,600,000 | 0.4 | COMM 2006-C7 | ||
| 61 | RMF | Jasper Center | Jasper | AL | Retail | 2,500,000 | 0.4 | CSMC 2006-C2 | ||
| 67 | WFB | Kroger Shops | Virginia Beach | VA | Retail | 1,797,552 | 0.3 | MLMT 2006-C1 | ||
| 68 | NCB | Greenwich 33 Apartment Corp. | New York | NY | Multifamily | 1,595,480 | 0.2 | MSC 2007-IQ13 | ||
| 69 | NCB | Willow House Owners Corp. | Rockville Centre | NY | Multifamily | 1,550,000 | 0.2 | MSC 2006-IQ11 | ||
| 71 | NCB | Stewart Franklin Owners Corp. | Garden City | NY | Multifamily | 1,400,000 | 0.2 | MSC 2006-IQ11 | ||
| 73 | RMF | Walgreens Avondale | Avondale | AZ | Retail | 1,300,000 | 0.2 | BSCMS 2006-T22 | ||
| 79 | NCB | West 12th Street Tenants Corp. | New York | NY | Multifamily | 898,658 | 0.1 | MSC 2006-IQ11 | ||
| Total | $250,682,758 | 35.2 | % | |||||||
| (1) | The table above represents the most recent securitization with respect to the mortgaged property securing the related mortgage loan, based on information provided by the related borrower or obtained through searches of a third-party database. While loans secured by the above mortgaged properties may have been securitized multiple times in prior transactions, mortgage loans in this securitization are only listed in the above chart if the mortgage loan paid off a loan in another securitization. The information has not otherwise been confirmed by the mortgage loan sellers. |
THE INFORMATION IN THIS STRUCTURAL AND COLLATERAL TERM SHEET IS NOT COMPLETE AND MAY BE AMENDED PRIOR TO THE TIME OF SALE. THIS TERM SHEET IS NOT AN OFFER TO SELL THESE SECURITIES AND IT IS NOT A SOLICITATION OF AN OFFER TO BUY THESE SECURITIES IN ANY JURISDICTION WHERE THE OFFER OR SALE IS NOT PERMITTED.
| 10 |
| Wells Fargo Commercial Mortgage Trust 2016-C33 | Characteristics of the Mortgage Pool |
| E. | Mortgage Loans with Scheduled Balloon Payments and Related Classes |
Class A-2(1)
| Loan No. | Mortgage Loan Seller | Mortgage Loan Name | State | Property Type | Mortgage Loan Cut-off Date Balance ($) | % of Initial Pool Balance (%) | Balloon Balance ($) |
% of Class | SF/ Pads/ Units | Loan per SF/ Pad/ Unit | U/W NCF DSCR (x) | U/W NOI Debt Yield (%) | Cut-off Date LTV Ratio (%) | Balloon or ARD LTV Ratio (%) | Rem. IO Period (mos.) | Rem. Term to Maturity or ARD (mos.) | ||||||
| 1 | LCF | Sanofi Office Complex | NJ | Office | $65,000,000 | 9.1 | % | $65,000,000 | 76.9 | % | 674,325 | $185 | 2.60 | x | 13.5 | % | 45.8 | % | 45.8 | % | 58 | 58 |
| 26 | RMF | Sentry Self-Storage Portfolio | VA | Self Storage | 9,310,000 | 1.3 | 8,894,741 | 10.5 | 146,269 | 64 | 1.50 | 9.7 | 61.8 | 59.1 | 23 | 59 | ||||||
| 53 | CIIICM | Glenwood Village MHC | OH | Manufactured Housing Community | 3,000,000 | 0.4 | 2,804,591 | 3.3 | 235 | 12,766 | 1.70 | 12.6 | 60.0 | 56.1 | 0 | 60 | ||||||
| 54 | CIIICM | H&H Self Storage | SC | Self Storage | 2,996,166 | 0.4 | 2,780,562 | 3.3 | 50,825 | 59 | 1.31 | 9.0 | 74.0 | 68.7 | 0 | 59 | ||||||
| 55 | CIIICM | Tara Oaks Apartments | TX | Multifamily | 2,996,105 | 0.4 | 2,776,091 | 3.3 | 126 | 23,779 | 1.38 | 10.2 | 74.9 | 69.4 | 0 | 59 | ||||||
| Total/Weighted Average | $83,302,270 | 11.7 | % | $82,255,986 | 97.3 | % | 2.35 | x | 12.8 | % | 50.2 | % | 49.3 | % | 48 | 58 | ||||||
| (1) | The table above presents the mortgage loan(s) whose balloon payments would be applied to pay down the principal balance of the Class A-2 Certificates, assuming a 0% CPR and applying the “Structuring Assumptions” described in the Preliminary Prospectus, including the assumptions that (i) none of the mortgage loans in the pool experience prepayments prior to maturity (or, in the case of an ARD loan, its anticipated repayment date), defaults or losses; (ii) there are no extensions of maturity dates of any mortgage loans in the pool; and (iii) each mortgage loan in the pool is paid in full on its stated maturity date (or, in the case of an ARD loan, its anticipated repayment date). Each Class of Certificates evidences undivided ownership interests in the entire pool of mortgage loans. Debt service coverage ratio, debt yield and loan-to-value ratio information do not take into account subordinate debt (whether or not secured by the related mortgaged property), if any, that currently exists or is allowed under the terms of any mortgage loan. See Annex A-1 to the Preliminary Prospectus. |
| (2) | Reflects the percentage equal to the Balloon Balance divided by the initial Class A-2 Certificate Balance. |
THE INFORMATION IN THIS STRUCTURAL AND COLLATERAL TERM SHEET IS NOT COMPLETE AND MAY BE AMENDED PRIOR TO THE TIME OF SALE. THIS TERM SHEET IS NOT AN OFFER TO SELL THESE SECURITIES AND IT IS NOT A SOLICITATION OF AN OFFER TO BUY THESE SECURITIES IN ANY JURISDICTION WHERE THE OFFER OR SALE IS NOT PERMITTED.
| 11 |
| Wells Fargo Commercial Mortgage Trust 2016-C33 | Characteristics of the Mortgage Pool |
| F. | Property Type Distribution(1) |
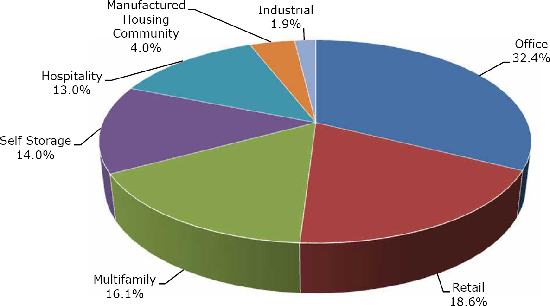
| Property Type | Number of Mortgaged Properties | Aggregate Cut-off Date Balance ($) | % of Initial Pool Balance (%) | Weighted Average Cut- off Date LTV Ratio (%) | Weighted Average Balloon or ARD LTV Ratio (%) | Weighted Average U/W NCF DSCR (x) | Weighted Average U/W NOI Debt Yield (%) | Weighted Average U/W NCF Debt Yield (%) | Weighted Average Mortgage Rate (%) | |||||||
| Office | 9 | $230,846,190 | 32.4 | % | 52.7 | % | 48.0 | % | 2.16 | x | 12.6 | % | 11.6 | % | 4.942 | % |
| Suburban | 8 | 190,346,190 | 26.7 | 57.0 | 51.2 | 1.96 | 11.9 | 10.9 | 5.002 | |||||||
| CBD | 1 | 40,500,000 | 5.7 | 32.8 | 32.8 | 3.13 | 16.0 | 14.8 | 4.657 | |||||||
| Retail | 25 | 132,219,992 | 18.6 | 68.6 | 58.7 | 1.48 | 9.9 | 9.3 | 4.973 | |||||||
| Anchored | 8 | 80,508,783 | 11.3 | 70.1 | 59.3 | 1.44 | 10.0 | 9.2 | 4.890 | |||||||
| Shadow Anchored | 8 | 24,297,552 | 3.4 | 67.1 | 55.5 | 1.48 | 10.2 | 9.6 | 5.122 | |||||||
| Single Tenant | 7 | 21,921,000 | 3.1 | 64.3 | 60.7 | 1.60 | 9.1 | 9.1 | 5.078 | |||||||
| Unanchored | 2 | 5,492,657 | 0.8 | 69.8 | 57.7 | 1.48 | 10.7 | 9.7 | 5.124 | |||||||
| Multifamily | 21 | 114,641,533 | 16.1 | 47.7 | 42.3 | 4.15 | 26.9 | 26.6 | 4.723 | |||||||
| Garden | 6 | 63,437,733 | 8.9 | 67.1 | 59.8 | 1.42 | 9.9 | 9.3 | 5.101 | |||||||
| Cooperative | 14 | 39,128,800 | 5.5 | 12.5 | 10.0 | 9.39 | 59.9 | 59.9 | 4.081 | |||||||
| Student Housing | 1 | 12,075,000 | 1.7 | 60.4 | 55.5 | 1.53 | 9.6 | 9.6 | 4.822 | |||||||
| Self Storage | 27 | 99,661,496 | 14.0 | 65.4 | 61.7 | 1.63 | 9.5 | 9.2 | 4.960 | |||||||
| Self Storage | 27 | 99,661,496 | 14.0 | 65.4 | 61.7 | 1.63 | 9.5 | 9.2 | 4.960 | |||||||
| Hospitality | 11 | 92,769,875 | 13.0 | 63.6 | 51.8 | 1.69 | 13.4 | 11.8 | 5.555 | |||||||
| Limited Service | 8 | 48,082,501 | 6.8 | 60.4 | 48.3 | 1.81 | 14.2 | 12.8 | 5.496 | |||||||
| Full Service | 2 | 39,587,374 | 5.6 | 66.9 | 56.1 | 1.59 | 12.7 | 10.9 | 5.574 | |||||||
| Extended Stay | 1 | 5,100,000 | 0.7 | 68.0 | 52.6 | 1.34 | 11.7 | 10.4 | 5.970 | |||||||
| Manufactured Housing Community | 9 | 28,630,000 | 4.0 | 69.4 | 58.6 | 1.45 | 10.3 | 10.0 | 5.584 | |||||||
| Manufactured Housing Community | 9 | 28,630,000 | 4.0 | 69.4 | 58.6 | 1.45 | 10.3 | 10.0 | 5.584 | |||||||
| Industrial | 2 | 13,450,000 | 1.9 | 68.6 | 58.5 | 1.43 | 10.9 | 9.3 | 5.059 | |||||||
| Warehouse | 1 | 9,250,000 | 1.3 | 69.5 | 59.0 | 1.43 | 11.2 | 9.4 | 5.190 | |||||||
| Flex | 1 | 4,200,000 | 0.6 | 66.7 | 57.3 | 1.43 | 10.1 | 9.0 | 4.770 | |||||||
| Total/Weighted Average: | 104 | $712,219,087 | 100.0 | % | 59.0 | % | 52.1 | % | 2.18 | x | 14.0 | % | 13.2 | % | 5.023 | % |
| (1) | Because this table presents information relating to the mortgaged properties and not the mortgage loans, the information for mortgage loans secured by more than one mortgaged property is based on allocated amounts (allocating the mortgage loan balance to each of those properties according to the relative appraised values of the mortgaged properties or the allocated loan amounts or property-specific release prices set forth in the related mortgage loan documents or such other allocation as the related mortgage loan seller deemed appropriate). For mortgaged properties securing residential cooperative mortgage loans, the debt service coverage ratio or debt yield for each such mortgaged property is calculated using underwritten net cash flow for the related residential cooperative property which is the projected net cash flow reflected in the most recent appraisal obtained by or otherwise in the possession of the related mortgage loan seller as of the cut-off date and the loan-to-value ratio, excluding the Ansley South Cooperative, Inc. mortgage loan, is calculated based upon the appraised value of the residential cooperative property determined as if such residential cooperative property is operated as a residential cooperative. The loan-to-value ratio for the Ansley South Cooperative, Inc. mortgage loan is calculated based on the appraised value of the residential cooperative property determined as if such residential cooperative property is operated as a market rate multifamily rental property. With respect to the Sanofi Office Complex mortgage loan and the 225 Liberty Street mortgage loan, each of which is part of a whole loan, the loan-to-value ratio, debt service coverage ratio and debt yield calculations include the relatedpari passu companion loan(s) but exclude any related subordinate companion loan(s) (unless otherwise stated). With respect to each mortgage loan, debt service coverage ratio, debt yield and loan-to-value ratio information do not take into account of any subordinate debt (whether or not secured by the related mortgaged property) that currently exists or is allowed under the terms of such mortgage loan. See Annex A-1 to the Preliminary Prospectus. |
THE INFORMATION IN THIS STRUCTURAL AND COLLATERAL TERM SHEET IS NOT COMPLETE AND MAY BE AMENDED PRIOR TO THE TIME OF SALE. THIS TERM SHEET IS NOT AN OFFER TO SELL THESE SECURITIES AND IT IS NOT A SOLICITATION OF AN OFFER TO BUY THESE SECURITIES IN ANY JURISDICTION WHERE THE OFFER OR SALE IS NOT PERMITTED.
| 12 |
| Wells Fargo Commercial Mortgage Trust 2016-C33 | Characteristics of the Mortgage Pool |
| G. | Geographic Distribution(1)(2) |
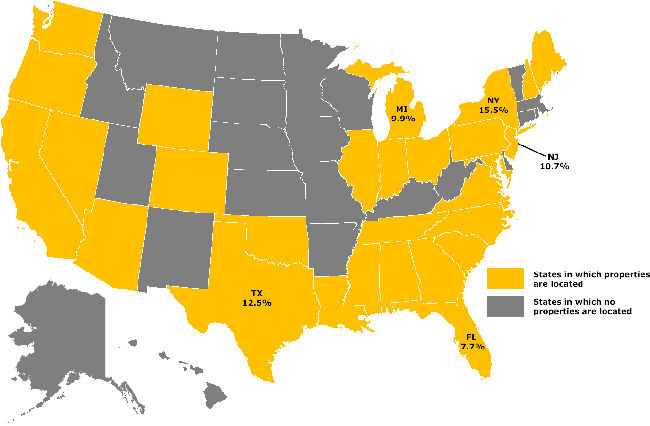
| Location | Number of Mortgaged Properties | Aggregate Cut-off Date Balance ($) | % of Initial Pool Balance (%) | Weighted Average Cut- off Date LTV Ratio (%) | Weighted Average Balloon or ARD LTV Ratio (%) | Weighted Average U/W NCF DSCR (x) | Weighted Average U/W NOI Debt Yield (%) | Weighted Average U/W NCF Debt Yield (%) | Weighted Average Mortgage Rate (%) | |||||||
| New York | 16 | $110,673,800 | 15.5 | % | 39.4 | % | 35.% | 3.94 | x | 21.3 | % | 20.7 | % | 4.713 | % | |
| Texas | 19 | 89,124,733 | 12.5 | 65.2 | 59.1 | 1.66 | 10.7 | 10.0 | 5.139 | |||||||
| New Jersey | 2 | 76,150,000 | 10.7 | 48.6 | 47.1 | 2.46 | 13.5 | 13.1 | 5.195 | |||||||
| Michigan | 6 | 70,206,150 | 9.9 | 68.1 | 56.9 | 1.61 | 11.4 | 10.1 | 4.735 | |||||||
| Florida | 7 | 54,777,345 | 7.7 | 61.5 | 56.2 | 1.58 | 10.2 | 9.8 | 5.074 | |||||||
| Other(3) | 54 | 311,287,058 | 43.7 | 64.3 | 55.6 | 1.86 | 13.6 | 12.7 | 5.114 | |||||||
| Total/Weighted Average | 104 | $712,219,087 | 100.0 | % | 59.0 | % | 52.1 | % | 2.18 | x | 14.0 | % | 13.2 | % | 5.023 | % |
| (1) | The mortgaged properties are located in 28 states and District of Columbia. |
| (2) | Because this table presents information relating to the mortgaged properties and not the mortgage loans, the information for mortgage loans secured by more than one mortgaged property is based on allocated amounts (allocating the mortgage loan balance to each of those properties according to the relative appraised values of the mortgaged properties or the allocated loan amounts or property-specific release prices set forth in the related mortgage loan documents or such other allocation as the related mortgage loan seller deemed appropriate). For mortgaged properties securing residential cooperative mortgage loans, the debt service coverage ratio or debt yield for each such mortgaged property is calculated using underwritten net cash flow for the related residential cooperative property which is the projected net cash flow reflected in the most recent appraisal obtained by or otherwise in the possession of the related mortgage loan seller as of the cut-off date and the loan-to-value ratio, excluding the Ansley South Cooperative, Inc. mortgage loan, is calculated based upon the appraised value of the residential cooperative property determined as if such residential cooperative property is operated as a residential cooperative. The loan-to-value ratio for the Ansley South Cooperative, Inc. mortgage loan is calculated based on the appraised value of the residential cooperative property determined as if such residential cooperative property is operated as a market rate multifamily rental property. With respect to the Sanofi Office Complex mortgage loan and the 225 Liberty Street mortgage loan, each of which is part of a whole loan, the loan-to-value ratio, debt service coverage ratio and debt yield calculations include the relatedpari passu companion loan(s) but exclude any related subordinate companion loan(s) (unless otherwise stated). With respect to each mortgage loan, debt service coverage ratio, debt yield and loan-to-value ratio information do not take into account of any subordinate debt (whether or not secured by the related mortgaged property) that currently exists or is allowed under the terms of such mortgage loan. See Annex A-1 to the Preliminary Prospectus. |
| (3) | Includes 23 other states and District of Columbia. |
THE INFORMATION IN THIS STRUCTURAL AND COLLATERAL TERM SHEET IS NOT COMPLETE AND MAY BE AMENDED PRIOR TO THE TIME OF SALE. THIS TERM SHEET IS NOT AN OFFER TO SELL THESE SECURITIES AND IT IS NOT A SOLICITATION OF AN OFFER TO BUY THESE SECURITIES IN ANY JURISDICTION WHERE THE OFFER OR SALE IS NOT PERMITTED.
| 13 |
| Wells Fargo Commercial Mortgage Trust 2016-C33 | Characteristics of the Mortgage Pool |
| H. | Characteristics of the Mortgage Pool(1) |
| CUT-OFF DATE BALANCE | ||||||||||
| Range of Cut-off Date Balances ($) | Number of Mortgage Loans | Aggregate Cut- off Date Balance | % of Initial Pool Balance | |||||||
| 898,658 - 1,000,000 | 2 | $1,808,658 | 0.3 | % | ||||||
| 1,000,001 - 2,000,000 | 11 | 15,150,077 | 2.1 | |||||||
| 2,000,001 - 3,000,000 | 15 | 39,538,178 | 5.6 | |||||||
| 3,000,001 - 4,000,000 | 7 | 25,168,108 | 3.5 | |||||||
| 4,000,001 - 5,000,000 | 4 | 18,300,000 | 2.6 | |||||||
| 5,000,001 - 6,000,000 | 3 | 16,450,000 | 2.3 | |||||||
| 6,000,001 - 7,000,000 | 4 | 25,861,509 | 3.6 | |||||||
| 7,000,001 - 8,000,000 | 3 | 22,394,874 | 3.1 | |||||||
| 8,000,001 - 9,000,000 | 3 | 25,300,000 | 3.6 | |||||||
| 9,000,001 - 10,000,000 | 5 | 47,611,846 | 6.7 | |||||||
| 10,000,001 - 15,000,000 | 12 | 150,652,345 | 21.2 | |||||||
| 15,000,001 - 20,000,000 | 2 | 33,250,000 | 4.7 | |||||||
| 20,000,001 - 30,000,000 | 4 | 99,233,491 | 13.9 | |||||||
| 30,000,001 - 50,000,000 | 3 | 126,500,000 | 17.8 | |||||||
| 50,000,001 - 65,000,000 | 1 | 65,000,000 | 9.1 | |||||||
| Total: | 79 | $712,219,087 | 100.0 | % | ||||||
| Average: | $9,015,431 | |||||||||
| UNDERWRITTEN NOI DEBT SERVICE COVERAGE RATIO | ||||||||||
| Range of U/W NOI DSCRs (x) | Number of Mortgage Loans | Aggregate Cut- off Date Balance | % of Initial Pool Balance | |||||||
| 1.20 | 2 | $13,025,000 | 1.8 | % | ||||||
| 1.21 - 1.30 | 1 | 6,730,820 | 0.9 | |||||||
| 1.31 - 1.40 | 8 | 96,821,166 | 13.6 | |||||||
| 1.41 - 1.50 | 9 | 102,029,344 | 14.3 | |||||||
| 1.51 - 1.60 | 10 | 44,629,762 | 6.3 | |||||||
| 1.61 - 1.70 | 12 | 103,713,880 | 14.6 | |||||||
| 1.71 - 1.80 | 5 | 18,536,612 | 2.6 | |||||||
| 1.81 - 1.90 | 4 | 83,568,471 | 11.7 | |||||||
| 1.91 - 2.00 | 6 | 44,950,234 | 6.3 | |||||||
| 2.01 - 2.50 | 4 | 28,584,999 | 4.0 | |||||||
| 2.51 - 3.00 | 2 | 76,000,000 | 10.7 | |||||||
| 3.01 - 3.50 | 1 | 40,500,000 | 5.7 | |||||||
| 3.51 - 4.00 | 1 | 14,000,000 | 2.0 | |||||||
| 4.01 - 25.87 | 14 | 39,128,800 | 5.5 | |||||||
| Total: | 79 | $712,219,087 | 100.0 | % | ||||||
| Weighted Average: | 2.31x | |||||||||
| UNDERWRITTEN NCF DEBT SERVICE COVERAGE RATIO | ||||||||||
| Range of U/W NCF DSCRs (x) | Number of Mortgage Loans | Aggregate Cut- off Date Balance | % of Initial Pool Balance | |||||||
| 1.20 | 3 | $19,755,820 | 2.8 | % | ||||||
| 1.21 - 1.30 | 7 | 98,075,000 | 13.8 | |||||||
| 1.31 - 1.40 | 12 | 93,809,271 | 13.2 | |||||||
| 1.41 - 1.50 | 10 | 80,181,720 | 11.3 | |||||||
| 1.51 - 1.60 | 11 | 107,829,207 | 15.1 | |||||||
| 1.61 - 1.70 | 8 | 34,704,036 | 4.9 | |||||||
| 1.71 - 1.80 | 3 | 56,466,316 | 7.9 | |||||||
| 1.81 - 1.90 | 4 | 38,683,918 | 5.4 | |||||||
| 1.91 - 2.00 | 1 | 8,600,000 | 1.2 | |||||||
| 2.01 - 2.50 | 3 | 15,484,999 | 2.2 | |||||||
| 2.51 - 3.00 | 1 | 65,000,000 | 9.1 | |||||||
| 3.01 - 3.50 | 2 | 54,500,000 | 7.7 | |||||||
| 4.01 - 25.87 | 14 | 39,128,800 | 5.5 | |||||||
| Total: | 79 | $712,219,087 | 100.0 | % | ||||||
| Weighted Average: | 2.18x | |||||||||
| LOAN PURPOSE | ||||||||||
| Loan Purpose | Number of Mortgage Loans | Aggregate Cut- off Date Balance | % of Initial Pool Balance | |||||||
| Refinance | 56 | $523,419,785 | 73.5 | % | ||||||
| Acquisition | 23 | 188,799,302 | 26.5 | |||||||
| Total: | 79 | $712,219,087 | 100.0 | % | ||||||
| MORTGAGE RATE | ||||||||||
| Range of Mortgage Rates (%) | Number of Mortgage Loans | Aggregate Cut- off Date Balance | % of Initial Pool Balance | |||||||
| 3.920 - 4.000 | 4 | $7,145,289 | 1.0 | % | ||||||
| 4.001 - 4.250 | 8 | 29,784,853 | 4.2 | |||||||
| 4.251 - 4.500 | 2 | 2,198,658 | 0.3 | |||||||
| 4.501 - 4.750 | 7 | 96,752,104 | 13.6 | |||||||
| 4.751 - 5.000 | 17 | 213,232,902 | 29.9 | |||||||
| 5.001 - 5.250 | 19 | 244,940,367 | 34.4 | |||||||
| 5.251 - 5.500 | 11 | 55,420,854 | 7.8 | |||||||
| 5.501 - 5.750 | 4 | 25,080,000 | 3.5 | |||||||
| 5.751 - 6.000 | 6 | 29,564,060 | 4.2 | |||||||
| 6.001 - 6.110 | 1 | 8,100,000 | 1.1 | |||||||
| Total: | 79 | $712,219,087 | 100.0 | % | ||||||
| Weighted Average: | 5.023% | |||||||||
| UNDERWRITTEN NOI DEBT YIELD | ||||||||||
| Range of U/W NOI Debt Yields (%) | Number of Mortgage Loans | Aggregate Cut- off Date Balance | % of Initial Pool Balance | |||||||
| 7.8 - 8.0 | 2 | $13,025,000 | 1.8 | % | ||||||
| 8.1 - 9.0 | 12 | 136,822,986 | 19.2 | |||||||
| 9.1 - 10.0 | 13 | 147,232,001 | 20.7 | |||||||
| 10.1 - 11.0 | 13 | 99,494,985 | 14.0 | |||||||
| 11.1 - 12.0 | 7 | 32,737,496 | 4.6 | |||||||
| 12.1 - 13.0 | 5 | 53,479,003 | 7.5 | |||||||
| 13.1 - 14.0 | 6 | 102,663,819 | 14.4 | |||||||
| 14.1 - 15.0 | 2 | 17,650,000 | 2.5 | |||||||
| 15.1 - 16.0 | 1 | 40,500,000 | 5.7 | |||||||
| 16.1 - 17.0 | 2 | 14,184,999 | 2.0 | |||||||
| 18.1 - 19.0 | 1 | 14,000,000 | 2.0 | |||||||
| 19.1 - 20.0 | 1 | 5,000,000 | 0.7 | |||||||
| 20.1 - 150.8 | 14 | 35,428,800 | 5.0 | |||||||
| Total: | 79 | $712,219,087 | 100.0 | % | ||||||
| Weighted Average: | 14.0% | |||||||||
| UNDERWRITTEN NCF DEBT YIELD | ||||||||||
| Range of U/W NCF Debt Yields (%) | Number of Mortgage Loans | Aggregate Cut- off Date Balance | % of Initial Pool Balance | |||||||
| 7.8 - 8.0 | 4 | $37,505,820 | 5.3 | % | ||||||
| 8.1 - 9.0 | 17 | 189,829,167 | 26.7 | |||||||
| 9.1 - 10.0 | 17 | 172,854,598 | 24.3 | |||||||
| 10.1 - 11.0 | 10 | 61,345,312 | 8.6 | |||||||
| 11.1 - 12.0 | 8 | 58,393,046 | 8.2 | |||||||
| 12.1 - 13.0 | 3 | 18,177,345 | 2.6 | |||||||
| 13.1 - 14.0 | 1 | 65,000,000 | 9.1 | |||||||
| 14.1 - 15.0 | 4 | 68,684,999 | 9.6 | |||||||
| 19.1 - 20.0 | 1 | 5,000,000 | 0.7 | |||||||
| 20.1 - 150.8 | 14 | 35,428,800 | 5.0 | |||||||
| Total: | 79 | $712,219,087 | 100.0 | % | ||||||
| Weighted Average: | 13.2% | |||||||||
| (1) | For mortgaged properties securing residential cooperative mortgage loans, the debt service coverage ratio or debt yield for each such mortgaged property is calculated using underwritten net cash flow for the related residential cooperative property which is the projected net cash flow reflected in the most recent appraisal obtained by or otherwise in the possession of the related mortgage loan seller as of the cut-off date and the loan-to-value ratio, excluding the Ansley South Cooperative, Inc. mortgage loan, is calculated based upon the appraised value of the residential cooperative property determined as if such residential cooperative property is operated as a residential cooperative. The loan-to-value ratio for the Ansley South Cooperative, Inc. mortgage loan is calculated based on the appraised value of the residential cooperative property determined as if such residential cooperative property is operated as a market rate multifamily rental property. With respect to Sanofi Office Complex mortgage loan and the 225 Liberty Street mortgage loan, each of which is part of apari passu whole loan, loan-to-value ratio, debt service coverage ratio and debt yield calculations include the relatedpari passu companion loan(s) but exclude any related subordinate companion loan(s) (unless otherwise stated). With respect to each mortgage loan, debt service coverage ratio, debt yield and loan-to-value ratio information do not take into account any subordinate debt (whether or not secured by the related mortgaged property), that currently exists or is allowed under the terms of such mortgage loan. See Annex A-1 to the Preliminary Prospectus. Prepayment provisions for each mortgage loan reflects the entire life of the loan (from origination to maturity or ARD). |
THE INFORMATION IN THIS STRUCTURAL AND COLLATERAL TERM SHEET IS NOT COMPLETE AND MAY BE AMENDED PRIOR TO THE TIME OF SALE. THIS TERM SHEET IS NOT AN OFFER TO SELL THESE SECURITIES AND IT IS NOT A SOLICITATION OF AN OFFER TO BUY THESE SECURITIES IN ANY JURISDICTION WHERE THE OFFER OR SALE IS NOT PERMITTED.
| 14 |
| Wells Fargo Commercial Mortgage Trust 2016-C33 | Characteristics of the Mortgage Pool |
| ORIGINAL TERM TO MATURITY OR ARD | ||||||||||
| Original Terms to Maturity or ARD (months) | Number of Mortgage Loans | Aggregate Cut- off Date Balance | % of Initial Pool Balance | |||||||
| 60 | 5 | $83,302,270 | 11.7 | % | ||||||
| 120 | 72 | 619,291,817 | 87.0 | |||||||
| 121 | 2 | 9,625,000 | 1.4 | |||||||
| Total: | 79 | $712,219,087 | 100.0 | % | ||||||
| Weighted Average: | 113 months | |||||||||
| REMAINING TERM TO MATURITY OR ARD | ||||||||||
| Range of Remaining Terms to Maturity or ARD (months) | Number of Mortgage Loans | Aggregate Cut- off Date Balance | % of Initial Pool Balance | |||||||
| 58 - 60 | 5 | $83,302,270 | 11.7 | % | ||||||
| 85 - 120 | 72 | 619,291,817 | 87.0 | |||||||
| 121 | 2 | 9,625,000 | 1.4 | |||||||
| Total: | 79 | $712,219,087 | 100.0 | % | ||||||
| Weighted Average: | 112 months | |||||||||
| ORIGINAL AMORTIZATION TERM(2) | ||||||||||
| Original Amortization Terms (months) | Number of Mortgage Loans | Aggregate Cut- off Date Balance | % of Initial Pool Balance | |||||||
| Non-Amortizing | 13 | $198,496,000 | 27.9 | % | ||||||
| 180 | 2 | 9,900,000 | 1.4 | |||||||
| 300 | 7 | 31,655,156 | 4.4 | |||||||
| 360 | 56 | 468,671,249 | 65.8 | |||||||
| 480 | 1 | 3,496,682 | 0.5 | |||||||
| Total: | 79 | $712,219,087 | 100.0 | % | ||||||
| Weighted Average(3): | 354 months | |||||||||
| (2) | The original amortization term shown for any mortgage loan that is interest-only for part of its term does not include the number of months in its interest-only period and reflects only the number of months as of the commencement of amortization remaining from the end of such interest-only period. |
| (3) | Excludes the non-amortizing mortgage loans. |
| REMAINING AMORTIZATION TERM(4) | ||||||||||
| Range of Remaining Amortization Terms (months) | Number of Mortgage Loans | Aggregate Cut- off Date Balance | % of Initial Pool Balance | |||||||
| Non-Amortizing | 13 | $198,496,000 | 27.9 | % | ||||||
| 180 | 2 | 9,900,000 | 1.4 | |||||||
| 241 - 300 | 7 | 31,655,156 | 4.4 | |||||||
| 301 - 360 | 56 | 468,671,249 | 65.8 | |||||||
| 421 - 479 | 1 | 3,496,682 | 0.5 | |||||||
| Total: | 79 | $712,219,087 | 100.0 | % | ||||||
| Weighted Average(5): | 353 months | |||||||||
| (4) | The remaining amortization term shown for any mortgage loan that is interest-only for part of its term does not include the number of months in its interest-only period and reflects only the number of months as of the commencement of amortization remaining from the end of such interest-only period. |
| (5) | Excludes the non-amortizing mortgage loans. |
| LOCKBOXES | ||||||||||
| Type of Lockbox | Number of Mortgage Loans | Aggregate Cut- off Date Balance | % of Initial Pool Balance | |||||||
| Springing | 45 | $401,824,474 | 56.4 | % | ||||||
| Hard | 16 | 243,962,931 | 34.3 | |||||||
| None | 17 | 48,681,682 | 6.8 | |||||||
| Soft | 1 | 17,750,000 | 2.5 | |||||||
| Total: | 79 | $712,219,087 | 100.0 | % | ||||||
| PREPAYMENT PROVISION SUMMARY | ||||||||||
| Prepayment Provision | Number of Mortgage Loans | Aggregate Cut- off Date Balance | % of Initial Pool Balance | |||||||
| Lockout / Def / Open | 53 | $602,874,191 | 84.6 | % | ||||||
| Lockout / GRTR 1% or YM / Open | 7 | 59,464,766 | 8.3 | |||||||
| GRTR 1% or YM / 1% Penalty / Open | 14 | 39,128,800 | 5.5 | |||||||
| Lockout / GRTR 1% or YM or Def / Open | 2 | 7,755,331 | 1.1 | |||||||
| YM / YM or Def / Open | 3 | 2,996,000 | 0.4 | |||||||
| Total: | 79 | $712,219,087 | 100.0 | % | ||||||
| CUT-OFF DATE LOAN-TO-VALUE RATIO | ||||||||||
| Range of Cut-off Date LTV Ratios (%) | Number of Mortgage Loans | Aggregate Cut- off Date Balance | % of Initial Pool Balance | |||||||
| 2.1 - 20.0 | 11 | $29,832,118 | 4.2 | % | ||||||
| 20.1 - 25.0 | 1 | 3,496,682 | 0.5 | |||||||
| 25.1 - 30.0 | 2 | 5,800,000 | 0.8 | |||||||
| 30.1 - 35.0 | 1 | 40,500,000 | 5.7 | |||||||
| 35.1 - 40.0 | 1 | 14,000,000 | 2.0 | |||||||
| 40.1 - 45.0 | 2 | 3,450,000 | 0.5 | |||||||
| 45.1 - 50.0 | 2 | 68,964,944 | 9.7 | |||||||
| 50.1 - 55.0 | 5 | 34,794,359 | 4.9 | |||||||
| 55.1 - 60.0 | 5 | 23,716,316 | 3.3 | |||||||
| 60.1 - 65.0 | 9 | 133,135,000 | 18.7 | |||||||
| 65.1 - 70.0 | 21 | 214,929,703 | 30.2 | |||||||
| 70.1 - 75.0 | 18 | 127,099,965 | 17.8 | |||||||
| 75.1 - 77.6 | 1 | 12,500,000 | 1.8 | |||||||
| Total: | 79 | $712,219,087 | 100.0 | % | ||||||
| Weighted Average: | 59.0% | |||||||||
| BALLOON OR ARD LOAN-TO-VALUE RATIO | ||||||||||
| Range of Balloon or ARD LTV Ratios (%) | Number of Mortgage Loans | Aggregate Cut- off Date Balance | % of Initial Pool Balance | |||||||
| 1.7 - 20.0 | 13 | $34,628,800 | 4.9 | % | ||||||
| 25.1 - 30.0 | 2 | 5,800,000 | 0.8 | |||||||
| 30.1 - 35.0 | 2 | 42,650,000 | 6.0 | |||||||
| 35.1 - 40.0 | 2 | 17,964,944 | 2.5 | |||||||
| 40.1 - 45.0 | 4 | 15,667,014 | 2.2 | |||||||
| 45.1 - 50.0 | 4 | 91,643,662 | 12.9 | |||||||
| 50.1 - 55.0 | 11 | 110,367,709 | 15.5 | |||||||
| 55.1 - 60.0 | 19 | 187,591,687 | 26.3 | |||||||
| 60.1 - 65.0 | 12 | 115,917,001 | 16.3 | |||||||
| 65.1 - 70.0 | 9 | 77,488,270 | 10.9 | |||||||
| 70.1 | 1 | 12,500,000 | 1.8 | |||||||
| Total: | 79 | $712,219,087 | 100.0 | % | ||||||
| Weighted Average: | 52.1% | |||||||||
| AMORTIZATION TYPE | ||||||||||
| Type of Amortization | Number of Mortgage Loans | Aggregate Cut- off Date Balance | % of Initial Pool Balance | |||||||
| Amortizing Balloon | 42 | $287,488,087 | 40.4 | % | ||||||
| Interest-only, Amortizing Balloon | 24 | 226,235,000 | 31.8 | |||||||
| Interest-only, Balloon | 9 | 130,500,000 | 18.3 | |||||||
| Interest-only, ARD | 4 | 67,996,000 | 9.5 | |||||||
| Total: | 79 | $712,219,087 | 100.0 | % | ||||||
| ORIGINAL TERM OF INTEREST-ONLY PERIOD FOR PARTIAL IO LOANS | ||||||||||
| Range of IO Terms (months) | Number of Mortgage Loans | Aggregate Cut- off Date Balance | % of Initial Pool Balance | |||||||
| 1 - 11 | 3 | $20,375,000 | 2.9 | % | ||||||
| 12 - 29 | 9 | 78,310,000 | 11.0 | |||||||
| 30 - 36 | 7 | 76,450,000 | 10.7 | |||||||
| 37 - 48 | 2 | 22,150,000 | 3.1 | |||||||
| 49 - 60 | 3 | 28,950,000 | 4.1 | |||||||
| Total: | 24 | $226,235,000 | 31.8 | % | ||||||
| Weighted Average: | 32 months | |||||||||
| SEASONING | ||||||||||
| Seasoning (months) | Number of Mortgage Loans | Aggregate Cut- off Date Balance | % of Initial Pool Balance | |||||||
| 0 | 27 | $176,130,000 | 24.7 | % | ||||||
| 1 | 31 | 273,994,975 | 38.5 | |||||||
| 2 | 12 | 161,334,554 | 22.7 | |||||||
| 3 | 7 | 81,432,213 | 11.4 | |||||||
| 5 | 1 | 13,027,345 | 1.8 | |||||||
| 7 | 1 | 6,300,000 | 0.9 | |||||||
| Total: | 79 | $712,219,087 | 100.0 | % | ||||||
| Weighted Average: | 1 month | |||||||||
THE INFORMATION IN THIS STRUCTURAL AND COLLATERAL TERM SHEET IS NOT COMPLETE AND MAY BE AMENDED PRIOR TO THE TIME OF SALE. THIS TERM SHEET IS NOT AN OFFER TO SELL THESE SECURITIES AND IT IS NOT A SOLICITATION OF AN OFFER TO BUY THESE SECURITIES IN ANY JURISDICTION WHERE THE OFFER OR SALE IS NOT PERMITTED.
| 15 |
| Wells Fargo Commercial Mortgage Trust 2016-C33 | Certain Terms and Conditions |
| V. | Certain Terms and Conditions |
| Interest Entitlements: | The interest entitlement of each Class of Offered Certificates on each Distribution Date generally will be the interest accrued during the related Interest Accrual Period on the related Certificate Balance or Notional Amount at the related pass-through rate, net of any prepayment interest shortfalls allocated to that Class for such Distribution Date as described below. If prepayment interest shortfalls arise from voluntary prepayments (without applicable Master Servicer consent) on particular non-specially serviced loans during any collection period, the applicable Master Servicer is required to make a compensating interest payment to offset those shortfalls, generally up to an amount equal to the portion of its master servicing fees that accrue at 0.25 basis points per annum. The remaining amount of prepayment interest shortfalls will be allocated to reduce the interest entitlement on all Classes of Certificates, pro rata, based on their respective amounts of accrued interest for the related Distribution Date. If a Class receives less than the entirety of its interest entitlement on any Distribution Date, then the shortfall, excluding any shortfall due to prepayment interest shortfalls, will be added to its interest entitlement for the next succeeding Distribution Date. |
| Principal Distribution Amount: | The Principal Distribution Amount for each Distribution Date generally will be the aggregate amount of principal received or advanced in respect of the mortgage loans, net of any non-recoverable advances and interest thereon and workout-delayed reimbursement amounts that are reimbursed to the applicable Master Servicer, the applicable Special Servicer or the Trustee during the related collection period. Non-recoverable advances and interest thereon are reimbursable from principal collections and advances before reimbursement from other amounts. Workout-delayed reimbursement amounts are reimbursable from principal collections. |
| Distributions: | On each Distribution Date, funds available for distribution from the mortgage loans, net of specified trust fees, expenses and reimbursements will generally be distributed in the following amounts and order of priority (in each case to the extent of remaining available funds): |
| 1. Class A-1, A-2, A-3, A-4, A-SB, X-A, X-B, X-E, X-F and X-G Certificates: To interest on the Class A-1, A-2, A-3, A-4, A-SB, X-A, X-B, X-E, X-F and X-G Certificates, pro rata, according to their respective interest entitlements. | |
| 2. Class A-1, A-2, A-3, A-4 and A-SB Certificates: To principal on the Class A-1, A-2, A-3, A-4 and A-SB Certificates in the following amounts and order of priority: (i) first, to principal on the Class A-SB Certificates, in an amount up to the Principal Distribution Amount for such Distribution Date until their Certificate Balance is reduced to the Class A-SB Planned Principal Balance for such Distribution Date; (ii) second, to principal on the Class A-1 Certificates until their Certificate Balance is reduced to zero, up to the remainder of the Principal Distribution Amount for such Distribution Date; (iii) third, to principal on the Class A-2 Certificates until their Certificate Balance is reduced to zero, up to the remainder of the Principal Distribution Amount for such Distribution Date; (iv) fourth, to principal on the Class A-3 Certificates until their Certificate Balance is reduced to zero, up to the remainder of the Principal Distribution Amount for such Distribution Date; (v) fifth, to principal on the Class A-4 Certificates until their Certificate Balance is reduced to zero, up to the remainder of the Principal Distribution Amount for such Distribution Date; and (vi) sixth, to principal on the Class A-SB Certificates until their Certificate Balance is reduced to zero, up to the remainder of the Principal Distribution Amount for such Distribution Date. However, if the Certificate Balance of each and every Class of Principal Balance Certificates, other than the Class A-1, A-2, A-3, A-4 and A-SB Certificates, has been reduced to zero as a result of the allocation of Mortgage Loan losses and expenses and any of the Class A-1, A-2, A-3, A-4 and A-SB Certificates remains outstanding, then the Principal Distribution Amount will be distributed to the Class A-1, A-2, A-3, A-4 and A-SB Certificates, pro rata, based on their respective outstanding Certificate Balances, until their Certificate Balances have been reduced to zero. | |
| 3. Class A-1, A-2, A-3, A-4 and A-SB Certificates: To reimburse the holders of the Class A-1, A-2, A-3, A-4 and A-SB Certificates, pro rata, on the basis of previously allocated unreimbursed losses, for any previously unreimbursed losses (plus interest thereon) on the mortgage loans that were previously allocated in reduction of the Certificate Balances of such Classes. | |
| 4. Class A-S Certificates: To make distributions on the Class A-S Certificates as follows: (a) first, to interest on the Class A-S Certificates in the amount of the interest entitlement for that Class; (b) next, to the extent of the portion of the Principal Distribution Amount remaining after distributions in respect of principal to each Class with a higher distribution priority (in this case, the Class A-1, A-2, A-3, A-4 and A-SB Certificates), to principal on the Class A-S Certificates until their Certificate Balance is reduced to zero; and (c) next, to reimburse the holders of the Class A-S Certificates for any previously unreimbursed losses (plus interest thereon) on the mortgage loans |
THE INFORMATION IN THIS STRUCTURAL AND COLLATERAL TERM SHEET IS NOT COMPLETE AND MAY BE AMENDED PRIOR TO THE TIME OF SALE. THIS TERM SHEET IS NOT AN OFFER TO SELL THESE SECURITIES AND IT IS NOT A SOLICITATION OF AN OFFER TO BUY THESE SECURITIES IN ANY JURISDICTION WHERE THE OFFER OR SALE IS NOT PERMITTED.
| 16 |
| Wells Fargo Commercial Mortgage Trust 2016-C33 | Certain Terms and Conditions |
that were previously allocated to that Class in reduction of their Certificate Balance.
5. Class B Certificates: To make distributions on the Class B Certificates as follows: (a) first, to interest on the Class B Certificates in the amount of the interest entitlement for that Class; (b) next, to the extent of the portion of the Principal Distribution Amount remaining after distributions in respect of principal to each Class with a higher distribution priority (in this case, the Class A-1, A-2, A-3, A-4, A-SB and A-S Certificates), to principal on the Class B Certificates until their Certificate Balance is reduced to zero; and (c) next, to reimburse the holders of the Class B Certificates for any previously unreimbursed losses (plus interest thereon) on the mortgage loans that were previously allocated to that Class in reduction of their Certificate Balance.
6. Class C Certificates: To make distributions on the Class C Certificates as follows: (a) first, to interest on the Class C Certificates in the amount of the interest entitlement for that Class; (b) next, to the extent of the portion of the Principal Distribution Amount remaining after distributions in respect of principal to each Class with a higher distribution priority (in this case, the Class A-1, A-2, A-3, A-4, A-SB, A-S and B Certificates), to principal on the Class C Certificates until their Certificate Balance is reduced to zero; and (c) next, to reimburse the holders of the Class C Certificates for any previously unreimbursed losses (plus interest thereon) on the mortgage loans that were previously allocated to that Class in reduction of their Certificate Balance.
7. Class D and X-D Certificates: To make distributions on the Class D and X-D Certificates as follows: (a) first, to interest on the Class D and X-D Certificates, pro rata, according to their respective interest entitlements; (b) next, to the extent of the portion of the Principal Distribution Amount remaining after distributions in respect of principal to each Class with a higher distribution priority (in this case, the Class A-1, A-2, A-3, A-4, A-SB, A-S, B and C Certificates, to principal on the Class D Certificates until their Certificate Balance is reduced to zero; and (c) next, to reimburse the holders of the Class D Certificates for any previously unreimbursed losses (plus interest thereon) on the mortgage loans that were previously allocated to that Class in reduction of their Certificate Balance.
8. Class E Certificates: To make distributions on the Class E Certificates as follows: (a) first, to interest on the Class E Certificates, in the amount of the interest entitlement for that Class; (b) next, to the extent of the portion of the Principal Distribution Amount remaining after distributions in respect of principal to each Class with a higher distribution priority (in this case, the Class A-1, A-2, A-3, A-4, A-SB, A-S, B, C and D Certificates), to principal on the Class E Certificates until their Certificate Balance is reduced to zero; and (c) next, to reimburse the holders of the Class E Certificates for any previously unreimbursed losses (plus interest thereon) on the mortgage loans that were previously allocated to that Class in reduction of their Certificate Balance.
| |
9. After the Class A-1, A-2, A-3, A-4, A-SB, A-S, B, C, D and E Certificates are paid all amounts to which they are entitled, the remaining funds available for distribution will be used to pay interest, principal and loss reimbursement amounts on the Class F and G Certificates sequentially in that order in a manner analogous to the Class E Certificates. | |
| Allocation of Yield Maintenance and Prepayment Premiums: | If any yield maintenance charge or prepayment premium is collected during any particular collection period with respect to any mortgage loan, then on the Distribution Date corresponding to that collection period, the certificate administrator will pay that yield maintenance charge or prepayment premium (net of liquidation fees payable therefrom) in the following manner: (1) to each of the Class A-1, A-2, A-3, A-4, A-SB, A-S, B, C and D Certificates, the product of (a) such yield maintenance charge or prepayment premium, (b) the related Base Interest Fraction (as defined in the Preliminary Prospectus) for such Class, and (c) a fraction, the numerator of which is equal to the amount of principal distributed to such Class for that Distribution Date, and the denominator of which is the total amount of principal distributed to all Principal Balance Certificates for that Distribution Date, and (2) to the Class X-A Certificates, the excess, if any, of (a) the product of (i) such yield maintenance charge or prepayment premium and (ii) a fraction, the numerator of which is equal to the amount of principal distributed to the Class A-1, A-2, A-3, A-4, A-SB and A-S Certificates for that Distribution Date, and the denominator of which is the total amount of principal distributed to all Principal Balance Certificates for that Distribution Date, over (b) the amount of such yield maintenance charge or prepayment premium distributed to the Class A-1, A-2, A-3, A-4, A-SB and A-S Certificates as described above, and (3) to the Class X-B Certificates, any remaining yield maintenance charge or prepayment premium not distributed as described above. No prepayment premiums or yield maintenance charges will be distributed to the holders of the Class X-D, X-E, X-F, X-G, E, F, G, V or R Certificates. For a description of when prepayment premiums and yield maintenance charges are generally required on the mortgage loans, see Annex A-1 to the Preliminary Prospectus. See also “Risk Factors—Risks Relating to the Mortgage Loans—Risks Relating to Enforceability of Yield Maintenance Charges, Prepayment Premiums or Defeasance Provisions” and “Risk Factors—Other Risks Relating to the |
THE INFORMATION IN THIS STRUCTURAL AND COLLATERAL TERM SHEET IS NOT COMPLETE AND MAY BE AMENDED PRIOR TO THE TIME OF SALE. THIS TERM SHEET IS NOT AN OFFER TO SELL THESE SECURITIES AND IT IS NOT A SOLICITATION OF AN OFFER TO BUY THESE SECURITIES IN ANY JURISDICTION WHERE THE OFFER OR SALE IS NOT PERMITTED.
| 17 |
| Wells Fargo Commercial Mortgage Trust 2016-C33 | Certain Terms and Conditions |
| Certificates—Your Yield May Be Affected by Defaults, Prepayments and Other Factors” in the Preliminary Prospectus. Prepayment premiums and yield maintenance charges will be distributed on each Distribution Date only to the extent they are actually received on the mortgage loans as of the related Determination Date. | |
| Realized Losses: | The Certificate Balances of the Class A-1, A-2, A-3, A-4, A-SB, A-S, B, C, D, E, F and G Certificates, will be reduced without distribution on any Distribution Date as a write-off to the extent of any losses realized on the mortgage loans allocated to such Class on such Distribution Date. Such losses will be applied in the following order, in each case until the related Certificate Balance is reduced to zero: first, to the Class G Certificates; second, to the Class F Certificates; third, to the Class E Certificates; fourth, to the Class D Certificates; fifth, to the Class C Certificates; sixth, to the Class B Certificates; seventh, to the Class A-S Certificates; and, finally, pro rata, to the Class A-1, A-2, A-3, A-4 and A-SB Certificates based on their outstanding Certificate Balances.
The notional amount of the Class X-A Certificates will be reduced by the amount of all losses that are allocated to the Class A-1, A-2, A-3, A-4, A-SB or A-S Certificates as write-offs in reduction of their Certificate Balances. The notional amount of the Class X-B Certificates will be reduced by the amount of all losses that are allocated to the Class B or C Certificates as write-offs in reduction of their Certificate Balances. The notional amount of the Class X-D Certificates will be reduced by the amount of all losses that are allocated to the Class D Certificates as write-offs in reduction of their Certificate Balance. The notional amount of the Class X-E Certificates will be reduced by the amount of all losses that are allocated to the Class E Certificates as write-offs in reduction of their Certificate Balance. The notional amount of the Class X-F Certificates will be reduced by the amount of all losses that are allocated to the Class F Certificates as write-offs in reduction of their Certificate Balance. The notional amount of the Class X-G Certificates will be reduced by the amount of all losses that are allocated to the Class G Certificates as write-offs in reduction of their Certificate Balance. |
| P&I Advances: | The related Master Servicer or, if such Master Servicer fails to do so, the Trustee, will be obligated to advance delinquent debt service payments with respect to the mortgage loans it services (other than balloon payments, excess interest and default interest) and assumed debt service payments on mortgage loans with delinquent balloon payments (excluding any related companion loan), except to the extent any such advance is deemed non-recoverable from collections on the related mortgage loan. In addition, if an Appraisal Reduction Amount exists for a given mortgage loan, the interest portion of any P&I advance for such mortgage loan will be reduced, which will have the effect of reducing the amount of interest available for distribution to the Certificates in reverse alphabetical order of their Class designations (except (a) that interest payments on the Class A-1, A-2, A-3, A-4, A-SB, X-A, X-B, X-E, X-F and X-G Certificates would be affected on a pari passu basis and (b) interest payments on the Class D and Class X-D Certificates would be affected on a pari passu basis and according to the alphabetical designation of the Class D Certificates). |
| Servicing Advances: | The related Master Servicer or, if such Master Servicer fails to do so, the Trustee, will be obligated to make servicing advances with respect to each mortgage loan it services, including the payment of delinquent property taxes, insurance premiums and ground rent, except to the extent that those advances are deemed non-recoverable from collections on the related mortgage loan. The applicable Master Servicer or the trustee, as applicable, will have the primary obligation to make any required servicing advances with respect to the Sanofi Office Complex whole loan. The master servicer or trustee, as applicable, under the LBTY 2016-225L securitization will have the primary obligation to make any required servicing advances with respect to the 225 Liberty Street whole loan. The Special Servicers will have no obligation to make servicing advances but may do so in an emergency situation. |
Appraisal Reduction Amounts:
| An Appraisal Reduction Amount generally will be created in the amount, if any, by which the principal balance of a required appraisal loan (which is a mortgage loan with respect to which certain defaults, modifications or insolvency events have occurred as further described in the Preliminary Prospectus) plus other amounts overdue or advanced in connection with such mortgage loan exceeds 90% of the appraised value of the related mortgaged property plus certain escrows and reserves (including letters of credit) held with respect to the mortgage loan.
A mortgage loan will cease to be a required appraisal loan when the same has ceased to be a specially serviced loan (if applicable), has been brought current for at least three consecutive months and no other circumstances exist that would cause such mortgage loan to be a required appraisal loan.
Appraisal Reduction Amounts will affect the amount of debt service advances in respect of the related mortgage loan. Appraisal Reduction Amounts will also be taken into account in the determination of the identity of the Class whose majority constitutes the “majority controlling class certificateholder” and is entitled to appoint the directing certificateholder.
|
THE INFORMATION IN THIS STRUCTURAL AND COLLATERAL TERM SHEET IS NOT COMPLETE AND MAY BE AMENDED PRIOR TO THE TIME OF SALE. THIS TERM SHEET IS NOT AN OFFER TO SELL THESE SECURITIES AND IT IS NOT A SOLICITATION OF AN OFFER TO BUY THESE SECURITIES IN ANY JURISDICTION WHERE THE OFFER OR SALE IS NOT PERMITTED.
| 18 |
| Wells Fargo Commercial Mortgage Trust 2016-C33 | Certain Terms and Conditions |
Clean-Up Call and Exchange Termination:
| On each Distribution Date occurring after the aggregate unpaid principal balance of the mortgage loans is reduced below 1% of the initial aggregate principal balance of the mortgage loans as of the Cut-off Date, certain specified persons will have the option to purchase all of the remaining mortgage loans (and the trust’s interest in all property acquired through exercise of remedies in respect of any mortgage loan) at the price specified in the Preliminary Prospectus. Exercise of the option will terminate the trust and retire the then-outstanding certificates.
If the aggregate Certificate Balances of each of the Class A-1, A-2, A-3, A-4, A-SB, A-S, B, C, D and E Certificates have been reduced to zero, the trust may also be terminated in connection with an exchange of all the then-outstanding certificates (other than the Class V and R Certificates) for the mortgage loans and REO properties then remaining in the issuing entity, but all of the holders of those Classes of outstanding certificates would have to voluntarily participate in the exchange.
|
| Liquidation Loan Waterfall: | Following the liquidation of any loan or property, the net liquidation proceeds generally will be applied (after reimbursement of advances and certain trust fund expenses), first, as a recovery of accrued interest, other than delinquent interest that was not advanced as a result of Appraisal Reduction Amounts, second, as a recovery of principal until all principal has been recovered, and then as a recovery of delinquent interest that was not advanced as a result of Appraisal Reduction Amounts. Please see “Description of the Certificates—Distributions—Application Priority of Mortgage Loan Collections or Whole Loan Collections” in the Preliminary Prospectus. |
| Majority Controlling Class Certificateholder and Directing Certificateholder: | A directing certificateholder may be appointed by the “majority controlling class certificate-holder”, which will be the holder(s) of a majority of the “controlling class”, which means the most subordinate class among the Class F and G Certificates that has a Certificate Balance, as notionally reduced by any Appraisal Reduction Amounts allocable to that class, that is at least equal to 25% of its total initial Certificate Balance; provided that if at any time the Certificate Balances of the Principal Balance Certificates (other than the Class F and G Certificates) have been reduced to zero as a result of principal payments on the mortgage loans, then the “controlling class” will be the most subordinate class of Class F and G Certificates that has a Certificate Balance greater than zero without regard to any Appraisal Reduction Amounts. The majority controlling class certificateholder will have a continuing right to appoint, remove or replace the directing certificateholder in its sole discretion. This right may be exercised at any time and from time to time. See “Pooling and Servicing Agreement—The Directing Certificateholder” in the Preliminary Prospectus. |
| Control and Consultation: | The rights of various parties to replace each Special Servicer and approve or consult with respect to major actions of each Special Servicer will vary according to defined periods.
A “Control Termination Event” occurs if the Class F Certificates have a Certificate Balance, net of any Appraisal Reduction Amounts allocable to that Class, that is less than 25% of the initial Certificate Balance of that Class or, while the Class F Certificates are the controlling class, the majority (by Certificate Balance) of the holders of the Class F Certificates irrevocably waived its right, in writing, to exercise any of the rights of the majority controlling class certificateholder and such rights have not been reinstated to a successor majority controlling class certificateholder.
A “Consultation Termination Event” occurs if the Class F Certificates have a Certificate Balance, without regard to any Appraisal Reduction Amounts allocable to that Class, that is less than 25% of the initial Certificate Balance of that Class or, while the Class F Certificates are the controlling class, the majority (by Certificate Balance) of the holders of the Class F Certificates irrevocably waived its right, in writing, to exercise any of the rights of the majority controlling class certificateholder and such rights have not been reinstated to a successor majority controlling class certificateholder.
If no Control Termination Event has occurred and is continuing, except with respect to the Excluded Loans (as defined below), (i) the directing certificateholder will be entitled to grant or withhold approval of asset status reports prepared, and material servicing actions proposed, by each Special Servicer, and (ii) the directing certificateholder will be entitled to terminate and replace each Special Servicer with or without cause, and appoint itself or another person as the successor special servicer. It will be a condition to such appointment that DBRS, Fitch and Moody’s confirm that the appointment would not result in a qualification, downgrade or withdrawal of any of their then-current ratings of certificates.
If a Control Termination Event has occurred and is continuing but no Consultation Termination Event has occurred and is continuing, each Special Servicer will be required to consult with the directing certificateholder (other than with respect to Excluded Loans) and the Operating Advisor in connection with asset status reports and material special servicing actions.
If a Consultation Termination Event has occurred and is continuing, each Special Servicer must seek to consult with the Operating Advisor in connection with asset status reports and material special servicing actions, and, in general, no directing certificateholder will be recognized or have any right to terminate the Special Servicers or approve, direct or consult with respect to |
THE INFORMATION IN THIS STRUCTURAL AND COLLATERAL TERM SHEET IS NOT COMPLETE AND MAY BE AMENDED PRIOR TO THE TIME OF SALE. THIS TERM SHEET IS NOT AN OFFER TO SELL THESE SECURITIES AND IT IS NOT A SOLICITATION OF AN OFFER TO BUY THESE SECURITIES IN ANY JURISDICTION WHERE THE OFFER OR SALE IS NOT PERMITTED.
| 19 |
| Wells Fargo Commercial Mortgage Trust 2016-C33 | Certain Terms and Conditions |
servicing matters.
With respect to the Sanofi Office Complex mortgage loan, the rights of the directing certificateholder described above will be subject to the consultation rights of the holder of the related pari passu companion loan(s) as described below.
Notwithstanding any contrary description set forth above, with respect to the Sanofi Office Complex mortgage loan, the holder of the pari passu companion loan(s) in the related whole loan (or its representative, including any directing certificateholder under any securitization of such pari passu companion loan(s)) will have consultation rights with respect to asset status reports and material special servicing actions involving the related whole loan, as provided for in the related intercreditor agreement and as described in the Preliminary Prospectus, and those rights will be in addition to the rights of the directing certificateholder in this transaction described above.
With respect to the 225 Liberty Street mortgage loan, such mortgage loan will be serviced under the LBTY 2016-225L trust and servicing agreement. The controlling class representative under the LBTY 2016-225L trust and servicing agreement will have certain consent and/or consultation rights with respect to the 225 Liberty Street whole loan during certain prescribed periods while the 225 Liberty Street whole loan is specially serviced under the LBTY 2016-225L trust and servicing agreement. In addition, each holder of a non-controlling pari passu companion loan (including the directing certificateholder under the WFCM 2016-C33 securitization) will have consultation rights with respect to asset status reports and material special servicing actions involving the related whole loan, as provided for in the related intercreditor agreement and as controlling class representative under the LBTY 2016-225L trust and servicing agreement.
Notwithstanding any contrary description set forth above, in the event that, with respect to any mortgage loan, the majority controlling class certificateholder or the directing certificateholder is (i) a borrower, a mortgagor or a manager of a mortgaged property or any affiliate thereof, (ii) any person that owns, directly or indirectly, 25% or more of a borrower, mortgagor or manager of a mortgaged property, (iii) any person that owns, directly or indirectly, 25% or more of the beneficial interests in any mezzanine lender of any mezzanine loan related to a mortgage loan that has accelerated such mezzanine loan or commenced foreclosure proceedings as set forth in clause (iv) or (iv) a mezzanine lender (or any affiliate thereof) of any mezzanine loan related to a mortgage loan that has accelerated such mezzanine loan (unless (a) acceleration was automatic under such mezzanine loan, (b) the event directly giving rise to the automatic acceleration under such mezzanine loan was not initiated by such mezzanine lender or an affiliate of such mezzanine lender and (c) such mezzanine lender is stayed from exercising and has not commenced the exercise of remedies associated with foreclosure of the equity collateral under such mezzanine loan) or commenced foreclosure proceedings with respect to such mezzanine loan against the equity interests in the borrower(s) of such mortgage loan (each, a “borrower party”), the majority controlling class certificateholder and the directing certificateholder will have no right to receive asset status reports or such other information as may be specified in the pooling and servicing agreement, to grant or withhold approval of, or consult with respect to, asset status reports prepared, and material servicing actions proposed, by applicable Special Servicer, with respect to such mortgage loan, and such mortgage loan will be referred to as an “Excluded Loan”.
In addition, notwithstanding any contrary description set forth above, in the event that, with respect to any mortgage loan, a controlling class certificateholder is a borrower party, such controlling class certificateholder will have no right to receive asset status reports or such other information as may be specified in the pooling and servicing agreement with respect to such mortgage loan, and such controlling class certificateholder will be referred to as an “excluded controlling class holder”.
| |
| Replacement of Special Servicers by General Vote of Certificateholders: | If a Control Termination Event has occurred and is continuing, each Special Servicer may be removed and replaced without cause upon the affirmative direction of certificate owners holding not less than 66-2/3% of a certificateholder quorum, following a proposal from certificate owners holding not less than 25% of the appraisal-reduced voting rights of all Certificates. The certificateholders who initiate a vote on a termination and replacement of a Special Servicer without cause must cause DBRS, Fitch and Moody’s to confirm the then-current ratings of the certificates (or decline to review the matter) and cause the payment of the fees and expenses incurred in the replacement. If no Control Termination Event has occurred and is continuing, either Special Servicer may be replaced by the directing certificateholder, subject to DBRS, Fitch and Moody’s confirming the then-current ratings of the Certificates (or declining to review the matter). |
| Excluded Special Servicer: | In the event that, with respect to any mortgage loan, a Special Servicer is a borrower party, such Special Servicer will be required to resign as special servicer of such mortgage loan (referred to as an “excluded special servicer loan”). If no Control Termination Event has occurred and is continuing, the directing certificateholder will be entitled to appoint (and may replace with or without cause) a separate special servicer that is not a borrower party (referred |
THE INFORMATION IN THIS STRUCTURAL AND COLLATERAL TERM SHEET IS NOT COMPLETE AND MAY BE AMENDED PRIOR TO THE TIME OF SALE. THIS TERM SHEET IS NOT AN OFFER TO SELL THESE SECURITIES AND IT IS NOT A SOLICITATION OF AN OFFER TO BUY THESE SECURITIES IN ANY JURISDICTION WHERE THE OFFER OR SALE IS NOT PERMITTED.
| 20 |
| Wells Fargo Commercial Mortgage Trust 2016-C33 | Certain Terms and Conditions |
| to as an “excluded special servicer”) with respect to such excluded special servicer loan unless such excluded special servicer loan is also an excluded loan. Otherwise, upon resignation of a Special Servicer with respect to an excluded special servicer loan, such resigning Special Servicer will be required to appoint the excluded special servicer. | |
| Appraisal Remedy: | If the Class of certificates comprising the controlling class loses its status as controlling class because of the application of an Appraisal Reduction Amount, the holders of a majority of the Voting Rights of such Class may require the applicable Special Servicer to order a second appraisal for any mortgage loan in respect of which an Appraisal Reduction Amount has been applied. The applicable Special Servicer must thereafter determine whether, based on its assessment of such second appraisal, any recalculation of the Appraisal Reduction Amount is warranted. Such Class will not be able to exercise any direction, control, consent and/or similar rights of the controlling class unless and until reinstated as the controlling class through such determination; and pending such determination, the rights of the controlling class will be exercised by the most senior control eligible certificates (which may only be any one of Class F or Class G), if any. |
| Sale of Defaulted Assets: | There will be no “fair value” purchase option. Instead, the pooling and servicing agreement will authorize each Special Servicer to sell defaulted mortgage loans serviced by such Special Servicer to the highest bidder in a manner generally similar to sales of REO properties.
The sale of a defaulted loan (other than with respect to the 225 Liberty Street whole loan) for less than par plus accrued interest and certain other fees and expenses owed on the loan will be subject to consent or consultation rights of the directing certificateholder and/or Operating Advisor and, in the case of the Sanofi Office Complex mortgage loan, consultation rights of the holders of the related pari passu companion loan, as described in the Preliminary Prospectus.
In the case of the Sanofi Office Complex whole loan, pursuant to the related intercreditor agreement and the pooling and servicing agreement, if the applicable Special Servicer offers to sell to any person (or offers to purchase) for cash such mortgage loan during such time as the related whole loan constitutes a defaulted mortgage loan, then in connection with any such sale, such Special Servicer is required to sell both the mortgage loan and the related pari passu companion loan as a single whole loan
In the case of the 225 Liberty Street mortgage loan, pursuant to the related intercreditor agreement and the LBTY 2016-225L trust and servicing agreement, as applicable, the LBTY 2016-225L special servicer may offer to sell to any person (or may offer to purchase) for cash the related whole loan during such time as the related companion loans constitutes a defaulted mortgage loan under the LBTY 2016-225L trust and servicing agreement, and, in connection with any such sale, the LBTY 2016-225L special servicer is required to sell both the mortgage loan and the related pari passu companion loan(s) and any subordinate companion loans as a whole loan. The directing certificateholder for this securitization will have consultation rights as the holder of an interest in the related mortgage loan, as described in the Preliminary Prospectus.
|
| “As-Is” Appraisals: | Appraisals must be conducted on an “as-is” basis, and must be no more than 9 months old, for purposes of determining Appraisal Reduction Amounts and market value in connection with REO sales. Required appraisals may consist of updates of prior appraisals. Internal valuations by the applicable Special Servicer are permitted if the principal balance of a mortgage loan is less than $2,000,000. |
| Operating Advisor: | The Operating Advisor will perform certain review duties if a Control Termination Event has occurred and is continuing, which will generally include a limited annual review of, and the delivery of a report regarding, certain actions of each Special Servicer with respect to the resolution and/or liquidation of specially serviced loans to the Certificate Administrator. The review and report generally will be based on any asset status reports and additional information delivered to the Operating Advisor by each Special Servicer. In addition, if a Control Termination Event has occurred and is continuing, each Special Servicer must seek to consult with the Operating Advisor (in addition to the directing certificateholder if no Consultation Termination Event has occurred and is continuing) in connection with material special servicing actions with respect to specially serviced loans serviced by such Special Servicer. Furthermore, under certain circumstances, but only if a Consultation Termination Event has occurred and is continuing, the Operating Advisor may recommend the replacement of a Special Servicer, in which case the Certificate Administrator will deliver notice of such recommendation to the certificateholders, and certificateholders with specified percentages of the voting rights may direct the replacement of such Special Servicer at their expense.
If a Consultation Termination Event has occurred and is continuing, the Operating Advisor may be removed and replaced without cause upon the affirmative direction of certificate owners holding not less than 75% of the appraisal-reduced voting rights of all Principal Balance Certificates, following a proposal from certificate owners holding not less than 25% of the appraisal-reduced voting rights of all certificates. The certificateholders who initiate a vote on a termination and replacement of the Operating Advisor without cause must cause DBRS, Fitch |
THE INFORMATION IN THIS STRUCTURAL AND COLLATERAL TERM SHEET IS NOT COMPLETE AND MAY BE AMENDED PRIOR TO THE TIME OF SALE. THIS TERM SHEET IS NOT AN OFFER TO SELL THESE SECURITIES AND IT IS NOT A SOLICITATION OF AN OFFER TO BUY THESE SECURITIES IN ANY JURISDICTION WHERE THE OFFER OR SALE IS NOT PERMITTED.
| 21 |
| Wells Fargo Commercial Mortgage Trust 2016-C33 | Certain Terms and Conditions |
| and Moody’s to confirm the then-current ratings of the certificates (or decline to review the matter) and cause the payment of the fees and expenses incurred in the replacement. The Operating Advisor generally may be discharged from its duties if and when the Class A-1, A-2, A-3, A-4, A-SB, A-S, B, C, D and E Certificates are retired. | |
| Asset Representations Reviewer: | The Asset Representations Reviewer will be required to review certain delinquent mortgage loans after a specified delinquency threshold has been exceeded (an “Asset Review Trigger”) and the required percentage of certificateholders vote to direct a review of such delinquent loans. An Asset Review Trigger will occur when either (1) mortgage loans with an aggregate outstanding principal balance of 25.0% or more of the aggregate outstanding principal balance of all of the mortgage loans (including any REO loans (or a portion of any REO loan in the case of a whole loan) held by the issuing entity as of the end of the applicable collection period are delinquent loans or (2) at least 15 mortgage loans are delinquent loans as of the end of the applicable collection period and the outstanding principal balance of such delinquent loans in the aggregate constitutes at least 20.0% of the aggregate outstanding principal balance of all of the mortgage loans (including any REO loans (or a portion of any REO loan in the case of a whole loan)) held by the issuing entity as of the end of the applicable collection period. See “Pooling and Servicing Agreement—The Asset Representations Reviewer—Asset Review” in the Preliminary Prospectus.
The Asset Representations Reviewer may be terminated and replaced without cause. Upon (i) the written direction of certificateholders evidencing not less than 25% of the voting rights requesting a vote to terminate and replace the Asset Representations Reviewer with a proposed successor Asset Representations Reviewer that is an eligible asset reviewer, and (ii) payment by such holders to the certificate administrator of the reasonable fees and expenses to be incurred by the certificate administrator in connection with administering such vote, the certificate administrator will promptly provide notice to all certificateholders and the Asset Representations Reviewer of such request by posting such notice on its internet website, and by mailing such notice to all certificateholders and the Asset Representations Reviewer. Upon the written direction of certificateholders evidencing at least 75% of a certificateholder quorum, the trustee will terminate all of the rights and obligations of the Asset Representations Reviewer under the pooling and servicing agreement by written notice to the Asset Representations Reviewer, and the proposed successor Asset Representations Reviewer will be appointed. See “Pooling and Servicing Agreement—The Asset Representations Reviewer” in the Preliminary Prospectus.
|
| Dispute Resolution Provisions: | The mortgage loan sellers will be subject to the dispute resolution provisions set forth in the pooling and servicing agreement to the extent those provisions are triggered with respect to any mortgage loan sold to the depositor by a mortgage loan seller and such mortgage loan seller will be obligated under the related mortgage loan purchase agreement to comply with all applicable provisions and to take part in any mediation or arbitration proceedings that may result.
Generally, in the event that a Repurchase Request (as defined in the Preliminary Prospectus) is not “Resolved” (as defined below) within 180 days after the related mortgage loan seller receives such Repurchase Request, then the enforcing servicer will be required to send a notice to the “Initial Requesting Certificateholder” (if any) indicating the enforcing servicer’s intended course of action with respect to the Repurchase Request. If (a) the enforcing servicer’s intended course of action with respect to the Repurchase Request does not involve pursuing further action to exercise rights against the related mortgage loan seller with respect to the Repurchase Request and the Initial Requesting Certificateholder, if any, or any other certificateholder or certificate owner wishes to exercise its right to refer the matter to mediation (including nonbinding arbitration) or arbitration, or (b) the enforcing servicer’s intended course of action is to pursue further action to exercise rights against the related mortgage loan seller with respect to the Repurchase Request but the Initial Requesting Certificateholder, if any, or any other certificateholder or certificate owner does not agree with the dispute resolution method selected by the enforcing servicer, then the Initial Requesting Certificateholder, if any, or such other certificateholder or certificate owner may deliver a written notice to the applicable Special Servicer indicating its intent to exercise its right to refer the matter to either mediation or arbitration.
|
| “Resolved” means, with respect to a Repurchase Request, (i) that any Material Defect has been cured, (ii) the related mortgage loan has been repurchased in accordance with the related mortgage loan purchase agreement, (iii) a mortgage loan has been substituted for the related mortgage loan in accordance with the related mortgage loan purchase agreement, (iv) the applicable mortgage loan seller makes a Loss of Value Payment, (v) a contractually binding agreement is entered into between the enforcing servicer, on behalf of the issuing entity, and the related mortgage loan seller that settles the related mortgage loan seller’s obligations under the related mortgage loan purchase agreement, or (vi) the related mortgage loan is no longer property of the issuing entity as a result of a sale or other disposition in accordance with the pooling and servicing agreement. See “Pooling and Servicing Agreement—Dispute Resolution Provisions” in the Preliminary Prospectus. |
THE INFORMATION IN THIS STRUCTURAL AND COLLATERAL TERM SHEET IS NOT COMPLETE AND MAY BE AMENDED PRIOR TO THE TIME OF SALE. THIS TERM SHEET IS NOT AN OFFER TO SELL THESE SECURITIES AND IT IS NOT A SOLICITATION OF AN OFFER TO BUY THESE SECURITIES IN ANY JURISDICTION WHERE THE OFFER OR SALE IS NOT PERMITTED.
| 22 |
| Wells Fargo Commercial Mortgage Trust 2016-C33 | Certain Terms and Conditions |
| Investor Communications: | The certificate administrator is required to include on any Form 10–D any request received from a certificateholder to communicate with other certificateholders related to certificateholders exercising their rights under the terms of the pooling and servicing agreement. Any certificateholder wishing to communicate with other certificateholders regarding the exercise of its rights under the terms of the Pooling and Servicing Agreement will be able to deliver a written request signed by an authorized representative of the requesting investor to the certificate administrator. |
| Certain Fee Offsets: | If a workout fee is earned by a Special Servicer following a loan default with respect to any mortgage loan that it services, then certain limitations will apply based on modification fees paid by the borrower. The modification fee generally must not exceed 1% of the principal balance of the loan as modified in any 12-month period. In addition, if the loan re-defaults, any subsequent workout fee on that loan must be reduced by a portion of the modification fees paid by the borrower in the previous 12-months. Likewise, liquidation fees collected in connection with a liquidation or partial liquidation of a mortgage loan must be reduced by a portion of the modification fees paid by the borrower in the previous 12 months. |
| Deal Website: | The Certificate Administrator will be required to maintain a deal website which will include, among other items: (a) summaries of asset status reports prepared by each Special Servicer, (b) inspection reports, (c) appraisals, (d) various “special notices” described in the Preliminary Prospectus, (e) the “Investor Q&A Forum” and (f) a voluntary “Investor Registry”. Investors may access the deal website following execution of a certification and confidentiality agreement. |
| Initial Majority Controlling Class Certificateholder: | It is expected that Rialto CMBS IX, LLC or another affiliate of Rialto Capital Advisors, LLC will be the initial majority controlling class certificateholder. |
| Whole Loans: | The mortgaged properties identified on Annex A-1 to the Preliminary Prospectus as Sanofi Office Complex and 225 Liberty Street secure both a mortgage loan to be included in the trust fund and one or more other mortgage loans that will not be included in the trust fund, which will be pari passu or subordinate in right of payment with the mortgage loan included in the trust fund. We refer to such group of mortgage loans as a “whole loan”. The Sanofi Office Complex whole loan will be principally serviced under the pooling and servicing agreement for this WFCM 2016-C33 securitization. The 225 Liberty Street whole loan will be principally serviced under the trust and servicing agreement for the LBTY 2016-225L securitization.
As of the closing date, the companion loan in such whole loan will be held by the party identified above under “IV. Characteristics of the Mortgage Pool—B. Summary of the Whole Loans”. |
THE INFORMATION IN THIS STRUCTURAL AND COLLATERAL TERM SHEET IS NOT COMPLETE AND MAY BE AMENDED PRIOR TO THE TIME OF SALE. THIS TERM SHEET IS NOT AN OFFER TO SELL THESE SECURITIES AND IT IS NOT A SOLICITATION OF AN OFFER TO BUY THESE SECURITIES IN ANY JURISDICTION WHERE THE OFFER OR SALE IS NOT PERMITTED.
| 23 |
| SANOFI OFFICE COMPLEX |

THE INFORMATION IN THIS STRUCTURAL AND COLLATERAL TERM SHEET IS NOT COMPLETE AND MAY BE AMENDED PRIOR TO THE TIME OF SALE. THIS TERM SHEET IS NOT AN OFFER TO SELL THESE SECURITIES AND IT IS NOT A SOLICITATION OF AN OFFER TO BUY THESE SECURITIES IN ANY JURISDICTION WHERE THE OFFER OR SALE IS NOT PERMITTED.
| 24 |
| SANOFI OFFICE COMPLEX |

THE INFORMATION IN THIS STRUCTURAL AND COLLATERAL TERM SHEET IS NOT COMPLETE AND MAY BE AMENDED PRIOR TO THE TIME OF SALE. THIS TERM SHEET IS NOT AN OFFER TO SELL THESE SECURITIES AND IT IS NOT A SOLICITATION OF AN OFFER TO BUY THESE SECURITIES IN ANY JURISDICTION WHERE THE OFFER OR SALE IS NOT PERMITTED.
| 25 |
| No. 1 – Sanofi Office Complex | ||||||
| Loan Information | Property Information | |||||
| Mortgage Loan Seller: | Ladder Capital Finance LLC | Single Asset/Portfolio: | Single Asset | |||
Credit Assessment (DBRS/Fitch/Moody’s): | NR/NR/NR | Property Type: | Office | |||
| Original Principal Balance(1): | $65,000,000 | Specific Property Type: | Suburban | |||
| Cut-off Date Balance(1): | $65,000,000 | Location: | Bridgewater, NJ | |||
| % of Initial Pool Balance: | 9.1% | Size: | 674,325 SF | |||
| Loan Purpose: | Refinance | Cut-off Date Balance Per SF(1): | $185.37 | |||
| Borrower Name: | ARC HR5SNFI001 SPE, LLC | Year Built/Renovated: | 1987/2006 | |||
| Sponsor: | American Finance Trust, Inc. | Title Vesting: | Fee | |||
| Mortgage Rate: | 5.093% | Property Manager: | Self-managed | |||
| Note Date: | December 11, 2015 | 4th Most Recent Occupancy (As of): | 100.0% (12/31/2012) | |||
| Anticipated Repayment Date: | January 6, 2021 | 3rd Most Recent Occupancy (As of): | 100.0% (12/31/2013) | |||
| Maturity Date: | July 31, 2026 | 2nd Most Recent Occupancy (As of): | 100.0% (12/31/2014) | |||
| IO Period: | 60 months | Most Recent Occupancy (As of): | 100.0% (12/31/2015) | |||
| Loan Term (Original): | 60 months | Current Occupancy (As of): | 100.0% (3/1/2016) | |||
| Seasoning: | 2 months | |||||
| Amortization Term (Original): | NAP | Underwriting and Financial Information: | ||||
| Loan Amortization Type: | Interest-only, ARD | |||||
| Interest Accrual Method: | Actual/360 | 4th Most Recent NOI(3): | NAV | |||
| Call Protection: | L(26),D(30),O(4) | 3rd Most Recent NOI(3): | NAV | |||
| Lockbox Type: | Hard/Upfront Cash Management | 2nd Most Recent NOI (As of)(3): | $18,214,079 (Annualized 9 12/31/2014) | |||
| Additional Debt(1): | Yes | Most Recent NOI (As of)(3): | $18,214,983 (TTM 9/30/2015) | |||
| Additional Debt Type(1): | Pari Passu | |||||
| U/W Revenues: | $17,336,962 | |||||
| U/W Expenses: | $520,109 | |||||
| U/W NOI: | $16,816,853 | |||||
| U/W NCF: | $16,769,651 | |||||
| Escrows and Reserves(2): | U/W NOI DSCR(1): | 2.61x | ||||
| U/W NCF DSCR(1): | 2.60x | |||||
| Type: | Initial | Monthly | Cap (If Any) | U/W NOI Debt Yield(1): | 13.5% | |
| Taxes | $0 | Springing | NAP | U/W NCF Debt Yield(1): | 13.4% | |
| Insurance | $0 | Springing | NAP | As-Is Appraised Value: | $272,800,000 | |
| Replacement Reserves | $0 | Springing | NAP | As-Is Appraisal Valuation Date: | November 24, 2015 | |
| TI/LC Reserve | $0 | $0 | NAP | Cut-off Date LTV Ratio(1): | 45.8% | |
| Condominium Reserves | $0 | Springing | NAP | LTV Ratio at Maturity or ARD(1): | 45.8% | |
| (1) | The Sanofi Office Complex Whole Loan (as defined below), with an original principal balance of $125,000,000, is comprised of eightpari passu notes (Notes A-1-A, A-1-B, A-2-A, A-2-B, A-3-A, A-3-B, A-4-A and A-4-B). The controlling Note A-1-A and non-controlling Notes A-1-B, A-2-A, and A-2-B had an aggregate original principal balance of $65,000,000, have an aggregate outstanding principal balance as of the Cut-off Date of $65,000,000 and will be contributed to the WFCM 2016-C33 Trust. The non-controlling Notes A-3-A, A-3-B, A-4-A and A-4-B had an aggregate original principal balance of $60,000,000 and are expected to be contributed to one or more future trusts. All statistical information related to balances per square foot, loan-to-value ratios, debt service coverage ratios and debt yields are based on the Sanofi Office Complex Whole Loan. |
| (2) | See “Escrows” section. |
| (3) | See “Cash Flow Analysis” section. |
The Mortgage Loan. The mortgage loan is part of a whole loan (the “Sanofi Office Complex Whole Loan”) that is evidenced by eightpari passu promissory notes (Notes A-1-A, A-1-B, A-2-A, A-2-B, A-3-A, A-3-B, A-4-A and A-4-B) and secured by a first mortgage encumbering an office complex located in Bridgewater, New Jersey (the “Sanofi Office Complex Property”). The Sanofi Office Complex Whole Loan was originated on December 11, 2015 by Ladder Capital Finance LLC. The Sanofi Office Complex Whole Loan had an original principal balance of $125,000,000, has an outstanding principal balance as of the Cut-off Date of $125,000,000 and accrues interest at an interest rate of 5.093%per annum(the “Initial Interest Rate”). The Sanofi Office Complex Whole Loan had an initial term of 60 months, has a remaining term of 58 months as of the Cut-off Date and requires interest-only payments through the anticipated repayment date (“ARD”). The ARD is January 6, 2021 and the final maturity date is July 31, 2026. In the event the Sanofi Office Complex Whole Loan is not paid off in full on or before the ARD, the interest rate will increase to the sum of 3.500% and the greater of (i) 5.093% and (ii) the sum of (a) the greater of the five-year offered side swap rate and the five-year treasury rate, plus (b) 3.500% (the “Adjusted Interest Rate”). The payment of interest accrued at the excess of the Adjusted Interest Rate over the Initial Interest Rate will be deferred until the final maturity date, to the extent not paid sooner pursuant to the Sanofi Office Complex Whole Loan documents, and in any event will not be paid until the principal balance of the Sanofi Office Complex Whole Loan is reduced to zero. If the Sanofi Office Complex Whole Loan is not repaid in full on or prior to the ARD, on and after the ARD, all excess cash flow will be used to pay down the principal balance of the Sanofi Office Complex Whole Loan. See
THE INFORMATION IN THIS STRUCTURAL AND COLLATERAL TERM SHEET IS NOT COMPLETE AND MAY BE AMENDED PRIOR TO THE TIME OF SALE. THIS TERM SHEET IS NOT AN OFFER TO SELL THESE SECURITIES AND IT IS NOT A SOLICITATION OF AN OFFER TO BUY THESE SECURITIES IN ANY JURISDICTION WHERE THE OFFER OR SALE IS NOT PERMITTED.
| 26 |
| SANOFI OFFICE COMPLEX |
“Description of the Mortgage Pool—Certain Terms of the Mortgage Loans-ARD Loans” and “Description of the Mortgage Pool—The Whole Loans—The Serviced Pari Passu Whole Loan—The Sanofi Office Complex Whole Loan” in the Preliminary Prospectus.
The controlling Note A-1-A and non-controlling Notes A-1-B, A-2-A, and A-2-B, which will be contributed to the WFCM 2016-C33 Trust, had an aggregate original principal balance of $65,000,000 and an aggregate outstanding principal balance of $65,000,000 as of the Cut-off Date. The non-controlling Notes A-3-A, Note A-3-B, Note A-4-A and Note A-4-B, with an aggregate original principal balance of $60,000,000, are each expected to be contributed to one or more future trusts. Each of the mortgage loans evidenced by Notes A-3-A, A-3-B, A-4-A and A-4-B are referred to herein as the “Sanofi Office Complex Companion Loans”. The lender provides no assurances that any non-securitizedpari-passunote will not be split further. See “Description of the Mortgage Pool—The Whole Loans—The Serviced Pari Passu Whole Loan—Sanofi Office Complex Whole Loan” in the Preliminary Prospectus.
Pari Passu Note Summary
| Original Balance | Note Holder | Controlling Piece | |||
| Note A-1-A | $23,333,333 | WFCM 2016-C33 | Yes | ||
| Note A-1-B | $11,666,667 | WFCM 2016-C33 | No | ||
| Note A-2-A | $20,000,000 | WFCM 2016-C33 | No | ||
| Note A-2-B | $10,000,000 | WFCM 2016-C33 | No | ||
| Note A-3-A | $20,000,000 | Ladder Capital Finance, LLC(1) | No | ||
| Note A-3-B | $10,000,000 | JPMorgan Chase Bank, National Association(1)(2) | No | ||
| Note A-4-A | $20,000,000 | Ladder Capital Finance, LLC(1) | No | ||
| Note A-4-B | $10,000,000 | JPMorgan Chase Bank, National Association(1)(2) | No | ||
| Total | $125,000,000 | ||||
| (1) | Notes A-3-A, A-3-B, A-4-A and A-4-B are expected to be contributed to a future trust or trusts. |
| (2) | Subsequent to the origination of the Sanofi Office Complex Whole Loan, JPMorgan Chase Bank, National Association purchased the Notes A-1-B, A-2-B, A-3-B and A-4-B from Ladder Capital Finance, LLC. Prior to the closing of the WFCM 2016-C33 Trust, JPMorgan Chase Bank, National Association will sell the Notes A-1-B and A-2-B to Ladder Capital Finance, LLC. |
Following the lockout period, the borrower has the right to defease the Sanofi Office Complex Whole Loan in whole, but not in part, on any date prior to October 6, 2020. In addition, the Sanofi Office Complex Whole Loan is prepayable without penalty on or after October 6, 2020.
Sources and Uses
| Sources | Uses | |||||||
| Original whole loan amount | $125,000,000 | 64.6% | Loan payoff(1) | $191,281,433 | 98.9% | |||
| Sponsor’s new cash contribution | 68,375,158 | 35.4 | Closing costs | 2,093,726 | 1.1% | |||
| Total Sources | $193,375,158 | 100.0% | Total Uses | $193,375,158 | 100.0% | |||
| (1) | The Sanofi Office Complex Property was previously securitized in the GCCFC 2006-GG7 transaction. The borrower acquired the Sanofi Office Complex Property in March 2014 for a total purchase price of $251,100,000 and assumed the prior debt. |
The Property. The Sanofi Office Complex Property is a class A, single-tenant office building containing 674,325 square feet located in Bridgewater, New Jersey, approximately 34.3 miles southwest of Manhattan. Originally constructed in 1987 for AT&T and renovated in 2006, the Sanofi Office Complex Property serves as the United States headquarters for Sanofi-Aventis U.S. Inc. (“Sanofi-Aventis”). The Sanofi Office Complex Property contains two, four-story buildings and one, five-story building, all of which are connected by a walkway. The Sanofi Office Complex Property has been 100.0% leased to Sanofi-Aventis since 2006. Amenities at the Sanofi Office Complex Property include open floor plans, a fitness center, 500-seat auditorium, 500-seat full-service cafeteria, a company store, credit union, executive area with a boardroom, and two large tiered conference rooms with full audio-visual capability. Sanofi-Aventis is a subsidiary of Sanofi S.A., a French multinational pharmaceutical company headquartered in Paris, France, which is ranked 241 on the 2015 Fortune Global 500 and is the world’s fifth-largest pharmaceutical company based on sales. Sanofi S.A. is a global healthcare leader engaged in the research, development, manufacturing and marketing of health products, with a diversified offer of medicines, vaccines and innovative therapeutic solutions. Sanofi S.A.’s three main business areas are pharmaceuticals, human vaccines and animal health. Globally, Sanofi S.A. has over 110,000 employees, 20 research and development sites and 107 industrial locations. Sanofi-Aventis’s United States operations include 18 facilities located in nine states, Washington D.C. and Puerto Rico, which house approximately 17,000 employees. In 2014, United States sales of approximately €11.0 billion represented one-third of 2014 global sales for Sanofi S.A. Sanofi, S.A. (NYSE: SNY) is rated AA-, A1 and AA by Fitch, Moody’s and S&P, respectively, and had a market capitalization of approximately $104.0 billion as of February 5, 2016. The Sanofi Office Complex Property features 3,344 surface parking spaces resulting in a parking ratio of 5.0 spaces per 1,000 square feet of net rentable area. As of March 1, 2016, the Sanofi Office Complex Property was 100.0% occupied by Sanofi-Aventis.
The Sanofi Office Complex Property is subject to a condominium regime. The Sanofi Office Complex Property consists of units I/II, and III of a commercial condominium known as 55 Corporate Drive Condominium. The remaining unit in the condominium, unit IV, is an additional office building 100% leased to Sanofi under a lease presently coterminous with the lease at the Sanofi Office Complex Property, is not owned by the Sanofi Office Complex Property borrower and is not collateral for the Sanofi Office Complex Whole Loan. The Sanofi Office Complex Property currently comprises a total of 76.6% of the interests in the condominium with unit IV comprising the remaining 23.4%. At origination, the condominium board consisted of 3 members, 2 of whom were appointed by the
THE INFORMATION IN THIS STRUCTURAL AND COLLATERAL TERM SHEET IS NOT COMPLETE AND MAY BE AMENDED PRIOR TO THE TIME OF SALE. THIS TERM SHEET IS NOT AN OFFER TO SELL THESE SECURITIES AND IT IS NOT A SOLICITATION OF AN OFFER TO BUY THESE SECURITIES IN ANY JURISDICTION WHERE THE OFFER OR SALE IS NOT PERMITTED.
| 27 |
| SANOFI OFFICE COMPLEX |
borrower. See “Description of the Mortgage Pool—Mortgage Pool Characteristics—Condominium Interests” in the Preliminary Prospectus.
The following table presents certain information relating to the tenant at the Sanofi Office Complex Property:
Major Tenant
| Tenant Name | Credit Rating (Fitch/ Moody’s/S&P) | Tenant NRSF | % of NRSF | Annual U/W Base Rent PSF(1) | Annual U/W Base Rent(1) | % of Total Annual U/W Base Rent | Lease Expiration Date |
| Major Tenant | |||||||
| Sanofi-Aventis | AA-/A1/AA | 674,325 | 100.0% | $27.06 | $18,249,434 | 100.0% | 7/31/2026(2) |
| Total Major Tenant | 674,325 | 100.0% | $27.06 | $18,249,434 | 100.0% | ||
| Vacant Space | 0 | 0.0% | |||||
| Collateral Total | 674,325 | 100.0% | |||||
| (1) | The Annual U/W Base Rent and Annual U/W Base Rent PSF include contractual rent steps through July 1, 2016, totaling $1,841,686. The tenant’s current base rent is $16,407,748 ($24.33 per square foot). |
| (2) | Sanofi-Aventis has three, five-year lease renewal options. |
The following table presents certain information relating to the lease rollover schedule at the Sanofi Office Complex Property:
Lease Expiration Schedule(1)
| Year Ending December 31, | No. of Leases Expiring | Expiring NRSF | % of Total NRSF | Cumulative Expiring NRSF | Cumulative % of Total NRSF | Annual U/W Base Rent | % of Total Annual U/W Base Rent | Annual U/W Base Rent PSF |
| MTM | 0 | 0 | 0.0% | 0 | 0.0% | $0 | 0.0% | $0.00 |
| 2016 | 0 | 0 | 0.0% | 0 | 0.0% | $0 | 0.0% | $0.00 |
| 2017 | 0 | 0 | 0.0% | 0 | 0.0% | $0 | 0.0% | $0.00 |
| 2018 | 0 | 0 | 0.0% | 0 | 0.0% | $0 | 0.0% | $0.00 |
| 2019 | 0 | 0 | 0.0% | 0 | 0.0% | $0 | 0.0% | $0.00 |
| 2020 | 0 | 0 | 0.0% | 0 | 0.0% | $0 | 0.0% | $0.00 |
| 2021 | 0 | 0 | 0.0% | 0 | 0.0% | $0 | 0.0% | $0.00 |
| 2022 | 0 | 0 | 0.0% | 0 | 0.0% | $0 | 0.0% | $0.00 |
| 2023 | 0 | 0 | 0.0% | 0 | 0.0% | $0 | 0.0% | $0.00 |
| 2024 | 0 | 0 | 0.0% | 0 | 0.0% | $0 | 0.0% | $0.00 |
| 2025 | 0 | 0 | 0.0% | 0 | 0.0% | $0 | 0.0% | $0.00 |
| 2026 | 1 | 674,325 | 100.0% | 674,325 | 100.0% | $18,249,434 | 100.0% | $27.06 |
| Thereafter | 0 | 0 | 0.0% | 674,325 | 100.0% | $0 | 0.0% | $0.00 |
| Vacant | 0 | 0 | 0.0% | 674,325 | 100.0% | $0 | 0.0% | $0.00 |
| Total/Weighted Average | 1 | 674,325 | 100.0% | $18,249,434 | 100.0% | $27.06 |
| (1) | Information obtained from the underwritten rent roll. |
The following table presents historical occupancy percentages at the Sanofi Office Complex Property:
Historical Occupancy
12/31/2012(1) | 12/31/2013(1) | 12/31/2014(1) | 12/31/2015(1) | 3/1/2016(2) |
| 100.0% | 100.0% | 100.0% | 100.0% | 100.0% |
| (1) | Information based on the Sanofi-Aventis lease. |
| (2) | Information obtained from the underwritten rent roll. |
THE INFORMATION IN THIS STRUCTURAL AND COLLATERAL TERM SHEET IS NOT COMPLETE AND MAY BE AMENDED PRIOR TO THE TIME OF SALE. THIS TERM SHEET IS NOT AN OFFER TO SELL THESE SECURITIES AND IT IS NOT A SOLICITATION OF AN OFFER TO BUY THESE SECURITIES IN ANY JURISDICTION WHERE THE OFFER OR SALE IS NOT PERMITTED.
| 28 |
| SANOFI OFFICE COMPLEX |
Operating History and Underwritten Net Cash Flow.The following table presents certain information relating to the historical operating performance and underwritten net cash flow at the Sanofi Office Complex Property:
Cash Flow Analysis(1)
Annualized 9 12/31/2014 | TTM 9/30/2015 | U/W | % of U/W Effective Gross Income | U/W $ per SF | ||||||
| Base Rent | $18,777,401(2) | $18,778,333(2) | $18,249,434(3) | 105.3% | $27.06(3) | |||||
| Grossed Up Vacant Space | 0 | 0 | 0 | 0.0 | 0.00 | |||||
| Total Reimbursables | 0 | 0 | 0 | 0.0 | 0.00 | |||||
| Other Income | 0 | 0 | 0 | 0.0 | 0.00 | |||||
| Less Vacancy & Credit Loss | 0 | 0 | (912,472)(4) | (5.3) | (1.35) | |||||
| Effective Gross Income | $18,777,401 | $18,778,333 | $17,336,962 | 100.0% | $25.71 | |||||
| Total Operating Expenses(5) | $563,322 | $563,350 | $520,109 | 3.0% | $0.77 | |||||
| Net Operating Income | $18,214,079 | $18,214,983 | $16,816,853 | 97.0% | $24.94 | |||||
| TI/LC | 0 | �� | 0 | 0 | 0.0 | 0.00 | ||||
| Capital Expenditures | 0 | 0 | 47,203 | 0.3 | 0.07 | |||||
| Net Cash Flow | $18,214,079 | $18,214,983 | $16,769,651 | 96.7% | $24.87 | |||||
| NOI DSCR(6) | 2.82x | 2.82x | 2.61x | |||||||
| NCF DSCR(6) | 2.82x | 2.82x | 2.60x | |||||||
| NOI DY(6) | 14.6% | 14.6% | 13.5% | |||||||
| NCF DY(6) | 14.6% | 14.6% | 13.4% |
| (1) | Historical financial statements prior to 2014 are not available as the borrower acquired the Sanofi Office Complex Property in March 2014. |
| (2) | Annualized 12/31/2014 and TTM 9/30/2015 Base Rent are based on the borrower’s reported financial statements which straightlined the tenant’s rent for accounting purposes. |
| (3) | The U/W Base Rent and U/W Base Rent PSF include contractual rent steps through July 1, 2016, totaling $1,841,686. The tenant’s current base rent is $16,407,748 ($24.33 per square foot). |
| (4) | The underwritten economic vacancy is 5.0%. The Sanofi Office Complex Property was 100.0% physically occupied as of March 1, 2016. |
| (5) | The lease with Sanofi-Aventis is NNN and the tenant is responsible for all operating expenses. Historical operating expenses represent a management fee. |
| (6) | The debt service coverage ratios and debt yields are based on the Sanofi Office Complex Whole Loan. |
Appraisal.As of the appraisal valuation date of November 24, 2015, the Sanofi Office Complex Property had an “as-is” appraised value of $272,800,000.
Environmental Matters.According to the Phase I environmental assessment dated November 24, 2015, there was no evidence of any recognized environmental conditions at the Sanofi Office Complex Property.
Market Overview and Competition.The Sanofi Office Complex Property is located in Bridgewater, New Jersey approximately 34.3 miles southeast of downtown Manhattan. Primary access to the area is provided by both Interstate-78 and Interstate-287, major arterials that cross the Bridgewater area in an east-west and north-south direction, respectively. Access to the Sanofi Office Complex Property from Interstate-78 and Interstate-287 is provided by US-202/206, located directly adjacent to the Sanofi Office Complex Property. The Sanofi Office Complex Property has access to the Raritan Valley line on New Jersey Transit via the Finderne and Somerville stations, located six and eight miles, respectively, from the Sanofi Office Complex Property. The Sanofi Office Complex Property is also located approximately 40.0 miles southwest of Newark Liberty International Airport. The estimated 2015 population within a one-, three- and five-mile radius of the Sanofi Office Complex Property was 4,002, 27,265 and 75,977, respectively; and the estimated 2015 median household income within the same radius was $95,135, $121,917 and $108,121, respectively.
According to the appraisal, the Sanofi Office Complex Property is located in the Branchburg/Bridgewater office submarket, which is part of the Central New Jersey Metro Area office market. As of the third quarter of 2015, the Branchburg/Bridgewater office submarket reported a 28.4% vacancy rate for all office space and an average asking rental rate of $22.63 per square foot, triple-net, while class A properties reported a 25.3% vacancy rate and an average asking rental rate of $30.51, triple-net. The appraiser determined there were 14 competitive properties within the area with a current vacancy rate of 13.7% and an average asking rent of $31.74 per square foot, triple-net.
THE INFORMATION IN THIS STRUCTURAL AND COLLATERAL TERM SHEET IS NOT COMPLETE AND MAY BE AMENDED PRIOR TO THE TIME OF SALE. THIS TERM SHEET IS NOT AN OFFER TO SELL THESE SECURITIES AND IT IS NOT A SOLICITATION OF AN OFFER TO BUY THESE SECURITIES IN ANY JURISDICTION WHERE THE OFFER OR SALE IS NOT PERMITTED.
| 29 |
| SANOFI OFFICE COMPLEX |
The following table presents certain information relating to comparable office leases to the Sanofi Office Complex Property:
Comparable Leases(1)
| Property Name/Location | Year Built/ Renovated | Stories | Total GLA (SF) | Total Occupancy | Distance from Subject | Tenant Name | Lease Date/Term | Lease Area (SF) | Annual Base Rent PSF | Lease Type |
Giralda Farms Madison, NJ | 2000/NAP | 3 | 147,419 | 100% | 13.9 miles | Merck & Company, Inc. | April 2014 / 11 Yrs | 147,419 | $21.50 | NNN |
1 Giralda Farms Madison, NJ | 1985/NAP | 4 | 160,000 | 100% | 14.1 miles | Pfizer | January 2013 / 11 Yrs | 116,000 | $34.75 | FSG |
175 Park Avenue Madison, NJ | 1971/2011 | 3 | 270,000 | 100% | 14.4 miles | Realogy Operations LLC | January 2013 / 17 Yrs | 270,000 | $26.05 | NNN |
Siemens Metropark Iselin, NJ | 2003/NAP | 8 | 239,452 | 100% | 17.1 miles | Siemens Corporation | January 2013 / 10 Yrs | 239,452 | $20.00 | NNN |
Forrestal Greene Plainsboro, NJ | 2000/NAP | 3 | 154,101 | 100% | 19.8 miles | Sandoz | March 2014 / 10 Yrs | 154,101 | $32.50 | FSG |
Novo Nordisk HQ Plainsboro, NJ | 1985/2013 | 3 | 731,104 | 68.1% | 20.9 miles | Novo Nordisk | April 2013 / 15 Yrs | 498,115 | $28.00 | NNN |
| (1) | Information obtained from the appraisal. |
The Borrower.The borrower is ARC HR5SNFI001 SPE, LLC, a Delaware limited liability company and single purpose entity with two independent directors. Legal counsel to the borrower delivered a non-consolidation opinion in connection with the origination of the Sanofi Office Complex Whole Loan. American Finance Trust, Inc. is the guarantor of certain nonrecourse carveouts under the Sanofi Office Complex Whole Loan.
The Sponsor.The sponsor is American Finance Trust, Inc. (“American Finance Trust”). As of September 30, 2015, American Finance Trust owned 463 properties located in 37 states comprising approximately 13.1 million square feet. All of American Finance Trust’s properties are freestanding, single-tenant properties which are 100.0% leased. As of September 30, 2014, American Finance Trust reported total assets of approximately $2.4 billion, and a net worth of approximately $1.2 billion. In addition, American Finance Trust reported total cash and cash equivalents of $172.0 million.
The external advisor and sponsor of American Finance Trust, and the owner of American Finance Special Limited Partner, LLC (which holds a 0.1% ownership interest in American Finance Trust), is an affiliate of AR Global Investments, LLC (“AR Global”). In addition, the Sanofi Office Complex Property is subject to a property management agreement with a wholly-owned subsidiary of AR Global (the “Operator”) pursuant to which the Operator is responsible for the management of the Sanofi Office Complex Property. Certain principals and affiliates of AR Global as well as the previous external advisor and sponsor of American Finance Trust are subject to litigation and governmental proceedings. See “Description of the Mortgage Pool—Loan Purpose; Default History, Bankruptcy Issues and Other Proceedings” in the Preliminary Prospectus.
Escrows.Upon the T&I Conditions Precedent (as defined below) no longer being in effect, the Sanofi Office Complex Whole Loan documents require monthly real estate tax and insurance premium reserve deposits in amounts equal to one-twelfth of the amount that the lender reasonably estimates will be necessary to pay real estate taxes and insurance premiums over the then succeeding 12-month period. Monthly replacement reserves of $14,048 are waived unless (i) an event of default under the Sanofi Office Complex Whole Loan exists; (ii) the borrower has defaulted in its obligation to perform capital expenditure work at the Sanofi Office Complex Property in accordance with the terms of the Sole Tenant (as defined below) lease; and/or (iii) the Sole Tenant lease and/or the guaranty of the Sole Tenant lease (the “Sole Tenant Lease Guaranty”) fail to be in full force and effect and/or either the landlord or tenant is in default of any of their respective obligations thereunder beyond applicable notice and cure periods. Monthly deposits into the condominium common charges account are waived until the lender has determined, in its sole discretion, that condominium common charges are required to become payable under the condominium documents governing the Sanofi Office Complex Property.
“T&I Conditions Precedent” means (i) no event of default has occurred and is continuing; (ii) tax bills for the Sanofi Office Complex Property are being delivered directly to the Sole Tenant; (iii) the Sole Tenant is obligated to pay, and is actually paying, taxes directly to the appropriate public office; (iv) the Sole Tenant is obligated to maintain, and is actually maintaining, the insurance in respect of the Sanofi Office Complex Property in accordance with the terms of the Sole Tenant’s lease, or self-insuring if permitted to do so under the terms of the Sole Tenant lease; (v) the Sole Tenant is paying insurance premiums directly to the respective insurer or agent (unless the Sole Tenant is self-insuring if permitted to do so under the terms of the Sole Tenant lease); (vi) the Sole Tenant lease and the Sole Tenant Lease Guaranty are in full force and effect and neither the borrower nor the Sole Tenant is in default of their respective obligations thereunder beyond applicable notice and cure periods; and (vii) unless and to the extent the borrower is maintaining a blanket insurance policy satisfying the requirements of the Sanofi Office Complex Whole Loan documents, Sanofi-Aventis or the guarantor under the Sole Tenant Lease Guaranty including any successor guarantor pursuant to the terms of the Sole Tenant lease (the “Sole Tenant Lease Guarantor”) has a senior unsecured debt rating of at least “BBB-“ by S&P (or the equivalent of such rating by Moody’s).
A “Sole Tenant” means (i) Sanofi-Aventis or (ii) any successor of Sole Tenant pursuant to the terms of such Sole Tenant lease.
THE INFORMATION IN THIS STRUCTURAL AND COLLATERAL TERM SHEET IS NOT COMPLETE AND MAY BE AMENDED PRIOR TO THE TIME OF SALE. THIS TERM SHEET IS NOT AN OFFER TO SELL THESE SECURITIES AND IT IS NOT A SOLICITATION OF AN OFFER TO BUY THESE SECURITIES IN ANY JURISDICTION WHERE THE OFFER OR SALE IS NOT PERMITTED.
| 30 |
| SANOFI OFFICE COMPLEX |
Lockbox and Cash Management.The Sanofi Office Complex Whole Loan requires a lender-controlled lockbox account, which is already in place, and that the borrower direct the tenants to pay their rents directly into such lockbox account. The loan documents also require that all rents received by the borrower or property manager will be deposited into the lockbox account within two business days of receipt. Funds deposited into the lockbox account are required to be swept on a daily basis into a cash management account controlled by the lender and applied and disbursed in accordance with the loan documents. Upon the occurrence of an Excess Cash Flow Sweep Trigger Event (as defined below) and prior to the ARD, all excess cash flow will be held as additional collateral for the Sanofi Office Complex Whole Loan. Notwithstanding the foregoing, on and after the ARD, all excess cash flow is required to be used to (i) pay down the principal balance of the Sanofi Office Complex Whole Loan until such time as the principal balance is reduced to zero and (ii) pay down all unpaid accrued interest since the ARD. Such interest in an amount equal to the excess of the Adjusted Interest Rate over the Initial Interest Rate will be deferred until the maturity date, to the extent not paid sooner pursuant to the Sanofi Office Complex Whole Loan documents.
An “Excess Cash Flow Sweep Trigger Event” will commence upon the earliest of (i) the date on which the Sole Tenant or any other Significant Tenant (as defined below) goes dark; (ii) the Sole Tenant Lease Guarantor has its senior debt rating downgraded below a rating of “BBB-” by S&P (or below the Moody’s equivalent of such S&P rating); (iii) the Sole Tenant or the Sole Tenant Lease Guarantor becomes insolvent or a debtor in any bankruptcy action; (iv) the borrower or the guarantor under the Sanofi Office Complex Whole Loan becomes insolvent or a debtor in any bankruptcy action; (v) the occurrence of an event of default under the Sanofi Office Complex Whole Loan documents; (vi) the Sole Tenant Lease Guaranty is no longer in full force and effect or the limitation of liability thereunder has been reduced; (vii) the trailing 12-month debt service coverage ratio is less than 2.25x; or (viii) the Sole Tenant or any other Significant Tenant is in monetary default under its lease.
An “Excess Cash Flow Sweep Trigger Event Cure” means with regard to clause (i) above, the date on which (a) a re-tenanting event occurs pursuant to the terms of the Sanofi Office Complex Whole Loan documents or (b) the Sole Tenant or Significant Tenant has reopened for business and is conducting normal business operations at substantially all of its demised premises; with regard to clause (ii) above, the date on which the senior unsecured debt rating of the Sole Tenant Lease Guarantor has been restored to at least “BBB-” by S&P (or the Moody’s equivalent of such S&P rating) and such rating has have been maintained for six consecutive months; with regard to clause (iii) above, the date on which the Sole Tenant and/or the Sole Tenant Lease Guarantor, as applicable, (I) becomes solvent to the lender’s satisfaction for three consecutive months or (II) is no longer a debtor in any bankruptcy action and has affirmed the Sole Tenant lease and/or Sole Tenant Lease Guaranty pursuant to a final non-appealable order of a court of competent jurisdiction; with regard to clause (iv) above, the date on which the borrower or the sponsor, as the case may be, becomes solvent to the lender’s satisfaction for three consecutive months or is no longer a debtor in any bankruptcy action; with regard to clause (v) above, upon the cure of such event of default; with regard to clause (vi) above, the date on which the Sole Tenant Lease Guaranty is again in full force and effect and/or the limitation on liability under the Sole Tenant Lease Guaranty has been increased or reset such that not less than $250,000,000 remains available thereunder; with regard to clause (vii) above, the date on which the debt service coverage ratio is at least 2.40x for six consecutive calendar months; and with regard to clause (viii) above, the date on which the Sole Tenant or such other Significant Tenant is no longer in monetary default under its lease or a re-tenanting event has occurred with respect to the applicable lease after expiration of applicable notice and cure periods.
A “Significant Tenant” means any tenant occupying 25.0% or more of the Sanofi Office Complex Property as measured by aggregate square footage or aggregate rent.
Property Management.The Sanofi Office Complex Property is managed by an affiliate of the borrower.
Assumption.The borrower has the right to transfer the Sanofi Office Complex Property provided that certain conditions are satisfied including (i) no event of default has occurred and is continuing; (ii) the lender has reasonably determined that the proposed transferee and any successor guarantor satisfy the lender’s credit review and underwriting standards, taking into consideration such transferee’s experience, financial strength and general business standing; and (iii) if required by the lender, a rating agency confirmation from DBRS, Fitch and Moody’s stating that such assumption will not result in a downgrade, withdrawal or qualification of the respective ratings to the Series 2016-C33 Certificates and similar confirmations with respect to the ratings of any securities backed by any of the Sanofi Office Complex Companion Loans.
Right of First Offer.Sanofi-Aventis has a right of first offer (“ROFO”) to purchase the Sanofi Office Complex Property. The ROFO is not extinguished by a foreclosure of the Sanofi Office Complex Property; however the ROFO does not apply to a purchase of the Sanofi Office Complex Property by lender at foreclosure or deed-in-lieu thereof.
Partial Release.Not Permitted.
Real Estate Substitution.Not Permitted.
Subordinate and Mezzanine Indebtedness.Not permitted.
Ground Lease. None.
Terrorism Insurance. The loan documents require that the “all risk” insurance policy required to be maintained by the borrower provides coverage for terrorism in an amount equal to the full replacement cost of the Sanofi Office Complex Property. The loan documents also require business interruption insurance covering no less than the 18-month period following the occurrence of a casualty event, together with a 12-month extended period of indemnity.
THE INFORMATION IN THIS STRUCTURAL AND COLLATERAL TERM SHEET IS NOT COMPLETE AND MAY BE AMENDED PRIOR TO THE TIME OF SALE. THIS TERM SHEET IS NOT AN OFFER TO SELL THESE SECURITIES AND IT IS NOT A SOLICITATION OF AN OFFER TO BUY THESE SECURITIES IN ANY JURISDICTION WHERE THE OFFER OR SALE IS NOT PERMITTED.
| 31 |
| SANOFI OFFICE COMPLEX |
Windstorm Insurance.The loan documents require windstorm insurance covering the full replacement cost of Sanofi Office Complex Property during the loan term. At the time of closing, the Sanofi Office Complex Property has windstorm insurance coverage.
THE INFORMATION IN THIS STRUCTURAL AND COLLATERAL TERM SHEET IS NOT COMPLETE AND MAY BE AMENDED PRIOR TO THE TIME OF SALE. THIS TERM SHEET IS NOT AN OFFER TO SELL THESE SECURITIES AND IT IS NOT A SOLICITATION OF AN OFFER TO BUY THESE SECURITIES IN ANY JURISDICTION WHERE THE OFFER OR SALE IS NOT PERMITTED.
| 32 |
(THIS PAGE INTENTIONALLY LEFT BLANK)
THE INFORMATION IN THIS STRUCTURAL AND COLLATERAL TERM SHEET IS NOT COMPLETE AND MAY BE AMENDED PRIOR TO THE TIME OF SALE. THIS TERM SHEET IS NOT AN OFFER TO SELL THESE SECURITIES AND IT IS NOT A SOLICITATION OF AN OFFER TO BUY THESE SECURITIES IN ANY JURISDICTION WHERE THE OFFER OR SALE IS NOT PERMITTED.
| 33 |
| WPC SELF STORAGE IX |
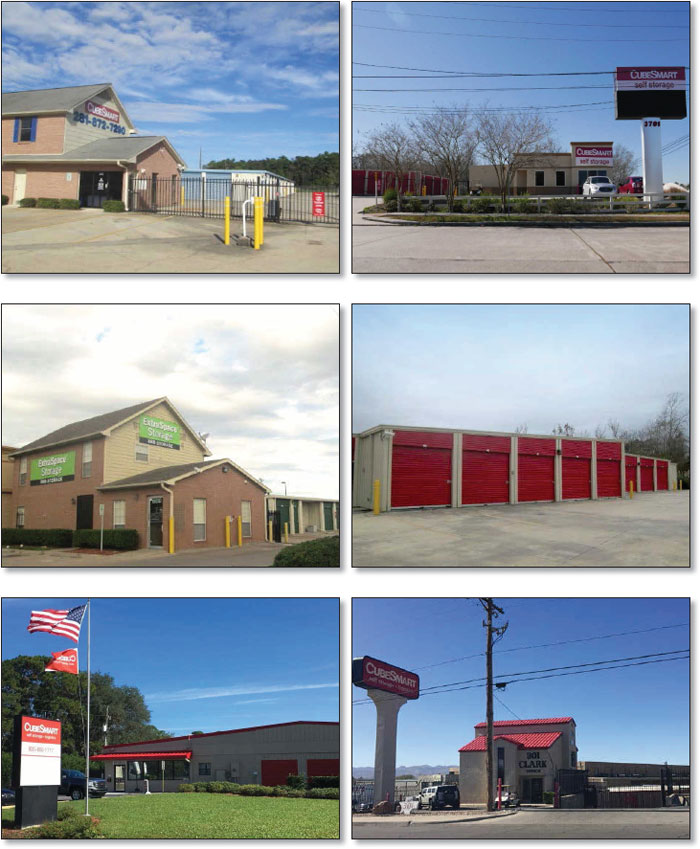
THE INFORMATION IN THIS STRUCTURAL AND COLLATERAL TERM SHEET IS NOT COMPLETE AND MAY BE AMENDED PRIOR TO THE TIME OF SALE. THIS TERM SHEET IS NOT AN OFFER TO SELL THESE SECURITIES AND IT IS NOT A SOLICITATION OF AN OFFER TO BUY THESE SECURITIES IN ANY JURISDICTION WHERE THE OFFER OR SALE IS NOT PERMITTED.
| 34 |
| WPC SELF STORAGE IX |
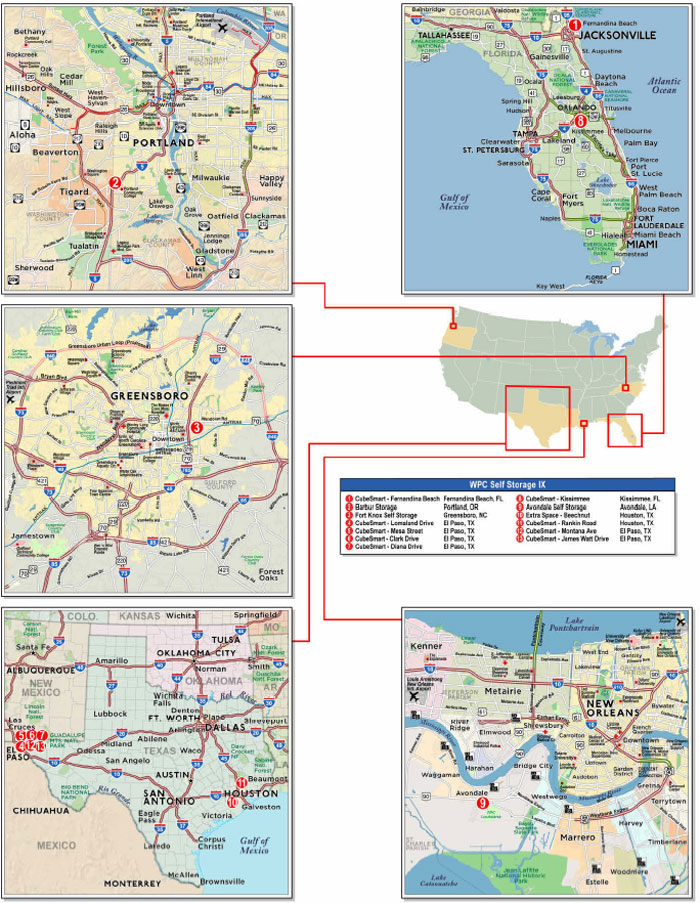
THE INFORMATION IN THIS STRUCTURAL AND COLLATERAL TERM SHEET IS NOT COMPLETE AND MAY BE AMENDED PRIOR TO THE TIME OF SALE. THIS TERM SHEET IS NOT AN OFFER TO SELL THESE SECURITIES AND IT IS NOT A SOLICITATION OF AN OFFER TO BUY THESE SECURITIES IN ANY JURISDICTION WHERE THE OFFER OR SALE IS NOT PERMITTED.
| 35 |
| No. 2 – WPC Self Storage IX | ||||||
| Loan Information | Property Information | |||||
| Mortgage Loan Seller: | Wells Fargo Bank, National Association | Single Asset/Portfolio: | Portfolio | |||
| Credit Assessment (DBRS/Fitch/ Moody’s): | NR/NR/NR | Property Type: | Self Storage | |||
| Original Principal Balance: | $49,000,000 | Specific Property Type: | Self Storage | |||
| Cut-off Date Balance: | $49,000,000 | Location: | Various – See Table | |||
| % of Initial Pool Balance: | 6.9% | Size: | 938,219 SF | |||
| Loan Purpose: | Acquisition | Cut-off Date Balance Per SF: | $52.23 | |||
| Borrower Names(1): | Various | Year Built/Renovated: | Various – See Table | |||
| Sponsor: | Corporate Property Associates 18 – Global Incorporated | Title Vesting: | Fee | |||
| Mortgage Rate: | 4.880% | Property Manager(3): | Various | |||
| Note Date: | February 2, 2016 | 4th Most Recent Occupancy(4): | NAV | |||
| Anticipated Repayment Date: | NAP | 3rd Most Recent Occupancy(4): | NAV | |||
| Maturity Date: | February 11, 2026 | 2nd Most Recent Occupancy (As of): | 81.5% (12/31/2013) | |||
| IO Period: | 120 months | Most Recent Occupancy (As of): | 82.3% (12/31/2014) | |||
| Loan Term (Original): | 120 months | Current Occupancy (As of)(4): | 83.0% (Various) | |||
| Seasoning: | 1 months | |||||
| Amortization Term (Original): | NAP | Underwriting and Financial Information: | ||||
| Loan Amortization Type: | Interest-only, Balloon | |||||
| Interest Accrual Method: | Actual/360 | 4th Most Recent NOI(5): | NAV | |||
| Call Protection: | L(25),D(91),O(4) | 3rd Most Recent NOI (As of) (5): | $4,269,630 (12/31/2013) | |||
| Lockbox Type: | Springing | 2nd Most Recent NOI (As of): | $4,834,587 (12/31/2014) | |||
| Additional Debt: | None | Most Recent NOI (As of)(5): | $5,187,463 (Various) | |||
| Additional Debt Type: | NAP | |||||
| U/W Revenues: | $7,822,383 | |||||
| U/W Expenses: | $3,403,617 | |||||
| U/W NOI: | $4,418,766 | |||||
| U/W NCF: | $4,278,033 | |||||
| Escrows and Reserves(2): | U/W NOI DSCR: | 1.82x | ||||
| U/W NCF DSCR: | 1.76x | |||||
| Type: | Initial | Monthly | Cap (If Any) | U/W NOI Debt Yield: | 9.0% | |
| Taxes | $0 | Springing | NAP | U/W NCF Debt Yield: | 8.7% | |
| Insurance | $0 | Springing | NAP | As-Is Appraised Value(6): | $74,880,000 | |
| Replacement Reserves | $0 | Springing | NAP | As-Is Appraisal Valuation Date(6): | Various | |
| Amortization Reserve | $0 | Springing | NAP | Cut-off Date LTV Ratio(6): | 65.4% | |
| Deferred Maintenance | $1,090,975 | $0 | NAP | LTV Ratio at Maturity or ARD(6): | 65.4% | |
| (1) | See “The Borrowers” section. |
| (2) | See “Escrows” section. |
| (3) | See “Property Management” section. |
| (4) | See “Historical Occupancy” section. |
| (5) | See “Cash Flow Analysis” section. Historical cash flow information was not available for all of the WPC Self Storage IX Properties. |
| (6) | See “Appraisal” section. |
The Mortgage Loan. The mortgage loan (the “WPC Self Storage IX Mortgage Loan”) is evidenced by a single promissory note that is secured by first mortgages encumbering a portfolio of 13 self storage properties located in five states (the “WPC Self Storage IX Properties”). The WPC Self Storage IX Mortgage Loan was originated on February 2, 2016 by Wells Fargo Bank, National Association. The WPC Self Storage IX Mortgage Loan had an original principal balance of $49,000,000, has an outstanding principal balance as of the Cut-off Date of $49,000,000 and accrues interest at an interest rate of 4.880%per annum. The WPC Self Storage IX Mortgage Loan had an initial term of 120 months, has a remaining term of 119 months as of the Cut-off Date and requires interest-only payments through the term on the WPC Self Storage IX Mortgage Loan. The WPC Self Storage IX Mortgage Loan matures on February 11, 2026.
Following the lockout period, the borrower has the right to defease the WPC Self Storage IX Mortgage Loan in whole or in part (see “Partial Release” section), on any day before November 11, 2025. In addition, the WPC Self Storage IX Mortgage Loan is prepayable without penalty on or after November 11, 2025.
THE INFORMATION IN THIS STRUCTURAL AND COLLATERAL TERM SHEET IS NOT COMPLETE AND MAY BE AMENDED PRIOR TO THE TIME OF SALE. THIS TERM SHEET IS NOT AN OFFER TO SELL THESE SECURITIES AND IT IS NOT A SOLICITATION OF AN OFFER TO BUY THESE SECURITIES IN ANY JURISDICTION WHERE THE OFFER OR SALE IS NOT PERMITTED.
| 36 |
| WPC SELF STORAGE IX |
Sources and Uses
| Sources | Uses | |||||||
| Original loan amount | $49,000,000 | 64.6% | Purchase price | $74,350,000 | 98.0% | |||
| Sponsor’s new cash contribution | 26,850,830 | 35.4% | Upfront reserves | 1,090,975 | 1.4 | |||
| Closing costs | 409,855 | 0.5 | ||||||
| Total Sources | $75,850,830 | 100.0% | Total Uses | $75,850,830 | 100.0% |
The Properties. The WPC Self Storage IX Mortgage Loan is secured by the fee interest in a portfolio of 13 self storage properties totaling 938,219 rentable square feet or 7,527 units (including 371 parking/RV spaces) located in five states: Texas (8), Florida (2), North Carolina (1), Oregon (1) and Louisiana (1). The WPC Self Storage IX Properties range in size from 36,827 square feet to 141,423 square feet and as of dates ranging from October 31, 2015 to January 19, 2016, the WPC Self Storage IX Properties were 83.0% occupied. A 3-story annex within the CubeSmart - Fernandina Beach Property (14.9% of the Allocated Cut-off Date Balance) was the subject of a 2008 foreclosure when owned by a predecessor-in-title. When the seller acquired the CubeSmart - Fernandina Beach Property, construction of the annex building was completed. All second- and third-floor units within the annex were underwritten as vacant but are currently available for lease. See “Description of the Mortgage Pool – Litigation and Other Considerations.”
The following table presents certain information relating to the WPC Self Storage IX Properties:
| Property Name – Location | Allocated Cut-off Date Balance | % of Portfolio Cut-off Date Balance | Occupancy | Year Built/ Renovated | Net Rentable Area (SF) | Appraised Value | Allocated LTV | |
| CubeSmart - Fernandina Beach - Fernandina Beach, FL | $7,288,000 | 14.9% | 79.5%(1) | 1986/NAP | 141,423 | 10,700,000 | 68.1% | |
| Extra Space - Portland - Portland, OR | $6,365,000 | 13.0% | 97.3% | 2000/NAP | 37,716 | 10,760,000 | 59.2% | |
| Extra Space - Greensboro - Greensboro, NC | $4,047,000 | 8.3% | 61.2% | 1953/1996 | 119,041 | 5,900,000 | 68.6% | |
| CubeSmart - Lomaland Drive - El Paso, TX | $3,728,000 | 7.6% | 88.5% | 1980/NAP | 60,115 | 5,000,000 | 74.6% | |
| CubeSmart - Mesa Street - El Paso, TX | $3,714,000 | 7.6% | 95.5% | 1980/NAP | 67,135 | 5,400,000 | 68.8% | |
| CubeSmart - Clark Drive - El Paso, TX | $3,638,000 | 7.4% | 79.5% | 1986/NAP | 97,113 | 4,860,000 | 74.9% | |
| CubeSmart - Diana Drive - El Paso, TX | $3,621,000 | 7.4% | 91.2% | 1980/NAP | 71,302 | 5,450,000 | 66.4% | |
| CubeSmart - Kissimmee - Kissimmee, FL | $3,457,000 | 7.1% | 92.5% | 1981/NAP | 74,581 | 5,100,000 | 67.8% | |
| CubeSmart - Avondale - Avondale, LA | $3,431,000 | 7.0% | 77.9% | 2003/NAP | 59,414 | 5,600,000 | 61.3% | |
| Extra Space - Beechnut - Houston, TX | $2,965,000 | 6.1% | 84.7% | 2001/NAP | 64,595 | 5,200,000 | 57.0% | |
| CubeSmart - Rankin Road - Houston, TX | $2,765,000 | 5.6% | 85.4% | 1998/NAP | 59,900 | 4,810,000 | 57.5% | |
| CubeSmart - Montana Ave - El Paso, TX | $2,549,000 | 5.2% | 92.3% | 1980/NAP | 49,057 | 4,000,000 | 63.7% | |
| CubeSmart - James Watt Drive - El Paso, TX | $1,432,000 | 2.9% | 83.4% | 1985/NAP | 36,827 | 2,100,000 | 68.2% | |
| Total/Weighted Average | $49,000,000 | 100.0% | 83.0% | 938,219 | 74,880,000 | 65.4% | ||
| (1) | In November 2015, the CubeSmart - Fernandina Beach Property added 287 climate controlled units, of which 234 second- and third-floor units are all underwritten as vacant. Prior to November 2015, the CubeSmart - Fernandina Beach Property was 91.0% occupied; however, the addition of the 287 climate controlled units caused occupancy to decline to 71.5%. As of January 19, 2016, occupancy increased to 79.5% |
The following table presents historical occupancy percentages at the WPC Self Storage IX Properties:
Historical Occupancy
| 12/31/2011(1) | 12/31/2012(1) | 12/31/2013(2) | 12/31/2014(2) | Various(3) | ||||
| NAV | NAV | 81.5% | 82.3% | 83.0% |
| (1) | The WPC Self Storage IX Properties were acquired by the borrower from August 2015 to November 2015; further historical occupancy information is not available. |
| (2) | Information obtained from the borrower. |
| (3) | Information obtained from the underwritten rent roll. Occupancy shown is as of dates ranging from October 31, 2015 to January 19, 2016. |
THE INFORMATION IN THIS STRUCTURAL AND COLLATERAL TERM SHEET IS NOT COMPLETE AND MAY BE AMENDED PRIOR TO THE TIME OF SALE. THIS TERM SHEET IS NOT AN OFFER TO SELL THESE SECURITIES AND IT IS NOT A SOLICITATION OF AN OFFER TO BUY THESE SECURITIES IN ANY JURISDICTION WHERE THE OFFER OR SALE IS NOT PERMITTED.
| 37 |
| WPC SELF STORAGE IX |
Operating History and Underwritten Net Cash Flow. The following table presents certain information relating to the historical operating performance and the underwritten net cash flow at the WPC Self Storage IX Properties:
Cash Flow Analysis
2013(1) | 2014 | Various(3) | U/W | % of U/W Effective Gross Income | U/W $ per SF | ||||||||
| Base Rent | $6,852,018 | $7,078,211 | $7,462,475 | $7,247,540 | 92.7% | $7.72 | |||||||
| Grossed Up Vacant Space | 588,336(2) | 543,229(2) | 540,847(2) | 2,211,852 | 28.3 | 2.36 | |||||||
| Less Concessions | (347,118) | (293,781) | (280,860) | 0 | 0 | 0.00 | |||||||
| Other Income | 707,146 | 824,202 | 879,011 | 574,843 | 7.3 | 0.61 | |||||||
| Less Vacancy & Credit Loss | (588,336) | (543,229) | (540,847) | (2,211,852)(4) | (28.3) | (2.36) | |||||||
| Effective Gross Income | $7,212,046 | $7,608,632 | $8,060,626 | $7,822,383 | 100.0% | $8.34 | |||||||
| Total Operating Expenses | $2,942,416 | $2,774,045 | $2,873,164 | $3,403,617 | 43.5% | $3.63 | |||||||
| Net Operating Income | $4,269,630 | $4,834,587 | $5,187,463 | $4,418,766 | 56.5% | $4.71 | |||||||
| Capital Expenditures | 0 | 0 | 0 | 140,733 | 1.8 | 0.15 | |||||||
| Net Cash Flow | $4,269,630 | $4,834,587 | $5,187,463 | $4,278,033 | 54.7% | $4.56 | |||||||
| NOI DSCR | 1.76x | 1.99x | 2.14x | 1.82x | |||||||||
| NCF DSCR | 1.76x | 1.99x | 2.14x | 1.76x | |||||||||
| NOI DY | 8.7% | 9.9% | 10.6% | 9.0% | |||||||||
| NCF DY | 8.7% | 9.9% | 10.6% | 8.7% |
| (1) | The 2013 financials represent the six-month annualized period ending December 31, 2013 for seven of the WPC Self Storage IX Properties and the trailing 12-month period ending December 31, 2013 for six of the WPC Self Storage IX Properties. |
| (2) | Seven of the WPC Self Storage IX Properties, representing approximately 53.0% of the Allocated Cut-off Date Balance, historically grossed up vacant space. See “Historical Occupancy” section for 2013, 2014 and the trailing 12-month period vacancies. |
| (3) | The most recent financials represent the trailing 12-month period ending August 31, 2015 for one of the WPC Self Storage IX Properties, ending September 30, 2015 for three of the WPC Self Storage IX Properties, and ending October 31, 2015 for nine of the WPC Self Storage IX Properties. |
| (4) | The underwritten economic vacancy is 23.4%. As of dates ranging from October 31, 2015 to January 19, 2016, the WPC Self Storage IX Properties were 83.0% physically occupied. |
Appraisal. As of the appraisal valuation dates ranging from November 12, 2015 to December 11, 2015, the WPC Self Storage IX Properties had an aggregate “as-is” appraised value of $74,880,000.
Environmental Matters. According to Phase I environmental assessments dated August 28, 2015 through November 23, 2015, there was no evidence of any recognized environmental conditions (“RECs”) at the WPC Self Storage IX Properties. However, there were RECs related to adjoining properties at the CubeSmart - Rankin Road (Houston, TX) property and the CubeSmart - Kissimmee (Kissimmee, FL) property.
According to a Phase I environmental assessment dated October 20, 2015, there was a soil vapor encroachment concern at the CubeSmart - Rankin Road (Houston, TX) property related to an adjoining property that conducted on-site dry cleaning. Due to the REC being related to the adjoining property and not the CubeSmart - Rankin Road (Houston, TX) property, no further action was required.
According to a Phase I environmental assessment dated September 17, 2015, there was a soil vapor encroachment concern at the CubeSmart - Kissimmee (Kissimmee, FL) property related to an adjoining property that serves as a vehicle salvage and towing facility. Due to the REC being related to the adjoining property and not the CubeSmart - Kissimmee, FL (Kissimmee, FL) property, no further action was required.
Market Overview and Competition. Six of the WPC Self Storage IX Properties (“El Paso Properties”), representing approximately 38.1% of the Allocated Cut-off Date Balance, are located in El Paso, Texas. El Paso is the largest metro area along the Texas-Mexico border, and as the sixth-largest city in Texas, is ranked 2nd in the Top 25 Foreign Trade Zones. According to the appraisals, over the next 5 years the population of El Paso is expected to grow at 1.2% annually, which compares favorably to the national projection of 0.7% annually. The El Paso Properties’ comparable market vacancy rates ranged from 11.3% to 15.4%, with a weighted average of 13.3%. No other market has more than two of the WPC Self Storage IX Properties or represents more than approximately 14.9% of the Allocated Cut-off Date Balance.
The Borrowers. The borrower structure comprises eight separate Delaware limited liability companies and partnerships, each of which is a single purpose entity with one independent director. Legal counsel to the borrower provided a non-consolidation opinion in connection with the origination of the WPC Self Storage IX Mortgage Loan. Corporate Property Associates 18 – Global Incorporated (“CPA 18”) is the guarantor of certain nonrecourse carveouts under the WPC Self Storage IX Mortgage Loan.
The Sponsor. The sponsor is CPA 18, a non-traded real estate investment trust. CPA 18 is managed by W.P. Carey (NYSE:WPC), an investment management company that provides long-term sale-leaseback and build-to-suit financing for companies worldwide. As of December 31, 2015, W.P. Carey managed a global investment portfolio comprising 869 commercial properties totaling 90.1 million square feet with an average occupancy rate of 98.8%.
Escrows.The loan documents provide for upfront reserves in the amount of $1,090,975 for deferred maintenance. The loan documents do not require monthly escrows for real estate taxes provided the following conditions are met: (i) no event of default
THE INFORMATION IN THIS STRUCTURAL AND COLLATERAL TERM SHEET IS NOT COMPLETE AND MAY BE AMENDED PRIOR TO THE TIME OF SALE. THIS TERM SHEET IS NOT AN OFFER TO SELL THESE SECURITIES AND IT IS NOT A SOLICITATION OF AN OFFER TO BUY THESE SECURITIES IN ANY JURISDICTION WHERE THE OFFER OR SALE IS NOT PERMITTED.
| 38 |
| WPC SELF STORAGE IX |
has occurred and is continuing and (ii) the borrower has provided the lender with timely proof of full payment prior to delinquency. The loan documents do not require monthly escrows for insurance provided the following conditions are met: (i) no event of default has occurred and is continuing; (ii) the WPC Self Storage IX Properties are insured via an acceptable blanket insurance policy; and (iii) the borrower provides the lender with evidence of renewal of the policies and timely proof of payment of the insurance premiums. The loan documents do not require monthly reserves for replacement reserves except upon the occurrence and continuance of an event of default, at which a time the borrower will be required to deposit $14,073 monthly into a replacement reserve escrow.
The WPC Self Storage IX Mortgage Loan is also structured with an amortization reserve account. During an Amortization Deposit Period (as defined below), the borrower is required to make monthly deposits into the amortization reserve account, as outlined in the amortization schedule in the loan agreement. The scheduled payments outlined in the amortization schedule are equivalent to the hypothetical principal payments assuming the WPC Self Storage IX Mortgage Loan had a 30-year amortization period (with the same 4.880%per annuminterest rate).
An “Amortization Deposit Period” is defined as any period on or after January 11, 2021, commencing upon the net cash flow debt yield being less than or equal to 10.5% at the end of any calendar quarter. An Amortization Deposit Period will end when the net cash flow debt yield is equal to or greater than 11.0% for one calendar quarter and any deposits in the amortization reserve account will be held in escrow until the net cash flow debt yield is greater than or equal to 11.0% for two consecutive calendar quarters provided that there is no event of default.
Lockbox and Cash Management.Upon the occurrence of a Cash Trap Event Period (as defined below), the borrower will be required to establish a lender-controlled lockbox account and direct all tenants to deposit all rents directly into such lockbox account. Additionally, all revenues and other monies received by the borrower or property manager relating to the WPC Self Storage IX Properties will be deposited into the lockbox account. During a Cash Trap Event Period, all excess funds on deposit in the lockbox account are swept to a lender-controlled subaccount on a monthly basis.
A “Cash Trap Event Period” will commence upon the earlier of (i) the occurrence and continuance of an event of default; and (ii) the amortizing debt service coverage ratio for the trailing 12-month period falling below 1.15x at the end of any calendar month. A Cash Trap Event Period will expire, with regard to clause (i), upon the cure of such event of default; and with regard to clause (ii), upon the amortizing debt service coverage ratio being equal to or greater than 1.25x for two consecutive calendar quarters.
Property Management.The WPC Self Storage IX Properties are managed by CubeSmart Asset Management, LLC and Extra Space Management, Inc.
Assumption. The borrower has a two-time right to transfer the WPC Self Storage IX Properties in whole, provided that no event of default has occurred and is continuing and certain other conditions are satisfied, including (i) the lender’s reasonable determination that the proposed transferee and guarantor satisfy the lender’s credit review and underwriting standards, taking into consideration transferee experience, financial strength and general business standing; (ii) execution of a recourse guaranty and an environmental indemnity by an affiliate of the transferee; and (iii) if requested by the lender, rating agency confirmation from DBRS, Fitch and Moody’s that the transfer will not result in a downgrade, withdrawal or qualification of the respective ratings assigned to the Series 2016-C33 Certificates.
The borrower also has a two-time right to transfer any individual property (provided that any given property can only be transferred once) along with the allocated loan amount of such a transferred property in the WPC Self Storage IX Mortgage Loan (“Partial Assumption”), provided that no event of default has occurred and is continuing and certain other conditions are satisfied, including (i) the portion of the WPC Self Storage IX Mortgage Loan relating to the transferred property shall no longer be cross-collateralized and/or cross-defaulted with the remaining properties of the WPC Self Storage IX Mortgage Loan; (ii) the loan-to-value ratio of both the property proposed to be transferred and the properties that would be remaining if such transfer occurred must be no greater than 65.0%; (iii) the amortizing debt service coverage ratio of both the property proposed to be transferred and the properties that would be remaining if such transfer occurred must be greater than 1.35x; and clauses (i) through (iii) outlined in the paragraph above.
Partial Release.Following the lockout period, the borrower is permitted to partially release any constituent properties in connection with a partial defeasance, subject to certain conditions including (i) no event of default has occurred and is continuing; (ii) partial defeasance of 125% of the released property’s allocated loan balance; (iii) the loan-to-value with respect to the remaining properties will be no greater than the lesser of 65.4% and the loan-to-value immediately prior to the release; (iv) the amortizing debt service coverage ratio with respect to the remaining properties will be no less than the greater of the debt service coverage ratio at closing and the debt service coverage ratio immediately prior to the release; and (v) the lender receives rating agency confirmation from DBRS, Fitch and Moody’s that the release will not result in a downgrade, withdrawal or qualification of the respective ratings assigned to the Series 2016-C33 Certificates.
Real Estate Substitution.The borrower may obtain a release of any individual WPC Self Storage IX Properties from the lien of the mortgage in connection with a substitution of a different property subject to the satisfaction of certain conditions, including without limitation (i) no event of default has occurred and is continuing; (ii) the substituted property must have a current appraised value equal to or greater than that of the released property, and the loan-to-value of the properties remaining following the substitution must be no greater than the lesser of 65.4% and the loan-to-value immediately prior to the substitution; (iii) the substituted property shall be equal or superior to that of the release property as to physical condition, building use and quality, lease terms favorable to the borrower and market attributes as determined by the lender; (iv) the trailing 12-month amortizing debt service coverage ratio for the properties remaining following the substitution must be no less than the greater of debt service coverage ratio
THE INFORMATION IN THIS STRUCTURAL AND COLLATERAL TERM SHEET IS NOT COMPLETE AND MAY BE AMENDED PRIOR TO THE TIME OF SALE. THIS TERM SHEET IS NOT AN OFFER TO SELL THESE SECURITIES AND IT IS NOT A SOLICITATION OF AN OFFER TO BUY THESE SECURITIES IN ANY JURISDICTION WHERE THE OFFER OR SALE IS NOT PERMITTED.
| 39 |
| WPC SELF STORAGE IX |
at closing and the debt service coverage ratio for the 12 months preceding the substitution; (v) the lender receives a legal opinion that the substitution satisfies REMIC requirements; and (vi) the lender receives rating agency confirmation from DBRS, Fitch and Moody’s that the substitution will not result in a downgrade, withdrawal or qualification of the respective ratings assigned to the Series 2016-C33 Certificates.
Subordinate and Mezzanine Indebtedness.Not permitted.
Ground Lease. None.
Terrorism Insurance. The loan documents require that the “all risk” insurance policy required to be maintained by the borrower provide coverage for terrorism in an amount equal to the full replacement cost of the WPC Self Storage IX Properties, as well as business interruption insurance covering no less than the 18-month period following the occurrence of a casualty event, together with a six-month extended period of indemnity.
Windstorm Insurance.The loan documents require windstorm insurance covering the full replacement cost of the WPC Self Storage IX Properties during the loan term. At the time of closing, the WPC Self Storage Properties had insurance coverage for windstorm.
Earthquake Insurance. The loan documents do not require earthquake insurance. A seismic report was required for the Barbur Storage (Portland, OR) property and indicated a probable maximum loss of 9.0%.
THE INFORMATION IN THIS STRUCTURAL AND COLLATERAL TERM SHEET IS NOT COMPLETE AND MAY BE AMENDED PRIOR TO THE TIME OF SALE. THIS TERM SHEET IS NOT AN OFFER TO SELL THESE SECURITIES AND IT IS NOT A SOLICITATION OF AN OFFER TO BUY THESE SECURITIES IN ANY JURISDICTION WHERE THE OFFER OR SALE IS NOT PERMITTED.
| 40 |
(THIS PAGE INTENTIONALLY LEFT BLANK)
THE INFORMATION IN THIS STRUCTURAL AND COLLATERAL TERM SHEET IS NOT COMPLETE AND MAY BE AMENDED PRIOR TO THE TIME OF SALE. THIS TERM SHEET IS NOT AN OFFER TO SELL THESE SECURITIES AND IT IS NOT A SOLICITATION OF AN OFFER TO BUY THESE SECURITIES IN ANY JURISDICTION WHERE THE OFFER OR SALE IS NOT PERMITTED.
| 41 |
(THIS PAGE INTENTIONALLY LEFT BLANK)
THE INFORMATION IN THIS STRUCTURAL AND COLLATERAL TERM SHEET IS NOT COMPLETE AND MAY BE AMENDED PRIOR TO THE TIME OF SALE. THIS TERM SHEET IS NOT AN OFFER TO SELL THESE SECURITIES AND IT IS NOT A SOLICITATION OF AN OFFER TO BUY THESE SECURITIES IN ANY JURISDICTION WHERE THE OFFER OR SALE IS NOT PERMITTED.
| 42 |
| 225 LIBERTY STREET |

THE INFORMATION IN THIS STRUCTURAL AND COLLATERAL TERM SHEET IS NOT COMPLETE AND MAY BE AMENDED PRIOR TO THE TIME OF SALE. THIS TERM SHEET IS NOT AN OFFER TO SELL THESE SECURITIES AND IT IS NOT A SOLICITATION OF AN OFFER TO BUY THESE SECURITIES IN ANY JURISDICTION WHERE THE OFFER OR SALE IS NOT PERMITTED.
| 43 |
| 225 LIBERTY STREET |
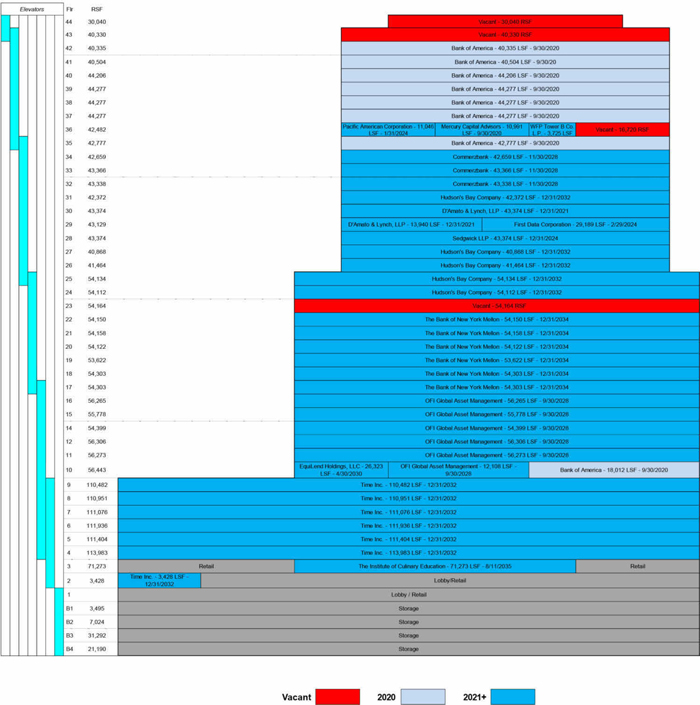
THE INFORMATION IN THIS STRUCTURAL AND COLLATERAL TERM SHEET IS NOT COMPLETE AND MAY BE AMENDED PRIOR TO THE TIME OF SALE. THIS TERM SHEET IS NOT AN OFFER TO SELL THESE SECURITIES AND IT IS NOT A SOLICITATION OF AN OFFER TO BUY THESE SECURITIES IN ANY JURISDICTION WHERE THE OFFER OR SALE IS NOT PERMITTED.
| 44 |
| 225 LIBERTY STREET |
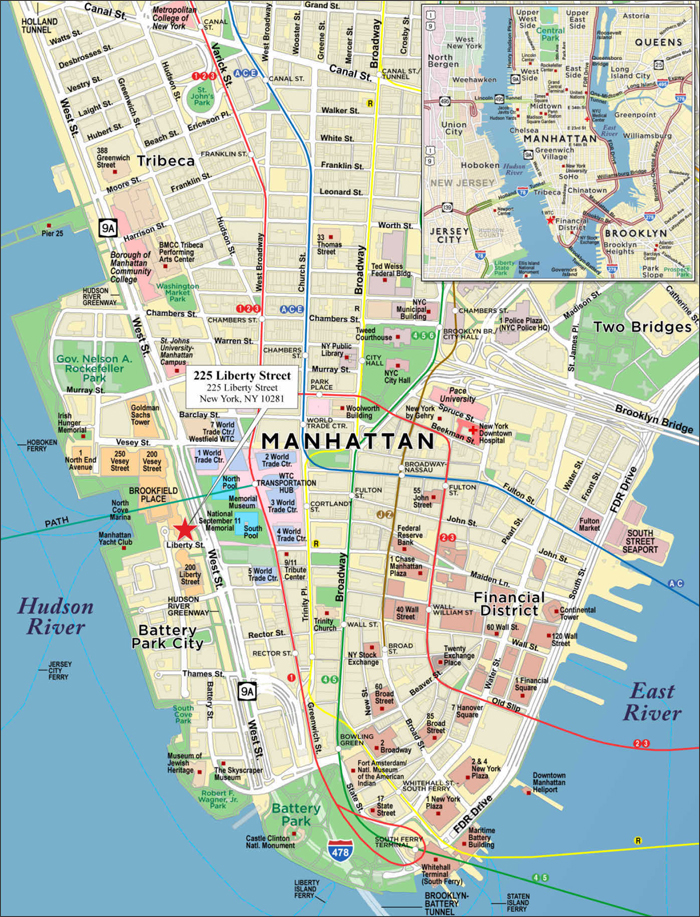
THE INFORMATION IN THIS STRUCTURAL AND COLLATERAL TERM SHEET IS NOT COMPLETE AND MAY BE AMENDED PRIOR TO THE TIME OF SALE. THIS TERM SHEET IS NOT AN OFFER TO SELL THESE SECURITIES AND IT IS NOT A SOLICITATION OF AN OFFER TO BUY THESE SECURITIES IN ANY JURISDICTION WHERE THE OFFER OR SALE IS NOT PERMITTED.
| 45 |
| No. 3 – 225 Liberty Street | |||||||
| Loan Information | Property Information | ||||||
| Mortgage Loan Seller(1): | Wells Fargo Bank, National Association | Single Asset/Portfolio: | Single Asset | ||||
| Credit Assessment (DBRS/Fitch/Moody’s): | AA(low)/AAA/A2 (sca.pd) | Property Type: | Office | ||||
| Original Principal Balance(2): | $40,500,000 | Specific Property Type: | CBD | ||||
| Cut-off Date Balance(2): | $40,500,000 | Location: | New York, NY | ||||
| % of Initial Pool Balance: | 5.7% | Size(2): | 2,427,515 SF | ||||
| Loan Purpose: | Refinance | Cut-off Date Balance Per SF(2): | $189.08 | ||||
| Borrower Name: | WFP Tower B Co. L.P. | Year Built/Renovated: | 1987/2015 | ||||
| Sponsor: | Brookfield Financial Properties, L.P. | Title Vesting: | Leasehold | ||||
| Mortgage Rate: | 4.657% | Property Manager: | Self-managed | ||||
| Note Date: | January 22, 2016 | 4th Most Recent Occupancy(6): | NAV | ||||
| Anticipated Repayment Date: | NAP | 3rd Most Recent Occupancy(6): | NAV | ||||
| Maturity Date: | February 6, 2026 | 2nd Most Recent Occupancy(6): | NAV | ||||
| IO Period: | 120 months | Most Recent Occupancy(6): | NAV | ||||
| Loan Term (Original): | 120 months | Current Occupancy (As of)(6): | 93.5% (1/31/2016) | ||||
| Seasoning: | 1 month | ||||||
| Amortization Term (Original): | NAP | Underwriting and Financial Information: | |||||
| Loan Amortization Type: | Interest-only, Balloon | ||||||
| Interest Accrual Method: | Actual/360 | 4th Most Recent NOI(7): | NAV | ||||
| Call Protection(1): | L(25),D(89),O(6) | 3rd Most Recent NOI(7): | NAV | ||||
| Lockbox Type: | Hard/Springing Cash Management | 2nd Most Recent NOI(7): | NAV | ||||
| Additional Debt(2)(3): | Yes | Most Recent NOI(7): | NAV | ||||
| Additional Debt Type(2)(3): | Pari Passu and junior notes; Future Mezzanine | ||||||
| Escrows and Reserves(4): | U/W Revenues(7): | $132,184,800 | |||||
| U/W Expenses(7): | $58,709,263 | ||||||
| Type: | Initial | Monthly | Cap (If Any) | U/W NOI(2)(7): | $73,475,537 | ||
| Taxes | $0 | Springing | NAP | U/W NCF(2)(7): | $67,846,470 | ||
| Insurance | $0 | Springing | NAP | U/W NOI DSCR(2)(7): | 3.39x | ||
| Replacement Reserve | $0 | Springing | NAP | U/W NCF DSCR(2)(7): | 3.13x | ||
| TI/LC Reserve | $0 | Springing | NAP | U/W NOI Debt Yield(2)(7): | 16.0% | ||
| Unfunded Obligations/Rollover Guaranty(5) | $72,789,685 | $0 | NAP | U/W NCF Debt Yield(2)(7): | 14.8% | ||
| Free Rent Reserve | $80,810,295 | $0 | NAP | As-Is Appraised Value(8): | $1,400,000,000 | ||
| Ground Rent Reserve | $0 | Springing | NAP | As-Is Appraisal Valuation Date(8): | October 20, 2015 | ||
| Cash Collateral Reserve | $0 | Springing | NAP | Cut-off Date LTV Ratio(8): | 32.8% | ||
| Master Retail Lease Funds | $0 | Springing | NAP | LTV Ratio at Maturity or ARD(8): | 32.8% | ||
| (1) | See “The Mortgage Loan” section. |
| (2) | The 225 Liberty Street Whole Loan (as defined below), totaling $900,000,000, is comprised of sixpari passu senior notes with an aggregate balance of $459,000,000 (Notes A-1A, A-1B, A-1C, A-1D, A-1E and A-1F) and three junior notes with an aggregate balance of $441,000,000 (Notes A-2A, A-2B and A-2C). The non-controlling senior Note A-1F had an original balance of $40,500,000, has an outstanding principal balance of $40,500,000 as of the Cut-off Date and will be contributed to the WFCM 2016-C33 Trust. Three of the senior notes with a combined outstanding principal balance of $337,500,000 and the three junior notes with a combined outstanding principal balance of $441,000,000 were contributed to the LBTY 2016-225L transaction. The remaining two non-controlling notes, which had an aggregate original principal balance of $81,000,000, are expected to be contributed to one or more future trusts. All statistical information related to balances per square foot, loan-to-value ratios, debt service coverage ratios and debt yields are based on the six senior notes. The Cut-off Date LTV Ratio, U/W NCF DSCR and U/W NCF DY based on the combined senior notes and junior notes totaling $900,000,000 are 64.3%, 1.60x and 7.5%, respectively. Furthermore, unless otherwise specifically noted, all numerical information, including references to square footage, height, occupancy, leases, net rentable area, appraised value, loan-to-value ratios, underwritten net operating income, underwritten net cash flow or similar terms with respect to the 225 Liberty Street Property (as defined below) or the tenants therein excludes the approximately 220,925 square feet of retail space and associated mechanical and storage space located on multiple lower floors at the 225 Liberty Street Property and the related leases and retail tenants. See “Retail Component” section. |
| (3) | See “Subordinate and Mezzanine Indebtedness” and “Other Indebtedness” sections. |
| (4) | See “Escrows” section. |
| (5) | See “Escrows” section. A guaranty has been provided by Brookfield Financial Properties, L.P. |
| (6) | See “Historical Occupancy” section. |
| (7) | See “Cash Flow Analysis” section. |
| (8) | See “Appraisal” section. The appraiser also concluded to an “as-stabilized” value of $1,650,000,000 based on an “as-stabilized” valuation date of November 1, 2017, which results in an “as-stabilized” Cut-off Date LTV Ratio and LTV Ratio at Maturity or ARD of 27.8% based on the senior debt. |
THE INFORMATION IN THIS STRUCTURAL AND COLLATERAL TERM SHEET IS NOT COMPLETE AND MAY BE AMENDED PRIOR TO THE TIME OF SALE. THIS TERM SHEET IS NOT AN OFFER TO SELL THESE SECURITIES AND IT IS NOT A SOLICITATION OF AN OFFER TO BUY THESE SECURITIES IN ANY JURISDICTION WHERE THE OFFER OR SALE IS NOT PERMITTED.
| 46 |
| 225 LIBERTY STREET |
The Mortgage Loan.The mortgage loan (the “225 Liberty Street Mortgage Loan”) is part of a whole loan (the “225 Liberty Street Whole Loan”) evidenced by sixpari passu senior promissory notes (Notes A-1A through A-1F) and three junior notes (Notes A-2A through A-2C) secured by the leasehold interest in an office building located in New York, New York (the “225 Liberty Street Property”). The 225 Liberty Street Whole Loan was co-originated on January 22, 2016 by Wells Fargo Bank, National Association, Citigroup Global Markets Realty Corp. (“CGMRC”) and German American Capital Corporation (“GACC”). The 225 Liberty Street Whole Loan had an original principal balance of $900,000,000, has an outstanding principal balance as of the Cut-off Date of $900,000,000 and accrues interest at an interest rate of 4.657%per annum. The 225 Liberty Street Whole Loan had an initial term of 120 months, has a remaining term of 119 months as of the Cut-off Date and requires interest-only payments through the term of the 225 Liberty Street Whole Loan. The 225 Liberty Street Whole Loan matures on February 6, 2026. See “Description of the Mortgage Pool—The Whole Loans—The Non-Serviced Whole Loan — The 225 Liberty Street Whole Loan” and “Pooling and Servicing Agreement — Servicing of the Non-Serviced Mortgage Loan” in the Preliminary Prospectus.
The 225 Liberty Street Mortgage Loan, evidenced by Note A-1F, which will be contributed to the WFCM 2016-C33 Trust, had an original principal balance of $40,500,000, has an outstanding principal balance as of the Cut-off Date of $40,500,000, representing a seniorpari passunon-controlling interest in the 225 Liberty Street Whole Loan. Three of the seniorpari passunotes (Notes A-1A, A-1B and A-1C) and all of the junior notes, which were contributed to the LBTY 2016-225L Trust, had an original aggregate principal balance of $778,500,000, representing the controlling interest in the 225 Liberty Street Whole Loan. The remaining seniorpari passunon-controlling notes, which had an aggregate original principal balance of $81,000,000, are expected to be contributed to future trusts. The lender provides no assurances that any non-securitized notes will not be split further.
Note Summary
| Notes | Original Balance | Note Holder | Controlling Interest | |
| A-1F | $40,500,000 | WFCM 2016-C33 | No | |
| A-1A, A-1B, A-1C(1) | $337,500,000 | LBTY 2016-225L | Yes(2) | |
| A-2A, A-2B, A-2C(1) | $441,000,000 | LBTY 2016-225L | Yes(2) | |
| A-1D | $40,500,000 | CGMRC | No | |
| A-1E | $40,500,000 | GACC | No | |
| Total | $900,000,000 |
| (1) | Contributed to the LBTY 2016-225L Trust. The notes were originally held by CGMRC, GACC and Wells Fargo Bank, N.A. |
| (2) | The 225 Liberty Street Whole Loan is serviced and administered according to the LBTY 2016-225L Trust and Servicing Agreement. |
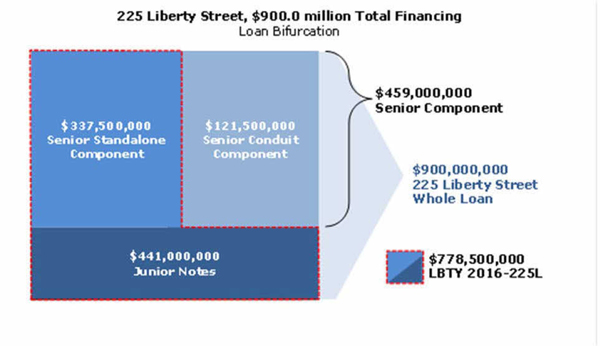
THE INFORMATION IN THIS STRUCTURAL AND COLLATERAL TERM SHEET IS NOT COMPLETE AND MAY BE AMENDED PRIOR TO THE TIME OF SALE. THIS TERM SHEET IS NOT AN OFFER TO SELL THESE SECURITIES AND IT IS NOT A SOLICITATION OF AN OFFER TO BUY THESE SECURITIES IN ANY JURISDICTION WHERE THE OFFER OR SALE IS NOT PERMITTED.
| 47 |
| 225 LIBERTY STREET |
Following the lockout period, the borrower has the right to defease the 225 Liberty Street Whole Loan in whole, but not in part, on any date before September 6, 2025. In addition, the 225 Liberty Street Whole Loan is prepayable without penalty on or after September 6, 2025. The lockout period will expire on the earlier to occur of (i) two years after the closing date of the securitization that includes the last note to be securitized and (ii) January 22, 2019.
Sources and Uses
| Sources | Uses | |||||||
| Original Whole Loan amount | $900,000,000 | 100.0% | Loan payoff(1) | $801,958,400 | 89.1% | |||
| Reserves(2) | 80,810,295 | 9.0 | ||||||
| Closing costs | 5,548,715 | 0.6 | ||||||
| Return of equity | 11,682,590 | 1.3 | ||||||
| Total Sources | $900,000,000 | 100.0% | Total Uses | $900,000,000 | 100.0% |
| (1) | Approximately $802.0 million, including accrued interest, was used to repay an existing bank loan with an outstanding principal balance of approximately $802.0 million encumbering both the 225 Liberty Street Property and the Retail Component (as defined below). Simultaneous with the repayment, the Retail Component, along with the retail components of 200 Vesey Street and 250 Vesey Street (both part of the Brookfield Place Complex, as defined below), were financed separately through a $325.0 million bank loan, which was effectuated as a loan amendment to the existing facility. |
| (2) | Brookfield Financial Properties, L.P. executed a guaranty for approximately $72.8 million of outstanding tenant improvements and the borrower funded a cash reserve of approximately $80.8 million for free rent. See “Escrow” section. |
The Property.The 225 Liberty Street Property consists of the leasehold interest in a 44-story, class A office tower totaling approximately 2.4 million square foot located in the Brookfield Place Complex (as defined below) along the Hudson River in Lower Manhattan. The 225 Liberty Street Property is the largest of four office towers within Brookfield Place Complex (formerly known as the World Financial Center). The Brookfield Place Complex is a mixed-use complex featuring approximately 7.1 million aggregate square feet of office space and approximately 340,000 aggregate square feet of retail space along with extensive public spaces (the “Brookfield Place Complex”). Formerly known as Two World Financial Center, the 225 Liberty Street Property, designed by renowned architect Cesar Pelli, was completed in 1987, and is the domed shape tower that includes the Winter Garden and is adjacent to West Street.
The office space in the 225 Liberty Street Property was 100.0% net leased to a subsidiary of Merrill Lynch since the 225 Liberty Street Property’s delivery in 1987 through September 30, 2013. Subsequent to Merrill Lynch’s subsidiary’s lease expiration (following its acquisition by Bank of America) and concurrent with a $210.9 million retail redevelopment at the Brookfield Place Complex, the 225 Liberty Street Property underwent a $71.6 million (as of January 15, 2016) renovation which included a new façade, elevator modernizations, fire alarm and building management systems upgrades, and two new lobbies. Over the last three years, the borrower has executed approximately 1.9 million square feet (79.9% of net rentable area (“NRA”)) of new office and storage leases, in addition to a 330,755 square foot (13.6% of NRA) lease renewal with Bank of America.
The 225 Liberty Street Property includes a diverse roster of office tenants and serves as the new global or United States headquarters for Time Inc. (27.7% of NRA; Moody’s (“M”)/S&P (“S”): Ba3/BB), Bank of New York Mellon (13.4% of NRA; M/Fitch (“F”)/S: A1/AA-/A), and Hudson’s Bay Company (9.6% of NRA; M/S: B1/B+), as well as the only United States office for Commerzbank (5.3% of NRA; M/F/S: A2/BBB/BBB+). Other office tenants at the 225 Liberty Street Property include Bank of America (13.1% of NRA; M/F/S: Baa1/A/BBB+), OFI Global Asset Management (12.0% of NRA), The Institute of Culinary Education (2.9% of NRA), and D’Amato & Lynch, LLP (2.4% of NRA). The 225 Liberty Street Property is currently 93.5% leased (94.0% excluding office storage space) to 13 office tenants. All office leases were executed with a weighted average in-place contractual rent of $55.79 per square foot, gross ($56.34 per square foot, gross, excluding office storage). The office portion of the 225 Liberty Street Property has a weighted average original lease term of 15.6 years, with a weighted average remaining lease term of 14.1 years. There is no rollover of office tenants at the 225 Liberty Street Property until 2020, with only 19.9% of total NRA scheduled to roll during the 225 Liberty Street Whole Loan term. Approximately 49.8% of the total vacant office space at the 225 Liberty Street Property is concentrated on the top two floors (2.9% of NRA), which offers 30,000 to 40,000 square foot flexible open floor plates, direct access to a private terrace on all four sides of the building, an optional interior staircase, and unobstructed Lower Manhattan and Hudson River views.
The 225 Liberty Street Whole Loan is secured by the borrower’s leasehold interest in the 225 Liberty Street Property pursuant to a long term ground lease with the Battery Park City Authority (“BPCA”) expiring in June 2069, with an annual base rental payment of $5.1 million, and no scheduled increases through maturity, subject to certain conditions. See “Ground Lease” section.
Retail Component / Master Lease.Unless otherwise specified herein, all numerical information with respect to the 225 Liberty Street Property or the tenants therein excludes the approximately 220,925 square feet of retail space and associated mechanical and storage space located on multiple lower floors at the 225 Liberty Street Property (collectively, the “Retail Component”) and the related leases and retail tenants. Although the borrower’s interest in the Retail Component constitutes collateral for the 225 Liberty Street Whole Loan, the Retail Component is excluded because: (i) the Retail Component has been leased to an affiliate of the sponsor, WFP Retail Co. L.P. (the “Retail Master Tenant”, as further described below) on a long-term basis at a rent of $1/year pursuant to the Second Amended and Restated Tower B Retail Lease dated as of January 22, 2016 by and between the borrower and Retail Master Tenant (the “Master Retail Lease”, as further described below), (ii) the subleasehold interest of the Retail Master Tenant in the Retail Component does not constitute collateral for the 225 Liberty Street Whole Loan and (iii) the Retail Component has not been taken into account in the underwriting or appraised value of the 225 Liberty Street Property.
The Retail Component is subject to the Master Retail Lease between the Retail Master Tenant and the borrower, WFP Tower B Co. L.P. (“Master Landlord”) that expires on June 16, 2069, one day before the Ground Lease. Both the Retail Master Tenant and the Master Landlord are currently Brookfield entities. The Retail Master Tenant is responsible for payment of $1 in annual rent to the Master Landlord, in addition to (i) its pro rata share of certain building expenses, (ii) the Retail Master Tenant Payment in lieu of
THE INFORMATION IN THIS STRUCTURAL AND COLLATERAL TERM SHEET IS NOT COMPLETE AND MAY BE AMENDED PRIOR TO THE TIME OF SALE. THIS TERM SHEET IS NOT AN OFFER TO SELL THESE SECURITIES AND IT IS NOT A SOLICITATION OF AN OFFER TO BUY THESE SECURITIES IN ANY JURISDICTION WHERE THE OFFER OR SALE IS NOT PERMITTED.
| 48 |
| 225 LIBERTY STREET |
Taxes (“PILOT”) payments, (iii) the retail rent payable to the BPCA, as Ground Lessor, and (iv) any other rent and payments applicable to the Retail Component for certain utilities or services.
The following table presents certain information relating to the tenancy at the 225 Liberty Street Property:
Major Tenants
| Tenant Name | Credit Rating (Fitch/Moody’s/S&P)(1) | Tenant NRSF(2) | % of NRSF(2) | Annual U/W Base Rent PSF(2) | Annual U/W Base Rent | % of Total Annual U/W Base Rent | Lease Expiration Date |
| Major Tenants | |||||||
| Time Inc. | NR/Ba3/BB | 673,260 | 27.7% | $50.24(3) | $33,826,516 | 26.8% | 12/31/2032(4)(5) |
| Bank of America | A/Baa1/BBB+ | 318,665 | 13.1% | $61.93 | $19,736,443 | 15.6% | 9/30/2020(6) |
| Hudson’s Bay Company(7) | NR/B1/B+ | 232,950 | 9.6% | $80.30(7) | $18,705,885(7) | 14.8% | 12/31/2032(8) |
| The Bank of New York Mellon | AA-/A1/A | 324,658 | 13.4% | $54.00(9) | $17,531,532(9) | 13.9% | 12/31/2034(10)(11) |
| OFI Global Asset Management | NR/NR/NR | 291,129 | 12.0% | $54.46 | $15,854,531 | 12.5% | 9/30/2028(12) |
| Commerzbank | BBB/A2/BBB+ | 129,363 | 5.3% | $50.15 | $6,487,554 | 5.1% | 11/30/2028(13) |
| Total Major Tenants | 1,970,025 | 81.2% | $56.92 | $112,142,461 | 88.7% | ||
| Non-Major Office Tenants | 253,235(14) | 10.4% | $50.95(14) | $12,901,653 | 10.2% | ||
| Occupied Office Total | 2,223,260(15) | 91.6% | $56.24(15) | $125,044,114 | 98.9% | ||
| Occupied Storage Tenants | 46,115 | 1.9% | $29.46 | $1,358,477 | 1.1% | ||
| Occupied Total | 2,269,375(16) | 93.5% | $55.70(16) | $126,402,591 | 100.0% | ||
| Vacant Office Space | 141,254 | 5.8% | |||||
| Vacant Storage Space | 16,886 | 0.7% | |||||
| Vacant Space Total | 158,140 | 6.5% | |||||
| Collateral Total | 2,427,515 | 100.0% | |||||
| (1) | Certain ratings are those of the parent company whether or not the parent guarantees the lease. |
| (2) | Major Tenant square footages exclude office storage space. |
| (3) | Time Inc. receives free rent through December 2017; all remaining free rent following the origination date was reserved upfront. |
| (4) | Time Inc. has a one-time contraction option on their then highest floor, currently the ninth floor totaling approximately 110,482 square feet (4.6% of NRA), on December 31, 2027 provided (i) the tenant has not leased any other space in the 225 Liberty Street Property on or after February 11, 2021, (ii) 18-months’ notice is given and (iii) payment of a contraction fee equal to five months of then-current base rent plus all unamortized tenant improvements and leasing commissions for the contraction space. |
| (5) | Time Inc. has two, five-year lease renewal options. |
| (6) | Bank of America has four lease renewal options, of either five or ten years, subject to certain conditions. |
| (7) | Hudson’s Bay Company is not yet in occupancy or paying rent. Hudson’s Bay Company is in possession of its space and expected to take occupancy in August 2016 after completion of their buildout and will receive free rent through October 2016; all remaining free rent following the origination date was reserved upfront. |
| (8) | Hudson’s Bay Company has two lease renewal options: the first for 13 years and the second for ten years. |
| (9) | The Bank of New York Mellon will receive eight months of free rent in total from October 2025 through January 2026 and October 2030 through January 2031. See “Cash Flow Analysis” section. |
| (10) | The Bank of New York Mellon has a two-time contraction option on either their lowest or highest floor, currently the 17th or 22nd floors, respectively, each totaling approximately 54,000 square feet (2.2% of NRA), on January 1, 2025 or January 1, 2030, provided (i) the tenant has not exercised either of its expansion options, (ii) 18-months’ notice is given and (iii) payment of a contraction fee equal to six months of then-current base rent plus all unamortized tenant improvements and leasing commissions for the contraction space. |
| (11) | The Bank of New York Mellon has three lease renewal options: the first for 10 years and the second and third for five years each. |
| (12) | OFI Global Asset Management has two, five-year lease renewal options. |
| (13) | Commerzbank has renewal options which may be exercised as either one, ten-year lease renewal option or two, five-year lease renewal options. |
| (14) | Includes the 3,725 square foot management office, for which no rent was attributed. Annual U/W Base Rent PSF excluding this space is $51.71 per square foot. |
| (15) | Includes the 3,725 square foot management office, for which no rent was attributed. Annual U/W Base Rent PSF excluding this space is $56.34 per square foot. |
| (16) | Includes the 3,725 square foot management office, for which no rent was attributed. Annual U/W Base Rent PSF excluding this space is $55.79 per square foot. |
THE INFORMATION IN THIS STRUCTURAL AND COLLATERAL TERM SHEET IS NOT COMPLETE AND MAY BE AMENDED PRIOR TO THE TIME OF SALE. THIS TERM SHEET IS NOT AN OFFER TO SELL THESE SECURITIES AND IT IS NOT A SOLICITATION OF AN OFFER TO BUY THESE SECURITIES IN ANY JURISDICTION WHERE THE OFFER OR SALE IS NOT PERMITTED.
| 49 |
| 225 LIBERTY STREET |
The following table presents certain information relating to the lease rollover schedule at the 225 Liberty Street Property:
Lease Expiration Schedule(1)(2)
| Year Ending December 31, | No. of Leases Expiring | Expiring NRSF | % of Total NRSF | Cumulative Expiring NRSF | Cumulative % of Total NRSF | Annual U/W Base Rent | % of Total Annual U/W Base Rent | Annual U/W Base Rent PSF(3) |
| MTM | 0 | 0 | 0.0% | 0 | 0.0% | $0 | 0.0% | $0.00 |
| 2016 | 0 | 0 | 0.0% | 0 | 0.0% | $0 | 0.0% | $0.00 |
| 2017 | 0 | 0 | 0.0% | 0 | 0.0% | $0 | 0.0% | $0.00 |
| 2018 | 1 | 3,725 | 0.2% | 3,725 | 0.2% | $0 | 0.0% | $0.00 |
| 2019 | 0 | 0 | 0.0% | 3,725 | 0.2% | $0 | 0.0% | $0.00 |
| 2020 | 2 | 341,746 | 14.1% | 345,471 | 14.2% | $20,725,631 | 16.4% | $60.65 |
| 2021 | 1 | 57,314 | 2.4% | 402,785 | 16.6% | $2,751,072 | 2.2% | $48.00 |
| 2022 | 0 | 0 | 0.0% | 402,785 | 16.6% | $0 | 0.0% | $0.00 |
| 2023 | 0 | 0 | 0.0% | 402,785 | 16.6% | $0 | 0.0% | $0.00 |
| 2024 | 3 | 83,609 | 3.4% | 486,394 | 20.0% | $4,742,889 | 3.8% | $56.73 |
| 2025 | 0 | 0 | 0.0% | 486,394 | 20.0% | $0 | 0.0% | $0.00 |
| 2026 | 0 | 0 | 0.0% | 486,394 | 20.0% | $0 | 0.0% | $0.00 |
| Thereafter(4) | 7 | 1,782,981 | 73.4% | 2,269,375 | 93.5% | $98,182,999 | 77.7% | $55.07(4) |
| Vacant | 0 | 158,140 | 6.5% | 2,427,515 | 100.0% | $0 | 0.0% | $0.00 |
| Total/Weighted Average(5) | 14 | 2,427,515 | 100.0% | $126,402,591 | 100.0% | $55.70(5) |
| (1) | Information obtained from the underwritten rent roll. |
| (2) | Certain tenants may have lease termination or contraction options that are exercisable prior to the originally stated expiration date of the subject lease and that are not considered in the Lease Expiration Schedule. |
| (3) | Weighted Average Annual U/W Base Rent PSF excludes vacant space. |
| (4) | Includes the 3,725 square foot management office, for which no rent was attributed. Annual U/W Base Rent PSF excluding this space is $55.18 per square foot. |
| (5) | Includes the 3,725 square foot management office, for which no rent was attributed. Annual U/W Base Rent PSF excluding this space is $55.79 per square foot. |
The following table presents historical occupancy percentages at the 225 Liberty Street Property:
Historical Occupancy
12/31/2012(1) | 12/31/2013(1) | 12/31/2014(1) | 12/31/2015(1) | 1/31/2016(2)(3) | ||||
| NAV | NAV | NAV | NAV | 93.5% |
| (1) | The office space in the 225 Liberty Street Property was 100.0% leased to a subsidiary of Merrill Lynch since the 225 Liberty Street Property’s delivery in 1987 through September 30, 2013. Subsequent to Merrill Lynch’s subsidiary’s lease expiration (following its acquisition by Bank of America), the 225 Liberty Street Property underwent a $71.6 million (as of January 15, 2016) redevelopment which included a new façade, elevator modernizations, fire alarm and building management systems upgrades, and two new lobbies. The borrower has executed approximately 1.9 million square feet (79.9% of NRA) of office and storage leases, in addition to a 330,755 square foot (13.6% of NRA) lease renewal with Bank of America. Leases for 100.0% of the occupied NRA were signed over the last three years, thus historical occupancy information is neither available nor reflective of current operations at the 225 Liberty Street Property. |
| (2) | Information obtained from the underwritten rent roll. |
| (3) | As of January 31, 2016, the 225 Liberty Street Property was 93.5% leased; Hudson’s Bay Company is expected to take occupancy in August 2016 (9.6% of NRA). |
THE INFORMATION IN THIS STRUCTURAL AND COLLATERAL TERM SHEET IS NOT COMPLETE AND MAY BE AMENDED PRIOR TO THE TIME OF SALE. THIS TERM SHEET IS NOT AN OFFER TO SELL THESE SECURITIES AND IT IS NOT A SOLICITATION OF AN OFFER TO BUY THESE SECURITIES IN ANY JURISDICTION WHERE THE OFFER OR SALE IS NOT PERMITTED.
| 50 |
| 225 LIBERTY STREET |
Operating History and Underwritten Net Cash Flow. The following table presents certain information relating to the historical operating performance and the underwritten net cash flow at the 225 Liberty Street Property:
Cash Flow Analysis(1)
| Appraiser YE 2016(2) | Borrower Year 1 Budget | Adjusted Borrower Year 1 Budget(3) | U/W | % of U/W Effective Gross Income | U/W $ per SF | ||||||||
| Base Rent | $130,936,804 | $136,898,954 | $126,402,592 | $126,402,591 | 95.6% | $52.07 | |||||||
| Rent Abatements | (4,447,643) | (58,916,625) | 0 | 0 | 0.0 | 0.00 | |||||||
| Straight Line Rents | 0 | 0 | 0 | $4,048,337(4) | 3.1 | 1.67 | |||||||
| Grossed Up Vacant Space | 0 | 0 | 0 | 10,069,980 | 7.6 | 4.15 | |||||||
| Total Reimbursables | 1,701,552 | 1,878,448 | 1,379,899 | 1,373,956 | 1.0 | 0.57 | |||||||
| Other Income(3) | 312,153 | 359,917 | 359,917 | 359,917 | 0.3 | 0.15 | |||||||
| Less Vacancy & Credit Loss | (1,285,030) | (1,632,840) | 0 | (10,069,980)(5) | (7.6) | (4.15) | |||||||
| Effective Gross Income | $127,217,836 | $78,587,854 | $128,142,408 | $132,184,800 | 100.0% | $54.45 | |||||||
| Total Operating Expenses | $56,219,376 | $60,513,232 | $60,275,336 | $58,709,263(6) | 44.4% | $24.18 | |||||||
| Net Operating Income | $70,998,460 | $18,074,622 | $67,867,072 | $73,475,537 | 55.6% | $30.27 | |||||||
| TI/LC | 0 | 0 | 0 | 5,143,565 | 3.9 | 2.12 | |||||||
| Capital Expenditures | 0 | 0 | 0 | 485,503 | 0.4 | 0.20 | |||||||
| Net Cash Flow | $70,998,460 | $18,074,622 | $67,867,072 | $67,846,470 | 51.3% | $27.95 | |||||||
| NOI DSCR(7) | 3.28x | 0.83x | 3.13x | 3.39x | |||||||||
| NCF DSCR(7) | 3.28x | 0.83x | 3.13x | 3.13x | |||||||||
| NOI DY(7) | 15.5% | 3.9% | 14.8% | 16.0% | |||||||||
| NCF DY(7) | 15.5% | 3.9% | 14.8% | 14.8% | |||||||||
| (1) | The office space in the 225 Liberty Street Property was 100.0% leased to a subsidiary of Merrill Lynch since the 225 Liberty Street Property’s delivery in 1987 through September 30, 2013. Subsequent to Merrill Lynch’s subsidiary’s lease expiration (following its acquisition by Bank of America), the 225 Liberty Street Property underwent a $71.6 million (as of January 15, 2016) renovation which included a new façade, elevator modernizations, fire alarm and building management systems upgrades, and two new lobbies. The borrower has executed approximately 1.9 million square feet (79.9% of NRA) of office and storage leases, in addition to a 330,755 square foot (13.6% of NRA) lease renewal with Bank of America. Leases for 100.0% of the occupied NRA were signed over the last three years, thus historical financial information is neither available nor reflective of current operations at the 225 Liberty Street Property. |
| (2) | Rent abatements for existing leases have been removed from the appraisal cash flow to reflect the upfront reserve and guaranty structure of the 225 Liberty Whole Loan. |
| (3) | The following adjustments have been made to the borrower’s budget: (i) speculative leasing has been removed; (ii) non-recurring repairs & maintenance expenses have been removed; and (iii) rent abatements have been excluded. |
| (4) | Straight Line Rents includes the present value of contractual rent steps (for the shorter of the lease term or 225 Liberty Whole Loan term) for investment-grade rated tenants including The Bank of New York Mellon ($1,857,597, which factors in its four-month free rent period in 2025), Bank of America ($1,312,822), and Commerzbank ($877,920). |
| (5) | The underwritten economic vacancy is 7.4%. As of January 31, 2016, the 225 Liberty Street Property was 93.5% leased and 83.9% physically occupied;Hudson’s Bay Company (9.6% of NRA) is in possession of its space and is expected to take occupancy in August 2016. |
| (6) | The 225 Liberty Street Property benefits from PILOT program with the BPCA. Pursuant to the Ground Lease (as defined below), the borrower is obligated to make PILOT payments to the BPCA, as the 225 Liberty Street Property is not subject to real estate taxes by reason of its ownership by the BPCA. PILOT payments are based on the assessed values provided by the City of New York to the BPCA, and are therefore equivalent to real estate taxes provided by the City of New York. There is no economic benefit to having the PILOT since the taxes are the same as if the City of New York were taxing the 225 Liberty Street Property. See “Payment in Lieu of Taxes” section. |
| (7) | Based on the sixpari-passu senior notes totaling $459,000,000. |
Appraisal. As of the appraisal valuation date of October 20, 2015, the 225 Liberty Street Property had an “as-is” appraised value of $1,400,000,000. The appraiser also concluded to an “as-stabilized” value of $1,650,000,000 with an “as-stabilized” valuation date of November 1, 2017 assuming the vacant office and storage space have been leased at market rents and excluding the cost of certain tenant improvements and leasing commissions.
Environmental Matters. According to a Phase I environmental site assessment dated October 26, 2015, there was no evidence of any recognized environmental conditions at the 225 Liberty Street Property.
Market Overview and Competition.The 225 Liberty Street Property is situated within the broader mixed-use Brookfield Place Complex, which is comprised of four office buildings with a total of approximately 7.1 million square feet. In addition to the class A office space, the lower levels of the Brookfield Place Complex are comprised of approximately 340,000 square feet of newly-delivered high-end retail space. The Brookfield Place Complex, formerly known as the World Financial Center, is a 7.5 million square foot office and retail complex in Battery Park City in Lower Manhattan. Brookfield or its affiliates own the entire leasehold estate in Brookfield Place Complex except for 200 Vesey Street, which is owned by a tenancy-in-common between a Brookfield affiliate and American Express (“AmEx”) or one of its affiliates. The related tenancy-in-common agreement currently provides that the use of certain floors within 200 Vesey Street are exclusive to a co-tenant. AmEx uses space it owns and leases in 200 Vesey Street as its global headquarters. The office portions of the Brookfield Place Complex are currently 95.7% occupied, with all four towers exhibiting an occupancy of 93.5% or greater. As is the case with the 225 Liberty Street Property, the other towers in the Brookfield Place Complex serve a strategic purpose for a number of corporate tenants including AmEx, Bank of America, Jones Day, RBC, Cadwalader, Wickersham & Taft LLP, and Dow Jones. In addition to the class A office space, the lower levels of the Brookfield Place Complex include approximately 340,000 square feet of newly delivered retail space, which was opened to the public in second quarter of 2015 and is presently 88.6% occupied (98.6% occupied for the approximately 192,000 square feet in 225 Liberty Street) by a diverse
THE INFORMATION IN THIS STRUCTURAL AND COLLATERAL TERM SHEET IS NOT COMPLETE AND MAY BE AMENDED PRIOR TO THE TIME OF SALE. THIS TERM SHEET IS NOT AN OFFER TO SELL THESE SECURITIES AND IT IS NOT A SOLICITATION OF AN OFFER TO BUY THESE SECURITIES IN ANY JURISDICTION WHERE THE OFFER OR SALE IS NOT PERMITTED.
| 51 |
| 225 LIBERTY STREET |
offering of dining and retail tenants. The retail space at the Brookfield Place Complex will be anchored by an approximate 86,000-square-foot Saks Fifth Avenue store which is expected to open in second quarter 2016.
The 225 Liberty Street Property is well located for transportation offerings, located immediately adjacent to the World Financial Center Ferry Terminal, and is expected to have direct connections to the Fulton Street Transit Center and the soon-to-be-completed World Trade Center Transit Hub.
According to the appraisal, Downtown Manhattan has evolved into a desirable destination for corporate office tenants, with a growing/affluent residential population, an increasingly diversified amenity base, and lower office rents than those available in comparable Midtown properties. From 2000 to 2014, approximately 17,954 new residential units were added to the Downtown Manhattan market increasing the population from 24,000 in 2001 to an estimated 61,000 in 2016. Further, several retail developments in Lower Manhattan are in various stages of completion, including, among others, the 340,000 square feet of newly delivered class A space at the Brookfield Place Complex, the 350,000 square feet of class A space that is expected to be completed in 2016 at the World Trade Center complex, and the to-be-built Pier 17 development, which is expected to add an additional 365,000 square feet of retail space at the South Street Seaport.
Even with its recent growth, Downtown office space continues to be attractively priced relative to the Midtown and Midtown South submarkets. While the fourth quarter 2015 average asking rents in Midtown and Midtown South were $79.60 per square foot and $70.89 per square foot, gross, respectively, Downtown office space averaged $60.71 per square foot, gross, according to a third party market research report. As the submarket has evolved, an increasing number of corporate tenants have re-located their headquarters from other areas of Manhattan to Downtown Manhattan, including Time Inc., Citigroup, Harper Collins, and Condé Nast. Additionally, the mix of tenants has also evolved to include a broader range of industries. Lower Manhattan leasing activity in 2015 was highlighted by the continuing rise of two sectors in Lower Manhattan: coworking and the technology, advertising, media and information (“TAMI”) industries. Together, they accounted for approximately 48.0% percent of all new Lower Manhattan office leasing activity, with TAMI tenants making up approximately 26.0%.
According to the appraiser, Downtown Manhattan’s office inventory of 87.8 million square feet is geographically segmented into five major submarkets: City Hall, World Trade Center, Financial East, Financial West and Insurance. Approximately 60.0% of Downtown’s inventory is class A space, the majority of which is located in the Financial East submarket. As of fourth quarter 2015, the Downtown class A submarket exhibited a vacancy rate of 10.7% and a rental rate of $63.95 per square foot, gross. The 225 Liberty Street Property is located within the World Trade Center office submarket (formerly known as World Trade/World Financial), which rests in the western portion of Downtown Manhattan, bordering the Hudson River to the west, the Insurance submarket to the east, Financial West to its south and City Hall to its north. The World Trade Center office submarket comprises 21.1 million square feet, 17.4 million of which is class A space. The class A space in this submarket is predominately comprised of the Brookfield Place Complex and the new World Trade Center complex, which together represent approximately 83.0% of the total submarket square footage. With the completions of Two World Trade Center and Three World Trade Center (both currently under construction), an additional 5.3 million square feet will be added to the submarket. This is largely offset by the recent trend of conversion of pre-war office buildings to residential buildings. According to a New York industry group, 10.0 million square feet of office space has been converted to residential or hotel use since 2004, and another 5.1 million square feet of space is in the potential conversion pipeline.
The World Trade Center submarket achieves the highest asking rents of any Downtown submarket, with an average Class A rental rate of $71.33 per square foot. Although the reported fourth quarter 2015 World Trade Center submarket Class A vacancy was 14.9%, this is largely driven by the newly delivered One and Four World Trade Center properties, which comprise approximately 28.8% of the total submarket square footage. The 225 Liberty Street Property is located within the four-building Brookfield Place Complex, which presently has an occupancy rate of 95.4%.
THE INFORMATION IN THIS STRUCTURAL AND COLLATERAL TERM SHEET IS NOT COMPLETE AND MAY BE AMENDED PRIOR TO THE TIME OF SALE. THIS TERM SHEET IS NOT AN OFFER TO SELL THESE SECURITIES AND IT IS NOT A SOLICITATION OF AN OFFER TO BUY THESE SECURITIES IN ANY JURISDICTION WHERE THE OFFER OR SALE IS NOT PERMITTED.
| 52 |
| 225 LIBERTY STREET |
The following table presents certain information relating to comparable office properties to the 225 Liberty Street Property:
Comparable Leases(1)
| Property Name/Location | Year Built/ Renovated | Stories | Total GLA (SF) | Total Occupancy | Distance from Subject | Tenant Name | Lease Date/Term | Lease Area (SF) | Annual Base Rent PSF | Lease Type |
One Liberty Plaza New York, NY
| 1972/2007 | 54 | 2,126,437 | 84% | 0.4 miles | Cambridge University Press | October 2015 / 16 Yrs | 44,556 | $51.00 | FSG |
250 Vesey Street New York, NY
| 1985/NAP | 34 | 1,600,000 | 96% | 0.2 miles | SunEdison | September 2015 / 6.5 Yrs | 6,929 | $64.00 | FSG |
300 Vesey Street New York, NY
| 1997/NAP | 15 | 507,711 | 73% | 0.2 miles | KCG Holdings (Knight Capital) | July 2015 / 15 Yrs | 169,000 | $70.00 | FSG |
255 Greenwich Street New York, NY
| 1987/NAP | 14 | 532,000 | 97% | 0.3 miles | Icahn School of Medicine | July 2015 / 16 Yrs | 14,607 | $60.00 | FSG |
200 Vesey Street New York, NY
| 1985/NAP | 51 | 2,300,000 | 96% | 0.2 miles | Bliss | March 2015 / 10.5 Yrs | 15,907 | $55.00 | FSG |
200 Liberty Street New York, NY | 1985/NAP | 40 | 1,711,365 | 100% | 0.1 miles | Santander Bank | January 2015 / 10 Yrs | 42,128 | $54.00 | FSG |
| (1) | Information obtained from the appraisal. |
The Borrower.The borrower is WFP Tower B Co. L.P., a New York Limited Partnership and single purpose entity with two independent directors. Legal counsel to the borrowers delivered a non-consolidation opinion in connection with the origination of the 225 Liberty Street Whole Loan. Brookfield Financial Properties, L.P. is the guarantor of certain nonrecourse carveouts under the 225 Liberty Street Whole Loan.
The Sponsor.The sponsor of the 225 Liberty Street Whole Loan is Brookfield Financial Properties, L.P., a subsidiary of Brookfield Property Partners L.P., a global real estate company that invests in and operates office, retail, industrial, multifamily, triple net leased, and hospitality assets. As of September 2015, its portfolio included interests in over 400 office and retail properties encompassing over 250.0 million square feet, 38,821 multifamily units, 47.0 million square feet of industrial space, and about 9.0 million square feet of office development pipeline worldwide. These assets are largely located in North America, Europe, and Australia but also include a growing presence in China, Brazil, and India.
Brookfield Property Partners L.P.’s office division, Brookfield Office Properties Inc. (S/DBRS: BBB/BBB) owns, develops and manages premier office properties in the United States, Canada, Australia and the United Kingdom. Brookfield Property Partners L.P. is involved in the ownership and management of office assets on a global basis. As of third quarter 2015, its office portfolio consisted of interests in 138 properties totaling 98.0 million square feet in the downtown core areas of New York, Washington D.C., Houston, Los Angeles, Toronto, Calgary, Ottawa, London, Sydney, Melbourne and Perth, among other cities. Landmark properties include assets operating as a “Brookfield Place” in Manhattan, Toronto and Perth, Bank of America Plaza in Los Angeles, Bankers Hall in Calgary and Darling Park in Sydney. As of third quarter 2015, Brookfield Property Partners L.P. had a portfolio of 12 operating properties in New York City comprising 19.8 million gross square feet. The seven buildings located in Lower Manhattan comprise 13.4 million gross square feet and are approximately 92.6% leased. The five properties located in Midtown Manhattan comprise 6.5 million gross square feet and are approximately 94.4% leased.
Escrows.The loan documents provide for an upfront reserve in the amount of $80,810,295 for free rent related to Time Inc. ($66,322,369), Hudson’s Bay Company ($14,029,414) and D’Amato & Lynch ($458,512). In addition, pursuant to existing leases at the 225 Liberty Street Property, the borrower is obligated to pay allowances for tenant improvements. An upfront unfunded obligation/rollover guaranty reserve in the aggregate amount of $72,789,685 (as outlined in the table below) was established at origination of the 225 Liberty Street Whole Loan. The loan documents provide for a guaranty from Brookfield Office Properties Inc. (the “Reserve Guarantor”) for the full amount of any unfunded obligations (the “Rollover Guaranty”). If at any time while the Rollover Guaranty remains in effect, the Reserve Guarantor fails to maintain a corporate credit rating/issuer credit rating (long-term local and foreign) from S&P of at least “BBB-” (which will not be dependent on the rating “outlook” or “trend”), the borrower will be required, within ten days of such failure, to either (i) provide a replacement rollover guaranty in substantially the same form as the Rollover Guaranty delivered by Reserve Guarantor from an approved replacement reserve guarantor (as further detailed in the 225 Liberty Whole Loan documents), which guarantees the same amount as the Rollover Guaranty being replaced, and obtain a rating agency confirmation in connection therewith, or (ii) deposit cash into the Rollover Account (as further detailed in the 225 Liberty Whole Loan documents), or deliver to the lender a letter of credit in lieu thereof, in either case in an amount equal to the sum of all amounts then guaranteed by the Rollover Guaranty.
THE INFORMATION IN THIS STRUCTURAL AND COLLATERAL TERM SHEET IS NOT COMPLETE AND MAY BE AMENDED PRIOR TO THE TIME OF SALE. THIS TERM SHEET IS NOT AN OFFER TO SELL THESE SECURITIES AND IT IS NOT A SOLICITATION OF AN OFFER TO BUY THESE SECURITIES IN ANY JURISDICTION WHERE THE OFFER OR SALE IS NOT PERMITTED.
| 53 |
| 225 LIBERTY STREET |
| Unfunded Obligations | |
| Tenant | Leasing Expenses |
| Hudson’s Bay Company | $68,646,291 |
| First Data Corporation | $1,744,588 |
| Time Inc. | $1,005,667 |
| The Bank of New York Mellon | $500,000 |
| The Institute of Culinary Education, Inc. | $487,767 |
| Remaining Tenants | $405,372 |
| Total Lease Costs | $72,789,685 |
During the continuance of a Trigger Period (as defined below), the borrower will deposit on each monthly payment date (i) an amount equal to one-twelfth of the taxes payable in the next 12 months, (ii) provided an acceptable blanket policy is no longer in place, an amount equal to one-twelfth of the insurance premiums payable in the next 12 months, (iii) $728,255 for annual capital expenditures into the replacement reserve and (iv) an amount equal to the ground rent payable for the succeeding month into the ground rent reserve.
During the continuance of a Mezzanine Trigger Period (as defined below), the lender will cause all excess cash flow to be deposited into the cash collateral reserve.
During the continuance of a Master Retail Lease Trigger Period (as defined below), the borrower must deposit all tenant improvement and leasing commission expenses the borrower becomes directly liable for pursuant to retail subleases as a result of a Master Retail Lease termination into the master retail lease funds.
Lockbox and Cash Management.The 225 Liberty Street Whole Loan requires a lender-controlled lockbox account, which is already in place, and that the borrower direct tenants to pay their rents directly into such lockbox account. The loan documents also require that all rents received by the borrower or the property manager be deposited into the lockbox account within two business days of receipt. Prior to the occurrence of a Trigger Period, all cash flow is distributed to the borrower. During a Trigger Period, all cash flow is swept to a lender-controlled cash management account; with respect to clause (ii), upon the termination of a Low Debt Service Trigger Period; and with respect to clause (iii) upon the termination of a Master Lease Trigger Period.
A “Trigger Period” will commence upon the occurrence or commencement of (i) an event of default; (ii) a Low Debt Service Trigger Period (as defined below); or (iii) a Mezzanine Trigger Period (as defined below). A Trigger Period will cease to exist, with respect to clause (i), upon the cure of such event of default.
A “Low Debt Service Trigger Period” will commence if, as of the last day of any calendar quarter, the 225 Liberty Street Whole Loan debt service coverage ratio (based on the combined senior notes and junior notes totaling $900,000,000) falls below 1.35x. A Low Debt Service Trigger Period will cease to exist if the debt service coverage ratio exceeds 1.35x for two consecutive calendar quarters.
A “Mezzanine Trigger Period” will commence and continue for as long as any mezzanine loan is outstanding.
A “Master Retail Lease Trigger Period” will commence if (i) a monetary default under the Master Retail Lease has occurred and is continuing beyond any notice and cure periods; (ii) a material non-monetary default has occurred and is continuing beyond any notice and cure periods; (iii) the Master Retail Lease is terminated. A Master Lease Trigger Period will cease to exist, with respect to clauses (i) and (ii), upon the cure of all defaults under the Master Retail Lease and, with respect to clause (iii), upon the borrower leasing the entire Retail Component pursuant to a new master retail lease with a retail tenant, each reasonably satisfactory to the lender.
Property Management. The 225 Liberty Street Property is managed by an affiliate of the borrower.
Assumption. The borrower has the two-time right to transfer the 225 Liberty Street Property provided that certain conditions are satisfied, including (i) no event of default has occurred and is continuing; (ii) either the transferee is a qualified transferee as described in the loan documents or the lender reasonably determines that the proposed transferee and guarantor satisfy the lender’s credit review and underwriting standards, taking into consideration the transferee’s experience, financial strength and general business standing; and (iii) the lender has received confirmation from DBRS, Fitch and Moody’s that such assumption will not result in a downgrade, withdrawal or qualification of the respective ratings assigned to the Series 2016-C33 Certificates and similar confirmations from each rating agency rating any securities backed by any 225 Liberty Street Companion Loans with respect to the ratings of such securities.
Partial Release. Not permitted.
Real Estate Substitution.Not permitted.
Subordinate and Mezzanine Indebtedness.The borrower is permitted to incur future mezzanine debt, provided the mezzanine loan does not exceed $150.0 million and the following conditions are satisfied: (i) a maximum combined loan-to-value ratio of no greater than 95.0% of the closing loan-to-value-ratio; (ii) a minimum combined debt service coverage ratio of no less than 110% of the closing debt service coverage ratio; (iii) a minimum combined net operating income debt yield of no less than 110.0% of the closing debt yield; (iv) the receipt of a rating agency confirmation from DBRS, Fitch and Moody’s that the mezzanine financing will not result in a downgrade, withdrawal or qualification of the respective ratings assigned to the Series 2016-C33 Certificates and
THE INFORMATION IN THIS STRUCTURAL AND COLLATERAL TERM SHEET IS NOT COMPLETE AND MAY BE AMENDED PRIOR TO THE TIME OF SALE. THIS TERM SHEET IS NOT AN OFFER TO SELL THESE SECURITIES AND IT IS NOT A SOLICITATION OF AN OFFER TO BUY THESE SECURITIES IN ANY JURISDICTION WHERE THE OFFER OR SALE IS NOT PERMITTED.
| 54 |
| 225 LIBERTY STREET |
similar confirmations from each rating agency rating any securities backed by any 225 Liberty Street Companion Loans with respect to the ratings of such securities; and (v) the execution of an intercreditor agreement acceptable to the lender.
Other Indebtedness.The 225 Liberty Street Whole Loan includes three junior notes with an aggregate original principal balance of $441,000,000 that were contributed to the LBTY 2016-225L transaction. See “Description of the Mortgage Pool – The Whole Loans — The Non-Serviced Whole Loan — The 225 Liberty Street Whole Loan” in the Preliminary Prospectus.
Additional Indebtedness.Brookfield Financial Properties, L.P. and certain affiliates are permitted to pledge their indirect ownership of the borrower subject to certain conditions, including: (i) the credit facility must be secured by a substantial portion of Brookfield Financial Properties, L.P.’s or such affiliate’s assets; (ii) no such corporate loan may be secured by a pledge from a party whose sole asset is its ownership interest in the borrower or 225 Liberty Street Property; and (iii) no event of default has occurred or is continuing. See “Description of the Mortgage Pool — Additional Indebtedness—Mezzanine Indebtedness”” in the Preliminary Prospectus.
Ground Lease.The 225 Liberty Street Property is subject to a long-term ground lease with the BPCA through 2069 (the “Ground Lease”). Pursuant to the Ground Lease, there are four principal components to the annual ground rent payment: (i) a fixed $5.1 million annual payment with no scheduled increases, subject to certain conditions set forth in the Ground Lease (the “Base Rent”), (ii) an annual retail rent for the Retail Component (based on the greater of a fixed and percentage retail rent) which rent, so long as the borrower does not have its own retail space that is not leased to the Retail Master Tenant pursuant to the Master Retail Lease, is the responsibility of the Retail Master Tenant and is currently estimated to be approximately $1.2 million for the calendar year 2016, (iii) an amount (the “Other Rent”) equal to the greater of (a) $0.75 per rentable square feet of space at the Brookfield Square Complex which is rented for purposes other than office or retail and (b) 10.0% of the annual gross income from such space, which rent is the responsibility of the Retail Master Tenant, and (iv) the PILOT payments (as described below).
The borrower is entitled, subject to certain conditions, to a 10-year rent abatement in ground rent in the amount of $1.0 millionper annum (such rental payment of $5.1 million, taking into account such rent abatement and other additional rent payable by the borrower to the BPCA) ending in March 2026. Pursuant to the terms of the Bank of New York Mellon lease, the entire $1.0 million ground rent abatement will be passed through to Bank of New York Mellon. At the expiration of the rent abatement, Bank of New York Mellon will no longer receive the $1.0 million payment and the annual ground rent payment will remain flat at $5.1 million. The 225 Liberty Street Whole Loan underwriting excludes both the borrower’s ground rent abatement and Bank of New York Mellon’s corresponding rent abatement.
PILOT.The 225 Liberty Street Property benefits from a PILOT program from the BPCA. Pursuant to the Ground Lease, the borrower is obligated to the BPCA for the PILOT payments, as the 225 Liberty Street Property is not subject to real estate taxes by reason of its ownership by the BPCA. PILOT payments are based on the assessed values provided by the City of New York to the BPCA, and are therefore equivalent to real estate taxes provided by the City of New York. There is no economic benefit to having the PILOT since the taxes are the same as if the City of New York were taxing the 225 Liberty Street Property.
Pursuant to the Master Retail Lease, the Retail Master Tenant is required to pay itspro rata share (currently 7.4310%) of such PILOT payments payable by the borrower to the BPCA, but only after first subtracting therefrom certain sums which may be received by the borrower from other ground lease tenants at the Brookfield Place Complex with respect to PILOT payments for the Winter Garden and the Liberty Street Bridge (such net amount, the “Retail Master Tenant PILOT Payments”). The chart below sets forth the net PILOT payments of $17,119,499 payable by the borrower for the 2015-2016 tax year, following reimbursement of the Retail Master Tenant PILOT Payments and payment obligations of other ground lease tenants at the Brookfield Place Complex with respect to their allocable share of PILOT payments allocated to the Winter Garden and the Liberty Street Bridge.
| 2015-2016 Tax Bill | $20,721,498 | |
| Adjustment | Percentage | Current Tax Bill |
| Total 225 Liberty PILOT | 100.00% | 20,721,498 |
| Less: Winter Garden and the Liberty Street Bridge | -15.50% | -3,211,832 |
| Addback: 225 Liberty Share of Winter Garden and the Liberty Street Bridge | 4.75% | 984,105 |
| Total 225 Liberty PILOT Due | 89.25% | 18,493,771 |
| Less: Retail share of 225 Liberty PILOT (7.4310%)(1) | -6.63% | -1,374,272 |
| Net 225 Liberty Office PILOT | 82.62% | $17,119,499 |
| (1) | Retail share of PILOT is calculated as 89.25% x 7.4310%. |
Terrorism Insurance. The loan documents require that the “all risk” insurance policy required to be maintained by the borrower provide coverage for terrorism in an amount equal to the full replacement cost of the 225 Liberty Street Property, provided however, that the borrower will not be required to spend more than 200.0% of the cost of property coverage and business interruption coverage in the event the Terrorism Risk Insurance Act or a similar government backstop is no longer in effect. The loan documents also require business interruption insurance covering no less than the 24-month period following the occurrence of a casualty event, together with a 12-month extended period of indemnity.
THE INFORMATION IN THIS STRUCTURAL AND COLLATERAL TERM SHEET IS NOT COMPLETE AND MAY BE AMENDED PRIOR TO THE TIME OF SALE. THIS TERM SHEET IS NOT AN OFFER TO SELL THESE SECURITIES AND IT IS NOT A SOLICITATION OF AN OFFER TO BUY THESE SECURITIES IN ANY JURISDICTION WHERE THE OFFER OR SALE IS NOT PERMITTED.
| 55 |
BUSINESS & RESEARCH CENTER AT GARDEN CITY |

THE INFORMATION IN THIS STRUCTURAL AND COLLATERAL TERM SHEET IS NOT COMPLETE AND MAY BE AMENDED PRIOR TO THE TIME OF SALE. THIS TERM SHEET IS NOT AN OFFER TO SELL THESE SECURITIES AND IT IS NOT A SOLICITATION OF AN OFFER TO BUY THESE SECURITIES IN ANY JURISDICTION WHERE THE OFFER OR SALE IS NOT PERMITTED.
| 56 |
BUSINESS & RESEARCH CENTER AT GARDEN CITY |

THE INFORMATION IN THIS STRUCTURAL AND COLLATERAL TERM SHEET IS NOT COMPLETE AND MAY BE AMENDED PRIOR TO THE TIME OF SALE. THIS TERM SHEET IS NOT AN OFFER TO SELL THESE SECURITIES AND IT IS NOT A SOLICITATION OF AN OFFER TO BUY THESE SECURITIES IN ANY JURISDICTION WHERE THE OFFER OR SALE IS NOT PERMITTED.
| 57 |
| No. 4 – Business & Research Center at Garden City | ||||||||
| Loan Information | Property Information | |||||||
| Mortgage Loan Seller: | Natixis Real Estate Capital LLC | Single Asset/Portfolio: | Single Asset | |||||
Credit Assessment (DBRS/Fitch/Moody’s): | NR/NR/NR | Property Type: | Office | |||||
| Original Principal Balance: | $37,000,000 | Specific Property Type: | Suburban | |||||
| Cut-off Date Balance: | $37,000,000 | Location: | Garden City, NY | |||||
| % of Initial Pool Balance: | 5.2% | Size: | 187,118 SF | |||||
| Loan Purpose: | Refinance | Cut-off Date Balance Per SF: | $197.74 | |||||
| Borrower Name: | Garden City 505, LLC | Year Built/Renovated: | 1964/2015 | |||||
| Sponsors: | David J. Cohen; Abraham Cohen | Title Vesting(2): | Fee | |||||
| Mortgage Rate: | 5.230% | Property Manager: | Colliers International LI Management, LLC | |||||
| Note Date: | March 9, 2016 | 4th Most Recent Occupancy (As of): | 93.1% (12/31/2012) | |||||
| Anticipated Repayment Date: | NAP | 3rd Most Recent Occupancy (As of)(3): | 93.1% (12/31/2013) | |||||
| Maturity Date: | March 9, 2026 | 2nd Most Recent Occupancy (As of) (3): | 100.0% (12/31/2014) | |||||
| IO Period: | None | Most Recent Occupancy (As of): | 100.0% (12/31/2015) | |||||
| Loan Term (Original): | 120 months | Current Occupancy (As of): | 100.0% (2/9/2016) | |||||
| Seasoning: | 0 months | |||||||
| Amortization Term (Original): | 360 months | Underwriting and Financial Information: | ||||||
| Loan Amortization Type: | Amortizing Balloon | |||||||
| Interest Accrual Method: | Actual/360 | 4th Most Recent NOI (As of): | $3,287,149 (12/31/2012) | |||||
| Call Protection: | L(24),D(92),O(4) | 3rd Most Recent NOI (As of): | $3,356,832 (12/31/2013) | |||||
| Lockbox Type: | Hard/Springing Cash Management | 2nd Most Recent NOI (As of)(4): | $3,484,005 (12/31/2014) | |||||
| Additional Debt: | NAP | Most Recent NOI (As of)(4): | $3,273,917 (12/31/2015) | |||||
| Additional Debt Type: | NAP | |||||||
| U/W Revenues: | $5,101,942 | |||||||
| U/W Expenses(4): | $1,858,690 | |||||||
| Escrows and Reserves(1): | U/W NOI: | $3,243,252 | ||||||
| U/W NCF: | $3,159,049 | |||||||
| Type: | Initial | Monthly | Cap (If Any) | U/W NOI DSCR: | 1.33x | |||
| Taxes(2) | $115,463 | $51,011 | NAP | U/W NCF DSCR: | 1.29x | |||
| Insurance | $87,019 | $9,017 | NAP | U/W NOI Debt Yield: | 8.8% | |||
| Replacement Reserves | $0 | $3,119 | NAP | U/W NCF Debt Yield: | 8.5% | |||
| TI/LC Reserve | $0 | $3,898 | NAP | As-Is Appraised Value: | $57,700,000 | |||
| Lifetime Brands Existing TI Reserve | $98,000 | $7,643 | $663,583 | As-Is Appraisal Valuation Date: | December 18, 2015 | |||
| Free Rent Reserve | $16,301 | $0 | NAP | Cut-off Date LTV Ratio: | 64.1% | |||
| Deferred Maintenance | $3,000 | $0 | NAP | LTV Ratio at Maturity or ARD: | 53.1% | |||
| (1) | See “Escrows” section. |
| (2) | See “PILOT Program” section and “Ground Lease” section. |
| (3) | See “Historical Occupancy” section. |
| (4) | See “Cash Flow Analysis” section. |
The Mortgage Loan. The mortgage loan (the “Business & Research Center at Garden City Mortgage Loan”) is evidenced by a single promissory note that is secured by a first mortgage encumbering the fee interest in an office complex located in Garden City, New York (the “Business & Research Center at Garden City Property”). The Business & Research Center at Garden City Mortgage Loan was originated on March 9, 2016 by Natixis Real Estate Capital LLC. The Business & Research Center at Garden City Mortgage Loan had an original principal balance of $37,000,000, has an outstanding principal balance as of the Cut-off Date of $37,000,000 and accrues interest at an interest rate of 5.230%per annum. The Business & Research Center at Garden City Mortgage Loan had an initial term of 120 months, has a remaining term of 120 months as of the Cut-off Date and requires payments of principal and interest based on a 30-year amortization schedule. The Business & Research Center at Garden City Mortgage Loan matures on March 9, 2026.
Following the lockout period, the borrower has the right to defease the Business & Research Center at Garden City Mortgage Loan in whole or in part on any date before December 9, 2025. In addition, the Business & Research Center at Garden City Mortgage Loan is prepayable without penalty on or after December 9, 2025.
THE INFORMATION IN THIS STRUCTURAL AND COLLATERAL TERM SHEET IS NOT COMPLETE AND MAY BE AMENDED PRIOR TO THE TIME OF SALE. THIS TERM SHEET IS NOT AN OFFER TO SELL THESE SECURITIES AND IT IS NOT A SOLICITATION OF AN OFFER TO BUY THESE SECURITIES IN ANY JURISDICTION WHERE THE OFFER OR SALE IS NOT PERMITTED.
| 58 |
BUSINESS & RESEARCH CENTER AT GARDEN CITY |
Sources and Uses
| Sources | Uses | |||||||
| Original loan amount | $37,000,000 | 100.0% | Loan payoff | $30,618,908 | 82.8% | |||
| Reserves | 319,784 | 0.9 | ||||||
| Closing costs | 605,571 | 1.6 | ||||||
| Return of equity | 5,455,737 | 14.7 | ||||||
| Total Sources | $37,000,000 | 100.0% | Total Uses | $37,000,000 | 100.0% |
The Property.The Business & Research Center at Garden City Property is an office complex consisting of two buildings totaling 187,118 square feet located on a 7.6-acre site, in Garden City, New York, approximately 28.0 miles east of New York City. The Business & Research Center at Garden City Property features updated building systems and distinctive architectural finishes. The Business & Research Center at Garden City Property received multiple engineering awards in connection with a 2007 retrofit.
Built in 1964, the building located on 1000 Stewart Avenue (“1000 Stewart Avenue”) is a 161,500 square foot (86.3% of the aggregate net rentable area), three-story mixed use building, 100.0% occupied by two tenants, Lifetime Brands Inc (“Lifetime Brands”) (NASDAQ: LCUT) occupying 148,017 square feet (79.1% of the aggregate net rentable area) and Home Medical Equipment LLC occupying 11,921 square feet (6.4% of the net rentable area). Since 2007, 1000 Stewart Avenue has served as the global headquarters of Lifetime Brands, a leading designer and provider of kitchenwares, tableware and home décor products including kitchen tools and gadgets, cutlery, cookware, dinnerware, flatware and food storage marketed under more than 30 brands including KitchenAid, Farberware, Mikasa, Sabatier and Bombay sold in national retailers including Target, Walmart and Macy’s. Lifetime Brands’ distribution network includes facilities strategically located near ports of entry on both the East and West Coasts and over 1.6 million square feet of warehouse and manufacturing space in five separate locations. In the third quarter of 2015, Lifetime Brands reported net sales of $163.2 million and net income of $5.1 million. Lifetime Brands’ space is comprised of 45,301 square feet of flex space (24.2% of the aggregate net rentable area) used as a showroom and 102,716 square feet of office space (54.9% of the aggregate net rentable area). Lifetime Brands has expanded multiple times, most recently by 13,000 square feet in October 2014, extending its lease expiration from 2022 to 2029 simultaneously. As part of the lease expansion and extension, the landlord agreed to pay a total amount not to exceed $1,130,340 ($7.64 per square foot) for tenant improvements to the premises. As of February 2016, $663,583 of the tenant improvement allowance was outstanding, $565,170 of which is not available to Lifetime Brands until June 2022. The loan documents provide for an upfront reserve in the amount of $98,000 and monthly deposits of $7,643 into the Lifetime Brands existing tenant improvements reserve, until the amount deposited equals $663,583 (see “Escrows” section). Lifetime Brands has invested approximately $10.0 million ($67.56 per square foot) at the Business & Research Center at Garden City Property.
Built in 1969, the building located on 500 Endo Boulevard (“500 Endo Boulevard”) is a 25,618 square foot (13.7% of the aggregate net rentable area) two-story building, 100.0% occupied by Nassau Community College. 500 Endo Boulevard is adjacent to Nassau Community College’s main campus, serving as an annex to the college and containing 13 classrooms, 11 offices, a computer lab and a student learning center/lounge. Founded in 1959, Nassau Community College is the largest single-campus community college in the state of New York.
The Business & Research Center at Garden City Property has 551 surface parking spaces, which includes 14 covered spaces, resulting in a parking ratio of 2.9 spaces per 1,000 square feet of rentable area. As of February 9, 2016, the Business & Research Center at Garden City Property was 100.0% occupied by three tenants, and the property has averaged 97.1% quarterly occupancy since 2009.
The Business & Research Center at Garden City Property is encumbered by a recorded document that restricts the use of the property solely to industrial use. See “Description of the Mortgage Pool - Use Restrictions” in the Preliminary Prospectus for additional information.
THE INFORMATION IN THIS STRUCTURAL AND COLLATERAL TERM SHEET IS NOT COMPLETE AND MAY BE AMENDED PRIOR TO THE TIME OF SALE. THIS TERM SHEET IS NOT AN OFFER TO SELL THESE SECURITIES AND IT IS NOT A SOLICITATION OF AN OFFER TO BUY THESE SECURITIES IN ANY JURISDICTION WHERE THE OFFER OR SALE IS NOT PERMITTED.
| 59 |
BUSINESS & RESEARCH CENTER AT GARDEN CITY |
The following table presents certain information relating to the tenancies at the Business & Research Center at Garden City Property:
Major Tenants
| Tenant Name | Credit Rating (Fitch/Moody’s/ S&P) | Tenant NRSF | % of NRSF | Annual U/W Base Rent PSF(1) | Annual U/W Base Rent(1) | % of Total Annual U/W Base Rent | Lease Expiration Date |
| Major Tenants | |||||||
| Lifetime Brands | NR/NR/NR | 148,017 | 79.1% | $22.23 | $3,290,804 | 76.4% | 5/31/2029(2) |
| Nassau Community College | NR/NR/NR | 25,618 | 13.7% | $34.00 | $871,012 | 20.2% | 6/30/2029(3)(4) |
| Home Medical Equipment LLC | NR/NR/NR | 11,921 | 6.4% | $12.33 | $147,045 | 3.4% | 12/25/2021 |
| Total Major Tenants | 185,556 | 99.2% | $23.22 | $4,308,861 | 100.0% | ||
| Building Maintenance Office | 1,562 | 0.8% | $0.00 | $0 | 0.0% | ||
| Occupied Collateral Total | 187,118 | 100.0% | $23.03 | $4,308,861 | 100.0% | ||
| Vacant Space | 0 | 0.0% | |||||
| Collateral Total | 187,118 | 100.0% | |||||
| (1) | The Annual U/W Base Rent and Annual U/W Base Rent PSF include contractual rent steps through March 2017, totaling $88,457. |
| (2) | Lifetime Brands has two, five-year lease renewal options. |
| (3) | Nassau Community College has one, five-year lease renewal option. |
| (4) | Nassau Community College may terminate its lease if the restrictive declaration in place at the Business & Research Center at Garden City Property is enforced. Nassau Community College has insurance against this event, and the Business & Research Center at Garden City Property is covered under the title insurance for losses caused by enforcement of the restrictive declaration. For additional information, see “Description of the Mortgage Pool - Use Restrictions” in the Preliminary Prospectus. |
The following table presents certain information relating to the lease rollover schedule at the Business & Research Center at Garden City Property:
Lease Expiration Schedule(1)
| Year Ending December 31, | No. of Leases Expiring | Expiring NRSF | % of Total NRSF | Cumulative Expiring NRSF | Cumulative % of Total NRSF | Annual U/W Base Rent | % of Total Annual U/W Base Rent | Annual U/W Base Rent PSF |
| MTM | 0 | 0 | 0.0% | 0 | 0.0% | $0 | 0.0% | $0.00 |
| 2016 | 0 | 0 | 0.0% | 0 | 0.0% | $0 | 0.0% | $0.00 |
| 2017 | 0 | 0 | 0.0% | 0 | 0.0% | $0 | 0.0% | $0.00 |
| 2018 | 0 | 0 | 0.0% | 0 | 0.0% | $0 | 0.0% | $0.00 |
| 2019 | 0 | 0 | 0.0% | 0 | 0.0% | $0 | 0.0% | $0.00 |
| 2020 | 0 | 0 | 0.0% | 0 | 0.0% | $0 | 0.0% | $0.00 |
| 2021 | 1 | 11,921 | 6.4% | 11,921 | 6.4% | $147,045 | 3.4% | $12.33 |
| 2022 | 0 | 0 | 0.0% | 11,921 | 6.4% | $0 | 0.0% | $0.00 |
| 2023 | 0 | 0 | 0.0% | 11,921 | 6.4% | $0 | 0.0% | $0.00 |
| 2024 | 0 | 0 | 0.0% | 11,921 | 6.4% | $0 | 0.0% | $0.00 |
| 2025 | 0 | 0 | 0.0% | 11,921 | 6.4% | $0 | 0.0% | $0.00 |
| 2026 | 0 | 0 | 0.0% | 11,921 | 6.4% | $0 | 0.0% | $0.00 |
| Thereafter | 2 | 173,635 | 92.8% | 185,556 | 99.2% | $4,161,816 | 96.6% | $23.97 |
| Building Maintenance Office(2) | 0 | 1,562 | 0.8% | 187,118 | 100.0% | $0 | 0.0% | $0.00 |
| Vacant | 0 | 0 | 0.0% | 187,118 | 100.0% | $0 | 0.0% | $0.00 |
| Total/Weighted Average | 3 | 187,118 | 100.0% | $4,308,861 | 100.0% | $23.03 |
| (1) | Information obtained from the underwritten rent roll. |
| (2) | The Building Maintenance Office is not subject to a lease and has no associated rent. |
The following table presents historical occupancy percentages at the Business & Research Center at Garden City Property:
Historical Occupancy
12/31/2012(1) | 12/31/2013(1)(2) | 12/31/2014(1)(2) | 12/31/2015(1) | 2/9/2016(3) | ||||
| 93.1% | 93.1% | 100.0% | 100.0% | 100.0% |
| (1) | Information obtained from the borrower. |
| (2) | Occupancy increased from 2013 to 2014 due to the Lifetime Brands expansion into 13,000 square feet (6.9% of the aggregate net rentable area) in October 2014. |
| (3) | Information obtained from the underwritten rent roll. |
THE INFORMATION IN THIS STRUCTURAL AND COLLATERAL TERM SHEET IS NOT COMPLETE AND MAY BE AMENDED PRIOR TO THE TIME OF SALE. THIS TERM SHEET IS NOT AN OFFER TO SELL THESE SECURITIES AND IT IS NOT A SOLICITATION OF AN OFFER TO BUY THESE SECURITIES IN ANY JURISDICTION WHERE THE OFFER OR SALE IS NOT PERMITTED.
| 60 |
BUSINESS & RESEARCH CENTER AT GARDEN CITY |
Operating History and Underwritten Net Cash Flow. The following table presents certain information relating to the historical operating performance and underwritten net cash flow at the Business & Research Center at Garden City Property:
Cash Flow Analysis
| 2012 | 2013 | 2014 | 2015 | U/W | % of U/W Effective Gross Income | U/W $ per SF | ||||||||
| Base Rent | $3,778,857 | $4,020,038 | $4,224,233 | $4,207,652 | $4,308,861(1) | 84.5% | $23.03 | |||||||
| Grossed Up Vacant Space | 0 | 0 | 0 | 0 | 0 | 0.0 | 0.00 | |||||||
| Total Reimbursables | 926,691 | 887,230 | 928,199 | 886,903 | 952,480 | 18.7 | 5.09 | |||||||
| Other Income | 129,538 | 134,513 | 129,659 | 109,124 | 109,124 | 2.1 | 0.58 | |||||||
| Rent Abatement | 0 | 0 | (58,013) | (175,560) | 0 | 0.0 | 0.00 | |||||||
| Less Vacancy & Credit Loss | 0 | 0 | 0 | 0 | (268,523)(2) | (5.3) | (1.44) | |||||||
| Effective Gross Income | $4,835,086 | $5,041,781 | $5,224,078 | $5,028,119 | $5,101,942 | 100.0% | $27.27 | |||||||
| Total Operating Expenses | $1,547,937 | $1,684,949 | $1,740,072 | $1,754,202 | $1,858,690(3) | 36.4% | $9.93 | |||||||
|
|
|
|
|
|
| ||||||||
| Net Operating Income | $3,287,149 | $3,356,832 | $3,484,005(4) | $3,273,917(4) | $3,243,252 | 63.6% | $17.33 | |||||||
| TI/LC | 0 | 0 | 0 | 0 | 46,780 | 0.9 | 0.25 | |||||||
| Capital Expenditures | 0 | 0 | 0 | 0 | 37,424 | 0.7 | 0.20 | |||||||
| Net Cash Flow | $3,287,149 | $3,356,832 | $3,484,005 | $3,273,917 | $3,159,049 | 61.9% | $16.88 | |||||||
| NOI DSCR | 1.34x | 1.37x | 1.42x | 1.34x | 1.33x | |||||||||
| NCF DSCR | 1.34x | 1.37x | 1.42x | 1.34x | 1.29x | |||||||||
| NOI DY | 8.9% | 9.1% | 9.4% | 8.8% | 8.8% | |||||||||
| NCF DY | 8.9% | 9.1% | 9.4% | 8.8% | 8.5% |
| (1) | U/W Base Rent includes contractual rent steps through March 2017, totaling $88,457. |
| (2) | The underwritten economic vacancy is 5.0%. The Business & Research Center at Garden City Property was 100.0% physically occupied as of February 9, 2016. |
| (3) | The Business & Research Center at Garden City Property benefits from a PILOT program, which results in a reduced property tax expense. The estimated unabated property tax expense for the 2015/2016 assessment year was $1,391,805. The U/W Total Operating Expenses reflect real estate taxes due under the PILOT program, which expires on December 31, 2029 (see “PILOT Program” section). |
| (4) | NOI decreased from 2014 to 2015 primarily due to a rent abatement related to the Lifetime Brands expansion in October 2014. |
Appraisal.As of the appraisal valuation date of December 18, 2015, the Business & Research Center at Garden City Property had an “as-is” appraised value of $57,700,000.
Environmental Matters.According tothePhase I environmental assessment dated February 8, 2016, there was no evidence of any recognized environmental conditions at the Business & Research Center at Garden City Property.
Market Overview and Competition.The Business & Research Center at Garden City Property is located in Garden City, New York, approximately 28.0 miles east of New York City. The Business & Research Center at Garden City Property is located at the southeast intersection of Stewart Avenue and Endo Boulevard, just off of the Meadowbrook State Parkway, which provides access to Long Island’s major thoroughfares including the Long Island Expressway, Northern State Parkway, Wantagh Parkway and the Southern State Parkway. The Business & Research Center at Garden City Property has access to bus routes N16 and N51 with stops along Stewart Avenue and bus routes N35 and N43 with stops along Endo Boulevard, one of which fronts the Business & Research Center at Garden City Property. The Business & Research Center at Garden City Property is also in close proximity to five Long Island Rail Road (“LIRR”) stations: Stewart Manor (5.7 miles), Nassau Boulevard (4.1 miles), Mineola Station (3.2 miles), Garden City (2.3 miles), and Country Life Press (2.5 miles). The LIRR provides an approximate 30 minute commute to Penn Station, which is a major intercity railroad station in New York City. The Business & Research Center at Garden City Property is also proximate to three airports: JFK International, approximately 18.0 miles southwest; LaGuardia International, approximately 20.2 miles northwest; and Islip MacArthur, approximately 33.1 miles east.
According to the appraisal, the 2015 population within a five-mile radius of the Business & Research Center at Garden City Property was approximately 486,072, with a 2015 median household income for the same radius of approximately $98,351. The Business & Research Center at Garden City Property is one mile away from the Roosevelt Field Mall, which according to the appraiser, is the largest high-end shopping mall in the state of New York, totaling approximately 2.2 million square feet. The Roosevelt Field Mall opened in 1956 and has since undergone a number of renovations and expansions. In March 2012, it was announced that a new 100,000 square-foot building anchored by luxury department store Neiman Marcus will be added to the Roosevelt Field Mall. Completed in February 2016, this expansion will create room for even more shops, and will also be accompanied by a new parking structure. The anchors of the Roosevelt Field Mall are Bloomingdale’s, JC Penney, Macy’s, Nordstrom, Dick’s Sporting Goods, and Neiman Marcus (expected opening in 2016).
According to a third party market research report, the Business & Research Center at Garden City Property is located in the Central Nassau office and industrial submarket of the Nassau and Suffolk County market. As of the fourth quarter of 2015, the office submarket contained inventory totaling approximately 14.9 million square feet with an 8.3% vacancy rate and average direct asking rent of $26.68 per square foot on a gross basis. As of the fourth quarter of 2015, the industrial submarket contained inventory totaling approximately 9.4 million square feet with a 4.2% vacancy rate and average direct asking rent of $12.97 per square foot on a triple-net basis.
THE INFORMATION IN THIS STRUCTURAL AND COLLATERAL TERM SHEET IS NOT COMPLETE AND MAY BE AMENDED PRIOR TO THE TIME OF SALE. THIS TERM SHEET IS NOT AN OFFER TO SELL THESE SECURITIES AND IT IS NOT A SOLICITATION OF AN OFFER TO BUY THESE SECURITIES IN ANY JURISDICTION WHERE THE OFFER OR SALE IS NOT PERMITTED.
| 61 |
BUSINESS & RESEARCH CENTER AT GARDEN CITY |
The following table presents certain information relating to comparable office leases for the Business & Research Center at Garden City Property:
Comparable Office Leases(1)
| Property Name/Location | Year Built/ Renovated | Stories | Total GLA (SF) | Total Occupancy | Distance from Subject | Tenant Name | Lease Date/Term | Lease Area (SF) | Annual Base Rent PSF | Lease Type |
| Stewart Ave, Garden City, NY | 1967/NAV | 6 | 147,710 | 83% | 1.1 miles | RedVision Systems Inc. | June 2015 / 7 Yrs | 7,150 | $26.00 | MG |
| Garden City Center, Garden City NY | 1990/NAV | 6 | 200,000 | 95% | 0.7 miles | Russo Law Group | June 2015 / 10 Yrs | 9,213 | $28.00 | MG |
| Treeline Garden City Plaza 200, Garden City, NY | 1969/NAV | 5 | 131,000 | 95% | 1.3 miles | Goldberg Segalla LLP | Feb 2015 / 9 Yrs | 7,268 | $28.84 | MG |
| Franklin Ave, Garden City, NY | 1980/NAV | 4 | 46,500 | 100% | 2.4 miles | Wells Fargo Advisors | Feb 2015 / 10 Yrs | 5,097 | $32.00 | MG |
| Atria West, Garden City, NY | 1986/NAV | 6 | 266,000 | 92% | 0.4 miles | BPA International | Sep 2014 / 5 Yrs | 11,330 | $29.50 | MG |
| Treeline Garden City Plaza 400, Garden City, NY | 1989/NAV | 5 | 176,073 | 97% | 1.4 miles | Sola Salon Studios | Aug 2014 / 15 Yrs | 8,824 | $27.00 | MG |
| (1) | Information obtained from the appraisal. |
The following table presents certain information relating to comparable industrial leases for the Business & Research Center at Garden City Property:
Comparable Industrial Leases(1)
| Property Name/Location | Year Built/ Renovated | Stories | Total GLA (SF) | Total Occupancy | Distance from Subject | Tenant Name | Lease Date/Term | Lease Area (SF) | Annual Base Rent PSF | Lease Type |
| 30 Chasner St., Hempstead, NY | 1920/NAV | 1 | 5,000 | 80% | 3.0 miles | Listed | NAP / 3 Yrs | 5,000 | $18.00 | MG |
| 95 Seaview Blvd., Port Washington NY | 1985/NAV | 1 | 50,000 | 100% | 6.6 miles | Astro Big | Dec 2015/ 10 Yrs | 3,750 | $15.00 | MG |
| 3580 Oceanside Rd., Oceanside, NY | 1953/NAV | 1 | 50,000 | 77% | 8.0 miles | Listed | NAP / 5 Yrs | 4,000 | $17.00 | MG |
| 44 Sea Cliff Avenue, Glen Cove, NY | 1961/NAV | 2 | 15,000 | 50% | 8.2 miles | NAV | Jul 2014/ 3 Yrs | 2,000 | $13.50 | MG |
| (1) | Information obtained from the appraisal. |
The Borrower.The borrower is Garden City 505, LLC, a Delaware limited liability company and a single purpose entity with one independent director. Legal counsel to the borrower delivered a non-consolidation opinion in connection with the origination of the Business & Research Center at Garden City Mortgage Loan. David J. Cohen and Abraham Cohen are the guarantors of certain nonrecourse carveouts under the Business & Research Center at Garden City Mortgage Loan.
The Sponsors.The sponsors are David J. Cohen and Abraham Cohen, founders of Carlton Associates, Inc., an asset management firm. Founded in 1992 by David, Abraham and their brother Jack, Carlton Associates, Inc. invests in fixed income and equities, with a particular focus on commercial real estate. Notable transactions in the Carlton Associates, Inc. real estate platform include: 469 7th Avenue, 1370 Broadway and 100 West 57th Street in New York City, New York; 1700 Market Street, 1500 Spring Garden and 1835 Market Street in Philadelphia, Pennsylvania; Huntington Center in Columbus, Ohio; and Bank of America Plaza in Chicago, Illinois.
Escrows.The loan documents provide for upfront reserves in the amount of $115,463 for real estate taxes payable under the PILOT Agreement (see “PILOT Program” section), $87,019 for insurance premiums, $98,000 for existing tenant improvements related to the Lifetime Brands lease, $16,301 for the outstanding Lifetime Brands rent abatement and $3,000 for deferred maintenance. The loan documents require monthly deposits of an amount equal to one-twelfth of the estimated annual real estate taxes payable under the PILOT Agreement (currently equates to $51,011); one-twelfth of the estimated annual insurance premiums (currently equates to $9,017); $3,119 for replacement reserves; $3,898 for general tenant improvements and leasing commissions (“TI/LC”) and $7,643 for future tenant improvements related to the Lifetime Brands lease, capped at $663,583.
Lockbox and Cash Management.The Business & Research Center at Garden City Mortgage Loan is structured with a lender-controlled hard lockbox, which is already in place, and springing cash management. The Business & Research Center at Garden City Mortgage Loan requires tenants to deposit all rents directly into such lockbox account. Prior to the occurrence of a Cash
THE INFORMATION IN THIS STRUCTURAL AND COLLATERAL TERM SHEET IS NOT COMPLETE AND MAY BE AMENDED PRIOR TO THE TIME OF SALE. THIS TERM SHEET IS NOT AN OFFER TO SELL THESE SECURITIES AND IT IS NOT A SOLICITATION OF AN OFFER TO BUY THESE SECURITIES IN ANY JURISDICTION WHERE THE OFFER OR SALE IS NOT PERMITTED.
| 62 |
BUSINESS & RESEARCH CENTER AT GARDEN CITY |
Management Period (as defined below), all funds in the lockbox account are required to be swept to the borrower’s operating account. During a Cash Management Period, all funds in the lockbox account will be swept to a lender-controlled cash management account.
A “Cash Management Period” will commence upon the occurrence of: (i) an event of default; (ii) the debt service coverage ratio falling below 1.15x after the end of two calendar quarters; or (iii) commencement of a Lease Sweep Period (as defined below). A Cash Management Period will end, if for six consecutive months (a) no event of default has continued beyond the applicable notice and cure period; (b) no event that would trigger another Cash Management Period has occurred; (c) the debt service coverage ratio is at least 1.20x; and (d) with respect to clause (iii) above, the Lease Sweep Period has ended.
A “Lease Sweep Period” will commence upon: (A) the Lifetime Brands lease or the Nassau Community College lease (individually, not collectively, a “Specified Lease”), or any material portion thereof, is surrendered, cancelled or terminated prior to its then current expiration date; or (B) Lifetime Brands or Nassau Community College (individually, not collectively, a “Specified Tenant”) discontinues its business at its premises or gives written notice that it intends to discontinue its business; or (C) the occurrence and continuance (beyond any applicable notice and cure periods) of a monetary or material non-monetary default under any Specified Lease; or (D) the Specified Tenant becomes the subject of a bankruptcy action.
A Lease Sweep Period will end upon: with respect to clause (A) or clause (B) above, the date on which (i) all of the space demised under the applicable Specified Lease has been fully leased pursuant to one or more replacement leases approved by the lender in accordance with the Business & Research Center at Garden City Mortgage Loan documents, (ii) all applicable approved leasing expenses (and any other expenses in connection with the re-tenanting of such space) have been paid in full, (iii) the replacement tenant has taken possession of and is occupying all of its space, is in occupancy, open for business and is paying unabated base rent in accordance with such lease and (iv) there are no offsets due such tenant under such replacement lease; with respect to in clause (C) above, if such default has been cured, and there has been no other monetary or material non-monetary default (beyond any applicable notice and cure periods) under the applicable Specified Lease for a period of six consecutive months following such cure; and with respect to clause (D) above, if the bankruptcy action is dismissed or the Specified Lease is affirmed.
Property Management. The Business & Research Center at Garden City Property is managed by Colliers International LI Management, LLC.
PILOT Program. The Business & Research Center at Garden City Property is subject to a Payment In Lieu Of Taxes Agreement (“PILOT Agreement”) dated as of February 1, 2016 and administered by The Town of Hempstead Industrial Development Agency (“IDA”). The PILOT Agreement has been extended through December 31, 2029. The IDA owns the fee title interest in the Business & Research Center at Garden City Property until the PILOT Agreement expires. At the expiration of the PILOT Agreement, fee title of the Business & Research Center at Garden City Property will be conveyed to the borrower and the Business & Research Center at Garden City Property will be taxed based on the full assessed value. The payments due under the PILOT Agreement are paid in four installments every year. See “Ground Lease” section below.
Assumption. The borrower has the right to transfer the Business & Research Center at Garden City Property provided that certain conditions are satisfied, including (i) no event of default has occurred and is continuing; (ii) the lender has approved, in its reasonable discretion, the proposed transferee; (iii) the lender has approved any successor guarantor, which approval shall not be unreasonably withheld so long as such successor guarantor satisfies the lender’s credit review and underwriting standards, including meeting the guarantor’s net worth and liquidity requirements of the applicable Business & Research Center at Garden City Property Mortgage Loan documents; and (iv) if required by the lender, a rating agency confirmation letter from DBRS, Fitch and Moody’s that the transfer will not result in a downgrade, withdrawal or qualification of the respective ratings assigned to the Series 2016-C33 Certificates.
Right of First Refusal. Nassau Community College has a right of first refusal (“ROFR��) to purchase the 500 Endo Boulevard building at the Business & Research Center at Garden City Property from the landlord upon certain terms and conditions. The tenant agreed in a subordination, nondisturbance and attornment agreement that such right of first refusal is fully subordinate to the Business and Research Center at Garden City Mortgage Loan and is inapplicable with respect to any foreclosure of the mortgage or acquisition of the Business and Research Center at Garden City Property by lender in lieu of foreclosure.
Partial Release. Not permitted.
Real Estate Substitution.Not permitted.
Subordinate and Mezzanine Indebtedness.Not permitted.
Ground Lease.The IDA is the fee owner of the Business & Research Center at Garden City Property. The IDA leases the entire Business & Research Center at Garden City Property to the Business & Research Center at Garden City Mortgage Loan borrower pursuant to a second amended and restated lease agreement dated as of February 1, 2016 (the “IDA Lease Agreement”) and ground rent payments are equal to $1.00 per year. The term of the IDA Lease Agreement expires on December 31, 2029. Among other things, the borrower covenanted in the IDA Lease Agreement that it, its affiliates, agents or subtenants, will maintain 310 full-time employees at the Business & Research Center at Garden City Property for the term of the IDA Lease Agreement. The fee interest in the Business & Research Center at Garden City Property will revert to the borrower on December 31, 2029 or upon early termination of the IDA Lease Agreement for the purchase price of $1.00 plus payment of all amounts due and payable under the PILOT Agreement as of the date of the conveyance and unpaid fees and expenses of the IDA. In the event that the borrower violates the terms of the IDA Lease Agreement and/or the PILOT Agreement, among other remedies available to the IDA are the termination of those agreements, loss of the associated payment in lieu of tax benefits, and pursuant to the Second Amended and Restated Recapture Agreement with the IDA, the borrower will be responsible for paying back a percentage (on a declining scale from 100%
THE INFORMATION IN THIS STRUCTURAL AND COLLATERAL TERM SHEET IS NOT COMPLETE AND MAY BE AMENDED PRIOR TO THE TIME OF SALE. THIS TERM SHEET IS NOT AN OFFER TO SELL THESE SECURITIES AND IT IS NOT A SOLICITATION OF AN OFFER TO BUY THESE SECURITIES IN ANY JURISDICTION WHERE THE OFFER OR SALE IS NOT PERMITTED.
| 63 |
BUSINESS & RESEARCH CENTER AT GARDEN CITY |
to 0%) of the direct monetary benefits, tax exemptions and abatements and other financial assistance derived by the Business & Research Center at Garden City Mortgage Loan borrower from the existence of the PILOT Agreement and the IDA Lease Agreement.
Terrorism Insurance. The loan documents provide that the required “all risk” insurance policy must include coverage for terrorism in an amount equal to the full replacement cost of the Business & Research Center at Garden City Property. The loan documents also require business interruption insurance covering no less than the 18-month period following the occurrence of a casualty event, together with a six-month extended period of indemnity.
Windstorm Insurance. The loan documents provide that the required “all risk” insurance policy must include coverage for windstorm/hail in an amount equal to the full replacement cost of the Business & Research Center at Garden City Property. At the time of the Business & Research Center at Garden City Mortgage Loan closing, the Business & Research Center at Garden City Property had insurance coverage for windstorm.
THE INFORMATION IN THIS STRUCTURAL AND COLLATERAL TERM SHEET IS NOT COMPLETE AND MAY BE AMENDED PRIOR TO THE TIME OF SALE. THIS TERM SHEET IS NOT AN OFFER TO SELL THESE SECURITIES AND IT IS NOT A SOLICITATION OF AN OFFER TO BUY THESE SECURITIES IN ANY JURISDICTION WHERE THE OFFER OR SALE IS NOT PERMITTED.
| 64 |
(THIS PAGE INTENTIONALLY LEFT BLANK)
THE INFORMATION IN THIS STRUCTURAL AND COLLATERAL TERM SHEET IS NOT COMPLETE AND MAY BE AMENDED PRIOR TO THE TIME OF SALE. THIS TERM SHEET IS NOT AN OFFER TO SELL THESE SECURITIES AND IT IS NOT A SOLICITATION OF AN OFFER TO BUY THESE SECURITIES IN ANY JURISDICTION WHERE THE OFFER OR SALE IS NOT PERMITTED.
| 65 |
| DOUBLETREE SEATTLE AIRPORT SOUTHCENTER |
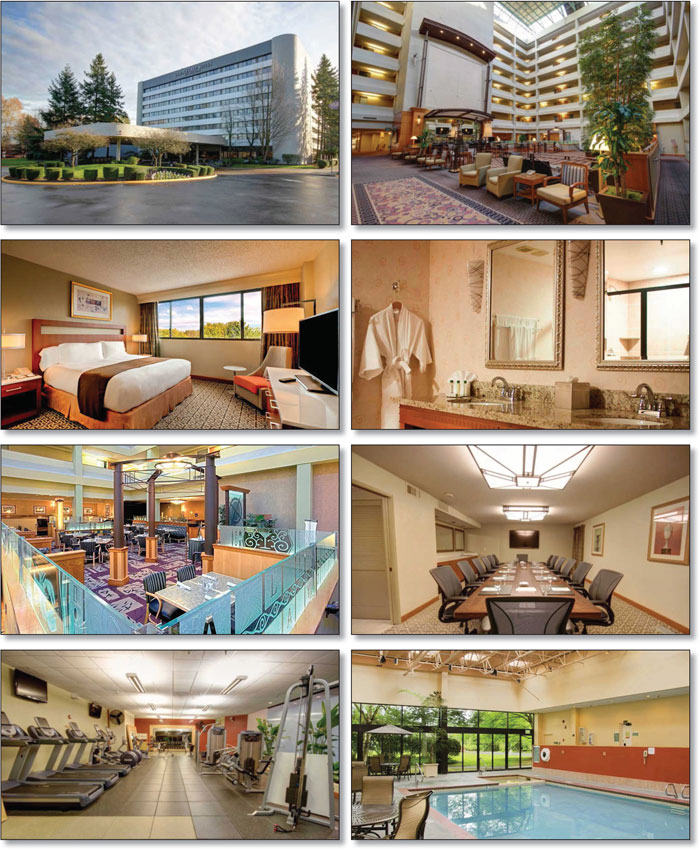
THE INFORMATION IN THIS STRUCTURAL AND COLLATERAL TERM SHEET IS NOT COMPLETE AND MAY BE AMENDED PRIOR TO THE TIME OF SALE. THIS TERM SHEET IS NOT AN OFFER TO SELL THESE SECURITIES AND IT IS NOT A SOLICITATION OF AN OFFER TO BUY THESE SECURITIES IN ANY JURISDICTION WHERE THE OFFER OR SALE IS NOT PERMITTED.
| 66 |
| DOUBLETREE SEATTLE AIRPORT SOUTHCENTER |

THE INFORMATION IN THIS STRUCTURAL AND COLLATERAL TERM SHEET IS NOT COMPLETE AND MAY BE AMENDED PRIOR TO THE TIME OF SALE. THIS TERM SHEET IS NOT AN OFFER TO SELL THESE SECURITIES AND IT IS NOT A SOLICITATION OF AN OFFER TO BUY THESE SECURITIES IN ANY JURISDICTION WHERE THE OFFER OR SALE IS NOT PERMITTED.
| 67 |
| No. 5 – DoubleTree Seattle Airport Southcenter | ||||||||
| Loan Information | Property Information | |||||||
| Mortgage Loan Seller: | C-III Commercial Mortgage LLC | Single Asset/Portfolio: | Single Asset | |||||
Credit Assessment (DBRS/Fitch/Moody’s): | NR/NR/NR | Property Type: | Hospitality | |||||
| Original Principal Balance: | $28,500,000 | Specific Property Type: | Full Service | |||||
| Cut-off Date Balance: | $28,437,374 | Location: | Seattle, WA | |||||
| % of Initial Pool Balance: | 4.0% | Size: | 219 Rooms | |||||
| Loan Purpose: | Refinance | Cut-off Date Balance Per Room: | $129,851 | |||||
| Borrower Name: | CHA Tukwila, LLC | Year Built/Renovated: | 1980/2015 | |||||
| Sponsor: | Ki Yong Choi | Title Vesting: | Fee | |||||
| Mortgage Rate: | 5.490% | Property Manager: | Self-managed | |||||
| Note Date: | December 29, 2015 | 4thMost Recent Occupancy (As of): | 82.3% (12/31/2012) | |||||
| Anticipated Repayment Date: | NAP | 3rdMost Recent Occupancy (As of): | 85.5% (12/31/2013) | |||||
| Maturity Date: | January 1, 2026 | 2ndMost Recent Occupancy (As of): | 86.4% (12/31/2014) | |||||
| IO Period: | None | Most Recent Occupancy (As of): | 82.5% (12/31/2015) | |||||
| Loan Term (Original): | 120 months | Current Occupancy (As of): | 83.5% (2/29/2016) | |||||
| Seasoning: | 2 months | |||||||
| Amortization Term (Original): | 360 months | Underwriting and Financial Information: | ||||||
| Loan Amortization Type: | Amortizing Balloon | |||||||
| Interest Accrual Method: | Actual/360 | 4thMost Recent NOI (As of)(2): | $2,518,022 (12/31/2013) | |||||
| Call Protection: | L(26),D(91),O(3) | 3rdMost Recent NOI (As of)(2): | $3,352,385 (12/31/2014) | |||||
| Lockbox Type: | Springing | 2ndMost Recent NOI (As of)(2): | $3,706,723 (12/31/2015) | |||||
| Additional Debt: | None | Most Recent NOI (As of) (2): | $3,949,255 (TTM 2/29/2016) | |||||
| Additional Debt Type: | NAP | |||||||
| U/W Revenues: | $12,723,113 | |||||||
| U/W Expenses: | $9,195,095 | |||||||
| U/W NOI: | $3,528,018 | |||||||
| Escrows and Reserves(1): | U/W NCF: | $3,019,093 | ||||||
| U/W NOI DSCR: | 1.82x | |||||||
| Type: | Initial | Monthly | Cap (If Any) | U/W NCF DSCR: | 1.56x | |||
| Taxes | $103,000 | $25,750 | NAP | U/W NOI Debt Yield: | 12.4% | |||
| Insurance | $116,557 | $12,951 | NAP | U/W NCF Debt Yield: | 10.6% | |||
| FF&E Reserve | $20,756 | $20,756 | NAP | As-Is Appraised Value: | $42,100,000 | |||
| Seasonality Reserve | $485,000 | $121,500 | $485,000 | As-Is Appraisal Valuation Date: | November 5, 2015 | |||
| PIP Reserve | $0 | Springing | NAP | Cut-off Date LTV Ratio: | 67.5% | |||
| Deferred Maintenance | $3,563 | $0 | NAP | LTV Ratio at Maturity or ARD: | 56.5% | |||
| (1) | See “Escrows” section. |
| (2) | See “Cash Flow Analysis” section. |
The Mortgage Loan. The mortgage loan (the “DoubleTree Seattle Airport Southcenter Mortgage Loan”) is evidenced by a single promissory note that is secured by a first mortgage encumbering the fee interest in a full-service hotel located in Seattle, Washington (the “DoubleTree Seattle Airport Southcenter Property”). The DoubleTree Seattle Airport Southcenter Mortgage Loan was originated on December 29, 2015 by C-III Commercial Mortgage LLC. The DoubleTree Seattle Airport Southcenter Mortgage Loan had an original principal balance of $28,500,000, has an outstanding principal balance as of the Cut-off Date of $28,437,374 and accrues interest at an interest rate of 5.490%per annum. The DoubleTree Seattle Airport Southcenter Mortgage Loan had an initial term of 120 months, has a remaining term of 118 months as of the Cut-off Date and requires payments of principal and interest based on a 30-year amortization schedule. The DoubleTree Seattle Airport Southcenter Mortgage Loan matures on January 1, 2026.
Following the lockout period, the borrower has the right to defease the DoubleTree Seattle Airport Southcenter Mortgage Loan in whole, but not in part, on any date before November 1, 2025. In addition, the DoubleTree Seattle Airport Southcenter Mortgage Loan is prepayable, without penalty, on or after November 1, 2025.
THE INFORMATION IN THIS STRUCTURAL AND COLLATERAL TERM SHEET IS NOT COMPLETE AND MAY BE AMENDED PRIOR TO THE TIME OF SALE. THIS TERM SHEET IS NOT AN OFFER TO SELL THESE SECURITIES AND IT IS NOT A SOLICITATION OF AN OFFER TO BUY THESE SECURITIES IN ANY JURISDICTION WHERE THE OFFER OR SALE IS NOT PERMITTED.
| 68 |
| DOUBLETREE SEATTLE AIRPORT SOUTHCENTER |
Sources and Uses
| Sources | Uses | ||||||||
| Original loan amount | $28,500,000 | 100.0% | Loan payoff(1) | $12,181,685 | 42.7 | % | |||
| Reserves | 728,876 | 2.6 | |||||||
| Closing costs | 260,894 | 0.9 | |||||||
| Return of equity | 15,328,545 | 53.8 | |||||||
| Total Sources | $28,500,000 | 100.0% | Total Uses | $28,500,000 | 100.0 | % | |||
| (1) | The DoubleTree Seattle Airport Southcenter Property was previously securitized in the CGCMT 2006-C4 transaction. |
The Property. The DoubleTree Seattle Airport Southcenter Property is a 219-key, eight-story, full-service hotel located in Seattle, Washington, approximately 12.2 miles south of downtown Seattle and 2.3 miles east of the Seattle-Tacoma International Airport. The DoubleTree Seattle Airport Southcenter Property was designed and developed as a DoubleTree Plaza in 1980. The most recent Property Improvement Plan (“PIP”) was issued in 2013 and such PIP renovations were completed in the first half of 2015 for a total cost of approximately $6.4 million ($29,224 per key), and included replacing the hard and soft goods throughout the DoubleTree Seattle Airport Southcenter Property; renovating the bathrooms and vanities; upgrading the pool, gym, and sauna; upgrading the banquet and restaurant kitchen and dining facility; renovating the lobby, café, and lounge; and striping and repaving the parking lot. The DoubleTree Seattle Airport Southcenter Property amenities feature a restaurant, lounge, coffee/sandwich shop, approximately 10,451 square feet of meeting space across eight meeting rooms, an indoor swimming pool, an indoor whirlpool, a fitness room, a sauna, racquetball courts, lobby workstations, a market pantry and vending areas. The DoubleTree Seattle Airport Southcenter Property features an all-suite guestroom configuration comprised of 90 King Suites, 20 Corner King Suites, 106 Double/Double Suites, 2 Plaza Suites and 1 Presidential Suite. The DoubleTree Seattle Airport Southcenter Property features 419 surface parking spaces resulting in a parking ratio of 1.9 spaces per room. The DoubleTree Seattle Airport Southcenter Property operates under a franchise agreement with Hilton Worldwide, Inc., which expires on July 31, 2024.
Operating History and Underwritten Net Cash Flow.The following table presents certain information relating to the historical operating performance and the underwritten net cash flow at the DoubleTree Seattle Airport Southcenter Property:
Cash Flow Analysis
| 2013(1) | 2014(1)(2) | 2015(2) | TTM 2/29/2016(2) | U/W | % of U/W Total Revenue | U/W $ per Room | ||||||||
| Occupancy | 85.5% | 86.4% | 82.5% | 83.5% | 80.0% | |||||||||
| ADR | $118.90 | $132.72 | $144.57 | $145.60 | $145.60 | |||||||||
| RevPAR | $101.62 | $114.66 | $119.35 | $121.63 | $116.48 | |||||||||
| Room Revenue | $8,122,753 | $9,162,926 | $9,539,912 | $9,748,958 | $9,336,077 | 73.4% | $42,630 | |||||||
| F&B Revenue | 2,864,524 | 3,266,487 | 2,952,461 | 3,091,172 | 3,065,000 | 24.1 | 13,995 | |||||||
| Other Revenue | 178,466 | 249,528 | 331,406 | 322,036 | 322,036 | 2.5 | 1,470 | |||||||
| Total Revenue | $11,165,743 | $12,678,941 | $12,823,779 | $13,162,166 | $12,723,113 | 100.0% | $58,096 | |||||||
| Total Department Expenses | 4,659,128 | 4,978,508 | 4,763,820 | 4,856,054 | 4,736,829 | 37.2 | 21,629 | |||||||
| Gross Operating Profit | $6,506,616 | $7,700,433 | $8,059,959 | $8,306,112 | $7,986,284 | 62.8% | $36,467 | |||||||
| Total Undistributed Expenses | 3,560,927 | 3,909,819 | 3,874,794 | 3,873,226 | 3,963,383 | 31.2 | 18,098 | |||||||
| Profit Before Fixed Charges | $2,945,689 | $3,790,614 | $4,185,164 | $4,432,886 | $4,022,901 | 31.6% | $18,369 | |||||||
| Total Fixed Charges | 427,667 | 438,229 | 478,441 | 483,631 | 494,883 | 3.9 | 2,260 | |||||||
| Net Operating Income | $2,518,022 | $3,352,385 | $3,706,723 | $3,949,255 | $3,528,018 | 27.7% | $16,110 | |||||||
| FF&E | 0 | 0 | 0 | 0 | 508,925 | 4.0 | 2,324 | |||||||
| Net Cash Flow | $2,518,022 | $3,352,385 | $3,706,723 | $3,949,255 | $3,019,093 | 23.7% | $13,786 | |||||||
| NOI DSCR | 1.30x | 1.73x | 1.91x | 2.04x | 1.82x | |||||||||
| NCF DSCR | 1.30x | 1.73x | 1.91x | 2.04x | 1.56x | |||||||||
| NOI DY | 8.9% | 11.8% | 13.0% | 13.9% | 12.4% | |||||||||
| NCF DY | 8.9% | 11.8% | 13.0% | 13.9% | 10.6% | |||||||||
| (1) | Due to occupancy exceeding 85% in 2013, the sponsor increased room rates in 2014, resulting in RevPAR growth of 12.8% from 2013. |
| (2) | For the period from December 2014 through May 2015, the DoubleTree Seattle Airport Southcenter Property was undergoing renovations and had approximately 5,500 room nights off-line resulting in lower occupancy for this period compared to the same period in 2014. For the three-month period ending February 2016, total revenue increased by $464,123, or 19.4%, compared to the same period for the year prior. |
Appraisal.As of the appraisal valuation date of November 5, 2015, the DoubleTree Seattle Airport Southcenter Property had an “as-is” appraised value of $42,100,000.
Environmental Matters.According to the Phase I environmental site assessment dated November 17, 2015, there was no evidence of any recognized environmental conditions at the DoubleTree Seattle Airport Southcenter Property.
THE INFORMATION IN THIS STRUCTURAL AND COLLATERAL TERM SHEET IS NOT COMPLETE AND MAY BE AMENDED PRIOR TO THE TIME OF SALE. THIS TERM SHEET IS NOT AN OFFER TO SELL THESE SECURITIES AND IT IS NOT A SOLICITATION OF AN OFFER TO BUY THESE SECURITIES IN ANY JURISDICTION WHERE THE OFFER OR SALE IS NOT PERMITTED.
| 69 |
| DOUBLETREE SEATTLE AIRPORT SOUTHCENTER |
Market Overview and Competition.The DoubleTree Seattle Airport Southcenter Property is located in Seattle, Washington, southeast of the intersection formed by Southcenter Parkway and Strander Boulevard. The DoubleTree Seattle Airport Southcenter Property is visible from Interstate 5 and is located near the intersection of Interstate 5 and Interstate 405. The DoubleTree Seattle Airport Southcenter Property is within 1,000 feet of the Westfield Southcenter Mall, which after undergoing a $240.0 million expansion from 2006 to 2010 became the largest shopping center (by square footage) in Washington and the Pacific Northwest. The Westfield Southcenter Mall is anchored by Nordstrom, Macy’s, JCPenney, and Sears. The surrounding neighborhood along Southcenter Parkway, includes numerous strip centers, restaurants, banks, office buildings and light industrial facilities. The Seattle-Tacoma International Airport is located approximately 2.3 miles to the west of the DoubleTree Seattle Airport Southcenter Property. The Seattle-Tacoma International Airport was the 13th busiest airport in the United States by passenger count, which reached approximately 42 million in 2015, an increase of 12.9% from 2014.
Regional demand is generated by a variety of sources and industries including aerospace and defense, healthcare, high-tech, and manufacturing with Boeing, PACCAR Inc., Alaska Airlines and Microsoft all maintaining a presence in the surrounding area. Boeing employs over 80,000 employees in the state of Washington with over $5.7 billion in supplier/vendor purchases in the state in 2014. Boeing maintains several office locations in the Seattle area with an office located less than one mile east of the DoubleTree Seattle Airport Southcenter Property. Microsoft’s Redmond Campus headquarters encompass over 8.0 million square feet of office space and 30,000-40,000 employees with additional office locations in Bellevue and Issaquah, Washington. Alaska Airlines maintains its headquarters in Seattle. PACCAR Inc. is a national business publication top 500 company and is one of the largest manufacturers of medium- and heavy-duty trucks in the world. PACCAR Inc. is headquartered in Bellevue, Washington and maintains a strong presence in Renton, Washington. The Seattle airport market (as identified by a third party hospitality research report) includes 61 hotels, encompassing 8,343 rooms, of varying scales from economy class to upper-upscale class. The DoubleTree Seattle Airport Southcenter Property is identified as upscale class by a third party hospitality research report and this subset includes 10 hotels in total encompassing 2,511 rooms.
The following table presents certain information relating to the DoubleTree Seattle Airport Southcenter Property’s competitive set:
Subject and Market Historical Occupancy, ADR and RevPAR(1)
Competitive Set | DoubleTree Seattle Airport Southcenter | Penetration Factor | |||||||||||||||
Year | Occupancy | ADR | RevPAR | Occupancy | ADR | RevPAR | Occupancy | ADR | RevPAR | ||||||||
| 12/31/2015 TTM | 74.0% | $127.10 | $94.07 | 82.0%(2) | $145.53 | $119.35 | 110.8% | 114.5% | 126.9% | ||||||||
| 12/31/2014 TTM | 70.6% | $118.00 | $83.31 | 86.4%(2) | $132.72 | $114.66 | 122.4% | 112.5% | 137.6% | ||||||||
| 12/31/2013 TTM | 71.1% | $110.69 | $78.71 | 85.5% | $118.90 | $101.62 | 120.2% | 107.4% | 129.1% | ||||||||
| (1) | Information obtained from a third party hospitality research report dated January 19, 2016. The competitive set includes the following hotels: Red Lion Hotel & Conference Center Seattle Renton, Residence Inn Seattle South Tukwila, Ramada Tukwila SeaTac Airport, Courtyard Seattle South Center, Larkspur Landing Renton, and Courtyard Seattle SeaTac Area. The appraisal identified a different competitive set from a third party hospitality research report which includes the following hotels: Embassy Suites Hilton Seattle Tacoma International Airport, DoubleTree by Hilton Seattle Airport, Hilton Seattle Airport & Conference Center and Marriott Seattle Airport. For the year ended 2014 the subject had penetration rates in this competitive set of 105.2%, 100.5% and 108.0% for Occupancy, ADR and RevPar, respectively. 2015 information was not available at the time the appraisal was completed. |
| (2) | For the period from December 2014 through May 2015, the DoubleTree Seattle Airport Southcenter Property was undergoing renovations and had a total of approximately 5,500 room nights off-line resulting in lower occupancy for this period than for the same period a year prior. |
The Borrower.The borrower is CHA Tukwila, LLC, a Delaware limited liability company and a single purpose entity with one independent director. Legal counsel to the borrower delivered a non-consolidation opinion in connection with the origination of the DoubleTree Seattle Airport Southcenter Mortgage Loan. Ki Yong Choi is the guarantor of certain nonrecourse carveouts under the DoubleTree Seattle Airport Southcenter Mortgage Loan.
The Sponsor.The sponsor is Ki Yong Choi. Founded in 1992, Cathedral Hill Associates Inc. (“CHA”), which is wholly owned by Ki Yong Choi, focuses on hotel ownership and management. CHA had previously owned the Cathedral Hill Hotel in San Francisco and currently owns and operates three branded, full service hotels including the DoubleTree Seattle Airport Southcenter Property, a Doubletree Hotel near the Galleria Mall in Dallas, Texas, and a Holiday Inn in La Mirada, California. The sponsor purchased the DoubleTree Seattle Airport Southcenter Property in 2005.
Escrows.The loan documents provide for upfront escrows in the amount of $103,000 for real estate taxes, $116,557 for insurance premiums, $3,563 for deferred maintenance and $485,000 for a seasonality reserve. The loan documents also provide for ongoing monthly escrows of $25,750 for real estate taxes, and $12,951 for insurance premiums. The seasonality reserve, if drawn upon, will be replenished monthly from June until September in the amount of $121,250, which can be altered at lender discretion, and is capped at $485,000. The loan documents require an upfront escrow of $20,756 for FF&E expenses with ongoing monthly escrows of $20,756. The required FF&E reserve deposits, to be adjusted each January, are equal to one-twelfth of 2.0% of the actual annual gross income from the prior year until January 1, 2017. From January 1, 2017 until December 1, 2017, the required FF&E reserve deposits are equal to one-twelfth of 3.0% of the actual annual gross income from the prior year, and from and after January 1, 2018, the required FF&E reserve deposits are equal to one-twelfth of 4.0% of the actual annual gross income from the prior year.
As additional security for the loan, the borrower is required to establish and maintain at all times a PIP reserve. Commencing on July 1, 2022 and continuing until the earlier of: (i) June 5, 2024, or (ii) the date that the lender has determined there are sufficient funds in the PIP reserve and the FF&E reserve to pay for all replacements and/or alternations to the DoubleTree Seattle Airport Southcenter Property required by the franchisor in connection with the franchise renewal and provided that the franchise renewal has occurred, the borrower is required to fund a PIP reserve in an amount equal to 50.0% of the excess cash flow each month. Once the
THE INFORMATION IN THIS STRUCTURAL AND COLLATERAL TERM SHEET IS NOT COMPLETE AND MAY BE AMENDED PRIOR TO THE TIME OF SALE. THIS TERM SHEET IS NOT AN OFFER TO SELL THESE SECURITIES AND IT IS NOT A SOLICITATION OF AN OFFER TO BUY THESE SECURITIES IN ANY JURISDICTION WHERE THE OFFER OR SALE IS NOT PERMITTED.
| 70 |
| DOUBLETREE SEATTLE AIRPORT SOUTHCENTER |
final PIP costs have been determined, if the balance then held in the PIP reserve and FF&E reserve is less than the cost of the PIP work, the borrower will have the option to: (a) allow the cash sweep to continue until the balance of the PIP reserve and FF&E reserve equals or exceeds the cost to complete all PIP work, or (b) provide satisfactory proof to the lender that the borrower has sufficient funds to pay the shortfall. Upon the balance of the PIP reserve and FF&E reserve being equal to or exceeding the determined cost of the PIP work, the cash flow sweep to those reserves will terminate.
Lockbox and Cash Management.Upon the occurrence of a Cash Management Period (as defined below), the borrower is required to establish a lender-controlled lockbox account and direct tenants to deposit all rents, and direct all credit card companies under merchant agreements to pay receipts, directly into such lockbox account. The loan documents also require that all cash payments received by the borrower or property manager are to be deposited into such lockbox account within one business day of receipt. During a Cash Management Period, all excess cash flow will be swept to a lender-controlled cash management account.
A “Cash Management Period” will commence upon: (i) the occurrence and continuance of an event of default; (ii) the debt service coverage ratio falling below 1.20x during the 12 months immediately preceding the date of determination; (iii) July 1, 2022; or (iv) the franchisor’s notice of nonrenewal of the franchise agreement. A Cash Management Period will end upon: with respect to clause (i), the cure of such event of default; with respect to clause (ii), the debt service coverage ratio being at least 1.30x for two consecutive calendar quarters; with respect to clause (iii), the franchise renewal occurring and either of the following has occurred (a) June 5, 2024, or (b) the lender has determined that there are sufficient funds in the PIP reserve and the FF&E reserve to pay for all PIP work; and with respect to clause (iv), the borrower entering into an approved replacement franchise agreement and the lender has determined there are sufficient funds in the PIP reserve and FF&E reserve to pay for all PIP work.
Property Management.The DoubleTree Seattle Airport Southcenter Property is managed by an affiliate of the borrower.
Assumption.The borrower has the right to transfer the DoubleTree Seattle Airport Southcenter Property provided that certain conditions are satisfied, including but not limited to: (i) no event of default has occurred and is continuing; (ii) the lender has reasonably determined that the proposed transferee and guarantor satisfy the lender’s credit review and underwriting standards, taking into consideration the transferee’s experience, financial strength and general business standing; and (iii) if requested by the lender, rating agency confirmation from DBRS, Fitch and Moody’s that such assumption will not result in a downgrade, withdrawal or qualification of the respective ratings assigned to the Series 2016-C33 Certificates.
Partial Release.Not permitted.
Real Estate Substitution.Not permitted.
Subordinate and Mezzanine Indebtedness.Not permitted.
Ground Lease.None.
Terrorism Insurance.The loan documents require that the “all risk” insurance policy required to be maintained by the borrower provide coverage for terrorism in an amount equal to the full replacement cost of the DoubleTree Seattle Airport Southcenter Property, as well as business interruption insurance covering no less than the 18-month period following the occurrence of a casualty event, together with a six-month extended period of indemnity.
Earthquake Insurance. The loan documents require earthquake insurance in amount not less than $25,000,000 with a deductible of 5.0% of the total insurable value. The seismic report indicated a probable maximum loss of 19.0%.
THE INFORMATION IN THIS STRUCTURAL AND COLLATERAL TERM SHEET IS NOT COMPLETE AND MAY BE AMENDED PRIOR TO THE TIME OF SALE. THIS TERM SHEET IS NOT AN OFFER TO SELL THESE SECURITIES AND IT IS NOT A SOLICITATION OF AN OFFER TO BUY THESE SECURITIES IN ANY JURISDICTION WHERE THE OFFER OR SALE IS NOT PERMITTED.
| 71 |
(THIS PAGE INTENTIONALLY LEFT BLANK)
THE INFORMATION IN THIS STRUCTURAL AND COLLATERAL TERM SHEET IS NOT COMPLETE AND MAY BE AMENDED PRIOR TO THE TIME OF SALE. THIS TERM SHEET IS NOT AN OFFER TO SELL THESE SECURITIES AND IT IS NOT A SOLICITATION OF AN OFFER TO BUY THESE SECURITIES IN ANY JURISDICTION WHERE THE OFFER OR SALE IS NOT PERMITTED.
| 72 |
| INDEPENDENCE MARKETPLACE |
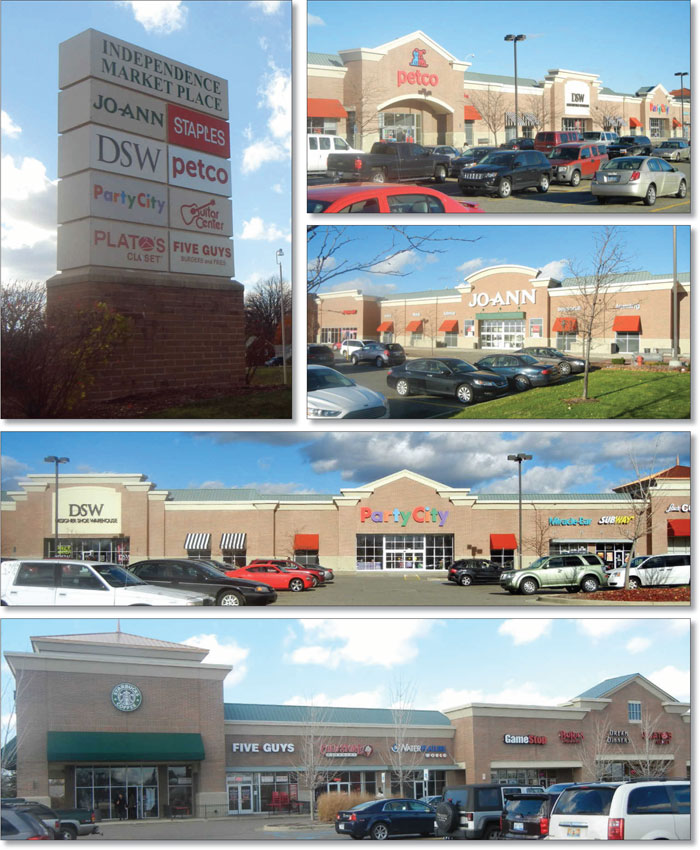
THE INFORMATION IN THIS STRUCTURAL AND COLLATERAL TERM SHEET IS NOT COMPLETE AND MAY BE AMENDED PRIOR TO THE TIME OF SALE. THIS TERM SHEET IS NOT AN OFFER TO SELL THESE SECURITIES AND IT IS NOT A SOLICITATION OF AN OFFER TO BUY THESE SECURITIES IN ANY JURISDICTION WHERE THE OFFER OR SALE IS NOT PERMITTED.
| 73 |
| INDEPENDENCE MARKETPLACE |
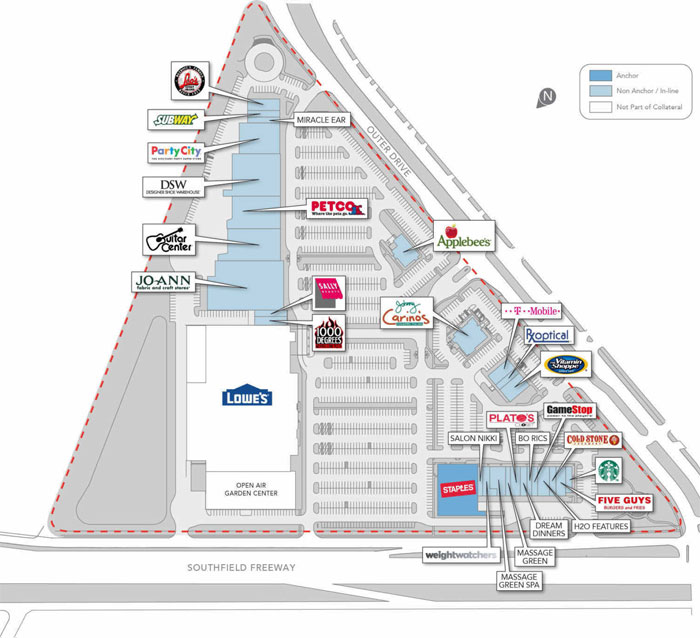
THE INFORMATION IN THIS STRUCTURAL AND COLLATERAL TERM SHEET IS NOT COMPLETE AND MAY BE AMENDED PRIOR TO THE TIME OF SALE. THIS TERM SHEET IS NOT AN OFFER TO SELL THESE SECURITIES AND IT IS NOT A SOLICITATION OF AN OFFER TO BUY THESE SECURITIES IN ANY JURISDICTION WHERE THE OFFER OR SALE IS NOT PERMITTED.
| 74 |
| INDEPENDENCE MARKETPLACE |

THE INFORMATION IN THIS STRUCTURAL AND COLLATERAL TERM SHEET IS NOT COMPLETE AND MAY BE AMENDED PRIOR TO THE TIME OF SALE. THIS TERM SHEET IS NOT AN OFFER TO SELL THESE SECURITIES AND IT IS NOT A SOLICITATION OF AN OFFER TO BUY THESE SECURITIES IN ANY JURISDICTION WHERE THE OFFER OR SALE IS NOT PERMITTED.
| 75 |
| No. 6 – Independence Marketplace | |||||||
| Loan Information | Property Information | ||||||
| Mortgage Loan Seller: | Ladder Capital Finance LLC | Single Asset/Portfolio: | Single Asset | ||||
Credit Assessment (DBRS/Fitch/Moody’s): | NR/NR/NR | Property Type: | Retail | ||||
| Original Principal Balance: | $27,000,000 | Specific Property Type: | Anchored | ||||
| Cut-off Date Balance: | $26,896,773 | Location: | Allen Park, MI | ||||
| % of Initial Pool Balance: | 3.8% | Size: | 178,308 SF | ||||
| Loan Purpose: | Refinance | Cut-off Date Balance Per SF: | $150.84 | ||||
| Borrower Name: | Outer Drive 39 Development Co., LLC | Year Built/Renovated: | 2005/NAP | ||||
| Sponsors(1): | Various | Title Vesting: | Fee | ||||
| Mortgage Rate: | 4.521% | Property Manager: | Self-managed | ||||
| Note Date: | December 1, 2015 | 4th Most Recent Occupancy (As of): | 94.0% (12/31/2011) | ||||
| Anticipated Repayment Date: | NAP | 3rd Most Recent Occupancy (As of): | 93.0% (12/31/2012) | ||||
| Maturity Date: | December 6, 2025 | 2ndMost Recent Occupancy (As of): | 94.0% (12/31/2013) | ||||
| IO Period: | None | Most Recent Occupancy (As of): | 97.0% (12/31/2014) | ||||
| Loan Term (Original): | 120 months | Current Occupancy (As of): | 100.0% (11/1/2015) | ||||
| Seasoning: | 3 months | ||||||
| Amortization Term (Original): | 360 months | Underwriting and Financial Information: | |||||
| Loan Amortization Type: | Amortizing Balloon | ||||||
| Interest Accrual Method: | Actual/360 | 4th Most Recent NOI (As of): | $2,630,216 (12/31/2012) | ||||
| Call Protection: | L(27),D(88),O(5) | 3rd Most Recent NOI (As of): | $2,584,857 (12/31/2013) | ||||
| Lockbox Type: | Hard/Upfront Cash Management | 2nd Most Recent NOI (As of): | $2,769,151 (12/31/2014) | ||||
| Additional Debt: | None | Most Recent NOI (As of): | $2,651,508 (TTM 9/30/2015) | ||||
| Additional Debt Type: | NAP | ||||||
| U/W Revenues: | $4,115,336 | ||||||
| U/W Expenses: | $1,379,410 | ||||||
| U/W NOI: | $2,735,926 | ||||||
| U/W NCF: | $2,544,725 | ||||||
| Escrows and Reserves(2): | U/W NOI DSCR: | 1.66x | |||||
| U/W NCF DSCR: | 1.55x | ||||||
| Type: | Initial | Monthly | Cap (If Any) | U/W NOI Debt Yield: | 10.2% | ||
| Taxes | $214,957 | $35,826 | NAP | U/W NCF Debt Yield: | 9.5% | ||
| Insurance | $13,286 | $3,322 | NAP | As-Is Appraised Value: | $39,000,000 | ||
| Replacement Reserves | $0 | $2,972 | NAP | As-Is Appraisal Valuation Date: | October 21, 2015 | ||
| TI/LC Reserve | $0 | $12,962 | NAP | Cut-off Date LTV Ratio: | 69.0% | ||
| Deferred Maintenance | $48,000 | $0 | NAP | LTV Ratio at Maturity or ARD: | 56.0% | ||
| (1) | See “The Sponsors” section. |
| (2) | See “Escrows” section. |
The Mortgage Loan.The mortgage loan (the “Independence Marketplace Mortgage Loan”) is evidenced by a single promissory note that is secured by a first mortgage encumbering an anchored retail center located in Allen Park, Michigan (the “Independence Marketplace Property”). The Independence Marketplace Mortgage Loan was originated on December 1, 2015 by Ladder Capital Finance LLC. The Independence Marketplace Mortgage Loan had an original principal balance of $27,000,000, has an outstanding principal balance as of the Cut-off Date of $26,896,773 and accrues interest at an interest rate of 4.521%per annum. The Independence Marketplace Mortgage Loan had an initial term of 120 months, has a remaining term of 117 months as of the Cut-off Date and requires payments of principal and interest through the term of the Independence Marketplace Mortgage Loan. The Independence Marketplace Mortgage Loan matures on December 6, 2025.
Following the lockout period, the borrower has the right to defease the Independence Marketplace Mortgage Loan in whole, but not in part, on any date before August 6, 2025. In addition, the Independence Marketplace Mortgage Loan is prepayable without penalty on or after August 6, 2025.
THE INFORMATION IN THIS STRUCTURAL AND COLLATERAL TERM SHEET IS NOT COMPLETE AND MAY BE AMENDED PRIOR TO THE TIME OF SALE. THIS TERM SHEET IS NOT AN OFFER TO SELL THESE SECURITIES AND IT IS NOT A SOLICITATION OF AN OFFER TO BUY THESE SECURITIES IN ANY JURISDICTION WHERE THE OFFER OR SALE IS NOT PERMITTED.
| 76 |
| INDEPENDENCE MARKETPLACE |
Sources and Uses
| Sources | Uses | |||||||
| Original loan amount | $27,000,000 | 100.0% | Loan payoff(1) | $25,617,610 | 94.9% | |||
| Reserves | 276,243 | 1.0 | ||||||
| Closing costs | 161,628 | 0.6 | ||||||
| Return of equity | 944,519 | 3.5 | ||||||
| Total Sources | $27,000,000 | 100.0% | Total Uses | $27,000,000 | 100.0% |
| (1) | The Independence Marketplace Property was previously securitized in the GSMS 2006-GG6 transaction. |
The Property. The Independence Marketplace Property is a class A anchored retail center totaling 178,308 square feet located in Allen Park, Michigan, approximately 9.0 miles southwest of downtown Detroit. Originally built in 2005 and situated on a 36.4-acre site, the Independence Marketplace Property is anchored by Jo-Ann Fabrics, Staples, and DSW and is shadow-anchored by a Lowe’s Home Improvement store (not part of the collateral). The other major tenants at the Independence Marketplace Property include Guitar Center, Petco, and Party City. Inline tenants include, among others, Subway, Starbucks and Five Guys. The Independence Marketplace Property is subject to a 16-unit condominium regime, with Unit 1 (land under Lowe’s and not collateral for the Independence Marketplace Mortgage Loan) representing 44.7% of the interests in the condominium regime; and units 2 through 16 (which comprise the Independence Marketplace Property) representing 55.3% of the interests in the condominium regime. The Independence Marketplace Property features 860 surface parking spaces resulting in a parking ratio of 4.8 spaces per 1,000 square feet of net rentable area. As of November 1, 2015, the Independence Marketplace Property was 100.0% occupied by 27 tenants.
The following table presents certain information relating to the tenancy at the Independence Marketplace Property:
Major Tenants
| Tenant Name | Credit Rating (Fitch/ Moody’s/ S&P)(1) | Tenant NRSF | % of NRSF | Annual U/W Base Rent PSF(2) | Annual U/W Base Rent(2) | % of Total Annual U/W Base Rent | Sales PSF(3) | Occupancy Cost(3) | Lease Expiration Date |
| Anchor Tenants – Not Part of Collateral | |||||||||
| Lowe’s | NR/A3/A- | NAV | NOT PART OF THE COLLATERAL | 12/5/2025 | |||||
| Anchor Tenant – Collateral | |||||||||
| Jo-Ann Fabrics | NR/B3/B | 35,000 | 19.6% | $12.00 | $420,000 | 14.1% | NAV | NAV | 1/31/2024(4) |
| Staples | BBB-/Baa2/BBB- | 20,388 | 11.4% | $14.00 | $285,432 | 9.6% | NAV | NAV | 9/30/2020(5) |
| DSW | NR/NR/NR | 20,087 | 11.3% | $14.00 | $281,218 | 9.5% | NAV | NAV | 9/30/2025(6)(7) |
| Total Anchor Tenant – Collateral | 75,475 | 42.3% | $13.07 | $986,650 | 33.2% | ||||
| Major Tenants – Collateral | |||||||||
| Guitar Center | NR/NR/NR | 17,023 | 9.5% | $12.91 | $219,735 | 7.4% | NAV | NAV | 12/31/2020(8) |
| Petco | NR/B2/B | 15,474 | 8.7% | $13.50 | $208,899 | 7.0% | NAV | NAV | 2/28/2023(9) |
| Party City | NR/B1/B | 12,000 | 6.7% | $15.00 | $180,000 | 6.0% | NAV | NAV | 1/31/2017(10) |
| Total Major Tenants – Collateral | 44,497 | 25.0% | $13.68 | $608,634 | 20.5% | ||||
| Non-Major Tenants – Collateral | 58,336 | 32.7% | $23.66 | $1,380,222 | 46.4% | ||||
| Occupied Collateral Total | 178,308 | 100.0% | $16.69 | $2,975,506 | 100.0% | ||||
| Vacant Space | 0 | 0.0% | |||||||
| Collateral Total | 178,308 | 100.0% | |||||||
| (1) | Certain ratings are those of the parent company whether or not the parent guarantees the lease. |
| (2) | Annual U/W Base Rent PSF and Annual U/W Base Rent include contractual rent steps through November 2016, totaling $25,713. |
| (3) | DSW is the only major tenant which is required to report sales. However as it is a new tenant it will not report until after the first lease year. |
| (4) | Jo-Ann Fabrics has two, five-year lease renewal options. |
| (5) | Staples has four, five-year lease renewal options. |
| (6) | DSW has two, five-year lease renewal options. |
| (7) | DSW has the right to terminate its lease with at least 30 days’ prior notice and paying a termination fee equal to $301,305 if the tenant’s gross sales in the trailing twelve month period ending October 2020 are less than $3.0 million. |
| (8) | Guitar Center has four, five-year lease renewal options. |
| (9) | Petco has three, five-year lease renewal options. |
| (10) | Party City has three, five-year lease renewal options. |
THE INFORMATION IN THIS STRUCTURAL AND COLLATERAL TERM SHEET IS NOT COMPLETE AND MAY BE AMENDED PRIOR TO THE TIME OF SALE. THIS TERM SHEET IS NOT AN OFFER TO SELL THESE SECURITIES AND IT IS NOT A SOLICITATION OF AN OFFER TO BUY THESE SECURITIES IN ANY JURISDICTION WHERE THE OFFER OR SALE IS NOT PERMITTED.
| 77 |
| INDEPENDENCE MARKETPLACE |
The following table presents certain information relating to the lease rollover schedule at the Independence Marketplace Property:
Lease Expiration Schedule(1)(2)
| Year Ending December 31, | No. of Leases Expiring | Expiring NRSF | % of Total NRSF | Cumulative Expiring NRSF | Cumulative % of Total NRSF | Annual U/W Base Rent | % of Total Annual U/W Base Rent | Annual U/W Base Rent PSF |
| MTM | 0 | 0 | 0.0% | 0 | 0.0% | $0 | 0.0% | $0.00 |
| 2016 | 1 | 2,000 | 1.1% | 2,000 | 1.1% | $58,000 | 1.9% | $29.00 |
| 2017 | 5 | 19,385 | 10.9% | 21,385 | 12.0% | $338,986 | 11.4% | $17.49 |
| 2018 | 2 | 4,025 | 2.3% | 25,410 | 14.3% | $101,019 | 3.4% | $25.10 |
| 2019 | 2 | 4,995 | 2.8% | 30,405 | 17.1% | $89,235 | 3.0% | $17.86 |
| 2020 | 7 | 57,003 | 32.0% | 87,408 | 49.0% | $900,042 | 30.2% | $15.79 |
| 2021 | 5 | 10,939 | 6.1% | 98,347 | 55.2% | $314,308 | 10.6% | $28.73 |
| 2022 | 1 | 2,700 | 1.5% | 101,047 | 56.7% | $62,100 | 2.1% | $23.00 |
| 2023 | 1 | 15,474 | 8.7% | 116,521 | 65.3% | $208,899 | 7.0% | $13.50 |
| 2024 | 1 | 35,000 | 19.6% | 151,521 | 85.0% | $420,000 | 14.1% | $12.00 |
| 2025 | 3 | 26,787 | 15.0% | 178,308 | 100.0% | $482,918 | 16.2% | $18.03 |
| 2026 | 0 | 0 | 0.0% | 178,308 | 100.0% | $0 | 0.0% | $0.00 |
| Thereafter | 0 | 0 | 0.0% | 178,308 | 100.0% | $0 | 0.0% | $0.00 |
| Vacant | 0 | 0 | 0.0% | 178,308 | 100.0% | $0 | 0.0% | $0.00 |
| Total/Weighted Average | 28 | 178,308 | 100.0% | $2,975,506 | 100.00% | $16.69 |
| (1) | Information obtained from the underwritten rent roll. |
| (2) | Certain tenants may have lease termination options that are exercisable prior to the originally stated expiration date of the subject lease and that are not considered in the Lease Expiration Schedule. |
The following table presents historical occupancy percentages at the Independence Marketplace Property:
Historical Occupancy
12/31/2011(1) | 12/31/2012(2) | 12/31/2013(2) | 12/31/2014(2) | 11/1/2015(3) |
| 94.0% | 93.0% | 94.0% | 97.0% | 100.0% |
| (1) | Information obtained from a third party source. |
| (2) | Information obtained from the borrower. |
| (3) | Information obtained from the underwritten rent roll. |
Operating History and Underwritten Net Cash Flow.The following table presents certain information relating to the historical operating performance and underwritten net cash flow at the Independence Marketplace Property:
Cash Flow Analysis
| 2012 | 2013 | 2014 | TTM 9/30/2015 | U/W | % of U/W Effective Gross Income | U/W $ per SF | |||||||||
| Base Rent | $2,922,540 | $2,871,611 | $2,891,066 | $2,908,535 | $2,975,506(1) | 72.3% | $16.69 | ||||||||
| Grossed Up Vacant Space | 0 | 0 | 0 | 0 | 0 | 0 | 0 | ||||||||
| Percentage Rent | 0 | 0 | 0 | 0 | 0 | 0 | 0 | ||||||||
| Total Reimbursables | 1,429,789 | 1,392,562 | 1,414,968 | 1,308,356 | 1,356,426 | 33.0 | 7.61 | ||||||||
| Other Income | 228 | 326 | 351 | 1,606 | 0 | 0 | 0 | ||||||||
| Less Vacancy & Credit Loss | (304,663) | (255,850) | (129,181) | (236,038) | (216,597)(2) | (5.3) | (1.21) | ||||||||
| Effective Gross Income | $4,047,894 | $4,008,648 | $4,177,204 | $3,982,460 | $4,115,336 | 100.0% | $23.08 | ||||||||
| Total Operating Expenses | $1,417,678 | $1,423,791 | $1,408,053 | $1,330,952 | $1,379,410 | 33.5% | $7.74 | ||||||||
| Net Operating Income | $2,630,216 | $2,584,857 | $2,769,151 | $2,651,508 | $2,735,926 | 66.5% | $15.34 | ||||||||
| TI/LC | 0 | 0 | 0 | 0 | 155,539 | 3.8 | 0.87 | ||||||||
| Capital Expenditures | 0 | 0 | 0 | 0 | 35,662 | 0.9 | 0.20 | ||||||||
| Net Cash Flow | $2,630,216 | $2,584,857 | $2,769,151 | $2,651,508 | $2,544,725 | 61.8% | $14.27 | ||||||||
| NOI DSCR | 1.60x | 1.57x | 1.68x | 1.61x | 1.66x | ||||||||||
| NCF DSCR | 1.60x | 1.57x | 1.68x | 1.61x | 1.55x | ||||||||||
| NOI DY | 9.8% | 9.6% | 10.3% | 9.9% | 10.2% | ||||||||||
| NCF DY | 9.8% | 9.6% | 10.3% | 9.9% | 9.5% |
| (1) | U/W Base Rent includes contractual rent steps through November 2016, totaling $25,713. |
| (2) | The underwritten economic vacancy is 5.0%. The Independence Marketplace Property was 100.0% physically occupied as of November 1, 2015. |
Appraisal. As of the appraisal valuation date of October 21, 2015, the Independence Marketplace Property had an “as-is” appraised value of $39,000,000.
THE INFORMATION IN THIS STRUCTURAL AND COLLATERAL TERM SHEET IS NOT COMPLETE AND MAY BE AMENDED PRIOR TO THE TIME OF SALE. THIS TERM SHEET IS NOT AN OFFER TO SELL THESE SECURITIES AND IT IS NOT A SOLICITATION OF AN OFFER TO BUY THESE SECURITIES IN ANY JURISDICTION WHERE THE OFFER OR SALE IS NOT PERMITTED.
| 78 |
| INDEPENDENCE MARKETPLACE |
Environmental Matters.According to the Phase I environmental assessment dated November 6, 2015 and additional due diligence previously performed at the Independence Marketplace Property, arsenic and chloride concentrations were found at the Independence Marketplace Property above the then current Michigan Department of Environmental Quality criteria. As such, the existing conditions at the Independence Marketplace Property constitute a recognized environmental condition. A baseline environmental assessment for the Independence Marketplace Place was affirmed by the Michigan Department of Environmental Quality in 2004 and accordingly, Michigan law generally provides liability protection to the owner of the property for such existing contamination so long as the owner exercises due care responsibilities such as reducing exposure and preventing exacerbation of the contamination. The Independence Marketplace Mortgage Loan documents require that the borrower follow a due care plan regarding the contamination. See “Description of the Mortgage Pool – Environmental Considerations” in the Preliminary Prospectus.
Market Overview and Competition.The Independence Marketplace Property is located in Allen Park, Michigan, approximately 9.0 miles southwest of the Detroit central business district (“CBD”). The Independence Marketplace Property has primary access from the Interstate 94 Freeway, Southfield Highway, Outer Drive, and Oakwood Boulevard. On a daily basis, approximately 34,371 cars travel daily past the Independence Marketplace Property along Outer Drive and approximately 92,562 cars travel past the Independence Marketplace Property along Southfield Freeway. Further, the Independence Marketplace Property is located 10.0 miles east of the Detroit Metropolitan Wayne County Airport and benefits from demand generators such as Ford Motor Company, Fairlane Town Center, Wayne State University and its proximity to the Detroit CBD.
The estimated 2015 population within a three- and five-mile radius of the Independence Marketplace Property was 105,108 and 316,194, respectively, while the median household income within the same radii was $46,559 and $40,972, respectively. According to the appraisal, the Independence Marketplace Property is located in the South Detroit/Downriver retail submarket. The South Detroit/Downriver retail submarket contained a total inventory of 2.8 million square feet of retail space with a vacancy rate of 20.9% as of year-end 2015, which is down from 22.0% as of year-end 2010. The appraiser concluded to a blended market rent of $17.18 per square foot triple net, approximately 3.9% above the Independence Marketplace Property’s weighted average underwritten base rent of $16.54 per square foot triple net.
The following table presents certain information relating to some comparable retail properties for the Independence Marketplace Property:
Comparable Leases(1)
| Property Name/ Location | Year Built/ Renovated | Anchor Tenants | Total GLA (SF) | Total Occupancy | Distance from Subject | Tenant Name | Lease Date / Term | Lease Area (SF) | Annual Base Rent PSF | Lease Type |
Woodhaven Commons Woodhaven, MI | 1996/NAP | Kroger, Target | 113,000 | 97% | 11.5 miles | Lane Bryant | March 2014 / 10 Yrs | 5,000 | $18.00 | NNN |
Canton Corners Shopping Canton, MI | 1988/NAP | Hobby Lobby, Buy Buy Baby | 195,528 | 92% | 16.3 miles | Yogurt City | May 2013 / 5.1 Yrs | 2,001 | $18.00 | NNN |
Canton Corners Shopping Canton, MI | 1988/NAP | Hobby Lobby, Buy Buy Baby | 195,528 | 92% | 16.3 miles | Genova Pizzeria | July 2013 / 5.5 Yrs | 1,524 | $18.33 | NNN |
Oakland Plaza Troy, MI | 1979/NAP | TJ Maxx, Michael’s | 171,511 | 100% | 21.4 miles | Michael’s | January 2014 / 11 Yrs | 21,677 | $12.00 | NNN |
| (1) | Information obtained from the appraisal and third party market research reports. |
The Borrower.The borrower is Outer Drive 39 Development Co., LLC, a Michigan limited liability company and a single purpose entity with one independent director. Legal counsel to the borrower delivered a non-consolidation opinion in connection with the origination of the Independence Marketplace Mortgage Loan. Redico Properties LLC (“Redico”), Daniel L. Stern and Christopher G. Brochert are the guarantors of certain nonrecourse carveouts under the Independence Marketplace Mortgage Loan.
The Sponsors.The sponsors are Redico, Daniel L. Stern and Christopher G. Brochert. Redico is a national real estate development, investment, construction and property management company that was founded nearly 40 years ago. Redico currently has invested in 24 mixed-use and office properties located in Michigan. Redico currently has a portfolio valued in excess of $2.0 billion, encompassing over 16.0 million square feet of space nationally. Daniel L. Stern and Christopher G. Brochert are partners of Lormax Stern. Since 1992 Lormax Stern has developed over 20.0 million square feet of retail space.
The sponsors have had prior defaults, foreclosures and deeds in lieu of foreclosure. Additionally the sponsors are minority partners in a partnership which is subject to litigation. For additional information regarding the sponsors, see “Description of the Mortgage Pool – Loan Purpose; Default History, Bankruptcy Issues and Other Proceedings” in the Preliminary Prospectus.
Escrows.The loan documents provide for upfront reserves of $214,957 for real estate taxes, $13,286 for insurance premiums and $48,000 for deferred maintenance. The loan documents also require ongoing monthly reserves in an amount equal to $35,826 for real estate taxes, $3,322 for insurance premiums, $2,972 for replacement reserves and $12,962 for tenant improvements and leasing commissions. Upon the occurrence of an event of default or if assessments are required under the condominium documents, ongoing monthly deposits are required in an amount equal to 1/12th of the declaration fees, or common charges, that the lender estimates to be payable during the ensuing 12 months.
THE INFORMATION IN THIS STRUCTURAL AND COLLATERAL TERM SHEET IS NOT COMPLETE AND MAY BE AMENDED PRIOR TO THE TIME OF SALE. THIS TERM SHEET IS NOT AN OFFER TO SELL THESE SECURITIES AND IT IS NOT A SOLICITATION OF AN OFFER TO BUY THESE SECURITIES IN ANY JURISDICTION WHERE THE OFFER OR SALE IS NOT PERMITTED.
| 79 |
| INDEPENDENCE MARKETPLACE |
Lockbox and Cash Management.The Independence Marketplace Mortgage Loan requires a lender-controlled lockbox account, which is already in place, and requires the borrower to direct tenants to pay their rents directly into such lockbox account. The loan documents also require that any rent received by the borrower or property manager must be deposited into the lockbox account within three business days of receipt. During a Sweep Event (as defined below), excess cash flow will be swept to a lender controlled account and held as additional security for the Independence Marketplace Mortgage Loan.
A “Sweep Event” will commence upon the earliest of (i) the occurrence and continuance of an event of default; (ii) the amortizing debt service coverage ratio being less than 1.15x for two consecutive calendar quarters; or (iii) the date which is six months prior to any expiration of the Lowe’s lease. A Sweep Event will expire with regard to clause (i), upon the cure of such event of default; with regard to clause (ii), upon the amortizing debt service coverage ratio being equal to or greater than 1.15x for two consecutive calendar quarters; and with regard to clause (iii), upon (1) the Lowe’s lease being extended for a term of at least five years or (2) a replacement tenant leasing unit one of the condominium pursuant to a lease for a term of at least five years.
Property Management. The Independence Marketplace Property is managed by an affiliate of the borrower.
Assumption.The borrower has a right to transfer the Independence Marketplace Property, provided that certain conditions are satisfied, including, but not limited to, (i) no event of default has occurred and is continuing; (ii) the lender’s reasonable determination that the proposed transferee and guarantor satisfy the lender’s credit review and underwriting standards, taking into consideration transferee’s experience, financial strength and general business standing; (iii) execution of a recourse guaranty and an environmental indemnity by an affiliate of the transferee; and (iv) if requested by the lender, rating agency confirmation from DBRS, Fitch and Moody’s that the transfer will not result in a downgrade, withdrawal or qualification of the respective ratings assigned to the Series 2016-C33 Certificates.
Partial Release.None.
Real Estate Substitution.Not permitted.
Subordinate and Mezzanine Indebtedness.Not permitted.
Ground Lease.None.
Terrorism Insurance.The loan documents require that the “all risk” insurance policy required to be maintained by the borrower provide coverage for terrorism in an amount equal to the full replacement cost of the Independence Marketplace Property; provided that the borrower is not required to expend on terrorism insurance more than twice the amount of the insurance premiums payable with respect of property and business interruption/rental loss insurance. The loan documents also require business interruption insurance covering no less than the 18 month period following the occurrence of a casualty event, together with a 12-month extended period of indemnity.
THE INFORMATION IN THIS STRUCTURAL AND COLLATERAL TERM SHEET IS NOT COMPLETE AND MAY BE AMENDED PRIOR TO THE TIME OF SALE. THIS TERM SHEET IS NOT AN OFFER TO SELL THESE SECURITIES AND IT IS NOT A SOLICITATION OF AN OFFER TO BUY THESE SECURITIES IN ANY JURISDICTION WHERE THE OFFER OR SALE IS NOT PERMITTED.
| 80 |
(THIS PAGE INTENTIONALLY LEFT BLANK)
THE INFORMATION IN THIS STRUCTURAL AND COLLATERAL TERM SHEET IS NOT COMPLETE AND MAY BE AMENDED PRIOR TO THE TIME OF SALE. THIS TERM SHEET IS NOT AN OFFER TO SELL THESE SECURITIES AND IT IS NOT A SOLICITATION OF AN OFFER TO BUY THESE SECURITIES IN ANY JURISDICTION WHERE THE OFFER OR SALE IS NOT PERMITTED.
| 81 |
| BRIER CREEK CORPORATE CENTER I & II |
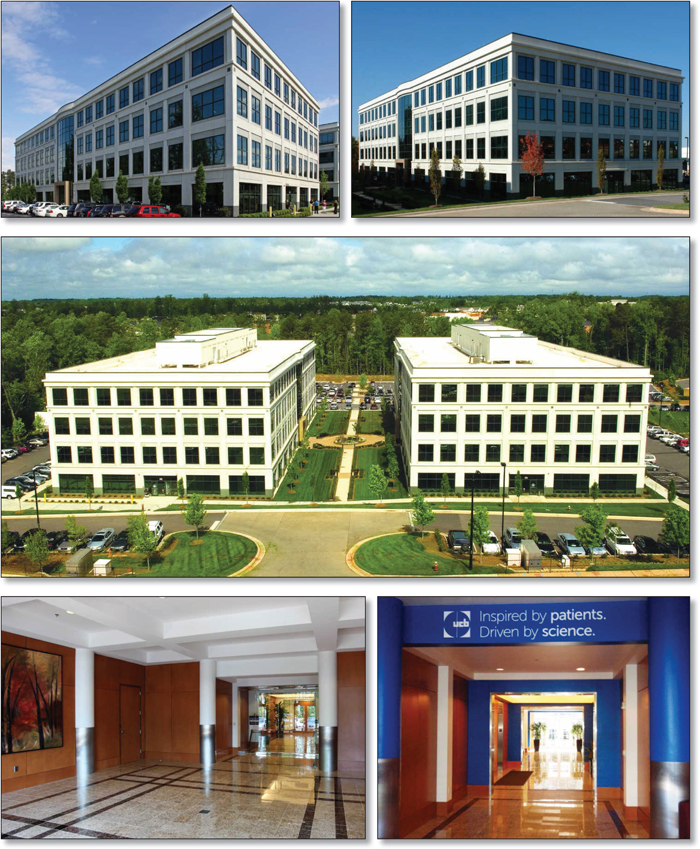
THE INFORMATION IN THIS STRUCTURAL AND COLLATERAL TERM SHEET IS NOT COMPLETE AND MAY BE AMENDED PRIOR TO THE TIME OF SALE. THIS TERM SHEET IS NOT AN OFFER TO SELL THESE SECURITIES AND IT IS NOT A SOLICITATION OF AN OFFER TO BUY THESE SECURITIES IN ANY JURISDICTION WHERE THE OFFER OR SALE IS NOT PERMITTED.
| 82 |
| BRIER CREEK CORPORATE CENTER I & II |

THE INFORMATION IN THIS STRUCTURAL AND COLLATERAL TERM SHEET IS NOT COMPLETE AND MAY BE AMENDED PRIOR TO THE TIME OF SALE. THIS TERM SHEET IS NOT AN OFFER TO SELL THESE SECURITIES AND IT IS NOT A SOLICITATION OF AN OFFER TO BUY THESE SECURITIES IN ANY JURISDICTION WHERE THE OFFER OR SALE IS NOT PERMITTED.
| 83 |
| No. 7 – Brier Creek Corporate Center I & II | |||||||
| Loan Information | Property Information | ||||||
| Mortgage Loan Seller: | Wells Fargo Bank, National Association | Single Asset/Portfolio: | Single Asset | ||||
Credit Assessment (DBRS/Fitch/Moody’s): | NR/NR/NR | Property Type: | Office | ||||
| Original Principal Balance: | $23,000,000 | Specific Property Type: | Suburban | ||||
| Cut-off Date Balance: | $22,919,344 | Location: | Raleigh, NC | ||||
| % of Initial Pool Balance: | 3.2% | Size: | 180,955 SF | ||||
| Loan Purpose: | Refinance | Cut-off Date Balance Per SF: | $126.66 | ||||
| Borrower Name: | Brier Creek 1 & 2, LLC | Year Built/Renovated: | 2005/NAP | ||||
| Sponsor: | Riprand Count Arco | Title Vesting: | Fee | ||||
| Mortgage Rate: | 4.960% | Property Manager: | Self-managed | ||||
| Note Date: | November 17, 2015 | 4th Most Recent Occupancy (As of): | 91.1% (12/31/2011) | ||||
| Anticipated Repayment Date: | NAP | 3rd Most Recent Occupancy (As of): | 100.0% (12/31/2012) | ||||
| Maturity Date: | December 11, 2025 | 2nd Most Recent Occupancy (As of): | 99.5% (12/31/2013) | ||||
| IO Period: | None | Most Recent Occupancy (As of): | 97.0% (12/31/2014) | ||||
| Loan Term (Original): | 120 months | Current Occupancy (As of)(2): | 94.0% (11/12/2015) | ||||
| Seasoning: | 3 months | ||||||
| Amortization Term (Original): | 360 months | Underwriting and Financial Information: | |||||
| Loan Amortization Type: | Amortizing Balloon | ||||||
| Interest Accrual Method: | Actual/360 | 4th Most Recent NOI (As of): | $2,890,651 (12/31/2012) | ||||
| Call Protection: | L(27),D(89),O(4) | 3rd Most Recent NOI (As of): | $2,407,139 (12/31/2013) | ||||
| Lockbox Type: | Springing | 2nd Most Recent NOI (As of): | $2,757,642 (12/31/2014) | ||||
| Additional Debt: | None | Most Recent NOI (As of): | $2,658,146 (12/31/2015) | ||||
| Additional Debt Type: | NAP | ||||||
| U/W Revenues: | $3,617,568 | ||||||
| U/W Expenses: | $1,405,159 | ||||||
| U/W NOI: | $2,212,410 | ||||||
| U/W NCF: | $1,995,340 | ||||||
| Escrows and Reserves(1): | U/W NOI DSCR: | 1.50x | |||||
| U/W NCF DSCR: | 1.35x | ||||||
| Type: | Initial | Monthly | Cap (If Any) | U/W NOI Debt Yield: | 9.7% | ||
| Taxes | $0 | $28,318 | NAP | U/W NCF Debt Yield: | 8.7% | ||
| Insurance | $0 | Springing | NAP | As-Is Appraised Value: | $31,425,000 | ||
| Replacement Reserves | $0 | $3,016 | NAP | As-Is Appraisal Valuation Date: | October 15, 2015 | ||
| TI/LC Reserve | $0 | $22,619 | NAP | Cut-off Date LTV Ratio: | 72.9% | ||
| UCB/Stock Building Reserve | $600,000 | $22,619 | $225,000 | LTV Ratio at Maturity or ARD: | 60.1% | ||
| (1) | See “Escrows” section. |
| (2) | See “Historical Occupancy” section. |
The Mortgage Loan. The mortgage loan (the “Brier Creek Corporate Center I & II Mortgage Loan”) is evidenced by a singlepromissory note that is secured by a first mortgage encumbering two adjacent office buildings located in Raleigh, North Carolina (the “Brier Creek Corporate Center I & II Property”). The Brier Creek Corporate Center I & II Mortgage Loan was originated on November 17, 2015 by Wells Fargo Bank, National Association. The Brier Creek Corporate Center I & II Mortgage Loan had an original principal balance of $23,000,000, has an outstanding principal balance as of the Cut-off Date of $22,919,344 and accrues interest at an interest rate of 4.960%per annum. The Brier Creek Corporate Center I & II Mortgage Loan had an initial term of 120 months, has a remaining term of 117 months as of the Cut-off Date and requires payments of principal and interest based on a 30-year amortization schedule through the term of the Brier Creek Corporate Center I & II Mortgage Loan. The Brier Creek Corporate Center I & II Mortgage Loan matures on December 11, 2025.
Following the lockout period, the borrower has the right to defease the Brier Creek Corporate Center I & II Mortgage Loan in whole, but not in part, on any date before September 11, 2025. In addition, the Brier Creek Corporate Center I & II Mortgage Loan is prepayable without penalty on or after September 11, 2025.
THE INFORMATION IN THIS STRUCTURAL AND COLLATERAL TERM SHEET IS NOT COMPLETE AND MAY BE AMENDED PRIOR TO THE TIME OF SALE. THIS TERM SHEET IS NOT AN OFFER TO SELL THESE SECURITIES AND IT IS NOT A SOLICITATION OF AN OFFER TO BUY THESE SECURITIES IN ANY JURISDICTION WHERE THE OFFER OR SALE IS NOT PERMITTED.
| 84 |
BRIER CREEK CORPORATE CENTER I & II |
Sources and Uses
| Sources | Uses | |||||||
| Original loan amount | $23,000,000 | 100.0% | Loan payoff | $16,669,142 | 72.5% | |||
| Reserves | 600,000 | 2.6 | ||||||
| Closing costs | 579,847 | 2.5 | ||||||
| Return of equity | 5,151,011 | 22.4 | ||||||
| Total Sources | $23,000,000 | 100.0% | Total Uses | $23,000,000 | 100.0% | |||
The Property.The Brier Creek Corporate Center I & II Property is comprised of two, four-story, class A office buildings totaling 180,955 square feet located in Raleigh, North Carolina, approximately 13.7 miles northwest of the Raleigh central business district. Built in 2005, the Brier Creek Corporate Center I & II Property is situated on a 15.2-acre parcel. The Brier Creek I building is comprised of 90,488 square feet and is 100.0% occupied by UCB Biosciences, Inc. (“UCB”), a biopharmaceutical company that focuses on the discovery and development of medicines and solutions for people living with severe immune system or central nervous system diseases. Founded in 1928 and headquartered in Brussels, Belgium, UCB has operations in approximately 40 countries with more than 8,500 employees and generated revenue of approximately €3.9 billion in 2015. The Brier Creek II building is comprised of 90,467 square feet and the largest tenant is Stock Building Supply (“Stock Building”), which represents 49.8% of the net rentable area of the Brier Creek II building and 24.9% of the net rentable area of the Brier Creek Corporate Center I & II Property. Stock Building, which is headquartered at the Brier Creek II building, is a provider of diversified building products and services to professional builders and contractors in the residential housing market.
UCB and Stock Building have both been in occupancy at the Brier Creek Corporate Center I & II Property since 2005. Additionally, the Brier Creek Corporate Center I & II Property has averaged 95.1% occupancy since 2005. The Brier Creek Corporate Center I & II Property features 608 surface parking spaces resulting in a parking ratio of 3.4 spaces per 1,000 square feet of net rentable area. As of November 12, 2015, the Brier Creek Corporate Center I & II Property was 84.3% physically occupied and 94.0% leased to six tenants.
The following table presents certain information relating to the tenancy at the Brier Creek Corporate Center I & II Property:
Major Tenants
| Tenant Name | Credit Rating (Fitch/Moody’s/ S&P)(1) | Tenant NRSF | % of NRSF | Annual U/W Base Rent PSF | Annual U/W Base Rent | % of Total Annual U/W Base Rent | Lease Expiration Date |
| Major Tenants | |||||||
| UCB | NR/NR/NR | 90,488 | 50.0% | $20.27 | $1,834,192 | 52.0% | 12/31/2020 |
| Stock Building | NR/NR/NR | 45,009 | 24.9% | $21.01 | $945,752 | 26.8% | 5/31/2020(2) |
| Domtar, Inc.(3) | NR/Baa3/BBB- | 17,562 | 9.7% | $22.00 | $386,364 | 11.0% | 3/31/2026 |
| OnRamp Access | NR/NR/NR | 11,979 | 6.6% | $21.31 | $255,251 | 7.2% | 1/31/2020 |
| SafeGuard | NR/NR/NR | 2,924 | 1.6% | $21.00 | $61,404 | 1.7% | 4/30/2017 |
| Total Major Tenants | 167,962 | 92.8% | $20.74 | $3,482,963 | 98.8% | ||
| Non-Major Tenants | 2,198 | 1.2% | $19.96 | $43,873 | 1.2% | ||
| Occupied Collateral Total | 170,160 | 94.0% | $20.73 | $3,526,836 | 100.0% | ||
| Vacant Space | 10,795 | 6.0% | |||||
| Collateral Total | 180,955 | 100.0% | |||||
| (1) | Certain ratings are those of the parent company whether or not the parent company guarantees the lease. |
| (2) | Stock Building has one, 5-year lease extension option. |
| (3) | Domtar, Inc. recently executed a lease and is expected to take occupancy and commence rental payments on April 1, 2016. |
THE INFORMATION IN THIS STRUCTURAL AND COLLATERAL TERM SHEET IS NOT COMPLETE AND MAY BE AMENDED PRIOR TO THE TIME OF SALE. THIS TERM SHEET IS NOT AN OFFER TO SELL THESE SECURITIES AND IT IS NOT A SOLICITATION OF AN OFFER TO BUY THESE SECURITIES IN ANY JURISDICTION WHERE THE OFFER OR SALE IS NOT PERMITTED.
| 85 |
BRIER CREEK CORPORATE CENTER I & II |
The following table presents certain information relating to the lease rollover schedule at the Brier Creek Corporate Center I & II Property:
Lease Expiration Schedule(1)
Year Ending December 31, | No. of Leases Expiring | Expiring NRSF | % of Total NRSF | Cumulative Expiring NRSF | Cumulative % of Total NRSF | Annual U/W Base Rent | % of Total Annual U/W Base Rent | Annual U/W Base Rent PSF(2) |
| MTM | 0 | 0 | 0.0% | 0 | 0.0% | $0 | 0.0% | $0.00 |
| 2016 | 1 | 2,198 | 1.2% | 2,198 | 1.2% | $43,874 | 1.2% | $19.96 |
| 2017 | 1 | 2,924 | 1.6% | 5,122 | 2.8% | $61,404 | 1.7% | $21.00 |
| 2018 | 0 | 0 | 0.0% | 5,122 | 2.8% | $0 | 0.0% | $0.00 |
| 2019 | 0 | 0 | 0.0% | 5,122 | 2.8% | $0 | 0.0% | $0.00 |
| 2020 | 3 | 147,476 | 81.5% | 152,598 | 84.3% | $3,035,194 | 86.1% | $20.58 |
| 2021 | 0 | 0 | 0.0% | 152,598 | 84.3% | $0 | 0.0% | $0.00 |
| 2022 | 0 | 0 | 0.0% | 152,598 | 84.3% | $0 | 0.0% | $0.00 |
| 2023 | 0 | 0 | 0.0% | 152,598 | 84.3% | $0 | 0.0% | $0.00 |
| 2024 | 0 | 0 | 0.0% | 152,598 | 84.3% | $0 | 0.0% | $0.00 |
| 2025 | 0 | 0 | 0.0% | 152,598 | 84.3% | $0 | 0.0% | $0.00 |
| 2026 | 1 | 17,562 | 9.7% | 170,160 | 94.0% | $386,364 | 11.0% | $22.00 |
| Thereafter | 0 | 0 | 0.0% | 170,160 | 94.0% | $0 | 0.0% | $0.00 |
| Vacant | 0 | 10,795 | 6.0% | 180,955 | 100.0% | $0 | 0.0% | $0.00 |
| Total/Weighted Average | 6 | 180,955 | 100.0% | $3,526,836 | 100.0% | $20.73 |
| (1) | Information obtained from the underwritten rent roll. |
| (2) | Weighted Average Annual U/W Base Rent PSF excludes vacant space. |
The following table presents historical occupancy percentages at the Brier Creek Corporate Center I & II Property:
Historical Occupancy
12/31/2011(1) | 12/31/2012(1) | 12/31/2013(1) | 12/31/2014(1) | 11/12/2015(2) |
| 91.1% | 100.0% | 99.5% | 97.0% | 94.0% |
| (1) | Information obtained from the borrower. |
| (2) | Information obtained from the underwritten rent roll. The November 12, 2015 occupancy includes the tenant Domtar, Inc. (9.7% of net rentable area), which recently executed a lease and is expected to take occupancy in April 2016. |
Operating History and Underwritten Net Cash Flow. The following table presents certain information relating to the historical operating performance and underwritten net cash flow at the Brier Creek Corporate Center I & II Property:
Cash Flow Analysis
| 2012 | 2013 | 2014 | 2015 | U/W | % of U/W Effective Gross Income | U/W $ per SF | |||||||||
| Base Rent | $3,798,255 | $3,371,361 | $3,409,415 | $3,225,986 | $3,526,836 | 97.5% | $19.49 | ||||||||
| Grossed Up Vacant Space | 0 | 0 | 0 | 0 | 248,285 | 6.9 | 1.37 | ||||||||
| Total Reimbursables | 402,785 | 383,316 | 460,092 | 377,669 | 182,442 | 5.0 | 1.01 | ||||||||
| Other Income | 20 | 2,838 | 340,554(1) | 615,000(1) | 0 | 0.0 | 0.00 | ||||||||
| Less Vacancy & Credit Loss | 0 | 0 | 0 | 0 | (339,995)(2) | (9.4) | (1.88) | ||||||||
| Effective Gross Income | $4,201,060 | $3,757,515 | $4,210,061 | $4,218,655 | $3,617,568 | 100.0% | $19.99 | ||||||||
| Total Operating Expenses | $1,310,409 | $1,350,376 | $1,452,419 | $1,560,509 | $1,405,159 | 38.8% | $7.77 | ||||||||
| Net Operating Income | $2,890,651 | $2,407,139 | $2,757,642 | $2,658,146 | $2,212,410 | 61.2% | $12.23 | ||||||||
| TI/LC | 0 | 0 | 0 | 0 | 180,878 | 5.0 | 1.00 | ||||||||
| Capital Expenditures | 0 | 0 | 0 | 0 | 36,191 | 1.0 | 0.20 | ||||||||
| Net Cash Flow | $2,890,651 | $2,407,139 | $2,757,642 | $2,658,146 | $1,995,340 | 55.2% | $11.03 | ||||||||
| NOI DSCR | 1.96x | 1.63x | 1.87x | 1.80x | 1.50x | ||||||||||
| NCF DSCR | 1.96x | 1.63x | 1.87x | 1.80x | 1.35x | ||||||||||
| NOI DY | 12.6% | 10.5% | 12.0% | 11.6% | 9.7% | ||||||||||
| NCF DY | 12.6% | 10.5% | 12.0% | 11.6% | 8.7% |
| (1) | 2014 and 2015 Other Income represents one time tenant termination fees. |
| (2) | The underwritten economic vacancy is 9.0%. The Brier Creek Corporate Center I & II Property was 84.3% physically occupied and 94.0% leased as of November 12, 2015. Domtar, Inc. (9.7% of net rentable area) recently executed a lease and is expected to take occupancy in April 2016. |
Appraisal.As of the appraisal valuation date of October 15, 2015, the Brier Creek Corporate Center I & II Property had an “as-is” appraised value of $31,425,000.
THE INFORMATION IN THIS STRUCTURAL AND COLLATERAL TERM SHEET IS NOT COMPLETE AND MAY BE AMENDED PRIOR TO THE TIME OF SALE. THIS TERM SHEET IS NOT AN OFFER TO SELL THESE SECURITIES AND IT IS NOT A SOLICITATION OF AN OFFER TO BUY THESE SECURITIES IN ANY JURISDICTION WHERE THE OFFER OR SALE IS NOT PERMITTED.
| 86 |
BRIER CREEK CORPORATE CENTER I & II |
Environmental Matters.According to the Phase I environmental report dated October 19, 2015, there was no evidence of any recognized environmental conditions at the Brier Creek Corporate Center I & II Property.
Market Overview and Competition.The Brier Creek Corporate Center I & II Property is located in Raleigh, North Carolina, approximately 13.7 miles northwest of the Raleigh central business district. Access to the neighborhood is provided by Interstate 540 and US Highway 70, which intersect approximately 1.0 mile northeast of the Brier Creek Corporate Center I & II Property. Additionally, the Raleigh-Durham International Airport is located approximately 2.0 miles south of the Brier Creek Corporate Center I & II Property. According to the appraisal, the city of Raleigh has a strong outlook with low business costs and a highly skilled workforce expected to attract outside investment. The Brier Creek Corporate Center I & II Property benefits from its proximity to multiple neighborhood amenities including the 18-hole Arnold Palmer-designed golf course at Brier Creek Country Club (approximately 1.8 miles west of the Brier Creek Corporate Center I & II Property) and Brier Creek Commons, a power center anchored by Target, Regal Cinema, Dick’s Sporting Goods, BJ’s, Petsmart, TJ Maxx and Home Goods. According to the appraisal, the success of the neighborhood, in which the Brier Creek Corporate Center I & II Property is located, is largely attributed to its central location in the middle of the Raleigh-Durham-Chapel Hill triangle and the Research Triangle Park being conveniently located approximately 6.3 miles west thereof. The estimated 2015 population within a one-, three- and five-mile radius of the Brier Creek Corporate Center I & II Property was 5,193, 34,566 and 77,984, respectively, and the estimated 2015 average household income within the same radii was $99,155, $98,093 and $96,514, respectively.
According to the appraisal, one of the primary growth centers for Raleigh-Durham is the Research Triangle Park, which houses companies predominately related to the telecommunications, biotech, environmental and life sciences fields. The Brier Creek Corporate Center I & II Property and its life science tenant UCB benefit from its proximity to the Research Triangle Park. The Raleigh-Durham market also features three major research universities: Duke, University of North Carolina Chapel Hill and North Carolina State. According to a third party market research report, the Brier Creek Corporate Center I & II Property is located in the Raleigh/Durham office market which, as of fourth quarter of 2015, was comprised of 4,684 buildings totaling 95.6 million square feet and reported a vacancy rate of 8.0% and average asking rent of $20.18 per square foot gross. The Brier Creek Corporate Center I & II Property is located within the Glenwood/Creedmoor office submarket which was comprised of 214 buildings totaling 4.0 million square feet and reported a vacancy rate of 5.7% and average asking rent of $19.09 per square foot gross as of the fourth quarter of 2015.
The following table presents certain information relating to comparable office leases for the Brier Creek Corporate Center I & II Property:
Comparable Leases(1)
| Property Name/Location | Year Built/ Renovated | Stories | Total GLA (SF) | Total Occupancy | Distance from Subject | Tenant Name | Lease Date/Term | Lease Area (SF) | Annual Base Rent PSF | Lease Type |
Brier Creek Corporate Center IV Raleigh, NC | 2006/NAP | 5 | 127,522 | 97% | 0.1 miles | Qualcomm Expansion | April 2015 / 5.0 Yrs | 17,449 | $20.69 | FSG |
| Brier Creek Corporate Center VI | 2008/NAP | 5 | 123,350 | 100% | 0.4 miles | Intense Healthcare | December 2012 / 8.0 Yrs | 7,654 | $20.85 | FSG |
Perimeter Park I-IV Morrisville, NC | 2012/NAP | NAV | 847,986 | 86% | 7.2 miles | APPTIO, Inc. | September 2014 / 5.3 Yrs | 14,825 | $23.55 | FSG |
Key Stone Office Park Durham, NC | 1999/2001 | 3 | 285,627 | 83% | 6.6 miles | Epizyme | June 2915 / 2.2 Yrs | 3,892 | $24.50 | FSG |
Concourse Lakeside I Morrisville, NC | 1998/NAP | 3 | 76,878 | 100% | 6.0 miles | SynteractHCR | April 2015 / 1.1 Yrs | 4,444 | $21.45 | FSG |
Concourse Lakeside II Morrisville, NC | 2000/NAP | 3 | 77,3203 | 84% | 6.1 miles | The Professional Alternat | September 2015 / 3.1 Yrs | 2,383 | $20.75 | FSG |
Nottingham Hall Durham, NC | 2001/NAP | 4 | 105,297 | 75% | 5.5 miles | Viamet Pharmaceuticals | October 2015 / 5.3 Yrs | 6,787 | $23.00 | FSG |
| (1) | Information obtained from the appraisal. |
The Borrower.The borrower is Brier Creek 1 & 2, LLC, a Delaware limited liability company and single purpose entity with one independent director. Legal counsel to the borrower delivered a non-consolidation opinion in connection with the origination of the Brier Creek Corporate Center I & II Mortgage Loan. Riprand Count Arco is the guarantor of certain nonrecourse carveouts under the Brier Creek Corporate Center I & II Mortgage Loan.
The Sponsor.The sponsor, Riprand Count Arco, is the founder of American Asset Corporation (“AAC”), a diversified real estate company with core capabilities including strategic planning, construction management, leasing and brokerage services and asset and
THE INFORMATION IN THIS STRUCTURAL AND COLLATERAL TERM SHEET IS NOT COMPLETE AND MAY BE AMENDED PRIOR TO THE TIME OF SALE. THIS TERM SHEET IS NOT AN OFFER TO SELL THESE SECURITIES AND IT IS NOT A SOLICITATION OF AN OFFER TO BUY THESE SECURITIES IN ANY JURISDICTION WHERE THE OFFER OR SALE IS NOT PERMITTED.
| 87 |
BRIER CREEK CORPORATE CENTER I & II |
property management. Founded in 1986, AAC’s diverse real estate portfolio has expended to include approximately 4.5 million square feet of retail, office and industrial space valued at approximately $700.0 million. Ten affiliates of the sponsor filed bankruptcy in 2012 and various sponsor affiliates have been involved in prior foreclosures, discounted payoffs or loan workouts. See “Description of the Mortgage Pool – Loan Purposes; Default History, Bankruptcy Issues and Other Proceedings” in the Preliminary Prospectus.
Escrows.The loan documents provide ongoing monthly reserves of $28,318 for real estate taxes and $3,016 for replacement reserves. The loan documents do not require monthly deposits for insurance premiums as long as (i) no event of default has occurred and is continuing; (ii) the Brier Creek Corporate Center I & II Property is insured via an acceptable blanket insurance policy; and (iii) the borrower provides the lender with timely proof of payment of insurance premiums.
The loan documents provide for an upfront reserve in the amount of $600,000 for the leasing expenses related to UCB ($450,000) and Stock Building ($150,000). Ongoing monthly escrows of $22,619 for leasing expenses are also required with the initial $225,000 of such monthly deposits into the leasing reserve only available for leasing expenses related to UCB ($150,000) and Stock Building ($75,000); additional monthly escrows deposited beyond the $225,000 level are available for any tenant. Following the payment date occurring in February 2020 and upon the occurrence of a Leasing Reserve Cap Event (as defined below), the ongoing monthly deposits for leasing reserves will be $15,080 and may be used for any tenant and the leasing reserve will be capped at $540,000.
A “Leasing Reserve Cap Event” will occur when the lender receives satisfactory evidence that at least 90% of the UCB and Stock Building spaces have been either renewed with the applicable tenant or leased to one or more satisfactory replacement tenants, each pursuant to a satisfactory renewal or new lease with a term of at least five years at a rental rate acceptable to the lender, that the applicable tenant or replacement tenant is in occupancy, open for business, paying full unabated rent and all tenant improvement costs and leasing commissions have been paid.
Lockbox and Cash Management.Upon the occurrence of a Cash Trap Event Period (as defined below), the borrower will be required to establish a lender-controlled lockbox account and direct all tenants to deposit all rents directly into such lockbox account. Additionally, all revenues and other monies received by the borrower or property manager relating to the Brier Creek Corporate Center I & II Property will be deposited into the lockbox account. During a Cash Trap Event Period, all excess funds in the lockbox account are swept to a lender-controlled subaccount.
A “Cash Trap Event Period” will commence upon (i) a Major Tenant Event Period (as defined below) or (ii) the earlier of (a) the occurrence and continuance of an event of default or (b) the net cash flow debt yield being less than 7.0% at the end of any calendar quarter. A Cash Trap Event Period will end, with respect to clause (i), upon the end of a Major Tenant Event Period; with respect to clause (ii)(a), upon the cure of such event of default; with respect to clause (ii)(b), upon the net cash flow debt yield being at least 7.25% for two consecutive calendar quarters or at least 7.0% for three consecutive calendar quarters.
A “Major Tenant Event Period” will commence upon the earlier of UCB or Stock Building (i) failing to renew or extend its lease for the entirety of its space on or prior to the date that is the earlier of 12 months prior to lease expiration or the deadline outlined in the lease, on terms and conditions acceptable to the lender including a term of no less than five years at a rental rate acceptable to lender; (ii) failing to continuously occupy its entire space or be open for business or giving notice of its intent to commence either of the foregoing; (iii) filing bankruptcy or similar insolvency proceeding; or (iv) terminating or canceling its lease (or the lease otherwise failing to be in full force and effect) or giving notice of its intent to do so. A Major Tenant Event Period will end, with respect to clause (i), upon the lender receiving satisfactory evidence that the applicable tenant has extended the term of its lease for at least five years for the entirety of its space and is paying full unabated rent acceptable to the lender; with respect to clause (ii), upon the applicable tenant resuming normal business operations in the entirety of its space and is open for two consecutive calendar quarters; with respect to clause (iii), upon the bankruptcy or insolvency proceeding being terminated and the applicable tenant’s lease being affirmed; with respect to clause (iv), upon the applicable tenant’s lease being in full force and effect for two consecutive calendar quarters; and with respect clauses (i), (ii), (iii) and (iv), upon the lender receiving satisfactory evidence that at least 95.0% of the applicable tenant space has been leased to one or more satisfactory replacement tenants on leases acceptable to the lender, the replacement tenant is open for business and is paying full unabated rent.
Property Management.The Brier Creek Corporate Center I & II Office Property is managed by an affiliate of the borrower.
Assumption.The borrower has the two-time right to transfer the Brier Creek Corporate Center I & II Property, provided that certain conditions are satisfied, including (i) no event of default has occurred and is continuing; (ii) the lender has reasonably determined that the proposed transferee and guarantor satisfy the lender’s credit review and underwriting standards, taking into consideration the transferee’s experience, financial strength and general business standing; and (iii) if required by lender, a rating agency confirmation from DBRS, Fitch and Moody’s that the transfer will not result in a downgrade, withdrawal or qualification of the respective ratings assigned to the Series 2016-C33 Certificates.
Partial Release.Not permitted.
Real Estate Substitution.Not permitted.
Subordinate and Mezzanine Indebtedness. The loan documents permit the pledge of indirect ownership interests in the borrower, provided that related debt facility is secured by a pledge of substantially all assets of the pledger and repayment of the debt facility is not tied specifically to the cash flow from the Brier Creek Corporate Center I & II Property.
Ground Lease. None.
THE INFORMATION IN THIS STRUCTURAL AND COLLATERAL TERM SHEET IS NOT COMPLETE AND MAY BE AMENDED PRIOR TO THE TIME OF SALE. THIS TERM SHEET IS NOT AN OFFER TO SELL THESE SECURITIES AND IT IS NOT A SOLICITATION OF AN OFFER TO BUY THESE SECURITIES IN ANY JURISDICTION WHERE THE OFFER OR SALE IS NOT PERMITTED.
| 88 |
BRIER CREEK CORPORATE CENTER I & II |
Terrorism Insurance.The loan documents require that the “all risk” insurance policy required to be maintained by the borrower provide coverage for terrorism in an amount equal to the full replacement cost of the Brier Creek Corporate Center I & II Property. The loan documents also require business interruption insurance covering no less than the 12-month period following the occurrence of a casualty event, together with a six-month extended period of indemnity.
THE INFORMATION IN THIS STRUCTURAL AND COLLATERAL TERM SHEET IS NOT COMPLETE AND MAY BE AMENDED PRIOR TO THE TIME OF SALE. THIS TERM SHEET IS NOT AN OFFER TO SELL THESE SECURITIES AND IT IS NOT A SOLICITATION OF AN OFFER TO BUY THESE SECURITIES IN ANY JURISDICTION WHERE THE OFFER OR SALE IS NOT PERMITTED.
| 89 |
ATLANTIC MINI SELF STORAGE PORTFOLIO |
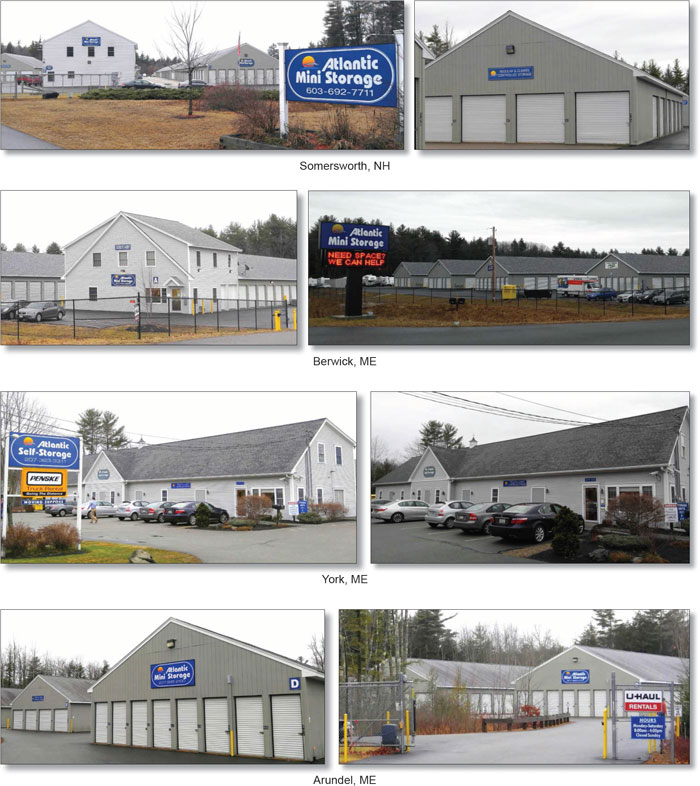
THE INFORMATION IN THIS STRUCTURAL AND COLLATERAL TERM SHEET IS NOT COMPLETE AND MAY BE AMENDED PRIOR TO THE TIME OF SALE. THIS TERM SHEET IS NOT AN OFFER TO SELL THESE SECURITIES AND IT IS NOT A SOLICITATION OF AN OFFER TO BUY THESE SECURITIES IN ANY JURISDICTION WHERE THE OFFER OR SALE IS NOT PERMITTED.
| 90 |
ATLANTIC MINI SELF STORAGE PORTFOLIO |

THE INFORMATION IN THIS STRUCTURAL AND COLLATERAL TERM SHEET IS NOT COMPLETE AND MAY BE AMENDED PRIOR TO THE TIME OF SALE. THIS TERM SHEET IS NOT AN OFFER TO SELL THESE SECURITIES AND IT IS NOT A SOLICITATION OF AN OFFER TO BUY THESE SECURITIES IN ANY JURISDICTION WHERE THE OFFER OR SALE IS NOT PERMITTED.
| 91 |
| No. 8 – Atlantic Mini Self Storage Portfolio | |||||||
| Loan Information | Property Information | ||||||
| Mortgage Loan Seller: | Rialto Mortgage Finance, LLC | Single Asset/Portfolio: | Portfolio | ||||
| Credit Assessment (DBRS/Fitch/Moody’s): | NR/NR/NR | Property Type: | Self Storage | ||||
| Original Principal Balance: | $20,980,000 | Specific Property Type: | Self Storage | ||||
| Cut-off Date Balance: | $20,980,000 | Location: | Various – See Table | ||||
| % of Initial Pool Balance: | 2.9% | Size: | 292,460 SF | ||||
| Loan Purpose: | Acquisition | Cut-off Date Balance Per SF: | $71.74 | ||||
| Borrower Names(1): | Various | Year Built/Renovated: | Various - See Table | ||||
| Sponsors: | Robert Moser; Robert Morgan | Title Vesting: | Fee | ||||
| Mortgage Rate: | 5.000% | Property Manager: | Self-managed | ||||
| Note Date: | January 19, 2016 | 4thMost Recent Occupancy(4): | NAV | ||||
| Anticipated Repayment Date: | NAP | 3rdMost Recent Occupancy(4): | NAV | ||||
| Maturity Date: | February 6, 2026 | 2ndMost Recent Occupancy (As of)(4): | 74.7% (12/31/2013) | ||||
| IO Period: | 36 months | Most Recent Occupancy (As of)(4): | 84.7% (12/31/2014) | ||||
| Loan Term (Original): | 120 months | Current Occupancy (As of) (4): | 90.6% (1/1/2016) | ||||
| Seasoning: | 1 month | ||||||
| Amortization Term (Original): | 360 months | Underwriting and Financial Information: | |||||
| Loan Amortization Type: | Interest-only, Amortizing Balloon | ||||||
| Interest Accrual Method: | Actual/360 | 4thMost Recent NOI (As of): | $1,373,576 (12/31/2012) | ||||
| Call Protection: | L(25),D(91),O(4) | 3rdMost Recent NOI (As of)(5): | $1,467,379 (12/31/2013) | ||||
| Lockbox Type: | Springing | 2ndMost Recent NOI (As of)(5): | $1,722,936 (12/31/2014) | ||||
| Additional Debt(2): | Yes | Most Recent NOI (As of)(5): | $2,025,842 (12/31/2015) | ||||
| Additional Debt Type(2): | Future Mezzanine | ||||||
| U/W Revenues: | $2,777,248 | ||||||
| U/W Expenses: | $748,765 | ||||||
| U/W NOI: | $2,028,483 | ||||||
| U/W NCF: | $1,988,278 | ||||||
| U/W NOI DSCR: | 1.50x | ||||||
| Escrows and Reserves(3): | U/W NCF DSCR: | 1.47x | |||||
| U/W NOI Debt Yield: | 9.7% | ||||||
| Type: | Initial | Monthly | Cap (If Any) | U/W NCF Debt Yield: | 9.5% | ||
| Taxes | $62,009 | $18,657 | NAP | As-Is Appraised Value(6): | $30,290,000 | ||
| Insurance | $22,619 | $2,464 | NAP | As-Is Appraisal Valuation Date: | December 18, 2015 | ||
| Replacement Reserves | $0 | $3,350 | NAP | Cut-off Date LTV Ratio(6): | 69.3% | ||
| Environmental Reserve | $10,000 | $0 | NAP | LTV Ratio at Maturity or ARD(6): | 61.3% | ||
| (1) | See “The Borrowers” section. |
| (2) | See “Subordinate and Mezzanine Indebtedness” section. |
| (3) | See “Escrows” section. |
| (4) | See “Historical Occupancy” section. |
| (5) | See “Cash Flow Analysis” section. |
| (6) | See “Appraisal” section. |
The Mortgage Loan. The mortgage loan (the “Atlantic Mini Self Storage Portfolio Mortgage Loan”) is evidenced by a single promissory note that is secured by a first mortgage encumbering four self storage properties located in New Hampshire and Maine (the “Atlantic Mini Self Storage Portfolio Properties”). The Atlantic Mini Self Storage Portfolio Mortgage Loan was originated on January 19, 2016 by Rialto Mortgage Finance, LLC. The Atlantic Mini Self Storage Portfolio Mortgage Loan had an original principal balance of $20,980,000, has an outstanding principal balance as of the Cut-off Date of $20,980,000 and accrues interest at an interest rate of 5.000%per annum. The Atlantic Mini Self Storage Portfolio Mortgage Loan had an initial term of 120 months, has a remaining term of 119 months as of the Cut-off Date and requires payments of interest-only for the first 36 payments following origination and, thereafter, requires payments of principal and interest based on a 30-year amortization schedule. The Atlantic Mini Self Storage Portfolio Mortgage Loan matures on February 6, 2026.
Following the lockout period, the borrowers have the right to defease the Atlantic Mini Self Storage Portfolio Mortgage Loan, in whole or in part (see “Partial Release” section), on any date before November 6, 2025. In addition, the Atlantic Mini Self Storage Portfolio Mortgage Loan is prepayable without penalty on or after November 6, 2025.
THE INFORMATION IN THIS STRUCTURAL AND COLLATERAL TERM SHEET IS NOT COMPLETE AND MAY BE AMENDED PRIOR TO THE TIME OF SALE. THIS TERM SHEET IS NOT AN OFFER TO SELL THESE SECURITIES AND IT IS NOT A SOLICITATION OF AN OFFER TO BUY THESE SECURITIES IN ANY JURISDICTION WHERE THE OFFER OR SALE IS NOT PERMITTED.
| 92 |
ATLANTIC MINI SELF STORAGE PORTFOLIO |
Sources and Uses
| Sources | Uses | ||||||||
| Original loan amount | $20,980,000 | 76.1 | % | Purchase price | $26,724,000 | 97.0 | % | ||
| Sponsor’s new cash contribution | 6,578,365 | 23.9 | Closing costs | 739,737 | 2.7 | ||||
| Reserves | 94,628 | 0.3 | |||||||
| Total Sources | $27,558,365 | 100.0 | % | Total Uses | $27,558,365 | 100.0 | % | ||
The Properties.The Atlantic Mini Self Storage Portfolio Properties comprise four self storage properties totaling 292,460 square feet with three properties located in Maine and one property located in New Hampshire. The Atlantic Mini Self Storage Portfolio Properties contain a mix of 263 climate controlled units (15.5% net rentable square feet; 14.4% of units) and 1,562 non-climate controlled units (84.5% of net rentable square feet; 85.6% of units). The Atlantic Mini Self Storage Portfolio Properties also include 145 RV/outdoor parking spaces and seven apartment units. As of January 1, 2016, the Atlantic Mini Self Storage Portfolio Properties were 90.6% occupied.
The following table presents certain information relating to the unit mix of the Atlantic Mini Self Storage Portfolio Properties:
| Property Name – Location | Allocated Cut-off Date Balance | % of Portfolio Cut-off Date Balance | Occupancy | Year Built/ Renovated | Net Rentable Area (SF) | As-Is Appraised Value(1) | Allocated Cut-off Date LTV(1) | |||||||
| Somersworth – Somersworth, NH | $6,550,000 | 31.2% | 97.5% | 2001/NAP | 100,450 | $8,760,000 | 74.8% | |||||||
| York – York, ME | $5,350,000 | 25.5% | 99.5% | 1996/NAP | 59,110 | $7,150,000 | 74.8% | |||||||
| Arundel – Arundel, ME | $4,700,000 | 22.4% | 96.3% | 2001/2013 | 58,900 | $6,300,000 | 74.6% | |||||||
| Berwick – Berwick, ME | $4,380,000 | 20.9% | 69.4% | 2013/NAP | 74,000 | $5,870,000 | 74.6% | |||||||
| Total/Weighted Average | $20,980,000 | 100.0% | 90.6% | 292,460 | $30,290,000 | 69.3% |
| (1) | The Total Appraised Value and Weighted Average Allocated Cut-off Date LTV represents the portfolio “as-is” appraised value. As of the appraisal valuation dates of December 18, 2015, the aggregate “as-is” appraised value of the Atlantic Mini Self Storage Portfolio Properties is $28,080,000 which represents a Cut-off Date LTV Ratio and LTV Ratio at Maturity of 74.7% and 66.1%, respectively. |
The following table presents historical occupancy percentages at the Atlantic Mini Self Storage Portfolio Properties:
Historical Occupancy
12/31/2011(1) | 12/31/2012(1) | 12/31/2013(2) (3) | 12/31/2014(2) | 1/1/2016(4) | ||||
| NAV | NAV | 74.7% | 84.7% | 90.6% |
| (1) | The Berwick property was constructed and brought online in phases in July 2013 (38,600 square feet), July 2014 (23,000 square feet) and July 2015 (12,400 square feet). As such, occupancy for 2011 and 2012 is not available for the Atlantic Mini Self Storage Portfolio Properties. |
| (2) | Information obtained from the borrowers. |
| (3) | Occupancy was calculated using occupancies as of December 31, 2013 for the Somersworth, York and Arundel properties and as of January 31, 2014 for the Berwick property. |
| (4) | Information obtained from the underwritten rent roll. |
THE INFORMATION IN THIS STRUCTURAL AND COLLATERAL TERM SHEET IS NOT COMPLETE AND MAY BE AMENDED PRIOR TO THE TIME OF SALE. THIS TERM SHEET IS NOT AN OFFER TO SELL THESE SECURITIES AND IT IS NOT A SOLICITATION OF AN OFFER TO BUY THESE SECURITIES IN ANY JURISDICTION WHERE THE OFFER OR SALE IS NOT PERMITTED.
| 93 |
ATLANTIC MINI SELF STORAGE PORTFOLIO |
Operating History and Underwritten Net Cash Flow.The following table presents certain information relating to the historical operating performance and underwritten net cash flow at the Atlantic Mini Self Storage Portfolio Properties:
Cash Flow Analysis
| 2012 | 2013(1) | 2014(1) | 2015(1) | U/W | % of U/W Effective Gross Income | U/W $ per SF | ||||||||||||||||||||||
| Base Rent | $1,713,541 | $1,849,137 | $2,192,313 | $2,503,779 | $2,689,848 | 96.9 | % | $9.20 | ||||||||||||||||||||
| Grossed Up Vacant Space | 0 | 0 | 0 | 0 | 307,512 | 11.1 | 1.05 | |||||||||||||||||||||
| Concessions | (54,786 | ) | (59,277 | ) | (76,527 | ) | (92,199 | ) | (85,528 | ) | (3.1 | ) | (0.29 | ) | ||||||||||||||
| Other Income(2) | 129,506 | 140,239 | 181,481 | 219,233 | 219,233 | 7.9 | 0.75 | |||||||||||||||||||||
| Less Vacancy & Credit Loss | 0 | 0 | 0 | 0 | (353,817) | (3) | (12.7 | ) | (1.21 | ) | ||||||||||||||||||
| Effective Gross Income | $1,788,261 | $1,930,099 | $2,297,267 | $2,630,813 | $2,777,248 | 100.0 | % | $9.50 | ||||||||||||||||||||
| Total Operating Expenses | $414,685 | $462,719 | $574,330 | $604,971 | $748,765 | 27.0 | % | $2.56 | ||||||||||||||||||||
| Net Operating Income | $1,373,576 | $1,467,379 | $1,722,936 | $2,025,842 | $2,028,483 | 73.0 | % | $6.94 | ||||||||||||||||||||
| Capital Expenditures | 0 | 0 | 0 | 0 | 40,204 | 1.4 | 0.14 | |||||||||||||||||||||
| Net Cash Flow | $1,373,576 | $1,467,379 | $1,722,936 | $2,025,842 | $1,988,278 | 71.6 | % | $6.80 | ||||||||||||||||||||
| NOI DSCR | 1.02x | 1.09x | 1.27x | 1.50x | 1.50x | |||||||||||||||||||||||
| NCF DSCR | 1.02x | 1.09x | 1.27x | 1.50x | 1.47x | |||||||||||||||||||||||
| NOI DY | 6.5% | 7.0% | 8.2% | 9.7% | 9.7% | |||||||||||||||||||||||
| NCF DY | 6.5% | 7.0% | 8.2% | 9.7% | 9.5% |
| (1) | The Berwick property (20.9% of the portfolio Cut-off Date Balance was constructed and brought online in phases in July 2013 (38,600 square feet), July 2014 (23,000 square feet) and July 2015 (12,400 square feet), which resulted in continual increasing revenues from 2013 through 2015. |
| (2) | Other Income includes truck rental fees, insurance revenue, retail sales, late fees, and administrative fees. |
| (3) | The underwritten economic vacancy is 14.7%. The Atlantic Mini Self Storage Portfolio Properties were 90.6% physically occupied as of January 1, 2016. |
Appraisal.As of the appraisal valuation date of December 18, 2015, the Atlantic Mini Self Storage Portfolio Properties had a portfolio “as-is” appraised value of $30,290,000. As of December 18, 2015, the Atlantic Mini Self Storage Portfolio Properties had an aggregate “as-is” appraised value of $28,080,000.
Environmental Matters.According to Phase I environmental assessments dated December 31, 2015, there was no evidence of any recognized environmental conditions at the Atlantic Mini Self Storage Portfolio Properties.
The Borrowers.The borrowers are Prime Storage Arundel, LLC, Prime Storage Berwick, LLC, Prime Storage York, LLC and Prime Storage Somersworth, LLC, four individual single purpose Delaware limited liability companies, each with one independent director in its organizational structure. Legal counsel to the borrowers delivered a non-consolidation opinion in connection with the origination of the Atlantic Mini Self Storage Portfolio Mortgage Loan. Robert Morgan and Robert Moser are the guarantors of certain non-recourse carveouts under the Atlantic Mini Self Storage Portfolio Mortgage Loan.
The Sponsors.The sponsors are Robert Moser and Robert Morgan, who together have developed, acquired and currently manage a portfolio of institutional-grade commercial real estate assets. Together, they own and manage over 4.6 million rentable square feet of self storage facilities in markets throughout the eastern and central United States valued at over $460.0 million. The sponsors are also the sponsors of the borrowers under the mortgage loans identified on Annex A-1 as Sentry Self-Storage Portfolio and Space Place – Columbia. The sponsors were a party to prior foreclosure litigation. See “Description of the Mortgage Pool – Loan Purpose; Default History, Bankruptcy Issues and Other Proceedings” in the Preliminary Prospectus.
Escrows.The loan documents provide for upfront reserves in the amount of$62,009 for real estate taxes, $22,619 for insurance premiums and $10,000 for an environmental escrow. The loan documents require ongoing monthly deposits of $18,657 for real estate taxes, $2,464 for insurance premiums and $3,350 for replacement reserves.
Lockbox and Cash Management.Upon the occurrence of a Cash Management Trigger Event (as defined below) the borrowers will be required to establish a lender-controlled lockbox account and direct each credit card company with which the borrowers have entered into merchant agreements to deliver all receipts payable with respect to the Atlantic Mini Self Storage Portfolio Properties directly into such lockbox account. Additionally, all revenues received by the borrowers or the property manager relating to the Atlantic Mini Self Storage Portfolio Properties are required to be deposited into the lockbox account within two business days of receipt. Other than during a Cash Sweep Event (as defined below), all excess funds on deposit are disbursed to the borrowers.
A “Cash Management Trigger Event” will commence upon the occurrence of the earlier of (i) an event of default; (ii) any bankruptcy action of the borrowers, guarantors or manager; or (iii) a Cash Management DSCR Trigger Event (as defined below). A Cash Management Trigger Event will end with respect to clause (i), when such event of default has been cured; with respect to clause (ii), when such bankruptcy action has been discharged, stayed, or dismissed within 30 days for the borrowers or guarantors and 120 days for the manager, among other conditions or, with respect to a bankruptcy action of the manager, the borrowers replacing the manager with a qualified manager acceptable to the lender; and with respect to clause (iii), the amortizing debt service coverage ratio based upon the trailing 12-month period immediately preceding the date of such determination being greater than 1.25x for two consecutive calendar quarters.
THE INFORMATION IN THIS STRUCTURAL AND COLLATERAL TERM SHEET IS NOT COMPLETE AND MAY BE AMENDED PRIOR TO THE TIME OF SALE. THIS TERM SHEET IS NOT AN OFFER TO SELL THESE SECURITIES AND IT IS NOT A SOLICITATION OF AN OFFER TO BUY THESE SECURITIES IN ANY JURISDICTION WHERE THE OFFER OR SALE IS NOT PERMITTED.
| 94 |
ATLANTIC MINI SELF STORAGE PORTFOLIO |
A “Cash Management DSCR Trigger Event” occurs upon any date the amortizing debt service coverage ratio based on the trailing 12-month period immediately preceding the date of such determination is less than 1.20x.
A “Cash Sweep Event” means (i) an event of default; (ii) any bankruptcy action of the borrowers, guarantors or manager; or (iii) a Cash Sweep DSCR Trigger Event (as defined below). A Cash Sweep Event will end with respect to clause (i), when such event of default has been cured, and with respect to clause (ii), when such bankruptcy action has been discharged, stayed, or dismissed, within 30 days for the borrowers or guarantors and 120 days for the manager, among other conditions or, with respect to a bankruptcy action of the manager, the borrowers replacing the manager with a qualified manager acceptable to the lender; and with respect toclause (iii), the amortizing debt service coverage ratio based upon the trailing 12-month period immediately preceding the date of such determination is greater than 1.20x for two consecutive quarters.
A “Cash Sweep DSCR Trigger Event” occurs upon any date the amortizing debt service coverage ratio based on the trailing 12-month period immediately preceding the date of such determination is less than 1.15x.
Property Management.The Atlantic Mini Self Storage Portfolio Properties are managed by an affiliate of the borrowers.
Assumption.The borrowers have the right to transfer the Atlantic Mini Self Storage Portfolio Properties, provided that certain conditions are satisfied, including (i) no event of default has occurred and is continuing; (ii) the lender’s reasonable determination that the proposed transferee and guarantor satisfy the lender’s credit review and underwriting standards, taking into consideration the transferee’s experience, financial strength and general business standing; (iii) execution of a recourse guaranty and an environmental indemnity by an affiliate of the transferee; and (iv) if requested by the lender, rating agency confirmation from each of DBRS, Fitch and Moody’s that the transfer will not result in a downgrade, withdrawal or qualification of the respective ratings assigned to the Series 2016-C33 Certificates.
Partial Release.Following the second anniversary of the issuance of the Series 2016-C33 Certificates and prior to November 6, 2025, the borrowers are permitted to partially release any constituent properties in connection with a partial defeasance, subject to certain conditions, including (i) no event of default has occurred and is continuing; (ii) partial defeasance of 115.0% of the released property’s original allocated loan balance; (iii) the amortizing debt service coverage ratio (based upon the trailing 12-month period immediately preceding the date of such determination) with respect to the remaining properties will be no less than the greater of (a) 1.47x and (b) the amortizing debt service coverage ratio immediately prior to the release; and (iv) the loan to value ratio with respect to the remaining properties will be no greater than the lesser of (a) 70.0%, and (b) the loan to value ratio immediately prior to the release.
Real Estate Substitution.Not permitted.
Subordinate and Mezzanine Indebtedness.The loan documents permit mezzanine financing subject to the satisfaction of certain conditions, including (i) the execution of an intercreditor agreement in form and substance acceptable to the lender; (ii) the combined loan to value ratio is not greater than 70.0%; (iii) the combined amortizing debt service coverage ratio is not less than 1.47x; and (iv) receipt of rating agency confirmation from each of DBRS, Fitch and Moody’s that the mezzanine financing will not result in a downgrade, withdrawal or qualification of the respective ratings assigned to the Series 2016-C33 Certificates.
Ground Lease.None.
Terrorism Insurance.The loan documents require that the “all risk” insurance policy required to be maintained by the borrowers provide coverage for terrorism in an amount equal to the full replacement cost of the Atlantic Mini Self Storage Portfolio Properties, as well as business interruption insurance covering no less than the 12-month period following the occurrence of a casualty event, together with a six-month extended period of indemnity.
Windstorm Insurance. The loan documents require windstorm insurance covering the full replacement cost of the Atlantic Mini Self Storage Portfolio Properties during the loan term. At the time of closing, the Atlantic Mini Self Storage Portfolio Properties had insurance coverage for windstorm.
THE INFORMATION IN THIS STRUCTURAL AND COLLATERAL TERM SHEET IS NOT COMPLETE AND MAY BE AMENDED PRIOR TO THE TIME OF SALE. THIS TERM SHEET IS NOT AN OFFER TO SELL THESE SECURITIES AND IT IS NOT A SOLICITATION OF AN OFFER TO BUY THESE SECURITIES IN ANY JURISDICTION WHERE THE OFFER OR SALE IS NOT PERMITTED.
| 95 |
(THIS PAGE INTENTIONALLY LEFT BLANK)
THE INFORMATION IN THIS STRUCTURAL AND COLLATERAL TERM SHEET IS NOT COMPLETE AND MAY BE AMENDED PRIOR TO THE TIME OF SALE. THIS TERM SHEET IS NOT AN OFFER TO SELL THESE SECURITIES AND IT IS NOT A SOLICITATION OF AN OFFER TO BUY THESE SECURITIES IN ANY JURISDICTION WHERE THE OFFER OR SALE IS NOT PERMITTED.
| 96 |
PARKVIEW AT SPRING STREET |
THE INFORMATION IN THIS STRUCTURAL AND COLLATERAL TERM SHEET IS NOT COMPLETE AND MAY BE AMENDED PRIOR TO THE TIME OF SALE. THIS TERM SHEET IS NOT AN OFFER TO SELL THESE SECURITIES AND IT IS NOT A SOLICITATION OF AN OFFER TO BUY THESE SECURITIES IN ANY JURISDICTION WHERE THE OFFER OR SALE IS NOT PERMITTED.
| 97 |
PARKVIEW AT SPRING STREET |
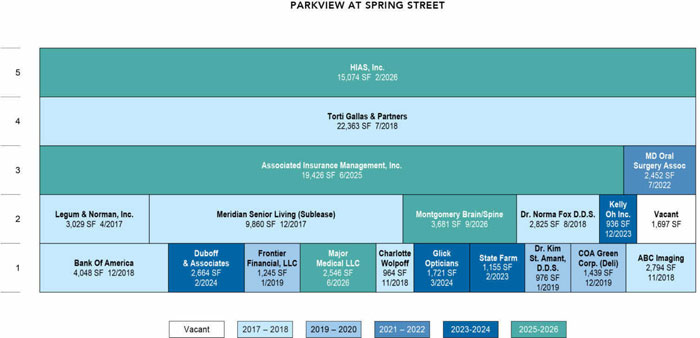
THE INFORMATION IN THIS STRUCTURAL AND COLLATERAL TERM SHEET IS NOT COMPLETE AND MAY BE AMENDED PRIOR TO THE TIME OF SALE. THIS TERM SHEET IS NOT AN OFFER TO SELL THESE SECURITIES AND IT IS NOT A SOLICITATION OF AN OFFER TO BUY THESE SECURITIES IN ANY JURISDICTION WHERE THE OFFER OR SALE IS NOT PERMITTED.
| 98 |
PARKVIEW AT SPRING STREET |

THE INFORMATION IN THIS STRUCTURAL AND COLLATERAL TERM SHEET IS NOT COMPLETE AND MAY BE AMENDED PRIOR TO THE TIME OF SALE. THIS TERM SHEET IS NOT AN OFFER TO SELL THESE SECURITIES AND IT IS NOT A SOLICITATION OF AN OFFER TO BUY THESE SECURITIES IN ANY JURISDICTION WHERE THE OFFER OR SALE IS NOT PERMITTED.
| 99 |
| No. 9 – Parkview at Spring Street |
| Loan Information | Property Information | ||||||
| Mortgage Loan Seller: | Wells Fargo Bank, National Association | Single Asset/Portfolio: | Single Asset | ||||
Credit Assessment (DBRS/Fitch/Moody’s): | NR/NR/NR | Property Type: | Office | ||||
| Original Principal Balance: | $17,750,000 | Specific Property Type: | Suburban | ||||
| Cut-off Date Balance: | $17,750,000 | Location: | Silver Spring, MD | ||||
| % of Initial Pool Balance: | 2.5% | Size: | 100,895 SF | ||||
| Loan Purpose: | Refinance | Cut-off Date Balance Per SF: | $175.93 | ||||
| Borrower Name: | 1300 Spring Street, LLC | Year Built/Renovated: | 1988/2014 | ||||
| Sponsor: | SAB Family Limited Partnership | Title Vesting: | Fee | ||||
| Mortgage Rate: | 4.860% | Property Manager: | Self-managed | ||||
| Note Date: | January 11, 2016 | 4th Most Recent Occupancy (As of)(2): | 90.5% (12/31/2011) | ||||
| Anticipated Repayment Date: | NAP | 3rd Most Recent Occupancy (As of)(2): | 90.5% (12/31/2012) | ||||
| Maturity Date: | January 11, 2026 | 2nd Most Recent Occupancy (As of)(2): | 86.6% (12/31/2013) | ||||
| IO Period: | 24 months | Most Recent Occupancy (As of)(2): | 94.7% (12/31/2014) | ||||
| Loan Term (Original): | 120 months | Current Occupancy (As of): | 98.3% (12/4/2015) | ||||
| Seasoning: | 2 months | ||||||
| Amortization Term (Original): | 360 months | Underwriting and Financial Information: | |||||
| Loan Amortization Type: | Interest-only, Amortizing Balloon | ||||||
| Interest Accrual Method: | Actual/360 | 4th Most Recent NOI (As of): | $1,541,149 (12/31/2012) | ||||
| Call Protection: | L(26),D(90),O(4) | 3rd Most Recent NOI (As of): | $1,553,164 (12/31/2013) | ||||
| Lockbox Type: | Soft/Springing Cash Management | 2nd Most Recent NOI (As of)(3): | $1,452,924 (12/31/2014) | ||||
| Additional Debt: | None | Most Recent NOI (As of)(3): | $1,274,981 (TTM 11/30/2015) | ||||
| Additional Debt Type: | NAP | ||||||
| U/W Revenues: | $3,009,019 | ||||||
| U/W Expenses: | $1,354,620 | ||||||
| Escrows and Reserves(1): | U/W NOI(3): | $1,654,399 | |||||
| U/W NCF: | $1,420,536 | ||||||
| Type: | Initial | Monthly | Cap (If Any) | U/W NOI DSCR: | 1.47x | ||
| Taxes | $108,984 | $18,164 | NAP | U/W NCF DSCR: | 1.26x | ||
| Insurance | $0 | Springing | NAP | U/W NOI Debt Yield: | 9.3% | ||
| Replacement Reserves | $0 | $1,682 | NAP | U/W NCF Debt Yield: | 8.0% | ||
| TI/LC Reserve | $250,000 | $10,000 | $500,000 | As-Is Appraised Value: | $27,300,000 | ||
| Tenant Specific TI/LC Reserve | $62,748 | $0 | NAP | As-Is Appraisal Valuation Date: | December 14, 2015 | ||
| Rent Concession Reserve | $25,899 | $0 | NAP | Cut-off Date LTV Ratio: | 65.0% | ||
| Torti Gallas Reserve | $0 | Springing | NAP | LTV Ratio at Maturity or ARD: | 56.1% | ||
| (1) | See “Escrows” section. |
| (2) | See “Historical Occupancy” section. |
| (3) | See “Cash Flow Analysis” section. |
The Mortgage Loan. The mortgage loan (the “Parkview at Spring Street Mortgage Loan”) is evidenced by a singlepromissory note secured by a first mortgage encumbering an office building located in Silver Spring, Maryland (the “Parkview at Spring Street Property”). The Parkview at Spring Street Mortgage Loan was originated on January 11, 2016 by Wells Fargo Bank, National Association. The Parkview at Spring Street Mortgage Loan had an original principal balance of $17,750,000, has an outstanding principal balance as of the Cut-off Date of $17,750,000 and accrues interest at an interest rate of 4.860%per annum. The Parkview at Spring Street Mortgage Loan had an initial term of 120 months, has a remaining term of 118 months as of the Cut-off Date and requires interest-only payments for the first 24 payments following origination and, thereafter, requires payments of principal and interest based on a 30-year amortization schedule. The Parkview at Spring Street Mortgage Loan matures on January 11, 2026.
Following the lockout period, the borrower has the right to defease the Parkview at Spring Street Mortgage Loan in whole, but not in part, on any date before October 11, 2025. In addition, the Parkview at Spring Street Mortgage Loan is prepayable without penalty on or after October 11, 2025.
THE INFORMATION IN THIS STRUCTURAL AND COLLATERAL TERM SHEET IS NOT COMPLETE AND MAY BE AMENDED PRIOR TO THE TIME OF SALE. THIS TERM SHEET IS NOT AN OFFER TO SELL THESE SECURITIES AND IT IS NOT A SOLICITATION OF AN OFFER TO BUY THESE SECURITIES IN ANY JURISDICTION WHERE THE OFFER OR SALE IS NOT PERMITTED.
| 100 |
PARKVIEW AT SPRING STREET |
Sources and Uses
| Sources | Uses | |||||||||
| Original loan amount | $17,750,000 | 100.0 | % | Loan payoff(1) | $13,951,316 | 78.6 | % | |||
| Reserves | 447,631 | 2.5 | ||||||||
| Closing costs | 174,176 | 1.0 | ||||||||
| Return of equity | 3,176,877 | 17.9 | ||||||||
| Total Sources | $17,750,000 | 100.0 | % | Total Uses | $17,750,000 | 100.0 | % | |||
| (1) | The Parkview at Spring Street Property was previously securitized in the LBUBS 2006-C4 transaction. |
The Property.The Parkview at Spring Street Property is a five-story office building totaling 100,895 square feet located in Silver Spring, Maryland, approximately 6.8 miles north of Washington, D.C. Built in 1988 and renovated in 2014, the Parkview at Spring Street Property is situated on a 1.2-acre parcel and features a Bank of America retail branch and a deli on the ground floor. The Parkview at Spring Street Property has a diverse tenant base, which includes the largest tenant, Torti Gallas & Partners, an architecture firm that has won over 400 international, national and local design awards for planning and design and is headquartered at the Parkview at Spring Street Property; Associated Insurance Management, Inc. (“AIM”), which is headquartered at the Parkview at Spring Street Property; and HIAS, Inc., the Hebrew Immigrant Aid Society. With the exception of the three largest tenants, no other tenant at the Parkview at Spring Street Property represents more than 9.8% of the net rentable area. The Parkview at Spring Street Property has averaged 92.3% occupancy since 1993. The Parkview at Spring Street Property features a three-level, below-grade structured parking deck with 216 parking spaces resulting in a parking ratio of 2.1 spaces per 1,000 square feet of net rentable area. As of December 4, 2015, the Parkview at Spring Street Property was 98.3% occupied by 19 tenants.
The following table presents certain information relating to the tenancy at the Parkview at Spring Street Property:
Major Tenants
| Tenant Name | Credit Rating (Fitch/Moody’s/ S&P)(1) | Tenant NRSF | % of NRSF | Annual U/W Base Rent PSF(2) | Annual U/W Base Rent(2) | % of Total Annual U/W Base Rent | Lease Expiration Date | ||||||||
| Major Tenants | |||||||||||||||
| Torti Gallas & Partners | NR/NR/NR | 22,363 | 22.2% | $28.50 | $637,346 | 22.5% | 7/31/2018(3) | ||||||||
| AIM(4) | NR/NR/NR | 19,426(4) | 19.3% | $26.27(4) | $510,321(4) | 18.0% | 6/30/2025(5) | ||||||||
| HIAS, Inc. | NR/NR/NR | 15,074 | 14.9% | $26.60 | $400,968 | 14.1% | 2/28/2026 | ||||||||
| Bank Of America | A/Baa1/BBB+ | 4,048 | 4.0% | $63.85 | $258,454 | 9.1% | 12/31/2018(6) | ||||||||
| Meridian Senior Living | NR/NR/NR | 9,860 | 9.8% | $23.47 | $231,385 | 8.2% | 12/31/2017 | ||||||||
| Total Major Tenants | 70,771 | 70.1% | $28.80 | $2,038,474 | 71.8% | ||||||||||
| Non-Major Tenants | 28,427 | 28.2% | $28.12 | $799,291 | 28.2% | ||||||||||
| Occupied Collateral Total | 99,198 | 98.3% | $28.61 | $2,837,765 | 100.0% | ||||||||||
| Vacant Space | 1,697 | 1.7% | |||||||||||||
| Collateral Total | 100,895 | 100.0% | |||||||||||||
| (1) | Certain ratings are those of the parent company whether or not the parent company guarantees the lease. |
| (2) | Annual U/W Base Rent PSF and Annual U/W Base Rent include contractual rent steps through July 2016 totaling $65,641. |
| (3) | Torti Gallas & Partners has one, 3-year lease renewal option. |
| (4) | AIM will not commence rental payments on its 2,076 square foot (2.1% on the net rentable are) expansion space until May 2016. The abated rent related to the expansion space was reserved at origination. |
| (5) | AIM has one, 5-year lease renewal option. |
| (6) | Bank of America has one, 5-year lease renewal option. |
THE INFORMATION IN THIS STRUCTURAL AND COLLATERAL TERM SHEET IS NOT COMPLETE AND MAY BE AMENDED PRIOR TO THE TIME OF SALE. THIS TERM SHEET IS NOT AN OFFER TO SELL THESE SECURITIES AND IT IS NOT A SOLICITATION OF AN OFFER TO BUY THESE SECURITIES IN ANY JURISDICTION WHERE THE OFFER OR SALE IS NOT PERMITTED.
| 101 |
PARKVIEW AT SPRING STREET |
The following table presents certain information relating to the lease rollover schedule at the Parkview at Spring Street Property:
Lease Expiration Schedule(1)
Year Ending December 31, | No. of Leases Expiring | Expiring NRSF | % of Total NRSF | Cumulative Expiring NRSF | Cumulative % of Total NRSF | Annual U/W Base Rent | % of Total Annual U/W Base Rent | Annual U/W Base Rent PSF(2) | |||||||||
| MTM | 0 | 0 | 0.0% | 0 | 0.0% | $0 | 0.0% | $0.00 | |||||||||
| 2016 | 0 | 0 | 0.0% | 0 | 0.0% | $0 | 0.0% | $0.00 | |||||||||
| 2017 | 2 | 12,889 | 12.8% | 12,889 | 12.8% | $325,137 | 11.5% | $25.23 | |||||||||
| 2018 | 5 | 32,994 | 32.7% | 45,883 | 45.5% | $1,082,434 | 38.1% | $32.81 | |||||||||
| 2019 | 3 | 3,660 | 3.6% | 49,543 | 49.1% | $96,344 | 3.4% | $26.32 | |||||||||
| 2020 | 0 | 0 | 0.0% | 49,543 | 49.1% | $0 | 0.0% | $0.00 | |||||||||
| 2021 | 0 | 0 | 0.0% | 49,543 | 49.1% | $0 | 0.0% | $0.00 | |||||||||
| 2022 | 1 | 2,452 | 2.4% | 51,995 | 51.5% | $76,576 | 2.7% | $31.23 | |||||||||
| 2023 | 2 | 2,091 | 2.1% | 54,086 | 53.6% | $58,819 | 2.1% | $28.13 | |||||||||
| 2024 | 2 | 4,385 | 4.3% | 58,471 | 58.0% | $113,212 | 4.0% | $25.82 | |||||||||
| 2025 | 1 | 19,426 | 19.3% | 77,897 | 77.2% | $510,321 | 18.0% | $26.27 | |||||||||
| 2026 | 3 | 21,301 | 21.1% | 99,198 | 98.3% | $574,923 | 20.3% | $26.99 | |||||||||
| Thereafter | 0 | 0 | 0.0% | 99,198 | 98.3% | $0 | 0.0% | $0.00 | |||||||||
| Vacant | 0 | 1,697 | 1.7% | 100,895 | 100.0% | $0 | 0.0% | $0.00 | |||||||||
| Total/Weighted Average | 19 | 100,895 | 100.0% | $2,837,765 | 100.0% | $28.61 |
| (1) | Information obtained from the underwritten rent roll. |
| (2) | Weighted Average Annual U/W Base Rent PSF excludes vacant space. |
The following table presents historical occupancy percentages at the Parkview at Spring Street Property:
Historical Occupancy
| 12/31/2011(1) | 12/31/2012(1) | 12/31/2013(2)(3) | 12/31/2014(2)(3) | 12/4/2015(4) | ||||
| 90.5% | 90.5% | 86.6% | 94.7% | 98.3% | ||||
| (1) | Information obtained from a third party market research report. |
| (2) | Information obtained from the borrower |
| (3) | Occupancy increased from 2013 to 2014 primarily due to AIM (19.3% of the net rentable area) and Major Medical LLC (2.5% of the net rentable area) taking occupancy. |
| (4) | Information obtained from the underwritten rent roll. |
Operating History and Underwritten Net Cash Flow. The following table presents certain information relating to the historical operating performance and underwritten net cash flow at the Parkview at Spring Street Property:
Cash Flow Analysis
| 2012 | 2013 | 2014 | TTM 11/30/2015 | U/W | % of U/W Effective Gross Income | U/W $ per SF | ||||||||||
| Base Rent | $2,546,505 | $2,549,844 | $2,435,323(1) | $2,310,664(1)(2) | $2,837,765(2) | 94.3 | % | $28.13 | ||||||||
| Grossed Up Vacant Space | 0 | 0 | 0 | 0 | 48,365 | 1.6 | 0.48 | |||||||||
| Total Reimbursables | 120,624 | 162,599 | 127,234 | 72,429 | 50,000 | 1.7 | 0.50 | |||||||||
| Other Income | 240,568 | 260,798 | 283,146 | 283,574 | 295,000 | 9.8 | 2.92 | |||||||||
| Less Vacancy & Credit Loss | 0 | 0 | 0 | 0 | (222,111)(3) | (7.4 | ) | (2.20) | ||||||||
| Effective Gross Income | $2,907,697 | $2,973,241 | $2,845,703 | $2,666,667 | $3,009,019 | 100.0 | % | $29.82 | ||||||||
| Total Operating Expenses | $1,366,548 | $1,420,077 | $1,392,779 | $1,391,686 | $1,354,620 | 45.0 | % | $13.43 | ||||||||
| Net Operating Income | $1,541,149 | $1,553,164 | $1,452,924 | $1,274,981 | $1,654,399 | 55.0 | % | $16.40 | ||||||||
| TI/LC | 0 | 0 | 0 | 0 | 213,684 | 7.1 | 2.12 | |||||||||
| Capital Expenditures | 0 | 0 | 0 | 0 | 20,179 | 0.7 | 0.20 | |||||||||
| Net Cash Flow | $1,541,149 | $1,553,164 | $1,452,924 | $1,274,981 | $1,420,536 | 47.2 | % | $14.08 | ||||||||
| NOI DSCR | 1.37x | 1.38x | 1.29x | 1.13x | 1.47x | |||||||||||
| NCF DSCR | 1.37x | 1.38x | 1.29x | 1.13x | 1.26x | |||||||||||
| NOI DY | 8.7% | 8.8% | 8.2% | 7.2% | 9.3% | |||||||||||
| NCF DY | 8.7% | 8.8% | 8.2% | 7.2% | 8.0% | |||||||||||
| (1) | TTM 11/30/2015 Base Rent decreased from 2014 due to a rent abatement period under the AIM lease from November 1, 2014 through June 30, 2015 and a rent abatement period under the HIAS, Inc. lease from August 13, 2015 through February 13, 2016. AIM does not commence rental payments on its 2,076 square foot expansion space until May 2016. The abated rent related to the expansion space was reserved at origination. |
| (2) | U/W Base Rent is higher than TTM 11/30/2015 primarily due to HIAS, Inc. commencing rental payments and contractual rent steps through July 2016 totaling $65,641. |
| (3) | The underwritten economic vacancy is 7.7%. The Parkview at Spring Street Property was 98.3% physically occupied as of December 4, 2015. |
THE INFORMATION IN THIS STRUCTURAL AND COLLATERAL TERM SHEET IS NOT COMPLETE AND MAY BE AMENDED PRIOR TO THE TIME OF SALE. THIS TERM SHEET IS NOT AN OFFER TO SELL THESE SECURITIES AND IT IS NOT A SOLICITATION OF AN OFFER TO BUY THESE SECURITIES IN ANY JURISDICTION WHERE THE OFFER OR SALE IS NOT PERMITTED.
| 102 |
PARKVIEW AT SPRING STREET |
Appraisal.As of the appraisal valuation date of December 14, 2015, the Parkview at Spring Street Property had an “as-is” appraised value of $27,300,000.
Environmental Matters.According to the Phase I environmental report dated December 18, 2015, there was no evidence of any recognized environmental conditions at the Parkview at Spring Street Property.
Market Overview and Competition.The Parkview at Spring Street Property is located in Silver Spring, Maryland, approximately 6.8 miles north of Washington, D.C. Access to the neighborhood is provided by Interstate 495 (the Capital Beltway), located approximately 1.4 miles northwest of the Parkview at Spring Street Property, which encircles Washington, D.C. and provides access throughout the metropolitan area and nearly all major roadways. Additionally, the Parkview at Spring Street Property is located approximately 0.6 miles northwest of the Paul S. Sarbanes Transit Center, a three-tiered transit facility located in downtown Silver Spring that incorporates the Metrobus, Ride On, Metrorail, MARC train, intercity Greyhound bus and local taxi services under one roof and serves approximately 60,000 passengers daily.
Downtown Silver Spring has recently been redeveloped with retail, office and multifamily properties, including the former City Place mall which is undergoing a $45.0 million renovation and will be rebranded as Ellsworth Place. Ellsworth Place is expected to re-open in Spring 2016 and includes national retail chains such as Whole Foods Market, a 20-screen Regal Theatres, Men’s Warehouse, Ann Taylor Loft, DSW Shoe Warehouse as well as many restaurants including Romano’s Macaroni Grill, Panera Bread, Red Lobster, Baja Fresh, Nando’s and Chick-fil-a. Downtown Silver Spring is also home to a number of major headquarters including the National Oceanic and Atmospheric Administration and Discovery Communications, which invested approximately $150.0 million to relocate from Bethesda and build its headquarters in Silver Spring in 2003. The estimated 2015 population within a one-, three- and five-mile radius of the Parkview at Spring Street Property was 33,108, 216,779 and 595,937, respectively, and the estimated 2015 average household income within the same radii was $104,273, $116,016 and $117,113, respectively.
According to a third party market research report, the Parkview at Spring Street Property is located in the Silver Spring office submarket which is part of the SE Montgomery County office submarket cluster. As of the fourth quarter of 2015, the SE Montgomery County office submarket cluster was comprised of 374 buildings totaling 12.9 million square feet and reported a 12.9% vacancy rate and average asking rent of $26.17 per square foot gross. For the same period, the Silver Spring office submarket was comprised of 185 buildings totaling 7.4 million square feet and reported a 10.8% vacancy rate and average asking rent of $27.64 per square foot gross.
The following table presents certain information relating to comparable office leases for the Parkview at Spring Street Property:
Comparable Leases(1)
| Property Name/Location | Year Built/ Renovated | Stories | Total GLA (SF) | Total Occupancy | Distance from Subject | Tenant Name | Lease Date/Term | Lease Area (SF) | Annual Base Rent PSF | Lease Type |
Silver Spring Plaza Silver Spring, MD | 1970/2001 | 14 | 243,582 | 82% | 0.2 miles | Handicap International | July 2015 / 5.0 Yrs | 3,521 | $24.00 | FSG |
Lee Plaza Building Silver Spring, MD | 1987/NAP | 10 | 141,780 | 92% | 0.3 miles | Richin & Gaines | July 2015 / 5.0 Yrs | 1,341 | $28.25 | FSG |
Plaza @ Station Square Silver Spring, MD | 1984/NAP | 10 | 139,105 | 98% | 0.5 miles | Localist Corp | May 2015 / 8.0 Yrs | 3,066 | $29.50 | FSG |
Wayne Plaza Silver Spring, MD | 1970/2006 | 9 | 91,000 | 89% | 0.5 miles | Tailored Solutions | January 2015 / 5.4 Yrs | 6,152 | $25.50 | BYS |
Blair Office Building Silver Spring, MD | 1963/1990 | 7 | 69,517 | 100% | 0.6 miles | Potomac Massage | August 2014 / 10.0 Yrs | 9,865 | $26.50 | FSG |
| (1) | Information obtained from the appraisal and third party market research reports. |
The Borrower.The borrower is 1300 Spring Street, LLC, a Maryland limited liability company and a single purpose entity. SAB Family Limited Partnership is the guarantor of certain nonrecourse carveouts under the Parkview at Spring Street Mortgage Loan.
The Sponsor.The sponsor is SAB Family Limited Partnership, which is controlled by Adam Bernstein who is the president and CEO of The Bernstein Companies, one of the oldest commercial real estate firms in Washington, D.C. Founded in 1933, The Bernstein Companies’ focus has ranged from residential investments and condominium conversions to suburban land development to investments in hotel, office, industrial and retail properties. Today, The Bernstein Companies is focused on strategic acquisitions, ground up developments, and investments, as well as management of its hotel and commercial properties. Since its inception, The Bernstein Companies has owned, developed, managed or financed over 3,000 apartment and condominium units, 2,000 hotel rooms and approximately 5.0 million square feet of commercial office space.
Escrows.The loan documents provide for upfront reserves of $108,984 for real estate taxes; $250,000 for tenant improvements and leasing commissions (“TI/LC”); $62,748 for outstanding TI/LC expenses related to the AIM lease; and $25,899 for rent abatements related to the HIAS, Inc. ($12,924) and AIM ($12,974) leases. The loan documents also provide for ongoing monthly reserves of $18,164 for real estate taxes and $1,682 for replacement reserves. Ongoing monthly TI/LC reserves of $10,000 are
THE INFORMATION IN THIS STRUCTURAL AND COLLATERAL TERM SHEET IS NOT COMPLETE AND MAY BE AMENDED PRIOR TO THE TIME OF SALE. THIS TERM SHEET IS NOT AN OFFER TO SELL THESE SECURITIES AND IT IS NOT A SOLICITATION OF AN OFFER TO BUY THESE SECURITIES IN ANY JURISDICTION WHERE THE OFFER OR SALE IS NOT PERMITTED.
| 103 |
PARKVIEW AT SPRING STREET |
required and capped at $500,000 after August 1, 2019 provided no event of default has occurred and is continuing and the amortizing debt service coverage ratio is at least 1.25x. The loan documents do not require monthly escrows for insurance premiums as long as (i) no event of default has occurred and is continuing; (ii) the Parkview at Spring Street Property is insured under an acceptable blanket insurance policy; and (iii) the borrower provides the lender with evidence of renewal of the policies and timely proof of the payment of insurance premiums.
If Torti Gallas & Partners fails to renew its lease by October 30, 2017 (nine months prior to its lease expiration), the loan documents require the borrower to either provide a letter of credit in an amount of $700,000 ($31.30 per square foot of the Torti Gallas & Partners’ space) or to deposit monthly reserves in an amount of $116,667 until the balance of such reserve is equal to $700,000. If the borrower fails to deliver the letter of credit or deposit funds into the Torti Gallas Reserve by November 15, 2017, the Parkview at Spring Street Mortgage Loan will become recourse to the borrower and guarantor in amount equal to $1.4 million.
Lockbox and Cash Management.The Parkview at Spring Street Mortgage Loan requires a lender-controlled lockbox account, which is already in place, and the borrower and property manager are required to deposit all rents directly into such lockbox account within one business day of receipt. Prior to the occurrence of a Cash Trap Event Period (as defined below), all funds on deposit in the lockbox account are required to be disbursed to the borrower. Upon the occurrence of a Cash Trap Event Period, the borrower will be required to direct all tenants to deposit all rents directly into such lockbox account and all excess funds in the lockbox account will be swept to a lender-controlled subaccount.
A “Cash Trap Event Period” will commence upon (i) the occurrence and continuance of an event of default or (ii) the amortizing debt service coverage ratio being less than 1.10x at the end of any month. A Cash Trap Event Period will end, with respect to clause (i), upon the cure of such event of default and with respect to clause (ii), upon the amortizing debt service coverage ratio being at least 1.10x for two consecutive calendar quarters.
Property Management.The Parkview at Spring Street Office Property is managed by an affiliate of the borrower.
Assumption.The borrower has the two-time right to transfer the Parkview at Spring Street Property, provided that certain conditions are satisfied, including (i) no event of default has occurred and is continuing; (ii) the lender has reasonably determined that the proposed transferee and guarantor satisfy the lender’s credit review and underwriting standards, taking into consideration the transferee’s experience, financial strength and general business standing; and (iii) if required by the lender, rating agency confirmation from DBRS, Fitch and Moody’s that the transfer will not result in a downgrade, withdrawal or qualification of the respective ratings assigned to the Series 2016-C33 Certificates.
Partial Release.Not permitted.
Real Estate Substitution.Not permitted.
Subordinate and Mezzanine Indebtedness. Not permitted.
Ground Lease. None.
Terrorism Insurance.The loan documents require that the “all risk” insurance policy required to be maintained by the borrower provide coverage for terrorism in an amount equal to the full replacement cost of the Parkview at Spring Street Property (provided that the borrower is not required to pay terrorism insurance premiums in excess of two times the premium for all risk and business interruption coverage if the Terrorism Risk Insurance Program Reauthorization Act is no longer in effect). The loan documents also require business interruption insurance covering no less than the 12-month period following the occurrence of a casualty event, together with a six-month extended period of indemnity.
THE INFORMATION IN THIS STRUCTURAL AND COLLATERAL TERM SHEET IS NOT COMPLETE AND MAY BE AMENDED PRIOR TO THE TIME OF SALE. THIS TERM SHEET IS NOT AN OFFER TO SELL THESE SECURITIES AND IT IS NOT A SOLICITATION OF AN OFFER TO BUY THESE SECURITIES IN ANY JURISDICTION WHERE THE OFFER OR SALE IS NOT PERMITTED.
| 104 |
(THIS PAGE INTENTIONALLY LEFT BLANK)
THE INFORMATION IN THIS STRUCTURAL AND COLLATERAL TERM SHEET IS NOT COMPLETE AND MAY BE AMENDED PRIOR TO THE TIME OF SALE. THIS TERM SHEET IS NOT AN OFFER TO SELL THESE SECURITIES AND IT IS NOT A SOLICITATION OF AN OFFER TO BUY THESE SECURITIES IN ANY JURISDICTION WHERE THE OFFER OR SALE IS NOT PERMITTED.
| 105 |
| OMNI OFFICENTRE |
THE INFORMATION IN THIS STRUCTURAL AND COLLATERAL TERM SHEET IS NOT COMPLETE AND MAY BE AMENDED PRIOR TO THE TIME OF SALE. THIS TERM SHEET IS NOT AN OFFER TO SELL THESE SECURITIES AND IT IS NOT A SOLICITATION OF AN OFFER TO BUY THESE SECURITIES IN ANY JURISDICTION WHERE THE OFFER OR SALE IS NOT PERMITTED.
| 106 |
| OMNI OFFICENTRE |

THE INFORMATION IN THIS STRUCTURAL AND COLLATERAL TERM SHEET IS NOT COMPLETE AND MAY BE AMENDED PRIOR TO THE TIME OF SALE. THIS TERM SHEET IS NOT AN OFFER TO SELL THESE SECURITIES AND IT IS NOT A SOLICITATION OF AN OFFER TO BUY THESE SECURITIES IN ANY JURISDICTION WHERE THE OFFER OR SALE IS NOT PERMITTED.
| 107 |
| No. 10 – Omni Officentre | |||||||
| Loan Information | Property Information | ||||||
| Mortgage Loan Seller: | Ladder Capital Finance LLC | Single Asset/Portfolio: | Single Asset | ||||
| Credit Assessment (DBRS/Fitch/Moody’s): | NR/NR/NR | Property Type: | Office | ||||
| Original Principal Balance: | $15,500,000 | Specific Property Type: | Suburban | ||||
| Cut-off Date Balance: | $15,500,000 | Location: | Southfield, MI | ||||
| % of Initial Pool Balance: | 2.2% | Size: | 294,090 SF | ||||
| Loan Purpose: | Refinance | Cut-off Date Balance Per SF: | $52.70 | ||||
| Borrower Name: | Omni Property Group, LLC | Year Built/Renovated: | 1979/NAP | ||||
| Sponsor: | Larry Nemer | Title Vesting: | Fee | ||||
| Mortgage Rate: | 4.752% | Property Manager: | Self-managed | ||||
| Note Date: | December 22, 2015 | 4th Most Recent Occupancy(2): | NAV | ||||
| Anticipated Repayment Date: | NAP | 3rd Most Recent Occupancy (As of)(2): | 60.2% (12/31/2012) | ||||
| Maturity Date: | January 6, 2026 | 2nd Most Recent Occupancy (As of)(2): | 61.0% (12/31/2013) | ||||
| IO Period: | 36 months | Most Recent Occupancy (As of)(2): | 71.0% (12/31/2014) | ||||
| Loan Term (Original): | 120 months | Current Occupancy (As of)(2): | 81.0% (11/4/2015) | ||||
| Seasoning: | 2 months | ||||||
| Amortization Term (Original): | 360 months | Underwriting and Financial Information: | |||||
| Loan Amortization Type: | Interest-only, Amortizing Balloon | ||||||
| Interest Accrual Method: | Actual/360 | 4th Most Recent NOI (As of) (3): | $1,229,725 (12/31/2012) | ||||
| Call Protection: | L(26),D(89),O(5) | 3rd Most Recent NOI (As of)(3): | $1,301,385 (12/31/2013) | ||||
| Lockbox Type: | Hard/Springing Cash Management | 2nd Most Recent NOI (As of)(3): | $1,584,380 (12/31/2014) | ||||
| Additional Debt: | None | Most Recent NOI (As of)(3): | $1,621,347 (TTM 9/30/2015) | ||||
| Additional Debt Type: | NAP | ||||||
| U/W Revenues: | $4,178,366 | ||||||
| U/W Expenses: | $1,959,536 | ||||||
| U/W NOI(3): | $2,218,830 | ||||||
| Escrows and Reserves(1): | U/W NCF: | $1,847,115 | |||||
| U/W NOI DSCR: | 2.29x | ||||||
| Type: | Initial | Monthly | Cap (If Any) | U/W NCF DSCR: | 1.90x | ||
| Taxes | $172,441 | $34,488 | NAP | U/W NOI Debt Yield: | 14.3% | ||
| Insurance | $25,597 | $3,200 | NAP | U/W NCF Debt Yield: | 11.9% | ||
| Replacement Reserve | $350,000 | $6,127 | NAP | As-Is Appraised Value: | $24,000,000 | ||
| TI/LC Reserve | $0 | $24,508 | NAP | As-Is Appraisal Valuation Date: | October 30, 2015 | ||
| BCBS TI/LC Reserve | $529,653 | $0 | NAP | Cut-off Date LTV Ratio: | 64.6% | ||
| Free Rent Reserve | $202,426 | $0 | NAP | LTV Ratio at Maturity or ARD: | 56.9% | ||
| (1) | See “Escrows” section. |
| (2) | See “Historical Occupancy” section. |
| (3) | See “Cash Flow Analysis” section. |
The Mortgage Loan.The mortgage loan (the “Omni Officentre Mortgage Loan”) is evidenced by a single promissory note that is secured by a first mortgage encumbering two four-story class B office buildings located in Southfield, Michigan (the “Omni Officentre Property”). The Omni Officentre Mortgage Loan was originated on December 22, 2015 by Ladder Capital Finance LLC. The Omni Officentre Mortgage Loan had an original principal balance of $15,500,000, has an outstanding principal balance as of the Cut-off Date of $15,500,000 and accrues interest at an interest rate of 4.752%per annum. The Omni Officentre Mortgage Loan had an initial term of 120 months, has a remaining term of 118 months as of the Cut-off Date and requires interest-only payments for the first 36 payments following origination and, thereafter, requires payments of principal and interest based on a 30-year amortization schedule. The Omni Officentre Mortgage Loan matures on January 6, 2026.
Following the lockout period, the borrower has the right to defease the Omni Officentre Mortgage Loan in whole, but not in part, on any date before September 6, 2025. In addition, the Omni Officentre Mortgage Loan is prepayable without penalty on or after September 6, 2025.
THE INFORMATION IN THIS STRUCTURAL AND COLLATERAL TERM SHEET IS NOT COMPLETE AND MAY BE AMENDED PRIOR TO THE TIME OF SALE. THIS TERM SHEET IS NOT AN OFFER TO SELL THESE SECURITIES AND IT IS NOT A SOLICITATION OF AN OFFER TO BUY THESE SECURITIES IN ANY JURISDICTION WHERE THE OFFER OR SALE IS NOT PERMITTED.
| 108 |
| OMNI OFFICENTRE |
Sources and Uses
| Sources | Uses | |||||||
| Original loan amount | $15,500,000 | 100.0% | Loan payoff | $12,286,982 | 79.3% | |||
| Reserves | 1,280,117 | 8.3 | ||||||
| Closing costs | 329,947 | 2.1 | ||||||
| Return of equity | 1,602,954 | 10.3 | ||||||
| Total Sources | $15,500,000 | 100.0% | Total Uses | $15,500,000 | 100.0% |
The Property.The Omni Officentre Property is comprised of two, four-story class B office buildings containing approximately 294,090 square feet located on a 15.4-acre parcel in Southfield, Michigan, approximately 15.2 miles northwest of Detroit. The Omni Officentre Property was originally built by the borrower in 1979 and features onsite security personnel, a 5,237-square-foot cafeteria, a convenience store and a 2,240-square-foot conference room. The largest tenant at Omni Officentre Property is Blue Cross Blue Shield of Michigan (“BCBS”), which has been in occupancy since April 2009. BCBS originally occupied 46,896 square feet (15.9% of the net rentable area) and has expanded three times, most recently in April 2015, to occupy a total of 105,016 square feet (35.7% of the net rentable area). In December 2015, BCBS executed a fifth amendment to its lease to further expand by an additional 13,061 square feet, to occupy a total of 118,077 square feet (40.1% of the net rentable area) and extend its lease to June 30, 2022. The Omni Officentre Property features 1,172 surface parking spaces, as well as two covered parking garage areas with an additional 17 spaces each, for a total of 1,206 parking spaces resulting in a parking ratio of 4.1 spaces per 1,000 square feet of rentable area. As of November 4, 2015, the Omni Officentre Property was 81.0% leased by 30 tenants.
The following table presents certain information relating to the tenancy at the Omni Officentre Property:
Major Tenants
| Tenant Name | Credit Rating (Fitch/Moody’s/ S&P) | Tenant NRSF | % of NRSF | Annual U/W Base Rent PSF(1) | Annual U/W Base Rent(1) | % of Total Annual U/W Base Rent | Lease Expiration Date |
| Major Tenants | |||||||
| BCBS | NR/NR/NR | 118,077(2) | 40.1% | $16.50(2) | $1,948,271(2) | 50.2% | 6/30/2022 |
| First Recovery Group, LLC | NR/NR/NR | 15,464 | 5.3% | $16.50 | $255,156 | 6.6% | 2/28/2018 |
| LogistiCare Solutions, LLC | NR/NR/NR | 13,848 | 4.7% | $17.00 | $235,416 | 6.1% | 2/28/2019(3) |
| Korotkin, Schlesinger & Associates | NR/NR/NR | 13,430 | 4.6% | $17.00 | $228,310 | 5.9% | 8/31/2021 |
| BCD Travel USA, LLC | NR/NR/NR | 9,356 | 3.2% | $17.00 | $159,052 | 4.1% | 2/28/2018 |
| Total Major Tenants | 170,175 | 57.9% | $16.61 | $2,826,205 | 72.8% | ||
| Non-Major Tenants(4) | 67,950 | 23.1% | $15.58 | $1,058,413 | 27.2% | ||
| Occupied Collateral Total | 238,125 | 81.0% | $16.31 | $3,884,617 | 100.0% | ||
| Vacant Space | 55,965 | 19.0% | |||||
| Collateral Total | 294,090 | 100.0% | |||||
| (1) | Annual U/W Base Rent PSF and Annual U/W Base Rent include contractual rent steps through August 2016, totaling $100,233. |
| (2) | BCBS’s square footage includes the 13,061-square-foot expansion on the first floor of the Omni Officentre Property. BCBS is currently building out the expansion space and is expected to take occupancy in May 2016 and will commence rental payments in January 2017. The abated rent related to the expansion space was reserved at origination. |
| (3) | LogistiCare Solutions, LLC has one, three-year lease renewal option. If the State of Michigan terminates all of its business contracts with the tenant, the tenant may terminate its lease upon the later of (i) July 31, 2017 and (ii) the last day of 6th complete month following the landlord’s receipt of the termination notice. |
| (4) | Non-Major Tenants includes the Sundries Store, conference room, and A&A Café Inc. totaling 8,138 square feet which have no associated rent and Federal Express, UPS, Metropolitan Fiber Systems and TCG Detroit which have no associated square footage. |
THE INFORMATION IN THIS STRUCTURAL AND COLLATERAL TERM SHEET IS NOT COMPLETE AND MAY BE AMENDED PRIOR TO THE TIME OF SALE. THIS TERM SHEET IS NOT AN OFFER TO SELL THESE SECURITIES AND IT IS NOT A SOLICITATION OF AN OFFER TO BUY THESE SECURITIES IN ANY JURISDICTION WHERE THE OFFER OR SALE IS NOT PERMITTED.
| 109 |
| OMNI OFFICENTRE |
The following table presents certain information relating to the lease rollover schedule at the Omni Officentre Property:
Lease Expiration Schedule(1)(2)
Year Ending December 31, | No. of Leases Expiring | Expiring NRSF | % of Total NRSF | Cumulative Expiring NRSF | Cumulative % of Total NRSF | Annual U/W Base Rent | % of Total Annual U/W Base Rent | Annual U/W Base Rent PSF(3) |
| MTM(4) | 3 | 8,138 | 2.8% | 8,138 | 2.8% | $0 | 0.0% | $0.00 |
| 2016 | 7(5) | 10,751(5) | 3.7% | 18,889 | 6.4% | $217,314(5) | 5.6% | $20.21(5) |
| 2017 | 8(6) | 20,870(6) | 7.1% | 39,759 | 13.5% | $372,306(6) | 9.6% | $17.84(6) |
| 2018 | 6 | 37,530 | 12.8% | 77,289 | 26.3% | $627,182 | 16.1% | $16.71 |
| 2019 | 2 | 21,941 | 7.5% | 99,230 | 33.7% | $368,951 | 9.5% | $16.82 |
| 2020 | 2 | 7,388 | 2.5% | 106,618 | 36.3% | $122,285 | 3.1% | $16.55 |
| 2021 | 1 | 13,430 | 4.6% | 120,048 | 40.8% | $228,310 | 5.9% | $17.00 |
| 2022 | 1 | 118,077 | 40.1% | 238,125 | 81.0% | $1,948,271 | 50.2% | $16.50 |
| 2023 | 0 | 0 | 0.0% | 238,125 | 81.0% | $0 | 0.0% | $0.00 |
| 2024 | 0 | 0 | 0.0% | 238,125 | 81.0% | $0 | 0.0% | $0.00 |
| 2025 | 0 | 0 | 0.0% | 238,125 | 81.0% | $0 | 0.0% | $0.00 |
| 2026 | 0 | 0 | 0.0% | 238,125 | 81.0% | $0 | 0.0% | $0.00 |
| Thereafter | 0 | 0 | 0.0% | 238,125 | 81.0% | $0 | 0.0% | $0.00 |
| Vacant | 0 | 55,965 | 19.0% | 294,090 | 100.0% | $0 | 0.0% | $0.00 |
| Total/Weighted | 30 | 294,090 | 100.0% | $3,884,617 | 100.00% | $16.31 |
| (1) | Information obtained from the underwritten rent roll. |
| (2) | Certain tenants may have lease termination options that are exercisable prior to the originally stated expiration date of the subject lease and that are not considered in the Lease Expiration Schedule. |
| (3) | Weighted average Annual U/W Base Rent PSF excludes vacant space. |
| (4) | MTM includes the Sundries Store, conference room, and A&A Café Inc. totaling 8,138 square feet which have no associated rent. |
| (5) | Includes leases for Federal Express, UPS and Metropolitan Fiber Systems which do not have any attributed square footage; the Annual U/W Base Rent PSF excluding rent associated with these tenants would be $18.91. |
| (6) | Includes the lease for TCG Detroit which does not have any attributed square footage; the Annual U/W Base Rent PSF excluding rent associated with TCG Detroit would be $17.24. |
The following table presents historical occupancy percentages at the Omni Officentre Property:
Historical Occupancy
12/31/2011(1) | 12/31/2012(2)(3) | 12/31/2013(2)(3)(4) | 12/31/2014(3)(4) | 11/4/2015 (4)(5) | ||||
| NAV | 60.2% | 61.0% | 71.0% | 81.0% |
| (1) | Historical occupancy prior to 2012 is unavailable |
| (2) | The December 31, 2012 and December 31, 2013 occupancies are based on the average occupancy for each respective year. |
| (3) | Information obtained from the borrower. |
| (4) | The increase in occupancy from December 31, 2013 to November 4, 2015 is primarily due to BCBS expanding its space by approximately 71,181 square feet (24.2% of the net rentable area). The November 4, 2015 occupancy includes the 13,061 square foot (4.4% of the net rentable area) BCBS expansion space; BCBS is currently building out the expansion space and is expected to take occupancy in May 2016. |
| (5) | Information obtained from the underwritten rent roll. |
THE INFORMATION IN THIS STRUCTURAL AND COLLATERAL TERM SHEET IS NOT COMPLETE AND MAY BE AMENDED PRIOR TO THE TIME OF SALE. THIS TERM SHEET IS NOT AN OFFER TO SELL THESE SECURITIES AND IT IS NOT A SOLICITATION OF AN OFFER TO BUY THESE SECURITIES IN ANY JURISDICTION WHERE THE OFFER OR SALE IS NOT PERMITTED.
| 110 |
| OMNI OFFICENTRE |
Operating History and Underwritten Net Cash Flow. The following table presents certain information relating to the historical operating performance and the underwritten net cash flow at the Omni Officentre Property:
Cash Flow Analysis
| 2012 | 2013(1) | 2014(1) | TTM 9/30/2015(2) | U/W(2) | % of U/W Effective Gross Income | U/W $ per SF | |
| Base Rent | $2,875,941 | $2,860,217 | $3,202,013 | $3,316,781 | $3,884,617 | 93.0% | $13.21 |
| Grossed Up Vacant Space | 0 | 0 | 0 | 0 | 933,980 | 22.4 | 3.18 |
| Total Reimbursables | 188,871 | 260,376 | 248,336 | 258,177 | 287,602 | 6.9 | 0.98 |
| Other Income | 2,900 | 2,900 | 3,300 | 0 | 6,148 | 0.1 | 0.02 |
| Less Vacancy & Credit Loss | 0 | 0 | 0 | 0 | (933,980)(3) | (22.4) | (3.18) |
| Effective Gross Income | $3,067,712 | $3,123,493 | $3,453,649 | $3,574,958 | $4,178,366 | 100.0% | $14.21 |
| Total Operating Expenses | $1,837,987 | $1,822,108 | $1,869,269 | $1,953,611 | $1,959,536 | 46.9% | $6.66 |
| Net Operating Income | $1,229,725 | $1,301,385 | $1,584,380 | $1,621,347 | $2,218,830 | 53.1% | $7.54 |
| TI/LC | 0 | 0 | 0 | 0 | 298,193 | 7.1 | 1.01 |
| Capital Expenditures | 0 | 0 | 0 | 0 | 73,523 | 1.8 | 0.25 |
| Net Cash Flow | $1,229,725 | $1,301,385 | $1,584,380 | $1,621,347 | $1,847,115 | 44.2% | $6.28 |
| NOI DSCR | 1.27x | 1.34x | 1.63x | 1.67x | 2.29x | ||
| NCF DSCR | 1.27x | 1.34x | 1.63x | 1.67x | 1.90x | ||
| NOI DY | 7.9% | 8.4% | 10.2% | 10.5% | 14.3% | ||
| NCF DY | 7.9% | 8.4% | 10.2% | 10.5% | 11.9% |
| (1) | The increase in Net Operating Income from 2013 to 2014 is due to tenants representing 57,148 square feet (19.4% of the net rentable area) taking occupancy and commencing rental payments in 2013 and 2014. |
| (2) | The increase in Net Operating Income from TTM 9/30/2015 to U/W is due to leasing activity, including the BCBS expansion, which has contributed $489,158 and underwritten contractual rent steps through August 2016 totaling $100,233. |
| (3) | The underwritten economic vacancy is 19.0%. The Omni Officentre Property was 81.0% leased as of November 4, 2015, which includes the 13,061-square-foot (4.4% of the net rentable area) BCBS expansion space; BCBS is currently building out the expansion space and is expected to take occupancy in May 2016. The physical occupancy excluding the expansion space is 76.5%. |
Appraisal. As of the appraisal valuation date of October 30, 2015, the Omni Officentre Property had an “as-is” appraised value of $24,000,000.
Environmental Matters. According to a Phase I environmental site assessment dated November 9, 2015, there was no evidence of any recognized environmental conditions at the Omni Officentre Property.
Market Overview and Competition.The Omni Officentre Property is located in Southfield, Michigan, approximately 15.2 miles northwest of Detroit. The Omni Officentre Property is located at the southeast corner of Northwestern Highway and First Center Drive with access to Interstate 696, 10 Mile Road, 11 Mile Road, 12 Mile Road, Civic Center Drive, Telegraph Road, and Lasher Road. The Detroit Metropolitan Wayne County Airport is located approximately 17.0 miles southwest from the Omni Officentre Property. The Omni Officentre Property is located in Oakland County, which had an estimated 2015 median household income of $65,061, 35.1% greater than the median household income for the state of Michigan. The largest employers within Oakland County are Beaumont Hospitals with approximately 11,683 employees, Chrysler Group with approximately 10,172 employees and General Motors Co. with approximately 8,550 employees. The estimated 2016 population within a three- and five-mile radius of the Omni Officentre Property was 66,826 and 255,461, respectively, while the estimated 2016 median household income within the same radii was $59,034 and $57,195, respectively.
According to the appraisal, the Omni Officentre Property is located in the South Southfield office submarket, which reported a 24.5% vacancy rate as of the first quarter 2015, a decrease from the year-end 2011 vacancy rate of 28.3%. The appraiser identified a competitive peer group for the Omni Officentre Property which had weighted average occupancy rate of 87.0%. The appraiser concluded to a blended market rent of $17.00 per square foot, which is approximately 4.2% higher than the Omni Officentre’s weighted average underwritten rent of $16.31 per square foot.
THE INFORMATION IN THIS STRUCTURAL AND COLLATERAL TERM SHEET IS NOT COMPLETE AND MAY BE AMENDED PRIOR TO THE TIME OF SALE. THIS TERM SHEET IS NOT AN OFFER TO SELL THESE SECURITIES AND IT IS NOT A SOLICITATION OF AN OFFER TO BUY THESE SECURITIES IN ANY JURISDICTION WHERE THE OFFER OR SALE IS NOT PERMITTED.
| 111 |
| OMNI OFFICENTRE |
The following table presents certain information relating to comparable office leases to the Omni Officentre Property:
Comparable Leases(1)
| Property Name/Location | Year Built/ Renovated | Stories | Total GLA (SF) | Total Occupancy | Distance from Subject | Tenant Name | Lease Date/Term | Lease Area (SF) | Annual Base Rent PSF | Lease Type |
| Allied Center Building Southfield, MI | 1967/2016 | 4 | 180,291 | 100% | 1.1 miles | Blue Care Network of Michigan | July 2015 / 10 Yrs | 180,291 | $17.50 | MG |
| Oakland Commons Phase I & II Southfield, MI | 1999/NAP | 6 | 315,380 | 91% | 1.3 miles | Credit Acceptance Corp | January 2014 / 5.3 Yrs | 3,075 | $17.25 | MG |
| Traveler’s Tower II Southfield, MI | 1981/2013 | 10 | 349,149 | 95% | 1.5 miles | Accretive Health | May 2015 / 11 Yrs | 107,572 | $15.75 | MG |
| Traveler’s Tower I Southfield, MI | 1973/2001 | 18 | 456,607 | 68% | 1.7 miles | MSX International | September 2015 / 10.6 Yrs | 39,402 | $16.10 | MG |
| American Center Southfield, MI | 1974/2001 | 25 | 508,860 | 88% | 2.3 miles | American Heart Association | July 2015 / 7.3 Yrs | 8,072 | $17.25 | MG |
| (1) | Information obtained from the appraisal and a third party market research report. |
The Borrower.The borrower is Omni Property Group, LLC, a Michigan limited liability company and single purpose entity. Larry Nemer is the guarantor of certain nonrecourse carveouts under the Omni Officentre Mortgage Loan.
The Sponsor.The sponsor is Larry Nemer, the president of Nemer Property Group, Inc., a full-service real estate organization. Nemer Property Group, Inc. provides design build, management, leasing, tenant improvement construction and design services to a portfolio comprised of approximately 2.0 million square feet of office space and 600,000 square feet of industrial space. Mr. Nemer has developed 13 office and industrial buildings in Troy, Michigan, Southfield, Michigan, and Romulus, Michigan totaling over 2.7 million square feet. In 2012, the prior debt secured by the Omni Officentre Property was modified by its prior lender to extend the term and reduce the outstanding principal. The sponsor was involved in three loan modifications and one discounted pay off between 2013 and 2015, including modification and principal forgiveness on the prior loan secured by the Omni Officentre Property. See “Description of the Mortgage Pool – Loan Purposes; Default History, Bankruptcy Issues and Other Proceedings” in the Preliminary Prospectus.
Escrows.The loan documents provide for upfront escrows in the amount of $172,441 for real estate taxes, $25,597 for insurance premiums, $350,000 for replacement reserves, $202,426 for free rent reserve related to the BCBS lease ($143,671) and Korotkin, Schlesinger & Associates lease ($58,755), and $529,653 for outstanding tenant improvement and leasing commissions related to the BCBS expansion space. The loan documents also provide for ongoing monthly reserves in the amount of $34,488 for real estate taxes, $3,200 for insurance premiums, $6,127 for replacement reserves and $24,508 for tenant improvements and leasing commissions.
Lockbox and Cash Management.The Omni Officentre Mortgage Loan documents require a lender-controlled lockbox account, which is already in place, and requires the borrower to direct tenants to pay all rents directly into such lockbox account. The loan documents also require that any rent received by the borrower or property manager is to be deposited into such lockbox account within 2 business days of receipt. Upon the occurrence and continuance of a Cash Management Period (as defined below), excess cash flow from the lockbox account will be swept to a lender-controlled cash management account.
A “Cash Management Period” will commence upon (i) the occurrence and continuance of an event of default; (ii) the amortizing debt service coverage ratio falling below 1.55x for two consecutive calendar quarters; (iii) the occurrence of an event of default under the management agreement; (iv) a Significant Tenant (as defined below) (A) or a Significant Tenant’s parent company becomes insolvent or the subject of a bankruptcy action, (B) vacates, surrenders or ceases to conduct business operations in substantially all of its space at the Omni Officentre Property for more than sixty days (excluding areas vacated for the purposes of performing construction, restoration or renovation which such vacancy will not exceed 90 days) or (C) notifies the borrower, property manager or any affiliate that it intends to vacate, surrender or cease to conduct its normal business operation at substantially all of its demised premises or otherwise “go dark”; or (v) 12 months prior to the BCBS lease expiration on June 30, 2022 or any subsequent lease expiration date, unless a BCBS Extension Event (as defined below) has occurred. A Cash Management Period will end upon the occurrence of the applicable Cash Management Cure (as defined below).
“Cash Management Cure” means, with respect to clause (i) above, upon the cure of such event of default; with respect to clause (ii) above, upon the amortizing debt service coverage ratio exceeding 1.60x for two consecutive calendar quarters; with respect to clause (iii) above, upon the cure of such event of default under the management agreement or borrower entering into a replacement management agreement in accordance with the loan documents; with respect to clause (iv)(A) above, upon either (y) the Significant Tenant (or Significant Tenant’s parent company) becoming solvent for one calendar quarter or no longer being a debtor in any bankruptcy action and affirming its lease (with no material changes to such lease) pursuant to a final, non-appealable order of a court of competent jurisdiction or (z) a re-tenanting event occurring with respect to at least 80.0% of the applicable Significant Tenant space; with respect to clause (iv)(B) above, upon the Significant Tenant either (I) reopening for business and, for one
THE INFORMATION IN THIS STRUCTURAL AND COLLATERAL TERM SHEET IS NOT COMPLETE AND MAY BE AMENDED PRIOR TO THE TIME OF SALE. THIS TERM SHEET IS NOT AN OFFER TO SELL THESE SECURITIES AND IT IS NOT A SOLICITATION OF AN OFFER TO BUY THESE SECURITIES IN ANY JURISDICTION WHERE THE OFFER OR SALE IS NOT PERMITTED.
| 112 |
| OMNI OFFICENTRE |
calendar quarter, both (x) conducting normal business operations at substantially all of its demised premises and (y) paying full unabated rent under its lease, and delivering an acceptable tenant estoppel certificate or (II) a re-tenanting event occurring with respect to at least 80.0% of the applicable Significant Tenant space; with respect to clause (iv)(C) above, upon the applicable Significant Tenant either (Y) irrevocably revoking or rescinding such notice, being open for business and conducting normal business operations in substantially all of its demised premises and paying full, unabated rent for two consecutive calendar quarters and delivering an acceptable tenant estoppel certificate or (Z) a re-tenanting event occurring with respect to at least 80.0% of the applicable Significant Tenant space; and with respect to clause (v) above, upon either (a) a BCBS Extension Event occurring and BCBS delivering an acceptable tenant estoppel certificate or (b) a re-tenanting event occurring with respect to at least 80.0% of the applicable BCBS space.
“Significant Tenant” means BCBS, any replacement of BCBS permitted under the loan documents or any other tenant which, together with its affiliates, leases more than 25.0% of the total square footage at the Omni Officentre Property or constitutes more than 25.0% of the total annual rents generated by the Omni Officentre Property.
“BCBS Extension Event” will commence upon (i) with respect to the June 30, 2022 expiration date, either (A) BCBS exercising its renewal option to extend its lease for an additional period of at least three years with respect to its entire space or (B) BCBS entering into an agreement extending its lease for an additional period of at least three years with respect to at least 80.0% of its space and (ii) with respect to any expiration of the BCBS lease occurring subsequent to the June 30, 2022 expiration date, BCBS entering into an agreement extending the term of its lease to a date beyond June 2027 with respect to at least 80.0% of its space. Under no circumstances will a BCBS Extension Event involve less than 94,405 square feet of space at the Omni Officentre Property (80% of its current space after the expansion).
Property Management. The Omni Officentre Property is managed by an affiliate of the borrower.
Assumption. The borrower has a right to transfer the Omni Officentre Property, provided that certain conditions are satisfied, including, but not limited to, (i) no event of default has occurred and is continuing; (ii) the lender’s reasonable determination that the proposed transferee and guarantor satisfy the lender’s credit review and underwriting standards, taking into consideration transferee’s experience, financial strength and general business standing; (iii) execution of a recourse guaranty and an environmental indemnity by an affiliate of the transferee; and (iv) if requested by the lender, rating agency confirmation from DBRS, Fitch and Moody’s that the transfer will not result in a downgrade, withdrawal or qualification of the respective ratings assigned to the Series 2016-C33 Certificates.
Partial Release. Not permitted.
Real Estate Substitution.Not permitted.
Subordinate and Mezzanine Indebtedness.Not permitted.
Ground Lease.None.
Terrorism Insurance. The loan documents require that the “all risk” insurance policy required to be maintained by the borrower provides coverage for terrorism in an amount equal to the full replacement cost of the Omni Officentre Property, as well as business interruption covering no less than the 12-month period following the occurrence of a casualty event, together with a 12-month extended period of indemnity.
THE INFORMATION IN THIS STRUCTURAL AND COLLATERAL TERM SHEET IS NOT COMPLETE AND MAY BE AMENDED PRIOR TO THE TIME OF SALE. THIS TERM SHEET IS NOT AN OFFER TO SELL THESE SECURITIES AND IT IS NOT A SOLICITATION OF AN OFFER TO BUY THESE SECURITIES IN ANY JURISDICTION WHERE THE OFFER OR SALE IS NOT PERMITTED.
| 113 |
| No. 11 – Desert Star Apartments |
| Loan Information | Property Information | ||||||
| Mortgage Loan Seller: | Rialto Mortgage Finance, LLC | Single Asset/Portfolio: | Single Asset | ||||
| Credit Assessment (DBRS/Fitch/Moody’s): | NR/NR/NR | Property Type: | Multifamily | ||||
| Original Principal Balance: | $14,500,000 | Specific Property Type: | Garden | ||||
| Cut-off Date Balance: | $14,500,000 | Location: | Phoenix, AZ | ||||
| % of Initial Pool Balance: | 2.0% | Size: | 437 Units | ||||
| Loan Purpose: | Refinance | Cut-off Date Balance Per Unit: | $33,181 | ||||
| Borrower Name: | W Bell LLC | Year Built/Renovated: | 1983/2015 | ||||
| Sponsor(1): | Vesna Djordjevich | Title Vesting: | Fee | ||||
| Mortgage Rate: | 5.200% | Property Manager: | Self-managed | ||||
| Note Date: | January 29, 2016 | 4thMost Recent Occupancy (As of): | 82.3% (12/31/2012) | ||||
| Anticipated Repayment Date: | NAP | 3rdMost Recent Occupancy (As of)(2): | 73.4% (12/31/2013) | ||||
| Maturity Date: | February 6, 2026 | 2ndMost Recent Occupancy (As of)(2): | 76.8% (12/31/2014) | ||||
| IO Period: | 24 months | Most Recent Occupancy (As of)(2): | 94.3% (12/31/2015) | ||||
| Loan Term (Original): | 120 months | Current Occupancy (As of)(2): | 96.3% (1/13/2016) | ||||
| Seasoning: | 1 month | ||||||
| Amortization Term (Original): | 360 months | Underwriting and Financial Information: | |||||
| Loan Amortization Type: | Interest-only, Amortizing Balloon | ||||||
| Interest Accrual Method: | Actual/360 | 4thMost Recent NOI (As of): | $899,867 (12/31/2012) | ||||
| Call Protection: | L(5),GRTR 1% or YM(111),O(4) | 3rdMost Recent NOI (As of)(3): | $887,430 (12/31/2013) | ||||
| Lockbox Type: | Springing | 2ndMost Recent NOI (As of)(3): | $896,044 (12/31/2014) | ||||
| Additional Debt: | None | Most Recent NOI (As of)(3): | $1,430,789 (12/31/2015) | ||||
| Additional Debt Type: | NAP | ||||||
| U/W Revenues: | $2,529,753 | ||||||
| U/W Expenses: | $1,099,771 | ||||||
| U/W NOI: | $1,429,982 | ||||||
| U/W NCF: | $1,320,732 | ||||||
| U/W NOI DSCR: | 1.50x | ||||||
| Escrows and Reserves: | U/W NCF DSCR: | 1.38x | |||||
| U/W NOI Debt Yield: | 9.9% | ||||||
| Type: | Initial | Monthly | Cap (If Any) | U/W NCF Debt Yield: | 9.1% | ||
| Taxes | $48,450 | $9,229 | NAP | As-Is Appraised Value: | $23,000,000 | ||
| Insurance | $13,478 | $4,279 | NAP | As-Is Appraisal Valuation Date: | October 22, 2015 | ||
| Replacement Reserves | $0 | $9,104 | $546,250 | Cut-off Date LTV Ratio: | 63.0% | ||
| Deferred Maintenance | $2,188 | $0 | NAP | LTV Ratio at Maturity or ARD: | 54.8% | ||
| (1) | The sponsor, Vesna Djordjevich, was involved in three bankruptcy proceedings filed between July 2010 and April 2014, which were not related to the Desert Star Apartments Property. See “Description of the Mortgage Pool—Loan Purpose; Default History, Bankruptcy Issues and Other Proceedings” in the Preliminary Prospectus. |
| (2) | See “Historical Occupancy” section. |
| (3) | See “Cash Flow Analysis” section |
The Desert Star Apartments mortgage loan is evidenced by a single promissory note that is secured by a first mortgage encumbering a 437-unit garden-style multifamily property located in Phoenix, Arizona (the “Desert Star Apartments Property”), approximately 16.8 miles north of the Phoenix central business district. Constructed in 1983 and renovated from 2013 to 2015, the Desert Star Apartments Property is situated on approximately 12.8 acres and comprises 24, two-story buildings. Community amenities at the Desert Star Apartments Property include an on-site leasing office, swimming pool, jacuzzi, laundry facility, a concrete-paved basketball court, fitness center and playground areas. Unit amenities include a fully equipped kitchen, individual climate control units, ceiling fans and walk-in closets. From 2013 to 2015, the borrower renovated 80.1% of the units at the Desert Star Apartments Property with 100 units renovated in 2013, 190 units renovated in 2014 and 60 units renovated in 2015. The total cost of the renovations was approximately $1,351,297 ($3,861 per unit) and included replacing all appliances, new air conditioning units, cabinetry, paint, carpet, tile and upgrading all electrical and GFI outlets. The Desert Star Apartments Property contains 541 surface parking spaces with 96 covered spaces, reflecting an overall parking ratio of 1.2 spaces per unit. As of January 13, 2016, the Desert Star Apartments Property was 96.3% leased.
Primary access to the Desert Star Apartments Property is provided by Interstate 17 (Black Canyon Freeway) and Loop 101. Interstate 17 is a north-south thoroughfare providing access to Downtown Phoenix to the south and the Greater Phoenix’s suburbs to the north. Loop 101 is a freeway system that forms a circle around the Phoenix metropolitan area. The neighborhood surrounding the Desert Star Apartments Property includes a mix of residential, commercial, recreational and light industrial development within a lower-income suburban area. The Desert Star Apartments Property is located approximately four miles
THE INFORMATION IN THIS STRUCTURAL AND COLLATERAL TERM SHEET IS NOT COMPLETE AND MAY BE AMENDED PRIOR TO THE TIME OF SALE. THIS TERM SHEET IS NOT AN OFFER TO SELL THESE SECURITIES AND IT IS NOT A SOLICITATION OF AN OFFER TO BUY THESE SECURITIES IN ANY JURISDICTION WHERE THE OFFER OR SALE IS NOT PERMITTED.
| 114 |
| DESERT STAR APARTMENTS |
southeast of the major employment corridor surrounding the intersection of Interstate 17 and Loop 101. Retail developments near the Desert Star Apartments Property include a Sam’s Club (0.3 miles west) and a WalMart Supercenter (0.7 miles west) as well as the Deer Valley Towne Center (3.7 miles northwest) and Bell Towne Center (1.1 miles east). Deer Valley Towne Center is a 459,967 square foot power center anchored by Target, AMC Theatres, Ross Dress for Less, PetSmart and Michaels. Bell Towne Center is a 593,799 square foot retail development anchored by Target, Sprouts, and Office Max.
Sources and Uses
| Sources | Uses | ||||||||
| Original loan amount | $14,500,000 | 100.0% | Loan payoff | $9,355,363 | 64.5 | % | |||
| Reserves | 64,116 | 0.4 | |||||||
| Closing costs | 330,148 | 2.3 | |||||||
| Return of equity | 4,750,374 | 32.8 | |||||||
| Total Sources | $14,500,000 | 100.0% | Total Uses | $14,500,000 | 100.0 | % |
The following table presents certain information relating to the unit mix of the Desert Star Apartments Property:
Apartment Unit Summary(1)
| Unit Type | No. of Units | % of Total Units | Average Unit Size (SF) | Average U/W Monthly Rent per Unit |
| Studio | 144 | 33.0% | 320 | $428 |
| One Bedroom / One Bath | 288 | 65.9% | 520 | $501 |
| Two Bedroom / One Bath | 4 | 0.9% | 825 | $696 |
| Two Bedroom / One Bath - Loft | 1 | 0.2% | 850 | $883 |
| Total/Weighted Average | 437 | 100.0% | 458 | $479 |
| (1) | Information obtained from the underwritten rent roll. |
The following table presents historical occupancy percentages at the Desert Star Apartments Property:
Historical Occupancy
12/31/2012(1) | 12/31/2013(1)(2) | 12/31/2014(1)(2) | 12/31/2015(1)(2) | 1/13/2016(3) | ||||
| 82.3% | 73.4% | 76.8% | 94.3% | 96.3% |
| (1) | Information obtained from the borrower. |
| (2) | From 2013 to 2015, the borrower renovated 350 units with 100 units renovated in 2013, 190 units renovated in 2014 and 60 units renovated in 2015, which caused a decline in occupancy during those periods. |
| (3) | Information obtained from the underwritten rent roll. |
THE INFORMATION IN THIS STRUCTURAL AND COLLATERAL TERM SHEET IS NOT COMPLETE AND MAY BE AMENDED PRIOR TO THE TIME OF SALE. THIS TERM SHEET IS NOT AN OFFER TO SELL THESE SECURITIES AND IT IS NOT A SOLICITATION OF AN OFFER TO BUY THESE SECURITIES IN ANY JURISDICTION WHERE THE OFFER OR SALE IS NOT PERMITTED.
| 115 |
| DESERT STAR APARTMENTS |
Operating History and Underwritten Net Cash Flow.The following table presents certain information relating to the historical operating performance and underwritten net cash flow at the Desert Star Apartments Property:
Cash Flow Analysis
| 2012 | 2013(1) | 2014(1) | 2015(1) | U/W | % of U/W Effective Gross Income | U/W $ per Unit | |||||||||
| Base Rent | $1,518,287 | $1,496,967 | $1,601,651 | $2,136,520 | $2,419,891 | 95.7% | $5,538 | ||||||||
| Grossed Up Vacant Space | 0 | 0 | 0 | 0 | 97,920 | 3.9 | 224 | ||||||||
| Concessions | (10,431) | (5,777) | (27,845) | (15,701) | (25,178) | (1.0) | (58) | ||||||||
| Other Income(2) | 153,366 | 173,081 | 169,072 | 248,023 | 248,023 | 9.8 | 568 | ||||||||
| Less Vacancy & Credit Loss | (10,703) | (198) | 1,252 | 92 | (210,902)(3) | (8.3) | (483) | ||||||||
| Effective Gross Income | $1,650,519 | $1,664,073 | $1,744,130 | $2,368,934 | $2,529,753 | 100.0% | $5,789 | ||||||||
| Total Operating Expenses | $750,652 | $776,643 | $848,086 | $938,145 | $1,099,771 | 43.5% | $2,517 | ||||||||
|
|
|
|
|
|
| |||||||||
| Net Operating Income | $899,867 | $887,430 | $896,044 | $1,430,789 | $1,429,982 | 56.5% | $3,272 | ||||||||
| Capital Expenditures | 0 | 0 | 0 | 0 | 109,250 | 4.3 | 250 | ||||||||
| Net Cash Flow | $899,867 | $887,430 | $896,044 | $1,430,789 | $1,320,732 | 52.2% | $3,022 | ||||||||
| NOI DSCR | 0.94x | 0.93x | 0.94x | 1.50x | 1.50x | ||||||||||
| NCF DSCR | 0.94x | 0.93x | 0.94x | 1.50x | 1.38x | ||||||||||
| NOI DY | 6.2% | 6.1% | 6.2% | 9.9% | 9.9% | ||||||||||
| NCF DY | 6.2% | 6.1% | 6.2% | 9.9% | 9.1% |
| (1) | From 2013 to 2015, the borrower renovated 80.1% of the units at the Desert Star Apartments Property with 100 units renovated in 2013, 190 units renovated in 2014, and 60 units renovated in 2015, which caused a fluctuation in Net Operating Income for those periods. |
| (2) | Other Income includes administrative fees, late fees, application fees and pet fees. |
| (3) | The underwritten economic vacancy is 9.4%. The Desert Star Apartments Property was 96.3% physically occupied as of January 13, 2016. |
The following table presents certain information relating to some comparable multifamily leases for the Desert Star Apartments Property:
Competitive Set(1)
| Average Rent (per unit) | ||||||||||
| Property | Location | Distance from Subject | Property Type | Number of Units | Studio | 1 BR | 2 BR | 3 BR | Overall Average PSF | Total Occupancy |
| Desert Star Apartments (Subject) | Phoenix | -- | Garden | 437 | $428 | $501 | $696 - $883 | NAP | $1.09 | 96% |
| Presidio North | Phoenix | 0.1 miles | Garden | 360 | $629 | $659 | $759 - $799 | NAP | $0.98 | 95% |
| Accolade | Phoenix | 0.8 miles | Garden | 548 | NAP | $700 | $780 - $825 | $1,125 - $1,195 | $0.91 | 98% |
| Bell Cove | Phoenix | 0.9 miles | Garden | 256 | NAP | $590 | $615 - $700 | NAP | $0.80 | 98% |
| Crystal Creek | Phoenix | 0.9 miles | Garden | 273 | $553 | $640 | $708 - $758 | NAP | $0.95 | 97% |
| Desert Homes | Phoenix | 1.5 miles | Garden | 412 | NAP | $678 | $730 - $750 | $915 | $0.84 | 99% |
| Bellridge | Phoenix | 1.5 miles | Garden | 351 | NAP | $550 - $580 | $720 | NAP | $1.10 | 95% |
| (1) | Information obtained from the appraisal. |
THE INFORMATION IN THIS STRUCTURAL AND COLLATERAL TERM SHEET IS NOT COMPLETE AND MAY BE AMENDED PRIOR TO THE TIME OF SALE. THIS TERM SHEET IS NOT AN OFFER TO SELL THESE SECURITIES AND IT IS NOT A SOLICITATION OF AN OFFER TO BUY THESE SECURITIES IN ANY JURISDICTION WHERE THE OFFER OR SALE IS NOT PERMITTED.
| 116 |
(THIS PAGE INTENTIONALLY LEFT BLANK)
THE INFORMATION IN THIS STRUCTURAL AND COLLATERAL TERM SHEET IS NOT COMPLETE AND MAY BE AMENDED PRIOR TO THE TIME OF SALE. THIS TERM SHEET IS NOT AN OFFER TO SELL THESE SECURITIES AND IT IS NOT A SOLICITATION OF AN OFFER TO BUY THESE SECURITIES IN ANY JURISDICTION WHERE THE OFFER OR SALE IS NOT PERMITTED.
| 117 |
| No. 12 – 116 Inverness |
| Loan Information | Property Information | |||||
| Mortgage Loan Seller: | Wells Fargo Bank, National Association | Single Asset/Portfolio: | Single Asset | |||
Credit Assessment (DBRS/Fitch/Moody’s): | NR/NR/NR | Property Type: | Office | |||
| Original Principal Balance: | $14,000,000 | Specific Property Type: | Suburban | |||
| Cut-off Date Balance: | $14,000,000 | Location: | Englewood, CO | |||
| % of Initial Pool Balance: | 2.0% | Size: | 214,478 SF | |||
| Loan Purpose: | Acquisition | Cut-off Date Balance Per SF: | $65.27 | |||
| Borrower Name: | 116 Inverness Drive East LLC | Year Built/Renovated: | 1982/2007 | |||
| Sponsor: | AICI, LLC | Title Vesting: | Fee | |||
| Mortgage Rate: | 4.580% | Property Manager: | Steelwave, Inc. | |||
| Note Date: | January 27, 2016 | 4th Most Recent Occupancy (As of): | 95.0% (12/31/2011) | |||
| Anticipated Repayment Date: | NAP | 3rd Most Recent Occupancy (As of)(5): | 91.7% (12/31/2012) | |||
| Maturity Date: | February 11, 2026 | 2nd Most Recent Occupancy (As of)(5): | 85.7% (12/31/2013) | |||
| IO Period: | 120 months | Most Recent Occupancy (As of)(5): | 79.8% (12/31/2014) | |||
| Loan Term (Original): | 120 months | Current Occupancy (As of)(5): | 88.3% (11/30/2015) | |||
| Seasoning: | 1 month | |||||
| Amortization Term (Original): | NAP | Underwriting and Financial Information: | ||||
| Loan Amortization Type: | Interest-only, Balloon | |||||
| Interest Accrual Method: | Actual/360 | 4thMost Recent NOI(6): | NAV | |||
| Call Protection: | L(25),D(91),O(4) | 3rdMost Recent NOI (As of)(6): | $1,790,217 (12/31/2013) | |||
| Lockbox Type: | Springing | 2ndMost Recent NOI (As of)(6): | $1,439,904 (12/31/2014) | |||
| Additional Debt: | None | Most Recent NOI (As of)(6): | $2,008,347 (12/31/2015) | |||
| Additional Debt Type: | NAP | |||||
| U/W Revenues: | $4,700,168 | |||||
| U/W Expenses: | $2,164,255 | |||||
| U/W NOI(2): | $2,535,913 | |||||
| U/W NCF: | $1,987,051 | |||||
| U/W NOI DSCR: | 3.90x | |||||
| Escrows and Reserves: | U/W NCF DSCR: | 3.06x | ||||
| U/W NOI Debt Yield: | 18.1% | |||||
| Type: | Initial | Monthly | Cap (If Any) | U/W NCF Debt Yield: | 14.2% | |
| Taxes(1) | $0 | Springing | NAP | As-Is Appraised Value: | $36,100,000 | |
| Insurance(2) | $0 | Springing | NAP | As-Is Appraisal Valuation Date: | December 2, 2015 | |
| Replacement Reserves(3) | $0 | Springing | NAP | Cut-off Date LTV Ratio: | 38.8% | |
| TI/LC Reserve(4) | $0 | Springing | NAP | LTV Ratio at Maturity or ARD: | 38.8% | |
| (1) | Ongoing monthly reserves for real estate taxes are not required as long as (i) no event of default has occurred and is continuing; (ii) the guarantor maintains a net worth and liquidity of $15.0 million and $2.0 million, respectively; and (iii) the borrower has paid all real estate taxes prior to delinquency. |
| (2) | Ongoing monthly reserves for insurance are not required as long as (i) the 116 Inverness Property is insured by an acceptable blanket insurance policy; (ii) the borrower provides the lender with evidence of renewal of the insurance policies and timely proof of payment of insurance premiums; (iii) no event of default has occurred and is continuing; and (iv) the guarantor maintains a net worth and liquidity of $15.0 million and $2.0 million, respectively. |
| (3) | Ongoing monthly replacement reserves are not required as long as no event of default has occurred and is continuing and the lender determines that the 116 Inverness Property is properly maintained. |
| (4) | Ongoing monthly TI/LC reserves are not required as long as no event of default has occurred and is continuing and the lender determines that the 116 Inverness Property is properly maintained. |
| (5) | See “Historical Occupancy” section. |
| (6) | See “Cash Flow Analysis” section. |
The 116 Inverness mortgage loan is evidenced by a single promissory note that is secured by a first mortgage encumbering the borrower’s fee interest in a four-story, class A office building totaling 214,478 square feet and located in Englewood, Colorado (the “116 Inverness Property”), approximately 15.9 miles southeast of the Denver central business district. Constructed in 1982 and renovated from 2006 to 2007, the 116 Inverness Property is situated on a 7.1-acre site and features a three-story parking garage containing 722 parking spaces and 60 surface parking spaces for a total of 782 parking spaces, resulting in a parking ratio of 3.6 spaces per 1,000 square feet of rentable area. The 2015 estimated population within a one-, three- and five-mile radius of the 116 Inverness Property was 11,657, 77,673 and 230,224, respectively, while the 2015 estimated median household income within the same radii was $73,355, $86,220 and $77,590, respectively. As of November 30, 2015 the 116 Inverness Property was 88.3% occupied by 17 tenants. According to a third party market research report, the 116 Inverness Property is located in the Inverness submarket of Denver, which, as of the fourth quarter of 2015, contained a total inventory of 16 buildings totaling approximately 2.1 million square feet. As of the fourth quarter of 2015 the Inverness class A office submarket reported a vacancy rate of 10.8% and an average asking rental rate of $24.73 per square foot, full service gross.
THE INFORMATION IN THIS STRUCTURAL AND COLLATERAL TERM SHEET IS NOT COMPLETE AND MAY BE AMENDED PRIOR TO THE TIME OF SALE. THIS TERM SHEET IS NOT AN OFFER TO SELL THESE SECURITIES AND IT IS NOT A SOLICITATION OF AN OFFER TO BUY THESE SECURITIES IN ANY JURISDICTION WHERE THE OFFER OR SALE IS NOT PERMITTED.
| 118 |
| 116 INVERNESS |
Sources and Uses
| Sources | Uses | |||||||
| Original loan amount | $14,000,000 | 38.4% | Purchase price | $35,975,000 | 98.8% | |||
| Sponsor’s new cash contribution | 22,415,257 | 61.6 | Closing costs | 440,257 | 1.2 | |||
| Total Sources | $36,415,257 | 100.0% | Total Uses | $36,415,257 | 100.0% |
The following table presents certain information relating to the tenancies at the 116 Inverness Property:
Major Tenants
| Tenant Name | Credit Rating (Fitch/ Moody’s/ S&P)(1) | Tenant NRSF | % of NRSF | Annual U/W Base Rent PSF(2) | Annual U/W Base Rent(2) | % of Total Annual U/W Base Rent | Lease Expiration Date |
| Major Tenants | |||||||
| Ultra Resources | NR/NR/NR | 36,951 | 17.2% | $24.50 | $905,300 | 20.1% | 7/31/2022(3) |
| Great-West Financial | AA/Aa3/AA | 32,311 | 15.1% | $25.00 | $807,775 | 18.0% | 1/31/2018(4) |
| Vantage Energy | NR/NR/NR | 26,499 | 12.4% | $24.50 | $649,226 | 14.4% | 6/30/2017(5) |
| Wells Fargo | AA-/A2/A | 17,293 | 8.1% | $23.50 | $406,386 | 9.0% | 6/30/2021(6) |
| Kellogg Company | BBB/Baa2/BBB | 12,390 | 5.8% | $24.50 | $303,555 | 6.7% | 10/31/2017(7) |
| Total Major Tenants | 125,444 | 58.5% | $24.49 | $3,072,241 | 68.3% | ||
| Non-Major Tenants | 64,008 | 29.8% | $22.26 | $1,424,908 | 31.7% | ||
| Occupied Collateral Total | 189,452 | 88.3% | $23.74 | $4,497,149 | 100.0% | ||
| Vacant Space | 25,026 | 11.7% | |||||
| Collateral Total | 214,478 | 100.0% | |||||
| (1) | Certain ratings are those of the parent company whether or not the parent guarantees the lease. |
| (2) | Annual U/W Base Rent PSF and Annual U/W Base Rent include contractual rent steps through December 2016 totaling $73,139. |
| (3) | Ultra Resources has one, 5-year lease renewal option. |
| (4) | Great-West Financial one, 3-year lease renewal option. |
| (5) | Vantage Energy has one, 3-year lease renewal option. |
| (6) | Wells Fargo has two, 5-year lease renewal options. |
| (7) | Kellogg Company has two, 3-year lease renewal options. |
THE INFORMATION IN THIS STRUCTURAL AND COLLATERAL TERM SHEET IS NOT COMPLETE AND MAY BE AMENDED PRIOR TO THE TIME OF SALE. THIS TERM SHEET IS NOT AN OFFER TO SELL THESE SECURITIES AND IT IS NOT A SOLICITATION OF AN OFFER TO BUY THESE SECURITIES IN ANY JURISDICTION WHERE THE OFFER OR SALE IS NOT PERMITTED.
| 119 |
| 116 INVERNESS |
The following table presents certain information relating to the lease rollover schedule at the 116 Inverness Property:
Lease Expiration Schedule(1)(2)
| Year Ending December 31, | No. of Leases Expiring | Expiring NRSF | % of Total NRSF | Cumulative Expiring NRSF | Cumulative % of Total NRSF | Annual U/W Base Rent | % of Total Annual U/W Base Rent | Annual U/W Base Rent PSF(3) |
| MTM | 0 | 0 | 0.0% | 0 | 0.0% | $0 | 0.0% | $0.00 |
| 2016 | 2 | 9,317 | 4.3% | 9,317 | 4.3% | $186,899 | 4.2% | $20.06 |
| 2017 | 7 | 51,712 | 24.1% | 61,029 | 28.5% | $1,203,842 | 26.8% | $23.28 |
| 2018 | 4 | 56,562 | 26.4% | 117,591 | 54.8% | $1,382,394 | 30.7% | $24.44 |
| 2019 | 0 | 0 | 0.0% | 117,591 | 54.8% | $0 | 0.0% | $0.00 |
| 2020 | 3 | 17,617 | 8.2% | 135,208 | 63.0% | $412,330 | 9.2% | $23.41 |
| 2021 | 1 | 17,293 | 8.1% | 152,501 | 71.1% | $406,386 | 9.0% | $23.50 |
| 2022 | 1 | 36,951 | 17.2% | 189,452 | 88.3% | $905,300 | 20.1% | $24.50 |
| 2023 | 0 | 0 | 0.0% | 189,452 | 88.3% | $0 | 0.0% | $0.00 |
| 2024 | 0 | 0 | 0.0% | 189,452 | 88.3% | $0 | 0.0% | $0.00 |
| 2025 | 0 | 0 | 0.0% | 189,452 | 88.3% | $0 | 0.0% | $0.00 |
| 2026 | 0 | 0 | 0.0% | 189,452 | 88.3% | $0 | 0.0% | $0.00 |
| Thereafter | 0 | 0 | 0.0% | 189,452 | 88.3% | $0 | 0.0% | $0.00 |
| Vacant | 0 | 25,026 | 11.7% | 214,478 | 100.0% | $0 | 0.0% | $0.00 |
| Total/Weighted Average | 18(4) | 214,478 | 100.0% | $4,497,149 | 100.0% | $23.74 |
| (1) | Information obtained from the underwritten rent roll. |
| (2) | Certain tenants may have lease termination options that are exercisable prior to the originally stated expiration date of the subject lease and that are not considered in the Lease Expiration Table. |
| (3) | Weighted Average Annual U/W Base Rent PSF excludes vacant space. |
| (4) | The 116 Inverness Property is occupied by 17 tenants subject to 18 leases. |
The following table presents historical occupancy percentages at the 116 Inverness Property:
Historical Occupancy
12/31/2011(1) | 12/31/2012(1)(2) | 12/31/2013(1)(2)(3) | 12/31/2014(1)(3)(4) | 11/30/2015(4)(5) |
| 95.0% | 91.7% | 85.7% | 79.8% | 88.3% |
| (1) | Information obtained from the borrower. |
| (2) | The decrease in occupancy between 2012 and 2013 was due to Chevron Mining, Inc. vacating its space upon its January 2013 lease expiration. |
| (3) | The decrease in occupancy between 2013 and 2014 was due to American President Lines, Ltd vacating its space upon its August 2014 lease expiration. |
| (4) | The increase in occupancy between 2014 and 11/30/2015 was due to Vantage Energy expanding its space by 8,603 square feet (4.0% of net rentable area) and new leases executed by Ultra Resources for 36,951 square feet (17.2% of net rentable area) and by PC-Tel, Inc. for 4,759 square feet (2.2% of net rentable area). |
| (5) | Information obtained from the underwritten rent roll. |
THE INFORMATION IN THIS STRUCTURAL AND COLLATERAL TERM SHEET IS NOT COMPLETE AND MAY BE AMENDED PRIOR TO THE TIME OF SALE. THIS TERM SHEET IS NOT AN OFFER TO SELL THESE SECURITIES AND IT IS NOT A SOLICITATION OF AN OFFER TO BUY THESE SECURITIES IN ANY JURISDICTION WHERE THE OFFER OR SALE IS NOT PERMITTED.
| 120 |
| 116 INVERNESS |
Operating History and Underwritten Net Cash Flow. The following table presents certain information relating to the historical operating performance and the underwritten net cash flow at the 116 Inverness Property:
Cash Flow Analysis(1)
| 2013(2) | 2014(2)(3) | 2015(3) | U/W(3) | % of U/W Effective Gross Income | U/W $ per SF | |
| Base Rent | $3,778,300 | $3,563,246 | $4,164,898 | $4,497,149 | 95.7% | $20.97 |
| Grossed Up Vacant Space | 0 | 0 | 0 | 613,137 | 13.0 | 2.86 |
| Total Reimbursables | 323,338 | 324,934 | 247,902 | 117,250 | 2.5 | 0.55 |
| Other Income | 30,962 | 42,161 | 80 | 80 | 0.0 | 0.00 |
| Parking Income | 46,225 | 59,705 | 85,690 | 85,690 | 1.8 | 0.40 |
| Less Vacancy & Credit Loss | (272,484) | (404,925) | (602,778) | (613,137)(4) | (13.0) | (2.86) |
| Effective Gross Income | $3,906,341 | $3,585,121 | $3,895,792 | $4,700,168 | 100.0% | $21.91 |
| Total Operating Expenses | $2,116,124 | $2,145,217 | $1,887,445 | $2,164,255 | 46.0% | $10.09 |
|
|
|
|
|
| |
| Net Operating Income | $1,790,217 | $1,439,904 | $2,008,347 | $2,535,913 | 54.0% | $11.82 |
| TI/LC | 0 | 0 | 0 | 505,966 | 10.8 | 2.36 |
| Capital Expenditures | 0 | 0 | 0 | 42,896 | 0.9 | 0.20 |
| Net Cash Flow | $1,790,217 | $1,439,904 | $2,008,347 | $1,987,051 | 42.3% | $9.26 |
| NOI DSCR | 2.75x | 2.21x | 3.09x | 3.90x | ||
| NCF DSCR | 2.75x | 2.21x | 3.09x | 3.06x | ||
| NOI DY | 12.8% | 10.3% | 14.3% | 18.1% | ||
| NCF DY | 12.8% | 10.3% | 14.3% | 14.2% |
| (1) | Operating history prior to 2013 is not available. |
| (2) | The decrease in Net Operating Income from 2013 to 2014 was primarily due to American President Lines, Ltd vacating upon its lease expiration. |
| (3) | The increase in Net Operating Income from 2014 to U/W was due to new leasing activity, Vantage Energy expanding its space by 8,603 square feet (4.0%) of net rentable area and contractual rent increases at the 116 Inverness Property. |
| (4) | The underwritten economic vacancy is 12.0%. The 116 Inverness Property is 88.3% physically occupied as of November 30, 2015. |
The following table presents certain information relating to comparable office leases for the 116 Inverness Property:
Comparable Leases(1)
| Property Name/Location | Year Built/ Renovated | Stories | Total GLA (SF) | Total Occupancy | Distance from Subject | Tenant Name | Lease / Term | Lease Area (SF) | Annual Base Rent PSF | Lease Type |
Dry Creek Corporate Center II & III Englewood, CO | 2001/NAP | 3 | 185,957 | 54% | 0.9 miles | Brokers Choice | August 2015 / 5.3 Yrs | 4,328 | $21.00 | FSG |
Inverness Gateway Englewood, CO | 1982/2010 | 3 | 55,706 | 67% | 0.0 miles | Tetra Tech | April 2015 / 7.0 Yrs | 37,138 | $14.00 | NNN |
Burns & Wilcox Center Centennial, CO | 1999/NAP | 4 | 96,269 | 82% | 2.8 miles | National Valuation Consultants | January 2015 / 7.8 Yrs | 13,479 | $23.00 | FSG |
Tuscany Plaza Greenwood Village, CO | 1985/NAP | 6 | 259,118 | 85% | 2.8 miles | CBIZ | June 2015 / 7.6 Yrs | 6,259 | $25.00 | FSG |
Legacy Cascades Centennial, CO | 1984/2007 | 7 | 321,491 | 70% | 2.9 miles | Forsythe Solutions | July 2015 / 6.1 Yrs | 6,478 | $26.00 | FSG |
| (1) | Information obtained from the appraisal and a third party research report. |
THE INFORMATION IN THIS STRUCTURAL AND COLLATERAL TERM SHEET IS NOT COMPLETE AND MAY BE AMENDED PRIOR TO THE TIME OF SALE. THIS TERM SHEET IS NOT AN OFFER TO SELL THESE SECURITIES AND IT IS NOT A SOLICITATION OF AN OFFER TO BUY THESE SECURITIES IN ANY JURISDICTION WHERE THE OFFER OR SALE IS NOT PERMITTED.
| 121 |
| No. 13 – The Vineyard at Arlington | ||||||||
| Loan Information | Property Information | |||||||
| Mortgage Loan Seller: | Rialto Mortgage Finance, LLC | Single Asset/Portfolio: | Single Asset | |||||
| Credit Assessment (DBRS/Fitch/ Moody’s): | NR/NR/NR | Property Type: | Multifamily | |||||
| Original Principal Balance: | $13,750,000 | Specific Property Type: | Garden | |||||
| Cut-off Date Balance: | $13,750,000 | Location: | Arlington, TX | |||||
| % of Initial Pool Balance: | 1.9% | Size: | 396 Units | |||||
| Loan Purpose: | Refinance | Cut-off Date Balance Per Unit: | $34,722 | |||||
| Borrower Names: | Vineyards at Arlington LLC and Arlington Realty Owner DE LLC, as tenants-in-common | Year Built/Renovated: | 1985/2015 | |||||
| Sponsors: | Barry Leon; Irving Langer | Title Vesting: | Fee | |||||
| Mortgage Rate: | 5.120% | Property Manager: | City Gate Property Group, LLC | |||||
| Note Date: | January 14, 2016 | 4thMost Recent Occupancy(3): | NAV | |||||
| Anticipated Repayment Date: | NAP | 3rdMost Recent Occupancy (As of)(3): | 76.8% (12/31/2013) | |||||
| Maturity Date: | February 6, 2026 | 2ndMost Recent Occupancy (As of)(3): | 89.4% (12/31/2014) | |||||
| IO Period: | 36 months | Most Recent Occupancy (As of)(3): | 94.7% (11/30/2015) | |||||
| Loan Term (Original): | 120 months | Current Occupancy (As of): | 92.9% (3/2/2016) | |||||
| Seasoning: | 1 month | |||||||
| Amortization Term (Original): | 360 months | Underwriting and Financial Information: | ||||||
| Loan Amortization Type: | Interest-only, Amortizing Balloon | |||||||
| Interest Accrual Method: | Actual/360 | 4thMost Recent NOI(4): | NAV | |||||
| Call Protection: | L(23),GRTR 1% or YM (93),O(4) | 3rdMost Recent NOI (As of)(4): | $937,223 (Annualized 11 4/30/2015) | |||||
| Lockbox Type: | Springing | 2ndMost Recent NOI (As of)(4): | $1,169,636 (12/31/2015) | |||||
| Additional Debt: | None | Most Recent NOI (As of): | $1,357,676 (TTM 2/29/2016) | |||||
| Additional Debt Type: | NAP | |||||||
| U/W Revenues: | $2,880,459 | |||||||
| U/W Expenses: | $1,428,336 | |||||||
| U/W NOI: | $1,452,123 | |||||||
| U/W NCF: | $1,356,687 | |||||||
| Escrows and Reserves: | U/W NOI DSCR: | 1.62x | ||||||
| U/W NCF DSCR: | 1.51x | |||||||
| Type: | Initial | Monthly | Cap (If Any) | U/W NOI Debt Yield: | 10.6% | |||
| Taxes | $52,257 | $24,884 | NAP | U/W NCF Debt Yield: | 9.9% | |||
| Insurance(1) | $60,513 | Springing | NAP | As-Is Appraised Value: | $19,460,000 | |||
| Replacement Reserves | $0 | $7,953 | NAP | As-Is Appraisal Valuation Date: | October 21, 2015 | |||
| Collateral Deposit Funds(2) | $500,000 | $0 | NAP | Cut-off Date LTV Ratio: | 70.7% | |||
| Deferred Maintenance | $7,500 | $0 | NAP | LTV Ratio at Maturity or ARD: | 62.7% | |||
| (1) | Ongoing reserves for insurance premiums are not required provided The Vineyard at Arlington Property is insured under an acceptable blanket insurance policy and the borrowers provide the lender with evidence of renewal of the insurance policies and timely proof of payment of the insurance premiums. |
| (2) | The Collateral Deposit Funds will be disbursed to the borrower upon The Vineyard at Arlington mortgage loan achieving a 9.25% net cash flow debt yield for the trailing 12 month period preceding the borrower’s written request to disburse the Collateral Deposit Funds. |
| (3) | See “Historical Occupancy” section. |
| (4) | See “Cash Flow Analysis” section. |
The Vineyard at Arlington mortgage loan is evidenced by a single promissory note that is secured by a first mortgage encumbering a 396-unit garden-style multifamily property located in Arlington, Texas (“The Vineyard at Arlington Property”) approximately 16.0 miles west of the Dallas central business district and 14.0 miles east of the Fort Worth central business district. Constructed in 1985 and renovated in 2015, The Vineyard at Arlington Property is situated on a 16.4-acre site and contains 29 buildings comprised of six, three-story and 22, two-story residential buildings and a one-story leasing office/clubhouse building.Common area amenities include a clubhouse and business center, fitness center, swimming pool, laundry facility, two tennis courts, racquetball court, picnic area, dog park and movie room. Unit amenities include in-unit washer and dryer connections (available in 200 units), a patio or balcony with exterior storage closets (available in 200 units) and a fully equipped kitchen with dishwasher. Since acquiring The Vineyard at Arlington Property in August 2014, the borrower has invested approximately $1,466,838 in capital improvements. Interior upgrades, totaling approximately $782,435, included new appliances and flooring for select units, as well as plumbing and electrical upgrades. Exterior and site upgrades, totaling approximately $684,403, included roof repair, HVAC, landscaping, pool, and building improvements. The Vineyard at Arlington Property contains 733 surface parking spaces, including 24 covered parking spaces, resulting in a parking ratio of 1.9 spaces per unit. As of March 2, 2016, The Vineyard at Arlington Property was 92.9% occupied.
THE INFORMATION IN THIS STRUCTURAL AND COLLATERAL TERM SHEET IS NOT COMPLETE AND MAY BE AMENDED PRIOR TO THE TIME OF SALE. THIS TERM SHEET IS NOT AN OFFER TO SELL THESE SECURITIES AND IT IS NOT A SOLICITATION OF AN OFFER TO BUY THESE SECURITIES IN ANY JURISDICTION WHERE THE OFFER OR SALE IS NOT PERMITTED.
| 122 |
The Vineyard at Arlington |
Primary access to the area is provided by State Highway 360, which is approximately 0.8 miles east of The Vineyard at Arlington Property and connects to Interstate 30 to the north and Interstate 20 to the south. Interstate 30 and Interstate 20 are east-west thoroughfares providing access to Dallas and Fort Worth. The area surrounding The Vineyard at Arlington Property consists of a mixture of commercial and residential development. Retail development is primarily in the form of anchored and non-anchored community retail strip centers located along the major thoroughfares and concentrated at major intersections. A major entertainment district, located approximately four miles north of The Vineyard at Arlington Property along Interstate Highway 30, is home to Six Flags over Texas theme park, Lone Star Park, Globe Life Park (home of Major League Baseball’s Texas Rangers), and AT&T Stadium (home of National Football League’s Dallas Cowboys). Additionally, The Parks at Arlington, a 1.5 million square foot regional mall anchored by Sears, JC Penney, Dillard’s, and Macy’s, is located approximately 5.0 miles southwest of The Vineyard at Arlington Property.
Sources and Uses
| Sources | Uses | ||||||||
| Original loan amount | $13,750,000 | 100.0% | Loan payoff | $10,101,835 | 73.5 | % | |||
| Reserves | 620,269 | 4.5 | |||||||
| Closing costs | 354,717 | 2.6 | |||||||
| Return of equity | 2,673,179 | 19.4 | |||||||
| Total Sources | $13,750,000 | 100.0% | Total Uses | $13,750,000 | 100.0 | % | |||
The following table presents certain information relating to the unit mix of The Vineyard at Arlington Property:
Unit Mix Summary(1)
| Unit Type | No. of Units | % of Total Units | Average Unit Size (SF) | Average U/W Monthly Rent per Unit | |||||
| Studio - Small | 83 | 21.0 | % | 418 | $532 | ||||
| Studio - Large | 73 | 18.4 | % | 520 | $580 | ||||
| 1 Bedroom / 1 Bathroom | 104 | 26.3 | % | 603 | $619 | ||||
| 1 Bedroom / 1 Bathroom | 96 | 24.2 | % | 618 | $649 | ||||
| 2 Bedroom / 1 Bathroom | 40 | 10.1 | % | 759 | $818 | ||||
| Total/Weighted Average | 396 | 100.0 | % | 568 | $621 | ||||
| (1) | Information obtained from the underwritten rent roll. |
The following table presents historical occupancy percentages at The Vineyard at Arlington Property:
Historical Occupancy
| 12/31/2012(1) | 12/31/2013(2) | 12/31/2014(2)(3) | 11/30/2015(2)(3) | 3/2/2016(4) | ||||
| NAV | 76.8% | 89.4% | 94.7% | 92.9% |
| (1) | Historical occupancy prior to 2013 is not available becausethe borrower purchased The Vineyard at Arlington Property in August 2014 and limited historical information was available. |
| (2) | Information obtained from the borrower. |
| (3) | Approximately 93 units were offline when the borrower purchased the property in August 2014. The increase in occupancy between 2013 and 11/30/2015 was a result of the borrower renovating the vacant units and bringing them back online. |
| (4) | Information obtained from the underwritten rent roll. |
THE INFORMATION IN THIS STRUCTURAL AND COLLATERAL TERM SHEET IS NOT COMPLETE AND MAY BE AMENDED PRIOR TO THE TIME OF SALE. THIS TERM SHEET IS NOT AN OFFER TO SELL THESE SECURITIES AND IT IS NOT A SOLICITATION OF AN OFFER TO BUY THESE SECURITIES IN ANY JURISDICTION WHERE THE OFFER OR SALE IS NOT PERMITTED.
| 123 |
The Vineyard at Arlington |
Operating History and Underwritten Net Cash Flow.The following table presents certain information relating to the historical operating performance and underwritten net cash flow at The Vineyard at Arlington Property:
Cash Flow Analysis
| Annualized 11 4/30/2015(1)(2) | 2015(1)(2) | TTM 2/29/2016(2) | U/W | % of U/W Effective Gross Income | U/W $ per Unit | ||||||||||||||
| Base Rent | $1,981,931 | $2,404,662 | $2,558,675 | $2,739,744 | 95.1% | $6,919 | |||||||||||||
| Grossed Up Vacant Space | 0 | 0 | 0 | 217,500 | 7.6 | 549 | |||||||||||||
| Concessions | 0 | 0 | 0 | 0 | 0.0 | 0 | |||||||||||||
| Other Income(3) | 116,370 | 241,206 | 288,812 | 273,371 | 9.5 | 690 | |||||||||||||
| Less Vacancy & Credit Loss | (167,617 | ) | (35,602 | ) | (81,170 | ) | (350,156) | (4) | (12.2 | ) | (884 | ) | |||||||
| Effective Gross Income | $1,930,684 | $2,610,266 | $2,766,317 | $2,880,459 | 100.0 | % | $7,274 | ||||||||||||
| Total Operating Expenses | $993,461 | $1,440,631 | $1,408,641 | $1,428,336 | 49.6 | % | $3,607 | ||||||||||||
| Net Operating Income | $937,223 | $1,169,636 | $1,357,676 | $1,452,123 | 50.4 | % | $3,667 | ||||||||||||
| Capital Expenditures | 0 | 0 | 0 | 95,436 | 3.3 | 241 | |||||||||||||
| Net Cash Flow | $937,223 | $1,169,636 | $1,357,676 | $1,356,687 | 47.1 | % | $3,426 | ||||||||||||
| NOI DSCR | 1.04 | x | 1.30 | x | 1.51 | x | 1.62 | x | |||||||||||
| NCF DSCR | 1.04 | x | 1.30 | x | 1.51 | x | 1.51 | x | |||||||||||
| NOI DY | 6.8 | % | 8.5 | % | 9.9 | % | 10.6 | % | |||||||||||
| NCF DY | 6.8 | % | 8.5 | % | 9.9 | % | 9.9 | % | |||||||||||
| (1) | The Borrower purchased The Vineyard at Arlington Property in August 2014. Monthly performance for August 2014 was not available and historical operating statements prior to August 2014 were limited. Annualized 11 4/30/2015 represents the annualized historical operating statements from May 2014 through July 2014 and September 2014 through April 2015. |
| (2) | The increase in Base Rent and Net Operating Income from Annualized 11 4/30/2015 to TTM 2/29/2016 was primarily due to the borrower’s renovation of vacant units and resulting increase in occupancy. |
| (3) | Other Income includes month to month rent, late charges, application fees, pet fees, administrative fees, insufficient funds fess, damage fee and miscellaneous income. |
| (4) | The underwritten economic vacancy is 11.8%. The Vineyard at Arlington Property was 92.9% physically occupied as of March 2, 2016. |
The following table presents certain information relating to some comparable multifamily properties for the The Vineyard at Arlington Property:
Competitive Set(1)
| Average Rent (per unit) | ||||||||||||||||||||
| Property | Location | Distance from Subject | Property Type | Number of Units | Studio | 1 BR | 2 BR | 3 BR | Overall Average PSF | Total Occupancy | ||||||||||
| The Vineyard at Arlington (Subject) | Arlington | -- | Garden | 396 | $532-$580 | $619-$649 | $818 | NAP | $1.09 | 93% | ||||||||||
| Chula Vista | Arlington | 2.5 miles | Garden | 137 | NAP | $525-$565 | $700-$799 | NAP | $0.92 | 98% | ||||||||||
| Cypress Club | Arlington | 0.8 miles | Garden | 272 | NAP | $650-$705 | $780-$860 | NAP | $0.91 | 98% | ||||||||||
| Highland Villas | Arlington | 0.3 miles | Garden | 148 | NAP | $763-$767 | $857-$902 | $1,038-$1,053 | $0.87 | 97% | ||||||||||
| Monterra Pointe | Arlington | 0.6 miles | Garden | 200 | NAP | $685-$803 | $815-$855 | NAP | $1.01 | 96% | ||||||||||
| Sutter Creek | Arlington | 0.7 miles | Garden | 616 | NAP | $612-$775 | $905-$958 | NAP | $1.07 | 96% | ||||||||||
| (1) | Information obtained from the appraisal and underwritten rent roll. |
THE INFORMATION IN THIS STRUCTURAL AND COLLATERAL TERM SHEET IS NOT COMPLETE AND MAY BE AMENDED PRIOR TO THE TIME OF SALE. THIS TERM SHEET IS NOT AN OFFER TO SELL THESE SECURITIES AND IT IS NOT A SOLICITATION OF AN OFFER TO BUY THESE SECURITIES IN ANY JURISDICTION WHERE THE OFFER OR SALE IS NOT PERMITTED.
| 124 |
(THIS PAGE INTENTIONALLY LEFT BLANK)
THE INFORMATION IN THIS STRUCTURAL AND COLLATERAL TERM SHEET IS NOT COMPLETE AND MAY BE AMENDED PRIOR TO THE TIME OF SALE. THIS TERM SHEET IS NOT AN OFFER TO SELL THESE SECURITIES AND IT IS NOT A SOLICITATION OF AN OFFER TO BUY THESE SECURITIES IN ANY JURISDICTION WHERE THE OFFER OR SALE IS NOT PERMITTED.
| 125 |
| No. 14 – Auburn Glen Apartments |
| Loan Information | Property Information | |||||||
| Mortgage Loan Seller: | Rialto Mortgage Finance, LLC | Single Asset/Portfolio: | Single Asset | |||||
| Credit Assessment (DBRS/Fitch/ Moody’s): | NR/NR/NR | Property Type: | Multifamily | |||||
| Original Principal Balance: | $13,500,000 | Specific Property Type: | Garden | |||||
| Cut-off Date Balance: | $13,500,000 | Location: | Jacksonville, FL | |||||
| % of Initial Pool Balance: | 1.9% | Size: | 250 Units | |||||
| Loan Purpose: | Refinance | Cut-off Date Balance Per Unit: | $54,000 | |||||
| Borrower Name: | Bancroft Auburn Glen, LLC | Year Built/Renovated: | 1974/2013 | |||||
| Sponsor: | Barrett Penan | Title Vesting: | Fee | |||||
| Mortgage Rate: | 5.170% | Property Manager: | Apartment Property Management Services, LLC | |||||
| Note Date: | February 1, 2016 | 4th Most Recent Occupancy(3): | NAV | |||||
| Anticipated Repayment Date: | NAP | 3rd Most Recent Occupancy(3): | NAV | |||||
| Maturity Date: | Februay 6, 2026 | 2nd Most Recent Occupancy (As of): | 96.6% (12/31/2013) | |||||
| IO Period: | 60 months | Most Recent Occupancy (As of): | 97.6% (12/31/2014) | |||||
| Loan Term (Original): | 120 months | Current Occupancy (As of): | 96.4% (1/15/2016) | |||||
| Seasoning: | 1 month | |||||||
| Amortization Term (Original): | 360 months | Underwriting and Financial Information: | ||||||
| Loan Amortization Type: | Interest-only, Amortizing Balloon | |||||||
| Interest Accrual Method: | Actual/360 | 4th Most Recent NOI(4): | NAV | |||||
| Call Protection: | L(25),D(90),O(5) | 3rd Most Recent NOI(4): | NAV | |||||
| Lockbox Type: | Springing | 2nd Most Recent NOI (As of)(4): | $1,070,716 (Annualized 9 12/31/2014) | |||||
| Additional Debt(1): | Yes | Most Recent NOI (As of): | $1,211,440 (12/31/2015) | |||||
| Additional Debt Type(1): | Future Mezzanine | |||||||
| U/W Revenues: | $2,297,211 | |||||||
| U/W Expenses: | $1,062,223 | |||||||
| U/W NOI: | $1,234,989 | |||||||
| U/W NCF: | $1,172,489 | |||||||
| U/W NOI DSCR: | 1.39x | |||||||
| Escrows and Reserves: | U/W NCF DSCR: | 1.32x | ||||||
| U/W NOI Debt Yield: | 9.1% | |||||||
| Type: | Initial | Monthly | Cap (If Any) | U/W NCF Debt Yield: | 8.7% | |||
| Taxes | $0 | $17,231 | NAP | As-Is Appraised Value(5): | $19,100,000 | |||
| Insurance | $50,137 | $5,305 | NAP | As-Is Appraisal Valuation Date(5): | January 15, 2016 | |||
| Replacement Reserves(2) | $600,000 | $5,208 | NAP | Cut-off Date LTV Ratio(5): | 62.8% | |||
| Deferred Maintenance | $34,175 | $0 | NAP | LTV Ratio at Maturity or ARD(5): | 58.1% | |||
| (1) | The borrower has the right to incur mezzanine financing subject to the satisfaction of certain conditions including (i) no event of default; (ii) the execution of an intercreditor agreement in form and substance acceptable to the lender; (iii) the combined LTV ratio is not greater than 75.0%; (iv) the combined net cash flow DSCR is equal to or greater than the net cash flow DSCR as of the origination date; and (v) receipt of rating agency confirmations from DBRS, Fitch and Moody’s that the mezzanine financing will not result in a downgrade, withdrawal or qualification of the respective ratings assigned to the Series 2016-C33 Certificates. |
| (2) | The Initial Replacement Reserves of $600,000 are for required capital improvements to the Auburn Glen Apartments Property to be completed within 12 months of origination. The required capital improvements include renovations to kitchen cabinets, resurfacing of kitchen counters, new kitchen appliances, lighting package, hardware package, new flooring, washer and dryer hook-ups, upgrades to bathrooms, upgrades to HVAC units and hot water heaters. |
| (3) | See “Historical Occupancy” section. |
| (4) | See “Cash Flow Analysis” section. |
| (5) | The appraiser concluded to an “as-complete” value of $21,500,000 as of January 15, 2017 which assumes the completion of a capital improvement project. The Cut-off Date LTV Ratio and LTV Ratio at Maturity or ARD are calculated based on the “as-complete” appraised value. The Cut-off Date LTV Ratio and LTV Ratio at Maturity or ARD based on the “as-is” appraised value of $19,100,000 are 70.7% and 65.3%, respectively. |
The Auburn Glen Apartments mortgage loan is evidenced by a single promissory note that is secured by a first mortgage encumbering a 250-unit garden-style multifamily property located in Jacksonville, Florida (the “Auburn Glen Apartments Property”) approximately 10.0 miles southeast of the Jacksonville central business district. Constructed in 1974 and renovated in 2009 and 2013, the Auburn Glen Apartments Property is situated on a 20.8-acre site and contains 23, two-story residential buildings and two, one-story buildings which house the leasing center/club house and common laundry facility. Common area amenities include an on site leasing office, resort style swimming pool, fitness center, business center, car care center, playground, laundry center, clubhouse, tennis courts, a BBQ area and four stocked lakes.Unit amenities include air conditioning, electric appliances, dishwashers, private balconies and patios, walk-in closets, and washer and dryer hook ups in select units. The Auburn Glen Apartments Property contains 504 surface parking spaces, resulting in a parking ratio of approximately 2.0 spaces per unit. The Borrower has invested approximately $392,539 in capital improvements, which included roof maintenance, HVAC, plumbing, flooring, and some unit upgrades and renovations. Within 12 months of closing, it is expected the borrower will invest an additional
THE INFORMATION IN THIS STRUCTURAL AND COLLATERAL TERM SHEET IS NOT COMPLETE AND MAY BE AMENDED PRIOR TO THE TIME OF SALE. THIS TERM SHEET IS NOT AN OFFER TO SELL THESE SECURITIES AND IT IS NOT A SOLICITATION OF AN OFFER TO BUY THESE SECURITIES IN ANY JURISDICTION WHERE THE OFFER OR SALE IS NOT PERMITTED.
| 126 |
| AUBURN GLEN APARTMENTS |
$585,000 ($3,900 per unit) in capital improvements to upgrade and renovate 150 of the apartment units. $600,000 was escrowed at closing for this planned renovation. As of January 15, 2016, the Auburn Glen Apartments Property was 96.4% occupied.
Primary access to the Auburn Glen Apartments Property is provided by Interstate 95, the primary north-south arterial bisecting the Jacksonville metropolitan statistical area and extending south to Miami and north along the eastern United States. The Auburn Glen Apartments Property is located immediately adjacent to Florida State College at Jacksonville campus and approximately 3.0 miles east of Florida Coastal School of Law. The Auburn Glen Apartments Property is also 3.4 miles east of Deerwood Center and 4.3 miles southwest of St. Johns Town Center, offering residents numerous shopping, dining and entertainment options. Deerwood Center is a Publix grocery-anchored center with an array of restaurants and boutique shops. St. Johns Town Center is a 1.6 million square foot regional mall anchored by Dick’s Sporting Goods, Dillard’s, DSW, Nordstrom, Ross Dress for Less, Staples and Target.
Sources and Uses
| Sources | Uses | |||||||||
| Original loan amount | $13,500,000 | 100.0 | % | Loan payoff | $9,420,457 | 69.8 | % | |||
| Reserves | 684,312 | 5.1 | ||||||||
| Closing costs | 275,339 | 2.0 | ||||||||
| Return of equity | 3,119,892 | 23.1 | ||||||||
| Total Sources | $13,500,000 | 100.0 | % | Total Uses | $13,500,000 | 100.0 | % | |||
The following table presents certain information relating to the unit mix of the Auburn Glen Apartments Property:
Apartment Unit Summary(1)
| Unit Type | No. of Units | % of Total Units | Average Unit Size (SF) | Average U/W Monthly Rent per Unit | |
| One Bedroom / One Bath (Large) | 62 | 24.8 | % | 800 | $671 |
| One Bedroom / One Bath (Small) | 72 | 28.8 | % | 520 | $603 |
| One Bedroom / One Bath (Large/Washer) | 24 | 9.6 | % | 800 | $678 |
| Two Bedrooms / Two Baths | 43 | 17.2 | % | 1,070 | $827 |
| Two Bedrooms / Two Baths (Washer) | 17 | 6.8 | % | 1,070 | $829 |
| Two Bedrooms / One Bath | 14 | 5.6 | % | 1,000 | $785 |
| Two Bedrooms / One Bath (Washer) | 18 | 7.2 | % | 1,000 | $788 |
| Total/Weighted Average | 250 | 100.0 | % | 810 | $704 |
| (1) | Information obtained from the underwritten rent roll. |
The following table presents historical occupancy percentages at the Auburn Glen Apartments Property:
Historical Occupancy
| 12/31/2011(1) | 12/31/2012(1) | 12/31/2013(2) | 12/31/2014(2) | 1/15/2016(3) | ||||
| NAV | NAV | 96.6% | 97.6% | 96.4% | ||||
| (1) | Historical occupancy prior to 2013 is not available because the borrower acquired the Auburn Glen Apartments Property in March 2014. Limited historical occupancy information prior to acquisition was available. |
| (2) | Information obtained from the borrower. |
| (3) | Information obtained from the underwritten rent roll. |
THE INFORMATION IN THIS STRUCTURAL AND COLLATERAL TERM SHEET IS NOT COMPLETE AND MAY BE AMENDED PRIOR TO THE TIME OF SALE. THIS TERM SHEET IS NOT AN OFFER TO SELL THESE SECURITIES AND IT IS NOT A SOLICITATION OF AN OFFER TO BUY THESE SECURITIES IN ANY JURISDICTION WHERE THE OFFER OR SALE IS NOT PERMITTED.
| 127 |
| AUBURN GLEN APARTMENTS |
Operating History and Underwritten Net Cash Flow.The following table presents certain information relating to the historical operating performance and underwritten net cash flow at the Auburn Glen Apartments Property:
Cash Flow Analysis(1)
| Annualized 9 12/31/2014 | 12/31/2015 | U/W | % of UW Effective Gross Income | U/W $ per Unit | |||||||
| Base Rent | $1,948,606 | $2,052,225 | $2,024,676 | 88.1 | % | $8,099 | |||||
| Grossed Up Vacant Space | 0 | 0 | 87,360 | 3.8 | 349 | ||||||
| Concessions | (5,136) | (2,896) | (5,136) | (0.2 | ) | (21) | |||||
| Other Income(2) | 270,538 | 297,636 | 297,636 | 13.0 | 1,191 | ||||||
| Less Vacancy & Credit Loss | (66,125) | (94,181) | (107,324)(3) | (4.7 | ) | (429) | |||||
| Effective Gross Income | $2,147,883 | $2,252,784 | $2,297,211 | 100.0 | % | $9,189 | |||||
| Total Operating Expenses | $1,077,166 | $1,041,344 | $1,062,223 | 46.2 | % | $4,249 | |||||
| Net Operating Income | $1,070,716 | $1,211,440 | $1,234,989 | 53.8 | % | $4,940 | |||||
| Capital Expenditures | 0 | 0 | 62,500 | 2.7 | 250 | ||||||
| Net Cash Flow | $1,070,716 | $1,211,440 | $1,172,489 | 51.0 | % | $4,690 | |||||
| NOI DSCR | 1.21x | 1.37x | 1.39x | ||||||||
| NCF DSCR | 1.21x | 1.37x | 1.32x | ||||||||
| NOI DY | 7.9% | 9.0% | 9.1% | ||||||||
| NCF DY | 7.9% | 9.0% | 8.7% | ||||||||
| (1) | The borrower acquired the Auburn Glen Apartments Property in March 2014. Operating history prior to acquisition is not available. |
| (2) | Other Income consists of application fees, termination fees, cable revenue, and late charges. |
| (3) | The underwritten economic vacancy is 5.3%. The Auburn Glen Apartments Property was 96.4% physically occupied as of January 15, 2016. |
The following table presents certain information relating to some comparable multifamily properties for the Auburn Glen Apartments Property:
Competitive Set(1)
| Average Rent (per unit) | ||||||||||
| Property | Location | Distance from Subject | Property Type | Number of Units |
Studio | 1 BR | 2 BR | 3 BR | Overall Average PSF | Total Occupancy |
| Auburn Glen Apartments (Subject) | Jacksonville | -- | Garden | 250 | NAP | $603-$678 | $785-$829 | NAP | $0.87 | 96.4% |
| The Grove at Deerwood | Jacksonville | 0.6 miles | Garden | 288 | NAP | $729-$819 | $959 | NAP | $1.11 | 97.0% |
| Park South at Deerwood | Jacksonville | 0.2 miles | Garden | 240 | NAP | $775 | $1,108 | $1,315 | $1.01 | 98.0% |
| Green Tree Place | Jacksonville | 0.7 miles | Garden | 352 | NAP | $862 | $918 | NAP | $1.01 | 97.0% |
| Bentley Green Apartments | Jacksonville | 0.5 miles | Garden | 820 | NAP | $878 | $968-$1,015 | $1,426 | $1.28 | 97.0% |
| The Fountains at Deerwood | Jacksonville | 0.4 miles | Garden | 240 | NAP | $856 | $1,015 | $1,220 | $0.89 | 96.0% |
| (1) | Information obtained from the appraisal and the underwritten rent roll. |
THE INFORMATION IN THIS STRUCTURAL AND COLLATERAL TERM SHEET IS NOT COMPLETE AND MAY BE AMENDED PRIOR TO THE TIME OF SALE. THIS TERM SHEET IS NOT AN OFFER TO SELL THESE SECURITIES AND IT IS NOT A SOLICITATION OF AN OFFER TO BUY THESE SECURITIES IN ANY JURISDICTION WHERE THE OFFER OR SALE IS NOT PERMITTED.
| 128 |
(THIS PAGE INTENTIONALLY LEFT BLANK)
THE INFORMATION IN THIS STRUCTURAL AND COLLATERAL TERM SHEET IS NOT COMPLETE AND MAY BE AMENDED PRIOR TO THE TIME OF SALE. THIS TERM SHEET IS NOT AN OFFER TO SELL THESE SECURITIES AND IT IS NOT A SOLICITATION OF AN OFFER TO BUY THESE SECURITIES IN ANY JURISDICTION WHERE THE OFFER OR SALE IS NOT PERMITTED.
| 129 |
| No. 15 – Beachside Resort |
| Loan Information | Property Information | ||||||
| Mortgage Loan Seller: | Ladder Capital Finance LLC | Single Asset/Portfolio: | Single Asset | ||||
| Credit Assessment (DBRS/Fitch/Moody’s): | NR/NR/NR | Property Type: | Hospitality | ||||
| Original Principal Balance: | $13,100,000 | Specific Property Type: | Limited Service | ||||
| Cut-off Date Balance: | $13,027,345 | Location: | Panama City Beach, FL | ||||
| % of Initial Pool Balance: | 1.8% | Size: | 147 Rooms | ||||
| Loan Purpose: | Refinance | Cut-off Date Balance Per Room: | $88,621 | ||||
| Borrower Name: | Panama City Beach Hotel LLC | Year Built/Renovated: | 1974/2013 | ||||
| Sponsor: | Michel O. Provosty, Jr. | Title Vesting: | Fee | ||||
| Mortgage Rate: | 5.200% | Property Manager: | Innisfree Hotels, Inc. | ||||
| Note Date: | September 28, 2015 | 4thMost Recent Occupancy(4): | NAV | ||||
| Anticipated Repayment Date: | NAP | 3rdMost Recent Occupancy(4): | NAV | ||||
| Maturity Date: | October 1, 2025 | 2ndMost Recent Occupancy(4): | NAV | ||||
| IO Period: | None | Most Recent Occupancy (As of): | 41.7% (12/31/2014) | ||||
| Loan Term (Original): | 120 months | Current Occupancy (As of): | 52.4% (12/31/2015) | ||||
| Seasoning: | 5 months | ||||||
| Amortization Term (Original): | 360 months | Underwriting and Financial Information: | |||||
| Loan Amortization Type: | Amortizing Balloon | ||||||
| Interest Accrual Method: | Actual/360 | 4thMost Recent NOI(5): | NAV | ||||
| Call Protection: | L(23), GRTR 1% or YM(93),O(4) | 3rdMost Recent NOI(5): | NAV | ||||
| Lockbox Type: | Springing | 2ndMost Recent NOI (As of): | $1,245,457 (12/31/2014) | ||||
| Additional Debt(1): | Yes | Most Recent NOI (As of): | $1,840,695 (12/31/2015) | ||||
| Additional Debt Type(1): | Future Mezzanine | ||||||
| U/W Revenues: | $3,978,279 | ||||||
| U/W Expenses: | $2,249,346 | ||||||
| U/W NOI: | $1,728,933 | ||||||
| U/W NCF: | $1,569,802 | ||||||
| Escrows and Reserves: | U/W NOI DSCR: | 2.00x | |||||
| U/W NCF DSCR: | 1.82x | ||||||
| Type: | Initial | Monthly | Cap (If Any) | U/W NOI Debt Yield: | 13.3% | ||
| Taxes | $46,701 | $4,670 | NAP | U/W NCF Debt Yield: | 12.1% | ||
| Insurance | $68,728 | $13,746 | NAP | As-Is Appraised Value: | $23,900,000 | ||
| FF&E Reserve(2) | $0 | 4% of Gross Revenue | NAP | As-Is Appraisal Valuation Date: | August 1, 2015 | ||
| Deferred Maintenance | $52,769 | $0 | NAP | Cut-off Date LTV Ratio: | 54.5% | ||
| Seasonality Reserve(3) | $697,000 | Various | NAP | LTV Ratio at Maturity or ARD: | 45.4% | ||
| (1) | Future mezzanine debt is permitted subject to the following conditions: (i) no more than one tranche of approved mezzanine loan is permitted at any time; (ii) a combined loan-to-value ratio of less than or equal to 75.0%; (iii) a combined debt service coverage ratio greater than or equal to 1.40x; (iv) the combined balance of the senior note and the subordinate note must not be greater than $17,775,000; and (v) receipt of rating agency confirmation from each of DBRS, Fitch, and Moody’s that such mezzanine financing will not result in a downgrade, withdrawal or qualification of the respective ratings assigned to the Series 2016-C33 Certificates. |
| (2) | With respect to any monthly payment date, 4.0% of gross revenue for the Beachside Resort Property for the month which is two months prior to the month in which such monthly payment date occurs. |
| (3) | May and June: 10% of $697,000 (as adjusted annually) rounded to the nearest $5,000; July: 35% of the $697,000 rounded to the nearest $5,000; August: Aggregate deposits made in the foregoing months subtracted from the remaining seasonality annual amount. September – April: None. |
| (4) | See “Subject and Market Historical Occupancy, ADR and RevPAR” section. |
| (5) | See “Cash Flow Analysis” section. |
The Beachside Resort mortgage loan is evidenced by a single promissory note secured by a first mortgage encumbering the fee interest in a 147-room limited service hotel located in Panama City Beach, Florida (the “Beachside Resort Property”). Built in 1974 and primarily renovated in 2013, the Beachside Resort Property consists of two buildings, both of which are exterior corridor structures. The low-rise building, on the eastern side of the Beachside Resort Property, is a three-story structure containing 57 rooms. The tower, on the western side of the Beachside Resort Property, is a seven story structure containing 90 rooms. The Beachside Resort Property features 125 standard rooms and 22 suites. Each guestroom features an armoire, dresser with mirror, nightstands, a work desk and chair, a couch and coffee table, wall-mounted and table-top lamps, wall mirrors, a coffee maker, a clock radio, and a television. Suites also include a sleeper sofa and a pantry area with refrigerator, stove, microwave, and wet bar. Amenities offered at the Beachside Resort Property include an outdoor pool, “kiddie pool,” and outdoor Jacuzzi, a pool-side bar and snack shop, and guest laundry facilities. The Beachside Resort Property is located along approximately 500 feet of beachfront, situated on the western end of Panama City Beach. Of the total 147 rooms, 138 (representing 93.9% of all rooms) feature balconies with unobstructed beachfront views of the Gulf of Mexico.
THE INFORMATION IN THIS STRUCTURAL AND COLLATERAL TERM SHEET IS NOT COMPLETE AND MAY BE AMENDED PRIOR TO THE TIME OF SALE. THIS TERM SHEET IS NOT AN OFFER TO SELL THESE SECURITIES AND IT IS NOT A SOLICITATION OF AN OFFER TO BUY THESE SECURITIES IN ANY JURISDICTION WHERE THE OFFER OR SALE IS NOT PERMITTED.
| 130 |
| BEACHSIDE RESORT |
The borrower purchased the Beachside Resort Property in 2012 from a lender that had acquired it in foreclosure. See “Description of the Mortgage Pool—Loan Purpose; Default History, Bankruptcy Issues and Other Proceedings” in the Preliminary Prospectus. Following the acquisition, the borrowerrenovated the Beachside Resort Property in phases from 2012-2015 for a total estimated cost of approximately $3.3 million ($22,531 per room). Phase I of the renovation included gut renovation of the low-rise building, including replacement of FF&E and repairs to electrical and plumbing systems; Phase II of the renovation included renovation of the tower building, including upgrades to interiors and replacement of FF&E; and Phase III of the renovation included improvements to the poolside bar and snack shop, upgrades to amenities including pool deck replacement, replacement of the low-rise building roof and demolition of an adjacent vacant parking structure.
Sources and Uses
| Sources | Uses | ||||||||
| Original loan amount | $13,100,000 | 100.0% | Loan payoff | $8,107,340 | 61.9 | % | |||
| Reserves | 865,198 | 6.6 | |||||||
| Closing costs | 771,681 | 5.9 | |||||||
| Return of equity | 3,355,781 | 25.6 | |||||||
| Total Sources | $13,100,000 | 100.0% | Total Uses | $13,100,000 | 100.0 | % |
The following table presents certain information relating to the Beachside Resort Property’s competitive set:
Subject and Market Historical Occupancy, ADR and RevPAR(1)
Competitive Set(2) | Beachside Resort(3) | Penetration Factor | |||||||||||||||
Year | Occupancy | ADR | RevPAR | Occupancy | ADR | RevPAR | Occupancy | ADR | RevPAR | ||||||||
| 12/31/2015 | 66.5% | $121.34 | $80.73 | 52.4% | $136.82 | $71.70 | 78.8% | 112.8% | 88.8% | ||||||||
| 12/31/2014 | 64.7% | $112.60 | $72.87 | 41.7% | $127.78 | $53.23 | 64.4% | 113.5% | 73.1% | ||||||||
| (1) | The borrower acquired the Beachside Resort Property in May 2012; however, historical occupancy, ADR and RevPAR prior to 2014 is not available due to the Beachside Resort Property undergoing significant renovations since acquisition and was not fully operational until the spring of 2015. |
| (2) | Information obtained from a third party hospitality research report dated January 19, 2016. The competitive set includes Beachbreak By The Sea, Days Inn Panama City Beach Ocean Front, Beachcomber By The Sea, Legacy By The Sea, Comfort Suites Panama City Beach, Country Inn & Suites Panama City Beach, and La Quinta Inns & Suites PCB Pier Park Area. |
| (3) | Information obtained from the borrower. |
The following table presents certain information relating to the historical operating performance and the underwritten net cash flow at the Beachside Resort Property:
Cash Flow Analysis(1)
| 2014(2) | 2015(2) | U/W | % of U/W Total Revenue | U/W $ per Room | |||||
| Occupancy | 41.7% | 52.4% | 52.4% | ||||||
| ADR | $127.78 | $136.82 | $136.82 | ||||||
| RevPAR | $53.23 | $71.70 | $71.70 | ||||||
| Room Revenue | $2,829,118 | $3,846,919 | $3,846,919 | 96.7% | $26,170 | ||||
| F&B Revenue | 42,855 | 105,869 | 105,869 | 2.7 | 720 | ||||
| Other Revenue | 17,026 | 25,491 | 25,491 | 0.6 | 173 | ||||
| Total Revenue | $2,888,999 | $3,978,279 | $3,978,279 | 100.0% | $27,063 | ||||
| Total Department Expenses | 639,812 | 936,675 | 936,675 | 23.5 | 6,372 | ||||
| Gross Operating Profit | $2,249,187 | $3,041,604 | $3,041,604 | 76.5% | $20,691 | ||||
| Total Undistributed Expenses | 814,153 | 966,936 | 1,078,698 | 27.1 | 7,338 | ||||
| Profit Before Fixed Charges | $1,435,035 | $2,074,668 | $1,962,906 | 49.3% | $13,353 | ||||
| Total Fixed Charges | 189,578 | 233,973 | 233,973 | 5.9 | 1,592 | ||||
| Net Operating Income | $1,245,457 | $1,840,695 | $1,728,933 | 43.5% | $11,761 | ||||
| FF&E | 0 | 0 | 159,131 | 4.0 | 1,083 | ||||
| Net Cash Flow | $1,245,457 | $1,840,695 | $1,569,802 | 39.5% | $10,679 | ||||
| NOI DSCR | 1.44x | 2.13x | 2.00x | ||||||
| NCF DSCR | 1.44x | 2.13x | 1.82x | ||||||
| NOI DY | 9.6% | 14.1% | 13.3% | ||||||
| NCF DY | 9.6% | 14.1% | 12.1% | ||||||
| (1) | The borrower acquired the Beachside Resort Property in May 2012; however, historical occupancy, ADR and RevPAR prior to 2014 is not available due to the Beachside Resort Property undergoing significant renovations since acquisition and was not fully operational until the spring of 2015. |
| (2) | Net Operating Income increased from 2014 to 2015 due to an increase in occupancy and renovations at the Beachside Resort Property that were completed in the spring of 2015. |
THE INFORMATION IN THIS STRUCTURAL AND COLLATERAL TERM SHEET IS NOT COMPLETE AND MAY BE AMENDED PRIOR TO THE TIME OF SALE. THIS TERM SHEET IS NOT AN OFFER TO SELL THESE SECURITIES AND IT IS NOT A SOLICITATION OF AN OFFER TO BUY THESE SECURITIES IN ANY JURISDICTION WHERE THE OFFER OR SALE IS NOT PERMITTED.
| 131 |
| Wells Fargo Commercial Mortgage Trust 2016-C33 | Transaction Contact Information |
| VI. | Transaction Contact Information |
Questions regarding this Structural and Collateral Term Sheet may be directed to any of the following individuals:
| Wells Fargo Securities, LLC | |
| Brigid Mattingly | Tel. (312) 269-3062 |
| A.J. Sfarra | Tel. (212) 214-5613 |
| Alex Wong | Tel. (212) 214-5615 |
THE INFORMATION IN THIS STRUCTURAL AND COLLATERAL TERM SHEET IS NOT COMPLETE AND MAY BE AMENDED PRIOR TO THE TIME OF SALE. THIS TERM SHEET IS NOT AN OFFER TO SELL THESE SECURITIES AND IT IS NOT A SOLICITATION OF AN OFFER TO BUY THESE SECURITIES IN ANY JURISDICTION WHERE THE OFFER OR SALE IS NOT PERMITTED.
| 132 |