UNITED STATES
SECURITIES AND EXCHANGE COMMISSION
Washington, D.C. 20549
FORM N-CSR
CERTIFIED SHAREHOLDER REPORT OF REGISTERED
MANAGEMENT INVESTMENT COMPANIES
Investment Company Act file number: 811-23149
Thrivent Core Funds
(Exact name of registrant as specified in charter)
625 Fourth Avenue South
Minneapolis, Minnesota 55415
(Address of principal executive offices) (Zip code)
Michael W. Kremenak, Secretary and Chief Legal Officer
625 Fourth Avenue South
Minneapolis, Minnesota 55415
(Name and address of agent for service)
Registrant’s telephone number, including area code: (612) 844-4198
Date of fiscal year end: October 31
Date of reporting period: April 30, 2018
| Item 1. | Report to Stockholders |
SEMIANNUAL REPORT
APRIL 30, 2018
THRIVENT CORE FUNDS
TABLEOF CONTENTS
THRIVENT CORE EMERGING MARKETS DEBT FUND
Kent L. White, CFA, and Cortney L. Swensen, CFA , Portfolio Co-Managers
The Fund seeks to maximize total return while providing high current income and capital appreciation. The Fund’s investment objective may be changed without shareholder approval.
Under normal circumstances, the Fund invests at least 80% of its net assets (plus the amount of any borrowing for investments purposes) in sovereign and corporate debt securities of issuers in emerging market countries. An “emerging market” country is any country determined by Thrivent Asset Management, LLC to have an emerging market economy, considering factors such as the country’s credit rating, its political and economic stability and the development of its financial and capital markets. These emerging market countries include every nation in the world except the U.S., Canada, Israel, Japan, Australia, New Zealand, Hong Kong, Singapore and all nations typically considered part of Western Europe. At times, the Fund may have a significant amount of its assets invested in a particular country or geographic region. The Fund primarily invests in the emerging market sovereign debt of countries covered by the Bloomberg Barclays EM USD Aggregate Index (the Fund’s benchmark index), but will also invest in the sovereign debt, quasi-sovereign debt and corporate bonds of emerging market countries outside of the benchmark where the Adviser finds attractive opportunities. The Fund may invest in investment-grade and high yield (i.e., “junk bond”) securities, which may include the lowest-rated bonds, including those in default. The Fund may invest in derivatives or other investments whose return is based on the return of an emerging market security, including exchange-traded funds (“ETFs”).
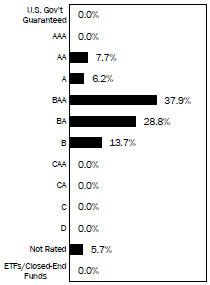
Bond Quality Ratings Distributions
| | | | |
Major Market Sectors (% of Net Assets) | |
Foreign Government | | | 95.5 | % |
Energy | | | 2.1 | % |
| | | | |
| Top 10 Countries | |
| (% of Net Assets) | |
Indonesia | | | 10.2 | % |
Turkey | | | 8.9 | % |
Argentina | | | 8.9 | % |
Mexico | | | 7.7 | % |
Russia | | | 6.9 | % |
Saudi Arabia | | | 5.2 | % |
Colombia | | | 4.5 | % |
South Africa | | | 4.3 | % |
Brazil | | | 4.2 | % |
Qatar | | | 4.2 | % |
| Investments in securities in these countries represent 65.0% of the total net assets of the Fund. | |
| | |
Bond quality ratings are obtained from Moody’s Investors Service, Inc. (“Moody’s”) and Standard & Poor’s Ratings Services (“S&P”). Ratings from S&P, when used, are converted into their equivalent Moody’s ratings. If Moody’s and S&P have assigned different ratings to a security, the lowest rating for the security is used. Not rated may include cash. Investments in derivatives and short-term investments are not reflected in the table.
Quoted Bond Quality Ratings Distributions, Major Market Sectors and Top 10 Countries are subject to change.
The lists of Major Market Sectors and Top 10 Countries exclude short-term investments and collateral held for securities loaned. Bond Quality Ratings Distributions exclude collateral held for securities loaned.
2
THRIVENT CORE INTERNATIONAL EQUITY FUND
Noah J. Monsen, CFA and Brian W. Bomgren, CQF, Portfolio Co-Managers
The Fund seeks long-term capital appreciation. The Fund’s investment objective may be changed without shareholder approval.
Under normal circumstances, the Fund invests at least 80% of its net assets (plus the amount of any borrowing for investments purposes) in equity securities. At least 65% of the Fund’s net assets will be invested in equity securities of issuers in international developed market countries. Developed market countries are countries covered by the MSCI EAFE + Canada Index, an international developed markets equity index (the Fund’s benchmark index). The Fund will primarily invest in the common stocks of mid- and large-capitalization companies represented in its benchmark, but may also invest in small capitalization companies. The Fund may invest in securities denominated in various currencies. The Fund may invest in derivatives or other investments whose return is based on the return of developed market equity securities, such as equity index futures.
| | | | |
Portfolio Composition (% of Portfolio) | |
Common Stock | | | 99.5% | |
Short-Term Investments | | | 0.3% | |
Preferred Stock | | | 0.2% | |
| | | | | |
Total | | | 100.0% | |
| | | | |
| Major Market Sectors | |
| (% of Net Assets) | |
Industrials | | | 17.7 | % |
Materials | | | 15.3 | % |
Financials | | | 14.8 | % |
Consumer Discretionary | | | 14.3 | % |
Consumer Staples | | | 8.5 | % |
Health Care | | | 6.8 | % |
Energy | | | 6.2 | % |
Information Technology | | | 5.9 | % |
Telecommunications Services | | | 5.6 | % |
Utilities | | | 2.5 | % |
| | | | |
| Top 10 Countries | |
| (% of Net Assets) | |
Japan | | | 25.7 | % |
United Kingdom | | | 17.8 | % |
France | | | 7.3 | % |
Germany | | | 6.9 | % |
Switzerland | | | 6.1 | % |
Canada | | | 5.5 | % |
Australia | | | 5.6 | % |
Netherlands | | | 5.5 | % |
Sweden | | | 5.0 | % |
Denmark | | | 3.6 | % |
Investments in securities in these countries represent 89.0% of the total net assets of the Fund. | |
Quoted Portfolio Composition, Major Market Sectors and Top 10 Countries are subject to change.
The lists of Major Market Sectors and Top 10 Countries exclude short-term investments and collateral held for securities loaned. The Portfolio Composition chart excludes collateral held for securities loaned.
3
THRIVENT CORE LOW VOLATILITY EQUITY FUND
Noah J. Monsen, CFA and Brian W. Bomgren, CQF, Portfolio Co-Managers
The Fund seeks to provide long-term capital appreciation with lower volatility relative to the domestic equity market. The Fund’s investment objective may be changed without shareholder approval.
Under normal circumstances, the Fund invests at least 80% of its net assets (plus the amount of any borrowing for investments purposes) in equity securities. The Adviser focuses mainly on the common stocks of domestic companies of any market capitalization, including small- and mid-cap sized companies. In seeking to achieve the Fund’s investment objective, the Adviser employs investment management techniques to identify securities that exhibit low volatility returns. Volatility refers to the variation in security and market prices over time. Over a full market cycle, the Fund seeks to produce returns similar to the MSCI USA Minimum Volatility (USD) Index (the Fund’s benchmark index).
| | | | |
| Portfolio Composition | |
| (% of Portfolio) | |
Common Stock | | | 99.9% | |
Short-Term Investments | | | 0.1% | |
| | | | | |
Total | | | 100.0% | |
| | | | |
| Major Market Sectors | |
| (% of Net Assets) | |
Information Technology | | | 21.0 | % |
Financials | | | 15.7 | % |
Health Care | | | 14.9 | % |
Industrials | | | 13.6 | % |
Consumer Staples | | | 12.6 | % |
Consumer Discretionary | | | 7.9 | % |
Utilities | | | 6.8 | % |
Real Estate | | | 2.1 | % |
Telecommunications Services | | | 2.1 | % |
Materials | | | 1.8 | % |
| | | | |
| Top 10 Holdings | |
| (% of Net Assets) | |
Intuit, Inc. | | | 2.2 | % |
Public Service Enterprise Group, Inc. | | | 2.2 | % |
NextEra Energy, Inc. | | | 2.1 | % |
McDonald’s Corporation | | | 2.1 | % |
Allstate Corporation | | | 2.1 | % |
Eli Lilly and Company | | | 2.1 | % |
UnitedHealth Group, Inc. | | | 2.1 | % |
Home Depot, Inc. | | | 2.1 | % |
Verizon Communications, Inc. | | | 2.1 | % |
Aflac, Inc. | | | 2.1 | % |
These securities represent 21.2% of the total net assets of the Fund. | |
Quoted Portfolio Composition, Major Market Sectors and Top 10 Holdings are subject to change.
The lists of Major Market Sectors and Top 10 Holdings exclude short-term investments and collateral held for securities loaned. The Portfolio Composition chart excludes collateral held for securities loaned.
4
THRIVENT CORE SHORT-TERM RESERVE FUND
William D. Stouten, Portfolio Manager
The Fund seeks a high level of current income consistent with liquidity and the preservation of capital.
The Fund invests primarily in investment-grade, fixed-income securities. Although the value of the Fund’s shares will fluctuate, Thrivent Asset Management seeks to manage the magnitude of fluctuation by limiting the Fund’s weighted-average-maturity to 90 days or less. Weighted-average-maturity measures the price sensitivity of a fixed-income security to changes in interest rates. Allowable investments consist primarily of U.S. dollar-denominated debt securities that may include, but are not limited to, obligations of U.S., state, and local governments, their agencies and instrumentalities; mortgage- and asset-backed securities; corporate debt securities; time deposits, repurchase agreements; and other securities that have debt-like characteristics. The Fund may also invest in other investment companies that have exposure to fixed income securities.
| | | | |
| Portfolio Composition | |
| (% of Portfolio) | |
Short-Term Investments | | | 100.0% | |
| | | | | |
Total | | | 100.0% | |
| | | | |
| Major Market Sectors | |
| (% of Net Assets) | |
Financials | | | 41.3 | % |
Consumer Non-Cyclical | | | 13.3 | % |
Foreign | | | 8.9 | % |
Asset-Backed Securities | | | 7.9 | % |
Utilities | | | 5.4 | % |
Energy | | | 5.1 | % |
Consumer Cyclical | | | 4.8 | % |
Communications Services | | | 4.6 | % |
Capital Goods | | | 3.4 | % |
Technology | | | 1.7 | % |
| | | | |
| Top 10 Holdings | |
| (% of Net Assets) | |
Macquarie Bank, Ltd. | | | 1.0 | % |
PepsiCo, Inc. | | | 0.9 | % |
Pfizer, Inc. | | | 0.9 | % |
National Australia Bank, Ltd. | | | 0.8 | % |
American Honda Finance Corporation | | | 0.7 | % |
Erste Abwicklungsanstalt | | | 0.7 | % |
Kells Funding, LLC | | | 0.7 | % |
KFW | | | 0.7 | % |
Ford Credit Auto Lease Trust | | | 0.6 | % |
Cisco Systems, Inc. | | | 0.6 | % |
| |
These securities represent 7.6% of the total net assets of the Fund. | |
Quoted Portfolio Composition, Major Market Sectors and Top 10 Holdings are subject to change.
5
SHAREHOLDER EXPENSE EXAMPLE
(unaudited)
As a shareholder of the Fund, you incur ongoing costs, including management fees and other Fund expenses. This Example is intended to help you understand your ongoing costs (in dollars) of investing in the Trust and to compare these costs with the ongoing costs of investing in other mutual funds. The Example is based on an investment of $1,000 invested at the beginning of the period and held for the entire period from November 1, 2017 through April 30, 2018.
Actual Expenses
In the table below, the first line provides information about actual account values and actual expenses. You may use the information in this line, together with the amount you invested, to estimate the expenses that you paid over the period. Simply divide your account value by $1,000 (for example, an $8,600 account value divided by $1,000 = 8.6), then multiply the result by the number in the first line under the heading entitled “Expenses Paid during Period” to estimate the expenses you paid on your account during the period.
Hypothetical Example for Comparison Purposes
In the table below, the second line provides information about hypothetical account values and hypothetical expenses based on the Fund’s actual expense ratio and an assumed rate of return of 5% per year before expenses, which is not the Fund’s actual return. The hypothetical account values and expenses may not be used to estimate the actual ending account balance or expenses you paid for the period. You may use this information to compare the ongoing costs of investing in the Fund and other funds. To do so, compare this 5% hypothetical example with the 5% hypothetical example that appears in the shareholder reports of the other funds.
| | | | | | | | | | | | | | | | |
| | | Beginning Account Value
11/1/2017 | | | Ending Account Value
4/30/2018 | | | Expenses Paid During
Period
11/1/2017 -
4/30/2018* | | | Annualized
Expense Ratio | |
Thrivent Core Emerging Markets Debt Fund | | | | | | | | | | | | | | | | |
Actual | | $ | 1,000 | | | $ | 972 | | | $ | 0.29 | | | | 0.06 | % |
Hypothetical** | | $ | 1,000 | | | $ | 1,024 | | | $ | 0.30 | | | | 0.06 | % |
Thrivent Core International Equity Fund | | | | | | | | | | | | | | | | |
Actual | | $ | 1,000 | | | $ | 1,026 | | | $ | 0.47 | | | | 0.10 | % |
Hypothetical** | | $ | 1,000 | | | $ | 1,024 | | | $ | 0.50 | | | | 0.10 | % |
Thrivent Core Low Volatility Equity Fund | | | | | | | | | | | | | | | | |
Actual | | $ | 1,000 | | | $ | 990 | | | $ | 0.20 | | | | 0.12 | % |
Hypothetical** | | $ | 1,000 | | | $ | 1,024 | | | $ | 0.60 | | | | 0.12 | % |
Thrivent Core Short-Term Reserve Fund | | | | | | | | | | | | | | | | |
Actual | | $ | 1,000 | | | $ | 1,008 | | | $ | 0.05 | | | | 0.01 | % |
Hypothetical** | | $ | 1,000 | | | $ | 1,025 | | | $ | 0.05 | | | | 0.01 | % |
| * | Expenses are equal to the Fund’s annualized expense ratio, multiplied by the average account value over the period, multiplied by 181/365 to reflect the one-half year period. Core International Equity Fund and Core Low Volatility Equity Fund expenses are equal to the fund’s annualized expense ratio, multiplied by the average account value over the period, multiplied by 168/365 and 62/365, respectively, to reflect the inception date short period. |
| ** | Assuming 5% annualized total return before expenses. |
6
EMERGING MARKETS DEBT FUND
Schedule of Investments as of April 30, 2018
(unaudited)
| | | | | | |
Principal Amount | | Long-Term Fixed Income (97.6%) | | Value | |
Argentina (8.9%) | | | | |
| | Argentina Government International Bond | | | | |
$3,250,000 | | 7.125%, 6/28/2117a | | $ | 2,887,625 | |
6,375,000 | | 6.875%, 4/22/2021 | | | 6,690,562 | |
3,865,000 | | 5.625%, 1/26/2022 | | | 3,897,852 | |
2,000,000 | | 4.625%, 1/11/2023 | | | 1,909,000 | |
11,702,000 | | 7.500%, 4/22/2026 | | | 12,263,696 | |
5,000,000 | | 6.875%, 1/26/2027 | | | 4,975,000 | |
4,000,000 | | 5.875%, 1/11/2028 | | | 3,664,000 | |
7,973,407 | | 8.280%, 12/31/2033 | | | 8,551,479 | |
2,103,057 | | 8.280%, 12/31/2033 | | | 2,202,952 | |
7,963,066 | | 2.500%, 12/31/2038b | | | 5,195,901 | |
3,671,000 | | 7.625%, 4/22/2046 | | | 3,542,515 | |
1,500,000 | | 6.875%, 1/11/2048 | | | 1,332,750 | |
| | | | | | |
| | Total | | | 57,113,332 | |
| | | | | | |
| |
Bahrain (3.0%) | | | | |
| | Bahrain Government International Bond | | | | |
2,000,000 | | 5.875%, 1/26/2021a | | | 2,009,376 | |
2,500,000 | | 6.125%, 7/5/2022a | | | 2,510,250 | |
4,000,000 | | 6.125%, 8/1/2023a | | | 3,990,000 | |
2,000,000 | | 6.875%, 10/5/2025a | | | 1,992,500 | |
3,500,000 | | 7.000%, 1/26/2026a | | | 3,468,955 | |
1,000,000 | | 7.000%, 10/12/2028a | | | 953,464 | |
2,500,000 | | 6.750%, 9/20/2029a | | | 2,304,000 | |
3,000,000 | | 7.500%, 9/20/2047a | | | 2,709,984 | |
| | | | | | |
| | Total | | | 19,938,529 | |
| | | | | | |
| |
Brazil (4.2%) | | | | |
| | Brazil Government International Bond | | | | |
4,800,000 | | 2.625%, 1/5/2023 | | | 4,516,800 | |
6,911,000 | | 6.000%, 4/7/2026 | | | 7,470,791 | |
2,000,000 | | 8.250%, 1/20/2034 | | | 2,473,020 | |
5,005,000 | | 7.125%, 1/20/2037 | | | 5,705,700 | |
5,500,000 | | 5.000%, 1/27/2045 | | | 4,757,500 | |
2,000,000 | | 5.625%, 2/21/2047 | | | 1,882,000 | |
| | | | | | |
| | Total | | | 26,805,811 | |
| | | | | | |
| |
Cayman Islands (1.9%) | | | | |
| | Dubai DOF Sukuk, Ltd. | | | | |
2,000,000 | | 3.875%, 1/30/2023 | | | 1,988,148 | |
| | KSA Sukuk, Ltd. | | | | |
4,000,000 | | 2.894%, 4/20/2022a | | | 3,854,320 | |
2,500,000 | | 3.628%, 4/20/2027a | | | 2,366,015 | |
| | RAK Capital | | | | |
2,000,000 | | 3.094%, 3/31/2025 | | | 1,883,760 | |
| | Sharjah Sukuk, Ltd. | | | | |
2,000,000 | | 3.839%, 1/27/2021 | | | 2,010,000 | |
| | | | | | |
| | Total | | | 12,102,243 | |
| | | | | | |
| |
Colombia (4.5%) | | | | |
| | Colombia Government International Bond | | | | |
3,870,000 | | 4.375%, 7/12/2021 | | | 3,966,750 | |
5,000,000 | | 2.625%, 3/15/2023 | | | 4,730,000 | |
910,000 | | 4.000%, 2/26/2024 | | | 907,725 | |
3,875,000 | | 3.875%, 4/25/2027 | | | 3,739,375 | |
4,000,000 | | 7.375%, 9/18/2037 | | | 5,070,000 | |
2,000,000 | | 6.125%, 1/18/2041 | | | 2,260,000 | |
7,705,000 | | 5.625%, 2/26/2044 | | | 8,259,760 | |
| | | | | | |
| | Total | | | 28,933,610 | |
| | | | | | |
| | | | | | |
Principal Amount | | Long-Term Fixed Income (97.6%) | | Value | |
Croatia (2.7%) | | | | |
| | Croatia Government International Bond | | | | |
| $2,650,000 | | 6.750%, 11/5/2019a | | $ | 2,782,500 | |
| 4,000,000 | | 6.625%, 7/14/2020a | | | 4,264,000 | |
| 4,500,000 | | 6.375%, 3/24/2021a | | | 4,828,500 | |
| 2,000,000 | | 5.500%, 4/4/2023a | | | 2,121,020 | |
| 3,021,000 | | 6.000%, 1/26/2024a | | | 3,292,213 | |
| | | | | | |
| | Total | | | 17,288,233 | |
| | | | | | |
| |
Dominican Republic (3.0%) | | | | |
| | Dominican Republic Government International Bond | | | | |
| 2,000,000 | | 7.500%, 5/6/2021a | | | 2,113,000 | |
| 1,500,000 | | 6.600%, 1/28/2024a | | | 1,597,500 | |
| 3,500,000 | | 5.500%, 1/27/2025a | | | 3,512,250 | |
| 3,000,000 | | 6.875%, 1/29/2026a | | | 3,250,500 | |
| 2,000,000 | | 5.950%, 1/25/2027a | | | 2,045,000 | |
| 4,000,000 | | 7.450%, 4/30/2044a | | | 4,380,000 | |
| 2,000,000 | | 6.850%, 1/27/2045a | | | 2,065,000 | |
| 1,000,000 | | 6.500%, 2/15/2048a | | | 993,500 | |
| | | | | | |
| | Total | | | 19,956,750 | |
| | | | | | |
| |
Hungary (2.5%) | | | | |
| | Hungary Government International Bond | | | | |
| 3,000,000 | | 6.250%, 1/29/2020 | | | 3,150,000 | |
| 2,500,000 | | 6.375%, 3/29/2021 | | | 2,693,750 | |
| 5,950,000 | | 5.750%, 11/22/2023 | | | 6,491,450 | |
| 2,000,000 | | 5.375%, 3/25/2024 | | | 2,150,000 | |
| 1,500,000 | | 7.625%, 3/29/2041 | | | 2,111,070 | |
| | | | | | |
| | Total | | | 16,596,270 | |
| | | | | | |
| |
Indonesia (10.2%) | | | | |
| | Indonesia Government International Bond | | | | |
| 5,750,000 | | 4.875%, 5/5/2021a | | | 5,956,327 | |
| 4,650,000 | | 3.750%, 4/25/2022a | | | 4,634,376 | |
| 2,500,000 | | 3.375%, 4/15/2023a | | | 2,428,210 | |
| 6,197,000 | | 5.875%, 1/15/2024a | | | 6,732,185 | |
| 575,000 | | 4.125%, 1/15/2025a | | | 573,756 | |
| 6,100,000 | | 4.750%, 1/8/2026a | | | 6,290,546 | |
| 3,000,000 | | 4.100%, 4/24/2028 | | | 2,943,558 | |
| 5,000,000 | | 8.500%, 10/12/2035a | | | 7,003,810 | |
| 2,000,000 | | 6.625%, 2/17/2037a | | | 2,383,932 | |
| 2,000,000 | | 7.750%, 1/17/2038a | | | 2,662,974 | |
| 3,226,000 | | 6.750%, 1/15/2044a | | | 4,001,405 | |
| 1,700,000 | | 5.125%, 1/15/2045a | | | 1,721,937 | |
| 4,000,000 | | 5.950%, 1/8/2046a | | | 4,533,728 | |
| 1,200,000 | | 5.250%, 1/8/2047a | | | 1,239,271 | |
| 1,500,000 | | 4.350%, 1/11/2048 | | | 1,394,521 | |
| | Perusahaan Penerbit SBSN Indonesia III | | | | |
| 3,000,000 | | 3.400%, 3/29/2021a | | | 2,972,400 | |
| 2,500,000 | | 4.350%, 9/10/2024a | | | 2,518,000 | |
| 3,500,000 | | 4.150%, 3/29/2027a | | | 3,408,125 | |
| 2,000,000 | | 4.400%, 3/1/2028a | | | 1,977,600 | |
| | | | | | |
| | Total | | | 65,376,661 | |
| | | | | | |
The accompanying Notes to Financial Statements are an integral part of this schedule.
EMERGING MARKETS DEBT FUND
Schedule of Investments as of April 30, 2018
(unaudited)
| | | | | | |
Principal Amount | | Long-Term Fixed Income (97.6%) | | Value | |
Kuwait (1.2%) | | | | |
| | Kuwait Government International Bond | | | | |
$3,500,000 | | 2.750%, 3/20/2022a | | $ | 3,390,625 | |
5,000,000 | | 3.500%, 3/20/2027a | | | 4,809,790 | |
| | | | | | |
| | Total | | | 8,200,415 | |
| | | | | | |
Mexico (7.7%) | | | | |
| | Mexico Government International Bond | | | | |
5,590,000 | | 5.750%, 10/12/2110 | | | 5,506,150 | |
5,220,000 | | 4.000%, 10/2/2023 | | | 5,272,200 | |
1,215,000 | | 3.600%, 1/30/2025 | | | 1,182,195 | |
3,000,000 | | 4.125%, 1/21/2026 | | | 2,988,000 | |
5,781,000 | | 4.150%, 3/28/2027 | | | 5,691,395 | |
3,085,000 | | 3.750%, 1/11/2028 | | | 2,906,070 | |
1,000,000 | | 6.750%, 9/27/2034 | | | 1,213,740 | |
5,878,000 | | 6.050%, 1/11/2040 | | | 6,459,922 | |
6,000,000 | | 5.550%, 1/21/2045 | | | 6,376,800 | |
5,250,000 | | 4.600%, 1/23/2046 | | | 4,811,625 | |
| | Petroleos Mexicanos | | | | |
2,850,000 | | 6.375%, 2/4/2021 | | | 2,999,625 | |
2,500,000 | | 6.500%, 3/13/2027 | | | 2,582,500 | |
| | | | | | |
| | Total | | | 47,990,222 | |
| | | | | | |
| |
Netherlands (1.2%) | | | | |
| | Petrobras Global Finance BV | | | | |
674,000 | | 8.375%, 5/23/2021 | | | 759,177 | |
3,000,000 | | 5.299%, 1/27/2025a | | | 2,948,250 | |
3,500,000 | | 7.375%, 1/17/2027 | | | 3,753,750 | |
| | | | | | |
| | Total | | | 7,461,177 | |
| | | | | | |
| |
Oman (2.6%) | | | | |
| | Oman Government International Bond | | | | |
3,000,000 | | 3.625%, 6/15/2021a | | | 2,902,500 | |
3,000,000 | | 4.125%, 1/17/2023a | | | 2,853,300 | |
5,000,000 | | 4.750%, 6/15/2026a | | | 4,656,500 | |
2,000,000 | | 5.375%, 3/8/2027a | | | 1,904,648 | |
3,000,000 | | 5.625%, 1/17/2028a | | | 2,864,916 | |
2,000,000 | | 6.750%, 1/17/2048a | | | 1,882,796 | |
| | | | | | |
| | Total | | | 17,064,660 | |
| | | | | | |
| |
Panama (3.0%) | | | | |
| | Panama Government International Bond | | | | |
1,000,000 | | 4.500%, 4/16/2050 | | | 965,700 | |
2,000,000 | | 9.375%, 1/16/2023 | | | 2,515,000 | |
3,000,000 | | 3.750%, 3/16/2025 | | | 2,977,500 | |
1,500,000 | | 8.875%, 9/30/2027 | | | 2,043,750 | |
1,688,000 | | 9.375%, 4/1/2029 | | | 2,401,180 | |
5,079,000 | | 6.700%, 1/26/2036 | | | 6,272,565 | |
1,500,000 | | 4.500%, 5/15/2047 | | | 1,462,500 | |
| | | | | | |
| | Total | | | 18,638,195 | |
| | | | | | |
| |
Peru (1.8%) | | | | |
| | Peru Government International Bond | | | | |
2,650,000 | | 5.625%, 11/18/2050 | | | 3,095,200 | |
1,000,000 | | 7.350%, 7/21/2025 | | | 1,228,000 | |
5,000,000 | | 8.750%, 11/21/2033 | | | 7,362,500 | |
| | | | | | |
| | Total | | | 11,685,700 | |
| | | | | | |
| | | | | | |
Principal Amount | | Long-Term Fixed Income (97.6%) | | Value | |
Philippines (2.7%) | | | | |
| | Philippines Government International Bond | | | | |
$2,000,000 | | 4.000%, 1/15/2021 | | $ | 2,044,500 | |
5,025,000 | | 7.750%, 1/14/2031 | | | 6,755,756 | |
2,625,000 | | 6.375%, 10/23/2034 | | | 3,293,073 | |
1,000,000 | | 5.000%, 1/13/2037 | | | 1,096,909 | |
3,720,000 | | 3.950%, 1/20/2040 | | | 3,619,638 | |
| | | | | | |
| | Total | | | 16,809,876 | |
| | | | | | |
| |
Poland (1.2%) | | | | |
| | Poland Government International Bond | | | | |
4,000,000 | | 5.000%, 3/23/2022 | | | 4,244,160 | |
3,000,000 | | 4.000%, 1/22/2024 | | | 3,072,198 | |
| | | | | | |
| | Total | | | 7,316,358 | |
| | | | | | |
| |
Qatar (4.2%) | | | | |
| | Qatar Government International Bond | | | | |
2,000,000 | | 5.250%, 1/20/2020a | | | 2,061,200 | |
6,000,000 | | 4.500%, 1/20/2022a | | | 6,150,000 | |
5,000,000 | | 3.250%, 6/2/2026a | | | 4,673,000 | |
1,000,000 | | 4.500%, 4/23/2028a | | | 998,104 | |
2,000,000 | | 9.750%, 6/15/2030a | | | 2,932,560 | |
2,000,000 | | 5.750%, 1/20/2042a | | | 2,196,000 | |
1,250,000 | | 4.625%, 6/2/2046a | | | 1,175,000 | |
4,000,000 | | 5.103%, 4/23/2048a | | | 3,964,600 | |
| | SoQ Sukuk A QSC | | | | |
2,500,000 | | 3.241%, 1/18/2023 | | | 2,430,665 | |
| | | | | | |
| | Total | | | 26,581,129 | |
| | | | | | |
| |
Russia (6.9%) | | | | |
| | Russia Government International Bond | | | | |
9,100,000 | | 5.000%, 4/29/2020a | | | 9,304,695 | |
2,000,000 | | 4.500%, 4/4/2022a | | | 2,029,064 | |
600,000 | | 4.875%, 9/16/2023a | | | 621,000 | |
7,600,000 | | 4.750%, 5/27/2026 | | | 7,720,156 | |
4,000,000 | | 4.250%, 6/23/2027a | | | 3,903,768 | |
2,000,000 | | 12.750%, 6/24/2028a | | | 3,232,352 | |
1,000,000 | | 4.375%, 3/21/2029a | | | 968,516 | |
1,335,000 | | 7.500%, 3/31/2030a | | | 1,489,246 | |
6,600,000 | | 5.625%, 4/4/2042a | | | 6,916,800 | |
8,000,000 | | 5.250%, 6/23/2047a | | | 7,751,392 | |
| | | | | | |
| | Total | | | 43,936,989 | |
| | | | | | |
| |
Saudi Arabia (5.2%) | | | | |
| | Saudi Arabia Government International Bond | | | | |
2,500,000 | | 2.375%, 10/26/2021a | | | 2,396,150 | |
3,000,000 | | 2.875%, 3/4/2023a | | | 2,861,754 | |
2,000,000 | | 4.000%, 4/17/2025a | | | 1,971,476 | |
5,000,000 | | 3.250%, 10/26/2026a | | | 4,614,920 | |
6,000,000 | | 3.625%, 3/4/2028a | | | 5,612,580 | |
5,000,000 | | 4.500%, 4/17/2030a | | | 4,932,000 | |
5,250,000 | | 4.500%, 10/26/2046a | | | 4,744,079 | |
4,000,000 | | 4.625%, 10/4/2047a | | | 3,660,000 | |
3,000,000 | | 5.000%, 4/17/2049a | | | 2,876,970 | |
| | | | | | |
| | Total | | | 33,669,929 | |
| | | | | | |
The accompanying Notes to Financial Statements are an integral part of this schedule.
EMERGING MARKETS DEBT FUND
Schedule of Investments as of April 30, 2018
(unaudited)
| | | | | | |
Principal Amount | | Long-Term Fixed Income (97.6%) | | Value | |
South Africa (4.3%) | | | | |
| | South Africa Government International Bond | | | | |
$3,500,000 | | 5.500%, 3/9/2020 | | $ | 3,621,926 | |
4,125,000 | | 5.875%, 5/30/2022 | | | 4,395,749 | |
2,000,000 | | 4.665%, 1/17/2024 | | | 1,990,440 | |
2,500,000 | | 5.875%, 9/16/2025 | | | 2,623,645 | |
4,100,000 | | 4.875%, 4/14/2026 | | | 4,026,872 | |
1,500,000 | | 4.850%, 9/27/2027 | | | 1,452,834 | |
4,000,000 | | 4.300%, 10/12/2028 | | | 3,672,176 | |
500,000 | | 6.250%, 3/8/2041 | | | 521,528 | |
5,200,000 | | 5.650%, 9/27/2047 | | | 4,982,640 | |
| | | | | | |
| | Total | | | 27,287,810 | |
| | | | | | |
| |
Sri Lanka (1.5%) | | | | |
| | Sri Lanka Government International Bond | | | | |
1,500,000 | | 6.250%, 10/4/2020a | | | 1,548,729 | |
1,500,000 | | 5.750%, 1/18/2022a | | | 1,511,117 | |
1,500,000 | | 5.875%, 7/25/2022a | | | 1,512,242 | |
1,000,000 | | 5.750%, 4/18/2023a | | | 993,676 | |
2,000,000 | | 6.850%, 11/3/2025a | | | 2,042,712 | |
1,500,000 | | 6.200%, 5/11/2027a | | | 1,447,233 | |
1,000,000 | | 6.750%, 4/18/2028a | | | 995,110 | |
| | | | | | |
| | Total | | | 10,050,819 | |
| | | | | | |
| |
Turkey (8.9%) | | | | |
| | Turkey Government International Bond | | | | |
1,500,000 | | 7.500%, 11/7/2019 | | | 1,580,895 | |
4,750,000 | | 7.000%, 6/5/2020 | | | 5,016,019 | |
2,500,000 | | 5.625%, 3/30/2021 | | | 2,578,230 | |
4,000,000 | | 5.125%, 3/25/2022 | | | 4,044,200 | |
8,000,000 | | 5.750%, 3/22/2024 | | | 8,110,160 | |
1,250,000 | | 7.375%, 2/5/2025 | | | 1,369,915 | |
3,000,000 | | 4.250%, 4/14/2026 | | | 2,709,996 | |
2,042,000 | | 4.875%, 10/9/2026 | | | 1,907,228 | |
4,300,000 | | 6.000%, 3/25/2027 | | | 4,315,738 | |
1,000,000 | | 6.125%, 10/24/2028 | | | 997,500 | |
2,500,000 | | 8.000%, 2/14/2034 | | | 2,871,265 | |
6,839,000 | | 6.875%, 3/17/2036 | | | 7,023,735 | |
5,935,000 | | 6.750%, 5/30/2040 | | | 5,963,666 | |
6,500,000 | | 6.625%, 2/17/2045 | | | 6,337,500 | |
3,000,000 | | 5.750%, 5/11/2047 | | | 2,619,726 | |
| | | | | | |
| | Total | | | 57,445,773 | |
| | | | | | |
| |
United Arab Emirates (2.4%) | | | | |
| | Abu Dhabi Government International Bond | | | | |
3,000,000 | | 2.500%, 10/11/2022a | | | 2,868,180 | |
3,000,000 | | 3.125%, 5/3/2026a | | | 2,828,328 | |
5,500,000 | | 3.125%, 10/11/2027a | | | 5,093,132 | |
4,000,000 | | 4.125%, 10/11/2047a | | | 3,652,848 | |
| | Dubai Government International Bond | | | | |
1,000,000 | | 7.750%, 10/5/2020 | | | 1,098,580 | |
| | | | | | |
| | Total | | | 15,541,068 | |
| | | | | | |
| | | | | | |
Principal Amount | | Long-Term Fixed Income (97.6%) | | Value | |
Uruguay (1.9%) | | | | |
| | Uruguay Government International Bond | | | | |
$1,071,287 | | 4.975%, 4/20/2055 | | $ | 1,031,114 | |
7,000,000 | | 5.100%, 6/18/2050 | | | 6,877,500 | |
1,000,000 | | 4.500%, 8/14/2024 | | | 1,028,150 | |
2,500,000 | | 4.375%, 10/27/2027 | | | 2,518,750 | |
| | | | | | |
| | Total | | | 11,455,514 | |
| | | | | | |
| | Total Long-Term Fixed Income
(cost $655,008,156) | | | 625,247,073 | |
| | | | | | |
Shares or Principal Amount | | Short-Term Investments (0.8%) | |
| | Thrivent Core Short-Term Reserve Fund | | | | |
531,751 | | 2.120% | | | 5,317,511 | |
| | | | | | |
| | Total Short-Term Investments
(cost $5,317,511) | | | 5,317,511 | |
| | | | | | |
| | Total Investments
(cost $660,325,667) 98.4% | | $ | 630,564,584 | |
| | | | | | |
| | Other Assets and Liabilities, Net 1.6% | | | 10,495,938 | |
| | | | | | |
| | Total Net Assets 100.0% | | $ | 641,060,522 | |
| | | | | | |
| a | Denotes securities sold under Rule 144A of the Securities Act of 1933, which exempts them from registration. These securities may be resold to other dealers in the program or to other qualified institutional buyers. As of April 30, 2018, the value of these investments was $274,073,912 or 42.8% of total net assets. |
| b | Denotes step coupon securities. Step coupon securities pay an initial coupon rate for the first period and then different coupon rates for following periods. The rate shown is as of April 30, 2018. |
Unrealized Appreciation (Depreciation)
Gross unrealized appreciation and depreciation of investments of the portfolio as a whole (including derivatives), based on cost for federal income tax purposes, were as follows:
| | | | |
Gross unrealized appreciation | | $ | 10,873 | |
Gross unrealized depreciation | | | (29,771,956 | ) |
| | | | |
Net unrealized appreciation (depreciation) | | $ | (29,761,083 | ) |
| |
Cost for federal income tax purposes | | $ | 660,325,667 | |
The accompanying Notes to Financial Statements are an integral part of this schedule.
EMERGING MARKETS DEBT FUND
Schedule of Investments as of April 30, 2018
(unaudited)
Fair Valuation Measurements
The following table is a summary of the inputs used, as of April 30, 2018, in valuing Emerging Markets Debt Fund’s assets carried at fair value.
| | | | | | | | | | | | | | | | |
Investments in Securities | | Total | | | Level 1 | | | Level 2 | | | Level 3 | |
Long-Term Fixed Income | | | | | | | | | | | | | | | | |
Energy | | | 13,043,302 | | | | – | | | | 13,043,302 | | | | – | |
Foreign Government | | | 612,203,771 | | | | – | | | | 612,203,771 | | | | – | |
| | | | | | | | | | | | | | | | |
Subtotal Investments in Securities | | $ | 625,247,073 | | | $ | – | | | $ | 625,247,073 | | | $ | – | |
| | | | | | | | | | | | | | | | |
| | | | |
Other Investments * | | Total | | | | | | | | | | |
Short-Term Investments | | | 5,317,511 | | | | | | | | | | | | | |
| | | | | | | | | | | | | | | | |
Subtotal Other Investments | | $ | 5,317,511 | | | | | | | | | | | | | |
| | | | | | | | | | | | | | | | |
Total Investments at Value | | $ | 630,564,584 | | | | | | | | | | | | | |
| | | | | | | | | | | | | | | | |
| * | Certain investments are measured at fair value using a net asset value per share that is not publicly available (practical expedient). According to disclosure requirements of Accounting Standards Codification (ASC) 820, Fair Value Measurement, securities valued using the practical expedient are not classified in the fair value hierarchy. The fair value amounts presented in this table are intended to permit reconciliation of the fair value hierarchy to the amounts presented in the Statement of Assets and Liabilities. |
There were no significant transfers between Levels during the period ended April 30, 2018. Transfers between Levels are identified as of the end of the period.
Investment in Affiliates
Affiliated issuers, as defined under the Investment Company Act of 1940, include those in which the Fund’s holdings of an issuer represent 5% or more of the outstanding voting securities of an issuer, any affiliated mutual fund, or a company which is under common ownership or control with the Fund. The Fund owns shares of Thrivent Cash Management Trust for the purpose of securities lending and Thrivent Core Short-Term Reserve Fund primarily to serve as a cash sweep vehicle for the Fund. Thrivent Cash Management Trust and Thrivent Core Funds are established solely for investment by Thrivent entities.
A summary of transactions (in thousands) for the fiscal year to date, in Emerging Markets Debt Fund, is as follows:
| | | | | | | | | | | | | | | | | | | | | | | | |
Fund | | Value
10/31/2017 | | | Gross
Purchases | | | Gross
Sales | | | Shares Held at
4/30/2018 | | | Value
4/30/2018 | | | % of Net
Assets
4/30/2018 | |
Affiliated Short-Term Investments | | | | | | | | | | | | | | | | | | | | | | | | |
Core Short-Term Reserve, 2.120% | | $ | 3,193 | | | $ | 140,293 | | | $ | 138,168 | | | | 532 | | | $ | 5,318 | | | | 0.8 | % |
| | | | | | | | | | | | | | | | | | | | | | | | |
Total Affiliated Short-Term Investments | | | 3,193 | | | | | | | | | | | | | | | | 5,318 | | | | 0.8 | |
| | | | | | | | | | | | | | | | | | | | | | | | |
Collateral Held for Securities Loaned | | | | | | | | | | | | | | | | | | | | | | | | |
Cash Management Trust- Collateral Investment | | | – | | | | 2,118 | | | | 2,118 | | | | – | | | | – | | | | – | |
| | | | | | | | | | | | | | | | | | | | | | | | |
Total Value | | $ | 3,193 | | | | | | | | | | | | | | | $ | 5,318 | | | | | |
| | | | | | | | | | | | | | | | | | | | | | | | |
| | | | | | | | | | | | | | | | |
Fund | | Net Realized
Gain/(Loss) | | | Change in
Unrealized
Appreciation/
(Depreciation) | | | Distributions of
Realized Capital
Gains | | | Income Earned
11/1/2017
- 4/30/2018 | |
Affiliated Short-Term Investments | | | | | | | | | | | | | | | | |
Core Short-Term Reserve, 2.120% | | $ | – | | | $ | – | | | $ | 0 | | | $ | 50 | |
| | | | | | | | | | | | | | | | |
Total Income from Affiliated Investments | | | | | | | | | | | | | | $ | 50 | |
| | | | | | | | | | | | | | | | |
Collateral Held for Securities Loaned | | | | | | | | | | | | | | | | |
Cash Management Trust- Collateral Investment | | | – | | | | – | | | | – | | | | 1 | |
| | | | | | | | | | | | | | | | |
Total Affiliated Income from Securities Loaned, Net | | | | | | | | | | | | | | $ | 1 | |
| | | | | | | | | | | | | | | | |
Total | | $ | – | | | $ | – | | | $ | 0 | | | | | |
| | | | | | | | | | | | | | | | |
The accompanying Notes to Financial Statements are an integral part of this schedule.
INTERNATIONAL EQUITY FUND
Schedule of Investments as of April 30, 2018
(unaudited)
| | | | | | |
Shares | | Common Stock (99.1%) | | Value | |
Australia (5.6%) | | | | |
35,377 | | ASX, Ltd. | | $ | 1,555,267 | |
321,042 | | Australia & New Zealand Banking Group, Ltd. | | | 6,453,632 | |
725,325 | | BHP Billiton, Ltd. | | | 16,921,236 | |
48,280 | | Carsales.com, Ltd. | | | 518,205 | |
294,632 | | DEXUS Property Group | | | 2,095,284 | |
1,032,321 | | FlexiGroup, Ltd. | | | 1,596,185 | |
473,067 | | GWA Group, Ltd. | | | 1,365,814 | |
37,778 | | Macquarie Group, Ltd. | | | 3,076,565 | |
3,800,328 | | Medibank Private, Ltd. | | | 8,352,176 | |
143,994 | | Monadelphous Group, Ltd. | | | 1,741,568 | |
27,946 | | Rio Tinto, Ltd. | | | 1,663,178 | |
295,507 | | Sandfire Resources NL | | | 1,748,912 | |
| | | | | | |
| | Total | | | 47,088,022 | |
| | | | | | |
| |
Austria (1.2%) | | | | |
150,831 | | OMV AG | | | 9,341,718 | |
16,856 | | Verbund AG | | | 522,016 | |
| | | | | | |
| | Total | | | 9,863,734 | |
| | | | | | |
| |
Belgium (1.0%) | | | | |
63,154 | | Solvay SA | | | 8,782,841 | |
| | | | | | |
| | Total | | | 8,782,841 | |
| | | | | | |
| |
Canada (5.5%) | | | | |
40,632 | | Artis Real Estate Investment Trust | | | 423,741 | |
41,024 | | Canfor Corporationa | | | 942,247 | |
53,447 | | CGI Group, Inc.a | | | 3,097,050 | |
383,581 | | CI Financial Corporation | | | 8,072,245 | |
137,128 | | Empire Company, Ltd. | | | 2,651,885 | |
102,302 | | Genworth MI Canada, Inc.b | | | 3,306,619 | |
26,236 | | Hudbay Minerals, Inc. | | | 183,291 | |
6,526 | | Linamar Corporation | | | 365,704 | |
177,618 | | Lundin Mining Corporation | | | 1,175,866 | |
195,260 | | Magna International, Inc. | | | 11,520,340 | |
116,480 | | Methanex Corporation | | | 7,035,392 | |
118,285 | | National Bank of Canada | | | 5,617,835 | |
49,049 | | Power Corporation of Canada | | | 1,165,532 | |
150,382 | | Transcontinental, Inc. | | | 3,167,046 | |
| | | | | | |
| | Total | | | 48,724,793 | |
| | | | | | |
| |
Denmark (3.6%) | | | | |
51,550 | | Danske Bank AS | | | 1,794,050 | |
517,712 | | Novo Nordisk AS | | | 24,346,932 | |
18,250 | | Rockwool International AS | | | 5,502,134 | |
| | | | | | |
| | Total | | | 31,643,116 | |
| | | | | | |
| |
Finland (1.8%) | | | | |
427,050 | | UPM-Kymmene Oyj | | | 15,237,812 | |
| | | | | | |
| | Total | | | 15,237,812 | |
| | | | | | |
| |
France (7.3%) | | | | |
17,612 | | BNP Paribas SA | | | 1,359,633 | |
110,645 | | Capgemini SA | | | 15,220,955 | |
14,269 | | Cie Generale des Etablissements Michelin | | | 2,006,546 | |
272,984 | | CNP Assurancesa | | | 6,992,132 | |
8,174 | | Gaztransport Et Technigaz SA | | | 506,754 | |
20,962 | | Ipsos SA | | | 798,043 | |
5,464 | | LNA Sante | | | 352,047 | |
2,882 | | Nexity SA | | | 180,212 | |
394,976 | | Peugeot SA | | | 9,725,714 | |
52,199 | | Schneider Electric SEa | | | 4,731,544 | |
| | | | | | |
Shares | | Common Stock (99.1%) | | Value | |
France (7.3%) - continued | | | | |
151,097 | | Total SA | | $ | 9,496,697 | |
103,558 | | Vinci SAb | | | 10,354,097 | |
| | | | | | |
| | Total | | | 61,724,374 | |
| | | | | | |
| |
Germany (6.7%) | | | | |
272,536 | | BASF SE | | | 28,355,551 | |
214,424 | | Evonik Industries AG | | | 7,618,514 | |
86,615 | | Freenet AG | | | 2,749,492 | |
68,863 | | Hannover Rueckversicherung SE | | | 9,671,495 | |
14,815 | | Henkel AG & Company KGaA | | | 1,763,629 | |
66,827 | | Hugo Boss AG | | | 6,264,741 | |
57,310 | | ProSiebenSat.1 Media AG | | | 2,079,093 | |
| | | | | | |
| | Total | | | 58,502,515 | |
| | | | | | |
| |
Hong Kong (1.3%) | | | | |
535,000 | | Hang Lung Properties, Ltd. | | | 1,266,117 | |
884,000 | | Hysan Development Company, Ltd. | | | 5,145,033 | |
276,000 | | Road King Infrastructure, Ltd. | | | 523,273 | |
225,000 | | Sun Hung Kai Properties, Ltd. | | | 3,623,500 | |
84,000 | | Swire Pacific, Ltd. | | | 830,030 | |
| | | | | | |
| | Total | | | 11,387,953 | |
| | | | | | |
| |
Ireland (0.4%) | | | | |
56,040 | | Seagate Technology plc | | | 3,244,156 | |
| | | | | | |
| | Total | | | 3,244,156 | |
| | | | | | |
| |
Israel (0.1%) | | | | |
67,112 | | Plus500, Ltd. | | | 1,304,133 | |
| | | | | | |
| | Total | | | 1,304,133 | |
| | | | | | |
| |
Italy (0.6%) | | | | |
55,677 | | Anima Holding SPAc | | | 399,479 | |
709,554 | | Banco BPM SPAa | | | 2,573,794 | |
229,505 | | Finecobank Banca Fineco SPA | | | 2,732,891 | |
10,409 | | Societa Iniziative Autostradali e Servizi SPA | | | 220,494 | |
| | | | | | |
| | Total | | | 5,926,658 | |
| | | | | | |
| |
Japan (25.7%) | | | | |
27,500 | | AOKI Holdings, Inc. | | | 421,935 | |
12,900 | | Aozora Bank, Ltd. | | | 520,407 | |
68,500 | | Arcs Company, Ltd. | | | 1,876,478 | |
33,900 | | Asahi Glass Company, Ltd. | | | 1,406,891 | |
773,700 | | Astellas Pharmaceutical, Inc. | | | 11,316,317 | |
42,800 | | Autobacs Seven Company, Ltd. | | | 807,950 | |
161,400 | | Bridgestone Corporation | | | 6,746,938 | |
81,900 | | Canon, Inc. | | | 2,817,294 | |
2,300 | | Central Glass Company, Ltd. | | | 54,493 | |
34,900 | | Chiyoda Company, Ltd. | | | 838,872 | |
34,300 | | Dai Nippon Printing Company, Ltd. | | | 738,556 | |
343,600 | | Daicel Corporation | | | 3,964,546 | |
55,500 | | DCM Holdings Company, Ltd. | | | 552,234 | |
538,300 | | Honda Motor Company, Ltd. | | | 18,509,962 | |
59,900 | | Inaba Denki Sangyo Company, Ltd. | | | 2,569,145 | |
336,400 | | Japan Tobacco, Inc. | | | 9,042,836 | |
66,200 | | JSR Corporation | | | 1,247,080 | |
128,000 | | Kaneka Corporation | | | 1,264,802 | |
43,000 | | KDDI Corporation | | | 1,154,275 | |
820,700 | | Konica Minolta Holdings, Inc. | | | 7,044,735 | |
306,500 | | Kuraray Company, Ltd. | | | 5,104,501 | |
91,400 | | Kyocera Corporation | | | 5,839,838 | |
174,800 | | Kyoei Steel, Ltd. | | | 3,639,932 | |
52,300 | | KYORIN Holdings, Inc. | | | 1,022,713 | |
The accompanying Notes to Financial Statements are an integral part of this schedule.
INTERNATIONAL EQUITY FUND
Schedule of Investments as of April 30, 2018
(unaudited)
| | | | | | |
Shares | | Common Stock (99.1%) | | Value | |
Japan (25.7%) - continued | | | | |
63,200 | | Lawson, Inc. | | $ | 4,175,061 | |
12,600 | | Ministop Company, Ltd. | | | 261,411 | |
92,000 | | Mitsuboshi Belting, Ltd. | | | 1,049,386 | |
2,397,900 | | Mizuho Financial Group, Inc. | | | 4,338,369 | |
79,000 | | NEC Networks & System Integration Corporation | | | 2,066,989 | |
47,600 | | NHK Spring Company, Ltd. | | | 526,011 | |
52,900 | | Nippon Kayaku Company, Ltd. | | | 661,925 | |
600 | | Nippon Shokubai Company, Ltd. | | | 40,770 | |
114,800 | | Nippon Telegraph & Telephone Corporation | | | 5,447,855 | |
1,648,000 | | Nissan Motor Company, Ltd. | | | 17,337,735 | |
152,000 | | Nitto Kogyo Corporation | | | 2,609,295 | |
888,200 | | NTT DOCOMO, Inc. | | | 22,945,768 | |
457,200 | | Osaka Gas Company, Ltd. | | | 9,845,332 | |
24,200 | | Plenus Company, Ltd.b | | | 417,116 | |
30,100 | | Ryoyo Electro Corporation | | | 498,382 | |
65,100 | | Sangetsu Company, Ltd. | | | 1,343,503 | |
176,000 | | Sankyo Company, Ltd. | | | 6,170,061 | |
8,400 | | Sanyo Special Steel Company, Ltd. | | | 213,722 | |
35,900 | | Senshu Ikeda Holdings, Inc. | | | 141,574 | |
22,100 | | Seven & I Holdings Company, Ltd. | | | 973,744 | |
37,500 | | SHIMAMURA Company, Ltd. | | | 4,363,999 | |
442,100 | | Shinko Electric Industries Company, Ltd. | | | 3,439,443 | |
65,400 | | ShinMaywa Industries, Ltd. | | | 732,970 | |
27,400 | | Sony Financial Holdings, Inc. | | | 499,882 | |
520,000 | | Sumitomo Electric Industries, Ltd. | | | 7,960,719 | |
136,600 | | Sumitomo Rubber Industries, Ltd. | | | 2,439,359 | |
22,300 | | Taikisha, Ltd. | | | 777,668 | |
22,500 | | Taiyo Holdings Company, Ltd. | | | 956,130 | |
12,800 | | Takara Standard Company, Ltd. | | | 217,519 | |
104,900 | | Toagosei Company, Ltd. | | | 1,237,949 | |
331,900 | | Tokyo Gas Company, Ltd. | | | 8,906,646 | |
60,700 | | Toppan Forms Company, Ltd. | | | 678,031 | |
528,000 | | Toppan Printing Company, Ltd. | | | 4,415,228 | |
257,700 | | Toyoda Gosei Company, Ltd. | | | 6,506,668 | |
238,000 | | Tsubakimoto Chain Company | | | 2,062,353 | |
213,400 | | TV Asahi Holdings Corporation | | | 5,004,575 | |
26,500 | | Yamato Kogyo Company, Ltd. | | | 781,185 | |
8,600 | | Yokohama Rubber Company, Ltd. | | | 202,496 | |
28,200 | | Yuasa Trading Company, Ltd. | | | 901,358 | |
| | | | | | |
| | Total | | | 221,650,917 | |
| | | | | | |
| |
Netherlands (5.5%) | | | | |
68,231 | | Euronext NVc | | | 4,891,077 | |
51,017 | | ForFarmers BV | | | 715,702 | |
551,867 | | RELX NV | | | 11,742,137 | |
465,703 | | Unilever NV | | | 26,698,056 | |
50,275 | | Wolters Kluwer NV | | | 2,720,367 | |
| | | | | | |
| | Total | | | 46,767,339 | |
| | | | | | |
| |
Norway (2.2%) | | | | |
293,967 | | DnB ASA | | | 5,497,580 | |
604,549 | | Telenor ASA | | | 13,381,029 | |
9,099 | | TGS Nopec Geophysical Company ASA | | | 286,927 | |
| | | | | | |
| | Total | | | 19,165,536 | |
| | | | | | |
| |
Portugal (0.1%) | | | | |
71,534 | | Navigator Company SA | | | 417,384 | |
| | | | | | |
| | Total | | | 417,384 | |
| | | | | | |
| | | | | | |
Shares | | Common Stock (99.1%) | | Value | |
Singapore (0.1%) | | | | |
641,600 | | Wing Tai Holdings, Ltd. | | $ | 983,041 | |
| | | | | | |
| | Total | | | 983,041 | |
| | | | | | |
| |
Spain (1.5%) | | | | |
31,502 | | Amadeus IT Holding SA | | | 2,298,377 | |
1,620,878 | | Banco de Sabadell SA | | | 3,171,874 | |
144,414 | | Bankinter SA | | | 1,509,289 | |
112,510 | | CaixaBank SA | | | 547,121 | |
82,711 | | Enagas SA | | | 2,404,073 | |
169,395 | | Mediaset Espana Comunicacion SAb | | | 1,621,137 | |
| | | | | | |
| | Total | | | 11,551,871 | |
| | | | | | |
| |
Sweden (5.0%) | | | | |
469,742 | | Atlas Copco AB, Class A | | | 18,369,891 | |
302,994 | | Atlas Copco AB, Class B | | | 10,739,167 | |
154,666 | | Granges AB | | | 2,163,569 | |
49,055 | | JM AB | | | 970,521 | |
25,776 | | Loomis AB | | | 938,680 | |
45,406 | | Nobina ABc | | | 297,980 | |
91,963 | | Sandvik AB | | | 1,568,009 | |
403,435 | | SKF AB | | | 8,167,470 | |
| | | | | | |
| | Total | | | 43,215,287 | |
| | | | | | |
| |
Switzerland (6.1%) | | | | |
130,984 | | Adecco SA | | | 8,674,441 | |
40,667 | | Ferguson plc | | | 3,112,962 | |
242,546 | | Novartis AG | | | 18,669,813 | |
49,447 | | Pargesa Holding SA | | | 4,627,730 | |
10,200 | | Roche Holding AG | | | 2,266,312 | |
41,486 | | Schindler Holding AG, Participation Certificate | | | 8,566,305 | |
557 | | SGS SA | | | 1,352,757 | |
47,778 | | TE Connectivity, Ltd. | | | 4,383,631 | |
| | | | | | |
| | Total | | | 51,653,951 | |
| | | | | | |
| |
United Kingdom (17.8%) | | | | |
216,592 | | Barclays plc | | | 617,530 | |
137,184 | | Berkeley Group Holdings plc | | | 7,680,158 | |
611,345 | | BHP Billiton plc | | | 13,035,444 | |
2,662,944 | | BP plc | | | 19,780,383 | |
1,097,008 | | Direct Line Insurance Group plc | | | 5,636,779 | |
19,603 | | Hargreaves Lansdown plc | | | 480,601 | |
2,325,175 | | HSBC Holdings plc | | | 23,149,552 | |
204,778 | | Inchcape plc | | | 2,045,820 | |
80,142 | | Jupiter Fund Management plc | | | 501,185 | |
1,947,106 | | KCOM Group plc | | | 2,680,598 | |
237,477 | | Mondi plc | | | 6,610,711 | |
183,830 | | National Express Group plc | | | 992,022 | |
37,180 | | Next plc | | | 2,685,762 | |
56,037 | | Northgate plc | | | 286,368 | |
719,979 | | Old Mutual plc | | | 2,480,394 | |
434,189 | | PageGroup plc | | | 3,204,601 | |
338,812 | | RELX plc | | | 7,241,477 | |
11,083 | | Rio Tinto plc | | | 604,093 | |
51,557 | | Royal Dutch Shell plc, Class A | | | 1,793,742 | |
327,634 | | Royal Dutch Shell plc, Class B | | | 11,696,237 | |
1,191,184 | | Royal Mail plc | | | 9,499,706 | |
61,745 | | Schroders plc | | | 2,793,397 | |
114,297 | | Smiths Group plc | | | 2,504,409 | |
24,289 | | Spirax-Sarco Engineering plc | | | 1,925,398 | |
409,825 | | Unilever plc | | | 22,988,077 | |
| | | | | | |
| | Total | | | 152,914,444 | |
| | | | | | |
The accompanying Notes to Financial Statements are an integral part of this schedule.
INTERNATIONAL EQUITY FUND
Schedule of Investments as of April 30, 2018
(unaudited)
| | | | | | |
Shares | | Common Stock (99.1%) | | Value | |
United States (<0.1%) | | | | |
17,783 | | Kulicke and Soffa Industries, Inc.a | | $ | 407,053 | |
| | | | | | |
| | Total | | | 407,053 | |
| | | | | | |
| | Total Common Stock
(cost $841,861,460) | | | 852,156,930 | |
| | | | | | |
| | |
Shares | | Preferred Stock (0.2%) | | | |
Germany (0.2%) | | | | |
13,201 | | Henkel AG & Company KGaA, 1.620% | | | 1,677,644 | |
| | | | | | |
| | Total | | | 1,677,644 | |
| | | | | | |
| | Total Preferred Stock
(cost $1,774,643) | | | 1,677,644 | |
| | | | | | |
| | |
Shares | | Collateral Held for Securities Loaned
(1.8%) | | | |
15,455,901 | | Thrivent Cash Management Trust | | | 15,455,901 | |
| | | | | | |
| | Total Collateral Held for Securities Loaned
(cost $15,455,901) | | | 15,455,901 | |
| | | | | | |
| | |
Shares or Principal Amount | | Short-Term Investments (0.3%) | | | |
| | Thrivent Core Short-Term Reserve Fund
| | | | |
280,225 | | 2.120% | | | 2,802,251 | |
| | | | | | |
| | Total Short-Term Investments
(cost $2,802,251) | | | 2,802,251 | |
| | | | | | |
| | Total Investments
(cost $861,894,255) 101.4% | | $ | 872,092,726 | |
| | | | | | |
| | Other Assets and Liabilities, Net (1.4%) | | | (12,184,039) | |
| | | | | | |
| | Total Net Assets 100.0% | | $ | 859,908,687 | |
| | | | | | |
| a | Non-income producing security. |
| b | All or a portion of the security is on loan. |
| c | Denotes securities sold under Rule 144A of the Securities Act of 1933, which exempts them from registration. These securities may be resold to other dealers in the program or to other qualified institutional buyers. As of April 30, 2018, the value of these investments was $5,588,536 or 0.6% of total net assets. |
The following table presents the total amount of securities loaned with continuous maturity, by type, offset by the gross payable upon return of collateral for securities loaned by Thrivent Core International Equity Fund as of April 30, 2018:
Securities Lending Transactions
| | | | |
Common Stock | | $ | 14,631,079 | |
| | | | |
Total lending | | $ | 14,631,079 | |
Gross amount payable upon return of collateral for securities loaned | | $ | 15,455,901 | |
| | | | |
Net amounts due to counterparty | | $ | 824,822 | |
| | | | |
Unrealized Appreciation (Depreciation)
Gross unrealized appreciation and depreciation of investments of the portfolio as a whole (including derivatives), based on cost for federal income tax purposes, were as follows:
| | | | |
Gross unrealized appreciation | | $ | 35,513,986 | |
Gross unrealized depreciation | | | (25,315,515 | ) |
| | | | |
Net unrealized appreciation (depreciation) | | $ | 10,198,471 | |
| |
Cost for federal income tax purposes | | $ | 861,894,255 | |
The accompanying Notes to Financial Statements are an integral part of this schedule.
INTERNATIONAL EQUITY FUND
Schedule of Investments as of April 30, 2018
(unaudited)
Fair Valuation Measurements
The following table is a summary of the inputs used, as of April 30, 2018, in valuing Core International Equity Fund’s assets carried at fair value.
| | | | | | | | | | | | | | | | |
Investments in Securities | | Total | | | Level 1 | | | Level 2 | | | Level 3 | |
Common Stock | | | | | | | | | | | | | | | | |
Consumer Discretionary | | | 123,071,091 | | | | 11,520,340 | | | | 111,550,751 | | | | – | |
Consumer Staples | | | 71,146,879 | | | | – | | | | 71,146,879 | | | | – | |
Energy | | | 52,902,458 | | | | – | | | | 52,902,458 | | | | – | |
Financials | | | 127,428,004 | | | | – | | | | 127,428,004 | | | | – | |
Health Care | | | 57,974,134 | | | | – | | | | 57,974,134 | | | | – | |
Industrials | | | 152,222,570 | | | | – | | | | 152,222,570 | | | | – | |
Information Technology | | | 50,876,108 | | | | 8,034,840 | | | | 42,841,268 | | | | – | |
Materials | | | 131,608,583 | | | | 7,035,392 | | | | 124,573,191 | | | | – | |
Real Estate | | | 14,890,019 | | | | – | | | | 14,890,019 | | | | – | |
Telecommunications Services | | | 48,359,017 | | | | – | | | | 48,359,017 | | | | – | |
Utilities | | | 21,678,067 | | | | – | | | | 21,678,067 | | | | – | |
Preferred Stock | | | | | | | | | | | | | | | | |
Consumer Staples | | | 1,677,644 | | | | – | | | | 1,677,644 | | | | – | |
| | | | | | | | | | | | | | | | |
Subtotal Investments in Securities | | $ | 853,834,574 | | | $ | 26,590,572 | | | $ | 827,244,002 | | | $ | – | |
| | | | | | | | | | | | | | | | |
| | | | |
Other Investments * | | Total | | | | | | | | | | |
Short-Term Investments | | | 2,802,251 | | | | | | | | | | | | | |
Collateral Held for Securities Loaned | | | 15,455,901 | | | | | | | | | | | | | |
| | | | | | | | | | | | | | | | |
Subtotal Other Investments | | $ | 18,258,152 | | | | | | | | | | | | | |
| | | | | | | | | | | | | | | | |
Total Investments at Value | | $ | 872,092,726 | | | | | | | | | | | | | |
| | | | | | | | | | | | | | | | |
| * | Certain investments are measured at fair value using a net asset value per share that is not publicly available (practical expedient). According to disclosure requirements of Accounting Standards Codification (ASC) 820, Fair Value Measurement, securities valued using the practical expedient are not classified in the fair value hierarchy. The fair value amounts presented in this table are intended to permit reconciliation of the fair value hierarchy to the amounts presented in the Statement of Assets and Liabilities. |
There were no significant transfers between Levels during the period ended April 30, 2018. Transfers between Levels are identified as of the end of the period.
Investment in Affiliates
Affiliated issuers, as defined under the Investment Company Act of 1940, include those in which the Fund’s holdings of an issuer represent 5% or more of the outstanding voting securities of an issuer, any affiliated mutual fund, or a company which is under common ownership or control with the Fund. The Fund owns shares of Thrivent Cash Management Trust for the purpose of securities lending and Thrivent Core Short-Term Reserve Fund primarily to serve as a cash sweep vehicle for the Fund. Thrivent Cash Management Trust and Thrivent Core Funds are established solely for investment by Thrivent entities.
A summary of transactions (in thousands) for the fiscal year to date, in International Equity Fund, is as follows:
| | | | | | | | | | | | | | | | | | | | | | | | |
Fund | | Value
11/14/2017 | | | Gross
Purchases | | | Gross
Sales | | | Shares Held at
4/30/2018 | | | Value
4/30/2018 | | | % of Net
Assets
4/30/2018 | |
Affiliated Short-Term Investments | | | | | | | | | | | | | | | | | | | | | | | | |
Core Short-Term Reserve, 2.120% | | $ | – | | | $ | 214,400 | | | $ | 211,598 | | | | 280 | | | $ | 2,802 | | | | 0.3 | % |
| | | | | | | | | | | | | | | | | | | | | | | | |
Total Affiliated Short-Term Investments | | | – | | | | | | | | | | | | | | | | 2,802 | | | | 0.3 | |
| | | | | | | | | | | | | | | | | | | | | | | | |
Collateral Held for Securities Loaned | | | | | | | | | | | | | | | | | | | | | | | | |
Cash Management Trust- Collateral Investment | | | – | | | | 60,331 | | | | 44,875 | | | | 15,456 | | | | 15,456 | | | | 1.8 | |
| | | | | | | | | | | | | | | | | | | | | | | | |
Total Collateral Held for Securities Loaned | | | – | | | | | | | | | | | | | | | | 15,456 | | | | 1.8 | |
| | | | | | | | | | | | | | | | | | | | | | | | |
Total Value | | $ | – | | | | | | | | | | | | | | | $ | 18,258 | | | | | |
| | | | | | | | | | | | | | | | | | | | | | | | |
| | | | | | | | | | | | | | | | |
Portfolio | | Net Realized
Gain/(Loss) | | | Change in
Unrealized
Appreciation/
(Depreciation) | | | Distributions of
Realized Capital
Gains | | | Income Earned
11/14/2017
- 4/30/2018 | |
Affiliated Short-Term Investments | | | | | | | | | | | | | | | | |
Core Short-Term Reserve, 2.120% | | $ | – | | | $ | – | | | $ | 0 | | | $ | 39 | |
| | | | | | | | | | | | | | | | |
Total Income from Affiliated Investments | | | | | | | | | | | | | | $ | 39 | |
| | | | | | | | | | | | | | | | |
Collateral Held for Securities Loaned | | | | | | | | | | | | | | | | |
Cash Management Trust- Collateral Investment | | | – | | | | – | | | | – | | | | 108 | |
| | | | | | | | | | | | | | | | |
Total Affiliated Income from Securities Loaned, Net | | | | | | | | | | | | | | $ | 108 | |
| | | | | | | | | | | | | | | | |
Total Value | | $ | – | | | $ | – | | | $ | 0 | | | | | |
| | | | | | | | | | | | | | | | |
The accompanying Notes to Financial Statements are an integral part of this schedule.
14
LOW VOLATILITY EQUITY FUND
Schedule of Investments as of April 30, 2018
(unaudited)
| | | | | | |
Shares | | Common Stock (99.9%) | | Value | |
Consumer Discretionary (7.9%) | | | | |
816 | | Booking Holdings, Inc.a | | $ | 1,777,248 | |
267,053 | | Comcast Corporation | | | 8,382,794 | |
92,380 | | Home Depot, Inc. | | | 17,071,824 | |
97,812 | | Liberty SiriusXM Groupa | | | 4,085,607 | |
208,215 | | LKQ Corporationa | | | 6,458,829 | |
30,151 | | Lowe’s Companies, Inc. | | | 2,485,347 | |
104,060 | | McDonald’s Corporation | | | 17,423,807 | |
39,563 | | Starbucks Corporation | | | 2,277,642 | |
48,619 | | Walt Disney Company | | | 4,877,944 | |
| | | | | | |
| | Total | | | 64,841,042 | |
| | | | | | |
| |
Consumer Staples (12.6%) | | | | |
260,790 | | Altria Group, Inc. | | | 14,632,927 | |
74,605 | | Archer-Daniels-Midland Company | | | 3,385,575 | |
48,886 | | Church & Dwight Company, Inc. | | | 2,258,533 | |
379,842 | | Coca-Cola Company | | | 16,412,973 | |
231,966 | | Conagra Brands, Inc. | | | 8,598,980 | |
3,225 | | Estee Lauder Companies, Inc. | | | 477,590 | |
410,755 | | Mondelez International, Inc. | | | 16,224,823 | |
160,767 | | PepsiCo, Inc. | | | 16,227,821 | |
235,071 | | Sysco Corporation | | | 14,701,340 | |
143,281 | | Tyson Foods, Inc. | | | 10,043,998 | |
| | | | | | |
| | Total | | | 102,964,560 | |
| | | | | | |
| |
Energy (1.4%) | | | | |
79,069 | | Exxon Mobil Corporation | | | 6,147,615 | |
68,366 | | Occidental Petroleum Corporation | | | 5,281,957 | |
| | | | | | |
| | Total | | | 11,429,572 | |
| | | | | | |
| |
Financials (15.7%) | | | | |
369,286 | | Aflac, Inc. | | | 16,828,363 | |
177,882 | | Allstate Corporation | | | 17,400,417 | |
15,734 | | American Express Company | | | 1,553,732 | |
50,489 | | American Financial Group, Inc. | | | 5,716,365 | |
121,569 | | Arthur J. Gallagher & Company | | | 8,508,614 | |
79,227 | | Berkshire Hathaway, Inc.a | | | 15,348,647 | |
155,846 | | Brown & Brown, Inc. | | | 4,243,687 | |
48,078 | | Cincinnati Financial Corporation | | | 3,381,807 | |
193,021 | | Loews Corporation | | | 10,125,882 | |
9,384 | | Markel Corporationa | | | 10,604,295 | |
139,499 | | Marsh & McLennan Companies, Inc. | | | 11,369,168 | |
142,826 | | Progressive Corporation | | | 8,610,980 | |
301,945 | | U.S. Bancorp | | | 15,233,125 | |
| | | | | | |
| | Total | | | 128,925,082 | |
| | | | | | |
| |
Health Care (14.9%) | | | | |
52,314 | | Abbott Laboratories | | | 3,041,013 | |
1,720 | | Amgen, Inc. | | | 300,105 | |
158,118 | | Boston Scientific Corporationa | | | 4,541,149 | |
60,757 | | CIGNA Corporation | | | 10,439,268 | |
108,355 | | Danaher Corporation | | | 10,870,174 | |
44,382 | | Edwards Lifesciences Corporationa | | | 5,652,491 | |
213,121 | | Eli Lilly and Company | | | 17,277,719 | |
49,049 | | Hill-Rom Holdings, Inc. | | | 4,209,876 | |
47,800 | | IDEXX Laboratories, Inc.a | | | 9,296,622 | |
130,076 | | Johnson & Johnson | | | 16,453,313 | |
452,065 | | Pfizer, Inc. | | | 16,550,100 | |
26,530 | | Quest Diagnostics, Inc. | | | 2,684,836 | |
72,569 | | UnitedHealth Group, Inc. | | | 17,155,312 | |
44,529 | | Zoetis, Inc. | | | 3,717,281 | |
| | | | | | |
| | Total | | | 122,189,259 | |
| | | | | | |
| | | | | | |
Shares | | Common Stock (99.9%) | | Value | |
Industrials (13.6%) | | | | |
40,786 | | 3M Company | | $ | 7,928,391 | |
115,638 | | AMETEK, Inc. | | | 8,071,532 | |
62,319 | | Emerson Electric Company | | | 4,138,605 | |
46,241 | | General Dynamics Corporation | | | 9,308,776 | |
2,941 | | Harris Corporation | | | 460,031 | |
108,110 | | Honeywell International, Inc. | | | 15,641,355 | |
11,812 | | Hubbell, Inc. | | | 1,226,794 | |
37,291 | | Illinois Tool Works, Inc. | | | 5,296,068 | |
47,091 | | Lockheed Martin Corporation | | | 15,108,677 | |
18,311 | | Northrop Grumman Corporation | | | 5,896,874 | |
22,012 | | Raytheon Company | | | 4,511,139 | |
88,773 | | Republic Services, Inc. | | | 5,741,838 | |
181,918 | | Waste Connections, Inc. | | | 13,152,671 | |
190,163 | | Waste Management, Inc. | | | 15,458,350 | |
| | | | | | |
| | Total | | | 111,941,101 | |
| | | | | | |
| |
Information Technology (21.0%) | | | | |
142,246 | | Automatic Data Processing, Inc. | | | 16,796,408 | |
68,353 | | Broadridge Financial Solutions, Inc. | | | 7,328,125 | |
213,276 | | CA, Inc. | | | 7,422,005 | |
40,918 | | CDW Corporation | | | 2,917,044 | |
144,536 | | Cisco Systems, Inc. | | | 6,401,499 | |
28,607 | | F5 Networks, Inc.a | | | 4,665,516 | |
58,331 | | Facebook, Inc.a | | | 10,032,932 | |
171,601 | | Fidelity National Information Services, Inc. | | | 16,296,947 | |
231,445 | | Fiserv, Inc.a | | | 16,400,193 | |
98,386 | | Intuit, Inc. | | | 18,180,749 | |
93,408 | | MasterCard, Inc. | | | 16,651,844 | |
79,743 | | Microsoft Corporation | | | 7,457,565 | |
356,379 | | Oracle Corporation | | | 16,275,829 | |
104,150 | | Synopsys, Inc.a | | | 8,905,867 | |
131,171 | | Visa, Inc. | | | 16,642,976 | |
| | | | | | |
| | Total | | | 172,375,499 | |
| | | | | | |
| |
Materials (1.8%) | | | | |
369,152 | | Newmont Mining Corporation | | | 14,503,982 | |
| | | | | | |
| | Total | | | 14,503,982 | |
| | | | | | |
| |
Real Estate (2.1%) | | | | |
23,519 | | American Tower Corporation | | | 3,207,051 | |
264,098 | | Brixmor Property Group, Inc. | | | 3,932,419 | |
37,758 | | Douglas Emmett, Inc. | | | 1,407,240 | |
146,418 | | First Industrial Realty Trust, Inc. | | | 4,555,064 | |
104,512 | | Liberty Property Trust | | | 4,370,692 | |
| | | | | | |
| | Total | | | 17,472,466 | |
| | | | | | |
| |
Telecommunications Services (2.1%) | | | | |
343,877 | | Verizon Communications, Inc. | | | 16,970,330 | |
| | | | | | |
| | Total | | | 16,970,330 | |
| | | | | | |
| |
Utilities (6.8%) | | | | |
58,294 | | Atmos Energy Corporation | | | 5,065,165 | |
217,314 | | Exelon Corporation | | | 8,623,019 | |
45,081 | | MDU Resources Group, Inc. | | | 1,269,932 | |
107,202 | | NextEra Energy, Inc. | | | 17,571,480 | |
338,978 | | Public Service Enterprise Group, Inc. | | | 17,677,703 | |
116,959 | | UGI Corporation | | | 5,659,646 | |
| | | | | | |
| | Total | | | 55,866,945 | |
| | | | | | |
| | Total Common Stock (cost $825,497,601) | | | 819,479,838 | |
| | | | | | |
The accompanying Notes to Financial Statements are an integral part of this schedule.
LOW VOLATILITY EQUITY FUND
Schedule of Investments as of April 30, 2018
(unaudited)
| | | | | | |
Shares or Principal Amount | | Short-Term Investments (0.1%) | | Value | |
| | Thrivent Core Short-Term Reserve Fund | | | | |
41,404 | | 2.120% | | $ | 414,037 | |
| | | | | | |
| | Total Short-Term Investments (cost $414,037) | | | 414,037 | |
| | | | | | |
| | Total Investments (cost $825,911,638) 100.0% | | $ | 819,893,875 | |
| | | | | | |
| | Other Assets and Liabilities, Net <0.1% | | | 395,311 | |
| | | | | | |
| | Total Net Assets 100.0% | | $ | 820,289,186 | |
| | | | | | |
| a | Non-income producing security. |
Unrealized Appreciation (Depreciation)
Gross unrealized appreciation and depreciation of investments of the portfolio as a whole (including derivatives), based on cost for federal income tax purposes, were as follows:
| | | | |
Gross unrealized appreciation | | $ | 17,921,636 | |
Gross unrealized depreciation | | | (23,939,399 | ) |
| | | | |
Net unrealized appreciation (depreciation) | | ($ | 6,017,763 | ) |
| |
Cost for federal income tax purposes | | $ | 825,911,638 | |
The accompanying Notes to Financial Statements are an integral part of this schedule.
LOW VOLATILITY EQUITY FUND
Schedule of Investments as of April 30, 2018
(unaudited)
Fair Valuation Measurements
The following table is a summary of the inputs used, as of April 30, 2018, in valuing Core Low Volatility Equity Fund’s assets carried at fair value.
| | | | | | | | | | | | | | | | |
Investments in Securities | | Total | | | Level 1 | | | Level 2 | | | Level 3 | |
Common Stock | | | | | | | | | | | | | | | | |
Consumer Discretionary | | | 64,841,042 | | | | 64,841,042 | | | | – | | | | – | |
Consumer Staples | | | 102,964,560 | | | | 102,964,560 | | | | – | | | | – | |
Energy | | | 11,429,572 | | | | 11,429,572 | | | | – | | | | – | |
Financials | | | 128,925,082 | | | | 128,925,082 | | | | – | | | | – | |
Health Care | | | 122,189,259 | | | | 122,189,259 | | | | – | | | | – | |
Industrials | | | 111,941,101 | | | | 111,941,101 | | | | – | | | | – | |
Information Technology | | | 172,375,499 | | | | 172,375,499 | | | | – | | | | – | |
Materials | | | 14,503,982 | | | | 14,503,982 | | | | – | | | | – | |
Real Estate | | | 17,472,466 | | | | 17,472,466 | | | | – | | | | – | |
Telecommunications Services | | | 16,970,330 | | | | 16,970,330 | | | | – | | | | – | |
Utilities | | | 55,866,945 | | | | 55,866,945 | | | | – | | | | – | |
| | | | | | | | | | | | | | | | |
Subtotal Investments in Securities | | $ | 819,479,838 | | | $ | 819,479,838 | | | $ | – | | | $ | – | |
| | | | | | | | | | | | | | | | |
| | | | |
Other Investments * | | Total | | | | | | | | | | |
Short-Term Investments | | | 414,037 | | | | | | | | | | | | | |
| | | | | | | | | | | | | | | | |
Subtotal Other Investments | | $ | 414,037 | | | | | | | | | | | | | |
| | | | | | | | | | | | | | | | |
Total Investments at Value | | $ | 819,893,875 | | | | | | | | | | | | | |
| | | | | | | | | | | | | | | | |
| * | Certain investments are measured at fair value using a net asset value per share that is not publicly available (practical expedient). According to disclosure requirements of Accounting Standards Codification (ASC) 820, Fair Value Measurement, securities valued using the practical expedient are not classified in the fair value hierarchy. The fair value amounts presented in this table are intended to permit reconciliation of the fair value hierarchy to the amounts presented in the Statement of Assets and Liabilities. |
There were no significant transfers between Levels during the period ended April 30, 2018. Transfers between Levels are identified as of the end of the period.
Investment in Affiliates
Affiliated issuers, as defined under the Investment Company Act of 1940, include those in which the Fund’s holdings of an issuer represent 5% or more of the outstanding voting securities of an issuer, any affiliated mutual fund, or a company which is under common ownership or control with the Fund. The Fund owns shares of Thrivent Core Short-Term Reserve Fund primarily to serve as a cash sweep vehicle for the Fund. Thrivent Core Funds are established solely for investment by Thrivent entities.
A summary of transactions (in thousands) for the fiscal year to date, in Core Low Volatility Equity Fund, is as follows:
| | | | | | | | | | | | | | | | | | | | | | | | |
Fund | | Value
2/28/2018 | | | Gross
Purchases | | | Gross
Sales | | | Shares Held at
4/30/2018 | | | Value
4/30/2018 | | | % of Net
Assets
4/30/2018 | |
Affiliated Short-Term Investments | | | | | | | | | | | | | | | | | | | | | | | | |
Core Short-Term Reserve, 2.120% | | $ | – | | | $ | 45,213 | | | $ | 44,799 | | | | 41 | | | $ | 414 | | | | 0.1 | % |
| | | | | | | | | | | | | | | | | | | | | | | | |
Total Affiliated Short-Term Investments | | | – | | | | | | | | | | | | | | | | 414 | | | | 0.1 | |
| | | | | | | | | | | | | | | | | | | | | | | | |
Total Value | | $ | – | | | | | | | | | | | | | | | $ | 414 | | | | | |
| | | | | | | | | | | | | | | | | | | | | | | | |
| | | | | | | | | | | | | | | | |
Fund | | Net Realized
Gain/(Loss) | | | Change in
Unrealized
Appreciation/
(Depreciation) | | | Distributions of
Realized Capital
Gains | | | Income Earned
2/28/2018
- 4/30/2018 | |
Affiliated Short-Term Investments | | | | | | | | | | | | | | | | |
Core Short-Term Reserve, 2.120% | | $ | – | | | $ | – | | | $ | – | | | $ | 9 | |
| | | | | | | | | | | | | | | | |
Total Income from Affiliated Investments | | | | | | | | | | | | | | $ | 9 | |
| | | | | | | | | | | | | | | | |
Total | | $ | – | | | $ | – | | | $ | – | | | | | |
| | | | | | | | | | | | | | | | |
The accompanying Notes to Financial Statements are an integral part of this schedule.
SHORT-TERM RESERVE FUND
Schedule of Investments as of April 30, 2018
(unaudited)
| | | | | | |
Principal Amount | | Asset-Backed Securities (7.9%)a | | Value | |
| | Ally Auto Receivables Trust | | | | |
$3,226,584 | | 1.400%, 12/17/2018, Ser. 2017-5 | | $ | 3,226,592 | |
8,116,691 | | 1.750%, 2/15/2019, Ser. 2017-1A | | | 8,116,774 | |
| | ARI Fleet Lease Trust | | | | |
25,996,313 | | 1.950%, 3/15/2019, Ser. 2018-Ab | | | 25,971,471 | |
| | Ascentium Equipment Receivables, LLC | | | | |
7,909,036 | | 1.450%, 11/13/2018, Ser. 2017-2Ab | | | 7,899,623 | |
30,000,000 | | 2.500%, 5/10/2019, Ser. 2018-1Ab | | | 30,000,000 | |
| | Bank of the West Auto Trust | | | | |
47,760 | | 1.350%, 10/15/2018, Ser. 2017-1b | | | 47,760 | |
| | BMW Vehicle Lease Trust | | | | |
1,834,134 | | 1.350%, 10/22/2018, Ser. 2017-2 | | | 1,834,131 | |
| | Canadian Pacer Auto Receivables Trust | | | | |
30,000,000 | | 2.300%, 4/19/2019, Ser. 2018-1Ab | | | 30,000,000 | |
| | CarMax Auto Owner Trust | | | | |
3,699,280 | | 1.350%, 11/15/2018, Ser. 2017-4 | | | 3,699,252 | |
22,000,000 | | 2.300%, 5/15/2019, Ser. 2018-2 | | | 22,000,000 | |
| | CCG Receivables Trust | | | | |
8,394,935 | | 1.850%, 2/14/2019, Ser. 2018-1b | | | 8,395,100 | |
| | Daimler Trucks Retail Trust | | | | |
17,413,086 | | 2.200%, 4/15/2019, Ser. 2018-1b | | | 17,413,397 | |
| | DLL Securitization Trust | | | | |
5,856,816 | | 1.500%, 11/15/2018, Ser. 2017-Ab | | | 5,854,640 | |
| | Enterprise Fleet Financing, LLC | | | | |
7,674,457 | | 1.500%, 10/22/2018, Ser. 2017-3b | | | 7,674,530 | |
21,436,416 | | 2.150%, 3/20/2019, Ser. 2018-1b | | | 21,437,010 | |
| | Foursight Capital Automobile Receivables Trust | | | | |
8,777,063 | | 2.200%, 3/15/2019, Ser. 2018-1b | | | 8,777,209 | |
| | GM Financial Consumer Automobile Receivables Trust | | | | |
378,660 | | 1.390%, 10/16/2018, Ser. 2017-3Ab | |
| 378,661
|
|
8,848,788 | | 1.700%, 1/16/2019, Ser. 2018-1 | | | 8,848,856 | |
30,000,000 | | 2.300%, 4/16/2019, Ser. 2018-2 | | | 30,000,000 | |
| | Great America Leasing Receivables | | | | |
11,124,309 | | 1.850%, 2/15/2019, Ser. 2018-1b | | | 11,124,529 | |
| | Honda Auto Receivables Owner Trust | | | | |
7,268,729 | | 1.430%, 12/21/2018, Ser. 2017-4 | | | 7,268,752 | |
| | | | | | |
Principal Amount | | Asset-Backed Securities (7.9%)a | | Value | |
| | Hyundai Auto Lease Securitization Trust | | | | |
$5,837,724 | | 1.420%, 11/15/2018, Ser. 2017-Cb | | $ | 5,837,740 | |
7,101,112 | | 1.950%, 3/15/2019, Ser. 2018-Ab | | | 7,101,229 | |
| | John Deere Owner Trust | | | | |
22,063,676 | | 1.950%, 3/15/2019, Ser. 2018-A | | | 22,064,179 | |
| | Kubota Credit Owner Trust | | | | |
23,500,000 | | 2.370%, 5/15/2019, Ser. 2018-1Ab,c | | | 23,500,000 | |
| | Mercedes-Benz Auto Lease Trust | | | | |
18,863,782 | | 1.750%, 2/15/2019, Ser. 2018-A | | | 18,863,989 | |
| | MMAF Equipment Finance LLC | | | | |
5,833,745 | | 1.500%, 12/14/2018, Ser. 2017-Bb | | | 5,831,148 | |
| | Santander Retail Auto Lease Trust | | | | |
6,752,324 | | 1.500%, 11/20/2018, Ser. 2017-Ab | | | 6,746,958 | |
| | Securitized Term Auto Receivables Trust | | | | |
25,000,000 | | 2.400%, 4/25/2019, Ser. 2018-1Ab,c | | | 25,000,000 | |
| | Volvo Financial Equipment, LLC | | | | |
15,464,146 | | 1.850%, 2/15/2019, Ser. 2018-1Ab | | | 15,464,401 | |
| | Wheels SPV 2, LLC | | | | |
711,194 | | 1.400%, 7/20/2018, Ser. 2017-1Ab | | | 711,195 | |
| | World Omni Auto Receivables Trust | | | | |
14,988,466 | | 1.750%, 2/15/2019, Ser. 2018-A | | | 14,988,619 | |
9,000,000 | | 2.250%, 4/15/2019, Ser. 2018-B | | | 9,000,203 | |
| | World Omni Automobile Lease Securitization Trust | | | | |
6,740,411 | | 1.950%, 3/15/2019, Ser. 2018-A | | | 6,736,810 | |
| | | | | | |
| | Total | | | 421,814,758 | |
| | | | | | |
| | |
Principal Amount | | Basic Materials (1.6%)a | | Value | |
| | Dow Chemical Company | | | | |
5,050,000 | | 2.400%, 5/4/2018 | | | 5,048,776 | |
| | EI du Pont de Nemours & Company | | | | |
7,483,000 | | 2.200%, 5/10/2018b | | | 7,478,388 | |
6,463,000 | | 2.340%, 5/29/2018b | | | 6,450,953 | |
| | Glencore Funding, LLC | | | | |
20,390,000 | | 2.290%, 5/3/2018b,d | | | 20,386,636 | |
15,000,000 | | 2.350%, 5/18/2018b,d | | | 14,984,100 | |
| | International Paper Company | | | | |
13,548,000 | | 2.250%, 5/2/2018b | | | 13,546,367 | |
15,725,000 | | 2.310%, 5/9/2018b | | | 15,716,300 | |
| | | | | | |
| | Total | | | 83,611,520 | |
| | | | | | |
| | |
Principal Amount | | Capital Goods (3.4%)a | | Value | |
| | General Dynamics Corporation | | | | |
15,000,000 | | 2.050%, 5/2/2018b | | | 14,998,551 | |
| | General Electric Company | | | | |
5,000,000 | | 5.625%, 5/1/2018 | | | 5,000,000 | |
The accompanying Notes to Financial Statements are an integral part of this schedule.
SHORT-TERM RESERVE FUND
Schedule of Investments as of April 30, 2018
(unaudited)
| | | | | | | | |
Principal Amount | | | Capital Goods (3.4%)a | | Value | |
| | $17,000,000 | | | 1.720%, 5/10/2018 | | $ | 16,991,882 | |
| | 15,000,000 | | | 2.300%, 6/29/2018 | | | 14,949,250 | |
| | | | John Deere Canada, ULC | | | | |
| | 15,000,000 | | | 1.970%, 5/7/2018b,d | | | 14,994,867 | |
| | 15,000,000 | | | 2.000%, 5/18/2018b,d | | | 14,986,350 | |
| | 8,000,000 | | | 2.000%, 5/22/2018b,d | | | 7,991,039 | |
| | 10,000,000 | | | 2.000%, 6/1/2018b,d | | | 9,983,422 | |
| | | | John Deere Capital Corporation | | | | |
| | 15,000,000 | | | 2.000%, 5/30/2018b | | | 14,976,750 | |
| | 18,900,000 | | | 2.901% (LIBOR 3M + 0.570%), 1/8/2019e | | | 18,970,397 | |
| | | | Stanley Black & Decker, Inc. | | | | |
| | 23,700,000 | | | 2.250%, 5/2/2018b | | | 23,697,394 | |
| | 11,920,000 | | | 2.250%, 5/10/2018b | | | 11,913,282 | |
| | | | Waste Management, Inc. | | | | |
| | 6,550,000 | | | 2.180%, 5/17/2018b,d | | | 6,543,019 | |
| | | | | | | | |
| | | | Total | | | 175,996,203 | |
| | | | | | | | |
| | |
Principal Amount | | | Communications Services (4.6%)a | | Value | |
| | | | CBS Corporation | | | | |
| | 23,000,000 | | | 2.400%, 5/1/2018b | | | 22,998,619 | |
| | 20,800,000 | | | 2.400%, 5/21/2018b | | | 20,772,360 | |
| | 10,000,000 | | | 2.280%, 5/22/2018b | | | 9,986,042 | |
| | 15,000,000 | | | 2.300%, 5/25/2018b | | | 14,976,031 | |
| | | | NBC Universal Enterprise, Inc. | | | | |
| | 22,000,000 | | | 2.280% , 5/16/2018b,d | | | 21,977,951 | |
| | | | Rogers Communications, Inc. | | | | |
| | 20,000,000 | | | 2.330%, 5/3/2018b,d | | | 19,996,375 | |
| | 15,000,000 | | | 2.290%, 5/10/2018b,d | | | 14,990,754 | |
| | 20,341,000 | | | 2.200%, 5/15/2018b,d | | | 20,321,930 | |
| | 25,000,000 | | | 2.300%, 5/22/2018b,d | | | 24,965,106 | |
| | | | Time Warner, Inc. | | | | |
| | 18,950,000 | | | 2.400%, 5/1/2018b,d | | | 18,948,862 | |
| | 10,000,000 | | | 2.410%, 5/7/2018b,d | | | 9,995,722 | |
| | | | Verizon Communications, Inc. | | | | |
| | 10,000,000 | | | 2.350%, 5/14/2018b | | | 9,991,273 | |
| | 18,000,000 | | | 2.270%, 5/17/2018b | | | 17,980,799 | |
| | 15,000,000 | | | 2.200%, 5/23/2018b | | | 14,978,054 | |
| | | | | | | | |
| | | | Total | | | 242,879,878 | |
| | | | | | | | |
| | |
Principal Amount | | | Consumer Cyclical (4.8%)a | | Value | |
| | | | American Honda Finance Corporation | | | | |
| | 25,000,000 | | | 2.150%, 6/26/2018d | | | 24,923,525 | |
| | 15,000,000 | | | 2.150%, 7/18/2018d | | | 14,933,837 | |
| | 25,000,000 | | | 2.150%, 7/23/2018d | | | 24,881,700 | |
| | 10,000,000 | | | 2.230%, 7/25/2018d | | | 9,951,386 | |
| | 35,424,000 | | | 2.165% (LIBOR 3M + 0.280%), 11/19/2018d,e | | | 35,469,484 | |
| | | | Ford Credit Auto Lease Trust | | | | |
| | 32,000,000 | | | 2.300%, 5/15/2019, Ser. 2018-A | | | 32,001,133 | |
| | | | Target Corporation | | | | |
| | 4,250,000 | | | 4.875%, 5/15/2018 | | | 4,253,517 | |
| | | | Toyota Credit Canada, Inc. | | | | |
| | 10,000,000 | | | 1.810%, 6/8/2018d | | | 9,979,536 | |
| | 15,000,000 | | | 2.050%, 6/22/2018d | | | 14,956,938 | |
| | 25,000,000 | | | 2.280%, 7/17/2018d | | | 24,882,025 | |
| | | | Toyota Finance Australia, Ltd. | | | | |
| | 25,000,000 | | | 2.106% (LIBOR 1M + 0.210%), 10/9/2018d,e | | | 24,985,875 | |
| | | | | | | | |
Principal Amount | | | Consumer Cyclical (4.8%)a | | Value | |
| | | | Toyota Financial Services de Puerto Rico, Inc. | | | | |
| | $3,690,000 | | | 1.900%, 6/29/2018 | | $ | 3,677,823 | |
| | | | Toyota Motor Credit Corporation | | | | |
| | 20,000,000 | | | 1.780%, 5/7/2018 | | | 19,993,350 | |
| | | | Toyota Motor Financial Netherlands BV | | | | |
| | 15,000,000 | | | 2.047% (LIBOR 1M + 0.150%), 9/10/2018d,e | | | 14,990,895 | |
| | | | | | | | |
| | | | Total | | | 259,881,024 | |
| | | | | | | | |
| | |
Principal Amount | | | Consumer Non-Cyclical (13.3%)a | | Value | |
| | | | Altria Group, Inc. | | | | |
| | 25,000,000 | | | 2.280%, 5/2/2018d | | | 24,996,987 | |
| | 5,000,000 | | | 2.300%, 5/10/2018d | | | 4,996,918 | |
| | 10,000,000 | | | 2.320%, 5/21/2018d | | | 9,986,758 | |
| | | | Archer-Daniels-Midland Company | | | | |
| | 10,000,000 | | | 1.900%, 5/11/2018b | | | 9,994,546 | |
| | 15,000,000 | | | 1.900%, 5/21/2018b | | | 14,983,987 | |
| | 16,740,000 | | | 1.880%, 5/23/2018b | | | 16,720,353 | |
| | 25,000,000 | | | 1.950%, 6/29/2018b | | | 24,919,167 | |
| | | | Coca-Cola Company | | | | |
| | 10,000,000 | | | 1.730%, 5/17/2018b | | | 9,991,420 | |
| | 15,000,000 | | | 1.770%, 6/18/2018b | | | 14,960,984 | |
| | 25,000,000 | | | 1.900%, 6/20/2018b | | | 24,932,142 | |
| | 10,000,000 | | | 1.940%, 6/26/2018b | | | 9,969,410 | |
| | 16,932,000 | | | 2.190%, 8/23/2018b | | | 16,812,573 | |
| | 10,000,000 | | | 2.270%, 9/13/2018b | | | 9,913,564 | |
| | 10,000,000 | | | 2.270%, 9/24/2018b | | | 9,905,226 | |
| | | | Diageo Capital plc | | | | |
| | 20,000,000 | | | 2.255%, 5/10/2018b,d | | | 19,987,672 | |
| | | | GlaxoSmithKline Capital, Inc. | | | | |
| | 16,200,000 | | | 5.650%, 5/15/2018 | | | 16,220,899 | |
| | | | Golden Funding Corporation | | | | |
| | 10,000,000 | | | 1.900%, 5/2/2018b,d | | | 9,999,050 | |
| | 10,400,000 | | | 1.930%, 5/7/2018b,d | | | 10,396,441 | |
| | 8,103,000 | | | 2.000%, 5/21/2018b,d | | | 8,094,114 | |
| | 2,056,000 | | | 2.080%, 5/23/2018b,d | | | 2,053,513 | |
| | 6,238,000 | | | 2.200%, 6/13/2018b,d | | | 6,222,744 | |
| | 3,885,000 | | | 2.370%, 7/18/2018b,d | | | 3,865,843 | |
| | 25,000,000 | | | 2.400%, 8/8/2018b,d | | | 24,835,556 | |
| | 21,500,000 | | | 2.400%, 8/30/2018b,d | | | 21,324,623 | |
| | | | McDonald’s Corporation | | | | |
| | 25,000,000 | | | 2.250%, 5/21/2018b | | | 24,966,896 | |
| | 15,000,000 | | | 2.200%, 6/1/2018b | | | 14,969,000 | |
| | | | McKesson Corporation | | | | |
| | 17,667,000 | | | 2.200%, 5/7/2018b | | | 17,659,442 | |
| | | | Medtronic Global Holdings SCA | | | | |
| | 10,000,000 | | | 2.080%, 5/31/2018b,d | | | 9,981,529 | |
| | | | Merck & Company, Inc. | | | | |
| | 6,916,000 | | | 1.300%, 5/18/2018 | | | 6,912,369 | |
| | 18,506,000 | | | 2.233% (LIBOR 3M + 0.360%), 5/18/2018e | | | 18,509,054 | |
| | | | Nestle Finance International, Ltd. | | | | |
| | 10,000,000 | | | 1.740%, 5/9/2018d | | | 9,995,743 | |
| | 25,000,000 | | | 1.750%, 5/14/2018d | | | 24,983,142 | |
| | 15,000,000 | | | 2.140%, 8/16/2018d | | | 14,906,220 | |
| | | | Novartis Finance Corporation | | | | |
| | 20,000,000 | | | 1.900%, 5/1/2018b,d | | | 19,999,054 | |
| | 5,000,000 | | | 1.930%, 5/14/2018b,d | | | 4,996,531 | |
| | 4,930,000 | | | 1.930%, 5/16/2018b,d | | | 4,926,071 | |
| | 10,000,000 | | | 1.930%, 5/21/2018b,d | | | 9,989,442 | |
The accompanying Notes to Financial Statements are an integral part of this schedule.
SHORT-TERM RESERVE FUND
Schedule of Investments as of April 30, 2018
(unaudited)
| | | | | | |
Principal Amount | | Consumer Non-Cyclical (13.3%)a | | Value | |
| | PepsiCo, Inc. | | | | |
$46,407,000 | | 2.348% (LIBOR 3M FLAT), 10/15/2018e | | $ | 46,409,644 | |
9,875,000 | | 2.494% (LIBOR 3M + 0.590%), 2/22/2019e | | | 9,920,787 | |
| | Pfizer, Inc. | | | | |
10,000,000 | | 1.820%, 5/1/2018b | | | 9,999,527 | |
45,700,000 | | 2.425% (LIBOR 3M + 0.300%), 6/15/2018e | | | 45,708,925 | |
| | Philip Morris International, Inc. | | | | |
15,000,000 | | 1.850%, 5/8/2018b | | | 14,994,173 | |
12,774,000 | | 5.650%, 5/16/2018 | | | 12,790,746 | |
| | Reckitt Benckiser Treasury Services plc | | | | |
15,000,000 | | 2.130%, 5/8/2018b,d | | | 14,994,080 | |
| | Roche Holdings, Inc. | | | | |
8,250,000 | | 1.860%, 6/15/2018b,d | | | 8,230,150 | |
| | Tyson Foods, Inc. | | | | |
5,000,000 | | 2.080%, 5/4/2018b | | | 4,998,788 | |
12,000,000 | | 2.320%, 5/7/2018b | | | 11,994,867 | |
20,000,000 | | 2.150%, 5/11/2018b | | | 19,986,403 | |
3,910,000 | | 2.150%, 5/17/2018b | | | 3,905,833 | |
| | | | | | |
| | Total | | | 712,812,906 | |
| | | | | | |
| | |
Principal Amount | | Energy (5.1%)a | | Value | |
| | BP Capital Markets plc | | | | |
25,000,000 | | 2.150%, 6/19/2018b,d | | | 24,926,042 | |
25,000,000 | | 2.150%, 6/20/2018b,d | | | 24,924,385 | |
15,000,000 | | 2.130%, 6/25/2018b,d | | | 14,949,670 | |
| | Chevron Corporation | | | | |
9,223,000 | | 2.350% (LIBOR 3M + 0.500%), 5/16/2018e | | | 9,224,872 | |
4,150,000 | | 1.718% , 6/24/2018 | | | 4,146,604 | |
11,730,000 | | 2.360% (LIBOR 3M + 0.510%), 11/16/2018e | | | 11,759,839 | |
| | Schlumberger Holdings Corporation | | | | |
10,000,000 | | 2.430%, 5/8/2018b | | | 9,995,498 | |
25,000,000 | | 2.500%, 5/23/2018b | | | 24,966,347 | |
15,000,000 | | 2.550%, 6/7/2018b | | | 14,965,483 | |
10,000,000 | | 2.550%, 7/2/2018b | | | 9,959,575 | |
| | Total Capital Canada, Ltd. | | | | |
10,000,000 | | 2.120%, 7/10/2018b,d | | | 9,959,451 | |
| | Total Capital International SA | | | | |
26,000,000 | | 2.381% (LIBOR 3M + 0.570%), 8/10/2018e | | | 26,043,656 | |
| | TransCanada American Investments, Ltd. | | | | |
10,000,000 | | 2.350%, 5/7/2018b,d | | | 9,996,461 | |
| | TransCanada PipeLines, Ltd. | | | | |
5,000,000 | | 2.400%, 5/16/2018b | | | 4,994,989 | |
20,000,000 | | 2.475%, 5/22/2018b | | | 19,972,084 | |
15,000,000 | | 2.350%, 5/24/2018b | | | 14,977,050 | |
5,000,000 | | 2.500%, 6/4/2018b | | | 4,988,552 | |
10,000,000 | | 2.470%, 6/12/2018b | | | 9,971,393 | |
16,750,000 | | 2.520%, 6/20/2018b | | | 16,692,220 | |
| | | | | | |
| | Total | | | 267,414,171 | |
| | | | | | |
| | |
Principal Amount | | Financials (41.3%)a | | Value | |
| | AllianceBernstein, LP | | | | |
15,000,000 | | 2.060%, 5/31/2018b | | | 14,975,523 | |
10,000,000 | | 2.280%, 6/12/2018b | | | 9,976,649 | |
| | | | | | |
Principal Amount | | Financials (41.3%)a | | Value | |
| | ANZ New Zealand International, Ltd. of London | | | | |
$15,000,000 | | 2.040%, 6/14/2018b,d | | $ | 14,965,125 | |
13,000,000 | | 2.077% (LIBOR 1M + 0.180%), 7/10/2018b,d,e | | | 13,000,078 | |
20,000,000 | | 2.098% (LIBOR 1M + 0.200%), 8/23/2018b,d,e | | | 19,992,100 | |
| | Australia & New Zealand Banking Group, Ltd. | | | | |
3,231,000 | | 1.800%, 5/29/2018b | | | 3,226,380 | |
10,000,000 | | 2.046% (LIBOR 1M + 0.150%), 7/19/2018b,e | | | 10,000,190 | |
| | Bank of America NA | | | | |
11,675,000 | | 1.750%, 6/5/2018 | | | 11,669,980 | |
| | Bank of Montreal Chicago | | | | |
15,000,000 | | 2.118% (LIBOR 1M + 0.240%), 11/5/2018e | | | 14,991,360 | |
| | Bank of New York Mellon Corporation | | | | |
5,575,000 | | 1.600%, 5/22/2018 | | | 5,572,714 | |
17,390,000 | | 2.284% (LIBOR 3M + 0.380%), 5/22/2018e | | | 17,393,204 | |
20,143,000 | | 2.333% (LIBOR 3M + 0.560%), 8/1/2018e | | | 20,169,328 | |
| | Bank of Nova Scotia | | | | |
10,000,000 | | 2.538% (LIBOR 3M + 0.200%), 4/10/2019e | | | 9,999,960 | |
| | Bank of Nova Scotia Houston | | | | |
15,000,000 | | 2.136% (LIBOR 1M + 0.240%), 10/17/2018e | | | 14,991,885 | |
| | Barton Capital SA | | | | |
12,865,000 | | 2.140%, 6/21/2018b,d | | | 12,826,366 | |
| | BB&T Corporation | | | | |
15,000,000 | | 2.050%, 6/19/2018 | | | 14,994,836 | |
| | BPCE SA | | | | |
10,000,000 | | 2.410%, 8/6/2018b | | | 9,936,736 | |
| | Branch Banking and Trust Company | | | | |
5,800,000 | | 2.303% (LIBOR 3M + 0.530%), 5/1/2019e | | | 5,821,753 | |
| | CAFCO, LLC | | | | |
10,000,000 | | 2.200%, 6/11/2018b,d | | | 9,977,250 | |
| | Chariot Funding, LLC | | | | |
25,000,000 | | 1.820%, 5/21/2018b | | | 24,972,583 | |
20,000,000 | | 1.840%, 6/6/2018b | | | 19,959,506 | |
8,980,000 | | 2.170%, 6/12/2018b | | | 8,958,591 | |
20,000,000 | | 2.220%, 6/19/2018b | | | 19,943,694 | |
25,000,000 | | 1.870%, 6/20/2018b | | | 24,928,069 | |
10,000,000 | | 1.860%, 7/2/2018b | | | 9,963,285 | |
15,000,000 | | 1.870%, 7/5/2018b | | | 14,941,535 | |
| | Charta, LLC | | | | |
10,000,000 | | 1.920%, 5/8/2018b,d | | | 9,996,047 | |
10,000,000 | | 2.300%, 6/22/2018b,d | | | 9,969,878 | |
15,000,000 | | 2.460%, 10/15/2018b,d | | | 14,825,280 | |
| | Ciesco, LLC | | | | |
14,190,000 | | 1.870%, 6/18/2018b,d | | | 14,150,947 | |
15,000,000 | | 2.260%, 6/25/2018b,d | | | 14,952,097 | |
| | Citibank NA | | | | |
10,000,000 | | 1.890%, 7/18/2018 | | | 9,993,038 | |
15,000,000 | | 2.171% (LIBOR 1M + 0.270%), 8/30/2018e | | | 14,998,140 | |
17,060,000 | | 2.030% (LIBOR 3M + 0.230%), 11/9/2018e | | | 17,070,772 | |
17,095,000 | | 2.542% (LIBOR 3M + 0.340%), 3/20/2019e | | | 17,125,816 | |
The accompanying Notes to Financial Statements are an integral part of this schedule.
SHORT-TERM RESERVE FUND
Schedule of Investments as of April 30, 2018
(unaudited)
| | | | | | |
Principal Amount | | Financials (41.3%)a | | Value | |
| | Citigroup, Inc. | | | | |
$5,840,000 | | 6.125%, 5/15/2018 | | $ | 5,848,001 | |
| | Commonwealth Bank of Australia | | | | |
15,000,000 | | 2.097% (LIBOR 1M + 0.200%), 5/10/2018b,e | | | 15,001,380 | |
15,000,000 | | 2.087% (LIBOR 1M + 0.190%), 9/10/2018b,e | | | 14,993,610 | |
| | Cooperatieve Rabobank UA | | | | |
15,000,000 | | 2.077% (LIBOR 1M + 0.180%), 7/20/2018e | | | 15,001,170 | |
10,000,000 | | 2.246% (LIBOR 1M + 0.350%), 10/15/2018e | | | 10,002,040 | |
| | CRC Funding, LLC | | | | |
5,000,000 | | 2.310%, 7/3/2018b,d | | | 4,981,271 | |
| | Dealers Capital Access Trust, LLC | | | | |
10,000,000 | | 1.920%, 5/16/2018 | | | 9,991,760 | |
25,000,000 | | 2.100%, 5/24/2018 | | | 24,968,567 | |
14,900,000 | | 2.200%, 6/25/2018 | | | 14,853,320 | |
| | Fairway Finance Company, LLC | | | | |
10,000,000 | | 1.990%, 5/10/2018b,d | | | 9,995,028 | |
11,738,000 | | 1.870%, 5/18/2018b,d | | | 11,727,084 | |
10,000,000 | | 2.020%, 5/22/2018b,d | | | 9,988,413 | |
| | Glaxosmithkline Finance plc | | | | |
20,480,000 | | 1.850%, 5/9/2018b,d | | | 20,470,876 | |
| | HSBC Bank plc | | | | |
21,700,000 | | 1.500%, 5/15/2018b | | | 21,693,406 | |
| | HSBC Bank USA NA | | | | |
7,500,000 | | 2.859% (LIBOR 3M + 0.500%), 10/29/2018e | | | 7,490,625 | |
| | HSBC USA, Inc. | | | | |
7,150,000 | | 2.564% (LIBOR 3M + 0.770%), 8/7/2018e | | | 7,160,961 | |
| | ING (US) Funding, LLC | | | | |
25,000,000 | | 2.077% (LIBOR 1M + 0.180%), 6/25/2018d,e | | | 25,005,350 | |
| | ING Bank NV | | | | |
4,000,000 | | 2.665% (LIBOR 3M + 0.780%), 8/17/2018b,e | | | 4,008,377 | |
6,695,000 | | 2.000% , 11/26/2018b | | | 6,671,338 | |
| | ING Funding, LLC | | | | |
2,750,000 | | 1.820%, 5/25/2018d | | | 2,746,377 | |
2,000,000 | | 1.820%, 5/29/2018d | | | 1,996,915 | |
15,000,000 | | 1.830%, 6/13/2018d | | | 14,963,517 | |
| | J.P. Morgan Chase Bank NA | | | | |
10,690,000 | | 2.673% (LIBOR 3M + 0.450%), 9/21/2018e | | | 10,704,538 | |
| | Jupiter Securitization Company, LLC | | | | |
10,000,000 | | 1.870% , 7/2/2018b,d | | | 9,963,285 | |
| | Liberty Street Funding, LLC | | | | |
15,000,000 | | 1.770%, 5/2/2018b,d | | | 14,998,575 | |
9,800,000 | | 1.910%, 5/7/2018b,d | | | 9,796,646 | |
15,000,000 | | 2.000%, 6/20/2018b,d | | | 14,956,841 | |
10,525,000 | | 2.350%, 7/19/2018b,d | | | 10,472,211 | |
10,000,000 | | 2.300%, 7/23/2018b,d | | | 9,946,473 | |
15,000,000 | | 2.370%, 8/8/2018b,d | | | 14,901,333 | |
10,000,000 | | 2.360%, 8/15/2018b,d | | | 9,929,261 | |
| | LMA Americas, LLC | | | | |
13,640,000 | | 1.730%, 5/2/2018b,d | | | 13,638,704 | |
2,000,000 | | 2.350%, 7/2/2018b,d | | | 1,992,668 | |
15,000,000 | | 2.350%, 7/11/2018b,d | | | 14,934,900 | |
| | Macquarie Bank, Ltd. | | | | |
25,000,000 | | 1.850%, 5/1/2018b | | | 24,998,760 | |
52,565,000 | | 2.038%, 5/21/2018b | | | 52,506,557 | |
| | | | | | |
Principal Amount | | Financials (41.3%)a | | Value | |
$7,000,000 | | 2.000%, 6/14/2018b | | $ | 6,982,063 | |
| | Marsh & McLennan Companies, Inc. | | | | |
25,000,000 | | 2.180%, 5/21/2018b | | | 24,966,779 | |
| | Massachusetts Educational Financing Authority | | | | |
20,000,000 | | 2.150%, 5/30/2018d | | | 19,995,400 | |
17,000,000 | | 2.100%, 6/1/2018d | | | 16,993,880 | |
6,500,000 | | 2.180%, 6/1/2018d | | | 6,497,985 | |
| | MetLife Short Term Funding, LLC | | | | |
5,000,000 | | 1.800%, 5/16/2018b,d | | | 4,995,984 | |
15,000,000 | | 1.860%, 5/21/2018b,d | | | 14,983,900 | |
15,000,000 | | 1.900%, 5/22/2018b,d | | | 14,983,032 | |
5,000,000 | | 2.000%, 6/1/2018b,d | | | 4,991,356 | |
10,000,000 | | 2.000%, 6/5/2018b,d | | | 9,980,460 | |
17,500,000 | | 1.700%, 6/7/2018b,d | | | 17,463,813 | |
24,100,000 | | 2.181%, 6/15/2018b,d | | | 24,039,027 | |
6,800,000 | | 2.200%, 6/21/2018b,d | | | 6,780,257 | |
10,000,000 | | 2.250%, 7/16/2018b,d | | | 9,952,752 | |
25,000,000 | | 2.240%, 7/30/2018b,d | | | 24,852,757 | |
| | Metropolitan Life Global Funding I | | | | |
15,000,000 | | 1.350%, 9/14/2018b | | | 14,943,817 | |
| | Mitsubishi UFJ Trust & Banking Corporation | | | | |
21,750,000 | | 2.404%, 8/1/2018b | | | 21,619,982 | |
| | National Australia Bank, Ltd. | | | | |
10,000,000 | | 1.900%, 6/14/2018b | | | 9,975,625 | |
1,620,000 | | 2.230%, 6/21/2018b | | | 1,615,371 | |
40,000,000 | | 2.047% (LIBOR 1M + 0.160%), 8/1/2018b,e | | | 39,997,360 | |
10,000,000 | | 2.101% (LIBOR 1M + 0.200%), 10/29/2018b,e | | | 9,996,030 | |
| | Natixis NY | | | | |
20,000,000 | | 2.370%, 7/31/2018 | | | 20,003,660 | |
1,000,000 | | 2.420%, 8/16/2018 | | | 992,968 | |
| | Natixis SA | | | | |
10,000,000 | | 2.248% (LIBOR 1M + 0.350%), 9/26/2018e | | | 9,999,150 | |
| | Nederlandse Waterschapsbank NV | | | | |
20,000,000 | | 1.770%, 5/2/2018b | | | 19,997,979 | |
20,000,000 | | 1.920%, 5/17/2018b | | | 19,981,971 | |
11,490,000 | | 1.910%, 5/24/2018b | | | 11,475,301 | |
20,000,000 | | 1.940%, 5/29/2018b | | | 19,969,341 | |
25,000,000 | | 2.150%, 7/23/2018b | | | 24,874,233 | |
| | New York Life Global Funding | | | | |
12,000,000 | | 2.505% (LIBOR 3M + 0.180%), 7/6/2018b,e | | | 12,005,406 | |
| | Nieuw Amsterdam Receivables Corporation | | | | |
10,000,000 | | 2.000%, 5/31/2018b,d | | | 9,983,260 | |
1,155,000 | | 2.500%, 8/13/2018b,d | | | 1,147,013 | |
| | Nordea Bank AB | | | | |
15,338,000 | | 1.625%, 5/15/2018b | | | 15,335,853 | |
1,755,000 | | 2.200%, 7/24/2018 | | | 1,746,186 | |
| | Old Line Funding, LLC | | | | |
20,000,000 | | 1.850%, 6/20/2018b,d | | | 19,942,455 | |
25,000,000 | | 2.050%, 6/22/2018b,d | | | 24,924,917 | |
25,000,000 | | 2.350%, 8/3/2018b,d | | | 24,844,636 | |
| | PNC Bank NA | | | | |
12,325,000 | | 1.600%, 6/1/2018 | | | 12,317,605 | |
10,820,000 | | 1.850%, 7/20/2018 | | | 10,806,674 | |
25,000,000 | | 2.435% (LIBOR 3M + 0.400%), 12/7/2018e | | | 25,049,858 | |
| | Pricoa Global Funding I | | | | |
11,331,000 | | 1.600%, 5/29/2018b | | | 11,324,939 | |
The accompanying Notes to Financial Statements are an integral part of this schedule.
SHORT-TERM RESERVE FUND
Schedule of Investments as of April 30, 2018
(unaudited)
| | | | | | |
Principal Amount | | Financials (41.3%)a | | Value | |
| | Pricoa Short Term Funding, LLC | | | | |
$7,000,000 | | 1.950%, 5/22/2018b | | $ | 6,992,013 | |
10,000,000 | | 1.820%, 6/20/2018b | | | 9,971,511 | |
5,000,000 | | 2.100%, 6/29/2018b | | | 4,982,917 | |
25,000,000 | | 2.250%, 7/18/2018b | | | 24,877,824 | |
25,000,000 | | 2.330%, 9/12/2018b | | | 24,774,156 | |
| | Simon Property Group, LP | | | | |
20,000,000 | | 1.760%, 5/14/2018b | | | 19,985,891 | |
| | Skandinaviska Enskilda Banken AB | | | | |
15,000,000 | | 2.208% (LIBOR 1M + 0.310%), 11/20/2018e | | | 15,000,180 | |
| | Societe Generale SA | | | | |
10,000,000 | | 2.230%, 7/31/2018b | | | 9,941,606 | |
2,100,000 | | 2.400%, 8/31/2018b | | | 2,083,110 | |
| | Sumitomo Mitsui Banking Corporation | | | | |
4,475,000 | | 2.170%, 7/23/2018b | | | 4,451,840 | |
10,000,000 | | 2.228% (LIBOR 1M + 0.330%), 10/26/2018e | | | 9,999,880 | |
| | Suncorp-Metway, Ltd. | | | | |
4,550,000 | | 2.000%, 6/14/2018b | | | 4,538,511 | |
8,650,000 | | 2.080%, 7/23/2018b | | | 8,605,435 | |
5,250,000 | | 2.350%, 7/26/2018b | | | 5,221,846 | |
15,000,000 | | 2.520%, 10/16/2018b | | | 14,821,494 | |
| | Svenska Handelsbanken NY | | | | |
15,000,000 | | 2.056% (LIBOR 1M + 0.160%), 5/17/2018e | | | 15,001,860 | |
| | Swedbank AB | | | | |
15,000,000 | | 1.820%, 6/18/2018 | | | 14,963,250 | |
| | Thunder Bay Funding, LLC | | | | |
25,000,000 | | 2.220%, 7/13/2018b,d | | | 24,888,127 | |
25,000,000 | | 2.400%, 7/30/2018b,d | | | 24,854,463 | |
25,000,000 | | 2.350%, 8/2/2018b,d | | | 24,848,947 | |
| | Toronto-Dominion Bank | | | | |
10,000,000 | | 2.101% (LIBOR 1M + 0.200%), 8/28/2018b,e | | | 9,996,590 | |
15,000,000 | | 2.247% (LIBOR 1M + 0.350%), 10/16/2018b,e | | | 15,004,125 | |
10,000,000 | | 2.131% (LIBOR 1M + 0.230%), 11/30/2018b,e | | | 9,995,690 | |
10,000,000 | | 2.147% (LIBOR 1M + 0.250%), 1/11/2019b,e | | | 9,996,030 | |
| | Toronto-Dominion Bank NY | | | | |
10,000,000 | | 2.096% (LIBOR 1M + 0.200%), 8/17/2018e | | | 9,998,240 | |
10,000,000 | | 2.525% (LIBOR 3M + 0.170%), 4/17/2019e | | | 10,005,656 | |
| | Toronto-Dominion Holdings USA, Inc. | | | | |
25,000,000 | | 1.900%, 5/4/2018b | | | 24,995,197 | |
| | Travelers Companies, Inc. | | | | |
14,975,000 | | 5.800%, 5/15/2018 | | | 14,994,269 | |
| | U.S. Bank NA | | | | |
25,000,000 | | 2.038% (LIBOR 1M + 0.140%), 7/23/2018e | | | 24,998,950 | |
10,000,000 | | 2.160%, 8/27/2018 | | | 9,999,128 | |
14,410,000 | | 2.094% (LIBOR 3M + 0.150%), 5/24/2019e | | | 14,417,604 | |
| | U.S. Bank NA Ohio | | | | |
25,000,000 | | 2.081% (LIBOR 1M + 0.180%), 8/27/2018e | | | 24,987,163 | |
| | Victory Receivables Corporation | | | | |
5,000,000 | | 1.780%, 5/1/2018b,d | | | 4,999,764 | |
15,000,000 | | 1.900%, 5/9/2018b,d | | | 14,993,325 | |
10,000,000 | | 1.970%, 5/16/2018b,d | | | 9,991,769 | |
| | | | | | |
Principal Amount | | Financials (41.3%)a | | Value | |
| | Wells Fargo Bank NA | | | | |
$15,000,000 | | 2.078% (LIBOR 1M + 0.200%), 7/5/2018e | | $ | 15,003,195 | |
8,010,000 | | 1.550% , 7/10/2018 | | | 8,001,639 | |
20,000,000 | | 2.098% (LIBOR 1M + 0.200%), 8/1/2018e | | | 20,000,320 | |
15,000,000 | | 2.218% (LIBOR 1M + 0.320%), 10/26/2018e | | | 15,001,215 | |
| | Westpac Banking Corporation | | | | |
16,480,000 | | 1.550%, 5/25/2018 | | | 16,474,079 | |
5,000,000 | | 2.300%, 8/10/2018b | | | 4,968,975 | |
10,000,000 | | 2.087% (LIBOR 1M + 0.190%), 8/20/2018b,e | | | 9,997,830 | |
15,000,000 | | 2.081% (LIBOR 1M + 0.190%), 9/6/2018b,e | | | 14,994,075 | |
15,000,000 | | 2.087% (LIBOR 1M + 0.190%), 9/10/2018b,e | | | 14,993,670 | |
15,000,000 | | 2.090% (LIBOR 1M + 0.190%), 9/27/2018b,e | | | 14,991,765 | |
10,000,000 | | 2.200% (FEDL 1M + 0.500%), 2/22/2019b,e | | | 9,999,978 | |
15,000,000 | | 2.205% (LIBOR 3M + 0.180%), 2/27/2019b,e | | | 15,024,870 | |
| | | | | | |
| | Total | | | 2,197,491,840 | |
| | | | | | |
| | |
Principal Amount | | Foreign (8.9%)a | | Value | |
| | Caisse d’Amortissement de la Dette Sociale | | | | |
15,000,000 | | 1.790%, 5/2/2018b | | | 14,998,677 | |
5,000,000 | | 1.870%, 5/14/2018b | | | 4,996,652 | |
25,000,000 | | 1.920%, 7/18/2018b | | | 24,881,774 | |
| | Caisse des Depots et Consignations | | | | |
10,000,000 | | 2.190%, 7/6/2018b | | | 9,959,781 | |
15,000,000 | | 2.180%, 7/11/2018b | | | 14,934,720 | |
15,000,000 | | 2.220%, 8/16/2018b | | | 14,899,110 | |
| | Erste Abwicklungsanstalt | | | | |
15,000,000 | | 1.760%, 5/8/2018b | | | 14,994,147 | |
35,000,000 | | 1.760%, 5/10/2018b | | | 34,982,801 | |
10,000,000 | | 1.770%, 5/11/2018b | | | 9,994,576 | |
10,000,000 | | 2.090%, 5/29/2018b | | | 9,984,372 | |
10,000,000 | | 2.200%, 6/21/2018b | | | 9,970,389 | |
10,000,000 | | 2.290%, 7/20/2018b | | | 9,949,667 | |
10,000,000 | | 2.030%, 7/25/2018b | | | 9,945,724 | |
10,000,000 | | 2.270%, 7/31/2018b | | | 9,941,146 | |
10,000,000 | | 2.084% (LIBOR 1M + 0.190%), 10/12/2018b,e | | | 9,994,670 | |
| | Kells Funding, LLC | | | | |
4,500,000 | | 1.850%, 5/7/2018b,d | | | 4,498,495 | |
35,000,000 | | 1.856%, 5/14/2018b,d | | | 34,975,636 | |
15,000,000 | | 2.070%, 5/15/2018b,d | | | 14,988,750 | |
10,000,000 | | 2.090%, 5/31/2018b,d | | | 9,983,260 | |
10,000,000 | | 2.180%, 6/14/2018b,d | | | 9,974,938 | |
10,000,000 | | 2.280%, 6/29/2018b,d | | | 9,965,500 | |
10,000,000 | | 2.300%, 7/11/2018b,d | | | 9,956,680 | |
10,000,000 | | 2.260%, 7/18/2018b,d | | | 9,951,239 | |
15,000,000 | | 2.250%, 7/20/2018b,d | | | 14,924,468 | |
25,000,000 | | 2.240%, 7/25/2018b,d | | | 24,863,953 | |
| | KFW | | | | |
15,000,000 | | 1.700%, 5/7/2018b,d | | | 14,995,179 | |
10,000,000 | | 2.080%, 6/11/2018b,d | | | 9,978,242 | |
15,000,000 | | 2.160%, 7/9/2018b,d | | | 14,941,287 | |
25,000,000 | | 2.170%, 7/10/2018b,d | | | 24,900,354 | |
10,000,000 | | 2.050%, 7/12/2018b,d | | | 9,958,694 | |
35,000,000 | | 2.089%, 7/25/2018b,d | | | 34,820,905 | |
15,000,000 | | 2.190%, 8/24/2018b,d | | | 14,894,053 | |
| | | | | | |
| | Total | | | 472,999,839 | |
| | | | | | |
The accompanying Notes to Financial Statements are an integral part of this schedule.
SHORT-TERM RESERVE FUND
Schedule of Investments as of April 30, 2018
(unaudited)
| | | | | | |
Principal Amount | | Technology (1.7%)a | | Value | |
| | Apple, Inc. | | | | |
$20,329,000 | | 2.037% (LIBOR 3M + 0.250%), 5/3/2018e | | $ | 20,329,169 | |
4,450,000 | | 1.670%, 6/11/2018b | | | 4,440,437 | |
1,300,000 | | 1.680%, 6/18/2018b | | | 1,296,707 | |
| | Cisco Systems, Inc. | | | | |
30,968,000 | | 2.435% (LIBOR 3M + 0.310%), 6/15/2018e | | | 30,984,795 | |
| | IBM Credit, LLC | | | | |
20,000,000 | | 1.920%, 6/6/2018b,d | | | 19,961,376 | |
| | Intel Corporation | | | | |
5,700,000 | | 1.860%, 5/1/2018b | | | 5,699,731 | |
| | Oracle Corporation | | | | |
7,810,000 | | 2.928% (LIBOR 3M + 0.580%), 1/15/2019e | | | 7,833,999 | |
| | | | | | |
| | Total | | | 90,546,214 | |
| | | | | | |
| | |
Principal Amount | | Transportation (1.4%)a | | Value | |
| | Canadian National Railway Company | | | | |
9,870,000 | | 5.550%, 5/15/2018d | | | 9,880,888 | |
25,250,000 | | 2.079%, 6/11/2018b,d | | | 25,192,556 | |
15,000,000 | | 2.000%, 6/12/2018b,d | | | 14,964,973 | |
15,000,000 | | 2.000%, 6/21/2018b,d | | | 14,956,667 | |
8,060,000 | | 2.150%, 7/5/2018b,d | | | 8,029,264 | |
| | | | | | |
| | Total | | | 73,024,348 | |
| | | | | | |
| | |
Principal Amount | | U.S. Municipals (1.6%)a | | Value | |
| | State of California | | | | |
15,000,000 | | 1.960%, 5/2/2018d | | | 15,000,150 | |
10,000,000 | | 1.940%, 5/24/2018d | | | 10,000,300 | |
3,000,000 | | 1.950%, 6/5/2018d | | | 3,000,120 | |
8,160,000 | | 2.080%, 6/5/2018d | | | 8,156,736 | |
15,000,000 | | 2.050%, 6/12/2018d | | | 14,999,400 | |
10,000,000 | | 2.180%, 6/13/2018d | | | 9,996,700 | |
| | State of Tennessee | | | | |
25,000,000 | | 2.030%, 6/14/2018d | | | 24,998,500 | |
| | | | | | |
| | Total | | | 86,151,906 | |
| | | | | | |
| | |
Principal Amount | | Utilities (5.4%)a | | Value | |
| | American Electric Power Company, Inc. | | | | |
10,000,000 | | 2.450%, 5/15/2018b | | | 9,990,625 | |
| | Arizona Public Service Company | | | | |
11,450,000 | | 2.150%, 5/7/2018 | | | 11,445,503 | |
| | Berkshire Hathaway Energy Company | | | | |
7,000,000 | | 2.200%, 5/2/2018b | | | 6,999,156 | |
16,980,000 | | 2.200%, 5/3/2018b | | | 16,976,922 | |
10,000,000 | | 2.250%, 5/7/2018b | | | 9,995,722 | |
| | CenterPoint Energy, Inc. | | | | |
5,900,000 | | 2.100%, 5/1/2018b | | | 5,899,646 | |
| | Duke Energy Corporation | | | | |
15,000,000 | | 2.200%, 5/8/2018b | | | 14,992,647 | |
10,000,000 | | 2.350%, 5/9/2018b | | | 9,994,467 | |
5,000,000 | | 2.340%, 5/10/2018b | | | 4,996,918 | |
8,000,000 | | 2.160%, 5/17/2018b | | | 7,991,466 | |
| | | | | | | | |
Principal Amount | | | Utilities (5.4%)a | | Value | |
| | | | Florida Power & Light Company | | | | |
| | $22,000,000 | | | 2.300%, 6/14/2018 | | $ | 21,939,088 | |
| | 25,000,000 | | | 2.400%, 6/18/2018 | | | 24,923,948 | |
| | 15,000,000 | | | 2.340%, 6/19/2018 | | | 14,953,333 | |
| | | | ITC Holdings Corporation | | | | |
| | 10,000,000 | | | 2.300%, 5/10/2018b | | | 9,993,836 | |
| | | | Oncor Electric | | | | |
| | 15,000,000 | | | 2.250%, 5/29/2018b | | | 14,971,918 | |
| | 25,000,000 | | | 2.350%, 6/26/2018b | | | 24,902,427 | |
| | | | PPL Capital Funding, Inc. | | | | |
| | 22,000,000 | | | 2.326%, 5/3/2018b,d | | | 21,996,013 | |
| | 8,298,000 | | | 2.200%, 5/14/2018b,d | | | 8,290,759 | |
| | | | Southern Company | | | | |
| | 15,000,000 | | | 2.280%, 5/3/2018b | | | 14,997,281 | |
| | 17,477,000 | | | 2.250%, 5/9/2018b | | | 17,467,331 | |
| | | | Xcel Energy, Inc. | | | | |
| | 15,000,000 | | | 2.180%, 5/14/2018b | | | 14,986,910 | |
| | | | | | | | |
| | | | Total | | | 288,705,916 | |
| | | | | | | | |
| | | | Total Investments
(cost $5,373,629,216) 101.0% | | $ | 5,373,330,523 | |
| | | | | | | | |
| | | | Other Assets and Liabilities, Net (1.0)% | | | (51,739,866 | ) |
| | | | | | | | |
| | | | Total Net Assets 100.0% | | $ | 5,321,590,657 | |
| | | | | | | | |
| a | The interest rate shown reflects the yield, coupon rate or the discount rate at the date of purchase. |
| b | Denotes securities sold under Rule 144A of the Securities Act of 1933, which exempts them from registration. These securities may be resold to other dealers in the program or to other qualified institutional buyers. As of April 30, 2018, the value of these investments was $3,681,109,324 or 69.2% of total net assets. |
| c | Denotes investments purchased on a when-issued or delayed delivery basis. |
| d | Denotes investments that benefit from credit enhancement or liquidity support provided by a third party bank, institution or government. |
| e | Denotes variable rate securities. The rate shown is as of April 30, 2018. The rates of certain variable rate securities are based on a published reference rate and spread; these may vary by security and the reference rate and spread are indicated in their description. The rates of other variable rate securities are determined by the issuer or agent and are based on current market conditions. These securities do not indicate a reference rate and spread in their description. |
| | | | |
Definitions: | | | | |
Ser. - Series |
|
| Reference Rate Index: |
| | |
FEDL 1M | | - | | Federal Funds 1 Month Rate |
LIBOR 1M | | - | | ICE Libor USD Rate 1 Month |
LIBOR 3M | | - | | ICE Libor USD Rate 3 Month |
The accompanying Notes to Financial Statements are an integral part of this schedule.
SHORT-TERM RESERVE FUND
Schedule of Investments as of April 30, 2018
(unaudited)
| | | | |
| Unrealized Appreciation (Depreciation) | |
|
| Gross unrealized appreciation and depreciation of investments, based on cost for federal income tax purposes, were as follows: | |
| |
Gross unrealized appreciation | | $ | 238,171 | |
Gross unrealized depreciation | | | (536,864 | ) |
| | | | |
Net unrealized appreciation (depreciation) | | ($ | 298,693 | ) |
| |
Cost for federal income tax purposes | | $ | 5,373,629,216 | |
Fair Valuation Measurements
The following table is a summary of the inputs used, as of April 30, 2018, in valuing Short-Term Reserve Fund’s assets carried at fair value or amortized cost, which approximates fair value.
| | | | | | | | | | | | | | | | |
Investments in Securities | | Total | | | Level 1 | | | Level 2 | | | Level 3 | |
Asset-Backed Securities | | | 421,814,758 | | | | – | | | | 421,814,758 | | | | – | |
Basic Materials | | | 83,611,520 | | | | – | | | | 83,611,520 | | | | – | |
Capital Goods | | | 175,996,203 | | | | – | | | | 175,996,203 | | | | – | |
Communications Services | | | 242,879,878 | | | | – | | | | 242,879,878 | | | | – | |
Consumer Cyclical | | | 259,881,024 | | | | – | | | | 259,881,024 | | | | – | |
Consumer Non-Cyclical | | | 712,812,906 | | | | – | | | | 712,812,906 | | | | – | |
Energy | | | 267,414,171 | | | | – | | | | 267,414,171 | | | | – | |
Financials | | | 2,197,491,840 | | | | – | | | | 2,197,491,840 | | | | – | |
Foreign | | | 472,999,839 | | | | – | | | | 472,999,839 | | | | – | |
Technology | | | 90,546,214 | | | | – | | | | 90,546,214 | | | | – | |
Transportation | | | 73,024,348 | | | | – | | | | 73,024,348 | | | | – | |
U.S. Municipals | | | 86,151,906 | | | | – | | | | 86,151,906 | | | | – | |
Utilities | | | 288,705,916 | | | | – | | | | 288,705,916 | | | | – | |
| | | | | | | | | | | | | | | | |
Total Investments at Value | | $ | 5,373,330,523 | | | $ | – | | | $ | 5,373,330,523 | | | $ | – | |
| | | | | | | | | | | | | | | | |
There were no significant transfers between Levels during the period ended April 30, 2018. Transfers between Levels are identified as of the end of the period.
The accompanying Notes to Financial Statements are an integral part of this schedule.
THRIVENT CORE FUNDS
STATEMENTOF ASSETSAND LIABILITIES
| | | | | | | | | | | | | | | | |
As of April 30, 2018 (unaudited) | | Emerging Markets
Debt Fund | | | International
Equity Fund | | | Low Volatility
Equity Fund | | | Short-Term
Reserve Fund | |
| | | | |
Assets | | | | | | | | | | | | | | | | |
Investments at cost | | $ | 660,325,667 | | | $ | 861,894,255 | | | $ | 825,911,638 | | | $ | 5,373,629,216 | |
Investments in unaffiliated securities at value (#) | | | 625,247,073 | | | | 853,834,574 | | | | 819,479,838 | | | | 5,373,330,523 | |
Investments in affiliated securities at value | | | 5,317,511 | | | | 18,258,152 | | | | 414,037 | | | | – | |
Cash | | | – | | | | 113 | (a) | | | – | | | | – | |
Dividends and interest receivable | | | 7,334,483 | | | | 4,970,095 | | | | 517,017 | | | | 5,563,054 | |
Prepaid expenses | | | 9,072 | | | | 8,815 | | | | 10,191 | | | | 19,450 | |
Prepaid trustee fees | | | 1,053 | | | | 1,053 | | | | 1,057 | | | | 1,053 | |
Receivable for: | | | | | | | | | | | | | | | | |
Investments sold | | | 7,250,058 | | | | 2,468,154 | | | | – | | | | – | |
Fund shares sold | | | 723,645 | | | | – | | | | – | | | | – | |
Total Assets | | | 645,882,895 | | | | 879,540,956 | | | | 820,422,140 | | | | 5,378,914,080 | |
| | | | |
Liabilities | | | | | | | | | | | | | | | | |
Distributions payable | | | 2,269,925 | | | | – | | | | – | | | | 8,698,516 | |
Accrued expenses | | | 47,994 | | | | 175,732 | | | | 110,680 | | | | 91,224 | |
Cash overdraft | | | – | | | | – | | | | – | | | | 21,574 | |
Payable for: | | | | | | | | | | | | | | | | |
Investments purchased | | | 2,484,767 | | | | 3,977,486 | | | | – | | | | 48,500,000 | |
Return of collateral for securities loaned | | | – | | | | 15,455,901 | | | | – | | | | – | |
Administrative service fees | | | 16,626 | | | | 20,100 | | | | 19,513 | | | | 7,500 | |
Transfer agent fees | | | 2,500 | | | | 2,500 | | | | 2,500 | | | | 2,500 | |
Director deferred compensation | | | 561 | | | | 550 | | | | 261 | | | | 2,109 | |
Commitments and contingent liabilities^ | | | – | | | | – | | | | – | | | | – | |
Total Liabilities | | | 4,822,373 | | | | 19,632,269 | | | | 132,954 | | | | 57,323,423 | |
| | | | |
Net Assets | | | | | | | | | | | | | | | | |
Capital stock (beneficial interest) | | | 672,433,909 | | | | 839,602,517 | | | | 825,000,499 | | | | 5,321,909,912 | |
Accumulated undistributed net investment income/(loss) | | | 95,407 | | | | 10,599,353 | | | | 2,191,229 | | | | 4,662 | |
Accumulated undistributed net realized gain/(loss) | | | (1,707,711 | ) | | | (398,387 | ) | | | (884,779 | ) | | | (25,224 | ) |
Net unrealized appreciation/(depreciation) on: | | | | | | | | | | | | | | | | |
Investments | | | (29,761,083 | ) | | | 10,198,471 | | | | (6,017,763 | ) | | | (298,693 | ) |
Foreign currency transactions | | | – | | | | (93,267 | ) | | | – | | | | – | |
Total Net Assets | | $ | 641,060,522 | | | $ | 859,908,687 | | | $ | 820,289,186 | | | $ | 5,321,590,657 | |
Shares of beneficial interest outstanding | | | 68,175,116 | | | | 83,877,073 | | | | 82,864,125 | | | | 532,191,457 | |
Net asset value per share | | $ | 9.40 | | | $ | 10.25 | | | $ | 9.90 | | | $ | 10.00 | |
(#) Includes securities on loan of | | $ | – | | | $ | 14,631,079 | | | $ | – | | | $ | – | |
| (a) | Includes foreign currency holdings of $113 (cost $113). |
| ^ | Commitments and contingent liability accrual. Additional information can be found in the accompanying Notes to Financial Statements. |
The accompanying Notes to Financial Statements are an integral part of this statement.
25
THRIVENT CORE FUNDS
STATEMENTOF OPERATIONS
| | | | | | | | | | | | | | | | |
For the six months ended April 30, 2018 (unaudited) | | Emerging Markets
Debt Fund | | | International
Equity Fund(a)
| | | Low Volatility
Equity Fund(b)
| | | Short-Term
Reserve Fund | |
Investment Income | | | | | | | | | | | | | | | | |
Dividends | | $ | – | | | $ | 12,233,872 | | | $ | 2,310,180 | | | $ | – | |
Interest | | | 10,673,631 | | | | 36,012 | | | | 29,208 | | | | 41,570,678 | |
Affiliated income from securities loaned, net | | | 1,045 | | | | 108,013 | | | | – | | | | – | |
Income from affiliated investments | | | 50,274 | | | | 38,879 | | | | 8,982 | | | | – | |
Non cash income | | | – | | | | 919,508 | | | | – | | | | – | |
Foreign tax withholding | | | – | | | | (1,389,934 | ) | | | – | | | | – | |
Total Investment Income | | | 10,724,950 | | | | 11,946,350 | | | | 2,348,370 | | | | 41,570,678 | |
| | | | |
Expenses | | | | | | | | | | | | | | | | |
Administrative service fees | | | 84,253 | | | | 96,463 | | | | 35,235 | | | | 45,000 | |
Amortization of offering costs | | | 5,686 | | | | 2,341 | | | | 1,121 | | | | – | |
Audit and legal fees | | | 13,078 | | | | 14,193 | | | | 5,784 | | | | 24,228 | |
Custody fees | | | 7,040 | | | | 94,718 | | | | 2,037 | | | | 75,538 | |
Insurance expenses | | | 2,666 | | | | 2,145 | | | | 885 | | | | 12,597 | |
Printing and postage expenses | | | 150 | | | | 1,675 | | | | 1,367 | | | | 1,270 | |
SEC and state registration expenses | | | 30,655 | | | | 104,531 | | | | 102,712 | | | | – | |
Transfer agent fees | | | 15,000 | | | | 15,000 | | | | 5,000 | | | | 15,000 | |
Directors’ fees | | | 3,737 | | | | 3,414 | | | | 1,188 | | | | 3,790 | |
Pricing service fees | | | – | | | | – | | | | – | | | | 40,818 | |
Other expenses | | | 3,877 | | | | 11,200 | | | | 1,812 | | | | 4,265 | |
Total Expenses Before Reimbursement | | | 166,142 | | | | 345,680 | | | | 157,141 | | | | 222,506 | |
| | | | |
Total Net Expenses | | | 166,142 | | | | 345,680 | | | | 157,141 | | | | 222,506 | |
| | | | |
Net Investment Income/(Loss) | | | 10,558,808 | | | | 11,600,670 | | | | 2,191,229 | | | | 41,348,172 | |
Realized and Unrealized Gains/(Losses) | | | | | | | | | | | | | | | | |
Net realized gains/(losses) on: | | | | | | | | | | | | | | | | |
Investments | | | (1,707,784 | ) | | | (75,840 | ) | | | (884,779 | ) | | | (25,222 | ) |
Distributions of realized capital gains from affiliated investments | | | 73 | | | | 48 | | | | – | | | | – | |
Net increase from payments by affiliates | | | – | | | | 76,217 | * | | | – | | | | – | |
Foreign currency transactions | | | – | | | | (398,812 | ) | | | – | | | | – | |
Change in net unrealized appreciation/(depreciation) on: | | | | | | | | | | | | | | | | |
Investments | | | (24,819,408 | ) | | | 10,198,471 | | | | (6,017,763 | ) | | | (161,570 | ) |
Foreign currency transactions | | | – | | | | (93,267 | ) | | | – | | | | – | |
| | | | |
Net Realized and Unrealized Gains/(Losses) | | | (26,527,119 | ) | | | 9,706,817 | | | | (6,902,542 | ) | | | (186,792 | ) |
| | | | |
Net Increase/(Decrease) in Net Assets Resulting From Operations | | $ | (15,968,311 | ) | | $ | 21,307,487 | | | $ | (4,711,313 | ) | | $ | 41,161,380 | |
| * | Net increase from payment from affiliate. Additional information can be found in the accompanying Notes to Financial Statements. |
| (a) | For the period from November 14, 2017 (inception) through April 30, 2018. |
| (b) | For the period from February 28, 2018 (inception) through April 30, 2018. |
The accompanying Notes to Financial Statements are an integral part of this statement.
26
THRIVENT CORE FUNDS
STATEMENTOF CHANGESIN NET ASSETS
| | | | | | | | | | | | |
| | | Emerging Markets Debt Fund | | | International
Equity Fund | |
For the periods ended | | 4/30/2018
(unaudited) | | | 10/31/2017(a) | | | 4/30/2018
(unaudited)(b) | |
Operations | | | | | | | | | | | | |
Net investment income/(loss) | | $ | 10,558,808 | | | $ | 1,945,176 | | | $ | 11,600,670 | |
Net realized gains/(losses) | | | (1,707,711 | ) | | | (17,955 | ) | | | (398,387 | ) |
Change in net unrealized appreciation/(depreciation) | | | (24,819,408 | ) | | | (4,941,675 | ) | | | 10,105,204 | |
Net Change in Net Assets Resulting From Operations | | | (15,968,311 | ) | | | (3,014,454 | ) | | | 21,307,487 | |
Distributions to Shareholders | | | | | | | | | | | | |
From net investment income | | | (10,486,366 | ) | | | (1,904,256 | ) | | | (1,001,317 | ) |
Total Distributions to Shareholders | | | (10,486,366 | ) | | | (1,904,256 | ) | | | (1,001,317 | ) |
| | | |
Capital Stock Transactions | | | | | | | | | | | | |
Sold | | | 120,829,402 | | | | 426,772,907 | | | | 838,700,000 | |
Distributions reinvested | | | – | | | | – | | | | 1,001,317 | |
In-kind contributions | | | 124,931,300 | | | | – | | | | – | |
Redeemed | | | – | | | | (99,700 | ) | | | (98,800 | ) |
Total Capital Stock Transactions | | | 245,760,702 | | | | 426,673,207 | | | | 839,602,517 | |
| | | |
Net Increase/(Decrease) in Net Assets | | | 219,306,025 | | | | 421,754,497 | | | | 859,908,687 | |
Net Assets, Beginning of Period | | | 421,754,497 | | | | – | | | | – | |
Net Assets, End of Period | | $ | 641,060,522 | | | $ | 421,754,497 | | | $ | 859,908,687 | |
Accumulated Undistributed Net Investment Income/(Loss) | | $ | 95,407 | | | $ | 22,965 | | | $ | 10,599,353 | |
| | | |
Capital Stock Share Transactions | | | | | | | | | | | | |
Sold | | | 12,288,463 | | | | 42,773,617 | | | | 83,788,324 | |
Distributions reinvested | | | – | | | | – | | | | 98,749 | |
In-kind contributions | | | 13,123,036 | | | | – | | | | – | |
Redeemed | | | – | | | | (10,000 | ) | | | (10,000 | ) |
| | | | | | | | | | | | |
Total Capital Stock Share Transactions | | | 25,411,499 | | | | 42,763,617 | | | | 83,877,073 | |
| | | | | | | | | | | | |
| (a) | For the period from September 5, 2017 (inception) through October 31, 2017. |
| (b) | For the period from November 14, 2017 (inception) through April 30, 2018. |
The accompanying Notes to Financial Statements are an integral part of this statement.
27
THRIVENT CORE FUNDS
STATEMENTOF CHANGESIN NET ASSETS –CONTINUED
| | | | | | | | | | | | |
| | | Low Volatility | | | | |
| | | Equity Fund | | | Short-Term Reserve Fund | |
| | | 4/30/2018 | | | 4/30/2018 | | | | |
For the periods ended | | (unaudited)(a) | | | (unaudited) | | | 10/31/2017 | |
Operations | | | | | | | | | | | | |
Net investment income/(loss) | | $ | 2,191,229 | | | $ | 41,348,172 | | | $ | 57,864,605 | |
Net realized gains/(losses) | | | (884,779 | ) | | | (25,222 | ) | | | 77,715 | |
Change in net unrealized appreciation/(depreciation) | | | (6,017,763 | ) | | | (161,570 | ) | | | (1,903,290 | ) |
Net Change in Net Assets Resulting From Operations | | | (4,711,313 | ) | | | 41,161,380 | | | | 56,039,030 | |
Distributions to Shareholders | | | | | | | | | | | | |
From net investment income | | | – | | | | (41,348,172 | ) | | | (57,864,605 | ) |
From net realized gains | | | – | | | | (60,502 | ) | | | – | |
Total Distributions to Shareholders | | | – | | | | (41,408,674 | ) | | | (57,864,605 | ) |
Capital Stock Transactions | | | | | | | | | | | | |
Sold | | | 825,099,999 | | | | 6,481,059,207 | | | | 10,504,705,250 | |
Redeemed | | | (99,500 | ) | | | (6,147,430,054 | ) | | | (10,277,162,836 | ) |
Total Capital Stock Transactions | | | 825,000,499 | | | | 333,629,153 | | | | 227,542,414 | |
| | | |
Net Increase/(Decrease) in Net Assets | | | 820,289,186 | | | | 333,381,859 | | | | 225,716,839 | |
Net Assets, Beginning of Period | | | – | | | | 4,988,208,798 | | | | 4,762,491,959 | |
Net Assets, End of Period | | $ | 820,289,186 | | | $ | 5,321,590,657 | | | $ | 4,988,208,798 | |
Accumulated Undistributed Net Investment Income/(Loss) | | $ | 2,191,229 | | | $ | 4,662 | | | $ | 4,662 | |
| | | |
Capital Stock Share Transactions | | | | | | | | | | | | |
Sold | | | 82,874,125 | | | | 648,105,920 | | | | 1,050,470,525 | |
Redeemed | | | (10,000 | ) | | | (614,743,005 | ) | | | (1,027,716,284 | ) |
| | | | | | | | | | | | |
Total Capital Stock Share Transactions | | | 82,864,125 | | | | 33,362,915 | | | | 22,754,241 | |
| | | | | | | | | | | | |
| (a) | For the period from February 28, 2018 (inception) through April 30, 2018 |
The accompanying Notes to Financial Statements are an integral part of this statement.
28
THRIVENT CORE FUNDS
NOTESTO FINANCIAL STATEMENTS
April 30, 2018
(unaudited)
1) ORGANIZATION
Thrivent Core Funds (the “Trust”) was organized as a Delaware statutory trust on March 18, 2016, and is registered as an open-end management investment company under the Investment Company Act of 1940. The Trust is divided into four separate series, each with its own investment objective and policies (each, a “Fund”). The four series of the Trust are Thrivent Core Emerging Markets Debt Fund, which is non-diversified, and Thrivent Core International Equity Fund, Thrivent Core Low Volatility Equity Fund, and Thrivent Core Short-Term Reserve Fund, which are diversified. Thrivent Core Short-Term Reserve Fund serves as a cash sweep vehicle for Thrivent Mutual Funds and Thrivent Series Fund, Inc. Thrivent Core International Equity Fund was incepted on November 14, 2017, while Thrivent Core Low Volatility Equity Fund was incepted on February 28, 2018.
The Funds are each an investment company which follows the accounting and reporting guidance of the Financial Accounting Standard Board (FASB) Accounting Standard Codification Topic 946 – Financial Services – Investment Companies.
Under the Trust’s organizational documents, its officers and trustees are indemnified against certain liabilities arising out of the performance of their duties to the Trust. In addition, in the normal course of business, the Trust enters into contracts with vendors and others that provide general damage clauses. The Trust’s maximum exposure under these contracts is unknown, as this would involve future claims that may be made against the Trust. However, based on experience, the Trust expects the risk of loss to be remote.
(2) SIGNIFICANT ACCOUNTING POLICIES
(A) Valuation of Investments – Securities traded on U.S. or foreign securities exchanges or included in a national market system are valued at the official closing price at the close of each business day unless otherwise stated below. Over-the-counter securities and listed securities for which no price is readily available are valued at the current bid price considered best to represent the value at that time. Security prices are based on quotes that are obtained from an independent pricing service approved by the Trust’s Board of Trustees (“Board”). The pricing service, in determining values of fixed-income securities, takes into consideration such factors as current quotations by broker/ dealers, coupon, maturity, quality, type of issue, trading characteristics, and other yield and risk factors it deems relevant in determining valuations. Securities which cannot be valued by the approved pricing service are valued using
valuations obtained from dealers that make markets in the securities. Investments in open-ended mutual funds are valued at the net asset value at the close of each business day.
The Board has delegated responsibility for daily valuation of the Funds’ securities to the investment adviser, Thrivent Asset Management, LLC (the “Adviser”). The Adviser has formed a Valuation Committee (“Committee”) that is responsible for overseeing the Funds’ valuation policies in accordance with Valuation Policies and Procedures. The Committee meets on a monthly and on an as-needed basis to review price challenges, price overrides, stale prices, shadow prices, manual prices, money market pricing, international fair valuation, and other securities requiring fair valuation.
The Committee monitors for significant events occurring prior to the close of trading on the New York Stock Exchange that could have a material impact on the value of any securities that are held by the Funds. Examples of such events include trading halts, national news/events, and issuer-specific developments. If the Committee decides that such events warrant using fair value estimates, the Committee will take such events into consideration in determining the fair value of such securities. If market quotations or prices are not readily available or determined to be unreliable, the securities will be valued at fair value as determined in good faith pursuant to procedures adopted by the Board.
In accordance with U.S. Generally Accepted Accounting Principles (“GAAP”), the various inputs used to determine the fair value of the Funds’ investments are summarized in three broad levels. Level 1 includes quoted prices in active markets for identical securities, typically included in this level are U.S. equity securities, futures, options and registered investment company funds. Level 2 includes other significant observable inputs such as quoted prices for similar securities, interest rates, prepayment speeds and credit risk, typically included in this level are fixed income securities, international securities, swaps and forward contracts. Level 3 includes significant unobservable inputs such as the Adviser’s own assumptions and broker evaluations in determining the fair value of investments. Of the Level 3 securities, those for which market values were not readily available or were deemed unreliable were fair valued as determined in good faith under procedures established by the Board. The valuation levels are not necessarily an indication of the risk associated with investing in these securities or other investments. Investments measured using net asset value per share as a practical expedient for fair value and that are not publicly available-for-sale are not categorized within the fair value hierarchy.
Valuation of International Securities – Because many foreign markets close before the U.S. markets, events may occur between the close of the foreign markets and the close of the U.S. markets that could have a material impact on the valuation of foreign securities. The Funds, under the supervision of the
29
THRIVENT CORE FUNDS
NOTESTO FINANCIAL STATEMENTS
April 30, 2018
(unaudited)
Board, evaluate the impacts of these events and may adjust the valuation of foreign securities to reflect fair value as of the close of the U.S. markets. The Board has authorized the Adviser to make fair valuation determinations pursuant to policies approved by the Board.
(B) Foreign Currency Translation – The accounting records of each Fund are maintained in U.S. dollars. Securities and other assets and liabilities that are denominated in foreign currencies are translated into U.S. dollars at the daily closing rates of exchange.
Foreign currency amounts related to the purchase or sale of securities and income and expenses are translated at the exchange rate on the transaction date. Net realized and unrealized currency gains and losses are recorded from closed currency contracts, disposition of foreign currencies, exchange gains or losses between the trade date and settlement date on securities transactions, and other translation gains or losses on dividends, interest income and foreign withholding taxes. The Funds do not separately report the effect of changes in foreign exchange rates from changes in market prices on securities held. Such changes are included in net realized and unrealized gain or loss from investments in the Statement of Operations.
For federal income tax purposes, the Funds treat the effect of changes in foreign exchange rates arising from actual foreign currency transactions and the changes in foreign exchange rates between the trade date and settlement date as ordinary income.
(C) Foreign Denominated Investments – Foreign denominated assets and currency contracts may involve more risks than domestic transactions including currency risk, political and economic risk, regulatory risk, and market risk. Certain Funds may also invest in securities of companies located in emerging markets. Future economic or political developments could adversely affect the liquidity or value, or both, of such securities.
(D) Federal Income Taxes – No provision has been made for income taxes because each Fund’s policy is to qualify as a regulated investment company under the Internal Revenue Code and distribute substantially all investment company taxable income and net capital gain on a timely basis. It is also the intention of each Fund to distribute an amount sufficient to avoid imposition of any federal excise tax. The Funds, accordingly, anticipate paying no federal taxes and no federal tax provision was recorded. Each Fund is treated as a separate taxable entity for federal income tax purposes. Funds may utilize earnings and profits distributed to shareholders on the redemption of shares as part of the dividends paid deduction.
GAAP requires management of the Funds (i.e., the Adviser) to make additional tax disclosures with respect to the tax effects
of certain income tax positions, whether those positions were taken on previously filed tax returns or are expected to be taken on future returns. These positions must meet a “more likely than not” standard that, based on the technical merits of the position, would have a greater than 50 percent likelihood of being sustained upon examination. In evaluating whether a tax position has met the more-likely-than-not recognition threshold, the Adviser must presume that the position will be examined by the appropriate taxing authority that has full knowledge of all relevant information.
The Adviser analyzed all open tax years, as defined by the statute of limitations, for all major jurisdictions. Open tax years are those that are open for examination by taxing authorities. Major jurisdictions for the Funds include U.S. Federal, Minnesota, Wisconsin, and Delaware as well as certain foreign countries. As of April 30, 2018, open U.S. Federal, Minnesota, Wisconsin and Delaware tax years include tax years ended October 31, 2016 through 2017. The Funds have no examinations in progress and none are expected at this time.
As of April 30, 2018, the Adviser has reviewed all open tax years and major jurisdictions and concluded that there is no effect to each fund’s tax liability, financial position or results of operations. There is no tax liability resulting from unrecognized tax benefits related to uncertain income tax positions taken or expected to be taken in future tax returns. The Funds also are not aware of any tax positions for which it is reasonably possible that the total amounts of unrecognized tax benefits will significantly change in the next 12 months.
(E) Expenses and Income – Estimated expenses are accrued daily. The Funds are charged for those expenses that are directly attributable to them. Expenses that are not directly attributable to a Fund are allocated among all appropriate Funds in proportion to their respective net assets, number of shareholder accounts or other reasonable basis.
Interest income is accrued daily on all debt securities, as is accretion of market discount and original issue discount and amortization of premium. Paydown gains and losses on mortgage- and asset-backed securities are recorded as components of interest income. Dividend income and capital gain distributions are recorded on the ex-dividend date. However, certain dividends from foreign securities are recorded as soon as the information is available to the Funds. Non-cash income, if any, is recorded at the fair market value of the securities received.
(F) Distributions to Shareholders – Net investment income is distributed to each shareholder as a dividend. Dividends from Emerging Markets Debt Fund are declared and distributed monthly. Dividends of International Equity Fund and Low Volatility Equity Fund are declared and distributed annually. Dividends from Short-Term Reserve Fund are declared daily
30
THRIVENT CORE FUNDS
NOTESTO FINANCIAL STATEMENTS
April 30, 2018
(unaudited)
and distributed monthly. Net realized gains from securities transactions, if any, are distributed at least annually after the close of the fiscal year.
(G) Derivative Financial Instruments – Certain Funds may invest in derivatives. Derivatives, a category that includes options, futures, swaps, foreign currency forward contracts and hybrid instruments, are financial instruments whose value is derived from another security, an index or a currency. Each applicable Fund may use derivatives for hedging (attempting to offset a potential loss in one position by establishing an interest in an opposite position). This includes the use of currency-based derivatives to manage the risk of its positions in foreign securities. Each applicable Fund may also use derivatives for replication of a certain asset class or speculation (investing for potential income or capital gain). These contracts may be transacted on an exchange or over-the-counter (OTC).
A derivative may incur a mark to market loss if the value of the derivative decreases due to an unfavorable change in the market rates or values of the underlying derivative. Losses can also occur if the counterparty does not perform under the derivative. A Fund’s risk of loss from the counterparty credit risk on OTC derivatives is generally limited to the aggregate unrealized gain netted against any collateral held by such Fund. With exchange traded futures and centrally cleared swaps, there is minimal counterparty credit risk to the Funds because the exchange’s clearinghouse, as counterparty to such derivatives, guarantees against a possible default. The clearinghouse stands between the buyer and the seller of the derivative; thus, the credit risk is limited to the failure of the clearinghouse. However, credit risk still exists in exchange traded futures and centrally cleared swaps with respect to initial and variation margin that is held in a broker’s customer accounts. While brokers are required to segregate customer margin from their own assets, in the event that a broker becomes insolvent or goes into bankruptcy and at that time there is a shortfall in the aggregate amount of margin held by the broker for all its clients, U.S. bankruptcy laws will typically allocate that shortfall on a pro-rata basis across all the broker’s customers, potentially resulting in losses to the Funds. Using derivatives to hedge can guard against potential risks, but it also adds to the Funds’ expenses and can eliminate some opportunities for gains. In addition, a derivative used for mitigating exposure or replication may not accurately track the value of the underlying asset. Another risk with derivatives is that some types can amplify a gain or loss, potentially earning or losing substantially more money than the actual cost of the derivative.
In order to define their contractual rights and to secure rights that will help the Funds mitigate their counterparty risk, the Funds may enter into an International Swaps and Derivatives Association, Inc. Master Agreement (“ISDA Master Agreement”) or similar agreement with its derivative contract
counterparties. An ISDA Master Agreement is a bilateral agreement between a Fund and a counterparty that governs OTC derivatives and foreign exchange contracts and typically includes, among other things, collateral posting terms and netting provisions in the event of a default and/or termination event. Under an ISDA Master Agreement, each Fund may, under certain circumstances, offset with the counterparty certain derivatives’ payables and/or receivables with collateral held and/or posted and create one single net payment. The provisions of the ISDA Master Agreement typically permit a single net payment in the event of a default (close-out netting) including the bankruptcy or insolvency of the counterparty. Note, however, that bankruptcy and insolvency laws of a particular jurisdiction may impose restrictions on or prohibitions against the right of offset in bankruptcy, insolvency or other events.
Collateral and margin requirements vary by type of derivative. Margin requirements are established by the broker or clearinghouse for exchange traded and centrally cleared derivatives (futures, options, and centrally cleared swaps). Brokers can ask for margining in excess of the minimum in certain situations. Collateral terms are contract specific for OTC derivatives (foreign currency exchange contracts, options, swaps). For derivatives traded under an ISDA Master Agreement, the collateral requirements are typically calculated by netting the mark to market amount for each transaction under such agreement and comparing that amount to the value of any collateral currently pledged by the Fund and the counterparty. For financial reporting purposes, non-cash collateral that has been pledged to cover obligations of the Fund has been noted in the Schedule of Investments. To the extent amounts due to the Fund from its counterparties are not fully collateralized, contractually or otherwise, the Fund bears the risk of loss from counterparty nonperformance. The Funds attempt to mitigate counterparty risk by only entering into agreements with counterparties that they believe have the financial resources to honor their obligations and by monitoring the financial stability of those counterparties.
Options – Certain Funds may buy put and call options and write put and covered call options. The Funds intend to use such derivative instruments as hedges to facilitate buying or selling securities or to provide protection against adverse movements in security prices or interest rates. The Funds may also enter into options contracts to protect against adverse foreign exchange rate fluctuations. Option contracts are valued daily and unrealized appreciation or depreciation is recorded. A Fund will realize a gain or loss upon expiration or closing of the option transaction. When an option is exercised, the proceeds upon sale for a written call option or the cost of a security for purchased put and call options is adjusted by the amount of premium received or paid.
Buying put options tends to decrease a Fund’s exposure to the underlying security while buying call options tends to
31
THRIVENT CORE FUNDS
NOTESTO FINANCIAL STATEMENTS
April 30, 2018
(unaudited)
increase a Fund’s exposure to the underlying security. The risk associated with purchasing put and call options is limited to the premium paid. There is no significant counterparty risk on exchange-traded options as the exchange guarantees the contract against default. Writing put options tends to increase a Fund’s exposure to the underlying security while writing call options tends to decrease a Fund’s exposure to the underlying security. The writer of an option has no control over whether the underlying security may be bought or sold, and therefore bears the market risk of an unfavorable change in the price of the underlying security. The counterparty risk for purchased options arises when a Fund has purchased an option, exercises that option, and the counterparty doesn’t buy from the Fund or sell to the Fund the underlying asset as required. In the case where a Fund has written an option, the Fund doesn’t have counterparty risk. Counterparty risk on purchased over-the-counter options is partially mitigated by the Fund’s collateral posting requirements. As the option increases in value to the Fund, the Fund receives collateral from the counterparty. Risks of loss may exceed amounts recognized on the Statement of Assets and Liabilities.
Futures Contracts – Certain Funds may use futures contracts to manage the exposure to interest rate and market or currency fluctuations. Gains or losses on futures contracts can offset changes in the yield of securities. When a futures contract is opened, cash or other investments equal to the required “initial margin deposit” are held on deposit with and pledged to the broker. Additional securities held by the Funds may be earmarked to cover open futures contracts. The futures contract’s daily change in value (“variation margin”) is either paid to or received from the broker, and is recorded as an unrealized gain or loss. When the contract is closed, realized gain or loss is recorded equal to the difference between the value of the contract when opened and the value of the contract when closed. Futures contracts involve, to varying degrees, risk of loss in excess of the variation margin disclosed in the Statement of Assets and Liabilities. Exchange-traded futures have no significant counterparty risk as the exchange guarantees the contracts against default.
Foreign Currency Forward Contracts – In connection with purchases and sales of securities denominated in foreign currencies, certain Funds may enter into foreign currency forward contracts. Additionally, the Funds may enter into such contracts to mitigate currency and counterparty exposure to other foreign-currency-denominated investments. These contracts are recorded at value and the related realized and change in unrealized foreign exchange gains and losses are included in the Statement of Operations. In the event that counterparties fail to settle these forward contracts, the Funds could be exposed to foreign currency fluctuations. Foreign currency contracts are valued daily and unrealized appreciation or depreciation is recorded daily as the difference between the contract exchange rate
and the closing forward rate applied to the face amount of the contract. A realized gain or loss is recorded at the time a forward contract is closed. These contracts are over-the-counter and the Fund is exposed to counterparty risk equal to the discounted net amount of payments to the Fund.
Swap Agreements – Certain Funds may enter into swap transactions, which involve swapping one or more investment characteristics of a security or a basket of securities with another party. Such transactions include market risk, risk of default by the other party to the transaction, risk of imperfect correlation and manager risk and may involve commissions or other costs. Swap transactions generally do not involve delivery of securities, other underlying assets or principal. Accordingly, the risk of loss with respect to swap transactions is generally limited to the net amount of payments that the Fund is contractually obligated to make, or in the case of the counterparty defaulting, the net amount of payments that the Fund is contractually entitled to receive. Risks of loss may exceed amounts recognized on the Statement of Assets and Liabilities. If there is a default by the counterparty, the Fund may have contractual remedies pursuant to the agreements related to the transaction. The contracts are valued daily and unrealized appreciation or depreciation is recorded. Swap agreements are valued at the clearinghouse end of day prices as furnished by an independent pricing service. The pricing service takes into account such factors as swap curves, default probabilities, recent trades, recovery rates and other factors it deems relevant in determining valuations. Daily fluctuations in the value of the centrally cleared credit default contracts are recorded in variation margin in the Statement of Assets and Liabilities and recorded as unrealized gain or loss. The Fund accrues for the periodic payment and amortizes upfront payments, if any, on swap agreements on a daily basis with the net amount recorded as realized gains or losses in the Statement of Operations. Receipts and payments received or made as a result of a credit event or termination of the contract are also recognized as realized gains or losses in the Statement of Operations. Collateral, in the form of cash or securities, may be required to be held with the Fund’s custodian, or a third party, in connection with these agreements. Certain swap agreements are over-the-counter and the Fund is exposed to counterparty risk, which is the discounted net amount of payments owed to the Fund. This risk is partially mitigated by the Fund’s collateral posting requirements. As the swap increases in value to the Fund, the Fund receives collateral from the counterparty. Certain interest rate and credit default index swaps must be cleared through a clearinghouse or central counterparty.
Credit Default Swaps – A credit default swap is a swap agreement between two parties to exchange the credit risk of a particular issuer, basket of securities or reference entity. In a credit default swap transaction, a buyer pays periodic fees in return for payment by the seller which is contingent
32
THRIVENT CORE FUNDS
NOTESTO FINANCIAL STATEMENTS
April 30, 2018
(unaudited)
upon an adverse credit event occurring in the underlying issuer or reference entity. The seller collects periodic fees from the buyer and profits if the credit of the underlying issuer or reference entity remains stable or improves while the swap is outstanding, but the seller in a credit default swap contract would be required to pay the amount of credit loss, determined as specified in the agreement, to the buyer in the event of an adverse credit event in the reference entity. A buyer of a credit default swap is said to buy protection whereas a seller of a credit default swap is said to sell protection. The Funds may be either the protection seller or the protection buyer.
Certain Funds enter into credit default derivative contracts directly through credit default swaps (CDS) or through credit default swap indices (CDX Indices). CDX indices are static pools of equally weighted credit default swaps referencing corporate bonds and/or loans designed to provide diversified credit exposure to these asset classes. Funds sell default protection and assume long-risk positions in individual credits
or indices. Index positions are entered into to gain exposure to the corporate bond and/or loan markets in a cost-efficient and diversified structure. In the event that a position defaults, by going into bankruptcy and failing to pay interest or principal on borrowed money, within any given CDX Index held, the maximum potential amount of future payments required would be equal to the pro-rata share of that position within the index based on the notional amount of the index. In the event of a default under a CDS contract the maximum potential amount of future payments would be the notional amount. For CDS, the default events could be bankruptcy and failing to pay interest or principal on borrowed money or a restructuring. A restructuring is a change in the underlying obligations which would include reduction in interest or principal, maturity extension and subordination to other obligations.
For financial reporting purposes, the Funds do not offset derivative assets and derivative liabilities that are subject to netting arrangements in the Statement of Assets and Liabilities.
The following table presents the gross and net information about liabilities subject to master netting arrangements, as presented in the Statement of Assets and Liabilities:
| | | | | | | | | | | | | | | | | | | | | | | | | | | | |
| | | | | | | | | | | | Gross Amounts Not Offset in the Statement
of Assets and Liabilities | | | | |
Fund | | Gross Amounts
of Recognized
Liabilities | | | Gross Amounts
Offset | | | Net Amounts
of Recognized
Liabilities | | | Financial
Instruments | | | Cash Collateral
Pledged | | | Non-Cash
Collateral
Pledged** | | | Net Amount | |
International Equity Securities Lending | | | 15,455,901 | | | | – | | | | 15,455,901 | | | | 14,631,079 | | | | – | | | | – | | | | 824,822 | ^ |
| ** | Excess of collateral pledged to the counterparty may not be shown for financial reporting purposes. |
| ^ | Net securities lending amounts represent the net amount payable to the counterparty in the event of a default. |
(H) Securities Lending – The Trust has entered into a Securities Lending Agreement (the “Agreement”) with Goldman Sachs Bank USA doing business as Goldman Sachs Agency Lending (“GSAL”) pursuant to which GSAL provides securities lending services. The Agreement authorizes GSAL to lend securities to authorized borrowers on behalf of the Funds. Pursuant to the Agreement, loaned securities are typically initially collateralized equal to at least 102% for U.S. securities and 105% for non-U.S. securities of the market value of the loaned securities. Daily market fluctuations could cause the value of loaned securities to be more or less than the value of the collateral received. Any additional collateral is adjusted and settled on the next business day. The Trust has the ability to recall the loans at any time and could do so in order to vote proxies or sell the loaned securities. All cash collateral received is invested in Thrivent Cash Management Trust. The Funds receive dividends and interest that would have been earned on the securities loaned while simultaneously seeking to earn income on the investment of
cash collateral. Amounts earned on investments in Thrivent Cash Management Trust, net of rebates, fees paid to GSAL for services provided and any other securities lending expenses, are included in income from securities loaned on the Statement of Operations. By investing any cash collateral it receives in these transactions, a Fund could realize additional gains or losses. If the borrower fails to return the securities or the invested collateral has declined in value, the Fund could lose money. Generally, in the event of borrower default, the Fund has the right to use the collateral to offset any losses incurred. However, in the event the Fund is delayed or prevented from exercising its right to dispose of the collateral, there may be a potential loss. Some of these losses may be indemnified by the lending agent.
As of April 30, 2018, the value of securities on loan is as follows:
| | | | |
Fund | | Securities on Loan | |
International Equity | | $ | 14,631,079 | |
33
THRIVENT CORE FUNDS
NOTESTO FINANCIAL STATEMENTS
April 30, 2018
(unaudited)
(I) When-Issued and Delayed Delivery Transactions – The Funds may purchase or sell securities on a when-issued or delayed delivery basis. These transactions involve a commitment by the Funds to purchase or sell securities for a predetermined price or yield, with payment and delivery taking place beyond the customary settlement period. When delayed delivery purchases are outstanding, the Funds will designate liquid assets in an amount sufficient to meet the purchase price. When purchasing a security on a delayed delivery basis, the Funds assume the rights and risks of ownership of the security, including the risk of price and yield fluctuations, and take such fluctuations into account when determining its net asset value. A Fund may dispose of a delayed delivery transaction after it is entered into, and may sell when-issued securities before they are delivered, which may result in a capital gain or loss. When a Fund has sold a security on a delayed delivery basis, a Fund does not participate in future gains and losses with respect to the security.
(J) Repurchase Agreements – The Funds may engage in repurchase agreement transactions in pursuit of its investment objective. A repurchase agreement consists of a purchase and a simultaneous agreement to resell an investment for later delivery at an agreed upon price and rate of interest. The Funds use a third-party custodian to maintain the collateral. If the original seller of a security subject to a repurchase agreement fails to repurchase the security at the agreed upon time, the Funds could incur a loss due to a drop in the value of the security during the time it takes the Funds to either sell the security or take action to enforce the original seller’s agreement to repurchase the security. Also, if a defaulting original seller filed for bankruptcy or became insolvent, disposition of such security might be delayed by pending legal action. The Funds may only enter into repurchase agreements with banks and other recognized financial institutions such as broker/dealers that are found by the Adviser to be creditworthy. During the six months ended April 30, 2018, the Funds did not engage in this type of investment.
(K) Credit Risk – Certain Funds may be susceptible to credit risk to the extent an issuer or counterparty defaults on its payment obligation. The Funds’ policy is to monitor the creditworthiness of issuers and counterparties. Interest receivable on defaulted securities is monitored for ability to collect payments in default and is adjusted accordingly.
(L) Loan Commitments – Certain Funds may enter into loan commitments, which generally have interest rates which are reset daily, monthly, quarterly or semi-annually by reference to a base lending rate, plus a premium. These base rates are primarily the London-Interbank Offered Rate (“LIBOR”), and secondarily the prime rate offered by one or more major United States banks (the “Prime Rate”) and the certificate of deposit (“CD”) rate or other base lending rates used by
commercial lenders. Loan commitments often require prepayments from excess cash flows or allow the borrower to repay at its election. The rate at which the borrower repays cannot be predicted with accuracy. Therefore, the remaining maturity may be considerably less than the stated maturity shown in the Schedule of Investments.
All or a portion of these loan commitments may be unfunded. A Fund is obligated to fund these commitments at the borrower’s discretion. Therefore, the Fund must have funds sufficient to cover its contractual obligation. These unfunded loan commitments, which are marked to market daily, are presented in the Schedule of Investments.
(M) Accounting Estimates – The preparation of financial statements in conformity with GAAP requires management to make estimates and assumptions that affect the reported amounts of assets and liabilities and disclosure of contingent assets and liabilities at the date of the financial statements and the reported amounts of income and expenses during the reporting period. Actual results could differ from these estimates.
(N) Amortization of Offering Costs – The offering costs referenced in the Statement of Operations for Emerging Markets Debt Fund, International Equity Fund and Low Volatility Equity Fund are costs incurred by the Fund in order to establish it for sale. These costs generally include any legal costs associated with registering the Fund. These costs are amortized over a period of 12 months from inception.
(O) Recent Accounting Pronouncements —
Premium Amortization on Purchased Callable Debt Securities
In March 2017, the Financial Accounting Standards Board (FASB) issued Accounting Standards Update (ASU) No. 2017-08 Premium Amortization on Purchased Callable Debt Securities. ASU No. 2017-08 updates the accounting standards to shorten the amortization period for certain purchased callable debt securities, held at a premium, to be amortized to the earliest call date. The update applies to securities with explicit, non-contingent call features that are callable at fixed prices and on preset dates. The amendments are effective for fiscal years, and interim periods within those fiscal years, beginning after December 15, 2018. At this time, management is evaluating the implications of this guidance and the impact it will have to financial statement amounts and footnote disclosures.
34
THRIVENT CORE FUNDS
NOTESTO FINANCIAL STATEMENTS
April 30, 2018
(unaudited)
(P) In-kind Contributions – During March 2018, the Thrivent Core Emerging Markets Debt Fund received an in-kind contribution which consisted of $124,931,300 in securities. As a result of the in-kind contribution, Thrivent Core Emerging Markets Debt Fund issued 13,123,036 shares at a $9.52/share net asset value. The in-kind amounts and shares issued are included in the Capital Stock Transactions of the Statement of Changes in Net Assets for Thrivent Core Emerging Markets Debt Fund. These in-kind transactions were conducted at market value. The transactions were as follows:
| | | | | | | | |
Contributing Fund/Portfolio | | Shares
Issued | | | In-kind
Amount | |
Balanced Income Plus Fund | | | 1,120,664 | | | $ | 10,668,722 | |
Balanced Income Plus Portfolio | | | 1,298,780 | | | $ | 12,364,385 | |
Diversified Income Plus Fund | | | 1,577,662 | | | $ | 15,019,338 | |
Diversified Income Plus Portfolio | | | 1,289,457 | | | $ | 12,275,624 | |
Growth and Income Plus Fund | | | 123,308 | | | $ | 1,173,896 | |
Growth and Income Plus Portfolio | | | 140,246 | | | $ | 1,335,143 | |
Opportunity Income Plus Fund | | | 6,361,609 | | | $ | 60,562,521 | |
Opportunity Income Plus Portfolio | | | 1,211,310 | | | $ | 11,531,671 | |
| | | | | | | | |
Totals | | | 13,123,036 | | | $ | 124,931,300 | |
(Q) Other – For financial statement purposes, investment security transactions are accounted for on the trade date. Interest income is recognized on an accrual basis. Discount and premium are amortized over the life of the respective securities on the interest method. Realized gains or losses on sales are determined on a specific cost identification basis.
(3) FEES AND COMPENSATION PAID TO AFFILIATES
(A) Fees – The Trust has entered into an administration and accounting services agreement with the Adviser pursuant to which the Adviser provides certain administrative and accounting personnel and services. The Fund pays an annual fixed fee plus percentage of net assets to the Adviser. These fees are accrued daily and paid monthly. For the six months ended April 30, 2018, the Adviser received aggregate fees for administrative and accounting personnel and services of $260,951 from the Trust.
Each Trustee who is not affiliated with the Adviser receives an annual fee from the Trust for services as a Trustee and is eligible to participate in a deferred compensation plan with respect to these fees. Participants in the plan may designate their deferred Trustee’s fees as if invested in a series of the Thrivent Mutual Funds, except for Money Market Fund as it is not eligible for the deferral plan. The value of each participant’s deferred compensation account will increase or decrease as if it were invested in shares of a particular series of Thrivent Mutual Funds. Their fees as well as the change in value are included in Trustee fees in the Statement of Operations. The deferred fees remain in the appropriate Fund until distribution in accordance with the plan. The Payable for trustee deferred compensation, located in the Statement of Assets and Liabilities, is unsecured.
Those trustees not participating in the above plan received $10,841 in fees from the Trust during the six months ended
April 30, 2018. In addition, the Trust reimbursed unaffiliated Trustees for reasonable expenses incurred in relation to attendance at the meetings and industry conferences.
Certain officers and non-independent Trustees of the Trust are employed at Thrivent Financial for Lutherans and receive no compensation from the Trust. Affiliated employees and board consultants are reimbursed for reasonable expenses incurred in relation to board meeting attendance.
(B) Indirect Expenses – The Funds may invest in other mutual funds. Fees and expenses of those underlying funds are not included in the Funds’ expense ratio. The Funds indirectly bear their proportionate share of the annualized weighted average expense ratio for the underlying funds in which it invests.
(C) Interfund Lending – The Funds may participate in an interfund lending program pursuant to an exemptive order issued by the SEC. The exemptive order permits the Funds to borrow cash for temporary purposes from other Thrivent Funds. For the period ended April 30, 2018, no Funds borrowed cash through the interfund lending program.
(4) FEDERAL INCOME TAX INFORMATION
Distributions are based on amounts calculated in accordance with the applicable federal income tax regulations, which may differ from GAAP. To the extent that these differences are permanent in nature, GAAP requires such amounts to be reclassified within the capital accounts based on their federal tax-basis treatment; temporary differences do not require reclassifications. At fiscal year-end, the character and amount of distributions, on a tax basis and components of distributable earnings, are finalized. Therefore, as of April 30, 2018, the tax-basis balance has not yet been determined.
35
THRIVENT CORE FUNDS
NOTESTO FINANCIAL STATEMENTS
April 30, 2018
(unaudited)
(5) SECURITY TRANSACTIONS
(A) Purchases and Sales of Investment Securities – For the six months ended April 30, 2018, the cost of purchases and the proceeds from sales of investment securities, other than U.S. Government and short-term securities, were as follows:
| | | | | | | | |
| | | In thousands | |
Fund | | Purchases | | | Sales | |
Emerging Markets Debt | | $ | 169,179 | | | $ | 46,355 | |
International Equity | | | 1,069,507 | | | | 225,738 | |
Low Volatility Equity | | | 867,141 | | | | 40,759 | |
Short-Term Reserve | | | 667,640 | | | | 827,888 | |
Purchases and sales of U.S. Government securities were:
| | | | | | | | |
| | | In thousands | |
Fund | | Purchases | | | Sales | |
Emerging Markets Debt | | $ | 9,004 | | | $ | 9,019 | |
(6) RELATED PARTY TRANSACTIONS
As of April 30, 2018, related parties held 100% of the outstanding shares of all Thrivent Core Funds. Subscription and redemption activity by concentrated accounts may have a significant effect on the operation of the Funds. In the case of a large redemption, the Funds may be forced to sell investments at inopportune times, resulting in additional losses for the Funds.
(7) SUBSEQUENT EVENTS
The Adviser of the Funds has evaluated the impact of subsequent events through the date the financial statements were issued, and, except as already included in the Notes to Financial Statements, has determined that no additional items require disclosure.
(8) PAYMENTS BY AFFILIATES
During the period ended April 30, 2018 the Adviser reimbursed International Equity Fund for a trade error. The amount of this reimbursement is reflected in the Net increase from payments by affiliates of the Statement of Operations.
(9) MARKET RISK
Over time, securities markets generally tend to move in cycles with periods when security prices rise and periods when security prices decline. The value of a Fund’s investments may move with these cycles and, in some instances, increase or decrease more than the applicable market(s) as measured by the Fund’s benchmark index(es). The securities markets may also decline because of factors that affect a particular industry. As of April 30, 2018, the following Funds had portfolio concentration greater than 25% in certain sectors.
| | | | | | |
Fund | | Sector | | % of
Total Net
Assets | |
Core Emerging Market Debt | | Foreign Government | | | 95.5 | % |
Core Short-Term Reserve | | Financials | | | 41.3 | % |
36
(This page intentionally left blank)
37
THRIVENT CORE FUNDS
FINANCIAL HIGHLIGHTS
FOR A SHARE OUTSTANDING THROUGHOUT EACH PERIOD *
| | | | | | | | | | | | | | | | | | | | | | | | |
| | | | | | Income From Investment Operations | | | Less Distributions From | |
| | | Net Asset
Value,
Beginning of
Period | | | Net
Investment
Income/
(Loss) | | | Net Realized
and Unrealized
Gain/(Loss) on
Investments(a) | | | Total from
Investment
Operations | | | Net
Investment
Income | | | Net Realized
Gain on
Investments | |
EMERGING MARKETS DEBT FUND | | | | | | | | | | | | | | | | | | | | | | | | |
Period Ended 4/30/2018 (unaudited) | | $ | 9.86 | | | $ | 0.19 | | | $ | (0.46 | ) | | $ | (0.27 | ) | | $ | (0.19 | ) | | $ | – | |
Year Ended 10/31/2017 (c) | | | 10.00 | | | | 0.05 | | | | (0.14 | ) | | | (0.09 | ) | | | (0.05 | ) | | | – | |
INTERNATIONAL EQUITY FUND | | | | | | | | | | | | | | | | | | | | | | | | |
Period Ended 4/30/2018 (unaudited)(d) | | | 10.00 | | | | 0.14 | | | | 0.12 | | | | 0.26 | | | | (0.01 | ) | | | – | |
LOW VOLATILITY EQUITY FUND | | | | | | | | | | | | | | | | | | | | | | | | |
Period Ended 4/30/2018 (unaudited)(e) | | | 10.00 | | | | 0.03 | | | | (0.13 | ) | | | (0.10 | ) | | | – | | | | – | |
SHORT-TERM RESERVE FUND | | | | | | | | | | | | | | | | | | | | | | | | |
Period Ended 4/30/2018 (unaudited) | | | 10.00 | | | | 0.08 | | | | 0.00 | | | | 0.08 | | | | (0.08 | ) | | | 0.00 | |
Year Ended 10/31/2017 | | | 10.00 | | | | 0.11 | | | | 0.00 | | | | 0.11 | | | | (0.11 | ) | | | – | |
Year Ended 10/31/2016 (f) | | | 10.00 | | | | 0.03 | | | | 0.00 | | | | 0.03 | | | | (0.03 | ) | | | – | |
| (a) | The amount shown may not correlate with the change in aggregate gains and losses of portfolio securities due to the timing of sales and redemptions of portfolio shares. |
| (b) | Total investment return assumes dividend reinvestment and does not reflect any deduction for applicable sales charges. Not annualized for periods less than one year. |
| (c) | Since inception, September 5, 2017. |
| (d) | Since inception, November 14, 2017. |
| (e) | Since inception, February 28, 2018. |
| (f) | Since inception, May 2, 2016. |
| * | All per share amounts have been rounded to the nearest cent. |
| ** | Computed on an annualized basis for periods less than one year |
The accompanying Notes to Financial Statements are an integral part of this statement.
38
THRIVENT CORE FUNDS
FINANCIAL HIGHLIGHTS –CONTINUED
RATIOS/SUPPLEMENTAL DATA
| | | | | | | | | | | | | | | | | | | | | | | | | | | | | | | | |
| | | | | | | | | | | | Ratio to Average Net Assets** | | | Ratio to Average Net Assets
Before Expenses Waived,
Credited or Paid Indirectly** | | | | |
Total Distributions | | Net Asset
Value, End of
Period | | | Total
Return(b) | | | Net Assets,
End of Period
(in millions) | | | Expenses | | | Net Investment
Income/(Loss) | | | Expenses | | | Net Investment
Income/(Loss) | | | **Portfolio
Turnover Rate | |
$ (0.19) | | $ | 9.40 | | | | (2.82) | % | | $ | 641.1 | | | | 0.06 | % | | | 4.07 | % | | | 0.06 | % | | | 4.07 | % | | | 11 | % |
(0.05) | | | 9.86 | | | | (0.94) | % | | | 421.8 | | | | 0.21 | % | | | 3.48 | % | | | 0.21 | % | | | 3.48 | % | | | 0 | % |
(0.01) | | | 10.25 | | | | 2.63 | % | | | 859.9 | | | | 0.10 | % | | | 3.41 | % | | | 0.10 | % | | | 3.41 | % | | | 35 | % |
– | | | 9.90 | | | | (1.00) | % | | | 820.3 | | | | 0.12 | % | | | 1.74 | % | | | 0.12 | % | | | 1.74 | % | | | 7 | % |
(0.08) | | | 10.00 | | | | 0.83 | % | | | 5,321.6 | | | | 0.01 | % | | | 1.68 | % | | | 0.01 | % | | | 1.68 | % | | | 103 | % |
(0.11) | | | 10.00 | | | | 1.12 | % | | | 4,988.2 | | | | 0.01 | % | | | 1.11 | % | | | 0.01 | % | | | 1.11 | % | | | 143 | % |
(0.03) | | | 10.00 | | | | 0.32 | % | | | 4,762.5 | | | | 0.01 | % | | | 0.67 | % | | | 0.01 | % | | | 0.67 | % | | | 31 | % |
The accompanying Notes to Financial Statements are an integral part of this statement.
39
ADDITIONAL INFORMATION
(unaudited)
PROXY VOTING
The policies and procedures that the Trust uses to determine how to vote proxies relating to portfolio securities are attached to the Trust’s Statement of Additional Information. You may request a free copy of the Statement of Additional Information or the report of how the Trust voted proxies relating to portfolio securities during the most recent 12-month period ended June 30 by calling 800-847-4836. You also may review the Statement of Additional Information or the report of how the Trust voted proxies relating to portfolio securities during the most recent 12-month period ended June 30 at sec.gov.
QUARTERLY SCHEDULE OF PORTFOLIO HOLDINGS
The Trust files its Schedule of Portfolio Holdings on Form N-Q with the SEC for the first and third quarters of each fiscal year. You may request a free copy of the Trust’s Forms N-Q by calling 800-847-4836. The Trust’s Forms N-Q also are available at se c.gov. You also may review and copy the Forms N-Q for the Trust at the SEC’s Public Reference Room in Washington, DC. You may get information about the operation of the Public Reference Room by calling 800-SEC-0330.
BOARD APPROVAL OF ADVISORY AGREEMENT
Section 15(c) of the Investment Company Act of 1940, as amended (the “1940 Act”), requires that a fund’s investment advisory agreement be approved initially by the fund’s board of trustees. Section 15(c) also requires that the continuation of these agreements, after an initial term of up to two years, be annually reviewed and approved by the board. Any such agreement must be approved by a vote of a majority of the trustees who are not parties to the agreement or “interested persons” (as defined in the 1940 Act) of a party to the agreement at an in-person meeting of the board called for the purpose of voting on such approval.
At its meeting on November 14-15, 2017 (the “Meeting”), the Board of Trustees (the “Board”) of the Thrivent Core Funds (the “Trust”), including the trustees who are not parties to the agreement or “interested persons” as defined in the 1940 Act (the “Independent Trustees”), considered and voted unanimously to renew the existing advisory agreement (the “Advisory Agreement”), as amended, between the Trust and Thrivent Asset Management, LLC (the “Adviser”) for the Thrivent Core Short-Term Reserve Fund (the “Fund”). The Trust was designed to provide shareholders of other Thrivent funds with certain benefits, including a reduction of operational complexities associated with investing in various asset classes. The series of the Trust are only available to other funds and accounts managed by the Adviser or its affiliates.
At the Meeting, the Board, including the Independent Trustees, also considered and voted unanimously to approve an amendment to the Advisory Agreement (the “Amended Advisory Agreement”) between the Trust and the Adviser for the addition of Thrivent Core Low Volatility Equity Fund (the “New Fund”) for an initial term of two years.
In connection with its evaluation of the agreement with the Adviser, the Board reviewed a broad range of information requested for this purpose and considered a variety of factors, including the purpose of the Trust and the Fund in relation to other Thrivent funds, as well as the following:
| | 1. | The nature, extent, and quality of the services provided by the Adviser; |
| | 2. | Investment performance; |
| | 3. | The cost of services provided and profit realized by the Adviser; |
| | 4. | Other benefits realized by the Adviser and its affiliates from their relationship with the Trust; and |
| | 5. | Any other factors that the Board deemed relevant to its consideration. |
With respect to the New Fund, the Board also considered many of the factors listed above to the extent such factor was applicable in the context of an approval of the Amended Advisory Agreement for the New Fund. Accordingly, the Board considered:
40
ADDITIONAL INFORMATION
(unaudited)
| | 1. | The nature, extent and quality of services the Adviser proposes to provide to the New Fund; |
| | 2. | Any other benefits anticipated to be derived by the Adviser or its affiliates from their relationships with the Trust with respect to the New Fund; and |
| | 3. | Any other factors that the Board deemed relevant to its consideration. |
The Contracts Committee of the Board (consisting of all of the Independent Trustees) met on five occasions from May 23 to November 14, 2017 to consider information relevant to the renewal process. The Independent Trustees also retained the services of Management Practice Inc. (“MPI”) as an independent consultant to assist in the compilation, organization, and evaluation of relevant information. This information included a statistical comparison of the net operating expenses of the Fund in comparison to a peer group of comparable funds; information with respect to services provided to the Fund and associated fees charged, including fees for transfer agent and administrative services; the cost of services and profit realized by the Adviser and its affiliates that provide services to the Fund; and information regarding the types of services furnished to the Fund, the personnel providing the services, including investment management, compliance and administrative personnel. In addition to its review of the information presented to the Board during the contract renewal process, the Board also considered information obtained from management throughout the course of the year.
The Board also received information from the Adviser on two occasions from October 31 to November 14, 2017 with respect to the New Fund.
The Independent Trustees were represented by independent counsel throughout the review process and during executive sessions without management present to consider approval of the Amended Advisory Agreement for the New Fund and the reapproval of the Advisory Agreement for the Fund. As noted above, the Independent Trustees were assisted throughout the process by an independent consultant, MPI. Each Independent Trustee relied on his or her own business judgment in determining the weight to be given to each factor considered in evaluating the materials that were presented to them. The Contracts Committee’s and Board’s review and conclusions were based on a comprehensive consideration of all information presented to them and were not the result of any single controlling factor. In addition, each Trustee may have weighed individual factors differently. The key factors considered and the conclusions reached are described below.
Nature, Extent and Quality of Services
At each of the Board’s regular quarterly meetings, management presented information describing the services furnished to the Fund by the Adviser, transfer agent and administrator. During these meetings, management reported on the investment management, portfolio trading and compliance services provided to the Fund. During the renewal process, the Board considered the specific services provided under the Advisory Agreement. The Board considered information relating to the investment experience and qualifications of the Adviser’s portfolio managers overseeing or proposed to oversee investments for the Fund. The Board also considered similar information with respect to the services to be provided to the New Fund pursuant to the Amended Advisory Agreement.
The Board received reports at each of its quarterly meetings from the Adviser’s Head of Equity Investments and one or more of the Head of Fixed Income Funds, the Chief Investment Strategist, and Senior Portfolio Management – Fixed Income, as supplemented by the Adviser’s Chief Investment Officer, who was also present at all of the meetings. At the quarterly meetings, the Adviser’s Head of Equity Investments, Head of Fixed Income Funds or Senior Portfolio Management – Fixed Income presented information about the Fund and other series of the Trust (collectively, the “Funds”). The Board received presentations or additional information from the Adviser regarding the Adviser’s equity fundamental research, emerging markets debt and Systematic Alpha teams. These reports and presentations gave the Board the opportunity to evaluate the portfolio managers’ abilities and the quality of services provided, or for Funds not yet launched, that would be provided, to the Funds. The Independent Trustees also met in-person, including in executive session, with and received quarterly reports from the Trust’s Chief Compliance Officer. The Board noted that the CCO met regularly between quarterly meetings with the Chair of the Ethics and Compliance Committee.
The Board considered the adequacy of the Adviser’s resources used to provide services to the Trust pursuant to the Advisory Agreement. The Adviser reviewed with the Board the Adviser’s process for overseeing its portfolio management team of the
41
ADDITIONAL INFORMATION
(unaudited)
Fund. In addition, the Adviser explained how its investments in technology and personnel have benefitted or would benefit the Funds and discussed continued investments in these resources. The Adviser also discussed how it has continued to strengthen its compliance program. The Board viewed these actions as a positive factor in reapproving the existing Advisory Agreement, as they demonstrated the Adviser’s commitment to provide the Funds with quality service and competitive investment performance. The Board concluded that, within the context of its full deliberations, the nature, extent and quality of the investment advisory services provided to the Fund by the Adviser supported renewal of the Advisory Agreement. The Board also concluded that, within the context of its full deliberations, the nature, extent and quality of the investment advisory services to be provided to the New Fund by the Adviser supported approval of the Amended Advisory Agreement.
Performance of the Funds
The Board noted the Fund’s short operational history and considered whether the Fund has operated within its investment objective, which is to seek a high level of current income consistent with liquidity and the preservation of capital. In this regard, the Board reviewed security-type and yield information and considered the Adviser’s opinion that, in its view, the Fund could withstand events that were reasonably likely to occur within the next twelve-month period. At quarterly meetings, the Adviser’s Head of Equity Investments, Head of Fixed Income Funds or Senior Portfolio Management – Fixed Income reviewed with the Board the economic and market environment and risk management in connection with the management of the Fund and other Thrivent funds. The Board noted that the Fund is designed to offer a sweep option for other investment companies and accounts managed by the Adviser or its affiliates and ultimately enhance the performance of those investment companies and accounts.
The New Fund had not commenced operations prior to the Meeting. Accordingly, the New Fund did not yet have an investment performance record. The Trustees also concluded that it was appropriate to consider the New Fund’s investment performance in connection with future reviews of the Amended Advisory Agreement.
Advisory Fees and Fund Expenses
The Board noted that the Adviser does not charge an advisory fee to the Funds, nor did the Adviser propose to charge an advisory fee to the New Fund. The Board reviewed information provided by the Adviser regarding custodial, administrative, transfer agent and other non-advisory fees and expenses. On the basis of its review, the Board concluded that continuing to not charge an advisory fee to the Funds for investment management services was reasonable.
Cost of Services and Profitability
The Board considered the profitability of the Adviser both overall and on a fund-by-fund basis. The Board considered the level of the Adviser’s profits with respect to all the Thrivent funds, including the Fund. The Board considered that the Adviser makes no profit under the Advisory Agreement and concluded that the Adviser’s profitability was not excessive in light of the nature, extent and quality of services provided to the Fund.
With respect to the New Fund, the Board considered that the Adviser would bear all costs to launch the New Fund. The Board did not consider the Adviser’s anticipated profitability with regard to the New Fund. The Board determined that it would have opportunity to consider profitability information in connection with future reviews of the Amended Advisory Agreement.
Other Benefits to the Adviser and its Affiliates
The Board considered information regarding potential “fall-out” or ancillary benefits that the Adviser and its affiliates may receive as a result of their relationship with the Funds, both tangible and intangible, such as their ability to leverage investment professionals who manage other portfolios, an enhanced reputation as an investment adviser which may help in attracting other clients and investment personnel, and the engagement of affiliates as service providers to the Funds. The Board noted that such benefits were difficult to quantify but were consistent with benefits received by other mutual fund advisers.
Based on the factors discussed above, the Contracts Committee unanimously recommended approval of the Advisory Agreement, and the Board, including all of the Independent Trustees voting separately, approved the Advisory Agreement. The Board, including the Independent Trustees voting separately, approved the Amended Advisory Agreement with respect to the New Fund for an initial term of two years.
42
(This page intentionally left blank)
(This page intentionally left blank)
This report is submitted for the information of shareholders
of Thrivent Core Funds. It is not authorized for distribution to
prospective investors unless preceded or accompanied by the
current prospectus for Thrivent Core Funds, which contains more
complete information about the Trust, including investment
objectives, risks, charges and expenses.
Not applicable to semiannual report
| Item 3. | Audit Committee Financial Expert |
Not applicable to semiannual report
| Item 4. | Principal Accountant Fees and Services |
Not applicable to semiannual report
| Item 5. | Audit Committee of Listed Registrants |
Not applicable
| | (a) | Registrant’s Schedule of Investments is included in the report to shareholders filed under Item 1. |
| | (b) | Not applicable to this filing. |
| Item 7. | Disclosure of Proxy Voting Policies and Procedures for Closed-End Management Investment Companies |
Not applicable
| Item 8. | Portfolio Managers of Closed-End Management Investment Companies |
Not applicable
| Item 9. | Purchases of Equity Securities by Closed-End Management Investment Company and Affiliated Purchasers. |
Not applicable
| Item 10. | Submission of Matters to a Vote of Security Holders |
There have been no material changes to the procedures by which shareholders may recommend nominees to registrant’s board of trustees.
| Item 11. | Controls and Procedures |
(a)(i) Registrant’s President and Treasurer have concluded that registrant’s disclosure controls and procedures (as defined in Rule 30a-3(c) under the Investment Company Act of 1940) are effective, based on their evaluation of these controls and procedures as of a date within 90 days of the filing date of this report.
(a)(ii) Registrant’s President and Treasurer are aware of no change in registrant’s internal control over financial reporting (as defined in Rule 30a-3(d) under the Investment Company Act of 1940) that occurred during registrant’s most recent fiscal quarter that has materially affected, or is reasonably likely to materially affect, registrant’s internal control over financial reporting.
| Item 12. | Disclosure of Securities Lending Activities for Closed-End Management Investment Companies |
Not applicable
Certifications pursuant to Rules 30a-2(a) and 30a-2(b) under the Investment Company Act of 1940 are attached hereto.
SIGNATURES
Pursuant to the requirements of the Securities Exchange Act of 1934 and the Investment Company Act of 1940, the registrant has duly caused this report to be signed on its behalf by the undersigned, thereunto duly authorized.
| | | | | | |
| Date: June 28, 2018 | | | | THRIVENT CORE FUNDS |
| | | |
| | | | By: | | /s/ David S. Royal |
| | | | | | David S. Royal |
| | | | | | President |
Pursuant to the requirements of the Securities Exchange Act of 1934 and the Investment Company Act of 1940, this report has been signed below by the following persons on behalf of the registrant and in the capacities and on the dates indicated.
| | | | | | |
| Date: June 28, 2018 | | | | By: | | /s/ David S. Royal |
| | | | | | David S. Royal |
| | | | | | President |
| | | |
| Date: June 28, 2018 | | | | By: | | /s/ Gerard V. Vaillancourt |
| | | | | | Gerard V. Vaillancourt |
| | | | | | Treasurer |