UNITED STATES
SECURITIES AND EXCHANGE COMMISSION
Washington, D.C. 20549
FORMN-CSR
CERTIFIED SHAREHOLDER REPORT OF REGISTERED
MANAGEMENT INVESTMENT COMPANIES
Investment Company Act file number:811-23149
Thrivent Core Funds
(Exact name of registrant as specified in charter)
625 Fourth Avenue South
Minneapolis, Minnesota 55415
(Address of principal executive offices) (Zip code)
John D. Jackson, Assistant Secretary
Thrivent Core Funds
625 Fourth Avenue South
Minneapolis, Minnesota 55415
(Name and address of agent for service)
Registrant’s telephone number, including area code: (612)844-7190
Date of fiscal year end: October 31
Date of reporting period: April 30, 2019
| Item 1. | Report to Stockholders |
SEMIANNUAL REPORT
April 30, 2019
THRIVENT CORE FUNDS
TABLEOF CONTENTS
| 2 | ||||
| 3 | ||||
| 4 | ||||
| 5 | ||||
| 6 | ||||
| 7 | ||||
| 12 | ||||
| 16 | ||||
| 19 | ||||
| 27 | ||||
| 28 | ||||
| 29 | ||||
| 31 | ||||
| 42 | ||||
| 44 | ||||
THRIVENT CORE EMERGING MARKETS DEBT FUND
Kent L. White, CFA, and Cortney L. Swensen, CFA , PortfolioCo-Managers
The Fund seeks to maximize total return while providing high current income and capital appreciation. The Fund’s investment objective may be changed without shareholder approval.
Investment in Thrivent Core Emerging Markets Debt involves risks including credit, derivatives, emerging markets, ETF, foreign securities, high yield, interest rate, investment adviser, issuer, liquidity, market,non-diversified, quantitative investing, and sovereign debt risks. A detailed description of each risk can be found in the significant risks section of the accompanying notes to financial statements.
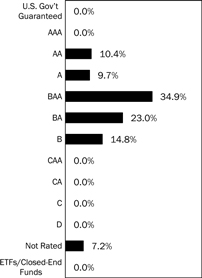
Bond Quality Ratings Distributions
Major Market Sectors (% of Net Assets) | ||||
Foreign Government | 94.9 | % | ||
Energy | 1.5 | % | ||
Utilities | 0.2 | % | ||
| Top 10 Countries | ||||
| (% of Net Assets) | ||||
Indonesia | 8.9 | % | ||
Turkey | 7.9 | % | ||
Saudi Arabia | 7.5 | % | ||
Qatar | 6.9 | % | ||
Mexico | 6.7 | % | ||
Argentina | 5.5 | % | ||
Russia | 4.7 | % | ||
Colombia | 4.4 | % | ||
Brazil | 4.0 | % | ||
Bahrain | 3.4 | % | ||
| Investments in securities in these countries represent 59.9% of the total net assets of the Fund. |
| |||
Bond quality ratings are obtained from Moody’s Investors Service, Inc. (“Moody’s”) and Standard & Poor’s Ratings Services (“S&P”). Ratings from S&P, when used, are converted into their equivalent Moody’s ratings. If Moody’s and S&P have assigned different ratings to a security, the lowest rating for the security is used. Not rated may include cash. Investments in derivatives and short-term investments are not reflected in the table.
Quoted Bond Quality Ratings Distributions, Major Market Sectors and Top 10 Countries are subject to change.
The lists of Major Market Sectors and Top 10 Countries exclude short-term investments and collateral held for securities loaned.
Bond Quality Ratings Distributions exclude collateral held for securitiesloaned.
2
THRIVENT CORE INTERNATIONAL EQUITY FUND
Noah J. Monsen, CFA and Brian W. Bomgren, CQF, PortfolioCo-Managers
The Fund seeks long-term capital appreciation. The Fund’s investment objective may be changed without shareholder approval.
Investment in Thrivent Core International Equity involves risks including equity security, foreign currency, foreign securities, investment adviser, issuer, large cap, market, mid cap, quantitative investing, and small cap risks. A detailed description of each risk can be found in the significant risks section of the accompanying notes to financial statements.
| Portfolio Composition | ||||
| (% of Portfolio) | ||||
Common Stock | 99.8% | |||
Short-Term Investments | 0.2% | |||
|
| |||
Total | 100.0% | |||
| Major Market Sectors | ||||
| (% of Net Assets) | ||||
Consumer Discretionary | 16.1 | % | ||
Consumer Staples | 13.0 | % | ||
Industrials | 12.9 | % | ||
Financials | 12.0 | % | ||
Materials | 10.2 | % | ||
Information Technology | 9.3 | % | ||
Health Care | 8.1 | % | ||
Communications Services | 6.7 | % | ||
Real Estate | 5.4 | % | ||
Utilities | 3.1 | % | ||
| Top 10 Countries | ||||
| (% of Net Assets) | ||||
Japan | 25.8 | % | ||
United Kingdom | 18.9 | % | ||
Canada | 9.7 | % | ||
Australia | 6.7 | % | ||
Switzerland | 6.5 | % | ||
Netherlands | 5.4 | % | ||
Sweden | 5.3 | % | ||
France | 5.1 | % | ||
Spain | 4.8 | % | ||
Denmark | 4.3 | % | ||
| Investments in securities in these countries represent 92.5% of the total net assets of the Fund. |
| |||
Quoted Portfolio Composition, Major Market Sectors and Top 10 Countries are subject to change.
The lists of Major Market Sectors and Top 10 Countries exclude short-term investments and collateral held for securities loaned.
The Portfolio Composition chart excludes collateral held for securities loaned.
3
THRIVENT CORE LOW VOLATILITY EQUITY FUND
Noah J. Monsen, CFA and Brian W. Bomgren, CQF, PortfolioCo-Managers
The Fund seeks to provide long-term capital appreciation with lower volatility relative to the domestic equity market. The Fund’s investment objective may be changed without shareholder approval.
Investment in Thrivent Core Low Volatility Equity involves risks including equity security, investment adviser, issuer, large cap, market, mid cap, quantitative investing, and small cap risks. A detailed description of each risk can be found in the significant risks section of the accompanying notes to financial statements.
| Portfolio Composition | ||||
| (% of Portfolio) | ||||
Common Stock | 99.8% | |||
Short-Term Investments | 0.2% | |||
|
| |||
Total | 100.0% | |||
| Major Market Sectors | ||||
| (% of Net Assets) | ||||
Information Technology | 17.7 | % | ||
Health Care | 16.2 | % | ||
Financials | 15.3 | % | ||
Consumer Staples | 14.3 | % | ||
Industrials | 11.0 | % | ||
Real Estate | 8.6 | % | ||
Utilities | 7.3 | % | ||
Consumer Discretionary | 6.3 | % | ||
Communications Services | 2.6 | % | ||
Materials | 0.4 | % | ||
| Top 10 Holdings | ||||
| (% of Net Assets) | ||||
PepsiCo, Inc. | 2.2 | % | ||
Mondelez International, Inc. | 2.1 | % | ||
NextEra Energy, Inc. | 2.1 | % | ||
Danaher Corporation | 2.1 | % | ||
McDonald's Corporation | 2.1 | % | ||
Home Depot, Inc. | 2.1 | % | ||
Amphenol Corporation | 2.0 | % | ||
UnitedHealth Group, Inc. | 2.0 | % | ||
Johnson & Johnson | 2.0 | % | ||
Colgate-Palmolive Company | 2.0 | % | ||
These securities represent 20.7% of the total net assets of the Fund. |
| |||
Quoted Portfolio Composition, Major Market Sectors and Top 10 Holdings are subject to change.
The lists of Major Market Sectors and Top 10 Holdings exclude short-term investments and collateral held for securities loaned.
The Portfolio Composition chart excludes collateral held for securities loaned.
4
THRIVENT CORE SHORT-TERM RESERVE FUND
William D. Stouten, Portfolio Manager
The Fund seeks a high level of current income consistent with liquidity and the preservation of capital.
Investment in Thrivent Core Short-Term Reserve Fund involves credit, government securities, interest rate, investment adviser, mortgage-backed and other asset-backed securities, portfolio turnover rate, prepayment, redemption and lending, and redemption and share ownership risks. A detailed description of each risk can be found in the significant risks section of the accompanying notes to financial statements.
| Portfolio Composition | ||||
| (% of Portfolio) | ||||
Short-Term Investments | 100.0% | |||
|
| |||
Total | 100.0% | |||
| Major Market Sectors | ||||
| (% of Net Assets) | ||||
Financials | 43.3 | % | ||
Utilities | 10.5 | % | ||
ConsumerNon-Cyclical | 9.9 | % | ||
Consumer Cyclical | 6.3 | % | ||
Asset-Backed Securities | 5.8 | % | ||
Capital Goods | 4.6 | % | ||
Energy | 4.1 | % | ||
U.S. Government & Agencies | 3.3 | % | ||
Foreign | 3.0 | % | ||
Basic Materials | 2.8 | % | ||
| Top 10 Holdings | ||||
| (% of Net Assets) | ||||
Dealers Capital Access Trust, LLC | 0.7 | % | ||
Federal Home Loan Bank | 0.7 | % | ||
Mitsubishi UFJ Trust & Banking Corporation | 0.6 | % | ||
Commonwealth Bank of Australia | 0.6 | % | ||
Erste Abwicklungsanstalt | 0.6 | % | ||
State of Tennessee | 0.5 | % | ||
Long Island Power Auth. | 0.5 | % | ||
PepsiCo, Inc. | 0.5 | % | ||
U.S. Bank NA Ohio | 0.5 | % | ||
American Honda Finance Corporation | 0.5 | % | ||
| These securities represent 5.7% of the total net assets of the Fund. |
| |||
Quoted Portfolio Composition, Major Market Sectors and Top 10 Holdings are subject to change.
5
SHAREHOLDER EXPENSE EXAMPLE
(unaudited)
As a shareholder of a Fund, you incur ongoing costs, including administrative fees and other Fund expenses. This Example is intended to help you understand your ongoing costs (in dollars) of investing in the Fund and to compare these costs with the ongoing costs of investing in other mutual funds. The Example is based on an investment of $1,000 invested at the beginning of the period and held for the entire period from November 1, 2018 through April 30, 2019.
Actual Expenses
In the table below, the first line provides information about actual account values and actual expenses. You may use the information in this line, together with the amount you invested, to estimate the expenses that you paid over the period. Simply divide your account value by $1,000 (for example, an $8,600 account value divided by $1,000 = 8.6), then multiply the result by the number in the first line under the heading entitled “Expenses Paid during Period” to estimate the expenses you paid on your account during the period.
Hypothetical Example for Comparison Purposes
In the table below, the second line provides information about hypothetical account values and hypothetical expenses based on the Fund’s actual expense ratio and an assumed rate of return of 5% per year before expenses, which is not the Fund’s actual return. The hypothetical account values and expenses may not be used to estimate the actual ending account balance or expenses you paid for the period. You may use this information to compare the ongoing costs of investing in the Fund and other funds. To do so, compare this 5% hypothetical example with the 5% hypothetical example that appears in the shareholder reports of the other funds.
| Beginning Account Value 11/1/2018 | Ending Account Value 4/30/2019 | Expenses Paid During Period 11/1/2018 - 4/30/2019* | Annualized Expense Ratio | |||||||||||||
Thrivent Core Emerging Markets Debt Fund | ||||||||||||||||
Actual | $ | 1,000 | $ | 1,071 | $ | 0.23 | 0.05 | % | ||||||||
Hypothetical** | $ | 1,000 | $ | 1,025 | $ | 0.23 | 0.05 | % | ||||||||
Thrivent Core International Equity Fund | ||||||||||||||||
Actual | $ | 1,000 | $ | 1,068 | $ | 0.32 | 0.06 | % | ||||||||
Hypothetical** | $ | 1,000 | $ | 1,024 | $ | 0.31 | 0.06 | % | ||||||||
Thrivent Core Low Volatility Equity Fund | ||||||||||||||||
Actual | $ | 1,000 | $ | 1,129 | $ | 0.20 | 0.04 | % | ||||||||
Hypothetical** | $ | 1,000 | $ | 1,025 | $ | 0.19 | 0.04 | % | ||||||||
Thrivent Core Short-Term Reserve Fund | ||||||||||||||||
Actual | $ | 1,000 | $ | 1,013 | $ | 0.04 | 0.01 | % | ||||||||
Hypothetical** | $ | 1,000 | $ | 1,025 | $ | 0.04 | 0.01 | % | ||||||||
| * | Expenses are equal to the Portfolio’s annualized expense ratio, multiplied by the average account value over the period, multiplied by 181/365 to reflect theone-half year period. |
| ** | Assuming 5% annualized total return before expenses. |
6
EMERGING MARKETS DEBT FUND
Schedule of Investments as of April 30, 2019
(unaudited)
Principal | Long-Term Fixed Income (96.6%) | Value | ||||
Argentina (5.5%) | ||||||
Argentina Government International Bond | ||||||
$3,250,000 | 7.125%, 6/28/2117 | $ | 2,169,375 | |||
4,875,000 | 6.875%, 4/22/2021 | 4,104,750 | ||||
3,865,000 | 5.625%, 1/26/2022 | 3,022,430 | ||||
3,000,000 | 4.625%, 1/11/2023 | 2,220,000 | ||||
11,702,000 | 7.500%, 4/22/2026 | 8,791,127 | ||||
5,000,000 | 6.875%, 1/26/2027 | 3,607,550 | ||||
6,000,000 | 5.875%, 1/11/2028 | 4,149,060 | ||||
7,973,407 | 8.280%, 12/31/2033 | 5,908,374 | ||||
2,103,057 | 8.280%, 12/31/2033 | 1,519,459 | ||||
7,963,066 | 3.750%, 12/31/2038a | 4,168,745 | ||||
3,671,000 | 7.625%, 4/22/2046 | 2,551,345 | ||||
2,500,000 | 6.875%, 1/11/2048 | 1,657,525 | ||||
|
| |||||
Total | 43,869,740 | |||||
|
| |||||
Bahrain (3.4%) | ||||||
Bahrain Government International Bond | ||||||
5,000,000 | 5.875%, 1/26/2021b | 5,082,100 | ||||
2,500,000 | 6.125%, 7/5/2022b | 2,583,210 | ||||
4,000,000 | 6.125%, 8/1/2023b | 4,167,832 | ||||
2,000,000 | 6.875%, 10/5/2025b | 2,180,000 | ||||
1,000,000 | 7.000%, 1/26/2026 | 1,076,250 | ||||
3,500,000 | 7.000%, 1/26/2026b | 3,766,875 | ||||
2,000,000 | 7.000%, 10/12/2028b | 2,160,000 | ||||
2,500,000 | 6.750%, 9/20/2029b | 2,650,000 | ||||
3,000,000 | 7.500%, 9/20/2047b | 3,196,500 | ||||
1,000,000 | 7.500%, 9/20/2047 | 1,065,500 | ||||
|
| |||||
Total | 27,928,267 | |||||
|
| |||||
Brazil (4.0%) | ||||||
Brazil Government International Bond | ||||||
4,800,000 | 2.625%, 1/5/2023 | 4,648,848 | ||||
6,911,000 | 6.000%, 4/7/2026c | 7,618,479 | ||||
3,000,000 | 4.625%, 1/13/2028c | 3,010,500 | ||||
2,000,000 | 4.500%, 5/30/2029 | 1,948,000 | ||||
2,000,000 | 8.250%, 1/20/2034 | 2,540,000 | ||||
5,005,000 | 7.125%, 1/20/2037 | 5,855,850 | ||||
5,500,000 | 5.000%, 1/27/2045 | 4,998,125 | ||||
2,000,000 | 5.625%, 2/21/2047 | 1,960,000 | ||||
|
| |||||
Total | 32,579,802 | |||||
|
| |||||
Cayman Islands (2.3%) | ||||||
Dubai DOF Sukuk, Ltd. | ||||||
2,000,000 | 6.450%, 5/2/2022 | 2,168,200 | ||||
2,000,000 | 3.875%, 1/30/2023 | 2,010,000 | ||||
KSA Sukuk, Ltd. | ||||||
7,000,000 | 2.894%, 4/20/2022b | 6,982,500 | ||||
2,500,000 | 3.628%, 4/20/2027b | 2,515,750 | ||||
RAK Capital | ||||||
2,000,000 | 3.094%, 3/31/2025 | 1,939,520 | ||||
Sharjah Sukuk, Ltd. | ||||||
2,000,000 | 3.839%, 1/27/2021 | 2,012,500 | ||||
|
| |||||
Total | 17,628,470 | |||||
|
| |||||
Colombia (4.4%) | ||||||
Colombia Government International Bond | ||||||
3,870,000 | 4.375%, 7/12/2021 | 3,971,587 | ||||
5,000,000 | 2.625%, 3/15/2023 | 4,900,000 | ||||
1,910,000 | 4.000%, 2/26/2024 | 1,966,345 | ||||
Principal | Long-Term Fixed Income (96.6%) | Value | ||||
Colombia (4.4%) - continued | ||||||
| $4,875,000 | 3.875%, 4/25/2027 | $ | 4,944,322 | |||
| 200,000 | 4.500%, 3/15/2029 | 211,000 | ||||
| 4,000,000 | 7.375%, 9/18/2037 | 5,210,000 | ||||
| 3,000,000 | 6.125%, 1/18/2041 | 3,528,750 | ||||
| 7,705,000 | 5.625%, 2/26/2044 | 8,648,862 | ||||
| 2,000,000 | 5.200%, 5/15/2049 | 2,140,000 | ||||
|
| |||||
Total | 35,520,866 | |||||
|
| |||||
Croatia (1.6%) | ||||||
Croatia Government International Bond | ||||||
| 2,000,000 | 6.625%, 7/14/2020b | 2,081,320 | ||||
| 4,500,000 | 6.375%, 3/24/2021b | 4,764,600 | ||||
| 2,000,000 | 5.500%, 4/4/2023b | 2,165,080 | ||||
| 3,021,000 | 6.000%, 1/26/2024b,c | 3,381,188 | ||||
|
| |||||
Total | 12,392,188 | |||||
|
| |||||
Dominican Republic (2.9%) | ||||||
Dominican Republic Government International Bond | ||||||
| 2,000,000 | 7.500%, 5/6/2021b | 2,068,020 | ||||
| 1,500,000 | 6.600%, 1/28/2024b | 1,621,500 | ||||
| 3,500,000 | 5.500%, 1/27/2025b | 3,613,750 | ||||
| 3,000,000 | 6.875%, 1/29/2026b | 3,315,000 | ||||
| 2,000,000 | 5.950%, 1/25/2027b | 2,107,500 | ||||
| 1,000,000 | 6.000%, 7/19/2028b | 1,053,750 | ||||
| 5,000,000 | 7.450%, 4/30/2044b | 5,656,250 | ||||
| 2,000,000 | 6.850%, 1/27/2045b | 2,142,500 | ||||
| 1,000,000 | 6.500%, 2/15/2048b | 1,038,510 | ||||
|
| |||||
Total | 22,616,780 | |||||
|
| |||||
Egypt (2.9%) | ||||||
Egypt Government International Bond | ||||||
| 4,000,000 | 6.125%, 1/31/2022 | 4,042,456 | ||||
| 4,000,000 | 5.875%, 6/11/2025 | 3,914,240 | ||||
| 3,000,000 | 7.500%, 1/31/2027 | 3,090,780 | ||||
| 4,000,000 | 7.600%, 3/1/2029 | 4,030,800 | ||||
| 5,000,000 | 8.500%, 1/31/2047 | 5,082,150 | ||||
| 3,000,000 | 7.903%, 2/21/2048 | 2,895,516 | ||||
|
| |||||
Total | 23,055,942 | |||||
|
| |||||
Hungary (1.7%) | ||||||
Hungary Government International Bond | ||||||
| 2,500,000 | 6.375%, 3/29/2021 | 2,658,800 | ||||
| 5,950,000 | 5.750%, 11/22/2023 | 6,596,586 | ||||
| 2,000,000 | 5.375%, 3/25/2024 | 2,198,952 | ||||
| 1,500,000 | 7.625%, 3/29/2041 | 2,254,200 | ||||
|
| |||||
Total | 13,708,538 | |||||
|
| |||||
Indonesia (8.9%) | ||||||
Indonesia Government International Bond | ||||||
| 4,650,000 | 3.750%, 4/25/2022b | 4,721,391 | ||||
| 4,000,000 | 3.375%, 4/15/2023b | 4,013,416 | ||||
| 6,197,000 | 5.875%, 1/15/2024b | 6,854,644 | ||||
| 575,000 | 4.125%, 1/15/2025b | 592,566 | ||||
| 6,100,000 | 4.750%, 1/8/2026b | 6,496,372 | ||||
| 5,000,000 | 8.500%, 10/12/2035b | 7,195,875 | ||||
| 2,000,000 | 6.625%, 2/17/2037b | 2,485,962 | ||||
| 2,000,000 | 7.750%, 1/17/2038b | 2,765,820 | ||||
| 3,226,000 | 6.750%, 1/15/2044b | 4,176,996 | ||||
The accompanying Notes to Financial Statements are an integral part of this schedule.
| 7 |
EMERGING MARKETS DEBT FUND
Schedule of Investments as of April 30, 2019
(unaudited)
Principal | Long-Term Fixed Income (96.6%) | Value | ||||
Indonesia (8.9%) - continued | ||||||
$3,700,000 | 5.125%, 1/15/2045b | $ | 3,970,126 | |||
4,000,000 | 5.950%, 1/8/2046b | 4,750,440 | ||||
1,200,000 | 5.250%, 1/8/2047b | 1,310,102 | ||||
1,500,000 | 4.350%, 1/11/2048 | 1,476,438 | ||||
Perusahaan Penerbit SBSN Indonesia III | ||||||
3,000,000 | 3.400%, 3/29/2021b | 3,031,110 | ||||
1,000,000 | 3.750%, 3/1/2023b | 1,013,200 | ||||
2,500,000 | 4.350%, 9/10/2024b | 2,588,750 | ||||
3,500,000 | 4.150%, 3/29/2027b | 3,556,875 | ||||
4,000,000 | 4.400%, 3/1/2028b | 4,118,000 | ||||
5,000,000 | 4.450%, 2/20/2029b | 5,162,500 | ||||
|
| |||||
Total | 70,280,583 | |||||
|
| |||||
Kuwait (1.6%) | ||||||
Kuwait Government International Bond | ||||||
5,500,000 | 2.750%, 3/20/2022b | 5,486,910 | ||||
7,000,000 | 3.500%, 3/20/2027b | 7,139,510 | ||||
|
| |||||
Total | 12,626,420 | |||||
|
| |||||
Mexico (6.7%) | ||||||
Mexico Government International Bond | ||||||
5,590,000 | 5.750%, 10/12/2110 | 5,736,738 | ||||
5,220,000 | 4.000%, 10/2/2023 | 5,363,550 | ||||
1,215,000 | 3.600%, 1/30/2025 | 1,213,785 | ||||
3,000,000 | 4.125%, 1/21/2026 | 3,051,000 | ||||
5,781,000 | 4.150%, 3/28/2027 | 5,860,778 | ||||
5,085,000 | 3.750%, 1/11/2028 | 4,991,945 | ||||
1,000,000 | 6.750%, 9/27/2034 | 1,221,420 | ||||
5,878,000 | 6.050%, 1/11/2040 | 6,737,658 | ||||
6,000,000 | 5.550%, 1/21/2045 | 6,570,000 | ||||
5,250,000 | 4.600%, 1/23/2046 | 5,055,750 | ||||
2,000,000 | 4.600%, 2/10/2048 | 1,934,000 | ||||
Petroleos Mexicanos | ||||||
2,850,000 | 6.375%, 2/4/2021 | 2,949,465 | ||||
2,500,000 | 6.500%, 3/13/2027 | 2,532,250 | ||||
|
| |||||
Total | 53,218,339 | |||||
|
| |||||
Netherlands (0.8%) | ||||||
Petrobras Global Finance BV | ||||||
3,000,000 | 5.299%, 1/27/2025 | 3,078,000 | ||||
1,500,000 | 7.375%, 1/17/2027 | 1,671,000 | ||||
2,000,000 | 5.750%, 2/1/2029 | 2,005,000 | ||||
|
| |||||
Total | 6,754,000 | |||||
|
| |||||
Nigeria (2.0%) | ||||||
Nigeria Government International Bond | ||||||
2,000,000 | 6.375%, 7/12/2023 | 2,060,400 | ||||
3,500,000 | 7.625%, 11/21/2025 | 3,735,760 | ||||
3,500,000 | 7.143%, 2/23/2030 | 3,483,060 | ||||
3,000,000 | 7.696%, 2/23/2038 | 2,958,300 | ||||
3,000,000 | 7.625%, 11/28/2047 | 2,873,580 | ||||
|
| |||||
Total | 15,111,100 | |||||
|
| |||||
Oman (3.1%) | ||||||
Oman Government International Bond | ||||||
3,000,000 | 3.625%, 6/15/2021b | 2,932,500 | ||||
3,000,000 | 4.125%, 1/17/2023b | 2,899,200 | ||||
2,000,000 | 5.932%, 10/31/2025b | 2,030,000 | ||||
Principal | Long-Term Fixed Income (96.6%) | Value | ||||
Oman (3.1%) - continued | ||||||
$5,000,000 | 4.750%, 6/15/2026b | $ | 4,625,000 | |||
2,000,000 | 5.375%, 3/8/2027b | 1,880,000 | ||||
4,000,000 | 5.625%, 1/17/2028b | 3,800,744 | ||||
6,000,000 | 6.750%, 1/17/2048b | 5,437,080 | ||||
|
| |||||
Total | 23,604,524 | |||||
|
| |||||
Panama (2.6%) | ||||||
Panama Government International Bond | ||||||
2,000,000 | 4.500%, 4/16/2050 | 2,088,400 | ||||
1,000,000 | 9.375%, 1/16/2023 | 1,218,750 | ||||
3,000,000 | 3.750%, 3/16/2025 | 3,085,530 | ||||
1,500,000 | 8.875%, 9/30/2027 | 2,079,375 | ||||
2,000,000 | 3.875%, 3/17/2028 | 2,071,020 | ||||
1,688,000 | 9.375%, 4/1/2029 | 2,458,150 | ||||
5,079,000 | 6.700%, 1/26/2036 | 6,602,700 | ||||
|
| |||||
Total | 19,603,925 | |||||
|
| |||||
Peru (1.8%) | ||||||
Peru Government International Bond | ||||||
3,650,000 | 5.625%, 11/18/2050 | 4,662,875 | ||||
1,000,000 | 7.350%, 7/21/2025 | 1,245,510 | ||||
5,000,000 | 8.750%, 11/21/2033 | 7,750,000 | ||||
|
| |||||
Total | 13,658,385 | |||||
|
| |||||
Philippines (3.2%) | ||||||
Philippines Government International Bond | ||||||
3,000,000 | 4.200%, 1/21/2024 | 3,172,335 | ||||
3,000,000 | 3.750%, 1/14/2029 | 3,143,841 | ||||
5,025,000 | 7.750%, 1/14/2031 | 7,050,728 | ||||
2,625,000 | 6.375%, 10/23/2034 | 3,469,683 | ||||
1,000,000 | 5.000%, 1/13/2037 | 1,176,071 | ||||
3,720,000 | 3.950%, 1/20/2040 | 3,889,546 | ||||
4,000,000 | 3.700%, 3/1/2041c | 4,033,332 | ||||
|
| |||||
Total | 25,935,536 | |||||
|
| |||||
Poland (0.9%) | ||||||
Poland Government International Bond | ||||||
4,000,000 | 5.000%, 3/23/2022 | 4,248,040 | ||||
3,000,000 | 4.000%, 1/22/2024 | 3,150,000 | ||||
|
| |||||
Total | 7,398,040 | |||||
|
| |||||
Qatar (6.9%) | ||||||
Qatar Government International Bond | ||||||
6,000,000 | 4.500%, 1/20/2022b | 6,237,600 | ||||
3,000,000 | 3.875%, 4/23/2023b | 3,097,056 | ||||
6,000,000 | 3.375%, 3/14/2024b | 6,082,500 | ||||
3,000,000 | 3.250%, 6/2/2026b | 2,989,548 | ||||
8,500,000 | 4.500%, 4/23/2028b | 9,180,000 | ||||
1,000,000 | 4.000%, 3/14/2029b | 1,041,096 | ||||
2,000,000 | 9.750%, 6/15/2030b | 3,107,600 | ||||
2,000,000 | 5.750%, 1/20/2042b | 2,432,500 | ||||
9,750,000 | 5.103%, 4/23/2048b | 10,883,438 | ||||
8,000,000 | 4.817%, 3/14/2049b | 8,590,000 | ||||
|
| |||||
Total | 53,641,338 | |||||
|
| |||||
The accompanying Notes to Financial Statements are an integral part of this schedule.
| 8 |
EMERGING MARKETS DEBT FUND
Schedule of Investments as of April 30, 2019
(unaudited)
Principal Amount | Long-Term Fixed Income (96.6%) | Value | ||||
Russia (4.8%) | ||||||
Russia Government International Bond | ||||||
$2,000,000 | 4.500%, 4/4/2022b | $ | 2,067,900 | |||
2,600,000 | 4.875%, 9/16/2023b | 2,743,000 | ||||
7,600,000 | 4.750%, 5/27/2026 | 7,894,318 | ||||
4,000,000 | 4.250%, 6/23/2027b | 4,023,400 | ||||
2,000,000 | 12.750%, 6/24/2028b | 3,241,040 | ||||
1,125,000 | 7.500%, 3/31/2030b | 1,254,656 | ||||
1,000,000 | 5.100%, 3/28/2035b | 1,034,988 | ||||
6,600,000 | 5.625%, 4/4/2042b | 7,316,377 | ||||
8,000,000 | 5.250%, 6/23/2047b | 8,290,000 | ||||
|
| |||||
Total | 37,865,679 | |||||
|
| |||||
Saudi Arabia (7.5%) | ||||||
Saudi Arabia Government International Bond | ||||||
3,000,000 | 5.250%, 1/16/2050b | 3,255,312 | ||||
2,500,000 | 2.375%, 10/26/2021b | 2,463,475 | ||||
3,000,000 | 2.875%, 3/4/2023b | 2,976,660 | ||||
6,000,000 | 4.000%, 4/17/2025b | 6,210,000 | ||||
9,000,000 | 3.250%, 10/26/2026b | 8,832,546 | ||||
6,000,000 | 3.625%, 3/4/2028b | 6,003,720 | ||||
3,000,000 | 4.375%, 4/16/2029b | 3,146,730 | ||||
7,000,000 | 4.500%, 4/17/2030b | 7,376,320 | ||||
5,250,000 | 4.500%, 10/26/2046b | 5,177,550 | ||||
4,000,000 | 4.625%, 10/4/2047b | 4,019,440 | ||||
9,000,000 | 5.000%, 4/17/2049b | 9,510,732 | ||||
|
| |||||
Total | 58,972,485 | |||||
|
| |||||
South Africa (3.3%) | ||||||
Eskom Holdings SOC, Ltd. | ||||||
1,500,000 | 6.350%, 8/10/2028b | 1,558,224 | ||||
South Africa Government International Bond | ||||||
4,125,000 | 5.875%, 5/30/2022 | 4,341,563 | ||||
2,000,000 | 4.665%, 1/17/2024 | 2,020,020 | ||||
4,500,000 | 5.875%, 9/16/2025 | 4,743,063 | ||||
1,600,000 | 4.875%, 4/14/2026 | 1,584,368 | ||||
1,500,000 | 4.850%, 9/27/2027 | 1,460,331 | ||||
4,000,000 | 4.300%, 10/12/2028 | 3,729,960 | ||||
500,000 | 5.875%, 6/22/2030 | 510,641 | ||||
500,000 | 6.250%, 3/8/2041 | 514,375 | ||||
5,200,000 | 5.650%, 9/27/2047 | 4,872,421 | ||||
|
| |||||
Total | 25,334,966 | |||||
|
| |||||
Sri Lanka (1.9%) | ||||||
Sri Lanka Government International Bond | ||||||
1,500,000 | 6.250%, 10/4/2020b | 1,508,925 | ||||
1,500,000 | 5.750%, 1/18/2022b | 1,488,110 | ||||
1,500,000 | 5.875%, 7/25/2022b | 1,483,257 | ||||
1,000,000 | 5.750%, 4/18/2023b | 980,755 | ||||
2,000,000 | 6.850%, 3/14/2024b | 2,018,884 | ||||
2,000,000 | 6.850%, 11/3/2025b | 1,997,546 | ||||
1,500,000 | 6.200%, 5/11/2027b | 1,416,758 | ||||
1,000,000 | 6.750%, 4/18/2028b | 963,111 | ||||
2,000,000 | 7.850%, 3/14/2029b | 2,056,600 | ||||
|
| |||||
Total | 13,913,946 | |||||
|
| |||||
Turkey (7.9%) | ||||||
Hazine Mustesarligi Varlik Kiralama AS | ||||||
3,000,000 | 5.800%, 2/21/2022b | 2,930,916 | ||||
Principal Amount | Long-Term Fixed Income (96.6%) | Value | ||||
Turkey (7.9%) - continued | ||||||
Turkey Government International Bond | ||||||
$2,750,000 | 7.000%, 6/5/2020 | $ | 2,774,629 | |||
2,500,000 | 5.625%, 3/30/2021 | 2,463,680 | ||||
3,000,000 | 6.250%, 9/26/2022 | 2,927,760 | ||||
5,000,000 | 7.250%, 12/23/2023c | 4,988,050 | ||||
8,000,000 | 5.750%, 3/22/2024 | 7,484,800 | ||||
2,250,000 | 7.375%, 2/5/2025 | 2,226,380 | ||||
3,000,000 | 4.250%, 4/14/2026 | 2,494,020 | ||||
2,042,000 | 4.875%, 10/9/2026 | 1,741,458 | ||||
4,300,000 | 6.000%, 3/25/2027 | 3,870,430 | ||||
1,000,000 | 5.125%, 2/17/2028 | 845,360 | ||||
4,000,000 | 6.125%, 10/24/2028 | 3,584,520 | ||||
1,500,000 | 7.625%, 4/26/2029 | 1,459,500 | ||||
2,500,000 | 8.000%, 2/14/2034 | 2,503,250 | ||||
6,839,000 | 6.875%, 3/17/2036 | 6,120,905 | ||||
5,935,000 | 6.750%, 5/30/2040 | 5,190,573 | ||||
6,500,000 | 6.625%, 2/17/2045 | 5,532,241 | ||||
3,000,000 | 5.750%, 5/11/2047 | 2,351,250 | ||||
|
| |||||
Total | 61,489,722 | |||||
|
| |||||
United Arab Emirates (2.1%) | ||||||
Abu Dhabi Government International Bond | ||||||
3,000,000 | 2.500%, 10/11/2022b | 2,970,000 | ||||
3,000,000 | 3.125%, 5/3/2026b | 3,007,500 | ||||
5,500,000 | 3.125%, 10/11/2027b | 5,465,790 | ||||
4,000,000 | 4.125%, 10/11/2047b | 4,072,000 | ||||
Dubai Government International Bond | ||||||
1,000,000 | 5.250%, 1/30/2043 | 1,057,540 | ||||
|
| |||||
Total | 16,572,830 | |||||
|
| |||||
Uruguay (1.9%) | ||||||
Uruguay Government International Bond | ||||||
1,071,287 | 4.975%, 4/20/2055 | 1,103,426 | ||||
9,000,000 | 5.100%, 6/18/2050 | 9,450,000 | ||||
2,500,000 | 4.375%, 10/27/2027 | 2,606,250 | ||||
2,040,312 | 4.375%, 1/23/2031 | 2,125,005 | ||||
|
| |||||
| Total | 15,284,681 | |||||
|
| |||||
| Total Long-Term Fixed Income (cost $783,479,459) | 760,567,092 | |||||
|
| |||||
Shares | Collateral Held for Securities Loaned (1.0%) | |||||
7,629,243 | Thrivent Cash Management Trust | 7,629,243 | ||||
|
| |||||
| Total Collateral Held for Securities Loaned (cost $7,629,243) | 7,629,243 | |||||
|
| |||||
Shares or | Short-Term Investments (7.2%) | |||||
Federal Home Loan Bank Discount Notes | ||||||
19,290,000 | 2.300%, 5/1/2019d | 19,290,000 | ||||
The accompanying Notes to Financial Statements are an integral part of this schedule.
| 9 |
EMERGING MARKETS DEBT FUND
Schedule of Investments as of April 30, 2019
(unaudited)
Shares or Principal Amount | Short-Term Investments (7.2%) | Value | ||||
Thrivent Core Short-Term Reserve Fund | ||||||
3,712,552 | 2.690% | $ | 37,125,522 | |||
|
| |||||
| Total Short-Term Investments (cost $56,415,522) | 56,415,522 | |||||
|
| |||||
| Total Investments (cost $847,524,224) 104.8% | $ | 824,611,857 | ||||
|
| |||||
| Other Assets and Liabilities, Net (4.8%) | (37,529,094) | |||||
|
| |||||
Total Net Assets 100.0% | $ | 787,082,763 | ||||
|
| |||||
| a | Denotes step coupon securities. Step coupon securities pay an initial coupon rate for the first period and then different coupon rates for following periods. The rate shown is as of April 30, 2019. |
| b | Denotes securities sold under Rule 144A of the Securities Act of 1933, which exempts them from registration. These securities may be resold to other dealers in the program or to other qualified institutional buyers. As of April 30, 2019, the value of these investments was $351,832,384 or 44.7% of total net assets. |
| c | All or a portion of the security is on loan. |
| d | The interest rate shown reflects the yield, coupon rate or the discount rate at the date of purchase. |
The following table presents the total amount of securities loaned with continuous maturity, by type, offset by the gross payable upon return of collateral for securities loaned by Thrivent Core Emerging Markets Debt Fund as of April 30, 2019:
Securities Lending Transactions
Long-Term Fixed Income | $ | 7,337,507 | ||
|
| |||
Total lending | $ | 7,337,507 | ||
Gross amount payable upon return of collateral for securities loaned | $ | 7,629,243 | ||
|
| |||
Net amounts due to counterparty | $ | 291,736 | ||
|
|
Unrealized Appreciation (Depreciation)
Gross unrealized appreciation and depreciation of investments of the portfolio as a whole (including derivatives), based on cost for federal income tax purposes, were as follows:
Gross unrealized appreciation | $ | 9,909,440 | ||
Gross unrealized depreciation | (33,137,060 | ) | ||
|
| |||
Net unrealized appreciation (depreciation) | $ | (23,227,620 | ) | |
Cost (includes notional principal amount of derivatives, if any) for federal income tax purposes | $ | 847,839,477 | ||
The accompanying Notes to Financial Statements are an integral part of this schedule.
| 10 |
EMERGING MARKETS DEBT FUND
Schedule of Investments as of April 30, 2019
(unaudited)
Fair Valuation Measurements
The following table is a summary of the inputs used, as of April 30, 2019, in valuing Emerging Markets Debt Fund’s assets carried at fair value.
Investments in Securities | Total | Level 1 | Level 2 | Level 3 | ||||||||||||
Long-Term Fixed Income | ||||||||||||||||
Energy | 12,235,715 | – | 12,235,715 | – | ||||||||||||
Foreign Government | 746,773,153 | – | 746,773,153 | – | ||||||||||||
Utilities | 1,558,224 | – | 1,558,224 | – | ||||||||||||
Short-Term Investments | 19,290,000 | – | 19,290,000 | – | ||||||||||||
|
|
|
|
|
|
|
| |||||||||
Subtotal Investments in Securities | $ | 779,857,092 | $ | – | $ | 779,857,092 | $ | – | ||||||||
|
|
|
|
|
|
|
| |||||||||
Other Investments * | Total | |||||||||||||||
Affiliated Short-Term Investments | 37,125,522 | |||||||||||||||
Collateral Held for Securities Loaned | 7,629,243 | |||||||||||||||
|
| |||||||||||||||
Subtotal Other Investments | $ | 44,754,765 | ||||||||||||||
|
| |||||||||||||||
Total Investments at Value | $ | 824,611,857 | ||||||||||||||
|
| |||||||||||||||
| * | Certain investments are measured at fair value using a net asset value per share that is not publicly available (practical expedient). According to disclosure requirements of Accounting Standards Codification (ASC) 820, Fair Value Measurement, securities valued using the practical expedient are not classified in the fair value hierarchy. The fair value amounts presented in this table are intended to permit reconciliation of the fair value hierarchy to the amounts presented in the Statement of Assets and Liabilities. |
There were no significant transfers between Levels during the period ended April 30, 2019. Transfers between Levels are identified as of the end of the period.
Investment in Affiliates
Affiliated issuers, as defined under the Investment Company Act of 1940, include those in which the Fund’s holdings of an issuer represent 5% or more of the outstanding voting securities of an issuer, any affiliated mutual fund, or a company which is under common ownership or control with the Fund. The Fund owns shares of Thrivent Cash Management Trust for the purpose of securities lending and Thrivent Core Short-Term Reserve Fund, a series of Thrivent Core Funds, primarily to serve as a cash sweep vehicle for the Fund. Thrivent Cash Management Trust and Thrivent Core Funds are established solely for investment by Thrivent entities.
A summary of transactions (in thousands; values shown as zero are less than $500) for the fiscal year to date, in Emerging Markets Debt Fund, is as follows:
Fund | Value 10/31/2018 | Gross Purchases | Gross Sales | Value 4/30/2019 | Shares Held at 4/30/2019 | % of Net Assets 4/30/2019 | ||||||||||||||||||
Affiliated Short-Term Investments | ||||||||||||||||||||||||
Core Short-Term Reserve, 2.690% | $ | 12,270 | $ | 76,760 | $ | 51,904 | $ | 37,126 | 3,713 | 4.7 | % | |||||||||||||
|
|
|
|
|
|
|
|
|
|
|
| |||||||||||||
Total Affiliated Short-Term Investments | 12,270 | 37,126 | 4.7 | |||||||||||||||||||||
|
|
|
|
|
| |||||||||||||||||||
Collateral Held for Securities Loaned | ||||||||||||||||||||||||
Cash Management Trust- Collateral Investment | 4,447 | 40,277 | 37,095 | 7,629 | 7,629 | 1.0 | ||||||||||||||||||
|
|
|
|
|
|
|
|
|
|
|
| |||||||||||||
Total Collateral Held for Securities Loaned | 4,447 | 7,629 | 1.0 | |||||||||||||||||||||
|
|
|
|
|
| |||||||||||||||||||
Total Value | $ | 16,717 | $ | 44,755 | ||||||||||||||||||||
|
|
|
| |||||||||||||||||||||
Fund | Net Realized Gain/(Loss) | Change in Unrealized Appreciation/ (Depreciation) | Distributions of Realized Capital Gains | Income Earned 11/1/2018 - 4/30/2019 | ||||||||||||
Affiliated Short-Term Investments | �� | |||||||||||||||
Core Short-Term Reserve, 2.690% | $ | – | $ | – | $ | – | $ | 93 | ||||||||
|
|
|
|
|
|
|
| |||||||||
Total Income from Affiliated Investments | $ | 93 | ||||||||||||||
|
| |||||||||||||||
Collateral Held for Securities Loaned | ||||||||||||||||
Cash Management Trust- Collateral Investment | – | – | – | 8 | ||||||||||||
|
|
|
|
|
|
|
| |||||||||
Total Affiliated Income from Securities Loaned, Net | $ | 8 | ||||||||||||||
|
|
|
|
|
|
|
| |||||||||
Total | $ | – | $ | – | $ | – | ||||||||||
|
|
|
|
|
| |||||||||||
The accompanying Notes to Financial Statements are an integral part of this schedule.
11
INTERNATIONAL EQUITY FUND
Schedule of Investments as of April 30, 2019
(unaudited)
Shares | Common Stock (99.1%) | Value | ||||
Australia (6.7%) | ||||||
992,187 | AGL Energy, Ltd. | $ | 15,565,777 | |||
389,260 | BHP Group, Ltd. | 10,300,733 | ||||
419,135 | Computershare, Ltd. | 5,272,824 | ||||
1,179,302 | FlexiGroup, Ltd. | 1,161,500 | ||||
540,421 | GWA Group, Ltd. | 1,283,524 | ||||
3,558,313 | Medibank Private, Ltd. | 7,171,300 | ||||
4,737,867 | Mirvac Group | 9,484,688 | ||||
389,898 | Sandfire Resources NL | 1,939,360 | ||||
154,996 | Scentre Group | 418,101 | ||||
318,843 | Seven West Media, Ltd.a | 127,248 | ||||
123,038 | Super Retail Group, Ltd. | 751,512 | ||||
3,003,166 | Telstra Corporation, Ltd. | 7,153,075 | ||||
818,317 | Vicinity Centres | 1,467,517 | ||||
|
| |||||
Total | 62,097,159 | |||||
|
| |||||
Canada (9.7%) | ||||||
110,220 | Bank of Montreal | 8,706,039 | ||||
278,693 | CGI, Inc.a | 20,059,988 | ||||
66,041 | Choice Properties REIT | 672,389 | ||||
673,846 | CI Financial Corporation | 9,692,478 | ||||
274,515 | Empire Company, Ltd. | 6,106,253 | ||||
140,382 | Genworth MI Canada, Inc.b | 4,362,247 | ||||
64,718 | Gildan Activewear, Inc. | 2,386,407 | ||||
98,541 | Granite REIT | 4,486,091 | ||||
43,085 | H&R REIT | 736,147 | ||||
32,611 | Laurentian Bank of Canada | 1,033,075 | ||||
106,866 | Magna International, Inc. | 5,946,024 | ||||
663,501 | Manulife Financial Corporation | 12,218,086 | ||||
99,163 | Methanex Corporation | 5,446,032 | ||||
59,927 | National Bank of Canada | 2,854,774 | ||||
111,226 | Quebecor, Inc. | 2,773,801 | ||||
51,632 | SmartCentres Real Estate Investment Trust | 1,305,734 | ||||
47,757 | Transcontinental, Inc. | 573,925 | ||||
|
| |||||
Total | 89,359,490 | |||||
|
| |||||
Denmark (4.3%) | ||||||
56,950 | Carlsberg AS | 7,363,681 | ||||
32,009 | GN Store Nord AS | 1,640,630 | ||||
529,751 | Novo Nordisk AS | 25,954,914 | ||||
4,088 | Rockwool International AS | 1,093,739 | ||||
62,005 | Topdanmark AS | 3,345,479 | ||||
|
| |||||
Total | 39,398,443 | |||||
|
| |||||
Finland (1.4%) | ||||||
464,488 | UPM-Kymmene Oyj | 13,114,785 | ||||
|
| |||||
Total | 13,114,785 | |||||
|
| |||||
France (5.1%) | ||||||
20,417 | Bureau Veritas SA | 517,546 | ||||
120,720 | Capgemini SA | 14,649,949 | ||||
82,740 | Cie Generale des Etablissements Michelin | 10,699,191 | ||||
303,409 | CNP Assurancesb | 7,166,773 | ||||
9,338 | Gaztransport Et Technigaz SA | 845,002 | ||||
23,947 | Ipsos SA | 694,614 | ||||
229,857 | Klepierre SA | 8,167,776 | ||||
6,242 | LNA Sante | 322,399 | ||||
7,665 | L’Oreal SA | 2,108,286 | ||||
22,123 | Peugeot SA | 580,043 | ||||
|
| |||||
Total | 45,751,579 | |||||
|
| |||||
Shares | Common Stock (99.1%) | Value | ||||
Germany (1.6%) | ||||||
83,928 | Aareal Bank AG | $ | 2,935,657 | |||
29,012 | Allianz SE | 7,012,638 | ||||
22,413 | Deutsche EuroShop AG | 673,582 | ||||
172,299 | Deutsche Pfandbriefbank AGc | 2,405,803 | ||||
13,568 | Fuchs Petrolub SE | 591,605 | ||||
5,958 | Jenoptik AG | 235,811 | ||||
|
| |||||
Total | 13,855,096 | |||||
|
| |||||
Hong Kong (0.8%) | ||||||
981,000 | Hysan Development Company, Ltd. | 5,498,242 | ||||
315,000 | Road King Infrastructure, Ltd. | 715,317 | ||||
51,500 | Swire Pacific, Ltd. | 652,169 | ||||
|
| |||||
Total | 6,865,728 | |||||
|
| |||||
Ireland (<0.1%) | ||||||
14,068 | Glanbia plc | 258,613 | ||||
|
| |||||
Total | 258,613 | |||||
|
| |||||
Italy (0.6%) | ||||||
48,078 | Amplifon SPA | 924,922 | ||||
470,680 | Banca Monte dei Paschi di Siena SPAa,b | 715,238 | ||||
196,943 | Finecobank Banca Fineco SPA | 2,594,129 | ||||
14,217 | Recordati SPA | 574,479 | ||||
|
| |||||
Total | 4,808,768 | |||||
|
| |||||
Japan (25.8%) | ||||||
31,400 | AOKI Holdings, Inc. | 328,165 | ||||
27,200 | Aoyama Trading Company, Ltd. | 597,448 | ||||
44,600 | Arcs Company, Ltd. | 904,160 | ||||
35,900 | Autobacs Seven Company, Ltd. | 626,096 | ||||
87,900 | Benesse Holdings, Inc. | 2,430,247 | ||||
39,300 | Bridgestone Corporation | 1,559,047 | ||||
581,500 | Canon, Inc. | 16,135,507 | ||||
39,900 | Chiyoda Company, Ltd. | 632,283 | ||||
852,500 | Citizen Watch Company, Ltd. | 4,806,590 | ||||
92,600 | Daito Trust Construction Company, Ltd. | 12,399,461 | ||||
282,400 | Denso Corporation | 12,339,477 | ||||
17,500 | Exedy Corporation | 401,016 | ||||
104,400 | Hino Motors, Ltd. | 989,762 | ||||
57,200 | Hitachi Zosen Corporation | 177,289 | ||||
44,400 | Hokuetsu Corporation | 242,202 | ||||
68,400 | Inaba Denki Sangyo Company, Ltd. | 2,786,495 | ||||
1,005,700 | Japan Tobacco, Inc. | 23,239,336 | ||||
330,600 | JFE Holdings, Inc. | 5,688,916 | ||||
254,400 | JSR Corporation | 3,881,768 | ||||
415,100 | KDDI Corporation | 9,567,037 | ||||
173,000 | Kyoei Steel, Ltd. | 2,874,554 | ||||
19,200 | KYORIN Holdings, Inc. | 360,811 | ||||
29,600 | Lintec Corporation | 639,266 | ||||
93,800 | Marubeni Corporation | 672,133 | ||||
14,400 | Ministop Company, Ltd. | 226,985 | ||||
473,700 | Mitsubishi Gas Chemical Company, Inc. | 7,111,583 | ||||
52,500 | Mitsuboshi Belting, Ltd. | 997,396 | ||||
58,500 | Mitsui & Company, Ltd. | 946,214 | ||||
90,300 | NEC Networks & System Integration Corporation | 2,175,345 | ||||
281,500 | NHK Spring Company, Ltd. | 2,535,598 | ||||
145,100 | Nippon Kayaku Company, Ltd. | 1,705,138 | ||||
570,900 | Nippon Steel Corporation | 10,211,567 | ||||
1,973,800 | Nissan Motor Company, Ltd. | 15,845,753 | ||||
168,700 | Nitto Kogyo Corporation | 3,312,028 | ||||
The accompanying Notes to Financial Statements are an integral part of this schedule.
| 12 |
INTERNATIONAL EQUITY FUND
Schedule of Investments as of April 30, 2019
(unaudited)
Shares | Common Stock (99.1%) | Value | ||||
Japan (25.8%) - continued | ||||||
40,600 | NTT DOCOMO, INC. | $ | 881,653 | |||
37,700 | Onward Holdings Company, Ltd. | 207,986 | ||||
27,600 | Plenus Company, Ltd. | 455,936 | ||||
55,900 | Resona Holdings, Inc. | 237,302 | ||||
34,400 | Ryoyo Electro Corporation | 529,640 | ||||
74,300 | Sangetsu Company, Ltd. | 1,392,759 | ||||
9,600 | Sanyo Special Steel Company, Ltd. | 192,502 | ||||
1,058,000 | Sekisui House, Ltd. | 17,058,434 | ||||
41,000 | Senshu Ikeda Holdings, Inc. | 101,876 | ||||
20,300 | SHIMAMURA Company, Ltd. | 1,513,650 | ||||
387,700 | Shinko Electric Industries Company, Ltd. | 3,421,535 | ||||
125,100 | Sugi Holdings Company, Ltd. | 6,326,994 | ||||
519,700 | Sumitomo Corporation | 7,448,769 | ||||
898,200 | Sumitomo Electric Industries, Ltd. | 11,951,173 | ||||
641,500 | Sumitomo Rubber Industries, Ltd. | 7,888,101 | ||||
187,300 | Sundrug Company, Ltd. | 5,021,611 | ||||
25,500 | Taikisha, Ltd. | 770,649 | ||||
25,700 | Taiyo Holdings Company, Ltd. | 905,271 | ||||
14,600 | Takara Standard Company, Ltd. | 222,247 | ||||
31,900 | Teijin, Ltd. | 548,748 | ||||
119,800 | Toagosei Company, Ltd. | 1,307,812 | ||||
69,300 | Toppan Forms Company, Ltd. | 633,780 | ||||
342,000 | Toyoda Gosei Company, Ltd. | 7,119,489 | ||||
8,400 | TS Tech Company, Ltd. | 252,273 | ||||
54,400 | Tsubakimoto Chain Company | 2,027,742 | ||||
20,200 | TSURUHA Holdings, Inc. | 1,721,562 | ||||
246,800 | TV Asahi Holdings Corporation | 4,355,461 | ||||
30,700 | United Arrows, Ltd. | 969,719 | ||||
996,300 | Yahoo Japan Corporation | 2,659,593 | ||||
32,200 | Yuasa Trading Company, Ltd. | 918,574 | ||||
|
| |||||
Total | 238,389,514 | |||||
|
| |||||
Netherlands (5.4%) | ||||||
147,726 | Euronext NVc | 10,264,351 | ||||
58,281 | ForFarmers BV | 498,317 | ||||
344,492 | Koninklijke Ahold Delhaize NV | 8,302,839 | ||||
77,175 | Koninklijke DSM NV | 8,826,664 | ||||
89,073 | Koninklijke Philips NV | 3,825,142 | ||||
248,648 | Unilever NV | 15,044,402 | ||||
55,845 | Wolters Kluwer NV | 3,897,856 | ||||
|
| |||||
Total | 50,659,571 | |||||
|
| |||||
New Zealand (<0.1%) | ||||||
132,147 | Contact Energy, Ltd. | 593,266 | ||||
|
| |||||
Total | 593,266 | |||||
|
| |||||
Norway (2.1%) | ||||||
258,828 | DnB ASAa | 4,977,058 | ||||
743,531 | Telenor ASAb | 14,946,361 | ||||
|
| |||||
Total | 19,923,419 | |||||
|
| |||||
Singapore (0.1%) | ||||||
733,000 | Wing Tai Holdings, Ltd. | 1,106,170 | ||||
|
| |||||
Total | 1,106,170 | |||||
|
| |||||
Spain (4.8%) | ||||||
240,313 | ACS Actividades de Construccion y Servicios, SA | 11,051,126 | ||||
142,755 | Amadeus IT Holding SA | 11,377,142 | ||||
265,273 | Bankinter SA | 2,120,388 | ||||
43,098 | CIA De Distribucion Integral | 1,022,500 | ||||
456,042 | Enagas SA | 13,008,802 | ||||
Shares | Common Stock (99.1%) | Value | ||||
Spain (4.8%) - continued | ||||||
861,907 | Mediaset Espana Comunicacion SA | $ | 6,684,210 | |||
|
| |||||
Total | 45,264,168 | |||||
|
| |||||
Sweden (5.3%) | ||||||
4,543 | AB Industrivarden | 102,239 | ||||
396,819 | Atlas Copco AB, Class A | 12,386,430 | ||||
354,114 | Atlas Copco AB, Class B | 10,085,939 | ||||
11,416 | Boliden ABa | 339,739 | ||||
24,386 | Castellum AB | 438,447 | ||||
176,687 | Granges AB | 1,918,376 | ||||
126,669 | Hexpol AB | 989,416 | ||||
25,082 | Investor AB | 1,196,204 | ||||
89,408 | �� | Nobina ABc | 574,060 | |||
268,174 | Sandvik AB | 4,966,149 | ||||
385,466 | SKF ABb | 7,155,011 | ||||
206,439 | Swedish Match AB | 10,065,884 | ||||
|
| |||||
Total | 50,217,894 | |||||
|
| |||||
Switzerland (6.5%) | ||||||
284,706 | Novartis AG | 23,328,838 | ||||
54,780 | Pargesa Holding SA | 4,305,102 | ||||
84,310 | Roche Holding AG | 22,246,320 | ||||
45,980 | Schindler Holding AG, Participation Certificate | 9,937,428 | ||||
|
| |||||
Total | 59,817,688 | |||||
|
| |||||
United Kingdom (18.9%) | ||||||
1,391,649 | Auto Trader Group plcc | 10,287,588 | ||||
412,612 | Barratt Developments plc | 3,245,958 | ||||
165,132 | Berkeley Group Holdings plc | 8,100,833 | ||||
673,071 | BHP Group plc | 15,887,579 | ||||
20,051 | Bovis Homes Group plc | 290,715 | ||||
414,676 | Bunzl plc | 12,507,099 | ||||
23,735 | Burberry Group plc | 625,585 | ||||
150,521 | Carnival plc | 7,979,825 | ||||
25,730 | Compass Group plc | 585,458 | ||||
83,719 | Countryside Properties plcc | 370,834 | ||||
493,127 | Direct Line Insurance Group plc | 2,121,953 | ||||
517,955 | Halma plc | 12,187,333 | ||||
365,818 | Imperial Brands plc | 11,639,678 | ||||
87,203 | Inchcape plc | 700,103 | ||||
2,224,333 | KCOM Group plc | 2,839,623 | ||||
15,490,128 | Lloyds TSB Group plc | 12,668,387 | ||||
513,994 | Marks and Spencer Group plc | 1,917,334 | ||||
58,838 | Meggitt plc | 418,681 | ||||
432,521 | Moneysupermarket.com Group plc | 2,054,434 | ||||
210,004 | National Express Group plc | 1,125,506 | ||||
64,015 | Northgate plc | 307,190 | ||||
419,682 | PageGroup plc | 2,950,468 | ||||
36,532 | Paragon Banking Group plc | 218,803 | ||||
362,286 | Redrow plc | 2,916,138 | ||||
574,836 | RELX plc | 13,207,237 | ||||
60,991 | Rightmove plc | 431,274 | ||||
28,051 | Royal Dutch Shell plc, Class A | 893,746 | ||||
607,855 | Royal Dutch Shell plc, Class B | 19,617,554 | ||||
27,748 | Spirax-Sarco Engineering plc | 2,991,729 | ||||
1,266,805 | Taylor Wimpey plc | 3,003,357 | ||||
362,699 | Unilever plc | 21,985,066 | ||||
48,707 | WH Smith plc | 1,303,121 | ||||
|
| |||||
Total | 177,380,189 | |||||
|
| |||||
The accompanying Notes to Financial Statements are an integral part of this schedule.
| 13 |
INTERNATIONAL EQUITY FUND
Schedule of Investments as of April 30, 2019
(unaudited)
Shares | Common Stock (99.1%) | Value | ||||
United States (<0.1%) | ||||||
8,264 | Kulicke and Soffa Industries, Inc. | $ | 192,303 | |||
|
| |||||
Total | 192,303 | |||||
|
| |||||
| Total Common Stock (cost $909,222,936) | 919,053,843 | |||||
|
| |||||
Shares | Collateral Held for Securities Loaned | |||||
33,348,904 | Thrivent Cash Management Trust | 33,348,904 | ||||
|
| |||||
Total Collateral Held for Securities Loaned | 33,348,904 | |||||
|
| |||||
Shares | Short-Term Investments (0.3%) | |||||
Thrivent Core Short-Term Reserve Fund | ||||||
227,372 | 2.690% | 2,273,718 | ||||
|
| |||||
| Total Short-Term Investments (cost $2,273,718) | 2,273,718 | |||||
|
| |||||
| Total Investments (cost $944,845,558) 103.0% | $ | 954,676,465 | ||||
|
| |||||
Other Assets and Liabilities, Net (3.0%) | (27,567,275) | |||||
|
| |||||
Total Net Assets 100.0% | $ | 927,109,190 | ||||
|
| |||||
| a | Non-income producing security. |
| b | All or a portion of the security is on loan. |
| c | Denotes securities sold under Rule 144A of the Securities Act of 1933, which exempts them from registration. These securities may be resold to other dealers in the program or to other qualified institutional buyers. As of April 30, 2019, the value of these investments was $23,902,636 or 2.6% of total net assets. |
The following table presents the total amount of securities loaned with continuous maturity, by type, offset by the gross payable upon return of collateral for securities loaned by Thrivent Core International Equity Fund as of April 30, 2019:
Securities Lending Transactions
Common Stock | $ | 27,512,388 | ||
|
| |||
Total lending | $ | 27,512,388 | ||
Gross amount payable upon return of collateral for securities loaned | $ | 33,348,904 | ||
|
| |||
Net amounts due to counterparty | $ | 5,836,516 | ||
|
|
| Definitions: | ||||
REIT - | Real Estate Investment Trust is a company that buys,develops, manages and/or sells real estate assets. | |||
Unrealized Appreciation (Depreciation)
Gross unrealized appreciation and depreciation of investments of the portfolio as a whole (including derivatives), based on cost for federal income tax purposes, were as follows:
Gross unrealized appreciation | $ | 41,917,349 | ||
Gross unrealized depreciation | (33,541,018 | ) | ||
|
| |||
Net unrealized appreciation (depreciation) | $ | 8,376,331 | ||
Cost (includes notional principal amount of derivatives, if any) for federal income tax purposes | $ | 946,300,134 | ||
The accompanying Notes to Financial Statements are an integral part of this schedule.
14
INTERNATIONAL EQUITY FUND
Schedule of Investments as of April 30, 2019
(unaudited)
Fair Valuation Measurements
The following table is a summary of the inputs used, as of April 30, 2019, in valuing International Equity Fund’s assets carried at fair value.
Investments in Securities | Total | Level 1 | Level 2 | Level 3 | ||||||||||||
Common Stock | ||||||||||||||||
Communications Services | 61,866,000 | – | 61,866,000 | – | ||||||||||||
Consumer Discretionary | 149,111,612 | 5,946,024 | 143,165,588 | – | ||||||||||||
Consumer Staples | 120,813,667 | – | 120,813,667 | – | ||||||||||||
Energy | 21,356,302 | – | 21,356,302 | – | ||||||||||||
Financials | 111,688,879 | – | 111,688,879 | – | ||||||||||||
Health Care | 75,353,313 | – | 75,353,313 | – | ||||||||||||
Industrials | 119,654,082 | – | 119,654,082 | – | ||||||||||||
Information Technology | 86,237,377 | 192,303 | 86,045,074 | – | ||||||||||||
Materials | 94,114,868 | 5,446,032 | 88,668,836 | – | ||||||||||||
Real Estate | 49,689,898 | – | 49,689,898 | – | ||||||||||||
Utilities | 29,167,845 | – | 29,167,845 | – | ||||||||||||
|
|
|
|
|
|
|
| |||||||||
Subtotal Investments in Securities | $ | 919,053,843 | $ | 11,584,359 | $ | 907,469,484 | $ | – | ||||||||
|
|
|
|
|
|
|
| |||||||||
Other Investments * | Total | |||||||||||||||
Affiliated Short-Term Investments | 2,273,718 | |||||||||||||||
Collateral Held for Securities Loaned | 33,348,904 | |||||||||||||||
|
| |||||||||||||||
Subtotal Other Investments | $ | 35,622,622 | ||||||||||||||
|
| |||||||||||||||
Total Investments at Value | $ | 954,676,465 | ||||||||||||||
|
| |||||||||||||||
| * | Certain investments are measured at fair value using a net asset value per share that is not publicly available (practical expedient). According to disclosure requirements of Accounting Standards Codification (ASC) 820, Fair Value Measurement, securities valued using the practical expedient are not classified in the fair value hierarchy. The fair value amounts presented in this table are intended to permit reconciliation of the fair value hierarchy to the amounts presented in the Statement of Assets and Liabilities. |
There were no significant transfers between Levels during the period ended April 30, 2019. Transfers between Levels are identified as of the end of the period.
Investment in Affiliates
Affiliated issuers, as defined under the Investment Company Act of 1940, include those in which the Fund’s holdings of an issuer represent 5% or more of the outstanding voting securities of an issuer, any affiliated mutual fund, or a company which is under common ownership or control with the Fund. The Fund owns shares of Thrivent Cash Management Trust for the purpose of securities lending and Thrivent Core Short-Term Reserve Fund, a series of Thrivent Core Funds, primarily to serve as a cash sweep vehicle for the Fund. Thrivent Cash Management Trust and Thrivent Core Funds are established solely for investment by Thrivent entities.
A summary of transactions (in thousands; values shown as zero are less than $500) for the fiscal year to date, in International Equity Fund, is as follows:
Fund | Value 10/31/2018 | Gross Purchases | Gross Sales | Value 4/30/2019 | Shares Held at 4/30/2019 | % of Net Assets 4/30/2019 | ||||||||||||||||||
Affiliated Short-Term Investments | ||||||||||||||||||||||||
Core Short-Term Reserve, 2.690% | $ | 170 | $ | 71,283 | $ | 69,179 | $ | 2,274 | 227 | 0.3 | % | |||||||||||||
|
|
|
|
|
|
|
|
|
|
|
| |||||||||||||
Total Affiliated Short-Term Investments | 170 | 2,274 | 0.3 | |||||||||||||||||||||
|
|
|
|
|
| |||||||||||||||||||
Collateral Held for Securities Loaned | ||||||||||||||||||||||||
Cash Management Trust- Collateral Investment | 28,504 | 98,912 | 94,067 | 33,349 | 33,349 | 3.6 | ||||||||||||||||||
|
|
|
|
|
|
|
|
|
|
|
| |||||||||||||
Total Collateral Held for Securities Loaned | 28,504 | 33,349 | 3.6 | |||||||||||||||||||||
|
|
|
|
|
| |||||||||||||||||||
Total Value | $ | 28,674 | $ | 35,623 | ||||||||||||||||||||
|
|
|
| |||||||||||||||||||||
Portfolio | Net Realized Gain/(Loss) | Change in Unrealized Appreciation/ (Depreciation) | Distributions of Realized Capital Gains | Income Earned 11/1/2018 - 4/30/2019 | ||||||||||||
Affiliated Short-Term Investments | ||||||||||||||||
Core Short-Term Reserve, 2.690% | $ | – | $ | – | – | $ | 30 | |||||||||
|
|
|
|
|
|
|
| |||||||||
Total Income from Affiliated Investments | $ | 30 | ||||||||||||||
|
| |||||||||||||||
Collateral Held for Securities Loaned | ||||||||||||||||
Cash Management Trust- Collateral Investment | – | – | – | 135 | ||||||||||||
|
|
|
|
|
|
|
| |||||||||
Total Affiliated Income from Securities Loaned, Net | $ | 135 | ||||||||||||||
|
| |||||||||||||||
Total Value | $ | – | $ | – | $ | – | ||||||||||
|
|
|
|
|
| |||||||||||
The accompanying Notes to Financial Statements are an integral part of this schedule.
15
LOW VOLATILITY EQUITY FUND
Schedule of Investments as of April 30, 2019
(unaudited)
Shares | Common Stock (99.7%) | Value | ||||
Communications Services (2.6%) | ||||||
172,019 | AT&T, Inc. | $ | 5,325,708 | |||
6,582 | John Wiley and Sons, Inc. | 303,957 | ||||
281,295 | Verizon Communications, Inc. | 16,087,261 | ||||
30,896 | Walt Disney Company | 4,231,825 | ||||
|
| |||||
Total | 25,948,751 | |||||
|
| |||||
Consumer Discretionary (6.3%) | ||||||
3,084 | AutoZone, Inc.a | 3,171,308 | ||||
816 | Booking Holdings, Inc.a | 1,513,672 | ||||
7,373 | Genuine Parts Company | 756,027 | ||||
99,854 | Home Depot, Inc. | 20,340,260 | ||||
103,540 | McDonald’s Corporation | 20,456,398 | ||||
78,185 | Ross Stores, Inc. | 7,635,547 | ||||
147,273 | TJX Companies, Inc. | 8,082,342 | ||||
|
| |||||
Total | 61,955,554 | |||||
|
| |||||
Consumer Staples (14.3%) | ||||||
267,371 | Altria Group, Inc. | 14,526,266 | ||||
379,842 | Coca-Cola Company | 18,635,048 | ||||
271,221 | Colgate-Palmolive Company | 19,742,176 | ||||
2,068 | Hershey Company | 258,190 | ||||
15,331 | Kimberly-Clark Corporation | 1,968,194 | ||||
408,702 | Mondelez International, Inc. | 20,782,497 | ||||
80,016 | Monster Beverage Corporationa | 4,768,954 | ||||
167,842 | PepsiCo, Inc. | 21,492,168 | ||||
154,255 | Philip Morris International, Inc. | 13,352,313 | ||||
69,262 | Procter & Gamble Company | 7,375,018 | ||||
179,590 | Wal-Mart Stores, Inc. | 18,469,036 | ||||
|
| |||||
Total | 141,369,860 | |||||
|
| |||||
Financials (15.3%) | ||||||
369,286 | Aflac, Inc. | 18,604,629 | ||||
3,692 | Alleghany Corporationa | 2,425,201 | ||||
186,888 | Allstate Corporation | 18,513,125 | ||||
32,505 | American Express Company | 3,810,561 | ||||
167,787 | American Financial Group, Inc. | 17,370,988 | ||||
335,859 | Annaly Capital Management, Inc. | 3,388,817 | ||||
60,157 | Aon plc | 10,836,682 | ||||
121,569 | Arthur J. Gallagher & Company | 10,165,600 | ||||
74,432 | Berkshire Hathaway, Inc.a | 16,130,159 | ||||
48,078 | Cincinnati Financial Corporation | 4,624,142 | ||||
32,075 | Discover Financial Services | 2,613,792 | ||||
43,538 | First American Financial Corporation | 2,484,278 | ||||
214,458 | Hartford Financial Services Group, Inc. | 11,218,298 | ||||
20,042 | Intercontinental Exchange, Inc. | 1,630,417 | ||||
9,384 | Markel Corporationa | 10,055,050 | ||||
139,499 | Marsh & McLennan Companies, Inc. | 13,153,361 | ||||
22,261 | Reinsurance Group of America, Inc. | 3,372,764 | ||||
11,313 | Torchmark Corporation | 991,697 | ||||
|
| |||||
Total | 151,389,561 | |||||
|
| |||||
Health Care (16.2%) | ||||||
52,314 | Abbott Laboratories | 4,162,102 | ||||
7,112 | Agilent Technologies, Inc. | 558,292 | ||||
19,462 | Amgen, Inc. | 3,489,926 | ||||
198,142 | Baxter International, Inc. | 15,118,235 | ||||
42,786 | Bristol-Myers Squibb Company | 1,986,554 | ||||
23,260 | Cigna Holding Company | 3,694,618 | ||||
15,437 | Cooper Companies, Inc. | 4,475,495 | ||||
154,772 | Danaher Corporation | 20,498,004 | ||||
18,478 | Eli Lilly and Company | 2,162,665 | ||||
37,290 | Humana, Inc. | 9,524,239 | ||||
140,402 | Johnson & Johnson | 19,824,762 | ||||
Shares | Common Stock (99.7%) | Value | ||||
Health Care (16.2%) - continued | ||||||
126,416 | Medtronic plc | $ | 11,227,005 | |||
74,205 | Merck & Company, Inc. | 5,840,675 | ||||
456,083 | Pfizer, Inc. | 18,521,531 | ||||
9,542 | Stryker Corporation | 1,802,579 | ||||
36,588 | Thermo Fisher Scientific, Inc. | 10,151,341 | ||||
85,524 | UnitedHealth Group, Inc. | 19,933,079 | ||||
50,702 | Varian Medical Systems, Inc.a | 6,904,091 | ||||
|
| |||||
Total | 159,875,193 | |||||
|
| |||||
Industrials (11.0%) | ||||||
140,699 | AMETEK, Inc. | 12,405,431 | ||||
24,724 | EMCOR Group, Inc. | 2,080,278 | ||||
59,973 | General Dynamics Corporation | 10,718,375 | ||||
108,110 | Honeywell International, Inc. | 18,771,139 | ||||
37,291 | Illinois Tool Works, Inc. | 5,803,598 | ||||
51,844 | Lockheed Martin Corporation | 17,281,161 | ||||
35,687 | Northrop Grumman Corporation | 10,346,018 | ||||
22,012 | Raytheon Company | 3,909,111 | ||||
21,691 | Regal-Beloit Corporation | 1,845,470 | ||||
116,179 | United Technologies Corporation | 16,568,287 | ||||
94,421 | Waste Connections, Inc. | 8,759,436 | ||||
|
| |||||
Total | 108,488,304 | |||||
|
| |||||
Information Technology (17.7%) | ||||||
19,797 | Accenture plc | 3,616,318 | ||||
202,681 | Amphenol Corporation | 20,178,920 | ||||
114,584 | Automatic Data Processing, Inc. | 18,836,464 | ||||
98,108 | CDK Global, Inc. | 5,917,875 | ||||
144,536 | Cisco Systems, Inc. | 8,086,789 | ||||
221,739 | Cognizant Technology Solutions Corporation | 16,178,077 | ||||
169,971 | Fidelity National Information Services, Inc. | 19,704,738 | ||||
113,828 | Fiserv, Inc.a | 9,930,355 | ||||
72,454 | International Business Machines Corporation | 10,163,123 | ||||
31,404 | Intuit, Inc. | 7,884,288 | ||||
36,760 | MasterCard, Inc. | 9,345,862 | ||||
79,743 | Microsoft Corporation | 10,414,436 | ||||
317,763 | Oracle Corporation | 17,581,827 | ||||
33,907 | Paychex, Inc. | 2,858,699 | ||||
110,623 | Synopsys, Inc.a | 13,394,233 | ||||
|
| |||||
Total | 174,092,004 | |||||
|
| |||||
Materials (0.4%) | ||||||
42,076 | Royal Gold, Inc. | 3,663,136 | ||||
|
| |||||
Total | 3,663,136 | |||||
|
| |||||
Real Estate (8.6%) | ||||||
98,601 | American Tower Corporation | 19,256,775 | ||||
6,836 | Boston Properties, Inc. | 940,770 | ||||
162,266 | Camden Property Trust | 16,332,073 | ||||
108,787 | Crown Castle International Corporation | 13,683,229 | ||||
412,177 | Douglas Emmett, Inc. | 16,977,571 | ||||
29,027 | Equity Residential | 2,218,243 | ||||
32,445 | First Industrial Realty Trust, Inc. | 1,144,335 | ||||
196,932 | Highwoods Properties, Inc. | 8,779,229 | ||||
22,957 | Public Storage, Inc. | 5,077,629 | ||||
|
| |||||
Total | 84,409,854 | |||||
|
| |||||
Utilities (7.3%) | ||||||
26,696 | ALLETE, Inc. | 2,174,389 | ||||
The accompanying Notes to Financial Statements are an integral part of this schedule.
| 16 |
LOW VOLATILITY EQUITY FUND
Schedule of Investments as of April 30, 2019
(unaudited)
Shares | Common Stock (99.7%) | Value | ||||
Utilities (7.3%) - continued | ||||||
5,090 | American Electric Power Company, Inc. | $ | 435,449 | |||
28,663 | Atmos Energy Corporation | 2,933,371 | ||||
96,267 | CMS Energy Corporation | 5,347,632 | ||||
50,872 | Consolidated Edison, Inc. | 4,383,132 | ||||
164,959 | Duke Energy Corporation | 15,031,064 | ||||
4,895 | Evergy, Inc. | 283,029 | ||||
24,650 | Exelon Corporation | 1,255,917 | ||||
27,970 | MDU Resources Group, Inc. | 731,415 | ||||
105,687 | NextEra Energy, Inc. | 20,549,780 | ||||
8,579 | ONE Gas, Inc. | 759,413 | ||||
103,846 | Southern Company | 5,526,684 | ||||
11,925 | Southwest Gas Holdings, Inc. | 992,041 | ||||
30,940 | Spire, Inc. | 2,604,839 | ||||
65,001 | UGI Corporation | 3,543,205 | ||||
102,283 | Xcel Energy, Inc. | 5,778,990 | ||||
|
| |||||
Total | 72,330,350 | |||||
|
| |||||
Total Common Stock (cost $880,632,459) | 983,522,567 | |||||
|
| |||||
Shares | Short-Term Investments (0.2%) | Value | ||||
Thrivent Core Short-Term Reserve Fund | ||||||
181,923 | 2.690% | 1,819,230 | ||||
|
| |||||
| Total Short-Term Investments (cost $1,819,230) | 1,819,230 | |||||
|
| |||||
| Total Investments (cost $882,451,689) 99.9% | $ | 985,341,797 | ||||
|
| |||||
| Other Assets and Liabilities, Net 0.1% | 648,379 | |||||
|
| |||||
Total Net Assets 100.0% | $ | 985,990,176 | ||||
|
| |||||
| a | Non-income producing security. |
Unrealized Appreciation (Depreciation)
Gross unrealized appreciation and depreciation of investments of the portfolio as a whole (including derivatives, if any), based on cost for federal income tax purposes, were as follows:
Gross unrealized appreciation | $ | 114,597,626 | ||
Gross unrealized depreciation | (11,654,884 | ) | ||
|
| |||
Net unrealized appreciation (depreciation) | $ | 102,942,742 | ||
Cost (includes notional principal amount of derivatives, if any) for federal income tax purposes | $ | 882,399,055 | ||
The accompanying Notes to Financial Statements are an integral part of this schedule.
| 17 |
LOW VOLATILITY EQUITY FUND
Schedule of Investments as of April 30, 2019
(unaudited)
Fair Valuation Measurements
The following table is a summary of the inputs used, as of April 30, 2019, in valuing Low Volatility Equity Fund’s assets carried at fair value.
Investments in Securities | Total | Level 1 | Level 2 | Level 3 | ||||||||||||
Common Stock | ||||||||||||||||
Communications Services | 25,948,751 | 25,948,751 | – | – | ||||||||||||
Consumer Discretionary | 61,955,554 | 61,955,554 | – | – | ||||||||||||
Consumer Staples | 141,369,860 | 141,369,860 | – | – | ||||||||||||
Financials | 151,389,561 | 151,389,561 | – | – | ||||||||||||
Health Care | 159,875,193 | 159,875,193 | – | – | ||||||||||||
Industrials | 108,488,304 | 108,488,304 | – | – | ||||||||||||
Information Technology | 174,092,004 | 174,092,004 | – | – | ||||||||||||
Materials | 3,663,136 | 3,663,136 | – | – | ||||||||||||
Real Estate | 84,409,854 | 84,409,854 | – | – | ||||||||||||
Utilities | 72,330,350 | 72,330,350 | – | – | ||||||||||||
|
|
|
|
|
|
|
| |||||||||
Subtotal Investments in Securities | $ | 983,522,567 | $ | 983,522,567 | $ | – | $ | – | ||||||||
|
|
|
|
|
|
|
| |||||||||
Other Investments * | Total | |||||||||||||||
Affiliated Short-Term Investments | 1,819,230 | |||||||||||||||
|
| |||||||||||||||
Subtotal Other Investments | $ | 1,819,230 | ||||||||||||||
|
| |||||||||||||||
Total Investments at Value | $ | 985,341,797 | ||||||||||||||
|
| |||||||||||||||
| * | Certain investments are measured at fair value using a net asset value per share that is not publicly available (practical expedient). According to disclosure requirements of Accounting Standards Codification (ASC) 820, Fair Value Measurement, securities valued using the practical expedient are not classified in the fair value hierarchy. The fair value amounts presented in this table are intended to permit reconciliation of the fair value hierarchy to the amounts presented in the Statement of Assets and Liabilities. |
There were no significant transfers between Levels during the period ended April 30, 2019. Transfers between Levels are identified as of the end of the period.
Investment in Affiliates
Affiliated issuers, as defined under the Investment Company Act of 1940, include those in which the Fund’s holdings of an issuer represent 5% or more of the outstanding voting securities of an issuer, any affiliated mutual fund, or a company which is under common ownership or control with the Fund. The Fund owns shares of Thrivent Cash Management Trust for the purpose of securities lending and Thrivent Core Short-Term Reserve Fund, a series of Thrivent Core Funds, primarily to serve as a cash sweep vehicle for the Fund. Thrivent Cash Management Trust and Thrivent Core Funds are established solely for investment by Thrivent entities.
A summary of transactions (in thousands; values shown as zero are less than $500) for the fiscal year to date, in Low Volatility Equity Fund, is as follows:
Fund | Value 10/31/2018 | Gross Purchases | Gross Sales | Value 4/30/2019 | Shares Held at 4/30/2019 | % of Net Assets 4/30/2019 | ||||||||||||||||||
Affiliated Short-Term Investments | ||||||||||||||||||||||||
Core Short-Term Reserve, 2.690% | $ | 830 | $ | 8,594 | $ | 7,605 | $ | 1,819 | 182 | 0.2 | % | |||||||||||||
|
|
|
|
|
|
|
|
|
|
|
| |||||||||||||
Total Affiliated Short-Term Investments | 830 | 1,819 | 0.2 | |||||||||||||||||||||
|
|
|
|
|
| |||||||||||||||||||
Collateral Held for Securities Loaned | ||||||||||||||||||||||||
Cash Management Trust- Collateral Investment | – | 21,318 | 21,318 | – | – | – | ||||||||||||||||||
|
|
|
|
|
|
|
|
|
|
|
| |||||||||||||
Total Value | $ | 830 | $ | 1,819 | ||||||||||||||||||||
|
|
|
| |||||||||||||||||||||
Fund | Net Realized Gain/(Loss) | Change in Unrealized Appreciation/ (Depreciation) | Distributions of Realized Capital Gains | Income Earned 11/1/2018 - 4/30/2019 | ||||||||||||
Affiliated Short-Term Investments | ||||||||||||||||
Core Short-Term Reserve, 2.690% | $ | – | $ | – | $ | – | $ | 19 | ||||||||
|
|
|
|
|
|
|
| |||||||||
Total Income from Affiliated Investments | $ | 19 | ||||||||||||||
|
| |||||||||||||||
Collateral Held for Securities Loaned | ||||||||||||||||
Cash Management Trust- Collateral Investment | – | – | – | 115 | ||||||||||||
|
|
|
|
|
|
|
| |||||||||
Total Affiliated Income from Securities Loaned, Net | $ | 115 | ||||||||||||||
|
|
|
|
|
|
|
| |||||||||
Total | $ | – | $ | – | $ | – | ||||||||||
|
|
|
|
|
| |||||||||||
The accompanying Notes to Financial Statements are an integral part of this schedule.
18
SHORT-TERM RESERVE FUND
Schedule of Investments as of April 30, 2019
(unaudited)
Principal | Asset-Backed Securities (5.8%)a | Value | ||||
Ally Auto Receivables Trust | ||||||
$7,934,071 | 2.709%, 2/18/2020, Ser.2019-1 | $ | 7,934,789 | |||
Americredit Automobile Receivables Trust | ||||||
4,561,228 | 2.660%, 3/18/2020, Ser.2019-1 | 4,561,714 | ||||
Ascentium Equipment Receivables, LLC | ||||||
7,180,047 | 2.731%, 11/12/2019, Ser.2018-2Ab | 7,180,459 | ||||
11,000,000 | 2.660%, 4/10/2020, Ser.2019-1Ab | 11,001,731 | ||||
BMW Vehicle Lease Trust | ||||||
5,336,875 | 2.496%, 10/21/2019, Ser.2018-1 | 5,336,478 | ||||
Canadian Pacer Auto Receivables Trust | ||||||
10,000,000 | 2.596%, 4/20/2020, Ser.2019-1Ab | 9,999,646 | ||||
CarMax Auto Owner Trust | ||||||
6,300,775 | 2.592%, 11/15/2019, Ser.2018-4 | 6,300,657 | ||||
13,432,344 | 2.780%, 1/15/2020, Ser.2019-1 | 13,434,946 | ||||
CCG Receivables Trust | ||||||
5,500,000 | 2.628%, 4/14/2020, Ser.2019-1b | 5,500,301 | ||||
CNH Equipment Trust | ||||||
3,066,395 | 2.470%, 10/15/2019, Ser.2018-B | 3,066,177 | ||||
16,949,193 | 2.753%, 2/28/2020, Ser.2019-A | 16,950,495 | ||||
Dell Equipment Finance Trust | ||||||
3,780,969 | 2.657%, 10/22/2019, Ser.2018-2b | 3,780,768 | ||||
11,000,000 | 2.648%, 4/22/2020, Ser.2019-1b | 11,000,835 | ||||
DLL Securitization Trust | ||||||
14,000,000 | 2.657%, 4/20/2020, Ser.2019-DA1b | 14,001,120 | ||||
Drive Auto Receivables Trust | ||||||
5,779,447 | 2.780%, 1/15/2020, Ser.2019-1 | 5,779,398 | ||||
9,127,238 | 2.648%, 3/16/2020, Ser.2019-2 | 9,127,289 | ||||
Enterprise Fleet Financing, LLC | ||||||
8,326,175 | 2.815%, 11/20/2019, Ser.2018-3b | 8,327,500 | ||||
Fifth Third Auto Trust | ||||||
17,500,000 | 2.576%, 5/15/2020, Ser.2019-1c | 17,500,000 | ||||
Ford Credit Auto Lease Trust | ||||||
16,141,415 | 2.664%, 3/15/2020, Ser.2019-A | 16,141,757 | ||||
GM Financial Consumer Automobile Receivables Trust | ||||||
9,000,000 | 2.597%, 5/20/2020, Ser.2019-2c | 9,000,000 | ||||
13,000,000 | 2.720%, 4/16/2020, Ser.2019-2 | 13,000,398 | ||||
Great American Auto Leasing, Inc. | ||||||
7,677,253 | 2.764%, 2/18/2020, Ser.2019-1b | 7,679,776 | ||||
Principal | Asset-Backed Securities (5.8%)a | Value | ||||
Hyundai Auto Lease Securitization Trust | ||||||
$8,925,995 | 2.662%, 3/13/2020, Ser.2019-Ab | $ | 8,926,269 | |||
Hyundai Auto Receivables Trust | ||||||
10,000,000 | 2.605%, 4/15/2020, Ser.2019-A | 10,000,425 | ||||
John Deere Owner Trust | ||||||
249,580 | 2.535%, 8/15/2019, Ser.2018-B | 249,572 | ||||
Mercedes-Benz Auto Lease Trust | ||||||
12,028,699 | 2.743%, 2/18/2020, Ser.2019-A | 12,029,966 | ||||
Nissan Auto Lease Trust | ||||||
12,000,000 | 2.659%, 4/15/2020, Ser.2019-A | 11,999,640 | ||||
Nissan Auto Receivables Owner Trust | ||||||
9,952,570 | 2.708%, 2/18/2020, Ser.2019-A | 9,954,172 | ||||
Volvo Financial Equipment, LLC | ||||||
14,218,989 | 2.745%, 2/18/2020, Ser.2019-1Ab | 14,221,839 | ||||
Westlake Automobile Receivables Trust | ||||||
10,974,349 | 2.769%, 2/18/2020, Ser.2019-1Ab | 10,976,295 | ||||
Wheels SPV 2, LLC | ||||||
975,069 | 2.550%, 7/20/2019, Ser.2018-1Ab | 975,076 | ||||
World Omni Auto Receivables Trust | ||||||
268,927 | 2.441%, 10/15/2019, Ser.2018-D | 268,905 | ||||
10,189,715 | 2.726%, 2/18/2020, Ser.2019-A | 10,190,796 | ||||
9,710,142 | 2.605%, 3/16/2020, Ser.2019-A | 9,709,888 | ||||
World Omni Select Auto Trust | ||||||
1,836,879 | 2.782%, 11/15/2019, Ser.2018-1Ab | 1,836,984 | ||||
|
| |||||
Total | 307,946,061 | |||||
|
| |||||
Principal | Basic Materials (2.8%)a | Value | ||||
Dow Chemical Company | ||||||
10,000,000 | 2.700%, 5/14/2019 | 9,989,702 | ||||
EI du Pont de Nemours & Company | ||||||
11,193,000 | 2.680%, 5/8/2019b | 11,186,550 | ||||
5,000,000 | 2.680%, 5/15/2019b | 4,994,563 | ||||
17,020,000 | 2.660%, 5/16/2019b | 17,000,204 | ||||
15,010,000 | 2.690%, 5/20/2019b | 14,987,927 | ||||
10,000,000 | 2.670%, 5/30/2019b | 9,977,750 | ||||
20,000,000 | 2.670%, 6/10/2019b | 19,938,773 | ||||
International Paper Company | ||||||
10,700,000 | 2.680%, 5/2/2019b | 10,698,444 | ||||
19,500,000 | 2.670%, 5/7/2019b | 19,490,028 | ||||
Nutrien, Ltd. | ||||||
10,000,000 | 2.690%, 5/2/2019b | 9,998,524 | ||||
20,000,000 | 2.700%, 5/9/2019b | 19,986,625 | ||||
|
| |||||
Total | 148,249,090 | |||||
|
| |||||
The accompanying Notes to Financial Statements are an integral part of this schedule.
| 19 |
SHORT-TERM RESERVE FUND
Schedule of Investments as of April 30, 2019
(unaudited)
Principal | Capital Goods (4.6%)a | Value | ||||
Boeing Company | ||||||
$10,000,000 | 2.540%, 5/22/2019b | $ | 9,984,404 | |||
11,830,000 | 2.600%, 6/14/2019b | 11,792,662 | ||||
15,000,000 | 2.610%, 6/28/2019b | 14,936,427 | ||||
20,000,000 | 2.615%, 7/10/2019b | 19,897,563 | ||||
10,000,000 | 2.620%, 7/23/2019b | 9,939,193 | ||||
Caterpillar Financial Services Corporation | ||||||
5,000,000 | 1.350%, 5/18/2019 | 4,996,537 | ||||
Eaton Corporation | ||||||
25,000,000 | 2.650%, 5/9/2019b | 24,983,531 | ||||
25,000,000 | 2.620%, 5/10/2019b | 24,981,688 | ||||
Honeywell International, Inc. | ||||||
24,457,000 | 2.623% (LIBOR 3M + 0.040%), 10/30/2019d | 24,463,187 | ||||
Textron, Inc. | ||||||
20,000,000 | 2.690%, 5/21/2019b | 19,966,353 | ||||
Waste Management, Inc. | ||||||
5,000,000 | 2.710%, 5/2/2019b | 4,999,276 | ||||
15,000,000 | 2.650%, 5/8/2019b | 14,991,260 | ||||
14,000,000 | 2.700%, 5/13/2019b | 13,986,679 | ||||
25,000,000 | 2.680%, 5/14/2019b | 24,974,363 | ||||
20,000,000 | 2.700%, 5/22/2019b | 19,967,171 | ||||
|
| |||||
Total | 244,860,294 | |||||
|
| |||||
Principal | Communications Services (2.7%)a | Value | ||||
Comcast Corporation | ||||||
15,000,000 | 2.650%, 5/8/2019b | 14,991,223 | ||||
25,000,000 | 2.650%, 5/24/2019b | 24,955,067 | ||||
Omnicom Cap, Inc. | ||||||
15,000,000 | 2.700%, 5/1/2019b | 14,998,911 | ||||
10,000,000 | 2.650%, 5/10/2019b | 9,992,675 | ||||
23,000,000 | 2.650%, 5/17/2019b | 22,971,055 | ||||
Rogers Communications, Inc. | ||||||
5,000,000 | 2.670%, 5/2/2019b | 4,999,273 | ||||
Verizon Communications, Inc. | ||||||
10,000,000 | 2.600%, 5/6/2019b | 9,995,620 | ||||
18,700,000 | 2.660%, 5/22/2019b | 18,669,202 | ||||
25,000,000 | 2.680%, 6/4/2019b | 24,934,205 | ||||
| �� |
|
| ||||
Total | 146,507,231 | |||||
|
| |||||
Principal | Consumer Cyclical (6.3%)a | Value | ||||
American Honda Finance Corporation | ||||||
25,000,000 | 2.620%, 5/28/2019e | 24,952,186 | ||||
7,813,000 | 1.200%, 7/12/2019e | 7,789,561 | ||||
23,500,000 | 3.033% (LIBOR 3M + 0.340%), 2/14/2020d,e | 23,560,916 | ||||
5,000,000 | 2.791% (LIBOR 3M + 0.150%), 2/21/2020d,e | 5,003,149 | ||||
25,000,000 | 2.843% (LIBOR 3M + 0.180%), 5/22/2020d,e | 25,018,056 | ||||
13,773,000 | 2.875% (LIBOR 3M + 0.260%), 6/16/2020d,e | 13,797,990 | ||||
Charta, LLC | ||||||
6,000,000 | 2.570%, 5/21/2019b,e | 5,991,362 | ||||
15,000,000 | 2.540%, 7/30/2019b,e | 14,902,554 | ||||
Ecolab, Inc. | ||||||
7,950,000 | 2.600%, 5/2/2019b | 7,948,844 | ||||
6,150,000 | 2.600%, 5/9/2019b | 6,145,949 | ||||
Nissan Motor Acceptance Corporation | ||||||
10,000,000 | 2.700%, 5/3/2019b,e | 9,997,983 | ||||
Principal | Consumer Cyclical (6.3%)a | Value | ||||
$4,000,000 | 2.730%, 5/13/2019b,e | $ | 3,996,468 | |||
15,000,000 | 2.730%, 5/20/2019b,e | 14,979,558 | ||||
15,000,000 | 2.660%, 5/30/2019b,e | 14,968,625 | ||||
20,000,000 | 2.700%, 6/11/2019b,e | 19,940,127 | ||||
10,000,000 | 2.690%, 6/13/2019b,e | 9,968,528 | ||||
Toyota Credit Canada, Inc. | ||||||
25,000,000 | 2.703% (LIBOR 1M + 0.230%), 7/10/2019d | 25,009,938 | ||||
25,000,000 | 2.633% (LIBOR 3M + 0.050%), 1/24/2020d | 25,000,005 | ||||
Toyota Financial Services de Puerto Rico, Inc. | ||||||
21,250,000 | 2.540%, 6/25/2019 | 21,169,510 | ||||
Toyota Motor Credit Corporation | ||||||
15,000,000 | 2.600%, 5/29/2019 | 14,970,891 | ||||
13,982,000 | 2.848% (LIBOR 3M + 0.260%), 4/17/2020d | 14,006,954 | ||||
Toyota Motor Financial Netherlands BV | ||||||
25,000,000 | 2.667% (LIBOR 3M + 0.070%), 6/25/2019d | 25,004,674 | ||||
|
| |||||
Total | 334,123,828 | |||||
|
| |||||
Principal | ConsumerNon-Cyclical (9.9%)a | Value | ||||
Altria Group, Inc. | ||||||
6,000,000 | 2.660%, 5/1/2019 | 5,999,566 | ||||
5,000,000 | 2.700%, 5/3/2019 | 4,998,912 | ||||
10,000,000 | 2.680%, 5/8/2019 | 9,994,173 | ||||
Amgen, Inc. | ||||||
9,845,000 | 2.200%, 5/22/2019 | 9,842,940 | ||||
Anheuser-Busch InBev Worldwide, Inc. | ||||||
15,000,000 | 2.680%, 5/16/2019b | 14,982,460 | ||||
25,000,000 | 2.680%, 5/21/2019b | 24,961,587 | ||||
10,000,000 | 2.680%, 5/23/2019b | 9,983,165 | ||||
Anthem, Inc | ||||||
5,000,000 | 2.660%, 5/28/2019b | 4,989,508 | ||||
Coca-Cola Company | ||||||
5,000,000 | 2.800%, 5/13/2019b | 4,995,585 | ||||
10,000,000 | 2.780%, 5/16/2019b | 9,989,107 | ||||
10,000,000 | 2.750%, 6/24/2019b | 9,962,035 | ||||
15,000,000 | 2.580%, 7/31/2019b | 14,903,707 | ||||
15,000,000 | 2.540%, 8/7/2019b | 14,896,091 | ||||
10,000,000 | 2.610%, 9/11/2019b | 9,905,121 | ||||
25,000,000 | 2.550%, 9/17/2019b | 24,751,792 | ||||
Diageo Capital plc | ||||||
25,000,000 | 2.670%, 5/22/2019b | 24,958,826 | ||||
24,120,000 | 2.720%, 6/12/2019b | 24,041,723 | ||||
Kellogg Company | ||||||
11,600,000 | 2.610%, 5/14/2019b | 11,588,055 | ||||
Merck & Company, Inc. | ||||||
17,495,000 | 3.072% (LIBOR 3M + 0.375%), 2/10/2020d | 17,539,962 | ||||
Mondelez International, Inc. | ||||||
2,000,000 | 2.680%, 5/6/2019b | 1,999,124 | ||||
11,030,000 | 2.650%, 5/13/2019b | 11,019,465 | ||||
15,750,000 | 2.650%, 6/13/2019b | 15,697,659 | ||||
Nestle Finance International, Ltd. | ||||||
25,000,000 | 2.710%, 5/20/2019 | 24,966,486 | ||||
10,000,000 | 2.730%, 6/18/2019 | 9,966,762 | ||||
PepsiCo, Inc. | ||||||
6,170,000 | 1.550%, 5/2/2019 | 6,170,000 | ||||
The accompanying Notes to Financial Statements are an integral part of this schedule.
| 20 |
SHORT-TERM RESERVE FUND
Schedule of Investments as of April 30, 2019
(unaudited)
Principal | ConsumerNon-Cyclical (9.9%)a | Value | ||||
$10,978,000 | 2.778% (LIBOR 3M + 0.040%), 5/2/2019d | $ | 10,978,000 | |||
25,000,000 | 2.872% (LIBOR 3M + 0.270%), 10/4/2019d | 25,027,794 | ||||
Pfizer, Inc. | ||||||
10,000,000 | 2.100%, 5/15/2019 | 9,998,300 | ||||
Philip Morris International, Inc. | ||||||
25,000,000 | 2.620%, 6/27/2019b | 24,899,426 | ||||
10,000,000 | 2.610%, 6/28/2019b | 9,959,044 | ||||
5,005,000 | 1.875%, 11/1/2019 | 4,984,408 | ||||
Reckitt Benckiser Treasury Services plc | ||||||
15,000,000 | 2.670%, 5/17/2019b | 14,982,639 | ||||
10,000,000 | 2.710%, 6/17/2019b | 9,966,880 | ||||
10,000,000 | 2.730%, 6/20/2019b | 9,964,753 | ||||
10,000,000 | 2.700%, 6/21/2019b | 9,964,048 | ||||
Roche Holdings, Inc. | ||||||
12,100,000 | 2.941% (LIBOR 3M + 0.340%), 9/30/2019b,d | 12,115,690 | ||||
Stanley Black & Decker, Inc. | ||||||
10,000,000 | 2.560%, 5/3/2019b | 9,997,713 | ||||
6,280,000 | 2.620%, 5/10/2019b | 6,275,257 | ||||
8,000,000 | 2.630%, 5/15/2019b | 7,991,000 | ||||
UnitedHealth Group, Inc. | ||||||
15,000,000 | 2.580%, 5/17/2019b | 14,981,789 | ||||
25,000,000 | 2.610%, 6/10/2019b | 24,926,257 | ||||
|
| |||||
Total | 530,116,809 | |||||
|
| |||||
Principal | Energy (4.1%)a | Value | ||||
BP Capital Markets plc | ||||||
12,450,000 | 2.650%, 5/15/2019b,e | 12,437,197 | ||||
25,000,000 | 2.640%, 6/17/2019b,e | 24,914,800 | ||||
21,000,000 | 2.610%, 6/28/2019b,e | 20,911,033 | ||||
8,000,000 | 2.650%, 7/8/2019b,e | 7,959,949 | ||||
15,000,000 | 2.640%, 7/16/2019b,e | 14,915,525 | ||||
Chevron Corporation | ||||||
5,000,000 | 3.094% (LIBOR 3M + 0.410%), 11/15/2019d | 5,010,239 | ||||
Schlumberger Investment SA | ||||||
25,000,000 | 2.580%, 5/13/2019b | 24,978,108 | ||||
25,000,000 | 2.550%, 6/19/2019b | 24,914,930 | ||||
14,000,000 | 2.560%, 7/19/2019b | 13,922,751 | ||||
Shell International Finance BV | ||||||
7,930,000 | 1.375%, 5/10/2019 | 7,927,938 | ||||
21,083,000 | 2.947% (LIBOR 3M + 0.350%), 9/12/2019d | 21,114,723 | ||||
Suncor Energy, Inc. | ||||||
8,000,000 | 2.730%, 5/23/2019b,e | 7,986,226 | ||||
10,000,000 | 2.780%, 5/28/2019b,e | 9,979,008 | ||||
10,000,000 | 2.680%, 5/29/2019b,e | 9,978,258 | ||||
10,000,000 | 2.750%, 6/28/2019b,e | 9,954,963 | ||||
Total Capital International SA | ||||||
5,000,000 | 2.100%, 6/19/2019 | 4,996,356 | ||||
|
| |||||
Total | 221,902,004 | |||||
|
| |||||
Principal | Financials (43.3%)a | Value | ||||
AllianceBernstein, LP | ||||||
7,500,000 | 2.560%, 5/21/2019b | 7,489,264 | ||||
9,550,000 | 2.550%, 5/28/2019b | 9,531,735 | ||||
ANZ New Zealand International, Ltd. | ||||||
5,000,000 | 2.600%, 9/23/2019b,e | 4,997,524 | ||||
Principal | Financials (43.3%)a | Value | ||||
Atlantic Asset Securitization, LLC | ||||||
$10,000,000 | 2.570%, 6/24/2019b | $ | 9,960,935 | |||
Australia and New Zealand Banking Group, Ltd. | ||||||
5,000,000 | 1.600%, 7/15/2019 | 4,990,112 | ||||
5,050,000 | 3.262% (LIBOR 3M + 0.660%), 9/23/2019b,d | 5,062,894 | ||||
10,000,000 | 2.660% (LIBOR 3M + 0.050%), 3/31/2020d | 9,999,945 | ||||
Bank of Montreal | ||||||
5,939,000 | 1.500%, 7/18/2019 | 5,925,297 | ||||
15,000,000 | 3.051% (LIBOR 3M + 0.440%), 6/15/2020d | 15,060,451 | ||||
Bank of Montreal Chicago | ||||||
25,000,000 | 2.920% (SOFRRATE + 0.440%), 5/9/2019d | 25,001,770 | ||||
10,000,000 | 2.687% (LIBOR 3M + 0.080%), 6/7/2019d | 10,000,692 | ||||
15,000,000 | 2.673% (LIBOR 1M + 0.180%), 4/3/2020d | 14,999,522 | ||||
15,000,000 | 2.654% (LIBOR 3M + 0.070%), 4/9/2020d | 14,999,940 | ||||
Bank of New York Mellon Corporation | ||||||
6,373,000 | 2.200%, 5/15/2019 | 6,372,241 | ||||
Bank of Nova Scotia | ||||||
15,000,000 | 2.661% (LIBOR 3M + 0.080%), 1/24/2020d | 15,005,380 | ||||
Bank of Nova Scotia Houston | ||||||
10,000,000 | 2.813% (LIBOR 3M + 0.130%), 5/16/2019d | 10,000,490 | ||||
10,000,000 | 2.680% (LIBOR 3M + 0.080%), 7/2/2019d | 10,001,253 | ||||
15,000,000 | 2.673% (LIBOR 1M + 0.200%), 8/14/2019d | 15,005,585 | ||||
10,000,000 | 2.791% (LIBOR 3M + 0.190%), 3/11/2020d | 10,012,671 | ||||
Barclays Bank plc | ||||||
4,670,000 | 2.750%, 8/12/2019b | 4,633,021 | ||||
Barton Capital SA | ||||||
25,000,000 | 2.540%, 5/20/2019b,e | 24,964,555 | ||||
Berkshire Hathaway Finance Corporation | ||||||
6,780,000 | 1.300%, 8/15/2019 | 6,753,964 | ||||
11,960,000 | 2.944% (LIBOR 3M + 0.260%), 8/15/2019d | 11,969,357 | ||||
14,000,000 | 2.904% (LIBOR 3M + 0.320%), 1/10/2020d | 14,027,516 | ||||
BPCE SA | ||||||
10,000,000 | 2.500%, 7/15/2019 | 9,994,700 | ||||
Branch Banking and Trust Company | ||||||
5,000,000 | 1.450%, 5/10/2019 | 4,998,500 | ||||
8,500,000 | 3.047% (LIBOR 3M + 0.450%), 1/15/2020d | 8,516,329 | ||||
CAFCO, LLC | ||||||
25,000,000 | 2.560%, 6/21/2019b,e | 24,909,036 | ||||
Canadian Imperial Bank of Commerce | ||||||
15,000,000 | 2.732% (LIBOR 1M + 0.230%), 8/1/2019d | 15,006,849 | ||||
Chariot Funding, LLC | ||||||
20,000,000 | 2.700%, 5/17/2019b | 19,976,644 | ||||
5,610,000 | 2.550%, 6/3/2019b | 5,596,781 | ||||
10,000,000 | 2.810%, 7/9/2019b | 9,951,000 | ||||
10,000,000 | 2.780%, 7/12/2019b | 9,948,961 | ||||
6,000,000 | 2.550%, 8/13/2019b | 5,956,425 | ||||
The accompanying Notes to Financial Statements are an integral part of this schedule.
| 21 |
SHORT-TERM RESERVE FUND
Schedule of Investments as of April 30, 2019
(unaudited)
Principal | Financials (43.3%)a | Value | ||||
Ciesco, LLC | ||||||
$20,000,000 | 2.880%, 5/29/2019b,e | $ | 19,959,899 | |||
Citibank NA | ||||||
7,700,000 | 2.875% (LIBOR 3M + 0.260%), 9/18/2019d | 7,707,284 | ||||
19,000,000 | 3.056% (LIBOR 3M + 0.320%), 5/1/2020d | 19,033,117 | ||||
Citigroup Global Markets, Inc. | ||||||
13,250,000 | 2.620%, 10/18/2019b | 13,087,181 | ||||
Commonwealth Bank of Australia | ||||||
32,650,000 | 3.051% (LIBOR 3M + 0.450%), 3/10/2020b,d | 32,755,205 | ||||
CRC Funding, LLC | ||||||
25,000,000 | 2.550%, 7/12/2019b,e | 24,870,881 | ||||
15,000,000 | 2.550%, 7/16/2019b,e | 14,918,091 | ||||
10,000,000 | 2.540%, 7/17/2019b,e | 9,944,663 | ||||
10,000,000 | 2.780%, 7/23/2019b,e | 9,940,220 | ||||
10,000,000 | 2.540%, 7/29/2019b,e | 9,935,750 | ||||
12,000,000 | 2.540%, 8/2/2019b,e | 11,919,442 | ||||
Credit Suisse New York | ||||||
25,000,000 | 2.300%, 5/28/2019 | 24,994,750 | ||||
Dealers Capital Access Trust, LLC | ||||||
10,000,000 | 2.580%, 5/9/2019 | 9,993,925 | ||||
40,000,000 | 2.560%, 5/28/2019 | 39,922,440 | ||||
20,000,000 | 2.550%, 5/31/2019 | 19,956,927 | ||||
5,000,000 | 2.550%, 7/22/2019 | 4,970,662 | ||||
Glaxosmithkline Finance plc | ||||||
10,000,000 | 2.550%, 6/17/2019b,e | 9,966,400 | ||||
13,950,000 | 2.600%, 8/16/2019b,e | 13,843,199 | ||||
Gotham Funding Corporation | ||||||
20,000,000 | 2.540%, 7/17/2019b,e | 19,888,807 | ||||
HSBC USA, Inc. | ||||||
5,288,000 | 2.250%, 6/23/2019 | 5,284,622 | ||||
ING (US) Funding, LLC | ||||||
14,250,000 | 2.674% (LIBOR 1M + 0.200%), 5/17/2019d,e | 14,251,597 | ||||
ING Bank NV | ||||||
8,700,000 | 1.650%, 8/15/2019b | 8,671,820 | ||||
5,000,000 | 3.294% (LIBOR 3M + 0.610%), 8/15/2019b,d | 5,008,215 | ||||
J.P. Morgan Securities, LLC | ||||||
25,000,000 | 2.697% (LIBOR 1M + 0.210%), 9/23/2019b,d | 25,010,815 | ||||
JPMorgan Chase Bank NA | ||||||
4,625,000 | 3.192% (LIBOR 3M + 0.590%), 9/23/2019d | 4,632,422 | ||||
Jupiter Securitization Company, LLC | ||||||
15,000,000 | 2.930%, 5/29/2019b,e | 14,969,925 | ||||
25,000,000 | 2.652% (LIBOR 3M + 0.060%), 10/22/2019b,d,e | 24,999,940 | ||||
La Fayette Asset Securitization, LLC | ||||||
10,000,000 | 2.600%, 6/3/2019b | 9,976,436 | ||||
5,709,000 | 2.600%, 6/5/2019b | 5,694,739 | ||||
5,000,000 | 3.000%, 6/11/2019b | 4,985,382 | ||||
25,000,000 | 2.580%, 6/13/2019b | 24,923,336 | ||||
15,000,000 | 2.540%, 7/18/2019b | 14,915,898 | ||||
Liberty Street Funding, LLC | ||||||
15,000,000 | 2.560%, 8/1/2019b,e | 14,902,582 | ||||
LMA Americas, LLC | ||||||
10,000,000 | 2.550%, 5/13/2019b | 9,991,088 | ||||
2,450,000 | 2.530%, 5/14/2019b | 2,447,648 | ||||
10,000,000 | 2.520%, 6/21/2019b | 9,963,022 | ||||
Principal | Financials (43.3%)a | Value | ||||
Marsh & McLennan Companies, Inc. | ||||||
$13,000,000 | 2.668%, 5/6/2019b | $ | 12,994,306 | |||
15,000,000 | 2.640%, 5/14/2019b | 14,984,553 | ||||
25,000,000 | 2.640%, 5/24/2019b | 24,955,067 | ||||
MetLife Short Term Funding, LLC | ||||||
15,000,000 | 2.540%, 6/3/2019b | 14,964,937 | ||||
10,000,000 | 2.560%, 7/15/2019b | 9,946,568 | ||||
25,000,000 | 2.580%, 8/14/2019b | 24,811,923 | ||||
7,500,000 | 2.650%, 8/19/2019b | 7,440,869 | ||||
Metropolitan Life Global Funding I | ||||||
4,999,000 | 1.750%, 9/19/2019b | 4,981,627 | ||||
Mitsubishi UFJ Trust & Banking Corporation | ||||||
15,000,000 | 2.590%, 5/20/2019 | 15,001,044 | ||||
25,000,000 | 2.570%, 6/12/2019 | 25,001,908 | ||||
35,000,000 | 2.560%, 7/19/2019b | 34,802,445 | ||||
Mizuho Bank, Ltd. | ||||||
10,000,000 | 2.689% (LIBOR 1M + 0.210%), 7/29/2019d | 10,003,952 | ||||
6,000,000 | 2.650%, 9/25/2019b | 5,999,161 | ||||
National Australia Bank, Ltd. | ||||||
15,000,000 | 2.741% (LIBOR 3M + 0.100%), 5/21/2019b,d | 15,000,683 | ||||
7,900,000 | 2.250%, 7/1/2019b | 7,895,050 | ||||
15,000,000 | 2.695% (LIBOR 1M + 0.200%), 8/2/2019b,d | 15,005,642 | ||||
13,857,000 | 3.173% (LIBOR 3M + 0.510%), 5/22/2020b,d | 13,921,516 | ||||
National Bank of Canada | ||||||
7,180,000 | 3.157% (LIBOR 3M + 0.560%), 6/12/2020d | 7,210,427 | ||||
Natixis NY | ||||||
10,000,000 | 2.700%, 5/17/2019 | 9,988,525 | ||||
Nederlandse Waterschapsbank NV | ||||||
15,000,000 | 2.520%, 6/24/2019b | 14,942,181 | ||||
15,000,000 | 2.520%, 6/28/2019b | 14,937,829 | ||||
New York Life Global Funding | ||||||
11,548,000 | 2.971% (LIBOR 3M + 0.390%), 10/24/2019b,d | 11,562,949 | ||||
11,605,000 | 2.692% (LIBOR 3M + 0.100%), 1/21/2020b,d | 11,609,758 | ||||
Nordea Bank AB New York | ||||||
10,000,000 | 2.580%, 5/13/2019 | 10,000,569 | ||||
25,000,000 | 2.643% (LIBOR 1M + 0.170%), 5/15/2019d | 25,002,174 | ||||
20,000,000 | 2.711% (LIBOR 3M + 0.070%), 5/21/2019d | 20,000,704 | ||||
15,000,000 | 2.651% (LIBOR 1M + 0.170%), 6/10/2019d | 15,003,133 | ||||
Nordea Bank Abp | ||||||
10,000,000 | 1.625%, 9/30/2019b | 9,956,735 | ||||
12,448,000 | 3.099% (LIBOR 3M + 0.470%), 5/29/2020b,d | 12,491,543 | ||||
Old Line Funding, LLC | ||||||
17,180,000 | 2.737% (LIBOR 1M + 0.250%), 7/19/2019b,d,e | 17,182,361 | ||||
Pricoa Global Funding I | ||||||
17,960,000 | 1.450%, 9/13/2019b | 17,881,500 | ||||
Pricoa Short Term Funding, LLC | ||||||
3,450,000 | 2.800%, 5/6/2019b | 3,448,598 | ||||
15,000,000 | 2.720%, 5/15/2019b | 14,984,688 | ||||
10,000,000 | 2.570%, 7/15/2019b | 9,946,568 | ||||
15,000,000 | 2.550%, 9/20/2019b | 14,846,990 | ||||
The accompanying Notes to Financial Statements are an integral part of this schedule.
| 22 |
SHORT-TERM RESERVE FUND
Schedule of Investments as of April 30, 2019
(unaudited)
Principal | Financials (43.3%)a | Value | ||||
Royal Bank of Canada | ||||||
$6,800,000 | 3.062% (LIBOR 3M + 0.480%), 7/29/2019d | $ | 6,807,435 | |||
15,195,000 | 2.869% (LIBOR 3M + 0.240%), 8/29/2019d | 15,209,091 | ||||
5,000,000 | 2.741% (LIBOR 3M + 0.140%), 1/16/2020b,d | 5,003,830 | ||||
10,000,000 | 2.995% (LIBOR 3M + 0.380%), 3/2/2020d | 10,027,858 | ||||
15,000,000 | 2.653% (LIBOR 1M + 0.180%), 4/14/2020b,d | 14,998,139 | ||||
10,000,000 | 2.730% (FEDL 1M + 0.280%), 4/27/2020d | 9,999,973 | ||||
Skandinaviska Enskilda Banken AB | ||||||
7,500,000 | 1.840%, 8/2/2019 | 7,485,437 | ||||
Sumitomo Mitsui Bank NY | ||||||
10,000,000 | 2.800%, 6/3/2019 | 10,003,127 | ||||
10,000,000 | 2.600%, 6/4/2019 | 10,001,324 | ||||
15,000,000 | 2.250%, 7/11/2019 | 14,988,000 | ||||
10,000,000 | 2.644% (LIBOR 1M + 0.170%), 8/7/2019d | 10,001,524 | ||||
Suncorp-Metway, Ltd. | ||||||
15,000,000 | 2.720%, 5/20/2019b | 14,978,375 | ||||
Svenska Handelsbanken AB | ||||||
10,213,000 | 2.250%, 6/17/2019 | 10,206,617 | ||||
7,240,000 | 3.105% (LIBOR 3M + 0.490%), 6/17/2019d | 7,244,055 | ||||
Svenska Handelsbanken NY | ||||||
10,000,000 | 2.839% (LIBOR 3M + 0.100%), 5/7/2019d | 10,000,172 | ||||
25,000,000 | 2.781% (LIBOR 1M + 0.300%), 6/24/2019d | 25,009,755 | ||||
10,000,000 | 2.773% (LIBOR 1M + 0.290%), 6/26/2019d | 10,004,077 | ||||
25,000,000 | 2.797% (LIBOR 1M + 0.310%), 8/21/2019d | 25,017,993 | ||||
10,000,000 | 2.686% (LIBOR 3M + 0.040%), 2/26/2020d | 9,999,955 | ||||
Swedbank AB | ||||||
15,000,000 | 2.620%, 8/19/2019 | 14,880,490 | ||||
Swedbank NY | ||||||
10,000,000 | 2.747% (LIBOR 1M + 0.260%), 5/21/2019d | 10,001,787 | ||||
25,000,000 | 2.661% (LIBOR 1M + 0.180%), 7/24/2019d | 25,008,013 | ||||
Thunder Bay Funding, LLC | ||||||
25,000,000 | 2.679% (LIBOR 1M + 0.200%), 7/29/2019b,d | 25,002,987 | ||||
25,000,000 | 2.631% (LIBOR 3M + (0.020)%), 8/28/2019b,d | 24,999,889 | ||||
25,000,000 | 2.560%, 9/10/2019b | 24,765,680 | ||||
15,000,000 | 2.610% (LIBOR 3M + 0.010%), 10/9/2019b,d | 14,999,901 | ||||
Toronto-Dominion Bank | ||||||
10,000,000 | 2.874% (LIBOR 1M + 0.400%), 6/7/2019b,d | 10,004,383 | ||||
15,000,000 | 2.808% (LIBOR 3M + 0.070%), 8/2/2019b,d | 15,002,285 | ||||
15,000,000 | 2.944% (LIBOR 3M + 0.210%), 11/6/2019b,d | 15,014,410 | ||||
Toronto-Dominion Bank NY | ||||||
25,000,000 | 2.570%, 7/8/2019 | 25,002,590 | ||||
10,000,000 | 2.763% (LIBOR 3M + 0.080%), 8/16/2019d | 10,001,983 | ||||
Principal | Financials (43.3%)a | Value | ||||
$15,000,000 | 2.718% (LIBOR 3M + 0.110%), 9/6/2019d | $ | 15,001,587 | |||
U.S. Bank NA | ||||||
10,891,000 | 3.062% (LIBOR 3M + 0.480%), 10/28/2019d | 10,911,295 | ||||
20,000,000 | 2.713% (LIBOR 3M + 0.125%), 1/17/2020d | 20,008,792 | ||||
4,900,000 | 2.901% (LIBOR 3M + 0.320%), 1/24/2020d | 4,911,451 | ||||
U.S. Bank NA Ohio | ||||||
25,000,000 | 2.717% (LIBOR 1M + 0.230%), 5/23/2019d | 25,002,013 | ||||
15,000,000 | 2.617% (LIBOR 1M + 0.140%), 7/3/2019d | 15,003,293 | ||||
15,000,000 | 2.747% (LIBOR 1M + 0.260%), 7/23/2019d | 15,005,371 | ||||
25,000,000 | 2.910%, 7/23/2019 | 25,025,582 | ||||
10,000,000 | 2.910%, 7/23/2019 | 10,010,228 | ||||
USAA Capital Corporation | ||||||
8,715,000 | 2.125%, 6/3/2019b | 8,711,060 | ||||
Ventas Realty, LP | ||||||
15,000,000 | 2.680%, 5/1/2019b | 14,998,915 | ||||
10,000,000 | 2.710%, 5/2/2019b | 9,998,552 | ||||
15,000,000 | 2.740%, 5/9/2019b | 14,990,156 | ||||
5,000,000 | 2.680%, 5/16/2019b | 4,994,118 | ||||
Victory Receivables Corporation | ||||||
10,000,000 | 2.560%, 6/18/2019b | 9,965,768 | ||||
Wells Fargo Bank NA | ||||||
10,000,000 | 1.750%, 5/24/2019 | 9,994,800 | ||||
10,000,000 | 2.779% (LIBOR 1M + 0.300%), 6/3/2019d | 10,003,283 | ||||
15,000,000 | 2.831% (LIBOR 3M + 0.180%), 6/24/2019d | 15,005,510 | ||||
15,000,000 | 2.721% (LIBOR 3M + 0.140%), 7/11/2019d | 15,005,689 | ||||
10,000,000 | 2.738% (LIBOR 3M + 0.150%), 10/17/2019d | 10,009,565 | ||||
22,653,000 | 3.258% (LIBOR 3M + 0.650%), 12/6/2019d | 22,732,668 | ||||
15,000,000 | 2.704% (LIBOR 3M + 0.060%), 3/20/2020d | 15,000,019 | ||||
10,000,000 | 2.740% (FEDL 1M + 0.290%), 4/6/2020d | 10,000,913 | ||||
Welltower, Inc. | ||||||
15,000,000 | 2.750%, 5/6/2019b | 14,993,457 | ||||
25,000,000 | 2.750%, 5/7/2019b | 24,987,264 | ||||
15,000,000 | 2.730%, 5/15/2019b | 14,983,500 | ||||
20,000,000 | 2.750%, 5/30/2019b | 19,955,000 | ||||
Westpac Banking Corporation | ||||||
15,000,000 | 2.751% (LIBOR 3M + 0.100%), 5/24/2019b,d | 15,000,708 | ||||
10,000,000 | 2.764% (LIBOR 3M + 0.070%), 8/16/2019b,d | 10,001,696 | ||||
16,603,000 | 3.038% (LIBOR 3M + 0.430%), 3/6/2020d | 16,650,694 | ||||
15,763,000 | 2.964% (LIBOR 3M + 0.280%), 5/15/2020d | 15,795,548 | ||||
Westpac Banking Corporation of New York | ||||||
10,000,000 | 2.779% (LIBOR 3M + 0.040%), 2/7/2020d | 9,999,989 | ||||
15,000,000 | 2.737% (LIBOR 3M + 0.040%), 2/11/2020d | 14,999,965 | ||||
The accompanying Notes to Financial Statements are an integral part of this schedule.
| 23 |
SHORT-TERM RESERVE FUND
Schedule of Investments as of April 30, 2019
(unaudited)
Principal | Financials (43.3%)a | Value | ||||
2.750% (FEDL 1M + 0.300%), | ||||||
$15,000,000 | 2/14/2020d | $ | 15,005,759 | |||
|
| |||||
Total | 2,324,903,495 | |||||
|
| |||||
Principal | Foreign (3.0%)a | Value | ||||
Caisse d’Amortissement de la Dette Sociale | ||||||
10,000,000 | 2.520%, 7/18/2019b | 9,944,437 | ||||
Erste Abwicklungsanstalt | ||||||
30,000,000 | 2.567%, 6/3/2019b | 29,930,158 | ||||
25,000,000 | 2.540%, 7/29/2019b | 24,843,750 | ||||
Kells Funding, LLC | ||||||
15,000,000 | 2.740%, 5/28/2019b,e | 14,971,218 | ||||
10,000,000 | 2.560%, 6/6/2019b,e | 9,974,522 | ||||
15,000,000 | 2.560%, 6/13/2019b,e | 14,954,368 | ||||
25,000,000 | 2.550%, 6/25/2019b,e | 24,902,039 | ||||
15,000,000 | 2.540%, 6/27/2019b,e | 14,938,979 | ||||
15,000,000 | 2.540%, 8/28/2019b,e | 14,872,000 | ||||
|
| |||||
Total | 159,331,471 | |||||
|
| |||||
Principal | Technology (2.1%)a | Value | ||||
Apple, Inc. | ||||||
3.034% (LIBOR 3M + 0.300%), | ||||||
4,075,000 | 5/6/2019d | 4,075,247 | ||||
10,000,000 | 2.670%, 6/17/2019b | 9,967,413 | ||||
5,000,000 | 2.640%, 6/25/2019b | 4,981,015 | ||||
15,000,000 | 2.620%, 6/26/2019b | 14,942,026 | ||||
22,600,000 | 2.611%, 9/17/2019b | 22,377,377 | ||||
13,305,000 | 2.939% (LIBOR 3M + 0.200%), 2/7/2020d | 13,323,126 | ||||
15,150,000 | 2.767% (LIBOR 3M + 0.070%), 5/11/2020d | 15,153,025 | ||||
Cisco Systems, Inc. | ||||||
12,075,000 | 2.973% (LIBOR 3M + 0.340%), 9/20/2019d | 12,092,709 | ||||
Intel Corporation | ||||||
14,800,000 | 2.777% (LIBOR 3M + 0.080%), 5/11/2020d | 14,810,295 | ||||
|
| |||||
Total | 111,722,233 | |||||
|
| |||||
Principal Amount | Transportation (0.2%)a | Value | ||||
Canadian National Railway Company | ||||||
10,000,000 | 2.740%, 7/10/2019b | 9,950,556 | ||||
|
| |||||
Total | 9,950,556 | |||||
|
| |||||
Principal | U.S. Government & Agencies | Value | ||||
Federal Farm Credit Bank | ||||||
20,000,000 | 2.570% (FEDL 1M + 0.120%), 2/18/2020d | 20,004,636 | ||||
6,250,000 | 2.427% (LIBOR 1M + (0.060)%), 7/20/2020d | 6,244,332 | ||||
25,000,000 | 2.540% (FEDL 1M + 0.090%), 7/30/2020d | 24,993,190 | ||||
25,000,000 | 2.560% (USBMMY 3M + 0.160%), 1/19/2021d | 25,008,011 | ||||
25,000,000 | 2.519% (LIBOR 1M + 0.040%), 1/28/2021d | 24,993,811 | ||||
10,120,000 | 2.570% (FEDL 1M + 0.120%), 2/9/2021d | 10,115,585 | ||||
Principal | U.S. Government & Agencies (3.3%)a | Value | ||||
Federal Home Loan Bank | ||||||
$5,000,000 | 2.387% (LIBOR 1M + (0.085)%), 9/9/2019d | $ | 4,998,594 | |||
38,800,000 | 2.483% (LIBOR 1M + FLAT), 10/26/2020d | 38,774,715 | ||||
Overseas Private Investment Corporation | ||||||
1,810,000 | 2.570%, 5/17/2019 | 1,854,643 | ||||
U.S. Treasury Notes | ||||||
6,245,000 | 2.460% (USBMMY 3M + 0.045%), 10/31/2020d | 6,240,504 | ||||
15,000,000 | 2.530% (USBMMY 3M + 0.115%), 1/31/2021d | 14,999,672 | ||||
|
| |||||
Total | 178,227,693 | |||||
|
| |||||
Principal | U.S. Municipals (2.3%)a | Value | ||||
Hennepin County, MN | ||||||
15,000,000 | 2.670%, 5/10/2019 | 14,996,550 | ||||
Massachusetts Educational Financing Auth. | ||||||
6,500,000 | 2.520%, 6/5/2019 | 6,498,245 | ||||
San Jose Financing Auth. | ||||||
7,894,000 | 2.570%, 6/13/2019 | 7,892,421 | ||||
State of California | ||||||
10,000,000 | 2.630%, 5/6/2019 | 9,999,000 | ||||
15,000,000 | 2.630%, 5/7/2019 | 14,998,350 | ||||
19,030,000 | 2.570%, 5/23/2019 | 19,027,526 | ||||
State of Tennessee | ||||||
7,600,000 | 2.580%, 5/10/2019 | 7,598,784 | ||||
10,000,000 | 2.820%, 5/22/2019 | 9,997,000 | ||||
5,000,000 | 2.500%, 6/25/2019 | 4,998,550 | ||||
26,663,000 | 2.600%, 8/8/2019 | 26,645,403 | ||||
|
| |||||
Total | 122,651,829 | |||||
|
| |||||
Principal | Utilities (10.5%)a | Value | ||||
American Electric Power Company, Inc. | ||||||
25,000,000 | 2.700%, 5/3/2019b | 24,994,542 | ||||
5,000,000 | 2.700%, 5/15/2019b | 4,994,479 | ||||
25,000,000 | 2.690%, 5/20/2019b | 24,962,680 | ||||
Centerpoint Energy, Inc. | ||||||
5,000,000 | 2.710%, 5/2/2019b | 4,999,274 | ||||
20,000,000 | 2.710%, 5/21/2019b | 19,968,803 | ||||
21,200,000 | 2.740%, 5/22/2019b | 21,165,344 | ||||
6,900,000 | 2.750%, 5/23/2019b | 6,888,208 | ||||
10,709,000 | 2.740%, 5/29/2019b | 10,685,889 | ||||
25,000,000 | 2.780%, 6/5/2019b | 24,932,600 | ||||
Consolidated Edison, Inc. | ||||||
1,660,000 | 2.600%, 5/1/2019b | 1,659,879 | ||||
15,000,000 | 2.650%, 5/3/2019b | 14,996,700 | ||||
15,000,000 | 2.700%, 5/7/2019b | 14,992,242 | ||||
5,000,000 | 2.630%, 5/8/2019b | 4,997,039 | ||||
DTE Electric Company | ||||||
15,555,000 | 2.550%, 5/10/2019 | 15,543,390 | ||||
Duke Energy Corporation | ||||||
13,000,000 | 2.650%, 5/3/2019b | 12,997,162 | ||||
25,000,000 | 2.640%, 5/7/2019b | 24,987,215 | ||||
6,745,000 | 2.630%, 5/8/2019b | 6,741,053 | ||||
10,000,000 | 2.650%, 5/10/2019b | 9,992,675 | ||||
Enterprise Products Operating, LLC | ||||||
15,000,000 | 2.680%, 5/24/2019b | 14,973,040 | ||||
The accompanying Notes to Financial Statements are an integral part of this schedule.
| 24 |
SHORT-TERM RESERVE FUND
Schedule of Investments as of April 30, 2019
(unaudited)
Principal Amount | Utilities (10.5%)a | Value | ||||
Florida Power & Light Company | ||||||
$15,000,000 | 2.560%, 5/7/2019 | $ | 14,992,183 | |||
Long Island Power Auth. | ||||||
25,150,000 | 2.530%, 6/5/2019 | 25,140,695 | ||||
Magellan Midstream Partners, LP | ||||||
5,788,000 | 2.640%, 5/3/2019b | 5,786,736 | ||||
Nextera Energy Capital Holdings | ||||||
15,000,000 | 2.750%, 5/7/2019b | 14,992,329 | ||||
10,000,000 | 2.750%, 5/29/2019b | 9,978,258 | ||||
10,000,000 | 2.700%, 5/31/2019b | 9,976,741 | ||||
10,000,000 | 2.740%, 6/10/2019b | 9,969,079 | ||||
Oncor Electric Delivery Company, LLC | ||||||
8,750,000 | 2.650%, 5/1/2019b | 8,749,364 | ||||
8,000,000 | 2.650%, 5/8/2019b | 7,995,319 | ||||
10,000,000 | 2.680%, 5/9/2019b | 9,993,413 | ||||
15,000,000 | 2.670%, 5/23/2019b | 14,974,173 | ||||
10,000,000 | 2.680%, 5/30/2019b | 9,977,500 | ||||
PPL Capital Funding, Inc. | ||||||
1,115,000 | 2.680%, 5/1/2019b | 1,114,919 | ||||
12,736,000 | 2.670%, 5/6/2019b | 12,730,422 | ||||
10,000,000 | 2.680%, 5/8/2019b | 9,994,149 | ||||
9,522,000 | 2.700%, 5/15/2019b | 9,511,486 | ||||
TransCanada American Investments, Ltd. | ||||||
3,000,000 | 2.700%, 6/18/2019b | 2,988,861 | ||||
TransCanada PipeLines, Ltd. | ||||||
24,000,000 | 2.775%, 5/6/2019b | 23,989,488 | ||||
10,000,000 | 2.810%, 5/8/2019b | 9,994,149 | ||||
6,710,000 | 2.840%, 5/13/2019b | 6,703,591 | ||||
4,800,000 | 2.830%, 5/16/2019b | 4,794,332 | ||||
15,000,000 | 2.730%, 5/23/2019b | 14,974,173 | ||||
5,000,000 | 2.780%, 5/28/2019b | 4,989,504 | ||||
10,000,000 | 2.870%, 5/29/2019b | 9,978,258 | ||||
6,700,000 | 2.770%, 6/12/2019b | 6,678,256 | ||||
Virginia Electric & Power Company | ||||||
10,000,000 | 2.630%, 5/3/2019 | 9,997,775 | ||||
23,000,000 | 2.680%, 6/10/2019 | 22,928,620 | ||||
Xcel Energy, Inc. | ||||||
5,305,000 | 2.600%, 5/1/2019b | 5,304,615 | ||||
|
| |||||
Total | 564,670,602 | |||||
|
| |||||
Total Investments (cost $5,404,950,095) 100.9% | $ | 5,405,163,196 | ||||
|
| |||||
Other Assets and Liabilities, Net (0.9)% | (47,155,663 | ) | ||||
|
| |||||
Total Net Assets 100.0% | $ | 5,358,007,533 | ||||
|
| |||||
| a | The interest rate shown reflects the yield, coupon rate or the discount rate at the date of purchase. |
| b | Denotes securities sold under Rule 144A of the Securities Act of 1933, which exempts them from registration. These securities may be resold to other dealers in the program or to other qualified institutional buyers. As of April 30, 2019, the value of these investments was $3,194,851,316 or 59.6% of total net assets. |
| c | Denotes investments purchased on a when-issued or delayed delivery basis. |
| d | Denotes variable rate securities. The rate shown is as of April 30, 2019. The rates of certain variable rate securities are based on a published reference rate and spread; these may vary by security and the reference rate and spread are indicated in their description. The rates of other variable rate securities are determined by the issuer or agent and are based on current market conditions. These securities do not indicate a reference rate and spread in their description. |
| e | Denotes investments that benefit from credit enhancement or liquidity support provided by a third party bank, institution or government. |
Definitions:
| ||||
Auth. - Authority | ||||
Ser. - Series | ||||
| Reference Rate Index: | ||||
FEDL 1M | - | Federal Funds 1 Month Rate | ||
LIBOR 1M | - | ICE Libor USD Rate 1 Month | ||
LIBOR 3M | - | ICE Libor USD Rate 3 Month | ||
SOFRRATE | - | Secured Overnight Financing Rate | ||
USBMMY 3M | - | U. S. Treasury Bill Rate 3 Month Money Market Yield | ||
Unrealized Appreciation (Depreciation)
Gross unrealized appreciation and depreciation of investments of the portfolio as a whole (including derivatives, if any), based on cost for federal income tax purposes, were as follows:
Gross unrealized appreciation | $ | 508,655 | ||
Gross unrealized depreciation | (295,554 | ) | ||
|
| |||
Net unrealized appreciation (depreciation) | $ | 213,101 | ||
Cost (includes notional principal amount of derivatives, if any) for federal income tax purposes | $ | 5,404,950,095 | ||
The accompanying Notes to Financial Statements are an integral part of this schedule.
| 25 |
SHORT-TERM RESERVE FUND
Schedule of Investments as of April 30, 2019
(unaudited)
Fair Valuation Measurements
The following table is a summary of the inputs used, as of April 30, 2019, in valuing Short-Term Reserve Fund’s assets carried at fair value or amortized cost, which approximates fair value.
Investments in Securities | Total | Level 1 | Level 2 | Level 3 | ||||||||||||
Asset-Backed Securities | 307,946,061 | – | 307,946,061 | – | ||||||||||||
Basic Materials | 148,249,090 | – | 148,249,090 | – | ||||||||||||
Capital Goods | 244,860,294 | – | 244,860,294 | – | ||||||||||||
Communications Services | 146,507,231 | – | 146,507,231 | – | ||||||||||||
Consumer Cyclical | 334,123,828 | – | 334,123,828 | – | ||||||||||||
ConsumerNon-Cyclical | 530,116,809 | – | 530,116,809 | – | ||||||||||||
Energy | 221,902,004 | – | 221,902,004 | – | ||||||||||||
Financials | 2,324,903,495 | – | 2,324,903,495 | – | ||||||||||||
Foreign | 159,331,471 | – | 159,331,471 | – | ||||||||||||
Technology | 111,722,233 | – | 111,722,233 | – | ||||||||||||
Transportation | 9,950,556 | – | 9,950,556 | – | ||||||||||||
U.S. Government & Agencies | 178,227,693 | – | 178,227,693 | – | ||||||||||||
U.S. Municipals | 122,651,829 | – | 122,651,829 | – | ||||||||||||
Utilities | 564,670,602 | – | 564,670,602 | – | ||||||||||||
|
|
|
|
|
|
|
| |||||||||
Total Investments at Value | $ | 5,405,163,196 | $ | – | $ | 5,405,163,196 | $ | – | ||||||||
|
|
|
|
|
|
|
| |||||||||
There were no significant transfers between Levels during the period ended April 30, 2019. Transfers between Levels are identified as of the end of the period.
The accompanying Notes to Financial Statements are an integral part of this schedule.
26
THRIVENT CORE FUNDS
STATEMENTOF ASSETSAND LIABILITIES
As of April 30, 2019 (unaudited) | Emerging Markets Debt Fund | International Equity Fund | Low Volatility Equity Fund | Short-Term Reserve Fund | ||||||||||||
Assets | ||||||||||||||||
Investments at cost | $ | 847,524,224 | $ | 944,845,558 | $ | 882,451,689 | $ | 5,404,950,095 | ||||||||
Investments in unaffiliated securities at value (#) | 779,857,092 | 919,053,843 | 983,522,567 | 5,405,163,196 | ||||||||||||
Investments in affiliated securities at value | 44,754,765 | 35,622,622 | 1,819,230 | – | ||||||||||||
Cash | 7,172 | 898,217 | (a) | – | 49,290 | |||||||||||
Dividends and interest receivable | 8,436,885 | 5,242,080 | 686,007 | 7,942,110 | ||||||||||||
Prepaid expenses | 5,652 | 6,149 | 6,296 | 18,091 | ||||||||||||
Prepaid trustee fees | 971 | 971 | 971 | 971 | ||||||||||||
Receivable for: | ||||||||||||||||
Investments sold | 3,010,312 | 1,556,829 | – | – | ||||||||||||
Total Assets | 836,072,849 | 962,380,711 | 986,035,071 | 5,413,173,658 | ||||||||||||
Liabilities | ||||||||||||||||
Distributions payable | – | – | – | 11,700,541 | ||||||||||||
Accrued expenses | 20,315 | 46,935 | 21,341 | 39,442 | ||||||||||||
Payable for: | ||||||||||||||||
Investments purchased | 41,320,314 | 1,852,772 | – | 16,913,913 | ||||||||||||
Investments purchased on a delayed delivery basis | – | – | – | 26,500,000 | ||||||||||||
Return of collateral for securities loaned | 7,629,243 | 33,348,904 | – | – | ||||||||||||
Administrative service fees | 16,890 | 19,586 | 20,244 | 7,500 | ||||||||||||
Transfer agent fees | 2,500 | 2,500 | 2,500 | 2,500 | ||||||||||||
Director deferred compensation | 824 | 824 | 810 | 2,229 | ||||||||||||
Commitments and contingent liabilities^ | – | – | – | – | ||||||||||||
Total Liabilities | 48,990,086 | 35,271,521 | 44,895 | 55,166,125 | ||||||||||||
Net Assets | ||||||||||||||||
Capital stock (beneficial interest) | 813,068,092 | 953,444,200 | 858,564,846 | 5,357,837,121 | ||||||||||||
Distributable earnings/(accumulated loss) | (25,985,329 | ) | (26,335,010 | ) | 127,425,330 | 170,412 | ||||||||||
Total Net Assets | $ | 787,082,763 | $ | 927,109,190 | $ | 985,990,176 | $ | 5,358,007,533 | ||||||||
Shares of beneficial interest outstanding | 83,224,833 | 96,857,967 | 86,197,157 | 535,784,178 | ||||||||||||
Net asset value per share | $ | 9.46 | $ | 9.57 | $ | 11.44 | $ | 10.00 | ||||||||
(#) Includes securities on loan of | $ | 7,337,507 | $ | 27,512,388 | $ | – | $ | – | ||||||||
| (a) | Includes foreign currency holdings of $898,217 (cost $897,331). |
| ^ | Commitments and contingent liabilities accrual. Additional information can be found in the accompanying Notes to Financial Statements. |
The accompanying Notes to Financial Statements are an integral part of this statement.
27
THRIVENT CORE FUNDS
STATEMENTOF OPERATIONS
For the six months ended April 30, 2019 (unaudited) | Emerging Markets Debt Fund | International Equity Fund | Low Volatility Equity Fund | Short-Term Reserve Fund | ||||||||||||
Investment Income | ||||||||||||||||
Dividends | $ | – | $ | 18,460,612 | $ | 10,225,994 | $ | – | ||||||||
Interest | 16,495,486 | 465 | – | 65,816,779 | ||||||||||||
Affiliated income from securities loaned, net | 8,457 | 135,381 | 115,388 | – | ||||||||||||
Income from affiliated investments | 93,246 | 29,686 | 19,004 | – | ||||||||||||
Foreign tax withholding | – | (1,569,792 | ) | (4,532 | ) | – | ||||||||||
Total Investment Income | 16,597,189 | 17,056,352 | 10,355,854 | 65,816,779 | ||||||||||||
Expenses | ||||||||||||||||
Administrative service fees | 97,470 | 111,566 | 114,167 | 45,000 | ||||||||||||
Amortization of offering costs | – | 212 | 2,419 | – | ||||||||||||
Audit and legal fees | 17,578 | 17,918 | 18,418 | 24,972 | ||||||||||||
Custody fees | 5,976 | 86,760 | 4,407 | 51,615 | ||||||||||||
Insurance expenses | 3,013 | 3,335 | 3,307 | 10,512 | ||||||||||||
Printing and postage expenses | 2,625 | 3,128 | 1,271 | 2,267 | ||||||||||||
SEC and state registration expenses | 2,683 | 16,828 | 4,068 | – | ||||||||||||
Transfer agent fees | 15,000 | 15,000 | 15,000 | 15,000 | ||||||||||||
Directors’ fees | 3,516 | 3,516 | 3,516 | 3,498 | ||||||||||||
Pricing service fees | 4,818 | 6,205 | 554 | 34,873 | ||||||||||||
Other expenses | 6,750 | 6,672 | 6,214 | 6,310 | ||||||||||||
Total Expenses Before Reimbursement | 159,429 | 271,140 | 173,341 | 194,047 | ||||||||||||
Less: | ||||||||||||||||
Total Net Expenses | 159,429 | 271,140 | 173,341 | 194,047 | ||||||||||||
Net Investment Income/(Loss) | 16,437,760 | 16,785,212 | 10,182,513 | 65,622,732 | ||||||||||||
Realized and Unrealized Gains/(Losses) | ||||||||||||||||
Net realized gains/(losses) on: | ||||||||||||||||
Investments | (951,296 | ) | (35,716,034 | ) | 18,288,641 | (30,001 | ) | |||||||||
Foreign currency transactions | – | (110,286 | ) | – | – | |||||||||||
Change in net unrealized appreciation/(depreciation) on: | ||||||||||||||||
Investments | 33,014,090 | 82,941,796 | 83,846,349 | 888,441 | ||||||||||||
Foreign currency transactions | – | (19,006 | ) | – | – | |||||||||||
Net Realized and Unrealized Gains/(Losses) | 32,062,794 | 47,096,470 | 102,134,990 | 858,440 | ||||||||||||
Net Increase/(Decrease) in Net Assets Resulting From Operations | $ | 48,500,554 | $ | 63,881,682 | $ | 112,317,503 | $ | 66,481,172 | ||||||||
The accompanying Notes to Financial Statements are an integral part of this statement.
28
THRIVENT CORE FUNDS
STATEMENTOF CHANGESIN NET ASSETS
| Emerging Markets Debt Fund | International Equity Fund | |||||||||||||||
For the periods ended | 4/30/2019 (unaudited) | 10/31/2018 | 4/30/2019 (unaudited) | 10/31/2018(a) | ||||||||||||
Operations | ||||||||||||||||
Net investment income/(loss) | $ | 16,437,760 | $ | 26,455,691 | $ | 16,785,212 | $ | 26,126,324 | ||||||||
Net realized gains/(losses) | (951,296 | ) | (2,183,543 | ) | (35,826,320 | ) | (13,331,863 | ) | ||||||||
Change in net unrealized appreciation/(depreciation) | 33,014,090 | (50,984,782 | ) | 82,922,790 | (73,168,153 | ) | ||||||||||
Net Change in Net Assets Resulting From Operations | 48,500,554 | (26,712,634 | ) | 63,881,682 | (60,373,692 | ) | ||||||||||
Distributions to Shareholders | ||||||||||||||||
From net investment income/net realized gains | (16,464,809 | ) | (26,395,545 | ) | (28,842,752 | ) | (1,001,317 | ) | ||||||||
Total Distributions to Shareholders | (16,464,809 | ) | (26,395,545 | ) | (28,842,752 | ) | (1,001,317 | ) | ||||||||
Capital Stock Transactions | ||||||||||||||||
Sold | 54,351,581 | 183,634,669 | 90,000,000 | 858,700,000 | ||||||||||||
Distributions reinvested | 16,464,809 | 7,978,341 | 28,842,752 | 1,001,317 | ||||||||||||
In-kind contributions | – | 124,931,300 | – | – | ||||||||||||
Redeemed | – | (960,000 | ) | (25,000,000 | ) | (98,800 | ) | |||||||||
Total Capital Stock Transactions | 70,816,390 | 315,584,310 | 93,842,752 | 859,602,517 | ||||||||||||
Net Increase/(Decrease) in Net Assets | 102,852,135 | 262,476,131 | 128,881,682 | 798,227,508 | ||||||||||||
Net Assets, Beginning of Period | 684,230,628 | 421,754,497 | 798,227,508 | – | ||||||||||||
Net Assets, End of Period | $ | 787,082,763 | $ | 684,230,628 | $ | 927,109,190 | $ | 798,227,508 | ||||||||
Capital Stock Share Transactions | ||||||||||||||||
Sold | 5,739,984 | 19,060,690 | 10,158,014 | 85,911,466 | ||||||||||||
Distributions reinvested | 1,767,808 | 874,746 | 3,393,265 | 98,749 | ||||||||||||
In-kind contributions | – | 13,123,036 | – | – | ||||||||||||
Redeemed | – | (105,048 | ) | (2,693,527 | ) | (10,000 | ) | |||||||||
|
|
|
|
|
|
|
| |||||||||
Total Capital Stock Share Transactions | 7,507,792 | 32,953,424 | 10,857,752 | 86,000,215 | ||||||||||||
|
|
|
|
|
|
|
| |||||||||
| (a) | For the period from November 14, 2017 (inception) through October 31, 2018. |
The accompanying Notes to Financial Statements are an integral part of this statement.
29
THRIVENT CORE FUNDS
STATEMENTOF CHANGESIN NET ASSETS –CONTINUED
| Low Volatility Equity Fund | Short-Term Reserve Fund | |||||||||||||||
| 4/30/2019 | 4/30/2019 | |||||||||||||||
For the periods ended | (unaudited) | 10/31/2018(a) | (unaudited) | 10/31/2018 | ||||||||||||
Operations | ||||||||||||||||
Net investment income/(loss) | $ | 10,182,513 | $ | 10,615,382 | $ | 65,622,732 | $ | 99,124,768 | ||||||||
Net realized gains/(losses) | 18,288,641 | 19,013,033 | (30,001 | ) | (17,348 | ) | ||||||||||
Change in net unrealized appreciation/(depreciation) | 83,846,349 | 19,043,759 | 888,441 | (538,217 | ) | |||||||||||
Net Change in Net Assets Resulting From Operations | 112,317,503 | 48,672,174 | 66,481,172 | 98,569,203 | ||||||||||||
Distributions to Shareholders | ||||||||||||||||
From net investment income/net realized gains | (33,567,673 | ) | – | (65,622,732 | ) | (99,185,270 | ) | |||||||||
Total Distributions to Shareholders | (33,567,673 | ) | – | (65,622,732 | ) | (99,185,270 | ) | |||||||||
Capital Stock Transactions | ||||||||||||||||
Sold | – | 825,099,999 | 5,997,396,660 | 12,052,138,996 | ||||||||||||
Distributions reinvested | 33,567,673 | – | – | – | ||||||||||||
Redeemed | – | (99,500 | ) | (5,494,796,349 | ) | (12,185,182,945 | ) | |||||||||
Total Capital Stock Transactions | 33,567,673 | 825,000,499 | 502,600,311 | (133,043,949 | ) | |||||||||||
Net Increase/(Decrease) in Net Assets | 112,317,503 | 873,672,673 | 503,458,751 | (133,660,016 | ) | |||||||||||
Net Assets, Beginning of Period | 873,672,673 | – | 4,854,548,782 | 4,988,208,798 | ||||||||||||
Net Assets, End of Period | $ | 985,990,176 | $ | 873,672,673 | $ | 5,358,007,533 | $ | 4,854,548,782 | ||||||||
Capital Stock Share Transactions | ||||||||||||||||
Sold | – | 82,874,125 | 599,739,666 | 1,205,213,900 | ||||||||||||
Distributions reinvested | 3,333,032 | – | – | – | ||||||||||||
Redeemed | – | (10,000 | ) | (549,479,635 | ) | (1,218,518,295 | ) | |||||||||
|
|
|
|
|
|
|
| |||||||||
Total Capital Stock Share Transactions | 3,333,032 | 82,864,125 | 50,260,031 | (13,304,395 | ) | |||||||||||
|
|
|
|
|
|
|
| |||||||||
| (a) | For the period from February 28, 2018 (inception) through October 31, 2018 |
The accompanying Notes to Financial Statements are an integral part of this statement.
30
THRIVENT CORE FUNDS
NOTESTO FINANCIAL STATEMENTS
April 30, 2019
(unaudited)
1) ORGANIZATION
Thrivent Core Funds (the “Trust”) was organized as a Delaware statutory trust on March 18, 2016, and is registered as anopen-end management investment company under the Investment Company Act of 1940. The Trust is divided into four separate series, each with its own investment objective and policies (each, a “Fund”). The four series of the Trust are Thrivent Core Emerging Markets Debt Fund, which isnon-diversified, and Thrivent Core International Equity Fund, Thrivent Core Low Volatility Equity Fund, and Thrivent Core Short-Term Reserve Fund, which are diversified. Thrivent Core Short-Term Reserve Fund serves as a cash sweep vehicle for Thrivent Mutual Funds, Thrivent Series Fund, Inc., and Thrivent Church Loan and Income Fund.
The Funds are each an investment company which follows the accounting and reporting guidance of the Financial Accounting Standard Board (FASB) Accounting Standard Codification Topic 946 – Financial Services – Investment Companies.
Under the Trust’s organizational documents, its officers and trustees are indemnified against certain liabilities arising out of the performance of their duties to the Trust. In addition, in the normal course of business, the Trust enters into contracts with vendors and others that provide general damage clauses. The Trust’s maximum exposure under these contracts is unknown, as this would involve future claims that may be made against the Trust. However, based on experience, the Trust expects the risk of loss to be remote.
(2) SIGNIFICANT ACCOUNTING POLICIES
Valuation of Investments– Securities traded on U.S. or foreign securities exchanges or included in a national market system are valued at the last sale price on the principal exchange or the official closing price of the national market system.Over-the-counter securities and listed securities for which no price is readily available are valued at the current bid price considered best to represent the value at that time. Security prices are based on quotes that are obtained from an independent pricing service approved by the Trust’s Board of Trustees (“Board”). The pricing service, in determining values of fixed-income securities, takes into consideration such factors as current quotations by broker/dealers, coupon, maturity, quality, type of issue, trading characteristics, and other yield and risk factors it deems relevant in determining valuations. Securities which cannot be valued by the approved pricing service are valued using valuations obtained from dealers that make markets in the securities. Investments in open-ended mutual funds are valued at the net asset value at the close of each business day.
The Board has delegated responsibility for daily valuation of the Funds’ securities to the investment adviser, Thrivent Asset Management, LLC (the “Adviser”). The Adviser has formed a Valuation Committee (“Committee”) that is responsible for
overseeing the Funds’ valuation policies in accordance with Valuation Policies and Procedures. The Committee meets on a monthly and on anas-needed basis to review price challenges, price overrides, stale prices, shadow prices, manual prices, money market pricing, international fair valuation, and other securities requiring fair valuation.
The Committee monitors for significant events occurring prior to the close of trading on the New York Stock Exchange that could have a material impact on the value of any securities that are held by the Funds. Examples of such events include trading halts, national news/events, and issuer-specific developments. If the Committee decides that such events warrant using fair value estimates, the Committee will take such events into consideration in determining the fair value of such securities. If market quotations or prices are not readily available or determined to be unreliable, the securities will be valued at fair value as determined in good faith pursuant to procedures adopted by the Board.
In accordance with U.S. Generally Accepted Accounting Principles (“GAAP”), the various inputs used to determine the fair value of the Funds’ investments are summarized in three broad levels. Level 1 includes quoted prices in active markets for identical securities, typically included in this level are U.S. equity securities, futures, options and registered investment company funds. Level 2 includes other significant observable inputs such as quoted prices for similar securities, interest rates, prepayment speeds and credit risk, typically included in this level are fixed income securities, international securities, swaps and forward contracts. Level 3 includes significant unobservable inputs such as the Adviser’s own assumptions and broker evaluations in determining the fair value of investments. Of the Level 3 securities, those for which market values were not readily available or were deemed unreliable were fair valued as determined in good faith under procedures established by the Board. The valuation levels are not necessarily an indication of the risk associated with investing in these securities or other investments. Investments measured using net asset value per share as a practical expedient for fair value and that are not publiclyavailable-for-sale are not categorized within the fair value hierarchy.
Valuation of International Securities – The Funds value certain foreign securities traded on foreign exchanges that close prior to the close of the New York Stock Exchange using a fair value pricing service. The fair value pricing service uses a multi-factor model that may take into account the local close, relevant general and sector indices, currency fluctuation, prices of other securities (including ADRs, New York registered shares, and ETFs), and futures, as applicable, to determine price adjustments for each security in order
31
THRIVENT CORE FUNDS
NOTESTO FINANCIAL STATEMENTS
April 30, 2019
(unaudited)
to reflect the effects of post-closing events. The Board has authorized the Adviser to make fair valuation determinations pursuant to policies approved by the Board.
Foreign Currency Translation – The accounting records of each Fund are maintained in U.S. dollars. Securities and other assets and liabilities that are denominated in foreign currencies are translated into U.S. dollars at the daily closing rates of exchange.
Foreign currency amounts related to the purchase or sale of securities and income and expenses are translated at the exchange rate on the transaction date. Net realized and unrealized currency gains and losses are recorded from closed currency contracts, disposition of foreign currencies, exchange gains or losses between the trade date and settlement date on securities transactions, and other translation gains or losses on dividends, interest income and foreign withholding taxes. The Funds do not separately report the effect of changes in foreign exchange rates from changes in market prices on securities held. Such changes are included in net realized and unrealized gain or loss from investments in the Statement of Operations.
For federal income tax purposes, the Funds treat the effect of changes in foreign exchange rates arising from actual foreign currency transactions and the changes in foreign exchange rates between the trade date and settlement date as ordinary income.
Federal Income Taxes – No provision has been made for income taxes because each Fund’s policy is to qualify as a regulated investment company under the Internal Revenue Code and distribute substantially all investment company taxable income and net capital gain on a timely basis. It is also the intention of each Fund to distribute an amount sufficient to avoid imposition of any federal excise tax. The Funds, accordingly, anticipate paying no federal taxes and no federal tax provision was recorded. Each Fund is treated as a separate taxable entity for federal income tax purposes. Funds may utilize earnings and profits distributed to shareholders on the redemption of shares as part of the dividends paid deduction.
GAAP requires management of the Funds (i.e., the Adviser) to make additional tax disclosures with respect to the tax effects of certain income tax positions, whether those positions were taken on previously filed tax returns or are expected to be taken on future returns. These positions must meet a “more likely than not” standard that, based on the technical merits of the position, would have a greater than 50 percent likelihood of being sustained upon examination. In evaluating whether a tax position has met themore-likely-than-not recognition threshold, the Adviser must presume that the position will be examined by the appropriate taxing authority that has full knowledge of all relevant information.
The Adviser analyzed all open tax years, as defined by the statute of limitations, for all major jurisdictions. Open tax years are those that are open for examination by taxing authorities. Major jurisdictions for the Funds include U.S. Federal, Minnesota, Wisconsin, and Massachusetts as well as certain foreign countries. As of April 30, 2019, open U.S. Federal, Minnesota, Wisconsin and Massachusetts tax years include tax years ended October 31, 2016 through 2018.The Funds have no examinations in progress and none are expected at this time.
As of April 30, 2019, the Adviser has reviewed all open tax years and major jurisdictions and concluded that there is no effect to each Fund’s tax liability, financial position or results of operations. There is no tax liability resulting from unrecognized tax benefits related to uncertain income tax positions taken or expected to be taken in future tax returns. The Funds also are not aware of any tax positions for which it is reasonably possible that the total amounts of unrecognized tax benefits will significantly change in the next 12 months.
Expenses and Income– Estimated expenses are accrued daily. The Funds are charged for those expenses that are directly attributable to them. Expenses that are not directly attributable to a Fund are allocated among all appropriate Funds in proportion to their respective net assets, number of shareholder accounts or other reasonable basis.
Interest income is accrued daily on all debt securities, as is accretion of market discount and original issue discount and amortization of premium. Paydown gains and losses on mortgage- and asset-backed securities are recorded as components of interest income. Dividend income and capital gain distributions are recorded on theex-dividend date. However, certain dividends from foreign securities are recorded as soon as the information is available to the Funds.Non-cash income, if any, is recorded at the fair market value of the securities received.
Distributions to Shareholders– Net investment income is distributed to each shareholder as a dividend. Dividends from Emerging Markets Debt Fund are declared and distributed monthly. Dividends from International Equity Fund and Low Volatility Equity Fund are declared and distributed annually.Dividends from Short-Term Reserve Fund are declared daily and distributed monthly. Net realized gains from securities transactions, if any, are distributed at least annually after the close of the fiscal year.
Derivative Financial Instruments – Certain Funds may invest in derivatives. Derivatives, a category that includes options, futures, swaps, foreign currency forward contracts and hybrid instruments, are financial instruments whose value is derived from another security, an index or a currency. Each applicable Fund may use derivatives for hedging (attempting to offset a potential loss in one position by
32
THRIVENT CORE FUNDS
NOTESTO FINANCIAL STATEMENTS
April 30, 2019
(unaudited)
establishing an interest in an opposite position). This includes the use of currency-based derivatives to manage the risk of its positions in foreign securities. Each applicable Fund may also use derivatives for replication of a certain asset class or speculation (investing for potential income or capital gain). These contracts may be transacted on an exchange orover-the-counter (“OTC”).
A derivative may incur a mark to market loss if the value of the derivative decreases due to an unfavorable change in the market rates or values of the underlying derivative. Losses can also occur if the counterparty does not perform under the derivative. A Fund’s risk of loss from the counterparty credit risk on OTC derivatives is generally limited to the aggregate unrealized gain netted against any collateral held by such Fund. With exchange traded futures and centrally cleared swaps, there is minimal counterparty credit risk to the Funds because the exchange’s clearinghouse, as counterparty to such derivatives, guarantees against a possible default. The clearinghouse stands between the buyer and the seller of the derivative; thus, the credit risk is limited to the failure of the clearinghouse. However, credit risk still exists in exchange traded futures and centrally cleared swaps with respect to initial and variation margin that is held in a broker’s customer accounts. While brokers are required to segregate customer margin from their own assets, in the event that a broker becomes insolvent or goes into bankruptcy and at that time there is a shortfall in the aggregate amount of margin held by the broker for all its clients, U.S. bankruptcy laws will typically allocate that shortfall on apro-rata basis across all the broker’s customers, potentially resulting in losses to the Funds. Using derivatives to hedge can guard against potential risks, but it also adds to the Funds’ expenses and can eliminate some opportunities for gains. In addition, a derivative used for mitigating exposure or replication may not accurately track the value of the underlying asset. Another risk with derivatives is that some types can amplify a gain or loss, potentially earning or losing substantially more money than the actual cost of the derivative.
In order to define their contractual rights and to secure rights that will help the Funds mitigate their counterparty risk, the Funds may enter into an International Swaps and Derivatives Association, Inc. Master Agreement (“ISDA Master Agreement”) or similar agreement with its derivative contract counterparties. An ISDA Master Agreement is a bilateral agreement between a Fund and a counterparty that governs OTC derivatives and foreign exchange contracts and typically includes, among other things, collateral posting terms and netting provisions in the event of a default and/or termination event. Under an ISDA Master Agreement, each Fund may, under certain circumstances, offset with the counterparty certain derivatives’ payables and/or receivables with collateral held and/or posted and create one single net payment. The provisions of the ISDA Master Agreement typically permit a single net payment in the event of a default(close-out
netting) including the bankruptcy or insolvency of the counterparty. Note, however, that bankruptcy and insolvency laws of a particular jurisdiction may impose restrictions on or prohibitions against the right of offset in bankruptcy, insolvency or other events.
Collateral and margin requirements vary by type of derivative. Margin requirements are established by the broker or clearinghouse for exchange traded and centrally cleared derivatives (futures, options, and centrally cleared swaps). Brokers can ask for margining in excess of the minimum in certain situations. Collateral terms are contract specific for OTC derivatives (foreign currency exchange contracts, options, swaps). For derivatives traded under an ISDA Master Agreement, the collateral requirements are typically calculated by netting the mark to market amount for each transaction under such agreement and comparing that amount to the value of any collateral currently pledged by the Fund and the counterparty. For financial reporting purposes,non-cash collateral that has been pledged to cover obligations of the Fund has been noted in the Schedule of Investments. To the extent amounts due to the Fund from its counterparties are not fully collateralized, contractually or otherwise, the Fund bears the risk of loss from counterparty nonperformance. The Funds attempt to mitigate counterparty risk by only entering into agreements with counterparties that they believe have the financial resources to honor their obligations and by monitoring the financial stability of those counterparties.
Options – Certain Funds may buy put and call options and write put and covered call options. The Funds intend to use such derivative instruments as hedges to facilitate buying or selling securities or to provide protection against adverse movements in security prices or interest rates. The Funds may also enter into options contracts to protect against adverse foreign exchange rate fluctuations. Option contracts are valued daily and unrealized appreciation or depreciation is recorded. A Fund will realize a gain or loss upon expiration or closing of the option transaction. When an option is exercised, the proceeds upon sale for a written call option or the cost of a security for purchased put and call options is adjusted by the amount of premium received or paid.
Buying put options tends to decrease a Fund’s exposure to the underlying security while buying call options tends to increase a Fund’s exposure to the underlying security. The risk associated with purchasing put and call options is limited to the premium paid. There is no significant counterparty risk on exchange-traded options as the exchange guarantees the contract against default. Writing put options tends to increase a Fund’s exposure to the underlying security while writing call options tends to decrease a Fund’s exposure to the underlying security. The writer of an option has no control over whether the underlying security may be bought or sold, and therefore bears the market risk of an unfavorable change in the price of the underlying security. The counterparty risk for purchased
33
THRIVENT CORE FUNDS
NOTESTO FINANCIAL STATEMENTS
April 30, 2019
(unaudited)
options arises when a Fund has purchased an option, exercises that option, and the counterparty doesn’t buy from the Fund or sell to the Fund the underlying asset as required. In the case where a Fund has written an option, the Fund doesn’t have counterparty risk. Counterparty risk on purchasedover-the-counter options is partially mitigated by the Fund’s collateral posting requirements. As the option increases in value to the Fund, the Fund receives collateral from the counterparty. Risks of loss may exceed amounts recognized on the Statement of Assets and Liabilities.
Futures Contracts – Certain Funds may use futures contracts to manage the exposure to interest rate and market or currency fluctuations. Gains or losses on futures contracts can offset changes in the yield of securities. When a futures contract is opened, cash or other investments equal to the required “initial margin deposit” are held on deposit with and pledged to the broker. Additional securities held by the Funds may be earmarked to cover open futures contracts. The futures contract’s daily change in value (“variation margin”) is either paid to or received from the broker, and is recorded as an unrealized gain or loss. When the contract is closed, realized gain or loss is recorded equal to the difference between the value of the contract when opened and the value of the contract when closed. Futures contracts involve, to varying degrees, risk of loss in excess of the variation margin disclosed in the Statement of Assets and Liabilities. Exchange-traded futures have no significant counterparty risk as the exchange guarantees the contracts against default.
Foreign Currency Forward Contracts – In connection with purchases and sales of securities denominated in foreign currencies, certain Funds may enter into foreign currency forward contracts. Additionally, the Funds may enter into such contracts to mitigate currency and counterparty exposure to other foreign-currency-denominated investments. These contracts are recorded at value and the related realized and change in unrealized foreign exchange gains and losses are included in the Statement of Operations. In the event that counterparties fail to settle these forward contracts, the Funds could be exposed to foreign currency fluctuations. Foreign currency contracts are valued daily and unrealized appreciation or depreciation is recorded daily as the difference between the contract exchange rate and the closing forward rate applied to the face amount of the contract. A realized gain or loss is recorded at the time a forward contract is closed. These contracts areover-the-counter and the Fund is exposed to counterparty risk equal to the discounted net amount of payments to the Fund.
Swap Agreements – Certain Funds may enter into swap transactions, which involve swapping one or more investment characteristics of a security or a basket of securities with another party. Such transactions include market risk, risk of default by the other party to the transaction, risk of
imperfect correlation and manager risk and may involve commissions or other costs. Swap transactions generally do not involve delivery of securities, other underlying assets or principal. Accordingly, the risk of loss with respect to swap transactions is generally limited to the net amount of payments that the Fund is contractually obligated to make, or in the case of the counterparty defaulting, the net amount of payments that the Fund is contractually entitled to receive. Risks of loss may exceed amounts recognized on the Statement of Assets and Liabilities. If there is a default by the counterparty, the Fund may have contractual remedies pursuant to the agreements related to the transaction. The contracts are valued daily and unrealized appreciation or depreciation is recorded. Swap agreements are valued at the clearinghouse end of day prices as furnished by an independent pricing service. The pricing service takes into account such factors as swap curves, default probabilities, recent trades, recovery rates and other factors it deems relevant in determining valuations. Daily fluctuations in the value of the centrally cleared credit default contracts are recorded in variation margin in the Statement of Assets and Liabilities and recorded as unrealized gain or loss. The Fund accrues for the periodic payment and amortizes upfront payments, if any, on swap agreements on a daily basis with the net amount recorded as realized gains or losses in the Statement of Operations. Receipts and payments received or made as a result of a credit event or termination of the contract are also recognized as realized gains or losses in the Statement of Operations. Collateral, in the form of cash or securities, may be required to be held with the Fund’s custodian, or a third party, in connection with these agreements. Certain swap agreements areover-the-counter and the Fund is exposed to counterparty risk, which is the discounted net amount of payments owed to the Fund. This risk is partially mitigated by the Fund’s collateral posting requirements. As the swap increases in value to the Fund, the Fund receives collateral from the counterparty. Certain interest rate and credit default index swaps must be cleared through a clearinghouse or central counterparty.
Credit Default Swaps – A credit default swap is a swap agreement between two parties to exchange the credit risk of a particular issuer, basket of securities or reference entity. In a credit default swap transaction, a buyer pays periodic fees in return for payment by the seller which is contingent upon an adverse credit event occurring in the underlying issuer or reference entity. The seller collects periodic fees from the buyer and profits if the credit of the underlying issuer or reference entity remains stable or improves while the swap is outstanding, but the seller in a credit default swap contract would be required to pay the amount of credit loss, determined as specified in the agreement, to the buyer in the event of an adverse credit event in the reference entity. A buyer of a credit default swap is said to buy protection
34
THRIVENT CORE FUNDS
NOTESTO FINANCIAL STATEMENTS
April 30, 2019
(unaudited)
whereas a seller of a credit default swap is said to sell protection. The Funds may be either the protection seller or the protection buyer.
Certain Funds enter into credit default derivative contracts directly through credit default swaps (CDS) or through credit default swap indices (“CDX Indices”). CDX Indices are static pools of equally weighted credit default swaps referencing corporate bonds and/or loans designed to provide diversified credit exposure to these asset classes. Funds sell default protection and assume long-risk positions in individual credits or indices. Index positions are entered into to gain exposure to the corporate bond and/or loan markets in a cost-efficient and diversified structure. In the event that a position defaults, by going into bankruptcy and failing to pay interest or principal
on borrowed money, within any given CDX Index held, the maximum potential amount of future payments required would be equal to thepro-rata share of that position within the index based on the notional amount of the index. In the event of a default under a CDS contract the maximum potential amount of future payments would be the notional amount. For CDS, the default events could be bankruptcy and failing to pay interest or principal on borrowed money or a restructuring. A restructuring is a change in the underlying obligations which would include reduction in interest or principal, maturity extension and subordination to other obligations.
For financial reporting purposes, the Funds do not offset derivative assets and derivative liabilities that are subject to netting arrangements in the Statement of Assets and Liabilities.
The following table presents the gross and net information about liabilities subject to master netting arrangements, as presented in the Statement of Assets and Liabilities:
Gross Amounts Not Offset in the Statement of Assets and Liabilities | ||||||||||||||||||||||||||||
Fund | Gross Amounts of Recognized Liabilities | Gross Amounts Offset | Net Amounts of Recognized Liabilities | Financial Instruments | Cash Collateral Pledged | Non-Cash Collateral Pledged(**) | Net Amount | |||||||||||||||||||||
Emerging Markets Debt Securities Lending | 7,629,243 | – | 7,629,243 | 7,337,507 | – | – | 291,736 | (^) | ||||||||||||||||||||
International Equity | 33,348,904 | – | 33,348,904 | 27,512,388 | – | – | 5,836,516 | (^) | ||||||||||||||||||||
| (**) | Excess of collateral pledged to the counterparty may not be shown for financial reporting purposes. |
| (^) | Net securities lending amounts represent the net amount payable to the counterparty in the event of a default. |
Securities Lending – The Trust has entered into a Securities Lending Agreement (the “Agreement”) with Goldman Sachs Bank USA doing business as Goldman Sachs Agency Lending (“GSAL”) pursuant to which GSAL provides securities lending services. The Agreement authorizes GSAL to lend securities to authorized borrowers on behalf of the Funds. Pursuant to the Agreement, loaned securities are typically initially collateralized equal to at least 102% for U.S. securities and 105% fornon-U.S. securities of the market value of the loaned securities. Daily market fluctuations could cause the value of loaned securities to be more or less than the value of the collateral received. Any additional collateral is adjusted and settled on the next business day. The Trust has the ability to recall the loans at any time and could do so in order to vote proxies or sell the loaned securities.All cash collateral received is invested in Thrivent Cash Management Trust. The Funds receive dividends and interest that would have been earned on the securities loaned while simultaneously seeking to earn income on the investment of cash collateral. Amounts earned on investments in Thrivent Cash Management Trust, net of rebates, fees paid to GSAL for services provided and any other securities lending expenses, are included in income from securities loaned on the Statement of Operations. By investing any cash collateral
it receives in these transactions, a Fund could realize additional gains or losses. If the borrower fails to return the securities or the invested collateral has declined in value, the Fund could lose money. Generally, in the event of borrower default, the Fund has the right to use the collateral to offset any losses incurred. However, in the event the Fund is delayed or prevented from exercising its right to dispose of the collateral, there may be a potential loss. Some of these losses may be indemnified by the lending agent.
As of April 30, 2019, the value of securities on loan is as follows:
Fund | Securities on Loan | |||
Emerging Markets Debt | $ | 7,337,507 | ||
International Equity | 27,512,388 | |||
When-Issued and Delayed Delivery Transactions – The Funds may purchase or sell securities on a when-issued or delayed delivery basis. These transactions involve a commitment by the Funds to purchase or sell securities for a predetermined price or yield, with payment and delivery taking place beyond the customary settlement period. When delayed delivery purchases are outstanding, the Funds will designate liquid assets in an amount sufficient to meet the purchase price. When purchasing a security on a delayed
35
THRIVENT CORE FUNDS
NOTES TO FINANCIAL STATEMENTS
April 30, 2019
(unaudited)
delivery basis, the Funds assume the rights and risks of ownership of the security, including the risk of price and yield fluctuations, and take such fluctuations into account when determining its net asset value. A Fund may dispose of a delayed delivery transaction after it is entered into, and may sell when-issued securities before they are delivered, which may result in a capital gain or loss. When a Fund has sold a security on a delayed delivery basis, a Fund does not participate in future gains and losses with respect to the security.
Repurchase Agreements – A Fund may engage in repurchase agreement transactions in pursuit of its investment objective. A repurchase agreement consists of a purchase and a simultaneous agreement to resell an investment for later delivery at an agreed upon price and rate of interest. The Funds use a third-party custodian to maintain the collateral. If the original seller of a security subject to a repurchase agreement fails to repurchase the security at the agreed upon time, a Fund could incur a loss due to a drop in the value of the security during the time it takes the Fund to either sell the security or take action to enforce the original seller’s agreement to repurchase the security. Also, if a defaulting original seller filed for bankruptcy or became insolvent, disposition of such security might be delayed by pending legal action. The Funds may only enter into repurchase agreements with banks and other recognized financial institutions such as broker/dealers that are found by the Adviser to be creditworthy. During the six months ended April 30, 2019, the Funds did not engage in this type of investment.
Loan Commitments – Certain Funds may enter into loan commitments, which generally have interest rates which are reset daily, monthly, quarterly or semi-annually by reference to a base lending rate, plus a premium. These base rates are primarily the London-Interbank Offered Rate (“LIBOR”), and secondarily the prime rate offered by one or more major United States banks (the “Prime Rate”) and the certificate of deposit (“CD”) rate or other base lending rates used by commercial lenders. Loan commitments often require prepayments from excess cash flows or allow the borrower to repay at its election. The rate at which the borrower repays cannot be predicted with accuracy. Therefore, the remaining maturity may be considerably less than the stated maturity shown in the Schedule of Investments.
All or a portion of these loan commitments may be unfunded. A Fund is obligated to fund these commitments at the borrower’s discretion; therefore, the Fund must have funds sufficient to cover its contractual obligation. These unfunded loan commitments, which are marked to market daily, are presented in the Schedule of Investments. During the year ended April 30, 2019, none of the Funds engaged in these types of investments.
Loss Contingencies – In the event of adversary action proceedings where a Fund is a defendant, a loss contingency will not be accrued as a liability until the amount of potential damages and the likelihood of loss can be reasonably estimated.
Accounting Estimates – The preparation of financial statements in conformity with GAAP requires management to make estimates and assumptions that affect the reported amounts of assets and liabilities and disclosure of contingent assets and liabilities at the date of the financial statements and the reported amounts of income and expenses during the reporting period. Actual results could differ from these estimates.
Amortization of Offering Costs – The offering costs referenced in the Statement of Operations for each of International Equity Fund and Low Volatility Equity Fund are costs incurred by the Fund in order to establish it for sale. These costs generally include any legal costs associated with registering the Fund.These costs are amortized over a period of 12 months from inception.
Recent Accounting Pronouncements —
Premium Amortization on Purchased Callable Debt Securities
In March 2017, the Financial Accounting Standards Board (FASB) issued Accounting Standards Update (ASU)No. 2017-08 Premium Amortization on Purchased Callable Debt Securities.ASUNo. 2017-08 updates the accounting standards to shorten the amortization period for certain purchased callable debt securities, held at a premium, to be amortized to the earliest call date. The update applies to securities with explicit,non-contingent call features that are callable at fixed prices and on preset dates. The amendments are effective for fiscal years, and interim periods within those fiscal years, beginning after December 15, 2018. Early adoption of these amendments is allowed, and Management has adopted the amendments as of the beginning of the fiscal period. Management has evaluated the implications of this guidance and the impact to the financial statement amounts and footnote disclosures and has determined there are no material impacts.
Fair Value Measurement (Topic 820)
In August 2018, the Financial Accounting Standards Board (FASB) issued Accounting Standards Update (ASU)No. 2018-13 Fair Value Measurement (Topic 820). ASUNo. 2018-13 updates the disclosure requirements on fair value measurements by modifying or removing certain disclosures and adding certain new disclosures. The amendments are effective for fiscal years, and the interim periods within those fiscal years, beginning after December 15, 2019. At this time, management is evaluating the implications of this guidance and the impact it will have to financial statement amounts and footnote disclosures.
36
THRIVENT CORE FUNDS
NOTES TO FINANCIAL STATEMENTS
April 30, 2019
(unaudited)
In-kind Contributions – During March 2018, the Thrivent Core Emerging Markets Debt Fund received anin-kind contribution which consisted of $124,931,300 in securities. As a result of thein-kind contribution, Thrivent Core Emerging Markets Debt Fund issued 13,123,036 shares at a $9.52/share net asset value. Thein-kind amounts and shares issued are included in the Capital Stock Transactions of the Statement of Changes in Net Assets for Thrivent Core Emerging Markets Debt Fund. Thesein-kind transactions were conducted at market value. The transactions were as follows:
Contributing Fund/Portfolio | Shares Issued | In-kind Amount | ||||||
Balanced Income Plus Fund | 1,120,664 | $ | 10,668,722 | |||||
Balanced Income Plus Portfolio | 1,298,780 | $ | 12,364,385 | |||||
Diversified Income Plus Fund | 1,577,662 | $ | 15,019,338 | |||||
Diversified Income Plus Portfolio | 1,289,457 | $ | 12,275,624 | |||||
Growth and Income Plus Fund | 123,308 | $ | 1,173,896 | |||||
Growth and Income Plus Portfolio | 140,246 | $ | 1,335,143 | |||||
Opportunity Income Plus Fund | 6,361,609 | $ | 60,562,521 | |||||
Opportunity Income Plus Portfolio | 1,211,310 | $ | 11,531,671 | |||||
|
|
|
| |||||
Totals | 13,123,036 | $ | 124,931,300 | |||||
Other – For financial statement purposes, investment security transactions are accounted for on the trade date. Realized gains or losses on sales are determined on a specific cost identification basis, which is the same basis for federal income tax purposes.
(3) FEES AND COMPENSATION PAID TO AFFILIATES
Fees – The Trust has entered into an administration and accounting services agreement with the Adviser pursuant to which the Adviser provides certain administrative and accounting personnel and services. The Fund pays an annual fixed fee plus percentage of net assets to the Adviser. These fees are accrued daily and paid monthly. For the six months ended April 30, 2019, the Adviser received aggregate fees for administrative and accounting personnel and services of $368,202 from the Trust.
The Trust has entered into an agreement with Thrivent Financial Investor Services Inc. (“Thrivent Investor Services”) to provide transfer agency services necessary to the Trust.These fees are accrued daily and paid monthly. For the year ended, April 30, 2019, Thrivent Investor Services received $60,000.00 for transfer agent services from the Trust.
Each Trustee who is not affiliated with the Adviser receives an annual fee from the Trust for services as a Trustee and is eligible to participate in a deferred compensation plan with respect to these fees. Participants in the plan may designate their deferred Trustee’s fees as if invested in a series of the Thrivent Mutual Funds, except for Money Market Fund as it is not eligible for the deferral plan. The value of each participant’s deferred compensation account will increase or decrease as if it were invested in shares of a particular series of Thrivent Mutual Funds. Each participant’s fees as well as the change in value are included in Trustee fees in
the Statement of Operations. The deferred fees remain in the appropriate Fund until distribution in accordance with the plan. The Payable for trustee deferred compensation, located in the Statement of Assets and Liabilities, is unsecured.
Those trustees not participating in the above plan received $13,465 in fees from the Trust during the six months ended April 30, 2019. In addition, the Trust reimbursed unaffiliated Trustees for reasonable expenses incurred in relation to attendance at the meetings and industry conferences.
Certain officers andnon-independent Trustees of the Trust are officers and directors of Thrivent Asset Mgt., Thrivent Investor Services and Thrivent Distributors, LLC.; however they receive no compensation from the Trust. Affiliated employees and board consultants are reimbursed for reasonable expenses incurred in relation to board meeting attendance.
Acquired Fund Fees and Expenses – The Funds may invest in other mutual funds. Fees and expenses of those underlying funds are not included in the Funds’ expense ratio. The Funds indirectly bear their proportionate share of the annualized weighted average expense ratio for the underlying funds in which it invests.
Interfund Lending – The Funds may participate in an interfund lending program (the “Program”) pursuant to an exemptive order issued by the SEC. The Program permits the Funds to borrow cash for temporary purposes from Thrivent Core Short-Term Reserve Fund. Interest is charged to each participating Fund based on its borrowings at the average of the repo rate and bank loan rate, each as defined in the Program. Each borrowing made under the Program matures no later than seven calendar days after the date of the borrowing, and each borrowing must be securitized by a
37
THRIVENT CORE FUNDS
NOTESTO FINANCIAL STATEMENTS
April 30, 2019
(unaudited)
pledge of segregated collateral with a market value at least equal to 102% of the outstanding principal value of the loan.For the six months ended April 30, 2019, no Funds borrowed cash through the interfund lending program.
(4) FEDERAL INCOME TAX INFORMATION
Distributions are based on amounts calculated in accordance with the applicable federal income tax regulations, which may differ from GAAP. To the extent that these differences are permanent in nature, GAAP requires such amounts to be reclassified within the capital accounts based on their federaltax-basis treatment; temporary differences do not require reclassifications. At fiscalyear-end, the character and amount of distributions, on a tax basis and components of distributable earnings, are finalized. Therefore, as of April 30, 2019, thetax-basis balance has not yet been determined.
At October 31, 2018, the following Funds had accumulated net realized capital loss carryovers expiring as follows:
Fund | Capital Loss Carryover | Expiration | ||||||
Emerging Markets Debt | $ | 1,833,806 | Unlimited | |||||
International Equity | 11,766,177 | Unlimited | ||||||
Short-Term Reserve | 17,348 | Unlimited | ||||||
(5) SECURITY TRANSACTIONS
Purchases and Sales of Investment Securities – For the six months ended April 30, 2019, the cost of purchases and the proceeds from sales of investment securities, other than U.S. Government and short-term securities, were as follows:
| In thousands | ||||||||
Fund | Purchases | Sales | ||||||
Emerging Markets Debt | $ | 119,901 | $ | 52,098 | ||||
International Equity | 427,123 | 349,856 | ||||||
Low Volatility Equity | 278,066 | 269,146 | ||||||
Short-Term Reserve | 743,806 | 688,505 | ||||||
Purchases and sales of U.S. Government securities were:
| In thousands | ||||||||
Fund | Purchases | Sales | ||||||
Short-Term Reserve | $ | 132,607 | $ | 17,840 | ||||
(7) RELATED PARTY TRANSACTIONS
As of April 30, 2019, related parties held 100% of the outstanding shares of all Thrivent Core Funds. Subscription and redemption activity by concentrated accounts may have a significant effect on the operation of the Funds. In the case of a large redemption, the Funds may be forced to sell investments at inopportune times, resulting in additional losses for the Funds.
(8) SUBSEQUENT EVENTS
The Adviser of the Funds has evaluated the impact of subsequent events through the date the financial statements
were issued, and, except as already included in the Notes to Financial Statements, has determined that no additional items require disclosure.
(9) MARKET RISK
Over time, securities markets generally tend to move in cycles with periods when security prices rise and periods when security prices decline. The value of a Fund’s investments may move with these cycles and, in some instances, increase or decrease more than the applicable market(s) as measured by the Fund’s benchmark index(es). The securities markets may also decline because of factors that affect a particular industry. As of April 30, 2019, the following Funds had portfolio concentration greater than 25% in certain sectors.
Fund | Sector | % of Total Net Assets | ||||
Core Emerging Market Debt | Foreign Government | 94.9 | % | |||
Core Short-Term Reserve | Financials | 43.3 | % | |||
(10) SIGNIFICANT RISKS
Credit Risk – Credit risk is the risk that an issuer of a debt security to which the Fund is exposed may no longer be able or willing to pay its debt. As a result of such an event, the debt security may decline in price and affect the value of the Fund.
Derivatives Risk – The use of derivatives (such as credit default swaps) involves additional risks and transaction costs which could leave the Fund in a worse position than if it had not used these instruments. The use of derivatives can lead to losses because of adverse movements in the price or value of the underlying asset, index or rate, which may be magnified by certain features of the contract. Changes in the value of the derivative may not correlate as intended with the underlying asset, rate or index, and the Fund could lose much more than the original amount invested. Derivatives can be highly volatile, illiquid and difficult to value. Certain derivatives may also be subject to counterparty risk, which is that the other party in the transaction will not fulfill its contractual obligations due to its financial condition, market events, or other reasons.
Emerging Markets Risk – The economic and political structures of developing countries, in most cases, do not compare favorably with the U.S. or other developed countries in terms of wealth and stability, and their financial markets often lack liquidity. Fund performance will likely be negatively affected by portfolio exposure to countries in the midst of, among other things, hyperinflation, currency devaluation, trade disagreements, sudden political upheaval, or interventionist government policies. Significant buying or selling actions by a few major investors may also heighten the volatility of emerging markets. These factors make
38
THRIVENT CORE FUNDS
NOTES TO FINANCIAL STATEMENTS
April 30, 2019
(unaudited)
investing in emerging market countries significantly riskier than in other countries, and events in any one country could cause the Fund’s share price to decline.
Equity Security Risk – Equity securities held by the Fund may decline significantly in price over short or extended periods of time, and such declines may occur because of declines in the equity market as a whole, or because of declines in only a particular country, company, industry, or sector of the market. From time to time, the Fund may invest a significant portion of its assets in companies in one or more related sectors or industries which would make the Fund more vulnerable to adverse developments affecting such sectors or industries. Equity securities are generally more volatile than most debt securities.
ETF Risk – An ETF is subject to the risks of the underlying investments that it holds. In addition, for index-based ETFs, the performance of an ETF may diverge from the performance of such index (commonly known as tracking error). ETFs are subject to fees and expenses (like management fees and operating expenses) that do not apply to an index, and the Fund will indirectly bear its proportionate share of any such fees and expenses paid by the ETFs in which it invests.
Foreign Currency Risk – The value of a foreign currency may decline against the U.S. dollar, which would reduce the dollar value of securities denominated in that currency. The overall impact of such a decline of foreign currency can be significant, unpredictable, and long lasting, depending on the currencies represented, how each one appreciates or depreciates in relation to the U.S. dollar, and whether currency positions are hedged. Under normal conditions, the Fund does not engage in extensive foreign currency hedging programs. Further, exchange rate movements are volatile, and it is not possible to effectively hedge the currency risks of many developing countries.
Foreign Securities Risk – Foreign securities generally carry more risk and are more volatile than their domestic counterparts, in part because of higher political and economic risks, lack of reliable information and fluctuations in currency exchange rates. The Fund’s investment in any country could be subject to governmental actions such as capital or currency controls, nationalizing a company or industry, expropriating assets, or imposing punitive taxes that would have an adverse effect on security prices, and impair the Fund’s ability to repatriate capital or income. Foreign securities may also be more difficult to resell than comparable U.S. securities because the markets for foreign securities are often less liquid. Even when a foreign security increases in price in its local currency, the appreciation may be diluted by adverse changes in exchange rates when
the security’s value is converted to U.S. dollars. Foreign withholding taxes also may apply and errors and delays may occur in the settlement process for foreign securities.
Government Securities Risk – The Fund invests in securities issued or guaranteed by the U.S. government or its agencies and instrumentalities (such as Federal Home Loan Bank, Ginnie Mae, Fannie Mae or Freddie Mac securities). Securities issued or guaranteed by Federal Home Loan Bank, Ginnie Mae, Fannie Mae or Freddie Mac are not issued directly by the U.S. government. Ginnie Mae is a wholly owned U.S. corporation that is authorized to guarantee, with the full faith and credit of the U.S. government, the timely payment of principal and interest of its securities. By contrast, securities issued or guaranteed by U.S. government-related organizations such as Federal Home Loan Bank, Fannie Mae and Freddie Mac are not backed by the full faith and credit of the U.S. government. No assurance can be given that the U.S. government would provide financial support to its agencies and instrumentalities if not required to do so by law. In addition, the value of U.S. government securities may be affected by changes in the credit rating of the U.S. government.
High Yield Risk – High yield securities – commonly known as “junk bonds” – to which the Fund is exposed are considered predominantly speculative with respect to the issuer’s continuing ability to make principal and interest payments. If the issuer of the security is in default with respect to interest or principal payments, the value of the Fund may be negatively affected. High yield securities generally have a less liquid resale market.
Interest Rate Risk – Interest rate risk is the risk that prices of debt securities decline in value when interest rates rise for debt securities that pay a fixed rate of interest. Debt securities with longer durations (a measure of price sensitivity of a bond or bond fund to changes in interest rates) or maturities (i.e., the amount of time until a bond’s issuer must pay its principal or face value) tend to be more sensitive to changes in interest rates than debt securities with shorter durations or maturities. Changes by the Federal Reserve to monetary policies could affect interest rates and the value of some securities.
Investment Adviser Risk – The Fund is actively managed and the success of its investment strategy depends significantly on the skills of the adviser in assessing the potential of the
39
THRIVENT CORE FUNDS
NOTESTO FINANCIAL STATEMENTS
April 30, 2019
(unaudited)
investments in which the Fund invests. This assessment of investments may prove incorrect, resulting in losses or poor performance, even in rising markets.
Issuer Risk – Issuer risk is the possibility that factors specific to an issuer to which the Fund is exposed will affect the market prices of the issuer’s securities and therefore the value of the Fund.
Large Cap Risk –Large-sized companies may be unable to respond quickly to new competitive challenges such as changes in technology. They may also not be able to attain the high growth rate of successful smaller companies, especially during extended periods of economic expansion.
Liquidity Risk – Liquidity is the ability to sell a security relatively quickly for a price that most closely reflects the actual value of the security. Dealer inventories of bonds are at or near historic lows in relation to market size, which has the potential to decrease liquidity and increase price volatility in the fixed income markets, particularly during periods of economic or market stress. As a result of this decreased liquidity, the Fund may have to accept a lower price to sell a security, sell other securities to raise cash, or give up an investment opportunity, any of which could have a negative effect on performance.
Market Risk – Over time, securities markets generally tend to move in cycles with periods when security prices rise and periods when security prices decline. The value of the Fund’s investments may move with these cycles and, in some instances, increase or decrease more than the applicable market(s) as measured by the Fund’s benchmark index(es). The securities markets may also decline because of factors that affect a particular industry.
Mid Cap Risk –Medium-sized companies often have greater price volatility, lower trading volume, and less liquidity than larger, more-established companies. These companies tend to have smaller revenues, narrower product lines, less management depth and experience, smaller shares of their product or service markets, fewer financial resources, and less competitive strength than larger companies.
Mortgage-Backed and Other Asset-Backed Securities Risk – The value of mortgage-backed and asset-backed securities will be influenced by the factors affecting the housing market and the assets underlying such securities. As a result, during periods of declining asset value, difficult or frozen credit markets, swings in interest rates, or deteriorating economic conditions, mortgage-related and asset-backed securities may decline in value, face valuation difficulties, become more volatile and/or become illiquid. In addition, both mortgage-backed and asset-backed securities are sensitive to changes in the repayment patterns of the underlying security. If the principal payment on the underlying asset is repaid faster or slower than the holder of the asset-backed or mortgage- backed
security anticipates, the price of the security may fall, particularly if the holder must reinvest the repaid principal at lower rates or must continue to hold the security when interest rates rise. This effect may cause the value of the Fund to decline and reduce the overall return of the Fund.
Non-Diversified Risk – The Fund is not “diversified” within the meaning of the 1940 Act. That means the Fund may invest a greater percentage of its assets in the securities of any single issuer compared to other funds. Anon-diversified portfolio is generally more susceptible than a diversified portfolio to the risk that events or developments affecting a particular issuer or industry will significantly affect the Fund’s performance.
Portfolio Turnover Rate Risk – The Fund may engage in active and frequent trading of portfolio securities in implementing its principal investment strategies. A high rate of portfolio turnover (100% or more) involves correspondingly greater expenses which are borne by the Fund and its shareholders and may also result in short-term capital gains taxable to shareholders.
Prepayment Risk – Mortgage-backed and asset-backed securities are sensitive to changes in the repayment patterns of the underlying securities, including the conversion, prepayment or redemption of the investments. If the principal payment on the underlying asset is repaid faster than the holder of the mortgage-backed or asset-backed security anticipates, the price of the security may fall, especially if the holder must reinvest the repaid principal at lower rates. When people start prepaying the principal on the collateral underlying a collateralized mortgage obligation (“CMOs”) (such as mortgages underlying a CMO), for example, some classes may retire substantially earlier than the stated maturity or final distribution dates.
Quantitative Investing Risk – The risk that securities selected according to a quantitative analysis methodology can perform differently from the market as a whole based on the model and the factors used in the analysis, the weight placed on each factor and changes in the factor’s historical trends. Such models are based on assumptions of these and other market factors, and the models may not take into account certain factors, or perform as intended, and may result in a decline in the value of the Fund’s portfolio.
Redemption and Lending Risk – The Fund participates in an interfund lending program (the “Program”) which enables a participating fund to lend cash directly to and borrow money from other participating funds for temporary purposes. The other participants in the Program are other mutual funds advised by the Adviser and its affiliates. Under the Program, all loans will be made by the Fund. There is risk that a borrowing fund could be unable to repay a loan when due, and a delay in repayment to the Fund could result in a
40
THRIVENT CORE FUNDS
NOTESTO FINANCIAL STATEMENTS
April 30, 2019
(unaudited)
lost opportunity and increase risk of the Fund experiencing a loss when meeting redemption requests if it is forced to sell securities at unfavorable prices in an effort to generate sufficient cash to pay redeeming shareholders.
Redemption and Share Ownership Risk – The Fund may need to sell portfolio securities to meet redemption requests. The Fund could experience a loss when selling portfolio securities to meet redemption requests if there is (i) significant redemption activity by shareholders, including, for example, when a single investor or few large investors make a significant redemption of Fund shares, (ii) a disruption in the normal operation of the markets in which the Fund buys and sells portfolio securities or (iii) the inability of the Fund to sell portfolio securities because such securities are illiquid. In such events, the Fund could be forced to sell securities at unfavorable prices in an effort to generate sufficient cash to pay redeeming shareholders. A majority of the Fund’s shares may be held by other mutual funds advised by the Adviser and its affiliates. It also is possible that some or all of these other mutual funds will decide to purchase or redeem shares of the Fund simultaneously or within a short period of time of one another in order to execute their asset allocation strategies. Accordingly, there is a risk that the share trading activities of these shareholders could disrupt the Fund’s investment strategies which could have adverse consequences for the Fund and other shareholders (e.g., by requiring the Fund to sell investments at inopportune times or causing the Fund to maintain larger-than-expected cash positions pending acquisition of investments).
Small Cap Risk – Smaller, less seasoned companies often have greater price volatility, lower trading volume, and less liquidity than larger, more established companies. These companies tend to have small revenues, narrower product lines, less management depth and experience, small shares of their product or service markets, fewer financial resources, and less competitive strength than larger companies. Such companies seldom pay significant dividends that could cushion returns in a falling market
Sovereign Debt Risk – Sovereign debt securities are issued or guaranteed by foreign governmental entities. These investments are subject to the risk that a governmental entity may delay or refuse to pay interest or repay principal on its sovereign debt, due, for example, to cash flow problems, insufficient foreign currency reserves, political considerations, the relative size of the governmental entity’s debt position in relation to the economy or the failure to put in place economic reforms required by the International Monetary Fund or other multilateral agencies. If a governmental entity defaults, it may ask for more time in which to pay or for further loans. There is no legal process for collecting sovereign debts that a government does not
pay nor are there bankruptcy proceedings through which all or part of the sovereign debt that a governmental entity has not repaid may be collected.
41
THRIVENT CORE FUNDS
FINANCIAL HIGHLIGHTS
FOR A SHARE OUTSTANDING THROUGHOUT EACH PERIOD *
| Income From Investment Operations | Less Distributions From | |||||||||||||||||||||||
| Net Asset Value, Beginning of Period | Net Investment Income/(Loss) | Net Realized and Unrealized Gain/(Loss) on Investments(a) | Total from Investment Operations | Net Investment Income | Net Realized Gain on Investments | |||||||||||||||||||
EMERGING MARKETS DEBT FUND | ||||||||||||||||||||||||
Period Ended 4/30/2019(unaudited) | $ | 9.04 | $ | 0.21 | $ | 0.42 | $ | 0.63 | $ | (0.21 | ) | $ | – | |||||||||||
Year Ended 10/31/2018 | 9.86 | 0.40 | (0.82 | ) | (0.42 | ) | (0.40 | ) | – | |||||||||||||||
Year Ended 10/31/2017(c) | 10.00 | 0.05 | (0.14 | ) | (0.09 | ) | (0.05 | ) | – | |||||||||||||||
INTERNATIONAL EQUITY FUND | ||||||||||||||||||||||||
Period Ended 4/30/2019(unaudited) | 9.28 | 0.14 | 0.45 | 0.59 | (0.30 | ) | – | |||||||||||||||||
Year Ended 10/31/2018(d) | 10.00 | 0.31 | (1.02 | ) | (0.71 | ) | (0.01 | ) | – | |||||||||||||||
LOW VOLATILITY EQUITY FUND | ||||||||||||||||||||||||
Period Ended 4/30/2019(unaudited) | 10.54 | 0.12 | 1.18 | 1.30 | (0.17 | ) | (0.23 | ) | ||||||||||||||||
Year Ended 10/31/2018(e) | 10.00 | 0.13 | 0.41 | 0.54 | – | – | ||||||||||||||||||
SHORT-TERM RESERVE FUND | ||||||||||||||||||||||||
Period Ended 4/30/2019(unaudited) | 10.00 | 0.13 | 0.00 | 0.13 | (0.13 | ) | – | |||||||||||||||||
Year Ended 10/31/2018 | 10.00 | 0.20 | 0.00 | 0.20 | (0.20 | ) | 0.00 | |||||||||||||||||
Year Ended 10/31/2017 | 10.00 | 0.11 | 0.00 | 0.11 | (0.11 | ) | – | |||||||||||||||||
Year Ended 10/31/2016(f) | 10.00 | 0.03 | 0.00 | 0.03 | (0.03 | ) | – | |||||||||||||||||
| (a) | The amount shown may not correlate with the change in aggregate gains and losses of portfolio securities due to the timing of sales and redemptions of portfolio shares. |
| (b) | Total investment return assumes dividend reinvestment and does not reflect any deduction for applicable sales charges. Not annualized for periods less than one year. Total return shown does not reflect charges and expenses imposed on contract holders by the variable accounts. Those charges and expenses reduce the return received by contract holders as compared to the return presented. |
| (c) | Since inception, September 5, 2017. |
| (d) | Since inception, November 14, 2017. |
| (e) | Since inception, February 28, 2018. |
| (f) | Since inception, May 2, 2016. |
| * | All per share amounts have been rounded to the nearest cent. |
| ** | Computed on an annualized basis for periods less than one year |
The accompanying Notes to Financial Statements are an integral part of this statement.
42
THRIVENT CORE FUNDS
FINANCIAL HIGHLIGHTS –CONTINUED
RATIOS/SUPPLEMENTAL DATA
| Ratio to Average Net Assets** | Ratio to Average Net Assets Before Expenses Waived, Credited or Acquired Fund Fees and Expenses** | |||||||||||||||||||||||||||||||
Total | Net Asset Value, End of Period | Total Return(b) | Net Assets, End of Period (in millions) | Expenses | Net Investment Income/(Loss) | Expenses | Net Investment Income/(Loss) | Portfolio Turnover Rate | ||||||||||||||||||||||||
$ (0.21) | $ | 9.46 | 7.05 | % | $ | 787.1 | 0.05 | % | 4.64 | % | 0.05 | % | 4.64 | % | 7 | % | ||||||||||||||||
(0.40) | 9.04 | (4.35) | % | 684.2 | 0.06 | % | 4.38 | % | 0.06 | % | 4.38 | % | 13 | % | ||||||||||||||||||
(0.05) | 9.86 | (0.94) | % | 421.8 | 0.21 | % | 3.48 | % | 0.21 | % | 3.48 | % | 0 | % | ||||||||||||||||||
(0.30) | 9.57 | 6.76 | % | 927.1 | 0.06 | % | 3.86 | % | 0.06 | % | 3.86 | % | 40 | % | ||||||||||||||||||
(0.01) | 9.28 | (7.08) | % | 798.2 | 0.08 | % | 3.42 | % | 0.08 | % | 3.42 | % | 73 | % | ||||||||||||||||||
(0.40) | 11.44 | 12.90 | % | 986.0 | 0.04 | % | 2.27 | % | 0.04 | % | 2.27 | % | 30 | % | ||||||||||||||||||
– | 10.54 | 5.40 | % | 873.7 | 0.06 | % | 1.88 | % | 0.06 | % | 1.88 | % | 40 | % | ||||||||||||||||||
(0.13) | 10.00 | 1.33 | % | 5,358.0 | 0.01 | % | 2.67 | % | 0.01 | % | 2.67 | % | 89 | % | ||||||||||||||||||
(0.20) | 10.00 | 2.01 | % | 4,854.5 | 0.01 | % | 1.99 | % | 0.01 | % | 1.99 | % | 213 | % | ||||||||||||||||||
(0.11) | 10.00 | 1.12 | % | 4,988.2 | 0.01 | % | 1.11 | % | 0.01 | % | 1.11 | % | 143 | % | ||||||||||||||||||
(0.03) | 10.00 | 0.32 | % | 4,762.5 | 0.01 | % | 0.67 | % | 0.01 | % | 0.67 | % | 31 | % | ||||||||||||||||||
The accompanying Notes to Financial Statements are an integral part of this statement.
43
ADDITIONAL INFORMATION
(unaudited)
PROXY VOTING
The policies and procedures that the Trust uses to determine how to vote proxies relating to portfolio securities are attached to the Trust’s Statement of Additional Information. The Trust files a report of how it voted proxies relating to portfolio securities on FormN-PX with the SEC. You may request a free copy of the Statement of Additional Information or the report of how the Trust voted proxies relating to portfolio securities during the most recent12-month period ended June 29 by calling800-847-4836. You also may review the Statement of Additional Information or the report of how the Trust voted proxies relating to portfolio securities during the most recent12-month period ended June 29 at SEC.gov.
QUARTERLY SCHEDULE OF PORTFOLIO HOLDINGS
Through April 2019, the Trust filed its Schedule of Investments on FormN-Q with the SEC for the first and third quarters of each fiscal year. Beginning April 2019, the Trust will no longer file FormN-Q and will begin filing FormN-PORT. Part F of each Fund’sN-PORT filing for the first and third quarters will include the complete schedule of investments which were previously filed on FormN-Q. The Trust’s most recent Schedule of Investments may be requested by calling800-847-4836 or at SEC.gov. You also may review and copy the FormsN-PORT-EX andN-Q for the Trust at the SEC’s Public Reference Room in Washington, DC. You may get information about the operation of the Public Reference Room by calling800-SEC-0330.
BOARD APPROVAL OF ADVISORY AGREEMENT
Section 15(c) of the Investment Company Act of 1940, as amended (the “1940 Act”), requires that a fund’s investment advisory agreement be approved initially by the fund’s board of trustees. Section 15(c) also requires that the continuation of such an agreement, after an initial term of up to two years, be annually reviewed and approved by the board. Any such agreement must be approved by a vote of a majority of the trustees who are not parties to the agreement or “interested persons” (as defined in the 1940 Act) of a party to the agreement at anin-person meeting of the board called for the purpose of voting on such approval.
At its meeting on November13-14, 2018, the Board of Trustees (the “Board”) of the Thrivent Core Funds (the “Trust”), including the trustees who are not parties to the agreement or “interested persons” as defined in the 1940 Act (the “Independent Trustees”), considered and voted unanimously to renew the existing advisory agreement (the “Advisory Agreement”), as amended, between the Trust and Thrivent Asset Management, LLC (the “Adviser”) for each series of the Trust, except the recently launched Thrivent Core Low Volatility Equity Fund (each, a “Fund”). The Trust was designed to provide shareholders of other Thrivent funds with certain benefits, including a reduction of operational complexities associated with investing in various asset classes. The series of the Trust are only available to other funds and accounts managed by the Adviser or its affiliates.
In connection with its evaluation of the agreement with the Adviser, the Board reviewed a broad range of information requested for this purpose and considered a variety of factors, including the purpose of the Trust and the Funds in relation to other Thrivent funds, as well as the following:
| 1. | The nature, extent, and quality of the services provided by the Adviser; |
| 2. | The performance of each Fund; |
| 3. | The net operating expense ratio of each Fund compared to a peer group; |
| 4. | The cost of services provided and profit realized by the Adviser; |
| 5. | Other benefits realized by the Adviser and its affiliates from their relationship with the Trust; and |
| 6. | Any other factors that the Board deemed relevant to its consideration. |
44
ADDITIONAL INFORMATION
(unaudited)
The Contracts Committee of the Board (consisting of all of the Independent Trustees) met on five occasions from May 22 to November 14, 2018 to consider information relevant to the renewal process furnished by the Adviser in advance of the meetings. The Board had the opportunity to ask questions and request further information in connection with its consideration. The Independent Trustees also retained the services of Management Practice Inc. (“MPI”) as an independent consultant to assist in the compilation, organization, and evaluation of relevant information. This information includedFund-by-Fund statistical comparisons of thenon-advisory fees and net operating expenses of each of the Funds in comparison to peer groups of comparable funds;1-year performance information for Thrivent Core Short-Term Reserve Fund; information with respect to services provided to the Funds and fees charged; asset and flow trends for the Funds; and information regarding the types of services furnished to the Funds.
The Board received information from the Adviser regarding the personnel providing services to the Funds, including investment management, compliance and administrative personnel. The Board also received monthly reports from the Adviser’s investment management staff with respect to the performance of the Funds. In addition to its review of the information presented to the Board during the contract renewal process, the Board also considered information obtained from management throughout the course of the year. The Board also reviewed information from MPI, includingFund-by-Fund analyses and independent assessment of information relating to the Funds and the agreements.
The Independent Trustees were represented by independent counsel throughout the review process and during executive sessions without management present to consider the reapproval of the Advisory Agreement for the Funds. As noted above, the Independent Trustees were assisted throughout the process by an independent consultant, MPI. Each Independent Trustee relied on his or her own business judgment in determining the weight to be given to each factor considered in evaluating the materials that were presented to them. The Contracts Committee’s and Board’s review and conclusions were based on a comprehensive consideration of all information presented to them and were not the result of any single controlling factor. In addition, each Trustee may have weighed individual factors differently. The key factors considered and the conclusions reached are described below.
Nature, Extent and Quality of Services
At each of the Board’s regular quarterly meetings, management presented information describing the services furnished to the Funds by the Adviser, transfer agent and administrator. During these meetings, management reported on the investment management, portfolio trading and compliance services provided to the Funds. During the renewal process, the Board considered the specific services provided under the Advisory Agreement. The Board considered information relating to the investment experience and qualifications of the Adviser’s portfolio managers overseeing investments for the Funds.
The Board received reports and presentations at each of its quarterly meetings from the Adviser’s senior investment team about each of the Funds. These reports and presentations gave the Board the opportunity to evaluate the abilities of the portfolio manager and other investment professionals and the quality of services they provide to the Funds. The Independent Trustees also metin-person, including in executive session, with and received quarterly reports from the Trust’s Chief Compliance Officer. The Board noted that the Chief Compliance Officer met regularly between quarterly meetings with the Chair of the Ethics and Compliance Committee.
The Board considered the adequacy of the Adviser’s resources used to provide services to the Trust pursuant to the Advisory Agreement. The Adviser reviewed with the Board the Adviser’s process for overseeing the portfolio management team of each Fund. In addition, the Adviser noted that its investments in technology and personnel have benefitted the Trust and other Thrivent funds and discussed continued investments in these resources, noting, in particular, additional personnel to enhance its research function. The Adviser also discussed how it has continued to strengthen its compliance program. The Board viewed these actions as a positive factor in reapproving the existing Advisory Agreement, as they demonstrated the Adviser’s commitment to provide the Funds with quality service and competitive investment performance. The Board concluded that, within the context of its full deliberations, the nature, extent and quality of the investment advisory services provided to the Funds by the Adviser supported renewal of the Advisory Agreement.
45
ADDITIONAL INFORMATION
(unaudited)
Performance of the Funds
The Board noted the Funds’ short operational history and considered whether each Fund has operated within its investment objective. At quarterly meetings, a member of the Adviser’s senior investment team reviewed with the Board the economic and market environment and risk management in connection with the management of the Funds and other Thrivent funds.
Advisory Fees and Fund Expenses
The Board noted that the Adviser does not charge an advisory fee to the Funds. The Board reviewed information provided by the Adviser regarding custodial, administrative, transfer agent and othernon-advisory fees and expenses.
Because the Adviser does not charge an advisory fee to the Funds, the Board did not consider whether economies of scale would be realized as the Funds grow and whether fee levels reflect economies of scale for the benefit of Fund shareholders. The Board did consider those factors for other Thrivent funds with advisory fees.
On the basis of its review, the Board concluded that continuing to not charge an advisory fee to the Funds for investment management services was reasonable.
Cost of Services and Profitability
The Board considered the profitability of the Adviser both overall and on afund-by-fund basis. The Board considered the level of the Adviser’s profits with respect to all the Thrivent funds, including the Funds. The Board considered that the Adviser makes no profit under the Advisory Agreement and concluded that the Adviser’s profitability on other fees was not excessive in light of the nature, extent and quality of services provided to the Funds.
Other Benefits to the Adviser and its Affiliates
The Board considered information regarding potential“fall-out” or ancillary benefits that the Adviser and its affiliates may receive as a result of their relationship with the Trust, both tangible and intangible, such as their ability to leverage investment professionals who manage other portfolios, an enhanced reputation as an investment adviser which may help in attracting other clients and investment personnel, and the engagement of affiliates as service providers to the Funds. The Board noted that such benefits were difficult to quantify but were consistent with benefits received by other mutual fund advisers.
Based on the factors discussed above, the Contracts Committee unanimously recommended approval of the Advisory Agreement, and the Board, including all of the Independent Trustees voting separately, approved the Advisory Agreement.
46
(This page intentionally left blank)
(This page intentionally left blank)
This report is submitted for the information of shareholders
of Thrivent Core Funds. It is not authorized for distribution to
prospective investors unless preceded or accompanied by the
current prospectus for Thrivent Core Funds, which contains more
complete information about the Trust, including investment
objectives, risks, charges and expenses.
| Item 2. | Code of Ethics |
Not applicable to semiannual report
| Item 3. | Audit Committee Financial Expert |
Not applicable to semiannual report
| Item 4. | Principal Accountant Fees and Services |
Not applicable to semiannual report
| Item 5. | Audit Committee of Listed Registrants |
Not applicable
| Item 6. | Investments |
| (a) | Registrant’s Schedule of Investments is included in the report to shareholders filed under Item 1. |
| (b) | Not applicable to this filing. |
| Item 7. | Disclosure of Proxy Voting Policies and Procedures forClosed-End Management Investment Companies |
Not applicable
| Item 8. | Portfolio Managers ofClosed-End Management Investment Companies |
Not applicable
| Item 9. | Purchases of Equity Securities byClosed-End Management Investment Company and Affiliated Purchasers. |
Not applicable
| Item 10. | Submission of Matters to a Vote of Security Holders |
There have been no material changes to the procedures by which shareholders may recommend nominees to registrant’s board of trustees.
| Item 11. | Controls and Procedures |
(a)(i) Registrant’s principal executive and principal financial officers, or persons performing similar functions, have concluded that registrant’s disclosure controls and procedures (as defined in Rule30a-3(c) under the Investment Company Act of 1940) are effective, based on their evaluation of these controls and procedures as of a date within 90 days of the filing date of this report.
(a)(ii) Registrant’s principal executive and principal financial officers, or persons performing similar functions, are aware of no change in registrant’s internal control over financial reporting (as defined in Rule30a-3(d) under the Investment Company Act of 1940) that occurred during registrant’s most recent fiscal quarter that has materially affected, or is reasonably likely to materially affect, registrant’s internal control over financial reporting.
| Item 12. | Disclosure of Securities Lending Activities forClosed-End Management Investment Companies |
Not applicable
| Item 13. | Exhibits |
| (a)(1) | Any code of ethics, or amendment thereto, that is the subject of the disclosure required by Item 2, to the extent that the registrant intends to satisfy the Item 2 requirements through filing of an exhibit: Not applicable. |
| (a)(2) | A separate certification for each principal executive officer and principal financial officer of the registrant as required by Rule30a-2(a) under the 1940 Act (17 CFR270.30a-2(a)) in the exact form set forth below: SeeEX-99.CERT attached hereto. |
| (a)(3) | Any written solicitation to purchase securities under Rule23c-1 under the 1940 Act (17 CFR270.23c-1) sent or given during the period covered by the report by or on behalf of the registrant to 10 or more persons: Not applicable. |
| (a)(4) | Change in the registrant’s independent public accountant: Not applicable |
| (b) | If the report is filed under Section 13(a) or 15(d) of the Exchange Act, provide the certifications required by Rule30a-2(b) under the 1940 Act (17 CFR270.30a-2(b)), Rule13a-14(b) or Rule15d-14(b) under the Exchange Act (17 CFR240.13a-14(b) or240.15d-14(b)), and Section 1350 of Chapter 63 of Title 18 of the United States Code (18 U.S.C. 1350) as an exhibit. A certification furnished pursuant to this paragraph will not be deemed “filed” for purposes of Section 18 of the Exchange Act (15 U.S.C. 78r), or otherwise subject to the liability of that section. Such certification will not be deemed to be incorporated by reference into any filing under the Securities Act of 1933 or the Exchange Act, except to the extent that the registrant specifically incorporates it by reference: SeeEX-99.906CERT attached hereto. |
SIGNATURES
Pursuant to the requirements of the Securities Exchange Act of 1934 and the Investment Company Act of 1940, the registrant has duly caused this report to be signed on its behalf by the undersigned, thereunto duly authorized.
| Date: June 28, 2019 | THRIVENT CORE FUNDS | |||||
| By: | /s/ David S. Royal | |||||
| David S. Royal | ||||||
| President and Chief Investment Officer | ||||||
Pursuant to the requirements of the Securities Exchange Act of 1934 and the Investment Company Act of 1940, this report has been signed below by the following persons on behalf of the registrant and in the capacities and on the dates indicated.
| Date: June 28, 2019 | By: | /s/ David S. Royal | ||||
| David S. Royal | ||||||
| President and Chief Investment Officer | ||||||
| (principal executive officer) | ||||||
| Date: June 28, 2019 | By: | /s/ Gerard V. Vaillancourt | ||||
| Gerard V. Vaillancourt | ||||||
| Treasurer and Principal Accounting Officer | ||||||
| (principal financial officer) | ||||||