
Bright Health Group 2023 J.P. Morgan Healthcare Conference January 11, 2023
Disclaimer Statements made in this presentation that are not statements of historical fact, including statements about our beliefs and expectations, are forward-looking statements, and should be evaluated as such. Forward-looking statements include information concerning possible or assumed future results of operations, including descriptions of our business plan and strategies, and operational and financial outlook and guidance. These statements often include words such as “anticipate,” “expect,” “plan,” “believe,” “intend,” “project,” “forecast,” “estimates,” “projections,” “outlook,” and other similar expressions. These forward-looking statements include any statements regarding our plans and expectations with respect to Bright Health Group, Inc. (the “Company”). Such forward-looking statements are subject to various risks, uncertainties and assumptions. Accordingly, there are or will be important factors that could cause actual outcomes or results to differ materially from those indicated in these statements. Factors that might materially affect such forward-looking statements include: our ability to continue as a going concern; our ability to quickly and efficiently wind down our IFP businesses and MA businesses outside of California; our ability to accurately estimate and effectively manage the costs relating to changes in our businesses offerings and models; a delay or inability to withdraw regulated capital from our subsidiaries; a lack of acceptance or slow adoption of our business model; our ability to retain existing consumers and expand consumer enrollment; our ability to accurately asses, code, and report IFP and MA risk adjustment factor scores for consumers; our ability to contract with care providers and arrange for the provision of quality care; our ability to accurately estimate our medical expenses, effectively manage our costs and claims liabilities or appropriately price our products and charge premiums; the impact of the ongoing COVID-19 pandemic on our business and results of operations; the risks associated with our reliance on third-party providers to operate our business; the impact of modifications or changes to the U.S. health insurance markets; our ability to manage the growth of our business; our ability to operate, update or implement our technology platform and other information technology systems; our ability to retain key executives; our ability to successfully pursue acquisitions and integrate acquired businesses; the occurrence of severe weather events, catastrophic health events, natural or man-made disasters, and social and political conditions or civil unrest; the impact of security incidents or breaches, loss of data and other related events on our members, patients, employees, and financial results; our ability to comply with requirements to maintain effective internal controls; our ability to adapt to the new risks associated with our expansion into Direct Contracting; and additional risks and uncertainties described in the Company's Form 10-K, Form 10-Q and Form 8-K reports (including all amendments to those reports). Except as required by law, we undertake no obligation to update publicly any forward-looking statements for any reason after the date of this release to conform these statements to actual results or to changes in our expectations. 2
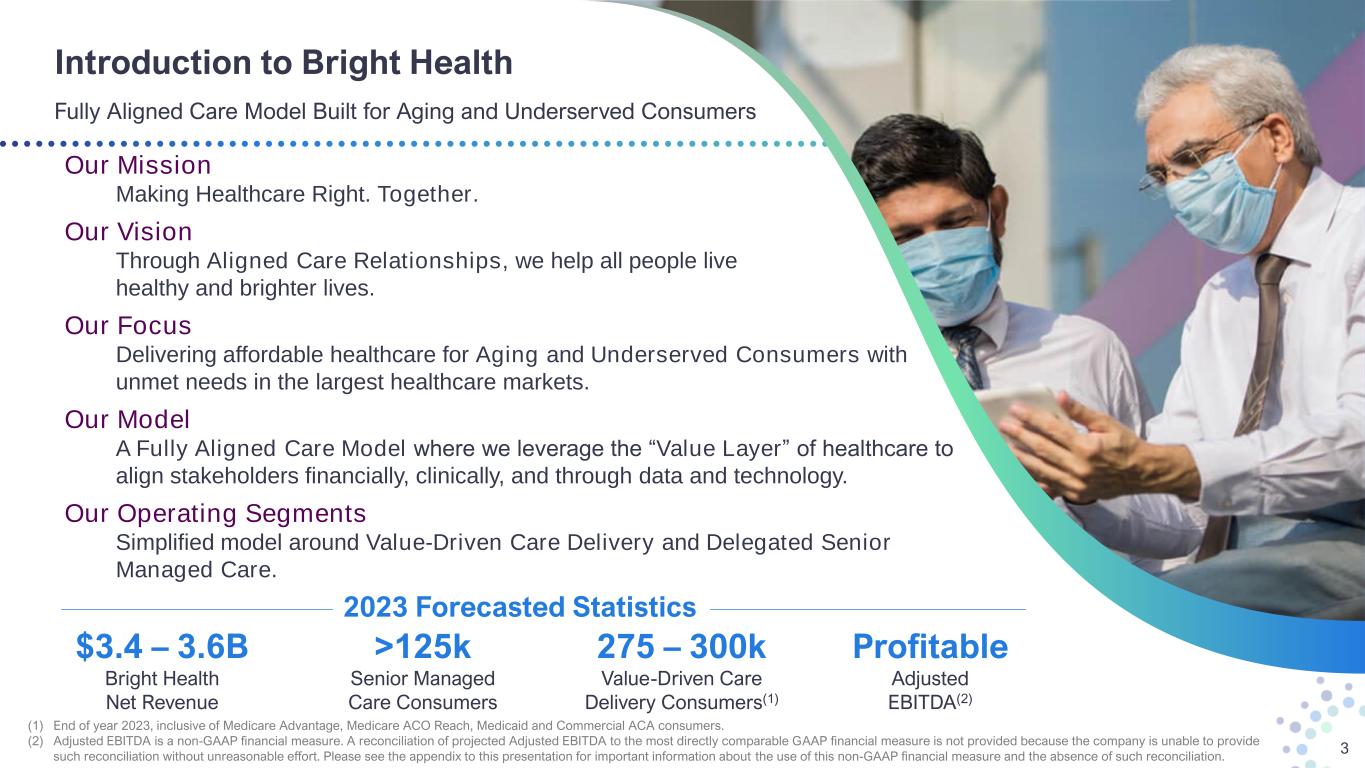
Introduction to Bright Health Fully Aligned Care Model Built for Aging and Underserved Consumers 3 Our Mission Making Healthcare Right. Together. Our Vision Through Aligned Care Relationships, we help all people live healthy and brighter lives. Our Focus Delivering affordable healthcare for Aging and Underserved Consumers with unmet needs in the largest healthcare markets. Our Model A Fully Aligned Care Model where we leverage the “Value Layer” of healthcare to align stakeholders financially, clinically, and through data and technology. Our Operating Segments Simplified model around Value-Driven Care Delivery and Delegated Senior Managed Care. $3.4 – 3.6B Bright Health Net Revenue >125k Senior Managed Care Consumers 275 – 300k Value-Driven Care Delivery Consumers(1) Profitable Adjusted EBITDA(2) 2023 Forecasted Statistics (1) End of year 2023, inclusive of Medicare Advantage, Medicare ACO Reach, Medicaid and Commercial ACA consumers. (2) Adjusted EBITDA is a non-GAAP financial measure. A reconciliation of projected Adjusted EBITDA to the most directly comparable GAAP financial measure is not provided because the company is unable to provide such reconciliation without unreasonable effort. Please see the appendix to this presentation for important information about the use of this non-GAAP financial measure and the absence of such reconciliation.

Investment Highlights A Technology-Enabled, Value-Driven Healthcare Company with Significant Future Upside 4 Accelerated Profitability(1) Outlook with Strengthened Capital Position1 Purpose-Built Technology and Capabilities to Enable Providers to Successfully Manage Total Cost of Care and Population Risk 4 Improved Business Risk Profile through Diversified Payor Partnerships and High Year-Over-Year Consumer Retention 5 Multiple Drivers of Robust Long-Term Profitable Growth6 Focused Business Model Serving the Fast-Growing Aging and Underserved Consumer Healthcare Segment in the Largest U.S. Markets 2 Simplified and Balanced Business Across Value-Driven Care Delivery and Delegated Senior Managed Care 3 (1) All references to profitability are on the basis of Adjusted EBITDA, a non-GAAP financial measure. Please see the appendix to this presentation for important information about the use of this non-GAAP financial measure and the absence of such reconciliation.

The Current Healthcare System Needs a Better and More Personalized Model Most Consumers Feel Unsatisfied and Underserved with their Healthcare Experience Today 5 Current Healthcare System High Costs Coupled with Sub- Optimal Outcomes and Experience Inadequate Access to Quality Care at an Affordable Cost Misaligned Incentives Rewarding Volume Over Value Disaggregated Health Data Leading to Suboptimal Outcomes Value-Based Models Historically Limited Outside of Medicare Only 6% of total spending was population based and not linked to FFS 50%+ of U.S. healthcare consumers feel they are treated more as “incidents” than people 45% of underinsured adults did not seek medical treatment due to cost concerns US Physician practices report that over 75% of their revenue comes from Fee-for-Service (FFS) reimbursement Payors and providers are reluctant to share data unless it serves their interests Financial Alignment 2 Data and Technology Alignment 3 Clinical Alignment 1 Fully Aligned Care Model
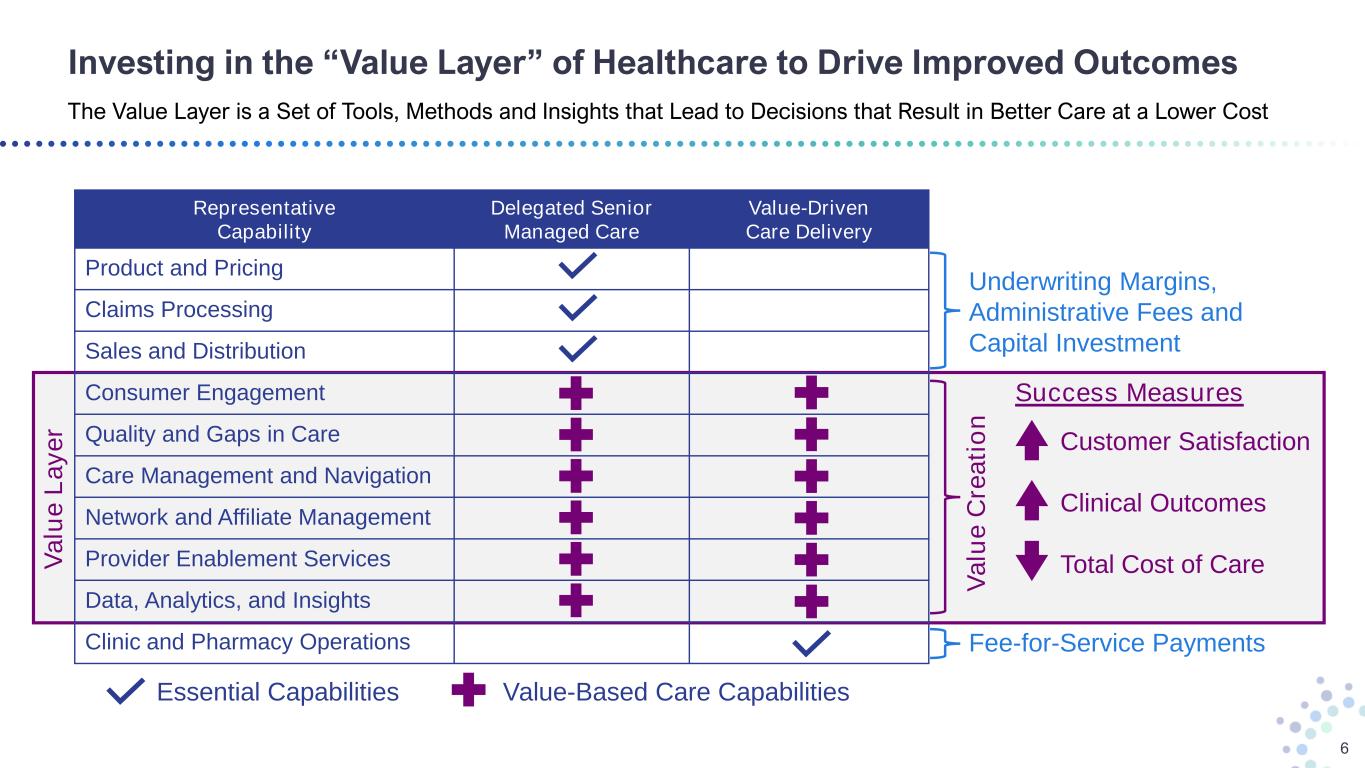
Investing in the “Value Layer” of Healthcare to Drive Improved Outcomes The Value Layer is a Set of Tools, Methods and Insights that Lead to Decisions that Result in Better Care at a Lower Cost 6 V a lu e L a y e r V a lu e C re a ti o n Underwriting Margins, Administrative Fees and Capital Investment Fee-for-Service Payments Representative Capability Delegated Senior Managed Care Value-Driven Care Delivery Product and Pricing Claims Processing Sales and Distribution Consumer Engagement Quality and Gaps in Care Care Management and Navigation Network and Affiliate Management Provider Enablement Services Data, Analytics, and Insights Clinic and Pharmacy Operations Customer Satisfaction Clinical Outcomes Total Cost of Care Success Measures Essential Capabilities Value-Based Care Capabilities
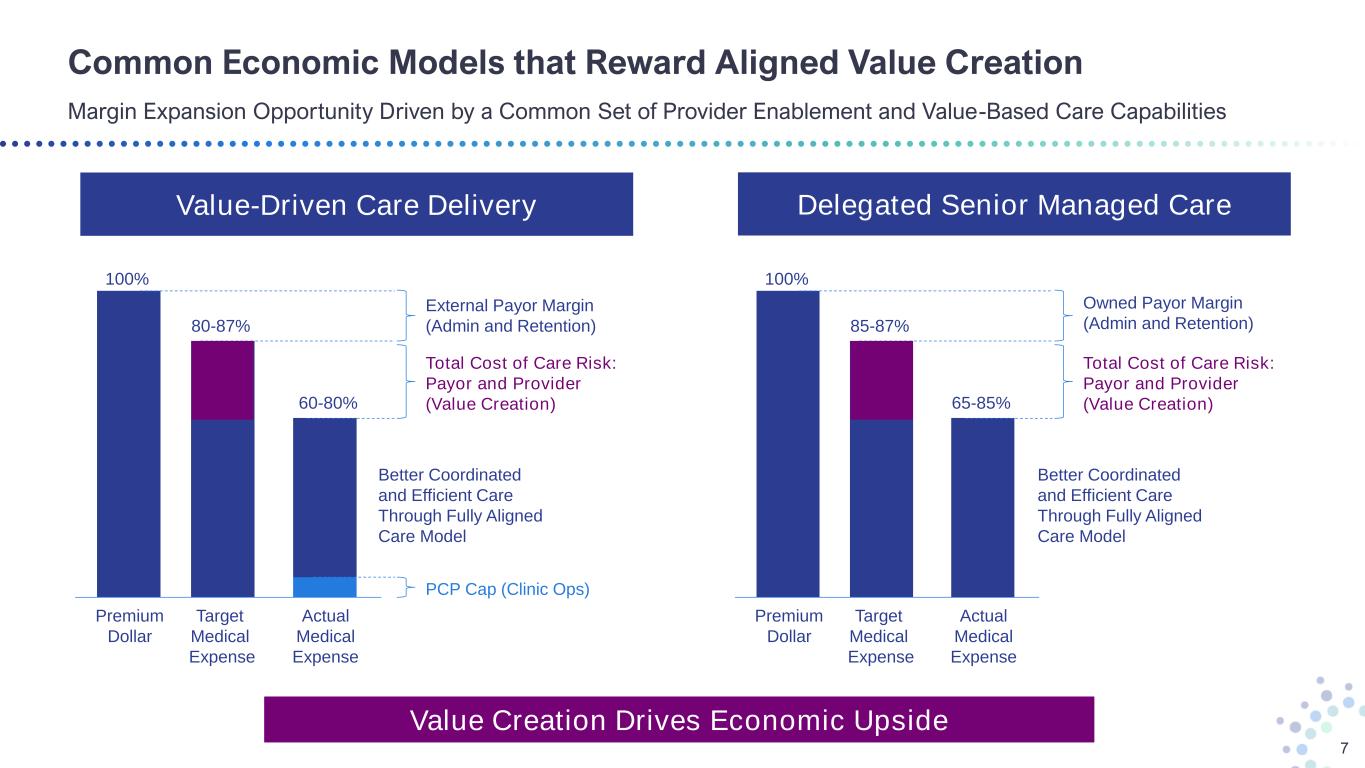
Common Economic Models that Reward Aligned Value Creation Margin Expansion Opportunity Driven by a Common Set of Provider Enablement and Value-Based Care Capabilities 7 Value-Driven Care Delivery Delegated Senior Managed Care 100% 80-87% 60-80% External Payor Margin (Admin and Retention) Total Cost of Care Risk: Payor and Provider (Value Creation) PCP Cap (Clinic Ops) Premium Dollar Target Medical Expense Actual Medical Expense 100% 85-87% 65-85% Owned Payor Margin (Admin and Retention) Total Cost of Care Risk: Payor and Provider (Value Creation) Premium Dollar Target Medical Expense Actual Medical Expense Value Creation Drives Economic Upside Better Coordinated and Efficient Care Through Fully Aligned Care Model Better Coordinated and Efficient Care Through Fully Aligned Care Model
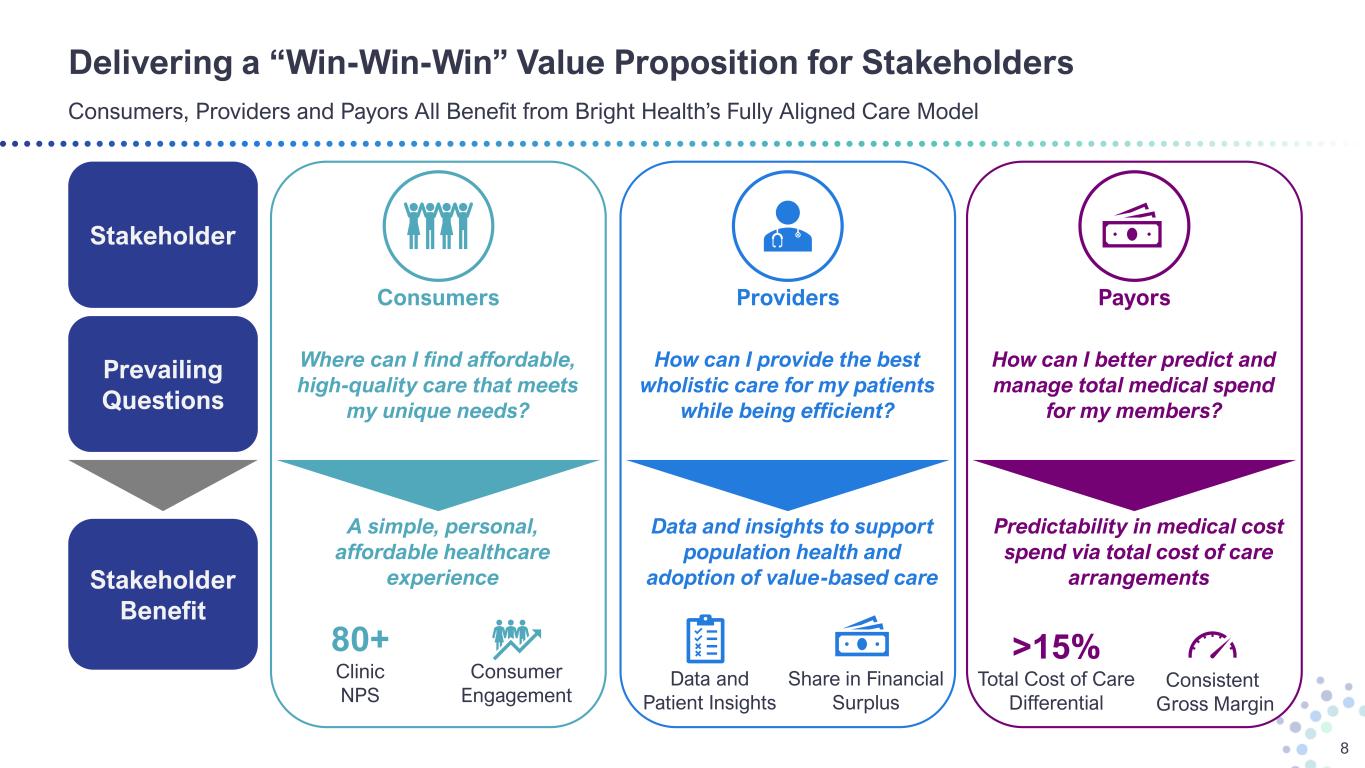
Delivering a “Win-Win-Win” Value Proposition for Stakeholders Consumers, Providers and Payors All Benefit from Bright Health’s Fully Aligned Care Model 8 Stakeholder Benefit Stakeholder Prevailing Questions A simple, personal, affordable healthcare experience Consumers Where can I find affordable, high-quality care that meets my unique needs? 80+ Clinic NPS Consumer Engagement Data and insights to support population health and adoption of value-based care Providers How can I provide the best wholistic care for my patients while being efficient? Data and Patient Insights Share in Financial Surplus Predictability in medical cost spend via total cost of care arrangements How can I better predict and manage total medical spend for my members? Payors >15% Total Cost of Care Differential Consistent Gross Margin
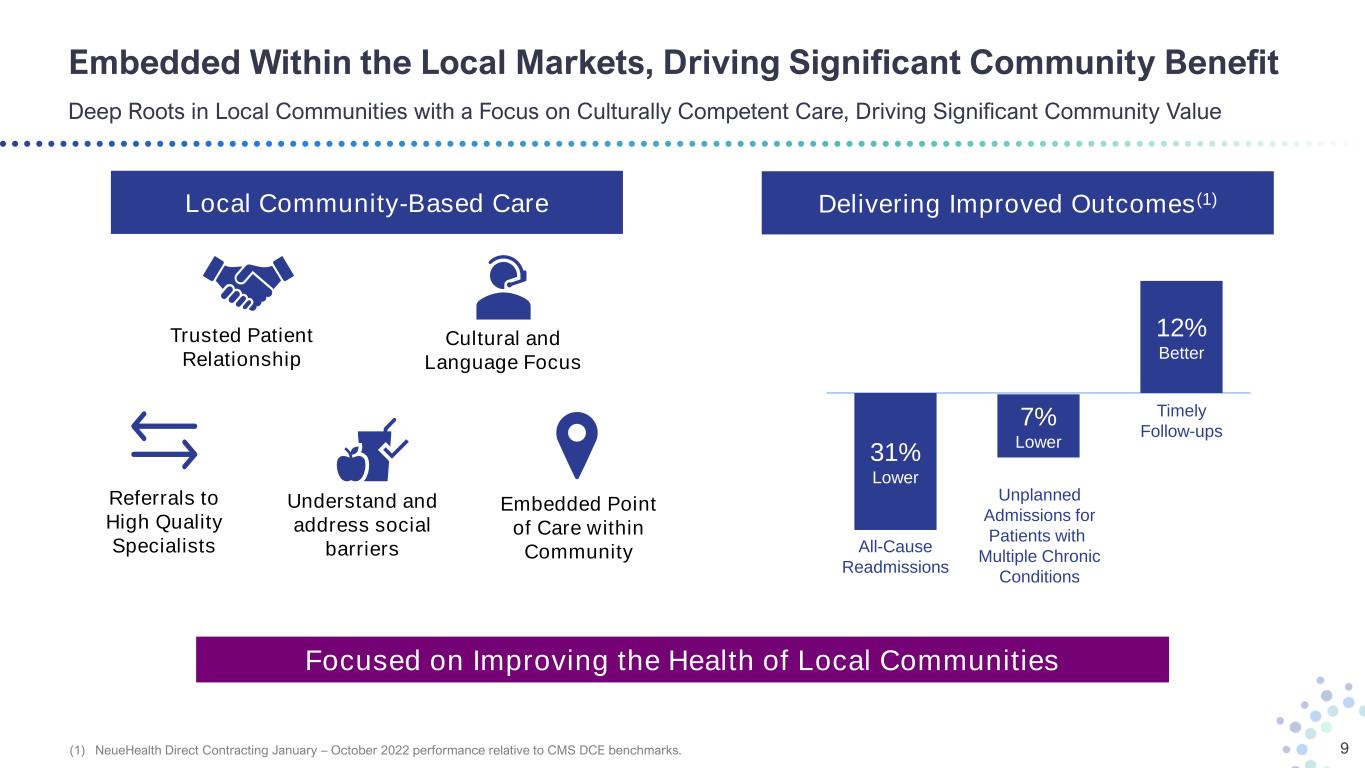
Embedded Within the Local Markets, Driving Significant Community Benefit Deep Roots in Local Communities with a Focus on Culturally Competent Care, Driving Significant Community Value 9 Trusted Patient Relationship Cultural and Language Focus Embedded Point of Care within Community Referrals to High Quality Specialists Understand and address social barriers 31% Lower 7% Lower 12% Better All-Cause Readmissions Unplanned Admissions for Patients with Multiple Chronic Conditions Timely Follow-ups Focused on Improving the Health of Local Communities Local Community-Based Care Delivering Improved Outcomes(1) (1) NeueHealth Direct Contracting January – October 2022 performance relative to CMS DCE benchmarks.

Bright Health’s Operating Segments A Common Model Serving the Fastest Growing Consumer Healthcare Segments in the Largest U.S. Markets 10 Aging and Underserved Consumers Fully Aligned Care Model Integrated Technology Platform Consumer Care Value-Driven Care Delivery partnering with leading health plans and government programs to deliver improved care to consumers 2023 Forecasts: $1.6 Billion + Value-Based Revenue 275-300k Value-Based Consumers(1) Bright HealthCare Delegated Medicare Advantage health plans partnering with high-performing providers serving aging and underserved consumers in California 2023 Forecasts: $1.8 Billion + Health Plan Premium Revenue >125k Medicare Advantage Consumers (1) End of year 2023, inclusive of Medicare Advantage, Medicare ACO Reach, Medicaid and Commercial ACA consumers.

Our Strategy has Sharpened and the Opportunity Has Continued to Grow Building on the Learnings and Foundation of the Fully Aligned Care Model for Future Performance with Strategic Partners 11 1 ’16 – ‘22 Lay the Foundation for the Fully Aligned Care Model 2 ’23 – ‘24 Deliver Fully Aligned Care Model with External Partners 3 ‘24+ Market and Line of Business Expansion with Partners Proof of Concept with Integrated Care • Establish clinical, financial, and data and technology alignment and lay foundational capabilities necessary to take and manage risk • Validate aligned enablement model that drives superior performance, leading clinical outcomes, and affordable care Performance with External Partners • Retain Bright HealthCare ACA members through external payor partners • One Medicare Advantage platform while achieving performance optimization • Continue to deliver a differentiated experience with attributed lives within our Value-Driven Care Delivery business Future Capital Efficient Growth • Enable long-term, sustainable differentiation through growth of our national and local payor partners in existing and new markets • Accelerate the growth of our Delegated Senior Managed Care business • Leverage the local depth and geographic scale to drive target margins

Consumer Care – Value-Driven Care Delivery A Community-Based, Value-Driven Care Model in Partnership with Leading National and Local Health Plans 12 • High consumer satisfaction and NPS • The Fully-Aligned Care Model drives differentiated performance for payors, resulting in lower risk- adjusted medical costs • Value-Based lives diversified across payor categories: Medicare Advantage, Medicare ACO Reach, Medicaid, Commercial ACA consumers • High consumer retention model - 70% of patients in our clinics are retained value-based lives • Returning patients create an opportunity for improved patient referrals and identifying gaps in care • Health plan partnerships deliver strong underlying unit costs that support competitive marketplace pricing Building on Existing Patient Relationships Competitive Advantages 275 – 300k Value Based Consumers $1.6 – 1.8B 2023E Revenue • Operate a network of owned and managed primary and specialty care value-driven clinics • Partner with affiliated providers who leverage our comprehensive member and physician enablement solutions • Partner with leading health plans in financially aligned total cost of care arrangements Fully Aligned Care Model 70% 2023E External Revenue Growth(1) (1) At midpoint of 2023 Consumer Care revenue guidance.
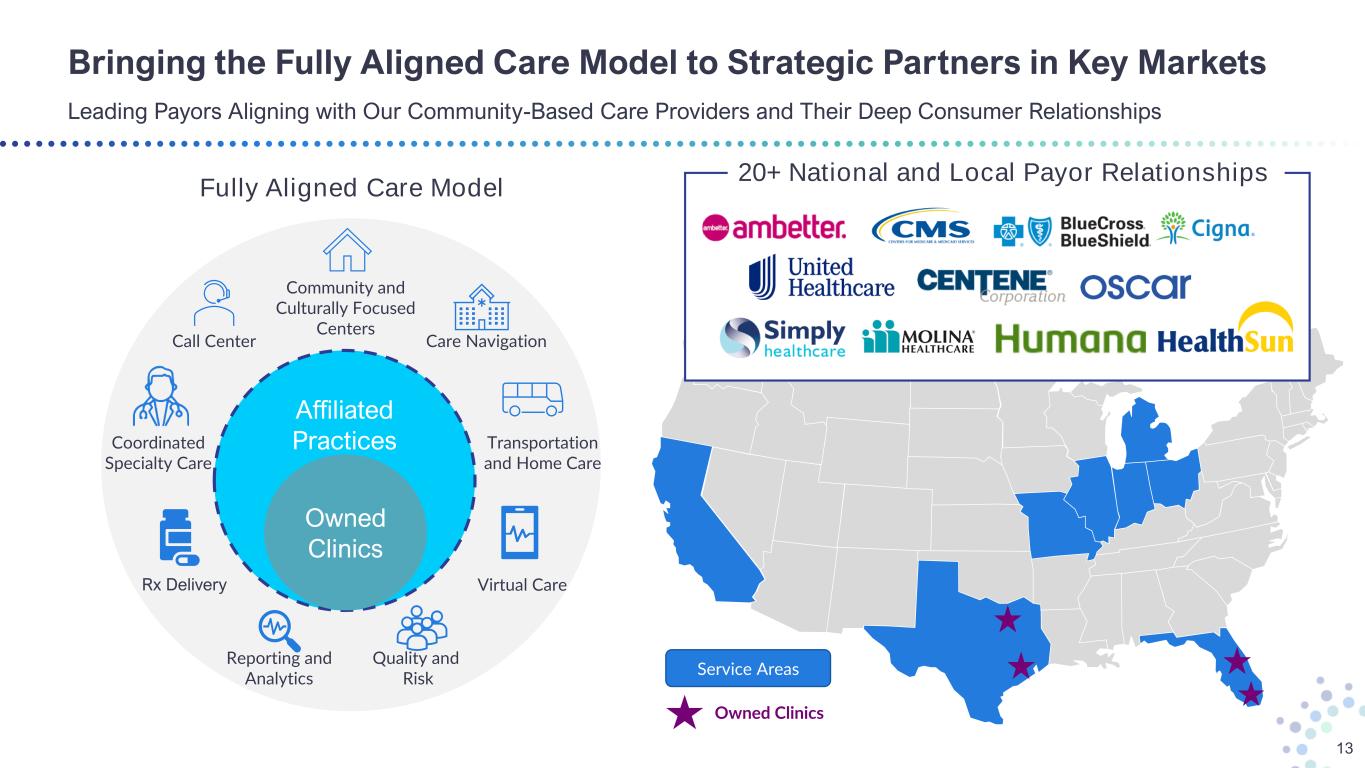
Owned Clinics Service Areas Bringing the Fully Aligned Care Model to Strategic Partners in Key Markets Leading Payors Aligning with Our Community-Based Care Providers and Their Deep Consumer Relationships 13 Affiliated Practices Owned Clinics Community and Culturally Focused Centers Virtual Care Coordinated Specialty Care Call Center Rx Delivery Transportation and Home Care Quality and Risk Reporting and Analytics 20+ National and Local Payor Relationships Fully Aligned Care Model Care Navigation
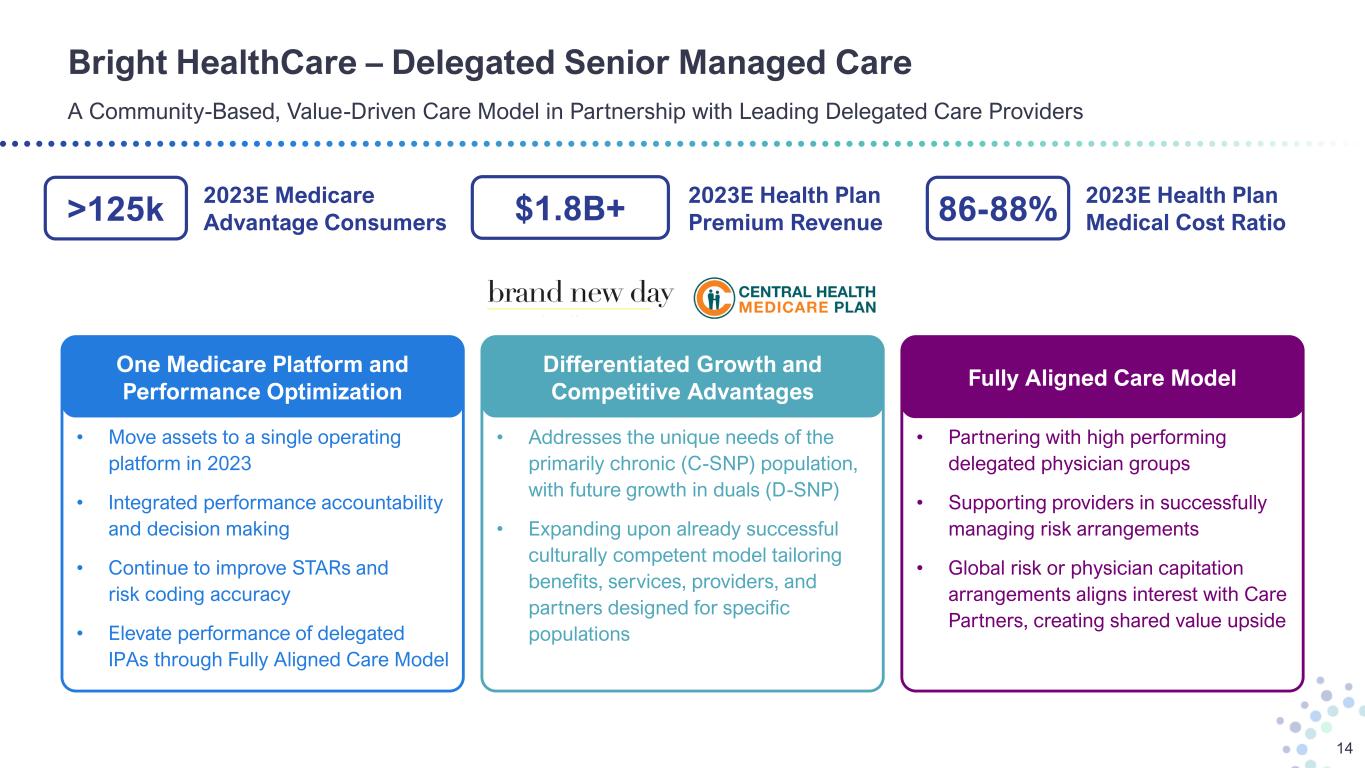
Bright HealthCare – Delegated Senior Managed Care A Community-Based, Value-Driven Care Model in Partnership with Leading Delegated Care Providers 14 >125k 2023E Medicare Advantage Consumers $1.8B+ 2023E Health Plan Premium Revenue 86-88% 2023E Health Plan Medical Cost Ratio • Addresses the unique needs of the primarily chronic (C-SNP) population, with future growth in duals (D-SNP) • Expanding upon already successful culturally competent model tailoring benefits, services, providers, and partners designed for specific populations • Move assets to a single operating platform in 2023 • Integrated performance accountability and decision making • Continue to improve STARs and risk coding accuracy • Elevate performance of delegated IPAs through Fully Aligned Care Model One Medicare Platform and Performance Optimization Differentiated Growth and Competitive Advantages • Partnering with high performing delegated physician groups • Supporting providers in successfully managing risk arrangements • Global risk or physician capitation arrangements aligns interest with Care Partners, creating shared value upside Fully Aligned Care Model

Bright Health’s 2023 Focused Priorities Strengthening the Business Foundation for Profitable and Capital Efficient Growth in the Future 15 Rightsize Cost Structure for our Go-Forward Business1 Manage the Company to Profitability and Positive Cash Flow 3 Inspire the Hearts and Minds of our Team Members4 Strengthen our Foundation for Growth in 2024 and Beyond5 Fundamental Execution of our Runout and Go-Forward Business 2

Q4 2022 Actions Improve Liquidity Position Going into 2023 Series B Convertible Preferred as well as Targeted RBC Recapture Provides for a Stronger Liquidity Position 16 • Approximately $2.8 billion in total Cash and Investments, including $221 million of non-regulated Cash and Short-Term Investments as of the end of Q3 2022. • Closed the sale of $175 million in convertible perpetual preferred stock on October 18, 2022. • Expect existing $350 million Credit Facility will have $300 million drawn at the end of Q1 2023. (1) Excludes any potential repayment under the current credit facility $221 Million Non-Regulated Cash and Equivalent Balance as of 9/30/22 • October 2022 Series B Convertible Preferred • Risk-Based Capital Surplus Sources of Cash • Lower Operating Expenses: o Continuing ops o Discontinued ops Uses of Cash $200 - $300 Million End of Year 2023 Target Balance of Cash and RBC Surplus(1)

Bright Health 2023 Outlook Raising 2023 Value-Driven Care Delivery Lives and Enterprise Revenue Forecast 17 (1) Adjusted Operating Expense Ratio and Adjusted EBITDA are forward-looking non-GAAP financial measures. Reconciliations of Adjusted Operating Cost Ratio and Adjusted EBITDA to the most directly comparable GAAP financial measures are not provided because the company is unable to provide such reconciliations without unreasonable effort. Please see the appendix to this presentation for important information about the use of these non-GAAP financial measures and the absence of such reconciliations. (2) Adjusted Operating Cost Ratio excludes stock-based compensation expense, changes in the fair value of contingent consideration, contract termination costs, and depreciation and amortization, and may exclude other items in the future. • Revenue of $3.4 – $3.6 Billion • Adjusted Operating Cost Ratio 11% – 12%(1)(2) • Adjusted EBITDA Profitable(1) • >125,000 Year-End 2023 Consumers • Revenue of $1.8+ Billion • Medical Cost Ratio 86% - 88% Bright Health Group Bright HealthCare • 210,000 to 235,000 Year-End 2023 Value-Based Consumers • ~65,000 Year-End ACO Reach Consumers • Revenue of $1.6 – $1.8 Billion Consumer Care
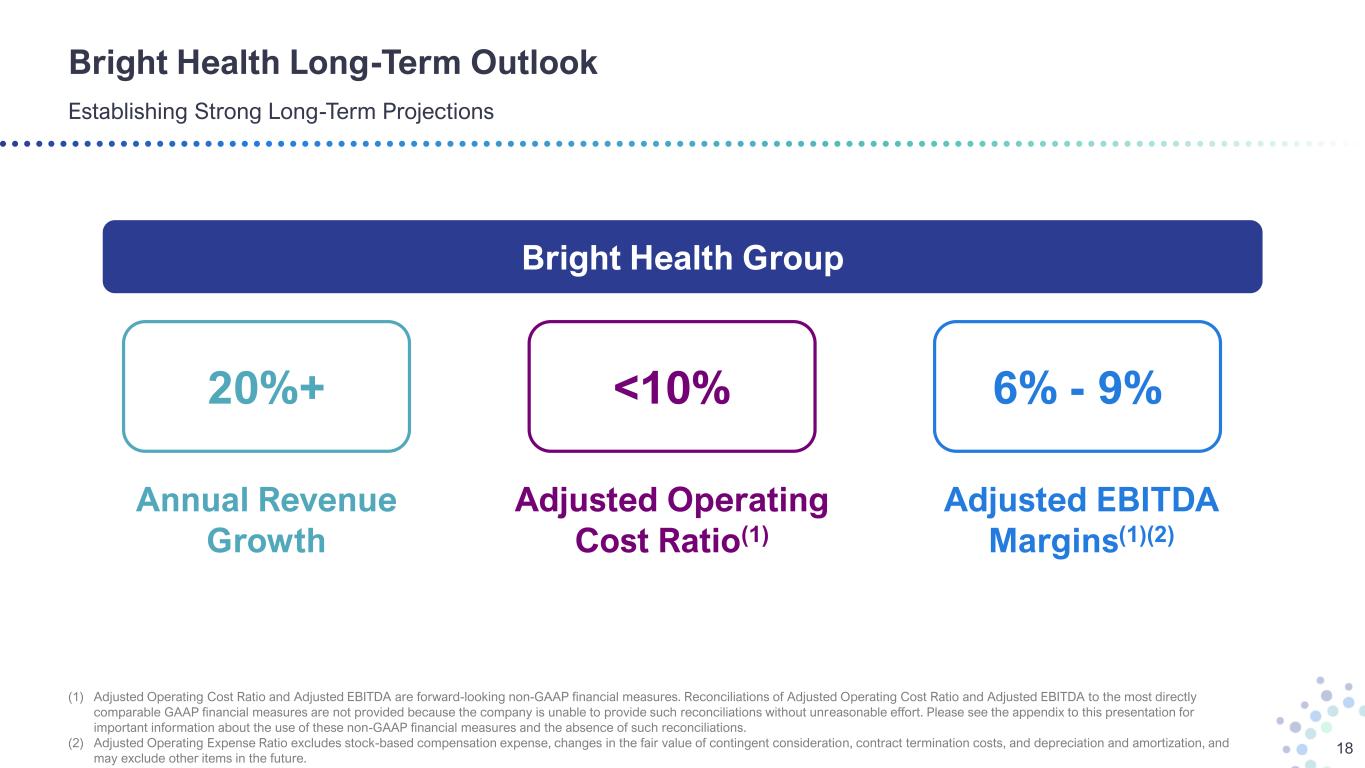
Bright Health Long-Term Outlook Establishing Strong Long-Term Projections 18 (1) Adjusted Operating Cost Ratio and Adjusted EBITDA are forward-looking non-GAAP financial measures. Reconciliations of Adjusted Operating Cost Ratio and Adjusted EBITDA to the most directly comparable GAAP financial measures are not provided because the company is unable to provide such reconciliations without unreasonable effort. Please see the appendix to this presentation for important information about the use of these non-GAAP financial measures and the absence of such reconciliations. (2) Adjusted Operating Expense Ratio excludes stock-based compensation expense, changes in the fair value of contingent consideration, contract termination costs, and depreciation and amortization, and may exclude other items in the future. 20%+ Annual Revenue Growth 6% - 9% Adjusted EBITDA Margins(1)(2) <10% Adjusted Operating Cost Ratio(1) Bright Health Group
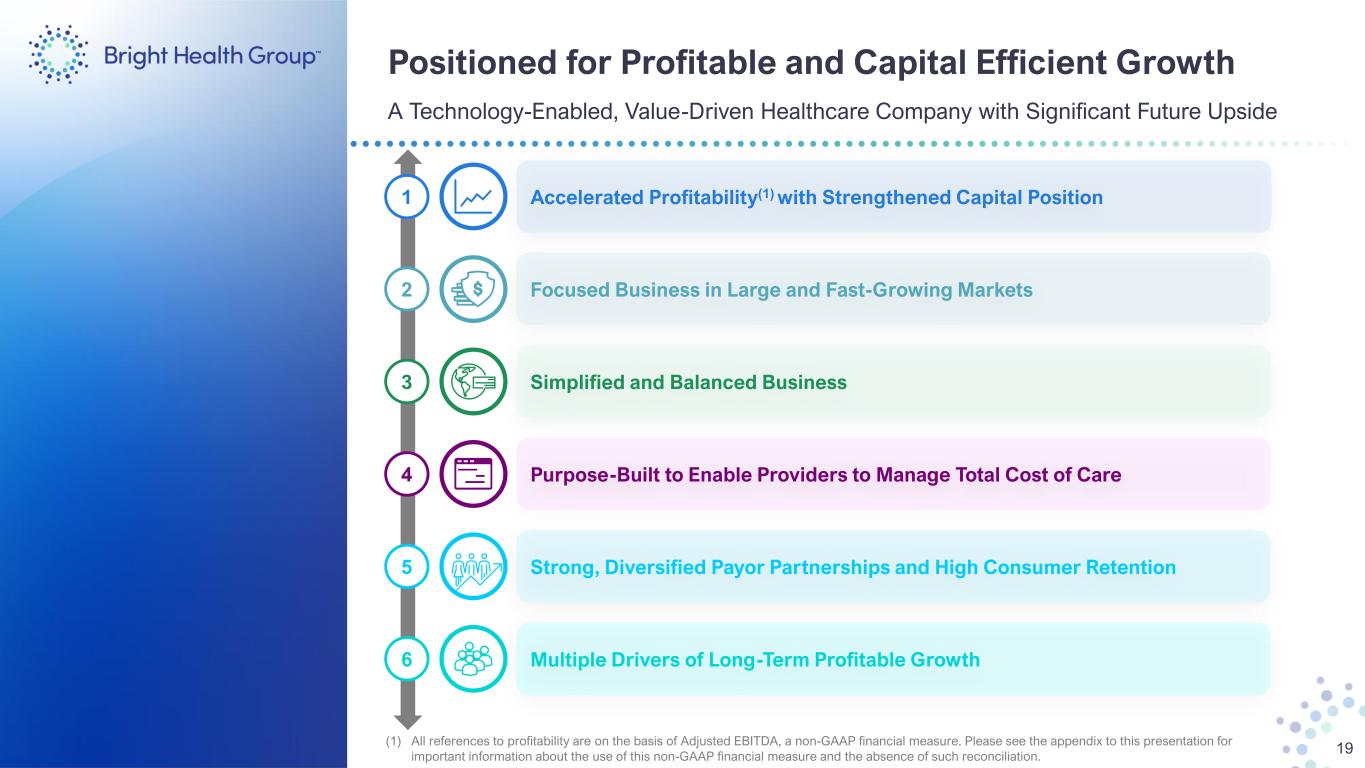
Positioned for Profitable and Capital Efficient Growth A Technology-Enabled, Value-Driven Healthcare Company with Significant Future Upside 19 Accelerated Profitability(1) with Strengthened Capital Position1 Purpose-Built to Enable Providers to Manage Total Cost of Care4 Strong, Diversified Payor Partnerships and High Consumer Retention 5 Multiple Drivers of Long-Term Profitable Growth6 Focused Business in Large and Fast-Growing Markets2 Simplified and Balanced Business3 (1) All references to profitability are on the basis of Adjusted EBITDA, a non-GAAP financial measure. Please see the appendix to this presentation for important information about the use of this non-GAAP financial measure and the absence of such reconciliation.

Appendix
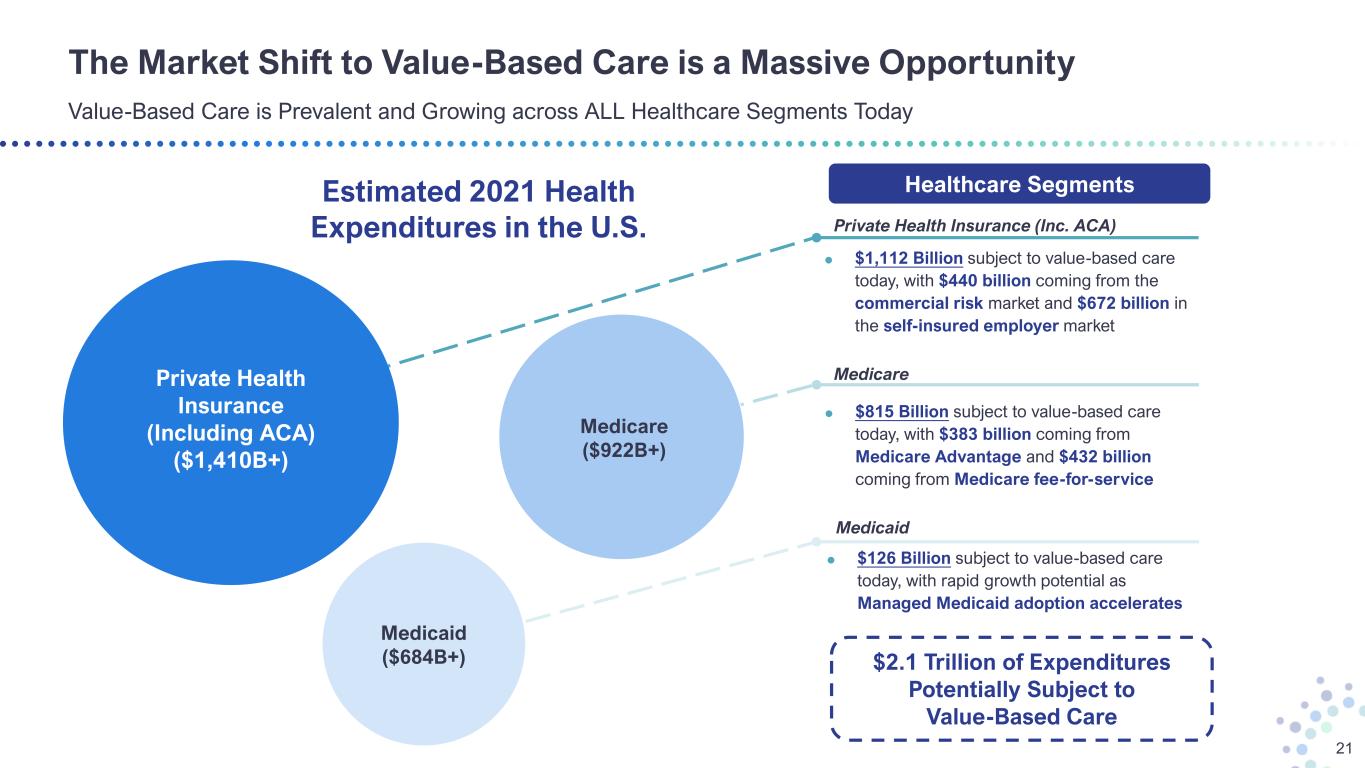
The Market Shift to Value-Based Care is a Massive Opportunity 21 Value-Based Care is Prevalent and Growing across ALL Healthcare Segments Today Estimated 2021 Health Expenditures in the U.S. Private Health Insurance (Including ACA) ($1,410B+) $1,112 Billion subject to value-based care today, with $440 billion coming from the commercial risk market and $672 billion in the self-insured employer market $815 Billion subject to value-based care today, with $383 billion coming from Medicare Advantage and $432 billion coming from Medicare fee-for-service $126 Billion subject to value-based care today, with rapid growth potential as Managed Medicaid adoption accelerates Healthcare Segments $2.1 Trillion of Expenditures Potentially Subject to Value-Based Care Medicare ($922B+) Medicaid ($684B+) Private Health Insurance (Inc. ACA) Medicare Medicaid
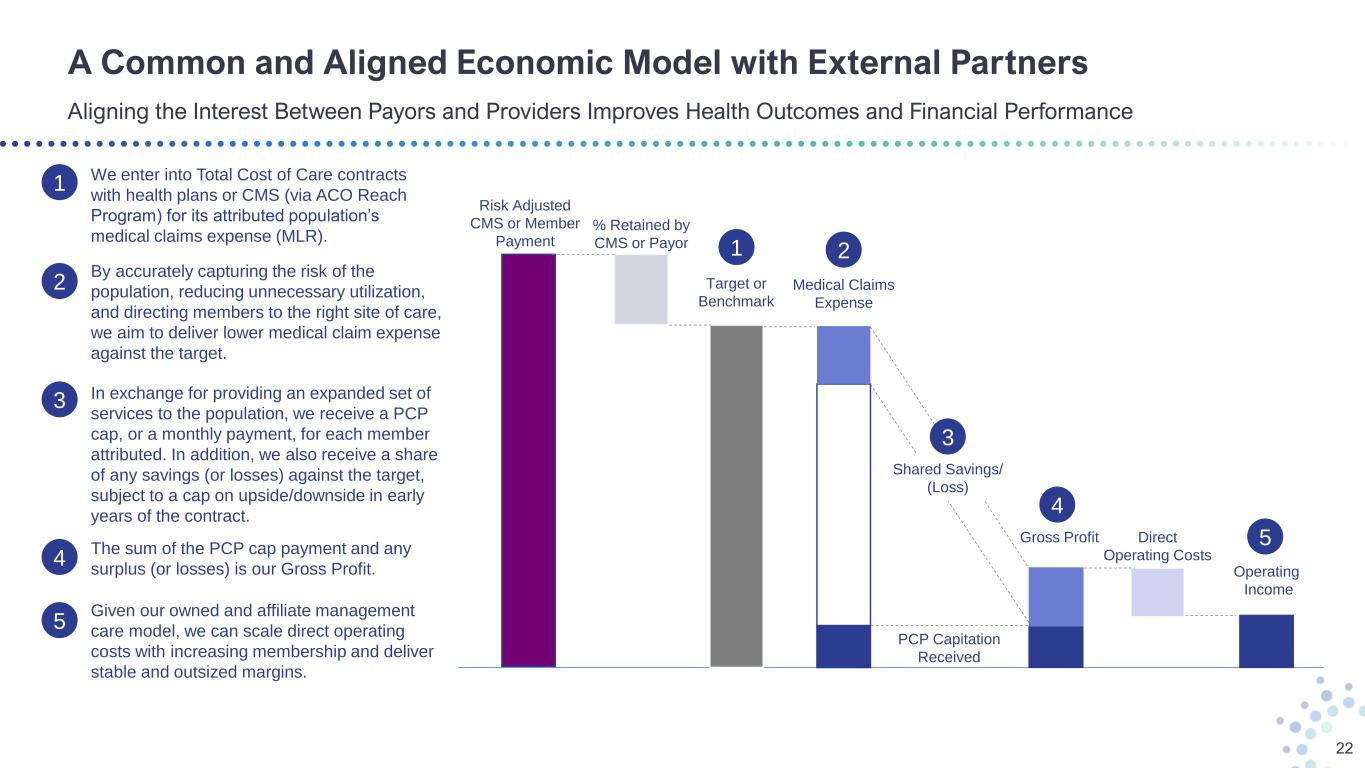
A Common and Aligned Economic Model with External Partners Aligning the Interest Between Payors and Providers Improves Health Outcomes and Financial Performance 22 Risk Adjusted CMS or Member Payment % Retained by CMS or Payor Target or Benchmark Medical Claims Expense Direct Operating Costs Operating Income 5 2 Gross Profit 4 1 PCP Capitation Received Shared Savings/ (Loss) 3 1 We enter into Total Cost of Care contracts with health plans or CMS (via ACO Reach Program) for its attributed population’s medical claims expense (MLR). 2 By accurately capturing the risk of the population, reducing unnecessary utilization, and directing members to the right site of care, we aim to deliver lower medical claim expense against the target. 3 In exchange for providing an expanded set of services to the population, we receive a PCP cap, or a monthly payment, for each member attributed. In addition, we also receive a share of any savings (or losses) against the target, subject to a cap on upside/downside in early years of the contract. 4 The sum of the PCP cap payment and any surplus (or losses) is our Gross Profit. 5 Given our owned and affiliate management care model, we can scale direct operating costs with increasing membership and deliver stable and outsized margins.
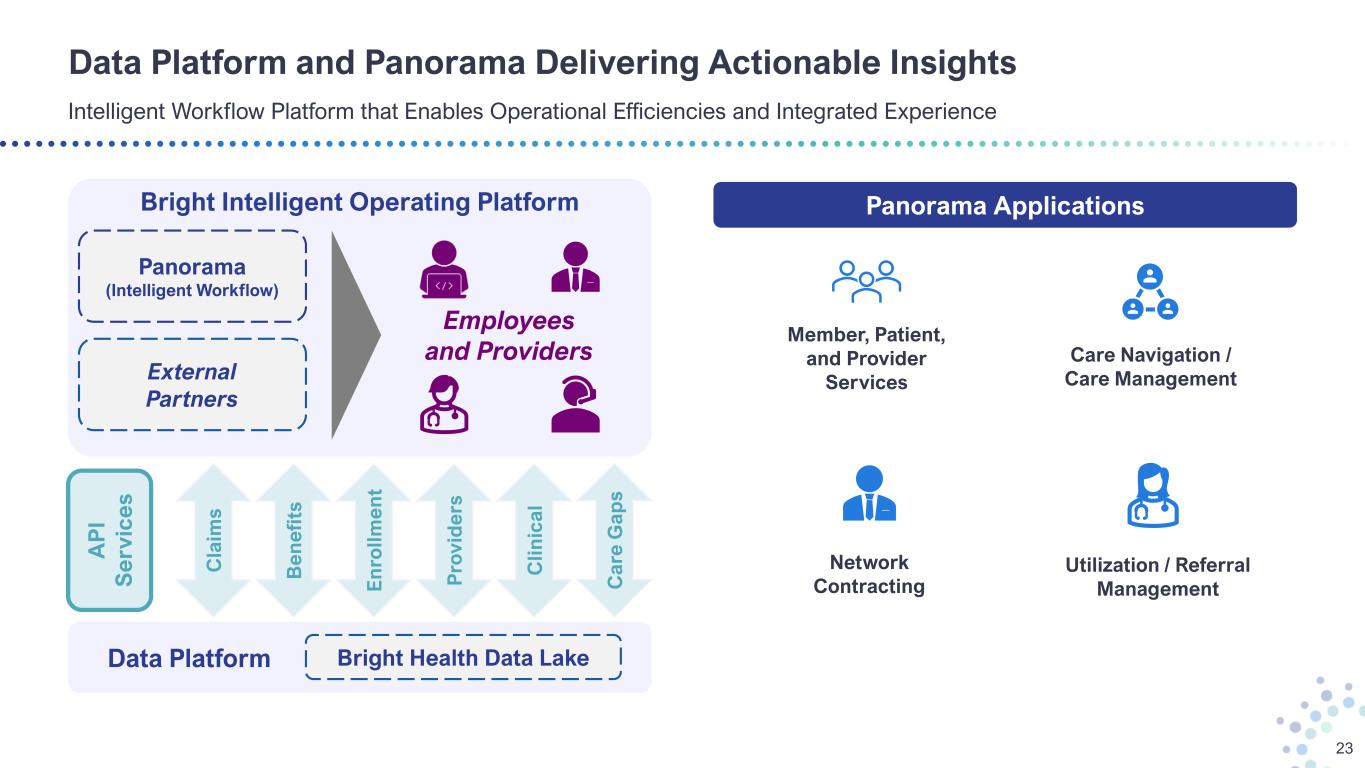
Bright Intelligent Operating Platform Data Platform and Panorama Delivering Actionable Insights Intelligent Workflow Platform that Enables Operational Efficiencies and Integrated Experience 23 Panorama (Intelligent Workflow) Employees and Providers C la im s B e n e fi ts E n ro ll m e n t P ro v id e rs C li n ic a l C a re G a p s A P I S e rv ic e s Data Platform Bright Health Data Lake Panorama Applications Member, Patient, and Provider Services Network Contracting Utilization / Referral Management Care Navigation / Care ManagementExternal Partners
Forward-Looking Non-GAAP Measures 24 This presentation contains Adjusted EBITDA and Adjusted Operating Cost Ratio, which are non-GAAP financial measures. These non-GAAP financial measures are additions, and not substitutes for or superior to the most directly comparable GAAP financial measures, Net Income (Loss) and Operating Costs, respectively. Additionally, Adjusted EBITDA is not intended to be a measure of free cash flow available for management’s discretionary use as it does not consider certain cash requirements such as interest payments, tax payments and debt service requirements. The presentation of these measures has limitations as an analytical tool and should not be considered in isolation or as a substitute for analysis of our results as reported under GAAP. Because not all companies use identical calculations, the presentation of these measures may not be comparable to other similarly titled measures of other companies and can differ significantly from company to company. Reconciliations of projected Adjusted EBITDA and projected Adjusted Operating Cost Ratio to the most directly comparable GAAP financial measures are not provided because the Company is unable to provide such reconciliations without unreasonable effort. The inability to provide a reconciliation is due to the uncertainty and inherent difficulty predicting the occurrence, the financial impact and the periods in which the non-GAAP adjustments may be recognized. With respect to Adjusted EBITDA, these GAAP measures may include the impact of such items as interest expense, income tax expense, depreciation and amortization, impairment of goodwill or intangible assets, transaction costs, share-based compensation expense, changes in the fair value of equity securities, changes in the fair value of contingent consideration, contract termination costs, restructuring costs; and the tax effect of all such items. Historically, the Company has excluded these items from non-GAAP financial measures. With respect to Adjusted Operating Cost Ratio, these GAAP measures may include the impact of such items as stock-based compensation, changes in the fair value of contingent consideration, contract termination costs, and depreciation and amortization. The Company currently expects to continue to exclude these items in future disclosures of non-GAAP financial measures and may also exclude other items that may arise (collectively, “non-GAAP adjustments”). The decisions and events that typically lead to the recognition of non-GAAP adjustments, such as a decision to exit part of the business, are inherently unpredictable as to if or when they may occur. For the same reasons, the Company is unable to address the probable significance of the unavailable information, which could be material to future results.


