UNITED STATES
SECURITIES AND EXCHANGE COMMISSION
WASHINGTON, D.C. 20549
FORM N-CSR
CERTIFIED SHAREHOLDER REPORT OF REGISTERED
MANAGEMENT INVESTMENT COMPANIES
811-23159
(Investment Company Act file number)
Griffin Institutional Access Credit Fund
(Exact name of registrant as specified in charter)
Griffin Capital Plaza
1520 E. Grand Avenue
El Segundo, CA 90245
(Address of principal executive offices) (Zip code)
ALPS Fund Services, Inc.
1290 Broadway, Suite 1100
Denver, CO 80203
(Name and address of agent for service)
Copy to:
Terrence O. Davis, Esq.
Greenberg Traurig, LLP
3333 Piedmont Road, NE, Suite 2500
Atlanta, GA 30305
Registrant's telephone number, including area code: 310.469.6100
Date of fiscal year end: December 31
Date of reporting period: January 1 - June 30, 2018
Item 1. Reports to Stockholders.
Table of Contents
| Shareholder Letter | 1 |
| Portfolio Update | 7 |
| Schedule of Investments | 9 |
| Statement of Assets and Liabilities | 18 |
| Statement of Operations | 20 |
| Statements of Changes in Net Assets | 21 |
| Statement of Cash Flows | 23 |
| Financial Highlights | 24 |
| Notes to Financial Statements | 29 |
| Additional Information | 41 |
| GRIFFIN INSTITUTIONAL ACCESS CREDIT FUND | 1 |
| SEMI-ANNUAL REPORT 2018 | |
Dear Fellow Shareholders,
We are pleased to present the semi-annual report for Griffin Institutional Access® Credit Fund (the “Fund”). We appreciate the support of our shareholders as well as our broker-dealer partners and will remain true to our stated investment objective of generating a return comprised of both current income and capital appreciation with low volatility and low correlation1 to the broader markets.
The Fund’s sub-adviser—BCSF Advisors, LP, an affiliate of Bain Capital Credit, LP— has continued to construct a well-diversified portfolio consisting primarily of floating rate, senior secured bank loans. The portfolio composition is ultimately determined through both fundamental quantitative and qualitative analysis to determine the optimal mix of securities across global markets with the potential to deliver the best risk-adjusted returns for investors During the first half of 2018, the Fund was granted exemptive relief which has allowed shareholders to gain exposure to the full breadth and expertise of the Bain Capital Credit Platform, including direct origination opportunities, as well as senior direct lending and non-performing loan (NPL) investments sourced from financial institutions in Europe.
Since its inception on April 3, 2017, the Fund delivered a total cumulative return of 5.95%, outperforming the S&P/ LSTA Leveraged Loan Index2 by 84 basis points.3 As of June 30, 2018, the Fund was diversified across 295 individual securities and 32 industries.4
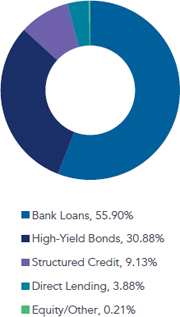
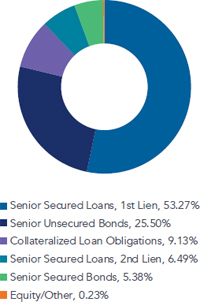
GRIFFIN INSTITUTIONAL ACCESS CREDIT FUND HOLDINGS
(Based on market value of invested assets as of June 30, 2018)
| Floating Rate Assets4: 66.97% | Fixed Rate Assets4: 33.03% |
| | |
| | |
| Sector Analysis4 | Asset Type4 |
| | |
 |  |
| 2 | GRIFFIN INSTITUTIONAL ACCESS CREDIT FUND |
| | SEMI-ANNUAL REPORT 2018 |
Investment Performance
Performance in the first half of 2018 was driven primarily by exposure to first and second lien loans and, to a lesser extent, collateralized loan obligation (CLO) debt and equity. High-yield bonds detracted from year-to-date performance as the sector experienced heightened price volatility. From an industry standpoint, four industries contributed the majority of the Fund’s returns: Healthcare; Airlines, Aerospace & Defense; Software/Entertainment Services; and Metals & Mining. In addition, several company specific events within these industries occurred in the first half of the year that benefited the portfolio.
In terms of positioning, we continue to favor bank loans over high-yield bonds due to our desire to be senior in the capital structure and maintain a floating-rate exposure. That being said, we were able to allocate to some attractive opportunities in the bond space due to selling pressure that occurred in the period. During the first half of the year, we began building a bar-belled CLO position – buying CLO equity and AAA-rated tranches, while limiting exposure to mezzanine tranches. Together, we believe floating-rate AAA CLO debt and CLO equity combine to create an attractive low-duration, high-yield asset blend with positive convexity, which compares favorably to high-yield bonds today.
On the private side, we were able to invest in several senior direct deals during the first half of the year. Due to the illiquidity of direct loans, we tend to be patient when allocating to the asset class. Fortunately, Bain Capital Credit’s broad platform and deep sourcing networks can allow the Fund to assess a plethora of opportunities across asset type, industry, and geography. We will continue to approach this market with caution, looking for opportunities that still yield premium over liquid markets and are accretive to the portfolio on a risk-adjusted basis.
Outside of the traditional credit asset classes, Bain Capital Credit, LP as a firm continues to focus on European non-performing loans (NPLs) given the size of the opportunity, high barriers to entry, and the attractive return potential. Within NPLs, assuming certain conditions are met, we intend to target portfolios of loans backed by hard collateral (e.g. real estate, small-to-medium sized enterprises, etc.) in an effort to minimize our downside and drive value. We continue to develop our pipeline for NPL investments and we expect the NPL exposure in the Fund to increase gradually in the coming quarters.
Market Overview and Outlook
Market volatility returned in earnest in the first half of 2018, caused by investor angst over inflation fears, a hawkish Federal Reserve, and intensifying global trade talks. In June, the Fed raised rates for the second time in 2018 and alluded to another two hikes before year end.
| GRIFFIN INSTITUTIONAL ACCESS CREDIT FUND | 3 |
| SEMI-ANNUAL REPORT 2018 | |
Though the 10-year Treasury did increase above 3% in April for the first time since 2014, its yield settled in at 2.85% at the end of June. Ultimately, the Treasury yield curve flattened during the first six months of the year5 – typically a bearish signal. Despite the volatility, risky assets eked out positive returns. Prices in both high-yield bonds and bank loans declined, but both asset classes earned positive, coupon-driven returns in the first half of 2018. Higher-quality, longer-duration credits (e.g. BB-rated high-yield bonds) sold off due to interest rate volatility and continued outflows from the high-yield asset class. Bank loan prices fell modestly as spreads widened ahead of a busy issuance calendar in the second half of 2018. Robust CLO formation and refinancings continued to provide a strong bid for bank loans as CLO managers looked to take advantage of tight liability spreads. Despite the volatility, default rates remain low. Trailing twelve-month default rates for both loans and bonds declined to approximately 2.0% at the end of June, including a rather large default in iHeartCommunications, Inc. in February 2018.6
We are one more quarter into what is now a nine-year economic expansion, just one year shy of the longest in U.S. history. Broadly, we feel good about market fundamentals and the macro backdrop, but expect volatility will reappear at some point in 2018. In addition, credit valuations remain near historical peaks in most markets. Another market trend we are watching closely is the continued degradation of loan documentation and creditor rights. Collateral leakage, pro-forma add-backs, and other debtor- or sponsor-friendly activities are clear late-cycle indicators. While it is difficult to avoid these situations entirely, Bain Capital Credit’s large industry research team works to dissect and interpret covenant language, collateral packages, and sponsor tendencies, all of which are extremely important in today’s market. For these reasons, we are positioned conservatively today and are selectively rotating into what we believe are attractive opportunities as they arise.
We are pleased with the development of the portfolio and our performance year-to date. We believe that our ability to actively manage across credit sectors and markets will allow us to provide value to our shareholders in the form of strong risk-adjusted returns. The portfolio management team continues to leverage the breadth of Bain Capital Credit’s global platform to uncover investment opportunities in line with the stated investment objective of the Fund.
Thank you for your investment in and support of Griffin Institutional Access Credit Fund.
Sincerely,

Randy I. Anderson, Ph.D., CRE
President
Griffin Capital Asset Management Company, LLC
Griffin Institutional Access Credit Fund (the “Fund”) is a closed-end interval fund. Limited liquidity is provided to shareholders only through the Fund’s quarterly repurchase offers for no less than 5% of the Fund’s shares outstanding at net asset value. The Fund is only suitable for investors who can bear the risks associated with the limited liquidity of the Fund and should be viewed as a long-term investment.
| 4 | GRIFFIN INSTITUTIONAL ACCESS CREDIT FUND |
| | SEMI-ANNUAL REPORT 2018 |
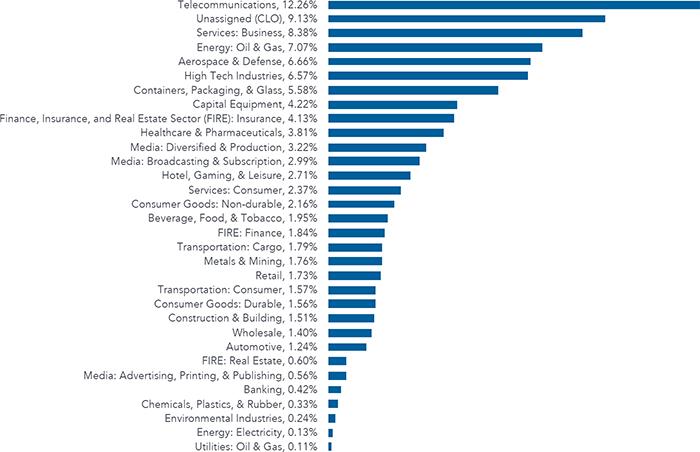
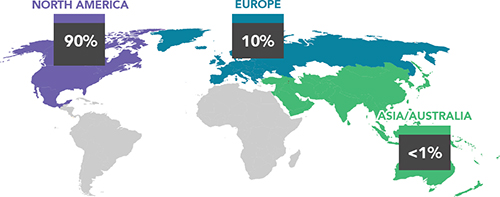
Industry Diversification4, 7
Geography4
| GRIFFIN INSTITUTIONAL ACCESS CREDIT FUND | 5 |
| SEMI-ANNUAL REPORT 2018 | |
FUND SUB-ADVISER (UNAUDITED)
BCSF Advisors, LP Griffin Institutional Access Credit Fund is sub-advised by BCSF Advisors, LP, an SEC-registered investment adviser and affiliate of Bain Capital Credit, LP. |  |
Bain Capital Credit, LP provides ongoing research, opinions and recommendations regarding the Fund’s investment portfolio. Bain Capital Credit was formed in 1998 as the credit investing arm of Bain Capital, one of the world’s premier alternative investment firms, with approximately $95 billion in assets under management.8 Bain Capital Credit invests across the full spectrum of credit strategies, including leveraged loans, high-yield bonds, distressed debt, direct lending, structured products, non-performing loans and equities. With offices in Boston, Chicago, New York, London, Dublin, Madrid, Hong Kong, Guangzhou, Mumbai, Melbourne and Sydney, Bain Capital Credit has a global footprint with approximately $39.5 billion9 in assets under management.
END NOTES
| 1. | Correlation is a statistical measure of how two securities move in relation to each other. A correlation ranges from -1 to 1. A positive correlation of 1 implies that as one security moves, either up or down, the other security will move in lockstep, in the same direction. A negative correlation of -1 indicates that the securities will move in the opposite direction. If the correlation is 0, the movements of the securities are said to have no correlation; they are completely random. |
| 2. | The S&P/LSTA Leveraged Loan Index is a daily total return index that uses mark-to-market pricing to calculate market value change. The LSTA tracks, on a real-time basis, the current outstanding balance and spread over the London Interbank Offered Rate (LIBOR) for fully funded term loans. The facilities included in the LSTA represent a broad cross section of leveraged loans syndicated in the United States, including dollar-denominated loans to overseas issuers. You cannot invest directly in an index. Index performance does not represent actual Fund or portfolio performance. A fund or portfolio may differ significantly from the securities included in the index. Index performance assumes reinvestment of dividends but does not reflect any management fees, transaction costs or other expenses that would be incurred by a fund or portfolio, or brokerage commissions on transactions in fund shares. Such fees, expenses, and commissions could reduce returns. |
| 3. | One basis point is equal to 1/100th of 1%, or 0.01%. |
| 4. | Based on market value of invested assets as of June 30, 2018. Holdings are subject to change without notice. |
| 6. | Source: JP Morgan Default Monitor as of June 30, 2018. |
| 7. | Based on Moody’s 35 Industry Categories (“Moody’s 35”). |
| 8. | Firm-level AUM for Bain Capital is estimated and is presented as of March 31, 2018. |
| 9. | AUM estimated as of July 1, 2018. Bain Capital Credit’s assets under management includes its subsidiaries and credit vehicles managed by its AIFM affiliate. |
DISCLOSURES (UNAUDITED)
Performance data quoted represents past performance. Past performance is no guarantee of future results. Investment returns and principal value of Griffin Institutional Access Credit Fund (the “Fund”) will fluctuate so that shares, when redeemed, may be worth more or less than their original cost. Current performance may be lower or higher than performance data quoted. The most recent performance is available at www.griffincapital.com or by calling 888.926.2688. Performance reflects management fees and other expenses. Performance uses the Class I share (NASDAQ: CRDIX) of Griffin Institutional Access Credit Fund. Investors of the Class I share do not pay a front-end sales charge/load.
Investors in the Fund should understand that the net asset value (“NAV”) of the Fund will fluctuate, which may result in a loss of the principal amount invested. The Fund is a closed-end interval fund, the shares have no history of public trading, nor is it intended at this time that the shares will be listed on a public exchange. No secondary market is expected to develop for the Fund’s shares, liquidity for the Fund’s shares will be provided only through quarterly repurchase offers for no less than 5% and no more than 25% of the Fund’s shares at NAV, and there is no guarantee that an investor will be able to sell all the shares that the investor desires to sell in the repurchase offer. Due to these restrictions, an investor should consider an investment in the Fund to be of limited liquidity. The Fund is suitable only for investors who can bear the risks associated with the limited liquidity of the Fund and should be viewed as a long-term investment. Investing in the Fund is speculative and involves a high degree of risk, including the risks associated with leverage.
Diversification does not assure a profit or protect against loss in a declining market.
By investing in the Fund, a shareholder will not be deemed to be an investor in any underlying fund and will not have the ability to exercise any rights attributable to an investor in any such underlying fund related to their investment.
This semi-annual report may contain certain forward-looking statements. Such forward-looking statements can generally be identified by our use of forward-looking terminology such as “may,” “will,” “expect,” “intend,” “anticipate,” “estimate,” “believe,” “continue,” or other similar words. Because such statements include risks, uncertainties and contingencies, actual results may differ materially from the expectations, intentions, beliefs, plans or predictions of the future expressed or implied by such forward-looking statements. These risks, uncertainties and contingencies include, but are not limited to: uncertainties relating to changes in general economic and real estate conditions; uncertainties relating to the implementation of our investment strategy; uncertainties relating to capital proceeds; and other risk factors as outlined in our prospectus, annual report and semi-annual report filed with the Securities and Exchange Commission (the “SEC”). This is neither an offer nor a solicitation to purchase securities.
The views and information discussed in this commentary are as of the date of publication, are subject to change, and may not reflect the writer’s current views. The views expressed represent an assessment of market conditions at a specific point in time, are opinions only and should not be relied upon as investment advice regarding a particular investment or markets in general. Such information does not constitute a recommendation to buy or sell specific securities or investment vehicles. It should not be assumed that any investment will be profitable or will equal the performance of the fund(s) or any securities or any sectors mentioned herein. The subject matter contained herein has been derived from several sources believed to be reliable and accurate at the time of compilation. Griffin Capital Securities, LLC does not accept any liability for losses either direct or consequential caused by the use of this information.
Distribution Policy Risk
The Fund’s distribution policy is to make quarterly distributions to shareholders. All or a portion of a distribution may consist solely of a return of capital (i.e. from your original investment) and not a return of net profit. Shareholders should not assume that the source of a distribution from the Fund is net profit. Shareholders should note that return of capital will reduce the tax basis of their shares and potentially increase the taxable gain, if any, upon disposition of their shares. Sources of distributions to shareholders for tax reporting purposes will depend upon the Fund’s investment experience during the remainder of its fiscal year and may be subject to changes based on tax regulations. Pursuant to Section 852 of the Internal Revenue Code, the taxability of distributions will be reported on Form 1099-DIV.
The Fund distribution rate is the amount, expressed as a percentage, a Fund investor would receive in distributions if the most recent Fund distribution stayed consistent going forward. It is calculated by annualizing the most recent Fund distribution yield. The percentage represents a single distribution from the Fund and does not represent the total return of the Fund.
ALPS Distributors, Inc. is the distributor of Griffin Institutional Access Credit Fund. Griffin Capital and ALPS Distributors, Inc. are not affiliated.
| Griffin Institutional Access Credit Fund | Portfolio Update |
June 30, 2018 (Unaudited)
Performance (for the period ended June 30, 2018)
| | 6 Month | 1 Year | Since Inception | Inception | Total Expense Ratio |
| Griffin Institutional Access Credit Fund - A - Without Load | 1.49% | 4.65% | 4.76% | 4/3/17 | 2.60% |
| Griffin Institutional Access Credit Fund - A - With Load* | -4.33% | -1.36% | -0.14% | 4/3/17 | |
| Griffin Institutional Access Credit Fund - C - Without Load | 1.49% | 4.65% | 4.75% | 4/3/17 | 3.35% |
| Griffin Institutional Access Credit Fund - C - With Load** | 0.51% | 3.66% | 3.95% | 4/3/17 | |
| Griffin Institutional Access Credit Fund - I - NAV | 1.50% | 4.66% | 4.77% | 4/3/17 | 2.35% |
| Griffin Institutional Access Credit Fund - L - Without Load | 1.48% | N/A | 3.35% | 9/5/17 | 2.85% |
| Griffin Institutional Access Credit Fund - L - With Load*** | -2.82% | N/A | -1.05% | 9/5/17 | |
| Griffin Institutional Access Credit Fund - F - NAV | 1.52% | N/A | 2.95% | 9/25/17 | 1.85% |
| S&P/LSTA Leveraged Loan Index | 2.16% | N/A | 3.36% | 4/3/17 | |
| * | Adjusted for initial maximum sales charge of 5.75%. |
| ** | Adjusted for contingent deferred sales charge of 1.00%. |
| *** | Adjusted for initial maximum sales charge of 4.25% |
The S&P/LSTA Leveraged Loan Index is a capitalization-weighted syndicated loan index based upon market weightings, spreads and interest payments. The S&P/LSTA Leveraged Loan Index covers the U.S. market back to 1997 and currently calculates on a daily basis.
Indexes are not actively managed and do not reflect deduction for fees, expenses or taxes. An investor cannot invest directly into an index.
The returns shown above do not reflect the deduction of taxes a shareholder would pay on Fund distributions or redemption of Fund shares.
The performance data quoted above represents past performance. Past performance is not a guarantee of future results. Investment return and value of the Fund shares will fluctuate so that an investor’s shares, when sold or redeemed, may be worth more or less than their original cost. Performance may be lower or higher than performance data quoted. Fund performance current to the most recent month-end is available by calling 1-888-926-2688 or by visiting www.griffincapital.com.
Class A shares are offered subject to a maximum sales charge of 5.75% of the offering price and Class L shares are offered subject to a maximum sales charge of 4.25% of the offering price. Class C, Class I and Class F shares are offered at net asset value per share. Class C shares may be subject to a 1.00% contingent deferred sales charge on shares redeemed during the first 365 days after their purchase. The Fund’s investment adviser has contractually agreed to waive its fees and to pay or absorb the ordinary annual operating expenses of the Fund (including offering expenses, but excluding taxes, interest, brokerage commissions, acquired fund fees and expenses and extraordinary expenses), to the extent that they exceed 2.60%, 3.35%, 2.35%, 2.85 and 1.85% per annum of the Fund’s average daily net assets attributable to Class A, Class C, Class I, Class L and Class F, respectively. The Expense Limitation Agreement will remain in effect at least until August 31, 2019, unless and until the Board approves its modification or termination. Without the waiver the expenses would be 5.15%, 6.25%, 5.62%, 4.17% and 3.27% for Class A, Class C, Class I, Class L and Class F, respectively per the Fund’s most recent prospectus. In addition to the Expense Limitation Agreement described above, the Adviser voluntarily has absorbed all of the operating expenses of the Fund since the commencement of the Fund’s operations. The Adviser will continue to bear such expenses on a going forward basis in its discretion and is under no obligation to continue to do so for any specified period of time. In the absence of the election by the Adviser to bear all of the Fund’s operating expenses, the performance of the Fund would have been reduced. Please review the Fund’s Prospectus for more details regarding the Fund’s fees and expenses. No assurances can be given that the Fund will pay a dividend in the future; or, if any such dividend is paid, the amount or rate of the dividend.
| Semi-Annual Report | June 30, 2018 | 7 |
| Griffin Institutional Access Credit Fund | Portfolio Update |
June 30, 2018 (Unaudited)
Performance of $10,000 Initial Investment (for the period ended June 30, 2018)
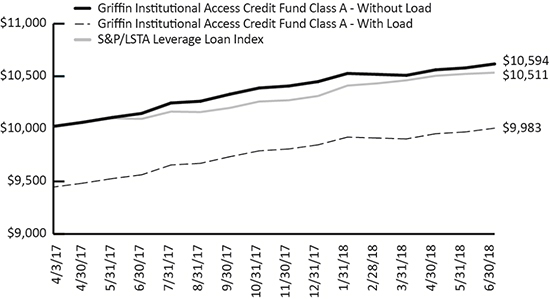
The graph shown above represents historical performance of a hypothetical investment of $10,000 in the Fund since inception. Past performance does not guarantee future results. All returns reflect reinvested dividends, but do not reflect the deduction of taxes that a shareholder would pay on Fund distributions or the redemption of Fund shares.
Industry Diversification (as a % of Net Assets)
| Telecommunications | 11.47% |
| Unassigned | 8.28% |
| Services: Business | 7.60% |
| Energy: Oil & Gas | 6.41% |
| Aerospace & Defense | 6.04% |
| High Tech Industries | 5.99% |
| Containers, Packaging, & Glass | 4.98% |
| Capital Equipment | 3.83% |
| FIRE: Insurance | 3.74% |
| Healthcare & Pharmaceuticals | 3.45% |
| Hotel, Gaming, & Leisure | 3.00% |
| Media: Diversified & Production | 2.92% |
| Media: Broadcasting & Subscription | 2.71% |
| Services: Consumer | 2.15% |
| Consumer goods: non-durable | 1.96% |
| Beverage, Food, & Tobacco | 1.77% |
| FIRE: Finance | 1.67% |
| Transportation: Cargo | 1.63% |
| Metals & Mining | 1.59% |
| Retail | 1.57% |
| Transportation: Consumer | 1.43% |
| Consumer goods: durable | 1.42% |
| Construction & Building | 1.37% |
| Wholesale | 1.27% |
| Automotive | 1.12% |
| FIRE: Real Estate | 0.54% |
| Media: Advertising, Printing & Publishing | 0.51% |
| Banking | 0.38% |
| Chemicals, Plastics, & Rubber | 0.30% |
| Environmental Industries | 0.21% |
| Energy: Electricity | 0.11% |
| Utilities: Oil & Gas | 0.10% |
| Cash, Cash Equivalents, & Other Net Assets | 8.48% |
| TOTAL | 100.00% |
Portfolio Composition (as a % of Net Assets)
| Bank Loans | 54.47% |
| Corporate Bonds | 28.56% |
| Collateralized Loan Obligations | 8.28% |
| Common Stocks | 0.20% |
| Warrants | 0.01% |
| Other Assets in Excess of Liabilities | 8.48% |
| TOTALS | 100.00% |
| 8 | 1.888.926.2688 | www.griffincapital.com |
| Griffin Institutional Access Credit Fund | Schedule of Investments |
June 30, 2018 (Unaudited)
| Description | | Currency | | Rate | | Maturity
Date | | Principal
Amount | | Value
(Note 2) | |
| BANK LOANS (54.47%)(a) | | | | | | | | | | | | |
| | | | | | | | | | | | | |
| 1011778 B.C. Unlimited Liability Company, First Lien Term B-3 Loan | | USD | | 1M US L + 2.25% | | 02/16/24 | | 95,939 | | $ | 95,533 | |
| Accudyne Industries Borrower S.C.A. / Accudyne Industries LLC, First Lien Initial Term Loan | | USD | | 1M US L + 3.25% | | 08/18/24 | | 155,562 | | | 155,546 | |
| Acosta, Inc., First Lien Tranche B-1 Loan | | USD | | 1M US L + 3.25% | | 09/26/21 | | 106,574 | | | 81,890 | |
| Advantage Sales & Marketing, Inc., First Lien Initial Term Loan | | USD | | 1M US L + 3.25% | | 07/23/21 | | 371,144 | | | 353,283 | |
| A-L Parent LLC, First Lien Initial Term Loan(b) | | USD | | 1M US L + 3.25% | | 12/01/23 | | 400,952 | | | 402,456 | |
| Albertson's Companies LLC, First Lien Last Out Term Loan(b) | | USD | | L + 3.00% | | 06/01/23 | | 433,928 | | | 431,909 | |
| Alliant Holdings Intermediate LLC, First Lien 2018 Initial Term Loan | | USD | | 1M US L + 3.00% | | 05/09/25 | | 559,141 | | | 556,313 | |
| Ancestry.com Operations, Inc., First Lien Term Loan | | USD | | 1M US L + 3.25% | | 10/19/23 | | 782,378 | | | 782,051 | |
| AqGen Ascensus, Inc., Delayed Draw Term Loan | | USD | | 3M US L + 3.50% | | 12/05/22 | | 240,667 | | | 239,463 | |
| AqGen Ascensus, Inc., First Lien Incremental Delayed Draw Term Loan(c) | | USD | | 3M US L + 3.50% | | 12/05/22 | | 247,704 | | | 248,013 | |
| AqGen Ascensus, Inc., First Lien Initial Incremental Term Loan | | USD | | 1M US L + 3.50% | | 12/05/22 | | 411,808 | | | 412,322 | |
| Aristocrat Leisure, Ltd., First Lien Term B-3 Loan | | USD | | 3M US L + 1.75% | | 10/19/24 | | 169,787 | | | 168,970 | |
| Ascena Retail Group, Inc., First Lien Tranche B Term Loan | | USD | | 1M US L + 4.50% | | 08/21/22 | | 287,544 | | | 257,640 | |
| Ascend Performance Materials Operations LLC, First Lien Term B Loan | | USD | | 3M US L + 5.25% | | 08/12/22 | | 226,442 | | | 227,857 | |
| ASP MCS Acquisition Corp., First Lien Initial Term Loan | | USD | | 3M US L + 4.75% | | 05/20/24 | | 424,482 | | | 419,176 | |
| Asurion LLC, First Lien Amendment No. 14 Replacement B-4 Term Loan | | USD | | 1M US L + 2.75% | | 08/04/22 | | 480,533 | | | 480,292 | |
| Asurion LLC, First Lien Replacement B-6 Term Loan | | USD | | 1M US L + 2.75% | | 11/03/23 | | 198,750 | | | 198,770 | |
| Asurion LLC, Second Lien Replacement B-2 Term Loan | | USD | | 1M US L + 6.00% | | 08/04/25 | | 1,085,308 | | | 1,097,010 | |
| Autodata, Inc., First Lien Initial Term Loan | | USD | | 1M US L + 3.25% | | 12/13/24 | | 498,750 | | | 497,503 | |
| Autodata, Inc., Second Lien Initial Term Loan | | USD | | 1M US L + 7.25% | | 12/12/25 | | 190,967 | | | 193,474 | |
| AVSC Holding Corp., First Lien Initial Term Loan | | USD | | 1M US L + 3.25% | | 03/03/25 | | 96,838 | | | 95,990 | |
| Baring Private Equity Asia VI Holding, Ltd., First Lien Initial Dollar Term Loan | | USD | | 1M US L + 3.00% | | 10/26/22 | | 85,603 | | | 85,496 | |
| BCP Renaissance Parent LLC, First Lien Initial Term Loan | | USD | | 3M US L + 3.50% | | 10/31/24 | | 87,088 | | | 87,160 | |
| BioClinica Holding I LP, First Lien Initial Term Loan | | USD | | 3M US L + 4.25% | | 10/20/23 | | 504,908 | | | 482,187 | |
| BlackBrush Oil & Gas LP, First Lien Closing Date Loan | | USD | | 3M US L + 8.00% | | 02/09/24 | | 2,151,724 | | | 2,119,449 | |
| BWay Holding Company, First Lien Initial Term Loan | | USD | | 3M US L + 3.25% | | 04/03/24 | | 780,017 | | | 781,723 | |
| Caelus Energy Alaska O3 LLC, Second Lien Loan | | USD | | 3M US L + 7.50% | | 04/15/20 | | 53,937 | | | 50,342 | |
| Camelot U.S. Acquisition 1 Co., First Lien New Term Loan | | USD | | 1M US L + 3.25% | | 10/03/23 | | 249,372 | | | 249,112 | |
| CB Poly Investments LLC, First Lien Closing Date Term Loan | | USD | | 1M US L + 3.75% | | 08/16/23 | | 1,049,551 | | | 1,060,047 | |
| CenturyLink, Inc., First Lien Initial Term B Loan | | USD | | 1M US L + 2.75% | | 01/31/25 | | 723,868 | | | 710,165 | |
| Checkout Holding Corp., First Lien Term B Loan | | USD | | 1M US L + 3.50% | | 04/09/21 | | 500,000 | | | 317,000 | |
| CMI Marketing, Inc., First Lien Revolving Credit Loan(c)(d) | | USD | | 3M US L + 5.00% | | 05/24/23 | | 120,000 | | | 118,800 | |
| CMI Marketing, Inc., First Lien Term Loan(d) | | USD | | 3M US L + 5.00% | | 05/24/24 | | 880,000 | | | 871,200 | |
| Comet Bidco, Ltd., First Lien Facility B Loan | | GBP | | 1M GBP L + 5.25% | | 09/30/24 | | 469,565 | | | 607,831 | |
| Comet Bidco, Ltd., First Lien Facility B2 Loan | | USD | | 3M US L + 5.00% | | 09/30/24 | | 364,375 | | | 353,142 | |
| Commercial Barge Line Company, First Lien Initial Term Loan(b) | | USD | | 1M US L + 8.75% | | 11/12/20 | | 627,237 | | | 439,153 | |
| Commercial Vehicle Group, Inc., First Lien Initial Term Loan | | USD | | 1M US L + 6.00% | | 04/12/23 | | 243,750 | | | 245,578 | |
See Notes to Financial Statements.
| Semi-Annual Report | June 30, 2018 | 9 |
| Griffin Institutional Access Credit Fund | Schedule of Investments |
June 30, 2018 (Unaudited)
| Description | | Currency | | Rate | | Maturity
Date | | Principal
Amount | | Value
(Note 2) | |
| Communications Sales & Leasing, Inc., First Lien Shortfall Term Loan | | USD | | 1M US L + 3.00% | | 10/24/22 | | 294,840 | | $ | 282,492 | |
| Compass Bidco B.V., First Lien Facility B2 Loan(b) | | EUR | | EUR L + 4.50% | | 05/09/25 | | 671,493 | | | 780,249 | |
| Compass Power Generation LLC, First Lien Term Loan | | USD | | 1M US L + 3.75% | | 12/20/24 | | 146,171 | | | 147,216 | |
| Concentra, Inc., First Lien Tranche B-1 Term Loan | | USD | | 1M US L + 2.75% | | 06/01/22 | | 150,567 | | | 150,818 | |
| Concentra, Inc., Second Lien Initial Term Loan | | USD | | 1M US L + 6.50% | | 06/01/23 | | 953,029 | | | 967,325 | |
| CPG International LLC, First Lien New Term Loan(b) | | USD | | 3M US L + 3.75% | | 05/05/24 | | 581,891 | | | 582,982 | |
| CVS Holdings I LP, Second Lien Initial Term Loan | | USD | | 1M US L + 6.75% | | 02/06/26 | | 112,634 | | | 112,423 | |
| Cyxtera DC Holdings, Inc., Second Lien Initial Term Loan | | USD | | 3M US L + 7.25% | | 05/01/25 | | 500,000 | | | 496,625 | |
| DAE Aviation Holdings, Inc., First Lien Initial Term Loan | | USD | | 1M US L + 3.75% | | 07/07/22 | | 654,565 | | | 656,856 | |
| Deck Chassis Acquisition, Inc., Second Lien Initial Term Loan | | USD | | 1M US L + 6.00% | | 06/15/23 | | 374,252 | | | 378,462 | |
| Deep Gulf Energy II LLC, 2018 Term Loan(b)(d)(e) | | USD | | 3M US L + 16.10% | | 09/30/19 | | 106,517 | | | 102,256 | |
| DXP Enterprises, Inc., First Lien Term Loan(b) | | USD | | L + 4.75% | | 08/29/23 | | 53,321 | | | 53,654 | |
| Emerald Expositions Holding, Inc., First Lien Initial Term Loan | | USD | | 1M US L + 2.75% | | 05/22/24 | | 479,699 | | | 479,100 | |
| Epicor Software Corp., First Lien Term B Loan | | USD | | 1M US L + 3.25% | | 06/01/22 | | 206,611 | | | 206,482 | |
| EXC Holdings III Corp., First Lien Initial Euro Term Loan | | EUR | | 3M EUR L + 3.50%, 0.00% Floor | | 12/02/24 | | 22,711 | | | 26,555 | |
| EXC Holdings III Corp., First Lien Initial USD Term Loan | | USD | | 3M US L + 3.50% | | 12/02/24 | | 157,298 | | | 159,068 | |
| EXC Holdings III Corp., Second Lien Initial Term Loan | | USD | | 6M US L + 7.50% | | 12/01/25 | | 143,183 | | | 146,583 | |
| Exclusive Bidco, First Lien Term Loan(b) | | EUR | | EUR L + 4.00% | | 06/06/25 | | 303,237 | | | 350,800 | |
| Eyemart Express LLC, First Lien Term Loan | | USD | | 1M US L + 3.00% | | 08/04/24 | | 249,372 | | | 250,853 | |
| EZE Software Group LLC, First Lien Term B-2 Loan | | USD | | 1M US L + 3.00% | | 04/06/20 | | 494,827 | | | 497,095 | |
| Filtration Group Corp., First Lien Initial Euro Term Loan | | EUR | | 3M EUR L + 3.50%, 0.00% Floor | | 03/29/25 | | 239,293 | | | 279,447 | |
| Financière Dry Mix Solutions S.A.S., First Lien Facility B Loan | | EUR | | 3M EUR L + 3.50%, 0.00% Floor | | 03/15/24 | | 199,319 | | | 232,219 | |
| First Data Corp., First Lien 2024A New Dollar Term Loan | | USD | | 1M US L + 2.00% | | 04/26/24 | | 500,000 | | | 497,688 | |
| Flex Acquisition Company, Inc., First Lien Initial Term Loan(b) | | USD | | 3M US L + 3.00% | | 12/29/23 | | 627,241 | | | 626,177 | |
| Frontier Communications Corp., First Lien Term B-1 Loan(b) | | USD | | 1M US L + 3.75% | | 06/15/24 | | 714,865 | | | 711,961 | |
| Gamma Infrastructure III B.V., First Lien Facility B Loan | | EUR | | 6M EUR L + 3.50%, 0.00% Floor | | 01/09/25 | | 186,957 | | | 218,329 | |
| Genworth Holdings, Inc., First Lien Initial Loan | | USD | | 1M US L + 4.50% | | 03/07/23 | | 49,686 | | | 50,742 | |
| Getty Images, Inc., First Lien Initial Term Loan | | USD | | 1M US L + 3.50% | | 10/18/19 | | 715,337 | | | 692,791 | |
| GTT Communications B.V., First Lien Closing Date EMEA Term Loan | | EUR | | 3M EUR L + 3.25%, 0.00% Floor | | 05/31/25 | | 425,353 | | | 493,468 | |
| Hargray Communications Group, Inc., First Lien Initial Term Loan | | USD | | 1M US L + 3.00% | | 05/16/24 | | 247,500 | | | 247,191 | |
| H-Food Holdings LLC, First Lien Initial Term Loan | | USD | | 1M US L + 3.00% | | 05/23/25 | | 491,581 | | | 487,996 | |
| Horizon Telcom, Inc. Delay Draw Term Loan(c)(d) | | USD | | L + 4.50% | | 06/15/23 | | 86,897 | | | 85,810 | |
| Horizon Telcom, Inc. First Lien Term Loan(d) | | USD | | L + 4.50% | | 06/15/23 | | 695,172 | | | 686,483 | |
| Horizon Telcom, Inc. Revolver(c)(d) | | USD | | L + 4.50% | | 06/15/23 | | 57,931 | | | 57,207 | |
| Hub International, Ltd., First Lien Initial Term Loan | | USD | | 3M US L + 3.00% | | 04/25/25 | | 687,712 | | | 684,105 | |
| Intelsat Jackson Holdings S.A., First Lien Tranche B-4 Term Loan | | USD | | 1M US L + 4.50% | | 01/02/24 | | 177,721 | | | 185,496 | |
| Intelsat Jackson Holdings S.A., First Lien Tranche B-5 Term Loan | | USD | | 6M US L + 6.63% | | 01/02/24 | | 289,875 | | | 299,876 | |
| IRB Holding Corp., First Lien Term B Loan | | USD | | 1M US L + 3.25% | | 02/05/25 | | 296,866 | | | 297,682 | |
| Jaguar Holding Company I LLC, First Lien 2018 Term Loan | | USD | | 1M US L + 2.50% | | 08/18/22 | | 985,989 | | | 981,264 | |
| Jazz Acquisition, Inc., First Lien Term Loan | | USD | | 3M US L + 3.50% | | 06/19/21 | | 1,295,102 | | | 1,270,819 | |
See Notes to Financial Statements.
| 10 | 1.888.926.2688 | www.griffincapital.com |
| Griffin Institutional Access Credit Fund | Schedule of Investments |
June 30, 2018 (Unaudited)
| Description | | Currency | | Rate | | Maturity
Date | | Principal
Amount | | Value
(Note 2) | |
| KBR, Inc., First Lien Term B Loan | | USD | | 1M US L + 3.75% | | 04/25/25 | | 750,000 | | $ | 752,344 | |
| Keane Group Holdings LLC, First Lien Initial Term Loan | | USD | | 1M US L + 3.75% | | 05/25/25 | | 162,267 | | | 162,876 | |
| KeyW Corp., First Lien Initial Term Loan | | USD | | 1M US L + 4.50% | | 05/08/24 | | 783,034 | | | 788,907 | |
| KeyW Corp., Second Lien Term Loan Loan | | USD | | 1M US L + 8.75% | | 05/08/25 | | 500,000 | | | 502,500 | |
| K-Mac Holdings Corp., Second Lien Initial Term Loan | | USD | | 1M US L + 6.75% | | 03/16/26 | | 93,023 | | | 93,372 | |
| Kronos Acquisition Intermediate, Inc., First Lien Initial Loan | | USD | | 1M US L + 4.00% | | 05/15/23 | | 983,049 | | | 980,386 | |
| Kronos, Inc., First Lien Incremental Term Loan | | USD | | 3M US L + 3.00% | | 11/01/23 | | 825,880 | | | 825,786 | |
| Lakeland Tours LLC, Delayed Draw Term Loan | | USD | | 3M US L + 4.00% | | 12/16/24 | | 9,330 | | | 9,446 | |
| Lakeland Tours LLC, First Lien Initial Term Loan | | USD | | 3M US L + 4.00% | | 12/16/24 | | 112,984 | | | 114,396 | |
| LOGIX Holding Company LLC, First Lien Initial Term Loan | | USD | | 1M US L + 5.75% | | 12/22/24 | | 343,800 | | | 345,949 | |
| Masergy Holdings, Inc., First Lien 2017 Replacement Term Loan | | USD | | 3M US L + 3.25% | | 12/15/23 | | 960,458 | | | 962,059 | |
| Masergy Holdings, Inc., Second Lien Initial Loan | | USD | | 3M US L + 7.50% | | 12/16/24 | | 462,778 | | | 465,477 | |
| Mavenir Systems, Inc., First Lien Initial Term Loan | | USD | | 1M US L + 6.00% | | 05/08/25 | | 244,243 | | | 243,327 | |
| Mavis Tire Express Services Corp., First Lien Closing Date Term Loan | | USD | | 1M US L + 3.25% | | 03/20/25 | | 214,940 | | | 214,134 | |
| Mavis Tire Express Services Corp., First Lien Delayed Draw Term Loan, Tranche 1(c) | | USD | | 3M US L + 1.00% | | 03/20/25 | | 32,594 | | | 32,472 | |
| Mavis Tire Express Services Corp., First Lien Delayed Draw Term Loan, Tranche 2 | | USD | | 1M US L + 3.25% | | 03/20/25 | | 1,897 | | | 1,890 | |
| MH Sub I LLC, First Lien Amendment No. 2 Initial Term Loan | | USD | | 1M US L + 3.75% | | 09/13/24 | | 652,882 | | | 653,562 | |
| MH Sub I LLC, Second Lien Amendment No. 2 Initial Term Loan | | USD | | 1M US L + 7.50% | | 09/15/25 | | 491,828 | | | 495,516 | |
| Microchip Technology, Inc., First Lien Initial Term Loan | | USD | | 1M US L + 2.00% | | 05/29/25 | | 338,664 | | | 339,511 | |
| Midas Intermediate Holdco II LLC, First Lien 2017 Refinancing Term Loan(b) | | USD | | L + 2.75% | | 08/18/21 | | 315,362 | | | 303,536 | |
| Moran Foods LLC, First Lien Term Loan | | USD | | 1M US L + 6.00% | | 12/05/23 | | 149,266 | | | 117,920 | |
| MRO Holdings, Inc., First Lien Initial Term Loan | | USD | | 3M US L + 5.25% | | 10/25/23 | | 724,585 | | | 730,020 | |
| Murray Energy Corp. | | USD | | 3M US L + 7.25% | | 04/16/20 | | 1,332,571 | | | 1,262,611 | |
| National CineMedia LLC, First Lien Initial Term Loan(b) | | USD | | L + 3.00% | | 06/20/25 | | 70,940 | | | 71,029 | |
| National Vision, Inc., First Lien New Term Loan | | USD | | 1M US L + 2.75% | | 11/20/24 | | 699,998 | | | 699,998 | |
| Netsmart Technologies, Inc., First Lien Term C-1 Loan Retired 07/02/2018 Loan | | USD | | 1M US L + 4.50% | | 04/19/23 | | 280,667 | | | 281,895 | |
| New Milani Group LLC, First Lien Term Loan(d) | | USD | | 3M US L + 4.25% | | 06/06/24 | | 800,000 | | | 792,000 | |
| NPC International, Inc., Second Lien Initial Term Loan | | USD | | 1M US L + 7.50% | | 04/18/25 | | 250,000 | | | 253,750 | |
| OEConnection LLC, Second Lien Term Loan Loan | | USD | | 1M US L + 8.00% | | 11/22/25 | | 167,079 | | | 167,079 | |
| Optiv, Inc., First Lien Initial Term Loan | | USD | | 1M US L + 3.25% | | 02/01/24 | | 89,362 | | | 87,268 | |
| Oxbow Carbon LLC, First Lien Tranche B Term Loan | | USD | | 1M US L + 3.75% | | 01/04/23 | | 49,584 | | | 50,142 | |
| Oxbow Carbon LLC, Second Lien Term Loan Loan | | USD | | 1M US L + 7.50% | | 01/04/24 | | 453,306 | | | 460,105 | |
| Packaging Coordinators Midco, Inc., First Lien Initial Term Loan | | USD | | 3M US L + 4.00% | | 06/30/23 | | 674,676 | | | 678,892 | |
| Packaging Coordinators Midco, Inc., Second Lien Initial Term Loan | | USD | | 3M US L + 8.75% | | 07/01/24 | | 512,500 | | | 512,500 | |
| Paladin Brands Holding, Inc., First Lien Loan | | USD | | 3M US L + 5.50% | | 08/15/22 | | 785,927 | | | 790,839 | |
| Parexel International Corp., First Lien Initial Term Loan | | USD | | 1M US L + 2.75% | | 09/27/24 | | 732,801 | | | 729,748 | |
| Park Place Technologies LLC, Second Lien Initial Loan | | USD | | 1M US L + 8.00% | | 03/29/26 | | 276,817 | | | 277,509 | |
| Pearl Intermediate Parent LLC, First Lien Delayed Draw Term Loan, Tranche 1(b) | | USD | | 3M US L + 2.75% | | 02/14/25 | | 31,205 | | | 30,919 | |
| Pearl Intermediate Parent LLC, First Lien Delayed Draw Term Loan, Tranche 2(c) | | USD | | 3M US L + 1.00% | | 02/14/25 | | 17,111 | | | 16,954 | |
| Pearl Intermediate Parent LLC, First Lien Initial Term Loan(b) | | USD | | 1M US L + 2.75% | | 02/14/25 | | 164,275 | | | 162,496 | |
See Notes to Financial Statements.
| Semi-Annual Report | June 30, 2018 | 11 |
| Griffin Institutional Access Credit Fund | Schedule of Investments |
June 30, 2018 (Unaudited)
| Description | | Currency | | Rate | | Maturity
Date | | Principal
Amount | | Value
(Note 2) | |
| Petco Animal Supplies, Inc., First Lien Term Loan | | USD | | 3M US L + 3.25% | | 01/26/23 | | 72,020 | | $ | 52,178 | |
| Pisces Midco, Inc., First Lien Initial Term Loan | | USD | | 3M US L + 3.75% | | 04/12/25 | | 278,847 | | | 278,934 | |
| Polycom, Inc., First Lien Initial Term Loan Retired 07/02/2018 Loan | | USD | | 1M US L + 5.25% | | 09/27/23 | | 427,878 | | | 428,680 | |
| Pre-Paid Legal Services, Inc., First Lien Initial Term Loan | | USD | | 1M US L + 3.25% | | 05/01/25 | | 88,323 | | | 88,958 | |
| Press Ganey Holdings, Inc., 2018 First Lien Replacement Term Loans Loan | | USD | | 1M US L + 2.75% | | 10/23/23 | | 549,540 | | | 548,739 | |
| Prime Security Services Borrower LLC, First Lien 2016-2 Refinancing Term B-1 Loan | | USD | | 1M US L + 2.75% | | 05/02/22 | | 64,770 | | | 64,563 | |
| Project Alpha Intermediate Holding, Inc., First Lien Term Loan | | USD | | 3M US L + 3.50% | | 04/26/24 | | 219,483 | | | 218,523 | |
| Pulsant Acquisitions Ltd., Facility B Term Loan(d) | | GBP | | 3M GBP L + 5.25% | | 05/18/23 | | 710,227 | | | 927,950 | |
| Quest Software US Holdings, Inc., First Lien Initial Term Loan | | USD | | 3M US L + 4.25% | | 05/16/25 | | 432,753 | | | 432,572 | |
| Quidditch Acquisition, Inc., First Lien Term B Loan | | USD | | 1M US L + 7.00% | | 03/21/25 | | 410,874 | | | 414,983 | |
| Rackspace Hosting, Inc., First Lien Term B Loan | | USD | | 3M US L + 3.00% | | 11/03/23 | | 522,798 | | | 517,430 | |
| Research Now Group, Inc., First Lien Initial Term Loan | | USD | | 3M US L + 5.50% | | 12/20/24 | | 335,235 | | | 330,206 | |
| RP Crown Parent LLC, First Lien Initial Term Loan | | USD | | 1M US L + 2.75% | | 10/12/23 | | 267,810 | | | 266,918 | |
| Safe Fleet Holdings LLC, Second Lien Initial Term Loan | | USD | | 1M US L + 6.75% | | 02/02/26 | | 667,223 | | | 668,057 | |
| Sapphire Bidco B.V., First Lien Facility B Loan | | EUR | | 3M EUR L + 3.25%, 0.00% Floor | | 05/05/25 | | 90,073 | | | 103,741 | |
| Scientific Games International, Inc., First Lien Initial Term B-5 Loan, Tranche 1 | | USD | | 2M US L + 2.75% | | 08/14/24 | | 150,009 | | | 149,616 | |
| Scientific Games International, Inc., First Lien Initial Term B-5 Loan, Tranche 2 | | USD | | 1M US L + 2.75% | | 08/14/24 | | 35,672 | | | 35,578 | |
| Sedgwick Claims Management Services, Inc., First Lien Initial Term Loan | | USD | | 1M US L + 2.75% | | 03/01/21 | | 618,222 | | | 615,827 | |
| Sequa Mezzanine Holdings LLC, First Lien Initial Term Loan | | USD | | 1M US L + 5.00% | | 11/28/21 | | 757,682 | | | 759,812 | |
| Severin Acquisition LLC, First Lien Term Loan(b) | | USD | | L + 3.25% | | 06/12/25 | | 135,990 | | | 135,426 | |
| SIG Combibloc Holdings S.C.A., First Lien Repriced Euro Term Loan | | EUR | | 1M EUR L + 3.25%, 0.00% Floor | | 03/11/22 | | 95,126 | | | 110,658 | |
| Silk Bidco AS, First Lien Facility B Loan | | EUR | | 6M EUR L + 4.00%, 0.00% Floor | | 02/24/25 | | 126,480 | | | 146,919 | |
| SolarWinds Holdings, Inc., First Lien 2018 Refinancing Term Loan | | USD | | 1M US L + 3.00% | | 02/05/24 | | 941,821 | | | 944,044 | |
| SonicWall US Holdings Inc., First Lien Initial Term Loan | | USD | | 3M US L + 3.50% | | 05/16/25 | | 141,628 | | | 141,274 | |
| Sophia LP, First Lien Term B Loan | | USD | | 3M US L + 3.25% | | 09/30/22 | | 979,258 | | | 978,951 | |
| SRS Distribution, Inc., First Lien Initial Term Loan | | USD | | 3M US L + 3.25% | | 05/23/25 | | 596,769 | | | 591,995 | |
| Sterling Midco Holdings, Inc., First Lien Initial Term Loan | | USD | | 1M US L + 3.50% | | 06/19/24 | | 15,802 | | | 15,743 | |
| STG-Fairway Acquisitions, Inc., First Lien Term Loan | | USD | | 1M US L + 5.25% | | 06/30/22 | | 636,363 | | | 636,363 | |
| Syneos Health, Inc., First Lien Replacement Term B Loan | | USD | | 1M US L + 2.00% | | 08/01/24 | | 149,857 | | | 149,442 | |
| Syniverse Holdings, Inc., First Lien Tranche C Term Loan | | USD | | 1M US L + 5.00% | | 03/09/23 | | 73,792 | | | 73,838 | |
| Tacala Investment Corp., Second Lien Initial Term Loan | | USD | | 1M US L + 7.00% | | 01/30/26 | | 340,426 | | | 344,043 | |
| TDC A/S, First Lien Facility B1 Loan(b) | | EUR | | EUR L + 3.50% | | 06/11/25 | | 1,042,126 | | | 1,205,334 | |
| Tecostar Holdings, Inc., First Lien 2017 Term Loan, Tranche 1 | | USD | | 1M US L + 3.50% | | 05/01/24 | | 1,117,862 | | | 1,122,753 | |
| Tecostar Holdings, Inc., First Lien 2017 Term Loan, Tranche 2 | | USD | | 3M US L + 2.50% | | 05/01/24 | | 5,779 | | | 5,804 | |
| Tempo Acquisition LLC, First Lien Initial Term Loan | | USD | | 1M US L + 3.00% | | 05/01/24 | | 593,275 | | | 591,976 | |
| Terminator Bidco AS, Facility B2 Term Loan(d) | | USD | | 3M US L + 5.00% | | 05/22/22 | | 1,000,000 | | | 977,500 | |
| Titan Acquisition, Ltd., First Lien Initial Term Loan | | USD | | 1M US L + 3.00% | | 03/28/25 | | 402,510 | | | 397,590 | |
| TMK Hawk Parent, Corp., First Lien Initial Term Loan | | USD | | 1M US L + 3.50% | | 08/28/24 | | 206,928 | | | 206,756 | |
| TNS, Inc., First Lien Initial Term Loan | | USD | | 1M US L + 4.00% | | 08/14/22 | | 247,212 | | | 248,757 | |
See Notes to Financial Statements.
| 12 | 1.888.926.2688 | www.griffincapital.com |
| Griffin Institutional Access Credit Fund | Schedule of Investments |
June 30, 2018 (Unaudited)
| Description | | Currency | | Rate | | Maturity
Date | | Principal
Amount | | Value
(Note 2) | |
| Transdigm, Inc., First Lien 2018 New Tranche F Term Loan | | USD | | 1M US L + 2.50% | | 06/09/23 | | | 126,242 | | $ | 125,868 | |
| Transdigm, Inc., First Lien New Tranche G Term Loan(b) | | USD | | 1M US L + 2.50% | | 08/22/24 | | | 563,517 | | | 560,950 | |
| Travelport Finance S.à r.l., First Lien Initial Term Loan | | USD | | 3M US L + 2.50% | | 03/17/25 | | | 210,250 | | | 209,790 | |
| Traverse Midstream Partners LLC, First Lien Advance Loan | | USD | | 3M US L + 4.00% | | 09/27/24 | | | 46,471 | | | 46,569 | |
| TRC Companies, Inc., First Lien Initial Term Loan | | USD | | 1M US L + 3.50% | | 06/21/24 | | | 323,743 | | | 322,934 | |
| Turbocombustor Technology, Inc., First Lien Initial Term Loan | | USD | | 1M US L + 4.50% | | 12/02/20 | | | 681,643 | | | 652,674 | |
| U.S. Anesthesia Partners, Inc., First Lien Initial Term Loan | | USD | | 1M US L + 3.00% | | 06/23/24 | | | 1,190,596 | | | 1,189,108 | |
| Ultra Resources, Inc., First Lien Loan | | USD | | 1M US L + 3.00% | | 04/12/24 | | | 250,000 | | | 231,125 | |
| Unitymedia Hessen GmbH & Co. KG, First Lien Facility C Loan | | EUR | | 3M EUR L + 2.75%, 0.00% Floor | | 01/15/27 | | | 246,269 | | | 285,975 | |
| Virgin Media Bristol LLC, First Lien K Facility Loan | | USD | | 1M US L + 2.50% | | 01/15/26 | | | 137,770 | | | 136,952 | |
| Weld North Education LLC, First Lien Initial Term Loan | | USD | | 3M US L + 4.25% | | 02/15/25 | | | 123,448 | | | 124,065 | |
| Wheels Up Partners LLC, First Lien Class A Notes Loan | | USD | | 3M US L + 6.50% | | 03/01/24 | | | 353,333 | | | 352,450 | |
| William Morris Endeavor Entertainment LLC, First Lien Term B-1 Loan | | USD | | 2M US L + 2.75% | | 05/18/25 | | | 1,016,157 | | | 1,006,630 | |
| Windstream Services LLC, First Lien 2016 Tranche B-6 Term Loan(b) | | USD | | 1M US L + 4.00% | | 03/29/21 | | | 728,272 | | | 692,314 | |
| Wink Holdco, Inc., First Lien Initial Term Loan | | USD | | 1M US L + 3.00% | | 12/02/24 | | | 249,373 | | | 248,750 | |
| WireCo WorldGroup, Inc., First Lien Initial Term Loan | | USD | | 1M US L + 5.00% | | 09/29/23 | | | 331,557 | | | 334,211 | |
| WP CPP Holdings LLC, First Lien Initial Term Loan | | USD | | 3M US L + 3.75% | | 04/30/25 | | | 309,901 | | | 311,490 | |
| | | | | | | | | | | | | | |
| TOTAL BANK LOANS | | | | | | | | | | | | | |
| (Cost $71,311,169) | | | | | | | | | | | | 71,109,897 | |
| | | | | | | | | | | | | | |
| CORPORATE BONDS (28.38%)(f) | | | | | | | | | | | | | |
| 1011778 BC ULC (New Red Finance, Inc.)(g) | | USD | | 5.00% | | 10/15/25 | | | 383,000 | | | 364,310 | |
| Acadia Healthcare Co., Inc. | | USD | | 5.63% | | 02/15/23 | | | 284,000 | | | 287,550 | |
| AECOM | | USD | | 5.13% | | 03/15/27 | | | 650,000 | | | 614,250 | |
| Aptim Corp.(g) | | USD | | 7.75% | | 06/15/25 | | | 481,000 | | | 392,015 | |
| Ardagh Packaging Finance PLC / Ardagh Holdings USA, Inc.(g) | | USD | | 6.00% | | 02/15/25 | | | 1,000,000 | | | 976,249 | |
| Ashtead Capital, Inc.(g) | | USD | | 4.13% | | 08/15/25 | | | 269,000 | | | 252,188 | |
| Avolon Holdings Funding, Ltd.(g) | | USD | | 5.50% | | 01/15/23 | | | 76,000 | | | 76,000 | |
| BBA US Holdings, Inc.(g) | | USD | | 5.38% | | 05/01/26 | | | 57,000 | | | 57,357 | |
| Beacon Roofing Supply, Inc.(g) | | USD | | 4.88% | | 11/01/25 | | | 250,000 | | | 232,500 | |
| BWAY Holding Co.(g) | | USD | | 7.25% | | 04/15/25 | | | 375,000 | | | 366,563 | |
| BWX Technologies, Inc.(g) | | USD | | 5.38% | | 07/15/26 | | | 323,000 | | | 327,845 | |
| California Resources Corp.(g) | | USD | | 8.00% | | 12/15/22 | | | 125,000 | | | 114,063 | |
| CB Escrow Corp.(g) | | USD | | 8.00% | | 10/15/25 | | | 314,000 | | | 294,375 | |
| CBS Radio, Inc.(g) | | USD | | 7.25% | | 11/01/24 | | | 306,000 | | | 292,995 | |
| CCO Holdings LLC / CCO Holdings Capital Corp.(g) | | USD | | 5.00% | | 02/01/28 | | | 596,000 | | | 548,320 | |
| CDK Global, Inc. | | USD | | 4.88% | | 06/01/27 | | | 291,000 | | | 280,451 | |
| CDK Global, Inc. | | USD | | 5.88% | | 06/15/26 | | | 116,000 | | | 118,755 | |
| Cequel Communications Holdings I LLC / Cequel Capital Corp.(g) | | USD | | 7.50% | | 04/01/28 | | | 379,000 | | | 385,519 | |
| Chaparral Energy, Inc.(g) | | USD | | 8.75% | | 07/15/23 | | | 291,000 | | | 293,728 | |
| Compass Minerals International, Inc.(g) | | USD | | 4.88% | | 07/15/24 | | | 177,000 | | | 166,876 | |
| Comstock Resources, Inc. | | USD | | 10.00% Cash or 12.25% PIK | | 03/15/20 | | | 250,000 | | | 262,500 | |
| Core & Main LP(g) | | USD | | 6.13% | | 08/15/25 | | | 250,000 | | | 238,125 | |
| CPG Merger Sub LLC(g) | | USD | | 8.00% | | 10/01/21 | | | 563,000 | | | 571,445 | |
See Notes to Financial Statements.
| Semi-Annual Report | June 30, 2018 | 13 |
| Griffin Institutional Access Credit Fund | Schedule of Investments |
June 30, 2018 (Unaudited)
| Description | | Currency | | Rate | | Maturity
Date | | | Principal
Amount | | | Value
(Note 2) | |
| CSC Holdings LLC(g) | | USD | | 5.38% | | 02/01/28 | | | 328,000 | | $ | 304,220 | |
| Extraction Oil & Gas, Inc.(g) | | USD | | 5.63% | | 02/01/26 | | | 496,000 | | | 475,570 | |
| Gates Global LLC / Gates Global Co.(g) | | USD | | 6.00% | | 07/15/22 | | | 299,000 | | | 303,485 | |
| Genworth Holdings, Inc. | | USD | | 4.80% | | 02/15/24 | | | 229,000 | | | 199,803 | |
| Genworth Holdings, Inc. | | USD | | 4.90% | | 08/15/23 | | | 182,000 | | | 160,160 | |
| GTT Communications, Inc.(g) | | USD | | 7.88% | | 12/31/24 | | | 750,000 | | | 746,250 | |
| Gulfport Energy Corp. | | USD | | 6.38% | | 01/15/26 | | | 636,000 | | | 612,149 | |
| HCA, Inc. | | USD | | 5.38% | | 02/01/25 | | | 797,000 | | | 786,798 | |
| Intelsat Jackson Holdings SA(g) | | USD | | 9.50% | | 09/30/22 | | | 729,000 | | | 845,640 | |
| Intrepid Aviation Group Holdings LLC / Intrepid Finance Co.(g) | | USD | | 6.88% | | 02/15/19 | | | 695,000 | | | 695,869 | |
| Intrum AB(g) | | EUR | | 3.13% | | 07/15/24 | | | 195,000 | | | 214,090 | |
| IRB Holding Corp.(g) | | USD | | 6.75% | | 02/15/26 | | | 324,000 | | | 310,230 | |
| Iron Mountain, Inc.(g) | | USD | | 5.25% | | 03/15/28 | | | 274,000 | | | 254,930 | |
| Jones Energy Holdings LLC / Jones Energy Finance Corp. | | USD | | 6.75% | | 04/01/22 | | | 125,000 | | | 78,125 | |
| KAR Auction Services, Inc.(g) | | USD | | 5.13% | | 06/01/25 | | | 103,000 | | | 98,623 | |
| Kronos Acquisition Holdings, Inc.(g) | | USD | | 9.00% | | 08/15/23 | | | 553,000 | | | 499,083 | |
| Level 3 Financing, Inc. | | USD | | 5.38% | | 01/15/24 | | | 660,000 | | | 648,450 | |
| Live Nation Entertainment, Inc.(g) | | USD | | 4.88% | | 11/01/24 | | | 358,000 | | | 347,260 | |
| Mattel, Inc.(g) | | USD | | 6.75% | | 12/31/25 | | | 375,000 | | | 366,094 | |
| Matterhorn Merger Sub LLC / Matterhorn Finance Sub, Inc.(g) | | USD | | 8.50% | | 06/01/26 | | | 679,000 | | | 656,932 | |
| MEDNAX, Inc.(g) | | USD | | 5.25% | | 12/01/23 | | | 500,000 | | | 491,250 | |
| Midas Intermediate Holdco II LLC / Midas Intermediate Holdco II Finance, Inc.(g) | | USD | | 7.88% | | 10/01/22 | | | 500,000 | | | 485,000 | |
| Multi-Color Corp.(g) | | USD | | 4.88% | | 11/01/25 | | | 610,000 | | | 569,588 | |
| Murray Energy Corp.(g) | | USD | | 11.25% | | 04/15/21 | | | 512,000 | | | 304,640 | |
| Nabors Industries, Inc.(g) | | USD | | 5.75% | | 02/01/25 | | | 122,000 | | | 115,595 | |
| National CineMedia LLC | | USD | | 5.75% | | 08/15/26 | | | 802,000 | | | 735,834 | |
| Netflix, Inc.(g) | | USD | | 5.88% | | 11/15/28 | | | 465,000 | | | 471,836 | |
| New Enterprise Stone & Lime Co., Inc.(g) | | USD | | 6.25% | | 03/15/26 | | | 242,000 | | | 245,025 | |
| Park Aerospace Holdings, Ltd.(g) | | USD | | 5.50% | | 02/15/24 | | | 1,000,000 | | | 989,790 | |
| Parsley Energy LLC / Parsley Finance Corp.(g) | | USD | | 5.38% | | 01/15/25 | | | 760,000 | | | 758,099 | |
| Pioneer Holdings LLC / Pioneer Finance Corp.(g) | | USD | | 9.00% | | 11/01/22 | | | 434,000 | | | 449,190 | |
| Pisces Midco Inc Pgem 8 04/15/26(g) | | USD | | 8.00% | | 04/15/26 | | | 114,000 | | | 110,215 | |
| Post Holdings, Inc.(g) | | USD | | 5.00% | | 08/15/26 | | | 250,000 | | | 233,750 | |
| Post Holdings, Inc.(g) | | USD | | 5.75% | | 03/01/27 | | | 121,000 | | | 117,068 | |
| Prime Security Services Borrower LLC / Prime Finance, Inc.(g) | | USD | | 9.25% | | 05/15/23 | | | 1,115,000 | | | 1,193,049 | |
| PVH Corp.(g) | | EUR | | 3.13% | | 12/15/27 | | | 242,000 | | | 279,642 | |
| QEP Resources, Inc. | | USD | | 5.63% | | 03/01/26 | | | 353,000 | | | 338,439 | |
| Radiate Holdco LLC / Radiate Finance, Inc.(g) | | USD | | 6.63% | | 02/15/25 | | | 177,000 | | | 162,398 | |
| Radiate Holdco LLC / Radiate Finance, Inc.(g) | | USD | | 6.88% | | 02/15/23 | | | 59,000 | | | 56,935 | |
| Radisson Hotel Holdings AB(g) | | EUR | | 6.88% | | 07/15/23 | | | 619,000 | | | 719,059 | |
| Range Resources Corp. | | USD | | 5.00% | | 03/15/23 | | | 500,000 | | | 488,250 | |
| RBS Global, Inc. / Rexnord LLC(g) | | USD | | 4.88% | | 12/15/25 | | | 220,000 | | | 207,900 | |
| Resolute Energy Corp. | | USD | | 8.50% | | 05/01/20 | | | 354,000 | | | 354,000 | |
| Sabre GLBL, Inc.(g) | | USD | | 5.25% | | 11/15/23 | | | 250,000 | | | 252,808 | |
| Sabre GLBL, Inc.(g) | | USD | | 5.38% | | 04/15/23 | | | 250,000 | | | 253,750 | |
| Sally Holdings LLC / Sally Capital, Inc. | | USD | | 5.63% | | 12/01/25 | | | 250,000 | | | 231,875 | |
| SBA Communications Corp. | | USD | | 4.88% | | 09/01/24 | | | 298,000 | | | 285,793 | |
| Scientific Games International, Inc.(g) | | EUR | | 3.38% | | 02/15/26 | | | 127,000 | | | 141,508 | |
| Scientific Games International, Inc.(g) | | USD | | 5.00% | | 10/15/25 | | | 70,000 | | | 66,850 | |
| Sirius XM Radio, Inc.(g) | | USD | | 3.88% | | 08/01/22 | | | 76,000 | | | 73,720 | |
See Notes to Financial Statements.
| 14 | 1.888.926.2688 | www.griffincapital.com |
| Griffin Institutional Access Credit Fund | Schedule of Investments |
June 30, 2018 (Unaudited)
| Description | | Currency | | Rate | | Maturity
Date | | | Principal
Amount | | | Value
(Note 2) | |
| Sirius XM Radio, Inc.(g) | | USD | | 5.00% | | 08/01/27 | | | 625,000 | | $ | 585,937 | |
| SM Energy Co. | | USD | | 5.00% | | 01/15/24 | | | 95,000 | | | 90,369 | |
| SM Energy Co. | | USD | | 5.63% | | 06/01/25 | | | 625,000 | | | 606,250 | |
| Sophia LP / Sophia Finance, Inc.(g) | | USD | | 9.00% | | 09/30/23 | | | 250,000 | | | 263,719 | |
| Sprint Corp. | | USD | | 7.88% | | 09/15/23 | | | 365,000 | | | 379,372 | |
| SPX FLOW, Inc.(g) | | USD | | 5.88% | | 08/15/26 | | | 250,000 | | | 248,750 | |
| SRC Energy, Inc.(g) | | USD | | 6.25% | | 12/01/25 | | | 481,000 | | | 482,804 | |
| SRS Distribution, Inc.(g) | | USD | | 8.25% | | 07/01/26 | | | 252,000 | | | 250,740 | |
| Summit Materials LLC / Summit Materials Finance Corp.(g) | | USD | | 5.13% | | 06/01/25 | | | 119,000 | | | 112,158 | |
| Tesla, Inc.(g) | | USD | | 5.30% | | 08/15/25 | | | 375,000 | | | 335,156 | |
| Titan Acquisition Ltd. / Titan Co-Borrower LLC(g) | | USD | | 7.75% | | 04/15/26 | | | 536,000 | | | 501,160 | |
| T-Mobile USA, Inc. | | USD | | 6.38% | | 03/01/25 | | | 1,125,000 | | | 1,169,999 | |
| T-Mobile USA, Inc. | | USD | | 6.50% | | 01/15/26 | | | 250,000 | | | 258,050 | |
| Travelport Corporate Finance PLC(g) | | USD | | 6.00% | | 03/15/26 | | | 316,000 | | | 319,160 | |
| TriMas Corp.(g) | | USD | | 4.88% | | 10/15/25 | | | 184,000 | | | 175,145 | |
| Ultra Resources, Inc.(g) | | USD | | 7.13% | | 04/15/25 | | | 237,000 | | | 167,678 | |
| United Continental Holdings, Inc. | | USD | | 5.00% | | 02/01/24 | | | 682,000 | | | 659,835 | |
| ViaSat, Inc.(g) | | USD | | 5.63% | | 09/15/25 | | | 220,000 | | | 207,900 | |
| W/S Packaging Holdings, Inc.(g) | | USD | | 9.00% | | 04/15/23 | | | 500,000 | | | 507,500 | |
| Wabash National Corp.(g) | | USD | | 5.50% | | 10/01/25 | | | 250,000 | | | 240,625 | |
| Wildhorse Resource Development Corp.(g) | | USD | | 6.88% | | 02/01/25 | | | 201,000 | | | 206,025 | |
| Wind Tre SpA(g) | | USD | | 5.00% | | 01/20/26 | | | 375,000 | | | 299,141 | |
| WMG Acquisition Corp.(g) | | USD | | 5.50% | | 04/15/26 | | | 164,000 | | | 162,975 | |
| XPO Logistics, Inc.(g) | | USD | | 6.50% | | 06/15/22 | | | 500,000 | | | 514,375 | |
| Zayo Group LLC / Zayo Capital, Inc.(g) | | USD | | 5.75% | | 01/15/27 | | | 500,000 | | | 492,500 | |
| Zayo Group LLC / Zayo Capital, Inc. | | USD | | 6.38% | | 05/15/25 | | | 500,000 | | | 511,250 | |
| TOTAL CORPORATE BONDS | | | | | | | | | | | | | |
| (Cost $38,231,751) | | | | | | | | | | | | 37,049,169 | |
| | | | | | | | | | | | | | |
| CONVERTIBLE CORPORATE BONDS (0.18%) | | | | | | | | | | | | | |
| Whiting Petroleum Corp. | | USD | | 1.25% | | 04/01/20 | | | 245,000 | | | 234,448 | |
| TOTAL CONVERTIBLE CORPORATE BONDS | | | | | | | | | | | | | |
| (Cost $231,141) | | | | | | | | | | | | 234,448 | |
| | | | | | | | | | | | | | |
| COLLATERALIZED LOAN OBLIGATIONS (8.28%) | | | | | | | | | | | | | |
| DEBT (2.38%) | | | | | | | | | | | | | |
| Atrium, Series 2017-12A(a)(g) | | USD | | 3M US L + 0.83% | | 04/22/27 | | | 300,000 | | | 299,540 | |
| Carlyle Global Market Strategies, Ltd., Series 2014- 3RA(a)(g) | | USD | | 3M US L + 1.05% | | 07/27/31 | | | 500,000 | | | 500,491 | |
| Dryden, Ltd., Series 2017-53A(a)(g) | | USD | | 3M US L + 1.12% | | 01/15/31 | | | 250,000 | | | 250,475 | |
| Dryden, Ltd., Series 2018-58A(a)(b)(g) | | USD | | L + 0.50% | | 07/17/31 | | | 12,500 | | | 10,348 | |
| Dryden, Ltd., Series 2018-58A(a)(b)(g) | | USD | | L + 1.00% | | 07/17/31 | | | 500,000 | | | 500,000 | |
| Madison Park Funding, Ltd., Series 2018-30A(a)(g) | | USD | | 3M US L + 0.75% | | 04/15/29 | | | 300,000 | | | 297,080 | |
| Magnetite, Ltd., Series 2018-15A(a)(g) | | USD | | 3M US L + 1.01% | | 07/25/31 | | | 250,000 | | | 250,000 | |
| Sound Point CLO, Ltd., Series 2017-3A(a)(g) | | USD | | 3M US L + 6.50% | | 10/20/30 | | | 500,000 | | | 514,079 | |
| THL Credit Wind River, Series 2014-1A(a)(g) | | USD | | 3M US L + 1.05% | | 07/18/31 | | | 500,000 | | | 500,465 | |
| | | | | | | | | | | | | 3,122,478 | |
| EQUITY (5.90%)(h) | | | | | | | | | | | | | |
| CARLYLE US CLO 2017-5, Ltd., Series 2017-5A(g) | | USD | | 17.13% | | 01/20/30 | | | 700,000 | | | 718,845 | |
| CIFC Funding 2018-II, Ltd., Series 2018-2A(g) | | USD | | 18.00% | | 04/20/31 | | | 300,000 | | | 266,722 | |
| CIFC Funding, Ltd., Series 2018-1A(g) | | USD | | 14.98% | | 04/18/31 | | | 200,000 | | | 202,514 | |
| Dryden, Ltd., Series 2014-31X(d)(g)(i) | | USD | | 0.00% | | 04/18/26 | | | 600,000 | | | 23,536 | |
| Dryden, Ltd., Series 2018-64A(g) | | USD | | 19.05% | | 04/18/31 | | | 900,000 | | | 784,606 | |
See Notes to Financial Statements.
| Semi-Annual Report | June 30, 2018 | 15 |
| Griffin Institutional Access Credit Fund | Schedule of Investments |
June 30, 2018 (Unaudited)
| Description | | Currency | | Rate | | Maturity
Date | | | Principal
Amount | | | Value
(Note 2) | |
| Madison Park Funding, Ltd., Series 2017-26A(g) | | USD | | 15.21% | | 07/29/47 | | | 500,000 | | $ | 380,882 | |
| Midocean Credit CLO, Ltd., Series 2018-8A(g) | | USD | | 33.68% | | 02/20/31 | | | 300,000 | | | 272,722 | |
| Octagon Investment Partners 37, Ltd., Series 2018- 2A(g)(j) | | USD | | TBD | | 07/25/30 | | | 1,000,000 | | | 910,000 | |
| OZLM XIX, Ltd., Series 2017-19A(g) | | USD | | 16.60% | | 11/22/30 | | | 1,100,000 | | | 951,177 | |
| Sound Point CLO, Ltd., Series 2018-2A(g) | | USD | | 17.64% | | 07/26/31 | | | 500,000 | | | 453,623 | |
| Sound Point CLO, Ltd., Series 2017-3A(g) | | USD | | 17.85% | | 10/20/30 | | | 600,000 | | | 621,092 | |
| Venture CDO, Ltd., Series 2017-30A(g) | | USD | | 18.03% | | 01/15/31 | | | 600,000 | | | 540,029 | |
| Venture CDO, Ltd., Series 2017-28A(g) | | USD | | 19.53% | | 10/20/29 | | | 200,000 | | | 179,909 | |
| Vibrant CIO VIII, Ltd., Series 2018-8A(g) | | USD | | 15.84% | | 01/20/31 | | | 500,000 | | | 492,674 | |
| Voya, Ltd., Series 2017-1A(g) | | USD | | 10.70% | | 04/17/30 | | | 505,000 | | | 383,770 | |
| Voya, Ltd., Series 2018-1A(g) | | USD | | 16.58% | | 04/19/31 | | | 500,000 | | | 501,420 | |
| | | | | | | | | | | | | 7,683,521 | |
| TOTAL COLLATERALIZED LOAN OBLIGATIONS | | | | | | | | | | | | | |
| (Cost $10,702,968) | | | | | | | | | | | | 10,805,999 | |
| | | | | | | | | | Shares | | | | |
| COMMON STOCKS (0.20%) | | | | | | | | | | | | | |
| Toshiba Corp.(k) | | JPY | | | | | | | 85,720 | | | 257,822 | |
| TOTAL COMMON STOCKS | | | | | | | | | | | | | |
| (Cost $249,264) | | | | | | | | | | | | 257,822 | |
| | | | | | | Expiration
Date | | | Shares | | | Value
(Note 2) | |
| WARRANTS (0.01%) | | | | | | | | | | | | | |
| Deep Gulf Energy II, LLC(d)(k)(l) | | USD | | | | 12/31/25 | | | 33 | | | 19,472 | |
| | | | | | | | | | | | | | |
| TOTAL WARRANTS | | | | | | | | | | | | | |
| (Cost $-) | | | | | | | | | | | | 19,472 | |
| | | | | | | | | | | | | | |
| TOTAL INVESTMENTS (91.52%) | | | | | | | | | | | | | |
| (Cost $120,726,293) | | | | | | | | | | | $ | 119,476,807 | |
| | | | | | | | | | | | | | |
| Other Assets In Excess Of Liabilities (8.48%) | | | | | | | | | | | | 11,066,549 | |
| NET ASSETS (100.00%) | | | | | | | | | | | $ | 130,543,356 | |
Libor Rates:
1M US L - 1 Month US LIBOR as of June 30, 2018 was 2.09%
2M US L - 2 Month US LIBOR as of June 30, 2018 was 2.17%
3M US L - 3 Month US LIBOR as of June 30, 2018 was 2.34%
6M US L - 6 Month US LIBOR as of June 30, 2018 was 2.50%
3M EUR L - 3 Month EURIBOR as of June 30, 2018 was -0.36%
6M EUR L - 6 Month EURIBOR as of June 30, 2018 was -0.32%
1M GBP L - 1 Month GBP LIBOR as of June 30, 2018 was 0.50%
3M GBP L - 3 Month GBP LIBOR as of June 30, 2018 was 0.67%
| (a) | Floating or variable rate security. The reference rate is described above. The rate in effect as of June 30, 2018 is based on the reference rate plus the displayed spread as of the security's last reset date. |
| (b) | All or a portion of this position has not settled as of June 30, 2018. The interest rate shown represents the stated spread over the applicable London Interbank Offered Rate ("LIBOR" or "L") or Euro Interbank Offered Rate (“EURIBOR” or “EUR L”); the Fund will not accrue interest until the settlement date, at which point LIBOR will be established. If the position is partially settled, the reference rate and floor shown is applicable to the settled portion. |
See Notes to Financial Statements.
| 16 | 1.888.926.2688 | www.griffincapital.com |
| Griffin Institutional Access Credit Fund | Schedule of Investments |
June 30, 2018 (Unaudited)
| (c) | A portion of this position or the entire position was not funded as of June 30, 2018. The Fund had approximately $562,237 in unfunded commitments pursuant to Delayed Draw Term Loan facility and unused Revolver capacity. The Schedule of Investments records each of these investments as fully funded and accordingly, a corresponding payable for investments purchased has also been recorded which represents the actual unfunded amount on the balance sheet date. |
| (d) | This investment is classified as a level 3 asset, and such classification was a result of unavailable quoted prices from an active market or the unavailability of other significant observable inputs. |
| (e) | 43.71% of the total coupon was PIK and 56.29% was cash. |
| (g) | Securities exempt from registration under Rule 144A of the Securities Act of 1933. These securities may be sold in the ordinary course of business in transactions exempt from registration, normally to qualified institutional buyers. As of June 30, 2018, the aggregate market value of those securities was $37,696,861, representing 28.88% of net assets. |
| (h) | CLO subordinated notes, income notes, and M notes are considered CLO equity positions. CLO equity positions are entitled to recurring distributions which are generally equal to the remaining cash flow of payments made by underlying securities less contractual payments to debt holders and fund expenses. The effective yield is estimated based upon the current projection of the amount and timing of these recurring distributions in addition to the estimated amount of terminal principal payment. Effective yields for the Fund's CLO equity positions are updated at least once a year, either on the anniversary of the formation of a CLO investment that the Fund holds in its portfolio or on a transaction such as a partial sale, add-on purchase, refinancing or reset. The estimated yield and investment cost may ultimately not be realized. |
| (i) | Securities were purchased pursuant to Regulation S under the Securities Act of 1933, which exempts securities offered and sold outside of the United States from registration. Such securities cannot be sold in the United States without either an effective registration statement filed pursuant to the Securities Act of 1933, or pursuant to an exemption from registration. These securities have been deemed liquid under guidelines approved by the Fund's Board of Trustees. As of June 30, 2018 the aggregate market value of those securities was $23,536 representing 0.02% of net assets. |
| (j) | Position is fully unsettled and therefore estimated yield has not been calculated. |
| (k) | Non-income producing security. |
| (l) | Security is wholly owned by a single member special purpose vehicle. |
Common Abbreviations:
EURIBOR - Euro InterBank Offered Rate
LIBOR - London Interbank Offered Rate
LLC - Limited Liability Company
LP - Limited Partnerships
PIK - Payment in Kind
OUTSTANDING FORWARD FOREIGN CURRENCY CONTRACTS
| Counterparty | | Buy/Sale
Currency | | Contracted
Amount* | | | Purchase/Sale
Contract | | Settlement
Date | | Current
Value(USD) | | | Unrealized
Appreciation/
(Depreciation) | |
| BNY Mellon | | USD/GBP | | | 1,180,000 | | | Sale | | 07/20/2018 | | $ | 1,558,553 | | | $ | 628 | |
| FXC | | USD/JPY | | | 28,520,000 | | | Sale | | 07/20/2018 | | | 257,899 | | | | 1,384 | |
| | | | | | | | | | | | | | | | | $ | 2,012 | |
| | | | | | | | | | | | | | | | | | | |
| BNY Mellon | | USD/EUR | | | 2,520,000 | | | Sale | | 07/20/2018 | | $ | 2,946,606 | | | $ | (20,760 | ) |
| | | | | | | | | | | | | | | | | $ | (20,760 | ) |
| * | The contracted amount is stated in the foreign currency in which the security is denominated. |
See Notes to Financial Statements.
| Semi-Annual Report | June 30, 2018 | 17 |
| Griffin Institutional Access Credit Fund | Statement of Assets and Liabilities |
June 30, 2018 (Unaudited)
| ASSETS | | | |
| Investments, at value (Cost $120,726,293) | | $ | 119,476,807 | |
| Cash | | | 15,072,090 | |
| Foreign currency, at value (Cost $634,534) | | | 634,565 | |
| Unrealized appreciation on forward foreign currency contracts | | | 2,012 | |
| Receivable for investments sold | | | 4,130,100 | |
| Receivable for shares sold | | | 1,877,720 | |
| Dividends and interest receivable | | | 855,166 | |
| Receivable due from Adviser (Note 4) | | | 301,143 | |
| Prepaid expenses and other assets | | | 68,232 | |
| Total Assets | | | 142,417,835 | |
| LIABILITIES | | | | |
| Payable for investments purchased | | | 9,619,992 | |
| Shareholder servicing fees payable (Note 4) | | | 11,945 | |
| Unrealized depreciation on forward foreign currency contracts | | | 20,760 | |
| Investment advisory fees payable (Note 4) | | | 189,822 | |
| Administration fees payable (Note 4) | | | 42,121 | |
| Transfer agency fees payable (Note 4) | | | 46,218 | |
| Distribution fees payable (Note 4) | | | 12,340 | |
| Payable for distributions | | | 1,823,229 | |
| Chief compliance officer fees payable (Note 4) | | | 6,026 | |
| Trustees' fees payable (Note 4) | | | 10,438 | |
| Legal fees payable | | | 37,106 | |
| Audit and tax fees payable | | | 30,857 | |
| Custody fees payable | | | 17,164 | |
| Accrued expenses and other liabilities | | | 6,461 | |
| Total Liabilities | | | 11,874,479 | |
| NET ASSETS | | $ | 130,543,356 | |
| NET ASSETS CONSIST OF | | | | |
| Paid-in capital | | $ | 131,764,565 | |
| Accumulated net investment loss | | | (34,619 | ) |
| Accumulated net realized gain | | | 41,011 | |
| Net unrealized depreciation | | | (1,227,601 | ) |
| NET ASSETS | | $ | 130,543,356 | |
See Notes to Financial Statements.
| 18 | 1.888.926.2688 | www.griffincapital.com |
| Griffin Institutional Access Credit Fund | Statement of Assets and Liabilities |
June 30, 2018 (Unaudited)
| PRICING OF SHARES | | | |
| Class A: | | | | |
| Net asset value | | $ | 24.92 | |
| Net assets | | $ | 20,427,253 | |
| Shares of beneficial interest outstanding (unlimited number of shares, no par value common stock authorized) | | | 819,641 | |
| Maximum offering price per share ((NAV/0.9425), based on maximum sales charge of 5.75% of the offering price) | | $ | 26.44 | |
| Class C: | | | | |
| Net asset value and offering | | $ | 24.92 | |
| Net assets | | $ | 10,235,097 | |
| Shares of beneficial interest outstanding (unlimited number of shares, no par value common stock authorized) | | | 410,652 | |
| Class I: | | | | |
| Net asset value and offering | | $ | 24.92 | |
| Net assets | | $ | 69,142,238 | |
| Shares of beneficial interest outstanding (unlimited number of shares, no par value common stock authorized) | | | 2,774,023 | |
| Class L: | | | | |
| Net asset value | | $ | 24.92 | |
| Net assets | | $ | 657,351 | |
| Shares of beneficial interest outstanding (unlimited number of shares, no par value common stock authorized) | | | 26,377 | |
| Maximum offering price per share ((NAV/0.9575), based on maximum sales charge of 4.25% of the offering price) | | $ | 26.03 | |
| Class F: | | | | |
| Net asset value and offering | | $ | 24.93 | |
| Net assets | | $ | 30,081,417 | |
| Shares of beneficial interest outstanding (unlimited number of shares, no par value common stock authorized) | | | 1,206,711 | |
See Notes to Financial Statements.
| Semi-Annual Report | June 30, 2018 | 19 |
| Griffin Institutional Access Credit Fund | Statement of Operations |
| | | For the Six
Months Ended
June 30, 2018
(Unaudited) | |
| INVESTMENT INCOME | | | | |
| Interest (net of foreign withholding tax of $3,223) | | $ | 3,262,424 | |
| Total Investment Income | | | 3,262,424 | |
| | | | | |
| EXPENSES | | | | |
| Investment advisory fees (Note 4) | | | 1,031,585 | |
| Administrative fees (Note 4) | | | 122,258 | |
| Transfer Agency fees (Note 4) | | | 90,236 | |
| Shareholder servicing fees: | | | | |
| Class A | | | 23,499 | |
| Class C | | | 10,129 | |
| Class L | | | 4 | |
| Distribution fees: | | | | |
| Class C | | | 30,388 | |
| Class L | | | 676 | |
| Legal fees | | | 67,739 | |
| Audit and tax fees | | | 65,019 | |
| Reports to shareholders and printing fees | | | 29,275 | |
| State registration fees | | | 20,109 | |
| Insurance fees | | | 26,151 | |
| Custody fees | | | 15,662 | |
| Chief compliance officer fees (Note 4) | | | 62,572 | |
| Offering cost (Note 2) | | | 83,178 | |
| Trustees' fees (Note 4) | | | 43,316 | |
| Other expenses | | | 7,891 | |
| Total Expenses | | | 1,729,687 | |
| Less: Fees waived/expenses reimbursed by Adviser (Note 4) | | | (1,729,687 | ) |
| Net Expenses | | | – | |
| Net Investment Income | | | 3,262,424 | |
| Net realized loss on investments | | | (152,094 | ) |
| Net realized gain on forward foreign currency transactions | | | 206,344 | |
| Net realized loss on foreign currency translation | | | (12,665 | ) |
| Net realized gain | | | 41,585 | |
| Net change in unrealized appreciation/(depreciation) on investments | | | (1,663,471 | ) |
| Net change in unrealized appreciation/(depreciation) on forward foreign currency transactions | | | (6,047 | ) |
| Net change in unrealized appreciation/(depreciation) on translation of assets and liabilities denominated in foreign currencies | | | 44,526 | |
| Net change in unrealized depreciation | | | (1,624,992 | ) |
| NET REALIZED AND UNREALIZED LOSS ON INVESTMENTS | | | (1,583,407 | ) |
| NET INCREASE IN NET ASSETS RESULTING FROM OPERATIONS | | $ | 1,679,017 | |
See Notes to Financial Statements.
| 20 | 1.888.926.2688 | www.griffincapital.com |
| Griffin Institutional Access Credit Fund | Statement of Changes in Net Assets |
| | | For the Six
Months Ended
June 30, 2018
(Unaudited) | | | For the Period
April 3, 2017
(Commencement
of Operations) to
December 31, 2017 | |
| OPERATIONS: | | | | | | |
| Net investment income | | $ | 3,262,424 | | | $ | 1,567,613 | |
| Net realized gain on investments | | | 41,585 | | | | 37,736 | |
| Net change in unrealized appreciation/(depreciation) on investments | | | (1,624,992 | ) | | | 397,391 | |
| Net Increase in Net Assets Resulting from Operations | | | 1,679,017 | | | | 2,002,740 | |
| DISTRIBUTIONS TO SHAREHOLDERS: | | | | | | | | |
| Class A | | | | | | | | |
| From net investment income | | | (523,275 | ) | | | (195,865 | ) |
| Class C | | | | | | | | |
| From net investment income | | | (246,192 | ) | | | (104,149 | ) |
| Class I | | | | | | | | |
| From net investment income | | | (1,610,452 | ) | | | (729,549 | ) |
| Class L(a) | | | | | | | | |
| From net investment income | | | (16,297 | ) | | | (7,568 | ) |
| Class F(b) | | | | | | | | |
| From net investment income | | | (974,494 | ) | | | (436,978 | ) |
| Total Distributions to Shareholders | | | (3,370,710 | ) | | | (1,474,109 | ) |
| BENEFICIAL INTEREST TRANSACTIONS, IN DOLLARS: | | | | | | | | |
| Class A | | | | | | | | |
| Shares sold | | | 6,664,136 | | | | 14,979,001 | |
| Distributions reinvested | | | 232,157 | | | | 100,857 | |
| Shares redeemed | | | (733,317 | ) | | | (36,689 | ) |
| Transferred out | | | (49,799 | ) | | | (507,511 | ) |
| Class C | | | | | | | | |
| Shares sold | | | 3,602,793 | | | | 7,102,320 | |
| Distributions reinvested | | | 141,205 | | | | 61,626 | |
| Shares redeemed | | | (61,927 | ) | | | – | |
| Transferred out | | | – | | | | (506,599 | ) |
| Class I | | | | | | | | |
| Shares sold | | | 29,345,840 | | | | 42,883,835 | |
| Distributions reinvested | | | 761,445 | | | | 442,561 | |
| Shares redeemed | | | (2,794,374 | ) | | | (916,892 | ) |
| Transferred in | | | 49,799 | | | | – | |
| Class L(a) | | | | | | | | |
| Shares sold | | | 129,262 | | | | 4,334 | |
| Distributions reinvested | | | 16,081 | | | | 7,416 | |
| Transferred in | | | – | | | | 506,599 | |
| Class F(b) | | | | | | | | |
| Shares sold | | | 4,959 | | | | 38,863,613 | |
| Distributions reinvested | | | 145,380 | | | | 24,326 | |
| Shares redeemed | | | (7,846,861 | ) | | | (1,416,669 | ) |
| Transferred in | | | – | | | | 507,511 | |
| Net Increase in Net Assets Derived from Beneficial Interest Transactions | | | 29,606,779 | | | | 102,099,639 | |
| Net increase in net assets | | | 27,915,086 | | | | 102,628,270 | |
| NET ASSETS: | | | | | | | | |
| Beginning of period | | | 102,628,270 | | | | – | |
| End of period * | | $ | 130,543,356 | | | $ | 102,628,270 | |
| *Including accumulated net investment income/(loss) of: | | $ | (34,619 | ) | | $ | 73,667 | |
See Notes to Financial Statements.
| Semi-Annual Report | June 30, 2018 | 21 |
| Griffin Institutional Access Credit Fund | Statement of Changes in Net Assets |
| | | For the Six
Months Ended
June 30, 2018
(Unaudited) | | | For the Period
April 3, 2017
(Commencement of
Operations) to
December 31, 2017 | |
| Other Information | | | | | | | | |
| BENEFICIAL INTEREST TRANSACTIONS, IN SHARES: | | | | | | | | |
| Class A | | | | | | | | |
| Beginning shares | | | 576,344 | | | | – | |
| Shares sold | | | 265,169 | | | | 593,898 | |
| Distributions reinvested | | | 9,294 | | | | 3,994 | |
| Shares redeemed | | | (29,174 | ) | | | (1,449 | ) |
| Transferred out | | | (1,992 | ) | | | (20,099 | ) |
| Net increase in shares outstanding | | | 243,297 | | | | 576,344 | |
| Ending shares | | | 819,641 | | | | 576,344 | |
| Class C | | | | | | | | |
| Beginning shares | | | 264,046 | | | | – | |
| Shares sold | | | 143,423 | | | | 281,702 | |
| Distributions reinvested | | | 5,654 | | | | 2,440 | |
| Shares redeemed | | | (2,471 | ) | | | – | |
| Transferred out | | | – | | | | (20,096 | ) |
| Net increase in shares outstanding | | | 146,606 | | | | 264,046 | |
| Ending shares | | | 410,652 | | | | 264,046 | |
| Class I | | | | | | | | |
| Beginning shares | | | 1,683,407 | | | | – | |
| Shares sold | | | 1,169,061 | | | | 1,702,079 | |
| Distributions reinvested | | | 30,486 | | | | 17,528 | |
| Shares redeemed | | | (110,923 | ) | | | (36,200 | ) |
| Transferred in | | | 1,992 | | | | – | |
| Net increase in shares outstanding | | | 1,090,616 | | | | 1,683,407 | |
| Ending shares | | | 2,774,023 | | | | 1,683,407 | |
| Class L(a) | | | | | | | | |
| Beginning shares | | | 20,563 | | | | – | |
| Shares sold | | | 5,170 | | | | 172 | |
| Distributions reinvested | | | 644 | | | | 293 | |
| Transferred in | | | – | | | | 20,098 | |
| Net increase in shares outstanding | | | 5,814 | | | | 20,563 | |
| Ending shares | | | 26,377 | | | | 20,563 | |
| Class F(b) | | | | | | | | |
| Beginning shares | | | 1,511,761 | | | | – | |
| Shares sold | | | 197 | | | | 1,546,583 | |
| Distributions reinvested | | | 5,819 | | | | 963 | |
| Shares redeemed | | | (311,066 | ) | | | (55,884 | ) |
| Transferred in | | | – | | | | 20,099 | |
| Net increase/(decrease) in shares outstanding | | | (305,050 | ) | | | 1,511,761 | |
| Ending shares | | | 1,206,711 | | | | 1,511,761 | |
| (a) | The Fund's Class L shares commenced operations on September 5, 2017. |
| (b) | The Fund's Class F shares commenced operations on September 25, 2017. |
See Notes to Financial Statements.
| 22 | 1.888.926.2688 | www.griffincapital.com |
| Griffin Institutional Access Credit Fund | Statement of Cash Flows |
| | | For the Six
Months Ended
June 30, 2018
(Unaudited) | |
| Cash Flows from Operating Activities: | | | | |
| Net increase in net assets resulting from operations | | $ | 1,679,017 | |
| Purchase of investments | | | (68,962,172 | ) |
| Proceeds from sales | | | 44,050,112 | |
| Net realized loss on investments | | | 152,094 | |
| Net change in unrealized depreciation on investments | | | 1,663,471 | |
| Net change in unrealized depreciation on forward foreign currency contracts | | | 6,047 | |
| Discount and premiums amortized | | | 149,566 | |
| (Increase)/Decrease in Assets: | | | | |
| Dividends and interest receivable | | | (98,841 | ) |
| Receivable due from adviser | | | 7,144 | |
| Prepaid offering costs | | | 83,178 | |
| Prepaid expenses and other assets | | | (57,306 | ) |
| Increase/(Decrease) in Liabilities: | | | | |
| Shareholder servicing fees payable | | | 4,564 | |
| Investment advisory fees payable | | | 34,990 | |
| Administrative fees payable | | | 8,162 | |
| Transfer agency fees payable | | | 19,411 | |
| Distribution fees payable | | | 8,196 | |
| Chief compliance officer fees payable | | | (2,956 | ) |
| Trustees' fees payable | | | (4,966 | ) |
| Legal fees payable | | | (4,258 | ) |
| Audit and tax fees payable | | | (79,041 | ) |
| Custody fees payable | | | (2 | ) |
| Insurance fees payable | | | (7,653 | ) |
| Accrued expenses and other liabilities | | | 1,295 | |
| Net cash provided by operating activities | | | (21,349,948 | ) |
| | | | | |
| Cash Flows from Financing Activities: | | | | |
| Proceeds from shares sold | | | 39,272,846 | |
| Payment on shares redeemed | | | (11,436,479 | ) |
| Cash distributions paid | | | (1,247,606 | ) |
| Net cash provided by financing activities | | | 26,588,761 | |
| | | | | |
| Effect of exchange rates on cash | | | (88 | ) |
| | | | | |
| Net Change in Cash and Foreign Rates on Cash and Foreign Currency | | | 5,238,725 | |
| | | | | |
| Cash and foreign currency, beginning of period | | $ | 10,467,930 | |
| Cash and foreign currency, end of period | | $ | 15,706,655 | |
| | | | | |
| Non-cash financing Activities not included herein consist of reinvestment of distributions of: | | | 1,296,268 | |
See Notes to Financial Statements.
| Semi-Annual Report | June 30, 2018 | 23 |
| Griffin Institutional Access Credit Fund – Class A | Financial Highlights |
For a Share Outstanding Throughout the Period Presented (Unaudited)
| | | For the
Six Months
Ended
June 30, 2018
(Unaudited) | | | For the Period
April 3, 2017
(Commencement
of Operations) to
December 31,
2017 | |
| Net asset value, beginning of period | | $ | 25.30 | | | $ | 25.00 | |
| | | | | | | | | |
| INCOME FROM INVESTMENT OPERATIONS: | | | | | | | | |
| Net investment income(a) | | | 0.73 | | | | 0.92 | |
| Net realized and unrealized gain/(loss) | | | (0.36 | ) | | | 0.16 | |
| Total from investment operations | | | 0.37 | | | | 1.08 | |
| | | | | | | | | |
| DISTRIBUTIONS: | | | | | | | | |
| From net investment income(b) | | | (0.75 | ) | | | (0.78 | ) |
| Total distributions | | | (0.75 | ) | | | (0.78 | ) |
| | | | | | | | | |
| Net increase/(decrease) in net asset value | | | (0.38 | ) | | | 0.30 | |
| Net asset value, end of period | | $ | 24.92 | | | $ | 25.30 | |
| TOTAL RETURN(c) | | | 1.49 | % | | | 4.38 | % |
| | | | | | | | | |
| RATIOS/SUPPLEMENTAL DATA: | | | | | | | | |
| Net assets, end of period (000s) | | $ | 20,427 | | | $ | 14,581 | |
| Ratios to Average Net Assets | | | | | | | | |
| Ratio of expenses to average net assets excluding fee waivers and reimbursements | | | 3.26 | %(d) | | | 5.15 | %(d)(e) |
| Ratio of expenses to average net assets including fee waivers and reimbursements | | | 0 | %(f) | | | 0 | %(f) |
| Ratio of net investment income to average net assets | | | 5.83 | %(d) | | | 4.86 | %(d) |
| | | | | | | | | |
| Portfolio turnover rate(g) | | | 44 | % | | | 48 | % |
| (a) | Calculated using the average shares method. |
| (b) | Distributions are based on a daily accrual of net investment income, which will vary based on investment yields and daily shares outstanding. |
| (c) | Total returns are for the period indicated and have not been annualized. Total returns would have been lower had certain expenses not been waived during the period. Returns shown do not reflect the deduction of taxes that a shareholder would pay on Fund distributions or the redemption of Fund shares. |
| (e) | The gross expense ratio included non-recurring organizational costs. |
| (f) | The Adviser voluntarily has absorbed all of the operating expenses of the Fund since the commencement of the Fund's operations. The Adviser will continue to bear such expenses on a going forward basis in its discretion and is under no obligation to continue to do so for any specified period of time. In the absence of the election by the Fund's investment adviser to bear all of the Fund's operating expenses, the ratio of expenses to average net assets including fee waivers and reimbursements would have been higher. |
| (g) | Portfolio turnover rate for periods less than one full year has not been annualized and is calculated at the Fund level. |
See Notes to Financial Statements.
| 24 | 1.888.926.2688 | www.griffincapital.com |
| Griffin Institutional Access Credit Fund – Class C | Financial Highlights |
For a Share Outstanding Throughout the Period Presented (Unaudited)
| | | For the
Six Months
Ended
June 30, 2018
(Unaudited) | | | For the Period
April 3, 2017
(Commencement
of Operations) to
December 31,
2017 | |
| Net asset value, beginning of period | | $ | 25.30 | | | $ | 25.00 | |
| | | | | | | | | |
| INCOME FROM INVESTMENT OPERATIONS: | | | | | | | | |
| Net investment income(a) | | | 0.73 | | | | 0.91 | |
| Net realized and unrealized gain/(loss) | | | (0.36 | ) | | | 0.17 | |
| Total from investment operations | | | 0.37 | | | | 1.08 | |
| | | | | | | | | |
| DISTRIBUTIONS: | | | | | | | | |
| From net investment income(b) | | | (0.75 | ) | | | (0.78 | ) |
| Total distributions | | | (0.75 | ) | | | (0.78 | ) |
| | | | | | | | | |
| Net increase/(decrease) in net asset value | | | (0.38 | ) | | | 0.30 | |
| Net asset value, end of period | | $ | 24.92 | | | $ | 25.30 | |
| TOTAL RETURN(c) | | | 1.49 | % | | | 4.37 | % |
| | | | | | | | | |
| RATIOS/SUPPLEMENTAL DATA: | | | | | | | | |
| Net assets, end of period (000s) | | $ | 10,235 | | | $ | 6,681 | |
| Ratios to Average Net Assets | | | | | | | | |
| Ratio of expenses to average net assets excluding fee waivers and reimbursements | | | 3.97 | %(d) | | | 6.25 | %(d)(e) |
| Ratio of expenses to average net assets including fee waivers and reimbursements | | | 0 | %(f) | | | 0 | %(f) |
| Ratio of net investment income to average net assets | | | 5.84 | %(d) | | | 4.83 | %(d) |
| | | | | | | | | |
| Portfolio turnover rate(g) | | | 44 | % | | | 48 | % |
| (a) | Calculated using the average shares method. |
| (b) | Distributions are based on a daily accrual of net investment income, which will vary based on investment yields and daily shares outstanding. |
| (c) | Total returns are for the period indicated and have not been annualized. Total returns would have been lower had certain expenses not been waived during the period. Returns shown do not reflect the deduction of taxes that a shareholder would pay on Fund distributions or the redemption of Fund shares. |
| (e) | The gross expense ratio included non-recurring organizational costs. |
| (f) | The Adviser voluntarily has absorbed all of the operating expenses of the Fund since the commencement of the Fund's operations. The Adviser will continue to bear such expenses on a going forward basis in its discretion and is under no obligation to continue to do so for any specified period of time. In the absence of the election by the Fund's investment adviser to bear all of the Fund's operating expenses, the ratio of expenses to average net assets including fee waivers and reimbursements would have been higher. |
| (g) | Portfolio turnover rate for periods less than one full year has not been annualized and is calculated at the Fund level. |
See Notes to Financial Statements.
| Semi-Annual Report | June 30, 2018 | 25 |
| Griffin Institutional Access Credit Fund – Class I | Financial Highlights |
For a Share Outstanding Throughout the Period Presented (Unaudited)
| | | For the
Six Months
Ended
June 30, 2018
(Unaudited) | | | For the Period
April 3, 2017
(Commencement
of Operations) to
December 31,
2017 | |
| Net asset value, beginning of period | | $ | 25.30 | | | $ | 25.00 | |
| | | | | | | | | |
| INCOME FROM INVESTMENT OPERATIONS: | | | | | | | | |
| Net investment income(a) | | | 0.73 | | | | 0.90 | |
| Net realized and unrealized gain/(loss) | | | (0.35 | ) | | | 0.19 | |
| Total from investment operations | | | 0.38 | | | | 1.09 | |
| | | | | | | | | |
| DISTRIBUTIONS: | | | | | | | | |
| From net investment income(b) | | | (0.76 | ) | | | (0.79 | ) |
| Total distributions | | | (0.76 | ) | | | (0.79 | ) |
| | | | | | | | | |
| Net increase/(decrease) in net asset value | | | (0.38 | ) | | | 0.30 | |
| Net asset value, end of period | | $ | 24.92 | | | $ | 25.30 | |
| TOTAL RETURN(c) | | | 1.50 | % | | | 4.38 | % |
| | | | | | | | | |
| RATIOS/SUPPLEMENTAL DATA: | | | | | | | | |
| Net assets, end of period (000s) | | $ | 69,142 | | | $ | 42,593 | |
| Ratios to Average Net Assets | | | | | | | | |
| Ratio of expenses to average net assets excluding fee waivers and reimbursements | | | 2.97 | %(d) | | | 5.62 | %(d)(e) |
| Ratio of expenses to average net assets including fee waivers and reimbursements | | | 0 | %(f) | | | 0 | %(f) |
| Ratio of net investment income to average net assets | | | 5.83 | %(d) | | | 4.78 | %(d) |
| | | | | | | | | |
| Portfolio turnover rate(g) | | | 44 | % | | | 48 | % |
| (a) | Calculated using the average shares method. |
| (b) | Distributions are based on a daily accrual of net investment income, which will vary based on investment yields and daily shares outstanding. |
| (c) | Total returns are for the period indicated and have not been annualized. Total returns would have been lower had certain expenses not been waived during the period. Returns shown do not reflect the deduction of taxes that a shareholder would pay on Fund distributions or the redemption of Fund shares. |
| (e) | The gross expense ratio included non-recurring organizational costs. |
| (f) | The Adviser voluntarily has absorbed all of the operating expenses of the Fund since the commencement of the Fund's operations. The Adviser will continue to bear such expenses on a going forward basis in its discretion and is under no obligation to continue to do so for any specified period of time. In the absence of the election by the Fund's investment adviser to bear all of the Fund's operating expenses, the ratio of expenses to average net assets including fee waivers and reimbursements would have been higher. |
| (g) | Portfolio turnover rate for periods less than one full year has not been annualized and is calculated at the Fund level. |
See Notes to Financial Statements.
| 26 | 1.888.926.2688 | www.griffincapital.com |
| Griffin Institutional Access Credit Fund – Class L | Financial Highlights |
For a Share Outstanding Throughout the Period Presented (Unaudited)
| | | For the
Six Months
Ended
June 30, 2018
(Unaudited) | | | For the Period
September 5,
2017 (Commencement
of Operations) to
December 31,
2017 | |
| Net asset value, beginning of period | | $ | 25.30 | | | $ | 25.21 | |
| | | | | | | | | |
| INCOME FROM INVESTMENT OPERATIONS: | | | | | | | | |
| Net investment income(a) | | | 0.73 | | | | 0.40 | |
| Net realized and unrealized gain/(loss) | | | (0.36 | ) | | | 0.06 | |
| Total from investment operations | | | 0.37 | | | | 0.46 | |
| | | | | | | | | |
| DISTRIBUTIONS: | | | | | | | | |
| From net investment income(b) | | | (0.75 | ) | | | (0.37 | ) |
| Total distributions | | | (0.75 | ) | | | (0.37 | ) |
| | | | | | | | | |
| Net increase/(decrease) in net asset value | | | (0.38 | ) | | | 0.09 | |
| Net asset value, end of period | | $ | 24.92 | | | $ | 25.30 | |
| TOTAL RETURN(c) | | | 1.48 | % | | | 1.84 | % |
| | | | | | | | | |
| RATIOS/SUPPLEMENTAL DATA: | | | | | | | | |
| Net assets, end of period (000s) | | $ | 657 | | | $ | 520 | |
| Ratios to Average Net Assets | | | | | | | | |
| Ratio of expenses to average net assets excluding fee waivers and reimbursements | | | 3.23 | %(d) | | | 4.17 | %(d) |
| Ratio of expenses to average net assets including fee waivers and reimbursements | | | 0 | %(e) | | | 0 | %(e) |
| Ratio of net investment income to average net assets | | | 5.79 | %(d) | | | 4.88 | %(d) |
| | | | | | | | | |
| Portfolio turnover rate(f) | | | 44 | % | | | 48 | % |
| (a) | Calculated using the average shares method. |
| (b) | Distributions are based on a daily accrual of net investment income, which will vary based on investment yields and daily shares outstanding. |
| (c) | Total returns are for the period indicated and have not been annualized. Total returns would have been lower had certain expenses not been waived during the period. Returns shown do not reflect the deduction of taxes that a shareholder would pay on Fund distributions or the redemption of Fund shares. |
| (e) | The Adviser voluntarily has absorbed all of the operating expenses of the Fund since the commencement of the Fund's operations. The Adviser will continue to bear such expenses on a going forward basis in its discretion and is under no obligation to continue to do so for any specified period of time. In the absence of the election by the Fund's investment adviser to bear all of the Fund's operating expenses, the ratio of expenses to average net assets including fee waivers and reimbursements would have been higher. |
| (f) | Portfolio turnover rate for periods less than one full year has not been annualized and is calculated at the Fund level. |
See Notes to Financial Statements.
| Semi-Annual Report | June 30, 2018 | 27 |
| Griffin Institutional Access Credit Fund – Class F | Financial Highlights |
For a Share Outstanding Throughout the Period Presented (Unaudited)
| | | For the
Six Months
Ended
June 30, 2018
(Unaudited) | | | For the Period
September 25,
2017
(Commencement
of Operations) to
December 31,
2017 | |
| Net asset value, beginning of period | | $ | 25.30 | | | $ | 25.25 | |
| | | | | | | | | |
| INCOME FROM INVESTMENT OPERATIONS: | | | | | | | | |
| Net investment income(a) | | | 0.72 | | | | 0.32 | |
| Net realized and unrealized gain/(loss) | | | (0.34 | ) | | | 0.03 | |
| Total from investment operations | | | 0.38 | | | | 0.35 | |
| | | | | | | | | |
| DISTRIBUTIONS: | | | | | | | | |
| From net investment income(b) | | | (0.75 | ) | | | (0.30 | ) |
| Total distributions | | | (0.75 | ) | | | (0.30 | ) |
| | | | | | | | | |
| Net increase/(decrease) in net asset value | | | (0.37 | ) | | | 0.05 | |
| Net asset value, end of period | | $ | 24.93 | | | $ | 25.30 | |
| TOTAL RETURN(c) | | | 1.52 | % | | | 1.41 | % |
| | | | | | | | | |
| RATIOS/SUPPLEMENTAL DATA: | | | | | | | | |
| Net assets, end of period (000s) | | $ | 30,081 | | | $ | 38,254 | |
| Ratios to Average Net Assets | | | | | | | | |
| Ratio of expenses to average net assets excluding fee waivers and reimbursements | | | 3.00 | %(d) | | | 3.27 | %(d) |
| Ratio of expenses to average net assets including fee waivers and reimbursements | | | 0 | %(e) | | | 0 | %(e) |
| Ratio of net investment income to average net assets | | | 5.74 | %(d) | | | 4.85 | %(d) |
| | | | | | | | | |
| Portfolio turnover rate(f) | | | 44 | % | | | 48 | % |
| (a) | Calculated using the average shares method. |
| (b) | Distributions are based on a daily accrual of net investment income, which will vary based on investment yields and daily shares outstanding. |
| (c) | Total returns are for the period indicated and have not been annualized. Total returns would have been lower had certain expenses not been waived during the period. Returns shown do not reflect the deduction of taxes that a shareholder would pay on Fund distributions or the redemption of Fund shares. |
| (e) | The Adviser voluntarily has absorbed all of the operating expenses of the Fund since the commencement of the Fund's operations. The Adviser will continue to bear such expenses on a going forward basis in its discretion and is under no obligation to continue to do so for any specified period of time. In the absence of the election by the Fund's investment adviser to bear all of the Fund's operating expenses, the ratio of expenses to average net assets including fee waivers and reimbursements would have been higher. |
| (f) | Portfolio turnover rate for periods less than one full year has not been annualized and is calculated at the Fund level. |
See Notes to Financial Statements.
| 28 | 1.888.926.2688 | www.griffincapital.com |
| Griffin Institutional Access Credit Fund | Notes to Financial Statements |
June 30, 2018 (Unaudited)
1. ORGANIZATION
Griffin Institutional Access Credit Fund (the “Fund”) is registered with the U.S. Securities and Exchange Commission (“SEC”) under the Investment Company Act of 1940, as amended (the “1940 Act”), as a non-diversified, closed-end management investment company. The Fund engages in a continuous offering of shares and operates as an interval fund that offers quarterly repurchases of shares at net asset value. The Fund’s SEC registered investment adviser is Griffin Capital Credit Advisor, LLC (the “Adviser”). BCSF Advisors, LP, an affiliate of Bain Capital Credit, LP, (the “Sub-Adviser”) serves as the Fund’s sub-adviser. The investment objective of the Fund is to generate a return comprised of both current income and capital appreciation with an emphasis on current income with low volatility and low correlation to the broader markets. The Fund pursues its investment objective by investing in a range of secured and unsecured debt obligations which may be syndicated, consisting of U.S high yield securities, global high yield securities and other fixed-income and fixed-income related securities, including direct originated debt obligations and collateralized loan obligations.
The Fund was organized as a statutory trust on April 5, 2016 under the laws of the State of Delaware. The Fund commenced operations on April 3, 2017, and is authorized to issue an unlimited number of shares with no par value.
Effective September 29, 2017 Griffin Capital BDC Corp., formerly known as Griffin-Benefit Street Partners BDC Corp. (the “BDC”) transferred all of its assets to the Fund, in exchange for Class F shares of the Fund and the Fund assumed all of the liabilities of the BDC. Class F shares are available to investors who were stockholders of the BDC at the time of the reorganization of the BDC into the Fund. Class F shares are not otherwise available or being offered to the general public. The Reorganization (the “Reorganization”) was accomplished on a Tax-free basis under applicable provisions of the Internal Revenue Code.
The Fund currently offers Class A, Class C, Class I and Class L. Class A, Class C and Class I shares commenced operations on April 3, 2017. Class L shares commenced operations on September 5, 2017. Class F Shares commenced operations on September 25, 2017 and were offered in conjunction with the reorganization and merger of Griffin Capital BDC Corp. Class F shares are no longer offered. Class A shares are offered subject to a maximum sales charge of 5.75% of the offering price and Class L shares are offered subject to a maximum sales charge of 4.25% of the offering price. Class C and Class I shares are offered at net asset value per share. Class C shares may be subject to a 1.00% contingent deferred sales charge on shares redeemed during the first 365 days after their purchase. Each class represents an interest in the same assets of the Fund and classes are identical except for differences in their sales charge structures and ongoing service and distribution charges. All classes of shares have equal voting privileges except that each class has exclusive voting rights with respect to its service and/or distribution plans. The Fund’s income, expenses (other than class specific distribution fees) and realized and unrealized gains and losses are allocated proportionately each day based upon the relative net assets of each class.
2. SIGNIFICANT ACCOUNTING POLICIES
Basis of Presentation – The following is a summary of significant accounting policies followed by the Fund in preparation of its financial statements. These policies are in conformity with accounting principles generally accepted in the United States of America (“GAAP”). The Fund is considered an investment company following accounting and reporting guidance in Accounting Standards Codification (“ASC”) Topic 946 – Financial Services – Investment Companies. The preparation of financial statements requires management to make estimates and assumptions that affect the reported amounts of assets and liabilities and disclosure of contingent assets and liabilities at the date of the financial statements and the reported amounts of income and expenses for the period. Actual results could differ from those estimates.
Security Valuation – In accordance with ASC Topic 820 - Fair Value Measurement and Disclosures, portfolio securities of the Fund are valued at their current market values determined on the basis of market quotations. If market quotations are not readily available, securities are valued at fair value pursuant to procedures adopted by the Board of Trustees (the “Trustees”). The Trustees have delegated the day to day responsibility for determining fair valuation to the Fair Value Pricing Committee in accordance with the policies approved by the Trustees. Fair valuation involves subjective judgments, and it is possible that the fair value determined for a security may differ materially from the value that could be realized upon the sale of the security. In determining the fair value of a security for which there are no readily available market quotations, the Adviser and Sub-Adviser, together with the Fair Value Pricing Committee, may consider several factors, including: (1) evaluation of all relevant factors, including but not limited to, pricing history, current market level, supply and demand of the respective security; (2) comparison to the values and current pricing of securities that have comparable characteristics; (3) knowledge of historical market information with respect to the security; and (4) other factors relevant to the security which would include, but not be limited to, duration, yield, fundamental analytical data, the Treasury yield curve, and credit quality. The Adviser and Sub-Adviser may also consider periodic financial statements (audited and unaudited) or other information provided by the issuer.
| Semi-Annual Report | June 30, 2018 | 29 |
| Griffin Institutional Access Credit Fund | Notes to Financial Statements |
June 30, 2018 (Unaudited)
Non-dollar-denominated securities, if any, are valued as of the close of the New York Stock Exchange (“the “NYSE”) at the closing price of such securities in their principal trading market, but may be valued at fair value if subsequent events occurring before the computation of net asset value materially have affected the value of the securities. Readily marketable portfolio securities listed on the NYSE are valued at the last sale price as of the close of the NYSE on the business day as of which such value is being determined. If there has been no sale on such day, the securities are valued at the mean of the closing bid and asked prices on such day as determined by a third-party pricing service. If no bid or asked prices are quoted on such day or if market prices may be unreliable because of events occurring after the close of trading, then the security is valued by such method as the Fair Value Pricing Committee shall determine in good faith to reflect its fair market value. The Adviser and Sub-Adviser have engaged independent third-party valuation specialists to assist the Fair Value Pricing Committee in valuing such securities in certain circumstances.
The Adviser will provide the Trustees with periodic reports, no less frequently than quarterly, that discuss the functioning of the valuation process, if applicable to that period, and that identify issues and valuation problems that have arisen, if any. To the extent deemed necessary by the Adviser, the Trustees will review any securities valued by the Adviser in accordance with the Fund’s valuation policies.
Fair Value Measurements – In accordance with ASC Topic 820 – Fair Value Measurement and Disclosures, a three-tier hierarchy has been established to classify fair value measurements for disclosure purposes. Inputs refer broadly to the assumptions that market participants would use in pricing the asset or liability, including assumptions about risk. Inputs may be observable or unobservable. Observable inputs are inputs that reflect the assumptions market participants would use in pricing the asset or liability that are developed based on market data obtained from sources independent of the reporting entity. Unobservable inputs are inputs that reflect the reporting entity’s own assumptions about the assumptions market participants would use in pricing the asset or liability that are developed based on the best information available. In accordance with the authoritative guidance on fair value measurements and disclosure under GAAP, the Fund discloses fair value of its investments in a hierarchy that prioritizes the inputs to valuation techniques used to measure the fair value.
Various inputs are used in determining the value of the Fund’s investments as of the reporting period end. These inputs are categorized in the following hierarchy under applicable financial accounting standards:
| Level 1 – | Unadjusted quoted prices in active markets for identical, unrestricted assets or liabilities that the Fund has the ability to access at the measurement date; |
| Level 2 – | Quoted prices which are not active, quoted prices for similar assets or liabilities in active markets or inputs other than quoted prices that are observable (either directly or indirectly) for substantially the full term of the asset or liability at the measurement date; and |
| Level 3 – | Significant unobservable prices or inputs (including the Fund’s own assumptions in determining the fair value of investments) where there is little or no market activity for the asset or liability at the measurement date. |
The availability of observable inputs can vary from security to security and is affected by a wide variety of factors, including, for example, the type of security, whether the security is new and not yet established in the marketplace, the liquidity of markets and other characteristics particular to the security. To the extent that valuation is based on models or inputs that are less observable or unobservable in the market, the determination of fair value requires more judgment. Accordingly, the degree of judgment exercised in determining fair value is greatest for instruments categorized in Level 3.
An investment level within the fair value hierarchy is based on the lowest level input, individually or in the aggregate, that is significant to fair value measurement. The valuation techniques used by the Fund to measure fair value during the period ended June 30, 2018 maximized the use of observable inputs and minimized the use of unobservable inputs.
| 30 | 1.888.926.2688 | www.griffincapital.com |
| Griffin Institutional Access Credit Fund | Notes to Financial Statements |
June 30, 2018 (Unaudited)
The inputs or methodologies used for valuing securities are not necessarily an indication of the risk or liquidity associated with investing in those securities. The following is a summary of the inputs used in valuing the Fund’s investments as of June 30, 2018:
| Investments in Securities at Value | | Level 1 -
Quoted Prices | | | Level 2 -
Other Significant
Observable Inputs | | | Level 3 -
Significant
Unobservable
Inputs | | | Total | |
| Bank Loans | | $ | – | | | $ | 66,490,691 | | | $ | 4,619,206 | | | $ | 71,109,897 | |
| Corporate Bonds | | | – | | | | 37,049,169 | | | | – | | | | 37,049,169 | |
| Collateralized Loan Obligations | | | – | | | | 10,782,463 | | | | 23,536 | | | | 10,805,999 | |
| Convertible Corporate Bonds | | | – | | | | 234,448 | | | | – | | | | 234,448 | |
| Common Stocks | | | 257,822 | | | | – | | | | – | | | | 257,822 | |
| Warrants | | | – | | | | – | | | | 19,472 | | | | 19,472 | |
| Total | | $ | 257,822 | | | $ | 114,556,771 | | | $ | 4,662,214 | | | $ | 119,476,807 | |
| Other Financial Instruments* | | | | | | | | | | | | | | | | |
| Assets: | | | | | | | | | | | | | | | | |
| Forward Foreign Currency Contracts | | $ | – | | | $ | 2,012 | | | $ | – | | | $ | 2,012 | |
| Liabilities: | | | | | | | | | | | | | | | | |
| Forward Foreign Currency Contracts | | | – | | | | (20,760 | ) | | | – | | | | (20,760 | ) |
| Total | | $ | – | | | $ | (18,748 | ) | | $ | – | | | $ | (18,748 | ) |
| * | Other financial instruments are derivative instruments reflected in the Statement of Investments. The derivatives shown in this table are reported at their unrealized appreciation/ (depreciation) at measurement date, which represents the change in the contract's value. |
The changes of fair value of investments for which the Fund has used Level 3 inputs to determine the fair value are as follows:
| Asset Type | | Balance as of
December 31,
2017 | | | Accrued
Discount/
premium | | | Realized
Gain/(Loss) | | | Change in
Unrealized
Appreciation/
Depreciation | | | Purchases | | | Sales
Proceeds | | | Transfer
into
Level 3 | | | Transfer
Out of
Level 3 | | | Balance
as of
June 30,
2018 | | | Net change in
unrealized
appreciation/
(depreciation)
included in the
Statements of
Operations
attributable to
Level 3
investments held
at June 30, 2018 | |
| Bank Loans | | $ | 2,357,991 | | | $ | 3,127 | | | $ | 45,416 | | | $ | (25,490 | ) | | $ | 4,545,323 | | | $ | (2,307,161 | ) | | $ | – | | | $ | – | | | $ | 4,619,206 | | $ | (22,949 | ) |
| Warrants | | | 4,000 | | | | – | | | | – | | | | 15,472 | | | | – | | | | – | | | | – | | | | – | | | | 19,472 | | | 15,472 | |
| Collateralized | | | | | | | | | | | | | | | | | | | | | | | | | | | | | | | | | | | | | | |
| Loan | | | | | | | | | | | | | | | | | | | | | | | | | | | | | | | | | | | | | | |
| Obligations | | | – | | | | (205,718 | ) | | | – | | | | (4,746 | ) | | | 234,000 | | | | – | | | | – | | | | – | | | | 23,536 | | | (4,746 | ) |
| | | $ | 2,361,991 | | | $ | (202,591 | ) | | $ | 45,416 | | | $ | (14,764 | ) | | $ | 4,779,323 | | | $ | (2,356,265 | ) | | $ | – | | | $ | – | | | $ | 4,662,214 | | $ | (12,223 | ) |
| Semi-Annual Report | June 30, 2018 | 31 |
| Griffin Institutional Access Credit Fund | Notes to Financial Statements |
June 30, 2018 (Unaudited)
The table below provides additional information about the Level 3 Fair Value Measurements as of June 30, 2018:
Quantitative Information about Level 3 Fair Value Measurements
| Asset Class | Fair Value (USD)(i) | Valuation Technique | Unobservable Inputs(a) | Minimum | Maximum | Weighted Average |
| Bank Loans | $102,256 | Market Comparable Companies | Comparative Yield | 21.00% | 22.00% | 21.50% |
| Warrants | 19,472 | Enterprise Value | PV-10 Multiple | 1.50 | 1.60 | 1.55 |
| Collateralized Loan Obligations | 23,536 | NAV/Liquidation | NA | NA | NA | NA |
| (i) | Level 3 investments total $4,662,214, which includes $4,516,950 of Bank Loans acquired during the quarter ended June 30, 2018 that were held at cost on the statement of investments. |
| (a) | A change to the unobservable input may result in a significant change to the value of the investment as follows: |
| Unobservable Input | Impact to Value if Input Increases | Impact to Value if Input Decreases |
| Comparative Yield | Decrease | Increase |
| PV-10 Multiple | Increase | Decrease |
The valuation techniques and significant inputs used in determining the fair values of portfolio assets and liabilities categorized as Level 3 of the fair value hierarchy are as follows:
Market Comparable Companies is a valuation technique used to evaluate the value of a company using the metrics of other businesses of similar size in the same industry.
Enterprise Value is a technique used to measure a company's market value. It is calculated by summing the enterprise's market capitalization, preferred stock, and debt and then subtracting cash and cash equivalents.
NAV/Liquidation Value is when the fair value of an investment is determined by the net asset value per share without adjustment or where the determination of fair value is determined by liquidation value without adjustment.
It is the Fund’s policy to hold new investments not valued by an independent pricing service at cost until quarter-end following the original trade date. Thereafter, the Fair Value Pricing Committee shall meet as soon as practicable to determine the appropriate methodology to value the investment. The Adviser and Sub-Adviser have engaged independent third-party valuation specialists to assist in valuing such investments. The Fair Value Pricing Committee will meet if there has been a material change to the underlying company, industry or market between the time of investment and the valuation date.
It is the Fund’s policy to recognize transfers into and out of all levels at the end of the reporting period. There were no transfers between levels during the period.
Investment Transactions – Investment security transactions are accounted for on trade date. Gains and losses on securities sold are determined on a specific identification basis.
Investment Income – Interest income is accrued and recorded on a daily basis including amortization of premiums, accretion of discounts and income earned from money market funds. Interest is not accrued on securities that are in default.
Foreign Currency Translation – The books and records of the Fund are maintained in U.S. dollars. Investment valuations and other assets and liabilities initially expressed in foreign currencies are converted each business day into U.S. dollars based upon current exchange rates. Prevailing foreign exchange rates may generally be obtained at the close of the NYSE (normally, 4:00 p.m. EST).
Foreign Securities – The Fund may directly purchase securities of foreign issuers. Investing in securities of foreign issuers involves special risks not typically associated with investing in securities of U.S. issuers. The risks include possible revaluation of currencies, the ability to repatriate funds, less complete financial information about companies and possible future adverse political and economic developments. Moreover, securities of many foreign issuers and their markets may be less liquid and their prices more volatile than those of securities of comparable U.S. issuers.
| 32 | 1.888.926.2688 | www.griffincapital.com |
| Griffin Institutional Access Credit Fund | Notes to Financial Statements |
June 30, 2018 (Unaudited)
Concentration of Credit Risk – The Fund places its cash with one banking institution, which is insured by Federal Deposit Insurance Corporation (“FDIC”). The FDIC limit is $250,000. At various times throughout the year, the amount on deposit may exceed the FDIC limit and subject the Fund to a credit risk. The Fund does not believe that such deposits are subject to any unusual risk associated with investment activities.
Loan Participation and Assignments – The Fund may invest in direct debt instruments which are interests in amounts owed to lenders or lending syndicates by corporate, governmental, or other borrowers. The Fund’s investments in loans may be in the form of participations in loans or assignments of all or a portion of the loans from third parties. A loan is often administered by a bank or other financial institution (the “agent”) that acts as agent for all holders. The agent administers the terms of the loan, as specified in the loan agreement. The Fund may invest in multiple series or tranches of a loan, which may have varying terms and carry different associated risks. The Fund generally has no right to enforce compliance with the terms of the loan agreement with the borrower. As a result, the Fund may be subject to the credit risk of both the borrower and the agent that is selling the loan agreement. When the Fund purchases assignments from lenders they acquire direct rights against the borrower of the loan. The Fund may enter into unfunded loan commitments, which are contractual obligations for future funding. Unfunded loan commitments represent a future obligation in full, even though a percentage of the notional loan amounts may not be utilized by the borrower. When investing in a loan participation, the Fund has the right to receive payments of principal, interest and any fees to which it is entitled only from the agent selling the loan agreement and only upon receipt of payments by the agent from the borrower. The Fund may receive a commitment fee based on the undrawn portion of the underlying line of credit portion of a floating rate loan. In certain circumstances, the Fund may receive a penalty fee upon the prepayment of a floating rate loan by a borrower. For the period ended June 30, 2018, no penalty fees were received by the Fund. Fees earned or paid are recorded as a component of interest income or interest expense, respectively, on the Statement of Operations. At June 30, 2018, the Fund had $562,237 in unfunded loan commitments.
Discounts and Premiums – Discounts and premiums on securities purchased are accreted/amortized over the life of the respective security using the effective interest method. The adjusted cost of investments represents the original cost adjusted for PIK interest and the accretion of discounts and amortization of premiums.
Distributions to Shareholders – The Fund intends to accrue dividends daily and to distribute as of the last business day of each quarter. Distributions of net capital gains are normally accrued and distributed in December. Income and capital gains distributions are determined in accordance with income tax regulations, which may differ from GAAP.
Indemnification – The Fund indemnifies its Officers and Trustees for certain liabilities that may arise from the performance of their duties to the Fund. Additionally, in the normal course of business, the Fund enters into contracts that contain a variety of representations and warranties and which provide general indemnities. The Fund’s maximum exposure under these arrangements is unknown, as this would involve future claims that may be made against the Fund that have not yet occurred. However, based on industry experience, the Fund expects the risk of loss due to these warranties and indemnities to be remote.
Offering Costs – Offering costs incurred by the Fund of $323,380 were treated as deferred charges until operations commenced and were amortized over a 12-month period using straight line method.
Federal Income Taxes – The Fund intends to continue to comply with the requirements of Subchapter M of the Internal Revenue Code applicable to regulated investment companies and will distribute all of its taxable income, if any, to shareholders. Accordingly, no provision for federal income taxes is required in the financial statements.
The Fund recognizes the tax benefits of uncertain tax positions only when the position is “more likely than not” to be sustained assuming examination by tax authorities. Management has reviewed the tax positions and has concluded that no liability for unrecognized tax benefits should be recorded related to uncertain tax positions expected to be taken in the Fund’s 2017 returns.
Commitments and Contingencies – In the normal course of business, the Fund's investment activities involve executions, settlement and financing of various transactions resulting in receivables from, and payables to, brokers, dealers and the Fund's custodian. These activities may expose the Fund to risk in the event that such parties are unable to fulfill contractual obligations. Management does not anticipate any material losses from counterparties with whom it conducts business. Consistent with standard business practice, the Fund enters into contracts that contain a variety of indemnifications, and is engaged from time to time in various legal actions. The maximum exposure of the Fund under these arrangements and activities is unknown. However, the Fund expects the risk of material loss to be remote.
| Semi-Annual Report | June 30, 2018 | 33 |
| Griffin Institutional Access Credit Fund | Notes to Financial Statements |
June 30, 2018 (Unaudited)
3. DERIVATIVE TRANSACTIONS
Derivative Instruments and Hedging Activities – The following discloses the Fund’s use of derivative instruments and hedging activities.
The Fund’s investment objectives allow the Fund to enter into various types of derivative contracts such as forward foreign currency contracts. In doing so, the Fund will employ strategies in differing combinations to permit it to increase, decrease, or change the level or types of exposure to market factors. Central to those strategies are features inherent to derivatives that make them more attractive for this purpose than equity or debt securities; they require little or no initial cash investment, they can focus exposure only on certain selected risk factors, and they may not require the ultimate receipt or delivery of the underlying security (or securities) to the contract. This may allow the Fund to pursue its objectives more quickly and efficiently than if it were to make direct purchases or sales of securities capable of effecting a similar response to market factors.
Foreign Exchange Rate Risk – Foreign exchange rate risk relates to the change in the U.S. dollar value of a security held that is denominated in a foreign currency. The value of a foreign currency denominated security will decrease as the dollar appreciates against the currency, while the value of the foreign currency denominated security will increase as the dollar depreciates against the currency.
Risk of Investing in Derivatives – The Fund’s use of derivatives can result in losses due to unanticipated changes in the market risk factors and the overall market.
Derivatives may have little or no initial cash investment relative to their market value exposure and therefore can produce significant gains or losses in excess of their cost. This use of embedded leverage allows the Fund to increase its market value exposure relative to its net assets and can substantially increase the volatility of the Fund’s performance.
Additional associated risks from investing in derivatives also exist and potentially could have significant effects on the valuation of the derivative and the Fund. Typically, the associated risks are not the risks that the Fund is attempting to increase or decrease exposure to, per their investment objectives, but are the additional risks from investing in derivatives.
Examples of these associated risks are liquidity risk, which is the risk that the Fund will not be able to sell the derivative in the open market in a timely manner, and counterparty credit risk, which is the risk that the counterparty will not fulfill its obligation to the Fund.
Forward Foreign Currency Contracts – The Fund engaged in currency transactions with counterparties during the period ended June 30, 2018 to hedge the value of portfolio securities denominated in particular currencies against fluctuations in relative value, to gain or reduce exposure to certain currencies, or to generate income or gains. A forward foreign currency contract is an agreement between two parties to buy and sell a currency at a set price on a future date. The contract is marked-to-market daily and the change in value is recorded by the Fund as an unrealized gain or loss. When a forward foreign currency contract is extinguished, the Fund records a realized gain or loss equal to the difference between the value of the contract at the time it was opened and the value of the contract at the time it was extinguished.
Forward foreign currency contracts involve elements of market risk in excess of the amounts reflected in the Statements of Assets and Liabilities. The Fund bears the risk of an unfavorable change in the foreign exchange rate underlying the forward foreign currency contract. Risks may also arise upon entering into these contracts from the potential inability of the counterparties to meet the terms of their contracts.
The tables below are a summary of the fair valuations of derivative instruments categorized by risk exposure.
Fair values of forward foreign currency contracts on the Statements of Assets and Liabilities as of June 30, 2018:
| Risk Exposure | | Statement of Assets
and Liabilities
Location | | Fair Value | | | Statement of Assets
and Liabilities
Location | | Fair Value | |
| Griffin Institutional Access Credit Fund | | | | | | | | | | | | |
| Foreign Exchange Rate Risk (Forward Foreign Currency Contracts) | | Unrealized appreciation on forward foreign currency contracts | | $ | 2,012 | | | Unrealized depreciation on forward foreign currency contracts | | $ | (20,760 | ) |
| Total | | | | $ | 2,012 | | | | | $ | (20,760 | ) |
Forward foreign currency contracts average notional value during the period ended June 30, 2018 is $20,405,000.
| 34 | 1.888.926.2688 | www.griffincapital.com |
| Griffin Institutional Access Credit Fund | Notes to Financial Statements |
June 30, 2018 (Unaudited)
The effect of forward foreign currency contracts on the Statements of Operations for the period ended June 30, 2018:
| Risk Exposure | | Location | | Realized
Gain/(Loss) on
Derivatives | | | Location | | Change in Unrealized
Appreciation/
(Depreciation)
on Derivatives Recognized in
Income | |
| Griffin Institutional Access Credit Fund | | | | | | | | | | | | |
| Foreign Exchange Rate Risk (Forward Foreign Currency Contracts) | | Net realized gain/(loss) on forward foreign currency contracts | | $ | 206,344 | | | Change in unrealized appreciation/(depreciation) on forward foreign currency contracts | | $ | (6,047 | ) |
| Total | | | | $ | 206,344 | | | | | $ | (6,047 | ) |
4. ADVISORY FEES, ADMINISTRATION FEES AND OTHER AGREEMENTS
Investment Advisory
Pursuant to the Investment Advisory Agreement with the Fund (“Advisory Agreement”), the Adviser is entitled to an investment advisory fee of 1.85% of the average daily net assets of the Fund, computed daily and payable monthly.
The Adviser and the Fund have entered into an expense limitation and reimbursement agreement (the “Expense Limitation Agreement”) under which the Adviser has agreed contractually to waive its fees and to pay or absorb the ordinary annual operating expenses of the Fund (including offering expenses, but excluding taxes, interest, brokerage commissions, acquired fund fees and expenses and extraordinary expenses) at least until April 30, 2019, so that the total annual operating expenses of the Fund do not exceed 2.60% per annum of Class A average daily net assets, 3.35% per annum of Class C average daily net assets, 2.35% per annum of Class I average daily net assets, 2.85% per annum of Class L average daily net assets and 1.85% per annum of Class F average daily net assets (the “Expense Limitations”). The agreement can be extended at the discretion of the Adviser and the Trustees.
In consideration of the Adviser’s agreement to limit the Fund’s expenses, the Fund has agreed to repay the Adviser in the amount of any fees waived and Fund expenses paid or absorbed, subject to the limitations that: (1) the reimbursement for fees and expenses will be made only if payable not more than three years from the date such expenses were incurred; and (2) the reimbursement may not be made if it would cause the Expense Limitations to be exceeded. In addition to the Expense Limitation Agreement described above, the Adviser voluntarily has waived or absorbed all of the operating expenses of the Fund since the commencement of the Fund’s operations. Fees waived and Fund expenses paid or absorbed with respect to Class F assets will not be repaid or reimbursed. The Adviser will continue to bear such expenses on a going forward basis in its discretion and is under no obligation to continue to do so for any specified period of time. Operating expenses absorbed by the Adviser during this voluntary period will be permanently waived.
During the period ended June 30, 2018, the fee waiver was as follows:
| | | Fees Waived/Reimbursed By Advisor | |
| Griffin Institutional Access Credit Fund | | $ | (1,729,687 | ) |
Sub-advisory services are provided to the Fund pursuant to an agreement between the Fund, Adviser and Sub-Adviser. Under the terms of the investment sub-advisory agreement, the Adviser compensates the Sub-Adviser based the Fund’s average daily net assets.
Fund Administration and Accounting Fees and Expenses
ALPS Fund Services, Inc. serves as the Fund’s administrator and accounting agent (the “Administrator”) and receives customary fees from the Fund for such services. The Administrator is also reimbursed by the Fund for certain out of pocket expenses.
Transfer Agent
DST Systems, Inc. serves as transfer, distribution paying and shareholder servicing agent for the Fund (the “Transfer Agent”).
| Semi-Annual Report | June 30, 2018 | 35 |
| Griffin Institutional Access Credit Fund | Notes to Financial Statements |
June 30, 2018 (Unaudited)
Compliance Services
Ryan Del Giudice serves as the Chief Compliance Officer to the Fund. Cipperman Compliance Services, LLC provides various compliance services to the Fund pursuant to a consulting agreement between Cipperman Compliance Services LLC and the Fund.
Distributor
The Fund has entered into a Distribution Agreement with ALPS Distributors, Inc. (the “Distributor”) to provide distribution services to the Fund. The Distributor serves as principal underwriter of shares of the Fund. Under the Distribution Agreement, the Class C shares and Class L shares will pay to the Distributor a Distribution Fee that will accrue at an annual rate equal to 0.75% and 0.25% of the Fund’s average daily net assets attributable to Class C shares and Class L shares, respectively, payable on a quarterly basis. For the period ended June 30, 2018, Class C shares and Class L shares incurred distribution fees of $30,388 and $676. Class A, Class I and Class F shares are not currently subject to a Distribution Fee. Under the Shareholder Services Plan, the Class A, Class C and Class L shares may pay up to 0.25% per year of their average daily net assets for such services. For the period ended June 30, 2018, Class A, Class C and Class L shares incurred shareholder servicing fees of $23,499, $10,129 and $4, respectively. Class I and Class F shares are not currently subject to a shareholder services fee.
The Distributor has entered into a wholesale marketing agreement with Griffin Capital Securities, LLC, a registered broker-dealer affiliate of the Adviser. Pursuant to the terms of the wholesale marketing agreement, Griffin Capital Securities will seek to market and otherwise promote the Fund through various wholesale distribution channels, including regional and independent retail broker-dealers and registered investment Advisers.
Officer and Trustee Compensation
Each Trustee who is not affiliated with the Fund or Adviser receives $5,000 per quarterly and special in-person meetings and $500 per special telephonic meetings, as well as reimbursement for any reasonable expenses incurred attending meetings. The chair of the Audit Committee receives an additional $10,000 annually. None of the executive officers receive compensation from the Fund.
Certain Trustees and officers of the Fund are also officers of the Adviser and are not paid by the Fund for serving in such capacities.
5. PURCHASES AND SALES OF INVESTMENT SECURITIES
The cost of purchases and proceeds from the sale of securities, other than short-term securities, for the period ended June 30, 2018 were as follows:
| | | Purchases of Securities | | | Proceeds from Sales of
Securities | |
| Griffin Institutional Access Credit Fund | | $ | 72,204,070 | | | $ | 46,613,949 | |
6. TAX BASIS INFORMATION
Distributions are determined in accordance with federal income tax regulations, which differ from GAAP, and, therefore, may differ significantly in amount or character from net investment income and realized gains for financial reporting purposes. Financial reporting records are adjusted for permanent book/tax differences to reflect tax character but are not adjusted for temporary differences. The amounts and characteristics of tax basis distributions and composition of distributable earnings/(accumulated losses) are finalized at fiscal year-end. Accordingly, tax basis balances have not been determined as of the date of the semi-annual report.
For the period ended December 31, 2017, the following reclassifications, which had no impact on results of operations or net assets, were recorded to reflect tax character:
| | | Paid-in Capital | | | Accumulated Net
Investment Income/(Loss) | | | Accumulated Net Realized
Gain/(Loss) on Investments | |
| Griffin Institutional Access Credit Fund | | $ | 58,147 | | | $ | (19,837 | ) | | $ | (38,310 | ) |
The tax character of distributions paid for the period ended December 31, 2017 was as follows:
| Year | | Ordinary Income | | | Long-Term Capital Gain | | | Return of Capital | |
| 2017 | | $ | 1,474,109 | | | $ | – | | | $ | – | |
| 36 | 1.888.926.2688 | www.griffincapital.com |
| Griffin Institutional Access Credit Fund | Notes to Financial Statements |
June 30, 2018 (Unaudited)
As of June 30, 2018, net unrealized appreciation/(depreciation) of investments based on the federal tax cost was as follows:
| | | Gross Appreciation
(excess of value
over tax cost) | | | Gross Depreciation
(excess of tax cost
over value) | | | Net Unrealized
Appreciation | | | Cost of Investments
for Income Tax
Purposes | |
| Griffin Institutional Access Credit Fund | | $ | 737,307 | | | $ | (2,009,967 | ) | | $ | (1,272,660 | ) | | $ | 120,681,646 | |
7. REPURCHASE OFFERS
The Fund is an interval fund and, as such, has adopted a fundamental policy to make quarterly repurchase offers, at net asset value, of no less than 5% of the Fund’s shares outstanding. There is no guarantee that shareholders will be able to sell all of the shares they desire to sell in a quarterly repurchase offer. Liquidity will be provided to shareholders only through the Fund’s quarterly repurchases. Shareholders will be notified in writing of each quarterly repurchase offer and the date the repurchase offer ends (the “Repurchase Request Deadline”). Shares will be repurchased at the NAV per share determined as of the close of regular trading on the NYSE no later than the 14th day after the Repurchase Request Deadline, or the next business day if the 14th day is not a business day (each a “Repurchase Pricing Date”).
During the period ended June 30, 2018, the Fund completed two quarterly repurchase offers. In these offers, the Fund offered to repurchase up to 5% of the number of its outstanding shares as of the Repurchase Pricing Dates. With regard to the Repurchase Pricing Date on February 5, 2018, the Trustees increased the number of shares available for repurchase by the Fund. With regard to each of the quarterly repurchase offers for the period ended June 30, 2018, all repurchase requests received by the Fund were fully honored. The result of those repurchase offers were as follows:
| | Repurchase Offer #1 | Repurchase Offer #2 |
| Commencement Date | December 27, 2017 | March 30, 2018 |
| Repurchase Request Deadline | February 5, 2018 | May 2, 2018 |
| Repurchase Pricing Date | February 5, 2018 | May 2, 2018 |
| Amount Repurchased | $7,857,065 | $3,579,413 |
| Shares Repurchased | 310,679 | 142,955 |
8. RISK FACTORS
In the normal course of business, the Fund invests in financial instruments and enters into financial transactions where risk of potential loss exists due to such things as changes in the market (market risk) or failure or inability of the other party to a transaction to perform (credit and counterparty risk). See below for a detailed description of select principal risks. The following list is not intended to be a comprehensive listing of all of the potential risks associated with the Fund. For a more comprehensive list of potential risks the Fund may be subject to, please refer to the Fund’s Prospectus and Statement of Additional Information (“SAI”).
Debt Securities Risk When the Fund invests in debt securities, the value of your investment in the Fund will fluctuate with changes in interest rates. Typically, a rise in interest rates causes a decline in the value of debt securities. In general, the market price of debt securities with longer maturities will increase or decrease more in response to changes in interest rates than shorter-term securities. Other risk factors include credit risk (the debtor may default) and prepayment risk (the debtor may pay its obligation early, reducing the amount of interest payments). These risks could affect the value of a particular investment, possibly causing the Fund’s share price and total return to be reduced and fluctuate more than other types of investments.
Secured Debt Risk Secured debt holds the most senior position in the capital structure of a borrower. Secured debt in most circumstances is fully collateralized by assets of the borrower. Thus, it is generally repaid before unsecured bank loans, corporate bonds, subordinated debt, trade creditors, and preferred or common stockholders. Substantial increases in interest rates may cause an increase in loan defaults as borrowers may lack resources to meet higher debt service requirements. The value of the Fund’s assets may also be affected by other uncertainties such as economic developments affecting the market for senior secured term loans or affecting borrowers generally. Moreover, the security for the Fund’s investments in secured debt may not be recognized for a variety of reasons, including the failure to make required filings by lenders, trustees or other responsible parties and, as a result, the Fund may not have priority over other creditors as anticipated.
Secured debt usually includes restrictive covenants, which must be maintained by the borrower. The Fund may have an obligation with respect to certain senior secured term loan investments to make additional loans upon demand by the borrower. Such instruments, unlike certain bonds, usually do not have call protection. This means that such interests, while having a stated term, may be prepaid, often without penalty. The rate of such prepayments may be affected by, among other things, general business and economic conditions, as well as the financial status of the borrower. Prepayment would cause the actual duration of a senior loan to be shorter than its stated maturity
| Semi-Annual Report | June 30, 2018 | 37 |
| Griffin Institutional Access Credit Fund | Notes to Financial Statements |
June 30, 2018 (Unaudited)
Secured debt typically will be secured by pledges of collateral from the borrower in the form of tangible and intangible assets. In some instances, the Fund may invest in secured debt that is secured only by stock of the borrower or its subsidiaries or affiliates. The value of the collateral may decline below the principal amount of the senior secured term loans subsequent to an investment by the Fund.
Subordinated and Unsecured or Partially Secured Loans Risk The Fund may invest in unsecured loans and secured subordinated loans, including second and lower lien loans. Second lien loans are generally second in line in terms of repayment priority. A second lien loan may have a claim on the same collateral pool as the first lien or it may be secured by a separate set of assets. Second lien loans generally give investors priority over general unsecured creditors in the event of an asset sale. The priority of the collateral claims of third or lower lien loans ranks below holders of second lien loans and so on. Such junior loans are subject to the same general risks inherent to any loan investment, including credit risk, market and liquidity risk, and interest rate risk. Due to their lower place in the borrower’s capital structure and possible unsecured or partially secured status, such loans involve a higher degree of overall risk than senior loans of the same borrower.
Bank Loans Risk The Fund expects that some of its investments will consist of interests in loans originated by banks and other financial institutions. The loans invested in by the Fund may include term loans and revolving loans, may pay interest at a fixed or floating rate and may be senior or subordinated. Purchasers of bank loans are predominantly commercial banks, investment funds and investment banks. As secondary market trading volumes for bank loans increase, new bank loans are frequently adopting standardized documentation to facilitate loan trading which should improve market liquidity. There can be no assurance as to when or even if this current market illiquidity and volatility will abate or that future levels of supply and demand in bank loan trading will provide an adequate degree of liquidity, that the current period of illiquidity will not persist or worsen and that the market will not experience periods of significant illiquidity in the future. In addition, the Fund will make investments in stressed or distressed bank loans which are often less liquid than performing bank loans.
Structured Products Risk The Fund may invest in Collateralized Debt Obligations (“CDOs”) and other structured products, consisting of Collateralized Bond Obligations, Collateralized Loan Obligations (“CLOs”) and credit-linked notes. Holders of structured products bear risks of the underlying investments, index or reference obligation and are subject to counterparty risk.
The Fund may have the right to receive payments only from the structured product, and generally does not have direct rights against the issuer or the entity that sold the assets to be securitized. While certain structured products enable the investor to acquire interests in a pool of securities without the brokerage and other expenses associated with directly holding the same securities, investors in structured products generally pay their share of the structured product’s administrative and other expenses. Although it is difficult to predict whether the prices of indices and securities underlying structured products will rise or fall, these prices (and, therefore, the prices of structured products) will be influenced by the same types of political and economic events that affect issuers of securities and capital markets generally. If the issuer of a structured product uses shorter term financing to purchase longer term securities, the issuer may be forced to sell its securities at below market prices if it experiences difficulty in obtaining short-term financing, which may adversely affect the value of the structured products owned by the Fund.
Certain structured products may be thinly traded or have a limited trading market. CLOs and credit-linked notes are typically privately offered and sold.
Direct Lending Risk To the extent the Fund is the sole lender in privately offered debt, it may be solely responsible for the expense of servicing that debt, including, if necessary, taking legal actions to foreclose on any security instrument securing the debt (e.g., the mortgage or, in the case of a mezzanine loan, the pledge). This may increase the risk and expense to the Fund compared to syndicated or publicly offered debt.
CLO Risk In addition to the general risks associated with debt securities and structured products discussed herein, CLOs carry additional risks, including, but not limited to (i) the possibility that distributions from collateral securities will not be adequate to make interest or other payments; (ii) the quality of the collateral may decline in value or default; (iii) the possibility that the investments in CLOs are subordinate to other classes or tranches thereof; and (iv) the complex structure of the security may not be fully understood at the time of investment and may produce disputes with the issuer or unexpected investment results.
CLO equity and junior debt securities that the Fund may acquire are subordinated to more senior tranches of CLO debt. CLO equity and junior debt securities are subject to increased risks of default relative to the holders of superior priority interests in the same securities. In addition, at the time of issuance, CLO equity securities are under-collateralized in that the liabilities of a CLO at inception exceed its total assets. Though not exclusively, the Fund will typically be in a first loss or subordinated position with respect to realized losses on the assets of the CLOs in which it is invested. The Fund may recognize phantom taxable income from its investments in the subordinated tranches of CLOs and structured notes. See “Tax Status” in the Fund’s SAI.
| 38 | 1.888.926.2688 | www.griffincapital.com |
| Griffin Institutional Access Credit Fund | Notes to Financial Statements |
June 30, 2018 (Unaudited)
Between the closing date and the effective date of a CLO, the CLO collateral manager will generally expect to purchase additional collateral obligations for the CLO. During this period, the price and availability of these collateral obligations may be adversely affected by a number of market factors, including price volatility and availability of investments suitable for the CLO, which could hamper the ability of the collateral manager to acquire a portfolio of collateral obligations that will satisfy specified concentration limitations and allow the CLO to reach the initial par amount of collateral prior to the effective date. An inability or delay in reaching the target initial par amount of collateral may adversely affect the timing and amount of interest or principal payments received by the holders of the CLO debt securities and distributions of the CLO on equity securities and could result in early redemptions which may cause CLO debt and equity investors to receive less than face value of their investment.
The failure by a CLO in which the Fund invests to satisfy financial covenants, including with respect to adequate collateralization and/or interest coverage tests, could lead to a reduction in the CLO’s payments to the Fund. In the event that a CLO fails certain tests, holders of CLO senior debt may be entitled to additional payments that would, in turn, reduce the payments the Fund would otherwise be entitled to receive. Separately, the Fund may incur expenses to the extent necessary to seek recovery upon default or to negotiate new terms, which may include the waiver of certain financial covenants, with a defaulting CLO or any other investment the Fund may make. If any of these occur, it could adversely affect the Fund’s operating results and cash flows.
The Fund’s CLO investments are exposed to leveraged credit risk. If certain minimum collateral value ratios and/or interest coverage ratios are not met by a CLO, primarily due to senior secured loan defaults, then cash flow that otherwise would have been available to pay distributions to the Fund on its CLO investments may instead be used to redeem any senior notes or to purchase additional senior secured loans, until the ratios again exceed the minimum required levels or any senior notes are repaid in full. The Fund’s CLO investments and/or the underlying senior secured loans may prepay more quickly than expected, which could have an adverse impact on the Company’s net assets.
Mezzanine Securities Risk Most of the Fund’s mezzanine securities and other investments (if any) are expected to be unsecured and made in companies whose capital structures have significant indebtedness ranking ahead of the investments, all or a significant portion of which may be secured. While the securities and other investments may benefit from the same or similar financial and other covenants as those enjoyed by the indebtedness ranking ahead of the investments and may benefit from cross-default provisions and security over the portfolio company’s assets, some or all of such terms may not be part of particular investments. Mezzanine securities and other investments generally are subject to various risks including, without limitation: (i) a subsequent characterization of an investment as a “fraudulent conveyance”; (ii) the recovery as a “preference” of liens perfected or payments made on account of a debt in the 90 days before a bankruptcy filing; (iii) equitable subordination claims by other creditors; (iv) so-called “lender liability” claims by the issuer of the obligations; and (v) environmental liabilities that may arise with respect to collateral securing the obligations.
High Yield Debt Risk A substantial portion of the high yield debt in which the Fund intends to invest are rated below investment-grade by one or more nationally recognized statistical rating organizations or are unrated but of comparable credit quality to obligations rated below investmentgrade, and have greater credit and liquidity risk than more highly rated debt obligations. Lower-rated securities may include securities that have the lowest rating or are in default. High yield debt is generally unsecured and may be subordinate to other obligations of the obligor. The lower rating of high yield debt reflects a greater possibility that adverse changes in the financial condition of the obligor or in general economic conditions (including, for example, a substantial period of rising interest rates or declining earnings) or both may impair the ability of the obligor to make payment of principal and interest. Many issuers of high yield debt are highly leveraged, and their relatively high debt-to-equity ratios create increased risks that their operations might not generate sufficient cash flow to service their debt obligations. In addition, many issuers of high yield debt may be in poor financial condition, experiencing poor operating results, having substantial capital needs or negative net worth or be facing special competitive or product obsolescence problems, and may include companies involved in bankruptcy or other reorganizations or liquidation proceedings. Certain of these securities may not be publicly traded, and therefore it may be difficult to obtain information as to the true condition of the issuers. Overall declines in the below investment-grade bond and other markets may adversely affect such issuers by inhibiting their ability to refinance their debt at maturity. High yield debt is often less liquid than higher rated securities.
Credit Risk There is a risk that debt issuers will not make payments, resulting in losses to the Fund. In addition, the credit quality of securities may be lowered if an issuer’s financial condition changes. Lower credit quality may lead to greater volatility in the price of a security and in shares of the Fund. Lower credit quality also may affect liquidity and make it difficult to sell the security. Default, or the market’s perception that an issuer is likely to default, could reduce the value and liquidity of securities, thereby reducing the value of your investment in Fund shares. In addition, default may cause the Fund to incur expenses in seeking recovery of principal or interest on its portfolio holdings.
Medium and Small Capitalization Company Risk Some issuers of the Fund’s investments may be medium or small capitalization companies which may be newly formed or have limited product lines, distribution channels, and financial or managerial resources. The risks associated with these investments are generally greater than those associated with investments in the securities of larger, more-established companies. The Fund does not maintain a policy limiting its ability to invest in medium or small capitalization companies. This may cause the Fund’s NAV to be more volatile when compared to investment companies that focus only on large capitalization companies. Generally, securities of medium and small capitalization companies are more likely to experience sharper swings in market values, less liquid markets, in which it may be more difficult for the Advisor to sell at times and at prices that the Advisor believes appropriate, and generally are more volatile than those of larger companies. Compared to large companies, smaller companies are more likely to have (i) less information publicly available, (ii) more limited product lines or markets and less mature businesses, (iii) fewer capital resources, (iv) more limited management depth, and (v) shorter operating histories. Further, the equity securities of smaller companies are often traded over-the-counter and generally experience a lower trading volume than is typical for securities that are traded on a national securities exchange. Consequently, the Fund may be required to dispose of these securities over a longer period of time (and potentially at less favorable prices) than would be the case for securities of larger companies, offering greater potential for gains and losses and associated tax consequences.
| Semi-Annual Report | June 30, 2018 | 39 |
| Griffin Institutional Access Credit Fund | Notes to Financial Statements |
June 30, 2018 (Unaudited)
9. ACCOUNTING PRONOUNCEMENTS
In November 2016, the FASB issued Accounting Standards Update “Restricted Cash” which will require entities to include the total of cash, cash equivalents, restricted cash, and restricted cash equivalents in the beginning and ending cash balances in the Statement of Cash Flows. The guidance is effective for fiscal years beginning after December 15, 2017, and interim periods within those years. The Funds’ adoption of this guidance, effective with the financial statements prepared as of June 30, 2018, is reflected in the Statement of Cash Flows and had no effect on the Funds’ net assets or results of operations.
10. SUBSEQUENT EVENTS
Subsequent events after the date of the Statement of Assets and Liabilities have been evaluated through the date the financial statements were issued.
The Fund completed a quarterly repurchase offer on August 03, 2018, which resulted in 335,619 Fund shares being repurchased for $8,396,285.
Management has determined that there were no other subsequent events to report through the issuance of these financial statements.
| 40 | 1.888.926.2688 www.griffincapital.com |
| Griffin Institutional Access Credit Fund | Additional Information |
June 30, 2018 (Unaudited)
1. PROXY VOTING POLICIES AND VOTING RECORD
A description of the policies and procedures that the Fund uses to vote proxies relating to portfolio securities is available without charge upon request by calling toll-free 888-926-2688, or on the Securities and Exchange Commission’s (“SEC”) website at https://www.sec.gov. Information regarding how the Fund voted proxies relating to portfolio securities during the most recent 12-month period ended June 30th is available without charge upon request by calling toll-free 888-926-2688, or on the SEC’s website at https://www.sec.gov.
2. QUARTERLY PORTFOLIO HOLDINGS
The Fund files a complete listing of portfolio holdings for the Fund with the SEC as of the first and third quarters of each fiscal year on Form N-Q. The filings are available upon request by calling 888-926-2688. Furthermore, you may obtain a copy of the filing on the SEC’s website at https://www.sec.gov. The Fund’s Form N-Q may also be reviewed and co pied at the SEC’s Public Reference Room in Washington, D.C., and information on the operation of the Public Reference Room may be obtained by calling 1-800-SEC-0330.
| Semi-Annual Report | June 30, 2018 | 41 |

Item 2. Code of Ethics.
Not applicable.
Item 3. Audit Committee Financial Expert.
Not applicable.
Item 4. Principal Accountant Fees and Services.
Not applicable.
Item 5. Audit Committee of Listed Registrants.
Not applicable to the registrant.
Item 6. Investments.
| (a) | The Schedule of Investments is included as part of the Report to Stockholders filed under Item 1 of this report. |
| (b) | Not applicable to the registrant. |
Item 7. Disclosure of Proxy Voting Policies and Procedures for Closed-End Management Investment Companies.
Not applicable.
Item 8. Portfolio Managers of Closed-End Management Investment Companies.
Item 9. Purchases of Equity Securities by Closed-End Management Investment Company and Affiliated Purchasers.
None.
Item 10. Submission of Matters to a Vote of Security Holders.
The registrant has not adopted procedures by which shareholders may recommend nominees to the registrant’s Board of Trustees.
Item 11. Controls and Procedures.
| (a) | Based on an evaluation of the registrant’s disclosure controls and procedures (as defined in Rule 30a-3(c) under the 1940 Act), the registrant’s principal executive officer and principal financial officer have concluded that the registrant’s disclosure controls and procedures are effective as of a date within 90 days of the filing date of this report. |
| (b) | There were no significant changes in the registrant’s internal control over financial reporting that occurred during the registrant’s last fiscal half-year that have materially affected, or are reasonably likely to materially affect, the registrant’s internal control over financial reporting. |
Item 12. Disclosure of Securities Lending Activities for Closed-End Management Investment Companies.
Not applicable.
Item 13. Exhibits.
| (a)(2) | Certifications required by Item 12(a)(2) of Form N-CSR are filed herewith as Exhibit 99.CERT. |
| (a)(3) | Not applicable to the registrant. |
| (b) | Certifications required by Item 12(b) of Form N-CSR are filed herewith as Exhibit 99.906CERT. |
SIGNATURES
Pursuant to the requirements of the Securities Exchange Act of 1934 and the Investment Company Act of 1940, the registrant has duly caused this report to be signed on its behalf by the undersigned, thereunto duly authorized.
GRIFFIN INSTITUTIONAL ACCESS CREDIT FUND
| By: | /s/ Kevin Shields | |
| | Kevin Shields | |
| | President (Principal Executive Officer) | |
| | | |
| Date: | September 5, 2018 | |
Pursuant to the requirements of the Securities Exchange Act of 1934 and the Investment Company Act of 1940, this report has been signed below by the following persons on behalf of the registrant and in the capacities and on the dates indicated.
By (Signature and Title)
| By: | /s/ Kevin Shields | |
| | Kevin Shields | |
| | President (Principal Executive Officer) | |
| | | |
| Date: | September 5, 2018 | |
By (Signature and Title)
| By: | /s/ Joseph Miller | |
| | Joseph Miller | |
| | Treasurer (Principal Financial Officer) | |
| | | |
| Date: | September 5, 2018 | |