UNITED STATES
SECURITIES AND EXCHANGE COMMISSION
WASHINGTON, D.C. 20549
FORM N-CSR
CERTIFIED SHAREHOLDER REPORT OF REGISTERED
MANAGEMENT INVESTMENT COMPANIES
811-23159
(Investment Company Act file number)
Griffin Institutional Access Credit Fund
(Exact name of registrant as specified in charter)
Griffin Capital Plaza
1520 E. Grand Avenue
El Segundo, CA 90245
(Address of principal executive offices)
(310) 469.6100
(Registrant's telephone number, including area code)
ALPS Fund Services, Inc.
1290 Broadway, Suite 1000
Denver, CO 80203
(Name and address of agent for service)
Copy to:
Terrence O. Davis, Esq.
Greenberg Traurig, LLP
3333 Piedmont Road, NE, Suite 2500
Atlanta, GA 30305
Date of fiscal year end:December 31
Date of reporting period:January 1 - June 30, 2019
Item 1. Reports to Stockholders.
ELECTRONIC REPORTS DISCLOSURE
Beginning on January 1, 2021, as permitted by regulations adopted by the Securities and Exchange Commission, paper copies of the Fund shareholder reports will no longer be sent by mail, unless you specifically request paper copies of the reports from the Fund or from your financial intermediary (such as a broker-dealer or bank). Instead, the reports will be made available on the Fund’s website (www.griffincapital.com), and you will be notified by mail each time a report is posted and provided with a website link to access the report. You may elect to receive all future reports in paper free of charge. If you invest through a financial intermediary, you can contact your financial intermediary to request that you continue to receive paper copies of your shareholder reports. If you invest directly with the Fund, you can call the Fund toll-free at 1-888-926-2688 or submit a signed letter of instruction requesting paper reports to Griffin Institutional Access Credit Fund, c/o DST Systems, Inc., 430 W 7th St, Kansas City, MO 64105-1407. Your election to receive reports in paper will apply to all funds held in your account if you invest through your financial intermediary or all funds held with the fund complex if you invest directly with a fund. If you already elected to receive shareholder reports electronically, you will not be affected by this change and you need not take any action. You may elect to receive shareholder reports and other communications from the Fund electronically anytime by contacting your financial intermediary or, if you invest directly with the Fund, by enrolling at www.griffincapital.com.
Table of Contents
| Shareholder Letter | 2 |
| Portfolio Update | 10 |
| Consolidated Schedule of Investments | 12 |
| Consolidated Statement of Assets and Liabilities | 32 |
| Consolidated Statement of Operations | 34 |
| Consolidated Statements of Changes in Net Assets | 35 |
| Consolidated Statement of Cash Flows | 37 |
| Consolidated Financial Highlights | 38 |
| Notes to Consolidated Financial Statements | 43 |
| Additional Information | 57 |
| Approval of the Investment Advisory Agreement | 58 |
| Privacy Policy | 61 |
Dear Fellow Shareholders,
We are pleased to present the semi-annual report for Griffin Institutional Access® Credit Fund (the “Fund”). We greatly appreciate the support of our shareholders as well as our broker-dealer partners and will remain true to our stated investment objective of generating a return comprised of both current income and capital appreciation with low volatility and low correlation to the broader markets. From the Fund’s inception through June 30, 2019, the Fund’s Class I shares (NASDAQ: CRDIX) generated a(n):
| ● | Total cumulative return of 13.07% and a 5.64% annualized return1 |
| ● | Standard Deviation of 2.75%1 |
The Fund’s sub-adviser—BCSF Advisors, LP, an affiliate of Bain Capital Credit, LP—has continued to construct a well-diversified alternative credit portfolio. The portfolio composition is ultimately determined through both fundamental quantitative and qualitative analysis to determine the optimal mix of securities across global markets with the potential to deliver strong risk-adjusted returns for investors.
GRIFFIN INSTITUTIONAL ACCESS CREDIT FUND
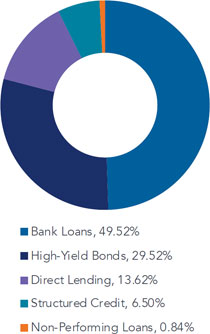
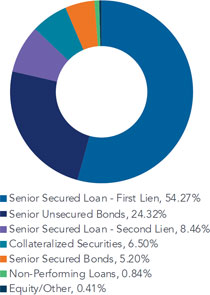
PORTFOLIO DIVERSIFICATION AS OF JUNE 30, 2019
| Floating Rate Assets2:69.02% | Fixed Rate Assets2:30.98% |
| | |
| | |
| Sector Analysis3 | Asset Type3 |
| | |
 |  |
Past performance is not a guarantee of future results.
During the first half of the year, the Fund’s performance has benefitted from a strong credit environment and active portfolio management across asset classes. The top contributors to returns at the asset class level were high-yield bonds, followed by loans and collateralized loan obligation (CLO) equity. At the industry level, several industries contributed to returns during the period notably Industrials, Telecom, and Aerospace & Defense.
From an asset allocation perspective, we continue to favor senior secured loans in both directly originated and syndicated transactions. We added to our bond position over the past six months, taking advantage of market volatility to purchase at discounted prices. These opportunities have been accretive to the Fund’s performance, as high-yield bonds have outperformed other asset classes year-to-date. Within structured products, the Fund holds a mix of both CLO equity and mezzanine debt. Following a strong recovery in the asset class over recent months, the portfolio management team harvested gains in CLO mezzanine debt and remains constructive on the asset class. Additionally, the Fund has been active in direct lending deals, which saw an uptick in volume in the second quarter following a relatively slow start to the year.
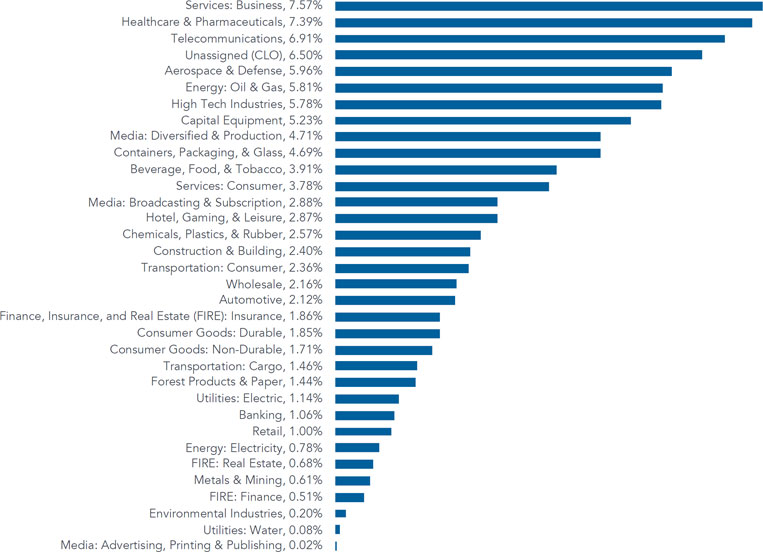
From an industry perspective, our positioning was relatively unchanged during the last six months. We maintain our overweight to Aerospace and Defense, an industry we like due to the high profit visibility exhibited by many companies in the space. Retail, as has been the case for several quarters, continues to be an underweight in the portfolio due to the secular headwinds that exist for brick-and-mortar retailers.
Market Overview and Outlook4
High-yield bonds and leveraged loans continued their year-to-date rally into the second quarter, albeit at a more measured pace than in the first three months of the year. The S&P/LSTA Leveraged Loan Index and ICE Bank of America Merrill Lynch US High Yield Index returned 5.7% and 10.2%, respectively, year-to-date through June 30, 2019, driven in large part by expectations of a shift in Federal Reserve (the “Fed”) policy. In Q1 2019, the Fed opted to keep its benchmark interest rate unchanged, halting a more than three-year trend of rate hikes that began in 2015. Adding to this dovish action, the Fed then suggested that rate cuts could be on the horizon. Markets began pricing in lower interest rates, which favored fixed-rate assets, particularly high-yield bonds. Fundamentally, we believe the market is in reasonably good shape. Leverage levels are slightly higher today, but interest coverage ratios remain healthy in most segments of the market. The default environment remains benign, with the leveraged credit trailing 12-month default rate at 1.4% at the end of June.5
Moving forward, a generally favorable economic backdrop coupled with a more accommodative Federal Reserve and European Central Bank could provide a tailwind for the risk assets. However, we believe it is unlikely that credit market performance in the second half of 2019 will match the pace of the prior six months, although continued modest economic growth could further propel markets higher. Notwithstanding this view, we believe periods of volatility, such as the fourth quarter of 2018 and to a lesser extent May 2019, will continue in the interim. Whether driven by a Fed misstep, concerns regarding global trade relations, or fears of a recession, these episodes of market volatility generally become more common late in the credit cycle. For these reasons we are maintaining our slightly defensive positioning in the Fund, leaning towards more liquid names in loans and high-yield bonds, while also building exposure to what we consider attractively priced CLO debt and equity assets. In addition, we continue to build direct lending exposure in the Fund, utilizing the breadth of the Bain platform to negotiate terms and credit structures on stable issuers. We are pleased with the Fund’s current portfolio composition and continue to leverage the breadth of the Bain Capital Credit global platform to generate a pipeline of new investment opportunities, consistent with the stated investment objective of the Fund.
Thank you for your investment in and support of Griffin Institutional Access Credit Fund.
Sincerely,

Randy I. Anderson, Ph.D., CRE
President, Griffin Capital Asset Management Company, LLC
Founding Partner, Griffin Institutional Access Credit Fund
Griffin Institutional Access Credit Fund (the “Fund”) is a closed-end interval fund. Limited liquidity is provided to shareholders only through the Fund’s quarterly repurchase offers for no less than 5% and no more than 25% of the Fund’s shares outstanding at net asset value. The Fund is suitable only for investors who can bear the risks associated with the limited liquidity of the Fund and should be viewed as a long-term investment. There is no secondary market for the Fund’s shares and none is expected to develop.
Industry Diversification3, 6
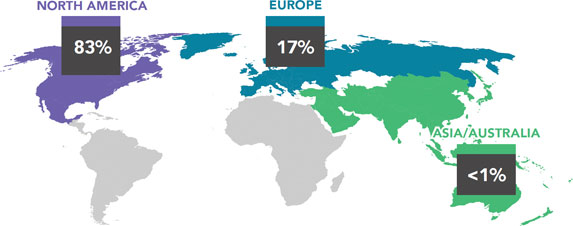
Geography3
FUND SUB-ADVISER (UNAUDITED)
BCSF Advisors, LP Griffin Institutional Access Credit Fund is sub-advised by BCSF Advisors, LP, an SEC-registered investment adviser and affiliate of Bain Capital Credit, LP. |  |
Bain Capital Credit, LP provides ongoing research, opinions and recommendations regarding the Fund’s investment portfolio. Bain Capital Credit was formed in 1998 as the credit investing arm of Bain Capital, one of the world’s premier alternative investment firms, with approximately $105 billion in assets under management.7 Bain Capital Credit invests across the full spectrum of credit strategies, including leveraged loans, high-yield bonds, distressed debt, direct lending, structured products, non-performing loans and equities. With offices in Boston, Chicago, New York, London, Dublin, Madrid, Hong Kong, Guangzhou, Seoul, Mumbai, Melbourne and Sydney, Bain Capital Credit has a global footprint with approximately $39 billion8 in assets under management.
ENDNOTES
| 1. | Data source: Griffin Capital Credit Advisor, LLC and Bloomberg. Performance reflects the Fund’s Class I share (CRDIX) and the reinvestment of dividends or other distributions. A glossary of terms can be found on page 7. |
| 2. | Based on Total Investment Exposure to debt securities less cash as of June 30, 2019. Total Investment Exposure is the total of the Fund’s net assets plus exposure gained through the use of total return swaps at the market value of the reference assets. A total return swap is a derivatives contract in which one party makes payments to the counterparty in exchange for the total return of the swap reference asset. There is no guarantee that the Fund’s leverage strategy will be successful. |
| 3. | Based on Total Investment Exposure less cash as of June 30, 2019. |
| 4. | Data as of June 30, 2019. Source: ICE Bank of America Merrill Lynch US High Yield Index, S&P/LSTA Leveraged Loan Index, S&P Leveraged Loan Commentary and Data unless otherwise noted. |
| 5. | Data as of June 30, 2019. Source: J.P. Morgan High Yield and Leveraged Loan Market Monitor June 2019. |
| 6. | Based on Moody’s 35 Industry Categories (“Moody’s 35”). |
| 7. | Firm-level assets under management (AUM) for Bain Capital is estimated and is presented as of March 31, 2019. |
| 8. | AUM estimated as of April 1, 2019. Bain Capital Credit’s assets under management includes its subsidiaries and credit vehicles managed by its Alternative Investment Fund Managers (AIFM) affiliate. |
GLOSSARY (UNAUDITED)
Alpha:A measure of risk-adjusted return implying how much a fund/manager outperformed its benchmark, given its risk profile.
Annualized Return: Calculated by annualizing cumulative return (i.e., adjusting it for a period of one year). Annualized return includes capital appreciation and assumes a reinvestment of dividends and distributions.
Beta:A measure of systematic risk (volatility), or the sensitivity of a fund to movements in a benchmark. A beta of 1 implies that you can expect the movement of a fund’s return series to match that of the benchmark used to measure beta. A value of less than 1 implies that the fund is less volatile than the index.
Bond:A debt instrument, also considered a loan, that an investor makes to a corporation, government, federal agency or other organization (known as an issuer) in which the issuer typically agrees to pay the owner the amount of the face value of the bond on a future date, and to pay interest at a specified rate at regular intervals.
Collateralized loan obligation (CLO): A security backed by a pool of commercial or personal loans, structured so there are several classes of bondholders with varying maturities, called tranches.
CLO equity: A tranche in the CLO structure with ownership interest.
Correlation:A statistical measure of how two securities move in relation to each other. A correlation ranges from -1 to 1. A positive correlation of 1 implies that as one security moves, either up or down, the other security will move in lockstep, in the same direction. A negative correlation of -1 indicates that the securities have moved in the opposite direction. If the correlation is 0, the movements of the securities are said to have no correlation; they are completely random.
Cumulative return:The compound return of an investment. It includes capital appreciation and assumes a reinvestment of dividends and distributions.
High-yield bond: A bond issued by an issuer that is considered a credit risk by a Nationally Recognized Statistical Rating Organization, as indicated by a low bond rating (e.g., “Ba” or lower by Moody’s Investors Services, or “BB” or below by Standard & Poor’s Corporation). Because of this risk, a high-yield bond generally pays a higher return (yield) than a bond with an issuer that carries lower default risk. Also known as a “junk” bond.
ICE Bank of America Merrill Lynch US High Yield Index:Tracks the performance of US dollar denominated below investment grade corporate debt publicly issued in the US domestic market.
Non-performing loan (NPL):Sum of borrowed money upon which the debtor has not made his scheduled payments for at least 90 days. A non-performing loan is either in default or close to being in default.
S&P/LSTA Leveraged Loan Index (LSTA):A daily total return index that uses mark-to-market pricing to calculate market value change. It tracks, on a real-time basis, the current outstanding balance and spread over LIBOR for fully funded term loans. The facilities included in the LSTA represent a broad cross section of leveraged loans syndicated in the United States, including dollar-denominated loans to overseas issuers.
Secured loan: A loan that is backed or secured by collateral, which reduces the risk associated with the loan.
Sharpe Ratio: Measures risk-adjusted returns by calculating the excess return (above the risk free rate) per unit of risk (standard deviation). The higher the ratio, the better the risk-adjusted returns. The average 3 month U.S. Treasury T-bill auction was used as the risk free rate in this material.
Standard Deviation:Measures the average deviations of a return series from its mean, and is often used as a measure of volatility/risk. A large standard deviation implies that there have been large swings in the return series of the manager.
IMPORTANT DISCLOSURES (UNAUDITED)
This is neither an offer to sell nor a solicitation to purchase any security. Investors should carefully consider the investment objectives, risks, charges and expenses of Griffin Institutional Access Credit Fund (the “Fund”). This and other important information about the Fund is contained in the prospectus, which can be obtained by contacting your financial advisor or visiting www.griffincapital.com. Please read the prospectus carefully before investing.
Performance data quoted represents past performance. Past performance is no guarantee of future results. Investment returns and principal value of the Fund will fluctuate so that shares, when redeemed, may be worth more or less than their original cost. Current performance may be lower or higher than performance data quoted. The most recent performance is available at www.griffincapital.com or by calling 888.926.2688. Performance reflects management fees and other expenses. Performance uses the Class I share (NASDAQ: CRDIX) of Griffin Institutional Access Credit Fund. Investors of the Class I share do not pay a front-end sales charge/load.
This material has been distributed for informational purposes only and should not be considered as investment advice or a recommendation of any particular security, strategy or investment product or be relied upon for any other purpose. Information contained herein has been obtained from sources deemed to be reliable, but not guaranteed. This material represents views as of the date of this presentation and is subject to change without notice of any kind. Griffin Capital does not accept any liability for losses either direct or consequential caused by the use of this information.
You cannot invest directly in an index. Index performance does not represent actual Fund or portfolio performance. A fund or portfolio may differ significantly from the securities included in the index. Index performance assumes reinvestment of dividends but does not reflect any management fees, transaction costs or other expenses that would be incurred by a fund or portfolio, or brokerage commissions on transaction in fund shares. Such fees, expenses, and commissions could reduce returns.
Investing in the Fund involves risks, including the risk that you may receive little or no return on your investment or that you may lose part or all of your investment. The ability of the Fund to achieve its investment objective depends, in part, on the ability of the Adviser to allocate effectively the assets of the Fund among the various securities and investments in which the Fund invests. There can be no assurance that the actual allocations will be effective in achieving the Fund’s investment objective or delivering positive returns. The Fund offers multiple different classes of shares. Class A shares (CRDTX), Class C shares (CGCCX) and Class I shares (CRDIX) commenced operations on April 3, 2017. Class L shares (CRDLX) were added on September 5, 2017; Class F shares (CRDFX) were added on September 25, 2017. An investment in any share class of the Fund represents an investment in the same assets of the Fund. However, the purchase restrictions and ongoing fees and expenses for each share class are different. Investors will pay offering expenses and, with regard to those share classes that impose a front-end sales load, a sales load of up to 5.75%. An investor will need to receive a total return at least in excess of these expenses to receive an actual return on the investment. You should carefully consider which class of shares to purchase.
The Fund is a closed-end interval fund, the shares have no history of public trading, nor is it intended that the shares will be listed on a public exchange at this time. No secondary market is expected to develop for the Fund’s shares. Limited liquidity is provided to shareholders only through the Fund’s quarterly repurchase offers for no less than 5% and no more than 25% of the Fund’s shares outstanding at net asset value. There is no guarantee that an investor will be able to sell all the shares that the investor desires to sell in the repurchase offer. The investment return and principal value of an investment will fluctuate so that an investor’s shares, when redeemed, may be worth more or less than the original cost. Due to these restrictions, an investor should consider an investment in the Fund to be of limited liquidity. The Fund is suitable only for investors who can bear the risks associated with the limited liquidity of the Fund and should be viewed as a long-term investment. Investing in the Fund is speculative and involves a high degree of risk, including the risks associated with leverage and the risk of a substantial loss of investment. There is no guarantee that the investment strategies will work under all market conditions.
As of June 30, 2019 the Fund’s annualized return since inception for Class I shares was 5.64% and the Fund’s Class I shares had a one year return of 6.72% (data source: Griffin Capital Credit Advisor, LLC). The Fund’s inception date was April 3, 2017. Per the Fund’s prospectus dated April 30, 2019, the total gross expense ratio is 3.33% for Class A, 4.08% for Class C, 3.04% for Class F, 3.08% for Class I, and 3.64% for Class L. Performance data quoted represents past performance. Past performance is no guarantee of future results and investment returns and principal value of the Fund will fluctuate so that shares, when redeemed, may be worth more or less than their original cost. Current performance may be lower or higher than performance data quoted. The Adviser and Fund have entered into an expense limitation agreement until at least April 30, 2020 under which the Adviser has contractually agreed to waive its fees and to pay or absorb the ordinary annual operating expenses of the Fund (including offering expenses, but excluding taxes, interest, brokerage commissions, acquired fund fees and expenses and extraordinary expenses) to the extent that they exceed 2.60% for Class A, 3.35% for Class C, 2.35% for Class I, and 2.85% for Class L, subject to possible recoupment from the Fund in future years. Separate of the expense limitation agreement, commencing on August 26, 2019, the Adviser voluntarily absorbs Fund expenses in excess of 1.25% and will continue to bear such expenses on a going forward basis in its discretion and is under no obligation to continue to do so for any specified period of time. Prior to August 26, 2019 and since the commencement of the operations of the Fund, the Adviser has borne all of the operating expenses of the Fund and waived its entire management fee. Without the waiver the expenses would have been higher. Fund returns would have been lower had expenses, such as management fees, not been waived during the period. The Fund return does not reflect the deduction of all fees and if the Fund return reflected the deduction of such fees, the performance would be lower. The maximum sales charge is 5.75% for Class A shares and 4.25% for Class L shares. Class C shareholders may be subject to a contingent deferred sales charge equal to 1.00% of the original purchase price of Class C shares redeemed during the first 365 days after their purchase.
Investors in the Fund should understand that the net asset value (“NAV”) of the Fund will fluctuate, which may result in a loss of the principal amount invested. The Fund’s investments may be negatively affected by the broad investment environment and capital markets in which the Fund invests, including the real estate market, the debt market and/or the equity securities market. The value of the Fund’s investments will increase or decrease based on changes in the prices of the investments it holds. This will cause the value of the Fund’s shares to increase or decrease. The Fund is “non-diversified” under the Investment Company Act of 1940 since changes in the financial condition or market value of a single issuer may cause a greater fluctuation in the Fund’s net asset value than in a “diversified” fund. Diversification does not eliminate the risk of experiencing investment losses. Holdings are subject to change without notice. The Fund is not intended to be a complete investment program.
When the Fund invests in debt securities, the value of your investment in the Fund will fluctuate with changes in interest rates. There is a risk that debt issuers will not make payments, resulting in losses to the Fund. The Adviser’s judgments about the attractiveness, value and potential appreciation of a particular sector and securities in which the Fund invests may prove to be incorrect and may not produce the desired results. Foreign investing involves special risks such as currency fluctuations and political uncertainty. The Fund’s use of derivative instruments involves risks different from, or possibly greater than, the risks associated with investing directly in securities and other traditional investments. Derivatives may involve certain costs and risks such as liquidity, interest rate, market, credit, management and pricing risk (i.e., derivatives may be difficult to value). Derivatives may also be leveraged and subject to counterparty risk (e.g., the risk of a counterparty’s defaulting on the obligation or bankruptcy). Investing in derivatives could substantially increase the impact of adverse price movements on the Fund’s portfolio. Derivatives are also subject to non-correlation risk because they may not be perfect substitutes for the instruments they are intended to hedge or replace. It may not be possible for the Fund to liquidate a derivative position at an advantageous time or price, which may result in significant losses. These investments give the Fund investment exposure that is greater than the investment amount. There is no guarantee that the Fund’s leverage strategy will be successful.
The Fund’s distribution policy is to make quarterly distributions to shareholders. The Fund intends to declare and pay distributions from its net investment income, however, the amount of distributions that the Fund may pay, if any, is uncertain. Shareholders should not assume that the source of a distribution from the Fund is net profit. All or a portion of a distribution may consist of a return of capital (i.e. from your original investment) and not a return of net profit. Historically, distributions have not included return of capital. Please refer to the Fund’s most recent Section 19(a) notice, if applicable, at www.griffincapital.com or the Fund’s semi-annual or annual reports filed with the U.S. Securities and Exchange Commission (the “SEC”) for the sources of distributions. The Fund’s distributions may be affected by numerous factors, including but not limited to changes in realized and projected market returns, fluctuations in market interest rates, Fund performance, and other factors. There can be no assurance that a change in market conditions or other factors will not result in a change in the Fund’s distribution rate or that the rate will be sustainable in the future. The Fund intends to distribute as of the last business day of each quarter. Distributions are not guaranteed.
The Fund is advised by Griffin Capital Credit Advisor, LLC (“GCCA”). GCCA is registered as an investment adviser with the SEC pursuant to the provisions of the Investment Advisers Act of 1940, as amended (the “Advisers Act”). GCCA is an indirect majority-owned subsidiary of Griffin Capital Company, LLC. The Fund is sub-advised by BCSF Advisors, LP (“BCSF”). BCSF is registered as an investment adviser with the SEC pursuant to the provisions of the Advisers Act. BCSF is an affiliate of Bain Capital Credit, LP. Registration with the SEC does not constitute an endorsement by the SEC nor does it imply a certain level of skill or training.
This semi-annual report may contain certain forward-looking statements. Such forward-looking statements can generally be identified by our use of forward-looking terminology such as “may,” “will,” “expect,” “intend,” “anticipate,” “estimate,” “believe,” “continue,” or other similar words. Because such statements include risks, uncertainties and contingencies, actual results may differ materially from the expectations, intentions, beliefs, plans or predictions of the future expressed or implied by such forward-looking statements. These risks, uncertainties and contingencies include, but are not limited to: uncertainties relating to changes in general economic, credit and real estate conditions; uncertainties relating to the implementation of our investment strategy; uncertainties relating to capital proceeds; and other risk factors as outlined in our prospectus, annual report and semi-annual report filed with the SEC. This is neither an offer nor a solicitation to purchase securities.
| Griffin Institutional Access Credit Fund | Portfolio Update |
June 30, 2019 (Unaudited)
Performance(for the period ended June 30, 2019)
| 6 Month | 1 Year | Since Inception**** | Inception |
| Griffin Institutional Access Credit Fund - A - With Load* | 1.32% | 0.75% | 2.94% | 4/3/17 |
| Griffin Institutional Access Credit Fund - A - Without Load | 7.48% | 6.89% | 5.70% | 4/3/17 |
| Griffin Institutional Access Credit Fund - C - With Load** | 6.48% | 5.89% | 5.70% | 4/3/17 |
| Griffin Institutional Access Credit Fund - C - Without Load | 7.48% | 6.89% | 5.70% | 4/3/17 |
| Griffin Institutional Access Credit Fund - I - NAV | 7.48% | 6.89% | 5.71% | 4/3/17 |
| Griffin Institutional Access Credit Fund - L - With Load*** | 2.90% | 2.35% | 3.14% | 9/5/17 |
| Griffin Institutional Access Credit Fund - L - Without Load | 7.48% | 6.90% | 5.64% | 9/5/17 |
| Griffin Institutional Access Credit Fund - F - NAV | 7.51% | 6.86% | 5.57% | 9/25/17 |
| S&P/LSTA Leveraged Loan Index | 5.74% | 3.97% | 4.04% | 4/3/17 |
| * | Adjusted for initial maximum sales charge of 5.75%. |
| ** | Adjusted for contingent deferred sales charge of 1.00%. |
| *** | Adjusted for initial maximum sales charge of 4.25% |
The S&P/LSTA Leveraged Loan Index is a capitalization-weighted syndicated loan index based upon market weightings, spreads and interest payments. The S&P/LSTA Leveraged Loan Index covers the U.S. market back to 1997 and currently calculates on a daily basis.
Indexes are not actively managed and do not reflect deduction for fees, expenses or taxes. An investor cannot invest directly into an index.
The returns shown above do not reflect the deduction of taxes a shareholder would pay on Fund distributions or redemption of Fund shares.
The performance data quoted above represents past performance. Past performance is not a guarantee of future results. Investment return and value of the Fund shares will fluctuate so that an investor’s shares, when sold or redeemed, may be worth more or less than their original cost. Performance may be lower or higher than performance data quoted. Fund performance current to the most recent month-end is available by calling 1-888-926-2688 or by visiting www.griffincapital.com.
Class A shares are offered subject to a maximum sales charge of 5.75% of the offering price and Class L shares are offered subject to a maximum sales charge of 4.25% of the offering price. Class C, Class I and Class F shares are offered at net asset value per share. Class C shares may be subject to a 1.00% contingent deferred sales charge on shares redeemed during the first 365 days after their purchase. The Adviser and the Fund have entered into an expense limitation and reimbursement agreement (the “Expense Limitation Agreement”) under which the Adviser has agreed contractually to waive its fees and to pay or absorb the ordinary annual operating expenses of the Fund (including offering expenses, but excluding taxes, interest, brokerage commissions, acquired fund fees and expenses and extraordinary expenses) at least until April 30, 2020, so that the total annual operating expenses of the Fund do not exceed 2.60% per annum of Class A average daily net assets, 3.35% per annum of Class C average daily net assets, 2.35% per annum of Class I average daily net assets, 2.85% per annum of Class L average daily net assets and 1.85% per annum of Class F average daily net assets (the “Expense Limitations”). The agreement can be extended at the discretion of the Adviser and the Trustees. Without the waiver, the expenses would be 3.33%, 4.08%, 3.08%, 3.64%, and 3.04% for Class A, Class C, Class I, Class L and Class F, respectively per the Fund’s most recent prospectus. In consideration of the Adviser’s agreement to limit the Fund’s expenses, the Fund has agreed to repay the Adviser in the amount of any fees waived and Fund expenses paid or absorbed, subject to the limitations that: (1) the reimbursement for fees and expenses will be made only if payable not more than three years from the date such expenses were incurred; and (2) the reimbursement may not be made if it would cause the lesser of the Expense Limitations in place at the time of waiver or at the time of reimbursement to be exceeded. Fees waived and Fund expenses paid or absorbed with respect to Class F assets will not be repaid or reimbursed. In addition to the Expense Limitation Agreement described above, the Adviser voluntarily has waived or absorbed all of the operating expenses of the Fund since the commencement of the Fund’s operations. The Adviser will continue to bear such expenses on a going forward basis in its discretion and is under no obligation to continue to do so for any specified period of time. Operating expenses absorbed by the Adviser during this voluntary period will be permanently waived. In the absence of the election by the Adviser to bear all of the Fund’s operating expenses, the performance of the Fund would have been reduced. Please review the Fund’s Prospectus for more details regarding the Fund’s fees and expenses. No assurances can be given that the Fund will pay a distribution in the future; or, if any such distribution is paid, the amount or rate of the distribution.
| 10 | 1.888.926.2688 | www.griffincapital.com |
| Griffin Institutional Access Credit Fund | Portfolio Update |
June 30, 2019 (Unaudited)
Performance of $10,000 Initial Investment(for the period ended June 30, 2019)
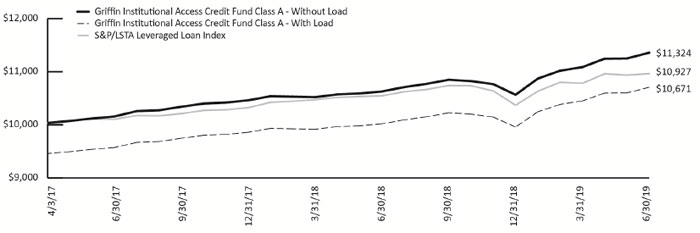
The graph shown above represents historical performance of a hypothetical investment of $10,000 in the Fund since inception. Past performance does not guarantee future results. All returns reflect reinvested dividends, but do not reflect the deduction of taxes that a shareholder would pay on Fund distributions or the redemption of Fund shares.
| Semi-Annual Report | June 30, 2019 | 11 |
| Griffin Institutional Access Credit Fund | Consolidated Schedule of Investments |
June 30, 2019 (Unaudited)
| Description | | Country | | Spread Above Index | | Rate | | Maturity Date | | Principal Amount | | | Value (Note 2) | |
| BANK LOANS (55.63%)(a) | | | | | | | | | | | | | | | | |
| | | | | | | | | | | | | | | | | |
| AEROSPACE & DEFENSE (3.96%) | | | | | | | | | | | | | | | | |
| Air Comm Corp LLC Term Loan(b)(c) | | United States | | L + 6.50% | | | | 07/01/25 | | $ | 1,714,680 | | | $ | 1,663,240 | |
| Ducommun, Inc., First Lien B Term Loan | | United States | | 3M US L + 4.00% | | 6.37% | | 11/21/25 | | | 354,709 | | | | 357,369 | |
| Dynasty Acquisition Co., Inc., First Lien Initial B-1 Term Loan | | United States | | 3M US L + 4.00% | | 6.33% | | 04/06/26 | | | 538,371 | | | | 541,351 | |
| EXC Holdings III Corp., First Lien 2019 Additional USD Term Loan | | United States | | 3M US L + 3.50% | | 5.83% | | 12/02/24 | | | 359,081 | | | | 359,979 | |
| EXC Holdings III Corp., First Lien Initial USD Term Loan | | United States | | 3M US L + 3.50% | | 5.83% | | 12/02/24 | | | 376,817 | | | | 376,346 | |
| Excelitas Technologies Corp., First Lien Initial Euro Term Loan | | United States | | 3M EUR L + 3.50%, 0.00% Floor | | 3.50% | | 12/02/24 | | € | 22,482 | | | | 25,469 | |
| Excelitas Technologies Corp., Second Lien Initial Term Loan | | United States | | 3M US L + 7.50% | | 9.83% | | 12/01/25 | | $ | 1,143,183 | | | | 1,146,990 | |
| Forming Machining Industries Holdings LLC, First Lien Initial Term Loan | | United States | | 3M US L + 4.25% | | 6.58% | | 10/09/25 | | | 697,601 | | | | 680,162 | |
| Forming Machining Industries Holdings LLC, Second Lien Initial Term Loan | | United States | | 3M US L + 8.25% | | 10.58% | | 10/05/26 | | | 310,000 | | | | 297,600 | |
| Jazz Acquisition, Inc., First Lien Term Loan | | United States | | 3M US L + 4.25% | | 6.58% | | 06/12/26 | | | 539,488 | | | | 536,456 | |
| Jazz Acquisition, Inc., Second Lien Term Loan(c) | | United States | | L + 8.00% | | | | 06/12/27 | | | 1,058,702 | | | | 1,050,761 | |
| Nordam Group LLC, First Lien Initial Term Loan | | United States | | 6M US L + 5.50% | | 7.88% | | 04/09/26 | | | 1,128,446 | | | | 1,129,857 | |
| Standard Aero Limited, First Lien Initial B-2 Term Loan | | United States | | 3M US L + 4.00% | | 6.33% | | 04/06/26 | | | 289,447 | | | | 291,049 | |
| Turbocombustor Technology, Inc., First Lien Initial Term Loan | | United States | | 1M US L + 4.50% | | 6.90% | | 12/02/20 | | | 1,437,487 | | | | 1,412,331 | |
| Wheels Up Partners LLC, First Lien A Term Loan(b) | | United States | | 3M US L + 6.50% | | 9.02% | | 03/01/24 | | | 319,644 | | | | 319,644 | |
| WP CPP Holdings LLC, First Lien Initial Term Loan | | United States | | 3M US L + 3.75% | | 6.34% | | 04/30/25 | | | 411,973 | | | | 411,973 | |
| WP CPP Holdings LLC, Second Lien Initial Term Loan | | United States | | 3M US L + 7.75% | | 10.34% | | 04/30/26 | | | 623,597 | | | | 622,817 | |
| | | | | | | | | | | | | | | | 11,223,394 | |
| AUTOMOTIVE (1.30%) | | | | | | | | | | | | | | | | |
| Commercial Vehicle Group, Inc., First Lien Initial Term Loan | | United States | | 1M US L + 6.00% | | 8.40% | | 04/12/23 | | | 237,362 | | | | 237,363 | |
| Mavis Tire Express Services Corp., First Lien Closing Date Term Loan | | United States | | 1M US L + 3.25% | | 5.65% | | 03/20/25 | | | 219,376 | | | | 215,720 | |
| Mavis Tire Express Services Corp., First Lien Delayed Draw Term Loan(d) | | United States | | 1M US L + 3.25% | | 2.82% | | 03/20/25 | | | 27,850 | | | | 27,386 | |
| Midas Intermediate Holdco II LLC, First Lien 2017 Refinancing Term Loan | | United States | | 3M US L + 2.75% | | 5.08% | | 08/18/21 | | | 905,369 | | | | 880,472 | |
| OEConnection LLC, Second Lien Term Loan | | United States | | 1M US L + 8.00% | | 10.41% | | 11/22/25 | | | 167,079 | | | | 165,408 | |
| Panther BF Aggregator 2 L P, First Lien Initial Dollar Term Loan | | United States | | 1M US L + 3.50% | | 5.90% | | 04/30/26 | | | 551,579 | | | | 548,305 | |
| Thor Industries, Inc., First Lien Initial Euro Term Loan | | United States | | 1M EUR L + 4.00%, 0.00% Floor | | 4.00% | | 02/01/26 | | € | 280,840 | | | | 311,626 | |
| Thor Industries, Inc., First Lien Initial USD Term Loan | | United States | | 1M US L + 3.75% | | 6.22% | | 02/01/26 | | $ | 296,805 | | | | 293,282 | |
| Wand Newco 3, Inc., First Lien Initial Term Loan | | United States | | 1M US L + 3.50% | | 5.92% | | 02/05/26 | | | 472,922 | | | | 473,735 | |
See Notes to Consolidated Financial Statements.
| 12 | 1.888.926.2688 | www.griffincapital.com |
| Griffin Institutional Access Credit Fund | Consolidated Schedule of Investments |
June 30, 2019 (Unaudited)
| Description | | Country | | Spread Above Index | | Rate | | Maturity Date | | Principal Amount | | | Value (Note 2) | |
| AUTOMOTIVE (continued) | | | | | | | | | | | | | | | | |
| Winter Park Intermediate, Inc., First Lien Initial Term Loan | | United States | | 3M US L + 4.75% | | 7.15% | | 04/04/25 | | $ | 538,071 | | | $ | 533,363 | |
| | | | | | | | | | | | | | | | 3,686,660 | |
| BANKING (0.26%) | | | | | | | | | | | | | | | | |
| First Data Corp., First Lien 2024A New Dollar Term Loan | | United States | | 1M US L + 2.00% | | 4.40% | | 04/26/24 | | | 500,000 | | | | 500,000 | |
| TNS, Inc., First Lien Initial Term Loan | | United States | | 3M US L + 4.00% | | 6.59% | | 08/14/22 | | | 247,212 | | | | 244,431 | |
| | | | | | | | | | | | | | | | 744,431 | |
| BEVERAGE, FOOD, & TOBACCO (2.46%) | | | | | | | | | | | | | | | | |
| 1011778 BC ULC, First Lien B-3 Term Loan | | Canada | | 1M US L + 2.25% | | 4.65% | | 02/16/24 | | | 95,410 | | | | 94,853 | |
| Advantage Sales & Marketing, Inc., First Lien Initial Term Loan | | United States | | 3M US L + 3.25% | | 5.58% | | 07/23/21 | | | 367,288 | | | | 337,079 | |
| Heritage Food Service Group, Inc. Term Loan(b) | | United States | | 3M US L + 4.50% | | 6.89% | | 10/20/21 | | | 1,763,174 | | | | 1,763,174 | |
| H-Food Holdings LLC, First Lien Initial Term Loan | | United States | | 1M US L + 3.00% | | 6.09% | | 05/23/25 | | | 798,835 | | | | 782,858 | |
| K-MAC Holdings Corp., Second Lien Initial Term Loan | | United States | | 1M US L + 6.75% | | 9.15% | | 03/16/26 | | | 2,294,013 | | | | 2,287,131 | |
| NPC International, Inc., Second Lien Initial Term Loan | | United States | | 3M US L + 7.50% | | 9.82% | | 04/18/25 | | | 250,000 | | | | 154,063 | |
| Quidditch Acquisition, Inc., First Lien B Term Loan | | United States | | 1M US L + 7.00% | | 9.40% | | 03/21/25 | | | 583,013 | | | | 588,843 | |
| Tacala Investment Corp., Second Lien Initial Term Loan | | United States | | 1M US L + 7.00% | | 9.40% | | 01/30/26 | | | 941,903 | | | | 950,145 | |
| | | | | | | | | | | | | | | | 6,958,146 | |
| CAPITAL EQUIPMENT (3.51%) | | | | | | | | | | | | | | | | |
| 10945048 Canada, Inc., Second Lien Term Loan(b) | | Canada | | 3M CDOR + 8.25% | | 10.23% | | 09/21/26 | | CAD | 3,020,000 | | | | 2,254,248 | |
| ASP Unifrax Holdings, Inc., First Lien EUR Term Loan(c) | | United States | | L + 3.75%, 0.00% Floor | | | | 12/12/25 | | € | 615,277 | | | | 683,145 | |
| ASP Unifrax Holdings, Inc., Second Lien Term Loan | | United States | | 3M US L + 8.50% | | 10.93% | | 12/14/26 | | $ | 917,431 | | | | 886,752 | |
| C&D Technologies, Inc., First Lien B Term Loan | | United States | | 1M US L + 5.75% | | 8.15% | | 12/20/25 | | | 446,946 | | | | 424,040 | |
| Crosby Group LLC, First Lien B Term Loan(c) | | United States | | L + 4.75% | | | | 06/19/26 | | | 325,643 | | | | 323,473 | |
| Doncasters US Finance LLC, First Lien B Term Loan | | United Kingdom | | 3M US L + 3.50% | | 5.83% | | 04/09/20 | | | 30,299 | | | | 24,229 | |
| Mirion Technologies LLC, First Lien Initial Dollar Term Loan | | United States | | 3M US L + 4.00% | | 6.33% | | 03/06/26 | | | 673,552 | | | | 676,815 | |
| Ohio Transmission Corporation, Term Loan(b) | | United States | | 3M US L + 8.50% | | 10.83% | | 04/09/27 | | | 1,961,592 | | | | 1,922,360 | |
| Ply Gem Midco, Inc., First Lien Initial Term Loan | | United States | | 3M US L + 3.75% | | 6.35% | | 04/12/25 | | | 974,997 | | | | 950,217 | |
| Rackspace Hosting, Inc., First Lien B Term Loan | | United States | | 3M US L + 3.00% | | 5.58% | | 11/03/23 | | | 433,329 | | | | 401,236 | |
| WireCo WorldGroup, Inc., First Lien Initial Term Loan | | Cayman Islands | | 1M US L + 5.00% | | 7.40% | | 09/29/23 | | | 662,460 | | | | 664,116 | |
| WireCo WorldGroup, Inc., Second Lien Initial Term Loan | | Cayman Islands | | 1M US L + 9.00% | | 11.40% | | 09/30/24 | | | 750,000 | | | | 750,000 | |
| | | | | | | | | | | | | | | | 9,960,631 | |
See Notes to Consolidated Financial Statements.
| Semi-Annual Report | June 30, 2019 | 13 |
| Griffin Institutional Access Credit Fund | Consolidated Schedule of Investments |
June 30, 2019 (Unaudited)
| Description | | Country | | Spread Above Index | | Rate | | Maturity Date | | Principal Amount | | | Value (Note 2) | |
| CHEMICALS, PLASTICS, & RUBBER (1.19%) | | | | | | | | | | | | | | | | |
| Ascend Performance Materials Operations LLC, First Lien B Term Loan | | United States | | 1M US L + 5.25% | | 7.65% | | 08/12/22 | | $ | 417,677 | | | $ | 418,722 | |
| ASK Chemicals GmbH, First Lien Facility B Term Loan | | Germany | | 6M EUR L + 5.25%, 0.00% Floor | | 5.25% | | 05/12/23 | | € | 1,000,000 | | | | 1,114,358 | |
| Plaskolite PPC Intermediate II LLC, First Lien Initial Term Loan | | United States | | 1M US L + 4.25% | | 6.64% | | 12/15/25 | | $ | 897,774 | | | | 892,163 | |
| Starfruit Finco B.V., First Lien Initial Dollar Term Loan | | Netherlands | | 1M US L + 3.25% | | 5.67% | | 10/01/25 | | | 601,495 | | | | 593,600 | |
| Univar USA, Inc., First Lien B-4 Term Loan | | United States | | 1M US L + 2.50% | | 4.90% | | 07/01/24 | | | 206,352 | | | | 206,417 | |
| Univar USA, Inc., First Lien Euro B-2 Term Loan | | United States | | 3M EUR L + 2.75%, 0.00% Floor | | 2.75% | | 07/01/24 | | € | 131,484 | | | | 150,562 | |
| | | | | | | | | | | | | | | | 3,375,822 | |
| CONSTRUCTION & BUILDING (0.81%) | | | | | | | | | | | | | | | | |
| CPG International LLC, First Lien New Term Loan | | United States | | 6M US L + 3.75% | | 5.93% | | 05/05/24 | | $ | 388,701 | | | | 382,870 | |
| Crown Subsea Communications Holding, Inc., First Lien Initial Term Loan | | United States | | 1M US L + 6.00% | | 8.40% | | 11/02/25 | | | 263,685 | | | | 262,696 | |
| KBR, Inc., First Lien B Term Loan | | United States | | 1M US L + 3.75% | | 6.15% | | 04/25/25 | | | 712,500 | | | | 714,506 | |
| Sequa Mezzanine Holdings LLC, First Lien Initial Term Loan | | United States | | 3M US L + 5.00% | | 7.56% | | 11/28/21 | | | 460,851 | | | | 451,828 | |
| Wilsonart LLC, First Lien Tranche D Term Loan | | United States | | 3M US L + 3.25% | | 5.58% | | 12/19/23 | | | 496,212 | | | | 485,792 | |
| | | | | | | | | | | | | | | | 2,297,692 | |
| CONSUMER GOODS: DURABLE (1.46%) | | | | | | | | | | | | | | | | |
| Auris Luxembourg III S.a r.l., First Lien Facility B1A Term Loan | | Denmark | | 3M EUR L + 4.00, 0.00% Floor | | 4.00% | | 02/27/26 | | € | 795,720 | | | | 914,114 | |
| Hayward Industries, Inc., First Lien Initial Term Loan | | United States | | 1M US L + 3.50% | | 5.90% | | 08/05/24 | | $ | 583,191 | | | | 572,256 | |
| Mascot Bidco Oy, First Lien Facility B Term Loan | | Finland | | 6M EUR L + 4.50%, 0.00% Floor | | 4.50% | | 03/30/26 | | € | 620,938 | | | | 708,328 | |
| New Milani Group LLC, First Lien Term Loan(b) | | United States | | 1M US L + 4.25% | | 6.59% | | 06/06/24 | | $ | 794,000 | | | | 778,120 | |
| TGG TS Acquisition Company aka, First Lien B Term Loan | | United States | | 3M US L + 6.50% | | 8.93% | | 12/14/25 | | | 1,157,612 | | | | 1,153,271 | |
| | | | | | | | | | | | | | | | 4,126,089 | |
| CONSUMER GOODS: NON-DURABLE (0.41%) | | | | | | | | | | | | | | | | |
| Kronos Acquisition Intermediate, Inc., First Lien Initial Term Loan | | Canada | | 1M US L + 4.00% | | 6.40% | | 05/15/23 | | | 1,233,049 | | | | 1,166,002 | |
| | | | | | | | | | | | | | | | | |
| CONTAINERS, PACKAGING, & GLASS (2.05%) | | | | | | | | | | | | | | | | |
| BWAY Holding Co., First Lien Initial Term Loan | | United States | | 3M US L + 3.25% | | 5.85% | | 04/03/24 | | | 1,020,763 | | | | 988,435 | |
| Flex Acquisition Co., Inc., First Lien Initial Term Loan | | United States | | 3M US L + 3.00% | | 5.32% | | 12/29/23 | | | 1,215,118 | | | | 1,158,159 | |
| Klockner Pentaplast of America, Inc., First Lien Euro Term Loan | | Luxembourg | | 3M EUR L + 4.75%, 0.00% Floor | | 4.75% | | 06/30/22 | | € | 189,191 | | | | 192,899 | |
| Packaging Coordinators Midco, Inc., First Lien Initial Term Loan | | United States | | 1M US L + 4.00% | | 6.33% | | 06/30/23 | | $ | 732,746 | | | | 735,267 | |
| Packaging Coordinators Midco, Inc., Second Lien Initial Term Loan | | United States | | 3M US L + 8.75% | | 11.08% | | 07/01/24 | | | 512,500 | | | | 511,219 | |
| Pro Mach Group, Inc., First Lien Initial Term Loan | | United States | | 1M US L + 2.75% | | 5.14% | | 03/07/25 | | | 496,241 | | | | 479,081 | |
See Notes to Consolidated Financial Statements.
| 14 | 1.888.926.2688 | www.griffincapital.com |
| Griffin Institutional Access Credit Fund | Consolidated Schedule of Investments |
June 30, 2019 (Unaudited)
| Description | | Country | | Spread Above Index | | Rate | | Maturity Date | | Principal Amount | | | Value (Note 2) | |
| CONTAINERS, PACKAGING, & GLASS (continued) | | | | | | | | | | | | | | | | |
| Terminator Bidco AS, First Lien Facility B2 Term Loan(b) | | Norway | | 3M US L + 4.50% | | 6.92% | | 06/20/22 | | $ | 1,000,000 | | | $ | 1,000,000 | |
| Titan Acquisition, Ltd., First Lien Initial Term Loan | | Canada | | 1M US L + 3.00% | | 5.40% | | 03/28/25 | | | 398,475 | | | | 381,484 | |
| Verallia Packaging, First Lien Facility B4 Term Loan | | France | | 1M EUR L + 2.75%, 0.00% Floor | | 2.75% | | 10/31/22 | | € | 215,547 | | | | 245,239 | |
| Verallia Packaging, First Lien Facility C Term Loan | | France | | 1M EUR L + 2.75%, 0.00% Floor | | 2.75% | | 08/01/25 | | | 106,667 | | | | 121,409 | |
| | | | | | | | | | | | | | | | 5,813,192 | |
| ENERGY: ELECTRICITY (0.82%) | | | | | | | | | | | | | | | | |
| AI Alpine AT BidCo GmbH, First Lien Facility B Term Loan | | United States | | 1M US L + 3.25% | | 5.64% | | 10/31/25 | | $ | 71,253 | | �� | | 70,273 | |
| AI Alpine AT BidCo GmbH, First Lien Facility B Term Loan | | Austria | | 1M EUR L + 3.50%, 0.00% Floor | | 3.50% | | 10/31/25 | | € | 316,093 | | | | 357,801 | |
| Infinite Electronics International, Inc., First Lien B-2 Term Loan | | United States | | 3M US L + 4.00% | | 6.33% | | 07/02/25 | | $ | 1,665,180 | | | | 1,656,854 | |
| Infinite Electronics International, Inc., Second Lien B-1 Term Loan(b) | | United States | | 3M US L + 8.00% | | 10.33% | | 07/02/26 | | | 240,000 | | | | 240,000 | |
| | | | | | | | | | | | | | | | 2,324,928 | |
| ENERGY: OIL & GAS (2.50%) | | | | | | | | | | | | | | | | |
| BlackBrush Oil & Gas LP, First Lien Closing Date Term Loan | | United States | | 3M US L + 8.00% | | 10.46% | | 02/09/24 | | | 2,151,724 | | | | 2,130,207 | |
| California Resources Corp., First Lien Term Loan | | United States | | 1M US L + 10.38% | | 12.78% | | 12/31/21 | | | 870,000 | | | | 886,529 | |
| Keane Group Holdings LLC, First Lien Initial Term Loan | | United States | | 1M US L + 3.75% | | 6.19% | | 05/25/25 | | | 160,645 | | | | 158,904 | |
| Lower Cadence Holdings LLC, First Lien Initial Term Loan | | United States | | 1M US L + 4.00% | | 6.40% | | 05/22/26 | | | 498,297 | | | | 496,533 | |
| NorthRiver Midstream Finance LP, First Lien Initial B Term Loan | | United States | | 3M US L + 3.25% | | 5.57% | | 10/01/25 | | | 361,482 | | | | 361,532 | |
| Oxbow Carbon LLC, First Lien Tranche B Term Loan | | United States | | 1M US L + 3.75% | | 6.15% | | 01/04/23 | | | 1,008,081 | | | | 1,011,236 | |
| Oxbow Carbon LLC, Second Lien Term Loan(c) | | United States | | 1M US L + 7.50% | | 9.90% | | 01/04/24 | | | 775,581 | | | | 776,550 | |
| Prairie ECI Acquiror LP, First Lien Initial Term Loan | | United States | | 3M US L + 4.75% | | 7.08% | | 03/11/26 | | | 114,918 | | | | 115,636 | |
| Savage Enterprises LLC, First Lien Initial Term Loan | | United States | | 1M US L + 4.50% | | 6.92% | | 08/01/25 | | | 530,106 | | | | 531,847 | |
| Ultra Resources, Inc., First Lien Term Loan(e) | | United States | | 1M US L + 3.75% | | 6.40% | | 04/12/24 | | | 804,516 | | | | 622,157 | |
| | | | | | | | | | | | | | | | 7,091,131 | |
| ENVIRONMENTAL INDUSTRIES (0.21%) | | | | | | | | | | | | | | | | |
| Filtration Group Corp., First Lien Initial Euro Term Loan | | United States | | 3M EUR L + 3.50%, 0.00% Floor | | 3.50% | | 03/29/25 | | € | 236,894 | | | | 271,527 | |
| TRC Companies, Inc., First Lien Initial Term Loan | | United States | | 1M US L + 3.50% | | 5.90% | | 06/21/24 | | $ | 320,481 | | | | 319,880 | |
| | | | | | | | | | | | | | | | 591,407 | |
| FIRE: INSURANCE (1.46%) | | | | | | | | | | | | | | | | |
| Asurion LLC, First Lien Amendment No. 14 Replacement B-4 Term Loan | | United States | | 1M US L + 3.00% | | 5.40% | | 08/04/22 | | | 434,331 | | | | 433,864 | |
| Asurion LLC, First Lien Replacement B-6 Term Loan | | United States | | 1M US L + 3.00% | | 5.40% | | 11/03/23 | | | 196,692 | | | | 196,534 | |
See Notes to Consolidated Financial Statements.
| Semi-Annual Report | June 30, 2019 | 15 |
| Griffin Institutional Access Credit Fund | Consolidated Schedule of Investments |
June 30, 2019 (Unaudited)
| Description | | Country | | Spread
Above Index | | Rate | | Maturity
Date | | Principal
Amount | | | Value
(Note 2) | |
| FIRE: INSURANCE (continued) | | | | | | | | | | | | | | |
| Asurion LLC, Second Lien Replacement B-2 Term Loan | | United States | | 1M US L + 6.50% | | 8.90% | | 08/04/25 | | $ | 1,085,308 | | | $ | 1,102,836 | |
| Genworth Holdings, Inc., First Lien Initial Term Loan | | United States | | 2M US L 4.50% | | 6.99% | | 03/07/23 | | | 49,189 | | | | 49,711 | |
| HUB International, Ltd., First Lien Initial Term Loan | | United States | | 3M US L + 3.00% | | 5.59% | | 04/25/25 | | | 680,835 | | | | 665,012 | |
| Ivy Finco Limited, Facility B Term Loan(b) | | Jersey | | 3M GBP L + 5.25% | | 5.97% | | 05/19/25 | | £ | 451,074 | | | | 557,088 | |
| Ivy Finco Limited, Term Loan, Acquisition Facility (Charlie)(b)(d) | | Jersey | | 3M GBP L + 5.25% | | 1.84% | | 05/19/25 | | | 113,864 | | | | 140,625 | |
| Ivy Finco Limited, Term Loan, Acquisition Facility (Original)(b)(d) | | Jersey | | 3M GBP L + 5.25% | | 1.84% | | 05/19/25 | | | 328,452 | | | | 405,647 | |
| Tempo Acquisition LLC, First Lien Initial Term Loan | | United States | | 1M US L + 3.00% | | 5.40% | | 05/01/24 | | $ | 587,282 | | | | 585,814 | |
| | | | | | | | | | | | | | | | 4,137,131 | |
| FIRE: REAL ESTATE (0.54%) | | | | | | | | | | | | | | |
| ASP MCS Acquisition Corp., First Lien Initial Term Loan | | United States | | 1M US L + 4.75% | | 7.15% | | 05/20/24 | | | 420,379 | | | | 264,839 | |
| Strand Court, Ltd., First Lien A-1 Term Loan(b) | | United Kingdom | | 6M EUR L + 6.75%, 0.50% Floor | | 7.25% | | 10/30/21 | | € | 507,321 | | | | 571,106 | |
| Strand Court, Ltd., First Lien A-2 Term Loan(b) | | United Kingdom | | 6M EUR L + 6.75%, 0.50% Floor | | 7.25% | | 10/30/21 | | | 604,220 | | | | 680,188 | |
| | | | | | | | | | | | | | | | 1,516,133 | |
| FOREST PRODUCTS & PAPER (0.73%) | | | | | | | | | | | | | | |
| Solenis Holdings LLC, First Lien Initial Dollar Term Loan | | United States | | 3M US L + 4.25% | | 6.77% | | 06/26/25 | | $ | 1,489,969 | | | | 1,474,324 | |
| Solenis Holdings LLC, Second Lien Initial Term Loan | | United States | | 3M US L + 8.50% | | 11.02% | | 06/26/26 | | | 604,384 | | | | 595,820 | |
| | | | | | | | | | | | | | | | 2,070,144 | |
| HEALTHCARE & PHARMACEUTICALS (6.51%) | | | | | | | | | | | | | | |
| Aea Holdings (luxembourg) S.a.r.l.(b)(c)(e) | | Luxembourg | | L + 9.25% | | | | 11/17/24 | | | 2,282,080 | | | | 2,304,901 | |
| Bausch Health Companies, Inc., First Lien First Incremental Term Loan | | United States | | 1M US L + 2.75% | | 5.16% | | 11/27/25 | | | 1,367,757 | | | | 1,361,349 | |
| BioClinica Holding I LP, First Lien Initial Term Loan | | United States | | 3M US L + 4.25% | | 6.81% | | 10/20/23 | | | 577,002 | | | | 548,152 | |
| Chip Holdco, Ltd., First Lien B Term Loan(b) | | United Kingdom | | 3M US L + 5.00% | | 7.33% | | 07/11/25 | | | 961,318 | | | | 961,318 | |
| Concentra, Inc., Second Lien Initial Term Loan | | United States | | 1M US L + 6.50% | | 8.96% | | 06/01/23 | | | 953,025 | | | | 962,160 | |
| Curium BidCo S.a r.l., First Lien B Term Loan(c) | | Luxembourg | | L + 4.00% | | | | 06/26/26 | | | 398,351 | | | | 398,102 | |
| Envision Healthcare Corp., First Lien Initial Term Loan | | United States | | 1M US L + 3.75% | | 6.15% | | 10/10/25 | | | 559,688 | | | | 496,023 | |
| Golden State Medical Supply, Inc., First Lien Term Loan(c) | | United States | | L + 4.75% | | | | 06/19/26 | | | 2,678,571 | | | | 2,665,178 | |
| Mendel Bidco, Inc., Term Loan(b) | | United States | | 3M US L + 4.50% | | 6.81% | | 06/17/27 | | | 2,715,805 | | | | 2,647,910 | |
| Mertus 522. Gmbh, Acquisition/Capex Facility(b)(d) | | Germany | | 3M EUR L + 5.75%, 0.00% Floor | | 1.44% | | 05/15/26 | | € | 467,970 | | | | 517,495 | |
| Mertus 522. Gmbh, Facility B(b) | | Germany | | 6M EUR L + 5.75%, 0.00% Floor | | 5.75% | | 05/15/26 | | | 800,751 | | | | 885,494 | |
| National Mentor Holdings, Inc., First Lien Initial C Term Loan | | United States | | 1M US L + 4.25% | | 6.66% | | 03/09/26 | | $ | 23,312 | | | | 23,441 | |
| National Mentor Holdings, Inc., First Lien Initial Term Loan | | United States | | 1M US L + 4.25% | | 6.66% | | 03/09/26 | | | 374,393 | | | | 376,461 | |
See Notes to Consolidated Financial Statements.
| 16 | 1.888.926.2688 | www.griffincapital.com |
| Griffin Institutional Access Credit Fund | Consolidated Schedule of Investments |
June 30, 2019 (Unaudited)
| Description | | Country | | Spread
Above Index | | Rate | | Maturity
Date | | Principal
Amount | | | Value
(Note 2) | |
| HEALTHCARE & PHARMACEUTICALS (continued) | | | | | | | | | | | | | | |
| Netsmart Technologies, Inc., First Lien D-1 Term Loan | | United States | | 1M US L + 3.75% | | 6.15% | | 04/19/23 | | $ | 225,963 | | | $ | 224,127 | |
| Parexel International Corp., First Lien Initial Term Loan | | United States | | 1M US L + 2.75% | | 5.15% | | 09/27/24 | | | 973,432 | | | | 934,846 | |
| Soursop, Ltd., Acquisition/Capex Facility(b)(d) | | Ireland | | 3M EUR L + 6.00%, 0.25% Floor | | 6.25% | | 11/03/25 | | € | 1,119,435 | | | | 1,260,181 | |
| Soursop, Ltd., First Lien Term Loan(b) | | Ireland | | 3M EUR L + 6.00%, 0.25% Floor | | 6.25% | | 11/03/25 | | | 432,376 | | | | 486,739 | |
| US Anesthesia Partners, Inc., First Lien Initial Term Loan | | United States | | 1M US L + 3.00% | | 5.40% | | 06/23/24 | | $ | 1,421,512 | | | | 1,395,449 | |
| | | | | | | | | | | | | | | | 18,449,326 | |
| HIGH TECH INDUSTRIES (4.88%) | | | | | | | | | | | | | | |
| AMI US Holdings Inc. Revolver Loan(b)(d) | | United States | | 1M US L + 5.50% | | 7.90% | | 04/01/24 | | | 145,361 | | | | 142,454 | |
| AMI US Holdings Inc. Term Loan(b) | | United States | | 1M US L + 5.50% | | 7.94% | | 04/01/25 | | | 1,101,953 | | | | 1,079,914 | |
| Carbonite, Inc., First Lien Initial Term Loan | | United States | | 1M US L + 3.75% | | 6.15% | | 03/26/26 | | | 268,404 | | | | 269,354 | |
| CMI Marketing, Inc., First Lien Initial Term Loan(b) | | United States | | 1M US L + 4.50% | | 6.90% | | 05/24/24 | | | 871,200 | | | | 871,200 | |
| CMI Marketing, Inc., First Lien Revolving Term Loan(b)(d) | | United States | | 3M US L + 4.50% | | 4.50% | | 05/24/23 | | | 120,000 | | | | 120,000 | |
| Drilling Info Holdings, Inc., First Lien Delayed Draw Term Loan(d) | | United States | | 1M US L + 4.25% | | 6.64% | | 07/30/25 | | | 5,070 | | | | 5,050 | |
| Drilling Info Holdings, Inc., First Lien Initial Term Loan | | United States | | 1M US L + 4.25% | | 6.65% | | 07/30/25 | | | 1,424,456 | | | | 1,419,114 | |
| Epicor Software Corp., First Lien B Term Loan | | United States | | 1M US L + 3.25% | | 5.66% | | 06/01/22 | | | 451,828 | | | | 449,569 | |
| Everest Bidco SAS, First Lien Facility B Term Loan | | France | | 3M EUR L + 4.00%, 0.00% Floor | | 4.00% | | 07/04/25 | | € | 303,237 | | | | 346,105 | |
| Everest Bidco SAS, Second Lien Term Loan(b) | | France | | 3M GBP L + 7.50%, 1.00% Floor | | 8.50% | | 07/03/26 | | £ | 378,378 | | | | 466,106 | |
| Kronos, Inc., First Lien Incremental Term Loan | | United States | | 3M US L + 3.00% | | 5.58% | | 11/01/23 | | $ | 813,719 | | | | 812,959 | |
| LTI Holdings, Inc., First Lien Initial Term Loan | | United States | | 1M US L + 3.50% | | 5.90% | | 09/06/25 | | | 1,290,262 | | | | 1,222,930 | |
| LTI Holdings, Inc., Second Lien Initial Term Loan | | United States | | 1M US L + 6.75% | | 9.15% | | 09/06/26 | | | 275,478 | | | | 256,607 | |
| MA FinanceCo. LLC, First Lien Tranche B-3 Term Loan | | United Kingdom | | 1M US L + 2.50% | | 4.90% | | 06/21/24 | | | 124,252 | | | | 122,040 | |
| RP Crown Parent LLC, First Lien Initial Term Loan | | United States | | 1M US L + 2.75% | | 5.15% | | 10/12/23 | | | 219,984 | | | | 219,297 | |
| Seattle SpinCo, Inc., First Lien Initial Term Loan | | United States | | 1M US L + 2.50% | | 4.90% | | 06/21/24 | | | 839,108 | | | | 824,163 | |
| SolarWinds Holdings, Inc., First Lien 2018 Refinancing Term Loan | | United States | | 1M US L + 2.75% | | 5.15% | | 02/05/24 | | | 932,355 | | | | 929,050 | |
| Ultimate Software Group, Inc., First Lien Initial Term Loan | | United States | | 3M US L + 3.75% | | 6.08% | | 05/04/26 | | | 670,561 | | | | 672,727 | |
| Vital Holdco Limited, Facility B1(b) | | United Kingdom | | 3M US L + 5.25% | | 7.80% | | 05/02/26 | | | 2,946,432 | | | | 2,872,773 | |
| Vital Holdco Limited, Facility B2(b) | | United Kingdom | | 3M US L + 5.25% | | 5.25% | | 05/02/26 | | € | 659,780 | | | | 731,480 | |
| | | | | | | | | | | | | | | | 13,832,892 | |
| HOTEL, GAMING, & LEISURE (1.77%) | | | | | | | | | | | | | | |
| Aimbridge Acquisition Co., Inc., First Lien Initial Term Loan | | United States | | 1M US L + 3.75% | | 6.14% | | 02/02/26 | | $ | 1,285,622 | | | | 1,292,051 | |
| AppLovin Corp., First Lien Initial Term Loan | | United States | | 1M US L + 3.50% | | 5.90% | | 08/15/25 | | | 306,273 | | | | 306,275 | |
See Notes to Consolidated Financial Statements.
| Semi-Annual Report | June 30, 2019 | 17 |
| Griffin Institutional Access Credit Fund | Consolidated Schedule of Investments |
June 30, 2019 (Unaudited)
| Description | | Country | | Spread
Above Index | | Rate | | Maturity
Date | | Principal
Amount | | | Value
(Note 2) | |
| HOTEL, GAMING, & LEISURE (continued) | | | | | | | | | | | | | | |
| Aristocrat Leisure, Ltd., First Lien B-3 Term Loan | | Australia | | 3M US L + 1.75% | | 4.34% | | 10/19/24 | | $ | 150,517 | | | $ | 149,416 | |
| Compass III, Ltd., First Lien Facility B2 Term Loan | | Netherlands | | 6M EUR L + 4.50%, 0.00% Floor | | 4.50% | | 05/09/25 | | € | 671,493 | | | | 769,442 | |
| HNVR Holdco, Ltd., First Lien Facility C Term Loan | | United Kingdom | | 6M EUR L + 4.50%, 0.00% Floor | | 4.50% | | 09/12/25 | | | 1,353,619 | | | | 1,553,246 | |
| IRB Holding Corp., First Lien B Term Loan | | United States | | 1M US L + 3.25% | | 5.64% | | 02/05/25 | | $ | 968,850 | | | | 958,178 | |
| | | | | | | | | | | | | | | | 5,028,608 | |
| MEDIA: ADVERTISING, PRINTING & PUBLISHING (0.02%) | | | | | | | | | | | | |
| Catalina Marketing Corp., First Lien First-Out Term Loan(e) | | United States | | 1M US L + 7.50% | | 9.89% | | 02/15/23 | | | 16,599 | | | | 14,006 | |
| Checkout Holding Corp., First Lien Term Loan(e) | | United States | | 1M US L + 10.50% | | 12.89% | | 08/15/23 | | | 79,618 | | | | 37,221 | |
| | | | | | | | | | | | | | | | 51,227 | |
| MEDIA: BROADCASTING & SUBSCRIPTION (0.94%) | | | | | | | | | | | | |
| CSC Holdings LLC, First Lien February 2019 Incremental Term Loan | | United States | | 1M US L + 3.00% | | 5.39% | | 04/15/27 | | | 814,124 | | | | 816,363 | |
| Gamma Infrastructure III B.V., First Lien Facility B Term Loan | | Netherlands | | 6M EUR L + 3.50%, 0.00% Floor | | 3.50% | | 01/09/25 | | € | 79,430 | | | | 89,530 | |
| Hargray Communications Group, Inc., First Lien Initial Term Loan | | United States | | 1M US L + 2.75% | | 5.15% | | 05/16/24 | | $ | 267,019 | | | | 265,894 | |
| Unitymedia Hessen GmbH & Co. KG, First Lien Facility C Term Loan | | Germany | | 6M EUR L + 2.75%, 0.00% Floor | | 2.75% | | 01/15/27 | | € | 246,269 | | | | 280,371 | |
| Virgin Media Bristol LLC, First Lien K Facility Term Loan | | United States | | 1M US L + 2.50% | | 4.89% | | 01/15/26 | | $ | 137,770 | | | | 137,425 | |
| Ziggo Secured Finance Partnership, First Lien E Facility Term Loan | | Netherlands | | 1M US L + 2.50% | | 4.89% | | 04/15/25 | | | 1,095,000 | | | | 1,074,469 | |
| | | | | | | | | | | | | | | | 2,664,052 | |
| MEDIA: DIVERSIFIED & PRODUCTION (2.29%) | | | | | | | | | | | | |
| Getty Images, Inc., First Lien Initial Dollar Term Loan | | United States | | 1M US L + 4.50% | | 6.94% | | 02/19/26 | | | 285,620 | | | | 284,667 | |
| Getty Images, Inc., First Lien Initial Euro Term Loan | | United States | | 1M EUR L + 5.00%, 0.00% Floor | | 5.00% | | 02/19/26 | | € | 312,066 | | | | 354,661 | |
| International Entertainment Investments Ltd., First Lien C1 Term Loan(b) | | United Kingdom | | 6M GBP L + 4.75% | | 5.66% | | 05/31/23 | | £ | 619,048 | | | | 786,159 | |
| International Entertainment Investments Ltd., First Lien C2 Term Loan(b) | | United Kingdom | | 6M GBP L + 4.75% | | 5.66% | | 05/31/23 | | | 380,952 | | | | 483,790 | |
| MH Sub I LLC, First Lien Amendment No. 2 Initial Term Loan | | United States | | 1M US L + 3.75% | | 6.15% | | 09/13/24 | | $ | 646,304 | | | | 636,043 | |
| MH Sub I LLC, Second Lien Amendment No. 2 Initial Term Loan | | United States | | 1M US L + 7.50% | | 9.90% | | 09/15/25 | | | 491,828 | | | | 494,287 | |
| National CineMedia LLC, First Lien Initial Term Loan | | United States | | 1M US L + 3.00% | | 5.44% | | 06/20/25 | | | 70,408 | | | | 70,232 | |
| Technicolor SA, First Lien Euro Term Loan | | France | | 3M EUR L + 3.50%, 0.00% Floor | | 3.50% | | 12/06/23 | | € | 1,836,556 | | | | 1,891,689 | |
| William Morris Endeavor Entertainment LLC, First Lien B-1 Term Loan | | United States | | 1M US L + 2.75% | | 5.16% | | 05/18/25 | | $ | 1,522,003 | | | | 1,475,072 | |
| | | | | | | | | | | | | | | | 6,476,600 | |
| METALS & MINING (0.37%) | | | | | | | | | | | | |
| Murray Energy Corp., First Lien Superpriority B-2 Term Loan | | United States | | 3M US L + 7.25% | | 9.77% | | 10/17/22 | | | 1,567,358 | | | | 1,059,275 | |
See Notes to Consolidated Financial Statements.
| 18 | 1.888.926.2688 | www.griffincapital.com |
| Griffin Institutional Access Credit Fund | Consolidated Schedule of Investments |
June 30, 2019 (Unaudited)
| Description | | Country | | Spread
Above Index | | Rate | | Maturity
Date | | Principal
Amount | | | Value
(Note 2) | |
| RETAIL (0.45%) | | | | | | | | | | | | |
| Albertson's LLC, First Lien 2018 B-7 Term Loan | | United States | | 1M US L + 3.00% | | 5.40% | | 11/17/25 | | $ | 299,241 | | | $ | 298,118 | |
| Ascena Retail Group, Inc., First Lien Tranche B Term Loan(c) | | United States | | 1M US L + 4.50% | | 6.94% | | 08/21/22 | | | 987,817 | | | | 649,900 | |
| Eyemart Express LLC, First Lien Term Loan | | United States | | 1M US L + 3.00% | | 5.44% | | 08/04/24 | | | 246,859 | | | | 244,956 | |
| Moran Foods LLC, First Lien Term Loan | | United States | | 3M US L + 6.00% | | 8.33% | | 12/05/23 | | | 131,470 | | | | 70,599 | |
| | | | | | | | | | | | | | | | 1,263,573 | |
| SERVICES: BUSINESS (4.90%) | | | | | | | | | | | | | | |
| Alliant Holdings Intermediate LLC, First Lien 2018 Initial Term Loan | | United States | | 1M US L + 3.00% | | 5.40% | | 05/09/25 | | | 1,051,037 | | | | 1,023,563 | |
| AMCP Clean Acquisition Co. LLC, First Lien Delayed Draw Term Loan(d) | | United States | | 3M US L + 4.25% | | 6.58% | | 06/16/25 | | | 162,937 | | | | 161,613 | |
| AMCP Clean Acquisition Co. LLC, First Lien Term Loan | | United States | | 3M US L + 4.25% | | 6.58% | | 06/16/25 | | | 673,432 | | | | 667,961 | |
| AqGen Ascensus, Inc., First Lien Replacement Term Loan(c) | | United States | | 6M US L + 4.00% | | 6.20% | | 12/05/22 | | | 1,767,532 | | | | 1,773,065 | |
| Baring Private Equity Asia VI Holding, Ltd., First Lien Initial Dollar Term Loan | | Netherlands | | 1M US L + 3.00% | | 5.40% | | 10/26/22 | | | 84,837 | | | | 83,777 | |
| Camelot U.S. Acquisition 1 Co., First Lien New Term Loan | | United States | | 1M US L + 3.25% | | 5.65% | | 10/03/23 | | | 138,571 | | | | 139,103 | |
| Comet Bidco, Ltd., First Lien Facility B Term Loan | | United Kingdom | | 1M US L + 5.25% | | 5.72% | | 09/30/24 | | £ | 469,565 | | | | 587,379 | |
| Comet Bidco, Ltd., First Lien Facility B2 Term Loan | | United Kingdom | | 3M US L + 5.00% | | 7.52% | | 09/30/24 | | $ | 362,553 | | | | 354,396 | |
| DiscoverOrg LLC, First Lien Initial Term Loan(c) | | United States | | L + 4.50% | | | | 02/02/26 | | | 1,250,000 | | | | 1,246,875 | |
| DiscoverOrg LLC, Second Lien Initial Term Loan | | United States | | 1M US L + 8.50% | | 10.90% | | 02/01/27 | | | 1,285,714 | | | | 1,274,464 | |
| Genuine Financial Holdings LLC, First Lien Initial Term Loan | | United States | | 1M US L + 3.75% | | 6.15% | | 07/11/25 | | | 496,250 | | | | 490,667 | |
| Irel AcquiCo GmbH, First Lien Facility B1 Term Loan | | Germany | | 3M EUR L + 3.75%, 0.00% Floor | | 3.75% | | 04/05/26 | | € | 591,249 | | | | 679,033 | |
| Jaguar Holding Company I LLC, First Lien 2018 Term Loan | | United States | | 1M US L + 2.50% | | 4.90% | | 08/18/22 | | $ | 975,824 | | | | 971,613 | |
| Park Place Technologies LLC, Second Lien Initial Term Loan | | United States | | 1M US L + 8.00% | | 10.40% | | 03/29/26 | | | 276,817 | | | | 274,394 | |
| Press Ganey Holdings, Inc., First Lien Incremental B-2018 Term Loan | | United States | | 1M US L + 2.75% | | 5.15% | | 10/23/23 | | | 543,961 | | | | 543,996 | |
| Research Now Group, Inc., First Lien Initial Term Loan | | United States | | 3M US L + 5.50% | | 8.08% | | 12/20/24 | | | 332,702 | | | | 332,286 | |
| Salient CRGT, Inc., First Lien Initial Term Loan | | United States | | 1M US L + 6.00% | | 8.40% | | 02/28/22 | | | 1,117,138 | | | | 1,072,453 | |
| Sophia LP, First Lien B Term Loan | | United States | | 3M US L + 3.25% | | 5.58% | | 09/30/22 | | | 942,871 | | | | 941,339 | |
| STG-Fairway Acquisitions, Inc., First Lien Term Loan | | United States | | 1M US L + 5.25% | | 7.65% | | 06/30/22 | | | 1,255,026 | | | | 1,255,810 | |
| | | | | | | | | | | | | | | | 13,873,787 | |
| SERVICES: CONSUMER (2.38%) | | | | | | | | | | | | | | |
| Ancestry.com Operations, Inc., First Lien Term Loan | | United States | | 1M US L + 3.25% | | 5.66% | | 10/19/23 | | | 712,668 | | | | 712,372 | |
| NVA Holdings, Inc., First Lien B-3 Term Loan | | United States | | 1M US L + 2.75% | | 5.15% | | 02/02/25 | | | 744,375 | | | | 744,062 | |
| NVA Holdings, Inc., First Lien Incremental B-4 Term Loan | | United States | | 1M US L + 3.50% | | 5.90% | | 02/02/25 | | | 145,335 | | | | 145,506 | |
See Notes to Consolidated Financial Statements.
| Semi-Annual Report | June 30, 2019 | 19 |
| Griffin Institutional Access Credit Fund | Consolidated Schedule of Investments |
June 30, 2019 (Unaudited)
| Description | | Country | | Spread
Above Index | | Rate | | Maturity
Date | | Principal
Amount | | | Value
(Note 2) | |
| SERVICES: CONSUMER (continued) | | | | | | | | | | | | | | | | |
| Prime Security Services Borrower LLC, First Lien December 2018 Incremental B-1 Term Loan | | United States | | 1M US L + 2.75% | | 5.15% | | 05/02/22 | | $ | 56,069 | | | $ | 55,756 | |
| Titan Acquisitionco New Zealand, Ltd., First Lien Initial Term Loan | | United States | | 3M US L + 4.25% | | 6.83% | | 05/01/26 | | | 539,150 | | | | 539,824 | |
| Trafalgar Bidco, Ltd., First Lien Term Loan (b) | | United Kingdom | | 3M GBP L + 5.00% | | 5.72% | | 09/11/24 | | £ | 1,502,760 | | | | 1,860,718 | |
| WeddingWire, Inc., Second Lien Initial Dollar Term Loan | | United States | | 1M US L + 8.25% | | 10.65% | | 12/21/26 | | $ | 533,333 | | | | 532,667 | |
| Weld North Education LLC, First Lien Initial Term Loan | | United States | | 3M US L + 4.25% | | 6.58% | | 02/15/25 | | | 1,174,347 | | | | 1,174,347 | |
| Wink Holdco, Inc., First Lien Initial Term Loan | | United States | | 1M US L + 3.00% | | 5.40% | | 12/02/24 | | | 991,829 | | | | 972,489 | |
| | | | | | | | | | | | | | | | 6,737,741 | |
| | | | | | | | | | | | | | | | | |
| TELECOMMUNICATIONS (4.42%) | | | | | | | | | | | | | | | | |
| Frontier Communications Corp., First Lien B-1 Term Loan | | United States | | 1M US L + 3.75% | | 6.16% | | 06/15/24 | | | 1,539,622 | | | | 1,513,326 | |
| Greeneden U.S. Holdings I LLC, First Lien Tranche B-3 Dollar Term Loan | | United States | | 1M US L + 3.25% | | 5.65% | | 12/01/23 | | | 996,866 | | | | 986,743 | |
| GTT Communications, Inc., First Lien Closing Date U.S. Term Loan(c) | | United States | | 1M US L + 2.75% | | 5.15% | | 05/31/25 | | | 918,020 | | | | 825,185 | |
| Horizon Telcom, Inc., First Lien Delayed Draw Term Loan(b)(d) | | United States | | 1M US L + 4.50% | | 6.90% | | 06/15/23 | | | 86,897 | | | | 86,028 | |
| Horizon Telcom, Inc., First Lien Revolving Term Loan(b)(d) | | United States | | 3M US L + 4.50% | | 0.50% | | 06/15/23 | | | 57,931 | | | | 57,352 | |
| Horizon Telcom, Inc., First Lien Term Loan(b) | | United States | | 1M US L + 4.50% | | 6.90% | | 06/15/23 | | | 689,959 | | | | 683,059 | |
| Intelsat Jackson Holdings S.A., First Lien Tranche B-3 Term Loan | | Luxembourg | | 1M US L + 3.75% | | 6.15% | | 11/27/23 | | | 177,721 | | | | 176,138 | |
| Intelsat Jackson Holdings SA, First Lien Tranche B-5 Term Loan(f) | | Luxembourg | | 6.63% | | 6.63% | | 01/02/24 | | | 289,875 | | | | 291,807 | |
| Logix Holding Co. LLC, First Lien Initial Term Loan | | United States | | 1M US L + 5.75% | | 8.15% | | 12/22/24 | | | 340,200 | | | | 340,200 | |
| Masergy Holdings, Inc., First Lien 2017 Replacement Term Loan | | United States | | 3M US L + 3.25% | | 5.58% | | 12/15/23 | | | 950,707 | | | | 937,635 | |
| Masergy Holdings, Inc., Second Lien Initial Term Loan | | United States | | 3M US L + 7.50% | | 9.83% | | 12/16/24 | | | 462,778 | | | | 455,836 | |
| Masmovil Ibercom SA, First Lien Facility B1 Term Loan(c) | | Spain | | L + 3.25%, 0.00% Floor | | | | 05/22/26 | | € | 974,453 | | | | 1,108,361 | |
| Masmovil Ibercom SA, First Lien Facility B2 Term Loan(c) | | Spain | | L + 3.25%, 0.00% Floor | | | | 05/22/26 | | | 155,912 | | | | 177,338 | |
| Mavenir Systems, Inc., First Lien Initial Term Loan | | United States | | 1M US L + 6.00% | | 8.42% | | 05/08/25 | | $ | 241,800 | | | | 241,649 | |
| Pulsant Acquisitions Ltd., Facility B Term Loan, First Lien Term Loan(b) | | United Kingdom | | 3M GBP L + 5.25% | | 6.25% | | 05/18/23 | | £ | 710,227 | | | | 883,913 | |
| Sprint Communications, Inc., First Lien 2019 Incremental Term Loan | | United States | | 1M US L + 3.00% | | 5.44% | | 02/02/24 | | $ | 756,417 | | | | 750,744 | |
| Uniti Group, Inc., First Lien Shortfall Term Loan | | United States | | 1M US L + 5.00% | | 7.40% | | 10/24/22 | | | 2,191,551 | | | | 2,141,222 | |
| Windstream Holdings, Inc., First Lien Facility (DIP) Term Loan | | United States | | 1M US L + 2.50% | | 4.91% | | 02/26/21 | | | 233,458 | | | | 234,237 | |
See Notes to Consolidated Financial Statements.
| 20 | 1.888.926.2688 | www.griffincapital.com |
| Griffin Institutional Access Credit Fund | Consolidated Schedule of Investments |
June 30, 2019 (Unaudited)
| | | | | | | | | | | | | | | |
| Description | | Country | | Spread
Above Index | | Rate | | Maturity
Date | | Principal
Amount | | | Value
(Note 2) | |
| TELECOMMUNICATIONS (continued) | | | | | | | | | | | | | | | | |
| Windstream Services LLC, First Lien 2016 Tranche B-6 Term Loan(g) | | United States | | 3M US L + 5.00% | | 10.50% | | 03/29/21 | | $ | 622,408 | | | $ | 641,858 | |
| | | | | | | | | | | | | | | | 12,532,631 | |
| | | | | | | | | | | | | | | | | |
| TRANSPORTATION: CARGO (0.64%) | | | | | | | | | | | | | | | | |
| Drive Chassis Holdco LLC, Second Lien B Term Loan | | United States | | 3M US L + 8.25% | | 10.83% | | 04/10/26 | | | 918,451 | | | | 885,157 | |
| Grammer Purchaser, Inc., First Lien Revolving Term Loan(b)(d) | | United States | | 3M US L + 4.75% | | 9.25% | | 09/30/24 | | | 90,000 | | | | 90,000 | |
| Grammer Purchaser, Inc., First Lien Term Loan(b) | | United States | | 3M US L + 4.75% | | 6.95% | | 09/30/24 | | | 849,911 | | | | 849,911 | |
| | | | | | | | | | | | | | | | 1,825,068 | |
| | | | | | | | | | | | | | | | | |
| TRANSPORTATION: CONSUMER (1.04%) | | | | | | | | | | | | | | | | |
| Lakeland Tours LLC, First Lien Initial Term Loan | | United States | | 3M US L + 4.00% | | 6.40% | | 12/16/24 | | | 889,854 | | | | 890,410 | |
| Safe Fleet Holdings LLC, Second Lien Initial Term Loan | | United States | | 1M US L + 6.75% | | 9.17% | | 02/02/26 | | | 667,223 | | | | 652,210 | |
| Toro Private Holdings III, Ltd., First Lien Initial Term Loan | | United Kingdom | | 3M US L + 5.00% | | 7.54% | | 05/29/26 | | | 561,838 | | | | 530,058 | |
| Toro Private Holdings III, Ltd., Second Lien Initial Term Loan | | United Kingdom | | 3M US L + 9.00% | | 11.54% | | 05/28/27 | | | 899,835 | | | | 868,341 | |
| | | | | | | | | | | | | | | | 2,941,019 | |
| | | | | | | | | | | | | | | | | |
| UTILITIES: ELECTRIC (0.32%) | | | | | | | | | | | | | | | | |
| Brookfield WEC Holdings, Inc., First Lien Initial Term Loan | | Canada | | 1M US L + 3.50% | | 5.90% | | 07/31/25 | | | 903,617 | | | | 903,554 | |
| | | | | | | | | | | | | | | | | |
| WHOLESALE (1.03%) | | | | | | | | | | | | | | | | |
| DXP Enterprises, Inc., First Lien Initial Term Loan | | United States | | 1M US L + 4.75% | | 7.15% | | 08/29/23 | | | 52,784 | | | | 52,916 | |
| Optiv, Inc., First Lien Initial Term Loan | | United States | | 1M US L + 3.25% | | 5.65% | | 02/01/24 | | | 88,428 | | | | 81,132 | |
| Quimper AB, First Lien Facility B1 Term Loan | | Sweden | | 3M EUR L + 4.25%, 0.00% Floor | | 4.25% | | 02/16/26 | | € | 956,550 | | | | 1,093,948 | |
| Quimper AB, First Lien Facility B2 Term Loan | | Sweden | | 3M EUR L + 4.25%, 0.00% Floor | | 4.25% | | 02/16/26 | | | 46,315 | | | | 52,967 | |
| Specialty Building Products Holdings LLC, First Lien 2018 Initial Term Loan(c) | | United States | | 1M US L + 5.75% | | 8.15% | | 10/01/25 | | $ | 679,674 | | | | 677,550 | |
| SRS Distribution, Inc., First Lien Initial Term Loan | | United States | | 1M US L + 3.25% | | 5.65% | | 05/23/25 | | | 1,007,094 | | | | 968,069 | |
| | | | | | | | | | | | | | | | 2,926,582 | |
| | | | | | | | | | | | | | | | | |
| TOTAL BANK LOANS | | | | | | | | | | | | | | | | |
| (Cost $159,006,387) | | | | | | | | | | | | | | | 157,648,868 | |
| | | | | | | | | | | | | | | | | |
| CORPORATE BONDS (30.81%)(f) | | | | | | | | | | | | | | | | |
| AEROSPACE & DEFENSE (2.03%) | | | | | | | | | | | | | | | | |
| Avolon Holdings Funding, Ltd.(h) | | Ireland | | | | 5.13% | | 10/01/23 | | | 249,000 | | | | 264,428 | |
| Avolon Holdings Funding, Ltd.(h) | | Ireland | | | | 5.25% | | 05/15/24 | | | 297,000 | | | | 317,315 | |
| Avolon Holdings Funding, Ltd.(h) | | Ireland | | | | 5.50% | | 01/15/23 | | | 76,000 | | | | 81,213 | |
| Bombardier, Inc.(h) | | Canada | | | | 6.13% | | 01/15/23 | | | 348,000 | | | | 353,655 | |
| Bombardier, Inc.(h) | | Canada | | | | 7.50% | | 03/15/25 | | | 128,000 | | | | 128,839 | |
| Bombardier, Inc.(h) | | Canada | | | | 7.88% | | 04/15/27 | | | 675,000 | | | | 677,531 | |
| Park Aerospace Holdings, Ltd.(h) | | Ireland | | | | 5.50% | | 02/15/24 | | | 1,000,000 | | | | 1,079,230 | |
See Notes to Consolidated Financial Statements.
| Semi-Annual Report | June 30, 2019 | 21 |
| Griffin Institutional Access Credit Fund | Consolidated Schedule of Investments |
June 30, 2019 (Unaudited)
| Description | | Country | | | | Rate | | Maturity Date | | Principal
Amount | | | Value
(Note 2) | |
| AEROSPACE & DEFENSE (continued) | | | | | | | | | | | | | | | | |
| Pioneer Holdings LLC / Pioneer Finance Corp.(h) | | United Kingdom | | | | 9.00% | | 11/01/22 | | $ | 1,334,000 | | | $ | 1,374,020 | |
| TransDigm, Inc.(h) | | United States | | | | 6.25% | | 03/15/26 | | | 825,000 | | | | 865,219 | |
| TransDigm, Inc. | | United States | | | | 6.38% | | 06/15/26 | | | 295,000 | | | | 299,794 | |
| TransDigm, Inc. | | United States | | | | 6.50% | | 07/15/24 | | | 115,000 | | | | 116,868 | |
| TransDigm, Inc. | | United States | | | | 6.50% | | 05/15/25 | | | 177,000 | | | | 179,655 | |
| | | | | | | | | | | | | | | | 5,737,767 | |
| | | | | | | | | | | | | | | | | |
| AUTOMOTIVE (0.76%) | | | | | | | | | | | | | | | | |
| Allison Transmission, Inc.(h) | | United States | | | | 5.88% | | 06/01/29 | | | 711,000 | | | | 750,105 | |
| KAR Auction Services, Inc.(h) | | United States | | | | 5.13% | | 06/01/25 | | | 103,000 | | | | 105,317 | |
| Meritor, Inc. | | United States | | | | 6.25% | | 02/15/24 | | | 563,000 | | | | 581,298 | |
| Midas Intermediate Holdco II LLC / Midas Intermediate Holdco II Finance, Inc.(h) | | United States | | | | 7.88% | | 10/01/22 | | | 750,000 | | | | 716,250 | |
| | | | | | | | | | | | | | | | 2,152,970 | |
| | | | | | | | | | | | | | | | | |
| BANKING (0.38%) | | | | | | | | | | | | | | | | |
| Lincoln Financing SARL(a)(h) | | Netherlands | | | | 3M EUR L + 3.88% | | 04/01/24 | | € | 930,000 | | | | 1,067,772 | |
| | | | | | | | | | | | | | | | | |
| BEVERAGE, FOOD, & TOBACCO (1.33%) | | | | | | | | | | | | | | | | |
| 1011778 BC ULC / New Red Finance, Inc.(h) | | Canada | | | | 5.00% | | 10/15/25 | | $ | 383,000 | | | | 386,945 | |
| JBS USA LUX SA / JBS USA Finance, Inc.(h) | | United States | | | | 5.75% | | 06/15/25 | | | 228,000 | | | | 237,975 | |
| JBS USA LUX SA / JBS USA Food Co. / JBS USA Finance, Inc.(h) | | United States | | | | 6.50% | | 04/15/29 | | | 1,020,000 | | | | 1,110,525 | |
| Matterhorn Merger Sub LLC / Matterhorn Finance Sub, Inc.(h) | | United States | | | | 8.50% | | 06/01/26 | | | 1,179,000 | | | | 1,052,257 | |
| Post Holdings, Inc.(h) | | United States | | | | 5.00% | | 08/15/26 | | | 250,000 | | | | 254,375 | |
| Post Holdings, Inc.(h) | | United States | | | | 5.75% | | 03/01/27 | | | 121,000 | | | | 125,538 | |
| Sigma Holdco BV(h) | | Netherlands | | | | 7.88% | | 05/15/26 | | | 656,000 | | | | 610,080 | |
| | | | | | | | | | | | | | | | 3,777,695 | |
| | | | | | | | | | | | | | | | | |
| CAPITAL EQUIPMENT (1.88%) | | | | | | | | | | | | | | | | |
| Cleaver-Brooks, Inc.(h) | | United States | | | | 7.88% | | 03/01/23 | | | 851,000 | | | | 818,202 | |
| CPG Merger Sub LLC(h) | | United States | | | | 8.00% | | 10/01/21 | | | 1,660,000 | | | | 1,691,125 | |
| EnPro Industries, Inc. | | United States | | | | 5.75% | | 10/15/26 | | | 242,000 | | | | 248,050 | |
| Manitowoc Co., Inc.(h) | | United States | | | | 9.00% | | 04/01/26 | | | 613,000 | | | | 614,532 | |
| PGT Escrow Issuer, Inc.(h) | | United States | | | | 6.75% | | 08/01/26 | | | 904,000 | | | | 959,370 | |
| RBS Global, Inc. / Rexnord LLC(h) | | United States | | | | 4.88% | | 12/15/25 | | | 220,000 | | | | 223,300 | |
| TriMas Corp.(h) | | United States | | | | 4.88% | | 10/15/25 | | | 184,000 | | | | 186,645 | |
| Wabash National Corp.(h) | | United States | | | | 5.50% | | 10/01/25 | | | 625,000 | | | | 595,313 | |
| | | | | | | | | | | | | | | | 5,336,537 | |
| | | | | | | | | | | | | | | | | |
| CHEMICALS, PLASTICS, & RUBBER (1.01%) | | | | | | | | | | | | | | | | |
| Compass Minerals International, Inc.(h) | | United States | | | | 4.88% | | 07/15/24 | | | 773,000 | | | | 739,181 | |
| Neon Holdings, Inc.(h) | | United States | | | | 10.13% | | 04/01/26 | | | 677,000 | | | | 668,537 | |
| Trinseo Materials Operating SCA / Trinseo Materials Finance, Inc.(h) | | United States | | | | 5.38% | | 09/01/25 | | | 411,000 | | | | 397,643 | |
| Venator Finance Sarl / Venator Materials LLC(h) | | United States | | | | 5.75% | | 07/15/25 | | | 1,159,000 | | | | 1,067,729 | |
| | | | | | | | | | | | | | | | 2,873,090 | |
| | | | | | | | | | | | | | | | | |
| CONSTRUCTION & BUILDING (0.37%) | | | | | | | | | | | | | | | | |
| Summit Materials LLC / Summit Materials Finance Corp.(h) | | United States | | | | 5.13% | | 06/01/25 | | | 386,000 | | | | 387,930 | |
| Summit Materials LLC / Summit Materials Finance Corp.(h) | | United States | | | | 6.50% | | 03/15/27 | | | 625,000 | | | | 651,562 | |
| | | | | | | | | | | | | | | | 1,039,492 | |
See Notes to Consolidated Financial Statements.
| 22 | 1.888.926.2688 | www.griffincapital.com |
| Griffin Institutional Access Credit Fund | Consolidated Schedule of Investments |
June 30, 2019 (Unaudited)
| Description | | Country | | | | Rate | | Maturity Date | | Principal
Amount | | | Value
(Note 2) | |
| CONSUMER GOODS: NON-DURABLE (0.92%) | | | | | | | | | | | | | | | | |
| Coty, Inc.(h) | | United States | | | | 6.50% | | 04/15/26 | | $ | 319,000 | | | $ | 311,424 | |
| Kronos Acquisition Holdings, Inc.(h) | | Canada | | | | 9.00% | | 08/15/23 | | | 1,263,000 | | | | 1,113,524 | |
| Mattel, Inc.(h) | | United States | | | | 6.75% | | 12/31/25 | | | 701,000 | | | | 722,906 | |
| Prestige Brands, Inc.(h) | | United States | | | | 6.38% | | 03/01/24 | | | 149,000 | | | | 156,636 | |
| William Carter Co.(h) | | United States | | | | 5.63% | | 03/15/27 | | | 287,000 | | | | 301,709 | |
| | | | | | | | | | | | | | | | 2,606,199 | |
| | | | | | | | | | | | | | | | | |
| CONTAINERS, PACKAGING, & GLASS (1.17%) | | | | | | | | | | | | | | | | |
| Ardagh Packaging Finance PLC / ArdaghHoldings USA, Inc.(h) | | Ireland | | | | 6.00% | | 02/15/25 | | | 1,250,000 | | | | 1,296,875 | |
| Berry Global Escrow Corp.(h) | | United States | | | | 5.63% | | 07/15/27 | | | 153,000 | | | | 159,502 | |
| BWAY Holding Co.(h) | | United States | | | | 7.25% | | 04/15/25 | | | 750,000 | | | | 725,625 | |
| Titan Acquisition Ltd. / Titan Co-Borrower LLC(h) | | United Kingdom | | | | 7.75% | | 04/15/26 | | | 639,000 | | | | 576,698 | |
| W/S Packaging Holdings, Inc.(h) | | United States | | | | 9.00% | | 04/15/23 | | | 500,000 | | | | 544,375 | |
| | | | | | | | | | | | | | | | 3,303,075 | |
| | | | | | | | | | | | | | | | | |
| ENERGY: OIL & GAS (3.29%) | | | | | | | | | | | | | | | | |
| Alta Mesa Holdings LP / Alta Mesa Finance Services Corp., Series WI | | United States | | | | 7.88% | | 12/15/24 | | | 1,266,000 | | | | 503,235 | |
| Bruin E&P Partners LLC(h) | | United States | | | | 8.88% | | 08/01/23 | | | 1,966,000 | | | | 1,661,270 | |
| California Resources Corp.(h) | | United States | | | | 8.00% | | 12/15/22 | | | 490,000 | | | | 371,787 | |
| CNX Resources Corp.(h) | | United States | | | | 7.25% | | 03/14/27 | | | 444,000 | | | | 381,840 | |
| Comstock Resources, Inc., Series WI | | United States | | | | 9.75% | | 08/15/26 | | | 365,000 | | | | 281,962 | |
| Covey Park Energy LLC / Covey Park Finance Corp.(h) | | United States | | | | 7.50% | | 05/15/25 | | | 358,000 | | | | 259,550 | |
| Extraction Oil & Gas, Inc.(h) | | United States | | | | 5.63% | | 02/01/26 | | | 301,000 | | | | 244,562 | |
| Great Western Petroleum LLC / Great Western Finance Corp.(h) | | United States | | | | 9.00% | | 09/30/21 | | | 907,000 | | | | 741,473 | |
| Gulfport Energy Corp. | | United States | | | | 6.38% | | 01/15/26 | | | 636,000 | | | | 484,950 | |
| Magnolia Oil & Gas Operating LLC / Magnolia Oil & Gas Finance Corp.(h) | | United States | | | | 6.00% | | 08/01/26 | | | 375,000 | | | | 384,375 | |
| Parsley Energy LLC / Parsley Finance Corp.(h) | | United States | | | | 5.38% | | 01/15/25 | | | 760,000 | | | | 782,800 | |
| QEP Resources, Inc. | | United States | | | | 5.63% | | 03/01/26 | | | 750,000 | | | | 708,750 | |
| Range Resources Corp. | | United States | | | | 5.00% | | 03/15/23 | | | 500,000 | | | | 472,500 | |
| SM Energy Co. | | United States | | | | 5.00% | | 01/15/24 | | | 95,000 | | | | 87,638 | |
| SM Energy Co. | | United States | | | | 5.63% | | 06/01/25 | | | 625,000 | | | | 571,875 | |
| SRC Energy, Inc. | | United States | | | | 6.25% | | 12/01/25 | | | 272,000 | | | | 248,880 | |
| Talos Production LLC / Talos Production Finance, Inc., Series WI | | United States | | | | 11.00% | | 04/03/22 | | | 705,000 | | | | 746,419 | |
| Ultra Resources, Inc.(h) | | United States | | | | 7.13% | | 04/15/25 | | | 168,000 | | | | 15,960 | |
| Ultra Resources, Inc.(e) | | United States | | | | 11.00% Cash and 0.25% PIK | | 07/12/24 | | | 293,400 | | | | 114,426 | |
| Vine Oil & Gas LP / Vine Oil & Gas Finance Corp.(h) | | United States | | | | 9.75% | | 04/15/23 | | | 401,000 | | | | 261,653 | |
| | | | | | | | | | | | | | | | 9,325,905 | |
| | | | | | | | | | | | | | | | | |
| FIRE: FINANCE (0.53%) | | | | | | | | | | | | | | | | |
| Fairstone Financial, Inc.(h) | | Canada | | | | 7.88% | | 07/15/24 | | | 222,000 | | | | 226,856 | |
| Springleaf Finance Corp. | | United States | | | | 6.63% | | 01/15/28 | | | 709,000 | | | | 746,223 | |
| SS&C Technologies, Inc.(h) | | United States | | | | 5.50% | | 09/30/27 | | | 518,000 | | | | 538,396 | |
| | | | | | | | | | | | | | | | 1,511,475 | |
| | | | | | | | | | | | | | | | | |
| FIRE: REAL ESTATE (0.18%) | | | | | | | | | | | | | | | | |
| Realogy Group LLC / Realogy Co.-Issuer Corp.(h) | | United States | | | | 4.88% | | 06/01/23 | | | 355,000 | | | | 321,275 | |
See Notes to Consolidated Financial Statements.
| Semi-Annual Report | June 30, 2019 | 23 |
| Griffin Institutional Access Credit Fund | Consolidated Schedule of Investments |
June 30, 2019 (Unaudited)
| Description | | Country | | | | Rate | | Maturity Date | | Principal
Amount | | | Value
(Note 2) | |
| FIRE: REAL ESTATE (continued) | | | | | | | | | | | | | | |
| Realogy Group LLC / Realogy Co.-Issuer Corp.(h) | | United States | | | | 9.38% | | 04/01/27 | | $ | 226,000 | | | $ | 199,162 | |
| | | | | | | | | | | | | | | | 520,437 | |
| FOREST PRODUCTS & PAPER (0.61%) | | | | | | | | | | | | | | |
| LABL Escrow Issuer LLC(h) | | United States | | | | 6.75% | | 07/15/26 | | | 662,000 | | | | 670,606 | |
| LABL Escrow Issuer LLC(h) | | United States | | | | 10.50% | | 07/15/27 | | | 656,000 | | | | 657,640 | |
| Multi-Color Corp.(h) | | United States | | | | 4.88% | | 11/01/25 | | | 380,000 | | | | 400,425 | |
| | | | | | | | | | | | | | | | 1,728,671 | |
| HEALTHCARE & PHARMACEUTICALS (0.90%) | | | | | | | | | | | | | | |
| Bausch Health Americas, Inc.(h) | | United States | | | | 8.50% | | 01/31/27 | | | 230,000 | | | | 253,465 | |
| Bausch Health Cos., Inc.(h) | | United States | | | | 5.75% | | 08/15/27 | | | 115,000 | | | | 121,150 | |
| Bausch Health Cos., Inc.(h) | | United States | | | | 9.00% | | 12/15/25 | | | 813,000 | | | | 911,414 | |
| IQVIA, Inc.(h) | | United States | | | | 5.00% | | 05/15/27 | | | 960,000 | | | | 993,600 | |
| Tenet Healthcare Corp.(h) | | United States | | | | 6.25% | | 02/01/27 | | | 269,000 | | | | 277,406 | |
| | | | | | | | | | | | | | | | 2,557,035 | |
| HIGH TECH INDUSTRIES (0.86%) | | | | | | | | | | | | | | |
| CDK Global, Inc. | | United States | | | | 4.88% | | 06/01/27 | | | 291,000 | | | | 301,284 | |
| CDK Global, Inc.(h) | | United States | | | | 5.25% | | 05/15/29 | | | 836,000 | | | | 867,350 | |
| CDK Global, Inc. | | United States | | | | 5.88% | | 06/15/26 | | | 116,000 | | | | 123,250 | |
| Genesys Telecommunications Laboratories, Inc./Greeneden Lux 3 Sarl/Greeneden US Ho(h) | | United States | | | | 10.00% | | 11/30/24 | | | 655,000 | | | | 713,131 | |
| Go Daddy Operating Co. LLC / GD Finance Co, Inc.(h) | | United States | | | | 5.25% | | 12/01/27 | | | 426,000 | | | | 442,508 | |
| | | | | | | | | | | | | | | | 2,447,523 | |
| HOTEL, GAMING, & LEISURE (1.23%) | | | | | | | | | | | | | | |
| Caesars Resort Collection LLC / CRC Finco, Inc.(h) | | United States | | | | 5.25% | | 10/15/25 | | | 1,305,000 | | | | 1,308,262 | |
| Eldorado Resorts, Inc. | | United States | | | | 6.00% | | 09/15/26 | | | 410,000 | | | | 449,975 | |
| MGM Growth Properties Operating Partnership LP / MGP Finance Co.-Issuer, Inc.(h) | | United States | | | | 5.75% | | 02/01/27 | | | 260,000 | | | | 280,475 | |
| Scientific Games International, Inc.(h) | | United States | | | | 3.38% | | 02/15/26 | | € | 127,000 | | | | 145,364 | |
| Scientific Games International, Inc.(h) | | United States | | | | 5.00% | | 10/15/25 | | $ | 255,000 | | | | 258,188 | |
| Scientific Games International, Inc.(h) | | United States | | | | 8.25% | | 03/15/26 | | | 984,000 | | | | 1,035,650 | |
| | | | | | | | | | | | | | | | 3,477,914 | |
| MEDIA: BROADCASTING & SUBSCRIPTION (2.07%) | | | | | | | | | | | | | | |
| CCO Holdings LLC / CCO Holdings Capital Corp.(h) | | United States | | | | 5.00% | | 02/01/28 | | | 596,000 | | | | 610,125 | |
| CSC Holdings LLC(h) | | United States | | | | 5.38% | | 02/01/28 | | | 328,000 | | | | 341,530 | |
| CSC Holdings LLC(h) | | United States | | | | 6.50% | | 02/01/29 | | | 386,000 | | | | 421,946 | |
| CSC Holdings LLC(h) | | United States | | | | 7.50% | | 04/01/28 | | | 379,000 | | | | 417,961 | |
| CSC Holdings LLC(h) | | United States | | | | 10.88% | | 10/15/25 | | | 1,250,000 | | | | 1,435,944 | |
| Cumulus Media New Holdings, Inc.(h) | | United States | | | | 6.75% | | 07/01/26 | | | 209,000 | | | | 209,000 | |
| Entercom Media Corp.(h) | | United States | | | | 6.50% | | 05/01/27 | | | 871,000 | | | | 908,017 | |
| iHeartCommunications, Inc. | | United States | | | | 6.38% | | 05/01/26 | | | 919,000 | | | | 979,884 | |
| Ziggo Bond Co. BV(h) | | Netherlands | | | | 6.00% | | 01/15/27 | | | 545,000 | | | | 549,088 | |
| | | | | | | | | | | | | | | | 5,873,495 | |
| MEDIA: DIVERSIFIED & PRODUCTION (1.45%) | | | | | | | | | | | | | | |
| Getty Images, Inc.(h) | | United States | | | | 9.75% | | 03/01/27 | | | 1,250,000 | | | | 1,290,625 | |
| Match Group, Inc.(h) | | United States | | | | 5.00% | | 12/15/27 | | | 126,000 | | | | 132,603 | |
| Match Group, Inc.(h) | | United States | | | | 5.63% | | 02/15/29 | | | 592,000 | | | | 626,780 | |
| National CineMedia LLC | | United States | | | | 5.75% | | 08/15/26 | | | 802,000 | | | | 767,915 | |
See Notes to Consolidated Financial Statements.
| 24 | 1.888.926.2688 | www.griffincapital.com |
| Griffin Institutional Access Credit Fund | Consolidated Schedule of Investments |
June 30, 2019 (Unaudited)
| Description | | Country | | | | Rate | | Maturity Date | | Principal
Amount | | | Value
(Note 2) | |
| MEDIA: DIVERSIFIED & PRODUCTION (continued) |
| Sirius XM Radio, Inc.(h) | | United States | | | | 3.88% | | 08/01/22 | | $ | 76,000 | | | $ | 76,570 | |
| Sirius XM Radio, Inc.(h) | | United States | | | | 5.00% | | 08/01/27 | | | 625,000 | | | | 638,219 | |
| Sirius XM Radio, Inc.(h) | | United States | | | | 5.50% | | 07/01/29 | | | 568,000 | | | | 583,733 | |
| | | | | | | | | | | | | | | | 4,116,445 | |
| METALS & MINING (0.26%) | | | | | | | | | | | | | | |
| Murray Energy Corp.(e)(h) | | United States | | | | 9.00% Cash and 3.00% PIK | | 04/15/24 | | | 1,551,935 | | | | 322,027 | |
| New Gold, Inc.(h) | | Canada | | | | 6.25% | | 11/15/22 | | | 444,000 | | | | 416,250 | |
| | | | | | | | | | | | | | | | 738,277 | |
| RETAIL (0.60%) | | | | | | | | | | | | | | |
| Albertsons Cos. LLC / Safeway, Inc. / New Albertsons LP / Albertson's LLC(h) | | United States | | | | 7.50% | | 03/15/26 | | | 410,000 | | | | 439,725 | |
| Party City Holdings, Inc.(h) | | United States | | | | 6.63% | | 08/01/26 | | | 563,000 | | | | 547,517 | |
| Penske Automotive Group, Inc. | | United States | | | | 5.38% | | 12/01/24 | | | 563,000 | | | | 579,890 | |
| Sally Holdings LLC / Sally Capital, Inc. | | United States | | | | 5.63% | | 12/01/25 | | | 146,000 | | | | 143,628 | |
| | | | | | | | | | | | | | | | 1,710,760 | |
| SERVICES: BUSINESS (2.35%) | | | | | | | | | | | | | | |
| Alliant Holdings Intermediate LLC / Alliant Holdings Co.-Issuer(h) | | United States | | | | 8.25% | | 08/01/23 | | | 605,000 | | | | 622,968 | |
| Aptim Corp.(h) | | United States | | | | 7.75% | | 06/15/25 | | | 1,140,000 | | | | 877,800 | |
| Eagle Holding Co. II LLC(e)(h) | | United States | | | | 7.75% | | 05/15/22 | | | 656,000 | | | | 662,560 | |
| Gogo Intermediate Holdings LLC / Gogo Finance Co., Inc.(h) | | United States | | | | 9.88% | | 05/01/24 | | | 533,000 | | | | 549,656 | |
| Herc Holdings, Inc.(h) | | United States | | | | 5.50% | | 07/15/27 | | | 888,000 | | | | 895,770 | |
| La Financiere Atalian SASU, Series REGs(i) | | France | | | | 5.13% | | 05/15/25 | | € | 430,000 | | | | 367,786 | |
| La Financiere Atalian SASU(i) | | France | | | | 4.00% | | 05/15/24 | | | 565,000 | | | | 484,416 | |
| MDC Partners, Inc.(h) | | United States | | | | 6.50% | | 05/01/24 | | $ | 1,703,000 | | | | 1,573,504 | |
| Sophia LP / Sophia Finance, Inc.(h) | | United States | | | | 9.00% | | 09/30/23 | | | 250,000 | | | | 259,063 | |
| United Rentals North America, Inc. | | United States | | | | 5.50% | | 05/15/27 | | | 333,000 | | | | 351,315 | |
| | | | | | | | | | | | | | | | 6,644,838 | |
| SERVICES: CONSUMER (1.26%) | | | | | | | | | | | | | | |
| Cedar Fair LP(h) | | United States | | | | 5.25% | | 07/15/29 | | | 421,000 | | | | 430,473 | |
| GrubHub Holdings, Inc.(h) | | United States | | | | 5.50% | | 07/01/27 | | | 767,000 | | | | 789,143 | |
| Netflix, Inc. | | United States | | | | 5.88% | | 11/15/28 | | | 465,000 | | | | 515,973 | |
| Prime Security Services Borrower LLC / Prime Finance, Inc.(h) | | United States | | | | 5.25% | | 04/15/24 | | | 532,000 | | | | 542,640 | |
| Prime Security Services Borrower LLC / Prime Finance, Inc.(h) | | United States | | | | 5.75% | | 04/15/26 | | | 532,000 | | | | 550,620 | |
| ServiceMaster Co. LLC(h) | | United States | | | | 5.13% | | 11/15/24 | | | 705,000 | | | | 727,031 | |
| | | | | | | | | | | | | | | | 3,555,880 | |
| TELECOMMUNICATIONS (1.90%) | | | | | | | | | | | | | | |
| Cincinnati Bell, Inc.(h) | | United States | | | | 7.00% | | 07/15/24 | | | 392,000 | | | | 347,900 | |
| Cincinnati Bell, Inc.(h) | | United States | | | | 8.00% | | 10/15/25 | | | 172,000 | | | | 147,060 | |
| GTT Communications, Inc.(h) | | United States | | | | 7.88% | | 12/31/24 | | | 815,000 | | | | 670,338 | |
| Intelsat Jackson Holdings SA(h) | | Luxembourg | | | | 8.50% | | 10/15/24 | | | 457,000 | | | | 454,715 | |
| Intelsat Jackson Holdings SA(h) | | Luxembourg | | | | 9.50% | | 09/30/22 | | | 171,000 | | | | 200,350 | |
| Level 3 Financing, Inc. | | United States | | | | 5.38% | | 01/15/24 | | | 660,000 | | | | 675,675 | |
| Sprint Communications, Inc. | | United States | | | | 11.50% | | 11/15/21 | | | 1,000,000 | | | | 1,160,000 | |
| T-Mobile USA, Inc. | | United States | | | | 6.38% | | 03/01/25 | | | 1,125,000 | | | | 1,171,125 | |
| T-Mobile USA, Inc. | | United States | | | | 6.50% | | 01/15/26 | | | 250,000 | | | | 270,890 | |
| ViaSat, Inc.(h) | | United States | | | | 5.63% | | 04/15/27 | | | 286,000 | | | | 298,155 | |
| | | | | | | | | | | | | | | | 5,396,208 | |
| TRANSPORTATION: CARGO (0.84%) | | | | | | | | | | | | | | |
| Flexi-Van Leasing, Inc.(h) | | United States | | | | 10.00% | | 02/15/23 | | | 296,000 | | | | 276,020 | |
See Notes to Consolidated Financial Statements.
| Semi-Annual Report | June 30, 2019 | 25 |
| Griffin Institutional Access Credit Fund | Consolidated Schedule of Investments |
June 30, 2019 (Unaudited)
| Description | | Country | | | | Rate | | Maturity Date | | Principal
Amount | | | Value
(Note 2) | |
| TRANSPORTATION: CARGO (continued) | | | | | | | | | | | | | | |
| XPO Logistics, Inc.(h) | | United States | | | | 6.50% | | 06/15/22 | | $ | 384,000 | | | $ | 392,640 | |
| XPO Logistics, Inc.(h) | | United States | | | | 6.75% | | 08/15/24 | | | 1,604,000 | | | | 1,714,275 | |
| | | | | | | | | | | | | | | | 2,382,935 | |
| TRANSPORTATION: CONSUMER (1.01%) | | | | | | | | | | | | | | |
| Sabre GLBL, Inc.(h) | | United States | | | | 5.25% | | 11/15/23 | | | 250,000 | | | | 258,750 | |
| Sabre GLBL, Inc.(h) | | United States | | | | 5.38% | | 04/15/23 | | | 250,000 | | | | 256,875 | |
| United Continental Holdings, Inc. | | United States | | | | 4.88% | | 01/15/25 | | | 646,000 | | | | 663,765 | |
| United Continental Holdings, Inc. | | United States | | | | 5.00% | | 02/01/24 | | | 682,000 | | | | 709,280 | |
| VistaJet Malta Finance PLC / XO Management Holding, Inc.(h) | | Switzerland | | | | 10.50% | | 06/01/24 | | | 976,000 | | | | 976,000 | |
| | | | | | | | | | | | | | | | 2,864,670 | |
| UTILITIES: ELECTRIC (0.88%) | | | | | | | | | | | | | | |
| Pacific Gas & Electric Co.(g) | | United States | | | | 3.95% | | 12/01/47 | | | 900,000 | | | | 813,375 | |
| Pacific Gas & Electric Co.(g) | | United States | | | | 6.05% | | 03/01/34 | | | 1,500,000 | | | | 1,676,250 | |
| | | | | | | | | | | | | | | | 2,489,625 | |
| UTILITIES: WATER (0.09%) | | | | | | | | | | | | | | |
| Core & Main LP(h) | | United States | | | | 6.13% | | 08/15/25 | | | 240,000 | | | | 243,600 | |
| | | | | | | | | | | | | | | | | |
| WHOLESALE (0.65%) | | | | | | | | | | | | | | |
| Beacon Roofing Supply, Inc.(h) | | United States | | | | 4.88% | | 11/01/25 | | | 1,250,000 | | | | 1,242,187 | |
| SRS Distribution, Inc.(h) | | United States | | | | 8.25% | | 07/01/26 | | | 614,000 | | | | 598,650 | |
| | | | | | | | | | | | | | | | 1,840,837 | |
| TOTAL CORPORATE BONDS | | | | | | | | | | | | | | |
| (Cost $87,618,566) | | | | | | | | | | | | | 87,321,127 | |
| | | | | | | | | | | | | | | | | |
| CONVERTIBLE CORPORATE BONDS (0.08%)(f) | | | | | | | | | | | | | | |
| ENERGY: OIL & GAS (0.08%) | | | | | | | | | | | | | | |
| Whiting Petroleum Corp. | | United States | | | | 1.25% | | 04/01/20 | | | 245,000 | | | | 237,650 | |
| | | | | | | | | | | | | | | | | |
| TOTAL CONVERTIBLE CORPORATE BONDS | | | | | | | | | | | | | | |
| (Cost $238,909) | | | | | | | | | | | | | 237,650 | |
| | | | | | | | | | | | | | | | | |
| | | | | Spread
Above Index | | | | | | | | | | | | |
COLLATERALIZED LOAN OBLIGATIONS (6.74%)(h) DEBT (2.31%)(a) | | | | | | | | | | | | | | |
| ARES XLVII CLO, Ltd., Series 2018-47A | | Cayman Islands | | 3M US L + 5.50% | | 8.10% | | 04/15/30 | | | 300,000 | | | | 281,584 | |
| Atlas Senior Loan Fund XIV, Series 2019-14A | | Cayman Islands | | 3M US L + 6.94% | | 9.34% | | 07/20/32 | | | 300,000 | | | | 295,610 | |
| BlueMountain CLO 2016-3, Ltd., Series 2018-3A | | Cayman Islands | | 3M US L + 5.95% | | 8.47% | | 11/15/30 | | | 300,000 | | | | 284,835 | |
| CIFC Funding 2014-II-R, Ltd., Series 2018-2RA | | Cayman Islands | | 3M US L + 5.69% | | 8.27% | | 04/24/30 | | | 300,000 | | | | 278,439 | |
| Dryden 37 Senior Loan Fund, Series 2017-37A | | Cayman Islands | | 3M US L + 5.15% | | 7.75% | | 01/15/31 | | | 300,000 | | | | 273,569 | |
| Greenwood Park CLO, Ltd., Series 2018-1A | | Cayman Islands | | 3M US L + 4.95% | | 7.55% | | 04/15/31 | | | 300,000 | | | | 280,599 | |
| Mountain View CLO 2015-9, Ltd., Series 2018-9A | | Cayman Islands | | 3M US L + 6.08% | | 8.68% | | 07/15/31 | | | 700,000 | | | | 646,557 | |
| Neuberger Berman CLO XXII, Ltd., Series 2018-22A | | Cayman Islands | | 3M US L + 6.06% | | 8.65% | | 10/17/30 | | | 300,000 | | | | 283,251 | |
| Sound Point CLO II, Ltd., Series 2018-1A | | Cayman Islands | | 3M US L + 5.50% | | 8.09% | | 01/26/31 | | | 300,000 | | | | 273,734 | |
| SOUND POINT CLO XXII, Ltd., Series 2019-1A | | Cayman Islands | | 3M US L + 6.30% | | 8.87% | | 01/20/32 | | | 300,000 | | | | 288,115 | |
See Notes to Consolidated Financial Statements.
| 26 | 1.888.926.2688 | www.griffincapital.com |
| Griffin Institutional Access Credit Fund | Consolidated Schedule of Investments |
June 30, 2019 (Unaudited)
| Description | | Country | | Spread
Above Index | | Rate | | Maturity Date | | Principal
Amount | | | Value
(Note 2) | |
| DEBT (continued) | | | | | | | | | | | | | | |
| Symphony CLO XIX, Ltd., Series 2018-19A | | Cayman Islands | | 3M US L + 5.20% | | 7.80% | | 04/16/31 | | $ | 300,000 | | | $ | 275,745 | |
| Symphony CLO XV, Ltd., Series 2018-15A | | Cayman Islands | | 3M US L + 6.33% | | 8.92% | | 01/17/32 | | | 1,000,000 | | | | 960,304 | |
| Symphony CLO XX, Ltd., Series 2019-20A | | Cayman Islands | | 3M US L + 6.29% | | 8.89% | | 01/16/32 | | | 400,000 | | | | 391,968 | |
| Venture 32 CLO, Ltd., Series 2018-32A | | Cayman Islands | | 3M US L + 5.75% | | 8.35% | | 07/18/31 | | | 300,000 | | | | 278,672 | |
| Venture 33 CLO, Ltd., Series 2018-33A | | Cayman Islands | | 3M US L + 5.95% | | 8.55% | | 07/15/31 | | | 200,000 | | | | 188,359 | |
| Venture 34 CLO, Ltd., Series 2018-34A | | Cayman Islands | | 3M US L + 6.13% | | 8.73% | | 10/15/31 | | | 200,000 | | | | 187,354 | |
| Venture 35 CLO, Ltd., Series 2018-35A | | Cayman Islands | | 3M US L + 6.20% | | 8.79% | | 10/22/31 | | | 200,000 | | | | 188,136 | |
| Venture 36 CLO, Ltd., Series 2019-36A | | Cayman Islands | | 3M US L + 6.92% | | 9.50% | | 04/20/32 | | | 300,000 | | | | 291,244 | |
| Venture XXII CLO, Ltd., Series 2018-22A | | Cayman Islands | | 3M US L + 5.65% | | 8.25% | | 01/15/31 | | | 300,000 | | | | 277,554 | |
| Voya CLO, Ltd., Series 2018-4 | | Cayman Islands | | 3M US L + 6.30% | | 8.90% | | 01/15/32 | | | 300,000 | | | | 299,296 | |
| | | | | | | | | | | | | | | | 6,524,925 | |
| EQUITY (4.43%)(j) | | | | | | | | | | | | | | |
| Barings CLO, Ltd. 2019-III, Series 2019-3A | | Cayman Islands | | | | 7.80% | | 04/20/31 | | | 1,200,000 | | | | 1,025,868 | |
| BlueMountain CLO XXII, Ltd., Series 2018- 22A | | Cayman Islands | | | | 10.16% | | 07/15/31 | | | 700,000 | | | | 560,374 | |
| CARLYLE US CLO 2017-5, Ltd., Series 2017-5A | | Cayman Islands | | | | 9.48% | | 01/20/30 | | | 700,000 | | | | 616,619 | |
| CIFC Funding 2018-I, Ltd., Series 2018-1A | | Cayman Islands | | | | 11.85% | | 04/18/31 | | | 200,000 | | | | 183,348 | |
| CIFC Funding 2018-II, Ltd., Series 2018-2A | | Cayman Islands | | | | 11.87% | | 04/20/31 | | | 300,000 | | | | 276,588 | |
| CIFC Funding 2019-I, Ltd., Series 2019-1A | | Cayman Islands | | | | 8.06% | | 04/20/32 | | | 1,100,000 | | | | 876,446 | |
| Dryden 40 Senior Loan Fund, Series 2015-40A | | Cayman Islands | | | | 11.01% | | 08/15/31 | | | 800,000 | | | | 525,467 | |
| Dryden, Ltd., Series 2018-64A | | Cayman Islands | | | | 9.33% | | 04/18/31 | | | 900,000 | | | | 702,340 | |
| Madison Park Funding XXI, Ltd., Series 2016-21A | | Cayman Islands | | | | 4.52% | | 07/25/29 | | | 500,000 | | | | 396,297 | |
| Madison Park Funding XXVI, Ltd., Series 2017-26A | | Cayman Islands | | | | 2.54% | | 07/29/47 | | | 500,000 | | | | 311,736 | |
| Midocean Credit CLO, Ltd., Series 2018-8A | | Cayman Islands | | | | 12.97% | | 02/20/31 | | | 300,000 | | | | 245,813 | |
| Octagon Investment Partners 37, Ltd., Series 2018-2A | | Cayman Islands | | | | 12.57% | | 07/25/30 | | | 1,000,000 | | | | 938,157 | |
| OZLM XIX, Ltd., Series 2017-19A | | Cayman Islands | | | | 8.55% | | 11/22/30 | | | 1,100,000 | | | | 812,970 | |
| Parallel 2018-1, Ltd., Series 2018-1A | | Cayman Islands | | | | 11.91% | | 04/20/31 | | | 1,200,000 | | | | 1,018,633 | |
| SOUND POINT CLO XIX, Ltd., Series 2018-1A | | Cayman Islands | | | | 9.63% | | 04/15/31 | | | 400,000 | | | | 351,577 | |
| Sound Point CLO XXI, Ltd., Series 2018-3A | | Cayman Islands | | | | 9.90% | | 10/26/31 | | | 1,200,000 | | | | 988,465 | |
| Sound Point CLO, Ltd., Series 2017-3A | | Cayman Islands | | | | 9.83% | | 10/20/30 | | | 600,000 | | | | 544,485 | |
| Sound Point CLO, Ltd., Series 2018-2A | | Cayman Islands | | | | 11.05% | | 07/26/31 | | | 500,000 | | | | 473,198 | |
| Venture CDO, Ltd., Series 2017-30A | | Cayman Islands | | | | 9.34% | | 01/15/31 | | | 600,000 | | | | 522,969 | |
| Vibrant CLO VIII, Ltd., Series 2018-8A | | Cayman Islands | | | | 10.90% | | 01/20/31 | | | 500,000 | | | | 398,198 | |
| Voya, Ltd., Series 2017-1A | | Cayman Islands | | | | 8.27% | | 04/17/30 | | | 505,000 | | | | 364,916 | |
| Voya, Ltd., Series 2018-1A | | Cayman Islands | | | | 12.72% | | 04/19/31 | | | 500,000 | | | | 426,575 | |
| | | | | | | | | | | | | | | | 12,561,039 | |
| TOTAL COLLATERALIZED LOAN OBLIGATIONS | | | | | | | | | | | | | | |
| (Cost $19,016,720) | | | | | | | | | | | | | 19,085,964 | |
| | | | | | | | | | | | | | | | | |
| | | | | | | | | | | | Shares | | | | | |
| COMMON STOCKS (0.01%) | | | | | | | | | | | | | | |
| ENERGY: OIL & GAS (0.00%) | | | | | | | | | | | | | | |
| Kosmos Energy, Ltd(i)(k) | | Ghana | | | | | | | | | 528 | | | | 3,311 | |
| Kosmos Energy, Ltd(i)(k) | | Ghana | | | | | | | | | 165 | | | | 1,034 | |
| | | | | | | | | | | | | | | | 4,345 | |
See Notes to Consolidated Financial Statements.
| Semi-Annual Report | June 30, 2019 | 27 |
| Griffin Institutional Access Credit Fund | Consolidated Schedule of Investments |
June 30, 2019 (Unaudited)
| Description | | Country | | | Shares | | | Value
(Note 2) | |
| MEDIA: ADVERTISING, PRINTING & PUBLISHING (0.01%) | | | | | | |
| PacificCo(k) | | United States | | | 1,260 | | | $ | 6,615 | |
| | | | | | | | | | | |
| TOTAL COMMON STOCKS | | | | | | | | | | |
| (Cost $388,856) | | | | | | | | | 10,960 | |
| | | | | | | | | | | |
| EQUITY INTEREST (1.45%)(b) | | | | | | | | |
| AEROSPACE & DEFENSE (0.26%) | | | | | | | | |
| GIACF Air Comm Equity Holdings, LLC - Preferred Stock (16.00% PIK)(e) | | United States | | | 731,600 | | | | 731,600 | |
| | | | | | | |
| CONSTRUCTION & BUILDING (1.02%) | | | | | | |
| Bain Capital Credit CC Fund(k)(l) | | United States | | | 2,570 | | | | 2,902,425 | |
| | | | | | | | | | | |
| TRANSPORTATION: CARGO (0.06%) | | | | | | | | | | |
| GIACF Grammer Equity Holdings, LLC - Common Stock(k) | | United States | | | 84,221 | | | | 93,486 | |
| GIACF Grammer Equity Holdings, LLC - Preferred Stock (10.00% PIK)(e) | | United States | | | 513 | | | | 53,842 | |
| GIACF Grammer Equity Holdings, LLC - Warrants(k) | | United States | | | 10,151 | | | | 11,166 | |
| | | | | | | | | |
| TRANSPORTATION: CONSUMER (0.11%) | | | | | | | 158,494 | |
| Toro Private Investments L.P.(i)(k) | | United States | | | 324,324 | | | | 324,324 | |
| | | | | | | |
| TOTAL EQUITY INTEREST | | | | | | |
| (Cost $3,761,005) | | | | | | | | | 4,116,843 | |
| | | | | | | | | | | |
| TOTAL INVESTMENTS (94.72%) | | | | | | | | |
| (Cost $270,030,443) | | | | | | | | $ | 268,421,412 | |
| | | | | | | | | | | |
| Other Assets In Excess Of Liabilities (5.28%) | | | | | 14,965,633 | |
| NET ASSETS (100.00%) | | | | | | | | $ | 283,387,045 | |
Libor Rates:
1M US L - 1 Month US LIBOR as of June 30, 2019 was 2.40%
2M US L - 2 Month US LIBOR as of June 30, 2019 was 2.33%
3M US L - 3 Month US LIBOR as of June 30, 2019 was 2.32%
6M US L - 6 Month US LIBOR as of June 30, 2019 was 2.20%
1M EUR L - 1 Month EURIBOR as of June 30, 2019 was (0.39)%
3M EUR L - 3 Month EURIBOR as of June 30, 2019 was (0.35)%
6M EUR L - 6 Month EURIBOR as of June 30, 2019 was (0.31)%
3M GBP L - 3 Month GBP LIBOR as of June 30, 2019 was 0.77%
6M GBP L - 6 Month GBP LIBOR as of June 30, 2019 was 0.85%
3M CDOR - 3 Month CDOR as of June 30, 2019 was 1.97%
| (a) | Floating or variable rate security. The reference rate is described above. The rate in effect as of June 30, 2019 is based on the reference rate plus the displayed spread as of the security's last reset date. |
| (b) | This investment is classified as a Level 3 asset and such classification was a result of unavailable quoted prices from an active market or the unavailability of other significant observable inputs (see note 2). |
| (c) | All or a portion of this position has not settled as of June 30, 2019. The interest rate shown represents the stated spread over the applicable London Interbank Offered Rate ("LIBOR" or "L") or Euro Interbank Offered Rate ("EURIBOR" or "EUR L"); the Fund will not accrue interest until the settlement date at which point LIBOR or EURIBOR will be established. If the position is partially settled, the reference rate and floor shown is applicable to the settled portion. |
See Notes to Consolidated Financial Statements.
| 28 | 1.888.926.2688 | www.griffincapital.com |
| Griffin Institutional Access Credit Fund | Consolidated Schedule of Investments |
June 30, 2019 (Unaudited)
| (d) | A portion of this position or the entire position was not funded as of June 30, 2019. The Fund had approximately $2,317,597 at par value in unfunded commitments pursuant to Delayed Draw Term Loan facilities and unused Revolver capacities. The Schedule of Investments records each of these investments as fully funded. A corresponding payable for investments purchased has also been recorded which represents the actual unfunded amount on the balance sheet date. |
| Unfunded Security | Total revolving and delayed
draw loan commitments | Less: drawn
commitments | Total undrawn
commitments |
| AMCP Clean Acquisition Co. LLC, First Lien Delayed Draw Term Loan | 162,937 | 162,937 | – |
| AMI US Holdings Inc. Revolver Loan | 145,361 | 29,072 | 116,289 |
| CMI Marketing, Inc., First Lien Revolving Term Loan | 120,000 | 2,458 | 117,542 |
| Drilling Info Holdings, Inc., First Lien Delayed Draw Term Loan | 5,070 | – | 5,070 |
| Grammer Purchaser, Inc., First Lien Revolving Term Loan | 90,000 | 7,650 | 82,350 |
| Horizon Telcom, Inc., First Lien Delayed Draw Term Loan | 86,897 | 12,526 | 74,371 |
| Horizon Telcom, Inc., First Lien Revolving Term Loan | 57,931 | – | 57,931 |
| Ivy Finco Limited, Term Loan, Acquisition Facility (Charlie) | 113,864 | – | 113,864 |
| Ivy Finco Limited, Term Loan, Acquisition Facility (Original) | 328,452 | – | 328,452 |
| Mavis Tire Express Services Corp., First Lien Delayed Draw Term Loan | 27,850 | 6,281 | 21,569 |
| Mertus 522. Gmbh, Acquisition/Capex Facility | 467,970 | – | 467,970 |
| Soursop, Ltd., Acquisition/Capex Facility | 1,119,435 | 187,246 | 932,189 |
| Total | 2,725,767 | 408,170 | 2,317,597 |
| (e) | Paid in kind security which may pay interest in additional par. |
| (g) | See Note 2 regarding defaulted securities. |
| (h) | Securities exempt from registration under Rule 144A of the Securities Act of 1933, as amended. These securities may be sold in the ordinary course of business in transactions exempt from registration normally to qualified institutional buyers. As of June 30, 2019, the aggregate market value of those securities was $87,808,892, representing 30.99% of net assets. |
| (i) | These assets are subject to certain legal restrictions and as such the Fund is restricted from selling or otherwise disposing of these assets (including sales pursuant to Rule 144A) for a certain period of time. |
| (j) | CLO subordinated notes, income notes, and M notes are considered CLO equity positions. CLO equity positions are entitled to recurring distributions which are generally equal to the remaining cash flow of payments made by underlying securities less contractual payments to debt holders and fund expenses. The effective yield is estimated based upon the current projection of the amount and timing of these recurring distributions in addition to the estimated amount of terminal principal payment. Effective yields for the Fund's CLO equity positions are updated at least once a quarter. The estimated yield and investment cost may ultimately not be realized. |
| (k) | Non-income producing security. |
| (l) | The Fund's interest in this investment is held through a wholly owned subsidiary of the Fund, GIACF Alternative Holdings, LLC, a Cayman Islands company formed to effect certain non-performing loan investments for the Fund. |
Common Abbreviations:
CDOR - Canadian Dollar Offered Rate
EURIBOR - Euro InterBank Offered Rate
LIBOR - London Interbank Offered Rate
LLC - Limited Liability Company
LP - Limited Partnerships
PIK - Payment in Kind
See Notes to Consolidated Financial Statements.
| Semi-Annual Report | June 30, 2019 | 29 |
| Griffin Institutional Access Credit Fund | Consolidated Schedule of Investments |
June 30, 2019 (Unaudited)
OUTSTANDING FORWARD FOREIGN CURRENCY CONTRACTS
| Counterparty | | Settlement
Date | | Fund
Receiving | | U.S. $ Value
at June 30,
2019 | | Fund
Delivering | | U.S. $ Value
at June 30,
2019 | | Unrealized
Appreciation/
(Depreciation) | |
| Bank Of New York Mellon | | 09/20/19 | | USD | | | 5,672,637 | | GBP | | | 5,671,850 | | $ | 787 | |
| | | | | | | | | | | | | | | $ | 787 | |
| Bank Of New York Mellon | | 09/20/19 | | USD | | | 2,269,102 | | CAD | | | 2,317,187 | | | (48,085 | ) |
| Bank Of New York Mellon | | 09/20/19 | | USD | | | 21,478,542 | | EUR | | | 21,561,004 | | | (82,462 | ) |
| | | | | | | | | | | | | | | $ | (130,547 | ) |
| | | | | | | | | | | | | | | $ | (129,760 | ) |
TOTAL RETURN SWAP CONTRACTS(a)
| Counterparty | | Fund Receives | | Fund Pays | | Notional Amount | | | Value | | | Unrealized
Appreciation/
(Depreciation) | |
| Citibank | | BWAY Holding Co., 3M US L + 3.25%, 5.85%, 04/03/24 | | 1M US L + 1.25% | | $ | 1,642,815 | | | $ | 1,644,224 | | | $ | 1,409 | |
| Citibank | | Flex Acquisition Co., Inc., 3M US L + 3.00%, 5.32%, 12/29/23 | | 1M US L + 1.25% | | | 866,209 | | | | 870,203 | | | | 3,994 | |
| Citibank | | Getty Images, Inc., 1M US L + 4.50%, 6.94%, 02/19/26 | | 1M US L + 1.25% | | | 874,605 | | | | 876,069 | | | | 1,464 | |
| Citibank | | Kronos Acquisition Intermediate, Inc., 1M US L + 4.00%, 6.40%, 05/15/23 | | 1M US L + 1.25% | | | 1,305,990 | | | | 1,306,854 | | | | 864 | |
| Citibank | | Pro Mach Group, Inc., 1M US L + 2.75%, 5.14%, 03/07/25 | | 1M US L + 1.25% | | | 1,351,000 | | | | 1,351,588 | | | | 588 | |
| Citibank | | Starfruit Finco B.V., 1M US L + 3.25%, 5.67%, 10/01/25 | | 1M US L + 1.25% | | | 1,384,695 | | | | 1,385,572 | | | | 877 | |
| Citibank | | Wilsonart LLC, 3M US L + 3.25%, 5.58%, 12/19/23 | | 1M US L + 1.25% | | | 1,286,390 | | | | 1,288,364 | | | | 1,974 | |
| Citibank | | Wink Holdco, Inc., 1M US L + 3.00%, 5.40%, 12/02/24 | | 1M US L + 1.25% | | | 917,089 | | | | 918,729 | | | | 1,640 | |
| | | | | | | $ | 9,628,793 | | | $ | 9,641,603 | | | $ | 12,810 | |
| | | | | | | | | | | | | | | | | |
| Citibank | | Alliant Holdings Intermediate LLC, 1M US L + 3.00%, 5.40%, 05/09/25 | | 1M US L + 1.25% | | $ | 1,185,600 | | | $ | 1,184,214 | | | $ | (1,386 | ) |
| Citibank | | Frontier Communications Corp., 1M US L + 3.75%, 6.16%, 06/15/24 | | 1M US L + 1.25% | | | 923,930 | | | | 921,979 | | | | (1,951 | ) |
| Citibank | | Genuine Financial Holdings LLC, 1M US L + 3.75%, 6.15%, 07/11/25 | | 1M US L + 1.25% | | | 638,365 | | | | 636,755 | | | | (1,610 | ) |
| Citibank | | Hayward Industries, Inc., 1M US L + 3.50%, 5.90%, 08/05/24 | | 1M US L + 1.25% | | | 1,358,798 | | | | 1,357,069 | | | | (1,729 | ) |
| Citibank | | H-Food Holdings LLC, 1M US L + 3.00%, 6.09%, 05/23/25 | | 1M US L + 1.25% | | | 874,425 | | | | 872,200 | | | | (2,225 | ) |
| Citibank | | HUB International, Ltd., 3M US L + 3.00%, 5.59%, 04/25/25 | | 1M US L + 1.25% | | | 1,392,937 | | | | 1,391,883 | | | | (1,054 | ) |
| Citibank | | Intelsat Jackson Holdings S.A., 1M US L + 3.75%, 6.15%, 11/27/23 | | 1M US L + 1.25% | | | 1,652,512 | | | | 1,650,173 | | | | (2,339 | ) |
| Citibank | | Keane Group Holdings LLC, 1M US L + 3.75%, 6.19%, 05/25/25 | | 1M US L + 1.25% | | | 575,650 | | | | 573,716 | | | | (1,934 | ) |
| Citibank | | LTI Holdings, Inc., 1M US L + 3.50%, 5.90%, 09/06/25 | | 1M US L + 1.25% | | | 871,150 | | | | 869,146 | | | | (2,004 | ) |
| Citibank | | MH Sub I LLC, 1M US L + 3.75%, 6.15%, 09/13/24 | | 1M US L + 1.25% | | | 1,642,980 | | | | 1,641,521 | | | | (1,459 | ) |
| Citibank | | Panther BF Aggregator 2 L P, 1M US L + 3.50%, 5.90%, 04/30/26 | | 1M US L + 1.25% | | | 436,805 | | | | 436,395 | | | | (410 | ) |
| Citibank | | Parexel International Corp., 1M US L + 2.75%, 5.15%, 09/27/24 | | 1M US L + 1.25% | | | 993,300 | | | | 991,092 | | | | (2,208 | ) |
| Citibank | | Ply Gem Midco, Inc., 3M US L + 3.75%, 6.35%, 04/12/25 | | 1M US L + 1.25% | | | 217,425 | | | | 217,332 | | | | (93 | ) |
| Citibank | | Solenis Holdings LLC, 3M US L + 4.25%, 6.77%, 06/26/25 | | 1M US L + 1.25% | | | 459,084 | | | | 458,852 | | | | (232 | ) |
| Citibank | | SRS Distribution, Inc., 1M US L + 3.25%, 5.65%, 05/23/25 | | 1M US L + 1.25% | | | 1,639,138 | | | | 1,637,009 | | | | (2,129 | ) |
| Citibank | | Titan Acquisition, Ltd., 1M US L + 3.00%, 5.40%, 03/28/25 | | 1M US L + 1.25% | | | 934,520 | | | | 934,383 | | | | (137 | ) |
| Citibank | | TNS, Inc., 3M US L + 4.00%, 6.59%, 08/14/22 | | 1M US L + 1.25% | | | 1,345,410 | | | | 1,343,711 | | | | (1,699 | ) |
| Citibank | | Travelport Finance Luxembourg Sarl, 3M US L + 5.00%, 7.54%, 05/29/26 | | 1M US L + 1.25% | | | 878,543 | | | | 873,621 | | | | (4,922 | ) |
See Notes to Consolidated Financial Statements.
| 30 | 1.888.926.2688 | www.griffincapital.com |
| Griffin Institutional Access Credit Fund | Consolidated Schedule of Investments |
June 30, 2019 (Unaudited)
TOTAL RETURN SWAP CONTRACTS(a) (continued)
| Counterparty | | Fund Receives | | Fund Pays | | Notional Amount | | | Value | | | Unrealized
Appreciation/
(Depreciation) | |
| Citibank | | William Morris Endeavor Entertainment LLC, 1M US L + 2.75%, 5.16%, 05/18/25 | | 1M US L + 1.25% | | $ | 871,060 | | | $ | 870,310 | | | $ | (750 | ) |
| | | | | | | $ | 18,891,632 | | | $ | 18,861,361 | | | $ | (30,271 | ) |
| Total | | | | | | $ | 28,520,425 | | | $ | 28,502,964 | | | $ | (17,461 | ) |
| (a) | The Fund's interest in these investments are held through a wholly owned subsidiary of the Fund, CRDTX SPV I, LLC, a Delaware Limited Liability Company. |
See Notes to Consolidated Financial Statements.
| Semi-Annual Report | June 30, 2019 | 31 |
| Griffin Institutional Access Credit Fund | Consolidated Statement of Assets and Liabilities |
June 30, 2019 (Unaudited)
| ASSETS | | | |
| Investments, at value (Cost $270,030,443) | | $ | 268,421,412 | |
| Cash | | | 13,602,140 | |
| Receivable for investments sold | | | 13,282,205 | |
| Receivable for shares sold | | | 3,513,868 | |
| Foreign currency, at value (Cost $2,340,454) | | | 2,365,688 | |
| Dividend and interest receivables | | | 2,338,471 | |
| Receivable due from Adviser (Note 4) | | | 346,180 | |
| Unrealized appreciation on total return swap contracts | | | 12,810 | |
| Unrealized appreciation on forward foreign currency contracts | | | 787 | |
| Prepaid expenses and other assets | | | 57,612 | |
| Total Assets | | | 303,941,173 | |
| LIABILITIES | | | | |
| Payable for investments purchased | | | 15,437,540 | |
| Payable for distributions | | | 4,347,297 | |
| Audit and tax fees payable | | | 193,408 | |
| Unrealized depreciation on forward foreign currency contracts | | | 130,547 | |
| Legal fees payable | | | 114,688 | |
| Administration fees payable (Note 4) | | | 110,883 | |
| Transfer agency fees payable (Note 4) | | | 33,648 | |
| Unrealized depreciation on total return swap contracts | | | 30,271 | |
| Custody fees payable | | | 27,943 | |
| Compliance service fees payable (Note 4) | | | 25,979 | |
| Distribution fees payable (Note 4) | | | 19,733 | |
| Shareholder servicing fees payable (Note 4) | | | 16,832 | |
| Trustees' fees payable (Note 4) | | | 15,768 | |
| Accrued expenses and other liabilities | | | 49,591 | |
| Total Liabilities | | | 20,554,128 | |
| NET ASSETS | | $ | 283,387,045 | |
| NET ASSETS CONSIST OF | | | | |
| Paid-in capital | | $ | 283,509,875 | |
| Total distributable earnings | | | (122,830 | ) |
| NET ASSETS | | $ | 283,387,045 | |
See Notes to Consolidated Financial Statements.
| 32 | 1.888.926.2688 | www.griffincapital.com |
| Griffin Institutional Access Credit Fund | Consolidated Statement of Assets and Liabilities |
June 30, 2019 (Unaudited)
| PRICING OF SHARES | | | |
| Class A: | | | | |
| Net asset value | | $ | 24.93 | |
| Net assets | | $ | 51,165,677 | |
| Shares of beneficial interest outstanding (unlimited number of shares, no par value common stock authorized) | | | 2,052,411 | |
| Maximum offering price per share ((NAV/0.9425), based on maximum sales charge of 5.75% of the offering price) | | $ | 26.45 | |
| Class C: | | | | |
| Net asset value and maximum offering price | | $ | 24.93 | |
| Net assets | | $ | 32,875,660 | |
| Shares of beneficial interest outstanding (unlimited number of shares, no par value common stock authorized) | | | 1,318,687 | |
| Class I: | | | | |
| Net asset value and maximum offering price | | $ | 24.93 | |
| Net assets | | $ | 169,227,777 | |
| Shares of beneficial interest outstanding (unlimited number of shares, no par value common stock authorized) | | | 6,787,929 | |
| Class L: | | | | |
| Net asset value | | $ | 24.93 | |
| Net assets | | $ | 3,054,129 | |
| Shares of beneficial interest outstanding (unlimited number of shares, no par value common stock authorized) | | | 122,521 | |
| Maximum offering price per share ((NAV/0.9575), based on maximum sales charge of 4.25% of the offering price) | | $ | 26.04 | |
| Class F: | | | | |
| Net asset value and maximum offering price | | $ | 24.94 | |
| Net assets | | $ | 27,063,802 | |
| Shares of beneficial interest outstanding (unlimited number of shares, no par value common stock authorized) | | | 1,085,374 | |
See Notes to Consolidated Financial Statements.
| Semi-Annual Report | June 30, 2019 | 33 |
| Griffin Institutional Access Credit Fund | Consolidated Statement of Operations |
| | | For the Six Months Ended June 30, 2019 (Unaudited) | |
| INVESTMENT INCOME | | | | |
| Interest income | | $ | 8,379,406 | |
| Dividend income | | | 83,431 | |
| Total Investment Income | | | 8,462,837 | |
| | | | | |
| EXPENSES | | | | |
| Investment advisory fees (Note 4) | | | 2,159,406 | |
| Administration fees (Note 4) | | | 216,135 | |
| Transfer Agency fees (Note 4) | | | 77,057 | |
| Shareholder servicing fees (Note 4): | | | | |
| Class A | | | 48,355 | |
| Class C | | | 31,455 | |
| Class L | | | 2,813 | |
| Distribution fees (Note 4): | | | | |
| Class C | | | 94,364 | |
| Class L | | | 2,925 | |
| Legal fees | | | 230,637 | |
| Audit and tax fees | | | 115,164 | |
| Compliance service fees (Note 4) | | | 86,494 | |
| Reports to shareholders and printing fees | | | 81,230 | |
| Trustees' fees (Note 4) | | | 44,291 | |
| Custody fees | | | 35,663 | |
| State registration fees | | | 25,855 | |
| Insurance fees | | | 24,583 | |
| Other expenses | | | 11,040 | |
| Total Expenses | | | 3,287,467 | |
| Fees waived/expenses reimbursed by Adviser (Note 4) | | | (3,287,467 | ) |
| Net Expenses | | | – | |
| Net Investment Income | | | 8,462,837 | |
| Net realized gain on investments | | | 230,000 | |
| Net realized gain on forward foreign currency transactions | | | 598,917 | |
| Net realized loss on foreign currency translation | | | (141,605 | ) |
| Net realized gain | | | 687,312 | |
| Net change in unrealized appreciation on investments | | | 7,257,742 | |
| Net change in unrealized depreciation on total return swap contracts | | | (17,461 | ) |
| Net change in unrealized depreciation on forward foreign currency transactions | | | (149,660 | ) |
| Net change in unrealized depreciation on translation of assets and liabilities denominated in foreign currencies | | | (29,104 | ) |
| Net change in unrealized appreciation | | | 7,061,517 | |
| NET REALIZED AND UNREALIZED GAIN ON INVESTMENTS | | | 7,748,829 | |
| NET INCREASE IN NET ASSETS RESULTING FROM OPERATIONS | | $ | 16,211,666 | |
See Notes to Consolidated Financial Statements.
| 34 | 1.888.926.2688 | www.griffincapital.com |
| Griffin Institutional Access Credit Fund | Consolidated Statements
of Changes in Net Assets |
| | | For the Six Months Ended June 30, 2019 (Unaudited) | | | For the Year Ended December 31, 2018 | |
| OPERATIONS: | | | | | | |
| Net investment income | | $ | 8,462,837 | | | $ | 8,297,176 | |
| Net realized gain | | | 687,312 | | | | 530,731 | |
| Net change in unrealized appreciation/(depreciation) | | | 7,061,517 | | | | (9,211,278 | ) |
| Net Increase/(Decrease) in Net Assets Resulting from Operations | | | 16,211,666 | | | | (383,371 | ) |
| DISTRIBUTIONS TO SHAREHOLDERS: | | | | | | | | |
| Class A | | | | | | | | |
| From distributable earnings | | | (1,352,708 | ) | | | (1,297,741 | ) |
| Class C | | | | | | | | |
| From distributable earnings | | | (878,560 | ) | | | (651,188 | ) |
| Class I | | | | | | | | |
| From distributable earnings | | | (4,911,704 | ) | | | (4,527,167 | ) |
| Class L | | | | | | | | |
| From distributable earnings | | | (81,756 | ) | | | (53,354 | ) |
| Class F | | | | | | | | |
| From distributable earnings | | | (945,712 | ) | | | (1,870,902 | ) |
| Total Distributions to Shareholders | | | (8,170,440 | ) | | | (8,400,352 | ) |
| BENEFICIAL INTEREST TRANSACTIONS, IN DOLLARS: | | | | | | | | |
| Class A | | | | | | | | |
| Shares sold | | | 20,151,636 | | | | 23,340,677 | |
| Distributions reinvested | | | 611,062 | | | | 566,653 | |
| Shares redeemed | | | (1,895,461 | ) | | | (4,860,061 | ) |
| Transferred out | | | (358,884 | ) | | | (924,029 | ) |
| Class C | | | | | | | | |
| Shares sold | | | 14,205,692 | | | | 13,779,726 | |
| Distributions reinvested | | | 449,621 | | | | 355,609 | |
| Shares redeemed | | | (626,335 | ) | | | (1,978,168 | ) |
| Transferred out | | | (52,846 | ) | | | – | |
| Class I | | | | | | | | |
| Shares sold | | | 52,621,812 | | | | 87,592,441 | |
| Distributions reinvested | | | 1,961,266 | | | | 2,019,662 | |
| Shares redeemed | | | (8,710,871 | ) | | | (9,893,290 | ) |
| Transferred in | | | 411,730 | | | | 923,862 | |
| Class L | | | | | | | | |
| Shares sold | | | 1,145,764 | | | | 1,341,314 | |
| Distributions reinvested | | | 45,033 | | | | 43,008 | |
| Shares redeemed | | | (44,604 | ) | | | – | |
| Class F | | | | | | | | |
| Shares sold | | | – | | | | 5,387 | |
| Distributions reinvested | | | 173,614 | | | | 297,733 | |
| Shares redeemed | | | (976,383 | ) | | | (10,221,265 | ) |
| Transferred in | | | – | | | | 167 | |
| Net Increase in Net Assets Derived from Beneficial Interest Transactions | | | 79,111,846 | | | | 102,389,426 | |
| Net increase in net assets | | | 87,153,072 | | | | 93,605,703 | |
| NET ASSETS: | | | | | | | | |
| Beginning of period | | | 196,233,973 | | | | 102,628,270 | |
| End of period | | $ | 283,387,045 | | | $ | 196,233,973 | |
See Notes to Consolidated Financial Statements.
| Semi-Annual Report | June 30, 2019 | 35 |
| Griffin Institutional Access Credit Fund | Consolidated Statements of Changes in Net Assets |
| | | For the Six Months Ended June 30, 2019 (Unaudited) | | | For the Year Ended December 31, 2018 | |
| Other Information | | | | | | | | |
| BENEFICIAL INTEREST TRANSACTIONS, IN SHARES: | | | | | | | | |
| Class A | | | | | | | | |
| Beginning shares | | | 1,305,814 | | | | 576,344 | |
| Shares sold | | | 812,821 | | | | 938,036 | |
| Distributions reinvested | | | 24,619 | | | | 22,989 | |
| Shares redeemed | | | (76,347 | ) | | | (194,627 | ) |
| Transferred out | | | (14,496 | ) | | | (36,928 | ) |
| Net increase in shares outstanding | | | 746,597 | | | | 729,470 | |
| Ending shares | | | 2,052,411 | | | | 1,305,814 | |
| Class C | | | | | | | | |
| Beginning shares | | | 753,530 | | | | 264,046 | |
| Shares sold | | | 574,558 | | | | 554,312 | |
| Distributions reinvested | | | 18,108 | | | | 14,432 | |
| Shares redeemed | | | (25,386 | ) | | | (79,260 | ) |
| Transferred out | | | (2,123 | ) | | | – | |
| Net increase in shares outstanding | | | 565,157 | | | | 489,484 | |
| Ending shares | | | 1,318,687 | | | | 753,530 | |
| Class I | | | | | | | | |
| Beginning shares | | | 4,919,684 | | | | 1,683,407 | |
| Shares sold | | | 2,124,334 | | | | 3,512,938 | |
| Distributions reinvested | | | 78,992 | | | | 81,941 | |
| Shares redeemed | | | (351,700 | ) | | | (395,516 | ) |
| Transferred in | | | 16,619 | | | | 36,914 | |
| Net increase in shares outstanding | | | 1,868,245 | | | | 3,236,277 | |
| Ending shares | | | 6,787,929 | | | | 4,919,684 | |
| Class L | | | | | | | | |
| Beginning shares | | | 76,255 | | | | 20,563 | |
| Shares sold | | | 46,242 | | | | 53,946 | |
| Distributions reinvested | | | 1,814 | | | | 1,746 | |
| Shares redeemed | | | (1,790 | ) | | | – | |
| Net increase in shares outstanding | | | 46,266 | | | | 55,692 | |
| Ending shares | | | 122,521 | | | | 76,255 | |
| Class F | | | | | | | | |
| Beginning shares | | | 1,117,837 | | | | 1,511,761 | |
| Shares sold | | | – | | | | 215 | |
| Distributions reinvested | | | 6,994 | | | | 12,030 | |
| Shares redeemed | | | (39,457 | ) | | | (406,183 | ) |
| Transferred in | | | – | | | | 14 | |
| Net decrease in shares outstanding | | | (32,463 | ) | | | (393,924 | ) |
| Ending shares | | | 1,085,374 | | | | 1,117,837 | |
See Notes to Consolidated Financial Statements.
| 36 | 1.888.926.2688 | www.griffincapital.com |
| Griffin Institutional Access Credit Fund | Consolidated Statement of Cash Flows |
| | | For the Six Months Ended June 30, 2019 (Unaudited) | |
| Operating Activities: | | | | |
| Net increase in net assets resulting from operations | | $ | 16,211,666 | |
| Adjustments to reconcile net increase in net assets from operations to net cash used in operating activities: | | | | |
| Purchase of investments | | | (143,122,842 | ) |
| Proceeds from sale of investments | | | 53,311,621 | |
| Net realized gain on investments | | | (230,000 | ) |
| Net unrealized appreciation/(depreciation) on investments | | | (7,257,742 | ) |
| Net unrealized appreciation/(depreciation) on forward foreign currency contracts | | | 149,660 | |
| Amortization and accretion of discounts and premiums, net | | | 80,942 | |
| Change in operating assets and liabilities: | | | | |
| Dividend and interest receivables | | | (929,131 | ) |
| Receivable due from adviser | | | 64,818 | |
| Prepaid expenses and other assets | | | (2,380 | ) |
| Audit and tax fees payable | | | (45,092 | ) |
| Legal fees payable | | | 77,993 | |
| Administration fees payable | | | 52,000 | |
| Transfer agency fees payable | | | 21,006 | |
| Custody fees payable | | | (3,039 | ) |
| Compliance service fees payable | | | 8,821 | |
| Distribution fees payable | | | 8,528 | |
| Shareholder servicing fees payable | | | 7,993 | |
| Trustees' fees payable | | | 15,768 | |
| Accrued expenses and other liabilities | | | (34,878 | ) |
| Net cash used in operating activities | | | (81,614,288 | ) |
| | | | | |
| Financing Activities: | | | | |
| Proceeds from sale of shares | | | 86,944,133 | |
| Cost of shares redeemed | | | (12,253,654 | ) |
| Distributions paid to common shareholders | | | (3,341,082 | ) |
| Net cash provided by financing activities | | | 71,349,397 | |
| | | | | |
| Effect of exchange rates on cash | | | 11,514 | |
| | | | | |
| Net Change in Cash and Foreign Rates on Cash and Foreign Currency | | | (10,253,377 | ) |
| | | | | |
| Cash and foreign currency, beginning of period | | $ | 26,221,205 | |
| Cash and foreign currency, end of period | | $ | 15,967,828 | |
| | | | | |
| Non-cash financing activities not included herein consist of reinvestment of distributions of: | | | 3,240,596 | |
See Notes to Consolidated Financial Statements.
| Semi-Annual Report | June 30, 2019 | 37 |
| | Consolidated |
| Griffin Institutional Access Credit Fund – Class A | Financial Highlights |
For a Share Outstanding Throughout the Period Presented (Unaudited)
| | | For the
Six Months
Ended
June 30, 2019
(Unaudited) | | | For the Year
Ended
December 31,
2018 | | | For the Period
April 3, 2017
(Commencement
of Operations) to
December 31,
2017 | |
| Net asset value, beginning of period | | $ | 24.01 | | | $ | 25.30 | | | $ | 25.00 | |
| | | | | | | | | | | | | |
| INCOME FROM INVESTMENT OPERATIONS: | | | | | | | | | | | | |
| Net investment income(a) | | | 0.89 | | | | 1.52 | | | | 0.92 | |
| Net realized and unrealized gain/(loss) | | | 0.90 | | | | (1.27 | ) | | | 0.16 | |
| Total from investment operations | | | 1.79 | | | | 0.25 | | | | 1.08 | |
| | | | | | | | | | | | | |
| DISTRIBUTIONS: | | | | | | | | | | | | |
| From net investment income(b) | | | (0.87 | ) | | | (1.54 | ) | | | (0.78 | ) |
| Total distributions | | | (0.87 | ) | | | (1.54 | ) | | | (0.78 | ) |
| | | | | | | | | | | | | |
| Net increase/(decrease) in net asset value | | | 0.92 | | | | (1.29 | ) | | | 0.30 | |
| Net asset value, end of period | | $ | 24.93 | | | $ | 24.01 | | | $ | 25.30 | |
| TOTAL RETURN(c) | | | 7.48 | % | | | 0.93 | % | | | 4.38 | % |
| | | | | | | | | | | | | |
| RATIOS/SUPPLEMENTAL DATA: | | | | | | | | | | | | |
| Net assets, end of period (000s) | | $ | 51,166 | | | $ | 31,350 | | | $ | 14,581 | |
| Ratios to Average Net Assets | | | | | | | | | | | | |
| Ratio of expenses to average net assets excluding fee waivers and reimbursements | | | 2.92 | %(d) | | | 3.32 | % | | | 5.15 | %(d)(e) |
| Ratio of expenses to average net assets including fee waivers and reimbursements | | | 0 | %(f) | | | 0 | %(f) | | | 0 | %(f) |
| Ratio of net investment income to average net assets | | | 7.22 | %(d) | | | 6.09 | % | | | 4.86 | %(d) |
| | | | | | | | | | | | | |
| Portfolio turnover rate(g) | | | 29 | % | | | 56 | % | | | 48 | % |
| (a) | Calculated using the average shares method. |
| (b) | Distributions are based on a daily accrual of net investment income which will vary based on investment yields and daily shares outstanding (see Note 6). |
| (c) | Total returns are for the period indicated and have not been annualized for periods less than a year and do not reflect the impact of sales charge. Total returns would have been lower had certain expenses not been waived during the period. Returns shown do not reflect the deduction of taxes that a shareholder would pay on Fund distributions or the redemption of Fund shares. |
| (e) | The gross expense ratio included non-recurring organizational costs. |
| (f) | The Adviser voluntarily has absorbed all of the operating expenses of the Fund since the commencement of the Fund's operations. In the absence of the election by the Fund's investment adviser to bear all of the Fund's operating expenses, the ratio of expenses to average net assets including fee waivers and reimbursements would have been higher. |
| (g) | Portfolio turnover rate for periods less than one full year has not been annualized and is calculated at the Fund level. |
See Notes to Consolidated Financial Statements.
| 38 | 1.888.926.2688 | www.griffincapital.com |
| | Consolidated |
| Griffin Institutional Access Credit Fund – Class C | Financial Highlights |
For a Share Outstanding Throughout the Period Presented (Unaudited)
| | | For the
Six Months
Ended
June 30, 2019
(Unaudited) | | | For the Year
Ended
December 31,
2018 | | | For the Period
April 3, 2017
(Commencement
of Operations) to
December 31,
2017 | |
| Net asset value, beginning of period | | $ | 24.01 | | | $ | 25.30 | | | $ | 25.00 | |
| | | | | | | | | | | | | |
| INCOME FROM INVESTMENT OPERATIONS: | | | | | | | | | | | | |
| Net investment income(a) | | | 0.89 | | | | 1.52 | | | | 0.91 | |
| Net realized and unrealized gain/(loss) | | | 0.89 | | | | (1.27 | ) | | | 0.17 | |
| Total from investment operations | | | 1.78 | | | | 0.25 | | | | 1.08 | |
| | | | | | | | | | | | | |
| DISTRIBUTIONS: | | | | | | | | | | | | |
| From net investment income(b) | | | (0.86 | ) | | | (1.54 | ) | | | (0.78 | ) |
| Total distributions | | | (0.86 | ) | | | (1.54 | ) | | | (0.78 | ) |
| | | | | | | | | | | | | |
| Net increase/(decrease) in net asset value | | | 0.92 | | | | (1.29 | ) | | | 0.30 | |
| Net asset value, end of period | | $ | 24.93 | | | $ | 24.01 | | | $ | 25.30 | |
| TOTAL RETURN(c) | | | 7.48 | % | | | 0.94 | % | | | 4.37 | % |
| | | | | | | | | | | | | |
| RATIOS/SUPPLEMENTAL DATA: | | | | | | | | | | | | |
| Net assets, end of period (000s) | | $ | 32,876 | | | $ | 18,091 | | | $ | 6,681 | |
| Ratios to Average Net Assets | | | | | | | | | | | | |
| Ratio of expenses to average net assets excluding fee waivers and reimbursements | | | 3.66 | %(d) | | | 4.07 | % | | | 6.25 | %(d)(e) |
| Ratio of expenses to average net assets including fee waivers and reimbursements | | | 0 | %(f) | | | 0 | %(f) | | | 0 | %(f) |
| Ratio of net investment income to average net assets | | | 7.22 | %(d) | | | 6.12 | % | | | 4.83 | %(d) |
| | | | | | | | | | | | | |
| Portfolio turnover rate(g) | | | 29 | % | | | 56 | % | | | 48 | % |
| (a) | Calculated using the average shares method. |
| (b) | Distributions are based on a daily accrual of net investment income which will vary based on investment yields and daily shares outstanding (see Note 6). |
| (c) | Total returns are for the period indicated and have not been annualized for periods less than a year and do not reflect the impact of sales charge. Total returns would have been lower had certain expenses not been waived during the period. Returns shown do not reflect the deduction of taxes that a shareholder would pay on Fund distributions or the redemption of Fund shares. |
| (e) | The gross expense ratio included non-recurring organizational costs. |
| (f) | The Adviser voluntarily has absorbed all of the operating expenses of the Fund since the commencement of the Fund's operations. In the absence of the election by the Fund's investment adviser to bear all of the Fund's operating expenses, the ratio of expenses to average net assets including fee waivers and reimbursements would have been higher. |
| (g) | Portfolio turnover rate for periods less than one full year has not been annualized and is calculated at the Fund level. |
See Notes to Consolidated Financial Statements.
| Semi-Annual Report | June 30, 2019 | 39 |
| | Consolidated |
| Griffin Institutional Access Credit Fund – Class I | Financial Highlights |
For a Share Outstanding Throughout the Period Presented (Unaudited)
| | | For the
Six Months
Ended
June 30, 2019
(Unaudited) | | | For the Year
Ended
December 31,
2018 | | | For the Period
April 3, 2017
(Commencement
of Operations) to
December 31,
2017 | |
| Net asset value, beginning of period | | $ | 24.01 | | | $ | 25.30 | | | $ | 25.00 | |
| | | | | | | | | | | | | |
| INCOME FROM INVESTMENT OPERATIONS: | | | | | | | | | | | | |
| Net investment income(a) | | | 0.89 | | | | 1.52 | | | | 0.90 | |
| Net realized and unrealized gain/(loss) | | | 0.89 | | | | (1.27 | ) | | | 0.19 | |
| Total from investment operations | | | 1.78 | | | | 0.25 | | | | 1.09 | |
| | | | | | | | | | | | | |
| DISTRIBUTIONS: | | | | | | | | | | | | |
| From net investment income(b) | | | (0.86 | ) | | | (1.54 | ) | | | (0.79 | ) |
| Total distributions | | | (0.86 | ) | | | (1.54 | ) | | | (0.79 | ) |
| | | | | | | | | | | | | |
| Net increase/(decrease) in net asset value | | | 0.92 | | | | (1.29 | ) | | | 0.30 | |
| Net asset value, end of period | | $ | 24.93 | | | $ | 24.01 | | | $ | 25.30 | |
| TOTAL RETURN(c) | | | 7.48 | % | | | 0.95 | % | | | 4.38 | % |
| | | | | | | | | | | | | |
| RATIOS/SUPPLEMENTAL DATA: | | | | | | | | | | | | |
| Net assets, end of period (000s) | | $ | 169,228 | | | $ | 118,119 | | | $ | 42,593 | |
| Ratios to Average Net Assets | | | | | | | | | | | | |
| Ratio of expenses to average net assets excluding fee waivers and reimbursements | | | 2.66 | %(d) | | | 3.07 | % | | | 5.62 | %(d)(e) |
| Ratio of expenses to average net assets including fee waivers and reimbursements | | | 0 | %(f) | | | 0 | %(f) | | | 0 | %(f) |
| Ratio of net investment income to average net assets | | | 7.24 | %(d) | | | 6.12 | % | | | 4.78 | %(d) |
| | | | | | | | | | | | | |
| Portfolio turnover rate(g) | | | 29 | % | | | 56 | % | | | 48 | % |
| (a) | Calculated using the average shares method. |
| (b) | Distributions are based on a daily accrual of net investment income which will vary based on investment yields and daily shares outstanding (see Note 6). |
| (c) | Total returns are for the period indicated and have not been annualized for periods less than a year and do not reflect the impact of sales charge. Total returns would have been lower had certain expenses not been waived during the period. Returns shown do not reflect the deduction of taxes that a shareholder would pay on Fund distributions or the redemption of Fund shares. |
| (e) | The gross expense ratio included non-recurring organizational costs. |
| (f) | The Adviser voluntarily has absorbed all of the operating expenses of the Fund since the commencement of the Fund's operations. In the absence of the election by the Fund's investment adviser to bear all of the Fund's operating expenses, the ratio of expenses to average net assets including fee waivers and reimbursements would have been higher. |
| (g) | Portfolio turnover rate for periods less than one full year has not been annualized and is calculated at the Fund level. |
See Notes to Consolidated Financial Statements.
| 40 | 1.888.926.2688 | www.griffincapital.com |
| | Consolidated |
| Griffin Institutional Access Credit Fund – Class L | Financial Highlights |
For a Share Outstanding Throughout the Period Presented (Unaudited)
| | | For the
Six Months
Ended
June 30, 2019
(Unaudited) | | | For the Year
Ended
December 31,
2018 | | | For the Period
September 5,
2017
(Commencement
of Operations) to
December 31,
2017 | |
| Net asset value, beginning of period | | $ | 24.01 | | | $ | 25.30 | | | $ | 25.21 | |
| | | | | | | | | | | | | |
| INCOME FROM INVESTMENT OPERATIONS: | | | | | | | | | | | | |
| Net investment income(a) | | | 0.89 | | | | 1.53 | | | | 0.40 | |
| Net realized and unrealized gain/(loss) | | | 0.89 | | | | (1.28 | ) | | | 0.06 | |
| Total from investment operations | | | 1.78 | | | | 0.25 | | | | 0.46 | |
| | | | | | | | | | | | | |
| DISTRIBUTIONS: | | | | | | | | | | | | |
| From net investment income(b) | | | (0.86 | ) | | | (1.54 | ) | | | (0.37 | ) |
| Total distributions | | | (0.86 | ) | | | (1.54 | ) | | | (0.37 | ) |
| | | | | | | | | | | | | |
| Net increase/(decrease) in net asset value | | | 0.92 | | | | (1.29 | ) | | | 0.09 | |
| Net asset value, end of period | | $ | 24.93 | | | $ | 24.01 | | | $ | 25.30 | |
| TOTAL RETURN(c) | | | 7.48 | % | | | 0.94 | % | | | 1.84 | % |
| | | | | | | | | | | | | |
| RATIOS/SUPPLEMENTAL DATA: | | | | | | | | | | | | |
| Net assets, end of period (000s) | | $ | 3,054 | | | $ | 1,831 | | | $ | 520 | |
| Ratios to Average Net Assets | | | | | | | | | | | | |
| Ratio of expenses to average net assets excluding fee waivers and reimbursements | | | 3.15 | %(d) | | | 3.45 | % | | | 4.17 | %(d) |
| Ratio of expenses to average net assets including fee waivers and reimbursements | | | 0 | %(e) | | | 0 | %(e) | | | 0 | %(e) |
| Ratio of net investment income to average net assets | | | 7.23 | %(d) | | | 6.14 | % | | | 4.88 | %(d) |
| | | | | | | | | | | | | |
| Portfolio turnover rate(f) | | | 29 | % | | | 56 | % | | | 48 | % |
| (a) | Calculated using the average shares method. |
| (b) | Distributions are based on a daily accrual of net investment income which will vary based on investment yields and daily shares outstanding (see Note 6). |
| (c) | Total returns are for the period indicated and have not been annualized for periods less than a year and do not reflect the impact of sales charge. Total returns would have been lower had certain expenses not been waived during the period. Returns shown do not reflect the deduction of taxes that a shareholder would pay on Fund distributions or the redemption of Fund shares. |
| (e) | The Adviser voluntarily has absorbed all of the operating expenses of the Fund since the commencement of the Fund's operations. In the absence of the election by the Fund's investment adviser to bear all of the Fund's operating expenses, the ratio of expenses to average net assets including fee waivers and reimbursements would have been higher. |
| (f) | Portfolio turnover rate for periods less than one full year has not been annualized and is calculated at the Fund level. |
See Notes to Consolidated Financial Statements.
| Semi-Annual Report | June 30, 2019 | 41 |
| | Consolidated |
| Griffin Institutional Access Credit Fund – Class F | Financial Highlights |
For a Share Outstanding Throughout the Period Presented (Unaudited)
| | | For the
Six Months
Ended
June 30, 2019
(Unaudited) | | | For the Year
Ended
December 31,
2018 | | | For the Period
September 25,
2017
(Commencement
of Operations) to
December 31,
2017 | |
| Net asset value, beginning of period | | $ | 24.01 | | | $ | 25.30 | | | $ | 25.25 | |
| | | | | | | | | | | | | |
| INCOME FROM INVESTMENT OPERATIONS: | | | | | | | | | | | | |
| Net investment income(a) | | | 0.89 | | | | 1.50 | | | | 0.32 | |
| Net realized and unrealized gain/(loss) | | | 0.90 | | | | (1.26 | ) | | | 0.03 | |
| Total from investment operations | | | 1.79 | | | | 0.24 | | | | 0.35 | |
| | | | | | | | | | | | | |
| DISTRIBUTIONS: | | | | | | | | | | | | |
| From net investment income(b) | | | (0.86 | ) | | | (1.53 | ) | | | (0.30 | ) |
| Total distributions | | | (0.86 | ) | | | (1.53 | ) | | | (0.30 | ) |
| | | | | | | | | | | | | |
| Net increase/(decrease) in net asset value | | | 0.93 | | | | (1.29 | ) | | | 0.05 | |
| Net asset value, end of period | | $ | 24.94 | | | $ | 24.01 | | | $ | 25.30 | |
| TOTAL RETURN(c) | | | 7.51 | % | | | 0.91 | % | | | 1.41 | % |
| | | | | | | | | | | | | |
| RATIOS/SUPPLEMENTAL DATA: | | | | | | | | | | | | |
| Net assets, end of period (000s) | | $ | 27,064 | | | $ | 26,843 | | | $ | 38,254 | |
| Ratios to Average Net Assets | | | | | | | | | | | | |
| Ratio of expenses to average net assets excluding fee waivers and reimbursements | | | 2.65 | %(d) | | | 3.03 | % | | | 3.27 | %(d) |
| Ratio of expenses to average net assets including fee waivers and reimbursements | | | 0 | %(e) | | | 0 | %(e) | | | 0 | %(e) |
| Ratio of net investment income to average net assets | | | 7.26 | %(d) | | | 5.99 | % | | | 4.85 | %(d) |
| | | | | | | | | | | | | |
| Portfolio turnover rate(f) | | | 29 | % | | | 56 | % | | | 48 | % |
| (a) | Calculated using the average shares method. |
| (b) | Distributions are based on a daily accrual of net investment income which will vary based on investment yields and daily shares outstanding (see Note 6). |
| (c) | Total returns are for the period indicated and have not been annualized for periods less than a year and do not reflect the impact of sales charge. Total returns would have been lower had certain expenses not been waived during the period. Returns shown do not reflect the deduction of taxes that a shareholder would pay on Fund distributions or the redemption of Fund shares. |
| (e) | The Adviser voluntarily has absorbed all of the operating expenses of the Fund since the commencement of the Fund's operations. In the absence of the election by the Fund's investment adviser to bear all of the Fund's operating expenses, the ratio of expenses to average net assets including fee waivers and reimbursements would have been higher. |
| (f) | Portfolio turnover rate for periods less than one full year has not been annualized and is calculated at the Fund level. |
See Notes to Consolidated Financial Statements.
| 42 | 1.888.926.2688 | www.griffincapital.com |
| Griffin Institutional Access Credit Fund | Notes to Consolidated
Financial Statements |
June 30, 2019 (Unaudited)
1. ORGANIZATION
Griffin Institutional Access Credit Fund (the “Fund”) is registered with the U.S. Securities and Exchange Commission (“SEC”) under the Investment Company Act of 1940, as amended (the “1940 Act”), as a non-diversified, closed-end management investment company. The Fund engages in a continuous offering of shares and operates as an interval fund that offers quarterly repurchases of shares at net asset value. The Fund’s SEC registered investment adviser is Griffin Capital Credit Advisor, LLC (the “Adviser”). BCSF Advisors, LP (the “Sub-Adviser”), an affiliate of Bain Capital Credit, LP, serves as the Fund’s sub-adviser. The investment objective of the Fund is to generate a return comprised of both current income and capital appreciation with an emphasis on current income with low volatility and low correlation to the broader markets. The Fund pursues its investment objective by investing in a range of secured and unsecured debt obligations, which may be syndicated, consisting of U.S. high yield securities, global high yield securities, and other fixed-income and fixed-income related securities, including direct originated debt obligations. The portfolio may consist of high yield bonds and bank loans, equity securities, collateralized loan obligations (“CLOs”), and, senior direct lending investments (“SDLs”), which may also include subordinate and unitranche direct lending. The Fund may also acquire warrants and other equity interests through its direct lending activities. The portfolio may also consist of, to a lesser extent, special situations investments such as non-performing loans (“NPLs”). In pursuing its investment objective, the Fund may also directly or indirectly invest in derivative investments, such as total return swap agreements.
The Fund was organized as a statutory trust on April 5, 2016 under the laws of the State of Delaware. The Fund commenced operations on April 3, 2017 and is authorized to issue an unlimited number of shares with no par value.
The Fund currently offers Class A, Class C, Class I and Class L shares. Class A, Class C and Class I shares commenced operations on April 3, 2017. Class L shares commenced operations on September 5, 2017. Effective September 29, 2017 Griffin Capital BDC Corp., formerly known as Griffin-Benefit Street Partners BDC Corp., (the “BDC”) transferred all of its assets to the Fund, in exchange for Class F shares of the Fund and the Fund assumed all of the liabilities of the BDC (the “Reorganization”). Class F Shares commenced operations on September 25, 2017 and were offered in conjunction with the Reorganization. Class F shares are no longer offered except for reinvestment of dividends. Class A and L shares are offered subject to a maximum sales charge of 5.75% and 4.25%, respectively, of their offering price. Class C and Class I shares are offered at net asset value per share. Class C shares may be subject to a 1.00% contingent deferred sales charge on shares redeemed during the first 365 days after their purchase. Each class represents an interest in the same assets of the Fund and classes are identical except for differences in their sales charge structures and ongoing service and distribution charges. All classes of shares have equal voting privileges except that each class has exclusive voting rights with respect to its service and/or distribution plans. The Fund’s income, expenses (other than class specific distribution fees) and realized and unrealized gains and losses are allocated proportionately each day based upon the relative net assets of each class.
2. SIGNIFICANT ACCOUNTING POLICIES
Basis of Presentation – The following is a summary of significant accounting policies followed by the Fund in preparation of its consolidated financial statements. These policies are in conformity with accounting principles generally accepted in the United States of America (“GAAP”). The Fund is considered an investment company following accounting and reporting guidance inAccounting Standards Codification (“ASC”) Topic 946 – Financial Services – Investment Companies. The preparation of the consolidated financial statements requires management to make estimates and assumptions that affect the reported amounts of assets and liabilities and disclosure of contingent assets and liabilities at the date of the consolidated financial statements and the reported amounts of income and expenses for the period. Actual results could differ from those estimates.
Consolidation of GIACF Alternative Holdings, LLC –GIACF Alternative Holdings, LLC, (the “NPL Subsidiary”), a Cayman Islands exempted company and wholly owned subsidiary of the Fund, was formed on September 18, 2018. The NPL Subsidiary acts as an investment vehicle for the Fund in order to effect certain NPL investments for the Fund. The Fund is the managing and sole member of the NPL Subsidiary pursuant to a limited liability agreement. Further, the Fund will remain the sole member and will continue to wholly own and control the NPL Subsidiary. As a wholly owned subsidiary of the Fund, the financial statements of the NPL Subsidiary are included in the consolidated financial statements and financial highlights of the Fund. All investments held by the NPL Subsidiary are disclosed in the Consolidated Schedule of Investments. All inter-company accounts and transactions have been eliminated in consolidation. The Fund may invest up to 25% of its total assets in the NPL Subsidiary. As of June 30, 2019, total assets of the Fund were $303,941,173 of which $2,902,425 or 0.95% represented net assets of the NPL Subsidiary.
| Semi-Annual Report | June 30, 2019 | 43 |
| Griffin Institutional Access Credit Fund | Notes to Consolidated
Financial Statements |
June 30, 2019 (Unaudited)
The NPL Subsidiary has received an undertaking from the Government of the Cayman Islands exempting it from all local income, profits and capital gains taxes. No such taxes are levied in the Cayman Islands at the present time. For U.S. income tax purposes, the NPL Subsidiary is a Controlled Foreign Corporation, which generates and is allocated no income that is considered effectively connected with U.S. trade of business and, as such, is not subject to U.S. income tax. However, as a wholly owned Controlled Foreign Corporation, the NPL Subsidiary’s net income and capital gain, to the extent of its earnings and profits, will be included each year in the Fund’s investment company taxable income.
Consolidation of CRDTX SPV I, LLC – CRDTX SPV I, LLC, (the “Swap Subsidiary”), a Delaware Limited Liability Company and wholly owned subsidiary of the Fund, was formed on November 27, 2018. The Swap Subsidiary, on behalf of the Fund, has entered into a series of single-asset total return swaps (the “Swaps”) on individual bank loans (each a ”Reference Asset”). The Fund is the managing and sole member of the Swap Subsidiary pursuant to a limited liability agreement. Further, the Fund will remain the sole member and will continue to wholly own and control the Swap Subsidiary. As a wholly owned subsidiary of the Fund, the financial statements of the Swap Subsidiary are included in the consolidated financial statements and financial highlights of the Fund. The Swaps that the Swap Subsidiary has entered into are disclosed in the Consolidated Schedule of Investments. All inter-company accounts and transactions have been eliminated in consolidation.
Single-Asset Subsidiaries – Certain investments of the Fund will be held in single-asset subsidiaries controlled by the Fund (the “Single-Asset Subsidiaries”). The Single Asset Subsidiaries are generally formed as needed to hold a particular equity investment obtained in private transactions. The financial statements of the Single-Asset Subsidiaries are included in the consolidated financial statements and financial highlights of the Fund. The equity holdings of the Single-Asset Subsidiaries are disclosed in the Consolidated Schedule of Investments. All inter-company accounts and transactions have been eliminated in consolidation.
The Fund will generally consolidate any wholly-owned or controlled subsidiary. For purposes of the Fund’s investment restrictions, guidelines and limitations, the Fund will aggregate direct investments with investment exposure provided by its wholly-owned and controlled subsidiaries.
Security Valuation – In accordance withASC Topic 820 – Fair Value Measurement and Disclosures, and consistent with the Fund’s Valuation Policy, portfolio securities of the Fund are valued at their current market values determined on the basis of readily available market quotations. Market quotations are obtained from independent pricing services approved by the Board of Trustees (the “Trustees”). Forward foreign currency exchange contracts are typically valued at their quoted daily prices obtained from an independent pricing service. With respect to the Swaps, each Reference Asset is marked daily at its quoted price obtained from an independent pricing service. The collective daily value of each Swap is based on the daily value of the Reference Asset together with accrued income of the Reference Asset and the accrued expenses incurred under the Swap agreement. The aggregate settlement values and notional amounts of the forward foreign currency exchange contracts and Swaps will not be recorded in the Consolidated Statement of Assets and Liabilities. Fluctuations in the value of the forward foreign currency exchange contracts, and Swaps will be recorded in the Consolidated Statement of Assets and Liabilities as an asset or liability and in the Consolidated Statement of Operations as unrealized appreciation or depreciation until terminated. When a Swap is terminated, the Fund records a realized gain or loss in the Consolidated Statement of Operations equal to the difference between the value of the Swap at the time it was opened and the value of the Swap at the time it was terminated.
If market quotations are not readily available, securities are valued at fair value in good faith pursuant to procedures adopted by the Trustees. The Trustees have delegated the day to day responsibility for determining fair valuation to the Fair Value Pricing Committee in accordance with the Valuation Policy approved by the Trustees. There is no single standard for determining fair value of a security. Rather, in determining the fair value of a security for which there are no readily available market quotations, the Adviser and Sub-Adviser, together with the Fair Value Pricing Committee, may consider several factors as relevant, including but not limited to: (1) evaluation of all relevant factors, including but not limited to, pricing history, current market level, supply and demand of the respective security; (2) comparison to the values, yields, and current pricing of securities that have comparable characteristics; (3) knowledge of current and historical market information with respect to the security; (4) other factors relevant to the security which would include, but not be limited to, duration, yield, fundamental analytical data, including enterprise value of portfolio company, relevant credit market indices, and credit quality. The Adviser and Sub-Adviser may also consider periodic financial statements (audited and unaudited) or other information provided by the issuer. The Fair Value Pricing Committee will give consideration to all factors which might reasonably affect the fair value of an investment. The Fund has retained the services of one or more independent third-party valuation specialists to assist the Fair Value Pricing Committee in determining the fair value of certain securities for which market quotations are not available. The independent third-party valuation specialist provides the Fair Value Pricing Committee with a valuation report that includes a description of the methodology used to measure fair value and the analysis and calculations supporting its conclusion. Fair valuation involves subjective judgments, and it is possible that the fair value determined for a security may differ materially from the value that could be realized upon the sale of the security.
The Adviser will provide the Trustees with periodic reports, no less frequently than quarterly, that discuss the functioning of the valuation process, if applicable to that period, and that identify issues and valuation problems that have arisen, if any. To the extent deemed necessary by the Adviser, the Trustees will review any securities valued by the Adviser and/or the Fair Value Pricing Committee in accordance with the Fund’s Valuation Policy.
| 44 | 1.888.926.2688 | www.griffincapital.com |
| Griffin Institutional Access Credit Fund | Notes to Consolidated
Financial Statements |
June 30, 2019 (Unaudited)
Fair Value Measurements – In accordance withASC Topic 820 – Fair Value Measurement and Disclosures, a three-tier hierarchy has been established to classify fair value measurements for disclosure purposes. Inputs refer broadly to the assumptions that market participants would use in pricing the asset or liability, including assumptions about risk. Inputs may be observable or unobservable. Observable inputs are inputs that reflect the assumptions market participants would use in pricing the asset or liability that are developed based on market data obtained from sources independent of the reporting entity. Unobservable inputs are inputs that reflect the reporting entity’s own assumptions about the assumptions market participants would use in pricing the asset or liability that are developed based on the best information available. In accordance with the authoritative guidance on fair value measurements and disclosure under GAAP, the Fund discloses fair value of its investments in a hierarchy that prioritizes the inputs to valuation techniques used to measure the fair value, as follows:
| Level 1 – | Unadjusted quoted prices in active markets for identical, unrestricted assets or liabilities that the Fund has the ability to access at the measurement date; |
| | |
| Level 2 – | Quoted prices which are not active, quoted prices for similar assets or liabilities in active markets or inputs other than quoted prices that are observable (either directly or indirectly) for substantially the full term of the asset or liability at the measurement date; and |
| | |
| Level 3 – | Significant unobservable prices or inputs (including the Fund’s own assumptions in determining the fair value of investments) where there is little or no market activity for the asset or liability at the measurement date. |
The availability of observable inputs can vary from security to security and is affected by a wide variety of factors, including, for example, the type of security, whether the security is new and not yet established in the marketplace, the liquidity of markets and other characteristics particular to the security. To the extent that valuation is based on models or inputs that are less observable or unobservable in the market, the determination of fair value requires more judgment. Accordingly, the degree of judgment exercised in determining fair value is greatest for instruments categorized in Level 3.
An investment level within the fair value hierarchy is based on the lowest level input, individually or in the aggregate, that is significant to fair value measurement. The valuation techniques used by the Fund to measure fair value during the semi-annual period ended June 30, 2019 maximized the use of observable inputs and minimized the use of unobservable inputs.
The inputs or methodologies used for valuing securities are not necessarily an indication of the risk or liquidity associated with investing in those securities. The following is a summary of the inputs used in valuing the Fund’s investments as of June 30, 2019:
| Investments in Securities at Value | | Level 1 -
Quoted Prices | | | Level 2 -
Other Significant
Observable Inputs | | | Level 3 -
Significant
Unobservable
Inputs | | | Total | |
| Bank Loans | | $ | – | | | $ | 124,224,533 | | | $ | 33,424,335 | | | $ | 157,648,868 | |
| Corporate Bonds | | | – | | | | 87,321,127 | | | | – | | | | 87,321,127 | |
| Convertible Corporate Bonds | | | – | | | | 237,650 | | | | – | | | | 237,650 | |
| Collateralized Loan Obligations | | | �� | | | | 19,085,964 | | | | – | | | | 19,085,964 | |
| Common Stocks | | | 4,345 | | | | 6,615 | | | | – | | | | 10,960 | |
| Equity Interest | | | – | | | | – | | | | 4,116,843 | | | | 4,116,843 | |
| Total | | $ | 4,345 | | | $ | 230,875,889 | | | $ | 37,541,178 | | | $ | 268,421,412 | |
| Other Financial Instruments* | | | | | | | | | | | | | | | | |
| Assets: | | | | | | | | | | | | | | | | |
| Forward Foreign Currency Contracts | | $ | – | | | $ | 787 | | | $ | – | | | $ | 787 | |
| Total Return Swap Contracts | | | – | | | | 12,810 | | | | – | | | | 12,810 | |
| Liabilities: | | | | | | | | | | | | | | | | |
| Forward Foreign Currency Contracts | | | – | | | | (130,547 | ) | | | – | | | | (130,547 | ) |
| Total Return Swap Contracts | | | – | | | | (30,271 | ) | | | – | | | | (30,271 | ) |
| Total | | $ | – | | | $ | (147,221 | ) | | $ | – | | | $ | (147,221 | ) |
| * | Other financial instruments are derivative instruments reflected in the Consolidated Schedule of Investments. The derivatives shown in this table are reported at their unrealized appreciation/ (depreciation) at measurement date, which represents the change in the contracts' value. |
| Semi-Annual Report | June 30, 2019 | 45 |
| Griffin Institutional Access Credit Fund | Notes to Consolidated Financial Statements |
June 30, 2019 (Unaudited)
The changes of fair value of investments for which the Fund has used Level 3 inputs to determine the fair value are as follows:
| | | Bank Loans | | | Equity Interest | | | Total | |
| Balance as of December 31, 2018 | | $ | 13,505,046 | | | | 2,667,450 | | | $ | 16,172,496 | |
| Accrued Discount/premium | | $ | 20,824 | | | | – | | | $ | 20,824 | |
| Realized Gain/(Loss) | | $ | 517 | | | | (2,030 | ) | | $ | (1,513 | ) |
| Change in Unrealized | | | | | | | | | | | | |
| Appreciation/Depreciation | | $ | 160,935 | | | | 420,480 | | | $ | 581,415 | |
| Purchases | | $ | 19,457,356 | | | | 1,091,424 | | | $ | 20,548,780 | |
| Sales Proceeds | | $ | (39,987 | ) | | | (60,481 | ) | | $ | (100,468 | ) |
| Transfer into Level 3 | | $ | 319,644 | | | | – | | | $ | 319,644 | |
| Transfer Out of Level 3 | | $ | – | | | | – | | | $ | – | |
| Balance as of June 30, 2019 | | $ | 33,424,335 | | | | 4,116,843 | | | $ | 37,541,178 | |
| Net change in unrealized appreciation/(depreciation) included in the Statements of Operations attributable to Level 3 investments held at June 30, 2019 | | $ | 160,935 | | | | 420,480 | | | $ | 581,415 | |
The table below provides additional information about the Level 3 Fair Value Measurements as of June 30, 2019:
Quantitative Information about Level 3 Fair Value Measurements
| | | | | Range | |
| Asset Class | Fair Value (USD) | Valuation Technique | Unobservable Inputs(a) | Minimum | Maximum | Weighted Average |
| Bank Loans | $18,094,681 | Comparative Yield | Yield | 6.00% | 12.00% | 8.47% |
| Bank Loans | $13,566,480(b) | Purchase Price | Purchase Price | $97.00 | $98.00 | $97.51 |
| Bank Loans | $1,763,174 | Enterprise Value | EBITDA Multiple | 10.0x | 11.0x | 10.5x |
| Equity Interest | $482,818 | Enterprise Value | EBITDA Multiple | 6.0x | 9.0x | 7.98x |
| Equity Interest | $2,902,425 | Discounted Cash Flows | Discount Rate | 14.85% | 14.85% | 14.85% |
| Equity Interest | $731,600(b) | Purchase Price | Purchase Price | $100.00 | $100.00 | $100.00 |
| (a) | A change to the unobservable input may result in a significant change to the value of the investment as follows: |
| Unobservable Input | Impact to Value if Input Increases | Impact to Value if Input Decreases |
| Yield | Decrease | Increase |
| EBITDA Multiple | Increase | Decrease |
| Discount Rate | Decrease | Increase |
| Purchase Price(b) | N/A | N/A |
| (b) | Investments acquired during the quarter ended June 30, 2019. |
The Fund utilized the comparative yield, enterprise value, and discounted cash flow techniques to determine the fair value of certain Level 3 assets as of June 30, 2019. The significant unobservable input used in the comparative yield analysis is yield. The comparative yield valuation technique measures fair value of an investment based upon an assessment of expected market yields of other businesses of similar size in the same industry. The significant unobservable input used in the enterprise value approach is the EBITDA multiple. EBITDA multiples are typically determined based upon review of market comparable transactions and publicly traded comparable companies. The multiple is used to estimate the enterprise value of the underlying investment. The discounted cash flow technique is an analysis whereby future expected cash flows of the investment are discounted to determine a present value using a discount rate.
Generally, new investments not valued by an independent pricing service are held at purchase price initially until the investment has been held by the Fund for a full quarter. The investment is generally transitioned to an independent third-party valuation specialist to assist the Fair Value Pricing Committee in determining the application of a valuation methodology at the next valuation date. The Fair Value Pricing Committee will convene if there has been a material change to the underlying company, industry or market between the time of investment and the valuation date.
| 46 | 1.888.926.2688 | www.griffincapital.com |
| Griffin Institutional Access Credit Fund | Notes to Consolidated
Financial Statements |
June 30, 2019 (Unaudited)
Investment Transactions – Investment security transactions are accounted for on trade date. Gains and losses on securities sold are determined on a specific identification basis.
Investment Income – Interest income is accrued and recorded on a daily basis including amortization of premiums, accretion of discounts and income earned from money market funds. Interest is not accrued on securities that are in default. Income from securitization vehicles and equity investments in the equity class securities of CLO vehicles (typically income notes or subordinated notes) is recorded daily using the effective interest method in accordance with the provisions of ASC 325-40, Beneficial Interests in Securitized Financial Assets, based upon a calculation of the effective yield to the expected redemption date based on an estimate of future cash flows, including those CLO equity investments that have not made their inaugural distribution for the relevant period end. The Fund monitors the expected residual payments, and the effective yield is determined and updated quarterly.
Foreign Currency Translation – The books and records of the Fund are maintained in U.S. dollars. Investment valuations and other assets and liabilities initially expressed in foreign currencies are converted each business day into U.S. dollars based upon current exchange rates. Prevailing foreign exchange rates may generally be obtained at the close of the NYSE (normally, 4:00 p.m. EST).
Foreign Securities – The Fund may directly purchase securities of foreign issuers. Investing in securities of foreign issuers involves special risks not typically associated with investing in securities of U.S. issuers. The risks include possible revaluation of currencies, the ability to repatriate funds, less complete financial information about companies and possible future adverse political and economic developments. Moreover, securities of many foreign issuers and their markets may be less liquid and their prices more volatile than those of securities of comparable U.S. issuers.
Cash and Cash Equivalents – The Fund places its cash with one banking institution, which is insured by the Federal Deposit Insurance Corporation (“FDIC”). The FDIC limit is $250,000. At various times throughout the year, the amount on deposit may exceed the FDIC limit and subject the Fund to a credit risk. The Fund does not believe that such deposits are subject to any unusual risk associated with investment activities.
Loan Participation and Assignments– The Fund may invest in direct debt instruments, which are interests in amounts owed to lenders or lending syndicates by corporate, governmental, or other borrowers. The Fund’s investments in loans may be in the form of participations in loans or assignments of all or a portion of the loans from third parties. A loan is often administered by a bank or other financial institution (the “agent”) that acts as agent for all holders. The agent administers the terms of the loan, as specified in the loan agreement. The Fund may invest in multiple series or tranches of a loan, which may have varying terms and carry different associated risks. The Fund generally has no right to enforce compliance with the terms of the loan agreement with the borrower. As a result, the Fund may be subject to the credit risk of both the borrower and the agent that is selling the loan agreement. When the Fund purchases assignments from lenders they acquire direct rights against the borrower of the loan. The Fund may enter into unfunded loan commitments, which are contractual obligations for future funding. Unfunded loan commitments represent a future obligation in full, even though a percentage of the notional loan amounts may not be utilized by the borrower. When investing in a loan participation, the Fund has the right to receive payments of principal, interest and any fees to which it is entitled only from the agent selling the loan agreement and only upon receipt of payments by the agent from the borrower. The Fund may receive a fee based on the undrawn portion of the underlying line of credit of a floating rate loan. In certain circumstances, the Fund may receive a penalty fee upon the prepayment of a floating rate loan by a borrower. For the six months ended June 30, 2019, no penalty fees were received by the Fund. Fees earned or paid are recorded as a component of interest income or interest expense, respectively, on the Consolidated Statement of Operations. At June 30, 2019, the Fund had $2,317,597 at par value in unfunded loan commitments.
Discounts and Premiums – Discounts and premiums on securities purchased are accreted/amortized over the life of the respective security using the effective interest method. The adjusted cost of investments represents the original cost adjusted for paid-in-kind (“PIK”) interest and the accretion of discounts and amortization of premiums.
Defaulted Securities –The Fund held defaulted securities and/or other securities for which the income has been deemed uncollectible. As of June 30, 2019, the aggregate value of those securities was $3,131,483 representing 0.01% of the Fund's net assets. The Fund no longer accrues income on securities for which income has been deemed uncollectible. Additionally, the Fund provides for losses on interest of receivable. Such securities have been identified on the accompanying Consolidated Schedule of Investments.
Distributions to Shareholders – The Fund intends to accrue dividends daily and to distribute as of the last business day of each quarter. Distributions of net capital gains are normally accrued and distributed in December. Income and capital gains distributions are determined in accordance with income tax regulations, which may differ from GAAP.
Indemnification– The Fund indemnifies its Officers and Trustees for certain liabilities that may arise from the performance of their duties to the Fund. Additionally, in the normal course of business, the Fund enters into contracts that contain a variety of representations and warranties and which provide general indemnities. The Fund’s maximum exposure under these arrangements is unknown, as this would involve future claims that may be made against the Fund that have not yet occurred. However, based on industry experience, the Fund expects the risk of loss due to these warranties and indemnities to be remote.
| Semi-Annual Report | June 30, 2019 | 47 |
| Griffin Institutional Access Credit Fund | Notes to Consolidated
Financial Statements |
June 30, 2019 (Unaudited)
Federal Income Taxes – The Fund intends to continue to comply with the requirements of Subchapter M of the Internal Revenue Code applicable to regulated investment companies and will distribute all of its taxable income, if any, to shareholders. Accordingly, no provision for federal income taxes is required in the consolidated financial statements.
The Fund recognizes the tax benefits of uncertain tax positions only when the position is “more likely than not” (more than a fifty percent chance) to be sustained assuming examination by tax authorities. Management has reviewed the tax positions and has concluded that no liability for unrecognized tax benefits should be recorded related to uncertain tax positions expected to be taken in the Fund’s 2018 returns.
Commitments and Contingencies– In the normal course of business, the Fund's investment activities involve executions, settlement and financing of various transactions resulting in receivables from, and payables to, brokers, dealers and the Fund's custodian. These activities may expose the Fund to risk in the event that such parties are unable to fulfill contractual obligations. Management does not anticipate any material losses from counterparties with whom it conducts business. Consistent with standard business practice, the Fund enters into contracts that contain a variety of indemnifications, and may be engaged from time to time in various legal actions. The maximum exposure of the Fund under these arrangements and activities is unknown. However, the Fund expects the risk of material loss to be remote.
3. DERIVATIVE TRANSACTIONS
The Fund’s investment objectives allow the Fund to enter into various types of derivative contracts such as total return swaps and forward foreign currency contracts. In doing so, the Fund and its Swap Subsidiary will employ strategies in differing combinations to permit it to increase, decrease, or change the level or types of exposure to market factors. Central to those strategies are features inherent to derivatives that make them more attractive for this purpose than equity or debt securities; they require little or no initial cash investment, they can focus exposure only on certain selected risk factors, and they may not require the ultimate receipt or delivery of the underlying security (or securities) to the contract. This may allow the Fund to pursue its objectives more quickly and efficiently than if it were to make direct purchases or sales of securities capable of effecting a similar response to market factors.
Risk of Investing in Derivatives – The Fund’s use of derivatives can result in losses due to unanticipated changes in the market risk factors and the overall market. Derivatives may have little or no initial cash investment relative to their market value exposure and therefore can produce significant gains or losses in excess of their cost. This use of embedded leverage allows the Fund to increase its market value exposure relative to its net assets and can substantially increase the volatility of the Fund’s performance. Additional associated risks from investing in derivatives also exist and potentially could have significant effects on the valuation of the derivative and the Fund. Typically, the associated risks are not the risks that the Fund is attempting to increase or decrease exposure to, per their investment objectives, but are the additional risks from investing in derivatives. Examples of these associated risks are liquidity risk, which is the risk that the Fund will not be able to sell the derivative in the open market in a timely manner, and counterparty credit risk, which is the risk that the counterparty will not fulfill its obligation to the Fund.
Forward Foreign Currency Contracts – The Fund engaged in currency transactions with counterparties during the six months ended June 30, 2019 to hedge the value of portfolio securities denominated in particular currencies against fluctuations in relative value or to gain or reduce exposure to certain currencies. A forward foreign currency contract is an agreement between two parties to buy and sell a currency at a set price on a future date. The contract is marked-to-market daily and the change in value is recorded by the Fund as an unrealized gain or loss. When a forward foreign currency contract is terminated, the Fund records a realized gain or loss equal to the difference between the value of the contract at the time it was opened and the value of the contract at the time it was extinguished.
Forward foreign currency contracts involve elements of market risk in excess of the amounts reflected in the Consolidated Statement of Assets and Liabilities. The Fund bears the risk of an unfavorable change in the foreign exchange rate underlying the forward foreign currency contract. Risks may also arise upon entering into these contracts from the potential inability of the counterparties to meet the terms of their contracts. Forward foreign currency exchange contracts are typically valued at their quoted daily prices obtained from an independent pricing service.
Total Return Swap Contracts – The Fund’s Swap Subsidiary has entered into a series of single-asset total return swaps on individual bank loans with Citibank, N.A. (“Citi”) as the counterparty. The Swaps allow the Fund to indirectly obtain exposure to the Reference Assets, each a bank loan, without owning or taking physical custody of the underlying bank loans. Each Swap is an agreement between the Swap Subsidiary and Citi in which Citi has contractually committed to make payments based on the total return (income plus realized appreciation) of each Reference Asset in exchange for a periodic payment from the Swap Subsidiary based on a floating interest rate and any realized depreciation of each Reference Asset. If the total return of the Reference Asset exceeds or falls short of the offsetting floating interest rate obligation, the Swap Subsidiary receives payment from or makes payment to Citi, respectively. Additionally, the Fund’s Swap Subsidiary posts collateral to cover its potential contractual obligations under the Swaps. Each Swap is marked-to-market daily consistent with the Fund’s Valuation Policy and changes in value are recorded by the Fund as unrealized gain or loss in the consolidated financial statements. When a Swap is terminated, the Fund records a realized gain or loss in the Consolidated Statement of Operations equal to the difference between the value of the Swap at the time it was opened and the value of the Swap at the time it was terminated.
| 48 | 1.888.926.2688 | www.griffincapital.com |
| Griffin Institutional Access Credit Fund | Notes to Consolidated
Financial Statements |
June 30, 2019 (Unaudited)
The Swaps effectively add leverage to the Fund’s portfolio by providing investment exposure to underlying bank loans without owning or taking physical custody of such bank loans. In an effort to limit leverage risk, the Fund will earmark assets determined to be liquid to cover its obligations under the Swap agreements. The use of Swaps includes the risks associated with each Reference Asset including the risk that the underlying bank loan defaults. The Fund bears the risk of unfavorable changes in market prices of the underlying Reference Assets. Risk may also arise upon entering into these contracts from the potential inability of the counterparty to meet the terms of its contract.
Fair values of forward foreign currency contracts and total return swap contracts on the Consolidated Statement of Assets and Liabilities as of June 30, 2019, categorized by risk exposure:
| Risk Exposure | | Consolidated
Statement of Assets
and Liabilities
Location | | Fair Value | | | Consolidated
Statement of Assets
and Liabilities
Location | | Fair Value | |
| Griffin Institutional Access Credit Fund | | | | | | | | | | | | |
| Foreign Exchange Rate Risk (Forward Foreign Currency Contracts) | | Unrealized appreciation on forward foreign currency contracts | | $ | 787 | | | Unrealized depreciation on forward foreign currency contracts | | $ | (130,547 | ) |
| Market and Credit Risk (Total Return Swap Contracts) | | Unrealized appreciation on total return swap contracts | | | 12,810 | | | Unrealized depreciation on total return swap contracts | | | (30,271 | ) |
| Total | | | | $ | 13,597 | | | | | $ | (160,818 | ) |
For the six months ended June 30, 2019, the average monthly notional value of forward foreign currency contracts was $23,177,657 and the ending notional amount of total return swap contracts was $28,520,425.
The effect of forward foreign currency contracts and total return swap contracts on the Consolidated Statement of Operations for the six months ended June 30, 2019:
| Risk Exposure | | Consolidated
Statement of Operations
Location | | Realized
Gain/(Loss) on
Derivatives | | | Consolidated
Statement of Operations
Location | | Change in Unrealized
Appreciation/
(Depreciation)
on Derivatives Recognized in
Income | |
| Griffin Institutional Access Credit Fund | | | | | | | | | | | |
| Foreign Exchange Rate Risk (Forward Foreign Currency Contracts) | | Net realized gain/(loss) on forward foreign currency contracts | | $ | 598,917 | | | Change in unrealized appreciation/ (depreciation) on forward foreign currency contracts | | $ | (149,660 | ) |
| Market and Credit Risk (Total Return Swap Contracts) | | Net realized gain/(loss) on total return swaps | | | – | | | Change in unrealized appreciation/ (depreciation) on total return swaps | | | (17,461 | ) |
| Total | | | | $ | 598,917 | | | | | $ | (167,121 | ) |
4. ADVISORY FEES, ADMINISTRATION FEES AND OTHER AGREEMENTS
Investment Advisory
Pursuant to the Investment Advisory Agreement with the Fund (“Advisory Agreement”), the Adviser is entitled to an investment advisory fee of 1.85% of the average daily net assets of the Fund, computed daily and payable monthly.
| Semi-Annual Report | June 30, 2019 | 49 |
| Griffin Institutional Access Credit Fund | Notes to Consolidated
Financial Statements |
June 30, 2019 (Unaudited)
The Adviser and the Fund have entered into an expense limitation and reimbursement agreement (the “Expense Limitation Agreement”) under which the Adviser has agreed contractually to waive its fees and to pay or absorb the ordinary annual operating expenses of the Fund (including offering expenses, but excluding taxes, interest, brokerage commissions, acquired fund fees and expenses and extraordinary expenses) at least until April 30, 2020, so that the total annual operating expenses of the Fund do not exceed 2.60% per annum of Class A average daily net assets, 3.35% per annum of Class C average daily net assets, 2.35% per annum of Class I average daily net assets, 2.85% per annum of Class L average daily net assets and 1.85% per annum of Class F average daily net assets (the “Expense Limitations”). The agreement can be extended at the discretion of the Adviser and the Trustees. In consideration of the Adviser’s agreement to limit the Fund’s expenses, the Fund has agreed to repay the Adviser in the amount of any fees waived and Fund expenses paid or absorbed, subject to the limitations that: (1) the reimbursement for fees and expenses will be made only if payable not more than three years from the date such expenses were incurred; and (2) the reimbursement may not be made if it would cause the lesser of the Expense Limitations in place at the time of waiver or at the time of reimbursement to be exceeded. Fees waived and Fund expenses paid or absorbed with respect to Class F assets will not be repaid or reimbursed.
Sub-advisory services are provided to the Fund pursuant to an agreement among the Fund, Adviser and Sub-Adviser ("Sub-Advisory Agreement"). Under the terms of the investment sub-advisory agreement, the Adviser compensates the Sub-Adviser based on the Fund’s average daily net assets.
In addition to the Expense Limitation Agreement described above, the Adviser voluntarily has waived or absorbed all of the operating expenses of the Fund since the commencement of the Fund’s operations. Operating expenses absorbed by the Adviser during this voluntary period will be permanently waived. The Adviser will continue to bear certain expenses on a going forward basis in its discretion and is under no obligation to continue to do so for any specified period of time. For additional information please see Note 9. Subsequent Events.
During the six months ended June 30, 2019, fees waived and reimbursed expenses to the Fund by the Adviser totaled $3,287,467.
Fund Administration and Accounting Fees and Expenses
ALPS Fund Services, Inc. serves as the Fund’s administrator and accounting agent (the “Administrator”) and receives customary fees from the Fund for such services. The Administrator is also reimbursed by the Fund for certain out of pocket expenses.
Transfer Agent
DST Systems, Inc. serves as transfer, distribution paying and shareholder servicing agent for the Fund.
Custodian
The Bank of New York Mellon Trust Company, National Association serves as the Fund’s custodian and receives customary fees from the Fund for such services.
Distributor
The Fund has entered into a Distribution Agreement with ALPS Distributors, Inc. (the “Distributor”) to provide distribution services to the Fund. The Distributor serves as principal underwriter of shares of the Fund. Under the Distribution Agreement, the Class C shares and Class L shares will pay to the Distributor a Distribution Fee that will accrue at an annual rate equal to 0.75% and 0.25% of the Fund’s average daily net assets attributable to Class C shares and Class L shares, respectively, payable on a monthly basis. For the six months ended June 30, 2019, Class C shares and Class L shares incurred distribution fees of $94,364 and $2,925, respectively. Class A, Class I and Class F shares are not currently subject to a Distribution Fee. Under the Shareholder Services Plan, the Class A, Class C and Class L shares may pay up to 0.25% per year of their average daily net assets for such services. For the six months ended June 30, 2019, Class A, Class C and Class L shares incurred shareholder servicing fees of $48,355, $31,455, and $2,813, respectively. Class I shares are not currently subject to a shareholder services fee.
The Distributor has entered into a wholesale marketing agreement with Griffin Capital Securities, LLC (“GCS”), a registered broker-dealer and an affiliate of the Adviser. Pursuant to the terms of the wholesale marketing agreement, GCS will seek to market and otherwise promote the Fund through various wholesale distribution channels, including regional and independent retail broker-dealers and registered investment Advisers.
Independent Registered Public Accounting Firm
PricewaterhouseCoopers LLP is the independent registered public accounting firm for the Fund.
Fund Counsel
Greenberg Traurig LLP acts as legal counsel to the Fund.
| 50 | 1.888.926.2688 | www.griffincapital.com |
| Griffin Institutional Access Credit Fund | Notes to Consolidated
Financial Statements |
June 30, 2019 (Unaudited)
Compliance Services
Ryan Del Giudice of Griffin Capital Company, LLC serves as the Chief Compliance Officer to the Fund. Separately, Cipperman Compliance Services, LLC provides various compliance services to the Fund pursuant to a consulting agreement between Cipperman Compliance Services, LLC and the Fund.
Officer and Trustee Compensation
Each “non-interested” Trustee receives $7,500 per quarter and $500 per special telephonic meetings, as well as reimbursement for any reasonable expenses incurred attending meetings. The chair of the Fund’s Audit Committee receives an additional $10,000 annually. Prior to April 1, 2019, each “non-interested” trustee received $5,000 per quarterly and special in-person meeting and $500 per special telephonic meeting, as well as reimbursement for any reasonable expenses incurred attending the meetings. The chair of the Audit Committee received an additional $10,000 annually. None of the executive officers receive or received compensation from the Fund.
Certain Trustees and officers of the Fund are also officers of the Adviser and are not paid by the Fund for serving in such capacities.
5. PURCHASES AND SALES OF INVESTMENT SECURITIES
The cost of purchases and proceeds from the sale of securities, other than short-term securities, for the six months ended June 30, 2019 were as follows:
| | | Purchases of Securities | | | Proceeds from Sales of
Securities | |
| Griffin Institutional Access Credit Fund | | $ | 145,385,001 | | | $ | 64,938,578 | |
6. TAX BASIS INFORMATION
Distributions are determined in accordance with federal income tax regulations, which differ from GAAP, and, therefore, may differ significantly in amount or character from net investment income and realized gains for financial reporting purposes. Financial reporting records are adjusted for permanent book/tax differences to reflect tax character but are not adjusted for temporary differences. The amounts and characteristics of tax basis distributions and composition of distributable earnings/(accumulated losses) are finalized at fiscal year-end. Accordingly, tax basis balances have not been determined as of the date of the semi-annual report.
The tax character of distributions paid for the year ended December 31, 2018 were as follows:
| Year | | | Ordinary Income | | | Long-Term Capital Gain | | | Return of Capital | |
| 2018 | | | $ | 8,400,352 | | | $ | – | | | $ | – | |
As of June 30, 2019, net unrealized appreciation/(depreciation) of investments based on the federal tax cost was as follows:
| | | Gross
Appreciation
(excess of value
over tax cost) | | | Gross
Depreciation
(excess of tax
cost over value) | | | Net Unrealized
Appreciation/(Depreciation) | | | Cost of
Investments for
Income Tax
Purposes | |
| Griffin Institutional Access Credit Fund | | $ | 4,685,517 | | | $ | (6,445,165 | ) | | $ | (1,759,648 | ) | | $ | 270,033,839 | |
The difference between book basis and tax basis unrealized appreciation/(depreciation) is primarily due to premium amortization, wash sales, forward contracts and passive foreign investment companies.
| Semi-Annual Report | June 30, 2019 | 51 |
| Griffin Institutional Access Credit Fund | Notes to Consolidated
Financial Statements |
June 30, 2019 (Unaudited)
Under current law, capital losses maintain their character as short-term or long-term and are carried forward to the next tax year without expiration. As of December 31, 2018, the following amounts are available as carry forwards to the next tax year:
| Fund Name | | Short Term | | | Long Term | |
| Griffin Institutional Access Credit Fund | | $ | 315,568 | | | $ | – | |
7. REPURCHASE OFFERS
The Fund is an interval fund and, as such, has adopted a fundamental policy to make quarterly repurchase offers, at net asset value, of no less than 5% of the Fund’s shares outstanding. There is no guarantee that shareholders will be able to sell all of the shares they desire to sell in a quarterly repurchase offer. Liquidity will be provided to shareholders only through the Fund’s quarterly repurchases. Shareholders will be notified in writing of each quarterly repurchase offer and the date the repurchase offer ends (the “Repurchase Request Deadline”). Shares will be repurchased at the NAV per share determined as of the close of regular trading on the NYSE no later than the 14th day after the Repurchase Request Deadline, or the next business day if the 14th day is not a business day (each a “Repurchase Pricing Date”).
During the six months ended June 30, 2019, the Fund completed two quarterly repurchase offers. In these offers, the Fund offered to repurchase up to 5% of the number of its outstanding shares as of the Repurchase Pricing Dates. With regard to each of the quarterly repurchase offers for the six months ended June 30, 2019, all repurchase requests received by the Fund were fully honored. The result of those repurchase offers were as follows:
| | Repurchase Offer #1 | Repurchase Offer #2 |
| Commencement Date | December 28, 2018 | March 29, 2019 |
| Repurchase Request Deadline | February 6, 2019 | May 7, 2019 |
| Repurchase Pricing Date | February 6, 2019 | May 7, 2019 |
| Amount Repurchased | $6,054,878 | $6,198,776 |
| Shares Repurchased | 246,033 | 248,648 |
8. RISK FACTORS
In the normal course of business, the Fund invests in financial instruments and enters into financial transactions where risk of potential loss exists due to such things as changes in the market (market risk) or failure or inability of the other party to a transaction to perform (credit and counterparty risk). See below for a detailed description of select principal risks. The following list is not intended to be a comprehensive listing of all of the potential risks associated with the Fund. For a more comprehensive list of potential risks the Fund may be subject to, please refer to the Fund’s Prospectus and Statement of Additional Information (“SAI”).
Debt Securities Risk When the Fund invests in debt securities, the value of your investment in the Fund will fluctuate with changes in interest rates. Typically, a rise in interest rates causes a decline in the value of debt securities. In general, the market price of debt securities with longer maturities will increase or decrease more in response to changes in interest rates than shorter-term securities. Other risk factors include credit risk (the debtor may default) and prepayment risk (the debtor may pay its obligation early, reducing the amount of interest payments). These risks could affect the value of a particular investment, possibly causing the Fund’s share price and total return to be reduced and fluctuate more than other types of investments.
Secured Debt Risk Secured debt holds the most senior position in the capital structure of a borrower. Secured debt in most circumstances is fully collateralized by assets of the borrower. Thus, it is generally repaid before unsecured bank loans, corporate bonds, subordinated debt, trade creditors, and preferred or common stockholders. Substantial increases in interest rates may cause an increase in loan defaults as borrowers may lack resources to meet higher debt service requirements. The value of the Fund’s assets may also be affected by other uncertainties such as economic developments affecting the market for senior secured term loans or affecting borrowers generally. Moreover, the security for the Fund’s investments in secured debt may not be recognized for a variety of reasons, including the failure to make required filings by lenders, trustees or other responsible parties and, as a result, the Fund may not have priority over other creditors as anticipated.
Secured debt usually includes restrictive covenants, which must be maintained by the borrower. The Fund may have an obligation with respect to certain senior secured term loan investments to make additional loans upon demand by the borrower. Such instruments, unlike certain bonds, usually do not have call protection. This means that such interests, while having a stated term, may be prepaid, often without penalty. The rate of such prepayments may be affected by, among other things, general business and economic conditions, as well as the financial status of the borrower. Prepayment would cause the actual duration of a senior loan to be shorter than its stated maturity
| 52 | 1.888.926.2688 | www.griffincapital.com |
| Griffin Institutional Access Credit Fund | Notes to Consolidated
Financial Statements |
June 30, 2019 (Unaudited)
Secured debt typically will be secured by pledges of collateral from the borrower in the form of tangible and intangible assets. In some instances, the Fund may invest in secured debt that is secured only by stock of the borrower or its subsidiaries or affiliates. The value of the collateral may decline below the principal amount of the senior secured term loans subsequent to an investment by the Fund.
Subordinated and Unsecured or Partially Secured Loans Risk The Fund may invest in unsecured loans and secured subordinated loans, including second and lower lien loans. Second lien loans are generally second in line in terms of repayment priority. A second lien loan may have a claim on the same collateral pool as the first lien or it may be secured by a separate set of assets. Second lien loans generally give investors priority over general unsecured creditors in the event of an asset sale. The priority of the collateral claims of third or lower lien loans ranks below holders of second lien loans and so on. Such junior loans are subject to the same general risks inherent to any loan investment, including credit risk, market and liquidity risk, and interest rate risk. Due to their lower place in the borrower’s capital structure and possible unsecured or partially secured status, such loans involve a higher degree of overall risk than senior loans of the same borrower.
Foreign Exchange Rate RiskForeign exchange rate risk relates to the change in the U.S. dollar value of a security held that is denominated in a foreign currency. The value of a foreign currency denominated security will decrease as the dollar appreciates against the currency, while the value of the foreign currency denominated security will increase as the dollar depreciates against the currency.
Bank Loans RiskThe Fund expects that some of its investments will consist of interests in loans originated by banks and other financial institutions. The loans invested in by the Fund may include term loans and revolving loans, may pay interest at a fixed or floating rate and may be senior or subordinated. Purchasers of bank loans are predominantly commercial banks, investment funds and investment banks. As secondary market trading volumes for bank loans increase, new bank loans are frequently adopting standardized documentation to facilitate loan trading which should improve market liquidity. There can be no assurance as to when or even if this current market illiquidity and volatility will abate or that future levels of supply and demand in bank loan trading will provide an adequate degree of liquidity, that the current period of illiquidity will not persist or worsen and that the market will not experience periods of significant illiquidity in the future. In addition, the Fund will make investments in stressed or distressed bank loans which are often less liquid than performing bank loans. The Fund may utilize Swaps for the purpose of gaining exposure to bank loans.
Swaps Risk The Fund’s use of swaps involves risks different from, or possibly greater than, the risks associated with investing directly in securities and other traditional investments and exposes the Fund to the risks associated with derivative instruments described above. In a standard “swap” transaction, two parties agree to exchange the returns, differentials in rates of return or some other amount earned or realized on the “notional amount” of predetermined investments or instruments, which may be adjusted for an interest factor. Swaps can involve greater risks than direct investment in securities, because swaps may be leveraged and subject to counterparty risk (e.g., the risk of a counterparty’s defaulting on the obligation or bankruptcy), credit risk and pricing risk (i.e., swaps may be difficult to value). Swaps are also subject to non-correlation risk because they may not be perfect substitutes for the instruments they are intended to hedge or replace. Swaps may also be considered illiquid. It may not be possible for the Fund to liquidate a swap position at an advantageous time or price, which may result in significant losses.
Leveraging Risk The use of leverage, such as in connection with Swaps and borrowing money to purchase securities, by the Fund will magnify the Fund’s gains or losses. Generally, the use of leverage also will cause the Fund to have higher expenses (especially interest and/or short selling related dividend expenses) than those of funds that do not use such techniques. In addition, a lender to the Fund may terminate or refuse to renew any credit facility. If the Fund is unable to access additional credit, it may be forced to sell investments at inopportune times, which may further depress the returns on the Fund. Because many derivatives have a leverage component, adverse changes in the value or level of the underlying asset, reference rate or index could result in a loss substantially greater than the amount invested in the derivative itself. When the Fund uses derivatives for leverage, investments in that Fund will tend to be more volatile, resulting in larger gains or losses in response to market changes. In an effort to limit leverage risk, the Fund will earmark assets determined to be liquid to cover its obligations under swap agreements.
Direct Origination RiskA portion of the Fund’s investment may be originated by certain affiliates of the Sub-Adviser, subject to the conditions of the Fund’s exemptive relief. The results of the Fund’s operations depend on several factors, including the availability of opportunities for the origination or acquisition of target investments, the level and volatility of interest rates, the availability of adequate short and long-term financing, conditions in the financial markets and economic conditions. Further, the Fund’s inability to raise capital and the risk of portfolio company defaults may materially and adversely affect the Fund’s investment originations, business, liquidity, financial condition, results of operations and its ability to make distributions to its shareholders. In addition, competition for originations of and investments in the Fund’s target investments may lead to the price of such assets increasing, which may further limit its ability to generate desired returns. Also, as a result of this competition, desirable investments in the Fund’s target investments may be limited in the future and the Fund may not be able to take advantage of attractive investment opportunities from time to time, as the Fund can provide no assurance that the Adviser and Sub-Adviser will be able to identify and make investments that are consistent with its investment objective. Additionally, the Fund may originate certain of its investments with the expectation of later syndicating a portion of such investment to third parties. Prior to such syndication, or if such syndication is not successful, the Fund’s exposure to the originated investment may exceed the exposure that the Adviser and Sub-Adviser intended to have over the long-term or would have had had it purchased such investment in the secondary market rather than originating it.
| Semi-Annual Report | June 30, 2019 | 53 |
| Griffin Institutional Access Credit Fund | Notes to Consolidated
Financial Statements |
June 30, 2019 (Unaudited)
Medium and Small Capitalization Company Risk Some issuers of the Fund’s investments may be medium or small capitalization companies which may be newly formed or have limited product lines, distribution channels, and financial or managerial resources. The risks associated with these investments are generally greater than those associated with investments in the securities of larger, more-established companies. The Fund does not maintain a policy limiting its ability to invest in medium or small capitalization companies. This may cause the Fund’s NAV to be more volatile when compared to investment companies that focus only on large capitalization companies. Generally, securities of medium and small capitalization companies are more likely to experience sharper swings in market values, less liquid markets, in which it may be more difficult for the Adviser to sell at times and at prices that the Adviser believes appropriate, and generally are more volatile than those of larger companies. Compared to large companies, smaller companies are more likely to have (i) less information publicly available, (ii) more limited product lines or markets and less mature businesses, (iii) fewer capital resources, (iv) more limited management depth, and (v) shorter operating histories. Further, the equity securities of smaller companies are often traded over-the-counter and generally experience a lower trading volume than is typical for securities that are traded on a national securities exchange. Consequently, the Fund may be required to dispose of these securities over a longer period of time (and potentially at less favorable prices) than would be the case for securities of larger companies, offering greater potential for gains and losses and associated tax consequences.
Valuation of Private Investments While the valuation of the Fund’s publicly-traded securities are more readily ascertainable, the Fund’s ownership interest in private investments are not publicly traded, and the Fund will use a third-party pricing service to provide pricing information for certain private investments. The fair value of loans, securities and other investments that are not publicly traded may not be readily determinable, and the Fund will value these investments at fair value as determined in good faith by the Board, including to reflect significant events affecting the value of the Fund’s investments. Certain of the Fund’s investments will be classified as Level 3 under Topic 820 of the U.S. Financial Accounting Standards Board’s Accounting Standards Codification, as amended, Fair Value Measurements and Disclosures. This means that the Fund’s portfolio valuations will be based on unobservable inputs and the Fund’s own assumptions about how market participants would price the asset or liability in question. The Fund expects that inputs into the determination of fair value of the Fund’s portfolio investments will require significant management judgment or estimation. The Fund has retained the services of one or more independent third-party valuation specialists to review the valuations of certain of these securities. Because such valuations, and particularly valuations of private securities and private companies, are inherently uncertain, may fluctuate over short periods of time and may be based on estimates, the Fund’s determinations of fair value may differ materially from the values that would have been used if a ready market for these securities existed. The Fund’s net asset value could be adversely affected if the determinations regarding the fair value of the Fund’s investments were materially higher than the values that the Fund ultimately realizes upon the disposal of such securities.
Liquidity of Investments Risk The lack of an established, liquid secondary market for a certain portion of the Fund’s investments may have an adverse effect on the market value of the Fund’s investments and the Fund’s ability to dispose of them. Additionally, certain investments may be subject to certain transfer restrictions that may also contribute to illiquidity. Further, Fund assets that are typically traded in a liquid market may become illiquid if the applicable trading market tightens. Therefore, no assurance can be given that the Fund can dispose of a particular investment at its prevailing fair value. A portion of the Fund’s investments may consist of securities that are subject to restrictions on resale by the Fund because they were acquired in a “private placement” or similar transaction or because the Fund is deemed to be an affiliate of the issuer of such securities. The Fund will be able to sell such securities only under applicable securities laws, which may permit only limited sales under specified conditions or subject the Fund to additional potential liability.
Non-Performing Loans RiskFund investments effected by the NPL Subsidiary are expected to include investments in non-performing and sub-performing loans which involve workout negotiations, restructuring and the possibility of foreclosure. These processes are lengthy and expensive. In addition, the Fund’s investments may include securities and debt obligation of financially distressed issuers, including companies involved in bankruptcy or other reorganization and liquidation proceedings. As a result, the Fund’s investments may be subject to additional bankruptcy related risks and returns on such investments may not be realized for a considerable period of time.
Structured Products Risk The Fund may invest in Collateralized Debt Obligations (“CDOs”) and other structured products, consisting of Collateralized Bond Obligations, Collateralized Loan Obligations (“CLOs”) and credit-linked notes. Holders of structured products bear risks of the underlying investments, index or reference obligation and are subject to counterparty risk.
The Fund may have the right to receive payments only from the structured product, and generally does not have direct rights against the issuer or the entity that sold the assets to be securitized. While certain structured products enable the investor to acquire interests in a pool of securities without the brokerage and other expenses associated with directly holding the same securities, investors in structured products generally pay their share of the structured product’s administrative and other expenses. Although it is difficult to predict whether the prices of indices and securities underlying structured products will rise or fall, these prices (and, therefore, the prices of structured products) will be influenced by the same types of political and economic events that affect issuers of securities and capital markets generally. If the issuer of a structured product uses shorter term financing to purchase longer term securities, the issuer may be forced to sell its securities at below market prices if it experiences difficulty in obtaining short-term financing, which may adversely affect the value of the structured products owned by the Fund. Certain structured products may be thinly traded or have a limited trading market. CLOs and credit-linked notes are typically privately offered and sold.
| 54 | 1.888.926.2688 | www.griffincapital.com |
| Griffin Institutional Access Credit Fund | Notes to Consolidated
Financial Statements |
June 30, 2019 (Unaudited)
CLO Risk In addition to the general risks associated with debt securities and structured products discussed herein, CLOs carry additional risks, including, but not limited to (i) the possibility that distributions from collateral securities will not be adequate to make interest or other payments; (ii) the quality of the collateral may decline in value or default; (iii) the possibility that the investments in CLOs are subordinate to other classes or tranches thereof; and (iv) the complex structure of the security may not be fully understood at the time of investment and may produce disputes with the issuer or unexpected investment results. CLO equity and junior debt securities that the Fund may acquire are subordinated to more senior tranches of CLO debt. CLO equity and junior debt securities are subject to increased risks of default relative to the holders of superior priority interests in the same securities. In addition, at the time of issuance, CLO equity securities are under-collateralized in that the liabilities of a CLO at inception exceed its total assets. Though not exclusively, the Fund will typically be in a first loss or subordinated position with respect to realized losses on the assets of the CLOs in which it is invested. The Fund may recognize phantom taxable income from its investments in the subordinated tranches of CLOs and structured notes. See “Tax Status” in the Fund’s SAI.
Between the closing date and the effective date of a CLO, the CLO collateral manager will generally expect to purchase additional collateral obligations for the CLO. During this period, the price and availability of these collateral obligations may be adversely affected by a number of market factors, including price volatility and availability of investments suitable for the CLO, which could hamper the ability of the collateral manager to acquire a portfolio of collateral obligations that will satisfy specified concentration limitations and allow the CLO to reach the initial par amount of collateral prior to the effective date. An inability or delay in reaching the target initial par amount of collateral may adversely affect the timing and amount of interest or principal payments received by the holders of the CLO debt securities and distributions of the CLO on equity securities and could result in early redemptions which may cause CLO debt and equity investors to receive less than face value of their investment.
The failure by a CLO in which the Fund invests to satisfy financial covenants, including with respect to adequate collateralization and/or interest coverage tests, could lead to a reduction in the CLO’s payments to the Fund. In the event that a CLO fails certain tests, holders of CLO senior debt may be entitled to additional payments that would, in turn, reduce the payments the Fund would otherwise be entitled to receive. Separately, the Fund may incur expenses to the extent necessary to seek recovery upon default or to negotiate new terms, which may include the waiver of certain financial covenants, with a defaulting CLO or any other investment the Fund may make. If any of these occur, it could adversely affect the Fund’s operating results and cash flows.
The Fund’s CLO investments are exposed to leveraged credit risk. If certain minimum collateral value ratios and/or interest coverage ratios are not met by a CLO, primarily due to senior secured loan defaults, then cash flow that otherwise would have been available to pay distributions to the Fund on its CLO investments may instead be used to redeem any senior notes or to purchase additional senior secured loans, until the ratios again exceed the minimum required levels or any senior notes are repaid in full. The Fund’s CLO investments and/or the underlying senior secured loans may prepay more quickly than expected, which could have an adverse impact on the Company’s net assets.
Mezzanine Securities Risk Most of the Fund’s mezzanine securities and other investments (if any) are expected to be unsecured and made in companies whose capital structures have significant indebtedness ranking ahead of the investments, all or a significant portion of which may be secured. While the securities and other investments may benefit from the same or similar financial and other covenants as those enjoyed by the indebtedness ranking ahead of the investments and may benefit from cross-default provisions and security over the portfolio company’s assets, some or all of such terms may not be part of particular investments. Mezzanine securities and other investments generally are subject to various risks including, without limitation: (i) a subsequent characterization of an investment as a “fraudulent conveyance”; (ii) the recovery as a “preference” of liens perfected or payments made on account of a debt in the 90 days before a bankruptcy filing; (iii) equitable subordination claims by other creditors; (iv) so-called “lender liability” claims by the issuer of the obligations; and (v) environmental liabilities that may arise with respect to collateral securing the obligations.
High Yield Debt Risk A substantial portion of the high yield debt in which the Fund intends to invest are rated below investment-grade by one or more nationally recognized statistical rating organizations or are unrated but of comparable credit quality to obligations rated below investment-grade, and have greater credit and liquidity risk than more highly rated debt obligations. Lower-rated securities may include securities that have the lowest rating or are in default. High yield debt is generally unsecured and may be subordinate to other obligations of the obligor. The lower rating of high yield debt reflects a greater possibility that adverse changes in the financial condition of the obligor or in general economic conditions (including, for example, a substantial period of rising interest rates or declining earnings) or both may impair the ability of the obligor to make payment of principal and interest. Many issuers of high yield debt are highly leveraged, and their relatively high debt-to-equity ratios create increased risks that their operations might not generate sufficient cash flow to service their debt obligations. In addition, many issuers of high yield debt may be in poor financial condition, experiencing poor operating results, having substantial capital needs or negative net worth or be facing special competitive or product obsolescence problems, and may include companies involved in bankruptcy or other reorganizations or liquidation proceedings. Certain of these securities may not be publicly traded, and therefore it may be difficult to obtain information as to the true condition of the issuers. Overall declines in the below investment-grade bond and other markets may adversely affect such issuers by inhibiting their ability to refinance their debt at maturity. High yield debt is often less liquid than higher rated securities.
| Semi-Annual Report | June 30, 2019 | 55 |
| Griffin Institutional Access Credit Fund | Notes to Consolidated
Financial Statements |
June 30, 2019 (Unaudited)
Credit RiskThere is a risk that debt issuers will not make payments, resulting in losses to the Fund. In addition, the credit quality of securities may be lowered if an issuer’s financial condition changes. Lower credit quality may lead to greater volatility in the price of a security and in shares of the Fund. Lower credit quality also may affect liquidity and make it difficult to sell the security. Default, or the market’s perception that an issuer is likely to default, could reduce the value and liquidity of securities, thereby reducing the value of your investment in Fund shares. In addition, default may cause the Fund to incur expenses in seeking recovery of principal or interest on its portfolio holdings.
Cybersecurity Risk Cybersecurity refers to the combination of technologies, processes and procedures established to protect information technology systems and data from unauthorized access, attack or damage. The Fund and its affiliates and third-party service providers are subject to cybersecurity risks. Cybersecurity risks have significantly increased in recent years and the Fund could suffer such losses in the future. The Fund’s and its affiliates’ and third-party service providers’ computer systems, software and networks may be vulnerable to unauthorized access, computer viruses or other malicious code and other events that could have a security impact. If one or more of such events occur, this potentially could jeopardize confidential and other information, including nonpublic personal information and sensitive business data, processed and stored in, and transmitted through, computer systems and networks, or otherwise cause interruptions or malfunctions in the Fund’s operations or the operations of their respective affiliates and third-party service providers. This could result in significant losses, reputational damage, litigation, regulatory fines or penalties, or otherwise adversely affect the Fund’s business, financial condition or results of operations. Privacy and information security laws and regulation changes, and compliance with those changes, may result in cost increases due to system changes and the development of new administrative processes. In addition, the Fund may be required to expend significant additional resources to modify the Fund’s protective measures and to investigate and remediate vulnerabilities or other exposures arising from operational and security risks.
9. SUBSEQUENT EVENTS
Subsequent events after the date of the Consolidated Statement of Assets and Liabilities have been evaluated through the date the consolidated financial statements were issued.
The Fund completed a quarterly repurchase offer on August 6, 2019, which resulted in 292,695 Fund shares being repurchased for $7,247,339.
The Adviser voluntarily has absorbed all of the operating expenses of the Fund since the commencement of the Fund's operations. In the absence of the election by the Fund's Adviser to bear all of the Fund's operating expenses, the ratio of expenses to average net assets including fee waivers and reimbursements would have been higher. As of August 26, 2019, the Adviser has determined to no longer waive its full 1.85% contractual advisory fee and to, instead, voluntarily waive 0.60% of its contractual advisory fee, effectively absorbing certain of the Fund's operating expenses above 1.25%. Fund expenses waived between 1.25% and the Expense Limitations will be permanently waived. Expenses in excess of the Expense Limitations are subject to the Expense Limitation Agreement. The Adviser will continue this voluntary waiver on a going forward basis in its discretion and is under no obligation to continue to do so for any specified period of time.
Management has determined that there were no other subsequent events to report through the issuance of these consolidated financial statements.
| 56 | 1.888.926.2688 | www.griffincapital.com |
| Griffin Institutional Access Credit Fund | Additional Information |
June 30, 2019 (Unaudited)
1. PROXY VOTING POLICIES AND VOTING RECORD
A description of the policies and procedures that the Fund uses to vote proxies relating to portfolio securities is available without charge upon request by calling toll-free 888-926-2688, or on the Securities and Exchange Commission’s (“SEC”) website at https://www.sec.gov. Information regarding how the Fund voted proxies relating to portfolio securities during the most recent 12-month period ended June 30th is available without charge upon request by calling toll-free 888-926-2688, or on the SEC’s website at https://www.sec.gov.
2. QUARTERLY PORTFOLIO HOLDINGS
The Fund files its complete schedule of portfolio holdings with the SEC for the first and third quarters of each fiscal year as an exhibit to its reports on Form N-PORT. The Fund’s Form N-PORT reports are available on the SEC’s web site at http://www.sec.gov. Prior to May 30, 2019, the Fund filed its complete schedule of portfolio holdings with the SEC for the first and third quarters of each fiscal year on Form N-Q. The Fund's Form N-Q's are available on the SEC's website at http://www.sec.gov and may also be reviewed at the SEC's Public Reference Room in Washington D.C. Information on the operation of the Public Reference Room may be obtained by calling 1-800-SEC-0330.
| Semi-Annual Report | June 30, 2019 | 57 |
| Griffin Institutional Access Credit Fund | Approval of the Investment
Advisory Agreement |
June 30, 2019 (Unaudited)
Trustees Consideration and Approval of Continuation of Advisory Agreement with Griffin Capital Credit Advisor, LLC
Griffin Capital Credit Advisor, LLC (the “Adviser”) supervises the investments of the Fund pursuant to an Investment Advisory Agreement. At a meeting of the Fund’s Board of Trustees on February 19, 2019 the Trustees approved the continuation of the Investment Advisory Agreement for a one-year term. In considering whether to approve the Investment Advisory Agreement, the Trustees reviewed and considered the information they deemed reasonably necessary, including the following material factors: (i) the nature, extent, and quality of the services provided by the Adviser; (ii) the investment performance of the Fund; (iii) the costs of the services provided by the Adviser; (iv) the profits to be realized by the Adviser and its affiliates from the relationship with the Fund; (v) the extent to which economies of scale would be realized as the Fund grows and whether advisory fee levels reflect those economies of scale for the benefit of the Fund’s investors.
At the meeting, the Trustees reviewed various informational materials, including the Investment Advisory Agreement for the Fund and a memorandum from the Adviser to the Trustees containing information about the advisory firm and its business. The memorandum provided information about the Adviser’s finances, personnel, services to the Fund, investment advice, fees, and compliance program. It also contained information on Fund expenses, including comparative expense ratio information for other investment companies with strategies similar to the Fund. The Trustees also reviewed a memorandum from the Fund’s legal counsel that summarized the fiduciary duties and responsibilities of the Board of Trustees in reviewing and approving the Investment Advisory Agreement, including the types of information and factors that should be considered in order to make an informed decision.
The Independent Trustees were assisted by counsel throughout the Management Agreement review process. The Board relied upon the advice of counsel and their own business judgment in determining the material factors to be considered in evaluating the Management Agreement and the weight to be given to each factor considered. The conclusions reached by the Trustees were based on a comprehensive evaluation of all of the information provided and were not the result of any one factor. Moreover, each Trustee may have afforded different weight to the various factors in reaching his conclusions with respect to the approval of the Management Agreement.
(i)The nature, extent, and quality of the services provided by the Adviser. The Trustees evaluated the Adviser’s staffing, personnel, and methods of operating; the education and experience of the Adviser’s personnel; the Adviser’s compliance programs, policies, and procedures; the financial condition of the Adviser; and the level of commitment to the Fund and the Adviser by the principals of the Adviser. The Trustees considered the responsibilities of the Adviser under the Management Agreement and reviewed the services provided to the Fund including, without limitation, the Adviser’s procedures for implementing the Fund’s strategy and assuring compliance with the Fund’s investment objectives and limitations, coordination of services for the Fund among the Fund’s service providers, expertise and experience. The Trustees noted that the Adviser seeks to achieve the Fund’s investment objective to generate a return comprised of both current income and capital appreciation with an emphasis on current income with low volatility and low correlation to the broader markets, by investing in a range of secured and unsecured debt obligations, which may be syndicated, consisting of U.S. high yield securities, global high yield securities, and other fixed income and fixed-income related securities, including direct originated debt obligations and collateralized loan obligations. The Trustees noted that the Fund’s principal officers are personnel of the Adviser, and its affiliates serve the Fund without additional compensation. The Board noted that the depth of experience of the personnel of the Adviser. After reviewing the foregoing information and other information in the Adviser’s Memorandum (e.g., the Adviser’s Form ADV and descriptions of the Adviser’s business and compliance program), the Board concluded that the nature, extent, and quality of the services provided by the Adviser to the Fund were satisfactory.
(ii)The investment performance of the Fund and the Adviser. The Trustees noted the Fund’s positive performance since its inception. The Board acknowledged that the Fund underperformed the S&P 500 in the since inception through January 31, 2019 period. The Board took note of the underperformance to the S&P 500 related general bull market that has occurred since that time. The Board also did note that the Fund had provided better risk-adjusted returns than the S&P 500 since inception. The Trustees further noted that the Fund outperformed many of its peers in the since inception period and that the two funds that it underperformed related significantly to the peer funds’ focus on public credit investments versus the Fund’s mix of private and public credit investments. After reviewing the Fund’s performance and other factors, the Board concluded that it was satisfied with the performance of the Fund.
(iii)The costs of the services to be provided by the Adviser. The Trustees evaluated the current and projected asset levels of the Fund; and the overall expenses of the Fund, including the nature and frequency of advisory fee payments. The Trustees then compared the fees and expenses of the Fund (including the management fee) to other peer funds. The Trustees determined that the base management fee set forth in the prospectus was higher than other funds, but noted that the base management fee set forth in the financial statements was considerably lower given the Adviser had voluntarily absorbed all of the operating expenses of the Fund since the commencement of the Fund’s operations. The Trustees agreed that it was also important to consider the entire expense ratio in the comparison. In that regard, they noted that the net expense ratio was below the average of the peer group. The Trustees noted that some peer funds also charged a performance fee in addition to their management fee, which would likely make the aggregate fee higher than the Fund’s in certain circumstances.
The Trustees also considered potential benefits for the Adviser in managing the Fund. Further, the Trustees noted that, to date, the Adviser had absorbed all of the Fund’s operating expenses, which could not be recouped.
| 58 | 1.888.926.2688 | www.griffincapital.com |
| Griffin Institutional Access Credit Fund | Approval of the Investment
Advisory Agreement |
June 30, 2019 (Unaudited)
Following further consideration and discussion of the foregoing, the Board concluded that the fee paid to the Adviser by the Fund was fair and reasonable in relation to the nature and quality of the services provided by the Adviser and that they reflected charges that were within a range of what could have been negotiated at arm’s length.
(iv)The profits to be realized by the Adviser and its affiliates from the relationship with the Fund. The Trustees reviewed the Adviser’s profitability analysis in connection with its management of the Fund, and noted that the Adviser had not earned a profit and was absorbing all of the Fund’s operating expenses. The Board concluded that the Adviser’s profitability was not excessive.
(v)The extent to which economies of scale would be realized as the Fund grows and whether advisory fee levels reflect those economies of scale for the benefit of the Fund’s investors. The Trustees considered that the Fund’s fee arrangements with the Adviser involved both the management fee and an Expense Limitation Agreement. The Trustees noted that, while the management fee remains the same at all asset levels, the Fund’s shareholders continue to benefit from the Fund’s expense limitation arrangement until the Fund’s assets grow to a level where the Fund’s expenses fell below the cap set by the arrangement and the Adviser begins receiving its full fee. Following further discussion of the Fund’s current and projected asset levels, expectations for growth, and fee levels, the Board determined that the Fund’s fee arrangements were fair and reasonable in relation to the nature and quality of the services provided by the Adviser and that the Expense Limitation Agreement has provided savings for the benefit of the Fund’s investors.
Based upon all of the foregoing considerations, the Board of Trustees, including a majority of the Independent Trustees, approved the continuation of the Investment Advisory Agreement for the Fund.
Trustees Consideration and Approval of Continuation of Sub-Advisory Agreement with BCSF Advisors, LP.
BCSF Advisors, LP (“BCSF”) provides ongoing research, opinions and recommendations regarding the Fund’s investment portfolio pursuant to an Investment Sub-Advisory Agreement. BCSF is an affiliate of Bain Capital Credit, LP. At a meeting of the Fund’s Board of Trustees on February 19, 2019, the Trustees approved the continuation of the Investment Sub-Advisory Agreement for a one-year term. In considering whether to approve the Investment Sub- Advisory Agreement, the Trustees reviewed and considered the information they deemed reasonably necessary, including the following material factors: (i) the nature, extent, and quality of the services provided by BCSF; (ii) the investment performance of the Fund and BCSF; (iii) the costs of the services provided by BCSF; (iv) the profits to be realized by BCSF and its affiliates from the relationship with the Fund; (v) the extent to which economies of scale would be realized as the Fund grows and whether the advisory fee levels reflect these economies of scale for benefit of the Fund’s investors.
(i)The nature, extent, and quality of the services provided by BCSF. The Trustees evaluated BCSF’s staffing, personnel, and methods of operating; the education and experience of BCSF’s personnel; BCSF’s compliance program, policies, and procedures; the financial condition of BCSF; and the level of commitment to the Fund and BCSF by the principals of BCSF. The Trustees discussed the financial stability of the firm. The Trustees considered the responsibilities of BCSF under the Investment Sub-Advisory Agreement and reviewed the services provided to the Fund including, without limitation, BCSF’s procedures for implementing the Fund’s strategy and assuring compliance with the Fund’s investment objectives and limitations, subject to the oversight of the Fund’s Adviser. The Trustees noted that BCSF supports the Adviser in seeking to achieve the Fund’s investment objective generate a return comprised of both current income and capital appreciation with an emphasis on current income with low volatility and low correlation to the broader markets, by investing in a range of secured and unsecured debt obligations, which may be syndicated, consisting of U.S. high yield securities, global high yield securities, and other fixed income and fixed-income related securities, including direct originated debt obligations and CLOs.
The Board also noted that BCSF provides services to the Fund’s special purpose vehicles which invest in NPLs and serve as counterparty to a series of total return swaps. After reviewing the foregoing information and further information in the Sub-Adviser’s Memorandum (e.g., BCSF’s Form ADV and descriptions of BCSF’s business and compliance program), the Board concluded that the nature, extent, and quality of the services provided by BCSF were satisfactory.
(ii)The investment performance of the Fund and BCSF. The Trustees discussed the performance of the Fund. The Trustees noted the Fund’s continued strong performance in the period since inception and recalled their deliberations relating to the Adviser. The Board noted that Adviser continued to be satisfied with BCSF’s performance and the data provided. After reviewing these considerations, the Board concluded that the investment performance of BCSF was satisfactory.
(iii)The costs of the services to be provided by BCSF. The Trustees evaluated the overall expenses of the Fund, including the nature and frequency of advisory and sub-advisory fee payments. The Trustees also considered potential benefits for BCSF in managing the Fund. The Trustees noted that the Adviser paid the sub-advisory fee to BCSF out of its management fee, and further noted that, accordingly, the Fund’s overall management fee and expenses was the appropriate vehicle to compare to other funds. The Board recalled their deliberations relating to the Adviser’s cost of services. Following further consideration and discussion of the foregoing, the Board concluded that the fees to be paid to BCSF by the Fund were fair and reasonable in relation to the nature and quality of the services provided by BCSF and that they reflected charges that were within a range of what could have been negotiated at arm’s length.
| Semi-Annual Report | June 30, 2019 | 59 |
| Griffin Institutional Access Credit Fund | Approval of the Investment
Advisory Agreement |
June 30, 2019 (Unaudited)
(iv)The profits to be realized by BCSF and its affiliates from the relationship with the Fund. The Trustees reviewed BCSF’s profitability analysis in connection with its management of the Fund, and noted that BCSF earned what the Board considered to be a reasonable profit from its relationship with the Fund. The Board concluded that BCSF’s profitability was not excessive.
(v)The extent to which economies of scale would be realized as the Fund grows and whether the advisory fee levels reflect these economies of scale for benefit of the Fund’s investors. The Trustees considered that the Fund’s fee arrangements with BCSF and noted that the subadvisory fee contained break points, which caused the Adviser to pay lower fees to BCSF based on higher asset levels. Following further discussion of the Fund’s current and projected asset levels, expectations for growth, and levels of fees, the Board determined that the Fund’s fee arrangements were fair and reasonable in relation to the nature and quality of the services provided by BCSF.
Based upon all of the foregoing considerations, the Board of Trustees, including a majority of the Independent Trustees, approved the continuation of the Investment Sub-Advisory Agreement with BCSF.
| 60 | 1.888.926.2688 | www.griffincapital.com |
| Griffin Institutional Access Credit Fund | Privacy Policy |
June 30, 2019 (Unaudited)
NOTICE OF PRIVACY POLICY AND PRACTICES
The Griffin Institutional Access Credit Fund (the “Fund”) is committed to maintaining the confidentiality, integrity, and security of your nonpublic personal information (“NPI”). When you provide personal information, the Fund believes that you should be aware of policies utilized to protect the confidentiality of that information. The Fund needs to share your NPI to conduct everyday business. The following information is intended to help you understand what NPI we collect, how we protect your NPI from unauthorized access and why the Fund may share your NPI with other affiliated and non-affiliated parties.
The Fund collects the following nonpublic personal information about you:
| ● | Information we receive from you on or in applications or other forms, correspondence, or conversations, including, but not limited to, your name, address, phone number, social security number, assets, income, and date of birth; and |
| ● | Information about your transactions with us, our affiliates, or others, including, but not limited to, your account number and balance, payments history, parties to transactions, cost basis information, and other financial information. |
How does the Fund protect your nonpublic personal information?
To protect your personal information from unauthorized access and use, the Fund maintains physical, electronic and procedural safeguards that comply with applicable federal and state standards to guard your NPI. These measures include computer safeguards and secured files and buildings.
What does the Fund do with your personal information?
The Fund does not permit use of your personal information for any joint marketing or non-business purpose. Further, the Fund does not permit the disclosure of your personal information to non-affiliated parties for marketing purposes. The Fund may, however, disclose your personal information to comply with regulatory requirements, court orders or other legal requirements.
Affiliated Parties
The Fund does not disclose any nonpublic personal information about our current or former shareholders to affiliated parties, except as permitted by applicable law or regulation and as described herein. The Fund may, for example, share NPI with personnel of the Fund’s investment adviser and affiliated broker-dealer which also serves as the Fund’s exclusive wholesale marketing agent. The Fund shares NPI with its affiliates for business purposes only in an effort to service your account(s) which includes, but is not limited to, assisting in processing your transactions, inquiring about your transactions and experience, sending you shareholder reports and other information about the Fund or to otherwise provide the applicable service and maintain your account(s). The Fund’s affiliated parties that receive your NPI are required to protect your NPI, provide it only to personnel who need and use it solely for the purpose for which they received it. The Fund and its affiliated parties that receive your NPI maintain physical, electronic and procedural safeguards that comply with applicable federal and state standards to guard your NPI.
Non-Affiliated Parties
The Fund does not disclose any nonpublic personal information about our current or former shareholders to non-affiliated third parties, except as permitted by applicable law or regulation and as described herein. The Fund may share NPI with non-affiliated service providers and their employees, including the Fund’s administrator, transfer agent, distributor, proxy solicitors and legal counsel, among others. The Fund shares NPI with its non-affiliated service providers to service your account(s) including, but not limited to, processing your transactions, sending you shareholder reports and other information about the Fund or to otherwise provide the applicable service and maintain your account(s). These non-affiliated service providers are required to protect your NPI and use it solely for the purpose for which they received it. The non-affiliated service providers are required to maintain physical, electronic and procedural safeguards that comply with applicable federal and state standards to guard your NPI.
| Semi-Annual Report | June 30, 2019 | 61 |
Item 2. Code of Ethics.
Not applicable.
Item 3. Audit Committee Financial Expert.
Not applicable.
Item 4. Principal Accountant Fees and Services.
Not applicable.
Item 5. Audit Committee of Listed Registrants.
Not applicable to the Registrant.
Item 6. Investments.
| (a) | The Schedule of Investments is included as part of the Report to Stockholders filed under Item 1 of this report. |
| (b) | Not applicable to the Registrant. |
Item 7. Disclosure of Proxy Voting Policies and Procedures for Closed-End Management Investment Companies.
Not applicable.
Item 8. Portfolio Managers of Closed-End Management Investment Companies.
Item 9. Purchases of Equity Securities by Closed-End Management Investment Company and Affiliated Purchasers.
None.
Item 10. Submission of Matters to a Vote of Security Holders.
No changes have occurred.
Item 11. Controls and Procedures.
| (a) | Based on an evaluation of the Registrant’s disclosure controls and procedures (as defined in Rule 30a-3(c) under the 1940 Act), the Registrant’s principal executive officer and principal financial officer have concluded that the Registrant’s disclosure controls and procedures are effective as of a date within 90 days of the filing date of this report. |
| (b) | There were no significant changes in the Registrant’s internal control over financial reporting that occurred during the period covered by this report that has materially affected, or are reasonably likely to materially affect, the Registrant’s internal control over financial reporting. |
Item 12. Disclosure of Securities Lending Activities for Closed-End Management Investment Companies.
Not applicable.
Item 13. Exhibits.
| (a)(2) | Certifications required by Item 13(a)(2) of Form N-CSR are filed herewith as Exhibit 99.CERT. |
| (a)(3) | Not applicable to the Registrant. |
| (b) | Certifications required by Item 13(b) of Form N-CSR are filed herewith as Exhibit 99.906CERT. |
SIGNATURES
Pursuant to the requirements of the Securities Exchange Act of 1934 and the Investment Company Act of 1940, the Registrant has duly caused this report to be signed on its behalf by the undersigned, thereunto duly authorized.
GRIFFIN INSTITUTIONAL ACCESS CREDIT FUND
| By: | /s/ Kevin Shields | |
| | Kevin Shields | |
| | President (Principal Executive Officer) | |
| | | |
| Date: | September 5, 2019 | |
Pursuant to the requirements of the Securities Exchange Act of 1934 and the Investment Company Act of 1940, this report has been signed below by the following persons on behalf of the Registrant and in the capacities and on the dates indicated.
By (Signature and Title)
| By: | /s/ Kevin Shields | |
| | Kevin Shields | |
| | President (Principal Executive Officer) | |
| | | |
| Date: | September 5, 2019 | |
By (Signature and Title)
| By: | /s/ Joseph Miller | |
| | Joseph Miller | |
| | Treasurer (Principal Financial Officer) | |
| | | |
| Date: | September 5, 2019 | |