Exhibit 99.1

Investor Presentation June 5, 2019
Disclaimers Terminology The terms “we,” “our,” “us,” “the Company,” “CSTR” and “CapStar” that appear in this presentation refer to CapStar Financial Holdings, Inc. and its wholly owned subsidiary, CapStar Bank. The terms “CapStar Bank,” “the Bank” and “our Bank” that appear in this presentation refer to CapStar Bank. Contents of Presentation Except as is otherwise expressly stated in this presentation, the contents of this presentation are presented as of the date on the front cover of this presentation. Market Data Market data used in this presentation has been obtained from government and independent industry sources and publications available to the public, sometimes with a subscription fee, as well as from research reports prepared for other purposes. Industry publications and surveys and forecasts generally state that the information contained therein has been obtained from sources believed to be reliable. CSTR did not commission the preparation of any of the sources or publications referred to in this presentation. CSTR has not independently verified the dataobtained from these sources, and, although CSTR believes such data to be reliable as of the dates presented, it could prove to be inaccurate. Forward-looking information obtained from these sources is subject to the same qualifications and the additional uncertainties regarding the other forward-looking statements in this presentation.Non-GAAP Disclaimer This presentation includes the following financial measures that have been prepared other than in accordance with generally accepted accounting principles in the United States(“non-GAAP financial measures”):pre-tax,pre-provision net income,pre-tax,pre-provision return on average assets, tangible equity, tangible common equity, tangible assets, return on average tangible equity, return on average tangible common equity, book value per share (as adjusted), tangible book value per share (as reported and as adjusted), tangible equity to tangible assets, tangible common equity to tangible assets and adjusted shares outstanding at the end of the period. CSTRnon-GAAP financial measures (i) provide useful informationto management and investors that is supplementary to its financial condition, results of operations and cash flows computed in accordance with GAAP, (ii) enable a more complete understanding of factors and trends affecting CSTR’s business, and (iii) allow investors to evaluate CSTR’s performancein a manner similar to management, the financial services industry, bank stock analysts and bank regulators; however, CSTR acknowledges that itsnon-GAAP financial measures have a number of limitations. As such, you should not view these disclosures as a substitute for results determined in accordance with GAAP, and they are not necessarily comparable tonon-GAAP financial measures that other companies use. See the Appendix to this presentation for a reconciliation ofnon-GAAP financial measures to the most directly comparable GAAP financial measures. 2
Safe Harbor Statements Certain statements in this presentation are forward-looking statements that reflect our current views with respect to, among other things, future events and our financial and operational performance. These statements are often, but not always, made through the use of words or phrases such as “may,” “should,” “could,” “predict,” “potential,” “believe,” “will likely result,” “expect,” “continue,” “will,” “anticipate,” “seek,” “aspire,” “estimate,” “intend,” “plan,” “project,” “projection,” “forecast,” “ roadmap,” “goal,” “target,” “guidance,” “would,” and “outlook,” or the negative version of those words or other comparable words of a future or forward-looking nature. These forward-looking statements are not historical facts, and are based on current expectations, estimates and projections about our industry, management’s beliefs and certain assumptions made by management, many of which, by their nature, are inherently uncertain and beyond our control. The inclusion of these forward-looking statements should not be regarded as a representation by us or any other person that such expectations, estimates and projections will be achieved. Accordingly, we caution you that any such forward-looking statements are not guarantees of future performance and are subject to risks, assumptions and uncertainties that are difficult to predict. Although we believe that the expectations reflected in these forward-looking statements are reasonable as of the date made, actual results may prove to be materially different from the results expressed or implied by the forward-looking statements. There are or will be important factors that could cause our actual results to differ materially from those indicated in these forward-looking statements, including, but not limited to, the following: The acceptance by customers of Athens of the Company’s products and services; the ability of the Company to meet expectations regarding the benefits, costs, synergies, and financial and operational impact of the Athens merger; the possibility that any of the anticipated benefits, costs, synergies and financial and operational improvements of the Athens merger will not be realized or will not be realized as expected; the possibility that the Athens merger integration may be more expensive or take more time to complete than anticipated; the opportunities to enhance market share in certain markets and acceptance of the Company generally in new markets; economic conditions (including interest rate environment, government economic and monetary policies, the strength of global financial markets and inflation and deflation) that impact the financial services industry as a whole and/or our business; the concentration of our business in the Nashville metropolitan statistical area (“MSA”) and the effect of changes in the economic, political and environmental conditions on this market; increased competition in the financial services industry, locally, regionally or nationally, whichmay adversely affect pricing and the other terms offered to our clients; an increase in the cost of deposits, loss of deposits or a change in the deposit mix, which could increase our cost of funding; an increase in the costs ofcapital, which could negatively affect our ability to borrow funds, successfully raise additional capital or participate in strategic acquisition opportunities; our dependence on our management team and board of directors and changes in our management and board composition; our reputation in the community; our ability to execute our strategy and to achieve our loan ROAA and efficiency ratio goals, hire seasoned bankers, loan and deposit growth through organic growth and strategic acquisitions; credit risks related to the size of our borrowers and our ability to adequately identify, assess and limit our credit risk; our concentrationof large loans to a small number of borrowers; the significant portion of our loan portfolio that originated during the past two years and therefore may less reliably predict future collectability than older loans; the adequacy of reserves (including our allowance for loan losses) and the appropriateness of our methodology for calculating such reserves;non-performing loans and leases;non-performing assets; charge-offs,non-accruals, troubled debt restructurings, impairments and other credit-related issues; adverse trends in the healthcare service industry, which is an integral component of our market’s economy; our management of risks inherent in our commercial real estate loan portfolio, and the risk of a prolonged downturn in the real estate market, which could impair the value of our collateral and our ability to sell collateral upon any foreclosure; governmental legislation and regulation, including changes in the nature and timing of the adoption and effectiveness of new requirements under the Dodd-Frank Act of 2010, as amended, Basel guidelines, capital requirements, accounting regulation or standards and other applicable laws and regulations; the impact of the Tax Cuts and Job Act of 2017, as amended, on the Company and its financial performance and results of operations; the loss of large depositor relationships, which could force us to fund our business through more expensive and less stable sources; operational and liquidity risks associated with our business, including liquidity risks inherent in correspondent banking; volatility in interest rates and our overall management of interest rate risk, including managing the sensitivity of our interest-earning assets and interest-bearing liabilities to interest rates, and the impact to our earnings from a change in interest rates; the potential for our bank’s regulatory lending limits and other factors related to our size to restrict our growth and prevent us from effectively implementing our business strategy; strategic acquisitions we may undertake to achieve our goals; the sufficiency of our capital, including sources of capital and the extent to which we may be required toraise additional capital to meet our goals; fluctuations in the fair value of our investment securities that are beyond our control; deterioration in the fiscal position of the U.S. government and downgrades in Treasury and federal agency securities; potential exposure to fraud, negligence, computer theft and cyber-crime; the adequacy of our risk management framework; our dependence on our information technology and telecommunications systems and the potential for any systems failures or interruptions;threats to and breaches of our information technology systems and data security, including cyber-attacks; our dependence upon outside third parties for the processing and handling of our records and data; our ability to adapt to technological change; the financial soundness of other financial institutions; our exposure to environmental liability risk associated with our lending activities; our engagement in derivative transactions; our involvement from time to time in legal proceedings and examinations and remedial actions by regulators; the susceptibility of our market to natural disasters and acts of God; and the effectiveness of our internal controls over financial reporting and our ability to remediate any future material weakness in our internal controls over financial reporting. The foregoing factors should not be construed as exhaustive and should be read in conjunction with those factors that are detailed from time to time in the Company’s periodic and current reports filed with the Securities and Exchange Commission, including those factors included in the Company’s Annual Report on Form10-K for the year ended December 31, 2018 under the headings “Item 1A. Risk Factors” and “Cautionary Note Regarding Forward-Looking Statements” and in the Company’s Quarterly Reports on Form10-Q and Current Reports on Form8-K. If one or more events related to these or other risks or uncertainties materialize, or if our underlying assumptions prove to be incorrect, actual results may differ materially from our forward-looking statements. Accordingly, you should not place undue reliance on any such forward-looking statements. Any forward-looking statement speaks only as of the date of this presentation, and we do not undertake any obligation to publicly update or review any forward-looking statement, whether as a result of new information, future developments or otherwise, except as required by law. New risks and uncertainties may emerge from time to time, and it is not possible for us to predict their occurrence or how they will affect us. 3
We’re Listening • Our customer tagline is “We’re Listening”. • Our shareholders are equally as important. • Today’s agenda includes the following: – Overview – Business model evolution • Asset quality improvement • Profitability improvement – M&A Update and Criteria – Q&A 4
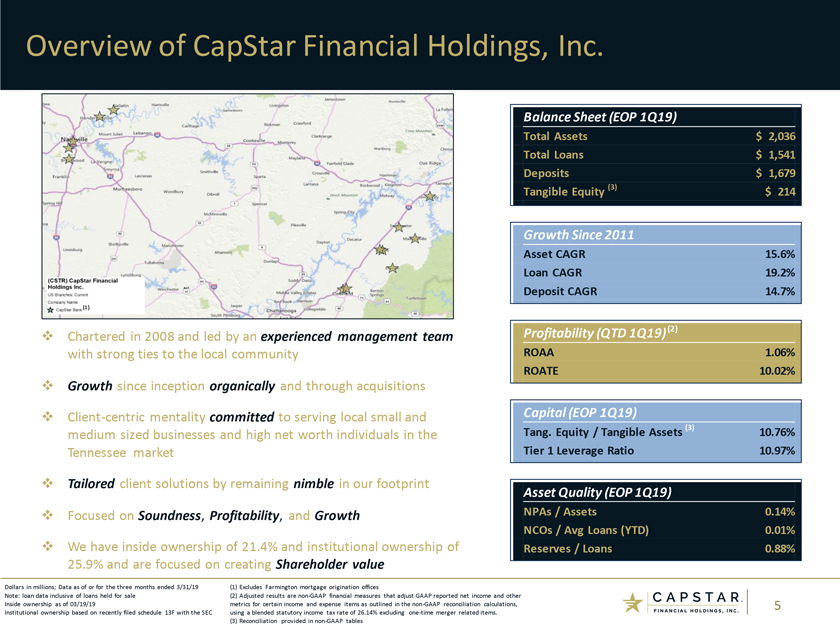
Overview of CapStar Financial Holdings, Inc. Balance Sheet (EOP 1Q19) Total Assets $ 2,036 Total Loans $ 1,541 Deposits $ 1,679 Tangible Equity (3) $ 214 Growth Since 2011 Asset CAGR 15.6% Loan CAGR 19.2% Deposit CAGR 14.7% (1) Profitability (QTD 1Q19)(2) ™ Chartered in 2008 and led by an experienced management team with strong ties to the local community ROAA 1.06% ROATE 10.02% ™ Growth since inception organically and through acquisitions ™ Client-centric mentality committed to serving local small and Capital (EOP 1Q19) Tang. Equity / Tangible Assets(3) 10.76% medium sized businesses and high net worth individuals in the Tennessee market Tier 1 Leverage Ratio 10.97% ™ Tailored client solutions by remaining nimble in our footprint Asset Quality (EOP 1Q19) ™ Focused on Soundness, Profitability, and Growth NPAs / Assets 0.14% NCOs / Avg Loans (YTD) 0.01% ™ We have inside ownership of 21.4% and institutional ownership of Reserves / Loans 0.88% 25.9% and are focused on creating Shareholder value Dollars in millions; Data as of or for the three months ended 3/31/19 (1) Excludes Farmington mortgage origination offices Note: loan data inclusive of loans held for sale (2) Adjusted results arenon-GAAP financial measures that adjust GAAP reported net income and other Inside ownership as of 03/19/19 metrics for certain income and expense items as outlined in thenon-GAAP reconciliation calculations, 5 Institutional ownership based on recently filed schedule 13F with the SEC using a blended statutory income tax rate of 26.14% excludingone-time merger related items. (3) Reconciliation provided innon-GAAP tables
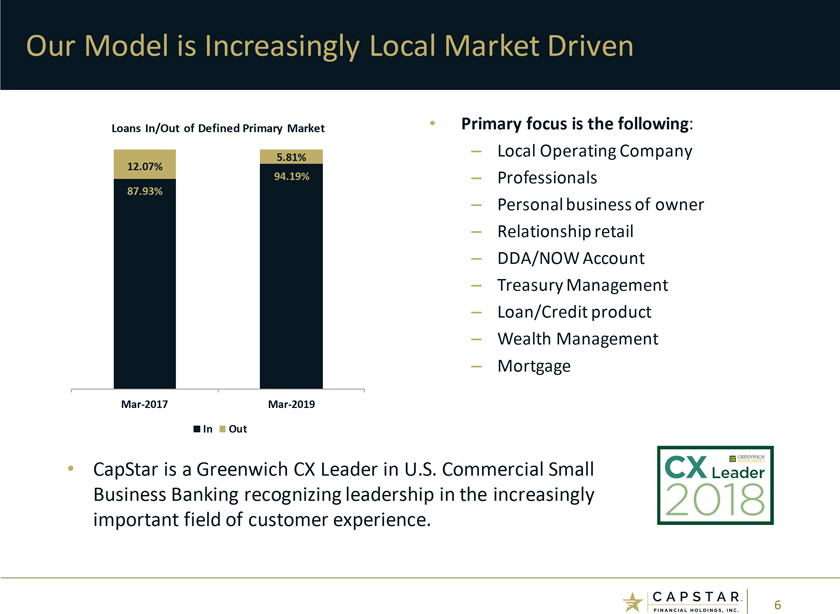
Our Model is Increasingly Local Market Driven Loans In/Out of Defined Primary Market • Primary focus is the following: – Local Operating Company 12.07% 5.81% 94.19% – Professionals 87.93% – Personal business of owner – Relationship retail – DDA/NOW Account – Treasury Management – Loan/Credit product – Wealth Management – MortgageMar-2017Mar-2019 In Out • CapStar is a Greenwich CX Leader in U.S. Commercial Small Business Banking recognizing leadership in the increasingly important field of customer experience. 6
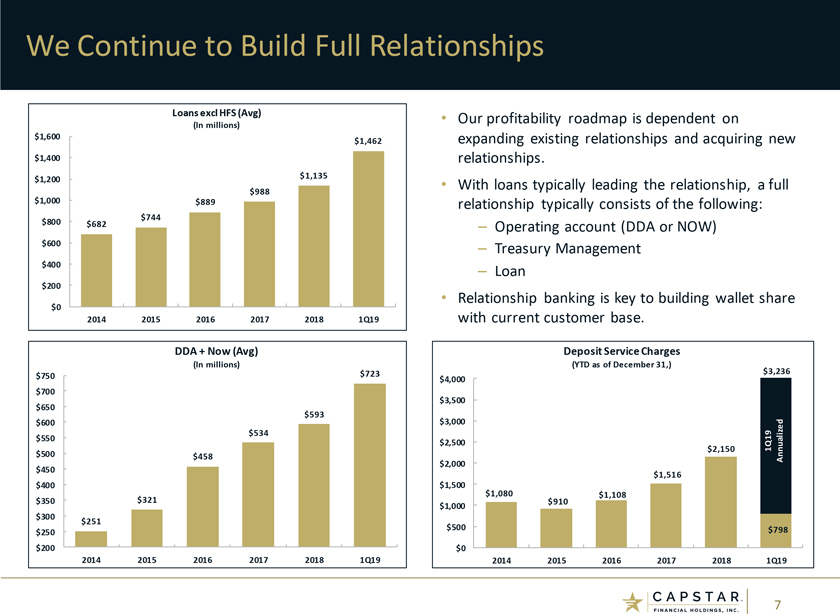
We Continue to Build Full Relationships Loans excl HFS (Avg) • Our profitability roadmap is dependent on (In millions) $1,600 expanding existing relationships and acquiring new $1,462 $1,400 relationships. $1,135 $1,200 • With loans typically leading the relationship, a full $988 $1,000 $889 relationship typically consists of the following: $744 $800 $682 – Operating account (DDA or NOW) $600 – Treasury Management $400 – Loan $200 $0 • Relationship banking is key to building wallet share 2014 2015 2016 2017 2018 1Q19 with current customer base. DDA + Now (Avg) Deposit Service Charges (In millions) (YTD as of December 31,) $3,236 $750 $723 $4,000 $700 $650 $3,500 $593 $3,000 $600 $534 $550 $2,500 $2,150 1Q19 $500 $458 Annualized $2,000 $450 $1,516 $400 $1,500 $1,080 $1,108 $350 $321 $910 $1,000 $300 $251 $500 $798 $250 $200 $0 2014 2015 2016 2017 2018 1Q19 2014 2015 2016 2017 2018 1Q19 7
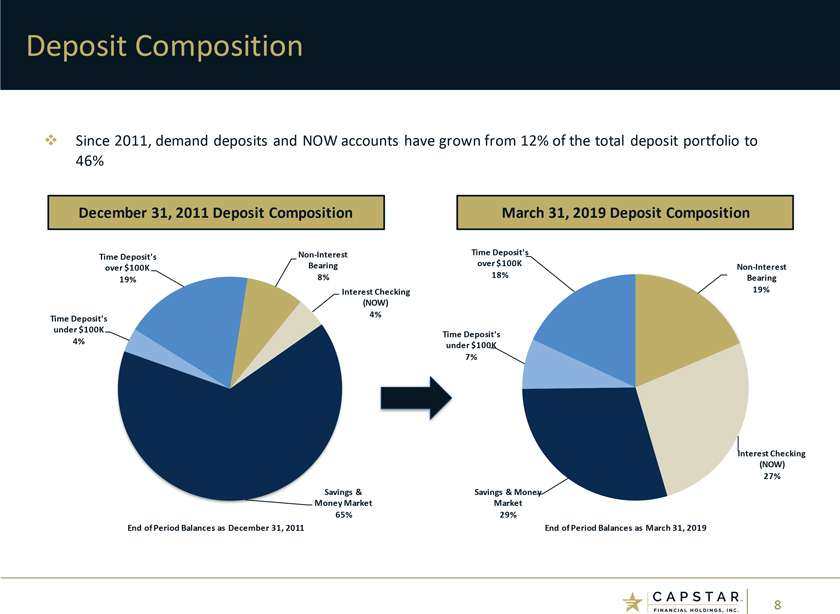
Deposit Composition ™ Since 2011, demand deposits and NOW accounts have grown from 12% of the total deposit portfolio to 46% December 31, 2011 Deposit Composition March 31, 2019 Deposit CompositionNon-Interest Time Deposit’s Time Deposit’s over $100K over $100K BearingNon-Interest 8% 18% Bearing 19% Interest Checking 19% (NOW) 4% Time Deposit’s under $100K 4% Time Deposit’s under $100K 7% Interest Checking (NOW) 27% Savings & Savings & Money Money Market Market 65% 29% End of Period Balances as December31, 2011 End of Period Balances as March 31, 2019 8
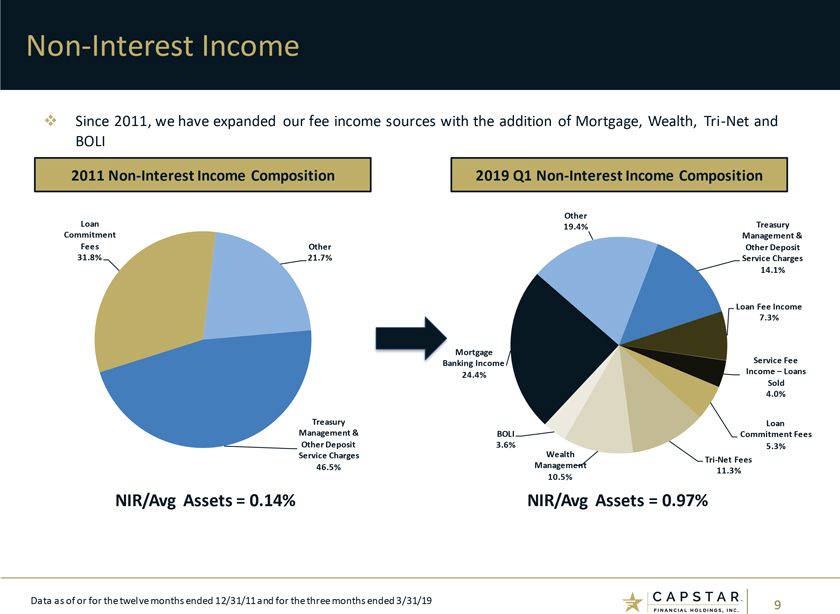
Non-Interest Income ™ Since 2011, we have expanded our fee income sources with the addition of Mortgage, Wealth,Tri-Net and BOLI 2011Non-Interest Income Composition 2019 Q1Non-Interest Income Composition Other Loan 19.4% Treasury Commitment Management & Fees Other Other Deposit 31.8% 21.7% Service Charges 14.1% Loan Fee Income 7.3% Mortgage Banking Income Service Fee Income –Loans 24.4% Sold 4.0% Treasury Loan Management & BOLI Commitment Fees Other Deposit 3.6% 5.3% Service Charges WealthTri-Net Fees 46.5% Management 10.5% 11.3% NIR/Avg Assets = 0.14% NIR/Avg Assets = 0.97% Data as of or for the twelve months ended 12/31/11 and for the three months ended 3/31/19 9
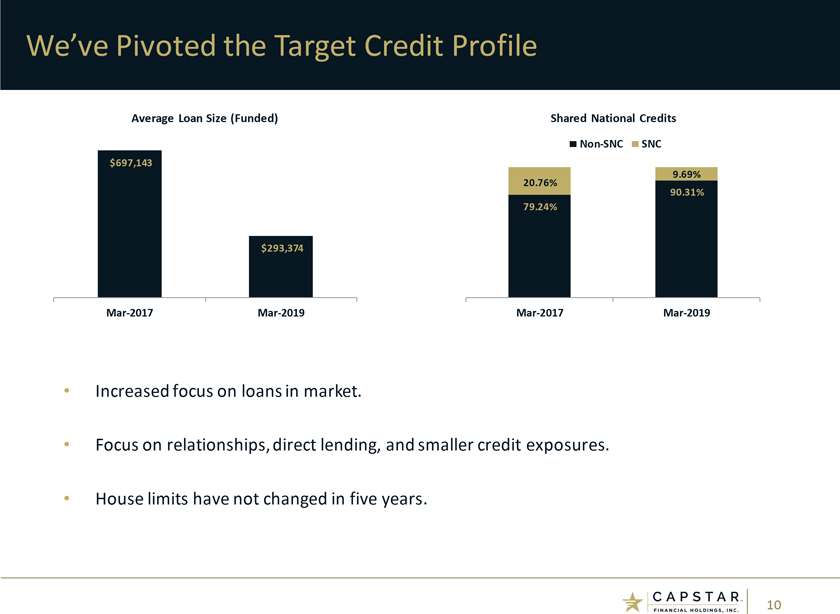
We’ve Pivoted the Target Credit Profile Average Loan Size (Funded) Shared National CreditsNon-SNC SNC $697,143 20.76% 9.69% 90.31% 79.24% $293,374Mar-2017Mar-2019Mar-2017Mar-2019 • Increased focus on loans in market. • Focus on relationships, direct lending, and smaller credit exposures. • House limits have not changed in five years. 10
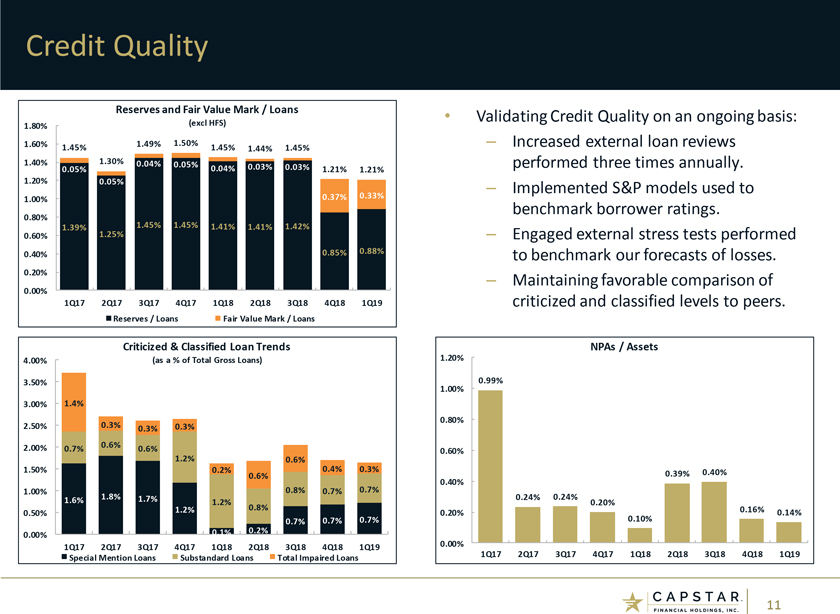
Credit Quality Reserves and Fair Value Mark / Loans • Validating Credit Quality on an ongoing basis: 1.80% (excl HFS) 1.60% 1.49% 1.50% – Increased external loan reviews 1.45% 1.45% 1.44% 1.45% 1.40% 1.30% 0.04% 0.05% performed three times annually. 0.05% 0.04% 0.03% 0.03% 1.21% 1.21% 1.20% 0.05% – Implemented S&P models used to 0.37% 0.33% 1.00% benchmark borrower ratings. 0.80% 1.45% 1.45% 1.39% 1.41% 1.41% 1.42% 0.60% 1.25% – Engaged external stress tests performed 0.40% 0.85% 0.88% to benchmark our forecasts of losses. 0.20% – Maintaining favorable comparison of 0.00% 1Q17 2Q17 3Q17 4Q17 1Q18 2Q18 3Q18 4Q18 1Q19 criticized and classified levels to peers. Reserves / Loans Fair Value Mark / Loans Criticized & Classified Loan Trends NPAs / Assets 4.00% (as a % of Total Gross Loans) 1.20% 3.50% 0.99% 1.00% 3.00% 1.4% 0.80% 2.50% 0.3% 0.3% 0.3% 2.00% 0.6% 0.7% 0.6% 0.60% 1.2% 0.6% 1.50% 0.2% 0.4% 0.3% 0.40% 0.6% 0.39% 0.40% 1.00% 1.8% 0.8% 0.7% 0.7% 0.24% 0.24% 1.6% 1.7% 1.2% 0.20% 1.2% 0.8% 0.16% 0.50% 0.20% 0.14% 0.7% 0.7% 0.7% 0.10% 0.1% 0.2% 0.00% 1Q17 2Q17 3Q17 4Q17 1Q18 2Q18 3Q18 4Q18 1Q19 0.00% Special Mention Loans Substandard Loans Total Impaired Loans 1Q17 2Q17 3Q17 4Q17 1Q18 2Q18 3Q18 4Q18 1Q19 11
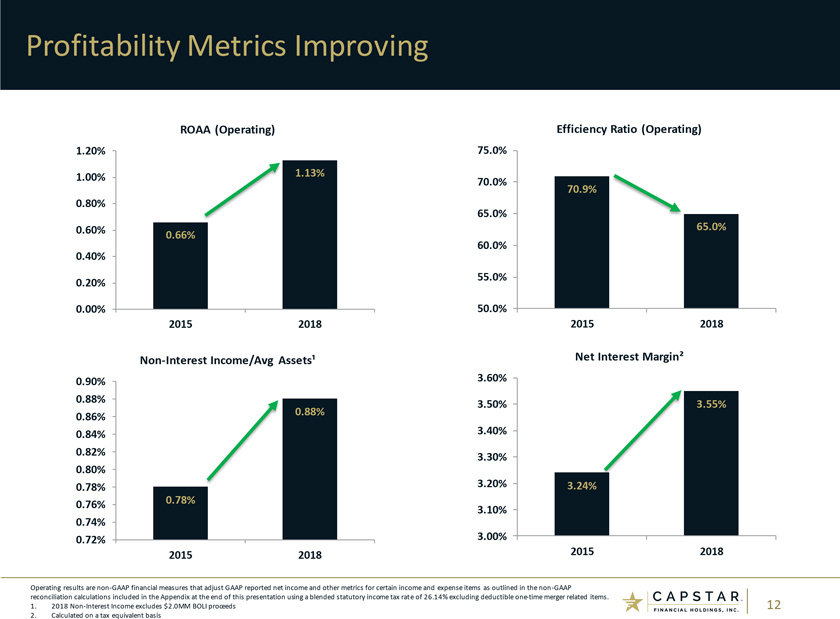
Profitability Metrics Improving ROAA (Operating) Efficiency Ratio (Operating) 1.20% 75.0% 1.00% 1.13% 70.0% 70.9% 0.80% 65.0% 0.60% 0.66% 65.0% 60.0% 0.40% 55.0% 0.20% 0.00% 50.0% 2015 2018 2015 2018Non-Interest Income/Avg Assets¹ Net Interest Margin² 0.90% 3.60% 0.88% 3.50% 3.55% 0.88% 0.86% 0.84% 3.40% 0.82% 3.30% 0.80% 0.78% 3.20% 3.24% 0.78% 0.76% 3.10% 0.74% 0.72% 3.00% 2015 2018 2015 2018 Operating results arenon-GAAP financial measures that adjust GAAP reported net income and other metrics for certain income and expense items as outlined in thenon-GAAP reconciliation calculations included in the Appendix at the end of this presentation using a blended statutory income tax rate of 26.14% excluding deductibleone-time merger related items. 1. 2018Non-Interest Income excludes $2.0MM BOLI proceeds 12 2. Calculated on a tax equivalent basis
Athens Merger update CapStar continues to move forward with the integration of Athens • Key Milestones – June 11, 2018 –Announcement of transaction – August 29, 2018 – Shareholder approvals obtained – September 12, 2018 –Regulatory approvals obtained – October 1, 2018 –Merger closed – April5-7, 2019 –Branding and Core operating systems conversion completed – Second Half 2019 –Expected Synergies on track to be realized 13
M&A Criteria • As we consider M&A, we look for the following key attributes that would enhance our profitability: – Scale – Low cost of funds – Nichenon-interest income sources – Complementary lines of business 14

Q&A 15
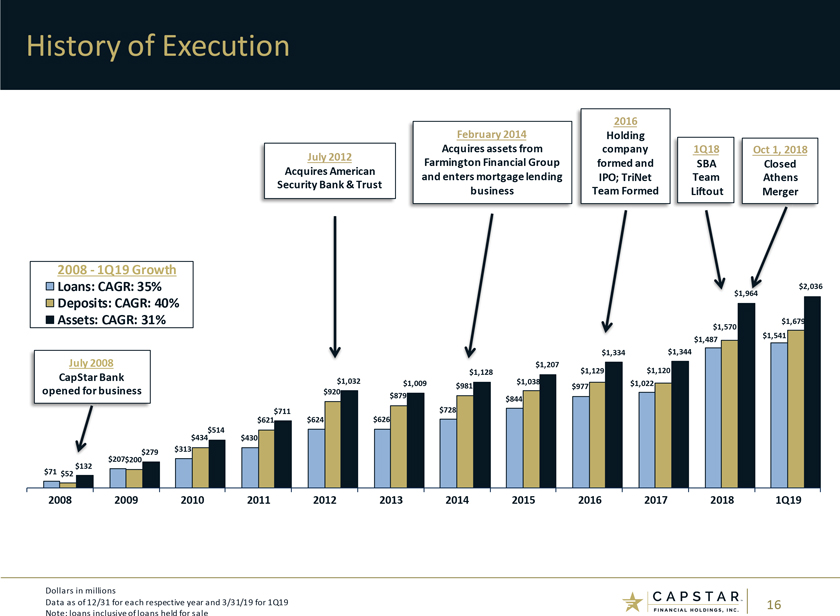
History of Execution 2016 February 2014 Holding July 2012 Acquires assets from company 1Q18 Oct 1, 2018 Acquires American Farmington Financial Group formed and SBA Closed Security Bank & Trust and enters mortgage lending IPO; TriNet Team Athens business Team Formed Liftout Merger 2008 -1Q19 Growth Loans: CAGR: 35% $1,964 $2,036 Deposits: CAGR: 40% Assets: CAGR: 31% $1,679 $1,570 $1,541 $1,487 $1,334 $1,344 July 2008 $1,207 $1,129 $1,120 $1,128 CapStar Bank $1,032 $1,009 $1,038 $1,022 $920 $981 $977 opened for business $879 $844 $711 $728 $621 $624 $626 $514 $434 $430 $313 $207 $279 $132 $200 $71 $52 2008 2009 2010 2011 2012 2013 2014 2015 2016 2017 2018 1Q19 Dollars in millions Data as of 12/31 for each respective year and 3/31/19 for 1Q19 16 Note: loans inclusive of loans held for sale
Our Culture ™ Experienced bankers with extensive industry knowledge ™ Product expertise in a range of business sectors ™ Strong credit quality ™ Tailored client solutions ™ Funding focus on core deposits ™ Organic and acquisitive growth 17
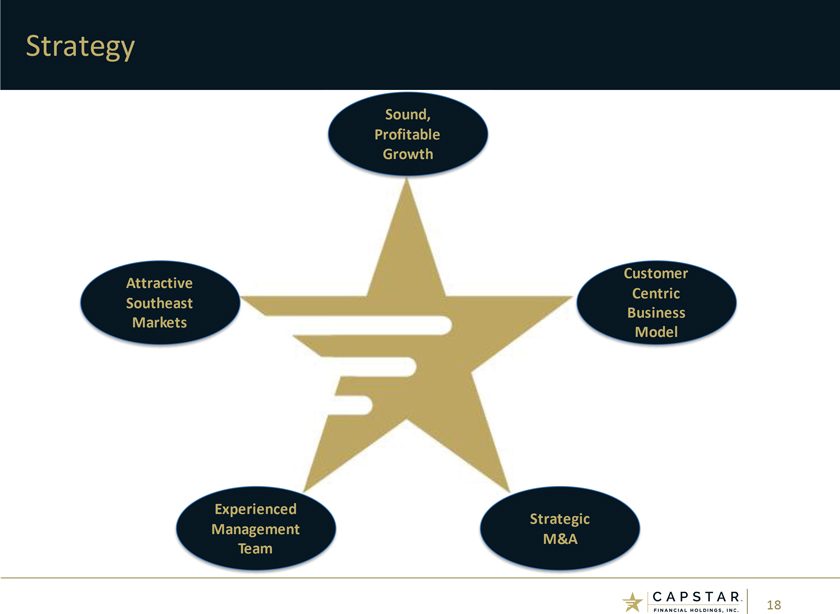
Strategy Sound, Profitable Growth Customer Attractive Centric Southeast Business Markets Model Experienced Strategic Management M&A Team 18
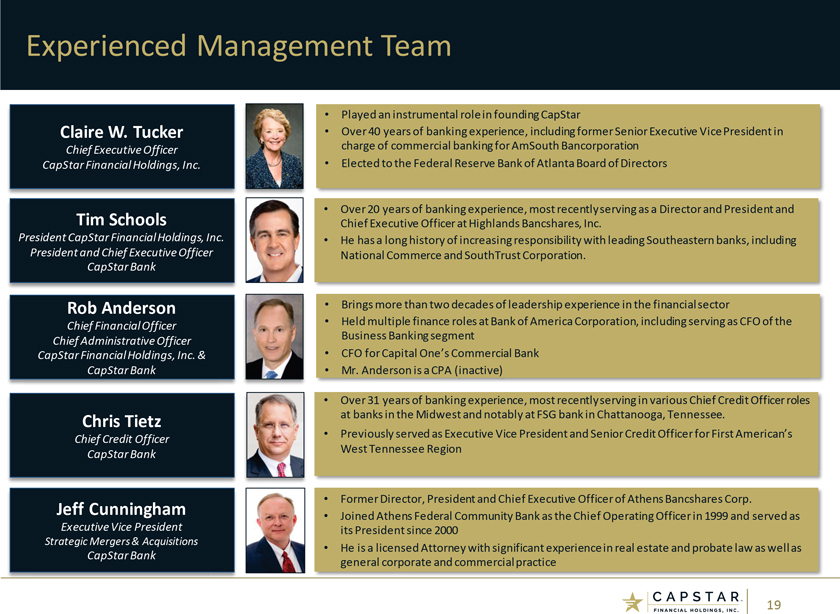
Experienced Management Team • Played an instrumental role in founding CapStar Claire W. Tucker • Over 40 years of banking experience, including former Senior Executive Vice President in Chief Executive Officer charge of commercial banking for AmSouth Bancorporation CapStar Financial Holdings, Inc. • Elected to the Federal Reserve Bank of Atlanta Board of Directors • Over 20 years of banking experience, most recently serving as a Director and President and Tim Schools Chief Executive Officer at Highlands Bancshares, Inc. President CapStar Financial Holdings, Inc. • He has a long history of increasing responsibility with leading Southeastern banks, including President and Chief Executive Officer National Commerce and SouthTrust Corporation. CapStar Bank Rob Anderson • Brings more than two decades of leadership experience in the financial sector Chief Financial Officer • Held multiple finance roles at Bank of America Corporation, including serving as CFO of the Business Banking segment Chief Administrative Officer CapStar Financial Holdings, Inc. & • CFO for Capital One’s Commercial Bank CapStar Bank • Mr. Anderson is a CPA (inactive) • Over 31 years of banking experience, most recently serving in various Chief Credit Officer roles Chris Tietz at banks in the Midwest and notably at FSG bank in Chattanooga, Tennessee. • Previously served as Executive Vice President and Senior Credit Officer for First American’s Chief Credit Officer West Tennessee Region CapStar Bank • Former Director, President and Chief Executive Officer of Athens Bancshares Corp. Jeff Cunningham • Joined Athens Federal Community Bank as the Chief Operating Officer in 1999 and served as Executive Vice President its President since 2000 Strategic Mergers & Acquisitions • He is a licensed Attorney with significant experience in real estate and probate law as well as CapStar Bank general corporate and commercial practice 19
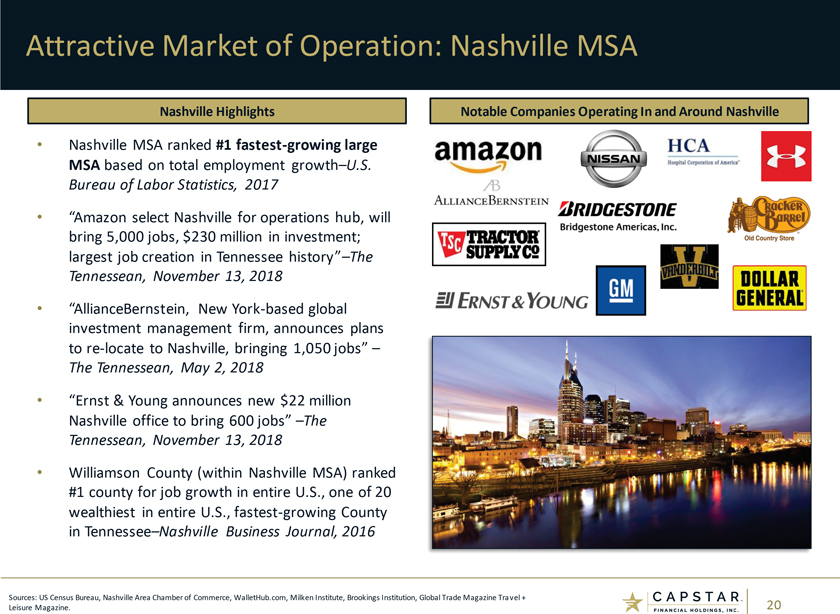
Attractive Market of Operation: Nashville MSA Nashville Highlights Notable Companies Operating In and Around Nashville • Nashville MSA ranked #1 fastest-growing large MSA based on total employment growth–U.S. Bureau of Labor Statistics, 2017 • “Amazon select Nashville for operations hub, will bring 5,000 jobs, $230 million in investment; largest job creation in Tennessee history”–The Tennessean, November 13, 2018 • “AllianceBernstein, New York-based global investment management firm, announces plans tore-locate to Nashville, bringing 1,050 jobs” – The Tennessean, May 2, 2018 • “Ernst & Young announces new $22 million Nashville office to bring 600 jobs” –The Tennessean, November 13, 2018 • Williamson County (within Nashville MSA) ranked #1 county for job growth in entire U.S., one of 20 wealthiest in entire U.S., fastest-growing County in Tennessee–Nashville Business Journal, 2016 Sources: US Census Bureau, Nashville Area Chamber of Commerce, WalletHub.com, Milken Institute, Brookings Institution, Global Trade Magazine Travel+ Leisure Magazine. 20
CapStar recognized by Greenwich Associates • CapStar is a 2018 Greenwich CX Leader in U.S. Commercial Small Business Banking recognizing leadership in the increasingly important field of customer experience. Source: Greenwich Associates 21
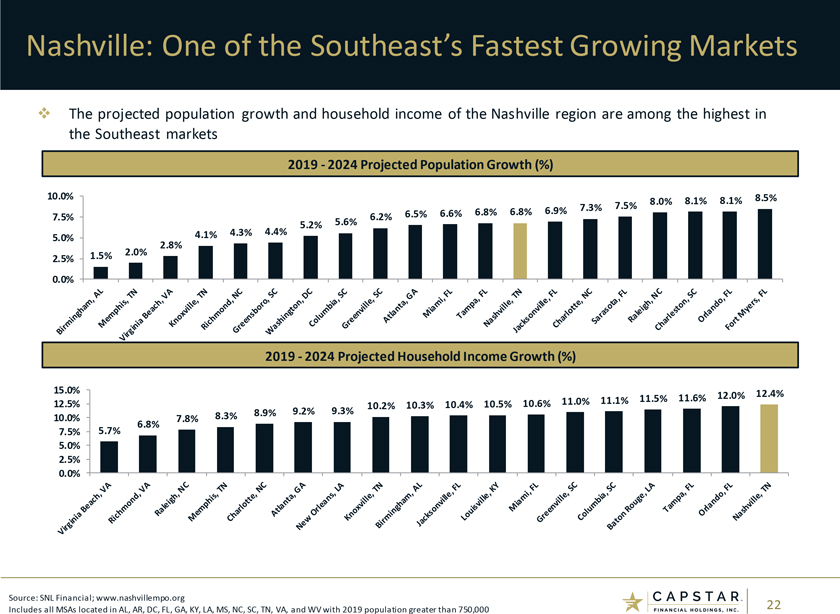
Nashville: One of the Southeast’s Fastest Growing Markets ™ The projected population growth and household income of the Nashville region are among the highest in the Southeast markets 2019 -2024 Projected Population Growth (%) 10.0% 8.5% 8.0% 8.1% 8.1% 7.3% 7.5% 6.5% 6.6% 6.8% 6.8% 6.9% 7.5% 6.2% 5.2% 5.6% 4.1% 4.3% 4.4% 5.0% 2.8% 1.5% 2.0% 2.5% 0.0% 2019 -2024 Projected Household Income Growth (%) 15.0% 12.4% 11.5% 11.6% 12.0% 12.5% 10.4% 10.5% 10.6% 11.0% 11.1% 10.2% 10.3% 8.9% 9.2% 9.3% 10.0% 6.8% 7.8% 8.3% 7.5% 5.7% 5.0% 2.5% 0.0% Source: SNL Financial; www.nashvillempo.org Includes all MSAs located in AL, AR, DC, FL, GA, KY, LA, MS, NC, SC, TN, VA, and WV with 2019 population greater than 750,000 22
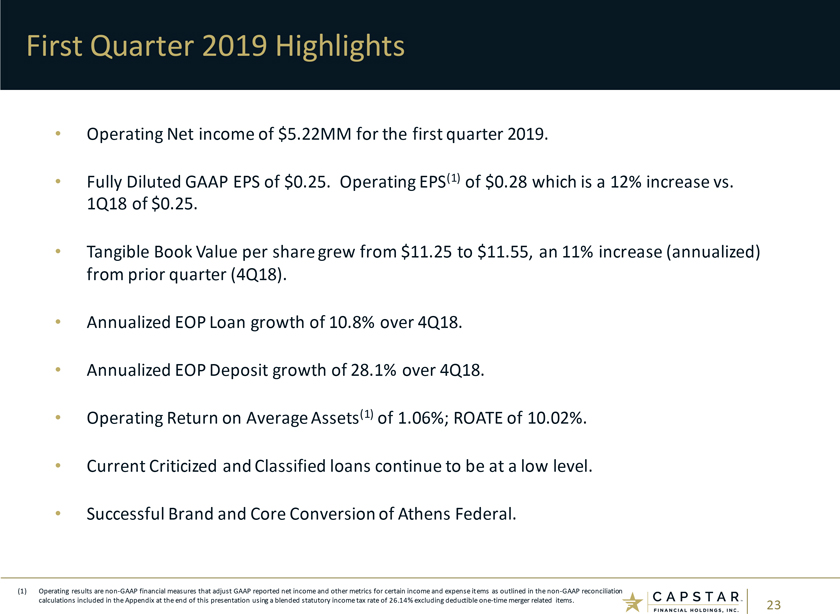
First Quarter 2019 Highlights • Operating Net income of $5.22MM for the first quarter 2019. • Fully Diluted GAAP EPS of $0.25. Operating EPS(1) of $0.28 which is a 12% increase vs. 1Q18 of $0.25. • Tangible Book Value per share grew from $11.25 to $11.55, an 11% increase (annualized) from prior quarter(4Q18). • Annualized EOP Loan growth of 10.8% over 4Q18. • Annualized EOP Deposit growth of 28.1% over 4Q18. • Operating Return on Average Assets(1) of 1.06%; ROATE of 10.02%. • Current Criticized and Classified loans continue to be at a low level. • Successful Brand and Core Conversion of Athens Federal. (1) Operating results arenon-GAAP financial measures that adjust GAAP reported net income and other metrics for certain income and expense items as outlined in thenon-GAAP reconciliation calculations included in the Appendix at the end of this presentation using a blended statutory income tax rate of 26.14% excluding deductibleone-time merger related items. 23
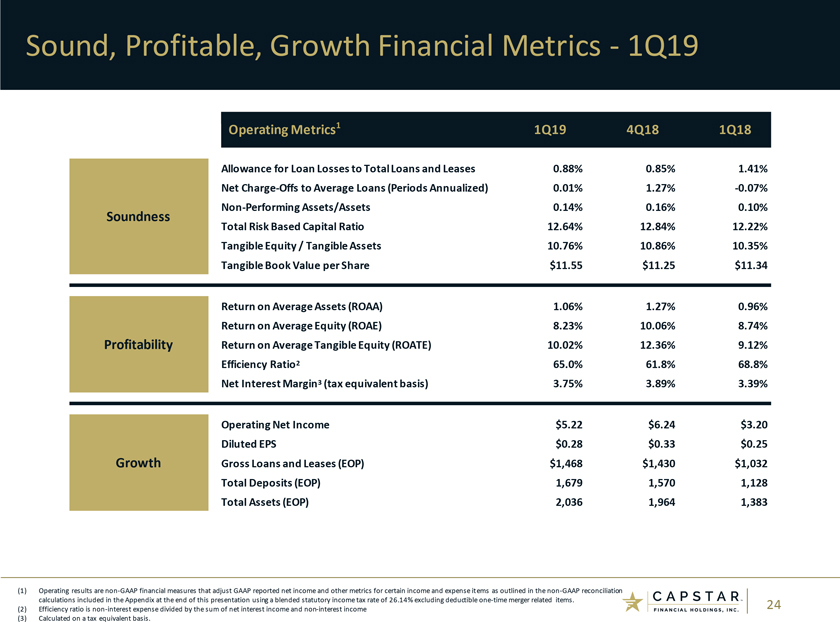
Sound, Profitable, Growth Financial Metrics -1Q19 Operating Metrics1 1Q19 4Q18 1Q18 Allowance for Loan Losses to Total Loans and Leases 0.88% 0.85% 1.41% Net Charge-Offs to Average Loans (Periods Annualized) 0.01% 1.27%-0.07%Non-Performing Assets/Assets 0.14% 0.16% 0.10% Soundness Total Risk Based Capital Ratio 12.64% 12.84% 12.22% Tangible Equity / Tangible Assets 10.76% 10.86% 10.35% Tangible Book Value per Share $11.55 $11.25 $11.34 Return on Average Assets (ROAA) 1.06% 1.27% 0.96% Return on Average Equity (ROAE) 8.23% 10.06% 8.74% Profitability Return on Average Tangible Equity (ROATE) 10.02% 12.36% 9.12% Efficiency Ratio2 65.0% 61.8% 68.8% Net Interest Margin3 (tax equivalent basis) 3.75% 3.89% 3.39% Operating Net Income $5.22 $6.24 $3.20 Diluted EPS $0.28 $0.33 $0.25 Growth Gross Loans and Leases (EOP) $1,468 $1,430 $1,032 Total Deposits (EOP) 1,679 1,570 1,128 Total Assets (EOP) 2,036 1,964 1,383 (1) Operating results arenon-GAAP financial measures that adjust GAAP reported net income and other metrics for certain income and expense items as outlined in thenon-GAAP reconciliation calculations included in the Appendix at the end of this presentation using a blended statutory income tax rate of 26.14% excluding deductibleone-time merger related items. 24 (2) Efficiency ratio isnon-interest expense divided by the sum of net interest income andnon-interest income (3) Calculated on a tax equivalent basis.
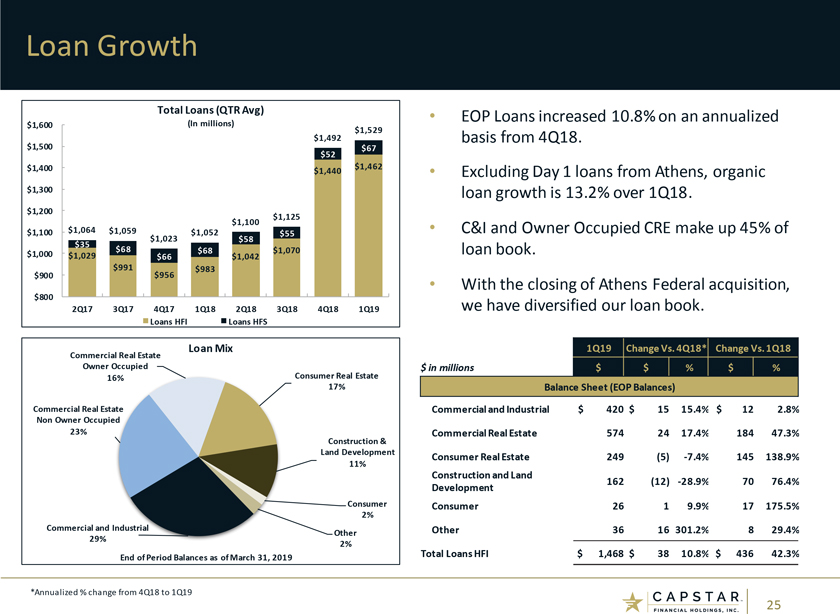
Loan Growth Total Loans (QTR Avg) • EOP Loans increased 10.8% on an annualized $1,600 (In millions) $1,529 $1,492 basis from 4Q18. $1,500 $67 $52 $1,400 $1,462 $1,440 • Excluding Day 1 loans from Athens, organic $1,300 loan growth is 13.2% over 1Q18. $1,200 $1,125 $1,100 $1,100 $1,064 $1,059 $1,052 • C&I and Owner Occupied CRE make up 45% of $55 $1,023 $58 $35 $68 $68 $1,070 loan book. $1,000 $1,029 $66 $1,042 $991 $956 $983 $900 • With the closing of Athens Federal acquisition, $800 2Q17 3Q17 4Q17 1Q18 2Q18 3Q18 4Q18 1Q19 we have diversified our loan book. Loans HFI Loans HFS Commercial Real Estate Loan Mix 1Q19 Change Vs. 4Q18* Change Vs. 1Q18 Owner Occupied $ in millions $ $ % $ % 16% Consumer Real Estate 17% Balance Sheet (EOP Balances) Commercial Real Estate Commercial and Industrial $ 420 $ 15 15.4% $ 12 2.8% Non Owner Occupied 23% Commercial Real Estate 574 24 17.4% 184 47.3% Construction & Land Development 11% Consumer Real Estate 249 (5)-7.4% 145 138.9% Construction and Land 162 (12)-28.9% 70 76.4% Development Consumer Consumer 26 1 9.9% 17 175.5% 2% Commercial and Industrial Other 36 16 301.2% 8 29.4% Other 29% 2% End of Period Balances as of March 31, 2019 Total Loans HFI $ 1,468 $ 38 10.8% $ 436 42.3% *Annualized % change from 4Q18 to 1Q19 25
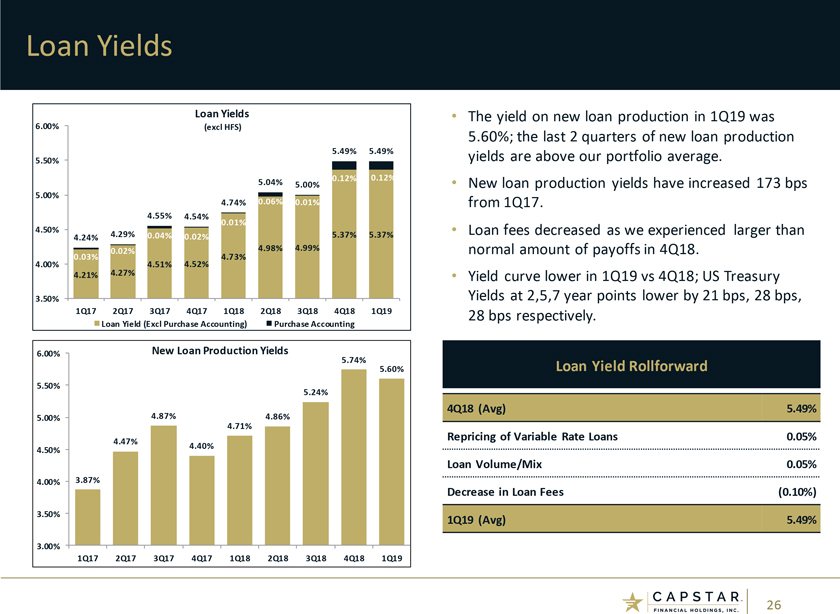
Loan Yields Loan Yields • The yield on new loan production in 1Q19 was 6.00% (excl HFS) 5.60%; the last 2 quarters of new loan production 5.49% 5.49% yields are above our portfolio average. 5.50% 0.12% 0.12% 5.04% 5.00% • New loan production yields have increased 173 bps 5.00% 4.74% 0.06% 0.01% from 1Q17. 4.55% 4.54% 0.01% 4.50% • Loan fees decreased as we experienced larger than 4.24% 4.29% 0.04% 0.02% 5.37% 5.37% 0.02% 4.98% 4.99% normal amount of payoffs in 4Q18. 0.03% 4.52% 4.73% 4.00% 4.51% 4.21% 4.27% • Yield curve lower in 1Q19 vs 4Q18; US Treasury 3.50% Yields at 2,5,7 year points lower by 21 bps, 28 bps, 1Q17 2Q17 3Q17 4Q17 1Q18 2Q18 3Q18 4Q18 1Q19 28 bps respectively. Loan Yield (Excl Purchase Accounting) Purchase Accounting 6.00% New Loan Production Yields 5.74% Loan Yield Rollforward 5.60% 5.50% 5.24% 4Q18 (Avg) 5.49% 5.00% 4.87% 4.86% 4.71% Repricing of Variable Rate Loans 0.05% 4.47% 4.40% 4.50% Loan Volume/Mix 0.05% 4.00% 3.87% Decrease in Loan Fees (0.10%) 3.50% 1Q19 (Avg) 5.49% 3.00% 1Q17 2Q17 3Q17 4Q17 1Q18 2Q18 3Q18 4Q18 1Q19 26
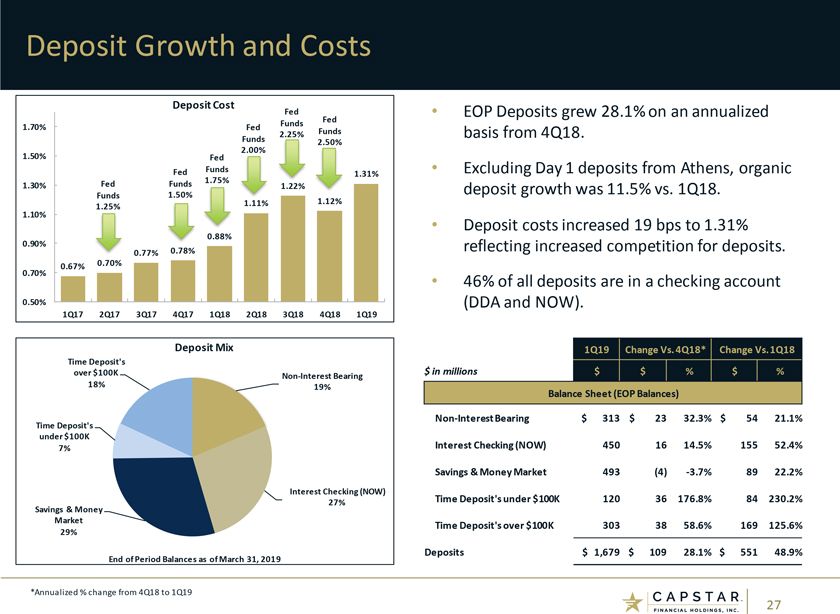
Deposit Growth and Costs Deposit Cost Fed • EOP Deposits grew 28.1% on an annualized Fed Funds 1.70% Fed 2.25% Funds basis from 4Q18. Funds 2.50% 2.00% 1.50% Fed Fed Funds • Excluding Day 1 deposits from Athens, organic 1.75% 1.31% 1.30% Fed Funds 1.22% deposit growth was 11.5% vs. 1Q18. Funds 1.50% 1.12% 1.25% 1.11% 1.10% Deposit costs 19 bps to 1.31% • increased 0.90% 0.88% 0.78% reflecting increased competition for deposits. 0.77% 0.67% 0.70% 0.70% • 46% of all deposits are in a checking account 0.50% (DDA and NOW). 1Q17 2Q17 3Q17 4Q17 1Q18 2Q18 3Q18 4Q18 1Q19 Deposit Mix 1Q19 Change Vs. 4Q18* Change Vs. 1Q18 Time Deposit’s over $100K $ in millions $ $ % $ %Non-Interest Bearing 18% 19% Balance Sheet (EOP Balances) Time Deposit’sNon-Interest Bearing $ 313 $ 23 32.3% $ 54 21.1% under $100K 7% Interest Checking (NOW) 450 16 14.5% 155 52.4% Savings & Money Market 493 (4)-3.7% 89 22.2% Interest Checking (NOW) Time Deposit’s under $100K 120 36 176.8% 84 230.2% Savings & Money 27% Market Time Deposit’s over $100K 303 38 58.6% 169 125.6% 29% Deposits $ 1,679 $ 109 28.1% $ 551 48.9% End of Period Balances as of March 31, 2019 *Annualized % change from 4Q18 to 1Q19 27
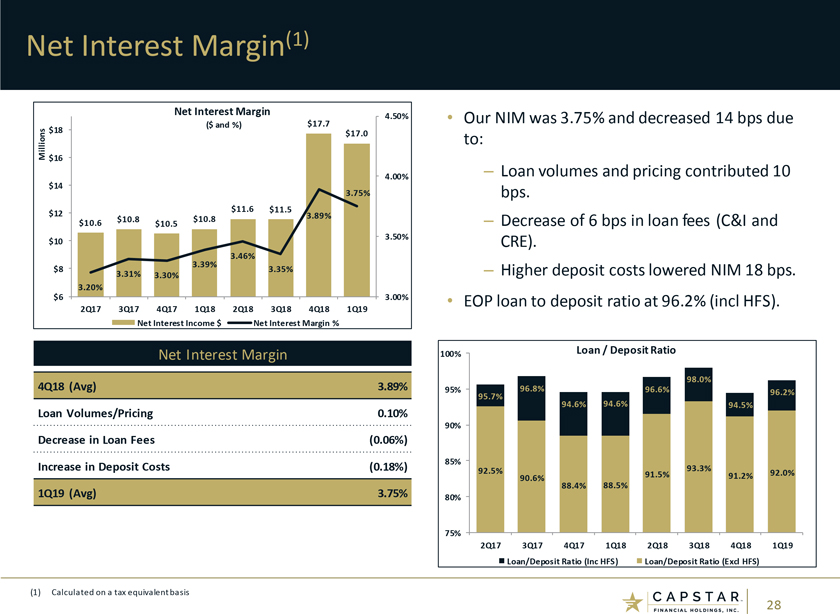
Net Interest Margin(1) Net Interest Margin $17.7 4.50% • Our NIM was 3.75% and decreased 14 bps due ($ and %) $18 $17.0 Millions to: $16 – 4.00% Loan volumes and pricing contributed 10 $14 3.75% bps. $11.6 $11.5 $12 3.89% $10.8 $10.8 – Decrease of 6 bps in loan fees (C&I and $10.6 $10.5 3.50% $10 CRE). 3.46% 3.39% $8 3.35% – Higher deposit costs lowered NIM 18 bps. 3.31% 3.30% 3.20% $6 3.00% • EOP loan to deposit ratio at 96.2% (incl HFS). 2Q17 3Q17 4Q17 1Q18 2Q18 3Q18 4Q18 1Q19 Net Interest Income $ Net Interest Margin % Net Interest Margin 100% Loan / Deposit Ratio 98.0% 4Q18 (Avg) 3.89% 95% 96.8% 96.6% 96.2% 95.7% 94.6% Loan Volumes/Pricing 0.10% 94.6% 94.5% 90% Decrease in Loan Fees (0.06%) 85% Increase in Deposit Costs (0.18%) 92.5% 93.3% 91.5% 91.2% 92.0% 90.6% 88.5% 88.4% 1Q19 (Avg) 3.75% 80% 75% 2Q17 3Q17 4Q17 1Q18 2Q18 3Q18 4Q18 1Q19 Loan/Deposit Ratio (Inc HFS) Loan/Deposit Ratio (Excl HFS) (1) Calculated on a tax equivalent basis 28
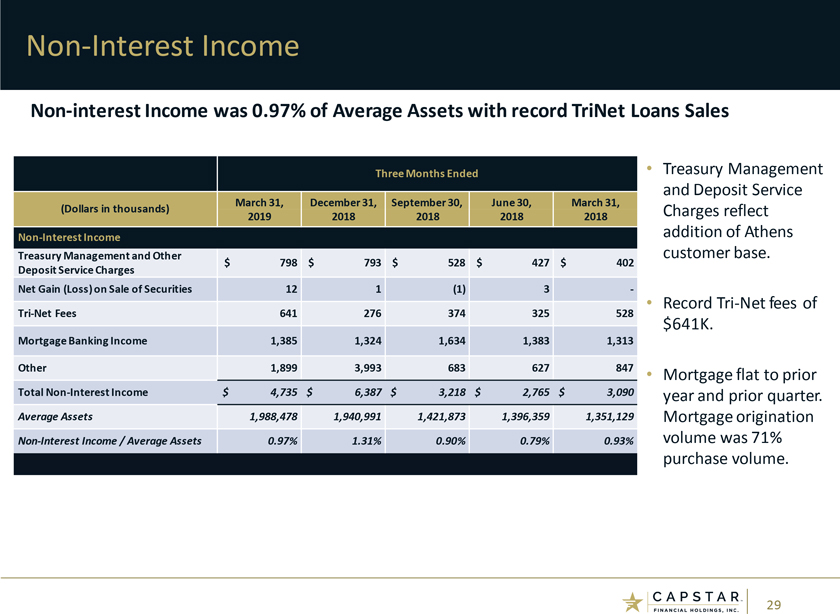
Non-Interest IncomeNon-interest Income was 0.97% of Average Assets with record TriNet Loans Sales Three Months Ended • Treasury Management and Deposit Service March 31, December 31, September 30, June 30, March 31, (Dollars in thousands) Charges reflect 2019 2018 2018 2018 2018Non-Interest Income addition of Athens Treasury Management and Other $ 798 $ 793 $ 528 $ 427 $ 402 customer base. Deposit ServiceCharges Net Gain (Loss) on Sale of Securities 12 1 (1) 3-Tri-Net Fees 641 276 374 325 528 • RecordTri-Net fees of $641K. Mortgage BankingIncome 1,385 1,324 1,634 1,383 1,313 Other 1,899 3,993 683 627 847 • Mortgage flat to prior TotalNon-Interest Income $ 4,735 $ 6,387 $ 3,218 $ 2,765 $ 3,090 year and prior quarter. Average Assets 1,988,478 1,940,991 1,421,873 1,396,359 1,351,129 Mortgage originationNon-Interest Income / Average Assets 0.97% 1.31% 0.90% 0.79% 0.93% volume was 71% purchase volume. 29
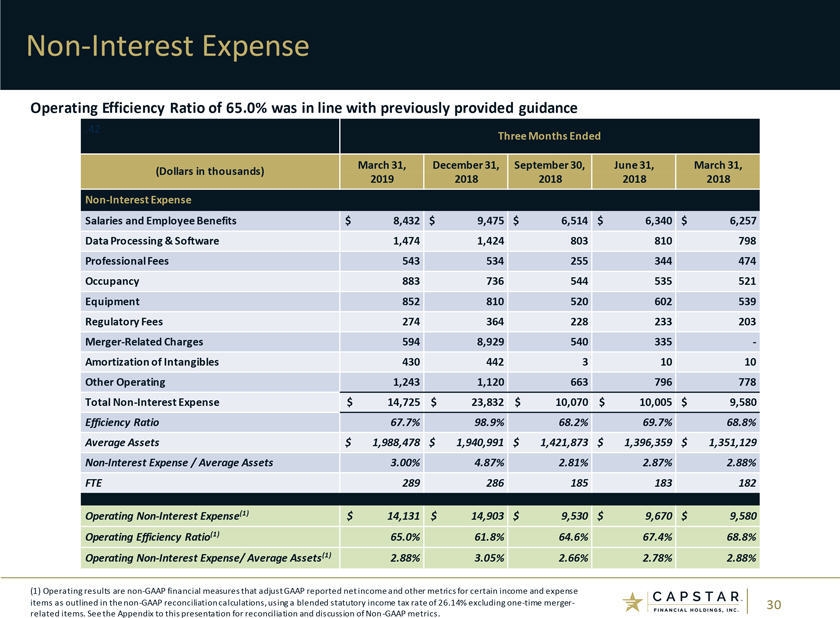
Non-Interest Expense Operating Efficiency Ratio of 65.0% was in line with previously provided guidance .42 Three Months Ended March 31, December 31, September 30, June 31, March 31, (Dollars in thousands) 2019 2018 2018 2018 2018Non-Interest Expense Salaries and Employee Benefits $ 8,432 $ 9,475 $ 6,514 $ 6,340 $ 6,257 Data Processing & Software 1,474 1,424 803 810 798 Professional Fees 543 534 255 344 474 Occupancy 883 736 544 535 521 Equipment 852 810 520 602 539 Regulatory Fees 274 364 228 233 203 Merger-RelatedCharges 594 8,929 540 335 -Amortization of Intangibles 430 442 3 10 10 Other Operating 1,243 1,120 663 796 778 TotalNon-Interest Expense $ 14,725 $ 23,832 $ 10,070 $ 10,005 $ 9,580 Efficiency Ratio 67.7% 98.9% 68.2% 69.7% 68.8% Average Assets $ 1,988,478 $ 1,940,991 $ 1,421,873 $ 1,396,359 $ 1,351,129Non-Interest Expense / Average Assets 3.00% 4.87% 2.81% 2.87% 2.88% FTE 289 286 185 183 182 OperatingNon-Interest Expense(1) $ 14,131 $ 14,903 $ 9,530 $ 9,670 $ 9,580 Operating Efficiency Ratio(1) 65.0% 61.8% 64.6% 67.4% 68.8% OperatingNon-InterestExpense/ Average Assets(1) 2.88% 3.05% 2.66% 2.78% 2.88% (1) Operating results arenon-GAAP financial measures that adjust GAAP reported net income and other metrics for certain income and expense items as outlined in thenon-GAAP reconciliation calculations, using a blended statutory income tax rate of 26.14% excludingone-time merger- 30 related items. See the Appendix to this presentation for reconciliation and discussion ofNon-GAAP metrics.
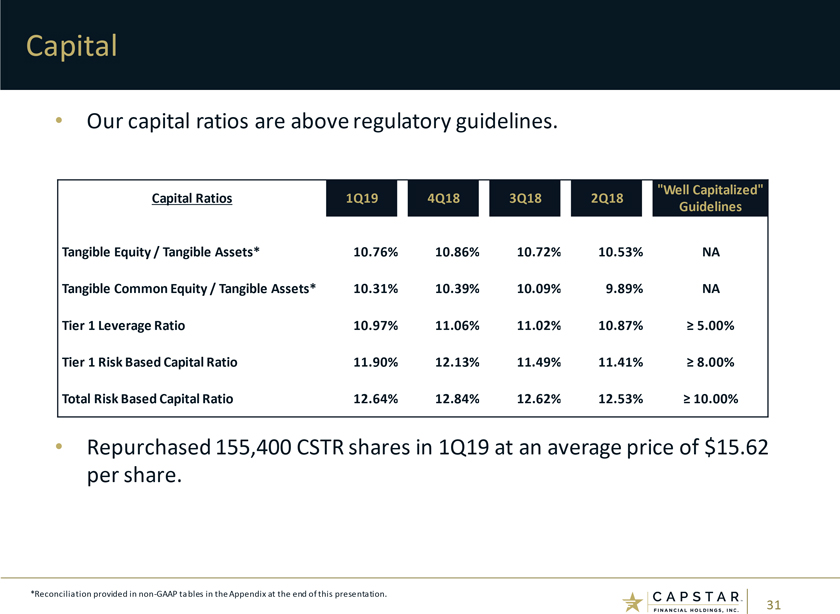
Capital • Our capital ratios are above regulatory guidelines. “Well Capitalized” Capital Ratios 1Q19 4Q18 3Q18 2Q18 Guidelines Tangible Equity / Tangible Assets* 10.76% 10.86% 10.72% 10.53% NA Tangible Common Equity / Tangible Assets* 10.31% 10.39% 10.09% 9.89% NA Tier 1 Leverage Ratio 10.97% 11.06% 11.02% 10.87%³ 5.00% Tier 1 Risk Based Capital Ratio 11.90% 12.13% 11.49% 11.41%³ 8.00% Total Risk Based Capital Ratio 12.64% 12.84% 12.62% 12.53%³ 10.00% • Repurchased 155,400 CSTR shares in 1Q19 at an average price of $15.62 per share. *Reconciliation provided innon-GAAP tables in the Appendix at the end of this presentation. 31
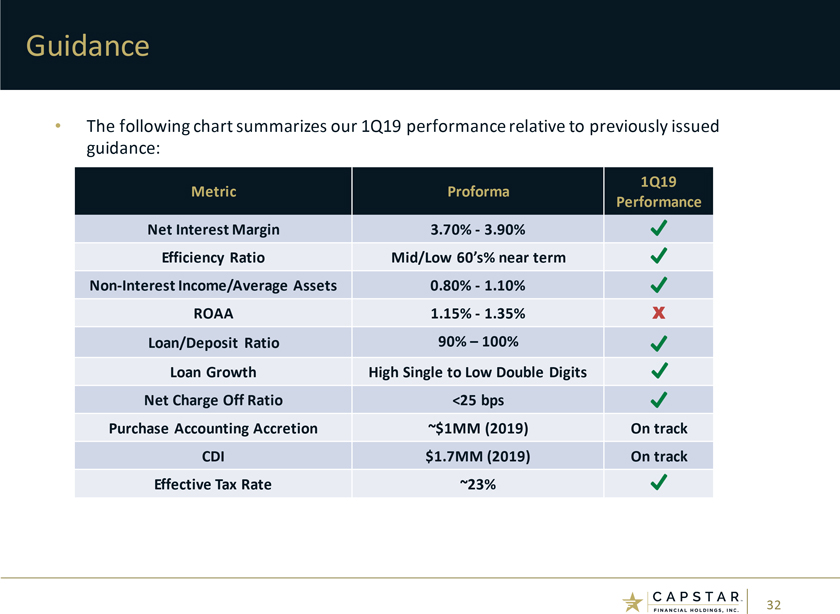
Guidance • The following chart summarizes our 1Q19 performance relative to previously issued guidance: 1Q19 Metric Proforma Performance Net Interest Margin 3.70%—3.90% Efficiency Ratio Mid/Low 60’s% near termNon-Interest Income/Average Assets 0.80%—1.10% ROAA 1.15%—1.35% X Loan/Deposit Ratio 90% –100% Loan Growth High Single to Low Double Digits Net Charge Off Ratio <25 bps Purchase Accounting Accretion ~$1MM (2019) On track CDI $1.7MM (2019) On track Effective Tax Rate ~23% 32
Key Takeaways* • CapStar’s strategy remains one of sound, profitable growth. • Focused on Athens integration and capturing expected synergies. • Focused on increasing primary bank status with more clients. • Organic growth opportunities through market share takeaway. • Continue to explore strategic and opportunistic M&A. *Refer to “Safe Harbor Statements” on slide 3 33
Contact Information Corporate Headquarters Executive Leadership CapStar Financial Holdings, Inc. Claire W. Tucker Chief Executive Officer 1201 Demonbreun Street, Suite 700 CapStar Financial Holdings, Inc. Nashville, TN 37203 (615)732-6402 Mail: P.O. Box 305065 Email: ctucker@capstarbank.com Nashville, TN 37230-5065 Tim Schools President, CapStar Financial Holdings, Inc. (615)732-6400 Telephone President and Chief Executive Officer, CapStar Bank www.capstarbank.com (615)732-7449 Email: tkschools@capstarbank.com Investor Relations Rob Anderson Chief Financial and Administrative Officer (615)732-6455 CapStar Financial Holdings, Inc. Email: ir@capstarbank.com (615)732-6470 Email: randerson@capstarbank.com 34

Appendix 35
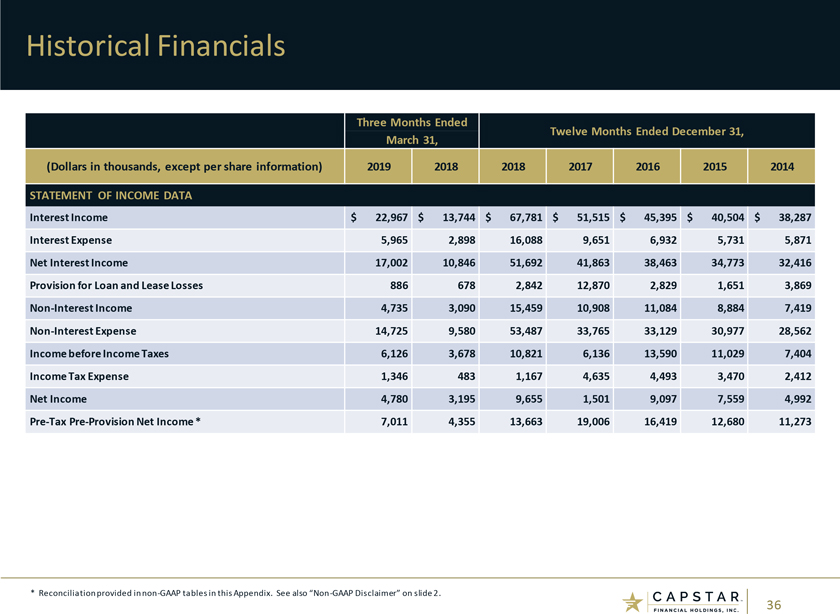
Historical Financials Three Months Ended Twelve Months Ended December 31, March 31, (Dollars in thousands, except per share information) 2019 2018 2018 2017 2016 2015 2014 STATEMENT OF INCOME DATA Interest Income $ 22,967 $ 13,744 $ 67,781 $ 51,515 $ 45,395 $ 40,504 $ 38,287 Interest Expense 5,965 2,898 16,088 9,651 6,932 5,731 5,871 Net Interest Income 17,002 10,846 51,692 41,863 38,463 34,773 32,416 Provision for Loan and Lease Losses 886 678 2,842 12,870 2,829 1,651 3,869Non-Interest Income 4,735 3,090 15,459 10,908 11,084 8,884 7,419Non-Interest Expense 14,725 9,580 53,487 33,765 33,129 30,977 28,562 Income before Income Taxes 6,126 3,678 10,821 6,136 13,590 11,029 7,404 Income Tax Expense 1,346 483 1,167 4,635 4,493 3,470 2,412 Net Income 4,780 3,195 9,655 1,501 9,097 7,559 4,992Pre-TaxPre-Provision Net Income * 7,011 4,355 13,663 19,006 16,419 12,680 11,273 * Reconciliation provided innon-GAAP tables in this Appendix. See also“Non-GAAP Disclaimer” on slide 2. 36
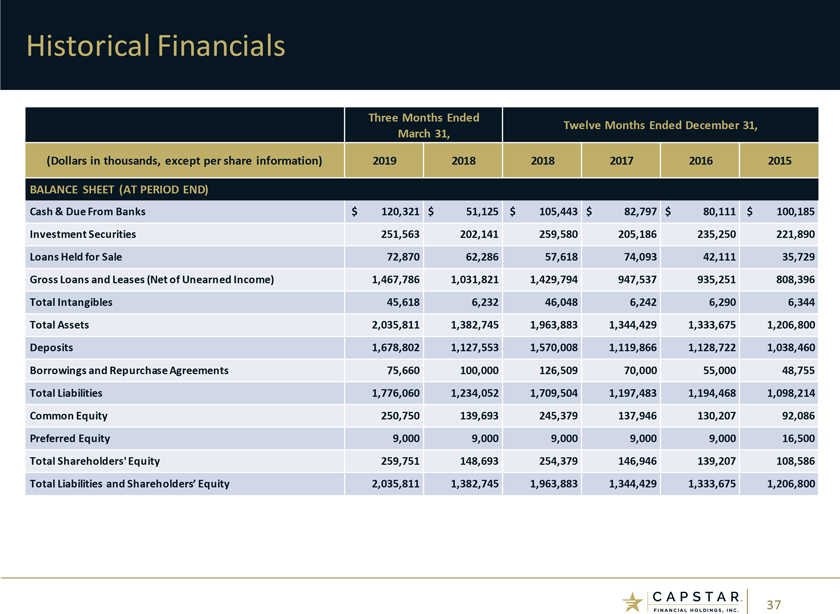
Historical Financials Three Months Ended Twelve Months Ended December 31, March 31, (Dollars in thousands, except per share information) 2019 2018 2018 2017 2016 2015 BALANCE SHEET (AT PERIOD END) Cash & Due From Banks $ 120,321 $ 51,125 $ 105,443 $ 82,797 $ 80,111 $ 100,185 Investment Securities 251,563 202,141 259,580 205,186 235,250 221,890 Loans Held for Sale 72,870 62,286 57,618 74,093 42,111 35,729 Gross Loans and Leases (Net of Unearned Income) 1,467,786 1,031,821 1,429,794 947,537 935,251 808,396 Total Intangibles 45,618 6,232 46,048 6,242 6,290 6,344 Total Assets 2,035,811 1,382,745 1,963,883 1,344,429 1,333,675 1,206,800 Deposits 1,678,802 1,127,553 1,570,008 1,119,866 1,128,722 1,038,460 Borrowings and Repurchase Agreements 75,660 100,000 126,509 70,000 55,000 48,755 Total Liabilities 1,776,060 1,234,052 1,709,504 1,197,483 1,194,468 1,098,214 Common Equity 250,750 139,693 245,379 137,946 130,207 92,086 Preferred Equity 9,000 9,000 9,000 9,000 9,000 16,500 Total Shareholders’ Equity 259,751 148,693 254,379 146,946 139,207 108,586 Total Liabilities and Shareholders’ Equity 2,035,811 1,382,745 1,963,883 1,344,429 1,333,675 1,206,800 37
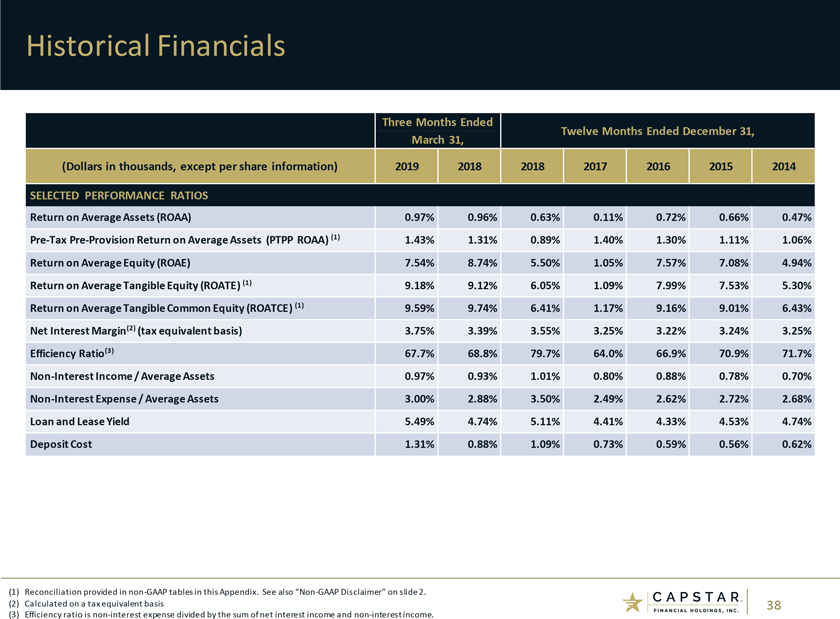
Historical Financials Three Months Ended Twelve Months Ended December 31, March 31, (Dollars in thousands, except per share information) 2019 2018 2018 2017 2016 2015 2014 SELECTED PERFORMANCE RATIOS Return on Average Assets (ROAA) 0.97% 0.96% 0.63% 0.11% 0.72% 0.66% 0.47%Pre-TaxPre-Provision Return on Average Assets (PTPP ROAA)(1) 1.43% 1.31% 0.89% 1.40% 1.30% 1.11% 1.06% Return on Average Equity (ROAE) 7.54% 8.74% 5.50% 1.05% 7.57% 7.08% 4.94% Return on Average Tangible Equity (ROATE)(1) 9.18% 9.12% 6.05% 1.09% 7.99% 7.53% 5.30% Return on Average Tangible Common Equity (ROATCE)(1) 9.59% 9.74% 6.41% 1.17% 9.16% 9.01% 6.43% Net Interest Margin(2) (tax equivalent basis) 3.75% 3.39% 3.55% 3.25% 3.22% 3.24% 3.25% Efficiency Ratio(3) 67.7% 68.8% 79.7% 64.0% 66.9% 70.9% 71.7%Non-Interest Income / Average Assets 0.97% 0.93% 1.01% 0.80% 0.88% 0.78% 0.70%Non-Interest Expense / Average Assets 3.00% 2.88% 3.50% 2.49% 2.62% 2.72% 2.68% Loan and Lease Yield 5.49% 4.74% 5.11% 4.41% 4.33% 4.53% 4.74% Deposit Cost 1.31% 0.88% 1.09% 0.73% 0.59% 0.56% 0.62% (1) Reconciliation provided innon-GAAP tables in this Appendix. See also“Non-GAAP Disclaimer” on slide 2. (2) Calculated on a tax equivalent basis 38 (3) Efficiency ratio isnon-interest expense divided by the sum of net interest income andnon-interest income.
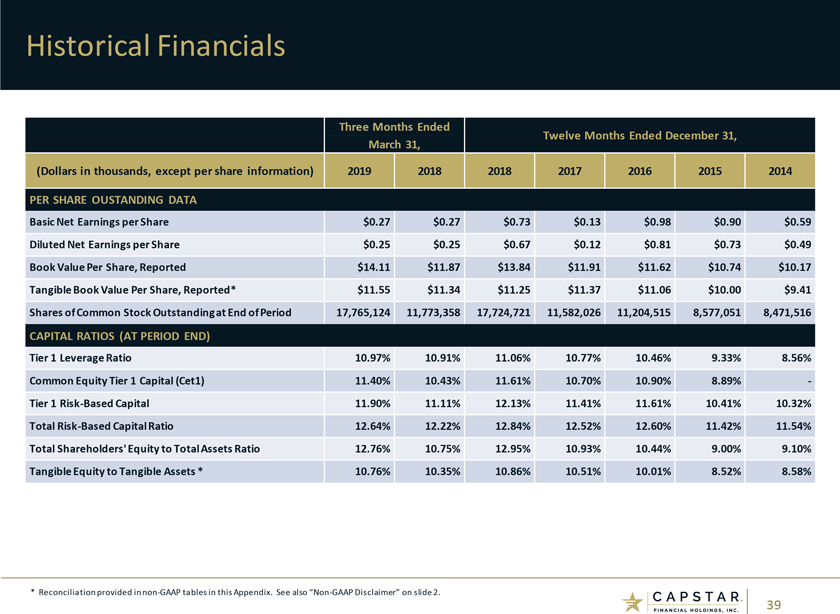
Historical Financials Three Months Ended Twelve Months Ended December 31, March 31, (Dollars in thousands, except per share information) 2019 2018 2018 2017 2016 2015 2014 PER SHARE OUSTANDING DATA Basic Net Earnings per Share $0.27 $0.27 $0.73 $0.13 $0.98 $0.90 $0.59 Diluted Net Earnings per Share $0.25 $0.25 $0.67 $0.12 $0.81 $0.73 $0.49 Book Value Per Share, Reported $14.11 $11.87 $13.84 $11.91 $11.62 $10.74 $10.17 Tangible Book Value Per Share, Reported* $11.55 $11.34 $11.25 $11.37 $11.06 $10.00 $9.41 Shares of Common Stock Outstanding at End of Period 17,765,124 11,773,358 17,724,721 11,582,026 11,204,515 8,577,051 8,471,516 CAPITAL RATIOS (AT PERIOD END) Tier 1 Leverage Ratio 10.97% 10.91% 11.06% 10.77% 10.46% 9.33% 8.56% Common Equity Tier 1 Capital (Cet1) 11.40% 10.43% 11.61% 10.70% 10.90% 8.89% -Tier 1 Risk-Based Capital 11.90% 11.11% 12.13% 11.41% 11.61% 10.41% 10.32% Total Risk-Based Capital Ratio 12.64% 12.22% 12.84% 12.52% 12.60% 11.42% 11.54% Total Shareholders’ Equity to Total Assets Ratio 12.76% 10.75% 12.95% 10.93% 10.44% 9.00% 9.10% Tangible Equity to Tangible Assets * 10.76% 10.35% 10.86% 10.51% 10.01% 8.52% 8.58% * Reconciliation provided innon-GAAP tables in this Appendix. See also“Non-GAAP Disclaimer” on slide 2. 39
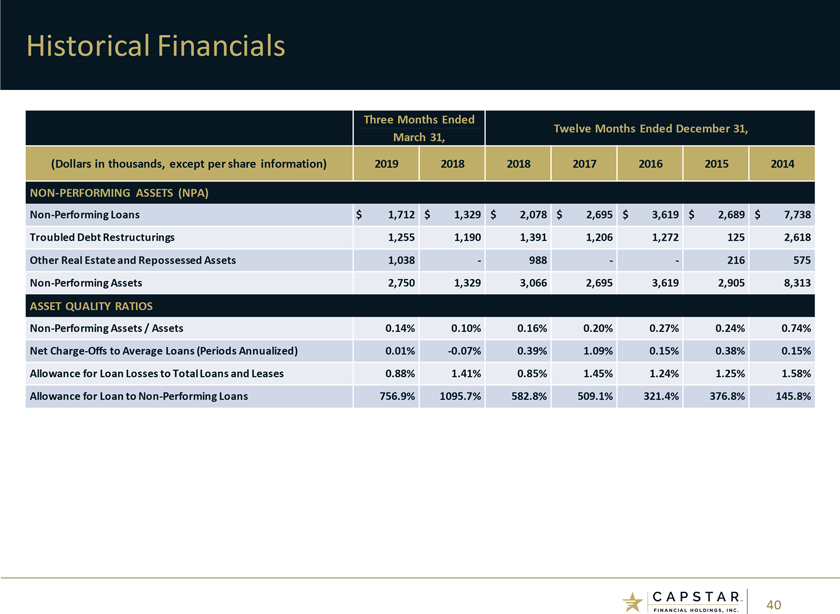
Historical Financials Three Months Ended Twelve Months Ended December 31, March 31, (Dollars in thousands, except per share information) 2019 2018 2018 2017 2016 2015 2014NON-PERFORMING ASSETS (NPA)Non-Performing Loans $ 1,712 $ 1,329 $ 2,078 $ 2,695 $ 3,619 $ 2,689 $ 7,738 Troubled Debt Restructurings 1,255 1,190 1,391 1,206 1,272 125 2,618 Other Real Estate and Repossessed Assets 1,038—988 — 216 575Non-Performing Assets 2,750 1,329 3,066 2,695 3,619 2,905 8,313 ASSET QUALITY RATIOSNon-Performing Assets / Assets 0.14% 0.10% 0.16% 0.20% 0.27% 0.24% 0.74% Net Charge-Offs to Average Loans (Periods Annualized) 0.01%-0.07% 0.39% 1.09% 0.15% 0.38% 0.15% Allowance for Loan Losses to Total Loans and Leases 0.88% 1.41% 0.85% 1.45% 1.24% 1.25% 1.58% Allowance for Loan toNon-Performing Loans 756.9% 1095.7% 582.8% 509.1% 321.4% 376.8% 145.8% 40
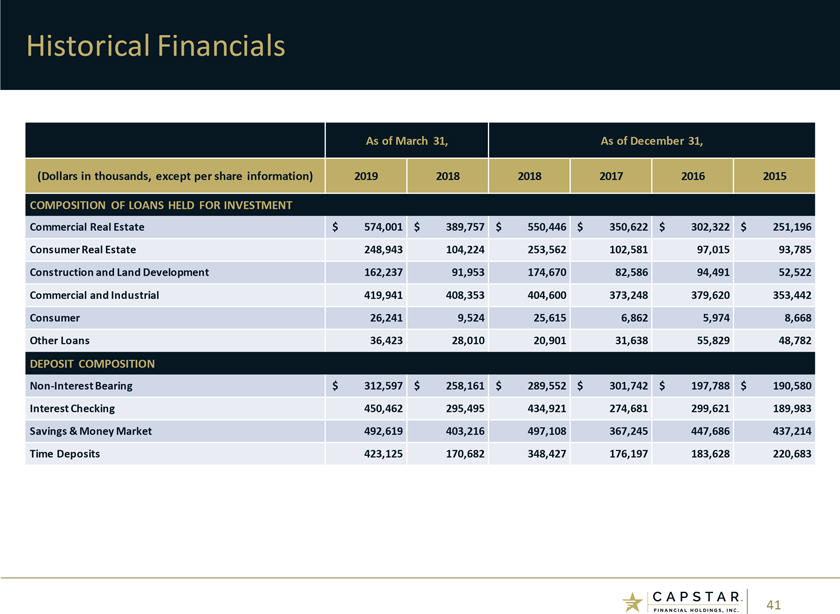
Historical Financials As of March 31, As of December 31, (Dollars in thousands, except per share information) 2019 2018 2018 2017 2016 2015 COMPOSITION OF LOANS HELD FOR INVESTMENT Commercial Real Estate $ 574,001 $ 389,757 $ 550,446 $ 350,622 $ 302,322 $ 251,196 Consumer Real Estate 248,943 104,224 253,562 102,581 97,015 93,785 Construction and Land Development 162,237 91,953 174,670 82,586 94,491 52,522 Commercial and Industrial 419,941 408,353 404,600 373,248 379,620 353,442 Consumer 26,241 9,524 25,615 6,862 5,974 8,668 Other Loans 36,423 28,010 20,901 31,638 55,829 48,782 DEPOSIT COMPOSITIONNon-Interest Bearing $ 312,597 $ 258,161 $ 289,552 $ 301,742 $ 197,788 $ 190,580 Interest Checking 450,462 295,495 434,921 274,681 299,621 189,983 Savings & Money Market 492,619 403,216 497,108 367,245 447,686 437,214 Time Deposits 423,125 170,682 348,427 176,197 183,628 220,683 41
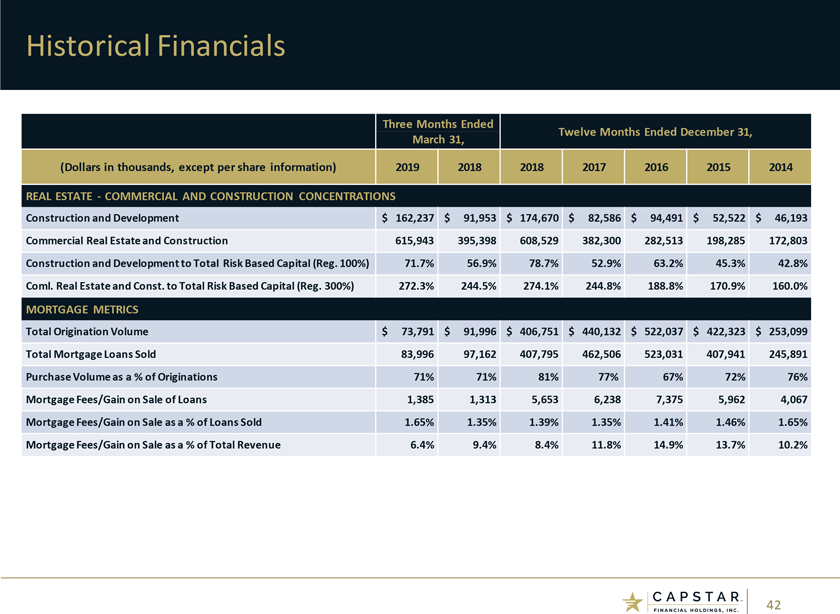
Historical Financials Three Months Ended Twelve Months Ended December 31, March 31, (Dollars in thousands, except per share information) 2019 2018 2018 2017 2016 2015 2014 REAL ESTATE—COMMERCIAL AND CONSTRUCTION CONCENTRATIONS Construction and Development $ 162,237 $ 91,953 $ 174,670 $ 82,586 $ 94,491 $ 52,522 $ 46,193 Commercial Real Estate and Construction 615,943 395,398 608,529 382,300 282,513 198,285 172,803 Construction and Development to Total Risk Based Capital (Reg. 100%) 71.7% 56.9% 78.7% 52.9% 63.2% 45.3% 42.8% Coml. Real Estate and Const. to Total Risk Based Capital (Reg. 300%) 272.3% 244.5% 274.1% 244.8% 188.8% 170.9% 160.0% MORTGAGE METRICS Total Origination Volume $ 73,791 $ 91,996 $ 406,751 $ 440,132 $ 522,037 $ 422,323 $ 253,099 Total Mortgage Loans Sold 83,996 97,162 407,795 462,506 523,031 407,941 245,891 Purchase Volume as a % of Originations 71% 71% 81% 77% 67% 72% 76% Mortgage Fees/Gain on Sale of Loans 1,385 1,313 5,653 6,238 7,375 5,962 4,067 Mortgage Fees/Gain on Sale as a % of Loans Sold 1.65% 1.35% 1.39% 1.35% 1.41% 1.46% 1.65% Mortgage Fees/Gain on Sale as a % of Total Revenue 6.4% 9.4% 8.4% 11.8% 14.9% 13.7% 10.2% 42
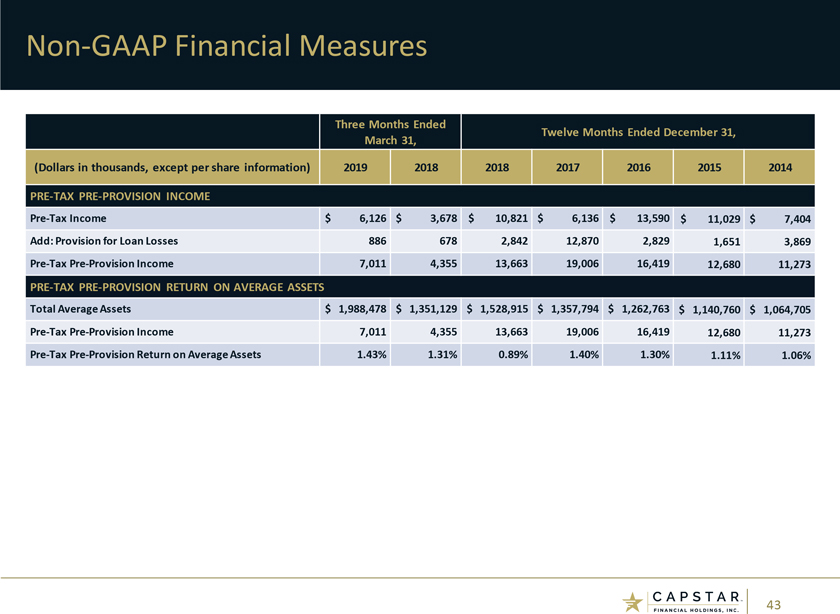
Non-GAAP Financial Measures Three Months Ended Twelve Months Ended December 31, March 31, (Dollars in thousands, except per share information) 2019 2018 2018 2017 2016 2015 2014PRE-TAXPRE-PROVISION INCOMEPre-Tax Income $ 6,126 $ 3,678 $ 10,821 $ 6,136 $ 13,590 $ 11,029 $ 7,404 Add: Provision for Loan Losses 886 678 2,842 12,870 2,829 1,651 3,869Pre-TaxPre-Provision Income 7,011 4,355 13,663 19,006 16,419 12,680 11,273PRE-TAXPRE-PROVISION RETURN ON AVERAGE ASSETS Total Average Assets $ 1,988,478 $ 1,351,129 $ 1,528,915 $ 1,357,794 $ 1,262,763 $ 1,140,760 $ 1,064,705Pre-TaxPre-Provision Income 7,011 4,355 13,663 19,006 16,419 12,680 11,273Pre-TaxPre-Provision Return on Average Assets 1.43% 1.31% 0.89% 1.40% 1.30% 1.11% 1.06% 43
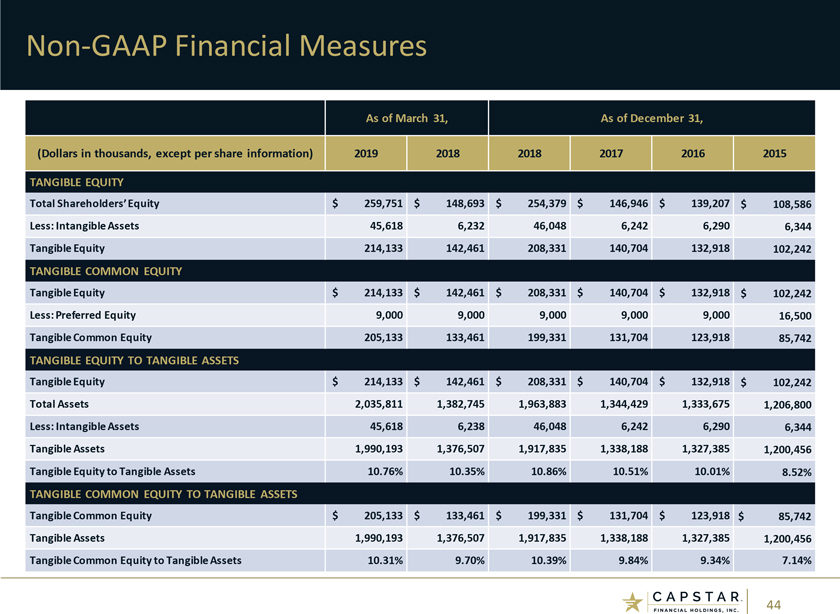
Non-GAAP Financial Measures As of March 31, As of December 31, (Dollars in thousands, except per share information) 2019 2018 2018 2017 2016 2015 TANGIBLE EQUITY Total Shareholders’ Equity $ 259,751 $ 148,693 $ 254,379 $ 146,946 $ 139,207 $ 108,586 Less: Intangible Assets 45,618 6,232 46,048 6,242 6,290 6,344 Tangible Equity 214,133 142,461 208,331 140,704 132,918 102,242 TANGIBLE COMMON EQUITY Tangible Equity $ 214,133 $ 142,461 $ 208,331 $ 140,704 $ 132,918 $ 102,242 Less: Preferred Equity 9,000 9,000 9,000 9,000 9,000 16,500 Tangible Common Equity 205,133 133,461 199,331 131,704 123,918 85,742 TANGIBLE EQUITY TO TANGIBLE ASSETS Tangible Equity $ 214,133 $ 142,461 $ 208,331 $ 140,704 $ 132,918 $ 102,242 Total Assets 2,035,811 1,382,745 1,963,883 1,344,429 1,333,675 1,206,800 Less: Intangible Assets 45,618 6,238 46,048 6,242 6,290 6,344 Tangible Assets 1,990,193 1,376,507 1,917,835 1,338,188 1,327,385 1,200,456 Tangible Equity to Tangible Assets 10.76% 10.35% 10.86% 10.51% 10.01% 8.52% TANGIBLE COMMON EQUITY TO TANGIBLE ASSETS Tangible Common Equity $ 205,133 $ 133,461 $ 199,331 $ 131,704 $ 123,918 $ 85,742 Tangible Assets 1,990,193 1,376,507 1,917,835 1,338,188 1,327,385 1,200,456 Tangible Common Equity to Tangible Assets 10.31% 9.70% 10.39% 9.84% 9.34% 7.14% 44

Non-GAAP Financial Measures Three Months Ended Twelve Months Ended December 31, March 31, (Dollars in thousands, except per share information) 2019 2018 2018 2017 2016 2015 2014 RETURN ON AVERAGE TANGIBLE EQUITY (ROATE) Total Average Shareholder’s Equity $ 257,105 $ 148,276 $ 175,686 $ 143,402 $ 120,123 $ 106,727 $ 101,030 Less: Average Intangible Assets 45,890 6,238 16,174 6,265 6,318 6,371 6,855 Average Tangible Equity 211,215 142,038 159,512 137,137 113,805 100,356 94,175 Net Income to Shareholders 4,780 3,195 9,655 1,501 9,097 7,559 4,992 Return on Average Tangible Equity (ROATE) 9.18% 9.12% 6.05% 1.09% 7.99% 7.53% 5.30% RETURN ON AVERAGE TANGIBLE COMMON EQUITY (ROATCE) Average Tangible Equity $ 211,215 $ 142,038 $ 159,512 $ 137,137 $ 113,805 $ 100,356 $ 94,175 Less: Preferred Equity 9,000 9,000 9,000 9,000 14,533 16,500 16,500 Average Tangible Common Equity 202,215 133,037 150,512 128,137 99,273 83,856 77,675 Net Income to Shareholders 4,780 3,195 9,655 1,501 9,097 7,559 4,992 Return on Average Tangible CommonEquity (ROATCE) 9.59% 9.74% 6.41% 1.17% 9.16% 9.01% 6.43% 45
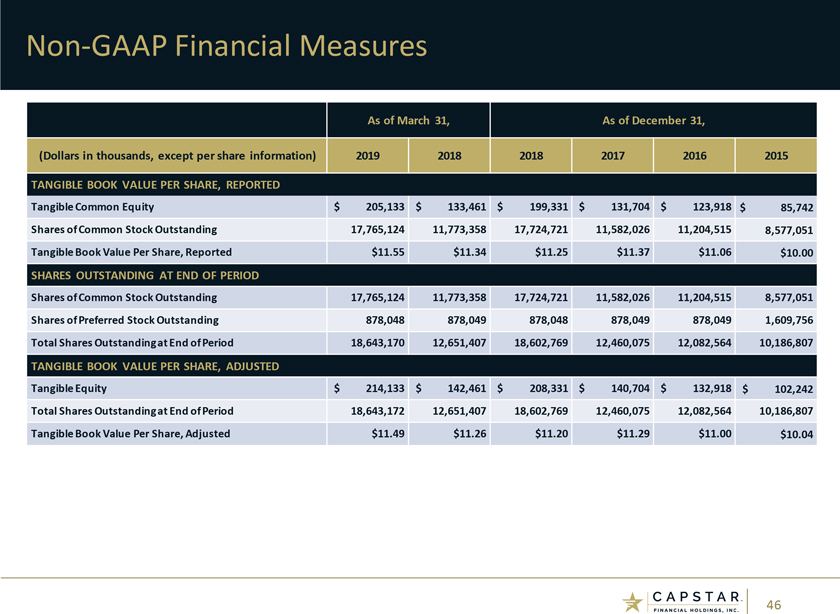
Non-GAAP Financial Measures As of March 31, As of December 31, (Dollars in thousands, except per share information) 2019 2018 2018 2017 2016 2015 TANGIBLE BOOK VALUE PER SHARE, REPORTED Tangible Common Equity $ 205,133 $ 133,461 $ 199,331 $ 131,704 $ 123,918 $ 85,742 Shares of Common Stock Outstanding 17,765,124 11,773,358 17,724,721 11,582,026 11,204,515 8,577,051 Tangible Book Value Per Share, Reported $11.55 $11.34 $11.25 $11.37 $11.06 $10.00 SHARES OUTSTANDING AT END OF PERIOD Shares of Common Stock Outstanding 17,765,124 11,773,358 17,724,721 11,582,026 11,204,515 8,577,051 Shares of Preferred Stock Outstanding 878,048 878,049 878,048 878,049 878,049 1,609,756 TotalShares Outstanding at End of Period 18,643,170 12,651,407 18,602,769 12,460,075 12,082,564 10,186,807 TANGIBLE BOOK VALUE PER SHARE, ADJUSTED TangibleEquity $ 214,133 $ 142,461 $ 208,331 $ 140,704 $ 132,918 $ 102,242 Total Shares Outstanding at End of Period 18,643,172 12,651,407 18,602,769 12,460,075 12,082,564 10,186,807 Tangible Book Value Per Share, Adjusted $11.49 $11.26 $11.20 $11.29 $11.00 $10.04 46
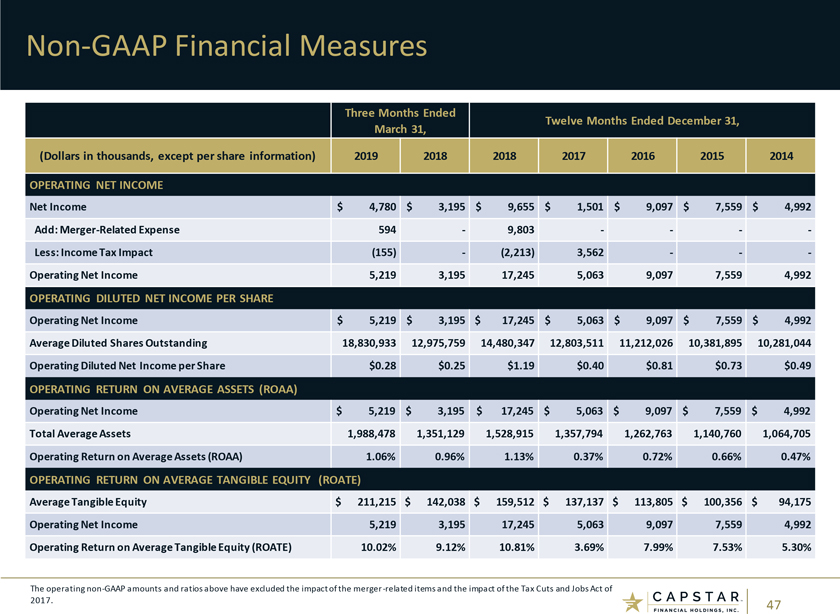
Non-GAAP Financial Measures Three Months Ended Twelve Months Ended December 31, March 31, (Dollars in thousands, except per share information) 2019 2018 2018 2017 2016 2015 2014 OPERATING NET INCOME Net Income $ 4,780 $ 3,195 $ 9,655 $ 1,501 $ 9,097 $ 7,559 $ 4,992 Add: Merger-Related Expense 594—9,803 — —Less: Income Tax Impact (155)—(2,213) 3,562 — -Operating Net Income 5,219 3,195 17,245 5,063 9,097 7,559 4,992 OPERATING DILUTED NET INCOME PER SHARE Operating Net Income $ 5,219 $ 3,195 $ 17,245 $ 5,063 $ 9,097 $ 7,559 $ 4,992 Average Diluted Shares Outstanding 18,830,933 12,975,759 14,480,347 12,803,511 11,212,026 10,381,895 10,281,044 Operating Diluted Net Incomeper Share $0.28 $0.25 $1.19 $0.40 $0.81 $0.73 $0.49 OPERATING RETURN ON AVERAGE ASSETS (ROAA) Operating Net Income $ 5,219 $ 3,195 $ 17,245 $ 5,063 $ 9,097 $ 7,559 $ 4,992 Total Average Assets 1,988,478 1,351,129 1,528,915 1,357,794 1,262,763 1,140,760 1,064,705 Operating Return on Average Assets (ROAA) 1.06% 0.96% 1.13% 0.37% 0.72% 0.66% 0.47% OPERATING RETURN ON AVERAGE TANGIBLE EQUITY (ROATE) Average Tangible Equity $ 211,215 $ 142,038 $ 159,512 $ 137,137 $ 113,805 $ 100,356 $ 94,175 Operating Net Income 5,219 3,195 17,245 5,063 9,097 7,559 4,992 OperatingReturn on Average Tangible Equity (ROATE) 10.02% 9.12% 10.81% 3.69% 7.99% 7.53% 5.30% The operatingnon-GAAP amounts and ratios above have excluded the impact of the merger-related items and the impact of the Tax Cuts and Jobs Act of 2017. 47

Non-GAAP Financial Measures Three Months Ended Twelve Months Ended December 31, March 31, (Dollars in thousands, except per share information) 2019 2018 2018 2017 2016 2015 2014 OPERATINGNON-INTEREST EXPENSENon-InterestExpense $ 14,725 $ 9,580 $ 53,487 $ 33,765 $ 33,129 $ 30,977 $ 28,562 Less: Merger-Related Expense (594)—(9,803) — —OperatingNon-Interest Expense 14,131 9,580 43,684 33,765 33,129 30,977 28,562 OPERATINGNON-INTEREST EXPENSE / AVERAGE ASSETS OperatingNon-Interest Expense $ 14,131 $ 9,580 $ 43,684 $ 33,765 $ 33,129 $ 30,977 $ 28,562 Total Average Assets 1,988,478 1,351,129 1,528,915 1,357,794 1,262,763 1,140,760 1,064,705 OperatingNon-Interest Expense / Average Assets 2.88% 2.88% 2.86% 2.49% 2.62% 2.72% 2.68% OPERATING EFFICIENCY RATIO OperatingNon-Interest Expense $ 14,131 $ 9,580 $ 43,684 $ 33,765 $ 33,129 $ 30,977 $ 28,562 Net Interest Income 17,002 10,846 51,692 41,863 38,463 34,773 32,416 Non Interest Income 4,735 3,090 15,459 10,908 11,084 8,884 7,419 Total Revenues 21,737 13,936 67,151 52,771 49,548 43,657 39,835 Operating Efficiency Ratio 65.0% 68.8% 65.0% 64.0% 66.9% 70.9% 71.7% The operatingnon-GAAP amounts and ratios above have excluded the impact of the merger-related items. 48

CAPSTAR FINANCIAL HOLDING, INC