Table of Contents
As filed with the Securities and Exchange Commission on February 21, 2023
Registration No. 333-268943
SECURITIES AND EXCHANGE COMMISSION
Washington, D.C. 20549
Pre-Effective Amendment No.1
To
REGISTRATION STATEMENT
Under Schedule B of
the Securities Act of 1933
Japan International Cooperation Agency
(Issuer)
Japan
(Guarantor)
(Names of Registrants)
Nibancho Center Building 5-25
Niban-cho
Chiyoda-ku
Tokyo 102-8012, Japan
(Address of Principal Executive Office of Japan International Cooperation Agency)
Names and addresses of Duly Authorized Representatives:
For the Issuer: TANAKA Satoko Chief Representative JICA USA Office 1776 I Street, N.W., Suite 895 Washington, D.C. 20006 | For the Guarantor: MINOWA Tetsuharu Ministry of Finance Consulate General of Japan in New York 299 Park Avenue, 18th Floor New York, New York 10171 |
Copies to:
Jesse S. Gillespie
Morrison & Foerster LLP
Shin-Marunouchi Building 29th Floor
5-1, Marunouchi 1-chome
Chiyoda-ku, Tokyo 100-6529
Japan
Approximate date of commencement of proposed sale to the public:
From time to time after this Registration Statement becomes effective as described herein.
CALCULATION OF REGISTRATION FEE
| ||||||||
Title of Each Class of Securities to be Registered(1) | Amount being Registered(2) | Proposed Maximum Offering Price Per Unit(3) | Proposed Maximum Aggregate Offering Price(3) | Amount of Registration Fee | ||||
Debt Securities | $1,776,750,000 | 100% | $1,776,750,000 | $195,797.85 | ||||
Guarantee of Japan | — | — | — | — | ||||
| ||||||||
|
(1) | Title of each class to be determined from time to time. |
(2) | In the case of debt securities issued at an original issue discount, such greater principal amount as will result in an aggregate public offering price of such registered amount and, in the case of debt securities denominated in a currency other than U.S. dollars, such principal amount in such currency as will result in an aggregate public offering price of such registered amount when converted into U.S. dollars at the exchange rate in effect on the date such debt securities are initially offered to the public. |
(3) | Estimated solely for the purpose of determining the registration fee. |
The debt securities covered by this Registration Statement are to be offered on a delayed or continuous basis pursuant to Releases Nos. 33-6240 and 33-6424 under the Securities Act of 1933, as amended.
Pursuant to Rule 429 under the Securities Act of 1933, the prospectus contained in this Registration Statement and supplements to such prospectus will be used in connection with $223,250,000 of debt securities registered under Registration Statement No. 333-216521, which together with the Debt Securities listed above total $2,000,000,000.
The registrants hereby amend this Registration Statement on such date or dates as may be necessary to delay its effective date until the registrants shall file a further amendment which specifically states that this Registration Statement shall thereafter become effective in accordance with Section 8(a) of the Securities Act of 1933 or until the Registration Statement shall become effective on such date as the Commission, acting pursuant to said Section 8(a), may determine.
Table of Contents
EXPLANATORY NOTE
This registration statement contains a prospectus, consisting of a cover page, pages ii through iii and pages 1 through 61 relating to debt securities of JICA and guarantees by Japan. A maximum principal amount of $2,000,000,000 or its equivalent in other currencies or currency units of debt securities may be offered and sold in the United States pursuant to the prospectus on or after the date of effectiveness of this registration statement. Of such aggregate principal offering amount, $1,776,750,000 is registered hereby, and $223,250,000 was previously registered under Registration Statement No. 333-216521. The first $223,250,000 offered and sold pursuant to the prospectus contained herein shall be deemed to be the securities registered under Registration Statement No. 333-216521.
JICA may offer debt securities as separate issues from time to time on the terms and in the manner to be specified in supplements to the prospectus contained in this registration statement. Upon any public offering or sale in the United States of such debt securities covered by the prospectus, one or more prospectus supplements describing such debt securities and the particular terms of such offer or sale will be filed in accordance with the rules and regulations of the U.S. Securities and Exchange Commission.
Table of Contents
The information in this prospectus is not complete and may be changed. Japan International Cooperation Agency may not sell these securities until the registration statement filed with the Securities and Exchange Commission is effective. This prospectus is not an offer to sell these securities and it is not soliciting an offer to buy these securities in any jurisdiction where the offer or sale is not permitted
Subject to Completion, Dated February 21, 2023
P R O S P E C T U S
Japan International Cooperation Agency
(Issuer)
Japan
(Guarantor)
$2,000,000,000
Debt Securities
Japan International Cooperation Agency (“JICA”) may offer any combination of debt securities from time to time in one or more offerings. JICA will provide specific terms of these securities in supplements to this prospectus. You should read this prospectus and any prospectus supplement carefully before you invest. This prospectus may not be used to make offers or sales of securities unless accompanied by a prospectus supplement.
Neither the United States Securities and Exchange Commission (the “Commission”) nor any other regulatory body has approved or disapproved of these securities or passed upon the accuracy or adequacy of this Prospectus. Any representation to the contrary is a criminal offense.
The date of this Prospectus is , 2023.
Table of Contents
Page | ||||
iii | ||||
iii | ||||
1 | ||||
2 | ||||
6 | ||||
51 | ||||
52 | ||||
55 | ||||
61 | ||||
61 | ||||
61 | ||||
62 | ||||
62 |
ii
Table of Contents
This prospectus is part of a registration statement that JICA and Japan filed with the Commission, under the U.S. Securities Act of 1933, as amended, utilizing a “shelf” registration process. Under this shelf registration process, JICA may sell any combination of the debt securities described in this prospectus (“Debt Securities”) in one or more offerings up to the total dollar amount registered with the Commission (or the equivalent in other currencies).
This prospectus provides a general description of the Debt Securities that JICA may offer. Each time JICA sells securities under this shelf registration process, JICA will provide a prospectus supplement that will contain specific information about the terms of that offering. The prospectus supplement may also add, update or change information contained in this prospectus. Before you invest, you should read both this prospectus and any prospectus supplement together with additional information described under the heading “Where You Can Find More Information”.
Issuance of any guarantee by Japan of any Debt Securities will be subject to limits imposed by annual budgetary authorizations set by the Japanese Diet. In addition, each particular issue of Debt Securities will require authorization by Japan of any guarantee of such Debt Securities on a case-by-case basis.
A portion of the securities offered hereby may be offered and sold outside of the United States in transactions not subject to the registration requirements of the U.S. Securities Act of 1933, as amended.
None of JICA, Japan or the underwriters of the Debt Securities to which any particular prospectus supplement relates has authorized any dealer, salesman or other person to give any information or to make any representation not contained in this prospectus or such a prospectus supplement. If any such dealer, salesman or other person has given or made such information or representation, you must not rely upon such information or representation as having been authorized by JICA, Japan or such underwriters. This prospectus does not constitute an offer to sell or a solicitation of an offer to buy any of the Debt Securities in any jurisdiction to any person to whom it is unlawful to make such offer in such jurisdiction.
This prospectus and any prospectus supplement and documents incorporated by reference in this prospectus and any prospectus supplement may contain forward-looking statements. Statements that are not historical facts, including statements about JICA’s beliefs and expectations, are forward-looking statements. Forward-looking statements speak only as of the date they are made, and JICA undertakes no obligation to update publicly any of them in light of new information or future events. Forward-looking statements involve inherent risks and uncertainties and actual results may differ materially from those contained in any forward-looking statements.
iii
Table of Contents
WHERE YOU CAN FIND MORE INFORMATION
JICA and Japan have filed, or will file, annual reports, amendments to annual reports and other information with the Commission. These reports and amendments include certain financial, statistical and other information about JICA and Japan, and may be accompanied by exhibits. You may read and copy any document JICA and Japan file with the Commission at the Commission’s public reference at 100 F Street, N.E., Washington, D.C. 20549. Please call the Commission at 1-800-SEC-0330 for further information on the public reference room. In addition, the Commission maintains an Internet site (www.sec.gov) that contains reports and other information regarding issuers that file electronically with the Commission.
The Commission allows JICA and Japan to “incorporate by reference” the information JICA and Japan file with the Commission, which means that JICA and Japan can disclose important information to you by referring you to those documents. Information that is incorporated by reference is an important part of this prospectus. JICA and Japan incorporate by reference the documents listed below and any future filings made with the Commission to the extent such filings indicate that they are intended to be incorporated by reference:
• | JICA’s annual report on Form 18-K for the fiscal year ended March 31, 2022, filed on September 27, 2022. |
• | Exhibit 2 to JICA’s annual report on Form 18-K for the fiscal year ended March 31, 2021, filed on September 27, 2021. |
Each time JICA or Japan files a document with the Commission that is incorporated by reference, the information in that document automatically updates the information contained in previously filed documents.
You should rely only on the information incorporated by reference or provided in this prospectus or any prospectus supplement. JICA and Japan have not authorized anyone else to provide you with different or additional information. JICA and Japan are not making an offer of these securities in any state where the offer is not permitted. You should not assume that the information in this prospectus or any prospectus supplement is accurate as of any date other than the dates set forth on the respective cover pages of these documents.
You may request a copy of the annual reports, amendments to annual reports and other information mentioned above by writing or calling JICA. Written requests for such documents should be directed to Japan International Cooperation Agency, Nibancho Center Building 5-25, Niban-cho, Chiyoda-ku, Tokyo 102-8012, Japan, Attention: JICA Headquarters, Japan. JICA’s telephone number is 81-3-5226-9279. The Internet site of JICA is http://www.jica.go.jp. The information on the website is not incorporated by reference into this prospectus.
In this document all amounts are expressed in Japanese Yen (“¥” or “yen”), except as otherwise specified. The spot buying rate quoted on the Tokyo foreign exchange market on February 10, 2023 as reported by the Bank of Japan at 5:00 p.m., Tokyo time, was ¥130.45 = $1.00, and the noon buying rate on February 3, 2023 for cable transfers in New York City payable in yen, as reported by the Federal Reserve Bank of New York, was ¥131.07 = $1.00.
References herein to Japanese fiscal years (“JFYs”) are to 12-month periods commencing in each case on April 1 of the year indicated and ending on March 31 of the following year.
1
Table of Contents
JAPAN INTERNATIONAL COOPERATION AGENCY
The following information should be read in conjunction with the information included in JICA’s annual report on Form 18-K for the fiscal year ended March 31, 2022 and any future periodic reports and amendments filed by JICA with the Commission.
Overview
JICA is an incorporated administrative agency established in October 2003 pursuant to the Act on General Rules for Incorporated Administrative Agencies and the Act of the Incorporated Administrative Agency—Japan International Cooperation Agency (the “JICA Act”). JICA’s main objective is to contribute to the promotion of international cooperation as well as the sound development of the Japanese and global economy by supporting the socioeconomic development, recovery or economic stability of developing regions. Following an overhaul in October 2008 (see “—History”), JICA is currently the sole implementing agency for all major Japanese Official Development Assistance (“ODA”) schemes, which are separated into three categories—Technical Cooperation, Grant Aid and Finance and Investment.
JICA is entirely owned by the Japanese government and is subject to control and supervision by the Minister for Foreign Affairs of Japan and the Minister of Finance of Japan. As of March 31, 2022, government investment by Japan contributed to ¥8,249 billion of net assets on the balance sheet of JICA’s Finance and Investment Account and the capital ratio, calculated as total net assets divided by total assets, was 70.99 %.
History
JICA’s origins can be traced back to January 1954, with the establishment of the Federation of Japan Overseas Associations. In subsequent years, the Society for Economic Cooperation in Asia, Japan Emigration Promotion, Co., Ltd., Overseas Technical Cooperation Agency, Japan Emigration Service and Japan Overseas Cooperation Volunteers were established, each with the objective of fostering international cooperation. JICA was originally established in May 1974 as a special public institution (“Former JICA”) with the promulgation of the Act of Japan International Cooperation Agency. In December 2001, a reorganization and rationalization plan for special public institutions was announced by the Japanese government. Included in this reform plan was a measure transforming JICA into an incorporated administrative agency. This was put into effect by the JICA Act, and Former JICA was re-established as an incorporated administrative agency in October 2003.
Separately, in December 1960, the Overseas Economic Cooperation Fund Law was promulgated pursuant to which the Overseas Economic Cooperation Fund was established to take over management of the Southeast Asia Development Cooperation Fund from the Export-Import Bank of Japan (“JEXIM”). In April 1999, the Japan Bank for International Cooperation Law was promulgated, and the Japan Bank for International Cooperation (“JBIC”) was established, which succeeded the operations of the Overseas Economic Cooperation Fund and JEXIM.
JICA, in its current form, was established in October 2008 following the enactment in November 2006 of the Act for Partial Amendments to the Act of the Incorporated Administrative Agency—Japan International Cooperation Agency. Pursuant to such Act, the operations of Former JICA, Finance and Investment previously managed by JBIC and a portion of Grant Aid provided by the Ministry of Foreign Affairs of Japan (“MOFA”) were succeeded by JICA. MOFA remains responsible for directly providing Grant Aid in conjunction with the execution of diplomatic policies.
Mission and Vision
JICA announced its current mission (“JICA, in accordance with the Development Cooperation Charter, will work on human security and quality growth”) and vision (“Leading the world with trust”) in July 2017, in light of the changing international relations. JICA will seek to achieve its mission and vision by committing itself to achieving them with pride and passion, immersing itself in the relevant site (gemba) and working together with people on-site, planning and acting strategically with broad and long-term perspective, bringing together diverse wisdom and resources, and thinking innovatively to bring about unprecedented impact. JICA, with its partners,
2
Table of Contents
will seek to take the lead in forging bonds of trust across the world, aspiring for a free, peaceful and prosperous world where people can hope for a better future and explore their diverse potential.
Strategy
Mid-Term Objectives and Plan
In accordance with Article 30, Paragraph 1 of the Act on General Rules for Incorporated Administrative Agencies, JICA has established a mid-term plan for achieving its mid-term objectives during the five-year period that commenced on April 1, 2022. Operational focuses for JICA’s mid-term objectives and plans include, among others:
• | addressing key development agendas, such as achieving “quality-growth” and poverty eradication through such growth, sharing universal values and realizing a peaceful and secure society, building a sustainable and resilient international community by addressing global challenges; and |
• | realizing the vision of a “Free and Open Indo-Pacific (FOIP)”, human resource development of future leaders of developing countries through “JICA Development Studies Program” and other programs, addressing climate change and environment conservation and contributing to Japan’s socio-economic revitalization and globalization. |
Sustainable Development Goals
JICA has been working to contribute to peace, stability and the prosperity of the international community. JICA intends to proactively contribute to achieving the Sustainable Development Goals (SDGs), adopted at the UN summit in 2015, through its leadership.
JICA plans to play a key role in achieving the SDGs, making use of Japan’s own experience in the socioeconomic development of Japan and in cooperation for the development of the international community. Specifically, JICA plans to play a key role in achieving goals for zero hunger, health, education, water/sanitation, energy, economic growth, industry/infrastructure, sustainable cities, climate actions and forests/biodiversity.
JICA intends to use Japan’s own knowledge, introduce innovations and collaborate with local and international partners in order to accelerate the achievement of the SDGs. For example, see “—Recent Developments—Measures to Address Climate Change.”
Recent Developments
Response to COVID-19
The rapid spread of COVID-19 has threatened the health and livelihoods of people across the world. The pandemic has damaged global economies, pushed millions of additional people into extreme poverty and negatively impacted future generations by disrupting their opportunities to receive education. Under JICA’s mission to achieve “human security”, JICA has long contributed to efforts for improving healthcare systems in developing countries including measures to combat infectious diseases. In the early twentieth century, Dr. NOGUCHI Hideyo, a Japanese scientist, worked hard to find the major causes of disease transmission. In his name, Ghana established the Noguchi Memorial Institute for Medical Research with Japan’s cooperation, including JICA’s technical support since 1986. This institute has not only conducted 80% of Ghana’s PCR testing to diagnose COVID-19 at the peak of its pandemic, but has also been training laboratory technicians in West Africa.
JICA has been responding to the urgent needs of developing countries under the unprecedented global crisis caused by the COVID-19 pandemic by fully utilizing its human resources and organizational networks, which have been developed over the years of its operations. JICA’s initiatives include provision of cold-chain equipment for transporting vaccines, supporting local production of safe PPE (personal protective equipment) for health workers, provision of water treatment chemicals, raising community awareness for hygiene and sanitation and capacity enhancement for testing and diagnosis. In addition, graduates of JICA’s training program are addressing the COVID-19 pandemic in their assigned countries.
3
Table of Contents
As of March 31, 2022, JICA had extended COVID-19 Crisis Response Emergency Support Loans to 14 countries totaling around 379.5 billion yen in the aggregate, pursuant to which it aims to mitigate the negative social and economic impact of the COVID-19 pandemic by providing budgetary support.
JICA also launched “JICA’s Initiative for Global Health and Medicine” to strengthen its work in protecting people’s lives while supporting Japan’s development policy and international efforts to achieve the pledge of “leaving no one’s health behind.” Under this initiative, JICA will take a holistic approach by focusing on prevention, precaution and treatment, and plans to provide support for infrastructural development by leveraging Japan’s experiences.
Measures to Address Climate Change
In its sustainability report pubslihed in November 2022, JICA outlined the following strategies, measures and policies to address climate change.
As a key partner to developing countries, JICA aims to lead sustainable development by promoting climate cooperation in support of transitioning to a decarbonized and climate-resilient society. Through these efforts, JICA contributes to the achievement of the Paris Agreement, which is an international treaty for achieving the objectives of the United Nations Framework Convention on Climate Change (UNFCCC); other multilateral environmental/climate-related conventions (such as the Convention on Biological Diversity, a legal framework for the conservation of biological diversity, the sustainable use of the components of biological diversity and the fair and equitable sharing of the benefits arising out of the utilization of genetic resources; the United Nations Convention to Combat Desertification, a legal framework set up to address desertification and the effects of drought; and the Sendai Framework for Disaster Risk Reduction, which provides United Nations Member States with concrete actions to protect development gains from the risk of disaster); associated SDGs; and other related initiatives led by the Japanese government (notably, the Osaka Blue Ocean Vision, through which Japan aims to reduce additional pollution by marine plastic litter and supports developing countries’ efforts in connection with the same).
Specifically, JICA has set forth the following actions as a focus:
• | Promoting implementation of the Paris Agreement by supporting developing partner countries in the planning and implementation of climate change policies and measures, along with the development of greenhouse gas (GHG) inventories and transparency frameworks, as well as by facilitating access to climate finance. |
• | Advancing co-benefit climate change solutions that contribute to both addressing development challenges and combating climate change by promoting projects in the following sectors: energy, urban development, transportation, forest and other natural environment conservation, agriculture, environmental management, disaster prevention, water resource management, and healthcare. |
JICA has also made efforts to combat climate change, including through sector specific strategies in the energy and agriculture sectors.
With respect to project implementation, JICA emphasizes measures including:
• | Collaboration with various stakeholders; |
• | Mobilizing additional finance (via collaboration with the private sector or other funding sources, such as the Green Climate Fund (GCF)); |
• | Utilizing knowledge and technology from Japan and other countries; |
• | Strategic dissemination of information; |
• | Inter-city and intra-regional collaboration/cooperation; and |
• | Innovation, such as via digital transformation (DX). |
4
Table of Contents
JICA identifies and assesses climate risks (hazards, exposures, and vulnerabilities) in its cooperation projects and considers necessary measures at the project formulation stage. Specifically, the “JICA Climate-FIT” tool, which is a methodology that aims to grasp the business effects of projects supported by JICA, is used by JICA to assess the climate risk of all of its projects and to examine the possibility of incorporating activities that further strengthen climate change countermeasures, such as mitigation and adaptation. In the project planning stage, JICA may provide assistance through its preparatory surveys, which are undertaken at the preparation stage of a project, either to set a development goal for cooperation and draft suitable cooperation scenarios for attaining such goal or to identify and formulate individual projects and basic plans for such projects. In addition to other procedures related to climate risk, JICA also enhances the climate-related capacity of recipient countries through measures such as improving institutional frameworks, policies and its enforcement capacity through first-hand technical cooperation.
As indicated by the G7 Leaders’ Communiqué from the June 2022 meeting of the Leaders of the Group of Seven (G7), Japan has ended new direct government support for unabated international thermal coal power generation by the end of 2021. In addition, recognizing the importance of national security and geostrategic interests, Japan has committed to end new direct public support for the international unabated fossil fuel energy sector by the end of 2022, except in limited circumstances clearly defined by each country consistent with a 1.5°C warming limit and the goals of the Paris Agreement.
JICA operates in accordance with such Japanese government policies.
5
Table of Contents
The following information updates information in Japan’s annual report on Form 18-K for the fiscal year ended March 31, 2022 and should be read in conjunction with any future periodic reports and amendments filed by Japan with the Commission. The following section has been updated to reflect current information and has not been revised in its entirety. In the following section, information pertaining to previous years is provided solely for your convenience.
GENERAL
Area and Population
Japan, an archipelago in the western Pacific, consists of four main islands (Hokkaido, Honshu, Kyushu and Shikoku) which are mostly mountainous located in the same approximate range of latitude as the east coast of the United States north of Florida. The total area of Japan is approximately 146,000 square miles, which is slightly less than that of California and about 4% of the United States. It is bordered by the Sea of Japan to the west and north, and by the Pacific Ocean to the east and south.
Japan has a total population of approximately 125 million (estimated as of January 1, 2023). It has one of the highest population densities in the world and approximately 24.2% of its people (estimated as of October 1, 2021) are concentrated in three metropolitan areas (Tokyo, Osaka and Nagoya). Japan’s rate of population decrease during the years 2017-2021 was 1.1%. Japan’s population decreased 0.5% during the 12 months ended October 1, 2021 (estimated as of October 1, 2021).
Government
The legislative power in Japan is vested in the Diet, which currently consists of a House of Representatives having 465 members and a House of Councillors having 248 members. Members of both houses are elected by direct universal suffrage, except that some members of each house are elected by proportional representation. The power of the House of Representatives is superior to that of the House of Councillors in respect of approving certain matters including the national budget and electing the Prime Minister.
The executive power is vested in the Cabinet consisting of a Prime Minister, elected by the Diet from among its members, and other Ministers appointed by the Prime Minister, a majority of whom must be members of the Diet. The judicial power is vested in the Supreme Court and such lower courts as are established by law.
Japan’s 47 prefectures, and its cities, towns and villages, have a certain degree of local autonomy through popularly elected legislative bodies and chief executives. The central government exercises its influence on local governments indirectly through financial aid and prescribing standards of local administration.
Political Parties
Members of the House of Representatives are elected for four-year terms unless the House of Representatives is dissolved prior to expiration of their terms. The House of Representatives was dissolved on October 14, 2021, and an election was held on October 31, 2021. 289 members were elected from single-member districts and 176 members were elected through a proportional representation process from 11 regional districts. Pursuant to a revision of the Public Offices Election Act in July 2018, the number of seats in the House of Councillors was increased to 248 from 242. The members are elected for six-year terms with one-half of the membership being elected every three years. In an election in July 2022, 124 members were elected, of which 50 members were elected through a proportional representation system and 74 members were elected from 45 districts that correspond to the 47 prefectures of Japan. Currently, the House of Councillors consists of 124 members whose term expires in July 2025 and 124 members whose term expires in July 2028.
6
Table of Contents
The following tables set forth the membership by political party of the House of Representatives as of January 18, 2023 and the House of Councillors as of January 25, 2023.
House of Representatives | ||||
Liberal Democratic Party | 260 | |||
The Constitutional Democratic Party of Japan and the Independent | 97 | |||
Nippon Ishin (Japan Innovation Party) | 40 | |||
Komeito | 32 | |||
Democratic Party For the People | 10 | |||
Japanese Communist Party | 10 | |||
Yushi no Kai | 5 | |||
REIWA SHINSENGUMI | 3 | |||
Independents | 5 | |||
Vacancies | 3 | |||
|
| |||
Total | 465 | |||
|
| |||
Source: House of Representatives. |
House of Councillors | ||||
Liberal Democratic Party | 118 | |||
The Constitutional Democratic Party of Japan and Social Democratic Party | 40 | |||
Komeito | 27 | |||
Nippon Ishin (Japan Innovation Party) | 21 | |||
Democratic Party For the People and The Shin-Ryokufukai | 13 | |||
Japanese Communist Party | 11 | |||
REIWA SHINSENGUMI | 5 | |||
NHK Party | 2 | |||
Okinawa Whirlwind | 2 | |||
Independents | 9 | |||
Vacancies | 0 | |||
|
| |||
Total | 248 | |||
|
| |||
Source: House of Councillors. |
Leadership
Japan’s current Prime Minister is KISHIDA Fumio, a member of the Liberal Democratic Party of Japan and member of the House of Representatives in the Diet. KISHIDA Fumio was elected as Japan’s 100th Prime Minister on October 4, 2021, succeeding the former Prime Minister SUGA Yoshihide.
International Organizations
Japan is a member of the United Nations and other international organizations, including the International Monetary Fund, International Bank for Reconstruction and Development, International Development Association, International Finance Corporation, International Fund for Agricultural Development, Multilateral Investment Fund, Multilateral Investment Guarantee Agency, Asian Development Bank, African Development Bank, African Development Fund, European Bank for Reconstruction and Development, Inter-American Development Bank and Inter-American Investment Corporation. See “—Subscriptions to International Financial Organizations”.
7
Table of Contents
International Trade Agreements
Japan signed an agreement to join the Trans-Pacific Partnership, or TPP, on February 4, 2016. Upon the ratification of the TPP, Japan and the other participating countries planned to not only eliminate tariffs on products but also liberalize services and investment, and establish rules in a wide range of fields, including intellectual property, e-commerce and the environment. Although Japan ratified the TPP on January 20, 2017, the United States announced its formal withdrawal from the TPP on January 23, 2017. On March 8, 2018, Japan and ten other countries excluding the United States signed the Comprehensive and Progressive Agreement for Trans-Pacific Partnership, pursuant to which each signatory country agreed to start the necessary preparations for the implementation of the TPP. The Comprehensive and Progressive Agreement for Trans-Pacific Partnership entered into force for Japan, Mexico, Singapore, New Zealand, Canada, and Australia on December 30, 2018, for Vietnam on January 14, 2019, for Peru on September 19, 2021 and for Malaysia November 29, 2022. On February 1, 2021, the United Kingdom formally applied to join the TPP. Japan intends to facilitate the process of commencing negotiations with the United Kingdom pursuant to the application procedures under the TPP and in cooperation with the other members.
Japan has also entered into Economic Partnership Agreements, or EPAs, with various countries, including Singapore, Mexico, Malaysia, Chile and Thailand. As of June 2022, Japan had entered into a total of 21 EPAs (including the TPP) with 24 countries and regions. Pursuant to the EPAs, Japan will collaborate comprehensively with the counterparties to, among other things, reduce or eliminate tariffs, grant most-favored-nation status in the fields of investment, services and government procurement and expedite patent review and enhance patent protection in the field of intellectual property.
Japan is also a member of international organizations which are based on international trade treaties and other agreements which seek to promote free trade in the international market, including the following: the World Trade Organization, the Organization for Economic Co-operation and Development, the World Customs Organization and the International Trade Centre.
8
Table of Contents
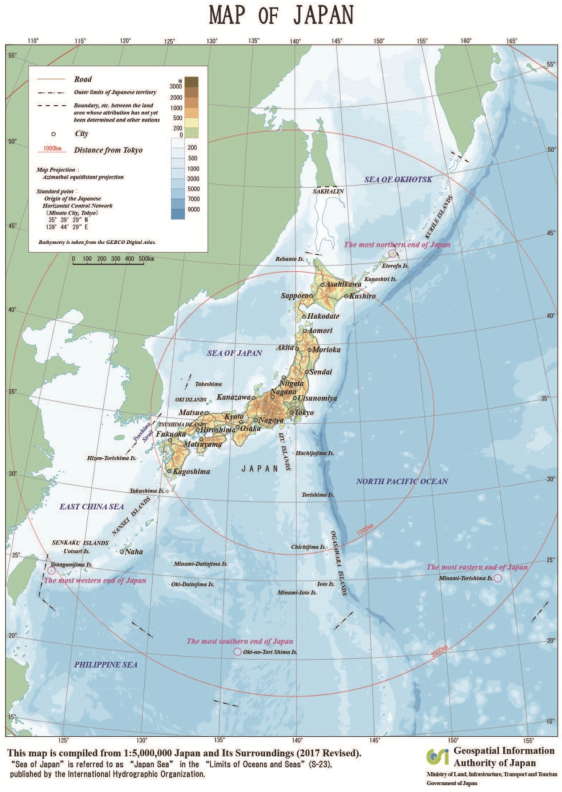
The following is a map of Japan, illustrating its location with respect to neighboring countries:
9
Table of Contents
THE ECONOMY
General
Japan has a highly advanced and diversified economy, which has developed in response to changing conditions in Japan and the world. During the era of high economic growth in the 1960s and the early 1970s, the expansion was based on the development of heavy industries consuming large quantities of resources. During the 1980s, there was rapid growth in high value-added industries, such as electronics and precision instruments, which employ high level technology and consume relatively low quantities of resources. The service sector of the economy grew significantly during the 1980s and 1990s.
While the Japanese economy expanded during the period from 2002 to 2007, amidst that expansion, and prior to the global economic crisis of 2008, Japan continued to face several domestic economic difficulties. Among other things, domestic consumption contributed to the economic recovery to a lesser degree than was the case in prior economic growth periods. Also, despite the improving employment environment at the time, the average wage failed to grow appreciably. While those Japanese manufacturing companies with a global competitive edge achieved growth on the back of the favorable world economy, small-to-medium enterprises and non-manufacturing sectors realized only limited productivity growth and profitability. This in turn caused imbalance in the level of economic recovery among the different regions in Japan. In the longer term, Japan faced a declining population, mass retirement of the baby boomer generation, environmental/energy conservation agenda, and fiscal deficit problem. Against this backdrop, the subprime loan crisis in the United States and increases in the prices of energy and raw materials precipitated weakness in the global economy, caused the Japanese economy to deteriorate. Throughout JFY 2008, the global economy continued to worsen, as the collapse of several major financial institutions in the United States and other factors contributed to a credit tightening, volatility in stock, currency and other markets, loss of consumer confidence and decrease in business and industrial activities on a global basis. The Japanese economy was also adversely affected by these factors, especially as Japan’s export sector was hit by the decline in global demand and appreciation of the yen against other major currencies. After February 2008, Japan had entered a recession. The Japanese economy in JFY 2010 picked up, despite a difficult situation where the unemployment rate remained at a high level.
On March 11, 2011, just as the Japanese economy was in a transition from the state of stagnation to recovery, the Great East Japan Earthquake (the “Earthquake”) struck Japan. As a result, the Japanese economy posted negative growth for the first and second quarter in 2011. Unlike the cases of the Great Hanshin-Awaji Earthquake in 1995 or Hurricane Katrina in 2005, personal consumption declined on a nationwide basis, with consumer sentiment deteriorating sharply after the Earthquake. The Earthquake had a severe impact on production in Japan through the shutdown of damaged factories, disruptions of the supply chains and power supply constraints. In particular, the Earthquake affected Japan’s auto industry which depends on the Tohoku region for the supply of key parts including semiconductors and other electronic components. The supply constraints and the slower growth in corporate earnings in the aftermath of the Earthquake also put downward pressure on capital investment activities. The Earthquake was accompanied by a nuclear power plant accident, which not only caused power supply constraints but also had a chilling effect on certain business activities, such as in the tourism and leisure sectors. Following the Earthquake, the number of visitors to Japan from foreign countries dropped by approximately half from the monthly averages in the prior year. The Earthquake and its aftermath prompted the Government of Japan to compile a series of supplementary budgets to support reconstruction efforts. On May 2, 2011, a first supplementary budget of approximately ¥4 trillion was approved by the Diet to finance reconstruction relating to damages from the Earthquake and tsunami. The budget was aimed at disaster relief, including providing temporary housing, rebuilding of facilities and disaster assistance loans. On July 25, 2011, the Japanese government approved a second supplementary budget of approximately ¥2 trillion aimed at further disaster relief, including increasing the Contingency Reserve for Recovery from the Great East Japan Earthquake. On November 21, 2011, the Japanese government approved the third supplementary budget of approximately ¥12 trillion aimed at disaster relief, including provision of emergency support to people affected by the disaster and reconstruction of public utilities and facilities. On February 8, 2012, the Japanese government approved the fourth supplementary budget including the establishment of a government guaranteed ¥500 billion credit facility in response to the so-called “Overlapping Debt Problem”,
10
Table of Contents
whereby the burden of existing debt makes it difficult to raise funds for victims of the Earthquake. Thereafter, the Japanese government approved budgets of approximately ¥4 trillion for JFY 2012, ¥5 trillion for JFY 2013 and ¥4 trillion for JFY 2014 to finance reconstruction efforts.
The Earthquake and the nuclear disaster in Fukushima were followed by severe flooding that occurred at the end of July 2011 in Thailand, one of Japan’s largest trading partners for both exports and imports. The suspended operations of the local factories in Thailand suppressed Japan’s Thailand bound exports of goods including intermediary materials for cars and electronics and thereby adversely affected the Japanese economy.
Thus, JFY 2011 started in a very challenging environment, with the Earthquake seriously crippling the economy, which posted negative growth for the first quarter. Over time, the government and the people joined forces in an all-out effort to rebuild the social and economic infrastructure, facilitating a rapid recovery of the supply chains and helping the economy on a track to a gradual recovery. Since the summer of 2011, however, the rapid appreciation of the yen, the reduced external demand due to the Thai flooding (as described above) and deceleration in the world economy stemming from the European sovereign debt crisis kept such recovery to a modest level.
In December 2012, the Cabinet Office of the Government of Japan announced “Abenomics” (named after the former Prime Minister ABE Shinzo), an economic strategy of pursuing an expansionary monetary policy, a flexible fiscal policy and an economic growth agenda that promotes private investment, with the goal of achieving GDP growth and job creation. Pursuant to this strategy, specific measures to be implemented include accelerating reconstruction efforts in areas damaged by the Earthquake, increasing stimulus spending and subsidies aimed at strategically important sectors and utilizing a more flexible approach to economic and fiscal management. Other more recent Abenomics measures include the liberalization of electricity retail sales in April 2016 and the liberalization of gas retail sales in April 2017.
Additionally, in January 2013, the Government of Japan and the Bank of Japan (the “BOJ”) issued a joint statement announcing measures to overcome deflation and achieve sustainable economic growth with price stability in order to establish a sustainable fiscal structure and sound fiscal management. In March 2013, KURODA Haruhiko, former President of the Asian Development Bank, was appointed as governor of the BOJ. In April 2013, the BOJ announced its new quantitative and qualitative monetary easing policy, under which the BOJ is aiming to achieve a price stability target of 2% in terms of the year-on-year rate of change in the consumer price index at the earliest possible time, with a time horizon of about two years. Nominal GDP increased by 2.4% during JFY 2021, and the annual growth rate of real GDP was 2.5%. The Japanese Diet has passed comprehensive social security and tax reform, including an increase in the consumption tax rate from 5% to 8% in 2014, and from 8% to 10% in 2015. Accordingly, the consumption tax rate was increased to 8% in April 2014. The increase in the consumption tax rate from 8% to 10% was postponed but introduced in October 2019. Due in part to this increase in the consumption tax, real GDP decreased during the fourth quarter of 2019 by 2.7% compared to the prior quarter. In addition to the increase in the consumption tax rate, as part of the tax reform, the effective corporate tax rate was reduced from 34.62% to 32.11% for JFY 2015 and it was further reduced to 29.97% for JFY 2016 and to 29.74% for JFY 2018.
The Japanese economy faces certain challenges. Challenges for the Japanese economy include, as further described herein, an increased dependence on LNG and other energy imports as a result of the nuclear accident at the Fukushima Daiichi Nuclear Plant and suspension of operations at other nuclear power plants and, over the long term, demographic challenges, such as the decline in the labor market due to the population aging and decreasing population, and the high levels of public debt and associated debt servicing payments. In addition, the Japanese economy is also exposed to challenges due to the potential impact of political disputes, technology and trade tensions with or among major trading partners, including China and the United States, as well as the potential escalation of geopolitical risks associated with the Middle East, North Korea or other countries or regions, which may negatively impact Japan’s international trade and economy more generally.
In December 2019, the emergence of COVID-19 was reported in Wuhan, Hubei Province, China and COVID-19 has subsequently spread throughout the world, including in Japan. On January 30, 2020, the World Health Organization declared COVID-19 a public health emergency of international concern and, on
11
Table of Contents
March 11, 2020, the World Health Organization declared COVID-19 a global pandemic. The COVID-19 pandemic is currently having an adverse impact on the global economy, the severity and duration of which is difficult to predict.
Economic activity in Japan has been significantly restricted by the COVID-19 pandemic and the measures implemented to slow the spread of the disease. Due primarily to the impact of the COVID-19 pandemic, real GDP decreased by 4.1% during JFY 2020 compared to the prior year. In response to this pandemic, the Japanese government and the BOJ have announced a number of fiscal, monetary and economic measures aimed at mitigating the resulting economic impact. While the COVID-19 pandemic is expected to continue to have a significant negative impact on the Japanese economy, the duration and extent of the economic impact of COVID-19 remain highly uncertain.
In order to slow the spread of COVID-19, the Japanese central and local governments have implemented a number of measures, including the declaration of multiple states of emergency by the Prime Minister of Japan. In addition, the emergence of a new COVID-19 variant in late 2021 prompted the Japanese government to re-impose international travel restrictions including closure of international borders to almost all foreign nationals and resulted in the introduction of certain other preventative measures. These restrictions had, and may further have in the future a severe impact on both business travel and inbound international tourism, an important and formerly growing sector of the Japanese economy. According to the Monthly Economic Report published by the Cabinet Office of Japan for January 2023 published on January 25, 2023, parts of the economy are showing weakness, while economic activity is recovering moderately as the impact of COVID-19 eases. Although many of the preventative measures such as restrictions on international travel have been recently relaxed, the number of infections continues to be high, and the duration and extent of the economic impact of COVID-19 still remain highly uncertain.
In addition, the global economy has recently been impacted by Russia’s large-scale military activity against Ukraine that was initiated in February 2022 and the related economic sanctions imposed on certain Russian entities and persons by many major countries. In particular, financial and commodity markets have experienced significant volatility and energy prices have sharply increased mainly due to concerns regarding disruptions in oil and natural gas supply. Driven in part by increases in energy prices as well as increases in raw materials prices, there has been a significant inflationary trend in consumer prices in many major economies including Japan, and monetary authorities in some major economies have been tightening monetary policy in response to this trend. Depending on how the conflict develops and any additional economic sanctions imposed on Russia, as well as the impact of inflation and monetary policy developments and economic conditions in Japan and globally may be negatively impacted for an uncertain period of time.
Specifically with respect to Japan, the year-on-year rate of increase in the consumer price index (the “CPI”) (all items less fresh food) is expected to be relatively high over the short term due to the effects of cost increases, led by a rise in import prices, being passed through to consumers. The Japanese government’s measures to reduce the household burden of higher gasoline prices, electricity charges, and manufactured and piped gas charges are expected to push down the year-on-year rate of change in the CPI (all items less fresh food) during the first half of fiscal 2023.
Thereafter, inflation is projected to moderately increase on the back of improvement in the output gap, rises in medium- to long-term inflation expectations and in wage growth and the waning effects of economic measures pushing down energy prices.
While it is not clear how inflation will affect the Japanese yen, consumer and industrial prices in Japan, it is possible that inflationary trends may negatively affect the Japanese economy.
12
Table of Contents
Summary of Key Economic Indicators
The following tables set forth information regarding certain of Japan’s key economic indicators for the periods indicated:
JFY 2017 | JFY 2018 | JFY 2019 | JFY 2020 | JFY 2021 | ||||||||||||||||
(yen amounts in billions, except percentages and index) | ||||||||||||||||||||
Percentage Changes of GDP from Previous Year | ||||||||||||||||||||
At Nominal Prices | 2.0 | % | 0.2 | % | 0.0 | % | -3.5 | % | 2.4 | % | ||||||||||
At Real Prices(a) | 1.8 | 0.2 | -0.8 | -4.1 | 2.5 | |||||||||||||||
Total Revenues of Consolidated General and Special Accounts | ¥ | 244,729 | ¥ | 243,868 | ¥ | 251,292 | ¥ | 353,277 | ¥ | 322,651 | ||||||||||
Total Expenditures of Consolidated General and Special Accounts | 229,389 | 226,661 | 232,905 | 305,846 | 285,348 | |||||||||||||||
Surplus of Consolidated Revenues over Consolidated Expenditures | 15,340 | 17,206 | 18,387 | 47,431 | 37,303 | |||||||||||||||
Public Debt | 934,321 | 954,863 | 965,926 | 993,542 | 1,037,735 |
(a) | Real prices are based on calendar year 2015. |
Source: Economic and Social Research Institute; Cabinet Office; and Ministry of Finance.
2017 | 2018 | 2019 | 2020 | 2021 | 2022 | |||||||||||||||||||
(yen or dollar amounts in billions, except percentages and index) | ||||||||||||||||||||||||
Unemployment Rate | 2.8 | % | 2.4 | % | 2.4 | % | 2.8 | % | 2.8 | % | — | |||||||||||||
Consumer Price Index(a) | 98.6 | 99.5 | 100.0 | 100.0 | 99.8 | 102.3 | ||||||||||||||||||
Annual Change | 0.5 | % | 1.0 | % | 0.5 | % | 0.0 | % | -0.2 | % | 2.5 | % | ||||||||||||
Corporate Goods Price Index(b) | 98.4 | 101.0 | 101.2 | 100.0 | 104.6 | 114.7 | ||||||||||||||||||
Annual Change | 2.3 | % | 2.6 | % | 0.2 | % | -1.2 | % | 4.6 | % | 9.7 | % | ||||||||||||
Current Account regarding Balance of Payments | ¥ | 22,778 | ¥ | 19,505 | ¥ | 19,251 | ¥ | 15,674 | ¥ | 15,488 | — | |||||||||||||
Official Foreign Exchange Reserves | $ | 1,264 | $ | 1,271 | $ | 1,324 | $ | 1,395 | $ | 1,406 | $ | 1,228 |
(a) | Calendar year 2020 = 100. |
(b) | Calendar year 2020 = 100. Indices are calculated using the monthly averages. |
Source: Ministry of Internal Affairs and Communications “Labor Force Survey”; Consumer Price Index, Statistics Bureau, Ministry of Internal Affairs and Communications; Domestic Corporate Goods Price Index, Bank of Japan; and Ministry of Finance.
Gross Domestic Product and National Income
In December 2016, the methodology of calculating Japan’s GDP was revised to implement the System of National Accounts 2008 (2008 SNA), the latest version of the international statistical standard for the national accounts adopted by the United Nations Statistical Commission, as well as other changes. In December 2020, the methodology of calculating Japan’s GDP was further revised to change the benchmark year for real prices from 2011 to 2015. Revised GDP figures based on this methodology were published for prior years starting from JFY 1994. The GDP figures set forth in the tables below reflect this revised methodology.
13
Table of Contents
The following table sets forth information pertaining to Japan’s gross domestic product for JFY 2017 through JFY 2021. Nominal GDP increased by 2.4% during JFY 2021, and the annual growth rate of real GDP was 2.5%. While the duration and extent of the economic impact of COVID-19 remain highly uncertain, it is likely that the continued spread of COVID-19 will have a significant negative impact on the Japanese economy, including with respect to nominal and real GDP.
Gross Domestic Product
JFY 2017 | JFY 2018 | JFY 2019 | JFY 2020 | JFY 2021 | Percentage of JFY 2021 GDP | |||||||||||||||||||
(yen amounts in billions) | ||||||||||||||||||||||||
Total Consumption | ||||||||||||||||||||||||
Private sectors | ¥ | 303,006 | ¥ | 304,774 | ¥ | 303,859 | ¥ | 288,505 | ¥ | 296,250 | 53.8 | % | ||||||||||||
Public sectors | 107,707 | 109,089 | 111,827 | 113,798 | 118,968 | 21.6 | ||||||||||||||||||
|
|
|
|
|
|
|
|
|
|
|
| |||||||||||||
410,713 | 413,863 | 415,686 | 402,303 | 415,217 | 75.4 | |||||||||||||||||||
Total Gross Capital Formation | ||||||||||||||||||||||||
Private sectors | ||||||||||||||||||||||||
Producers’ Durable Equipment | 90,183 | 92,386 | 91,643 | 86,041 | 90,079 | 16.4 | ||||||||||||||||||
Residential Construction | 21,248 | 20,539 | 21,393 | 19,869 | 21,129 | 3.8 | ||||||||||||||||||
Public sectors | 27,687 | 28,391 | 29,297 | 30,839 | 29,807 | 5.4 | ||||||||||||||||||
|
|
|
|
|
|
|
|
|
|
|
| |||||||||||||
139,118 | 141,315 | 142,332 | 136,749 | 141,015 | 25.6 | |||||||||||||||||||
Additions to Business Inventories | ||||||||||||||||||||||||
Private sectors | 1,748 | 2,212 | 883 | -961 | 1,106 | 0.2 | ||||||||||||||||||
Public sectors | 89 | -71 | -5 | -101 | -90 | -0.0 | ||||||||||||||||||
|
|
|
|
|
|
|
|
|
|
|
| |||||||||||||
1,838 | 2,141 | 878 | -1,062 | 1,016 | 0.2 | |||||||||||||||||||
Net Exports of Goods and Services | 4,044 | -749 | -2,060 | -429 | -6,718 | -1.2 | ||||||||||||||||||
|
|
|
|
|
|
|
|
|
|
|
| |||||||||||||
Nominal Gross Domestic Expenditures | ¥ | 555,713 | ¥ | 556,571 | ¥ | 556,836 | ¥ | 537,562 | ¥ | 550,530 | 100.0 | % | ||||||||||||
|
|
|
|
|
|
|
|
|
|
|
| |||||||||||||
Real Gross Domestic Expenditures(b) | ¥ | 553,174 | ¥ | 554,546 | ¥ | 550,131 | ¥ | 527,388 | ¥ | 540,796 | ||||||||||||||
|
|
|
|
|
|
|
|
|
| |||||||||||||||
Surplus of the Nation on Current Account | ||||||||||||||||||||||||
Exports of Goods and Services and Other Receipts from Abroad | 31,346 | 33,864 | 34,329 | 29,794 | 41,193 | |||||||||||||||||||
Less: Imports of Goods and Services and Other Payments Abroad | 11,026 | 12,153 | 12,483 | 10,156 | 11,943 | |||||||||||||||||||
|
|
|
|
|
|
|
|
|
| |||||||||||||||
20,320 | 21,712 | 21,847 | 19,639 | 29,251 | ||||||||||||||||||||
|
|
|
|
|
|
|
|
|
| |||||||||||||||
Gross National Income | ¥ | 576,033 | ¥ | 578,282 | ¥ | 578,683 | ¥ | 557,200 | ¥ | 579,781 | ||||||||||||||
Percentage Changes of GDP from Previous Year | ||||||||||||||||||||||||
At Nominal Prices | 2.0 | % | 0.2 | % | 0.0 | % | -3.5 | % | 2.4 | % | ||||||||||||||
At Real Prices(b) | 1.8 | 0.2 | -0.8 | -4.1 | 2.5 | |||||||||||||||||||
Deflator(C) | 0.2 | -0.1 | 0.9 | 0.7 | -0.1 |
(a) | GDP financial data are subject to change. |
(b) | Real prices are based on calendar year 2015. |
(c) | Deflator is a price index used to convert nominal prices into real prices. Deflator is derived by dividing nominal GDP by real GDP. |
Source: Economic and Social Research Institute, Cabinet Office.
14
Table of Contents
The following table sets forth information pertaining to Japan’s gross domestic product, as seasonally adjusted, for each of the eight quarters ended September 30, 2022.
Quarterly Gross Domestic Product(a) | ||||||||||||||||||||||||||||||||
2020 | 2021 | 2022 | ||||||||||||||||||||||||||||||
Fourth Quarter | First Quarter | Second Quarter | Third Quarter | Fourth Quarter | First Quarter | Second Quarter | Third Quarter | |||||||||||||||||||||||||
(yen amounts in billions) | ||||||||||||||||||||||||||||||||
Nominal Gross Domestic Expenditures(b) | ¥ | 548,689 | ¥ | 548,493 | ¥ | 550,578 | ¥ | 547,268 | ¥ | 551,927 | ¥ | 552,910 | ¥ | 558,196 | ¥ | 554,126 | ||||||||||||||||
|
|
|
|
|
|
|
|
|
|
|
|
|
|
|
| |||||||||||||||||
Real Gross Domestic Expenditures(b)(c) | ¥ | 539,388 | ¥ | 538,623 | ¥ | 540,376 | ¥ | 537,937 | ¥ | 544,416 | ¥ | 541,965 | ¥ | 547,946 | ¥ | 546,815 | ||||||||||||||||
|
|
|
|
|
|
|
|
|
|
|
|
|
|
|
| |||||||||||||||||
Percentage Changes of GDP from the Previous Quarter | ||||||||||||||||||||||||||||||||
At Nominal Prices(d) | 1.7 | % | -0.0 | % | 0.4 | % | -0.6 | % | 0.9 | % | 0.2 | % | 1.0 | % | -0.7 | % | ||||||||||||||||
At Real Prices(c)(d) | 1.9 | -0.1 | 0.3 | -0.5 | 1.2 | -0.5 | 1.1 | -0.2 | ||||||||||||||||||||||||
Deflator(e) | -0.2 | 0.1 | 0.1 | -0.2 | -0.3 | 0.6 | -0.1 | -0.5 |
(a) | Quarterly GDP financial data are subject to change. |
(b) | Numbers are based on seasonally-adjusted GDP figures. |
(c) | Real prices are based on calendar year 2015. |
(d) | Percentage changes are based on seasonally-adjusted GDP figures. |
(e) | Deflator is a price index used to convert nominal prices into real prices. Deflator is derived by dividing nominal GDP by real GDP. |
Source: Economic and Social Research Institute, Cabinet Office.
Per Capita Gross Domestic Product
The following table indicates per capita gross domestic product for the last five years:
Per Capita GDP | ||||||||
Fiscal Year | Amount (in thousands of yen) | Year-on-year change (%) | ||||||
2017 | ¥ | 4,379 | 2.1 | |||||
2018 | 4,392 | 0.3 | ||||||
2019 | 4,401 | 0.2 | ||||||
2020 | 4,261 | -3.2 | ||||||
2021 | 4,386 | 2.9 | ||||||
Source: Economic and Social Research Institute, Cabinet Office. |
National Income
The following table sets forth national income for calendar year 2017 through calendar year 2021.
National Income | ||||||||||||||||||||
2017 | 2018 | 2019 | 2020 | 2021 | ||||||||||||||||
(yen amounts in billions) | ||||||||||||||||||||
Domestic Factor Income | ¥ | 380,613 | ¥ | 381,191 | ¥ | 379,551 | ¥ | 357,831 | ¥ | 365,220 | ||||||||||
Net Income from Abroad | 20,461 | 21,289 | 21,857 | 19,576 | 26,669 | |||||||||||||||
|
|
|
|
|
|
|
|
|
| |||||||||||
National Income at Factor Cost | ¥ | 401,074 | ¥ | 402,481 | ¥ | 401,408 | ¥ | 377,407 | ¥ | 391,888 | ||||||||||
|
|
|
|
|
|
|
|
|
| |||||||||||
Percentage Changes of Income at Factor Cost from Previous Year | 2.0 | % | 0.4 | % | (0.3 | )% | (6.0 | )% | 3.8 | % |
Source: Economic and Social Research Institute, Cabinet Office.
15
Table of Contents
Industry
The following table sets forth the proportion of gross domestic product contributed by major industrial sectors of the economy for calendar year 2017 through calendar year 2021.
GDP by Industrial Sectors (at nominal prices)
2017 | 2018 | 2019 | 2020 | 2021 | ||||||||||||||||
Industry | ||||||||||||||||||||
Agriculture, forestry and fishing | 1.1 | % | 1.0 | % | 1.0 | % | 1.0 | % | 1.0 | % | ||||||||||
Mining | 0.1 | 0.1 | 0.1 | 0.1 | 0.1 | |||||||||||||||
Manufacturing | 20.4 | 20.6 | 20.2 | 20.0 | 20.5 | |||||||||||||||
Electricity, gas and water supply and waste management service | 2.9 | 2.9 | 3.1 | 3.2 | 2.8 | |||||||||||||||
Construction | 5.4 | 5.4 | 5.5 | 5.7 | 5.5 | |||||||||||||||
Wholesale and retail trade | 13.0 | 12.7 | 12.4 | 12.7 | 13.6 | |||||||||||||||
Transport and postal services | 5.3 | 5.3 | 5.4 | 4.2 | 4.1 | |||||||||||||||
Accommodation and food service activities | 2.6 | 2.6 | 2.5 | 1.7 | 1.4 | |||||||||||||||
Information and communications | 4.8 | 4.9 | 4.9 | 5.1 | 5.1 | |||||||||||||||
Finance and insurance | 4.0 | 4.1 | 4.0 | 4.2 | 4.3 | �� | ||||||||||||||
Real estate | 11.8 | 11.7 | 11.8 | 12.2 | 11.9 | |||||||||||||||
Professional, scientific and technical activities | 8.0 | 8.1 | 8.3 | 8.7 | 8.8 | |||||||||||||||
Public administration | 4.9 | 4.9 | 5.0 | 5.2 | 5.1 | |||||||||||||||
Education | 3.4 | 3.4 | 3.5 | 3.5 | 3.5 | |||||||||||||||
Human health and social work activities | 7.6 | 7.7 | 7.8 | 8.2 | 8.3 | |||||||||||||||
Other service activities | 4.1 | 4.0 | 4.1 | 3.7 | 3.7 | |||||||||||||||
|
|
|
|
|
|
|
|
|
| |||||||||||
Total | 99.5 | % | 99.5 | % | 99.5 | % | 99.5 | % | 99.6 | % |
Source: Economic and Social Research Institute, Cabinet Office, Annual Report on National Accounts.
Energy
The following table sets forth the total amounts of primary energy supplied and the percentages supplied by different sources for JFY 2017 through JFY 2021.
JFY | Total Primary Energy Supplied (peta- joules) | Sources of Primary Energy Supplied(a) | ||||||||||||||||||||||
Oil | Coal | Nuclear | Natural Gas | Other | ||||||||||||||||||||
2017 | 20,098 | 39.0 | % | 25.1 | % | 1.4 | % | 23.4 | % | 11.1 | % | |||||||||||||
2018(b) | 19,720 | 37.6 | 25.1 | 2.8 | 22.9 | 11.7 | ||||||||||||||||||
2019(b) | 19,136 | 37.1 | 25.3 | 2.8 | 22.4 | 12.4 | ||||||||||||||||||
2020(b) | 17,961 | 36.4 | 24.6 | 1.8 | 23.8 | 13.4 | ||||||||||||||||||
2021(b) | 18,575 | 36.3 | 25.4 | 3.2 | 21.5 | 13.6 |
(a) | Figures represent the proportion of each source as a share of the domestic primary energy supplied. Domestic primary energy supplied is total primary energy supplied less exports and inventory adjustments. |
(b) | Standard heating value by energy source, which is used to create total primary energy supplied statistics, is revised every five years. Figures for 2018 through 2021 represent the revised standard heating value by energy source. |
Source: Agency for Natural Resources and Energy, Ministry of Economy, Trade and Industry, Report on Energy Supply and Demand.
Since JFY 2011, largely due to the effects of the Earthquake, the import of oil and natural gas as alternatives to nuclear energy increased significantly as the demand increased for power generation at thermal power stations.
16
Table of Contents
The table below sets forth information regarding crude oil imports for JFY 2017 through JFY 2021.
JFY 2017 | JFY 2018 | JFY 2019 | JFY 2020 | JFY 2021 | ||||||||||||||||
Volume of imports (thousand kilo-liters per day) | 501 | 475 | 471 | 385 | 403 | |||||||||||||||
Cost of imports (c.i.f. in billions of yen) | ¥ | 7,283 | ¥ | 8,721 | ¥ | 7,980 | ¥ | 4,058 | ¥ | 8,017 | ||||||||||
Average price (c.i.f. in yen kilo-liters) | ¥ | 39,828 | ¥ | 50,274 | ¥ | 46,389 | ¥ | 28,872 | ¥ | 54,515 |
Source: Customs and Tariff Bureau, Ministry of Finance.
Japan has historically depended on oil for most of its energy requirements and almost all its oil is imported, mostly from the Middle East. Oil price movements thus have a major impact on the domestic economy. Oil price has fluctuated significantly in recent years, reaching approximately ¥75,000 per kilo-liter in January 2014, then dropping below ¥37,000 per kilo-liter in February 2015, and increasing again to approximately ¥50,000 per kilo-liter in June 2015. In the first quarter of 2016, oil price dropped below ¥30,000 per kilo-liter due to oversupply and uncertainties regarding the Chinese economy. After the first quarter, oil price began increasing due to the mild recovery of the world economy and the OPEC agreement to reduce production. Although the oil price significantly declined soon after the outbreak of COVID-19 in 2020, below ¥20,000 per kilo-liter in May 2020, it has steadily increased since then, as the world economy has gradually recovered from the impact of COVID-19. Recently, the oil price has increased sharply to ¥82,444 per kilo-liter in December 2022, in part due to the conflict between Russia and Ukraine and the resulting disruption in the oil supply.
Japan has worked to reduce its dependence on oil by encouraging energy conservation and the use of alternative fuels. In addition, a restructuring of industry, with emphasis shifting from primary industries to processing and assembly type industries and from manufacturing industry to service industry, has also contributed to the reduction of oil consumption.
The following table sets forth information relating to total electric power generating capacity and electric power generation for JFY 2016 through JFY 2020.
JFY 2016 | JFY 2017 | JFY 2018 | JFY 2019 | JFY 2020 | ||||||||||||||||
(megawatts) | ||||||||||||||||||||
Electric power generating capacity(a): | ||||||||||||||||||||
Fossil Fuel | 194,669 | 193,462 | 193,026 | 189,784 | 191,758 | |||||||||||||||
Hydro-electric | 50,117 | 50,014 | 50,037 | 50,033 | 50,033 | |||||||||||||||
Nuclear | 41,482 | 39,132 | 38,042 | 33,083 | 3,308 | |||||||||||||||
Other | 13,092 | 16,600 | 18,988 | 20,997 | 23,677 | |||||||||||||||
|
|
|
|
|
|
|
|
|
| |||||||||||
Total | 299,362 | 299,209 | 300,093 | 293,897 | 298,550 | |||||||||||||||
|
|
|
|
|
|
|
|
|
| |||||||||||
(gigawatt-hours) | ||||||||||||||||||||
Electric power generation: | ||||||||||||||||||||
Fossil Fuel | 877,016 | 861,435 | 823,589 | 792,810 | 789,725 | |||||||||||||||
Nuclear | 17,300 | 31,278 | 62,109 | 61,035 | 37,011 | |||||||||||||||
Hydro-electric | 84,570 | 90,128 | 87,398 | 86,314 | 86,310 | |||||||||||||||
Other | 19,024 | 24,500 | 27,311 | 30,611 | 35,637 | |||||||||||||||
|
|
|
|
|
|
|
|
|
| |||||||||||
Total | 997,911 | 1,007,341 | 1,000,409 | 970,771 | 948,979 | |||||||||||||||
|
|
|
|
|
|
|
|
|
|
(a) | At the end of fiscal year—March 31 |
Source: Handbook of Electric Power Industry, Agency for Natural Resources and Energy, Ministry of Economy, Trade and Industry.
On October 26, 2020, former Prime Minister SUGA Yoshihide declared that Japan intends to achieve carbon neutrality by 2050. To this end, Japan aims to reduce greenhouse gas emissions to virtually zero by 2050 and realize a decarbonized society. On December 25, 2020, the government developed formulated a “Green Growth Strategy Through Achieving Carbon Neutrality in 2050,” which sets high goals for 14 key fields across
17
Table of Contents
energy, transportation/manufacturing and home/office industries. This strategy makes explicit current challenges and future actions by priority field, and formulates action plans covering comprehensive policies in areas such as budgets, taxes, regulation reforms and standardization, and international collaboration. In addition, on June 9, 2021, the government decided on a regional decarbonization roadmap that outlines the process and concrete measures for transitioning to decarbonized society. Based on this roadmap, the Japanese government intends to propagate decarbonization throughout Japan by creating at least 100 decarbonization leading areas by FY2030 and implementing priority measures that will serve as the foundation for decarbonization throughout Japan, especially through an intensive five-year period of policy implementation. The administration of the current Prime Minister, KISHIDA Fumio, has succeeded the policy of the former Prime Minister, SUGA Yoshihide. The Japanese government announced the “Basic Policy on Economic and Fiscal Management and Reform 2022” on June 7, 2022, which intends to focus on investment in green transformation (GX).
Price Indices
The table below sets forth information concerning changes in Japan’s corporate goods and consumer price indices for the periods indicated.
Corporate Goods Price Index(a) | Consumer Price Index(b) | |||||||||||||||
Index(c) | Annual % Change | Index | Annual % Change | |||||||||||||
2018 | 101.0 | 2.6 | 99.5 | 1.0 | ||||||||||||
2019 | 101.2 | 0.2 | 100.0 | 0.5 | ||||||||||||
2020 | 100.0 | -1.2 | 100.0 | 0.0 | ||||||||||||
2021 | 104.6 | 4.6 | 99.8 | -0.2 | ||||||||||||
2022 | 114.7 | 9.7 | 102.3 | 2.5 |
(a) | All commodities. Calendar year 2020 = 100. Source: Domestic Corporate Goods Price Index, Bank of Japan. |
(b) | General index. Calendar year 2020 = 100. Source: Consumer Price Index, Statistics Bureau, Ministry of Internal Affairs and Communications. |
(c) | Indices are calculated using the monthly averages. |
Labor
The number of employees increased from 2004 to 2007 and decreased from 2008 to 2012. After recovering in 2013, the number of employees increased from 2014 to 2019, followed by a decrease in 2020, the first in eight years. In 2020, the average employment was estimated at 67.1 million, of which 23.1% were employed in mining, manufacturing and construction, 3.2% were employed in agriculture, forestry and fisheries, and 73.8% were employed in services and other sectors. In 2021, the average employment was estimated at 67.1 million, of which 22.8% were employed in mining, manufacturing and construction, 3.1% were employed in agriculture, forestry and fisheries, and 74.1% were employed in services and other sectors. The unemployment rate (seasonally adjusted) in Japan gradually increased from 2008 to the middle of 2009, but has gradually decreased since the end of 2009. In 2020, the unemployment rate increased for the first time in eleven years. It ranged between 2.7% and 3.0% during 2021. The seasonally adjusted unemployment rate was 2.6% for July, 2.5% for August, 2.6% for September, 2.6% for October and 2.5% for November in 2022, the most recent five months for which statistics are available. Concerning short-term prospects, employment conditions in Japan are expected to continue to pick up while affected by the COVID-19 pandemic and the resulting disruption of business activities. However, both the duration and extent of the impact on employment in Japan remain highly uncertain.
18
Table of Contents
The following table indicates unemployment statistics for Japan for each of the last five years:
Calendar Year | Unemployment Rate (%) | |||
2017 | 2.8 | |||
2018 | 2.4 | |||
2019 | 2.4 | |||
2020 | 2.8 | |||
2021 | 2.8 |
Source: Ministry of Internal Affairs and Communications “Labor Force Survey”.
The table below sets forth information regarding wage index (total cash earnings (nominal)) and industrial production index (manufacturing and mining) for the periods indicated.
Wage Index(a) | Industrial Production Index(b) | |||||||||||||||
Calendar Year | Index(c) | Annual % Change | Index | Annual % Change | ||||||||||||
2017 | — | (d) | — | (d) | 103.1 | 3.1 | ||||||||||
2018 | 101.6 | 1.4 | 104.2 | 1.1 | ||||||||||||
2019 | 101.2 | -0.4 | 101.1 | -3.0 | ||||||||||||
2020 | 100.0 | -1.2 | 90.6 | -10.4 | ||||||||||||
2021 | 100.3 | 0.3 | 95.7 | 5.6 |
(a) | Calendar year 2020 = 100. Source: Monthly Labor Survey, Ministry of Health, Labor and Welfare. |
(b) | Calendar year 2015 = 100. Source: Ministry of Economy, Trade and Industry. |
(c) | Indices are calculated using the monthly averages. |
(d) | Information on calendar year 2017 is not available. |
The following table shows selected employment information by industry.
2017 | 2018 | 2019 | 2020 | 2021 | ||||||||||||||||
(all figures in percentages, except as indicated) | ||||||||||||||||||||
Employed persons (in thousands of persons) | 65,420 | 66,820 | 67,500 | 67,100 | 67,130 | |||||||||||||||
Employment by Industry: | ||||||||||||||||||||
Agriculture, forestry and fisheries | 3.38 | % | 3.41 | % | 3.29 | % | 3.17 | % | 3.10 | % | ||||||||||
Mining, manufacturing and construction | 23.78 | 23.53 | 23.26 | 23.06 | 22.84 | |||||||||||||||
Services and other sectors | 72.84 | 73.06 | 73.45 | 73.77 | 74.07 | |||||||||||||||
|
|
|
|
|
|
|
|
|
| |||||||||||
Total | 100.0 | % | 100.0 | % | 100.0 | % | 100.0 | % | 100.0 | % |
Source: Ministry of Internal Affairs and Communications “Labor Force Survey”.
19
Table of Contents
The following table shows employment rate by age and gender.
2017 | 2018 | 2019 | 2020 | 2021 | ||||||||||||||||
(all figures in percentages) | ||||||||||||||||||||
Total | 58.8 | % | 60.0 | % | 60.6 | % | 60.3 | % | 60.4 | % | ||||||||||
Employment rate by age: | ||||||||||||||||||||
15 - 64 years old | 75.3 | 76.8 | 77.7 | 77.3 | 77.7 | |||||||||||||||
15 - 24 years old | 42.5 | 45.9 | 47.5 | 46.4 | 46.6 | |||||||||||||||
25 - 34 years old | 83.6 | 84.8 | 85.3 | 85.1 | 86.0 | |||||||||||||||
35 - 44 years old | 83.6 | 85.0 | 85.6 | 85.0 | 85.4 | |||||||||||||||
45 - 54 years old | 85.1 | 85.7 | 86.4 | 86.0 | 86.0 | |||||||||||||||
55 - 64 years old | 73.4 | 75.2 | 76.3 | 76.7 | 77.0 | |||||||||||||||
55 - 59 years old | 81.0 | 81.7 | 82.3 | 82.2 | 82.1 | |||||||||||||||
60 - 64 years old | 66.2 | 68.8 | 70.3 | 71.0 | 71.5 | |||||||||||||||
65 and over | 23.0 | 24.3 | 24.9 | 25.1 | 25.1 | |||||||||||||||
65 - 69 years old | 44.3 | 46.6 | 48.4 | 49.6 | 50.3 | |||||||||||||||
70 - 74 years old | 27.2 | 30.2 | 32.2 | 32.5 | 32.6 | |||||||||||||||
75 and over | 9.0 | 9.8 | 10.3 | 10.4 | 10.5 | |||||||||||||||
25 - 44 years old | 83.6 | 84.9 | 85.5 | 85.0 | 85.7 | |||||||||||||||
Employment rate by gender: | ||||||||||||||||||||
Male | 68.4 | 69.3 | 69.7 | 69.3 | 69.1 | |||||||||||||||
Female | 49.8 | 51.3 | 52.2 | 51.8 | 52.2 |
Source: Ministry of Internal Affairs and Communications “Labor Force Survey”.
The following table shows employment data by type of employment.
2017 | 2018 | 2019 | 2020 | 2021 | ||||||||||||||||
(in thousands of persons) | ||||||||||||||||||||
Employee (except for executive of company or corporation) | 54,740 | 56,170 | 56,880 | 56,550 | 56,620 | |||||||||||||||
Regular employee | 34,340 | 34,920 | 35,150 | 35,560 | 35,870 | |||||||||||||||
Non-regular employee | 20,400 | 21,260 | 21,730 | 21,000 | 20,750 |
Source: Ministry of Internal Affairs and Communications “Labor Force Survey”.
Aging Workforce and Population Decrease
One of the risks that the Japanese economy bears is the issue of the aging of the population accompanied with an overall population decrease. Population aging and decrease have placed downward pressure on economic growth. The negative impact can be reduced by enhancing productivity and competitiveness through the further opening of the Japanese economy to the world. These trends have an impact not only on the macro growth rate but also on consumption patterns (such as the older generations spending more than younger generations on service consumption) and, consequently, the country’s economic structure.
The impact of the aging and shrinking population on Japan’s fiscal structure looms as a long-term risk. Social security benefit payments under the current system continues to increase. The ratio of pensions to national income are expected to remain at the same level, but that of welfare including medical benefits and nursing-care benefits have continuously increased and is expected to further grow. Population aging and decrease will thus modify the Japanese revenue structure. Furthermore, amid increasing capital mobility, it is imperative for Japan to foster an environment attractive to business enterprises. Under these circumstances, it has become more and more difficult to impose additional tax burdens on the income of individuals and corporations. The effects of the aging and shrinkage of the population would also be prominent in Japan’s regional economies.
20
Table of Contents
The following table indicates the age distribution of Japan’s population:
Population and Percentage distribution by Age (5-Year Age Group)
Both sex | ||||||||||||||||||||
Age groups | 2017 | 2018 | 2019 | 2020 | 2021 | |||||||||||||||
Population (in thousands of persons) | ||||||||||||||||||||
Total | 126,706 | 126,443 | 126,167 | 126,146 | 125,502 | |||||||||||||||
0 - 4 years old | 4,909 | 4,838 | 4,758 | 4,541 | 4,389 | |||||||||||||||
5 - 9 | 5,251 | 5,184 | 5,101 | 5,114 | 5,038 | |||||||||||||||
10 - 14 | 5,432 | 5,392 | 5,351 | 5,376 | 5,357 | |||||||||||||||
15 - 19 | 5,995 | 5,907 | 5,820 | 5,706 | 5,580 | |||||||||||||||
20 - 24 | 6,228 | 6,330 | 6,388 | 6,320 | 6,263 | |||||||||||||||
25 - 29 | 6,291 | 6,223 | 6,240 | 6,384 | 6,379 | |||||||||||||||
30 - 34 | 7,112 | 6,936 | 6,752 | 6,714 | 6,556 | |||||||||||||||
35 - 39 | 7,884 | 7,694 | 7,551 | 7,498 | 7,354 | |||||||||||||||
40 - 44 | 9,443 | 9,093 | 8,718 | 8,476 | 8,173 | |||||||||||||||
45 - 49 | 9,457 | 9,666 | 9,802 | 9,868 | 9,732 | |||||||||||||||
50 - 54 | 8,156 | 8,360 | 8,567 | 8,738 | 9,252 | |||||||||||||||
55 - 59 | 7,592 | 7,651 | 7,711 | 7,940 | 7,824 | |||||||||||||||
60 - 64 | 7,804 | 7,591 | 7,523 | 7,442 | 7,391 | |||||||||||||||
65 - 69 | 9,921 | 9,368 | 8,709 | 8,236 | 7,869 | |||||||||||||||
70 - 74 | 7,749 | 8,234 | 8,686 | 9,189 | 9,672 | |||||||||||||||
75 - 79 | 6,738 | 6,932 | 7,241 | 7,065 | 6,712 | |||||||||||||||
80 - 84 | 5,293 | 5,347 | 5,328 | 5,404 | 5,563 | |||||||||||||||
85 - 89 | 3,396 | 3,514 | 3,612 | 3,742 | 3,872 | |||||||||||||||
90 - 94 | 1,582 | 1,674 | 1,761 | 1,811 | 1,904 | |||||||||||||||
95 - 99 | 405 | 439 | 479 | 500 | 537 | |||||||||||||||
100 and over | 67 | 69 | 69 | 80 | 85 | |||||||||||||||
Regrouped | ||||||||||||||||||||
0 - 14 years old | 15,592 | 15,415 | 15,210 | 15,032 | 14,784 | |||||||||||||||
15 - 64 | 75,962 | 75,451 | 75,072 | 75,088 | 74,504 | |||||||||||||||
65 and over | 35,152 | 35,578 | 35,885 | 36,027 | 36,214 | |||||||||||||||
65 - 74 years old | 17,670 | 17,603 | 17,395 | 17,425 | 17,540 | |||||||||||||||
75 and over | 17,482 | 17,975 | 18,490 | 18,602 | 18,674 |
21
Table of Contents
Both sex | ||||||||||||||||||||
Age groups | 2017 | 2018 | 2019 | 2020 | 2021 | |||||||||||||||
Percentage Distribution (%) | ||||||||||||||||||||
Total | 100.00 | 100.00 | 100.00 | 100.00 | 100.00 | |||||||||||||||
0 - 4 years old | 3.87 | 3.83 | 3.77 | 3.60 | 3.50 | |||||||||||||||
5 - 9 | 4.14 | 4.10 | 4.04 | 4.05 | 4.01 | |||||||||||||||
10 - 14 | 4.29 | 4.26 | 4.24 | 4.26 | 4.27 | |||||||||||||||
15 - 19 | 4.73 | 4.67 | 4.61 | 4.52 | 4.45 | |||||||||||||||
20 - 24 | 4.92 | 5.01 | 5.06 | 5.01 | 4.99 | |||||||||||||||
25 - 29 | 4.97 | 4.92 | 4.95 | 5.06 | 5.08 | |||||||||||||||
30 - 34 | 5.61 | 5.49 | 5.35 | 5.32 | 5.22 | |||||||||||||||
35 - 39 | 6.22 | 6.08 | 5.98 | 5.94 | 5.86 | |||||||||||||||
40 - 44 | 7.45 | 7.19 | 6.91 | 6.72 | 6.51 | |||||||||||||||
45 - 49 | 7.46 | 7.64 | 7.77 | 7.82 | 7.75 | |||||||||||||||
50 - 54 | 6.44 | 6.61 | 6.79 | 6.93 | 7.37 | |||||||||||||||
55 - 59 | 5.99 | 6.05 | 6.11 | 6.29 | 6.23 | |||||||||||||||
60 - 64 | 6.16 | 6.00 | 5.96 | 5.90 | 5.89 | |||||||||||||||
65 - 69 | 7.83 | 7.41 | 6.90 | 6.53 | 6.27 | |||||||||||||||
70 - 74 | 6.12 | 6.51 | 6.88 | 7.28 | 7.71 | |||||||||||||||
75 - 79 | 5.32 | 5.48 | 5.74 | 5.60 | 5.35 | |||||||||||||||
80 - 84 | 4.18 | 4.23 | 4.22 | 4.28 | 4.43 | |||||||||||||||
85 - 89 | 2.68 | 2.78 | 2.86 | 2.97 | 3.09 | |||||||||||||||
90 - 94 | 1.25 | 1.32 | 1.40 | 1.44 | 1.52 | |||||||||||||||
95 - 99 | 0.32 | 0.35 | 0.38 | 0.40 | 0.43 | |||||||||||||||
100 and over | 0.05 | 0.05 | 0.05 | 0.06 | 0.07 | |||||||||||||||
Regrouped | ||||||||||||||||||||
0 - 14 years old | 12.31 | 12.19 | 12.06 | 11.92 | 11.78 | |||||||||||||||
15 - 64 | 59.95 | 59.67 | 59.50 | 59.52 | 59.36 | |||||||||||||||
65 and over | 27.74 | 28.14 | 28.44 | 28.56 | 28.86 | |||||||||||||||
65 - 74 years old | 13.95 | 13.92 | 13.79 | 13.81 | 13.98 | |||||||||||||||
75 and over | 13.80 | 14.22 | 14.66 | 14.75 | 14.88 |
If the population of Japan continues to decrease, it may have a material adverse impact on Japan’s overall socioeconomics in the future, including with respect to economic scale, standard of living and sustainability of the social security system.
22
Table of Contents
FOREIGN TRADE AND BALANCE OF PAYMENTS
Foreign Trade
Japan is one of the leading trading nations of the world, ranking fifth to China, the United States, Germany and the Netherlands in merchandise exports and ranking fourth to the United States, China and Germany in merchandise imports among the IMF member countries in 2021.
In 2021, Japan had a trade deficit of ¥1,784 billion due to an increase in imports including crude oil and non-ferrous metals, which was partially offset by an increase in exports including steel and automobile parts. In 2022, Japan had a trade deficit of ¥19,971 billion. However, the impact of the global COVID-19 pandemic and potential international trade disruptions resulting from the conflict between Russia and Ukraine on exports, imports and the overall trade balance is highly uncertain.
The following tables set forth information relating to foreign trade for the years indicated. In these tables exports are stated on an f.o.b. basis and imports on a c.i.f. basis. Monetary figures are based on actual movements of goods as calculated by the Ministry of Finance. (This method of computation differs from that used in calculating balance of payments, in which both exports and imports are stated on an f.o.b. basis.)
Foreign Trade of Japan
Value Index(a) | Quantum Index(a) | Unit Value Index(a) | Terms of Trade(b) | |||||||||||||||||||||||||
Exports | Imports | Exports | Imports | Exports | Imports | Index | ||||||||||||||||||||||
2017 | 103.5 | 96.1 | 105.9 | 102.9 | 97.8 | 93.4 | 104.7 | |||||||||||||||||||||
2018 | 107.8 | 105.5 | 107.7 | 105.8 | 100.1 | 99.7 | 100.4 | |||||||||||||||||||||
2019 | 101.7 | 100.2 | 103.0 | 104.6 | 98.8 | 95.9 | 103.0 | |||||||||||||||||||||
2020 | 90.5 | 86.7 | 91.0 | 97.9 | 99.4 | 88.6 | 112.2 | |||||||||||||||||||||
2021 | 109.9 | 108.3 | 101.9 | 102.8 | 107.8 | 105.3 | 102.6 |
(a) | Calendar year 2015=100. |
(b) | Unit value index of exports divided by unit value index of imports, multiplied by 100. |
Source: Japan Tariff Association, Ministry of Finance.
23
Table of Contents
Composition of Japan’s Exports and Imports
2017 | 2018 | 2019 | 2020 | 2021 | ||||||||||||||||||||||||||||||||||||
(yen amounts in billions) | ||||||||||||||||||||||||||||||||||||||||
JAPAN’S EXPORTS | ||||||||||||||||||||||||||||||||||||||||
Textile Products | ¥ | 886 | 1.1 | % | ¥ | 901 | 1.1 | % | ¥ | 886 | 1.2 | % | ¥ | 754 | 1.1 | % | ¥ | 862 | 1.0 | % | ||||||||||||||||||||
Metals and Metal Products | 5,907 | 7.5 | 6,257 | 7.7 | 5,659 | 7.4 | 5,204 | 7.6 | 7,140 | 8.6 | ||||||||||||||||||||||||||||||
Machinery and Equipment: | ||||||||||||||||||||||||||||||||||||||||
Ships | 1,322 | 1.7 | 1,368 | 1.7 | 1,493 | 1.9 | 1,142 | 1.7 | 1,050 | 1.3 | ||||||||||||||||||||||||||||||
Motor Vehicles | 11,825 | 15.1 | 12,307 | 15.1 | 11,971 | 15.6 | 9,580 | 14.0 | 10,722 | 12.9 | ||||||||||||||||||||||||||||||
TV and Radio Receivers | 107 | 0.1 | 117 | 0.1 | 116 | 0.2 | 89 | 0.1 | 96 | 0.1 | ||||||||||||||||||||||||||||||
Motorcycles | 320 | 0.4 | 337 | 0.4 | 267 | 0.3 | 225 | 0.3 | 307 | 0.4 | ||||||||||||||||||||||||||||||
Scientific and Optical Instruments | 2,416 | 3.1 | 2,314 | 2.8 | 2,130 | 2.8 | 1,968 | 2.9 | 2,322 | 2.8 | ||||||||||||||||||||||||||||||
Other(a) | 34,143 | 43.6 | 35,501 | 43.6 | 32,700 | 42.5 | 29,532 | 43.2 | 35,803 | 43.1 | ||||||||||||||||||||||||||||||
|
|
|
|
|
|
|
|
|
|
|
|
|
|
|
|
|
|
|
| |||||||||||||||||||||
Total Machinery and Equipment | 50,133 | 64.0 | 51,944 | 63.8 | 48,678 | 63.3 | 42,536 | 62.2 | 50,300 | 60.5 | ||||||||||||||||||||||||||||||
Chemicals | 8,192 | 10.5 | 8,922 | 10.9 | 8,739 | 11.4 | 8,534 | 12.5 | 10,552 | 12.7 | ||||||||||||||||||||||||||||||
Foods and Beverages | 645 | 0.8 | 741 | 0.9 | 754 | 1.0 | 790 | 1.2 | 992 | 1.2 | ||||||||||||||||||||||||||||||
Other Exports(b) | 12,524 | 16.0 | 12,714 | 15.6 | 12,216 | 15.9 | 10,581 | 15.5 | 13,244 | 15.9 | ||||||||||||||||||||||||||||||
|
|
|
|
|
|
|
|
|
|
|
|
|
|
|
|
|
|
|
| |||||||||||||||||||||
Grand Total | ¥ | 78,286 | 100.0 | % | ¥ | 81,479 | 100.0 | % | ¥ | 76,932 | 100.0 | % | ¥ | 68,399 | 100.0 | % | ¥ | 83,091 | 100.0 | % | ||||||||||||||||||||
|
|
|
|
|
|
|
|
|
|
|
|
|
|
|
|
|
|
|
| |||||||||||||||||||||
JAPAN’S IMPORTS | ||||||||||||||||||||||||||||||||||||||||
Foods and Beverages | ¥ | 7,018 | 9.3 | % | ¥ | 7,247 | 8.8 | % | ¥ | 7,192 | 9.1 | % | ¥ | 6,679 | 9.8 | % | ¥ | 7,383 | 8.7 | % | ||||||||||||||||||||
Raw Materials | 4,725 | 6.3 | 4,992 | 6.0 | 4,861 | 6.2 | 4,682 | 6.9 | 6,936 | 8.2 | ||||||||||||||||||||||||||||||
Chemicals | 7,567 | 10.0 | 8,550 | 10.3 | 8,163 | 10.4 | 7,859 | 11.6 | 9,769 | 11.5 | ||||||||||||||||||||||||||||||
Mineral Fuels: | ||||||||||||||||||||||||||||||||||||||||
Petroleum | 7,155 | 9.5 | 8,906 | 10.8 | 7,969 | 10.1 | 4,646 | 6.8 | 6,929 | 8.2 | ||||||||||||||||||||||||||||||
Coal | 2,570 | 3.4 | 2,812 | 3.4 | 2,528 | 3.2 | 1,708 | 2.5 | 2,801 | 3.3 | ||||||||||||||||||||||||||||||
Other(c) | 6,115 | 8.1 | 7,576 | 9.2 | 6,453 | 8.2 | 4,900 | 7.2 | 7,277 | 8.6 | ||||||||||||||||||||||||||||||
|
|
|
|
|
|
|
|
|
|
|
|
|
|
|
|
|
|
|
| |||||||||||||||||||||
Total Mineral Fuel | 15,840 | 21.0 | 19,294 | 23.3 | 16,951 | 21.6 | 11,254 | 16.5 | 17,007 | 20.0 | ||||||||||||||||||||||||||||||
Machinery and Equipment | 24,490 | 32.5 | 25,952 | 31.4 | 25,319 | 32.2 | 22,973 | 33.8 | 26,766 | 31.5 | ||||||||||||||||||||||||||||||
Other Imports(d) | 15,740 | 20.9 | 16,669 | 20.2 | 16,114 | 20.5 | 14,564 | 21.4 | 17,014 | 20.0 | ||||||||||||||||||||||||||||||
|
|
|
|
|
|
|
|
|
|
|
|
|
|
|
|
|
|
|
| |||||||||||||||||||||
Grand Total | ¥ | 75,379 | 100.0 | % | ¥ | 82,703 | 100.0 | % | ¥ | 78,600 | 100.0 | % | ¥ | 68,011 | 100.0 | % | ¥ | 84,875 | 100.0 | % | ||||||||||||||||||||
|
|
|
|
|
|
|
|
|
|
|
|
|
|
|
|
|
|
|
|
(a) | This category includes general machinery, electronic components including semiconductors and electronic equipment including electronic circuit. |
(b) | This category includes raw materials, mineral fuels and vehicle parts. |
(c) | This category includes liquid natural gas and petroleum products. |
(d) | This category includes clothing and accessories thereof, non-ferrous metal and scientific and optical instruments. |
Source: The Summary Report on Trade of Japan, Japan Tariff Association, Ministry of Finance.
24
Table of Contents
Geographic Distribution of Japan’s Exports and Imports
2018 | 2019 | 2020 | 2021 | 2022 | ||||||||||||||||||||||||||||||||||||
(yen amounts in billions) | ||||||||||||||||||||||||||||||||||||||||
JAPAN’S EXPORTS | ||||||||||||||||||||||||||||||||||||||||
Asia | ¥ | 44,736 | 54.9 | % | ¥ | 41,327 | 53.7 | % | ¥ | 39,220 | 57.3 | % | ¥ | 48,158 | 58.0 | % | ¥55,411 | 56.4 | % | |||||||||||||||||||||
China | 15,898 | 19.5 | 14,682 | 19.1 | 15,082 | 22.1 | 17,984 | 21.6 | 19,007 | 19.4 | ||||||||||||||||||||||||||||||
(Asia NIES) | 16,888 | 20.7 | 15,597 | 20.3 | 14,808 | 21.6 | 17,849 | 21.5 | 21,260 | 21.7 | ||||||||||||||||||||||||||||||
(ASEAN) | 12,634 | 15.5 | 11,578 | 15.1 | 9,843 | 14.4 | 12,461 | 15.0 | 15,545 | 15.8 | ||||||||||||||||||||||||||||||
Oceania | 2,402 | 2.9 | 2,053 | 2.7 | 1,688 | 2.5 | 2,194 | 2.6 | 2,816 | 2.9 | ||||||||||||||||||||||||||||||
Australia | 1,886 | 2.3 | 1,580 | 2.1 | 1,295 | 1.9 | 1,675 | 2.0 | 2,173 | 2.2 | ||||||||||||||||||||||||||||||
North America | 16,500 | 20.3 | 16,222 | 21.1 | 13,384 | 19.6 | 15,748 | 19.0 | 19,391 | 19.7 | ||||||||||||||||||||||||||||||
U.S.A. | 15,470 | 19.0 | 15,255 | 19.8 | 12,611 | 18.4 | 14,832 | 17.8 | 18,259 | 18.6 | ||||||||||||||||||||||||||||||
Canada | 1,029 | 1.3 | 968 | 1.3 | 773 | 1.1 | 917 | 1.1 | 1,132 | 1.2 | ||||||||||||||||||||||||||||||
Central and South America | 3,399 | 4.2 | 3,221 | 4.2 | 2,285 | 3.3 | 3,086 | 3.7 | 3,737 | 3.8 | ||||||||||||||||||||||||||||||
Western Europe | 9,389 | 11.5 | 9,010 | 11.7 | 7,651 | 11.2 | 8,851 | 10.7 | 10,742 | 10.9 | ||||||||||||||||||||||||||||||
EU(a) | 9,209 | 11.3 | 8,955 | 11.6 | 6,460 | 9.4 | 7,668 | 9.2 | 9,359 | 9.5 | ||||||||||||||||||||||||||||||
Central and Eastern Europe, | 1,719 | 2.1 | 1,757 | 2.3 | 1,514 | 2.2 | 1,946 | 2.3 | 2,036 | 2.1 | ||||||||||||||||||||||||||||||
Russia | 805 | 1.0 | 783 | 1.0 | 628 | 0.9 | 862 | 1.0 | 606 | 0.6 | ||||||||||||||||||||||||||||||
Middle East | 2,434 | 3.0 | 2,356 | 3.1 | 1,809 | 2.6 | 2,052 | 2.5 | 2,781 | 2.8 | ||||||||||||||||||||||||||||||
Africa | 900 | 1.1 | 984 | 1.3 | 848 | 1.2 | 1,055 | 1.3 | 1,272 | 1.3 | ||||||||||||||||||||||||||||||
|
|
|
|
|
|
|
|
|
|
|
|
|
|
|
|
|
|
|
| |||||||||||||||||||||
Total | ¥ | 81,479 | 100.0 | % | ¥ | 76,932 | 100.0 | % | ¥ | 68,399 | 100.0 | % | ¥ | 83,091 | 100.0 | % | ¥98,186 | 100.0 | % | |||||||||||||||||||||
|
|
|
|
|
|
|
|
|
|
|
|
|
|
|
|
|
|
|
| |||||||||||||||||||||
JAPAN’S IMPORTS | ||||||||||||||||||||||||||||||||||||||||
Asia | ¥ | 39,218 | 47.4 | % | ¥ | 37,413 | 47.6 | % | ¥ | 34,678 | 51.0 | % | ¥ | 41,094 | 48.4 | % | ¥53,333 | 45.1 | % | |||||||||||||||||||||
China | 19,194 | 23.2 | 18,454 | 23.5 | 17,508 | 25.7 | 20,382 | 24.0 | 24,834 | 21.0 | ||||||||||||||||||||||||||||||
(Asia NIES) | 7,859 | 9.5 | 7,231 | 9.2 | 6,706 | 9.9 | 8,293 | 9.8 | 10,919 | 9.2 | ||||||||||||||||||||||||||||||
(ASEAN) | 12,399 | 15.0 | 11,757 | 15.0 | 10,678 | 15.7 | 12,483 | 14.7 | 17,697 | 15.0 | ||||||||||||||||||||||||||||||
Oceania | 5,659 | 6.8 | 5,587 | 7.1 | 4,359 | 6.4 | 6,434 | 7.6 | 12,694 | 10.7 | ||||||||||||||||||||||||||||||
Australia | 5,053 | 6.1 | 4,958 | 6.3 | 3,831 | 5.6 | 5,753 | 6.8 | 11,624 | 9.8 | ||||||||||||||||||||||||||||||
North America | 10,318 | 12.5 | 9,935 | 12.6 | 8,631 | 12.7 | 10,430 | 12.3 | 13,915 | 11.8 | ||||||||||||||||||||||||||||||
U.S.A. | 9,015 | 10.9 | 8,640 | 11.0 | 7,454 | 11.0 | 8,916 | 10.5 | 11,723 | 9.9 | ||||||||||||||||||||||||||||||
Canada | 1,295 | 1.6 | 1,286 | 1.6 | 1,169 | 1.7 | 1,507 | 1.8 | 2,181 | 1.8 | ||||||||||||||||||||||||||||||
Central and South America | 3,226 | 3.9 | 3,169 | 4.0 | 2,998 | 4.4 | 3,679 | 4.3 | 4,891 | 4.1 | ||||||||||||||||||||||||||||||
Western Europe | 10,370 | 12.5 | 10,394 | 13.2 | 9,021 | 13.3 | 10,860 | 12.8 | 12,942 | 11.0 | ||||||||||||||||||||||||||||||
EU(a) | 9,718 | 11.8 | 9,722 | 12.4 | 7,832 | 11.5 | 9,453 | 11.1 | 11,375 | 9.6 | ||||||||||||||||||||||||||||||
Central and Eastern Europe, | 2,546 | 3.1 | 2,333 | 3.0 | 1,843 | 2.7 | 2,375 | 2.8 | 2,974 | 2.5 | ||||||||||||||||||||||||||||||
Russia | 1,723 | 2.1 | 1,561 | 2.0 | 1,145 | 1.7 | 1,552 | 1.8 | 1,958 | 1.7 | ||||||||||||||||||||||||||||||
Middle East | 10,375 | 12.5 | 8,852 | 11.3 | 5,558 | 8.2 | 8,471 | 10.0 | 15,427 | 13.1 | ||||||||||||||||||||||||||||||
Africa | 991 | 1.2 | 918 | 1.2 | 922 | 1.4 | 1,531 | 1.8 | 1,982 | 1.7 | ||||||||||||||||||||||||||||||
|
|
|
|
|
|
|
|
|
|
|
|
|
|
|
|
|
|
|
| |||||||||||||||||||||
Grand Total | ¥ | 82,703 | 100.0 | % | ¥ | 78,600 | 100.0 | % | ¥ | 68,011 | 100.0 | % | ¥ | 84,875 | 100.0 | % | ¥118,157 | 100.0 | % | |||||||||||||||||||||
|
|
|
|
|
|
|
|
|
|
|
|
|
|
|
|
|
|
|
|
(a) | Data after February 2020 does not include the United Kingdom, as the United Kingdom exited the European Union (EU) on January 31, 2020. |
Source: Press Releases, Ministry of Finance.
Balance of Payments
In 2021, Current Account surplus decreased to ¥15,488 billion, mainly due to an increase in Imports under the influence of the energy price hike observed in the latter half of the year.
25
Table of Contents
Balance of Payments of Japan
2017 | 2018 | 2019 | 2020 | 2021 | ||||||||||||||||
(in billions of yen) | ||||||||||||||||||||
Current Account | ¥ | 22,778 | ¥ | 19,505 | ¥ | 19,251 | ¥ | 15,674 | ¥ | 15,488 | ||||||||||
Balance on Goods and Services | 4,221 | 105 | -932 | -877 | -2,562 | |||||||||||||||
Trade Balance | 4,911 | 1,127 | 150 | 2,778 | 1,670 | |||||||||||||||
Exports (f.o.b.) | 77,254 | 81,226 | 75,775 | 67,263 | 82,284 | |||||||||||||||
Imports (f.o.b.) | 72,342 | 80,100 | 75,625 | 64,485 | 80,614 | |||||||||||||||
Services | -691 | -1,021 | -1,082 | -3,655 | -4,232 | |||||||||||||||
Primary Income(a) | 20,684 | 21,403 | 21,553 | 19,121 | 20,478 | |||||||||||||||
Secondary Income(b) | -2,127 | -2,003 | -1,370 | -2,570 | -2,429 | |||||||||||||||
Capital Account | -280 | -211 | -413 | -207 | -420 | |||||||||||||||
Financial Account(c) | 18,811 | 20,136 | 24,862 | 13,807 | 10,753 | |||||||||||||||
Assets | -10,738 | -3,279 | -9,883 | -15,575 | -20,336 | |||||||||||||||
Liabilities | -29,549 | -23,415 | -34,745 | -29,382 | -31,089 | |||||||||||||||
Net Errors and Omissions | -3,687 | 842 | 6,024 | -1,659 | -4,315 |
(a) | Primary Income mainly shows balance of payments of interests and dividends from external financial credits and debts and includes such items as receipt and payment of dividends and interests between parent companies and their subsidiaries, receipt and payment of stock dividends and bond interests, and receipt and payment of interests related to loans, borrowings, and deposits. |
(b) | Secondary Income shows balance of payments of provision of assets unaccompanied by consideration between residents and non-residents and includes such items as receipt and payment of financial support, donations, and gifts by the government or by the people. |
(c) | Positive figures (+) show increases in net assets, negative figures (-) show decreases in net assets in “Financial Account”. |
Source: Balance of Payments, Ministry of Finance.
Official Reserves Assets
As of December 31, | Gold(a) | Foreign Currency Reserves | IMF Reserve Position | SDRs (Special Drawing Rights) | Other Reserve Assets | Total | ||||||||||||||||||
(in millions of dollar) | ||||||||||||||||||||||||
2018 | $ | 31,531 | $ | 1,208,958 | $ | 11,464 | $ | 18,484 | $ | 538 | $ | 1,270,975 | ||||||||||||
2019 | 37,469 | 1,255,322 | 11,202 | 19,176 | 581 | 1,323,750 | ||||||||||||||||||
2020 | 46,526 | 1,312,160 | 15,147 | 20,215 | 632 | 1,394,680 | ||||||||||||||||||
2021 | 49,505 | 1,278,925 | 10,643 | 62,330 | 4,347 | 1,405,750 | ||||||||||||||||||
2022 | 49,295 | 1,103,907 | 10,817 | 59,275 | 4,282 | 1,227,576 |
(a) | The valuation of gold reflects marked-to-market values. |
Source: International Reserves/Foreign Currency Liquidity, Ministry of Finance.
26
Table of Contents
Foreign Exchange Rates
The following table sets forth the high, low and average daily interbank rate for the U.S. dollar against the yen in the Tokyo foreign exchange market for the years indicated.
2018 | 2019 | 2020 | 2021 | 2022 | ||||||||||||||||
Average (Central Rate) | ¥ | 110.40 | ¥ | 108.99 | ¥ | 106.73 | ¥ | 109.89 | ¥131.57 | |||||||||||
High | 114.55 | 112.24 | 112.18 | 115.45 | 150.48 | |||||||||||||||
Low | 104.64 | 104.46 | 101.60 | 102.60 | 113.63 |
Source: Status of Transactions on Tokyo Foreign Exchange Market, Bank of Japan.
In recent months, the exchange rate for the U.S. dollar against the yen has sharply increased. As of February 10, 2023, the spot buying rate quoted on the Tokyo foreign exchange market as reported by the Bank of Japan at 5:00 p.m., Tokyo time, was ¥130.45 = $1.00, and the noon buying rate on February 3, 2023 for cable transfers in New York City payable in yen, as reported by the Federal Reserve Bank of New York, was ¥131.07 = $1.00.
Foreign exchange intervention is conducted to influence foreign exchange rates by buying and selling currencies in the foreign exchange market. In Japan, foreign exchange intervention is to be carried out under the authority of the Minister of Finance. The Bank of Japan conducts foreign exchange interventions on behalf of and at the instruction of the minister. When the minister deems it necessary to intervene in the foreign exchange market, the Ministry of Finance gives the Bank of Japan specific instructions for foreign exchange intervention. With respect to funding, as foreign exchange intervention involves buying and selling currencies, it requires funds such as Japanese yen and U.S. dollars. In Japan, the Foreign Exchange Fund Special Account (FEFSA), which falls under the jurisdiction of the Ministry of Finance, is used for foreign exchange intervention.
The total amount of foreign exchange intervention operations by the MOF for the period from August 30, 2022 through October 27, 2022 was ¥9,188.1 billion. Following such operations, Japan’s reserve assets totaled $1,194,568 million as of October 31, 2022, down $97,504 million from the end of August. As of December 31, 2022, Japan’s reserve assets totaled $1,227,576 million.
27
Table of Contents
Foreign Direct Investment
The following table sets forth information regarding annual foreign direct investment in Japan and annual foreign direct investment abroad for the periods indicated.
Foreign direct investment in Japan (by industry)(a)
2017 | 2018 | 2019 | 2020 | 2021 | ||||||||||||||||
(in billions of yen) | ||||||||||||||||||||
Manufacturing (total)(b) | ¥ | 1,016.6 | ¥ | 1,188.5 | ¥ | 606.7 | ¥ | 331.3 | ¥ | 1,356.8 | ||||||||||
Food | 28.8 | 9.8 | 58.2 | -43.9 | -66.6 | |||||||||||||||
Textile | 2.8 | -4.2 | 2.7 | 4.2 | 6.2 | |||||||||||||||
Lumber and pulp | -0.1 | 0.4 | 2.3 | 0.9 | 8.8 | |||||||||||||||
Chemicals and pharmaceuticals | 15.1 | 298.6 | 120.9 | 135.3 | 1,471.3 | |||||||||||||||
Petroleum | 19.3 | 1.3 | -93.7 | 7.2 | 5.1 | |||||||||||||||
Rubber and leather | 0.1 | -0.8 | — | -0.6 | -0.8 | |||||||||||||||
Glass and ceramics | 11.0 | 2.0 | -17.3 | 25.4 | -5.1 | |||||||||||||||
Iron, non-ferrous, and metals | -1.1 | 7.3 | 12.1 | 2.9 | 10.2 | |||||||||||||||
General machinery | 172.9 | 25.7 | -53.0 | 21.0 | 13.7 | |||||||||||||||
Electric machinery | 419.5 | 529.5 | 327.5 | 157.6 | 235.0 | |||||||||||||||
Transportation equipment | 362.4 | 180.3 | 244.0 | 27.9 | -329.3 | |||||||||||||||
Precision machinery | -31.3 | 2.7 | -10.1 | 9.4 | 5.7 | |||||||||||||||
Non-manufacturing (total)(c) | 32.8 | -88.4 | 892.8 | 811.4 | 1,348.8 | |||||||||||||||
Farming and forestry | 1.4 | 3.7 | 0.5 | 0.3 | 0.4 | |||||||||||||||
Fishery and marine products | — | 1.7 | 0.9 | 1.2 | 1.1 | |||||||||||||||
Mining | 18.5 | 3.3 | 4.2 | 1.5 | 5.4 | |||||||||||||||
Construction | 3.4 | -29.6 | 20.1 | -1.4 | 9.8 | |||||||||||||||
Transportation | 86.1 | 5.6 | 23.1 | 21.1 | 48.7 | |||||||||||||||
Communications | -74.9 | -384.4 | -30.7 | 13.8 | 424.6 | |||||||||||||||
Wholesale and retail | -599.6 | -570.4 | -680.9 | -96.5 | -240.3 | |||||||||||||||
Finance and insurance | 171.1 | 702.1 | 1,301.1 | 743.3 | 929.7 | |||||||||||||||
Real estate | 47.8 | 78.9 | 32.7 | -28.9 | -76.8 | |||||||||||||||
Services | 270.7 | 10.5 | 137.8 | 87.7 | 61.3 | |||||||||||||||
|
|
|
|
|
|
|
|
|
| |||||||||||
Total | ¥ | 1,049.4 | ¥ | 1,100.1 | ¥ | 1,499.5 | ¥ | 1,142.8 | ¥ | 2,705.7 | ||||||||||
|
|
|
|
|
|
|
|
|
|
(a) | Starting with transactions recognized in January 2014, the BOJ began using the Sixth Edition of “Balance of Payments and International Investment Position Manual” (BPM6) released by International Monetary Fund in 2008 to calculate the data provided in this table. |
(b) | The total amounts for Manufacturing include other types of manufacturing not separately listed in the table and therefore are different from the sum of listed subcategories of manufacturing. |
(c) | The total amounts for Non-manufacturing include other industries not separately listed in the table and therefore are different from the sum of listed subcategories of Non-manufacturing industries. |
Source: Outward / Inward Direct Investment, breakdown by Region and Industry, Ministry of Finance.
28
Table of Contents
Foreign direct investment in Japan (by region)(a)
2017 | 2018 | 2019 | 2020 | 2021 | ||||||||||||||||
(in billions of yen) | ||||||||||||||||||||
North America | ¥ | 436.9 | ¥ | 642.1 | ¥ | 1,386.2 | ¥ | 318.5 | ¥ | 747.3 | ||||||||||
Asia | 341.4 | -6.6 | 553.3 | 535.1 | 1,899.6 | |||||||||||||||
Europe | -150.1 | -125.4 | -688.2 | 334.4 | -259.0 | |||||||||||||||
Other regions | 421.2 | 590.0 | 248.0 | -45.3 | 317.8 | |||||||||||||||
|
|
|
|
|
|
|
|
|
| |||||||||||
Total | ¥ | 1,049.4 | ¥ | 1,100.1 | ¥ | 1,499.5 | ¥ | 1,142.8 | ¥ | 2,705.7 | ||||||||||
|
|
|
|
|
|
|
|
|
|
(a) | Starting with transactions recognized in January 2014, the BOJ began using the Sixth Edition of “Balance of Payments and International Investment Position Manual” (BPM6) released by International Monetary Fund in 2008 to calculate the data provided in this table. |
Source: Outward / Inward Direct Investment, breakdown by Region and Industry, Ministry of Finance.
Foreign direct investment abroad (by industry)(a)
2017 | 2018 | 2019 | 2020 | 2021 | ||||||||||||||||
(in billions of yen) | ||||||||||||||||||||
Manufacturing (total)(b) | ¥ | 6,209.9 | ¥ | 6,365.9 | ¥ | 11,344.9 | ¥ | 1,588.4 | ¥ | 4,192.2 | ||||||||||
Food | 1,137.7 | 65.7 | 581.9 | 1,619.7 | 360.0 | |||||||||||||||
Textile | 91.6 | 184.5 | 70.7 | 41.7 | 26.1 | |||||||||||||||
Lumber and pulp | 44.8 | 171.9 | 138.7 | 255.7 | 50.8 | |||||||||||||||
Chemicals and pharmaceuticals | 1,047.4 | 1,617.8 | 4,593.9 | -3,449.0 | 1,101.5 | |||||||||||||||
Petroleum | 21.1 | 67.7 | 20.5 | 25.0 | 23.0 | |||||||||||||||
Rubber and leather | 105.9 | 192.4 | 213.1 | 79.9 | -46.3 | |||||||||||||||
Glass and ceramics | 170.3 | 222.8 | 233.9 | 144.0 | 27.6 | |||||||||||||||
Iron, non-ferrous, and metals | 415.8 | 414.1 | 443.5 | 197.6 | 137.5 | |||||||||||||||
General machinery | 1,036.6 | 834.9 | 714.4 | -214.5 | 601.0 | |||||||||||||||
Electric machinery | 684.7 | 1,036.2 | 1,391.7 | 1,420.5 | 1,452.8 | |||||||||||||||
Transportation equipment | 947.0 | 1,219.6 | 2,437.3 | 1,205.8 | 145.7 | |||||||||||||||
Precision machinery | 325.0 | 128.7 | 306.1 | 122.1 | 140.2 | |||||||||||||||
Non-manufacturing (total)(c) | 12,251.3 | 9,643.5 | 14,013.7 | 8,626.3 | 11,917.8 | |||||||||||||||
Farming and forestry | -12.8 | 8.0 | 6.2 | 39.1 | 35.7 | |||||||||||||||
Fishery and marine products | 5.7 | 7.4 | 3.7 | 0.3 | -5.5 | |||||||||||||||
Mining | 124.0 | 1,062.6 | 1,060.1 | 267.4 | 8.6 | |||||||||||||||
Construction | 173.6 | 258.3 | 202.5 | 103.0 | 82.7 | |||||||||||||||
Transportation | 133.3 | 242.4 | 239.9 | 122.8 | 137.5 | |||||||||||||||
Communications | 2,636.5 | 4,179.4 | 636.0 | -2,629.2 | 937.6 | |||||||||||||||
Wholesale and retail | 3,194.1 | 1,508.7 | 6,311.8 | 3,709.0 | 3,517.3 | |||||||||||||||
Finance and insurance | 3,691.8 | 2,826.4 | 4,018.4 | 5,500.5 | 5,858.8 | |||||||||||||||
Real estate | 725.1 | 424.5 | 1,173.6 | 215.4 | 377.7 | |||||||||||||||
Services | 1,013.8 | -1,456.5 | -189.7 | 610.0 | 274.3 | |||||||||||||||
|
|
|
|
|
|
|
|
|
| |||||||||||
Total | ¥ | 18,461.2 | ¥ | 16,009.4 | ¥ | 25,358.6 | ¥ | 10,214.7 | ¥ | 16,110.0 | ||||||||||
|
|
|
|
|
|
|
|
|
|
(a) | Starting with transactions recognized in January 2014, the BOJ began using the Sixth Edition of “Balance of Payments and International Investment Position Manual” (BPM6) released by International Monetary Fund in 2008 to calculate the data provided in this table. |
(b) | The total amounts for Manufacturing include other types of manufacturing not separately listed in the table and therefore are different from the sum of listed subcategories of manufacturing. |
(c) | The total amounts for Non-manufacturing include other industries not separately listed in the table and therefore are different from the sum of listed subcategories of Non-manufacturing industries. |
Source: Outward / Inward Direct Investment, breakdown by Region and Industry, Ministry of Finance.
29
Table of Contents
Foreign direct investment abroad (by region)(a)
2017 | 2018 | 2019 | 2020 | 2021 | ||||||||||||||||
(in billions of yen) | ||||||||||||||||||||
North America | ¥ | 5,244.5 | ¥ | 2,192.4 | ¥ | 5,551.2 | ¥ | 5,916.7 | ¥ | 6,609.0 | ||||||||||
Asia | 4,480.9 | 5,570.2 | 5,540.7 | 3,392.5 | 5,052.9 | |||||||||||||||
Europe | 6,275.8 | 5,157.9 | 11,603.4 | -1,705.9 | 4,180.8 | |||||||||||||||
Other regions | 2,460.0 | 3,088.8 | 2,663.3 | 2,611.4 | 267.3 | |||||||||||||||
|
|
|
|
|
|
|
|
|
| |||||||||||
Total | ¥ | 18,461.2 | ¥ | 16,009.4 | ¥ | 25,358.6 | ¥ | 10,214.7 | ¥ | 16,110.0 | ||||||||||
|
|
|
|
|
|
|
|
|
|
(a) | Starting with transactions recognized in January 2014, the BOJ began using the Sixth Edition of “Balance of Payments and International Investment Position Manual” (BPM6) released by International Monetary Fund in 2008 to calculate the data provided in this table. |
Source: Outward / Inward Direct Investment, breakdown by Region and Industry, Ministry of Finance.
30
Table of Contents
FINANCIAL SYSTEM
The Bank of Japan and Monetary Policy
The Bank of Japan (“BOJ”), with 55% of its capital owned by the government, is the central bank and sole issuing bank, as well as the depository and fiscal agent for the government. As of the end of September 2022, the BOJ had total assets of ¥685,790 billion.
One of the missions of the BOJ is to contribute to the sound development of the national economy, through the pursuit of price stability. In order to fulfill this mission, the BOJ controls the overall volume of money in the economy and through market operations, along with monetary policy decided at the BOJ Policy Board Meeting. From March 2001 to March 2006, in order to fight deflation and revive the Japanese economy, the BOJ implemented a quantitative easing policy by conducting money market operations to adjust the outstanding balance of the current accounts at the BOJ. And in March 2006, the BOJ announced an exit from the quantitative easing policy and a return to monetary policy that targeted policy interest rate (uncollateralized overnight call rate). At the same time, the BOJ decided to encourage the rate to remain at effectively zero percent. Then, the BOJ increased the policy interest rate to 0.25% in July 2006, and to 0.5% in February 2007. From the Fall of 2008, however, when the turmoil in global financial markets intensified, the BOJ implemented various monetary policy measures including reductions in the policy interest rate. It decreased the policy interest rate to 0.3% in October 2008, and further to 0.1% in December 2008. Furthermore, in October 2010, in order to further enhance monetary easing, the BOJ implemented a comprehensive monetary easing policy, which included the establishment of an Asset Purchase Program (APP) to purchase financial assets, including risk assets, as well as to provide loans. Since the APP’s introduction, the BOJ has repeatedly and significantly increased the maximum amount outstanding of the APP, from about ¥35 trillion to about ¥101 trillion at the end of 2013. Moreover, in February 2012, the BOJ decided to pursue powerful monetary easing by conducting its virtually zero interest rate policy and by implementing the APP, with the aim of achieving the goal of 1% in terms of the year-on-year rate of change in the consumer price index (CPI). In order to state clearly the shared understanding concerning the roles of the government and the BOJ, the BOJ decided to release “Measures Aimed at Overcoming Deflation” in October 2012. In January 2013, the BOJ introduced the “price stability target” of 2% in terms of the year-on-year rate of change in the CPI. The BOJ also introduced the “open-ended asset purchasing method”, aimed at achieving this target. It released a joint statement with the government to announce that in order to overcome deflation early and achieve sustainable economic growth with price stability, the government and the BOJ would strengthen their policy coordination and work together. Furthermore, in April 2013, the BOJ introduced a policy of “quantitative and qualitative monetary easing”, aimed at achieving this target at the earliest possible time. In order to do so, under this policy, the BOJ would enter a new phase of monetary easing both in terms of quantity and quality. The BOJ would double the monetary base in two years by conducting money market operations so that the monetary base would increase at an annual pace of about ¥60-70 trillion. The BOJ would also purchase Japanese government bonds (“JGBs”) so that their amount outstanding would increase at an annual pace of about ¥50 trillion, and the average remaining maturity of the BOJ’s JGB purchases would be extended from slightly less than three years at the time to about seven years, which was equivalent to the average maturity of the amount outstanding of JGBs issued. Additionally, the BOJ would purchase exchange-traded funds (“ETFs”) and Japan real estate investment trusts (“J-REITs”) so that their amounts outstanding would increase at an annual pace of about ¥1 trillion and about ¥30 billion, respectively. In October 2014, the BOJ expanded its quantitative and qualitative monetary easing measures to further increase its purchases of JGBs, ETFs and J-REITs to achieve an increase in its purchases of JGBs, ETFs and J-REITs at an annual pace of about ¥80 trillion, ¥3 trillion and ¥90 billion, respectively. In order to maintain momentum towards 2% “price stability target,” in January 2016, the BOJ adopted “quantitative and qualitative monetary easing with a negative interest rate,” under which (i) a negative interest rate of minus 0.1% is applied to a part of BOJ accounts held by financial institutions(a) (if judged necessary by the BOJ, the rate will be lowered even further), (ii) the BOJ will conduct money market operations so that the monetary base will increase at an annual pace of about ¥80 trillion, and (iii) the BOJ will purchase
(a) | More specifically, accounts held by financial institutions are divided into three levels referred to as “basic balance” (a positive interest rate of 0.1% is applied), “macro add-on balance” (a zero interest rate is applied), and “policy-rate balance” (a negative interest rate of minus 0.1% is applied). “Policy-rate balance” is the balance in excess of “basic balance” and “macro add-on balance.” |
31
Table of Contents
assets as follows: (1) purchase JGBs so that their amount outstanding will increase at an annual pace of about ¥80 trillion, (2) purchase ETFs and J-REITs so that their amounts outstanding will increase at an annual pace of about ¥3 trillion (decided further expansion to about ¥3.3 trillion and to about ¥6 trillion in April 2016 and July 2016, respectively) and about ¥90 billion, respectively, and (3) maintain the amounts outstanding of commercial paper and corporate bonds at about ¥2.2 trillion and about ¥3.2 trillion, respectively. In September 2016, the BOJ announced a new framework for strengthening monetary easing by adopting a program of “quantitative and qualitative monetary easing with yield curve control”, or QQE with yield curve control, under which the BOJ (i) set guidelines for market operations that specify (1) a short-term policy interest rate (set at the minus 0.1% level adopted in January 2016) and (2) a target level of a long-term interest rate (target yield of the 10-year JGB set at around 0%, to be facilitated through continued BOJ purchases of JGBs) and (ii) introduced new tools of market operations so as to control the yield curve smoothly, consisting of (1) outright purchases of JGBs with yields designated by the BOJ and (2) fixed-rate funds-supplying operations for a period of up to ten years. With regard to asset purchase except for JGB purchases, the BOJ also set the following guidelines: (i) purchase ETFs and J-REITs so that their amounts outstanding will increase at an annual pace of about ¥6 trillion and about ¥90 billion, respectively, and (ii) maintain the amounts outstanding of commercial paper and corporate bonds at about ¥2.2 trillion and ¥3.2 trillion, respectively. Finally, the BOJ announced its “inflation-overshooting commitment”, under which it will continue with QQE with yield curve control, aiming to achieve the price stability target of 2%, as long as it is necessary for maintaining the target in a stable manner, and will continue to expand the monetary base until the year-on-year rate of increase in the observed CPI (all items less fresh food) exceeds the price stability target of 2% and stays above the target in a stable manner. In July 2018, to maintain strong monetary easing, the BOJ decided to strengthen the framework for continuous strong monetary easing. The BOJ introduced forward guidance for policy rates and announced its intent to maintain the current extremely low levels of short- and long-term interest rates for an extended period of time, taking into account uncertainties regarding economic activity and prices including the effects of the consumption tax hike in October 2019. Also, it was announced that the yields may move upward and downward to some extent mainly depending on developments in economic activity and prices(b). In addition, with regard to ETFs and J-REIT unit purchases, the BOJ announced that it may increase or decrease the amount of purchases depending on market conditions. Further, in April 2019, to make its policy to persistently continue with strong monetary easing clearer, the BOJ clarified its forward guidance for policy rates: The BOJ intends to maintain the current extremely low levels of short- and long-term interest rates for an extended period of time, taking into account uncertainties regarding economic activity and prices including developments in overseas economies and the effects of the consumption tax hike.
Furthermore, on March 16, 2020, in response to the adverse impact of the global spread of COVID-19 on the Japanese economy, the BOJ announced its plan to further strengthen its monetary easing policy, including (1) ensuring ample supply of yen funding through active purchases of JGBs and the following measures as well as providing U.S. dollar liquidity, (2) the introduction of special operations to support companies under which the BOJ will extend zero-interest rate loans collateralized by corporate debt as well as increasing the upper limit for its purchases of commercial paper and corporate bonds by ¥2 trillion until the end of September 2020, resulting in an upper limit for its balance of outstanding commercial paper and corporate bonds of ¥3.2 trillion and ¥4.2 trillion, respectively and (3) an increase in the upper limit for its purchases of ETFs and J-REITs to ¥12 trillion and ¥180 billion, respectively. On April 27, 2020, given the increasingly severe situation due to impact of the spread of COVID-19, the BOJ decided to further enhance monetary easing through (1) an increase in purchases of commercial paper and corporate bonds, to be conducted through the end of September 2020, setting the maximum amounts of additional purchase to ¥7.5 trillion for each asset, (2) strengthening the BOJ’s Special Funds-Supplying Operations to Facilitate Financing in Response to the Novel Coronavirus (COVID-19), which were introduced and became effective in March 2020, and (3) further active purchases of JGBs and treasury discount bills. On June 18, 2021, the BOJ extended the duration of the Special Program to Support Financing in Response to the COVID-19 and the duration of purchase of commercial paper and corporate bonds, with an upper limit on the amount outstanding of about ¥20 trillion in total, until the end of March, 2022. On December 17, 2021, the BOJ announced that it would further extend the duration of a part of the Special
(b) | In case of rapid increases in the yields, the BOJ will purchase JGBs promptly and appropriately. |
32
Table of Contents
Funds-Supplying Operations to Facilitate Financing in Response to COVID-19 until September 2022 but plans to gradually decrease the balance of commercial paper and corporate bonds to the pre-pandemic level (approximately ¥2 trillion yen and ¥3 trillion yen, respectively).
In statements released on June 17, 2022 and July 21, 2022, the BOJ recognized that the consumer price index (for all items less fresh food) will likely increase at a year-on-year rate of 2% due to rises in energy and food prices for the time being, but it is expected to decelerate thereafter because the positive contribution of the rise in energy prices to the consumer price index is likely to wane. The BOJ also confirmed that it will maintain its monetary easing policy until the year-on-year rate of increase in the consumer price index (for all items less fresh food) exceeds 2% in a stable manner.
Citing increased volatility in overseas financial and capital markets that have significantly affected these markets in Japan, as announced in a statement released on December 20, 2022, the BOJ decided to modify its conduct of yield curve control with respect to Japanese government bonds, with the goal of improving market functioning and encouraging a smoother formation of the entire yield curve, while maintaining accommodative financial conditions. With respect to yield curve control, the BOJ decided to, while significantly increasing the amount of Japanese government bond purchases, expand the range of 10-year Japanese government bond yield fluctuations from the target level of between around plus and minus 0.25 percentage points to between around plus and minus 0.5 percentage points. The BOJ announced that these measures were intended to achieve the price stability target mentioned above by enhancing the sustainability of monetary easing under its monetary easing policy.
The long-term effect of the BOJ’s policies remains unclear. The BOJ’s policies may impact the strength of the Japanese yen relative to the U.S. dollar and other foreign currencies and may inadvertently have a negative effect on the Japanese economy more generally if tighter monetary policies ultimately result in decreased economic activity.
The following table sets forth the principal economic indicators relating to monetary policy from 2018 through 2022.
Monetary Base | Money Stock | Loans and Bills Discounts Domestically Licensed Banks | ||||||||||||||||||||||||||
Current Account Balances(a) | Total(a) | Annual % Change | Total(a) | Annual % Change | Total(a) | Annual % Change | ||||||||||||||||||||||
(yen amounts in billions) | ||||||||||||||||||||||||||||
2018 | 382,178 | 491,499 | 7.3 | 1,002,456 | 2.9 | 488,331 | 2.8 | |||||||||||||||||||||
2019 | 396,404 | 509,008 | 3.6 | 1,026,199 | 2.4 | 500,517 | 2.5 | |||||||||||||||||||||
2020 | 438,051 | 555,229 | 9.0 | 1,092,626 | 6.5 | 524,164 | 4.7 | |||||||||||||||||||||
2021 | 521,752 | 643,496 | 16.2 | 1,162,693 | 6.5 | 536,911 | 2.4 | |||||||||||||||||||||
2022 | 528,008 | 653,203 | 1.6 | 1,201,203 | 3.3 | 549,437 | 2.3 |
(a) | Average amounts outstanding. |
Source: Bank of Japan Statistics, Bank of Japan.
Government Financial Institutions
The activities of private institutions are supplemented by a number of financial institutions under government supervision, the appointment of whose senior officials is subject to approval by the government and whose funds are supplied principally or partially by the government. Among these are Japan Finance Corporation (“JFC”), the successor to National Life Finance Corporation (“NLFC”), Japan Finance Corporation for Small and Medium Enterprise (“JASME”), and Agriculture, Forestry and Fisheries Finance Corporation (“AFC”), whose main purposes are to contribute to the improvement of the quality of the national life. They also include Japan Bank for International Cooperation (“JBIC”) and The Okinawa Development Finance Corporation (“ODFC”),
33
Table of Contents
whose purposes are to supplement private financing in their respective fields of activity, and Development Bank of Japan Inc. (“DBJ”) and The Shoko Chukin Bank (“SCB”), which will be privatized.
The central government has been steadily promoting reform of governmental financial institutions. The “Outline of Administrative Reforms” decided by the Cabinet on December 1, 2000, requires that the businesses and organizational forms of all special public institutions, which include governmental financial institutions, undergo a thorough review. Pursuant to the Act on Promotion of Administrative Reform for Realization of Small and Efficient Government (the “Administrative Reform Promotion Act”), which was enacted on May 26, 2006, (1) the former Development Bank of Japan was succeeded to by DBJ as of October 1, 2008, which is currently wholly owned by the Japanese government and will be privatized, (2) the international financial operations of JBIC, together with the functions of NLFC, JASME, AFC were transferred to JFC as of October 1, 2008, and the overseas economic cooperation operations of JBIC were transferred to JICA, and (3) as of October 1, 2008, Japan Finance Corporation for Municipal Enterprises was succeeded by Japan Finance Organization for Municipalities, which is funded by local governments. Each of these measures was implemented through individual laws that were enacted in 2007, pursuant to which these successor institutions were formed on October 1, 2008.
With regard to (1) above, as originally enacted, the Development Bank of Japan Inc. Act (Act No. 85 of 2007), as amended (the “DBJ Act”), contemplated full privatization of DBJ over a period of five to seven years from its establishment on October 1, 2008. During that time period, the DBJ Act (as originally enacted) provided that the Japanese government would dispose of all of the common stock of DBJ that it currently owns (the “full privatization”), and that steps would be taken to abolish the DBJ Act promptly after the full privatization. On June 26, 2009, the Japanese Diet approved the Act for Partial Amendment of the Development Bank of Japan Inc. Act (Act No. 67 of 2009) (the “2009 Amendment Act”), which, as part of the Japanese government’s response to economic and financial crises, enables the Japanese government to strengthen DBJ’s financial base through capital injections up to the end of March 2012. In addition, under the Amendment Act, the targeted timing for the full privatization of DBJ has been extended to approximately five to seven years from April 1, 2012. Further, the Amendment Act provides that the Japanese government is to review the organization of DBJ, including the way of the Japanese government’s holding of the DBJ shares, by the end of fiscal year 2011, and until such time, the Japanese government shall not be disposing of the DBJ’s shares held by it. Additionally, on May 2, 2011, in order to address the Great East Japan Earthquake of March 11, 2011, the Japanese Diet approved the Act for Extraordinary Expenditure and Assistance to Cope with the Great East Earthquake (Act No. 40 of 2011) (the “Extraordinary Expenditure Act”). The Extraordinary Expenditure Act enables to the Japanese government to strengthen DBJ’s financial base through capital injection through March 2015 so that DBJ can smoothly implement its crisis response operations. In addition, under Extraordinary Expenditure Act, the targeted timing for the full privatization of DBJ has been extended to approximately five to seven years from April 1, 2015. Further, the Extraordinary Expenditure Act provides that the Japanese government is to review the organization of DBJ, including the way of the Japanese government’s holding of the DBJ’s shares by the end of fiscal year 2014, and until such time, the Japanese government shall not dispose of the DBJ’s shares held by it. On May 13, 2015, the Japanese Diet approved the Act for Partial Amendment of the Development Bank of Japan Inc. Act (Act No. 23 of 2015) (the “2015 Amendment Act”), under which the specific targeted timing for the full privatization of DBJ has been withdrawn and taking into consideration the current business environment in the private financial sector, DBJ, utilizing its investment and loan functions, is to take measures necessary for implementing the its crisis response operations and supply of growth capital—that is, DBJ is to take all possible measures to supply funds to deal with large-scale disasters, economic crises and so forth, and to promote the supply of growth capital to revitalize regional economies and to reinforce the competitiveness of enterprises. In order to assure the sufficient implementation of the necessary operations, under the 2015 Amendment Act, the Japanese government shall maintain its stake in excess of one-third for DBJ’s crisis response operations, and one half or more for DBJ’s special investment operations, for as long as the government shall take such measures. Furthermore, on May 22, 2020, the Act for Partial Amendment of the Development Bank of Japan Inc. Act (Act No. 29 of 2020) was promulgated, under which, the time limit of DBJ’s special investment operations has been extended by five years.
34

Table of Contents
With regard to (2) above, The Japan Bank for International Cooperation Act (the “JBIC Act”) was passed into law on April 28, 2011 to spin off the Japan Bank for International Cooperation Operations from the domestic financial operations of the Japan Finance Corporation. Pursuant to the JBIC Act, Japan Bank for International Cooperation was newly established on April 1, 2012.
Private Financial Institutions
According to the Financial Services Agency, as of January 4, 2023, the private banking system included four city banks, 13 trust banks, and 17 other banks, as well as 62 1st local banks as of May 1, 2021, 37 2nd local banks as of May 1, 2021 and the Saitama Resona Bank, which is categorized as neither a 1st nor 2nd local bank. In addition, 56 foreign banks had branches in Japan as of November 21, 2022.
There are also credit associations, credit cooperative associations, labor credit associations and the national federations of each of such associations, which are engaged mainly in making small business loans. Agricultural cooperatives, prefectural credit federations of such cooperatives and The Norinchukin Bank operate in the field of agricultural credit.
35
Table of Contents
GOVERNMENT FINANCE
Revenues, Expenditures and Budgets
The responsibility for the preparation of the budget and the administration of government finances rests with the Ministry of Finance. The fiscal year commences on April 1, and the Cabinet usually submits the budget to the Diet for its decision in the preceding January. Supplementary budgets revising the original budget may be submitted to the Diet from time to time during the fiscal year.
For advancing fiscal consolidation, the Cabinet approved the “Basic Framework for Fiscal Consolidation: Medium-term Fiscal Plan” on August 8, 2013. This plan provided the following targets for achieving fiscal consolidation.
• | Halving the primary deficit of the national and local governments to GDP ratio by JFY 2015 from the ratio in JFY 2010. (This target has been achieved.) |
• | Achieving a primary surplus of the national and local governments to GDP ratio by JFY 2020; and |
• | Steadily reducing the public debt to GDP ratio. |
These targets were firmly maintained in the “Basic Policies for the Economic and Fiscal Management and Reform 2015” decided by the Cabinet on June 30, 2015, including “The Plan to Advance Economic and Fiscal Consolidation” , or the fiscal consolidation plan, which the government believes would be an effective and concrete plan for achieving the primary surplus target by JFY2020, covering a five-year period (JFY2016-JFY2020). Under the fiscal consolidation plan, the government was committed to assessing the progress of reforming expenditure and revenue measures by using several benchmarks. However, the actual improvement in the primary balance was slower than the estimate under the “Plan to Advance Economic and Fiscal Revitalization”, or the Revitalization Plan, owing to more moderate growth in tax revenue than the initial assumption due to a decline in economic growth, as well as the impact of the postponement of the consumption tax rate hike to 10% from 8%, and the addition of supplementary budgets. Furthermore, in the “New Economic Policy Package”, the government revised the purposes of use of the tax revenue generated from the consumption tax rate hike in October 2019 to ensure stable fiscal resources in preparation for the human resources development revolution. Due to these factors, it was not possible to achieve the primary surplus target by JFY 2020.
Given the changing population structure including as a result of the aging population and decreasing working population, it is necessary to strengthen the basis for the social security system by the time the baby-boomer generation starts reaching 75 years of age and to ensure establishment of a path for fiscal consolidation by the time every member of the baby-boomer generation reaches 75 years of age. From these viewpoints, the new fiscal consolidation targets were set in the “Basic Policy on Economic and Fiscal Management and Reform 2018” by the Cabinet on June 15, 2018, which aims for a primary surplus of the central and local governments by JFY2025 by steadily implementing economic revitalization and fiscal consolidation measures. At the same time, the government will firmly maintain its aim of steadily reducing the public debt to GDP ratio.
In order to achieve the primary surplus target, the government will implement steadily the expenditure reforms on all fronts in parallel with economic revitalization.
On April 7, 2020, the Prime Minister of Japan at the time, ABE Shinzo, announced Emergency Economic Measures to Cope with COVID-19 pandemic, which were further revised on April 20, 2020, including (i) measures to prevent the spread of infection and secure resources and infrastructure for medical treatment, (ii) measures to protect employment and support businesses including ensuring the availability of interest-free, unsecured loans, deferral of national taxes and social security premiums for affected businesses and cash payments to all residents in Japan and small and medium-sized businesses affected by COVID-19, (iii) demand stimulus measures to be implemented after the pandemic is contained targeting affected industries such as tourism, transportation, food services and entertainment as well as regional economic development, (iv) measures to develop a resilient economic structure including support for development of business supply chains, support for agricultural exports and domestic supply and promotion of digital technologies in education and business and
36
Table of Contents
(v) securing contingency funds to address COVID-19. On December 8, 2020, the Prime Minister of Japan at the time, SUGA Yoshihide, announced Comprehensive Economic Measures to Secure People`s Lives and Livelihoods toward Relief and Hope, including (i) containment measures for COVID-19 pandemic, (ii) measures to promote economic structural change and positive cycles for Post-Corona era, (iii) measures to secure safety and relief, including disaster prevention and mitigation and promotion of national land toughening and (iv) proper and timely implementation of the contingency funds for measures against COVID-19. In connection with these measures, the Diet approved three supplementary budgets for JFY 2020 in April and June 2020 and January 2021. The total expenditures from the general account increased to ¥175.7 trillion with these supplementary budgets. The expenditures increases in the supplementary budgets were largely financed through issuance of government bonds.
The fiscal and financial operations of the government and its agencies are budgeted and recorded in the following three sets of accounts:
• | General Account. The general account is used primarily to record operations in basic areas of governmental activity. |
• | Special Accounts. The accounts of the central government consist of the general account and special accounts. Special accounts can be set up to carry out specific projects, to manage specific funds, and for other purposes. Special accounts can be set up when the government (i) implements a specific program such as insurance and public works, (ii) possesses and manages special funds such as Fiscal Loan Program Funds and Foreign Exchange Funds, and (iii) uses a certain revenue to secure a special expenditure and thus needs to deal with such revenue and expenditure on a separate basis from the general revenue and expenditure such as Local Allocation and Local Transfer Tax and Government Bonds Consolidation Funds. As of September 2022, the government had 13 special accounts. |
• | Government-Affiliated Agencies. The government-affiliated agencies are government-owned corporations which consist of three financial corporations. |
The settlement of accounts for revenues and expenditures is made by the Ministry of Finance, based on reports submitted by the respective Ministers. The settlement of accounts is required by law to be audited annually in detail by the Board of Audit, an organ independent of the Cabinet, and submitted by the Cabinet to the Diet in the following fiscal year.
37
Table of Contents
The following tables set forth information with respect to the General Account, the Special Accounts and the Government Affiliated Agencies for JFY 2016 through JFY 2021, and the budget for JFY 2022.
Summary of Consolidated General and Special Accounts(a)
JFY 2016 | JFY 2017 | JFY 2018 | JFY 2019 | JFY 2020 | JFY 2021 | JFY 2022 Initial Budget(c) | ||||||||||||||||||||||
(in billions of yen) | ||||||||||||||||||||||||||||
REVENUES | ||||||||||||||||||||||||||||
Total Revenues, General Account | ¥ | 102,774 | ¥ | 103,644 | ¥ | 105,697 | ¥ | 109,162 | ¥ | 184,579 | ¥ | 169,403 | ¥ | 107,596 | ||||||||||||||
Total Revenues, Special Accounts | 410,161 | 386,487 | 381,177 | 386,552 | 417,561 | 455,554 | 470,533 | |||||||||||||||||||||
Less: Inter-Account Transactions(b) | 253,522 | 245,402 | 243,007 | 244,423 | 248,863 | 302,306 | 306,597 | |||||||||||||||||||||
|
|
|
|
|
|
|
|
|
|
|
|
|
| |||||||||||||||
Total Consolidated Revenues | ¥ | 259,413 | ¥ | 244,729 | ¥ | 243,868 | ¥ | 251,292 | ¥ | 353,277 | ¥ | 322,651 | ¥ | 271,533 | ||||||||||||||
|
|
|
|
|
|
|
|
|
|
|
|
|
| |||||||||||||||
EXPENDITURES | ||||||||||||||||||||||||||||
Total Expenditures, General Account | ¥ | 97,541 | ¥ | 98,116 | ¥ | 98,975 | ¥ | 101,366 | ¥ | 147,597 | ¥ | 144,650 | ¥ | 107,596 | ||||||||||||||
Total Expenditures, Special Accounts | 395,361 | 374,150 | 368,936 | 374,170 | 404,519 | 441,081 | 467,282 | |||||||||||||||||||||
Less: Inter-Account Transactions(b) | 251,842 | 242,877 | 241,249 | 242,631 | 246,270 | 300,383 | 305,170 | |||||||||||||||||||||
|
|
|
|
|
|
|
|
|
|
|
|
|
| |||||||||||||||
Total Consolidated Expenditures | ¥ | 241,061 | ¥ | 229,389 | ¥ | 226,661 | ¥ | 232,905 | ¥ | 305,846 | ¥ | 285,348 | ¥ | 269,708 | ||||||||||||||
|
|
|
|
|
|
|
|
|
|
|
|
|
| |||||||||||||||
Surplus of Consolidated Revenues over Consolidated Expenditures | ¥ | 18,353 | ¥ | 15,340 | ¥ | 17,206 | ¥ | 18,387 | ¥ | 47,431 | ¥ | 37,303 | ¥ | 1,824 |
(a) | Because of the manner in which the government accounts are kept, it is not practicable to show a consolidation of the Government Affiliated Agencies with the General and Special Accounts. |
(b) | Inter-Account Transactions include transfers between the General Account and the Special Accounts, transfers between the Special Accounts, and transfers between sub- accounts of the Special Accounts. |
(c) | As of the date of this registration statement, details for the revised budget for JFY 2022 are not available. For information in respect of the General Account and Special Accounts for the revised budget for JFY 2022, refer to the tables on pages 38 and 39. |
Source: Budget, Ministry of Finance.
38
Table of Contents
General Account
JFY 2016 | JFY 2017 | JFY 2018 | JFY 2019 | JFY 2020 | JFY 2021 | JFY 2022 Revised Budget(a) | ||||||||||||||||||||||
(in billions of yen) | ||||||||||||||||||||||||||||
REVENUES | ||||||||||||||||||||||||||||
Tax and Stamp Revenues | ¥ | 55,469 | ¥ | 58,787 | ¥ | 60,356 | ¥ | 58,442 | ¥ | 60,822 | ¥ | 67,038 | ¥ | 68,359 | ||||||||||||||
Carried-over Surplus | 3,945 | 5,232 | 5,528 | 6,723 | 7,796 | 36,981 | 2,326 | |||||||||||||||||||||
Government Bond Issues | 38,035 | 33,555 | 34,395 | 36,582 | 108,554 | 57,655 | 62,479 | |||||||||||||||||||||
Income from Operations | 47 | 50 | 51 | 51 | 46 | 61 | 51 | |||||||||||||||||||||
Gains from Deposition of Assets | 384 | 278 | 268 | 226 | 293 | 319 | 306 | |||||||||||||||||||||
Miscellaneous Receipts | 4,895 | 5,741 | 5,098 | 7,139 | 7,068 | 7,349 | 5,698 | |||||||||||||||||||||
|
|
|
|
|
|
|
|
|
|
|
|
|
| |||||||||||||||
Total Revenues | ¥ | 102,774 | ¥ | 103,644 | ¥ | 105,697 | ¥ | 109,162 | ¥ | 184,579 | ¥ | 169,403 | ¥ | 139,220 | ||||||||||||||
|
|
|
|
|
|
|
|
|
|
|
|
|
| |||||||||||||||
EXPENDITURES | ||||||||||||||||||||||||||||
Local Allocation Tax Grants, etc. | ¥ | 15,339 | ¥ | 15,567 | ¥ | 16,026 | ¥ | 16,032 | ¥ | 16,256 | ¥ | 19,558 | ¥ | 17,513 | ||||||||||||||
National Debt Service | 22,086 | 22,521 | 22,529 | 22,286 | 22,326 | 24,589 | 24,072 | |||||||||||||||||||||
Social Security | 32,208 | 32,521 | 32,569 | 33,501 | 42,998 | 50,161 | 40,939 | |||||||||||||||||||||
Public Works | 6,710 | 6,912 | 6,913 | 7,610 | 8,413 | 8,600 | 8,053 | |||||||||||||||||||||
Education and Science | 5,598 | 5,703 | 5,748 | 5,911 | 9,194 | 7,956 | 8,813 | |||||||||||||||||||||
National Defense | 5,150 | 5,274 | 5,475 | 5,627 | 5,505 | 6,014 | 5,810 | |||||||||||||||||||||
Former Military Personnel Pensions | 335 | 286 | 241 | 202 | 169 | 140 | 122 | |||||||||||||||||||||
Economic Assistance | 743 | 651 | 642 | 653 | 763 | 669 | 847 | |||||||||||||||||||||
Food Supply | 1,140 | 1,181 | 1,122 | 1,121 | 1,498 | 1,772 | 1,761 | |||||||||||||||||||||
Energy | 973 | 969 | 973 | 1,049 | 1,027 | 1,267 | 2,197 | |||||||||||||||||||||
Promotion of SMEs | 430 | 319 | 525 | 779 | 16,257 | 9,944 | 1,419 | |||||||||||||||||||||
Miscellaneous | 6,830 | 6,211 | 6,212 | 6,596 | 23,190 | 13,980 | 15,913 | |||||||||||||||||||||
Contingency funds for measures against the COVID-19 and soaring crude oil and commodity prices | — | — | — | — | — | — | 9,860 | |||||||||||||||||||||
Contingency funds for Economic Emergency including the impact from the Ukraine crisis | — | — | — | — | — | — | 1,000 | |||||||||||||||||||||
Contingencies | — | — | — | — | — | — | 900 | |||||||||||||||||||||
|
|
|
|
|
|
|
|
|
|
|
|
|
| |||||||||||||||
Total Expenditures | ¥ | 97,542 | ¥ | 98,116 | ¥ | 98,975 | ¥ | 101,366 | ¥ | 147,597 | ¥ | 144,650 | ¥ | 139,220 | ||||||||||||||
|
|
|
|
|
|
|
|
|
|
|
|
|
| |||||||||||||||
Surplus of Revenues over Expenditures | ¥ | 5,232 | ¥ | 5,528 | ¥ | 6,723 | ¥ | 7,796 | ¥ | 36,981 | ¥ | 24,754 | ¥ | — |
(a) | As revised to reflect the revised budget for JFY 2022 approved by the Diet on December 2, 2022. |
Source: Budget, Ministry of Finance.
39
Table of Contents
Special Accounts
JFY 2016 | JFY 2017 | JFY 2018 | JFY 2019 | JFY 2020 | JFY 2021 | JFY 2022 Revised Budget(a) | ||||||||||||||||||||||||||||||||||||||||||||||||||
Rev. | Exp. | Rev. | Exp. | Rev. | Exp. | Rev. | Exp. | Rev. | Exp. | Rev. | Exp. | Rev. | Exp. | |||||||||||||||||||||||||||||||||||||||||||
(in billions of yen) | ||||||||||||||||||||||||||||||||||||||||||||||||||||||||
Fiscal Investment and Loan Program | ¥ | 42,124 | ¥ | 41,166 | ¥ | 28,207 | ¥ | 27,409 | ¥ | 26,070 | ¥ | 25,175 | ¥ | 28,484 | ¥ | 27,873 | ¥ | 52,366 | ¥ | 51,967 | ¥ | 35,860 | ¥ | 35,346 | ¥ | 36,064 | ¥ | 36,027 | ||||||||||||||||||||||||||||
Government Bonds Consolidation Fund | 198,994 | 195,911 | 191,227 | 188,134 | 186,158 | 183,082 | 186,970 | 183,878 | 188,973 | 185,921 | 239,702 | 236,623 | 237,174 | 237,174 | ||||||||||||||||||||||||||||||||||||||||||
Foreign Exchange Fund | 2,948 | 70 | 2,808 | 70 | 3,101 | 85 | 3,599 | 160 | 3,133 | 234 | 2,475 | 177 | 2,491 | 1,147 | ||||||||||||||||||||||||||||||||||||||||||
Local Allocation and Local Transfer Tax | 53,577 | 52,590 | 52,517 | 51,780 | 52,483 | 51,596 | 51,985 | 51,488 | 51,978 | 50,829 | 55,326 | 53,632 | 53,436 | 51,966 | ||||||||||||||||||||||||||||||||||||||||||
Measure for Energy | 9,608 | 9,082 | 10,191 | 9,742 | 10,613 | 10,158 | 10,887 | 10,377 | 11,155 | 10,618 | 11,649 | 10,914 | 14,053 | 14,053 | ||||||||||||||||||||||||||||||||||||||||||
Pensions | 90,142 | 85,786 | 90,158 | 87,413 | 91,700 | 89,464 | 93,209 | 90,919 | 94,591 | 91,804 | 96,376 | 92,725 | 97,045 | 97,045 | ||||||||||||||||||||||||||||||||||||||||||
Stable Supply of Foodstuff | 940 | 820 | 979 | 842 | 970 | 814 | 968 | 851 | 926 | 821 | 980 | 913 | 1,316 | 1,314 | ||||||||||||||||||||||||||||||||||||||||||
Debt Management of National Forest and Field Service | 329 | 329 | 342 | 342 | 349 | 349 | 356 | 356 | 363 | 363 | 360 | 360 | 353 | 353 | ||||||||||||||||||||||||||||||||||||||||||
Trade Reinsurance(b) | 37 | 12 | — | — | — | — | — | — | — | — | — | — | — | — | ||||||||||||||||||||||||||||||||||||||||||
Automobile Safety | 606 | 426 | 625 | 431 | 672 | 451 | 684 | 500 | 651 | 434 | 559 | 395 | 520 | 449 | ||||||||||||||||||||||||||||||||||||||||||
Labor Insurance | 6,296 | 5,941 | 6,040 | 5,656 | 6,073 | 5,735 | 6,371 | 5,928 | 10,589 | 9,519 | 10,486 | 8,610 | 8,855 | 8,034 | ||||||||||||||||||||||||||||||||||||||||||
Reconstruction from the Great East Japan Earthquake | 4,105 | 2,961 | 2,924 | 2,188 | 2,532 | 1,868 | 2,587 | 1,677 | 2,498 | 1,854 | 1,430 | 1,112 | 922 | 922 | ||||||||||||||||||||||||||||||||||||||||||
Others | 456 | 267 | 469 | 143 | 456 | 158 | 452 | 164 | 338 | 153 | 353 | 273 | 300 | 264 | ||||||||||||||||||||||||||||||||||||||||||
|
|
|
|
|
|
|
|
|
|
|
|
|
|
|
|
|
|
|
|
|
|
|
|
|
|
|
| |||||||||||||||||||||||||||||
Total Revenues and Expenditures(c) | ¥ | 410,162 | ¥ | 395,361 | ¥ | 386,487 | ¥ | 374,150 | ¥ | 381,177 | ¥ | 368,936 | ¥ | 386,552 | ¥ | 374,170 | ¥ | 417,561 | ¥ | 404,519 | ¥ | 455,554 | ¥ | 441,081 | ¥ | 452,529 | ¥ | 448,751 | ||||||||||||||||||||||||||||
|
|
|
|
|
|
|
|
|
|
|
|
|
|
|
|
|
|
|
|
|
|
|
|
|
|
|
|
(a) | As revised to reflect the revised budget for JFY 2022 approved by the Diet on December 2, 2022. |
(b) | The account was abolished effective JFY 2017. |
(c) | Without adjustment for inter-account transactions. Total Revenues and Expenditures may differ from the actual totals of the listed accounts due to rounding. |
Source: Budget, Ministry of Finance.
40
Table of Contents
Government Affiliated Agencies
JFY 2016 | JFY 2017 | JFY 2018 | JFY 2019 | JFY 2020 | JFY 2021 | JFY 2022 Initial Budget(a) | ||||||||||||||||||||||||||||||||||||||||||||||||||
Rev. | Exp. | Rev. | Exp. | Rev. | Exp. | Rev. | Exp. | Rev. | Exp. | Rev. | Exp. | Rev. | Exp. | |||||||||||||||||||||||||||||||||||||||||||
(in billions of yen) | ||||||||||||||||||||||||||||||||||||||||||||||||||||||||
Total | ¥ | 1,065 | ¥ | 907 | ¥ | 1,130 | ¥ | 962 | ¥ | 1,231 | ¥ | 1,064 | ¥ | 1,265 | ¥ | 1,064 | ¥ | 1,096 | ¥ | 804 | ¥ | 996 | ¥ | 665 | ¥ | 2,005 | ¥ | 2,519 |
(a) | There were no revisions to the relevant information for Government Affiliated Agencies in the revised budget for JFY 2022 approved by the Diet on December 2, 2022. |
Source: Budget, Ministry of Finance.
41
Table of Contents
Tax Structure
The central government derives tax revenues (including stamp revenues) through taxes on income, consumption and property, etc. The taxes on income, consumption and property (including stamp revenues, etc.) account for 54.1%, 40.9% and 5.1%, respectively, of the total central government taxes and stamp revenues in the JFY 2022 initial national budget.
The individual national income tax is progressive, with rates currently ranging from 5% to 45% of taxable income, and the local taxes are a 10% single rate. Interest income is generally taxed at the rate of 20.315%, including both national and local taxes, separately from other types of income, and subject to certain exemptions. The statutory national corporate income tax rate was reduced from 23.4% in JFY 2016 to 23.2% in JFY 2018, except that, for small and medium corporations, the first ¥8 million of income is taxed at 15%. In addition, corporations are subject to local income taxation. The effective corporate income tax rate (national and local) was reduced from 29.97% in JFY 2016 to 29.74% in JFY 2018.
Comprehensive Reform of Social Security and Tax. Japan’s fiscal conditions face challenges, with its tax revenues covering about 49% of its expenditures under the revised budget for JFY 2022, and with the ratio of long-term debt outstanding of central and local governments to gross domestic product having reached 218% at the end of JFY 2020. The ratio of long-term debt outstanding of central and local governments to gross domestic product is expected to be increased to 223% at the end of JFY 2021 and further increased to 225% at the end of JFY 2022. Such ratio may further increase in subsequent fiscal years due to the negative impact of COVID-19 on gross domestic product and additional government debt issued in connection with stimulus measures implemented in response to COVID-19. See also “Japan’s Public Debt” below. The Government of Japan seeks to tackle these fiscal challenges through the “comprehensive reform of social security and tax”, which was approved by the Diet in August��2012, and thereby maintain the market’s and the international community’s confidence in Japan and build the foundation for stable economic growth. In the reform, the government planned to set aside consumption tax revenues for social security payments, and, on the condition that the economic situation improves, gradually increase the consumption tax rate to 8% in April 2014 and to 10% in October 2015. In accordance with the plan, the consumption tax rate was increased to 8% in April 2014. However, the government decided to postpone the implementation date of the further consumption tax hike to 10% from October 1, 2015 to April 1, 2017, as a result of taking comprehensive account of the economic condition and other factors, and on June 1, 2016, the then-current Japan Prime Minister ABE Shinzo announced a plan to further postpone the consumption tax hike to 10% from April 1, 2017, to October 1, 2019. The consumption tax rate has been increased to 10% since October 1, 2019.
Fiscal Investment and Loan Program
The Fiscal Investment and Loan Program (the “FILP”) plan is formulated at the same pace as the General Account budget. The FILP plan details the allocation of public funds to various special accounts, government affiliated agencies, local governments, public corporations and other public institutions.
Under the FILP plan, funds are supplied to government-related entities such as public corporations, government affiliated agencies, special accounts and local governments. The total amount of the initial plan for JFY 2023 is ¥16,269 billion. The sources of funds for the initial plan in JFY 2023 are Fiscal Loan (¥12,710 billion), Industrial Investment (¥430 billion), Government-Guaranteed domestic bonds (¥1,783 billion), Government-Guaranteed foreign bonds (¥1,307 billion) and Government-Guaranteed long-term borrowings in foreign currencies (¥40 billion). The Fiscal Loan utilizes the Fiscal Loan Fund consisting of funds procured through the issuance of FILP bonds and reserves or surplus funds deposited from government special accounts to provide long-term, fixed and low-interest loans to such entities as special government accounts, local governments, government-affiliated agencies and incorporated administrative agencies.
The following table (the “FILP Classification Table by Purpose”) shows the uses of funds allocated under the initial plan for the periods indicated.
(Note) | The FILP Classification Table by Purpose has been prepared and published to specify fields where FILP contributes to the national economy or livelihood. Classification of the table had been almost the same |
42
Table of Contents
from JFY 1961 to JFY 2014. However, since the classification became to be inappropriate for reflecting realities of recent FILP-target projects, it was revised in JFY 2015 by sorting out the classification or putting some classifications together. |
Old classification | JFY 2011 | JFY 2012 | JFY 2013 | JFY 2014 | ||||||||||||
(in billions of yen) | ||||||||||||||||
Housing | ¥ | 578 | ¥ | 923 | ¥ | 929 | ¥ | 942 | ||||||||
Living environment | 2,725 | 2,713 | 2,805 | 2,306 | ||||||||||||
Social welfare | 550 | 743 | 703 | 920 | ||||||||||||
Education | 1,176 | 1,232 | 1,522 | 1,278 | ||||||||||||
Small and medium enterprises | 3,627 | 4,323 | 4,197 | 3,861 | ||||||||||||
Agriculture, forestry and fisheries | 345 | 373 | 407 | 476 | ||||||||||||
National land conservation/disaster recovery | 180 | 645 | 348 | 477 | ||||||||||||
Road construction | 2,248 | 2,813 | 2,939 | 2,270 | ||||||||||||
Transportation/communications | 408 | 384 | 519 | 629 | ||||||||||||
Regional development | 467 | 447 | 372 | 259 | ||||||||||||
Industry/technology | 625 | 2,015 | 2,005 | 1,448 | ||||||||||||
Trade/economic cooperation | 1,978 | 1,039 | 1,644 | 1,313 | ||||||||||||
|
|
|
|
|
|
|
| |||||||||
Total | ¥ | 14,906 | ¥ | 17,648 | ¥ | 18,390 | ¥ | 16,180 | ||||||||
|
|
|
|
|
|
|
|
New classification | JFY 2014 | JFY 2015 | JFY 2016 | JFY 2017 | JFY 2018 | JFY 2019 | JFY 2020 | JFY 2021 | JFY 2022 | JFY 2023 | ||||||||||||||||||||||||||||||
(in billions of yen) | ||||||||||||||||||||||||||||||||||||||||
SMEs and micro enterprises | ¥ | 3,750 | ¥ | 3,448 | ¥ | 3,182 | ¥ | 2,969 | ¥ | 2,912 | ¥ | 2,997 | ¥ | 2,903 | ¥ | 14,521 | ¥ | 3,567 | ¥4,972 | |||||||||||||||||||||
Agriculture, forestry and fisheries | 318 | 280 | 322 | 339 | 573 | 604 | 590 | 759 | 699 | 796 | ||||||||||||||||||||||||||||||
Education | 1,134 | 1,038 | 1,055 | 932 | 943 | 930 | 898 | 4,859 | 5,671 | 805 | ||||||||||||||||||||||||||||||
Welfare/medical care | 772 | 773 | 811 | 670 | 627 | 541 | 477 | 2,042 | 1,044 | 436 | ||||||||||||||||||||||||||||||
Environment | 50 | 61 | 61 | 64 | 61 | 33 | 54 | 57 | 93 | 101 | ||||||||||||||||||||||||||||||
Industry/innovation | 834 | 939 | 864 | 822 | 919 | 1,019 | 1,166 | 1,213 | 1,009 | 1,052 | ||||||||||||||||||||||||||||||
Housing | 849 | 742 | 621 | 541 | 461 | 546 | 521 | 792 | 815 | 768 | ||||||||||||||||||||||||||||||
Social capital | 4,467 | 3,999 | 3,087 | 5,093 | 4,761 | 3,745 | 3,752 | 3,065 | 2,634 | 2,921 | ||||||||||||||||||||||||||||||
Overseas investment and loans | 1,547 | 1,378 | 2,000 | 2,455 | 2,003 | 1,857 | 2,039 | 2,029 | 2,472 | 3,543 | ||||||||||||||||||||||||||||||
Others | 2,460 | 1,964 | 1,477 | 1,243 | 1,204 | 849 | 821 | 11,568 | 884 | 875 | ||||||||||||||||||||||||||||||
|
|
|
|
|
|
|
|
|
|
|
|
|
|
|
|
|
|
|
| |||||||||||||||||||||
Total | ¥ | 16,180 | ¥ | 14,622 | ¥ | 13,481 | ¥ | 15,128 | ¥ | 14,463 | ¥ | 13,119 | ¥ | 13,220 | ¥ | 40,906 | ¥ | 18,886 | ¥16,269 | |||||||||||||||||||||
|
|
|
|
|
|
|
|
|
|
|
|
|
|
|
|
|
|
|
|
43
Table of Contents
DEBT RECORD
There has been no default in the payment of interest or principal of any internal Japanese government obligation since the establishment of the modern Japanese state in 1868 or of any external Japanese government obligation within a period of 20 years prior hereto.
44
Table of Contents
JAPAN’S PUBLIC DEBT
The following table summarizes, as of the dates indicated, the outstanding direct internal and external funded and floating debt of Japan. The term “floating debt” is used herein to mean all debt with maturities of one year or less from the date of issue. All other debt is classified as “funded debt.” Detailed debt tables are presented below.
Outstanding General Bonds reached ¥991 trillion at the end of JFY 2021. The amount of public bonds issued by the Japanese government as a percentage of its general account total revenues was 46.0% under the revised budget for JFY 2021 and 35.9% under the revised budget for JFY 2022. The amount of General Bond issuances in the JFY 2022 revised budget is ¥39,627 billion and is less than the JFY 2021 revised budget level of ¥65,655 billion.
Summary of Japan’s Public Debt
Funded | Floating Internal | |||||||||||
At the end of JFY | Internal | External | ||||||||||
(in billions of yen) | (in thousands of yen) | (in billions of yen) | ||||||||||
2017 | ¥ | 934,321 | — | ¥ | 153,492 | |||||||
2018 | 954,863 | — | 148,491 | |||||||||
2019 | 965,926 | — | 148,614 | |||||||||
2020 | 993,542 | — | 222,921 | |||||||||
2021 | 1,037,735 | — | 203,572 |
As of March 31, 2022 Japan had guaranteed payment of principal and interest of various internal yen obligations in the aggregate principal amount of ¥24,081 billion and of various external obligations aggregating the equivalent of ¥6,990 billion.
The following table sets forth the aggregate annual payments of principal in respect of the direct internal funded debt of Japan outstanding as of March 31, 2022 for the periods indicated.
Principal Payments on Direct Funded Debt of Japan
JFY | Internal | |||
(in billions of yen) | ||||
2022 | ¥ | 111,368 | ||
2023 | 114,141 | |||
2024 | 74,373 | |||
2025 | 80,834 | |||
2026 to 2060 | 656,977 | |||
|
| |||
Total | ¥ | 1,037,694 | ||
|
|
45
Table of Contents
INTERNAL DEBT
Direct Debt of the Japanese Government
Funded Debt
Title and Interest Rate | Year of Issue | Year of Maturity | Principal Amounts Outstanding as of March 31, 2022 (in millions) | |||||
1. Bonds | ||||||||
Interest-Bearing Treasury Bond — 40 years, 14 Series (0.4-2.4%) | 2007-2022 | 2048-2061 | ¥ | 35,098,500 | ||||
Interest-Bearing Treasury Bond — 30 years, 73 Series (0.3-2.9%) | 1999-2022 | 2029-2051 | 151,208,242 | |||||
Interest-Bearing Treasury Bond — 20 years, 124 Series (0.2-2.4%) | 2002-2022 | 2022-2041 | 286,009,942 | |||||
Interest-Bearing Treasury Bond — 15 years, 4 Series (variable rate) | 2007-2008 | 2022-2023 | 2,837,800 | |||||
Interest-Bearing Treasury Bond — 10 years, 43 Series (0.1-0.9%) | 2012-2022 | 2022-2031 | 320,319,156 | |||||
Interest-Bearing Treasury Bond for Individual Investors — 10 years, 110 Series (variable rate) | 2012-2022 | 2022-2032 | 9,615,467 | |||||
Inflation-Indexed Bonds —10 years, 10 Series (0.005-0.2%) | 2013-2022 | 2023-2031 | 11,465,067 | |||||
Interest-Bearing Treasury Bond — 5 years, 19 Series (0.005-0.1%) | 2017-2022 | 2022-2026 | 136,099,300 | |||||
Interest-Bearing Treasury Bond for Individual Investors — 5 years, 60 Series (0.05%) | 2017-2022 | 2022-2027 | 946,956 | |||||
Interest-Bearing Treasury Bond for Individual Investors — 3 years, 36 Series (0.05%) | 2019-2022 | 2022-2025 | 1,796,212 | |||||
Interest-Bearing Treasury Bond — 2 years, 24 Series (0.005-0.1%) | 2020-2022 | 2022-2024 | 71,542,000 | |||||
6% Bereaved Family Treasury Bond, 7 Series | 2013-2019 | 2022-2028 | 1 | |||||
6% Repatriation Treasury Bond, 1 Series | 2014 | 2024 | 0 | |||||
Non-interest Special Benefit Treasury Bond, 1 Series | 2013 | 2023 | 1 | |||||
Non-interest Special Benefit Treasury Bond IV, 2 Series | 2013-2016 | 2023-2026 | 4 | |||||
Non-interest Special Benefit Treasury Bond X, 2 Series | 2013-2016 | 2023-2026 | 19 | |||||
Non-interest Special Benefit Treasury Bond XIII, 1 Series | 2021 | 2026 | 19 | |||||
Non-interest Special Benefit Treasury Bond XVII, 3 Series | 2012-2016 | 2022-2026 | 113 | |||||
Non-interest Special Benefit Treasury Bond XXII, 6 Series(a) | 2012-2017 | 2022-2027 | 564 | |||||
Non-interest Special Benefit Treasury Bond XXVII, 7 Series(a) | 2013-2021 | 2023-2031 | 19,401 | |||||
Non-interest Special Benefit Treasury Bond XXIX, 1 Series | 2021 | 2026 | 160 | |||||
Non-interest Treasury Bond for Special Condolence XI, 1 Series | 2020 | 2025 | 130,801 | |||||
|
| |||||||
Total Bonds | ¥ | 1,027,089,728 | ||||||
|
| |||||||
2. Borrowings | ||||||||
Former Temporary Military Expenditure(b) | 1943-1945 | ¥ | 41,422 | |||||
Allotment of Local Allocation and Local Transfer Tax | 2007 | 2037 | 8,758,222 | |||||
Former National Centers for Advanced and Specialized Medical Care | 2010 | 2023-2035 | 19,832 | |||||
Special Account for Energy Policy (0.01-1.3 %) | 2009-2022 | 2022-2036 | 103,298 | |||||
Special Account for Stable Food Supply (0.01-1.2%) | 2010-2022 | 2023-2035 | 24,044 | |||||
Special Account for National Forest Debt Management (0.0-0.06%) | 1996-2022 | 2022-2033 | 1,143,754 | |||||
Special Account for Motor Vehicle Safety (0.0-0.4%) | 2003-2022 | 2023-2041 | 554,939 | |||||
|
| |||||||
Total Borrowings | ¥ | 10,645,511 | ||||||
|
| |||||||
Total Direct Internal Funded Debt | ¥ | 1,037,735,239 | ||||||
|
|
(a) | The amounts outstanding for Non-interest Special Benefit Treasury Bond XXII, 6 Series and for Non-interest Special Benefit Treasury Bond XXVII, 7 Series are higher than the amounts outstanding for the other Non-interest Special Benefit Treasury Bond series listed in this table because these bonds relate to “special benefit for the wives of the war dead, etc.”, for which benefit payments are high compared to other special benefits. |
(b) | Represents borrowings by the government from special corporations of currencies of areas under Japanese control during World War II. The maturity of such borrowings and other matters relating to such borrowings remain undetermined. |
46
Table of Contents
Floating Debt
Title | Interest | Year of Maturity | Principal Amounts Outstanding as of March 31, 2022 (in millions) | |||||
1. Bonds | ||||||||
Treasury Discount Bills | ||||||||
Food Financing Bills | Non-interest bearing | 2022 | ¥ | 179,000 | ||||
Foreign Exchange Fund Financing Bills | Non-interest bearing | 2022 | 84,859,480 | |||||
Petroleum Financing Bills | Non-interest bearing | 2022 | 1,160,400 | |||||
Treasury Bills, 22 Series | Non-interest bearing | 2022-2023 | 69,096,640 | |||||
Note in Substitution for Currency of the International Monetary Fund | Non-interest bearing | Payable on demand | 3,690,438 | |||||
Note for Contribution to the Special Funds of the Asian Development Bank | Non-interest bearing | Payable on demand | 39,942 | |||||
Note in Substitution for Currency of the African Development Fund | Non-interest bearing | Payable on demand | 52,004 | |||||
Note in Substitution for Currency of the International Fund for Agricultural Development | Non-interest bearing | Payable on demand | 4,637 | |||||
Note in Substitution for Currency of the Global Environment Facility Trust Fund of the International Bank for Reconstruction and Development | Non-interest bearing | Payable on demand | 57,463 | |||||
Note in Substitution for Currency of the Multilateral Investment Guarantee Agency | Non-interest bearing | Payable on demand | 721 | |||||
Note in Substitution for Currency of the Green Climate Fund | Non-interest bearing | Payable on demand | 58,876 | |||||
Government Bonds issued to Development Bank of Japan | Non-interest bearing | Payable on demand | 1,324,665 | |||||
Government Bonds issued to Nuclear Damage Liability Facilitation Fund | Non-interest bearing | Payable on demand | 3,264,900 | |||||
|
| |||||||
Total Bonds | ¥ | 163,789,163 | ||||||
|
| |||||||
2. Borrowings | ||||||||
Special Account for Local Allocation Tax | 0.000-0.05% | 2022 | ¥ | 30,112,295 | ||||
Special Account of Pension | 0.05% | 2022 | 1,440,920 | |||||
Special Account for Energy Policy | 0.000% | 2022-2023 | 8,229,822 | |||||
|
| |||||||
Total Borrowings | ¥ | 39,783,037 | ||||||
Total Direct Internal Floating Debt | ¥ | 203,572,201 | ||||||
|
| |||||||
Total Direct Internal Debt | ¥ | 1,241,307,439 | ||||||
|
|
47
Table of Contents
Debt Guaranteed by the Japanese Government
Title | Interest | Year of Issue | Year of Maturity | Principal Amounts Outstanding as of March 31, 2022 (in millions) | ||||||||||||
1. Bonds Issued by Government-Affiliated Corporations | ||||||||||||||||
Japan Finance Corporation | 0.001-0.911% | 2012-2021 | 2022-2031 | ¥ | 735,000 | |||||||||||
Japan Expressway Holding and Debt Repayment Agency | 0.001-2.700% | 2006-2022 | 2022-2061 | 13,671,500 | ||||||||||||
New Kansai International Airport Co., Ltd. | 0.105-2.400% | 2007-2019 | 2022-2029 | 247,100 | ||||||||||||
Development Bank of Japan | 0.001-2.200% | 2007-2021 | 2022-2061 | 1,315,000 | ||||||||||||
Deposit Insurance Corporation of Japan | 0.001-0.100% | 2018-2021 | 2022-2024 | 1,480,000 | ||||||||||||
Nuclear Damage Compensation and Decommissioning Facilitation Corporation | 0.001% | 2018-2021 | 2022-2025 | 800,000 | ||||||||||||
The Corporation for Revitalizing Earthquake-Affected Business | 0.001% | 2017 | 2021 | — | ||||||||||||
Private Finance Initiative Promotion Corporation of Japan | 0.001-0.145% | 2017-2021 | 2026-2027 | 88,000 | ||||||||||||
Fund Corporation for the Overseas Development of Japan’s ICT and Postal Services Inc. | 0.110% | 2021 | 2031 | 10,000 | ||||||||||||
Organization for Promoting Urban Development | 0.020-0.699% | 2013-2022 | 2023-2042 | 95,800 | ||||||||||||
Central Japan International Airport Co., Ltd. | 0.001-0.671% | 2013-2022 | 2023-2042 | 154,500 | ||||||||||||
Japan Finance Organization for Municipalities | 0.001-2.200% | 2007-2021 | 2022-2030 | 4,010,000 | ||||||||||||
Japan Housing Finance Agency | 0.001-0.265% | 2021-2022 | 2026-2034 | 220,000 | ||||||||||||
|
| |||||||||||||||
Total | ¥ | 22,826,900 | ||||||||||||||
|
| |||||||||||||||
2. Borrowings of Government-Affiliated Corporations | ||||||||||||||||
Incorporated Administrative Agency — Farmers Pension Fund | 0% | 2019-2022 | 2022-2024 | ¥ | 202,200 | |||||||||||
Japan Railway Construction, Transport and Technology Agency | 0% | 2020 | 2021 | — | ||||||||||||
Japan Oil, Gas and Metals National Corporation | 0% | 2021-2022 | 2022-2023 | 476,363 | ||||||||||||
Banks’ Shareholdings Purchase Corporation | 0% | 2022 | 2023 | 180,000 | ||||||||||||
Deposit Insurance Corporation of Japan | 0% | 2021-2022 | 2022-2023 | 25,500 | ||||||||||||
Japan Investment Corporation | 0% | 2021 | 2022 | 150,000 | ||||||||||||
Nuclear Damage Compensation and Decommissioning Facilitation Corporation | 0% | 2021 | 2022 | 200,000 | ||||||||||||
The Corporation for Revitalizing Earthquake-Affected Business | 0% | 2021 | 2022 | 14,600 | ||||||||||||
Organization for Promoting Urban Development | 0% | 2021 | 2025 | 5,500 | ||||||||||||
|
| |||||||||||||||
Total | ¥ | 1,254,163 | ||||||||||||||
Total Internal Debt Guaranteed by the Japanese Government | ¥ | 24,081,063 | ||||||||||||||
|
|
48
Table of Contents
EXTERNAL DEBT
Debt Guaranteed by the Japanese Government
Interest | Year of Loan | Year of Maturity | Principal Amounts Outstanding as of March 31, 2022 (in thousands) | |||||||||||||||
Japan Bank for International Cooperation | 0.375-3.500% | 2013-2022 | 2022-2031 | $ | 45,300,000 | |||||||||||||
0.375% | 2021 | 2026 | £ | 250,000 | ||||||||||||||
Japan International Cooperation Agency | 1.000-3.375% | 2016-2021 | 2026-2031 | $ | 2,580,000 | |||||||||||||
Development Bank of Japan | 0.500-3.250% | 2014-2021 | 2022-2031 | $ | 13,150,000 | |||||||||||||
4.750% | 2007 | 2027 | € | 700,000 | ||||||||||||||
1.050-2.300% | 1998-2006 | 2022-2028 | ¥ | 280,000,000 | ||||||||||||||
| ||||||||||||||||||
Totals by currency | $ | 61,030,000 | ||||||||||||||||
£ | 250,000 | |||||||||||||||||
€ | 700,000 | |||||||||||||||||
¥ | 280,000,000 |
49
Table of Contents
SUBSCRIPTIONS TO INTERNATIONAL FINANCIAL ORGANIZATIONS
The following table sets forth information relating to Japan’s obligations to contribute to the capital and financing requirements of international financing organizations in which it participates as of March 31, 2022.
Organization | Subscription Amount | |||
(in USD millions) | ||||
International Monetary Fund | $ | 42,606 | (a) | |
International Bank for Reconstruction and Development | 23,280 | (b) | ||
International Development Association | 50,118 | (c) | ||
International Finance Corporation | 1,716 | (d) | ||
Multilateral Investment Guarantee Agency | 97 | (e) | ||
International Fund for Agricultural Development | 600 | (f) | ||
Asian Development Bank | 23,186 | (g) | ||
African Development Bank | 10,922 | (h) | ||
African Development Fund | 4,767 | (i) | ||
European Bank for Reconstruction and Development | 2,889 | (j) | ||
Inter-American Development Bank | 8,878 | (k) | ||
Inter-American Investment Corporation | 81 | (l) | ||
Multilateral Investment Fund | 655 | (m) |
(a) | Equivalent of SDR 30,820.5 million as of March 31, 2022. |
(b) | As stated in IBRD Financial Statements as of June 30, 2021. |
(c) | As stated in IDA Financial Statements as of June 30, 2021. |
(d) | As stated in IFC Financial Statements as of June 30, 2021. |
(e) | As stated in MIGA Financial Statements as of June 30, 2021. |
(f) | As stated in IFAD Financial Statements as of December 31, 2020. |
(g) | As stated in ADB Financial Statements as of December 31, 2021. |
(h) | As stated in AfDB Financial Statements as of December 31, 2021. Equivalent of UA 7,804 million. |
(i) | As stated in AfDF Financial Statements as of December 31, 2021. Equivalent of UA 3,406 million. |
(j) | As stated in EBRD Financial Statements as of December 31, 2020. Equivalent of € 2,557 million. |
(k) | As stated in IDB Financial Statements as of December 31, 2021. |
(l) | As stated in IIC Financial Statements as of December 31, 2021. |
(m) | As stated in MIF Financial Statements as of December 31, 2020. |
50
Table of Contents
The net proceeds from the sale of the Debt Securities will be allocated to JICA’s Finance and Investment Account dedicated to its ODA Loans and Private Sector Investment Finance activities. An amount equal to part or all of such net proceeds may be allocated for investments in one or more Eligible Projects (as defined below).
“Eligible Projects” means projects selected under the Development Cooperation Charter, which was endorsed by the Japanese government in 2015 with the aim to proactively contribute to peace, stability and prosperity in the international community. JICA selects Eligible Projects through a rigid process that involves evaluation based on OECD-DAC Criteria for Evaluating Development Assistance, review by external experts and approval by the Japanese government. Through each Eligible Project, JICA strives to promote socio-economic development of developing countries and address challenges to Sustainable Development Goals (SDGs) adopted at the UN Sustainable Development Summit.
Eligible Projects will be subject to on-site monitoring by one of JICA’s 98 overseas offices located around the world. During the monitoring stage of any project, JICA may confer with the recipient country government or recipient company where necessary, with a view to ensuring the smooth and efficient implementation of the project. Disbursements are often made over a period of time depending on the project’s schedule. Eligible Projects will be subject to periodic progress reports that must be submitted to JICA by the recipient. JICA supervision of an Eligible Project may extend to both implementation of the project (including construction, engineering, institutional development, etc.) and all aspects of the loan process.
In addition, JICA will, in principle, conduct an ex-post evaluation process within three years of the completion of an Eligible Project. Such evaluations are disclosed on JICA’s website and an Evaluation Report is issued annually.
51
Table of Contents
DESCRIPTION OF THE DEBT SECURITIES AND GUARANTEE
The following is a brief summary of the terms and conditions of the Debt Securities and the fiscal agency agreement or agreements pursuant to which they will be issued (the “Fiscal Agency Agreement”). JICA has filed copies of the forms of Debt Securities and the form of Fiscal Agency Agreement as exhibits to the registration statement of which this prospectus is a part. The following summary does not purport to be complete, and you should refer to such exhibits for more complete information.
General
From time to time, JICA may authorize and issue Debt Securities in one or more series. The prospectus supplement that relates to your Debt Securities will specify the following terms:
• | The designation, aggregate principal amount, currency, any limitation on such principal amount and authorized denominations; |
• | The percentage of their principal amount at which such Debt Securities will be issued; |
• | The maturity date or dates; |
• | The interest rate or rates, if any, which may be fixed or variable, and the dates for payment of interest, if any; |
• | The paying agencies where payments of principal, premium, if any, and interest, if any, will be made; |
• | Any optional or mandatory redemption terms or repurchase or sinking fund provisions; and |
• | Other specific provisions. |
If JICA issues any Debt Securities at an original issue discount or payable in a currency other than the United States dollar, the prospectus supplement relating to such Debt Securities will also describe special U.S. federal income tax and other considerations applicable to such Debt Securities.
JICA and Japan will appoint a fiscal agent (the “Fiscal Agent”) or agents in connection with the Debt Securities. The Fiscal Agency Agreement will set forth the Fiscal Agent’s duties. The Fiscal Agent will be a bank or trust company named in the applicable prospectus supplement, but JICA and Japan may replace the Fiscal Agent and may appoint different fiscal agents for different series of Debt Securities. JICA and Japan may maintain deposit accounts and conduct other banking and financial transactions with the Fiscal Agent. The Fiscal Agent is the agent of JICA and Japan, is not a trustee for the holders of Debt Securities and does not have the same responsibilities or duties to act for such holders as would a trustee.
Rank of Debt Securities
The Debt Securities constitute direct, unconditional, unsubordinated and unsecured obligations of JICA and shall at all times rank pari passu and without any preference among themselves. The payment obligations of JICA under the Debt Securities shall, save for such exceptions as may be provided by applicable legislation, at all times rank at least equally with all its other present and future unsecured and unsubordinated obligations.
Guarantee of Japan
The payment of principal and interest in respect of the Debt Securities (including any additional amounts) will be unconditionally and irrevocably guaranteed by Japan. Such guarantee will be a direct, unconditional and general obligation of Japan for the performance of which the full faith and credit of Japan will be pledged and rank pari passu with all other general obligations of Japan without any preference one above the other by reason of priority of date of issue, currency of payment or otherwise.
Issuance of the guarantee will be subject to limits imposed by annual budgetary authorizations set by the Japanese Diet. In addition, the issue of the Debt Securities will necessitate the obtaining of authorization by Japan of the guarantee thereof. Accordingly, the guarantee of Japan, the form of which is included as an exhibit to the form of the Fiscal Agency Agreement filed as an exhibit to the registration statement of which this prospectus is a part, is not valid or obligatory until such guarantee has been authenticated.
52
Table of Contents
Additional Amounts
JICA will pay all amounts that it is required to pay on the bonds without withholding or deduction for, or on account of, any present or future taxes, duties, assessments or governmental charges of whatever nature imposed or levied by or on behalf of Japan, or any taxing authority in Japan (“Taxes”), unless the withholding or deduction of such Taxes is required by law. In that event, JICA will pay such additional amounts that are necessary so that the net amounts received by any beneficial owner of the bonds after such withholding or deduction will equal the amounts that would have been receivable in the absence of such withholding or deduction, except that no such additional amounts will be payable under certain circumstances.
Redemption
If the Debt Securities of a series provide for mandatory redemption, or redemption at the election of JICA, such redemption shall be on at least 30 days’ notice. In event of redemption in part, the Fiscal Agent will select the Debt Securities to be redeemed by lot or in any usual manner it approves. The Fiscal Agent will mail notice of such redemption to holders of registered Debt Securities of such series, to their last addresses as they appear on the register of the Debt Securities of such series.
Acceleration of Maturity
With respect to any series of Debt Securities, in case of the following types of default, the principal amount of a Debt Security of such series will become due and payable at the option of the registered holder of such Debt Security upon the registered holder’s written notice to the Fiscal Agent, unless all defaults shall have been cured prior to the receipt of such notice by the Fiscal Agent:
• | Default in any payment, when due, of principal (if due in installments) or premium, if any, or interest on any of the Debt Securities of such series, or, if such series is entitled to a sinking fund, in the deposit, when due, of any sinking fund payment, and continuance of such default for a period of 30 days; |
• | Default in the performance by JICA of any other covenant contained in the Debt Securities of such series, and the continuance of such default for a period of 90 days after written notice thereof to JICA from the registered holder of such Debt Security is received by the fiscal agent. |
The Fiscal Agency Agreement will not require JICA to furnish to the Fiscal Agent periodic evidence as to the absence of default.
Governing Law
The Fiscal Agency Agreement, the Debt Securities and the guarantee of Japan will all provide that they shall be governed by, and interpreted in accordance with, the laws of the State of New York, except with respect to authorization and execution by JICA and Japan of the Fiscal Agency Agreement and the Debt Securities and the guarantee of Japan, as the case may be, and any other matters required to be governed by the laws of Japan.
Jurisdiction and Enforceability
JICA will effect the irrevocable appointment of the Fiscal Agent as its authorized agent upon which process may be served in any action based upon the Debt securities (i.e., asserting rights set forth in the Debt Securities) which any holder of a Debt Security may institute in any State or Federal court in The City of New York. JICA will accept the jurisdiction of such court in such action. JICA will also waive irrevocably any immunity from jurisdiction (but not execution) to which it might otherwise be entitled in any action based upon the Debt Securities. The Fiscal Agent is not the agent for service for actions brought under the federal securities laws, and JICA’s waiver of immunity does not extend to such actions. Although Japan is subject to suit based upon the guarantee of the Debt Securities before the Tokyo District Court, Japan has not consented to the jurisdiction of any court outside Japan in connection with actions brought against it for any purpose in any way relating to the Debt Securities or its guarantee of the Debt Securities, has not appointed an agent for service of process in connection with any such action and has not agreed to waive any degree of sovereign immunity to which it may be entitled in any such action.
53
Table of Contents
If you bring an action against JICA under federal securities laws or against Japan for any purpose, unless JICA or Japan (as the case may be) waives immunity with respect to such action, you would be able to obtain a United States judgment in such action against JICA or Japan, as the case may be, only if a court were to determine that the United States Foreign Sovereign Immunities Act of 1976, as amended, precludes the granting of sovereign immunity. Even if you could obtain a United States judgment in any such action under that Act, you may not be able to obtain a judgment in Japan based on such a United States judgment. Moreover, you may not be able to execute upon property of JICA or Japan located in the United States to enforce a judgment obtained under that Act except under the limited circumstances specified in that Act.
54
Table of Contents
The information provided in this section entitled “Taxation” is provided for the convenience only of investors, who are advised to consult their own legal, tax, accountancy or other professional advisers in order to ascertain their particular circumstances regarding taxation.
Japanese Taxation
The following description of Japanese taxation (limited to national taxes) applies to interest with respect to the Debt Securities issued by JICA outside Japan and payable outside Japan, as well as to certain aspects of capital gains, inheritance and gift taxes. Prospective investors should note that the following description of Japanese taxation is not exhaustive.
Tax Withholding Rules
Certain recipients of interest on the Debt Securities are subject to the following Japanese tax withholding rules:
If the recipient of interest on any Debt Securities is:
• | an individual non-resident of Japan with no permanent establishment within Japan; |
• | a non-Japanese corporation with no permanent establishment within Japan; or |
• | an individual non-resident of Japan or non-Japanese corporation with a permanent establishment within Japan, but the receipt of interest on the relevant Debt Securities is not attributable to such permanent establishment, |
and the recipient is not a person nor entity controlling, or controlled by, JICA, or otherwise having a prescribed special relationship with JICA as described in Article 6, Paragraph (4) of the Act on Special Measures Concerning Taxation of Japan and Cabinet Order No. 43 of 31 March 1957 promulgated thereunder, as amended (the “Cabinet Order”) (a “Specially-Related Party of JICA”), then, no Japanese income or corporate tax is payable with respect to such interest by way of withholding or otherwise, if such recipient complies with certain requirements. Such requirements include:
• | if the relevant Debt Securities are held through a certain participant in an international clearing organization such as Euroclear and Clearstream, Luxembourg and DTC or a certain financial intermediary prescribed by the Act on Special Measures Concerning Taxation of Japan and the Cabinet Order and related governmental ordinances and regulations (collectively, the “Special Measures Act”) (each, a “Participant”), the requirement to provide, at the time of entrusting a Participant with the custody of the relevant Debt Securities, certain information prescribed by the Special Measures Act (the “Interest Recipient Information”) to enable the Participant to establish that the recipient is exempt from the requirement for Japanese tax to be withheld or deducted and to advise the Participant if the recipient ceases to be so exempt; and |
• | if the relevant Debt Securities are not held by a Participant, the requirement to submit to the fiscal agent (or a separate paying agent, if one is appointed) a written application for tax exemption (Hikazei tekiyo Shinkokusho) (the “Written Application for Tax Exemption”), together with certain documentary evidence. |
The above-described exemption from withholding tax with respect to interest on the Debt Securities will not be applicable to any Debt Securities on which interest is calculated based on the amount of profits or assets of JICA or a Specially-Related Party of JICA or on any of certain other indices relating to JICA or a Specially-Related Party of JICA as described in Article 6 of the Act on Special Measures Concerning Taxation of Japan and the Cabinet Order.
Failure to comply with the requirements described above or payment of interest to a recipient who is an individual non-resident of Japan or a non-Japanese corporation that in either case is a Specially-Related Party of
55
Table of Contents
JICA will result in the withholding by JICA of income tax at the rate of 15.315%, unless any lower rate or exemption is applicable under the relevant tax treaty between Japan and another country. Individual non-residents of Japan or non-Japanese corporations that are entitled to a reduced rate of Japanese withholding tax or exemption from Japanese withholding tax on payment of interest by JICA are required to submit an “Application Form for Income Tax Convention regarding Relief from Japanese Income Tax and Special Income Tax for Reconstruction on Interest” in advance through JICA to the relevant tax authority before payment of interest.
If the recipient of interest on any Debt Securities is:
• | a Japanese bank; |
• | a Japanese insurance company; |
• | a Japanese financial instruments firm; or |
• | any other Japanese financial institution that falls under one of certain categories prescribed by the Cabinet Order under Article 6, Paragraph (11) of the Act on Special Measures Concerning Taxation of Japan, |
and such recipient receives payment of interest not through a certain payment handling agents in Japan (the “Japanese Payment Handling Agents”) and complies with, among others, the requirement to provide the Interest Recipient Information or to submit the Written Application for Tax Exemption, as the case may be, no income tax will be imposed by way of withholding. The recipient will, however, be subject to regular corporate tax with respect to such interest.
If the recipient of interest on any Debt Security is:
• | an individual non-resident of Japan with a permanent establishment within Japan; or |
• | a non-Japanese corporation with a permanent establishment within Japan, |
and the receipt of interest is attributable to such permanent establishment, then such interest will not be subject to the withholding by JICA of income tax at the rate of 15.315%, provided that the recipient complies with, among others, the requirement to provide the Interest Recipient Information or to submit the Written Application for Tax Exemption, as the case may be, and that the recipient is not a Specially-Related Party of JICA. The amount of such interest will, however, be included in the recipient’s Japanese source income which is subject to Japanese taxation, and will be subject to regular income tax or corporate tax, as the case may be.
The above-described exemption from withholding tax with respect to interest on the Debt Securities will not be applicable to any Debt Securities on which interest is calculated based on the amount of profits or assets of JICA or a Specially-Related Party of JICA or on any of certain other indices relating to JICA or a Specially-Related Party of JICA as described in Article 6 of the Act on Special Measures Concerning Taxation of Japan and the Cabinet Order.
If the recipient of interest on any Debt Securities is an individual resident of Japan or a Japanese corporation other than any of the following institutions that complies with the requirement described below:
• | Japanese banks; |
• | Japanese insurance companies; |
• | Japanese financial instruments firms; |
• | other Japanese financial institutions that fall under certain categories prescribed by the Cabinet Order under Article 8, Paragraphs (1) and (2) of the Act on Special Measures Concerning Taxation of Japan (together with Japanese banks, insurance companies and financial instruments firms, the “Specified Financial Institutions”); or |
• | Japanese public corporations designated by the relevant law (“Public Corporations”), |
and such recipient receives payment of interest through certain Japanese Payment Handling Agents, such agents will withhold income tax at the rate of 15.315%. An individual recipient that receives interest through a Japanese
56
Table of Contents
Payment Handling Agent may elect conclusive taxation exempt from tax reporting. In all other cases, the recipient must include the amount of interest in the recipient’s gross income and will be subject to regular income tax or corporate tax, as the case may be.
If the recipient of interest on any Debt Securities is:
• | a Public Corporation that keeps such Debt Securities deposited with, and receives the interest on such Debt Securities through, a Japanese Payment Handling Agent with custody of the Debt Securities (the “Japanese Custodian”); or |
• | a Specified Financial Institution that keeps such Debt Securities deposited with, and receives the interest on such Debt Securities through, the Japanese Custodian, |
and such recipient submits through the Japanese Custodian, to the competent tax authority, the report prescribed by the Special Measures Act, no income tax will be imposed by way of withholding.
Capital Gains, Inheritance and Gift Taxes
Gains derived from the sale outside Japan of Debt Securities by an individual non-resident of Japan or a non-Japanese corporation with no permanent establishment within Japan are generally not subject to Japanese income or corporate tax. An individual, regardless of his or her residency, who has acquired Debt Securities as legatee, heir or donee from an individual may be required to pay Japanese inheritance or gift tax at progressive rates.
U.S. Taxation
This section describes the material U.S. federal income tax consequences of owning certain Debt Securities. It applies to you only if you are a United States holder (as defined below) and you acquire Debt Securities in the applicable offering at the applicable offering price and you hold your Debt Securities as capital assets for tax purposes. This section does not apply to you if you are a member of a class of holders subject to special rules, such as:
• | a dealer in securities or currencies, |
• | a trader in securities that elects to use a mark-to-market method of accounting for your securities holdings, |
• | a bank, |
• | a life insurance company, |
• | a tax-exempt organization, |
• | a person that owns Debt Securities that are a hedge or that are hedged against interest rate or currency risks, |
• | a person that owns Debt Securities as part of a straddle or conversion transaction for tax purposes, |
• | a person that purchases or sells Debt Securities as part of a wash sale for tax purposes, or |
• | a person whose functional currency for tax purposes is not the U.S. dollar. |
This section deals only with fixed rate Debt Securities denominated in U.S. dollars, with no more than de minimis original issue discount, that are due to mature 30 years or less from the date on which they are issued. An applicable prospectus supplement will discuss the United States federal income tax consequences of owning any other Debt Securities.
If a partnership holds Debt Securities, the U.S. federal income tax treatment of a partner generally will depend on the status of the partner and the tax treatment of the partnership. A partner in a partnership holding Debt Securities should consult its tax advisor with regard to the U.S. federal income tax treatment of an investment in Debt Securities.
57
Table of Contents
This section is based on the Internal Revenue Code of 1986, as amended the “Code”, its legislative history, existing and proposed regulations under the Code, published rulings and court decisions, all as currently in effect. These authorities are subject to change, possibly on a retroactive basis.
You are a United States holder if you are a beneficial owner of a Debt Security and you are, for federal income tax purposes:
• | an individual citizen or resident of the United States, |
• | a domestic corporation (or other entity treated as a corporation for U.S. federal income tax purposes), |
• | an estate whose income is subject to U.S. federal income tax regardless of its source, or |
• | a trust if (1) a U.S. court can exercise primary supervision over the trust’s administration and one or more United States persons are authorized to control all substantial decisions of the trust, or (2) it has a valid election in effect under applicable U.S. Treasury regulations to be treated as a United States person. |
This subsection addresses only U.S. federal income taxation. Please consult your own tax advisor concerning the consequences of owning and disposing of the Debt Securities in your particular circumstances under the Code and the laws of any other taxing jurisdiction.
Payments of Interest
This discussion assumes that the Debt Securities will be issued with no more than de minimis original issue discount for U.S. federal income tax purposes. You will be taxed on interest on your Debt Securities as ordinary income at the time you receive the interest or when it accrues, depending on your method of accounting for tax purposes.
You must include any tax withheld from the interest payment as ordinary income even though you do not in fact receive it, and you must also include as ordinary income any additional amounts paid with respect to withholding tax on the Debt Securities, including withholding tax on payments of such additional amounts. You may be entitled to deduct or credit tax withheld, subject to applicable limits. The rules governing foreign tax credits are complex and you should consult your tax advisor regarding the availability of the foreign tax credit in your situation. Interest paid by JICA on the Debt Securities is income from sources outside the United States subject to the rules regarding the foreign tax credit allowable to a United States holder and, depending on your circumstances, will be either “passive”, “general” or “foreign branch” income for purposes of computing the foreign tax credit.
Purchase, Sale, and Retirement of the Debt Securities
You generally will recognize capital gain or loss on the sale or retirement of your Debt Security equal to the difference between the amount you realize on the sale or retirement, excluding any amounts attributable to accrued but unpaid interest, and your tax basis in your Debt Security. Your tax basis in your Debt Security generally will be its cost. Capital gain of a noncorporate United States holder generally is taxed at preferential rates where the property is held for more than one year. Your ability to deduct capital losses may be limited.
Medicare Tax
A United States holder that is an individual or estate, or a trust that does not fall into a special class of trusts that is exempt from such tax, will be subject to a 3.8% tax on the lesser of (1) the United States holder’s “net investment income” for the relevant taxable year and (2) the excess of the United States holder’s modified adjusted gross income for the taxable year over a certain threshold (which in the case of individuals will be between $125,000 and $250,000, depending on the individual’s circumstances). A United States holder’s net investment income generally will include its interest income and its net gains from the disposition of Debt Securities, unless such interest income or net gains are derived in the ordinary course of the conduct of a trade or business (other than a trade or business that consists of certain passive or trading activities). If you are a
58
Table of Contents
United States holder that is an individual, estate or trust, you are urged to consult your tax advisors regarding the applicability of the Medicare tax to your income and gains in respect of your investment in the Debt Securities.
Information with Respect to Foreign Financial Assets
Owners of “specified foreign financial assets” with an aggregate value in excess of $50,000 (and in some circumstances, a higher threshold) may be required to file an information report with respect to such assets with their tax returns. “Specified foreign financial assets” include any financial accounts maintained by foreign financial institutions, as well as any of the following, but only if they are not held in accounts maintained by financial institutions: (i) stocks and securities issued by non-United States persons, (ii) financial instruments and contracts held for investment that have non-U.S. issuers or counterparties, and (iii) interests in foreign entities. Holders are urged to consult their tax advisors regarding the application of this legislation to their ownership of the Debt Securities.
Backup Withholding and Information Reporting
If you are a noncorporate United States holder, information reporting requirements on Internal Revenue Service Form 1099 generally will apply to:
• | payments of principal and interest on a Debt Security within the United States, including payments made by wire transfer from outside the United States to an account you maintain in the United States; and |
• | the payment of the proceeds from the sale of a Debt Security effected at a U.S. office of a broker. |
Additionally, backup withholding will apply to such payments if you are a noncorporate United States holder that:
• | fails to provide an accurate taxpayer identification number, |
• | is notified by the Internal Revenue Service that it has failed to report all interest and dividends required to be shown on its federal income tax returns, or |
• | in certain circumstances, fails to comply with applicable certification requirements. |
If you are a U.S. alien holder, you generally are exempt from backup withholding and information reporting requirements with respect to:
• | payments of principal and interest made to you outside the United States by JICA or another non-U.S. payor and |
• | other payments of principal and interest and the payment of the proceeds from the sale of a Debt Security effected at a U.S. office of a broker, as long as the income associated with such payments is otherwise exempt from U.S. federal income tax, and: |
• | the payor or broker does not have actual knowledge or reason to know that you are a United States person and you have furnished to the payor or broker: |
• | an Internal Revenue Service Form W-8BEN or an acceptable substitute form upon which you certify, under penalties of perjury, that you are a non-United States person, or |
• | other documentation upon which it may rely to treat the payments as made to a non-United States person in accordance with U.S. Treasury regulations, or |
• | you otherwise establish an exemption. |
59
Table of Contents
Payment of the proceeds from the sale of a Debt Security effected at a foreign office of a broker generally will not be subject to information reporting or backup withholding. However, unless the broker does not have actual knowledge or reason to know that you are a United States person and the documentation requirements described above are met or you otherwise establish an exemption, a sale of a Debt Security that is effected at a foreign office of a broker will be subject to information reporting and backup withholding if:
• | the proceeds are transferred to an account maintained by you in the United States, |
• | the payment of proceeds or the confirmation of the sale is mailed to you at a U.S. address, or |
• | the sale has some other specified connection with the United States as provided in U.S. Treasury regulations. |
In addition, unless the broker does not have actual knowledge or reason to know that you are a United States person and the documentation requirements described above are met or you otherwise establish an exemption, a sale of a Debt Security effected at a foreign office of a broker will be subject to information reporting if the broker is:
• | a United States person, |
• | a controlled foreign corporation for U.S. tax purposes, |
• | a foreign person 50% or more of whose gross income is effectively connected with the conduct of a U.S. trade or business for a specified three-year period, or |
• | a foreign partnership, if at any time during its tax year: (1) one or more of its partners are “United States persons”, as defined in U.S. Treasury regulations, who in the aggregate hold more than 50% of the income or capital interest in the partnership, or (2) such foreign partnership is engaged in the conduct of a U.S. trade or business. |
Backup withholding will apply if the sale is subject to information reporting and the broker has actual knowledge that you are a United States person.
Backup withholding is not an additional tax. You generally may obtain a refund of any amounts withheld under the backup withholding rules that exceed your income tax liability by filing a refund claim with the Internal Revenue Service.
60
Table of Contents
JICA may sell Debt Securities directly, to or through underwriters or through agents. Each prospectus supplement with respect to Debt Securities will set forth the terms of the offering of such Debt Securities, including the name or names of the underwriters or agents, the public offering price of such Debt Securities and the net proceeds to JICA from such sale, any underwriting discounts or other items constituting underwriters’ or agents’ compensation, any discounts or concessions allowed or reallowed or paid to dealers and any securities exchanges on which such Debt Securities may be listed.
If underwriters are used in the sale, they will acquire Debt Securities for their own account and may resell them from time to time in one or more transactions, including negotiated transactions, at a fixed public offering price or at varying prices determined at the time of sale. The offer of Debt Securities to the public may take the form of an offer through underwriting syndicates represented by managing underwriters, or a direct offer by one or more investment banking firms or others, as designated. Unless the applicable prospectus supplement otherwise indicates, the obligations of the underwriters to purchase Debt Securities will be subject to certain conditions precedent and the underwriters will be obligated to purchase all Debt Securities offered thereby if any are purchased. Any initial public offering price and any discounts or concessions allowed or reallowed or paid to dealers may be changed from time to time.
JICA may, directly or through agents that it designates, sell Debt Securities from time to time. The applicable prospectus supplement will name any agent involved in the offer or sale of Debt Securities and set forth any commissions payable by JICA to such agent. Unless such prospectus supplement otherwise indicates, any such agent will be acting on a best efforts basis for the period of its appointment.
If the applicable prospectus supplement so indicates, JICA will authorize agents, underwriters or dealers to solicit offers by certain specified institutions to purchase Debt Securities from JICA at the public offering price set forth in such prospectus supplement pursuant to “delayed delivery” contracts. Purchasers of Debt Securities under delayed delivery contracts will pay the public offering price plus accrued interest, if any, and will take delivery of the Debt Securities on a date or dates stated in the applicable prospectus supplement. Such contracts will be subject only to those conditions set forth in such prospectus supplement and such prospectus supplement will set forth the commission payable for solicitation of such contracts.
The applicable prospectus supplement will describe limitations on sales to certain persons of Debt Securities (including limitations imposed by relevant Japanese laws), if any.
AUTHORIZED AGENTS IN THE UNITED STATES
The authorized agent in the United States for JICA, for purposes of the United States Securities Act of 1933, as amended, is TANAKA Satoko, whose address is: JICA USA Office, 1776 I Street, N.W., Suite 895, Washington, D.C. 20006. The authorized agents for Japan are MINOWA Tetsuharu, located at Ministry of Finance, Consulate General of Japan in New York, 299 Park Avenue, 18th Floor, New York, NY 10171 and ODAWARA Takuya, located at Embassy of Japan, 2520 Massachusetts Avenue, N.W., Washington, D.C. 20008.
VALIDITY OF THE DEBT SECURITIES
Anderson Mori & Tomotsune will pass upon the validity of each series of Debt Securities and the guarantee of such Debt Securities, and all other matters of Japanese law and procedure on behalf of JICA and Japan. Morrison & Foerster LLP will pass upon the validity of each series of Debt Securities and the guarantee of such Debt Securities. In giving their opinions, Morrison & Foerster LLP may rely as to all matters of Japanese law and procedure on the opinion of Anderson Mori & Tomotsune, and Anderson Mori & Tomotsune may rely as to matters of New York law upon the opinion of Morrison & Foerster LLP.
61
Table of Contents
The financial statements of the general account and the finance and investment account of JICA as of and for the fiscal year ended March 31, 2022 included in JICA’s annual report on Form 18-K for the fiscal year ended March 31, 2022, filed September 27, 2022, and as of and for the fiscal year ended March 31, 2021 included in Exhibit 2 to JICA’s annual report on Form 18-K for the fiscal year ended March 31, 2021, filed on September 27, 2021, have been audited by Ernst & Young ShinNihon LLC, independent auditors, as stated in their reports appearing in JICA’s annual report on Form 18-K for the fiscal year ended March 31, 2022 and Exhibit 2 to JICA’s annual report on Form 18-K for the fiscal year ended March 31, 2021, and which are incorporated by reference in this prospectus and elsewhere in the registration statement. Such financial statements are incorporated by reference in reliance upon the reports of such firm given upon their authority as experts in accounting and auditing.
The registration statement of which this prospectus is a part, any post-effective amendment to such registration statement, and the prospectus supplement or supplements relating to any series or issue of the Debt Securities, which are on file with the Commission, contain further information concerning such series or issue.
The President of JICA, in his official capacity as such President, thereunto duly authorized, has supplied the information set forth in this Prospectus under the caption “Japan International Cooperation Agency”, and such information is stated on his authority.
The Minister of Finance of Japan, in his official capacity as such Minister, thereunto duly authorized, has supplied the information set forth in this Prospectus under the caption “Japan”, and such information is stated on his authority.
62
Table of Contents
PART II
INFORMATION NOT REQUIRED IN PROSPECTUS
(The information in this Part II relates to the registrant Japan International Cooperation Agency, except with respect to certain exhibits which are filed on behalf of both registrants.)
An itemized statement of the estimated amount of expenses, other than underwriting discounts and commissions, payable by JICA in connection with the sale of a particular issue of Debt Securities will be provided in an amendment to JICA’s annual report on Form 18-K incorporated by reference in, or in a post-effective amendment to, this registration statement.
UNDERTAKINGS
The registrants undertake:
(1) To file, during any period in which offers or sales are being made, a post-effective amendment to this registration statement:
(i) To include any prospectus required by Section 10(a)(3) of the Securities Act of 1933;
(ii) To reflect in the prospectus any facts or events arising after the effective date of the registration statement (or the most recent post-effective amendment thereof) which, individually or in the aggregate, represent a fundamental change in the information set forth in the registration statement;
(iii) To include any material information with respect to the plan of distribution not previously disclosed in the registration statement or any material change to such information in the registration statement;
provided, however, that the registrants shall not be required to file a post-effective amendment otherwise required by clause (i), (ii) or (iii) above if the information required to be included in a post-effective amendment is contained in annual reports on Form 18-K or amendments thereto filed by the registrants under the Securities Exchange Act of 1934 that are incorporated by reference in the registration statement.
(2) That, for the purpose of determining any liability under the Securities Act of 1933, each such post-effective amendment shall be deemed to be a new registration statement relating to the securities offered therein, and the offering of such securities at that time shall be deemed to be the initial bona fide offering thereof.
(3) To remove from registration by means of a post-effective amendment any of the securities being registered which remain unsold at the termination of the offering.
(4) That, for purposes of determining any liability under the Securities Act of 1933, each filing of the registrants’ respective annual reports on Form 18-K under the Securities Exchange Act of 1934 that is incorporated by reference in this registration statement shall be deemed to be a new registration statement relating to the securities offered therein, and the offering of such securities at that time shall be deemed to be the initial bona fide offering thereof.
AGREEMENT TO PROVIDE LEGAL OPINIONS
The registrants hereby agree to furnish copies of the opinions of Anderson Mori & Tomotsune, Japanese counsel to Japan International Cooperation Agency and Japan, as required, in amendments to Japan International Cooperation Agency’s annual reports on Form 18-K incorporated by reference in, or in post-effective amendments to, this registration statement.
II-1
Table of Contents
CONTENTS
This Pre-Effective Amendment No. 1 to the Registration Statement consists of:
(1) | Facing sheet. |
(2) | Part I consisting of the prospectus. |
(3) | Part II consisting of pages numbered II-1 through II-5. |
(4) | The following Exhibits: |
1.1 | Form of Underwriting Agreement.* |
3.1 | Certificate as to laws relating to authorization of Debt Securities and the Guarantee thereof by Japan (with English translations of the Act of the Incorporated Administrative Agency—Japan International Cooperation Agency and excerpts from the Act Concerning Special Measures with respect to Acceptance of Foreign Capital from International Bank for Reconstruction and Development, etc.).* |
4.1 | Form of Fiscal Agency Agreement (with forms of Debt Securities and Guarantee attached).* |
8.1 | Opinion (including consent) of Morrison & Foerster LLP in respect of specified United States federal income tax matters.* |
23.1 | Consent of TANAKA Akihiko, President (included on page II-3). |
23.2 | Consent of SUZUKI Shunichi, Minister of Finance of Japan (included on page II-4). |
23.3 | Consent of Anderson Mori & Tomotsune.* |
23.4 | Consent of Morrison & Foerster LLP.* |
23.5 | Consent of Ernst & Young ShinNihon LLC. |
24.1 | Power of Attorney of Japan International Cooperation Agency* |
24.2 | Power of Attorney (included on page II-3).* |
* | Previously filed. |
II-2
Table of Contents
SIGNATURES
(of the Issuer)
Pursuant to the requirements of the Securities Act of 1933, as amended, the registrant Japan International Cooperation Agency has duly caused this Pre-Effective Amendment No. 1 to the Registration Statement to be signed on its behalf by the undersigned, thereunto duly authorized, in Tokyo, on the 21st day of February, 2023.
JAPAN INTERNATIONAL COOPERATION AGENCY | ||
By: | **
TANAKA Akihiko* President |
Pursuant to the requirements of the Securities Act of 1933, as amended, this Registration Statement has been signed by the following persons in the capacities and on the dates indicated.
Signature | Title | Date | ||
**
TANAKA Akihiko | President | February 21, 2023 | ||
**
YOKOYAMA Tadashi | Senior Vice President | February 21, 2023 | ||
**
SANO Keiko | Auditor | February 21, 2023 | ||
**
TANAKA Satoko | Duly Authorized Representative in the United States of Japan International Cooperation Agency | February 21, 2023 |
** | By: | /s/ HIRATA HITOSHI
HIRATA Hitoshi | Attorney-in- fact | February 21, 2023 |
* | Consent is hereby given to the use of his name in connection with the information specified in this Registration Statement to have been supplied by him and stated on his authority. |
II-3
Table of Contents
SIGNATURES
(of the Guarantor)
Pursuant to the requirements of the Securities Act of 1933, as amended, the registrant Japan has duly caused this Pre-Effective Amendment No. 1 to the Registration Statement to be signed on its behalf by the undersigned, thereunto duly authorized, in The City of New York, and State of New York, on the 21st day of February, 2023.
JAPAN | ||
By: | SUZUKI Shunichi* Minister of Finance | |
By: | /s/ MINOWA TETSUHARU
MINOWA Tetsuharu, pursuant to delegated authority Ministry of Finance, Government of Japan |
Pursuant to the requirements of the Securities Act of 1933, as amended, the undersigned, the duly authorized representative of Japan in the United States, has signed this Pre-Effective Amendment No. 1 to the Registration Statement on the 21st day of February, 2023.
/s/ MINOWA TETSUHARU
MINOWA Tetsuharu |
* | Consent is hereby given to the use of his name in connection with the information specified in this Registration Statement to have been supplied by him and stated on his authority. |
II-4
Table of Contents
EXHIBITS
1.1 | Form of Underwriting Agreement.* | |
3.1 | Certificate as to laws relating to authorization of Debt Securities and the Guarantee thereof by Japan (with English translations of the Act of the Incorporated Administrative Agency—Japan International Cooperation Agency and excerpts from the Act Concerning Special Measures with respect to Acceptance of Foreign Capital from International Bank for Reconstruction and Development, etc.).* | |
4.1 | Form of Fiscal Agency Agreement (with forms of Debt Securities and Guarantee attached).* | |
8.1 | Opinion (including consent) of Morrison & Foerster LLP in respect of specified United States federal income tax matters.* | |
23.1 | Consent of TANAKA Akihiko, President (included on page II-3). | |
23.2 | Consent of SUZUKI Shunichi, Minister of Finance of Japan (included on page II-4). | |
23.3 | Consent of Anderson Mori & Tomotsune.* | |
23.4 | Consent of Morrison & Foerster LLP.* | |
23.5 | Consent of Ernst & Young ShinNihon LLC. | |
24.1 | Power of Attorney of Japan International Cooperation Agency* | |
24.2 | Power of Attorney (included on page II-3 of the original Registration Statement).* |
* | Previously filed. |
II-5