| | |
| Cautionary Statement Regarding Forward-Looking Statements |
|
This presentation may contain forward-looking statements within the meaning of the federal securities laws. Forward-looking statements relate to expectations, beliefs, projections, future plans and strategies, anticipated events or trends and similar expressions concerning matters that are not historical facts. In some cases, you can identify forward-looking statements by the use of forward-looking terminology such as “may,” “will,” “should,” “expects,” “intends,” “plans,” “anticipates,” “believes,” “estimates,” “predicts,” or “potential” or the negative of these words and phrases or similar words or phrases which are predictions of or indicate future events or trends and which do not relate solely to historical matters. You can also identify forward-looking statements by discussions of strategy, plans or intentions.
Forward-looking statements involve known and unknown risks, uncertainties, assumptions and contingencies, many of which are beyond the Company’s control, and may cause the Company’s actual results to differ significantly from those expressed in any forward-looking statement. Factors that might cause such a difference include, without limitation, our ability to grow our business by raising capital for our funds and the companies that we manage; our position as an owner, operator and investment manager of digital infrastructure and our ability to manage any related conflicts of interest; adverse changes in general economic and political conditions, including those resulting from supply chain difficulties, inflation, interest rate increases, a potential economic slowdown or a recession; our exposure to business risks in Europe, Asia and other foreign markets; our ability to obtain and maintain financing arrangements, including securitizations, on favorable or comparable terms or at all; the ability of our managed companies to attract and retain key customers and to provide reliable services without disruption; the reliance of our managed companies on third-party suppliers for power, network connectivity and certain other services; our ability to increase assets under management ("AUM") and expand our existing and new investment strategies; our ability to integrate and maintain consistent standards and controls, including our ability to manage our acquisitions in the digital infrastructure and investment management industries effectively; our business and investment strategy, including the ability of the businesses in which we have significant investments to execute their business strategies; performance of our investments relative to our expectations and the impact on our actual return on invested equity, as well as the cash provided by these investments and available for distribution; our ability to deploy capital into new investments consistent with our investment management strategies; the availability of, and competition for, attractive investment opportunities and the earnings profile of such new investments; our ability to achieve any of the anticipated benefits of certain joint ventures, including any ability for such ventures to create and/or distribute new investment products; our expected hold period for our assets and the impact of any changes in our expectations on the carrying value of such assets; the general volatility of the securities markets in which we participate; the market value of our assets; interest rate mismatches between our assets and any borrowings used to fund such assets; effects of hedging instruments on our assets; the impact of economic conditions on third parties on which we rely; the impact of any security incident or deficiency affecting our systems or network or the system and network of any of our managed companies or service providers; any litigation and contractual claims against us and our affiliates, including potential settlement and litigation of such claims; our levels of leverage; the impact of legislative, regulatory and competitive changes, including those related to privacy and data protection; the impact of our transition from a real estate investment trust ("REIT") to a taxable C corporation for tax purposes, and the related liability for corporate and other taxes; whether we will be able to utilize existing tax attributes to offset taxable income to the extent contemplated; our ability to maintain our exemption from registration as an investment company under the Investment Company Act of 1940, as amended (the “1940 Act”); changes in our board of directors or management team, and availability of qualified personnel; our ability to make or maintain distributions to our stockholders; and our understanding of and ability to successfully navigate the competitive landscape in which we and our managed companies operate and other risks and uncertainties, including those detailed in the Company’s Annual Report on Form 10-K for the fiscal year ended December 31, 2021 and Quarterly Reports on Form 10-Q for the fiscal quarters ended March 31, 2022, June 30, 2022 and September 30, 2022, each under the heading “Risk Factors,” as such factors may be updated from time to time in the Company’s subsequent periodic filings with the U.S. Securities and Exchange Commission (“SEC”). All forward-looking statements reflect the Company’s good faith beliefs, assumptions and expectations, but they are not guarantees of future performance. Additional information about these and other factors can be found in the Company’s reports filed from time to time with the SEC.
The Company cautions investors not to unduly rely on any forward-looking statements. The forward-looking statements speak only as of the date of this presentation. The Company is under no duty to update any of these forward-looking statements after the date of this presentation, nor to conform prior statements to actual results or revised expectations, and the Company does not intend to do so.
This presentation is for informational purposes only and does not constitute an offer to sell or a solicitation of an offer to buy any securities of the Company. This information is not intended to be indicative of future results. Actual performance of the Company may vary materially.
The appendices herein contain important information that is material to an understanding of this presentation and you should read this presentation only with and in context of the appendices.
| | | | | | | | |
DigitalBridge | Supplemental Financial Report | | |
| | |
| Important Note Regarding Non-GAAP Financial Measures |
|
This financial supplemental package includes certain non-GAAP financial measures and operating metrics that are not defined by generally accepted accounting principles, or GAAP.
Following our decision not to maintain qualification as a REIT for 2022, we no longer present Funds From Operations and Adjusted Funds From Operations, supplemental non-GAAP measures commonly used by equity REITs. Resulting from the significant growth in our digital investment management business, effective the second quarter of 2022, we report Distributable Earnings (“DE”), Adjusted Earnings before Interest, Taxes, Depreciation and Amortization (“Adjusted EBITDA”) and, specific to our IM segment, Fee Related Earnings (“FRE”) as non-GAAP financial measures attributable to the DBRG OP, which more closely align the key performance metrics of our core business to the alternative investment management industry.
We use these non-GAAP financial measures in evaluating the Company’s business performance and in making operating decisions. As we evaluate profitability based upon continuing operations, these non-GAAP measures exclude results from discontinued operations. These non-GAAP financial measures should not be considered alternatives to GAAP net income or loss as indicators of operating performance, or to cash flows from operating activities as measures of liquidity, nor as indicators of the availability of funds for our cash needs, including funds available to make distributions. Our calculation of these non-GAAP measures may differ from methodologies utilized by other companies for similarly titled performance measures and, as a result, may not be directly comparable to those calculated by other companies in similar lines of business.
In evaluating the information presented throughout this supplemental financial report, refer to the appendices to this presentation for definitions and reconciliations of non-GAAP financial measures to GAAP measures. For purposes of comparability, historical information in this presentation may reflect certain adjustments to information reported in prior periods.
Distributable Earnings: DE is an after-tax measure that differs from GAAP net income or loss from continuing operations as a result of the following adjustments, including adjustment for our share of similar items recognized by our equity method investments: transaction-related and restructuring charges; realized and unrealized gains and losses, except realized gains and losses from digital assets in Corporate and Other; depreciation, amortization and impairment charges; debt prepayment penalties, and amortization of deferred financing costs, debt premiums and debt discounts; our share of unrealized carried interest, net of associated compensation expense; equity-based compensation expense; equity method earnings from BRSP which is replaced with dividends declared by BRSP; effect of straight-line lease income and expense; impairment of equity investments directly attributable to decrease in value of depreciable real estate held by the investee; non-revenue enhancing capital expenditures; income tax effect on certain of the foregoing adjustments. Income taxes included in DE reflect the benefit of deductions arising from certain expenses that are excluded from the calculation of DE, such as equity-based compensation, as these deductions do decrease actual income tax paid or payable by the Company in any one period. There are no differences in the Company’s measurement of DE and AFFO. Therefore, previously reported AFFO is the equivalent to DE and prior period information has not been recast. DE is presented on a reportable segment basis and for the Company in total.
We believe that DE is a meaningful supplemental measure as it reflects the ongoing operating performance of our core business by generally excluding items that are non-core in nature and allows for better comparability of operating results period-over-period and to other companies in similar lines of business.
Adjusted Earnings before Interest, Taxes, Depreciation and Amortization (Adjusted EBITDA): Adjusted EBITDA represents DE adjusted to exclude the following items: interest expense as included in DE, income tax expense or benefit as included in DE, preferred stock dividends, equity method earnings, placement fee expense, our share of realized carried interest and incentive fees net of associated compensation expense, certain investment costs for capital raising that are not reimbursable by our sponsored funds, and capital expenditures as deducted in DE. Adjusted EBITDA is presented on a reportable segment basis and for the Company in total.
We believe that Adjusted EBITDA is a meaningful supplemental measure of performance because it presents the Company’s operating performance independent of its capital structure, leverage and non-cash items, which allows for better comparability against entities with different capital structures and income tax rates. However, because Adjusted EBITDA is calculated before recurring cash charges including interest expense and taxes and does not deduct capital expenditures or other recurring cash requirements, its usefulness as a performance measure may be limited.
Investment Management Fee Related Earnings (IM FRE): IM FRE is calculated as recurring fee income and other income inclusive of cost reimbursements, and net of compensation expense (excluding equity-based compensation, carried interest and incentive compensation) and administrative expense (excluding placement fees and straight-line rent). IM FRE is used to assess the extent to which direct base compensation and operating expenses are covered by recurring fee revenues in the digital investment management business. We believe that IM FRE is a useful supplemental performance measure because it may provide additional insight into the profitability of the overall digital investment management business.
IM FRE is measured as Adjusted EBITDA for the IM segment, adjusted to reflect the Company’s IM segment as a stabilized business by excluding FRE associated with new investment strategies that have 1) not yet held a first close raising FEEUM; or 2) not yet achieved break-even Adjusted EBITDA only for investment products that may be terminated solely at the Company’s discretion, collectively referred to as “Start-up FRE.” The Company evaluates new investment strategies on a regular basis and excludes Start-Up FRE from IM FRE until such time a new strategy is determined to form part of the Company’s core investment management business.
| | | | | | | | |
DigitalBridge | Supplemental Financial Report | | |
| | |
| Note Regarding DBRG Reportable Segments / Consolidated and OP Share of Consolidated Amounts |
|
This presentation includes supplemental financial information for the following segments:
Investment Management (IM)
This business represents a leading global digital infrastructure investment platform, managing capital on behalf of a diverse base of global investors. The Company's flagship opportunistic strategy is conducted through its DigitalBridge Partners platform ("DBP") and separately capitalized vehicles, while other strategies, including digital core, credit, ventures and public equities, are conducted through other investment vehicles. The Company earns management fees, generally based on the amount of assets or capital managed in investment vehicles, and has the potential to earn incentive fees and carried interest based upon the performance of such investment vehicles, subject to achievement of minimum return hurdles. Earnings from our IM segment were attributed 31.5% to Wafra through the end of May 2022 when Wafra's investment in the IM business was redeemed by the Company.
Operating
This business is composed of balance sheet equity interests in digital infrastructure and real estate operating companies, which generally earn rental income from providing use of digital asset space and/or capacity through leases, services and other agreements. The Company currently owns interests in two companies: DataBank, including zColo, an edge colocation data center business; and Vantage SDC, a stabilized hyperscale data center business. Both DataBank and Vantage are also portfolio companies managed under IM for the equity interests owned by third party capital.
Corporate and Other
This segment is composed of the Company's other investment activities and corporate activities.
Other investment activities are composed of the Company's equity interests in: (i) digital investment vehicles, the largest of which is in the DBP flagship funds, and seed investments in various strategies such as digital core, liquid and credit; and (ii) remaining non-digital investments, primarily in BRSP. Outside of its general partner interests, the Company's other equity interests in its sponsored and/or managed digital investment vehicles are considered to be incidental to its digital investment management business. The primary economics to the Company are represented by fee income and carried interest as general partner and/or manager, rather than economics from its equity interest in the investment vehicles as a limited partner or equivalent. With respect to seed investments, these are not intended to be a long-term deployment of capital by the Company and are expected to be warehoused temporarily on the Company's balance sheet until sufficient third party capital has been raised. The remaining non-digital investments are expected to be monetized over an extended period beyond the near term. These other investment activities generate largely equity method earnings or losses and to a lesser extent, revenues in the form of interest income or dividend income from warehoused investments and consolidated investment vehicles. Effective the third quarter of 2021, these activities are no longer presented separately as the Digital Other and Other segments, which is consistent with and reflects management's focus on its core digital operations and overall simplification of the Company's business. This change in segment presentation is reflected retrospectively.
Corporate activities include corporate level cash and corresponding interest income, corporate level financing and related interest expense, corporate level transaction costs, costs in connection with unconsummated investments, income and expense related to cost reimbursement arrangements with affiliates, fixed assets for administrative use, compensation expense not directly attributable to reportable segments, corporate level administrative and overhead costs, and adjustments to eliminate intercompany fees. Costs which are directly attributable, or otherwise can be subjected to a reasonable and systematic allocation, have been allocated to each of the reportable segments. As segment results are presented before elimination of intercompany fees, elimination adjustment pertains to fee income earned by the IM segment from third party capital in investment vehicles managed by the Company and consolidated within the Operating segment and in Corporate and Other.
Throughout this presentation, consolidated figures represent the interest of both the Company (and its subsidiary DigitalBridge Operating Company, LLC or the “DBRG OP”) and noncontrolling interests. Figures labeled as DBRG OP share represent the Company’s pro-rata share.
| | | | | | | | |
DigitalBridge | Supplemental Financial Report | | |
| | | | | | | | | | | |
| | | Page |
| I. | Financial Overview | |
| a. | | 6 |
| b. | | 7 |
| II. | Financial Results | |
| a. | | 8 |
| b. | | 9 |
| c. | | 10 |
| d. | | 11-12 |
|
| Fourth Quarter 2022 Valuation Allowance | 13 |
| III. | Capitalization | |
| a. | Debt Summary | 14 |
| b. | Secured Fund Fee Revenue Notes and Variable Funding Notes | 15 |
| c. | Convertible/Exchangeable Notes & Perpetual Preferred Stock | 16 |
| IV. | Operating | 17-19 |
| V. | Other | 20 |
| VI. | Cash G&A Expense | 21 |
| | | |
| Appendices | |
| Reconciliations of IM FRE and Operating Adjusted EBITDA to Net Income (Loss) | 23 |
| Reconciliations of DE and Adjusted EBITDA and to Net Income (Loss) | 24-25 |
| Definitions | 26 |
| | | | | | | | | | | |
DigitalBridge | Supplemental Financial Report | | 5 | |
| | |
| Ia. Summary Financial Metrics |
|
| | | | | | | | | | | | | | | | | | | | | | | | | | |
| ($ and shares in thousands, except per share data and as noted) (Unaudited) | 12/31/2022 - 4Q22 | 9/30/2022 - 3Q22 | 6/30/2022 - 2Q22 | 3/31/2022 - 1Q22 | 12/31/2021 - 4Q21 | 9/30/2021 - 3Q21 | 6/30/2021 - 2Q21 | 3/31/2021 - 1Q21 |
| Financial Data | | | | | | | | |
| Total Company | | | | | | | | |
Net income (loss) attributable to common stockholders(1) | $ | (19,356) | $ | (63,273) | $ | (37,321) | $ | (262,316) | $ | (20,686) | $ | 41,036 | $ | (141,260) | $ | (264,806) |
Net income (loss) attributable to common stockholders per basic share(1)(2) | (0.12) | (0.39) | (0.24) | (1.84) | (0.16) | 0.33 | (1.18) | (2.23) |
Distributable Earnings ("DE") (1) | (11,411) | 39,317 | 7,585 | 1,569 | (5,352) | 700 | (5,578) | (10,213) |
DE per basic share(1)(2) | (0.07) | 0.22 | 0.04 | 0.01 | (0.04) | 0.01 | (0.04) | (0.08) |
| Adjusted EBITDA | 27,759 | 29,097 | 30,928 | 20,494 | 20,957 | 17,622 | 15,377 | 12,538 |
| | | | | | | | |
| Investment Management | | | | | | | | |
Total Assets Under Management ("AUM") (in billions)(3) | $ | 52.8 | $ | 50.3 | $ | 47.9 | $ | 46.6 | $ | 45.3 | $ | 37.8 | $ | 34.9 | $ | 32.0 |
| Fee Earning Equity Under Management ("FEEUM") (in billions) | $ | 22.2 | $ | 20.5 | $ | 19.0 | $ | 18.8 | $ | 18.3 | $ | 16.5 | $ | 14.5 | $ | 12.9 |
| IM management fee income - DBRG OP share | 45,272 | 42,039 | 36,948 | 29,921 | 38,396 | 35,724 | 33,348 | 21,409 |
| IM FRE - DBRG OP share | 24,228 | 21,498 | 20,759 | 16,989 | 23,757 | 22,922 | 19,470 | 13,583 |
| IM FRE margin % | 53.5% | 51.1% | 56.2% | 56.8% | 61.9% | 64.2% | 58.4% | 63.4% |
| Net realized carried interest and incentive fees | 12,377 | 20,258 | — | (1,172) | 1,092 | 7 | 1,565 | (11) |
| | | | | | | | |
| Balance Sheet and Capitalization | | | | | | | | |
| Consolidated assets | $ | 11,028,503 | $ | 11,740,829 | $ | 11,877,288 | $ | 11,232,157 | $ | 14,197,816 | $ | 15,442,981 | $ | 15,921,346 | $ | 16,625,250 |
Consolidated debt(4) | 5,212,657 | 5,394,134 | 5,612,274 | 5,187,597 | 4,922,722 | 4,621,240 | 3,919,255 | 7,023,226 |
| DBRG OP Share: | | | | | | | | |
| Total Assets | 3,334,288 | 3,755,231 | 4,177,806 | 3,561,501 | 6,233,158 | 6,086,259 | 6,929,390 | 7,324,784 |
| Corporate debt | 578,422 | 578,422 | 648,422 | 578,422 | 638,739 | 800,000 | 545,000 | 500,000 |
| Investment-level debt | 568,230 | 775,358 | 1,097,943 | 880,464 | 727,789 | 591,943 | 528,609 | 2,892,620 |
Total Debt(4) | 1,146,652 | 1,353,780 | 1,746,365 | 1,458,886 | 1,366,528 | 1,391,943 | 1,073,609 | 3,392,620 |
| | | | | | | | |
| Corporate cash | 733,382 | 423,441 | 55,628 | 813,237 | 986,197 | 606,447 | 396,906 | 236,489 |
| Corporate cash & VFN / Revolver borrowing availability | 1,033,382 | 723,441 | 285,628 | 1,013,237 | 1,186,197 | 806,447 | 751,906 | 636,489 |
| | | | | | | | |
| Perpetual Preferred Equity, $25 per share liquidation preference | 827,779 | 827,779 | 883,500 | 883,500 | 883,500 | 947,500 | 1,033,750 | 1,033,750 |
| | | | | | | | |
Basic shares and OP units outstanding(2) | 172,712 | 175,918 | 176,930 | 162,461 | 155,138 | 136,791 | 136,454 | 134,727 |
Diluted shares and OP units outstanding(2) | 181,692 | 186,911 | 189,572 | 176,087 | 184,359 | 174,598 | 175,233 | 171,863 |
| Common dividend per share | $ | 0.01 | $ | 0.01 | $ | — | $ | — | $ | — | $ | — | $ | — | $ | — |
Notes:
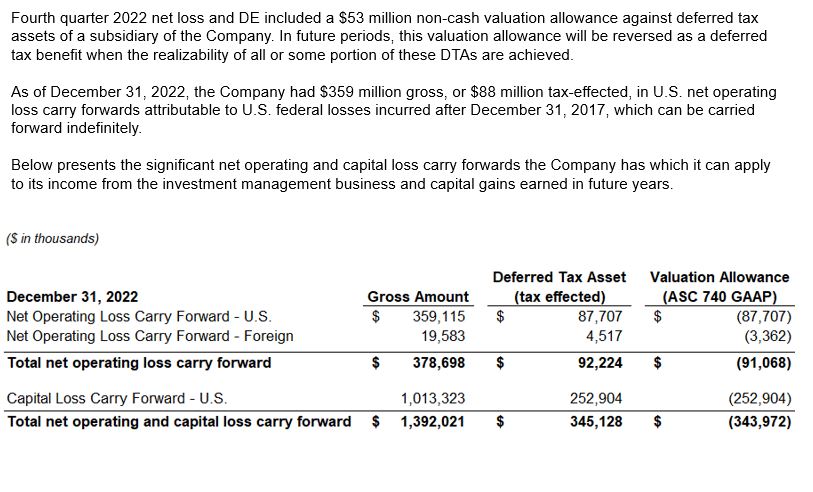
(1) Fourth quarter 2022 net loss and DE included a $53 million non-cash valuation allowance against deferred tax assets (“DTAs”) of a subsidiary of the Company. In future periods, this valuation allowance will be reversed as a deferred tax benefit when the realizability of all or some portion of these DTAs are achieved.
(2) In August 2022, the Company effectuated a 1-for-4 reverse stock split of its shares of class A and B common stock. All prior period common share and per share information is presented after giving effect to the reverse stock split.
(3) Total AUM includes IM AUM of $51.3 billion, Operating AUM of $1.0 billion and Digital Other AUM of $0.5 billion.
(4) Represents principal balance and excludes debt issuance costs, discounts and premiums.
| | | | | | | | | | | |
DigitalBridge | Supplemental Financial Report | | 6 | |
| | |
| Ib. Investment Management |
|
| | | | | | | | | | | | | | | | | | | | | | | | | | | | | | | | |
| | | | | | | | | | |
| ($ in millions) | | | 12/31/22 | 9/30/22 | 6/30/22 | 3/31/22 | 12/31/21 | 9/30/21 | 6/30/21 | 3/31/21 |
Investment Management AUM (1) | | | $ | 51,303 | | $ | 48,304 | | $ | 45,296 | | $ | 44,517 | | $ | 43,619 | | $ | 36,337 | | $ | 33,551 | | $ | 30,711 | |
| | | | | | | | | | |
| Investment Management FEEUM | | 12/31/22 Annual IM Fee Rate | 12/31/22 | 9/30/22 | 6/30/22 | 3/31/22 | 12/31/21 | 9/30/21 | 6/30/21 | 3/31/21 |
| DigitalBridge Partners I (DBP I) | | 1.10% | $ | 3,165 | | $ | 2,802 | | $ | 3,048 | | $ | 3,034 | | $ | 3,215 | | $ | 3,040 | | $ | 3,081 | | $ | 3,179 | |
| DigitalBridge Partners II (DBP II) | | 1.18% | 7,996 | | 7,996 | | 7,996 | | 7,996 | | 8,001 | | 7,146 | | 5,519 | | 3,964 | |
| Separately Capitalized Portfolio Companies | | 0.79% | 2,512 | | 2,370 | | 2,401 | | 2,372 | | 2,148 | | 2,576 | | 2,576 | | 2,534 | |
| Co-Investment (Sidecar) Capital | | 0.49% | 6,525 | | 6,310 | | 4,651 | | 4,370 | | 4,105 | | 3,184 | | 2,817 | | 2,744 | |
| Digital Core, Liquid and Credit Strategies | | 0.57% | 2,036 | | 1,021 | | 933 | | 1,013 | | 786 | | 510 | | 512 | | 432 | |
| IM FEEUM | | 0.86% | $ | 22,234 | | $ | 20,499 | | $ | 19,029 | | $ | 18,785 | | $ | 18,255 | | $ | 16,456 | | $ | 14,505 | | $ | 12,853 | |
| | | | | | | | | | |
| ($ in thousands) | | | | | | | | | | |
| IM FRE | | | 4Q22 | 3Q22 | 2Q22 | 1Q22 | 4Q21 | 3Q21 | 2Q21 | 1Q21 |
| Fee income | | | $ | 44,371 | | $ | 41,353 | | $ | 44,758 | | $ | 43,155 | | $ | 43,145 | | $ | 37,751 | | $ | 33,304 | | $ | 28,917 | |
Fee income, other (2) | | | 901 | | 686 | | 355 | | 523 | | 8,787 | | 12,809 | | 8,996 | | 2,148 | |
| Other income | | | 535 | | 386 | | 530 | | 251 | | 273 | | 483 | | 84 | | 54 | |
| Compensation expense—cash | | | (17,805) | | (18,876) | | (17,725) | | (17,675) | | (16,275) | | (16,933) | | (14,426) | | (10,852) | |
| Administrative expenses | | | (6,417) | | (4,450) | | (4,794) | | (4,012) | | (3,446) | | (2,675) | | (2,337) | | (2,067) | |
| Exclude: Start-up FRE of certain new strategies | | | 2,643 | | 2,399 | | 2,335 | | 2,362 | | 2,306 | | 2,224 | | 2,059 | | 1,938 | |
IM FRE (3) | | | $ | 24,228 | | $ | 21,498 | | $ | 25,459 | | $ | 24,604 | | $ | 34,790 | | $ | 33,659 | | $ | 27,680 | | $ | 20,138 | |
| | | | | | | | | | |
DBRG OP share of IM FRE(4) | | | $ | 24,228 | | $ | 21,498 | | $ | 20,759 | | $ | 16,989 | | $ | 23,757 | | $ | 22,922 | | $ | 19,470 | | $ | 13,583 | |
Notes:
(1) Includes AUM of: $6.2 billion DBP I, $10.7 billion DBP II, $7.4 billion Separately Capitalized Portfolio Companies $24.8 billion Co-Investment (Sidecar) Capital, and $2.2 billion Digital Core, Liquid and Credit Strategies.
(2) Includes service fee income and one time catch-up fees earned, which are customary fees paid on newly raised 3rd party capital as if it were raised on the first closing date.
(3) For a reconciliation of net income / (loss) to IM FRE, please refer to the Appendices section of this presentation.
(4) In May 2022, DigitalBridge acquired Wafra’s 31.5% ownership in the Company's investment management business that Wafra initially acquired in July 2020, which resulted in 100% of the Company's IM FRE becoming entitled to DigitalBridge.
| | | | | | | | | | | |
DigitalBridge | Supplemental Financial Report | | 7 | |
| | |
| IIa. Financial Results - Balance Sheet |
|
| | | | | | | | | | | | | | |
| ($ in thousands, except per share data) (unaudited) | | As of December 31, 2022 |
| | Consolidated | | Noncontrolling Interests' Share |
| Assets | | | | |
| Cash and cash equivalents | | $ | 918,254 | | | $ | 104,926 | |
| Restricted cash | | 118,485 | | | 99,097 | |
| Real estate, net | | 5,921,298 | | | 5,203,076 | |
| Equity and debt investments | | 1,322,050 | | | 456,812 | |
| Loans receivable | | 137,945 | | | 4,127 | |
| Goodwill | | 761,368 | | | 412,084 | |
| Deferred leasing costs and intangible assets, net | | 1,092,167 | | | 882,000 | |
| Other assets | | 654,050 | | | 532,093 | |
| Due from affiliates | | 45,360 | | | — | |
| Assets held for disposition | | 57,526 | | | — | |
| Total assets | | $ | 11,028,503 | | | $ | 7,694,215 | |
| Liabilities | | | | |
| Debt, net | | $ | 5,156,140 | | | $ | 4,024,414 | |
| Accrued and other liabilities | | 1,272,096 | | | 799,263 | |
| Intangible liabilities, net | | 29,824 | | | 26,068 | |
| Liabilities related to assets held for disposition | | 380 | | | — | |
| | | | |
| | | | |
| | | | |
| Total liabilities | | 6,458,440 | | | 4,849,745 | |
| Commitments and contingencies | | | | |
| Redeemable noncontrolling interests | | 100,574 | | | 100,574 | |
| Equity | | | | |
| Stockholders’ equity: | | | | |
| Preferred stock, $0.01 par value per share; $827,779 liquidation preference; 250,000 shares authorized; 33,111 shares issued and outstanding | | 800,355 | | | — | |
| Common stock, $0.04 par value per share | | | | |
| Class A, 949,000 shares authorized; 159,762 shares issued and outstanding | | 6,390 | | | — | |
| Class B, 1,000 shares authorized; 166 shares issued and outstanding | | 7 | | | — | |
| Additional paid-in capital | | 7,818,068 | | | — | |
| Accumulated deficit | | (6,962,613) | | | — | |
| Accumulated other comprehensive income | | (1,509) | | | — | |
| Total stockholders’ equity | | 1,660,698 | | | — | |
| Noncontrolling interests in investment entities | | 2,743,896 | | | 2,743,896 | |
| Noncontrolling interests in Operating Company | | 64,895 | | | — | |
| Total equity | | 4,469,489 | | | 2,743,896 | |
| Total liabilities, redeemable noncontrolling interests and equity | | $ | 11,028,503 | | | $ | 7,694,215 | |
| | | | | | | | | | | |
DigitalBridge | Supplemental Financial Report | | 8 | |
| | |
| IIb. Financial Results - Consolidated Segment Operating Results |
|
| | | | | | | | | | | | | | | | | | | | | | | | | | | | | |
| Three Months Ended December 31, 2022 |
| ($ in thousands) (unaudited) | Investment Management | | Operating | | Corporate and Other | | Discontinued Operations | | Total |
| Revenues | | | | | | | | | |
| Property operating income | $ | — | | | $ | 229,045 | | | $ | 17,363 | | | $ | — | | | $ | 246,408 | |
| Fee income | 45,272 | | | — | | | (1,017) | | | — | | | 44,255 | |
| Interest income | 431 | | | 141 | | | 7,145 | | | — | | | 7,717 | |
| Other income | 1,381 | | | 92 | | | 1,228 | | | — | | | 2,701 | |
| Total revenues | 47,084 | | | 229,278 | | | 24,719 | | | — | | | 301,081 | |
| Expenses | | | | | | | | | |
| Property operating expense | — | | | 97,457 | | | 4,708 | | | — | | | 102,165 | |
| Interest expense | 2,632 | | | 45,222 | | | 7,194 | | | — | | | 55,048 | |
| Investment expense | 1,002 | | | 5,547 | | | 1,076 | | | — | | | 7,625 | |
| Transaction-related costs | 1,715 | | | — | | | 1,614 | | | — | | | 3,329 | |
| | | | | | | | | |
| Depreciation and amortization | 6,135 | | | 133,269 | | | 7,994 | | | — | | | 147,398 | |
| | | | | | | | | |
| Compensation expense | | | | | | | | | |
| Cash and equity-based compensation | 30,829 | | | 19,746 | | | 10,804 | | | — | | | 61,379 | |
| Carried interest and incentive fee compensation | 92,738 | | | — | | | — | | | — | | | 92,738 | |
| Administrative expenses | 7,958 | | | 7,706 | | | 23,373 | | | — | | | 39,037 | |
| Total expenses | 143,009 | | | 308,947 | | | 56,763 | | | — | | | 508,719 | |
| Other income (loss) | | | | | | | | | |
| | | | | | | | | |
| Other gain (loss), net | 248 | | | 3,188 | | | (3,762) | | | — | | | (326) | |
| Equity method earnings (loss) | 2,072 | | | — | | | 23,088 | | | — | | | 25,160 | |
| Equity method earnings (loss) - carried interest | 176,944 | | | — | | | — | | | — | | | 176,944 | |
| Income (loss) before income taxes | 83,339 | | | (76,481) | | | (12,718) | | | — | | | (5,860) | |
| Income tax benefit (expense) | (2,172) | | | (509) | | | (28,558) | | | — | | | (31,239) | |
| Income (loss) from continuing operations | 81,167 | | | (76,990) | | | (41,276) | | | — | | | (37,099) | |
| Income (loss) from discontinued operations | — | | | — | | | — | | | (146) | | | (146) | |
| Net income (loss) | 81,167 | | | (76,990) | | | (41,276) | | | (146) | | | (37,245) | |
| Net income (loss) attributable to noncontrolling interests: | | | | | | | | | |
| Redeemable noncontrolling interests | 19 | | | — | | | 5,192 | | | — | | | 5,211 | |
| Investment entities | 46,685 | | | (66,611) | | | (3,228) | | | (13,129) | | | (36,283) | |
| Operating Company | 2,479 | | | (713) | | | (4,297) | | | 948 | | | (1,583) | |
| Net income (loss) attributable to DigitalBridge Group, Inc. | 31,984 | | | (9,666) | | | (38,943) | | | 12,035 | | | (4,590) | |
| | | | | | | | | |
| Preferred stock dividends | — | | | — | | | 14,766 | | | — | | | 14,766 | |
| Net income (loss) attributable to common stockholders | $ | 31,984 | | | $ | (9,666) | | | $ | (53,709) | | | $ | 12,035 | | | $ | (19,356) | |
| | | | | | | | | | | |
DigitalBridge | Supplemental Financial Report | | 9 | |
| | |
| IIc. Financial Results - Noncontrolling Interests’ Share Segment Operating Results |
|
| | | | | | | | | | | | | | | | | | | | | | | | | | | | | |
| Three Months Ended December 31, 2022 |
| ($ in thousands) (unaudited) | Investment Management | | Operating | | Corporate and Other | | Discontinued Operations | | Total |
| Revenues | | | | | | | | | |
| Property operating income | $ | — | | | $ | 201,858 | | | $ | 7,546 | | | $ | — | | | $ | 209,404 | |
| Fee income | — | | | — | | | — | | | — | | | — | |
| Interest income | — | | | 1 | | | 111 | | | — | | | 112 | |
| Other income | — | | | 82 | | | 505 | | | — | | | 587 | |
| Total revenues | — | | | 201,941 | | | 8,162 | | | — | | | 210,103 | |
| Expenses | | | | | | | | | |
| Property operating expense | — | | | 85,922 | | | 2,047 | | | — | | | 87,969 | |
| Interest expense | — | | | 39,063 | | | 1,195 | | | — | | | 40,258 | |
| Investment expense | — | | | 4,835 | | | 404 | | | — | | | 5,239 | |
| | | | | | | | | |
| Depreciation and amortization | — | | | 117,317 | | | 3,237 | | | — | | | 120,554 | |
| | | | | | | | | |
| Compensation expense | | | | | | | | | |
| Cash and equity-based compensation | — | | | 17,654 | | | — | | | — | | | 17,654 | |
| Carried interest and incentive fee compensation | 31,506 | | | — | | | — | | | — | | | 31,506 | |
| Administrative expenses | — | | | 6,733 | | | 418 | | | — | | | 7,151 | |
| Total expenses | 31,506 | | | 271,524 | | | 7,301 | | | — | | | 310,331 | |
| Other income (loss) | | | | | | | | | |
| | | | | | | | | |
| Other gain (loss), net | — | | | 2,732 | | | (2,492) | | | — | | | 240 | |
| Equity method earnings (loss) | 778 | | | — | | | 5,835 | | | — | | | 6,613 | |
| Equity method earnings (loss) - carried interest | 64,837 | | | — | | | — | | | — | | | 64,837 | |
| Income (loss) before income taxes | 34,109 | | | (66,851) | | | 4,204 | | | — | | | (28,538) | |
| Income tax benefit (expense) | — | | | (454) | | | (169) | | | — | | | (623) | |
| Net income (loss) | 34,109 | | | (67,305) | | | 4,035 | | | — | | | (29,161) | |
| Income (loss) from discontinued operations | — | | | — | | | — | | | (13,129) | | | (13,129) | |
| Non-pro rata allocation of income (loss) to noncontrolling interests | 12,595 | | | 694 | | | (2,071) | | | — | | | 11,218 | |
| Net income (loss) attributable to noncontrolling interests | $ | 46,704 | | | $ | (66,611) | | | $ | 1,964 | | | $ | (13,129) | | | $ | (31,072) | |
| | | | | | | | | | | |
DigitalBridge | Supplemental Financial Report | | 10 | |
| | | | | | | | | | | | | | | | | | | | | | | | | | | | | | | | | | | | | | | | | |
| OP pro rata share by segment | | Amounts
attributable to
noncontrolling interests | | DBRG consolidated as reported |
| ($ in thousands; for the three months ended December 31, 2022; and unaudited) | IM | | Operating | | Corporate and Other | | Discontinued Operations | | Total OP pro rata share | | |
| Net income (loss) attributable to common stockholders | $ | 31,984 | | | $ | (9,666) | | | $ | (53,709) | | | $ | 12,035 | | | $ | (19,356) | | | $ | — | | | $ | (19,356) | |
| Net income (loss) attributable to noncontrolling common interests in Operating Company | 2,479 | | | (713) | | | (4,297) | | | 948 | | | (1,583) | | | — | | | (1,583) | |
| Net income (loss) attributable to common interests in Operating Company and common stockholders | 34,463 | | | (10,379) | | | (58,006) | | | 12,983 | | | (20,939) | | | — | | | (20,939) | |
| | | | | | | | | | | | | |
| Adjustments for Distributable Earnings (DE): | | | | | | | | | | | | | |
Transaction-related and restructuring charges(1) | 9,276 | | | 80 | | | 13,260 | | | 126 | | | 22,742 | | | 1,030 | | | 23,772 | |
| Non-real estate (gains) losses, excluding realized gains or losses of digital assets within the Corporate and Other segment | (1,515) | | | (425) | | | (10,269) | | | (8,029) | | | (20,238) | | | 4,188 | | | (16,050) | |
| Net unrealized carried interest | (26,913) | | | — | | | — | | | — | | | (26,913) | | | (43,628) | | | (70,541) | |
| Equity-based compensation expense | 7,939 | | | (11) | | | (329) | | | (238) | | | 7,361 | | | 188 | | | 7,549 | |
| Depreciation and amortization | 6,135 | | | 16,576 | | | 8,074 | | | 206 | | | 30,991 | | | 120,675 | | | 151,666 | |
| Straight-line rent revenue and expense | 66 | | | (282) | | | (3,105) | | | 6 | | | (3,315) | | | (3,748) | | | (7,063) | |
| Amortization of acquired above- and below-market lease values, net | — | | | 19 | | | — | | | — | | | 19 | | | 81 | | | 100 | |
| | | | | | | | | | | | | |
| | | | | | | | | | | | | |
| Non-revenue enhancing capital expenditures | — | | | (1,786) | | | — | | | — | | | (1,786) | | | (12,988) | | | (14,774) | |
| Debt prepayment penalties and amortization of deferred financing costs and debt premiums and discounts | 356 | | | 596 | | | 592 | | | 16 | | | 1,560 | | | 4,012 | | | 5,572 | |
| Adjustment to reflect BRSP cash dividend declared | — | | | — | | | 4,122 | | | — | | | 4,122 | | | — | | | 4,122 | |
| | | | | | | | | | | | | |
| Income tax effect on certain of the foregoing adjustments | — | | | 55 | | | — | | | — | | | 55 | | | | | 55 | |
| Adjustments attributable to noncontrolling interests in investment entities | — | | | — | | | — | | | — | | | — | | | (69,810) | | | (69,810) | |
| DE from discontinued operations | — | | | — | | | — | | | (5,070) | | | (5,070) | | | — | | | (5,070) | |
| After-tax DE | $ | 29,807 | | | $ | 4,443 | | | $ | (45,661) | | | $ | — | | | $ | (11,411) | | | $ | — | | | $ | (11,411) | |
Notes:
(1) Restructuring charges primarily represent costs and charges incurred as a result of corporate restructuring and reorganization to implement the digital evolution. These costs and charges include severance, retention, relocation, transition, shareholder settlement and other related restructuring costs, which are not reflective of the Company’s core operating performance.
| | | | | | | | | | | |
DigitalBridge | Supplemental Financial Report | | 11 | |
| | | | | | | | | | | | | | | | | | | | | | | | | | | | | | | | |
| OP pro rata share by segment | |
| ($ in thousands; for the three months ended December 31, 2022; and unaudited) | IM | | Operating | | Corporate and Other | | Discontinued Operations | | Total OP pro rata share | |
| After-tax DE | $ | 29,807 | | | $ | 4,443 | | | $ | (45,661) | | | $ | — | | | $ | (11,411) | | |
| Interest expense included in DE | 2,275 | | | 6,072 | | | 5,409 | | | — | | | 13,756 | | |
| Income tax expense (benefit) included in DE | 2,172 | | | 55 | | | 28,389 | | | — | | | 30,616 | | |
| Preferred dividends | — | | | — | | | 14,765 | | | — | | | 14,765 | | |
| Earnings of equity method investments | — | | | — | | | (8,842) | | | — | | | (8,842) | | |
| | | | | | | | | | |
| Net realized carried interest and incentive fees | (12,377) | | | — | | | — | | | — | | | (12,377) | | |
| Investment costs and non-revenue enhancing capital expenditures in DE | (292) | | | 1,544 | | | — | | | — | | | 1,252 | | |
| | | | | | | | | | |
| Adjusted EBITDA | $ | 21,585 | | | $ | 12,114 | | | $ | (5,940) | | | $ | — | | | $ | 27,759 | | |
| | | | | | | | | | | |
DigitalBridge | Supplemental Financial Report | | 12 | |
| | |
| Fourth Quarter 2022 Valuation Allowance |
|
| | | | | | | | | | | |
DigitalBridge | Supplemental Financial Report | | 13 | |
| | |
| IIIa. Capitalization - Debt Summary |
|
| | | | | | | | | | | | | | | | | | | | | | | | | | | | | | | | | | | | | | | | | | | | |
| ($ in thousands; as of December 31, 2022) | | | | | | | | | | | | | | |
| Consolidated debt | Payments due by period(1) | | | |
| 2023 | | 2024 | | 2025 | | 2026 | | 2027 and after | | Total | | | |
| Investment-level debt: | | | | | | | | | | | | | | |
| Operating - Fixed | $ | 219,792 | | | $ | 600,753 | | | $ | 700,000 | | | $ | 1,519,690 | | | $ | 600,000 | | | $ | 3,640,235 | | | | |
| Operating - Variable | 9,000 | | | 278,250 | | | 475,250 | | | 231,000 | | | — | | | 993,500 | | | | |
| Other - Variable | — | | | 500 | | | — | | | — | | | — | | | 500 | | | | |
| | | | | | | | | | | | | | |
| Total Investment-level debt | 228,792 | | | 879,503 | | | 1,175,250 | | | 1,750,690 | | | 600,000 | | | 4,634,235 | | | | |
| Corporate debt: | | | | | | | | | | | | | | |
| 2021-1, A-1 Variable Funding Notes | — | | | — | | | — | | | — | | | — | | | — | | | | |
| 2021-1, Class A-2 Term Notes | — | | | — | | | — | | | 300,000 | | | — | | | 300,000 | | | | |
| Convertible/exchangeable senior notes | 200,000 | | | — | | | 78,422 | | | — | | | — | | | 278,422 | | | | |
| Total debt - consolidated | $ | 428,792 | | | $ | 879,503 | | | $ | 1,253,672 | | | $ | 2,050,690 | | | $ | 600,000 | | | $ | 5,212,657 | | | | |
| | | | | | | | | | | | | | |
| | | | | | | | | | | | Fixed/Variable | WA Interest Rate | WA Remaining Term |
| DBRG OP share of debt | Payments due by period(1) |
| 2023 | | 2024 | | 2025 | | 2026 | | 2027 and after | | Total |
| Investment-level debt: | | | | | | | | | | | | | | |
| Operating - Fixed | $ | 28,859 | | | $ | 78,879 | | | $ | 91,910 | | | $ | 178,653 | | | $ | 78,780 | | | $ | 457,081 | | Fixed | 2.4% | 3.1 |
| Operating - Variable | 992 | | | 30,663 | | | 52,373 | | | 26,997 | | | — | | | 111,025 | | Variable | 8.4% | 2.6 |
| Other - Variable | — | | | 124 | | | — | | | — | | | — | | | 124 | | Variable | 6.0% | 1.6 |
| | | | | | | | | | | | | | |
| Total Investment-level debt | 29,851 | | | 109,666 | | | 144,283 | | | 205,650 | | | 78,780 | | | 568,230 | | | | |
| Corporate debt: | | | | | | | | | | | | | | |
| 2021-1, A-1 Variable Funding Notes | — | | | — | | | — | | | — | | | — | | | — | | Variable | n/a | 3.7 |
| 2021-1, Class A-2 Term Notes | — | | | — | | | — | | | 300,000 | | | — | | | 300,000 | | Fixed | 3.9% | 3.7 |
| Convertible/exchangeable senior notes | 200,000 | | | — | | | 78,422 | | | — | | | — | | | 278,422 | | Fixed | 5.2% | 0.9 |
| Total debt - DBRG OP share | $ | 229,851 | | | $ | 109,666 | | | $ | 222,705 | | | $ | 505,650 | | | $ | 78,780 | | | $ | 1,146,652 | | | | |
| | | | | | | | | | | | | | |
| Net corporate debt | | | | | | | | | | | | | | |
| Cash and cash equivalents - consolidated | | | | | | | | | | | $ | 918,254 | | | | |
| less: Noncontrolling interests | | | | | | | | | | | (104,926) | | | | |
| less: Investment level cash - DBRG OP share | | | | | | | | | | | (79,946) | | | | |
| Corporate cash - DBRG OP share | | | | | | | | | | | 733,382 | | | | |
| Corporate debt - DBRG OP share | | | | | | | | | | | (578,422) | | | | |
| Net corporate debt - DBRG OP share | | | | | | | | | | | $ | 154,960 | | | | |
Notes:
(1) Maturity dates are based on initial maturity dates or extended maturity dates, where applicable, the extension option is at the Company’s discretion and if the criteria to extend have been met as of the reporting date.
| | | | | | | | | | | |
DigitalBridge | Supplemental Financial Report | | 14 | |
| | |
| IIIb. Capitalization - DBRG Series 2021-1 |
|
| | | | | | | | | | | |
| ($ in thousands, as of December 31, 2022) | | | |
| Class A-2 Term Notes | | | |
| Amount outstanding | | $ | 300,000 | | |
| Interest rate | | 3.933 | % | |
| Anticipated Repayment Date (ARD) | | September 25, 2026 | |
| Kroll Rating | | BBB | |
| | | |
| Class A-1 Variable Funding Notes | | | |
| Maximum Available | | $ | 300,000 | | (1) |
| Amount outstanding | | $ | — | | |
| Interest Rate | | 1M Term SOFR + 3.00% | (1) |
Fully extended Anticipated Repayment Date (ARD)(2) | | September 25, 2026 | |
| | | |
| Financial covenants: | | Covenant level | |
Debt Service Coverage Ratio(3) | | Minimum 1.75x | |
Loan to Value Ratio(4) | | Less than 35.0% | |
Investment Management Expense Ratio(5) | | Less than 60.0% | |
| Company status: As of February 23, 2023, DBRG is meeting all required covenant threshold levels. |
Notes:
(1) Effective April 1, 2022, the maximum principal amount of the Series 2021-1 Class A-1 Variable Funding Notes increased to $300 million and Term SOFR replaced LIBOR as the benchmark for accruing interest on the Series 2021-1 Class A-1 Variable Funding Notes. 1 month term SOFR is adjusted to include 0.11448% as defined in the Amendment No.1 to Class A-1 Note Purchase Agreement.
(2) Anticipated Repayment Date is September 25, 2026 including two 1-year extension options subject to 1) either rating agency confirmation and consent of VFN noteholders are obtained or DSCR exceeding 1.75x, 2) term notes rating not less than BBB- 3) the payment of a 0.05% extension fee and 4) other customary conditions.
(3) Debt service coverage ratio covenant thresholds: minimum of 1.75x for ability to borrow from the VFN; below 1.75x to 1.50x = 50% cash trap; below 1.50x to 1.20x = 100% cash trap; and below 1.20x = cash sweep.
(4) 100% cash sweep until LTV is less than 35%.
(5) 50% cash sweep until ratio is less than 60%.
| | | | | | | | | | | |
DigitalBridge | Supplemental Financial Report | | 15 | |
| | |
| IIIc. Capitalization - Convertible/Exchangeable Notes & Perpetual Preferred Stock |
|
| | | | | | | | | | | | | | | | | | | | | | | | | | | | | | | | | | | | | | |
| ($ in thousands; except per share data; as of December 31, 2022) |
| Convertible/exchangeable debt | | | | | | | | | | | | |
| Description | | Outstanding principal | | Final due date(1) | | Interest rate | | Conversion price (per share of common stock) | | Conversion ratio | | Conversion shares |
| 5.75% Exchangeable senior notes | | $ | 78,422 | | | July 15, 2025 | | 5.75% fixed | | $ | 9.20 | | | 108.6956 | | | 8,524 | |
| 5.0% Convertible senior notes | | 200,000 | | | April 15, 2023 | | 5.00% fixed | | 63.02 | | | 15.8675 | | | 3,174 | |
| Total convertible debt | | $ | 278,422 | | | | | | | | | | | |
| | | | | | | | | | | | | | | | | | | | |
| Perpetual preferred stock | | | | | | |
| Description | | Liquidation
preference | | Shares outstanding (In thousands) | | Callable period |
| Series H 7.125% cumulative redeemable perpetual preferred stock | | 210,756 | | | 8,430 | | | Callable |
| Series I 7.15% cumulative redeemable perpetual preferred stock | | 324,728 | | | 12,989 | | | Callable |
| Series J 7.125% cumulative redeemable perpetual preferred stock | | 292,295 | | | 11,692 | | | Callable |
| Total preferred stock | | $ | 827,779 | | | 33,111 | | | |
Notes:
(1) Callable at principal amount only if DBRG common stock has traded at least 130% of the conversion price for 20 of 30 consecutive trading days: on or after July 21, 2023, for the 5.75% exchangeable senior notes and on or after April 22, 2020, for the 5.0% convertible senior notes.
| | | | | | | | | | | |
DigitalBridge | Supplemental Financial Report | | 16 | |
| | | | | | | | | | | | | | | | | | | | | | | | | | | | | |
| ($ in millions, unless otherwise noted) | | | | | | | | | |
| Portfolio Overview | | 12/31/22 | 9/30/22 | 6/30/22 | 3/31/22 | 12/31/21 | 9/30/21 | 6/30/21 | 3/31/21 |
| Consolidated amount | | | | | | | | | |
Asset(1) | | $ | 8,704 | | $ | 8,515 | | $ | 8,429 | | $ | 8,397 | | $ | 7,624 | | $ | 7,211 | | $ | 6,736 | | $ | 6,633 | |
Debt(2)(3) | | (4,634) | | (4,506) | | (4,477) | | (4,479) | | (4,217) | | (3,817) | | (3,374) | | (3,369) | |
| Net Carrying Value - Consolidated | | $ | 4,070 | | $ | 4,009 | | $ | 3,952 | | $ | 3,918 | | $ | 3,407 | | $ | 3,394 | | $ | 3,362 | | $ | 3,264 | |
| | | | | | | | | |
| DBRG OP share of consolidated amount | | | | | | | | | |
Asset(1) | | $ | 1,052 | | $ | 1,133 | | $ | 1,466 | | $ | 1,460 | | $ | 1,233 | | $ | 1,157 | | $ | 1,093 | | $ | 1,073 | |
Debt(2)(3) | | (568) | | (598) | | (746) | | (746) | | (661) | | (588) | | (529) | | (528) | |
| Net Carrying Value - DBRG OP share | | $ | 484 | | $ | 535 | | $ | 720 | | $ | 714 | | $ | 572 | | $ | 569 | | $ | 564 | | $ | 545 | |
| | | | | | | | | |
| DBRG net carrying value % interest | | 12 | % | 13 | % | 18 | % | 18 | % | 17 | % | 17 | % | 17 | % | 17 | % |
| | | | | | | | | |
| ($ in millions, unless otherwise noted) | | | | | | | | | |
| Operating Metrics | | 12/31/2022 4Q22 | 9/30/2022 3Q22 | 6/30/2022 2Q22 | 3/31/2022 - 1Q22 | 12/31/2021 - 4Q21 | 9/30/2021 - 3Q21 | 6/30/2021 - 2Q21 | 3/31/2021 - 1Q21 |
| Number of Data Centers | | 84 | 82 | 82 | 78 | 78 | 76 | 76 | 76 |
| Max Critical I.T. Square Feet | | 2,405,387 | 2,349,827 | 2,317,827 | 1,980,317 | 1,949,144 | 1,819,946 | 1,809,943 | 1,791,781 |
| Leased Square Feet | | 1,887,659 | 1,852,321 | 1,817,101 | 1,608,378 | 1,552,517 | 1,467,420 | 1,439,291 | 1,423,322 |
| % Utilization Rate | | 78.5% | 78.8% | 78.4% | 81.2% | 79.7% | 80.6% | 79.5% | 79.4% |
| MRR (Annualized) | | $ | 913.4 | $ | 889.0 | $ | 892.0 | $ | 812.3 | $ | 790.4 | $ | 773.1 | $ | 750.2 | $ | 743.0 |
| Bookings (Annualized) | | $ | 18.2 | $ | 22.4 | $ | 56.5 | $ | 14.2 | $ | 15.3 | $ | 16.6 | $ | 16.4 | $ | 23.0 |
| Quarterly Churn (% of Prior Quarter MRR) | | 1.3% | 1.0% | 1.7% | .9% | 1.9% | 1.3% | 1.3% | 1.3% |
Notes:
(1) Includes all components related to real estate assets, including tangible real estate and lease-related intangibles and cash.
(2) Represents unpaid principal balance.
(3) For the fourth quarter 2022, in addition to debt presented, the Operating segment has $136 million consolidated, or $16 million DBRG OP share, of finance lease obligations, which represents the present value of payments on leases classified as finance leases, in the Other Liabilities line item on the Company’s Balance Sheet.
| | | | | | | | | | | |
DigitalBridge | Supplemental Financial Report | | 17 | |
| | | | | | | | | | | | | | | | | | | | | | | | | | | | | |
| ($ in thousands) | | | | | | | | | |
| Operating Adjusted EBITDA | | 4Q22 | 3Q22 | 2Q22 | 1Q22 | 4Q21 | 3Q21 | 2Q21 | 1Q21 |
| Consolidated amount | | | | | | | | | |
| Total revenues | | $ | 229,278 | | $ | 225,387 | | $ | 227,687 | | $ | 202,522 | | $ | 189,938 | | $ | 194,966 | | $ | 189,093 | | $ | 189,202 | |
| Property operating expenses | | (97,457) | | (100,051) | | (94,744) | | (84,003) | | (78,950) | | (80,226) | | (77,140) | | (79,862) | |
| Compensation and administrative expenses | | (27,452) | | (37,974) | | (29,139) | | (26,855) | | (28,879) | | (29,766) | | (28,488) | | (25,947) | |
| Investment expenses | | (5,547) | | (5,288) | | (5,487) | | (8,016) | | (5,153) | | (4,862) | | (5,255) | | (6,565) | |
| Straight-line rent expenses and amortization of above- and below-market lease intangibles | | (1,749) | | (2,827) | | (236) | | (377) | | 370 | | 482 | | (98) | | (399) | |
| Compensation expense—equity-based | | (95) | | 10,852 | | 752 | | 752 | | 1,918 | | 308 | | 308 | | 308 | |
| Installation services | | — | | — | | — | | — | | 2,097 | | (4,058) | | 576 | | 880 | |
| Transaction-related and restructuring charges | | 1,574 | | 1,105 | | 2,400 | | 4,636 | | 3,188 | | 4,042 | | 2,999 | | 4,670 | |
Operating Adjusted EBITDA - Consolidated (1) | | $ | 98,552 | | $ | 91,204 | | $ | 101,233 | | $ | 88,659 | | $ | 84,529 | | $ | 80,886 | | $ | 81,995 | | $ | 82,287 | |
| | | | | | | | | |
| DBRG OP share of consolidated amount | | | | | | | | | |
| Total revenues | | $ | 27,927 | | $ | 38,305 | | $ | 41,448 | | $ | 36,882 | | $ | 32,464 | | $ | 33,771 | | $ | 32,624 | | $ | 32,741 | |
| Property operating expenses | | (11,794) | | (17,096) | | (17,649) | | (15,614) | | (13,740) | | (14,115) | | (13,690) | | (14,165) | |
| Compensation and administrative expenses | | (3,106) | | (7,348) | | (6,246) | | (5,752) | | (5,457) | | (5,615) | | (5,350) | | (4,888) | |
| Investment expenses | | (716) | | (729) | | (793) | | (1,169) | | (732) | | (709) | | (819) | | (1,090) | |
| Straight-line rent expenses and amortization of above- and below-market lease intangibles | | (263) | | (227) | | 246 | | 195 | | 244 | | 295 | | 247 | | 192 | |
| Compensation expense—equity-based | | (11) | | 2,092 | | 164 | | 164 | | 384 | | 62 | | 62 | | 62 | |
| Installation services | | — | | — | | — | | — | | 419 | | (812) | | 115 | | 176 | |
| Transaction-related and restructuring charges | | 77 | | 175 | | 473 | | 791 | | 618 | | 759 | | 587 | | 920 | |
| Operating Adjusted EBITDA - DBRG OP share | | $ | 12,114 | | $ | 15,172 | | $ | 17,643 | | $ | 15,497 | | $ | 14,200 | | $ | 13,636 | | $ | 13,776 | | $ | 13,948 | |
Notes:
(1) For a reconciliation of net income/(loss) to Adjusted EBITDA, please refer to the Appendices section of this presentation.
| | | | | | | | | | | |
DigitalBridge | Supplemental Financial Report | | 18 | |
| | | | | | | | | | | | | | | | | | | | | | | | | | | | | |
| ($ in thousands) | | | | | | | | | |
| Capital Expenditures | | | | | | | | | |
| Consolidated amount | | 4Q22 | 3Q22 | 2Q22 | 1Q22 | 4Q21 | 3Q21 | 2Q21 | 1Q21 |
| Non-revenue enhancing capital expenditures | | $ | 14,775 | $ | 10,992 | $ | 13,377 | $ | 7,418 | $ | 6,410 | $ | 7,387 | $ | 4,423 | $ | 1,220 |
| Revenue enhancing capital expenditures | | 135,506 | 147,046 | 101,100 | 84,668 | 94,018 | 42,841 | 40,460 | 34,652 |
| Total capital expenditures | | $ | 150,281 | $ | 158,038 | $ | 114,477 | $ | 92,086 | $ | 100,428 | $ | 50,228 | $ | 44,883 | $ | 35,872 |
| | | | | | | | | |
| Leasing Commissions | | $ | 2,194 | $ | 2,146 | $ | 2,660 | $ | 1,266 | $ | 1,535 | $ | 1,233 | $ | 5,024 | $ | 775 |
| | | | | | | | | |
| DBRG OP share of consolidated amount | | | | | | | | | |
| Non-revenue enhancing capital expenditures | | $ | 1,746 | $ | 1,878 | $ | 2,571 | $ | 1,372 | $ | 1,097 | $ | 1,349 | $ | 764 | $ | 226 |
| Revenue enhancing capital expenditures | | 15,053 | 25,118 | 21,249 | 17,578 | 18,090 | 8,315 | 7,538 | 6,532 |
| Total capital expenditures | | $ | 16,799 | $ | 26,996 | $ | 23,820 | $ | 18,950 | $ | 19,187 | $ | 9,664 | $ | 8,302 | $ | 6,758 |
| | | | | | | | | |
| Leasing Commissions | | $ | 244 | $ | 367 | $ | 489 | $ | 308 | $ | 307 | $ | 213 | $ | 756 | $ | 155 |
| | | | | | | | | | | |
DigitalBridge | Supplemental Financial Report | | 19 | |
| | | | | | | | | | | | | | | | | | | | | | | | | | | | | |
| ($ in thousands) | | | | | | | | | |
| Consolidated amount | | 4Q22 | 3Q22 | 2Q22 | 1Q22 | 4Q21 | 3Q21 | 2Q21 | 1Q21 |
| DBRG's GP Co-investment in DBP I and II Investments | | $ | 343,137 | | $ | 277,450 | | $ | 284,282 | | $ | 248,663 | | $ | 242,856 | | $ | 230,972 | | $ | 225,411 | | $ | 173,831 | |
| Equity interests in digital investment vehicles and warehouse / seed investments | | 316,299 | | 769,431 | | 906,076 | | 423,467 | | 290,113 | | $ | 272,134 | | $ | 198,934 | | $ | 179,945 | |
| Other - digital assets net carrying value | | $ | 659,436 | | $ | 1,046,881 | | $ | 1,190,358 | | $ | 672,130 | | $ | 532,969 | | $ | 503,106 | | $ | 424,345 | | $ | 353,776 | |
| | | | | | | | | |
| DBRG OP share of consolidated amount | | | | | | | | | |
| DBRG's GP Co-investment in DBP I and II Investments | | $ | 270,400 | | $ | 215,872 | | $ | 217,504 | | $ | 187,247 | | $ | 183,612 | | $ | 173,732 | | $ | 171,012 | | $ | 160,342 | |
| Equity interests in digital investment vehicles and warehouse / seed investments | | 178,379 | | 467,014 | | 591,066 | | 308,578 | | 174,566 | | $ | 165,902 | | $ | 98,476 | | $ | 83,384 | |
| Other - digital assets net carrying value | | $ | 448,779 | | $ | 682,886 | | $ | 808,570 | | $ | 495,825 | | $ | 358,178 | | $ | 339,634 | | $ | 269,488 | | $ | 243,726 | |
| | | | | | | | | | | |
DigitalBridge | Supplemental Financial Report | | 20 | |
| | | | | | | | | | | | | | | | | | | | | | | | | | | | | |
| ($ in thousands) | | | | | | | | | |
| | 4Q22 | 3Q22 | 2Q22 | 1Q22 | 4Q21 | 3Q21 | 2Q21 | 1Q21 |
| Investment Management Cash G&A | | | | | | | | | |
| Cash and equity-based compensation | | $ | 30,829 | | $ | 22,566 | | $ | 23,230 | | $ | 24,808 | | $ | 20,802 | | $ | 21,606 | | $ | 16,262 | | $ | 12,385 | |
| Administrative expenses | | 7,958 | | 4,517 | | 4,869 | | 4,171 | | 4,387 | | 5,820 | | 9,345 | | 2,131 | |
| Compensation expense—equity-based | | (7,939) | | (2,654) | | (3,361) | | (3,190) | | (2,011) | | (2,046) | | (1,785) | | (1,533) | |
| Administrative expenses—straight-line rent | | (66) | | (68) | | (76) | | (159) | | (75) | | (74) | | (50) | | (5) | |
| Administrative expenses—placement agent fee | | — | | — | | — | | — | | (880) | | (3,069) | | (6,959) | | (59) | |
| Transaction-related and restructuring charges | | (6,560) | | (1,035) | | (2,143) | | (3,943) | | (2,502) | | (2,629) | | (50) | | — | |
| Investment Management Cash G&A | | 24,222 | | 23,326 | | 22,519 | | 21,687 | | 19,721 | | 19,608 | | 16,763 | | 12,919 | |
| | | | | | | | | |
| Corporate & Other Cash G&A | | | | | | | | | |
| Cash and equity-based compensation | | 10,804 | | 12,404 | | 9,333 | | 20,778 | | 12,084 | | 15,200 | | 13,061 | | 48,372 | |
| Administrative expenses | | 23,373 | | 17,992 | | 12,574 | | 16,815 | | 21,171 | | 12,474 | | 9,548 | | 7,747 | |
| Compensation expense—equity-based | | 329 | | (5,171) | | (4,840) | | (5,878) | | (3,837) | | (4,651) | | (5,721) | | (14,065) | |
| Administrative expenses—straight-line rent | | 485 | | 660 | | 741 | | 856 | | 1,195 | | 602 | | 375 | | 591 | |
| Administrative expenses—noncontrolling interests | | (248) | | (338) | | (327) | | (302) | | (377) | | (332) | | (255) | | (248) | |
| Transaction-related and restructuring charges | | (18,443) | | (10,549) | | (2,828) | | (14,352) | | (14,229) | | (5,027) | | (1,399) | | (29,626) | |
| Corporate & Other Cash G&A | | 16,300 | | 14,998 | | 14,653 | | 17,917 | | 16,007 | | 18,266 | | 15,609 | | 12,771 | |
| | | | | | | | | |
| DBRG Cash G&A excluding Portfolio Company G&A | | $ | 40,522 | | $ | 38,324 | | $ | 37,172 | | $ | 39,604 | | $ | 35,728 | | $ | 37,874 | | $ | 32,372 | | $ | 25,690 | |
| | | | | | | | | |
| Corporate & Other EBITDA | | | | | | | | | |
| EBITDA, excluding Cash G&A | | $ | 10,360 | | $ | 9,825 | | $ | 9,414 | | $ | 8,162 | | $ | 1,273 | | $ | 1,515 | | $ | (239) | | $ | (284) | |
| Cash G&A | | (16,300) | | (14,998) | | (14,653) | | (17,917) | | (16,007) | | (18,266) | | (15,609) | | (12,771) | |
| Corporate & Other EBITDA | | $ | (5,940) | | $ | (5,173) | | $ | (5,239) | | $ | (9,755) | | $ | (14,734) | | $ | (16,751) | | $ | (15,848) | | $ | (13,055) | |
| | | | | | | | | | | |
DigitalBridge | Supplemental Financial Report | | 21 | |
Appendices
| | | | | | | | | | | |
DigitalBridge | Supplemental Financial Report | | 22 | |
| | |
| Reconciliations of IM FRE and Operating Adjusted EBITDA to Net Income (Loss) |
|
| | | | | | | | | | | | | | | | | | | | | | | | | | | | | |
| ($ in thousands) | | 4Q22 | 3Q22 | 2Q22 | 1Q22 | 4Q21 | 3Q21 | 2Q21 | 1Q21 |
| IM net income (loss) | | 81,167 | | 46,065 | | 67,995 | | (9,143) | | 28,194 | | 39,272 | | 15,786 | | 7,663 | |
| Adjustments: | | | | | | | | | |
| Interest expense (income) | | 2,200 | | 2,906 | | 2,771 | | 2,500 | | 2,499 | | 2,250 | | — | | (1) | |
| Investment expense, net of reimbursement | | 156 | | 230 | | (200) | | 138 | | (12) | | — | | — | | 32 | |
| Depreciation and amortization | | 6,135 | | 5,369 | | 5,375 | | 5,276 | | 5,928 | | 8,242 | | 6,298 | | 8,912 | |
| Compensation expense—equity-based | | 6,639 | | 2,654 | | 3,361 | | 3,191 | | 2,011 | | 2,046 | | 1,786 | | 1,533 | |
| Compensation expense—carried interest and incentive | | 92,738 | | 80,831 | | 49,069 | | (20,352) | | 25,921 | | 31,736 | | 8,266 | | (33) | |
| Administrative expenses—straight-line rent | | 1,541 | | 68 | | 76 | | 159 | | 75 | | 74 | | 50 | | (2) | |
| Administrative expenses—placement agent fee | | — | | — | | — | | — | | 880 | | 3,069 | | 6,959 | | 59 | |
| Transaction-related and restructuring charges | | 8,101 | | 2,317 | | 4,042 | | 3,942 | | 2,516 | | 2,627 | | 51 | | — | |
| Incentive/performance fee income | | (176,944) | | (121,698) | | (110,779) | | 40 | | (5,720) | | (1,313) | | (4,489) | | — | |
| Equity method (earnings) losses | | (2,072) | | (1,016) | | (1,016) | | 31,062 | | (31,608) | | (59,196) | | (11,203) | | 195 | |
| Other (gain) loss, net | | (248) | | 110 | | 424 | | 3,055 | | (52) | | (461) | | (119) | | (165) | |
| Income tax (benefit) expense | | 2,172 | | 1,263 | | 2,006 | | 2,374 | | 1,852 | | 3,089 | | 2,236 | | 7 | |
| IM Adjusted EBITDA | | $ | 21,585 | | $ | 19,099 | | $ | 23,124 | | $ | 22,242 | | $ | 32,484 | | $ | 31,435 | | $ | 25,621 | | $ | 18,200 | |
| Exclude: Start-up FRE of certain new strategies | | 2,643 | | 2,399 | | 2,335 | | 2,362 | | 2,306 | | 2,224 | | 2,059 | | 1,938 | |
| IM FRE | | $ | 24,228 | | $ | 21,498 | | $ | 25,459 | | $ | 24,604 | | $ | 34,790 | | $ | 33,659 | | $ | 27,680 | | $ | 20,138 | |
| Wafra’s 31.5% ownership | | — | | — | | (4,700) | | (7,615) | | (11,033) | | (10,737) | | (8,210) | | (6,555) | |
| DBRG OP share of IM FRE | | $ | 24,228 | | $ | 21,498 | | $ | 20,759 | | $ | 16,989 | | $ | 23,757 | | $ | 22,922 | | $ | 19,470 | | $ | 13,583 | |
| | | | | | | | | |
| | 4Q22 | 3Q22 | 2Q22 | 1Q22 | 4Q21 | 3Q21 | 2Q21 | 1Q21 |
| Operating net income (loss) from continuing operations | | (76,990) | | (93,772) | | (85,428) | | (74,141) | | (83,909) | | (71,822) | | (10,850) | | (64,260) | |
| Adjustments: | | | | | | | | | |
| Interest expense | | 45,222 | | 40,770 | | 37,233 | | 36,184 | | 35,144 | | 29,839 | | 29,272 | | 31,132 | |
| Income tax (benefit) expense | | 509 | | (5) | | 161 | | (330) | | (1,941) | | 1,922 | | (66,788) | | (12,268) | |
| Depreciation and amortization | | 133,269 | | 130,663 | | 145,817 | | 122,891 | | 126,436 | | 120,458 | | 126,227 | | 122,221 | |
| Straight-line rent expenses and amortization of above- and below-market lease intangibles | | (1,749) | | (2,827) | | (236) | | (377) | | 370 | | 482 | | (98) | | (399) | |
| Compensation expense—equity-based | | (95) | | 10,852 | | 752 | | 752 | | 1,918 | | 308 | | 308 | | 308 | |
| Installation services | | — | | — | | — | | — | | 2,097 | | (4,058) | | 576 | | 880 | |
| Transaction-related and restructuring charges | | 1,574 | | 1,105 | | 2,400 | | 4,636 | | 3,188 | | 4,042 | | 2,999 | | 4,670 | |
| Other gain/loss, net | | (3,188) | | 4,418 | | 534 | | (956) | | 1,226 | | (285) | | 349 | | 3 | |
| Operating Adjusted EBITDA | | $ | 98,552 | | $ | 91,204 | | $ | 101,233 | | $ | 88,659 | | $ | 84,529 | | $ | 80,886 | | $ | 81,995 | | $ | 82,287 | |
| | | | | | | | | | | |
DigitalBridge | Supplemental Financial Report | | 23 | |
| | |
| Reconciliations of DE and Adjusted EBITDA to Net Income (Loss) |
|
| | | | | | | | | | | | | | | | | | | | | | | | | | | | | |
| ($ in thousands) | | 4Q22 | 3Q22 | 2Q22 | 1Q22 | 4Q21 | 3Q21 | 2Q21 | 1Q21 |
| Net income (loss) attributable to common stockholders | | $ | (19,356) | | $ | (63,273) | | $ | (37,321) | | $ | (262,316) | | $ | (20,686) | | $ | 41,036 | | $ | (141,260) | | $ | (264,806) | |
| Net income (loss) attributable to noncontrolling common interests in Operating Company | | (1,583) | | (4,834) | | (3,090) | | (22,862) | | (1,946) | | 4,311 | | (14,980) | | (27,896) | |
| Net income (loss) attributable to common interests in Operating Company and common stockholders | | (20,939) | | (68,107) | | (40,411) | | (285,178) | | (22,632) | | 45,347 | | (156,240) | | (292,702) | |
| | | | | | | | | |
| Adjustments for Distributable Earnings (DE): | | | | | | | | | |
| Transaction-related and restructuring charges | | 23,772 | | 23,249 | | 29,300 | | 24,668 | | 29,977 | | 19,501 | | 5,174 | | 34,482 | |
| Non-real estate (gains) losses, excluding realized gains or losses of digital assets within the Corporate and Other segment | | (16,050) | | 51,162 | | 13,433 | | 130,224 | | (52,611) | | 11,319 | | (151,773) | | 267,812 | |
| Net unrealized carried interest | | (70,541) | | (1,228) | | (58,775) | | 13,078 | | (7,375) | | (27,953) | | (6,485) | | 189 | |
| Equity-based compensation expense | | 7,549 | | 18,619 | | 9,344 | | 18,720 | | 19,416 | | 9,038 | | 11,642 | | 19,299 | |
| Depreciation and amortization | | 151,666 | | 149,131 | | 155,909 | | 132,876 | | 147,137 | | 140,110 | | 170,454 | | 205,325 | |
| Straight-line rent revenue and expense | | (7,063) | | (8,895) | | (2,956) | | (2,548) | | (1,986) | | (1,925) | | (2,309) | | 17,225 | |
| Amortization of acquired above- and below-market lease values, net | | 100 | | 80 | | (10) | | (248) | | (333) | | (172) | | (1,498) | | 6,005 | |
| Impairment loss | | — | | — | | 12,184 | | 23,799 | | (40,732) | | (8,210) | | 242,903 | | 106,077 | |
| Gain from sales of real estate | | — | | — | | — | | 3 | | (197) | | (514) | | (2,969) | | (38,102) | |
| Non-revenue enhancing capital expenditures | | (14,774) | | (10,992) | | (13,377) | | (1,372) | | (1,097) | | (1,349) | | (764) | | (226) | |
| Debt prepayment penalties and amortization of deferred financing costs and debt premiums and discounts | | 5,572 | | 5,627 | | 5,238 | | 98,465 | | 36,685 | | 7,651 | | 10,196 | | 45,627 | |
| Adjustment to reflect BRSP cash dividend declared | | 4,122 | | 10,201 | | (4,660) | | (9,089) | | (28,243) | | 9,478 | | (40,165) | | 55,648 | |
| Preferred share redemption (gain) loss | | — | | — | | — | | — | | 2,127 | | 2,865 | | — | | — | |
| Income tax effect on certain of the foregoing adjustments | | 55 | | — | | — | | (589) | | 8,195 | | 1,663 | | (42,536) | | (17,657) | |
| Adjustments attributable to noncontrolling interests in investment entities | | (69,810) | | (136,338) | | (91,676) | | (132,237) | | (105,150) | | (83,074) | | (15,334) | | (406,824) | |
| DE from discontinued operations | | (5,070) | | 6,808 | | (5,958) | | (9,003) | | 11,467 | | (123,075) | | (25,874) | | (12,391) | |
| After-tax DE | | $ | (11,411) | | $ | 39,317 | | $ | 7,585 | | $ | 1,569 | | $ | (5,352) | | $ | 700 | | $ | (5,578) | | $ | (10,213) | |
| | | | | | | | | | | |
DigitalBridge | Supplemental Financial Report | | 24 | |
| | |
| Reconciliations of DE and Adjusted EBITDA to Net Income (Loss) |
|
| | | | | | | | | | | | | | | | | | | | | | | | | | | | | |
| ($ in thousands) | | 4Q22 | 3Q22 | 2Q22 | 1Q22 | 4Q21 | 3Q21 | 2Q21 | 1Q21 |
| After-tax DE | | $ | (11,411) | | $ | 39,317 | | $ | 7,585 | | $ | 1,569 | | $ | (5,352) | | $ | 700 | | $ | (5,578) | | $ | (10,213) | |
| Interest expense included in DE | | 13,756 | | 16,348 | | 14,142 | | 13,280 | | 13,775 | | 14,160 | | 11,834 | | 12,387 | |
| Income tax expense (benefit) included in DE | | 30,616 | | (7,839) | | (2,662) | | (6,849) | | 631 | | (12,638) | | (8,224) | | (5,613) | |
| Preferred dividends | | 14,765 | | 15,283 | | 15,759 | | 15,759 | | 16,139 | | 17,456 | | 18,516 | | 18,516 | |
| Earnings of equity method investments | | (8,842) | | (16,285) | | (6,982) | | (6,691) | | (6,441) | | (5,784) | | (6,216) | | (4,440) | |
| Placement fee expense | | — | | — | | — | | — | | 603 | | 2,102 | | 4,767 | | 40 | |
| Net realized carried interest and incentive fees | | (12,377) | | (20,258) | | — | | 1,172 | | (1,092) | | (7) | | (1,565) | | 11 | |
| Investment costs and non-revenue enhancing capital expenditures in DE | | 1,252 | | 2,531 | | 3,086 | | 2,023 | | 2,463 | | 1,402 | | 1,620 | | 1,649 | |
| Non pro-rata allocation of income (loss) to noncontrolling interests | | — | | — | | — | | 231 | | 231 | | 231 | | 223 | | 201 | |
| Adjusted EBITDA | | $ | 27,759 | | $ | 29,097 | | $ | 30,928 | | $ | 20,494 | | $ | 20,957 | | $ | 17,622 | | $ | 15,377 | | $ | 12,538 | |
| | | | | | | | | | | |
DigitalBridge | Supplemental Financial Report | | 25 | |
Assets Under Management (“AUM”)
Assets owned by the Company’s balance sheet and assets for which the Company and its affiliates provide investment management services, including assets for which the Company may or may not charge management fees and/or performance allocations. Balance sheet AUM is based on the undepreciated carrying value of digital investments and the impaired carrying value of non digital investments as of the report date. Investment management AUM is based on the cost basis of managed investments as reported by each underlying vehicle as of the report date. AUM further includes uncalled capital commitments, but excludes DBRG OP’s share of non wholly-owned real estate investment management platform’s AUM. The Company's calculations of AUM may differ from the calculations of other asset managers, and as a result, this measure may not be comparable to similar measures presented by other asset managers.
Contracted Revenue Growth (“Bookings”)
The Company defines Bookings as either (1) a new data center customer contract for new or additional services over and above any services already being provided as well as (2) an increase in contracted rates on the same services when a contract renews. In both instances a booking is considered to be generated when a new contract is signed with the recognition of new revenue to occur when the new contract begins billing.
Churn
The Company calculates Churn as the percentage of MRR lost during the period divided by the prior period’s MRR. Churn is intended to represent data center customer contracts which are terminated during the period and not renewed.
DigitalBridge Operating Company, LLC (“DBRG OP”)
The operating partnership through which the Company conducts all of its activities and holds substantially all of its assets and liabilities. DBRG OP share excludes noncontrolling interests in investment entities.
Fee-Earning Equity Under Management (“FEEUM”)
Equity for which the Company and its affiliates provides investment management services and derives management fees and/or performance allocations. FEEUM generally represents the basis used to derive fees, which may be based on invested equity, stockholders’ equity, or fair value pursuant to the terms of each underlying investment management agreement. The Company's calculations of FEEUM may differ materially from the calculations of other asset managers, and as a result, this measure may not be comparable to similar measures presented by other asset managers.
Fee Related Earnings Margin % ("FRE Margin %")
FRE Margin % represents IM FRE divided by management fee revenues, excluding one-time catch-up fees and/or incentives fees.
Non-revenue Enhancing Capital Expenditures
Represents capitalized expenditures needed to maintain operating real estate which are not expected to generate incremental revenue.
Revenue Enhancing Capital Expenditures
Represents capitalized expenditures including major capital improvements for expansions, transformations and incremental improvements to the operating portfolio intended to result in increased revenues and Adjusted EBITDA at the property.
Max Critical I.T. Square Feet
Amount of total rentable square footage.
Monthly Recurring Revenue (“MRR”)
The Company defines MRR as revenue from ongoing services that is generally fixed in price and contracted for longer than 30 days.
UPB: Unpaid Principal Balance
% Utilization Rate: Amount of leased square feet divided by max critical I.T. square feet.
| | | | | | | | | | | |
DigitalBridge | Supplemental Financial Report | | 26 | |