Exhibit 99.1


Technical Report
Musselwhite Mine
Ontario, Canada
Prepared by:
Ryan Wilson, P. Geo.
DRA Americas Inc.
David Frost, FAusIMM
DRA Americas Inc.
Daniel M. Gagnon, P. Eng.
DRA Americas Inc.
James (Jim) Theriault, P. Eng.
SLR Consulting (Canada) Ltd.
Paul Gauthier, P.Eng.
WSP Canada Inc.
Paul Palmer, P.Eng.
WSP Canada Inc.
William Richard (Rick) McBride, P.Eng.
WSP Canada Inc.
Report Date: November 18, 2024
 | December 2024 |
Forward-looking Statement
This Technical Report (Report) has an effective date of November 18, 2024 and, unless otherwise specified, statements herein were made as of that date. The Report contains forward-looking information which includes, but is not limited to, statements with respect to the results of the Report, including gold price and exchange rate assumptions, IRR, NPV, pay back periods, cash flow forecasts, projected capital and operating costs, metal or mineral recoveries, mine life and production rates and other prospective metrics; mineral resource and reserves estimates. These statements are based on information that was available to Orla Mining Ltd. (Orla) and the Qualified Persons who authored the Report as of the effective date of the Report. There is no assurance that actual results will meet stated expectations. In certain cases, forward-looking information may be identified by such terms as “anticipates”, “believes”, “could”, “estimates”, “expects”, “may”, “shall”, “targets”, “will”, or “would”. Forward-looking information contained in this Report is based on certain factors and assumptions made by Orla management and the Qualified Persons in light of their experience and perception of historical trends, conditions existing as of the effective date of the Report and expected future developments, as well as other factors Orla management and the Qualified Persons believe are appropriate in the circumstances.
Forward-looking information involves known and unknown risks, uncertainties and other factors which may cause the actual results, performance or achievements to be materially different from any anticipated future results, performance or achievements expressed or implied by the forward-looking information. Such factors include uncertainties inherent to feasibility studies, risks inherent in the exploration and development of mineral deposits, including risks relating to changes in project parameters as plans continue to be redefined, risks relating to grade or recovery rates, reliance on key personnel, operational risks, regulatory, capitalization and liquidity risks. The Report may also be subject to legal, political, environmental or other risks that could materially affect the potential development of the Musselwhite Mine, including risks. Please refer to Orla's and Newmont Corporation's (Newmont's) latest management’s discussions and analysis, and other disclosure documents filed and available on SEDAR+ at www.sedarplus.ca for other risks that could materially affect the forward-looking information presented in this Report. This list is not exhaustive of the factors that may affect any of the forward-looking information discussed herein. These and other factors should be considered carefully, and readers should not place undue reliance on forward-looking information contained herein. Neither Orla nor the Qualified Persons who authored this Report undertake to update any forward-looking information that may change from time to time, except in accordance with applicable securities laws.
| | December 2024 |
 | TECHNICAL REPORT –
MUSSELWHITE MINE, ONTARIO, CANADA
Document # C8630-0000-PM-RPT-001 – Rev. 0
/ Page ii |
Table of contents
| 1 | Executive Summary | 1 |
| 1.1 | Property Description and Location | 1 |
| 1.2 | Accessibility, Climate, Local Resources, Infrastructure, and Physiography | 2 |
| 1.3 | History | 3 |
| 1.4 | Geological Setting and Mineralization | 5 |
| 1.5 | Exploration Work and Drilling | 8 |
| 1.6 | Data Verification, Sampling Preparation, Analysis, and Security | 12 |
| 1.7 | Mineral Processing and Metallurgical Testing | 12 |
| 1.8 | Mineral Resources Estimate | 12 |
| 1.9 | Mineral Reserve Estimation | 13 |
| 1.10 | Mining Methods | 15 |
| 1.11 | Recovery Methods | 18 |
| 1.12 | Project Infrastructure | 19 |
| 1.13 | Environmental Studies, Permitting and Social or Community Impact | 21 |
| 1.14 | Capital and Operating Costs | 22 |
| 1.15 | Economic Analysis | 26 |
| 1.16 | Adjacent Properties | 29 |
| 1.17 | Interpretation and Conclusions | 30 |
| 1.18 | Opportunities | 33 |
| 1.19 | Risk Evaluation | 34 |
| 1.20 | Recommendations | 36 |
| | | |
| 2 | Introduction | 42 |
| 2.1 | Terms of Reference and Purpose | 42 |
| 2.2 | Qualified Persons | 43 |
| 2.3 | Site Visit | 44 |
| 2.4 | Non-GAAP Financial Measures | 44 |
| 2.5 | Units and Currency | 44 |
| | | |
| 3 | Reliance on Other Experts | 45 |
| | | |
| 4 | Property Description and Location | 46 |
| 4.1 | Project Location | 46 |
| 4.2 | Mining Titles | 47 |
| 4.3 | Royalties, Agreement and Encumbrances | 49 |
| 4.4 | Surface Rights | 51 |
| 4.5 | Environmental Liabilities and Permitting | 52 |
| 4.6 | Other Significant Factors and Risks | 53 |
| | | |
| 5 | Accessibility, Climate, Local Resources, Infrastructure, and Physiography | 54 |
 | December 2024 |
| | TECHNICAL REPORT –
MUSSELWHITE MINE, ONTARIO, CANADA
Document # C8630-0000-PM-RPT-001 – Rev. 0
/ Page iii |
| 5.1 | Accessibility | 54 |
| 5.2 | Climate | 54 |
| 5.3 | Local Resources and Infrastructure | 54 |
| 5.4 | Physiography | 55 |
| 5.5 | Other Significant Factors and Risks | 56 |
| | | |
| 6 | History | 58 |
| 6.1 | Mine Chronology | 60 |
| 6.2 | Historic Gold Production | 62 |
| 6.3 | Other Significant Factors and Risks | 63 |
| | | |
| 7 | Geological Setting and Mineralization | 64 |
| 7.1 | Regional Geology | 64 |
| 7.2 | Project Geology | 64 |
| 7.3 | Mineralization | 73 |
| 7.4 | Other Significant Factors and Risks | 78 |
| | | |
| 8 | Deposit Types | 79 |
| | | |
| 9 | Exploration | 80 |
| 9.1 | Historical Chronology of Notable Exploration Work | 80 |
| 9.2 | Recent Exploration Work (post-2006) | 81 |
| | | |
| 10 | Drilling | 87 |
| 10.1 | Drilling: 1974 – 2005 (Dome Exploration et al. and Placer Dome) | 89 |
| 10.2 | Drilling: 2006 – 2018 (Goldcorp) | 92 |
| 10.3 | Drilling: 2019 – 2024 (Newmont) | 93 |
| 10.4 | Standard Operating Procedures | 95 |
| 10.5 | Diamond Drill Hole Planning Procedure | 96 |
| 10.6 | Drill Core Sampling Procedure | 97 |
| 10.7 | Hydrogeology | 110 |
| 10.8 | Geotechnical | 110 |
| 10.9 | Other Significant Factors and Risks | 114 |
| | | |
| 11 | Sample Preparation, Analysis and Security | 115 |
| 11.1 | Historical (Pre-2006) | 115 |
| 11.2 | Goldcorp (2006 – 2018) | 121 |
| 11.3 | Newmont (2019 – Present) | 134 |
| 11.4 | Security | 151 |
| 11.5 | Qualified Person’s Opinion | 151 |
| | | |
| 12 | Data Verification | 152 |
| 12.1 | AMEC – 2003 Data Verification (Kinross) | 152 |
| 12.2 | AMEC – 2006 Data Verification (Goldcorp) | 152 |
| 12.3 | Newmont – 2020 Data Verification (Internal) | 153 |
| 12.4 | DRA – 2024 Data Verification (Orla Mining) | 153 |
| | December 2024 |
| | TECHNICAL REPORT –
MUSSELWHITE MINE, ONTARIO, CANADA
Document # C8630-0000-PM-RPT-001 – Rev. 0
/ Page iv |
| 12.5 | Qualified Person’s Opinion | 159 |
| | | |
| 13 | Mineral Processing and Metallurgical Testing | 160 |
| 13.1 | Introduction | 160 |
| 13.2 | Metallurgical Test Work | 160 |
| 13.3 | Gold Recovery Model | 202 |
| | | |
| 14 | Mineral Resource Estimate | 205 |
| 14.1 | Mineral Resource Estimate Definition and Procedure | 205 |
| 14.2 | General Description | 207 |
| 14.3 | East Limb Deposits | 208 |
| 14.4 | West Limb Deposits | 232 |
| 14.5 | Underground Mineral Resources | 252 |
| 14.6 | Mineral Resource Statement | 255 |
| 14.7 | Qualified Person’s Opinion | 256 |
| | | |
| 15 | Mineral Reserve Estimates | 257 |
| 15.1 | Introduction | 257 |
| 15.2 | Estimation Methodology | 257 |
| 15.3 | Modify Factors | 258 |
| 15.4 | Stope Optimization | 266 |
| 15.5 | Mineral Reserve Estimate | 266 |
| 15.6 | Factor Potentially Affecting the Mineral Reserve Estimate | 268 |
| | | |
| 16 | Mining Methods | 269 |
| 16.1 | General Description of Mineralization at Musselwhite | 269 |
| 16.2 | Geotechnical | 269 |
| 16.3 | Future Geotechnical Conditions | 281 |
| 16.4 | Hydrogeology | 282 |
| 16.5 | Mine Design | 283 |
| 16.6 | Mining Methods | 285 |
| 16.7 | Mine Infrastructure | 290 |
| 16.8 | Mine Equipment | 296 |
| 16.9 | Underground Mine Personnel | 297 |
| 16.10 | Life-of-Mine Plan | 298 |
| | | |
| 17 | Recovery Methods | 301 |
| 17.1 | Introduction | 301 |
| 17.2 | Process Flow Diagram | 301 |
| 17.3 | Major Equipment List | 301 |
| 17.4 | Process Description | 305 |
| 17.5 | Reagents and Consumables | 308 |
| 17.6 | Utilities and Services | 314 |
| 17.7 | Plant Capacity, Historical Performance, and Life-of-Mine Production Plan | 315 |
| | December 2024 |
| | TECHNICAL REPORT –
MUSSELWHITE MINE, ONTARIO, CANADA
Document # C8630-0000-PM-RPT-001 – Rev. 0
/ Page v |
| 18 | Project Infrastructure | 317 |
| 18.1 | Existing Project Infrastructure | 317 |
| 18.2 | Road and Access Road | 318 |
| 18.3 | Airstrip | 318 |
| 18.4 | Tailings Storage Facility | 318 |
| 18.5 | Open Pits | 324 |
| 18.6 | Camp and Accommodations –Village | 325 |
| 18.7 | Communication | 325 |
| 18.8 | Site Water Management | 326 |
| 18.9 | Electrical Power | 326 |
| 18.10 | Fuel Systems | 327 |
| | | |
| 19 | Market Studies and Contracts | 328 |
| 19.1 | Market Studies | 328 |
| 19.2 | Commodity Pricing | 328 |
| 19.3 | Contracts | 328 |
| | | |
| 20 | Environmental Studies, Permitting and Social or Community Impact | 329 |
| 20.1 | Environmental Baseline | 329 |
| 20.2 | Environmental Studies | 334 |
| 20.3 | Environmental Management System | 334 |
| 20.4 | Greenhouse Gas Emissions | 334 |
| 20.5 | Waste Rock Management and Water Management | 335 |
| 20.6 | Cover Trials | 336 |
| 20.7 | Environmental Permitting | 337 |
| 20.8 | Key Environmental Risks and Concerns | 338 |
| 20.9 | Social and Community Impacts | 339 |
| 20.10 | Mine Closure | 341 |
| | | |
| 21 | Capital and Operating Costs | 343 |
| 21.1 | Capital Cost Estimate (Capex) | 343 |
| 21.2 | Operating Cost Estimate (Opex) | 353 |
| | | |
| 22 | Economic Analysis | 361 |
| 22.1 | Overview | 361 |
| 22.2 | Forward Looking Information | 361 |
| 22.3 | Assumptions | 362 |
| 22.4 | Economic Analysis Parameters | 362 |
| 22.5 | Gold Production | 364 |
| 22.6 | Capital Expenditures | 364 |
| 22.7 | Royalties | 365 |
| 22.8 | Taxation | 365 |
| 22.9 | Financial Analysis Results | 366 |
| 22.10 | Sensitivity Analysis | 369 |
| | December 2024 |
| | TECHNICAL REPORT –
MUSSELWHITE MINE, ONTARIO, CANADA
Document # C8630-0000-PM-RPT-001 – Rev. 0
/ Page vi |
| 22.11 | 2024 Production Projections versus Actuals | 371 |
| | | |
| 23 | Adjacent Properties | 372 |
| | | |
| 24 | Other Relevant Data and Information | 376 |
| | | |
| 25 | Interpretation and Conclusions | 377 |
| 25.1 | Conclusions | 377 |
| 25.2 | Opportunities | 381 |
| 25.3 | Risk Evaluation | 381 |
| | | |
| 26 | Recommendations | 385 |
| 26.1 | Geology and Exploration | 385 |
| 26.2 | Rock Testing | 385 |
| 26.3 | Mineral Processing and Metallurgical Testing | 386 |
| 26.4 | Mineral Resources Estimate | 386 |
| 26.5 | Mineral Reserve Estimate | 387 |
| 26.6 | Geotechnical Recommendations | 387 |
| 26.7 | Recovery Methods | 388 |
| 26.8 | Tailings Storage Facility | 388 |
| 26.9 | Environment | 388 |
| 26.10 | Capital and Operating Costs | 389 |
| 26.11 | Adjacent Properties | 389 |
| | | |
| 27 | References | 390 |
| 27.1 | Geology | 390 |
| 27.2 | Mineral Processing and Metallurgical Testing | 392 |
| 27.3 | Mineral Resources Estimate | 392 |
| 27.4 | Recovery Methods | 393 |
| 27.5 | Project Infrastructure | 393 |
| 27.6 | Environmental Studies, Permitting and Social or Community Impact | 394 |
| | | |
| 28 | Abbreviations | 395 |
| | | |
| 29 | Certificate of QP | 405 |
List Of tables
| Table 1.1 – Musselwhite Mine Chronology | 4 |
| Table 1.2 – Musselwhite Mine Drilling Summary by Year | 10 |
| Table 1.3 – Summary of New Drilling Included in the 2023 Geology and Resource Model Update | 11 |
| Table 1.4 – Mineral Resource Estimate East and West Limb Deposits, Dec. 31, 2023 | 13 |
| Table 1.5 – Musselwhite Mineral Reserves as of December 31, 2023 | 14 |
| Table 1.6 – Life of Mine Plan | 18 |
| Table 1.7 – Schedule of Lateral Development | 18 |
| | December 2024 |
| | TECHNICAL REPORT –
MUSSELWHITE MINE, ONTARIO, CANADA
Document # C8630-0000-PM-RPT-001 – Rev. 0
/ Page vii |
| Table 1.8 – Schedule of Vertical Development | 18 |
| Table 1.9 – 2024 Mine Plan Capital Cost Estimate by Category by Year (US$ M) | 23 |
| Table 1.10 – 2024 Mill Plan Capital Cost Estimate by Category by Year (US$ M) | 23 |
| Table 1.11 – Mine Operating Unit Cost Factors for Determining the 2024 Budget | 24 |
| Table 1.12 – LoM Operating Costs by Year for the Mine | 25 |
| Table 1.13 – Life of Mine, Mill Operating Cost Estimate | 26 |
| Table 1.14 – Economic Analysis Parameters | 27 |
| Table 1.15 – Sensitivity of Project After-Tax NPV to Gold Price, Capex, Opex and Head Grade | 29 |
| Table 2.1 – Qualified Persons and their Respective Sections of Responsibilities | 43 |
| Table 2.2 – Site Visit by Qualified Persons | 44 |
| Table 4.1 – Overview of Permits | 52 |
| Table 6.1 – Musselwhite Mine Chronology | 60 |
| Table 6.2 – Musselwhite Mine Production History | 62 |
| Table 7.1 – Summary of the Main Mine Areas and Ore/Mineralized Zones with Corresponding Mineralization Styles | 74 |
| Table 9.1 – Musselwhite Exploration Details from 2007 to 2023 | 82 |
| Table 10.1 – Drilling Summary | 87 |
| Table 10.2 – Musselwhite Mine Drilling Summary by Year: 1974-2005 | 89 |
| Table 10.3 – Drill Holes by Area (Underground and Surface): 1974-1993 | 90 |
| Table 10.4 – Placer Dome Drill Holes by Area (Underground and Surface): 1994-2005 | 90 |
| Table 10.5 – Goldcorp Drill Summary by Year: 2006-2018 | 92 |
| Table 10.6 – Goldcorp Drill Summary by Target Area (Surface and Underground): 2006-2018 | 92 |
| Table 10.7 – Newmont Drill summary by Year: 2019 – 2024 | 93 |
| Table 10.8 – Newmont Drill Summary by Area (Surface and Underground): 2019-2024 | 94 |
| Table 10.9 – Summary of New Drilling Included in the 2023 Geology and Resource Model Update | 95 |
| Table 11.1 – Certified Reference Materials Used at Musselwhite, 2008 | 124 |
| Table 11.2 – CRM Standards Failure Rates: 2021 | 138 |
| Table 11.3 – CRM Standards Failure Rates: 2022 | 138 |
| Table 11.4 – Certified Reference and Blank Materials: 2023 | 139 |
| Table 11.5 – Duplicate Results: 2021 | 147 |
| Table 11.6 – Duplicate Results: 2022 | 147 |
| Table 11.7 – Duplicate Results: 2023 | 147 |
| Table 13.1 – Life of Mine Plan by Zone | 160 |
| Table 13.2 – Summary of Variability Sample Chemical Analysis, RDW | 163 |
| Table 13.3 – Summary of Variability Sample Mineralogy, RDW | 164 |
| Table 13.4 – Master Composite Sample Chemical Analysis, RDW | 165 |
| Table 13.5 – Master Composite Sample Mineralogy, RDW | 165 |
| Table 13.6 – Variability Leach Test Conditions, RDW | 166 |
| Table 13.7 – Master Composite Leach Test Conditions, RDW | 168 |
| Table 13.8 – Master Composite Baseline Leach Test Recoveries, RDW | 168 |
| Table 13.9 – Summary Variability Sample Chemical Analysis, Lynx | 169 |
| Table 13.10 – Summary of Variability Sample Mineralogy, Lynx | 170 |
| Table 13.11 – Master Composite Sample Chemical Analysis, Lynx | 170 |
| Table 13.12 – Master Composite Sample Mineralogy, Lynx | 170 |
| Table 13.13 – Master Comminution Test Results Summary, Lynx | 171 |
| Table 13.14 – Variability Leach Test Conditions, Lynx | 172 |
| Table 13.15 – Master Composite Leach Test Conditions, Lynx | 174 |
| Table 13.16 – Master Composite Baseline Leach Test Recoveries, Lynx | 174 |
| Table 13.17 – Summary of Variability Sample Chemical Analysis, FO2325 | 176 |
| | December 2024 |
| | TECHNICAL REPORT –
MUSSELWHITE MINE, ONTARIO, CANADA
Document # C8630-0000-PM-RPT-001 – Rev. 0
/ Page viii |
| Table 13.18 – Summary of Variability Sample Mineralogy, FO2325 | 177 |
| Table 13.19 – Master Composite Sample Chemical Analysis, FO2325 | 178 |
| Table 13.20 – Master Composite Sample Mineralogy, FO2325 | 178 |
| Table 13.21 – Master Comminution Test Results Summary, FO2325 | 179 |
| Table 13.22 – Variability Leach Test Conditions, FO2325 | 180 |
| Table 13.23 – Master Composite Leach Test Conditions, FO2325 | 182 |
| Table 13.24 – Master Composite Baseline Leach Test Recoveries, FO2325 | 182 |
| Table 13.25 – Summary of Variability Sample Chemical Analysis, PQD Ext1 | 184 |
| Table 13.26 – Summary of Variability Sample Mineralogy, PQD Ext 1 | 186 |
| Table 13.27 – Master Composite Sample Chemical Analysis, PQD Ext 1 | 186 |
| Table 13.28 – Master Composite Sample Mineralogy, PQD Ext 1 | 186 |
| Table 13.29 – Master Comminution Test Results Summary, PQD Ext 1 | 187 |
| Table 13.30 – Master Comminution GRG Concentrates Summary, PQD Ext 1 | 188 |
| Table 13.31 – Variability Leach Test Conditions, PQD Ext 1 | 189 |
| Table 13.32 – Master Composite Leach Test Conditions, PQD Ext 1 | 191 |
| Table 13.33 – Master Composite Baseline Leach Test Recoveries, PQD Ext 1 | 191 |
| Table 13.34 – Summary Variability Sample Chemical Analysis, FO2628 | 192 |
| Table 13.35 – Summary of Variability Sample Mineralogy, FO2628 | 193 |
| Table 13.36 – Master Composite Sample Chemical Analysis, FO2628 | 193 |
| Table 13.37 – Master Composite Sample Mineralogy, FO2628 | 194 |
| Table 13.38 – Master Comminution Test Results Summary, FO2628 | 194 |
| Table 13.39 – Variability Leach Test Conditions, FO2628 | 195 |
| Table 13.40 – Master Composite Leach Test Conditions, FO2628 | 197 |
| Table 13.41 – Master Composite Baseline Leach Test Recoveries, FO2628 | 198 |
| Table 14.1 – East Limb Deposits – Specific Gravity Values Summarized by Estimation Domain | 209 |
| Table 14.2 – Summary of Lithological, Structural and Estimation Domains | 210 |
| Table 14.3 – Cell Declustering Parameters used in RMSP for Weight Calculations | 213 |
| Table 14.4 – Basic Descriptive Statistics for Raw Data Samples (Declustered) Summarized by Domain | 214 |
| Table 14.5 – Basic Descriptive Statistics for 1.0-m Composite Data (Declustered) Summarized by Domain | 218 |
| Table 14.6 – Summary of Selected Capping Grades by Statistical Domain | 219 |
| Table 14.7 – Variogram Model Parameters for East Limb Deposits | 221 |
| Table 14.8 – Block Model Definition Parameters for East Limb Deposits | 223 |
| Table 14.9 – Ordinary Kriging (OK) Interpolation Parameters Summary for East Limb Deposits | 224 |
| Table 14.10 – Resource Classification Guidance, East Limb Deposits (Excluding Redwing) | 227 |
| Table 14.11 – Resource Classification Guidance, Red Wing Deposit | 228 |
| Table 14.12 – Comparison of OK and NN Interpolation, East Limb Block Model | 231 |
| Table 14.13 – West Limb Deposits – Specific Gravity Values by Estimation Domain | 233 |
| Table 14.14 – Summary of Estimation Domains Based on Lithology and Structure at West Limb Deposits | 234 |
| Table 14.15 – Cell Declustering Parameters used in RMSP for Weight Calculations | 236 |
| Table 14.16 – Basic Descriptive Statistics for Raw Data Samples (Declustered) Summarized by Domain | 237 |
| Table 14.17– Basic Descriptive Statistics for 1.0-m Capped Composite Data (Declustered) Summarized by Domain | 241 |
| Table 14.18 – Variogram Model Parameters for West Limb Deposits | 243 |
| Table 14.19 – Block Model Definition Parameters for West Limb Deposits | 245 |
| Table 14.20 – Ordinary Kriging (OK) Interpolation Parameters Summary for West Limb Deposits | 246 |
| Table 14.21 – Resource Classification Guidance, West Limb Deposits | 247 |
| Table 14.22 – Comparison of OK and NN Interpolation, West Limb Block Model | 251 |
| Table 14.23 – Musselwhite Resource Cut-Off Grades by Mining Area/Zone | 252 |
| Table 14.24 – Standard Mining Shape Design Parameters by Method, Musselwhite Mine | 253 |
| | December 2024 |
| | TECHNICAL REPORT –
MUSSELWHITE MINE, ONTARIO, CANADA
Document # C8630-0000-PM-RPT-001 – Rev. 0
/ Page ix |
| Table 14.25 – Standard Mining Shape Design Parameters by Zone, Musselwhite Mine | 253 |
| Table 14.26 – Mineral Resource Estimate East and West Limb Deposits, Dec. 31, 2023 | 255 |
| Table 15.1 – Mining Cost per Zone | 260 |
| Table 15.2 – Dilution and Mining Recovery | 261 |
| Table 15.3 – Ore Reserve Calculation Parameters | 262 |
| Table 15.4 – Cut-Off Grade Calculation | 266 |
| Table 15.5 – 2023 Musselwhite Mineral Reserves as of December 31,2023 | 267 |
| Table 16.1 – 2024 Seismic Related FOG (Based on Musselwhite Mine Presentation and Reports) | 275 |
| Table 16.2 – Risk and Hazard Mitigation Based on FOG History | 277 |
| Table 16.3 – Mine Design Parameters – Development | 284 |
| Table 16.4 – Mine Design Parameters – Production Stope | 284 |
| Table 16.5 – Underground Mobile Equipment List | 297 |
| Table 16.6 – LoM Development Schedule | 298 |
| Table 16.7 – LoM Production Schedule by Mining Zone | 299 |
| Table 17.1 – Summary of Major Processing Equipment | 304 |
| Table 17.2 – Reagents and Consumables by Processing Area | 308 |
| Table 17.3 – Summary of Mill Air Compressors | 315 |
| Table 17.4 – Summary of Musselwhite Mill Capacity and Recent Operational Data | 316 |
| Table 17.5 – Summary of Musselwhite Mill Life-of-Mine Production Plan | 316 |
| Table 19.1 – Base Case Metal Pricing | 328 |
| Table 20.1 – Summary of Environmental Permits and Approvals | 337 |
| Table 21.1 – 2024 Mine Plan Capital Cost Estimate by Category | 343 |
| Table 21.2 – 2024 Mine Plan, Capital Listing by Year (US$ M) | 344 |
| Table 21.3 – Mill Sustaining Capital Listing by Year (US$ M) | 350 |
| Table 21.4 – G&A Capital Listing by Year (US$ M) | 352 |
| Table 21.5 – Mine Operating Unit Cost Factors for Determining the 2024 Budget | 353 |
| Table 21.6 – Mine Plan Operating Unit Costs Compared to Actuals | 354 |
| Table 21.7 – Life-of-Mine, Mine Operating Cost Estimate | 355 |
| Table 21.8 – Annual Mine Operating Cost Breakdown | 357 |
| Table 21.9 – Life of Mine, Mill Operating Cost Estimate | 358 |
| Table 21.10 – Annual Mill Operating Cost Breakdown | 359 |
| Table 21.11 – General and Administrative Unit Cost Factors for Determining the 2024 Budget | 360 |
| Table 22.1 – Economic Analysis Parameters | 363 |
| Table 22.2 – Economic Model Summary (Tail of Closure Capex Payments Not Shown) | 368 |
| Table 22.3 – Sensitivity of Project Pre-Tax NPV to Gold Price, Capex, Opex and Head Grade | 369 |
| Table 22.4 – Sensitivity of Project After-Tax NPV to Gold Price, Capex, Opex and Head Grade | 369 |
| Table 22.5 – Comparison between the 2024 Nine Months to September Actual Operating Statistics versus the Projection | 371 |
| Table 23.1 – Romios Gold Resources Inc. | 372 |
List of Figures
| Figure 1.1 – Musselwhite Mine Location | 2 |
| Figure 1.2 – Musselwhite Mine Regional Geologic Setting | 6 |
| Figure 1.3 – Composite Geology Vertical Section Showing Key Mineralized Zones with Stratigraphic and Structural Relationships, Musselwhite Mine | 8 |
| Figure 1.4 – Existing Project Infrastructure | 19 |
| | December 2024 |
| | TECHNICAL REPORT –
MUSSELWHITE MINE, ONTARIO, CANADA
Document # C8630-0000-PM-RPT-001 – Rev. 0
/ Page x |
| Figure 1.5 – Musselwhite Simplified Process Flowsheet | 20 |
| Figure 1.6 – Sensitivity of Project After-Tax NPV to Gold Price, Capex, Opex and Head Grade | 29 |
| Figure 4.1 – Musselwhite Mine Location | 46 |
| Figure 4.2 – Musselwhite Mine Mining Leases | 48 |
| Figure 4.3 – Musselwhite Mine - Property, Claims, Leases, and Agreement Area | 48 |
| Figure 4.4 – Musselwhite Mine Claims and Leases with Expiry Dates | 49 |
| Figure 4.5 – Locations of the Signatory Communities Relative to the Musselwhite Mine | 51 |
| Figure 5.1 – Opapimiskan Lake and Musselwhite Mine | 57 |
| Figure 7.1 – Musselwhite Mine Regional Geologic Setting | 65 |
| Figure 7.2 – Regional Scale Litho-Structural Interpretation | 65 |
| Figure 7.3 – Geological Setting of the Musselwhite Mine | 66 |
| Figure 7.4 – Musselwhite Mine Stratigraphy – East Limb | 67 |
| Figure 7.5 – Musselwhite Mine Stratigraphy – West Limb | 68 |
| Figure 7.6 – Musselwhite Mine Section 12,500N (Looking North) | 69 |
| Figure 7.7 – Structural Interpretation of the Musselwhite Mine Area | 71 |
| Figure 7.8 – Geological Plan Map of the 595 m Level | 72 |
| Figure 7.9 – Relationship Between Zones of High Strain and Mineralization at Musselwhite | 73 |
| Figure 7.10 – Composite Geology Vertical Section (Looking North) of the Musselwhite Mine | 75 |
| Figure 9.1 – Musselwhite Exploration from 2007 to 2024 | 81 |
| Figure 9.2 – 2007 Soils Sampling Campaign at Camp/Bay Target Area | 82 |
| Figure 9.3 – 2008-2010 Ground Geophysical Survey Locations | 83 |
| Figure 9.4 – 2012 Soils Sampling Locations | 84 |
| Figure 9.5 – 2014 Soil Survey Locations | 84 |
| Figure 9.6 – 2017 Soil Survey Locations | 85 |
| Figure 9.7 – 2018 Exploration – Vegetation Sampling | 85 |
| Figure 9.8 – 2019 Exploration – Vegetation Sampling | 86 |
| Figure 9.9 – Airborne Gravity Gradiometry (AGG) Survey | 86 |
| Figure 10.1 – Surface Map Showing Musselwhite Drill Holes with Grade-Thickness Composites (3 g/t Au COG) Along Entire Orebody Trend | 88 |
| Figure 10.2 – Plan Map Showing Musselwhite Drill holes Relative to Geology (West Up) | 88 |
| Figure 10.3 – Exploration Core Shack | 99 |
| Figure 10.4 – Core Farm / Storage Area | 100 |
| Figure 10.5 – Example of Core Rack Arrangement | 100 |
| Figure 10.6 – Core Unpacking Area in Core Shack | 101 |
| Figure 10.7 – Core Logging Area in Core Shack at Musselwhite | 102 |
| Figure 10.8 – Example of Logged and Tagged Core Ready for Cutting | 102 |
| Figure 10.9 – Specific Gravity (SG) Measurement Station at Musselwhite | 105 |
| Figure 10.10 – Automated Diamond Core Saw Setup at Musselwhite | 106 |
| Figure 10.11 – Shipping Totes Used for Drill Core Sample Transport at Musselwhite | 108 |
| Figure 10.12 – Coarse Reject Sample Storage in Drums at Musselwhite Site | 109 |
| Figure 10.13 – Pulp Reject Sample Storage on Shelving in Sea Can at Musselwhite Site | 109 |
| Figure 10.14 – Typical Geological Mapping at Musselwhite (Heading 1470 mL) | 112 |
| Figure 11.1 – Blanks Results from Actlabs: April 2018 | 116 |
| Figure 11.2 – Blanks QA/QC Results from Internal Lab: April 2018 | 116 |
| Figure 11.3 – 2005 Analytical Results for STD 900 (Accepted Value of 3.21 g/t Au) | 118 |
| Figure 11.4 – 2005 Analytical Results for STD 999 (Accepted Value of 7.18 g/t Au) | 118 |
| Figure 11.5 – 2005 Blank Sample Analyses | 119 |
| Figure 11.6 – 2005 Pulp Duplicate Analyses | 120 |
| Figure 11.7 – 2005 Percent Relative Difference | 120 |
| | December 2024 |
| | TECHNICAL REPORT –
MUSSELWHITE MINE, ONTARIO, CANADA
Document # C8630-0000-PM-RPT-001 – Rev. 0
/ Page xi |
| Figure 11.8 – Geology CRM Mus-2 Assay Results | 125 |
| Figure 11.9 – Geology CRM 977-7 Assay Results | 125 |
| Figure 11.10 – Geology CRM 999-4 Assay Results | 126 |
| Figure 11.11 – Geology Standard GS-13B: Au PPM: Daily Results for April 2018 | 126 |
| Figure 11.12 – Geology Standard GS-3S: Au PPM: Daily Results for April 2018 | 127 |
| Figure 11.13 – Geology Standard GS-7G: Au PPM: Daily Results for April 2018 | 127 |
| Figure 11.14 – Au in Coarse Duplicates (All Samples) | 128 |
| Figure 11.15 – Au in Coarse Duplicates (Low-grade Samples) | 129 |
| Figure 11.16 – Au in Pulp Duplicates (All Samples) | 129 |
| Figure 11.17 – Au in Pulp Duplicates (Low-Grade Samples) | 130 |
| Figure 11.18 – Actlabs Coarse Split Duplicate Results: April 2018 | 131 |
| Figure 11.19 – Actlabs Pulp Split Duplicate Results: April 2018 | 131 |
| Figure 11.20 – Pulp Check April 2018 | 133 |
| Figure 11.21 – Pulp Check May 2019 | 133 |
| Figure 11.22 – Standards Box and Whisker Results: 2023 | 140 |
| Figure 11.23 – CRM Results for OREAS 211 | 141 |
| Figure 11.24 – CRM Results for OREAS 216B | 141 |
| Figure 11.25 – CRM Results for OREAS 229B | 142 |
| Figure 11.26 – CRM Results for OREAS 237 | 142 |
| Figure 11.27 – CRM Results for OREAS 237B | 143 |
| Figure 11.28 – CRM Results for OREAS 238 | 143 |
| Figure 11.29 – Blanks Results: 2023 | 145 |
| Figure 11.30 – Field Duplicate Precision and Bias | 148 |
| Figure 11.31 – Prep Duplicate Precision and Bias | 148 |
| Figure 11.32 – Pulp Duplicate Precision and Bias | 149 |
| Figure 11.33 – 2023 Density Quality Control Check | 150 |
| Figure 12.1 – Common East Limb Rock Types in the East Limb, 1195 mL Ramp Area, Musselwhite Mine | 154 |
| Figure 12.2 – PQ Deeps Alteration and Mineralization Styles, 1445 mL – 14314N Crosscut, Musselwhite Mine | 155 |
| Figure 12.3 – Lynx Zone Alteration and Mineralization Styles, 1320 mL Longitudinal Ore Drift North, Musselwhite Mine | 156 |
| Figure 12.4 – Underground Drill Hole Location Verification, 1445 mL, Musselwhite Mine | 156 |
| Figure 12.5 – Banding and Deformation Fabrics in Southern Iron Formation (SIF) Outcrops, South Shore Exposures, Musselwhite Mine | 157 |
| Figure 12.6 – Selected Drill Core Photographs Showing Alteration and Mineralization Styles, Lynx and North Shore Drilling (PQ Deeps), Musselwhite Mine | 158 |
| Figure 12.7 – Selected Drill Core Photographs Showing Alteration and Mineralization Styles, Redwings, Musselwhite Mine | 158 |
| Figure 12.8 – Selected Drill Core Photographs Showing Alteration and Mineralization Styles, West Limb, Musselwhite Mine | 159 |
| Figure 13.1 – PQ Deeps Extension 1 Variability Samples, Longitudinal View | 161 |
| Figure 13.2 – Upper Lynx and Lynx Variability Samples, Longitudinal View | 162 |
| Figure 13.3 – Red Wings Variability Samples, Longitudinal View | 162 |
| Figure 13.4 – Cyanidation Leach Kinetics, RDW | 166 |
| Figure 13.5 – Cyanidation Leach Recovery vs. Sulfide Sulfur Head Grade, RDW | 167 |
| Figure 13.6 – Lime and Cyanide Consumption vs. Sulfide Sulfur Head Grade, RDW | 167 |
| Figure 13.7 – Cyanidation Leach Kinetics, Lynx | 172 |
| Figure 13.8 – Cyanidation Leach Recovery vs. Sulfide Sulfur Head Grade, Lynx | 173 |
| Figure 13.9 – Lime and Cyanide Consumption vs. Sulfide Sulfur Head Grade, Lynx | 173 |
| Figure 13.10 – Particle Size Effects on Recovery, Lynx | 175 |
| Figure 13.11 – Cyanide Concentration Effects on Recovery, Lynx | 175 |
| | December 2024 |
| | TECHNICAL REPORT –
MUSSELWHITE MINE, ONTARIO, CANADA
Document # C8630-0000-PM-RPT-001 – Rev. 0
/ Page xii |
| Figure 13.12 – Cyanidation Leach Kinetics, FO2325 | 180 |
| Figure 13.13 – Cyanidation Leach Recovery vs. Sulfide Sulfur Head Grade, FO2325 | 181 |
| Figure 13.14 – Lime and Cyanide Consumption vs. Sulfide Sulfur Head Grade, FO2325 | 181 |
| Figure 13.15 – Particle Size Effects on Recovery, FO2325 | 183 |
| Figure 13.16 – Cyanide Concentration Effects on Recovery, FO2325 | 183 |
| Figure 13.17 – Cyanidation Leach Kinetics, PQD Ext 1 | 189 |
| Figure 13.18 – Cyanidation Leach Recovery vs. Sulfide Sulfur Head Grade, PQD Ext 1 | 190 |
| Figure 13.19 – Lime and Cyanide Consumption vs. Sulfide Sulfur Head Grade, PQD Ext 1 | 190 |
| Figure 13.20 – Cyanidation Leach Kinetics, FO2628 | 196 |
| Figure 13.21 – Cyanidation Leach Recovery vs. Sulfide Sulfur Head Grade, FO2628 | 196 |
| Figure 13.22 – Lime and Cyanide Consumption vs. Sulfide Sulfur Head Grade, FO2628 | 197 |
| Figure 13.23 – Particle Size Effects on Recovery, FO2628 | 198 |
| Figure 13.24 – Cyanide Concentration Effects on Recovery, FO2628 | 199 |
| Figure 13.25 – Gold Grade Variability by Future Ore Zone | 199 |
| Figure 13.26 – Sulfide Grade Variability by Future Ore Zone | 200 |
| Figure 13.27 – Gold Recovery Variability by Future Ore Zone | 200 |
| Figure 13.28 – Gold Recovery Variability by Sulfide Grade | 201 |
| Figure 13.29 – Lime Consumption Variability by Future Ore Zone | 202 |
| Figure 13.30 – Cyanide Consumption Variability by Future Ore Zone | 202 |
| Figure 13.31 – 2023 Gold Recovery Model vs. Monthly Mill Recovery, January 2021 through December 2023 | 203 |
| Figure 13.32 – 2023 Recovery Model vs Variability Samples Recovery, below 20 g/t Au | 204 |
| Figure 14.1 – 3D Orthographic View of East Limb Deposit Lithological Domains | 212 |
| Figure 14.2 – Representative Log Histogram Plots Summarized by Grouped Domains | 215 |
| Figure 14.3 – Box and Whisker Plots Summarized by Grouped Estimation Domains | 216 |
| Figure 14.4 – Representative Cumulative Distribution Function (CDF) Plots Summarized by Grouped Domains | 217 |
| Figure 14.5 – Representative Log Probability Plots of Selected Statistical Domains | 220 |
| Figure 14.6 – Representative Normal Scores Variograms (Back-transformed) for the Lower Volcanics, East Limb Deposits | 222 |
| Figure 14.7 – Comparison of Assay and Block Grades on Representative Vertical Section (13,500N), East Limb Block Model | 229 |
| Figure 14.8 – East Limb Deposits Swath Plot of Estimation Domain 700 – X-direction (East-West) – 1 m Capped Composites vs. Estimated Block Grades | 230 |
| Figure 14.9 – East Limb Deposits Swath Plot of Estimation Domain 700 – Y-direction (North-South) – 1 m Capped Composites vs. Estimated Block Grades | 230 |
| Figure 14.10 – East Limb Deposits Swath Plot of Estimation Domain 700 – Z-direction (Elevation) – 1 m Capped Composites vs. Estimated Block Grades | 231 |
| Figure 14.11 – Orthographic 3D View (13,450N; Looking Northwest), West Limb Lithological Domains | 236 |
| Figure 14.12 – Representative Histogram Plots for Raw Data Samples (Declustered) Summarized by Domain | 238 |
| Figure 14.13 – Box Plots Summarized by Grouped Domains | 239 |
| Figure 14.14 – Cumulative Distribution Function (CDF) Plot Summarized by Domain | 239 |
| Figure 14.15 – Representative Ranked Composite Plots of Selected Statistical Domains at West Limb – Musselwhite Mine | 242 |
| Figure 14.16 – Representative Normal Scores Variograms (Back-transformed) for West Limb Deposits | 244 |
| Figure 14.17 – Comparison of Assay and Block Grades on Representative Vertical Section (12,050N), West Limb Block Model | 248 |
| Figure 14.18 – West Limb Deposits Swath Plot of Estimation Domain 300 – Y-direction (North-South) – 1 m Capped Composites vs. Estimated Block Grades and NN/IDW Models | 249 |
| Figure 14.19 – West Limb Deposits Swath Plot of Estimation Domain 500 – Y-direction (North-South) – 1 m Capped Composites vs. Estimated Block Grades and NN/IDW Models | 250 |
| Figure 14.20 – West Limb Deposits Swath Plot of Estimation Domain 501 – Y-direction (North-South) – 1 m Capped Composites vs. Estimated Block Grades and NN/IDW Models | 250 |
| | December 2024 |
| | TECHNICAL REPORT –
MUSSELWHITE MINE, ONTARIO, CANADA
Document # C8630-0000-PM-RPT-001 – Rev. 0
/ Page xiii |
| Figure 14.21 – West Limb Deposits Swath Plot of Estimation Domain 700 – Y-direction (North-South) – 1 m Capped Composites vs. Estimated Block Grades and NN/IDW Models | 251 |
| Figure 14.22 – Resource Constraining Underground Reporting Shapes, Longitudinal View (Looking West), Musselwhite Mine | 254 |
| Figure 15.1 – 5 Years Gold price (US$/oz) | 259 |
| Figure 15.2 – Long Section Illustrating the Mineral Reserves (Proven and Probable) | 268 |
| Figure 16.1 – Seismic Risk Management Approach Flow Chart | 279 |
| Figure 16.2 – Double Lift AVOCA Mining Method Apply in Redwing Zone | 286 |
| Figure 16.3 – Mining Sequence Schematic Modified AVOCA | 287 |
| Figure 16.4 – Illustration of Transversal Stoping in PQ Deeps Zone | 288 |
| Figure 16.5 – Musselwhite Material Handling System | 289 |
| Figure 16.6 – Musselwhite Main Dewatering System | 293 |
| Figure 16.7 – Musselwhite Material Handling System | 294 |
| Figure 17.1 – Musselwhite Simplified Process Flowsheet | 302 |
| Figure 17.2 – Existing Site Processing Facilities Layout | 303 |
| Figure 18.1 – Existing Project Infrastructure | 317 |
| Figure 18.2 – Aerial View of the Project | 318 |
| Figure 18.3 – General Arrangement of Tailings Storage Facility and Water Management | 319 |
| Figure 18.4 – Thickened Tailings Deposition Dyke Raises – 2010 to 2023 | 320 |
| Figure 18.5 – Existing Musselwhite Village – Aerial View | 325 |
| Figure 22.1 – Gold Sales on an Annual and Cumulative Basis | 364 |
| Figure 22.2 – Sustaining and Closure Capital Costs over the Project (tail of Closure Capital Expenditures not shown) | 365 |
| Figure 22.3 – Pre-Tax Free Cash Flow (Annual and Cumulative) (tail of Closure Capex payments not shown) | 367 |
| Figure 22.4 – After-Tax Free Cash Flow (Annual and Cumulative) (tail of Closure Capex payments not shown) | 367 |
| Figure 22.5 – Sensitivity of Project Pre-Tax NPV to Gold Price, Capex, Opex and Head Grade | 370 |
| Figure 22.6 – Sensitivity of Project After-Tax NPV to Gold Price, Capex, Opex and Head Grade | 370 |
| Figure 23.1 – Location Map of Adjacent and Proximal Properties | 375 |
| | December 2024 |
| | TECHNICAL REPORT –
MUSSELWHITE MINE, ONTARIO, CANADA
Document # C8630-0000-PM-RPT-001 – Rev. 0
/ Page 1 |
DRA Americas Inc. (DRA) was retained by Orla Mining Ltd. (Orla) to prepare an independent Technical Report (the Report) in collaboration with various consulting companies, including WSP Canada Inc. (WSP) and SLR Consulting (Canada) Ltd (SLR). The purpose of the Technical Report is to support the disclosure of data for the active Musselwhite Mine operation (Musselwhite Mine), which is currently held by Goldcorp Canada Ltd., a subsidiary of Newmont Corporation, with an effective date of November 18, 2024. This Report was prepared in compliance with the disclosure requirements of the Canadian National Instrument 43-101 (NI 43-101) and in accordance with the requirements of Form 43-101 F1.
According to the plan of arrangement outlined in Orla’s press release dated November 18, 2024, entitled “Orla Mining Announces Strategic Expansion into Canada with Acquisition of the Musselwhite Gold Mine.”, the transaction is expected to close in Q1 of 2025. Orla's Board of Directors has unanimously approved the transaction, subject to certain regulatory and shareholder approvals.
| 1.1 | Property Description and Location |
The Musselwhite Mine property is located in the Patricia Mining District in north-western Ontario; National Topographic System (NTS) 53 B/9, latitude 52°36'50" N and longitude 90°21'43" W. UTM Coordinates correspond to NAD83 UTM Zone 15N. The Musselwhite Mine is located on traditional territory of North Caribou Lake First Nation, in the Kenora District of Ontario, Canada (Figure 1.1). The operation is approximately 500 kilometers north of Thunder Bay and is accessible by road via Ontario highways ON-17 and ON-599N and by air.
| | December 2024 |
| | TECHNICAL REPORT –
MUSSELWHITE MINE, ONTARIO, CANADA
Document # C8630-0000-PM-RPT-001 – Rev. 0
/ Page 2 |
Figure 1.1 – Musselwhite Mine Location
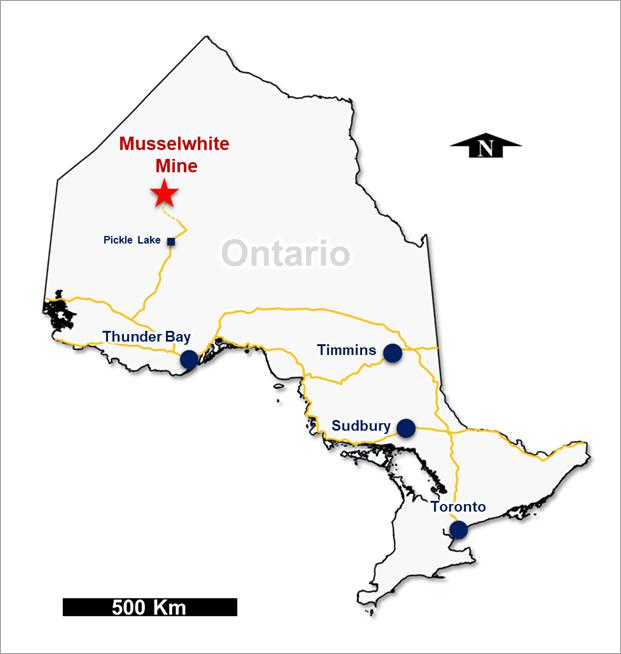
Source: Orla, 2024
| 1.2 | Accessibility, Climate, Local Resources, Infrastructure, and Physiography |
The property is accessed by chartered air service from Thunder Bay and a weekly community flight is from Sioux Lookout/Pickle Lake and touches down in the Cat Lake, North Caribou Lake, Kingfisher Lake and Wunnumin Lake. A gravel air strip suitable for STOL-type (short take-off and landing) aircraft is maintained year-round. The communities of Mishkeegogamang and Pickle Lake have year-round road access while communities north of Pickle Lake only have winter road access. For the remainder of the year, access to these northern communities is by aircraft.
The nearest permanent weather monitoring station is located in Pickle Lake. Weather statistics from Environment Canada (https://www.canada.ca/en/services/environment/weather/data-research. html) for the period 1990 – 2012 indicate a mean daily temperature of 0.7°C. Temperatures for the period range between a maximum of 39°C and a minimum of -43°C. The mean annual rainfall is
| | December 2024 |
| | TECHNICAL REPORT –
MUSSELWHITE MINE, ONTARIO, CANADA
Document # C8630-0000-PM-RPT-001 – Rev. 0
/ Page 3 |
recorded at 510 mm and the mean annual snowfall is 249 cm. The average wind speed is 8.5 km/h and predominantly originates from the west.
Local resources include services from several local First Nation corporations and joint ventures. The local population provides the workforce which accounts for approximately 19% of the mine personnel; additionally skilled labour is available throughout the greater mining areas of northwest Ontario.
Infrastructure to take water supply from Opapimiskan Lake to the mine is present and required quantities of water are not a limiting factor under the Permit to take water.
Road access to the Musselwhite site by the all-weather gravel road from the Town of Pickle Lake includes 42 km of access road that begins at the North Road some 160 km from Pickle Lake. There are six (6) Bailey type bridges between Pickle Lake and the turnoff to Musselwhite and one bridge built to MNR standards on the Musselwhite access road. Site personnel fly in and fly out of the site on a mine owned aircraft that is operated by Wasaya Airlines from Thunder Bay. A weekly community flight is from Sioux Lookout/Pickle Lake and touches down in the Cat Lake, North Caribou Lake, Kingfisher Lake and Wunnumin Lake.
Provincial power and communication lines currently service the mine from the substation located at Pickle Lake via the Musselwhite-owned and operated overhead power transmission line. More recently power to the site was upgraded via a connection to power supplied by Wataynikaneyap Power LP.
Musselwhite’s airstrip, camp, mine complex, tailings storage facility, and mill area are located on the south shore of Lake Opapimiskan.
The topography of the mine site is relatively flat, with granite intrusions associated with regional highlands. Local relief, which ranges from 5 m to a maximum of 45 m. Extensive, low-lying swampy areas surround streams, ponds, and lakes on the property. Regional drainage is north-east towards Hudson Bay, with an average gradient of 3 m/km.
The Opapimiskan Lake area lies within the northern coniferous section of the boreal forest. Predominant species include black spruce, tamarack, and cedar, with local stands of white birch, jack pine, and poplar on better-drained areas.
The Musselwhite Mine has a long and storied history that spans over four (4) decades and is summarized in Table 1.1.
As of February 28, 2024, the operation has milled approximately 30.5 Mt of ore at a head grade of about 5.68 g/t Au, for a total of over 5.5 million recovered ounces.
| | December 2024 |
| | TECHNICAL REPORT –
MUSSELWHITE MINE, ONTARIO, CANADA
Document # C8630-0000-PM-RPT-001 – Rev. 0
/ Page 4 |
Table 1.1 – Musselwhite Mine Chronology
| Year | Description |
| 1960 | Harold and Alan Musselwhite prospect the region. |
| 1962 | Gold first discovered in the area by brothers Harold and Allan Musselwhite of Kenpat Mines Ltd. who found erratic gold mineralization in a quartz vein on the north side of Opapimiskan Lake and several showings in iron formation on the south side of the lake. |
| 1962 to 1973 | Early exploration and claims to gold at the site |
| 1973 | The Musselwhite Prospecting Grubstake is initiated |
| 1973 to 1984 | Several exploration campaigns are carried out. |
| 1983 | The Musselwhite Joint Venture is formed. |
| 1985 to 1986 | Surface drilling confirms a discovery with economic potential has been made. |
| 1986 to 1987 | A Pre-Feasibility Study is completed. |
| 1988 to 1989 | An underground exploration program is completed. The three (3) remaining partners, Placer Dome (43%), Inco Gold (32%) and Corona (25%), initiate a feasibility study. The economics do not justify developing the mine. |
| 1992 to 1993 | A drilling program focuses on the OP and PQ mineralized zones. |
| 1993 | Placer Dome purchases the 25% share of Musselwhite, acquired by Homestake Mining Co. through the latter's merger with Corona. |
| 1994 | An underground program begins on the T-Antiform structure. The PQ zone is explored by surface diamond drilling. |
| 1994 to 1995 | Sinking of exploration shaft commences. |
| 1995 | All-weather road connection to north road is completed. Portal excavation commences. |
| 1996 | The Musselwhite Joint Venture partners decide to put the property into production, and construction begins immediately following completion of a feasibility study. Underground development of the T-Antiform deposit, and open pit mining of the OP zone, begin. |
| 1997 | The first gold bar is poured on March 10, 1997, and the mine enters commercial production on April 1, 1997. Production from the open pit is suspended in August 1997. |
| 2001 | One million ounces are produced as of November 7, 2001. |
| 2002 | Underground crusher and conveyor are commissioned. |
| 2002 to 2003 | The merger of Kinross, TVX, and Echo Bay is completed. The new Kinross Gold Corporation acquires approximately 32% of the Musselwhite Mine. |
| 2003 | PQ Deeps deposit discovered. This deposit is notably higher grade than the existing mine’s reserve at the time. |
| 2005 | Mine produces record 250,383 ounces of gold. |
| 2006 | Barrick successfully completes take-over of Placer Dome and sells Musselwhite Mine to Goldcorp Canada Ltd. |
| 2006 | Total gold production reaches 2 million ounces. |
| 2007 | Mining commenced in the Esker Deposit. Goldcorp acquired the 32% Kinross Gold Corporation participation becoming the 100% owner. |
| 2010 | Third millionth ounce pour. In February Musselwhite becomes the first Canadian Mine to adopt the International Cyanide Code. |
| | December 2024 |
| | TECHNICAL REPORT –
MUSSELWHITE MINE, ONTARIO, CANADA
Document # C8630-0000-PM-RPT-001 – Rev. 0
/ Page 5 |
| Year | Description |
| 2011 | Esker Vent shaft sinking project commenced. |
| 2012 | June the site was evacuated, except for a skeleton crew, due to a severe forest fire. It was stopped by the MNR fire fighters, mostly aircraft, very close to the Esker site. |
| 2014 | September Harmonic filter bank installed and commissioned at Esker site; Poured cumulative 4,000,000 oz Au on July 31, 2014; Abandonment of the Esker Mine Shaft Project; the 6.2 m (20.3 ft) diameter shaft is now used as an exhaust raise from 315 m (1,033.5 ft) L. The Esker Mine Shaft Project was cancelled in favour of the new Winze Project. |
| 2015 | Total gold production reaches 4 million ounces. |
| 2016 | Materials Handling Project works commence; The unlined raise (“Esker Mine Shaft”) was completed in 2016. Two new 2,012 kW (1,500 hp) variable pitch downcast fans were installed for this project and also to upgrade existing mine ventilation. |
| 2017 | Implementation of multi-unit tele-remote scoop operation on site and remote mucking operation from Thunder Bay office. Underground tagging and tracker system (Electronic Tag Board) implemented. |
| 2018 | Musselwhite Integrated Remote Operations Centre (IROC) opened in Thunder Bay in June to provide tele remote operational support to the underground mining operations. |
| 2019 | Newmont acquired Musselwhite in connection with its $10-billion acquisition of Goldcorp in 2019. Materials Handling Project completed, with the first ore processed in Q1. |
| 2019 to 2021 | Conveyor system caught fire on March 29, leading to a power shutdown and subsequent flooding that would halt production for a period of nearly 1 year. Restoration efforts were nearing completion when Covid-19 pandemic related shutdowns led to further commissioning delays in 2020 and 2021. |
| 2020 | Geotechnical studies and Map3D numerical model completed to assess the proposed mine plan and provide guidance on PQD Extension 1. |
| 2021 | Strategic planning session with a cross-functional team to understand the potential of the PQD orebody / align on the path to add PQD reserves to the LoM. Supported by completion of much technical work / test work / studies. |
| 2022 | In 2022, Musselwhite transitions all line-of-sight load, haul and dump activities underground to fully remote operations with the introduction of automation technology. |
| 2023 | Electrical Upgrade completed - The Wataynikaneyap Project, expands the power capacity line serving Musselwhite Mine from a maximum site capacity of 19,500 kW to 23,000 kW. |
| 2024 | As announced on November 18, 2024, Orla Mining Ltd. agreed to acquire Musselwhite from Newmont. |
| 1.4 | Geological Setting and Mineralization |
The North Caribou Greenstone Belt (NCGB) is located in the middle of the North Caribou terrane of the Western Superior Province, on the south side of a large-scale crustal boundary between the North Caribou Core and Island Lake Domain (Stott et al., 2010) as depicted in Figure 1.2. It comprises nine (9) volcanic-dominated assemblages formed during two major magmatic phases
| | December 2024 |
| | TECHNICAL REPORT –
MUSSELWHITE MINE, ONTARIO, CANADA
Document # C8630-0000-PM-RPT-001 – Rev. 0
/ Page 6 |
dated at ca. 2980 and ca. 2870 Ma. Sedimentary-dominated assemblages lie in the core of the NCGB, and are interpreted to have been deposited after 2980 Ma in the northern NCGB, and after 2850 Ma in the southeastern NCGB. Stratigraphic correlations between assemblages of the NCGB are based on the nature of their contacts, geochronological constraints, and geological and geochemical characteristics of their respective sequence. All assemblages are metamorphosed ranging from greenschist to amphibolite, with rare pockets of granulite. The NCGB is bounded by five (5) main intrusive phases emplaced during the two magmatic phases at ca. 2870-2850 Ma and ca. 2750-2690 Ma (Oswald, 2018).
Figure 1.2 – Musselwhite Mine Regional Geologic Setting
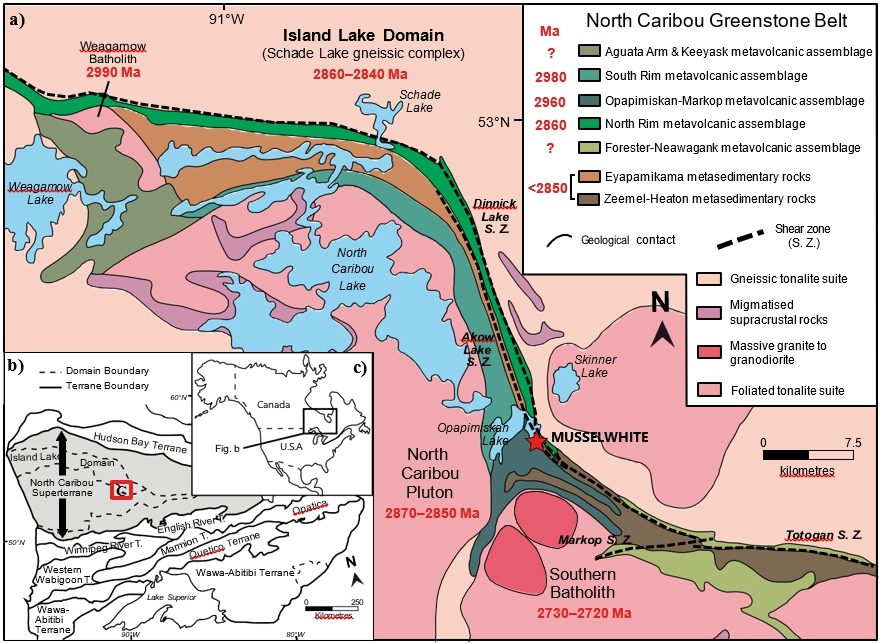
Source: Oswald, 2018
The envelope of the main structural fabric and fold structures is roughly parallel to the contact of the narrow, elongate, two-arc shape of the North Caribou belt. Three (3) major phases of ductile to brittle-ductile deformation have been documented (D1, D2, D3) with the dominant regional structural pattern being related to D2. Gold occurrences have been identified in seven of the nine assemblages of the NCGB. Other commodity occurrences include Ag-Zn-Pb-Cu, Zn-Cu-Pb and Pt-Pd. Gold is frequently spatially associated with D2 related structures. Most gold occurrences are quartz-vein type hosted in mafic volcanic rocks and silicate facies iron formation, with subordinate mineralization hosted in biotite and amphibolite schists. (Oswald, 2018).
| | December 2024 |
| | TECHNICAL REPORT –
MUSSELWHITE MINE, ONTARIO, CANADA
Document # C8630-0000-PM-RPT-001 – Rev. 0
/ Page 7 |
Mineralization at Musselwhite is predominantly found in sub-vertical high strain zones in the favourable silicate facies of the Northern Iron Formation, and to a lesser extent the oxide facies in both the Northern and Southern Iron Formation. Significant mineralization is also locally hosted in mafic volcanics and garnet-biotite schists in the West Limb deposits. In addition to the main hosts of mineralization, anomalous gold concentrations also occur property-wide and within all of the major lithologies. A positive correlation exists between gold and pyrrhotite mineralization in the Northern Iron Formation silicate facies. In general terms, this translates to 1 g/t Au for each percentage increase in pyrrhotite, up to approximately 15% pyrrhotite. This correlation between gold and pyrrhotite does not apply to mineralization in the Southern Iron Formation or the West Limb. The locations of key mineralized zones are shown with stratigraphic and structural relationships on a composite geology vertical section in Figure 1.3.
Mineralization is sulfide replacement of iron formation with quartz-pyrrhotite flooding and veining. Mineralization is best developed where structural permeability has been increased, either by folding, brittle or ductile deformation or in combination. Mineralization is thought to have been emplaced during D2 deformation and peak metamorphism (Oswald, 2018).
Quartz-pyrrhotite veins/floods are composed of massive, glassy blue to grey quartz with up to 20% fine to medium-grained pyrrhotite locally and occur as anastomosing networks of multiple veinlets that pinch and swell along strike as well as up and down dip. Accessory minerals include albite, almandine garnet and calcite, minor arsenopyrite, pyrite, chalcopyrite, and native gold. Sulfide mineralization in the veins is strongly structurally controlled, occurring within small-scale boudins, along the margins of the veins and as fine stringers within the vein itself. Sulfide replacement style mineralization is characterized by 2% to locally 15% fine-grained disseminated pyrrhotite, trace to locally 2% arsenopyrite, trace to 2% pyrite. Gangue minerals consist of almandine garnet, quartz and or chert, grunerite, actinolite, biotite, magnetite, calcite with accessory epidote and zircon.
Visible native gold is commonly observed as isolated specks within quartz. The majority of the gold occurs in pyrrhotite micro-fractures within garnet-rich, silicate domains.
| | December 2024 |
| | TECHNICAL REPORT –
MUSSELWHITE MINE, ONTARIO, CANADA
Document # C8630-0000-PM-RPT-001 – Rev. 0
/ Page 8 |
Figure 1.3 – Composite Geology Vertical Section Showing Key Mineralized Zones with Stratigraphic and Structural Relationships, Musselwhite Mine

Source: Oswald, 2018
| 1.5 | Exploration Work and Drilling |
| 1.5.1 | Historical Chronology of Notable Exploration Work |
The following is a summarized chronology of exploration related work carried out at and around the location of the Musselwhite mine:
| ● | 1938 – (Satterley 1941) First geological map of the North Caribou Greenstone Belt produced at a scale of 1 inch to 1 Mile (1:63360). |
| ● | 1960 – Geological survey of Canada conducted an airborne magnetometer survey of the North Caribou Greenstone Belt. |
| ● | 1962 – Economic gold mineralization was first identified on the adjacent Musselwhite mining leases by the Musselwhite Brothers in 1962 |
| ● | 1963 – The Karl Zeemal property was optioned by Kenpat Mines Ltd. in 1963. The company conducted geological and geophysical surveys. |
| | December 2024 |
| | TECHNICAL REPORT –
MUSSELWHITE MINE, ONTARIO, CANADA
Document # C8630-0000-PM-RPT-001 – Rev. 0
/ Page 9 |
| ● | 1962 to 1963 – Inco Limited conducted an 18-hole diamond drill hole program around Zeemal Lake and an additional Eight holes in area of Karl and Markop Lakes. |
| ● | 1973 – The Musselwhite brothers optioned their property to a consortium led by Dome Exploration Ltd. Subsequent exploration activities resulted in the discovery of the “West Anticline Zone” in 1980. |
| ● | 1981 – The Dome Exploration Ltd Consortium commissioned Aerodat Ltd. to conduct an airborne magnetic and electromagnetic geophysical survey over the area surrounding the Musselwhite deposit. |
| ● | 1984 – Dome Mines Ltd. excavated an exploration decline into the West Anticline Zone to help delineate gold mineralization in this area. |
| ● | 1985 – The Ontario Geological Survey commissioned Aerodat Ltd. to perform an extensive Airborne Magnetic and Electromagnetic survey of the North Caribou Greenstone Belt. Maps 80744 and 80745 cover the Karl Zeemal area. |
| ● | 1986 – Extensive surface drilling by Dome Mines Ltd focused on the East Bay Synform |
| ● | 1987 – Geocanex Ltd. conducted surface mapping and diamond drill programs on behalf of Santa Maria Resources Ltd on the Zeemal Lake property. |
| ● | 1988 – Power Explorations Inc. conducted extensive mapping, prospecting, trenching and diamond drilling along the mineralized Karl-Zeemal iron formation. |
| ● | 2005 – Goldcorp Canada Inc. extensive exploration drilling along the mineralized trend identified by Power Explorations Inc. in their 1988 drilling. |
| ● | 2006 – Barrick Gold acquired 100% of Placer Dome shares in January, and Goldcorp Canada Ltd. later acquired sole ownership of Musselwhite Mine from Barrick Gold and Kinross Gold Corp. |
| ● | 2018 – Goldcorp Canada Inc. soil-, litho-, and bio-geochemical sampling program. Detailed exploration drilling along mineralized trends and geochemical anomalies conducted within the Karl Zeemal and North Shore target areas. |
| ● | 2019 – Newmont Corporation acquired ownership of Goldcorp Inc. and all its properties. Greenfields exploration program conducted by Bayside Geoscience within Newmont-Goldcorp northern tenement along NCGB, and the near-mine Karl Zeemel target area. |
| ● | 2023 – Outcrop sampling program, and a 30,319 ha fixed-wing airborne gravity gradiometric survey was conducted over the Musselwhite Mine property and portions of regional claim tenement by CGG Canada Services Ltd. |
From 1974 to 2023, a total of 9,333 diamond drill holes with a cumulative length of 1,872,415 m have been completed at Musselwhite Mine and surrounding near-mine target areas (Table 1.2).
| | December 2024 |
| | TECHNICAL REPORT –
MUSSELWHITE MINE, ONTARIO, CANADA
Document # C8630-0000-PM-RPT-001 – Rev. 0
/ Page 10 |
Table 1.2 – Musselwhite Mine Drilling Summary by Year
| Year | Holes | Metres |
| 1974 | 4 | 320 |
| 1975 | 12 | 691 |
| 1976 | 18 | 1,032 |
| 1978 | 36 | 3,013 |
| 1979 | 32 | 2,893 |
| 1980 | 17 | 2,701 |
| 1981 | 94 | 15,781 |
| 1982 | 61 | 9,508 |
| 1983 | 61 | 6,866 |
| 1984 | 64 | 1,756 |
| 1985 | 28 | 4,684 |
| 1986 | 122 | 23,351 |
| 1987 | 67 | 16,974 |
| 1988 | 44 | 12,300 |
| 1989 | 218 | 15,134 |
| 1992 | 12 | 2,055 |
| 1993 | 103 | 16,943 |
| 1994 | 330 | 50,780 |
| 1995 | 137 | 23,658 |
| 1996 | 146 | 26,916 |
| 1997 | 338 | 26,833 |
| 1998 | 303 | 44,456 |
| 1999 | 328 | 54,430 |
| 2000 | 328 | 57,640 |
| 2001 | 153 | 32,389 |
| 2002 | 205 | 41,929 |
| 2003 | 384 | 90,276 |
| 2004 | 327 | 76,368 |
| 2005 | 275 | 49,212 |
| 2006 | 190 | 40,452 |
| 2007 | 282 | 49,882 |
| 2008 | 262 | 52,986 |
| 2009 | 397 | 63,957 |
| | December 2024 |
| | TECHNICAL REPORT –
MUSSELWHITE MINE, ONTARIO, CANADA
Document # C8630-0000-PM-RPT-001 – Rev. 0
/ Page 11 |
| Year | Holes | Metres |
| 2010 | 332 | 60,733 |
| 2011 | 322 | 61,874 |
| 2012 | 214 | 71,487 |
| 2013 | 169 | 38,256 |
| 2014 | 153 | 48,755 |
| 2015 | 208 | 55,042 |
| 2016 | 361 | 77,489 |
| 2017 | 334 | 81,766 |
| 2018 | 391 | 94,163 |
| 2019 | 336 | 94,169 |
| 2020 | 189 | 43,055 |
| 2021 | 243 | 61,875 |
| 2022 | 366 | 86,750 |
| 2023 | 337 | 78,836 |
| 2024 | 109 | 26,355 |
| Total | 9,442 | 1,898,770 |
Drilling included in the 2023 model update included 407 new holes. A summary of the number of holes and metres drilled in each mine area and broken down by spacing classification is provided in Table 1.3.
Table 1.3 – Summary of New Drilling Included in the 2023 Geology and Resource Model Update
| Deposit | Delineation | Reserves | Resources | Wingspan |
No. of
Holes | Metres
Drilled | No. of
Holes | Metres
Drilled | No. of
Holes | Metres
Drilled | No. of
Holes | Metres
Drilled |
| Red Wing | 10 | 1,203 | 39 | 4,513 | 34 | 4,003 | 11 | 2,805 |
| PQ Deeps | 110 | 25,114 | 11 | 3,324 | 10 | 3,309 | 4 | 1,266 |
| Lynx | 29 | 6508 | 39 | 11,079 | 5 | 1,065 | 19 | 5,499 |
| T-Antiform | N/A | N/A | 9 | 1,836 | N/A | N/A | 12 | 2,487 |
| West Limb | 49 | 9,849 | 5 | 1,602 | N/A | N/A | 11 | 3,504 |
| Totals | 198 | 42,674 | 103 | 22,354 | 49 | 8,377 | 57 | 15,561 |
| | December 2024 |
| | TECHNICAL REPORT –
MUSSELWHITE MINE, ONTARIO, CANADA
Document # C8630-0000-PM-RPT-001 – Rev. 0
/ Page 12 |
| 1.6 | Data Verification, Sampling Preparation, Analysis, and Security |
Qualified Person, Ryan Wilson, P. Geo., completed a site visit on November 6 and 7, 2024. The visit included an underground tour, during which multiple active headings were observed in both the PQ Deeps and Lynx areas of the East Limb, as well as a diamond drill setup. Surface stops were also made to the core logging, sampling and preparation facilities, in addition to outcrop exposures along the south shore of Opapimiskan Lake. Review of key drill core intercepts supported the mineralization styles observed underground, as well as slightly differing styles from both Redwings and the West Limb. Standard operating procedures and related documentation for all drilling, geological, sampling, assaying and database management were also reviewed during additional meetings with the site exploration team. Sample storage, security and chain of custody systems and infrastructure were also noted.
Specific core intervals were pulled and inspected, photographed, and/or filmed for later review and reference. No analytical facilities (e.g., Actlabs in Dryden) were inspected during the visit.
No samples were collected for additional laboratory verification; however, mineralized intervals were inspected and compared with assay values for confirmation of mineralization.
The quality of the drill hole database and contained assay results is considered reliable and adequate for the estimation of Mineral Resources. The data available are a reasonable and accurate representation of the Musselwhite Mine and are of sufficient quality to provide the basis for the conclusions and recommendations reached in this Technical Report.
| 1.7 | Mineral Processing and Metallurgical Testing |
Metallurgical test work completed on variability samples selected from across the current reserve shows minor to no amounts of elements and minerals that are deleterious to gold recovery and reagent consumption. Ores to be processed over the current life-of-mine are consistently of moderate hardness, with respect to grinding. Gold recoveries are expected to remain high, on average, and are reasonably predicted by the 2023 site model, with occasionally lower gold recovery resulting from elevated sulfide sulfur content and potentially changing gold mineralogy. Sulfide sulfur content did not explain all recovery outliers and variability.
| 1.8 | Mineral Resources Estimate |
The Mineral Resource Estimate for the Musselwhite Mine includes Measured and Indicated Resources of 2,155 kt @ 4.25 g/t Au for 294 koz, and Inferred Resources of 1,188 kt @ 4.96 g/t Au for 190 koz.
The MRE has been prepared using a cut-off grade of not less than 3.80 g/t Au, and the underground Mineral Resources are reported using a gold price of US$1,600.
| | December 2024 |
| | TECHNICAL REPORT –
MUSSELWHITE MINE, ONTARIO, CANADA
Document # C8630-0000-PM-RPT-001 – Rev. 0
/ Page 13 |
The MRE statement for the Musselwhite Mine prepared by DRA is summarized in Table 1.4. Additional details are also provided in the adjoining footnotes.
Table 1.4 – Mineral Resource Estimate East and West Limb Deposits, Dec. 31, 2023
| Category | Tonnage | Average Grade | Gold Ounces |
| (Mt) | (g/t Au) | (koz Au) |
| East and West Limb Deposits | | | |
| Measured | 0.87 | 4.36 | 122 |
| Indicated | 1.29 | 4.17 | 173 |
| Total Measured + Indicated | 2.16 | 4.25 | 294 |
| Inferred | 1.19 | 4.96 | 190 |
| Notes: | | | |
| 1. | The Mineral Resource Estimate has been estimated using the Canadian Institute of Mining, Metallurgy and Petroleum (CIM) Definitions Standards for Mineral Resource and Mineral Reserve in accordance with National Instrument 43-101 – Standards of Disclosure for Mineral Projects. Mineral Resources which are not Mineral Reserves, do not have demonstrated economic viability. |
| 2. | Mineral Resources are reported exclusive of mineral reserves. |
| 3. | Reference point for Mineral Resources is point of delivery to the process plant (diluted and mine recovered). |
| 4. | Mineral Resources are constrained within stope shapes generated by Deswik Stope Optimizer. Design parameters varied by both mining method (Transverse and Avoca) and zone for mining recovery (93–94%) and dilution (14–30%) factors, respectively; refer to Section 14.5. |
| 5. | Stope shapes were developed using a gold sales price of US$1,600/oz. |
| 6. | Underground resources were estimated using a variable cut-off grade of not less than 3.80 g/t Au. |
| 7. | Resource estimations were interpolated using Ordinary Kriging (OK). |
| 8. | The effective date of the Mineral Resource Estimate is December 31, 2023. |
| 9. | Figures have been rounded to an appropriate level of precision for the reporting of Mineral Resources. As a result, totals may not compute exactly as shown. |
| 1.9 | Mineral Reserve Estimation |
The mine design, scheduling, and mineral reserve estimate were prepared by the technical services department at Musselwhite and verified by the QP responsible for these estimates.
Material factors that may cause actual results to materially vary from the conclusions, estimates, designs, forecasts, or projections, include any significant differences in anyone, or more, of the material factors, or information, including metal prices, mining methods, mining dilution and recovery, labor costs, consumables costs, metal recoveries and transportation costs.
| 1.9.1 | Methodology for Estimating Mineral Reserves |
Musselwhite employed procedures recognized in the mining industry to estimate Mineral Reserves. The method consists of converting Measured and Indicated Mineral Resources to Proven and Probable Reserves by identifying material that exceeds the Cut-Off grade while conforming to the geometrical constraints determined by the mining method and applying modifying factors such as dilution and mining recovery.
| | December 2024 |
| | TECHNICAL REPORT –
MUSSELWHITE MINE, ONTARIO, CANADA
Document # C8630-0000-PM-RPT-001 – Rev. 0
/ Page 14 |
The conversion of Mineral Resources to Mineral Reserves involves the application of modifying factors. The economic modifying factors used in estimating the Mineral Reserve are metal prices and Cut-Off, while the mining modifying factors used in the estimate are dilution and mining recovery.
The metal prices used in the Mineral Reserve estimate are based on Newmont –Musselwhite guideline for 2024 of US$1,400/oz.
Mineable Shape Optimizer (MSO) embedded in Deswik mine design software was used to determine the mineable portion of the Mineral Resource. The application generates and evaluates potentially mineable shapes in the geological block model to define optimal stope designs that maximize the economic value of the orebody.
| 1.9.4 | Mineral Reserve Statement |
Table 1.5 presents the Mineral Reserve for Musselwhite Mine as of December 31, 2023.
Table 1.5 –Musselwhite Mineral Reserves as of December 31, 2023
| Description | Tonnage
(Mt) | Gold Grade
(g/t Au) | Contain Gold
(Au koz) |
| Proven | 3.25 | 6.76 | 707 |
| Probable | 4.10 | 5.81 | 766 |
| Proven and Probable | 7.36 | 6.23 | 1,473 |
| | | | |
| Notes: | | | |
| 1. | The Mineral Reserve Estimate has been estimated using the Canadian Institute of Mining, Metallurgy and Petroleum (CIM) Definitions Standards for Mineral Resource and Mineral Reserve in accordance with National Instrument NI 43-101 – Standards of Disclosure for Mineral Projects. |
| 2. | The mineral reserve was created using Deswik Software with an effective date of December 31, 2023. |
| 3. | Mineral Reserves are reported within stope shapes using cut-off basis with a gold price of US$1,400/oz. |
| 4. | The mineral reserves cut-off grade varies by zone. The mineral reserves were estimated using a cut-off grade of not less than 3.80 g/t Au. |
| 5. | Values are inclusive of mining recovery and dilution. Values are determined as of delivery to the mill and therefore not inclusive of milling recoveries. |
| 6. | Tonnage and contained metal have been rounded to reflect the accuracy of the estimate and numbers may not sum exactly. |
| | December 2024 |
| | TECHNICAL REPORT –
MUSSELWHITE MINE, ONTARIO, CANADA
Document # C8630-0000-PM-RPT-001 – Rev. 0
/ Page 15 |
| 1.10.1 | General Description of the Mineralization at Musselwhite |
Mineralization at Musselwhite is sulfide replacement of iron formation with quartz-pyrrhotite flooding and veining. Mineralization is best developed where structural permeability has been increased, either by folding, brittle or ductile deformation or in combination. Mineralization is thought to have been emplaced during D2 deformation and peak metamorphism.
Visible native gold, usually the size of a pin tip, is commonly observed as isolated specks within quartz. The majority of the gold occurs within pyrrhotite micro-fractures within garnet rich, silicate domains.
The deposit consists of seven (7) zones called West Limb (WEL), Upper Lynx (ULYNX), Redwings (RDW), Lynx North (LNXN), Lynx (LYNX), T-Antiform (TANT), and PQ Deeps which contains 60% of the ore reserve.
The Musselwhite Mine has developed geotechnical systems that are standard for underground operating mines in Ontario and Canada. The standards are based on protocols outlined in the following key documents:
| ● | Musselwhite Mine Ground Control Management Plan (GCMP) dated January 26, 2024; |
| ● | Musselwhite Mine Seismic Risk Management Plan (SRMP) date January 12, 2024. |
Musselwhite Mine has an ongoing process of geotechnical data collection involving the systematic gathering, analysis, and interpretation of information about the expected and encountered ground conditions. This data is then used to define the pre-mining condition by defining the rockmass classification system and compare against empirical methods to define the appropriate stope/drift spans, underground support requirements and pillar dimensions. Designs are further complemented with 3D numerical modeling. This is further updated during mining and post mining to address changing ground conditions to identify changes to the mining sequence, stope sizing, ground support and seismic re-entry protocols.
The Musselwhite Mine rock mechanics department also completes various types of underground operation reports due to fall of ground and seismic damage events. These reports are used to assist with making operational changes to address safety and production challenges.
The key geotechnical challenge at Musselwhite Mine is the transition from a lower stress seismic environment to a medium and higher stress environment within the PQ Deeps zone. Musselwhite Mine has addressed seismic related events by changing to ground support, planned extensions to the seismic system and pre-conditioning of secondary transverse stopes. Additional operational considerations may be required as the seismicity in the mine increases including just in time
| | December 2024 |
| | TECHNICAL REPORT –
MUSSELWHITE MINE, ONTARIO, CANADA
Document # C8630-0000-PM-RPT-001 – Rev. 0
/ Page 16 |
development, modifications to re-entry protocols, changes to mining sequence, stope size review, expansion of stope pre-conditioning and increased ground support requirements in order to meet future production plans. These types of operation consideration will need to be studied by the Musselwhite Mine with assistance from external consultants as required.
The underground mining is directly below Opapimiskan Lake. Three (3) type of water inflows are considered as risk. The greatest inflows risk is the result of a major instability in the crown pillar (i.e., wedge failure or collapse of the surface crown). A second risk is the un-grouted exploration boreholes drilled directly below the pond (in winter). The third risk would be the potential excavation of fractures (such as dyke or water bearing faults) intersection inflows. Several consultants have been invited to carry out hydrogeology related studies. Itasca Consultant Canada Inc. (Itasca) evaluated the crown pillar design thickness between 25 to 35 m and determined it is within the stable limit.
The Mineral Reserve estimate is based on a mine design and schedule which was prepared in Deswik software. The development parameters used for mine design and planning include the cross-sections of drifts and ramps, the diameter of ventilation raises, and the advance rates for the diverse headings. The production parameters include mining methods, pillar thicknesses, dip constraints, minimum mining widths, stope dimensions, and production rates.
The mining method predominantly in use at Musselwhite is sub-level blasthole stoping with backfill. The sub-level blasting stoping method is excavated using three methods:
| ● | Modified AVOCA method; and |
| ● | Transverse Longhole method. |
The AVOCA and Modified AVOCA mining methods are the standard mining method for most of the orebodies (e.g., Redwing, West Limb, Lynx) above the 4250 m mine elevation (950 Level) and where the orebody width has increased at depth, below 4250 m to 3750 m elevations, the mining method has changed to Transverse (PQ Deeps).
| 1.10.6 | Mine Infrastructure |
Musselwhite Mine is a mechanized mine, and access to the underground workings is provided by a system of ramps. The main ramp extends from the portal to 3750 mL in PQ Deeps.
| | December 2024 |
| | TECHNICAL REPORT –
MUSSELWHITE MINE, ONTARIO, CANADA
Document # C8630-0000-PM-RPT-001 – Rev. 0
/ Page 17 |
Ore extracted from the PQ Deeps zone is hoisted by an internal winze to the 280 mL. From the Truck Loadout (TLO) on 280 L ore is transferred to a dumping point at 460 mL, and thereafter conveyed to surface. The distance between the TLO and the 460 mL is approximately 3,000 m in a ramp of + and -15%. The current trucking performance on this level is around 320 t per shift per truck.
In the LoM, around 60% of the total ore production will be produced from this zone.
The cement slurry for the cemented rockfill is produced underground by a portable cement slurry plant. The cement powder is transported underground by tote bag with a flatbed truck that carries 4 bags per trip. Only three (3) to four (4) trips can be transported per shift. Musselwhite has recognized that this process is inefficient and creates delays in the mining sequence of the PQ Deeps zone. Options to improve this process are under evaluation.
The underground mine has two (2) independent pump systems, one cascading system from the 770 mL to the 220 mL and pumped to the Tailings Storage Facility (TSF). On the 770 mL, an UV system is installed to remove bacteria where this industrial is directed to an underground reservoir that feeds the PQ Deeps zone.
The pumping on the 537 Level collects the ground water from the mid mine and esker. This water is directly pumped to the surface.
The mine is serviced by an underground repair bay for light breakdown repairs. Major repairs and overhauls are conducted in the surface maintenance facility.
Musselwhite is a mechanized mine employing rubber-tired diesel equipment for all phases of mining operations. Its mobile mine equipment fleet includes seven (7) jumbo drills, two (2) cable bolters, three (3) longhole production drill rigs, fifteen (15) Load Haul Dumps (LHD), fourteen (14) 45-ton underground mine trucks, two (2) transmixers, two (2) shotcrete sprayers and five (5) explosives chargers, and a number of ancillary vehicles for mine services and personnel. The mine ventilation system takes into consideration the air flow required to remove the exhaust products from internal combustion engines.
The underground mine works two (2) 12-hour shifts, and there are four (4) rosters, working rotations of 14 days on and 14 days off. Currently, Musselwhite is using an underground contractor to supplement their development crews. All production activities (except development) are performed by Musselwhite personnel.
| | December 2024 |
| | TECHNICAL REPORT –
MUSSELWHITE MINE, ONTARIO, CANADA
Document # C8630-0000-PM-RPT-001 – Rev. 0
/ Page 18 |
Table 1.6 presents the LoM underground mine schedule developed in the reserve estimation process. The table includes 7.36 Mt of ore at a grade of 6.23 g/t on December 31, 2023, and the totals coincide with the Mineral Reserve Estimate.
Table 1.6 – Life of Mine Plan
| Zone | Unit | 2024 | 2025 | 2026 | 2027 | 2028 | 2029 | 2030 | LoM |
| Proven and Probable | kt | 1,041 | 1,069 | 1,073 | 1,072 | 1,070 | 937 | 1,096 | 7,357 |
| Grade | g/t | 5.94 | 6.09 | 6.87 | 5.83 | 7.40 | 6.10 | 5.36 | 6.23 |
| Ounces | koz | 199 | 209 | 237 | 201 | 254 | 184 | 189 | 1,473 |
Mine development is segmented into lateral and vertical headings due to the difference in methodology, advance rates and costs. Tables 1.7 and 1.8 depict the schedule of mine development beginning January 1, 2024, and including the decline ramp, crosscuts, ore drives and sublevels.
Table 1.7 – Schedule of Lateral Development
| Description | Unit | 2024 | 2025 | 2026 | 2027 | 2028 | 2029 | 2030 | LoM |
| Total Lateral Development | m | 12,746 | 8,537 | 7,393 | 6,303 | 5,765 | 3,497 | 903 | 45,144 |
Table 1.8 – Schedule of Vertical Development
| Description | Unit | 2024 | 2025 | 2026 | 2027 | 2028 | 2029 | 2030 | LoM |
| Total Vertical Development | m | 104 | 471 | 0 | 186 | 58 | 527 | 0 | 1,346 |
The Musselwhite processing facility was constructed in 1996 and began operations in 1997. The total operating life of the mill has been over 25 years. Upgrades over time have increased the original processing design throughput from 3,200 tonnes per day (tpd) to 4,000 tpd nominally (Samuel Engineering, 2018). Mill throughput is currently limited to approximately 1.1 Mtpa by mine production, which is the current life-of-mine plan requirement. Average gold recovery has been above 95% over the last 15 years of operation.
| | December 2024 |
| | TECHNICAL REPORT –
MUSSELWHITE MINE, ONTARIO, CANADA
Document # C8630-0000-PM-RPT-001 – Rev. 0
/ Page 19 |
The Musselwhite process flowsheet begins with primary crushing underground. The product from the primary crusher reports to a secondary crusher on surface and is then milled in an open-circuit rod mill followed by a closed-circuit ball mill. The ball mill circuit contains gravity concentration and intensive cyanide leaching. The grinding circuit product passes through the remaining gold extraction processes consisting of cyanide leaching, carbon-in-pulp adsorption, carbon elution and regeneration, electrowinning and refining. Doré bars assay approximately 90% gold. Mill tailings are first treated in a two-thickener counter-current-decantation circuit to recycle cyanide, followed by cyanide detoxification, thickening and final deposition.
Figure 1.5 illustrates a simplified Process Flowsheet for the Musselwhite Mill.
| 1.12 | Project Infrastructure |
The Musselwhite Mine has been in production since 1997 and has the necessary infrastructure required to support the current underground mining operation. This includes, but is not limited to, process plant, laboratory, airstrip, fuel storage, chemical storage, power supply, water supply, tailings storage facility, camp, waste facility, and all the necessary offices, warehouses, and workshops to sustain the current operation.
Figure 1.4 illustrates all existing infrastructure and locations of the plant and mine.
Figure 1.4 – Existing Project Infrastructure
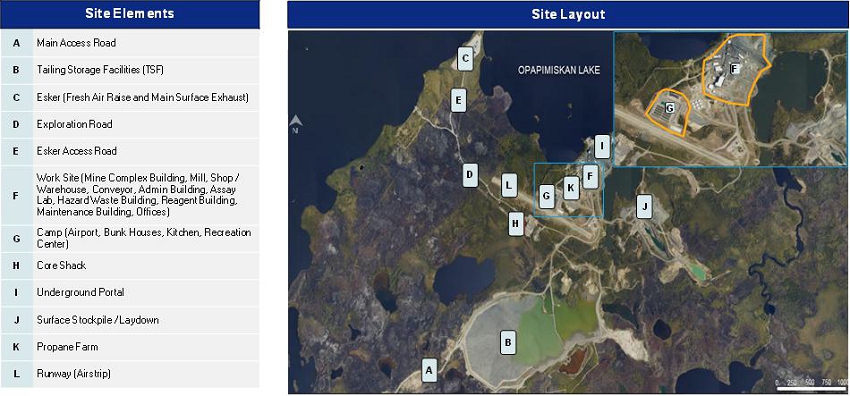
Source: Newmont, 2024
| | December 2024 |
| | TECHNICAL REPORT –
MUSSELWHITE MINE, ONTARIO, CANADA
Document # C8630-0000-PM-RPT-001 – Rev. 0
/ Page 20 |
Figure 1.5 – Musselwhite Simplified Process Flowsheet

Source: DRA, 2024
| | December 2024 |
| | TECHNICAL REPORT –
MUSSELWHITE MINE, ONTARIO, CANADA
Document # C8630-0000-PM-RPT-001 – Rev. 0
/ Page 21 |
| 1.13 | Environmental Studies, Permitting and Social or Community Impact |
The Musselwhite Mine underwent a federal Environmental Assessment (EA) prior to going into production in 1997. To support the EA process, an Environmental Impact Statement (EIS) and Comprehensive Study Report were completed in 1995 (Newmont, 2024a). In addition, the mine has received several provincial environmental approvals over the years. One of the main approvals is the Environmental Assessment (EA) for the installation and operation of up to 20 megawatts of diesel-generated capacity, as mandated by the former Electricity Project Regulation (O.Reg. 116/01). The on-site diesel generation is comprised of eleven (11) diesel generator sets with varying outputs. Public and Indigenous Communities (ICs) consultation was completed during the preparation of the EA.
The site has extensive monitoring programs that are reported to regulatory agencies on a periodic basis, in accordance with regulatory requirements. Comprehensive surface and groundwater monitoring supports a detailed understanding of current conditions and is incorporated into predictive models to support risk mitigation and closure planning.
The latest amendment to the Closure Plan for the mine was completed in 2018 and filed in 2019 (SNC-Lavalin, 2018) and the associated Financial Assurance was recently updated, at the request of the Ministry of Mines (MINES), to account for inflation from 2018 to 2024. Musselwhite complies with the requisite bonding levels for the implementation of the approved Closure Plan. The next update to the Closure Plan is tentatively scheduled for late 2025 to early 2026 and will incorporate findings from various ongoing studies, monitoring and predictive modelling.
Mining impacted water is routed from the TSF Pond and either recycled back to the mill or pumped to the Polishing Pond from where it is discharged seasonally through a treatment wetland. Primary inputs to the TSF Pond include bleed water from tailings deposition, dewatering from the underground workings, pump back from the groundwater interception system and seepage collection pond and direct precipitation. The mine consistently meets water quality discharge limits although it is understood that levels of Co are somewhat elevated and both Fe and As have been flagged as potential contaminants of concern. Studies are ongoing to characterize TSF geochemical performance and predict future water quality and possible requirement for additional mitigations.
Musselwhite Mine is located on the traditional territory of North Caribou Lake First Nation and the mine’s associated activities are within the shared traditional territories of the Nations. Kingfisher Lake is located 58 km to the northeast; North Caribou Lake is located 76 km to the northwest; Wunnumin Lake is located 84 km to the east; Cat Lake is located 140 km to the southwest, and Mishkeegogamang is located 30 km south of Pickle Lake. Kingfisher Lake and Wunnumin Lake First Nation communities are affiliated with the Shibogama First Nation Council. North Caribou Lake and Cat Lake are affiliated with the Windigo First Nations Council. Mishkeegogamang is an independent band (SNC-Lavalin, 2018).
| | December 2024 |
| | TECHNICAL REPORT –
MUSSELWHITE MINE, ONTARIO, CANADA
Document # C8630-0000-PM-RPT-001 – Rev. 0
/ Page 22 |
The Project has identified more than 150 stakeholders including Indigenous Communities (IC) Signatory and affiliates communities, Indigenous Organizations and community members outside of Signatory Communities, municipalities, government and regulators, suppliers, contractors, consultants, Academy/Training Partner and others (Civil Society, Chamber of Commerce, Community Investments, Mining Associations) (Newmont, 2024b).
Musselwhite was one of the first mines in Canada to enter into a comprehensive agreement with local ICs. The agreement is called the Musselwhite Agreement and was originally signed in 1992. Signatories of the Agreement are four ICs and two First Nation Councils. These include North Caribou Lake First Nation, Cat Lake First Nation, Kingfisher Lake First Nation, Wunnumin Lake First Nation, Windigo First Nation Council, and Shibogama First Nation Council. The Agreement has been reviewed and renegotiated in the past, with the last amendment being completed in 2019. There is also a Trapper Compensation Agreement with North Caribou Lake First Nations and a Cooperation Agreement with Mishkeegogamang First Nation. The Musselwhite Agreement sets targets for ICs employment, opportunities for business development, and environmental protection. The Agreement establishes revenue sharing, implementation funding and environmental funding. The established target for the percentage of ICs employees included in the Musselwhite Agreement has been proven to be challenging despite the continuous operator efforts.
| 1.14 | Capital and Operating Costs |
| 1.14.1 | Capital Cost Estimate (Capex) |
The following capital cost estimate (Capex) is based on sustaining expenditures as the plan does not include any additional Project capital.
| 1.14.1.1 | Mine Capital Cost Estimate (Mine Capex) |
The overall mine capital cost estimate for the life of mine is US$250.3 million, based on the 2024 LoM plan for solely mining the 2023 mineral reserves. The spending pattern by cost category is shown in millions of US$ in Table 1.9. The cost of the individual items within the categories were provided by the site as part of establishing the 2023 mineral reserves. Equipment replacements amounting to US$55.3M are included within the Asset Integrity Category. Variances between the 2024 plan and Year-to-Date (YTD) September 2024 for the individual categories of capital expenditures were noted. In particular, the equipment replacements contained within the asset integrity category were not pursued as a means of offsetting over expenditures in the development categories. The expectation is that adjustments will be made for the 2024 mineral reserves determination.
| | December 2024 |
| | TECHNICAL REPORT –
MUSSELWHITE MINE, ONTARIO, CANADA
Document # C8630-0000-PM-RPT-001 – Rev. 0
/ Page 23 |
Table 1.9 – 2024 Mine Plan Capital Cost Estimate by Category by Year (US$ M)
| Category | Totals | 2024 | 2025 | 2026 | 2027 | 2028 | 2029 | 2030 |
| Lateral Devt. | 56.1 | 16.6 | 12.8 | 8.4 | 7.1 | 5.0 | 4.8 | 1.3 |
| Vertical Devt. | 3.1 | 0.3 | 1.2 | - | 0.3 | 0.1 | 1.3 | - |
| Asset Integrity | 127.2 | 29.8 | 29.2 | 25.7 | 14.3 | 13.4 | 7.5 | 7.3 |
| Project | 63.9 | 19.2 | 3.0 | 16.9 | 8.5 | 13.6 | 2.7 | - |
| Total Mine | 250.3 | 65.9 | 46.2 | 51.0 | 30.2 | 32.1 | 16.3 | 8.6 |
The estimated life of mine capital cost per tonne milled for the mine, including the project capital, is US$34.02/t.
| 1.14.1.2 | Mill Capital Cost Estimate (Mill Capex) |
The overall mill capital cost estimate for the life of mine is US$12.7 million, based on the 2024 LoM plan for solely mining the 2023 mineral reserves. The spending pattern by cost category is shown in millions of US$ in Table 1.10. The cost of the individual items within the categories were provided by the site as part of establishing the 2023 mineral reserves. A cost estimate for grinding floor rehabilitation of US$0.3M was later added, following the site visit. Variances between the 2024 plan and YTD September 2024 for the individual categories of capital expenditures were noted and the expectation is that adjustments will be made for the 2024 mineral reserves determination.
Table 1.10 – 2024 Mill Plan Capital Cost Estimate by Category by Year (US$ M)
| Category | Totals | 2024 | 2025 | 2026 | 2027 | 2028 | 2029 | 2030 |
| TSF | 7.9 | 2.2 | - | 1.5 | - | 2.7 | 1.5 | - |
| Infrastructure | 4.5 | 1.2 | 3.3 | - | - | - | - | - |
| Upgrades | 0.3 | 0.1 | 0.2 | - | - | - | - | - |
| Total Mill | 12.7 | 3.5 | 3.5 | 1.5 | - | 2.7 | 1.5 | - |
The estimated life of mine capital cost per tonne milled for the mill is US$1.73/t.
| 1.14.1.3 | G&A Capital Cost Estimate (G&A Capex) |
All G&A capital envisioned for the 2024 LoM plan is sustaining, there is no G&A Project Capital.
The G&A sustaining capital amounts to US$37.4 million over the 2024 LoM plan for solely mining the 2023 mineral reserves. The estimated life of mine capital cost for the G&A capital is US$5.09 per tonne milled.
| | December 2024 |
| | TECHNICAL REPORT –
MUSSELWHITE MINE, ONTARIO, CANADA
Document # C8630-0000-PM-RPT-001 – Rev. 0
/ Page 24 |
| 1.14.2 | Operating Cost Estimate (Opex) |
| 1.14.2.1 | Mine Operating Cost Estimate (Mine Opex) |
The Mine Operating Costs at the mine site have been reviewed by the mining QP and found to be reasonable for a mechanized mine utilizing the Avoca mining methods. The mine has demonstrated typical operating costs for a facility of its size.
The mine operating cost estimates are based on recent actual costs with minor specific adjustments for mine improvement initiatives that are currently being implemented.
The forward looking mine operating cost estimates include further improvement plans and thereby are foreseen to be at a minimum at a pre-feasibility level of confidence, having an accuracy level of ±25% and a contingency range not exceeding 25% until such time as the improvement plans are factual.
Mine operating costs are based on the 2024 budgeted life of mine cost factors as presented in Table 1.11.
Table 1.11 – Mine Operating Unit Cost Factors for Determining the 2024 Budget
| Description | Value | Unit |
| Exchange Rate | 0.75 | US$ / CA$ |
| Mine Services (Fixed) | 18.9 | M US$/y |
| Lateral Dev't (Opex) | 4,890 | US$/ metre |
| Vertical Dev't (Opex) | N/A | US$/ metre |
| Stoping - Drill | 67.91 | US$/PD metre |
| Stoping – Blast | 4.23 | US$/prod blast tonne |
| Stoping – Muck | 13.13 | US$/prod ore tonne |
| Stoping - Ground Support | 3.82 | US$/prod ore tonne |
| Backfill – Un-consolidated Roack Fill (URF) | 4.97 | US$/URF tonne |
| Backfill – Cemented Rock Fill (CRF) | 37.20 | US$/CRF tonne |
| Mine Services (Variable) | 11.68 | US$/total tonne moved |
| Hoisting | 3.16 | US$/hoist tonne |
| Crushing | 8.40 | US$/ore tonne mined |
| Engineering | 2.09 | US$/total tonne moved |
| Geology | 3.88 | US$/ore tonne mined |
The mine cost factors were applied to the WSP derived LoM production schedule for the reserves to provide the Table 1.12.
| | December 2024 |
| | TECHNICAL REPORT –
MUSSELWHITE MINE, ONTARIO, CANADA
Document # C8630-0000-PM-RPT-001 – Rev. 0
/ Page 25 |
Table 1.12 – LoM Operating Costs by Year for the Mine
| Area | LoM | 2024 | 2025 | 2026 | 2027 | 2028 | 2029 | 2030 |
| Development1 | 162.0 | 44.8 | 28.2 | 27.3 | 23.6 | 23.0 | 12.0 | 3.0 |
| Drill2 | 36.6 | 7.4 | 4.8 | 6.8 | 5.7 | 2.8 | 4.8 | 4.4 |
| Blast | 22.6 | 2.8 | 3.1 | 3.2 | 3.1 | 3.3 | 3.2 | 3.9 |
| Muck | 78.4 | 9.6 | 10.7 | 10.8 | 10.9 | 11.3 | 11.1 | 13.8 |
| Ground Support | 22.8 | 2.8 | 3.1 | 3.2 | 3.2 | 3.3 | 3.2 | 4.0 |
| Backfill - URF | 12.8 | 1.8 | 2.4 | 1.8 | 1.9 | 1.0 | 1.4 | 2.6 |
| Backfill - CRF | 54.2 | 2.5 | 3.8 | 7.3 | 4.9 | 14.5 | 11.6 | 9.7 |
| Mine Services (Variable) | 179.3 | 30.9 | 28.9 | 26.4 | 23.8 | 24.8 | 21.7 | 22.7 |
| Mine Services (Fixed) | 132.2 | 18.9 | 18.9 | 18.9 | 18.9 | 18.9 | 18.9 | 18.9 |
| Hoisting | 18.2 | 2.2 | 2.4 | 2.5 | 2.5 | 2.9 | 2.5 | 3.3 |
| Crushing | 61.8 | 8.7 | 9.0 | 9.0 | 9.0 | 9.0 | 7.9 | 9.2 |
| Engineering | 32.0 | 5.5 | 5.2 | 4.7 | 4.3 | 4.4 | 3.9 | 4.0 |
| Geology | 28.6 | 4.0 | 4.2 | 4.2 | 4.2 | 4.2 | 3.6 | 4.3 |
| Total (US$ M) | 841.4 | 142.2 | 124.6 | 126.0 | 115.8 | 123.5 | 105.7 | 103.7 |
| Mine Cost / t milled | 114.37 | 136.56 | 116.57 | 117.47 | 108.09 | 115.38 | 112.77 | 94.61 |
| Notes: | | | | | | | | |
| 1 | No change in the unit cost for lateral or vertical development, the resultant reduction is from less metres required per year as only mining the reserves. |
| 2 | Reduction in drill cost in 2025 and beyond reflects successful implementation of programmed Ikon detonators mine wide in 2024 significantly reducing the need to redrill the blastholes. |
| | December 2024 |
| | TECHNICAL REPORT –
MUSSELWHITE MINE, ONTARIO, CANADA
Document # C8630-0000-PM-RPT-001 – Rev. 0
/ Page 26 |
| 1.14.2.2 | Mill Operating Cost Estimate (Mill Opex) |
The overall mill operating cost estimate for the LoM is US$185.0 million, as summarized by the cost center activities in Table 1.13 with the estimated LoM mining cost of $25.14 per tonne milled comparing favourably to the prior three years at $22.18 per tonne milled.
Table 1.13 – Life of Mine, Mill Operating Cost Estimate
| Area | Average Prior
Three Years
(US$ / t milled) | LoM Average
Unit Cost
(US$ / t milled) | LoM Total
Cost by
Activity
(US$ M) |
| Labor | 5.71 | 5.40 | 39.76 |
| Flights & Accommodations | 0.82 | 1.17 | 8.60 |
| Energy | 2.53 | 2.23 | 16.40 |
| Contractors & Technical Services | 2.34 | 4.03 | 29.65 |
| Reagents, Consumables & Supplies | 5.79 | 5.88 | 43.27 |
| Freight | 0.28 | 0.84 | 6.20 |
| Maintenance | 4.71 | 5.59 | 41.13 |
| Total | 22.18 | 25.14 | 185.01 |
| 1.14.2.3 | G&A Operating Cost Estimate (G&A Opex) |
The overall General and Administrative (G&A) operating cost estimate for the LoM is US$313.9 million.
The results of the economic analysis contain forward-looking information under Canadian securities law. The results rely on inputs that are subject to known and unknown risks, uncertainties, and other factors, which may cause actual results to differ materially from those presented here.
The economic analysis is based on the discounted cash flow (DCF) method on a pre-tax and after-tax basis. The key metric determined in the analysis is the Net Present Value (NPV) at a discount rate of 5%. For the purposes of the evaluation, it is assumed that the operations are established within a single corporate entity. The Project has been evaluated on an unlevered, all-equity basis.
The cash flow model uses inputs from all elements of the Project to provide a comprehensive financial projection for the Project, on an annual basis over the remaining project life. All prices and costs are in Q4 2023 US dollars. The base date of the economic analysis is 1st January, 2024 and the analysis utilizes production projections for the Year 2024. No provision is made for the effects
| | December 2024 |
| | TECHNICAL REPORT –
MUSSELWHITE MINE, ONTARIO, CANADA
Document # C8630-0000-PM-RPT-001 – Rev. 0
/ Page 27 |
of inflation in this analysis. Current Federal and Provincial (Ontario) tax regulations were used to assess corporate tax liabilities.
Table 1.14 provides a summary of the key technical assumptions and inputs. At a long-term gold price assumption of $2,150 per ounce, the financial results indicate a positive pre-tax NPV of $1,037 M and a positive after-tax NPV of $782 M.
Table 1.14 – Economic Analysis Parameters
| Description | Units | Value |
| Macroeconomic Parameters | | |
| Gold Price | $/oz | 2,150 |
| Exchange Rate | USD:CAD | 1.00:1.33 |
| Discount Rate | % | 5.0 |
| Project Parameters | | |
| Remaining Mine Life | years | 7 |
| Mineable Mineral Reserves | Mt | 7.4 |
| Ore Grade Mined (LoM average) | g/t Au | 6.2 |
| Annual Mill Throughput (LoM average) | ktpa | 1,051 |
| Gold Recovery (LoM average) | % | 96.00 |
| Gold Payability (LoM average) | % | 99.95 |
| Gold Sold (LoM average) | koz/y | 202 |
| Capital Cost Estimates | | |
| Sustaining Capital (LoM) | $ M | 301 |
| Closure Capital | $ M | 105 |
| | December 2024 |
| | TECHNICAL REPORT –
MUSSELWHITE MINE, ONTARIO, CANADA
Document # C8630-0000-PM-RPT-001 – Rev. 0
/ Page 28 |
| Description | Units | Value |
| Unit Operating Costs Estimates (LoM Average) | | |
| Mining | $/oz | 595 |
| Processing | $/oz | 131 |
| General & Administrative | $/oz | 195 |
| Freight | $/oz | 2 |
| Royalties | $/oz | 58 |
| Total | $/oz | 981 |
| Cash Cost Metrics1 | | |
| Cash Costs (LoM Average) | $/oz | 941 |
| All-In Sustaining Cost (LoM average) | $/oz | 1,269 |
1 - Cash costs and All-in Sustaining Costs (AISC) are non-GAAP financial measures or ratios and have no standardised meaning under IFRS Accounting Standards (“IFRS”) and may not be comparable to similar measures used by other issuers. Cash Costs The Company calculates total cash costs as the sum of operating costs, royalty costs, production taxes, refining and shipping costs, net of by-product silver credits. Cash costs per ounce is calculated by taking total cash costs and dividing such amount by payable gold ounces. While there is no standardized meaning of the measure across the industry, the Company believes that this measure is useful to external users in assessing operating performance. All-In Sustaining Cost (AISC) The Company has provided AISC performance measures that reflect all the expenditures that are required to produce an ounce of gold from operations. While there is no standardized meaning of the measure across the industry, the Company's definition conforms to the AISC definition as set out by the World Gold Council in its guidance dated November 14, 2018. The Company believes that this measure is useful to market participants in assessing operating performance and the Company's ability to generate cash flow from operating activities.” |
A sensitivity analysis was carried out to assess the impact of variations in gold price, Capex (Sustaining and Closure), Opex, and gold head grade on the NPV. The after-tax results of the sensitivity analysis are presented in Table 1.15 and Figure 1.6. The NPV is most sensitive to variations in the gold price and head grade, followed by variations in the Opex and then Capex. Both gold price and head grade have an almost identical impact on the NPV. The Project maintains a positive NPV at the lower end of the range of gold price and head grade tested.
| | December 2024 |
| | TECHNICAL REPORT –
MUSSELWHITE MINE, ONTARIO, CANADA
Document # C8630-0000-PM-RPT-001 – Rev. 0
/ Page 29 |
Table 1.15 – Sensitivity of Project After-Tax NPV to Gold Price, Capex, Opex and Head Grade
| Price | Units | -20% | -10% | Base | +10% | +20% |
| NPV @ 5.0% | $M | 426 | 604 | 782 | 960 | 1,138 |
| Opex | Units | -20% | -10% | Base | +10% | +20% |
| NPV @ 5.0% | $M | 936 | 859 | 782 | 705 | 628 |
| Capex | Units | -20% | -10% | Base | +10% | +20% |
| NPV @ 5.0% | $M | 831 | 806 | 782 | 757 | 733 |
| Grade | Units | -20% | -10% | Base | +10% | +20% |
| NPV @ 5.0% | $M | 436 | 609 | 782 | 955 | 1,128 |
Figure 1.6 – Sensitivity of Project After-Tax NPV to Gold Price, Capex, Opex and Head Grade
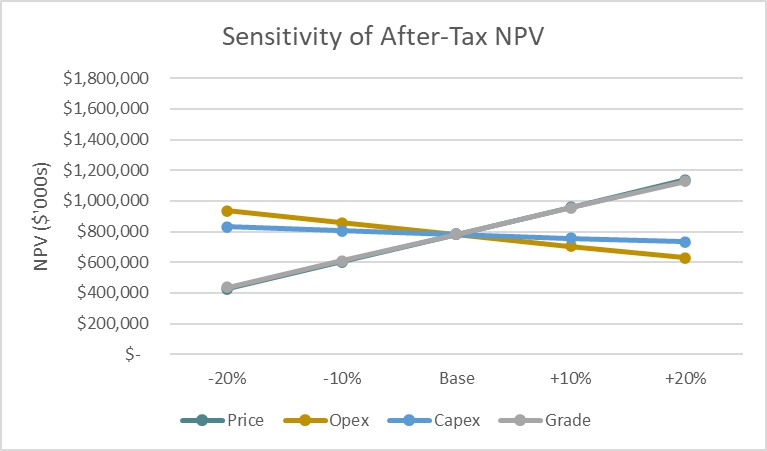
Source: DRA, 2024
There are several exploration properties held by competitors or individuals (and/or estates) in the Musselwhite Mine region, including the following landholdings:
| ● | Romios Gold Resources Inc.; |
| ● | Last Resort Resources Ltd.; |
| | December 2024 |
| | TECHNICAL REPORT –
MUSSELWHITE MINE, ONTARIO, CANADA
Document # C8630-0000-PM-RPT-001 – Rev. 0
/ Page 30 |
| ● | Gravel Ridge Resources Ltd.; |
| ● | Dixon Metals Corp., and; |
The relative locations and sizes of these adjacent and proximal properties are further summarized in Section 23. Where applicable, summaries of the types of exploration being carried out on these properties are also provided.
The QP for this Report has been unable to verify any of the described activities related to adjacent properties. As such, this information is not necessarily indicative or related to the mineralization and resources described for the Musselwhite Mine.
The Musselwhite site team provided relevant data to DRA, which was verified by the QP using the Mining Lands Administration System (MLAS) of Geology Ontario.
| 1.17 | Interpretation and Conclusions |
| 1.17.1 | Geology And Exploration |
The Musselwhite Mine is considered an advanced property and has produced over five million ounces over its 27+ year mine life.
The geology and related controls on gold mineralization and its distribution at Musselwhite Mine and across the property in general have been well studied and are clearly understood.
The procedures and protocols followed have been proven over the years, and are considered in line with industry-best practices.
While some minor deficiencies are described within this Report, it is the QP’s opinion that there are no significant geology, exploration or drilling related issues that jeopardize the Musselwhite Mine’s ongoing viability.
Ongoing exploration and infill drilling is warranted to continue replacing extracted Mineral Reserves and add to the overall Resource base via a combination of potential mine-scale zone extensions and/or new discoveries within the greater property land package.
It is the QP’s opinion that the geological interpretation and related data are valid for the estimation of Mineral Resources. The assumptions made and methodology applied are considered reasonable and representative of typical banded iron formation-hosted Archean gold mineralization systems. As
| | December 2024 |
| | TECHNICAL REPORT –
MUSSELWHITE MINE, ONTARIO, CANADA
Document # C8630-0000-PM-RPT-001 – Rev. 0
/ Page 31 |
such, the QP considers the presented Mineral Resources to have been prepared in accordance with current CIM standards, definitions and guidelines for Mineral Resources Estimation.
| 1.17.3 | Mineral Processing And Metallurgical Testing |
Metallurgical test work completed on variability samples selected from across the current reserve show minor to no amounts of elements and minerals that are deleterious to gold recovery and reagent consumption. Ores to be processed over the current life-of-mine are consistently of moderate hardness, with respect to grinding. Gold recoveries are expected to remain high, on average, and are reasonably predicted by the 2023 site model, with occasionally lower gold recovery resulting from elevated sulfide sulfur content and potentially changing gold mineralogy. Sulfide sulfur content did not explain all recovery outliers and variability.
| 1.17.4 | Mineral Resources Estimate |
An updated MRE (effective date of December 31, 2023) was completed for the Musselwhite Mine using new information from continued drilling and exploration work since the last publicly available technical report and subsequent internal updates. The MRE is presented in Section 14 and summarized in Section 1.8.
It is the QP’s opinion that the geological interpretation and related data are valid for the estimation of Mineral Resources. The assumptions made and methodology applied are considered reasonable and representative of typical BIF-hosted gold mineralization systems.
The QP considers the reported Mineral Resources to have been prepared in accordance with current CIM standards, definitions and guidelines for Mineral Resources Estimation.
The QP is also currently unaware of any legal, title, environmental, permitting, taxation, socio- economic, geopolitical or other factor that may materially affect the MRE presented herein.
It should be noted that although additional drilling has been completed subsequent to the effective date of the MRE, the QP considers this drilling as not likely to have a significant effect on the overall resource reported herein.
Geotechnical
Musselwhite Mine is an experienced underground operation with respect to geotechnical design. There is lower operation risk in the upper areas of the mine related to geotechnical events since these are at depths and in areas that Musselwhite Mine has demonstrated experience. There is higher operational risk in the deeper areas of the mine (PQ Deeps) due to increased seismic events. In 2023 there were few seismic events compared to 15 events from January to August 2024. There is clear evidence that the Musselwhite Mine has been addressing these geotechnical challenges
| | December 2024 |
| | TECHNICAL REPORT –
MUSSELWHITE MINE, ONTARIO, CANADA
Document # C8630-0000-PM-RPT-001 – Rev. 0
/ Page 32 |
through the updating and implementing procedures outlined in the GCMP and the SRMP. In addition, the Musselwhite Mine underground geotechnical local and corporate teams have been completing studies to address geotechnical challenges. Some examples include:
| ● | Completing local 3D numerical modeling studies to identify stress related issues (diminishing pillars); |
| ● | Completing site visit reports and recommendations related to Falls of Ground (FOG) and stress related events; |
| ● | Completing studies to define changes to the ground support system due to increased seismic events; |
| ● | Recommending changes to mine production sequence (using rock pre-conditioning in secondary stopes) and modifying stope designs to minimize stope dilution; and |
| ● | Increasing coverage of the seismic system. |
The future geotechnical challenges in mining deeper in the PQ Deeps has been identified in Section 1.19.5 under Mining Risks.
This is a mature and proven brownfields mineral processing facility. Based on the available metallurgical, plant and technical information provided, and a site visit, the current flow sheet and plant infrastructure is suited for processing the current LoM reserve.
| 1.17.7 | Project Infrastructure |
The surface infrastructure currently in place, as of the date of this Report, has been adequately maintained and has demonstrated its capacity to support the current levels of mine production. It is reasonable to expect that, with ongoing sustaining maintenance, the existing infrastructure will continue to perform effectively and support future production activities.
| 1.17.8 | Environmental Studies, Permitting and Social or Community Impact |
The site has extensive monitoring programs that are reported to the agencies on a periodic basis in accordance with regulatory requirements.
The mine is advancing a wide range of ongoing studies related to the environmental and geotechnical performance of the TSF, as well surface water and groundwater modelling to support the protection of the environment and the implementation of mitigative measures. The studies, including the evaluation of closure cover requirements, options for transitioning the groundwater interception system to closure, and the possible requirement for additional mitigations and closure measures will be incorporated into the next Closure Plan update.
| | December 2024 |
| | TECHNICAL REPORT –
MUSSELWHITE MINE, ONTARIO, CANADA
Document # C8630-0000-PM-RPT-001 – Rev. 0
/ Page 33 |
Based on the available information, the Project has an after-tax NPV of $782 M using a discount rate of 5%. The sensitivity analysis indicates that the Project economics are most sensitive to the gold price and ore head grade. Even with a gold price 20% below the base case of $2,150/oz, the Project maintains a positive after-tax-NPV.
| 1.17.10 | Adjacent Properties |
Apart from the active drilling at Romios’ Lundmark-Akow Lake project, exploration work at any of the other adjacent and/or contiguous properties appears to be very early (i.e., grassroots) in nature or even non-existent.
The QP does not foresee that the claim packages on adjacent properties will have any material impact on the Musselwhite property’s continued viability, particularly with appropriate tracking of competitor exploration activities.
| 1.18.1 | Geology and Exploration |
Several opportunities exist in the Project area within both the immediate mine area and the greater land package. At the mine scale, key target areas which could provide potential zone extensions include the PQ Deeps, Lynx, Esker and Redwings trends. At the property scale, there are numerous opportunities for the discovery of new satellite or stand-alone deposits; regional lithostratigraphic and structural interpretations of airborne geophysical data indicate the potential for other BIF-hosted gold deposits similar in nature to Musselwhite, in addition to other orogenic and/or intrusion-related gold systems. Regional exploration remains ongoing to help targeting and prioritization efforts.
This is a mature and proven brownfields mineral processing facility with a flowsheet and infrastructure that is suited for the life-of-mine production plan. No notable opportunities have been identified.
| 1.18.3 | Capital and Operating Cost Estimate |
Mill spending on contractors, technical services and maintenance is higher than expectations for a conventional gold mill of this size and may represent opportunities for cost savings for the upcoming LoM.
| 1.18.4 | Adjacent Properties |
There exist opportunities in the vicinity of the Musselwhite claim package to identify new mineralized trends and/or deposits that could extend onto contiguous claim blocks of adjacent properties. With
| | December 2024 |
| | TECHNICAL REPORT –
MUSSELWHITE MINE, ONTARIO, CANADA
Document # C8630-0000-PM-RPT-001 – Rev. 0
/ Page 34 |
any future exploration successes, it may prove prudent to acquire such adjacent claims and/or consider purchases once sufficient confidence in the geology and mineralization is attained. Moreover, because the Musselwhite land package is very large and contiguous, active and ongoing exploration activities presents the opportunity for the distribution of work credits to help maintain the land package until properly explored.
Risks identified during the 2023 internal Qualified Persons checks include:
| ● | There is difficulty in comparing the granularity captured in logging codes to the interpreted lithologies, despite the geology model being well constructed and reflective of the geological understanding of the deposit. |
| ● | In some areas of the lower mine, there is a discrepancy between the geology recorded in the drilling to the back and face mapping of up to 5 m. Investigations indicated that this is an issue caused by rotational errors in the mine surveys for different drifts. This will introduce challenges in producing a unified model that supports both short- and long-term planning due to the spatial discrepancies. Additionally, F1 reconciliation will not be as representative as the variance will be related to spatial inaccuracies rather than the comparison of short- and long-term models. |
| ● | Given the limited delineation (infill) drilling opportunities in the Upper Lynx zone, the mineralization is showing wider in some areas of the resource model compared to reality. In order to mitigate this risk, the short-term planning group utilizes a short-term model that includes additional geological data (chip samples, mapping, etc.) for a more accurate representation of the mineralization. |
| ● | Due to the unfavourable orientation of a few drill holes (down-dip of a parasitic fold limb) in the Redwings zone, additional drilling is required to better delineate the mineralization and improve confidence in some of the Inferred Resources in this area. |
| 1.19.2 | Mineral Processing and Metallurgical Testing |
There are outliers in the variability test work database from which gold recovery is lower than historical plant performance and the database itself which may result in periodically lower recoveries in the plant and may indicate a change in metallurgy beyond the current life-of-mine plan.
| 1.19.3 | Mineral Resources Estimate |
Given that Musselwhite is a brownfields operation with a long history (>27 years) and proven track record with solid reconciliation, there are no significant concerns with the methodologies and procedures applied for Mineral Resource estimation purposes.
| | December 2024 |
| | TECHNICAL REPORT –
MUSSELWHITE MINE, ONTARIO, CANADA
Document # C8630-0000-PM-RPT-001 – Rev. 0
/ Page 35 |
It is the QP’s opinion that the geological interpretation and related data are valid for the estimation of Mineral Resources. The assumptions made and methodology applied are considered reasonable and representative of typical BIF-hosted gold mineralization systems.
The QP considers the reported Mineral Resources to have been prepared in accordance with current CIM standards, definitions and guidelines for Mineral Resources Estimation.
The QP is also currently unaware of any legal, title, environmental, permitting, taxation, socio- economic, geopolitical or other factor that may materially affect the MRE presented herein.
Future mining in the PQ Deeps will result in increased Transverse Longhole mining methods at greater depths than are currently experienced at Musselwhite Mine. The potential mining risks associated with mining deeper at Musselwhite Mine include the following:
| ● | Production rate impacts (possible reductions) in the PQ Deeps areas due to increased seismic activity. Increased seismic activity will result in more frequent and larger rock bursts related events that will results in temporary work stoppages and replacement of damaged ground support. Additional issues might occur in redrilling of squeezed production drill holes, using just in time development (to minimize replacing damaged ground support) in some areas and increased pillar stress in secondary stopes (areas that will be a focus of seismicity). |
| ● | Increased operating costs due to changes in ground support (more dynamic ground support, thicker mesh, extending mesh installation and using shotcrete) if required. |
| ● | Potential stress related impacts to the permanent LoM infrastructure like the ramp. The ramp is located in the hanging wall and as the mine goes deeper the ramp could be impacted by seismic related events. |
The following factors represent challenges and risks for mining the Musselwhite ore body for the remaining LoM.
| ● | Heavy traffic on the 280 mL could limit the capacity of transferring ore from the TLO to the 460 mL dumping point. As presented in the LoM schedule, 60% of the ore will be hauled on this level. |
| ● | The ventilation volume on the 280 mL will limit the quantity of heavy equipment to transport ore that could potentially impact the production from PD Deeps. |
| ● | Heavy dilution from the seismicity could impact the mine productivity. |
| ● | The actual portable cemented rockfill plants could a create bottleneck and delays in stopes backfilling in PQ Deeps. In the LoM, 60% of ore mined will be mined from this zone. |
| | December 2024 |
| | TECHNICAL REPORT –
MUSSELWHITE MINE, ONTARIO, CANADA
Document # C8630-0000-PM-RPT-001 – Rev. 0
/ Page 36 |
| ● | Heavy ground support due to the seismicity in at depth in PQ deeps will impact productivity and development costs. |
| ● | Increase in distance to transport personnel underground in PQ Deeps zone will impact total mine production. |
| ● | Distance from PQ Deeps existing infrastructure (repair shop, material transportation, etc.) will impact production. |
This is a mature and proven brownfields mineral processing facility with a flowsheet and infrastructure that is suited for the life-of-mine production plan. No notable risks have been identified.
| 1.19.7 | Tailings Storage Facility |
| ● | Careful monitoring of excess porewater pressures during construction is required to ensure that the TSF maintains geotechnical stability |
| ● | TSF geotechnical stability against static liquefaction is sensitive to phreatic level. Additional mitigations, such as installation of drainage layers to lower the phreatic surface, may be warranted to improve stability under worst case scenarios |
| 1.19.8 | Environmental Studies, Permitting and Social or Community Impact |
The key environmental risks and concerns related to the TSF and their potential impacts on the surrounding environment have been identified in Section 20.7.
The Project economic performance is highly sensitive to the price of gold, as demonstrated in the sensitivity analysis. A key risk is the possibility of a significant decline in the price of gold during the life of the Project, which would negatively impact the Project economics. This risk is somewhat mitigated by the fact that the selected gold price used in the analysis is below the current spot gold price.
| 1.20.1 | Geology and Exploration |
Geology
| · | Continue to improve understanding/interpretation of both large and small-scale structural elements that could affect zone delineation/continuity or give rise to previously unidentified zone/trend extensions (i.e., new exploration targets). |
| | December 2024 |
| | TECHNICAL REPORT –
MUSSELWHITE MINE, ONTARIO, CANADA
Document # C8630-0000-PM-RPT-001 – Rev. 0
/ Page 37 |
Resources
| ● | Additional infill drilling to increase confidence in the current resource base. |
| ● | Additional extension/expansion drilling to add new Resources to the Inferred category for future upgrading. |
| ● | Additional collection of density data, especially in previously unsampled areas (more pertinent at East Limb Deposits). |
Exploration
| ● | Conduct additional lithogeochemical studies to help identify pathfinder elements and assess mass balance of alteration fronts (i.e., zonation) towards the development of new exploration targeting strategies. |
| ● | Continue regional exploration programs focused on proximal targets/satellites, as well as more distal targets within the greater land package. |
| ● | Consider Mobile Metal Ion (MMI) soil geochemistry testwork to help with earlier stage exploration targeting. |
| ● | Continue underground drilling to target infill and extension in key mineralized zones. Consider resuming surface directional drilling at the PQ Deeps extension area (North Shore Drilling) to confirm continuity along the deposit plunge. |
| ● | Outline a long-term plan to explore the broader mine lease area and regional claims for additional BIF-hosted and other orogenic gold mineralization systems. |
Further testing planned as Musselwhite Mine is developed deeper. Laboratory testing is performed by accredited labs using ASTM standards and International Society of Rock Mechanics suggested method for rock testing.
| 1.20.3 | Mineral Resources Estimate |
The following items are recommended for further consideration:
| 1.20.3.1 | East Limb Deposits |
Geological Model
Detailed discussion of the controls on mineralization should be undertaken with emphasis on specific zones (e.g., Upper Lynx). This will help with future estimations of domaining decisions and reduce the level of geological risk associated with this zone.
| | December 2024 |
| | TECHNICAL REPORT –
MUSSELWHITE MINE, ONTARIO, CANADA
Document # C8630-0000-PM-RPT-001 – Rev. 0
/ Page 38 |
Modelling of the intraformational units within the HW Mafic package is an opportunity to increase the accuracy of the estimation in that area and add ounces to the resource. An indicator model may be helpful in defining areas of interest.
Density Measurements
It is recommended that density sampling frequency be increased in areas outside of known ore zones and to review the relevant procedure accordingly.
Review results of the ongoing density study to better understand the SG data set to inform future work. The QP recommends exploring the use of a density estimation for future updates, especially within the 4EA where the data set is most dense.
| 1.20.3.2 | West Limb Deposits |
Geological Model
The Leapfrog geological model was considered a positive improvement for estimation. However, several recommendations can be made for future work, including:
| ● | Some small lithology volumes were delivered with the model which appear to be artifacts. It would be best if these can be cleaned up for future models. |
| ● | Further interpretation of smaller scale structures and/or lithologies is likely required. For example, the Rifle 4E is a high-grade narrow structure that has been mined underground and should be properly represented in the geology model. |
| ● | Avoid using a background mafic unit to have proper separation of distinct mafic packages for estimation purposes. |
Density Measurements
It is recommended that density sampling frequency be increased and possible review of the procedure to emphasize taking SG samples on material outside of known ore zones.
It may also be recommended that a density sampling campaign be undertaken to gain more data from core that is currently on surface in storage.
Reconciliation
Monitor performance of the model as further reconciliation information is collected to ensure the estimate reflects a realistic scenario.
| | December 2024 |
| | TECHNICAL REPORT –
MUSSELWHITE MINE, ONTARIO, CANADA
Document # C8630-0000-PM-RPT-001 – Rev. 0
/ Page 39 |
| 1.20.4 | Mineral Reserve Estimate |
In the next review of mining reserves, the QP recommends that the metal price be reviewed to align with current market trends. In the case of Musselwhite, the metal price may impact mining reserves.
Based on the reviews completed, the following are geotechnical recommendations:
| ● | Complete 3D numerical modeling studies that include Mineral Reserves, Resources, High and Low potential zones. The models should be calibrated using past seismic related failures. From these studies identify potential impacts to the mine production and the stability of LoM capital infrastructure related to seismicity. |
| ● | Extend seismic system further in the PQ Deeps. |
| ● | Update seismic risk assessment based on 2024 data (by ESG) to determine future seismic event potential. |
| ● | Complete additional studies as required based on the numerical modeling study results that may include changes to production sequence in the PQ Deeps, standard and dynamic ground support system reviews, changes to re-entry protocols, stope sizing review, expansion of stope pre-conditioning and just in time development approaches. |
| ● | Retain and/or train existing underground geotechnical staff in mine seismicity related activities. |
The following items are recommended for further consideration regarding the Project's process operations:
| ● | Utilize the 2023 site gold recovery model while incorporating downside recovery risk of 2 to 4% within financial sensitivity analyses. |
| ● | Pursue metallurgical test work outliers to determine cause(s), such as mineralogical analysis and gold deportment of leach test residues. |
| ● | Align metallurgical test work with the progress of exploration to facilitate early identification of changing metallurgy, causes, and potential solutions (if justified). |
| ● | Incorporate historical and future geometallurgical data within software designed to facilitate data analyses, gold production model development and support geometallurgical program management. |
| | December 2024 |
| | TECHNICAL REPORT –
MUSSELWHITE MINE, ONTARIO, CANADA
Document # C8630-0000-PM-RPT-001 – Rev. 0
/ Page 40 |
This is a mature and proven brownfields mineral processing facility with a flowsheet and infrastructure that is suited for the life-of-mine production plan. No notable recommendations have been made.
| 1.20.8 | Tailings Storage Facility |
| ● | Advance TSF closure cover design to facilitate optimal closure |
| ● | As identified by the Independent Tailings Review Board (ITRB), the option of adding a tailings desulfurization circuit to the process flowsheet should be re-evaluated. |
| ● | Continue to refine stability and deformation analysis of TSF performance to further optimize tailings deposition protocols to protect against liquefaction. |
| ● | Continue to evaluate a range of options to improve tailings deposition to achieve the planar tailings beaches (as per deposition plan) and maximize tailings storage capacity. |
| 1.20.9 | Environmental Studies, Permitting And Social Or Community Impact |
| ● | Advance closure cover design to facilitate optimal closure. |
| ● | Initiate focused studies on the potential for incorporating a constructed wetland treatment system to address a reasonable worst-case scenario for TSF seepage water quality. |
| ● | Evaluate alternative (passive) means to support the long-term protection of Zeemel Lake. |
| ● | Initiate progressive reclamation and closure of areas of the TSF that have obtained closure configuration as soon as a closure cover design is finalized and approved. |
| ● | Further enhance the existing wetland downstream of the Polishing Pond to allow for increased hydraulic retention time and improved performance. |
| ● | Cobalt seems to be a COC for both surface water and groundwater. Continue monitoring cobalt and understanding COC fate and transport in groundwater to be able to predict the effectiveness of closure alternatives. In addition, the proponent should explore options for flexibility or a less-rigorous site-specific standard (if warranted) (ITRB, 2024). |
| ● | Continue the development and understanding of the hydrogeology and water quality conditions around the entire TSF (not just to the south) (ITRB, 2024). |
| ● | Complete a second phase of geochemical testing with focus on tailings acidification potential and effects (ITRB, 2024). |
| ● | Complete an annual “checkup” into the natural wetland to identify and address any health issues before they affect treatment performance (ITRB, 2024). |
| ● | Honour the commitments to the ICs and maintain a consistent approach in managing the social impacts and risks associated with the Musselwhite operations. |
| | December 2024 |
| | TECHNICAL REPORT –
MUSSELWHITE MINE, ONTARIO, CANADA
Document # C8630-0000-PM-RPT-001 – Rev. 0
/ Page 41 |
| 1.20.10 | Capital And Operating Costs |
A comprehensive review of contractors, technical services and maintenance spending is recommended to identify milling cost savings opportunities.
| 1.20.11 | Adjacent Properties |
Due to the aforementioned opportunities and risks associated with adjacent and/or nearby properties, the QP recommends the following:
| ● | Tracking of ongoing activities via MLS and other public sources should be monitored in order to allow for improved decision-making processes associated with landholdings. |
| ● | Maintaining an updated tracking system of current landholdings to ensure all financial obligations (or distribution of work credits) are met to avoid unplanned lapses of active claim blocks, preferably by a dedicated lands administrator or consulting service provider. |
| | December 2024 |
| | TECHNICAL REPORT –
MUSSELWHITE MINE, ONTARIO, CANADA
Document # C8630-0000-PM-RPT-001 – Rev. 0
/ Page 42 |
DRA Americas Inc. (DRA) was retained by Orla Mining Ltd. (Orla) to prepare this independent Technical Report (the Report) in collaboration with various consulting companies, including WSP Canada Inc. and SLR Consulting (Canada) Ltd. The purpose of this Technical Report is to support the disclosure of data for the active Musselwhite Mine operation (Musselwhite Mine), in accordance with NI 43-101 guidelines.
The consultants contributed to completion of the component Technical Report sections as follows:
DRA Americas Inc. (DRA): Property description and location, accessibility, climate, local resources, infrastructure, physiography, history, geological setting and mineralization, deposit types, exploration, drilling, sample preparation, data verification, mineral resource estimation, mineral processing, metallurgical testing, recovery methods, project infrastructure (site/mill), market studies and contracts, capital and operating costs for mineral processing and site/mill infrastructure, economic analysis, adjacent properties, and overall report compilation.
WSP Canada Inc. (WSP): Mineral reserve estimation, mining methods, and capital and operating costs for mining.
SLR Consulting (Canada) Ltd. (SLR): Project infrastructure (tailings storage facility, TSF), environmental studies, permitting, social / community impact, and capital and operating costs for TSF and environmental/permitting aspects.
Orla's corporate strategy is to acquire, develop, and operate mineral properties where the Company's expertise can substantially increase stakeholder value. The Company has two (2) material gold projects: (1) Camino Rojo, located in Zacatecas State, Mexico and (2) South Railroad, located in Nevada, United States.
| 2.1 | Terms of Reference and Purpose |
The purpose of the Technical Report is to support the disclosure of data for the active Musselwhite Mine operation (Musselwhite Mine), which is currently held by Goldcorp Canada Ltd., a subsidiary of Newmont Corporation, with an effective date of November 18, 2024. This Report was prepared in compliance with the disclosure requirements of the Canadian National Instrument 43-101 (NI 43-101) and in accordance with the requirements of Form 43-101 F1.
According to the plan of arrangement outlined in Orla’s press release dated November 18, 2024, entitled “Orla Mining Announces Strategic Expansion into Canada with Acquisition of the Musselwhite Gold Mine”, the transaction is expected to close in Q1 of 2025. Orla's Board of Directors has unanimously approved the transaction, subject to certain regulatory and shareholder approvals.
| | December 2024 |
| | TECHNICAL REPORT –
MUSSELWHITE MINE, ONTARIO, CANADA
Document # C8630-0000-PM-RPT-001 – Rev. 0
/ Page 43 |
The responsibilities for the preparation of the different sections of this Report are shown in Table 2.1.
Table 2.1 – Qualified Persons and their Respective Sections of Responsibilities
| Section | Title of Section | Qualified Persons |
| 1 | Summary | All |
| 2 | Introduction | Ryan Wilson (DRA) |
| 3 | Reliance on Other Experts | Ryan Wilson (DRA) |
| 4 | Property Description and Location | Ryan Wilson (DRA) |
| 5 | Accessibility, Climate, Local Resources, Infrastructure and Physiography | Ryan Wilson (DRA) |
| 6 | History | Ryan Wilson (DRA) |
| 7 | Geological Setting and Mineralization | Ryan Wilson (DRA) |
| 8 | Deposit Types | Ryan Wilson (DRA) |
| 9 | Exploration | Ryan Wilson (DRA) |
| 10 | Drilling | Ryan Wilson (DRA) |
| 11 | Sample Preparation, Analysis and Security | Ryan Wilson (DRA) |
| 12 | Data Verification | Ryan Wilson (DRA) |
| 13 | Mineral Processing and Metallurgical Testing | Dave Frost (DRA) |
| 14 | Mineral Resources Estimates | Ryan Wilson (DRA) |
| 15 | Mineral Reserve Estimates | Paul Gauthier (WSP) |
16 except for
16.2-16.4 | Mining Methods | Paul Gauthier (WSP) |
| 16.2-16.4 | Geotechnical | Paul Palmer (WSP) |
| 17 | Recovery Methods | Dave Frost (DRA) |
18 except for
18.4 and 18.5 | Project Infrastructure | Dave Frost (DRA) |
| 18.4 and 18.5 | Tailings Storage Facility and Open Pits | Jim Theriault (SLR) |
| 19 | Market Studies and Contracts | Daniel Gagnon (DRA) |
| 20 | Environmental Studies, Permitting and Social or Community Impact | Jim Theriault (SLR) |
| 21 | Capital and Operating Costs | Rick McBride (WSP) |
| 22 | Economic Analysis | Daniel Gagnon (DRA) |
| 23 | Adjacent Properties | Ryan Wilson (DRA) |
| 24 | Other Relevant Data and Information | Ryan Wilson (DRA) |
| 25 | Interpretation and Conclusions | All |
| 26 | Recommendations | All |
| 27 | References | All |
| | December 2024 |
| | TECHNICAL REPORT –
MUSSELWHITE MINE, ONTARIO, CANADA
Document # C8630-0000-PM-RPT-001 – Rev. 0
/ Page 44 |
The following QPs have completed property site visits:
Table 2.2 – Site Visit by Qualified Persons
| Qualified Person | Company | Date of Site Visit |
| Ryan Wilson | DRA | Nov. 6th and 7th, 2024 |
| Paul Gauthier | WSP | Sept. 4th and 5th, 2024 |
| 2.4 | Non-GAAP Financial Measures |
Certain financial measures referred to in this Report are not measures recognized under IFRS and are referred to as non-Generally Accepted Accounting Principles (non-GAAP) financial measures or ratios. These measures have no standardized meaning under International Financial Reporting Standards (IFRS) and may not be comparable to similar measures presented by other companies. The definitions established and calculations performed by Orla are based on management’s reasonable judgement and are consistently applied. These measures are intended to provide additional information and should not be considered in isolation or as a substitute for measures prepared in accordance with IFRS.
The Company calculates total cash costs as the sum of operating costs, royalty costs, production taxes, refining and shipping costs, net of by-product silver credits. Cash costs per ounce is calculated by taking total cash costs and dividing such amount by payable gold ounces. While there is no standardized meaning of the measure across the industry, the Company believes that this measure is useful to external users in assessing operating performance.
The Company has provided AISC performance measures that reflect all the expenditures that are required to produce an ounce of gold from operations. While there is no standardized meaning of the measure across the industry, the Company's definition conforms to the AISC definition as set out by the World Gold Council in its guidance dated November 14, 2018. The Company believes that this measure is useful to market participants in assessing operating performance and the Company's ability to generate cash flow from operating activities.
In this Report, all currency amounts are US Dollars (“USD” or “US$”) unless otherwise stated. Quantities are generally stated in Système international d’unités (“SI”) metrics units, the standard Canadian and international practices, including metric tonne (“tonne”, “t”) for weight, and kilometre (“km”) or metre (“m”) for distances. Abbreviations used in this Report are listed in Section 28.
| | December 2024 |
| | TECHNICAL REPORT –
MUSSELWHITE MINE, ONTARIO, CANADA
Document # C8630-0000-PM-RPT-001 – Rev. 0
/ Page 45 |
| 3 | Reliance on Other Experts |
The QPs have assumed, and relied on the fact, that all the information and existing technical documents listed in the References Section 27 of this Report are accurate and complete in all material aspects. While the QPs reviewed all the available information presented, we cannot guarantee its accuracy and completeness. The QPs reserve the right, but will not be obligated, to revise the report and conclusions, if additional information becomes known subsequent to the date of this Report.
Ryan Wilson fully relied upon Orla for matters pertaining to mineral claims, mining leases and related royalty information (memo received November 12, 2024), as such information is used in Section 4.
Daniel M. Gagnon fully relied upon:
| § | Royalty memo received from Orla dated November 12, 2024; and |
| § | Taxation memo received from Orla dated November 14, 2024, as such information is used in Section 22. |
| | December 2024 |
| | TECHNICAL REPORT –
MUSSELWHITE MINE, ONTARIO, CANADA
Document # C8630-0000-PM-RPT-001 – Rev. 0
/ Page 46 |
| 4 | Property Description and Location |
The Musselwhite Mine property is located in the Patricia Mining District in north-western Ontario; National Topographic System (NTS) 53 B/9, latitude 52°36'50" N and longitude 90°21'43" W. UTM Coordinates correspond to NAD83 UTM Zone 15N. The Musselwhite Mine is located on traditional territory of North Caribou Lake First Nation, in the Kenora District of Ontario, Canada (Figure 4.1). The operation is approximately 500 kilometers north of Thunder Bay and is accessible by road via Ontario highways ON-17 and ON-599N and by air.
Figure 4.1 – Musselwhite Mine Location
Source: Orla, 2024
| | December 2024 |
| | TECHNICAL REPORT –
MUSSELWHITE MINE, ONTARIO, CANADA
Document # C8630-0000-PM-RPT-001 – Rev. 0
/ Page 47 |
Gold in the area was first discovered by Allan and Harold Musselwhite (the Musselwhite Brothers) in 1962. Larger financing allowing for further work began with the Original Musselwhite Grubstake Agreement in 1973, that described the equity interest and participation percent of 10 participants plus the Musselwhite Brothers. Through the following decades, companies withdrew their interest, transferred interest, or merged companies. Presently, Musselwhite Mine is 100% owned by Newmont Corporation (Newmont)., and operated by Goldcorp Canada Ltd., a wholly owned subsidiary of Newmont. Production-related royalties are calculated annually.
Orla Mining has entered into a binding agreement to acquire Musselwhite from Newmont Corp.
The Musselwhite Property is comprised of 940 exploration claims and 338 mining leases, issued under the Ontario Mining Act.
The total of 338 leases covers a total leased area of 5,427 hectares. The area which these mining rights cover is located in the Patricia Mining Division, in the townships of Skinner Lake Area and Zeemal Lake Area, in the Provincial Grid 53B09.
Newmont held a 100% interest in the 338 mining leases which are registered under Goldcorp Canada Ltd. in the Opapimiskan Lake area of northwestern Ontario.
These leases are shown relative to the agreement area outline, lakes, mining infrastructure, and immediately surrounding claims in Figures 4.2 and 4.3; expiry dates of the claims and leases are included in Figure 4.4.
The mining leases are surrounded by the 940 exploration claims that cover 60,222 hectares covering most of the North Caribou Greenstone Belt (NCGB).
The Mining Act of Ontario grants and renews mining rights to leases and patents for a period of 21 years. Renewal/expiry of the Musselwhite Mine leases will occur between 2025 and 2033.
The leased and active mining lease groups and surface lease groups are detailed in Appendix 1. Individual leases, along with their granted dates and expiry dates, are listed in Appendix 2. A complete listing of all Musselwhite Mine owned and active claims are provided in Appendix 3. All Claims are 100% owned by Goldcorp Canada Ltd.
| | December 2024 |
| | TECHNICAL REPORT –
MUSSELWHITE MINE, ONTARIO, CANADA
Document # C8630-0000-PM-RPT-001 – Rev. 0
/ Page 48 |
Figure 4.2 – Musselwhite Mine Mining Leases
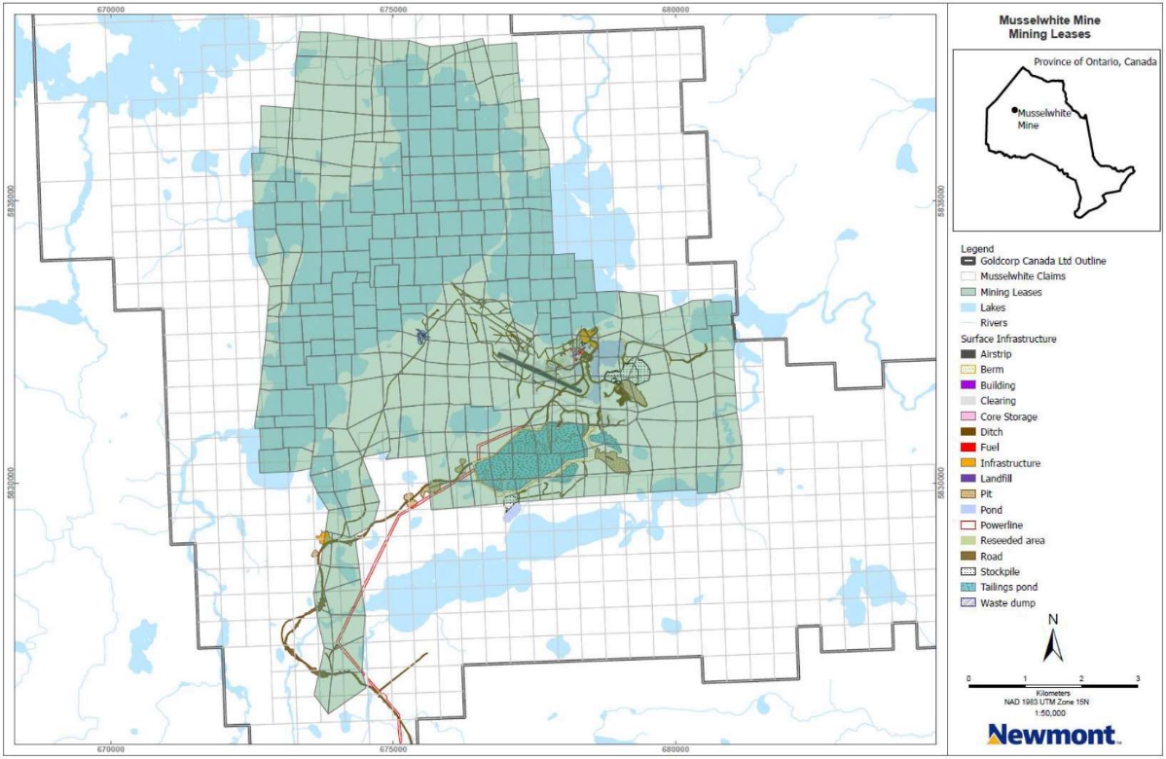
Source: Newmont, 2023
Figure 4.3 – Musselwhite Mine - Property, Claims, Leases, and Agreement Area
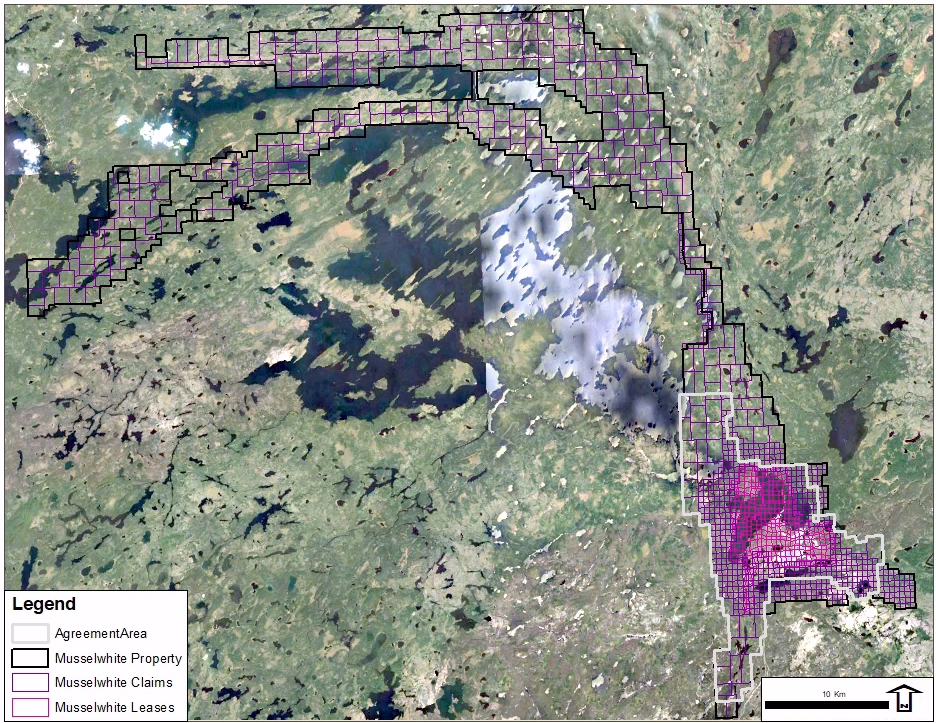
Source: Newmont, 2023
| | December 2024 |
| | TECHNICAL REPORT –
MUSSELWHITE MINE, ONTARIO, CANADA
Document # C8630-0000-PM-RPT-001 – Rev. 0
/ Page 49 |
Figure 4.4 – Musselwhite Mine Claims and Leases with Expiry Dates
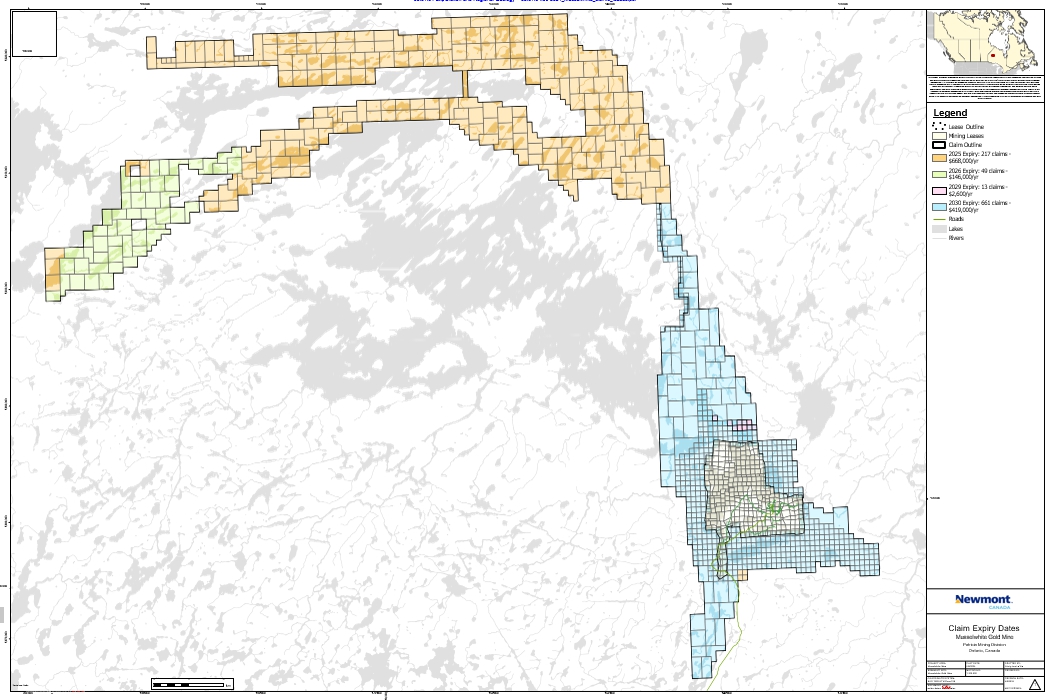
Source: Newmont, 2024
| 4.3 | Royalties, Agreement and Encumbrances |
There are currently three (3) open and active Royalty Agreements, with two being actively paid. The two agreements being paid currently are noted as follows:
| ● | 1975 – Musselwhite Brothers, Brian Musselwhite; Goldcorp Canada Ltd.; Vivian Musselwhite Started 8/8/1980, and; |
| ● | 1980 – Gold Fields Resources, currently Franco Nevada, Franco-Nevada Corporation; Goldcorp Canada Ltd. Started 9/30/1980. |
The third open agreement, which is not being paid currently as it applies to areas outside of the current mine plan is detailed as follows:
| ● | 2017 – Premier Gold Mines NWO Inc., Franco-Nevada Corporation; Goldcorp Canada Ltd.; Goldcorp Inc.; Premier Gold Mines Limited; Premier Gold Mines NWO Inc. Started 7/19/2017. |
| | December 2024 |
| | TECHNICAL REPORT –
MUSSELWHITE MINE, ONTARIO, CANADA
Document # C8630-0000-PM-RPT-001 – Rev. 0
/ Page 50 |
Musselwhite Mine is located on traditional First Nation territory and the area is surrounded by forested Crown Lands. Further details on social considerations, including agreements, are discussed in Section 20 of the Report.
In the late 1990s, in order to get the mine into production, an agreement was made with the local First Nations communities. The original agreement expired in February 2001 and was re-negotiated to terms benefiting both the First Nations peoples and the Musselwhite Mine. In the new agreement, restrictions on daily mill throughput have been removed, and revenue-sharing provisions have been incorporated to help direct some of the mine’s economic benefits directly into local communities.
The existing Musselwhite 2019 Amending Agreement with neighbouring First Nations is signed by:
| ● | North Caribou Lake First Nation; |
| ● | Kingfisher Lake First Nation; |
| ● | Wunnumin Lake First Nation; |
| ● | Windigo First Nations Council; |
| ● | Shibogama First Nations Council, and; |
| ● | Goldcorp Canada Ltd., a subsidiary of Newmont.. |
The geographic locations of the signatory communities relative to the Musselwhite Mine are presented in Figure 4.5.
The Chronological history of the Agreement is outlined as follows:
| ● | 1992 First Agreement signed; |
| ● | 1997 Commercial production began; |
| ● | 2001 Agreement renegotiated (first time for revenue sharing); |
| ● | 2007 Agreement renegotiated (revenue funding formula updated); |
| ● | 2017 Agreement Review, and; |
In 2014, Newmont entered into a cooperation agreement with Mishkeegogamang First Nation (MFN) under which MFN would receive annual payments for certain items related to the impact of Musselwhite Mine, including sustainable community and economic development. The parties are currently negotiating a new cooperation agreement with respect to Musselwhite Mine.
| | December 2024 |
| | TECHNICAL REPORT –
MUSSELWHITE MINE, ONTARIO, CANADA
Document # C8630-0000-PM-RPT-001 – Rev. 0
/ Page 51 |
There are additional currently active agreements with communities, companies and individuals for the purposes of MoU for winter road, lease, site access, easements, environmental funding, and access.
The QP is not aware of any additional encumbrances.
Figure 4.5 – Locations of the Signatory Communities Relative to the Musselwhite Mine
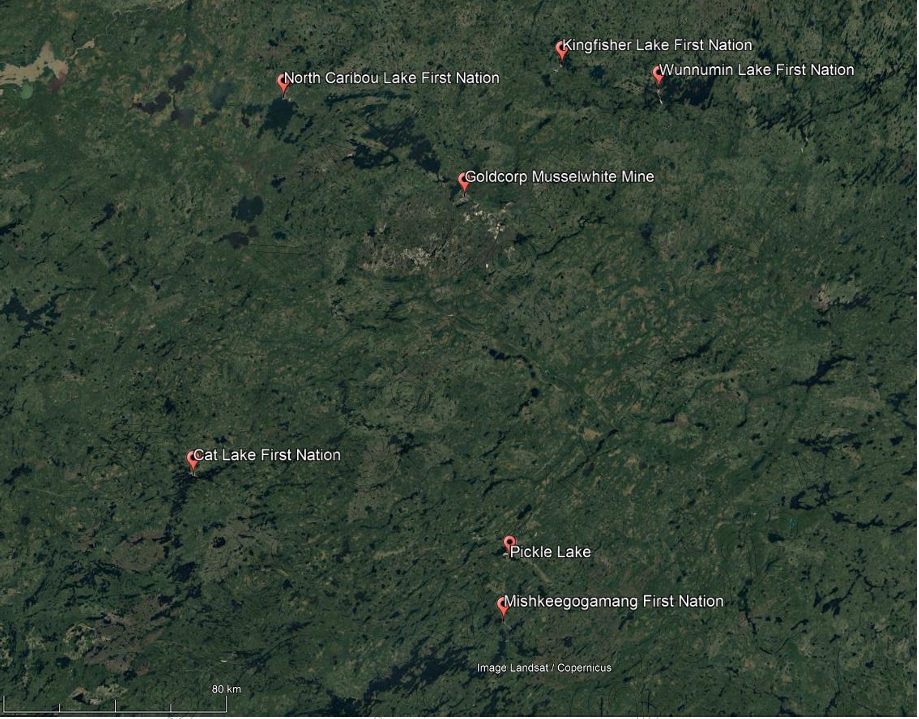
Source: Google Maps, 2024
Surface rights have also been granted by the Government of Ontario with the mining leases, with the exception of waterways and lakes. These surface rights are outlined in Section 4.2 (Appendix 1)
| | December 2024 |
| | TECHNICAL REPORT –
MUSSELWHITE MINE, ONTARIO, CANADA
Document # C8630-0000-PM-RPT-001 – Rev. 0
/ Page 52 |
| 4.5 | Environmental Liabilities and Permitting |
Musselwhite Mine is an existing mine with existing environmental and permitting considerations for operations liabilities. These permitting considerations are discussed in Section 20 of the Report. An overview of permits is presented in Table 4.1.
Musselwhite Mine and its consultants (SNC Lavalin, Golder Associates Ltd., Piteau Associates, Water Management Consultants, Minnow Environmental Inc., O’Kane Consultants Inc.) have prepared the technical data concerning the environmental and closure aspects of the mine site.
Currently, the mine site appears to be following all applicable corporate standards and environmental regulations. All requisite permits have been obtained for the mining and continued development of the mine site.
Table 4.1 – Overview of Permits
| Issuing Ministry | Type of Permit or
Approval | Permit ID | Permit Issue
Date | Permit Expiry
Date |
| Ministry of Natural Resources and Forestry | Aggregate Permit | 17622 | 11/9/2009 | N/A |
| Ministry of Natural Resources and Forestry | Aggregate Permit | 605203 | 8/17/2005 | N/A |
| Ministry of Natural Resources and Forestry | Aggregate Permit | 98807 | 11/1/2001 | N/A |
| Ministry of Natural Resources and Forestry | Consolidated Work Permit | N/A | 8/1/2024 | 8/15/2028 |
| Ministry of Natural Resources and Forestry | Land Use Permit | SL-2021-PLA-00020-LUP-001 | 8/1/2021 | 7/31/2026 |
| Ministry of Natural Resources and Forestry | Land Use Permit | LUP 1225-1005841 | 10/1/2015 | 9/30/2025 |
| Ministry of Natural Resources and Forestry | Burn Permit | SLK-001 | 2/6/2024 | 10/31/2024 |
| Ministry of Mines | Closure Plan Amendment | N/A | 7/31/2019 | N/A |
| Ministry of Environment, Conservation and Parks | Environmental Compliance Approval | 5276-CDTGPL | 7/25/2022 | N/A |
| Ministry of Environment, Conservation and Parks | Permit to Take Water (PTTW) | PTTW 3616-BW6KZY | 12/10/2020 | 6/23/2030 |
| Ministry of Environment, Conservation and Parks | Permit to Take Water (PTTW) | PTTW 1323-BEZMZ2 | 9/19/2019 | 9/18/2029 |
| Ministry of Environment, Conservation and Parks | Permit to Take Water (PTTW) | PTTW 4846-A2DGU5 | 9/28/2015 | 9/30/2025 |
| Ministry of Environment, Conservation and Parks | Permit to Take Water (PTTW) | PTTW 8884-A2DGZA | 9/28/2015 | 9/30/2025 |
| | December 2024 |
| | TECHNICAL REPORT –
MUSSELWHITE MINE, ONTARIO, CANADA
Document # C8630-0000-PM-RPT-001 – Rev. 0
/ Page 53 |
| Issuing Ministry | Type of Permit or
Approval | Permit ID | Permit Issue
Date | Permit Expiry
Date |
| Ministry of Environment, Conservation and Parks | Permit to Take Water (PTTW) | PTTW 6201-9EPJH7 | 1/6/2014 | 1/6/2034 |
| Ministry of Environment, Conservation and Parks | Air Emissions | 5751-AYEPSJ | 5/24/2018 | N/A |
| Ministry of Environment, Conservation and Parks | Air Emissions | COA 4814-8DESGE | 2/4/2011 | N/A |
| 4.6 | Other Significant Factors and Risks |
To the extent known to the QP, there are no other significant factors and risks that may affect access, title, or the right or ability to perform work on the Musselwhite Mine that have not been discussed in this Report.
| | December 2024 |
| | TECHNICAL REPORT –
MUSSELWHITE MINE, ONTARIO, CANADA
Document # C8630-0000-PM-RPT-001 – Rev. 0
/ Page 54 |
| 5 | Accessibility, Climate, Local Resources, Infrastructure, and Physiography |
The property is accessed by chartered air service from Thunder Bay and a weekly community flight is from Sioux Lookout/Pickle Lake and touches down in Cat Lake, North Caribou Lake, Kingfisher Lake and Wunnumin Lake. A 1,500 m gravel strip suitable for STOL-type (short take-off and landing) aircraft is maintained year-round on site. A 45 km all-weather road connects the property with the North Road (formerly Ontario Provincial Highway 808) that extends north from the town of Pickle Lake.
The communities of Mishkeegogamang and Pickle Lake have year-round road access. Communities north of Pickle Lake have winter road access from the North Road to Windigo Lake. For the remainder of the year, access to these northern communities is by aircraft.
The community of Pickle Lake serves as a distribution center for many of the northern communities since it has both air and ground freight services. It is also a transfer point for air traffic connecting to Thunder Bay and Sioux Lookout. Industries operating north of Pickle Lake are based on the natural resource sector and include forestry and fishing. Tourism and craft activities also create limited levels of employment opportunities.
The nearest permanent weather monitoring station is located in Pickle Lake. Weather statistics from Environment Canada (https://www.canada.ca/en/services/environment/weather/data-research. html) for the period 1990 – 2012 indicate a mean daily temperature of 0.7°C. Temperatures for the period range between a maximum of 39°C and a minimum of -43°C. The mean annual rainfall is recorded at 510 mm and the mean annual snowfall is 249 cm. The average wind speed is 8.5 km/h and predominantly originates from the west.
Despite the extreme cold in winter the mine has operated year-round in the past and there is no reason foreseen that this will change in the future.
| 5.3 | Local Resources and Infrastructure |
Local Resources include, but are not limited to:
| ● | Shibogama OEMS Joint Venture Services; |
| ● | Mishkeegogamang First Nation corporation; |
| | December 2024 |
| | TECHNICAL REPORT –
MUSSELWHITE MINE, ONTARIO, CANADA
Document # C8630-0000-PM-RPT-001 – Rev. 0
/ Page 55 |
| ● | North Caribou First Nation, and; |
There is also local population which account for approximately 19% of the workforce at the mine.
As the mine is located in a remote area, it relies heavily on Skilled Labour sourced from throughout the greater mining areas of northwestern Ontario.
Infrastructure to take water supply from Opapimiskan Lake to the mine is abundant and not a limiting factor under the Permit to take water (up to 10,460,000 litres / day).
Road access to the Musselwhite site is by all-weather gravel road from the Town of Pickle Lake. The 42 km Musselwhite access road begins at the North Road approximately 160 km from Pickle Lake. There are six (6) Bailey type bridges between Pickle Lake and the turnoff to Musselwhite and one bridge built to MNR standards on the Musselwhite access road. Site personnel fly in and fly out of the site on a mine owned aircraft that is operated by Wasaya Airlines from Thunder Bay and a weekly community flight is from Sioux Lookout/Pickle Lake and touches down in Cat Lake, North Caribou Lake, Kingfisher Lake and Wunnumin Lake.
Provincial power and communication lines currently service the mine from the substation located at Pickle Lake via the Musselwhite-owned and operated overhead power transmission line.
More recently power to the site was upgraded via a connection to power supplied by Wataynikaneyap Power LP.
The Wataynikaneyap Project, a power grid expansion links 17 remote communities in Northern Ontario and expands the power capacity line serving Musselwhite Mine (completed July 2023) from a maximum site capacity of 19,500 kW to 23,000 kW.
Musselwhite’s airstrip, camp, mine complex, tailings storage facility, and mill area are located on the south shore of Opapimiskan Lake (Figure 5.1).
The major infrastructure at the mine site consists of the STOL airstrip, ATCO-type bunkhouses, a recreation/kitchen facility, ATCO-type offices, the mill buildings, a tailings pond, a portal and conveyor adits, an exploration shaft, a fresh air ventilation raise, and various pump stations and drill access roads.
The topography of the mine site is relatively flat, with granite intrusions associated with regional highlands. Local relief, which ranges from 5 m to a maximum of 45 m, can be attributed to glacial deposits in the form of moraines, eskers, and drumlins. Extensive, low-lying swampy areas surround
| | December 2024 |
| | TECHNICAL REPORT –
MUSSELWHITE MINE, ONTARIO, CANADA
Document # C8630-0000-PM-RPT-001 – Rev. 0
/ Page 56 |
streams, ponds, and lakes on the property. The elevation of Opapimiskan Lake is reported to be 300.5 m and 296.0 m by the East Bay Mine grid and the Surveying and Mapping Branch of the Department of Energy, Mines and Resources, respectively. Regional drainage is north-east towards Hudson Bay, with an average gradient of 3 m/km.
The Opapimiskan Lake area lies within the northern coniferous section of the boreal forest. Predominant species include black spruce, tamarack, and cedar, with local stands of white birch, jack pine, and poplar on better-drained areas such as eskers and moraines. A forest fire destroyed most of the area south of Opapimiskan Lake in 1979. Vegetation is slowly returning, but currently has no economic value.
The physiography of the Musselwhite Mine area is favourable for underground (U/G) mining with sufficient room for a processing plant, waste rock dumps, tailings storage, and other mine infrastructure.
| 5.5 | Other Significant Factors and Risks |
To the extent known to the QP, there are no other significant factors and risks that may affect the viability of the mine that have not been discussed in this Report.
| | December 2024 |
| | TECHNICAL REPORT –
MUSSELWHITE MINE, ONTARIO, CANADA
Document # C8630-0000-PM-RPT-001 – Rev. 0
/ Page 57 |
Figure 5.1 – Opapimiskan Lake and Musselwhite Mine
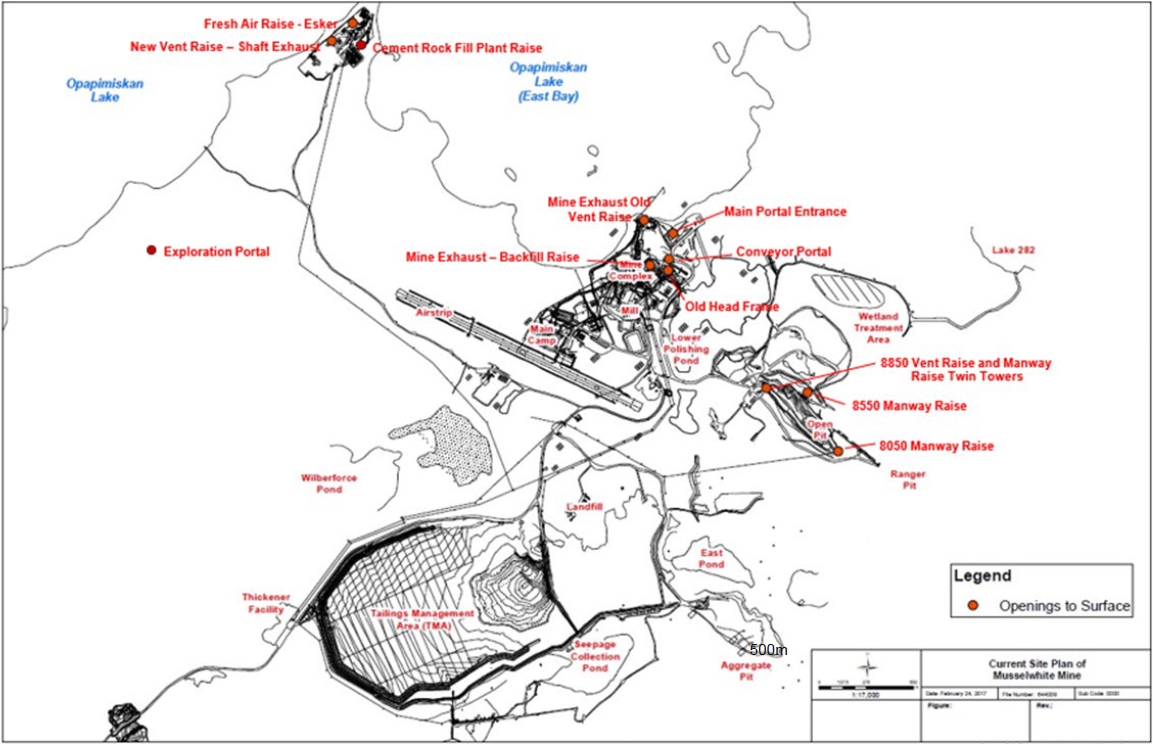
Source: Goldcorp, 2016
| | December 2024 |
| | TECHNICAL REPORT –
MUSSELWHITE MINE, ONTARIO, CANADA
Document # C8630-0000-PM-RPT-001 – Rev. 0
/ Page 58 |
The Weagamow-North Caribou Lake belt was first mapped by Satterly (1941) at a scale of 1” to 1 mile. Emslie (1962), Thurston (1979) and Andrews et al. (1981) subsequently mapped the area at a reconnaissance scale. In 1960, the Ontario Department of Mines (ODM), now the Ontario Geological Survey (OGS), completed an airborne magnetic survey over the belt at a scale of 1" to 1 mile.
From 1984 to 1986, an integrated geosciences survey of the belt was undertaken by the OGS. This work included bedrock and surface mapping, mineral deposit and aggregate assessment studies, and reconnaissance till prospecting for gold. Results of this work are reported by Breaks et al. (1984, 1985, and 1986) and Piroshco and Shields (1985). The area was also covered by an airborne electromagnetic and magnetic survey in 1985 (OGS, 1985).
Harold and Alan Musselwhite first discovered gold mineralization in the Opapimiskan Lake area in 1962. Exploration efforts were restricted to a gold-bearing quartz- carbonate vein on the north shore of Opapimiskan Lake, and to an occurrence named the IF Showing on the south shore.
From 1962 to 1963, Inco Limited conducted an 18-hole diamond drill hole program around Zeemal Lake and an additional eight holes in the areas of Karl and Markop Lakes.
Late in 1963, Kenpat Mines Ltd. conducted geophysical and geological mapping surveys, performed extensive trenching, and completed 20 diamond drill holes totalling 1,171 m prior to abandoning the property.
The Musselwhite Prospecting Grubstake was initiated in 1973 to explore the Opapimiskan Lake area for gold mineralization. Three surface gold showings, the No. 1, No. 2, and Everyway showings, were discovered by Harold and Allan Musselwhite by panning regolith material covering iron formation outcroppings on the south shore of Opapimiskan Lake.
During the period 1973 through 1983, considerable exploration in the form of prospecting, geological mapping, soil and rock sampling, trenching, geophysical surveying, and extensive surface diamond drilling was completed. In addition, a cut and chained picket grid, with lines at 120 m (400 ft) centers, was established and used as control over the entire property. This grid has not been maintained and, although it can still be seen in selected areas, is of little value to present exploration.
The Musselwhite Joint Venture was formed in 1983. In the fall of that year, construction of the winter access road was initiated to facilitate an underground exploration and bulk sampling program on the West Anticline area. A 605 m ramp was driven to access mineralization on the 215 m level. During the program, a 5,180-t bulk sample was mined and 1,756 m of underground drilling was completed. In November 1984, the Project was completed and the excavations were allowed to flood. The results of this work, failed to substantiate the grade and continuity of mineralization indicated from surface drilling. As a consequence, exploration ceased in this portion of the property.
| | December 2024 |
| | TECHNICAL REPORT –
MUSSELWHITE MINE, ONTARIO, CANADA
Document # C8630-0000-PM-RPT-001 – Rev. 0
/ Page 59 |
In 1985, a limited surface diamond-drilling program was conducted to test other favourable iron formation targets on the property and to maintain the remaining mining claims in good standing. Two significant drill intersections were reported from targets in the East Bay Area. Following an office compilation program, surface drilling in 1986 confirmed that a discovery with economic potential had been made.
Through 1986 up to September 1987, four separate gold zones were identified and delineated. In the fall of 1987, a Pre-Feasibility Report addressing the economic viability of mining the T-Antiform deposit was completed. Based on the results of this study, an underground exploration program was initiated in January 1988 to test this mineralized zone. In conjunction with this underground program, surface diamond drilling continued during the winter months in 1988 and 1989, with the objective of delineating the plunge extent of the T-Antiform Deposit. A 240 m vertical shaft was excavated with drifts and cross-cuts developed on the 100 m, 150 m, and 200 m levels. A 5,500-t bulk sample and 178 underground diamond drill holes were completed in order to evaluate the potential of the T-Antiform. Once again, the Project was deemed to be uneconomic, and the workings were allowed to flood.
A small surface drill program was conducted in early 1992, with the objective of locating a high-grade gold zone in order to revive the project. In the fall of 1992, it was determined that the property had the potential to support a 2,500 tpd operation and provide an attractive cash flow. Late in 1992, Placer Dome acquired Homestake's 25% interest in the property. In January 1993, accelerated exploration began, with the principal objectives of defining the extent, grade and continuity of the T- Antiform deposit between 10,000N and 10,500N, and evaluating the open pit potential of the OP Zone. During 1994, diamond drilling continued on the north extension of the T- Antiform and on near-surface targets with open pit potential. In addition, a major underground program to dewater and refurbish the old 1989 workings was instituted to facilitate the collection of a 30,000-t bulk sample and to conduct approximately 28,000 m of underground diamond drilling from 10,000N to 10,500N.
After re-examination of all available data in February 1996, a decision was made by Placer Dome and TVX Gold to proceed with the construction of a 3,300 tpd mine with Placer Dome as the operator. Construction began shortly thereafter.
The extraction of the OP zone in the open pit workings began in August 1996, and full production was initiated from the underground workings in early April of 1997.
The Musselwhite Mine’s construction from 1996 to 1997, concluded with the wet commissioning of the mill and the first ounce poured on March 10, 1997.
The mine underwent a capital expansion in 2002 and 2003 that included the installation of underground crushing and conveying facilities, and the upgrade of mill facilities in an attempt to
| | December 2024 |
| | TECHNICAL REPORT –
MUSSELWHITE MINE, ONTARIO, CANADA
Document # C8630-0000-PM-RPT-001 – Rev. 0
/ Page 60 |
expand production to 4,000 tpd. Mill trials in 2005 showed that the mill was capable of sustaining a milling rate of 4,600 tpd.
During the years 2003-2006, much effort was placed on mine exploration to replace production and enhance the reserve database. This effort ultimately resulted in the discovery of the PQ Deeps deposit.
The Musselwhite Mine’s long and storied history that spans over four decades is summarized in Table 6.1.
Table 6.1 – Musselwhite Mine Chronology
| Year | Description |
| 1960 | Harold and Alan Musselwhite prospect the region. |
| 1962 | Gold first discovered in the area by brothers Harold and Allan Musselwhite of Kenpat Mines Ltd. who found erratic gold mineralization in a quartz vein on the north side of Opapimiskan Lake and several showings in iron formation on the south side of the lake. |
| 1962 to 1973 | Early exploration and claims to gold at the site |
| 1973 | The Musselwhite Prospecting Grubstake is initiated |
| 1973 to 1984 | Several exploration campaigns are carried out. |
| 1983 | The Musselwhite Joint Venture is formed. |
| 1985 to 1986 | Surface drilling confirms a discovery with economic potential has been made. |
| 1986 to 1987 | A Pre-Feasibility Study is completed. |
| 1988 to 1989 | An underground exploration program is completed. The three (3) remaining partners, Placer Dome (43%), Inco Gold (32%) and Corona (25%), initiate a feasibility study. The economics do not justify developing the mine. |
| 1992 to 1993 | A drilling program focuses on the OP and PQ mineralized zones. |
| 1993 | Placer Dome purchases the 25% share of Musselwhite, acquired by Homestake Mining Co. through the latter's merger with Corona. |
| 1994 | An underground program begins on the T-Antiform structure. The PQ zone is explored by surface diamond drilling. |
| 1994 to 1995 | Sinking of exploration shaft commences. |
| 1995 | All-weather road connection to north road is completed. Portal excavation commences. |
| 1996 | The Musselwhite Joint Venture partners decide to put the property into production, and construction begins immediately following completion of a feasibility study. Underground development of the T-Antiform deposit, and open pit mining of the OP zone, begin. |
| 1997 | The first gold bar is poured on March 10, 1997, and the mine enters commercial production on April 1, 1997. Production from the open pit is suspended in August 1997. |
| 2001 | One million ounces are produced as of November 7, 2001. |
| 2002 | Underground crusher and conveyor are commissioned. |
| | December 2024 |
| | TECHNICAL REPORT –
MUSSELWHITE MINE, ONTARIO, CANADA
Document # C8630-0000-PM-RPT-001 – Rev. 0
/ Page 61 |
| Year | Description |
| 2002 to 2003 | The merger of Kinross, TVX, and Echo Bay is completed. The new Kinross Gold Corporation acquires approximately 32% of the Musselwhite Mine. |
| 2003 | PQ Deeps deposit discovered. This deposit is notably higher grade than the existing mine’s reserve at the time. |
| 2005 | Mine produces record 250,383 ounces of gold. |
| 2006 | Barrick successfully completes take-over of Placer Dome and sells Musselwhite Mine to Goldcorp Canada Ltd. |
| 2006 | Total gold production reaches 2 million ounces. |
| 2007 | Mining commenced in the Esker Deposit. Goldcorp acquired the 32% Kinross Gold Corporation participation becoming the 100% owner. |
| 2010 | Third millionth ounce pour. In February Musselwhite becomes the first Canadian Mine to adopt the International Cyanide Code. |
| 2011 | Esker Vent shaft sinking project commenced. |
| 2012 | June the site was evacuated, except for a skeleton crew, due to a severe forest fire. It was stopped by the MNR fire fighters, mostly aircraft, very close to the Esker site. |
| 2014 | September Harmonic filter bank installed and commissioned at Esker site; Poured cumulative 4,000,000 oz Au on July 31, 2014; Abandonment of the Esker Mine Shaft Project; the 6.2 m (20.3 ft) diameter shaft is now used as an exhaust raise from 315 m (1,033.5 ft) L. The Esker Mine Shaft Project was cancelled in favour of the new Winze Project. |
| 2015 | Total gold production reaches 4 million ounces. |
| 2016 | Materials Handling Project works commence; The unlined raise (“Esker Mine Shaft”) was completed in 2016. Two new 2,012 kW (1,500 hp) variable pitch downcast fans were installed for this project and also to upgrade existing mine ventilation. |
| 2017 | Implementation of multi-unit tele-remote scoop operation on site and remote mucking operation from Thunder Bay office. Underground tagging and tracker system (Electronic Tag Board) implemented. |
| 2018 | Musselwhite Integrated Remote Operations Centre (IROC) opened in Thunder Bay in June to provide tele remote operational support to the underground mining operations. |
| 2019 | Newmont acquired Musselwhite in connection with its $10-billion acquisition of Goldcorp in 2019. Materials Handling Project completed, with the first ore processed in Q1. |
| 2019 to 2021 | Conveyor system caught fire on March 29, leading to a power shutdown and subsequent flooding that would halt production for a period of nearly 1 year. Restoration efforts were nearing completion when Covid-19 pandemic related shutdowns led to further commissioning delays in 2020 and 2021. |
| 2020 | Geotechnical studies and Map3D numerical model completed to assess the proposed mine plan and provide guidance on PQD Extension 1. |
| 2021 | Strategic planning session with a cross-functional team to understand the potential of the PQD orebody / align on the path to add PQD reserves to the LoM. Supported by completion of much technical work / test work / studies. |
| 2022 | In 2022, Musselwhite transitions all line-of-sight load, haul and dump activities underground to fully remote operations with the introduction of automation technology. |
| | December 2024 |
| | TECHNICAL REPORT –
MUSSELWHITE MINE, ONTARIO, CANADA
Document # C8630-0000-PM-RPT-001 – Rev. 0
/ Page 62 |
| Year | Description |
| 2023 | Electrical Upgrade completed - The Wataynikaneyap Project, expands the power capacity line serving Musselwhite Mine from a maximum site capacity of 19,500 kW to 23,000 kW. |
| 2024 | As announced on November 18, 2024, Orla Mining Ltd. agreed to acquire Musselwhite from Newmont. |
| 6.2 | Historic Gold Production |
As of February 28, 2024, the operation has milled approximately 30.5 Mt of ore at a head grade of approximately 5.68 g/t Au, for a total of over 5.5 million recovered ounces (Table 6.2).
Table 6.2 – Musselwhite Mine Production History
| Year | Tonnes | Grade | Ounces |
| 1997 | 960,693 | 5.34 | 159,991 |
| 1998 | 1,194,483 | 5.49 | 199,821 |
| 1999 | 1,218,925 | 5.61 | 209,232 |
| 2000 | 1,230,768 | 6.47 | 245,206 |
| 2001 | 1,290,225 | 5.90 | 232,988 |
| 2002 | 1,156,856 | 5.91 | 209,459 |
| 2003 | 1,330,321 | 5.45 | 222,465 |
| 2004 | 1,457,639 | 5.35 | 240,046 |
| 2005 | 1,476,584 | 5.42 | 250,383 |
| 20061 | No data | No data | No data |
| 20071 | 1,325,726 | 5.45 | 222,379 |
| 20081 | 1,236,800 | Missing data | 210,500 |
| 20091 | 1,289,472 | 5.93 | 233,823 |
| 20101 | 1,446,814 | 5.78 | 258,638 |
| 20111 | 1,327,300 | 5.91 | 242,000 |
| 20121 | 1,299,600 | 6.03 | 239,200 |
| 20131 | 1,391,800 | 5.92 | 256,300 |
| 20141 | 1,221,200 | 7.38 | 278,300 |
| 20151 | 1,209,200 | 7.15 | 270,300 |
| 20161 | 1,188,000 | 7.17 | 261,000 |
| 20171 | 1,221,000 | 6.90 | 236,000 |
| 20181 | 1,106,000 | 5.96 | 205,000 |
| | December 2024 |
| | TECHNICAL REPORT –
MUSSELWHITE MINE, ONTARIO, CANADA
Document # C8630-0000-PM-RPT-001 – Rev. 0
/ Page 63 |
| Year | Tonnes | Grade | Ounces |
| 20191,2 | 15,800 | Missing data | 3,000 |
| 20201 | 733,000 | 4.51 | 100,000 |
| 2021 | 923,219 | 5.34 | 152,251 |
| 2022 | 1,042,193 | 5.40 | 173,317 |
| 2023 | 1,028,185 | 5.70 | 180,418 |
| 20243 | 149,774 | 6.00 | 27,573 |
| Totals 1997-20243,4 | 30,471,577 | 5.68 | 5,519,590 |
Note: 1. Data source: Ontario Mineral Inventory, 2024 https://www.geologyontario.mndm.gov.on.ca/mndmfiles/mdi/data/records/MDI53B09SW00007.html 2. 2019 – Conveyor Fire. 3. 2024 - Partial year to June 2024 4. Totals calculated using rounded tonnes and ounces from 2006 to 2020, so may not reconcile exactly with other sources. |
| 6.3 | Other Significant Factors and Risks |
To the extent known to the QP, there are no other significant historical factors and risks that may affect the mine’s viability that have not been discussed in this Report.
| | December 2024 |
| | TECHNICAL REPORT –
MUSSELWHITE MINE, ONTARIO, CANADA
Document # C8630-0000-PM-RPT-001 – Rev. 0
/ Page 64 |
| 7 | Geological Setting and Mineralization |
The North Caribou Greenstone Belt (NCGB) is located in the middle of the North Caribou terrane of the Western Superior Province, on the south side of a large-scale crustal boundary between the North Caribou Core and Island Lake Domain (Stott et al., 2010) as depicted in Figure 7.1. It comprises nine volcanic-dominated assemblages formed during two major magmatic phases dated at ca. 2980 and ca. 2870 Ma. Sedimentary-dominated assemblages lie in the core of the NCGB and are interpreted to have been deposited after 2980 Ma in the northern NCGB, and after 2850 Ma in the southeastern NCGB. Stratigraphic correlations between assemblages of the NCGB are based on the nature of their contacts, geochronological constraints, and geological and geochemical characteristics of their respective sequence. All assemblages are metamorphosed ranging from greenschist to amphibolite, with rare pockets of granulite. The NCGB is bounded by five main intrusive phases emplaced during the two magmatic phases at ca. 2870-2850 Ma and ca. 2750-2690 Ma (Oswald, 2018 and references therein).
The envelope of the main structural fabric and fold structures is roughly parallel to the contact of the narrow, elongate, two-arc shape of the North Caribou belt. Three (3) major phases of ductile to brittle-ductile deformation have been documented (D1, D2, D3) with the dominant regional structural pattern being related to D2. Gold occurrences have been identified in seven of the nine assemblages of the NCGB. Other commodity occurrences include Ag-Zn-Pb-Cu, Zn-Cu-Pb and Pt-Pd. Gold is frequently spatially associated with D2 related structures. Most gold occurrences are quartz-vein type hosted in mafic volcanic rocks and silicate facies iron formation, with subordinate mineralization hosted in biotite and amphibolite schists. (Oswald, 2018 and references therein).
Much of the greenstone belt, including the mine area, is covered by water and glacial overburden. Bedrock exposure within the mine lease is estimated at less than 2% of the total area, resulting in interpretation of the bedrock geology relying heavily upon geophysical methods (e.g., airborne magnetic surveys) and drill hole data. One such aeromagnetic interpretation is presented in Figure 7.2.
At the mine property scale (Figure 7.3), rock units are folded into a series of open folds in the West Anticline Area, a tight synform (the East Bay Synform) and a near vertical limb (the PQ limb). Musselwhite Mine geology staff interprets that the East Bay Synform, which contains over 95% of the mineral resource, is a shear zone with dextral offset.
| | December 2024 |
| | TECHNICAL REPORT –
MUSSELWHITE MINE, ONTARIO, CANADA
Document # C8630-0000-PM-RPT-001 – Rev. 0
/ Page 65 |
Figure 7.1 – Musselwhite Mine Regional Geologic Setting

Source: Oswald, 2018
Figure 7.2 – Regional Scale Litho-Structural Interpretation
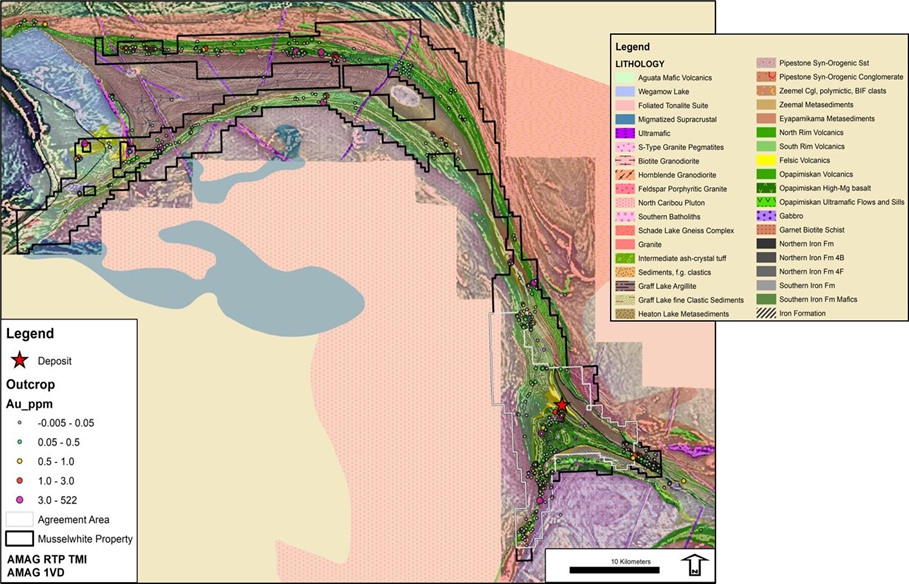
Source: Newmont, 2024
| | December 2024 |
| | TECHNICAL REPORT –
MUSSELWHITE MINE, ONTARIO, CANADA
Document # C8630-0000-PM-RPT-001 – Rev. 0
/ Page 66 |
Figure 7.3 – Geological Setting of the Musselwhite Mine
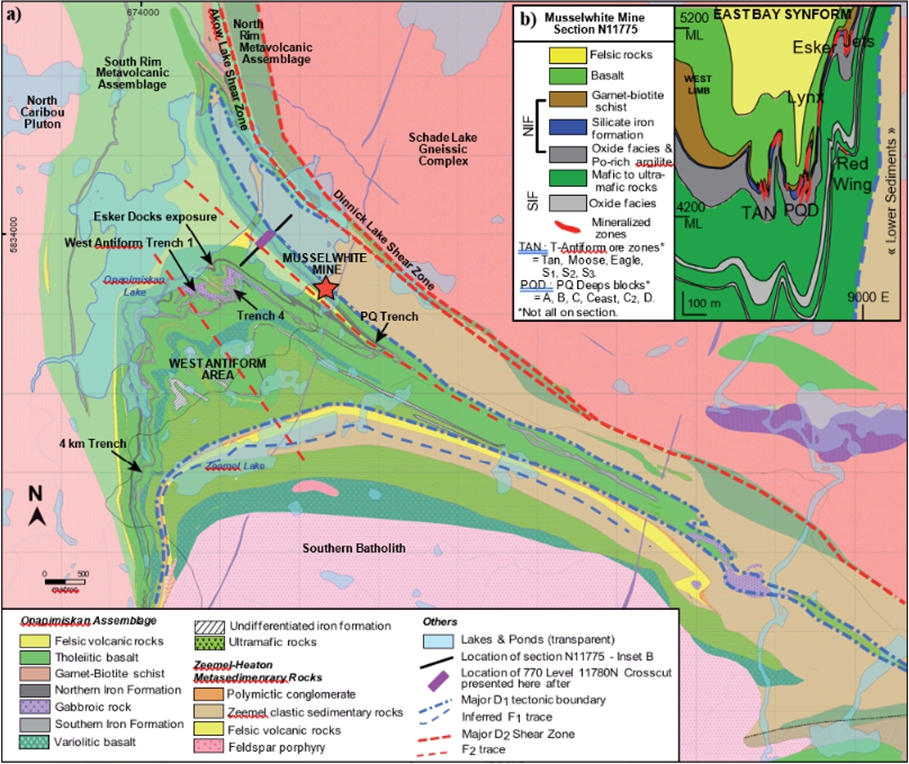
Source: Oswald et al., 2015
The stratigraphy of the mine area consists of basalts, a suite of iron formations, metasediments, and a felsic volcanic unit. These rock units appear to maintain a consistent stratigraphic relationship and unit thickness (except for tectonic thickening and fault duplication) over a broad area beyond the limits of the mine area. Through time and changes in logging protocol, the nomenclature for various units has evolved. The mine stratigraphic units are described in Figures 7.4 and 7.5. A representative composite vertical section through 12,500N (Figure 7.6) also illustrates the stratigraphic relationships of the units with respect to the complex folding across the mine property.
Gold in the mineral resource category is dominantly found within the lithologies of the Northern Iron Formation and is most strongly associated with the 4EA lithology (Figures 7.4 and 7.5). Exceptions to this rule include the Thunderwolves and Redwing zones, where gold is mostly contained within the iron formation units of the SIF along the East Limb.
| | December 2024 |
| | TECHNICAL REPORT –
MUSSELWHITE MINE, ONTARIO, CANADA
Document # C8630-0000-PM-RPT-001 – Rev. 0
/ Page 67 |
Figure 7.4 – Musselwhite Mine Stratigraphy – East Limb

Source: Oswald, 2018
| | December 2024 |
| | TECHNICAL REPORT –
MUSSELWHITE MINE, ONTARIO, CANADA
Document # C8630-0000-PM-RPT-001 – Rev. 0
/ Page 68 |
Figure 7.5 – Musselwhite Mine Stratigraphy – West Limb
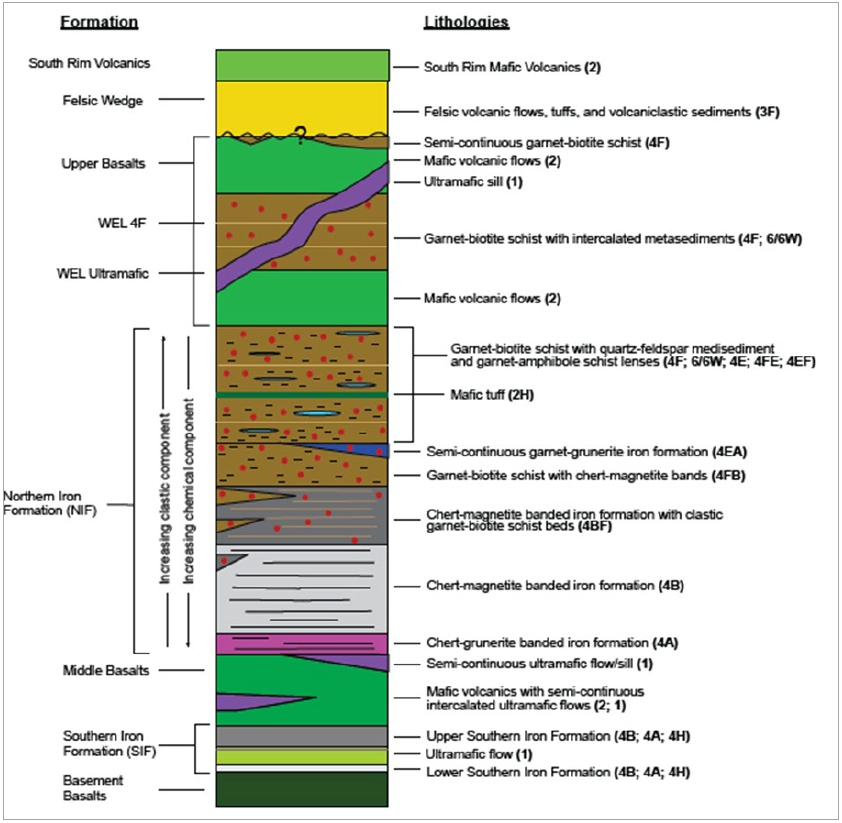
Source: Oswald, 2018
| | December 2024 |
| | TECHNICAL REPORT –
MUSSELWHITE MINE, ONTARIO, CANADA
Document # C8630-0000-PM-RPT-001 – Rev. 0
/ Page 69 |
Figure 7.6 – Musselwhite Mine Section 12,500N (Looking North)
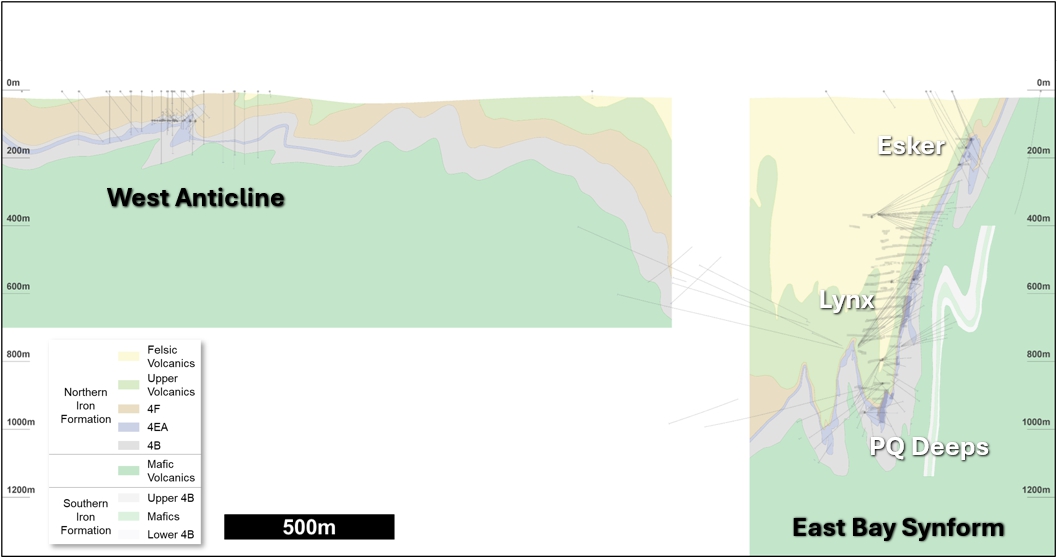
Source: Orla, 2024 (modified after AMEC, 2006)
| | December 2024 |
| | TECHNICAL REPORT –
MUSSELWHITE MINE, ONTARIO, CANADA
Document # C8630-0000-PM-RPT-001 – Rev. 0
/ Page 70 |
The broader architecture of the structural geology at the mine is relatively simple, starting from the west the lithologies are folded into a series of open anticlines and synclines (the West Anticline). Moving east, units are clearly sheared and exhibit tighter folds in the East Bay Synform (T-Antiform), progressing into near vertical and parallel lithologies in the east. It is interpreted that the pattern of increasing strain and shearing from west to east is associated with the North Caribou – Totogon shear zone. A structural interpretation map of the general mine area is provided in Figure 7.7.
In the immediate vicinity of the mineral reserves the lithologies are sheared and folded into a tight anticline-syncline pair, with both plunging at 10 to 15 degrees to the north-west (mine grid north); these relationships are shown on a representative geological plan map of the 595 mL (Figure 7.8). The development of areas of higher strain or shear zones, thought to be contemporaneous with the folding, are now known to be directly related to gold mineralization (Figure 7.9).
The mineralized zones have a complex relationship between brittle and ductile deformation, with both deformation styles being evident at both meso- and microscopic scales. The occurrence of gold with brittle-ductile deformation is the subject of ongoing research at the mine in conjunction with specialists from Lakehead University in Thunder Bay, Ontario.
The rocks at Musselwhite Mine have been metamorphosed to amphibolite facies. This is evidenced by the mineralogy which includes grunerite, hornblende, and almandine garnets. The rocks are thought to have been heated to 540°C – 600°C (Otto, 2002).
Sedimentary rocks in the mine area commonly contain garnet ± staurolite and are therefore deemed to be of amphibolite grade. Rocks on the north side of Opapimiskan Lake have been mapped as part of the biotite zone by Breaks et al (2001) with the garnet isograd trending northwest along the center of the NCGB.
| | December 2024 |
| | TECHNICAL REPORT –
MUSSELWHITE MINE, ONTARIO, CANADA
Document # C8630-0000-PM-RPT-001 – Rev. 0
/ Page 71 |
Figure 7.7 – Structural Interpretation of the Musselwhite Mine Area
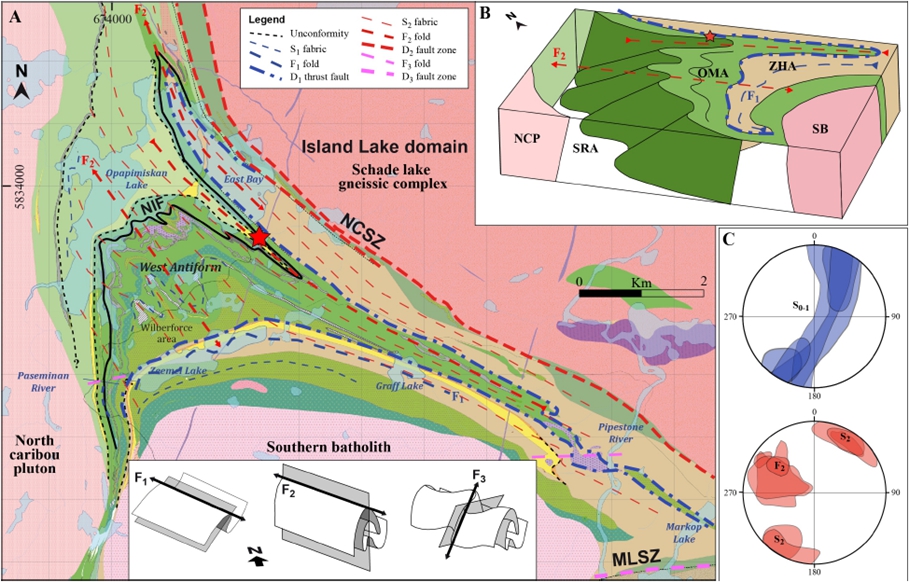
A) Structural Map Showing Key Fabrics. B) Schematic Block Diagram. C) Compiled Stereographic Projections of Key Structural Elements
Source: Oswald, 2018
| | December 2024 |
| | TECHNICAL REPORT –
MUSSELWHITE MINE, ONTARIO, CANADA
Document # C8630-0000-PM-RPT-001 – Rev. 0
/ Page 72 |
Figure 7.8 – Geological Plan Map of the 595 m Level

Source: Orla, 2024 (Modified after AMEC, 2006)
| | December 2024 |
| | TECHNICAL REPORT –
MUSSELWHITE MINE, ONTARIO, CANADA
Document # C8630-0000-PM-RPT-001 – Rev. 0
/ Page 73 |
Figure 7.9 – Relationship Between Zones of High Strain and Mineralization at Musselwhite
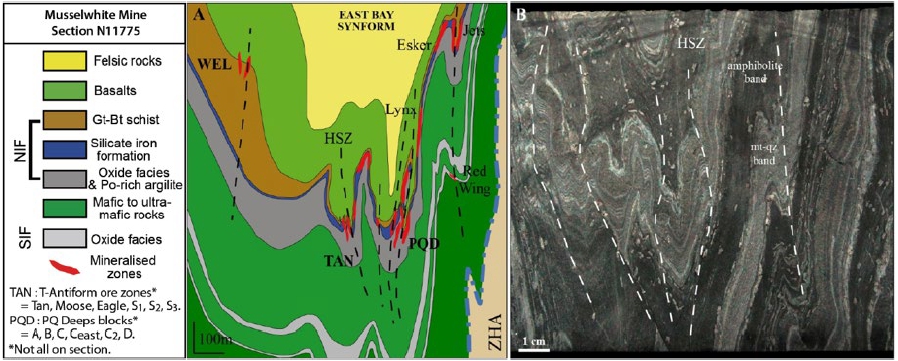
A) Representative Vertical Section at 11,775N (Looking North). B) Slab of Chert-Magnetite BIF from 920 mL Showing Similar Gold Geometry and Structures.
Source: Oswald, 2018
Mineralization at Musselwhite is predominantly found in sub-vertical high strain zones in the favourable silicate facies of the Northern Iron Formation, and to a lesser extent the oxide facies in both the Northern and Southern Iron Formation. Significant mineralization is also locally hosted in mafic volcanics and garnet-biotite schists in the West Limb deposits. In addition to the main hosts of mineralization, anomalous gold concentrations occur across the property and within all the major lithologies. A positive correlation exists between gold and pyrrhotite mineralization in the Northern Iron Formation silicate facies. In general terms, this translates to 1 g/t Au for each percentage increase in pyrrhotite, up to approximately 15% pyrrhotite. This correlation between gold and pyrrhotite does not apply to mineralization in the Southern Iron Formation or the West Limb.
Gold mineralization is interpreted to have formed as the result of sulfide replacement of iron formation with quartz-pyrrhotite flooding and veining. Mineralization is best developed where structural permeability has been increased, either by folding, brittle or ductile deformation or in combination. Mineralization is thought to have been emplaced during D2 deformation and peak metamorphism (Oswald, 2018).
Quartz-pyrrhotite veins/flooding are composed of massive, glassy blue to grey quartz with up to 20% fine to medium-grained pyrrhotite locally and occur as anastomosing networks of multiple veinlets that pinch and swell along strike as well as up and down dip. Accessory minerals include albite, almandine garnet and calcite, minor arsenopyrite, pyrite, chalcopyrite, and native gold. Sulphide mineralization in the veins is strongly structurally controlled, occurring within small-scale boudins, along the margins of the veins and as fine stringers within the vein itself. Sulphide replacement style mineralization is characterized by 2% to 15% fine-grained disseminated pyrrhotite, trace to 2%
| | December 2024 |
| | TECHNICAL REPORT –
MUSSELWHITE MINE, ONTARIO, CANADA
Document # C8630-0000-PM-RPT-001 – Rev. 0
/ Page 74 |
arsenopyrite, and trace to 2% pyrite. Gangue minerals consist of almandine garnet, quartz and or chert, grunerite, actinolite, biotite, magnetite, and calcite with accessory epidote and zircon.
Visible native gold, usually the size of a pin tip, is commonly observed as isolated specks within quartz. The majority of the gold occurs within pyrrhotite micro-fractures within garnet-rich silicate domains.
The various mine areas and corresponding ore/mineralized zones are summarized in Table 7.1. A composite cross-section of the Musselwhite Mine stratigraphy also identifies the locations of key mineralized zones with respect to interpreted geology and structural elements in Figure 7.10.
Table 7.1 – Summary of the Main Mine Areas and Ore/Mineralized Zones with
Corresponding Mineralization Styles
| Mine Area | Ore Zone | Mineralized
Zone | Main Host Rock | Other Host Rock | Mineralization
Style |
| T-Antiform | Moose | | Garnet-Grunerite BIF (4EA) | | Replacement |
| Eagle | | Garnet-Grunerite BIF (4EA) | | Replacement |
| Tan (WA, C, T, S) | | Garnet-Grunerite BIF (4EA) | | Replacement |
| S1 | | Garnet-Grunerite BIF (4EA) | | Replacement |
| S2 | | Garnet-Grunerite BIF (4EA) | | Replacement |
| S3 | | Garnet-Grunerite BIF (4EA) | | Replacement |
| PQ Shallows | OP Zone | | Garnet-Grunerite BIF (4EA) | Oxide BIF (4B) | Mixed |
| PQ Zone | | Garnet-Grunerite BIF (4EA) | Oxide BIF (4B) | Mixed |
| PQ Deeps | A-Block | | Garnet-Grunerite BIF (4EA) | Oxide BIF (4B) | Replacement |
| B-Block | | Garnet-Grunerite BIF (4EA) | Oxide BIF (4B) | Mixed |
| C-Block | | Garnet-Grunerite BIF (4EA) | | Replacement |
| C-Block (East) | | Garnet-Grunerite BIF (4EA) | | Replacement |
| C2-Block | | Garnet-Grunerite BIF (4EA) | | Replacement |
| D-Block | | Oxide BIF (4B) | | Veining |
| East Limb | Esker | | Garnet-Grunerite BIF (4EA) | | Replacement |
| Jets | | Garnet-Grunerite BIF (4EA) | | Replacement |
| Lynx | | Garnet-Grunerite BIF (4EA) | Garnet-Biotite Schist (4F) | Replacement |
| | Upper Lynx | Garnet-Grunerite BIF (4EA) | | Replacement |
| SIF | | Redwings | Grunerite BIF (4A) | Oxide BIF (4B) | Replacement |
| | Thunderwolves | Grunerite BIF (4A) | Oxide BIF (4B) | Replacement |
| | Snoppy | Grunerite BIF (4A) | Oxide BIF (4B) | Mixed |
| | South Snoppy | Grunerite BIF (4A) | Oxide BIF (4B) | Mixed |
| West Limb | Spur | | Garnet-Biotite Schist (4F) | Altered Mafics (2T) | Veining |
| | Spur East | Garnet-Biotite Schist (4F) | Altered Mafics (2T) | Veining |
Source: Modified after Oswald, 2018
| | December 2024 |
| | TECHNICAL REPORT –
MUSSELWHITE MINE, ONTARIO, CANADA
Document # C8630-0000-PM-RPT-001 – Rev. 0
/ Page 75 |
Figure 7.10 – Composite Geology Vertical Section (Looking North) of the Musselwhite Mine
Source: Oswald, 2018
As with any long-running active operation, the focus on key mineralized areas and related ore zones has shifted over the years at Musselwhite with continued exploitation, new discoveries/extensions and/or evolved interpretations as new data becomes available. Following are summaries of both recent and historical key mineralized areas within the mine.
| 7.3.1 | Recent Key Mineralized Areas |
The PQ Deeps (C-Block) and Lynx occur in the East Limb of the deposit and host the vast majority of remaining gold resources and reserves at Musselwhite based on current data and scheduling forecasts (i.e., Life of Mine planning; see Table 16.7). Mineralization is hosted in a garnet-grunerite schist (4EA) in the hinge of a synclinal fold. The orientation of mineralization is parallel to the plunge of the fold axis and is known to have a continuity of at least 5 km along plunge, and is still open at depth. Grade is moderately continuous in a vertical direction (up to 125 m) and least continuous in
| | December 2024 |
| | TECHNICAL REPORT –
MUSSELWHITE MINE, ONTARIO, CANADA
Document # C8630-0000-PM-RPT-001 – Rev. 0
/ Page 76 |
the east-west direction (15-15 m). Grade and size of the PQ Deeps and Lynx zones are believed to influenced by the intersection of sub-vertical shear zones with the favourable host rock. The basis for future exploration is to target the down-plunge extension of 4EA unit.
Located within the PQ limb, in the vicinity of the esker dividing Opapimiskan Lake, three separately correlated gold zones named the Esker, Root, and Core zones have been identified. These zones have been traced 900 m along strike, from section 11,700N to 12,600N in a dynamic fold system characterized by a north-westerly plunge of 5 m to 10 m.
Structurally controlled, gold-bearing axial planar quartz-pyrrhotite veins result in strata- bound gold zones found primarily within a garnet-actinolite-chert-grunerite (4EA) host. Additional work will be required to resolve the economic potential within this extremely complex geological setting.
The Redwings zone is hosted in chert-magnetite BIF of the Southern Iron Formation. Mineralization occurs as pyrrhotite cement and stringers in breccias hosted in a parasitic fold. The best gold grades occur in the antiform hinge and short limb of the parasitic fold and are most continuous down-plunge of the fold. Continuity in the main reserves and resource is 2 km, and mineralization is open down plunge. Exploratory drilling indicates the same fold is still present 1 km down plunge and is the focus of exploration targeting.
Mineralization in the West Limb is predominantly hosted in rock types that have traditionally been considered waste elsewhere in the mine. Current reserves and resources are hosted in mafic volcanic greenschist/amphibolites and garnet-biotite schists. Gold is associated with wispy pyrrhotite disseminations aligned parallel to the dominant foliation. The best grades are associated with a gentle parasitic fold and occur in the hanging wall and foot wall rocks to an ultramafic sill that cuts the contact between the mafic volcanics and schists. Exploration is focused on following this zone of structural complexity up and down-plunge and identifying other potential areas of increased permeability.
| 7.3.1.5 | Deposits along the T-Antiform |
The T-Antiform structure was historically known to host the largest gold concentrations on the Musselwhite Mine property. The structure has been evaluated and tested by diamond drilling from where it subcrops at 9,150N to 12,400N, a distance of 3,250 m. While the structure is well developed along this entire length, the gold mineralization appears to decrease to the north of 11,800N.
| | December 2024 |
| | TECHNICAL REPORT –
MUSSELWHITE MINE, ONTARIO, CANADA
Document # C8630-0000-PM-RPT-001 – Rev. 0
/ Page 77 |
The T-Antiform is an asymmetrical fold with the right limb being stretched and almost detached from the left limb. This division was used historically (ca. 1989) to divide the antiform into two (2) deposits: the “T” deposit and the “S” deposit.
The T deposit can be further subdivided into three separate zones. From west to east, they are known as the “WA”, “T” and “C” zones. Each zone is dominated by a second-order antiform. Areas containing weak mineralization between these zones are dominated by synforms. All three zones in the T deposit trend at 317°, are near-vertical dipping, and plunge 16° to 18° to the north-west. Based on gold grade distribution in diamond drill holes, there appears to be an echelon movement from west to east going from the south to the north in the better-mineralized structure (i.e., the WA and C zones are better mineralized in the southwest and northeast portions of the T deposit, respectively).
The S deposit is located on the attenuated, and partly detached, east limb of the T-Antiform structure. This fold structure starts to the south of 9,150N and extends north of 11,200N. Mineralization along this limb has since been subdivided into 3 separate (S1, S2 and S3) zones based on continued drilling and development and associated characterization/interpretation. The plunge of the S zones is consistently shallower than that of the C, T, and WA zones. The S zones plunge on the order of 10° to 12°, while the zones on the west limb of the T-Antiform average approximately 15° to 18°. The amplitude of the east limb (S zones) increases in a northward direction from less than 50 m in the south to at least 200 m by 11,200N. Starting about 10,600N, the volume of gold mineralization associated with the S limb increases significantly, and by 11,000N becomes the dominant mineralized structure of the overall antiform.
| 7.3.2 | Historical key mineralized areas |
| 7.3.2.1 | PQ Deposit (Shallows) |
The PQ (Shallows) deposit is situated within the Northern Iron Formation horizon of the north-east limb of the East Bay synform. Results from diamond drilling conducted on 50 m centers indicate a tabular, strata-bound body dipping steeply at about 85° to the north-east and plunging gently at 5° to 10° to the north-west. The deposit has a plunge length of approximately 1,300 m, and averages 50 m vertically and 4 m in width.
Gold mineralization is spatially associated with disseminated specks, wisps, and stringers of pyrrhotite comprising 3% to 25% of the rock locally. The sulfide distribution is structurally controlled by the orientation of the S2 fracture cleavage and is focused within tight F2 minor fold flexures. In a typical section, the footwall contact is generally well defined by a non-mineralized garnet-biotite schist horizon, except toward the top and bottom of the zone where mineralization tapers and tends to diverge from this position. The hanging wall contact is defined by an assay cut-off.
| | December 2024 |
| | TECHNICAL REPORT –
MUSSELWHITE MINE, ONTARIO, CANADA
Document # C8630-0000-PM-RPT-001 – Rev. 0
/ Page 78 |
| 7.3.2.2 | West Anticline Deposit |
The West Anticline area is a structurally complex environment comprised of numerous second- and third-order F2 minor fold closures. These structures display curvilinear plunge axes with a regional trend of 30° to 40° to the north-west. The area has been further subdivided into four principal exploration areas, the West Anticline, Bay, Camp, and Canoe zones.
Within the West Anticline zone, quartz-pyrrhotite vein systems occur extensively throughout the middle iron formation, from the footwall to hanging wall contacts. Veining appears best developed in F2 antiformal closures. Throughout these favourable areas, the spacing of the veins is between 1.5 m and 2.5 m. The veins are well developed and display good lateral continuity.
Strata-bound mineralization is extensive throughout the area, with the best zones developed within a garnet-biotite-chert-magnetite unit directly beneath a well-bedded, grunerite-rich iron formation domain. There is also relatively extensive strata-bound mineralization, lower in the stratigraphy; however, it is of lower grade and is more erratic in nature.
| 7.3.2.3 | Intraformational (PG Zone) |
The PG Zone (also known as the Conveyor Intraformational) is an iron formation unit that is stratigraphically 10 m to 15 m above the Northern Iron Formation and parallel to the PQ Limb. The deposit is located from 10,050N to 10,300N, is 80 m in height, 1.5 m wide and dips near vertical. The lithology of the zone is typically 4EA.
The W zone is located on the eastern margin of the W-antiform. This antiform is adjacent to the T-Antiform and is the second major F2 closure north-west of the East Bay synformal axial plane. Although only one diamond drill hole was drilled exclusively to test this environment, some 30 additional intersections have been reported in the W zone from drill holes directed at the T-Antiform. Further work is required to fully outline this zone.
The Jets Zone is located 50 m to the east of the Esker / Island deposits and is associated with a shear zone that extends from 9,700N to 12,500N. It is typically 75 m in height and sub-vertical. The deposit plunges at 8° to the north. Mineralization in the Jets Zone is not stratabound, but is shear bounded, and the deposit contains both 4EA and 4B.
| 7.4 | Other Significant Factors and Risks |
To the extent known to the QP, there are no other significant Geological Setting and Mineralization factors and risks that may affect the viability of the mine that have not been discussed in this Report.
| | December 2024 |
| | TECHNICAL REPORT –
MUSSELWHITE MINE, ONTARIO, CANADA
Document # C8630-0000-PM-RPT-001 – Rev. 0
/ Page 79 |
The mineralization at Musselwhite Mine can be classified as an Iron Formation-hosted gold deposit. Typically, gold in these deposits occurs in cross-cutting quartz veins and veinlets or as fine disseminations associated with pyrite, pyrrhotite, and arsenopyrite hosted in iron formations and adjacent rocks within volcanic or sedimentary sequences (McMillan, 1996).
The Musselwhite Mine deposit exhibits many features common with this deposit type:
| ● | Gold occurring as free (native) gold in quartz veining, sulfides and metamorphic minerals; |
| ● | Quartz veining (but not predominantly cross cutting); |
| ● | Predominantly stratabound mineralization, and; |
| ● | Gold mineralization associated with shear zones. |
Mineralization is generally within, or near, favourable iron formations. Most deposits occur adjacent to prominent regional structural and stratigraphic features, and mineralization is often related to local structures.
Other examples of this style of deposit in Canada include Lupin and Cullaton Lake (Northwest Territories), Detour Lake, Madsen Red Lake, Pickle Crow and Dona Lake (Ontario), and Meadowbank (Nunavut).
International examples include Homestake (South Dakota, USA), Mt. Morgans (Western Australia), Hill 50 (Australia); Morro Vehlo, Amapari, Raposos, Mineas Gerais (Brazil); Vubachikwe and Bar 20 (Zimbabwe), and Mallappakoda, Kolar District (India).
| | December 2024 |
| | TECHNICAL REPORT –
MUSSELWHITE MINE, ONTARIO, CANADA
Document # C8630-0000-PM-RPT-001 – Rev. 0
/ Page 80 |
The Musselwhite deposit was discovered by Harold and Alan Musselwhite in the 1960s through prospecting efforts. Gold panning along the shore of Opapamiskan Lake led to the discovery of auriferous quartz veins on the north shore and abundant gold grains in the regolith near the Western Antiform at the south shore approximately two kilometres southwest of the deposit. The Musselwhite Mine went into production in 1997 following a lengthy process of exploration activities carried out by a number of involved companies. A chronology of notable exploration-related work completed in the vicinity of the Musselwhite Mine is summarized below in Section 9.1. More detailed information on the earlier of these historic exploration efforts can be found in the previous technical report prepared by AMEC for Goldcorp Inc. in 2006.
| 9.1 | Historical Chronology of Notable Exploration Work |
The following is a summarized chronology of exploration-related work carried out at and around the location of the Musselwhite Mine:
| ● | 1938 – First geological map of the North Caribou Greenstone Belt produced at a scale of 1 inch to 1 Mile (1:63,360) (Satterley, 1941). |
| ● | 1960 – Geological Survey of Canada conducted an airborne magnetometer survey of the North Caribou Greenstone Belt. |
| ● | 1962 – Economic gold mineralization was first identified on the adjacent Musselwhite mining leases by the Musselwhite Brothers in 1962. |
| ● | 1963 – The Karl Zeemal property was optioned by Kenpat Mines Ltd.. The company conducted geological and geophysical surveys. |
| ● | 1962 to 1963 – Inco Limited conducted an 18-hole diamond drill hole program around Zeemal Lake and an additional eight holes in the areas of Karl and Markop Lakes. |
| ● | 1973 – The Musselwhite brothers optioned their property to a consortium led by Dome Exploration Ltd. Subsequent exploration activities resulted in the discovery of the “West Anticline Zone” in 1980. |
| ● | 1981 – The Dome Exploration Ltd. Consortium commissioned Aerodat Ltd. to conduct an airborne magnetic and electromagnetic geophysical survey over the area surrounding the Musselwhite deposit. |
| ● | 1984 – Dome Mines Ltd. excavated an exploration decline into the West Anticline Zone and delineated gold deposits totaling approximately 540,000 ounces. |
| ● | 1985 – The Ontario Geological Survey commissioned Aerodat Ltd. to perform an extensive Airborne Magnetic and Electromagnetic survey of the North Caribou Greenstone Belt. Maps 80744 and 80745 cover the Karl Zeemal area. |
| ● | 1986 – Extensive surface drilling by Dome Mines Ltd focused on the East Bay Synform. |
| | December 2024 |
| | TECHNICAL REPORT –
MUSSELWHITE MINE, ONTARIO, CANADA
Document # C8630-0000-PM-RPT-001 – Rev. 0
/ Page 81 |
| ● | 1987 – Geocanex Ltd. conducted surface mapping and diamond drill programs on behalf of Santa Maria Resources Ltd. on the Zeemal Lake property. |
| ● | 1988 – Power Explorations Inc. conducted extensive mapping, prospecting, trenching and diamond drilling along the mineralized Karl-Zeemal iron formation. |
| ● | 2005 – Goldcorp Canada Inc. carried out extensive exploration drilling along the mineralized trend identified by Power Explorations Inc. in their 1988 drilling (Karl-Zeemal target). |
| ● | 2006 – Barrick Gold acquired 100% of Placer Dome shares in January, and Goldcorp Canada Ltd. later acquired sole ownership of Musselwhite Mine from Barrick Gold and Kinross Gold Corp. |
| ● | 2018 – Goldcorp Canada Inc. conducted soil-, litho-, and bio-geochemical sampling programs. Detailed exploration drilling also completed along mineralized trends and geochemical anomalies within the Karl Zeemal and North Shore (PQ Deep) target areas. |
| ● | 2019 – Newmont Corporation acquired ownership of Goldcorp Canada Ltd. and all its properties. Greenfields exploration program conducted by Bayside Geoscience within Newmont-Goldcorp northern tenement along NCGB, and the near-mine Karl Zeemal target area. |
| ● | 2023 – Newmont Corporation conducted various outcrop sampling programs, in addition to a 30,319 Ha fixed-wing airborne gravity gradiometric survey completed over the Musselwhite Mine property and portions of regional claim tenement by CGG Canada Services Ltd. |
| 9.2 | Recent Exploration Work (post-2006) |
Surface exploration activities completed at and surrounding the Musselwhite Mine during the period from 2007 to 2024 are summarized in Figure 9.1. Further details are also provided in Table 9.1 and corresponding Figure 9.2 to Figure 9.9. The QP notes from discussions with the site Exploration team that industry-best practices have been followed for this work in terms of procedures, sampling and analytical methodologies, and subsequent data analyses.
Information on surface exploration drilling can be found in Section 10 of this Report.
Figure 9.1 – Musselwhite Exploration from 2007 to 2024
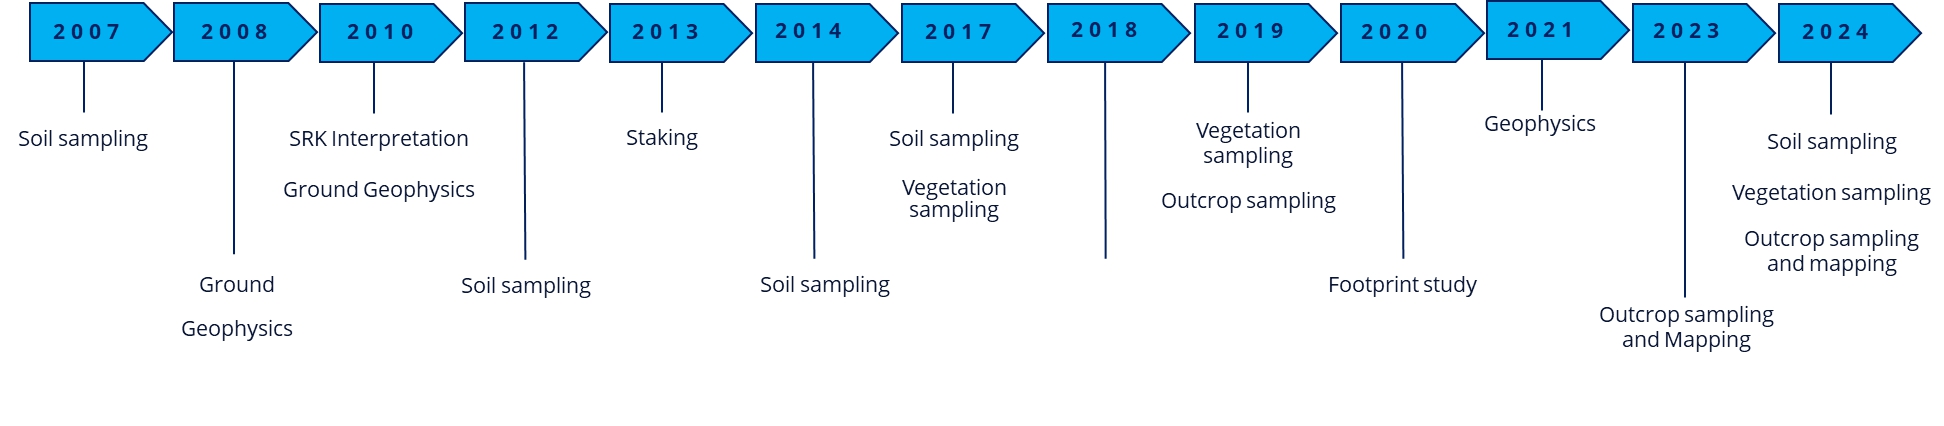
Source: Newmont, 2024
| | December 2024 |
| | TECHNICAL REPORT –
MUSSELWHITE MINE, ONTARIO, CANADA
Document # C8630-0000-PM-RPT-001 – Rev. 0
/ Page 82 |
Table 9.1 – Musselwhite Exploration Details from 2007 to 2023
| Year(s) | Activity | Target Area(s) | Figure |
| 2007 | Soils sampling | Camp / Bay area | 9.2 |
| 2008-2010 | Ground geophysics | N-NW and E-SE of mine (unnamed) | 9.3 |
| 2012 | Soils sampling | Southeast of mine property
(claims no longer held) | 9.4 |
| 2014 | Soils sampling | Three campaigns (Camp/Bay + two unnamed) | 9.5 |
| 2017 | Soils sampling | Arseno Lake and Karl Zeemel | 9.6 |
| 2018 | Vegetation sampling
(black spruce) | Seeseep Lake and Karl Zeemel (2018) | 9.7 |
| 2019 | Vegetation sampling
(black spruce) | North Bend, Akow Lake & Skinner Lake (2019) | 9.8 |
| 2020 | Footprint characterization study | Variety of Newmont-owned Superior Province deposits (incl. Musselwhite) | - |
| 2021 | Airborne gravity gradiometry (AGG) | Southern portion of Musselwhite property | 9.9 |
| 2023 | Review of compiled
geochemical data | Assorted target areas | - |
Figure 9.2 – 2007 Soils Sampling Campaign at Camp/Bay Target Area
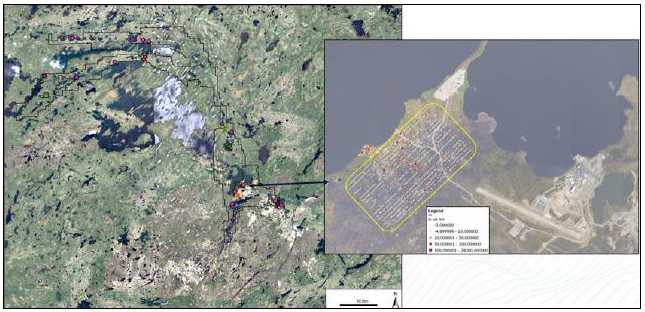
Source: Newmont, 2024
| | December 2024 |
| | TECHNICAL REPORT –
MUSSELWHITE MINE, ONTARIO, CANADA
Document # C8630-0000-PM-RPT-001 – Rev. 0
/ Page 83 |
Figure 9.3 – 2008-2010 Ground Geophysical Survey Locations
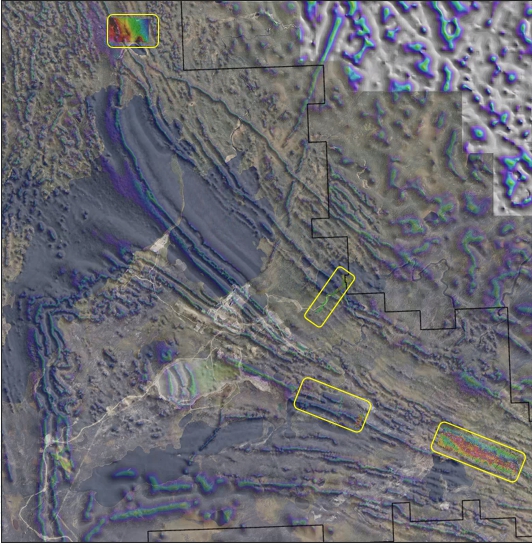
Source: Newmont, 2024
| | December 2024 |
| | TECHNICAL REPORT –
MUSSELWHITE MINE, ONTARIO, CANADA
Document # C8630-0000-PM-RPT-001 – Rev. 0
/ Page 84 |
Figure 9.4 – 2012 Soils Sampling Locations
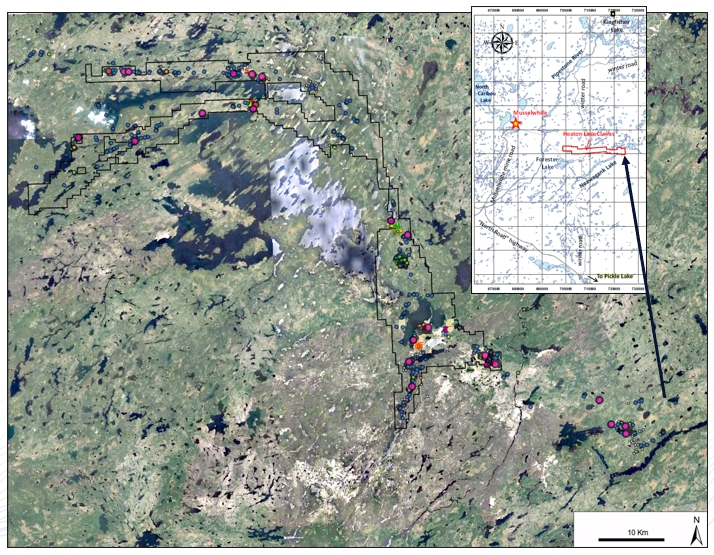
Source: Newmont, 2024
Figure 9.5 – 2014 Soil Survey Locations
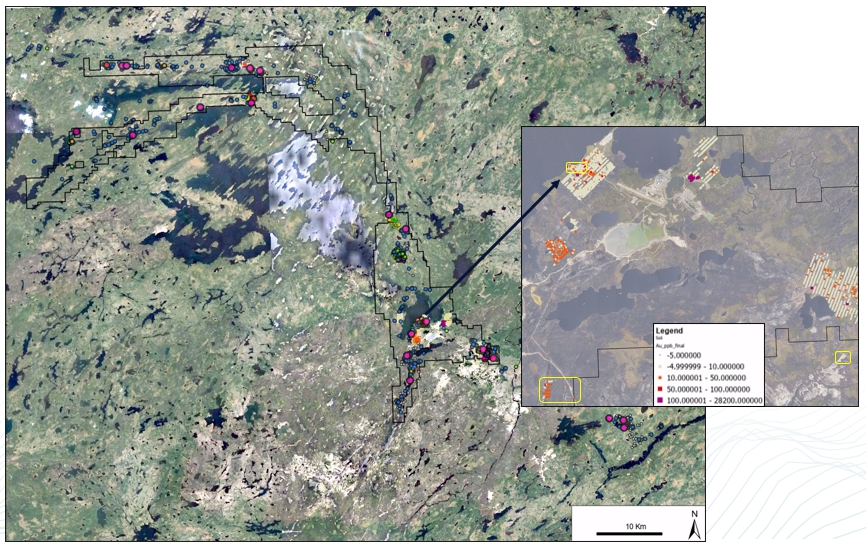
Source: Newmont, 2024
| | December 2024 |
| | TECHNICAL REPORT –
MUSSELWHITE MINE, ONTARIO, CANADA
Document # C8630-0000-PM-RPT-001 – Rev. 0
/ Page 85 |
Figure 9.6 – 2017 Soil Survey Locations
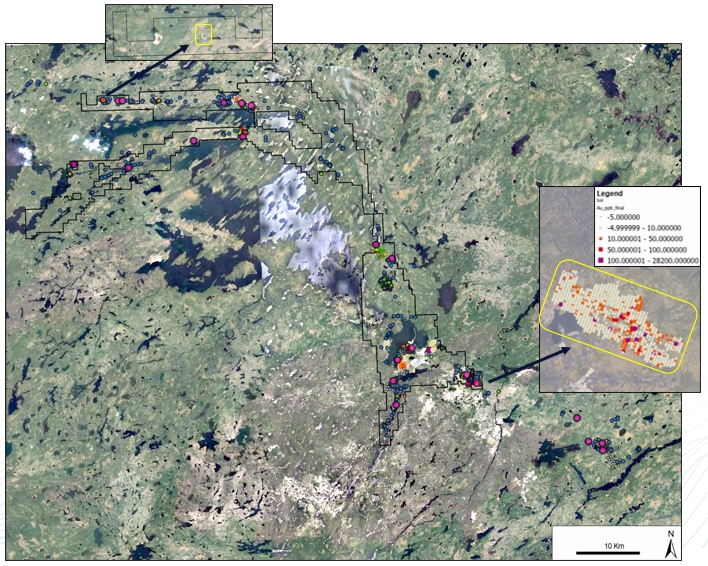
Source: Newmont, 2024
Figure 9.7 – 2018 Exploration – Vegetation Sampling
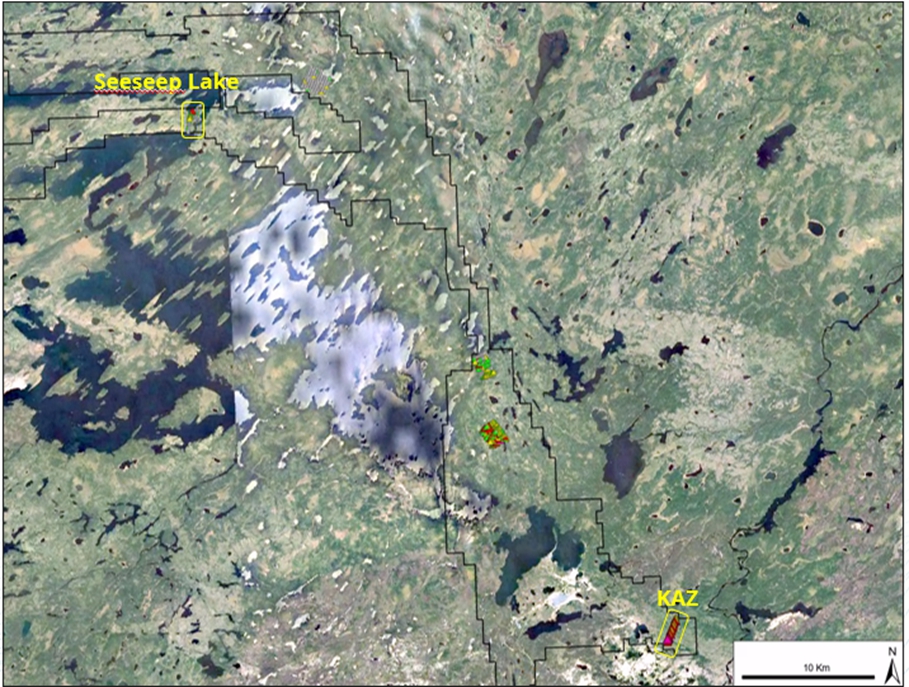
Source: Newmont, 2024
| | December 2024 |
| | TECHNICAL REPORT –
MUSSELWHITE MINE, ONTARIO, CANADA
Document # C8630-0000-PM-RPT-001 – Rev. 0
/ Page 86 |
Figure 9.8 – 2019 Exploration – Vegetation Sampling
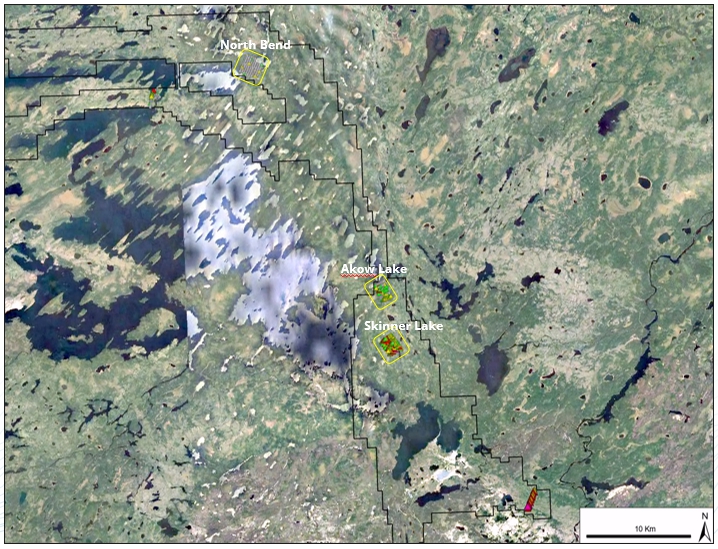
Source: Newmont, 2024
Figure 9.9 – Airborne Gravity Gradiometry (AGG) Survey
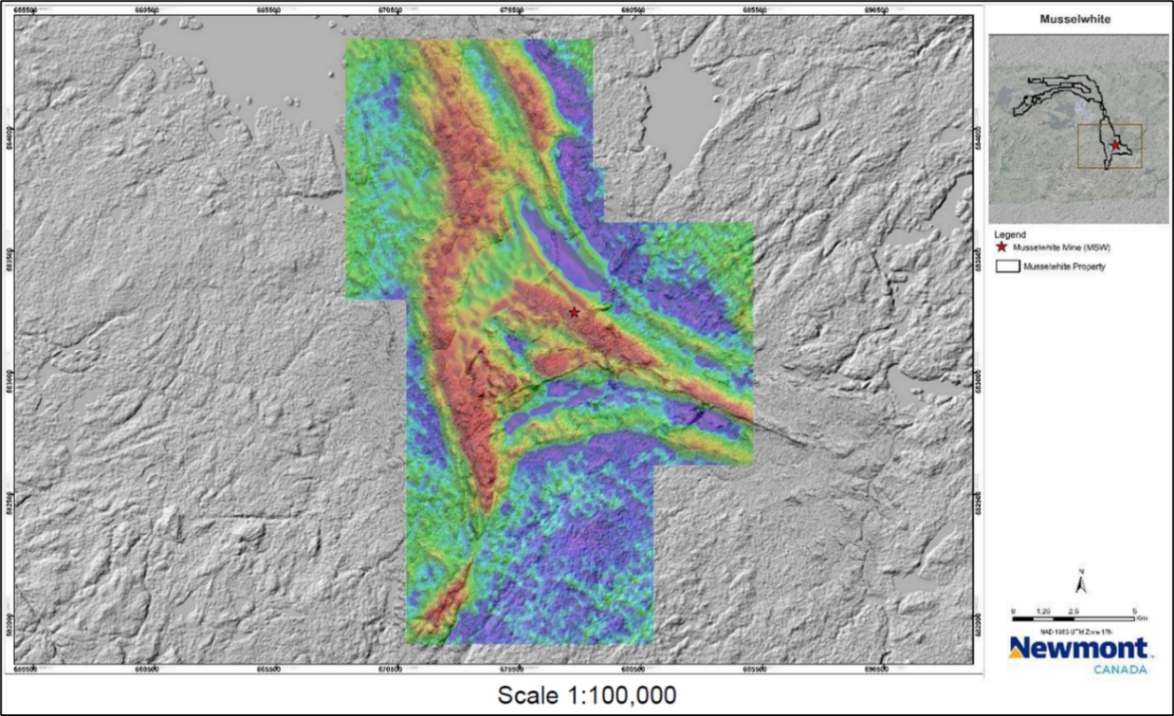
Source: Newmont, 2024
| | December 2024 |
| | TECHNICAL REPORT –
MUSSELWHITE MINE, ONTARIO, CANADA
Document # C8630-0000-PM-RPT-001 – Rev. 0
/ Page 87 |
The total number of drill holes, metres and the number of assay samples collected from corresponding core over Musselwhite’s entire mine life are summarized by ownership in Table 10.1.
Table 10.1 – Drilling Summary
| Company Name | From | To | #Holes | #Meters | #Samples |
| Newmont | 2019 | 2024 | 1,580 | 391,039 | 349,082 |
| Goldcorp | 2006 | 2018 | 3,615 | 796,842 | 529,196 |
| Placer Dome | 1994 | 2005 | 2,684 | 476,419 | 272,163 |
| Dome Expl. et al. | 1973 | 1993 | 1,664 | 246,529 | 114,226 |
| Total | 1973 | 2024 | 9,543 | 1,910,828 | 1,264,667 |
The Musselwhite Mine is considered an advanced property and as such does not require the same level of detailed data regarding its drilling to meet standards of disclosure.
The relationship between sample length and the true thickness of the mineralization is well understood and proven over the many years of exploration and production at Musselwhite. The location, azimuth and dips of drill holes, and the depth of the relevant sample intervals are available for review in the geological database. The effects of higher-grade intervals within lower-grade intersections are also well understood.
The positions of all drill holes relative to the orebody are illustrated in Figure 10.1; a similar depiction in Figure 10.2 presents the same drill holes relative to the surface geology.
| | December 2024 |
| | TECHNICAL REPORT –
MUSSELWHITE MINE, ONTARIO, CANADA
Document # C8630-0000-PM-RPT-001 – Rev. 0
/ Page 88 |
Figure 10.1 – Surface Map Showing Musselwhite Drill Holes with Grade-Thickness
Composites (3 g/t Au COG) Along Entire Orebody Trend
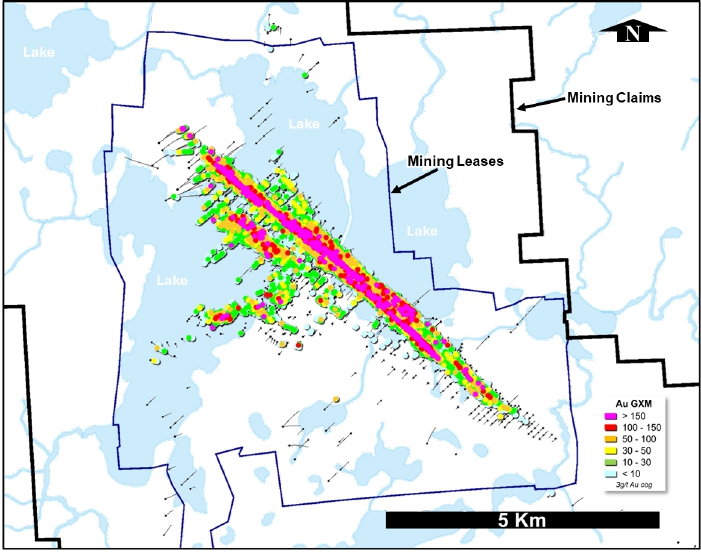
Source: Orla, 2024
Figure 10.2 – Plan Map Showing Musselwhite Drill holes Relative to Geology (West Up)
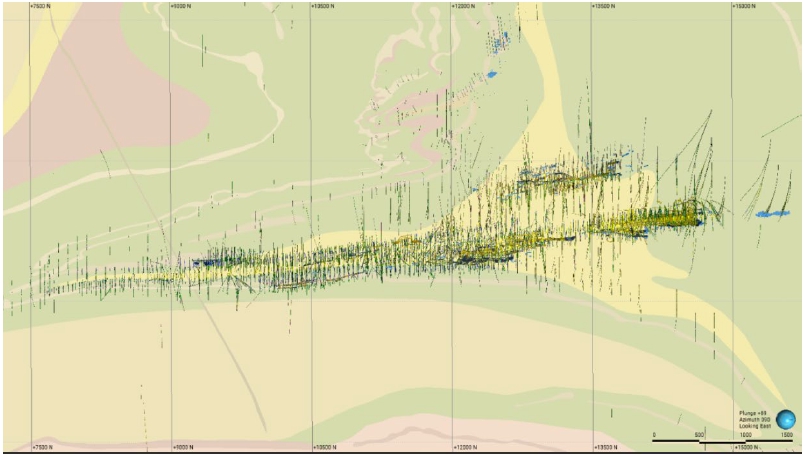
Source: Newmont, 2024
| | December 2024 |
| | TECHNICAL REPORT –
MUSSELWHITE MINE, ONTARIO, CANADA
Document # C8630-0000-PM-RPT-001 – Rev. 0
/ Page 89 |
| 10.1 | Drilling: 1974 – 2005 (Dome Exploration et al. and Placer Dome) |
All exploration and definition drilling conducted on the property from 1974 to 2005 had been by diamond drilling. From 1974 to 2005 a total of 4,247 diamond drill holes with a cumulative length of 710,889 m had been completed at Musselwhite Mine by Dome Exploration et al. and Placer Dome (Table 10.2).
Table 10.2 – Musselwhite Mine Drilling Summary by Year: 1974-2005
| Year | Holes | Metres |
| 1974 | 4 | 320 |
| 1975 | 12 | 691 |
| 1976 | 18 | 1,032 |
| 1978 | 36 | 3,013 |
| 1979 | 32 | 2,893 |
| 1980 | 17 | 2,701 |
| 1981 | 94 | 15,781 |
| 1982 | 61 | 9,508 |
| 1983 | 61 | 6,866 |
| 1984 | 64 | 1,756 |
| 1985 | 28 | 4,684 |
| 1986 | 122 | 23,351 |
| 1987 | 67 | 16,974 |
| 1988 | 44 | 12,300 |
| 1989 | 218 | 15,134 |
| 1992 | 12 | 2,055 |
| 1993 | 103 | 16,943 |
| 1994 | 330 | 50,780 |
| 1995 | 137 | 23,658 |
| 1996 | 146 | 26,916 |
| 1997 | 338 | 26,833 |
| 1998 | 303 | 44,456 |
| 1999 | 328 | 54,430 |
| 2000 | 328 | 57,640 |
| 2001 | 153 | 32,389 |
| 2002 | 205 | 41,929 |
| 2003 | 384 | 90,276 |
| 2004 | 327 | 76,368 |
| 2005 | 275 | 49,212 |
| Total | 4,247 | 710,889 |
| | December 2024 |
| | TECHNICAL REPORT –
MUSSELWHITE MINE, ONTARIO, CANADA
Document # C8630-0000-PM-RPT-001 – Rev. 0
/ Page 90 |
Earlier drill holes carried out by Dome Exploration and others (Dome Exp et al.) are summarized and categorized by target area and by underground or surface designation in Table 10.3.
Table 10.3 – Drill Holes by Area (Underground and Surface): 1974-1993
| Area | Workplace | #Holes | #Metres | Sample Count |
| CMP | Surface | 135 | 13,152 | 6,996 |
| ESK | Surface | 27 | 4,269 | 1,171 |
| KAZ | Surface | 50 | 5,338 | 2 |
| PQD | Surface | 95 | 15,603 | 5,089 |
| REG | Surface | 30 | 4,102 | 277 |
| SIF | Surface | 12 | 1,559 | 161 |
| SUR | Surface | 597 | 122,462 | 51,312 |
| TAN | Surface | 10 | 1,344 | 448 |
| WAT | Surface | 209 | 32,644 | 13,415 |
| WEL | Surface | 28 | 3,041 | 900 |
| ESK | Underground | 4 | 117 | 73 |
| LNX | Underground | 1 | 219 | 76 |
| PQD | Underground | 6 | 706 | 544 |
| SIF | Underground | 2 | 594 | 441 |
| TAN | Underground | 393 | 39,126 | 31,753 |
| WAT | Underground | 63 | 1,765 | 1,081 |
| WEL | Underground | 2 | 489 | 487 |
| Total | 1,664 | 246,529 | 114,226 |
Summaries of the drill holes carried out by Placer Dome are categorized by target area and by underground or surface designation in Table 10.4.
Table 10.4 – Placer Dome Drill Holes by Area (Underground and Surface): 1994-2005
| Area | Workplace | #Holes | #Metres | Sample Count |
| ESK | Surface | 291 | 70,174 | 30,082 |
| KAZ | Surface | 45 | 2,335 | 2,313 |
| LNX | Surface | 1 | 799 | 227 |
| PQD | Surface | 61 | 50,450 | 15,390 |
| REG | Surface | 35 | 9,941 | 3,174 |
| SIF | Surface | 1 | 313 | 154 |
| | December 2024 |
| | TECHNICAL REPORT –
MUSSELWHITE MINE, ONTARIO, CANADA
Document # C8630-0000-PM-RPT-001 – Rev. 0
/ Page 91 |
| Area | Workplace | #Holes | #Metres | Sample Count |
| SUR | Surface | 214 | 30,848 | 14,649 |
| TAN | Surface | 9 | 5,061 | 1,737 |
| WAT | Surface | 101 | 14,489 | 6,706 |
| WEL | Surface | 30 | 7,847 | 5,548 |
| WIL | Surface | 6 | 2,418 | 565 |
| ESK | Underground | 202 | 33,068 | 19,642 |
| ITF | Underground | 13 | 387 | 289 |
| LNX | Underground | 2 | 438 | 351 |
| PQD | Underground | 482 | 101,246 | 70,408 |
| SIF | Underground | 14 | 4,820 | 2,086 |
| SUR | Underground | 26 | 2,882 | 2,183 |
| TAN | Underground | 1,118 | 129,277 | 90,222 |
| WAT | Underground | 9 | 175 | 182 |
| WEL | Underground | 24 | 9,452 | 6,255 |
| Total | 2,684 | 476,419 | 272,163 |
The majority of the core collected was NQ-sized (47.6 mm). Many holes were collared with HQ (63.5 mm)- and PQ (83.1 mm)-sized equipment and then reduced to NQ and sometimes BQ (36.4 mm) with depth. A small number of early underground holes were also apparently drilled with AQ (27 mm)-sized equipment.
Drill hole collar positions were located using a Total Station surveying instrument. The local grid is rotated so the strike direction of the T-Antiform is oriented in the north-south direction. Downhole surveys were collected with a Sperry-Sun single-shot instrument or with acid etch dip tests for all holes drilled prior to March 2001 and for short holes (<200 m long) drilled since March 2001 (azimuth data from the Sperry-Sun surveys were ignored due to the effects of abundant magnetite on compass measurements). In March 2001, a Maxibor light-tube downhole surveying instrument was purchased and has since been used since then to survey most of the holes longer than 200 m. AMEC had observed at the time that at least some of the deep holes surveyed with the Maxibor equipment show a significant amount of azimuth deviation. Caution should be exercised when interpreting the geology and grade distribution of areas defined by pre-2001 drill holes greater than 200 m long, because their trajectories are not precisely surveyed.
| | December 2024 |
| | TECHNICAL REPORT –
MUSSELWHITE MINE, ONTARIO, CANADA
Document # C8630-0000-PM-RPT-001 – Rev. 0
/ Page 92 |
| 10.2 | Drilling: 2006 – 2018 (Goldcorp) |
The drilling performed by Goldcorp from 2006-2018 is summarized by year in Table 10.5.
Table 10.5 – Goldcorp Drill Summary by Year: 2006-2018
| Year | Holes | Metres |
| 2006 | 190 | 40,452 |
| 2007 | 282 | 49,882 |
| 2008 | 262 | 52,986 |
| 2009 | 397 | 63,957 |
| 2010 | 332 | 60,733 |
| 2011 | 322 | 61,874 |
| 2012 | 214 | 71,487 |
| 2013 | 169 | 38,256 |
| 2014 | 153 | 48,755 |
| 2015 | 208 | 55,042 |
| 2016 | 361 | 77,489 |
| 2017 | 334 | 81,766 |
| 2018 | 391 | 94,163 |
| Total | 3,615 | 796,842 |
The same Goldcorp drill holes are also summarized by target area and surface or underground designation in Table 10.6.
Table 10.6 – Goldcorp Drill Summary by Target Area (Surface and Underground):
2006-2018
| Area | Workplace | #Holes | #Metres | Sample Count |
| ESK | Surface | 160 | 27,418 | 16,255 |
| KAZ | Surface | 32 | 2,430 | 2,791 |
| LNX | Surface | 31 | 21,603 | 2,197 |
| NSD | Surface | 32 | 53,684 | 10,001 |
| PQD | Surface | 18 | 20,809 | 4,673 |
| PRJ | Surface | 15 | 5,236 | 280 |
| REG | Surface | 16 | 5,219 | 921 |
| SIF | Surface | 1 | 563 | 111 |
| SUR | Surface | 4 | 270 | 182 |
| WAT | Surface | 56 | 15,907 | 7,865 |
| | December 2024 |
| | TECHNICAL REPORT –
MUSSELWHITE MINE, ONTARIO, CANADA
Document # C8630-0000-PM-RPT-001 – Rev. 0
/ Page 93 |
| Area | Workplace | #Holes | #Metres | Sample Count |
| WEL | Surface | 13 | 4,270 | 3,946 |
| WIL | Surface | 4 | 1,534 | 569 |
| CMP | Underground | 1 | 975 | 665 |
| ESK | Underground | 150 | 8,865 | 5,805 |
| ITF | Underground | 101 | 8,631 | 6,109 |
| LNX | Underground | 730 | 158,328 | 91,463 |
| PQD | Underground | 1,147 | 201,371 | 162,784 |
| PRJ | Underground | 35 | 8,826 | 3,103 |
| SIF | Underground | 122 | 27,461 | 17,344 |
| SUR | Underground | 20 | 1,023 | 941 |
| TAN | Underground | 431 | 69,521 | 54,189 |
| WAT | Underground | 24 | 9,062 | 5,788 |
| WEL | Underground | 472 | 143,840 | 131,214 |
| Total | 3,615 | 796,842 | 529,196 |
| 10.3 | Drilling: 2019 – 2024 (Newmont) |
The most recent drilling was carried out by Newmont from 2019 to 2024 and is summarized on an annual basis in Table 10.7.
Table 10.7 – Newmont Drill summary by Year: 2019 – 2024
| Year | Holes | Metres |
| 2019 | 336 | 94,169 |
| 2020 | 189 | 43,055 |
| 2021 | 243 | 61,875 |
| 2022 | 366 | 86,750 |
| 2023 | 337 | 78,836 |
| 2024 | 109 | 26,355 |
| Total | 1,580 | 391,039 |
The same Newmont drill holes are presented by area and identified as either surface or underground in Table 10.8.
| | December 2024 |
| | TECHNICAL REPORT –
MUSSELWHITE MINE, ONTARIO, CANADA
Document # C8630-0000-PM-RPT-001 – Rev. 0
/ Page 94 |
Table 10.8 – Newmont Drill Summary by Area (Surface and Underground): 2019-2024
| Area | Workplace | #Holes | #Metres | Sample Count |
| KAZ | Surface | 8 | 903 | 1,031 |
| NSD | Surface | 23 | 38,639 | 5,703 |
| SIF | Surface | 35 | 9,603 | 6,941 |
| SUR | Surface | 12 | 3,054 | 3,123 |
| WEL | Surface | 15 | 10,625 | 6,096 |
| LNX | Underground | 474 | 122,106 | 113,234 |
| PQD | Underground | 396 | 100,129 | 101,401 |
| PRJ | Underground | 5 | 851 | 6 |
| SIF | Underground | 401 | 56,373 | 52,595 |
| TAN | Underground | 23 | 5,531 | 6,552 |
| WEL | Underground | 188 | 43,226 | 52,400 |
| Total | 1,580 | 391,039 | 349,082 |
All 2023 underground drilling is NQ size core. Exploration reserve, resource and inventory drilling is completed using oriented core, meanwhile delineation (infill) drilling (measured spacing) is not. Drill core from all areas of drilling at Musselwhite is typically highly competent, with recoveries greater than 95%. Rare exceptions are restricted to local brittle faults which are documented in geotechnical logging.
Drill hole collar and down hole survey data are stored in Global Exploration Database (GED). Drill hole collar coordinates are collected by the underground mine surveyors. When the data is entered into GED, the Exploration Supervisor will be notified if the measured coordinates are more than 2 metres from planned. 5% of collar surveys are requested as duplicates for quality control. Single shot down hole surveys are recorded during the drilling process to allow tracking of hole deviations. Final downhole surveys are completed using a Reflex gyro in continuous survey mode. Final surveys are compared to the single shot surveys and dog legs are checked on all holes for quality control. The down hole survey tools are checked weekly in a test stand on surface, and re-calibrated as needed.
Drilling included in the 2023 model update included 407 new holes that were not included in the previous year’s internal model. A summary of the number of holes and metres drilled in each mine area, broken down by spacing classification, is provided in Table 10.9.
| | December 2024 |
| | TECHNICAL REPORT –
MUSSELWHITE MINE, ONTARIO, CANADA
Document # C8630-0000-PM-RPT-001 – Rev. 0
/ Page 95 |
Table 10.9 – Summary of New Drilling Included in the 2023 Geology and Resource Model Update
| Deposit | Delineation | Reserves | Resources | Wingspan |
No. of
Holes | Meters
Drilled | No. of
Holes | Meters
Drilled | No. of
Holes | Meters
Drilled | No. of
Holes | Meters
Drilled |
| Red Wing | 10 | 1,203 | 39 | 4,513 | 34 | 4,003 | 11 | 2,805 |
| PQ Deeps | 110 | 25,114 | 11 | 3,324 | 10 | 3,309 | 4 | 1,266 |
| Lynx | 29 | 6508 | 39 | 11,079 | 5 | 1,065 | 19 | 5,499 |
| TAN | N/A | N/A | 9 | 1,836 | N/A | N/A | 12 | 2,487 |
| West Limb | 49 | 9,849 | 5 | 1,602 | N/A | N/A | 11 | 3,504 |
| Totals | 198 | 42,674 | 103 | 22,354 | 49 | 8,377 | 57 | 15,561 |
| 10.4 | Standard Operating Procedures |
Drilling programs at Musselwhite currently maintain and employ a set of Standard Operating Procedures (SOPs) and guidelines for all drilling and geological functions. These protocols follow industry-best practices, including:
| ● | NEM-MWM-EXP-001 – Assaying |
| ● | NEM-MWM-EXP-003 – Drill Core Sampling Procedure |
| ● | NEM-MWM-EXP-005 – Geotechnical Core Logging Procedure & Guidelines |
| ● | NEM-MWM-EXP-013 – Diamond Drill Hole Planning |
| ● | NEM-MWM-EXP-015 – Underground Drill Site Setup and Inspection |
| ● | NEM-MWM-EXP-016 – Standards for Diamond Drilling Intersection of Gas-Bearing Faults |
| ● | NEM-MWM-EXP-017 – Action When Intersecting High Pressure Water |
| ● | NEM-TES-GDL-211 – Bulk Density Sample Collection Guideline |
| ● | NEM-TES-GDL-212 – Geotechnical Core Data Collection Guideline |
| ● | EM-TES-GDL-226 – Geometallurgy Guideline |
| ● | NEM-MWM-EXP-020 – Core Cutting and Handling |
| ● | NEM-MWM-EXP-028 – Whole Core Sampling |
| ● | NEM-MWM-EXP-006 – Specific Gravity Sampling |
Additional / related SOPs that have been discussed and/or referenced include, but not limited to:
| | December 2024 |
| | TECHNICAL REPORT –
MUSSELWHITE MINE, ONTARIO, CANADA
Document # C8630-0000-PM-RPT-001 – Rev. 0
/ Page 96 |
| ● | Drill hole Finalization Best Practice |
| ● | Grouting QA/QC for Geology |
| ● | Teching, Logging, Sampling Best Practices |
| ● | Oriented Core Best Practices |
| 10.5 | Diamond Drill Hole Planning Procedure |
The information in Sections 10.5.1 and 10.5.2 is largely extracted and/or summarized from the site procedural document entitled: "NEM-MWM-EXP-013 – Diamond Drill Hole Planning". Any further details as documented therein remain correct and valid.
The purpose of the Diamond Drill Hole Planning Procedure is to ensure that no diamond drill hole (DDH) intersects any mine development, that all drill hole details are recorded accurately and there is effective communication between departments.
The implementation plan includes the following areas of control:
| 10.5.1 | Drill Program Planning – General |
All planned DDH setup locations must be brought to the attention of both the Mine and Engineering departments at least one month prior to the initial drilling date to ensure that all services are available and the proposed setup locations are free to use.
All surface drill sites must be inspected by a geologist, drill supervisor, and a representative from the Sustainability department prior to the start of a program.
During ongoing exploration drill programs, a weekly plan and update is to be sent out to all personnel involved.
All planned drill holes must be checked by a secondary competent person to ensure the correct target and mineral resource / mineral reserve (MRMR) classification is being drilled, and that no drill hole intersects any pre-existing mine development.
| 10.5.2 | Drill Program Planning – Detailed |
Identify the target using the current geological model. If required, develop a conceptual shape and use the standardized naming convention for the target zone and drill holes. Open all as-builts, back mapping, design triangulations (Devcon files from Vulcan software) and structural data (faults, etc.) to determine the location of all current and future mine workings before proceeding. The Current and Finalized DDH databases should also be viewed.
| | December 2024 |
| | TECHNICAL REPORT –
MUSSELWHITE MINE, ONTARIO, CANADA
Document # C8630-0000-PM-RPT-001 – Rev. 0
/ Page 97 |
Ascertain the collar co-ordinates, required dip, azimuth and length for the drill hole to intersect the target in question. All drill holes should be planned to go through the targeted mineralized horizon with minimal waste drilled once through the zone.
Verify that the designed drill holes are not duplicating or intersecting previously drilled holes. Load all resource triangulations and determine if any other targets could be intersected by lengthening/adjusting a planned drill hole.
If a DDH is planned to intersect a structure of interest such as methane or water, Exploration Geology is responsible for conveying this information to the drill supervisor, Mine Department and Engineering.
All planned drill hole information must be entered into GED. The drill hole information must also be transferred into the drill hole tracking sheet for the current year.
When all required DDH have been planned and all data is recorded accurately in GED, the drill holes must be checked by a secondary competent person.
Once approved, a layout will be issued with a map of the drill hole trace with respect to underground workings, all relevant drill hole information and the intersection points (if applicable) for methane and water structures.
If any changes are made to the drill plan after the layout has been issued, a new updated layout must be issued. Changes to the drill plan cannot be communicated solely through the use of email or verbally.
When a DDH is approaching the end of hole and the final depth must be determined by visual inspection, the end of hole depth must be resolved by a Geologist. Diamond drillers are not responsible for making such decisions.
| 10.6 | Drill Core Sampling Procedure |
The information in Sections 10.6.1 to 10.6.6 is largely extracted and/or summarized from various site procedural documents, as listed in Section 10.4. Any further details as documented therein remain correct and valid.
The purpose of the Drill Core Sampling Procedure outlined in NEM-MWM-EXP-003 is to ensure the collection of high quality, representative samples of drill core samples at the Musselwhite Mine Site. The objective is to ensure that quality exploration, development, and production samples are collected, and subsequently assays and used to derive reliable resource, reserve and ore control models in support of operations, exploration and projects.
| | December 2024 |
| | TECHNICAL REPORT –
MUSSELWHITE MINE, ONTARIO, CANADA
Document # C8630-0000-PM-RPT-001 – Rev. 0
/ Page 98 |
Hole conditioners (inorganic drilling fluids) are injected into the hole to prevent wall caving and to stabilize the hole when in-hole conditions warrant their use such as blocky ground, sandy ground or deep holes, etc. Their usage is to be recorded on the daily drill reports.
Samples are collected by retrieving the core barrel via wire line from the sampled interval.
The sample barrel is removed from the rods and taken to an area where the rock sample can be removed from the core barrel. Core is removed from the barrel and slid into wooden core trays laid out on a table. Each core tray holds up to 3 m of core.
Once core is removed from the barrel, a metre block is placed at the end of each run. Runs are typically 3 m in length, but in some cases 6 m barrels are used when deep drilling.
Core boxes should be clean and sufficiently sturdy to protect the core. An empty core tray is placed, face down, as a lid on top of the tray holding the core. The core trays are then taped together tightly on both ends to avoid loss of fines and contamination. Boxes are clearly labelled in permanent marker with the correct hole ID and box number. Meter marks are drawn on the core by the drillers with a white grease pencil.
Drillers load the core boxes into their vehicles and deliver the core to the appropriate core facility after each shift.
Most drill holes have a pre-determined final depth due to known lithological marker horizons; but in some cases, the hole may be placed on GEO Call and a geologist will notify the driller when to stop the hole.
The drillers will take gyro-shot surveys at depths pre-determined by the geologist during the drilling process and return the survey sheets at the end of each shift so the geologist can monitor the dip deviation of the drill hole. When the hole is complete, the driller will either perform a downhole survey, or they will contact a surveyor to perform the survey.
Drilled meterage depths are recorded on the Daily Shift report.
When a core box is dropped or core is mixed up at the drill, the driller is to flag the box and notify the Exploration Supervisor of the hole ID and depth/interval.
| 10.6.1 | Site Visits By Geologists, Exploration Supervisor And Logistics Supervisor |
Once drill holes are planned, the Geologist or Exploration Supervisor issues a layout with the drill holes for a specific fan and provides copies to the surveyor, drill foreman and drillers. The layout includes planned collar coordinates, dip, azimuth, depth of hole, and any other relevant comments.
Supervisors will inform Drill Foreman and drillers of any substandard practices including footage errors, dirty/grease covered core, etc.
| | December 2024 |
| | TECHNICAL REPORT –
MUSSELWHITE MINE, ONTARIO, CANADA
Document # C8630-0000-PM-RPT-001 – Rev. 0
/ Page 99 |
Drill rig inspections will be done bi-weekly by the Logistics Supervisor and/or Geologist/Exploration Supervisor. Drilling and sampling practices will be observed, and the drillers log will be checked at each rig visit and substandard practices will be discussed with the Drill Foreman, drillers and helpers.
| 10.6.2 | Core Logging Geologist – Sampling |
All drill core is ultimately delivered to the core compound, which includes two identical core shacks, one for exploration and one for definition programs (Figure 10.3), as well as a core storage/laydown area (Figure 10.4 and Figure 10.5). The core is brought into the appropriate core shack, unpacked and checked for obvious errors by technicians (Figure 10.6).
Figure 10.3 – Exploration Core Shack
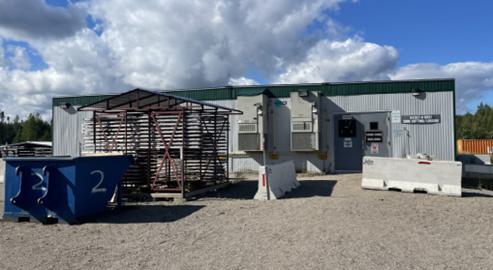
Source: Newmont, 2024
| | December 2024 |
| | TECHNICAL REPORT –
MUSSELWHITE MINE, ONTARIO, CANADA
Document # C8630-0000-PM-RPT-001 – Rev. 0
/ Page 100 |
Figure 10.4 – Core Farm / Storage Area
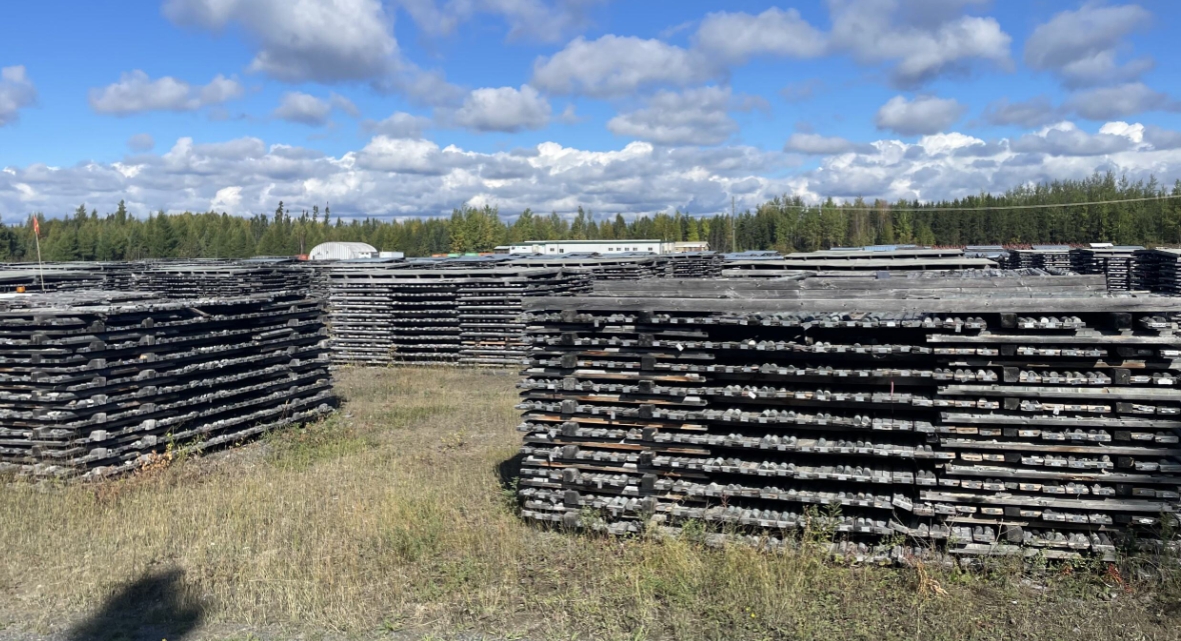
Source: Newmont, 2024
Figure 10.5 – Example of Core Rack Arrangement

Source: Newmont, 2024
| | December 2024 |
| | TECHNICAL REPORT –
MUSSELWHITE MINE, ONTARIO, CANADA
Document # C8630-0000-PM-RPT-001 – Rev. 0
/ Page 101 |
Figure 10.6 – Core Unpacking Area in Core Shack
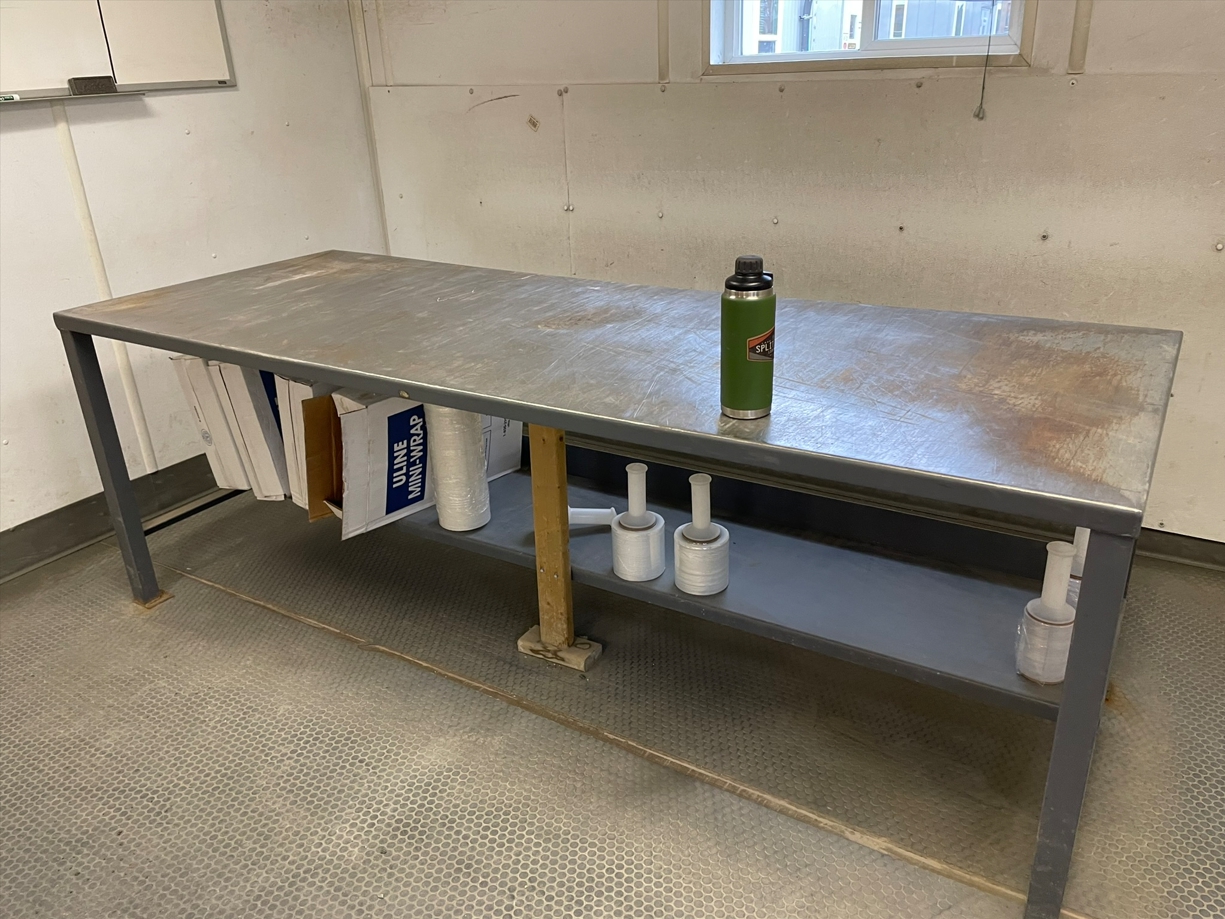
Source: DRA, 2024
The core is then transferred to one of the core logging areas (Figure 10.7); the logging geologist is responsible for selecting sample intervals and marking up samples on all drill core, which is subsequently racked in queue for cutting purposes (Figure 10.8).
| | December 2024 |
| | TECHNICAL REPORT –
MUSSELWHITE MINE, ONTARIO, CANADA
Document # C8630-0000-PM-RPT-001 – Rev. 0
/ Page 102 |
Figure 10.7 – Core Logging Area in Core Shack at Musselwhite
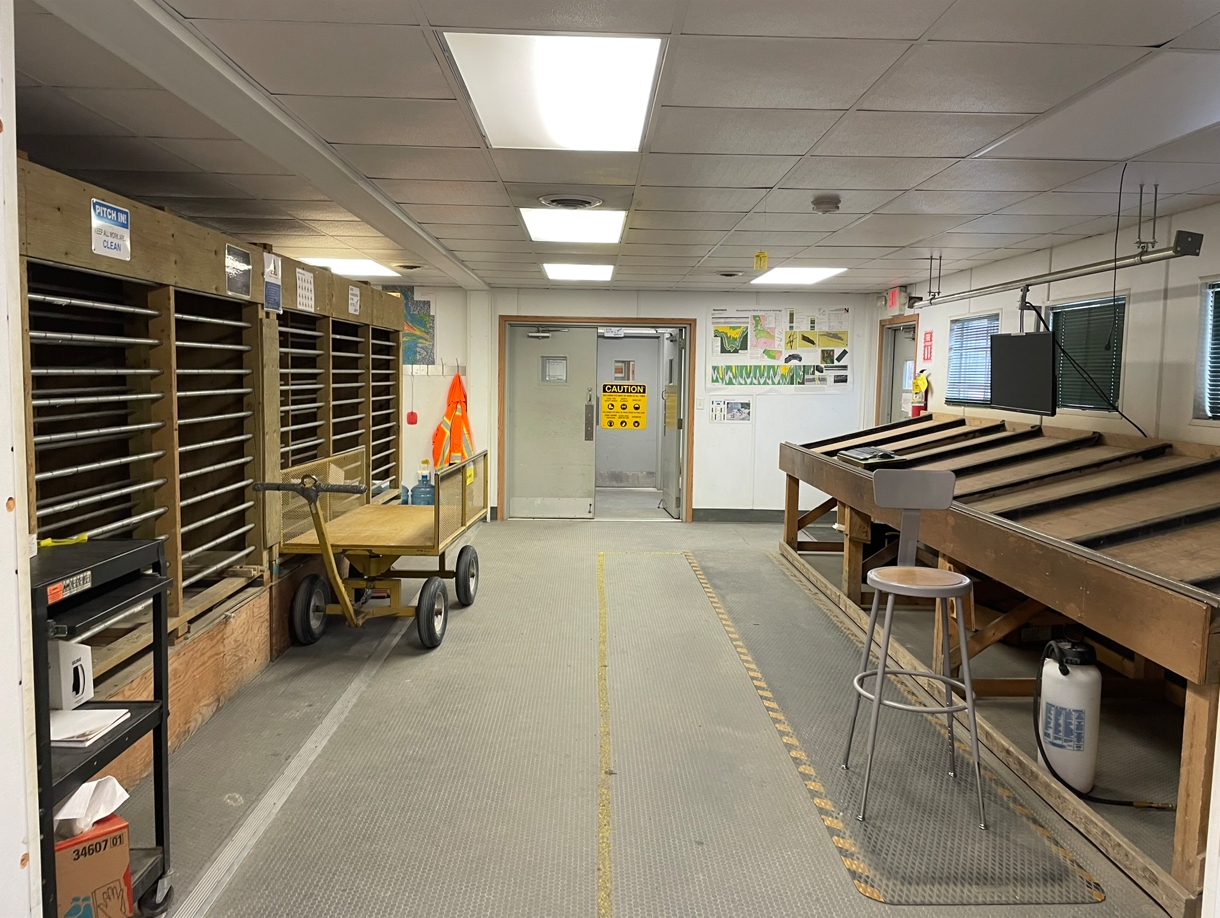
Source: DRA, 2024
Figure 10.8 – Example of Logged and Tagged Core Ready for Cutting
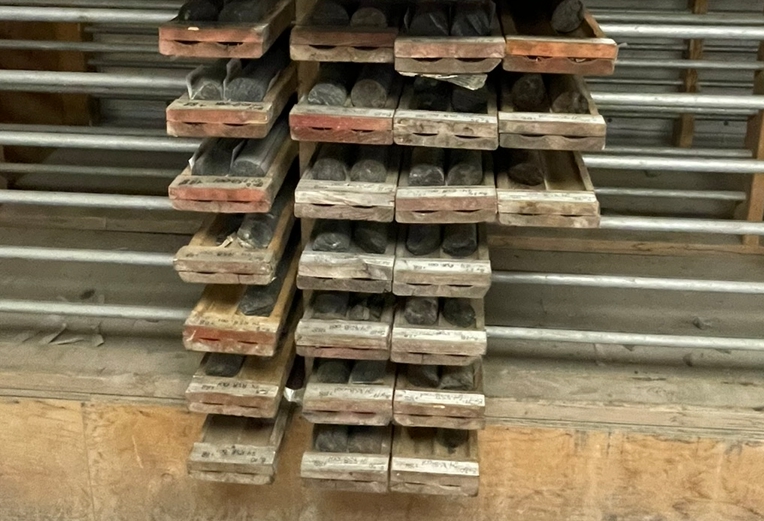
Source: DRA, 2024
All Inventory and Resource holes are to be sampled from top to bottom. All Reserve holes are sampled starting at 25 m to end of hole with every 4th hole on a fan being sampled from top to bottom.
| | December 2024 |
| | TECHNICAL REPORT –
MUSSELWHITE MINE, ONTARIO, CANADA
Document # C8630-0000-PM-RPT-001 – Rev. 0
/ Page 103 |
Delineation holes only sample the ‘ore units’ with 2m buffers for waste, unless otherwise specified. ‘Ore units’ include all known zones, all units that begin with a ‘4’, all visible mineralization, and all intervals in which previously logged adjacent drill holes show mineralization in the same area. The only areas that may be unsampled are known areas of waste including unmineralized felsic lapilli tuff (3F), mafic (2), or ultramafic (1) that are not proximal to known or developing mineralized zones.
If mineralization other than the typical Musselwhite pyrrhotite, pyrite, chalcopyrite, arsenopyrite assemblage occurs, or if there is an unusual occurrence of any of the above sulfides, the logging geologist must inform the supervisor. The supervisor will determine if further geochemical testing is required.
Samples are to never cross lithological contacts or mineralization boundaries, unless the lithological contacts are of minor units less than 30 cm and mineralization intervals less than 30 cm. If minor units or mineralization intervals are less than 30 cm, then the sample should constrain the unit or mineralization within the sample length requirements (20 cm minor unit constrained to a 30 cm sample).
Sample intervals are to be between 30 cm (min) to 1 m (max) in length for NQ/NQ2 sized drill core (drill core size typically used at Musselwhite).
If the core has poor RQD, it is okay in this case to sample the whole core if it is needed for reliable assay. A comment stating that the whole core was used must be put in the Sample Log comment box.
Using a tape measure and yellow grease pencil, sample intervals are to be marked on the core with a line perpendicular to the core axis, with arrows at right angles to identify the break between samples. Meterage is written next to the mark and the sample measurements are made to one decimal place. The words ‘start’ and ‘stop’ are written where the sample sequence beginnings and ends.
Choose a sample tag booklet (or multiple booklets from the same sequence) and proceed to fill out the meterage. The tag order should continue from the beginning of the hole to the end so you should designate a sufficient numerical sequence of tag books ahead of time for that entire hole.
If the sample sequence ends in the middle of a drill hole, and a new one must be started, the geologist must make note of the sequence change in the sampling comments, flag the box, and notify the cutters.
It is not necessary to fill out the majority of the sample booklet information; only what is necessary for the geologist to accurately enter into Visual Logger including, but not limited to, the meterage (i.e., to and from depths).
| | December 2024 |
| | TECHNICAL REPORT –
MUSSELWHITE MINE, ONTARIO, CANADA
Document # C8630-0000-PM-RPT-001 – Rev. 0
/ Page 104 |
When entering the information into Visual Logger, be sure to enter the sample number, sample type, method (whether it is whole core or half core) and sample intervals.
If the mineralization in a sample is significant, i.e., likely >10 g/t, then put an ‘X’ on the tag. This will ensure that the lab runs a blank after the sample to reduce contamination during the crushing/pulverizing stage.
There are several options for the order in which to write the sample intervals on the tags and enter them into Visual Logger. However, double-check the data on a regular basis while sampling to ensure that the sample intervals are correctly written on the sample tags and properly entered into Visual Logger and that no samples were missed on the core.
The blank tags are pre-labelled in the sample booklets. Standard tags are also pre-labelled, but the geologist must write what standard ID is being inserted. Duplicates are taken at the discretion of the geologist, on any sample ID, as long as the ID is not reserved for a blank or a standard. A minimum of two duplicate samples must be taken from every 100 samples. Duplicate samples must be manually entered into Visual Logger. Standards and blanks occur every 10 samples on the 0’s (e.g., 10, 20, 30). When entering sample data, the geologist will have to manually enter the blanks, standards, and duplicates. The geologist will choose a specific standard from the drop-down menu. 3.16. Lift the core near the start of each sampled interval and place the sample tags securely under the core. The blank, standard, and duplicate tags are to be inserted with the preceding sample tag (e.g., 10 will be inserted with 9) and should be placed on top of the preceding tag.
Specific Gravity (SG) measurements should be completed on both Exploration and Delineation drill core. SG samples are to be taken systematically, one per modeled lithology or one every ten metres, whichever is shorter. SG sample sizes should be 20-30 cm in length and are representative of the mineralization seen within the zone. The data is collected by means of the Archimedes’ method, which entails measuring the weight of the dry core sample, followed by weighing the core under complete immersion in distilled water; the SG is then calculated as (dry weight) / (dry weight – wet weight). The setup used at Musselwhite is shown in Figure 10.9.
| | December 2024 |
| | TECHNICAL REPORT –
MUSSELWHITE MINE, ONTARIO, CANADA
Document # C8630-0000-PM-RPT-001 – Rev. 0
/ Page 105 |
Figure 10.9 – Specific Gravity (SG) Measurement Station at Musselwhite
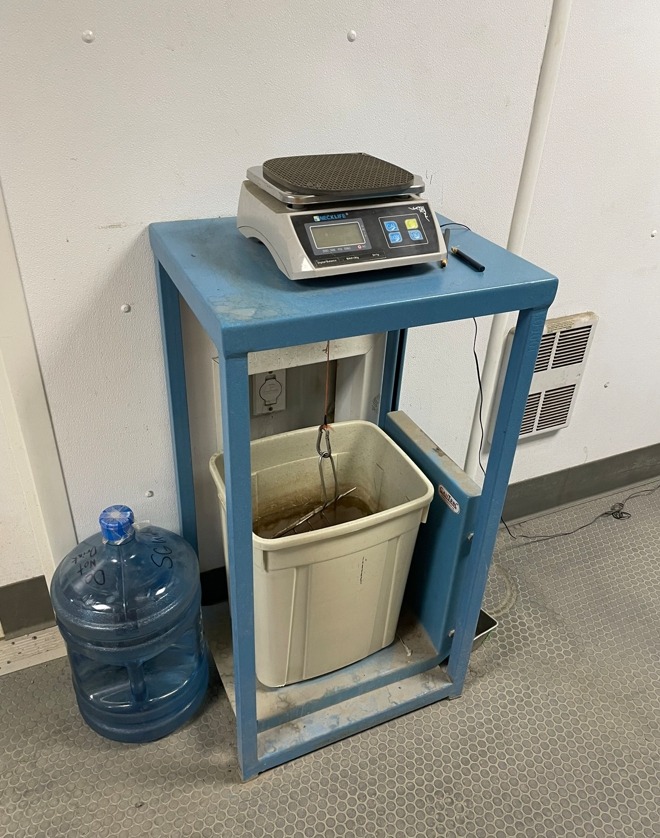
Source: DRA, 2024
Metallurgical sampling should use a ¼ split, retaining ¼ unless testing requires all remaining material. If all remaining material is to be taken for the sampling, it should be recorded in the core box (and the log). Sample lists should be maintained as samples are collected.
Geotechnical data collection includes both Basic and Detailed Logging. A plan will be developed at the start of a drilling program that defines the holes that will be subject to Basic Logging, and the holes that will be subject to Detailed Logging.
Basic (Rock Mass) Logging – consists of the basic geotechnical parameters that contribute to assessments of rock mass quality.
Detailed Logging – consists of RMR-based logging format plus detailed discontinuity parameters, including Joint Roughness, infilling thickness, and strength.
If geotechnical testing is required, it should be conducted according to industry acceptable standards. Sample dimensions will depend on test type. Samples collected should be clearly labeled with hole number, depth interval, and material type. Sample lists should be maintained as samples are collected.
| | December 2024 |
| | TECHNICAL REPORT –
MUSSELWHITE MINE, ONTARIO, CANADA
Document # C8630-0000-PM-RPT-001 – Rev. 0
/ Page 106 |
| 10.6.3 | Core Photography – Geologist |
Once sampling is complete, the geologist photographs the core in both a wet and dry state. Ensure as best as possible that the image is of good quality (i.e., not blurry or over exposed by sunlight)
Sample tags, box numbers, block numbers, box depths, scale and color card and important geological notes must be visible in the photo.
Photos are taken using Imago Capture X. Labelling format includes the hole ID, the from – to meterage, and a D or W to differentiate wet and dry. e.g., 20-RDW-012 meterage 90 m to 102 m would be labelled 20-RDW-012_090.00_102.00(W) for the wet photo and 20RDW-012_090.00_102.00(D) for the dry photo.
Once labelling is complete, core photos are uploaded to the Imago Portal.
| 10.6.4 | Core Cutting and Bagging – Core Technicians |
The Core Technician (Tech) sets up his/her saw and performs a pre-work inspection of the area and equipment before cutting begins. The Tech must refer to the NEM-MWM-EXP-020 Core Cutting and Handling document. All Inventory, Resource, and select Reserve holes will be cut. All delineation holes and select Reserve holes will be whole core sampled as per NEM-MWM-EXP-028 Whole Core Sampling. An automated diamond core saw setup is now used at Musselwhite for both safety and efficiency purposes (Figure 10.10).
Figure 10.10 – Automated Diamond Core Saw Setup at Musselwhite
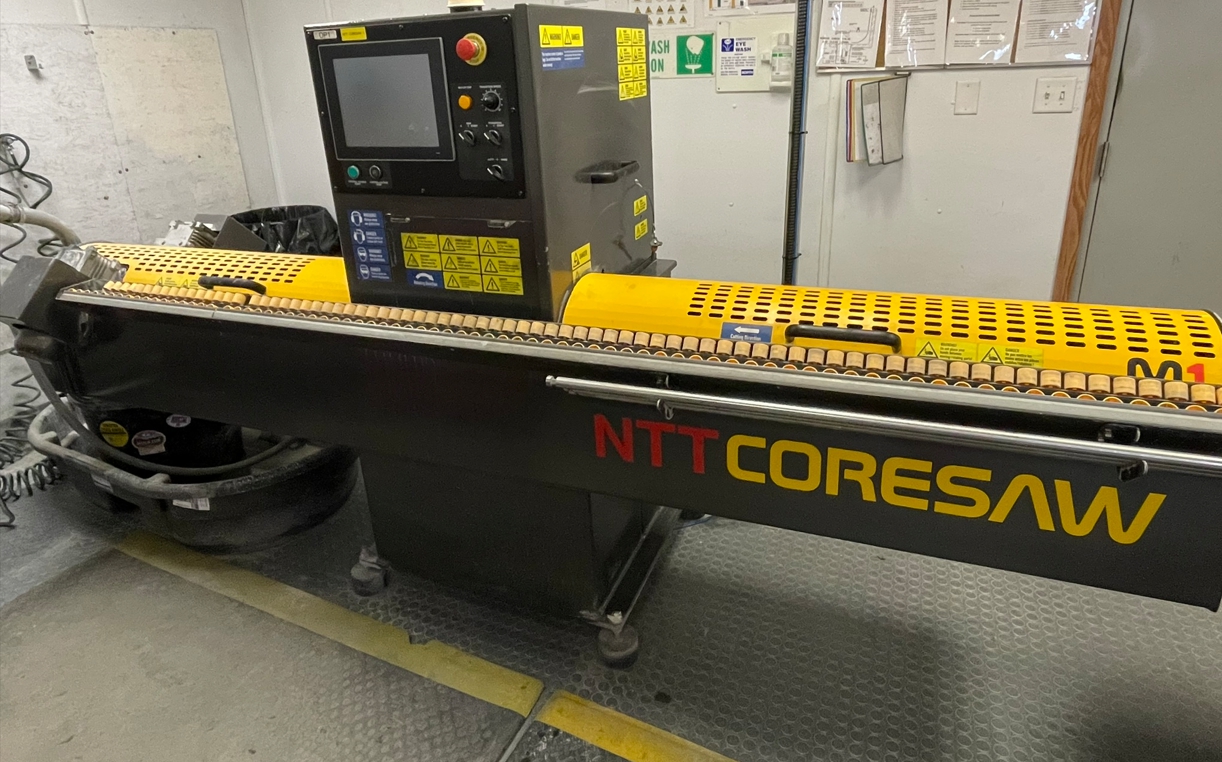
Source: DRA, 2024
| | December 2024 |
| | TECHNICAL REPORT –
MUSSELWHITE MINE, ONTARIO, CANADA
Document # C8630-0000-PM-RPT-001 – Rev. 0
/ Page 107 |
The Core Technician will load approximately four (4) core trays onto a table (in order). They will be given a cut sheet that lists what samples are to be sampled for the dispatch.
Before the core can be cut, it must be placed in the holder so the saw will cut perpendicular to how it is oriented in the box; though not required, it can be helpful to draw a line along the core box onto the core as a guide. If the core has been oriented, cut along the red line and not the black line. It is essential that the top half of the core is sampled and the bottom half is returned to the core box. This is continued throughout the entire length of the sampled interval.
For duplicate tags, the half core left in the box from the previous sample will be used. There will be no core left in box when there is a duplicate sample taken.
Once core has been cut, the half that was originally on top is put into a pan on top of a wax sheet or in a plastic sample bag to be transported to the lab. The core in the bags or pans should be broken small enough to allow them to fit properly. The barcode side of the sample tag is placed under the core.
For the internal on-site lab, sample pans can then be placed in numerical order on the core racks prior to being transported to the assay lab. For an off-site lab, the sample bags are placed into labelled rice bags to ensure secure transport.
The remaining half of the sample will be placed in the same position in the core tray with the non-barcode side of the sample tag placed underneath. The core will be rotated in the core box channel and flush with the tray top to prevent it from falling out during transport/handling. The end of each sample is marked with a red lumber crayon, both on the core and core tray.
Care is taken at all times during the sampling process to ensure that samples and sample tags remain together so that they do not become mixed up. This also applies to the insertion and placement of blank or standard material as indicated by the sample tags.
If the core is being sent to an off-site lab, the Field Technician will fill out a Request for Analysis (RFA) form for the dispatch, including the number of samples and the sample ID sequence(s) included in the dispatch. The Field Tech attaches a copy of the RFA to the crate with the samples and emails another copy to the lab representative at the time the samples are shipped. When the lab receives the samples, the lab representative emails a Sample Submission Confirmation to the Exploration Manager and Supervisors. If the samples are sent to the on-site lab, the Field Tech personally delivers the samples to the lab. Examples of the secure shipping totes used for sample batch shipping are shown in Figure 10.11.
| | December 2024 |
| | TECHNICAL REPORT –
MUSSELWHITE MINE, ONTARIO, CANADA
Document # C8630-0000-PM-RPT-001 – Rev. 0
/ Page 108 |
Figure 10.11 – Shipping Totes Used for Drill Core Sample Transport at Musselwhite
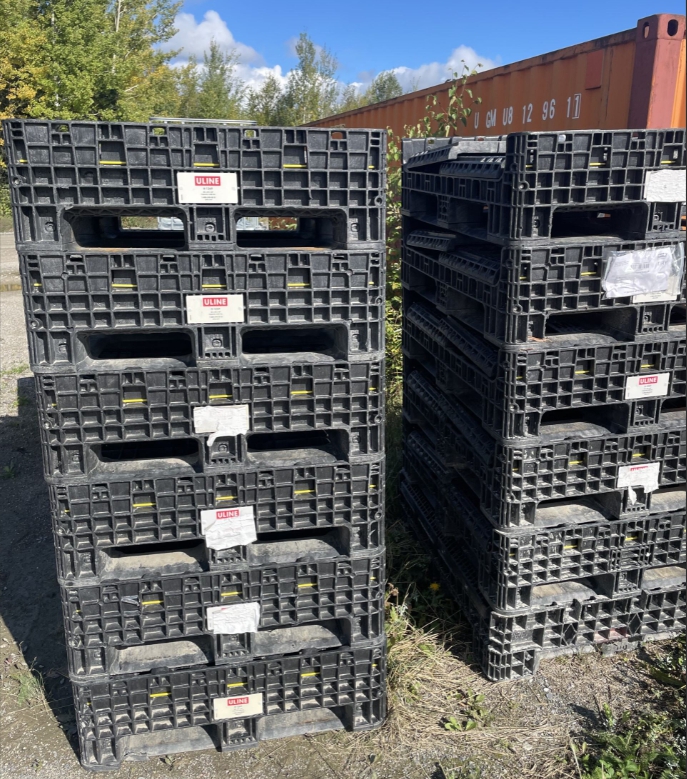
Source: Newmont, 2024
Once assays are finalized at the external lab, they are relayed in a .csv and PDF to the Exploration Manager, Supervisors, and the Database Geologist.
Coarse rejects for cut Exploration drill core, that are processed at an external lab, are to be stored at the lab for one year post receipt of assay certificates and site QA/QC checks. After one year, the Exploration Manager can give written approval to the lab to dispose. For whole core samples, the coarse rejects must be returned to site for long term storage
Coarse rejects that are processed at the internal lab, must be stored in bins on site (Figure 10.12) for three (3) months post receipt of assay certificates and site QA/QC checks. After three (3) months, the Exploration Manager can give written approval to the lab to dispose.
Pulp rejects for Exploration and Delineation drill core that are, or may be, used to quantify a mineral resource or reserve, must be kept until that portion of the resource or reserve is mined out or deemed to never be economic.
Pulp rejects can be stored at the lab in a secure, dry area, or on site. If stored on site, pulps must be in a dry area protected from the elements. Pulp rejects must be stored on engineered shelving, all samples individually labelled, and the outside of the box clearly labelled with sample IDs within (Figure 10.13).
| | December 2024 |
| | TECHNICAL REPORT –
MUSSELWHITE MINE, ONTARIO, CANADA
Document # C8630-0000-PM-RPT-001 – Rev. 0
/ Page 109 |
Figure 10.12 – Coarse Reject Sample Storage in Drums at Musselwhite Site
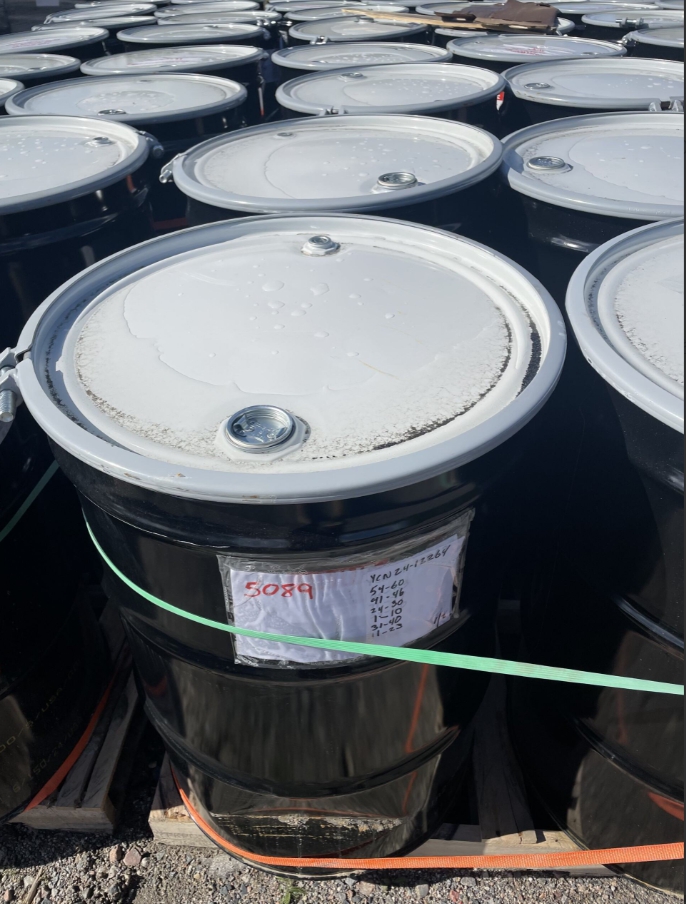
Source: Newmont, 2024
Figure 10.13 – Pulp Reject Sample Storage on Shelving in Sea Can at Musselwhite Site

Source: Newmont, 2024
| | December 2024 |
| | TECHNICAL REPORT –
MUSSELWHITE MINE, ONTARIO, CANADA
Document # C8630-0000-PM-RPT-001 – Rev. 0
/ Page 110 |
All Exploration drill core from holes that have not been mined out must be kept. Drill core that has been mined out will be kept for seven (7) years if storage allows.
Delineation drill core may be disposed of if both wet and dry photographs have been taken and properly catalogued, assay certificates are received, and site QA/QC checks have been passed, and all drill holes have been finalized.
Musselwhite Drill Core and Geological Sample Storage Guidelines are available for storage requirements.
| 10.6.6 | Training Requirements |
Training of new geologists should be completed by the Senior Geologist, an experienced Geologist, or other qualified designate. An experienced geologist should review the new geologist’s logging and sampling before the core is taken off the bench and brought into the cut shacks. The teching and logging best practices should be utilized.
Training of new geotechnicians should be completed by an experienced geotechnician or experienced geologist. The teching and logging best practice should always be utilized.
Geotechnical mapping for rock mass classification, further discussed in Section 16.4, includes collection of data for the joint water reduction factor and ground water rating for inflows used in stope stability assessments. Geotechnical drill holes for site characterization are completed when significant vertical development is planned. During drilling, water inflows are logged and form an input for ground stability assessments.
| 10.8.1 | Geological Data Acquisition |
The geotechnical data acquisition program at Musselwhite is described below. As Musselwhite Mine is an operating mine, data is confirmed with visual observation and back analysis using numerical modeling or empirical techniques to increase the confidence in the data used and to help ensure that the quality of the geotechnical data meets industry standards. The Senior Geotechnical Engineer at Musselwhite reviews the geotechnical core logging for accuracy on an annual basis. Laboratory core testing used laboratories that follow ASTM standards and International Society of Rock Mechanics suggested methods for testing intact rock samples. Laboratory testing results are adjusted based on underground observation of the rock mass behavior and are included in the analytical tools to forecast future response to the rock mass to mining. Currently, Musselwhite Mine has a good understanding and good data to be able to evaluate potential geotechnical risk for extraction of reserves.
| | December 2024 |
| | TECHNICAL REPORT –
MUSSELWHITE MINE, ONTARIO, CANADA
Document # C8630-0000-PM-RPT-001 – Rev. 0
/ Page 111 |
The acquisition, storage, and analysis of geotechnical data is a crucial aspect of mine design and planning, as it plays a significant role in determining safe and efficient methods of controlling ground conditions during the mining process. The procedures involved in collecting geotechnical data at Musselwhite Mine are aligned with the GCMP and as described below.
A variety of sources are utilized to gather geotechnical data, including:
| ● | Logging of selected exploration and underground grade control diamond drill core samples, which provides information on the composition and strength of rock formations. |
| ● | Rock property testing of selected in situ core samples, which determines the physical and mechanical properties of rock, such as density, porosity, and strength. |
| ● | Structural mapping of exposed rock masses in underground drifts, which helps to identify potential geological hazards and to develop strategies for ground support. |
| ● | Geological mapping of underground development, which provides comprehensive understanding of the geological setting and helps to identify potential geological hazards. |
| ● | Recording rock noise and rock fall events, which provides information on the stability of the rock mass and helps to identify potential ground control issues. |
| ● | Routine monitoring and observation of underground workings, which provides ongoing monitoring of ground conditions and helps to identify any changes or potential hazards. |
| ● | Consultants site visit reports, which provide independent expert assessments of ground conditions and provide recommendations for managing ground control risks. |
By utilizing a comprehensive range of data sources and conducting thorough analysis, the Musselwhite Mine can ensure that it has a robust understanding of ground conditions, thereby enabling it to develop effective ground control strategies that promote safe and efficient mining operations.
The process of mapping drift backs and walls is an essential step in creating accurate and useful geological maps that contain valuable information about the underground geological features, such as faults, lithology, veins, and alteration. These maps contribute significantly to the dataset and accuracy of the current geological model. An example of typical geological mapping performed at the Musselwhite Mine is illustrated in Figure 10.14. The geological mapping is stored in Musselwhite’s Deswik MDM server.
| | December 2024 |
| | TECHNICAL REPORT –
MUSSELWHITE MINE, ONTARIO, CANADA
Document # C8630-0000-PM-RPT-001 – Rev. 0
/ Page 112 |
Figure 10.14 – Typical Geological Mapping at Musselwhite (Heading 1470 mL)
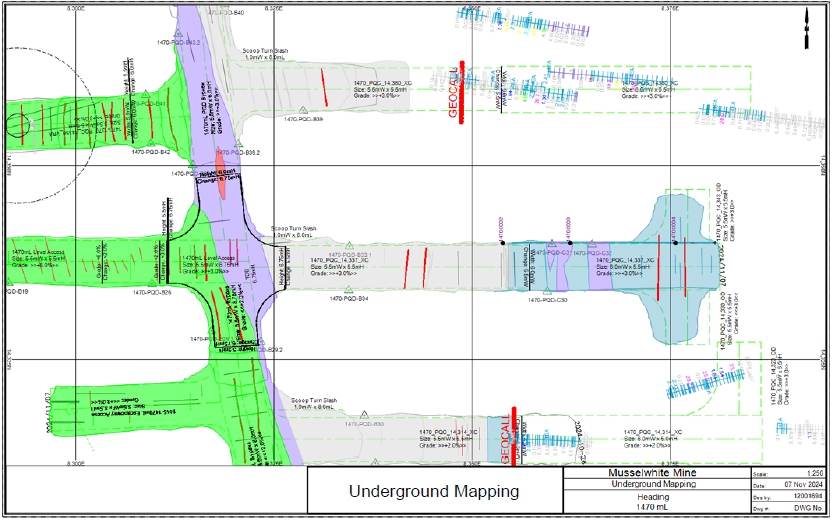
Source: Newmont, 2024
| 10.8.3 | Geotechnical Mapping |
Geotechnical mapping is a critical part of underground mine design and planning. It provides valuable information on the physical and mechanical properties of the rock in the mine, including strength, deformation characteristics, and stability. This information is essential for identifying and managing geotechnical hazards, such as rockfalls, collapses, and underground water flows, which can pose significant risks to people safety and mine infrastructure.
The geotechnical mapping data and hazard mapping is located on the shared network at Musselwhite Mine.
| 10.8.4 | Geotechnical Core Logging |
Geotechnical core logging, detailed examination, and description of rock samples obtained from drilling provides a comprehensive understanding of the geotechnical characteristics of the mine which is a valuable input in engineering design and construction.
Musselwhite’s geotechnical core logging procedure and guidelines is based on Document NEM-MWM-EXP-005. There are two (2) procedures for geotechnical core logging: Standard and Detailed.
| | December 2024 |
| | TECHNICAL REPORT –
MUSSELWHITE MINE, ONTARIO, CANADA
Document # C8630-0000-PM-RPT-001 – Rev. 0
/ Page 113 |
During the Standard geotechnical core logging process, the following parameters are typically recorded:
| ● | Rock Quality Designation (RQD) length, and; |
The Detailed geotechnical core logging process collects the following parameters:
| ● | Joint alternation (Ja), and; |
These parameters are entered into Musselwhite’s Standard Geotechnical Logging template (Excel), which is located on the shared network at Musselwhite Mine. This template forms the basis for Rock Mass Rating (RMR) (Bieniawski 1976) and Q’ rating (Barton et al., 1974) calculations.
Every fourth drill hole on every fan of drilling that targets resource and reserve, as well as any drill hole flagged by Rock Mechanics are also logged. Geotechnical core logging intervals are generally recorded by drill run block by block, with a maximum interval length of 3 m. Shorter intervals are broken out where especially poor ground conditions over a short interval exists.
A total of 12 uniaxial compressive strength tests were carried out on both iron formation and intermediate-mafic volcanic rocks. Four of the iron formation samples were tested with strain gauges to allow elastic moduli determination (Young’s Modulus and Possion’s Ratio). The tests were performed according to American Society for Testing and Materials (ASTM) standards.
In March 2010, additional UCS tests were performed in the Norman B. Keevil Institute of Mining Engineering at University of British Columbia. The main rock strength parameters used in assessments by Musselwhite Mine are provided in the GCMP and include UCS, Young’s Modulus, Possion’s ratio, density and Indirect Tensile strength.
Further testing is planned as Musselwhite Mine is developed deeper. Laboratory testing is performed by accredited labs using ASTM standards and International Society of Rock Mechanics suggested method for rock testing.
| | December 2024 |
| | TECHNICAL REPORT –
MUSSELWHITE MINE, ONTARIO, CANADA
Document # C8630-0000-PM-RPT-001 – Rev. 0
/ Page 114 |
The Geomechanics Research Centre (GRC) of MIRARCO at Laurentian University performed in situ stress measurements at Musselwhite Mine. Full stress tensors were determined by the over core strain relief technique, employing 12-gauge CSIRO hollow inclusion triaxial strain cells The field component of this project was conducted between November 26 and December 13, 2008, and laboratory and analytical components were completed on January 15, 2009.
A total of five (5) measurements in two different almost perpendicular boreholes were attempted from the 657-770 diamond drilling station at a depth of 740 m.
The ratio of the major to minor principal stress was observed to be about 2.0 and the ratio of the intermediate to minor principal stress about 1.3.
Additional stress measurements for the deepest zone at Musselwhite Mine (PQ Deeps) should be planned to understand if the stress regime is changing at depth.
RMR (1976) and Q’ are being employed to qualify ground conditions. In general, the RMR values in the transverse stopes vary between 60% and 70% (Good) for the hanging wall, 70% to 80% (Good) for the foot wall, 65% to 70% (Good) for the back, and 70% to 75% (Good) for the ore. RMR and Q’ are obtained from core logging and underground mapping.
Systematic geological mapping of development fronts has been carried out since 2008 and the data is being recorded and updated.
| 10.9 | Other Significant Factors and Risks |
There were no drilling, sampling or recovery factors identified by DRA that could materially impact the accuracy and reliability of the results to a degree that would risk the ongoing viability of the Musselwhite Mine. The QP is comfortable that industry best practices are being implemented for all drilling and subsequent geological functions.
| | December 2024 |
| | TECHNICAL REPORT –
MUSSELWHITE MINE, ONTARIO, CANADA
Document # C8630-0000-PM-RPT-001 – Rev. 0
/ Page 115 |
| 11 | Sample Preparation, Analysis and Security |
| 11.1 | Historical (Pre-2006) |
Diamond drill core samples at Musselwhite Mine have been prepared and analyzed at a number of laboratories since exploration drilling began in 1974 up until 2005. For the purposes of this Report, there is little historical documentation available in the public domain or the provided site records. As a result, this Report will use the 2006 AMEC technical report as a focal point for review of historical sample preparation and QA/QC analysis approaches used at Musselwhite.
The long production history and continued strong reconciliation data at Musselwhite support that there is no significant concern for pre-2006 work affecting current conditions at the mine.
| 11.1.1 | Sample Preparations |
Documentation from the 2006 AMEC report indicated that the samples were prepared and analyzed primarily at the Musselwhite Mine laboratory. During periods of increased sample generation, samples were also shipped to ALS Chemex in Thunder Bay. The maximum capacity of the mine assay lab was approximately 350 samples per day (including 100 production samples per day from the mine and mill, and 70 quality control samples).
All samples (core, mucks and chips) were received and recorded at the on-site lab and placed into individual trays. The samples were placed in a 120°C drying oven for 3 to 4 hours depending on the humidity of the sample. Since late August 2002, Musselwhite’s laboratory has employed the use of an automated sample preparation system manufactured by Rocklabs. Some contamination issues were recognized during the equipment start-up phase and remedial action was taken resulting in the process described below.
Monthly QA/QC reports reviewed from 2006-2008 did not include reporting on blanks. It is assumed that blank insertions were ongoing as this was already a standard site practice dating back to at least 2005; however, this could not be verified by the QP. Moreover, the Musselwhite Laboratory Audit (AMEC, 2009) states that both coarse and fine blanks were being used from January 2008 to January 2009. Of 4,885 blank samples assayed at the mine laboratory, a failure/contamination rate of only 1.6% was indicated. It was suggested that the majority of these failures were likely due to sample switches based on a slight positive correlation identified by plotting blank samples against the preceding samples.
There also was no direct documentation available regarding the use of blanks during the period from 2010 to 2015; however, there are daily blank results available from January to November 2016. The results appear to be very consistently below 0.01 g/t, well within acceptable limits, with very few
| | December 2024 |
| | TECHNICAL REPORT –
MUSSELWHITE MINE, ONTARIO, CANADA
Document # C8630-0000-PM-RPT-001 – Rev. 0
/ Page 116 |
exceptions. This indicates that cross-contamination was not a significant issue during this time period.
A later 2018 assay QC program review report by Analytical Solutions Ltd. continued to confirm that barren coarse material was submitted with samples to determine if there is any contamination or sample cross-contamination occurring during sample preparations or analytical procedures. For the period reviewed, there was a total of 2,063 blanks submitted to Actlabs and 284 blanks submitted to the mine laboratory. Of these, only 22 sample results returned values above the 0.05 g/t acceptable threshold; all cases were noted as having been sent for re-assay to help determine the root causes (e.g., sample switches, contamination, etc.). All failures and exception handling decisions were also noted as being documented in the database.
The representative results from April 2018 monthly report are shown in Figure 11.1 (Actlabs) and Figure 11.2 (internal mine lab). Of these plots, only two new blanks (and one re-assay) came back as failures; overall, it is clear that both labs were performing well in terms of cross-contamination for both preparation and analytical aspects. All failures were investigated and exception handling decisions were noted as having been documented.
Figure 11.1 – Blanks Results from Actlabs: April 2018
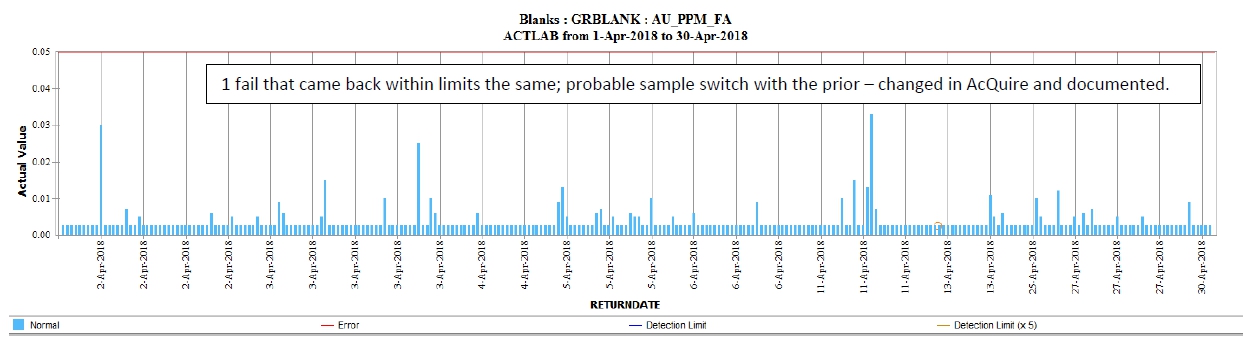
Source: Goldcorp, 2018
Figure 11.2 – Blanks QA/QC Results from Internal Lab: April 2018
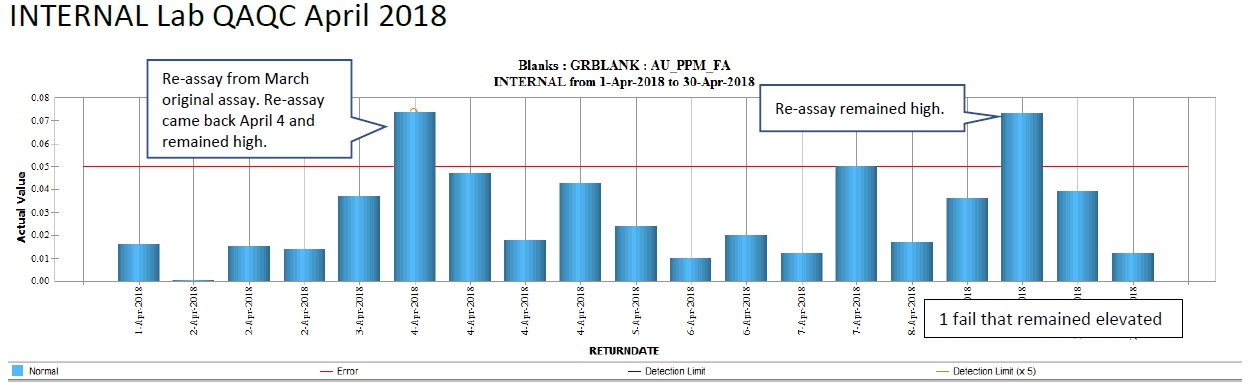
Source: Goldcorp, 2018
| | December 2024 |
| | TECHNICAL REPORT –
MUSSELWHITE MINE, ONTARIO, CANADA
Document # C8630-0000-PM-RPT-001 – Rev. 0
/ Page 117 |
The automatic Rocklabs preparation system was a fully integrated crushing to final pulverizing process. Samples are first coarse crushed in a “Big Boyd” jaw crusher which crushes the material to a nominal ½ inch size weighing approximately 3 kg. The sample was then introduced into a Boyd crusher, which takes the sample down to 95% passing #6 mesh. The sample is ground in a single deck pulverizer to 95% passing #10 mesh and split down to 600 g. From the single deck pulverizer, the sample passes through a double deck pulverizer which reduces the material to 95% passing #150 mesh. It is during this process that the first 150 g of the sample is used to “wash” the double deck pulverizer to eliminate any chance of contamination from the previous sample. The remaining 450 g of the sample, after passing through the double deck pulverizer is homogenized and placed in a Kraft paper bag.
All of the samples submitted undergo a Fire Assay (FA) pre-concentration method followed by an Atomic Absorption (AA) or gravimetric finish on a one assay ton aliquot (~30 g). The gravimetric finish is employed if the AA results are greater than 10 g/t gold. At the time, it was AMEC’s opinion that the sample preparation and assaying methods conformed to industry-standard practices for this type of gold deposit.
The Musselwhite laboratory had participated in the Geostatistical round-robin assay accuracy program since the lab opened in 1997. This involves the assaying of eleven pulps and six carbon samples and comparing the results against 100 labs worldwide. AMEC had reviewed the 2005 results and found that the Musselwhite lab assay results were within ½ standard deviation from the mean which is excellent.
AMEC commented at the time that Musselwhite Mine’s QA/QC program ensured an acceptable level of confidence in the quality of the data used to estimate Mineral Resources and Reserves on the property.
The Musselwhite Mine geology department employed a set of quality assurance and quality control (QA/QC) protocols to monitor the performance of the commercial and mine labs. Analytical accuracy is monitored with the insertion of commercially prepared standard reference materials purchased from Geostat (Australia). In 2005, two different standards (STD 900 and STD 999) were inserted at a rate of approximately one standard per 20 samples. The results are presented in chronological order in Figure 11.3 and Figure 11.4.
Figure 11.3 demonstrates that Standard 900 often returned assay values that were slightly above the mean value of 3.21 g/t. The moving average trend line is almost always above the certified mean value, but beneath the Upper Warning Limit (UWL).
| | December 2024 |
| | TECHNICAL REPORT –
MUSSELWHITE MINE, ONTARIO, CANADA
Document # C8630-0000-PM-RPT-001 – Rev. 0
/ Page 118 |
The performance of Standard 999 (Figure 11.4) was somewhat better as the results were commonly closer to the mean. Moreover, the moving average trend line is almost always in the vicinity of the mean certified value. Failures beyond the 3SD tolerance limits were less frequent with STD 999 than with STD 900.
Figure 11.3 – 2005 Analytical Results for STD 900 (Accepted Value of 3.21 g/t Au)
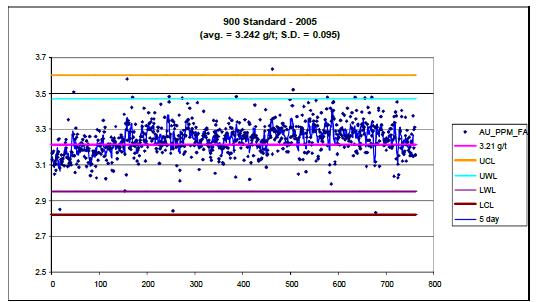
Source: AMEC, 2006
Figure 11.4 – 2005 Analytical Results for STD 999 (Accepted Value of 7.18 g/t Au)
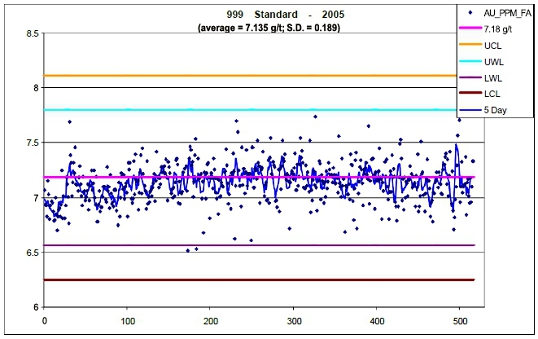
Source: AMEC, 2006
Sample contamination was monitored by inserting blank samples at a rate of one blank for every 20 samples. A total of 1,275 blanks were analyzed in 2005 with 22 samples returning values greater
| | December 2024 |
| | TECHNICAL REPORT –
MUSSELWHITE MINE, ONTARIO, CANADA
Document # C8630-0000-PM-RPT-001 – Rev. 0
/ Page 119 |
than 0.8 g/t (Figure 11.5). The one point removed in Figure 11.5 graded 1.38 g/t and was removed in order to make the graph more presentable. Assay batches containing a blank whose assay value exceeded 0.8 g/t would be flagged for possible re-assay, with the ultimate decision to re-assay being the responsibility of the Geology Department.
Figure 11.5 – 2005 Blank Sample Analyses
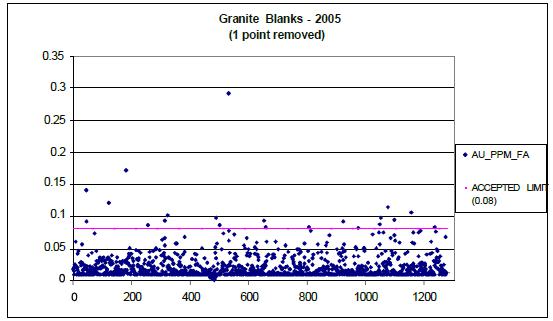
Source: AMEC, 2006
The Geology Department also inserted duplicate pulps prepared from coarse reject material at a rate of one duplicate for every 20 samples to monitor analytical precision. In 2005, a total of 2196 duplicates were analyzed. Figure 11.6 is a scatter plot which illustrates the good correlation between the original assays and the duplicates. A further check on the precision (Figure 11.7) shows that the 90% cumulative frequency mark corresponds to a 12% relative variance, indicating that the lab precision is good.
| | December 2024 |
| | TECHNICAL REPORT –
MUSSELWHITE MINE, ONTARIO, CANADA
Document # C8630-0000-PM-RPT-001 – Rev. 0
/ Page 120 |
Figure 11.6 – 2005 Pulp Duplicate Analyses
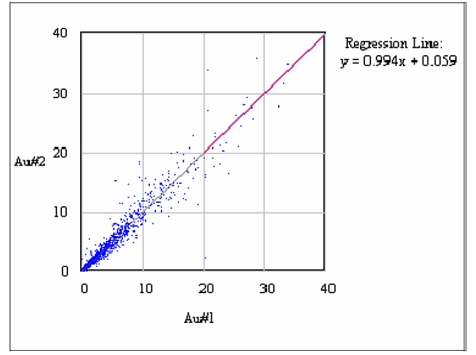
Source: AMEC, 2006
Figure 11.7 – 2005 Percent Relative Difference
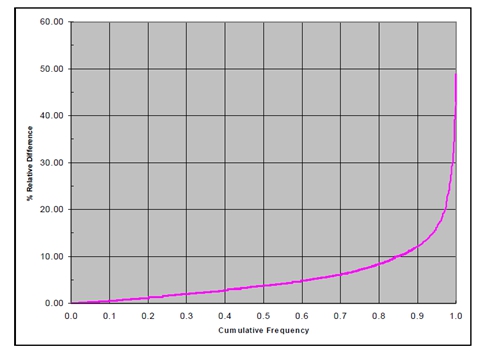
Source: AMEC, 2006
| | December 2024 |
| | TECHNICAL REPORT –
MUSSELWHITE MINE, ONTARIO, CANADA
Document # C8630-0000-PM-RPT-001 – Rev. 0
/ Page 121 |
A large number of Specific Gravity (SG) determinations have been completed on core samples at Musselwhite. The most recent density analysis campaign was completed in October 2000 and involved 945 measurements of the mineralized 4EA unit using the Archimedes’ method. The method involves weighing a sample in air and dividing this value by the difference between the mass in air and the mass in water. The mean SG from this campaign was 3.30, a value that compares very well with the results of 3,027 historical determinations, from which an average SG value of 3.29 was obtained.
For the Mineral Resource and Reserve tonnage estimate of 2005, an average SG of 3.29 was applied to all modelled volumes. It was AMEC’s opinion at the time that the SG used in tonnage estimates was appropriate.
Most of the production to that date had been from the T-Antiform mineralized horizons. It was commented at the time that the mine would soon be accessing some of the other adjacent lenses, a minor amount of which appeared to be hosted in a mineralogically differing rock type from the typical 4EA unit. AMEC had recommended that the Musselwhite Mine geology department undertake a new density determination campaign specifically targeting the ore horizons that are not directly associated with the T-Anticline.
| 11.2 | Goldcorp (2006 – 2018) |
Sampling and assay information for the Goldcorp era from 2006 to 2018 is taken from selected monthly QA/QC Reports and the AMEC Laboratory Audit of 2009.
| 11.2.1 | Sample Preparations |
The AMEC laboratory audit describes sample preparation as follows:
Geological samples are delivered to the mine laboratory by the Mine Geology Department in canvas bags with bar code tags. Sample numbers have six digits and a defined prefix: E for exploration samples, G for muck samples, and C for chip samples. No written logs or chain of custody forms accompany the batches.
At arrival, geology personnel place the samples on aluminium trays and organize them on racks with up to 60 sample capacity, after which laboratory personnel check the batches and enter the samples into the Laboratory Information Management System (LIMS) by reading the bar code tags. Samples are weighed at reception as a confirmation step for data entry, but no record is kept. On average, 200 samples are submitted every day to the laboratory. The sample reception room is small but is kept clean and in order.
| | December 2024 |
| | TECHNICAL REPORT –
MUSSELWHITE MINE, ONTARIO, CANADA
Document # C8630-0000-PM-RPT-001 – Rev. 0
/ Page 122 |
When deemed wet on visual inspection, samples are dried at 120°C in a large gas oven with forced air circulation and automatic temperature control. Up to five racks with samples may be directly introduced into the oven.
The Musselwhite Mine laboratory has two Rocklabs Boyd automated preparation systems. Each line consists of a set comprising crusher(s), rotary cone splitters and ring-and-puck pulverizers, all serially interconnected. The preparation process is as follows:
Crushing to 95% passing 6.00 mm on a Big Boyd Crusher (BBC); this step is only conducted on line 1, as primary crushing, in case of coarser feed material.
Crushing to 90% passing 3.35 mm (6 Tyler mesh) on a Small Boyd Crusher (SBC); this step is conducted on both lines: as secondary crushing on line 1, in case of coarser feed material, or as primary crushing on line 2, in case of finer feed material.
Splitting muck samples using a rotary splitter divider (RSD1) to obtain a 3,000 g sub-sample (SS1; core samples bypass this step).
Pulverizing sub-sample SS1 or whole core samples from the SBC on a single-deck continuous ring mill (SDCRM) to 90% passing 1.70 mm (10 Tyler mesh).
Re-splitting samples using a second rotary splitter divider (RSD2) to obtain a 600 g sub-sample (SS2).
Pulverizing sub-samples SS2 in a double-deck continuous ring mill (DDCRM) to 95% passing 0.106 mm (150 mesh Tyler); the first portion of the DDCRM sample is allowed to pass through the mill to clean it, and only the rest of the sample is bagged for assaying.
Review of internal monthly QA/QC Reports titled “Monthly Quality Control / Quality Assurance Report for Geological and Mill Samples” from 2006 through to 2009 indicate rigorous processes with constructive review and recommendations for continuous improvement.
The Musselwhite Mine Laboratory Audit Review of March 2009 by AMEC indicated that the on-site lab was performing well. The report pointed out deficiencies and made some practical recommendations for improvement. It is presumed that Musselwhite acted on the recommendations but this cannot be verified as there were no QA/QC documents made available to review for the years of 2010 through to 2016. However, as rigorous protocols were already in place, there is no reason to believe that these same or similar practices were not being followed.
| | December 2024 |
| | TECHNICAL REPORT –
MUSSELWHITE MINE, ONTARIO, CANADA
Document # C8630-0000-PM-RPT-001 – Rev. 0
/ Page 123 |
Upon review of later documents, notable was a change of best practice acknowledgement memo dated Oct 16th, 2017, wherein it was recommended that re-assaying occur whenever a sample is switched with a reference or blank in order to provide verification of results.
A document entitled “Review of Assay Quality Control Program for Goldcorp, Musselwhite Mine” dated November 2018 states in its summary that,
“The Goldcorp Musselwhite Mine submits drill core to Activation Laboratories (Actlabs) in Dryden, Ontario, an ISO-accredited Canadian commercial laboratory. Drill core is prepared and assayed using industry-standard protocols. Underground drill core, muck and chip samples are also processed at the Musselwhite Mine internal laboratory.
Goldcorp Musselwhite Mine Geology Group maintains a quality control program that meets industry standards. Sample preparation and analytical procedures are all industry-standard and produce analytical results for gold with accuracy and precision that is suitable for Mineral Resource estimation.”
Moreover, the report stated that Musselwhite Geology staff were conducting regular inspections of the Actlabs (bi-annual) and mine laboratory (monthly) facilities. Though no issues of significant concern were noted in the inspection reports at the time, it was recommended to prepare checklist templates for these lab visits to ensure consistency and for comparison purposes.
These reports also confirmed that for quality control by the geology department, certified standards (of varying gold grade ranges) and blanks were each being inserted approximately every 20 samples.
Quality control was initiated during the initial import of the assays from either lab. If the QC sample fails, re-runs are requested. Once the re-runs come back, they are checked again to ensure the quality of the data. If not, then they will be investigated further as to the cause of the failure. Importantly, it was noted at the time that all failures were documented.
It was also reported that the Musselwhite geology team would document and keep track of several internal laboratory quality control measures for due diligence purposes. This included pulp duplicates and sieve tests for systematic issues that may need additional investigations.
The monthly QA/QC report from April 2006 shows results for commercial standards named Mus-2 (Chemex), Ma-2C (Canmet), 997-7 (Geostats), 999-4 (Geostats), and 997-5 (Geostats). The standards ranged from 0.31 g/t to 7.31 g/t and were used alternately on each tray of 21 geological samples. The standard Ma-2 was only documented as being used once per day with muck/chip or drill core samples.
| | December 2024 |
| | TECHNICAL REPORT –
MUSSELWHITE MINE, ONTARIO, CANADA
Document # C8630-0000-PM-RPT-001 – Rev. 0
/ Page 124 |
As of April 2007, the QA/QC report no longer included results form the Ma-2C (Canmet) standard.but continued to use standards Mus-2 (Chemex), 997-7 (Geostats), 999-4 (Geostats), and 997-5 (Geostats).
A monthly report from April 2008 continues to report results for the same four standard samples, but changes were implemented later in 2008 (standards 999-6 and 307-7 were added). It has been standard practice at Musselwhite to monitor CRM performance and phase out those with mixed results where no other underlying cause (e.g., sample switches or systematic lack of accuracy, i.e., poor lab performance) could be determined.
The 2009 Laboratory Audit memo goes on to state that in 2008, Musselwhite geologists used a total of six commercial CRMs produced by Geostats and one in-house reference material (round-robin certified) for accuracy monitoring (Table 11.1).
Based on CRM warning limits, the responsible geologist would decide whether the assay batch results were considered acceptable. This was done using warning limits established according to the certified values (mean, or accepted value, and round-robin standard deviation, SD). If a CRM assay returned was outside the accepted value +/- 3SD, the batch would be rejected and re-assayed. The CRMs used by Musselwhite in 2008 included:
Table 11.1 – Certified Reference Materials Used at Musselwhite, 2008
| CRM ID | BV (g/t Au) | SD (g/t Au) | Manufacturer |
| 997-7 | 0.310 | 0.040 | Geostats |
| 999-4 | 3.020 | 0.160 | Geostats |
| 900-5 | 3.210 | 0.130 | Geostats |
| Mus-2 | 3.811 | 0.128 | Musselwhite Lab |
| 997-5 | 7.310 | 0.330 | Geostats |
| 999-6 | 7.180 | 0.310 | Geostats |
| 307-7 | 7.870 | 0.280 | Geostats |
Representative examples of performance on CRMs taken from the April 2008 monthly QA/QC Report are presented in Figure 11.8 to Figure 11.10.
| | December 2024 |
| | TECHNICAL REPORT –
MUSSELWHITE MINE, ONTARIO, CANADA
Document # C8630-0000-PM-RPT-001 – Rev. 0
/ Page 125 |
Figure 11.8 – Geology CRM Mus-2 Assay Results
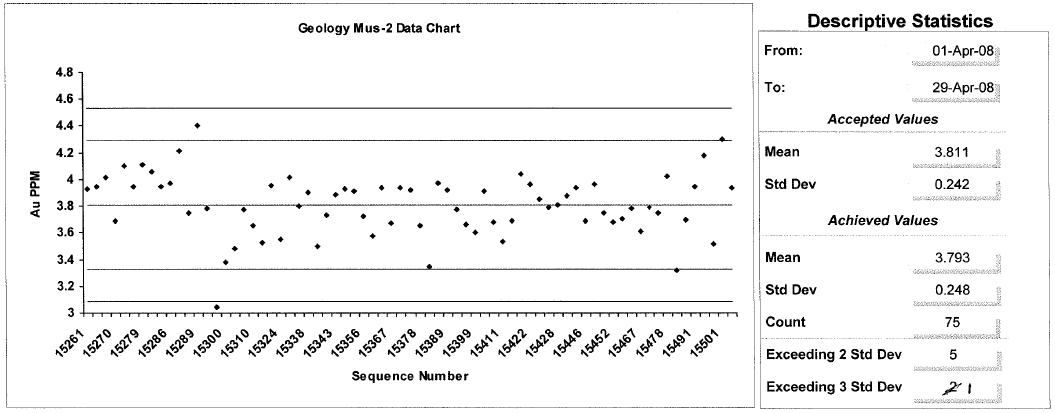
Source: Goldcorp, 2008
Figure 11.9 – Geology CRM 977-7 Assay Results
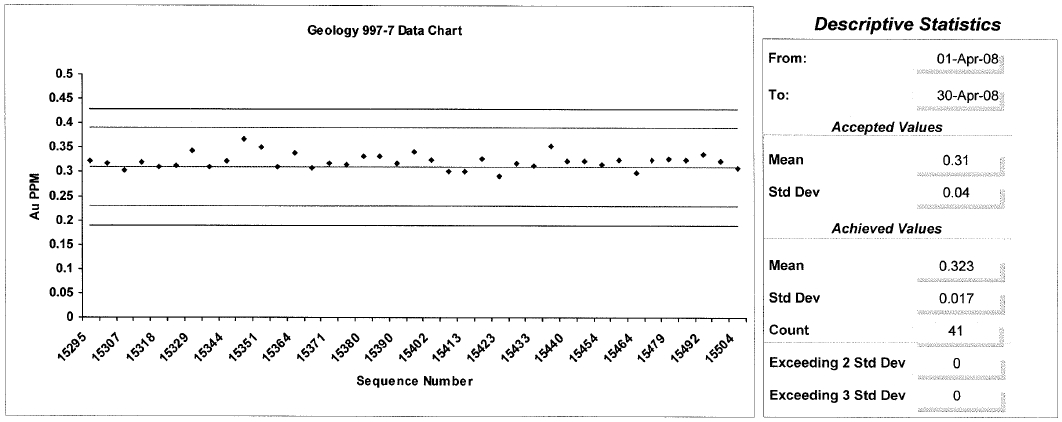
Source: Goldcorp, 2008
| | December 2024 |
| | TECHNICAL REPORT –
MUSSELWHITE MINE, ONTARIO, CANADA
Document # C8630-0000-PM-RPT-001 – Rev. 0
/ Page 126 |
Figure 11.10 – Geology CRM 999-4 Assay Results
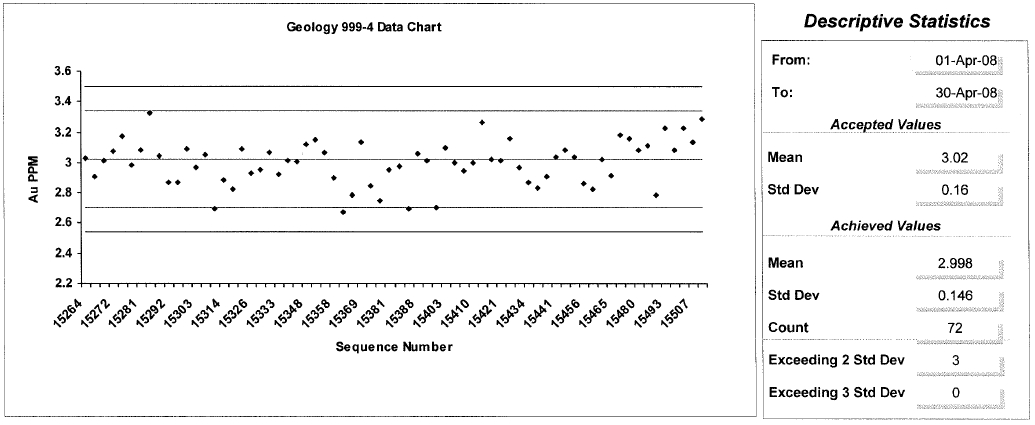
Source: Goldcorp, 2008
Overall, such results appear reasonable with the vast majority of standards falling within the 2SD acceptable limits and only a few noted within the 3SD range; moreover, there did not appear to be any significant bias or calibration drift trends at the time.There were no reports made available from 2009 to 2015 to review CRM testing performance, however, there were monthly results provided for the period from January to November 2016 for standards STD909 and STD900 (Geostats). These plots showed clear documentation of explanations for failures (where possible) that had been investigated at the time; it is assumed that sample batches containing standard failures were re-analyzed as per site protocols.
Representative examples of CRM performance monitoring taken from the April 2018 QA/QC Report are presented in Figure 11.11 to Figure 11.13. At the time, Musselwhite geologists used a total of four commercial standards produced by CDN Resource Laboratories Ltd., including GS-P4F (0.498 g/t accepted value), GS-3S (3.58 g/t accepted value), GS-7G (7.19 g/t accepted value) and GS-13B (13.28 g/t accepted value).
Figure 11.11 – Geology Standard GS-13B: Au PPM: Daily Results for April 2018
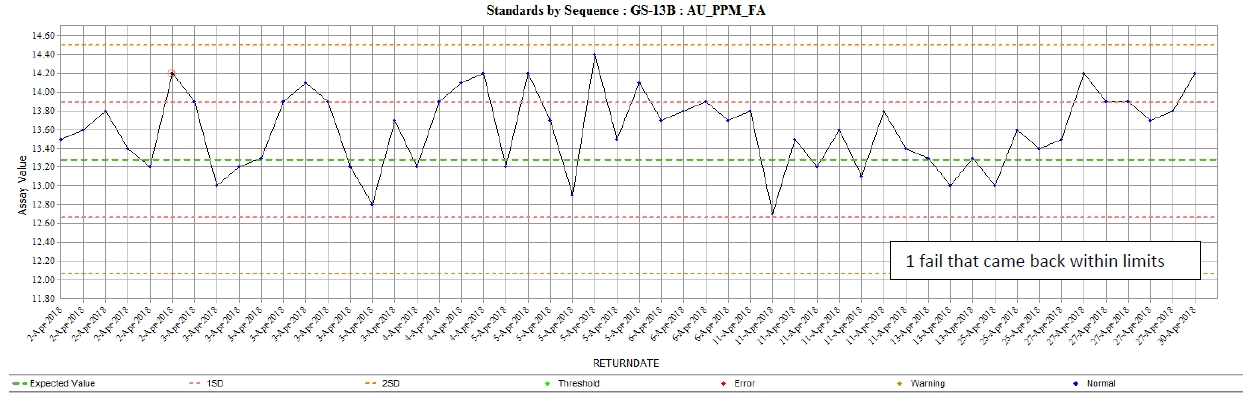
Source: Goldcorp, 2018
| | December 2024 |
| | TECHNICAL REPORT –
MUSSELWHITE MINE, ONTARIO, CANADA
Document # C8630-0000-PM-RPT-001 – Rev. 0
/ Page 127 |
Figure 11.12 – Geology Standard GS-3S: Au PPM: Daily Results for April 2018
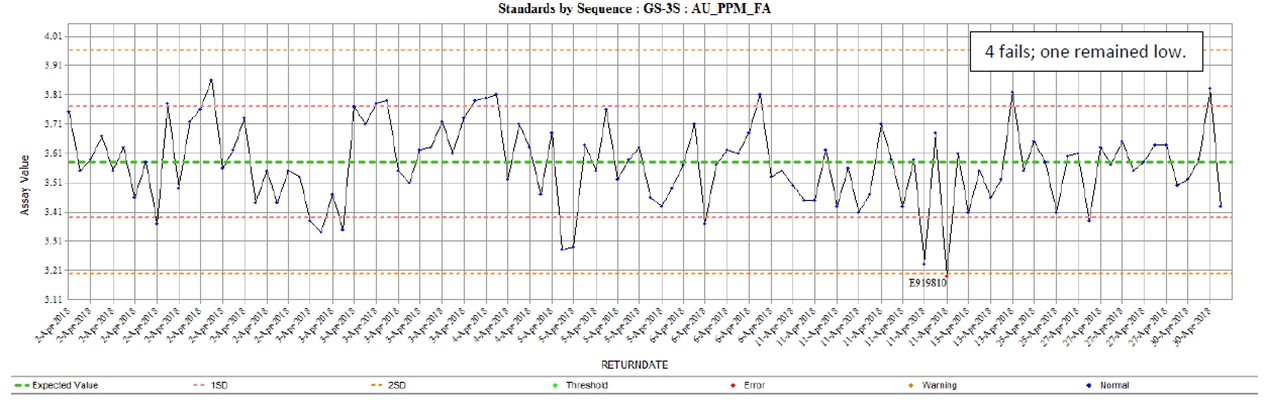
Source: Goldcorp, 2018
Figure 11.13 – Geology Standard GS-7G: Au PPM: Daily Results for April 2018
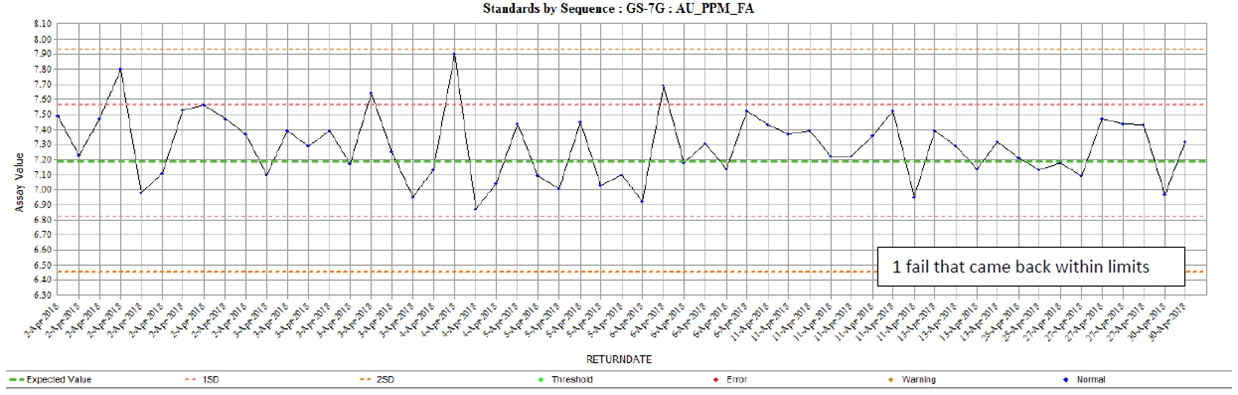
Source: Goldcorp, 2018
A 2018 summary report by Analytical Solutions Ltd. that reviewed the assay QA/QC program during the period from January to August 2018 indicated that a total of four reference materials from CDN Resource Laboratories were submitted 2,041 times to Actlabs and 290 times to the mine laboratory. The report summarizes that the reference material results for gold were generally within ± 5% of the accepted value and within ± 3SD, indicating a seemingly good level of accuracy. The QC failure rate was documented as 6% for Actlabs and 3% for the mine laboratory. At the time, results outside of the expected tolerances were suspected of being caused by poor homogeneity of the CRMs in use and not necessarily reflective of laboratory performance. No evidence of systematic bias was indicated in the report.
Monthly Musselwhite QA/QC reports from 2006 to 2008 indicate that one randomized sample per tray was selected and weighed twice for duplicate assay, as was one geological sample per day selected randomly and split a second time to yield a replicate cut for duplicate assay. The results of these duplicate tests were reported graphically with scatter plots, side by side box plots, Q-Q plots, and relative difference plots, in addition to Thompson-Howarth Precision plots. Interpretation of the
| | December 2024 |
| | TECHNICAL REPORT –
MUSSELWHITE MINE, ONTARIO, CANADA
Document # C8630-0000-PM-RPT-001 – Rev. 0
/ Page 128 |
numerical results for duplication precision with measures such as linear correlations, regression lines and coefficients of variance were commented on as being good, particularly for samples grading higher than 0.5 g/t.
AMEC reviewed a total of 327 coarse duplicates and 3,031 pulp duplicates assayed at the Musselwhite Mine Laboratory (MML) between January 2008 and January 2009, and prepared Max-Min plots for both coarse duplicates (Figures 11.14 and 11.15) and pulp duplicates (Figures 11.16 and 11.17). In total, 86 failures were identified for coarse duplicates (26.3%), and 745 failures were identified for pulp duplicates (24.6%). It is unclear what recommendations were made, or corrective actions taken, in order to improve these failure rates at the time.
Figure 11.14 – Au in Coarse Duplicates (All Samples)
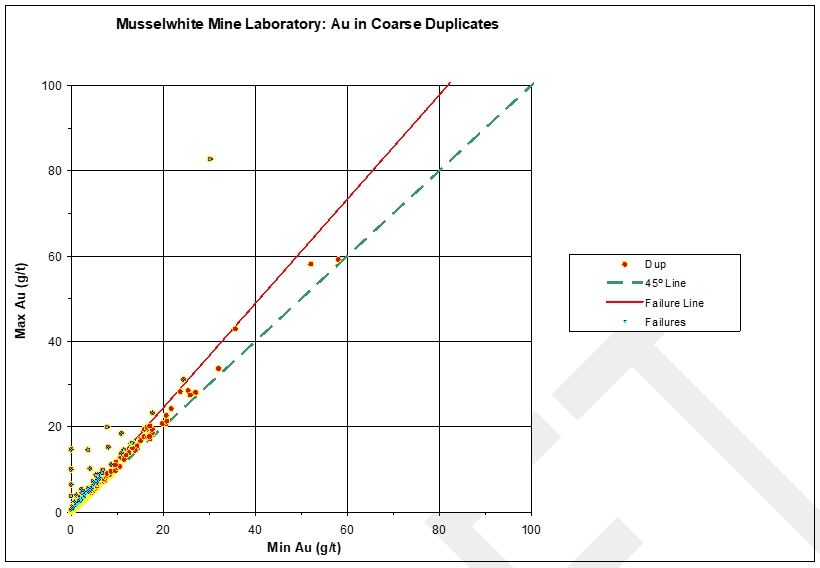
Source: AMEC, 2009
| | December 2024 |
| | TECHNICAL REPORT –
MUSSELWHITE MINE, ONTARIO, CANADA
Document # C8630-0000-PM-RPT-001 – Rev. 0
/ Page 129 |
Figure 11.15 – Au in Coarse Duplicates (Low-grade Samples)
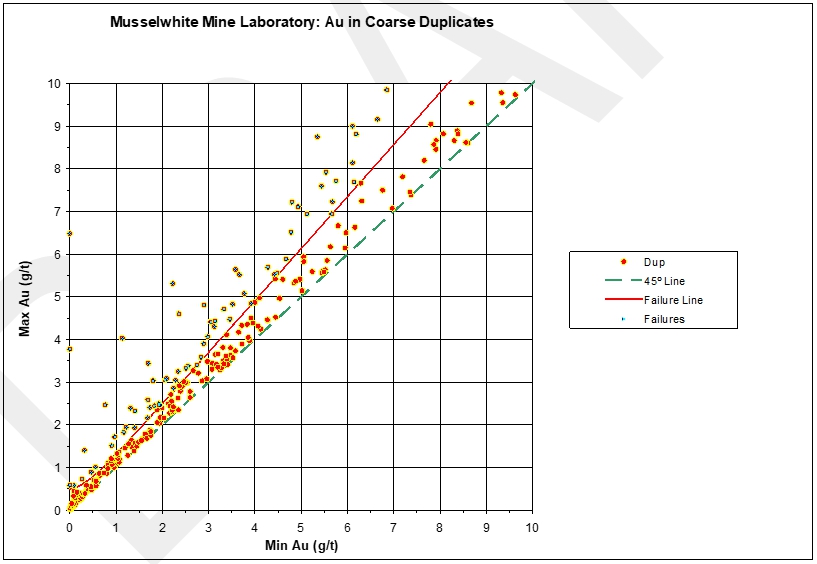
Source: AMEC, 2009
Figure 11.16 – Au in Pulp Duplicates (All Samples)
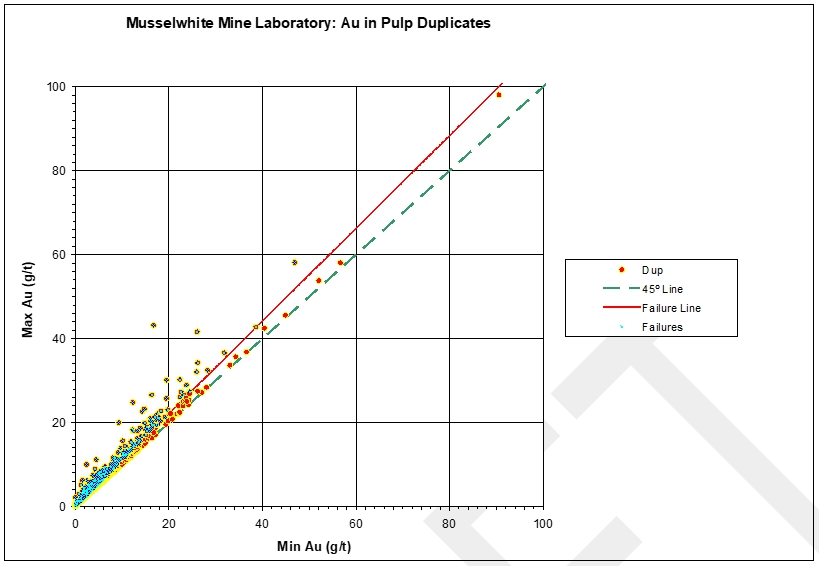
Source: AMEC, 2009
| | December 2024 |
| | TECHNICAL REPORT –
MUSSELWHITE MINE, ONTARIO, CANADA
Document # C8630-0000-PM-RPT-001 – Rev. 0
/ Page 130 |
Figure 11.17 – Au in Pulp Duplicates (Low-Grade Samples)
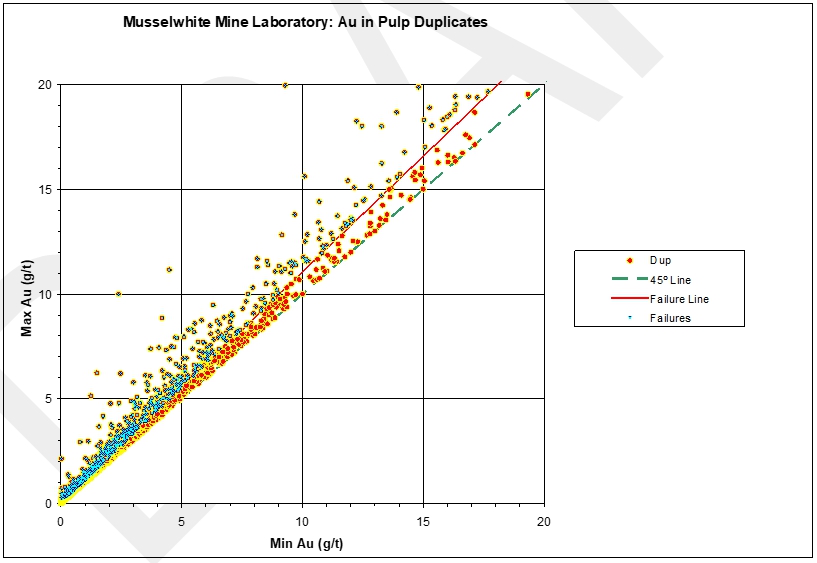
Source: AMEC, 2009
There were no QA/QC reports with information on duplicates made available for review during the period from 2010 to 2017; as such, the QP cannot comment appropriately on duplicate precision testwork completed at the time.
Results similar to those reported in 2009 were observed from a sample report dated April 2018 for duplicate samples submitted to Actlabs. For coarse reject splits, the failure rate with %Difference >20% was 25.5% (Figure 11.18); for pulp splits, the failure rate with %Difference >20% was 22.6% (Figure 11.19). The report stated that no correction measures were completed on duplicates for Musselwhite QA/QC at the time.
| | December 2024 |
| | TECHNICAL REPORT –
MUSSELWHITE MINE, ONTARIO, CANADA
Document # C8630-0000-PM-RPT-001 – Rev. 0
/ Page 131 |
Figure 11.18 – Actlabs Coarse Split Duplicate Results: April 2018
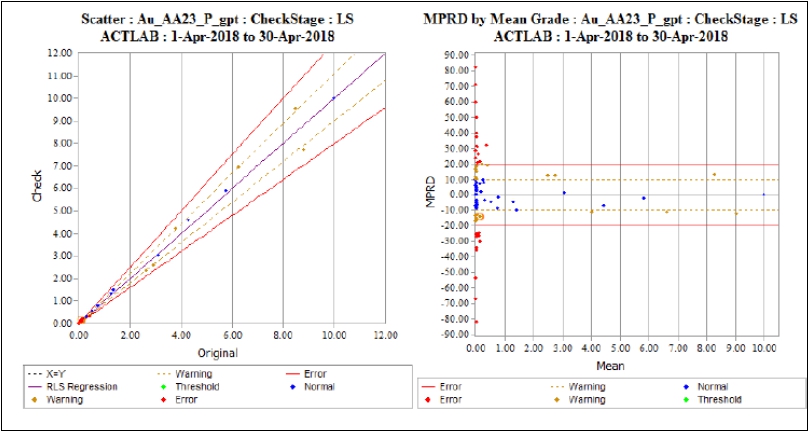
Source: Goldcorp, 2018
Figure 11.19 – Actlabs Pulp Split Duplicate Results: April 2018
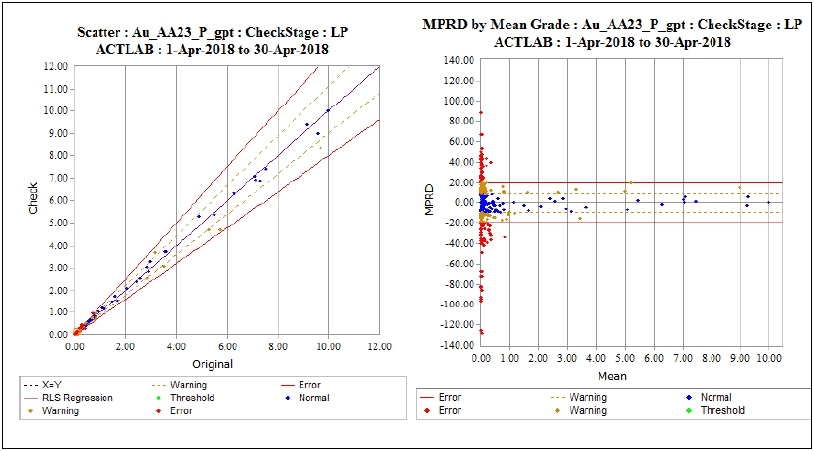
Source: Goldcorp, 2018
An external 2018 report (Analytical Solutions, 2018) concluded that of 3,209 lab pulp duplicates analysed by fire assay, 1,117 duplicate pairs reported above 0.5 g/t and 87% of these pairs report within +/- 25% which is an expected result for this deposit style. Similarly, of the 786 preparation duplicates provided by Actlabs’ QC program, 317 duplicate pairs reported above 0.05 g/t gold and 79% within ± 25%. As expected, the reproducibility of the preparation duplicates were not as good
| | December 2024 |
| | TECHNICAL REPORT –
MUSSELWHITE MINE, ONTARIO, CANADA
Document # C8630-0000-PM-RPT-001 – Rev. 0
/ Page 132 |
as for the laboratory pulp duplicates. The results for preparation duplicates were considered within the expected range for the deposit type. These conclusions are consistent with both the 2009 AMEC and 2018 internal results which showed similar variability.
The provided monthly QA/QC reports from 2006 to 2008 do not cover any check assay programs and therefore there is no comment on this control type for the time period.
The 2009 external report (AMEC, 2009) reviewed the check sample data obtained between January 2008 and January 2009 and mentioned that every two months (on average), Musselwhite Mine submitted pulp duplicate samples to ALS Chemex for external check assays. However, it was noted that the mine processed these samples using the same method as for internal pulp duplicate samples. The check samples were therefore only useful to assess analytical accuracy (and not preparation procedures).
The 2018 external report by Analytical Solutions (ASL) commented that each month, 5% of samples analysed at Actlabs are submitted to the Musselwhite Mine laboratory for check assaying; check assay pairs were noted to agree well for samples containing >0.2 g/t gold. The report further concludes that 82% of the check assay pairs above 0.5 g/t report within ± 25%, which is comparable to routine assay reporting and meets reasonable quality expectation. For check assay results below 0.2 g/t gold, ASL concluded that the mine laboratory is biased high with respect to Actlabs (by up to 10 to 20%). The report further concludes that large percentage differences were likely due to the mine laboratory’s higher detection limit than Actlabs.
Representative results from the check assay programs completed on pulp samples in April 2018 and May 2019 are presented in Figures 11.20 and 11.21, respectively. Strong correlations (>0.9) were noted in both programs, which supports good practices being applied in both internal and external labs. The check assay program is noted to occur on a monthly basis on approximately 5% of the samples analysed at Actlabs.
| | December 2024 |
| | TECHNICAL REPORT –
MUSSELWHITE MINE, ONTARIO, CANADA
Document # C8630-0000-PM-RPT-001 – Rev. 0
/ Page 133 |
Figure 11.20 – Pulp Check April 2018
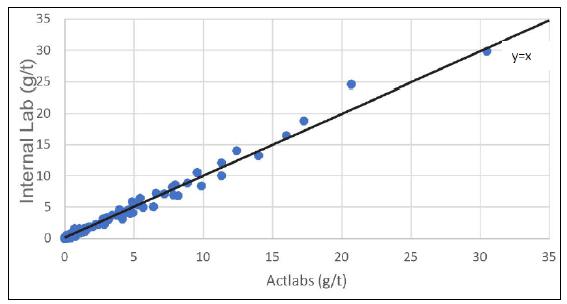
Source: Goldcorp, 2018
Figure 11.21 – Pulp Check May 2019
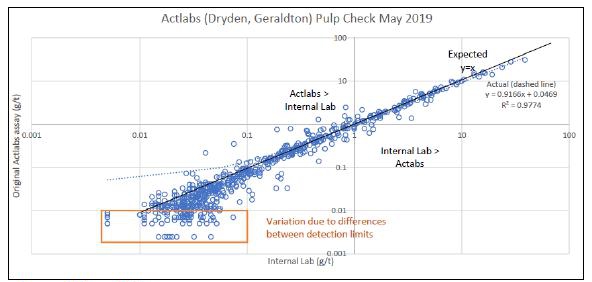
Source: Goldcorp, 2019
There was no SG verification work described in the 2009 audit by AMEC nor in any of the monthly reports reviewed for the Goldcorp era.
| | December 2024 |
| | TECHNICAL REPORT –
MUSSELWHITE MINE, ONTARIO, CANADA
Document # C8630-0000-PM-RPT-001 – Rev. 0
/ Page 134 |
| 11.3 | Newmont (2019 – Present) |
| 11.3.1 | Sample Preparations |
All resource and inventory drilling is NQ core and half-sawn for sampling. Reserve drilling is all NQ core, with 20% half cut for sampling and 80% whole core sampled. Whole core sampling of reserve core started in 2023 based on recommendations from the 2022 East Limb resource model internal peer review.
Core intervals selected for assay will be selected by the geologist in accordance with standard operating procedure NEM-MWM-EXP-003 Drill Core Sampling and the Teching, Logging, Sampling Best Practices. The Exploration Core Cutter inserts four granite cut-off samples in every 100 samples at designated intervals based on sampling completed by the Musselwhite Exploration Geologist. Four (4) individual Certified Reference Material (CRM) packets, in every 100 samples, are entered into the sampling stream at designated intervals by the Exploration Core Cutter.
The Exploration Geologist chooses which standard to use at their discretion. Dispatched crates carrying zip-tied rice bags filled with plastic-bagged core samples are shipped from Musselwhite Mine warehouse via Manitoulin Transport. To avoid delays in getting crates directly to the external assay laboratory (Activation Laboratories Ltd.; “Actlabs”, the best practice is to not load sample crates on Saturdays. The unlocked transport trucks overnight in Pickle Lake at the unsecured Sigfusson Northern lot off the highway. The crates are not transferred from their original container or truck. The transport then stops at the Manitoulin depot in Dryden, Ontario. The truck is unloaded and sorted into destination areas (local, east, west) and loaded onto other trucks. Crates destined for Actlabs Dryden (primary external assay lab) are sent there.
In Dryden, the crates are dropped off inside the Actlabs building; samples are never stored outside pre-analysis. Once received by an Actlabs facility, the samples are unpacked, sorted by hand, and recorded. This record is cross referenced with the Request for Analysis that was sent with the crate. Actlabs may also forward Musselwhite Mine samples to their other laboratories in the region depending on capacity (Geraldton and Thunder Bay) with approval from the site database administrator. Prior to June 2021, Musselwhite Mine samples were also dispatched to Actlabs in Geraldton, Ontario.
Musselwhite samples are analyzed by Actlabs in Dryden (or other regional facilities), Ontario, using the following methods:
Crushing
| ● | >80% of the crushed sample passed through a 2 mm mesh screen. Crusher sieve tests are completed on the first 5 samples in a dispatch and again on samples that are multiples of 50 to ensure they are passing at 2 mm. |
| | December 2024 |
| | TECHNICAL REPORT –
MUSSELWHITE MINE, ONTARIO, CANADA
Document # C8630-0000-PM-RPT-001 – Rev. 0
/ Page 135 |
Pulverizing
| ● | >95% of the ring pulverized pulp passes a 106 µm mesh screen. A pulverizer test is completed on the first sample of the dispatch containing greater than 100g of material and again on every 50th sample. |
Analysis
| ● | Tray size for the wet lab is 42 samples with 35 samples being client samples, and 7 Activation Laboratories Ltd.’s (Actlabs) internal quality control (QC) samples randomly placed. The seven (7) QC samples include 2 blanks, 2 CRMs and 3 duplicated (including pulp and prep duplicated). |
Actlabs conducts fire assay fusion with an Atomic Absorption (AA). If the resulting gold content is greater than 10 g/t, the analysis is repeated with a gravimetric finish. Actlabs’ internal quality assurance/quality control (QA/QC) policy is an allowable 1% contamination from previous sample, measured in the blank material, and the CRMs are required to be within 3 standard deviations of the accepted value.
The QA/QC Geologist evaluates the reference material for passing within 3 standard deviations from average based on the standard’s certificate of analysis. If there is a failure, the pulp re-assays are requested from the analytical lab; the re-assays include samples above/below the failure that are to/from the area of influence for another passing standard/blank. If the re-assay fails, the appropriate action is chosen with the involvement of the Exploration Manager, Exploration Supervisors and Exploration Geologists.
All failures, re-assays, standard swaps, and further investigations are documented for audit purposes by the QA/QC Geologist.
The QA/QC Geologist does not evaluate these types of duplicates for failures. The results are reported in the monthly QA/QC report.
| 11.3.3.2 | Prep and Pulp Duplicates |
At Musselwhite, the prep and pulp duplicates analyzed are part of the assay laboratory’s internal QC standards.
The QA/QC Geologist does not evaluate these types of duplicates for failures that would result in re-assay. The results are reported in the monthly QA/QC report.
| | December 2024 |
| | TECHNICAL REPORT –
MUSSELWHITE MINE, ONTARIO, CANADA
Document # C8630-0000-PM-RPT-001 – Rev. 0
/ Page 136 |
| 11.3.3.3 | Third Party Umpire Checks |
1% of drill core samples sent to an external laboratory are returned, as pulp, to Musselwhite for re-analysis at the Musselwhite Internal Lab. Pulps are selected by the QA/QC Geologist to represent the grades that are typically seen in the deposit; certified reference material is inserted into the sample stream prior to re-analysis.
The QA/QC Geologist does not evaluate umpire checks for failures. The results are reported in the monthly QA/QC report.
| 11.3.3.4 | Specific Gravity (Density) Sampling |
During the monthly logging peer review, which investigates 5% of holes logged during the month, the Exploration Geologist re-measures the SG samples of the investigated holes. This is completed on-site at Musselwhite Mine. Moreover, beginning in January 2023, external checks are also completed by sending 5% of specific gravity samples to Actlabs Dryden for measurement; the sample may also be sent to other regional facilities at the discretion of the Dryden lab manager.
The QA/QC Geologist includes reference to the reproducibility of SG measurements taken for the logging peer review in the monthly QA/QC report.
The QA/QC geologist and/or an Exploration Geologist will do a random laboratory visit annually provided personal safety is not a factor.
The QA/QC Geologist is responsible for the monthly and annual QA/QC reporting. Reports are submitted to the Exploration Manager and Exploration team.
It is the responsibility of the QA/QC Geologist, Exploration Manager and Exploration Supervisors to ensure that QA/QC procedures, including corrective actions, are maintained and documented.
Certificates of Analysis are received from Actlabs in both PDF and .csv form.
Assay results will be reviewed for QA/QC as soon as possible by the QA/QC Geologist. Once data has been sufficiently vetted, the QA/QC Geologist will approve the data within the AcQuire EXPLORATION database on the MUSVSQLPRD01 server.
All QA/QC failures will be documented in the AcQuire database and listed in an excel tracking sheet that are available for future audits or investigations.
| | December 2024 |
| | TECHNICAL REPORT –
MUSSELWHITE MINE, ONTARIO, CANADA
Document # C8630-0000-PM-RPT-001 – Rev. 0
/ Page 137 |
Once diamond drills holes are sign-off and finalized, meaning all aspects of the drill hole has been checked for data accuracy, quality, and completeness, the hole will be ‘locked’ to prevent any data modifications.
Review of monthly Exploration Geology QC reports indicated that Musselwhite Exploration Department standard operating procedures and requirements were set-forth by Newmont’s Global guidance documents and that the results of the assays and other QA/QC work was reported monthly.
The monthly reports acknowledge that exploration and production drill hole samples were sent to Activation Laboratories (Actlabs) located in either Dryden, Ontario or Geraldton, Ontario, where the samples (including inserted control materials) are crushed, pulverized and analyzed.
The reports go on to confirm that in addition to the Exploration Department inserting certified reference material (CRMs), blanks and duplicates for quality control; there are several other quality control measures explored. Pulp checks are completed on 1% of samples sent to Actlabs by the Internal lab. Actlabs sieve tests on Musselwhite samples are also included in the reports.
Additional data and documentation for all sample QA/QC processes at Musselwhite Mine, Internal Lab monthly QA/QC reports, sample preparation at each lab and chain of custody documents are noted as being available.
Notable was a change made to CRM insertion protocols by Newmont in February 2020:
“For quality control by the Exploration Department, 4 different certified standards (CRMs) are inserted for every 100 samples and a blank is inserted every 20 samples. Mid-February, we switched all labs from the CDN Resource material to OREAS material with the expectation that the OREAS standards will perform better based on studies presented in EXPLORE magazine (December 2015, Gold Homogeneity in Certified Reference Materials; a Comparison of Five Manufactures). Our standards cover a range gold content that is experienced at Musselwhite.”
Four (4) individual Certified Reference Material (CRM) packets, in every 100 samples, are entered into the sampling stream at designated intervals by the Exploration Core Cutter.
For CRMs, the certified reference value +/- three standard deviations (3SD) is considered an acceptable range. Values falling outside the three standard deviations require a re-assay; if the re-assay fails then another re-assay or an investigation, including discussions with the laboratory, may be required at the discretion of the QP.
The earliest annual CRM performance reports made available for review by the QP during Newmont’s ownership comes from the 2021 and 2022 Resource Model MW Exploration Geology QC Reports.
| | December 2024 |
| | TECHNICAL REPORT –
MUSSELWHITE MINE, ONTARIO, CANADA
Document # C8630-0000-PM-RPT-001 – Rev. 0
/ Page 138 |
The 2021 Newmont QA/QC report states that a total of 20,809 regular assay samples were returned during the period between May 23rd, 2020, and July 5th, 2021. Of these, 897 results were rejected and re-assays were requested due to CRM or blank failures. This indicates a combined failure rate of less than 5% of the total samples.
The CRM standards used in 2021 included OREAS 216B, OREAS 219, OREAS 229, OREAS 237, OREAS 238, and OREAS 239.
The failure rates for these standards are summarized in Table 11.2.
Table 11.2 – CRM Standards Failure Rates: 2021
| CRM | Results | Fails | Fail % |
| OREAS 216B | 215 | 15 | 7.0% |
| OREAS 219 | 222 | 6 | 2.7% |
| OREAS 229B | 206 | 4 | 1.9% |
| OREAS 237 | 40 | 3 | 7.5% |
| OREAS 238 | 204 | 7 | 3.4% |
| OREAS 239 | 33 | 3 | 9.1% |
| Total | 920 | 38 | 4.1% |
The 2022 report states that a total of 69,090 regular assay samples were returned during the period between July 6th 2021 and July 20th, 2022; an additional 3,085 blanks (4.5% of total) and 3,074 standards (4.4% of total) were also inserted into the sample stream.
The CRM standards used in the beginning of the period included OREAS 216B, OREAS 219, OREAS 229, OREAS 237, OREAS 238, and OREAS 239; however, three of these were discontinued and replaced, as follows:
| ● | OREAS 211 replaced OREAS 219; |
| ● | OREAS 241 replaced OREAS 216B, and; |
| ● | OREAS 243 replaced OREAS 229B. |
Additionally, OREAS 238 was not replaced when supplies ran out, however, the reason was not disclosed.
The failure rates for the CRM standards used in 2022 are summarized in Table 11.3.
Table 11.3 – CRM Standards Failure Rates: 2022
| CRM ID# | Results | Fails | Fail % |
| OREAS 211 | 6 | 1 | 16.7% |
| OREAS 216B | 522 | 23 | 4.4% |
| | December 2024 |
| | TECHNICAL REPORT –
MUSSELWHITE MINE, ONTARIO, CANADA
Document # C8630-0000-PM-RPT-001 – Rev. 0
/ Page 139 |
| CRM ID# | Results | Fails | Fail % |
| OREAS 219 | 539 | 23 | 4.3% |
| OREAS 229B | 468 | 21 | 4.5% |
| OREAS 237 | 495 | 16 | 3.2% |
| OREAS 238 | 525 | 29 | 5.5% |
| OREAS 239 | 493 | 25 | 5.1% |
| OREAS 243 | 493 | 26 | 5.3% |
| Total | 3541 | 164 | 4.6% |
Most recently, Newmont’s 2023 Musselwhite Resource QA/QC Report lists the following as certified reference and blank materials used for drilling in 2023 (Table 11.4).
Table 11.4 – Certified Reference and Blank Materials: 2023
| Standard ID | Standard Type | Lab Method | Best Value
(g/t) | St. Dev | Material Type | Min
3SD | Max
3SD |
| OREAS 219 (discontinued) | CRM | AA | 0.76 | 0.024 | Greenstone-hosted ore blend | 0.688 | 0.832 |
| OREAS 211 | CRM | AA | 0.768 | 0.027 | Greenstone-hosted ore blend | 0.687 | 0.849 |
| OREAS 216B (discontinued) | CRM | AA | 6.66 | 0.158 | Greenstone-hosted ore blend | 6.186 | 7.134 |
| OREAS 241 | CRM | AA | 6.91 | 0.309 | Greenstone-hosted ore blend | 5.98 | 7.84 |
| OREAS 237 (discontinued) | CRM | AA | 2.21 | 0.054 | Metasediment-hosted orogenic blend | 2.05 | 2.37 |
| OREAS 237B | CRM | AA | 2.26 | 0.067 | Metasediment-hosted orogenic blend | 2.06 | 2.46 |
| OREAS 238 (Not replacing) | CRM | AA | 3.03 | 0.08 | Stockwork gold blend | 2.79 | 3.27 |
| OREAS 239 (discontinued) | CRM | AA | 3.55 | 0.086 | Metasediment-hosted orogenic blend | 3.29 | 3.81 |
| OREAS 239B | CRM | AA | 3.61 | 0.11 | Metasediment-hosted orogenic blend | 3.28 | 3.94 |
| OREAS 229B (discontinued) | CRM | GRAV | 11.95 | 0.288 | Greenstone-hosted ore blend | 11.086 | 12.814 |
| OREAS 243 | CRM | GRAV | 12.39 | 0.306 | Greenstone-hosted ore blend | 11.48 | 13.308 |
| Granite Blank | Blank | AA | 0.05 | 0.017 | Granite cut-offs locally sourced | | |
The results for all CRM tests are summarized in the Box and Whisker Graph in Figure 11.22, with individual Standard Performance Charts for selected CRMs from 2023 presented in Figure 11.23 to Figure 11.29. Overall, the labs appear to be performing reasonably well with relatively low
| | December 2024 |
| | TECHNICAL REPORT –
MUSSELWHITE MINE, ONTARIO, CANADA
Document # C8630-0000-PM-RPT-001 – Rev. 0
/ Page 140 |
coefficients of variation (<3%) indicated, in addition to very few failures from the data reviewed. Moreover, there does not appear to be any major issues with bias or calibration drift, and the QA/QC Geologist continues to monitor CRM performance in order to investigate noted trends with the laboratory, or make adjustments to the standards used as needed to track overall lab performance.
Figure 11.22 – Standards Box and Whisker Results: 2023
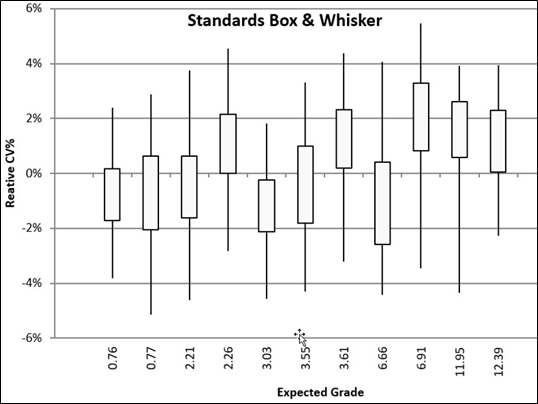
Source: Newmont, 2023
| | December 2024 |
| | TECHNICAL REPORT –
MUSSELWHITE MINE, ONTARIO, CANADA
Document # C8630-0000-PM-RPT-001 – Rev. 0
/ Page 141 |
Figure 11.23 – CRM Results for OREAS 211
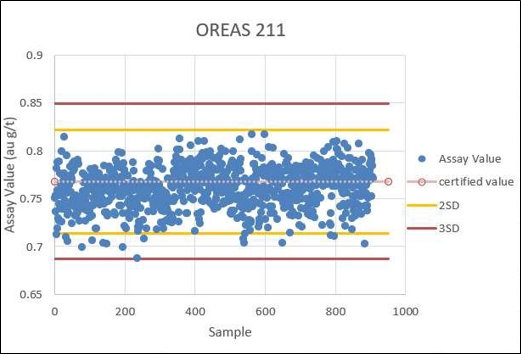
Source: Newmont, 2023
Figure 11.24 – CRM Results for OREAS 216B
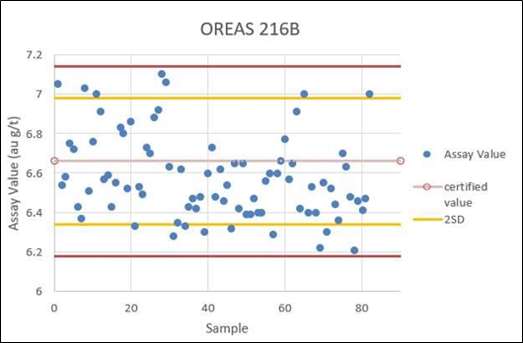
Source: Newmont, 2023
| | December 2024 |
| | TECHNICAL REPORT –
MUSSELWHITE MINE, ONTARIO, CANADA
Document # C8630-0000-PM-RPT-001 – Rev. 0
/ Page 142 |
Figure 11.25 – CRM Results for OREAS 229B
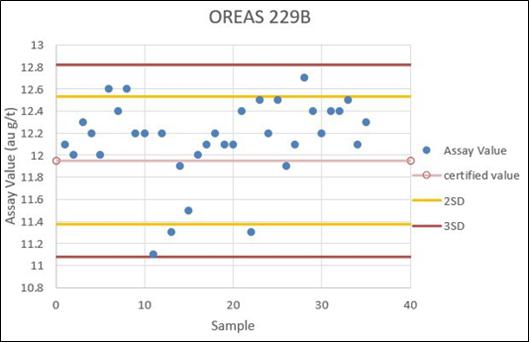
Source: Newmont, 2023
Figure 11.26 – CRM Results for OREAS 237
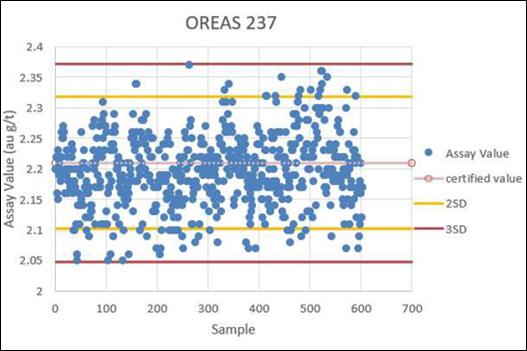
Source: Newmont, 2023
| | December 2024 |
| | TECHNICAL REPORT –
MUSSELWHITE MINE, ONTARIO, CANADA
Document # C8630-0000-PM-RPT-001 – Rev. 0
/ Page 143 |
Figure 11.27 – CRM Results for OREAS 237B
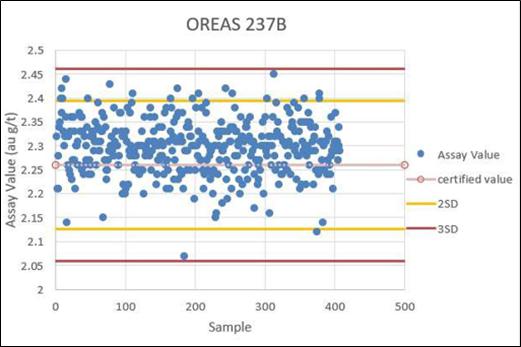
Source: Newmont, 2023
Figure 11.28 – CRM Results for OREAS 238
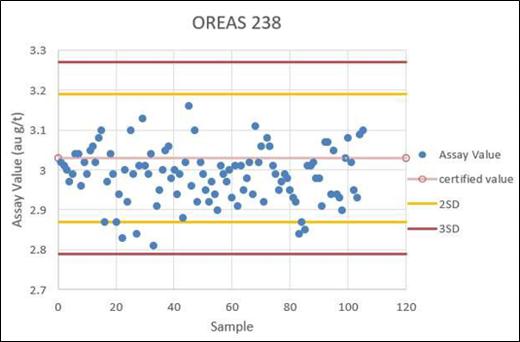
Source: Newmont, 2023
| | December 2024 |
| | TECHNICAL REPORT –
MUSSELWHITE MINE, ONTARIO, CANADA
Document # C8630-0000-PM-RPT-001 – Rev. 0
/ Page 144 |
Monthly QC Reports dating from 2019 onward provide statistics and graphs of blank sample assay values.
The monthly reports state that for barren granite cut-offs, quality control is first done during the initial import of the assays from either lab (Musselwhite or Actlabs). If the QC sample fails at 3 standard deviations, re-runs are requested. Once the re-runs come back, they are checked to ensure the QC. If not, then they will be investigated further as to the cause of the failure. All failures are documented.
For due diligence, several quality control measures completed by the lab are also documented. These include duplicate analyses for systematic issues; in addition, random pulps (at least 5% each month), from Actlabs are sent to the Internal Lab as an additional check on quality.
The 2021 Resource Model MW Exploration Geology QC Report stated that 20,809 regular sample assays were returned between May 23rd, 2020 and July 5th, 2021. Of these, 123 results were from the Musselwhite internal Lab and 20,686 results from Actlabs. A total of 936 blank and 925 standard results were returned, of which, 5 blanks and 5 standards were from the Internal lab and 931 blanks and 920 standards were from Actlabs. It was reported that there were only two failures from those sent to Actlabs (0.2%), and zero failures from those sent to the internal mine lab.
The 2022 Resource Model MW Exploration Geology QC Report states that of 69,090 regular sample assays, 3085 blanks were inserted, returned and loaded between July 6th, 2021 and July 20th, 2022.
Of the 3,085 results received from Actlabs, there were two (2) failures identified (F194000 and F195940) from which the remaining core was sent for re-assay and results returned within limits.
As indicated above in Table 11.4, the standard blank material used at Musselwhite is a locally sourced granite (cut-offs), which has been determined to have an accepted value of 0.05 g/t Au with a standard deviation of 0.017.
A total of 4,480 blank control samples were submitted for analysis in 2023; results are summarized in Figure 11.29. As the plot shows only one (1) sample to be a gross failure, it is clear that the lab is performing at a high level in terms of sample preparation practices to avoid cross-contamination between samples.
| | December 2024 |
| | TECHNICAL REPORT –
MUSSELWHITE MINE, ONTARIO, CANADA
Document # C8630-0000-PM-RPT-001 – Rev. 0
/ Page 145 |
Figure 11.29 – Blanks Results: 2023
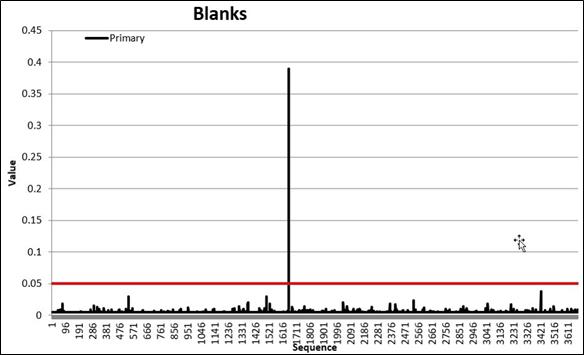
Source: Newmont, 2023
Monthly QA/QC reports from May 2018 and May 2019 indicated that duplicate samples were assayed and compared over this time period.
The May 2018 QA/QC report indicated that for pulp analysis duplicates, the internal lab randomly selected duplicates for re-assay from the unsplit output of the automated crusher pulverizer. The failure rate with %Difference above 20% was 43.5%, which is considered relatively high.
Similarly, the May 2019 QA/QC report stated that pulp duplicate splits were randomly selected by the internal lab using a threshold set at 10x the detection limit (0.1 g/t). The failure rate with %Difference above 20% was indicated at 43.75%. It was once again concluded that the pulp assay variance among duplicates was quite high compared to past performance. Results were likely exaggerated due to the low values (< 2g/t) of the samples. No corrective measures were documented.
The May 2020 QA/QC report stated that for duplicates assayed at Actlabs: i) of 14 core duplicate split samples taken (with grade greater than 10xDL lower limit of 0.05 g/t), 64.3% had a % difference greater than 20%; ii) of 16 coarse reject split samples taken (with grade greater than 10xDL lower limit of 0.05 g/t), 18.75% had a % difference greater than 20%, and; iii) of 57 pulp split samples
| | December 2024 |
| | TECHNICAL REPORT –
MUSSELWHITE MINE, ONTARIO, CANADA
Document # C8630-0000-PM-RPT-001 – Rev. 0
/ Page 146 |
taken (with grade greater than 10x the detection limit of 0.05 g/t), 10.5% had a % difference greater than 20%.
The 2021 Resource Model MW Exploration Geology QC Report states the following:
For half-cut field duplicates, there were 171 field duplicate samples taken, from which 107 samples >10x the lower detection limit (0.05 g/t) were analysed. Based on the same criteria, 174 of 296 lab prep duplicates and 681 of 1,816 lab pulp duplicates were analysed.
The results indicated that prep and pulp duplicate assays were returned in the acceptable range, meanwhile the field duplicates returned elevated values, though still in a reasonable range for the deposit type according to previous studies (Table 11.5).
The 2022 Resource Model MW Exploration Geology QC Report outlines the following:
For field duplicates, there were 1,783 samples taken, from which 872 samples >10x the lower detection limit (0.05 g/t) were analysed. Based on the same criteria, 406 of 1,224 lab prep duplicates and 1,931 of 6,183 lab pulp duplicates were analysed.
Based on the results of the analyses, it may be concluded that both field duplicate and pulp duplicate precision levels need to be monitored though they remain in the general historical range (Table 11.6).
The number of field duplicates, prep/reject duplicates, and pulp duplicates included in the 2023 QA/QC Report were 101, 597, and 2,730 samples, respectively.
It was noted that beginning in 2023, all underground delineation holes were changed to whole core sampling.
The results for field duplicate, prep duplicate and pulp duplicate precision and bias testing are presented in Figure 11.30 to Figure 11.32, respectively.
The results from all three types of duplicate analyses are also summarized in Table 11.7.
| | December 2024 |
| | TECHNICAL REPORT –
MUSSELWHITE MINE, ONTARIO, CANADA
Document # C8630-0000-PM-RPT-001 – Rev. 0
/ Page 147 |
Table 11.5 – Duplicate Results: 2021
| Data | N | Precision 1 | Precision 2 | Bias P50 | Primary Grade | Duplicate Grade | Assay Bias | Failure % |
| Actual | NMC Target | Theory | Actual | NMC Target | Theory |
| Field Dupl. | 107 | 35% | ≤20% | 23% | 84% | ≤40% | 47% | 6.8% | 1.62 | 1.55 | 4.0% | 18% |
| Prep Dupl. | 174 | 10% | | 17% | 24% | | 33% | 0.0% | 1.67 | 1.62 | 2.7% | 1% |
| Pulp Dupl. | 681 | 7% | | 8% | 20% | | 16% | 0.0% | 1.89 | 1.87 | 1.1% | 8% |
Table 11.6 – Duplicate Results: 2022
| Data | N | Precision 1 | Precision 2 | Bias P50 | Primary Grade | Duplicate Grade | Assay Bias | Failure % |
| Actual | NMC Target | Theory | Actual | NMC Target | Theory |
| Field Dupl. | 872 | 34% | ≤20% | 23% | 79% | ≤40% | 47% | -0.8% | 4.31 | 4.22 | 2.2% | 20% |
| Prep Dupl. | 406 | 11% | | 17% | 27% | | 33% | 1.5% | 2.58 | 2.55 | 1.2% | 0% |
| Pulp Dupl. | 1931 | 9% | | 8% | 24% | | 16% | 0.4% | 1.63 | 1.62 | 0.6% | 14% |
Table 11.7 – Duplicate Results: 2023
| Data | N | Precision 1 | Precision 2 | Bias P50 | Primary Grade | Duplicate Grade | Assay Bias | Failure % |
| Actual | NMC Target | Theory | Actual | NMC Target | Theory |
| Field Dupl. | 1001 | 33% | ≤20% | 24% | 83% | ≤40% | 48% | 0.0% | 4.92 | 5.07 | -2.9% | 17% |
| Prep Dupl. | 597 | 14% | | 18% | 27% | | 36% | -1.0% | 2.54 | 2.51 | 0.9% | 2% |
| Pulp Dupl. | 2730 | 11% | | 8% | 27% | | 16% | -0.1% | 3.40 | 3.38 | 0.7% | 20% |
| | December 2024 |
| | TECHNICAL REPORT –
MUSSELWHITE MINE, ONTARIO, CANADA
Document # C8630-0000-PM-RPT-001 – Rev. 0
/ Page 148 |
Figure 11.30 – Field Duplicate Precision and Bias
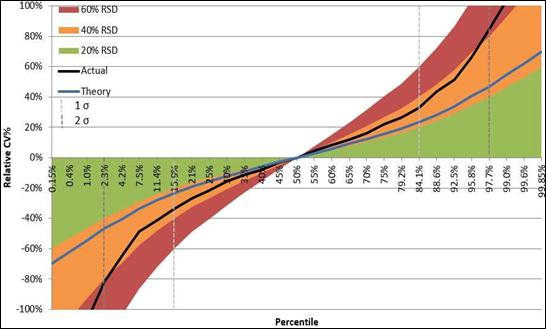
Source: Newmont, 2023
Figure 11.31 – Prep Duplicate Precision and Bias
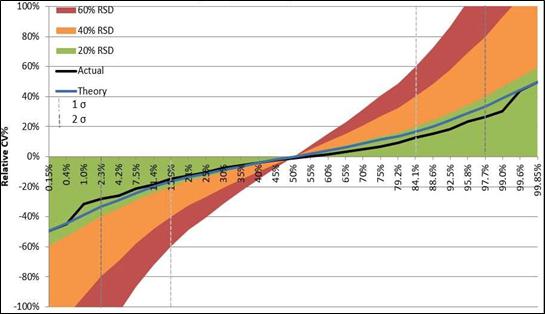
Source: Newmont, 2023
| | December 2024 |
| | TECHNICAL REPORT –
MUSSELWHITE MINE, ONTARIO, CANADA
Document # C8630-0000-PM-RPT-001 – Rev. 0
/ Page 149 |
Figure 11.32 – Pulp Duplicate Precision and Bias

Source: Newmont, 2023
The results indicated that the performance of the field and pulp duplicates are outside 2SD of theory.
The field duplicates reflected the homogeneity of the Musselwhite sampled lithologies. However, the pulp failure rate could be linked to the sample grades; samples with failures average a grade of 0.346 g/t, whereas the samples that are within 2SD average 3.846 g/t.
Due to the transition between AcQuire and GED at the time, not all lab locations could be identified so the results included all Actlabs locations for data analysis.
| 11.3.10 | Crush and Grinding Size Tests |
Crush and pulp sieve tests have been supplied by Actlabs in Thunder Bay, Dryden, Fredericton, North Bay, and Timmins since the beginning of 2022 until May 2023 for the finalized drill holes that are a part of the 2023 Resource Model.
For the crush sieve tests, 2,428 sieve tests were conducted and passed along to the 2023 Resource QA/QC Report QP. Several fails where corrective action was taken along with a re-test. A few did not have corrective action indicated but would have been followed up in the monthly report.
For the pulp sieve test, 2065 sieve tests were conducted and passed along to the 2023 Resource QA/QC Report QP. There were several failures where the corrective action and re-test was supplied, few did not have corrective action indicated but would have been followed up at the monthly report.
| | December 2024 |
| | TECHNICAL REPORT –
MUSSELWHITE MINE, ONTARIO, CANADA
Document # C8630-0000-PM-RPT-001 – Rev. 0
/ Page 150 |
Sieve reports prepared by Actlabs are subject to data entry error because all is hand-typed from their logbooks. It is up to the author to initiate an investigation into failures, without explanation already provided, each month but most often, the error is a result of data entry.
Specific gravity measurements were taken at Musselwhite Mine by Newmont Exploration Geologists and quality control was done by the geologist doing the monthly logging peer review by re-measuring selected samples in the exploration and production drill holes.
As of January 2023, external checks were done by sending 5% of specific gravity samples to Actlabs Dryden where secondary gravity measurements were taken; the samples could also be sent to other regional facilities at the discretion of the Dryden lab manager.
In the 407 finalized holes, there were 7,437 SG measurements taken. Musselwhite began to send density samples to Actlabs for QC purposes in January 2023; as a result, there were 191 data pairs available for comparison. Prior to sending to Actlabs, the geologist would do QC checks as part of the logging review process; 164 results were available for comparison. The QA/QC check compliance rate was at 4.8% for the suite of drill holes.
The results of the density quality control check from the 2023 Resource QA/QC Report are illustrated in Figure 11.30. Overall, there is a strong correlation around the 1:1 line, however the quality check showed more variability than ideal. It was recommended to check the lab’s scale calibration log for accuracy, and to verify whether internal standards were being used to ensure precision in their own technique.
Figure 11.33 – 2023 Density Quality Control Check
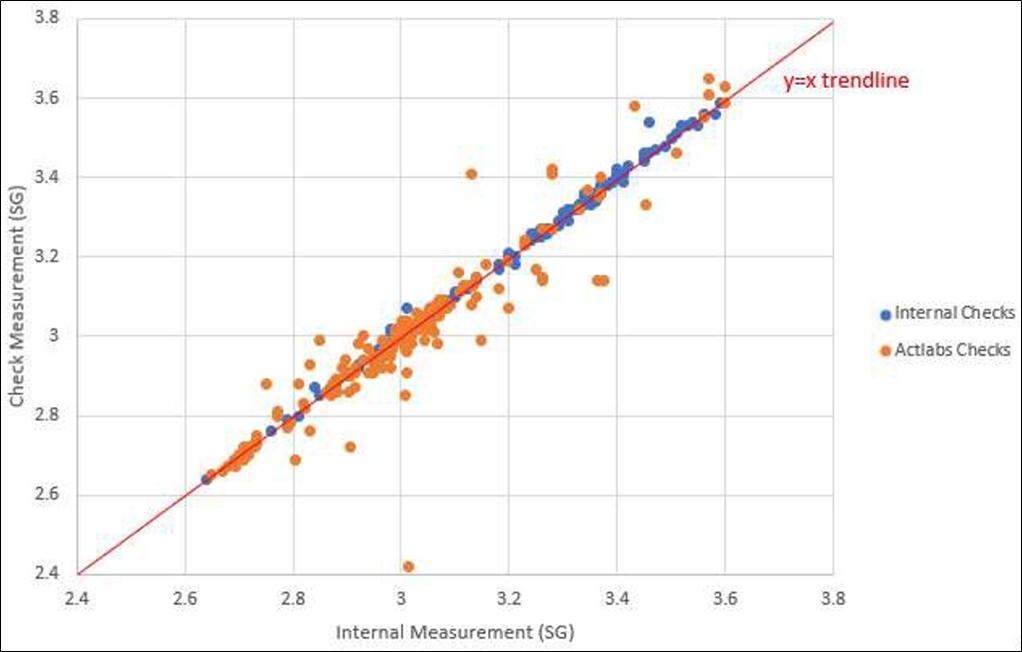
Source: Newmont, 2023
| | December 2024 |
| | TECHNICAL REPORT –
MUSSELWHITE MINE, ONTARIO, CANADA
Document # C8630-0000-PM-RPT-001 – Rev. 0
/ Page 151 |
The Musselwhite Mine is an enclosed site with perimeter fence and security services supplied by Synterra Security Solutions LP (Synterra).
Synterra is a majority First Nation owned company in partnership with the Canadian Security Management, Naicatchewenin Development Corporation, Wunnumin Lake First Nation, and Kingfisher Lake First Nation.
With regards to sample security for QA/QC the chain of custody records are maintained using tamperproof security tags which are applied to the sample the sample bags after the core is cut and sampling protocol executed.
These tags are not removed until they arrive at Actlabs which is the accredited laboratory where the assays are performed.
All transport of assay samples is executed by Manitoulin Transport.
| 11.5 | Qualified Person’s Opinion |
It is of the QP’s opinion that the SOPs employed by Musselwhite Mine in the sampling and analysis of drill core samples, including the implemented QA/QC program, do not lead to any factors that may significantly impact the integrity of the data. As such, the QP believes the data to be of sufficient reliability and therefore adequate for the purposes of the Mineral Resource Estimate.
| | December 2024 |
| | TECHNICAL REPORT –
MUSSELWHITE MINE, ONTARIO, CANADA
Document # C8630-0000-PM-RPT-001 – Rev. 0
/ Page 152 |
Following review of public records and the reports provided by the Musselwhite site team, information on historical data verification efforts was found to be limited. Some of the earliest accounts identified were by AMEC for Kinross in 2003 and Goldcorp in 2006, as outlined below.
| 12.1 | AMEC – 2003 Data Verification (Kinross) |
ASCII format files containing all of the drill hole header, survey, lithology, and assay data were obtained from Musselwhite’s Vulcan drill hole database. The database consisted of 3,261 drill hole records containing 260,085 assay records. AMEC imported the files into a Microsoft Access database to conduct validation exercises on the header, survey, and assay data.
The assay database was initially checked by sorting all of the records according to gold grade. The highest value in the database was 761.83 g/t Au in hole #0325. This value agreed with the assay entered into the drill log (original assay certificates were not available for corroboration). The lowest value in the database was –1, which had been assigned to a total of 555 records. To flag missing samples, no negative values were used to estimate the resource.
The assay database was further checked by comparing the dumped assays for 17 randomly selected holes (0.5% of the database) against the source data. The source data consisted of Musselwhite’s Laboratory Information Management System (LIMS) for holes drilled since 1996. For drill holes completed before 1997, the values entered into the drill logs were used as the source data, as the original assay certificates were not available for validation purposes. No errors were found in this validation exercise.
The dumped collar location data and downhole survey data for the same 17 holes were also checked against the source data in the drill logs. Once again, no original records were available for validation purposes, other than the values entered into the drill logs. All of the downhole surveys for these holes were completed with a Sperry-sun instrument. As with the assay validation, no errors were discovered in this exercise.
AMEC concluded that the assay and survey database acquired at the time for the Musselwhite Mine was sufficiently free of errors to be reasonable and sufficient for Mineral Resource Estimation.
| 12.2 | AMEC – 2006 Data Verification (Goldcorp) |
Text and ASCII format files containing all of the drill hole header, survey, lithology, and assay data were obtained from Musselwhite’s Vulcan drill hole database for the PQ Deeps, Esker and T-Antiform deposits. The complete Musselwhite Mine database consisted of 4,266 drill hole records containing 382,526 assay records. At the time, AMEC imported the files into a Microsoft Access database to conduct validation exercises on the header, survey, and assay data.
| | December 2024 |
| | TECHNICAL REPORT –
MUSSELWHITE MINE, ONTARIO, CANADA
Document # C8630-0000-PM-RPT-001 – Rev. 0
/ Page 153 |
The assay database was checked by comparing the dumped assays for 20 randomly selected holes (0.5% of the database) against the source data. The source data consisted of Musselwhite’s Laboratory Information Management System (LIMS) for holes drilled since 1996. No errors were found in this validation exercise.
The dumped collar location data and downhole survey data for the same 20 holes were also checked against the source data in the drill logs and against the respective plotted paper sections. All of the downhole surveys for these holes were completed with a Maxibor instrument. As with the assay validation, no errors were discovered in this exercise.
At the time, AMEC concluded that the assay and survey database acquired at the time for the Musselwhite Mine was sufficiently free of errors to be considered reasonable and adequate for Mineral Resource Estimation purposes.
| 12.3 | Newmont – 2020 Data Verification (Internal) |
An internal Reserve and Resource Review (3R) was completed for Musselwhite in September and October 2020. No material issues were found in the reporting of the 2019 and the preliminary 2020 mineral resource and mineral reserve estimates. There were 13 moderate (system-wide) findings from the 3R, only one of which was related to geology and data collection practices. All moderate findings had action plans which were completed by December 2021.
Since that time, one of the mineral processing items was revised to a Critical Risk. An outcome of the metallurgical accounting audit issued in 2021 identified that the mill did not have a feed sample for head-grade check-in verification purposes. This critical risk finding was resolved in 2023 by adding a mill feed sampler to the grinding circuit in the mill.
Additionally, internal peer reviews by site-based Qualified Persons were completed on the annual geology and resource models, as well as the final production shapes generated for resource and reserve declarations. Findings and recommendations from these peer reviews are further discussed in Sections 25 and 26.
The current QP has reviewed various of the described internal reviews and considers the employed methodologies to be reasonable and adequate for data verification purposes.
| 12.4 | DRA – 2024 Data Verification (Orla Mining) |
The current QP visited the Musselwhite Mine on November 6 and 7, 2024. The primary aims of the visit were to meet and hold technical discussions with site personnel, better understand the nature of the alteration and mineralization with respect to the host rocks and surrounding geology, review current interpretations and modelling approaches, and address several geological functions, including:
| | December 2024 |
| | TECHNICAL REPORT –
MUSSELWHITE MINE, ONTARIO, CANADA
Document # C8630-0000-PM-RPT-001 – Rev. 0
/ Page 154 |
| ● | Drilling, logging and sampling procedures; |
| ● | Data collection, treatment and storage; |
| ● | Analytical and QA/QC procedures, and; |
| ● | Core/reject sample chain of custody and storage processes. |
To improve understanding of the deposit-scale geology and related mineralization styles, multiple stops were made as part of an underground tour of the East Limb deposits, including the 1195 mL ramp, a crosscut on the 1445 mL and a longitudinal drive on the 1320 mL.
The stop in the 1195 mL ramp area was precipitated by safety precautions while waiting for an earlier morning blast to clear. However, it afforded the opportunity to get situated within the 3D geometry of the orebody and observe several rock types common to the East Limb, including the non- to poorly mineralized 4B and 4F lithofacies of the Northern Iron Formation (NIF) as well as the Upper Volcanic mafic unit (Figure 12.1).
Figure 12.1 – Common East Limb Rock Types in the East Limb, 1195 mL Ramp Area,
Musselwhite Mine

Source: DRA, 2024
| | December 2024 |
| | TECHNICAL REPORT –
MUSSELWHITE MINE, ONTARIO, CANADA
Document # C8630-0000-PM-RPT-001 – Rev. 0
/ Page 155 |
The subsequent stop in the 1445 mL 14314N crosscut was instrumental to understand the styles of alteration and mineralization in the PQ Deep zones, which represent the vast majority of remaining reserves in the current LoM plan. The main mineralized 4EA lithofacies of the NIF was observed over a broad interval (cut by a metre-scale ultramafic dyke), with mineralization clearly associated with abundant pyrrhotite replacement and quartz veining/flooding of the iron formation (Figure 12.2). Common gangue minerals identified include garnet (almandine), amphibole (grunerite) and biotite. As the crosscut extended slightly beyond the most intense sulfide mineralization, it was noted that garnet abundance appears to increase towards the margins of fluid flow and into non-mineralized equivalents of the dominant host rocks.
Figure 12.2 –PQ Deeps Alteration and Mineralization Styles, 1445 mL – 14314N Crosscut,
Musselwhite Mine
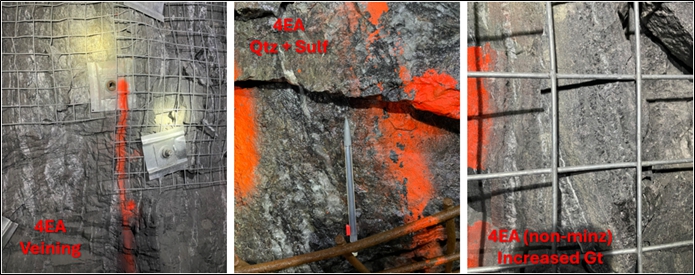
Source: DRA, 2024
The third stop was in the 1320 mL longitudinal ore drift north within what is classified as the Lynx zone, interpreted as an equivalent to the PQ Deeps located higher along the East Limb. It was evident that alteration and mineralization styles in the mineralized 4EA here closely resemble those observed during the previous stop, supporting this interpretation. It was an interesting exposure to better understand the mining approach; senior production geology staff explained that these longitudinal drives aim to closely position the west wall along the contact with the non- to weakly mineralized 4F lithofacies (Figure 12.3).
| | December 2024 |
| | TECHNICAL REPORT –
MUSSELWHITE MINE, ONTARIO, CANADA
Document # C8630-0000-PM-RPT-001 – Rev. 0
/ Page 156 |
Figure 12.3 –Lynx Zone Alteration and Mineralization Styles, 1320 mL Longitudinal Ore Drift
North, Musselwhite Mine
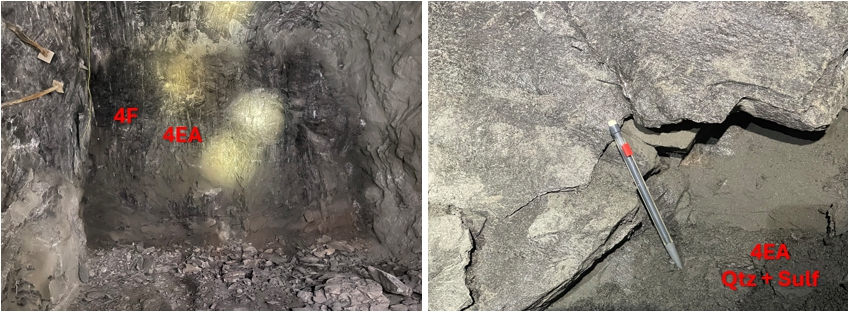
Source: DRA, 2024
Although no proper drill collar location or orientation check surveys were conducted during the course of this underground tour, a couple instances of exposed drill holes along the walls of visited headings/drives were identified (Figure 12.4). It was clear from approximations that the locations of these holes closely matched the corresponding drill hole traces on provided vertical sections and level plans. As a result, it appears that the systems in place at Musselwhite for drill collar and downhole surveys are both reasonable and adequate.
Figure 12.4 –Underground Drill Hole Location Verification, 1445 mL, Musselwhite Mine
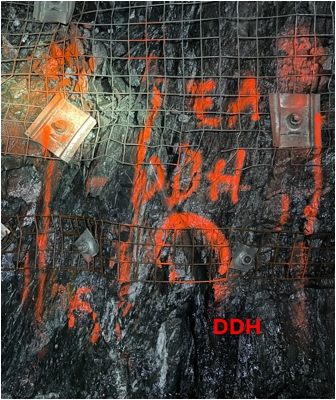
Source: DRA, 2024
| | December 2024 |
| | TECHNICAL REPORT –
MUSSELWHITE MINE, ONTARIO, CANADA
Document # C8630-0000-PM-RPT-001 – Rev. 0
/ Page 157 |
The final stop for the underground portion of the site visit was at a new drill setup in the 1080 mL Exploration Decline. Unfortunately, the drill was not active as it was in the midst of being set up at this location; drilling operations could thus not be directly observed by the QP. It was explained by exploration management that the drill platform is intended as a long-term setup in order to complete infill drilling for reserves upgrades to the north of the ramp.
Following the underground tour, a quick visit was also made to a series of outcrop exposures along the southern shore of Opapimiskan Lake. Complex banding and deformation fabrics were observed in poorly mineralized lithofacies of the Southern Iron Formation (SIF), aiding to place the mine deposits in a larger property-scale context.
Figure 12.5 – Banding and Deformation Fabrics in Southern Iron Formation (SIF) Outcrops,
South Shore Exposures, Musselwhite Mine
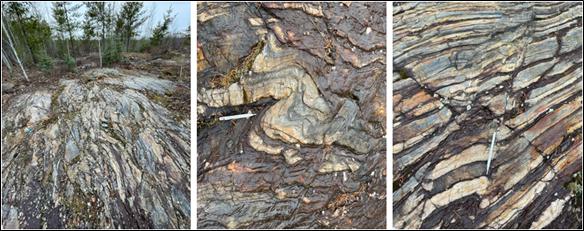
Source: DRA, 2024
The QP was also able to review key drill intercepts from a number of holes from several areas including the Lynx, PQ Deeps (NSD), Redwings and the West Limb zones. The mostly sawn half cores (partial quartered sections) allowed for further inspection of the alteration and mineralization styles common to the Musselwhite Mine. The reviewed intercepts included the following:
| · | 23-LNX-047 (10.5m @ 22.16 g/t Au); |
| · | 20-NSD-003 (8.2m @ 12.64 g/t); |
| · | 18-NSD-006 (12.5m @ 11.07 g/t); |
| · | 24-RDW-007 (7.2m @ 6.8 g/t); |
| · | 18-WEL-018 (11.2m @ 9.92 g/t); and |
| · | 18-WEL-020 (8.3m @ 4.81 g/t). |
Observations from the Lynx (LNX) and PQ Deeps (NSD) holes mirrored the relationships identified during the underground portion of the visit discussed above, with gold grades closely linked to pyrrhotite abundance (Figure 12.6).
| | December 2024 |
| | TECHNICAL REPORT –
MUSSELWHITE MINE, ONTARIO, CANADA
Document # C8630-0000-PM-RPT-001 – Rev. 0
/ Page 158 |
Figure 12.6 – Selected Drill Core Photographs Showing Alteration and Mineralization Styles,
Lynx and North Shore Drilling (PQ Deeps), Musselwhite Mine
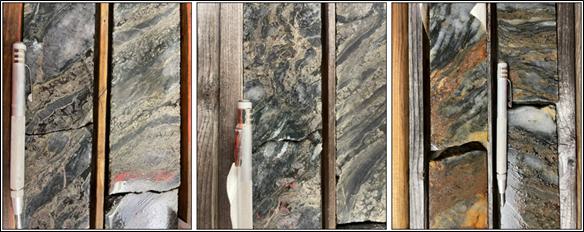
Source: DRA, 2024
Review of the Redwings intercept highlighted slightly different styles in the Southern Iron Formation, with sulfide mineralization appearing to follow along foliation to a greater extent and less abundant quartz veining (Figure 12.7). It was discussed with the exploration staff that pyrrhotite content appears less directly related to gold grades with occasional semi-massive sulfide intersections.
Figure 12.7 – Selected Drill Core Photographs Showing Alteration and Mineralization Styles,
Redwings, Musselwhite Mine
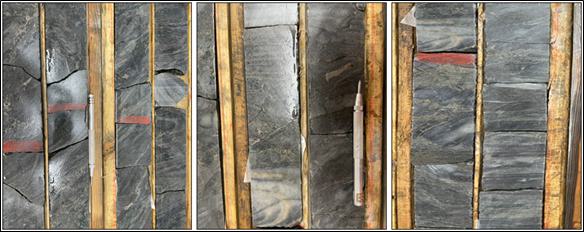
Source: DRA, 2024
Inspection of the West Limb intercepts revealed similar relationships as those from the Lynx and PQ Deeps zones, however, noticeably absent is the 4EA lithofacies. Here, gold grades appear more strongly controlled by chemical and rheological differences between iron formation, mafic volcanics and ultramafic intrusive dykes. Notably, mafic volcanics also act as an important host to gold in the vicinity. It is clear from the reviewed intercepts that gold is strongly associated with pyrrhotite content and increased quartz veining and flooding (Figure 12.8).
| | December 2024 |
| | TECHNICAL REPORT –
MUSSELWHITE MINE, ONTARIO, CANADA
Document # C8630-0000-PM-RPT-001 – Rev. 0
/ Page 159 |
Figure 12.8 – Selected Drill Core Photographs Showing Alteration and Mineralization Styles,
West Limb, Musselwhite Mine
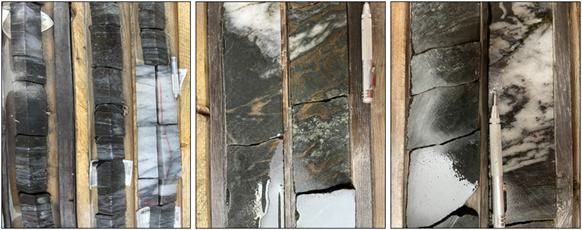
Source: DRA, 2024
Unfortunately, no QP check assay samples were able to be collected during the site visit due to time constraints; similarly, no surface exploration drill collars were verified via ground-truthing as weather conditions hampered access to more distal areas with relatively recent drill activity. However, based on the long production life (>27 years) of the Musselwhite Mine and continual positive reconciliation data, there is no significant concern or reason to suspect that the procedures in place are anything less than reasonable and adequate.
| 12.5 | Qualified Person’s Opinion |
The QP is satisfied that not only the presence of gold has been demonstrated at the Musselwhite Mine, but that the site has continued to advance the understanding of the nature and controls on alteration and mineralization, which were substantiated during the QP’s site visit.
All geological functions that were observed and/or reviewed with the Musselwhite site team are found to be performed well within industry-best practices. These include logging and sampling procedures, data collection, data treatment and storage, analytical procedures (including QA/QC), and core/sample chain of custody and storage practices.
The QP concludes that all processes observed, discussed and/or verified have resulted in data suitable for use in subsequent Mineral Resource Estimation.
| | December 2024 |
| | TECHNICAL REPORT –
MUSSELWHITE MINE, ONTARIO, CANADA
Document # C8630-0000-PM-RPT-001 – Rev. 0
/ Page 160 |
| 13 | Mineral Processing and Metallurgical Testing |
The Musselwhite Life-of-Mine (LoM) Plan consists of production from several zones summarized in Table 13.1. PQ Deeps represents 63% of the mill feed over the mine life, followed by Upper Lynx (12%), Lynx (9%) (is also referred as Lynx North) and lesser amounts of West Limb, Redwings, and T-Antiform.
Metallurgical test work, including chemical and mineralogical analysis, comminution, gravity separation and cyanidation leaching, was completed to characterize samples from the PQD, LYNX, RDW and WEL zones and evaluate gold extraction using the existing Musselwhite processing flowsheet (described in Section 17).
Table 13.1 – Life of Mine Plan by Zone
| Zone | Tonnage
(t) | Grade
(g/t Au) | Distribution
(%, tonnes) |
| PQ Deeps (PQD) | 4,594,524 | 6.94 | 63 |
| Upper Lynx (ULYNX) | 870,944 | 4.63 | 12 |
| Lynx (LYNX) | 623,082 | 5.21 | 9 |
| West Limb (WEL) | 553,573 | 5.84 | 7 |
| Redwings (RDW) | 379,677 | 5.80 | 5 |
| T-Antiform (TANT) | 335,063 | 4.77 | 4 |
| Total | 7,356,863 | 6.23 | 100 |
| 13.2 | Metallurgical Test Work |
This deposit is a single lithology and considered to be a single metallurgical domain. Variability samples were selected from each zone to represent ore to be processed during the life-of-mine plan as understood at the time of sampling. Metallurgical sampling frequencies, and sample numbers, for each zone were chosen based on Newmont’s Geometallurgical Sample Determination and Collection (Bingo Chart) Guideline and prioritized according to gold grade and tonnage, to represent future production. Deposit complexity, process knowledge and experience, and project stage factors were also incorporated into the calculation. Sample selection was finalized with spatial considerations, including waste at expected dilution levels. Longitudinal views of variability locations and recoveries for PQ Deeps Extension 1, Upper Lynx and Lynx, and Red Wing samples are shown in Figure 13.1 to Figure 13.3, respectively.
| | December 2024 |
| | TECHNICAL REPORT –
MUSSELWHITE MINE, ONTARIO, CANADA
Document # C8630-0000-PM-RPT-001 – Rev. 0
/ Page 161 |
Geometallurgical sampling frequencies averaged 61,000 t per recovery variability sample and 140,000 t per comminution variability sample. Sampling frequencies were generally higher in new production zones, than in historical production zones. T-Antiform samples were not considered due to no available drill core, low tonnage and depletion of this zone.
Figure 13.1 – PQ Deeps Extension 1 Variability Samples, Longitudinal View
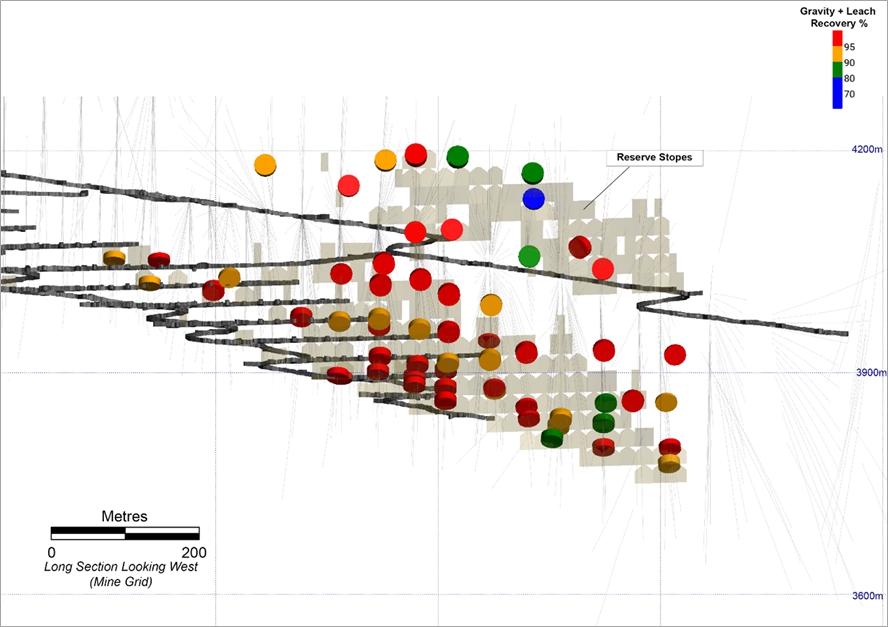
Source: Orla, 2024
| | December 2024 |
| | TECHNICAL REPORT –
MUSSELWHITE MINE, ONTARIO, CANADA
Document # C8630-0000-PM-RPT-001 – Rev. 0
/ Page 162 |
Figure 13.2 – Upper Lynx and Lynx Variability Samples, Longitudinal View
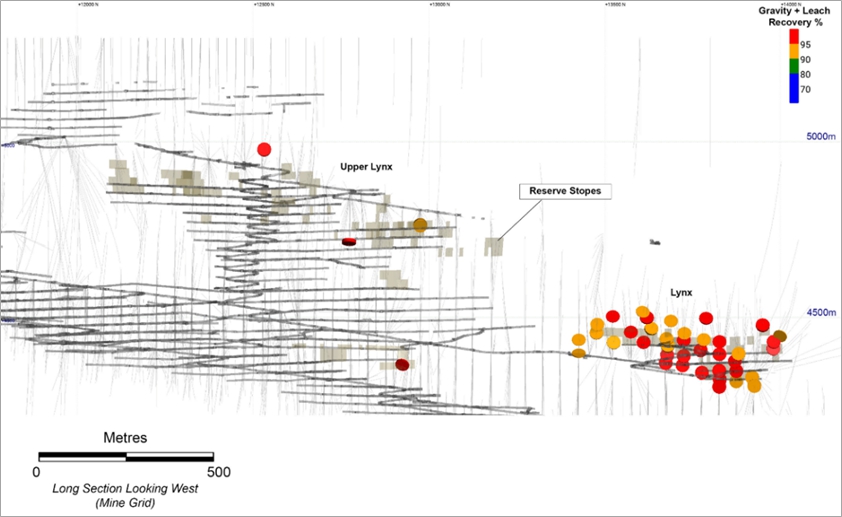
Source: Orla, 2024
Figure 13.3 – Red Wings Variability Samples, Longitudinal View
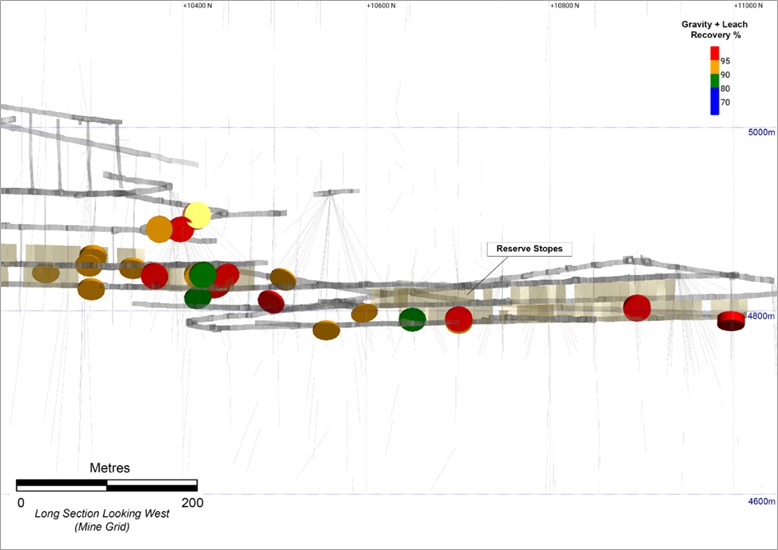
Source: Orla, 2024
| | December 2024 |
| | TECHNICAL REPORT –
MUSSELWHITE MINE, ONTARIO, CANADA
Document # C8630-0000-PM-RPT-001 – Rev. 0
/ Page 163 |
Twenty-five (25) variability samples were tested by Newmont Metallurgical Services (NMS) in 2021 to characterize future ore from the Redwings deposit (RDW) and its metallurgical response to the mineral processing flowsheet at Musselwhite. Three (3) master composites were prepared from the variability composite samples to examine the effects of head grade, particle size and cyanide concentrations on gold recovery.
| 13.2.2.1 | Chemical and Mineralogical Characterization |
Chemical analysis was completed on each variability sample and is summarized in Table 13.2. Gold grades of these variability samples were determined by fire assay, averaging 10.55 g/t and ranging between 0.70 and 61.6 g/t. Sulfide sulfur averaged 5.33% and ranged between 1.11 and 21.1 wt.%. The presence of other elements that may be harmful to human health, such as arsenic and mercury, and deleterious with respect to cyanidation, such as copper, was low to below detection limits.
Table 13.2 – Summary of Variability Sample Chemical Analysis, RDW
| Element | Units | Average | Minimum | Maximum |
| Au | g/t | 10.55 | 0.702 | 61.61 |
| C | % | 1.14 | 0.46 | 2.93 |
| CAI | % | 0.09 | 0.02 | 0.26 |
| Fe | % | 21.70 | 7.79 | 40.40 |
| S | % | 5.68 | 1.25 | 21.3 |
| S²⁻ | % | 5.33 | 1.11 | 21.1 |
| Ag | ppm | 4 | <3 | 9 |
| Al | ppm | 1,620 | 361 | 13,605 |
| As | ppm | 71 | <2 | 664 |
| Ba | ppm | 10 | <2 | 53 |
| Be | ppm | <2 | <2 | <2 |
| Ca | ppm | 35,467 | 12,194 | 83,650 |
| Cd | ppm | <30 | <30 | <30 |
| Co | ppm | 3 | <2 | 8 |
| Cr | ppm | 116 | 9 | 321 |
| Cu | ppm | 49 | 25 | 330 |
| K | ppm | 582 | 352 | 3,518 |
| Mg | ppm | 10,732 | 5,099 | 27,544 |
| Mn | ppm | 2,747 | 1,450 | 4,489 |
| Mo | ppm | <2 | <2 | <2 |
| | December 2024 |
| | TECHNICAL REPORT –
MUSSELWHITE MINE, ONTARIO, CANADA
Document # C8630-0000-PM-RPT-001 – Rev. 0
/ Page 164 |
| Element | Units | Average | Minimum | Maximum |
| Na | ppm | 649 | 128 | 5,488 |
| Ni | ppm | 28 | <20 | 47 |
| Pb | ppm | 437 | <10 | 437 |
| Sb | ppm | <25 | <25 | <25 |
| Se | ppm | 12 | <10 | 12 |
| Sr | ppm | 43 | 10 | 168 |
| Ti | ppm | 28 | <10 | 560 |
| Tl | ppm | 34 | <20 | 170 |
| V | ppm | 10 | <2 | 19 |
| Yb | ppm | 96 | 90 | 99 |
| Zn | ppm | 77 | 28 | 172 |
Note: CAI = Organic carbon | |
| | | | | | |
Semi-quantitative mineralogical analysis was completed by XRD on each variability sample and is summarized in Table 13.3. Quartz, amphibole, magnetite and pyrrhotite were the main mineral phases detected with minor to trace amounts of plagioclase, chlorite, illite/sericite, and biotite identified.
Several variability samples contained significant amounts of pyrrhotite, ranging between 10 and 59%. Pyrrhotite, copper and sulfide concentrations in the variability samples were closely associated.
Table 13.3 – Summary of Variability Sample Mineralogy, RDW
| Statistic | Qz
(%) | Amp
(%) | Mag
(%) | Po
(%) | Cal
(%) | Dol/Ank
(%) |
| Median | 49 | 24 | 20 | 9 | 5 | 1.6 |
| Minimum | 3 | 7 | 6 | 2 | 1.4 | 0.4 |
| Maximum | 75 | 44 | 33 | 59 | 12 | 8.0 |
| Note: | | | |
| Qz- Quartz | Amp - Amphibole | Mag – Magnetite | Cal – Calcite |
| Pl- Plagioclase | Po- Pyrrohtite | Bt – Biotite | Grt - Garnet |
| | December 2024 |
| | TECHNICAL REPORT –
MUSSELWHITE MINE, ONTARIO, CANADA
Document # C8630-0000-PM-RPT-001 – Rev. 0
/ Page 165 |
Head chemical analysis completed on each master composite sample is summarized in Table 13.4. Gold grades of the master composite samples were determined by fire assay and ranged between 2.07 and 15.38 g/t.
Table 13.4 – Master Composite Sample Chemical Analysis, RDW
Master
Composite | Au
(g/t) | C
(%) | S (%) | CAl
(%) | Fe
(%) | S²⁻
(%) |
| MC-1 | 2.07 | 0.85 | 2.68 | 0.07 | 20.5 | 2.37 |
| MC-2 | 6.89 | 0.85 | 4.72 | <0.01 | 17.6 | 4.27 |
| MC-3 | 15.38 | 1.32 | 8.37 | <0.01 | 21.6 | 8.27 |
Note: CAI = Organic carbon | | | | | | |
Semi-quantitative mineralogical analysis completed by XRD on each master composite sample is summarized in Table 13.5. Quartz, amphibole, magnetite and pyrrhotite were the main mineral phases detected with minor to trace amounts of plagioclase, chlorite, illite/sericite, and biotite identified.
Table 13.5 – Master Composite Sample Mineralogy, RDW
Master
Composite | Qz
(%) | Amp
(%) | Mag
(%) | Po
(%) | Cal
(%) | Dol/Ank
(%) |
| MC-1 | 42.6 | 39.8 | 9.3 | 5.4 | | 2.9 |
| MC-2 | 47.2 | 31.0 | 5.1 | 5.6 | 6.4 | |
| MC-3 | 49.0 | 34.1 | | 11.0 | 2.9 | 3.0 |
| Note: | | | |
| Qz- Quartz | Amp - Amphibole | Mag – Magnetite | Cal – Calcite |
| Pl- Plagioclase | Po- Pyrrohtite | Bt – Biotite | Grt - Garnet |
A gravity separation was completed on 1 kg of each variability and master composite sample ground to the target P₈₀, prior to cyanidation test work, using a laboratory Knelson concentrator followed by hand panning of the gravity concentrate produced. Each concentrate was dried, weighed, screened and assayed for gold by size fraction. Knelson concentrator and hand panning tails were blended and split, with one half for cyanidation testing and the other half for assay.
Gravity gold recovery averaged 31.2% and ranged between 18.1 and 53.1% from the variability composite samples.
Twenty-five (25) kinetic leach tests were completed on the gravity tailings of each variability composite sample. Leach test conditions were selected to represent existing processing conditions and are summarized in Table 13.6. Solution samples were taken at 2, 6, 24 and 33-hour intervals
| | December 2024 |
| | TECHNICAL REPORT –
MUSSELWHITE MINE, ONTARIO, CANADA
Document # C8630-0000-PM-RPT-001 – Rev. 0
/ Page 166 |
to evaluate gold leaching kinetics and maintain solution chemistry. Cyanidation leach slurries were sparged with oxygen.
Table 13.6 –Variability Leach Test Conditions, RDW
| Test Parameter | Units | Target |
| P₈₀ | µm | 106 |
| Solids Density | Solid w/w% | 54 |
| pH | pH | 10.6 - 0.9 |
| Cyanide | mg/L | 740 |
| Lead Nitrate | g/t | 280 |
| Dissolved Oxygen | ppm | 20 - 24 |
Gold recovery averaged 90.2% and ranged between 82.6 and 94.0%. On average, leaching was rapid with 80% of the gold recovered during the first six hours of leaching and final recoveries achieved within 24 hours, as illustrated in Figure 13.4.
Figure 13.4 – Cyanidation Leach Kinetics, RDW
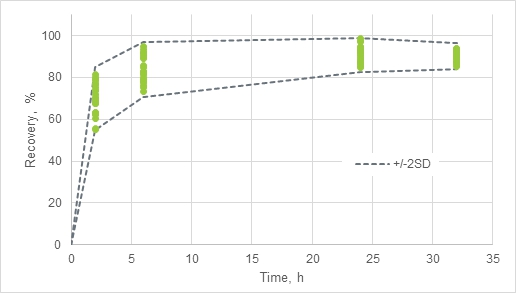
Source: Newmont, 2021
Overall gold recovery, combining gravity and leach recoveries, averaged 93.2% and ranged between 87.5 and 96.3%. The presence of sulfide sulfur has a moderately negative effect on gold recovery, as illustrated in Figure 13.5. Leach test tailings losses were significant for a few of the high-grade variability samples, with correspondingly high concentrations of contained pyrrhotite.
| | December 2024 |
| | TECHNICAL REPORT –
MUSSELWHITE MINE, ONTARIO, CANADA
Document # C8630-0000-PM-RPT-001 – Rev. 0
/ Page 167 |
Figure 13.5 – Cyanidation Leach Recovery vs. Sulfide Sulfur Head Grade, RDW

Source: Newmont, 2021
Hydrated lime consumption averaged 0.95 kg/t and ranged between 0.60 and 1.57 kg/t. Cyanide consumption averaged 0.47 kg/t and ranged between 0.24 and 1.26 kg/t. Increasing sulfide content resulted in increases in both lime and cyanide consumption, as shown in Figure 13.6.
Figure 13.6 – Lime and Cyanide Consumption vs. Sulfide Sulfur Head Grade, RDW

Source: Newmont, 2021
Fifteen (15) gravity separation and leach tests were completed on each of the master composite samples to assess the effects of head grade, particle size, and cyanide concentration on gold
| | December 2024 |
| | TECHNICAL REPORT –
MUSSELWHITE MINE, ONTARIO, CANADA
Document # C8630-0000-PM-RPT-001 – Rev. 0
/ Page 168 |
extraction. Leach test conditions are summarized in Table 13.7. Solution samples were taken at 2, 6, 24 and 33-hour intervals to evaluate leaching kinetics and maintain solution chemistry.
Table 13.7 –Master Composite Leach Test Conditions, RDW
| Test Parameter | Units | Targets |
| P80 | µm | MC-1: 75, 100, 125 |
| | | MC-2: 65, 90, 115 MC-3: 65, 90, 115 |
| Solids Density | Solid w/w% | 54 |
| pH | pH | 10.6 - 0.9 |
| Cyanide | mg/L | 320, 360, 400, 440, and 480 |
| Lead Nitrate | g/t | 280 |
| Dissolved Oxygen | ppm | 20 - 24 |
Gold recovery from two of the three master composite samples was significantly lower than the variability sample recoveries making up each composite sample, at baseline conditions, as shown in Table 13.8. This could not be explained from the test data, and for this reason the master composition test work results were not considered further.
Table 13.8 – Master Composite Baseline Leach Test Recoveries, RDW
| Estimate | Units | MC-1 | MC-2 | MC-3 |
| Master Composition Test Result | % | 90.1 | 85.5 | 81.5 |
| Aggregate Variability Test Result | % | 91.0 | 93.2 | 93.3 |
Twenty-six (26) variability composite samples were tested by NMS in 2022 to future ore from the Lynx deposit and its metallurgical response to the mineral processing flowsheet at Musselwhite. Three (3) master composites were prepared from the variability composite samples to examine the effects of head grade, particle size and cyanide concentrations on gold recovery.
| 13.2.3.1 | Chemical and Mineralogical Characteristics |
Chemical analysis was completed on each variability composite sample and is summarized in Table 13.9. Gold grades of the variability samples were determined using the screen fire assay method, averaging 6.31 g/t and ranging between 0.54 and 16.56 g/t. Sulfide sulfur averaged 1.37% and ranged between 0.32 and 3.41 wt.%. The presence of other elements that may be harmful to human health, such as arsenic and mercury, and deleterious to cyanidation leaching, such as copper, was low to below detection limits.
| | December 2024 |
| | TECHNICAL REPORT –
MUSSELWHITE MINE, ONTARIO, CANADA
Document # C8630-0000-PM-RPT-001 – Rev. 0
/ Page 169 |
Table 13.9 – Summary Variability Sample Chemical Analysis, Lynx
| Element | Units | Average | Minimum | Maximum |
| Au | g/t | 6.31 | 0.54 | 16.56 |
| C | % | 0.29 | 0.12 | 0.47 |
| CAI | % | 0.09 | 0.05 | 0.20 |
| Fe | % | 24.9 | 22.2 | 27.9 |
| S | % | 1.48 | 0.34 | 3.79 |
| S²⁻ | % | 1.37 | 0.32 | 3.41 |
| Ag | ppm | <3 | <3 | <3 |
| Al | ppm | 30,171 | 19,069 | 39,036 |
| As | ppm | 13 | <2 | 135 |
| Ba | ppm | 143 | 72 | 209 |
| Be | ppm | <2 | <2 | <2 |
| Ca | ppm | 14,901 | 10,927 | 18,359 |
| Cd | ppm | 25 | <30 | 36 |
| Co | ppm | 14 | 7 | 20 |
| Cr | ppm | 189 | 129 | 266 |
| Cu | ppm | 121 | 17 | 219 |
| K | ppm | 7,350 | 3,705 | 11,231 |
| Mg | ppm | 12,146 | 8,697 | 14,428 |
| Mn | ppm | 3,678 | 2,535 | 4,468 |
| Mo | ppm | 0 | <2 | 3 |
| Na | ppm | 3,720 | 1,915 | 6,031 |
| Ni | ppm | 44 | 36 | 53 |
| Pb | ppm | <10 | <10 | <10 |
| Sb | ppm | <25 | <25 | <25 |
| Se | ppm | <10 | <10 | <10 |
| Sr | ppm | 52 | 38 | 66 |
| Ti | ppm | 1,774 | 1,333 | 2,359 |
| Tl | ppm | 570 | 408 | 755 |
| V | ppm | 61 | 43 | 81 |
| Zn | ppm | 99 | 48 | 130 |
Note: CAI = Organic carbon |
Semi-quantitative mineralogical analysis was completed by XRD on each variability composite sample and is summarized in Table 13.10. Amphibole, quartz, garnet, and biotite were the main
| | December 2024 |
| | TECHNICAL REPORT –
MUSSELWHITE MINE, ONTARIO, CANADA
Document # C8630-0000-PM-RPT-001 – Rev. 0
/ Page 170 |
mineral phases detected with minor to trace amounts of plagioclase, chlorite, illite/sericite, magnetite, calcite and pyrrhotite identified.
Table 13.10 – Summary of Variability Sample Mineralogy, Lynx
| Statistic | Qz
(%) | Amp
(%) | Pl
(%) | Po
(%) | Bt
(%) | Grt
(%) |
| Median | 25 | 36 | 4 | 3 | 11.5 | 10 |
| Minimum | 20 | 27 | 3 | 0.5 | 5 | |
| Maximum | 34 | 50 | 7 | 8 | 18 | 20 |
Note: Qz- Quartz Amp - Amphibole Mag – Magnetite Cal – Calcite Pl- Plagioclase Po- Pyrrohtite Bt – Biotite Grt - Garnet |
Head chemical analysis completed on each master composite sample is summarized in Table 13.11. Gold grades of the master composite samples were determined using the screen fire assay method, and ranged between 3.75 and 9.85 g/t.
Table 13.11 –Master Composite Sample Chemical Analysis, Lynx
Master
Composite | Au
(g/t) | C
(%) | S
(%) | CAl
(%) | Fe
(%) | S²⁻
(%) | |
| MC-1 | 3.75 | 0.36 | 1.26 | 0.11 | 23.0 | 1.16 | |
| MC-2 | 5.71 | 0.27 | 2.04 | 0.09 | 23.7 | 1.91 | |
| MC-3 | 9.85 | 0.29 | 2.68 | 0.13 | 23.7 | 2.45 | |
Note: CAI = Organic carbon |
Semi-quantitative mineralogical analysis completed by XRD on each master composite sample is summarized in Table 13.12. Amphibole, quartz, garnet, and biotite were the main mineral phases detected with minor to trace amounts of plagioclase, chlorite, illite/sericite, magnetite, calcite and pyrrhotite identified.
Table 13.12 –Master Composite Sample Mineralogy, Lynx
Master
Composite | Qz
(%) | Amp
(%) | Pl
(%) | Po
(%) | Bt
(%) | Grt
(%) |
| MC-1 | 25 | 38 | | 1.8 | 14 | 8 |
| MC-2 | 25 | 37 | | 5 | 10 | 13 |
| MC-3 | 27 | 36 | 2 | 6 | 10 | 12 |
Note: Qz- Quartz Amp - Amphibole Mag – Magnetite Cal – Calcite Pl- Plagioclase Po- Pyrrohtite Bt – Biotite Grt - Garnet |
| | December 2024 |
| | TECHNICAL REPORT –
MUSSELWHITE MINE, ONTARIO, CANADA
Document # C8630-0000-PM-RPT-001 – Rev. 0
/ Page 171 |
Seven (7) variability composites were selected for comminution test work. Bond Abrasion Index (Ai), Bond Rod Mill Work Index (RWi), and Bond Ball Mill Work Index (BWi), and Abrasion Index tests were completed on these samples by Hazen Research, Inc. (Hazen). A Harness Index Test (HIT) was completed on each sample by NMS to develop a predictor of traditional comminution test parameters for samples in the future, and for this reason is not discussed further here. Comminution test results are summarized in Table 13.13.
Abrasion Index (Ai) is a measure of an ore’s ability to wear away steel to which it comes into contact during handling and processing, such as grinding mill liners and media. The average Abrasion Index was 0.4240 g and ranged between 0.3187 and 0.5306 g, indicating a slightly to average abrasive ore.
Bond Rod and Ball Mill Work Index are both measures of the power requirements to grind an ore to a specific particle size. Bond Rod Mill Work Index averaged 14.8 kWh/t and ranged between 13.7 and 17.0 kWh/t with a closing size of 1,190 µm. Bond Ball Mill Work Index averaged 13.3 kWh/t and ranged between 12.0 and 14.9 kWh/t to a closing size of 149 µm. These results indicated moderate ore hardness.
Table 13.13 –Master Comminution Test Results Summary, Lynx
| Statistic | Ai
(g) | BWi
(kWh/t) | RWi
(kWh/t) |
| Average | 0.4240 | 13.3 | 14.8 |
| Minimum | 0.3187 | 12.0 | 13.7 |
| Maximum | 0.5306 | 14.9 | 17.0 |
A gravity separation was completed on 1 kg of each variability composite and master composite sample ground to the target P80, prior to cyanidation test work, using a laboratory Knelson concentrator followed by hand panning of the gravity concentrate. Each concentrate was dried, weighed, screened and assayed for gold by size fraction. Knelson concentrator and hand panning tails were blended and split, with one half for cyanidation leach testing and the other half for assay.
Gravity gold recovery averaged 44% and ranged between 23 and 69% from the variability composite samples.
Twenty-three (23) kinetic leach tests were completed on the gravity tailings of each variability composite sample. Leach test conditions were selected to represent existing processing conditions and are summarized in Table 13.14. Solution samples were taken at 2, 6, 24 and 32-hour intervals to evaluate leaching kinetics and maintain solution chemistry. Cyanidation leach slurries were sparged with oxygen. Activated carbon was added after 24 hours of leaching.
| | December 2024 |
| | TECHNICAL REPORT –
MUSSELWHITE MINE, ONTARIO, CANADA
Document # C8630-0000-PM-RPT-001 – Rev. 0
/ Page 172 |
Table 13.14 –Variability Leach Test Conditions, Lynx
| Test Condition | Units | Target |
| P₈₀ | µm | 75 |
| Solids Density | Solid w/w% | 54 |
| pH | pH | 10.6 - 10.9 |
| Cyanide | mg/L | 400 |
| Lead Nitrate | g/t | 270 |
| Dissolved Oxygen | ppm | 20 - 24 |
Gold recovery averaged 92.4% and ranged between 88.7 and 96.3%. On average, gold recovery kinetics were rapid with 80% of the gold recovered in the first 6 hours and final recoveries achieved at 24 hours, as illustrated in Figure 13.7.
Figure 13.7 –Cyanidation Leach Kinetics, Lynx
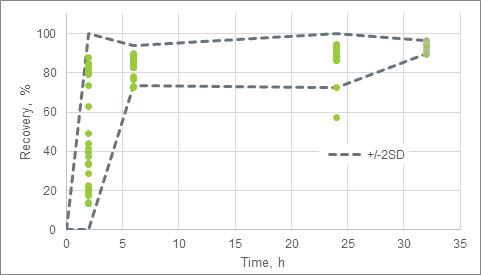
Source: Newmont, 2022
Overall gold recovery, combining gravity and leach recoveries, averaged 95.6% and ranged between 92.4 and 98.8%. Sulfide had moderately negative impacts on gold recovery illustrated in Figure 13.8.
| | December 2024 |
| | TECHNICAL REPORT –
MUSSELWHITE MINE, ONTARIO, CANADA
Document # C8630-0000-PM-RPT-001 – Rev. 0
/ Page 173 |
Figure 13.8 –Cyanidation Leach Recovery vs. Sulfide Sulfur Head Grade, Lynx
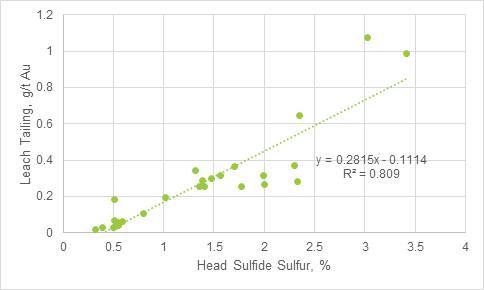
Source: Newmont, 2022
Hydrated lime consumption averaged 0.67 kg/t and ranged between 0.51 and 1.06 kg/t. Cyanide consumption averaged 0.51 kg/t and ranged between 0.25 and 0.70 kg/t. Increasing sulfide content did not effect hydrated lime consumption and slightly increased cyanide consumption, as shown in Figure 13.9.
Figure 13.9 –Lime and Cyanide Consumption vs. Sulfide Sulfur Head Grade, Lynx
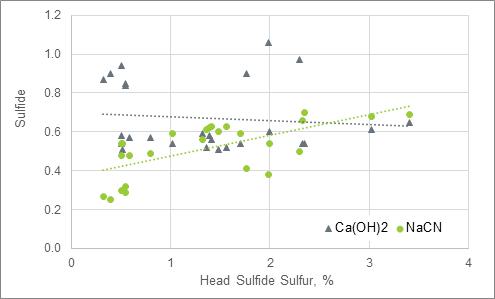
Source: Newmont, 2022
| | December 2024 |
| | TECHNICAL REPORT –
MUSSELWHITE MINE, ONTARIO, CANADA
Document # C8630-0000-PM-RPT-001 – Rev. 0
/ Page 174 |
Fifteen (15) gravity separation and kinetic leach tests were completed on each of the master composite samples to assess the effects of head grade, particle size, and cyanide concentration on gold extraction. Leach test conditions are summarized in Table 13.15. Solution samples were made at 2, 6, 24 and 32-hour intervals to evaluate leach kinetics and maintain solution chemistry.
Table 13.15 –Master Composite Leach Test Conditions, Lynx
| Test Condition | Units | Target |
| P₈₀ | µm | 75 |
| Solids Density | Solid w/w% | 54 |
| pH | pH | 10.6 - 10.9 |
| Cyanide | mg/L | 400 |
| Lead Nitrate | g/t | 270 |
| Dissolved Oxygen | ppm | 20 - 24 |
Gold recovery from each master composite sample was consistent with the variability sample recoveries making up each composite sample, at baseline conditions, as shown in Table 13.16.
Table 13.16 – Master Composite Baseline Leach Test Recoveries, Lynx
| Estimate | Units | MC-1 | MC-2 | MC-3 |
| Master Composition Test Result | % | 95.0 | 95.4 | 93.9 |
| Aggregate Variability Test Result | % | 94.9 | 95.3 | 93.5 |
Decreasing particle size significantly improved gravity, leaching and overall gold recovery from each of the Lynx master composite samples, as illustrated in Figure 13.10. Recovery variations at each particle size reflect the different head grades of each master composite.
Increasing cyanide concentration had little effect on gold recovery by leach, particularly above the current target of 400 ppm, as illustrated in Figure 13.11.
| | December 2024 |
| | TECHNICAL REPORT –
MUSSELWHITE MINE, ONTARIO, CANADA
Document # C8630-0000-PM-RPT-001 – Rev. 0
/ Page 175 |
Figure 13.10 – Particle Size Effects on Recovery, Lynx
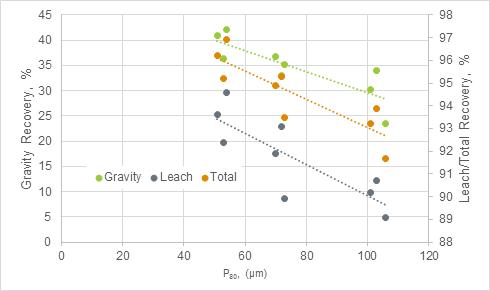
Source: Newmont, 2022
Figure 13.11 – Cyanide Concentration Effects on Recovery, Lynx
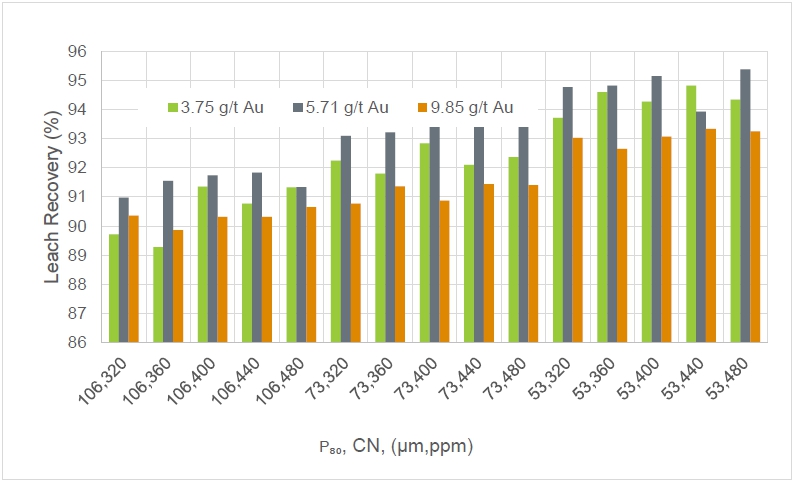
Source: Newmont, 2022
| | December 2024 |
| | TECHNICAL REPORT –
MUSSELWHITE MINE, ONTARIO, CANADA
Document # C8630-0000-PM-RPT-001 – Rev. 0
/ Page 176 |
| 13.2.4 | Future Ores 2023-2025 (2022) |
Twenty-three (23) variability samples were tested by NMS in 2022 to characterize the metallurgical response of Future Ores 2023-2025 (FO2325) to the Musselwhite processing flowsheet. Three (3) master composites were prepared from the variability samples to represent each year of production and examine the effects of particle size and cyanide concentrations on gold recovery.
Future ore samples were selected to represent ore mined and processed during the period of 2023 through 2025, specifically the PQ Deeps (PQD), Redwings (RDW) and Upper Lynx (ULNX) zones. Most of the variability samples represented PQD mineralization with two (2) samples representing Redwings and two (2) samples representing Upper Lynx.
| 13.2.4.1 | Sample Characterization |
Chemical analysis was completed on each variability sample and is summarized in Table 13.17. Gold grades of the variability samples were determined using the screen fire assay method, averaging 8.09 g/t and ranged between 1.61 and 21.33 g/t. Sulfide sulfur averaged 2.37% and ranged between 0.72 and 6.10 wt.%. The presence of other elements that may be harmful to human health, such as arsenic and mercury, and deleterious to cyanidation, such as copper, were low to below detection limits.
Table 13.17 – Summary of Variability Sample Chemical Analysis, FO2325
| Element | Units | Average | Minimum | Maximum |
| Au | g/t | 8.09 | 1.61 | 21.33 |
| C | % | 0.31 | 0.10 | 1.12 |
| CAI | % | 0.08 | 0.05 | 0.15 |
| Fe | % | 18.3 | 8.9 | 23.9 |
| S | % | 2.70 | 0.77 | 6.69 |
| S²⁻ | % | 2.37 | 0.72 | 6.10 |
| Ag | ppm | <3 | <3 | <3 |
| Al | ppm | 40,149 | 2,438 | 63,230 |
| As | ppm | 27 | <2 | 448 |
| Ba | ppm | 89 | <2 | 155 |
| Be | ppm | 3 | 3 | 4 |
| Ca | ppm | 17,212 | 10,708 | 37,574 |
| Cd | ppm | <30 | <30 | <30 |
| Co | ppm | 16 | <2 | 31 |
| Cr | ppm | 190 | 98 | 255 |
| Cu | ppm | 180 | 142 | 224 |
| | December 2024 |
| | TECHNICAL REPORT –
MUSSELWHITE MINE, ONTARIO, CANADA
Document # C8630-0000-PM-RPT-001 – Rev. 0
/ Page 177 |
| Element | Units | Average | Minimum | Maximum |
| K | ppm | 4,958 | 562 | 15,428 |
| Mg | ppm | 10,160 | 6,816 | 13,087 |
| Mn | ppm | 2,951 | 1,875 | 4,432 |
| Mo | ppm | <2 | <2 | <2 |
| Na | ppm | 3,348 | 380 | 8,689 |
| Ni | ppm | 44 | <20 | 75 |
| Pb | ppm | <10 | <10 | <10 |
| Sr | ppm | 49 | 30 | 74 |
| Ti | ppm | 1,822 | 26 | 2,966 |
| Tl | ppm | 549 | <20 | 923 |
| V | ppm | 74 | <2 | 141 |
| Zn | ppm | 99 | 48 | 130 |
Note: CAI = Organic carbon |
Semi-quantitative mineralogical analysis was completed by XRD on each variability sample and is summarized in Table 13.18. Amphibole, quartz, garnet, biotite, and plagioclase were the main mineral phases detected with trace amounts of chlorite, illite/sericite, magnetite and pyrrhotite identified.
Table 13.18 – Summary of Variability Sample Mineralogy, FO2325
| Statistic | Qz
(%) | Amp
(%) | Pl
(%) | Po
(%) | Bt
(%) | Grt
(%) |
| Median | 23 | 36 | 6 | 3 | 9 | 16 |
| Minimum | 16 | 13 | 1 | 0.9 | 3 | 9 |
| Maximum | 55 | 52 | 14 | 9 | 26 | 26 |
Note: Qz- Quartz Amp - Amphibole Mag – Magnetite Cal – Calcite Pl- Plagioclase Po- Pyrrohtite Bt – Biotite Grt - Garnet |
Head chemical analysis completed on each master composite sample is summarized in Table 13.19. Gold grades of the master composite samples were determined using the screen fire assay method, and ranged between 4.49 and 6.29 g/t.
| | December 2024 |
| | TECHNICAL REPORT –
MUSSELWHITE MINE, ONTARIO, CANADA
Document # C8630-0000-PM-RPT-001 – Rev. 0
/ Page 178 |
Table 13.19 – Master Composite Sample Chemical Analysis, FO2325
Master
Composite | Au
(g/t) | C
(%) | S
(%) | CAl
(%) | Fe
(%) | S²⁻
(%) |
| MC-1 | 4.49 | 0.14 | 1.29 | 0.03 | 23.1 | 1.14 |
| MC-2 | 5.85 | 0.39 | 1.80 | 0.03 | 18.7 | 1.59 |
| MC-3 | 6.29 | 0.17 | 1.62 | 0.05 | 23.2 | 1.45 |
Note: CAI = Organic carbon |
Semi-quantitative mineralogical analysis completed by XRD on each master composite sample is summarized in Table 13.20. Amphibole, quartz, garnet, biotite, and plagioclase were the main mineral phases detected with minor to trace amounts of chlorite, illite/sericite, magnetite and pyrrhotite measured
Table 13.20 – Master Composite Sample Mineralogy, FO2325
Master
Composite | Qz
(%) | Amp
(%) | Pl
(%) | Po
(%) | Bt
(%) | Grt
(%) |
| MC-1 | 25 | 36 | | 2 | 9 | 17 |
| MC-2 | 27 | 34 | 11 | 2 | 9 | 10 |
| MC-3 | 25 | 35 | 9 | 3 | 6 | 13 |
Note: Qz- Quartz Amp - Amphibole Mag – Magnetite Cal – Calcite Pl- Plagioclase Po- Pyrrohtite Bt – Biotite Grt - Garnet |
Seventeen (17) of the variability samples were selected for comminution test work. Semi-autogenous grinding characterization (SMC), Bond Abrasion Index (Ai), Bond Rod Mill Work Index (RWi), and Bond Ball Mill Work Index (BWi), and Abrasion Index tests were completed on fourteen (14) of these samples at Hazen Research, Inc. (Hazen). A Harness Index Test (HIT) was completed on each sample by NMS to develop a predictor of traditional comminution test parameters for samples in the future, and for this reason is not discussed further here. Comminution test results are summarized in Table 13.21 and discussed below.
The value of Axb is a measure of an ore’s hardness to impact breakage or competency, that decreases with increasing hardness. These samples have an average, or moderate, ore hardness when compared to the SMC test database. One (1) Upper Lynx sample was classified as extremely hard, with an Axb value of 26.5.
Abrasion Index is a measure of an ore’s ability to wear away steel to which it comes into contact during handling and processing, such as grinding mill liners and media. Ai average is 0.4414 g and
| | December 2024 |
| | TECHNICAL REPORT –
MUSSELWHITE MINE, ONTARIO, CANADA
Document # C8630-0000-PM-RPT-001 – Rev. 0
/ Page 179 |
ranged between 0.2788 and 0.8575 g, indicating a slightly abrasive to abrasive ore, with one (1) Upper Lynx sample classified as highly abrasive.
Bond Rod and Ball Mill Work Index are both measures of power requirements to grind ore to a specific particle size. Bond Rod Mill Work Index averaged 11.7 kWh/t and ranged between 10.0 and 15.5 kWh/t with a closing size of 1,190 µm. Bond Ball Mill Work Index averaged 11.9 kWh/t and ranged between 10.7 and 15.0 kWh/t to a closing size of 149 µm. These results indicated moderate ore hardness. One Upper Lynx sample was significantly harder, with a RWi of 15.0 kWh/t and a BWi of 15.5 kWh/t. This was the same sample presenting as extremely hard or competent with respect to impact breakage.
Table 13.21 – Master Comminution Test Results Summary, FO2325
| Statistic | SG | A | B | Axb | ta | Ai
(g) | RWi
(kWh/t) | BWi
(kWh/t) |
| Average | 3.32 | 67.8 | 0.62 | 41.4 | 0.32 | 0.4414 | 11.7 | 11.9 |
| Minimum | 3.01 | 62.7 | 0.34 | 26.5 | 0.23 | 0.2788 | 10.0 | 10.7 |
| Maximum | 3.47 | 77.9 | 0.77 | 49.9 | 0.39 | 0.8575 | 15.5 | 15.0 |
A gravity separation was completed on 1 kg of each variability composite and master composite sample ground to the target P₈₀, prior to cyanidation test work, using a laboratory Knelson concentrator followed by hand panning of the gravity concentrate. Each concentrate was dried, weighed, screened and assayed for gold by size fraction. Knelson concentrator and hand panning tailings were blended and split, with one half for cyanidation testing and the other half for assay.
Gravity gold recovery averaged 51% and ranged between 32 and 69% from the variability composite samples.
Twenty-three (23) kinetic leach tests were completed on the gravity tailings of each variability composite sample. Leach test conditions were selected to represent existing processing conditions and are summarized in Table 13.22. Solution samples were taken at 2, 6, 24 and 32-hour intervals to evaluate leach kinetics and maintain solution chemistry. Cyanidation leach slurries were sparged with oxygen. Activated carbon was added after 24 hours of leaching.
| | December 2024 |
| | TECHNICAL REPORT –
MUSSELWHITE MINE, ONTARIO, CANADA
Document # C8630-0000-PM-RPT-001 – Rev. 0
/ Page 180 |
Table 13.22 – Variability Leach Test Conditions, FO2325
| Test Condition | Units | Target |
| P80 | µm | 75 |
| Solids Density | Solid w/w% | 54 |
| pH | pH | 10.6 - 10.9 |
| Cyanide | mg/L | 400 |
| Lead Nitrate | g/t | 270 |
| Dissolved Oxygen | ppm | 20 - 24 |
Gold recovery averaged 91.8% and ranged between 84.6 and 95.2%. On average, 80% of the gold was recovered in 6 hours, with final recoveries achieved at 32 hours, as illustrated in Figure 13.12.
Figure 13.12 – Cyanidation Leach Kinetics, FO2325
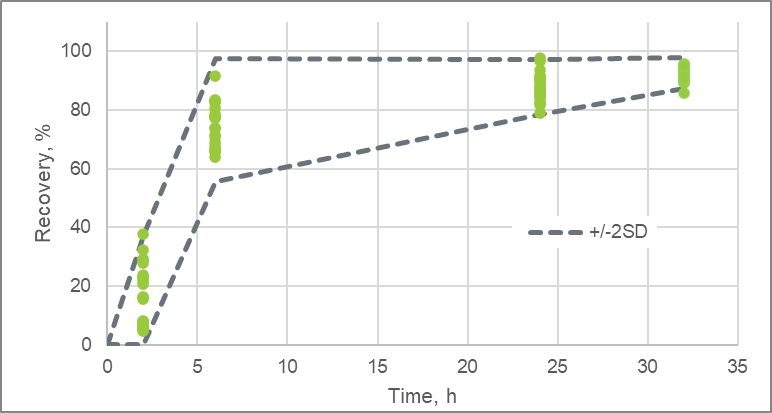
Source: Newmont, 2022
Overall gold recovery, combining gravity and leach recoveries, averaged 95.8% and ranged between 90.7 and 98.3%. Sulfide sulfur content had a moderately negative impact on gold recovery as illustrated in Figure 13.13.
| | December 2024 |
| | TECHNICAL REPORT –
MUSSELWHITE MINE, ONTARIO, CANADA
Document # C8630-0000-PM-RPT-001 – Rev. 0
/ Page 181 |
Figure 13.13 – Cyanidation Leach Recovery vs. Sulfide Sulfur Head Grade, FO2325
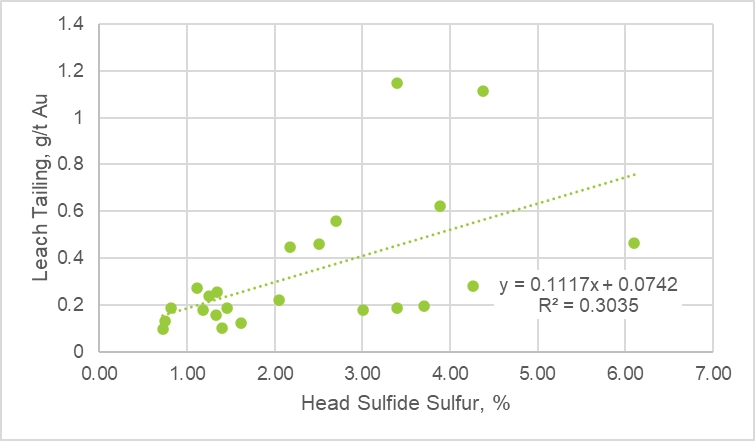
Source: Newmont, 2022
Hydrated lime consumption averaged 0.58 kg/t and ranged between 0.46 and 0.75 kg/t. Cyanide consumption averaged 0.57 kg/t and ranged between 0.49 and 0.75 kg/t. Increasing sulfide sulfur content did not affect hydrated lime consumption and slightly increased cyanide consumption, as shown in Figure 13.14.
Figure 13.14 – Lime and Cyanide Consumption vs. Sulfide Sulfur Head Grade, FO2325
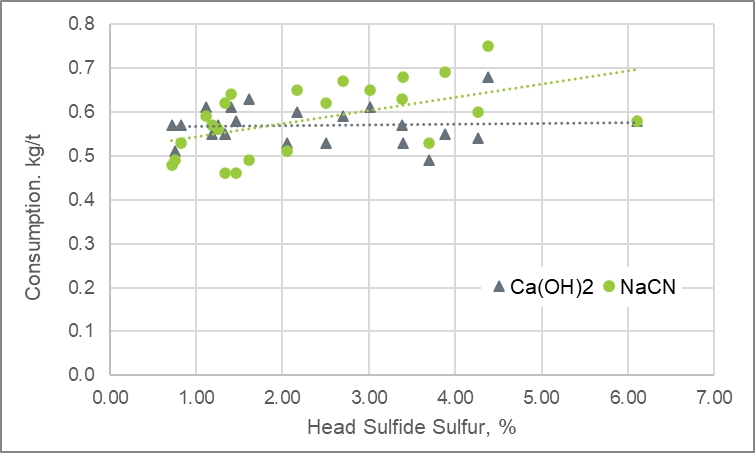
Source: Newmont, 2022
| | December 2024 |
| | TECHNICAL REPORT –
MUSSELWHITE MINE, ONTARIO, CANADA
Document # C8630-0000-PM-RPT-001 – Rev. 0
/ Page 182 |
Fifteen (15) gravity separation and leach tests were completed on each of the master composite samples to assess the effects of particle size and cyanide concentration on gold extraction. Leach test conditions are summarized in Table 13.22, with particle size and cyanide concentration varied according to Table 13.23. Solution samples were taken at 2, 6, 24 and 32-hour intervals to evaluate leach kinetics and maintain solution chemistry.
Table 13.23 – Master Composite Leach Test Conditions, FO2325
| Test Condition | Units | Target |
| P₈₀ | µm | 53, 75, and 106 |
| Solids Density | Solid w/w% | 54 |
| pH | pH | 10.6 - 10.9 |
| Cyanide | mg/L | 320, 360, 400, 440, and 480 |
| Lead Nitrate | g/t | 270 |
| Dissolved Oxygen | ppm | 20 - 24 |
Gold recovery from each master composite sample was in reasonably good agreement with the variability sample recoveries making up each composite sample, at baseline conditions, as shown in Table 13.24.
Table 13.24 – Master Composite Baseline Leach Test Recoveries, FO2325
| Estimate | Units | MC-1 | MC-2 | MC-3 |
| Master Composition Test Result | % | 95.1 | 96.2 | 95.5 |
| Aggregate Variability Test Result | % | 95.7 | 96.9 | 95.0 |
Decreasing particle size significantly improved gravity, leach and overall gold recovery from each of the Future Ores 2023-2025 master composite samples, as illustrated in Figure 13.15. Recovery variations at each particle size reflect the different head grades of each master composite.
| | December 2024 |
| | TECHNICAL REPORT –
MUSSELWHITE MINE, ONTARIO, CANADA
Document # C8630-0000-PM-RPT-001 – Rev. 0
/ Page 183 |
Figure 13.15 – Particle Size Effects on Recovery, FO2325
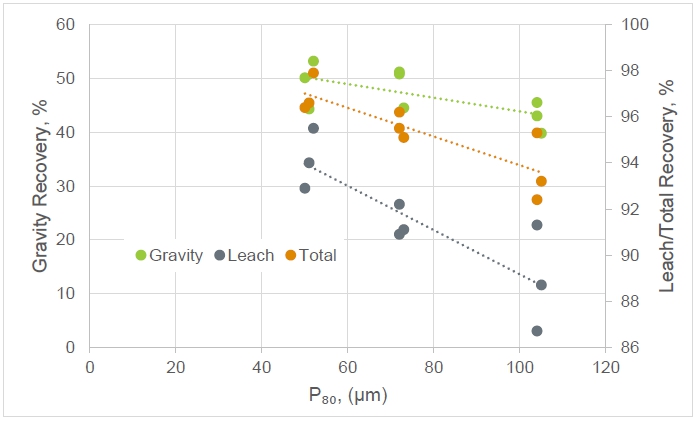
Source: Newmont, 2022
Increasing cyanide concentration had little effect on gold recovery via leaching, particularly above the current target of 400 ppm CN, as illustrated in Figure 13.16
Figure 13.16 – Cyanide Concentration Effects on Recovery, FO2325
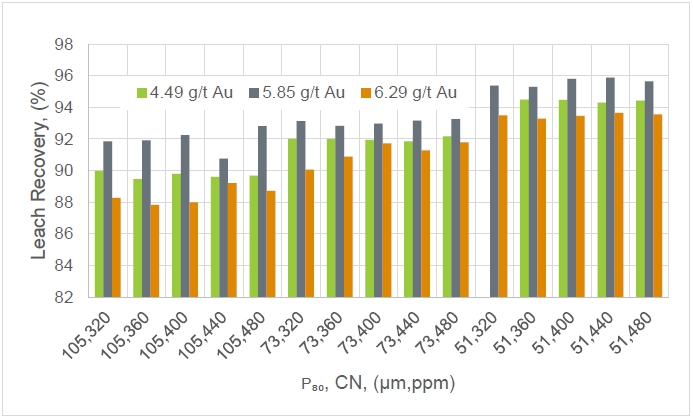
Source: Newmont, 2022
| | December 2024 |
| | TECHNICAL REPORT –
MUSSELWHITE MINE, ONTARIO, CANADA
Document # C8630-0000-PM-RPT-001 – Rev. 0
/ Page 184 |
| 13.2.5 | PQ Deeps Extension 1 Stage 2B/3 (2022) |
The PQD zone represents about 60% of the mill feed from 2023 through 2028. Variability samples were selected to represent ore to be processed during this period. A minimum of twenty-five (25) variability and comminution samples was recommended based on Newmont’s Geometallurgical Bingo Chart Guideline. A total of 27 variability samples, 23 from this program and 4 from the 2021 future ores program, and 14 comminution samples, 13 from this program and 1 from the 2021 future ores program were selected across this deposit. Based on the estimate of 2.7 Mt of potential ore in this zone, at that time, the sample density is 100,000 tonne per variability sample and 193,000 tonnes per comminution sample. Twenty-three (23) variability samples from the PQ Deeps Extension 1 zone (PQD Ext1) were tested by Base Metallurgical Laboratory (BML) and NMS in 2022 to characterize this future ore and its metallurgical response to the mineral processing flowsheet at Musselwhite. Three (3) master composites were produced from the variability samples, with different gold head grade targets, and tested to examine the effects of head grade, particle size and cyanidation leach conditions and for tailings characterization.
| 13.2.5.1 | Sample Characterization |
Chemical analysis was completed on each variability sample and is summarized in Table 13.25.
Gold grades of the variability samples were determined using both fire assay and the screen fire assay methods. By fire assay, the head grade averaged 7.95 g/t and ranged between 1.33 and 27.56 g/t. These results agreed well with the more complex screen fire assay method, which averaged 7.38 g/t and ranged between 0.82 and 29.39 g/t. Sulfide sulfur averaged 1.47% and ranged between 0.76 and 3.11 wt.%. The presence of other elements that may be harmful to human health, such as arsenic and mercury, and deleterious to cyanidation leaching, such as copper, was low to below detection limits.
Table 13.25 – Summary of Variability Sample Chemical Analysis, PQD Ext1
| Element | Units | Average | Minimum | Maximum |
| AuFAA1 | g/t | 7.95 | 1.33 | 27.56 |
| AuFAA2 | g/t | 7.38 | 0.82 | 29.39 |
| C | % | 0.20 | 0.04 | 0.63 |
| CAI | % | 0.08 | 0.01 | 0.23 |
| Fe | % | 16.8 | 13.7 | 20.2 |
| S | % | 1.55 | 0.77 | 3.23 |
| S²⁻ | % | 1.47 | 0.76 | 3.11 |
| Ag | ppm | <3 | <3 | <3 |
| Al | ppm | 31225 | 19871 | 40628 |
| As | ppm | 7 | <2 | 71 |
| | December 2024 |
| | TECHNICAL REPORT –
MUSSELWHITE MINE, ONTARIO, CANADA
Document # C8630-0000-PM-RPT-001 – Rev. 0
/ Page 185 |
| Element | Units | Average | Minimum | Maximum |
| Ba | ppm | 140 | 86 | 177 |
| Be | ppm | <2 | <2 | <2 |
| Ca | ppm | 14923 | 5895 | 23348 |
| Cd | ppm | <30 | <30 | <30 |
| Co | ppm | 21 | 11 | 39 |
| Cr | ppm | 109 | 62 | 203 |
| Cu | ppm | 100 | 73 | 156 |
| K | ppm | 7051 | 3137 | 11690 |
| Mg | ppm | 11944 | 8141 | 15044 |
| Mn | ppm | 4146 | 3010 | 5174 |
| Mo | ppm | <2 | <2 | <2 |
| Na | ppm | 2982 | 709 | 5707 |
| Ni | ppm | 63 | 44 | 98 |
| Pb | ppm | <10 | <10 | <10 |
| Sb | ppm | <25 | <25 | <25 |
| Se | ppm | <10 | <10 | <10 |
| Sr | ppm | 55 | 27 | 78 |
| Ti | ppm | 2308 | 1404 | 3899 |
| V | ppm | 119 | 41 | 250 |
Note: FAA1 = Au by Fire Assay with AA finish FAA2 = Au by Screen Fire Assay with AA finish CAI = Organic carbon |
Semi-quantitative mineralogical analysis was completed by XRD on each variability sample and is summarized in Table 13.26. Amphibole, quartz, garnet, biotite, and plagioclase were the mineral phases detected with minor to trace amounts of chlorite, illite/sericite, magnetite and pyrrhotite identified.
| | December 2024 |
| | TECHNICAL REPORT –
MUSSELWHITE MINE, ONTARIO, CANADA
Document # C8630-0000-PM-RPT-001 – Rev. 0
/ Page 186 |
Table 13.26 – Summary of Variability Sample Mineralogy, PQD Ext 1
| Statistic | Qz
(%) | Amp
(%) | Pl
(%) | Po
(%) | Bt
(%) | Grt
(%) |
| Median | 26 | 27 | 3 | 2 | 24 | 13 |
| Minimum | 18 | 14 | 1.6 | 0.7 | 11 | 6 |
| Maximum | 33 | 37 | 11 | 5 | 39 | 24 |
Note: Qz- Quartz Amp - Amphibole Mag – Magnetite Cal – Calcite Pl- Plagioclase Po- Pyrrohtite Bt – Biotite Grt - Garnet |
Head chemical analysis completed on each master composite sample is summarized in Table 13.27. Gold grades of these master composite samples were determined by fire assay and ranged between 4.96 and 11.05 g/t.
Table 13.27 –Master Composite Sample Chemical Analysis, PQD Ext 1
Master
Composite | Au
(g/t) | C
(%) | S
(%) | CAl
(%) | Fe
(%) | S²⁻
(%) |
| MC-1 | 11.05 | 0.13 | 1.87 | 0.03 | 20.6 | 1.79 |
| MC-2 | 5.368 | 0.15 | 1.73 | 0.06 | 21.2 | 1.72 |
| MC-3 | 4.956 | 0.35 | 0.88 | 0.13 | 22.4 | 0.89 |
Note: CAI = Organic carbon |
Semi-quantitative mineralogical analysis completed by XRD on each master composite sample is summarized in Table 13.28. Amphibole, quartz, garnet, biotite, and plagioclase were the main mineral phases detected with minor to trace amounts of chlorite, illite/sericite, magnetite and pyrrhotite identified.
Table 13.28 –Master Composite Sample Mineralogy, PQD Ext 1
Master
Composite | Qz
(%) | Amp
(%) | Pl
(%) | Po
(%) | Bt
(%) | Grt
(%) |
| MC-1 | 22 | 31 | | 2 | 25 | 15 |
| MC-2 | 16 | 36 | 3 | 1.4 | 31 | 9 |
| MC-3 | 18 | 37 | 5 | 1 | 29 | 9 |
Note: Qz- Quartz Amp - Amphibole Mag – Magnetite Cal – Calcite Pl- Plagioclase Po- Pyrrohtite Bt – Biotite Grt - Garnet |
| | December 2024 |
| | TECHNICAL REPORT –
MUSSELWHITE MINE, ONTARIO, CANADA
Document # C8630-0000-PM-RPT-001 – Rev. 0
/ Page 187 |
Bond Abrasion Index (Ai), Bond Rod Mill Work Index (RWi), Bond Ball Mill Work Index (BWi) tests and Hardness Index (HIT) tests were completed on thirteen of the variability samples. A Hardness Index Test (HIT) was completed on each sample by NMS to develop a predictor of traditional comminution test parameters for samples in the future, and for this reason is not discussed further here. Comminution test results are summarized in Table 13.29 and discussed below.
Abrasion Index is a measure of an ore’s ability to wear away steel to which it comes into contact during handling and processing, such as grinding mill liners and media. Ai average 0.2691 g and ranged between 0.1574 and 0.3236 g, indicating a slightly abrasive ore.
Bond Rod and Ball Mill Work Index are both measures of power requirements to grind ore to a specific particle size. Bond Rod Mill Work Index averaged 12.1 kWh/t and ranged between 9.0 and 14.5 kWh/t with a closing size of 1,180 µm. Bond Ball Mill Work Index averaged 12.7 kWh/t and ranged between 11.4 and 14.1 kWh/t to a closing size of 150 µm. These results indicated moderate ore hardness.
Table 13.29 –Master Comminution Test Results Summary, PQD Ext 1
| Statistic | Ai
(g) | RWi
(kWh/t) | BWi
(kWh/t) |
| Average | 0.2691 | 12.1 | 12.7 |
| Minimum | 0.1574 | 9.0 | 11.4 |
| Maximum | 0.3236 | 14.5 | 14.1 |
| 13.2.5.3 | Gravity Concentration |
A single-stage Gravity Recoverable Gold (GRG) test was completed on each master composite to estimate the content of gravity recoverable gold. A 25 kg sample of each master composite was dry ground to a P₈₀ of 75 µm. GRG test results are summarized in Table 13.30.
GRG content was high and estimated at 59.2%, 56.4% and 49.4% for Master Composites 1, 2, and 3, respectively. Gravity concentrate grades ranged between 481 and 1,524 g/t Au. Over 70% of the unrecovered gold, reporting to the gravity tailings, was below 75 µm in size.
| | December 2024 |
| | TECHNICAL REPORT –
MUSSELWHITE MINE, ONTARIO, CANADA
Document # C8630-0000-PM-RPT-001 – Rev. 0
/ Page 188 |
Table 13.30 –Master Comminution GRG Concentrates Summary, PQD Ext 1
Size Fraction
(µm) | MC-1
Au (g/t) | MC-1
Dist. (%) | MC-2
Au (g/t) | MC-2
Dist. (%) | MC-3
Au (g/t) | MC-3
Dist. (%) |
| 600 | 6.26 | 0.077 | 120 | 3.109 | 2.33 | 0.071 |
| 425 | 208 | 0.326 | 386 | 1.537 | 8.07 | 0.035 |
| 300 | 2,538 | 2.825 | 668 | 2.114 | 4.34 | 0.015 |
| 212 | 1,905 | 1.497 | 1,309 | 2.312 | 871 | 1.883 |
| 150 | 1,720 | 2.703 | 1,330 | 5.764 | 631 | 2.318 |
| 106 | 691 | 5.478 | 1,547 | 25.54 | 153 | 3.573 |
| 75 | 491 | 7.943 | 1,100 | 32.47 | 224 | 11.48 |
| 53 | 659 | 8.377 | 147 | 3.064 | 305 | 13.52 |
| 38 | 1,519 | 10.35 | 263 | 2.435 | 808 | 20.98 |
| 25 | 3,156 | 8.265 | 2,398 | 8.426 | 1,669 | 18.05 |
| 20 | 12,916 | 12.67 | 7,982 | 9.349 | 2,394 | 9.836 |
| -20 | 40,190 | 39.48 | 11,037 | 3.878 | 4,439 | 18.24 |
| Total | 1,524 | 100.0 | 827 | 100.0 | 481 | 100.0 |
A gravity separation was completed on 1 kg of each variability composite and master composite sample ground to the target P₈₀, prior to cyanidation test work, using a laboratory Knelson concentrator followed by hand panning of the gravity concentrate. Each concentrate was dried, weighed, screened and assayed for gold by size fraction. Knelson concentrator and hand panning tailings were blended and split, with one half for cyanidation testing and the other half for assay. Gravity gold recovery averaged 27% and ranged between 13 and 41% from the variability composite samples.
Twenty-three (23) kinetic leach tests were completed on the gravity tailings of each variability sample. Leach test conditions were selected to represent existing processing conditions and are summarized in Table 13.31. Solution samples were taken at 2, 6, 24 and 32-hour intervals to evaluate leaching kinetics and maintain solution chemistry. Cyanidation leach slurries were sparged with oxygen to achieve dissolved oxygen levels.
| | December 2024 |
| | TECHNICAL REPORT –
MUSSELWHITE MINE, ONTARIO, CANADA
Document # C8630-0000-PM-RPT-001 – Rev. 0
/ Page 189 |
Table 13.31 –Variability Leach Test Conditions, PQD Ext 1
| Test Condition | Units | Target |
| P₈₀ | µm | 74 |
| Slurry Density | Solid w/w% | 54 |
| pH | pH | 10.6 - 10.9 |
| Cyanide | mg/L | 400 |
| Lead Nitrate | g/t | 270 |
| Dissolved Oxygen | ppm | 20 - 24 |
Gold recovery averaged 90.4% and ranged between 69.3 and 96.5%. Gold recovery kinetics were highly variable, as illustrated in Figure 13.17. On average, gold recovery kinetics were rapid with more than 80% of the gold recovered in the first 6 hours and final recoveries in less than 24 hours.
Figure 13.17 –Cyanidation Leach Kinetics, PQD Ext 1
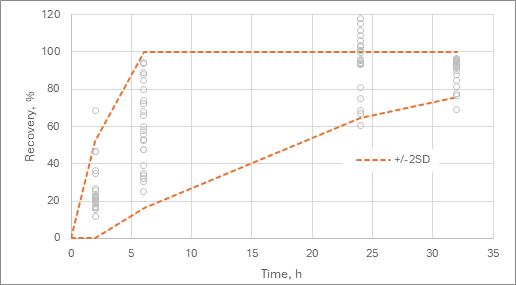
Source: Newmont, 2022
Overall gold recovery, combining gravity and leach recoveries, averaged 93.0% and ranged between 77.2 and 97.8%. Leach feed grade did not explain variations in gold recovery. Sulfide sulfur content had significant negative impacts on gold recovery as illustrated in Figure 13.18.
| | December 2024 |
| | TECHNICAL REPORT –
MUSSELWHITE MINE, ONTARIO, CANADA
Document # C8630-0000-PM-RPT-001 – Rev. 0
/ Page 190 |
Figure 13.18 –Cyanidation Leach Recovery vs. Sulfide Sulfur Head Grade, PQD Ext 1

Source: Newmont, 2022
Hydrated lime consumption averaged 0.69 kg/t and ranged between 0.52 and 0.97 kg/t. Cyanide consumption averaged 0.30 kg/t and ranged between 0.11 and 0.42 kg/t. Increasing sulfide content slightly increased hydrated lime consumption and had not affect on cyanide consumption, as shown in Figure 13.19.
Figure 13.19 –Lime and Cyanide Consumption vs. Sulfide Sulfur Head Grade, PQD Ext 1
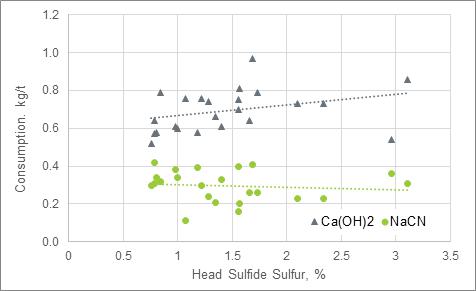
Source: Newmont, 2022
Nine (9) gravity separation and leach tests were completed on each of the master composite samples to assess the effects of particle size and leaching conditions on gold extraction. Leach test
| | December 2024 |
| | TECHNICAL REPORT –
MUSSELWHITE MINE, ONTARIO, CANADA
Document # C8630-0000-PM-RPT-001 – Rev. 0
/ Page 191 |
conditions are summarized in Table 13.31, with particle size, lead nitrate addition, dissolved oxygen concentration, and cyanide concentration varied according to Table 13.32. Solution samples were taken at 2, 6, 24 and 32-hour intervals to evaluate leach kinetics and maintain solution chemistry.
Table 13.32 – Master Composite Leach Test Conditions, PQD Ext 1
| Test Condition | Units | Target |
| P₈₀ | µm | 74 |
| Slurry Density | Solid w/w% | 54 |
| pH | pH | 10.6 - 10.9 |
| Cyanide | mg/L | 400 |
| Lead Nitrate | g/t | 270 |
| Dissolved Oxygen | ppm | 20 - 24 |
Gold recovery from two of the three master composite samples was significantly lower than the variability sample recoveries making up each composite sample, at baseline conditions, as shown in Table 13.33. This could not be explained from the test data, and for this reason, master composition test work results were not further considered.
Table 13.33 – Master Composite Baseline Leach Test Recoveries, PQD Ext 1
| Estimate | Units | MC-1 | MC-2 | MC-3 |
| Master Composition Test Result | % | 90.5 | 86.0 | 91.8 |
| Aggregate Variability Test Result | % | 89.7 | 92.2 | 95.4 |
| 13.2.6 | Future Ores 2026-2028 (2023) |
Twenty-one (21) variability samples were tested by NMS in 2023 to characterize future ores to be processed from 2026 through 2028 and their metallurgical response of ores to the mineral processing flowsheet at Musselwhite. Three (3) master composites were produced from the variability samples to examine the effects of particle size and cyanide concentrations on gold recovery, by production phase.
Ore samples were selected from the PQ Deeps (PQE), West Limb (WEL), and Lynx (LNX) zones to represent ore to be processed during the period of 2026 through 2028.
| | December 2024 |
| | TECHNICAL REPORT –
MUSSELWHITE MINE, ONTARIO, CANADA
Document # C8630-0000-PM-RPT-001 – Rev. 0
/ Page 192 |
| 13.2.6.1 | Sample Characterization |
Chemical analysis was completed on each variability sample and is summarized in Table 13.34. Gold grades of the variability samples were determined by fire assay, averaging 8.02 g/t and ranging between 2.72 and 21.77 g/t. Sulfide sulfur averaged 1.43% and ranged between 0.76 and 3.11 wt.%. The presence of other elements that may be harmful to human health, such as arsenic and mercury, and deleterious to cyanidation leaching, such as copper, was low to below detection limits.
Table 13.34 – Summary Variability Sample Chemical Analysis, FO2628
| Element | Units | Average | Minimum | Maximum |
| AuFA | g/t | 8.02 | 2.72 | 21.77 |
| C | % | 0.13 | 0.01 | 0.95 |
| CAI | % | 0.01 | 0.01 | 0.04 |
| Fe | % | 19.2 | 9.03 | 22.6 |
| S | % | 1.75 | 0.71 | 3.69 |
| S²⁻ | % | 1.60 | 0.63 | 3.44 |
| Ag | ppm | <3 | <3 | <3 |
| Al | ppm | 32138 | 24952 | 47095 |
| As | ppm | 36 | <2 | 503 |
| Ba | ppm | 122 | 34 | 184 |
| Be | ppm | 0 | <2 | 0 |
| Ca | ppm | 18340 | 11656 | 44699 |
| Cd | ppm | <30 | <30 | <30 |
| Co | ppm | 25 | 14 | 53 |
| Cr | ppm | 239 | 170 | 422 |
| Cu | ppm | 93 | 50 | 202 |
| K | ppm | 5671 | 1546 | 12493 |
| Mg | ppm | 13602 | 5378 | 28980 |
| Mn | ppm | 4018 | 2141 | 8672 |
| Mo | ppm | <2 | <2 | <2 |
| Na | ppm | 3235 | 1045 | 11270 |
| Ni | ppm | 64 | 37 | 163 |
| Pb | ppm | <10 | <10 | <10 |
| Sb | ppm | <25 | <25 | <25 |
| Se | ppm | <10 | <10 | <10 |
| Sr | ppm | 57 | 37 | 98 |
| | December 2024 |
| | TECHNICAL REPORT –
MUSSELWHITE MINE, ONTARIO, CANADA
Document # C8630-0000-PM-RPT-001 – Rev. 0
/ Page 193 |
| Element | Units | Average | Minimum | Maximum |
| Ti | ppm | 2524 | 1563 | 4645 |
| Tl | ppm | | | |
| V | ppm | 107 | 59 | 226 |
| Yb | ppm | | | |
| Zn | ppm | 158 | 123 | 195 |
Note: FAA = Au by Fire Assay with AA finish CAI = Organic carbon |
Semi-quantitative mineralogical analysis was completed by XRD on each variability sample and is summarized in Table 13.35. Amphibole, quartz, garnet and biotite were the main minerals phases observed with minor to trace amounts of plagioclase, illite/sericite, chlorite, calcite, dolomite, magnetite and pyrhotite identified.
Table 13.35 – Summary of Variability Sample Mineralogy, FO2628
| Statistic | Qz
(%) | Amp
(%) | Pl
(%) | Po
(%) | Bt
(%) | Grt
(%) |
| Median | 33 | 25 | 3.5 | 3 | 10 | 18.5 |
| Minimum | 19 | 14 | 0.9 | 1.1 | 4 | 10 |
| Maximum | 40 | 39 | 5 | 5 | 21 | 30 |
Note: Qz- Quartz Amp - Amphibole Mag – Magnetite Cal – Calcite Pl- Plagioclase Po- Pyrrohtite Bt – Biotite Grt - Garnet |
Head chemical analysis completed on each master composite sample is summarized in Table 13.36. Gold grades of these samples were determined by fire assay, and ranged between 5.21 and 7.55 g/t.
Table 13.36 –Master Composite Sample Chemical Analysis, FO2628
Master
Composite | Au
(g/t) | C
(%) | S
(%) | CAl
(%) | Fe
(%) | S²⁻
(%) |
| MC-1 | 5.413 | 0.31 | 1.6 | 0.12 | 17.8 | 1.53 |
| MC-2 | 7.547 | 0.19 | 1.81 | 0.12 | 22.5 | 1.69 |
| MC-3 | 5.211 | 0.17 | 1.28 | 0.07 | 22.0 | 1.20 |
Note: CAI = Organic carbon |
Semi-quantitative mineralogical analysis completed by XRD on each master composite sample is summarized in Table 13.37. Amphibole, quartz, garnet, and biotite were the main mineral phases detected with minor to trace amounts of plagioclase, chlorite, illite/sericite, calcite and pyrrhotite identified.
| | December 2024 |
| | TECHNICAL REPORT –
MUSSELWHITE MINE, ONTARIO, CANADA
Document # C8630-0000-PM-RPT-001 – Rev. 0
/ Page 194 |
Table 13.37 – Master Composite Sample Mineralogy, FO2628
Master
Composite | Qz
(%) | Amp
(%) | Pl
(%) | Po
(%) | Bt
(%) | Grt
(%) |
| MC-1 | 26 | 31 | 6 | 3 | 11 | 13 |
| MC-2 | 25 | 36 | | 3 | 11 | 17 |
| MC-3 | 26 | 34 | 5 | 4 | 9 | 16 |
Note: Qz- Quartz Amp - Amphibole Mag – Magnetite Cal – Calcite Pl- Plagioclase Po- Pyrrohtite Bt – Biotite Grt - Garnet |
SAG comminution (SMC) tests were completed on 17 of the variability samples by JKTech. Bond Abrasion Index (Ai), Bond Rod Mill Work Index (RWi), Bond Ball Mill Work Index (BWi) were completed on all 21 variability samples by NMS. A Harness Index Test (HIT) was completed on each sample by NMS to develop a predictor of traditional comminution test parameters for samples in the future, and for this reason is not discussed further here. Comminution test results are summarized in Table 13.38 and discussed below.
The value of Axb is a measure of an ore’s hardness to impact breakage, that decreases with increasing hardness. These samples are average, or moderate, ore hardness when compared to the SMC test database.
Abrasion Index is a measure of an ore’s ability to wear away steel to which it comes into contact during handling and processing, such as grinding mill liners and media. Ai average 0.2793 g and ranged between 0.1690 and 0.3860 g, indicating a slightly abrasive ore.
Bond Rod and Ball Mill Work Index are both measures of power requirements to grind ore to a specific particle size. Bond Rod Mill Work Index averaged 11.6 kWh/t and ranged between 9.74 and 14.4 kWh/t with a closing size of 1,180 µm. Bond Ball Mill Work Index averaged 11.7 kWh/t and ranged between 10.2 and 13.7 kWh/t to a closing size of 150 µm. These results indicated moderate ore hardness.
Table 13.38 – Master Comminution Test Results Summary, FO2628
| Statistic | SG | A | B | Axb | ta | Ai
(g) | RWi
(kWh/t) | BWi
(kWh/t) |
| Average | 3.20 | 69.3 | 0.70 | 48.0 | 0.39 | 0.2793 | 11.6 | 11.7 |
| Minimum | 3.02 | 63.1 | 0.45 | 33.9 | 0.27 | 0.1690 | 9.7 | 10.2 |
| Maximum | 3.43 | 78.5 | 0.89 | 61.0 | 0.49 | 0.3860 | 14.4 | 13.7 |
| | December 2024 |
| | TECHNICAL REPORT –
MUSSELWHITE MINE, ONTARIO, CANADA
Document # C8630-0000-PM-RPT-001 – Rev. 0
/ Page 195 |
A gravity separation was completed on 1 kg of each variability composite and master composite sample ground to the target P₈₀, prior to cyanidation test work, using a laboratory Knelson concentrator followed by hand panning of the gravity concentrate. Each concentrate was dried, weighed, screened and assayed for gold by size fraction. Knelson concentrator and hand panning tails were blended and split, with one half for cyanidation leach testing and the other half for assay. Gravity gold recovery averaged 39% and ranged between 18 and 56% from the variability composite samples.
Twenty-one (21) kinetic leach tests were completed on the gravity tailings of each variability composite sample. Leach test conditions were selected to represent existing processing conditions and are summarized in Table 13.39. Solution samples were taken at 2, 6, 24 and 32-hour intervals to evaluate leach kinetics and maintain solution chemistry. Cyanidation leach slurries were sparged with oxygen. Activated carbon was added after 24 hours of leaching. Carbon was added to a concentration of 20 g/L after 24 hours.
Table 13.39 –Variability Leach Test Conditions, FO2628
| Test Parameter | Units | Target |
| P₈₀ | µm | 75 |
| Slurry Density | Solid w/w% | 54 |
| pH | pH | 10.6 - 10.9 |
| Cyanide | mg/L | 400 |
| Lead Nitrate | g/t | 270 |
| Dissolved Oxygen | ppm | 20 - 24 |
Gold recovery averaged 92.4% and ranged between 83.8 and 96.1%. Gold recovery kinetics were initially highly variable, with final recoveries achieved by 24 hours, as illustrated in Figure 13.20.
Overall gold recovery, combining gravity and leach recoveries, averaged 95.1% and ranged between 88.8 and 98.1%.
Sulfide sulfur had moderately negative impacts on gold recovery illustrated in Figure 13.21.
| | December 2024 |
| | TECHNICAL REPORT –
MUSSELWHITE MINE, ONTARIO, CANADA
Document # C8630-0000-PM-RPT-001 – Rev. 0
/ Page 196 |
Figure 13.20 – Cyanidation Leach Kinetics, FO2628
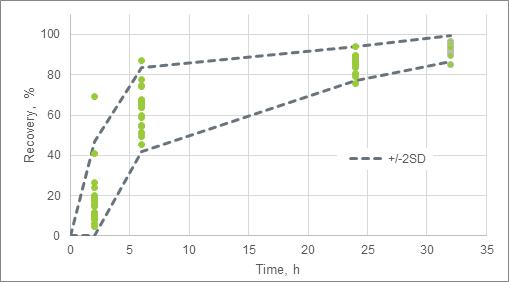
Source: Newmont, 2023
Figure 13.21 – Cyanidation Leach Recovery vs. Sulfide Sulfur Head Grade, FO2628
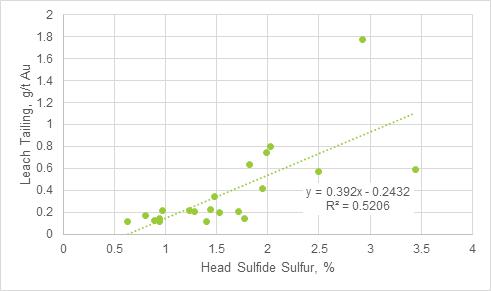
Source: Newmont, 2023
Hydrated lime consumption averaged 0.55 kg/t and ranged between 0.50 and 0.63 kg/t. Cyanide consumption averaged 0.46 kg/t and ranged between 0.25 and 0.58 kg/t. Increasing sulfide content slightly increased hydrated lime and cyanide consumption, as shown in Figure 13.22.
| | December 2024 |
| | TECHNICAL REPORT –
MUSSELWHITE MINE, ONTARIO, CANADA
Document # C8630-0000-PM-RPT-001 – Rev. 0
/ Page 197 |
Figure 13.22 – Lime and Cyanide Consumption vs. Sulfide Sulfur Head Grade, FO2628
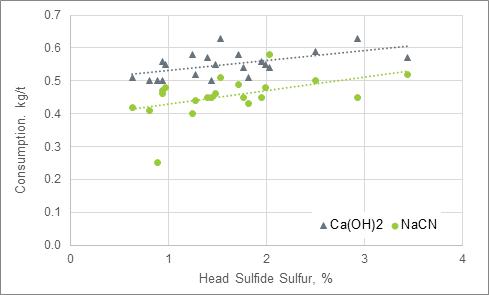
Source: Newmont, 2023
Fifteen (15) gravity separation and kinetic leach tests were completed on each of the three (3) master composite samples to assess the effects of particle size and cyanide concentration on gold extraction. Leach test conditions are summarized in Table 13.39 with particle size and cyanide concentration varied according to Table 13.40. Solution samples were taken at 2, 6, 24 and 32-hour intervals to evaluate leaching kinetics and maintain solution chemistry.
Table 13.40 – Master Composite Leach Test Conditions, FO2628
| Test Condition | Units | Target |
| P₈₀ | µm | 53, 75, and 106 |
| Slurry Density | Solid w/w% | 54 |
| pH | pH | 10.6 - 10.9 |
| Cyanide | mg/L | 320, 360, 400, 440, and 480 |
| Lead Nitrate | g/t | 270 |
| Dissolved Oxygen | ppm | 20 - 24 |
Gold recovery from the three (3) master composite samples was consistent with the variability sample recoveries making up each composite sample, at baseline conditions, as shown in Table 13.41.
| | December 2024 |
| | TECHNICAL REPORT –
MUSSELWHITE MINE, ONTARIO, CANADA
Document # C8630-0000-PM-RPT-001 – Rev. 0
/ Page 198 |
Table 13.41 – Master Composite Baseline Leach Test Recoveries, FO2628
| Estimate | Units | MC-1 | MC-2 | MC-3 |
| Master Composition Test Result | % | 95.9 | 95.3 | 96.4 |
| Aggregate Variability Test Result | % | 94.6 | 94.9 | 96.2 |
Decreasing particle size negatively affects gravity recovery, positively affects leach recovery, resulting in a slight increase in overall gold recovery from each of the master composite samples, as illustrated in Figure 13.23. Recovery variations at each particle size reflect the different head grades of each master composite.
Figure 13.23 – Particle Size Effects on Recovery, FO2628
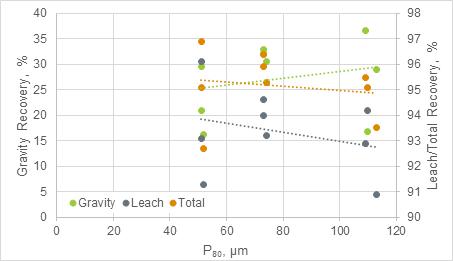
Source: Newmont, 2023
Increasing cyanide concentration had little effect on gold leach recovery at the current grind size of 75 µm and above the current cyanide target of 400 ppm, as illustrated in Figure 13.24. Cyanide concentration had a significant effect on gold recovery a finer grind size, indicating potentially higher gold recovery for these ores at a finer grind product size of 53 µm and higher cyanide concentration of 480 ppm.
| | December 2024 |
| | TECHNICAL REPORT –
MUSSELWHITE MINE, ONTARIO, CANADA
Document # C8630-0000-PM-RPT-001 – Rev. 0
/ Page 199 |
Figure 13.24 – Cyanide Concentration Effects on Recovery, FO2628
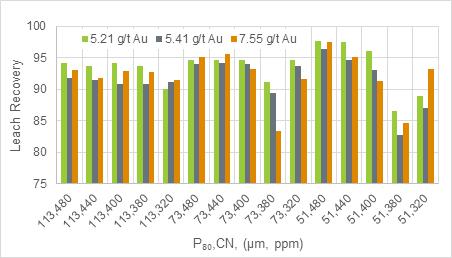
Source: Newmont, 2023
| 13.2.7 | Discussion of Test Program Results |
Assuming equal representation for each variability sample tested, gold grades averaged 9.0 g/t and ranged between 0.7 to 74.7 g/t, as shown in Figure 13.25. Sulfide sulfur grades averaged 2.5% and ranged between 0.3 and 21.1 %, as shown in Figure 13.26. Redwings ore had the highest degree of gold and sulfide sulfur head variability.
Figure 13.25 –Gold Grade Variability by Future Ore Zone
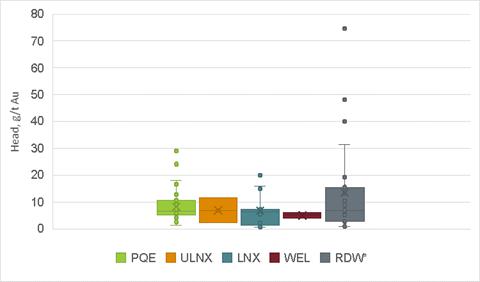
Source: DRA, 2024
| | December 2024 |
| | TECHNICAL REPORT –
MUSSELWHITE MINE, ONTARIO, CANADA
Document # C8630-0000-PM-RPT-001 – Rev. 0
/ Page 200 |
Figure 13.26 – Sulfide Grade Variability by Future Ore Zone
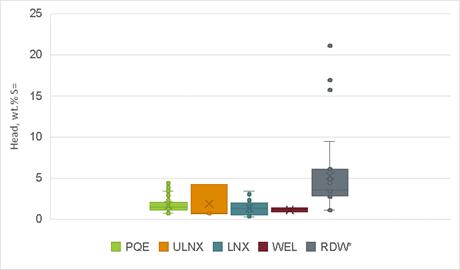
Source: DRA, 2024
Gold recovery by gravity concentration and cyanide leaching from these samples was high, with a few exceptions. Overall gold recovery averaged 94.6% from the variability samples tested, ranging between 77.2 and 98.8%. A comparison of overall gold recovery variability by production zone is shown in Figure 13.27. Note that RDW test work shown in this figure was completed at a particle size of 110 µm (P₈₀), compared to the remaining test work completed at 74 µm. This is expected to cause the RDW recovery shown to be 1 to 2% lower than would be achieved at particle size comparable to the other zones shown, according to the RDW master composite test data. PQD Extension 1 ore had the highest degree of gold recovery variability.
Figure 13.27 – Gold Recovery Variability by Future Ore Zone
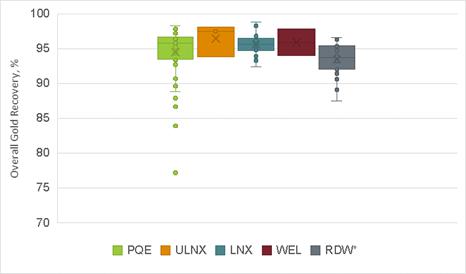
Source: DRA, 2024
| | December 2024 |
| | TECHNICAL REPORT –
MUSSELWHITE MINE, ONTARIO, CANADA
Document # C8630-0000-PM-RPT-001 – Rev. 0
/ Page 201 |
Gold recovery is negatively affected by increasing sulfide content, as shown in Figure 13.28, but sulfide sulfur content alone did not explain gold recovery variations. Several PQD Ext1 samples were identified as outliers, ranging between 69.3 and 87.8% gold recovery, despite sulfide content ranging between only 1.4 and 3.4%. This suggests other mineralogical factors, which should be investigated through gold deportment study gold recovery outlier samples.
Figure 13.28 – Gold Recovery Variability by Sulfide Grade
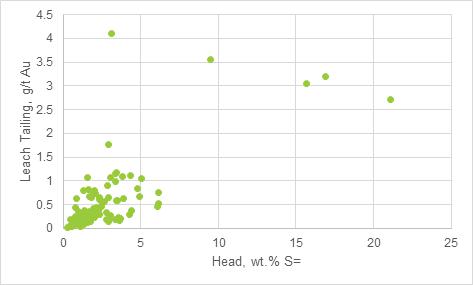
Source: DRA, 2024
Lime consumption averaged 0.69 kg/t from the variability samples tested, ranging between 0.49 and 1.57 kg/t, depending upon ore zone. A comparison of lime consumption by production zone is shown in Figure 13.29.
Cyanide consumption averaged 0.47 kg/t from the variability samples tested, ranging between 0.11 and 1.26 kg/t, and was reasonably consistent between ore zones. A comparison of cyanide consumption by production zone is shown in Figure 13.30.
| | December 2024 |
| | TECHNICAL REPORT –
MUSSELWHITE MINE, ONTARIO, CANADA
Document # C8630-0000-PM-RPT-001 – Rev. 0
/ Page 202 |
Figure 13.29 – Lime Consumption Variability by Future Ore Zone
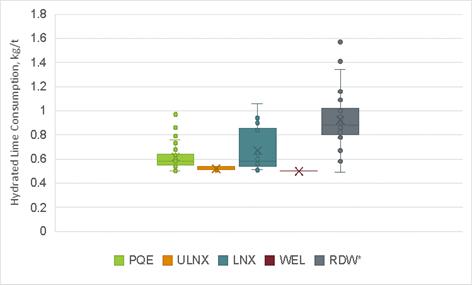
Source: DRA, 2024
Figure 13.30 – Cyanide Consumption Variability by Future Ore Zone

Source: DRA, 2024
Gold recovery is forecasted using a model that is updated annually, based on daily historical plant performance over the previous fifty-five (55) months (Newmont, 2023). The model, provided by site, and used in calculating LoM reserves and production is the following:

| | December 2024 |
| | TECHNICAL REPORT –
MUSSELWHITE MINE, ONTARIO, CANADA
Document # C8630-0000-PM-RPT-001 – Rev. 0
/ Page 203 |
Model performance against reconciled monthly gold recovery for the period of January 2021 through December 2023 at the Musselwhite mill is shown in Figure 13.31. PQ Deeps, Red Wings and Upper Lynx represented approximately 55%, 17%, and 8% of the mill feed, respectively over the period of 2021 through 2023. This model reasonably predicts average historical gold recovery, particularly around the average LoM head grade of 6.23 g/t Au.
Figure 13.31 – 2023 Gold Recovery Model vs. Monthly Mill Recovery, January 2021 through
December 2023
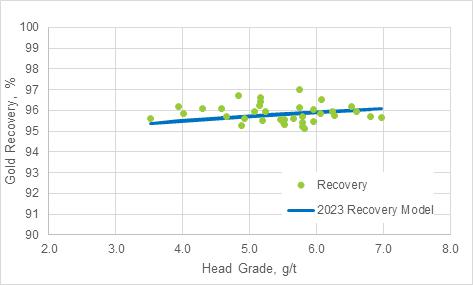
Source: DRA, 2024
Model performance against variability sample gold recoveries from the metallurgical test program is shown in Figure 13.32, up to 20 g/t Au. This model also reasonably predicts average gold recovery of the variability test samples, particularly around the average LoM head grade of 6.23 g/t Au. However, there is significant variability in gold recovery that is not predicted by the model and the potential for lower recovery from some of the areas to be mined is evident.
| | December 2024 |
| | TECHNICAL REPORT –
MUSSELWHITE MINE, ONTARIO, CANADA
Document # C8630-0000-PM-RPT-001 – Rev. 0
/ Page 204 |
Figure 13.32 – 2023 Recovery Model vs Variability Samples Recovery, below 20 g/t Au

Source: DRA, 2024
| | December 2024 |
| | TECHNICAL REPORT –
MUSSELWHITE MINE, ONTARIO, CANADA
Document # C8630-0000-PM-RPT-001 – Rev. 0
/ Page 205 |
| 14 | Mineral Resource Estimate |
| 14.1 | Mineral Resource Estimate Definition and Procedure |
The current mineral resource estimate for the Musselwhite Mine has been prepared following the CIM standards and definitions, as required under NI 43-101 regulations. The standards and definitions are as follows:
“Mineral Resources are sub-divided, in order of increasing geological confidence, into Inferred, Indicated and Measured categories. An Inferred Mineral Resource has a lower level of confidence than that applied to an Indicated Mineral Resource. An Indicated Mineral Resource has a higher level of confidence than an Inferred Mineral Resource but has a lower level of confidence than a Measured Mineral Resource.”
“A Mineral Resource is a concentration or occurrence of solid material of economic interest in or on the Earth’s crust in such form, grade or quality and quantity that there are reasonable prospects for eventual economic extraction.”
“The location, quantity, grade or quality, continuity and other geological characteristics of a Mineral Resource are known, estimated or interpreted from specific geological evidence and knowledge, including sampling. “
“Material of economic interest refers to diamonds, natural solid inorganic material, or natural solid fossilized organic material including base and precious metals, coal, and industrial minerals.”
“The term Mineral Resource covers mineralization and natural material of intrinsic economic interest which has been identified and estimated through exploration and sampling and within which Mineral Reserves may subsequently be defined by the consideration and application of Modifying Factors. The phrase ‘reasonable prospects for eventual economic extraction’ implies a judgment by the Qualified Person in respect of the technical and economic factors likely to influence the prospect of economic extraction. The Qualified Person should consider and clearly state the basis for determining that the material has reasonable prospects for eventual economic extraction. Assumptions should include estimates of cut-off grade and geological continuity at the selected cut- off, metallurgical recovery, smelter payments, commodity price or product value, mining and processing method and mining, processing and general and administrative costs. The Qualified Person should state if the assessment is based on any direct evidence and testing.”
“Interpretation of the word ‘eventual’ in this context may vary depending on the commodity or mineral involved. For example, for some coal, iron, potash deposits and other bulk minerals or commodities, it may be reasonable to envisage ‘eventual economic extraction’ as covering time periods in excess of 50 years. However, for many gold deposits, application of the concept would normally be restricted to perhaps 10 to 15 years, and frequently to much shorter periods of time.”
| | December 2024 |
| | TECHNICAL REPORT –
MUSSELWHITE MINE, ONTARIO, CANADA
Document # C8630-0000-PM-RPT-001 – Rev. 0
/ Page 206 |
| 14.1.1 | Measured Mineral Resource |
“A Measured Mineral Resource is that part of a Mineral Resource for which quantity, grade or quality, densities, shape, and physical characteristics are estimated with confidence sufficient to allow the application of Modifying Factors to support detailed mine planning and final evaluation of the economic viability of the deposit.”
“Geological evidence is derived from detailed and reliable exploration, sampling and testing and is sufficient to confirm geological and grade or quality continuity between points of observation.”
“A Measured Mineral Resource has a higher level of confidence than that applying to either an Indicated Mineral Resource or an Inferred Mineral Resource. It may be converted to a Proven Mineral Reserve or to a Probable Mineral Reserve.”
“Mineralization or other natural material of economic interest may be classified as a Measured Mineral Resource by the Qualified Person when the nature, quality, quantity, and distribution of data are such that the tonnage and grade or quality of the mineralization can be estimated to within close limits and that variation from the estimate would not significantly affect potential economic viability of the deposit. This category requires a high level of confidence in, and understanding of, the geology and controls of the mineral deposit.”
| 14.1.2 | Indicated Mineral Resource |
“An Indicated Mineral Resource is that part of a Mineral Resource for which quantity, grade or quality, densities, shape and physical characteristics are estimated with sufficient confidence to allow the application of Modifying Factors in sufficient detail to support mine planning and evaluation of the economic viability of the deposit.”
“Geological evidence is derived from adequately detailed and reliable exploration, sampling and testing and is sufficient to assume geological and grade or quality continuity between points of observation.”
“An Indicated Mineral Resource has a lower level of confidence than that applying to a Measured Mineral Resource and may only be converted to a Probable Mineral Reserve.”
“Mineralization may be classified as an Indicated Mineral Resource by the Qualified Person when the nature, quality, quantity and distribution of data are such as to allow confident interpretation of the geological framework and to reasonably assume the continuity of mineralization. The Qualified Person must recognize the importance of the Indicated Mineral Resource category to the advancement of the feasibility of the project. An Indicated Mineral Resource estimate is of sufficient quality to support a Pre-Feasibility Study which can serve as the basis for major development decisions.”
| | December 2024 |
| | TECHNICAL REPORT –
MUSSELWHITE MINE, ONTARIO, CANADA
Document # C8630-0000-PM-RPT-001 – Rev. 0
/ Page 207 |
| 14.1.3 | Inferred mineral resource |
“An Inferred Mineral Resource is that part of a Mineral Resource for which quantity and grade or quality are estimated on the basis of limited geological evidence and sampling. Geological evidence is sufficient to imply but not verify geological and grade or quality continuity.”
“An Inferred Mineral Resource has a lower level of confidence than that applying to an Indicated Mineral Resource and must not be converted to a Mineral Reserve. It is reasonably expected that the majority of Inferred Mineral Resources could be upgraded to Indicated Mineral Resources with continued exploration.”
“An Inferred Mineral Resource is based on limited information and sampling gathered through appropriate sampling techniques from locations such as outcrops, trenches, pits, workings and drill holes. Inferred Mineral Resources must not be included in the economic analysis, production schedules, or estimated mine life in publicly disclosed Pre-Feasibility or Feasibility Studies, or in the Life of Mine plans and cash flow models of developed mines. Inferred Mineral Resources can only be used in economic studies as provided under NI 43-101.”
“There may be circumstances, where appropriate sampling, testing, and other measurements are sufficient to demonstrate data integrity, geological and grade/quality continuity of a Measured or Indicated Mineral Resource, however, quality assurance and quality control, or other information may not meet all industry norms for the disclosure of an Indicated or Measured Mineral Resource. Under these circumstances, it may be reasonable for the Qualified Person to report an Inferred Mineral Resource if the Qualified Person has taken steps to verify the information meets the requirements of an Inferred Mineral Resource.”
Two models were used to generate the mineral resource statement presented in this Report; these include the East Limb and the West Limb models. All model estimation was completed in accordance with stringent internal standards and guidelines by qualified personnel within the Musselwhite Geology and Resources team. The models and all supporting data were subsequently reviewed and validated by Qualified Person, Ryan Wilson, P.Geo., of DRA Americas Inc.
Estimation was focused on Au content using exclusively diamond drill data. The extents of the 2023 East Limb model remained largely the same as the previous internal version with the exception of a slight expansion to the north to encompass the PQ Deeps mineral inventory extensions for targeting purposes. The West Limb model as presented in this Report has not been updated since 2021 and therefore, its extents and estimate remain unchanged since that time. Previous internal reports have also included a third model for the West Anticline (WAT) area. However, the latest internal update of this model in early 2023 indicated that it no longer contains any resource material; as such, the WAT model is not discussed any further here.
| | December 2024 |
| | TECHNICAL REPORT –
MUSSELWHITE MINE, ONTARIO, CANADA
Document # C8630-0000-PM-RPT-001 – Rev. 0
/ Page 208 |
The Opapimiskan-Markop Assemblage in the deposit area is folded into a D2 synform with multiple synform-antiform pairs. Fold axes have a variable plunge from about 5 deg in the Esker North (east) to 43 deg in the West Anticline (west). From a structural top the assemblage consists of calc-alkaline felsic to intermediate volcanic and sedimentary rocks, tholeiitic, mafic volcanic and subvolcanic rocks, and tholeiitic, komatiitic basalt and ultramafic volcanic rocks.
The geology model used for the 2023 resource update has been transitioned back to an explicit modelling workflow using Vulcan software for wireframe generation, with the aim to achieve better internal consistency and allow for easier modifications in both short-term and annual model updates.
| 14.3.1.1 | Drill Hole Database and Data Verification |
The Musselwhite Mine Geology and Resources team provided the diamond drill hole assays database used by DRA to review and confirm the Mineral Resources reported herein for the East Limb deposits. Further information regarding the database and its verification can be found in Section 12 of this Report.
The topographic data used for the project was provided by the Musselwhite Mine Geology and Resources team in the form of a regional Digital Elevation Model (DEM) and deemed of appropriate quality by DRA to be used for planning purposes. An interpreted bedrock surface based on available drilling data was also provided.
Work is ongoing to formally examine the bulk density data at Musselwhite and finalize a procedure for proper data collection; this project is expected to be completed in the near future. As a result, the density values used in previous models are carried forward here (Table 14.1). It is recommended that further work be completed to analyze any trends or correlations in the density data set.
It is recommended that an increased frequency of density measurements be collected, especially in lithologies or areas where previous sampling has been sparse as the focus of efforts to date have largely focused on former grade shell areas (known mineralization)
| | December 2024 |
| | TECHNICAL REPORT –
MUSSELWHITE MINE, ONTARIO, CANADA
Document # C8630-0000-PM-RPT-001 – Rev. 0
/ Page 209 |
Table 14.1 – East Limb Deposits – Specific Gravity Values Summarized by Estimation Domain
| Domain | Specific Gravity
(SG) |
| 100 (Ultramafics) | 3.00 |
| 200 (Felsics) | 2.85 |
| 300 (Upper Mafics) | 3.09 |
| 301 (Lower Mafics) | 3.00 |
| 302 (Lower Mafics) | 3.00 |
| 401-408 (Intraformational) | 3.07 |
| 500 (4F Schist) | 3.10 |
| 600 (4EA) | 3.29 |
| 700 (4B) | 3.37 |
| 701 (4B-RDW) | 3.40 |
| 702 (4B-RDW) | 3.11 |
| 999 (OVB) | 2.20 |
| 14.3.1.4 | Three-Dimensional (3D) Modelling |
The Musselwhite Mine Geology and Resources team provided the QP with a set of wireframes for the lithological domains at the East Limb deposits. Following review of the approach and methodology used to generate the wireframes, in addition to discussions during the QP site visit, DRA conducted an independent review of the interpreted zones both on section and in 3D using MinePlan 3D.
The model was constructed using an explicit modelling workflow in Vulcan software. Sectional polyline interpretations were created for the modelled lithologies at a typical resolution of 25 m. Tighter spacings (12.5 m) were used in areas with more drilling and/or more complex fold geometries and larger spacings (>25 m) were used where the model was projected through areas with lesser drilling. Tie lines were created for each unit by snapping to the synform and antiform hinges of prominent folds to aid in creating triangulated surfaces.
The model extents were chosen to cover the entirety of the East Limb, T-Antiform, and Red Wing areas and were unchanged from the previous 2022 internal model extents.
Units modelled for the lithological model include the Northern Iron Formation (NIF) Felsic Volcanics, NIF Upper Volcanics, NIF 4F, NIF 4EA, NIF 4B, Southern Iron Formation (SIF) Mafics, SIF Lower 4B, and Basement rocks. Two prominent intrusions modelled include the Snoppy Dyke and PQD Ultramafic Dyke. A total of seven intraformational (ITF) schists were also modelled, including the Hanging-wall ITF (HWITF), Felsic ITF (FITF), Lynx North ITF (LNIF), Lynx North ITF X1 (LNIF-X1), Upper ITF North (UITF-N), Upper ITF X1 (UITF-X1) and Upper ITF X2 (UITF-X2).
| | December 2024 |
| | TECHNICAL REPORT –
MUSSELWHITE MINE, ONTARIO, CANADA
Document # C8630-0000-PM-RPT-001 – Rev. 0
/ Page 210 |
Structural modelling resulted in the construction of 15 major structures based on geotechnical Rock- Quality Designation (RQD) data, structural logging and lithological logging. These have been classified into three structural groupings, including series of seven gas faults (FLT_Gas_1 to FLT_Gas_7), six longitudinal faults (FLT_B-Block Shear, FLT_Conveyor Shear, FLT_RQD_1, FLT_TAN_1, FLT_TAN_2, FLT_60_South), and two cross faults (FLT-RDW_X1, FLT_RDW_X2).
The quality and density of available structural data, in combination with the structural complexity of the East Limb means that these structures are supported by varying degrees of verifiable data along the strike of the model. As a result, only four structures with higher confidence were used in domaining the resource model.
In general, the final estimation domains are defined by a combination of interpreted stratigraphic units and fault blocks, with subdomains further divided where warranted by statistical differences. The resulting lithological, structural and estimation domains for the Musselwhite Mine are summarized in Table 14.2, and a representative 3D orthographic projection is also provided in Figure 14.1.
The model was also independently checked by the site team against underground production mapping where data was available, and appears to accurately reflect the underground data. Volumes in five key areas were compared to a previous 2022 internal model and volumetric changes are typically < ± 1%.
Table 14.2 – Summary of Lithological, Structural and Estimation Domains
| Lithology | dom_lith | dom_hz | dom_est | dom_stat | Interpolation | Associated Zones |
| Overburden | 999 | N/A | N/A | 999 | Assigned waste | N/A |
| PQ Ultramafic Dyke | 100 | N/A | N/A | 100 | Assigned waste | Near PQD |
| Snoppy Dyke | 101 | N/A | N/A | 101 | Assigned waste | N/A |
| Felsic Volcanics | 200 | N/A | 200 | 200 | OK | N/A |
| Upper Volcanics | 300 | 1 | 3001 | 300 | Unfolded OK | N/A |
| 2 | 3002 | Unfolded OK | N/A |
| 3 | 3003 | Unfolded OK | N/A |
| 4 | 3004 | Unfolded OK | N/A |
| 5 | 3005 | Unfolded OK | N/A |
| Lower Volcanics | 301 | N/A | 301 | 301 | OK | N/A |
| 302 | N/A | 302 | OK | N/A |
| | December 2024 |
| | TECHNICAL REPORT –
MUSSELWHITE MINE, ONTARIO, CANADA
Document # C8630-0000-PM-RPT-001 – Rev. 0
/ Page 211 |
| Lithology | dom_lith | dom_hz | dom_est | dom_stat | Interpolation | Associated Zones |
| 4E (intraformational) | 401 | N/A | 401 | 400 | OK | HWIF |
| 402 | N/A | 402 | OK | UITF |
| 403 | N/A | 403 | OK | UITF X1 |
| 404 | N/A | 404 | OK | LNIF |
| 405 | N/A | 405 | OK | FITF |
| 406 | N/A | 406 | OK | UITF X2 |
| 407 | N/A | 407 | OK | TAN IF |
| 408 | N/A | 408 | OK | LNIF X1 |
| 4F Schist | 500 | 1 | 5001 | 500 | Unfolded OK | N/A (Typical HW l i tho) |
| 2 | 5002 | Unfolded OK | N/A (Typical HW l i tho) |
| 3 | 5003 | Unfolded OK | N/A (Typical HW l i tho) |
| 4 | 5004 | Unfolded OK | N/A (Typical HW l i tho) |
| 5 | 5005 | Unfolded OK | N/A (Typical HW l i tho) |
| 4EA | 600 | 1 | 6001 | 6001 | Unfolded OK | PQC, Lynx, Ulynx, Snoppy, West, Esker |
| 2 | 6002 | 6002 | Unfolded OK | PQC, Lynx, Ulynx, Snoppy, West, Esker |
| 3 | 6003 | 6003 | Unfolded OK | PQC, Lynx, Ulynx, Snoppy, West, Esker |
| 4 | 6004 | 6004 | Unfolded OK | PQC, Lynx, Ulynx, Snoppy, West, Esker |
| 5 | 6005 | 6005 | Unfolded OK | PQC, Lynx, Ulynx, Snoppy, West, Esker |
| 4B | 700 | 1 | 7001 | 700 | Unfolded OK | Ulynx, PQC2 |
| 2 | 7002 | Unfolded OK | Ulynx, PQC2 |
| 3 | 7003 | Unfolded OK | Ulynx, PQC2 |
| 4 | 7004 | Unfolded OK | Ulynx, PQC2 |
| 5 | 7005 | Unfolded OK | Ulynx, PQC2 |
| | December 2024 |
| | TECHNICAL REPORT –
MUSSELWHITE MINE, ONTARIO, CANADA
Document # C8630-0000-PM-RPT-001 – Rev. 0
/ Page 212 |
| Lithology | dom_lith | dom_hz | dom_est | dom_stat | Interpolation | Associated
Zones |
| 4B (RDW) | 701 | N/A | 701 | 701 | Unfolded OK | RDWL |
| 702 | N/A | 702 | 702 | Unfolded OK | RDWH, RDWY |
| N/A = Not Applicable |
Figure 14.1 – 3D Orthographic View of East Limb Deposit Lithological Domains
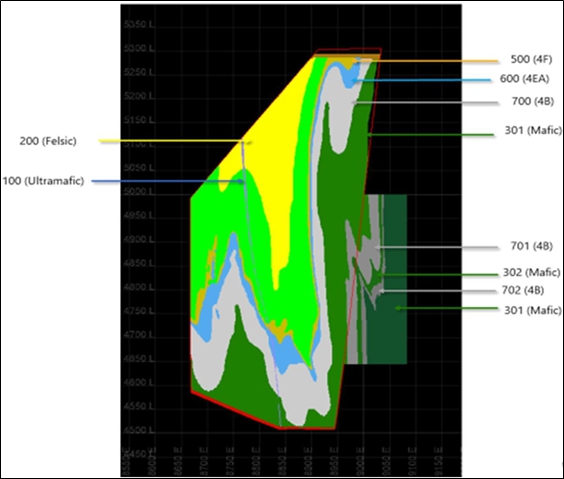
Source: Newmont, 2023
| | December 2024 |
| | TECHNICAL REPORT –
MUSSELWHITE MINE, ONTARIO, CANADA
Document # C8630-0000-PM-RPT-001 – Rev. 0
/ Page 213 |
| 14.3.1.5 | Descriptive Statistics |
Data was flagged according to lithological and structural domains, then statistically analyzed to determine the final domain selections for resource estimation (as shown above in Table 14.2). It is important to note that due to the nature of fan drilling completed from underground drill platforms, clustering of data is common in proximity to the drill collar locations. As a result, cell declustering weights are first calculated in RMSP prior to statistical analysis to reduce this effect; the parameters used for declustering are given in Table 14.3.
Table 14.3 – Cell Declustering Parameters used in RMSP for Weight Calculations
| Direction | Cell Dimension (m) |
| X | 50 |
| Y | 50 |
| Z | 50 |
The overall analysis included basic descriptive statistics, log histograms, box plots and Cumulative Distribution Function (CDF) plots of all raw data samples contained within each domain of the geological model. Length-weighted results are summarized by domain in Table 14.4 and Figure 14.2 to Figure 14.4.
| | December 2024 |
| | TECHNICAL REPORT –
MUSSELWHITE MINE, ONTARIO, CANADA
Document # C8630-0000-PM-RPT-001 – Rev. 0
/ Page 214 |
Table 14.4 – Basic Descriptive Statistics for Raw Data Samples (Declustered) Summarized by Domain
| Description | 100 | 101 | 200 | 300 | 301 | 400 | 500 | 600 | 700 | 701 | 702 |
| count | 4314 | 463 | 44,712 | 300,263 | 52,661 | 15,106 | 63,176 | 169,805 | 276,426 | 34,241 | 13,167 |
| mean | 0.25 | 0.88 | 0.16 | 0.61 | 0.11 | 2.16 | 0.64 | 2.00 | 0.52 | 0.56 | 1.44 |
| stdev | 1.59 | 2.96 | 1.06 | 3.68 | 1.96 | 5.84 | 2.52 | 7.78 | 8.15 | 3.50 | 3.80 |
| cv | 6.40 | 3.35 | 6.74 | 6.06 | 18.49 | 2.70 | 3.95 | 3.89 | 15.59 | 6.26 | 2.65 |
| min | 0.00 | 0.00 | 0.00 | 0.00 | 0.00 | 0.00 | 0.00 | 0.00 | 0.00 | 0.00 | 0.00 |
| P10 | 0.01 | 0.01 | 0.00 | 0.01 | 0.00 | 0.02 | 0.01 | 0.02 | 0.01 | 0.01 | 0.01 |
| P50 | 0.03 | 0.07 | 0.02 | 0.04 | 0.02 | 0.21 | 0.06 | 0.20 | 0.08 | 0.10 | 0.29 |
| P90 | 0.21 | 2.06 | 0.22 | 0.89 | 0.14 | 6.05 | 1.30 | 5.39 | 0.89 | 1.16 | 3.81 |
| max | 77.50 | 36.60 | 62.70 | 735.44 | 903.00 | 204.00 | 238.00 | 2,640.0 | 5,270.0 | 676.17 | 250.13 |
| | December 2024 |
| | TECHNICAL REPORT –
MUSSELWHITE MINE, ONTARIO, CANADA
Document # C8630-0000-PM-RPT-001 – Rev. 0
/ Page 215 |
Figure 14.2 – Representative Log Histogram Plots Summarized by Grouped Domains
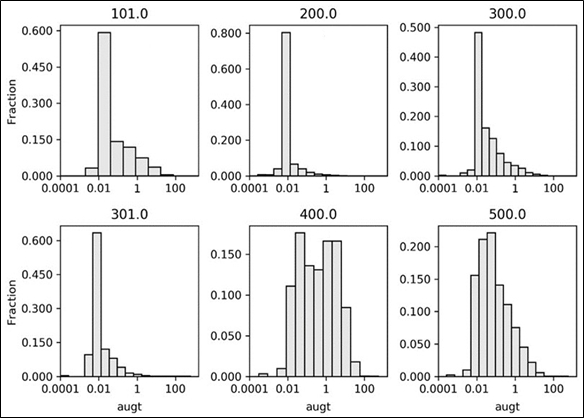
Source: Newmont, 2023
| | December 2024 |
| | TECHNICAL REPORT –
MUSSELWHITE MINE, ONTARIO, CANADA
Document # C8630-0000-PM-RPT-001 – Rev. 0
/ Page 216 |
Figure 14.3 – Box and Whisker Plots Summarized by Grouped Estimation Domains
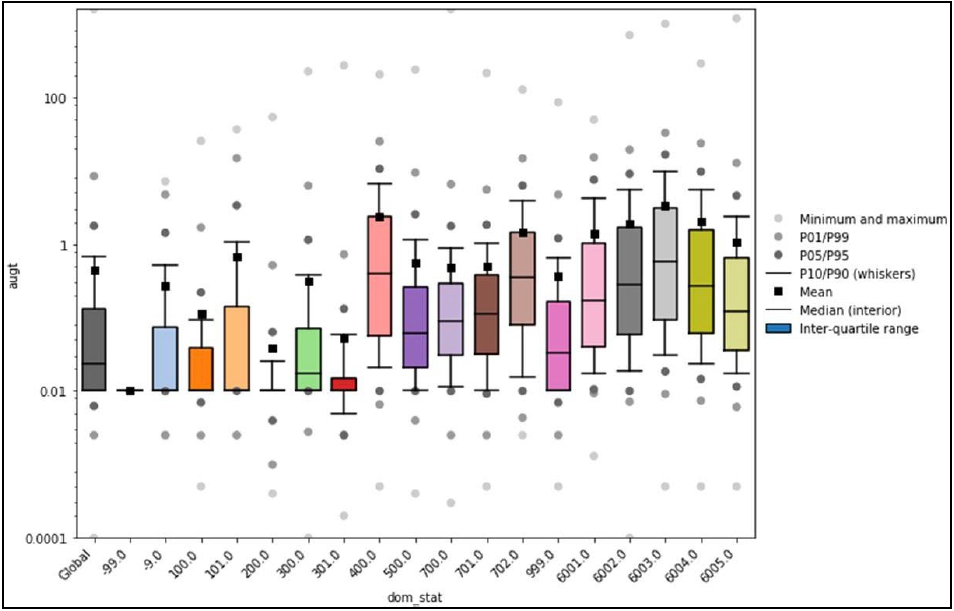
Source: Newmont, 2023
| | December 2024 |
| | TECHNICAL REPORT –
MUSSELWHITE MINE, ONTARIO, CANADA
Document # C8630-0000-PM-RPT-001 – Rev. 0
/ Page 217 |
Figure 14.4 – Representative Cumulative Distribution Function (CDF) Plots Summarized by Grouped Domains
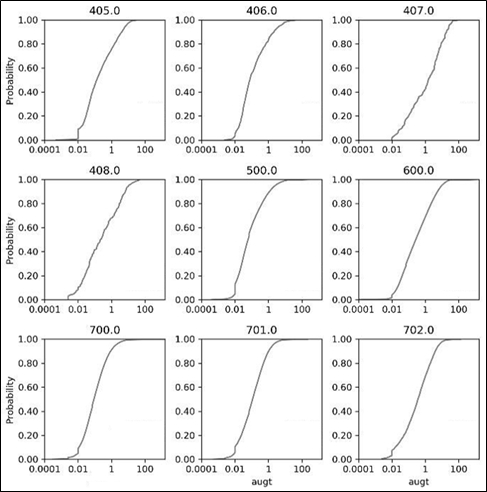
Source: Newmont, 2023
Drill hole intercepts through the interpreted domains are composited to 1.0-m equal length intervals, with a 0.5 m tolerance for shorter intervals resulting from intersection of wireframes or unsampled/missing intervals. Globally, the most common sample length at Musselwhite is one (1) m through mineralized areas (supported by descriptive statistics); moreover, this composite length has been used historically as a standard practice at the mine.
A large portion of holes at Musselwhite have been unsampled over the life of mine due to the assumption that the material was uneconomic and related geological sampling decisions. To account for these missing data, a waste grade of 0.01 g/t Au (detection limit) has been assigned during the compositing process for the unsampled areas. Basic descriptive statistics for the composited data within wireframes (i.e., zone intercepts) are provided in Table 14.5.
| | December 2024 |
| | TECHNICAL REPORT –
MUSSELWHITE MINE, ONTARIO, CANADA
Document # C8630-0000-PM-RPT-001 – Rev. 0
/ Page 218 |
Table 14.5 – Basic Descriptive Statistics for 1.0-m Composite Data (Declustered) Summarized by Domain
| Description | 100 | 101 | 200 | 300 | 301 | 400 | 500 | 600 | 700 | 701 | 702 |
| count | 3,751 | 440 | 40,128 | 260,389 | 47,323 | 11,780 | 56,354 | 154,866 | 257,233 | 29,791 | 9,943 |
| mean | 0.21 | 0.85 | 0.15 | 0.55 | 0.10 | 2.13 | 0.61 | 1.92 | 0.49 | 0.52 | 1.39 |
| stdev | 1.22 | 2.55 | 1.03 | 2.52 | 0.89 | 5.18 | 2.26 | 5.60 | 3.57 | 2.54 | 3.04 |
| cv | 5.71 | 3.00 | 6.74 | 4.57 | 9.02 | 2.43 | 3.69 | 2.92 | 7.31 | 4.89 | 2.19 |
| min | 0.00 | 0.00 | 0.00 | 0.00 | 0.00 | 0.00 | 0.00 | 0.00 | 0.00 | 0.00 | 0.00 |
| P10 | 0.01 | 0.01 | 0.00 | 0.01 | 0.00 | 0.03 | 0.01 | 0.02 | 0.01 | 0.01 | 0.02 |
| P50 | 0.03 | 0.07 | 0.02 | 0.05 | 0.02 | 0.33 | 0.07 | 0.27 | 0.09 | 0.13 | 0.34 |
| P90 | 0.21 | 2.19 | 0.24 | 0.97 | 0.15 | 5.84 | 1.31 | 5.28 | 0.93 | 1.11 | 3.81 |
| max | 39.22 | 36.60 | 53.64 | 224.61 | 271.18 | 204.00 | 238.00 | 1,184.2 | 1,591.1 | 214.01 | 127.14 |
| | December 2024 |
| | TECHNICAL REPORT –
MUSSELWHITE MINE, ONTARIO, CANADA
Document # C8630-0000-PM-RPT-001 – Rev. 0
/ Page 219 |
Grade capping (top cutting) is used to limit the spatial extrapolation of occasional isolated high grades in the resource model estimates. Capping analyses undertaken included the use of log histograms, log probability plots, ranked composites, and outlier analysis.
Log probability plots generally show clear inflection points at the selected capping value when a threshold is applied to view the upper most samples. Outliers were examined by viewing the ranked composites for each estimation domain. Top cuts were also investigated by capping the highest-grade values sequentially and analyzing the effect on the coefficient of variation (CV) of the remaining data. Capping was ultimately applied to the composites at the time of grade estimation.
The final selected capping grades used in the resource estimate are summarized along with a subset of basic descriptive statistics in Table 14.6. It should be noted that no capping was applied to the 100 or 101 domains as these are barren dykes and assigned a waste grade. Representative log probability plots are also provided in Figure 14.5.
DRA has reviewed and agrees with the grade capping methodology and selections used by the Musselwhite Geology and Resources team; these data are considered sufficient for subsequent resource estimation purposes.
Table 14.6 – Summary of Selected Capping Grades by Statistical Domain
Stat
Domain | Uncapped
Mean (g/t) | Uncapped
CV | Capping
Grade (g/t) | Capped
Comps (#) | Capped
Comps (%) | Capped
Mean (g/t) | Capped
CV | Metal Loss
(%) |
| 100 | 0.21 | 5.71 | - | - | - | - | - | - |
| 101 | 0.85 | 3.00 | - | - | - | - | - | - |
| 200 | 0.15 | 6.74 | 5.00 | 69 | 0.17 | 0.13 | 3.40 | 15.73 |
| 300 | 0.55 | 4.57 | 63.00 | 37 | 0.01 | 0.55 | 4.22 | 0.86 |
| 301 | 0.10 | 9.02 | 5.00 | 84 | 0.18 | 0.09 | 3.67 | 13.76 |
| 400 | 2.13 | 2.43 | 80.00 | 3 | 0.03 | 2.11 | 2.29 | 0.60 |
| 500 | 0.61 | 3.69 | 18.00 | 265 | 0.47 | 0.59 | 3.05 | 4.07 |
| 600 | 1.92 | 2.92 | 100.00 | 15 | 0.01 | 1.90 | 2.40 | 0.79 |
| 700 | 0.49 | 7.31 | 60.00 | 58 | 0.02 | 0.47 | 3.80 | 2.76 |
| 701 | 0.52 | 4.89 | 32.00 | 13 | 0.04 | 0.49 | 2.88 | 5.00 |
| 702 | 1.39 | 2.19 | 80.00 | 1 | 0.01 | 1.39 | 2.16 | 0.08 |
| | December 2024 |
| | TECHNICAL REPORT –
MUSSELWHITE MINE, ONTARIO, CANADA
Document # C8630-0000-PM-RPT-001 – Rev. 0
/ Page 220 |
Figure 14.5 – Representative Log Probability Plots of Selected Statistical Domains

Source: Newmont, 2023
Variography aims to assess the spatial continuity of grade for an element of interest, and ultimately helps guide the definition of parameters for the interpolation of Mineral Resources. The selected approach, Ordinary Kriging (OK), is a linear geostatistical estimator that requires input parameters to limit the size of the search neighbourhood (via a defined search ellipsoid) for each point to be interpolated within the block model.
Downhole and directional variography were run using RMSP software. Variograms are run to analyze the spatial relationships of composited data within the selected statistical domain.
Variography was carried out on the unfolded, uncapped data. Variograms were modelled with three spherical models and the nugget set using an omnidirectional variogram with 5 m lag spacing.
Nugget values for Musselwhite range from 0.1 to 0.35. The structure ranges are very long in the direction of maximum continuity and can reach the sill at ranges up to 200 m.
Variogram model parameters are summarized in Table 14.7, and representative back-transformed normal scores models are also shown in Figure 14.6.
| | December 2024 |
| | TECHNICAL REPORT –
MUSSELWHITE MINE, ONTARIO, CANADA
Document # C8630-0000-PM-RPT-001 – Rev. 0
/ Page 221 |
Table 14.7 – Variogram Model Parameters for East Limb Deposits
| Dom_Lith | 200 | 300 | 301 | 302 | 400 | 500 | 600 | 700 | 701 | 702 |
| Nugget | 0.25 | 0.26 | 0.15 | 0.35 | 0.28 | 0.1 | 0.2 | 0.25 | 0.278 | 0.2 |
| Angle1 | 0 | 0 | 0 | 0 | 0 | 0 | 0 | 0 | 0 | 0 |
| Angle2 | 0 | 0 | 0 | 0 | 0 | 0 | 0 | 0 | 0 | 0 |
| Angle3 | 0 | 0 | 0 | 0 | 0 | 0 | 0 | 0 | 0 | 0 |
| Sill (Str 1) | 0.25 | 0.34 | 0.25 | 0.25 | 0.24 | 0.5 | 0.4 | 0.43 | 0.222 | 0.3 |
| Range 1 (Str 1) | 5 | 5 | 5 | 5 | 5 | 5 | 3 | 2 | 10 | 5 |
| Range 2 (Str 1) | 2 | 5 | 2 | 2 | 2 | 5 | 3 | 2 | 5 | 2 |
| Range 3 (Str 1) | 5 | 1 | 1 | 1 | 1 | 3 | 3 | 1 | 5 | 2 |
| Type (Str 1) | Sph | Sph | Sph | Sph | Sph | Sph | Sph | Sph | Sph | Sph |
| Sill (Str 2) | 0.25 | 0.2 | 0.25 | 0.2 | 0.16 | 0.25 | 0.1 | 0.17 | 0.222 | 0.25 |
| Range 1 (Str 2) | 20 | 30 | 10 | 10 | 10 | 15 | 15 | 10 | 20 | 10 |
| Range 2 (Str 2) | 15 | 15 | 8 | 8 | 8 | 30 | 15 | 15 | 20 | 10 |
| Range 3 (Str 2) | 15 | 15 | 8 | 8 | 8 | 10 | 7 | 8 | 15 | 8 |
| Type (Str 2) | Sph | Sph | Sph | Sph | Sph | Sph | Sph | Sph | Sph | Sph |
| Sill (Str 3) | 0.25 | 0.2 | 0.35 | 0.2 | 0.32 | 0.15 | 0.3 | 0.15 | 0.278 | 0.25 |
| Range 1 (Str 3) | 150 | 200 | 150 | 150 | 150 | 200 | 70 | 70 | 95 | 80 |
| Range 2 (Str 3) | 45 | 100 | 45 | 45 | 45 | 150 | 50 | 20 | 80 | 45 |
| Range 3 (Str 3) | 45 | 30 | 10 | 10 | 10 | 30 | 30 | 15 | 30 | 10 |
| Type (Str 3) | Sph | Sph | Sph | Sph | Sph | Sph | Sph | Sph | Sph | Sph |
| | December 2024 |
| | TECHNICAL REPORT –
MUSSELWHITE MINE, ONTARIO, CANADA
Document # C8630-0000-PM-RPT-001 – Rev. 0
/ Page 222 |
Figure 14.6 – Representative Normal Scores Variograms (Back-transformed) for the Lower Volcanics, East Limb Deposits

Source: Newmont, 2023
The variograms were also used to help guide the selection of maximum search ellipsoid distances (ranges) for Measured, Indicated and Inferred Resource categories, in conjunction with geological information and other statistical factors, such as average drill hole spacing.
| | December 2024 |
| | TECHNICAL REPORT –
MUSSELWHITE MINE, ONTARIO, CANADA
Document # C8630-0000-PM-RPT-001 – Rev. 0
/ Page 223 |
| 14.3.2 | Mineral Resource Estimate |
Gold is currently the only mineral of interest at the Musselwhite Mine and therefore was the sole variable estimated as part of this resource update. Following generation of the mineralized wireframes in Maptek Vulcan software, the relevant data was transferred to RMSP (version 1.12.2) to build the block model and perform the subsequent grade and tonnage computations.
Sub-blocking was used to define narrow zones and to maintain volume integrity with the lithological surfaces and triangulations.
The block model was non-rotated and aligned north–south with the primary Musselwhite Mine grid. Block model definition parameters are found in Table 14.8.
Various block sizes were tested, and the resulting sizes provide adequate resolution along the lithological surfaces while keeping a reasonable file size.
Further discussion with the Engineering team to test the effects of different block sizes and ensure optimal size is being used is recommended.
Table 14.8 – Block Model Definition Parameters for East Limb Deposits
| Description | Value |
| Model Dimension X (m) | 1134 |
| Model Dimension Y (m) | 8220 |
| Model Dimension Z (m) | 2155 |
| Origin X (Easting) | 8200.5 |
| Origin Y (Northing) | 7755.0 |
| Origin Z (Lower Elev.) | 3202.5 |
| Rotation (º) | 0 |
| Block Size X (m) | 1 |
| Sub-block Size X (m) | 1 |
| Block Size Y (m) | 10 |
| Sub-block Size Y (m) | 2.5 |
| Block Size Z (m) | 5 |
| Sub-block Size Z (m) | 2.5 |
| 14.3.2.2 | Search Strategy and Interpolation |
Gold block values were interpolated for each individual estimation domain using the generated composites and the Ordinary Kriging (OK) method. The set of search parameters used in the multi-
| | December 2024 |
| | TECHNICAL REPORT –
MUSSELWHITE MINE, ONTARIO, CANADA
Document # C8630-0000-PM-RPT-001 – Rev. 0
/ Page 224 |
pass interpolations, derived mainly from variographic analysis and supported by geological interpretations and statistical factors such as average drill hole spacing, are summarized by estimation domain in Table 14.9.
Table 14.9 – Ordinary Kriging (OK) Interpolation Parameters Summary for East Limb Deposits
| Domain | Pass | Estimation
Method | Min
Samples | Max
Samples | Max.
Samples
/DDH | Major
Axis | Semi
Axis | Minor
Axis |
| 6001 | 1 | OK
Unfolded | 6 | 8 | 2 | 30 | 60 | 0.25 |
| 2 | OK
Unfolded | 8 | 10 | 2 | 70 | 110 | 0.3 |
| 3 | OK
Unfolded | 8 | 10 | 3 | 100 | 180 | 0.3 |
| 6003 | 1 | OK
Unfolded | 8 | 10 | 3 | 40 | 50 | 40 |
| 2 | OK
Unfolded | 8 | 10 | 3 | 70 | 80 | 70 |
| 3 | OK
Unfolded | 8 | 10 | 3 | 100 | 150 | 100 |
| 6005 | 1 | OK
Unfolded | 6 | 8 | 2 | 30 | 60 | 0.25 |
| 2 | OK
Unfolded | 8 | 10 | 3 | 70 | 110 | 0.3 |
| 3 | OK
Unfolded | 8 | 12 | 3 | 150 | 200 | 0.3 |
| 6002 | 1 | OK
Unfolded | 6 | 10 | 2 | 100 | 50 | 0.25 |
| 2 | OK
Unfolded | 8 | 16 | 3 | 150 | 75 | 0.3 |
| 3 | OK
Unfolded | 8 | 16 | 3 | 300 | 150 | 0.3 |
| 6004 | 1 | OK
Unfolded | 6 | 10 | 2 | 30 | 60 | 5 |
| 2 | OK
Unfolded | 6 | 12 | 2 | 70 | 120 | 7 |
| 3 | OK
Unfolded | 8 | 12 | 3 | 100 | 200 | 10 |
| 7001 | 1 | OK
Unfolded | 6 | 10 | 2 | 100 | 75 | 0.2 |
| 2 | OK
Unfolded | 8 | 16 | 3 | 200 | 150 | 1 |
| 7002 | 1 | OK
Unfolded | 8 | 10 | 3 | 40 | 40 | 0.2 |
| 2 | OK
Unfolded | 12 | 16 | 3 | 100 | 80 | 0.2 |
| | | | | | | | |
| | December 2024 |
| | TECHNICAL REPORT –
MUSSELWHITE MINE, ONTARIO, CANADA
Document # C8630-0000-PM-RPT-001 – Rev. 0
/ Page 225 |
| Domain | Pass | Estimation
Method | Min
Samples | Max
Samples | Max.
Samples
/DDH | Major
Axis | Semi
Axis | Minor
Axis |
| | 3 | OK
Unfolded | 12 | 16 | 3 | 200 | 200 | 1 |
| 7003 | 1 | OK
Unfolded | 12 | 16 | 3 | 150 | 100 | 0.2 |
| 2 | OK
Unfolded | 8 | 10 | 3 | 220 | 120 | 0.2 |
| 3 | OK
Unfolded | 8 | 10 | 3 | 300 | 400 | 1 |
| 7004 | 1 | OK
Unfolded | 10 | 16 | 3 | 50 | 20 | 5 |
| 2 | OK
Unfolded | 12 | 16 | 3 | 220 | 120 | 10 |
| 3 | OK
Unfolded | 12 | 16 | 3 | 260 | 190 | 15 |
| 7005 | 1 | OK
Unfolded | 6 | 8 | 2 | 70 | 20 | 15 |
| 2 | OK
Unfolded | 6 | 10 | 2 | 100 | 50 | 30 |
| 701 | 1 | OK
Unfolded | 8 | 10 | 3 | 50 | 25 | 0.5 |
| 2 | OK
Unfolded | 8 | 12 | 3 | 100 | 50 | 0.5 |
| 3 | OK
Unfolded | 8 | 12 | 3 | 150 | 90 | 0.5 |
| 702 | 1 | OK
Unfolded | 8 | 12 | 3 | 30 | 30 | 10 |
| 2 | OK
Unfolded | 8 | 12 | 3 | 50 | 50 | 30 |
| 3 | OK
Unfolded | 6 | 12 | 3 | 100 | 100 | 50 |
3001,
3002,
3003 | 1 | OK
Unfolded | 8 | 16 | 3 | 40 | 80 | 0.3 |
| 2 | OK
Unfolded | 8 | 12 | 3 | 85 | 100 | 0.3 |
| 3004 | 1 | OK
Unfolded | 8 | 12 | 3 | 40 | 80 | 0.3 |
| 2 | OK
Unfolded | 8 | 12 | 3 | 85 | 100 | 0.3 |
| 3 | OK
Unfolded | 8 | 12 | 3 | 200 | 400 | 0.3 |
| 3005 | 1 | OK
Unfolded | 12 | 16 | 3 | 40 | 80 | 0.3 |
| 2 | OK
Unfolded | 12 | 16 | 3 | 85 | 100 | 0.3 |
| | December 2024 |
| | TECHNICAL REPORT –
MUSSELWHITE MINE, ONTARIO, CANADA
Document # C8630-0000-PM-RPT-001 – Rev. 0
/ Page 226 |
| Domain | Pass | Estimation
Method | Min
Samples | Max
Samples | Max.
Samples
/DDH | Major
Axis | Semi
Axis | Minor
Axis |
5001,
5002,
5003,
5004,
5005 | 1 | OK
Unfolded | 6 | 10 | 2 | 50 | 35 | 1 |
| 2 | OK
Unfolded | 8 | 12 | 3 | 100 | 70 | 1 |
| 3 | OK
Unfolded | 8 | 12 | 3 | 300 | 150 | 1 |
| 200 | 1 | OK | 8 | 16 | 3 | 80 | 120 | 50 |
| 2 | OK | 8 | 16 | 3 | 160 | 240 | 100 |
| 3 | OK | 8 | 16 | 3 | 500 | 800 | 300 |
| 301 | 1 | OK | 8 | 16 | 3 | 150 | 80 | 50 |
| 2 | OK | 8 | 16 | 3 | 300 | 160 | 100 |
| 3 | OK | 8 | 16 | 3 | 800 | 500 | 300 |
| 302 | 1 | OK | 8 | 16 | 3 | 150 | 80 | 50 |
| 2 | OK | 8 | 16 | 3 | 300 | 160 | 100 |
| 3 | OK | 8 | 16 | 3 | 800 | 500 | 300 |
| 401-408 | 1 | OK | 8 | 16 | 3 | 65 | 25 | 10 |
| 2 | OK | 8 | 16 | 3 | 120 | 50 | 20 |
| 3 | OK | 8 | 16 | 3 | 360 | 150 | 60 |
Unfolding
Primary lithologies (300, 500, 600, 700, 701, 702) were estimated using an unfolded model. This estimation technique honors the folding found in areas of the deposit and allows samples to be selected in a way that more closely represents the geological interpretation compared to other estimation techniques.
RMSP’s unfolding workflow has two (2) steps: 1) build a discretization of the mesh into UV coordinates with a series of cube-like structure constructed by extending vectors from the bottom surface to the top surface, and; 2) map Cartesian coordinates between the meshes into a new UVW coordinate system using the cuboids constructed between the given surfaces. This methodology allows for validating the unfolded object by plotting using the UVW coordinates and avoids any issues that are typically encountered with back-transforming folded data by keeping the original XYZ coordinates with each data point. Unfolding vectors can also be checked visually for errors, i.e., illogical intersection of vectors.
Estimation Parameters
All domains were estimated using multi-pass OK. Barren lithologies were not estimated and assigned a grade of 0.01 g/t; these include the PQ ultramafic dyke and the two (2) Snoppy dykes.
| | December 2024 |
| | TECHNICAL REPORT –
MUSSELWHITE MINE, ONTARIO, CANADA
Document # C8630-0000-PM-RPT-001 – Rev. 0
/ Page 227 |
As described in Table 14.9, estimation domains were estimated using multiple passes. The first pass on each domain generally uses a minimum of 6 or 8 samples and a maximum of 10 samples, with a limit of 2 or 3 samples per drill hole for the main silicate iron formation domains. The second pass uses a larger search region with a minimum of 8 samples, maximum of 16 samples and a maximum of 3 samples per drill hole. The third pass was not utilized in all lithologies, but uses a minimum of 8 samples and a maximum of 16 samples with a maximum of 3 samples per drill hole.
The same capping values were used for all passes of each estimation domain.
| 14.3.2.3 | Mineral Resource Classification |
The Mineral Resources reported herein for the East Limb deposits at Musselwhite Mine have been classified into Measured, Indicated and Inferred categories. This classification is based on the interpreted geological and grade continuity of the observed gold mineralization.
Primary categorization was based on multiple-pass OK interpolation which employed increasing search ellipsoid ranges (refer back to Table 14.9).
A drill hole spacing (DHSS) study was completed in 2021 by Resource Modeling Solution external consultants and recommended 50 x 25 m would be a better representation for Indicated Resource, reducing to 25 x 12.5 m for Measured Resource (Table 14.10). This measurement for Indicated represents a slight increase on the vertical drill spacing recommendations compared to previously used criteria. The increased vertical drill density of 12.5 m provides increased resolution across the strike of the orebody to aid in defining the geometry of the tight structural folds of the interpreted lithologies.
This drill hole spacing was independent of the Redwing area and until further investigation can be completed, the Redwing will continue to use the tighter historic recommendations (Table 14.11).
Table 14.10 – Resource Classification Guidance, East Limb Deposits (Excluding Redwing)
| Classification | Drill Spacing (m) |
| Vertical | Strike |
| Measured | 12.5 | 25 |
| Indicated | 25 | 50 |
| Inferred | 25 | 100 |
| High Confidence Inventory | 25 | 200 |
| | December 2024 |
| | TECHNICAL REPORT –
MUSSELWHITE MINE, ONTARIO, CANADA
Document # C8630-0000-PM-RPT-001 – Rev. 0
/ Page 228 |
Table 14.11 – Resource Classification Guidance, Red Wing Deposit
| Classification | Drill Spacing (m) |
| Vertical | Strike |
| Measured | 12.5 | 25 |
| Indicated | 12.5 | 50 |
| Inferred | 12.5 | 100 |
| High Confidence Inventory | 25 | 200 |
The resource categories use an unconstrained, anisotropic (major direction down plunge) estimate to determine the average distance to the three closest holes (using a minimum and maximum of one sample per hole). The blocks were then flagged by using half the diagonal distance of the drill grid as outlined in internal site guidelines.
Further classification support is provided by considering proportions of sampled and unsampled intervals in the database. Composites are flagged with either a 1 or 0, indicating if they were sampled or unsampled (assigned a detection limit grade). A kriging estimate is then performed using this data and the same estimation parameters as the final estimate. This produces a value for each block between 0 and 1, which indicates a relative proportion of the number of detection limit samples used to inform the grade of each block.
| 14.3.3 | Block Model Validation |
The block model was validated by the Musselwhite Geology and Resources team using a combination of visual inspection, swath plots (in folded and unfolded space) and comparison with nearest neighbour (NN) estimates.
Similar exercises were carried out by DRA, confirming the generated block model to be reasonable and valid for the purposes of reporting Mineral Resources.
| 14.3.3.1 | Visual Inspection |
Estimated blocks and drill hole intercepts were reviewed by DRA both on 2D sections (vertical and plan views) and interactively within the Isatis.neo 3D software environment. The block grades were considered to suitably respect assay grades throughout the deposit. A representative vertical section through the core of the deposit is shown in Figure 14.7.
| | December 2024 |
| | TECHNICAL REPORT –
MUSSELWHITE MINE, ONTARIO, CANADA
Document # C8630-0000-PM-RPT-001 – Rev. 0
/ Page 229 |
Figure 14.7 – Comparison of Assay and Block Grades on Representative Vertical Section
(13,500N), East Limb Block Model
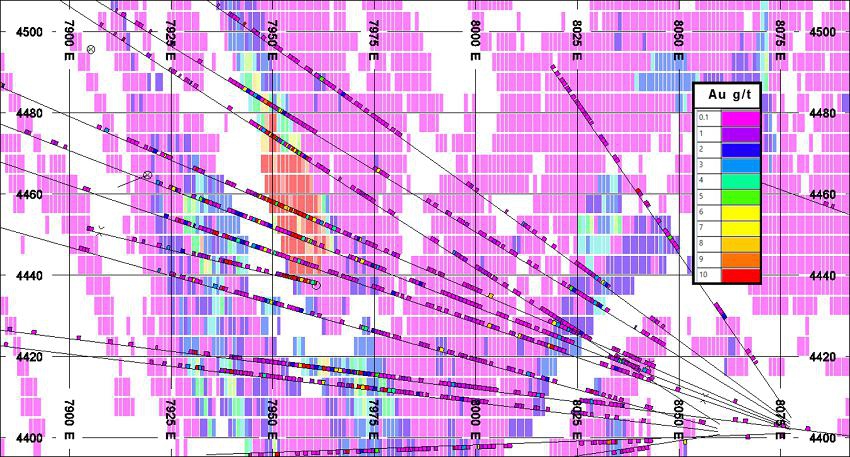
Source: DRA, 2024
Swath plots for each domain were created in RMSP and used to understand and validate the ordinary kriged estimate against the composite grades and a nearest neighbour estimate. Representative plots against the X, Y and Z directions are shown below in Figure 14.8 to Figure 14.10.
Given the folded geometry of the deposit, the plots are sometimes difficult to interpret as looking at the Y plot may be most applicable to the Musselwhite plunge, but potentially introduces 3 separate fold limbs to analyze in a single plot. Therefore, units that were unfolded were also used to create swath plots in unfolded space.
Due to the nature of the unfolded estimate, some of the folded swath plots show localized divergence from the naïve mean of the composites. Further work is required to align the swath plots with the proper sample selection of firm boundaries.
Overall, it is generally clear that estimated block grades closely match those of the 1 m composite data throughout the deposits, with a minor amount of smoothing (as expected).
| | December 2024 |
| | TECHNICAL REPORT –
MUSSELWHITE MINE, ONTARIO, CANADA
Document # C8630-0000-PM-RPT-001 – Rev. 0
/ Page 230 |
Figure 14.8 – East Limb Deposits Swath Plot of Estimation Domain 700 – X-direction (East-
West) – 1 m Capped Composites vs. Estimated Block Grades

Source: Newmont, 2023
Figure 14.9 – East Limb Deposits Swath Plot of Estimation Domain 700 – Y-direction (North-
South) – 1 m Capped Composites vs. Estimated Block Grades
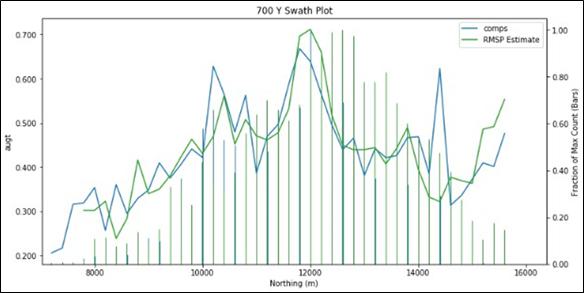
Source: Newmont, 2023
| | December 2024 |
| | TECHNICAL REPORT –
MUSSELWHITE MINE, ONTARIO, CANADA
Document # C8630-0000-PM-RPT-001 – Rev. 0
/ Page 231 |
Figure 14.10 – East Limb Deposits Swath Plot of Estimation Domain 700 – Z-direction
(Elevation) – 1 m Capped Composites vs. Estimated Block Grades

Source: Newmont, 2023
| 14.3.3.3 | Alternative Interpolation Methods |
A Nearest Neighbour (NN) model was also run as a secondary interpolation method in order to compare against the selected OK method used for this resource estimate. The results of this comparison are summarized in both outputs are reported here as a global bias check. The correlation between the models is generally reasonable for such a structurally complex deposit, with many domains falling within 5–10% of the NN estimate. Larger exceptions to this include those domains with few real samples, which were mostly estimated using assigned grades during compositing (e.g., domains 200 and 702).
Table 14.12; both outputs are reported here as a global bias check. The correlation between the models is generally reasonable for such a structurally complex deposit, with many domains falling within 5–10% of the NN estimate. Larger exceptions to this include those domains with few real samples, which were mostly estimated using assigned grades during compositing (e.g., domains 200 and 702).
Table 14.12 – Comparison of OK and NN Interpolation, East Limb Block Model
| Domain | Composite
Grade (g/t) | OK Grade
(g/t) | NN Grade
(g/t) | % Difference
(NN/OK) |
| 200 | 0.13 | 0.06 | 0.05 | -25 |
| 300 | 0.55 | 0.31 | 0.32 | 4 |
| 301 | 0.09 | 0.06 | 0.05 | -22 |
| | December 2024 |
| | TECHNICAL REPORT –
MUSSELWHITE MINE, ONTARIO, CANADA
Document # C8630-0000-PM-RPT-001 – Rev. 0
/ Page 232 |
| Domain | Composite
Grade (g/t) | OK Grade
(g/t) | NN Grade
(g/t) | % Difference
(NN/OK) |
| 401 | 2.70 | 2.50 | 2.39 | -5 |
| 402 | 6.36 | 5.90 | 5.94 | 1 |
| 403 | 0.53 | 0.46 | 0.48 | 3 |
| 404 | 7.54 | 9.18 | 8.96 | -2 |
| 405 | 1.21 | 1.62 | 1.63 | 1 |
| 406 | 0.98 | 0.90 | 0.96 | 6 |
| 408 | 2.34 | 3.15 | 3.46 | 9 |
| 500 | 0.59 | 0.73 | 0.67 | -9 |
| 600 | 1.90 | 2.37 | 1.92 | -24 |
| 700 | 0.47 | 0.48 | 0.44 | -8 |
| 701 | 0.49 | 0.44 | 0.40 | -12 |
| 702 | 1.39 | 1.26 | 0.99 | -28 |
The Opapimiskan-Markop Assemblage in the deposit area is folded into a D2 synform with multiple synform-antiform pairs. Fold axes have a variable plunge from about 5 deg in the Esker North (east) to 43 deg in the West Anticline (west). From a structural top the assemblage consists of calc-alkaline felsic to intermediate volcanic and sedimentary rocks, tholeiitic, mafic volcanic and subvolcanic rocks, and tholeiitic, komatiitic basalt and ultramafic volcanic rocks.
The geology model used for the latest 2021 internal resource update continued to apply an implicit modelling workflow using Leapfrog software for wireframe generation. This was the case for all domains except the intraformational Rifle zone, which was modelled explicitly in Vulcan due to its narrow nature.
| 14.4.1.1 | Drill Hole Database and Data Verification |
The Musselwhite Mine Geology and Resources team provided the diamond drill hole assays database used by DRA to review and confirm the Mineral Resources reported herein for the West Limb deposits. Further information regarding the database and its verification can be found in Section 12 of this Report.
The topographic data used for the project was provided by the Musselwhite Mine Geology and Resources team in the form of a regional Digital Elevation Model (DEM) and deemed of appropriate
| | December 2024 |
| | TECHNICAL REPORT –
MUSSELWHITE MINE, ONTARIO, CANADA
Document # C8630-0000-PM-RPT-001 – Rev. 0
/ Page 233 |
quality by the QP to be used for planning purposes. An interpreted bedrock surface based on available drilling data was also provided.
Work remained ongoing at the time of the West Limb resource update to formally examine the bulk density data at Musselwhite and develop a procedure for improved data collection protocols. As a result, the average density values used in previous models are carried forward here (Table 14.14). It is recommended that further work be completed to analyze any trends or correlations in the density data set.
It is also recommended that an increased frequency of density measurements be collected, especially in lithologies or areas where previous sampling has been sparse as the focus of efforts to date have largely focused on former grade shell areas.
Table 14.13 – West Limb Deposits – Specific Gravity Values by Estimation Domain
| Domain | Specific Gravity
(SG) |
| 100 (Ultramafics) | 3.00 |
| 200 (Felsics) | 2.80 |
| 300 (Upper Mafics) | 2.95 |
| 301 (Lower Mafics) | 2.95 |
| 303 (Lower Mafics) | 3.00 |
| 400 (Intraformational) | 3.15 |
| 500 (4F Schist) | 3.00 |
| 501 | 3.10 |
| 600 (4EA) | 3.29 |
| 14.4.1.4 | Three-Dimensional (3D) Modelling |
The Musselwhite Mine Geology and Resources team provided the QP with a set of wireframes for the lithological domains at the West Limb deposits. Following review of the approach and methodology used to generate the wireframes, in addition to discussions during the QP site visit, DRA conducted an independent review of the interpreted zones both on section and in 3D using MinePlan 3D and Isatis.neo software packages.
3D lithological units and structures were created using Leapfrog Geo software. The features to be modeled in the West Limb model comprise a simplified lithology model and a structural framework. The lithology model is broken down into two separate models, a simplified and a refined model. The difference between these two models is the internal resolution at which the Northern Iron Formation (NIF) is modelled.
| | December 2024 |
| | TECHNICAL REPORT –
MUSSELWHITE MINE, ONTARIO, CANADA
Document # C8630-0000-PM-RPT-001 – Rev. 0
/ Page 234 |
The simplified model was constructed with the aim to be more easily extended away from the current WEL drilling for future targeting, as well as to provide a framework within which the internal NIF could be built. The refined model includes the major internal facies changes in the NIF that are required for proper resource estimation. The refined model itself is simplified from the raw logging data to group the 4BF facies with the 4B facies, and the 4FB facies with the 4F facies. This was done because the gradational nature and complex facies changes through the sedimentary pile are not captured in enough detail or with enough reliability to accurately model these transitional facies.
Three structures were identified and modeled as part of the structural framework. Reliable logging data for throughgoing structures in the WEL is relatively sparse. The structures were modelled in areas with abundant supporting data, and then projected to the model extents through areas of lesser data. These structures should thus be considered only approximate in nature, and further groundtruthing can better verify their existence along the entire strike length of the model area in order to tie in their exact locations.
In addition to the vertical facies changes within the NIF, major lateral facies changes are also present. As a result, the stratigraphy in the West Limb is notably different than the East limb, and these changes in stratigraphy have important implications for mineralization in the West Limb. The most significant difference is that the overall thickness of the stratigraphic components of the West Limb are noticeably thicker than their East Limb counterparts, which is particularly evident in the drastic contrast in thickness of the clastic-dominated 4F component of the NIF. For more details regarding the geology of the WEL, refer to Section 7.
In general, the final estimation domains are defined by a combination of interpreted stratigraphic units and fault blocks. A total of 12 lithological domains have been modelled for estimation purposes, with several of these being further subdivided into 4 fault blocks by the 3 structures detailed above. The resulting lithological, structural and estimation domains for the Musselwhite Mine are summarized in Table 14.14, and a 3D orthographic view (sliced at 13,450N; looking northwest) is also provided in Figure 14.11. These geological models are equally used for resource estimation purposes.
Table 14.14 – Summary of Estimation Domains Based on Lithology and Structure at West
Limb Deposits
| dom_lith | Description |
| 300 | Basement volcanics 12,400N to 14,200N |
| 300 | Basement volcanics background |
| 300 | Lithology of WEL central fault block |
| 200 |
| 301 |
| 500 |
| 302 |
| | December 2024 |
| | TECHNICAL REPORT –
MUSSELWHITE MINE, ONTARIO, CANADA
Document # C8630-0000-PM-RPT-001 – Rev. 0
/ Page 235 |
| dom_lith | Description |
| 100 | |
| 700 |
| 501 |
| 303 |
| 300 | Lithology of WEL east fault block |
| 200 |
| 500 |
| 100 |
| 700 |
| 600 |
| 501 |
| 300 | Lithology of WEL upper fault block |
| 200 |
| 301 |
| 500 |
| 100 |
| 501 |
| 300 | Lithology of WEL west fault block |
| 200 |
| 301 |
| 500 |
| 300 |
| 100 |
| 700 |
| 600 |
| 501 |
| 303 |
| 400 | Rifle zone intraformational (4E) |
| | December 2024 |
| | TECHNICAL REPORT –
MUSSELWHITE MINE, ONTARIO, CANADA
Document # C8630-0000-PM-RPT-001 – Rev. 0
/ Page 236 |
Figure 14.11 – Orthographic 3D View (13,450N; Looking Northwest), West Limb Lithological
Domains
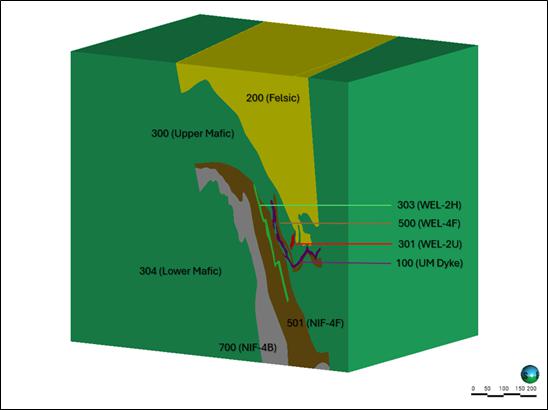
Source: DRA, 2024
| 14.4.1.5 | Descriptive Statistics |
Similar to the East Limb model, data was flagged according to lithological and structural domains, then statistically analyzed using Snowden Supervisor software and Python scripts to determine and/or confirm the final estimation domains. These statistics are run on both raw and composited data sets for comparative purposes.
Cell declustering weights are first calculated in Vulcan prior to statistical analysis to reduce the effect(s) of data clusters caused by fan drilling from available underground drill platforms; the parameters used for declustering are given in Table 14.15.
Table 14.15 – Cell Declustering Parameters used in RMSP for Weight Calculations
| Direction | Cell Dimension (m) |
| X | 25 |
| Y | 25 |
| Z | 25 |
| | December 2024 |
| | TECHNICAL REPORT –
MUSSELWHITE MINE, ONTARIO, CANADA
Document # C8630-0000-PM-RPT-001 – Rev. 0
/ Page 237 |
The overall analysis included basic descriptive statistics, log histograms, box plots and Cumulative Distribution Function (CDF) plots of all raw data samples contained within each domain of the geological model. Length-weighted results are summarized by domain in Table 14.16 and Figure 14.12 to Figure 14.14.
Table 14.16 – Basic Descriptive Statistics for Raw Data Samples (Declustered) Summarized by Domain
| Domain | Count | Mean | St Dev | Var | CV | Min | Lower Quart | Median | Upper Quart | Max |
| 100 | 9,251 | 0.173 | 0.960 | 0.922 | 5.539 | 0.001 | 0.001 | 0.026 | 0.089 | 79.000 |
| 200 | 7,577 | 0.244 | 1.998 | 3.993 | 8.201 | 0.001 | 0.001 | 0.015 | 0.111 | 168.286 |
| 300 | 54,452 | 0.455 | 2.460 | 6.054 | 5.011 | 0.001 | 0.001 | 0.035 | 0.170 | 261.465 |
| 301 | 1,684 | 0.199 | 0.943 | 0.889 | 4.738 | 0.001 | 0.001 | 0.014 | 0.046 | 19.423 |
| 302 | 73 | 0.039 | 0.088 | 0.008 | 2.260 | 0.001 | 0.002 | 0.022 | 0.037 | 0.665 |
| 303 | 3,418 | 0.076 | 0.748 | 0.559 | 9.872 | 0.001 | 0.003 | 0.008 | 0.018 | 32.804 |
| 304 | 6,701 | 0.039 | 0.315 | 0.099 | 8.154 | 0.001 | 0.001 | 0.001 | 0.005 | 11.320 |
| 400 | 49 | 7.897 | 9.570 | 91.594 | 1.212 | 0.014 | 1.459 | 4.433 | 7.314 | 41.970 |
| 500 | 8,488 | 1.355 | 4.371 | 19.108 | 3.227 | 0.001 | 0.025 | 0.108 | 0.737 | 101.364 |
| 501 | 30,527 | 0.311 | 2.176 | 4.736 | 7.008 | 0.001 | 0.013 | 0.029 | 0.084 | 196.386 |
| 600 | 446 | 0.548 | 3.232 | 10.448 | 5.897 | 0.001 | 0.028 | 0.061 | 0.175 | 59.315 |
| 700 | 18,127 | 0.809 | 3.109 | 9.665 | 3.842 | 0.001 | 0.022 | 0.107 | 0.567 | 174.000 |
| | December 2024 |
| | TECHNICAL REPORT –
MUSSELWHITE MINE, ONTARIO, CANADA
Document # C8630-0000-PM-RPT-001 – Rev. 0
/ Page 238 |
Figure 14.12 – Representative Histogram Plots for Raw Data Samples (Declustered)
Summarized by Domain
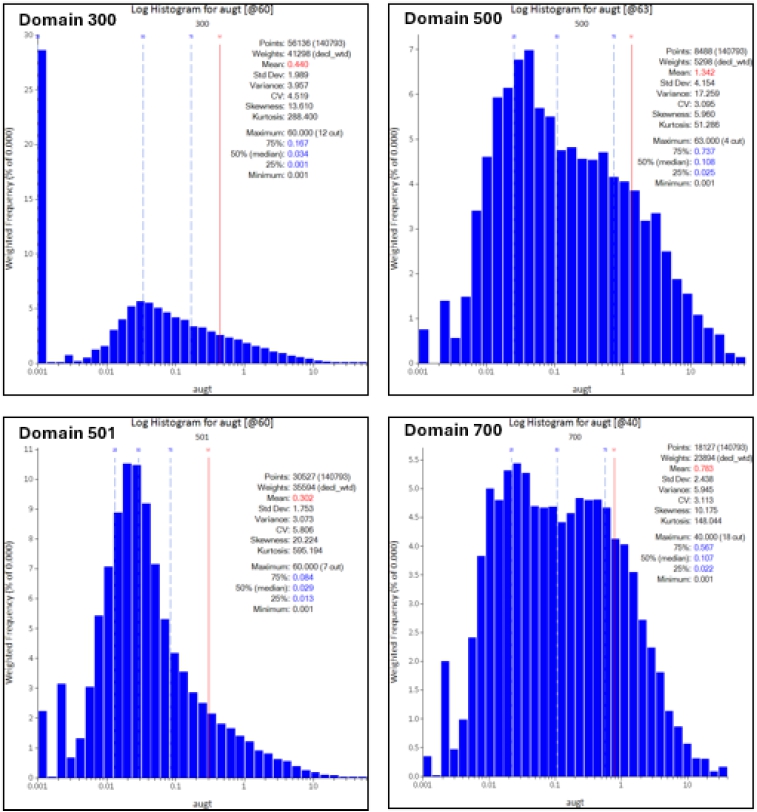
Source: Newmont, 2021
| | December 2024 |
| | TECHNICAL REPORT –
MUSSELWHITE MINE, ONTARIO, CANADA
Document # C8630-0000-PM-RPT-001 – Rev. 0
/ Page 239 |
Figure 14.13 – Box Plots Summarized by Grouped Domains
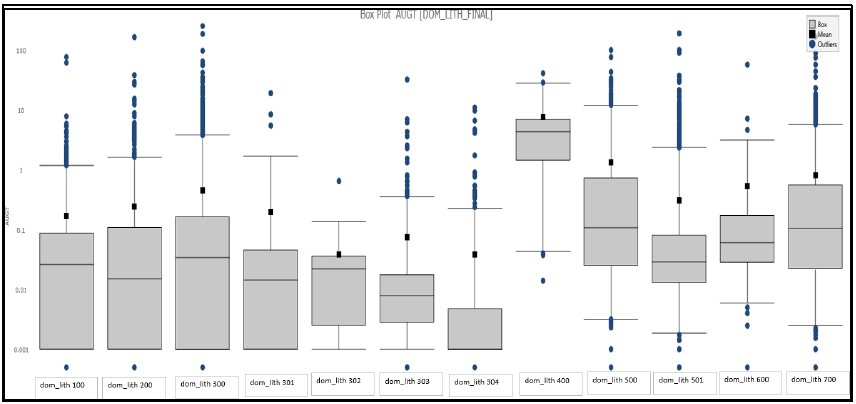
Source: Newmont, 2021
Figure 14.14 – Cumulative Distribution Function (CDF) Plot Summarized by Domain

Source: Newmont, 2021
| | December 2024 |
| | TECHNICAL REPORT –
MUSSELWHITE MINE, ONTARIO, CANADA
Document # C8630-0000-PM-RPT-001 – Rev. 0
/ Page 240 |
Drill hole intercepts through the interpreted domains are composited to 1.0-m equal length intervals, with a 0.5 m tolerance for shorter intervals resulting from intersection of wireframes or unsampled/missing intervals. Globally, the most common sample length at Musselwhite is one (1) metre through mineralized areas (supported by descriptive statistics); moreover, this composite length has been used historically as a standard practice at the mine.
Compared to the East Limb area, unsampled intervals are much less prevalent in the West Limb. A resampling campaign was undertaken years ago when it was discovered that lithologies previously thought to be uneconomic, did in fact host significant gold values. For any areas that remain unsampled, a detection limit grade (0.01 g/t) is still assigned during the compositing process.
Basic descriptive statistics for the composited data within wireframes (i.e., zone intercepts) are provided, together with capping details, in Table 14.17.
Grade capping (top cutting) is used to limit the spatial extrapolation of occasional isolated high grades in the resource model estimates. Capping analyses undertaken included the use of log histograms, log probability plots, ranked composites, and outlier analysis.
Log probability plots generally show clear inflection points at the selected capping value when a threshold is applied to view the upper most samples. Outliers were examined by viewing the ranked composites for each estimation domain. Top cuts were also investigated by capping the highest-grade values sequentially and analyzing the effect on the coefficient of variation (CV) of the remaining data. Capping was ultimately applied to the composites at the time of grade estimation.
The final selected capping grades used in the resource estimate are summarized along with a subset of basic descriptive statistics in Table 14.17. Representative ranked composite plots are also provided in Figure 14.15.
DRA has reviewed and agrees with the grade capping methodology and selections used by the Musselwhite Geology and Resources team; these data are considered sufficient for subsequent resource estimation purposes.
| | December 2024 |
| | TECHNICAL REPORT –
MUSSELWHITE MINE, ONTARIO, CANADA
Document # C8630-0000-PM-RPT-001 – Rev. 0
/ Page 241 |
Table 14.17 – Basic Descriptive Statistics for 1.0-m Capped Composite Data (Declustered)
Summarized by Domain
| Domain | Count | Mean | St Dev | Var | CV | Capping Grade
(g/t) | Capped Comps | Capped Comps
(%) | Capped Mean
(g/t) | Capped CV |
| 200 | 5,751 | 0.256 | 2.094 | 4.385 | 8.180 | 23 | 6 | 0.08 | 0.238 | 4.520 |
| 300 | 27,952 | 0.330 | 1.898 | 3.602 | 5.750 | 60 | 11 | 0.02 | 0.324 | 4.490 |
| 301 | 1,644 | 0.199 | 0.943 | 0.889 | 4.738 | - | - | - | - | - |
| 303 | 2,479 | 0.263 | 2.814 | 7.919 | 10.700 | 10 | 2 | 0.06 | 0.263 | 7.570 |
| 304 | 2,069 | 0.045 | 0.358 | 0.128 | 7.960 | 7 | 3 | 0.04 | 0.042 | 7.320 |
| 400 | 49 | 7.977 | 9.764 | 95.336 | 1.224 | 40 | 1 | 2.04 | 7.905 | 1.214 |
| 500 | 6,973 | 1.266 | 4.232 | 17.910 | 3.343 | 63 | 5 | 0.06 | 1.254 | 3.207 |
| 501 | 18,813 | 0.244 | 1.577 | 2.487 | 6.464 | 60 | 6 | 0.02 | 0.241 | 5.445 |
| 600 | 145 | 0.870 | 4.772 | 22.772 | 5.485 | 11 | 2 | 0.46 | 0.840 | 2.924 |
| 700 | 10,539 | 0.830 | 3.296 | 10.863 | 3.971 | 40 | 19 | 0.10 | 0.814 | 3.134 |
| | December 2024 |
| | TECHNICAL REPORT –
MUSSELWHITE MINE, ONTARIO, CANADA
Document # C8630-0000-PM-RPT-001 – Rev. 0
/ Page 242 |
Figure 14.15 – Representative Ranked Composite Plots of Selected Statistical Domains at West Limb – Musselwhite Mine

Source: Newmont, 2021
Variography aims to assess the spatial continuity of grade for an element of interest, and ultimately helps guide the definition of parameters for the interpolation of Mineral Resources. The selected approach, Ordinary Kriging (OK), is a linear geostatistical estimator that requires input parameters to limit the size of the search neighbourhood (via a defined search ellipsoid) for each point to be interpolated within the block model.
Downhole and directional variography were run using Snowden Supervisor software. Variograms are run to analyze the spatial relationships of composited data within the selected statistical domain.
| | December 2024 |
| | TECHNICAL REPORT –
MUSSELWHITE MINE, ONTARIO, CANADA
Document # C8630-0000-PM-RPT-001 – Rev. 0
/ Page 243 |
Variography was undertaken on capped transformed data. Top cuts were only applied to reduce the effect of extreme outliers, thus affecting only a few of the uppermost composites. The experimental variograms were generated using a normal scores transform; following the fitting of variogram models, the sills are back-transformed to the original data space within the Supervisor software.
Variograms were modelled with three spherical models and the nugget set using a downhole variogram generated with a lag spacing of 1m
Nugget values for the West Limb domains are quite low and range from 0.1 to 0.17. The structure ranges are very long in the direction of maximum continuity and can reach the sill at ranges in excess of 300m.
Variogram model parameters are summarized in Table 14.18, and representative back-transformed normal scores models are also shown in Figure 14.16.
Table 14.18 – Variogram Model Parameters for West Limb Deposits
| Dom_Lith | 200 | 300 | 303 | 304 | 400 | 500 | 501 | 600 | 700 |
| Nugget | 0.17 | 0.14 | 0.16 | 0.06 | 0.10 | 0.10 | 0.15 | 0.16 | 0.13 |
| Angle1 | 355 | 0 | 0 | 0 | 0 | 0 | 0 | 0 | 0 |
| Angle2 | -20 | 0 | 0 | 0 | 0 | 0 | 0 | 0 | 0 |
| Angle3 | 70 | 0 | 0 | 0 | 0 | 0 | 0 | 0 | 0 |
| Sill (Str 1) | 0.74 | 0.63 | 0.70 | 0.87 | 0.74 | 0.46 | 0.74 | 0.59 | 0.69 |
| Range 1 (Str 1) | 8.0 | 10.1 | 29.1 | 29.7 | 54.1 | 10.0 | 6.9 | 14.8 | 5.7 |
| Range 2 (Str 1) | 3.5 | 3.5 | 32.2 | 6.3 | 25.8 | 5.9 | 12.8 | 7.5 | 8.8 |
| Range 3 (Str 1) | 13.2 | 5.0 | 16.5 | 36.1 | 2.5 | 13.6 | 4.3 | 13.1 | 3.6 |
| Type (Str 1) | Sph | Sph | Sph | Sph | Sph | Sph | Sph | Sph | Sph |
| Sill (Str 2) | 0.05 | 0.14 | 0.09 | 0.07 | 0.11 | 0.20 | 0.06 | 0.25 | 0.12 |
| Range 1 (Str 2) | 9.9 | 13.0 | 62.6 | 100.4 | 70.2 | 26.9 | 47.7 | 311.4 | 59.2 |
| Range 2 (Str 2) | 11.0 | 15.6 | 93.5 | 7.9 | 60.1 | 12.8 | 53.8 | 23.6 | 33.0 |
| Range 3 (Str 2) | 55.2 | 9.6 | 22.5 | 79.9 | 15.5 | 24.2 | 19.0 | 39.1 | 16.6 |
| Type (Str 2) | Sph | Sph | Sph | Sph | Sph | Sph | Sph | Sph | Sph |
| Sill (Str 3) | 0.03 | 0.10 | 0.05 | 0.00 | 0.04 | 0.24 | 0.03 | 0.00 | 0.06 |
| Range 1 (Str 3) | 51.6 | 123.3 | 673.2 | 0.0 | 88.5 | 352.8 | 364.1 | 0.0 | 251.3 |
| Range 2 (Str 3) | 25.3 | 75.9 | 175.0 | 0.0 | 99.3 | 26.3 | 99.0 | 0.0 | 59.6 |
| Range 3 (Str 3) | 57.4 | 64.6 | 26.5 | 0.0 | 60.0 | 39.1 | 28.0 | 0.0 | 27.5 |
| Type (Str 3) | Sph | Sph | Sph | Sph | Sph | Sph | Sph | Sph | Sph |
| | December 2024 |
| | TECHNICAL REPORT –
MUSSELWHITE MINE, ONTARIO, CANADA
Document # C8630-0000-PM-RPT-001 – Rev. 0
/ Page 244 |
Figure 14.16 – Representative Normal Scores Variograms (Back-transformed) for West Limb Deposits
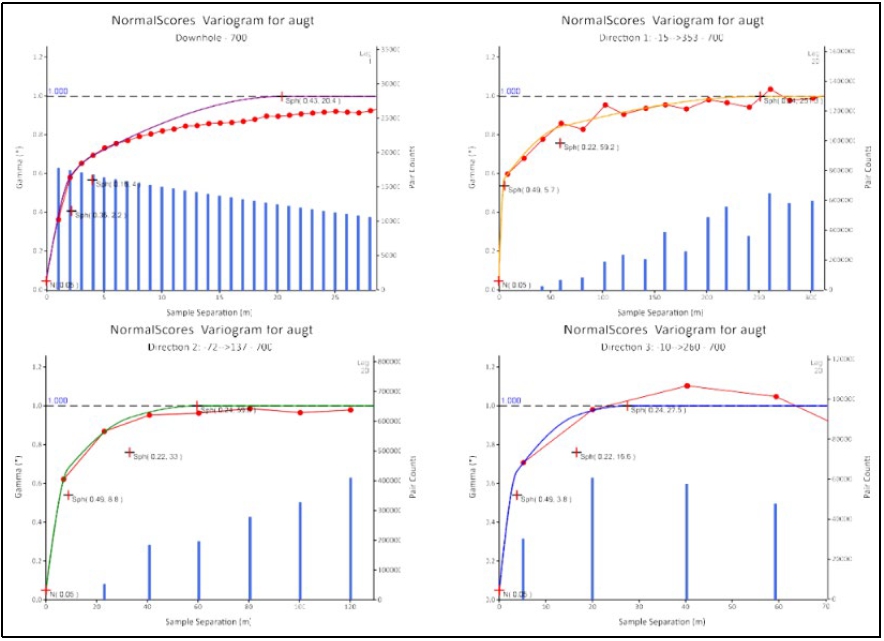
Source: Newmont, 2021
The variograms were also used to help guide the selection of maximum search ellipsoid distances (ranges) for Measured, Indicated and Inferred Resource categories, in conjunction with geological information and other statistical factors, such as average drill hole spacing.
| 14.4.2 | Mineral Resource Estimate |
Gold is currently the only mineral of interest at the Musselwhite Mine and therefore was the only variable estimated as part of this resource update. Except for the statistical analyses, the vast majority of the resource estimation was carried out in Maptek Vulcan software in order to build the block model and perform the subsequent grade and tonnage computations.
Sub-blocking was used to define narrow zones and to maintain volume integrity with the lithological surfaces and triangulations.
| | December 2024 |
| | TECHNICAL REPORT –
MUSSELWHITE MINE, ONTARIO, CANADA
Document # C8630-0000-PM-RPT-001 – Rev. 0
/ Page 245 |
The block model was non-rotated and aligned north–south with the primary Musselwhite Mine grid. Block model definition parameters are found in Table 14.19.
Various block sizes were tested, and the resulting sizes provide adequate resolution along the lithological surfaces while keeping a reasonable file size.
Further discussion with the Engineering team to test the effects of different block sizes and ensure optimal size is being used is recommended.
Table 14.19 – Block Model Definition Parameters for West Limb Deposits
| Description | Value |
| Model Dimension X (m) | 1000 |
| Model Dimension Y (m) | 2190 |
| Model Dimension Z (m) | 1000 |
| Origin X (Easting) | 7200 |
| Origin Y (Northing) | 12000 |
| Origin Z (Lower Elev.) | 4100 |
| Rotation (º) | 0 |
| Block Size X (m) | 1 |
| Sub-block Size X (m) | 1 |
| Block Size Y (m) | 10 |
| Sub-block Size Y (m) | 2.5 |
| Block Size Z (m) | 5 |
| Sub-block Size Z (m) | 2.5 |
| 14.4.2.2 | Search Strategy and Interpolation |
Gold block values were interpolated for each individual estimation domain using the generated composites and the Ordinary Kriging (OK) method. The set of search parameters used in the multi-pass interpolations, derived mainly from variographic analysis and supported by geological interpretations and statistical factors such as average drill hole spacing, are summarized by estimation domain in Table 14.20.
| | December 2024 |
| | TECHNICAL REPORT –
MUSSELWHITE MINE, ONTARIO, CANADA
Document # C8630-0000-PM-RPT-001 – Rev. 0
/ Page 246 |
Table 14.20 – Ordinary Kriging (OK) Interpolation Parameters Summary for West Limb Deposits
| Domain | Pass | Estimation
Method | Min. No.
of
Samples | Max. No.
of
Samples | Max
Samples
per
Octant | Max. Samples per
Drill Hole | Major
Axis | Semi-
Major
Axis | Minor
Axis |
| 200 | 1 | OK | 6 | 16 | 3 | 3 | 60 | 25 | 60 |
| 200 | 2 | OK | 3 | 16 | | 2 | 120 | 50 | 60 |
| 300 | 1 | OK | 8 | 16 | | 3 | 35 | 40 | 20 |
| 300 | 2 | OK | 8 | 16 | 3 | 3 | 125 | 75 | 60 |
| 300 | 3 | OK | 3 | 16 | | 2 | 125 | 75 | 60 |
| 301 | 1 | OK | 8 | 16 | 3 | 3 | 125 | 75 | 60 |
| 303 | 1 | OK | 8 | 16 | 3 | 3 | 100.0 | 100 | 25 |
| 304 | 1 | OK | 6 | 16 | 3 | 3 | 100.0 | 10 | 80 |
| 304 | 2 | OK | 3 | 16 | | 2 | 200 | 40 | 80 |
| 400 | 1 | OK | 8 | 16 | 3 | 3 | 90 | 90 | 30 |
| 500 | 1 | OK | 8 | 16 | | 3 | 75 | 30 | 10 |
| 500 | 2 | OK | 8 | 16 | 3 | 3 | 100 | 35 | 40 |
| 500 | 3 | OK | 2 | 16 | | 1 | 200 | 150 | 40 |
| 501 | 1 | OK | 8 | 12 | | 3 | 50 | 50 | 10 |
| 501 | 2 | OK | 8 | 16 | 3 | 3 | 100 | 100 | 40 |
| 501 | 3 | OK | 3 | 16 | | 2 | 200 | 200 | 40 |
| 600 | 1 | OK | 8 | 16 | 3 | 3 | 100 | 30 | 15 |
| 700 | 1 | OK | 8 | 16 | 3 | 3 | 100 | 60 | 15 |
| 700 | 2 | OK | 4 | 16 | | 2 | 200 | 120 | 20 |
Locally Varying Anisotropy
Domains for the resource model were primarily estimated using locally varying anisotropy with ordinary kriging. It was decided not to produce an unfolded estimation for the West Limb model because tight folds are not as apparent as compared to the geology in the East Limb.
Locally Varying Anisotropy (LVA) was used by coding a bearing, plunge and dip into each block per domain. These coordinates were derived from a single trend plane roughly following the strike and dip of each geological unit. The plunge was based on visual observations of the plunging mineralization. In certain areas, this plunge appears more steeply dipping to the north than what I typically seen in the East Limb model area. Bearing, plunge and dip variables were checked visually in Vulcan on section to verify correct coding.
| | December 2024 |
| | TECHNICAL REPORT –
MUSSELWHITE MINE, ONTARIO, CANADA
Document # C8630-0000-PM-RPT-001 – Rev. 0
/ Page 247 |
Estimation Parameters
All domains were estimated using multi-pass OK. Barren lithologies were not estimated and assigned a waste grade of 0.01 g/t (detection limit).
Most domains were estimated using at least two (2) passes. The first pass on each domain generally uses a minimum of eight (8) samples and a maximum of 16 samples, with a limit of three (3) samples per drill hole. The second pass uses a larger search region with a minimum of 12 samples, maximum of 16 samples, maximum of three (3) samples per octant and a maximum of three (3) samples per drill hole.
The same capping values were used for all passes of each estimation domain. Inventory passes were estimated with a wider search radius and at least two (2) samples from minimum of two (2) drill holes.
| 14.4.2.3 | Mineral Resource Classification |
The Mineral Resources reported herein for the West Limb deposits at Musselwhite Mine have been classified into Measured, Indicated and Inferred categories. This classification is based on the interpreted geological and grade continuity of the observed gold mineralization.
Primary categorization was based on multiple-pass OK interpolation, which employed increasing search ellipsoid ranges (refer back to Table 14.20), and drill spacing using the three-hole rule.
A recent drill hole spacing (DHSS) study was completed in 2021 by Resource Modeling Solution external consultants and recommended Indicated Resources be defined using 12.5 m (vertical) x 50 m (sections). The increased vertical drill density of 12.5 m provides increased resolution across the strike of the orebody to aid in defining the geometry of the tight structural folds of the interpreted lithologies. These recommended criteria were adhered to in the current Mineral Resource Estimate (Table 14.21).
Table 14.21 – Resource Classification Guidance, West Limb Deposits
| Classification | Drill Spacing (m) |
| Vertical | Strike |
| Measured | 25 | 12.5 |
| Indicated | 50 | 12.5 |
| Inferred | 100 | 12.5 |
| High Confidence Inventory | 200 | 25 |
| Low Confidence Inventory | 300 | 37.5 |
| Unclassified | >300 | >37.5 |
| | December 2024 |
| | TECHNICAL REPORT –
MUSSELWHITE MINE, ONTARIO, CANADA
Document # C8630-0000-PM-RPT-001 – Rev. 0
/ Page 248 |
The resource categories use an unconstrained, anisotropic (major direction down plunge) estimate to determine the average distance to the three closest holes (using a minimum and maximum of one sample per hole). The blocks were then flagged by using half the diagonal distance of the drill grid as outlined in internal site guidelines.
Classifications were manually modified in a few instances where estimation artifacts around the periphery of domains were categorized as indicated. In such cases, a 3D triangulation was created around the area(s) of interest and classifications were manually downgraded.
| 14.4.3 | Block Model Validation |
The block model was validated by the Musselwhite Geology and Resources team using a combination of visual inspection, swath plots (in folded and unfolded space) and comparison with nearest neighbour (NN) estimates.
Similar exercises were carried out by DRA, confirming the generated block model to be reasonable and valid for the purposes of reporting Mineral Resources.
| 14.4.3.1 | Visual Inspection |
Estimated blocks and drill hole intercepts were reviewed by DRA both on 2D sections (vertical and plan views) and interactively within the Isatis.neo 3D software environment. The block grades were considered to suitably respect assay grades throughout the deposit. A representative vertical section through the core of the deposit is shown in Figure 14.17.
Figure 14.17 – Comparison of Assay and Block Grades on Representative Vertical Section (12,050N), West Limb Block Model
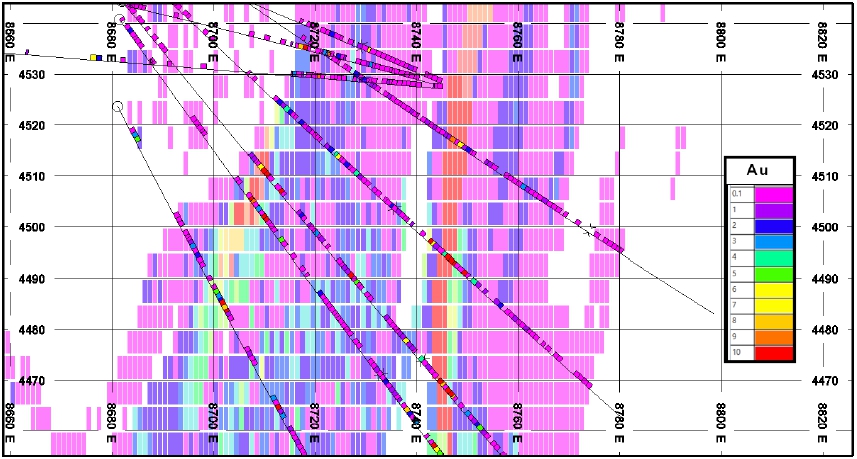
Source: DRA, 2024
| | December 2024 |
| | TECHNICAL REPORT –
MUSSELWHITE MINE, ONTARIO, CANADA
Document # C8630-0000-PM-RPT-001 – Rev. 0
/ Page 249 |
Swath plots for each domain were created in Maptek Vulcan and used to understand and validate the ordinary kriged estimate against both the composite grades and nearest neighbour and inverse distance weighting estimates. Representative plots against the Y direction (25 m spacing) are shown below in Figure 14.18 to Figure 14.21.
Overall, it is generally clear that block grades estimated by kriging closely match those of the 1 m composite data throughout the deposits, in addition to NN and IDW estimates, with a minor amount of smoothing (as expected).
Figure 14.18 – West Limb Deposits Swath Plot of Estimation Domain 300 – Y-direction (North-
South) – 1 m Capped Composites vs. Estimated Block Grades and NN/IDW Models
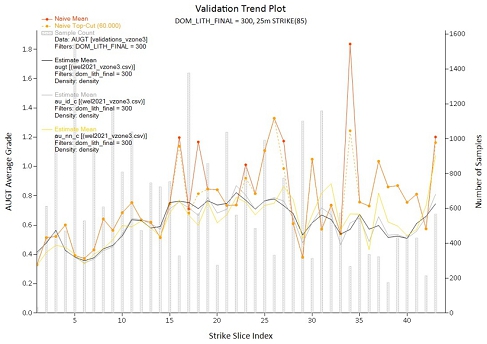
Source: Newmont, 2021
| | December 2024 |
| | TECHNICAL REPORT –
MUSSELWHITE MINE, ONTARIO, CANADA
Document # C8630-0000-PM-RPT-001 – Rev. 0
/ Page 250 |
Figure 14.19 – West Limb Deposits Swath Plot of Estimation Domain 500 – Y-direction (North-
South) – 1 m Capped Composites vs. Estimated Block Grades and NN/IDW Models

Source: Newmont, 2021
Figure 14.20 – West Limb Deposits Swath Plot of Estimation Domain 501 – Y-direction (North-
South) – 1 m Capped Composites vs. Estimated Block Grades and NN/IDW Models
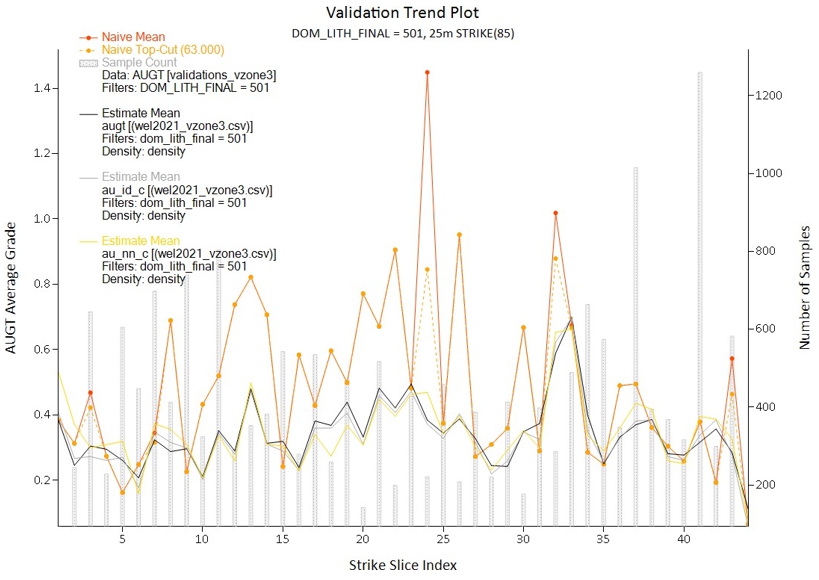
Source: Newmont, 2021
| | December 2024 |
| | TECHNICAL REPORT –
MUSSELWHITE MINE, ONTARIO, CANADA
Document # C8630-0000-PM-RPT-001 – Rev. 0
/ Page 251 |
Figure 14.21 – West Limb Deposits Swath Plot of Estimation Domain 700 – Y-direction (North-
South) – 1 m Capped Composites vs. Estimated Block Grades and NN/IDW Models
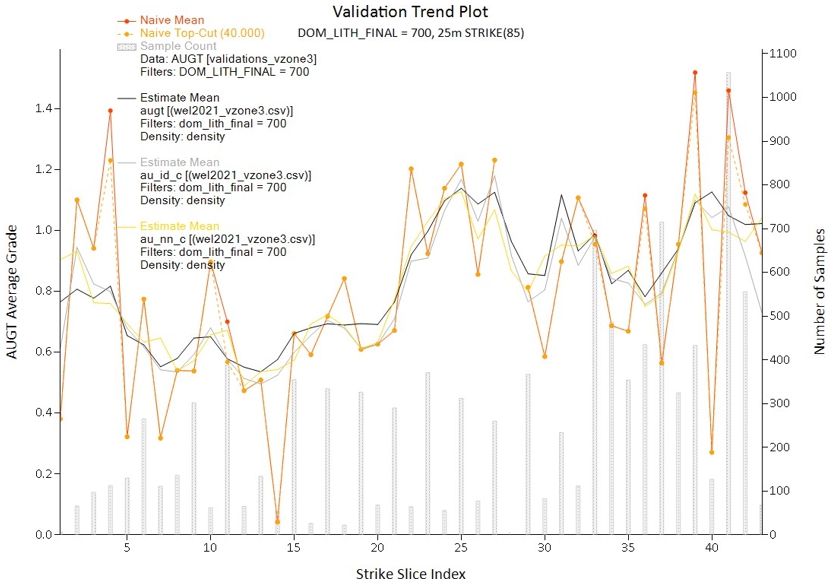
Source: Newmont, 2021
| 14.4.3.3 | Alternative Interpolation Methods |
A nearest neighbour (NN) model was also run as a secondary interpolation method in order to compare against the selected OK method used for this resource estimate. The results of this comparison are summarized in Table 14.22; both outputs are reported here as a global bias check. It is evident that the key mineralized domains (300, 500, 501 and 700) have performed well, with grade differences of less than 3% between the two models. Similar to the East Limb, the larger exceptions are related to low-grade domains (generally deemed waste) with a small number of real samples taken and thus estimated using mostly assigned grades during compositing (e.g., domains 200 and 304).
Table 14.22 – Comparison of OK and NN Interpolation, West Limb Block Model
| Domain | Composite Grade (g/t) | OK Grade
(g/t) | NN Grade
(g/t) | % Difference (NN/OK) |
| 200 | 0.28 | 0.19 | 0.26 | 36 |
| 300 | 0.75 | 0.61 | 0.63 | 3 |
| 301 | 0.20 | 0.26 | 0.19 | -27 |
| 303 | 0.03 | 0.03 | 0.02 | -33 |
| 304 | 0.03 | 0.04 | 0.02 | -50 |
| 400 | 7.90 | 6.96 | 7.46 | 7 |
| | December 2024 |
| | TECHNICAL REPORT –
MUSSELWHITE MINE, ONTARIO, CANADA
Document # C8630-0000-PM-RPT-001 – Rev. 0
/ Page 252 |
| Domain | Composite
Grade (g/t) | OK Grade
(g/t) | NN Grade
(g/t) | % Difference
(NN/OK) |
| 500 | 1.52 | 1.34 | 1.37 | 2 |
| 501 | 0.42 | 0.34 | 0.35 | 3 |
| 600 | 0.72 | 0.74 | 0.74 | 0 |
| 700 | 0.87 | 0.85 | 0.83 | -2 |
| 14.5 | Underground Mineral Resources |
The underground resources were constrained by potential mining shapes for reporting purposes. The resource shapes were created using Deswik Stope Optimizer (DSO); variable operating cut-off grades were applied for stope creation based on the site practice of allocating operating costs by mining area/zone (Table 14.23).
Table 14.23 – Musselwhite Resource Cut-Off Grades by Mining Area/Zone
| Mining Area/Zone | In-Situ Operating
Cut-off Grade
(g/t Au) |
| PQ Deeps | - |
| Transverse | 4.0 |
| Avoca | 4.6 |
| West Limb (WEL) | 4.4 |
| Upper Lynx (ULYNX) | 4.1 |
| Redwings (RDW) | 3.8 |
| Lynx North (LNXN) | 3.9 |
| Lynx (LYNX) | 4.6 |
| T-Antiform (TANT) | 3.9 |
| Mine Average | 4.0 |
The potential mining shapes were generated in DSO using the average (typically) strike length blasted, the standard stope parameters (Table 14.24 and Table 14.25) and appropriate in-situ cut-off grade. The selected cut-off grades ensure that each production blast segment will provide an operating profit at the guidance gold price. Further economic analysis is also completed in Deswik to ensure the stopes generate a profit for the required sustaining capital spend. In addition, all resource material arising from planned development with grades above a strategic cut-off of 1.97 g/t Au is also included in the final resource.
| | December 2024 |
| | TECHNICAL REPORT –
MUSSELWHITE MINE, ONTARIO, CANADA
Document # C8630-0000-PM-RPT-001 – Rev. 0
/ Page 253 |
Table 14.24 – Standard Mining Shape Design Parameters by Method, Musselwhite Mine
| Mining Method | Minimum
Mining Width | Maximum
HW Dip | Maximum
FW Dip | Minimum
Lense Gap | Mining
Recovery |
| Units | (m) | (o) | (o) | (m) | (%) |
| Transverse | 10 | 90 | 65 | 10 | 93 |
| Avoca | 4 | 55 | 65 | 10 | 94 |
| Narrow Avoca | 3 | 55 | 65 | 10 | 94 |
Table 14.25 – Standard Mining Shape Design Parameters by Zone, Musselwhite Mine
| Zone | Minimum
Rib Pillar Width | Mining
Dilution |
| Units | (m) | (%) |
| PQ Deeps (PQD) | 10 | - |
| Transverse | - | 14 |
| Avoca | - | 30 |
| West Limb (WEL) | 5 | 20 |
| Upper Lynx (ULYNX) | 5 | 25 |
| Redwings (RDW) | 5 | 15 |
| Lynx North (LNXN) | 10 | 20 |
| Lynx (LYNX) | 10 | 25 |
| T-Antiform (TANT) | 5 | 20 |
| All Others | 5 | 20 |
The optimization considered Measured, Indicated and Inferred blocks in the Mineral Resource Inventory. Overall, the underground resources are reported at a cut-off grade of not less than 3.8 g/t Au using a gold price of US$1,600/oz.
The resulting resource shapes generated for the 2023 Musselwhite Mine resource update are shown in 3D in Figure 14.22.
| | December 2024 |
| | TECHNICAL REPORT –
MUSSELWHITE MINE, ONTARIO, CANADA
Document # C8630-0000-PM-RPT-001 – Rev. 0
/ Page 254 |
Figure 14.22 – Resource Constraining Underground Reporting Shapes, Longitudinal View (Looking West), Musselwhite Mine
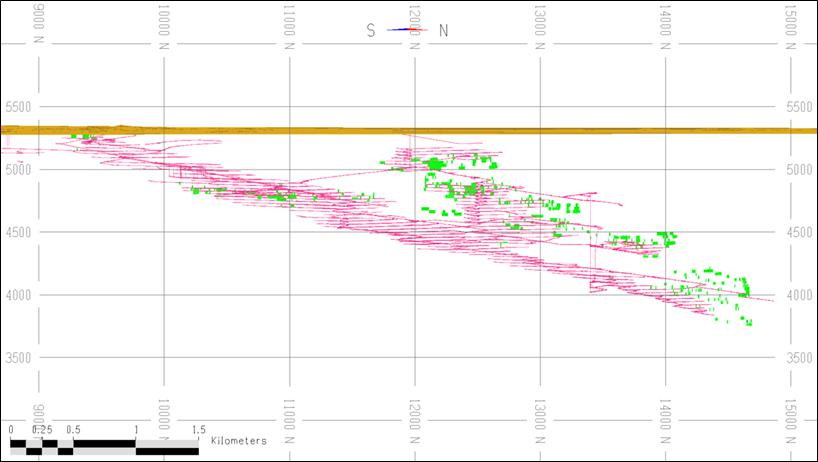
Source: DRA, 2024
| | December 2024 |
| | TECHNICAL REPORT –
MUSSELWHITE MINE, ONTARIO, CANADA
Document # C8630-0000-PM-RPT-001 – Rev. 0
/ Page 255 |
| 14.6 | Mineral Resource Statement |
The Mineral Resource Estimate statement for the East and West Limb Deposits prepared by the Musselwhite Mine Geology and Resources team, and reviewed by the QP, is summarized in Table 14.26. Additional details on mining and processing modifying factors are also provided in the adjoining footnotes.
The Mineral Resource Estimate for the Musselwhite Mine includes Measured and Indicated Resources of 2,155 kt @ 4.25 g/t Au for 294 koz, and Inferred Resources of 1,188 kt @ 4.96 g/t Au for 190 koz.
The MRE has been prepared using a cut-off grade of not less than 3.80 g/t Au, and the underground Mineral Resources are reported using a gold price of US$ 1,600.
Table 14.26–Mineral Resource Estimate East and West Limb Deposits, Dec. 31, 2023
| Category | Tonnage | Average Grade | Gold Ounces |
| (Mt) | (g/t Au) | (koz Au) |
| East and West Limb Deposits | | | |
| Measured | 0.87 | 4.36 | 122 |
| Indicated | 1.29 | 4.17 | 173 |
| Total Measured + Indicated | 2.16 | 4.25 | 294 |
| Inferred | 1.19 | 4.96 | 190 |
| Notes: |
| 1. | The Mineral Resource Estimate has been estimated using the Canadian Institute of Mining, Metallurgy and Petroleum (CIM) Definitions Standards for Mineral Resource and Mineral Reserve in accordance with National Instrument 43-101 – Standards of Disclosure for Mineral Projects. Mineral Resources which are not Mineral Reserves, do not have demonstrated economic viability. |
| 2. | Mineral Resources are reported exclusive of mineral reserves. |
| 3. | Reference point for Mineral Resources is point of delivery to the process plant (diluted and mine recovered). |
| 4. | Mineral Resources are constrained within stope shapes generated by Deswik Stope Optimizer. Design parameters varied by both mining method (Transverse and Avoca) and zone for mining recovery (93–94%) and dilution (14–30%) factors, respectively; refer to Section 14.5. |
| 5. | Stope shapes were developed using a gold sales price of US$1,600/oz. |
| 6. | Underground resources were estimated using a variable cut-off grade of not less than 3.80 g/t Au. |
| 7. | Resource estimations were interpolated using Ordinary Kriging (OK). |
| 8. | The effective date of the Mineral Resource Estimate is December 31, 2023. |
| 9. | Figures have been rounded to an appropriate level of precision for the reporting of Mineral Resources. As a result, totals may not compute exactly as shown. |
| | December 2024 |
| | TECHNICAL REPORT –
MUSSELWHITE MINE, ONTARIO, CANADA
Document # C8630-0000-PM-RPT-001 – Rev. 0
/ Page 256 |
| 14.7 | Qualified Person’s Opinion |
The Mineral Resources reported herein have been prepared by the Musselwhite Mine Geology and Resource team, and subsequently reviewed and validated by R.S. Wilson, P.Geo., of DRA Americas Inc.
It is the QP’s opinion that the geological interpretation and related data are valid for the estimation of Mineral Resources. The assumptions made and methodology applied are considered reasonable and representative of typical banded iron formation-hosted Archean gold mineralization systems. As such, the QP considers the presented Mineral Resources to have been prepared in accordance with current CIM standards, definitions and guidelines for Mineral Resources Estimation.
The QP cautions that Mineral Resources that are not Mineral Reserves do not have demonstrated economic viability. Additionally, there is no certainty that all or part of the Mineral Resources will be converted into Mineral Reserves.
The QP is currently unaware of any legal, title, environmental, permitting, taxation, socio-economic, geopolitical or other factor that may materially affect the Mineral Resources estimate presented in this Report for the East and West Limb Deposits at Musselwhite Mine.
| | December 2024 |
| | TECHNICAL REPORT –
MUSSELWHITE MINE, ONTARIO, CANADA
Document # C8630-0000-PM-RPT-001 – Rev. 0
/ Page 257 |
| 15 | Mineral Reserve Estimates |
This section presents the Musselwhite Mine Mineral Reserve Estimate effective December 31, 2023, and discusses the key assumptions, parameters, and methods used for converting Mineral Resources to Mineral Reserves.
A Mineral Reserve is an estimate of tonnage and grade or quality of measured and indicated mineral resources that, in the opinion of the Qualified Person (QP), can be the basis of an economically viable project. More specifically, it is the economically mineable part of a measured or indicated mineral resource, which includes diluting materials and allowances for losses that may occur when the material is mined or extracted. A Probable mineral reserve is the economically mineable part of an indicated and, in some cases, measured mineral resource. A Proven Mineral Reserve is the economically mineable part of a measured mineral resource and can only result from the conversion of a measured mineral resource.
The mine design, scheduling, and mineral reserve estimate were prepared by the Musselwhite Mine technical services department under the supervision of the QP responsible for these estimates. WSP has reproduced the mineral reserve to confirm the accuracy and solidity of the mineral reserve.
Mineral Reserve Qualified Person, Paul Gauthier, P.Eng., completed a site visit on September 4 and 5, 2024. The visit included multiple stops made to active headings, maintenance shops and other underground facilities. Discussions with site management for the purpose of data verification also took place.
| 15.2 | Estimation Methodology |
The methodology used to prepare the 2024 mine design is similar to that implemented for the previous year updates, with updates to account for changes in actual operating performance over the 12 months preceding the effective date of December 31, 2023, of this Report. The process consists of converting Measured and Indicated Mineral Resources to Proven and Probable Reserves by identifying material that exceeds the NSR cut-off values while conforming to the geometrical constraints determined by the mining method and applying modifying factors such as dilution and mining recovery. The conversion of Measured and Indicated Mineral Resources to Proven and Probable Mineral Reserves involves the following procedures:
| ● | Review the geological block model of the resource received from geology; |
| ● | Review the long-term metal price assumptions to ensure they are reasonable; |
| ● | Estimate the on-site production costs according to the mining method and mining situation; |
| ● | Estimate the economic modifying factors; |
| ● | Apply economic modifying factors to the block model and exclude Inferred Mineral Resources; |
| | December 2024 |
| | TECHNICAL REPORT –
MUSSELWHITE MINE, ONTARIO, CANADA
Document # C8630-0000-PM-RPT-001 – Rev. 0
/ Page 258 |
| ● | Analyze resource characteristics to select viable mining methods for each geological domain; |
| ● | Estimate mining modifying factors: dilution and mining recovery; |
| ● | Determine mine design parameters, such as stope dimensions, minimum mining width, and minimum footwall angle for LHS; |
| ● | Outline potentially mineable shapes in the block model based on the resource value exceeding the cut-off grade; |
| ● | Screen potentially mineable shapes with the Mineable Shape Optimizer application in Deswik software; |
| ● | Refine potentially mineable shapes by removing un-mineable resource material; |
| ● | Design mine development and mine infrastructure in mine design software; |
| ● | Carry out economic analysis of the mineable shapes, removing areas that are not viable; |
| ● | Determine production sequencing with Scheduler software; |
| ● | Prepare a life-of-mine plan for development and production |
| ● | Estimate capital, operating, and sustaining capital costs associated with the life-of-mine plan; |
| ● | Verify the economic viability of the proposed reserve; and |
| ● | Prepare the Mineral Reserve statement. |
As described in the previous section, converting Mineral Resources to Mineral Reserves involves applying modifying factors. A Qualified Person (QP) must apply and evaluate modifying factors to convert measured and indicated mineral resources to proven and probable mineral reserves. These factors include but are not restricted to mining; processing; metallurgical; infrastructure; economic; marketing; legal; environmental compliance; plans, negotiations, or agreements with local individuals or groups; and governmental factors. The number, type and specific characteristics of the modifying factors applied will necessarily be a function of and depend upon the mineral, mine, property, or project. The following subsections discuss the mining and economic modifying factors that were applied in estimating the 2023 year-end Mineral Reserve.
| 15.3.1 | Metal Prices and Exchange Rate |
The metal price in the mineral reserve estimate varies in range from 1,200 US$/oz to 1,600 US$/oz. In the 2023 MRMR, for the long-range gold price was establish at 1,400 US$/oz. Figure 15.1 illustrates the metal prices trend for the last 5 years based on World Gold site.
| | December 2024 |
| | TECHNICAL REPORT –
MUSSELWHITE MINE, ONTARIO, CANADA
Document # C8630-0000-PM-RPT-001 – Rev. 0
/ Page 259 |
Figure 15.1 – 5 Years Gold price (US$/oz)
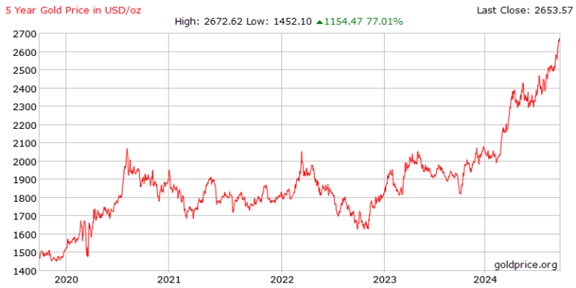
Source: World Gold Council, 2024
The long-term exchange rate was for the 2023 MRMR was established at $CA0.75/$US1.00.
The QP reviewed the long-term exchange rate and metal prices and is of the opinion that they are reasonable for the estimation of the Mineral Reserve.
| 15.3.2 | Mineral Reserve Statement |
As Musselwhite Mine is a gold deposit, the viability of mining the resource is assessed in terms of grade unit values. The reserve estimate for Musselwhite Mine is based on a long term mine plan that is economically and technically viable. The reserve and resource estimates are completed using a methodology compliant with the Canada’s National Instrument 43-101, and the CIM Estimation of Mineral Resources and Mineral Reserves Best Practice Guidelines.
| 15.3.3 | Mine Production Cost and Sustaining Capital Costs |
| 15.3.3.1 | Mines Production Cost |
The operating costs are commonly considered as the costs that are incurred in the current year of production. The basis for calculation of operating costs includes the following common cost centers:
| ● | Mining that includes all costs to extract and haul ore to a process plant facility or extract and haul waste to the storage location. The costs associated with mining are: the development costs, production stope drilling and blasting, stope mucking, ore and waste transportation and stope backfilling, hoisting and crushing and Mine Services (including engineering and geology). |
| | December 2024 |
| | TECHNICAL REPORT –
MUSSELWHITE MINE, ONTARIO, CANADA
Document # C8630-0000-PM-RPT-001 – Rev. 0
/ Page 260 |
| ● | Processing that includes all costs to process ore delivered from the mine to the process plant and to the tailing disposal. |
| ● | General and Administration (G&A) represent the necessary costs to maintain the mine daily operations and administer its business, but not directly attributable to the production. |
Operating costs for the Musselwhite Mine have been established based on the location of each zone, the mining method (longitudinal or transversal), and ore haulage to the crushing station. Table 15.1 presents the operating costs for each zone used in Deswik.
Table 15.1 – Mining Cost per Zone
| Zone | Unit | Value |
| PQ Deeps (PQD) | CA$/ore tonne | 150.83 |
| West Limb (WEL) | CA$/ore tonne | 172.29 |
| Upper Lynx (ULYNX) | CA$/ore tonne | 137.79 |
| Redwings (RDW) | CA$/ore tonne | 133.61 |
| Lynx North (LNXN) | CA$/ore tonne | 141.17 |
| Lynx (LYNX) | CA$/ore tonne | 133.04 |
| T-Antiform (T-ANT) | CA$/ore tonne | 122.35 |
| Others (Mine Average) | CA$/ore tonne | 149.83 |
| 15.3.3.2 | Sustaining Capital |
The sustaining capital is required by a mining operation to maintain production at the planned level. This sustaining capital is distinct from the routine operating costs associated with labour, consumables, maintenance, and third-party supply, and is generally of a shorter-term nature. The sustaining capital items include the following:
| ● | Mine development (Underground haulage drifts and ventilation raises); |
| ● | Equipment rebuilds (mining fleet, plant equipment) costs required to extend the useful life of asset; |
| ● | Equipment replacement or expansion as required by the reserve LoM plan; |
| ● | Process facility replacements; |
| ● | Expansion of tailing storage facility; |
| ● | Infrastructure facility replacements; |
| ● | Additional land purchases; and |
| | December 2024 |
| | TECHNICAL REPORT –
MUSSELWHITE MINE, ONTARIO, CANADA
Document # C8630-0000-PM-RPT-001 – Rev. 0
/ Page 261 |
The sustaining capital for Musselwhite Mine is estimated at 27.17 CA$/ore tonne milled based on the parameters above.
| 15.3.4 | Dilution and Mining Recovery |
In the 2023 Mineral Reserve estimate, Musselwhite’s technical services department assessed the factors for dilution and mining recovery based on recent operating performance and reconciliation calculations of production data. These assumptions are applied based on the mining method, stope width, zone dips.
The dilution and recovery factors for transversal stoping, Avoca and modified Avoca are estimated in percentage in the Deswik mine design software according to the width and dip of the veins. The dilution and mining recovery is estimated in terms of percentage. Table 15.2 represents the dilution and mining recovery used in the cut-offs grade calculation.
Table 15.2 – Dilution and Mining Recovery
| Zone | Minimum Rib
Pillar Width (m) | Dilution
(%) | Mining Recovery
(%) |
| PQ Deeps (PQD) | | | |
| Transversal | 10 | 14 | 93 |
| Avoca | - | 30 | 94 |
| West Limb (WEL) | 5 | 20 | 94 |
| Upper Lynx (ULYNX) | 5 | 25 | 94 |
| Redwings (RDW) | 5 | 15 | 94 |
| Lynx North (LNXN)) | 10 | 20 | 94 |
| Lynx (LYNX) | 10 | 25 | 94 |
| T-Antiform (T-ANT) | 5 | 20 | 94 |
| Others (Mine Average) | 5 | 20 | 94 |
| | December 2024 |
| | TECHNICAL REPORT –
MUSSELWHITE MINE, ONTARIO, CANADA
Document # C8630-0000-PM-RPT-001 – Rev. 0
/ Page 262 |
| 15.3.5 | Cut-Offs Grade Parameters |
The cut-off grade (CoG) analysis is based on the 23MRMR_COG_24BP V1.0 rev1 provided by Musselwhite Mine. Subsequent reviewed of these parameters occurred, but did not impact the cut-off grade. Table 15.3 illustrates the parameters used to calculate the CoG.
Table 15.3 – Ore Reserve Calculation Parameters
| Parameter | Unit | Value |
| Metal Price | US$/oz | 1,400 |
| Exchange Rate | US$:CA$ | 0.75 |
| Discount Rate | % | 5 |
| Production Rate | Mtpa | 1.03 |
| Mining Dilution | Variable / zones / mining method | |
| Mining Recovery | Variable per mining method | |
| Mill Recovery | % | 94.1310 *
(head grade
(g au/tonne)0.0105 |
| Lateral Development | CA$/metre | 6,520.00 |
| Vertical Development | CA$/metre | - |
| Mining Cost/Zone | | |
| - PQ Deeps (PQD) | CA$/ore tonne | 150.83 |
| - West Limb (WEL) | CA$/ore tonne | 172.29 |
| - Upper Lynx (ULYNX) | CA$/ore tonne | 137.79 |
| - Redwings (RDW) | CA$/ore tonne | 133.61 |
| - Lynx North (LNXN) | CA$/ore tonne | 141.17 |
| - Lynx (LYNX) | CA$/ore tonne | 133.04 |
| - T-Antiform (TANT) | CA$/ore tonne | 122.35 |
| - Others (Mine Average) | CA$/ore tonne | 149.83 |
| Processing Cost | CA$/ore tonne milled | 28.00 |
| G & A | CA$/ore tonne milled | 35.49 |
| Royalties | CA$/oz of gold produced | 73.18 |
| Sustaining Capital | CA$/ore tonne | 27.17 |
| 15.3.6 | Ground Support Systems |
The primary methods of ground support at Musselwhite Mine include:
| | December 2024 |
| | TECHNICAL REPORT –
MUSSELWHITE MINE, ONTARIO, CANADA
Document # C8630-0000-PM-RPT-001 – Rev. 0
/ Page 263 |
| ● | External support (screen, steel straps, shotcrete); and |
| ● | Rock fill (cemented and uncemented). |
Musselwhite Mine ground support requirements have evolved as the operation encountered changing ground conditions and changes to equipment. The current standards at Musselwhite Mine are summarized as follows.
In 2019, two ground support standards were established. The first standard for permanent headings consists of 2.4 m long #7 fully grouted resin rebars on 1.2 m by 1.2 m in the back and in the walls of the drift with #6 gauge welded wire mesh. The mesh must be within 2.5 m of the floor and the last row of rebars must be within 1.5 m of the floor. The second standard for temporary headings, open for less than two (2) years or as specified the Rock Mechanics Department, consists of 2.4 m long #7 fully grouted resin rebars on 1.2 m by 1.2 m in the back and 1.8 m long FS-39 friction stabilisers on 1.2 m by 1.2 m in the walls of the drift with #6 gauge welded wire mesh. The mesh must be within 2.5 m of the floor and the last row of friction stabiliser must be within 1.5 m of the floor.
In 2021 the jumbo bolting initiative had commenced as a trial at Musselwhite to improve rates and decrease costs associated with development. This led to the incorporation and implementation of MD Bolts into the ground support standard for the Red Wings zone in 2022. Other areas are currently being evaluated for jumbo bolting with MD bolts. Areas that were excavated prior to the latest revision of the support standard are not brought up to the current standard unless the given area has either been designated for rehab, or personnel and/or equipment will be actively working in the area. If any re-development of an area with drilling and blasting is planned, workers must ensure minimum ground support standards extend to 10 m on either side of the work area after the activity has taken place prior to accessing the area.
The primary types of internal support include:
| ● | Inflatable Friction Bolt – Employed extensively for short term excavations, such as pre-support in longitudinal mining fronts, wide span temporary intersections, to pre-support undercutting and to re-support walls that are suffering deformation. |
| ● | Resin Rebar Bolt – Resin rebar rock bolts are used in all areas of long- and medium-term excavation life. Currently, rebar is being used in mechanized bolter installation (jumbo bolting). |
| ● | Mechanical Rock Bolt – Mechanical rock bolts are used during advance to tie the first row of screen to the last row of screen in lieu of double plating rebar and where corrosion is not anticipated to be a factor, and the rebar primary support is installed to standard. Mechanical bolts may also be used to pin mesh to replace damage welded wire mesh where rebars were installed to standard and are in good condition |
| | December 2024 |
| | TECHNICAL REPORT –
MUSSELWHITE MINE, ONTARIO, CANADA
Document # C8630-0000-PM-RPT-001 – Rev. 0
/ Page 264 |
| ● | Friction Stabiliser – In the walls of temporary headings 1.8 m long FS-39 are installed on 1.2 m x 1.2 m square pattern. Face bolting is done with 1.8 m long FS-46 Friction stabiliser on 1.2 m x 1.2 m pattern. |
| ● | Cable Bolts/Cable Lok Bolts – Cable bolting is an effective means of stabilizing and supporting large masses of rock and is used in conjunction with primary support. One of the advantages in using cable bolts is that they can be cut and installed at any length. In addition, cable bolts used for ‘point-load’ support of the walls of an open stope in longhole mining and in the back of excavations with large or unstable spans. The double strand cable bolt is grouted into the drill hole using regular Portland (Type 10) cement mixed from 0.35:1 to 0.375:1 water: cement ratio. Plates can be added at the collar for post-tensioning. Bolt lengths are typically 5m, 6m and 8m. Empirical methods for cable bolt design are used including the stability graph method and/or analytical design. |
| ● | MD and MDX Bolt – The MD bolt is installed in a 47 mm friction bolt reinforced with a 20mm bar and a wedge arrangement at the bolt top end. Once the bolt is fully driven into the hole (like the friction bolt), the nut at the bottom is rotated to actuate a set of wedges that firmly anchor the bolt top end in the rock. The standard bolting pattern utilized is 1.4 m x 1.1 m for 2.4 m long MD bolt in the back, shoulders and walls. First bolts installed maximum 1.5 m from floor. |
| ● | Versabolts – Where high stress, seismic activities or large deformation is expected Versabolts will be used. The bolt is 20.5 mm diameter with yield strength of 15 tonnes and ultimate tensile strength of 21 t. The dynamic capacity is rated at 26 kJ. It is installed with resin as a regular rebars on 1.2 m x 1.2 m pattern. The pattern may be modified by the Rock Mechanics Department based on ground conditions and expected stress level. |
| ● | Screen/Mesh – The following are the screen types used at Musselwhite Mine: |
| § | #6 gauge (100 mm x 100 mm) Weld Wire Mesh (WWM) is the main type of screen installed using 1.5 m x 3.0 m (5 ft x 10 ft) sheets and 2.4 m x 2.5 m (7.8 ft x 8.2ft); |
| § | #9 gauge WWM screen has also been used in the past and is still used for temporary support of the face in raise mining; |
| § | #4 gauge WWM is being considered for seismic active areas based on recent events in 2024; and |
| § | #0 gauge WWM (mesh straps) at 0.3 m wide and lengths of 1.8 and 2.4 m are applied with primary support to help prevent joints/cracks from opening up and to secure unstable block. The mesh straps are installed in pilar and along brows and installed perpendicular to the plane of weakness. |
| • | Galvanized regular chain link mesh is also used in special applications such as refuge stations and electrical substations or where corrosion is anticipated. |
| • | Steel Straps used at Musselwhite Mine are made of 6 mm thick steel, 100 mm wide and vary in length from 1.2 m to 2.4 m. The steel straps are pinned with primary support in a similar method as mesh straps. |
| | December 2024 |
| | TECHNICAL REPORT –
MUSSELWHITE MINE, ONTARIO, CANADA
Document # C8630-0000-PM-RPT-001 – Rev. 0
/ Page 265 |
| ● | Shotcrete – Shotcrete has had limited use as ground support at Musselwhite Mine due to the good ground conditions. As mining progress deeper areas will require additional support to contain stress fractured material. Shotcrete is delivered pre-mixed and transformed to wet mix underground. Fibers are added as required when making the wet mix underground. For surface retain purpose, the thickness of shotcrete is designed as 50 mm. While for structural support, the thickness should be at least 75 mm or as per Rock Mechanics Department recommendations. |
| ● | Rockfill – Rockfill is a key element of the stoping methods used at Musselwhite Mine. A good quality rockfill is required to mine safely and minimize dilution. The rockfill system consists of both consolidated and unconsolidated rockfill. The rockfill can be obtained from either open pit crushed material or development waste. The purpose of the rockfill is to: |
| § | Limit the volume of open ground; |
| § | Prevent uncontrolled convergence, raveling and caving of the open stope; |
| § | Act as a working platform for the longitudinal retreat stopes; and |
| § | Allow for secondary stope recovery (both below and adjacent). |
Depending on the application, unconsolidated rockfill (URF) or consolidated rockfill (CRF) material can be utilized as rockfill. In the case of CRF, a 4-5% binder of cement with varied compositions depending on availability of materials (50% Portland GU/50% fly ash, 100% Portland GU, slag cement blends with Portland GU).
All ground support products come from DSI (with the exception of MD Bolts). MD Bolts are provided by Sandvik. The length of support used is dependent on the ground conditions, adverse structures, span of the opening, excavation life (short term or long term) and stress regime. When adverse structure is to be supported, the Rock Mechanics Department will assess the stability of the excavation and determine a suitable ground support system to be installed.
| 15.3.6.1 | Ground Control Quality Program |
Musselwhite Mine has a ground control quality program which is primarily a bolt pull testing to ensure support capacity and installation quality. Additionally, part of the quality program is visual inspection of the installed support to ensure compliance with the Musselwhite Mine ground support standards and rock mechanic requirements for specific locations. The visual inspections also can confirm that the installed support tis appropriate for the rock mass conditions encountered and determine if adjustment is required.
| 15.3.7 | Cut-off Grade Calculation |
Based on the parameters above, the reserve cut-off grade has been calculated per mining zone, mining method, and their production costs. Table 15.4 shows the results of the cut-off based on different circumcises in the mining operation.
| | December 2024 |
| | TECHNICAL REPORT –
MUSSELWHITE MINE, ONTARIO, CANADA
Document # C8630-0000-PM-RPT-001 – Rev. 0
/ Page 266 |
Table 15.4 – Cut-Off Grade Calculation
| Zone | | Full Cost Break-
Even Cut-off
GradeA | Operating
Cut-
off GradeB | In-Situ Operating
Cut-off GradeC |
| PQ Deeps (PQD) | % | 4.7 | 4.0 | - |
| West Limb (WEL) | % | 5.2 | 4.2 | 5.1 |
| Upper Lynx (ULYNX) | % | 4.7 | 3.8 | 4.7 |
| Redwings (RDW) | % | 4.3 | 3.8 | 4.3 |
| Lynx North (LNXN)) | % | 4.5 | 3.7 | 4.5 |
| Lynx (LYNX) | % | 4.7 | 4.2 | 5.3 |
| T-Antiform (TANT) | % | 4.4 | 3.8 | 4.5 |
| Mine Average | % | 4.8 | 3.8 | 4.6 |
Note: A The Full Cut-Off Break-Even Grade is the zone cut-off based on the 24BP mining shapes and schedule over the current Life of Mine (LoM). It is based on an application of operating costs, sustaining drifting costs, other sustaining capital average from steady state years of the 24BP (2024 trough 2028, inclusive). Each zone’s final reserves grade should be above this grade unless otherwise supported by new economic validation on new tonnes, development, and grade and include all the cost items listed above B The Operating Cut-Off Grade (CoG) is reserve operating CoG. It is also based on 24BP mining shapes and schedule over the current LoM. It is also built on an application of operating costs appropriate for the zone. Each horizon in the zone should be above this grade with sufficient profit to cover the cost of any capital drifting required to access the horizon and meet the hurdle rate. C In-situ Operating Cut-Off Grade is used solely in software for generating drill shapes. It is the grade necessary to meeting the diluted Operating CoG based on the expected mining dilution. This varies by zone and incorporates the appropriate zone and mining method dilution factor. |
Mineable Shape Optimizer (MSO) embedded in Deswik mine design software was used to determine the mineable portion of the Mineral Resource. Through an iterative process, the application generates and evaluates potentially mineable shapes in the geological block model to define optimal stope designs that maximize the economic value of the orebody. At the same time, it analyzes deposit geometry, mining methods, geological and geotechnical constraints, modifying factors, and mine design parameters. Deswik mine design software was used to refine the optimized blocks into mineable stope shapes.
| 15.5 | Mineral Reserve Estimate |
Table 15.5 presents the Mineral Reserve estimate for Musselwhite as of December 31, 2023. It consists of Proven and Probable ore.
Figure 15.2 illustrates the Mineral Reserves in a long section view according to the CoG of the ore per zone.
| | December 2024 |
| | TECHNICAL REPORT –
MUSSELWHITE MINE, ONTARIO, CANADA
Document # C8630-0000-PM-RPT-001 – Rev. 0
/ Page 267 |
The Mineral Reserves are disclosed with a “mill feed” reference point; consequently, they are reported as run-of-mine ore delivered to the processing plant and do not include reductions attributed to anticipated plant recovery and losses. The Mineral Reserves are inclusive of mining recovery and dilution as described in Section 15.3.4.
The mine design, mine plan, and Mineral Reserve Estimate were prepared by the Technical Services Department at Musselwhite and validate by WSP’s QP. The QP is of the opinion that the Musselwhite Mine Mineral Reserve was prepared in accordance with:
| ● | The Canadian Institute of Mining, Metallurgy and Petroleum (CIM) Estimation of Mineral Resources and Mineral Reserves Best Practice Guidelines (November 29, 2019). |
| ● | CIM Definition Standards for Mineral Resources and Mineral Reserves |
| ● | Disclosure requirements for Mineral Reserves set out in NI 43-101, including sections 2.2, 2.3, and 3.4 |
The QP is not aware of any mining, metallurgical, infrastructure, permitting, or other relevant factors that could materially affect the Mineral Reserve estimate.
Table 15.5 – 2023 Musselwhite Mineral Reserves as of December 31,2023
| Description | Tonnage
(Mt) | Gold Grade
(g/t Au) | Contain Gold
(Au koz) |
| Proven | 3.25 | 6.76 | 707 |
| Probable | 4.10 | 5.81 | 766 |
| Proven and Probable | 7.36 | 6.23 | 1,473 |
Notes: 1. The Mineral Reserve Estimate has been estimated using the Canadian Institute of Mining, Metallurgy and Petroleum (CIM) Definitions Standards for Mineral Resource and Mineral Reserve in accordance with National Instrument NI 43-101 – Standards of Disclosure for Mineral Projects. 2. The mineral reserve was created using Deswik Software with an effective date of December 31, 2023. 3. Mineral Reserves are reported within stope shapes using cut-off basis with a gold price of US$1,400/oz. 4. The mineral reserves cut-off grade varies by zone. The mineral reserves were estimated using a cut-off grade of not less than 3.80 g/t Au. 5. Values are inclusive of mining recovery and dilution. Values are determined as of delivery to the mill and therefore not inclusive of milling recoveries. 6. Tonnage and contained metal have been rounded to reflect the accuracy of the estimate and numbers may not sum exactly. |
| | December 2024 |
| | TECHNICAL REPORT –
MUSSELWHITE MINE, ONTARIO, CANADA
Document # C8630-0000-PM-RPT-001 – Rev. 0
/ Page 268 |
Figure 15.2 – Long Section Illustrating the Mineral Reserves (Proven and Probable)
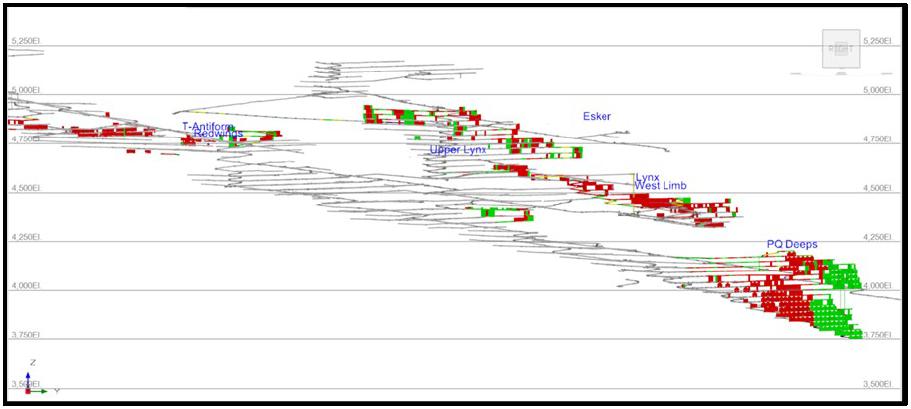
Source: WSP, 2024
| 15.6 | Factor Potentially Affecting the Mineral Reserve Estimate |
The Mineral Reserve estimate could be materially affected by the following risk factors:
| ● | Lack of underground ventilation that could affect productivity; |
| ● | Geotechnical conditions, especially in proximity of Faults; |
| ● | Dewatering capacity to manage groundwater inflows as the mine deepens; |
| ● | Dilution exceeding estimates; |
| ● | Mining recovery falling short of estimates; |
| ● | Currency exchange rates; |
| ● | Equipment productivities; |
| ● | Metallurgical recoveries; |
| ● | Mill throughput capacities; |
| ● | Operating costs exceeding estimates; |
| ● | Capital costs exceeding estimates; |
| ● | Changes to the permitting and regulatory environment; |
| ● | Changes in the taxation conditions; and |
| ● | Ability to maintain mining concessions and/or surface rights. |
| | December 2024 |
| | TECHNICAL REPORT –
MUSSELWHITE MINE, ONTARIO, CANADA
Document # C8630-0000-PM-RPT-001 – Rev. 0
/ Page 269 |
| 16.1 | General Description of Mineralization at Musselwhite |
Musselwhite Mine is an underground producing operation that has been around 3,000 tpd of ore. Mineral Reserve grade mineralization consists of pyrrhotite, lesser amounts of arsenopyrite, chalcopyrite and native gold. The gold is associated with quartz veining, garnet porphyroblasts and amphibole group minerals, but predominantly blue-green amphibole and grunerite. The gold mineralization is closely associated with ductile shear zones and brittle-ductile deformation. Gold is found in fractures and as inclusions in the matrix of garnets, amphiboles and quartz veins.
Two (2) broad mineralization styles have been documented based on contrasting mineralogical and structural characteristics. The first style, known as quartz-pyrrhotite veining/flooding, is dominant in competent lithologies and is locally cross-cutting (East Limb). The second style, known as strata-bound sulfide replacement, occurs primarily as halos to the zones of quartz flooding (West Limb).
The Musselwhite Mine is in an area where the orebody has been isoclinally folded into a series of northwesterly trending antiforms and synforms. These structures plunge 12-15° to the northwest. In the T-Antiform/PQ Deeps area, the lithology has been folded into an antiformal-synformal pair. The great majority of the ore occurs in high-strain zones in the steeply dipping / near-vertical portions of the folds. These high-strain zones resemble shear (fault) zones. The mineralized zones are confined to the favourable stratigraphy and typically will not crosscut it. Important lithological units include:
| ● | 4EA - Iron Formation, chert-grunerite-garnet-amphibole; |
| ● | 4F - Iron Formation, garnet-biotite-schist ; |
| ● | 4B - Iron Formation, chert-magnetite; |
| ● | A-Vol - Volcanic, intermediate to felsic; and |
| ● | B-Vol - Volcanic, intermediate-mafic. |
The following sections outlines the various geotechnical conditions that have been developed and are implemented at the Musselwhite Mine with a focus on the Mineral Reserves defined as current geotechnical conditions and can be applied for the Mineral Resources. Future geotechnical considerations are based on the Mineral Resources and areas defined as Mineral Inventory (High and Low confidence).
The current geotechnical systems at Musselwhite Mine are primarily based on information provided in the following documents:
| ● | Musselwhite Ground Mine Control Management Plan (GCMP) dated January 26, 2024; and |
| | December 2024 |
| | TECHNICAL REPORT –
MUSSELWHITE MINE, ONTARIO, CANADA
Document # C8630-0000-PM-RPT-001 – Rev. 0
/ Page 270 |
| ● | Musselwhite Mine Seismic Risk Management Plan (SRMP) date January 12, 2024. |
The GCMP summarizes the following key topics:
| ● | Roles and responsibilities; |
| ● | Geology and Orebody and Host Rock Data; |
| ● | Short Term and Long Term Mine Planning and Design; |
| ● | Previous Occurrences of Ground Instability; |
| ● | Support System Design Standards, Ground Support Systems and Quality Control Plan; |
| ● | Assessing Ground Stability Methods (Empirical, Numerical Modeling, Instrumentation, Seismic Risk Management; |
| ● | Risk Assessment Process; |
| ● | Training and Competency. |
Musselwhite Mine has ongoing process of geotechnical data collection involving the systematic gathering, analysis, and interpretation of information about the ground conditions. This includes a variety of techniques such as geological mapping, drilling and sampling, and laboratory testing. The data collected is then used to update and refine the understanding of the ground conditions and to inform decisions about mining operations. The following is a summary of geotechnical data collection:
| ● | Geotechnical Mapping – Mapping of drift backs and walls to collect physical and mechanical properties of the rocks in the mine, including their strength, deformation characteristics, and stability. This information is essential for identifying and managing geotechnical hazards, such as rockfalls, collapses, and underground water flows, which can pose significant risks to miners' safety and mine infrastructure. This information is stored in Musselwhite Mine Deswik MDM Sever. |
| ● | Geotechnical Core Logging – Geotech core logging is normally required on new mining areas where no previous geotechnical data is available or on planned permanent infrastructures where it is deemed necessary by Rock Mechanics. During the geotechnical core logging process, the following parameters are typically recorded in an Excel spreadsheet and stored on the shared Musselwhite Mine Rock Mechanics network: |
| | December 2024 |
| | TECHNICAL REPORT –
MUSSELWHITE MINE, ONTARIO, CANADA
Document # C8630-0000-PM-RPT-001 – Rev. 0
/ Page 271 |
| 16.2.2 | Orebody and Host Rock Data |
Rock Mass Rating
The following is a summary rock mass quality data that has been based on geological mapping that has been carried out since 2008. The typical hanging wall rock mass ratings are:
| ● | RMR (Bieniawski 1976): RMR = 60-70 (classified as “Good”); and |
| ● | Q (Barton 1974): 6.0 to 15.6 (classified as “Fair to Good”). |
Rock Strength
Rock strength data for the various rock units at Musselwhite Mine have been collected including Unconfined Compressive Strength (UCS), Possion’s Ratio, Young’s Modulus, Density and Indirect/Direct Tensile Strength.
Example UCS data for some of the key rock types indicates “Very Strong” rock summarized as follows:
| ● | 4EA UCS (Mean) = 177 MPa; |
| ● | 4F UCS (Mean) = 108 MPa; and |
| ● | 4B UCS (Mean) = 233 MPa. |
In-situ Stress Environment
The Geomechanics Research Centre, GRC, of MIRARCO at Laurentian University performed in-situ stress measurements at Musselwhite Mine. Full stress tensors were determined by the overcore strain relief technique employing 12-gauge CSIRO Hollow Inclusion triaxial strain cells. The field component of this project was conducted between November 26 and December 13, 2008; laboratory and analytical components were completed on January 15, 2009. A total of five (5) measurements in two different almost perpendicular boreholes were attempted from the 657-770 DD station at a depth of 740 m. Data reduction and best combination of the results suggest:
| ● | Major Principal Stress: 33.0 MPa Magnitude and 270°/-2°; |
| ● | Intermediate Principal Stress: 21.7 MPa Magnitude and 360°/12°; and |
| ● | Minor Principal Stress: 16.6 MPa Magnitude and 189°/78°. |
The ratio of major to minor principal stress was observed to be about 2.0 and the intermediate to minor principal stress about 1.3.
| | December 2024 |
| | TECHNICAL REPORT –
MUSSELWHITE MINE, ONTARIO, CANADA
Document # C8630-0000-PM-RPT-001 – Rev. 0
/ Page 272 |
| 16.2.3 | Major Structures and Controlling Features |
Three (3) categories of fault sets have been defined at Musselwhite Mine:
| 1. | Water Faults – Several different water faults are present throughout Musselwhite Mine. Faulting is highly variable ranging from mm scale seams to metres of rubble core. Overall, they are poorly defined due to lack of drilling, but generally steeply dipping, and are much more prevalent in the upper mine (Esker). |
| 2. | Gas Faults (Methane) – Several different methane faults are present throughout Musselwhite Mine. These faults are all shallow dipping (~14° west), and plunge ~ 10° north. Methane faulting ranges from hairline carb healed to open space with well-formed calcite crystals, possible salt, and occasionally cubic pyrite. Generally pink hematite alteration halos are present. Statistically degasses 17% of the time when intersected regardless of the rock type. |
| 3. | Gas Faults (Di-methyl sulfide) – Sub-horizontal structure at ~4160 m elevation and defined from 12800N-13800N. Ranges from hairline splays to open space with well-formed quartz and calcite crystals, and occasionally salt crystals. Faulting is usually associated with a bright green alteration halo, with lesser amount of pink hematite alteration. When intersected the structure degasses both dimethyl sulfide and methane. Statistically degasses 27% of the time when intersected in banded iron formation (BIF). |
| | ● | Key Discontinuity Sets (Dip and Dip Direction): |
| § | 83°/090° (north-south strike, vertical joints); |
| § | 87°/167° (east-west strike, vertical joints); and |
| § | 25°/210° (flat jointing). |
Key discontinuity sets have an average spacing of 1.0 to 1.5 m with slightly rough surfaces with little to no separation and hard joint wall rock. There is also random general vertical faulting similar to 4F which is vertical and parallel the ore zone.
| 16.2.4 | Ground Stability Assessment |
The stability of mine openings is assessed using the following techniques:
| ● | Analysis for structural instability (geometry of blocks or wedges): |
| § | Fabric analysis (line mapping, rock mass, etc.); |
| § | Stereonet projections; and |
| ● | Assessment of acceptable spans and support requirements using empirical methods; |
| ● | Determination of stress using analytical methods (3D numerical modeling (Map3D and Examine 3D) is performed as a part of the stope design procedure); |
| ● | Observation of rock mass response and calibration of numerical modeling; and |
| | December 2024 |
| | TECHNICAL REPORT –
MUSSELWHITE MINE, ONTARIO, CANADA
Document # C8630-0000-PM-RPT-001 – Rev. 0
/ Page 273 |
| ● | Review of core logging data. |
In large spans, the presence of flat jointing in the back may become a problem. When this occurs, the rock mass rating (RMR) is adjusted accordingly (-10%) and the maximum design span altered (decreased). To a lesser extent, structurally defined wedges are identified as possible stability problems
Pre-Mining Assessment
Initial ground control assessment during development will evaluate the rock mass with mapping techniques and rock mass classification system to produce a detailed fabric analysis. This information enables the use of empirical methods to define the appropriate span, support requirements and pillar dimensions. Designs are complemented with numerical modeling.
Active Mining Assessment
After the pre-mining assessment, stope design can then be implemented. Changing ground conditions are monitored as required. Information is communicated from Operations to Engineering by the ground control logbook, email and Ground Support Evaluations (GSE) plans. Daily visual monitoring is to be conducted by the Crew Leaders. This includes inspection and assessment of the type of ground support, quality of ground support installation, scaling practices, abnormal structure (flat joints, open structures, etc.) and recording instrumentation readings as required.
Regular visual inspections are to be conducted by Geology and Engineering. This includes inspection and assessment of the type of ground support, quality of ground support installation, scaling practices, abnormal structure, collecting RMR and Q’, and talking to the miners about ground conditions. In addition, stope geometry (stope boundaries, pillar outlines) are confirmed and checked visually or by completing a Cavity Monitored Survey (CMS) survey.
Recommendations for additional ground support or appropriate instrumentation should be designed if it is necessary. GSE will be issued by Engineering to rehab the ground, if necessary.
Post-Mining Assessment
Post-mining assessment utilizes the same methods described in pre- and active mining assessments. However, the focus is to collect information that will enable “re-calibration” of the design methodology. This is accomplished through collecting CMS data, back analysis of unusual rock mass behavior such as falls of ground (FOG) and interpreting instrumentation data. This process is particularly useful when unexpected ground control problems arise.
| | December 2024 |
| | TECHNICAL REPORT –
MUSSELWHITE MINE, ONTARIO, CANADA
Document # C8630-0000-PM-RPT-001 – Rev. 0
/ Page 274 |
Crown, sill and rib pillars are designed by combining numerical, empirical and analytical approaches.
Crown Pillars
Musselwhite Mine had consultants perform analyses to determine the minimum safe thickness of crown pillar that may be left in place. The current crown pillar ranges between 40-50 m in thickness. Through numerical modeling, the stresses can be predicted at the crown pillar core. These values are updated as changes within the mining plan occur that could influence pillar loading. The average modeled stress is currently 6.0 MPa. If we take the lower range of unconfined compressive strength to be 100 MPa, then stress can be ruled out as a factor for instability. Hence, the structure related failure will be the main factor should be considered. Itasca completed a study report that provided a wedge analysis, the plug failure mechanism analysis, numeric stress modelling and empirical methods published by Carter (1992).
Crown pillars are located above the Snoopy (30 m thick crown pillar), Jets South (35 m thick crown pillar) and Esker zones. A follow up review by Musselwhite Mine in 2019 indicated a low level of concern for the current crown pillars. Long term stability recommendations indicate that the Snoppy 30 mL and 50 mL stopes and the Upper Esker have empty stopes that should be backfilled. The Jets South stope has already been backfill based on mine records so should not be a concern.
Sill Pillars
Sill pillar dimensions are determined by combining empirical methods and experience gained at the mine. Stress criteria is also applied. The stress criteria are to consider dynamic ground support if the major principal stress of the sill pillar in the core exceeds 129 MPa and if deviatoric stress in the core is more than 0.56 as obtained with linear numerical modelling. No sill pillar is designed less than 3.0 m thickness. For the pillar where the worker will work above it, the thickness of the pillar should not be less than the span of the void below, or 7 m, if the span of the void is less than 7 m.
Diminishing Pillars
Diminishing Pillars are created at Musselwhite Mine when there are two mining fronts that are converging towards a single access. The two fronts converge until one final mass blast removes the pillar in one blast. These diminishing pillars are sized based on stress analysis performed using linear numerical modelling (MAP3D/RS3 software). The core of the pillar must have a deviatoric ((𝜎1−𝜎3)/𝑈𝐶𝑆) of 0.45 or lower or major principal stress less than 110 MPa. If the pillar is in an area of low stress, then the minimum pillar size is 25 m.
| | December 2024 |
| | TECHNICAL REPORT –
MUSSELWHITE MINE, ONTARIO, CANADA
Document # C8630-0000-PM-RPT-001 – Rev. 0
/ Page 275 |
| 16.2.6 | Previous Occurrences of Ground Instability and Seismic Events |
Musselwhite Mine maintains a database of reportable falls of ground (FOG). The database contains a total of 53 recorded incidents of FOG from March 21, 2008 to November 25, 2023. The estimated tonnage, location (zone) if an injury and/or damage has occurred and general comments are provided in the database. Tonnage sizes vary from <10 t up to 1,000-1,700 t. There were two serious injuries in 2015 and 2017 and 15 recorded damage events that often included damaging equipment (scoops) when conducting remote mucking in open stopes and a couple of incidents with the bolting machine when involved in ground support installation. It should be noted that the last FOG updated event in the GCMP was a seismic shakedown event in November 2023.
As Musselwhite Mine production increases in the PQ Deeps there will be increased incidents of seismic related ground instabilities (e.g., rockbursts). The larger seismic events are reviewed by Musselwhite Mine Rock Mechanics Department based on the SRMP protocols when event Moment Magnitude is greater than 0.5 or there are more than 15 events per hour. A review of seismic events database between September 23, 2023 to August 3, 2024 indicated 18 events were recorded larger than Moment Magnitude 0.5. Three (3) events were report in 2023 and 15 were reported from January to August 2024.
A detailed review of nine (9) of those seismic events reported in 2024 is provided in Table 16.1. These events had varying Moment Magnitudes between 0.37 and 1.99. Most events seem to be occurring after a mass blast with many of the larger events occurring along the Gas Fault 2 or in locations where the stope extraction footprint is expanded resulting in seismic events happening in secondary stope pillars. Most of the rock damage is minor (1 to 15 t) and occurring in locations where no mesh is installed in the lower wall. Recommendation from Musselwhite Mine Rock Mechanics team has included increasing the use of dynamic ground support (MDX bolts), installing screen on the lower wall and changing screen to #4.
Table 16.1 – 2024 Seismic Related FOG (Based on Musselwhite Mine Presentation and Reports)
Seismic
Event Size
(Magnitude) | Location | Date | Damage Recorded | Comments |
| 0.7 | 1395 mL 14180Xcut | January 15, 2024 | 1.5 tonnes dislodged between two (2) split sets bolts | Damage in a secondary stope xcut access. Primary stopes mined on either side of xcut. |
| 0.37 (>15 events per hour) | 1345 mL | March 3, 2024 | Wall Damage observer in 1345 Acc TLO | No significant damage observed on 1370, 1320 or 1295 mL |
| 0.51 | 1370 mL | March 19, 2024 | No observed damage in the 1345 and 1370 mL | Event occurred 17 hrs after 1379T201 Mass Blast |
| | December 2024 |
| | TECHNICAL REPORT –
MUSSELWHITE MINE, ONTARIO, CANADA
Document # C8630-0000-PM-RPT-001 – Rev. 0
/ Page 276 |
Seismic
Event Size
(Magnitude) | Location | Date | Damage Recorded | Comments |
| 1.7 | 1370 mL | May 2, 2024 | No observed damage in the 1345, 1370 and 1395 mL | Event occurred 4 hrs after 1345T090 Cap Blast in the wall of T201 with event appearing to occur along Gas Fault 2 |
| 1.7 | 1345 mL | May 2, 2024 | Minor loose recorded on 1320, 1345 and 1370 mL | Event occurred < 1 hr after 1370T157 Cap Blast in the pillar wall of secondary. Event appearing to occur along Gas Fault 2 |
| 0.95 | 1345 mL | June 19, 2024 | Minor loose recorded on 1345 mL and no damage in the 1320, and 1370 mL | Event could be related to June 16, 2024 Toe shot. Event appearing to occur along Gas Fault 2 |
| 0.93 | 1370 mL – 180Xcut | August 3, 2024 | Some lower wall damage 1370 mL Xcut | Event could be related to August 1 Stope blast. Event appearing to occur along Gas Fault 2 |
| 1.9 | 1270 mL | August 21, 2024 | TARP Category 4 with two levels above and below 1270 mL inspected. 15 Tonnes of material ejected on 1270 access | Event could be related to August 18 Raise Shot and rockburst occurred in a very block rock mas and near a dyke. |
| 1.99 | 1295 mL | August 30, 2024 | 1320T044 was blasted and 790 events in 2 hours. TARP Category 4 and inspections for 1270, 1295 and 1320 mL. Some damage on 1295 mL with ejection of 1 tonne and floor heave. | High induced stress at the stope abutment and Xcut pillar following the void blast. Mining at depth and expanding stope extraction footprint. Recommend #4 screen and lower along the wall and dynamic bolts. |
| | December 2024 |
| | TECHNICAL REPORT –
MUSSELWHITE MINE, ONTARIO, CANADA
Document # C8630-0000-PM-RPT-001 – Rev. 0
/ Page 277 |
The lessons learned from the FOG has allowed Musselwhite Mine to create some design protocols as outlined in Table 16.2.
Table 16.2 – Risk and Hazard Mitigation Based on FOG History1
| List of Area with Risk | Hazard | Mitigation |
| Placement of By-Pass Access in PQD (1245 mL and below) | Induced by stope abutment stress | Follow Rock Mechanics recommendation, typically the By-Pass will be designed minimum 25 m away from the stope or farther if adverse conditions are expected. |
| Development towards mafic and/or 4F units | Excessive overbreak | - Short round blasting - Low energy/density explosive - Tightly spaced uncharged relief holes - In-cycle shotcrete |
| Standoff distance between production access in longitudinal stope | Stress interaction between excavations | Ensure a minimum 8 m stand off distance between access as per Rock Mechanics guidelines. |
| Stope Width | Unstable Pillar | 25 m width of secondary stope and 20 m width of primary stope |
| Secondary Stopes | High concentration of stress | Apply pre-conditioning |
| Stope Hanging Wall | Unstable hanging walls causing overhang | Apply buffer rings in the interim and final hanging walls If weak zones are present and Hanging Wall is at risk of instability, it is recommended to install smart cable to monitor its stability |
| Stope Brow | Adverse condition when brow in contact or within 4F and Ultra Mafic Unit | Apply Rock Mechanics recommendation for brow cable design Apply shotcrete arches |
| Stope Back | Stability number fall in the stable with support zone | Dropped down shoulder to
35°-38° Apply Rock Mechanics recommendation for back cable design Additional surface support may be required if in adverse condition |
| | December 2024 |
| | TECHNICAL REPORT –
MUSSELWHITE MINE, ONTARIO, CANADA
Document # C8630-0000-PM-RPT-001 – Rev. 0
/ Page 278 |
| 16.2.7 | Seismic Risk Management |
Up until late 2023 most of the seismic related events were rock yielding instead of bursting. Destress mining was not an operation originally employed at Musselwhite Mine. In late 2023 and through 2024 the PQ Deeps area has been experiencing increased seismic events with up to 15 recorded from January to August 2024.
In early January 2024, Musselwhite Mine Rock Mechanics Department developed a Seismic Risk Management Plan (SRMP). The following sections are taken from the January 2024 SRMP.
The objective of the SRMP aims to identify high-risk areas in the mine, implement targeted mitigation plans, monitor micro-seismic activity regularly, ensure the reliable performance of the monitoring system, designate responsible personnel for emergency response, maintain comprehensive documentation of seismic events, and establish a clear re-entry protocol following such events to prioritize the safety of all individuals involved using appropriate and industry accepted control measures.
Monitoring and data acquisition systems are implemented and utilized to gather pertinent geological, geotechnical, mining, and seismic data. Subsequently, the data collected from these systems undergoes a thorough seismic event analysis to comprehend and quantify the seismic response to mining and seismic hazard. Once the seismic hazard is comprehensively understood, appropriate control measures are implemented to manage the risk.
Figure 16.1 summarizes the risk-based approach used to manage seismic hazard at Musselwhite Mine.
| | December 2024 |
| | TECHNICAL REPORT –
MUSSELWHITE MINE, ONTARIO, CANADA
Document # C8630-0000-PM-RPT-001 – Rev. 0
/ Page 279 |
Figure 16.1 – Seismic Risk Management Approach Flow Chart2
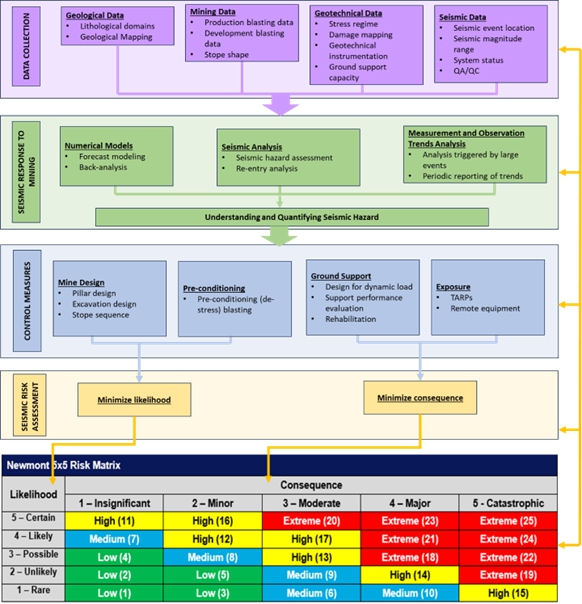
Musselwhite Mine seismic system was installed in 2013. Seismic activity is monitored on a daily basis by the Rock Mechanics Department.
The seismic system was expanded in 2022 to include the PQ Deeps section. Currently the seismic system includes:
| 2 | (modified after Potvin et al, 2019) |
| | December 2024 |
| | TECHNICAL REPORT –
MUSSELWHITE MINE, ONTARIO, CANADA
Document # C8630-0000-PM-RPT-001 – Rev. 0
/ Page 280 |
| ● | Thirty-six (36) uniaxial accelerometers (model A1-30-1.0); |
| ● | Seven (7) triaxial accelerometers (A3, model A3-1.0-1.25); |
| ● | Seven (7) uniaxial 15 Hz geophones (G1, model G1-1.1-1.0); |
| ● | Six (6) 15 Hz triaxial geophones (G3, model G3-1.1-2.0); and |
| ● | One (1) 4.5 Hz triaxial geophone (S3, model G3-0.7-4.0). |
The Acquisition Computer serves as the nerve center of the seismic monitoring system, where seismic data from the Paladin through fiber optic cable is collected, processed, and analyzed to create events. The final data collected by the Acquisition PC is transferred to the Processing Computer through the SeisnetCopy Transfer Data method for interpretation and visualization. The computer is equipped with specialized software that helps in interpreting seismic data and identifying potential risks or hazards. The SeisVis program is used to view and identify the locations and magnitudes of seismic events. This software analyzes the seismic data collected by the monitoring system, which helps in identifying patterns, trends, and potential risks associated with seismic activity. By using this data, mine operators can make informed decisions about safety protocols and potential operational changes.
The seismic system is set up to immediately alert Rock Mechanics Department and Mine Management in the event of a significant seismic activity or seismic functional issues through a program called SeisAlert. The SiesAlert is set-up as such that in any occurrence of macro-seismic event more than 0.5 Moment Magnitude is recorded, or clusters of microseismic events more than the set threshold is forming (15/hour), or non-recording of seismic events within certain set time, the Rock Mechanics Department and list of Mine management including Dispatch are alerted via email. SeisAlert message received are to be checked and confirmed by the Rock Mechanics Department and advises Mine Operations of any necessary actions to be taken. Actions may either be the implementation of the Seismic Trigger Action Response Plan (TARP) or direct relay of instructions via radio/phone communication by Geotechnical team to the Underground Supervisors.
TARP:
The Seismicity TARP has 4 Category Thresholds defined as follows:
| ● | Category 1 – Event Magnitude < 0.5; |
| ● | Category 2 - Event Magnitude 0.5 to <1.0; |
| ● | Category 3 - Event Magnitude 1 to <1.5; and |
| ● | Category 4 - Event Magnitude > 1.5. |
With increasing Event Magnitudes there are different protocols requiring underground workers to vacate a certain distance from the Event area for a minimum period of time. After the seismic activity is reduced inspections by Site Supervisor and/or Rock Mechanics Department are completed to determine if damage has been sustained in the areas of the Event. The Rock Mechanics Department will issue recommendations for ground support repair if required.
| | December 2024 |
| | TECHNICAL REPORT –
MUSSELWHITE MINE, ONTARIO, CANADA
Document # C8630-0000-PM-RPT-001 – Rev. 0
/ Page 281 |
The Category 4 is currently defined to withdraw underground workers from the Event mining level and two mine levels above and below until Rock Mechanics Department has completed an inspection. Lower categories result in minimum delays of 2 to 4 hours prior to returning to the working areas as directed by the Rock Mechanics department. In 2024 5 out of 15 seismic Events were >1.5 Moment Magnitude (Category 4).
| 16.3 | Future Geotechnical Conditions |
Musselwhite Mine has only started experiencing increased seismic activity as mining occurs in the PQ Deeps area. Up until 2023 there were few seismic related events (three (3) events greater than 0.5 Moment Magnitude) that may have required re-entry protocols defined in the TARP or damage due to seismic related events. As mining progresses in PQ Deeps increased seismic frequency and magnitudes will occur and this is demonstrated by the 15 seismic events (Moment Magnitude greater than 0.5) that have occurred between January and August 2024. The Musselwhite Mine Rock Mechanics department has been addressing many of the recent challenges related to increased mine induced seismicity by completing numerical modeling studies, back analysing past failure and recommending/implementing some of the following actions:
| ● | Installing dynamic ground support (Versabolts) in seismic active or areas there is the potential for increased seismicity. |
| ● | Start installing screen on the entire wall in areas of increased seismicity. Many of the current FOG related events to seismicity have been in lower walls where no screen is installed. |
| ● | Changing the screen type to #4 gauge (current is #6) in seismicity active areas. |
| ● | Numerical modeling completed in PQ Deeps has identified with increased depth access development will experience high abutment stresses from the advancing stoping fronts and in some cases some secondary pillars may fail before extraction as more pillars are excavated. Secondary stope pillars will need to be assessed individually. Just in time development might need to be considered to access pillars after failure and shortly before extraction. |
| ● | The implementation of pre-conditioning of secondary stopes in the PQ Deeps. One row of blast holes with lower explosives is completed to break up the secondary stope to allow it to fail |
| ● | Planning for the expansion of the seismic system as the PQ Deeps is mined deeper. |
One current recommendation is to complete detailed numerical modeling of the current Mineral Reserves for the PQ Deeps and include the Mineral Resource and Mineral Inventory Zones (High and Low Inventory) that are planned deeper to understand the changing conditions and determine potential impacts that could be experienced.
The one key geotechnical challenge in mining deeper at Musselwhite Mine (PQ Deeps) will be the impact to production when working in a seismically active mine. Additional studies will need to be completed by Musselwhite Mine with support from external consultants to review production sequence, the increased requirement for dynamic ground support, changes to re-entry protocols,
| | December 2024 |
| | TECHNICAL REPORT –
MUSSELWHITE MINE, ONTARIO, CANADA
Document # C8630-0000-PM-RPT-001 – Rev. 0
/ Page 282 |
stope sizing review, expansion of stope pre-conditioning and just in time development approaches to minimize impacts to schedule and operating costs due to increased seismicity.
| 16.4.1 | Hydrogeological Setting |
The underground mining is directly below Opapimiskan Lake. Three (3) type of water inflows are considered as risk. The greatest inflows risk is the result of a major instability in the crown pillar (i.e. wedge failure or collapse of the surface crown). A second risk is the un-grouted exploration boreholes drilled directly above the pond (in winter). The third risk would be the potential excavation of fractures (such as dyke or water bearing faults) intersection inflows. Several consultants have carried out hydrogeology related studies. Itasca Consultant Canada Inc. (Itasca) evaluated the crown pillar design thickness between 25 to 35 m is in the stable limit. For intersected diamond drill holes, a N sized hole would produce a discharge of 0.029 m³/s and a B sized hole a discharge of 0.016 m³/s. These correspond to hourly discharge rates of 104 m³/hr and 56 m³/hr.
There is also a cement dam that plugs the drift in 150 mL which connect to the bottom of the open pit. There is a facility set up on the 150 mL to monitor the water pressure behind the cement bulkhead. The procedure requires the mining and engineering departments to read the water pressure, inspect the dam and flush the open pit bottom sediment regularly.
The Esker zone is the only area with hydrogeological concern to date for Musselwhite Mine. The mining in the Esker is completed. The water flow coming out from the Esker is monitored by the mining department. Any future mining in the Esker that may intersect a water bearing fault or un-grouted diamond drill holes will be subject to a risk assessment. If the risks identified cannot be mitigated, then future mining will not proceed.
| 16.4.2 | Hydrogeological and Groundwater |
The majority of the hydrogeological assessments for Musselwhite Mine are outlined in the Musselwhite Mine Closure Plan and focus on the defining hydrogeological conditions for tailings infrastructure (ponds) and is summarized as follows.
Golder Associates Ltd. conducted hydrogeological investigations at the Musselwhite Mine site including field studies, laboratory testing, and modelling. The field work was conducted in two phases. An initial phase in 1989 associated with the first feasibility study and a second more detailed study in 1995 associated with confirmation of the proposed tailings pond site. Hydraulic conductivity estimated (from Golder in 1989) was in the range of 1 x10⁻⁵ m/s for fractured rock. Field programs consisted of the drilling of 24 boreholes to determine the subsurface conditions in the immediate area of the south side of the Tailings Pond (formerly Crazy Wind Pond).
Opapimiskan Lake likely comprises a regionally significant groundwater discharge zone. In broad terms, groundwater flow directions in the overburden and shallow bedrock (approximately 10 m
| | December 2024 |
| | TECHNICAL REPORT –
MUSSELWHITE MINE, ONTARIO, CANADA
Document # C8630-0000-PM-RPT-001 – Rev. 0
/ Page 283 |
below surface) likely mimic the topography. A component of flow is northward to Opapimiskan Lake and a component discharging from the Tailings Pond to Zeemel Lake to the south. The base flow in the streams in the area is maintained by groundwater discharge, which is recharged by infiltrating precipitation. Regional groundwater flow directions are generally expected to be perpendicular to the contours. Between the existing Tailings Pond and Zeemel Lake, the groundwater flows approximately westward, sub-parallel to the dam, and then turns southward toward Zeemel Lake.
Local groundwater-flow directions always vary relative to the generalized regional flow directions, and these variations are evident in the area between the existing Tailings Pond and Zeemel Lake.
The piezometric head information gathered from measurements in the groundwater monitoring wells is compared to the water elevation measurements in the tailings. The groundwater flow rate from the existing Tailings Pond through the sand toward Zeemel Lake is about 10 L/s. The migration rate under existing conditions is about 30 m/y. It is expected that there is little groundwater flow in the unfractured bedrock underlying the various surface infrastructure sites.
Most of the hydrogeology activities in recent years has been related to the groundwater levels between the Tailing Management Area (TMA) and Zeemel Lake. Subsequence studies and investigation have been completed by Piteau (2016 and 2017) on controlling ground water conditions to contain a sulphate plume from the TMA.
Information provided in the GCMP also included investigation work completed by AMEC in 2005 around the portal area. AMEC reviewed drill hole hydrogeological testing from three drill holes and indicated that groundwater inflow for the base case ranged from 1 to 250 imperial gallons per minute which is representative of the groundwater regime in the portal area.
The Mineral Reserve estimate is based on a mine design and schedule that was prepared in Deswik software. Tables 16.3 and 16.4 summarize the parameters for development and production used for mine design and planning at Musselwhite Mine. The development parameters include the cross-sections of drifts and ramps, and the total advance rates in lateral development. The production parameters include mining method, pillar thickness, dip constraints, minimum mining widths, stope dimensions, and production rates.
Stope productivities were based on typical total stope cycles, including cable bolting, slot raising, longhole drilling, production blasting, remote mucking, fill fence construction, backfilling, and delay for backfill curing time.
Primary ramp development rates and stope access are an important assumption for the mine plan and mine stope sequencing in PQ Deeps.
| | December 2024 |
| | TECHNICAL REPORT –
MUSSELWHITE MINE, ONTARIO, CANADA
Document # C8630-0000-PM-RPT-001 – Rev. 0
/ Page 284 |
Table 16.3 – Mine Design Parameters – Development
| Item | Description |
| Ramp | |
| Dimension | 5.5 m x 5.5 m |
| Ramp Grade | -15% |
| Ramp Radius | 25m |
| Footwall Drifts | 5.5 m x 5.5 m |
| Crosscuts and Ore Drives | 5.5 m x 5.5 m |
| Total Average - Advance Rates/Day | 27 m/day |
| Musselwhite's Crew | 20 m/day |
| Contractor's Crew | 7 m/day |
Table 16.4 – Mine Design Parameters – Production Stope
| Item | Description |
| Modifying Factors | |
| Cut-Off Grade | See Section 15.3 |
| Dilution Factors | See Section 15.3.4 |
| Mining Recovery | See Section 15.3.4 |
| Minimum Rib Pillar Width | See Section 15.3.4 |
| Mininum Mining Width (Transverse) | 10 m |
| Mininum Mining Width (Avoca & Modified Avoca) | 3 m |
| Maximum Hanging Wall Dip (Transverse) | 90o |
| Maximum Hanging Wall Dip (Avoca & Modified Avoca) | 55o |
| Maximum Footwall Dip (Transverse) | 65o |
| Maximum Hanging Wall Dip (Avoca & Modified Avoca) | 65o |
| Minimum Lenses Gap | 10 m |
| PQ Deeps Stope Dimensions | |
| Primaries Transverse | 20m W x 20m H x 20-35m D |
| Secondaries Transverse | 25m W x 20m H x 20-35m D |
| | December 2024 |
| | TECHNICAL REPORT –
MUSSELWHITE MINE, ONTARIO, CANADA
Document # C8630-0000-PM-RPT-001 – Rev. 0
/ Page 285 |
The configuration of the deposit is suitable for sublevel-type mining methods. Musselwhite Mine uses three (3) mining methods:
| ● | In longitudinal narrow veins between 3 to 12 m, Avoca and Modified Avoca is used. The Modified Avoca is a very sequential method. |
| ● | In wide ore zone, transversal longhole stoping (LHS) is used with delay cemented rock fill in primary stopes, and uncemented rock fill in the secondary stopes. |
| ● | The AVOCA and Modify AVOCA mining methods are the standard mining method for most of the orebodies (e.g., Redwing, West Limb, Lynx) above the 4250 m mine elevation (950 mL) and where the orebody width has increased at depth, below 4250 m to 3750 m elevations, the mining method has changed to Transverse (PQ Deeps). Based on the Mineral Reserves almost 40% of the Mineral Reserves are AVOCA and Modified AVOCA with the remainder as Transverse. |
| 16.6.2.1 | Standard AVOCA Method |
Standard AVOCA is a mining method where ore zones are extracted longitudinally with most of the development in the orebody. Ore drives are developed at the top and bottom of a slice of ore, with a spacing of 25 m floor to floor. The ore between the ore drives is then blasted, using either upholes or downholes, and the broken ore is extracted from the lower level. When a certain block of ore is extracted, the void is filled with unconsolidated waste and the process is repeated, using the fill as a working platform for the next lift.
Standard Avoca has double end access, with extraction from the lower sub-level at one end and filling from the upper sub-level at the other end. Figure 16.2 represents double lift AVOCA standard method using in Redwing zone.
| | December 2024 |
| | TECHNICAL REPORT –
MUSSELWHITE MINE, ONTARIO, CANADA
Document # C8630-0000-PM-RPT-001 – Rev. 0
/ Page 286 |
Figure 16.2 – Double Lift AVOCA Mining Method Apply in Redwing Zone
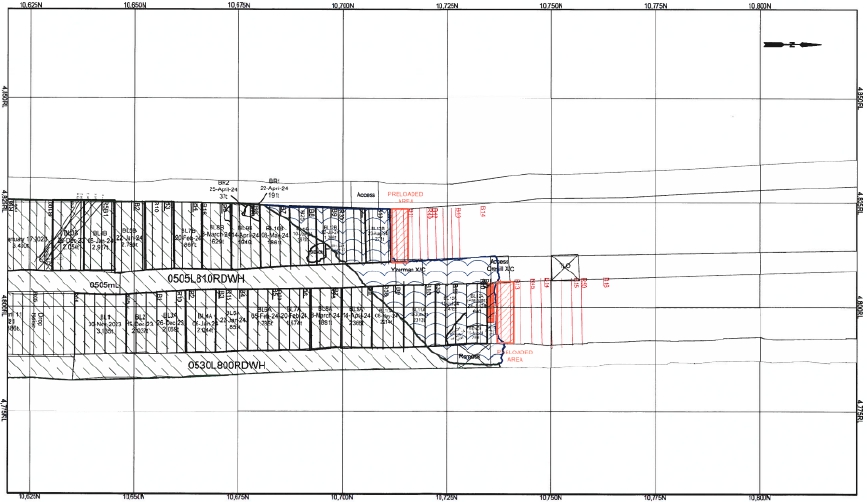
Source: Musselwhite Mine – September 2024
| 16.6.2.2 | Modified AVOCA Method |
Modified Avoca has been adapted for single end access. The face is retreated a certain distance, dependent on hanging wall stability. The void is then tight filled with rockfill from the upper sub-level.
Two (2) approaches are then available, as follows:
| ● | Fill can be mucked out to a naturally compacted angle of repose and subsequent rings are blasted to a free face. |
| ● | Subsequent rings are choke blasted against the fill - the blasting compacts the fill and causes it to stand steeply and contribute minimal dilution. |
At Musselwhite where the ore is between 4 and 12 m in width, AVOCA and or modified AVOCA will be employed typically in conjunction with unconsolidated mine waste as rockfill. This mining method is sequential and could potentially generate delay for the next panel to be mined. Figure 16.3 shows a schematic of the modified AVOCA sequence.
| | December 2024 |
| | TECHNICAL REPORT –
MUSSELWHITE MINE, ONTARIO, CANADA
Document # C8630-0000-PM-RPT-001 – Rev. 0
/ Page 287 |
Figure 16.3 – Mining Sequence Schematic Modified AVOCA

Source: WSP, 2024
| 16.6.2.3 | Transverse Longhole Stoping Method |
Transverse longhole stoping (LHS) is a bulk mining method in which the long axis of the stope and access drifts are perpendicular to the strike of the orebody. Typically, drawpoints are located in under-cut access drifts which extend from the footwall or hanging wall, and the free face is mined in a horizontal retreat from the hanging wall or footwall to the footwall or hanging wall. This methodology requires more waste development (for footwall/hanging wall drifts and drawpoints), however, since each stope has an independent access, it has more flexibility with regards to sequencing and scheduling, allowing a primary/secondary extraction sequence at Musselwhite.
| | December 2024 |
| | TECHNICAL REPORT –
MUSSELWHITE MINE, ONTARIO, CANADA
Document # C8630-0000-PM-RPT-001 – Rev. 0
/ Page 288 |
At Musselwhite Mine transverse blocks are planned where the ore width exceeds 12 m with a strike length of over 50 m and stope height of 25 m. Stope dimensions are determined by considering the impacts of economics and stability. Voids are to be filled with a combination of cemented rockfill and unconsolidated rockfill. Figure 16.4 presents a section view of transversal stoping in PQ Deeps zone.
Figure 16.4 – Illustration of Transversal Stoping in PQ Deeps Zone

Source: Musselwhite Mine, September 2024
| 16.6.3 | Ore and Waste Handling |
| 16.6.3.1 | PQ Deeps (PQD) Ore and Waste Handling |
Ore from the PQ Deeps zone is trucked by an internal ramp from the production stopes to the dumping point at 1170 mL elevation. The crushing system includes a silo above the crusher with a capacity of 3,200 t. After crushing, the ore is transported by a short conveyor to another silo with a capacity of 3,600-t vicinity of the winze, where it is subsequently hoisted and discharged into another silo at elevation 280 mL with a capacity of 1,200 t. The crushed ore is transported by 45-tonne trucks from the truck loadout (TLO) to the crushing station at elevation 460, where it is conveyed by conveyor to surface.
The transport distance from the truck loadout at elevation 280 to the dumping point at elevation 460 is 3,000 m with a ramp grade of + and – 15%.
Waste produced by the development is recycled underground as backfill in the PQ Deeps zone. Figure 16.5 illustrates the movement material at the Musselwhite.
| | December 2024 |
| | TECHNICAL REPORT –
MUSSELWHITE MINE, ONTARIO, CANADA
Document # C8630-0000-PM-RPT-001 – Rev. 0
/ Page 289 |
Figure 16.5 – Musselwhite Material Handling System
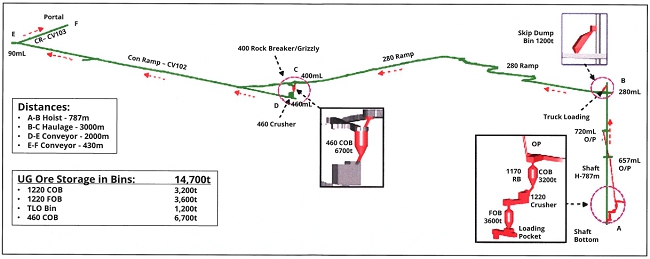
Source: Musselwhite Mine, September 2024
| 16.6.3.2 | Other Active Zones Ore and Waste Handling |
The other active zones, West Limb, Upper Lynx, Redwings, Lynx and Lynx North, and T-Antiform is trucked by internal ramp to the crushing station at the elevation 460. The crushed ore is transported to surface by two (2) conveyors (CB-2 and CB-1) on a total distance of 2430 metres.
As mentioned, the waste produced from the development is recycled underground as cemented or uncemented backfill.
Rockfill is a key element of the stoping methods used at Musselwhite Mine. A good quality rockfill is required to mine safely and minimize dilution. The rockfill system consists of both consolidated and unconsolidated rockfill.
The purpose of the rockfill is to:
| ● | Limit the volume of open ground; |
| ● | Prevent uncontrolled convergence, raveling and caving of the open stope; |
| ● | Act as a working platform for the longitudinal retreat stopes; and |
| ● | Allow for secondary stope recovery (both below and adjacent). |
Depending on the application, unconsolidated rockfill (URF) or consolidated rockfill (CRF) material can be utilized as rockfill. In the case of CRF, a 4-5% binder of cement with varied compositions depending on availability of materials (50% Portland GU/50% fly ash, 100% Portland GU, slag cement blends with Portland .GU) type 10.
| | December 2024 |
| | TECHNICAL REPORT –
MUSSELWHITE MINE, ONTARIO, CANADA
Document # C8630-0000-PM-RPT-001 – Rev. 0
/ Page 290 |
| 16.6.4.1 | Underground Cement Slurry Plant |
There is an existing CRF facility on surface. Currently, this facility is not in service as it cannot meet the CRF production requirements. This is due to the extended delivery times and frequent plugging experienced by the system.
Currently, bulk cement bags (1.8 t) are delivered to the Musselwhite Mine, then off loaded and staged on surface by mine personnel. Four (4) cement bags are loaded onto Multi-crete boom truck then the boom truck transports the cement bags to the underground mobile CRF plants where the bags are unloaded and staged for production. Each load takes a total of 175 minutes from surface loading to underground unloading, with this cycle can be repeated 2-3 times per shift.
Two (2) portable slurry batch plants are now being utilized underground to facilitate the CRF filling process. During the CRF filling process, the nine (9) Cubic-yard scoop is typically used. The scoop is fully loaded with development waste muck and then sprayed with a predetermined volume of the cement slurry before being dumped into the stope. This process helps to ensure that the CRF is properly mixed and distributed throughout the stope. The cement slurry recipe and the quantity of slurry added to the waste muck is given by the technical service.
Musselwhite has recognized this process inefficiency, and other options to improve the efficiency of the open voids (stopes) filling. These options are:
| ● | Utilize existing infrastructure including the Esker CRF Facility (silos) and the underground reticulation network for dry storage and transfer cement underground respectively. The existing underground reticulation will be rehabilitated and expanded to transfer cement to an underground storage silo on the 1270 mL. A bulk transport carrier will deliver cement from the underground silo to CRF plant locations as required. |
| ● | Construct a Paste backfill plant with a new underground network distribution for the PQ Deeps where the majority of the ore reserves are located. |
These options are under investigation no decision has been taken by Musselwhite management.
| 16.7.1 | Mine Access And Underground Facilities |
Access to the underground operation is through a twin decline system. The main decline is the primary access for personnel, equipment and materials. It has been driven at -12.5% grade to provide access to levels on a nominal 25 m intervals (i.e., floor to floor). Secondary egress and alternative emergency access is provided by the conveyor ramp, which was driven at -20% grade.
| | December 2024 |
| | TECHNICAL REPORT –
MUSSELWHITE MINE, ONTARIO, CANADA
Document # C8630-0000-PM-RPT-001 – Rev. 0
/ Page 291 |
| 16.7.2 | Ventilation Infrastructure |
The Musselwhite Mine is a mature mine site with a ventilation network that has been developed over time to support historic and current mining activities. Historically, the Musselwhite ventilation system has supplied air to the six (6) main mining areas at Musselwhite Mine with a system capacity of approximately 1,475,000 CFM via a push system. The fresh intake air is supplied through the Main Fresh Air Raise (FAR) and the 250 FAR raise with the main fans located on surface. Air is returned though the Main Exhaust Raise and the main ramping system to surface. Booster fans are provided at various locations throughout the mine to push air to depth and to direct to active working areas.
The ventilation at Musselwhite Mine is designed to evacuate and dilute any contaminants created by mining activities, in alignment with Ontario Mining Health and Safety Laws which prescribes detailed ventilation requirements for all diesel equipment operating underground at the mine.
The ventilation system at the Musselwhite Mine is currently undergoing an underground expansion to ensure additional ventilation supply to the PQ Deeps Zone that is plunging deeper and to the north of the historical mining areas. The current underground mobile fleet consists of diesel-powered equipment only.
The existing ventilation system currently supplies 400,000 CFM to the PQ Deeps Zone. The ventilation expansion will modify the existing ventilation system to direct an additional 200,000 CFM of supply to the PQ Deeps Zone. The additional volume allows for an additional two (2) haul trucks and one (1) scooptram in the PQ Deeps zone beyond the current equipment fleet usage. The extension of the ventilation system does not provide any additional total airflow to the mine
The ventilation upgrades consist of commissioning of an additional booster fan at the 720 WEL and twin booster fans for the 1080-metre level at the top of the PQ Deeps Zone. Additionally, two (2) other ventilation fan installations (each consisting of twin fans installed in parallel) are indicated for the 720-m level at the Lynx Bypass North and the 1370 m level for the 1370 to 1445 PQ Deeps Vent raise. Lateral development along with several ventilation raise development excavations have been completed to complete the ventilation circuit. The ventilation routes are planned to be modified in the changeover via ventilation interlock ventilation doors, bulkheads and louvres to handle the increased volume and ensure air velocities to acceptable industry standards and gas sensors and cameras are planned for monitoring capabilities. The ventilation expansion is projected to be commissioned by the end of 2024. The remainder of the ventilation supply to the mine (~875,000 CFM) is to be used to ventilate the other active mining areas of the mine including transfer drifts, ramps and the winze as well as other production zones.
Implementation of Battery Electric Vehicle (BEV) technology into the equipment fleet may allow for additional equipment as haul distances become longer without requiring the provision of additional ventilation supply.
| | December 2024 |
| | TECHNICAL REPORT –
MUSSELWHITE MINE, ONTARIO, CANADA
Document # C8630-0000-PM-RPT-001 – Rev. 0
/ Page 292 |
| 16.7.3 | Existing Mine Dewatering Infrastructure |
The Musselwhite Mine has two (2) independent pumping systems, the first from the 770 level to the 220 level for subsequent pumping to surface, and the second from the 537 level to surface. The overall capacity of the two (2) pumping systems is 1400 US GPM. Figure 16.6 depicts the main underground dewatering system.
Pumping Station – 770 Level
The 770 pumping station arrangement consists of:
| ● | Two (2) large parallel sumps with solids filtration wall; |
| ● | One (1) clean water reservoir; and |
| ● | Two (2) 350 HP multi-stage clean water pumps and a recycling pump. |
The 770 pumping station has two (2) systems of filtration:
| ● | Gravity low energy sump; and |
| ● | Filtration wall to remove the smaller suspended particles. |
The maximum pumping capacity installs at 770 level is 400 USGPM, and the clean water is cascading to the 220-level pumping station.
The 770 level has water recycling system. This system receives water from the 770 clean water sump, and then runs through a UV system to remove bacteria to provide industrial water for PQ Deeps and Lynx.
The solids are removed from the dirty water sump with mucking scooptram and disposed in old mining areas.
Pumping Station – 220 Level
The 220 pumping station has:
| ● | Two (2) parallel cone sumps; and |
| ● | Two (2) sets of three (3) centrifugal pump of 100 HP each. |
The water is pumped directly to the surface. The solid in the cone sump are pumped out or muck out with a scooptram.
The 220 pumping station has a total capacity of 800 USGPM.
| | December 2024 |
| | TECHNICAL REPORT –
MUSSELWHITE MINE, ONTARIO, CANADA
Document # C8630-0000-PM-RPT-001 – Rev. 0
/ Page 293 |
Pumping Station – 537 Level
The 537 pumping station consists of:
| ● | Three (3) large parallel sumps (two (2) dirty water sumps and one (1) clean water sump); and |
| ● | Solid filtrations are similar to 770 level sump. |
The clean water sump provides water for the mid and upper part of the mine and Esker via the 400 level.
The clean water is directly pumped to surface and discharged in the tailing pond. The maximum capacity of tis infrastructure is 600 USGPM.
Figure 16.6 – Musselwhite Main Dewatering System
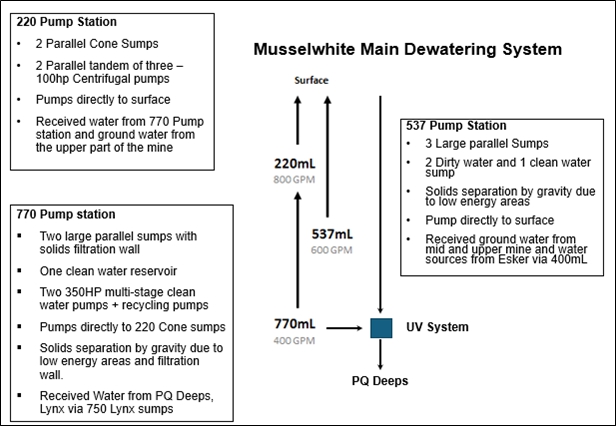
Source: Musselwhite Mine; Dewatering Overview, September 2024
| 16.7.4 | PQ Deeps Industrial Water Supply Plan |
The 770 Level sump will feed an UV system to remove bacteria and send to a clean reservoir. The treated water will be pumped in the PQ Deeps to supply industrial water for the mine operation activities.
In the case of a lack of water or operational problems at the 770 level sump, a supplemental water line from surface will acts as a back up line to ensure the demand is met. Figure 16.7 illustrates the industrial water distribution in PQ Deeps.
| | December 2024 |
| | TECHNICAL REPORT –
MUSSELWHITE MINE, ONTARIO, CANADA
Document # C8630-0000-PM-RPT-001 – Rev. 0
/ Page 294 |
Figure 16.7 – Musselwhite Material Handling System
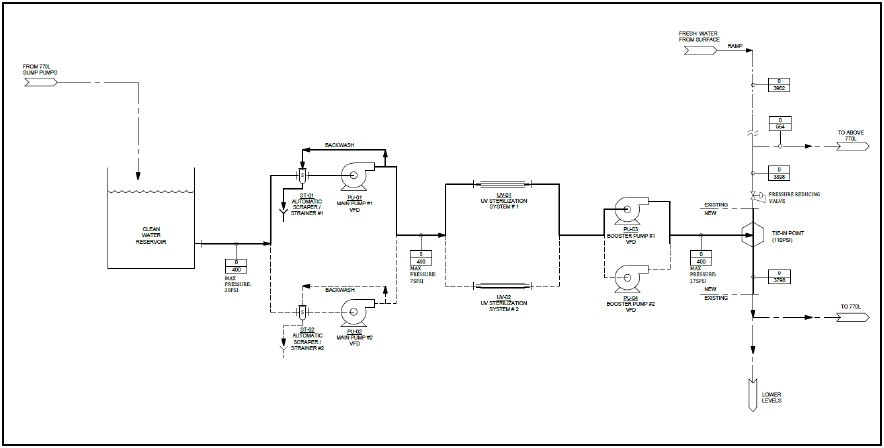
Source: Musselwhite Mine; Dewatering Overview, September 2024
| 16.7.5 | Underground Electric Power Distribution |
The Underground power consists of 5 kV and 13.8 kV transformers on most active levels and for power convenience on non-active levels.
In the upper part of the mine, the power supply is provided by a 5 kV cable that feeds the electrical substations to step-down to 600 V.
In the lower part of the mine, the power supply is provided by a 13.8 kV cable and stepping-down transformers to 600 V. These substations are mostly located on each level.
Eventually, a new circuit from surface substation will be required to feed new mining areas.
| 16.7.6 | Underground Communication |
The underground communications system includes a fiber optic trunk line along with leaky feeder, ethernet and WiFi connections for voice and data transmissions. Personnel are equipped with tracking devices and digital radios and plans are in place to establish monitoring of mobile equipment in real-time in addition to existing on-board digital radios.
The IT/OT communication systems are separated. IT wireless access points is for the IT network access, and the OT network is used for teleoperation, cameras, seismic systems and PLC’s.
| | December 2024 |
| | TECHNICAL REPORT –
MUSSELWHITE MINE, ONTARIO, CANADA
Document # C8630-0000-PM-RPT-001 – Rev. 0
/ Page 295 |
| 16.7.7.1 | Underground Mobile Repair Bays |
Musselwhite Mine maintenance philosophy is to achieve high availability and increase the lifespan of their equipment through a proactive planned maintenance program. The continuous improvement plan is to learn, grow and adjust their maintenance program to maximize the Mineral Resources.
| ● | There are three (3) underground mobile maintenance shops located on 488 mL, 920 mL and 1045 mL. The 488 mL shop is the largest, and all aspects of maintenance is completed there. On the level, there are 25 tons/5 tons overhead crane assembly on a trolley/bridge system, tool crib, bolt room, welding bay, oil lube bay room, refuge station, lunchroom, office, tire storage, staging area for parts of planned work and warehouse that stocks the majority of parts needed to maintain the equipment serviced there. |
| ● | The 920 shop is used mostly by the beat mechanics, there is a lightly stock warehouse, lunchroom, and four (4) service bays with jib cranes. |
| ● | The 1045 service bay is used by Toromont beat mechanic contractor. This service bay has storage shelves for spare parts, lunchroom and refuge stations. |
Two (2) temporary shops on 450 mL and 475 mL are used by contractors (Redpath and Multi-Crete).
| 16.7.7.2 | Underground Fixed Equipment |
There are two (2) small shops underground for fixed maintenance. These small shops have storage, and they are used for small jobs only. Major works go to the surface. The fixed shops are located on the 460 mL and 1220 mL.
The fixed maintenance program is based out of SAP orders and notifications, consisting of daily, weekly, monthly, quarterly, semi-annual, and annual PM schedules, along with the daily work order repair process they use.
The electrical department has a repair shop small warehouse and lunchroom at the 720 mL. The electrical is lightly stocked. The electrical department uses the surface shop warehouse as their main supplier parts.
| 16.7.7.4 | Lunchroom and Refuge Station |
Each underground shops have a lunchroom and a permanent refuge station, and they are equipped with safety materials in case of emergency or underground fire. Several other refuge stations are built in strategic locations across the mine.
| | December 2024 |
| | TECHNICAL REPORT –
MUSSELWHITE MINE, ONTARIO, CANADA
Document # C8630-0000-PM-RPT-001 – Rev. 0
/ Page 296 |
Portable refuge stations are in the new development heading. These portable refuge stations could relocate at different locations based on the new development area. This refuge stations are standalone and they are not required any mine services.
| 16.7.7.5 | Fuel and Lubricant Bays |
The fuel is sent underground via a borehole from surface down the main fuels station located on the 657 mL. From this level, the fuel is distributed by a fuel tanker truck to the portable StaStat fuel station of 7 000 liters capacity. Musselwhite has six (6) underground fuel, oil and grease stations.
The oil is transported in StaStat fuel station in pails of 25 liters and grease in tote.
The Musselwhite mine is a mechanized operation employing rubber-tired diesel equipment for all phases of mining operations. Table 16.5 lists the mobile equipment operating in the mine.
The electric-hydraulic development jumbos are two-boom units. One of these jumbos is equipped with radio-remote-control to use in drifts and stopes rehabilitation. The primary ground support in development heading is completed with jumbos. The jumbos are equipped with retractable slides, except the rehabilitation jumbo where the slides are fixed.
Musselwhite operates fifteen LHDs for production and development. Most units are equipped with radio-remote-control systems to permit mucking inside open stopes, with the operator situated in a safe location in the stope access behind the brow. The stopes are backfilled with uncemented or cemented waste rock and dumped to the stope with LHD.
Caterpillar 45 tons haul trucks are used to transport ore by an internal ramp to the ore passes located at different elevation in the mine.
Musselwhite operates three production drill rigs for drilling in the LH stopes. The production drilling is supplement by a drilling contractor on a base On and Off.
The cable bolters (2) are drilling and installing cables in development and production stopes. These units provide a more efficient capability for installing cable bolts, which will significantly benefit mining operations. Cable bolting is required to support the hanging wall, the ore drive in the LHS stopes and permanent opening and stope brows.
The QP reviewed the underground equipment fleet and observed many of the machines in operation. The QP is of the opinion that the number of units in the fleet and the types, makes, and models are appropriate for the production rate, mining methods and development requirements at Musselwhite.
| | December 2024 |
| | TECHNICAL REPORT –
MUSSELWHITE MINE, ONTARIO, CANADA
Document # C8630-0000-PM-RPT-001 – Rev. 0
/ Page 297 |
Table 16.5 – Underground Mobile Equipment List
| Equipment Type | Make and Model | Number of
Units |
| Jumbo/Bolter | Sandvik DD321 and DD422I | 7 |
| ANFO Loader | Maclean AC3 | 5 |
| Cable Bolter | Epiroc Cabletech | 2 |
| Block Holer | Maclean BH3 and BH4 | 2 |
| Underground Grader | Caterpillar 120H and 135H | 2 |
| Haul Truck Dump/Ejector Box | Caterpillar AD45B | 14 |
| Cassette/Emulsion Carrier | Maclean MTC00312 | 1 |
| Boom Truck | Maclean BT3 | 4 |
| Cassette/Fuel Carrier | Maclean CS3 | 2 |
| Water Canon | Maclean WC3 | 2 |
| Longhole Drill | Sandvik DL422iE and DL432i | 3 |
| Shotcrete Sprayer | Kubota R-520SF | 1 |
| Shotcrete Sprayer | Normet Spraymec MF050 DVC | 1 |
| Transmixer | Normet Ultimec LF500 | 2 |
| Scissor Lift | Maclean SL2 and SL3 | 6 |
| Scooptram (LHD) | Caterpillar R1300G | 2 |
| Scooptram (LHD) | Caterpillar R1700G | 4 |
| Scooptram (LHD) | Caterpillar R2900G | 9 |
| Backhoe | Kubota R520SL-RBH | 1 |
| Underground Shop Telehandler | Kubota & Manitou MH25-4 and R520S-F | 2 |
| Shop Forklift | Kubota R520S-F and R520 LRBH | 2 |
| Man Carrier | Toyota HJZ 79 | 17 |
| Service Vehicle | Toyota HJZ 79 | 34 |
| 16.9 | Underground Mine Personnel |
The underground mine works two (2) 12-hour shifts per day. There are four (4) rosters, working rotations of 14 days on and 14 days off, with two (2) rosters working at the mine at any given time. The majority of the mine personnel reside in the city of Thunder Bay; however, some commute from other cities in Canada.
Musselwhite employ a mining contractor (Redpath) to supplement their development to meet the development schedule to ensure sufficient feed at the treatment plant.
| | December 2024 |
| | TECHNICAL REPORT –
MUSSELWHITE MINE, ONTARIO, CANADA
Document # C8630-0000-PM-RPT-001 – Rev. 0
/ Page 298 |
The QP reviewed the personnel organization and is of the opinion that it is appropriate for the scale of an underground mining operation, such as Musselwhite.
Table 16.6 presents the LoM schedule for lateral development, which consists of ramps and drifts. Table 16.7 shows the vertical development schedule, which consists for raises for ventilation and escapeways. LoM mining rates are similar to current operating rates, and underground development for mining the current mineral reserve is expected to be materially complete in 2030.
Table 16.6 – LoM Development Schedule
| Description | Unit | 2024 | 2025 | 2026 | 2027 | 2028 | 2029 | 2030 | LoM |
| Lateral Development |
| Musselwhite | Ore Development | m | 3,220 | 2,610 | 2,566 | 2,498 | 2,134 | 984 | 447 | 14,458 |
| Capital Waste Development | m | 3,577 | 2,773 | 1,811 | 1,534 | 1,087 | 1,041 | 282 | 12,106 |
| Operating Waste Development | m | 2,226 | 1,592 | 2,482 | 2,242 | 2,544 | 1,472 | 174 | 12,732 |
| Contractor | Contractor Development | m | 3,722 | 1,563 | 534 | 28 | - | - | - | 5,848 |
| Total Lateral Development | m | 12,746 | 8,537 | 7,393 | 6,303 | 5,765 | 3,497 | 903 | 45,144 |
| Vertical Development |
| Contractor | Operating Development | m | - | - | - | 68 | 20 | - | - | 88 |
| Capital Development | m | 104 | 471 | - | 118 | 38 | 527 | - | 1,258 |
| Total Vertical Development | m | 104 | 471 | - | 186 | 58 | 527 | - | 1,346 |
Table 16.7 presents the LoM production schedule developed in the reserve estimation process. The table includes 7.35 Mt at an ore grade of 6.23 g/t that coincide with the December 31, 2023, Mineral Reserve.
The following trends can be noted in the LoM production schedule:
| ● | The mine maintains a steady production output of approximately 1.05 Mtpa over the LoM. |
| ● | Mineral Reserves of 7.35Mt are sufficient to continue operations at this production rate until the end of 2030. |
| | December 2024 |
| | TECHNICAL REPORT –
MUSSELWHITE MINE, ONTARIO, CANADA
Document # C8630-0000-PM-RPT-001 – Rev. 0
/ Page 299 |
| ● | The majority of the mined tonnage is produced from the PQ Deeps zone when the other mining zone will be mined simultaneously. |
| ● | The PQ Deeps will be extracted as transversal stoping (Primary – Secondary) with delay backfill cemented/uncemented. |
| ● | The PQ Deeps contain approximately 60% of the total reserve that contain over 1 Moz of gold. |
| ● | Redwing mining zone will be mined out in 2028, and the T-Antiform will be depleted in 2027. |
Table 16.7 – LoM Production Schedule by Mining Zone
| Zone | Unit | 2024 | 2025 | 2026 | 2027 | 2028 | 2029 | 2030 | LoM |
| PQ Deeps (PQD) | tonnes | 619,316 | 615,730 | 618,208 | 481,824 | 822,344 | 668,007 | 769,095 | 4,594,524 |
| g/t | 6.78 | 6.88 | 8.25 | 6.81 | 8.00 | 6.37 | 5.00 | 6.94 |
| Ounces | 134,999 | 136,262 | 164,020 | 105,462 | 211,632 | 136,771 | 123,614 | 1,012,760 |
| West Limb (WEL) | tonnes | - | - | 6,386 | 108,067 | 69,451 | 102,602 | 267,067 | 553,573 |
| g/t | - | - | 4.59 | 4.79 | 5.14 | 5.62 | 6.57 | 5.84 |
| Ounces | - | - | 942 | 16,636 | 11,469 | 18,549 | 56,428 | 104,024 |
| Upper Lynx (ULYNX) | tonnes | 114,064 | 114,724 | 124,275 | 168,939 | 141,713 | 147,685 | 59,545 | 870,944 |
| g/t | 4.25 | 3.62 | 4.16 | 4.79 | 5.53 | 5.07 | 4.68 | 4.63 |
| Ounces | 15,580 | 13,349 | 16,603 | 25,990 | 25,207 | 24,051 | 8,952 | 129,734 |
| Redwings (RDW) | tonnes | 126,960 | 99,749 | 70,947 | 69,124 | 12,897 | - | - | 379,677 |
| g/t | 5.11 | 6.69 | 6.29 | 5.47 | 4.88 | - | - | 5.80 |
| Ounces | 20,839 | 21,464 | 14,339 | 12,166 | 2,024 | - | - | 70,831 |
| Lynx North (LNXN) | tonnes | 72,065 | 149,072 | 163,040 | 196,549 | 23,769 | 18,587 | - | 623,082 |
| g/t | 5.20 | 5.08 | 5.00 | 5.29 | 5.38 | 7.07 | - | 5.21 |
| Ounces | 12,039 | 24,366 | 26,206 | 33,453 | 4,108 | 4,226 | - | 104,398 |
| Lynx (LYNX) | tonnes | - | - | - | - | - | - | - | - |
| g/t | - | - | - | - | - | - | - | - |
| Ounces | - | - | - | - | - | - | - | - |
| T-Antiform (TANT) | tonnes | 108,678 | 89,617 | 89,735 | 47,033 | - | - | - | 335,063 |
| g/t | 4.44 | 4.81 | 5.13 | 4.75 | - | - | - | 4.77 |
| Ounces | 15,502 | 13,859 | 14,798 | 7,187 | - | - | - | 51,346 |
| Total All Zones | tonnes | 1,041,084 | 1,068,891 | 1,072,592 | 1,071,536 | 1,070,173 | 936,881 | 1,095,707 | 7,356,863 |
| Grade All Zones | g/t | 5.94 | 6.09 | 6.87 | 5.83 | 7.40 | 6.10 | 5.36 | 6.23 |
| Ounces All Zones | Ounces | 198,959 | 209,300 | 236,909 | 200,894 | 254,440 | 183,597 | 188,994 | 1,473,093 |
| | December 2024 |
| | TECHNICAL REPORT –
MUSSELWHITE MINE, ONTARIO, CANADA
Document # C8630-0000-PM-RPT-001 – Rev. 0
/ Page 300 |
| | December 2024 |
| | TECHNICAL REPORT –
MUSSELWHITE MINE, ONTARIO, CANADA
Document # C8630-0000-PM-RPT-001 – Rev. 0
/ Page 301 |
The Musselwhite processing facility was constructed in 1996 and began operations in 1997. Upgrades over time have increased the original processing design throughput from 3,200 tpd to 4,000 tpd, nominally (Samuel Engineering, 2018). Mill availability is 95%, with mill throughput currently limited to about 70% of available capacity by underground mine production.
Ore extracted from the underground mining operation is processed on-site through a metallurgical circuit that features two-stage crushing (primary crushing underground and secondary crushing on the surface), two-stage grinding circuit (using a rod mill and a ball mill) with gravity separation, cyanide leaching, gold recovery by carbon-in-pulp (CIP), elution, electrowinning, refining and carbon reactivation. Before disposal, the mill tailings undergo chemical treatment to remove cyanide followed by thickening to recycle process water and facility deposition in the Tailings Storage Facility (TSF). This facility operates a single-line process, from mining through to the final gold recovery. Figure 17.1 illustrates the simplified flowsheet for the Musselwhite gold mill. Figure 17.2 depicts the existing mill layout.
Table 17.1 depicts a summary of the major processing equipment used in the Musselwhite Mine and plant.
| | December 2024 |
| | TECHNICAL REPORT –
MUSSELWHITE MINE, ONTARIO, CANADA
Document # C8630-0000-PM-RPT-001 – Rev. 0
/ Page 302 |
Figure 17.1 – Musselwhite Simplified Process Flowsheet
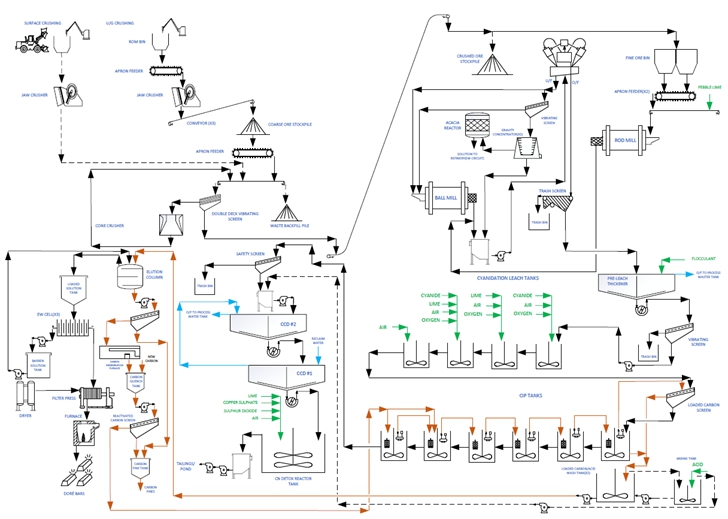
Source: DRA, 2024
| | December 2024 |
| | TECHNICAL REPORT –
MUSSELWHITE MINE, ONTARIO, CANADA
Document # C8630-0000-PM-RPT-001 – Rev. 0
/ Page 303 |
Figure 17.2 – Existing Site Processing Facilities Layout
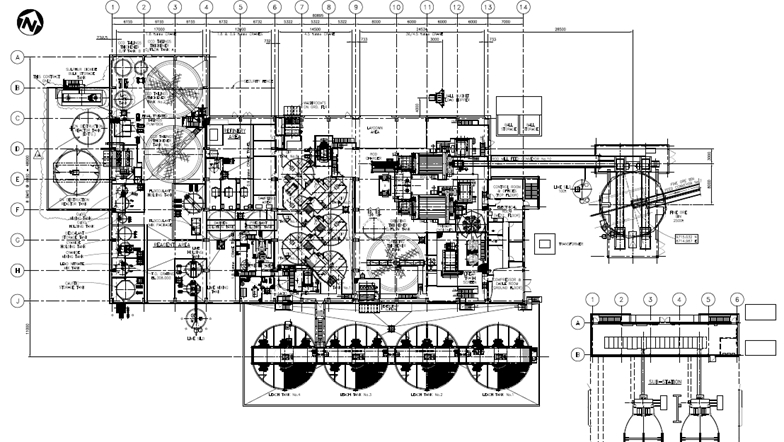
Source: Placer Dome, 2010
| | December 2024 |
| | TECHNICAL REPORT –
MUSSELWHITE MINE, ONTARIO, CANADA
Document # C8630-0000-PM-RPT-001 – Rev. 0
/ Page 304 |
Table 17.1 – Summary of Major Processing Equipment
| Process | No. | Unit | Manufacturer | Dimensions | Drive |
| (kW) | (hp) |
| U/G CO Stockpile Feeder | 1 | Apron Feeder | - | 1,500 mm | 60 in | - | - |
| Crushing | 1 | Jaw Crusher (Waste Rock) | Nordberg | 1.1 × 1.4 m | 43 × 55 in | 185 | 250 |
| 1 | Jaw Crusher (Underground) | Birdsboro Buchanan | 1.2 × 1.5 m | 48 × 60 in | 223 | 300 |
| 1 | Double-Deck Vibrating Screen | Deister | 2.4 × 7.3 m | 8 × 24 ft | 2-18 | 2-25 |
| 1 | Cone Crusher | Symmons | 2,100 mm | 7 ft | 375 | 500 |
| Elution | 1 | Hot Water Boiler | Cleaver Brooks | 12 m² | 130 ft² | - | - |
| Grinding | 2 | FOB Feeders | - | 1,200 mm | 4 ft | - | - |
| | 1 | Rod Mill | Nordberg | Φ 3.6 × 5.2 m | Φ 12 × 17 ft | 1,040 | 1,400 |
| | 1 | Ball Mill | Nordberg | Φ 4.1 × 5.5 m | Φ 13 1/2× 18 ft | 1,350 | 1,810 |
| Gravity Circuit | 2 | Separators | Knelson | 760 mm | 30 in | - | - |
| CIL/CIP | 2 | Leach Agitators | - | - | - | 75 | 100 |
| 6 | CIP Agitators | - | - | - | 15 | 20 |
| 4 | Leach Tanks | - | Φ12.5 m × 13.0 m | - | - | - |
| 6 | CIP Tanks | - | Φ 6.1 m diameter × 6.6 m | - | - | - |
| 1 | Vibrating Screen | - | 900 × 1,800 mm | - | - | - |
| 1 | Safety Screen | - | 1,500 × 3,000 mm | - | - | - |
| Vibrating Safety Screen | 1 | - | - | - | 5 × 12 in | - | - |
| CCD Thickeners | 2 | - | - | 10.7 m diameter | 35.1 ft | - | - |
| | December 2024 |
| | TECHNICAL REPORT –
MUSSELWHITE MINE, ONTARIO, CANADA
Document # C8630-0000-PM-RPT-001 – Rev. 0
/ Page 305 |
An underground Birdsboro-Buchanan jaw crusher, commissioned in 2002, is situated on Level 460. Ore is dumped into various ore passes, such as a dump pocket on Level 400, through 600 mm (24 in) grizzly openings, where it is crushed in the single jaw crusher. Oversized material on the grizzly screen is further reduced by a hydraulic rock breaker located on Level 480, above the jaw crusher.
Crushed ore, sized between 127 mm (5 in) and 140 mm (5.5 in), is then deposited onto a 1,525 mm (60 in) wide apron feeder at Level 90 m (295.3 ft) and transported to the surface via a series of three conveyors, through a dedicated incline passage with a nominal gradient of 20%. The ore is then stored in an open stockpile with a live capacity of 1,500 tonnes on the surface. Up to 10,000 tonnes of RoM ore may also be stockpiled nearby.
The crushing plant located on surface includes a vibrating grizzly feeder, a primary single-toggle jaw crusher, and a secondary cone crusher. Operation of the vibrating grizzly feeder and primary crusher was discontinued in 2002. Stockpiled ore is retrieved by an apron feeder and conveyed to a double-deck vibrating screen in the surface crusher building. Material smaller than 9 mm (3/8 inch) from the screen is conveyed to a fine-ore bin with a capacity of 2,500 tonnes. The oversize material from the screen is recycled to the secondary crusher, which operates in closed-circuit with the double-deck screen
The surface jaw crusher is occasionally used for processing waste rock. When in operation, the discharge from the surface jaw crusher is conveyed to a vibrating double-deck screen. Crushed product is conveyed to stockpile.
Crushed ore is retrieved from the fine ore bin via one of two 1,200 mm (48 in) apron feeders, conveyed, and directly discharged into a single steel-lined rod mill powered by a 1,040 kW (1,395 hp) synchronous motor. The discharge from the rod mill is collected in a common grinding mill pumpbox, and the slurry is pumped to a cyclone cluster with three (3) operating cyclones and two (2) spares. Lead nitrate is added to the cyclone feed pumpbox.
A portion of the cyclone underflow is gravity-fed to the gravity circuit and the remainder fed to the polymet rubber-lined ball mill, which is powered by a 1,350 kW (1,810 hp) synchronous motor. The discharge slurry from the ball mill flows by gravity to the cyclone feed pumpbox. The ore is ground to 80% passing 75 µm (P80) in this rod mill and ball mill configuration.
The cyclone overflow flows over a trash screen. Trash screen’s underflow is gravitated to a 10.7 m (35 ft) diameter pre-leach thickener.
| | December 2024 |
| | TECHNICAL REPORT –
MUSSELWHITE MINE, ONTARIO, CANADA
Document # C8630-0000-PM-RPT-001 – Rev. 0
/ Page 306 |
The scalped portion of the cyclone underflow is directed to two, 30-inch Knelson concentrators running in parallel. The recovered concentrate is further upgraded in an Acacia high-intensity, cyanide leach reactor. The Acacia reactor product solution reports to the electrowinning feed tank, and the tailings report to cyclone feed pump box. Gravity separation contributes to approximately 25% to 30% of the total gold recovery. The tailings from the Knelson concentrators are gravitated back to the grinding mill pump box.
The pre-leach thickener underflow of 55% wt.% solids is directed over a second vibrating screen for trash removal, and the screen underflow is then pumped to the first of four leach tanks in series, each with a capacity of 1,500 m³ (400,000 US gallons), providing a total retention time of 32 hours. An automatic sampler cuts a representative sample, upstream of the leach circuit. Sodium cyanide is added to tanks 1 and 3 to maintain a cyanide concentration of 400 ppm, while the slurry alkalinity is regulated to pH 11.0 by adding pebble lime to the rod mill feed conveyor and lime slurry to tanks 2 and 3. Compressed air is injected into all four leach tanks, and oxygen is sparged into tanks 1, 2 and 3 during the summer months to enhance recovery.
| 17.4.5 | Carbon-in-Pulp Adsorption and Elution |
The Carbon-in-Pulp (CIP) circuit comprises six (6) tanks arranged in series, with each tank providing approximately one (1) hour of retention time. Activated carbon is moved counter-current to the pulp flow, with fresh carbon added to the sixth tank and removed from the first. Carbon density is maintained between 20 to 30 g/t in each CIL tank. The dissolved gold is adsorbed onto the activated carbon particles. The loaded carbon, grading between 3,000 and 6,000 g/t Au, is then transferred from CIP tank No.1 over a vibrating screen into an acid-wash vessel. The screen undersize flows by gravity back to the first CIP tank. The CIP outflow passes over a safety carbon screen, the screen underflow is pumped into the CCD tailing wash circuit.
The loaded carbon is washed with a nominal 3% hydrochloric acid to remove soluble deposits, followed by four rinses with fresh water to neutralize it. The washed carbon then flows by gravity into a 5-tonne stainless steel elution/stripping column. Gold elution is performed using a hot barren solution containing 1% sodium cyanide and 2% sodium hydroxide, heated to 145ºC (293ºF) and at a pressure of 345 kPa (50 psi) for about 8 hours (conventional pressurized Zadra technique). The entire batch cycle, including loading and unloading, takes around 12 hours. The recovered loaded solution is stored in a 122,000-litre (32,000 US gallon) surge tank (4.5 m diameter × 7.7 m high) before being sent to the electrowinning process.
| | December 2024 |
| | TECHNICAL REPORT –
MUSSELWHITE MINE, ONTARIO, CANADA
Document # C8630-0000-PM-RPT-001 – Rev. 0
/ Page 307 |
| 17.4.6 | Electrowinning and Refining |
Electrowinning is conducted in three 1.42 m3 parallel cells, each equipped with six stainless steel 0.8 m2 wool cathodes. Each cell operates at a current of 500 amps. The solution is recirculated through the cells until it reaches a barren concentration of less than 1.0 g/t (0.03 oz/T). The cathodes are periodically removed, washed with high-pressure water to remove sludge, and then pressure filtered. After cleaning, the stripped cathodes are returned to the cells. The barren strip solution is stored in a 4.5 m diameter × 7.7 m high surge tank for reuse in the elution process. The recovered filter cake is dried, mixed with flux reagents, and melted in a single-pour, gas-fired furnace at approximately 1100°C (1950°F) to produce doré bars weighing around 1,000 ounces. Doré bars average 90% gold and 9% silver with the remainder being impurities.
| 17.4.7 | Carbon Reactivation |
The carbon is thermally reactivated in a single 250 kg/h vertical gas kiln operating at a nominal temperature of 700°C (1300°F). The reactivated carbon then drops into the quench tank, which also functions as the carbon conditioning tank, from where it is pumped back into the CIP circuit via a 900 mm x 1,800 mm vibrating screen over CIP tank No. 6. Fresh carbon is also added to this quench tank. Carbon fines are recovered in bags, dewatered and routinely shipped for secondary processing and value recovery of the contained gold offsite.
| 17.4.8 | Tailings Treatment, Thickening and Deposition |
The CIP tailings, which flow by gravity from the 5' x 12' vibrating safety screen, are washed in a counter-current fashion using two 16 m diameter high-capacity thickeners connected in series. With a wash ratio of approximately 0.9:1, around 72% of the cyanide in the CIP tailings is recovered and recycled. The overflow from the first-stage thickener is pumped to the process water storage tank for reuse in the grinding circuit. The underflow, containing 50% solids and less than 90 ppm cyanide, is pumped to a single-stage, agitated, 6.1 m diameter x 7.0 m detox reactor tank, where the remaining cyanide is detoxified using copper sulfate, SO2 and air. The designed retention time in the reactor vessel is about one hour.
The treated tailings are then pumped several kilometers through a double-walled 254 mm HDPE pipeline to the tailings thickening building, where the water content is further reduced to 66–68% solids prior to deposition in the tailing’s facility. Thickener overflow reports by gravity through an open ditch to the reclaim water pond for reuse in processing.
Tailings thickener underflow, averaging 65 to 70 wt.% solids during the summer and 60 to 65wt.% solids in the winter, is pumped to the designated discharge location to raise the TSF stack according to the deposition plan.
| | December 2024 |
| | TECHNICAL REPORT –
MUSSELWHITE MINE, ONTARIO, CANADA
Document # C8630-0000-PM-RPT-001 – Rev. 0
/ Page 308 |
| 17.5 | Reagents and Consumables |
A summary of the reagents and consumables used in the Musselwhite processing plant is provided in Table 17.2.
Table 17.2 – Reagents and Consumables by Processing Area
| Description | Chemical Formula | Process Area |
| Pebble Lime | CaO | Grinding |
| 3” Grinding Rods | - | Grinding |
| 2.5” Grinding Balls | - | Grinding |
| Lead Nitrate | Pb (NO3)2 | Grinding |
| Flocculant | - | Grinding |
| Pulverized Lime | CaO | Leaching Tailings |
| Oxygen | O2 | Leaching |
| Sodium Cyanide | NaCN | Leaching |
| Carbon | C | CIP |
| Hydrochloric Acid | HCL | CIP |
| Sodium Hydroxide (Caustic) | NaOH | CIP |
| Scale Inhibitors | - | CIP |
| Copper Sulfate | CuSO₄ | Tailings |
| Sulphur Dioxide | SO2 | Tailings |
| Flocculant | - | Grinding Tailings |
| Borax | Na₂B₄O₇·10H₂O | Refinery |
| Calcium Fluoride (Fluorspar) | CaF₂ | Refinery |
| Lead Oxide (Litharge) | | Refinery |
| Sodium Nitrate (Niter) | NaNO3 | Refinery |
| Silica (Silicon Dioxide) | SiO2 | Refinery |
| 17.5.1 | Comminution, Extraction and Tailings |
| 17.5.1.1 | Calcium Oxide (Lime) |
Pebble lime is added directly to the rod mill via the in-feed conveyor to optimize process acidity. Pulverized lime is slaked onsite and added as a slurry to the leach tanks and CCD thickener washing circuit to help neutralize tailings and post cyanide detoxification.
| | December 2024 |
| | TECHNICAL REPORT –
MUSSELWHITE MINE, ONTARIO, CANADA
Document # C8630-0000-PM-RPT-001 – Rev. 0
/ Page 309 |
Calcium oxide (lime) poses several workplace hazards due to its highly caustic nature. Skin and eye contact can cause severe irritation or chemical burns, and inhalation of lime dust can lead to respiratory irritation or chronic lung conditions. Lime also reacts with moisture, releasing heat, which can cause burns and intensify respiratory issues.
Lime is pneumatically off-loaded from tanker trucks into a 50-tonne (55-ton) storage silo.
Lead nitrate is added to the cyanide leaching solution to enhance the dissolution of gold during cyanidation. It accelerates the gold leaching reaction by reducing the passivation of the gold surface, which can occur due to the formation of sulfide layers that hinder cyanide's ability to access the gold.
Lead nitrate poses significant workplace hazards due to its toxicity. Lead is a designated substance in the province of Ontario requiring a specific hazard control program which is well established at Musselwhite. Inhalation of dust or fumes can lead to lead poisoning, causing serious health issues such as neurological damage, respiratory problems, and kidney damage. Skin and eye contact with lead nitrate can cause irritation and contribute to lead absorption through the skin. Prolonged exposure may result in chronic lead poisoning, with symptoms like fatigue, headaches, and abdominal pain.
Magnafloc 351 is a non-combustible granular powder flocculant, a copolymer of sodium acrylate and acrylamide and is utilized in the tailings treatment process to aggregate fine particles for easier removal from water.
As a granular powder, it can cause respiratory irritation if inhaled and may irritate the skin or eyes upon contact.
Flocculating agents come in 25 kg (55 lb) bags. They are prepared at a 1% concentration in water mixing tanks and diluted to 0.1% in day tanks for distribution at addition points using positive displacement pumps.
Oxygen is added to the leach tanks to optimize the gold leaching process by accelerating the dissolution of gold into the cyanide solution. It plays a key role in oxidizing the gold, which allows cyanide to more effectively form gold-cyanide complexes, leading to faster and more efficient extraction.
Oxygen is highly reactive and can significantly increase the risk of fire or explosion if it encounters flammable materials.
Oxygen is delivered by tanker truck and stored in a 1 tonne (1 t) capacity tank.
| | December 2024 |
| | TECHNICAL REPORT –
MUSSELWHITE MINE, ONTARIO, CANADA
Document # C8630-0000-PM-RPT-001 – Rev. 0
/ Page 310 |
Sodium cyanide is in cyanide leaching. It dissolves gold from the ore by forming a gold-cyanide complex, which can then be separated from the surrounding materials. This process, known as cyanidation, allows for the efficient recovery of gold from low-grade ore.
Workplace hazards associated with sodium cyanide primarily involve its potential to release highly toxic hydrogen cyanide gas when exposed to moisture or acids, posing serious risks of poisoning through inhalation, skin contact, or ingestion. Sodium cyanide is also highly toxic if mishandled, and exposure can lead to symptoms such as dizziness, headache, nausea, and, in severe cases, respiratory failure or death.
Sodium cyanide is received as solid white briquettes in reusable 1,350 kg (3,000 lb) totes. It is mixed with water to form an aqueous solution and delivered to addition points by metering pumps. In solid form, cyanide is not combustible. However, in contact with moisture or acids, it releases highly flammable hydrogen cyanide gas. Hydrogen cyanide is a flammable liquid whose vapor forms an explosive mixture with air over a wide range.
Carbon is used in the Carbon-in-Pulp (CIP) circuit. In this process, activated carbon is used to adsorb dissolved gold from the leach solution. The system consists of a series of tanks where fresh carbon is introduced to capture gold, after which the carbon undergoes acid washing, elution, and high-temperature reactivation. The reactivated carbon is then reused in the CIP circuit to enhance gold recovery. The carbon used in the process is derived from coked coconut shells.
Activated carbon can cause respiratory irritation from inhaling carbon dust, as well as skin and eye irritation from direct contact. Prolonged exposure to carbon dust can lead to more serious respiratory issues. Additionally, activated carbon is combustible and may pose a fire risk, particularly when exposed to heat, sparks, or volatile compounds.
Carbon is received in 750 kg sacs.
| 17.5.1.7 | Hydrochloric Acid |
Hydrochloric acid (HCl) at the Musselwhite Mine is used in the acid-washing stage to dissolve and remove any mineral deposits, such as calcium or other contaminants, that might have built up on the carbon. This ensures the carbon remains active for re-use in gold recovery operations, helping to maintain efficiency in the extraction process and reducing costs.
HCl is highly corrosive. It can cause severe burns upon contact with skin or eyes, and inhaling its fumes can lead to serious respiratory irritation and damage. Ingesting HCl is extremely dangerous and can cause severe internal injuries.
| | December 2024 |
| | TECHNICAL REPORT –
MUSSELWHITE MINE, ONTARIO, CANADA
Document # C8630-0000-PM-RPT-001 – Rev. 0
/ Page 311 |
Hydrochloric acid is delivered in bulk as a concentrated 31% solution by truck and stored in a dedicated tank. It is distributed at full strength using positive displacement metering pumps. Hydrochloric acid itself is not combustible but can produce hydrogen gas upon contact with certain metals, which may form explosive mixtures with air.
Sodium hydroxide (NaOH) is during the elution process, where it helps to strip gold from activated carbon after adsorption. It is also used to maintain the required alkaline conditions, preventing the formation of toxic hydrogen cyanide gas. Sodium hydroxide ensures that the pH levels remain high, making the extraction process safer and more efficient.
Sodium hydroxide is highly corrosive. It can cause severe chemical burns if it contacts the skin or eyes, and inhalation of dust or mist can lead to respiratory irritation. Ingesting sodium hydroxide is extremely dangerous and can cause serious internal injuries.
Sodium hydroxide (caustic soda) is received as dry pellets in 25 kg (55 lb) bags, which are manually dumped into a mix tank to create a 20% aqueous solution. It is distributed at full strength using positive metering pumps.
Scale inhibitors like organic phosphates and polymers are essential for preventing mineral scale buildup, such as calcium carbonate and gypsum, within critical equipment like pipelines, heat exchangers, and pumps. These inhibitors help maintain the efficiency of systems such as leaching and grinding circuits, where water interacts with ore during gold extraction. By reducing the formation of scale, the inhibitors ensure smoother operation, lower maintenance costs, and extend the lifespan of processing equipment, ultimately improving plant performance and reliability.
Scale inhibitors, particularly those containing organic phosphates or polymers, pose several workplace hazards. These chemicals are typically classified as flammable or combustible, with flashpoints between 55°C and 75°C. Workers handling these substances can be exposed to risks of skin and eye irritation, respiratory issues if inhaled, and potential fire hazards due to their flammability.
They are supplied in 200 L (55 US gallon) steel drums.
Copper sulfate is used as a catalyst in the cyanide detoxification of mill tailings. The treatment reduces cyanide levels to acceptable limits before the tailings are transported and deposited into the tailings storage facility, significantly reducing the potential environmental hazards associated with cyanide.
| | December 2024 |
| | TECHNICAL REPORT –
MUSSELWHITE MINE, ONTARIO, CANADA
Document # C8630-0000-PM-RPT-001 – Rev. 0
/ Page 312 |
Copper sulfate poses several workplace hazards due to its toxicity and corrosive nature. Skin or eye contact with copper sulfate can cause irritation or burns, while inhalation of its dust can lead to respiratory issues. Ingestion is particularly dangerous, potentially causing nausea, vomiting, and even organ damage. Copper sulfate is not combustible.
Copper sulfate pentahydrate is supplied in 25 kg (55 lb) bags, mixed with fresh water to form a 5% solution, and pumped to the tailing treatment circuit using metering pumps.
Sulfur dioxide (SO₂) is also used at the Musselwhite Mine in the cyanide detoxification process, to treat cyanide-containing tailings before discharge.
SO₂ is a highly toxic, colorless gas that can be stored as a liquid at temperatures below -10°C. It is non-combustible and will extinguish fire. Inhalation of SO₂ gas can cause severe respiratory irritation, coughing, shortness of breath, and in high concentrations, respiratory failure. Skin or eye contact with the gas or liquid form can result in burns or irritation.
Sodium metabisulfite was used as an alternative to SO2 when the supply was limited. It was received in 1,000 kg (2,200 lb) bags and mixed into a 15% solution. Sodium metabisulfite is non-combustible in solid form but is corrosive to animal tissue. In contact with moisture, it can generate heat, potentially igniting surrounding combustible materials.
Several chemicals are used in the doré refining process to facilitate this pyrometallurgical process and remove impurities prior to product shipment.
Borax is typically used as a flux during the refinery process. It helps remove impurities from the gold and lowers the melting point of the ore, making it easier to extract and refine the metal. This improves the efficiency of gold recovery and results in a purer final product.
Despite its benefits, borax can pose workplace hazards. Inhalation or skin contact with high concentrations of borax may lead to respiratory issues or skin irritation. To minimize risks, workers should use protective equipment, ensure proper ventilation, and handle borax in controlled conditions.
Calcium fluoride is used as a flux in the refinery process, alongside other flux materials such as borax, litharge, and silica, to aid in the removal of impurities and lower the melting point during the refining of gold.
| | December 2024 |
| | TECHNICAL REPORT –
MUSSELWHITE MINE, ONTARIO, CANADA
Document # C8630-0000-PM-RPT-001 – Rev. 0
/ Page 313 |
Calcium fluoride, or fluorspar, poses workplace hazards primarily due to its dust form. Inhalation of calcium fluoride dust can cause respiratory irritation and, with prolonged exposure, may lead to lung conditions such as pneumoconiosis. Skin and eye contact with the dust can result in irritation or dermatitis, and ingestion in large quantities may cause fluoride poisoning, leading to symptoms like nausea and vomiting. Long-term excessive exposure to fluoride can also result in fluorosis, affecting bones and teeth.
Litharge is used as one of the fluxes in the refinery process.
Litharge poses significant workplace hazards, primarily due to its toxicity. Inhalation of litharge dust can lead to lead poisoning, causing severe health issues such as neurological damage, respiratory problems, and kidney damage. Prolonged exposure can result in chronic lead poisoning, with symptoms including fatigue, headaches, and abdominal pain. Skin and eye contact with litharge can also cause irritation.
Niter is used as one of the fluxes used in the gold refinery process. It is combined with other flux materials such as borax, litharge, silica, and fluorspar. These fluxes help in removing impurities during the high-temperature refinery process to refine gold. Niter is specifically used as an oxidizing agent in this context to assist in the purification of molten metals.
Niter can cause respiratory irritation if inhaled, skin and eye irritation upon contact, and it can be a fire hazard when exposed to heat or flammable materials due to its strong oxidizing properties.
Silica is one of the fluxes used in the refining process. Alongside other materials like borax and fluorspar, silica is not considered combustible and is essential for aiding in the removal of impurities during refining. This material plays a role in improving the efficiency and quality of the gold extraction process by helping to bind impurities for easier removal.
Silica (SiO₂), particularly in its respirable crystalline form, poses significant workplace hazards, primarily through inhalation of fine dust generated during mining and processing. Prolonged exposure can lead to serious health issues such as silicosis, lung cancer, and other respiratory diseases.
| | December 2024 |
| | TECHNICAL REPORT –
MUSSELWHITE MINE, ONTARIO, CANADA
Document # C8630-0000-PM-RPT-001 – Rev. 0
/ Page 314 |
| 17.6 | Utilities and Services |
Production samples for ore control, processing operations and production reporting are prepared and analyzed onsite at the Assay Laboratory, which is equipped and staffed to provide fire and wet chemical assay.
Water is used extensively in ore processing for activities such as grinding, leaching, and thickening. The Musselwhite mill operates at a very high water recycle rate, employing a comprehensive water management system that includes a network of pipelines, pumps, and storage tanks to facilitate the supply and circulation of process water.
Potable water in the gold processing plant is essential for ensuring the health and safety of plant personnel and supporting various domestic and sanitary needs within the facility. The potable water distribution network supplies water to key areas such as offices, cafeterias, change houses, first aid stations, and emergency facilities.
The fire protection reticulation system consists of an 850 m (2,788 ft) long fire reticulation main installed around the mill site, with 250 mm (10 in) DR11 HDPE piping and 150 mm (6 in) lead-in pipe connections to various surface buildings. The loop is fed via a 350 m (1,146 ft) length of 350 mm (12 in) diameter DR11 HDPE pipe from the pump house. Pipe is buried relatively shallow, varying from 1.2 m (4 ft) to 2.7 m (9 ft) due to the natural water table. Automatic fire sprinkler protection is installed throughout the crusher, assay laboratory, and areas of combustibility within the mill, including the reclaim conveyor gallery, conveyor transfer towers. and mill lubrication systems.
Process water is used extensively for various mineral processing operations, such as grinding, leaching, and tailings management. The process water is distributed throughout the plant via a network of pipelines, pumps, and storage tanks, ensuring a consistent supply to various circuits.
Over 90% of the process water demand at the mill is recycled from the pre-leach thickener, CCD circuit and supernatant fluid from the Tailings Storage Facility (TSF). The mill's daily water consumption is about 2,000 m³ (528,344 US gallons), of which only 10 m³ (2,642 US gallons), or 0.5%, consists of fresh water.
| | December 2024 |
| | TECHNICAL REPORT –
MUSSELWHITE MINE, ONTARIO, CANADA
Document # C8630-0000-PM-RPT-001 – Rev. 0
/ Page 315 |
The Musselwhite Mill is equipped with two (2) independent compressed air systems: one dedicated to the mine and the other to the mill. In addition, there are several standalone compressors located in remote areas. An overview of the mill compressors is shown in Table 17.3.
Table 17.3 – Summary of Mill Air Compressors
| Location | HP | CFM | Number (Required) | Application |
| Mill Building | 200 | UNK | 3 (2) | Mill |
| Mill Building | 75 | UNK | 2 (1) | Instrument |
| Mill Building | 15 | UNK | 1 | Mill Clutches |
| Mill Building | 15 | UNK | 1 | SO2 Padding |
| Tailings Thickener | 20 | UNK | 1 | Thickener |
Mill power is supplied by the site electrical system, as described in Section 18. Emergency backup power capacity includes critical process equipment, including leach and CIP tank agitators and tailings pumps.
Life-of-Mine plant power demand for processing is estimated at 19.8 kWh/t, with a fixed load of approximately 1.5 MW.
| 17.7 | Plant Capacity, Historical Performance, and Life-of-Mine Production Plan |
The Musselwhite mill operates 24 hours per day for 365 days per year. Milling rate and plant utilization have been historically high and are currently limited by underground mine production. Plant capacity was determined from historical plant performance combined with a reasonable expectation of performance for this facility, which is summarized and compared with historical performance in Table 17.4. Note that 2021 was the first full year of mill operation, over the past five (5) years, following the underground conveyor fire in 2019, subsequent restoration of operations in 2019 and 2020 and the COVID-19 pandemic in 2020.
| | December 2024 |
| | TECHNICAL REPORT –
MUSSELWHITE MINE, ONTARIO, CANADA
Document # C8630-0000-PM-RPT-001 – Rev. 0
/ Page 316 |
Table 17.4 – Summary of Musselwhite Mill Capacity and Recent Operational Data
| KPI | Units | Capacity | 2021 | 2022 | 2023 |
| Throughput | Mtpa | 1.459 | 0.923 | 1.042 | 1.028 |
| Utilization | % | 90 | 66 | 71 | 72 |
| Milling Rate | t/h | 185 | 160 | 168 | 164 |
| Head Grade | g/t, Au | - | 5.34 | 5.40 | 5.70 |
| Solution Loss | g/t, Au | - | 0.012 | 0.011 | 0.009 |
| Recovery | % | - | 96.1 | 95.7 | 95.7 |
| Production | oz | - | 152,251 | 173,317 | 180,418 |
The life of mine production plan is summarized in Table 17.5. The existing mill will continue to process mined ore, as per this plan, without modification. Plant equipment and infrastructure were observed to be in good order and actively maintained when visited and toured in September 2024.
Table 17.5 – Summary of Musselwhite Mill Life-of-Mine Production Plan
| KPI | Units | 2024 | 2025 | 2026 | 2027 | 2028 | 2029 | 2030 | Avg. |
| Throughput | Mtpa | 1.04 | 1.07 | 1.07 | 1.07 | 1.07 | 0.94 | 1.10 | 1.05 |
| Utilization | % | 71.8 | 74.0 | 74.2 | 74.2 | 73.8 | 64.8 | 75.8 | 72.7 |
| Milling Rate | t/h | 165 | 165 | 165 | 165 | 165 | 165 | 165 | 165 |
| Grade | g/t, Au | 5.94 | 6.09 | 6.87 | 5.83 | 7.40 | 6.10 | 5.36 | 6.23 |
| Recovery | % | 95.9 | 95.9 | 96.1 | 95.9 | 96.1 | 95.9 | 95.9 | 96.0 |
| Production | koz, Au | 191 | 201 | 228 | 193 | 245 | 176 | 181 | 202 |
| | December 2024 |
| | TECHNICAL REPORT –
MUSSELWHITE MINE, ONTARIO, CANADA
Document # C8630-0000-PM-RPT-001 – Rev. 0
/ Page 317 |
| 18.1 | Existing Project Infrastructure |
The Musselwhite Mine has been in production since 1997 and has the necessary infrastructure required to support the current underground mining operation. This includes, but is not limited to, process plant, laboratory, airstrip, fuel storage, chemical storage, power supply, water supply, tailings storage facility, camp, waste facility, and all the necessary offices, warehouses, and workshops to sustain the current operation.
Figure 18.1 shows all existing infrastructure and locations of the plant and mine and Figure 18.2 provides an aerial view Project infrastructure.
Figure 18.1 – Existing Project Infrastructure

Source: Newmont, 2024
| | December 2024 |
| | TECHNICAL REPORT –
MUSSELWHITE MINE, ONTARIO, CANADA
Document # C8630-0000-PM-RPT-001 – Rev. 0
/ Page 318 |
Figure 18.2 – Aerial View of the Project
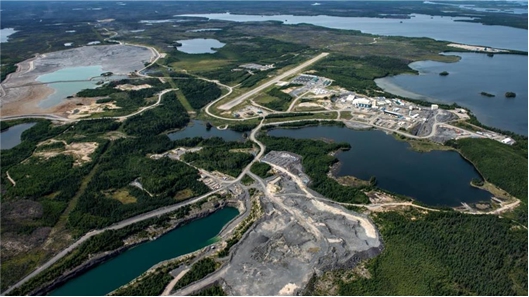
Source: Newmont, 2024
The operation is approximately 500 kilometers north of Thunder Bay and is accessible by road via Ontario highway ON-17 and ON-599N.
Road access to the site is via two (2) gates, both of which are locked at night. The site is monitored by a closed-circuit television (CCTV) camera monitoring system.
Musselwhite Mine features a fully operational airstrip that facilitates fly-in, fly-out personnel transfers through charter flights to and from Thunder Bay regional airport.
A private all-weather unsealed airstrip is established at site and can accommodate turbo propelled aircraft with a capacity of 40 passengers. The airstrip averages about 10 flights/week (generally over a Tuesday through Friday period). Chartered flights typically comprise De Havilland Dash 8 (48 seats) and 9-seat single-engine Pilatus (PC12) aircraft.
| 18.4 | Tailings Storage Facility |
The Tailings Storage Facility (TSF) is located about 2 km southwest of the mill complex, north of Zeemel Lake and southeast of Wilberforce Pond (Figure 18.3). The TSF was constructed in 1996 to provide containment for conventional slurry deposited tailings by a combination of natural topography and seven zoned perimeter earth fill embankment dams with low permeability cores. The TSF was initially designed to store conventional tailings slurry (~50% solids content by weight)
| | December 2024 |
| | TECHNICAL REPORT –
MUSSELWHITE MINE, ONTARIO, CANADA
Document # C8630-0000-PM-RPT-001 – Rev. 0
/ Page 319 |
with plans for a water cover at closure. In 2010, a tailings thickener was added to increase the solids content (~65% to 68% solids content by weight) and convert the TSF to a thickened tailings stack.
Figure 18.3 – General Arrangement of Tailings Storage Facility and Water Management
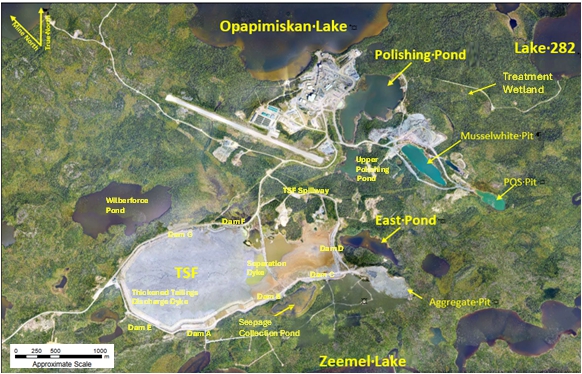
Source: Piteau, 2023 (2018 Air photo)
A thickened tailings discharge dyke was constructed upstream of the perimeter TSF embankment dams along the south, west and northern portion of the TSF stack to provide containment and a base for thickened tailings stack. The tailings discharge dyke has since been regularly raised using the upstream construction method to a current elevation of approximately 326 masl (Figure 18.4). The tailings discharge dyke has been permitted to be raised to a maximum elevation of 342 masl. The TSF dams have a hazard classification of low to significant.
A Separation Dyke was constructed to partition the original TSF into a west cell for tailings deposition and an east cell for water management. The Separation Dyke is approximately 700 m long. Thickened tailings are discharged from the Thickened Tailings Discharge Dyke through a series of spigots (approximately 20) located on elevated wooden trestles.
| | December 2024 |
| | TECHNICAL REPORT –
MUSSELWHITE MINE, ONTARIO, CANADA
Document # C8630-0000-PM-RPT-001 – Rev. 0
/ Page 320 |
Figure 18.4 – Thickened Tailings Deposition Dyke Raises – 2010 to 2023
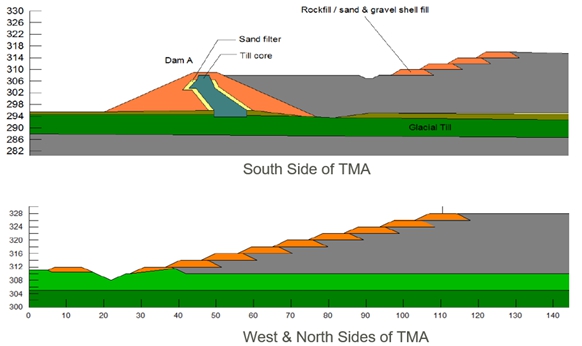
Source: Newmont, 2023
Water from the active western portion of the TSF flows through the Separation Dyke Culvert into the east cell of the TSF. Excess water from the east cell of the TSF is pumped to the Mill for reuse in the process and to the Upper Polishing Pond and then conveyed via gravity to the Lower Polishing Pond through the Polishing Pond Access Road culvert. Any water released from the TSF through the Emergency Spillway would also report to the Upper Polishing Pond and on to the Polishing Pond via the access road culvert. Spill containment measures for the tailings pipeline are provided by the East and West Spill Collection Ponds.
A Seepage Collection Pond (SCP) is located downgradient of the south-east portion of the TSF, and a groundwater seepage interception system has been in operation since approximately 2010 (Piteau, 2023) to protect Zeemel Lake, which is a high value fish habitat. Both the SCP and groundwater interception system are pumped to the TSF Pond from where it is either recycled back to the mill or pumped to the Upper Polishing Pond. Further discussion of water management is presented in Section 20 of the Report.
| 18.4.1 | Dam Raising And Storage Capacity |
The Engineer of Record (EoR) has estimated the remaining capacity in the TSF (as of late 2023), assuming a maximum tailings discharge elevation of 342 m at the west side of the TSF, to be approximately 12.8 Mm³ (ITRB, 2023). The current life-of-mine plan will require approximately 7.3 Mm³ of tailings disposal capacity through the end of 2033. These available storage capacity
| | December 2024 |
| | TECHNICAL REPORT –
MUSSELWHITE MINE, ONTARIO, CANADA
Document # C8630-0000-PM-RPT-001 – Rev. 0
/ Page 321 |
estimates are based on the assumption that the deposited tailings are developed as planar slopes of 1% to 2% at a 4000 tpd production rate.
Surveys of the TSF geometry indicate that the TSF stack is developing slightly concave slopes. It is understood that the existing tailings deposition strategy warrants further optimization to improve depositional control and reduce the erosive channeling of flow which has the potential to transport tailings all the way to the Separation Dyke, rather than flowing to the design configuration. Options under consideration for improving tailings depositional efficiency and minimizing channeled flow include incorporating energy dissipation elements at the tailings discharge points, depositing from multiple spigot points at a time, and incorporating “training berms” on the tailings surface to facilitate improved control of where deposited tailings flow and accumulate.
| 18.4.2 | Tsf engineering oversight |
The TSF has a high level of design and operational oversight including a dedicated EoR and Deputy EoR. The Site has a dedicated Responsible Tailings Facility Person (RTFP) and deputy RTFP who perform regular inspections of the TSF, monitor the TSF instrumentation and communicate regularly with the EoR. The site also engages an Independent Tailings Review Board (ITRB) that was established in 2019 to provide independent assessment to senior management, corporate representatives, local First Nations technical representatives, and regulators, if applicable, as to whether the TSF is designed, constructed and operated appropriately, safely and effectively. The ITRB provides non-binding advice and recommendations so that the design engineer, the EoR and the owner maintain full responsibility and authority for the design and operation of the TSF.
The ITRB mandate includes oversight of the TSF and associated water management including the SCP, groundwater interception system, Polish Pond and treatment wetland performance.
The site has been responsive to ITRB recommendations and is advancing relevant studies, models and field trials to address stated concerns and identified risks. The ITRB has been active in evaluating the stability and modelling of TSF and has worked with the EoR to develop monitoring and construction protocols that mitigate risks associated with the generation of excess porewater pressure. The ITRB is in agreement with the EoR and RTFP that the TSF and related water management structures are performing consistent with the design and operated in a responsible manner (ITRB, 2023).
The site is a member of MAC, an active participant in the OMA and shares best practices and lessons learned from other mines with similar challenges.
| 18.4.3 | instrumentation and monitoring |
The TSF has an extensive array of instrumentation including standpipes, Vibrating Wire Piezometers (VWPs) and inclinometers. This instrumentation is supplemented by additional CPT data which is used to calibrate deformation and stability modelling and the development of Trigger Action
| | December 2024 |
| | TECHNICAL REPORT –
MUSSELWHITE MINE, ONTARIO, CANADA
Document # C8630-0000-PM-RPT-001 – Rev. 0
/ Page 322 |
Response Plans (TARP). Musselwhite employs technology and data management software that require a high level of engagement and oversight (i.e., dedicated staff to maintain). Instrumentation is read/downloaded regularly by the RTFP and viewed by the EoR (WSP, 2023). The monitoring data is also reviewed by the ITRB to provide additional insight and inform recommendations for additional study and modelling inputs.
Shallow VWPs have been installed in the thickened tailings stack to monitor for potential excess porewater pressure generation during dyke raise construction and mitigate associated risks.
| 18.4.4 | Dam Safety And Tsf Geotechnical Performance |
The EoR and the RTFP consider that the TSF is performing consistent with the geotechnical, civil and hydrologic design expectations. Based on the information presented at the latest ITRB review (ITRB, 2024) the ITRB agreed with this assessment with the provision that observed erosion gullies on the downstream face of the discharge dykes are an exception and processes are to be implemented to further mitigate this type of erosion.
The preliminary results of the static deformation model provide useful information for assessing the performance of the TSF and the need for buttressing the toes of the discharge dykes. The height of the phreatic surface is shown to be critical to the performance of the TSF, with a higher phreatic surface increasing the likelihood of triggering static liquefaction and failure of a dyke. The ITRB recommends (ITRB, 2024):
| · | Review of the location, number and availability of the vibrating wire piezometers within the discharge dykes and assess if sufficient instruments are available to be used as a critical control for phreatic surface elevation |
| · | Assess options that could be constructed to control the level of the phreatic surface within the tailings. Options could include granular drains (French Drains), drain tubes, and granular blanket drains. Drainage measures would be more effective if implemented as low as possible within the tailings mass. |
It is noted that while a lower phreatic surface increases geotechnical stability, it would result in more unsaturated tailings which exposes more tailings to oxidation. Studies are ongoing to determine an appropriate balance for optimal TSF geotechnical and geochemical performance.
The current method of tailings deposition has a number of shortcomings, such as concentrated erosion gullies that form at the point of tailings discharge and prevent tailings from depositing high on the beach, resulting in a concave beach profile. The ITRB has made several recommendations that may improve tailings deposition performance including running the thickener to achieve maximum possible slurry density, operating two discharge points at a time, and incorporating energy dissipation measures and splash pads at the discharge point to absorb energy from the elevated pipes.
| | December 2024 |
| | TECHNICAL REPORT –
MUSSELWHITE MINE, ONTARIO, CANADA
Document # C8630-0000-PM-RPT-001 – Rev. 0
/ Page 323 |
| 18.4.5 | Environmental performance |
The tailings are potentially acid generating (PAG) and, where exposed at the inactive area, have gone acidic at the surface in less than 10 years. However, the MIN3P modelling indicates the tailings may have enough carbonate minerals (NP) to neutralize acid in the saturated tailings and maintain neutral pH in seepage for hundreds of years (Ecometrix, 2023).
Oxidation of the tailings and release of acidity and contaminants of potential concern (CoPCs) is controlled by the diffusion of oxygen at the facility scale and the particle scale. Neutralization of acidity is an important factor in the source loadings, even though the tailings are classified as PAG.
During operations, high moisture content and alkalinity in the process water can mitigate acid generation. After closure, PAG tailings are likely to develop acidic runoff and seepage after some lag period, but carbonate minerals in the saturated lower portion of the tailings can potentially provide sufficient neutralization to maintain circumneutral drainage.
To date, the TSF has been performing well and runoff and seepage collected in the TSF Pond is suitable for discharge to the Polishing Pond and ultimately to the treatment wetland for additional polishing before discharge at the final point of compliance.
Geochemical modelling of the TSF geochemical performance is ongoing and indicates that the Neutralization Potential (NP) from carbonate minerals in unsaturated tailings is likely to be consumed post-closure, but carbonate NP in saturated tailings in the lower half of the TSF is likely sufficient to maintain circum-neutral seepage for the foreseeable future after closure (Ecometrix, 2023). However, the possibility of carbonate mineral depletion and acidic seepage with high concentrations of metals cannot be ruled out. Runoff from bare tailings was assessed as a base-case scenario. This scenario was evaluated only as an aid to understanding the geochemical processes in the tailings, as establishment of vegetation will be required at closure. The modelling of the bare tailings closure scenario suggest that active water treatment would likely be required if the TSF was closed with an exposed tailings surface.
The model forecasts were sensitive to profiles of moisture content and hence oxygen diffusion and sulfide oxidation rates, particularly for the possibility of high moisture saturations in the tailings. Simulation of the tailings covered with either of two (2) alternative cover designs (multi-layer cover or engineered water shedding cover), incorporating either a silty layer or an HDPE liner, yielded substantially improved porewater quality in the tailings with at least an order of magnitude lower concentrations and mass loads than the Base Case. These alternate cover designs greatly reduced oxygen diffusion due to high moisture contents in the cover and, in the case of the HDPE liner, low permeability (Ecometrix, 2023). The evaluation of optimal closure cover design is ongoing, but studies to date indicate that incorporation of a robust oxygen diffusion barrier significantly improves long-term TSF performance.
| | December 2024 |
| | TECHNICAL REPORT –
MUSSELWHITE MINE, ONTARIO, CANADA
Document # C8630-0000-PM-RPT-001 – Rev. 0
/ Page 324 |
The 2018 Closure Plan describes the potential for adding sulfide flotation to the tailings flowsheet, but it has not been implemented. The ITRB has suggested that the case for tailings desulfurization be reconsidered (ITRB, 2024).
| 18.4.5.1 | Groundwater Contamination and Mitigation |
Seepage from the TSF into groundwater was identified shortly after the operation of the TSF began. A plume of contaminated groundwater was noted to be heading towards Zeemel Lake. It is believed that this seepage does not originate from any one location in the TSF but is widespread over the bottom of the original TSF (Piteau, 2023).
In 2010, Musselwhite commissioned a groundwater interception system as part of a plan to halt the migration of the seepage plume downstream of the TSF (referred to as the Western Seep). The system, which consists of seven (7) pump wells is currently pumping about 20,000 m³ of groundwater per month back into the TSF. During the winter period, the rate of pumping is reduced due to low groundwater flow and to maintain an optimal water balance within the TSF. The pumped groundwater is discharged upstream of Dam A. A vast array of monitoring wells is used to capture data related to the plume and track progression.
Water is most likely leaking through the entire footprint of the TSF with varying intensity, but the groundwater monitoring data suggests general zones of concentrated leakage, along the southern side of the TSF. A second concentrated seep path, referred to as the Eastern Seep, flows towards the SCP in a bedrock channel and then on towards the Paseminon River (Piteau, 2023). The Eastern Seep continues to be monitored, and studies are ongoing to determine if any additional mitigations will be required at closure.
A small open pit was mined during 1996 – 1997, and a second open pit was mined out in 2004. These pits are both located approximately 1 to 2 km south of the mine site (Piteau, 2023). It is estimated that a total of 2.5 million tonnes of unprocessed, uneconomic rock has been excavated from the open pits. The open pit rock exhibits virtually no potential to generate acid drainage. Therefore, the rock from the open pit stockpile can be used for construction purposes on surface. It is estimated that approximately 2.19 million tonnes of non-acid generating (NAG) rock remain on surface adjacent to the open pit that will be recontoured and covered with topsoil and seeded (Newmont, 2024).
The open pit is passively filling and has stabilized without surface discharge. The open pit water quality is not problematic and suitable for discharge to the environment. Monitoring indicates that there is little to no open pit water seeping into groundwater. The quality of pit water and seepage/runoff from surrounding waste rock is monitored and is not anticipated to present geochemical issues. The mine has a permit to take water for the open pit.
| | December 2024 |
| | TECHNICAL REPORT –
MUSSELWHITE MINE, ONTARIO, CANADA
Document # C8630-0000-PM-RPT-001 – Rev. 0
/ Page 325 |
If tailings desulfurization is added to the process flowsheet, the sulfide flotation concentrate would be stored underwater in the open pit. This management strategy is described in the 2018 Closure Plan (SNC-Lavalin, 2018).
| 18.6 | Camp and Accommodations –Village |
The Musselwhite Mine site includes a residential village to support the operational workforce. The village facilities recently upgraded bunkhouse buildings as depicted in Figure 18.5. Additionally, there are two (2) supplementary bunkhouses with a combined capacity of 96 bedrooms that are utilized to accommodate Project-related personnel and peak occupancy periods.
The main village area encompasses a recreation building with sports amenities, a kitchen and dining facility, medical services, and the site's airport. The village also includes various administrative offices and support facilities necessary for sustaining the mining operations.
Figure 18.5 – Existing Musselwhite Village – Aerial View
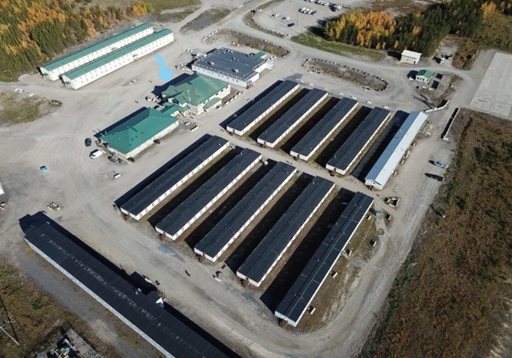
Source: Newmont, 2022
A fibre optic link provides internet access and VOIP phone connectivity to the Musselwhite Mine and connects all facilities to the offices outside the mine site. Where the use of fibre optic is not feasible, voice and data communications are facilitated through radio and wireless backbone systems.
| | December 2024 |
| | TECHNICAL REPORT –
MUSSELWHITE MINE, ONTARIO, CANADA
Document # C8630-0000-PM-RPT-001 – Rev. 0
/ Page 326 |
Additionally, a cellular network is available at Musselwhite site.
In the event of disruptions to the fibre optic service, satellite phones, satellite internet and copper lines serve as emergency backup communication options.
| 18.8 | Site Water Management |
Additional details on water management are provided in Section 20 of the Report.
The Wataynikaneyap Project, a power grid expansion linking 17 remote communities in Northern Ontario includes infrastructure that expanded the power capacity line serving Musselwhite Mine (completed July 2023). This infrastructure project increased the maximum site capacity from 19,500 kW to 23,000 kW, enabling Musselwhite Mine to run completely independent of the existing generators on-site. The generators are now kept only to provide redundancy/back-up power when needed. There is sufficient power supplied to site to support the LoM plan and accommodate increasing ventilation requirements during plan execution.
Electrical power is provided from the provincial power grid via a 115 kV overhead, wooden pole mounted transmission line from the Hydro One Crow River substation at Pickle Lake, over a distance of 187.5 km.
This powerline feeds two onsite substations; the Main Sub and the Esker Sub. The 115 kV main transmission powerline (three (3) conductors + static protection) is owned by the site and Wildon Wiring is the appointed specialized maintenance contractor. Annual inspections and maintenance continue on this powerline. Helicopter inspection is done annually. The powerline is oversized by design, and able to carry much more current than required. It is also designed for higher voltage, if necessary (up to 240 kV). However, the existing powerline experiences occasional blackouts caused by lightning strikes and tree contact.
Due to the length of the Musselwhite 115 kV transmission line (187.5 km), a static VAR compensator system is required on the primary side of each of the main two substations to regulate power factor. In 2013, a redundant ABB SVC-Q system was commissioned at the Esker Substation known as SVC-1 and SVC-2, each rated at 30 MVAR. The old SVC at the Main Musselwhite substation was replaced with a StatCom version.
The 115 kV transmission line can be isolated by installed SF6 breakers at each end: Pickle Lake and Musselwhite / Esker subs respectively. There are two SF6-filled circuit switchers isolating ET1 and ET1 at Esker substation. There are three (3) SF6 breakers for SVC1, SVC2, and the starting reactor.
| | December 2024 |
| | TECHNICAL REPORT –
MUSSELWHITE MINE, ONTARIO, CANADA
Document # C8630-0000-PM-RPT-001 – Rev. 0
/ Page 327 |
Surface transformers are typical oil-filled type. Underground transformers are all skid-mounted, dry-type, mine units, except for small, encapsulated units used to generate low voltage (lighting, 120 outlets, etc.). Larger oil-filled units are equipped with oil temperature, oil level, winding temperature and gas accumulation/pressure protective devices. Spare transformers are also available. The 4,160 V and 13.8kV power is distributed radially from the two main substations to various load centers using a high resistance grounded system.
Fixed speed motor loads of 200 kW and above are fed at 4,160 V. Smaller motor drives and loads are fed at 600 V from outdoor unit substations and pole and pad mounted distribution transformers. The switchgear in the main substation is GE Power Vac 4 kV equipment with electronic GE Multilin F60 protection relays on modular platforms.
At Esker substation, three (3) 4,160 V feeders supply power to surface facilities, such as vent fans, and four 13.8 kV feeders supply underground operations from the Esker substation. Two (2) 13.8 kV feeders are routed down the old shaft and service 100 to 400 mL. The other two (2) feeders are delivered down the ventilation shafts and service areas below 400 mL and lower ore bodies.
Diesel and gasoline fuels are transported to site by tanker vehicles and stored in aboveground double-walled steel tanks. All fuel tanks are located on concrete pads.
| | December 2024 |
| | TECHNICAL REPORT –
MUSSELWHITE MINE, ONTARIO, CANADA
Document # C8630-0000-PM-RPT-001 – Rev. 0
/ Page 328 |
| 19 | MARKET STUDIES AND CONTRACTS |
Considering that Musselwhite is an operational facility producing a readily marketable commodity in the form of gold doré bars, further market studies are not deemed necessary at this time. The gold doré bars are securely transported to a refinery for subsequent processing.
Gold production is marketed at prevailing spot prices in the open market. The estimated costs associated with bullion transport, liability charges, and refining are derived from contractual agreements with third-party service providers.
For the financial model base case, the following gold price projection has been adopted, as presented in Table 19.1. This price projection was derived from publicly available average long term price of gold from by 20 of the leading international banks and financial service firms.
Table 19.1 – Base Case Metal Pricing
| Element | Unit | Financial Model |
| Au | $US/oz | 2,150 |
Musselwhite Mine has established various contracts, agreements, and/or purchase orders in place for the supply of materials and services that are essential to the operation. All contracts are negotiated with vendors, each defining specific scopes, terms, and conditions. These contracts are regularly reviewed and renewed as necessary. The terms are consistent with industry standards and typical of similar agreements within Canada.
| | December 2024 |
| | TECHNICAL REPORT –
MUSSELWHITE MINE, ONTARIO, CANADA
Document # C8630-0000-PM-RPT-001 – Rev. 0
/ Page 329 |
| 20 | ENVIRONMENTAL STUDIES, PERMITTING AND SOCIAL OR COMMUNITY IMPACT |
| 20.1 | Environmental Baseline |
The Musselwhite Property lies in the central portion of the Weagamow-North Caribou Lake greenstone belt in the south-central part of the Sachigo Sub-province. The belt is narrow and trends roughly southeast - northwest. Near Opapimiskan Lake, the belt splits with a narrow strip trending off to the southwest while the main part of the belt continues to the southeast. Within the northern two-thirds of the belt, a thick sequence of meta-sedimentary rocks is flanked on both sides by predominantly magnesium and iron rich meta-volcanic rocks forming a large synclinal structure. Near Opapimiskan Lake, the meta-volcanic rocks are divided into the North and South Rim Volcanic sequence. In this area, the latter are comprised of Mg-rich basalts compared to the more iron-rich compositions to the north. These structures form the footwall rocks to the iron formations of Musselwhite Mine (SNC-Lavalin, 2018).
The climate at Musselwhite Mine is characterized by warm summers, cold winters, and moderate precipitation, which is typical of the interior of northern Ontario. Temperature, rainfall, snowpack, evaporation and wind have been monitored since 2000. January is the coldest month of the year, and July the warmest one with average temperatures of -19.1°C and 18.0°C respectively. Annual rainfall at Musselwhite ranges from 327 mm to 729 mm. The peak rainfall varied from year to year but occurred in summer between June and September (SNC-Lavalin, 2018).
The currently approved Facility Production Limit is 6,000 tonnes of ore per day, and operation of the diesel fired generators is permitted to a maximum total generating capacity of 20 megawatts to provide power to the facility. The maximum Point of Impingement (POI) concentrations for the significant contaminants were calculated based on the maximum operating scenario where all significant sources are operating simultaneously at their individual maximum rates of production. The predicted POI concentrations were compared against criteria listed in the Ministry of Environment, Conservation and Parks (MECP) publication "Air Contaminants Benchmarks List (ACB)”, dated April 2023. All the predicted POI concentrations were below the corresponding limits. At 21.8%, oxides of nitrogen (NOX) of normal operations had the highest concentration relative to the corresponding MECP ACB, for 1-hour averaging period (WSP, 2024).
Emergency power equipment is exempt from permitting but not the requirements of O.Reg. 419/05. Therefore, the emissions of nitrogen oxides were modelled during the testing of the emergency diesel generators for comparison against the MECP screening criteria of 1,880 µg/m³ for the 30-minute averaging time at non-sensitive receptors. The maximum predicted concentration resulted
| | December 2024 |
| | TECHNICAL REPORT –
MUSSELWHITE MINE, ONTARIO, CANADA
Document # C8630-0000-PM-RPT-001 – Rev. 0
/ Page 330 |
from testing of the 5.3 MW emergency generator, resulted in a modelled POI concentration of 246 µg/m³ (13.1% of the screening criteria) (WSP, 2024).
The tailings are classified as predominantly Potentially Acid Generating (PAG) based on static testing and paste pH surveys. These tests indicate that some surficial tailings go acidic after being exposed at surface for less than 10 years. The modelling indicates, however, that the Neutralization Potential (NP) from carbonate minerals in unsaturated tailings is likely to be consumed post-closure, but carbonate NP in saturated tailings in the lower half of the TSF is likely sufficient to maintain circum-neutral seepage for the foreseeable future after closure. However, the possibility of carbonate mineral depletion and acidic seepage with high concentrations of metals cannot be ruled out. This emphasizes the importance of understanding the actual ratios of NP to Acid Potential (AP) throughout the tailings as well as defining the NP/AP value that will define non-PAG (Ecometrix, 2023). Additional geochemistry modelling is recommended to better understand the ongoing acidification of the tailings evident with trends in seepage water quality since 2017 (Ecometrix, 2023).
Tailings management requires a balance between geochemical benefits of maintaining a high degree of tailings saturation to inhibit oxidation measured against the increased tailings stack geotechnical stability associated with a lower water table. Studies are ongoing to better understand this balance and to optimize tailings deposition and closure through the incorporation of an oxygen diffusion barriers and/or a low permeability cover.
| 20.1.4.2 | Waste Rock and Open Pit |
An assessment of the potential for Metal Leaching (ML) / Acid Rock Drainage (ARD) was completed during the federal EA process (Section 20.7.1). According to the Mine Rock Management Plan (Newmont, 2024a), neither the waste rock material nor open pit walls are expected to generate ARD. In addition, metals levels in Musselwhite ore and waste rock are relatively low. Only copper and arsenic were above typical levels found in the Earth’s crust. Since the underground waste rock exhibits somewhat higher potential to generate acid drainage compared to the open pit is to be used preferentially as underground fill (Newmont, 2024a). Based on this, the Mine Rock Management Plan focuses on segregation of PAG/non-PAG rock coming from underground to surface, well designated areas to store PAG/non-PAG waste rock on surface, keeping all or most of the PAG waste rock underground for roadbeds/other uses, and communication to the site of changes in the Plan (Newmont, 2024a).
| | December 2024 |
| | TECHNICAL REPORT –
MUSSELWHITE MINE, ONTARIO, CANADA
Document # C8630-0000-PM-RPT-001 – Rev. 0
/ Page 331 |
The Musselwhite Mine conducts a comprehensive water quality monitoring program to meet the requirements established in the ECA ISW 1156-A3AL84 issued under the Ontario Water Resources Act and the Metal and Diamond Mining Effluent Regulations (MDMER) under the federal Fisheries Act (Section 20.1.7). A Surface Water Biennial Monitoring Report (SWBMR) is submitted to the MECP. This report summarizes the collected water quality data and includes an assessment of water quality upstream and downstream of Lake 282 and within Zeemel Lake with regards to effluent quality and potential groundwater influence.
Regional surface water monitoring program was initiated in 1992. The objective of the regional monitoring is to monitor the water quality in the upstream and downstream regional rivers around the mine. The stations have been established to satisfy both, regulatory requirements (ECA ISW) and requests from the Indigenous Communities (ICs). In total, there are seven surface water quality stations around the mine and the sampling is completed three times per year. According to the SWBMR (Minnow, 2024), samples occasionally did not meet water quality guidelines; however, with the sole exception of cobalt concentration in one station (MUS-08), there were no patterns to suggest that the exceedances/increases in the concentrations were associated with a mine-related influence.
Surface water quality monitoring program at the Site was initiated in 1997 to monitor eleven locations. Sites have been added or removed from the program as needed (SNC-Lavalin, 2018). The current monitoring locations are sampled either thrice weekly, weekly, monthly or annually in accordance with both, regulatory commitments and agreements with the ICs. The ECA ISW allows effluent discharge from April 15th to November 30th of each year. The ECA ISW includes criteria for total arsenic, copper, lead, nickel, zinc, ammonia, cyanide, weak acid dissociable (WAD) cyanide, total suspended solids, and pH. According to the SWBMR (Minnow, 2024), Musselwhite effluent consistently met all ECA limits and conditions in 2022 and 2023.
For Zeemel Lake, the lack of any temporal trends suggested that the TSF is not measurably influencing water quality in this Lake for the considered period (i.e., 2014 to 2023) (Minnow, 2024).
Groundwater has been sampled since 1995. Due to monitoring results indicating the presence of a groundwater plume from the TSF, monitoring wells have been installed throughout the mine. Before the mine was constructed (1995), groundwater monitoring wells were installed downstream of the current TSF to gather baseline data before the deposition of tailings. In 1996, after Stage 1 construction of the tailings dams and before deposition of tailings, 11 additional monitoring wells were installed along the southern boundary of the TSF, nine of which are still being sampled. In 2000, GW-19 was installed at the western edge of the plume between Dam A and Zeemel Lake. In 2004, three additional monitoring points were installed to improve the understanding of the groundwater plume (GW-20, 21 and 22). These monitoring points were located near the eastern
| | December 2024 |
| | TECHNICAL REPORT –
MUSSELWHITE MINE, ONTARIO, CANADA
Document # C8630-0000-PM-RPT-001 – Rev. 0
/ Page 332 |
edge of the plume and in the down-gradient portion of the plume core. GW-22 was decommissioned. Five additional monitoring wells were added in 2006. In 2007, two (2) monitoring wells (GW-29 and GW-30) were installed. In 2010, seven pumping wells were installed between the TSF and Zeemel Lake to intercept the groundwater plume from the TSF. These wells, PW-3 through PW-9, were installed in a line on the north side of the access road, 200-300 m down-gradient of the TSF. The water from each well in this system is pumped to a sump, and then pumped to the TSF. The system was commissioned in July 2010. In addition, ten monitoring wells (GW-31 through GW-40) were installed alongside and down-gradient of the pumping wells to monitor the efficacy of the interception system. Six monitoring wells were installed between the pumping wells; three were installed in a line between the pumping wells and Zeemel Lake; and one was installed at the shore of Zeemel Lake. In 2021, additional monitoring wells were installed including eight (8) new monitoring wells at four (4) locations (GW-03(T), GW-04(T), GW-05(T), GW-06(T)), with shallow monitoring wells installed in the tailings, and deep monitoring wells installed in the underlying till. The wells are sampled three (3) times per year (Piteau, 2023).Several plumes of mining impacted groundwater have developed in the groundwater system due to mining operations, with elevated concentrations noted for sulfate, chloride, iron, cobalt, cyanide and ammonia. These plumes migrate along the western and the eastern flowpaths. The western flowpath ultimately discharges to Zeemel Lake relatively close to the Fish Habitat if the interception system is not operating. The eastern flowpath trends along a buried bedrock valley toward the Paseminon River (Piteau, 2023).
According to the 2023 Biennial Groundwater Monitoring Report (Piteau, 2023), only iron and cobalt persistently exceeded the internal trigger levels voluntarily enacted by Musselwhite in 2005. Notably, none of the wells next to Zeemel Lake exceeded the cobalt trigger, but three exceeded the iron trigger. However, pre-mining iron concentrations at one of these locations (GW-10) were similar to concentrations routinely observed at this location since operations started in 1997. Furthermore, the iron concentrations at GW-10 do not respond to pumping as readily as other constituents (e.g., sulfate, chloride, arsenic, etc.). Altogether, these results suggest that the elevated iron at GW-10 may be naturally occurring. No pre-mining data are available for the other two (2) locations (GW-40 and 56), but the behaviour is very similar to GW-10. As such, the interception system is preventing higher iron concentrations from discharging to Zeemel Lake. None of the down-gradient wells along the eastern flowpath exceeded the iron or cobalt triggers.
| 20.1.7.1 | Terrestrial Ecology |
The Musselwhite Mine site area does fall in the range of known species at risk as identified through the Species at Risk Act (SARA). Species of wildlife listed as vulnerable by SARA that may be found in the mine site area include the Woodland Caribou, Bald Eagle, Golden Eagle, Wolverine, Monarch Butterfly, Yellow Rail, Black Tern and the Short – Eared Owl. Animal species occupying the regenerating forest include moose, woodland caribou, black bear, wolves, beaver, fox and rabbit (SNC-Lavalin, 2018). A Species at Risk Assessment was completed by Goldcorp in 2016 and
| | December 2024 |
| | TECHNICAL REPORT –
MUSSELWHITE MINE, ONTARIO, CANADA
Document # C8630-0000-PM-RPT-001 – Rev. 0
/ Page 333 |
species listed under the International Union for Conservation of Nature (IUCN) Red List, and national and provincial conservation list species were compiled for areas affected by Goldcorp operations. The study concluded that there are 27 SAR potentially occurring in the Musselwhite study area including the species listed above. The Barn Swallow is a medium-sized songbird listed as threatened under Ontario’s Endangered Species Act (2012) has been identified in the Musselwhite Mine area and the species and its habitat are protected.
Fish studies in the lakes surrounding the mine site have been occurring since pre-operation years. The primary large-bodied fish species that have been caught and included in historical studies include walleye (Stizostedion vitreum), lake whitefish (Coregonus clupeaformis), northern pike (Esox lucius), white sucker (Catostomus commersoni), yellow perch (Perca flavescens) and shorthead redhorse sucker (Moxostoma macrolepidotum). Other large and small bodied species have been caught and studied as well, some of which are only found in specific lakes surrounding the mine site (ex: lake trout (Salvelinus namaycush) in Zeemel Lake and lake sturgeon (Acipenser fulvescens) in Lake Wastayanipi). Most of these fish have some economic or cultural importance. These fish associate with several different habitats and are primarily cool water and cold-water species. General life history characteristics for fish in these northern waters include slow growth rates and late age of maturity, particularly in comparison with species found in more temperate regions (SNC-Lavalin, 2018).
Originally, Zeemel Lake was developed as an offsetting project (fish habitat area) as part of the requirements of a Fisheries Authorization Permit.
The mine is subject to the Metal and Diamond Mining Effluent Regulations (MDMER). These regulations authorize the deposit of effluent from metal and diamond mines into water frequented by fish under subsection 36(3) of the Fisheries Act. In accordance with MDMER, Musselwhite Mine is required to undertake Environmental Effects Monitoring (EEM) studies. The EEM studies involve assessing whether the effluent is having an effect on fish, fish habitat, and use of fish by humans. It may also involve investigating the cause of an effect and identifying solutions to eliminate it. For Musselwhite, the results of Phase 6 EEM suggest a potential subtle effect from Musselwhite’s effluent on resident fish, primarily regarding relative liver weights (most notable in female white sucker and walleye) and to a lesser extent relative gonad weight. Phase 7 EEM Study Design considered options to determine if Musselwhite Mine effluent is having an effect on resident fish (Minnow, 2022). Musselwhite submitted the Phase 7 EEM Study Design on March 9, 2023. The comments from Environment and Climate Change (ECC) Canada were provided on June 12, 2023. The field studies were completed and the report issued to ECC Canada in June 2024.
| | December 2024 |
| | TECHNICAL REPORT –
MUSSELWHITE MINE, ONTARIO, CANADA
Document # C8630-0000-PM-RPT-001 – Rev. 0
/ Page 334 |
| 20.2 | Environmental Studies |
The mine is in the early stages of updating its closure plan and is conducting numerous ongoing studies to better quantify risks, liabilities and potential mitigations to better support operational improvements and improved closured planning.
Key ongoing environmental studies include:
| ● | Geochemical characterization and modelling of TSF tailings performance to date. This work is integral to optimizing the tailings deposition strategy and supporting the design of the TSF closure cover and evaluating the possible need for additional mitigations. |
| ● | Hydrogeological characterization and conceptualization of the tailings stack and prediction of TSF drain down and seepage to both surface and groundwater. These will ultimately result in more, and better quantify source terms in this model (as well as the groundwater flow model). |
| ● | Groundwater modelling continues to evolve with an emphasis of better understanding the primary seepage pathways for the TSF to the environment (i.e., western seep, eastern seep) and incorporating post-closure groundwater quality predictions of several mitigative designs based on current knowledge and developing a framework for a groundwater Trigger Action Response Plan (TARP). |
| ● | Tailings cover and revegetation trials along the south side of the TSF where deposition has reached final configuration. These plots are instrumented and monitored to provide insight into cover performance and requirements for closure. |
A wetland performance assessment was recently completed on the treatment wetland to evaluate performance, the potential to treat mine effluent, and the potential for further optimization for closure (Lorax, 2023).
| 20.3 | Environmental Management System |
Musselwhite has comprehensive environmental plans and procedures. These plans outline roles, responsibilities and responses to various events. As part of this Environmental Management System, the Project has implemented several monitoring plans through the years including among others, a surface water monitoring, groundwater monitoring, waste rock management plan, water management plan, aquatic monitoring program, cultural heritage management plan, biodiversity action plan, chemical management plan, domestic and hazardous waste management plan, and compliance monitoring program.
| 20.4 | Greenhouse Gas Emissions |
Musselwhite’s Scope 1 and Scope 2 emissions were 44,360 Tonnes of CO2e in 2023 while Scope 3 emissions were 94,033 Tonnes of CO2e (Newmont, 2024e). Musselwhite experienced during 2023 a decrease in direct energy consumption, contributing to a decrease in Scope 1 emissions.
| | December 2024 |
| | TECHNICAL REPORT –
MUSSELWHITE MINE, ONTARIO, CANADA
Document # C8630-0000-PM-RPT-001 – Rev. 0
/ Page 335 |
Propane consumption was significantly reduced due to a warmer winter, and diesel consumption for electricity production decreased due to improved connectivity to the grid (connection to low-cost and low-carbon power Wataynikaneyap (Watay) Power joint venture) and reduced reliance on diesel-powered generators. A training program on the GHG emissions calculation methodology was implemented (Newmont, 2024).
| 20.5 | Waste Rock Management and Water Management |
| 20.5.1 | Waste Rock Management |
It was estimated that a total of 2.5 million tonnes of unprocessed, uneconomic rock has been excavated from the open pit. The mine rock from the open pit has been placed on the north-eastern end of the open pit adjacent the polishing pond. This area drains naturally toward the polishing pond. The runoff may contain increased levels of suspended solids; however, the stockpile is not predicted to generate acid (Newmont, 2024a). Therefore, metal concentrations in the runoff will be low. It is reported that the open pit rock exhibits virtually no potential to generate acid drainage. Therefore, the rock from the open pit stockpile can be used for construction purposes on surface.
At closure, the waste rock dump will be recontoured and covered with topsoil and seeded (Newmont, 2024a) The site control management priorities focus on:
| ● | Segregation of PAG/non PAG rock coming from underground to surface; |
| ● | Well designated areas where to store PAG/non PAG waste rock on surface; |
| ● | Keep all or most of the PAG waste rock underground for road beds/other uses; and |
| ● | Communication to entire site of changes in the plan. |
Seepage from the waste rock piles is monitored and any PAG waste rock currently on surface will be either returned underground or stored in the flooded open pit.
| 20.5.2 | TSF Water Management |
Tailings runoff from the active deposition western portion of the TSF is directed towards the east portion of the TSF where it collects in the TSF Pond (Figure 18.3). Seepage from the southern perimeter dam finger drains (Dams C and B) is collected in the Seepage Collection Pond (SCP) and pumped back to the TSF Pond. A groundwater plume that flows towards Zeemel Lake is intercepted by a series of groundwater interception wells and pumped back to TSF Pond. Excess water from the TSF Pond is either recycled back to the mill via a pump barge or pumped to the Upper Polishing Pond from where it flows passively to the Polishing Pond and ultimately through the Treatment Wetland and the final point of compliance before reaching Lake 282. Discharge from the Polishing Pond to the Treatment Wetland is only permitted during the ice-free period of May through November. The Polishing Pond Dam has a valved gate that can be closed to limit or stop discharge to the Treatment Wetland. The limited period of discharge from the Polishing Pond requires careful
| | December 2024 |
| | TECHNICAL REPORT –
MUSSELWHITE MINE, ONTARIO, CANADA
Document # C8630-0000-PM-RPT-001 – Rev. 0
/ Page 336 |
management of water level to ensure that the system can hold all of the excess water that accumulates over the period of no discharge.
The current Closure Plan assumes that seepage and groundwater quality will improve after implementation of the approved closure measures (i.e., installation of TSF closure cover) to the point where the groundwater interception wells that currently protect Zeemel Lake and pump back from the SCP will eventually be turned off. The Closure Plan further assumes that excess water from the TSF Pond will be of suitable quality to allow passive discharge, via constructed spillway channel, to the Polishing Pond without the requirement for additional treatment beyond the existing Treatment Wetland.
Studies are ongoing to refine how the TSF will transition to closure and the possible need for additional mitigation measures to meet closure objectives and commitments.
| 20.5.3 | Open Pit Water Management |
The Musselwhite open pits are being allowed to passively flood and monitoring to date indicates that there are no issues with water quality. The waste rock piles adjacent to the open pit(s) is not anticipated to adversely impact pit water quality. Musselwhite Mine has a permit to take water (PTTW-4846-A2DGUS) to manage water levels (SNC-Lavalin, 2018).
The flooded open pits may be used to store excess PAG rock that remains on surface at closure and the main pit (Musselwhite Pit) would be used to store sulfide floatation concentrate in the event that a tailings desulfurization circuit is incorporated into the tailings processing flowsheet.
| 20.5.4 | Site Water Management |
Excess water from the TSF is pumped from the reclaim pond to the segmented polishing pond for settling and degradation of residual cyanide and nitrogen compounds (notably ammonia). Water is then directed to the downstream four-hectare surface flow wetland area via gravity. The wetland is used for further polishing where baffles have been installed to lengthen the flow path and increase the retention time. Musselwhite’s final point of compliance is the wetland outlet (EF-3), where water is discharged into a rip-rap ditch that directs water to Lake 282.
As part of the tailings rehabilitation plan for Musselwhite Mine, the Site started the construction of trial dry covers on the inactive tailings in the TMA in 2015. The inactive tailings area is located downstream of the Thickened Tailings Discharge Dyke and upstream of the Perimeter Dams A to C, along the south side of the TMA. The tailings in this inactive area consists mostly of the coarse sandy fraction due to segregation on the tailings beach from a slurry deposition. Eleven trial plots with varying depths and material types (sand, gravel, organics, hydro-seeding) were installed, as
| | December 2024 |
| | TECHNICAL REPORT –
MUSSELWHITE MINE, ONTARIO, CANADA
Document # C8630-0000-PM-RPT-001 – Rev. 0
/ Page 337 |
well as one plot without cover to act as control, so that their performance can be observed and compared for the long-term (SNC-Lavalin, 2018).
The goal of the trial plots is to find the optimal cover type that; inhibits tailings oxidation and AMD production, eliminates windblown tailings, reduces seepage from the TMA, reduces tailings erosion and improves aesthetics of the inactive tailings area. Several of the plots continue to be monitored. Information gained from these cover trials will also aid in development of the procedure for applying the dry cover to the entire TMA.
| 20.7 | Environmental Permitting |
| 20.7.1 | Environmental Approvals |
The Musselwhite Mine underwent a federal Environmental Assessment (EA) prior to going into production in 1997. To support the EA process, an Environmental Impact Statement (EIS) and Comprehensive Study Report were completed in 1995 (Newmont, 2024a). In addition, the mine has received several provincial environmental approvals over the years. One of the main approvals is the Environmental Assessment (EA) for the installation and operation of up to 20 megawatts of diesel-generated capacity, as per the former Electricity Project Regulation (O.Reg. 116/01). The on-site diesel generation is comprised of eleven (11) diesel generator sets (gensets) with varying outputs. Public and Indigenous Communities (ICs) consultation was completed during the preparation of this EA.
| 20.7.2 | Permits and Authorizations |
The Musselwhite Mine currently holds the necessary operational environmental permits. The majority of these permits are province-issued and governed by the Ministry of Environment, Conservation and Parks (MECP) in Ontario, as presented in Table 20.1.
Table 20.1 – Summary of Environmental Permits and Approvals
| Permit/Approval | # | Issue Date | Expiration Date | Details |
Environmental
Compliance Approval
(ECA) Air | 5751-AYEPSJ | May 24, 2018 | N/A | Pertaining to the operation of process equipment and associated air and noise emissions. |
Certificate of Approval
(CofA) Air | 4814-8DESGE | Feb. 4, 2011 | N/A | For the operation of a transformer STATCOM at the Pickle Lake substation. |
Amended
ECA Industrial Sewage
Works (ISW) | 5276-CDTGPL | July 25, 2022 | N/A | Amended approval for industrial sewage works. |
| | December 2024 |
| | TECHNICAL REPORT –
MUSSELWHITE MINE, ONTARIO, CANADA
Document # C8630-0000-PM-RPT-001 – Rev. 0
/ Page 338 |
| Permit/Approval | # | Issue Date | Expiration Date | Details |
Amended
Permit to Take Water
(PTTW) | 4846-A2DGU5 | Sept.16, 2015 | Sept. 30, 2025 | Related to open pit
dewatering. |
PTTW Groundwater
(underground mine
workings) | 6201-9EPJH7 | Jan. 6, 2014 | Jan. 6, 2034 | Issued for underground
mine workings. |
PTTW (Groundwater
interception system) | 1323-BEZMZ2 | Sept.19/20219 | Sept.18/2029 | Seven wells installed to
manage seepage from
the TSF. |
Amended
PTTW Surface Water
(Opapimiskan Lake) | 8884-A2DGZA | Sept 16, 2015 | Sept. 30, 2025 | Amended permit for
surface water. |
| PTTW Groundwater | 3616-BW6KZY | Dec. 10, 2020 | June 23, 2030 | For two wells supplying
water for the cement
rock fill plant. |
In addition to the permits included above, the Ministry of Natural Resources and Forestry (MNRF) has issued some Land Use Permits (LUPs) and aggregate permits for the Project. The LUPs lease right of ways for power lines and access road to the Project. The aggregate permits were issued between 2001 and 2009 and allow the extraction of aggregates from areas in the vicinity of the East Pond and Zeemel Lake.
| 20.7.3 | Permitting Schedule |
Based on the current site conditions and the assumption that no expansions are planned, it is expected that no new permits will be required to advance the Project to the LoM phase. The existing permits are sufficient to support the Project’s operational needs for the duration of its planned activities.
| 20.8 | Key Environmental Risks and Concerns |
This section identifies key environmental risks and concerns related to the TSF and their potential impacts on the surrounding environment:
| ● | Geochemical Performance Degradation: |
Potential for the geochemical performance of the TSF stack to degrade, resulting in acidic or metal laden seepage that is not suitable for passive discharge to the Polishing Pond without additional treatment.
| ● | Groundwater Flowpath to Zeemel Lake: |
| | December 2024 |
| | TECHNICAL REPORT –
MUSSELWHITE MINE, ONTARIO, CANADA
Document # C8630-0000-PM-RPT-001 – Rev. 0
/ Page 339 |
The western TSF groundwater flowpath (towards Zeemel Lake) is currently intercepted by a groundwater interception system and could adversely impact the aquatic habitat of Zeemel Lake if the interception system is not operating.
| ● | Extended Operation of Groundwater Interception System: |
Potential that the existing groundwater interception system that protects Zeemel Lake may be required to operate considerably longer than anticipated in the current closure plan (i.e., in perpetuity) or require transition to more passive mitigation alternatives such as a slurry wall and/or incorporation of additional passive mitigative elements such as permeable reactive barriers.
| ● | Eastern TSF Groundwater Flowpath Concerns: |
The eastern TSF groundwater flowpath, which trends along the buried bedrock valley toward the Paseminon River, may have degraded conditions in the future that require additional mitigation to protect downgradient aquatic receivers.
| ● | Water Quality Exceedances: |
The potential exceedances/increases in cobalt/iron concentrations in surface water/groundwater not meeting water quality guidelines and requiring additional engineered treatment wetlands or other water treatment alternatives.
The TSF stack stability is a concern, and additional information is provided in Section 18.4 of the Report.
| 20.9 | Social and Community Impacts |
| 20.9.1 | Social Baseline (Setting) |
The Musselwhite Mine is located on the southern shore of the Opapimiskan Lake, 480 km north of Thunder Bay in northwestern Ontario. The nearest town, Pickle Lake is located approximately 130 km to the south. Musselwhite Mine is located on the traditional territory of North Caribou Lake First Nation and the mine’s associated activities are within the shared traditional territories of the Nations. Kingfisher Lake is located 58 km to the northeast; North Caribou Lake is located 76 km to the northwest; Wunnumin Lake is located 84 km to the east; Cat Lake is located 140 km to the southwest, and Mishkeegogamang is located 30 km south of Pickle Lake. Kingfisher Lake and Wunnumin Lake First Nation communities are affiliated with the Shibogama First Nation Council. North Caribou Lake and Cat Lake are affiliated with the Windigo First Nations Council. Mishkeegogamang is an independent band (SNC-Lavalin, 2018).
The Indigenous Communities (ICs) around Musselwhite are very much in line with the social characteristics of all remote Canadian Indigenous communities. These are characterized by fast
| | December 2024 |
| | TECHNICAL REPORT –
MUSSELWHITE MINE, ONTARIO, CANADA
Document # C8630-0000-PM-RPT-001 – Rev. 0
/ Page 340 |
growing population, high illness and disease burden, high unemployment rates, inadequate basic infrastructure and housing stock coupled with overcrowding and a lack of access to major capital sources and tools for businesses to succeed. The municipality of Pickle Lake serves as the transportation hub for people and goods travelling to the remote communities in Northwestern Ontario (Newmont, 2024b).
| 20.9.2 | Stakeholder Engagement |
The Project has identified more than 150 stakeholders including ICs Signatory and affiliates communities, Indigenous Organizations and community members outside of Signatory Communities, municipalities, government and regulators, suppliers, contractors, consultants, Academy/Training Partner and others (Civil Society, Chamber of Commerce, Community Investments, Mining Associations). For each stakeholder the following information is tracked and monitored: History of relationship with Musselwhite, key interests, issues, risks, impact generated by the Project, degree of influence they have on the mine, attitude towards the mine, sphere of influence, and the Project’s goal with each particular stakeholder. Stakeholder mapping has been completed and considered for the engagement with the various stakeholders (Newmont, 2024b).
Musselwhite provides mine updates and engages with its stakeholders using various methods including: committee meetings, community dialogues / feedback mechanisms, telephone calls / emails, annual sustainability reports, fact sheets, advertising, Facebook, conferences, and mining association committees.
| 20.9.3 | Indigenous Engagement |
Musselwhite was one of the first mines in Canada to enter into a comprehensive agreement with local ICs. The agreement is called the Musselwhite Agreement and was originally signed in 1992. Signatories of the Agreement are four ICs and two (2) First Nation Councils. These include North Caribou Lake First Nation, Cat Lake First Nation, Kingfisher Lake First Nation, Wunnumin Lake First Nation, Windigo First Nation Council, and Shibogama First Nation Council. The Agreement has been reviewed and renegotiated in the past, with the last amendment being completed in 2019. There is also a Trapper Compensation Agreement with North Caribou Lake First Nations and a Cooperation Agreement with Mishkeegogamang First Nation.
There is also a Community Investment Committee in place to evaluate donation/sponsorship requests (Newmont, 2024c)
The Musselwhite Agreement sets targets for ICs employment, opportunities for business development, and environmental protection. The Agreement establishes revenue sharing, implementation funding and environmental funding. The established target for the percentage of ICs
| | December 2024 |
| | TECHNICAL REPORT –
MUSSELWHITE MINE, ONTARIO, CANADA
Document # C8630-0000-PM-RPT-001 – Rev. 0
/ Page 341 |
employees included in the Musselwhite Agreement has been proven to be challenging despite the continuous operator efforts.
It is already a commitment from the former operator to review and modernize the Trapper Compensation Agreement dated 1992. Letters (including this commitment) were sent to North Caribou Lake First Nation, and Windigo First Nation Council.
In general, the ICs have shown continuous support to the Project. It is relevant to provide early assurance to the affected communities that under new ownership, Orla will continue to honour its commitments to ICs and will maintain a consistent approach in managing the social impacts and risks associated with the Musselwhite operations.
| 20.9.5 | Archaeology and Cultural Heritage |
The engagement process includes consultation with stakeholders around the identification of cultural heritage sites, as well as decisions regarding disturbance of such sites. If cultural heritage sites are identified to be impacted, a specific stakeholder engagement plan will be developed.
| 20.10.1 | Regulatory Requirements |
In Ontario, the Mining Act requires proponents to submit a closure plan to MINES and have the ministry “file”/approve before the proponent can undertake construction activities. A closure plan outlines how the land will be rehabilitated and the associated costs. In addition, the proponent must provide MINES with financial assurance according to the estimated cost of the rehabilitation measures described in the closure plan. The closure plan regulation has been modified recently (Ontario Regulation 35/24). This regulation update was completed to ensure that the closure meets or exceeds the objective of the various parts of the Mining Code and incorporated additional certifications to fill the existing gaps in the regulation.
The Closure Plan was completed in 2018 and filed in 2019 (SNC-Lavalin, 2018). The Ministry of Mines (MINES) has requested an update to the Financial Assurance to account for inflation from 2018 to 2024. This was reflected in an amended cost estimate (Newmont, 2024d). According to the Closure Plan, the Life of Mine (LoM) is expected to be up to 2029, with active closure stage to occur between 2029 and 2030, and a post closure period from 2030 to 2040 (Newmont, 2024).
The Closure Plan considers the various components of the mine and proposed the dismantling and demolition of equipment from the underground and surface facilities unless a future use is considered viable by Orla, government bodies, and the partnering First Nations communities. The site would be re-graded and contoured to re-establish pre-mining drainages and covering the surface with overburden material to promote the succession of natural vegetation in the area. During
| | December 2024 |
| | TECHNICAL REPORT –
MUSSELWHITE MINE, ONTARIO, CANADA
Document # C8630-0000-PM-RPT-001 – Rev. 0
/ Page 342 |
final closure, the equipment from underground will be removed and the underground development allowed to flood. Mine accesses will be sealed to prevent public entry.
The approved closure concepts assume the groundwater seepage interception system that currently protects Zeemel Lake can be shut off eventually once the closure cover (i.e. proposed 600 mm of cover and 100 mm of topsoil) is installed. In the interim, groundwater collected from the seepage interception system would continue to be pumped to the TSF Pond. The existing Closure Plan predicted that following capping of the TSF the seepage water quality in the TSF Pond will be suitable to be passively discharged, via a spillway channel, to the Upper Polishing Pond and ultimately through the existing treatment wetland to the final point of compliance.
The next update of the Closure Plan is tentatively planned for late 2025 to early 2026 and will incorporate findings from the various ongoing studies related to TSF stack environmental performance and potential additional mitigative actions including the possible requirement for a more robust TSF closure cover and more targeted treatment capacity for mining impacted waters.
| 20.10.3 | Aggregates and Overburden |
There are gravel and aggregate pits onsite located east and south of the Tailings Pond, and identified as Borrow Pit 1, Borrow Pit 2, and Borrow Pit (Gate House) (SNC-Lavalin, 2018). In addition, overburden will be required to support site regrading and revegetation.
It is understood that the aggregate pits contain significant quantities of sand and gravel; however, no estimates of remaining quantities were available for review. It is unclear if sufficient overburden stockpile quantities are readily available to support closure and reclamation or if additional, yet to be permitted, borrow sources will be required.
| 20.10.4 | Financial Assurance |
Musselwhite complies with the requisite bonding levels for the implementation of the approved Closure Plan. Ongoing closure studies suggest that the next iteration of the Closure Plan will incorporate a more robust TFS closure cover and additional surface and groundwater mitigations. The associated costs of the evolving closure measures will be reflected in the FA at the time of the next Closure Plan update.
| | December 2024 |
| | TECHNICAL REPORT –
MUSSELWHITE MINE, ONTARIO, CANADA
Document # C8630-0000-PM-RPT-001 – Rev. 0
/ Page 343 |
| 21 | Capital and Operating Costs |
| 21.1 | Capital Cost Estimate (Capex) |
The following capital cost estimate (Capex) is based on sustaining expenditures as the plan does not include any additional Project capital.
The overall mine capital cost estimate for the life of mine is US$250.3 million, based on the 2024 LoM plan for the reserves only. The estimated life of mine capital cost for the mine, including the project capital, is US$34.02 per tonne milled.
Capital costs are grouped in four categories in the LoM reserve plan and allocated according to the related mine plan physicals: sustaining lateral development, sustaining vertical development, asset integrity, and Project capital. Table 21.1 provides the capital cost by category.
Table 21.1 – 2024 Mine Plan Capital Cost Estimate by Category
| Category | Unit | Value |
| Lateral | US$ M | 56.1 |
| Vertical | US$ M | 3.1 |
| Asset Integrity | US$ M | 127.2 |
| Project | US$ M | 63.9 |
| Total | US$ M | 250.3 |
The mine project capital is included with the mine sustaining capital to form the mine’s overall listing of the capital requirements in Tables 21.1 and in 21.2.
Table 21.2 itemizes the capital expenditures planned for the balance of the mine life. The overall mine capital is estimated in 2024 dollars with no inflation or escalation considered. The paste plant capital has been removed from the plan realizing that improvements in production parameters related to the use of pastefill and revision to the mine’s backfill cost are not incorporated in the reserves only plan. The QP has reviewed the planned annual expenditures and agree that they are reasonable.
Capital cost estimates are at a minimum of a pre-feasibility level of confidence, having an accuracy level of ±25% and a contingency range not exceeding 25%.
| | December 2024 |
| | TECHNICAL REPORT –
MUSSELWHITE MINE, ONTARIO, CANADA
Document # C8630-0000-PM-RPT-001 – Rev. 0
/ Page 344 |
Table 21.2 – 2024 Mine Plan, Capital Listing by Year (US$ M)
| Project Description | 2024 | 2025 | 2026 | 2027 | 2028 | 2029 | 2030 | Item
Totals |
| UG Lateral Development | 16.6 | 12.8 | 8.4 | 7.1 | 5.0 | 4.8 | 1.3 | 56.1 |
| UG Raise Development | 0.3 | 1.2 | - | 0.3 | 0.1 | 1.3 | - | 3.1 |
| Vent Upgrade | 18.1 | - | - | - | - | - | - | 18.1 |
| PQ Deeps Extension 1 Study | 1.1 | 3.0 | 16.9 | 8.5 | 13.6 | 2.7 | - | 45.8 |
| Level Infrastructure | 2.6 | 3.8 | 2.7 | 5.3 | 4.5 | 4.5 | 5.3 | 28.7 |
| SC1007 - R2900G - scoop | 2.0 | - | 2.0 | 2.0 | - | - | - | 6.1 |
| Development Scoop | 2.0 | - | - | - | - | - | - | 2.0 |
| TR4510 - CAT AD45B Ejector | 2.0 | - | - | - | - | - | - | 2.0 |
| 400RB/COB Rehab/Transition Chutes | 1.9 | 1.9 | - | - | - | - | - | 3.8 |
| UG Electrical infrastructure | 1.9 | 1.4 | 1.9 | 1.9 | 1.9 | 1.9 | 1.9 | 12.6 |
| TR4511 - AD45B Dump – CRF | 1.5 | - | - | - | - | - | - | 1.5 |
| CAT AD45B Dump Truck TR4505 | 1.5 | - | - | - | - | - | - | 1.5 |
| Other Capital | 1.4 | 0.4 | 0.9 | - | - | - | - | 2.7 |
| 657 Rock breaker - Lynx North | 1.4 | - | - | - | - | - | - | 1.4 |
| Vent Doors for 1270 Back Door | 1.2 | - | - | - | - | - | - | 1.2 |
| Sat Stat (3 grease 2 fuel) | 1.1 | - | - | - | - | - | - | 1.1 |
| Haul Truck Ejector - TR4517 - AD45B | 1.1 | - | - | - | - | - | - | 1.1 |
| SC1014 - R2900G – scoop | 1.1 | - | - | - | - | - | - | 1.1 |
| SC1015 - R2900G – scoop | 1.1 | - | - | - | - | - | - | 1.1 |
| UG Personnel Carriers (Toyotas) | 0.7 | 0.9 | - | - | 0.9 | - | - | 2.5 |
| Main Vent Fan Assembly | 0.7 | - | - | - | - | - | - | 0.7 |
| MW: Core Shed Upgrade | 0.5 | - | - | - | - | - | - | 0.5 |
| | December 2024 |
| | TECHNICAL REPORT –
MUSSELWHITE MINE, ONTARIO, CANADA
Document # C8630-0000-PM-RPT-001 – Rev. 0
/ Page 345 |
| Project Description | 2024 | 2025 | 2026 | 2027 | 2028 | 2029 | 2030 | Item
Totals |
| New Carrier for #2 Emulsion Cassette | 0.5 | - | - | - | - | - | - | 0.5 |
| Onboard Payload Measurement System | 0.5 | - | - | - | - | - | - | 0.5 |
| Refuge Stations | 0.4 | 0.5 | 0.5 | 0.5 | 0.5 | 0.5 | - | 2.8 |
| Grader | 0.4 | - | 0.4 | - | - | - | - | 0.8 |
| Underground Integrated Tool Carrier | 0.4 | 0.4 | 0.4 | - | - | - | - | 1.1 |
| UG Air and Water Monitoring Sensors | 0.4 | 0.4 | 0.5 | - | - | - | - | 1.2 |
| M Work Order Deployment | 0.3 | - | - | - | - | - | - | 0.3 |
| Stench system upgrade | 0.2 | - | - | - | - | - | - | 0.2 |
| UG Feeder Replacement | 0.2 | - | - | - | - | - | - | 0.2 |
| Wear Management Integration | 0.2 | - | - | - | - | - | - | 0.2 |
| Isuzu 4x4 Tilt Tray Truck | 0.2 | 0.2 | - | - | - | - | - | 0.4 |
| SR3-CL Laser Scanner System | 0.2 | - | - | - | - | - | - | 0.2 |
| Micro Seismic System Upgrade | 0.1 | 0.1 | 0.1 | 0.1 | 0.1 | 0.1 | 0.1 | 0.7 |
| Increase UG Compressed Air | 0.1 | 1.4 | - | - | - | - | - | 1.5 |
| UG Engineering Study – Dewatering | 0.1 | - | - | - | - | - | - | 0.1 |
| NOC Installation | 0.0 | - | - | - | - | - | - | 0.0 |
| Refuge Station Phone Communication Modernization | - | 0.3 | - | - | - | - | - | 0.3 |
| Secondary Egress | - | - | 0.1 | - | - | - | - | 0.1 |
| 460 mL Tramp Metal system | - | 0.3 | - | - | - | - | - | 0.3 |
| TR4503 - AD45B Ejector | - | 1.7 | - | - | - | - | - | 1.7 |
| 1220 tramp steel redesign and installation | - | 0.2 | - | - | - | - | - | 0.2 |
| SC1009 - R2900G - scoop | - | 2.0 | - | - | - | - | - | 2.0 |
| Conveyor cleaner machine | - | 0.1 | - | - | - | - | - | 0.1 |
| | December 2024 |
| | TECHNICAL REPORT –
MUSSELWHITE MINE, ONTARIO, CANADA
Document # C8630-0000-PM-RPT-001 – Rev. 0
/ Page 346 |
| Project Description | 2024 | 2025 | 2026 | 2027 | 2028 | 2029 | 2030 | Item
Totals |
| UG Power Monitoring Improvements | - | - | 0.1 | - | - | - | - | 0.1 |
| Scissor Lift Replacement | - | - | 0.5 | 0.5 | - | 0.5 | - | 1.4 |
| Women's UG Dry | - | - | - | 0.6 | - | - | - | 0.6 |
| TR4516 - AD45B Ejector | - | - | 1.7 | - | - | - | - | 1.7 |
| TR4512 - AD45B Dump | - | 1.5 | - | - | - | - | - | 1.5 |
| TR4515 - AD45B Ejector | - | 1.7 | - | - | - | - | - | 1.7 |
| TR4508 - AD45B Dump | - | - | 1.5 | - | - | - | - | 1.5 |
| TR4504 - AD45B Ejector | - | 1.7 | - | - | - | - | - | 1.7 |
| SC1011 - R2900G - scoop | - | - | 1.1 | - | - | - | - | 1.1 |
| LHD Loader - SC1005 - R2900G | - | 2.0 | - | - | - | - | - | 2.0 |
| New or Conversion Jumbo | - | - | - | 1.7 | 1.7 | - | - | 3.3 |
| Water Truck Replacement | - | - | 0.8 | - | - | - | - | 0.8 |
| TR4501 - AD45B Dump | - | 1.5 | - | - | - | - | - | 1.5 |
| SC914 - R1700G - scoop | - | 0.7 | - | - | - | - | - | 0.7 |
| TR4502 - AD45B Dump - CRF | - | - | 1.5 | - | - | - | - | 1.5 |
| Development Jumbo | - | - | 1.7 | - | - | - | - | 1.7 |
| Cable Bolting Resin System | - | - | 0.8 | - | - | - | - | 0.8 |
| Explosive Handling Vehicle | - | - | 1.9 | 1.9 | 3.8 | - | - | 7.5 |
| Development Change from ANFO to Emulsion | - | 1.5 | - | - | - | - | - | 1.5 |
| Motivator for Battery Drills and Jumbos | - | 0.4 | 0.4 | - | - | - | - | 0.8 |
| Raise bore Drill | - | - | 3.0 | - | - | - | - | 3.0 |
| Replace JB11 with Bolting Jumbo | - | - | 1.7 | - | - | - | - | 1.7 |
| Sandvik Equipment hooked up to UG IT Network | - | 0.2 | - | - | - | - | - | 0.2 |
| | December 2024 |
| | TECHNICAL REPORT –
MUSSELWHITE MINE, ONTARIO, CANADA
Document # C8630-0000-PM-RPT-001 – Rev. 0
/ Page 347 |
| Project Description | 2024 | 2025 | 2026 | 2027 | 2028 | 2029 | 2030 | Item
Totals |
| Replace North Fringe UG Refuge Stations with MineARC | - | 0.5 | - | - | - | - | - | 0.5 |
| Surface Explosive Magazine Relocation | - | 0.2 | - | - | - | - | - | 0.2 |
| TLO Automation | - | 1.2 | - | - | - | - | - | 1.2 |
| UG - PRV's - Connection to PLC System | - | - | 0.1 | - | - | - | - | 0.1 |
| UG Fuel/Lube Truck | - | 0.6 | - | - | - | - | - | 0.6 |
| Total Mine Capital by Year (US$) | 65.9 | 46.2 | 51.0 | 30.2 | 32.1 | 16.3 | 8.6 | 250.3 |
| | December 2024 |
| | TECHNICAL REPORT –
MUSSELWHITE MINE, ONTARIO, CANADA
Document # C8630-0000-PM-RPT-001 – Rev. 0
/ Page 348 |
| 21.1.1.1 | Mine Project Capital |
The mine has two (2) standalone projects with one termed the Ventilation at Depth Project and the other termed the PQ Deeps, Extension 1, Stage 4 Project. The Ventilation at Depth Project brings an added 200 Kcfm air to the top of the PQ Deeps and that Project is nearing completion and commissioning is expected by the end of 2024. The PQ Deeps Extension 1 Project entails the ongoing installation over the life of mine plan for the PQ Deeps mining area of its ventilation raises, transfer drifts, level controls with main air fans, instrumentation for airflow and condition monitoring, and excavation and installation at the top of the PQ Deeps area of its main pump station. Cascade pumping to that main station is included in the sustaining capital.
As does Table 21.1, the Table 21.2 capital listing by year includes the two (2) PQ Deeps related projects. Ther are no other Project Capital requirements envisioned for achievement of the Life of Mine Plan in the capital by year listing.
| 21.1.1.2 | Mine Sustaining Capital |
The mine site will require sustaining capital for continuing underground mine development of levels and raises, installation of level infrastructure, purchase of replacement equipment, and material handling system rehabilitation and improvements, as well as other miscellaneous studies and projects.
The sustaining capital is part of the mine’s overall listing of the capital requirements in Table 21.2.
Underground development costs are directly correlated with development metres and are estimated based on expected unit rates per metre, applied to the number of metres of mine development required each year. Development capital is expected to be substantially complete by 2030. Lateral development totals US$56.1 million for 12,106 metres over the LoM. Vertical development totals US$3.1 million for 1,258 metres.
Meters of development are also used to categorize the infrastructure requirements associated with level development. Items such as extension of electrical infrastructure, air and waterlines, and dewatering systems. Microseismic system extension is part of the infrastructure requirements categorized by metres of development, while the addition of mining levels determines the need to add refuge stations, install rock breakers, and add fuel stations. Installation of second egresses is part of the vertical development metres category. The equipment replacements for two jumbos and a raise borer are based wear and tear directly relatable to the metres of development. The equipment and installations then associated with metres of development total US$6.3 million over the LoM for the reserves.
Asset Integrity capital based on ore tonnes includes ongoing equipment rebuilds and replacements of another 54 pieces of mobile equipment totalling US$49.0 million, and another US$12.4 million for investment in facilities and assets. Other significant sustaining investments include the rehabilitation
| | December 2024 |
| | TECHNICAL REPORT –
MUSSELWHITE MINE, ONTARIO, CANADA
Document # C8630-0000-PM-RPT-001 – Rev. 0
/ Page 349 |
of the 400RB/COB / Transition Chutes in 2024 and 2025 totalling US$3.8 million, Vent Doors for 1270 Back Door in 2024 totalling $1.3 million, TLO Automation in 2025 totalling US$1.2 million, UG Air and Water Monitoring Sensors totalling US$1.2 million over a three year period beginning in 2024, a Main Vent Fan Assembly for US$0.7 million, a Women's UG Dry for US$0.6 million, and miscellaneous other capital expenditures over the LoM of US$3.6 million.
The Project Capital exceptions are the two (2) PQ Deeps-based projects totalling US$63.9 million that are ongoing Ventilation at Depth and the recently approved PQ Deeps Extension 1. Although being treated as one-time projects the zone they service contains a significant amount of the mine’s reserves and as such, have been considered in this report as part of the mine-wide unit costs for sustaining capital. The lateral development for the PQ Deeps, the level infrastructure, the replacement of current mining equipment with new for this area of the mine are not included in the Project Capital and already are components of the sustaining capital costs. Ventilation related capital tied to these projects was all that was removed from the unit costs derivation used for the purposes of determining the 2023 MRMR cut off grades, however when completing by level and zone economic testing for the PQ Deeps, and the economic assessments to test the resultant reserves, the project costs were considered.
Replacements and investments in the mine’s general equipment assets, human resources, information technology, supply chain, environmental, health and safety, and security is covered in Section 21.3 of this Report.
| 21.1.2.1 | Mill Project Capital |
All Mill capital envisioned for the 2024 LoM plan is sustaining, there is no Mill Project Capital.
| 21.1.2.2 | Mill Sustaining Capital |
The Mill sustaining capital amounts to US$12.7 million over the 2024 LoM for the reserves only plan. The estimated life of mine capital cost for the mill sustaining capital is US$1.73/t milled.
Table 21.3 identifies the capital expenditures by year for each item within the plan. TSF dyke raising, including reclaim water barge relocation, is the largest item totalling US$7.9 million over the LoM plan. Rod and ball mill motor replacement is US$3.3 million with mill infrastructure replacement totalling US$1.2 million, and minor infrastructure upgrades of US$0.3 million. Cost estimates were provided by site, with a pre-feasibility-level estimate for grinding floor rehab provided by DRA.
| | December 2024 |
| | TECHNICAL REPORT –
MUSSELWHITE MINE, ONTARIO, CANADA
Document # C8630-0000-PM-RPT-001 – Rev. 0
/ Page 350 |
Table 21.3 – Mill Sustaining Capital Listing by Year (US$ M)
| Project Description | 2024 | 2025 | 2026 | 2027 | 2028 | 2029 | 2030 | Item
Totals |
| TSF: Tailings Dyke | 1.5 | - | 1.5 | - | 2.8 | 1.5 | - | 7.2 |
| Mill - Rod and Ball Mill Motor Replacement | 0.5 | 2.8 | - | - | - | - | - | 3.3 |
| Leach Tank Re-Coating | 0.3 | - | - | - | - | - | - | 0.3 |
| Double Decker Screen - Mill Crusher Replacement | 0.3 | - | - | - | - | - | - | 0.3 |
| Tails - Barge Overhead Line and Pole Replacement | 0.7 | - | - | - | - | - | - | 0.7 |
| Kitting laydown building for Mill Maintenance | 0.1 | - | - | - | - | - | - | 0.1 |
| Handrails and Catwalk for Working on Mill Trunnion Area | - | 0.2 | - | - | - | - | - | 0.2 |
| Safety Screen Replacement | - | 0.2 | - | - | - | - | - | 0.2 |
| Grinding Floor Structural Rehab | - | 0.3 | - | - | - | - | - | 0.3 |
| Gold Room Filter Press Replacement | 0.1 | - | - | - | - | - | - | 0.1 |
| Total Mill Capital | 3.4 | 3.5 | 1.5 | 0.0 | 2.8 | 1.5 | 0.0 | 12.7 |
| | December 2024 |
| | TECHNICAL REPORT –
MUSSELWHITE MINE, ONTARIO, CANADA
Document # C8630-0000-PM-RPT-001 – Rev. 0
/ Page 351 |
| 21.1.3.1 | G&A Project Capital |
All G&A capital envisioned for the 2024 LoM plan is sustaining, there is no G&A Project Capital.
| 21.1.3.2 | G&A Sustaining Capital |
The G&A sustaining capital amounts to US$37.4 million over the 2024 LoM for the reserves only plan. The estimated life of mine capital cost for the G&A capital is US$5.09 per tonne milled.
Table 21.3 identifies the capital expenditures by year for each item within the plan. IT corporate capital allocations is the largest item totalling US$15.6 million over the LoM plan. Bunkhouse replacement at camp is $US7.3 million while the site’s technology infrastructure upgrades is next at US$5.3 million. Other items of significance are the IT/OT infrastructure modernization at US$1.8 million, the airplane engines’ mid-life component replacement at US$1.7 million, and the Air Compressor waste heat recovery project at US$1.2 million. The other 15 G&A capital items in the G&A capital list in Table 21.4 amount to a collective total of US$4.5 million.
The G&A capital was related to the ore tonnes in a similar manner to the other mine capital as part of the unit costs derivation used for the purposes of determining the 2023 MRMR cut off grades.
| | December 2024 |
| | TECHNICAL REPORT –
MUSSELWHITE MINE, ONTARIO, CANADA
Document # C8630-0000-PM-RPT-001 – Rev. 0
/ Page 352 |
Table 21.4 – G&A Capital Listing by Year (US$ M)
| Project Description | 2024 | 2025 | 2026 | 2027 | 2028 | 2029 | 2030 | Item
Totals |
| IT Corporate Capital Allocations | 4.7 | 2.4 | 1.7 | 1.6 | 1.8 | 2.0 | 1.5 | 15.6 |
| Bunkhouse Replacement at Camp | 4.4 | 1.0 | - | - | 1.9 | - | - | 7.3 |
| Data Center UPS and HVAC upgrade | 0.8 | - | - | - | - | - | - | 0.8 |
| MCB Building Subfloor | 0.2 | - | - | - | - | - | - | 0.2 |
| Propane Farm Vaporizer Replacement | 0.2 | 0.1 | - | - | - | - | - | 0.3 |
| Light Vehicles (Trucks) for Site Use | 0.2 | - | - | - | - | - | - | 0.2 |
| Camp Network Expansion | 0.1 | - | - | - | - | - | - | 0.1 |
| Surface UPS Upgrade | 0.1 | - | - | - | - | - | - | 0.1 |
| Covered Storage for Inventory stored outside | - | 0.3 | - | - | - | - | - | 0.3 |
| Air Compressor waste heat recovery project | - | - | 1.2 | - | - | - | - | 1.2 |
| Heated Surface Storage | - | - | 0.3 | - | - | - | - | 0.3 |
| Caterpillar IT38H Loader | - | 0.3 | - | - | - | - | - | 0.3 |
| Airplane Engines Mid-life Component Replacement | - | - | - | 0.9 | 0.8 | - | - | 1.7 |
| Electrical Infrastructure: Watay Power Shedding System | - | 0.5 | - | - | - | - | - | 0.5 |
| OT Network Backbone Equipment for EoL devices | - | 0.3 | - | - | - | - | - | 0.3 |
| IT/OT Infrastructure Modernization | - | - | 0.4 | 0.4 | 0.4 | 0.4 | 0.4 | 1.8 |
| Bunkhouse Repairs & Improvements (V, W, K) | - | 0.2 | 0.2 | - | - | - | - | 0.4 |
| Site Technology Infrastructure Upgrades | - | 1.5 | 1.5 | 0.8 | 0.8 | 0.4 | 0.4 | 5.3 |
| Rough Terrain Forklift Replacement for Manitou | - | 0.1 | - | - | - | - | - | 0.1 |
| 916 Loader | - | 0.2 | - | - | - | - | - | 0.2 |
| Watay Power Line Fiber Tie In | - | 0.8 | - | - | - | - | - | 0.8 |
| Total G&A Capital | 10.6 | 7.5 | 5.2 | 3.6 | 5.5 | 2.8 | 2.3 | 37.4 |
| | December 2024 |
| | TECHNICAL REPORT –
MUSSELWHITE MINE, ONTARIO, CANADA
Document # C8630-0000-PM-RPT-001 – Rev. 0
/ Page 353 |
| 21.2 | Operating Cost Estimate (Opex) |
The mine operating cost estimates are based on recent actual costs with minor specific adjustments for mine improvement initiatives that are currently being implemented.
The forward looking mine operating cost estimates include further improvement plans and thereby are foreseen to be at a minimum at a pre-feasibility level of confidence, having an accuracy level of ±25% and a contingency range not exceeding 25% until such time as the improvement plans are factual.
Mine operating costs are based on the 2024 budgeted LoM cost factors as presented in Table 21.5.
Table 21.5 – Mine Operating Unit Cost Factors for Determining the 2024 Budget
| Description | Value | Unit |
| Exchange Rate | 0.75 | US$ / CA$ |
| Mine Services (Fixed) | 18.9 | M US$/y |
| Lateral Dev't (Opex) | 4,890 | US$/ metre |
| Vertical Dev't (Opex) | - | US$/ metre |
| Stoping – Drill | 67.91 | US$/PD metre |
| Stoping – Blast | 4.23 | US$/prod blast tonne |
| Stoping – Muck | 13.13 | US$/prod ore tonne |
| Stoping – Ground Support | 3.82 | US$/prod ore tonne |
| Backfill – URF | 4.97 | US$/URF tonne |
| Backfill – CRF | 37.20 | US$/CRF tonne |
| Mine Services (Variable) | 11.68 | US$/total tonne moved |
| Hoisting | 3.16 | US$/hoist tonne |
| Crushing | 8.40 | US$/ore tonne mined |
| Engineering | 2.09 | US$/total tonne moved |
| Geology | 3.88 | US$/ore tonne mined |
| | December 2024 |
| | TECHNICAL REPORT –
MUSSELWHITE MINE, ONTARIO, CANADA
Document # C8630-0000-PM-RPT-001 – Rev. 0
/ Page 354 |
The actual costs by plant compared to the budgets is shown in Table 21.6 where the costs at the mine, mill, and on surface are shown to have increased between 2021 and 2023 for the 2024 Plan.
Table 21.6 – Mine Plan Operating Unit Costs Compared to Actuals
| Area | Unit | 2021
Actuals | 2022
Actuals | 2023
Actuals2 | 2024
Plan3 |
| Mining | US$ / ore tonne | 93 | 119 | 135 | 137 |
| Process | US$ / ore tonne | 17 | 16 | 21 | 23 |
| Site G&A1 | US$ / ore tonne | 52 | 43 | 37 | 43 |
| Total | US$ / ore tonne | 162 | 178 | 193 | 202 |
Note: 1 2023 compared to 2021, G&A reductions of about US$11/t are related to transportation and accommodation costs redistributed to Mine and Mill as a direct cost based on headcount. 2021 Actuals and 2022 Actuals are derived by WSP from actual information contained within the minesite’s 23MRMR Cut Off Grade Approval file. 2 2023 Actuals is from the minesite’s 2024 QP Report 3 2024 Plan is derived by WSP from their adjusted reserve plan production schedule with the 2024 Mine Plan factors in Table 21.4 applied. |
The redistribution of the camp costs to the direct costs of operations based on headcount impacts 2023 actuals resulting in the site G&A cost decreasing while the direct mining costs increase.
Of equal significance is the increasing reliance on the PQ Deeps for production. The PQ Deeps has the hoist cost of $3.16 per tonne hoisted applied to all PQ Deeps ore production. Historically mining from the Redwings, T-Antiform, and Upper Linx zones that do not use the hoist led to a lesser overall mining cost. For instance, hoisting for 2023 and in the 2024 plan was required for about 65% of the overall ore tonnes while the LoM shows hoisting increases to 72% of the overall ore tonnes in 2025 and continues to increase to 95% of the overall ore tonnes by the end of the LoM plan.
Transverse mining in the PQ Deeps zone requires the use of cemented rockfill (CRF). The derivation of the cost by zone calculation shows that the $37.20/t cemented rockfill requirement (versus $4.97/t for uncemented fill in the other mining zones) is all PQ Deeps related. The historical mine physicals information for 2020 through 2023 shows about 1/3 of the total backfill was CRF, indicating use in the other mining zones, but the LoM plan shows only the PQ Deeps using CRF going forward. The percentage of planned cemented rock fill stays around 33% of the overall fill, but with 50% of the ore tonnes in the LoM plan coming from stopes in the PQ Deeps there is an overall cemented fill increase in the LoM plan.
For future cost workups it is recommended that other detrimental factors such as application of a distance for the haul metric and erosion of the effective work hours per shift with longer travel distances and added seismic event protocols should be considered for future cost workups.
| | December 2024 |
| | TECHNICAL REPORT –
MUSSELWHITE MINE, ONTARIO, CANADA
Document # C8630-0000-PM-RPT-001 – Rev. 0
/ Page 355 |
Conversely the capital plan includes funds for automation, yet the operating costs have not been adjusted to reflect associated productivity improvements. The two are thereby seen for the purposes of this report as offsetting.
The overall mine operating cost estimate for the life of mine is US$841.4 million, as summarized by the cost center activities in Table 21.7 with the estimated life of mine mining cost of $114.37 per tonne milled comparing favourably to the prior three years $102.61 per tonne milled as the increased reliance on the PQ Deeps requires added hoisting and cemented rock fill costs that then increases the overall mining costs. The reduction in the LoM average mining cost compared to the 2024 Plan mining cost is aligned with a reduction in the operating metres back towards the historical average.
Table 21.7 – Life-of-Mine, Mine Operating Cost Estimate
| Area | Average Prior
Three Years
(US$ / t milled) | LoM Average
Unit Cost
(US$ / t milled) | LoM Total
Cost by
Activity
(US$ M) |
| Development | 16.07 | 22.02 | 162.0 |
| Stoping – Drill | 4.63 | 4.97 | 36.6 |
| Stoping – Blast | 1.97 | 3.07 | 22.6 |
| Stoping – Muck | 14.89 | 10.65 | 78.4 |
| Stoping – Ground Support | 1.48 | 3.10 | 22.8 |
| Backfill – URF | 8.96 | 1.73 | 12.8 |
| Backfill – CRF | 0.00 | 7.37 | 54.2 |
| Mine Services (Variable) | 7.86 | 24.37 | 179.3 |
| Mine Services (Fixed) | 29.34 | 17.97 | 132.2 |
| Hoisting | 3.93 | 2.48 | 18.2 |
| Crushing | 3.81 | 8.40 | 61.8 |
| Engineering | 3.38 | 4.35 | 32.0 |
| Geology | 6.29 | 3.89 | 28.6 |
| Total | 102.61 | 114.37 | 841.4 |
The LoM Plan operating costs consider estimated costs to fully deplete the Mineral Reserve. Any exploration and drilling costs related to potential future mine life extensions which are not required to mine and process the Mineral Reserve have been removed from the LoM plan cost determinations.
As much as possible, mine physicals (lateral metres of advance, production drill metres, stope tonnes blasted, material movement tonnes, etc.) were taken from the Deswik mine design model and Deswik scheduler for validation by WSP and checked against recent production metrics. The
| | December 2024 |
| | TECHNICAL REPORT –
MUSSELWHITE MINE, ONTARIO, CANADA
Document # C8630-0000-PM-RPT-001 – Rev. 0
/ Page 356 |
unit costs for each cost center activity during steady-state years was calculated, some being fixed annual costs. These operating unit costs form the basis for all reserve financial and economic testing through generation of a final reserve cashflow.
Operating unit cost estimates are based on recent actual costs with minor specific adjustments for business improvement initiatives that are currently being implemented. The unit costs were applied to the mine physicals to arrive at the operating costs. The costs are estimated in 2024 dollars with no inflation or escalation considered. Estimates were prepared on an annual basis using the Deswik model and scheduler to consider specific mine site activity levels and cost drivers for application of the planned unit costs. The estimates consider current and expected labour headcount and salaries, major consumables and unit prices, power costs, fixed and mobile equipment costs, and maintenance costs. The total mine operating cost estimate includes all site costs related to the mining, as well as mine related regional office costs.
Mining costs were developed for the Avoca mining method, with the resulting unit cost estimates applied to the tonnages extracted using that mining method as defined in the LoM Plan. Mining costs cover expected direct costs for the mining including drilling, blasting, mucking, hauling, backfilling, mine dewatering and ground support.
General and administrative costs are discussed separately in Section 21.2.3. G&A includes costs associated with support of the operation: administrative personnel and functions, administrative facilities, site services, security, and other support costs. The practice at the mine site is for the accommodations and transportation costs to be distributed back to the mine based on employee headcount.
The Mine Operating Costs at the mine site has reviewed by the mining QP and found to be reasonable for a mechanized mine utilizing the Avoca mining methods. The mine has demonstrated typical operating costs for a facility of its size.
The expenditure pattern for the mine operating costs is depicted Table 21.8.
| | December 2024 |
| | TECHNICAL REPORT –
MUSSELWHITE MINE, ONTARIO, CANADA
Document # C8630-0000-PM-RPT-001 – Rev. 0
/ Page 357 |
Table 21.8 – Annual Mine Operating Cost Breakdown
| Area | LoM | 2024 | 2025 | 2026 | 2027 | 2028 | 2029 | 2030 |
| Development1 | 162.0 | 44.8 | 28.2 | 27.3 | 23.6 | 23.0 | 12.0 | 3.0 |
| Drill2 | 36.6 | 7.4 | 4.8 | 6.8 | 5.7 | 2.8 | 4.8 | 4.4 |
| Blast | 22.6 | 2.8 | 3.1 | 3.2 | 3.1 | 3.3 | 3.2 | 3.9 |
| Muck | 78.4 | 9.6 | 10.7 | 10.8 | 10.9 | 11.3 | 11.1 | 13.8 |
| Ground Support | 22.8 | 2.8 | 3.1 | 3.2 | 3.2 | 3.3 | 3.2 | 4.0 |
| Backfill – URF | 12.8 | 1.8 | 2.4 | 1.8 | 1.9 | 1.0 | 1.4 | 2.6 |
| Backfill – CRF | 54.2 | 2.5 | 3.8 | 7.3 | 4.9 | 14.5 | 11.6 | 9.7 |
| Mine Services (Variable) | 179.3 | 30.9 | 28.9 | 26.4 | 23.8 | 24.8 | 21.7 | 22.7 |
| Mine Services (Fixed) | 132.2 | 18.9 | 18.9 | 18.9 | 18.9 | 18.9 | 18.9 | 18.9 |
| Hoisting | 18.2 | 2.2 | 2.4 | 2.5 | 2.5 | 2.9 | 2.5 | 3.3 |
| Crushing | 61.8 | 8.7 | 9.0 | 9.0 | 9.0 | 9.0 | 7.9 | 9.2 |
| Engineering | 32.0 | 5.5 | 5.2 | 4.7 | 4.3 | 4.4 | 3.9 | 4.0 |
| Geology | 28.6 | 4.0 | 4.2 | 4.2 | 4.2 | 4.2 | 3.6 | 4.3 |
| Total (US$ M) | 841.4 | 142.2 | 124.6 | 126.0 | 115.8 | 123.5 | 105.7 | 103.7 |
| Mine Cost / t milled | 114.37 | 136.56 | 116.57 | 117.47 | 108.09 | 115.38 | 112.77 | 94.61 |
Notes: 1 No change in the unit cost for lateral or vertical development, the resultant reduction is from less metres required per year as only mining the reserves. 2 Reduction in drill cost in 2025 and beyond reflects successful implementation of programmed Ikon detonators mine wide in 2024 significantly reducing the need to redrill the blastholes. |
| | December 2024 |
| | TECHNICAL REPORT –
MUSSELWHITE MINE, ONTARIO, CANADA
Document # C8630-0000-PM-RPT-001 – Rev. 0
/ Page 358 |
The mill operating cost estimates are based on recent actual costs provided by site. Similar to mining, the actual milling cost to the budgets is shown in above in Table 21.6 are shown to have increased between 2021 and 2023 for the 2024 Plan. The redistribution of accommodation, flight and freight costs to the direct costs of mill operations impacted the 2023 actuals resulting in the site G&A cost decreasing while the direct milling costs increase. Intercompany technology service cost allocations to the direct costs of mill operations have also impacted the 2023 actuals.
The overall mill operating cost estimate for the life of mine is US$185.0 million, as summarized by the cost center activities in Table 21.9 with the estimated life of mine mining cost of $25.14 per tonne milled comparing favourably to the prior three years $22.18 per tonne milled.
Table 21.9 – Life of Mine, Mill Operating Cost Estimate
| Area | Average Prior Three Years
(US$ / t milled) | LoM Average Unit Cost
(US$ / t milled) | LoM Total
Cost by
Activity
(US$ M) |
| Labour | 5.71 | 5.40 | 39.76 |
| Flights and Accommodations | 0.82 | 1.17 | 8.60 |
| Energy | 2.53 | 2.23 | 16.40 |
| Contractors and Technical Services | 2.34 | 4.03 | 29.65 |
| Reagents, Consumables and Supplies | 5.79 | 5.88 | 43.27 |
| Freight | 0.28 | 0.84 | 6.20 |
| Maintenance | 4.71 | 5.59 | 41.13 |
| Total | 22.18 | 25.14 | 185.01 |
These operating unit costs form the basis for all reserve financial and economic testing through generation of a final reserve cashflow.
Operating unit cost estimates are based on recent actual costs. The costs are estimated in 2024 dollars with no inflation or escalation considered. The estimates consider current and expected labour headcount and salaries, flights and accommodations, contractor spending, major consumables and unit prices, energy costs, freight and maintenance costs. The total mill operating cost estimate includes all site costs related to the milling, as well as mill- related regional office costs.
The Mill Operating Costs at the mine site have been reviewed by the QP and found to be reasonable for a conventional gold milling plant with thickened tailings deposition.
The expenditure pattern for the mill operating costs is depicted in Table 21.10.
| | December 2024 |
| | TECHNICAL REPORT –
MUSSELWHITE MINE, ONTARIO, CANADA
Document # C8630-0000-PM-RPT-001 – Rev. 0
/ Page 359 |
Table 21.10 – Annual Mill Operating Cost Breakdown
| Area | LoM | 2024 | 2025 | 2026 | 2027 | 2028 | 2029 | 2030 |
| Labour | 39.76 | 5.68 | 5.68 | 5.68 | 5.68 | 5.68 | 5.68 | 5.68 |
| Flights and Accommodations | 8.60 | 1.23 | 1.23 | 1.23 | 1.23 | 1.23 | 1.23 | 1.23 |
| Energy | 16.40 | 2.33 | 2.36 | 2.37 | 2.36 | 2.36 | 2.23 | 2.39 |
| Contractors and Technical Services | 29.65 | 4.24 | 4.24 | 4.24 | 4.24 | 4.24 | 4.24 | 4.24 |
| Reagents, Consumables and Supplies | 43.27 | 6.12 | 6.29 | 6.31 | 6.30 | 6.29 | 5.51 | 6.44 |
| Freight | 6.20 | 0.88 | 0.90 | 0.90 | 0.90 | 0.90 | 0.79 | 0.92 |
| Maintenance | 41.13 | 5.82 | 5.98 | 6.00 | 5.99 | 5.98 | 5.24 | 6.13 |
| Total (US$ M) | 185.01 | 26.30 | 26.67 | 26.72 | 26.71 | 26.68 | 24.91 | 27.03 |
| Mill Cost / t milled | 25.14 | 25.26 | 24.95 | 24.90 | 24.91 | 24.94 | 26.59 | 24.66 |
| | December 2024 |
| | TECHNICAL REPORT –
MUSSELWHITE MINE, ONTARIO, CANADA
Document # C8630-0000-PM-RPT-001 – Rev. 0
/ Page 360 |
| 21.2.3 | General And Administrative Operating |
General and Administrative costs are comprised of general site and regional office costs, safety and security, site services, environmental and social expenditures, community relations, and other site administrative and support costs, as depicted by the unit cost factors in Table 21.11. The overall General and Administrative (G&A) operating cost estimate for the LoM is US$ 313.9 million.
Table 21.11 – General and Administrative Unit Cost Factors for Determining the 2024 Budget
| Description | Value | Unit |
| Exchange Rate | 0.75 | US$ / CA$ |
| Plant | 8.21 | US$ M /year |
| Administration | 18.91 | US$ M /year |
| Safety | 2.66 | US$ M /year |
| Human Resources | 1.06 | US$ M /year |
| Sustainability | 1.10 | US$ M /year |
| First Nations Payments and Freight | 0.60 | US$ M /year |
| Treatment and Refining | 2.44 | US$ /ounce recovered |
| Environmental | 1.13 | US$/ore tonne milled |
| First Nation Agreements | 27.83 | US$/ounce recovered |
| Royalties | | |
| 293569004 Royalty MSW Bros | 30,000 | US$ /year |
| 293569005 Royalty Franco | 24.48 | US$ /ounce recovered |
| | December 2024 |
| | TECHNICAL REPORT –
MUSSELWHITE MINE, ONTARIO, CANADA
Document # C8630-0000-PM-RPT-001 – Rev. 0
/ Page 361 |
The economic analysis presented in this Section contains forward-looking information under Canadian securities law. The results of the analysis rely on inputs that are subject to known and unknown risks, uncertainties, and other factors, which may cause actual results to differ materially from those presented here.
The economic analysis is based on the discounted cash flow (DCF) method on a pre-tax and after-tax basis. Current Federal and Provincial (Ontario) tax regulations were used to assess corporate tax liabilities. The key metric determined in the analysis is the Net Present Value (NPV) at a discount rate of 5%. A sensitivity analysis was carried out to assess the impact of variations in gold price, Capex, Opex, head gold grade on the NPV.
For the purposes of the evaluation, it is assumed that the operations are established within a single corporate entity. The Project has been evaluated on an unlevered, all-equity basis.
The production schedule used in this analysis is based on the LoM Production Plan and the Plant Production Schedule outlined in Sections 16 and 17, respectively. The capital and operating costs are taken from the estimates detailed in Section 21.
All costs and pricing are in Q4 2023 US dollars. The base date of the economic analysis is 1st January 2024, and the analysis utilizes production projections for the Year 2024 (refer to Section 22.11). No provision is made for the effects of inflation in this analysis.
| 22.2 | Forward Looking Information |
The results of the economic analyses discussed in this section represent forward-looking information as defined under Canadian securities law. The results depend on inputs that are subject to known and unknown risks, uncertainties, and other factors that may cause actual results to differ materially from those presented here. Forward-looking information includes assumptions and estimations of:
| ● | Amount of mineral reserves and the associated gold grade; |
| ● | Mining dilution and mining recovery; |
| ● | Geotechnical and hydrogeological considerations during mining; |
| ● | Process plant production plan; |
| ● | Recovery rates of gold in the processing plant; |
| ● | Ability of plant, equipment, processes to operate as anticipated; |
| | December 2024 |
| | TECHNICAL REPORT –
MUSSELWHITE MINE, ONTARIO, CANADA
Document # C8630-0000-PM-RPT-001 – Rev. 0
/ Page 362 |
| ● | Sustaining and operating costs; |
| ● | Closure costs and unforeseen reclamation expenses; |
| ● | Environmental, social, and licensing risks; |
| ● | Ability to maintain social license to operate; |
| ● | Taxation policy and tax rate. |
The following assumptions were made in the development of the economic analysis:
| ● | A reference date of 1st January 2024 was used for the analysis. The analysis utilizes production projections for the Year 2024 (refer to Section 22.11). |
| ● | Revenue from the Project is derived from the sale of gold doré only. |
| ● | All gold doré is sold in the same year that it is produced. |
| ● | The existing contractual arrangements for the sale of gold doré will remain in place until the end of the mine life. |
| ● | No penalty elements will be present in the gold doré over the remaining life-of-mine. |
| ● | The existing royalty agreements applicable to the Project will remain in place until the end of the mine life. |
| ● | Corporate tax liabilities were calculated using current Federal and Provincial (Ontario) tax regulations. |
| ● | Ontario Mining Tax is deductible for federal and provincial income tax purposes. |
| ● | A long-term gold price of US$2,150 was selected based on consensus analyst estimates. |
| ● | A long-term US Dollar to Canadian Dollar exchange rate of 1.00 USD:1.33 CAD, assumed constant over the LoM. |
| ● | All costs and pricing are in Q4 2023 US dollars. No provision is made for the effects of inflation in this analysis. |
| ● | No salvage or residual value was considered from the sale of equipment or other assets at the end of the LoM. |
| 22.4 | Economic Analysis Parameters |
The key parameters utilized in the financial analysis are summarized in Table 22.1.
| | December 2024 |
| | TECHNICAL REPORT –
MUSSELWHITE MINE, ONTARIO, CANADA
Document # C8630-0000-PM-RPT-001 – Rev. 0
/ Page 363 |
Table 22.1 – Economic Analysis Parameters
| Description | Units | Value |
| Macroeconomic Parameters | | |
| Gold Price | $/oz | 2,150 |
| Exchange Rate | USD:CAD | 1.00:1.33 |
| Discount Rate | % | 5.0 |
| Project Parameters | | |
| Remaining Mine Life | years | 7 |
| Mineable Mineral Reserves | Mt | 7.4 |
| Ore Grade Mined (LoM average) | g/t Au | 6.2 |
| Annual Mill Throughput (LoM average) | ktpa | 1,051 |
| Gold Recovery (LoM average) | % | 96.0 |
| Gold Payability (LoM average) | % | 99.95 |
| Gold Sold (LoM average) | koz/y | 202 |
| Capital Cost Estimates | | |
| Sustaining Capital (LoM) | $ M | 301 |
| Closure Capital | $ M | 105 |
| Unit Operating Costs Estimates (LoM Average) | | |
| Mining | $/oz | 595 |
| Processing | $/oz | 131 |
| General & Administrative | $/oz | 195 |
| Freight | $/oz | 2 |
| Royalties | $/oz | 58 |
| Total | $/oz | 981 |
| Cash Cost Metrics1 | | |
| Cash Costs (LoM Average) | $/oz | 941 |
| All-In Sustaining Cost (LoM average) | $/oz | 1,269 |
1 - Cash costs and All-in Sustaining Costs (AISC) and free cash flow are non-GAAP financial measures or ratios and have no standardised meaning under IFRS Accounting Standards (“IFRS”) and may not be comparable to similar measures used by other issuers. Cash Costs The Company calculates total cash costs as the sum of operating costs, royalty costs, production taxes, refining and shipping costs, net of by-product silver credits. Cash costs per ounce is calculated by taking total cash costs and dividing such amount by payable gold ounces. While there is no standardized meaning of the measure across the industry, the Company believes that this measure is useful to external users in assessing operating performance. All-In Sustaining Cost (AISC) The Company has provided AISC performance measures that reflect all the expenditures that are required to produce an ounce of gold from operations. While there is no standardized meaning of the measure across the industry, the Company's definition conforms to the AISC definition as set out by the World Gold Council in its guidance dated November 14, 2018. The Company believes that this measure is useful to market participants in assessing operating performance and the Company's ability to generate cash flow from operating activities.” |
| | December 2024 |
| | TECHNICAL REPORT –
MUSSELWHITE MINE, ONTARIO, CANADA
Document # C8630-0000-PM-RPT-001 – Rev. 0
/ Page 364 |
A total of 1,414 koz of gold will be produced over the remaining life of mine. An overview of the gold production on an annual and cumulative basis is presented in Figure 22.1.
It is assumed that the existing payment terms for gold sales will remain in place for the remaining mine life. These terms consider a gold payability of 99.95% and include a treatment and refining charge of US$0.65/oz. It is anticipated that no penalties will be applicable to the gold doré.
Figure 22.1 – Gold Sales on an Annual and Cumulative Basis
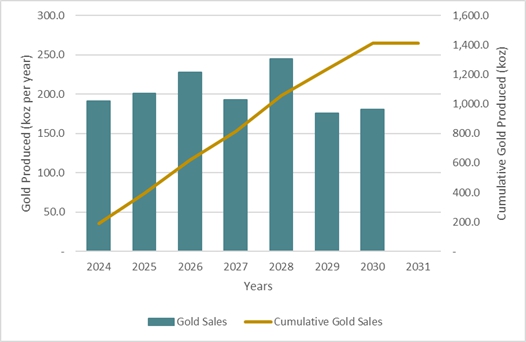
Source: DRA, 2024
The Sustaining Capital and Closure Capital costs have been distributed across the remaining life of mine. Figure 22.2 provides an overview of the capital expenditures over the remaining LoM. The tail of Closure Capital expenditures in later years is not shown for clarity.
The closure capital estimate considered in this analysis is based on the current Closure Plan. It is understood that the mine is advancing a range of ongoing studies to support the protection of the environment and the implementation of mitigative measures, which may result in possible additional mitigations and closure measures to be incorporated into the next Closure Plan update.
| | December 2024 |
| | TECHNICAL REPORT –
MUSSELWHITE MINE, ONTARIO, CANADA
Document # C8630-0000-PM-RPT-001 – Rev. 0
/ Page 365 |
Figure 22.2 – Sustaining and Closure Capital Costs over the Project (tail of Closure Capital
Expenditures not shown)

Source: DRA, 2024
There are a number of active agreements for the payment of royalties from the Project to third parties, on the basis of either Net Smelter Return (NSR) or Net Profit Interest (NPI). The royalties modelled in this analysis include:
| · | Franco Nevada Royalty: A 5% NPI royalty. |
| · | Aggregate Royalties / Other Payments: Modelled using an equation to cover annual payments due to the Musselwhite Brothers, First Nations, and as per the Mish Cooperation Agreement. |
Based on interpretation of available data at the time of this Report, the total estimated royalty payments over the remaining life of the Project are $82.5 M.
The tax calculations for the Project are developed on the basis of current Federal and Provincial (Ontario) tax regulations.
The income tax rates applied are:
| · | 15% for federal income tax; and |
| | December 2024 |
| | TECHNICAL REPORT –
MUSSELWHITE MINE, ONTARIO, CANADA
Document # C8630-0000-PM-RPT-001 – Rev. 0
/ Page 366 |
| · | 10% for provincial (Ontario) income tax, which includes the Manufacturing and Processing Tax Credit. |
The income tax basis was calculated by subtracting the following deductions allowed by tax regulations from the estimated taxable income:
| · | Capital Cost Allowances (CCA); |
| · | Canadian Development Expense (CDE) allowances; |
| · | Canadian Exploration Expense (CEE) allowances; and |
| · | Tax losses, which are allowed to be carried forward twenty years and carried back three years. |
The total estimated income tax paid over the remaining life of the Project is $241 M.
The Project is designated as a ‘Remote Mine’ as per Ontario Mining Tax regulations, based on the 2023 Ontario Mining Tax filing. On this basis, the mining tax rate applied is 5%.
An annual profit exemption of CA$500,000 is applicable to the Ontario Mining Tax determination. The tax basis was calculated by subtracting the following deductions allowed by tax regulations from the estimated taxable income:
| · | Depreciation allowance (mining, processing, and transportation assets); |
| · | Exploration and development expenditures allowance; and |
The total estimated Ontario Mining Tax paid over the remaining life of the Project is $57 M. The Ontario Mining Tax is deductible from income derived from mining operations in the determination of federal and provincial income tax.
| 22.9 | Financial Analysis Results |
At a long-term gold price of $2,150 per ounce and a discount rate of 5%, the results of the economic analysis indicate a positive pre-tax NPV of $1,037 M and a positive after-tax NPV of $782 M.
Figures 22.3 and 22.4 present the annual and cumulative free cash flows of the project on a pre-tax and after-tax basis, respectively. A summary of the economic model is presented in Table 22.2. The tail of Closure Capital expenditures in later years is not shown for clarity, however these expenditures are included in any totals.
| | December 2024 |
| | TECHNICAL REPORT –
MUSSELWHITE MINE, ONTARIO, CANADA
Document # C8630-0000-PM-RPT-001 – Rev. 0
/ Page 367 |
Figure 22.3 – Pre-Tax Free Cash Flow (Annual and Cumulative) (tail of Closure Capex
payments not shown)
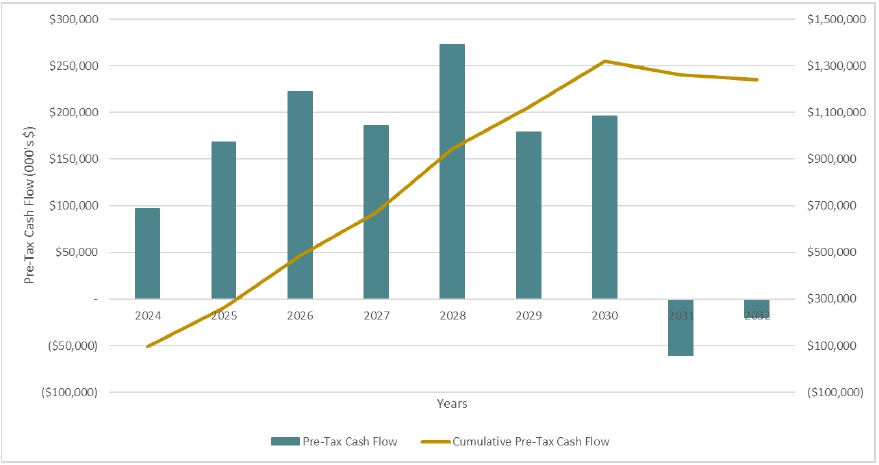
Source: DRA, 2024
Figure 22.4 – After-Tax Free Cash Flow (Annual and Cumulative) (tail of Closure Capex
payments not shown)
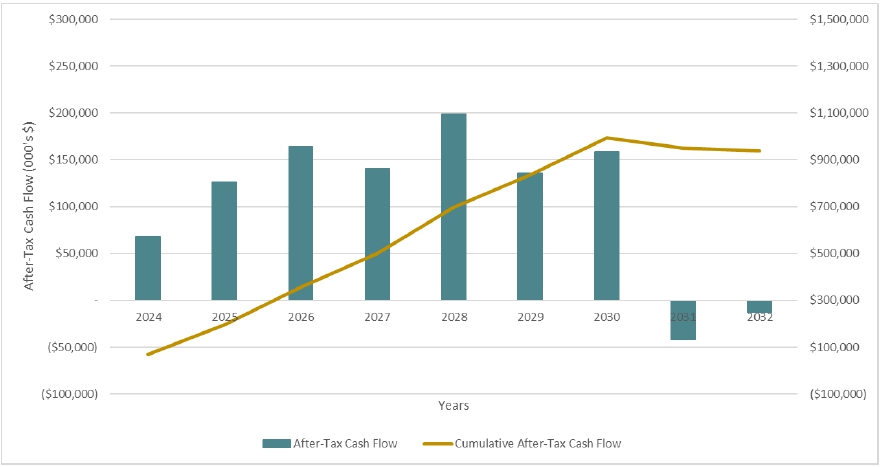
Source: DRA, 2024
| | December 2024 |
| | TECHNICAL REPORT –
MUSSELWHITE MINE, ONTARIO, CANADA
Document # C8630-0000-PM-RPT-001 – Rev. 0
/ Page 368 |
Table 22.2 – Economic Model Summary (Tail of Closure Capex Payments Not Shown)
| | | | | | | | | | | | | | |
| Period | | | Y1 | Y2 | Y3 | Y4 | Y5 | Y6 | Y7 | Y8 | Y9 |
| Period End | | | 2024 | 2025 | 2026 | 2027 | 2028 | 2029 | 2030 | 2031 | 2032 |
| Mine Operating | | | Y | Y | Y | Y | Y | Y | Y | N | N |
| Plant Operating | | | Y | Y | Y | Y | Y | Y | Y | N | N |
| MACROECONOMIC ASSUMPTIONS | | (Tot. / Avg.) | | | | | | | | | |
| Gold Price | ($/oz) | | $2,150 | $2,150 | $2,150 | $2,150 | $2,150 | $2,150 | $2,150 | $2,150 | $2,150 |
| Exchange Rate (USD:CAD) | | | 1.33 | 1.33 | 1.33 | 1.33 | 1.33 | 1.33 | 1.33 | 1.33 | 1.33 |
| PRODUCTION | | (Tot. / Avg.) | | | | | | | | | |
| Ore Mined | (ktonnes) | | 1,041.1 | 1,068.9 | 1,072.6 | 1,071.5 | 1,070.2 | 936.9 | 1,095.7 | - | - |
| Ore Milled | (ktonnes) | | 1,042.2 | 1,068.9 | 1,072.6 | 1,071.5 | 1,070.2 | 936.9 | 1,095.7 | - | - |
| Head Grade | (g/t) | | 5.9 | 6.1 | 6.9 | 5.8 | 7.4 | 6.1 | 5.4 | - | - |
| Gold Recovery | (%) | | 95.9 | 95.9 | 96.1 | 95.9 | 96.1 | 95.9 | 95.9 | - | - |
| Payable Gold Produced | (koz) | | 190.9 | 200.7 | 227.4 | 192.5 | 244.5 | 176.0 | 181.1 | - | - |
| REVENUE | | (Tot. / Avg.) | | | | | | | | | |
| Net Revenue | ($'000s) | $3,037,514 | $410,381 | $431,351 | $488,868 | $413,839 | $525,452 | $378,383 | $389,241 | - | - |
| OPERATING COSTS | | (Tot. / Avg.) | | | | | | | | | |
| Operating Costs Applicable to Sales | ($'000s) | $1,387,095 | $217,191 | $201,983 | $207,209 | $193,244 | $207,778 | $180,100 | $179,588 | - | - |
| Mining Opex | ($'000s) | $841,390 | $142,169 | $124,603 | $125,997 | $115,821 | $123,479 | $105,656 | $103,666 | - | - |
| Process Opex | ($'000s) | $184,990 | $26,309 | $26,663 | $26,712 | $26,698 | $26,680 | $24,908 | $27,020 | - | - |
| G&A Opex | ($'000s) | $275,470 | $39,038 | $39,339 | $40,089 | $39,116 | $40,560 | $38,505 | $38,824 | - | - |
| CAS Change in Inventory | ($'000s) | $215 | $215 | - | - | - | - | - | - | - | - |
| Transportation Costs | ($'000s) | $2,530 | $342 | $359 | $407 | $345 | $438 | $315 | $324 | - | - |
| Royalty / Other Payments | ($'000s) | $82,499 | $9,120 | $11,018 | $14,004 | $11,265 | $16,622 | $10,717 | $9,754 | - | - |
| Operating Costs - Other (Cash) | ($'000s) | $7,133 | ($196) | $2,862 | $18 | $1,978 | $18 | $18 | $18 | $1,208 | - |
| CAPITAL COSTS | | (Tot. / Avg.) | | | | | | | | | |
| Sustaining Capital | ($'000s) | $300,575 | $79,989 | $57,255 | $57,723 | $33,813 | $40,334 | $20,596 | $10,866 | - | - |
| Closure Capital | ($'000s) | $104,735 | - | - | - | $908 | $1,815 | $959 | $1,152 | $59,428 | $20,091 |
| Total Capital Costs | ($'000s) | $405,311 | $79,989 | $57,255 | $57,723 | $34,720 | $42,149 | $21,555 | $12,019 | $59,428 | $20,091 |
| Change in Net Working Capital | ($'000s) | $20,431 | $16,862 | $1,706 | $1,406 | ($1,271) | $2,399 | ($2,502) | $1,830 | - | - |
| PRE-TAX CASH FLOW | | (Tot. / Avg.) | | | | | | | | | |
| Pre-Tax Cash Flow | ($'000s) | $1,217,545 | $96,536 | $167,546 | $222,511 | $185,166 | $273,107 | $179,211 | $195,786 | ($60,636) | ($20,091) |
| Cumulative Pre-Tax Cash Flow | ($'000s) | | $96,536 | $264,081 | $486,592 | $671,758 | $944,865 | $1,124,076 | $1,319,861 | $1,259,225 | $1,239,134 |
| TAXES | | (Tot. / Avg.) | | | | | | | | | |
| Income Taxes | ($'000s) | $241,253 | $22,897 | $33,804 | $48,893 | $36,774 | $62,779 | $36,264 | $28,932 | ($18,756) | ($7,540) |
| Ontario Mining Tax | ($'000s) | $56,660 | $5,586 | $7,435 | $9,663 | $7,304 | $11,413 | $7,142 | $8,118 | - | - |
| AFTER-TAX CASH FLOW | | (Tot. / Avg.) | | | | | | | | | |
| After-Tax Cash Flow | ($'000s) | $919,632 | $68,053 | $126,307 | $163,955 | $141,087 | $198,915 | $135,804 | $158,736 | ($41,880) | ($12,550) |
| Cumulative After-Tax Cash Flow | ($'000s) | | $68,053 | $194,360 | $358,315 | $499,403 | $698,318 | $834,123 | $992,858 | $950,978 | $938,427 |
Source: DRA, 2024
| | December 2024 |
| | TECHNICAL REPORT –
MUSSELWHITE MINE, ONTARIO, CANADA
Document # C8630-0000-PM-RPT-001 – Rev. 0
/ Page 369 |
| 22.10 | Sensitivity Analysis |
A sensitivity analysis was carried out, using the base case described above as a starting point, to assess the impact of changes in the price of gold, Capex (Sustaining and Closure), Opex, and head grade on the Project NPV at 5% discount rate. The impact of each variable is examined individually with an interval of ±20% and increments of 10% applied. The results of the sensitivity analysis are presented in Tables 22.3 and 22.4 as well as Figures 22.5 and 22.6.
The NPV is most sensitive to variations in the gold price and head grade followed by Opex and then Capex. The impacts of changes in the gold price and head grade are almost identical as both of these factors directly impact the gross revenue. Overall, the NPV remains positive even at the lower end of the gold price and head grade ranges tested.
Table 22.3 – Sensitivity of Project Pre-Tax NPV to Gold Price, Capex, Opex and Head Grade
| Price | Units | -20% | -10% | Base | +10% | +20% |
| NPV @ 5.0% | $M | 540 | 788 | 1,037 | 1,286 | 1,534 |
| Opex | Units | -20% | -10% | Base | +10% | +20% |
| NPV @ 5.0% | $M | 1,252 | 1,145 | 1,037 | 929 | 822 |
| Capex | Units | -20% | -10% | Base | +10% | +20% |
| NPV @ 5.0% | $M | 1,102 | 1,070 | 1,037 | 1,004 | 972 |
| Grade | Units | -20% | -10% | Base | +10% | +20% |
| NPV @ 5.0% | $M | 553 | 795 | 1,037 | 1,279 | 1,521 |
Table 22.4 – Sensitivity of Project After-Tax NPV to Gold Price, Capex, Opex and Head Grade
| Price | Units | -20% | -10% | Base | +10% | +20% |
| NPV @ 5.0% | $M | 426 | 604 | 782 | 960 | 1,138 |
| Opex | Units | -20% | -10% | Base | +10% | +20% |
| NPV @ 5.0% | $M | 936 | 859 | 782 | 705 | 628 |
| Capex | Units | -20% | -10% | Base | +10% | +20% |
| NPV @ 5.0% | $M | 831 | 806 | 782 | 757 | 733 |
| Grade | Units | -20% | -10% | Base | +10% | +20% |
| NPV @ 5.0% | $M | 436 | 609 | 782 | 955 | 1,128 |
| | December 2024 |
| | TECHNICAL REPORT –
MUSSELWHITE MINE, ONTARIO, CANADA
Document # C8630-0000-PM-RPT-001 – Rev. 0
/ Page 370 |
Figure 22.5 – Sensitivity of Project Pre-Tax NPV to Gold Price, Capex, Opex and Head Grade
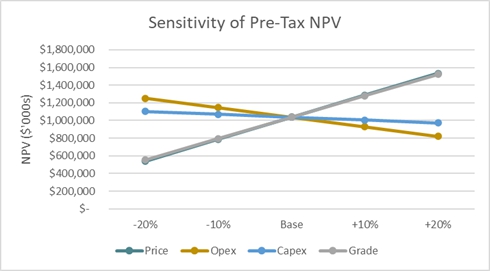
Source: DRA, 2024
Figure 22.6 – Sensitivity of Project After-Tax NPV to Gold Price, Capex, Opex and Head Grade

Source: DRA, 2024
| | December 2024 |
| | TECHNICAL REPORT –
MUSSELWHITE MINE, ONTARIO, CANADA
Document # C8630-0000-PM-RPT-001 – Rev. 0
/ Page 371 |
| 22.11 | 2024 Production Projections versus Actuals |
This analysis utilizes projections for 2024 rather than actual operating data. Table 22.5 provides a comparison between the projections for 2024 (Nine Months Ended September) versus the actual operating data for this period reported in public disclosures. The full-year 2024 projections considered in this analysis have been scaled linearly to estimate the projections for 2024 Nine Months Ended September to enable a comparison with the actual operating data.
In general, the actual operating data appears to be reasonably aligned with the projections for 2024 Nine Months Ended September, particularly in terms of the amount of ore mined and processed. The actual gold production is higher than the projection, driven primarily by a higher average ore head grade and slightly higher average gold recovery. The actual Costs Applicable to Sales and Cash Costs metrics are also within 5% of the projection.
Table 22.5 – Comparison between the 2024 Nine Months to September Actual Operating Statistics versus the Projection
| Parameter | Units | 2024 FY | 2024 Nine Months to
September |
| Projection | Projection | Actual |
| Throughput, Ore Mined | kt | 1,042 | 782 | 780 |
| Grade, Ore Mined | g/t Au | 5.944 | 5.944 | |
| Throughput, Ore Milled | kt | 1042 | 782 | 779 |
| Grade, Ore Milled | g/t Au | 5.944 | 5.944 | 6.487 |
| Contained Metal, Ore Milled | koz | 199 | 149 | 161 |
| Recovery, Ore Milled | % | 95.9 | 95.9 | 96.3 |
| Produced Metal | koz | 191 | 143 | 155 |
| Costs Applicable to Sales | $ millions | 211 | 159 | 163 |
| Cash Costs | | 1,064 | 1,064 | 1,050 |
The 2024 Nine Months to September projection has been developed by linearly scaling the 2024 Full Year projection |
| | December 2024 |
| | TECHNICAL REPORT –
MUSSELWHITE MINE, ONTARIO, CANADA
Document # C8630-0000-PM-RPT-001 – Rev. 0
/ Page 372 |
There are several exploration properties held by competitors or individuals (and/or estates) in the Musselwhite Mine region, including the following landholdings:
| ● | Romios Gold Resources Inc.; |
| ● | Last Resort Resources Ltd.; |
| ● | Gravel Ridge Resources Ltd.; |
A regional location map summarizes the relative locations and sizes of these adjacent and proximal properties in Figure 23.1. The relevant data was provided to DRA by the Musselwhite site team, and subsequently verified by the current Geology and Resources QP using the Mining Lands Administration System (MLAS) of Geology Ontario.
Details on information and/or data availability for the named claimholders is presented here:
| 1. | Romios Gold Resources Inc. |
Romios Gold Resources Inc. (Romios) holds several claims packages adjacent or contiguous to the Musselwhite’s mining and exploration claims. These properties include the Lundmark-Akow Lake, North Caribou River, Arseno Lake, Eyap Lake and Markop project areas (Table 23.1).
Table 23.1 – Romios Gold Resources Inc.
| Claim Package Name | Area
(ha) | Claim
# | Target Commodity | Exploration Activities |
| Lundmark-Akow Lake | 7,808 | 414 | Volcanogenic Massive Sulphide
(Cu-Au-Ag+/-Zn-Pb) system | Diamond Drilling, VTEM-Aeromagnetic surveys, Max-Min, VLF, Gravity and TDEM surveys |
| North Caribou River | 1,073 | 55 | Shear hosted Gold | Grassroots work adjacent to a heavily drilled fault structure |
| Arseno Lake | 1,654 | 86 | Bathurst-type Base Metal Sulphide Zone within Banded Iron Formation | Grassroots project along strike from the nearby Arseno Lake Pb-Zn-Ag+/- Au deposit |
| Eyap Lake new target area | No data | No data | No data | No data |
| | December 2024 |
| | TECHNICAL REPORT –
MUSSELWHITE MINE, ONTARIO, CANADA
Document # C8630-0000-PM-RPT-001 – Rev. 0
/ Page 373 |
| Claim Package Name | Area
(ha) | Claim
# | Target Commodity | Exploration Activities |
| Markop Lake | 5,861 | 298 | Gold in BIF | Grass-roots exploration focussing on a new target model for this area, Timiskaming-type, basin-bounding fault- controlled gold |
| Total | 16,396+ | 853+ | | |
According to public record, 2609572 Ontario Inc. (based in Sioux Lookout) had a permit awarded (March 15, 2022) for early exploration activities (mechanized drilling); however, the target commodity is not noted in the public domain. The claim package consists of 81 claims and is located approximately 43 km northeast of the Musselwhite Mine and SW of Kingfisher First Nation, within the Misamikwash Lake Area District of Kenora Northwest Region, Ontario.
Fortescue (https://fortescue.com) is an Australian-owned clean energy producer formerly focused on iron ore. There was nothing found in DRA’s search of public information regarding ongoing exploration activities in the vicinity of Musselwhite.
| 4. | Last Resort Resources Ltd. |
Founded in 2020, Last Resort Resources is a privately owned prospecting company. Their work appears mostly focused on lithium/spodumene exploration. There was no identifiable information located on the company’s website with respect to its filed claims in the Musselwhite area.
| 5. | Gravel Ridge Resources Ltd. |
The Gravel Ridge Resources website only presented an exploration permit for early exploration activities for another property located to the southwest of the Musselwhite claims; it does not indicate interest in any of the claims identified in the vicinity of Musselwhite as per Figure 23.1. Locations of claims identified in the public records found by DRA are not those identified on the provided map.
Public records suggest Perry Vern English was an independent prospector who has recently joined GoldON Resources as a Strategic Advisor (goldonresources.com). GoldOn’s properties appear to be located chiefly around the Madsen, Red Lake and Pickle Lake Areas, with their focus on gold +/- silver targets. Regardless, no information was found by DRA regarding activities associated with the claims identified in Figure 23.1.
| | December 2024 |
| | TECHNICAL REPORT –
MUSSELWHITE MINE, ONTARIO, CANADA
Document # C8630-0000-PM-RPT-001 – Rev. 0
/ Page 374 |
The environmental registry of Ontario includes permit applications submitted by Steven Dean Anderson but none of these are related to the claims identified as internal to Musselwhite’s exploration claims package to the northwest.
No publicly available information on any legal entity or otherwise named Dixon Metals Corp. could be located, although the name is identified as holding claims (Figure 23.1). The claim area on the map is located approximately 48 km east of the Musselwhite Mine.
However, the Geology and Resources QP for the current Technical Report has been unable to verify any of the described activities related to adjacent properties. As such, this information is not necessarily indicative or related to the mineralization and resources described for the Musselwhite Mine in this report.
All relevant data included here was provided to DRA by the Musselwhite site team, and subsequently verified by the current Geology and Resources QP using the Mining Lands Administration System (MLAS) of Geology Ontario.
| | December 2024 |
| | TECHNICAL REPORT –
MUSSELWHITE MINE, ONTARIO, CANADA
Document # C8630-0000-PM-RPT-001 – Rev. 0
/ Page 375 |
Figure 23.1 – Location Map of Adjacent and Proximal Properties

Source: Orla, 2024
| | December 2024 |
| | TECHNICAL REPORT –
MUSSELWHITE MINE, ONTARIO, CANADA
Document # C8630-0000-PM-RPT-001 – Rev. 0
/ Page 376 |
| 24 | Other Relevant Data and Information |
No additional information or explanation is necessary to make this Technical Report understandable and not misleading.
| | December 2024 |
| | TECHNICAL REPORT –
MUSSELWHITE MINE, ONTARIO, CANADA
Document # C8630-0000-PM-RPT-001 – Rev. 0
/ Page 377 |
| 25 | Interpretation and Conclusions |
| 25.1.1 | Geology and Exploration |
The Musselwhite Mine is considered an advanced property and has produced over five million ounces over its 27+ year mine life.
The geology and related controls on mineralization are well studied and clearly understood.
The procedures and protocols followed have been proven over the years.
Notable exploration work dates back to the 1930’s with the first geological map of the North Caribou Greenstone Belt produced in 1938. Later exploration work included an airborne magnetometer survey in 1960 followed up by geological and geophysical surveys on the Karl Zeemal property by in 1963. 18 diamond drill holes were drilled around Zeemal Lake and an additional Eight holes in area of Karl and Markop Lakes in 1962-63.
Dome Exploration Ltd. exploration activities resulted in the discovery of the “West Anticline Zone” in 1980 and followed up with airborne magnetic and electromagnetic geophysical survey over the area surrounding the Musselwhite deposit.
In 1984 an exploration decline into the West Anticline Zone and delineated gold deposits totaling approximately 540,000 ounces. In 1985, the Ontario Geological Survey performed an extensive Airborne Magnetic and Electromagnetic survey of the North Caribou Greenstone Belt, and extensive surface drilling continued by Dome Mines Ltd focused on the East Bay Synform in 1986.
In 1987-88, extensive mapping, prospecting, trenching and diamond drilling was performed along the mineralized Karl-Zeemal iron formation including Zeemal lake property.
From 2005 though 2018 Goldcorp Canada Inc. continued exploration drilling along the mineralized trend identified by Power Explorations Inc. in their 1988 drilling.
Finally, starting in 2019 – Newmont Corporation began a greenfield exploration program within Newmont-Goldcorp northern tenement along NCGB, and the near-mine Karl Zeemal target area, and in 2023 performed outcrop sampling program, and a 30,319 Ha2 fixed-wing airborne gravity gradiometric survey.
While some deficiencies are described within this report, it is the QP’s opinion that there are no significant geology, exploration or drilling related issues that jeopardize the Musselwhite Mine’s ongoing viability.
| | December 2024 |
| | TECHNICAL REPORT –
MUSSELWHITE MINE, ONTARIO, CANADA
Document # C8630-0000-PM-RPT-001 – Rev. 0
/ Page 378 |
Ongoing exploration and infill drilling is warranted to continue replacing extracted Mineral Reserves and add to the overall Resource base via a combination of potential mine-scale zone extensions and/or new discoveries within the greater property land package.
| 25.1.2 | Data Verification and Mineral Resources |
It is the QP’s opinion that the geological interpretation and related data are valid for the estimation of Mineral Resources. The assumptions made and methodology applied are considered reasonable and representative of typical banded iron formation-hosted Archean gold mineralization systems. As such, the QP considers the presented Mineral Resources to have been prepared in accordance with current CIM standards, definitions and guidelines for Mineral Resources Estimation.
| 25.1.3 | Mineral Processing and Metallurgical Testing |
Metallurgical test work completed on variability samples selected from across the current reserve show minor to no amounts of elements and minerals that are deleterious to gold recovery and reagent consumption. Ores to be processed over the current life-of-mine are consistently of moderate hardness, with respect to grinding. Gold recoveries are expected to remain high, on average, and are reasonably predicted by the 2023 site model, with occasionally lower gold recovery resulting from elevated sulfide sulfur content and potentially changing gold mineralogy. Sulfide sulfur content did not explain all recovery outliers and variability.
| 25.1.4 | Mineral Resources Estimate |
An updated Mineral Resource Estimate has been completed for the East and West Limb deposits at the Musselwhite Mine using new information from continued drilling and exploration work since the last publicly available technical report (AMEC, 2006). The effective date for the resources reported herein is December 31, 2023.
It is the QP’s opinion that the geological interpretation and related data are valid for the estimation of Mineral Resources. The assumptions made and methodology applied are considered reasonable and representative of typical BIF-hosted gold mineralization systems.
The Mineral Resource Estimate for the Musselwhite Mine includes Measured and Indicated Resources of 2,155 kt @ 4.25 g/t Au for 294 koz, and Inferred Resources of 1,188 kt @ 4.96 g/t Au for 190 koz.
The MRE has been prepared using a cut-off grade of not less than 3.80 g/t Au, and the underground Mineral Resources are reported using a gold price of US$ 1,600.
It is important to recall that Mineral Resources that are not Mineral Reserves do not have demonstrated economic viability. Additionally, there is no certainty that all or part of the Mineral Resources will be converted into Mineral Reserves.
| | December 2024 |
| | TECHNICAL REPORT –
MUSSELWHITE MINE, ONTARIO, CANADA
Document # C8630-0000-PM-RPT-001 – Rev. 0
/ Page 379 |
The QP considers the reported Mineral Resources to have been prepared in accordance with current CIM standards, definitions and guidelines for Mineral Resources Estimation.
The QP is also currently unaware of any legal, title, environmental, permitting, taxation, socioeconomic, geopolitical or other factor that may materially affect the Mineral Resources estimate presented in this report for the Musselwhite Mine.
It should be noted that although additional drilling has been completed subsequent to the effective date of this Report, the QP considers this drilling as not likely to have a significant effect on the overall resource reported herein.
| 25.1.5 | Geotechnical Conclusions |
Musselwhite Mine is an experienced underground operation with respect to geotechnical design. There is lower operation risk in the upper areas of the mine related to geotechnical events since these are at depths and in areas that Musselwhite Mine has demonstrated experience. There is higher operational risk in the deeper areas of the mine (PQ Deeps) due to increased seismic events. In 2023 there were few seismic events compared to 15 events from January to August 2024. There is clear evidence that the Musselwhite Mine has been addressing these geotechnical challenges through the updating and implementing procedures outlined in the GCMP and the SRMP. In addition, the Musselwhite Mine Rock Mechanics Department and corporate teams have been completing studies to address geotechnical challenges. Some examples include:
| ● | Completing local 3D numerical modeling studies to identify stress related issues (diminishing pillars); |
| ● | Completing site visit reports and recommendations related to FOG and stress related events; |
| ● | Completing studies to define changes to the ground support system due to increased seismic events; |
| ● | Recommending changes to mine production sequence (using rock pre-conditioning in secondary stopes) and modifying stope designs to minimize stope dilution; and |
| ● | Increasing coverage of the seismic system. |
The future geotechnical challenges in mining deeper in the PQ Deeps has been identified in Section 25.3.4 under Mining Risks.
The Musselwhite processing facility was constructed in 1996 and began operations in 1997. The total operating life of the mill has been over twenty-five (25) years. Upgrades over time have increased the original processing design throughput from 3,200 tpd to 4,000 tpd, nominally. Mill throughput is currently limited to approximately 1.1 Mtpa by mine production, which is the current life-of-mine plan requirement. Average gold recovery has been above 95% over the last 15 years of
| | December 2024 |
| | TECHNICAL REPORT –
MUSSELWHITE MINE, ONTARIO, CANADA
Document # C8630-0000-PM-RPT-001 – Rev. 0
/ Page 380 |
operation. Based on the available metallurgical, plant and technical information provided, and a site visit, the current flow sheet and plant infrastructure is suited for processing the current LoM reserve.
| 25.1.7 | Project Infrastructure |
The existing surface infrastructure supports current mine production levels. With ongoing maintenance and necessary improvements, it is expected to continue meeting operational demands and support future growth.
| 25.1.8 | Environmental Studies, Permitting and Social or Community Impact |
Currently, the mine has the required permits to operate. Most of them are provincial and issued by the Ministry of Environment, Conservation and Parks (MECP) in Ontario. In addition, the Ministry of Natural Resources and Forestry (MNRF) has issued some Land Use Permits (LUPs) and aggregate permits for the project. The LUPs lease right of ways for power lines and access road to the Project. The aggregate permits were issued between 2001 and 2009 and allow the extraction of aggregates from areas in the vicinity of the East Pond and Zeemel Lake.
The site has extensive monitoring programs that are reported to regulatory agencies on a periodic basis, in accordance with regulatory requirements. Comprehensive surface and groundwater monitoring supports a detailed understanding of current conditions and is incorporated into predictive models to support risk mitigation and closure planning
The mine is advancing a wide range of ongoing studies related to the environmental and geotechnical performance of the TSF, as well surface water and groundwater modelling to support the protection of the environment and the implementation of mitigative measures. The studies, including the evaluation of closure cover requirements, options for transitioning the groundwater interception system to closure, and the possible requirement for additional mitigations and closure measures will be incorporated into the next Closure Plan update.
Based on the available information, the Project has a positive after-tax NPV of $782 M using a discount rate of 5%. The sensitivity analysis indicates that the Project economics are most sensitive to the gold price and ore head grade. Even with a gold price 20% below the base case of $2,150/oz, the Project maintains a positive after-tax-NPV.
| 25.1.10 | Adjacent Properties |
Apart from the active drilling at Romios’ Lundmark-Akow Lake project, exploration work at any of the other adjacent and/or contiguous properties appears to be very early (i.e., grassroots) in nature or even non-existent.
| | December 2024 |
| | TECHNICAL REPORT –
MUSSELWHITE MINE, ONTARIO, CANADA
Document # C8630-0000-PM-RPT-001 – Rev. 0
/ Page 381 |
The QP does not foresee that the claim packages on adjacent properties will have any material impact on the Musselwhite property’s continued viability, particularly with appropriate tracking of competitor exploration activities.
| 25.2.1 | Geology and Exploration |
Several opportunities exist in the Project area within both the immediate mine area and the greater land package. At the mine scale, key target areas which could provide potential zone extensions include the PQ Deeps, Lynx, Esker and Redwings trends. At the property scale, there are numerous opportunities for the discovery of new satellite or stand-alone deposits; regional lithostratigraphic and structural interpretations of airborne geophysical data indicate the potential for other BIF-hosted gold deposits similar in nature to Musselwhite, in addition to other orogenic and/or intrusion-related gold systems. Regional exploration remains ongoing to help targeting and prioritization efforts.
This is a mature and proven brownfields mineral processing facility with a flowsheet and infrastructure that is suited for the life-of-mine production plan. No notable opportunities have been identified.
| 25.2.3 | Capital and Operating Costs |
Mill spending on contractors, technical services and maintenance is higher than expectations for a conventional gold mill of this size and may represent opportunities for cost savings for the upcoming LoM.
| 25.2.4 | Adjacent Properties |
There exist opportunities in the vicinity of the Musselwhite claim package to identify new mineralized trends and/or deposits that could extend onto contiguous claim blocks of adjacent properties. With any future exploration successes, it may prove prudent to acquire such adjacent claims and/or consider purchases once sufficient confidence in the geology and mineralization is attained. Moreover, because the Musselwhite land package is very large and contiguous, active and ongoing exploration activities presents the opportunity for the distribution of work credits to help maintain the land package until properly explored.
Overall, the identified risks are assessed as posing low to no risk to the viability of the Musselwhite Mine.
| | December 2024 |
| | TECHNICAL REPORT –
MUSSELWHITE MINE, ONTARIO, CANADA
Document # C8630-0000-PM-RPT-001 – Rev. 0
/ Page 382 |
Risks identified during the 2023 internal Qualified Persons checks include:
| ● | There is difficulty in comparing the granularity captured in logging codes to the interpreted lithologies, despite the geology model being well constructed and reflective of the geological understanding of the deposit. |
| ● | In some areas of the lower mine, there is a discrepancy between the geology recorded in the drilling to the back and face mapping of up to 5 metres. Investigations indicated that this is an issue caused by rotational errors in the mine surveys for different drifts. This will introduce challenges in producing a unified model that supports both short- and long-term planning due to the spatial discrepancies. Additionally, F1 reconciliation will not be as representative as the variance will be related to spatial inaccuracies rather than the comparison of short- and long-term models. |
| ● | Given the limited delineation (infill) drilling opportunities in the Upper Lynx zone, the mineralization is showing wider in some areas of the resource model compared to reality. In order to mitigate this risk, the short-term planning group utilizes a short-term model that includes additional geological data (chip samples, mapping, etc.) for a more accurate representation of the mineralization. |
Due to the unfavourable orientation of a few drill holes (down-dip of a parasitic fold limb) in the Redwings zone, additional drilling is required to better delineate the mineralization and improve confidence in some of the Inferred Resources in this area.
| 25.3.2 | Mineral Processing and Metallurgical Testing |
There are outliers in the variability test work database from which gold recovery is lower than historical plant performance and the database itself which may result in periodically lower recoveries in the plant and may indicate a change in metallurgy beyond the current life-of-mine plan.
Future mining in the PQ Deeps will result in increased Transverse Longhole mining methods at greater depths that are currently experienced at Musselwhite Mine. The potential mining risks associated with mining deeper at Musselwhite Mine include the following:
| ● | Production rate impacts (possible reductions) in the PQ Deeps areas due to increased seismic activity. Increased seismic activity will result in more frequent and larger rock bursts related events that will results in temporary work stoppages and replacement of damaged ground support. Additional issues might occur in redrilling of squeezed production drill holes, using just in time development (to minimize replacing damaged ground support) in some areas and increased pillar stress in secondary stopes (areas that will be a focus of seismicity). |
| | December 2024 |
| | TECHNICAL REPORT –
MUSSELWHITE MINE, ONTARIO, CANADA
Document # C8630-0000-PM-RPT-001 – Rev. 0
/ Page 383 |
| ● | Increased operating costs due to changes in ground support (more dynamic ground support, thicker mess, extending mesh installation and using shotcrete) if required. |
| ● | Potential stress related impacts to the permanent LoM infrastructure like the ramp. The ramp is located in the hanging wall and as the mine goes deeper the ramp could be impacted by seismic related events. |
The following factors represent challenges and risks for mining the Musselwhite orebody for the remaining LoM.
| ● | Heavy traffic on the 280 mL could limit the capacity of transferring ore from the TLO to the 460 mL dumping point. As presented in the LoM schedule, 60% of the ore will be hauled on this level. |
| ● | The ventilation volume on the 280 mL will limit the quantity of heavy equipment to transport ore that could potentially impact the production from PD Deeps. |
| ● | Heavy dilution from the seismicity could impact the mine productivity. |
| ● | The actual portable cemented rockfill plants could a create bottleneck and delays in stopes backfilling in PQ Deeps. In the LoM, 60% of ore mined will be mined from this zone. |
| ● | Heavy ground support due to the seismicity in at depth in PQ deeps will impact productivity and development costs. |
| ● | Increase in distance to transport personnel underground in PQ Deeps zone will impact total mine production. |
| ● | Distance from PQ Deeps existing infrastructure (repair shop, material transportation, etc.) will impact production. |
This is a mature and proven brownfields mineral processing facility with a flowsheet and infrastructure that is suited for the life-of-mine production plan. No notable risks have been identified.
| 25.3.6 | Tailings Storage Facility |
| ● | Careful monitoring of excess porewater pressures during construction is required to ensure that the TSF maintains geotechnical stability |
| ● | TSF geotechnical stability against static liquefaction is sensitive to phreatic level. Additional mitigations, such as installation of drainage layers to lower the phreatic surface, may be warranted to improve stability under worst case scenarios |
| | December 2024 |
| | TECHNICAL REPORT –
MUSSELWHITE MINE, ONTARIO, CANADA
Document # C8630-0000-PM-RPT-001 – Rev. 0
/ Page 384 |
The Project economic performance is highly sensitive to the price of gold, as demonstrated in the sensitivity analysis. A key risk is the possibility of a significant decline in the price of gold during the life of the Project, which would negatively impact the Project economics. This risk is somewhat mitigated by the fact that the selected gold price used in the analysis is below the current spot gold price.
| 25.3.8 | Adjacent Properties |
The risk associated with the identification of new mineralized trends and/or deposits that could extend onto contiguous claim blocks of adjacent properties is that there are potentially large acquisition costs, whether needed for surface or mineral rights, NSRs, permitting requirements, etc.
Ongoing activities of adjacent and/or proximal properties should be monitored regularly to help control risk of any potential conflicts with adjacent property claim holders. Additionally, if Musselwhite’s own claims are not being actively tracked, there is always the risk of unnecessary and/or unplanned claims lapses due to lack of diligence in status review and missed renewal dates or failure to maintain required work credits.
| | December 2024 |
| | TECHNICAL REPORT –
MUSSELWHITE MINE, ONTARIO, CANADA
Document # C8630-0000-PM-RPT-001 – Rev. 0
/ Page 385 |
| 26.1 | Geology and Exploration |
| ● | Continue to improve understanding/interpretation of both large and small-scale structural elements that could affect zone delineation/continuity or give rise to previously unidentified zone/trend extensions (i.e., new exploration targets). |
| ● | Additional infill drilling to increase confidence in the current resource base. |
| ● | Additional extension/expansion drilling to add new Resources to the Inferred category for future upgrading. |
| ● | Additional collection of density data, especially in previously unsampled areas (more pertinent at East Limb Deposits). |
| ● | Conduct additional lithogeochemical studies to help identify pathfinder elements and assess mass balance of alteration fronts (i.e., zonation) towards the development of new exploration targeting strategies. |
| ● | Continue regional exploration programs focused on proximal targets/satellites, as well as more distal targets within the greater land package. |
| ● | Consider Mobile Metal Ion (MMI) soil geochemistry testwork to help with earlier stage exploration targeting. |
| ● | Continue underground drilling to target infill and extension in key mineralized zones. Consider resuming surface directional drilling at the PQ Deeps extension area (North Shore Drilling) to confirm continuity along the deposit plunge. |
| ● | Outline a long-term plan to explore the broader mine lease area and regional claims for additional BIF-hosted and other orogenic gold mineralization systems. |
Further testing planned as Musselwhite Mine is developed deeper. Laboratory testing is performed by accredited labs using ASTM standards and International Society of Rock Mechanics suggested method for rock testing.
| | December 2024 |
| | TECHNICAL REPORT –
MUSSELWHITE MINE, ONTARIO, CANADA
Document # C8630-0000-PM-RPT-001 – Rev. 0
/ Page 386 |
| 26.3 | Mineral Processing and Metallurgical Testing |
The following items are recommended for further consideration regarding the Project's process operations:
| ● | Utilize the 2023 site gold recovery model while incorporating downside recovery risk of 2 to 4% within financial sensitivity analyses. |
| ● | Pursue metallurgical test work outliers to determine cause(s), such as mineralogical analysis and gold deportment of leach test residues. |
| ● | Align metallurgical test work with the progress of exploration to facilitate early identification of changing metallurgy, causes, and potential solutions (if justified). |
| ● | Incorporate historical and future geometallurgical data within software designed to facilitate data analyses, gold production model development and support geometallurgical program management. |
| 26.4 | Mineral Resources Estimate |
The following items are recommended for further consideration:
Geological Model
Detailed discussion of the controls on mineralization should be undertaken with emphasis on specific zones (e.g., Upper Lynx). This will help with future estimations of domaining decisions and reduce the level of geological risk associated with this zone.
Modelling of the intraformational units within the HW Mafic package is an opportunity to increase the accuracy of the estimation in that area and add ounces to the resource. An indicator model may be helpful in defining areas of interest.
Density Measurements
It is recommended that density sampling frequency be increased in areas outside of known ore zones and to review the relevant procedure accordingly.
Review results of the ongoing density study to better understand the SG data set to inform future work. The QP recommends exploring the use of a density estimation for future updates, especially within the 4EA where the data set is most dense.
| | December 2024 |
| | TECHNICAL REPORT –
MUSSELWHITE MINE, ONTARIO, CANADA
Document # C8630-0000-PM-RPT-001 – Rev. 0
/ Page 387 |
Geological Model
The Leapfrog geological model was considered a positive improvement for estimation. However, several recommendations can be made for future work, including:
| ● | Some small lithology volumes were delivered with the model which appear to be artifacts. It would be best if these can be cleaned up for future models. |
| ● | Further interpretation of smaller scale structures and/or lithologies is likely required. For example, the Rifle 4E is a high-grade narrow structure that has been mined underground and should be properly represented in the geology model. |
| ● | Avoid using a background mafic unit to have proper separation of distinct mafic packages for estimation purposes. |
Density Measurements
It is recommended that density sampling frequency be increased and possible review of the procedure to emphasize taking SG samples on material outside of known ore zones.
It may also be recommended that a density sampling campaign be undertaken to gain more data from core that is currently on surface in storage.
Reconciliation
Monitor performance of the model as further reconciliation information is collected to ensure the estimate reflects a realistic scenario.
| 26.5 | Mineral Reserve Estimate |
In the next review of mining reserves, the QP recommends that the metal price be reviewed to align with current market trends. In the case of Musselwhite, the metal price may impact mining reserves.
| 26.6 | Geotechnical Recommendations |
Based on the reviews completed, the following are geotechnical recommendations:
| ● | Complete 3D numerical modeling studies that include Mineral Reserves, Resources, High and Low potential zones. The models should be calibrated using past seismic related failures. From these studies identify potential impacts to the mine production and the stability of LoM capital infrastructure related to seismicity. |
| ● | Extend seismic system further in the PQ Deeps. |
| ● | Update seismic risk assessment based on 2024 data (by ESG) to determine future seismic event potential. |
| | December 2024 |
| | TECHNICAL REPORT –
MUSSELWHITE MINE, ONTARIO, CANADA
Document # C8630-0000-PM-RPT-001 – Rev. 0
/ Page 388 |
| ● | Complete additional studies as required based on the numerical modeling study results that may include changes to production sequence in the PQ Deeps, standard and dynamic ground support system reviews, changes to re-entry protocols, stope sizing review, expansion of stope pre-conditioning and just in time development approaches. |
| ● | Retain and/or train existing underground geotechnical staff in mine seismicity related activities. |
This is a mature and proven brownfields mineral processing facility with a flowsheet and infrastructure that is suited for the life-of-mine production plan. No notable recommendations have been made.
| 26.8 | Tailings Storage Facility |
| ● | Advance TSF closure cover design to facilitate optimal closure |
| ● | As per recommendation by the ITRB, the option of adding a tailings desulfurization circuit to the process flowsheet should be re-evaluated |
| ● | Continue to refine stability and deformation analysis of TSF performance to further optimize tailings deposition protocols to protect against liquefaction |
| ● | Continue to evaluate a range of options to improve tailings deposition to achieve the planar tailings beaches (as per deposition plan) and maximize tailings storage capacity. |
| ● | Advance closure cover design to facilitate optimal closure |
| ● | Initiate focused studies on the potential for incorporating a constructed wetland treatment system to address a reasonable worst-case scenario for TSF seepage water quality |
| ● | The option of adding a tailings desulfurization circuit to the process flowsheet should be re-evaluated in the context of ongoing geochemical evaluations of TSF performance. |
| ● | Evaluate alternative (passive) means to support the long-term protection of Zeemel Lake |
| ● | Initiate progressive reclamation and closure of areas of the TSF that have obtained closure configuration as soon as a closure cover design is finalized and approved. |
| ● | Further enhance the existing wetland downstream of the Polishing Pond to allow for increased hydraulic retention time and improved performance |
| ● | Continue monitoring cobalt in both surface and groundwater to better understand fate and transport in the context of evaluating the effectiveness of closure alternatives. |
| ● | Continue the development and understanding of the hydrogeology and water quality conditions around the entire TSF (not just to the south) (ITRB, 2024). |
| | December 2024 |
| | TECHNICAL REPORT –
MUSSELWHITE MINE, ONTARIO, CANADA
Document # C8630-0000-PM-RPT-001 – Rev. 0
/ Page 389 |
| ● | Complete a second phase of geochemical testing with focus on tailings acidification potential and effects (ITRB, 2024). |
| ● | Complete an annual “checkup” into the natural wetland to identify and address any health issues before they affect treatment performance (ITRB, 2024). |
| ● | Honour the commitments to the ICs and maintain a consistent approach in managing the social impacts and risks associated with the Musselwhite operations. |
| 26.10 | Capital and Operating Costs |
A comprehensive review of contractors, technical services and maintenance spending is recommended to identify milling cost savings opportunities.
Due to the aforementioned opportunities and risks associated with adjacent and/or nearby properties, the QP recommends that regular tracking of ongoing activities via MLS and other public sources should be monitored in order to allow for improved decision-making processes associated with landholdings.
The QP also recommends that it is critical to maintain an updated tracking system of current landholdings to ensure all financial obligations (or distribution of work credits) are met to avoid unplanned lapses of active claim blocks, preferably by a dedicated lands administrator or consulting service provider.
| | December 2024 |
| | TECHNICAL REPORT –
MUSSELWHITE MINE, ONTARIO, CANADA
Document # C8630-0000-PM-RPT-001 – Rev. 0
/ Page 390 |
AMEC (2006, July). Review of Musselwhite Mine Operation, Ontario, Canada – NI 43-101 Technical Report (Prepared for Goldcorp Inc.)
AMEC (2003, March). Technical Report – Review of Musselwhite Mine Operations, Ontario (Prepared for Kinross)
Analytical Solutions Ltd. (2018, November), Review of Assay Quality Control Program - January to August 2018.
Andrews, A.J., Sharpe, D.R. and Janes, D.A. (1981). Preliminary reconnaissance of the Weagamow–North CaribouLake metavolcanic-metasedimentary melt, including the Opapimiskan Lake (Musselwhite) gold occurrence; Ontario Geological Survey, Miscellaneous Paper 100, p.196-202.
Barton, N.R., Lien, R. and Lunde, J. (1974). Engineering classification of rock masses for the design of tunnel support. Rock Mech. 6(4), 189-239.
Bieniawski, Z.T. (1976). Rock mass classification in rock engineering. In Exploration for rock engineering, proc. of the symp., (ed. Z.T. Bieniawski) 1, 97-106. Cape Town: Balkema.
Breaks F.W., Osmani I.A. and de Kemp E.A. (2001). Geology of the North Caribou Lake area, northwestern Ontario. Ontario Geological Survey, Open File Report 6023, 80 p.
Breaks, F.W., Bartlett, J.R., de Kemp, E.A. and Osmani, I.A. (1986). Precambrian geology of the Doubtful–Akowlakes area (Opapimiskan Lake project), Kenora District (Patricia Portion); Ontario Geological Survey, Preliminary Map P.2965.
Breaks, F.W., Bartlett, J.R., de Kemp, E.A. and Shield, H.N. (1985). Geological series, Precambrian geology, Eyapamikama Lake area, (Opapimiskan Lake project), Kenora District (Patricia Portion) Preliminary Map Series.
Breaks, F.W., Bartlett, J.R., deKemp, E.A., Finamore, P.F., Jones, G.R., MacDonald, A.J., Shields, H.N. and Wallace, H. (1984). Opapimiskan Lake project: Precambrian geology, Quaternary geology and mineral deposits of the North Caribou Lake area, District of Kenora, Patricia Portion; Ontario Geological Survey, Miscellaneous Paper 119, p.258-273.
DRA America Inc. (2024, November). Photos taken by author during site visit.
Emslie, R.F. (1962). Wunnummin Lake (NTS 53A), Ontario; Geological Survey of Canada, Map 1–1962
| | December 2024 |
| | TECHNICAL REPORT –
MUSSELWHITE MINE, ONTARIO, CANADA
Document # C8630-0000-PM-RPT-001 – Rev. 0
/ Page 391 |
Hill M.-L., Cheatle A.M. and Liferovich R. (2006). Musselwhite mine: An orogenic gold deposit in the western Superior province. Geological Association of Canada – Mineralogical Association of Canada joint annual meeting, May 14-17, Montreal, Program with Abstracts, 31:67.
McMillan N. (1996). Late Archaean, syn-amphibolite facies, lode-gold deposits overprinted by Palaeoproterozoic deformation, metamorphism and hydrothermal activity at Marymia, Western Australia. Unpublished PhD thesis. Department of Geology and Geophysics, The University of Western Australia, 261 p.
Newmont (2024). Core Shack and Core Storage Photos sent directly to author.
Newmont (2024). Geological Mapping Samples sent directly to author.
Newmont (2024). Musselwhite exploration Work Summary (In-house PowerPoint Presentation) – Musselwhite Mine, Canada
Newmont (2023, December 31). Qualified Persons Report – Musselwhite Mine, Canada
Newmont (2021, July). Resource Model QAQC Report for Musselwhite
Newmont (2023, July). Resource Model QAQC report for MusselwhiteNewmont, July 2022, 2022 Resource Model QAQC Report for Musselwhite
Ontario Geological Survey, 1985.
Ontario Mineral Inventory (2024, July). Website: https://www.geologyontario.mndm.gov.on.ca/mndmfiles/mdi/data/records/MDI53B09SW00007.html
Oswald W., Castonguay S., Dubé B., McNicoll V., Biczok J., Malo M. and Mercier-Langevin P. (2015). Geological setting of the world-class Musselwhite gold mine, Superior Province, northwestern Ontario: Implications for exploration. In: Dubé B. & Mercier-Langevin P. (Eds.) Targeted Geoscience Initiative 4: Contributions to the Understanding of Precambrian Lode Gold Deposits and Implications for Exploration. Geological Survey of Canada, Open File 7852, pp. 69-84
Oswald, W. (2018). Geology of the banded iron formation-hosted Musselwhite gold deposit, Superior Province, Ontario, Canada / Géologie du gisement aurifère encaissé dans des formations de fer Musselwhite, Province du Supérieur, Ontario, Canada. Thèse. Québec, Université du Québec, Institut national de la recherche scientifique, Doctorat en sciences de la terre, 511 p.
Otto A. (2002). Ore forming processes in the BIF-hosted gold deposit Musselwhite Mine, Ontario, Canada. M.Sc. thesis, Freiberg Institute of Mining and Technology, 86 p. and appendices.
| | December 2024 |
| | TECHNICAL REPORT –
MUSSELWHITE MINE, ONTARIO, CANADA
Document # C8630-0000-PM-RPT-001 – Rev. 0
/ Page 392 |
Piroshco, D.W., Shields, H.N. (1985). Geology and gold mineralization of the Eyapamikama Lake area of the North Caribou Lake greenstone belt, District of Kenora (Patricia Portion)
Satterly J. (1941). Geology of the Windigo-North Caribou lakes area.
SNC Lavalin, (2018, November). Closure Plan Amendment, Goldcorp Canada Limited, Musselwhite Mine
Stott, G.M., Corkery, M.T., Percival, J.A., Simard, M., and Goutier, J. (2010). A Revised Terrane Subdivision of the Superior Province. Summary of Field Work and Other Activities 2010, Ontario Geological Survey, Open File Report 6260: 20-1-20-2.
Thurston, P.C., Sage, R.P. and Siragusa, G.M. (1979). Geology of the Winisk Lake area, District of Kenora (PatriciaPortion); Ontario Geological Survey, Report 193, 169p.
| 27.2 | Mineral Processing and Metallurgical Testing |
Alcalde, J. (2022, September 22). Musselwhite Future Ores 2023-2025, Newmont Metallurgical Services.
Alcalde, J. (2022, September 23). Musselwhite Lynx 2022, Newmont Metallurgical Services.
Alcalde, J. (2022, September 23). Musselwhite PD Deeps Extension 1 Stage 2B/3, Newmont Metallurgical Services.
Alcalde, J. (2023, December 7). Musselwhite Future Ores 2026-2028, Newmont Metallurgical Services.
Shuey, S. (2021, December 7). Musselwhite Redwings Metallurgical Results, Newmont Metallurgical Services.
Weirmeir, D. (2023, August 25). Metallurgical Memo – Musselwhite Grade/Recovery Curve 2023, Newmont Canada.
| 27.3 | Mineral Resources Estimate |
Newmont. (2023, December 31). Musselwhite Mine, Ontario, Canada – Qualified Persons Report.
Newmont (2021, April 12). Musselwhite Mine, Ontario, Canada – 2021 West Limb (WEL) Resource Model Report.
Newmont (2023, November 15). Musselwhite Mine, Ontario, Canada – 2023 East Limb (EL) Resource Model Report.
| | December 2024 |
| | TECHNICAL REPORT –
MUSSELWHITE MINE, ONTARIO, CANADA
Document # C8630-0000-PM-RPT-001 – Rev. 0
/ Page 393 |
Newmont (2023, July 30). Musselwhite Mine, Ontario, Canada – 2023 Geological Model: East Limb, T-Antiform and Red Wing Areas Report.
Newmont (2021, February 9). Musselwhite Mine, Ontario, Canada – 2020 Geological Model: West Limb (WEL) Area Report.
Bisson, G. (2018, November 7). Property Risk Evaluation Report: Goldcorp Inc. - Musselwhite Mine.
Dugalic, M.M. (2018, September 25-27). Machinery Breakdown Risk Survey: Marsh Risk Consulting Corporate.
Hawcroft, (2022, June). Newmont Corporation Musselwhite Mine Industrial Special Risk Survey and Processing Operation Final Report.
Samuel Engineering (2018, December 21). Goldcorp Musselwhite Debottlenecking Study, SE Project No. 18205-01. Submitted to Goldcorp Inc.
| 27.5 | Project Infrastructure |
Ecometrix (2023, November 24). Source Model for the Musselwhite Mine Tailings Storage Facility.
Hawcroft (2022, June). Industrial Special Risk Survey – Mine, Surface and Processing Operation.
ITRB (2024, August 6). Musselwhite Independent Tailings Review Board, Summary Report of ITRB Review #6 – (June 25 – 27, 2024)
ITRB (2023, November 14). Musselwhite Independent Tailings Review Board, Summary Report of ITRB Review – September 2023 (ITRB Report 5)
Knight Piesold (2021, June 10). 2020 TSF Dam Safety Review.
Newmont (2021, July 16). Musselwhite Mine Dewatering system overview.
Newmont (2023, June 28). Musselwhite Village Upgrade Project, Project Execution Plan including Business Readiness Plan, Supplemental Stage 4 PEP.
Newmont (2023, July 10). Musselwhite Tailings Storage Facility Level 2 & 3 Risk Assessment Newmont, September 2024, Mine Rock Management Plan.
Piteau Associates (2023). Musselwhite Mine 2023 Biennial Groundwater Monitoring Report.
| | December 2024 |
| | TECHNICAL REPORT –
MUSSELWHITE MINE, ONTARIO, CANADA
Document # C8630-0000-PM-RPT-001 – Rev. 0
/ Page 394 |
WSP Canada Inc (2024, 2023, March 13). Dam Safety Inspection – Musselwhite Mine Tailings Storage Facility.
WSP Canada Inc (2023, March 23). Tailings Storage Facility Design Basis Report.
| 27.6 | Environmental Studies, Permitting and Social or Community Impact |
Ecometrix (2023, November 24). Source Model for the Musselwhite Mine. Tailings Storage Facility.
ITRB (2024, August 2). Musselwhite Independent Tailings Review Board – Report 6.
Lorax (2023, May 11). Performance Assessment for Musselwhite Mine Treatment Wetland.
Minnow (2022, December 22). Musselwhite Mine Phase 6 ECC Response Letter.
Minnow (2024, June). Musselwhite Mine 2022 to 2023. Surface Water Biennial Monitoring Report.
Newmont (2024a, October 1). Mine Rock Management Plan.
Newmont (2024b). Musselwhite Stakeholder Engagement Plan 2024.
Newmont (2024c, August). Management Presentation.
Newmont (2024d, October). 2024 Closure Plan Amendment, Goldcorp Canada Limited, Musselwhite Mine.
Newmont (2024e). 2023-climate-performance-update.
Piteau Associates (2021, October). Musselwhite Mine 2021 Groundwater Closure Design Update.
Piteau Associates (2023, June). Musselwhite Mine. 2023. Biennial Groundwater Monitoring Report.
SNC-Lavalin (2018, November). Technical Report – Closure Plan. Musselwhite Mine, Thunder Bay, Ontario.
WSP Canada Inc. (2024, March). Emission Summary and Dispersion Modelling Report. Musselwhite Mine.
| | December 2024 |
| | TECHNICAL REPORT –
MUSSELWHITE MINE, ONTARIO, CANADA
Document # C8630-0000-PM-RPT-001 – Rev. 0
/ Page 395 |
| Abbreviation | Description |
| μm | Microns, Micrometre |
| μm/m3 | Micron per Cubic Metre |
| ' or ft | Feet |
| " or in | Inch |
| $ | Dollar Sign |
| $/oz | Dollar per Ounce |
| $/t | Dollar per Metric Tonne |
| % | Percent |
| ~ | Approximately Equal to |
| < | Inferior to |
| > | Superior to |
| ° | Degree |
| °C | Degree Celsius |
| ºF | Degree Fahrenheit |
| 2D | Two-Dimentional |
| 3D | Three-Dimensional |
| 3R | Reserve and Resource Review |
| |
| AA | Atomic Absorption |
| ACB | Air Contaminants Benchmarks |
| Actlabs | Activation Laboratories |
| Ag | Silver |
| AGG | Airborne gravity Gradiometry |
| Ai | Bond Abrasion Index |
| AISC | All-in Sustaining Costs |
| Al | Aluminum |
| Amp | Amphibole |
| AP | Acid Potential |
| ARD | Acid Rock Drainage |
| As | Silver |
| ASTM | ASTM Standards |
| Au | Gold |
| |
| | December 2024 |
| | TECHNICAL REPORT –
MUSSELWHITE MINE, ONTARIO, CANADA
Document # C8630-0000-PM-RPT-001 – Rev. 0
/ Page 396 |
| Abbreviation | Description |
| Ba | Barium |
| BBC | Big Boyd Crusher |
| Be | Beryllium |
| BEV | Battery Electric Vehicle |
| BIF | Banded Iron Formation |
| BML | Base Metallurgical Laboratory |
| Bt | Biotite |
| Bwi | Bond Ball Mill Work Index |
| |
| C | Carbon |
| ca. | Circa |
| CAD or CA$ | Canadian Dollar |
| CA$/t | Canadian Dollar per Tonne |
| Cal | Calcite |
| CAl | Organic Carbon |
| Capex | Capital Cost Estimate |
| CCA | Capital Cost Allowances |
| CCTV | Closed-Circuit Television |
| Cd | Cadmium |
| CDE | Canadian Development Expense |
| CDF | Cumulative Distribution Function |
| CEE | Canadian Exploration Expense |
| CFM | Cubic Feet per Minute |
| CIL | Carbon-in-Leach |
| CIM | Canadian Institute of Mining, Metallurgy and Petroleum |
| CIP | Carbon-in-Pulp |
| cm | Centimetre |
| CMS | Cavity Monitored Survey |
| Co | Cobalt |
| COC | Constituents of Concern |
| CofA | Certificate of Approval |
| CoG | Cut-off Grade |
| CoPC | Contaminants of Potential Concern |
| Cr | Chromium |
| | December 2024 |
| | TECHNICAL REPORT –
MUSSELWHITE MINE, ONTARIO, CANADA
Document # C8630-0000-PM-RPT-001 – Rev. 0
/ Page 397 |
| Abbreviation | Description |
| CRF | Consolidated Rockfill |
| CRF | Cemented Rockfill |
| CRM | Certified Reference Material |
| Cu | Copper |
| CV | Coefficient of Variation |
| |
| DCF | Discounted Cash Flow |
| DDCRM | Double-Deck Continuous Ring Mill |
| DDH | Diamond Drill Hole |
| DEM | Digital Elevation Model |
| DHSS | Drill Hole Spacing |
| Dol | Dolomite |
| DRA | DRA America Inc. |
| DSO | Deswik Stope Optimizer |
| |
| EA | Environmental Assessment |
| ECA | Environmental Compliance Approval |
| ECC | Environment and Climate Change |
| EEM | Environmental Effects Monitoring |
| EIS | Environmental Impact Statement |
| EoR | Engineer of Record |
| |
| FA | Fire Assay |
| FAA | Fire Assay with AA Finish |
| FAR | Fresh Air Raise |
| Fe | Iron |
| FIFO | Fly-In Fly-Out |
| FIFT | Felsic ITF |
| FO | Future Ores |
| FOG | Falls of Ground |
| ft | Foot |
| |
| g | Gram |
| G&A | General and Administration |
| | December 2024 |
| | TECHNICAL REPORT –
MUSSELWHITE MINE, ONTARIO, CANADA
Document # C8630-0000-PM-RPT-001 – Rev. 0
/ Page 398 |
| Abbreviation | Description |
| g/L | Gram per Litre |
| g/t | Gram per Tonne |
| GCMP | Ground Control Management Plan |
| GED | Global Exploration Database |
| GRC | Geomechanics Research Centre |
| GRG | Gravity Recoverable Gold |
| Grt | Garnet |
| GSE | Ground Support Evaluation |
| |
| ha | Hectare |
| Hazen | Hazen Research, Inc. |
| HCl | Hydrochloric Acid |
| HDPE | High-Density Polyethylene |
| HIT | Harness Index Test |
| hp | horsepower |
| HQ | |
| HWITF | Hanging Wall ITF |
| |
| IC | Indigenous Communities |
| ID | Identification |
| IDW | Inverse Distance Weighting |
| IFRS | International Financial Reporting Standards |
| in | Inch |
| IROC | Integrated Remote Operations Centre |
| isw | Industrial Sewage Works |
| IT/OT | Input/Output |
| Itasca | Itasca Consultant Canada Inc. |
| ITF | Intraformational |
| ITRB | Independent Tailings Review Board |
| |
| K | Potassium |
| kg/h | Kilogram per Hour |
| kg/t | Kilogram per Tonne |
| kJ | Kilojoule |
| | December 2024 |
| | TECHNICAL REPORT –
MUSSELWHITE MINE, ONTARIO, CANADA
Document # C8630-0000-PM-RPT-001 – Rev. 0
/ Page 399 |
| Abbreviation | Description |
| km | Kilometre |
| km/h | Kilometre per Hour |
| koz | Kilo Ounce |
| koz/y | Kilo Ounce per Year |
| kPa | Kilopascal |
| kt | Kilotonne |
| ktpa | Kilotonne per annum |
| kV | Kilovolt |
| kW | Kilowatt |
| kWh/t | Kilowatthour per Tonne |
| |
| L/s | Litre per Second |
| L | Litre |
| lb | Pound |
| LHD | Load Haul Dump |
| LHS | Longhole Stoping |
| LIMS | Laboratory Information Management System |
| LNIF | Lynx North ITF |
| LNIF-X1 | Lynx North ITF X1 |
| LNX | Lynx |
| LNXN | Lynx North |
| LoM | Life-of-Mine |
| LUP | Land Use Permit |
| LVA | Locally Varying Anisotropy |
| LYNX | Lynx |
| |
| m | Metre |
| m/km | Metre per Kilometre |
| m³ | Cubic Metre |
| m³/hr | Cubic Metre per Hour |
| m³/s | Cubic Metre per Second |
| m/y | Metre per Year |
| Ma | Million Years |
| Mag | Magnetite |
| | December 2024 |
| | TECHNICAL REPORT –
MUSSELWHITE MINE, ONTARIO, CANADA
Document # C8630-0000-PM-RPT-001 – Rev. 0
/ Page 400 |
| Abbreviation | Description |
| masl | Metre Above Sea Level |
| MDMER | Metal and Diamond Mining Effluent Regulations |
| MECP | Ministry of Environment, Conservation and Parks |
| Mg | Million Gram |
| mg/L | Milligram per Litre |
| MINES | Ministry of Mines |
| mL | Metre Level |
| ML | Metal Leaching |
| MLAS | Mining Lands Administration System |
| mm | Millimetre |
| Mm³ | Cubic Million Metre |
| MMI | Mobile Metal Iron |
| MML | Musselwhite Mine Laboratory |
| Mn | Manganese |
| MNRF | Ministry of Natural Resources and Forestry |
| Moz | Million Ounce |
| MPa | Megapascal |
| MRE | Mineral Resources Estimate |
| MRMR | Mineral Resources to Mineral Reserves |
| MSO | Mineable Shape Optimizer |
| Mt | Million Tonne |
| Mtpa | Million Tonne per Annum |
| MW | Musselwhite |
| |
| N | North |
| N/A | Not Applicable |
| Na | Sodium |
| NaCN | Sodium Cyanide |
| NAG | Non-Acid Generating |
| NaOH | Sodium Hydroxide |
| NCGB | North Caribou Greenstone Belt |
| Ni | Nickel |
| NI 43-101 | National Instrument 43-101 |
| NIF | Norther Iron Formation |
| | December 2024 |
| | TECHNICAL REPORT –
MUSSELWHITE MINE, ONTARIO, CANADA
Document # C8630-0000-PM-RPT-001 – Rev. 0
/ Page 401 |
| Abbreviation | Description |
| NMS | Newmont Metallurgical Services |
| NN | Nearest Neighbour |
| No or # | Number |
| Non-GAAP | Non-Generally Accepted Accounting Principles |
| NOX | Oxides of Nitrogen |
| NP | Neutralization Potential |
| NPI | Net Profit Interest |
| NPV | Net Present Value |
| NSR | Net Smelter Return |
| NTS | National Topographic System |
| |
| ODM | Ontario Department of Mines |
| OGS | Ontario Geological Survey |
| OK | Ordinary Kriging |
| ON | Ontario |
| Opex | Operating Cost Estimate |
| Orla | Orla Mining Ltd. |
| oz | Ounce |
| oz/T | Ounce per Ton |
| |
| P₈₀ | Passing 80% |
| PAG | Potentially Acid Generating |
| Pb | Lead |
| Pd | Palladium |
| PG | PG Zone 7.3.4 |
| Pl | Plagioclase |
| Po | Pyrrhotite |
| POI | Point of Impingement |
| ppm | Parts per Million |
| PQD | PQ Deep |
| psi | Pound per Square Inch |
| Pt | Platinum |
| PTTW | Permit to Take Water |
| | |
| Q1, Q2, Q3, Q4 | First Quarter, Second Quarter, Third Quarter, Fourth Quarter |
| | December 2024 |
| | TECHNICAL REPORT –
MUSSELWHITE MINE, ONTARIO, CANADA
Document # C8630-0000-PM-RPT-001 – Rev. 0
/ Page 402 |
| Abbreviation | Description |
| QA/QC | Quality Assurance / Quality Control |
| QP | Qualified Person |
| Qz | Quartz |
| |
| RDW | Redwings |
| RFA | Request for Analysis |
| RMR | Rock Mass Rating |
| ROM | Run of Mine |
| RQD | Rock- Quality Designation |
| RSD | Rotary Splitter Divider |
| RTFP | Responsible Tailings Facility Person |
| Rwi | Bond Rod Mill Work Index |
| |
| S | Sulfur |
| S²⁻ | Sulfide Ion |
| SARA | Species at Risk Act |
| Sb | Antinomy |
| SBC | Small Boyd Crusher |
| SCP | Seepage Collection Pond |
| SDCRM | Single-Deck Continuous Ring Mill |
| Se | Selenium |
| SG | Specific Gravity |
| SI | International System of Units |
| SIF | Southern Iron Formation |
| SiO2 | Silica |
| SLR | SLR Consulting (Canada) Ltd. |
| SMC | Semi-Autogenous Grinding Characterization |
| SO2 | Sulfur Dioxide |
| SOP | Standard Operating Procedure |
| Sr | Strontium |
| SRMP | Seismic Risk Management Plan |
| STD | Standard |
| STOL | Short Take-off and Landing |
| SWBMR | Surface Water Biennial Monitoring Report |
| | December 2024 |
| | TECHNICAL REPORT –
MUSSELWHITE MINE, ONTARIO, CANADA
Document # C8630-0000-PM-RPT-001 – Rev. 0
/ Page 403 |
| Abbreviation | Description |
| |
| t | Tonne |
| T | Ton |
| t/d | Tonne per Day |
| t/h | Tonne per Hour |
| T-ANTI | T-Antiform |
| TANT | T-Antiform |
| TARP | Trigger Action Response Plan |
| Tech | Core Technician |
| Ti | Titanium |
| TLO | Truck Loadout |
| tpd | Tonne per Day |
| TSF | Tailings Storage Facility |
| |
| UCS | Unconfined Compressive Strength |
| UG | Underground |
| UITF-N | Upper ITF North |
| UITF-X1 | Upper ITF X1 |
| UITF-X2 | Upper ITF X2 |
| ULYNX | Upper Lynx |
| URF | Un-Consolidated Rockfill |
| US$ or USD | United States Dollar |
| US$ M | Million of United States Dollar |
| US$/oz | United States Dollar per Ounce |
| US$/t | United States Dollar per Tonne |
| USGPM | US Gallon per Minute |
| UV | Ultraviolet |
| UWL | Upper Warning Limit |
| |
| V | Volt |
| VDR | Virtual Data Room |
| vs. | Versus |
| VWP | Vibrating wire piezometer |
| | |
| | December 2024 |
| | TECHNICAL REPORT –
MUSSELWHITE MINE, ONTARIO, CANADA
Document # C8630-0000-PM-RPT-001 – Rev. 0
/ Page 404 |
| Abbreviation | Description |
| W | West |
| w/w% | Percent of Weight per Weight |
| WAD | Weak Acid Dissociable |
| WAT | West Anticline |
| WEL | West Limb |
| WSP | WSP Canada Inc. |
| wt.% | Weight Percent |
| WWM | weld wire mesh |
| |
| XRD | X-Ray Diffraction |
| |
| Yb | Ytterbium |
| YTD | Year-to-Date |
| |
| Zn | Zinc |
| | December 2024 |
| | TECHNICAL REPORT –
MUSSELWHITE MINE, ONTARIO, CANADA
Document # C8630-0000-PM-RPT-001 – Rev. 0
/ Page 405 |
| | December 2024 |
| |
 |
| | 555 René-Lévesque Blvd West / 6th floor / Montréal / Quebec / Canada / H2Z 1B1
T +1 514 288-5211 / E info@draglobal.com / https://www.draglobal.com/ |
CERTIFICATE OF QUALIFIED PERSON
To accompany the Report entitled “Technical Report - Musselwhite Mine, Ontario, Canada” with an effective date of November 18, 2024 (the “Technical Report”), prepared for Orla Mining Ltd. (“Orla” or the “Company”).
I, Ryan Wilson, P. Geo., do hereby certify that:
| 1. | I am Geological Mining Specialist with DRA Americas Inc., located at 555 Blvd René-Lévesque West, 6th Floor, Montreal, Quebec, Canada H2Z 1B1. |
| 2. | I am a graduate of University of Ottawa, Ottawa, Ontario, Canada in 2007 with a B.Sc. in Earth Sciences and in 2012 with an M.Sc. in Economic Geology, and a graduate of McGill University, Montreal, Quebec, Canada in 2022 with a Ph.D. in Mining Engineering. |
| 3. | I am registered as a Professional Geologist in the Province of Ontario (PGO Reg. #2511) and in the Province of Quebec (OGQ Reg. #10435). |
| 4. | I have worked and conducted research in the geological sciences and mining sector continuously since my graduation in 2007. |
| 5. | I have worked on similar projects to the Musselwhite Mine in North America, South America and Australia; my experience for the purpose of the Technical Report includes: |
| • | Over 15 years of experience in exploration, mining and metals split between industry and specialized research. Specifically, 8 years of experience focused on intrusion-related and orogenic gold deposits in Timmins gold camp, Timmins, Ontario, Canada. |
| • | Technical assistance in exploration, geology and resources for a variety of projects from greenfield exploration to active mine operations in Canada. Geostatistical assistance in project evaluation for multiple projects in Australia. Additional research and collaboration on several mine-to-plant simulation studies in Canada and Chile. |
| • | Participation in the preparation of multiple NI 43-101 Technical Reports. |
| 6 | I have read the definition of “qualified person” set out in the National Instrument 43-101 and certify that by reason of my education, affiliation with a professional association and past relevant work experience, I fulfil the requirements to be an independent qualified person for the purposes of NI 43-101. |
| |
 |
| | / Page 1 of 2 |
| 7 | I am independent of the issuer applying all the tests in section 1.5 of NI 43-101. |
| 8 | I have participated in the preparation of this Technical Report and am responsible for Sections 2 to 12, 14, 23 and 24, and portions of Sections 1, 25, 26 and 27 of the Technical Report. |
| 9. | I visited the property that is the subject of the Technical Report on November 6 and 7, 2024. |
| 10. | I have had no prior involvement with the property that is the subject of the Technical Report. |
| 11. | I have read NI 43-101 and the sections of the Technical Report for which I am responsible have been prepared in compliance with NI 43-101. |
| 12. | As at the effective date of the Technical Report, to the best of my knowledge, information and belief, the sections of the Technical Report for which I am responsible contain all scientific and technical information that is required to be disclosed to make the portions of the Technical Report for which I am responsible not misleading. |
Dated this 20th day of December 2024, Montreal, Quebec.
| “Original Signed and sealed on file” | |
| Ryan Wilson, P. Geo. | |
| Geological Mining Specialist | |
| DRA Americas Inc. | |
| |
|
| | / Page 2 of 2 |
| |
|
| | 555 René-Lévesque Blvd West / 6th floor / Montréal / Quebec / Canada / H2Z 1B1
T +1 514 288-5211 / E info@draglobal.com / https://www.draglobal.com/ |
CERTIFICATE OF QUALIFIED PERSON
To accompany the Report entitled “Technical Report - Musselwhite Mine, Ontario, Canada” with an effective date of November 18, 2024 (the “Technical Report”), prepared for Orla Mining Ltd. (“Orla” or the “Company”).
I, David Frost, FAusIMM, of Toronto, Ontario, Canada, do hereby certify that:
| 1. | I am the Vice President Process Engineering with DRA Americas Inc., located at 20 Queen St W 29th Floor, Toronto, Ontario, M5H 3R3, Canada. |
| 2. | I am a graduate of RMIT University with a Bachelor of Metallurgical Engineering in Metallurgy in 1993. |
| 3. | I am a registered Fellow Member of the Australian Institute of Mining and Metallurgy (FAusIMM) membership #110899. |
| 4. | I have worked as a Metallurgist and Process Engineer in various capacities since my graduation from university in 1993. |
| 5. | My relevant work experience includes: |
| • | More than 30 years of practical experience including 15 years in process plant operations including the operation of complex flotation circuits and more than 15 years in process plant flowsheet design; |
| • | Multiple base metal flotation flowsheet designs for projects globally inclusive of large-scale conventional copper flotation and gold recovery circuit designs; and |
| • | Participant and author of several NI 43-101 Technical Reports inclusive of copper flotation and gravity gold recovery flowsheets. |
| 6 | I have read the definition of “qualified person” set out in the NI 43-101 - Standards of Disclosure for Mineral Projects (“NI 43-101”) and certify that, by reason of my education, affiliation with a professional association, and past relevant work experience, I fulfill the requirements to be a qualified person for the purposes of NI 43 101. |
| 7 | I am independent of the issuer applying all the tests in Section 1.5 of NI 43-101. |
| 8 | I am responsible for the preparation of Sections 13, 17, and 18 except for Sections 18.4 and 18.5. I am also responsible for the associated portions of Sections 1 and 25 to 27 of the Technical Report. |
| |
|
| | / Page 1 of 2 |
| 9. | I did not visit the property that is the subject of the Technical Report. |
| 10. | I have not had prior involvement with the property that is the subject of the Technical Report. |
| 11. | I have read NI 43-101 and the sections of the Technical Report for which I am responsible have been prepared in compliance with NI 43-101. |
| 12. | As at the effective date of the Technical Report, to the best of my knowledge, information and belief, the sections of the Technical Report for which I am responsible contain all scientific and technical information that is required to be disclosed to make the portions of the Technical Report for which I am responsible not misleading. |
Dated this 20th day of December 2024, Montreal, Quebec.
| “Original Signed and sealed on file” | |
| David Frost, FAusIMM | |
| Vice President Process Engineering | |
| DRA Americas Inc. | |
| |
|
| | / Page 2 of 2 |
| |
|
| | 555 René-Lévesque Blvd West / 6th floor / Montréal / Quebec / Canada / H2Z 1B1
T +1 514 288-5211 / E info@draglobal.com / https://www.draglobal.com/ |
CERTIFICATE OF QUALIFIED PERSON
To accompany the Report entitled “Technical Report - Musselwhite Mine, Ontario, Canada” with an effective date of November 18, 2024 (the “Technical Report”), prepared for Orla Mining Ltd. (“Orla” or the “Company”).
I, Daniel M. Gagnon, P. Eng., do hereby certify that:
| 1. | I am Senior Vice President East Canada and Mining, with DRA Americas Inc., located at 555 René Lévesque West, 6th Floor, Montreal, Quebec Canada H2Z 1B1. |
| 2. | I am a graduate of École Polytechnique de Montréal, Montreal, Quebec, Canada in 1995 with a bachelor’s degree in Mining Engineering. |
| 3. | I am registered as a Professional Engineer in the Province of Quebec (Reg. #118521). |
| 4. | I have worked as a Mining Engineer for a total of 28 years continuously since my graduation. |
| 5. | I have worked on similar projects to the Musselwhite Mine in North and South America; my experience for the purpose of the Technical Report includes: |
| • | Design, scheduling, cost estimation and Mineral Reserve estimation for several open pit studies in Canada, the USA, South America, West Africa, and Morocco. |
| • | Technical assistance in mine design and scheduling for mine operations in Canada, the USA, and Morocco. |
| • | Participation and author of several NI 43-101 Technical Reports. |
| 6 | I have read the definition of “qualified person” set out in the NI 43-101 - Standards of Disclosure for Mineral Projects (“NI 43-101”) and certify that, by reason of my education, affiliation with a professional association, and past relevant work experience, I fulfill the requirements to be a qualified person for the purposes of NI 43 101. |
| 7 | I am independent of the Company applying all the tests in Section 1.5 of NI 43-101. |
| |
|
| | / Page 1 of 2 |
| 8 | I have participated in the preparation of this Technical Report and am responsible for Sections 19 and 22, and portions of Sections 1, 25, 26, and 27 of the Technical Report. |
| 9. | I did not visit the property that is the subject of the Technical Report |
| 10. | I have had no prior involvement with the property that is the subject of the Technical Report. |
| 11. | I have read NI 43-101 and the sections of the Technical Report for which I am responsible have been prepared in compliance with NI 43-101. |
| 12. | As at the effective date of the Technical Report, to the best of my knowledge, information and belief, the sections of the Technical Report for which I am responsible contain all scientific and technical information that is required to be disclosed to make the portions of the Technical Report for which I am responsible not misleading. |
Dated this 20th day of December 2024, Montreal, Quebec.
| “Original Signed and sealed on file” | |
| Daniel M. Gagnon, P. Eng. | |
| Senior Vice President East Canada and Mining | |
| DRA Americas Inc. | |
| |
|
| | / Page 2 of 2 |
CERTIFICATE OF QUALIFIED PERSON
To accompany the Report entitled “Technical Report - Musselwhite Mine, Ontario, Canada” with an effective date of November 18, 2024 (the “Technical Report”), prepared for Orla Mining Ltd. (“Orla” or the “Company”).
I, James (Jim) Theriault, of Markham, Ontario, do hereby certify:
| 1. | I am a Managing Principal and Technical Director of Mining Environment with SLR Consulting (Canada) Ltd., located at 300 Town Centre Blvd., Suite 200, Markham, Ontario. |
| 2. | I am a graduate of Queen’s University in Kingston, Ontario with a B.Sc.Eng. in Geological Engineering (1993) and a M.Sc.Eng., in Civil/Environmental Engineering (1996). |
| 3. | I am a member in good standing with the Professional Engineers of Ontario and registered as a Professional Engineer, license number 90541665. |
| 4. | My relevant experience includes 28 years of consulting on mining and environmental remediation projects. I have worked on similar projects to the Musselwhite Mine in Ontario; my experience for the purpose of the Technical Report includes: |
| • | Siting and design of tailings and mine waste management facilities. |
| • | Providing technical support to private sector, government and First Nations clients through all stages of mine development, operations and closure. |
| • | Involvement as technical specialist and subject matter expert in environmental assessment and public consultation for mine development and permitting. |
| • | Integration of passive and biological treatment into mine operation and mine closure strategies. |
| • | Participation and author of several NI 43-101 Technical Reports. |
| 5. | I have read the definition of “qualified person” set out in the NI 43-101 - Standards of Disclosure for Mineral Projects (“NI 43-101”) and certify that, by reason of my education, affiliation with a professional association, and past relevant work experience, I fulfill the requirements to be a qualified person for the purposes of NI 43 101. |
| 6 | I am independent of the issuer applying to all the tests in Section 1.5 of NI 43-101. |
| 7 | I am responsible for the preparation of Sections 18.4 to 18.5 and 20. I am also responsible for the associated portions of 1 and 25 to 27 of the Technical Report. |
| 8 | I have not visited the property in connection with this Technical Report. |
| 9. | I have had prior involvement with the property that is the subject of the Technical Report, including: |
| • | Construction supervision of the initial tailings impoundment dams (1996) |
| • | Design and construction supervision of the Stage 2 Dam Raises (1998) |
| • | Support of various environmental studies during early mine operation including evaluating/improving the treatment wetland hydrology, and evaluating options for transitioning the TSF from water cover to thickened tailings stack (early 2000s) |
| 10. | I have read NI 43-101 and the sections of the Technical Report for which I am responsible have been prepared in compliance with NI 43-101. |
| 11. | As at the effective date of the Technical Report, to the best of my knowledge, information and belief, the sections of the Technical Report for which I am responsible contain all scientific and technical information that is required to be disclosed to make the portions of the Technical Report for which I am responsible not misleading. |
Dated this 20th day of December 2024, Montreal, Quebec.
| “Original Signed and Sealed on file” | |
| James (Jim) Theriault, P. Eng. | |
| Managing Principal | |
| SLR Consulting (Canada) Ltd. | |
CERTIFICATE OF QUALIFIED PERSON PAUL GAUTHIER
I, Paul Gauthier, state that:
| (a) | I am a Senior Principal Mining Engineer at: |
| | WSP Canada Inc.
1125 - 1135, boul. Lebourgneuf
Quebec City, Quebec, G2K 0J2 |
| (b) | This certificate applies to the technical report titled “Technical Report - Musselwhite Mine, Ontario, Canada” with an effective date of November 18, 2024 (the “Technical Report”). |
| (c) | I am a “qualified person” for the purposes of National Instrument 43-101 (“NI 43-101”). My qualifications as a qualified person are as follows. I am a graduate of Université Laval with Bac, es Sciences Appliquées (Mining Engineer) in 1977, I am a member in good standing of the Professional Engineers of Ontario (PEO #100080984) and Professional of Ordre des Ingénieurs du Quebec (OIQ#3 1178). My relevant experience after graduation, for the purpose of the Technical Report, includes over 45 years of experience in mining engineering in the areas of mineral reserve evaluation for underground and open pit, mine design and scheduling for projects nationally and internationally in a variety of commodities including 15 years of direct working experience in gold mining operations located in Quebec and USA, 15 years of experience in base metals operation in Quebec and Ontario, 10 years of experience in diamond operation in Ontario and Quebec, and 5 years of consulting experience with a strong focus on gold and base metals related projects. |
| (d) | I did complete a personal inspection of the property described in the Technical Report on September 4th and 5th, 2024. |
| (e) | I am responsible for Items 15 and 16 (except for 16.2 to 16.4) and portions of 1, 25, and 26 of the Technical Report. |
| (f) | I am independent of the issuer as described in section 1.5 of NI 43-101. |
| (g) | I have no involvement with the property that is the subject of the Technical Report |
| (h) | I have read NI 43-101 and the parts of the Technical Report for which I am responsible have been prepared in compliance with NI 43-101; and |
| (i) | At the effective date of the Technical Report, to the best of my knowledge, information, and belief, the parts of the Technical Report for which I am responsible, contain(s) all scientific and technical information that is required to be disclosed to make the Technical Report not misleading. |
Dated at Quebec City, Quebec this December 20th, 2024.
| Signed by Paul Gauthier | |
| | |
| Paul Gauthier; P.Eng. | |
CERTIFICATE OF QUALIFIED PERSON PAUL PALMER
I, Paul Palmer, state that:
| (a) | I am a Principal Geological Engineer at: |
| | WSP Canada Inc.
36 Pippy Place, Suite 100
St. John’s, Newfoundland, A1B 3X4 |
| (b) | This certificate applies to the technical report titled “Technical Report - Musselwhite Mine, Ontario, Canada” with an effective date of November 18, 2024 (the “Technical Report”). |
| (c) | I am a “qualified person” for the purposes of National Instrument 43-101 (“NI 43-101”). My qualifications as a qualified person are as follows. I am a graduate of University of Toronto with a B.ASc. in Geological Engineering from 1994, I am a member in good standing of the Professional Engineers of Ontario (#100050189) and Professional Engineers and Geoscientists Newfoundland and Labrador (#11387). My relevant experience after graduation, for the purpose of the Technical Report, includes over 29 years of experience in geological engineering in the areas of mine geology, mineral resource evaluation and underground geotechnical engineering of mineral projects nationally and internationally in a variety of commodities including 2.5 years of direct working experience in gold mining operations located in northern Manitoba, 2.5 years of experience in base metals operation in Northern Manitoba, and 24 years of consulting experience with a strong focus on gold and base metals related projects. |
| (d) | I did not complete a personal inspection of the property described in the Technical Report. |
| (e) | I am responsible for Items 16.2 to 16.4 and portions of 1, 25 and 26 of the Technical Report. |
| (f) | I am independent of the issuer as described in section 1.5 of NI 43-101. |
| (g) | I have had minor involvement with the property that is the subject of the Technical Report by completing internal underground geotechnical audits for Newmont at Musslewhite Mine in 2019. |
| (h) | I have read NI 43-101 and the parts of the Technical Report for which I am responsible have been prepared in compliance with NI 43-101; and |
| (i) | At the effective date of the Technical Report, to the best of my knowledge, information, and belief, the parts of the Technical Report for which I am responsible, contain(s) all scientific and technical information that is required to be disclosed to make the Technical Report not misleading. |
Dated at St. John’s, Newfoundland this December 20th, 2024.
| Signed by Paul Palmer | |
| | |
| Paul Palmer; P.Eng. | |
CERTIFICATE OF QUALIFIED PERSON WILLIAM RICHARD MCBRIDE
I, William Richard McBride, P. Eng., state that:
| (a) | I am a Senior Principal Mining Engineer at: |
| | WSP Canada Inc.
33 MacKenzie Street, Suite 100
Sudbury, Ontario, P3C 4Y1 |
| (b) | This certificate applies to the technical report titled “Technical Report - Musselwhite Mine, Ontario, Canada” with an effective date of November 18, 2024 (the “Technical Report”). |
| (c) | I am a “qualified person” for the purposes of National Instrument 43-101 (“NI 43-101”). My qualifications as a qualified person are as follows: I am a graduate of Queen’s University (Kingston) with a Bachelor of Science degree in Mining Engineering granted in 1973. I am a Registered Member of the Professional Engineers of Ontario (PEO), License Number29888013. My relevant experience after graduation for the purpose of the Technical Report includes over 50 years of working as a mining engineer and consultant working on projects involving multiple commodities such as copper, gold, and nickel and projects involving public disclosure reporting. |
| (d) | I did not complete a personal inspection of the property described in the Technical Report. |
| (e) | I am responsible for Item(s) 1.14 and 21 of the Technical Report. |
| (f) | I am independent of the issuer as described in section 1.5 of NI 43-101. |
| (g) | I have not had any prior involvement with the property that is the subject of the Technical Report. |
| (h) | I have read NI 43-101 and the parts of the Technical Report for which I am responsible have been prepared in compliance with NI 43-101; and |
| (i) | At the effective date of the Technical Report, to the best of my knowledge, information, and belief, the parts of the Technical Report for which I am responsible, contain(s) all scientific and technical information that is required to be disclosed to make the Technical Report not misleading. |
Dated at Sudbury, ON, Canada this 20th day of December 2024.
| Signed by William Richard McBride | |
| | |
William Richard McBride, P. Eng.
Registered Member PEO (# 29888013) | |
| | TECHNICAL REPORT –
MUSSELWHITE MINE, ONTARIO, CANADA
Document # C8630-0000-PM-RPT-001 – Rev. 0
|
Appendix 1 –
Musselwhite Mining and Surface Lease
| | December 2024 |
| | TECHNICAL REPORT –
MUSSELWHITE MINE, ONTARIO, CANADA
Document # C8630-0000-PM-RPT-001 – Rev. 0
|
Musselwhite Mining and Surface Lease
| Lease Group Code | Lease Names | Tenure Type | Acquisition | Expiry Date | Official Area Value (ha) |
| MM/DD/YYYY | MM/DD/YYYY |
| 42034-0944_OML | 529888, 529889, 529890, 529891, 529892, 529893,
529910, 529911, 529912, 529913, 529914, 529915 | ON: Mining
Lease (MR) | 7/5/2006 | 5/31/2033 | 205.71 |
| 42034-0944_OSL | 529888, 529889, 529890, 529891, 529892, 529893,
529910, 529911, 529912, 529913, 529914, 529915 | ON: Surface
Lease | 7/5/2006 | 6/1/2033 | 205.71 |
| 42034-0945_OML | 529487, 529493, 529494, 529495, 529496, 529828,
529829, 529830, 529831, 529832, 529833, 529834, ... | ON: Mining
Lease (MR) | 7/5/2006 | 6/1/2033 | 225.74 |
| 42034-0945_OSL | 529487, 529493, 529494, 529495, 529496, 529828,
529829, 529830, 529831, 529832, 529833, 529834, ... | ON: Surface
Lease | 7/5/2006 | 6/1/2033 | 225.74 |
| 42034-0946_OML | 529843, 529848, 529849, 529850, 529851, 529852,
529853, 529857, 529858, 529866, 529867, 529868, ... | ON: Mining
Lease (MR) | 7/5/2006 | 6/1/2033 | 619.86 |
| 42034-0946_OSL | 529843, 529848, 529849, 529850, 529851, 529852,
529853, 529857, 529858, 529866, 529867, 529868, ... | ON: Surface
Lease | 7/5/2006 | 6/1/2033 | 619.86 |
| 42034-0947_OML | 529519, 529520, 529523, 529524, 529531, 529532,
529535, 529536, 529543, 529544, 529549, 529550, ... | ON: Mining
Lease (MR) | 7/5/2006 | 2/28/2033 | 334.2 |
| 42034-0947_OSL | 529519, 529520, 529523, 529524, 529531, 529532,
529535, 529536, 529543, 529544, 529549, 529550, ... | ON: Surface
Lease | 7/5/2006 | 2/28/2033 | 336.3218 |
| 42034-0948_OML | 508458, 508460, 529497, 529500, 529826, 529827,
529837, 529838, 529839, 529840, 529844, 529845, ... | ON: Mining
Lease (MR) | 7/5/2006 | 4/30/2029 | 320.93 |
| 42034-0948_OSL | 529826, 529827, 529837, 529838, 529839, 529840,
529844, 529845, 529846, 529847, 529854, 529855, ... | ON: Surface
Lease | 7/5/2006 | 4/30/2029 | 320.93 |
| 42034-0949_OML | 486396, 529502, 529503, 529504, 529505, 529726,
529727, 529732, 529733, 529734, 529735, 529740, ... | ON: Mining
Lease (MR) | 1/27/1994 | 6/1/2025 | 522.89 |
| 42034-0949_OSL | 529503, 529504, 529732, 529734, 529735, 529740,
529745, 529750, 529756, 529757, 550135, 550136, ... | ON: Surface
Lease | 1/27/1994 | 6/1/2025 | 522.89 |
| 42034-0950_OML | 369744, 369747, 369750, 369753, 369754, 369755,
369756, 369757, 369758, 369763, 369764, 369765, ... | ON: Mining
Lease (MR) | 7/5/2006 | 6/1/2025 | 610.214 |
| | December 2024 |
| | TECHNICAL REPORT –
MUSSELWHITE MINE, ONTARIO, CANADA
Document # C8630-0000-PM-RPT-001 – Rev. 0
|
| Lease Group Code | Lease Names | Tenure Type | Acquisition | Expiry Date | Official Area Value (ha) |
| MM/DD/YYYY | MM/DD/YYYY |
| 42034-0950_OSL | 369744, 369747, 369750, 369753, 369755, 369756,
369757, 369758, 369764, 369765, 370868, 370869, ... | ON: Surface
Lease | 7/5/2006 | 6/1/2025 | 610.214 |
| 42034-0951_OML | 369745, 369746, 369748, 369749, 369751, 369752,
369766, 369767, 370874, 370875, 370876, 370877, ... | ON: Mining
Lease (MR) | 7/5/2006 | 6/1/2025 | 465.17 |
| 42034-0951_OSL | 369745, 369746, 369748, 369749, 369751, 369752,
369766, 369767, 370874, 370875, 370876, 370877, ... | ON: Surface
Lease | 7/5/2006 | 6/1/2025 | 465.17 |
| 42034-0952_OML | 529762, 529763, 529764, 529765, 529768, 529769,
529770, 529771, 529776, 529777, 529778, 529779, ... | ON: Mining
Lease (MR) | 7/5/2006 | 6/1/2025 | 522.25 |
| 42034-0952_OSL | 529762, 529763, 529783, 529784, 529786, 529787,
529788, 529790, 529795, 529796, 529797, 529798, ... | ON: Surface
Lease | 7/5/2006 | 6/1/2025 | 522.25 |
| 42034-0953_OML | 369768, 369769, 369770, 370866, 449146, 449147,
449148, 449149, 449155, 449156, 449157, 449158, ... | ON: Mining
Lease (MR) | 7/5/2006 | 6/1/2025 | 575.261 |
| 42034-0953_OSL | 502219, 502220, 502222, 502223, 529436, 529437,
529766, 529799, 529800, 529801, 529802 | ON: Surface
Lease | 7/5/2006 | 6/1/2025 | 585.79 |
| 42034-0954_OML | 369771, 369772, 369773, 449144, 449145, 449150,
449151, 449152, 449153, 449154, 508456, 508457 | ON: Mining
Lease (MR) | 1/27/1994 | 6/1/2025 | 526.52 |
| 42034-0954_OSL | 369771, 369772, 369773, 529430, 529431, 529433,
529443, 529450 | ON: Surface
Lease | 1/27/1994 | 6/1/2025 | 526.52 |
| 42034-0960_OML | 529401, 529418, 529419, 529811, 529812, 529813,
529814, 529815, 529816, 529817, 529818, 529822, ... | ON: Mining
Lease (MR) | 7/5/2006 | 6/1/2033 | 267.49 |
| 42034-0960_OSL | 529401, 529418, 529419, 529811, 529812, 529813,
529814, 529815, 529816, 529817, 529818, 529822, ... | ON: Surface
Lease | 7/5/2006 | 6/1/2033 | 267.49 |
| 42034-0961_OML | 529402, 529403, 529404, 529405, 529413, 529414,
529415, 529416, 529417, 529420, 529421, 529422, ... | ON: Mining
Lease (MR) | 7/5/2006 | 2/1/2032 | 224.99 |
| 42034-0961_OSL | 529402, 529403, 529404, 529405, 529413, 529414,
529415, 529416, 529417, 529420, 529421, 529422, ... | ON: Surface
Lease | 7/5/2006 | 2/1/2032 | 224.33 |
| | December 2024 |
| | TECHNICAL REPORT –
MUSSELWHITE MINE, ONTARIO, CANADA
Document # C8630-0000-PM-RPT-001 – Rev. 0
|
Appendix 2 –
Individual Active Mining Leases
| | December 2024 |
| | TECHNICAL REPORT –
MUSSELWHITE MINE, ONTARIO, CANADA
Document # C8630-0000-PM-RPT-001 – Rev. 0
|
Individual Active Mining Leases
| # | Lease Code | Lease
Name | Status | Grant
Date | Expiry
Date | Area
(ha) |
| 1 | LEA-107504_OML | 369771 | Taken to Lease | 9/9/1980 | 5/31/2025 | 22.115 |
| 2 | LEA-107505_OML | 369772 | Taken to Lease | 9/9/1980 | 5/31/2025 | 15.001 |
| 3 | LEA-107506_OML | 529806 | Taken to Lease | 9/11/1980 | 5/31/2025 | 27.957 |
| 4 | LEA-107507_OML | 449145 | Taken to Lease | 9/9/1980 | 5/31/2025 | 13.841 |
| 5 | LEA-107508_OML | 449154 | Taken to Lease | 9/9/1980 | 5/31/2025 | 17.398 |
| 6 | LEA-107510_OML | 529475 | Taken to Lease | 9/11/1980 | 5/31/2025 | 7.745 |
| 7 | LEA-107511_OML | 529460 | Taken to Lease | 9/11/1980 | 5/31/2025 | 19.032 |
| 8 | LEA-107512_OML | 529453 | Taken to Lease | 9/11/1980 | 5/31/2025 | 12.933 |
| 9 | LEA-107513_OML | 529776 | Taken to Lease | 9/11/1980 | 5/31/2025 | 17.959 |
| 10 | LEA-107514_OML | 529783 | Taken to Lease | 9/11/1980 | 5/31/2025 | 16.278 |
| 11 | LEA-107515_OML | 529790 | Taken to Lease | 9/11/1980 | 5/31/2025 | 28.597 |
| 12 | LEA-107516_OML | 529795 | Taken to Lease | 9/11/1980 | 5/31/2025 | 15.139 |
| 13 | LEA-107517_OML | 529440 | Taken to Lease | 9/11/1980 | 5/31/2025 | 17.992 |
| 14 | LEA-107518_OML | 529433 | Taken to Lease | 9/11/1980 | 5/31/2025 | 11.449 |
| 15 | LEA-107519_OML | 529432 | Taken to Lease | 9/11/1980 | 5/31/2025 | 17.638 |
| 16 | LEA-107520_OML | 529441 | Taken to Lease | 9/11/1980 | 5/31/2025 | 17.673 |
| 17 | LEA-107521_OML | 529452 | Taken to Lease | 9/11/1980 | 5/31/2025 | 12.853 |
| 18 | LEA-107522_OML | 529461 | Taken to Lease | 9/11/1980 | 5/31/2025 | 18.966 |
| 19 | LEA-107523_OML | 529474 | Taken to Lease | 9/11/1980 | 5/31/2025 | 7.757 |
| 20 | LEA-107524_OML | 529777 | Taken to Lease | 9/11/1980 | 5/31/2025 | 18.921 |
| 21 | LEA-107525_OML | 529770 | Taken to Lease | 9/11/1980 | 5/31/2025 | 20.745 |
| 22 | LEA-107526_OML | 529763 | Taken to Lease | 9/11/1980 | 5/31/2025 | 14.362 |
| 23 | LEA-107527_OML | 529762 | Taken to Lease | 9/11/1980 | 5/31/2025 | 19.896 |
| 24 | LEA-107528_OML | 529771 | Taken to Lease | 9/11/1980 | 5/31/2025 | 20.101 |
| 25 | LEA-107529_OML | 529802 | Taken to Lease | 9/11/1980 | 5/31/2025 | 10.335 |
| 26 | LEA-107530_OML | 529799 | Taken to Lease | 9/11/1980 | 5/31/2025 | 4.320 |
| 27 | LEA-107531_OML | 502222 | Taken to Lease | 9/9/1980 | 5/31/2025 | 17.446 |
| 28 | LEA-107532_OML | 502223 | Taken to Lease | 9/9/1980 | 5/31/2025 | 13.954 |
| 29 | LEA-107533_OML | 529766 | Taken to Lease | 9/11/1980 | 5/31/2025 | 17.073 |
| 30 | LEA-107534_OML | 502220 | Taken to Lease | 9/9/1980 | 5/31/2025 | 20.226 |
| 31 | LEA-107535_OML | 502219 | Taken to Lease | 9/9/1980 | 5/31/2025 | 20.155 |
| 32 | LEA-107536_OML | 529437 | Taken to Lease | 9/11/1980 | 5/31/2025 | 12.647 |
| 33 | LEA-107537_OML | 529436 | Taken to Lease | 9/11/1980 | 5/31/2025 | 10.560 |
| 34 | LEA-107538_OML | 529801 | Taken to Lease | 9/11/1980 | 5/31/2025 | 6.494 |
| | December 2024 |
| | TECHNICAL REPORT –
MUSSELWHITE MINE, ONTARIO, CANADA
Document # C8630-0000-PM-RPT-001 – Rev. 0
|
| # | Lease Code | Lease
Name | Status | Grant
Date | Expiry
Date | Area
(ha) |
| 35 | LEA-107539_OML | 529800 | Taken to Lease | 9/11/1980 | 5/31/2025 | 3.754 |
| 36 | LEA-107540_OML | 502224 | Taken to Lease | 9/9/1980 | 5/31/2025 | 19.617 |
| 37 | LEA-107541_OML | 529780 | Taken to Lease | 9/11/1980 | 5/31/2025 | 15.445 |
| 38 | LEA-107542_OML | 529767 | Taken to Lease | 9/11/1980 | 5/31/2025 | 19.115 |
| 39 | LEA-107543_OML | 550131 | Taken to Lease | 9/11/1980 | 5/31/2025 | 4.165 |
| 40 | LEA-107544_OML | 370866 | Taken to Lease | 9/9/1980 | 5/31/2025 | 16.572 |
| 41 | LEA-107545_OML | 449153 | Taken to Lease | 9/9/1980 | 5/31/2025 | 16.537 |
| 42 | LEA-107546_OML | 449144 | Taken to Lease | 9/9/1980 | 5/31/2025 | 16.521 |
| 43 | LEA-107547_OML | 369773 | Taken to Lease | 9/9/1980 | 5/31/2025 | 16.846 |
| 44 | LEA-107548_OML | 449150 | Taken to Lease | 9/9/1980 | 5/31/2025 | 17.005 |
| 45 | LEA-107549_OML | 449151 | Taken to Lease | 9/9/1980 | 5/31/2025 | 15.677 |
| 46 | LEA-107550_OML | 449152 | Taken to Lease | 9/9/1980 | 5/31/2025 | 18.429 |
| 47 | LEA-107551_OML | 529473 | Taken to Lease | 9/11/1980 | 5/31/2025 | 6.847 |
| 48 | LEA-107552_OML | 529462 | Taken to Lease | 9/11/1980 | 5/31/2025 | 22.260 |
| 49 | LEA-107553_OML | 529451 | Taken to Lease | 9/11/1980 | 5/31/2025 | 14.487 |
| 50 | LEA-107554_OML | 529442 | Taken to Lease | 9/11/1980 | 5/31/2025 | 17.116 |
| 51 | LEA-107555_OML | 369768 | Taken to Lease | 9/9/1980 | 5/31/2025 | 7.691 |
| 52 | LEA-107556_OML | 449149 | Taken to Lease | 9/9/1980 | 5/31/2025 | 14.104 |
| 53 | LEA-107557_OML | 449158 | Taken to Lease | 9/9/1980 | 5/31/2025 | 17.345 |
| 54 | LEA-107558_OML | 502221 | Taken to Lease | 9/9/1980 | 5/31/2025 | 22.807 |
| 55 | LEA-107559_OML | 529456 | Taken to Lease | 9/11/1980 | 5/31/2025 | 4.564 |
| 56 | LEA-107560_OML | 529457 | Taken to Lease | 9/11/1980 | 5/31/2025 | 9.351 |
| 57 | LEA-107561_OML | 449157 | Taken to Lease | 9/9/1980 | 5/31/2025 | 17.081 |
| 58 | LEA-107562_OML | 449148 | Taken to Lease | 9/9/1980 | 5/31/2025 | 14.061 |
| 59 | LEA-107563_OML | 369769 | Taken to Lease | 9/9/1980 | 5/31/2025 | 14.881 |
| 60 | LEA-107564_OML | 369770 | Taken to Lease | 9/9/1980 | 5/31/2025 | 24.314 |
| 61 | LEA-107565_OML | 449147 | Taken to Lease | 9/9/1980 | 5/31/2025 | 14.139 |
| 62 | LEA-107566_OML | 449156 | Taken to Lease | 9/9/1980 | 5/31/2025 | 16.685 |
| 63 | LEA-107567_OML | 529477 | Taken to Lease | 9/11/1980 | 5/31/2025 | 8.705 |
| 64 | LEA-107568_OML | 529458 | Taken to Lease | 9/11/1980 | 5/31/2025 | 18.853 |
| 65 | LEA-107569_OML | 529455 | Taken to Lease | 9/11/1980 | 5/31/2025 | 13.166 |
| 66 | LEA-107570_OML | 529438 | Taken to Lease | 9/11/1980 | 5/31/2025 | 18.470 |
| 67 | LEA-107571_OML | 529435 | Taken to Lease | 9/11/1980 | 5/31/2025 | 9.848 |
| 68 | LEA-107572_OML | 529434 | Taken to Lease | 9/11/1980 | 5/31/2025 | 18.648 |
| 69 | LEA-107573_OML | 529439 | Taken to Lease | 9/11/1980 | 5/31/2025 | 19.345 |
| 70 | LEA-107574_OML | 529454 | Taken to Lease | 9/11/1980 | 5/31/2025 | 12.261 |
| | December 2024 |
| | TECHNICAL REPORT –
MUSSELWHITE MINE, ONTARIO, CANADA
Document # C8630-0000-PM-RPT-001 – Rev. 0
|
| # | Lease Code | Lease
Name | Status | Grant
Date | Expiry
Date | Area
(ha) |
| 71 | LEA-107575_OML | 529459 | Taken to Lease | 9/11/1980 | 5/31/2025 | 18.662 |
| 72 | LEA-107576_OML | 529476 | Taken to Lease | 9/11/1980 | 5/31/2025 | 8.224 |
| 73 | LEA-107577_OML | 449155 | Taken to Lease | 9/9/1980 | 5/31/2025 | 17.341 |
| 74 | LEA-107578_OML | 449146 | Taken to Lease | 9/9/1980 | 5/31/2025 | 14.439 |
| 75 | LEA-107579_OML | 529431 | Taken to Lease | 9/11/1980 | 5/31/2025 | 19.009 |
| 76 | LEA-107580_OML | 529778 | Taken to Lease | 9/11/1980 | 5/31/2025 | 12.749 |
| 77 | LEA-107581_OML | 529769 | Taken to Lease | 9/11/1980 | 5/31/2025 | 16.367 |
| 78 | LEA-107582_OML | 529785 | Taken to Lease | 9/11/1980 | 5/31/2025 | 21.462 |
| 79 | LEA-107583_OML | 529788 | Taken to Lease | 9/11/1980 | 5/31/2025 | 12.240 |
| 80 | LEA-107584_OML | 529797 | Taken to Lease | 9/11/1980 | 5/31/2025 | 18.161 |
| 81 | LEA-107585_OML | 529804 | Taken to Lease | 9/11/1980 | 5/31/2025 | 27.877 |
| 82 | LEA-107586_OML | 529805 | Taken to Lease | 9/11/1980 | 5/31/2025 | 2.772 |
| 83 | LEA-107587_OML | 529796 | Taken to Lease | 9/11/1980 | 5/31/2025 | 2.881 |
| 84 | LEA-107588_OML | 529789 | Taken to Lease | 9/11/1980 | 5/31/2025 | 6.519 |
| 85 | LEA-107589_OML | 529784 | Taken to Lease | 9/11/1980 | 5/31/2025 | 11.974 |
| 86 | LEA-107590_OML | 529803 | Taken to Lease | 9/11/1980 | 5/31/2025 | 26.164 |
| 87 | LEA-107591_OML | 529798 | Taken to Lease | 9/11/1980 | 5/31/2025 | 26.959 |
| 88 | LEA-107592_OML | 529787 | Taken to Lease | 9/11/1980 | 5/31/2025 | 10.978 |
| 89 | LEA-107593_OML | 529786 | Taken to Lease | 9/11/1980 | 5/31/2025 | 23.592 |
| 90 | LEA-107594_OML | 529779 | Taken to Lease | 9/11/1980 | 5/31/2025 | 18.274 |
| 91 | LEA-107595_OML | 529768 | Taken to Lease | 9/11/1980 | 5/31/2025 | 19.664 |
| 92 | LEA-107596_OML | 529765 | Taken to Lease | 9/11/1980 | 5/31/2025 | 18.738 |
| 93 | LEA-107597_OML | 550130 | Taken to Lease | 9/11/1980 | 5/31/2025 | 15.651 |
| 94 | LEA-107598_OML | 529764 | Taken to Lease | 9/11/1980 | 5/31/2025 | 24.858 |
| 95 | LEA-107599_OML | 529430 | Taken to Lease | 9/11/1980 | 5/31/2025 | 15.083 |
| 96 | LEA-107600_OML | 529443 | Taken to Lease | 9/11/1980 | 5/31/2025 | 15.429 |
| 97 | LEA-107601_OML | 529450 | Taken to Lease | 9/11/1980 | 5/31/2025 | 15.694 |
| 98 | LEA-107602_OML | 529463 | Taken to Lease | 9/11/1980 | 5/31/2025 | 20.120 |
| 99 | LEA-107603_OML | 529472 | Taken to Lease | 9/11/1980 | 5/31/2025 | 11.142 |
| 100 | LEA-107604_OML | 529478 | Taken to Lease | 9/11/1980 | 5/31/2025 | 15.661 |
| 101 | LEA-107605_OML | 508456 | Taken to Lease | 9/9/1980 | 5/31/2025 | 16.208 |
| 102 | LEA-107606_OML | 508457 | Taken to Lease | 9/9/1980 | 5/31/2025 | 17.157 |
| 103 | LEA-107609_OML | 529885 | Taken to Lease | 9/11/1980 | 5/31/2025 | 13.227 |
| 104 | LEA-107610_OML | 529862 | Taken to Lease | 9/11/1980 | 5/31/2025 | 18.617 |
| 105 | LEA-107611_OML | 477788 | Taken to Lease | 9/9/1980 | 5/31/2025 | 19.678 |
| 106 | LEA-107612_OML | 370874 | Taken to Lease | 9/9/1980 | 5/31/2025 | 8.842 |
| | December 2024 |
| | TECHNICAL REPORT –
MUSSELWHITE MINE, ONTARIO, CANADA
Document # C8630-0000-PM-RPT-001 – Rev. 0
|
| # | Lease Code | Lease
Name | Status | Grant
Date | Expiry
Date | Area
(ha) |
| 107 | LEA-107613_OML | 369751 | Taken to Lease | 9/9/1980 | 5/31/2025 | 12.444 |
| 108 | LEA-107614_OML | 369748 | Taken to Lease | 9/9/1980 | 5/31/2025 | 15.282 |
| 109 | LEA-107615_OML | 369745 | Taken to Lease | 9/9/1980 | 5/31/2025 | 6.361 |
| 110 | LEA-107616_OML | 369766 | Taken to Lease | 9/9/1980 | 5/31/2025 | 13.064 |
| 111 | LEA-107617_OML | 369767 | Taken to Lease | 9/9/1980 | 5/31/2025 | 15.238 |
| 112 | LEA-107618_OML | 369746 | Taken to Lease | 9/9/1980 | 5/31/2025 | 10.753 |
| 113 | LEA-107619_OML | 369749 | Taken to Lease | 9/9/1980 | 5/31/2025 | 28.067 |
| 114 | LEA-107620_OML | 369752 | Taken to Lease | 9/9/1980 | 5/31/2025 | 18.419 |
| 115 | LEA-107621_OML | 529757 | Taken to Lease | 9/11/1980 | 5/31/2025 | 8.216 |
| 116 | LEA-107622_OML | 529750 | Taken to Lease | 9/11/1980 | 5/31/2025 | 3.605 |
| 117 | LEA-107623_OML | 529745 | Taken to Lease | 9/11/1980 | 5/31/2025 | 10.205 |
| 118 | LEA-107624_OML | 529740 | Taken to Lease | 9/11/1980 | 5/31/2025 | 12.700 |
| 119 | LEA-107625_OML | 529735 | Taken to Lease | 9/11/1980 | 5/31/2025 | 18.750 |
| 120 | LEA-107626_OML | 529732 | Taken to Lease | 9/11/1980 | 5/31/2025 | 19.957 |
| 121 | LEA-107627_OML | 529504 | Taken to Lease | 9/11/1980 | 5/31/2025 | 15.528 |
| 122 | LEA-107628_OML | 529503 | Taken to Lease | 9/11/1980 | 5/31/2025 | 21.370 |
| 123 | LEA-107629_OML | 529734 | Taken to Lease | 9/11/1980 | 5/31/2025 | 16.083 |
| 124 | LEA-107630_OML | 550135 | Taken to Lease | 9/11/1980 | 5/31/2025 | 26.334 |
| 125 | LEA-107631_OML | 550148 | Taken to Lease | 9/11/1980 | 5/31/2025 | 10.892 |
| 126 | LEA-107632_OML | 550149 | Taken to Lease | 9/11/1980 | 5/31/2025 | 11.212 |
| 127 | LEA-107633_OML | 550146 | Taken to Lease | 9/11/1980 | 5/31/2025 | 14.848 |
| 128 | LEA-107634_OML | 550139 | Taken to Lease | 9/11/1980 | 5/31/2025 | 33.917 |
| 129 | LEA-107635_OML | 550136 | Taken to Lease | 9/11/1980 | 5/31/2025 | 14.021 |
| 130 | LEA-107636_OML | 370875 | Taken to Lease | 9/9/1980 | 5/31/2025 | 13.843 |
| 131 | LEA-107637_OML | 477787 | Taken to Lease | 9/9/1980 | 5/31/2025 | 17.753 |
| 132 | LEA-107638_OML | 529863 | Taken to Lease | 9/11/1980 | 5/31/2025 | 14.966 |
| 133 | LEA-107639_OML | 529884 | Taken to Lease | 9/11/1980 | 5/31/2025 | 17.288 |
| 134 | LEA-107640_OML | 529883 | Taken to Lease | 9/11/1980 | 5/31/2025 | 19.509 |
| 135 | LEA-107641_OML | 529864 | Taken to Lease | 9/11/1980 | 5/31/2025 | 9.623 |
| 136 | LEA-107642_OML | 477786 | Taken to Lease | 9/9/1980 | 5/31/2025 | 20.807 |
| 137 | LEA-107643_OML | 370880 | Taken to Lease | 9/9/1980 | 5/31/2025 | 9.587 |
| 138 | LEA-107644_OML | 370879 | Taken to Lease | 9/9/1980 | 5/31/2025 | 6.345 |
| 139 | LEA-107645_OML | 370878 | Taken to Lease | 9/9/1980 | 5/31/2025 | 12.441 |
| 140 | LEA-107646_OML | 370877 | Taken to Lease | 9/9/1980 | 5/31/2025 | 20.790 |
| 141 | LEA-107647_OML | 370876 | Taken to Lease | 9/9/1980 | 5/31/2025 | 16.253 |
| 142 | LEA-107648_OML | 529756 | Taken to Lease | 9/11/1980 | 5/31/2025 | 5.613 |
| | December 2024 |
| | TECHNICAL REPORT –
MUSSELWHITE MINE, ONTARIO, CANADA
Document # C8630-0000-PM-RPT-001 – Rev. 0
|
| # | Lease Code | Lease
Name | Status | Grant
Date | Expiry
Date | Area
(ha) |
| 143 | LEA-107649_OML | 529727 | Taken to Lease | 9/11/1980 | 5/31/2025 | 7.085 |
| 144 | LEA-107650_OML | 529502 | Taken to Lease | 9/11/1980 | 5/31/2025 | 15.207 |
| 145 | LEA-107651_OML | 529505 | Taken to Lease | 9/11/1980 | 5/31/2025 | 21.892 |
| 146 | LEA-107652_OML | 529726 | Taken to Lease | 9/11/1980 | 5/31/2025 | 14.549 |
| 147 | LEA-107653_OML | 529733 | Taken to Lease | 9/11/1980 | 5/31/2025 | 26.319 |
| 148 | LEA-107654_OML | 529741 | Taken to Lease | 9/11/1980 | 5/31/2025 | 16.898 |
| 149 | LEA-107655_OML | 529744 | Taken to Lease | 9/11/1980 | 5/31/2025 | 18.789 |
| 150 | LEA-107656_OML | 529751 | Taken to Lease | 9/11/1980 | 5/31/2025 | 8.049 |
| 151 | LEA-107657_OML | 529755 | Taken to Lease | 9/11/1980 | 5/31/2025 | 13.277 |
| 152 | LEA-107658_OML | 529754 | Taken to Lease | 9/11/1980 | 5/31/2025 | 10.480 |
| 153 | LEA-107659_OML | 529752 | Taken to Lease | 9/11/1980 | 5/31/2025 | 12.961 |
| 154 | LEA-107660_OML | 529743 | Taken to Lease | 9/11/1980 | 5/31/2025 | 24.546 |
| 155 | LEA-107661_OML | 529742 | Taken to Lease | 9/11/1980 | 5/31/2025 | 4.074 |
| 156 | LEA-107662_OML | 486396 | Taken to Lease | 9/9/1980 | 5/31/2025 | 11.937 |
| 157 | LEA-107663_OML | 550138 | Taken to Lease | 9/11/1980 | 5/31/2025 | 15.832 |
| 158 | LEA-107664_OML | 550145 | Taken to Lease | 9/11/1980 | 5/31/2025 | 16.590 |
| 159 | LEA-107665_OML | 508459 | Taken to Lease | 9/9/1980 | 5/31/2025 | 15.337 |
| 160 | LEA-107666_OML | 550134 | Taken to Lease | 9/11/1980 | 5/31/2025 | 9.602 |
| 161 | LEA-107667_OML | 550133 | Taken to Lease | 9/11/1980 | 5/31/2025 | 15.055 |
| 162 | LEA-107668_OML | 550132 | Taken to Lease | 9/11/1980 | 5/31/2025 | 14.800 |
| 163 | LEA-107669_OML | 529498 | Taken to Lease | 9/11/1980 | 5/31/2025 | 5.308 |
| 164 | LEA-107670_OML | 529499 | Taken to Lease | 9/11/1980 | 5/31/2025 | 10.274 |
| 165 | LEA-107671_OML | 529841 | Taken to Lease | 9/11/1980 | 5/31/2025 | 23.038 |
| 166 | LEA-107672_OML | 529842 | Taken to Lease | 9/11/1980 | 5/31/2025 | 6.892 |
| 167 | LEA-107673_OML | 529859 | Taken to Lease | 9/11/1980 | 5/31/2025 | 16.045 |
| 168 | LEA-107674_OML | 529865 | Taken to Lease | 9/11/1980 | 5/31/2025 | 13.059 |
| 169 | LEA-107675_OML | 529882 | Taken to Lease | 9/11/1980 | 5/31/2025 | 15.704 |
| 170 | LEA-107676_OML | 436844 | Taken to Lease | 9/9/1980 | 5/31/2025 | 18.363 |
| 171 | LEA-107677_OML | 550137 | Taken to Lease | 9/11/1980 | 5/31/2025 | 23.500 |
| 172 | LEA-107678_OML | 550140 | Taken to Lease | 9/11/1980 | 5/31/2025 | 41.569 |
| 173 | LEA-107679_OML | 550147 | Taken to Lease | 9/11/1980 | 5/31/2025 | 30.545 |
| 174 | LEA-107680_OML | 550150 | Taken to Lease | 9/11/1980 | 5/31/2025 | 9.530 |
| 175 | LEA-107681_OML | 529562 | Taken to Lease | 9/11/1980 | 5/31/2025 | 6.085 |
| 176 | LEA-107682_OML | 529563 | Taken to Lease | 9/11/1980 | 5/31/2025 | 13.063 |
| 177 | LEA-107683_OML | 477792 | Taken to Lease | 9/9/1980 | 5/31/2025 | 17.634 |
| 178 | LEA-107684_OML | 370870 | Taken to Lease | 9/9/1980 | 5/31/2025 | 14.626 |
| | December 2024 |
| | TECHNICAL REPORT –
MUSSELWHITE MINE, ONTARIO, CANADA
Document # C8630-0000-PM-RPT-001 – Rev. 0
|
| # | Lease Code | Lease
Name | Status | Grant
Date | Expiry
Date | Area
(ha) |
| 179 | LEA-107685_OML | 370869 | Taken to Lease | 9/9/1980 | 5/31/2025 | 16.478 |
| 180 | LEA-107686_OML | 370868 | Taken to Lease | 9/9/1980 | 5/31/2025 | 16.451 |
| 181 | LEA-107687_OML | 369756 | Taken to Lease | 9/9/1980 | 5/31/2025 | 17.853 |
| 182 | LEA-107688_OML | 369758 | Taken to Lease | 9/9/1980 | 5/31/2025 | 17.326 |
| 183 | LEA-107689_OML | 370871 | Taken to Lease | 9/9/1980 | 5/31/2025 | 12.156 |
| 184 | LEA-107690_OML | 477791 | Taken to Lease | 9/9/1980 | 5/31/2025 | 24.583 |
| 185 | LEA-107691_OML | 529564 | Taken to Lease | 9/11/1980 | 5/31/2025 | 21.078 |
| 186 | LEA-107692_OML | 529565 | Taken to Lease | 9/11/1980 | 5/31/2025 | 17.221 |
| 187 | LEA-107693_OML | 529887 | Taken to Lease | 9/11/1980 | 5/31/2025 | 14.532 |
| 188 | LEA-107694_OML | 529860 | Taken to Lease | 9/11/1980 | 5/31/2025 | 20.797 |
| 189 | LEA-107695_OML | 477790 | Taken to Lease | 9/9/1980 | 5/31/2025 | 21.459 |
| 190 | LEA-107696_OML | 370872 | Taken to Lease | 9/9/1980 | 5/31/2025 | 8.881 |
| 191 | LEA-107697_OML | 369757 | Taken to Lease | 9/9/1980 | 5/31/2025 | 14.946 |
| 192 | LEA-107698_OML | 369755 | Taken to Lease | 9/9/1980 | 5/31/2025 | 13.497 |
| 193 | LEA-107699_OML | 369753 | Taken to Lease | 9/9/1980 | 5/31/2025 | 9.022 |
| 194 | LEA-107700_OML | 369764 | Taken to Lease | 9/9/1980 | 5/31/2025 | 14.121 |
| 195 | LEA-107701_OML | 369765 | Taken to Lease | 9/9/1980 | 5/31/2025 | 12.354 |
| 196 | LEA-107702_OML | 369744 | Taken to Lease | 9/9/1980 | 5/31/2025 | 10.626 |
| 197 | LEA-107703_OML | 369747 | Taken to Lease | 9/9/1980 | 5/31/2025 | 12.681 |
| 198 | LEA-107704_OML | 369750 | Taken to Lease | 9/9/1980 | 5/31/2025 | 13.662 |
| 199 | LEA-107705_OML | 370873 | Taken to Lease | 9/9/1980 | 5/31/2025 | 8.511 |
| 200 | LEA-107706_OML | 477789 | Taken to Lease | 9/9/1980 | 5/31/2025 | 18.279 |
| 201 | LEA-107707_OML | 529861 | Taken to Lease | 9/11/1980 | 5/31/2025 | 16.018 |
| 202 | LEA-107708_OML | 529886 | Taken to Lease | 9/11/1980 | 5/31/2025 | 13.271 |
| 203 | LEA-107709_OML | 436842 | Taken to Lease | 9/9/1980 | 5/31/2025 | 15.270 |
| 204 | LEA-107710_OML | 436843 | Taken to Lease | 9/9/1980 | 5/31/2025 | 16.399 |
| 205 | LEA-107711_OML | 370867 | Taken to Lease | 9/9/1980 | 5/31/2025 | 16.387 |
| 206 | LEA-107712_OML | 369763 | Taken to Lease | 9/9/1980 | 5/31/2025 | 12.845 |
| 207 | LEA-107713_OML | 369754 | Taken to Lease | 9/9/1980 | 5/31/2025 | 7.959 |
| 208 | LEA-108173_OML | 529500 | Taken to Lease | 9/11/1980 | 4/30/2029 | 11.467 |
| 209 | LEA-108174_OML | 529497 | Taken to Lease | 9/11/1980 | 4/30/2029 | 11.397 |
| 210 | LEA-108175_OML | 508458 | Taken to Lease | 9/9/1980 | 4/30/2029 | 17.230 |
| 211 | LEA-108176_OML | 508460 | Taken to Lease | 9/9/1980 | 4/30/2029 | 14.811 |
| 212 | LEA-108182_OML | 529840 | Taken to Lease | 9/11/1980 | 3/31/2029 | 19.698 |
| 213 | LEA-108183_OML | 529844 | Taken to Lease | 9/11/1980 | 3/31/2029 | 12.508 |
| 214 | LEA-108184_OML | 529839 | Taken to Lease | 9/11/1980 | 3/31/2029 | 18.198 |
| | December 2024 |
| | TECHNICAL REPORT –
MUSSELWHITE MINE, ONTARIO, CANADA
Document # C8630-0000-PM-RPT-001 – Rev. 0
|
| # | Lease Code | Lease
Name | Status | Grant
Date | Expiry
Date | Area
(ha) |
| 215 | LEA-108185_OML | 529826 | Taken to Lease | 9/11/1980 | 3/31/2029 | 17.703 |
| 216 | LEA-108186_OML | 529827 | Taken to Lease | 9/11/1980 | 3/31/2029 | 17.309 |
| 217 | LEA-108187_OML | 529838 | Taken to Lease | 9/11/1980 | 3/31/2029 | 15.050 |
| 218 | LEA-108188_OML | 529845 | Taken to Lease | 9/11/1980 | 3/31/2029 | 12.390 |
| 219 | LEA-108189_OML | 529856 | Taken to Lease | 9/11/1980 | 3/31/2029 | 25.387 |
| 220 | LEA-108190_OML | 529855 | Taken to Lease | 9/11/1980 | 3/31/2029 | 9.522 |
| 221 | LEA-108191_OML | 529846 | Taken to Lease | 9/11/1980 | 3/31/2029 | 8.320 |
| 222 | LEA-108192_OML | 529837 | Taken to Lease | 9/11/1980 | 3/31/2029 | 14.106 |
| 223 | LEA-108193_OML | 529847 | Taken to Lease | 9/11/1980 | 3/31/2029 | 22.266 |
| 224 | LEA-108194_OML | 529854 | Taken to Lease | 9/11/1980 | 3/31/2029 | 39.957 |
| 225 | LEA-108195_OML | 529870 | Taken to Lease | 9/11/1980 | 3/31/2029 | 15.267 |
| 226 | LEA-108196_OML | 529871 | Taken to Lease | 9/11/1980 | 3/31/2029 | 13.245 |
| 227 | LEA-108747_OML | 529402 | Taken to Lease | 9/11/1980 | 1/31/2032 | 17.533 |
| 228 | LEA-108748_OML | 529403 | Taken to Lease | 9/11/1980 | 1/31/2032 | 12.635 |
| 229 | LEA-108749_OML | 529404 | Taken to Lease | 9/11/1980 | 1/31/2032 | 3.698 |
| 230 | LEA-108750_OML | 529405 | Taken to Lease | 9/11/1980 | 1/31/2032 | 4.121 |
| 231 | LEA-108751_OML | 529413 | Taken to Lease | 9/11/1980 | 1/31/2032 | 28.210 |
| 232 | LEA-108752_OML | 529414 | Taken to Lease | 9/11/1980 | 1/31/2032 | 19.032 |
| 233 | LEA-108753_OML | 529415 | Taken to Lease | 9/11/1980 | 1/31/2032 | 15.127 |
| 234 | LEA-108754_OML | 529416 | Taken to Lease | 9/11/1980 | 1/31/2032 | 19.110 |
| 235 | LEA-108755_OML | 529417 | Taken to Lease | 9/11/1980 | 1/31/2032 | 11.718 |
| 236 | LEA-108756_OML | 529420 | Taken to Lease | 9/11/1980 | 1/31/2032 | 21.174 |
| 237 | LEA-108757_OML | 529421 | Taken to Lease | 9/11/1980 | 1/31/2032 | 17.500 |
| 238 | LEA-108758_OML | 529422 | Taken to Lease | 9/11/1980 | 1/31/2032 | 20.244 |
| 239 | LEA-108759_OML | 529423 | Taken to Lease | 9/11/1980 | 1/31/2032 | 13.694 |
| 240 | LEA-108760_OML | 529424 | Taken to Lease | 9/11/1980 | 1/31/2032 | 21.524 |
| 241 | LEA-109022_OML | 550152 | Taken to Lease | 2/21/1991 | 2/28/2033 | 28.977 |
| 242 | LEA-109023_OML | 550151 | Taken to Lease | 2/21/1991 | 2/28/2033 | 11.810 |
| 243 | LEA-109024_OML | 550155 | Taken to Lease | 2/21/1991 | 2/28/2033 | 20.953 |
| 244 | LEA-109025_OML | 550154 | Taken to Lease | 2/21/1991 | 2/28/2033 | 8.518 |
| 245 | LEA-109026_OML | 550158 | Taken to Lease | 2/21/1991 | 2/28/2033 | 25.303 |
| 246 | LEA-109027_OML | 550157 | Taken to Lease | 2/21/1991 | 2/28/2033 | 14.943 |
| 247 | LEA-109028_OML | 529519 | Taken to Lease | 2/21/1991 | 2/28/2033 | 8.984 |
| 248 | LEA-109029_OML | 529520 | Taken to Lease | 2/21/1991 | 2/28/2033 | 25.973 |
| 249 | LEA-109030_OML | 529523 | Taken to Lease | 2/21/1991 | 2/28/2033 | 17.833 |
| 250 | LEA-109031_OML | 529531 | Taken to Lease | 2/21/1991 | 2/28/2033 | 6.508 |
| | December 2024 |
| | TECHNICAL REPORT –
MUSSELWHITE MINE, ONTARIO, CANADA
Document # C8630-0000-PM-RPT-001 – Rev. 0
|
| # | Lease Code | Lease
Name | Status | Grant
Date | Expiry
Date | Area
(ha) |
| 251 | LEA-109032_OML | 529524 | Taken to Lease | 2/21/1991 | 2/28/2033 | 8.265 |
| 252 | LEA-109033_OML | 529532 | Taken to Lease | 2/21/1991 | 2/28/2033 | 34.307 |
| 253 | LEA-109034_OML | 529535 | Taken to Lease | 2/21/1991 | 2/28/2033 | 28.554 |
| 254 | LEA-109035_OML | 529536 | Taken to Lease | 2/21/1991 | 2/28/2033 | 14.443 |
| 255 | LEA-109036_OML | 529543 | Taken to Lease | 2/21/1991 | 2/28/2033 | 8.247 |
| 256 | LEA-109037_OML | 529544 | Taken to Lease | 2/21/1991 | 2/28/2033 | 27.912 |
| 257 | LEA-109038_OML | 529550 | Taken to Lease | 2/21/1991 | 2/28/2033 | 30.134 |
| 258 | LEA-109039_OML | 529549 | Taken to Lease | 2/21/1991 | 2/28/2033 | 14.659 |
| 259 | LEA-109062_OML | 529911 | Taken to Lease | 9/11/1980 | 5/31/2033 | 16.351 |
| 260 | LEA-109063_OML | 529910 | Taken to Lease | 9/11/1980 | 5/31/2033 | 15.624 |
| 261 | LEA-109064_OML | 529912 | Taken to Lease | 9/11/1980 | 5/31/2033 | 16.173 |
| 262 | LEA-109065_OML | 529913 | Taken to Lease | 9/11/1980 | 5/31/2033 | 16.766 |
| 263 | LEA-109066_OML | 529914 | Taken to Lease | 9/11/1980 | 5/31/2033 | 17.563 |
| 264 | LEA-109067_OML | 529915 | Taken to Lease | 9/11/1980 | 5/31/2033 | 16.701 |
| 265 | LEA-109068_OML | 529893 | Taken to Lease | 9/11/1980 | 5/31/2033 | 17.091 |
| 266 | LEA-109069_OML | 529892 | Taken to Lease | 9/11/1980 | 5/31/2033 | 19.986 |
| 267 | LEA-109070_OML | 529891 | Taken to Lease | 9/11/1980 | 5/31/2033 | 18.155 |
| 268 | LEA-109071_OML | 529890 | Taken to Lease | 9/11/1980 | 5/31/2033 | 18.405 |
| 269 | LEA-109072_OML | 529889 | Taken to Lease | 9/11/1980 | 5/31/2033 | 19.575 |
| 270 | LEA-109073_OML | 529888 | Taken to Lease | 9/11/1980 | 5/31/2033 | 21.099 |
| 271 | LEA-109077_OML | 529902 | Taken to Lease | 9/11/1980 | 5/31/2033 | 18.214 |
| 272 | LEA-109078_OML | 529903 | Taken to Lease | 9/11/1980 | 5/31/2033 | 16.879 |
| 273 | LEA-109079_OML | 529904 | Taken to Lease | 9/11/1980 | 5/31/2033 | 14.844 |
| 274 | LEA-109080_OML | 529900 | Taken to Lease | 9/11/1980 | 5/31/2033 | 12.822 |
| 275 | LEA-109081_OML | 529901 | Taken to Lease | 9/11/1980 | 5/31/2033 | 13.703 |
| 276 | LEA-109082_OML | 529899 | Taken to Lease | 9/11/1980 | 5/31/2033 | 13.999 |
| 277 | LEA-109083_OML | 529874 | Taken to Lease | 9/11/1980 | 5/31/2033 | 21.743 |
| 278 | LEA-109084_OML | 529875 | Taken to Lease | 9/11/1980 | 5/31/2033 | 18.887 |
| 279 | LEA-109085_OML | 529876 | Taken to Lease | 9/11/1980 | 5/31/2033 | 18.197 |
| 280 | LEA-109086_OML | 529873 | Taken to Lease | 9/11/1980 | 5/31/2033 | 12.408 |
| 281 | LEA-109087_OML | 529872 | Taken to Lease | 9/11/1980 | 5/31/2033 | 11.649 |
| 282 | LEA-109088_OML | 529851 | Taken to Lease | 9/11/1980 | 5/31/2033 | 12.242 |
| 283 | LEA-109089_OML | 529852 | Taken to Lease | 9/11/1980 | 5/31/2033 | 14.500 |
| 284 | LEA-109090_OML | 529853 | Taken to Lease | 9/11/1980 | 5/31/2033 | 18.598 |
| 285 | LEA-109091_OML | 529850 | Taken to Lease | 9/11/1980 | 5/31/2033 | 16.859 |
| 286 | LEA-109092_OML | 529849 | Taken to Lease | 9/11/1980 | 5/31/2033 | 15.890 |
| | December 2024 |
| | TECHNICAL REPORT –
MUSSELWHITE MINE, ONTARIO, CANADA
Document # C8630-0000-PM-RPT-001 – Rev. 0
|
| # | Lease Code | Lease
Name | Status | Grant
Date | Expiry
Date | Area
(ha) |
| 323 | LEA-109137_OML | 529823 | Taken to Lease | 9/11/1980 | 5/31/2033 | 21.363 |
| 324 | LEA-109138_OML | 529822 | Taken to Lease | 9/11/1980 | 5/31/2033 | 21.888 |
| 325 | LEA-109212_OML | 529833 | Taken to Lease | 9/11/1980 | 5/31/2033 | 17.463 |
| 326 | LEA-109213_OML | 529487 | Taken to Lease | 9/11/1980 | 5/31/2033 | 19.024 |
| 327 | LEA-109214_OML | 529496 | Taken to Lease | 9/11/1980 | 5/31/2033 | 15.627 |
| 328 | LEA-109215_OML | 529495 | Taken to Lease | 9/11/1980 | 5/31/2033 | 16.612 |
| 329 | LEA-109216_OML | 529494 | Taken to Lease | 9/11/1980 | 5/31/2033 | 15.621 |
| 330 | LEA-109217_OML | 529493 | Taken to Lease | 9/11/1980 | 5/31/2033 | 10.981 |
| 331 | LEA-109218_OML | 529828 | Taken to Lease | 9/11/1980 | 5/31/2033 | 13.639 |
| 332 | LEA-109219_OML | 529829 | Taken to Lease | 9/11/1980 | 5/31/2033 | 17.434 |
| 333 | LEA-109220_OML | 529830 | Taken to Lease | 9/11/1980 | 5/31/2033 | 22.271 |
| 334 | LEA-109221_OML | 529831 | Taken to Lease | 9/11/1980 | 5/31/2033 | 20.719 |
| 335 | LEA-109222_OML | 529832 | Taken to Lease | 9/11/1980 | 5/31/2033 | 20.225 |
| 336 | LEA-109223_OML | 529836 | Taken to Lease | 9/11/1980 | 5/31/2033 | 6.939 |
| 337 | LEA-109224_OML | 529835 | Taken to Lease | 9/11/1980 | 5/31/2033 | 9.829 |
| 338 | LEA-109225_OML | 529834 | Taken to Lease | 9/11/1980 | 5/31/2033 | 18.380 |
| | December 2024 |
| | TECHNICAL REPORT –
MUSSELWHITE MINE, ONTARIO, CANADA
Document # C8630-0000-PM-RPT-001 – Rev. 0
|
Appendix 3 –
Musselwhite Mine Claims
| | December 2024 |
| | TECHNICAL REPORT –
MUSSELWHITE MINE, ONTARIO, CANADA
Document # C8630-0000-PM-RPT-001 – Rev. 0
|
Musselwhite Mine Claims
| # | Claim Name | Claim
Acquisition Date | Claim Expiry
Date | Official Area
Value (ha) |
| (MM/DD/YYYY) | (MM/DD/YYYY) |
| 1 | 100746 | 4/10/2018 | 10/26/2030 | 19.626 |
| 2 | 101311 | 4/10/2018 | 10/27/2030 | 19.648 |
| 3 | 101312 | 4/10/2018 | 10/27/2030 | 19.650 |
| 4 | 101493 | 4/10/2018 | 11/6/2030 | 19.643 |
| 5 | 103046 | 4/10/2018 | 9/26/2030 | 19.642 |
| 6 | 103159 | 4/10/2018 | 10/27/2030 | 19.651 |
| 7 | 103263 | 4/10/2018 | 10/27/2030 | 19.646 |
| 8 | 103282 | 4/10/2018 | 9/26/2030 | 19.642 |
| 9 | 105575 | 4/10/2018 | 9/26/2030 | 19.644 |
| 10 | 107027 | 4/10/2018 | 9/26/2030 | 19.639 |
| 11 | 107195 | 4/10/2018 | 3/11/2030 | 19.648 |
| 12 | 107954 | 4/10/2018 | 1/28/2030 | 19.635 |
| 13 | 107955 | 4/10/2018 | 1/28/2030 | 19.636 |
| 14 | 108795 | 4/10/2018 | 9/10/2030 | 19.625 |
| 15 | 108873 | 4/10/2018 | 1/28/2030 | 19.641 |
| 16 | 109175 | 4/10/2018 | 9/12/2030 | 19.626 |
| 17 | 110987 | 4/10/2018 | 2/11/2030 | 19.650 |
| 18 | 110988 | 4/10/2018 | 2/11/2030 | 19.652 |
| 19 | 110989 | 4/10/2018 | 2/11/2030 | 19.655 |
| 20 | 111372 | 4/10/2018 | 10/22/2030 | 19.528 |
| 21 | 111846 | 4/10/2018 | 9/11/2030 | 19.608 |
| 22 | 112059 | 4/10/2018 | 9/26/2030 | 19.637 |
| 23 | 112852 | 4/10/2018 | 1/28/2030 | 19.653 |
| 24 | 112853 | 4/10/2018 | 4/15/2030 | 19.653 |
| 25 | 113176 | 4/10/2018 | 10/26/2030 | 19.614 |
| 26 | 113272 | 4/10/2018 | 10/26/2030 | 19.618 |
| 27 | 113796 | 4/10/2018 | 9/22/2030 | 19.603 |
| 28 | 113821 | 4/10/2018 | 10/22/2030 | 19.551 |
| 29 | 113912 | 4/10/2018 | 10/27/2030 | 19.607 |
| 30 | 114337 | 4/10/2018 | 2/11/2030 | 19.654 |
| 31 | 114365 | 4/10/2018 | 10/27/2030 | 19.606 |
| | December 2024 |
| | TECHNICAL REPORT –
MUSSELWHITE MINE, ONTARIO, CANADA
Document # C8630-0000-PM-RPT-001 – Rev. 0
|
| # | Claim Name | Claim
Acquisition Date | Claim Expiry
Date | Official Area
Value (ha) |
| (MM/DD/YYYY) | (MM/DD/YYYY) |
| 32 | 114606 | 4/10/2018 | 7/16/2030 | 19.566 |
| 33 | 114666 | 4/10/2018 | 2/11/2030 | 19.652 |
| 34 | 114751 | 4/10/2018 | 1/13/2030 | 19.597 |
| 35 | 114752 | 4/10/2018 | 1/13/2030 | 19.600 |
| 36 | 114853 | 4/10/2018 | 11/6/2030 | 19.640 |
| 37 | 114913 | 4/10/2018 | 10/26/2030 | 19.619 |
| 38 | 115288 | 4/10/2018 | 10/22/2030 | 19.545 |
| 39 | 116821 | 4/10/2018 | 11/6/2030 | 19.645 |
| 40 | 117380 | 4/10/2018 | 10/27/2030 | 19.648 |
| 41 | 117381 | 4/10/2018 | 10/27/2030 | 19.648 |
| 42 | 117790 | 4/10/2018 | 6/24/2030 | 19.645 |
| 43 | 117791 | 4/10/2018 | 10/27/2030 | 19.645 |
| 44 | 118157 | 4/10/2018 | 9/26/2030 | 19.644 |
| 45 | 118361 | 4/10/2018 | 10/27/2030 | 19.649 |
| 46 | 118461 | 4/10/2018 | 6/24/2030 | 19.645 |
| 47 | 118855 | 4/10/2018 | 9/26/2030 | 19.642 |
| 48 | 121116 | 4/10/2018 | 11/6/2030 | 19.646 |
| 49 | 123564 | 4/10/2018 | 9/11/2030 | 19.608 |
| 50 | 123586 | 4/10/2018 | 1/28/2030 | 19.646 |
| 51 | 123833 | 4/10/2018 | 10/27/2030 | 19.648 |
| 52 | 123834 | 4/10/2018 | 10/27/2030 | 19.651 |
| 53 | 124419 | 4/10/2018 | 10/27/2030 | 19.646 |
| 54 | 125396 | 4/10/2018 | 1/28/2030 | 19.640 |
| 55 | 125861 | 4/10/2018 | 9/11/2030 | 19.611 |
| 56 | 126293 | 4/10/2018 | 9/12/2030 | 19.625 |
| 57 | 126357 | 4/10/2018 | 10/26/2030 | 19.625 |
| 58 | 126572 | 4/10/2018 | 3/11/2030 | 19.644 |
| 59 | 126733 | 4/10/2018 | 9/26/2030 | 19.646 |
| 60 | 126778 | 4/10/2018 | 1/13/2030 | 19.607 |
| 61 | 126875 | 4/10/2018 | 10/26/2030 | 19.623 |
| 62 | 127065 | 4/10/2018 | 6/24/2030 | 19.643 |
| 63 | 127698 | 4/10/2018 | 9/26/2030 | 19.641 |
| 64 | 128082 | 4/10/2018 | 9/26/2030 | 19.644 |
| | December 2024 |
| | TECHNICAL REPORT –
MUSSELWHITE MINE, ONTARIO, CANADA
Document # C8630-0000-PM-RPT-001 – Rev. 0
|
| # | Claim Name | Claim
Acquisition Date | Claim Expiry
Date | Official Area
Value (ha) |
| (MM/DD/YYYY) | (MM/DD/YYYY) |
| 65 | 128738 | 4/10/2018 | 2/11/2030 | 19.642 |
| 66 | 128739 | 4/10/2018 | 2/11/2030 | 19.642 |
| 67 | 128917 | 4/10/2018 | 10/27/2030 | 19.648 |
| 68 | 130002 | 4/10/2018 | 9/26/2030 | 19.639 |
| 69 | 130003 | 4/10/2018 | 9/26/2030 | 19.639 |
| 70 | 130379 | 4/10/2018 | 9/11/2030 | 19.611 |
| 71 | 131005 | 4/10/2018 | 9/11/2030 | 19.617 |
| 72 | 131381 | 4/10/2018 | 10/27/2030 | 19.603 |
| 73 | 131965 | 4/10/2018 | 4/12/2030 | 19.592 |
| 74 | 132576 | 4/10/2018 | 10/22/2030 | 19.541 |
| 75 | 132618 | 4/10/2018 | 4/12/2030 | 19.600 |
| 76 | 132619 | 4/10/2018 | 9/11/2030 | 19.608 |
| 77 | 132637 | 4/10/2018 | 4/12/2030 | 19.600 |
| 78 | 133412 | 4/10/2018 | 3/11/2030 | 19.646 |
| 79 | 133861 | 4/10/2018 | 11/6/2030 | 19.640 |
| 80 | 133942 | 4/10/2018 | 10/27/2030 | 19.602 |
| 81 | 134361 | 4/10/2018 | 9/10/2030 | 19.627 |
| 82 | 134546 | 4/10/2018 | 10/27/2030 | 19.600 |
| 83 | 135449 | 4/10/2018 | 2/11/2030 | 19.638 |
| 84 | 136656 | 4/10/2018 | 9/26/2030 | 19.636 |
| 85 | 136903 | 4/10/2018 | 1/28/2030 | 19.640 |
| 86 | 137996 | 4/10/2018 | 1/28/2030 | 19.652 |
| 87 | 138104 | 4/10/2018 | 11/6/2030 | 19.642 |
| 88 | 138429 | 4/10/2018 | 9/26/2030 | 19.639 |
| 89 | 138628 | 4/10/2018 | 9/26/2030 | 19.646 |
| 90 | 138750 | 4/10/2018 | 1/28/2030 | 19.627 |
| 91 | 139202 | 4/10/2018 | 7/16/2030 | 19.566 |
| 92 | 139441 | 4/10/2018 | 9/11/2030 | 19.616 |
| 93 | 139710 | 4/10/2018 | 9/26/2030 | 19.635 |
| 94 | 140272 | 4/10/2018 | 2/11/2030 | 19.644 |
| 95 | 140463 | 4/10/2018 | 2/11/2030 | 19.654 |
| 96 | 140741 | 4/10/2018 | 11/6/2030 | 19.638 |
| 97 | 141048 | 4/10/2018 | 3/11/2030 | 19.649 |
| | December 2024 |
| | TECHNICAL REPORT –
MUSSELWHITE MINE, ONTARIO, CANADA
Document # C8630-0000-PM-RPT-001 – Rev. 0
|
| # | Claim Name | Claim
Acquisition Date | Claim Expiry
Date | Official Area
Value (ha) |
| (MM/DD/YYYY) | (MM/DD/YYYY) |
| 98 | 141994 | 4/10/2018 | 1/28/2030 | 19.621 |
| 99 | 142443 | 4/10/2018 | 10/7/2030 | 19.605 |
| 100 | 142913 | 4/10/2018 | 1/28/2030 | 19.633 |
| 101 | 142914 | 4/10/2018 | 1/28/2030 | 19.636 |
| 102 | 142915 | 4/10/2018 | 1/28/2030 | 19.638 |
| 103 | 144002 | 4/10/2018 | 11/6/2030 | 19.641 |
| 104 | 144030 | 4/10/2018 | 9/12/2030 | 19.621 |
| 105 | 144055 | 4/10/2018 | 9/12/2030 | 19.620 |
| 106 | 145203 | 4/10/2018 | 2/11/2030 | 19.646 |
| 107 | 145204 | 4/10/2018 | 2/11/2030 | 19.649 |
| 108 | 145295 | 4/10/2018 | 1/13/2030 | 19.599 |
| 109 | 145301 | 4/10/2018 | 10/27/2030 | 19.600 |
| 110 | 146319 | 4/10/2018 | 11/6/2030 | 19.642 |
| 111 | 146416 | 4/10/2018 | 2/11/2030 | 19.652 |
| 112 | 146550 | 4/10/2018 | 10/26/2030 | 19.610 |
| 113 | 146851 | 4/10/2018 | 11/6/2030 | 19.649 |
| 114 | 147953 | 4/10/2018 | 2/23/2030 | 19.596 |
| 115 | 147954 | 4/10/2018 | 2/23/2030 | 19.596 |
| 116 | 148089 | 4/10/2018 | 10/7/2030 | 19.608 |
| 117 | 148244 | 4/10/2018 | 9/26/2030 | 19.652 |
| 118 | 148451 | 4/10/2018 | 9/22/2030 | 19.608 |
| 119 | 148665 | 4/10/2018 | 10/22/2030 | 19.535 |
| 120 | 148705 | 4/10/2018 | 8/28/2030 | 19.603 |
| 121 | 148870 | 4/10/2018 | 9/9/2030 | 19.629 |
| 122 | 148922 | 4/10/2018 | 3/11/2030 | 19.640 |
| 123 | 149222 | 4/10/2018 | 4/12/2030 | 19.597 |
| 124 | 149249 | 4/10/2018 | 4/12/2030 | 19.596 |
| 125 | 149374 | 4/10/2018 | 10/27/2030 | 19.601 |
| 126 | 149375 | 4/10/2018 | 10/27/2030 | 19.605 |
| 127 | 150923 | 4/10/2018 | 1/28/2030 | 19.625 |
| 128 | 150997 | 4/10/2018 | 1/28/2030 | 19.646 |
| 129 | 151455 | 4/10/2018 | 10/22/2030 | 19.540 |
| 130 | 151514 | 4/10/2018 | 10/22/2030 | 19.560 |
| | December 2024 |
| | TECHNICAL REPORT –
MUSSELWHITE MINE, ONTARIO, CANADA
Document # C8630-0000-PM-RPT-001 – Rev. 0
|
| # | Claim Name | Claim
Acquisition Date | Claim Expiry
Date | Official Area
Value (ha) |
| (MM/DD/YYYY) | (MM/DD/YYYY) |
| 131 | 151517 | 4/10/2018 | 10/22/2030 | 19.564 |
| 132 | 151522 | 4/10/2018 | 10/22/2030 | 19.534 |
| 133 | 152150 | 4/10/2018 | 10/27/2030 | 19.605 |
| 134 | 152171 | 4/10/2018 | 12/31/2029 | 19.602 |
| 135 | 152185 | 4/10/2018 | 2/23/2030 | 19.602 |
| 136 | 152331 | 4/10/2018 | 10/27/2030 | 19.647 |
| 137 | 153114 | 4/10/2018 | 9/11/2030 | 19.615 |
| 138 | 153421 | 4/10/2018 | 11/6/2030 | 19.642 |
| 139 | 153825 | 4/10/2018 | 2/11/2030 | 19.647 |
| 140 | 154021 | 4/10/2018 | 8/28/2030 | 19.600 |
| 141 | 154022 | 4/10/2018 | 12/28/2029 | 19.602 |
| 142 | 154377 | 4/10/2018 | 10/27/2030 | 19.649 |
| 143 | 154622 | 4/10/2018 | 1/28/2030 | 19.653 |
| 144 | 154945 | 4/10/2018 | 9/26/2030 | 19.641 |
| 145 | 155064 | 4/10/2018 | 10/27/2030 | 19.645 |
| 146 | 155645 | 4/10/2018 | 11/6/2030 | 19.641 |
| 147 | 156091 | 4/10/2018 | 10/26/2030 | 19.615 |
| 148 | 156092 | 4/10/2018 | 10/26/2030 | 19.619 |
| 149 | 156135 | 4/10/2018 | 11/6/2030 | 19.641 |
| 150 | 156136 | 4/10/2018 | 11/6/2030 | 19.641 |
| 151 | 156171 | 4/10/2018 | 10/26/2030 | 19.621 |
| 152 | 156172 | 4/10/2018 | 10/26/2030 | 19.621 |
| 153 | 156173 | 4/10/2018 | 10/26/2030 | 19.621 |
| 154 | 158190 | 4/10/2018 | 9/26/2030 | 19.648 |
| 155 | 158596 | 4/10/2018 | 9/12/2030 | 19.619 |
| 156 | 159347 | 4/10/2018 | 10/27/2030 | 19.602 |
| 157 | 160026 | 4/10/2018 | 10/26/2030 | 19.608 |
| 158 | 160522 | 4/10/2018 | 2/11/2030 | 19.654 |
| 159 | 160677 | 4/10/2018 | 1/28/2030 | 19.629 |
| 160 | 162089 | 4/10/2018 | 4/12/2030 | 19.590 |
| 161 | 163318 | 4/10/2018 | 11/6/2030 | 19.649 |
| 162 | 164073 | 4/10/2018 | 11/6/2030 | 19.643 |
| 163 | 164132 | 4/10/2018 | 10/26/2030 | 19.614 |
| | December 2024 |
| | TECHNICAL REPORT –
MUSSELWHITE MINE, ONTARIO, CANADA
Document # C8630-0000-PM-RPT-001 – Rev. 0
|
| # | Claim Name | Claim
Acquisition Date | Claim Expiry
Date | Official Area
Value (ha) |
| (MM/DD/YYYY) | (MM/DD/YYYY) |
| 164 | 164580 | 4/10/2018 | 3/11/2030 | 19.646 |
| 165 | 164669 | 4/10/2018 | 1/13/2030 | 19.603 |
| 166 | 165432 | 4/10/2018 | 10/26/2030 | 19.608 |
| 167 | 166005 | 4/10/2018 | 1/28/2030 | 19.625 |
| 168 | 166006 | 4/10/2018 | 1/28/2030 | 19.630 |
| 169 | 166398 | 4/10/2018 | 1/28/2030 | 19.647 |
| 170 | 167996 | 4/10/2018 | 10/22/2030 | 19.524 |
| 171 | 168098 | 4/10/2018 | 10/22/2030 | 19.552 |
| 172 | 168099 | 4/10/2018 | 10/22/2030 | 19.555 |
| 173 | 168759 | 4/10/2018 | 2/23/2030 | 19.608 |
| 174 | 168763 | 4/10/2018 | 2/23/2030 | 19.590 |
| 175 | 168933 | 4/10/2018 | 10/27/2030 | 19.645 |
| 176 | 168952 | 4/10/2018 | 10/27/2030 | 19.650 |
| 177 | 169202 | 4/10/2018 | 1/28/2030 | 19.616 |
| 178 | 169203 | 4/10/2018 | 1/28/2030 | 19.618 |
| 179 | 169204 | 4/10/2018 | 1/28/2030 | 19.618 |
| 180 | 169205 | 4/10/2018 | 1/28/2030 | 19.618 |
| 181 | 169714 | 4/10/2018 | 9/11/2030 | 19.617 |
| 182 | 169856 | 4/10/2018 | 9/11/2030 | 19.612 |
| 183 | 170316 | 4/10/2018 | 10/27/2030 | 19.644 |
| 184 | 171012 | 4/10/2018 | 10/27/2030 | 19.653 |
| 185 | 171128 | 4/10/2018 | 10/26/2030 | 19.608 |
| 186 | 171129 | 4/10/2018 | 10/26/2030 | 19.609 |
| 187 | 171230 | 4/10/2018 | 1/28/2030 | 19.623 |
| 188 | 171241 | 4/10/2018 | 10/26/2030 | 19.617 |
| 189 | 171316 | 4/10/2018 | 2/11/2030 | 19.631 |
| 190 | 171597 | 4/10/2018 | 6/24/2030 | 19.645 |
| 191 | 171598 | 4/10/2018 | 10/27/2030 | 19.651 |
| 192 | 171796 | 4/10/2018 | 9/9/2030 | 19.629 |
| 193 | 172024 | 4/10/2018 | 2/11/2030 | 19.631 |
| 194 | 172188 | 4/10/2018 | 11/6/2030 | 19.640 |
| 195 | 172216 | 4/10/2018 | 9/26/2030 | 19.639 |
| 196 | 172222 | 4/10/2018 | 11/6/2030 | 19.643 |
| | December 2024 |
| | TECHNICAL REPORT –
MUSSELWHITE MINE, ONTARIO, CANADA
Document # C8630-0000-PM-RPT-001 – Rev. 0
|
| # | Claim Name | Claim
Acquisition Date | Claim Expiry
Date | Official Area
Value (ha) |
| (MM/DD/YYYY) | (MM/DD/YYYY) |
| 197 | 172599 | 4/10/2018 | 2/11/2030 | 19.648 |
| 198 | 172600 | 4/10/2018 | 2/11/2030 | 19.648 |
| 199 | 172877 | 4/10/2018 | 9/12/2030 | 19.607 |
| 200 | 173214 | 4/10/2018 | 6/24/2030 | 19.647 |
| 201 | 173215 | 4/10/2018 | 10/27/2030 | 19.649 |
| 202 | 173861 | 4/10/2018 | 11/6/2030 | 19.646 |
| 203 | 173864 | 4/10/2018 | 11/6/2030 | 19.641 |
| 204 | 174443 | 4/10/2018 | 10/27/2030 | 19.645 |
| 205 | 174619 | 4/10/2018 | 11/6/2030 | 19.640 |
| 206 | 174627 | 4/10/2018 | 9/11/2030 | 19.614 |
| 207 | 174918 | 4/10/2018 | 3/11/2030 | 19.646 |
| 208 | 175011 | 4/10/2018 | 2/11/2030 | 19.655 |
| 209 | 176778 | 4/10/2018 | 1/28/2030 | 19.610 |
| 210 | 176849 | 4/10/2018 | 9/26/2030 | 19.650 |
| 211 | 177330 | 4/10/2018 | 9/12/2030 | 19.611 |
| 212 | 177522 | 4/10/2018 | 11/6/2030 | 19.640 |
| 213 | 178893 | 4/10/2018 | 6/26/2030 | 19.605 |
| 214 | 179519 | 4/10/2018 | 1/28/2030 | 19.644 |
| 215 | 179520 | 4/10/2018 | 1/28/2030 | 19.644 |
| 216 | 179552 | 4/10/2018 | 9/10/2030 | 19.627 |
| 217 | 180196 | 4/10/2018 | 9/26/2030 | 19.639 |
| 218 | 180572 | 4/10/2018 | 2/11/2030 | 19.632 |
| 219 | 180617 | 4/10/2018 | 9/26/2030 | 19.648 |
| 220 | 180780 | 4/10/2018 | 2/11/2030 | 19.638 |
| 221 | 182107 | 4/10/2018 | 1/28/2030 | 19.638 |
| 222 | 182168 | 4/10/2018 | 9/11/2030 | 19.613 |
| 223 | 182182 | 4/10/2018 | 3/11/2030 | 19.648 |
| 224 | 183629 | 4/10/2018 | 1/28/2030 | 19.612 |
| 225 | 185360 | 4/10/2018 | 1/28/2030 | 19.650 |
| 226 | 185778 | 4/10/2018 | 1/28/2030 | 19.613 |
| 227 | 186624 | 4/10/2018 | 1/28/2030 | 19.640 |
| 228 | 186761 | 4/10/2018 | 9/10/2030 | 19.624 |
| 229 | 186762 | 4/10/2018 | 9/10/2030 | 19.624 |
| | December 2024 |
| | TECHNICAL REPORT –
MUSSELWHITE MINE, ONTARIO, CANADA
Document # C8630-0000-PM-RPT-001 – Rev. 0
|
| # | Claim Name | Claim
Acquisition Date | Claim Expiry
Date | Official Area
Value (ha) |
| (MM/DD/YYYY) | (MM/DD/YYYY) |
| 230 | 186763 | 4/10/2018 | 9/10/2030 | 19.625 |
| 231 | 186816 | 4/10/2018 | 1/28/2030 | 19.623 |
| 232 | 186972 | 4/10/2018 | 1/28/2030 | 19.647 |
| 233 | 187063 | 4/10/2018 | 9/11/2030 | 19.608 |
| 234 | 187098 | 4/10/2018 | 1/28/2030 | 19.630 |
| 235 | 187113 | 4/10/2018 | 12/31/2029 | 19.602 |
| 236 | 188583 | 4/10/2018 | 10/26/2030 | 19.615 |
| 237 | 188894 | 4/10/2018 | 1/28/2030 | 19.635 |
| 238 | 188895 | 4/10/2018 | 1/28/2030 | 19.640 |
| 239 | 189005 | 4/10/2018 | 10/7/2030 | 19.607 |
| 240 | 189782 | 4/10/2018 | 10/27/2030 | 19.651 |
| 241 | 189783 | 4/10/2018 | 10/27/2030 | 19.653 |
| 242 | 190480 | 4/10/2018 | 10/27/2030 | 19.645 |
| 243 | 190481 | 4/10/2018 | 10/27/2030 | 19.650 |
| 244 | 191417 | 4/10/2018 | 3/11/2030 | 19.640 |
| 245 | 192132 | 4/10/2018 | 9/26/2030 | 19.642 |
| 246 | 193087 | 4/10/2018 | 2/11/2030 | 19.650 |
| 247 | 193088 | 4/10/2018 | 2/11/2030 | 19.655 |
| 248 | 194322 | 4/10/2018 | 2/11/2030 | 19.644 |
| 249 | 195103 | 4/10/2018 | 1/28/2030 | 19.646 |
| 250 | 195774 | 4/10/2018 | 1/28/2030 | 19.612 |
| 251 | 196120 | 4/10/2018 | 8/28/2030 | 19.606 |
| 252 | 196331 | 4/10/2018 | 9/12/2030 | 19.619 |
| 253 | 196785 | 4/10/2018 | 10/22/2030 | 19.538 |
| 254 | 196786 | 4/10/2018 | 10/22/2030 | 19.541 |
| 255 | 196787 | 4/10/2018 | 9/22/2030 | 19.606 |
| 256 | 196832 | 4/10/2018 | 10/27/2030 | 19.648 |
| 257 | 197977 | 4/10/2018 | 10/7/2030 | 19.588 |
| 258 | 198032 | 4/10/2018 | 2/23/2030 | 19.603 |
| 259 | 198172 | 4/10/2018 | 2/23/2030 | 19.596 |
| 260 | 198631 | 4/10/2018 | 11/6/2030 | 19.638 |
| 261 | 198654 | 4/10/2018 | 1/28/2030 | 19.618 |
| 262 | 198886 | 4/10/2018 | 9/26/2030 | 19.644 |
| | December 2024 |
| | TECHNICAL REPORT –
MUSSELWHITE MINE, ONTARIO, CANADA
Document # C8630-0000-PM-RPT-001 – Rev. 0
|
| # | Claim Name | Claim
Acquisition Date | Claim Expiry
Date | Official Area
Value (ha) |
| (MM/DD/YYYY) | (MM/DD/YYYY) |
| 263 | 199143 | 4/10/2018 | 1/28/2030 | 19.646 |
| 264 | 201202 | 4/10/2018 | 1/28/2030 | 19.619 |
| 265 | 201445 | 4/10/2018 | 9/12/2030 | 19.620 |
| 266 | 201558 | 4/10/2018 | 1/28/2030 | 19.635 |
| 267 | 201559 | 4/10/2018 | 1/28/2030 | 19.634 |
| 268 | 201603 | 4/10/2018 | 9/10/2030 | 19.622 |
| 269 | 202661 | 4/10/2018 | 11/6/2030 | 19.651 |
| 270 | 204008 | 4/10/2018 | 1/13/2030 | 19.601 |
| 271 | 204012 | 4/10/2018 | 10/27/2030 | 19.600 |
| 272 | 204851 | 4/10/2018 | 12/31/2029 | 19.602 |
| 273 | 204852 | 4/10/2018 | 12/2/2030 | 19.603 |
| 274 | 205389 | 4/10/2018 | 10/22/2030 | 19.558 |
| 275 | 205498 | 4/10/2018 | 10/27/2030 | 19.603 |
| 276 | 205499 | 4/10/2018 | 10/27/2030 | 19.605 |
| 277 | 205514 | 4/10/2018 | 2/23/2030 | 19.602 |
| 278 | 205534 | 4/10/2018 | 2/23/2030 | 19.590 |
| 279 | 205813 | 4/10/2018 | 6/26/2030 | 19.605 |
| 280 | 205929 | 4/10/2018 | 4/12/2030 | 19.588 |
| 281 | 206261 | 4/10/2018 | 10/27/2030 | 19.645 |
| 282 | 206262 | 4/10/2018 | 10/27/2030 | 19.647 |
| 283 | 206642 | 4/10/2018 | 1/28/2030 | 19.616 |
| 284 | 206652 | 4/10/2018 | 12/28/2029 | 19.600 |
| 285 | 206726 | 4/10/2018 | 10/22/2030 | 19.547 |
| 286 | 206973 | 4/10/2018 | 11/6/2030 | 19.647 |
| 287 | 206974 | 4/10/2018 | 10/27/2030 | 19.651 |
| 288 | 207276 | 4/10/2018 | 1/28/2030 | 19.653 |
| 289 | 207277 | 4/10/2018 | 1/28/2030 | 19.653 |
| 290 | 208916 | 4/10/2018 | 10/27/2030 | 19.647 |
| 291 | 208943 | 4/10/2018 | 6/24/2030 | 19.643 |
| 292 | 209006 | 4/10/2018 | 11/6/2030 | 19.641 |
| 293 | 209126 | 4/10/2018 | 2/11/2030 | 19.649 |
| 294 | 211934 | 4/10/2018 | 2/11/2030 | 19.646 |
| 295 | 212535 | 4/10/2018 | 2/11/2030 | 19.650 |
| | December 2024 |
| | TECHNICAL REPORT –
MUSSELWHITE MINE, ONTARIO, CANADA
Document # C8630-0000-PM-RPT-001 – Rev. 0
|
| # | Claim Name | Claim
Acquisition Date | Claim Expiry
Date | Official Area
Value (ha) |
| (MM/DD/YYYY) | (MM/DD/YYYY) |
| 296 | 212536 | 4/10/2018 | 2/11/2030 | 19.652 |
| 297 | 213252 | 4/10/2018 | 10/26/2030 | 19.609 |
| 298 | 213253 | 4/10/2018 | 10/26/2030 | 19.612 |
| 299 | 214649 | 4/10/2018 | 2/23/2030 | 19.594 |
| 300 | 215136 | 4/10/2018 | 1/28/2030 | 19.647 |
| 301 | 216279 | 4/10/2018 | 4/12/2030 | 19.594 |
| 302 | 216951 | 4/10/2018 | 10/22/2030 | 19.560 |
| 303 | 216952 | 4/10/2018 | 10/22/2030 | 19.562 |
| 304 | 217483 | 4/10/2018 | 4/12/2030 | 19.600 |
| 305 | 217637 | 4/10/2018 | 2/23/2030 | 19.597 |
| 306 | 218164 | 4/10/2018 | 2/23/2030 | 19.592 |
| 307 | 218770 | 4/10/2018 | 1/28/2030 | 19.636 |
| 308 | 218771 | 4/10/2018 | 1/28/2030 | 19.638 |
| 309 | 219192 | 4/10/2018 | 9/11/2030 | 19.612 |
| 310 | 219228 | 4/10/2018 | 11/6/2030 | 19.649 |
| 311 | 219274 | 4/10/2018 | 2/11/2030 | 19.646 |
| 312 | 219340 | 4/10/2018 | 1/28/2030 | 19.652 |
| 313 | 219735 | 4/10/2018 | 10/27/2030 | 19.653 |
| 314 | 219806 | 4/10/2018 | 9/26/2030 | 19.642 |
| 315 | 219826 | 4/10/2018 | 10/27/2030 | 19.647 |
| 316 | 219913 | 4/10/2018 | 9/11/2030 | 19.609 |
| 317 | 220415 | 4/10/2018 | 6/24/2030 | 19.643 |
| 318 | 220416 | 4/10/2018 | 6/24/2030 | 19.645 |
| 319 | 220432 | 4/10/2018 | 6/24/2030 | 19.643 |
| 320 | 220488 | 4/10/2018 | 11/6/2030 | 19.642 |
| 321 | 221207 | 4/10/2018 | 11/6/2030 | 19.640 |
| 322 | 221547 | 4/10/2018 | 6/24/2030 | 19.642 |
| 323 | 221549 | 4/10/2018 | 9/12/2030 | 19.623 |
| 324 | 221578 | 4/10/2018 | 9/26/2030 | 19.639 |
| 325 | 221605 | 4/10/2018 | 10/26/2030 | 19.619 |
| 326 | 223652 | 4/10/2018 | 10/27/2030 | 19.650 |
| 327 | 224074 | 4/10/2018 | 1/13/2030 | 19.601 |
| 328 | 225879 | 4/10/2018 | 10/26/2030 | 19.615 |
| | December 2024 |
| | TECHNICAL REPORT –
MUSSELWHITE MINE, ONTARIO, CANADA
Document # C8630-0000-PM-RPT-001 – Rev. 0
|
| # | Claim Name | Claim
Acquisition Date | Claim Expiry
Date | Official Area
Value (ha) |
| (MM/DD/YYYY) | (MM/DD/YYYY) |
| 329 | 226093 | 4/10/2018 | 1/28/2030 | 19.638 |
| 330 | 226670 | 4/10/2018 | 11/6/2030 | 19.649 |
| 331 | 227221 | 4/10/2018 | 2/11/2030 | 19.648 |
| 332 | 227449 | 4/10/2018 | 9/26/2030 | 19.647 |
| 333 | 227745 | 4/10/2018 | 9/26/2030 | 19.641 |
| 334 | 227868 | 4/10/2018 | 9/11/2030 | 19.608 |
| 335 | 228437 | 4/10/2018 | 9/26/2030 | 19.641 |
| 336 | 228480 | 4/10/2018 | 11/6/2030 | 19.643 |
| 337 | 228866 | 4/10/2018 | 9/12/2030 | 19.623 |
| 338 | 229935 | 4/10/2018 | 11/6/2030 | 19.636 |
| 339 | 230086 | 4/10/2018 | 2/11/2030 | 19.632 |
| 340 | 230724 | 4/10/2018 | 10/27/2030 | 19.602 |
| 341 | 231325 | 4/10/2018 | 1/28/2030 | 19.612 |
| 342 | 231470 | 4/10/2018 | 10/26/2030 | 19.612 |
| 343 | 231931 | 4/10/2018 | 9/12/2030 | 19.608 |
| 344 | 232829 | 4/10/2018 | 8/28/2030 | 19.603 |
| 345 | 233171 | 4/10/2018 | 1/28/2030 | 19.653 |
| 346 | 234146 | 4/10/2018 | 10/22/2030 | 19.549 |
| 347 | 234451 | 4/10/2018 | 11/6/2030 | 19.646 |
| 348 | 234452 | 4/10/2018 | 11/6/2030 | 19.648 |
| 349 | 237752 | 4/10/2018 | 9/11/2030 | 19.613 |
| 350 | 237816 | 4/10/2018 | 1/28/2030 | 19.619 |
| 351 | 238624 | 4/10/2018 | 9/11/2030 | 19.615 |
| 352 | 239149 | 4/10/2018 | 7/16/2030 | 19.566 |
| 353 | 239228 | 4/10/2018 | 2/11/2030 | 19.649 |
| 354 | 239229 | 4/10/2018 | 2/11/2030 | 19.652 |
| 355 | 239230 | 4/10/2018 | 2/11/2030 | 19.652 |
| 356 | 239280 | 4/10/2018 | 1/28/2030 | 19.611 |
| 357 | 239281 | 4/10/2018 | 9/11/2030 | 19.613 |
| 358 | 239354 | 4/10/2018 | 2/11/2030 | 19.646 |
| 359 | 240050 | 4/10/2018 | 11/6/2030 | 19.642 |
| 360 | 241482 | 4/10/2018 | 9/26/2030 | 19.647 |
| 361 | 241703 | 4/10/2018 | 2/11/2030 | 19.654 |
| | December 2024 |
| | TECHNICAL REPORT –
MUSSELWHITE MINE, ONTARIO, CANADA
Document # C8630-0000-PM-RPT-001 – Rev. 0
|
| # | Claim Name | Claim
Acquisition Date | Claim Expiry
Date | Official Area
Value (ha) |
| (MM/DD/YYYY) | (MM/DD/YYYY) |
| 362 | 242138 | 4/10/2018 | 2/11/2030 | 19.636 |
| 363 | 242950 | 4/10/2018 | 9/26/2030 | 19.651 |
| 364 | 244203 | 4/10/2018 | 9/12/2030 | 19.625 |
| 365 | 245375 | 4/10/2018 | 9/9/2030 | 19.631 |
| 366 | 245874 | 4/10/2018 | 1/28/2030 | 19.647 |
| 367 | 246146 | 4/10/2018 | 9/26/2030 | 19.642 |
| 368 | 246380 | 4/10/2018 | 12/28/2029 | 19.600 |
| 369 | 246776 | 4/10/2018 | 11/6/2030 | 19.638 |
| 370 | 246918 | 4/10/2018 | 9/26/2030 | 19.646 |
| 371 | 247325 | 4/10/2018 | 1/13/2030 | 19.603 |
| 372 | 247812 | 4/10/2018 | 9/12/2030 | 19.619 |
| 373 | 248845 | 4/10/2018 | 9/26/2030 | 19.639 |
| 374 | 249423 | 4/10/2018 | 2/11/2030 | 19.634 |
| 375 | 249768 | 4/10/2018 | 2/11/2030 | 19.655 |
| 376 | 249997 | 4/10/2018 | 10/26/2030 | 19.609 |
| 377 | 250095 | 4/10/2018 | 9/11/2030 | 19.619 |
| 378 | 250413 | 4/10/2018 | 11/6/2030 | 19.636 |
| 379 | 251433 | 4/10/2018 | 9/12/2030 | 19.608 |
| 380 | 253185 | 4/10/2018 | 10/22/2030 | 19.527 |
| 381 | 253278 | 4/10/2018 | 11/6/2030 | 19.638 |
| 382 | 253317 | 4/10/2018 | 9/26/2030 | 19.650 |
| 383 | 253493 | 4/10/2018 | 9/26/2030 | 19.642 |
| 384 | 253494 | 4/10/2018 | 9/26/2030 | 19.644 |
| 385 | 254116 | 4/10/2018 | 9/10/2030 | 19.622 |
| 386 | 254321 | 4/10/2018 | 9/10/2030 | 19.625 |
| 387 | 255642 | 4/10/2018 | 9/12/2030 | 19.620 |
| 388 | 255656 | 4/10/2018 | 9/12/2030 | 19.623 |
| 389 | 255856 | 4/10/2018 | 9/11/2030 | 19.619 |
| 390 | 255857 | 4/10/2018 | 9/11/2030 | 19.619 |
| 391 | 255858 | 4/10/2018 | 1/28/2030 | 19.622 |
| 392 | 256090 | 4/10/2018 | 2/11/2030 | 19.646 |
| 393 | 256091 | 4/10/2018 | 2/11/2030 | 19.648 |
| 394 | 256182 | 4/10/2018 | 9/9/2030 | 19.633 |
| | December 2024 |
| | TECHNICAL REPORT –
MUSSELWHITE MINE, ONTARIO, CANADA
Document # C8630-0000-PM-RPT-001 – Rev. 0
|
| # | Claim Name | Claim
Acquisition Date | Claim Expiry
Date | Official Area
Value (ha) |
| (MM/DD/YYYY) | (MM/DD/YYYY) |
| 395 | 257195 | 4/10/2018 | 11/6/2030 | 19.636 |
| 396 | 259373 | 4/10/2018 | 7/16/2030 | 19.566 |
| 397 | 259427 | 4/10/2018 | 2/11/2030 | 19.648 |
| 398 | 259975 | 4/10/2018 | 9/26/2030 | 19.650 |
| 399 | 260014 | 4/10/2018 | 1/13/2030 | 19.603 |
| 400 | 260020 | 4/10/2018 | 12/28/2029 | 19.600 |
| 401 | 260389 | 4/10/2018 | 9/26/2030 | 19.639 |
| 402 | 261301 | 4/10/2018 | 1/28/2030 | 19.627 |
| 403 | 262150 | 4/10/2018 | 11/6/2030 | 19.643 |
| 404 | 262237 | 4/10/2018 | 6/24/2030 | 19.642 |
| 405 | 262238 | 4/10/2018 | 6/24/2030 | 19.643 |
| 406 | 262426 | 4/10/2018 | 1/28/2030 | 19.607 |
| 407 | 263320 | 4/10/2018 | 10/22/2030 | 19.541 |
| 408 | 263396 | 4/10/2018 | 12/31/2029 | 19.600 |
| 409 | 263751 | 4/10/2018 | 9/12/2030 | 19.626 |
| 410 | 264041 | 4/10/2018 | 10/27/2030 | 19.603 |
| 411 | 264042 | 4/10/2018 | 10/27/2030 | 19.603 |
| 412 | 264082 | 4/10/2018 | 2/23/2030 | 19.606 |
| 413 | 264088 | 4/10/2018 | 2/23/2030 | 19.592 |
| 414 | 264881 | 4/10/2018 | 10/27/2030 | 19.650 |
| 415 | 265151 | 4/10/2018 | 9/12/2030 | 19.607 |
| 416 | 265227 | 4/10/2018 | 12/31/2029 | 19.602 |
| 417 | 265915 | 4/10/2018 | 1/28/2030 | 19.616 |
| 418 | 265988 | 4/10/2018 | 10/27/2030 | 19.600 |
| 419 | 266906 | 4/10/2018 | 9/26/2030 | 19.642 |
| 420 | 266907 | 4/10/2018 | 11/6/2030 | 19.647 |
| 421 | 267009 | 4/10/2018 | 6/24/2030 | 19.645 |
| 422 | 267010 | 4/10/2018 | 6/24/2030 | 19.645 |
| 423 | 267633 | 4/10/2018 | 10/27/2030 | 19.648 |
| 424 | 267634 | 4/10/2018 | 10/27/2030 | 19.650 |
| 425 | 267958 | 4/10/2018 | 1/28/2030 | 19.623 |
| 426 | 267983 | 4/10/2018 | 11/6/2030 | 19.638 |
| 427 | 268514 | 4/10/2018 | 2/11/2030 | 19.652 |
| | December 2024 |
| | TECHNICAL REPORT –
MUSSELWHITE MINE, ONTARIO, CANADA
Document # C8630-0000-PM-RPT-001 – Rev. 0
|
| # | Claim Name | Claim
Acquisition Date | Claim Expiry
Date | Official Area
Value (ha) |
| (MM/DD/YYYY) | (MM/DD/YYYY) |
| 428 | 268681 | 4/10/2018 | 10/26/2030 | 19.614 |
| 429 | 270074 | 4/10/2018 | 2/23/2030 | 19.594 |
| 430 | 270098 | 4/10/2018 | 10/27/2030 | 19.607 |
| 431 | 270551 | 4/10/2018 | 10/26/2030 | 19.615 |
| 432 | 270800 | 4/10/2018 | 9/22/2030 | 19.606 |
| 433 | 270852 | 4/10/2018 | 10/7/2030 | 19.594 |
| 434 | 270853 | 4/10/2018 | 10/7/2030 | 19.596 |
| 435 | 271077 | 4/10/2018 | 1/28/2030 | 19.651 |
| 436 | 271364 | 4/10/2018 | 10/22/2030 | 19.530 |
| 437 | 271365 | 4/10/2018 | 10/22/2030 | 19.532 |
| 438 | 271391 | 4/10/2018 | 10/22/2030 | 19.557 |
| 439 | 271824 | 4/10/2018 | 11/6/2030 | 19.648 |
| 440 | 271827 | 4/10/2018 | 1/28/2030 | 19.642 |
| 441 | 271829 | 4/10/2018 | 11/6/2030 | 19.636 |
| 442 | 271830 | 4/10/2018 | 11/6/2030 | 19.638 |
| 443 | 271911 | 4/10/2018 | 9/9/2030 | 19.629 |
| 444 | 272041 | 4/10/2018 | 2/23/2030 | 19.588 |
| 445 | 272329 | 4/10/2018 | 10/27/2030 | 19.645 |
| 446 | 272330 | 4/10/2018 | 10/27/2030 | 19.647 |
| 447 | 273087 | 4/10/2018 | 9/11/2030 | 19.609 |
| 448 | 274706 | 4/10/2018 | 1/28/2030 | 19.623 |
| 449 | 274713 | 4/10/2018 | 10/26/2030 | 19.615 |
| 450 | 274899 | 4/10/2018 | 10/27/2030 | 19.649 |
| 451 | 274900 | 4/10/2018 | 10/27/2030 | 19.651 |
| 452 | 274968 | 4/10/2018 | 9/26/2030 | 19.641 |
| 453 | 274988 | 4/10/2018 | 10/27/2030 | 19.647 |
| 454 | 274989 | 4/10/2018 | 10/27/2030 | 19.648 |
| 455 | 275517 | 4/10/2018 | 10/26/2030 | 19.625 |
| 456 | 275628 | 4/10/2018 | 11/6/2030 | 19.641 |
| 457 | 275629 | 4/10/2018 | 9/26/2030 | 19.642 |
| 458 | 276070 | 4/10/2018 | 10/26/2030 | 19.626 |
| 459 | 276075 | 4/10/2018 | 10/26/2030 | 19.625 |
| 460 | 276472 | 4/10/2018 | 11/6/2030 | 19.640 |
| | December 2024 |
| | TECHNICAL REPORT –
MUSSELWHITE MINE, ONTARIO, CANADA
Document # C8630-0000-PM-RPT-001 – Rev. 0
|
| # | Claim Name | Claim
Acquisition Date | Claim Expiry
Date | Official Area
Value (ha) |
| (MM/DD/YYYY) | (MM/DD/YYYY) |
| 461 | 277080 | 4/10/2018 | 11/6/2030 | 19.640 |
| 462 | 277906 | 4/10/2018 | 2/11/2030 | 19.646 |
| 463 | 277907 | 4/10/2018 | 2/11/2030 | 19.652 |
| 464 | 278003 | 4/10/2018 | 1/13/2030 | 19.597 |
| 465 | 278629 | 4/10/2018 | 9/11/2030 | 19.618 |
| 466 | 280494 | 4/10/2018 | 9/26/2030 | 19.640 |
| 467 | 281428 | 4/10/2018 | 1/28/2030 | 19.642 |
| 468 | 281429 | 4/10/2018 | 1/28/2030 | 19.644 |
| 469 | 282418 | 4/10/2018 | 11/6/2030 | 19.640 |
| 470 | 283478 | 4/10/2018 | 10/7/2030 | 19.590 |
| 471 | 283479 | 4/10/2018 | 9/22/2030 | 19.603 |
| 472 | 283497 | 4/10/2018 | 4/12/2030 | 19.600 |
| 473 | 283501 | 4/10/2018 | 10/22/2030 | 19.555 |
| 474 | 284118 | 4/10/2018 | 10/27/2030 | 19.603 |
| 475 | 284119 | 4/10/2018 | 10/27/2030 | 19.605 |
| 476 | 284475 | 4/10/2018 | 9/26/2030 | 19.636 |
| 477 | 284869 | 4/10/2018 | 10/22/2030 | 19.544 |
| 478 | 285156 | 4/10/2018 | 9/11/2030 | 19.611 |
| 479 | 285802 | 4/10/2018 | 1/28/2030 | 19.644 |
| 480 | 285820 | 4/10/2018 | 11/6/2030 | 19.640 |
| 481 | 285885 | 4/10/2018 | 11/6/2030 | 19.642 |
| 482 | 286075 | 4/10/2018 | 9/26/2030 | 19.647 |
| 483 | 286554 | 4/10/2018 | 9/12/2030 | 19.619 |
| 484 | 286595 | 4/10/2018 | 9/10/2030 | 19.627 |
| 485 | 286596 | 4/10/2018 | 1/28/2030 | 19.629 |
| 486 | 286976 | 4/10/2018 | 10/27/2030 | 19.647 |
| 487 | 287072 | 4/10/2018 | 10/27/2030 | 19.648 |
| 488 | 287110 | 4/10/2018 | 11/6/2030 | 19.647 |
| 489 | 287616 | 4/10/2018 | 10/26/2030 | 19.623 |
| 490 | 289301 | 4/10/2018 | 3/11/2030 | 19.648 |
| 491 | 290151 | 4/10/2018 | 6/26/2030 | 19.605 |
| 492 | 290687 | 4/10/2018 | 9/10/2030 | 19.622 |
| 493 | 290688 | 4/10/2018 | 9/10/2030 | 19.624 |
| | December 2024 |
| | TECHNICAL REPORT –
MUSSELWHITE MINE, ONTARIO, CANADA
Document # C8630-0000-PM-RPT-001 – Rev. 0
|
| # | Claim Name | Claim
Acquisition Date | Claim Expiry
Date | Official Area
Value (ha) |
| (MM/DD/YYYY) | (MM/DD/YYYY) |
| 494 | 290801 | 4/10/2018 | 9/26/2030 | 19.639 |
| 495 | 291976 | 4/10/2018 | 10/26/2030 | 19.617 |
| 496 | 291977 | 4/10/2018 | 9/11/2030 | 19.617 |
| 497 | 292320 | 4/10/2018 | 11/6/2030 | 19.640 |
| 498 | 292727 | 4/10/2018 | 1/28/2030 | 19.633 |
| 499 | 292728 | 4/10/2018 | 1/28/2030 | 19.636 |
| 500 | 293293 | 4/10/2018 | 11/6/2030 | 19.651 |
| 501 | 293796 | 4/10/2018 | 10/27/2030 | 19.651 |
| 502 | 293916 | 4/10/2018 | 11/6/2030 | 19.639 |
| 503 | 294384 | 4/10/2018 | 10/27/2030 | 19.648 |
| 504 | 294490 | 4/10/2018 | 10/27/2030 | 19.646 |
| 505 | 295912 | 4/10/2018 | 9/11/2030 | 19.612 |
| 506 | 296076 | 4/10/2018 | 2/11/2030 | 19.642 |
| 507 | 296522 | 4/10/2018 | 9/26/2030 | 19.646 |
| 508 | 297301 | 4/10/2018 | 9/11/2030 | 19.618 |
| 509 | 297513 | 4/10/2018 | 1/28/2030 | 19.608 |
| 510 | 298012 | 4/10/2018 | 1/28/2030 | 19.610 |
| 511 | 299554 | 4/10/2018 | 9/26/2030 | 19.650 |
| 512 | 299909 | 4/10/2018 | 2/23/2030 | 19.607 |
| 513 | 300465 | 4/10/2018 | 9/22/2030 | 19.607 |
| 514 | 300666 | 4/10/2018 | 8/28/2030 | 19.603 |
| 515 | 301334 | 4/10/2018 | 10/27/2030 | 19.602 |
| 516 | 301350 | 4/10/2018 | 4/12/2030 | 19.600 |
| 517 | 302511 | 4/10/2018 | 1/28/2030 | 19.614 |
| 518 | 303097 | 4/10/2018 | 12/28/2029 | 19.597 |
| 519 | 303098 | 4/10/2018 | 2/23/2030 | 19.597 |
| 520 | 306599 | 4/10/2018 | 3/11/2030 | 19.642 |
| 521 | 306670 | 4/10/2018 | 11/6/2030 | 19.643 |
| 522 | 307247 | 4/10/2018 | 2/11/2030 | 19.644 |
| 523 | 307828 | 4/10/2018 | 1/13/2030 | 19.600 |
| 524 | 309959 | 4/10/2018 | 2/11/2030 | 19.654 |
| 525 | 310246 | 4/10/2018 | 1/28/2030 | 19.610 |
| 526 | 311452 | 4/10/2018 | 10/26/2030 | 19.626 |
| | December 2024 |
| | TECHNICAL REPORT –
MUSSELWHITE MINE, ONTARIO, CANADA
Document # C8630-0000-PM-RPT-001 – Rev. 0
|
| # | Claim Name | Claim
Acquisition Date | Claim Expiry
Date | Official Area
Value (ha) |
| (MM/DD/YYYY) | (MM/DD/YYYY) |
| 527 | 311813 | 4/10/2018 | 1/28/2030 | 19.621 |
| 528 | 312010 | 4/10/2018 | 10/26/2030 | 19.623 |
| 529 | 312147 | 4/10/2018 | 1/28/2030 | 19.640 |
| 530 | 314184 | 4/10/2018 | 9/26/2030 | 19.635 |
| 531 | 314497 | 4/10/2018 | 2/11/2030 | 19.648 |
| 532 | 314580 | 4/10/2018 | 1/13/2030 | 19.597 |
| 533 | 315101 | 4/10/2018 | 9/11/2030 | 19.612 |
| 534 | 315513 | 4/10/2018 | 3/11/2030 | 19.644 |
| 535 | 315601 | 4/10/2018 | 11/6/2030 | 19.642 |
| 536 | 315727 | 4/10/2018 | 2/11/2030 | 19.654 |
| 537 | 316380 | 4/10/2018 | 11/6/2030 | 19.636 |
| 538 | 316964 | 4/10/2018 | 1/28/2030 | 19.608 |
| 539 | 317901 | 4/10/2018 | 10/22/2030 | 19.538 |
| 540 | 317923 | 4/10/2018 | 8/28/2030 | 19.606 |
| 541 | 317967 | 4/10/2018 | 10/22/2030 | 19.555 |
| 542 | 318128 | 4/10/2018 | 9/9/2030 | 19.630 |
| 543 | 318129 | 4/10/2018 | 9/9/2030 | 19.633 |
| 544 | 318585 | 4/10/2018 | 10/27/2030 | 19.605 |
| 545 | 318616 | 4/10/2018 | 12/2/2030 | 19.603 |
| 546 | 318622 | 4/10/2018 | 2/23/2030 | 19.588 |
| 547 | 319401 | 4/10/2018 | 9/26/2030 | 19.641 |
| 548 | 319452 | 4/10/2018 | 9/11/2030 | 19.622 |
| 549 | 319857 | 4/10/2018 | 1/28/2030 | 19.614 |
| 550 | 320747 | 4/10/2018 | 4/12/2030 | 19.600 |
| 551 | 320749 | 4/10/2018 | 2/23/2030 | 19.597 |
| 552 | 320967 | 4/10/2018 | 10/27/2030 | 19.648 |
| 553 | 321033 | 4/10/2018 | 9/26/2030 | 19.646 |
| 554 | 321750 | 4/10/2018 | 9/11/2030 | 19.617 |
| 555 | 322026 | 4/10/2018 | 10/27/2030 | 19.602 |
| 556 | 322424 | 4/10/2018 | 11/6/2030 | 19.651 |
| 557 | 322532 | 4/10/2018 | 11/6/2030 | 19.639 |
| 558 | 323063 | 4/10/2018 | 11/6/2030 | 19.642 |
| 559 | 323127 | 4/10/2018 | 3/11/2030 | 19.644 |
| | December 2024 |
| | TECHNICAL REPORT –
MUSSELWHITE MINE, ONTARIO, CANADA
Document # C8630-0000-PM-RPT-001 – Rev. 0
|
| # | Claim Name | Claim
Acquisition Date | Claim Expiry
Date | Official Area
Value (ha) |
| (MM/DD/YYYY) | (MM/DD/YYYY) |
| 560 | 323204 | 4/10/2018 | 11/6/2030 | 19.643 |
| 561 | 323586 | 4/10/2018 | 10/27/2030 | 19.651 |
| 562 | 324025 | 4/10/2018 | 1/28/2030 | 19.619 |
| 563 | 325180 | 4/10/2018 | 9/11/2030 | 19.616 |
| 564 | 326240 | 4/10/2018 | 9/26/2030 | 19.650 |
| 565 | 327248 | 4/10/2018 | 2/11/2030 | 19.648 |
| 566 | 327249 | 4/10/2018 | 2/11/2030 | 19.649 |
| 567 | 327296 | 4/10/2018 | 10/26/2030 | 19.614 |
| 568 | 328046 | 4/10/2018 | 10/26/2030 | 19.608 |
| 569 | 328265 | 4/10/2018 | 3/5/2030 | 19.639 |
| 570 | 328286 | 4/10/2018 | 9/26/2030 | 19.641 |
| 571 | 329699 | 4/10/2018 | 11/6/2030 | 19.646 |
| 572 | 329755 | 4/10/2018 | 1/28/2030 | 19.652 |
| 573 | 331297 | 4/10/2018 | 8/28/2030 | 19.606 |
| 574 | 331347 | 4/10/2018 | 4/12/2030 | 19.596 |
| 575 | 331639 | 4/10/2018 | 1/13/2030 | 19.601 |
| 576 | 331716 | 4/10/2018 | 10/22/2030 | 19.566 |
| 577 | 331782 | 4/10/2018 | 2/11/2030 | 19.644 |
| 578 | 332040 | 4/10/2018 | 10/26/2030 | 19.608 |
| 579 | 332104 | 4/10/2018 | 10/26/2030 | 19.610 |
| 580 | 332105 | 4/10/2018 | 10/26/2030 | 19.612 |
| 581 | 332879 | 4/10/2018 | 10/22/2030 | 19.541 |
| 582 | 332880 | 4/10/2018 | 9/22/2030 | 19.606 |
| 583 | 332925 | 4/10/2018 | 10/7/2030 | 19.592 |
| 584 | 333039 | 4/10/2018 | 10/22/2030 | 19.523 |
| 585 | 333040 | 4/10/2018 | 12/31/2029 | 19.602 |
| 586 | 333227 | 4/10/2018 | 10/27/2030 | 19.603 |
| 587 | 333240 | 4/10/2018 | 12/28/2029 | 19.600 |
| 588 | 333243 | 4/10/2018 | 4/12/2030 | 19.600 |
| 589 | 333263 | 4/10/2018 | 2/23/2030 | 19.608 |
| 590 | 333408 | 4/10/2018 | 1/28/2030 | 19.614 |
| 591 | 333409 | 4/10/2018 | 1/28/2030 | 19.616 |
| 592 | 333417 | 4/10/2018 | 12/28/2029 | 19.602 |
| | December 2024 |
| | TECHNICAL REPORT –
MUSSELWHITE MINE, ONTARIO, CANADA
Document # C8630-0000-PM-RPT-001 – Rev. 0
|
| # | Claim Name | Claim
Acquisition Date | Claim Expiry
Date | Official Area
Value (ha) |
| (MM/DD/YYYY) | (MM/DD/YYYY) |
| 593 | 335004 | 4/10/2018 | 9/11/2030 | 19.614 |
| 594 | 335178 | 4/10/2018 | 11/6/2030 | 19.642 |
| 595 | 335631 | 4/10/2018 | 11/6/2030 | 19.640 |
| 596 | 335638 | 4/10/2018 | 9/11/2030 | 19.614 |
| 597 | 335644 | 4/10/2018 | 10/26/2030 | 19.612 |
| 598 | 336032 | 4/10/2018 | 6/24/2030 | 19.643 |
| 599 | 336036 | 4/10/2018 | 10/27/2030 | 19.647 |
| 600 | 336037 | 4/10/2018 | 10/27/2030 | 19.650 |
| 601 | 336654 | 4/10/2018 | 2/11/2030 | 19.650 |
| 602 | 337184 | 4/10/2018 | 9/11/2030 | 19.609 |
| 603 | 338274 | 4/10/2018 | 1/28/2030 | 19.612 |
| 604 | 339155 | 4/10/2018 | 9/12/2030 | 19.625 |
| 605 | 341140 | 4/10/2018 | 1/28/2030 | 19.642 |
| 606 | 342064 | 4/10/2018 | 11/6/2030 | 19.636 |
| 607 | 342078 | 4/10/2018 | 2/11/2030 | 19.634 |
| 608 | 343336 | 4/10/2018 | 10/27/2030 | 19.647 |
| 609 | 343337 | 4/10/2018 | 10/27/2030 | 19.647 |
| 610 | 343338 | 4/10/2018 | 10/27/2030 | 19.648 |
| 611 | 343353 | 4/10/2018 | 10/27/2030 | 19.650 |
| 612 | 344132 | 4/10/2018 | 9/26/2030 | 19.635 |
| 613 | 345411 | 4/10/2018 | 10/27/2030 | 19.653 |
| 614 | 583085 | 4/3/2020 | 2/11/2030 | 255.258 |
| 615 | 584784 | 4/16/2020 | 4/12/2030 | 235.080 |
| 616 | 587915 | 5/11/2020 | 6/10/2030 | 157.478 |
| 617 | 587916 | 5/11/2020 | 6/10/2030 | 157.478 |
| 618 | 587917 | 5/11/2020 | 4/7/2030 | 118.076 |
| 619 | 587918 | 5/11/2020 | 4/7/2030 | 137.756 |
| 620 | 587919 | 5/11/2020 | 4/7/2030 | 177.072 |
| 621 | 587920 | 5/11/2020 | 4/7/2030 | 177.022 |
| 622 | 587921 | 5/11/2020 | 4/7/2030 | 196.728 |
| 623 | 587922 | 5/11/2020 | 4/7/2030 | 196.728 |
| 624 | 587923 | 5/11/2020 | 4/7/2030 | 176.989 |
| 625 | 587924 | 5/11/2020 | 4/15/2030 | 176.989 |
| | December 2024 |
| | TECHNICAL REPORT –
MUSSELWHITE MINE, ONTARIO, CANADA
Document # C8630-0000-PM-RPT-001 – Rev. 0
|
| # | Claim Name | Claim
Acquisition Date | Claim Expiry
Date | Official Area
Value (ha) |
| (MM/DD/YYYY) | (MM/DD/YYYY) |
| 626 | 587925 | 5/11/2020 | 4/7/2030 | 157.272 |
| 627 | 587926 | 5/11/2020 | 4/15/2030 | 235.907 |
| 628 | 588001 | 5/12/2020 | 4/10/2025 | 156.279 |
| 629 | 588002 | 5/12/2020 | 4/10/2025 | 175.856 |
| 630 | 588003 | 5/12/2020 | 4/10/2025 | 175.906 |
| 631 | 588004 | 5/12/2020 | 4/10/2026 | 117.298 |
| 632 | 588005 | 5/12/2020 | 4/10/2026 | 156.279 |
| 633 | 588006 | 5/12/2020 | 4/10/2026 | 175.856 |
| 634 | 588007 | 5/12/2020 | 4/10/2026 | 136.819 |
| 635 | 588008 | 5/12/2020 | 4/10/2026 | 175.906 |
| 636 | 588009 | 5/12/2020 | 4/10/2026 | 117.182 |
| 637 | 588010 | 5/12/2020 | 4/10/2026 | 97.677 |
| 638 | 588011 | 5/12/2020 | 4/10/2026 | 175.856 |
| 639 | 588012 | 5/12/2020 | 4/10/2026 | 175.906 |
| 640 | 588013 | 5/12/2020 | 4/10/2026 | 117.137 |
| 641 | 588014 | 5/12/2020 | 4/10/2026 | 117.165 |
| 642 | 588015 | 5/12/2020 | 4/10/2026 | 97.635 |
| 643 | 588016 | 5/12/2020 | 4/10/2026 | 175.789 |
| 644 | 588017 | 5/12/2020 | 4/10/2026 | 117.187 |
| 645 | 588018 | 5/12/2020 | 4/10/2026 | 117.221 |
| 646 | 588019 | 5/12/2020 | 4/10/2026 | 175.823 |
| 647 | 588020 | 5/12/2020 | 4/10/2026 | 156.324 |
| 648 | 588021 | 5/12/2020 | 4/10/2026 | 117.243 |
| 649 | 588022 | 5/12/2020 | 4/10/2026 | 175.906 |
| 650 | 588023 | 5/12/2020 | 4/10/2026 | 117.132 |
| 651 | 588024 | 5/12/2020 | 4/10/2026 | 156.264 |
| 652 | 588025 | 5/12/2020 | 4/10/2026 | 117.232 |
| 653 | 588026 | 5/12/2020 | 1/11/2025 | 97.527 |
| 654 | 588027 | 5/12/2020 | 1/11/2025 | 117.037 |
| 655 | 588028 | 5/12/2020 | 4/10/2026 | 117.037 |
| 656 | 588029 | 5/12/2020 | 4/10/2026 | 117.037 |
| 657 | 588030 | 5/12/2020 | 4/10/2026 | 156.045 |
| 658 | 588031 | 5/12/2020 | 4/10/2026 | 156.084 |
| | December 2024 |
| | TECHNICAL REPORT –
MUSSELWHITE MINE, ONTARIO, CANADA
Document # C8630-0000-PM-RPT-001 – Rev. 0
|
| # | Claim Name | Claim
Acquisition Date | Claim Expiry
Date | Official Area
Value (ha) |
| (MM/DD/YYYY) | (MM/DD/YYYY) |
| 659 | 588032 | 5/12/2020 | 4/10/2026 | 117.070 |
| 660 | 588033 | 5/12/2020 | 4/10/2026 | 117.070 |
| 661 | 588034 | 5/12/2020 | 4/10/2026 | 175.605 |
| 662 | 588035 | 5/12/2020 | 4/10/2026 | 175.605 |
| 663 | 588036 | 5/12/2020 | 4/10/2026 | 117.104 |
| 664 | 588037 | 5/12/2020 | 4/10/2026 | 175.656 |
| 665 | 588038 | 5/12/2020 | 4/10/2026 | 175.656 |
| 666 | 588039 | 5/12/2020 | 4/10/2026 | 156.135 |
| 667 | 588040 | 5/12/2020 | 4/10/2026 | 117.132 |
| 668 | 588041 | 5/12/2020 | 4/10/2026 | 117.132 |
| 669 | 588042 | 5/12/2020 | 4/10/2026 | 175.706 |
| 670 | 588043 | 5/12/2020 | 4/10/2026 | 175.706 |
| 671 | 588044 | 5/12/2020 | 4/10/2026 | 156.168 |
| 672 | 588045 | 5/12/2020 | 4/10/2026 | 117.156 |
| 673 | 588046 | 5/12/2020 | 4/10/2026 | 175.772 |
| 674 | 588047 | 5/12/2020 | 4/10/2026 | 214.831 |
| 675 | 588048 | 5/12/2020 | 4/10/2026 | 117.210 |
| 676 | 588049 | 5/12/2020 | 4/10/2026 | 117.031 |
| 677 | 588050 | 5/12/2020 | 4/10/2026 | 156.049 |
| 678 | 588051 | 5/12/2020 | 4/10/2026 | 175.522 |
| 679 | 588052 | 5/12/2020 | 4/10/2026 | 117.043 |
| 680 | 588053 | 5/12/2020 | 4/10/2026 | 175.555 |
| 681 | 588054 | 5/12/2020 | 4/10/2025 | 136.615 |
| 682 | 588055 | 5/12/2020 | 4/10/2025 | 117.120 |
| 683 | 588056 | 5/12/2020 | 4/10/2025 | 195.158 |
| 684 | 588057 | 5/12/2020 | 4/10/2025 | 156.160 |
| 685 | 588058 | 5/12/2020 | 4/10/2025 | 97.560 |
| 686 | 588059 | 5/12/2020 | 4/10/2025 | 156.021 |
| 687 | 588060 | 5/12/2020 | 4/10/2025 | 175.572 |
| 688 | 588061 | 5/12/2020 | 4/10/2025 | 195.132 |
| 689 | 588062 | 5/12/2020 | 4/10/2025 | 194.959 |
| 690 | 588063 | 5/12/2020 | 4/10/2025 | 156.007 |
| 691 | 588064 | 5/12/2020 | 4/10/2025 | 175.555 |
| | December 2024 |
| | TECHNICAL REPORT –
MUSSELWHITE MINE, ONTARIO, CANADA
Document # C8630-0000-PM-RPT-001 – Rev. 0
|
| # | Claim Name | Claim
Acquisition Date | Claim Expiry
Date | Official Area
Value (ha) |
| (MM/DD/YYYY) | (MM/DD/YYYY) |
| 692 | 588065 | 5/12/2020 | 4/10/2025 | 136.576 |
| 693 | 588066 | 5/12/2020 | 4/10/2025 | 175.505 |
| 694 | 588067 | 5/12/2020 | 4/10/2025 | 156.042 |
| 695 | 588068 | 5/12/2020 | 4/10/2025 | 156.071 |
| 696 | 588069 | 5/12/2020 | 4/10/2025 | 155.968 |
| 697 | 588070 | 5/12/2020 | 4/10/2025 | 175.505 |
| 698 | 588071 | 5/12/2020 | 4/10/2025 | 156.042 |
| 699 | 588072 | 5/12/2020 | 4/10/2025 | 156.071 |
| 700 | 588073 | 5/12/2020 | 4/10/2025 | 116.953 |
| 701 | 588074 | 5/12/2020 | 4/10/2025 | 175.472 |
| 702 | 588075 | 5/12/2020 | 4/10/2025 | 136.506 |
| 703 | 588077 | 5/12/2020 | 4/10/2025 | 116.931 |
| 704 | 588078 | 5/12/2020 | 4/10/2025 | 155.938 |
| 705 | 588079 | 5/12/2020 | 4/10/2025 | 136.476 |
| 706 | 588080 | 5/12/2020 | 4/10/2025 | 97.445 |
| 707 | 588081 | 5/12/2020 | 4/10/2025 | 116.931 |
| 708 | 588082 | 5/12/2020 | 4/10/2025 | 116.942 |
| 709 | 588083 | 5/12/2020 | 4/10/2025 | 116.964 |
| 710 | 588084 | 5/12/2020 | 4/10/2025 | 116.964 |
| 711 | 588085 | 5/12/2020 | 4/10/2025 | 155.908 |
| 712 | 588086 | 5/12/2020 | 4/10/2025 | 116.920 |
| 713 | 588087 | 5/12/2020 | 4/10/2025 | 116.942 |
| 714 | 588088 | 5/12/2020 | 4/10/2025 | 116.920 |
| 715 | 588089 | 5/12/2020 | 4/10/2025 | 116.942 |
| 716 | 588090 | 5/12/2020 | 4/10/2025 | 116.920 |
| 717 | 588091 | 5/12/2020 | 4/10/2025 | 116.942 |
| 718 | 588092 | 5/12/2020 | 4/10/2025 | 116.920 |
| 719 | 588093 | 5/12/2020 | 4/10/2025 | 116.942 |
| 720 | 588094 | 5/12/2020 | 4/10/2025 | 116.920 |
| 721 | 588095 | 5/12/2020 | 4/10/2025 | 116.942 |
| 722 | 588096 | 5/12/2020 | 4/10/2025 | 155.908 |
| 723 | 588097 | 5/12/2020 | 4/10/2025 | 116.927 |
| 724 | 588098 | 5/12/2020 | 4/10/2025 | 97.401 |
| | December 2024 |
| | TECHNICAL REPORT –
MUSSELWHITE MINE, ONTARIO, CANADA
Document # C8630-0000-PM-RPT-001 – Rev. 0
|
| # | Claim Name | Claim
Acquisition Date | Claim Expiry
Date | Official Area
Value (ha) |
| (MM/DD/YYYY) | (MM/DD/YYYY) |
| 725 | 588140 | 5/12/2020 | 4/10/2025 | 175.381 |
| 726 | 588141 | 5/12/2020 | 4/10/2025 | 116.942 |
| 727 | 588142 | 5/12/2020 | 4/10/2025 | 136.459 |
| 728 | 588161 | 5/12/2020 | 4/10/2025 | 175.422 |
| 729 | 588162 | 5/12/2020 | 4/10/2025 | 155.973 |
| 730 | 588163 | 5/12/2020 | 4/10/2025 | 194.892 |
| 731 | 588164 | 5/12/2020 | 4/10/2025 | 175.455 |
| 732 | 588165 | 5/12/2020 | 4/10/2025 | 155.997 |
| 733 | 588166 | 5/12/2020 | 4/10/2025 | 175.422 |
| 734 | 588167 | 5/12/2020 | 4/10/2025 | 175.472 |
| 735 | 588168 | 5/12/2020 | 4/10/2025 | 136.512 |
| 736 | 588184 | 5/12/2020 | 4/10/2025 | 116.942 |
| 737 | 588185 | 5/12/2020 | 4/10/2025 | 175.455 |
| 738 | 588186 | 5/12/2020 | 4/10/2025 | 175.505 |
| 739 | 588187 | 5/12/2020 | 4/10/2025 | 136.541 |
| 740 | 588188 | 5/12/2020 | 4/10/2025 | 136.491 |
| 741 | 588189 | 5/12/2020 | 4/10/2025 | 117.020 |
| 742 | 588190 | 5/12/2020 | 4/10/2025 | 117.043 |
| 743 | 588191 | 5/12/2020 | 4/10/2025 | 156.012 |
| 744 | 588192 | 5/12/2020 | 4/10/2025 | 175.555 |
| 745 | 588193 | 5/12/2020 | 4/10/2025 | 156.090 |
| 746 | 588194 | 5/12/2020 | 4/10/2025 | 195.021 |
| 747 | 588195 | 5/12/2020 | 4/10/2025 | 175.555 |
| 748 | 588196 | 5/12/2020 | 4/10/2025 | 175.605 |
| 749 | 588197 | 5/12/2020 | 4/10/2025 | 195.173 |
| 750 | 588198 | 5/12/2020 | 4/10/2025 | 175.438 |
| 751 | 588211 | 5/13/2020 | 4/10/2025 | 175.438 |
| 752 | 588212 | 5/13/2020 | 4/10/2025 | 175.438 |
| 753 | 588213 | 5/13/2020 | 4/10/2025 | 175.438 |
| 754 | 588214 | 5/13/2020 | 4/10/2025 | 155.982 |
| 755 | 588215 | 5/13/2020 | 4/10/2025 | 175.488 |
| 756 | 588216 | 5/13/2020 | 4/10/2025 | 175.488 |
| 757 | 588217 | 5/13/2020 | 4/10/2025 | 136.487 |
| | December 2024 |
| | TECHNICAL REPORT –
MUSSELWHITE MINE, ONTARIO, CANADA
Document # C8630-0000-PM-RPT-001 – Rev. 0
|
| # | Claim Name | Claim
Acquisition Date | Claim Expiry
Date | Official Area
Value (ha) |
| (MM/DD/YYYY) | (MM/DD/YYYY) |
| 758 | 588218 | 5/13/2020 | 4/10/2025 | 175.522 |
| 759 | 588219 | 5/13/2020 | 4/10/2025 | 195.028 |
| 760 | 588220 | 5/13/2020 | 4/10/2025 | 175.572 |
| 761 | 588221 | 5/13/2020 | 4/10/2025 | 175.572 |
| 762 | 588222 | 5/13/2020 | 4/10/2025 | 175.572 |
| 763 | 588223 | 5/13/2020 | 4/10/2025 | 156.044 |
| 764 | 588224 | 5/13/2020 | 4/10/2025 | 175.539 |
| 765 | 588225 | 5/13/2020 | 4/10/2025 | 156.027 |
| 766 | 588226 | 5/13/2020 | 4/10/2025 | 175.539 |
| 767 | 588227 | 5/13/2020 | 4/10/2025 | 175.589 |
| 768 | 588228 | 5/13/2020 | 4/10/2025 | 175.589 |
| 769 | 588229 | 5/13/2020 | 4/10/2025 | 156.077 |
| 770 | 588230 | 5/13/2020 | 4/10/2025 | 156.101 |
| 771 | 588231 | 5/13/2020 | 4/10/2025 | 156.101 |
| 772 | 588232 | 5/13/2020 | 4/10/2025 | 156.110 |
| 773 | 588233 | 5/13/2020 | 4/10/2025 | 175.633 |
| 774 | 588234 | 5/13/2020 | 4/10/2025 | 175.639 |
| 775 | 588235 | 5/13/2020 | 4/10/2025 | 156.116 |
| 776 | 588236 | 5/13/2020 | 4/10/2025 | 156.151 |
| 777 | 588237 | 5/13/2020 | 4/10/2025 | 175.672 |
| 778 | 588238 | 5/13/2020 | 4/10/2025 | 175.689 |
| 779 | 588239 | 5/13/2020 | 4/10/2025 | 175.689 |
| 780 | 588240 | 5/13/2020 | 4/15/2030 | 157.272 |
| 781 | 588241 | 5/13/2020 | 1/28/2030 | 117.915 |
| 782 | 588242 | 5/13/2020 | 2/11/2030 | 235.604 |
| 783 | 588243 | 5/13/2020 | 1/28/2030 | 176.573 |
| 784 | 588244 | 5/13/2020 | 1/28/2030 | 176.523 |
| 785 | 588245 | 5/13/2020 | 1/28/2030 | 176.473 |
| 786 | 588246 | 5/13/2020 | 1/28/2030 | 254.905 |
| 787 | 588247 | 5/13/2020 | 1/28/2030 | 235.219 |
| 788 | 588248 | 5/13/2020 | 1/28/2030 | 156.813 |
| 789 | 588249 | 5/13/2020 | 10/7/2030 | 235.219 |
| 790 | 588250 | 5/13/2020 | 4/7/2030 | 156.754 |
| | December 2024 |
| | TECHNICAL REPORT –
MUSSELWHITE MINE, ONTARIO, CANADA
Document # C8630-0000-PM-RPT-001 – Rev. 0
|
| # | Claim Name | Claim
Acquisition Date | Claim Expiry
Date | Official Area
Value (ha) |
| (MM/DD/YYYY) | (MM/DD/YYYY) |
| 791 | 588251 | 5/13/2020 | 4/7/2030 | 176.356 |
| 792 | 588252 | 5/13/2020 | 4/7/2030 | 176.356 |
| 793 | 588253 | 5/13/2020 | 4/7/2030 | 156.694 |
| 794 | 588254 | 5/13/2020 | 4/7/2030 | 176.306 |
| 795 | 588255 | 5/13/2020 | 4/7/2030 | 117.510 |
| 796 | 588256 | 5/13/2020 | 10/22/2030 | 195.566 |
| 797 | 588257 | 5/13/2020 | 10/22/2030 | 175.956 |
| 798 | 588258 | 5/13/2020 | 10/22/2030 | 175.906 |
| 799 | 588259 | 5/13/2020 | 10/22/2030 | 156.294 |
| 800 | 588260 | 5/13/2020 | 10/22/2030 | 175.789 |
| 801 | 588261 | 5/13/2020 | 10/22/2030 | 117.159 |
| 802 | 592255 | 5/25/2020 | 4/12/2030 | 176.373 |
| 803 | 592256 | 5/25/2020 | 4/12/2030 | 176.369 |
| 804 | 592257 | 5/25/2020 | 4/12/2030 | 176.323 |
| 805 | 592258 | 5/25/2020 | 4/12/2030 | 156.694 |
| 806 | 592259 | 5/25/2020 | 4/12/2030 | 215.397 |
| 807 | 592260 | 5/25/2020 | 10/22/2030 | 117.460 |
| 808 | 592261 | 5/25/2020 | 10/22/2030 | 117.460 |
| 809 | 592418 | 5/26/2020 | 10/20/2030 | 176.190 |
| 810 | 592419 | 5/26/2020 | 7/16/2030 | 156.635 |
| 811 | 592420 | 5/26/2020 | 7/16/2030 | 156.635 |
| 812 | 592421 | 5/26/2020 | 7/16/2030 | 156.576 |
| 813 | 592422 | 5/26/2020 | 7/16/2030 | 156.576 |
| 814 | 592423 | 5/26/2020 | 10/22/2030 | 273.943 |
| 815 | 592424 | 5/26/2020 | 4/10/2025 | 175.388 |
| 816 | 592425 | 5/26/2020 | 4/10/2025 | 175.388 |
| 817 | 592426 | 5/26/2020 | 4/10/2025 | 175.310 |
| 818 | 592427 | 5/26/2020 | 4/10/2025 | 175.338 |
| 819 | 592428 | 5/26/2020 | 4/10/2025 | 175.388 |
| 820 | 592429 | 5/26/2020 | 4/10/2025 | 175.338 |
| 821 | 592430 | 5/26/2020 | 4/10/2025 | 175.288 |
| 822 | 592431 | 5/26/2020 | 4/10/2025 | 155.778 |
| 823 | 592432 | 5/26/2020 | 4/10/2025 | 175.243 |
| | December 2024 |
| | TECHNICAL REPORT –
MUSSELWHITE MINE, ONTARIO, CANADA
Document # C8630-0000-PM-RPT-001 – Rev. 0
|
| # | Claim Name | Claim
Acquisition Date | Claim Expiry
Date | Official Area
Value (ha) |
| (MM/DD/YYYY) | (MM/DD/YYYY) |
| 824 | 592433 | 5/26/2020 | 4/10/2025 | 175.288 |
| 825 | 592434 | 5/26/2020 | 4/10/2025 | 175.338 |
| 826 | 592435 | 5/26/2020 | 4/10/2025 | 175.388 |
| 827 | 592436 | 5/26/2020 | 4/10/2025 | 175.388 |
| 828 | 592437 | 5/26/2020 | 4/10/2025 | 116.892 |
| 829 | 592438 | 5/26/2020 | 4/10/2025 | 175.288 |
| 830 | 592439 | 5/26/2020 | 4/10/2025 | 194.690 |
| 831 | 592440 | 5/26/2020 | 4/10/2025 | 175.137 |
| 832 | 592441 | 5/26/2020 | 4/10/2025 | 175.187 |
| 833 | 592442 | 5/26/2020 | 4/10/2025 | 175.238 |
| 834 | 592443 | 5/26/2020 | 4/10/2025 | 175.351 |
| 835 | 592444 | 5/26/2020 | 4/10/2025 | 175.187 |
| 836 | 592445 | 5/26/2020 | 4/10/2025 | 175.137 |
| 837 | 592446 | 5/26/2020 | 4/10/2025 | 116.753 |
| 838 | 592447 | 5/26/2020 | 4/10/2025 | 175.171 |
| 839 | 592448 | 5/26/2020 | 4/10/2025 | 175.221 |
| 840 | 592449 | 5/26/2020 | 4/10/2025 | 116.842 |
| 841 | 592450 | 5/26/2020 | 4/10/2025 | 175.221 |
| 842 | 592451 | 5/26/2020 | 4/10/2025 | 175.171 |
| 843 | 592452 | 5/26/2020 | 4/10/2025 | 116.753 |
| 844 | 592453 | 5/26/2020 | 4/10/2025 | 155.670 |
| 845 | 592454 | 5/26/2020 | 4/10/2025 | 175.171 |
| 846 | 592455 | 5/26/2020 | 4/10/2025 | 175.221 |
| 847 | 592456 | 5/26/2020 | 4/10/2025 | 155.789 |
| 848 | 592457 | 5/26/2020 | 4/10/2025 | 155.789 |
| 849 | 592458 | 5/26/2020 | 4/10/2025 | 175.221 |
| 850 | 592459 | 5/26/2020 | 4/10/2025 | 175.171 |
| 851 | 592460 | 5/26/2020 | 4/10/2025 | 155.670 |
| 852 | 592461 | 5/26/2020 | 4/10/2025 | 175.171 |
| 853 | 592462 | 5/26/2020 | 4/10/2025 | 175.221 |
| 854 | 592463 | 5/26/2020 | 4/10/2025 | 155.789 |
| 855 | 592464 | 5/26/2020 | 4/10/2025 | 175.221 |
| 856 | 592465 | 5/26/2020 | 4/10/2025 | 175.171 |
| | December 2024 |
| | TECHNICAL REPORT –
MUSSELWHITE MINE, ONTARIO, CANADA
Document # C8630-0000-PM-RPT-001 – Rev. 0
|
| # | Claim Name | Claim
Acquisition Date | Claim Expiry
Date | Official Area
Value (ha) |
| (MM/DD/YYYY) | (MM/DD/YYYY) |
| 857 | 592466 | 5/26/2020 | 4/10/2025 | 155.670 |
| 858 | 592467 | 5/26/2020 | 4/10/2025 | 155.670 |
| 859 | 592468 | 5/26/2020 | 4/10/2025 | 155.715 |
| 860 | 592469 | 5/26/2020 | 4/10/2025 | 175.238 |
| 861 | 592470 | 5/26/2020 | 4/10/2025 | 136.253 |
| 862 | 592599 | 5/26/2020 | 4/10/2025 | 175.238 |
| 863 | 592600 | 5/26/2020 | 4/10/2025 | 175.187 |
| 864 | 592601 | 5/26/2020 | 4/10/2025 | 175.238 |
| 865 | 592602 | 5/26/2020 | 4/10/2025 | 175.187 |
| 866 | 592603 | 5/26/2020 | 4/10/2025 | 136.253 |
| 867 | 592604 | 5/26/2020 | 4/10/2025 | 175.238 |
| 868 | 592605 | 5/26/2020 | 4/10/2025 | 175.238 |
| 869 | 592606 | 5/26/2020 | 4/10/2025 | 155.730 |
| 870 | 592607 | 5/26/2020 | 4/10/2025 | 155.700 |
| 871 | 592608 | 5/26/2020 | 4/10/2025 | 155.700 |
| 872 | 592609 | 5/26/2020 | 4/10/2025 | 155.730 |
| 873 | 592610 | 5/26/2020 | 4/10/2025 | 175.238 |
| 874 | 592611 | 5/26/2020 | 4/10/2025 | 116.859 |
| 875 | 592612 | 5/26/2020 | 4/10/2025 | 175.288 |
| 876 | 592613 | 5/26/2020 | 4/10/2025 | 175.238 |
| 877 | 592614 | 5/26/2020 | 4/10/2025 | 155.700 |
| 878 | 592615 | 5/26/2020 | 4/10/2025 | 155.730 |
| 879 | 592616 | 5/26/2020 | 4/10/2025 | 175.238 |
| 880 | 592617 | 5/26/2020 | 4/10/2025 | 175.288 |
| 881 | 592618 | 5/26/2020 | 4/10/2025 | 175.288 |
| 882 | 592619 | 5/26/2020 | 4/10/2025 | 175.238 |
| 883 | 592620 | 5/26/2020 | 4/10/2025 | 155.730 |
| 884 | 592621 | 5/26/2020 | 4/10/2025 | 155.700 |
| 885 | 592622 | 5/26/2020 | 4/10/2025 | 155.700 |
| 886 | 592623 | 5/26/2020 | 4/10/2025 | 155.730 |
| 887 | 592624 | 5/26/2020 | 4/10/2025 | 175.238 |
| 888 | 592625 | 5/26/2020 | 4/10/2025 | 175.288 |
| 889 | 592626 | 5/26/2020 | 4/10/2025 | 175.288 |
| | December 2024 |
| | TECHNICAL REPORT –
MUSSELWHITE MINE, ONTARIO, CANADA
Document # C8630-0000-PM-RPT-001 – Rev. 0
|
| # | Claim Name | Claim
Acquisition Date | Claim Expiry
Date | Official Area
Value (ha) |
| (MM/DD/YYYY) | (MM/DD/YYYY) |
| 890 | 592627 | 5/26/2020 | 4/10/2025 | 175.288 |
| 891 | 592628 | 5/26/2020 | 4/10/2025 | 175.238 |
| 892 | 592629 | 5/26/2020 | 4/10/2025 | 155.730 |
| 893 | 592630 | 5/26/2020 | 4/10/2025 | 155.700 |
| 894 | 592631 | 5/26/2020 | 4/10/2025 | 116.775 |
| 895 | 592632 | 5/26/2020 | 4/10/2025 | 194.653 |
| 896 | 592633 | 5/26/2020 | 4/10/2025 | 175.204 |
| 897 | 592634 | 5/26/2020 | 4/10/2025 | 77.883 |
| 898 | 592635 | 5/26/2020 | 4/10/2025 | 97.354 |
| 899 | 592636 | 5/26/2020 | 4/10/2025 | 116.825 |
| 900 | 592637 | 5/26/2020 | 4/10/2025 | 116.825 |
| 901 | 592638 | 5/26/2020 | 4/10/2025 | 97.352 |
| 902 | 592639 | 5/26/2020 | 4/10/2025 | 116.814 |
| 903 | 592640 | 5/26/2020 | 4/10/2025 | 116.781 |
| 904 | 592641 | 5/26/2020 | 4/10/2025 | 175.238 |
| 905 | 592642 | 5/26/2020 | 4/12/2030 | 195.974 |
| 906 | 594470 | 6/8/2020 | 4/7/2030 | 235.064 |
| 907 | 594471 | 6/8/2020 | 9/21/2030 | 136.784 |
| 908 | 594472 | 6/8/2020 | 4/10/2026 | 175.739 |
| 909 | 594473 | 6/8/2020 | 4/12/2030 | 176.323 |
| 910 | 594474 | 6/8/2020 | 4/12/2030 | 156.694 |
| 911 | 594475 | 6/8/2020 | 4/12/2030 | 176.240 |
| 912 | 594476 | 6/8/2020 | 10/20/2030 | 234.953 |
| 913 | 594477 | 6/8/2020 | 10/20/2030 | 176.240 |
| 914 | 594478 | 6/8/2020 | 10/22/2030 | 176.140 |
| 915 | 594479 | 6/8/2020 | 10/22/2030 | 176.140 |
| 916 | 594480 | 6/8/2020 | 10/22/2030 | 156.517 |
| 917 | 594481 | 6/8/2020 | 10/22/2030 | 215.213 |
| 918 | 594482 | 6/8/2020 | 4/10/2025 | 175.288 |
| 919 | 594483 | 6/8/2020 | 4/10/2025 | 194.816 |
| 920 | 594484 | 6/8/2020 | 4/10/2025 | 175.288 |
| 921 | 594485 | 6/8/2020 | 4/10/2025 | 175.238 |
| 922 | 594486 | 6/8/2020 | 4/10/2025 | 116.842 |
| | December 2024 |
| | TECHNICAL REPORT –
MUSSELWHITE MINE, ONTARIO, CANADA
Document # C8630-0000-PM-RPT-001 – Rev. 0
|
| # | Claim Name | Claim
Acquisition Date | Claim Expiry
Date | Official Area
Value (ha) |
| (MM/DD/YYYY) | (MM/DD/YYYY) |
| 923 | 594487 | 6/8/2020 | 4/10/2025 | 175.305 |
| 924 | 594488 | 6/8/2020 | 11/3/2025 | 155.730 |
| 925 | 594489 | 6/8/2020 | 11/3/2025 | 155.730 |
| 926 | 594490 | 6/8/2020 | 11/3/2025 | 155.730 |
| 927 | 594491 | 6/8/2020 | 11/3/2025 | 155.730 |
| 928 | 594492 | 6/8/2020 | 11/3/2025 | 155.730 |
| 929 | 594493 | 6/8/2020 | 11/3/2025 | 155.730 |
| 930 | 869648 | 12/5/2023 | 12/5/2025 | 19.462 |
| 931 | 869649 | 12/5/2023 | 12/5/2025 | 19.462 |
| 932 | 869650 | 12/5/2023 | 12/5/2025 | 19.462 |
| 933 | 869651 | 12/5/2023 | 12/5/2025 | 19.462 |
| 934 | 869658 | 12/5/2023 | 12/5/2025 | 19.461 |
| 935 | 869659 | 12/5/2023 | 12/5/2025 | 19.461 |
| 936 | 869660 | 12/5/2023 | 12/5/2025 | 19.461 |
| 937 | 870044 | 12/11/2023 | 12/11/2025 | 19.652 |
| 938 | 870045 | 12/11/2023 | 12/11/2025 | 19.652 |
| 939 | 870046 | 12/11/2023 | 12/11/2025 | 19.653 |
| 940 | 870047 | 12/11/2023 | 12/11/2025 | 19.653 |
| | December 2024 |